camp butner live-site uxo classification using hierarchical clustering and gaussian mixture modeling
TRANSCRIPT

5218 IEEE TRANSACTIONS ON GEOSCIENCE AND REMOTE SENSING, VOL. 52, NO. 8, AUGUST 2014
Camp Butner Live-Site UXO ClassificationUsing Hierarchical Clustering and
Gaussian Mixture ModelingAlex Bijamov, Juan Pablo Fernández, Benjamin E. Barrowes, Member, IEEE, Irma Shamatava,
Kevin O’Neill, and Fridon Shubitidze, Senior Member, IEEE
Abstract—We demonstrate in detail a semisupervised scheme toclassify unexploded ordnance (UXO) by using as an example thedata collected with a time-domain electromagnetic towed array de-tection system during a live-site blind test conducted at the formerCamp Butner in North Carolina, USA. The model that we use tocharacterize targets and generate discrimination features relies ona solution of the inverse UXO problem using the orthonormalizedvolume magnetic source model. Unlike other classification tech-niques, which often rely on library matching or expert knowledge,our combined clustering/Gaussian-mixture-model approach firstuses the inherent properties of the data in feature space to build acustom training list that is then used to score all unknown targetsby assigning them a likelihood of being UXO. The ground truth forthe most likely candidates is then requested and used to correct themodel parameters and reassign the scores. The process is repeatedseveral times until the desired statistical margin is reached, atwhich point a final dig is produced. Our method could decreaseintervention by human experts and, as the results of the blindtest show, identify all targets of interest correctly while minimizingfalse-alarm counts.
Index Terms—Agglomerative hierarchical clustering, CampButner, classification, electromagnetic induction (EMI), ESTCP,inverse problems, ONVMS, semisupervised learning, unexplodedordnance (UXO).
I. INTRODUCTION
UNEXPLODED ordnance (UXO) are a deadly remnant ofpast wars and military training. Unexploded bombs and
mortar rounds, dating back to World War I or even further,continue to be found and keep posing a significant humanitarian
Manuscript received December 11, 2012; revised May 1, 2013 andSeptember 10, 2013; accepted October 15, 2013. This work was supported inpart by the Strategic Environmental Research and Development Program underProject MR-1572.
A. Bijamov and F. Shubitidze are with Thayer School of Engineering,Dartmouth College, Hanover, NH 03755 USA (e-mail: [email protected]).
J. P. Fernández was with Thayer School of Engineering, Dartmouth College,Hanover, NH 03755 USA. He is now with MathWorks, Inc., Natick, MA 01760USA.
B. E. Barrowes is with the U.S. Army Cold Regions Research and Engi-neering Laboratory, Hanover, NH 03755 USA, and also with Thayer School ofEngineering, Dartmouth College, Hanover, NH 03755 USA.
I. Shamatava is with Thayer School of Engineering, Dartmouth College,Hanover, NH 03755 USA, and also with Sky Research, Inc., Hanover, NH03755 USA.
K. O’Neill is with Thayer School of Engineering, Dartmouth College,Hanover, NH 03755 USA.
Color versions of one or more of the figures in this paper are available onlineat http://ieeexplore.ieee.org.
Digital Object Identifier 10.1109/TGRS.2013.2287510
risk in our time. The character and pervasiveness of modernwarfare have caused the number of UXO to grow significantly.In the U.S. alone, there are approximately ten million acres ofland that were once used by the Department of Defense or theDepartment of Energy for training purposes and are now poten-tially contaminated with UXO. The detection and disposal ofUXO is an expensive and time-consuming process that makesthe cleaning up of contaminated land a major environmentalchallenge. Because it is not yet practical to detect the explosivewithin more or less intact buried ordnance, one must insteaddetect the ordnance itself, i.e., its metal structure. While it isrelatively easy to detect buried metallic objects of any kind,it is not trivial to differentiate them by type: Depending ontheir location, potentially dangerous targets of interest (TOI)and innocuous clutter can produce magnetic-field anomalies ofcomparable magnitude. Typically, a more sophisticated analysismust be carried out to determine the exact nature of the sourceproducing a given measured response.
Recent years have seen the development of various sensingtechnologies based on electromagnetic induction (EMI) [1]–[3], which involves a range of frequencies between tens of hertzand hundreds of kilohertz in which the ground is essentiallytransparent. In land-based UXO detection scenarios, one orseveral EMI transmitters are used to send a “primary” magneticfield through the ground, which induces eddy currents andmagnetic response in nearby metallic bodies. In time-domainEMI systems, in accordance with Faraday’s law, turning theexcitation off causes underground objects to produce a time-decaying (“secondary”) EMI field that is then detected by oneor more receivers and analyzed. Physical differences in theshape and composition of targets (their volume, metal thick-ness, etc.) cause these secondary signals to have different time-decay characteristics (e.g., initial intensity, early- or late-timedecay rate) even after the effects of the targets’ locations andorientations with respect to the sensor have been factored out.
The Environmental Security Technology Certification Pro-gram (ESTCP) recently launched a series of blind tests atincreasingly challenging and complex live sites [4]–[6] todemonstrate the state of the art in EMI detection technologiesand UXO discrimination and classification algorithms. Thefirst test was conducted in 2007 at the former Camp Sibert inAlabama, USA, using first-generation sensors (the commer-cially available EM61-MK2 and EM63, both developed byGeonics Ltd.). The Sibert test was relatively simple: one hadto discriminate well-isolated large intact 4.2′′ mortars from
0196-2892 © 2013 IEEE. Personal use is permitted, but republication/redistribution requires IEEE permission.See http://www.ieee.org/publications_standards/publications/rights/index.html for more information.

BIJAMOV et al.: UXO CLASSIFICATION USING HIERARCHICAL CLUSTERING AND GMM 5219
smaller range scrap, shrapnel, and cultural debris. The secondESTCP discrimination study was set up in 2009 at the UXOsite in San Luis Obispo (SLO), CA, and featured both a morechallenging topography and a wider mix of TOI [4], [5]. Mag-netometers and first-generation EMI sensors were deployedto the site and used for an initial exploratory survey. Threeadvanced EMI sensing systems were then used to perform aclose interrogation of the detected anomalies. Among the mu-nitions buried at SLO were 60-mm and 81-mm projectiles, 4.2′′
mortars, and 2.36′′ rockets; three additional types of ordnancewere discovered during the course of the demonstration.
In this paper, we concentrate on the third ESTCP discrimina-tion test, which took place at the former Camp Butner, locatedapproximately 15 mi north of the city of Durham and straddlingDurham, Granville, and Person Counties, all in North Carolina[7]–[9]. The War Department acquired the 40,384-acre propertyfrom private landowners in 1942 and used it during WorldWar II as a training and cantonment facility for infantry di-visions (including the 78th, 89th, and 4th) and miscellaneousartillery and engineering units [5]. A large variety of munitionshave been reported as used at the camp, including rifle grenades,2.36′′ rockets, 37- and 40-mm rounds, 81-mm mortars, and105-, 155-, and 240-mm projectiles [5]. The particular rangechosen for the test was known to contain mainly M48 fuzes,37-mm rounds (some with a copper driving band and somewithout), and 105-mm projectiles, along with explosionbyproducts such as partial mortars (i.e., stretched-out half-shells), smaller shrapnel, and artificial metallic clutter. Therewere 2291 anomalies in total, of which 171 were TOI.
Although we briefly discuss the processes of data acqui-sition and inversion, our main objective here is to report onthe performance of an automated classification approach thatreduces human involvement (and human error) and attempts toprocess data with high sensitivity (i.e., detecting all potentiallydangerous targets) and specificity (i.e., leaving buried as manyinnocuous targets as possible). Several clustering and statisticalsignal processing techniques [10] have been used previously toidentify UXO starting from magnetometer and EMI data [11]–[14]. In at least one case, the classification is based on “shapeand size information” extracted from direct magnetic field ob-servations “examined visually” and “viewed as [. . .] image[s],”with no underlying physical model [15]. (The method presentedin that reference is found to outperform a physics-based model,although that may be because the physics in the model is notquite correct.) Library matching and support vector machines orneural-net-based decision-making [16]–[23] have been studiedand applied to UXO classification based on different features,such as size or temporal decay [9]. Instances of successfulapplication of Bayesian data fusion, multivariate Gaussianrepresentation of EMI signals, and semisupervised learningtechniques have been also reported [24]–[27]. Most of thesetechniques, which are based on the simple dipole model, requirehuman knowledge and intervention and need a sample of train-ing data, which in some cases may not be representative, or evenavailable. The work in [10] describes a procedure that lookssimultaneously for relevant features and classification protocolsand is thus similar in spirit and more general than the one pro-posed here. On the other hand, that procedure is designed and
honed for tasks with high dimensionality and possibly many ir-relevant features; as we shall see in the following, the data at ourdisposal has very few dimensions, and every feature is germane.
The goal of our automated classification process, which usesa more detailed model to invert the data and provide classifi-cation features, is to reduce the workload of human experts byhaving them perform the crucial tasks of decision-making andquality control while delegating to the software routine taskssuch as feature extraction, clustering, and labeling. Anotherfeature of our method is that it does not require any precollectedtraining data. Instead, the algorithm “trains itself” by askingfor a set of anomalies to be unearthed—either because theirfeatures are particularly representative of an already identifiedcategory of targets, or because they belong to a yet-unexploredregion of the feature space—and then taking in the new knowl-edge. At the first stage of the process, the method examinesthe data and uses only unsupervised learning techniques tobuild and request a custom training set required to identifythe “suspicious” regions characterizing all the types of UXOexpected at the site. Once this partial truth is known, the modelincorporates it and starts an iterative process, internally updat-ing its settings to accommodate newly available informationand then either requesting more ground truth to further fine-tune the classification or, at the end, providing a final priority-weighted dig list.
The third and most important feature of the method is itsperformance. On the Camp Butner test, our procedure yielded100% accuracy in TOI detection and by-caliber classification;it required 295 false alarms to be dug out, thus leaving in theground more than 85% of the clutter.
II. METHODS
A. Data Acquisition
The data presented here were acquired at Camp Butner usingthe time-domain electromagnetic towed array detection system(TEMTADS), an outstanding next-generation EMI sensor de-veloped by the Naval Research Laboratory, SAIC, and G&GSciences that had previously been used at SLO. TEMTADSconsists of 25 horizontal collocated transmit/receive pairs, eachcomposed of a 35-cm square transmitter coil surrounding a25-cm square receiver coil, arranged in a rectangular 5 × 5 gridwith 40-cm neighbor-to-neighbor separation [28] (see Fig. 1);this rigid arrangement greatly enhances the positional accuracyof the apparatus. During a measurement, the transmitters are ac-tivated one by one, in sequence, with all 25 receivers receiving;625 transients are obtained as a result, sampled logarithmicallyover 123 time gates ranging from approximately 100μs to 25 ms.The sensor thus gathers the secondary field under differentillumination conditions and provides a wide and diverse arrayof data for processing and inversion. It was possible to collectdata with TEMTADS because the site topography was ratherbenign, i.e., flat, grassy, and treeless.
B. Data Inversion
UXO discrimination demands a fast and accurate repre-sentation of a target’s EMI response. The model used most

5220 IEEE TRANSACTIONS ON GEOSCIENCE AND REMOTE SENSING, VOL. 52, NO. 8, AUGUST 2014
Fig. 1. Schematic of the TEMTADS sensor array and its transmit/receive pairs.
frequently for this purpose approximates the whole object witha set of orthogonal colocated point dipoles whose inducedeffective moment is related to the primary field through asymmetric polarizability tensor [29]. The model is fast and easyto implement and interpret, but it rests on assumptions thatoften limit its usefulness [30]. Large and complex targets (e.g.,those containing sections with different materials, fins, rings,etc.) require more advanced methods such as the normalizedsurface magnetic source (NSMS) model [31]–[34] that we usedat Camp Sibert and SLO [23]. The NSMS method spreads anonuniform distribution of normally oriented dipole moment(scaled by the primary field) over a virtual prolate spheroidalsurface that encloses the target. This distribution can be deter-mined directly by minimizing the difference between measuredand modeled data for a known object-sensor combination at agiven relative location and orientation. The integral of the distri-bution over the spheroidal surface is a global effective magneticpolarizability (referred to as “total NSMS”) that generalizes thepolarizability tensor of the dipole model and provides a morerigorous description of a single object.
In real-world situations, however, TOI tend to be surroundedby metallic debris and often cluster together. In consequence,it is often not clear if a given detected signal originates fromone target or from a number of them. This uncertainty hinderedthe performance of our classification scheme in the SLO test[23] and prompted us to look for a characterization modelthat would properly decouple overlapping signals. The resultwas the orthonormalized volume magnetic source (ONVMS)model [35], [36], which represents subsurface scatterers usinga volumetric distribution of magnetic field sources and searchesfor the optimal configuration of source locations and strengthsproducing a given measured response.
The ONVMS model starts from the assumption that there area number M of point dipoles within a computational volumethat coincides with the field of view of the sensor. The magneticfield due to the ith dipole can be expressed at any observationpoint r as the matrix–vector product
H(r) = Gi(r)mi, (1)
where Gi is the Green function associated with the source, andmi is its dipole moment [30]. When there are several such
sources the total field is the superposition
H(r) =
M∑i=1
Gi(r)mi = [G1 G2 · · ·]
⎡⎣m1
m2...
⎤⎦ , (2)
which can be inverted via a least-squares search to find thelocations and dipole moments of the sources given an arrayof measured H-values corresponding to multiple transmitters,multiple receivers, and different vector components. This mul-titarget dipole model works well for one or two sources, butfor larger numbers (and thus matrix sizes) becomes time-consuming and increasingly ill-posed, often requiring regular-ization. To avoid these issues, the ONVMS method uses ageneralization of the Gram–Schmidt procedure [37] to con-struct a set of orthonormal Green functions Ψk starting fromGi and synthesizes a modeled field using H(r) = ΣM
k=1Ψkbk,where the source-amplitude coefficients bk can be determinedfrom measured data by inverting matrices of size 6 × 6 [38];the dipole moments mi can be then synthesized in terms of bk.During actual inversion, the model is combined with differentialevolution optimization [39], [40] to iterate through variouspositions of the sources until a suitable discrepancy is attainedbetween modeled and measured field [38]. Knowledge of thefinal locations and dipole moments allows calculation of thetime-dependent polarizability tensor ¯̄Mi for each target [30],[35]. Finally, by combining the data from all time channelsand determining their joint eigenbasis [41], we obtain temporaldecay curves of the primary components of the magnetic po-larizability tensors in the targets’ principal body axes: Qx,i(t),Qy,i(t), and Qz,i(t).
The advantage of the ONVMS technique is that, by con-structing the orthonormalized sets of Green functions, it takesinto account mutual couplings between different sections of thedifferent targets and, at the same time, avoids the appearanceof singular matrices in multitarget situations. It is indifferentto the number of targets: Once the amplitudes and the loca-tions of the source dipoles are determined, one needs onlyto look at their spatial patterns and compute and diagonalizethe time-dependent total polarizability tensor for each spatialgroup. The resulting time-dependent diagonal elements have aphenomenology similar to those of dipole polarizabilities [42]or total NSMS amplitudes [43], providing insight into intrinsic
BIJAMOV et al.: UXO CLASSIFICATION USING HIERARCHICAL CLUSTERING AND GMM 5221
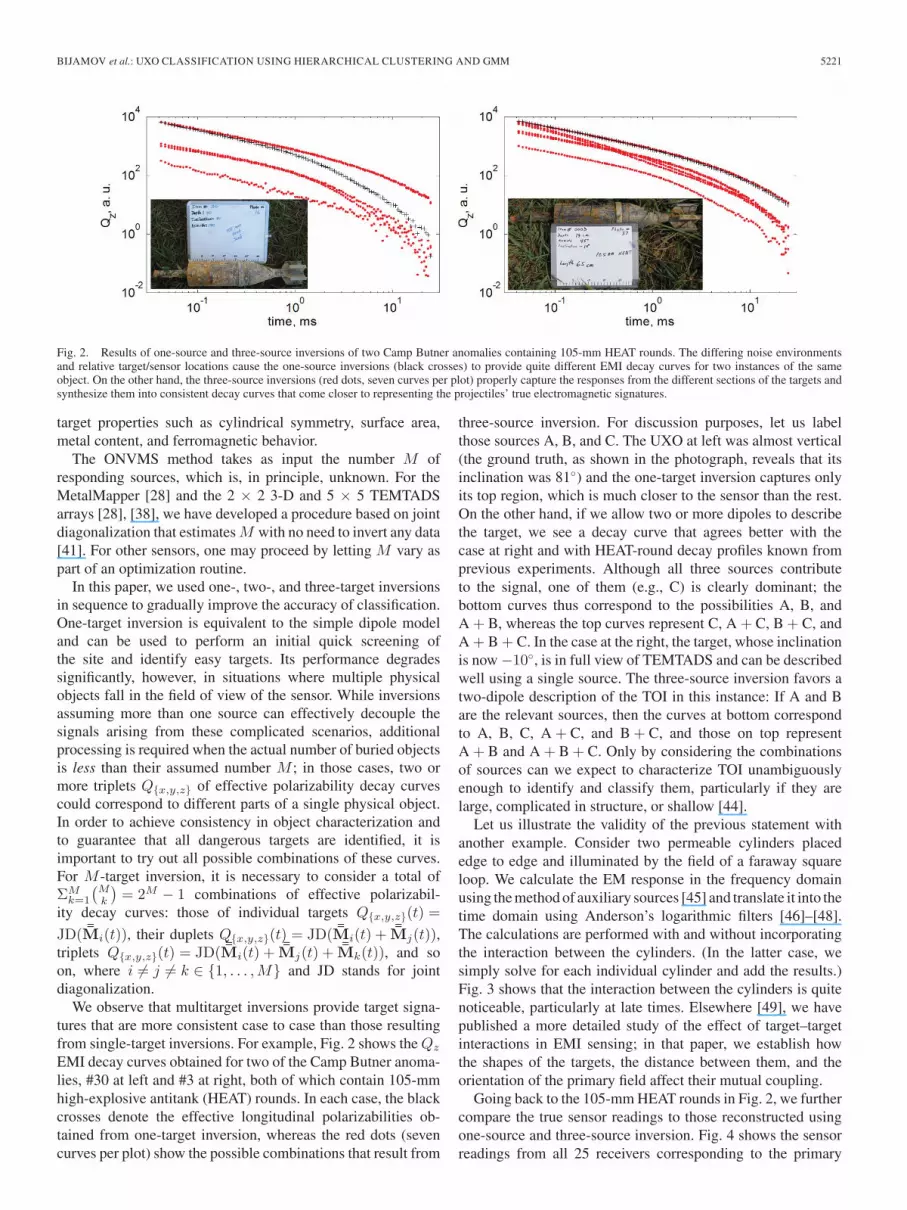
Fig. 2. Results of one-source and three-source inversions of two Camp Butner anomalies containing 105-mm HEAT rounds. The differing noise environmentsand relative target/sensor locations cause the one-source inversions (black crosses) to provide quite different EMI decay curves for two instances of the sameobject. On the other hand, the three-source inversions (red dots, seven curves per plot) properly capture the responses from the different sections of the targets andsynthesize them into consistent decay curves that come closer to representing the projectiles’ true electromagnetic signatures.
target properties such as cylindrical symmetry, surface area,metal content, and ferromagnetic behavior.
The ONVMS method takes as input the number M ofresponding sources, which is, in principle, unknown. For theMetalMapper [28] and the 2 × 2 3-D and 5 × 5 TEMTADSarrays [28], [38], we have developed a procedure based on jointdiagonalization that estimates M with no need to invert any data[41]. For other sensors, one may proceed by letting M vary aspart of an optimization routine.
In this paper, we used one-, two-, and three-target inversionsin sequence to gradually improve the accuracy of classification.One-target inversion is equivalent to the simple dipole modeland can be used to perform an initial quick screening ofthe site and identify easy targets. Its performance degradessignificantly, however, in situations where multiple physicalobjects fall in the field of view of the sensor. While inversionsassuming more than one source can effectively decouple thesignals arising from these complicated scenarios, additionalprocessing is required when the actual number of buried objectsis less than their assumed number M ; in those cases, two ormore triplets Q{x,y,z} of effective polarizability decay curvescould correspond to different parts of a single physical object.In order to achieve consistency in object characterization andto guarantee that all dangerous targets are identified, it isimportant to try out all possible combinations of these curves.For M -target inversion, it is necessary to consider a total ofΣM
k=1
(Mk
)= 2M − 1 combinations of effective polarizabil-
ity decay curves: those of individual targets Q{x,y,z}(t) =
JD( ¯̄Mi(t)), their duplets Q{x,y,z}(t) = JD( ¯̄Mi(t) +¯̄Mj(t)),
triplets Q{x,y,z}(t) = JD( ¯̄Mi(t) +¯̄Mj(t) +
¯̄Mk(t)), and soon, where i �= j �= k ∈ {1, . . . ,M} and JD stands for jointdiagonalization.
We observe that multitarget inversions provide target signa-tures that are more consistent case to case than those resultingfrom single-target inversions. For example, Fig. 2 shows the Qz
EMI decay curves obtained for two of the Camp Butner anoma-lies, #30 at left and #3 at right, both of which contain 105-mmhigh-explosive antitank (HEAT) rounds. In each case, the blackcrosses denote the effective longitudinal polarizabilities ob-tained from one-target inversion, whereas the red dots (sevencurves per plot) show the possible combinations that result from
three-source inversion. For discussion purposes, let us labelthose sources A, B, and C. The UXO at left was almost vertical(the ground truth, as shown in the photograph, reveals that itsinclination was 81◦) and the one-target inversion captures onlyits top region, which is much closer to the sensor than the rest.On the other hand, if we allow two or more dipoles to describethe target, we see a decay curve that agrees better with thecase at right and with HEAT-round decay profiles known fromprevious experiments. Although all three sources contributeto the signal, one of them (e.g., C) is clearly dominant; thebottom curves thus correspond to the possibilities A, B, andA + B, whereas the top curves represent C, A + C, B + C, andA + B + C. In the case at the right, the target, whose inclinationis now −10◦, is in full view of TEMTADS and can be describedwell using a single source. The three-source inversion favors atwo-dipole description of the TOI in this instance: If A and Bare the relevant sources, then the curves at bottom correspondto A, B, C, A + C, and B + C, and those on top representA + B and A + B + C. Only by considering the combinationsof sources can we expect to characterize TOI unambiguouslyenough to identify and classify them, particularly if they arelarge, complicated in structure, or shallow [44].
Let us illustrate the validity of the previous statement withanother example. Consider two permeable cylinders placededge to edge and illuminated by the field of a faraway squareloop. We calculate the EM response in the frequency domainusing the method of auxiliary sources [45] and translate it into thetime domain using Anderson’s logarithmic filters [46]–[48].The calculations are performed with and without incorporatingthe interaction between the cylinders. (In the latter case, wesimply solve for each individual cylinder and add the results.)Fig. 3 shows that the interaction between the cylinders is quitenoticeable, particularly at late times. Elsewhere [49], we havepublished a more detailed study of the effect of target–targetinteractions in EMI sensing; in that paper, we establish howthe shapes of the targets, the distance between them, and theorientation of the primary field affect their mutual coupling.
Going back to the 105-mm HEAT rounds in Fig. 2, we furthercompare the true sensor readings to those reconstructed usingone-source and three-source inversion. Fig. 4 shows the sensorreadings from all 25 receivers corresponding to the primary

5222 IEEE TRANSACTIONS ON GEOSCIENCE AND REMOTE SENSING, VOL. 52, NO. 8, AUGUST 2014
Fig. 3. Time-domain responses from a system of two cylinders with and without incorporating their mutual interaction. The cylinders have conductivity 4×10⁶ S/m, relative permeability 150, diameter 2a = 10 cm and length L = 20 cm. Their edge-to-edge separation is (left) D = a/100 and (right) D = a/2. Theprimary field is generated by a 1 m × 1 m rectangular loop placed 1 m away from the targets. The curves labeled “No Interaction” show the sum of the individualtarget responses; those labeled “Interaction” display the solution of the full problem.
Fig. 4. Reconstruction of the magnetic field in all 25 TEMTADS receivers using one-source and three-source inversion for the targets of Fig. 2. The primaryfield is that of the central transmitter (No. 12 in Fig. 1). The three-source inversion approximates the original measured data better than the one-source model. Theloss of accuracy is particularly noticeable for the case in which the target is vertical and the one-source inversion forces the dipole to shift toward the part of thetarget closer to the sensor.
field generated by the central transmitter. The three-sourcemodel clearly provides better agreement with the measured datathan does the one-source inversion, particularly for the case inwhich the target is vertical.
In this paper, we have concentrated on Qz , the largest effec-tive polarizability, to perform classification; we have noticedthat the other amplitudes are often compromised due to lowSNR, particularly for small or deep targets [23]. (Henceforth,we suppress the subscript z.) We decrease the dimensionalityof the feature space by fitting the decay curves to the followingempirical law popularized by Pasion and Oldenburg [16]:
Q(t) = k t−be−gt. (3)
To decrease the effects of noise, we first linearize (3) by takingits logarithm. We then extract the Pasion–Oldenburg parametersb, g, and log k using nonlinear least squares, imposing theconstraints b > 0 and g > 0 to preserve the physical essenceof the data. The fits are always performed for times t > 0.1 msto avoid perturbations due to the primary field, whose shutoff isnot instantaneous. In order to disregard the “leveling off” of thedecay curves in log space when they reach the noise threshold,we also assign an upper bound to the time channels usedfor the fit. This bound depends on the particular anomaly, and
within each anomaly differs for the x-, y-, and z-decay curves.To find the bound, we estimate the inherent noise level of thedecay curve Q(t) as its mean value over the last N time chan-nels (with N = 10 chosen by hand) and set the threshold valuetmax to the time in which the curve falls below this average:Q(tmax) ≤ mean(Q123−N , . . . , Q123). Due to the presence ofseveral highly noisy anomalies, we must impose a lower boundon tmax to ensure that there is sufficient information for thefits; we chose tmax > 0.3 ms. These considerations result indramatically improved fits, as shown in Fig. 5 [23].
C. Classification
In this paper, we combine agglomerative hierarchical clus-tering [50]–[52] and probabilistic classification to performsemiunsupervised learning for UXO discrimination. The clas-sification features that we use are the Pasion–Oldenburg pa-rameters extracted from ONVMS decay curves. We first usedclustering in feature space to split the entire data set into afinite number of clusters. The number of clusters is an externalparameter and is set to be between 1% and 5% of the number ofitems in the data set. There are several options for clusteringbased on different criteria and distance metrics; we found

BIJAMOV et al.: UXO CLASSIFICATION USING HIERARCHICAL CLUSTERING AND GMM 5223
Fig. 5. Actual Qz EMI decay curves (dots) and constrained Pasion–Oldenburg fits (solid lines) for some of the TOI at Camp Butner. The verticallines mark tmax, the upper threshold of the fitting domain.
the following two combinations particularly useful for initialscreening of the feature space [23].
1) Ward linkage with Euclidean distances [53]–[56]. TheWard technique encourages the formation of homoge-neous clusters by controlling the sum over all clus-ters of the sum of squared Euclidean distances betweenthe members of a cluster and its centroid; i.e., E =∑K
k=1
∑xj∈Ck
‖xj −mk‖2, where K is the total num-ber of clusters and mk is the centroid of cluster Ck [55].At each step of the process, the two clusters whose mergerincreases E by the least amount are merged, decreasingthe number of clusters by one unit. The process starts withthe individual data points as clusters and stops when thedesired number of clusters, set a priori to about 5% of thetotal number of anomalies, is reached.
2) Weighted pair group method average (WPGMA) linkagewith Mahalanobis distances. Like Ward’s, this methodstarts with the individual data points and merges theminto clusters, decreasing the number of entities one byone until a preset value is reached. The clusters joinedat each step are those found to be separated by the short-est WPGMA metric, which is defined recursively [54],[55] by the rule d(R,P +Q) = (d(R,P ) + d(R,Q))/2expressing the separation between cluster R and anotherresulting from the merger of P and Q [57]. (To computethe separation between data points at the last level ofrecursion, we use the Mahalanobis distance [58], [59],which takes into the account the natural variation andspread of physically different feature values in their owndimension and is thus potentially useful for clustering.)
Upon finding the clusters, we requested the ground truth forthe anomalies that lay closest to the geometric center of each.The clusters that happened to be centered around TOI werefurther labeled as potential UXO clusters and used as a basisto construct a Gaussian mixture model (GMM) in which eachsuspicious cluster was fit with a multivariate normal distribu-tion. Every anomaly was assigned a score—a measure of itsprobability of being a particular type of UXO—based on itsposition relative to the UXO clusters; those scores, in turn, wereused to sort the anomalies and generate a prioritized dig list.
As mentioned above, multitarget inversion often providesbetter target localization and more precise and consistent—and
thus more reliable—classification features. In a two-target in-version case, however, this means having three times as manydata points in feature space, because each physical anomaly isrepresented by a triplet of points. If any of these three pointsis suspected to be a UXO, the whole anomaly (i.e., all objectsburied at that specific location at the UXO site) will be treatedas UXO.
Although it is still possible to perform the data clustering inmultitarget inversion feature space, there is no straightforwardway to identify which group of points to request as training dataand how to interpret the results. Suppose a training data pointis requested from a certain cluster that contains only clutter(perhaps even having outlier values as features). Whereas thedata point corresponding to this object indeed has features pe-culiar to clutter, it can happen that this point belongs to a tripletcontaining a UXO, which will be revealed after the ground truthfor the particular anomaly is studied. Since it is impossible todetermine, without prior library knowledge, which of the pointsin the two-target-inversion triplet (target 1, target 2, or theirsuperposition) actually represents the signal from the UXO, onewould have to flag all three locations in feature space as poten-tial UXO and contend with an intolerably large false-alarm rate.
To get around this issue, we employ a two-step approach.In the first step, the features extracted only from single-targetinversions are clustered, and the corresponding ground truthis requested. The central elements belonging to each of theclusters are then probed, and those identified as UXO aremarked. The clusters associated with them are used to constructthe first generation of GMMs, which are then imported intothe multi-target inverted feature space. Items in the latter spaceare then rated as to their likelihood of being UXO, based onthe initial GMMs. Ground truth is then requested for the itemsrated most likely to be UXO. The multivariate GMM can bethen constructed around the identified UXO clusters, and therest of the anomalies are assigned a score that quantifies theirlikelihood of being UXO.
The combined clustering/GMM approach therefore providesa natural way to find intrinsic patterns in noisy feature data andyields a convenient probabilistic measure of class membershipfor unknown items. It also reduces the amount of requiredtraining data and improves both classification sensitivity andspecificity.
III. RESULTS
In this section, we apply the classification technique de-scribed earlier to the Camp Butner blind-test data. The classifi-cation process, summarized in Fig. 6, consisted of the followingsteps.
1) No initial training data were requested. (We knew, how-ever, that three types of UXO targets were expected:37- and 105-mm projectiles and M48 fuzes.)
2) The features b, g, and log k were extracted from the datafor all anomalies starting from one-target, two-target, andthree-target inversion.
3) An initial Ward clustering (with Euclidean distances)was performed, and, in order to probe the feature

5224 IEEE TRANSACTIONS ON GEOSCIENCE AND REMOTE SENSING, VOL. 52, NO. 8, AUGUST 2014
Fig. 6. Flowchart summarizing the classification algorithm employed in this paper. The stars denote the steps where external expert judgment was required.The initial classifier is generated using a rough approximation based on one-source inversion. The classifier is then sequentially updated to incorporate the newlyavailable ground truth.
space, the ground truth was requested for the 69 tar-gets whose features were located closest to the clustercentroids.
4) Clusters containing at least one UXO were identified, anda smaller domain was selected within the feature spacefor further interrogation. (One projectile of each kind wasidentified, but no fuzes.)
5) A second clustering (WPGMA, with Mahalanobis dis-tances) was performed within the selected domain, pri-marily to seek for M48 fuzes. The targets with featuresclosest to the corresponding cluster centroids (26 at thisstep) were singled out and their ground truth requested.The clusters with at least one identified UXO weremarked as suspicious.
6) All targets whose features (based on two-object inver-sion) fell inside any of the suspicious clusters were usedto train a three-component GMM classifier and score allof the unknown targets.
7) All targets with a score greater than a specifically selectedthreshold were assumed to be UXO, and the ground truthwas requested for them. (Selecting this threshold is one ofthe few parts of the process that involves human decision-making.) This set consisted of 131 targets, three of whichhad already been requested previously; of these, 118 wereconfirmed to be UXO.
8) A new three-component GMM classifier was trained us-ing features from the three-object EMI inversions. Allthe items were rescored to correct for changes and incor-porate new information. Another 20 targets with scoresdecreasing from a certain expert-defined low value wereselected for additional verification. At this point, if theverification had yielded that all the chosen targets were
clutter, the algorithm would stop, and the scored valueswould be used to produce a final dig list.
9) Four out of the 20 items requested happened to be UXO,and the classification continued. (The ground truth forthree of these 20 items had already been requested in theprevious steps, and one had been confirmed as UXO.)
10) All confirmed UXO were separated into three groups(105-mm, xxx, and 37-mm); no further within-group dis-crimination was performed. Each of the three groups wasused to train a separate one-component GMM classifierthat scored all the targets with respect to target type(based on the features obtained from precise three-objectEMI inversions). The ground truth was then selectedindividually for each object type, which is based on acertain threshold score. This step helped describe theindividual clusters in more detail.
11) A total of 36 items were requested from a 105-mm scoreddata set, with 18 being already known; 174 items wererequested from a 37-mm scored data set, with 118 beingalready known; and 53 items were requested from a M48scored data set, with 27 of them being already known. Atthis stage, a total of 322 items were requested, of which162 were UXO.
12) Finally, a three-component GMM classifier was trainedon the confirmed UXO and further used to score all of theunknown targets. A specific threshold was then selected,and the final dig list was produced.
Fig. 7 shows the results of the first two clustering processes,corresponding to Steps 2–5 given earlier. Only four UXOtargets were identified at this stage: two 37-mm munitions(with features very close to each other in Fig. 7), one M48 fuze,

BIJAMOV et al.: UXO CLASSIFICATION USING HIERARCHICAL CLUSTERING AND GMM 5225
Fig. 7. Clustering of the EMI features from a single-object inversion for Camp Butner. (Left) Results of the first clustering using weighted linkage withMahalanobis distances. Dots are color-coded by cluster membership. (Right) All four identified UXO (black markers) after the second clustering round withina smaller domain (log k ∈ [2, 8], b ∈ [0.05, 2], g ∈ [0.05, 2]) using Ward linkage and Euclidean distances. Two of the four dots belong to the same cluster of37-mm targets.
Fig. 8. Clusters used to train the first GMM classifier and its scoring results. (Left) Assumed UXO clusters (black dots) used to generate the three-componentGMM classifier. There are three clusters, one for each type of UXO. Each cluster is centered close to a target previously identified as UXO (shown as a red dotand visible only for the cluster at center) and contains other anomalies that presumably are dangerous. (Right) Histogram of the anomalies sorted by an arbitraryscore that measures their likelihood of being UXO. The ground truth was requested based on thresholding the score at an externally selected value close to 0.5.
Fig. 9. Updated GMM classifier after confirming 118 UXO items in the Camp Butner data. (Left) Score isosurfaces based on the GMM classifier trained onall currently identified UXO, in the feature space corresponding to three-object EMI inversion. (Right) Score histogram using the new classifier. An additional20 items were requested to investigate the region corresponding to log (score) within [−6, −5]. This region was identified by the expert after observing thecorresponding score isosurfaces and the histogram.
and one 105-mm projectile. Fig. 8 illustrates the training dataused to create a three-component GMM classifier in Step 6and the resulting score distribution histogram. The externalinteraction from the expert in this case consisted in selectingan anomaly scoring threshold beyond which the ground truthwould be requested. We picked a value of log (score) ∼0.5,which resulted in the right peak of the histogram being probedand yielded a high number of 118 confirmed UXO out of 131probed items.
The newly acquired data was then used to retrain the GMMclassifier (Step 8) using the features from a precise three-objectEMI inversion set. (Note that, since three-target inversions pro-vide seven decay curves per anomaly, only the features closestto the centroids of clusters already identified as containingUXO were considered for GMM training.) The results of theupdated GMM-based clustering appear in Fig. 9. A broadeningof the histogram peak corresponding to UXO is observed.
Based on the updated histogram, we requested the groundtruth from 20 additional suspicious items in order to assessstatistically the performance of the classifier. The region con-taining these items had scores between −6 and −5. Here, theexpert intervened again by visually observing the isosurfaces(and how they encompass the existing UXO clusters) and byconsidering the spread of the histogram peak corresponding tothe UXO. (These tasks can potentially be automated to increaseprocess efficiency). At this stage, if all of the 20 items werereturned as clutter, the process would stop, and the scored itemswould be used to create the final dig list. However, it turned outthat 4 out of 20 items were UXO; therefore, the classifier had tobe updated once again to ensure that all possible outliers wereaccounted for.
In order to resolve possible biases from simultaneous treat-ment of different types of targets, all confirmed UXO itemswere separated into three categories based on their type

5226 IEEE TRANSACTIONS ON GEOSCIENCE AND REMOTE SENSING, VOL. 52, NO. 8, AUGUST 2014
Fig. 10. The one-component GMM classifier was then applied to features resulting from three-object inversion. (Left) 37-mm targets; Middle: M48 fuzes;(Right) 105-mm targets. The corresponding score histograms are on the bottom row. Initially, 174 anomalies were requested (with 118 being already known)based on the log (score) cutoff value of about −6 for 37-mm targets. After that, 53 anomalies (of which 27 were known) were requested based on a log (score)cutoff value of about −5 for M48 fuzes. Finally, 36 anomalies (18 of them known already) were requested based on a cutoff of about −20 for 105-mm targets.
Fig. 11. Final GMM classifier based on three-object EMI inversion of Camp Butner data. (Left) Three-component GMM classifier score isosurfaces in theclassification case based on all UXO targets. (Right) Score histogram showing the number of anomalies scored within a particular range of the log (probabilitydensity) in arbitrary units. A total of 377 anomalies were scored as UXO based on a log (score) cutoff of about −10. This value was specified by hand to allowenough statistics and sufficient isosurface separation from identified UXO clusters.
(105-mm, M48, and 37-mm), and each group was used totrain a separate one-component GMM classifier that was thenused to score every target with a separate score for each targettype (Step 10). The ground truth was then selected individuallyfor each of the object types, based on threshold score valuesthat once more were identified visually by the expert. Fig. 10presents the results obtained with these individual classifiers for37-mm, M48 and 105-mm target clusters, respectively.
The ground truth obtained as a result of Steps 5–11 com-prised 322 requested anomalies, of which 160 were confirmedas UXO. At the final stage, a three-component GMM classifierwas trained on the confirmed UXO from the accumulatedground truth and used to score all of the unknown targets (seeFig. 11). A specific threshold was then selected manually, andthe final dig list was produced. The results of the overall processare summarized in the ROC curve of Fig. 12. For more detailsthe readers are referred to [60].
IV. CONCLUSION
A hierarchical agglomerative clustering approach combinedwith Gaussian-mixture probabilistic modeling was applied toa blind UXO test carried out at the former Camp Butner. The
Fig. 12. ROC curve for Camp Butner live-site classification. The total numberof anomalies was 2291. One hundred percent of the 171 TOI were identifiedcorrectly; there were only 295 false positives. The inset zooms in on the regionof interest. The dark blue dot corresponds to the stop-digging threshold (theUXO/clutter boundary) suggested by the dig list; the cyan dot specifies theactual position of this boundary. In ideal circumstances, the blue and cyanpoints would coincide, but performing extra digs helps maintain better statisticsand improves the results.
ground truth for a total of 322 items was requested in a five-level iterative prediction–correction process. At the end, out ofa total of 2291 anomalies, the method yielded 100% accuracy

BIJAMOV et al.: UXO CLASSIFICATION USING HIERARCHICAL CLUSTERING AND GMM 5227
in detecting 171 UXO at a cost of 295 false alarms. Machine-learning techniques therefore hold promise for performinghigh-quality automated UXO discrimination while reducing theworkload for human experts and in general speeding up theprocess.
That said, it would be desirable to improve the process fur-ther, so that it results in even better classification and involvesthe expert even less. One possibility to reduce the number offalse alarms and improve the overall quality of the classificationmay be to incorporate the symmetry exhibited by UXO byanalyzing the decay curves of the transverse components ofthe effective polarizability. It could be also possible to createa library of features from previous discrimination tests. Thisknowledge, which is already available, could be used to makeeducated guesses that would help sort out and identify TOIin new live sites. This functionality would be also of helpin identifying targets of unknown or unexpected type, whichare bound to appear in real sites and confuse any statisticalclassification algorithm. Even in those cases, we would havetwo crucial pieces of information: The fact that all UXO exhibitcylindrical symmetry to some extent and the fact that suchanomalous targets will be at most a small fraction of thetotal. The first fact should allow the system to point out goodcandidates for the expert user to inspect visually, and the secondguarantees that this part of the process is not too onerous.
Further improvement of our combined clustering/GMM al-gorithm must involve ways to perform optimal data clustering,scoring, and thresholding automatically. While external inputsfrom an expert are valuable for guiding the learning process,it is desirable to reduce human judgment to the point whereit provides only systemwide quality checks and classificationcontrol. An ideal learning mechanism would first exhaust theinformation contained in the data themselves before leavingthe crucial decision-making to human experts, who continueto be better than computers at some tasks involving pat-tern recognition, matching, or classification. Such a combinedframework may result in overall improved performance andeffective resource allocation. A system needing less humaninput will be also more useful in situations where the operatorslack experience, and the system can potentially help themgain it.
REFERENCES
[1] S. V. Chilaka, D. L. Faircloth, L. S. Riggs, and H. H. Nelson, “Enhanceddiscrimination among UXO-like targets using extremely low-frequencymagnetic fields,” IEEE Trans. Geosci. Remote Sens., vol. 44, no. 1,pp. 10–21, Jan. 2006.
[2] F. Shubitidze, K. O’Neill, I. Shamatava, K. Sun, and K. D. Paulsen, “Fastand accurate calculation of physically complete EMI response by a het-erogeneous metallic object,” IEEE Trans. Geosci. Remote Sens., vol. 43,no. 8, pp. 1736–1750, Aug. 2005.
[3] I. J. Won, D. A. Keiswetter, and T. H. Bell, “Electromagnetic inductionspectroscopy for clearing landmines,” IEEE Trans. Geosci. Remote Sens.,vol. 39, no. 4, pp. 703–709, Apr. 2001.
[4] ESTCP, VA, USA, “2009 ESTCP UXO classification study, Former CampSan Luis Obispo, CA,” presented at the Environmental Security Technol-ogy Certification Program Demonstration Plan, Arlington, VA, USA,2009.
[5] ESTCP, Alexandria, VA, USA, “2010 ESTCP UXO classification study,Former Camp Butner, NC,” presented at the Environmental Security Tech-nology Certification Program Demonstration Plan, Arlington, VA, USA,2010.
[6] H. Nelson, A. Andrews, and K. Kaye, “ESTCP pilot program, classifica-tion approaches in munitions response,” Environ. Sec. Technol. Certifica-tion Program, Alexandria, VA, USA, 2007.
[7] F. Shubitidze, “Camp Butner UXO data inversion and classification usingadvanced EMI models,” presented at the SERDP ESTCP Partners En-vironmental Technology Technical Symp. Workshop, Washington, DC,USA, 2010.
[8] A. Paski, “Former Camp Butner site description and EM61 data collectionand analysis,” presented at the SERDP ESTCP Partners EnvironmentalTechnology Technical Symposium Workshop, Washington, DC, USA,2010.
[9] L. R. Pasion, “UXO discrimination using full coverage and cued interro-gation data sets at Camp Butner, NC,” presented at the SERDP ESTCPPartners Environmental Technology Technical Symposium Workshop,Washington, DC, USA, 2010.
[10] B. Krishnapuram, A. J. Harternink, L. Carin, and M. A. T. Figueiredo,“A Bayesian approach to joint feature selection and classifier design,”IEEE Trans. Pattern Anal. Mach. Intell., vol. 26, no. 9, pp. 1105–1111,Sep. 2004.
[11] L. M. Collins, Z. Yan, J. Li, H. Wang, L. Carin, J. Sean,S. I. Rose-Pehrsson, H. H. Nelson, and J. R. McDonald, “A comparisonof the performance of statistical and fuzzy algorithms for unexplodedordnance detection,” IEEE Trans. Fuzzy Syst., vol. 9, no. 1, pp. 17–30,Feb. 2001.
[12] W. Hu, S. L. Tantum, and L. M. Collins, “EMI-based classification ofmultiple closely spaced subsurface objects via independent componentanalysis,” IEEE Trans. Geosci. Remote Sens., vol. 42, no. 11, pp. 2544–2554, Nov. 2004.
[13] Y. Zhang, L. Collins, H. Yu, C. E. Baum, and L. Carin, “Sensing ofunexploded ordnance with magnetometer and induction data: Theory andsignal processing,” IEEE Trans. Geosci. Remote Sens., vol. 41, no. 5,pp. 1005–1015, May 2003.
[14] A. B. Tarokh, E. L. Miller, I. J. Won, and H. Huang, “Statistical classifi-cation of buried objects from spatially sampled time or frequency domainelectromagnetic induction data,” Radio Sci., vol. 39, no. 4, pp. RS4S05-1–RS4S05-11, Aug. 2004.
[15] D. Williams, Y. Yu, L. Kennedy, X. Zhu, and L. Carin, “A bivari-ate Gaussian model for unexploded ordnance classification with EMIdata,” IEEE Geosci. Remote Sens. Lett., vol. 4, no. 4, pp. 629–633,Oct. 2007.
[16] L. R. Pasion and D. W. Oldenburg, “A discrimination algorithm for UXOusing time domain electromagnetics,” J. Environ. Eng. Geophys., vol. 6,no. 2, pp. 91–102, 2001.
[17] L. Beran and D. W. Oldenburg, “Selecting a discrimination algorithm forunexploded ordnance remediation,” IEEE Trans. Geosci. Remote Sens.,vol. 46, no. 9, pp. 2547–2557, Sep. 2008.
[18] S. D. Billings, “Processing and discrimination strategies for next-generation EMI sensor data,” presented at the SERDP ESTCP PartnersEnvironmental Technology Technical Symp. Workshop, Washington, DC,USA, 2009.
[19] A. Aliamiri, J. Stalnaker, and E. L. Miller, “Statistical classification ofburied unexploded ordnance using nonparametric prior models,” IEEETrans. Geosci. Remote Sens., vol. 45, no. 9, pp. 2794–2806, Sep. 2007.
[20] S. D. Billings, “Data modeling, feature extraction, and classifica-tion of magnetic and EMI data,” Sky Res. Inc., Ashland, OR, USA,Sep. 2008.
[21] L. Beran, S. D. Billings, and D. W. Oldenburg, “A comparison of classifi-cation algorithms for UXO discrimination,” presented at the UXO Forum,St. Louis, MO, USA, 2004.
[22] J. P. Fernández, F. Shubitidze, I. Shamatava, B. E. Barrowes, andK. O’Neill, “Realistic subsurface anomaly discrimination using electro-magnetic induction and an SVM classifier,” EURASIP J. Adv. SignalProcess., vol. 2010, no. 1, p. 305890, May 2010.
[23] A. Bijamov, F. Shubitidze, J. P. Fernandez, I. Shamatava, B. E. Barrowes,and K. O’Neill, “Comparison of supervised and unsupervised machinelearning techniques for UXO classification using EMI data,” in Proc.SPIE, Orlando, FL, USA, 2011, pp. 801706-1–801706-11.
[24] D. Williams, C. Wang, X. Liao, and L. Carin, “Classification of un-exploded ordnance using incomplete multisensor multiresolution data,”IEEE Trans. Geosci. Remote Sens., vol. 45, no. 7, pp. 2364–2373,Jul. 2007.
[25] Q. Liu, X. Liao, and L. Carin, “Detection of unexploded ordnance via ef-ficient semisupervised and active learning,” IEEE Trans. Geosci. RemoteSens., vol. 46, no. 9, pp. 2558–2567, Sep. 2008.
[26] Y. Zhang, L. M. Collins, and L. Carin, “Unexploded ordnance detectionusing Bayesian physics-based data fusion,” Integr. Comput.-Aided Eng.,vol. 10, no. 3, pp. 231–247, Aug. 2003.
5228 IEEE TRANSACTIONS ON GEOSCIENCE AND REMOTE SENSING, VOL. 52, NO. 8, AUGUST 2014
[27] Y. Zhang, X. Liao, and L. Carin, “Detection of buried targets via activeselection of labeled data: Application to sensing subsurface UXO,” IEEETrans. Geosci. Remote Sens., vol. 42, no. 11, pp. 2535–2543, Nov. 2004.
[28] M. Prouty, “Detection and classification with the MetalMapper at formerCamp San Luis Obispo,” Geometrics, Inc., San Jose, CA, USA, ESTCPProj. No. MM-0603, 2009.
[29] T. H. Bell, B. J. Barrow, and J. T Miller, “Subsurface discrimination usingelectromagnetic induction sensors,” IEEE Trans. Geosci. Remote Sens.,vol. 39, no. 6, pp. 1286–1293, Jun. 2001.
[30] F. Shubitidze, J. P. Fernández, B. E. Barrowes, K. O’Neill, I. Shamatava,and A. Bijamov, “Comparison of the physically complete model with asimple dipole model for UXO detection and discrimination,” in Proc.SPIE, 2010, pp. 766408-1–766408-12.
[31] I. Shamatava, F. Shubitidze, K. O’Neill, K. Sun, and K. D. Paulsen,“Simple magnetic charge model for representation of EMI responses froma buried UXO,” in Proc. DIPED, 2004, pp. 155–159.
[32] F. Shubitidze, K. O’Neill, B. E. Barrowes, I. Shamatava,J. P. Fernández, K. Sun, and K. D. Paulsen, “Application of thenormalized surface magnetic charge model to UXO discrimination incases with overlapping signals,” J. Appl. Geophys., vol. 61, no. 3/4,pp. 292–303, Mar. 2007.
[33] F. Shubitidze, K. O’Neill, I. Shamatava, K. Sun, and K. Paulsen, “Asimple magnetic charge model for classification of multiple buried metal-lic objects in cases with overlapping signals,” in Proc. SAGEEP, 2005,pp. 1270–1279.
[34] F. Shubitidze, K. O’Neill, I. Shamatava, K. Sun, and K. Paulsen, “Com-bined differential evolution and surface magnetic charge model algorithmfor discrimination of UXO from non-UXO items: Simple and generalinversions,” in Proc. SPIE, 2005, pp. 346–347.
[35] F. Shubitidze, D. Karkashadze, J. P. Fernández, B. E. Barrowes,K. O’Neill, T. M. Grzegorczyk, and I. Shamatava, “Applying a volumedipole distribution model to next-generation sensor data for multi-objectdata inversion and discrimination,” in Proc. SPIE, 2010, pp. 766407-1–766407-11.
[36] F. Shubitidze, J. P. Fernández, B. E. Barrowes, I. Shamatava, A. Bijamov,K. A. O’Neill, and D. Karkashadze, “The orthonormalized volume mag-netic source model for discrimination of unexploded ordinance,” IEEETrans. Geosci. Remote Sens., DOI: 10.1109/TGRS.2013.2283346, to bepublished.
[37] J. E. Gentle, Matrix Algebra: Theory, Computations, and Applications inStatistics. New York, NY, USA: Springer-Verlag, 2007.
[38] F. Shubitidze, “A complex approach to UXO discrimination: Combiningadvanced EMI forward models and statistical signal processing,” Sky Res.Inc., Ashland, OR, USA, 2012.
[39] R. Storn and K. Price, “Differential evolution—A simple and efficientheuristic for global optimization over continuous spaces,” J. Global Op-tim., vol. 11, no. 4, pp. 341–359, Dec. 1997.
[40] K. Price, R. M. Storn, and J.A. Lampinen, Differential Evolution: APractical Approach to Global Optimization (Natural Computing Series).New York, NY, USA: Springer-Verlag, 2005.
[41] F. Shubitidze, J. P. Fernández, I. Shamatava, B. E. Barrowes, andK. O’Neill, “Joint diagonalization applied to the detection and discrim-ination of unexploded ordnance,” Geophysics, vol. 77, no. 4, pp. WB149–WB160, Jul. 2012.
[42] J. P. Fernández, B. E. Barrowes, T. M. Grzegorczyk, N. Lhomme,K. O’Neill, and F. Shubitidze, “A man-portable vector sensor for iden-tification of unexploded ordnance,” IEEE Sensors J., vol. 11, no. 10,pp. 2542–2555, Oct. 2011.
[43] F. Shubitidze, J. P. Fernandez, I. Shamatava, L. R. Pasion, B. E. Barrowes,and K. O’Neill, “Application of the normalized surface magnetic sourcemodel to a blind unexploded ordnance discrimination test,” Appl. Comput.Electromagn. Soc. J., vol. 25, no. 1, pp. 89–98, Jan. 2010.
[44] K. Sun, K. O’Neill, B. E. Barrowes, J. P. Fernández, F. Shubitidze,I. Shamatava, and K. D. Paulsen, “Dumbbell dipole model and its ap-plication in UXO discrimination,” in Proc. SPIE, 2006, p. 621706.
[45] F. Shubitidze, K. O’Neill, S. A. Haider, K. Sun, and K. D. Paulsen,“Application of the method of auxiliary sources to the wide-band electro-magnetic induction problem,” IEEE Trans. Geosci. Remote Sens., vol. 40,no. 4, pp. 928–942, Apr. 2002.
[46] G. A. Newman, G. Hohmann, and W. Anderson, “Transient electro-magnetic response of a three-dimensional body in a layered earth,”Geophysics, vol. 51, no. 8, pp. 1608–1627, Aug. 1986.
[47] W. L. Anderson, “Fast Hankel transforms using related and lagged convo-lutions,” ACM Trans. Math. Softw., vol. 8, no. 4, pp. 344–368, Dec. 1982.
[48] L.-P. Song, F. Shubitidze, L. R. Pasion, D. W. Oldenburg, andS. D. Billings, “Computing transient electromagnetic responses of a
metallic object using a spheroidal excitation approach,” IEEE Geosci.Remote Sens. Lett., vol. 5, no. 3, pp. 359–363, Jul. 2008.
[49] F. Shubitidze, K. O’Neill, K. Sun, and I. Shamatava, “Coupling betweenhighly conducting and permeable metallic objects in the EMI frequencyrange,” Appl. Comput. Electromagn. Soc. J., vol. 19, no. 1B, pp. 139–148,Mar. 2004.
[50] W. K. Härdle and L. Simar, Applied Multivariate Statistical Analysis,2nd ed. Berlin, Germany: Springer-Verlag, 2007.
[51] I. T. Nabney, NETLAB: Algorithms for Pattern Recognition. Berlin,Germany: Springer-Verlag, 2002.
[52] Statistics Toolbox User’s Guide, The MathWorks, Natick, MA, USA,2007.
[53] J. H. Ward, “Hierarchical grouping to optimize an objective function,”J. Amer. Stat. Assoc., vol. 58, no. 301, pp. 236–244, Mar. 1963.
[54] A. K. Jain and R. C. Dubes, Algorithms for Clustering Data. EnglewoodCliffs, NJ, USA: Prentice-Hall, 1988.
[55] R. Xu and D. Wunsch, Clustering, 1st ed. Hoboken, NJ, USA: Wiley,2008.
[56] G. N. Lance and W. T. Williams, “A general theory of classificatorysorting strategies. 2. Clustering systems,” Comput. J., vol. 10, no. 3,pp. 271–277, 1967.
[57] J. Quackenbush, “Computational analysis of microarray data,” Nat. Rev.Gen., vol. 2, no. 6, pp. 418–427, Jun. 2001.
[58] P. C. Mahalanobis, “On the generalized distance in statistics,” in Proc.Nat. Inst. Sci. India, 1936, pp. 49–55.
[59] A. C. Rencher, Multivariate Statistical Inference and Applications.New York, NY, USA: Wiley, 1998.
[60] A. Bijamov, “Numerical methods in electromagnetics: Evanescentnanometry for DNA sequencing, and EM induction for UXO detectionand discrimination,” Ph.D. dissertation, Dartmouth College, Hanover,NY, USA, 2011.
Alex Bijamov received the B.S. degree in physicsfrom Tbilisi State University, Tbilisi, Georgia, in2006 and the Ph.D. degree in engineering sci-ences from Dartmouth College, Hanover, NH, USA,in 2011.
From 2011 and 2012, he was a ResearchAssociate with Thayer School of Engineering,Dartmouth College, where he developed advancedmodels for electromagnetic-induction-based targetdetection and classification, and worked on statisti-cal signal processing. His research interests include
remote sensing, imaging technologies, computer vision, and machine learning.Dr. Bijamov has served as a Reviewer for the Optical Society of America.
He received a Bronze Medal at the Third Asian Physics Olympiad and a GoldMedal at a Gold Medal at the 33rd International Physics Olympiad.
Juan Pablo Fernández received the Physics degreefrom Universidad de los Andes, Bogotá, Colombia,in 1990; the Ph.D. degree in theoretical low-temperature physics from the University ofMassachusetts, Amherst, MA, USA, in 2004; andthe M.S. degree in engineering sciences fromDartmouth College, Hanover, NH, USA, in 2007.
He has taught physics, mathematics, astronomy,Spanish, and scientific writing at several universitiesin Colombia and the U.S. and has worked as a writer,an editor, and a translator. From June 2010 and May
2012, he was a Visiting Research Scientist with the Center for AdaptiveBehavior and Cognition, Max Planck Institute for Human Development, Berlin,Germany. He was a Research Associate with the Thayer School of Engineering,Dartmouth College, and a Research Consultant with the U.S. Army ColdRegions Research and Engineering Laboratory, Hanover. He is currently aSignal Processing Content Specialist with MathWorks, Inc., Natick, MA, USA.
Dr. Fernández is a member of the Applied Computational ElectromagneticsSociety. He received a “Francisco de Paula Santander” grant for creativewriting from the Instituto Colombiano de Cultura in 1990 and was shortlistedfor the Premio Nacional de Literatura in 1998. He also received the EugeneM. Isenberg Award from the Isenberg School of Management, University ofMassachusetts, in 1997 and 1998.
BIJAMOV et al.: UXO CLASSIFICATION USING HIERARCHICAL CLUSTERING AND GMM 5229
Benjamin E. Barrowes (M’99) received the B.S.and M.S. degrees in electrical engineering fromBrigham Young University, Provo, UT, USA, in1999, and the Ph.D. degree from MassachusettsInstitute of Technology, Cambridge, MA, USA,in 2004.
From 2004 to 2005, he was a Director’s fundedPostdoctoral Researcher with the Physics Division,Los Alamos National Laboratory, Los Alamos, NM,USA. He is currently a Physicist with the U.S. ArmyCold Regions Research and Engineering Laboratory,
Hanover, NH, USA. His research interests include electromagnetic wave theoryand modeling with applications on wind–wave interaction, electromagneticscattering from the sea surface and from random media, nanoscale energy-generating techniques, computer interface methodologies, electromagnetic in-duction models for nonspherical geometries, and biological electromagneticphenomena. His other research interests include automatic code conversion/translation and arbitrary precision computing.
Dr. Barrowes received two Rocky Mountain Space Grant ConsortiumGRANTs, and a National Science Foundation Graduate Fellowship Award.
Irma Shamatava received the M.S. degree in radiophysics from Sokhumi State University (formerly theSukhumi branch of Tbilisi State University), Tbilisi,Georgia.
She was a member of the Computer Center staffand an Assistant Teacher of physics and mathematicswith Sokhumi State University. She is currently aResearcher with the Thayer School of Engineering,Dartmouth College, Hanover, NH, USA, and withSky Research, Inc., Hanover. Her research interestsinclude analytical and numerical modeling of elec-
tromagnetic scattering by subsurface metallic objects, particularly unexplodedordnance.
Kevin O’Neill received the B.A. degree (magnacum laude) from Cornell University, Ithaca, NY,USA, and the M.A., M.S.E., and Ph.D. degrees fromPrinceton University, Princeton, NJ, USA.
After a National Science Foundation PostdoctoralFellowship with the Thayer School of Engineering,Dartmouth College, Hanover, NH, USA, and theU.S. Army Cold Regions Research and EngineeringLaboratory (CRREL), Hanover, he became a Re-search Civil Engineer with CRREL, where his re-search has focused on numerical modeling of porous
media transport phenomena and of geotechnically relevant electromagneticproblems. He has been a Visiting Fellow with the Department of Agronomy,Cornell University, and a Visiting Scientist with the Center for ElectromagneticTheory and Applications, Massachusetts Institute of Technology, Cambridge,MA, USA. Since 1984, has been on the adjunct faculty member with the ThayerSchool of Engineering, Dartmouth College, Hanover, NH, USA. His currentresearch interests include electromagnetic remote sensing of surfaces, layers,and particularly buried objects such as unexploded ordnance.
Fridon Shubitidze (A’98–M’04–SM’06) receivedthe M.S. degree in radio physics from Sokhumi StateUniversity [formerly the Sukhumi branch of TbilisiState University (TSU)], Tbilisi, Georgia, in 1994and the Cand.Sci. degree in radio physics (appliedelectromagnetics) from TSU, Tbilisi, in 1997.
In 1994, he was a member of the Research Staffof the Laboratory of Applied Electrodynamics, De-partment of Physics, TSU. At the same time, he waswith the Department of Physics and Mathematics,Sokhumi State University, as a Senior Teacher and
became an Associate Professor in 1998. From 1998 to 1999, he was a Post-doctoral Fellow with the National Technical University of Athens, Athens,Greece, performing research on computer simulation of electrostatic discharge;electrodynamic aspects of electromagnetic compatibility, numerical modelingof conformal antennas; electromagnetic wave scattering; field visualizationand identification of objects by scattered field analysis; investigation of wavepropagation through anisotropy, plasma, and chiral media; and innovativenumerical methods. From June to August 2005, he was a Visiting Scientist withthe Department of Earth and Ocean Science, University of British Columbia,Vancouver, BC, Canada. From April 2007 to May 2013, he worked with SkyResearch, Inc., Hanover, NH, USA. He is currently a Research AssociateProfessor with the Thayer School of Engineering, Dartmouth College, Hanover,NH, USA. His current research interests include numerical modeling of forwardand inverse electromagnetic scattering by subsurface metallic objects, inves-tigation of global magnetoquasi-static fields due to ionospheric currents, andelectrostatic fields’ effects on robotic and construction systems for Mars andLunar exploration, magnetic nanoparticle hyperthermia for cancer treatment,and advanced sensors for DNA sequencing.
Dr. Shubitidze and his group received the Munitions Response Project-of-the-Year Award given by the Strategic Environmental Research and Develop-ment Program in 2011.