hand gesture recognition based on signals cross-correlation " any sufficiently advanced...
TRANSCRIPT
Hand gesture recognition based on signals cross-
correlation
Anna Lekova Bulgarian Academy of Sciences
Institute of Systems Engineering and Robotics
Mo Adda University of Portsmouth,
School of Computing
“Any sufficiently advanced technology is indistinguishable from magic”
Arthur C. Clarke
Interactive gestures and body movements let us control and interact mobile devices, screens and robots. Vision-
based gesture recognition systems analyze the detected infrared and visible light after converting them into some
measurable signal, e.g. voltage or current. Since, infrared and visible light are electromagnetic waves (EMW) with
particular wavelength between 0.4 and 1.6µm, we introduce a concept of a new kind of sensor for direct perception
of EMW to see objects. We propose a novel framework for hand gesture featuring, profiling and recognizing based
on signal processing and cross correlation of detected signals instead of Euclidean space analysis of image pixels by
visual-based algorithms. Hand segmentation is accomplished on infrared radiation, while hand joints are categorized
according to the intensity of visible light on hand edges. The meaning of a gesture is described by wave-based
profiles representing the informative features of hand joints and their spatial relations over some period of time. A
hand joint profile is a waveform of known shape obtained by superposition of feature waves. During the hand
segmentation, we use online fuzzy clustering to categorize the infrared radiation. During the feature extraction, the
clustering algorithm categorizes the grayscale light intensity on hand edges. During the training, the hand joint
profiles are stored in the database as sampled sequences corresponding to the superposition of sine waves with
amplitudes and frequencies derived from the obtained clusters. During the recognition phase, the current hand
gesture is matched to the hand joint profiles in the database by fast signals cross-correlation. Our first
implementation of the proposed framework inputs the raw data of Microsoft Kinect infrared and RGB image sensors
that are wavelength dependent and produce a signal for electric current that is directly proportional to the changes in
the focused flow of reflected light during hand gesturing.
1. Introduction
Interactive gestures are quite magical nowadays. They let us control and interact with mobile devices,
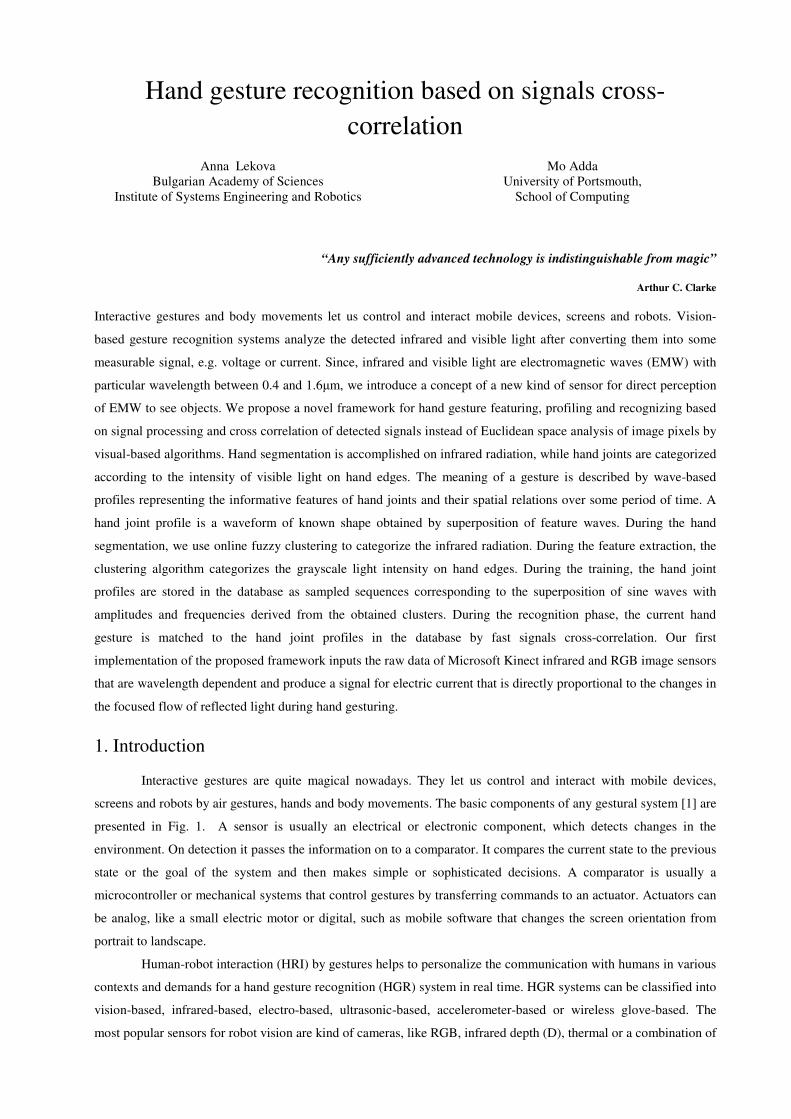
screens and robots by air gestures, hands and body movements. The basic components of any gestural system [1] are
presented in Fig. 1. A sensor is usually an electrical or electronic component, which detects changes in the
environment. On detection it passes the information on to a comparator. It compares the current state to the previous
state or the goal of the system and then makes simple or sophisticated decisions. A comparator is usually a
microcontroller or mechanical systems that control gestures by transferring commands to an actuator. Actuators can
be analog, like a small electric motor or digital, such as mobile software that changes the screen orientation from
portrait to landscape.
Human-robot interaction (HRI) by gestures helps to personalize the communication with humans in various
contexts and demands for a hand gesture recognition (HGR) system in real time. HGR systems can be classified into
vision-based, infrared-based, electro-based, ultrasonic-based, accelerometer-based or wireless glove-based. The
most popular sensors for robot vision are kind of cameras, like RGB, infrared depth (D), thermal or a combination of
them. In recent years Microsoft Kinect sensor [2] for gesture recognition has been deployed widely for robots’
vision. Although, Kinect is an RGB-D sensor providing synchronized RGB and depth images that overcomes the
classical problems in computer vision concerning limitations of optical sensors sensitive to light illumination and
cluttered background, it is questionable though, whether vision-based sensors and software is the most effective way
for robots’ vision and gesture recognition in terms of lightweight and fast processing of algorithms.
Fig.1. The basic components of any gestural system. (Image taken from [1])
Real-world signals are analog. Not only the well-known electricity and magnetism but light and heat are a
measured response to continuously changes in energy levels of physical processes. Visible light (VL) and infrared
(IR) are composed of electromagnetic waves (EMW) with wavelength ranging from 0.4 to 1.6µm and the different
colors of the VL are variations in the wavelengths. Do we need another kind of sensors for direct perception of
electromagnetic radiation (EMR) to see objects? An interesting fact is that visual perception is mostly based on
experience of the brain. For instance, the first days after birth babies see everything upside down. So, can robots
learn how to reconstruct visual perception only by harvesting IR or VL analog signals? The concept we follow in
this work is influenced by achievements in nano-technologies [3], nano-antennas [4] and interesting facts related to
visions in some animals. Some animals use different eyes organs like “Ampullae of Lorenzini” [5] in sharks,
electroceptive in fishes, pit organs and IR heat-sensitive membrane in some snakes [6] and organs in the mouth of
platypus [7] to sense electro fields. Traditionally, waves are captured by antennas that convert EMR into some
measurable signal, e.g. electric current. This naturally leads us to signal harvesting, processing and featuring by a
grid of nano-antennas (nantennas) instead of Euclidean space analysis of image pixels.
The devices to detect VL and IR can be divided into three main categories: thermal detectors, quantum (photon)
light detectors (QLD) such as a charge-coupled device (CCD) or a Bayer patterned sensor in digital cameras and
radiation-field light detectors (RFLD), such as a very small antenna made-up with nanotechnology proportional to
the length of light wave. Each type of light detectors is capable of sensing incident IR or VL radiation and
converting it into some measurable signals. The last two detectors are wavelength dependent and they produce a
signal for a current that is directly proportional to the response of changes in the focused flow of reflected light.
QLD technologies exploit semiconductor devices for sensing VL or IR radiation, i.e., when subjected to light
radiation, photons interact with electrons within the semiconductor to create mobile electric charges, while RFLD
directly detect a radiation field similar to radio receivers depending on the frequency of the detected wave
converting then the light into electrical signals. This naturally leads us to process and feature directly EMW. We
propose a novel framework for hand gesture profiling and recognition based on signal processing and cross
correlation of EMW instead of visual-based algorithms for image pixels analysis in space and frequency domains.
Hand tracking is done by shining infrared light into the space around objects and nano-antennas capture reflections
from IR or VL wavelengths. Hand segmentation is accomplished on infrared radiation; and base on it a set of
monochromatic sensor data is separated for processing to decompose the hand in hand joints. A hand joint (HJ) is
Sensor Comparator Actuator
Environment
Feedback
Disturbances
Input
measured by
alerts drives
affect
affects
Output
defined by its informative features - grayscale patterns on edges of the segmented hand. During the hand
segmentation, we use online fuzzy clustering to categorize the infrared radiation and find the corresponding depth
map and depth threshold where the hands are located. During feature extraction, we use online fuzzy clustering to
categorize the light intensity on hand edges together with its spatiotemporal information. The meaning of a gesture
is described by wave-based profiles of hand joints and their spatiotemporal relations. A hand joint profile is a
waveform of known shape obtained by superposition of feature waves shifted by phase. During the training phase,
the hand joint profiles are stored in the database (DB) of the robot as sampled sequences corresponding to the sum
of sine waves with amplitudes and frequencies derived from the obtained clusters. Signals cross-correlation is used
for matching of the observed waveform to the profiles in the DB.
The progress made by current research [4] indicating that RF concepts can be transferred to optical and infrared
frequencies and the state-of-the-art works [8-11] confirm that signal-processing algorithms for time series analysis
might be a better alternative for hand gesture recognition. Time series analysis and measures are for acceleration
signals [8], Doppler shifts along with Wi-Fi [9] or TV transmissions [10], as well as electrical fields to sense hand
movements [11] instead of spectral, spatial and temporal models of regions in visual image sequences. In addition,
signal-processing algorithms run faster than the pattern recognition techniques used in vision-based systems, since
they require less preprocessing of the raw data and limited training phase. Moreover, pattern recognition based on
waveforms cross-correlation is a function of a time-lag that can identify a short signal (feature) occurring in a long
signal stream.
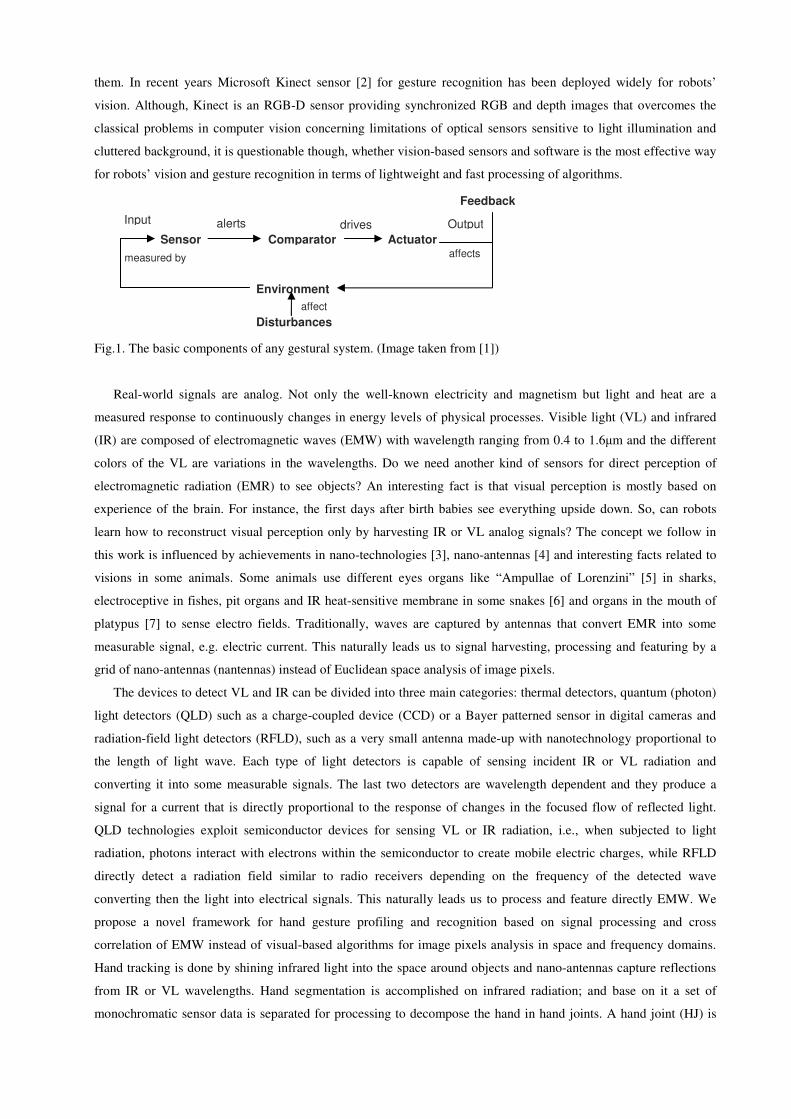
Fig.2. Signal processing in local and remote scenarios
Although real-world signals can be processed in their analog form, processing signals digitally provides the
advantages of high speed and accuracy. Often analog signals need to be processed so that the information they
contain can be analyzed. Analog VL and IR signals can be converted to another type of signals that may be of use
for HGR or changed to digital format by Analog-to-Digital Convertors (ADC) for processing by Digital Signal
Processors (DSPs).. After digitizing, DSP manipulates the signals mathematically and perform functions like “add”,
“divide”, etc. It then returns the digitized information back to analog form through the use of a Digital-to-Analog
Convertor (DAC) to be used in real word. As shown in Fig.2, DSP information is used to control the robot hand.
grayscale image
b) remote scenario (Kinect sensor) robot hand
input
OV A1 f1 A2 f2 A3 f3 …
a) local scenario (Kinect sensor)
DSP
RAM (DB)
DAC
ADC
output format1 [-0.27,-1.16, 0.38, 0.89, 0.73,-0.5, -0.71, 0.12, 0.23, 0.52,…,0.28]
format2
1 2 6
3 7 8 9
5 4
depth image
During the input phase VL analog signal might be harvest through a vision-based sensor (Kinect) or other detectors.
This continuous signal is then converted to a digital form by ADC and passed to DSP. It performs signals “adding”
and saves the complex waves into the memory. The output could be converted back to analog signal in real world or
continues in the digital format for more complex DSP functions. For instance, DSP may compress signals so that
they can be transmitted quickly without noise and interference from one place to another or can perform an interface
for hand robot control.
Since the raw data obtained from Microsoft Kinect IR CMOS and Bayer patterned RGB sensors is wavelength
dependent and produce a current signal that is directly proportional to changes in the focused flow of reflected light
during gesturing, we ask the following question: can we consider this spatial color detection in cameras organizing
RGB colors on a square grid of photo sensors as a grid of wavelength dependent nano-antennas? The range around
each photo detector keeps the electrical charge of which is initially fixed image and then sends it to ADC for
analyzing analog pulses and converts them to digital format. The resulted intensity of current (IC) value corresponds
to the intensity in light (IL) value in a specific position and each active element in the Bayer filter mosaic sensors is
possible to be addressed individually.
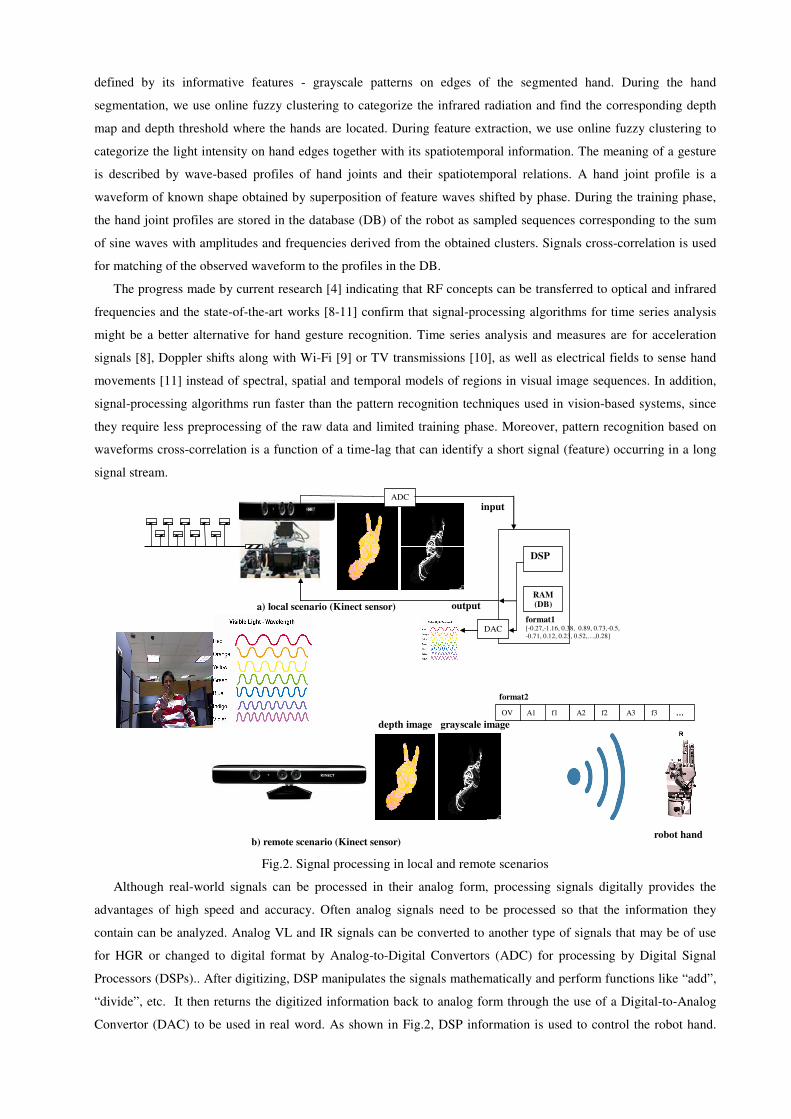
The electric current charges of which is initially fixed image can be obtained from a new sensor for seeing
gestures, presented in Fig.3. It consists of a grid of nantennas (nodes) connected in a network in order to allow nodes
communication in a local scope. Thus, distributed preprocessing of converted current signal from visible and
infrared light will be performed. It is already known that RF concepts can be transferred to optical and infrared
amplitudes and frequencies [4]. Fig.3 (a) shows, for instance, 9 nantennas forming a 3x3 grid, and an IR projector
illuminating the object to detect depth and distinguish it from the background and interferences. The reflected VL
and IR waves are converted to a current signal at each nantenna. Two major operations will take place: edge
preprocessing and clustering.
For image recognition and pattern analysis, it is assumed that converting color image to grayscale has a little
impact on recognition performance. A grayscale (monochromatic) image is a result of harvesting and measuring the
intensity of light at each node in a single band of the electromagnetic spectrum, and the light intensity varies from
black at the weakest to white at the strongest intensities. On the other hand, edge detection that operates on
monochromatic light gives us the boundaries between related objects. Edges are informative enough for HGR and
thus reduce the data to be processed. Edge detection algorithms accentuate regions that change greatly in intensity
over short image distance and the most used algorithms are gradient-based, evaluating 2D gradient magnitude (GM)
by 3x3 square kernels. The purpose of the clustering is to categorize the input examples in fuzzy partitions resulting
in overlapping clusters (features) for hand joints in terms of brighter and darker light intensity on edges in vicinity.
We apply the online Low-complexity Constrained Fuzzy Clustering algorithm (LCFC) proposed in [12].
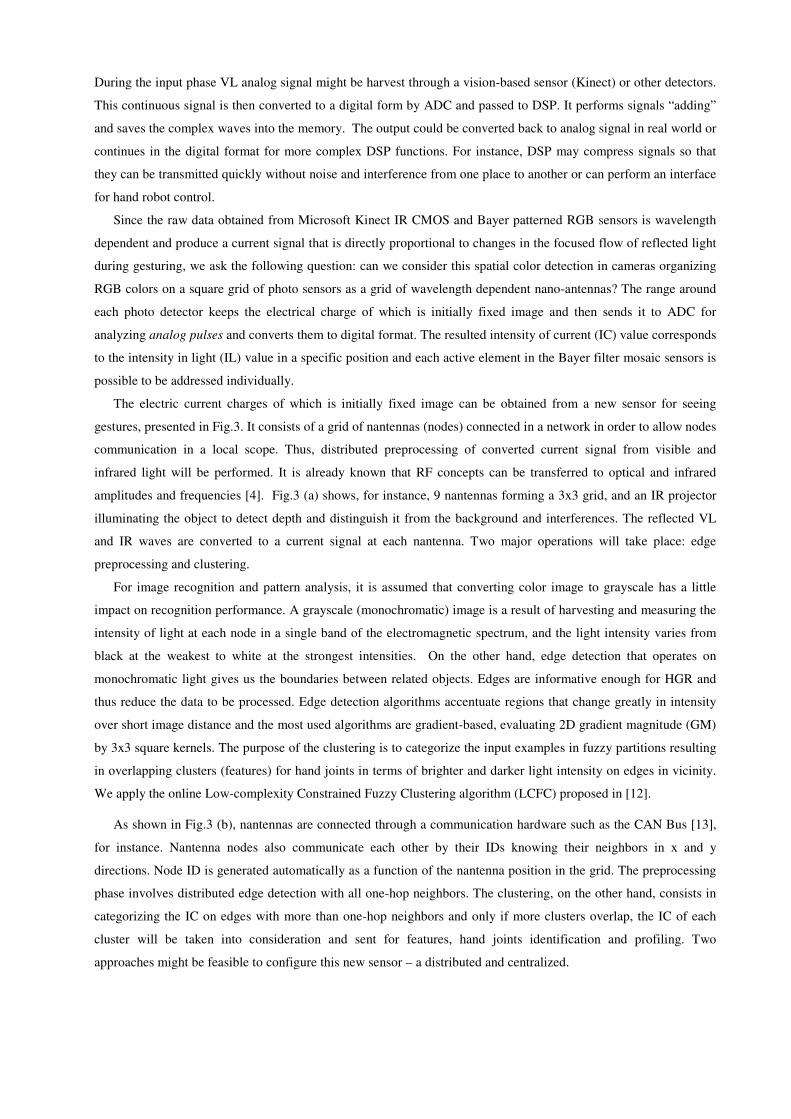
As shown in Fig.3 (b), nantennas are connected through a communication hardware such as the CAN Bus [13],
for instance. Nantenna nodes also communicate each other by their IDs knowing their neighbors in x and y
directions. Node ID is generated automatically as a function of the nantenna position in the grid. The preprocessing
phase involves distributed edge detection with all one-hop neighbors. The clustering, on the other hand, consists in
categorizing the IC on edges with more than one-hop neighbors and only if more clusters overlap, the IC of each
cluster will be taken into consideration and sent for features, hand joints identification and profiling. Two
approaches might be feasible to configure this new sensor – a distributed and centralized.
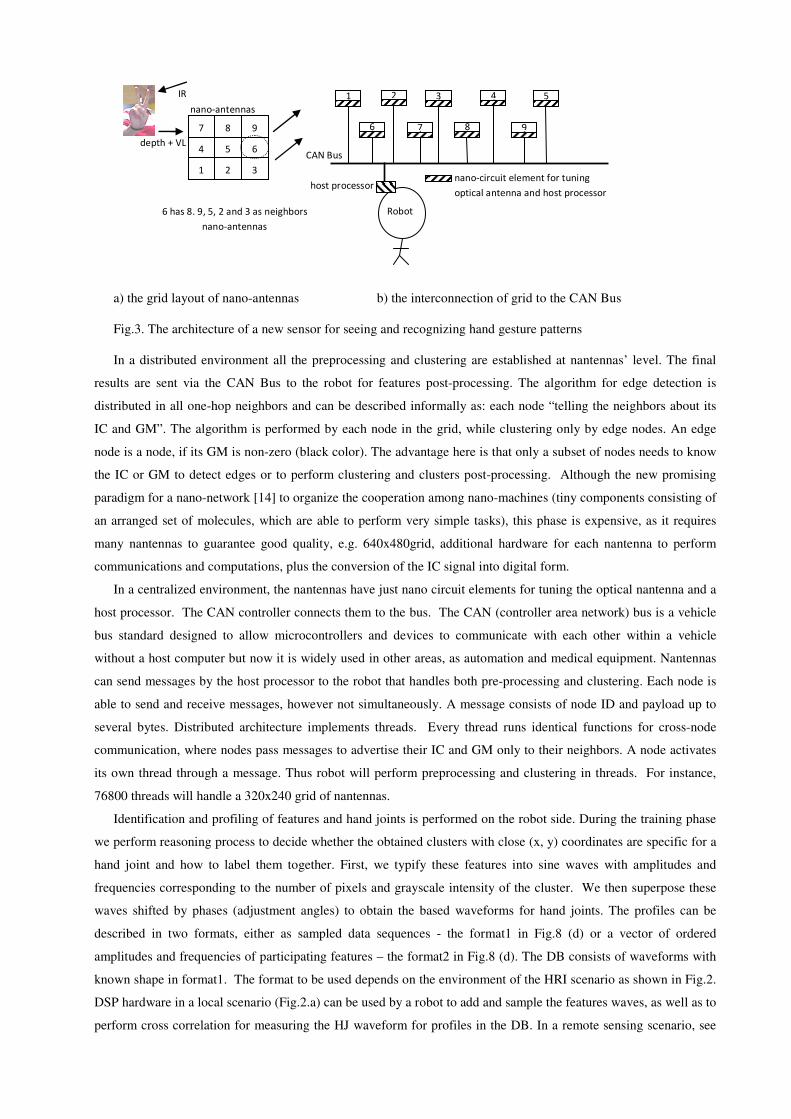
a) the grid layout of nano-antennas b) the interconnection of grid to the CAN Bus
Fig.3. The architecture of a new sensor for seeing and recognizing hand gesture patterns
In a distributed environment all the preprocessing and clustering are established at nantennas’ level. The final
results are sent via the CAN Bus to the robot for features post-processing. The algorithm for edge detection is
distributed in all one-hop neighbors and can be described informally as: each node “telling the neighbors about its
IC and GM”. The algorithm is performed by each node in the grid, while clustering only by edge nodes. An edge
node is a node, if its GM is non-zero (black color). The advantage here is that only a subset of nodes needs to know
the IC or GM to detect edges or to perform clustering and clusters post-processing. Although the new promising
paradigm for a nano-network [14] to organize the cooperation among nano-machines (tiny components consisting of
an arranged set of molecules, which are able to perform very simple tasks), this phase is expensive, as it requires
many nantennas to guarantee good quality, e.g. 640x480grid, additional hardware for each nantenna to perform
communications and computations, plus the conversion of the IC signal into digital form.
In a centralized environment, the nantennas have just nano circuit elements for tuning the optical nantenna and a
host processor. The CAN controller connects them to the bus. The CAN (controller area network) bus is a vehicle
bus standard designed to allow microcontrollers and devices to communicate with each other within a vehicle
without a host computer but now it is widely used in other areas, as automation and medical equipment. Nantennas
can send messages by the host processor to the robot that handles both pre-processing and clustering. Each node is
able to send and receive messages, however not simultaneously. A message consists of node ID and payload up to
several bytes. Distributed architecture implements threads. Every thread runs identical functions for cross-node
communication, where nodes pass messages to advertise their IC and GM only to their neighbors. A node activates
its own thread through a message. Thus robot will perform preprocessing and clustering in threads. For instance,
76800 threads will handle a 320x240 grid of nantennas.
Identification and profiling of features and hand joints is performed on the robot side. During the training phase
we perform reasoning process to decide whether the obtained clusters with close (x, y) coordinates are specific for a
hand joint and how to label them together. First, we typify these features into sine waves with amplitudes and
frequencies corresponding to the number of pixels and grayscale intensity of the cluster. We then superpose these
waves shifted by phases (adjustment angles) to obtain the based waveforms for hand joints. The profiles can be
described in two formats, either as sampled data sequences - the format1 in Fig.8 (d) or a vector of ordered
amplitudes and frequencies of participating features – the format2 in Fig.8 (d). The DB consists of waveforms with
known shape in format1. The format to be used depends on the environment of the HRI scenario as shown in Fig.2.
DSP hardware in a local scenario (Fig.2.a) can be used by a robot to add and sample the features waves, as well as to
perform cross correlation for measuring the HJ waveform for profiles in the DB. In a remote sensing scenario, see
Robot
host processor
CAN Bus
nano-circuit element for tuning
optical antenna and host processor
7 8 9
4 5 6
1 2 3
1 1
1 2
1 6
1 3
1 7
1 8
1 9
1 5
1 4
6 has 8. 9, 5, 2 and 3 as neighbors
nano-antennas
nano-antennas
depth + VL
IR
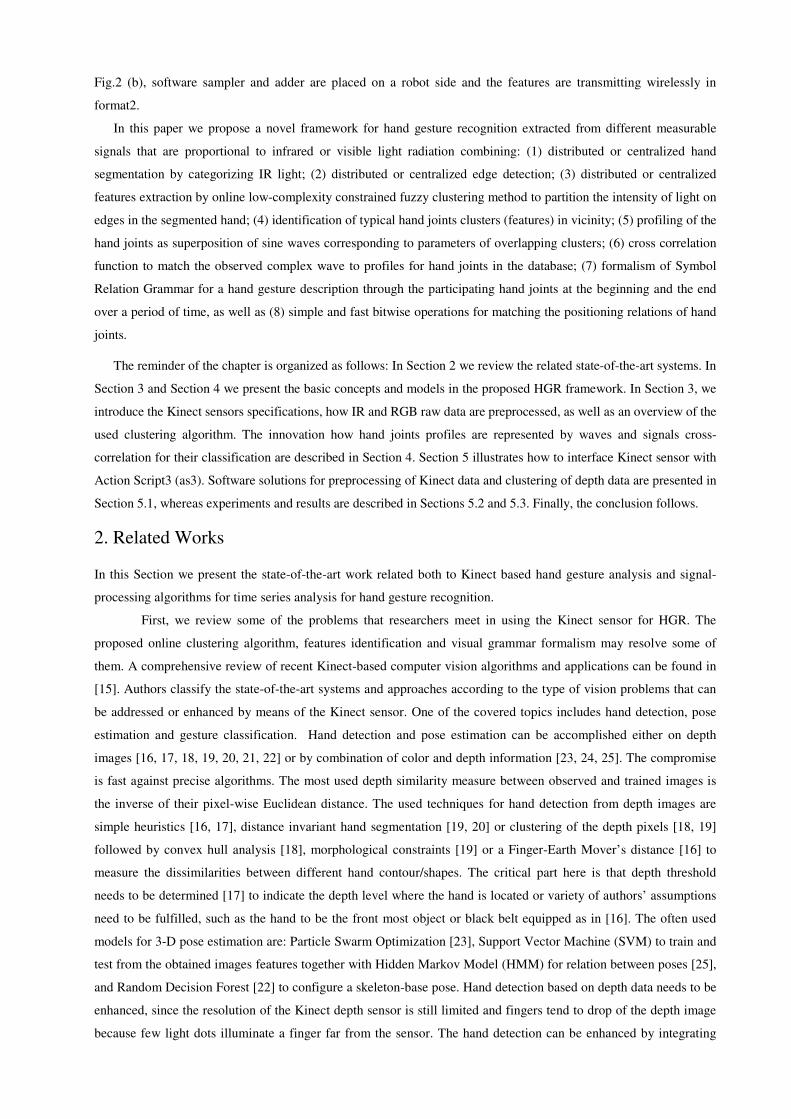
Fig.2 (b), software sampler and adder are placed on a robot side and the features are transmitting wirelessly in
format2.
In this paper we propose a novel framework for hand gesture recognition extracted from different measurable
signals that are proportional to infrared or visible light radiation combining: (1) distributed or centralized hand
segmentation by categorizing IR light; (2) distributed or centralized edge detection; (3) distributed or centralized
features extraction by online low-complexity constrained fuzzy clustering method to partition the intensity of light on
edges in the segmented hand; (4) identification of typical hand joints clusters (features) in vicinity; (5) profiling of the
hand joints as superposition of sine waves corresponding to parameters of overlapping clusters; (6) cross correlation
function to match the observed complex wave to profiles for hand joints in the database; (7) formalism of Symbol
Relation Grammar for a hand gesture description through the participating hand joints at the beginning and the end
over a period of time, as well as (8) simple and fast bitwise operations for matching the positioning relations of hand
joints.
The reminder of the chapter is organized as follows: In Section 2 we review the related state-of-the-art systems. In
Section 3 and Section 4 we present the basic concepts and models in the proposed HGR framework. In Section 3, we
introduce the Kinect sensors specifications, how IR and RGB raw data are preprocessed, as well as an overview of the
used clustering algorithm. The innovation how hand joints profiles are represented by waves and signals cross-
correlation for their classification are described in Section 4. Section 5 illustrates how to interface Kinect sensor with
Action Script3 (as3). Software solutions for preprocessing of Kinect data and clustering of depth data are presented in
Section 5.1, whereas experiments and results are described in Sections 5.2 and 5.3. Finally, the conclusion follows.
2. Related Works
In this Section we present the state-of-the-art work related both to Kinect based hand gesture analysis and signal-
processing algorithms for time series analysis for hand gesture recognition.
First, we review some of the problems that researchers meet in using the Kinect sensor for HGR. The
proposed online clustering algorithm, features identification and visual grammar formalism may resolve some of
them. A comprehensive review of recent Kinect-based computer vision algorithms and applications can be found in
[15]. Authors classify the state-of-the-art systems and approaches according to the type of vision problems that can
be addressed or enhanced by means of the Kinect sensor. One of the covered topics includes hand detection, pose
estimation and gesture classification. Hand detection and pose estimation can be accomplished either on depth
images [16, 17, 18, 19, 20, 21, 22] or by combination of color and depth information [23, 24, 25]. The compromise
is fast against precise algorithms. The most used depth similarity measure between observed and trained images is
the inverse of their pixel-wise Euclidean distance. The used techniques for hand detection from depth images are
simple heuristics [16, 17], distance invariant hand segmentation [19, 20] or clustering of the depth pixels [18, 19]
followed by convex hull analysis [18], morphological constraints [19] or a Finger-Earth Mover’s distance [16] to
measure the dissimilarities between different hand contour/shapes. The critical part here is that depth threshold
needs to be determined [17] to indicate the depth level where the hand is located or variety of authors’ assumptions
need to be fulfilled, such as the hand to be the front most object or black belt equipped as in [16]. The often used
models for 3-D pose estimation are: Particle Swarm Optimization [23], Support Vector Machine (SVM) to train and
test from the obtained images features together with Hidden Markov Model (HMM) for relation between poses [25],
and Random Decision Forest [22] to configure a skeleton-base pose. Hand detection based on depth data needs to be
enhanced, since the resolution of the Kinect depth sensor is still limited and fingers tend to drop of the depth image
because few light dots illuminate a finger far from the sensor. The hand detection can be enhanced by integrating
color information [24] and motion detection based on frame differencing. Authors in [24] recognize gestures by
Dynamic Time Warping (DTW) - a method that calculates an optimal match between two given sequences (e.g.
time series) which vary in time or speed. DTW measure is used to match the similarity between two temporal time
series of skeleton data in [26]. Hand gesture classification for pattern recognition targeting user-dependent gestures
requires a training phase before use. The most popular approaches in literature for pattern recognition are HMM,
DTW, Neural Networks (NN), Gaussian models, support vector machines (SVM) and Bayesian networks. DTW is
very efficient in operating with limited training data in contrast to HMM based methods which require extensive
training in order to be effective.
Some interesting research for bringing gesture recognition on all devices use different sensors than vision-
based and process analog signals. In [8] acceleration data is received in handheld devices for processing; Doppler
shifts from the conventional wireless signals during gesturing is evaluated by Fourier analysis [9]; changes between
signals in gesturing during TV transmissions (or Wi-Fi) is distinguished in AllSee [10]; electrical fields are sensed
during hand movements by electrical-field-based 3-D gesture-controller integrated circuit [11]. The main advantage
of signal-processing algorithms for hand gesture recognition like DTW and cross-correlation is that they run faster
than the above mentioned pattern recognition techniques, since they require less preprocessing of the raw data and
limited training, which is necessary and extensive for HMM, for instance. However, the amount of storage space
used by the signal-processing algorithm grows as the number of features to be recognized increases, while it remains
constant for HMM. The consumption of significant power and computational resources limit handheld devices
applicability for gesture recognition. Always-on cameras and wireless receivers that require rich signal processing
capabilities drain the battery, as well as computing FFTs and frequency-time Doppler profiles do. For that reason,
AllSee extracts gesture information using simple rules that have minimal complexity to distinguish between signals
in order to reduce the required signal processing capabilities. For example, to classify between the push and pull
gestures, the rule is: if the maximum changes in the signal occurs closer to the start of a gesture segment, it is a pull
action; otherwise, it is a push action.
The promising research in nanotechnology with optical and infrared nantennas based on metal
nanostructures allow for efficient conversion of propagating light into nano-scale [4] will strongly enhance the
radiation-field light detectors. As proposed in [4], nano-circuit elements and optical nantennas could be tuned to
color variations in the wavelengths. With the first nano-networks test beds for molecular communication solutions
[14], we can put the signal-preprocessing at nano-scale level and thus improve significantly the HGR time response,
as well as save device resources.
Our approach outperforms the state-of-the-art systems in terms of accuracy, fast algorithm, simple hand
joints profiling and classification based on signals cross-correlation. The used depth threshold for hand(s) location,
which is calculated based on depth stream online and evolve, resolves some of the problems that researchers face
when using Kinect sensor for hand gesture recognition. To the best of our knowledge, this is the first work
involving hand gesture recognition based on a signal cross-correlation as a similarity measure between the observed
and trained waves that profile the hand joints and their features in a novel way. We found two works where a cross-
correlation coefficient is used as a similarity measure however, not as signals processing. In [27] for instance, it is
used at feature extraction phase after image segmentation and morphological operation for hand gesture extraction.
Authors in [26] denote a set of feature time-series obtained from skeletal motion and use a distance metric based on
DTW. We first introduce a concept for a new sensor for seeing hand gestures by a grid of IR and VL wavelength
dependent nantennas and preprocessing the converted waves to current signal light in a distributed way at the
nantennas level.
3. Hand gesture recognition framework: preprocessing and categorizing of raw
data
In this section we present the Kinect sensors, IR and RGB data preprocessing, an overview of the online low-
complexity constrained fuzzy clustering algorithm and post-processing of clusters in vicinity.
Our first implementation of the proposed HGR framework exploits as inputs the raw data from Microsoft
Kinect infrared depth and Bayer patterned RGB image sensors, see Fig.2. We assume that with a small amount of
quantization error, we can extract the amplitude and frequency for VL and IR signals from these data since visual-
based sensors are wavelength dependent and produce an electric current that is directly proportional to changes in
intensity of light. Addressable photo sensors are grouped in a square grid and electric current charges are converted
into digital image format by ADC. The resulted RGB value corresponds to the light intensity in a specific position.
We apply the centralized approach for preprocessing and clustering of light intensity. Grayscale model is
synthesized from the RGB and passed as an input to edge detection algorithm. Then edges are converted to
monochromatic HSV (hue, saturation and value) model and passed as an input to clustering algorithm. The overall
process flow in hand gesture recognition framework using Microsoft Kinect sensor as shown in Fig.4.
Fig4. Overall process flow in hand gesture recognition framework
3.1. IR and RGB raw data and video streams from Kinect Sensor
Real-time hands gestures’ recognition is a challenging task because of there are thousands of different hand
directions, sizes and shapes. The advent of quite cheap color image and depth sensors have aided research in this
field. One of the most popular devices is Microsoft Kinect sensor [2]. Details about its hardware specifications can
be found in [15, 28]. The depth sensor captures video data in 3D under any ambient light conditions and provides
raw depth data, from which we identify the pixels of segment hands. It consists of an infrared laser projector
combined with a monochrome CMOS sensor. The monochrome depth sensing video stream has a VGA resolution
of 640 × 480 pixels with 11-bit depth, which provides 2,048 levels of sensitivity. The Kinect can stream the view
Kinect Video
Digital RGBImage
Digital
Image Digital Image Depth map
RGBImage
frames
Image Preprocessing
Depth Analysis,COG hands segmentation & RGBtoHSV, COG
(x,y,D)
(x,y,HSV)
partitioning (LCFC) extraction of features & binary locations
#clustersi
IF #clus i = #clus i-1
No
Yes
sum of sine waves
Gesture i
HJs locations
Visual Grammar
RGB-Di
HJs
Cross-correlation of signals to
profiles in DB
binary
esture 1
amma
mage
0 1
1 0 1 0 0 0 0 0 0 0 0 0 0 0 0
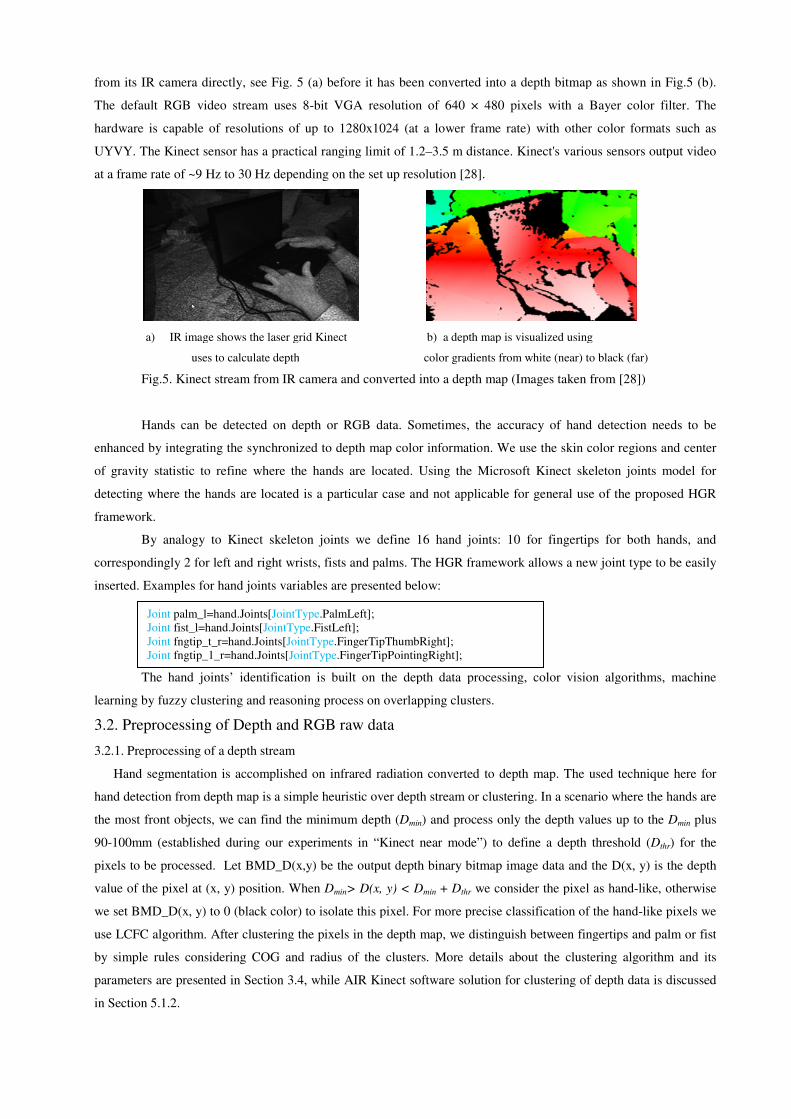
from its IR camera directly, see Fig
The default RGB video stream uses 8
hardware is capable of resolutions
UYVY. The Kinect sensor has a practical ranging
at a frame rate of ~9 Hz to 30 Hz depending on
a) IR image shows the laser grid Kinect
uses to calculate depth
Fig.5. Kinect stream from IR camera and converted into a depth map
Hands can be detected on
enhanced by integrating the synchronized to depth map color information
of gravity statistic to refine where the hands are located
detecting where the hands are located
framework.
By analogy to Kinect skeleton joints we define 16 hand joints: 10 for fingertips for both hands, and
correspondingly 2 for left and right wrists, fists and palms. The
inserted. Examples for hand joints var
The hand joints’ identification
learning by fuzzy clustering and reasoning process on
3.2. Preprocessing of Depth and RGB raw data
3.2.1. Preprocessing of a depth stream
Hand segmentation is accomplished on infrared radiation
hand detection from depth map is a simple heuristic over depth
the most front objects, we can find the minimum depth
90-100mm (established during our experiments in “Kinect near mode”)
pixels to be processed. Let BMD_D
value of the pixel at (x, y) position. When
we set BMD_D(x, y) to 0 (black color) to isolate this pixel.
use LCFC algorithm. After clustering
by simple rules considering COG and radius of
parameters are presented in Section 3
in Section 5.1.2.
Joint palm_l=hand.Joints[JointTypeJoint fist_l=hand.Joints[JointTypeJoint fngtip_t_r=hand.Joints[Joint fngtip_1_r=hand.Joints[
Fig. 5 (a) before it has been converted into a depth bitmap as shown in
The default RGB video stream uses 8-bit VGA resolution of 640 × 480 pixels with a Bayer color filter. The
utions of up to 1280x1024 (at a lower frame rate) with other color formats such as
. The Kinect sensor has a practical ranging limit of 1.2–3.5 m distance. Kinect's various sensors output video
frame rate of ~9 Hz to 30 Hz depending on the set up resolution [28].
IR image shows the laser grid Kinect b) a depth map is visualized using
uses to calculate depth color gradients from white (near) to black
. Kinect stream from IR camera and converted into a depth map (Images taken from [
depth or RGB data. Sometimes, the accuracy of hand detection needs to be
by integrating the synchronized to depth map color information. We use the skin color regions
efine where the hands are located. Using the Microsoft Kinect skeleton joints model
detecting where the hands are located is a particular case and not applicable for general
By analogy to Kinect skeleton joints we define 16 hand joints: 10 for fingertips for both hands, and
correspondingly 2 for left and right wrists, fists and palms. The HGR framework allows a new joint type to be easily
hand joints variables are presented below:
identification is built on the depth data processing, color vision algorithms, machine
and reasoning process on overlapping clusters.
and RGB raw data
depth stream
Hand segmentation is accomplished on infrared radiation converted to depth map. The used technique
a simple heuristic over depth stream or clustering. In a scenario where the hands are
find the minimum depth (Dmin) and process only the depth va
(established during our experiments in “Kinect near mode”) to define a depth
Let BMD_D(x,y) be the output depth binary bitmap image data and the D(x, y) is the depth
. When Dmin> D(x, y) < Dmin + Dthr we consider the pixel as hand
we set BMD_D(x, y) to 0 (black color) to isolate this pixel. For more precise classification
clustering the pixels in the depth map, we distinguish between fingertips and palm or fist
considering COG and radius of the clusters. More details about the clustering algorithm and its
eters are presented in Section 3.4, while AIR Kinect software solution for clustering of depth data
JointType.PalmLeft]; JointType.FistLeft];
=hand.Joints[JointType.FingerTipThumbRight]; =hand.Joints[JointType.FingerTipPointingRight];
map as shown in Fig.5 (b).
with a Bayer color filter. The
other color formats such as
distance. Kinect's various sensors output video
depth map is visualized using
dients from white (near) to black (far)
taken from [28])
of hand detection needs to be
. We use the skin color regions and center
Kinect skeleton joints model for
not applicable for general use of the proposed HGR
By analogy to Kinect skeleton joints we define 16 hand joints: 10 for fingertips for both hands, and
framework allows a new joint type to be easily
is built on the depth data processing, color vision algorithms, machine
. The used technique here for
In a scenario where the hands are
and process only the depth values up to the Dmin plus
to define a depth threshold (Dthr) for the
be the output depth binary bitmap image data and the D(x, y) is the depth
we consider the pixel as hand-like, otherwise
For more precise classification of the hand-like pixels we
distinguish between fingertips and palm or fist
. More details about the clustering algorithm and its
ering of depth data is discussed
In a scenario where a hand is not the front most object, the segmentation is aided by RGB skin detected regions.
We calculate COG (see next subsection) of the segmented skin-like regions and use it in the reasoning process to
ignore other body parts or noise, e.g. an object with the same depth values.
3.2.2. Preprocessing of RGB to monochromatic intensity of light
Each RGB pixel is transformed to HSV model before converting it to grayscale. Hue and Saturation channels are
used for detecting the skin-like regions using predefined thresholds. We apply the commonly used HSV threshold
values that are good for most images (H has to be normalized by 360): Hmin = 0, Hmax =0.14, Smin = 0.2 and Smax
= 0.68; Vmin=0.36 and Vmax=1. For dealing with different skin color of people these thresholds vary. Let
BMD_HSV(x, y) be the output binary bitmap image data and the H(x, y), S(x, y) and V(x, y) are the hue, saturation
and value of the pixel at (x, y) position. When Hmin > H(x, y) < Hmax & Smin >S(x, y) < Smax & Vmin >V(x y) <
Vmax we consider the pixel as skin-like, otherwise we set BMD_HSV(x, y) to 0 (black color) to isolate this pixel.
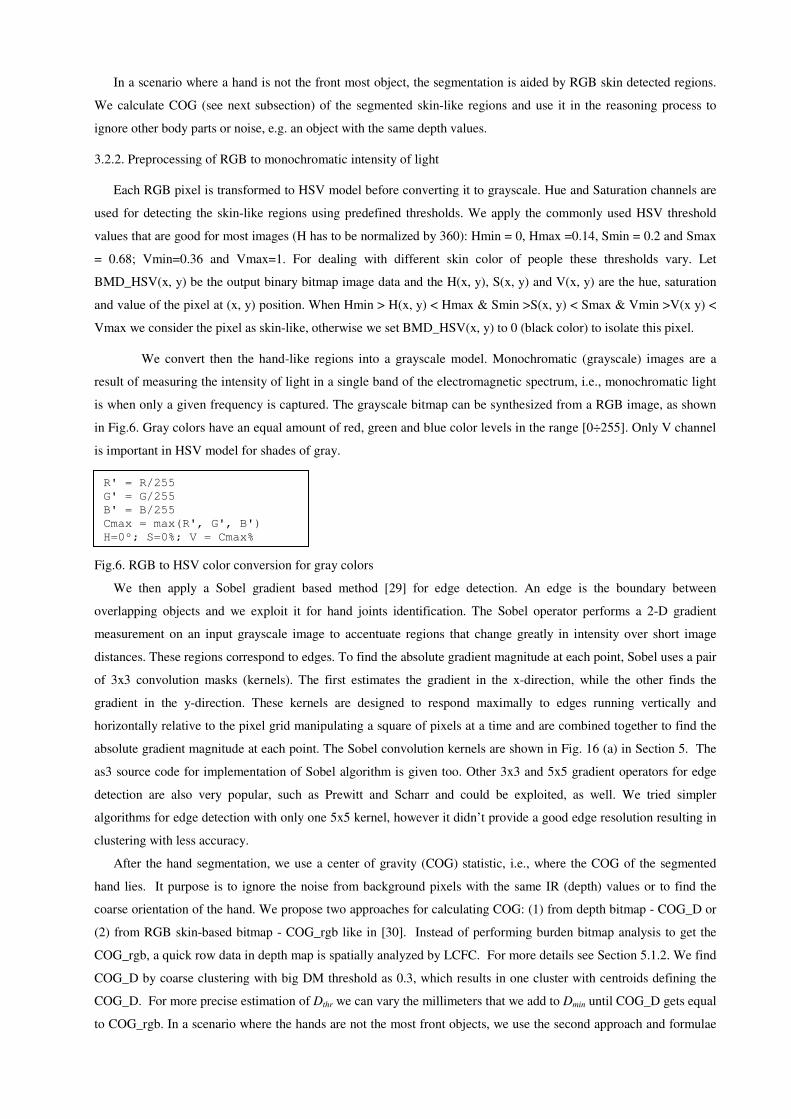
We convert then the hand-like regions into a grayscale model. Monochromatic (grayscale) images are a
result of measuring the intensity of light in a single band of the electromagnetic spectrum, i.e., monochromatic light
is when only a given frequency is captured. The grayscale bitmap can be synthesized from a RGB image, as shown
in Fig.6. Gray colors have an equal amount of red, green and blue color levels in the range [0÷255]. Only V channel
is important in HSV model for shades of gray.
Fig.6. RGB to HSV color conversion for gray colors
We then apply a Sobel gradient based method [29] for edge detection. An edge is the boundary between
overlapping objects and we exploit it for hand joints identification. The Sobel operator performs a 2-D gradient
measurement on an input grayscale image to accentuate regions that change greatly in intensity over short image
distances. These regions correspond to edges. To find the absolute gradient magnitude at each point, Sobel uses a pair
of 3x3 convolution masks (kernels). The first estimates the gradient in the x-direction, while the other finds the
gradient in the y-direction. These kernels are designed to respond maximally to edges running vertically and
horizontally relative to the pixel grid manipulating a square of pixels at a time and are combined together to find the
absolute gradient magnitude at each point. The Sobel convolution kernels are shown in Fig. 16 (a) in Section 5. The
as3 source code for implementation of Sobel algorithm is given too. Other 3x3 and 5x5 gradient operators for edge
detection are also very popular, such as Prewitt and Scharr and could be exploited, as well. We tried simpler
algorithms for edge detection with only one 5x5 kernel, however it didn’t provide a good edge resolution resulting in
clustering with less accuracy.
After the hand segmentation, we use a center of gravity (COG) statistic, i.e., where the COG of the segmented
hand lies. It purpose is to ignore the noise from background pixels with the same IR (depth) values or to find the
coarse orientation of the hand. We propose two approaches for calculating COG: (1) from depth bitmap - COG_D or
(2) from RGB skin-based bitmap - COG_rgb like in [30]. Instead of performing burden bitmap analysis to get the
COG_rgb, a quick row data in depth map is spatially analyzed by LCFC. For more details see Section 5.1.2. We find
COG_D by coarse clustering with big DM threshold as 0.3, which results in one cluster with centroids defining the
COG_D. For more precise estimation of Dthr we can vary the millimeters that we add to Dmin until COG_D gets equal
to COG_rgb. In a scenario where the hands are not the most front objects, we use the second approach and formulae
R' = R/255
G' = G/255
B' = B/255
Cmax = max(R', G', B')
H=0º; S=0%; V = Cmax%
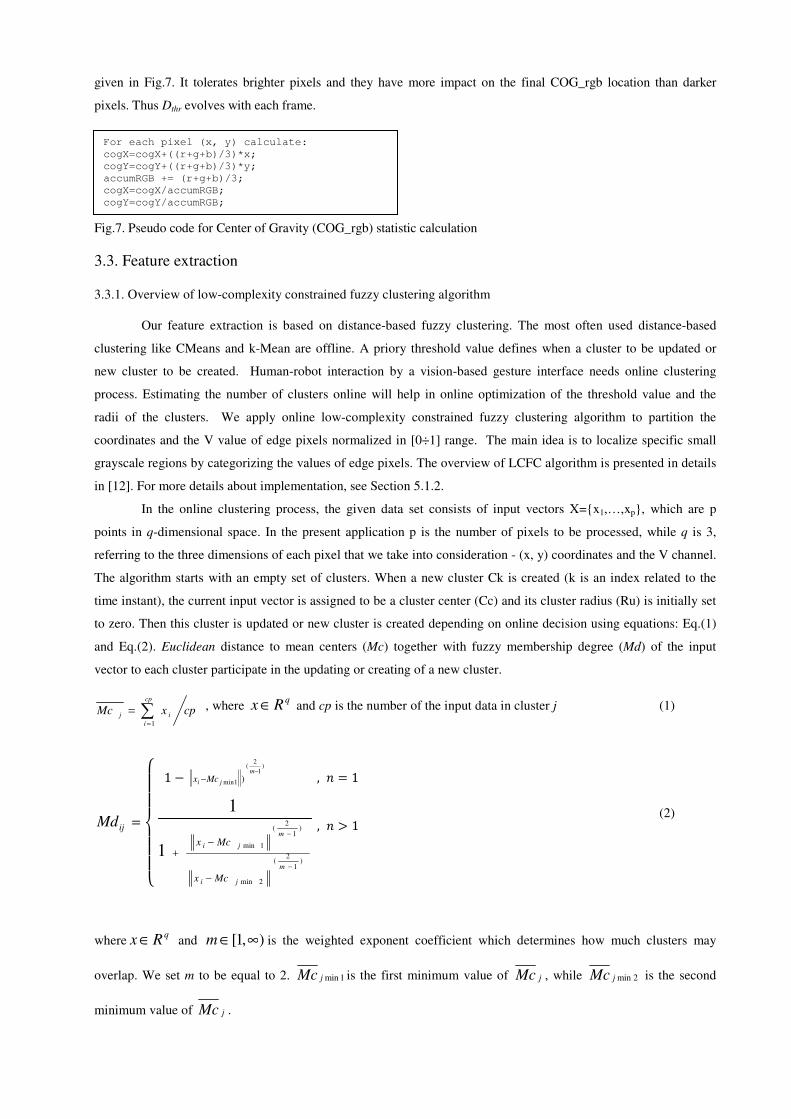
given in Fig.7. It tolerates brighter pixels and they have more impact on the final COG_rgb location than darker
pixels. Thus Dthr evolves with each frame.
Fig.7. Pseudo code for Center of Gravity (COG_rgb) statistic calculation
3.3. Feature extraction
3.3.1. Overview of low-complexity constrained fuzzy clustering algorithm
Our feature extraction is based on distance-based fuzzy clustering. The most often used distance-based
clustering like CMeans and k-Mean are offline. A priory threshold value defines when a cluster to be updated or
new cluster to be created. Human-robot interaction by a vision-based gesture interface needs online clustering
process. Estimating the number of clusters online will help in online optimization of the threshold value and the
radii of the clusters. We apply online low-complexity constrained fuzzy clustering algorithm to partition the
coordinates and the V value of edge pixels normalized in [0÷1] range. The main idea is to localize specific small
grayscale regions by categorizing the values of edge pixels. The overview of LCFC algorithm is presented in details
in [12]. For more details about implementation, see Section 5.1.2.
In the online clustering process, the given data set consists of input vectors X={x1,…,xp}, which are p
points in q-dimensional space. In the present application p is the number of pixels to be processed, while q is 3,
referring to the three dimensions of each pixel that we take into consideration - (x, y) coordinates and the V channel.
The algorithm starts with an empty set of clusters. When a new cluster Ck is created (k is an index related to the
time instant), the current input vector is assigned to be a cluster center (Cc) and its cluster radius (Ru) is initially set
to zero. Then this cluster is updated or new cluster is created depending on online decision using equations: Eq.(1)
and Eq.(2). Euclidean distance to mean centers (Mc) together with fuzzy membership degree (Md) of the input
vector to each cluster participate in the updating or creating of a new cluster.
cpxMccp
i
ij ∑=
=1
, where q
Rx ∈ and cp is the number of the input data in cluster j (1)
ijMd �
��������� 1 � )
1
2(
1min )−
−m
ji Mcx , � 1
)1
2(
2min
)1
2(
1min1
1
−
−
−
−+
m
ji
m
ji
Mcx
Mcx
, � 1� (2)
whereq
Rx ∈ and ),1[ ∞∈m is the weighted exponent coefficient which determines how much clusters may
overlap. We set m to be equal to 2. 1minjMc is the first minimum value of jMc , while 2minjMc is the second
minimum value of jMc .
For each pixel (x, y) calculate:
cogX=cogX+((r+g+b)/3)*x;
cogY=cogY+((r+g+b)/3)*y;
accumRGB += (r+g+b)/3;
cogX=cogX/accumRGB;
cogY=cogY/accumRGB;
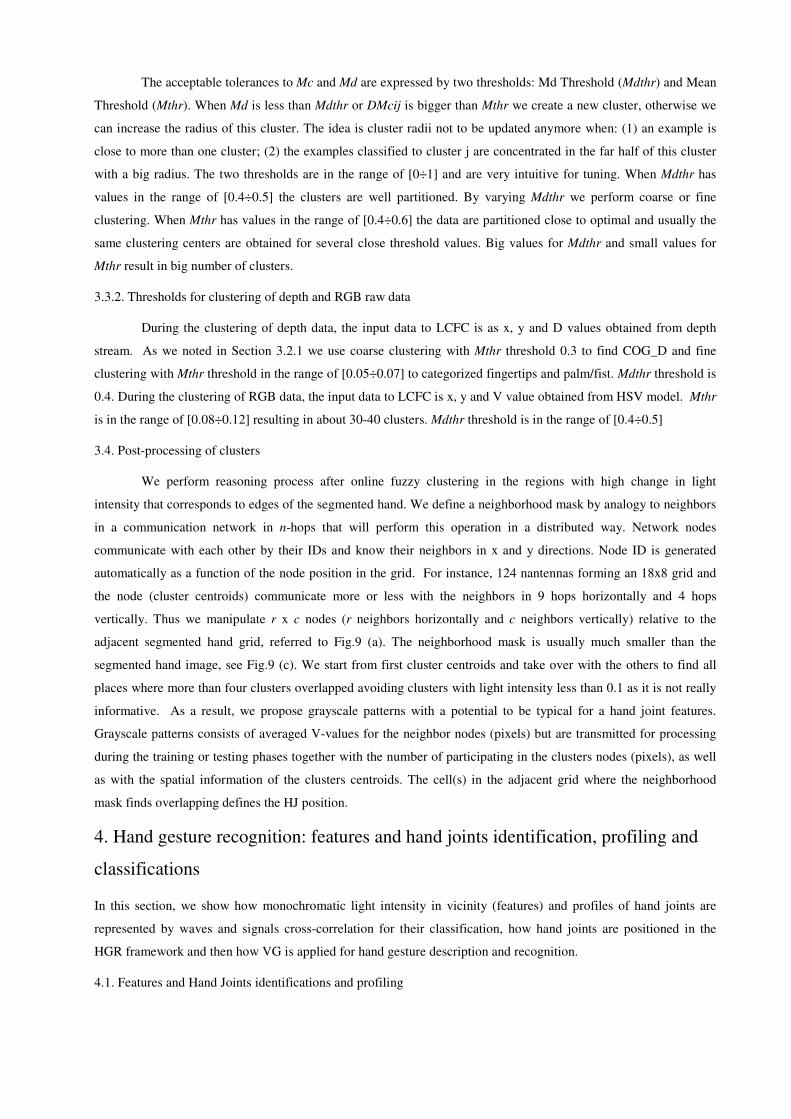
The acceptable tolerances to Mc and Md are expressed by two thresholds: Md Threshold (Mdthr) and Mean
Threshold (Mthr). When Md is less than Mdthr or DMcij is bigger than Mthr we create a new cluster, otherwise we
can increase the radius of this cluster. The idea is cluster radii not to be updated anymore when: (1) an example is
close to more than one cluster; (2) the examples classified to cluster j are concentrated in the far half of this cluster
with a big radius. The two thresholds are in the range of [0÷1] and are very intuitive for tuning. When Mdthr has
values in the range of [0.4÷0.5] the clusters are well partitioned. By varying Mdthr we perform coarse or fine
clustering. When Mthr has values in the range of [0.4÷0.6] the data are partitioned close to optimal and usually the
same clustering centers are obtained for several close threshold values. Big values for Mdthr and small values for
Mthr result in big number of clusters.
3.3.2. Thresholds for clustering of depth and RGB raw data
During the clustering of depth data, the input data to LCFC is as x, y and D values obtained from depth
stream. As we noted in Section 3.2.1 we use coarse clustering with Mthr threshold 0.3 to find COG_D and fine
clustering with Mthr threshold in the range of [0.05÷0.07] to categorized fingertips and palm/fist. Mdthr threshold is
0.4. During the clustering of RGB data, the input data to LCFC is x, y and V value obtained from HSV model. Mthr
is in the range of [0.08÷0.12] resulting in about 30-40 clusters. Mdthr threshold is in the range of [0.4÷0.5]
3.4. Post-processing of clusters
We perform reasoning process after online fuzzy clustering in the regions with high change in light
intensity that corresponds to edges of the segmented hand. We define a neighborhood mask by analogy to neighbors
in a communication network in n-hops that will perform this operation in a distributed way. Network nodes
communicate with each other by their IDs and know their neighbors in x and y directions. Node ID is generated
automatically as a function of the node position in the grid. For instance, 124 nantennas forming an 18x8 grid and
the node (cluster centroids) communicate more or less with the neighbors in 9 hops horizontally and 4 hops
vertically. Thus we manipulate r x c nodes (r neighbors horizontally and c neighbors vertically) relative to the
adjacent segmented hand grid, referred to Fig.9 (a). The neighborhood mask is usually much smaller than the
segmented hand image, see Fig.9 (c). We start from first cluster centroids and take over with the others to find all
places where more than four clusters overlapped avoiding clusters with light intensity less than 0.1 as it is not really
informative. As a result, we propose grayscale patterns with a potential to be typical for a hand joint features.
Grayscale patterns consists of averaged V-values for the neighbor nodes (pixels) but are transmitted for processing
during the training or testing phases together with the number of participating in the clusters nodes (pixels), as well
as with the spatial information of the clusters centroids. The cell(s) in the adjacent grid where the neighborhood
mask finds overlapping defines the HJ position.
4. Hand gesture recognition: features and hand joints identification, profiling and
classifications
In this section, we show how monochromatic light intensity in vicinity (features) and profiles of hand joints are
represented by waves and signals cross-correlation for their classification, how hand joints are positioned in the
HGR framework and then how VG is applied for hand gesture description and recognition.
4.1. Features and Hand Joints identifications and profiling
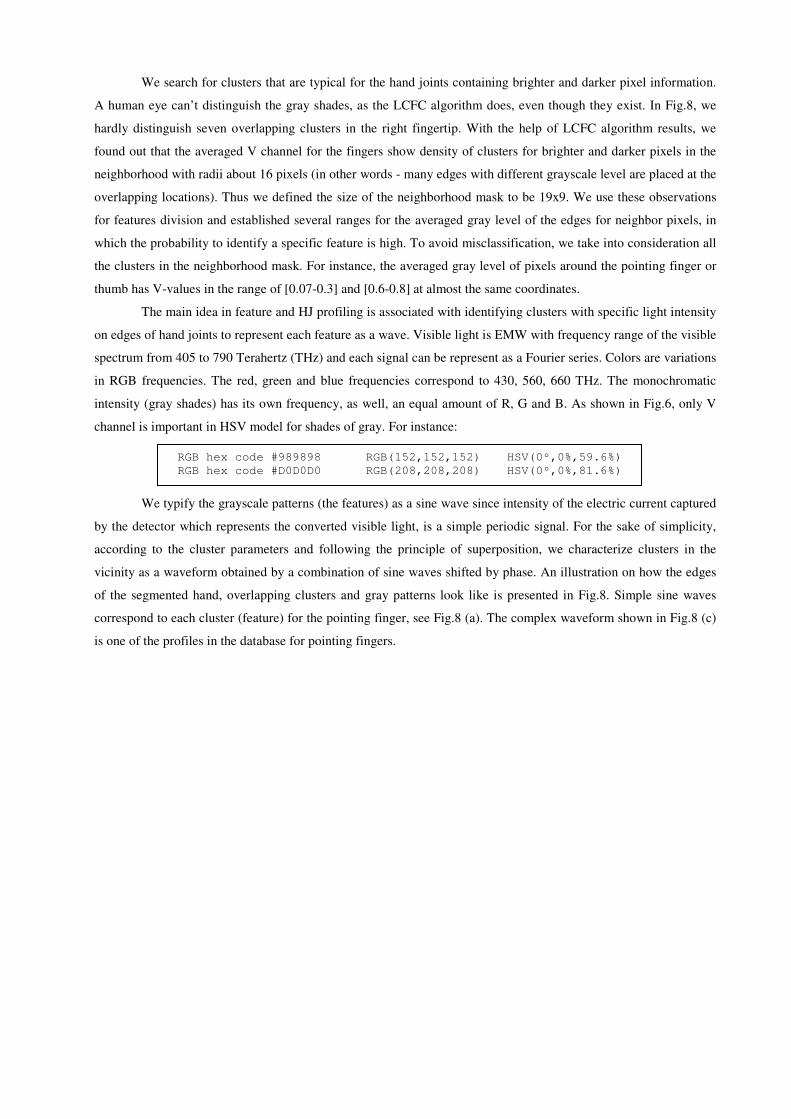
We search for clusters that are typical for the hand joints containing brighter and darker pixel information.
A human eye can’t distinguish the gray shades, as the LCFC algorithm does, even though they exist. In Fig.8, we
hardly distinguish seven overlapping clusters in the right fingertip. With the help of LCFC algorithm results, we
found out that the averaged V channel for the fingers show density of clusters for brighter and darker pixels in the
neighborhood with radii about 16 pixels (in other words - many edges with different grayscale level are placed at the
overlapping locations). Thus we defined the size of the neighborhood mask to be 19x9. We use these observations
for features division and established several ranges for the averaged gray level of the edges for neighbor pixels, in
which the probability to identify a specific feature is high. To avoid misclassification, we take into consideration all
the clusters in the neighborhood mask. For instance, the averaged gray level of pixels around the pointing finger or
thumb has V-values in the range of [0.07-0.3] and [0.6-0.8] at almost the same coordinates.
The main idea in feature and HJ profiling is associated with identifying clusters with specific light intensity
on edges of hand joints to represent each feature as a wave. Visible light is EMW with frequency range of the visible
spectrum from 405 to 790 Terahertz (THz) and each signal can be represent as a Fourier series. Colors are variations
in RGB frequencies. The red, green and blue frequencies correspond to 430, 560, 660 THz. The monochromatic
intensity (gray shades) has its own frequency, as well, an equal amount of R, G and B. As shown in Fig.6, only V
channel is important in HSV model for shades of gray. For instance:
We typify the grayscale patterns (the features) as a sine wave since intensity of the electric current captured
by the detector which represents the converted visible light, is a simple periodic signal. For the sake of simplicity,
according to the cluster parameters and following the principle of superposition, we characterize clusters in the
vicinity as a waveform obtained by a combination of sine waves shifted by phase. An illustration on how the edges
of the segmented hand, overlapping clusters and gray patterns look like is presented in Fig.8. Simple sine waves
correspond to each cluster (feature) for the pointing finger, see Fig.8 (a). The complex waveform shown in Fig.8 (c)
is one of the profiles in the database for pointing fingers.
RGB hex code #989898 RGB(152,152,152) HSV(0º,0%,59.6%)
RGB hex code #D0D0D0 RGB(208,208,208) HSV(0º,0%,81.6%)
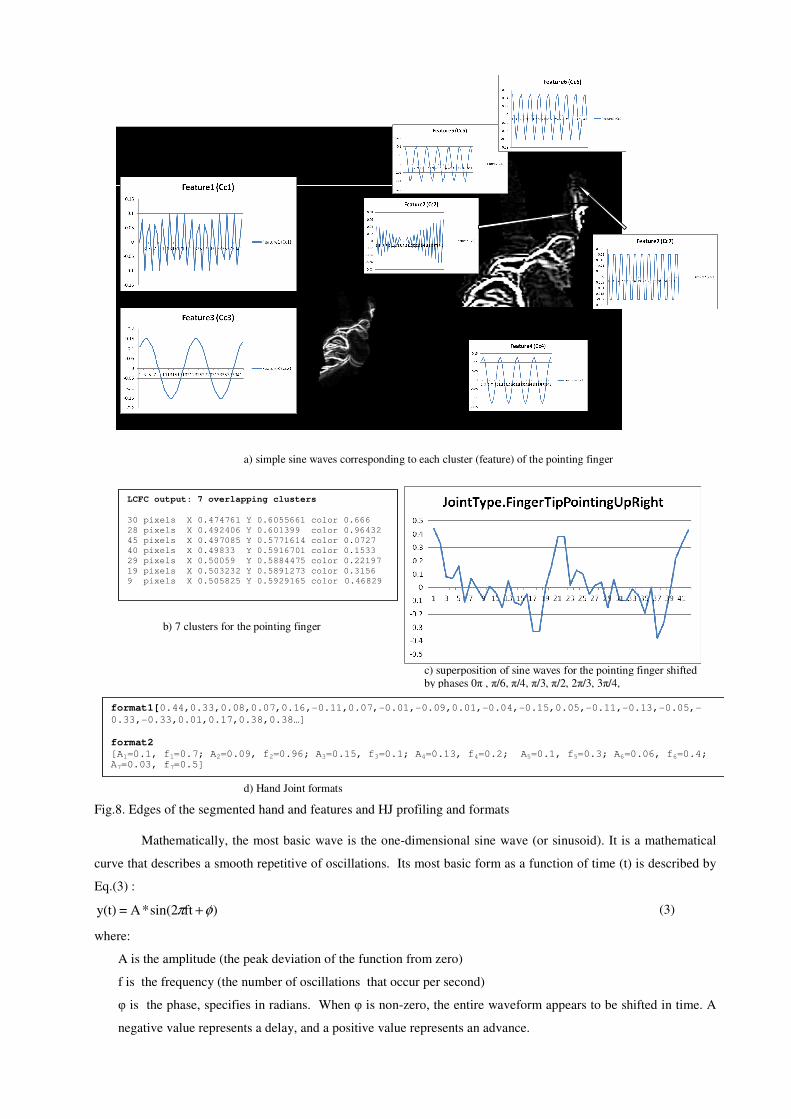
Fig.8. Edges of the segmented hand and features and HJ profiling and formats
Mathematically, the most basic wave is the one-dimensional sine wave (or sinusoid). It is a mathematical
curve that describes a smooth repetitive of oscillations. Its most basic form as a function of time (t) is described by
Eq.(3) :
)ftsin(2*A=y(t) φπ + (3)
where:
A is the amplitude (the peak deviation of the function from zero)
f is the frequency (the number of oscillations that occur per second)
φ is the phase, specifies in radians. When φ is non-zero, the entire waveform appears to be shifted in time. A
negative value represents a delay, and a positive value represents an advance.
format1[0.44,0.33,0.08,0.07,0.16,-0.11,0.07,-0.01,-0.09,0.01,-0.04,-0.15,0.05,-0.11,-0.13,-0.05,-
0.33,-0.33,0.01,0.17,0.38,0.38…]
format2
[A1=0.1, f1=0.7; A2=0.09, f2=0.96; A3=0.15, f3=0.1; A4=0.13, f4=0.2; A5=0.1, f5=0.3; A6=0.06, f6=0.4; A7=0.03, f7=0.5]
c) superposition of sine waves for the pointing finger shifted by phases 0π , π/6, π/4, π/3, π/2, 2π/3, 3π/4,
a) simple sine waves corresponding to each cluster (feature) of the pointing finger
LCFC output: 7 overlapping clusters
30 pixels X 0.474761 Y 0.6055661 color 0.666
28 pixels X 0.492406 Y 0.601399 color 0.96432
45 pixels X 0.497085 Y 0.5771614 color 0.0727
40 pixels X 0.49833 Y 0.5916701 color 0.1533
29 pixels X 0.50059 Y 0.5884475 color 0.22197
19 pixels X 0.503232 Y 0.5891273 color 0.3156
9 pixels X 0.505825 Y 0.5929165 color 0.46829
d) Hand Joint formats
b) 7 clusters for the pointing finger
Equation (3) is enough to represent the intensity of the current captured by the sensor which represents a
simple periodic signal. We epitomize the intensity of the gray color in each cluster as the frequency of the sine
wave. We take into consideration the number of participating pixels in the cluster (correspondingly the number of
nantennas from which this gray intensity in the cluster is obtained), as well as a phase abstraction representing an
advance in time that sinusoids for right handed positioning clusters (ordered by x coordinate) have. As an
alternative, features might be ordered by their y coordinates. The number of examples in each cluster corresponds to
wave amplitude, frequency associated with intensity of gray color, and phases distinguishing how the waves are to
be superposed in time. We then compose a complex waveform by superposition of individual for features sine
waves. Thus a hand joint profile is a waveform of known shape S(t) obtained by summing of individual sine waves
with amplitudes Ai and frequencies fi corresponding to the amplitudes and frequencies derived from the obtained
clusters and shifted by phase with increasing positive values for π correspondingly to their locations, e.g. 0π , π/6,
π/4, π/3, π/2, 2π/3, 3π/4, 5π/6, … as presented by Eq.(4). The number S, corresponding to the number of overlapping
clusters, defines the number of sine waves to be summed, and n is the number of samples.
∑=
+S
0iniin )t*f*sin(2*A=(t)S iφπ (4)
where:
11-nn t=t t+
precisionf max
1*2
1=t
i =1,…,S and n=1,…,N
During the training phase, the database has to be fed with such hand joint profiles. However, since the S(t) is a
continuous signal, we need to quantize it into digital numbers that represents the quantities. The conversion rate (or
sampling frequency) is critical and is determined by the amount of signal information that is needed for a given
application. The sampling rate must be at least twice the highest frequency of the continuous signal in order to
provide enough accurate samples to reconstruct the original signal. The sampling period is the time between samples
(t1) and is defined by the minimum t (the inverse of twice the highest frequency) divided by the precision of the
discretization. For instance, since we work with normalized image resolution values - fmax is 1 and fmin is 0.05
and correspondingly sampling rates could be 0.05, 0.5 and 1sec. Fig.18 in Section 5 illustrates how the number of
samples per time unit taken from the continuous signal are generated.
4.2. Classification Logic
Hand joints classification is based on cross-correlation, a signal-processing technique for matching the
similarity between signals. The observed current frame waveform for a potential hand joint is matched by cross-
correlation to hand joint profiles in the DB, presented in format1 of Fig.8 (d). Measuring cross-correlation is
organized by two classifiers in a hierarchical way. The first one compares the data sequence x(n) sampled from the
current features to each profile y(n) in the DB using the Eq.(5). Cross-correlation of the two input signals produces a
third signal CC(n) obtained by averaging the sum of products of the corresponding pairs of N sampling points taken.
)()(1
)(1
0nynx
NnCC
N
n
∗∑=−
=
(5)
We analyze the number of negative samples in CC(n) and continue with the second classifier only if the
negative samples are less than five. If the number is more than five, the cross-correlation coefficient (CCoef) of the
two signals is very small and it is not worth any calculations. We calculate CCoef, which lies between -1 and +1,
from Equation (6) in order to obtain a grade of similarity. The value of +1 means 100% similarity, while small
values indicate very low correlation.
∑ −∗−∑
−∗−∑
=−
=
−
=
−
=
1
0
221
0
1
0
))(())((
))(())((
N
n
N
n
N
n
ynyxnx
ynyxnx
CCoef (6)
where: x and y are the means of x(n) and y(n).
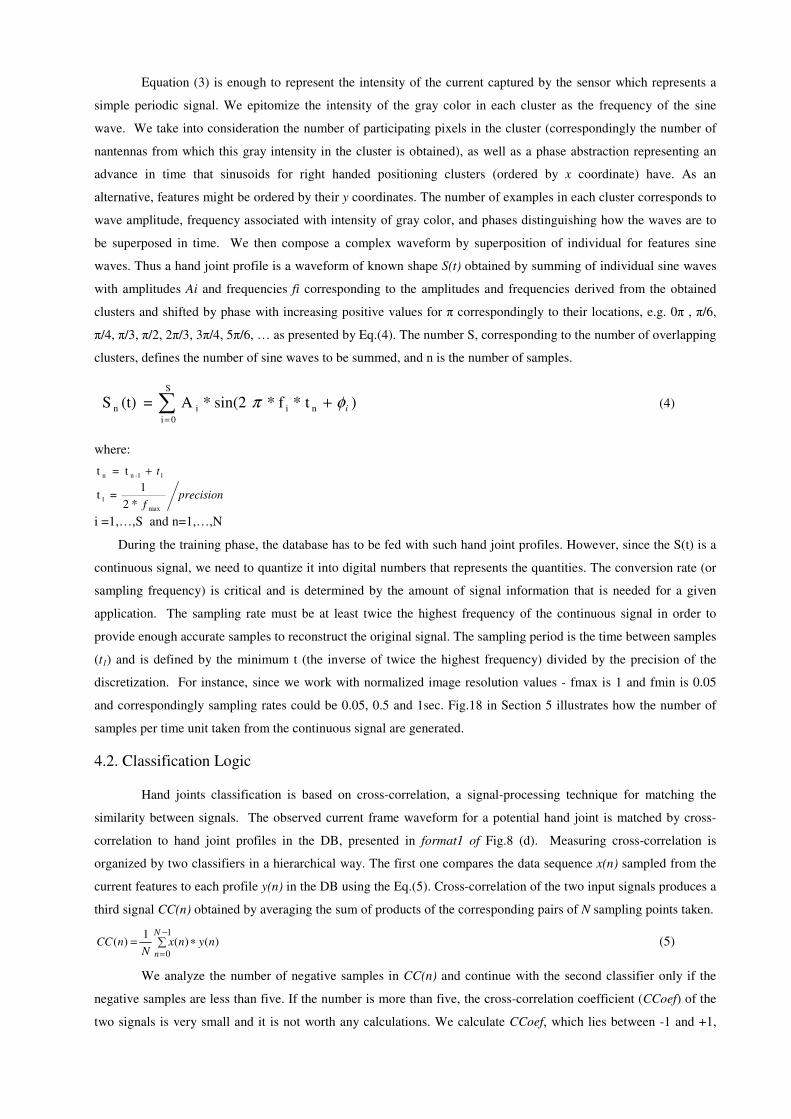
4.3. Positioning and timing information
Once the hand joints are identified and classified, the HGR framework positions them using binary encoding
corresponding to their locations in a hand according to their positions in a grid adjacent to the segmented hand. It
has 4x4 cells and takes the size of the segmented hand. We use COG_D (x,y) coordinates for tuning the size of the
grid to end the wrist in order to increase the precision for localizing fingertips since some of the wrist and finger
hand joints show equal wave profiles. Moreover, the cells where COG_D and the fingertip are positioned help us to
define the hand direction. Most researchers assume that the hand is always pointing upward but this is not true. For
instance, in Fig.9 (a), we compare the grid cells where COG_D and a hand joint of type FingerTipPointing by simple
logic to detect a left oriented hand. We define a pattern of bits to describe the HJ location that is relative to the
adjacent grid. The corresponding decimal number is used at the gesture recognition phase. At the beginning, the HJ
Location (HJL) consists of only zeros - “0” and when we classify a HJ (e.g. the presence of a finger) we assign a one
- “1” according to (x, y) coordinates of neighbor pixels. For instance, if the adjecent to hand grid has 100x100 pixels
the HJL1 in Fig.9 (a) has 01 at position x in the range [0-0.25] and y in the range [0.25-0.5] because there are
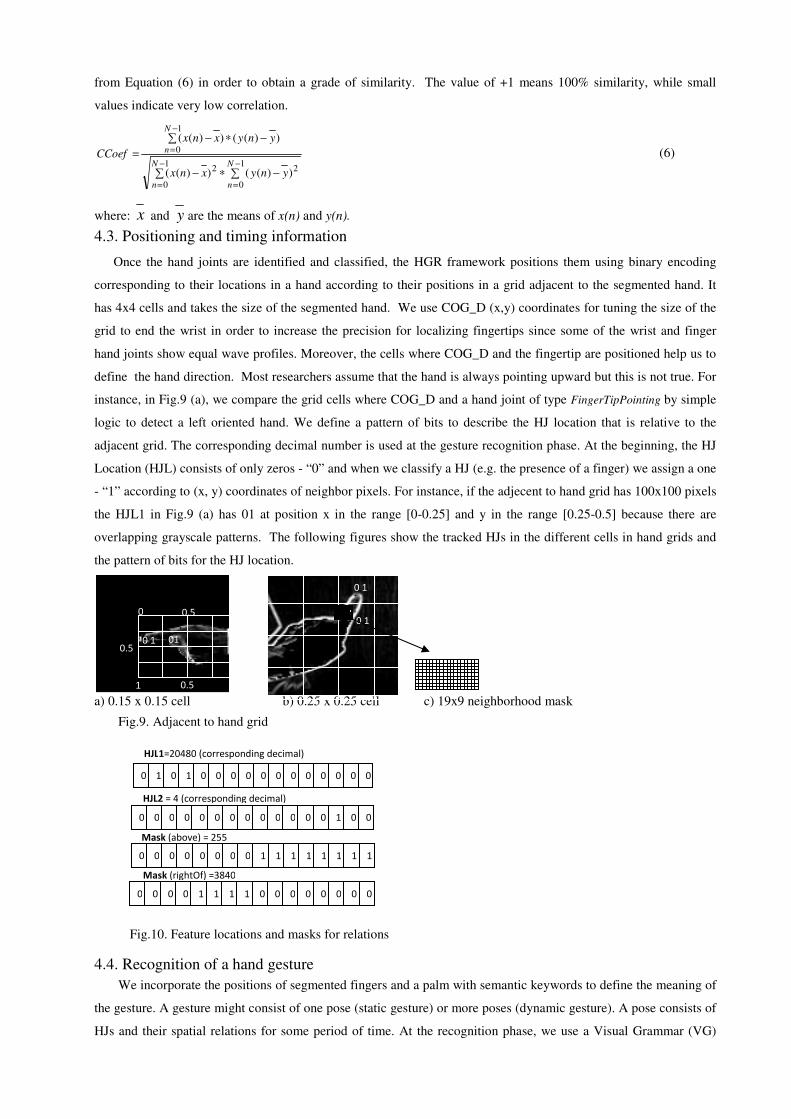
overlapping grayscale patterns. The following figures show the tracked HJs in the different cells in hand grids and
the pattern of bits for the HJ location.
a) 0.15 x 0.15 cell b) 0.25 x 0.25 cell c) 19x9 neighborhood mask
Fig.9. Adjacent to hand grid
Fig.10. Feature locations and masks for relations
4.4. Recognition of a hand gesture We incorporate the positions of segmented fingers and a palm with semantic keywords to define the meaning of
the gesture. A gesture might consist of one pose (static gesture) or more poses (dynamic gesture). A pose consists of
HJs and their spatial relations for some period of time. At the recognition phase, we use a Visual Grammar (VG)
0 1 0 1 0 0 0 0 0 0 0 0 0 0 0 0
HJL2 = 4 (corresponding decimal)
Mask (above) = 255
Mask (rightOf) =3840
0 0 0 0 0 0 0 0 0 0 0 0 0 1 0 0
0 0 0 0 0 0 0 0 1 1 1 1 1 1 1 1
0 0 0 0 1 1 1 1 0 0 0 0 0 0 0 0
HJL1=20480 (corresponding decimal)
0 1
0 1 0
1
1
0.5
0.5 1
0.5
010 1
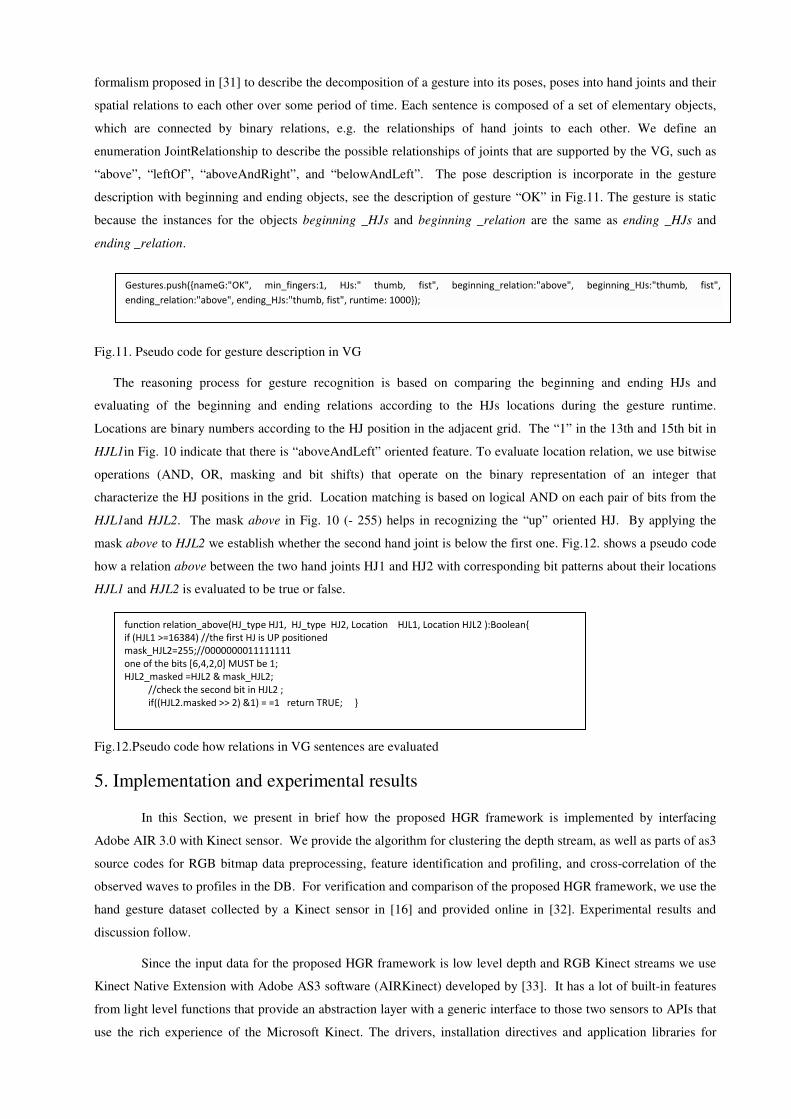
formalism proposed in [31] to describe the decomposition of a gesture into its poses, poses into hand joints and their
spatial relations to each other over some period of time. Each sentence is composed of a set of elementary objects,
which are connected by binary relations, e.g. the relationships of hand joints to each other. We define an
enumeration JointRelationship to describe the possible relationships of joints that are supported by the VG, such as
“above”, “leftOf”, “aboveAndRight”, and “belowAndLeft”. The pose description is incorporate in the gesture
description with beginning and ending objects, see the description of gesture “OK” in Fig.11. The gesture is static
because the instances for the objects beginning _HJs and beginning _relation are the same as ending _HJs and
ending _relation.
Fig.11. Pseudo code for gesture description in VG
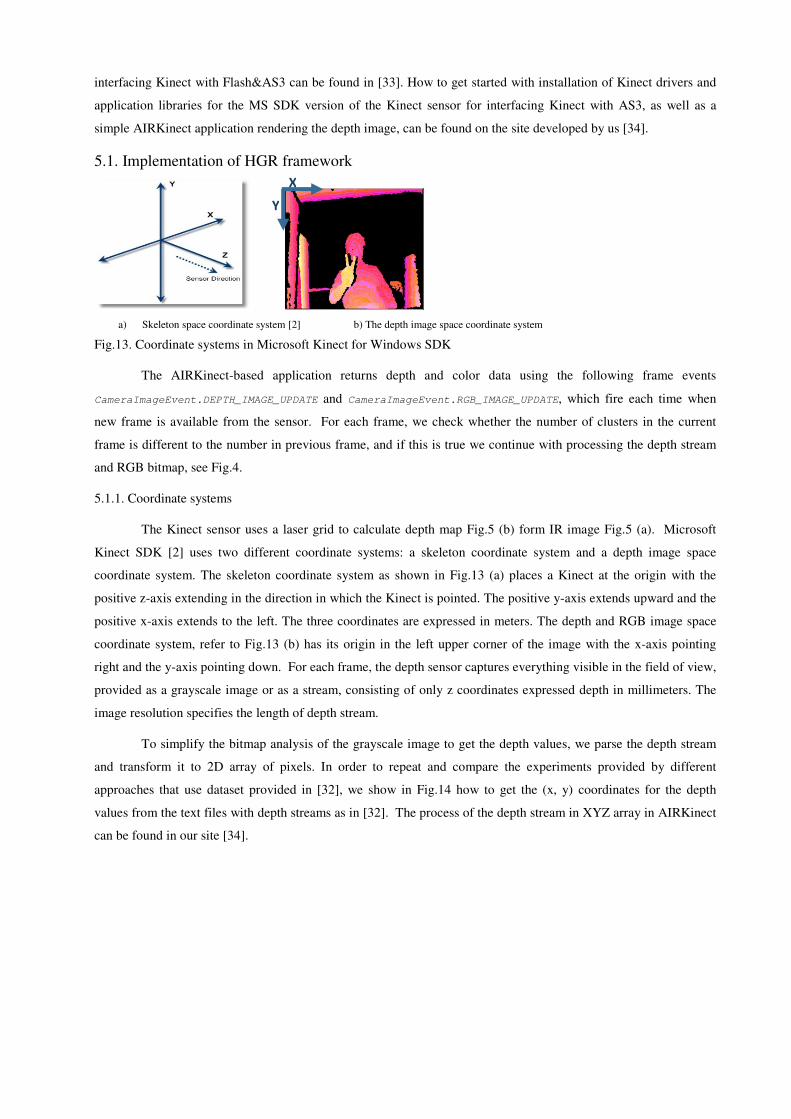
The reasoning process for gesture recognition is based on comparing the beginning and ending HJs and
evaluating of the beginning and ending relations according to the HJs locations during the gesture runtime.
Locations are binary numbers according to the HJ position in the adjacent grid. The “1” in the 13th and 15th bit in
HJL1in Fig. 10 indicate that there is “aboveAndLeft” oriented feature. To evaluate location relation, we use bitwise
operations (AND, OR, masking and bit shifts) that operate on the binary representation of an integer that
characterize the HJ positions in the grid. Location matching is based on logical AND on each pair of bits from the
HJL1and HJL2. The mask above in Fig. 10 (- 255) helps in recognizing the “up” oriented HJ. By applying the
mask above to HJL2 we establish whether the second hand joint is below the first one. Fig.12. shows a pseudo code
how a relation above between the two hand joints HJ1 and HJ2 with corresponding bit patterns about their locations
HJL1 and HJL2 is evaluated to be true or false.
Fig.12.Pseudo code how relations in VG sentences are evaluated
5. Implementation and experimental results
In this Section, we present in brief how the proposed HGR framework is implemented by interfacing
Adobe AIR 3.0 with Kinect sensor. We provide the algorithm for clustering the depth stream, as well as parts of as3
source codes for RGB bitmap data preprocessing, feature identification and profiling, and cross-correlation of the
observed waves to profiles in the DB. For verification and comparison of the proposed HGR framework, we use the
hand gesture dataset collected by a Kinect sensor in [16] and provided online in [32]. Experimental results and
discussion follow.
Since the input data for the proposed HGR framework is low level depth and RGB Kinect streams we use
Kinect Native Extension with Adobe AS3 software (AIRKinect) developed by [33]. It has a lot of built-in features
from light level functions that provide an abstraction layer with a generic interface to those two sensors to APIs that
use the rich experience of the Microsoft Kinect. The drivers, installation directives and application libraries for
Gestures.push({nameG:"OK", min_fingers:1, HJs:" thumb, fist", beginning_relation:"above", beginning_HJs:"thumb, fist",
ending_relation:"above", ending_HJs:"thumb, fist", runtime: 1000});
function relation_above(HJ_type HJ1, HJ_type HJ2, Location HJL1, Location HJL2 ):Boolean{
if (HJL1 >=16384) //the first HJ is UP positioned
mask_HJL2=255;//0000000011111111
one of the bits [6,4,2,0] MUST be 1;
HJL2_masked =HJL2 & mask_HJL2;
//check the second bit in HJL2 ;
if((HJL2.masked >> 2) &1) = =1 return TRUE; }
interfacing Kinect with Flash&AS3 can be found in [33]. How to get started with installation of Kinect drivers and
application libraries for the MS SDK version of the Kinect sensor for interfacing Kinect with AS3, as well as a
simple AIRKinect application rendering the depth image, can be found on the site developed by us [34].
5.1. Implementation of HGR framework
a) Skeleton space coordinate system [2] b) The depth image space coordinate system
Fig.13. Coordinate systems in Microsoft Kinect for Windows SDK
The AIRKinect-based application returns depth and color data using the following frame events
CameraImageEvent.DEPTH_IMAGE_UPDATE and CameraImageEvent.RGB_IMAGE_UPDATE, which fire each time when
new frame is available from the sensor. For each frame, we check whether the number of clusters in the current
frame is different to the number in previous frame, and if this is true we continue with processing the depth stream
and RGB bitmap, see Fig.4.
5.1.1. Coordinate systems
The Kinect sensor uses a laser grid to calculate depth map Fig.5 (b) form IR image Fig.5 (a). Microsoft
Kinect SDK [2] uses two different coordinate systems: a skeleton coordinate system and a depth image space
coordinate system. The skeleton coordinate system as shown in Fig.13 (a) places a Kinect at the origin with the
positive z-axis extending in the direction in which the Kinect is pointed. The positive y-axis extends upward and the
positive x-axis extends to the left. The three coordinates are expressed in meters. The depth and RGB image space
coordinate system, refer to Fig.13 (b) has its origin in the left upper corner of the image with the x-axis pointing
right and the y-axis pointing down. For each frame, the depth sensor captures everything visible in the field of view,
provided as a grayscale image or as a stream, consisting of only z coordinates expressed depth in millimeters. The
image resolution specifies the length of depth stream.
To simplify the bitmap analysis of the grayscale image to get the depth values, we parse the depth stream
and transform it to 2D array of pixels. In order to repeat and compare the experiments provided by different
approaches that use dataset provided in [32], we show in Fig.14 how to get the (x, y) coordinates for the depth
values from the text files with depth streams as in [32]. The process of the depth stream in XYZ array in AIRKinect
can be found in our site [34].
X
Y
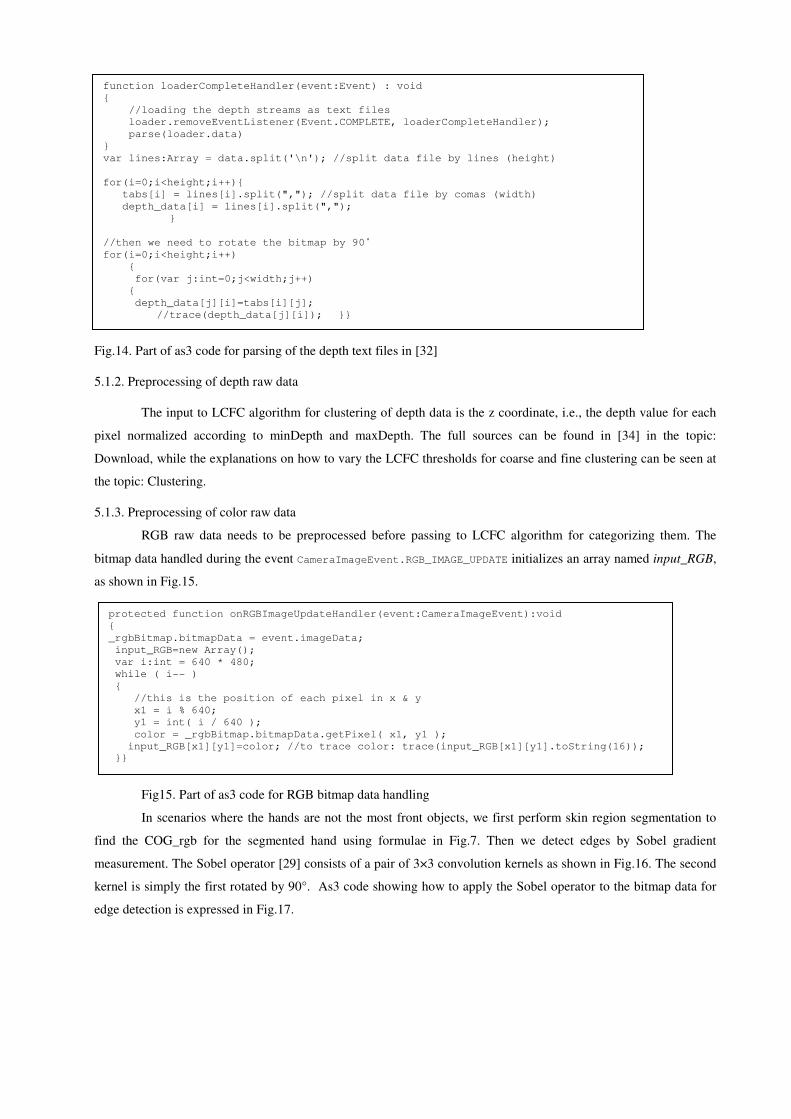
Fig.14. Part of as3 code for parsing of the depth text files in [32]
5.1.2. Preprocessing of depth raw data
The input to LCFC algorithm for clustering of depth data is the z coordinate, i.e., the depth value for each
pixel normalized according to minDepth and maxDepth. The full sources can be found in [34] in the topic:
Download, while the explanations on how to vary the LCFC thresholds for coarse and fine clustering can be seen at
the topic: Clustering.
5.1.3. Preprocessing of color raw data
RGB raw data needs to be preprocessed before passing to LCFC algorithm for categorizing them. The
bitmap data handled during the event CameraImageEvent.RGB_IMAGE_UPDATE initializes an array named input_RGB,
as shown in Fig.15.
Fig15. Part of as3 code for RGB bitmap data handling
In scenarios where the hands are not the most front objects, we first perform skin region segmentation to
find the COG_rgb for the segmented hand using formulae in Fig.7. Then we detect edges by Sobel gradient
measurement. The Sobel operator [29] consists of a pair of 3×3 convolution kernels as shown in Fig.16. The second
kernel is simply the first rotated by 90°. As3 code showing how to apply the Sobel operator to the bitmap data for
edge detection is expressed in Fig.17.
protected function onRGBImageUpdateHandler(event:CameraImageEvent):void
{
_rgbBitmap.bitmapData = event.imageData;
input_RGB=new Array();
var i:int = 640 * 480;
while ( i-- )
{
//this is the position of each pixel in x & y
x1 = i % 640;
y1 = int( i / 640 );
color = _rgbBitmap.bitmapData.getPixel( x1, y1 );
input_RGB[x1][y1]=color; //to trace color: trace(input_RGB[x1][y1].toString(16));
}}
function loaderCompleteHandler(event:Event) : void
{
//loading the depth streams as text files
loader.removeEventListener(Event.COMPLETE, loaderCompleteHandler);
parse(loader.data)
}
var lines:Array = data.split('\n'); //split data file by lines (height)
for(i=0;i<height;i++){
tabs[i] = lines[i].split(","); //split data file by comas (width)
depth_data[i] = lines[i].split(",");
}
//then we need to rotate the bitmap by 90˚
for(i=0;i<height;i++)
{
for(var j:int=0;j<width;j++)
{
depth_data[j][i]=tabs[i][j];
//trace(depth_data[j][i]); }}
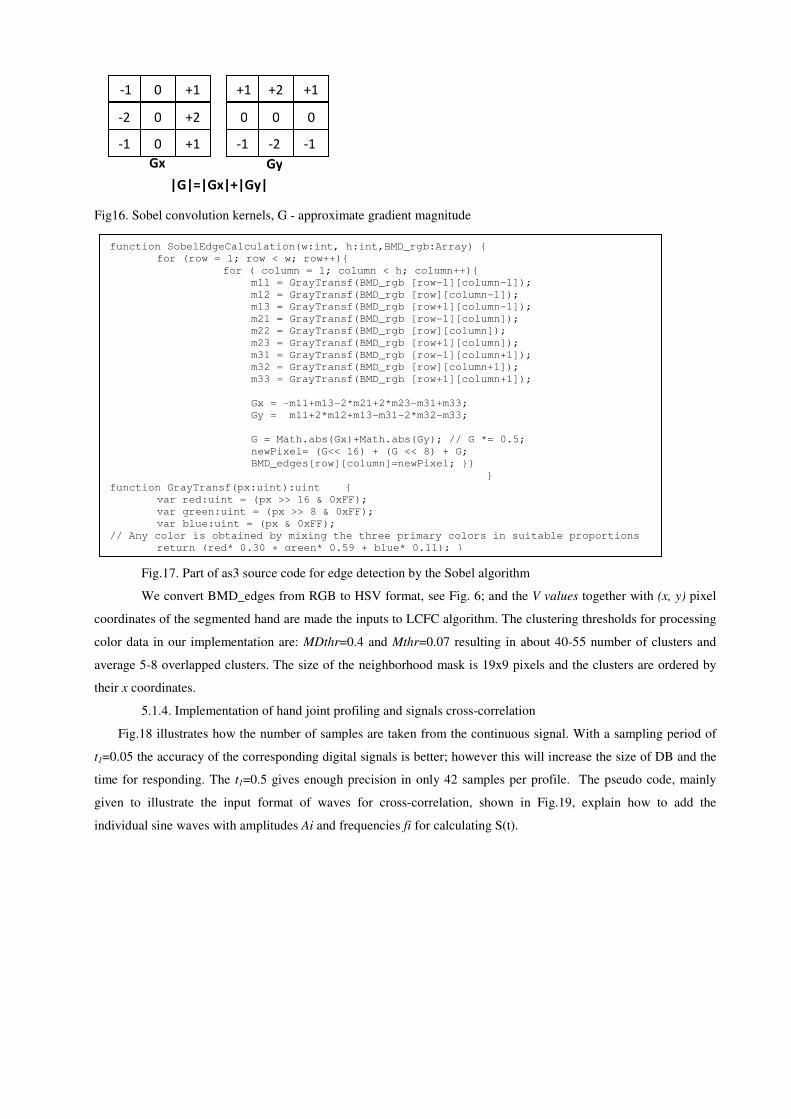
Fig16. Sobel convolution kernels, G - approximate gradient magnitude
Fig.17. Part of as3 source code for edge detection by the Sobel algorithm
We convert BMD_edges from RGB to HSV format, see Fig. 6; and the V values together with (x, y) pixel
coordinates of the segmented hand are made the inputs to LCFC algorithm. The clustering thresholds for processing
color data in our implementation are: MDthr=0.4 and Mthr=0.07 resulting in about 40-55 number of clusters and
average 5-8 overlapped clusters. The size of the neighborhood mask is 19x9 pixels and the clusters are ordered by
their x coordinates.
5.1.4. Implementation of hand joint profiling and signals cross-correlation
Fig.18 illustrates how the number of samples are taken from the continuous signal. With a sampling period of
t1=0.05 the accuracy of the corresponding digital signals is better; however this will increase the size of DB and the
time for responding. The t1=0.5 gives enough precision in only 42 samples per profile. The pseudo code, mainly
given to illustrate the input format of waves for cross-correlation, shown in Fig.19, explain how to add the
individual sine waves with amplitudes Ai and frequencies fi for calculating S(t).
function SobelEdgeCalculation(w:int, h:int,BMD_rgb:Array) {
for (row = 1; row < w; row++){
for ( column = 1; column < h; column++){
m11 = GrayTransf(BMD_rgb [row-1][column-1]);
m12 = GrayTransf(BMD_rgb [row][column-1]);
m13 = GrayTransf(BMD_rgb [row+1][column-1]);
m21 = GrayTransf(BMD_rgb [row-1][column]);
m22 = GrayTransf(BMD_rgb [row][column]);
m23 = GrayTransf(BMD_rgb [row+1][column]);
m31 = GrayTransf(BMD_rgb [row-1][column+1]);
m32 = GrayTransf(BMD_rgb [row][column+1]);
m33 = GrayTransf(BMD_rgb [row+1][column+1]);
Gx = -m11+m13-2*m21+2*m23-m31+m33;
Gy = m11+2*m12+m13-m31-2*m32-m33;
G = Math.abs(Gx)+Math.abs(Gy); // G *= 0.5;
newPixel= (G<< 16) + (G << 8) + G;
BMD_edges[row][column]=newPixel; }}
}
function GrayTransf(px:uint):uint {
var red:uint = (px >> 16 & 0xFF);
var green:uint = (px >> 8 & 0xFF);
var blue:uint = (px & 0xFF);
// Any color is obtained by mixing the three primary colors in suitable proportions
return (red* 0.30 + green* 0.59 + blue* 0.11); }
-1
-2
-1
0
0
0
+1
+2
+1
+1
0
-1
+2
0
-2
+1
0
-1
|G|=|Gx|+|Gy|
Gy Gx
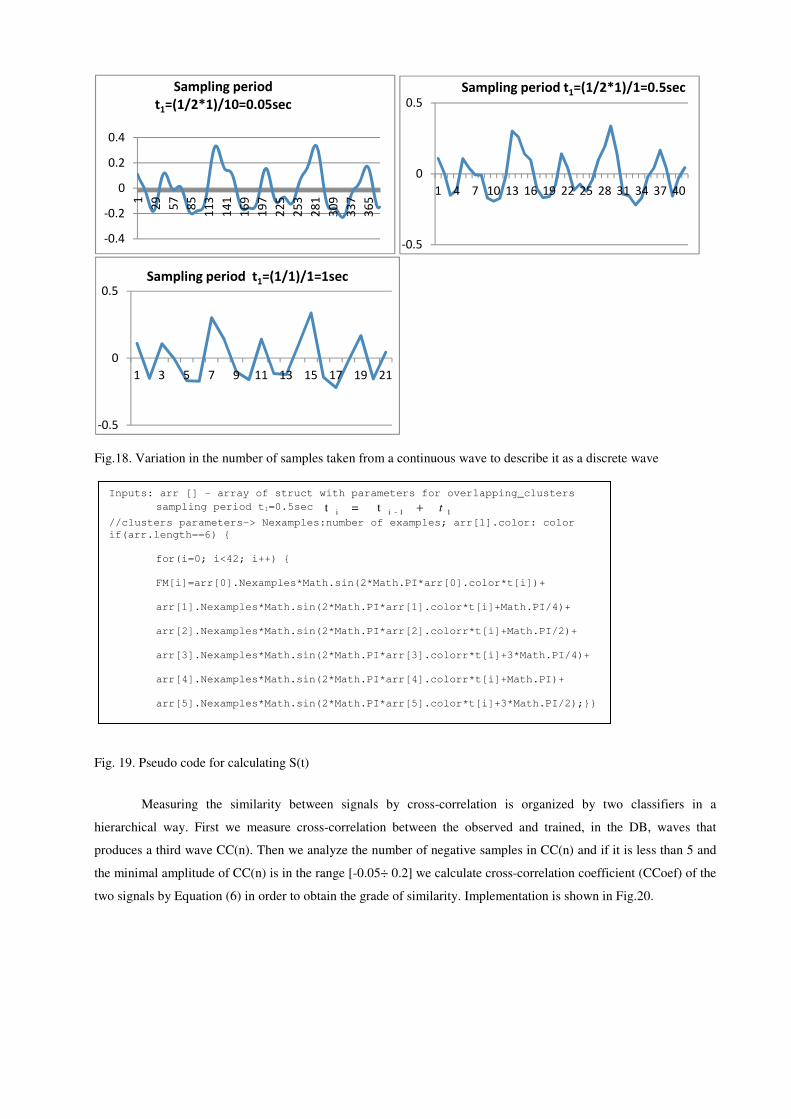
Fig.18. Variation in the number of samples taken from a continuous wave to describe it as a discrete wave
Fig. 19. Pseudo code for calculating S(t)
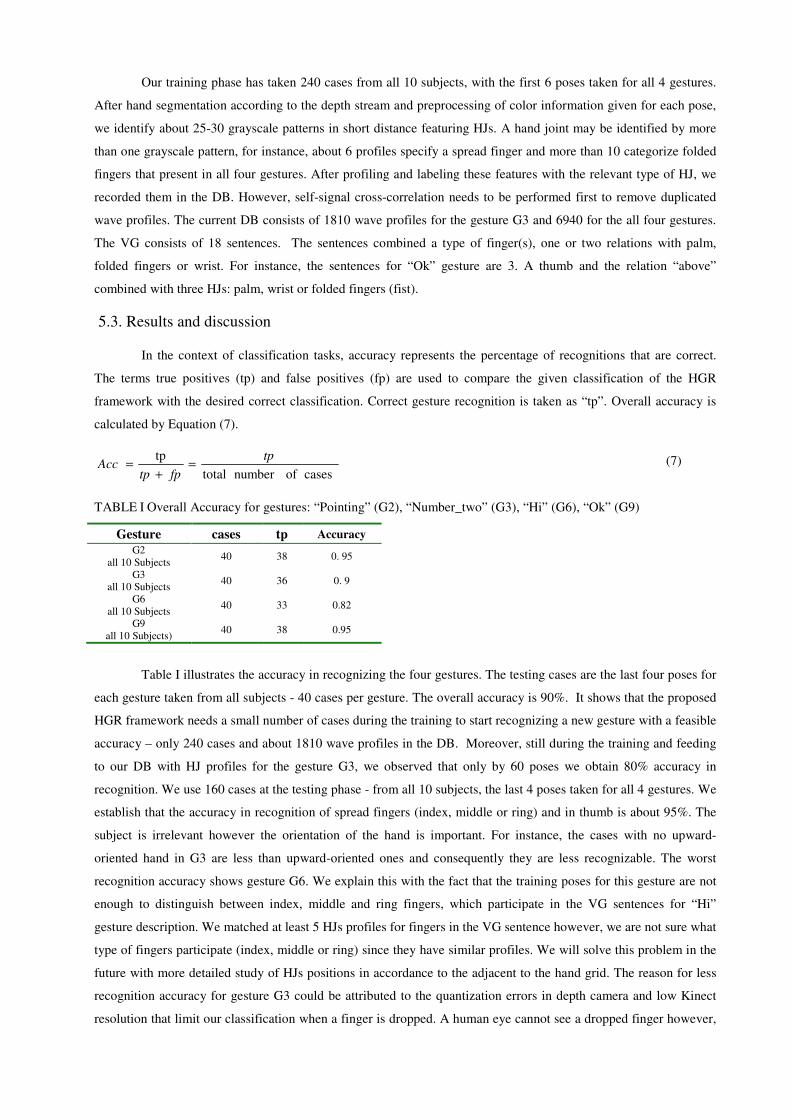
Measuring the similarity between signals by cross-correlation is organized by two classifiers in a
hierarchical way. First we measure cross-correlation between the observed and trained, in the DB, waves that
produces a third wave CC(n). Then we analyze the number of negative samples in CC(n) and if it is less than 5 and
the minimal amplitude of CC(n) is in the range [-0.05÷ 0.2] we calculate cross-correlation coefficient (CCoef) of the
two signals by Equation (6) in order to obtain the grade of similarity. Implementation is shown in Fig.20.
-0.4
-0.2
0
0.2
0.41
29
57
85
11
3
14
1
16
9
19
7
22
5
25
3
28
1
30
9
33
7
36
5
Sampling period
t1=(1/2*1)/10=0.05sec
-0.5
0
0.5
1 4 7 10 13 16 19 22 25 28 31 34 37 40
Sampling period t1=(1/2*1)/1=0.5sec
-0.5
0
0.5
1 3 5 7 9 11 13 15 17 19 21
Sampling period t1=(1/1)/1=1sec
Inputs: arr [] - array of struct with parameters for overlapping_clusters
sampling period t1=0.5sec 11-ii t=t t+
//clusters parameters-> Nexamples:number of examples; arr[1].color: color
if(arr.length==6) {
for(i=0; i<42; i++) {
FM[i]=arr[0].Nexamples*Math.sin(2*Math.PI*arr[0].color*t[i])+
arr[1].Nexamples*Math.sin(2*Math.PI*arr[1].color*t[i]+Math.PI/4)+
arr[2].Nexamples*Math.sin(2*Math.PI*arr[2].colorr*t[i]+Math.PI/2)+
arr[3].Nexamples*Math.sin(2*Math.PI*arr[3].colorr*t[i]+3*Math.PI/4)+
arr[4].Nexamples*Math.sin(2*Math.PI*arr[4].colorr*t[i]+Math.PI)+
arr[5].Nexamples*Math.sin(2*Math.PI*arr[5].color*t[i]+3*Math.PI/2);}}
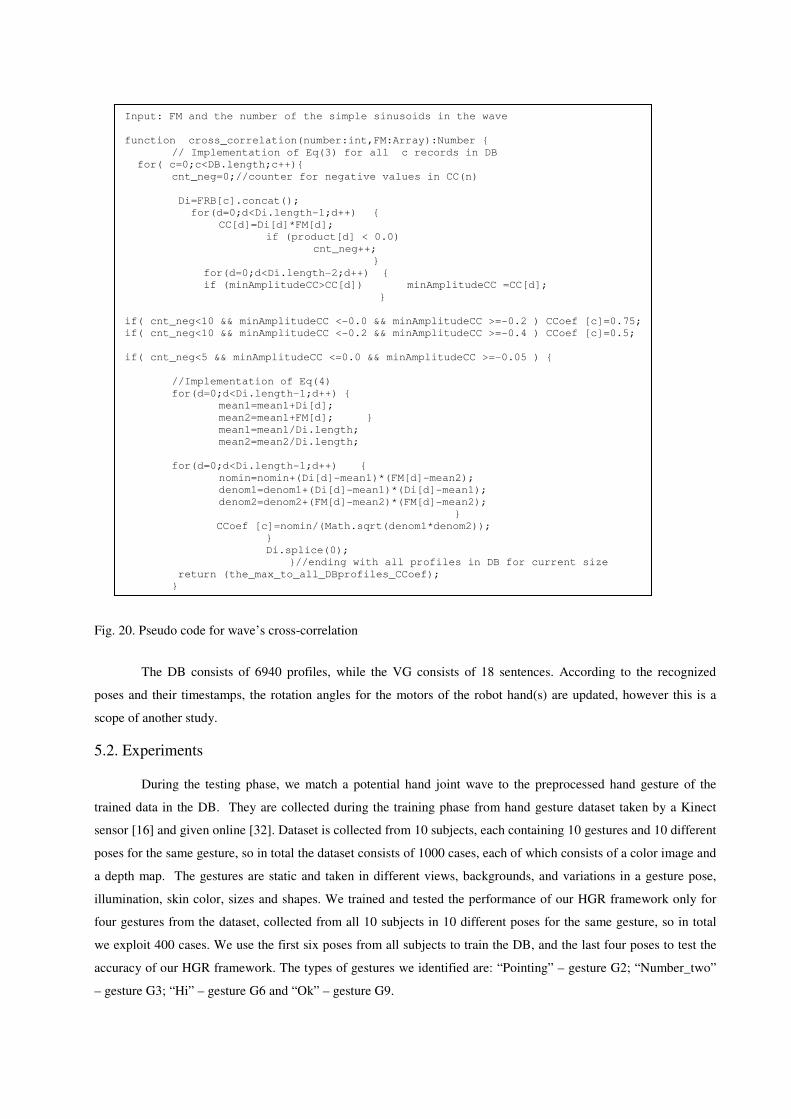
Fig. 20. Pseudo code for wave’s cross-correlation
The DB consists of 6940 profiles, while the VG consists of 18 sentences. According to the recognized
poses and their timestamps, the rotation angles for the motors of the robot hand(s) are updated, however this is a
scope of another study.
5.2. Experiments
During the testing phase, we match a potential hand joint wave to the preprocessed hand gesture of the
trained data in the DB. They are collected during the training phase from hand gesture dataset taken by a Kinect
sensor [16] and given online [32]. Dataset is collected from 10 subjects, each containing 10 gestures and 10 different
poses for the same gesture, so in total the dataset consists of 1000 cases, each of which consists of a color image and
a depth map. The gestures are static and taken in different views, backgrounds, and variations in a gesture pose,
illumination, skin color, sizes and shapes. We trained and tested the performance of our HGR framework only for
four gestures from the dataset, collected from all 10 subjects in 10 different poses for the same gesture, so in total
we exploit 400 cases. We use the first six poses from all subjects to train the DB, and the last four poses to test the
accuracy of our HGR framework. The types of gestures we identified are: “Pointing” – gesture G2; “Number_two”
– gesture G3; “Hi” – gesture G6 and “Ok” – gesture G9.
Input: FM and the number of the simple sinusoids in the wave
function cross_correlation(number:int,FM:Array):Number {
// Implementation of Eq(3) for all c records in DB
for( c=0;c<DB.length;c++){
cnt_neg=0;//counter for negative values in CC(n)
Di=FRB[c].concat();
for(d=0;d<Di.length-1;d++) {
CC[d]=Di[d]*FM[d];
if (product[d] < 0.0)
cnt_neg++;
}
for(d=0;d<Di.length-2;d++) {
if (minAmplitudeCC>CC[d]) minAmplitudeCC =CC[d];
}
if( cnt_neg<10 && minAmplitudeCC <-0.0 && minAmplitudeCC >=-0.2 ) CCoef [c]=0.75;
if( cnt_neg<10 && minAmplitudeCC <-0.2 && minAmplitudeCC >=-0.4 ) CCoef [c]=0.5;
if( cnt_neg<5 && minAmplitudeCC <=0.0 && minAmplitudeCC >=-0.05 ) {
//Implementation of Eq(4)
for(d=0;d<Di.length-1;d++) {
mean1=mean1+Di[d];
mean2=mean1+FM[d]; }
mean1=mean1/Di.length;
mean2=mean2/Di.length;
for(d=0;d<Di.length-1;d++) {
nomin=nomin+(Di[d]-mean1)*(FM[d]-mean2);
denom1=denom1+(Di[d]-mean1)*(Di[d]-mean1);
denom2=denom2+(FM[d]-mean2)*(FM[d]-mean2);
}
CCoef [c]=nomin/(Math.sqrt(denom1*denom2));
}
Di.splice(0);
}//ending with all profiles in DB for current size
return (the_max_to_all_DBprofiles_CCoef);
}
Our training phase has taken 240 cases from all 10 subjects, with the first 6 poses taken for all 4 gestures.
After hand segmentation according to the depth stream and preprocessing of color information given for each pose,
we identify about 25-30 grayscale patterns in short distance featuring HJs. A hand joint may be identified by more
than one grayscale pattern, for instance, about 6 profiles specify a spread finger and more than 10 categorize folded
fingers that present in all four gestures. After profiling and labeling these features with the relevant type of HJ, we
recorded them in the DB. However, self-signal cross-correlation needs to be performed first to remove duplicated
wave profiles. The current DB consists of 1810 wave profiles for the gesture G3 and 6940 for the all four gestures.
The VG consists of 18 sentences. The sentences combined a type of finger(s), one or two relations with palm,
folded fingers or wrist. For instance, the sentences for “Ok” gesture are 3. A thumb and the relation “above”
combined with three HJs: palm, wrist or folded fingers (fist).
5.3. Results and discussion
In the context of classification tasks, accuracy represents the percentage of recognitions that are correct.
The terms true positives (tp) and false positives (fp) are used to compare the given classification of the HGR
framework with the desired correct classification. Correct gesture recognition is taken as “tp”. Overall accuracy is
calculated by Equation (7).
cases ofnumber total
tp tp
fptpAcc =
+= (7)
TABLE I Overall Accuracy for gestures: “Pointing” (G2), “Number_two” (G3), “Hi” (G6), “Ok” (G9)
Gesture cases tp Accuracy
G2 all 10 Subjects
40 38 0. 95
G3 all 10 Subjects
40 36 0. 9
G6 all 10 Subjects
40 33 0.82
G9 all 10 Subjects)
40 38 0.95
Table I illustrates the accuracy in recognizing the four gestures. The testing cases are the last four poses for
each gesture taken from all subjects - 40 cases per gesture. The overall accuracy is 90%. It shows that the proposed
HGR framework needs a small number of cases during the training to start recognizing a new gesture with a feasible
accuracy – only 240 cases and about 1810 wave profiles in the DB. Moreover, still during the training and feeding
to our DB with HJ profiles for the gesture G3, we observed that only by 60 poses we obtain 80% accuracy in
recognition. We use 160 cases at the testing phase - from all 10 subjects, the last 4 poses taken for all 4 gestures. We
establish that the accuracy in recognition of spread fingers (index, middle or ring) and in thumb is about 95%. The
subject is irrelevant however the orientation of the hand is important. For instance, the cases with no upward-
oriented hand in G3 are less than upward-oriented ones and consequently they are less recognizable. The worst
recognition accuracy shows gesture G6. We explain this with the fact that the training poses for this gesture are not
enough to distinguish between index, middle and ring fingers, which participate in the VG sentences for “Hi”
gesture description. We matched at least 5 HJs profiles for fingers in the VG sentence however, we are not sure what
type of fingers participate (index, middle or ring) since they have similar profiles. We will solve this problem in the
future with more detailed study of HJs positions in accordance to the adjacent to the hand grid. The reason for less
recognition accuracy for gesture G3 could be attributed to the quantization errors in depth camera and low Kinect
resolution that limit our classification when a finger is dropped. A human eye cannot see a dropped finger however,
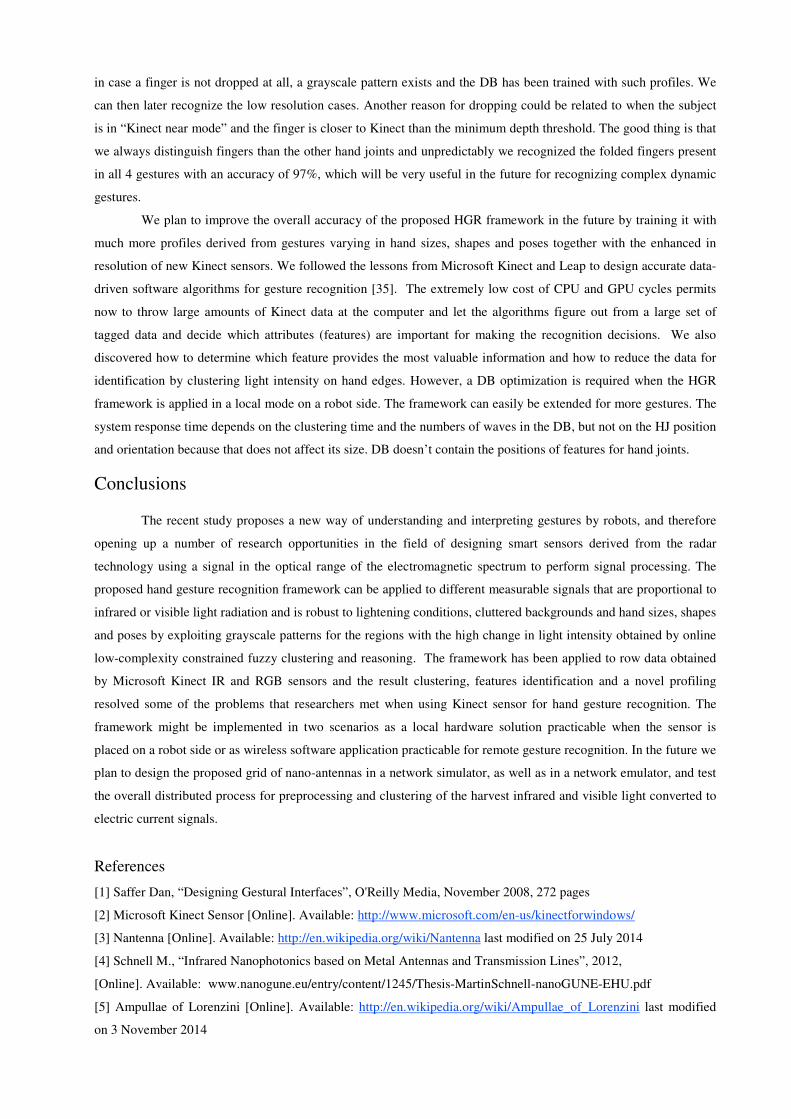
in case a finger is not dropped at all, a grayscale pattern exists and the DB has been trained with such profiles. We
can then later recognize the low resolution cases. Another reason for dropping could be related to when the subject
is in “Kinect near mode” and the finger is closer to Kinect than the minimum depth threshold. The good thing is that
we always distinguish fingers than the other hand joints and unpredictably we recognized the folded fingers present
in all 4 gestures with an accuracy of 97%, which will be very useful in the future for recognizing complex dynamic
gestures.
We plan to improve the overall accuracy of the proposed HGR framework in the future by training it with
much more profiles derived from gestures varying in hand sizes, shapes and poses together with the enhanced in
resolution of new Kinect sensors. We followed the lessons from Microsoft Kinect and Leap to design accurate data-
driven software algorithms for gesture recognition [35]. The extremely low cost of CPU and GPU cycles permits
now to throw large amounts of Kinect data at the computer and let the algorithms figure out from a large set of
tagged data and decide which attributes (features) are important for making the recognition decisions. We also
discovered how to determine which feature provides the most valuable information and how to reduce the data for
identification by clustering light intensity on hand edges. However, a DB optimization is required when the HGR
framework is applied in a local mode on a robot side. The framework can easily be extended for more gestures. The
system response time depends on the clustering time and the numbers of waves in the DB, but not on the HJ position
and orientation because that does not affect its size. DB doesn’t contain the positions of features for hand joints.
Conclusions
The recent study proposes a new way of understanding and interpreting gestures by robots, and therefore
opening up a number of research opportunities in the field of designing smart sensors derived from the radar
technology using a signal in the optical range of the electromagnetic spectrum to perform signal processing. The
proposed hand gesture recognition framework can be applied to different measurable signals that are proportional to
infrared or visible light radiation and is robust to lightening conditions, cluttered backgrounds and hand sizes, shapes
and poses by exploiting grayscale patterns for the regions with the high change in light intensity obtained by online
low-complexity constrained fuzzy clustering and reasoning. The framework has been applied to row data obtained
by Microsoft Kinect IR and RGB sensors and the result clustering, features identification and a novel profiling
resolved some of the problems that researchers met when using Kinect sensor for hand gesture recognition. The
framework might be implemented in two scenarios as a local hardware solution practicable when the sensor is
placed on a robot side or as wireless software application practicable for remote gesture recognition. In the future we
plan to design the proposed grid of nano-antennas in a network simulator, as well as in a network emulator, and test
the overall distributed process for preprocessing and clustering of the harvest infrared and visible light converted to
electric current signals.
References
[1] Saffer Dan, “Designing Gestural Interfaces”, O'Reilly Media, November 2008, 272 pages
[2] Microsoft Kinect Sensor [Online]. Available: http://www.microsoft.com/en-us/kinectforwindows/
[3] Nantenna [Online]. Available: http://en.wikipedia.org/wiki/Nantenna last modified on 25 July 2014
[4] Schnell M., “Infrared Nanophotonics based on Metal Antennas and Transmission Lines”, 2012,
[Online]. Available: www.nanogune.eu/entry/content/1245/Thesis-MartinSchnell-nanoGUNE-EHU.pdf
[5] Ampullae of Lorenzini [Online]. Available: http://en.wikipedia.org/wiki/Ampullae_of_Lorenzini last modified
on 3 November 2014
[6] Infrared sensing in snakes [Online]. Available: http://en.wikipedia.org/wiki/Infrared_sensing_in_snakes last
modified on 14 May 2014
[7] Patel M., “Platypus Electroreception”, Biology 342: Animal Behavior Fall 2007, [Online]. Available:
http://www.reed.edu/biology/professors/srenn/pages/teaching/web_2007/myp_site/index.html
[8] Marasovic T., V. Papic, “User-Dependent Gesture Recognition on Android Handheld Devices”, SoftCOM 2014
22nd International Conference on Software, Communications and Computer Networks, Hrvatska, Sept., 2014
[9] Pu Q., Gupta S, Gollakota S and S. Patel, “Whole-Home Gesture Recognition Using Wireless Signals”,
MobiCom’13, Miami, FL, USA 2013
[10] Kellogg B., Talla V. and S. Gollakota, “Bringing Gesture Recognition To All Devices”, 11th USENIX
Symposium on Networked Systems and Design Implementation, Seattle NSDI’14, WA 2014, pp.303-316
[11] Evanczuk S., “Microchip elevates HMI design with e-field-based 3-D gesture-recognition chip”, EDN, Dec.
2012, Vol. 57 Issue 18, p14
[12] Lekova A., “Evolving fuzzy modeling based on low-complexity constrained fuzzy clustering”, Comptes
rendus de l'Académie bulgare des Sciences, Vol. 67, Issue No10, 2014, pp.1411-1418
[13] CAN Bus. [Online]. Available: http://en.wikipedia.org/wiki/CAN_bus last modified on 29 October 2014
[14] Akyildiz Ian F., Brunetti F. and C. Blázquez, “Nanonetworks: A new communication paradigm”, Computer
Networks : The International Journal of Computer and Telecommunications Networking, Vol.52 Number 12,
Elsevier North-Holland, Inc. New York, NY, USA 2008, pp. 2260-2279
[15] Han J., L. Shao , D. Xu and J. Shotton, “Enhanced Computer Vision with Microsoft Kinect Sensor: A
Review”, IEEE TRANSACTIONS ON CYBERNETICS, Vol. 43, Issue 5, October 2013, pp.1318-1334
[16] Ren Z., J. Yuan and Z. Zhang, “Robust Hand Gesture Recognition based on Finger-Earth Mover’s Distance
with a Commodity Depth Camera”, Proc. of ACM International Conf. on Multimedia ACM MM’11, USA,
November 2011, pp. 1093-1096
[17] Tara R. Y., P. Santosa, and T. Adji, “Hand segmentation from depth image using anthropometric approach in
natural interface development”, IJSER International Journal of Scientific and Engineering Research, Vol. 3, Issue 5,
May 2012, pp.1–5
[18] Lee U. and J. Tanaka, “Hand controller: Image manipulation interface using fingertips and palm tracking with
Kinect depth data,” in Proc. of Asia Pacific Conf. Computer and. Human Interaction, 2012, pp. 705–706.
[19] Asad M. and Ch. Abhayaratne, “Kinect depth stream pre-processing for hand gesture recognition”, IEEE
International Conference on Image Processing, ICIP 2013, Melbourne, VIC. Sept. 2013, 3735-3739
[20] Raheja J.L, A. Chaudhary, K. Singal, “Tracking of Fingertips and Centre of Palm using KINECT ”, In
proceedings of the 3rd IEEE International Conference on Computational Intelligence, Modelling and Simulation,
Malaysia, 2011, pp.248-252.
[21] Liang H., J. Yuan, and D. Thalmann, “3-D fingertip and palm tracking in depth image sequences,” in Proc. of
20th ACM Int. Conference on Multimedia MM’12, Singapore 2012, pp.785–788.
[22] Keskin C., F. Kira, Y. Kara, and L. Akarun, “Real time hand pose estimation using depth sensors,” in IEEE
Proc. of Computer Vision Workshops (ICCV), Barcelona, 2011, pp.1228–1234.
[23] Oikonomidis I., N. Kyriazis, and A. Argyros, “Efficient model-based 3-D tracking of hand articulations using
Kinect,” in Proc. of the 22nd British Machine Vision Conference, BMVC’2011, UK, 2011, pp.101.1–101.11.
[24] Doliotis P. et all, “Comparing gesture recognition accuracy using color and depth information,” Proc. Conf.
Pervasive Technologies Related to Assistive Environments, 2011, article 20.

[25] Tang M, “Hand Gesture Recognition Using Microsoft’s Kinect”, 2011: Dept. Electrical Eng., Stanford Univ.
[Online on Scribd]. Available: http://www.scribd.com/doc/91488017/Tang-Hand-Gesture-Recognition
[26] Raptis M., D. Kirovski, H. Hoppe, “Real-Time Classification of Dance Gestures from Skeleton Animation”, in
Proc. of the 2011 ACM SIGGRAPH - Eurographics Symposium on Computer Animation, NY, 2011, pp.147-156.
[27] Azad R., B. Azad, I. Kazerooni, “Real-Time and Robust Method for Hand Gesture Recognition System Based
on Cross-Correlation Coefficient”, ACSIJ Advances in Computer Science: an International Journal, Vol. 2, Issue 5,
No.6 , 2013, pp.121-125
[28] Kinect [Online]. Available: http://en.wikipedia.org/wiki/Kinect last modified on 12 November 2014
[29] Duda R. and P. Hart, “Pattern Classification and scene analysis”, Wiley & Sons, 1973
[30] Malima A., E. Özgür and M. Çetin, “A Fast Algorithm For Vision-Based Hand Gesture Recognition For Robot
Control”, 14th IEEE Conf. on Signal Processing and Communications Applications, Turkey, April 2006, pp.1-4
[31] Ferrucci F. et all, “Symbol-Relation Grammars: A Formalism for Graphical Languages”, Elsevier Journal
Information and Computation, Vol. 131, Issue 1, November 1996, pp. 1-46
[32] Hand gesture dataset taken with a Kinect Sensor [Online]. Available:
http://eeeweba.ntu.edu.sg/computervision/people/home/renzhou/HandGesture.htm
[33] Verweirder W, R. Gerbasi and J. Imhof, “Airkinect-2-core” [Online]. Available:
http://as3nui.github.io/airkinect-2-core/
[34] AS3KinectNUI for gestures recognition [Online]. Available: http://as3kinect.aabg.eu/depth/
[35] Cardinal D.,”Making gesture recognition work: Lessons from Microsoft Kinect and Leap”, [Online on July 15,
2013]. Available: http://www.extremetech.com/extreme/160162-making-gesture-recognition-work-lessons-from-
microsoft-kinect-and-leap