group climate development in cognitive and interpersonal group therapy for social phobia
TRANSCRIPT
1 GROUP CLIMATE DEVELOPMENT
Group Climate Development in Cognitive and Interpersonal Group Therapy for Social Phobia
Tore Bonsaksen
Oslo University College, Oslo, Norway
Anners Lerdal
Lovisenberg Deaconal University College, Oslo, Norway, and
Research Center, Oslo University Hospital - Aker, Oslo, Norway
Finn-Magnus Borge
Modum Bad, Vikersund, Norway
Hal Sexton
Research Institute, Modum Bad, Vikersund, Norway
Asle Hoffart
Research Institute, Modum Bad, Vikersund, Norway, and
Department of Psychology, University of Oslo, Norway
Author note
Tore Bonsaksen, Oslo University College, Oslo, Norway; Anners Lerdal, Lovisenberg
Deaconal University College, Oslo, Norway, and Research Center, Oslo University Hospital -
Aker, Oslo, Norway; Finn-Magnus Borge, Modum Bad, Vikersund, Norway; Hal Sexton,
Research Institute, Modum Bad, Vikersund, Norway; and Asle Hoffart, Research Institute,
Modum Bad, Vikersund, Norway, and Department of Psychology, University of Oslo,
Norway. Correspondence concerning this article should be addressed to Tore Bonsaksen,
Oslo University College, pb. 4 St. Olavs Plass, 0130 Oslo, Norway. E-mail:

2 GROUP CLIMATE DEVELOPMENT
Abstract
This study was designed as a longitudinal study of 80 participants in cognitive group therapy
(RCT, n = 40) and interpersonal group therapy (RIPT, n = 40) for social phobia during ten
weeks residential therapy. The aim was to investigate the patterns of group climate
development and its impact on treatment outcome. Data was collected using MacKenzie’s
Group Climate Questionnaire (GCQ) four times during treatment, and a multilevel (mixed)
model approach was used in the analyses. Engagement in RCT groups showed a linear
increase during treatment in contrast to a linear decline among patients in RIPT groups. This
divergence might be explained by the focus on extragroup and intragroup relationships in
RCT and RIPT respectively. Neither conflict nor avoidance followed the expected pattern nor
did their mean levels influence outcome. However, when six extreme values of conflict were
removed, there was support for a low-high-low pattern of conflict. In general, these results do
not support MacKenzie’s generic model of group climate development but suggest that
sample characteristics, the treatment models and setting can play major roles in determining
the group climate. Of the group climate variables, only the mean level of engagement
predicted a change in social anxiety over the course of treatment.
Keywords: group development, group therapy, cognitive therapy, interpersonal
therapy

3 GROUP CLIMATE DEVELOPMENT
Group Climate Development in Cognitive and Interpersonal Group Therapy for Social Phobia
The interpersonal process in therapy groups is both complex and continuously
evolving. MacKenzie (1983) has addressed important aspects of the group therapy process
and its development by introducing the concept of the group climate. This concept extends
Yalom’s original concept of cohesion in that it describes not only the degree to which the
group represents a sense of warmth, acceptance, support, and belongingness to the members
(Yalom, 2005). It also describes the group process along two other interactional dimensions,
namely conflict and avoidance. Study of the group climate over the course of treatment
enables the outlining of the interplay between various aspects of the group and how these
evolve over time.
MacKenzie (1983) adopted the social psychology concept of group development and
argued its significance to the field of group therapy. This viewpoint (elaborated in
MacKenzie, 1990) emphasizes that the psychotherapy group, like all kinds of groups, is a
social system that develops in stages with certain interactional tasks related. In the first
developmental stage of engagement, the group members’ task is to engage in therapy and in
the relationships with the other members of the group (MacKenzie, 1990). This is a time to
carefully share thoughts and feelings with others and to experience that the group members
have important issues in common to work on. The first stage of therapy tends to establish a
sense of togetherness in the group. At this time, the therapist is vital to the group, representing
a hope and a strategy for change. In the second stage, the differentiation stage, the group
members more easily feel their own distinctness in the group and present themselves as
individuals, separate from one another and from the therapist. This makes the group more
laden with conflict, and integrating the diversity of the group must be both acknowledged and
balanced with the group’s need for structure and norms for relating in the group. In the third
developmental stage of individuation, the group characteristically shifts its focus from

4 GROUP CLIMATE DEVELOPMENT
interpersonal differentiation and conflict to each member’s issues to work on. This shift in
group attention contributes to strengthened cohesion in the group, resulting in mutual
responsibility, active participation, warmth, empathy, and trust between the group members.
In later stages of the group’s development, interpersonal themes are more flexibly interwoven.
Hence, subsequent stages are less distinct as the group members often discuss topics
introduced in earlier stages in more sophisticated ways. The termination stage is a time for
mourning the loss of the group and for reorienting towards the outside world.
The group climate can be viewed as comprised of engagement, conflict, and avoidance
(MacKenzie, 1983). According to the theoretical description of group development1
(MacKenzie, 1990), engagement in a therapy group was initially expected to be high
(engagement stage). It was expected to drop after a few weeks (due to conflict in the
differentiation stage) before it rose throughout treatment (individuation stage and later).
Conflict was expected to follow a course from an initial low level (engagement stage),
followed by a rise after a few weeks (differentiation stage) before it decreased throughout the
remainder of treatment. MacKenzie did not view engagement and conflict as necessarily
correlating negatively with each other, meaning that the group may be simultaneously
engaged and in conflict (MacKenzie, 1983). Still, in terms of developmental stages, the
dimensions were expected to develop in opposite directions. Avoidance was initially expected
to be high, reducing over the course of treatment. Nevertheless, increasing levels of anxiety as
group conflict emerges, was expected to lead to group avoidance in the differentiation stage.
The impending termination also was expected to increase group avoidance in the termination
stage. Otherwise, group avoidance is generally expected to decrease, but with fluctuations
throughout the course of treatment. Figure 1 shows the courses of engagement, conflict, and
avoidance as they are expected to occur on the basis of the presented theory2.
5 GROUP CLIMATE DEVELOPMENT
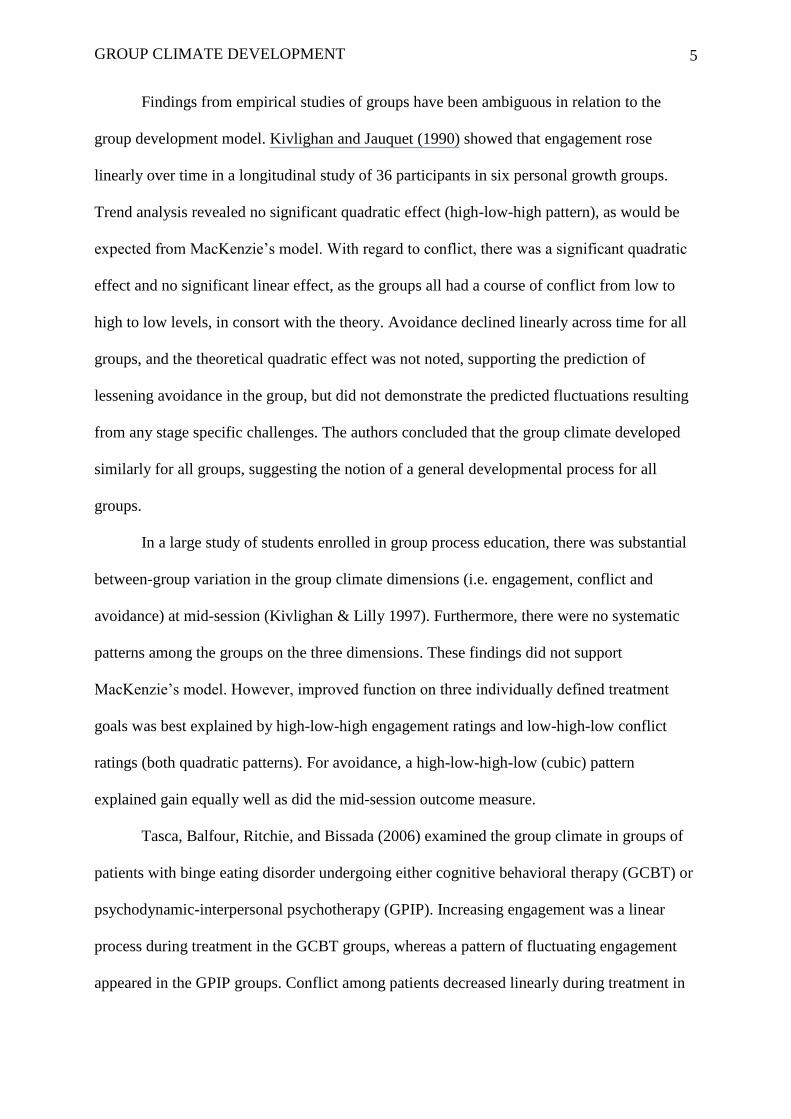
Findings from empirical studies of groups have been ambiguous in relation to the
group development model. Kivlighan and Jauquet (1990) showed that engagement rose
linearly over time in a longitudinal study of 36 participants in six personal growth groups.
Trend analysis revealed no significant quadratic effect (high-low-high pattern), as would be
expected from MacKenzie’s model. With regard to conflict, there was a significant quadratic
effect and no significant linear effect, as the groups all had a course of conflict from low to
high to low levels, in consort with the theory. Avoidance declined linearly across time for all
groups, and the theoretical quadratic effect was not noted, supporting the prediction of
lessening avoidance in the group, but did not demonstrate the predicted fluctuations resulting
from any stage specific challenges. The authors concluded that the group climate developed
similarly for all groups, suggesting the notion of a general developmental process for all
groups.
In a large study of students enrolled in group process education, there was substantial
between-group variation in the group climate dimensions (i.e. engagement, conflict and
avoidance) at mid-session (Kivlighan & Lilly 1997). Furthermore, there were no systematic
patterns among the groups on the three dimensions. These findings did not support
MacKenzie’s model. However, improved function on three individually defined treatment
goals was best explained by high-low-high engagement ratings and low-high-low conflict
ratings (both quadratic patterns). For avoidance, a high-low-high-low (cubic) pattern
explained gain equally well as did the mid-session outcome measure.
Tasca, Balfour, Ritchie, and Bissada (2006) examined the group climate in groups of
patients with binge eating disorder undergoing either cognitive behavioral therapy (GCBT) or
psychodynamic-interpersonal psychotherapy (GPIP). Increasing engagement was a linear
process during treatment in the GCBT groups, whereas a pattern of fluctuating engagement
appeared in the GPIP groups. Conflict among patients decreased linearly during treatment in

6 GROUP CLIMATE DEVELOPMENT
both groups. Avoidance was stable throughout treatment for GPIP patients, whereas it
decreased linearly for GCBT patients. These results may suggest that the group climate in
interpersonal group treatment developed along MacKenzie’s theoretical trajectory – or at least
more so than in cognitive group treatment.
Studies to date have shown inconsistent patterns of group climate measures during
treatment. Some important methodological differences between the studies require
mentioning. First, the structure of the group climate scales differs between the studies.
Kivlighan and Lilly (1997) and Kivlighan and Jauquet (1990) used the scales as originally
developed (MacKenzie, 1983), while Tasca et al (2006) used a revised factor structure
(described in MacKenzie, 1990). Second, the studies conceptualized the group climate in
different ways, i.e. as a group level characteristic in which the group was the study unit
(Kivlighan & Lilly, 1997), or as a characteristic of the individuals within the group (Tasca et
al, 2006).
The Group Climate in Relation to Diagnosis, Treatment, and Level of Analysis
This is, to our knowledge, the first study of group climate that a) exclusively uses a
clinical sample of inpatients, and where b) all have a social phobia diagnosis. Therefore, we
have limited opportunity to compare our results with other studies in the field. Theoretically,
we will propose that the social phobia diagnosis, where the patients are characterized by low
self-esteem, fear of scrutiny and, consequently, high levels of social avoidance, will lead to
lower levels of engagement and higher levels of avoidance in the group when compared to
groups targeted at other mental disorders. We also propose that the process in social phobia
groups will progress more slowly than in other types of diagnostically targeted groups. As
patients with social phobia tend to be very careful in social interaction as not to provoke
others’ negative reactions towards them, the levels of expressed disagreement and conflict
may be particularly low in these groups. We will also assume that more chronic and severe

7 GROUP CLIMATE DEVELOPMENT
social phobia, which was abundant in the present sample, will lead in the direction of a
relatively less engaged and more avoiding group climate.
MacKenzie’s concept of group climate implies that it represents an actual feature of
the common social world of the group members. Thus, the members’ scorings should be
considered a group level variable. To address this group level, we used patient nested within
treatment group (as different from group sessions) as unit in our multilevel analyses of the
course of group climate over time. In this way, the individual patients’ scores were corrected
for the average level in their respective treatment groups. There may be good reason to
investigate also how outcome from group therapy may be associated to an aggregated group
level measure of the group climate, as advocated by several authors (Budman, Soldz, Demby,
Feldstein, Springer, & Davis, 1989; Burlingame, Kivlighan & Lilly, 1997; MacKenzie &
Strauss, 2004). Given our limited sample size, however, we decided here to link the
individual’s group experiences to his or her outcome. Thus, we treated the group climate as a
group-level variable in describing the course of the group climate, and as an individual-level
variable in predicting outcome. However, to evaluate to what extent these two different
approaches were justified, we computed the intraclass correlations of the ratings. To the
extent that the ratings reflect the actual group climate, they will vary considerably more
between sessions than between members within the same session. To the extent that the
ratings are subjective and random in relation to the actual group climate, they will vary
between members in the same sessions as much as they vary between sessions (Hoyle,
Georgesen, & Webster, 2001).
The study by Tasca et al (2006) is so far the only empirical study that has compared
the group climate in two different treatments (i.e. cognitive vs. psychodynamic-interpersonal
therapy). Based on their findings for engagement, they suggested, “the courses of the
therapeutic interactions within GCBT and GPIP are quite different in nature” (p. 509). It was

8 GROUP CLIMATE DEVELOPMENT
suggested that psychodynamic and interpersonal therapies are relationship focused and
therefore challenging to the therapeutic bond, so that the therapeutic alliance and, similarly,
group engagement in group therapy, will occur in rupture and repair-sequences throughout
treatment (Safran, Muran, Samstag, & Stevens, 2001). On the other hand, the cognitive
therapy process is empirically described as leading a smoother course with a maintained
collaborative therapeutic relationship as a means to develop cognitive skills throughout the
treatment (Raue, Goldried, & Barkham, 1997), in accordance with the cognitive therapy
outline (Beck, 1995).
As the RIPT treatment in our study was much based on the developing, understanding,
and changing relationships as the therapeutic mechanism of change, the group climate in
RIPT treatment groups may also tend to progress in a similar fashion as the GPIP groups did
(i.e. in a non-linear rising slope). On the other hand, the RCT treatment with its focus on well-
structured patient-therapist collaboration in problem formulation, goal setting, and
implementation of new action strategies where the patients increasingly take the lead in their
own therapeutic process, may show a gradually increasing group engagement more similar to
the development shown in the GCBT groups.
The present study is a sub-study of a randomized clinical trial conducted by Borge,
Hoffart, Sexton, Clark, Markowitz, and McManus (2008), where the purpose was to compare
the effects from residential cognitive therapy (RCT) and residential interpersonal therapy
(RIPT) in relation to social phobia symptoms. This study examined MacKenzie’s group
development hypotheses in our sample of patients with social phobia (Figure 1). The theory
posits that (a) a rising slope with also high-low-high quadratic pattern would characterize
engagement, (b) a rising slope with also low-high-low quadratic pattern would characterize
conflict, but that (c) a decreasing slope with also low-high-low quadratic pattern would best
describe avoidance.

9 GROUP CLIMATE DEVELOPMENT
Method
Participants
Participants in the study were selected from applicants for treatment at Modum Bad, a
national Norwegian clinic providing residential treatments for a diversity of non-psychotic
disorders. An extensive list of criteria was used to determine participant inclusion in the
study, most importantly 1) DSM-IV diagnosis of social phobia (American Psychiatric
Association, 1994; First, Spitzer, Gibbon, & Williams, 1995). In addition, inclusion was
based on 2) both the assessor and the patient considered social phobia as the main current
problem, and that the patient had no immediate need for additional treatment; 3) no current
psychotic disorder or substance abuse; 4) no organic mental disorder; 5) willingness to
suspend use of psychotropic medication, alcohol and other substances; 6) acceptance of
random allocation; 7) not previously treated with similar models; 8) ability to speak
Norwegian; 9) age 18-65 years. Personality disorder was not considered a reason for
exclusion. Those with a history of recurrent major depression currently successfully in
remission after treatment with antidepressant medications were excluded. Ultimately, 80
candidates entered. The included patients were randomized for either RIPT or RCT treatment,
while stratifying for gender (Borge et al, 2008). Altogether, there were five consequent
treatment groups in both treatment conditions, each treatment group consisting of eight
members.
The mean age for the total sample was 37.5 years (SD = 11.4 years). The age
distribution was the same in the two conditions (RIPT Mage = 37.2 years, SD = 11.6; RCT Mage
= 37.7 years, SD = 11.3). At the time of admission (baseline), the RIPT condition had 18 out
of 40 patients in employment, compared to 11 out of 40 patients in the RCT condition. The
difference was not statistically significant (χ2
= 2.65, p = 0.10).

10 GROUP CLIMATE DEVELOPMENT
Mean admission score on the Social Phobia and Anxiety Inventory, Social Phobia
subscale (SPAI-SP; Turner, Beidel, Dancu, & Stanley, 1989) was 134.8 (SD = 25.4) for the
total sample. This score was not significantly different for the patients in the two conditions
(RIPT MSPAI-SP = 137.6, SD = 27.3; RCT MSPAI-SP = 132.2, SD = 23.4). For the total sample,
the mean duration of social phobia was 19.7 years (SD = 12.3 years), and there was no
significant difference between the treatments (RIPT Mduration = 19.8 years, SD = 12.3; RCT
Mduration = 19.8 years, SD = 13.2). Also, there were no significant differences between the
treatments with regard to other clinical variables (depression, other anxiety disorders,
substance related disorders and personality disorders). In the sample, 60% had a personality
disorder, avoidant personality disorder being the most frequent (55%).
Therapists
The RCT staff consisted of two individual therapists (psychologists) and four milieu
therapists (psychiatric nurses). The RIPT staff similarly consisted of two individual therapists
(one clinical social worker and one resident physician) and four milieu therapists (three
psychiatric nurses and one occupational therapist). The group therapy was in both conditions
delivered as co-therapy, lead by one individual therapist and one milieu therapist. In both
treatment conditions, the staff was trained prior to the study to carry out the therapies by
international experts. Both therapies were also supervised by local professionals.
Treatments
The treatments were based on the manuals for individual social phobia treatment of
Clark (1997) and Lipsitz and Markowitz (1997), after modifications for use in a residential
setting. The RCT team further developed a treatment protocol for the residential modification
of cognitive therapy based on the Clark model (Hoffart, Borge, Myklebust, Nore, &
Langehaug, 2003). This RCT modification emphasized the application of a personalized
cognitive model, including the patients’ thoughts, images, anxiety symptoms, safety

11 GROUP CLIMATE DEVELOPMENT
behaviors, and attentional strategies. The patients were encouraged to let go of safety
behaviors, redirect focus onto the situation and away from themselves, and to try this shift of
strategy in social situations in real life. Through this experiential technique, the patients were
able to explore how this change would affect their level of anxiety and their own performance
in fear-eliciting social situations (Borge et al, 2008).
The RIPT team developed a modified treatment protocol of interpersonal therapy
based on a combination of the model developed by Lipsitz and Markowitz (1997) and a group
model of IPT (Wilfley, MacKenzie, Welch, Ayres, & Weissman, 2000), further elaborated at
a later stage in the process (Hoffart et al, 2007). The modification emphasized socialization to
a medical model, implying that the patients view of themselves as socially incompetent was
untrue, and rather that their problems in social situations were imposed by their illness. The
patients were helped to establish an interpersonal focus for treatment. The focus could be for
instance, becoming open about personal matters, expressing anger, assert one’s interests, or
chatting with others. Throughout therapy, these themes would be guiding the patients’
interaction with others and anchor their reflections upon their social experiences within the
group. Stimulating interaction among the group members, and reflection-on-action in the
group, were basic therapeutic techniques employed in this work. The group format also made
possible the in-vivo exploration of important events in the group that were related to the
patients’ interpersonal focus (Borge et al, 2008; Hoffart et al, 2007).
In order to assess adherence to treatment protocol, 23 randomly selected videotaped
group sessions (RCT = 12, RIPT = 11) were rated according to a modified version of the
Collaborative Study Psychotherapy Rating Scale – Form 6 (Hollon, 1984), a scale which
incorporated items from both cognitive (12 items) and interpersonal (12 items) therapy. The
ratings were performed by two psychology undergraduates. Interrater reliability was
satisfactory, as the intraclass correlations (ICC) were .85 and .94 for the mean of RCT and

12 GROUP CLIMATE DEVELOPMENT
RIPT items, respectively (Borge et al, 2008). There were model-consistent differences
between the two treatments, as the RCT sessions were rated higher than the RIPT sessions on
the cognitive therapy items, and lower on the interpersonal therapy items (Hoffart, Borge,
Sexton, & Clark, 2009).
Both treatments were delivered in a closed group format. There were eight persons in
each group. There were four group sessions weekly, lasting for one hour and a quarter. The
weekly individual sessions had duration of 45 minutes. In addition to individual therapy
sessions and group therapy sessions, all patients participated in the general program on the
ward, mainly consisting of physical training sessions (twice weekly) and ward community
meetings (once weekly). The relative time spent in individual therapy and group therapy
during the week was calculated, and showed that the largest part of the therapy was conducted
in group settings (88 %) as opposed to the individual format (12 %). Patients usually went
home for the weekends. Towards the end of the program, a person close to the patient
(spouse, parent or close friend) took part in a modified program for five days.
Measures and Procedure
We measured MacKenzie’s group climate dimensions with a Norwegian version of the
Group Climate Questionnaire (GCQ) (MacKenzie, 1983). The GCQ, a 12 items self-
administered questionnaire assessing the group atmosphere, was given for all patients in both
conditions. The GCQ items are statements, with which the patients rated their level of
agreement on a 7-point Likert type scale (0 = not at all, 6 = extremely). The GCQ is a short
form of an original 32-item questionnaire (MacKenzie, 1981), in which previous factor
analysis demonstrated the three dimensions of the group climate: Engagement, conflict, and
avoidance (MacKenzie, 1983). The back-translated measure used in this study was identical
in meaning with the original.

13 GROUP CLIMATE DEVELOPMENT
Engagement in the group reflects the aspects of liking and caring in the group and
collaborative, problem solving efforts in the group. This dimension also reflects participation,
constructive confrontations, and self-disclosure. The conflict dimension refers to a sense of
friction and anger. It also captures distrust and rejection in the group. The avoidance
dimension refers to the members being dependent on the leader, experiencing remoteness
from other group members and being unwilling to take responsibility for bringing up
important material to the group discussion. Avoidance also refers to a group more concerned
with conformity than therapeutic work, and captures tension and anxiety in the group. In
MacKenzie’s original article (1983), the latter aspect was apart from the established scales. In
every other respect, the GCQ scale structure used in this study is in line with the structure as
originally established.
Because different factor structures of the GCQ have been found in previous studies,
we checked the structure in our sample using Principal Component Analysis (PCA) with
varimax rotation based on the scores from the first measurement. The KMO value was .78,
which indicates that the patterns of correlation are relatively compact, displaying relatively
distinct and reliable factors (Field, 2005). The Bartlett’s test was statistically significant (p <
0.001), indicating that the matrix was adequate (Tabachnick & Fidell, 2007).
Three factors had Eigenvalues above 1. These factors explained 26.2 %, 20.0 %, and
11.0 % of the variance, respectively, with a cumulative 57.2 % explained variance. The result
was in accordance (apart from item 12, which in this study was included in the avoidance
factor) with MacKenzie’s original solution and this was selected for our study. All items
loaded > .40 on one of the three factors. Item 8, an engagement item in MacKenzie’s work
(MacKenzie, 1983), had “split loading”, i.e. loaded > .40 on both the engagement and the
conflict factor, but had the highest loading on the engagement factor.

14 GROUP CLIMATE DEVELOPMENT
Earlier studies have shown satisfactory reliability of the GCQ measure, Cronbach’s α
ranging from .72 - .95 (Kivlighan & Goldfine, 1991; Kivlighan & Lilly, 1997; Tasca et al,
2006). In this study, Cronbach’s α was .76 for the engagement items, .60 for the avoidance
items, and .77 for the conflict items.
The GCQ was completed four times, immediately after a group therapy session in the
second (T1), fourth (T2), sixth (T3), and eighth (T4) week during the ten week treatment.
Presumably the scores from T1 would then indicate the group climate in the engagement stage
while the scores from T2, T3, and T4 would indicate the group climate later in the group’s
development. We suspected that the theoretically proposed stages of MacKenzie (1983; 1990)
would not be readily identified from the data, but we still let them serve as our interpretation
guide. Unfortunately we did not have measurement for a time that could indicate the group
climate in the termination stage of treatment, as the last time of measurement (T4) was two
weeks before treatment termination.
The self-report Social Phobia and Anxiety Inventory (SPAI; Turner et al, 1989)
consists of a social phobia subscale and an agoraphobia subscale. The social phobia subscale
consists of 32 items, where 11 of these relate to the level of anxiety in specific social
situations. Two items relate to anticipatory and in vivo thoughts when in the company of
others. Three items relate to commonly experienced somatic symptoms. The scores on the
social phobia subscale range from 0 to 192. Scores on the social phobia subscale of the SPAI
from admission, midtreatment and discharge are presented in this article.
Statistical Analysis
Our longitudinal data are multilevel, where the patients are lower level units nested
within groups, who are upper level units. Therefore we used mixed (fixed and random effects)
models (Fitzmaurice, Laird, & Ware, 2004) to analyze our data. Unlike traditional models for
repeated measures, multilevel models can effectively manage unequal number of observations

15 GROUP CLIMATE DEVELOPMENT
and missing data in the repeated measure. Multilevel models also take account of and adjust
for any bias in standard errors and statistical tests resulting from the interdependence
(autocorrelation) of repeated observations that is typical in such data. This interdependency is
accounted for by introducing individual-specific random effects and by modeling the
covariance of the residuals. In our analyses, a first-order autoregressive covariance structure
gave the best fit (Akaike’s Information Criterion). The additional interdependence between
members of a treatment group was modeled by using individual patient nested within
treatment group and treatment group as random factors. This led to an improvement of fit for
all the tested models. Hence, by applying these models with individuals nested within
treatment group and with the treatment group treated as random effects, there is a decreased
probability of making Type I error (Baldwin, Murray, & Shadish, 2005).
The first model consisted of (1) GCQ Scale = Intercept + Condition + Time. Group
was included as a random factor in all models. The Condition + Time analysis examined
whether the overall levels on the GCQ dimensions differed in the two treatments (Condition),
and whether the GCQ scores changed linearly over time (Time). The Condition × Time
interaction term was added in the second model, which thus consisted of (2) GCQ Scale =
Intercept + Condition + Time + (Condition × Time). The interaction term indicates whether
the GCQ scores changed differently in the two treatments. In cases of significant interaction
(Condition × Time), analyses were then performed separately for each condition. Quadratic
development was added in the third model: (3) GCQ Scale = Intercept + Condition + Time +
(Condition × Time) + Time2. This analysis added the quadratic term (Time
2) to the model in
order to investigate non-linear development. Then, interaction between treatment and
quadratic development (Condition × Time2) was added in the fourth model: (4) GCQ Scale =
Intercept + Condition + Time + (Condition × Time) + Time2
+ (Condition × Time2). This
latter term would indicate whether the quadratic development differs in the two treatments.

16 GROUP CLIMATE DEVELOPMENT
Follow-up analyses were performed separately for each condition in cases of significant
interactions.
Intraclass correlations [ICC (1, 1)] (Shrout & Fleiss, 1979) were derived from one-way
analysis of variance, where the GCQ scales were treated as dependent variables and the
treatment group as the factor variable. This analysis was repeated for all four times of
assessment; first for the total sample, and then for the two treatment conditions separately.
Multiple regression analysis was performed to investigate the impact of the group
climate on change in social phobia symptoms during treatment. The analyses were performed
separately for each GCQ scale. The dependent variable was SPAI-SP scores at the end of
treatment. SPAI-SP scores at admission were included as predictor in the first block. In the
second block, the individuals’ GCQ scale mean score across the four assessments were
included. In the third block, a condition and condition with the GCQ scale interaction terms
were included.
Results
Effectiveness of the treatments
The treatments were equally effective (Table 1). Patients in both RCT and RIPT
improved significantly during treatment (sample mean Cohen’s d = .76, change from pre- to
posttreatment) in their social phobic symptoms as measured by the Social Phobia and Anxiety
Inventory, social phobia subscale (SPAI-SP; Turner et al, 1989). Drop out from treatment was
minor (RIPT n = 3, RCT n = 8; Fisher’s Exact test; p = 0.193, ns) (Borge et al., 2008).
The Levels of the Group Climate Variables
The mean group climate scores in this study were for engagement 2.82 (SD = .85) and
3.12 (SD = .54), for conflict .63 (SD = .65) and .76 (SD = .68), and for avoidance 2.50 (SD =
.74) and 2.44 (SD = .58) for patients in RCT and RIPT treatments, respectively. According to
the scale criteria, these results indicate that the patients on the average viewed the group in

17 GROUP CLIMATE DEVELOPMENT
which they were part as about moderately (3) engaged, less than a little (1) in conflict, and
somewhat (2) to moderately (3) avoiding.
The Course of the Group Climate
Table 2, Table 3, and Table 4 show the results for the tested models of engagement,
conflict, and avoidance, respectively, whereas Figure 1 presents the theoretical and Figure 2
presents the observed development of these factors graphically. The overall sample showed
no significant linear or quadratic trend in engagement. When testing for interactions, we
found that treatment condition significantly moderated linear trends in the sample (t = 6.14, p
< 0.001, df = 88). The RCT subset of the sample had a significant linear increase in
engagement throughout treatment (t = 4.80, p < 0.001, df = 46). The RIPT subset of the
sample had a significant linear decrease in engagement development during treatment (t = -
3.74, p = 0.001, df = 35) (Table 2).
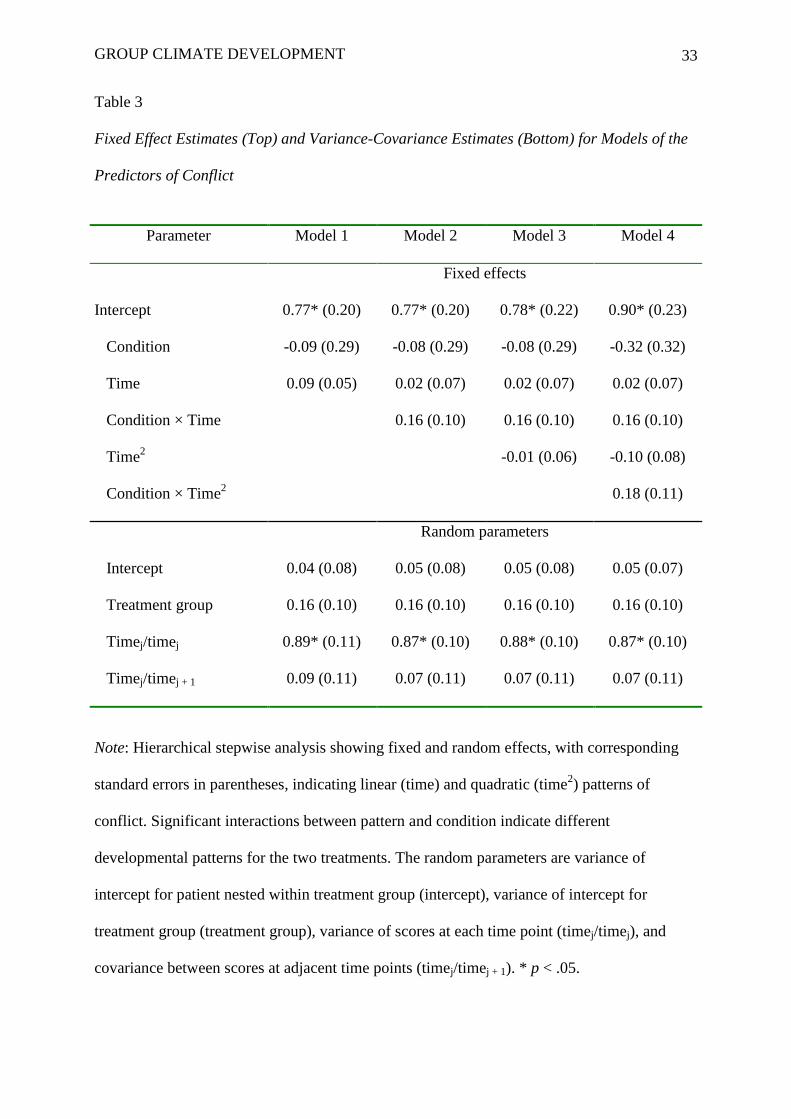
For the sample as a whole there was no significant change in conflict during treatment.
There was no interaction between treatment condition and the linear and quadratic terms,
indicating that there were no differences in terms of conflict development between the
patients in the two treatments (Table 3). However, when the six extreme observations were
removed (identified from Box plots of each condition at each time point and consisting of two
observations from RIPT and four from RCT) from the dataset and the analysis repeated there
was a quadratic time effect (t = -2.10, p = 0.037, df = 201), indicating a low-high-low pattern
of conflict across time. The interaction between quadratic time and treatment condition was
not statistically significant. Avoidance did not change significantly over the course of the
treatment in either treatment nor was there an interaction by treatment condition (Table 4).
Intraclass Correlations
Table 5 shows the intraclass correlations [ICC (1, 1)] for the group climate scales on
the four measurement occasions. Amongst the patients in the RCT groups, there was

18 GROUP CLIMATE DEVELOPMENT
moderate agreement within the treatment groups with respect to the levels of both
engagement and avoidance on most measurement occasions. Amongst the patients in the
RIPT groups, there was strong agreement within the treatment groups with respect to the
levels of conflict.
The Group Climate Variables’ Impact on Outcome
The pretreatment SPAI-SP score accounted for 27 % of the variance in outcome
(SPAI-SP at posttreatment) in the total sample (Table 6). The mean level of engagement
across assessments explained an additional 5 % of the variance in outcome. Engagement was
the only GCQ subscale that contributed as a significant predictor of outcome change when
controlling for pretreatment SPAI-SP score (β = -.24, p < 0.05). There were no significant
interactions between treatment condition and the GCQ subscales.
Discussion
Summary of Findings
The hypothesis that engagement would follow a quadratic course with a linear rise
during treatment was not supported. Neither the total sample nor either of the two treatment
conditions showed quadratic effects in engagement. Instead, there were opposite linear trends
for RCT and RIPT groups, where patients in the RCT condition showed a linearly increasing
engagement during treatment, while those in the RIPT condition showed a linearly decreasing
pattern of engagement. The main analysis did not support the hypothesis that conflict would
follow a quadratic course with a linear rise during treatment, although this type of
development was supported from the additional analysis after six extreme observations
(outliers) had been removed. The hypothesis that avoidance would decrease linearly and with
a quadratic low-high-low effect was not supported. The mean level of engagement predicted a
decrease in anxiety over the course of treatment.
GCQ Factor Structure

19 GROUP CLIMATE DEVELOPMENT
The factor structure of the GCQ here generally followed the originally established
structure (MacKenzie, 1983). The one exception is item 12, which loaded on the avoidance
scale here, whereas it was apart from the three scales in MacKenzie’s work. This may be a
consequence of the sample. It is possible that patients with social phobia relate the process
captured in item 12, “the members appeared tense and anxious”, to avoidance more easily
than other groups of patients. For social phobia patients, anxiety often leads to their silence
and interpersonal withdrawal, which may well be interpreted as a defensive attempt to appear
normal and acceptable to others. Also, when group members become silent and distance
themselves from one another, the group depends upon external leadership to progress.
Therefore, it seems likely that the targeted issue of social phobia may lead to the association
of tension and anxiety (item 12) with other aspects of avoidance [not talking about important
issues (item 3), a tendency towards dependency (item 5), interpersonal remoteness (item 7),
and conformity (item 9)].
The Levels of Engagement, Conflict, and Avoidance
The mean group climate scores from this study showed that the level of engagement
(RCT = 2.82, RIPT = 3.12) differed from those in the previous studies. The groups in the
Tasca et al study (2006) had mean engagement ratings of 4.09 (GCBT) and 4.24 (GPIP),
whereas Kivlighan and Lilly’s (1997) groups of students showed 2.57 as the mean score3 for
engagement at midtreatment. This is interesting as it confirms our initial belief that
engagement may be lower in social phobia groups compared to groups for other
psychological disorders. On the other hand, this also indicates that the engagement levels in a
non-diagnosed sample of students (as in Kivlighan & Lilly, 1997) may even be lower than
that in a clinical sample with social phobia, like ours. This may be interpreted as a function of
treatment motivation: Even if a sample of social phobia patients share some disorder
characteristics that can reduce group engagement, they also share a motivation to do

20 GROUP CLIMATE DEVELOPMENT
something about their problems that works in the direction of a more engaged group climate.
The motivation to make the most of their group experience may not be as high in groups of
students.
The mean conflict level among the patients in our study (RCT = .63, RIPT = .76) was
lower than what has been found in earlier studies. The GCBT groups had a mean level of 1.03
and the GPIP groups, 1.33 in the study by Tasca et al (2006). The student group (Kivlighan &
Lilly, 1997) had 1.70 as their midtreatment mean level of conflict. Although the differences
are small, this supports our initial prediction that there may be low levels of conflict in groups
with social phobia patients, in comparison to other types of groups.
The levels of avoidance among the patients in our study (RCT = 2.50, RIPT = 2.44)
are fairly equal to the results from earlier studies, as Tasca et al (2006) found mean levels of
2.60 (GCBT) and 2.35 (GPIP) and Kivlighan and Lilly (1997) found mean midtreatment
levels of 2.36 in groups of students. This comparison shows that our initial belief that
avoidance among patients in social phobia groups would be especially high was unwarranted.
Homogeneity of Group Climate Scores Within Groups
The ICCs varied across scales, time, and treatment type in this study. Particularly high
ICCs were found related to conflict in the RIPT groups, and especially so in the first half of
the treatment. Here, the group members were much united in their perception of conflict. Our
interpretation of this finding is that obvious conflict in the RIPT groups was a powerful
dimension of the group experience, which enabled the group members to “speak with one
voice”. Otherwise, the individual’s subjective perception of the group with respect to
engagement and avoidance was less related to the other group members’ perception of these
dimensions. We believe that the relationship focus in RIPT is the primary cause for this to be
the case in RIPT groups, whereas the structured sessions with less focus on intragroup

21 GROUP CLIMATE DEVELOPMENT
relationships can cause the patients in the RCT groups to experience a lesser degree of
homogeneity related to group conflict.
There were also moderate ICCs on most measurement occasions related to
engagement and avoidance for the patients in the RCT groups. Again, the more structured
sessions and the more directive leadership style in cognitive therapy may more easily
establish common grounds in the group with respect to mutual feelings of friendliness and
trust; a trust which may be based on a common feeling that therapy unfolds in a predictable
way. The strong relationship focus in the RIPT groups, focusing on learning from the
processes going on within the group, may make therapy a more unpredictable experience for
these patients, and may cause patients in RIPT groups to have a more individualized
perception of the group’s engagement.
The results of this study show that the levels of conflict and avoidance were fairly
equal across the treatments. Thus, it is interesting to notice the variance amongst the
participants within each group with respect to the perception of these factors (Table 5).
Whereas the members in the RIPT groups were much united in their perception of conflict,
the members in the RCT groups rather shared a perception of avoidance in the group. Group
conflict may be one of the themes that have been avoided in the RCT groups. If this is the
case, it can contribute to explain these differences between the treatments: Whereas the
members in the RIPT groups may have spoken openly about their conflicts in the group, and
thus have perceived conflict with much agreement, the members in the RCT groups may have
experienced some tension in the group that was not talked about. This may have lead to
higher agreement on avoidance amongst the RCT members.
The Course of the Group Climate
The scores from the RCT groups also displayed the increasing engagement found in
earlier studies (Kivlighan & Jauquet, 1990, Tasca et al, 2006). The rising, quadratic pattern of

22 GROUP CLIMATE DEVELOPMENT
engagement development hypothesized by MacKenzie (1990) and in earlier studies
(Kivlighan & Lilly, 1997; Tasca et al, 2006) did not occur within the groups in this study.
Significantly, among the RIPT patients, there was a linear decrease in engagement – opposite
of the predicted direction. There was no quadratic high-low-high pattern of engagement
development.
An explanation for the unexpected linear decline in engagement for the patients in the
RIPT groups may be that this treatment focuses strongly on the interpersonal issues in the
group through the early stages of treatment. Later in the course of treatment, RIPT focuses
more on how changes that occur in the treatment situation can be translated to the outside
world of the individual group members. This is a strategy that may lead to less interpersonal
engagement within the treatment group. In light of the positive outcome results for RIPT
patients, we consider this decrease in group engagement as likely resulting from a shift in
focus from the intragroup processes in the early stages of treatment to real world relationships
in the later stages. For RCT, on the other hand, the rising slope of group engagement may
result from patients’ positive intrapersonal changes affecting the interplay within the group.
These changes may lead to a stronger sense of the possibilities inherent in the relationships
with others in the group.
Based on the many discrepancies between this study and other studies on one hand and
theory on the other, we believe that the theory of group development (MacKenzie, 1990) that
we have applied in this study should be modified. In particular, it needs to be more precisely
attuned to specific sample characteristics as well as to specific treatments and treatment
formats. There is reason to believe that heterogeneously composed groups (as in the studies
by Kivlighan & Lilly, 1997, and MacKenzie, 1983) and groups targeted at binge eating
disorder (as in Tasca et al, 2006) will develop differently than groups composed of socially
phobic individuals. These groups will often progress slowly, as the members need time to

23 GROUP CLIMATE DEVELOPMENT
express themselves in the group. This is often quite different in groups for other disorders,
such as those for binge eating disorder, because strong affects are much more openly
experienced and displayed in such groups. The theory may also be better suited to describe
development in outpatient groups, in which patients meet for therapy once weekly, than
groups within residential settings with participants that encounter each other frequently and in
a variety of settings.
Others (Kivlighan & Jauquet, 1990; Kivlighan & Lilly, 1997; Tasca et al, 2006) have
described conflict development in different ways based on their empirical data, but all seem to
differ from the quadratic development that was proposed by MacKenzie (1983). In this study
there was no significant time trend or interaction with treatment when all the observations
were in the model. However, the results from the additional analysis after removing six
outliers showed low-high-low patterns of conflict for both treatments, in accordance with
MacKenzie’s model for conflict development (MacKenzie, 1983; 1990).
Our hypothesis of reduced avoidance over the course of treatment was not confirmed.
It is possible that sample characteristics play an important role. As social phobia would imply
problems with social behaviors such as assertiveness, connectedness, and openness, these may
be less enhanced during treatment than in groups dealing with other central issues.
Another factor that may be important in the interpretation of our results is that of
culture. The impact of culture on group therapy processes is an underdeveloped area of
research, and Norwegian culture is yet to be studied in this respect. However, Norwegians in
general may be characterized as somewhat socially withdrawn, avoidant of interpersonal
conflict, careful not to be too open about themselves, and avoid prying or leading other people
in the direction of a potentially embarrassing intimacy. In other words, the stereotype
Norwegian may have more in common to social phobia patients than people from countries
like the United States. This may contribute to explain the relatively low levels of engagement

24 GROUP CLIMATE DEVELOPMENT
and conflict found in our study sample. A high level of avoidance would also be consistent
with an explanation emphasizing cultural differences, but this was not found in our study.
The Impact of the Group Climate on Outcome
The individuals’ mean level across the time points of engagement, which incorporates
many aspects of the concept of cohesion, predicted a positive outcome (decreased anxiety).
This further strengthens the empirical relationship between these variables. The same result
has been shown in several process-outcome studies of group therapy (Burlingame, Fuhriman,
& Johnson, 2001; MacKenzie & Tschuschke, 1994; Marziali, Munroe-Blum, & McCleary,
1997; Taube-Schiff, Suvak, Antony, Bieling, & McCabe, 2007).
Methodology and Study Limitations
The present study of group climate during the course of an inpatient treatment differs
from earlier work that examined outpatient treatment or group educational programs. We also
only had access to group climate data at four points in time, i.e. every other week, while
others collected data after each weekly group session as well as being somewhat longer (14-
16 weeks vs. 10 weeks here). These differences may limit comparisons with earlier ones.
The longer the period between measurements, the further the group could develop
between measurements. As for the inpatient groups, the members will have had numerous
encounters with each other during the period between measurements, both formally in group
settings, but also informally. A period of two weeks between measurements is probably not
sufficient to capture the fluctuations of the group climate within that period. Nevertheless, we
regard the patients’ scores as valid expressions about their perceptions of the group climate at
these four time points.
This study produced a factor structure (for conflict and avoidance) for the GCQ which
was different from what was used in the Tasca et al study (2006), but very similar to the
factor structure used in other studies (Kivlighan & Jauquet, 1990; Kivlighan & Lilly, 1997).

25 GROUP CLIMATE DEVELOPMENT
This also may limit comparisons between these two studies. Also, as described earlier, the
varying magnitude of the intraclass correlations indicate limited validity of findings based on
group-level analyses of the group climate. Furthermore, in this study the internal consistency
of Avoidance was lower (0.60) than is generally considered optimal.
A reservation must also be made concerning the great number of statistical tests
performed in this study. As the number of statistical tests increases, so does the danger of
making Type II errors.
Conclusion
The study has described and explored the development of engagement, conflict, and
avoidance in a ten-week cognitive and interpersonal group therapy as part of the residential
treatment of social phobia. Measurements of the group climate were performed relatively
infrequently (four times in 10 weeks) - a fact that should be kept in mind when considering
the results. However, the study indicates that there were differences in group climate
development between cognitive and interpersonal group therapy in the pattern of engagement.
The mean level of engagement also predicted change in social anxiety over the course of
treatment. It seems probable that sample characteristics, the treatment models and setting
contribute to determining both the levels and the patterns of development of the group
climate. Thus, many factors may impact group climate such that one generic model does not
seem to fit all groups. MacKenzie’s theoretical model of group climate development was not
supported by the results of this study. It appears that group development needs to be viewed
much more specifically, i.e., in terms of participants, context, content, and culture.

26 GROUP CLIMATE DEVELOPMENT
References
American Psychiatric Association (1994). Diagnostic and Statistical Manual of Mental
Disorders, 4th
ed. Washington, DC: American Psychiatric Association.
Baldwin, S.A., Murray, D.M., & Shadish, W.R. (2005). Empirically Supported Treatments or
Type I Errors? Problems With the Analysis of Data From Group-Administered
Treatments. Journal of Consulting and Clinical Psychology, 5 (73), 924-935. doi:
10.1037/0022-006X.73.5.924
Beck, J. (1995). Cognitive therapy: Basics and beyond. New York: Guilford Press.
Borge, F.M., Hoffart, A., Sexton, H., Clark, D.M., Markowitz, J.C., & McManus, F. (2008).
Residential Cognitive Therapy versus Residential Interpersonal Therapy for Social
Phobia: A Randomized Clinical Trial. Journal of Anxiety Disorders, 22, 991-1010. doi:
10.1016/j.janxdis.2007.10.002
Budman, S.H., Soldz, S., Demby, A., Feldstein, M., Springer, T., & Davis, M.S. (1989).
Cohesion, Alliance, and Outcome in Group Psychotherapy. Psychiatry, 52, 339-350.
Burlingame, G.M., Fuhriman, A., & Johnson, J.E. (2001). Cohesion in Group Psychotherapy.
Psychotherapy, 4 (38), 373-379. doi: 10.1037/0033-3204.38.4.373
Burlingame, G.M., MacKenzie, K.R., & Strauss, B. (2004). Small-Group Treatment:
Evidence for Effectiveness and Mechanisms of Change. In M.J. Lambert (ed.), Bergin
and Garfield’s Handbook of Psychotherapy and Behavior Change, 5th
ed., 647-696.
New York: John Wiley and Sons, Inc.
Clark, D.M. (1997). Cognitive therapy for social phobia: Some notes for therapists.
Unpublished manuscript. Oxford: University of Oxford.
Field, A. (2005). Discovering Statistics Using SPSS, 2nd
ed. London: Sage Publications Ltd.

27 GROUP CLIMATE DEVELOPMENT
First, B.M., Spitzer, R.L., Gibbon, M., & Williams, J.B.W. (1995). User’s Guide for the
Structured Clinical Interview for DSM-IV Axis I Disorders: SCID-I Clinician Version.
Washington, DC: American Psychiatric Press.
Fitzmaurice, G. M., Laird, N. M., & Ware, J. H. (2004). Applied longitudinal analysis.
New York: Wiley.
Hoffart, A., Abrahamsen, G., Bonsaksen, T., Borge, F.M., Ramstad, R., Lipsitz, J.D., &
Markowitz, J.C. (2007). A Residential Interpersonal Treatment for Social Phobia.
New York: Nova Science Publishers.
Hoffart, A., Borge, F.M., Myklebust, S., Nore, G., & Langehaug, U. (2003). Residential
Cognitive Treatment Manual for Social Phobia. Unpublished manuscript. Modum Bad.
Hoffart, A., Borge, F.M., Sexton, H., & Clark, D. (2009). Change Processes in Residential
Cognitive and Interpersonal Psychotherapy for Social Phobia: A Process-Outcome Study.
Behavior Therapy, 40, 10-22. doi: 10.1016/j.beth.2007.12.003
Hollon, S.D. (1984). Final report: System for rating psychotherapy audiotapes. Bethesda:
Department of Health and Human Services.
Hoyle, R.H., Georgesen, J.C., & Webster, J.M. (2001). Analyzing Data From Individuals in
Groups: The Past, the Present, and the Future. Group Dynamics: Theory, Research, and
Practice, 5 (1), 41-47. doi: 10.1037//1089-2699.5.1.41
Kivlighan, D.M. & Goldfine, D.C. (1991). Endorsement of therapeutic factors as a function
of stage of group development and participant interpersonal attitudes. Journal of
Consulting Psychology, 42, 338-349. doi: 10.1037/0022-0167.38.2.150
Kivlighan, D.M. & Jauquet, C.A. (1990). Quality of Group Member Agendas and Group
Session Climate. Small Group Research, 21, 205-219.
28 GROUP CLIMATE DEVELOPMENT
Kivlighan, D.M. & Lilly, R.L. (1997). Developmental Changes in Group Climate as They
Relate to Therapeutic Gain. Group Dynamics: Theory, Research, and Practice, 3, 208-
221. doi: 10.1037/1089-2699.1.3.208
Lipsitz, J.D. & Markowitz, J.C. (1997). Manual for Interpersonal Psychotherapy of Social
Phobia. Unpublished manuscript. Columbia University College of Physicians and
Surgeons, New York.
MacKenzie, K.R. (1990). Introduction to Time-Limited Group Psychotherapy.
Washington, DC: American Psychiatric Press, Inc.
MacKenzie, K.R. (1983). The clinical application of a group climate measure. In R.R. Dies
& K.R. MacKenzie (eds.), Advances in Group Psychotherapy: Integrating Research
and Practice, 159-170. Madison, CT.: International Universities Press.
MacKenzie, K.R. (1981). Measurement of Group Climate. International Journal of Group
Psychotherapy, 31, 287-295.
MacKenzie, K.R. & Tschuschke, V. (1994). Relatedness, group work, and outcome in long-
term inpatient psychotherapy groups. Journal of Psychotherapy Practice and Research, 2,
147-156.
Marziali, E., Munroe-Blum, H., & McCleary, L. (1997). The contribution of group cohesion
and group alliance to the outcome of group psychotherapy. International Journal of
Group Psychotherapy, 47, 475-497.
Raue, P.J., Goldried, M.R., & Barkham, M. (1997). The therapeutic alliance in
psychodynamic-interpersonal and cognitive-behavioral therapy. Journal of Consulting
and Clinical Psychology, 65, 582-587. doi: 10.1037/0022-006X.65.4.582
Safran, J.D., Muran, J.C., Samstag, L.W., & Stevens, C. (2001). Repairing alliance ruptures.
Psychotherapy, 38, 406-412. doi: 10.1037/0033-3204.38.4.406

29 GROUP CLIMATE DEVELOPMENT
Shrout, P.E., & Fleiss, J.L. (1979). Intraclass correlations: Uses in Assessing Rater
Reliability. Psychological Bulletin, 86 (2), 420-428. doi: 10.1037/0033-2909.86.2.420
Tabachnick, B.G. & Fidell, L.S. (2007). Using multivariate statistics, 5th
ed. Boston, MA:
Pearson Education, Inc.
Tasca, G.A., Balfour, L., Ritchie, K., & Bissada, H. (2006). Developmental Changes in Group
Climate in two types of Group Therapy for Binge-Eating Disorder: A Growth Curve
Analysis. Psychotherapy Research, 16, 499-514. doi: 10.1080/10503300600593359
Taube-Schiff, M., Suvak, M.K., Antony, M.M., Bieling, P.J., & McCabe, R.E. (2007). Group
cohesion in cognitive-behavioral group therapy for social phobia. Behavior Research and
Therapy, 45, 687-698. doi: 10.1016/j.brat.2006.06.004
Turner, S.M., Beidel, D.C., Dancu, C.V., & Stanley, M.A. (1989). An Empirically Derived
Inventory to Measure Social Fears and Anxiety: The Social Phobia and Anxiety
Inventory. Psychological Assessment, 1, 35-40. doi: 10.1037/1040-3590.1.1.35
Wilfley, D.E., MacKenzie, K.R., Welch, R., Ayres, V., & Weissman, M.M. (eds.), (2000).
Interpersonal psychotherapy for group. New York: Basic Books.
Yalom, I., with Leszcz, M. (2005). The theory and practice of group psychotherapy, 5th
ed.
New York: Basic Books.

30 GROUP CLIMATE DEVELOPMENT
Footnotes
1Minor fluctuations in the group climate, as described by MacKenzie (1983) we
disregarded, as we studied the overall patterns of group climate development.
2The group climate in the termination stage was not assessed in this study (see
Measures and Procedure chapter). Thus, we expected avoidance to develop as stated in
hypothesis (c) and as shown in figure 1.
3Kivlighan and Lilly’s (1997) mean scores from midtreatment are provided as gamma
estimates.

31 GROUP CLIMATE DEVELOPMENT
Table 1
Mean scores of the Social Phobia and Anxiety Inventory (social phobia subscale) at
pretreatment, midtreatment and posttreatment, and effect sizes
Condition Pretreatment Midtreatment Posttreatment ES
M SD M SD M SD
RCT
132.17
23.41
119.26
27.98
108.91
35.25
0.76
RIPT 137.55 27.28 122.14 29.01 113.95 33.21 0.77
Total sample 134.86 25.40 120.70 28.35 111.42 34.11 0.76
Note: Effect size is computed by the formula, d = tc [2(1-r)/n]1/2
based on the mean of change
from pre- to posttreatment.

32 GROUP CLIMATE DEVELOPMENT
Table 2
Fixed Effect Estimates (Top) and Variance-Covariance Estimates (Bottom) for Models of the
Predictors of Engagement
Note: Hierarchical stepwise analysis showing fixed and random effects, with corresponding
standard errors in parentheses, indicating linear (time) and quadratic (time2) patterns of
engagement. Significant interactions between pattern and condition indicate different
developmental patterns for the two treatments. The random parameters are variance of
intercept for patient nested within treatment group (intercept), variance of intercept for
treatment group (treatment group), variance of scores at each time point (timej/timej), and
covariance between scores at adjacent time points (timej/timej + 1). * p < .05.
Parameter Model 1 Model 2 Model 3 Model 4
Fixed effects
Intercept 3.12* (0.20) 3.11* (0.19) 3.04* (0.20) 3.04* (0.21)
Condition -0.31 (0.29) -0.27 (0.27) -0.27 (0.28) -0.27 (0.29)
Time 0.03 (0.04) -0.18* (0.05) -0.18* (0.05) -0.18* (0.05)
Condition × Time 0.44* (0.07) 0.44* (0.07) 0.44* (0.07)
Time2
0.05 (0.04) 0.05 (0.06)
Condition × Time2
-0.00 (0.08)
Random parameters
Intercept 0.13 (0.09) 0.24* (0.07) 0.24* (0.07) 0.24* (0.07)
Treatment group 0.16 (0.10) 0.14 (0.09) 0.14 (0.09) 0.14 (0.10)
Timej/timej 0.60* (0.09) 0.44* (0.05) 0.44* (0.05) 0.44* (0.05)
Timej/timej + 1 0.20 (0.13) -0.02 (0.12) -0.03 (0.12) -0.03 (0.12)
33 GROUP CLIMATE DEVELOPMENT
Table 3
Fixed Effect Estimates (Top) and Variance-Covariance Estimates (Bottom) for Models of the
Predictors of Conflict
Note: Hierarchical stepwise analysis showing fixed and random effects, with corresponding
standard errors in parentheses, indicating linear (time) and quadratic (time2) patterns of
conflict. Significant interactions between pattern and condition indicate different
developmental patterns for the two treatments. The random parameters are variance of
intercept for patient nested within treatment group (intercept), variance of intercept for
treatment group (treatment group), variance of scores at each time point (timej/timej), and
covariance between scores at adjacent time points (timej/timej + 1). * p < .05.
Parameter Model 1 Model 2 Model 3 Model 4
Fixed effects
Intercept 0.77* (0.20) 0.77* (0.20) 0.78* (0.22) 0.90* (0.23)
Condition -0.09 (0.29) -0.08 (0.29) -0.08 (0.29) -0.32 (0.32)
Time 0.09 (0.05) 0.02 (0.07) 0.02 (0.07) 0.02 (0.07)
Condition × Time 0.16 (0.10) 0.16 (0.10) 0.16 (0.10)
Time2
-0.01 (0.06) -0.10 (0.08)
Condition × Time2
0.18 (0.11)
Random parameters
Intercept 0.04 (0.08) 0.05 (0.08) 0.05 (0.08) 0.05 (0.07)
Treatment group 0.16 (0.10) 0.16 (0.10) 0.16 (0.10) 0.16 (0.10)
Timej/timej 0.89* (0.11) 0.87* (0.10) 0.88* (0.10) 0.87* (0.10)
Timej/timej + 1 0.09 (0.11) 0.07 (0.11) 0.07 (0.11) 0.07 (0.11)

34 GROUP CLIMATE DEVELOPMENT
Table 4
Fixed Effect Estimates (Top) and Variance-Covariance Estimates (Bottom) for Models of the
Predictors of Avoidance
Note: Hierarchical stepwise analysis showing fixed and random effects, with corresponding
standard errors in parentheses, indicating linear (time) and quadratic (time2) patterns of
avoidance. Significant interactions between pattern and condition indicate different
developmental patterns for the two treatments. The random parameters are variance of
intercept for patient nested within treatment group (intercept), variance of intercept for
treatment group (treatment group), variance of scores at each time point (timej/timej), and
covariance between scores at adjacent time points (timej/timej + 1). * p < .05.
Parameter Model 1 Model 2 Model 3 Model 4
Fixed effects
Intercept 2.45* (0.14) 2.45* (0.14) 2.35* (0.15) 2.37* (0.16)
Condition 0.05 (0.20) 0.04 (0.20) 0.04 (0.20) -0.00 (0.22)
Time -0.06 (0.04) -0.02 (0.05) -0.02 (0.05) -0.02 (0.05)
Condition × Time -0.08 (0.07) -0.07 (0.07) -0.07 (0.07)
Time2
0.07 (0.04) 0.06 (0.05)
Condition × Time2
0.03 (0.08)
Random parameters
Intercept 0.25* (0.08) 0.25* (0.08) 0.25* (0.08) 0.25* (0.08)
Treatment group 0.05 (0.05) 0.05 (0.05) 0.05 (0.05) 0.05 (0.05)
Timej/timej 0.44* (0.06) 0.44* (0.06) 0.43* (0.06) 0.44* (0.06)
Timej/timej + 1 0.12 (0.12) 0.13 (0.12) 0.13 (0.12) 0.13 (0.12)

35 GROUP CLIMATE DEVELOPMENT
Table 5
Intraclass Correlations (ICC) for the Group Climate Scales
Measurement GCQ Scale RCT RIPT Total
1 Engagement 0.28 0.21 0.41
Conflict 0.08 0.73 0.40
Avoidance 0.05 0.02 0.03
2 Engagement 0.35 -0.03 0.22
Conflict 0.25 0.73 0.66
Avoidance 0.42 -0.09 0.19
3 Engagement 0.00 0.05 0.01
Conflict 0.01 0.41 0.11
Avoidance 0.15 0.06 0.10
4 Engagement 0.45 -0.03 0.33
Conflict 0.06 0.33 0.09
Avoidance 0.24 0.01 0.14
Note: The intraclass correlations indicating homogeneity of scores are derived from one-way
analysis of variance (ANOVA), where the independent variable was treatment group. The
intraclass correlations were computed by the formula: ICC = (BMS-WMS) / BMS + (k - 1)

36 GROUP CLIMATE DEVELOPMENT
WMS, where BMS is the between groups mean square, WHS is the within group mean
square, and k is the number of participants in the group.

37 GROUP CLIMATE DEVELOPMENT
Table 6
Social Phobia and Anxiety Inventory Scores predicted by the Group Climate
Predictor Coefficient
Block 1 Block 2 Block 3
r2 β t β t β t
SPAI admission .27 .52 5.24** .53 5.52** .52 5.41**
Engagement .32 -.24 -2.48* -.00 -.01
Condition .34 .47 1.00
Condition × Engagement -.52 -.88
SPAI admission .27 .52 5.24** .52 5.15** .51 4.99**
Conflict .27 .02 .15 .21 .63
Condition .27 .08 .53
Condition × Conflict -.22 -.62
SPAI admission .27 .52 5.24** .48 4.80** .48 4.62**
Avoidance .29 .15 1.43 .24 .77
Condition .29 .14 .35
Condition × Avoidance -.15 -.31
Note: Multiple regression analyses with the individuals’ mean levels of engagement, conflict,
and avoidance across the four time points used as predictors of change in anxiety (SPAI-SP
scores) during treatment, controlling for pretreatment level of anxiety. The table presents
variance in outcome explained by the models (r2), standardized beta weights (β), and t-values.
** p < 0.001, * p < 0.05.

38 GROUP CLIMATE DEVELOPMENT
Figure 1. The hypothesized development of engagement, conflict, and avoidance during group
therapy
Figure 1. Based on group development theory (MacKenzie, 1990) we expected engagement
to increase in a high-low-high pattern, conflict to increase in a low-high-low pattern, and
avoidance to decrease in a low-high-low pattern.
Time
En
ga
ge
me
nt
Time
Co
nflic
t
Time
Avo
ida
nce

39 GROUP CLIMATE DEVELOPMENT
Figure 2. Group Climate Development in Group Therapy for Social Phobia
Figure 2. Engagement followed opposite linear patterns in RCT and RIPT. For both
treatments, the additional analysis revealed a low-high-low pattern of conflict, whereas no
pattern of avoidance was found.
2,4
2,6
2,8
3
3,2
3,4
3,6
T1 T2 T3 T4
RIPT RCT
0,2
0,4
0,6
0,8
1
1,2
1,4
T1 T2 T3 T4
RIPT RCT
2
2,2
2,4
2,6
2,8
3
3,2
T1 T2 T3 T4
RIPT RCT
Engag
emen
t C
onfl
ict
Avoidance
Avoid
ance