groff et al (2013) exploring the relationship between foot and car patrol in violent crime areas.pdf
TRANSCRIPT

Exploring the relationshipbetween foot and car patrol
in violent crime areasElizabeth R. Groff, Lallen Johnson,
Jerry H. Ratcliffe and Jennifer WoodDepartment of Criminal Justice, Temple University,
Philadelphia, Pennsylvania, USA
Abstract
Purpose – The purpose of this paper is to describe how the Philadelphia Police Department instituteda large-scale randomized controlled trial of foot patrol as a policing strategy and experienced 23percent fewer violent crimes during the treatment period. The authors examine whether activitiespatrol officers were conducting might have produced the crime reduction. The activities of foot andcar patrol officers research takes a closer look at what types are examined separately and differences
between car patrol activities pre-intervention and during the intervention are explored. Activities offoot versus car patrol officers during the study period are compared across treatment and control areas.Design/methodology/approach – Official data on police officer activity are used to compareactivities conducted by foot patrol officers with those by car patrol officers in 60 treatment (foot beat)and 60 control areas consisting of violent crime hot spots. Activities of car patrol officers are describedpre-intervention and during the intervention. Foot patrol officers’ activities are described withintreatment and control areas during the treatment phase of the experiment. Car patrol officers’ activitiesare reported separately. The statistical significance of changes in car patrol activity pre and duringintervention is evaluated using a series of mixed model ANOVAs.Findings – There were noticeable differences in the activities conducted by foot and car patrol. Footpatrol officers spent most of their time initiating pedestrian stops and addressing disorder incidents,while car patrol officers handled the vast majority of reported crime incidents. Car patrol activitydeclined in both treatment and control areas during the intervention but there was no statisticallysignificant difference between the treatment and the control areas.Research limitations/implications – The major limitation of this study is the restricted set of datadescribing officer activity that is captured by official records. Future studies should include a more robustethnographic component to better understand the broad spectrum of police activity in order to moreeffectively gauge the ways in which foot patrol and car-based officers’ activities interact to addresscommunity safety. This understanding can help extend the literature on “co-production” by highlightingthe safety partnerships that may develop organically across individual units within a police organization.Practical implications – The study provides evidence that individual policing strategiesundertaken by agencies impact one another. When implementing and evaluating new programs, itwould be beneficial for police managers and researchers to consider the impact on activities of thedominant patrol style, as necessary, to understand how a specific intervention might have achieved itsgoal or why it might have failed to show an effect.Originality/value – The research contributes to the understanding of the separate and joint effects of footand car patrol on crime. In addition, it provides police managers with a clearer picture of the ways in whichfoot patrol police and car-based officers work to co-produce community safety in violent inner-city areas.
Keywords United States of America, Policing, Violent crime, Policing strategies, Cities,Foot patrol, Car patrol, Randomized controlled experiment, Police activity
Paper type Research paper
But in our view, [y] the citizens of Newark [y] knew what the foot patrol officers were doing,they knew it was different from what motorized officers do, and they knew that having officerswalk beats did in fact make their neighborhoods safer (Wilson and Kelling, 1982, p. 29).
The current issue and full text archive of this journal is available atwww.emeraldinsight.com/1363-951X.htm
Received 25 May 2011Revised 6 November 2011
29 January 2012Accepted 6 February 2012
Policing: An International Journal ofPolice Strategies & Management
Vol. 36 No. 1, 2013pp. 119-139
r Emerald Group Publishing Limited1363-951X
DOI 10.1108/13639511311302506
119
Patrol in violentcrime areas
1. IntroductionThroughout the history of American policing, the idea of foot patrol has swung inand out of popularity (Rosenbaum et al., 1994). In the late 1960s, The President’sCommission on Law Enforcement and Administration of Justice heavily promotedcommunity policing programs (prominently featuring foot patrol) as a method foraddressing the nation’s crime problems (Greene, 1987). However, the expectedreduction in crime from foot patrol did not materialize (Esbensen, 1987; Pate, 1986),at least not before the recent Philadelphia foot patrol experiment (PFPE) whichfound a 23 percent reduction in crime in foot patrol areas as compared to controlareas (Ratcliffe et al., 2011).
The PFPE is one of the few studies of foot patrol which documented successfulcrime reduction. Thus, the finding is unusual enough to warrant further investigation.Typical of randomized-controlled experiments, the PFPE provided a solid answer to“what worked” but nothing about “why it worked.” As part of the experimental designwe included several components aimed at trying to understand the “how” and “why”questions, i.e. to look inside the black box of the experiment. These included walk-alongs with foot patrol officers, focus groups, and an examination of foot and car patrolactivities via official incident data.
One important dimension concerns the activities of both foot and car police officersthat may have led to the crime reduction. During our field observations and focusgroups with police officers, we observed and heard that foot patrol officers did notoperate in isolation from the rest of the department. Car patrol officers wouldoccasionally lend a hand (bringing paperwork, taking someone to the station house,etc.), although not always. We started to wonder whether the treatment was the resultof a co-production relationship – that is, foot patrol did not yield this effect in isolation.Foot patrols are typically implemented as one component of an organization’s overallpolicing strategy; yet, when foot patrol is evaluated, car patrol officers working thesame area are usually not considered. In other words, little is done to understand howthe introduction of a foot patrol strategy might lead to the co-production of publicsafety by foot and car patrol officers working with one another as well as in concertwith the community. More broadly, our question is whether, and how, foot patrolactivities served to alter, and even re-calibrate car patrol activities.
This research explicitly puts foot patrol in context by separating and thencomparing the activities of foot patrol officers from those undertaken by car patrolofficers. The results of our examination contribute to our understanding of the separateand joint effects of foot and car patrol on crime. In addition, they provide policemanagers with a clearer picture of the ways in which foot patrol police and car-basedofficers might work with one another and with the public to co-produce communitysafety in violent inner-city areas. This information can be used to more effectivelydeploy foot and car patrol officers.
2. Overview of the PFPEThe PFPE developed when the Philadelphia police department (PPD) decided toaddress summer violence by assigning the graduates of its March and June 2009classes to foot patrol beats (Ratcliffe et al., 2011). The first step was to identify potentialareas for foot beats. Three years (2006-2008) of violent incident data were weightedsuch that later incidents counted more than prior ones and aggregated to polygonsconstructed around every intersection in the city[1]. Police commanders workedwith researchers to create areas feasible for foot patrol from the highest weighted score
120
PIJPSM36,1

intersections. From these, the 120 highest violent crime areas were retained for thestudy. A randomized block design was used to assign the 120 areas to treatment (addedfoot patrol) and control (business as usual/car patrol) conditions[2].
Treatment areas (i.e. the ones assigned foot patrol officers) were patrolled bytwo pairs of officers over two staggered 12-week-evaluation periods. Officers receiveda one-week orientation around their foot beat, and then were shadowed by anexperienced officer on the beat for a couple of weeks. Officer pairs were initiallyassigned to the morning (10 a.m.-6 p.m.) or evening shift (6 p.m.-2 a.m.) which theypatrolled Tuesday through Saturday night. The pairs assigned to each beat alternatedbetween morning and evening shifts every two weeks. As a result, treatment areaswere not patrolled from 2 a.m. to 10 a.m. each day, and from 2 a.m. Sunday through10 a.m. Tuesday every week. Considering the timeframe of both phases, it wasestimated that 57,000 hours of foot patrol activity would take place. District captainswere responsible for staffing foot beats and ensuring that they were fully operationalover the study period. Foot beat officers were given an intelligence brief about their footpatrol area by the criminal intelligence unit, in addition to whatever information theyacquired during the orientation period. Officers were not formally instructed onappropriate policing styles from police headquarters.
The results of the experiment indicated violent crime hotspots that received footpatrol had a reduction in violence of about 23 percent as compared to the controlhotspots. This translates to a total crime reduction in the target areas of 90 violentcrimes. During the same time period there was an increase of 37 violent crimes in thedisplacement areas leaving a total net effect of 53 violent crimes prevented.
The goal of the original experiment was to identify whether foot patrol reducedviolent crime. The original study did not attempt to separate the activities of foot patrolofficers from those of car patrol officers. Additionally, the original study did notattempt to examine the time periods when foot patrol officers were on patrol, butfocussed on officer activity and criminal activity which occurred at any time during thetreatment period. This is important because if it was the case that foot patrol officerswere temporally displacing crime, the finding of a 23 percent reduction in violent crimeover the entire period may be a conservative measure compared to one which considersonly the times during which the officers were on duty. By separating the activities offoot patrol officers from those done by car patrol officers, and temporally limiting themeasures of crime and officer activity, the current study is able to directly measureofficer activity by the type of patrol and examine the effect of foot patrol on theactivities of car patrol officers in the same areas.
3. The relationship of foot and car patrol to crimeThere are several explanations which provide the basis for understanding how theactivities of foot patrol and car patrol might work both individually and jointly toreduce crime. Deterrence is the simplest and most direct mechanism for crimereduction. In addition, the emphasis on co-production of community safety inherent inboth community policing and broken windows policing is salient to understandinghow the police reduce crime.
Deterrence is the basic mechanism underlying the connection between increasedpolice presence and reductions in crime. According to classical theorists such asBeccaria (1764/1963) and Bentham (1789/1948), potential offenders weigh the potentialcosts against potential benefits when deciding whether or not to commit crime.As rational beings, people will engage in crime if the benefits exceed the potential costs
121
Patrol in violentcrime areas
associated with the act. Thus, deterrence theorists argue the state can adjust thelikelihood of someone engaging in crime by altering the costs. Three costs which are ofcritical importance include the swiftness by which punishment for criminal acts isadministered, the certainty that the behavior will be discovered, and the severity of thesanction (Nagin and Pogarsky, 2001). Patrol officers, whether on foot or in cars,represent tangible evidence of increased certainty that criminal behavior will bedetected. Given the immediacy of foot patrol officers in an environment, it follows thatthe offending public might be more deterred by the increased presence of foot patrolofficers than officers in cars.
The co-production of community safety literature as currently framed centers on policeand communities working in partnership (Innes and Roberts, 2008; Ostrom and Gordon,1973). Put simply, it explicitly recognizes the necessity of the role of citizens, thecommunity, police, and other city agencies in achieving public safety. Various policingstrategies incorporate elements of co-production such as broken windows policing(Kelling and Coles, 1996; Sousa and Kelling, 2006; Wilson and Kelling, 1982), communitypolicing (Skogan, 1995, 2006, 2008), third-party policing (Mazerolle et al., 1998),reassurance policing (Innes and Roberts, 2008), and problem-oriented policing (Eck andSpelman, 1987; Goldstein, 1990). They differ on the degree to which the community(including residents, business owners, organizations, and users) is expected to play anactive role in co-production (Innes and Roberts, 2008). We focus our discussion on the twomost salient to foot patrol in the PFPE, community policing and broken windows policing.
Although community policing is at its core an organizational strategy, some of itsprinciples were evident in the activities of foot patrol officers. Community policingencompasses four principles: first, a reorientation toward communication with membersof the public that goes both ways; second, a dedication to problem solving; third, acommitment to addressing the concerns expressed by the community; and finally, adedication to employing non-law enforcement resources to solve problems (Skogan, 1995,p. 87). Foot patrol officers, because of their accessibility, can easily become the conduits for“two-way communication between police and the public” (Skogan, 1995, p. 87).
Broken windows policing emphasizes the role foot patrol officers can play inestablishing a minimum level of order (Wilson and Kelling, 1982). Speaking about theNewark foot patrol experiment, Wilson and Kelling (1982, p. 30) note “[w]hat foot-patrol officers did was to elevate, to the extent they could, the level of public order inthese neighborhoods. Though the neighborhoods were predominantly black and thefoot patrolmen were mostly white, this ‘order-maintenance’ function of the police wasperformed to the general satisfaction of both parties.” They outline how foot patrolofficers were able to negotiate order by establishing rules that “were defined andenforced in collaboration with the ‘regulars’ on the street” (Wilson and Kelling, 1982,p. 30). They saw foot patrol as establishing the basic threshold of order upon whichresidents and business owners could build. In this way, the policing component ofbroken windows theory views police officers as co-producing public safety with thepublic. Our observations suggested there were co-production dynamics at work withinthe police department as well as between the police and the community, i.e. differentofficers with different roles complementing each other’s activities to jointly produce theobserved crime reduction effect in Philadelphia.
4. Activities of foot and car patrol officersThe relative merits of car patrol vs foot patrol are widely recognized. In Newark,officers often noted foot patrol “was hard work, it kept them outside on cold, rainy
122
PIJPSM36,1

nights, and it reduced their chances for making a ‘good pinch.’ In some departments,assigning officers to foot patrol had been used as a form of punishment” (Wilson andKelling, 1982, p. 29). At the same time, car patrol officers often resent foot patrolbecause the limited mobility of foot patrol reduces the number of officers available toanswer calls for service. But little is known about how the two different roles mightwork together to jointly reduce crime in foot patrol areas.
We could identify only one study, conducted by Payne and Trojanowicz (1985), thatexamined both foot and car patrol activities. In that case, the authors were focussed ondeveloping measures to evaluate officer performance. Even so, their findings haverelevance to the question of what types of activities are typically undertaken by foot vscar patrol officers. Using the officers’ daily report forms, they found that car patrolofficers conducted approximately six times the number of felony arrests and five timesthe amount of misdemeanor arrests as foot patrol officers. However, foot patrol officersconducted twice the number of investigations and seven times the number of publicservice activities as car patrol officers. It appeared that foot patrol officers were morelikely than their car patrol counterparts to interact with the public using what Payneand Trojanowicz (1985) described as a “non-adversarial” approach (public service,friendly interaction) while car patrol officers were more likely to take on “adversarial”roles (where a citizen is perceived as a threat and possibly arrested).
The above findings suggest that foot patrol officers emphasize different policingstyles and activities than their car patrol counterparts. Our goal here is to describe thetypes of activity undertaken by both foot and car patrol officers in Philadelphia as anempirical basis for theorizing how such styles and activities might work in tandem togenerate crime reduction benefits. The differences between foot and car patrol officersin the number and type of activities undertaken provide evidence to suggest that whentrying to interpret why foot patrol works as a dedicated intervention, car patrol may bean important component of the equation. Empirically, it was assumed in both thedesign and evaluation of the PFPE that the amount of car patrol activity experiencedby the experimental areas would be essentially unbiased across treatment andcontrol groups. Was that an accurate assumption? Specifically, we ask two empiricalquestions. First, did the activities of foot patrol officers substantially differ from theirvehicle-based colleagues? Second, did the amount of car patrol received vary betweentreatment and control beats in the pretreatment period (i.e. prior to the implementationof foot patrol) and during the treatment period (i.e. while foot patrol officers were onduty)? We also examine how the co-production of community safety literature might beconceptually extended to include contributions by different roles within the policedepartment such as foot and motor patrol.
5. Analytical approachThis research takes advantage of the deployment of foot patrol during the PFPE(Ratcliffe et al., 2011) to more closely examine the activities of both foot and car patrolofficers. To explore potential relationships between foot and car patrol tactics weextracted crime incident data from the PPD’s incident database (INCT). Data includedviolent, burglary, theft, vehicle, disorder, firearm, and drug offenses. In addition, thedata included information on the circumstances under which incidents were discovered(e.g. in the course of conducting a pedestrian stop, or issuing a traffic violation).
All incidents were geocoded using XY coordinates provided by the policedepartment. We focussed only on the time periods when foot patrol was operational.Excluded from this analysis were incidents occurring from 2 a.m. to 10 a.m. each day,
123
Patrol in violentcrime areas

and from 2 a.m. Sunday through 10 a.m. Tuesday every week. The original PFPEstudy examined all crime that occurred during the pre-treatment and treatmentperiods regardless of time or day of week. By including only the incidents occurringwhen foot patrol officers were on duty, we restrict our measures to only the timeperiods when the incident could have been addressed by foot patrol officers.The strategy also allows the activities undertaken during the time periods whenboth foot and car patrols were on duty to be isolated from activity occurring at othertimes but in the target areas.
Since foot patrol officers graduated from two different classes of the police academy(within the same year), they were assigned to foot patrol in two phases. Phase 1 footbeats began on March 31, 2009 with 24-foot beats and lasted through September26. Phase 2 began on July 7, 2009, included 26 beats, and also terminated onSeptember 26. In keeping with the original analysis of PFPE, we compare the threemonths of each phase (the intervention period) with the three months immediatelypreceding each phase (pre-intervention period)[3].
There is some potential for measurement error on several fronts when using officialdata. For example, the incident dataset only includes cases deemed serious enough forpolice officers to have an interaction with the dispatcher (e.g. assignment to a call,requesting an individual’s identity be checked, filling out a crime report, etc.).Therefore, informal interactions with citizens are not represented in these data.Informal interactions are likely to represent a larger percentage of foot patrol than carpatrol officers’ activity. An additional drawback is that property crimes are loggedwhen reported and represent the time of discovery rather than the time the eventoccurred. This makes it impossible to say with certainty whether the crime occurredwhile foot patrol officers were on duty.
5.1 Identification of incidents addressed by foot patrol and car patrol officersWhen officers report to duty to begin their shift, each officer is assigned anidentification number (or call sign) and these were used to distinguish between footand car patrol officers. Call signs are attributed to every incident in the dataset,allowing us to parcel out whether two-foot patrol officers or a car unit provided theprimary response. We were provided with the call signs used by foot patrol officersduring the experiment. Using this information, a dummy variable was created withinthe dataset indicating whether an incident was addressed by a foot patrol officer ora car unit. This technique allows us to separate the activities of foot patrol officers fromthose of car patrol officers[4].
A geographic information system was used to identify foot patrol and car patrolincidents taking place within control and treatment areas. Counts of violent, burglary,theft, vehicle, disorder, firearm, and drug offenses were then aggregated to the areasin which they occurred. Nature code indicators (where the police department record acode representing the original nature of the incident) of pedestrian stops and trafficviolations were also aggregated to treatment and control areas.
Descriptive statistics were used to paint a picture of the activities of foot patrol andcar patrol officers within foot patrol areas, during the treatment phase of theexperiment and answer the question of whether the activities of foot patrol officersdiffered substantially from the vehicle-based counterparts in the same areas. A centralaim of this research is to determine whether the addition of foot patrol led to asignificant change in the types of activity undertaken by car patrol or to a reduction ofcar patrol activity within foot patrol areas. To this end, we employed a series of mixed
124
PIJPSM36,1
model ANOVAs. The mixed model design, allows for the analysis of change over time,across a number of cases within multiple groups (Meyers et al., 2006).
6. Results6.1 How do the activities of foot patrol differ from car patrol?To answer the question of whether the activities of foot patrol and car patrol officersdiffer, we first describe them separately and then compare them.
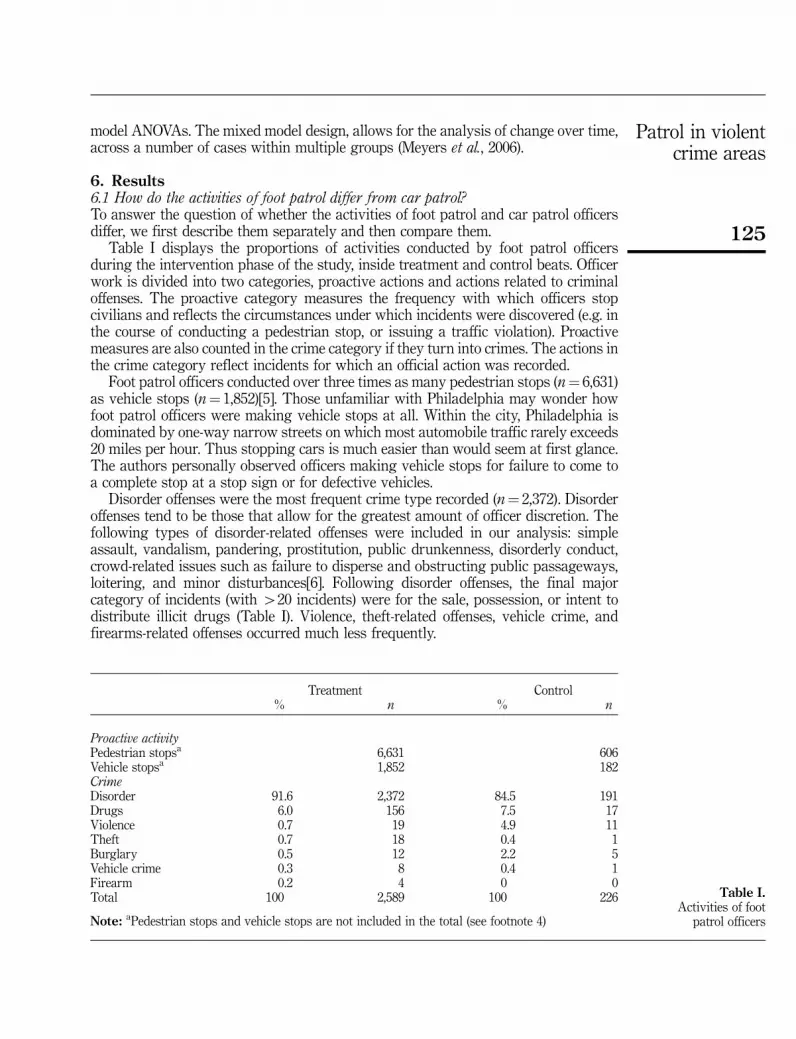
Table I displays the proportions of activities conducted by foot patrol officersduring the intervention phase of the study, inside treatment and control beats. Officerwork is divided into two categories, proactive actions and actions related to criminaloffenses. The proactive category measures the frequency with which officers stopcivilians and reflects the circumstances under which incidents were discovered (e.g. inthe course of conducting a pedestrian stop, or issuing a traffic violation). Proactivemeasures are also counted in the crime category if they turn into crimes. The actions inthe crime category reflect incidents for which an official action was recorded.
Foot patrol officers conducted over three times as many pedestrian stops (n¼ 6,631)as vehicle stops (n¼ 1,852)[5]. Those unfamiliar with Philadelphia may wonder howfoot patrol officers were making vehicle stops at all. Within the city, Philadelphia isdominated by one-way narrow streets on which most automobile traffic rarely exceeds20 miles per hour. Thus stopping cars is much easier than would seem at first glance.The authors personally observed officers making vehicle stops for failure to come toa complete stop at a stop sign or for defective vehicles.
Disorder offenses were the most frequent crime type recorded (n¼ 2,372). Disorderoffenses tend to be those that allow for the greatest amount of officer discretion. Thefollowing types of disorder-related offenses were included in our analysis: simpleassault, vandalism, pandering, prostitution, public drunkenness, disorderly conduct,crowd-related issues such as failure to disperse and obstructing public passageways,loitering, and minor disturbances[6]. Following disorder offenses, the final majorcategory of incidents (with 420 incidents) were for the sale, possession, or intent todistribute illicit drugs (Table I). Violence, theft-related offenses, vehicle crime, andfirearms-related offenses occurred much less frequently.
Treatment Control% n % n
Proactive activityPedestrian stopsa 6,631 606Vehicle stopsa 1,852 182CrimeDisorder 91.6 2,372 84.5 191Drugs 6.0 156 7.5 17Violence 0.7 19 4.9 11Theft 0.7 18 0.4 1Burglary 0.5 12 2.2 5Vehicle crime 0.3 8 0.4 1Firearm 0.2 4 0 0Total 100 2,589 100 226
Note: aPedestrian stops and vehicle stops are not included in the total (see footnote 4)
Table I.Activities of foot
patrol officers
125
Patrol in violentcrime areas
Table I includes foot patrol actions within the control area to provide a check onwhether foot patrol officers were working in control areas. Although foot patrol officerswere instructed to spend most of their time in assigned treatment areas, our primaryobservations indicated they sometimes expanded the boundaries by a couple of blocks.In occasional cases where treatment beats and control beats were geographicallyproximal, expanding the boundaries by even a couple of blocks would have thembriefly patrolling in a control site. To quantify the extent of contamination, we reportthe activity of foot patrol officers in control areas as well as treatment areas. We findevidence of activity by foot patrol officers in control beats but it was relativelyinfrequent, accounting for only 8 percent of all foot patrol officer activity. Withincontrol areas, the highest volume of activity was related to pedestrian stops followedby disorder offenses, vehicle stops, and drug offenses. When foot patrol officersconducted activities in control areas they were more likely to handle a violent crimeincident, which suggests that officers may have been responding to calls for servicerelated to violent crime incidents.
Turning to car patrol activities, Table II displays the activity of car patrol officers byproactive actions and crime incidents within treatment and control beats. Because carpatrol officers were working before the experiment began and continued to workduring the intervention we were able to examine the pre-intervention and interventiontime periods for both treatment and control areas. The pre-intervention period providesa baseline for car patrol activities when no foot patrol was implemented. Of the twotypes of proactive actions we measured, pedestrian stops were once again the highestvolume activity but unlike foot patrol the second most frequent activity is vehiclestops. Crimes most frequently addressed were the same for car and foot patrol.Disorder offenses were the most frequently encountered crime category accounting forabout 78 percent of all crime-related officer activity and, similar to foot patrol, they faroutstrip other actions taken by car patrol officers. Drugs and violent crime incidentsaccount for another 16 percent of crime-related activity by car patrol officers. Theremaining 6 percent consists of vehicle crime, theft, burglary, and firearm violations.Car patrol proactive and crime-related activities in the control areas followed the samepattern as in the treatment areas. These findings are consistent with the experimentalframework in which control areas received “business as usual” policing.
6.2 What was the effect of foot patrol on car patrol activity types and volume?Now that we have a better sense of what foot patrol and car patrol officers do with theirtime, we turn to the question of whether the presence of foot patrol officers wasassociated with changes in the number or type of activity conducted by car patrolofficers working in the treatment areas. Table II displays counts of incidents addressedby car patrol officers within treatment and control areas before and during interventionas well as the relative percent change.
The left half of Table II compares the treatment beat’s pre-intervention level of carpatrol activity with activity after the foot patrols were initiated. While the foot patrolofficers were deployed, car patrol activity declined about 3 percent. Proactive activitiessuch as pedestrian and vehicle stops conducted by car patrol officers were only slightlyreduced (by 2 percent each in the treatment areas) between the pre-intervention andintervention periods. The relative proportions of crime-related activities changed verylittle but there were differences in the magnitude and direction of change by crimetype. For some crimes such as disorder, drugs, and violent crime, car patrol activitywent down. Most obvious are the proportional changes in violent crime responses
126
PIJPSM36,1

Tre
atm
ent
bea
tsC
ontr
olb
eats
Pre
-in
terv
enti
onIn
terv
enti
onP
re-i
nte
rven
tion
Inte
rven
tion
%n
%n
Rel
ativ
ech
ang
ein
trea
tmen
tar
eas
(%)
%n
%n
Rel
ativ
ech
ang
ein
con
trol
area
s(%
)
Pro
act
ive
act
ivit
yP
edes
tria
nst
opsa
6,79
16,
662
�1.
95,
888
4,40
2�
25.2
Veh
icle
stop
sa4,
826
4,73
1�
2.0
4,17
33,
499
�16
.2C
rim
eD
isor
der
77.8
2,79
579
.52,
758
�1.
379
.42,
885
77.5
2,52
1�
12.6
Dru
gs
10.2
365
9.4
326
�10
.78.
430
47.
925
8�
15.1
Vio
len
ce5.
620
23.
913
7�
32.2
4.8
174
5.0
162
�6.
9V
ehic
lecr
ime
2.3
812.
910
124
.73.
111
24.
013
117
.0T
hef
t1.
864
1.9
663.
12.
590
2.9
944.
4B
urg
lary
1.6
581.
656
�3.
41.
452
2.2
7034
.6V
UFA
/fir
earm
0.8
290.
726
�10
.30.
416
0.6
1918
.8T
otal
100.
03,
594
100.
03,
470
�3.
510
0.0
3,63
310
0.0
3,25
5�
10.4
Note
:aP
edes
tria
nst
ops
and
veh
icle
stop
sar
en
otin
clu
ded
inth
eto
tal
(see
foot
not
e4)
Table II.Activities of car
patrol officers
127
Patrol in violentcrime areas
by car patrol officers in treatment beats. For example, car patrol officers responded to32 percent fewer violent incidents within treatment beats from pre-interventionthrough the intervention phases. During the pre-intervention period 5.6 percent of allactivity was devoted to violent crime. That proportion declines to 3.9 percent duringthe intervention period.
For other crimes such as burglary and Violation of the Uniform Firearms Act(VUFA)/firearm, car patrol handled fewer reports within the treatment areas. Withintreatment beats, car patrol dealt with fewer burglaries (�3 percent). Car patrol officersexperienced a modest reduction in the number of firearm incidents they addressed overtime within treatment beats (�10 percent). On the other hand, the frequency of othercrime types to which car patrol officers responded in treatment beats such as vehiclecrimes and theft increased 25 and 3 percent, respectively. The differences suggest thatthe addition of foot patrol had some effect on the activities of car patrol officers (i.e. theyreduced the need for mobile officers to deal with more serious crimes but not lessserious ones and slightly reduced the proactive work of car patrol).
6.2.1 Treatment vs control area changes in car patrol activities. Because the PFPEwas a randomized-controlled experiment and we collected data describing policeactivity during the days and times foot patrol was on duty, we can use the control areasto identify any changes in car patrol activities not related to the presence of foot patrol.A dramatically different picture emerges when car patrol activities are examinedpre-intervention vs intervention period in the control areas. Car patrol activity overalldecreased 10.4 percent in the control areas as compared to pre-intervention levels.Pedestrian stops and vehicle stops by car patrol officers declined slightly in thetreatment areas once the intervention began but fell dramatically in the control areas(25.2 and 16.2 percent, respectively). This translates into an average of almost 25 fewerper week (about one half a pedestrian stop per beat per week). Vehicle stops decreasedby about 16 percent. Compared to part I and part II crimes, officers tend to have morediscretion over these types of activities. In other words, car patrol seemed to be cuttingback on self-initiated activities (i.e. those not assigned by a dispatcher) in the controlareas to a greater extent than in the areas where foot patrol officers were working[7].
Change in reported crime types handled by car patrol from pre-intervention tointervention in the control areas was mixed. Disorder offenses had the largestmagnitude decrease falling by 364 events (12.6 percent) but drug and violent offensesalso decreased (by 15 and 7 percent). It is worth noting that the number of responses toviolent crime handled by car patrol officers in control beats decreased by 12 eventspre-intervention to intervention. This result suggests there was less violence to addressin the control areas during the intervention period.
There were also significant contrasts between the activities of car patrol officers intreatment areas during the intervention period. In terms of proactive activity, car patrolofficers made 34 percent more pedestrian stops (6,662 vs 4,402) and 26 percent morevehicle stops (4,731 vs 3,499) in the treatment areas than in the control areas. Therewere also large differences in the types of crime addressed. Car patrol reported21 percent more drug-related incidents (326 vs 258), vehicle stops and 27 percent morefirearm offenses (26 vs 19) in treatments than in control beats. This demonstratesmore effort being expended by car patrol in treatment areas than in control areas.It may suggest that car patrol officers were targeting foot patrol areas – a possibilitythat will be explored in further detail in the discussion section.
When considering crime incident types pre-intervention vs intervention period inthe treatment beats vs the control areas, differences begin to emerge. For some crimes
128
PIJPSM36,1
such as disorder, drugs, and violent crime, car patrol activity went down in bothtreatment and control areas. For example, car patrol officers responded to 32 percent fewerviolent incidents within treatment beats from pre-intervention through the interventionphases, whereas the control beats experienced a much smaller decline of roughly7 percent. This lends additional support to findings by Ratcliffe et al. (2011) that footpatrol had a significant crime reduction effect on violent crime during the interventionperiod. In the case of drugs and violence, the drop in car patrol activity in the treatmentareas was higher than in the control areas. Before intervention, car patrol officersresponded to 365 drug incidents within foot patrol areas; however, that figure declined by11 percent during the intervention phase. Control areas experienced an even largerdecrease in drug incidents addressed by car officers of 15 percent. In contrast, car patrolofficers in both the treatment and control areas reported increases in both vehicle crimesand theft in the control beats vs the treatment beats during the intervention.
One of our original questions was whether foot patrol reduced car patrol effort in footpatrol areas. These findings reveal that was not the case; while the official activities ofcar patrol officers went down slightly, there was no evidence that instituting foot patrolin small areas caused car patrol officers to abandon those areas. In fact, there was aneven larger reduction of car patrol activity in the control areas, about 10 percent, frompre-intervention through intervention. It may be inaccurate to attribute the slightdecrease in the effort expended by car patrol to the efforts of foot patrol. It seems carpatrol was involved in fewer official actions in both the treatment and control areasduring the intervention period as compared to the pre-intervention period.
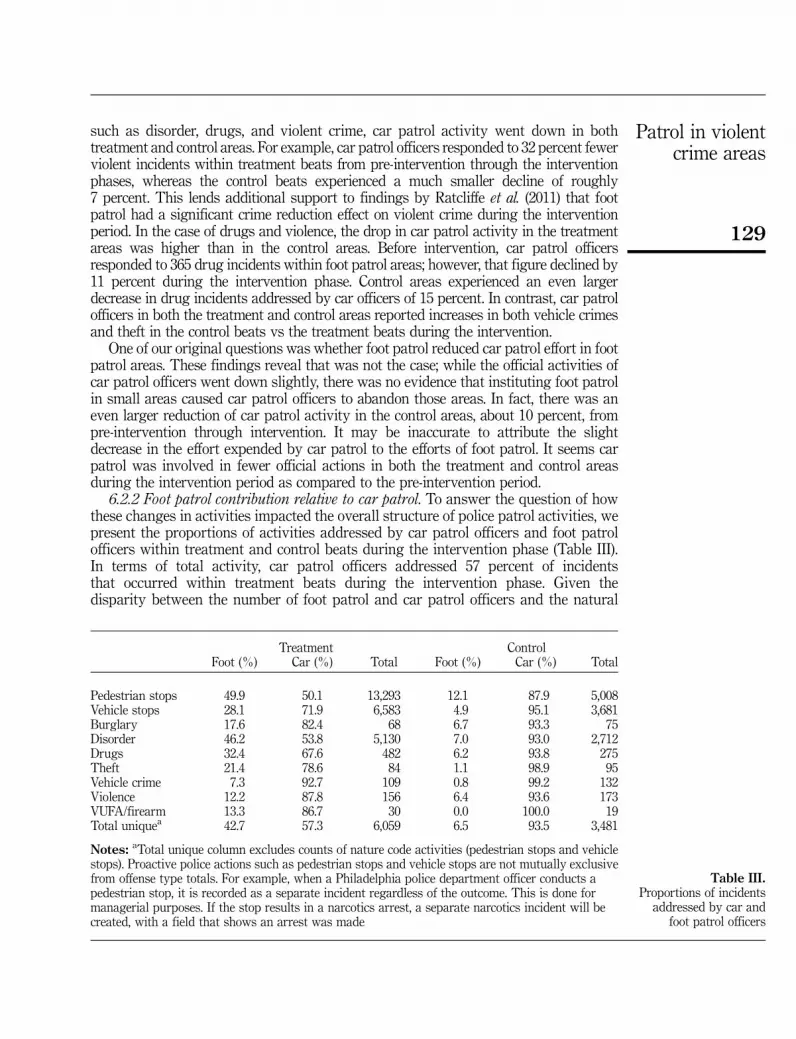
6.2.2 Foot patrol contribution relative to car patrol. To answer the question of howthese changes in activities impacted the overall structure of police patrol activities, wepresent the proportions of activities addressed by car patrol officers and foot patrolofficers within treatment and control beats during the intervention phase (Table III).In terms of total activity, car patrol officers addressed 57 percent of incidentsthat occurred within treatment beats during the intervention phase. Given thedisparity between the number of foot patrol and car patrol officers and the natural
Treatment ControlFoot (%) Car (%) Total Foot (%) Car (%) Total
Pedestrian stops 49.9 50.1 13,293 12.1 87.9 5,008Vehicle stops 28.1 71.9 6,583 4.9 95.1 3,681Burglary 17.6 82.4 68 6.7 93.3 75Disorder 46.2 53.8 5,130 7.0 93.0 2,712Drugs 32.4 67.6 482 6.2 93.8 275Theft 21.4 78.6 84 1.1 98.9 95Vehicle crime 7.3 92.7 109 0.8 99.2 132Violence 12.2 87.8 156 6.4 93.6 173VUFA/firearm 13.3 86.7 30 0.0 100.0 19Total uniquea 42.7 57.3 6,059 6.5 93.5 3,481
Notes: aTotal unique column excludes counts of nature code activities (pedestrian stops and vehiclestops). Proactive police actions such as pedestrian stops and vehicle stops are not mutually exclusivefrom offense type totals. For example, when a Philadelphia police department officer conducts apedestrian stop, it is recorded as a separate incident regardless of the outcome. This is done formanagerial purposes. If the stop results in a narcotics arrest, a separate narcotics incident will becreated, with a field that shows an arrest was made
Table III.Proportions of incidents
addressed by car andfoot patrol officers
129
Patrol in violentcrime areas
radio-response focus of car patrol, it is not surprising that across all categories ofcrime, disorder, and nature types, car patrol officers handled more incidents than theirfoot patrol counterparts[8].
Table III does suggest, however, that the above relationship varies by type ofincident. Foot patrol made significant contributions, initiating 50 percent of pedestrianstops and handling 46 percent of disorder offenses and 32 percent of drug offenses. Carpatrol officers continued to handle the lion’s share of vehicle stops (72 percent) andother reported offenses. For example, car patrol officers handled around 90 percentof firearms, violent incidents, and vehicle crimes, as well as about 82 percent ofburglaries, and 79 percent of thefts. This was expected since car patrol officers areofficially called radio response officers and assigned the overwhelming majority ofcalls for service received through the computer-aided dispatch system.
Table III also displays the proportions of foot and car patrol activity occurringwithin control beats. In theory, control beats were supposed to be patrolled by carpatrol officers, exclusively. Therefore, this section of the table provides some indicationof contamination effects – that is, the extent to which foot patrol officers compromisedthe construct validity of the experiment by patrolling in control beats. This appears tobe a minimal concern as only 8 percent of incidents were addressed by foot patrolofficers within control beats[9].
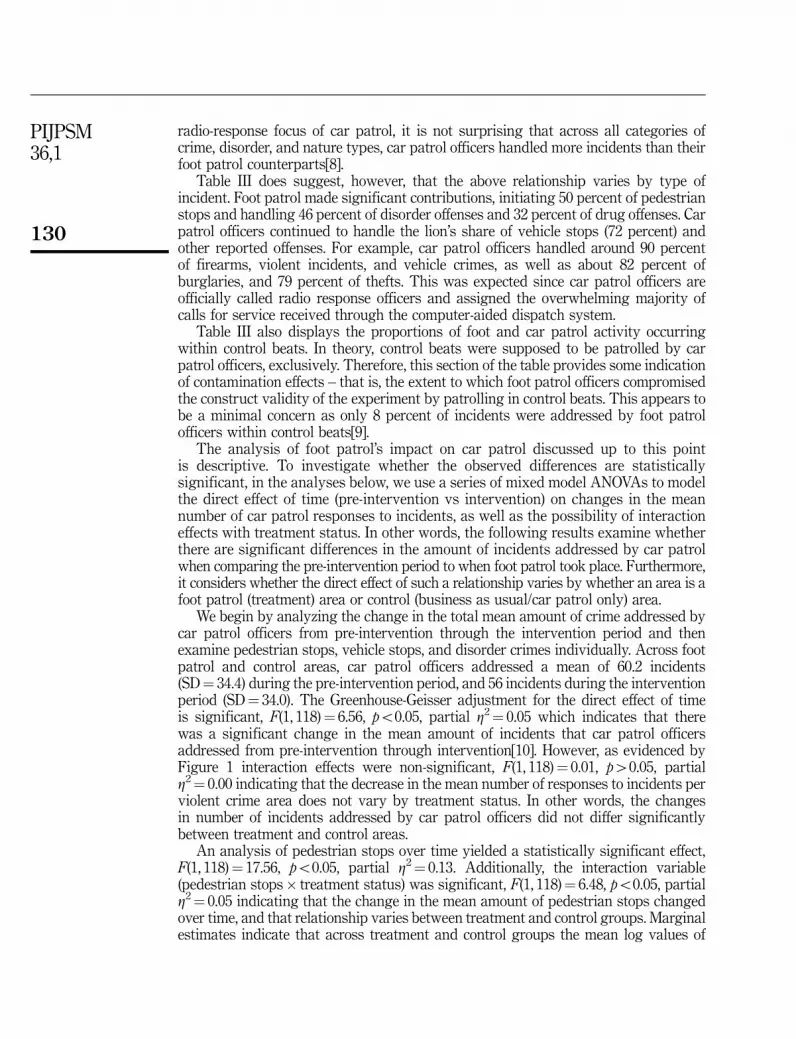
The analysis of foot patrol’s impact on car patrol discussed up to this pointis descriptive. To investigate whether the observed differences are statisticallysignificant, in the analyses below, we use a series of mixed model ANOVAs to modelthe direct effect of time (pre-intervention vs intervention) on changes in the meannumber of car patrol responses to incidents, as well as the possibility of interactioneffects with treatment status. In other words, the following results examine whetherthere are significant differences in the amount of incidents addressed by car patrolwhen comparing the pre-intervention period to when foot patrol took place. Furthermore,it considers whether the direct effect of such a relationship varies by whether an area is afoot patrol (treatment) area or control (business as usual/car patrol only) area.
We begin by analyzing the change in the total mean amount of crime addressed bycar patrol officers from pre-intervention through the intervention period and thenexamine pedestrian stops, vehicle stops, and disorder crimes individually. Across footpatrol and control areas, car patrol officers addressed a mean of 60.2 incidents(SD¼ 34.4) during the pre-intervention period, and 56 incidents during the interventionperiod (SD¼ 34.0). The Greenhouse-Geisser adjustment for the direct effect of timeis significant, F(1, 118)¼ 6.56, po0.05, partial Z2¼ 0.05 which indicates that therewas a significant change in the mean amount of incidents that car patrol officersaddressed from pre-intervention through intervention[10]. However, as evidenced byFigure 1 interaction effects were non-significant, F(1, 118)¼ 0.01, p40.05, partialZ2¼ 0.00 indicating that the decrease in the mean number of responses to incidents perviolent crime area does not vary by treatment status. In other words, the changesin number of incidents addressed by car patrol officers did not differ significantlybetween treatment and control areas.
An analysis of pedestrian stops over time yielded a statistically significant effect,F(1, 118)¼ 17.56, po0.05, partial Z2¼ 0.13. Additionally, the interaction variable(pedestrian stops� treatment status) was significant, F(1, 118)¼ 6.48, po0.05, partialZ2¼ 0.05 indicating that the change in the mean amount of pedestrian stops changedover time, and that relationship varies between treatment and control groups. Marginalestimates indicate that across treatment and control groups the mean log values of
130
PIJPSM36,1
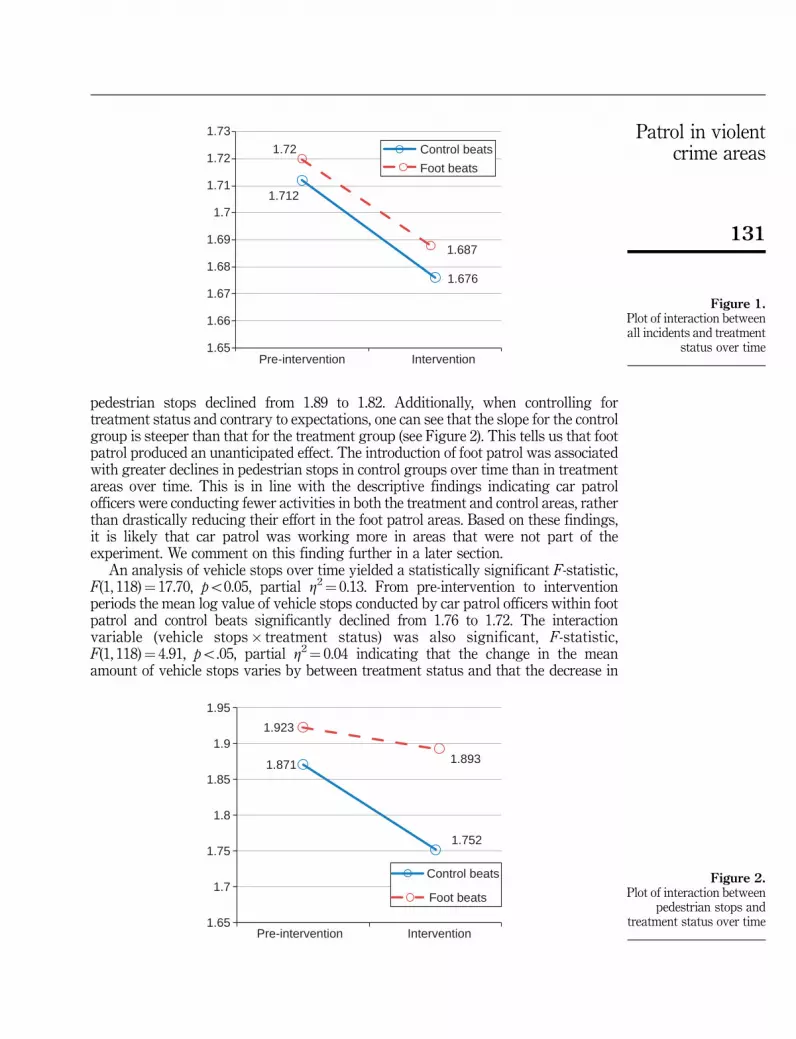
pedestrian stops declined from 1.89 to 1.82. Additionally, when controlling fortreatment status and contrary to expectations, one can see that the slope for the controlgroup is steeper than that for the treatment group (see Figure 2). This tells us that footpatrol produced an unanticipated effect. The introduction of foot patrol was associatedwith greater declines in pedestrian stops in control groups over time than in treatmentareas over time. This is in line with the descriptive findings indicating car patrolofficers were conducting fewer activities in both the treatment and control areas, ratherthan drastically reducing their effort in the foot patrol areas. Based on these findings,it is likely that car patrol was working more in areas that were not part of theexperiment. We comment on this finding further in a later section.
An analysis of vehicle stops over time yielded a statistically significant F-statistic,F(1, 118)¼ 17.70, po0.05, partial Z2¼ 0.13. From pre-intervention to interventionperiods the mean log value of vehicle stops conducted by car patrol officers within footpatrol and control beats significantly declined from 1.76 to 1.72. The interactionvariable (vehicle stops� treatment status) was also significant, F-statistic,F(1, 118)¼ 4.91, po.05, partial Z2¼ 0.04 indicating that the change in the meanamount of vehicle stops varies by between treatment status and that the decrease in
1.871
1.752
1.923
1.893
1.65
1.7
1.75
1.8
1.85
1.9
1.95
Pre-intervention Intervention
Control beats
Foot beats
Figure 2.Plot of interaction between
pedestrian stops andtreatment status over time
1.712
1.676
1.72
1.687
1.65
1.66
1.67
1.68
1.69
1.7
1.71
1.72
1.73
Pre-intervention Intervention
Control beats
Foot beats
Figure 1.Plot of interaction betweenall incidents and treatment
status over time
131
Patrol in violentcrime areas
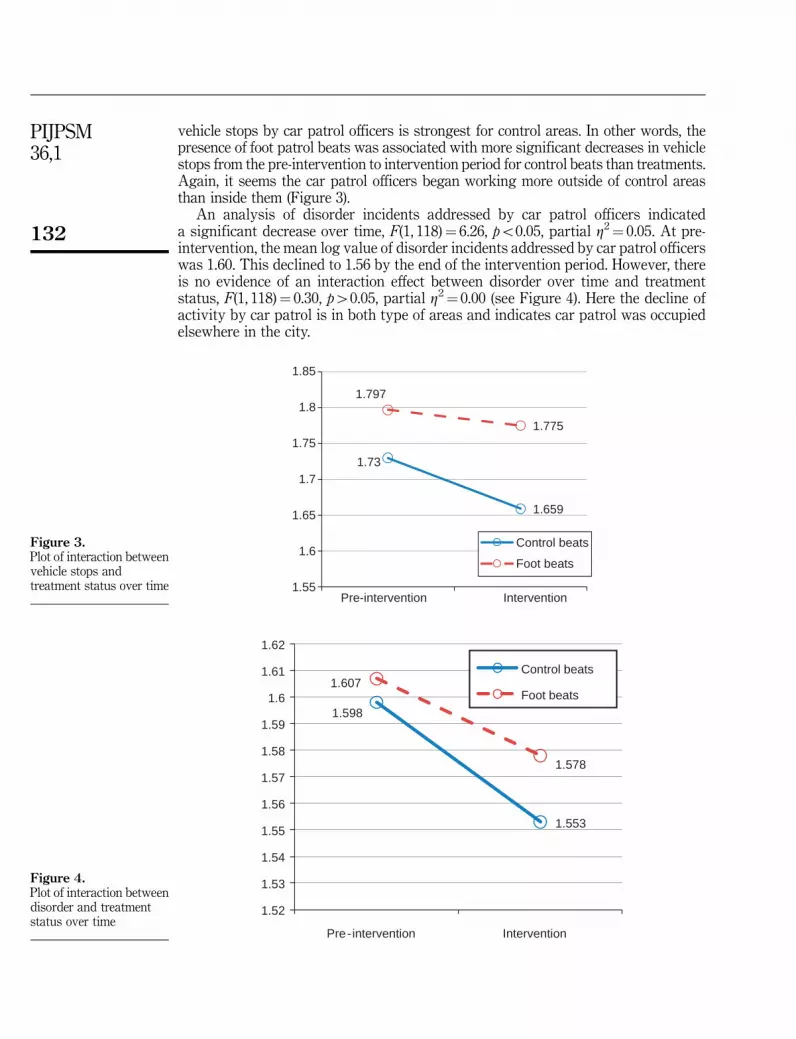
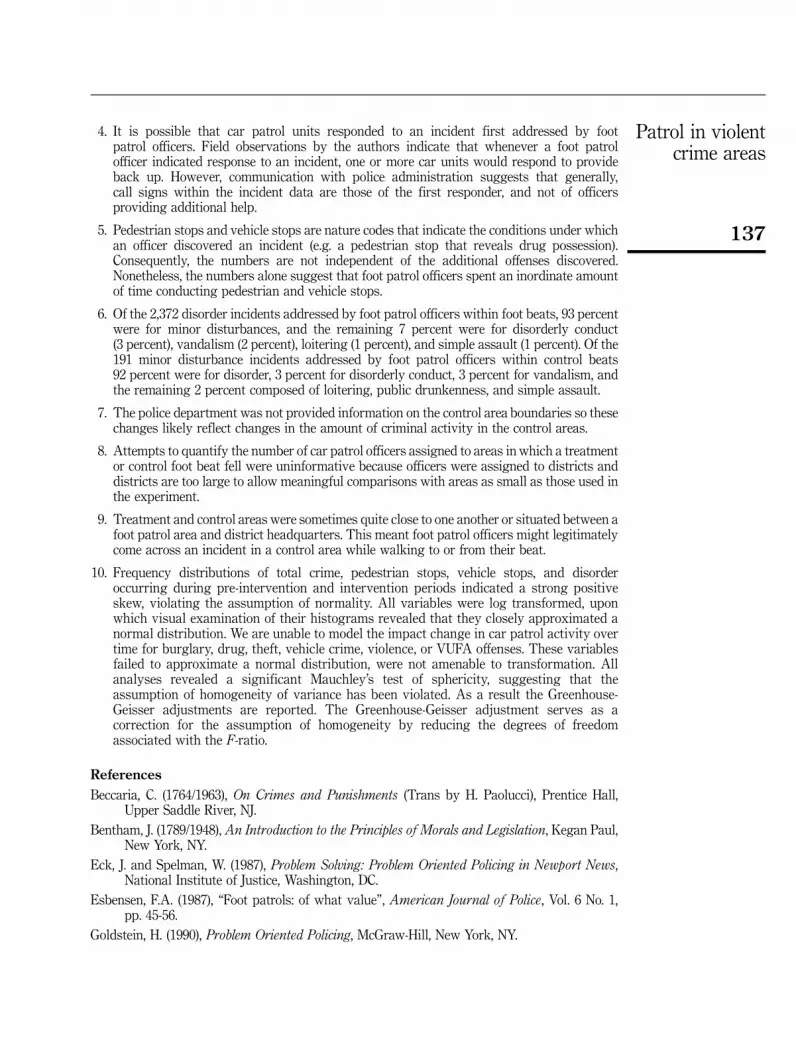
vehicle stops by car patrol officers is strongest for control areas. In other words, thepresence of foot patrol beats was associated with more significant decreases in vehiclestops from the pre-intervention to intervention period for control beats than treatments.Again, it seems the car patrol officers began working more outside of control areasthan inside them (Figure 3).
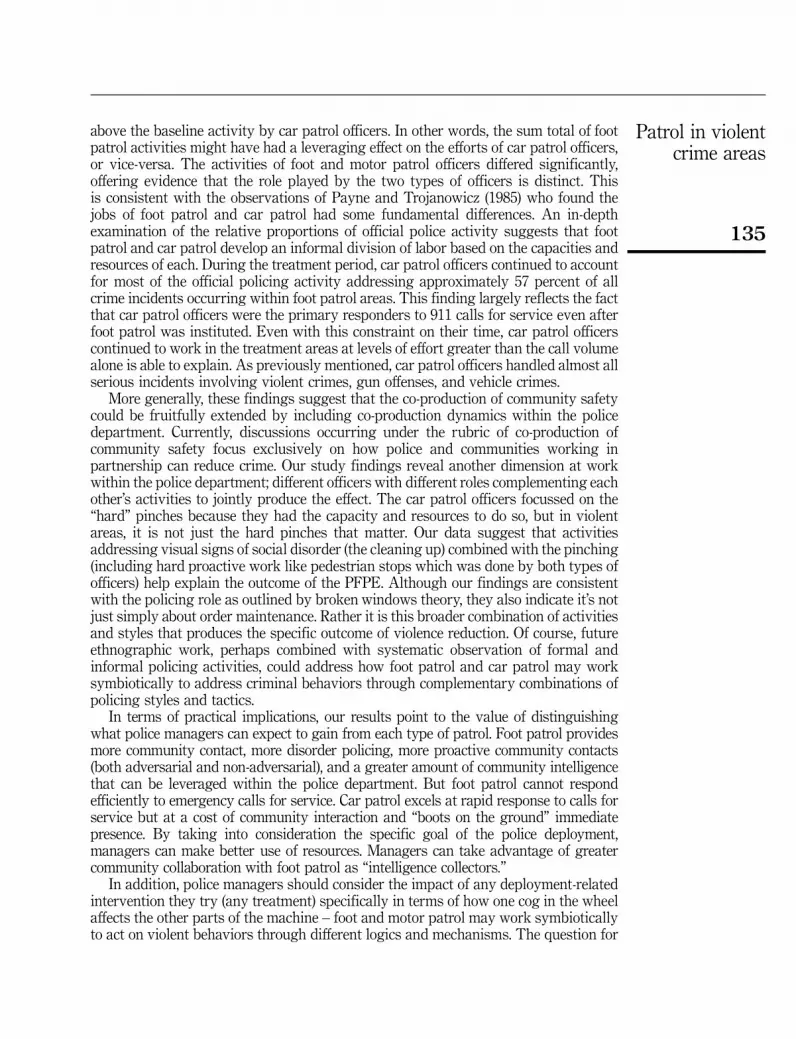
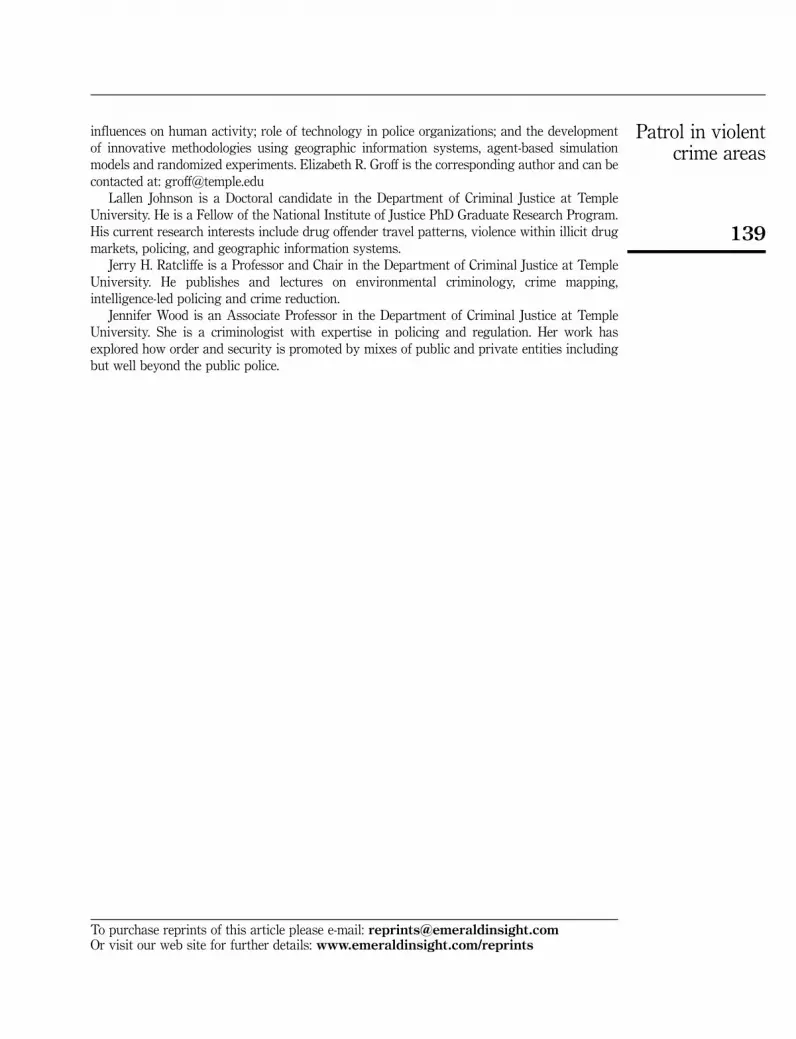
An analysis of disorder incidents addressed by car patrol officers indicateda significant decrease over time, F(1, 118)¼ 6.26, po0.05, partial Z2¼ 0.05. At pre-intervention, the mean log value of disorder incidents addressed by car patrol officerswas 1.60. This declined to 1.56 by the end of the intervention period. However, thereis no evidence of an interaction effect between disorder over time and treatmentstatus, F(1, 118)¼ 0.30, p40.05, partial Z2¼ 0.00 (see Figure 4). Here the decline ofactivity by car patrol is in both type of areas and indicates car patrol was occupiedelsewhere in the city.
1.73
1.659
1.797
1.775
1.55
1.6
1.65
1.7
1.75
1.8
1.85
Pre-intervention Intervention
Control beats
Foot beats
Figure 3.Plot of interaction betweenvehicle stops andtreatment status over time
1.598
1.553
1.607
1.578
1.52
1.53
1.54
1.55
1.56
1.57
1.58
1.59
1.6
1.61
1.62
Pre-intervention Intervention
Control beats
Foot beats
Figure 4.Plot of interaction betweendisorder and treatmentstatus over time
132
PIJPSM36,1

7. DiscussionThe PFPE found that foot patrol achieved a 23 percent reduction in violent crime.The positive results raise additional questions about how the reduction in violentcrime was achieved. Although the presence of foot patrol officers was the treatmentin the experiment (i.e. the systematic difference between treatment and controlareas) they were not working in isolation. Car patrol was still providing “businessas usual” policing. The established literatures on deterrence, broken windows, andthe co-production of community safety all point to the importance of investigatingthe kinds of activities undertaken by foot patrol and car patrol officers that may havecontributed to this decline. We first identified and described how much and whattype of policing activity can be attributed to the efforts of foot patrol and car patrolofficers separately. Next, we examined whether the addition of foot patrol officerschanged the types or volume of activity by car patrol officers. Using these findingswe suggest an extension of the concept of co-producing community safety to includepartnerships between different units within the police department as well as betweenthe police and the community.
One possible outcome of adding foot patrol might have been to reduce the efforts ofcar patrol officers in target areas, translating into greater decreases in car patrolactivity for the treatment areas. This finding would suggest foot patrol could replacecar patrol in sort of a “zero sum game” of police deployment. The data in Philadelphiaindicate a slight decline in car patrol activity in both treatment and control areas oncefoot patrol was deployed but there was no statistical difference between the declinein the treatment areas and in the control areas. In other words, car patrol officersremained active in areas where foot patrol was deployed. There was no wholesaleabandonment of treatment areas for those assigned to the control condition (the other60 highest crime areas in Philadelphia).
In fact, proactive actions such as pedestrian and vehicle stops declined less intreatment areas than control. This finding was especially surprising since foot patrolofficer’s activity was primarily devoted to pedestrian stops and to reporting disorderoffenses. There are several possible explanations for the larger decline in proactivetypes of activities in the control areas. Although car patrol officers were not officiallyinformed of the locations of the treatment beats, nor asked to concentrate theiractivities in those areas, they undoubtedly became aware of them over time. Therefore,it could be that car patrol officers targeted these because they had been labeled as highcrime areas and worked in them more than they would have otherwise. Even morelikely, car patrol officers could have focussed their patrols in treatment areas to provideadditional protection for foot patrol officers. Recall that all foot patrol officers wererecent graduates from the police academy and it is possible that the experiencedofficers wished to spend more time in and around the foot patrol areas as therookie officers became acclimated to their new roles. Providing support for thishypothesis, field researchers indicated car patrol units would frequently ride by footpatrol officers to check on their well-being.
But what explains the decrease in car patrol activity in both treatment and controlareas? It could be that natural short-term fluctuations in crime meant it had moveda few blocks in the months between identification of the areas and the deployment offoot patrol. Any change in the geographic distribution of crime incidents would impactcar patrol officers more since their activities are largely driven by calls for service andthey work where the calls take them. Summer is also a popular vacation time periodand the decrease could stem from car patrol officers on the street.
133
Patrol in violentcrime areas

The finding of no significant differences pre-intervention to intervention in carpatrol activity between treatment and control areas is also important because itvalidates the assumption in the PFPE that car patrol activities would not bias theresults of the experiment. This raises the question of whether it was foot patrol only orthe joint presence of foot and car patrol that was behind the observed crime reductions?Broken windows theory and community policing principles support the explanationthat foot patrol was primarily responsible. On the other hand, in line with deterrencetheory, the finding that car patrol continued to actively police target areas leaves openthe possibility that the combination of foot and car patrol may have been important toosince both types of officers contribute to increased certainty of punishment within adeterrence framework. The emphasis on order maintenance activities by foot patrolofficers in PFPE is consistent with broken windows theory’s view of foot patrol as keyto establishing order in a place (Wilson and Kelling, 1982). While we were not able toquantify the magnitude of their community liaison work, the activities of foot patrolseemed to be consistent both with community policing and with the order maintenancefunction in broken windows theory even though no specific instructions were given onwhich specific activities to perform and to what extent. For instance, car patrol officerswere less likely to address disorder incidents and initiate pedestrian stops, but morelikely to address more serious incidents such as violent crimes, gun offenses, andvehicle crimes. This corroborates earlier findings based on the Flint, MI foot patrolstudy, which revealed car patrol officers conducted six times the number of felonyarrests as foot patrol officers (Trojanowicz, 1988). Other research found foot patrolofficers are better at softer tasks such as removing vagrants and addressing merchantcomplaints (Esbensen, 1987). Although this research cannot gauge how well foot patrolofficers addressed disorder offenses, it does suggest that they specialize in them, inlarge part because they develop fine-grained local knowledge about disorderlybehaviors in the beats to which they are assigned. Disorder offenses constituted92 percent of all foot patrol officers’ activity.
The data indicate that the foot patrol officers reacted consistently to signs of socialdisorder in their foot beats, devoting a great deal of their time to “cleaning up” theirfoot beats. We would suggest that as rookies, foot patrol officers were ready to makea difference in the community and therefore naturally gravitated toward dealing withissues they observed. These issues were usually related to the types of fear producingsocial incivilities noted in broken windows theory (Wilson and Kelling, 1982). Brokenwindows theory postulates that the combination of a foot patrol officer’s presence andhis activities to decrease the social disorder at places serves to (re-)establish anormative order in a community, and may make the area ready for residents andbusiness owners to implement informal control. Thus, it is possible that foot patrol andmotor patrol officers worked in tandem to yield the observed 23 percent reduction inviolent crime both instrumentally through the mechanism of deterrence and normativelyby affirming, and representing, community order. The question our data do not answer iswhether, and to what extent, community members, both residents and business owners,actually exercised greater informal control in their neighborhoods due to the presence offoot patrol and their effects on community order. Future research could also examine theissue of disorder policing by foot patrol to investigate the extent to which the number ofdisorder incidents addressed by foot patrol explains subsequent changes in the amountof serious crime experienced in high crime areas.
Our findings also support the proposition that the reduction in crime that occurredin treatment areas resulted from the additional activities of foot patrol officers over and
134
PIJPSM36,1
above the baseline activity by car patrol officers. In other words, the sum total of footpatrol activities might have had a leveraging effect on the efforts of car patrol officers,or vice-versa. The activities of foot and motor patrol officers differed significantly,offering evidence that the role played by the two types of officers is distinct. Thisis consistent with the observations of Payne and Trojanowicz (1985) who found thejobs of foot patrol and car patrol had some fundamental differences. An in-depthexamination of the relative proportions of official police activity suggests that footpatrol and car patrol develop an informal division of labor based on the capacities andresources of each. During the treatment period, car patrol officers continued to accountfor most of the official policing activity addressing approximately 57 percent of allcrime incidents occurring within foot patrol areas. This finding largely reflects the factthat car patrol officers were the primary responders to 911 calls for service even afterfoot patrol was instituted. Even with this constraint on their time, car patrol officerscontinued to work in the treatment areas at levels of effort greater than the call volumealone is able to explain. As previously mentioned, car patrol officers handled almost allserious incidents involving violent crimes, gun offenses, and vehicle crimes.
More generally, these findings suggest that the co-production of community safetycould be fruitfully extended by including co-production dynamics within the policedepartment. Currently, discussions occurring under the rubric of co-production ofcommunity safety focus exclusively on how police and communities working inpartnership can reduce crime. Our study findings reveal another dimension at workwithin the police department; different officers with different roles complementing eachother’s activities to jointly produce the effect. The car patrol officers focussed on the“hard” pinches because they had the capacity and resources to do so, but in violentareas, it is not just the hard pinches that matter. Our data suggest that activitiesaddressing visual signs of social disorder (the cleaning up) combined with the pinching(including hard proactive work like pedestrian stops which was done by both types ofofficers) help explain the outcome of the PFPE. Although our findings are consistentwith the policing role as outlined by broken windows theory, they also indicate it’s notjust simply about order maintenance. Rather it is this broader combination of activitiesand styles that produces the specific outcome of violence reduction. Of course, futureethnographic work, perhaps combined with systematic observation of formal andinformal policing activities, could address how foot patrol and car patrol may worksymbiotically to address criminal behaviors through complementary combinations ofpolicing styles and tactics.
In terms of practical implications, our results point to the value of distinguishingwhat police managers can expect to gain from each type of patrol. Foot patrol providesmore community contact, more disorder policing, more proactive community contacts(both adversarial and non-adversarial), and a greater amount of community intelligencethat can be leveraged within the police department. But foot patrol cannot respondefficiently to emergency calls for service. Car patrol excels at rapid response to calls forservice but at a cost of community interaction and “boots on the ground” immediatepresence. By taking into consideration the specific goal of the police deployment,managers can make better use of resources. Managers can take advantage of greatercommunity collaboration with foot patrol as “intelligence collectors.”
In addition, police managers should consider the impact of any deployment-relatedintervention they try (any treatment) specifically in terms of how one cog in the wheelaffects the other parts of the machine – foot and motor patrol may work symbioticallyto act on violent behaviors through different logics and mechanisms. The question for
135
Patrol in violentcrime areas

managers is therefore how to combine these street-level resources optimally to get thebest outcome – foot and motor patrol officers may produce, at least sometimes, anorganic division of labor, but administrators can foster this division of labor as well, andprovide for guidelines of co-production. Specifically, in terms of foot patrol, policemanagers should expect car patrol officers naturally and maybe even unconsciously tryto work more in the areas where foot patrol officers are deployed. This is not surprisingconsidering the dangerous nature of police work, especially in the most violent areas of acity like Philadelphia. Moskos (2008, pp. 1-2) describes the “Blue Brotherhood” not as asecret subculture but as one of the few organizational cultures where employees arewilling to risk their lives to protect fellow employees. As a result, the bond between thefoot patrol (rookie) and car patrol (veteran) officers – who likely knew very little aboutone another – is not due to membership in what the public may perceive as a secretculture but in the shared experience working in an extremely risky employment sector.In light of this, police managers of future foot patrol initiatives can expect more car patrolactivity in foot patrol areas just as a function of looking out for fellow officers.
Our findings also suggest the typical activities of foot patrol officers are bestthought of as the “hands-on” component of an overall patrol strategy that includes carpatrol. When foot patrol officers are used in addition to, not instead of, regular carpatrols, their presence on the street (rather than in a car) has immediate advantages ingathering information through conversations with street users and official pedestrianstops. They experience street-level disorder themselves and thus make it a priority.In the PFPE, although the types of activities overlapped, there were clear differences inemphasis. As we stated before, foot patrol primarily dealt with disorder crimes whilecar patrol handled almost all the rest. By taking on complementary responsibilities,foot patrol and car patrol can achieve a reduction in violent crime.
In summary, the quantitative data used here offer insight into the activities of footand car patrol officers during the PFPE. The Philadelphia experience shows that whenfoot patrols are initiated, car patrols remain active in the foot patrol areas and maintainapproximately the same level of proactive enforcement activity. Consistent with theoryand previous research, car patrol officers concentrate on the serious crime incidentswhile foot patrol officers focus on order maintenance activities. The fact that thesetwo different types of officers work dynamically to improve public safety suggeststhe co-production of community safety has an additional dimension within policedepartments that has yet to be used to its full advantage. Police managers need tocarefully consider not only where to place foot patrol but also how to best leverageexisting car patrol in overlapping areas.
Notes
1. For details on the methodology please see Ratcliffe et al. (2011). Following Sherman andWeisburd (1995) violent incidents included homicides, aggravated assaults, and robberiesoccurring outdoors.
2. Car patrol units and other PPD units were not excluded from patrolling or working in thetarget areas; thus the only formal intervention was the introduction of foot patrols in additionto business as usual. Car patrol officers were not officially informed as to the experimentalareas. The 120 target areas were ranked by the weighted violent crime rate. Starting with thetwo highest violent crime areas and working down the list, one of each pair of places wereassigned to treatment using the software version of a “flip of a coin” (see Ratcliffe et al., 2011).
3. The specific dates are as follows: Phase 1 (pre-intervention: 1/6/2009-3/28/2009, intervention: 3/31/2009-6/20/2009), Phase 2 (pre-intervention: 4/14/2009-7/4/2009, intervention: 7/7/2009-9/26/2009).
136
PIJPSM36,1
4. It is possible that car patrol units responded to an incident first addressed by footpatrol officers. Field observations by the authors indicate that whenever a foot patrolofficer indicated response to an incident, one or more car units would respond to provideback up. However, communication with police administration suggests that generally,call signs within the incident data are those of the first responder, and not of officersproviding additional help.
5. Pedestrian stops and vehicle stops are nature codes that indicate the conditions under whichan officer discovered an incident (e.g. a pedestrian stop that reveals drug possession).Consequently, the numbers are not independent of the additional offenses discovered.Nonetheless, the numbers alone suggest that foot patrol officers spent an inordinate amountof time conducting pedestrian and vehicle stops.
6. Of the 2,372 disorder incidents addressed by foot patrol officers within foot beats, 93 percentwere for minor disturbances, and the remaining 7 percent were for disorderly conduct(3 percent), vandalism (2 percent), loitering (1 percent), and simple assault (1 percent). Of the191 minor disturbance incidents addressed by foot patrol officers within control beats92 percent were for disorder, 3 percent for disorderly conduct, 3 percent for vandalism, andthe remaining 2 percent composed of loitering, public drunkenness, and simple assault.
7. The police department was not provided information on the control area boundaries so thesechanges likely reflect changes in the amount of criminal activity in the control areas.
8. Attempts to quantify the number of car patrol officers assigned to areas in which a treatmentor control foot beat fell were uninformative because officers were assigned to districts anddistricts are too large to allow meaningful comparisons with areas as small as those used inthe experiment.
9. Treatment and control areas were sometimes quite close to one another or situated between afoot patrol area and district headquarters. This meant foot patrol officers might legitimatelycome across an incident in a control area while walking to or from their beat.
10. Frequency distributions of total crime, pedestrian stops, vehicle stops, and disorderoccurring during pre-intervention and intervention periods indicated a strong positiveskew, violating the assumption of normality. All variables were log transformed, uponwhich visual examination of their histograms revealed that they closely approximated anormal distribution. We are unable to model the impact change in car patrol activity overtime for burglary, drug, theft, vehicle crime, violence, or VUFA offenses. These variablesfailed to approximate a normal distribution, were not amenable to transformation. Allanalyses revealed a significant Mauchley’s test of sphericity, suggesting that theassumption of homogeneity of variance has been violated. As a result the Greenhouse-Geisser adjustments are reported. The Greenhouse-Geisser adjustment serves as acorrection for the assumption of homogeneity by reducing the degrees of freedomassociated with the F-ratio.
References
Beccaria, C. (1764/1963), On Crimes and Punishments (Trans by H. Paolucci), Prentice Hall,Upper Saddle River, NJ.
Bentham, J. (1789/1948), An Introduction to the Principles of Morals and Legislation, Kegan Paul,New York, NY.
Eck, J. and Spelman, W. (1987), Problem Solving: Problem Oriented Policing in Newport News,National Institute of Justice, Washington, DC.
Esbensen, F.A. (1987), “Foot patrols: of what value”, American Journal of Police, Vol. 6 No. 1,pp. 45-56.
Goldstein, H. (1990), Problem Oriented Policing, McGraw-Hill, New York, NY.
137
Patrol in violentcrime areas

Greene, J.R. (1987), “Foot patrol and community policing: past practices and future prospects”,American Journal of Police, Vol. 6 No. 1, pp. 1-16.
Innes, M. and Roberts, C. (2008), “Reassurance policing: community intelligence and theco-production of neighborhood order”, in Williamson, T. (Ed.), The Handbook ofKnowledge-based Policing: Current Conceptions and Future Directions, John Wiley andSons, West Sussex, pp. 241-62.
Kelling, G.L. and Coles, C. (1996), Fixing Broken Windows: Restoring Order and Reducing Crimein American Cities, Free Press, New York, NY.
Mazerolle, L.G., Kadleck, C. and Roehl, J. (1998), “Controlling drug and disorder problems: therole of place managers”, Criminology, Vol. 36 No. 2, pp. 371-404.
Meyers, L.S., Gamst, G. and Guarino, A.J. (2006), Applied Multivariate Research: Design andInterpretation, Sage, Thousand Oaks, CA.
Moskos, P. (2008), Cop in the Hood: My Year Policing Baltimore’s Eastern District Princeton,Princeton University Press, Princeton, NJ.
Nagin, D.S. and Pogarsky, G. (2001), “Integrating celerity, impulsivity, and extralegal sanction threatsinto a model of general deterrence: theory and evidence”, Criminology, Vol. 39 No. 4, pp. 865-92.
Ostrom, E. and Gordon, W. (1973), “Does local community control of police make a difference?Some preliminary findings”, American Journal of Political Science, Vol. 17 No. 1, pp. 48-76.
Pate, A. (1986), “Experimenting with foot patrol: the Newark experience”, in Rosenbaum, D.P.(Ed.), Community Crime Prevention: Does it Work? Sage, Newbury Park, CA, pp. 137-56.
Payne, D.M. and Trojanowicz, R.C. (1985), Performance Profiles of Foot Versus Motor Officers,National Center for Community Policingo. Document Number, East Lansing, MI.
Ratcliffe, J.H., Taniguchi, T., Groff, E.R. and Wood, J.D. (2011), “The Philadelphia foot patrolexperiment: a randomized controlled trial of police patrol effectiveness in violent crimehotspots”, Criminology, Vol. 49 No. 3, pp. 795-831.
Rosenbaum, D.P., Yeh, S. and Wilkinson, D.L. (1994), “Impact of community policing on policepersonnel: a quasi-experimental test”, Crime and Delinquency, Vol. 40 No. 3, pp. 331-53.
Sherman, L.W. and WEisburd, D. (1995), “General deterrent effects of police patrol in crime ‘hotspots’: a randomized, controlled trial”, Justice Quarterly, Vol. 12 No. 4, pp. 625-48.
Skogan, W.G. (1995), “Community policing in the United States”, in Brodeur, J.-P. (Ed.),Comparisons in Policing: An International Perspective, Avebury Press, Aldershot, pp. 86-111.
Skogan, W.G. (2006), “The promise of community policing”, in Weisburd, D. and Braga, A.A. (Eds),Police Innovation: Contrasting Perspectives, Cambridge University Press, Cambridge, pp. 27-43.
Skogan, W.G. (2008), “An overview of community policing: origins, concepts andimplementation”, in Williamson, T. (Ed.), The Handbook of Knowledge-based Policing:Current Conceptions and Future Directions, John Wiley and Sons, West Sussex, pp. 43-58.
Sousa, W.H. and Kelling, G.L. (2006), “Of ‘broken windows,’ criminology, and criminal justice”,in Weisburd, D. and Braga, A.A. (Eds), Police Innovation: Contrasting Perspectives,Cambridge University Press, Cambridge, pp. 77-97.
Trojanowicz, R.C. (1988), “Evaluating a neighbourhood foot patrol program: the flint, Michiganproject”, in Rosenbaum, D.P. (Ed.), Community Crime Prevention: Does it Work?Sage, Newbury Park, CA, pp. 157-78.
Wilson, J.Q. and Kelling, G.L. (1982), “Broken windows: the police and neighborhood safety”,Atlantic Monthly, Vol. 249 No. 3, pp. 29-38.
About the authors
Elizabeth R. Groff is an Assistant Professor in the Department of Criminal Justice at TempleUniversity. Her research interests include: place-based criminology; modeling geographical
138
PIJPSM36,1
influences on human activity; role of technology in police organizations; and the developmentof innovative methodologies using geographic information systems, agent-based simulationmodels and randomized experiments. Elizabeth R. Groff is the corresponding author and can becontacted at: [email protected]
Lallen Johnson is a Doctoral candidate in the Department of Criminal Justice at TempleUniversity. He is a Fellow of the National Institute of Justice PhD Graduate Research Program.His current research interests include drug offender travel patterns, violence within illicit drugmarkets, policing, and geographic information systems.
Jerry H. Ratcliffe is a Professor and Chair in the Department of Criminal Justice at TempleUniversity. He publishes and lectures on environmental criminology, crime mapping,intelligence-led policing and crime reduction.
Jennifer Wood is an Associate Professor in the Department of Criminal Justice at TempleUniversity. She is a criminologist with expertise in policing and regulation. Her work hasexplored how order and security is promoted by mixes of public and private entities includingbut well beyond the public police.
To purchase reprints of this article please e-mail: [email protected] visit our web site for further details: www.emeraldinsight.com/reprints
139
Patrol in violentcrime areas