gp - vote 04 - health.pdf - national treasury
TRANSCRIPT
PR 143/2006ISBN 0-621-36722-2
ANNUAL REPORT 2005/2006
DEPARTMENT OF HEALTH
I
DEPA
RTM
ENT O
F HEA
LTH
GAUTENG DEPARTMENT OF HEALTH
ANNUAL REPORT 2005/2006
In terms of the Public Finance Management Act and Rule 9.4(1) of the Gauteng Legislature Standing Rules
August 2006
Publisher:Gauteng Department of Health
Private Bag X085Marshalltown 2107
South Africa
Tel: (011) 355 3503Fax: (011) 838 3613
PR:143/2006ISBN: 0-621-36722-2

II
AN
NU
AL
REP
OR
T 20
05/2
006

III
DEPA
RTM
ENT O
F HEA
LTH
Contents
SECTION 1: Executive Summary 1
1.1 Foreword from the MEC: Health: Mr Brian Hlongwa 11.2 Foreword by the Acting Head of Department: Dr. A Rahman 3
SECTION 2: Departmental Overview 5
2.1 Organisation of the Department 52.2 Constitutional, Natiional and Provincial Legislative Mandates 52.3 Good Governance Legislative Reponsibilities 62.3.1 Inter-governmental Structures 62.3.2 Commumity Participation 62.4 Strengthening Accountability to Stakeholders 62.4.1 Stakeholders 72.4.2 Functions and Monitoring Mechanisms and 8
Implementation of the Mandate by Key Actors
SECTION 3: Report on Performance in Budget Programmes 11
3.1 Programme 1: Administration 113.2 Programme 2: District Health Services 293.3 Programme 3: Emergency Medical Services 643.4 Programme 4: Provincial Hospital Services 703.5 Programme 5: Central Hospital Services 813.6 Programme 6: Health Training and Sciences 873.7 Programme 7: Health Care Support Services 953.8 Programme 8: Health Facilities Management 993.9 Programme 9: Financial Information 2005/2006 Financial Year 108
SECTION 4: Summary on Departmental Key Performance at a glance 112
SECTION 5: Outlook for the comming year 114
SECTION 6: Financial Requirements 117
Audited Annual Financial Statements 145
ADENDUM A: Medical Supplies Depot 203
ADENDUM B: Human Resource Oversight Report 227
ADENDUM C: Service Excellence Awards, Mental Health Services and Mandates 279
Page
IV
AN
NU
AL
REP
OR
T 20
05/2
006
AKNOWLEDGEMENTS
The information in this annual report has been compiled from inputs received from the managementand staff of the Gauteng Department of Health, from various internal reports. We thank the manyindividuals who helped in the production of the annual report and a special mention to Ms SellinahDumela and her team including Mr Zolani Mnqibisa as well as Mr Philemon Nzimande for their effortsin co-coordinating the compilation and printing of the annual report.
We are indebted to Niran Singh and the staff of Shereno printers who have ensured that the schedulesfor design and publication are met. We also thank Patrick Cockayne for the editorial assistance.
We would like to thank our key stakeholders and strategic partners for their valuable contributions tothe provision of quality health services to the people of Gauteng.
1
DEPA
RTM
ENT O
F HEA
LTH
SECTION 1:EXECUTIVE SUMMARY
1.1 Foreword from the MEC: Health: Mr Brian Hlongwa
It is an honour for me to table to the house the AnnualReport of the Gauteng Department of Health for thefinancial year 2005/2006, when the country iscelebrating three key milestones in our history: • In June we commemorated the thirtieth anniversary of
the June 16 Uprising, the catalyst for our freedom;• In May we celebrated 10 years since the adoption of
our Constitution, our fundamental mandate forimproving the lives of our people.
• In August we celebrated the Golden Anniversary of theWomen’s march to the Union Building in 1956. This isa celebration of the extra-ordinary sacrifices made bywomen in the struggle for liberation and justice theGauteng Health Department is placing emphasis onprogrammes to improve the health status of women.
The past year has seen significant progress in theGauteng Department of Health’s commitment to providequality health services to the people of the province.
In line with the National Health Act of 2005, we haveestablished the Provincial Health Council, where ourMember of Executive Council (MEC) meets regularly
with Members of the Mayoral Committee (MMC) forHealth, the Emergency Medical Services for the threeMetropolitan Councils to ensure cooperativegovernance and delivery of integrated health andemergency medical services. We have established aProvincial Health Council Technical Committee and arein the process of establishing District Councils.
Our health professionals in hospitals and clinics still seefar too many women survivors of sexual assault andphysical abuse and women continue to carry adisproportionate burden of HIV and Aids. Thedepartment will continue to work with civil society, theprivate sector and community organisations to findlasting solutions.
Gauteng is a key province in the national drive to curbthe growth of Tuberculosis (TB) and to spread themessage that this disease can be cured. In the currentbudget the amount allocated to HIV and Aids has beenincreased by 47.8% and we have set ourselves targetsto raise our immunisation coverage to 90% by the endof the year.
The 10% increase in the budget allocation over theprevious year, is a clear indication of the GautengGovernment’s view that health issues should be apriority in the future social and economic developmentof our province and a key element of our strategy toalleviate poverty and create a better life for all ourpeople.
This Annual Report provides a detailed overview of thecritical programmes and projects that are beingimplemented in the department.
An amount of R922 million has been allocatedtowards capital projects including machinery andequipment. One of the highlights of the coming yearwill be the official opening of the new PretoriaAcademic Hospital.
The World Health Organisation has declared 2006 theyear where special attention be given to the global crisisin the health workforce. According to the most recentWHO survey there is an estimated world-wide shortageof 4.3 million doctors, nurses, midwives and otherhealth support workers. We in Gauteng have notescaped this global trend. We have put in place humanresource strategies to meet the current challenges andfuture demands.
2
AN
NU
AL
REP
OR
T 20
05/2
006
To deliver on this mandate, we have set ourselves atarget of increasing the number of nurses produced byour colleges by 20% annually. In the last financial yearwe admitted 3 651 student nurses of all categories intothe education programme, which is exceeds our targetby 600.
Public requirement of our services continue to grow.Patient visits to primary health care facilities in Gautenghave increased from 10.4 million in 2002 to 14.1 millionin 2005/2006. To meet the demand for these essentialservices we will soon open new Primary Health Carefacilities in nine more areas.
The rising demand can directly be attributed to thesuccess of the Gauteng Health Departmentís efforts tomake health care facilities accessible to the entirepopulation. We are the most urbanised province in thecountry and are consistently drawing new migrants insearch of economic opportunities.
This is the first annual report that has been producedsince my appointment as MEC for Health in Gauteng. Inmy short tenure at the department I have beenimpressed by the dedication and commitment displayed
by the overwhelming number of health careprofessionals and support staff in our province.
This Department has committed itself to follow apeople-centred approach to health care provision. Forus the needs of the public and our patients come firstand we are continuously evaluating our services fromtheir perspectives.
The coming year will present us with new challenges. Iam confident that we will continue to meet thesechallenges as we move towards our objective to build ahealthy, skilled and productive people ñ and ensuring abetter health for all in Gauteng.
In conclusion I want to thank the leadership and supportof the Premier, our Minister of Health, the National andthe Provincial Health Councils, the PortfolioCommittees on Health and Finance for the constructiverole they play in policy formulation and implementation.My sincere appreciation also goes to the acting DirectorGeneral and the senior leadership cadre in thedepartment for their contribution towards the successesof the past year.

3
DEPA
RTM
ENT O
F HEA
LTH
In my capacity as an Acting Accounting Officer for theGauteng Department of Health, it is my pleasure andprivilege to submit to you the Department’s AnnualReport and Annual Financial Statements for the2005/2006 financial year.
Building on the broad consultative process weundertook when we drafted our Five Year Programmeof Action (2004-2009), we are still committed to deliveryof quality health services with and within ourcommunities and also to ensure an equitable andefficient health system.
For the 2005/2006 financial year, the GautengDepartment of Health was appropriated R9.8 billion bythe Gauteng Legislature. This budget was a tool toallow continuance of our policy implementation andprogrammes within the medium-term expenditureframework. The increase in the demand of servicedelivery was met by the fast tracking of infra-structureprojects and purchase of high-tech equipment whichsaw an increase in expenditure in excess of theappropriated budget of R133 million.
The shortage of health professionals continues to posea formidable challenge for the Department. Whilstacknowledging that this is an internationalphenomenon, our recruitment and retention strategy isbeginning to yield results. Despite the fact that theattrition rate is still high, we managed to attract 2,950health professionals for the period under review, withsignificant gains when compared to 2004/2005.
We also continued to make strides in revenuecollection. Over the past five years revenue hasincreased by 62%, from R157 million in 2001/2002 to R254 million in the 2005/2006 financial year. For thecurrent financial year, revenue collection has increasedby 16% over that of the previous financial year,excluding donations. Patient fees alone amounted toR204 million.
Free primary health care has improved access to healthcare services. Patient visits have increased from 10.4million in 2002 to 14.1 million in the year under review.
Tuberculosis (TB) and HIV/AIDS remain the majorchallenge of the era we live in. The TB cure rate for theyear under review remained at 64%, falling below thenational target of 70%. In the coming financial year wewill launch a Provincial TB Crisis Plan, whereby we willfocus on creating awareness of the curability of TBamongst the population within the JohannesburgMetropolitan.
During 2005/2006 we have consolidated theComprehensive Plan for the Prevention, Care, andTreatment of HIV and AIDS Programme. We continue toemphasize prevention. The number of patients ontreatment increased from 12,983 in 2004/2005 to 41 795 by the end of 2005/2006, of which 6 000 werechildren, well exceeding the target of 25 000.
The recent challenges around mental health servicesare being addressed to ensure public trust. Acomprehensive audit was carried out in all our mentalhealth institutions to review the patient care safety andinfrastructure needs.
We are making significant strides in other areas of servicedelivery as outlined in this report. I am pleased to say thatin spite of the constraints I have mentioned above, we arewell on course to meet our service delivery objectives. Wewill work harder to rectify the shortcomings that have beenhighlighted by the Auditor-General.
1.2 Foreword by the Acting Head ofDepartment: Dr. A. Rahman

4
AN
NU
AL
REP
OR
T 20
05/2
006
In conclusion, I would like to express my sincereappreciation to the leadership of the Hon. MEC. Mr. Hlongwa and the Health Portfolio Committee fortheir support and guidance. A word of thanks tomembers of senior management and staff for theircommitment in delivery of quality health services in thedepartment.
5
DEPA
RTM
ENT O
F HEA
LTH
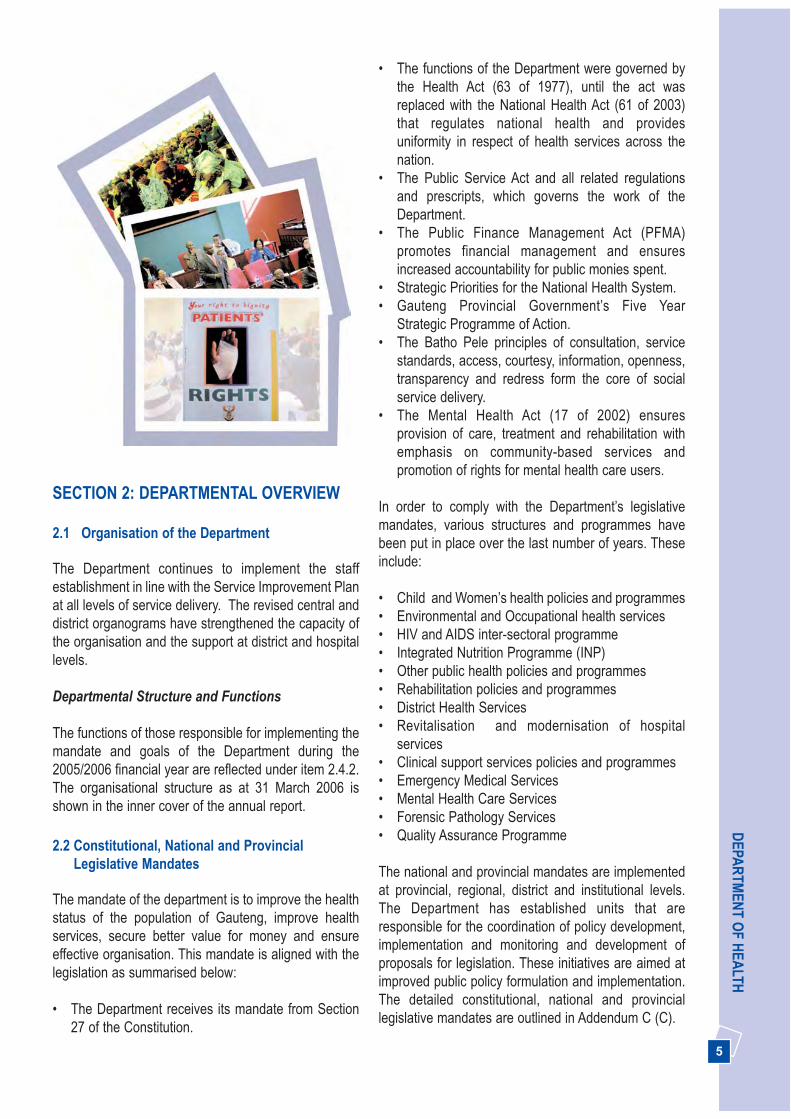
SECTION 2: DEPARTMENTAL OVERVIEW
2.1 Organisation of the Department
The Department continues to implement the staffestablishment in line with the Service Improvement Planat all levels of service delivery. The revised central anddistrict organograms have strengthened the capacity ofthe organisation and the support at district and hospitallevels.
Departmental Structure and Functions
The functions of those responsible for implementing themandate and goals of the Department during the2005/2006 financial year are reflected under item 2.4.2.The organisational structure as at 31 March 2006 isshown in the inner cover of the annual report.
2.2 Constitutional, National and ProvincialLegislative Mandates
The mandate of the department is to improve the healthstatus of the population of Gauteng, improve healthservices, secure better value for money and ensureeffective organisation. This mandate is aligned with thelegislation as summarised below:
• The Department receives its mandate from Section27 of the Constitution.
• The functions of the Department were governed bythe Health Act (63 of 1977), until the act wasreplaced with the National Health Act (61 of 2003)that regulates national health and providesuniformity in respect of health services across thenation.
• The Public Service Act and all related regulationsand prescripts, which governs the work of theDepartment.
• The Public Finance Management Act (PFMA)promotes financial management and ensuresincreased accountability for public monies spent.
• Strategic Priorities for the National Health System.• Gauteng Provincial Government’s Five Year
Strategic Programme of Action. • The Batho Pele principles of consultation, service
standards, access, courtesy, information, openness,transparency and redress form the core of socialservice delivery.
• The Mental Health Act (17 of 2002) ensuresprovision of care, treatment and rehabilitation withemphasis on community-based services andpromotion of rights for mental health care users.
In order to comply with the Department’s legislativemandates, various structures and programmes havebeen put in place over the last number of years. Theseinclude:
• Child and Women’s health policies and programmes • Environmental and Occupational health services • HIV and AIDS inter-sectoral programme • Integrated Nutrition Programme (INP) • Other public health policies and programmes• Rehabilitation policies and programmes• District Health Services • Revitalisation and modernisation of hospital
services • Clinical support services policies and programmes• Emergency Medical Services • Mental Health Care Services• Forensic Pathology Services• Quality Assurance Programme
The national and provincial mandates are implementedat provincial, regional, district and institutional levels.The Department has established units that areresponsible for the coordination of policy development,implementation and monitoring and development ofproposals for legislation. These initiatives are aimed atimproved public policy formulation and implementation.The detailed constitutional, national and provinciallegislative mandates are outlined in Addendum C (C).

6
AN
NU
AL
REP
OR
T 20
05/2
006
hospitals and primary health care servicesrespectively.
• The AIDS Council strengthens partnerships with civilsociety and assists with the procurement of privatesector resources.
• The Accreditation Committee consists ofindependent experts who monitor the quality ofservices in the province and advises the MEC.
• There are a range of community-based activitiesfrom mass-based immunisation campaigns tolaunches of specific health promotion initiatives incommunities.
• Invitations to stakeholders to the legislature fortabling of the budget and the annual report of theDepartment.
• Gauteng Department of Health Imbizos, annualsummit and roving meetings in municipalities andsub-districts further enhance participation.
2.4 Strengthening Accountability to Stakeholders
• The implementation of the Public FinanceManagement Act (PFMA) has facilitated efficiencygains and improved accountability of differentstakeholders.
• The governance structures mentioned above havealso strengthened accountability.
• Accountability is further enhanced through regularconsultative meetings, the sharing of informationthrough newsletters, and the publication of quarterlyand annual reports.
• Public meetings and specific health promotionevents.
• Annual consultative summits for the HIV and AIDSprogramme, consultative summit, and radiomessages and campaigns. The health summits and the youth summits are mechanisms to strengthenaccountability.
• Community participation as outlined above.
2.3 Good Governance Legislative Responsibilities
Good governance in the Department is ensured interalia, through guidance from, and compliance with, thefollowing legislation and policies:
• The Public Service Act • The Public Finance Management Act • The Promotion of Access to Information Act • The National Health Act• The Hospital Ordinance Amendment Act • The Batho Pele principles • The Patients’ Rights Charter and the Department of
Health Pledge of Service
The Department has established structures and/ormechanisms to ensure accountability and participativegovernance.
2.3.1 Inter-governmental Structures
In accordance with the National Health Act 61 of 2003,promulgated in 2005, the MEC for Health constitutedthe political structure currently called the ProvincialHealth Council. This provincial health council is chairedby the MEC for Health and consists of members ofmayoral councils for health and emergency medicalservices and meets quarterly.
The Provincial Health Council Technical Committee isan advisory body to the Provincial Health Council and ischaired by the Head of Department for Health. Itconsists of senior managers from the HealthDepartment and municipalities as well asrepresentatives from local government i.e. SALGA. Thiscommittee meets quarterly, approximately two weeksprior to the council meetings. In addition, the MEC forHealth has monthly roving meetings with municipalities,the relevant mayor, health councillors, stakeholders,and also visits to institutions.
At a national level, the minister and the nine provincialMECs meet on a 6 weekly basis to discuss sectoralpolicy and related issues. The National Health Councilis supported by the National Health Council TechnicalCommittee and consists of the national Director-General for health and the nine provincial heads ofhealth.
2.3.2 Community Participation
• Hospital boards and ward-based health sub-committees enhance community participation in
7
DEPA
RTM
ENT O
F HEA
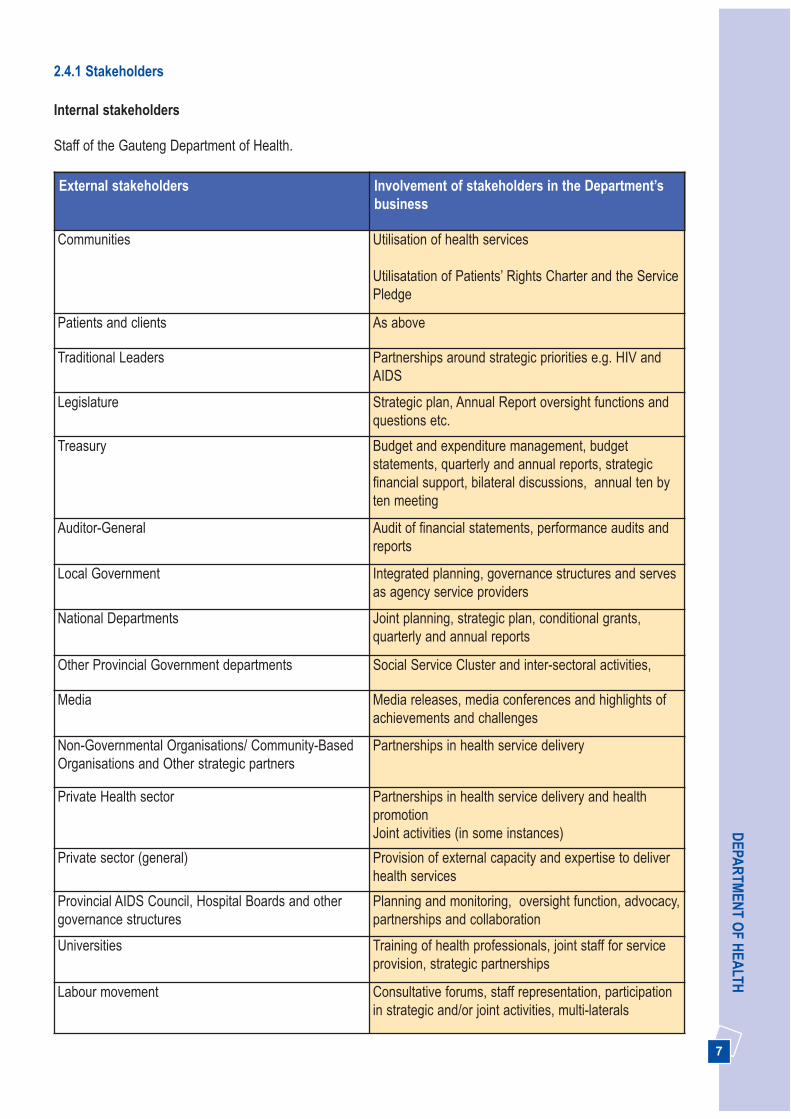
LTH2.4.1 Stakeholders
Internal stakeholders
Staff of the Gauteng Department of Health.
External stakeholders Involvement of stakeholders in the Department’sbusiness
Communities Utilisation of health services
Utilisatation of Patients’ Rights Charter and the ServicePledge
Patients and clients As above
Traditional Leaders Partnerships around strategic priorities e.g. HIV andAIDS
Legislature Strategic plan, Annual Report oversight functions andquestions etc.
Treasury Budget and expenditure management, budgetstatements, quarterly and annual reports, strategicfinancial support, bilateral discussions, annual ten byten meeting
Auditor-General Audit of financial statements, performance audits andreports
Local Government Integrated planning, governance structures and servesas agency service providers
National Departments Joint planning, strategic plan, conditional grants,quarterly and annual reports
Other Provincial Government departments Social Service Cluster and inter-sectoral activities,
Media Media releases, media conferences and highlights ofachievements and challenges
Non-Governmental Organisations/ Community-BasedOrganisations and Other strategic partners
Partnerships in health service delivery
Private Health sector Partnerships in health service delivery and healthpromotionJoint activities (in some instances)
Private sector (general) Provision of external capacity and expertise to deliverhealth services
Provincial AIDS Council, Hospital Boards and othergovernance structures
Planning and monitoring, oversight function, advocacy,partnerships and collaboration
Universities Training of health professionals, joint staff for serviceprovision, strategic partnerships
Labour movement Consultative forums, staff representation, participationin strategic and/or joint activities, multi-laterals
8
AN
NU
AL
REP
OR
T 20
05/2
006
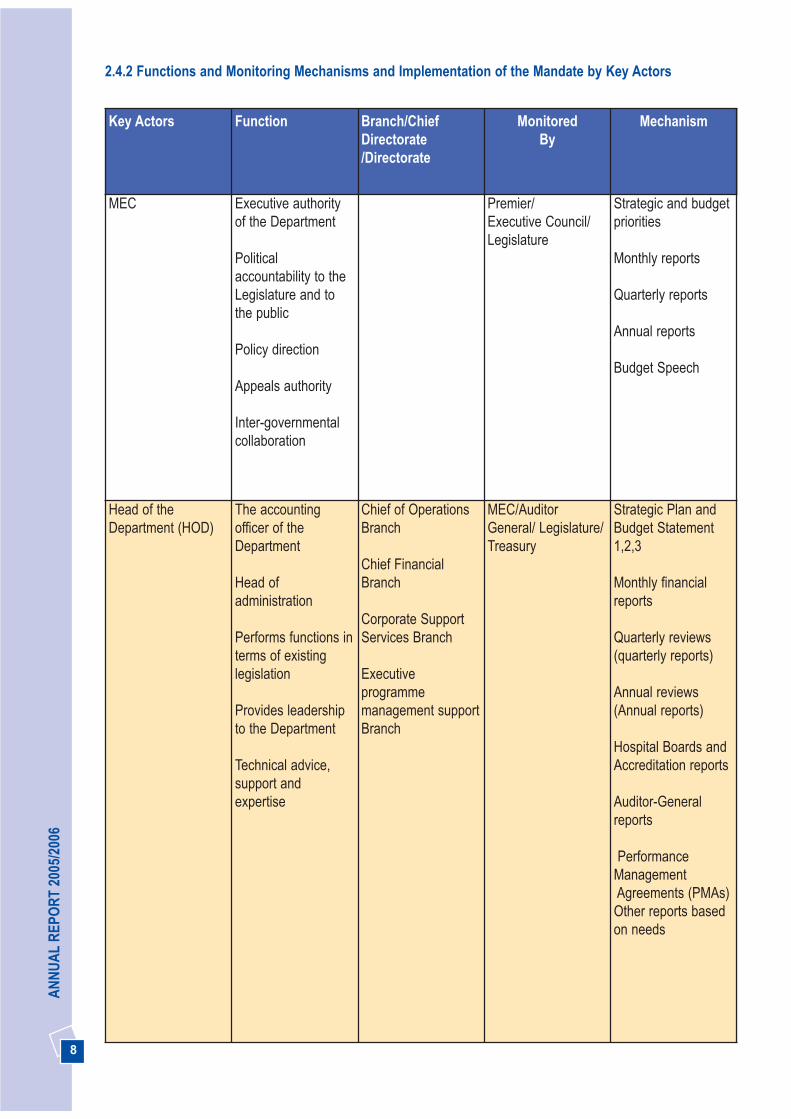
Key Actors Function Branch/ChiefDirectorate/Directorate
Monitored By
Mechanism
MEC Executive authorityof the Department
Politicalaccountability to theLegislature and tothe public
Policy direction
Appeals authority
Inter-governmentalcollaboration
Premier/Executive Council/Legislature
Strategic and budgetpriorities
Monthly reports
Quarterly reports
Annual reports
Budget Speech
Head of theDepartment (HOD)
The accountingofficer of theDepartment
Head ofadministration
Performs functions interms of existinglegislation
Provides leadershipto the Department
Technical advice,support andexpertise
Chief of OperationsBranch
Chief FinancialBranch
Corporate SupportServices Branch
Executiveprogrammemanagement supportBranch
MEC/AuditorGeneral/ Legislature/Treasury
Strategic Plan andBudget Statement1,2,3
Monthly financialreports
Quarterly reviews(quarterly reports)
Annual reviews(Annual reports)
Hospital Boards andAccreditation reports
Auditor-Generalreports
PerformanceManagementAgreements (PMAs)Other reports basedon needs
2.4.2 Functions and Monitoring Mechanisms and Implementation of the Mandate by Key Actors

9
DEPA
RTM
ENT O
F HEA
LTH
Key Actors Function Branch/ChiefDirectorate/Directorate
Monitored By
Mechanism
Chief of Operations(COO)
Ensure efficient,cost-effective andcomprehensivehealth services inGauteng
Health Programmes
Hospital Services
Health ServicesSupport and DistrictHealth services
Health Regions:TshwaneMetsweding,Johannesburg/Westrand Ekurhuleni/Sedibeng
HOD High level businessplans
Monthly reports andquarterly reviewreports
Annual reports
Delegations reports
PMAs
Branch meetings
Senior managementmeetings
Provides strategicdirection, technicaladvice and guidanceto direct reports
Provides support toensureimplementation ofprogrammes
Chief FinancialOfficer (CFO)
Assists theAccounting Officer indischarging theduties prescribed inthe PFMA andannual Division ofRevenue Act relatedto:• Effective financialmanagement, soundbudgeting andbudgetary practices
• The operation ofinternal controlsand the timelyproduction offinancial reports
ManagementAccounting
Revenue andContractManagement
Risk managementand Internal Control
Financial Accounting
Supply chainmanagement
HOD High-level businessplans
Monthly reports andquarterly reviewreports
Annual reports
Delegations reports
PMAs
Branch meetings
Senior managementmeetings
10
AN
NU
AL
REP
OR
T 20
05/2
006
Key Actors Function Branch/ChiefDirectorate/Directorate
Monitored By
Mechanism
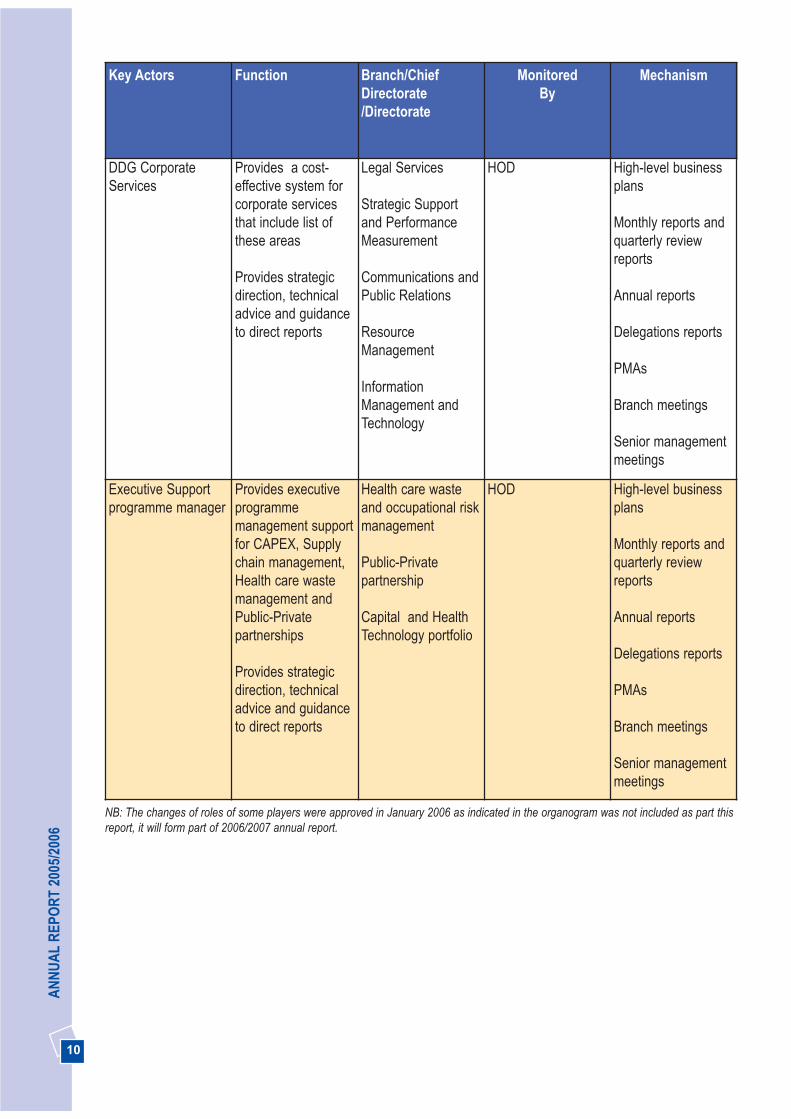
DDG CorporateServices
Provides a cost-effective system forcorporate servicesthat include list ofthese areas
Provides strategicdirection, technicaladvice and guidanceto direct reports
Legal Services
Strategic Supportand PerformanceMeasurement
Communications andPublic Relations
ResourceManagement
InformationManagement andTechnology
HOD High-level businessplans
Monthly reports andquarterly reviewreports
Annual reports
Delegations reports
PMAs
Branch meetings
Senior managementmeetings
Executive Supportprogramme manager
Provides executiveprogrammemanagement supportfor CAPEX, Supplychain management,Health care wastemanagement andPublic-Privatepartnerships
Provides strategicdirection, technicaladvice and guidanceto direct reports
Health care wasteand occupational riskmanagement
Public-Privatepartnership
Capital and HealthTechnology portfolio
HOD High-level businessplans
Monthly reports andquarterly reviewreports
Annual reports
Delegations reports
PMAs
Branch meetings
Senior managementmeetings
NB: The changes of roles of some players were approved in January 2006 as indicated in the organogram was not included as part thisreport, it will form part of 2006/2007 annual report.
11
DEPA
RTM
ENT O
F HEA
LTH
SECTION 3: REPORT ONPERFORMANCE IN BUDGETPROGRAMMES
In compliance with both the Legislature and Treasuryreporting frameworks, this section outlines theperformance of the eight budget programmes of theDepartment for 2005/2006 financial year, namely:
Programme 1: AdministrationProgramme 2: District Health ServicesProgramme 3: Emergency Medical ServicesProgramme 4: Provincial Hospital ServicesProgramme 5: Central Hospital ServicesProgramme 6: Health Training and SciencesProgramme 7: Health Care Support ServicesProgramme 8: Health Facility Management
The Department’s analytical review of programmeperformance in each of the budget programmes isoutlined against the following six strategic goals whichaddress the delivery priorities of the Department.
STRATEGIC GOALS
1. Promote health, prevent and manage illnesses orconditions with emphasis on poverty, lifestyle,trauma and violence, and psychosocial factors
2. Effectively implement the comprehensive HIV andAIDS strategy
3. Strengthen the district health system and provide
caring, responsive and quality health services at alllevels
4. Implement the people’s contract through effectiveleadership and governance
5. Become a leader in human resource developmentand management for health
6. Operate smarter and invest in health technology,communication and management informationsystems
It should be noted that the six strategic goals are cross-cutting in all programmes. Certain goals are addressedmore intensively in certain programmes or parts ofprogrammes. Where possible, the specific strategicgoal being addressed in a particular budget programmeis indicated in the narrative.
For a rapid overview of achievements against thestrategic goals and their specific objectives, see thetables at the end of the sections of each of the eightbudget programmes. In addition the summary of keyachievements will be outlined in section 4 of the annualreport.
3.1 BUDGET PROGRAMME 1:ADMINISTRATION
The administration programme has two sub-programmes – the Office of the Provincial Minister (orMEC) and Management. The purpose of thisprogramme is to provide political and strategic directionand leadership and ensure implementation of all goalsaccording to accepted norms and standards.
Strategic Goal: Promote health, prevent andmanage illnesses or conditions with emphasis onpoverty, lifestyle, trauma and violence andpsychosocial factors

12
AN
NU
AL
REP
OR
T 20
05/2
006
3.1.1 Promotion of Healthy Lifestyles
The Mindset Channel, which was launched byNational Health Department aims at making qualityeducation available to the public and health careworkers. This programme has been extended andreaches patients and staff in hospitals and clinics. Wehave increased the number of sites in the province from40 in 2004/2005 to 112 sites. The Department alsoparticipated for the first time in programmedevelopment, by giving input into the first episode of the “Stop TB – Because We Can!” series, called“Getting in Early”.
3.1.2 Providing rehabilitation and supportfor people with disabilities
Provision of free health services
The Department continues to provide free health carefor people with physical and mental disabilities, andthose receiving social grants. Uniform implementationof free health care remains a challenge. To address thisan in-service training on implementation of nationalpolicies and guidelines has been carried out. Twohundred and fifty one physiotherapists, occupationaltherapists, speech thearapists and audiologists,including administration staff attended trainingsessions. The training included marketing of the healthcare service using posters and pamphlets. Wheelchairusers are able to access free repair services throughthe province’s wheelchair repair workshops, and this isconsidered part of the free health care service.
wheelchairs
Hearing Aids
Artificial limbs
1421
423
644
2003
1793
1244
504
2004
2070
1484
374
20050
500
1000
1500
2000
2500
Fig 1. Gauteng number of Assistive Devices 2003-2005
13
DEPA
RTM
ENT O
F HEA
LTH3.1.3 Providing Clinical Support Services
Pharmaceuticals Services
The Department has revised a new organogram forpharmaceutical services and upgraded posts ofpharmacists to address the challenge of attracting andretaining pharmacists and pharmacist assistants.
The Medicom pharmacy module has been successfullyimplemented at Weskoppies and Pretoria AcademicHospitals. The PharmAssist system, as a stockmanagement solution for non-medicom hospitals, hasbeen implemented in 70% of hospitals. ThePharmAssist was enhanced to include a dispensingprogramme. This has been successfully piloted at thePretoria West Hospital, and will be rolled out to allhospitals.
Pharmacy and therapeutic committees are functioningin 70% of our hospitals. The provincial pharmacy andtherapeutic committee has approved a provincialprotocol formular of drugs to be used at various levelsin the health care system. The formular protocol wasdeveloped as a “guide to accessible and affordablemedicine” and is expected to be launched as part of thePharmacy Week in September 2006.
The Department continues to implement ProjectTokiso to comply with the Pharmacy Act with regards tothe supply and management of medicines and therequirements of good pharmacy practice. The auditconducted in 2004/2005 showed that 80% of Gautenghospitals comply fully with the Pharmacy Act. All thehospital pharmacies have been licensed by the NationalDepartment of Health and recorded by the SouthAfrican Pharmacy Council, as required by legislation.
As a result, in the year under review:• The construction of six new pharmacies was
completed at the Dr Yusuf Dadoo, Kopanong,Edenvale, Weskoppies and Coronation Hospitals.Pholosong and Coronation Hospitals were openedin the year under review and the other pharmacieswill be operational in the 2006/2007 financial year.Construction on new pharmacies at the Heidelberg,Far East Rand, Helen Joseph, Leratong andPretoria regional hospitals is underway. However theprovince still faces a backlog regardinginfrastructure upgrade and development needs forthe pharmacies.
• A total of 163 pharmacist assistants completingtraining in April 2006 for basic pharmacists assistantprogramme will be placed in accredited pharmacies.
Provision of assistive devices
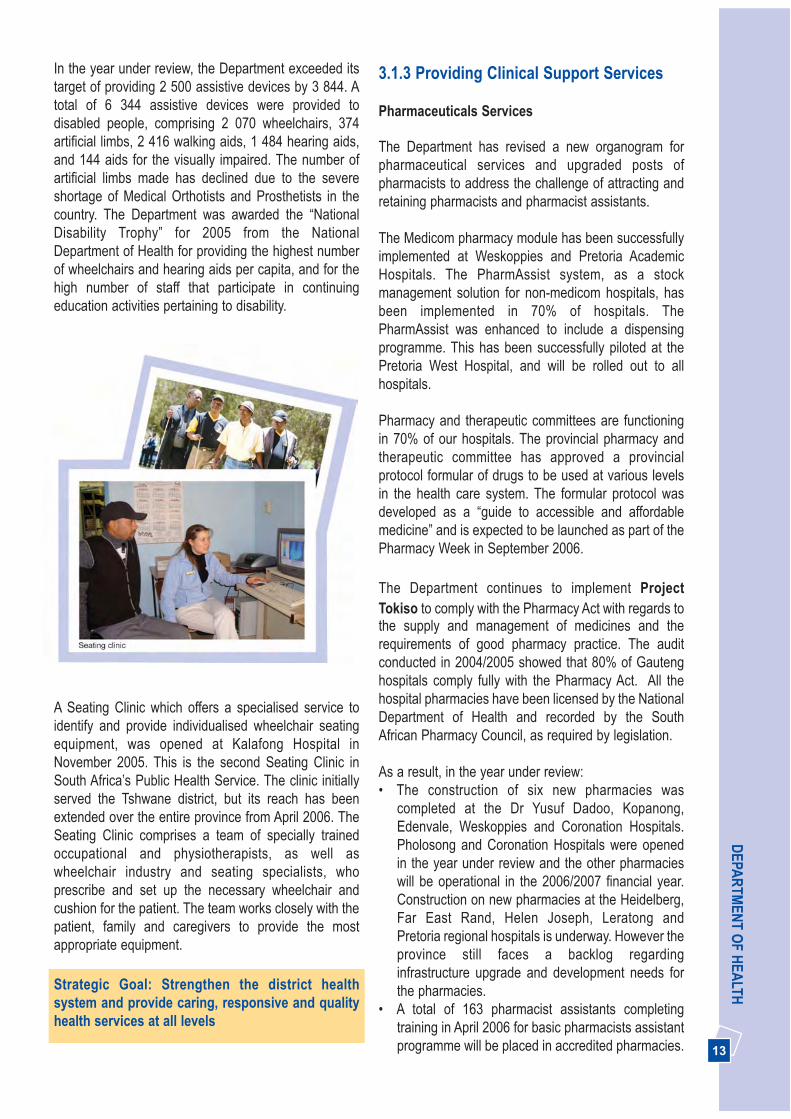
In the year under review, the Department exceeded itstarget of providing 2 500 assistive devices by 3 844. Atotal of 6 344 assistive devices were provided todisabled people, comprising 2 070 wheelchairs, 374artificial limbs, 2 416 walking aids, 1 484 hearing aids,and 144 aids for the visually impaired. The number ofartificial limbs made has declined due to the severeshortage of Medical Orthotists and Prosthetists in thecountry. The Department was awarded the “NationalDisability Trophy” for 2005 from the NationalDepartment of Health for providing the highest numberof wheelchairs and hearing aids per capita, and for thehigh number of staff that participate in continuingeducation activities pertaining to disability.
2 X SUGESSTED PICTURE OF A SEATING CLINIC AND WHHELCHAIRS
A Seating Clinic which offers a specialised service toidentify and provide individualised wheelchair seatingequipment, was opened at Kalafong Hospital inNovember 2005. This is the second Seating Clinic inSouth Africa’s Public Health Service. The clinic initiallyserved the Tshwane district, but its reach has beenextended over the entire province from April 2006. TheSeating Clinic comprises a team of specially trainedoccupational and physiotherapists, as well aswheelchair industry and seating specialists, whoprescribe and set up the necessary wheelchair andcushion for the patient. The team works closely with thepatient, family and caregivers to provide the mostappropriate equipment.
Strategic Goal: Strengthen the district healthsystem and provide caring, responsive and qualityhealth services at all levels

14
AN
NU
AL
REP
OR
T 20
05/2
006
Service Administration (DPSA), which plans to roll outthis programme nationally. It is a great honour to theGauteng Department of Health to have this locallydeveloped programme implemented nationally. Theprogramme’s main strategies are to:
• Establish what behaviours lead to good relationshipsbetween health care users and health care workersin health care institutions.
• Develop a programme that can be used to establishgood relationships between health care users andworkers in the health care institutions in Gauteng.
• Transfer knowledge, skills and attitudes to the frontline workers at the health care institutions to improverelationships between health care users andworkers.
A positive change in behaviours is expected to result inimproved patient satisfaction, a happier staff withimproved job satisfaction, and, in the longer term,reduced attrition and improved recruitment into thehealth services.
Clinical care
The quality of clinical care remains a challenge. TheClinical Audit Tool has been expanded and 26 (90%)hospitals have been audited to assess quality of care,identify and resolve common problem areas. Jobdescriptions of nurses have been finalised and linked tostaff development plans; unit managers receive priorityas the Department has realised that the quality ofsupervision largely determines the quality of clinicalcare. A successful seminar for approximately 100clinicians was held in March 2006 to enable clinicians toshare best practices and update their knowledge onvarious clinical issues.
The province has been instrumental in revitalising theprocess of developing clinical standards nationally, andis planning to increase activities in this regard. Severalclinical policies and guidelines have been developedlocally based on the work of the Serious AdverseEvents Committee, which will contribute to theimprovement of quality of care. All complaints areinvestigated and addressed to reduce possibilities oflitigation. New reporting systems for morbidity andmortality have also been introduced and it is hoped thatthis will result in the early identification of issues thatrequire attention.
• 66 community service pharmacists and 38pharmacist interns have been placed in variousinstitutions.
Laboratory services
A service level agreement has been signed between theDepartment and the National Health Laboratory Service(NHLS) for the provision of laboratory services in2005/2006 financial year. Over 12 million laboratorytests were processed by NHLS in the year underreview.
Blood Services
Significant progress has been made in negotiating aservice level agreement with Blood TransfusionServices, the provider of blood product services in theprovince. The agreement is expected to be signed inthe new financial year.
3.1.4 Improved Quality of Care
Providing people centred care
Customer care
Quality of care continues to be a priority and greatstrides have been made in the year under review. Thetoll-free hotline introduced by the Department in2003/2004 has successfully migrated to the GautengShared Service Centre (GSSC), with the toll freenumber: 0800203886. This move expanded the numberof calls to be managed by the Department and publicaccess to the hotline, with the number of calls forcomplaints or enquiries increasing by 63% (3 573) inthe year under review. Almost half of the calls receivedare now enquiries rather than complaints. It is mostencouraging that members of the community now usethe hotline to obtain information about services as wellas lodging complaints.
Best Practice Programme
The Best Practice Programme was launched in the2004/2005 financial year to build relationships betweenhealth care workers and health service users throughtraining front line workers in health facilities. It has nowbeen rolled out to 11 health care institutions and hasbeen favourably received by staff and service users.The Department welcomes the adoption of our BestPractice Programme by the Department of Public

15
DEPA
RTM
ENT O
F HEA
LTHService excellence awards
Service Excellence Awards is one intervention toimprove the quality of care. The provincial and nationalCecilia Makiwane Nurses Award was awarded to SisterLaurentina Shibambo a rehabilitation unit coordinator,of South Rand Hospital for implementing a BestPractice programme which transformed nurse-patientrelations and clinical audits. The Department is proudthat her achievements have been recognised at thenational level. The Khanyisa Awards recognises andmotivates excellence in service delivery and promotes aculture of Batho Pele Principles. This awards have beenexpanded to include two categories namely: Best Sub-district and Best Emergency Medical Services, outlinedin Addendum C (A).
.SUGGESTED 2 OF PICTURES OF SERVICEEXCELLENCE AWARDS
Accreditation process
The Department continues to implement theaccreditation process in hospitals and communityhealth centres. Twelve hospitals have been accreditedincluding Laudium Community Health Centre. Otherhospitals and community health centres are beingevaluated in line with the programme requirements,including conducting baseline assessments ofcommunity health centres. The Discovery, Soshanguveand Stanza Bopape Community Health Centres havereached the third stage of the accreditation process andare likely to be accredited in 2006/2007 financial year. Arevised tool to assess sustainability is being developedto follow up on accredited institutions.
Reducing waiting times
Waiting times continue to pose a great challenge atclinics and hospitals and are monitored quarterly.Compared to a waiting times assessment in a 2005baseline study, hospital pharmacy waiting timesdecreased by 19% at regional hospitals, and 2% atdistrict hospitals. However waiting times at pharmaciesin the academic hospitals increased by 2% and by 35%in the Outpatient Department due to the renovations atChris Hani Baragwanath Hospital and the relocation ofPretoria Academic Hospital. The difference in waitingtimes is very slight when compared on a quarter toquarter basis.
It is anticipated that new interventions will furtherdecrease waiting times. A total of 68 queue managershave now been trained and are employed in themajority of Gauteng hospitals. The queue managers’presence has significantly improved the waitingexperience of patients. Additional queue managers willbe trained in the 2006/2007 financial year. TheDepartment continues to use technology to furtherimprove queue management. An electronic monitoringsystem aimed at monitoring queing times will be pilotedat Helen Joseph Hospital.
Strategic Goal: Implement the people’s contractthrough effective leadership and governance
3.1.5 Community participation structures
Hospital boards are key to the structured participation ofcommunities in the management of hospitals. The newNational Health Act requires that the MEC for Healthappoint a representative board for each provincialhospital and that the Minister appoints a representativeboard for the central hospitals.
By the end of the current three-year hospital boardsterm of office in December 2005 all provincial hospitalshad functioning boards. All hospitals now havefunctional hospital boards, with the exception ofWeskoppies Hospital, which has too few members toform a quorum. The process of appointing additionalboard members, namely one representative fromassociated universities and one representative perboard from the province and ex-officio members frommanagement and staff, to make up the full complementof the hospital boards required by the Act is underway.An orientation and induction training programme for allnew hospital board members commenced and will becompleted in June 2006.
16
AN
NU
AL
REP
OR
T 20
05/2
006
2 X SUGGESTED PICTURE COMMUNITYPARTICIPATION
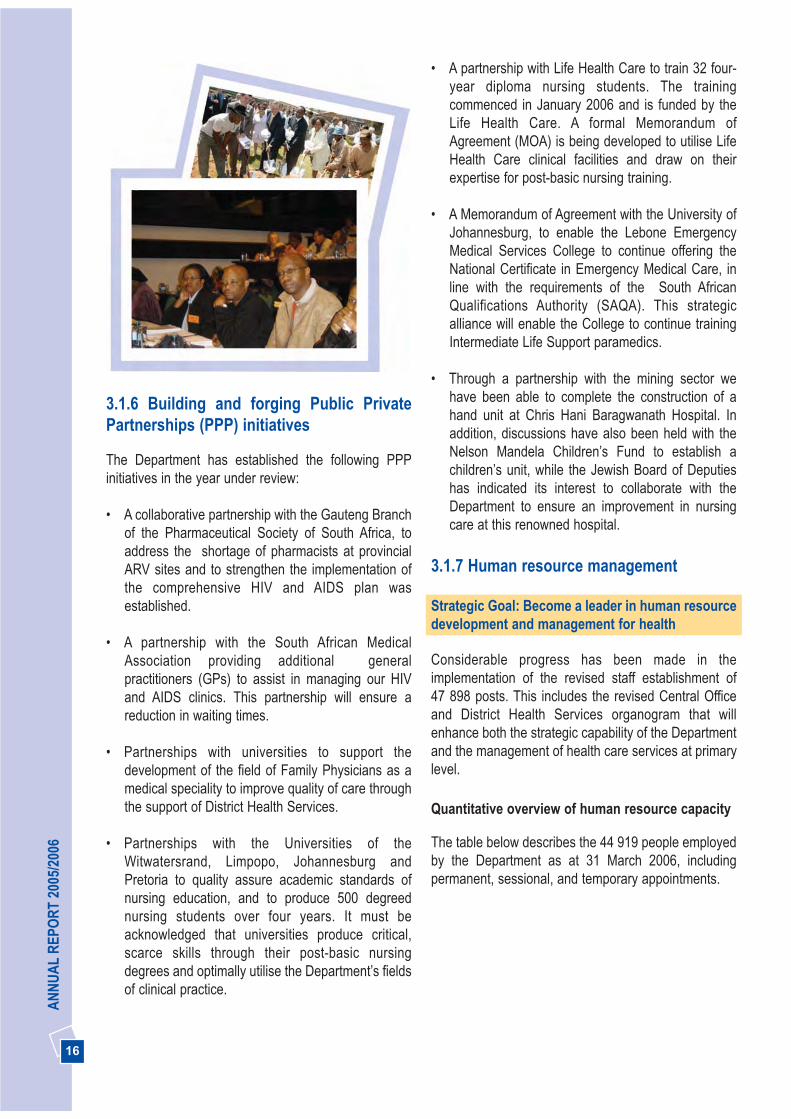
3.1.6 Building and forging Public PrivatePartnerships (PPP) initiatives
The Department has established the following PPPinitiatives in the year under review:
• A collaborative partnership with the Gauteng Branchof the Pharmaceutical Society of South Africa, toaddress the shortage of pharmacists at provincialARV sites and to strengthen the implementation ofthe comprehensive HIV and AIDS plan wasestablished.
• A partnership with the South African MedicalAssociation providing additional generalpractitioners (GPs) to assist in managing our HIVand AIDS clinics. This partnership will ensure areduction in waiting times.
• Partnerships with universities to support thedevelopment of the field of Family Physicians as amedical speciality to improve quality of care throughthe support of District Health Services.
• Partnerships with the Universities of theWitwatersrand, Limpopo, Johannesburg andPretoria to quality assure academic standards ofnursing education, and to produce 500 degreednursing students over four years. It must beacknowledged that universities produce critical,scarce skills through their post-basic nursingdegrees and optimally utilise the Department’s fieldsof clinical practice.
• A partnership with Life Health Care to train 32 four-year diploma nursing students. The trainingcommenced in January 2006 and is funded by theLife Health Care. A formal Memorandum ofAgreement (MOA) is being developed to utilise LifeHealth Care clinical facilities and draw on theirexpertise for post-basic nursing training.
• A Memorandum of Agreement with the University ofJohannesburg, to enable the Lebone EmergencyMedical Services College to continue offering theNational Certificate in Emergency Medical Care, inline with the requirements of the South AfricanQualifications Authority (SAQA). This strategicalliance will enable the College to continue trainingIntermediate Life Support paramedics.
• Through a partnership with the mining sector wehave been able to complete the construction of ahand unit at Chris Hani Baragwanath Hospital. Inaddition, discussions have also been held with theNelson Mandela Children’s Fund to establish achildren’s unit, while the Jewish Board of Deputieshas indicated its interest to collaborate with theDepartment to ensure an improvement in nursingcare at this renowned hospital.
3.1.7 Human resource management
Strategic Goal: Become a leader in human resourcedevelopment and management for health
Considerable progress has been made in theimplementation of the revised staff establishment of 47 898 posts. This includes the revised Central Officeand District Health Services organogram that willenhance both the strategic capability of the Departmentand the management of health care services at primarylevel.
Quantitative overview of human resource capacity
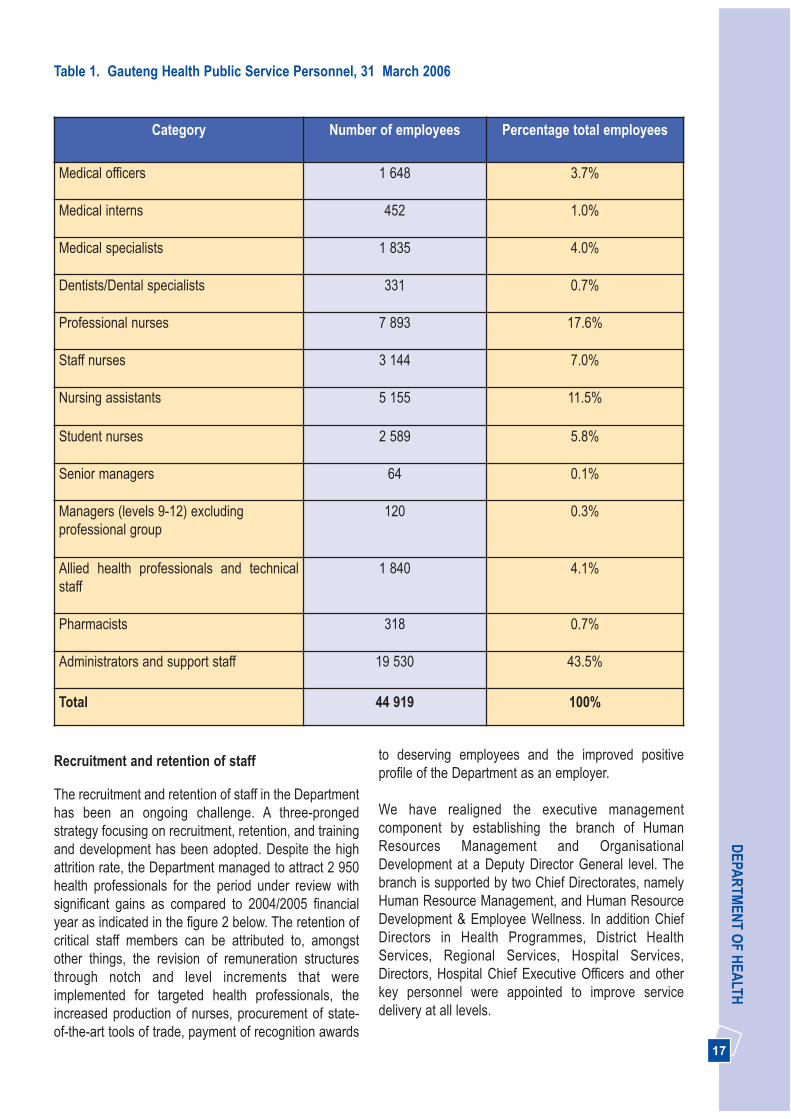
The table below describes the 44 919 people employedby the Department as at 31 March 2006, includingpermanent, sessional, and temporary appointments.
17
DEPA
RTM
ENT O
F HEA
LTH
Recruitment and retention of staff
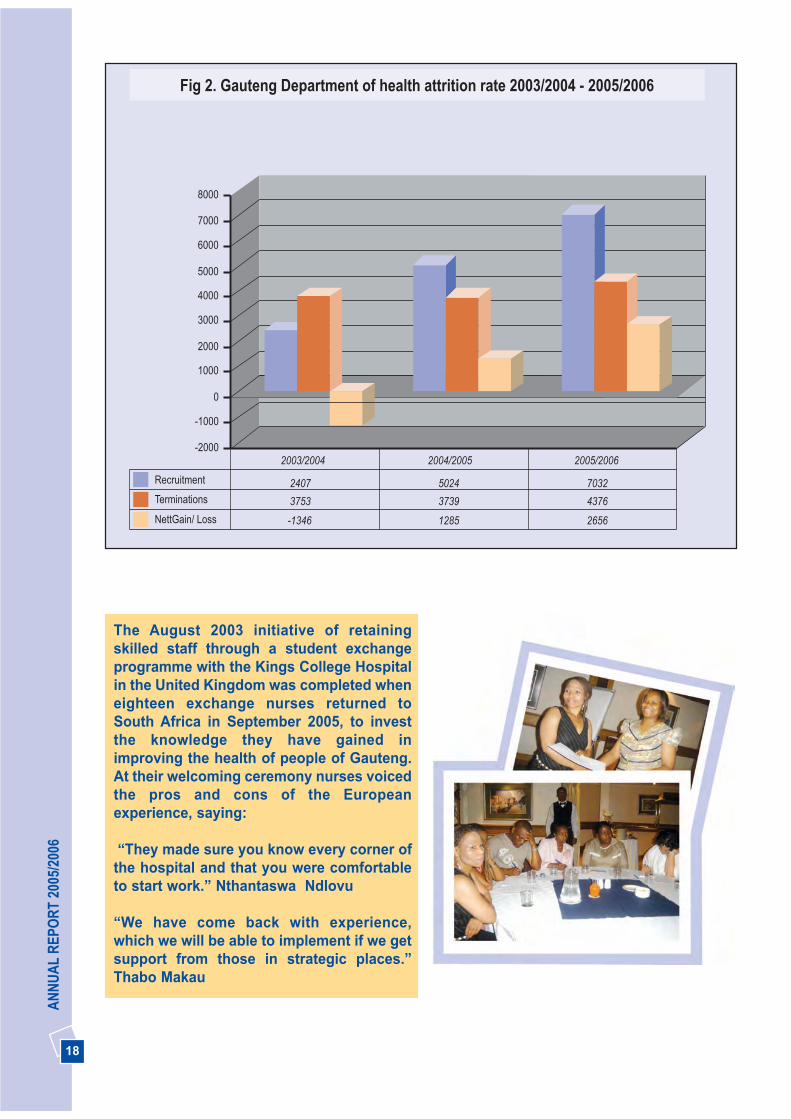
The recruitment and retention of staff in the Departmenthas been an ongoing challenge. A three-prongedstrategy focusing on recruitment, retention, and trainingand development has been adopted. Despite the highattrition rate, the Department managed to attract 2 950health professionals for the period under review withsignificant gains as compared to 2004/2005 financialyear as indicated in the figure 2 below. The retention ofcritical staff members can be attributed to, amongstother things, the revision of remuneration structuresthrough notch and level increments that wereimplemented for targeted health professionals, theincreased production of nurses, procurement of state-of-the-art tools of trade, payment of recognition awards
to deserving employees and the improved positiveprofile of the Department as an employer.
We have realigned the executive managementcomponent by establishing the branch of HumanResources Management and OrganisationalDevelopment at a Deputy Director General level. Thebranch is supported by two Chief Directorates, namelyHuman Resource Management, and Human ResourceDevelopment & Employee Wellness. In addition ChiefDirectors in Health Programmes, District HealthServices, Regional Services, Hospital Services,Directors, Hospital Chief Executive Officers and otherkey personnel were appointed to improve servicedelivery at all levels.
Category Number of employees Percentage total employees
Medical officers 1 648 3.7%
Medical interns 452 1.0%
Medical specialists 1 835 4.0%
Dentists/Dental specialists 331 0.7%
Professional nurses 7 893 17.6%
Staff nurses 3 144 7.0%
Nursing assistants 5 155 11.5%
Student nurses 2 589 5.8%
Senior managers 64 0.1%
Managers (levels 9-12) excludingprofessional group
120 0.3%
Allied health professionals and technicalstaff
1 840 4.1%
Pharmacists 318 0.7%
Administrators and support staff 19 530 43.5%
Total 44 919 100%
Table 1. Gauteng Health Public Service Personnel, 31 March 2006
18
AN
NU
AL
REP
OR
T 20
05/2
006
The August 2003 initiative of retainingskilled staff through a student exchangeprogramme with the Kings College Hospitalin the United Kingdom was completed wheneighteen exchange nurses returned toSouth Africa in September 2005, to investthe knowledge they have gained inimproving the health of people of Gauteng.At their welcoming ceremony nurses voicedthe pros and cons of the Europeanexperience, saying:
“They made sure you know every corner ofthe hospital and that you were comfortableto start work.” Nthantaswa Ndlovu
“We have come back with experience,which we will be able to implement if we getsupport from those in strategic places.”Thabo Makau
-2000
-1000
0
1000
2000
3000
4000
5000
6000
7000
8000
Recruitment 2407 5024 7032
Terminations 3753 3739 4376
NettGain/ Loss -1346 1285 2656
2003/2004 2004/2005 2005/2006
Fig 2. Gauteng Department of health attrition rate 2003/2004 - 2005/2006

19
DEPA
RTM
ENT O
F HEA
LTHIn September 2005 the Department conducted a surveyof all central office staff to measure staff satisfactionlevels with regards to their work environment andrelationship to management. Of those who responded:
• 40% of health professionals and managers do notbelieve they have good prospects for promotion,whilst 60% do believe;
• Most staff have nowhere to relax and take a break;• 84% feel the temperature in the building is not
comfortable during either summer and winter;• 49% of administrative staff do not feel safe at work;• 51% do not believe that enough staff meetings are
held, and that those held are not constructive;• A large number of health professionals and
managers believe that they do not get enough notice
of meetings and cannot plan for other commitments;The outcome of this study will assist the Department todevelop strategies that will improve the workingenvironment and conditions of service, and thuscontribute to staff retention.
Employment equity
The Department embraces the ideals of theEmployment Equity Act and regard it as best practice tobroaden participation and employment of designatedgroups to reflect the demographic profile of our country.This is evident in the composition of the staff profile,which is 88 % black (exceeding the 70% equity target)and 77% female, of which 89 % are black as indicatedin the table below:
Table 2. Gauteng Department of Health according to race and gender
Race All Personnel Women
African 37 193 29 452
Coloured 1 136 943
Indian 1 168 651
White 5 422 3 699
Total 44 919 34 745
Women account for 59% of senior and middle management positions. The Department has strengthenedmanagement capacity at chief director level resulting in the Senior Management Team comprising of two womenat Deputy Director General level, and seven female Chief Directors and fifteen female Directors. However thereis still a challenge of women in clinical senior management positions as indicated in figure 3 below.
Management Female, 25, 9%
Medical,Female, 50, 17%Management Male, 41, 14%
Medical Male, 177, 60%
Fig 3. Gauteng Department of Health composition of clinical senior management
20
AN
NU
AL
REP
OR
T 20
05/2
006
The Department is also continuing with the strategy ofappointing retired nurses on six month contract basis inan effort to reinstil the ethics and ethos of nursing.
Gender Mainstreaming
The Department continues to be seen as promotinggender issues in the province through departmentalfestivities such as the Women’s Month Celebration,which was coupled with the Gender Summit thatattracted more than 300 delegates from all institutions.The Department also organised events to mark the 16Days of No Violence against Women and Children, thelaunch of policies and guidelines regardingmanagement and prevention of sexual harassment,and the unveiling of the Gauteng Department of HealthWomen’s Collage at the Women’s Day Celebration.
SUGGESTED PICTURE OF WOMENS COLLGE ANDWOMENS CELEBRATION
Performance management
All institutions have continued to implement thePerformance Management and Development System.Human Resources have developed monitoringguidelines to assist regions and institutions to ensure compliance in implementation of PerformanceAgreements for Chief Executive Officers (CEOs). Thetool has been customised to ensure that CEOs’performance is assessed on the same areas.Consultations on the tool commenced at the recentCEO Imbizo. A standardised tool for performanceagreements of senior clinicians has also beendeveloped.
3.1.8 Workplace HIV and AIDS andEmployee Wellness Programme
The Department’s Employee Wellness Programme thatincludes the Employee Assistance Programme (EAP),HIV and AIDS work place and the Occupational Health
and Safety (OHS) programmes commenced in2004/2005 and is accessed by all our staff members. Theutilisation rate thereof is 11% for the year under review. Two new programmes were launched during the year,namely: • A management of Violence in the Workplace
Programme, which was implemented as a pilotproject in collaboration with the International LabourOrganisation (ILO), International Council of Nurses(ICN), World Health Organisation (WHO) and PublicService International (PSI). To date 300 employeeshave been trained. The ILO visited the Departmentto extend personal congratulations for theimplementation of the pilot programmme.
• A “Care for the caregiver” programme focusing oncreation of support groups for healthcare workers,in partnership with Democratic nurses of SouthAfrica (DENOSA) and the Canadian InternationalDevelopment Agency (CIDA) was launched inFebruary 2006. This programme is being piloted atChris Hani Baragwanath Hospital.
3.1.9 Labour Relations Management
The Department’s effort to facilitate adherence to labourrelations management standards has resulted in areduction in the number of labour disputes in theDepartment. A total of 108 disputes were declaredduring the year under review.
Almost all Gauteng Health institutions have appointedfulltime dedicated Labour Relations Officers and theDepartment is finalising other appointments of LabourRelations Officers and middle managers to strengthenits capacity to effectively manage labour relationsissues. In addition, five senior managers have beentrained on Labour Relations Management and 16Labour Relations Officers on Industrial Relations. Theincreased capacity, training and awareness of labourrelations issues resulted in the number of misconductcases reported dropping from 216 in 2004/2005 to 181in 2005/2006, and the number of misconduct casesrelated to fraud and theft dropping by 38% in the sameperiod.
In addition a comprehensive handbook on labourrelations guidelines on resolutions and procedures hasbeen developed for staff, enabling them to comply withlabour relations procedures. This contributed to adramatic reduction of strike days from 3 106 in2004/2005 to 163 in the year under review, and enabledthe Department to recover funds from employeesengaged in illegal strike action.

21
DEPA
RTM
ENT O
F HEA
LTHprogress has been made in validating data to ensurequality support of decision-making.
3.1. 11 Implementation of an effectivecommunication strategy
Different forms of communication have been used topackage and disseminate information about healthservices. Targeted internal and external stakeholdersreceive a monthly newsletter and the bi-monthly “HealthTalk” newsletter.
A six month agreement was negotiated with numerouslocal radio stations to market health services andeducate the public about the correct use of EmergencyMedical services (ambulances) and other Departmentalhealth services. The agreements were with Jozi FM,Moretele CR, Radio Soshanguve, VCR Stereo, RadioImpact, Radio TNG, Tuks FM, Iscorian and East Randcommunity radio stations. In addition a similarcampaign was run through the South AfricanBroadcasting Corporation (SABC) radio stations fromAugust 2005 to February 2006, reaching 21.8 millionlisteners per week. These stations were Umkhozi,Lesedi, Thobela, Phalaphala, Mughana Lonene,Mothtsweding, RSG and SA FM.
Communications about specific programmes such asHIV and AIDS and Healthy Lifestyles have beendecentralised to ensure that targeted messages arecommunicated closer to the service delivery point.
The outcome of Imbizos resolutions held in theDepartment with Gauteng Provincial GovernmentExecutive Council and outreach meetings with allmunicipalities and sub-districts are communicated to allmanagers for implementation.
3.1.12 Financial management
Improve Financial Management
Financial Management is crucial to the successfulfunctioning of the Department since it relates to howavailable resources have been utilised. TheDepartment’s objective of improving financialmanagement was guided by the requirements anddirectives of the Public Finance Management Act(PFMA), Treasury regulations and the Division ofRevenue Act, whose short and long term vision isensuring that sound financial management isimplemented and practised.
The 20 internal Labour Appeal cases that wereoutstanding in 2004/2005 financial year, have beenfinalised and appeals are now being dealt with as theyarise.
A summit with organised labour was held to follow up onthe 2004 Gauteng Provincial Government Public HealthSummit, during which organised labour andgovernment committed themselves to act in unison toaddress the ongoing challenges of transforming theState to ensure effective service delivery. The 2005summit acknowledged the alignment of theDepartmental, Provincial and National priorities, andthe resolutions agreed and signed by both partiesincluded the following pledge:
“We pledge to work together to intensify servicedelivery, recognising that this goes beyond theneed to treat our people with courtesy and respectand involves the entire service delivery value chainto ensure effective service delivery - BATHO PELE.The Gauteng Provincial Government five yearstrategic priorities as adopted in the Public ServiceSummit will remain our guiding priorities. Wefurther pledge to work together at all levels of hepublic health service and peoples contract to builda better Gauteng, fight poverty and better serve thepeople of our province.”
Strategic goal: Operate smarter and invest in healthtechnology, communication and managementinformation systems
3.1.10 Establishing Integrated ManagementInformation System (MIS)
The Information Technology and ManagementInformation strategic plan was finalised during the yearunder review and is now awaiting approval. The plan isaimed at ensuring the integration of various healthinformation systems and databases and thestreamlining of information flows to deliver quality datato support sound planning and decision-making.
The Management Information System is currently beingrolled out through the District Health InformationSystem Software (DHISS) and is implemented in allhospitals and clinics. The DHISS is a nationallyprescribed data set that carries aggregated data basedon nationally agreed data elements for hospitals andclinics. During the year under review significant

22
AN
NU
AL
REP
OR
T 20
05/2
006
Greater emphasis was put on the following financialmanagement functional areas:• Aligning strategic planning and budgeting processes
and linking Departmental priorities to the budget;• Reviewing the internal control environment and
improving financial controls; • Ensuring that the accounting treatment of
transactions is in line with prescribed modified cashbasis of accounts;
• Improving the integrity of financial information byanalysing and reconciling information from standalone systems to the financial information containedin the Basic Accounting System (BAS);
• Supporting and building financial capacity throughfinancial training initiatives at institutions andimproved management reporting within theinstitutions.
The challenge has been and still is the lack of financialskills. This is being addressed through trainingprogrammes developed by the Department’s humanresource training and development unit and otheraccredited financial training sources.
Structure and systems
The Department has established a FinancialAccounting directorate to strengthen financialmanagement to comply with the provisions of thePFMA, Treasury regulations and best practiceaccounting in areas that were previously neglected.
Tremendous effort was put into setting up systems toreconcile stand alone systems, patient debtors,inventory and personnel to the Basic AccountingSystem (BAS) financial system.
Cost Centre Management
Managers at institutional level need more tools toeffectively manage their operations. Improved financialknowledge and operational financial systems allowthem to gain a thorough understanding of theiroperations and the ability to manage their expenditureagainst budget. Cost Centre Management enablesmanagers to understand their cost drivers and theimpact of inflationary increases in medical, blood andblood related costs, coupled with a shrinking of theirbudgets in real terms.
Cost Centre Management and reporting as aninnovative tool to address this need is critical. Hospitalshave currently implemented manual cost centres, andan automated reporting system, is now being rolled out.
The tool was introduced to enable the Department torun cost centre management reports and so assistmanagers to make decisions and to improveefficiencies in the hospitals. The system is functioning atthe Far East Rand Hospital and will be implemented inthree central hospitals in the 2006/2007 financial year.
Revenue generation
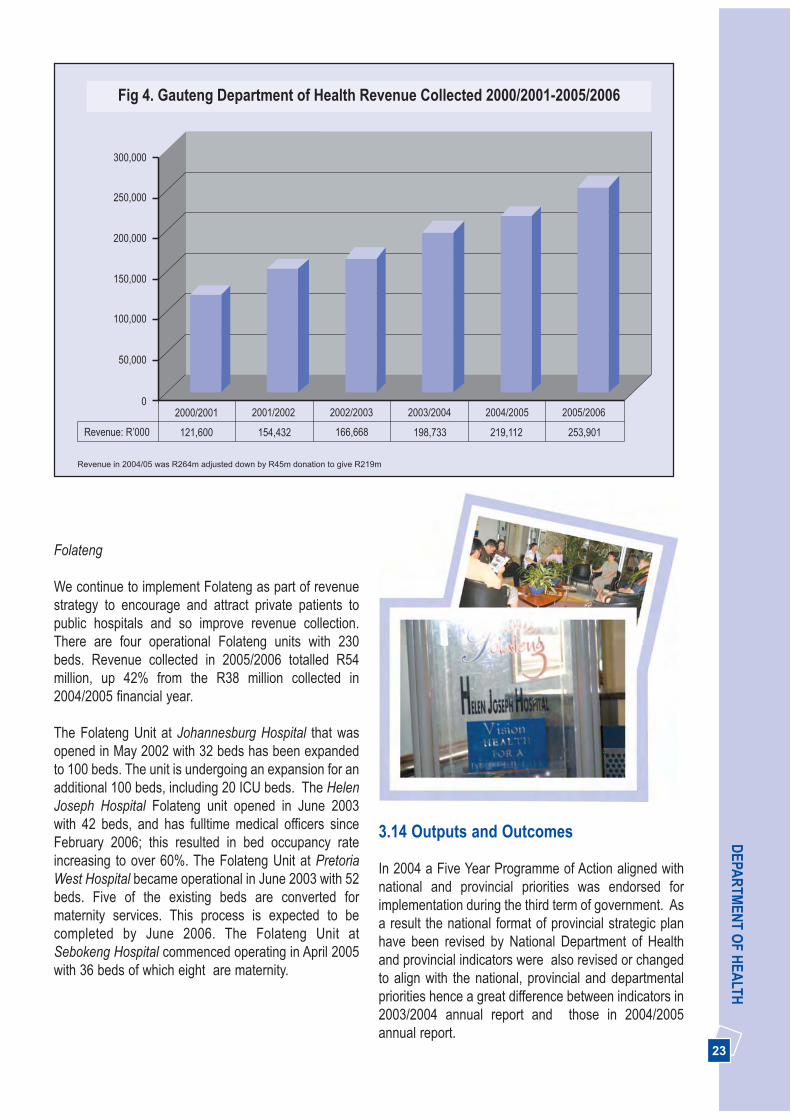
Patient fees are the main source of income for theDepartment. The Department has a revenue retentionagreement with the Provincial Treasury. Over the pastfive years revenue has increased by 65%, from R154.4million in 2001/2002 to R254 million in 2005/2006financial year. This constitute an increase of 16.2% fromthe previous financial year.
23
DEPA
RTM
ENT O
F HEA
LTH
Folateng
We continue to implement Folateng as part of revenuestrategy to encourage and attract private patients topublic hospitals and so improve revenue collection.There are four operational Folateng units with 230beds. Revenue collected in 2005/2006 totalled R54million, up 42% from the R38 million collected in2004/2005 financial year.
The Folateng Unit at Johannesburg Hospital that wasopened in May 2002 with 32 beds has been expandedto 100 beds. The unit is undergoing an expansion for anadditional 100 beds, including 20 ICU beds. The HelenJoseph Hospital Folateng unit opened in June 2003with 42 beds, and has fulltime medical officers sinceFebruary 2006; this resulted in bed occupancy rateincreasing to over 60%. The Folateng Unit at PretoriaWest Hospital became operational in June 2003 with 52beds. Five of the existing beds are converted formaternity services. This process is expected to becompleted by June 2006. The Folateng Unit atSebokeng Hospital commenced operating in April 2005with 36 beds of which eight are maternity.
3.14 Outputs and Outcomes
In 2004 a Five Year Programme of Action aligned withnational and provincial priorities was endorsed forimplementation during the third term of government. Asa result the national format of provincial strategic planhave been revised by National Department of Healthand provincial indicators were also revised or changedto align with the national, provincial and departmentalpriorities hence a great difference between indicators in2003/2004 annual report and those in 2004/2005annual report.
300,000
250,000
200,000
150,000
100,000
50,000
02000/2001 2001/2002 2002/2003 2003/2004 2004/2005 2005/2006
Revenue: R’000 121,600 154,432 166,668 198,733 219,112 253,901
Fig 4. Gauteng Department of Health Revenue Collected 2000/2001-2005/2006
������������� ����������������������������� �����������������������

24
AN
NU
AL
REP
OR
T 20
05/2
006
The national indicators outlined in 2004/2005 annualreport were based on the new national format forprovincial strategic plans which were implemented in2005/2006 financial year. Indicators which were notreported in the 2004/2005 annual reports are notreported as part of the 2005/2006 annual report. Furtherrevision of national provincial strategic plans formatresulted in some indicators prescribed by NationalHealth and National Treasury for the annualperformance plans of 2004-07 and 2005-08 differingwith indicators in the precribed format of annual reportfor Health Departments in the country.
Table 4. 2005/2006 Budget statement outputs and service delivery trends for Administration programme
Description ofoutput
Unit of Measure 2004/2005(actual)
2005/2006(target)
Progress made towards theachievement of the outputs2005/2006
Health promotionprogramme toaddress key riskfactors
Number of hospitals andPHC facilities withmultimedia healthpromotion programme
40 12 112
Target exceeded
Signed district healthplans in all districtsaccording to thedistrict healthplanning guidelines
Percentage of districtswith district health plansaccording to the districthealth planningguidelines
100 100 100
Target achieved
Provide assistivedevices to peoplewith disabilities
Number of assistivedevices issued
3 820 2 500 Manual Wheelchairs = 2 018Motorised wheelchairs = 52 Hearing Aid = 1 484 Artificial Limbs = 374 Walking Aids = 2 416Visual impaired aids = 144Total = 6 3 44
Target exceeded
Since 1994, significant progress has been made withplanning processes, alignment with budget, informationdata sets and systems, and setting and measurementof indicators. More work needs to be done to improvedata quality and to ensure consistency in measurementof these different indicators. This has resulted in theimprovement of quality of information andcompleteness thereof.

25
DEPA
RTM
ENT O
F HEA
LTHDescription of output Unit of Measure 2004/2005
(actual)2005/2006
(target)Progress madetowards theachievement of theoutputs 2005/2006
Improved pharmaceuticalmanagement of stock
Percentage compliance ofhospital pharmacies withannual stock taking
100 100 100
Target achieved
Availability of medicines onEssential Drug List (EDL)
Percentage of hospital andregional pharmacies withEDL medicines
98 98 98
Target achieved
Implementation ofintegrated Health wellnessprogramme
Percentage of institutionswith a dedicated Health andwellness programmechampion/coordinator
# 100 100
Target achieved
Implementation andmaintenance of theprescribed staffperformance managementsystem
Percentage of provincialhospitals and clinicsimplementing the prescribedsystem
100 100 100
Target achieved
Recruitment and retentionof staff
Attrition rate for - Permanent Doctors(excluding interns andcommunity service medicalofficers)
- Professional nurses
#
#
30
7
21.2
Target exceeded
8.9
Nurses leaving theDepartment to othercountries and privatesector
Employment equity Percentage of women insenior management positions
40Management
excludingclinical
42 25.3
Combined figure forsenior clinical (21.9)and management(37.5) positions with achallenge of women inclinical senior positions.This includes loss ofClinical Professionals atsenior managementlevel and impact ofuniversity strategy forregistrar training
26
AN
NU
AL
REP
OR
T 20
05/2
006
Description of output Unit of Measure 2004/2005(actual)
2005/2006(target)
Progress madetowards theachievement of theoutputs 2005/2006
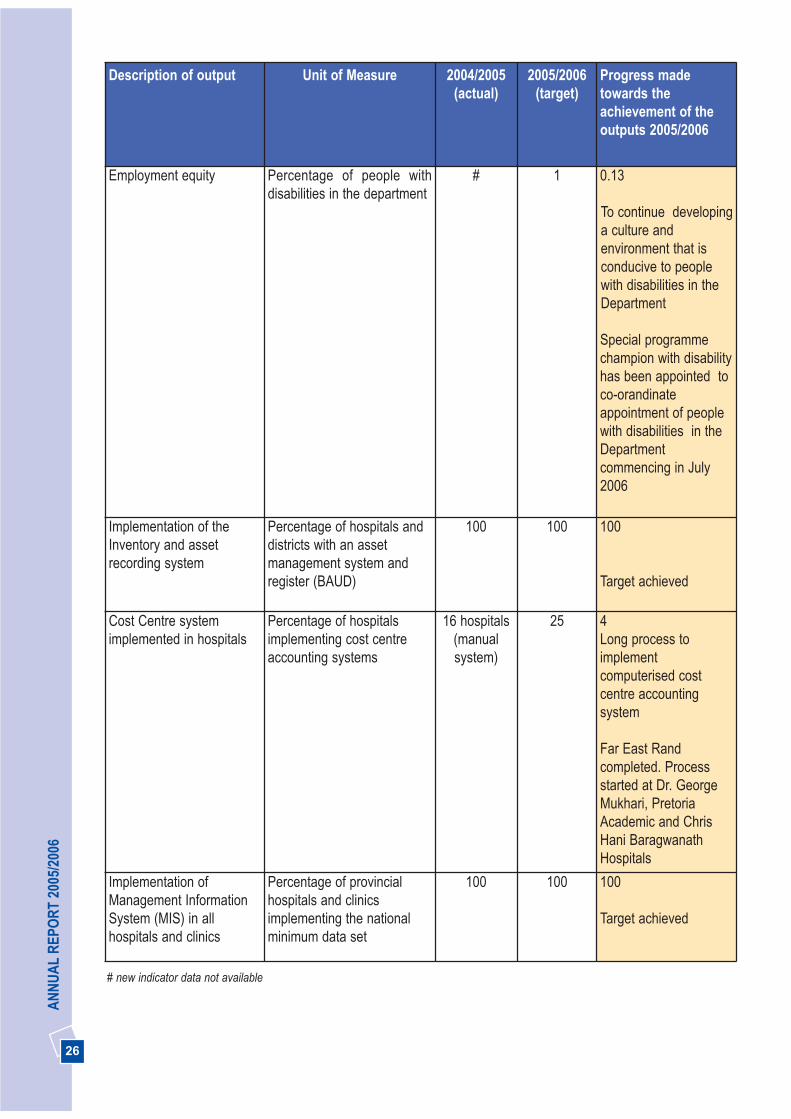
Employment equity Percentage of people withdisabilities in the department
# 1 0.13
To continue developinga culture andenvironment that isconducive to peoplewith disabilities in theDepartment
Special programmechampion with disabilityhas been appointed toco-orandinateappointment of peoplewith disabilities in theDepartmentcommencing in July2006
Implementation of theInventory and assetrecording system
Percentage of hospitals anddistricts with an assetmanagement system andregister (BAUD)
100 100 100
Target achieved
Cost Centre systemimplemented in hospitals
Percentage of hospitalsimplementing cost centreaccounting systems
16 hospitals(manualsystem)
25 4Long process toimplementcomputerised costcentre accountingsystem
Far East Randcompleted. Processstarted at Dr. GeorgeMukhari, PretoriaAcademic and ChrisHani BaragwanathHospitals
Implementation ofManagement InformationSystem (MIS) in allhospitals and clinics
Percentage of provincialhospitals and clinicsimplementing the nationalminimum data set
100 100 100
Target achieved
# new indicator data not available
27
DEPA
RTM
ENT O
F HEA
LTH
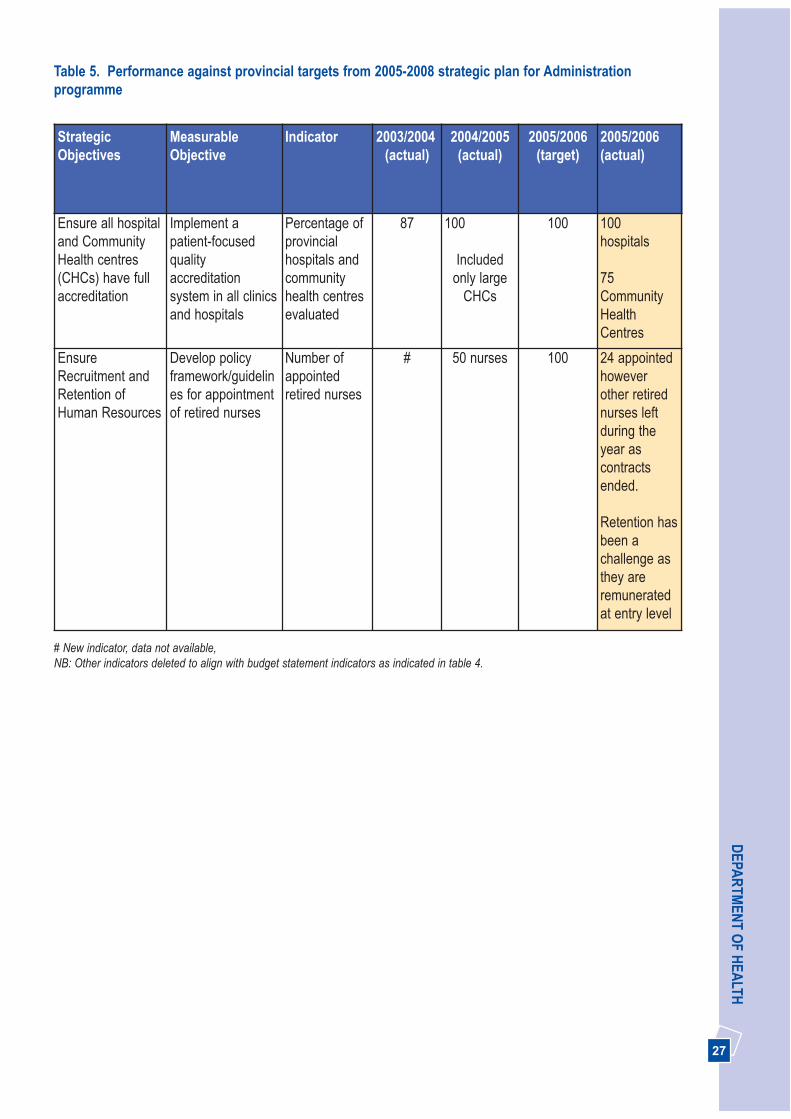
StrategicObjectives
MeasurableObjective
Indicator 2003/2004(actual)
2004/2005(actual)
2005/2006(target)
2005/2006(actual)
Ensure all hospitaland CommunityHealth centres(CHCs) have fullaccreditation
Implement apatient-focusedqualityaccreditationsystem in all clinicsand hospitals
Percentage ofprovincialhospitals andcommunityhealth centresevaluated
87 100
Includedonly large
CHCs
100 100hospitals
75CommunityHealthCentres
EnsureRecruitment andRetention ofHuman Resources
Develop policyframework/guidelines for appointmentof retired nurses
Number ofappointedretired nurses
# 50 nurses 100 24 appointedhoweverother retirednurses leftduring theyear ascontractsended.
Retention hasbeen achallenge asthey areremuneratedat entry level
Table 5. Performance against provincial targets from 2005-2008 strategic plan for Administrationprogramme
# New indicator, data not available, NB: Other indicators deleted to align with budget statement indicators as indicated in table 4.

Indicator Type 2003/2004(actual)
2004/2005(actual)
2005/06(target)
2005/06(actual)
Nationaltarget
2007/08
Input
1. Medical officers per100,000 people
No 33.70 28.61 31.87 43.62* 18.7
2. Professional nurses per100,000 people
No 97.77 66.22 73.95 87.51* 105
3. Pharmacists per100,000 people
No 3.03 2.82 2.91 3.52* 3.4
Process
4. Vacancy rate forprofessional nurses
% 36.10 26.87 17.45 23 15
5. Attrition rate for doctors % 35.82 33.81 33.00 21.2 25
6. Attrition rate forprofessional nurses
% 8.50 11.44 7** 8.9 Nurses leaving theDepartment to othercountries and privatesector
25
7. Absenteeism forprofessional nurses
% 2 2.8 2.7 2.91An increase might berelated to HIV and AIDS
5
Efficiency
8. Nurse clinical workload(PHC)
No 3.73 5.6 5.8 30 patients seen perday. patients seen atPHC facilities increased
-
9. Doctor clinical workload(PHC)
No 0.20 0.31 0.32 An average ratio of5.12Patients seen at PHCfacilities increased
-
Outcome
10. Supernumerary staff asa percentage ofestablishment
% 0 0 0 0-
0
28
AN
NU
AL
REP
OR
T 20
05/2
006
Table 6. Performance against standard national indicators from 2005-2008 strategic plan for Administrationprogramme (Human Resource Management)
* Based on 2005 Mid-year population estimates ** target was changed from 9.5% to 7% to align with budget statement NB: Seven indicators not included in the strategic plan and annual report is due to lack of well established systems to collect data
29
DEPA
RTM
ENT O
F HEA
LTH
.
3.2 BUDGET PROGRAMME 2:DISTRICT HEALTH SERVICES
District Health Services has four sub-programmes,rendering comprehensive primary health care services,district hospital services, comprehensive HIV and AIDScare, nutrition, including the delivery of priority healthprogrammes.
Strategic Goal: Strengthen the district healthsystem and provide caring, responsive and qualityhealth services at all levels
3.2.1 Planning and monitoring of districthealth services
The District Health System (DHS) is the vehicle torender comprehensive primary health care (PHC)services to communities and is the cornerstone of theNational Health System. Its role is to strengthen PHCservices by improving access to quality and cost effectivehealth care services, and community participation.
Additional funds have been allocated to the UrbanRenewal Nodes in Alexandra and Kliptown (City ofJohannesburg) and Bekkersdal (West Rand DistrictCouncil) to strengthen PHC services.
During the year business plans to strengthen theDistrict Health System were implemented. This focuses
on recruitment of personnel including Family Physicians,procurement of equipment and establishing a budget toimprove after-hours accessibility of the services.
All health districts and health sub-districts are alignedwith municipal boundaries. The Department isworking through the Department of Local Governmentwith North West and Mpumalanga provinces on thetransfer of services to Gauteng in accordance with theDisestablishment of Cross boundary Municipalitieslegislation.
The Minimum Data Set within the District HealthInformation System (DHIS) ensures that we submit jointquarterly reports to the Provincial Health Council.Approximately 80% of managers have been trained onthe system to ensure effective district planning.
3.2.2 Improving quality and efficiency ofPHC service
The Department continues to provide PHC servicesjointly with local government. The Departmentsubsidises local government for the provision of primaryhealth services through cash transfer payments,supplying EDL drugs and surgical sundries, paying forlaboratory investigations and seconding personnel towork in local government facilities.
The Service Improvement Plan currently beingimplemented requires that services and resources beshifted from hospitals to PHC services within the DistrictHealth System over time. As a result a stronger referralsystem is being implemented so that patients aretreated at the appropriate level in the health system.This will ensure sustainability and improve efficiencies.The planned shift in services and resources includesthe expansion of home-based care (HBC) and step-down beds.
The annual District Health Expenditure Reviews(DHER) have been completed for 2004/2005 for all sixhealth districts and the process for 2005/2006 isunderway. The reviews will culminate in thedevelopment of joint district health plans in line withthe National Health Planning Guidelines. Serviceutilisation figures have increased significantly.
PHC services were strengthened through theimplementation of a Clinic Supervisory Manual. Clinicsupervisory visits were conducted in 85% of sub-
30
AN
NU
AL
REP
OR
T 20
05/2
006
districts with monthly monitoring reports beingsubmitted for primary health care services, priorityprogrammes and drug supply.
The annual Primary Health Care ResearchConference, held in September 2005 attractedapproximately 500 professional staff from all disciplinesand papers on a variety of primary health care andpriority programmes were presented.
3.2.3 Providing access to primary healthcare and emergency medical services
The free primary health care services has improvedaccess to health care and patient visits have increasedfrom 10.4 million in 2002 to 14.1 million in 2005/2006.Utilisation figures are on the increase with visits percapita in the province rising from 1.5 in 2004/2005 to1.9 in 2005/2006
Operating hours have been extended in 73% of sub-districts, to improve accessibility and to offer after-hourand emergency services. Partnerships have beenforged with universities to promote the development ofFamily Physicians as a medical speciality in order toprovide support to the District Health Services andthereby improve after-hour services and care.
The geographic accessibility and range of the PHCservices available have been improved by the openingof Community Health Centres in Stanza Bopape,Stretford and Mario Rantho in Soshanguve, includingthe Ramokonopi Midwife and Obstetric Unit (MOU) tobe officially opened in 2006/2007 financial year and the
secondment of provincial personnel to localgovernment clinics.
3.2.4 Strengthening of the District Health System
In alignment with the National Health Act of 2005, theProvincial Health Council was established, quarterlymeetings take place between the Department andmunicipalities to ensure cooperative governance andintegrated health services. The Provincial HealthCouncil Technical Committee was established tosupport the Provincial Health Council.
In line with National Health Act, the Department islooking at an appropriate model of providing PHCfunctions which were previously rendered by the localgovernment.
Strategic Goal: Implement the people’s contractthrough effective leadership and govenance
3.2.5 Implementation of a comprehensivecommunity health worker programme
The Community Health Worker (CHW) Programme,which addresses the training, support andreimbursement of CHWs, is being implemented.Already more than 2 000 CHWs have been trained toprovide community-based Health Programmes. Thisprogramme will further be supported by the ExpandedPublic Works Programme within the Social Cluster. Theprogramme is geared towards alleviating poverty anddeveloping skills in our disadvantaged communities upto National Qualification Framework (NQF) level 4.
Non governmental organisations (NGOs) are beingsupported to supervise CHWs to implement outreachprogrammes, and to provide a range of basic services,including direct observed treatment (DOTS) for TBpatients, prevention of mother-to-child-transmission(PMTCT) and voluntary counselling and testing (VCT)for the comprehensive HIV and AIDS programme. Atotal of 69 community based organisations (CBOs)have been contracted to build NGO capacity aroundHIV and AIDS care.
31
DEPA
RTM
ENT O
F HEA
LTHdistrict hospitals are in the Ekurhuleni/Sedibeng healthregion, three in Tshwane/Metsweding and three inJohannesburg/West Rand.
Hospital efficiency in district hospitals remains achallenge with a bed occupancy rate (BOR) of 68%falling below the 75% target. This is largely due topatients by-passing district hospitals to higher levelsof care based on perception that care is better atregional and central hospitals. The average length ofstay (ALOS) is 3.3 days. A Gateway clinic has beenestablished at Yusuf Dadoo Hospital to help addressthe problem of patients by-passing district hospitals.In addition, 178 Step Down beds have beenestablished, at the Pretoria West, South Rand,Kopanong and Heidelberg Hospitals. Step Downguidelines are being developed by the provincialsteering committee to ensure appropriate referrals tothese facilities.
However district hospitals need still to address anumber of challenges: reducing cost per patient perday equivalent (PDE) and increasing the appropriateactual workload, as well as linking hospitals withneighbouring primary care facilities to manageambulatory care patients.
2 X PICTURES FOR DISTRCT HOSPITALS
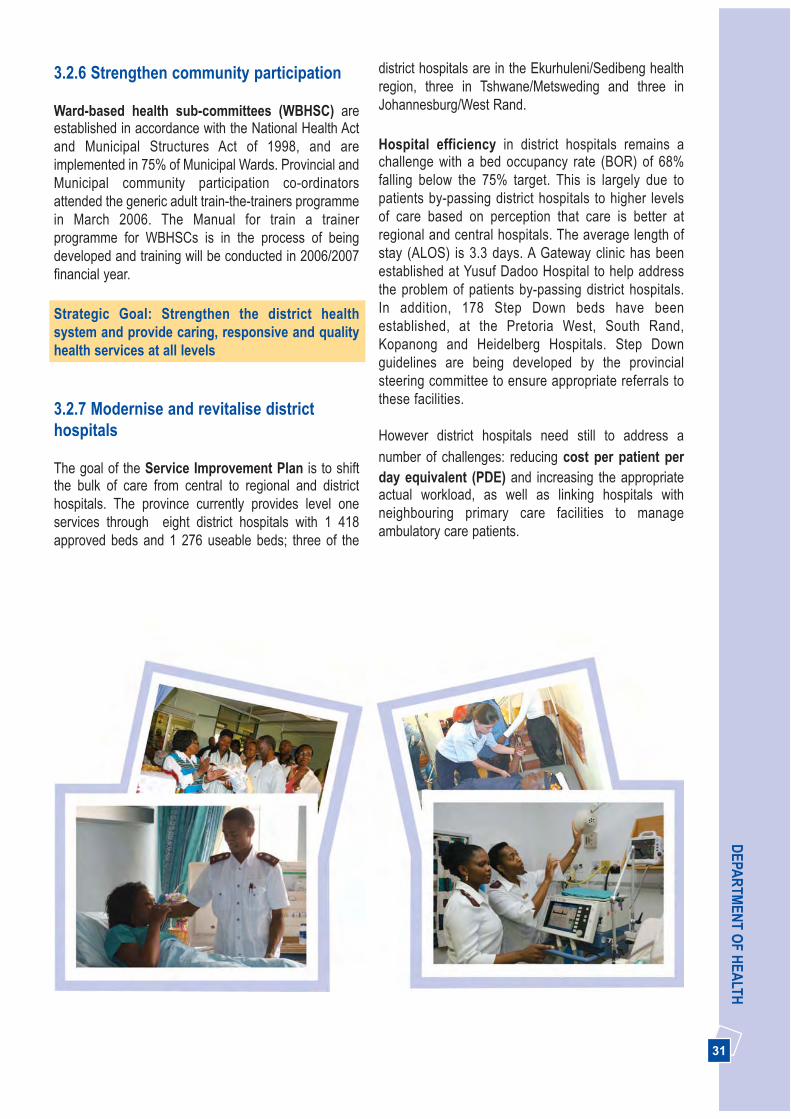
3.2.6 Strengthen community participation
Ward-based health sub-committees (WBHSC) areestablished in accordance with the National Health Actand Municipal Structures Act of 1998, and areimplemented in 75% of Municipal Wards. Provincial andMunicipal community participation co-ordinatorsattended the generic adult train-the-trainers programmein March 2006. The Manual for train a trainerprogramme for WBHSCs is in the process of beingdeveloped and training will be conducted in 2006/2007financial year.
Strategic Goal: Strengthen the district healthsystem and provide caring, responsive and qualityhealth services at all levels
3.2.7 Modernise and revitalise districthospitals
The goal of the Service Improvement Plan is to shiftthe bulk of care from central to regional and districthospitals. The province currently provides level oneservices through eight district hospitals with 1 418approved beds and 1 276 useable beds; three of the
32
AN
NU
AL
REP
OR
T 20
05/2
006
3.2.8 District Hospitals 2005/2006 Key Achievements
Hospital Key achievements at a glance
South Rand Hospital • Accredited by WHO/UNICEF as Mother and Baby Friendly Hospital
Carletonville Hospital • Introduced night shifts for cleaning at admission and casualty area andthis has improved the appearance of the hospital
• Combined trips whenever possible during inter-facility transfers to saveon cost and time
• Decreased theft in hospital• Processed all payments as required within the time frame of 30 days
Mamelodi Hospital • Visit by the President of South Africa: Mr Thabo Mbeki showed politicalsupport and encouraged staff
• Celebration of Labour Day encouraged and yielded improvement ofservices
• Received stage three of accreditation process
Kopanong Hospital • Received full accreditation• No maternal deaths reported for 2005/2006• Reduced overall waiting times by 20% as compared to 2004/2005• Established a TB Focal Point
Pretoria West Hospital • Received full accreditation• Opened a 2 beds Kangaroo Mother Care unit• Opened South African Police Service ward for awaiting-trial patients
Dr Yusuf Dadoo Hospital • Extended emergency casualty services to provide a 24 hour service• Established Gateway Clinic• Established Kangaroo Mother Care Unit• Received full accreditation
Germiston Hospital • Opened a Crisis Centre• Filling almost all Medical Officers posts
Heidelberg Hospital • Received full accreditation• Launched an integrated Health Wellness Programme • Appointment of one Chief Medical Officer, Assistant Director: Nursing,
Assistant Director: Administration • Purchased new radiology equipment
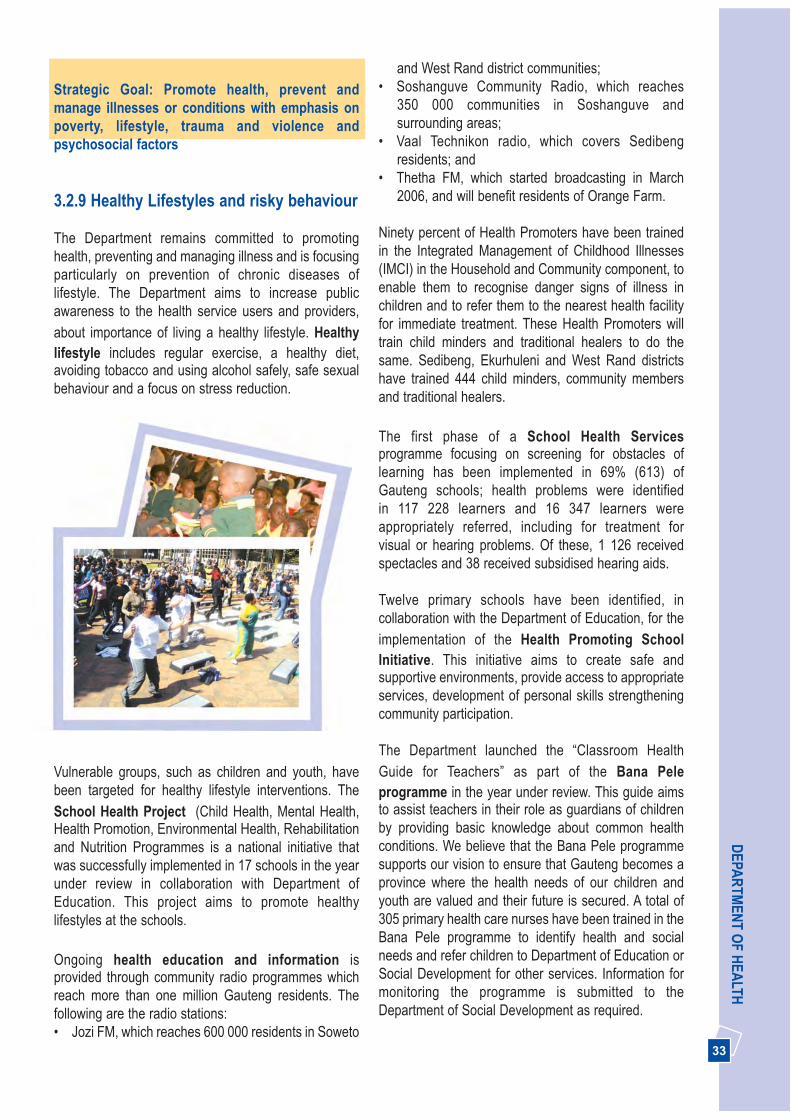
33
DEPA
RTM
ENT O
F HEA
LTH
Strategic Goal: Promote health, prevent andmanage illnesses or conditions with emphasis onpoverty, lifestyle, trauma and violence andpsychosocial factors
3.2.9 Healthy Lifestyles and risky behaviour
The Department remains committed to promotinghealth, preventing and managing illness and is focusingparticularly on prevention of chronic diseases oflifestyle. The Department aims to increase publicawareness to the health service users and providers,about importance of living a healthy lifestyle. Healthylifestyle includes regular exercise, a healthy diet,avoiding tobacco and using alcohol safely, safe sexualbehaviour and a focus on stress reduction.
2X SUGGESTED PICTUREs ON HEALTHYLIFESTYLES
Vulnerable groups, such as children and youth, havebeen targeted for healthy lifestyle interventions. TheSchool Health Project (Child Health, Mental Health,Health Promotion, Environmental Health, Rehabilitationand Nutrition Programmes is a national initiative thatwas successfully implemented in 17 schools in the yearunder review in collaboration with Department ofEducation. This project aims to promote healthylifestyles at the schools.
Ongoing health education and information isprovided through community radio programmes whichreach more than one million Gauteng residents. Thefollowing are the radio stations: • Jozi FM, which reaches 600 000 residents in Soweto
and West Rand district communities; • Soshanguve Community Radio, which reaches
350 000 communities in Soshanguve andsurrounding areas;
• Vaal Technikon radio, which covers Sedibengresidents; and
• Thetha FM, which started broadcasting in March2006, and will benefit residents of Orange Farm.
Ninety percent of Health Promoters have been trainedin the Integrated Management of Childhood Illnesses(IMCI) in the Household and Community component, toenable them to recognise danger signs of illness inchildren and to refer them to the nearest health facilityfor immediate treatment. These Health Promoters willtrain child minders and traditional healers to do thesame. Sedibeng, Ekurhuleni and West Rand districtshave trained 444 child minders, community membersand traditional healers.
The first phase of a School Health Servicesprogramme focusing on screening for obstacles oflearning has been implemented in 69% (613) ofGauteng schools; health problems were identified in 117 228 learners and 16 347 learners wereappropriately referred, including for treatment for visual or hearing problems. Of these, 1 126 receivedspectacles and 38 received subsidised hearing aids.
Twelve primary schools have been identified, incollaboration with the Department of Education, for theimplementation of the Health Promoting SchoolInitiative. This initiative aims to create safe andsupportive environments, provide access to appropriateservices, development of personal skills strengtheningcommunity participation.
The Department launched the “Classroom HealthGuide for Teachers” as part of the Bana Peleprogramme in the year under review. This guide aimsto assist teachers in their role as guardians of childrenby providing basic knowledge about common healthconditions. We believe that the Bana Pele programmesupports our vision to ensure that Gauteng becomes aprovince where the health needs of our children andyouth are valued and their future is secured. A total of305 primary health care nurses have been trained in theBana Pele programme to identify health and socialneeds and refer children to Department of Education orSocial Development for other services. Information formonitoring the programme is submitted to theDepartment of Social Development as required.

34
AN
NU
AL
REP
OR
T 20
05/2
006
2 X SUGGESTED PICTURE ON LAUNCH OFBANAPELE X PICTURE OF YOUTH CELEBRATION
We increased the number of Youth-Friendly HealthServices from 38 in 2004/2005 to 52 in 2005/2006 in alldistricts. These services include family planning,involves young people in identifying health problemsand design programmes to address these issues.
3.2.10 Improving Mother and Child Health
Improving the health of women and children remains apriority. Strategies and programmes to reduce maternaland perinatal mortality and morbidity are identifiedthrough regular maternal and perinatal mortality andmorbidity meetings in provincial hospitals and MidwifeObstetric Units (MOUs). The strategies andrecommendations from the Saving Mothers Report areimplemented in the Maternal and Neonatal Care Unit.
An audit conducted on the implementation of therecommended of the Saving Mothers Report publishedin 2001 showed that 94% of health facilities arecomplying. Implementation will continue until allfacilities are compliant. Protocols and guidelines for themanagement of pregnant women are implemented in allour health facilities and staff have been trained on theuse of these protocols, partogram and qualityassurance programmes to improve quality of care. Inaddition, we are currently piloting the World HealthOrganisation Basic Antenatal Care (BANC) programme,a strategy to improve the health of pregnant women.
The Integrated Management of Childhood Illnesses(IMCI) programme, a child survival strategy for childrenunder 6 years of age is being implemented in 84% ofour primary health care facilities, compared to 64% in
2004. Training to implement IMCI is continually offeredto medical staff, as well as senior and middle managers,to enable them to advocate for its effectiveimplementation and sustainability respectively.
The Perinatal Problem Identification Programme(PPIP) was introduced in 1999 and is now implementedin 20 hospitals and while implementation of thisprogramme in 22 MOUs commenced in 2005/2006financial year. The PPIP is a cost effective strategy thatidentifies and addresses key indicators for avoidabledeaths. This strategy helped to dramatically reduce thePerinatal Mortality Rate (PNMR) from 37/1000 in 2002to 30/1000 in 2003, based on available survey results.
Kangaroo Mother Care Units (KMCs) are operationalin 21 hospitals. This programme will be implemented inall hospitals providing maternity and neonatal servicesin the next financial year. The implementation of theKMC programme has resulted in the reduction of infantmortality for low birth weight, from 19 deaths per 1 000population in 2001 to 18 deaths per 1 000 population in2003, based on available survey results.
2x SUGGESTED PICTUREs FOR BESTIMMUNISATION COVERAGE CERTIFICATE ORPICTURE ON IMMUNISATION
We continue to ensure that the Expanded Programmeon Immunisation (EPI) reaches all children under fiveyears of age in the province. The community radio talkshows and print media coverage have raisedawareness around eradicating polio and this resulted inincreased immunisation coverage. In addition theimpact of the 2004 mass immunisation campaign andlaunching of ‘every day an immunisation day’ resulted inimmunisation coverage increasing to 83%. The NationalDepartment recognised and awarded the province witha certificate for having the Best Immunisation
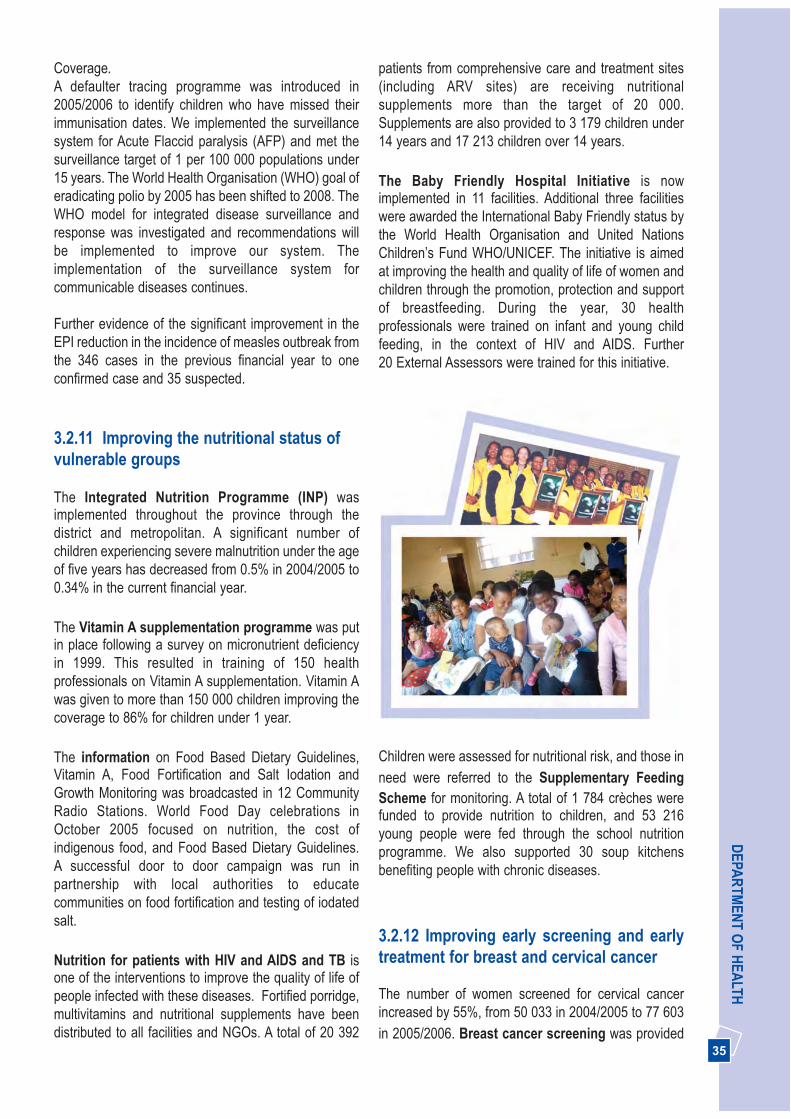
35
DEPA
RTM
ENT O
F HEA
LTHCoverage.A defaulter tracing programme was introduced in2005/2006 to identify children who have missed theirimmunisation dates. We implemented the surveillancesystem for Acute Flaccid paralysis (AFP) and met thesurveillance target of 1 per 100 000 populations under15 years. The World Health Organisation (WHO) goal oferadicating polio by 2005 has been shifted to 2008. TheWHO model for integrated disease surveillance andresponse was investigated and recommendations willbe implemented to improve our system. Theimplementation of the surveillance system forcommunicable diseases continues.
Further evidence of the significant improvement in theEPI reduction in the incidence of measles outbreak fromthe 346 cases in the previous financial year to oneconfirmed case and 35 suspected.
3.2.11 Improving the nutritional status ofvulnerable groups
The Integrated Nutrition Programme (INP) wasimplemented throughout the province through thedistrict and metropolitan. A significant number ofchildren experiencing severe malnutrition under the ageof five years has decreased from 0.5% in 2004/2005 to0.34% in the current financial year.
The Vitamin A supplementation programme was putin place following a survey on micronutrient deficiencyin 1999. This resulted in training of 150 healthprofessionals on Vitamin A supplementation. Vitamin Awas given to more than 150 000 children improving thecoverage to 86% for children under 1 year.
The information on Food Based Dietary Guidelines,Vitamin A, Food Fortification and Salt Iodation andGrowth Monitoring was broadcasted in 12 CommunityRadio Stations. World Food Day celebrations inOctober 2005 focused on nutrition, the cost ofindigenous food, and Food Based Dietary Guidelines. A successful door to door campaign was run inpartnership with local authorities to educatecommunities on food fortification and testing of iodatedsalt.
Nutrition for patients with HIV and AIDS and TB isone of the interventions to improve the quality of life ofpeople infected with these diseases. Fortified porridge,multivitamins and nutritional supplements have beendistributed to all facilities and NGOs. A total of 20 392
patients from comprehensive care and treatment sites(including ARV sites) are receiving nutritionalsupplements more than the target of 20 000.Supplements are also provided to 3 179 children under14 years and 17 213 children over 14 years.
The Baby Friendly Hospital Initiative is nowimplemented in 11 facilities. Additional three facilitieswere awarded the International Baby Friendly status bythe World Health Organisation and United NationsChildren’s Fund WHO/UNICEF. The initiative is aimedat improving the health and quality of life of women andchildren through the promotion, protection and supportof breastfeeding. During the year, 30 healthprofessionals were trained on infant and young childfeeding, in the context of HIV and AIDS. Further 20 External Assessors were trained for this initiative.
2x SUGGESTED PICTURE ON BABY FRIENDLY ORPCTURE ON BREAST SCREENING MONTH
Children were assessed for nutritional risk, and those inneed were referred to the Supplementary FeedingScheme for monitoring. A total of 1 784 crèches werefunded to provide nutrition to children, and 53 216young people were fed through the school nutritionprogramme. We also supported 30 soup kitchensbenefiting people with chronic diseases.
3.2.12 Improving early screening and earlytreatment for breast and cervical cancer
The number of women screened for cervical cancerincreased by 55%, from 50 033 in 2004/2005 to 77 603in 2005/2006. Breast cancer screening was provided
36
AN
NU
AL
REP
OR
T 20
05/2
006
to 7 649 women thus exceeding the provincial target.Screening services afford women the opportunity to beoffered early treatment and follow up. The rise in thenumber of patients screened can be attributed to theawareness campaigns and the distribution ofeducational materials in all sub-districts and informalsettlements. These were aimed at sensitising women tothe importance of early screening and the location ofscreening services. We also embarked on a project toensure access to surgery for breast cancer at theJohannesburg, Chris Hani Baragwanath and HelenJoseph Hospitals.
3.2. 13 Reducing prevalence ofcomplications of communicable diseases
Tuberculosis (TB) Control programme
TB cure rate remains a challenge with the cure rate at64% below the national target of 70%. One factorcontributing to the low cure rate is the integrity of datacollected in the electronic TB register. Together with ourpartners we will implement the Tuberculosis CrisisPlan in 2006/2007 focusing on Johannesburg Metro.This will further be expanded to other districts.
During 2005/2006 financial year care and treatment wasprovided to 41 753 new TB patients. Of all TB patients,90% (74 543) of TB patients are on Directly ObservedTreatment (DOT) support, and 10% (10 087) are selfsupervised patients. Training on data collection andverification was provided to primary health care workersto prevent a shortage of drugs for TB patients. TB focalpoints were established in all hospitals to ensure that allTB patients and their families are educated aboutongoing treatment and referred to the DOTS system forfollow up.
SUGGESTED PICTURES ON TB MONTHCELEBRATIONS
The TB and HIV collaboration programme is now inplace in all sub-districts as compared to only 16 sub-districts for 2004/2005 financial year. This TB and HIVcollaboration programme has gained momentum due tothe fact that 50% of HIV patients are co-infected withTB. Health services continue to offer voluntarycounselling and testing and screening of all HIVpatients for TB.
Other Communicable diseases
Communicable diseases in the province are under astrict surveillance system in order to monitor and controlthe spread of infection within communities. Allinstitutions are implementing the Provincial InfectionControl programme launched in January 2005.
The number of confirmed malaria cases reported in theprovince increased from December 2005, as comparedto previous years. By the end of the financial year therewere 1 499 confirmed cases, which had been importedfrom malaria endemic areas in other provinces andother countries. Ekurhuleni experienced the highestnumber of cases. An active surveillance system hasbeen implemented in all districts. This, together with the distribution of Information, Education andCommunication (IEC) material in four approvedlanguages, including Portuguese, in all districts andairports. The staff were trained in the prevention andmanagement of malaria and the importance ofeducating the community to take precautions beforetravelling to malaria endemic areas. This initiativeresulted in the reduction of confirmed cases from 960 inJanuary 2006 to 117 in March 2006 as reflected in thegraph below.
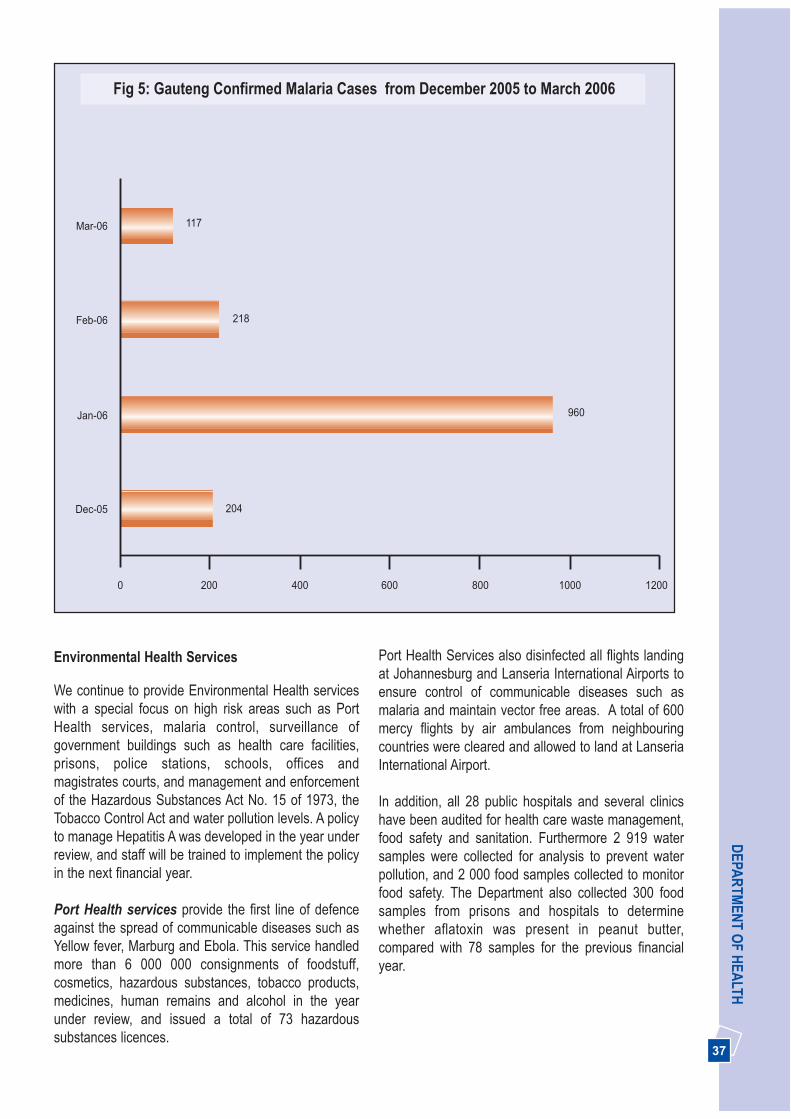
37
DEPA
RTM
ENT O
F HEA
LTH
Environmental Health Services
We continue to provide Environmental Health serviceswith a special focus on high risk areas such as PortHealth services, malaria control, surveillance ofgovernment buildings such as health care facilities,prisons, police stations, schools, offices andmagistrates courts, and management and enforcementof the Hazardous Substances Act No. 15 of 1973, theTobacco Control Act and water pollution levels. A policyto manage Hepatitis A was developed in the year underreview, and staff will be trained to implement the policyin the next financial year.
Port Health services provide the first line of defenceagainst the spread of communicable diseases such asYellow fever, Marburg and Ebola. This service handledmore than 6 000 000 consignments of foodstuff,cosmetics, hazardous substances, tobacco products,medicines, human remains and alcohol in the yearunder review, and issued a total of 73 hazardoussubstances licences.
Port Health Services also disinfected all flights landingat Johannesburg and Lanseria International Airports toensure control of communicable diseases such asmalaria and maintain vector free areas. A total of 600mercy flights by air ambulances from neighbouringcountries were cleared and allowed to land at LanseriaInternational Airport.
In addition, all 28 public hospitals and several clinicshave been audited for health care waste management,food safety and sanitation. Furthermore 2 919 watersamples were collected for analysis to prevent waterpollution, and 2 000 food samples collected to monitorfood safety. The Department also collected 300 foodsamples from prisons and hospitals to determinewhether aflatoxin was present in peanut butter,compared with 78 samples for the previous financialyear.
Dec-05
Jan-06
Feb-06
Mar-06 117
218
960
204
0 200 400 600 800 1000 1200
Fig 5: Gauteng Confirmed Malaria Cases from December 2005 to March 2006
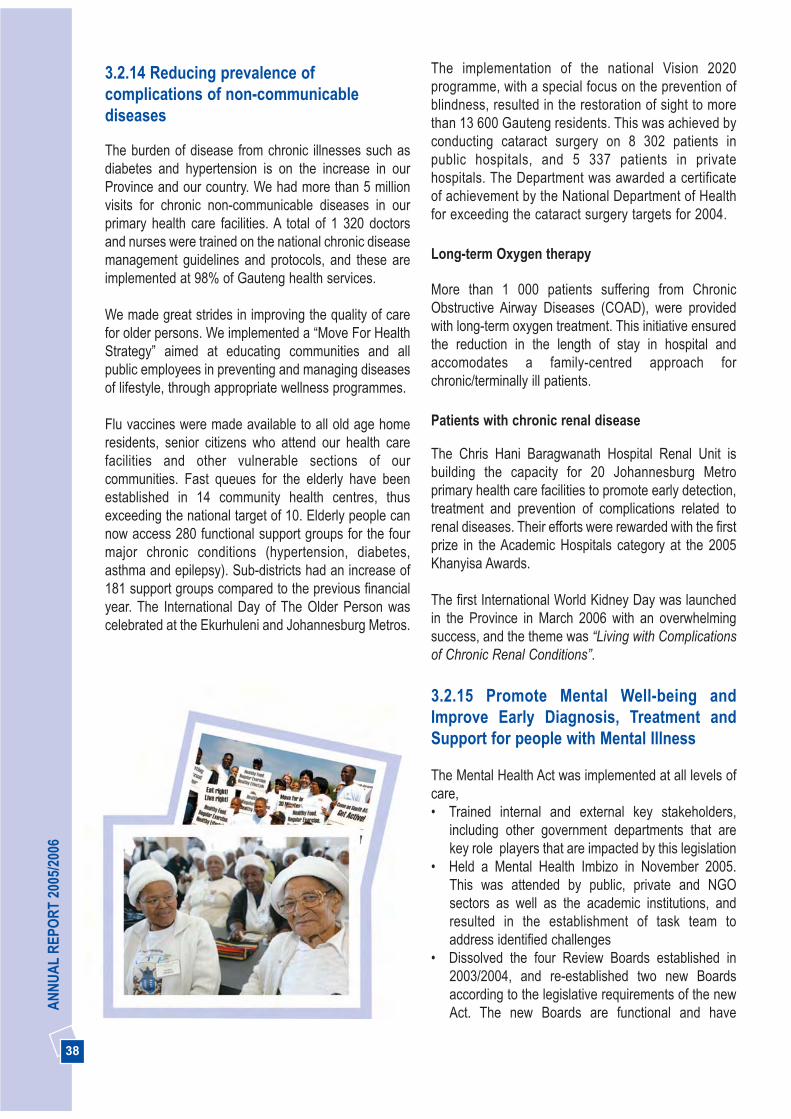
38
AN
NU
AL
REP
OR
T 20
05/2
006
3.2.14 Reducing prevalence ofcomplications of non-communicablediseases
The burden of disease from chronic illnesses such asdiabetes and hypertension is on the increase in ourProvince and our country. We had more than 5 millionvisits for chronic non-communicable diseases in ourprimary health care facilities. A total of 1 320 doctorsand nurses were trained on the national chronic diseasemanagement guidelines and protocols, and these areimplemented at 98% of Gauteng health services.
We made great strides in improving the quality of carefor older persons. We implemented a “Move For HealthStrategy” aimed at educating communities and allpublic employees in preventing and managing diseasesof lifestyle, through appropriate wellness programmes.
Flu vaccines were made available to all old age homeresidents, senior citizens who attend our health carefacilities and other vulnerable sections of ourcommunities. Fast queues for the elderly have beenestablished in 14 community health centres, thusexceeding the national target of 10. Elderly people cannow access 280 functional support groups for the fourmajor chronic conditions (hypertension, diabetes,asthma and epilepsy). Sub-districts had an increase of181 support groups compared to the previous financialyear. The International Day of The Older Person wascelebrated at the Ekurhuleni and Johannesburg Metros.
2X SUGGESTED PICTURES FOR INTERNATIONALDAY OF THE OLDER PERSONS WAS CELEBRATED
AT EKURHULENI AND JOBURG METRO.SUGGESTED COPY OF CERITICATE FOR
CATARACT SURGERY
Restoration of sight
The implementation of the national Vision 2020programme, with a special focus on the prevention ofblindness, resulted in the restoration of sight to morethan 13 600 Gauteng residents. This was achieved byconducting cataract surgery on 8 302 patients inpublic hospitals, and 5 337 patients in privatehospitals. The Department was awarded a certificateof achievement by the National Department of Healthfor exceeding the cataract surgery targets for 2004.
Long-term Oxygen therapy
More than 1 000 patients suffering from ChronicObstructive Airway Diseases (COAD), were providedwith long-term oxygen treatment. This initiative ensuredthe reduction in the length of stay in hospital andaccomodates a family-centred approach forchronic/terminally ill patients.
Patients with chronic renal disease
The Chris Hani Baragwanath Hospital Renal Unit isbuilding the capacity for 20 Johannesburg Metroprimary health care facilities to promote early detection,treatment and prevention of complications related torenal diseases. Their efforts were rewarded with the firstprize in the Academic Hospitals category at the 2005Khanyisa Awards.
The first International World Kidney Day was launchedin the Province in March 2006 with an overwhelmingsuccess, and the theme was “Living with Complicationsof Chronic Renal Conditions”.
3.2.15 Promote Mental Well-being andImprove Early Diagnosis, Treatment andSupport for people with Mental Illness
The Mental Health Act was implemented at all levels ofcare, • Trained internal and external key stakeholders,
including other government departments that arekey role players that are impacted by this legislation
• Held a Mental Health Imbizo in November 2005.This was attended by public, private and NGOsectors as well as the academic institutions, andresulted in the establishment of task team toaddress identified challenges
• Dissolved the four Review Boards established in2003/2004, and re-established two new Boardsaccording to the legislative requirements of the newAct. The new Boards are functional and have
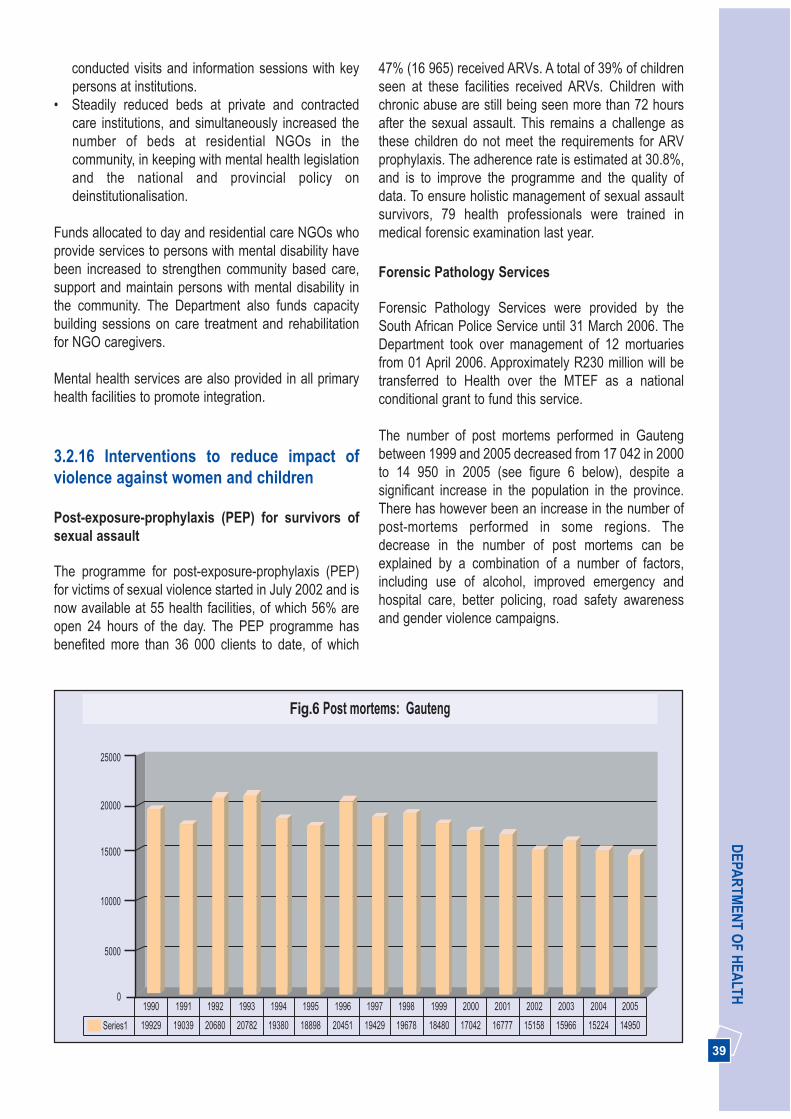
39
DEPA
RTM
ENT O
F HEA
LTHconducted visits and information sessions with keypersons at institutions.
• Steadily reduced beds at private and contractedcare institutions, and simultaneously increased thenumber of beds at residential NGOs in thecommunity, in keeping with mental health legislationand the national and provincial policy ondeinstitutionalisation.
Funds allocated to day and residential care NGOs whoprovide services to persons with mental disability havebeen increased to strengthen community based care,support and maintain persons with mental disability inthe community. The Department also funds capacitybuilding sessions on care treatment and rehabilitationfor NGO caregivers.
Mental health services are also provided in all primaryhealth facilities to promote integration.
3.2.16 Interventions to reduce impact ofviolence against women and children
Post-exposure-prophylaxis (PEP) for survivors ofsexual assault
The programme for post-exposure-prophylaxis (PEP)for victims of sexual violence started in July 2002 and isnow available at 55 health facilities, of which 56% areopen 24 hours of the day. The PEP programme hasbenefited more than 36 000 clients to date, of which
47% (16 965) received ARVs. A total of 39% of childrenseen at these facilities received ARVs. Children withchronic abuse are still being seen more than 72 hoursafter the sexual assault. This remains a challenge asthese children do not meet the requirements for ARVprophylaxis. The adherence rate is estimated at 30.8%,and is to improve the programme and the quality ofdata. To ensure holistic management of sexual assaultsurvivors, 79 health professionals were trained inmedical forensic examination last year.
Forensic Pathology Services
Forensic Pathology Services were provided by theSouth African Police Service until 31 March 2006. TheDepartment took over management of 12 mortuariesfrom 01 April 2006. Approximately R230 million will betransferred to Health over the MTEF as a nationalconditional grant to fund this service.
The number of post mortems performed in Gautengbetween 1999 and 2005 decreased from 17 042 in 2000to 14 950 in 2005 (see figure 6 below), despite asignificant increase in the population in the province.There has however been an increase in the number ofpost-mortems performed in some regions. Thedecrease in the number of post mortems can beexplained by a combination of a number of factors,including use of alcohol, improved emergency andhospital care, better policing, road safety awarenessand gender violence campaigns.
Series1 19929 19039 20680 20782 19380 18898 20451 19429 19678 18480 17042 16777 15158 15966 15224 14950
1990 1991 1992 1993 1994 1995 1996 1997 1998 1999 2000 2001 2002 2003 2004 20050
5000
10000
15000
20000
25000
Fig.6 Post mortems: Gauteng
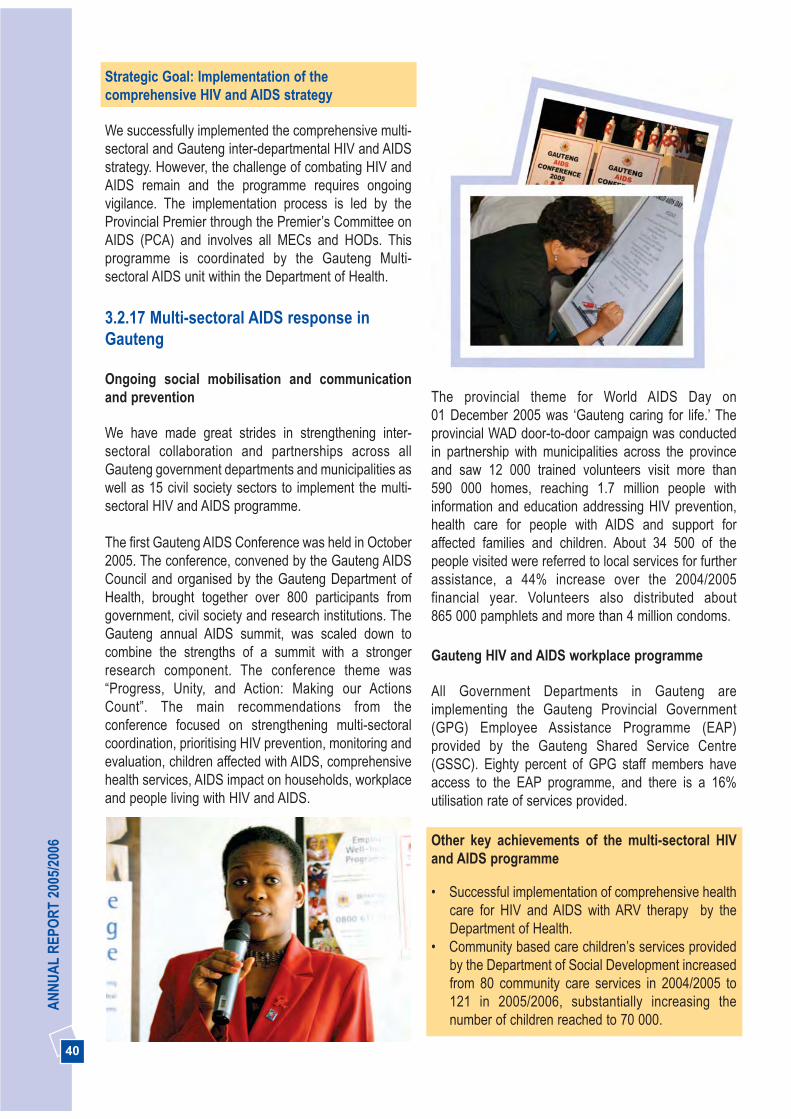
40
AN
NU
AL
REP
OR
T 20
05/2
006
Strategic Goal: Implementation of the comprehensive HIV and AIDS strategy
We successfully implemented the comprehensive multi-sectoral and Gauteng inter-departmental HIV and AIDSstrategy. However, the challenge of combating HIV andAIDS remain and the programme requires ongoingvigilance. The implementation process is led by theProvincial Premier through the Premier’s Committee onAIDS (PCA) and involves all MECs and HODs. Thisprogramme is coordinated by the Gauteng Multi-sectoral AIDS unit within the Department of Health.
3.2.17 Multi-sectoral AIDS response inGauteng
Ongoing social mobilisation and communicationand prevention
We have made great strides in strengthening inter-sectoral collaboration and partnerships across allGauteng government departments and municipalities aswell as 15 civil society sectors to implement the multi-sectoral HIV and AIDS programme.
The first Gauteng AIDS Conference was held in October2005. The conference, convened by the Gauteng AIDSCouncil and organised by the Gauteng Department ofHealth, brought together over 800 participants fromgovernment, civil society and research institutions. TheGauteng annual AIDS summit, was scaled down tocombine the strengths of a summit with a strongerresearch component. The conference theme was“Progress, Unity, and Action: Making our ActionsCount”. The main recommendations from theconference focused on strengthening multi-sectoralcoordination, prioritising HIV prevention, monitoring andevaluation, children affected with AIDS, comprehensivehealth services, AIDS impact on households, workplaceand people living with HIV and AIDS.
The provincial theme for World AIDS Day on 01 December 2005 was ‘Gauteng caring for life.’ Theprovincial WAD door-to-door campaign was conductedin partnership with municipalities across the provinceand saw 12 000 trained volunteers visit more than 590 000 homes, reaching 1.7 million people withinformation and education addressing HIV prevention,health care for people with AIDS and support foraffected families and children. About 34 500 of thepeople visited were referred to local services for furtherassistance, a 44% increase over the 2004/2005financial year. Volunteers also distributed about 865 000 pamphlets and more than 4 million condoms.
Gauteng HIV and AIDS workplace programme
All Government Departments in Gauteng areimplementing the Gauteng Provincial Government(GPG) Employee Assistance Programme (EAP)provided by the Gauteng Shared Service Centre(GSSC). Eighty percent of GPG staff members haveaccess to the EAP programme, and there is a 16%utilisation rate of services provided.
Other key achievements of the multi-sectoral HIVand AIDS programme
• Successful implementation of comprehensive healthcare for HIV and AIDS with ARV therapy by theDepartment of Health.
• Community based care children’s services providedby the Department of Social Development increasedfrom 80 community care services in 2004/2005 to121 in 2005/2006, substantially increasing thenumber of children reached to 70 000.

41
DEPA
RTM
ENT O
F HEA
LTH• Municipalities increased coordination through the
Local AIDS Councils and trained 15 000 people andeducated an additional 500 000 people on door-to-door.
• The faith-based sector, through the South AfricanAIDS Council, African Federation of Churches, theMuslim AIDS Project and The Evangelical Alliance ofSouth Africa, mobilised 540 000 people and trained47 401 members.
• A total of 385 HIV and AIDS programme managersfrom 12 government departments, municipalitiesand sectors were trained as part of a managementand development programme.
• Traditional healers made a breakthrough by settingup a coordinating Committee at the traditionalhealer’s summit. In addition, the traditional healersprovide a visible support for the AIDS programme.
The detailed 2005/2006 Multi-sectoral AIDS programmeannual report will be presented separately to theLegislature.
3.2.18 Implementation of thecomprehensive HIV and AIDS programmeby the Health Department
HIV Sero-prevalence among women
As can been seen in figure 7, it appears that the HIVprevalence rate in the province has been increasingsteadily from 1998 to 2005. The Sero-prevelance rateamongst pregnant women in Gauteng has decreasedby 0.7% from 33.1% in 2004 to 32.4% in 2005 but stillhigher than the national prevalance rate of 30.2%. Thethe Gauteng Syphlis rate was 4.3%, an increase of3.4% from 2004, and further increased above thenational average of 2.7%.
Source: GDH Annual Report 2001/02 and National HIV and Syphilis Antenatal Sero-Prevalence Survey in South Africa 2004/5
1994 1995 1996 1997 1998 1999 2000 2001 2002 2003 2004 2005
40
35
30
25
20
15
10
5
0
1215.5
17.1
22.5 23.9
29.4 29.831.6
29.633.1 32.4
6.4
3.8
9.6
9.6
2.7
6
2.1
0.94.3
Fig 7. Antenatal HIV Sero-Prevalence for Gauteng (1994-2004) and Syphilis (1999-2004)
Gauteng syphils prevalence
Gauteng HIV prevalence
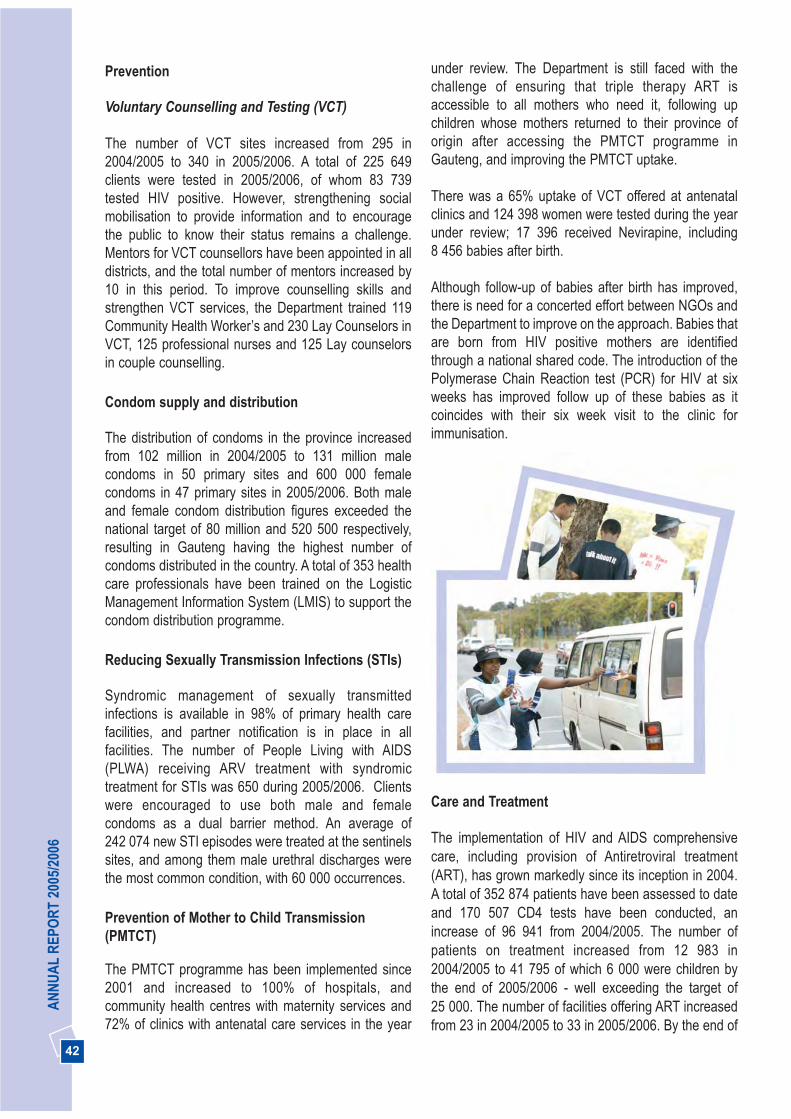
42
AN
NU
AL
REP
OR
T 20
05/2
006
Prevention
Voluntary Counselling and Testing (VCT)
The number of VCT sites increased from 295 in2004/2005 to 340 in 2005/2006. A total of 225 649clients were tested in 2005/2006, of whom 83 739tested HIV positive. However, strengthening socialmobilisation to provide information and to encouragethe public to know their status remains a challenge.Mentors for VCT counsellors have been appointed in alldistricts, and the total number of mentors increased by10 in this period. To improve counselling skills andstrengthen VCT services, the Department trained 119Community Health Worker’s and 230 Lay Counselors inVCT, 125 professional nurses and 125 Lay counselorsin couple counselling.
Condom supply and distribution
The distribution of condoms in the province increasedfrom 102 million in 2004/2005 to 131 million malecondoms in 50 primary sites and 600 000 femalecondoms in 47 primary sites in 2005/2006. Both maleand female condom distribution figures exceeded thenational target of 80 million and 520 500 respectively,resulting in Gauteng having the highest number ofcondoms distributed in the country. A total of 353 healthcare professionals have been trained on the LogisticManagement Information System (LMIS) to support thecondom distribution programme.
Reducing Sexually Transmission Infections (STIs)
Syndromic management of sexually transmittedinfections is available in 98% of primary health carefacilities, and partner notification is in place in allfacilities. The number of People Living with AIDS(PLWA) receiving ARV treatment with syndromictreatment for STIs was 650 during 2005/2006. Clientswere encouraged to use both male and femalecondoms as a dual barrier method. An average of242 074 new STI episodes were treated at the sentinelssites, and among them male urethral discharges werethe most common condition, with 60 000 occurrences.
Prevention of Mother to Child Transmission(PMTCT)
The PMTCT programme has been implemented since2001 and increased to 100% of hospitals, andcommunity health centres with maternity services and72% of clinics with antenatal care services in the year
under review. The Department is still faced with thechallenge of ensuring that triple therapy ART isaccessible to all mothers who need it, following upchildren whose mothers returned to their province oforigin after accessing the PMTCT programme inGauteng, and improving the PMTCT uptake.
There was a 65% uptake of VCT offered at antenatalclinics and 124 398 women were tested during the yearunder review; 17 396 received Nevirapine, including8 456 babies after birth.
Although follow-up of babies after birth has improved,there is need for a concerted effort between NGOs andthe Department to improve on the approach. Babies thatare born from HIV positive mothers are identifiedthrough a national shared code. The introduction of thePolymerase Chain Reaction test (PCR) for HIV at sixweeks has improved follow up of these babies as itcoincides with their six week visit to the clinic forimmunisation.
Care and Treatment
The implementation of HIV and AIDS comprehensivecare, including provision of Antiretroviral treatment(ART), has grown markedly since its inception in 2004.A total of 352 874 patients have been assessed to dateand 170 507 CD4 tests have been conducted, anincrease of 96 941 from 2004/2005. The number ofpatients on treatment increased from 12 983 in2004/2005 to 41 795 of which 6 000 were children bythe end of 2005/2006 - well exceeding the target of25 000. The number of facilities offering ART increasedfrom 23 in 2004/2005 to 33 in 2005/2006. By the end of

43
DEPA
RTM
ENT O
F HEA
LTHthe year 40 sites had been accredited to providetreatment. Services will start at the remaining sevensites as soon as the infrastructure has been completed.The Department is actively recruiting pharmacists,medical practitioners, dieticians, social workers, nursesand counsellors to make up the teams to providecomprehensive care. In addition to care, educationalmaterials stressing the need to know your HIV status,as well as prevention were distributed. The importanceof diagnosing TB and completing TB treatment,nutrition, and condom use are also distributed at allhealth facilities.
The programme also actively addresses children whoneed to be placed on treatment through assessingpregnant mothers, and following them up throughpregnancy until they have delivered their babies. Thesemothers receive ARTs to enable them to stay healthyand to care for their babies. The babies are diagnosedthrough the polymerase chain reaction tests at 6 weeks.
Universal access to palliative care
Due to the AIDS epidemic in South Africa as a whole, itis necessary to consider how best to provide care forpeople with diseases and their families. Gauteng hasestablished a total of 257 beds in step-down facilities innine hospitals and funds 250 hospice beds as well as
132 NGOs to provide home-based care. NGOs aremonitored regularly to improve adherence to the fundingpolicy and reporting procedures. The number of patientscared for at home by community health workers hassignificantly increased from 51 994 in 2004/2005 to 53347 in 2005/2006.
The Department also funds 38 NGOs to organisesupport groups for people living with HIV and AIDS, andin 2005/2006 funded the income generating projects of10 support groups. A total of 383 support groups wereoperating in health facilities and within the community inthe year under review. Training was provided to supportgroup members to equip them with counselling skillsand basic HIV and AIDS information. Additionally, 101members of the support groups were trained as PeerEducators and 91 as Lay Counsellors.
3.2.19 Outputs and Outcomes
The outputs and outcomes for the budget statement andnational indicators, including provincial specific outputs,have been outlined separately to ensure compliancewith Legislative, National Health and National Treasuryrequirements. This process will enhance monitoring ofperformance at different levels.
Table 7. 2005/2006 Budget Statement outputs and service delivery trends for District Health ServicesProgramme
Description of output Unit of Measure 2004/2005(actual)
2005/2006(target)
Progress madetowards theachievement of theoutputs for 2005/2006
Immunisation coverage forchildren under 1 year
Immunisation coverage forchildren under 1 year (%)
90 polio90 measlesBased onimmunisationcampaignfirst round
85 83**
Based on routine data.Reduction due to crossboundary issues
Increased TB cure rate innew smear positive cases
New smear-positive TB curerate at first attempt*
58 65 64**
DOT needs to bestrengthened toimprove TB cure rate
Availability of Condoms Number of male condomsdistributed per month
8.5 million 8.5 million 10.9 million
Target exceeded
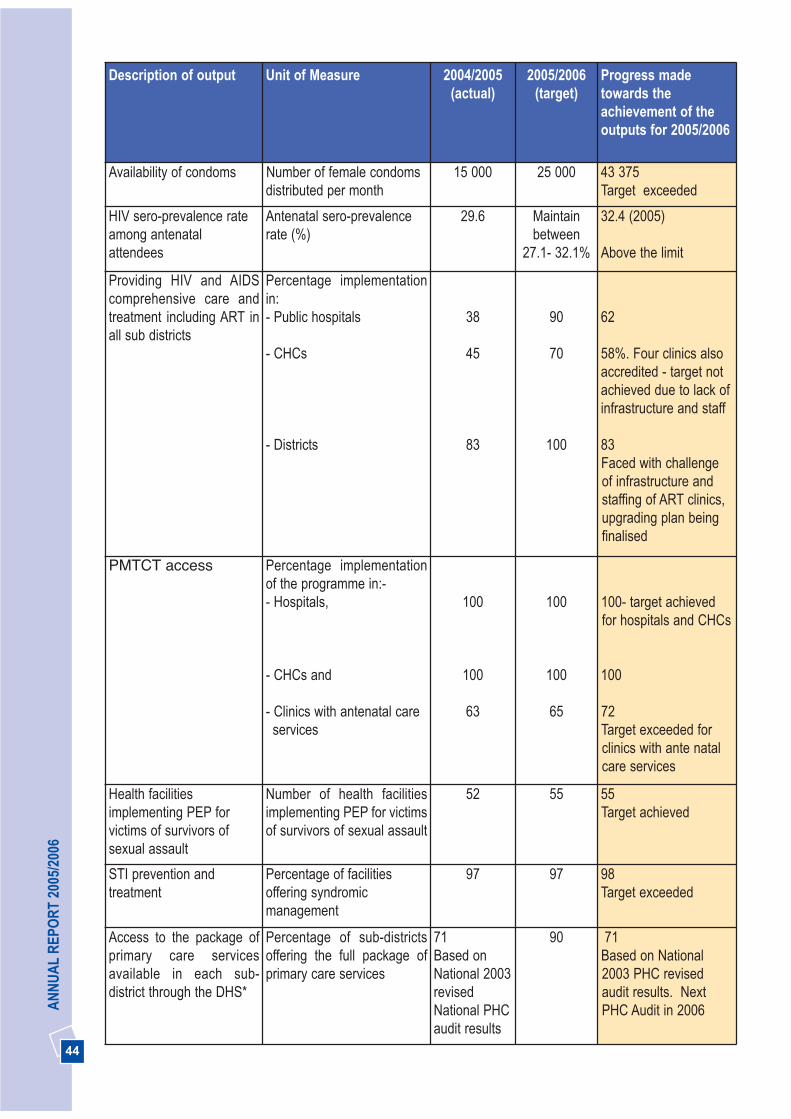
44
AN
NU
AL
REP
OR
T 20
05/2
006
Description of output Unit of Measure 2004/2005(actual)
2005/2006(target)
Progress madetowards theachievement of theoutputs for 2005/2006
Availability of condoms Number of female condomsdistributed per month
15 000 25 000 43 375Target exceeded
HIV sero-prevalence rateamong antenatalattendees
Antenatal sero-prevalencerate (%)
29.6 Maintainbetween
27.1- 32.1%
32.4 (2005)
Above the limit
Providing HIV and AIDScomprehensive care andtreatment including ART inall sub districts
Percentage implementationin: - Public hospitals
- CHCs
- Districts
38
45
83
90
70
100
62
58%. Four clinics alsoaccredited - target notachieved due to lack ofinfrastructure and staff
83Faced with challengeof infrastructure andstaffing of ART clinics,upgrading plan beingfinalised
PMTCT access Percentage implementationof the programme in:-- Hospitals,
- CHCs and
- Clinics with antenatal careservices
100
100
63
100
100
65
100- target achievedfor hospitals and CHCs
100
72Target exceeded forclinics with ante natalcare services
Health facilitiesimplementing PEP forvictims of survivors ofsexual assault
Number of health facilitiesimplementing PEP for victimsof survivors of sexual assault
52 55 55Target achieved
STI prevention andtreatment
Percentage of facilitiesoffering syndromicmanagement
97 97 98Target exceeded
Access to the package ofprimary care servicesavailable in each sub-district through the DHS*
Percentage of sub-districtsoffering the full package ofprimary care services
71Based onNational 2003revisedNational PHCaudit results
90 71Based on National2003 PHC revisedaudit results. NextPHC Audit in 2006
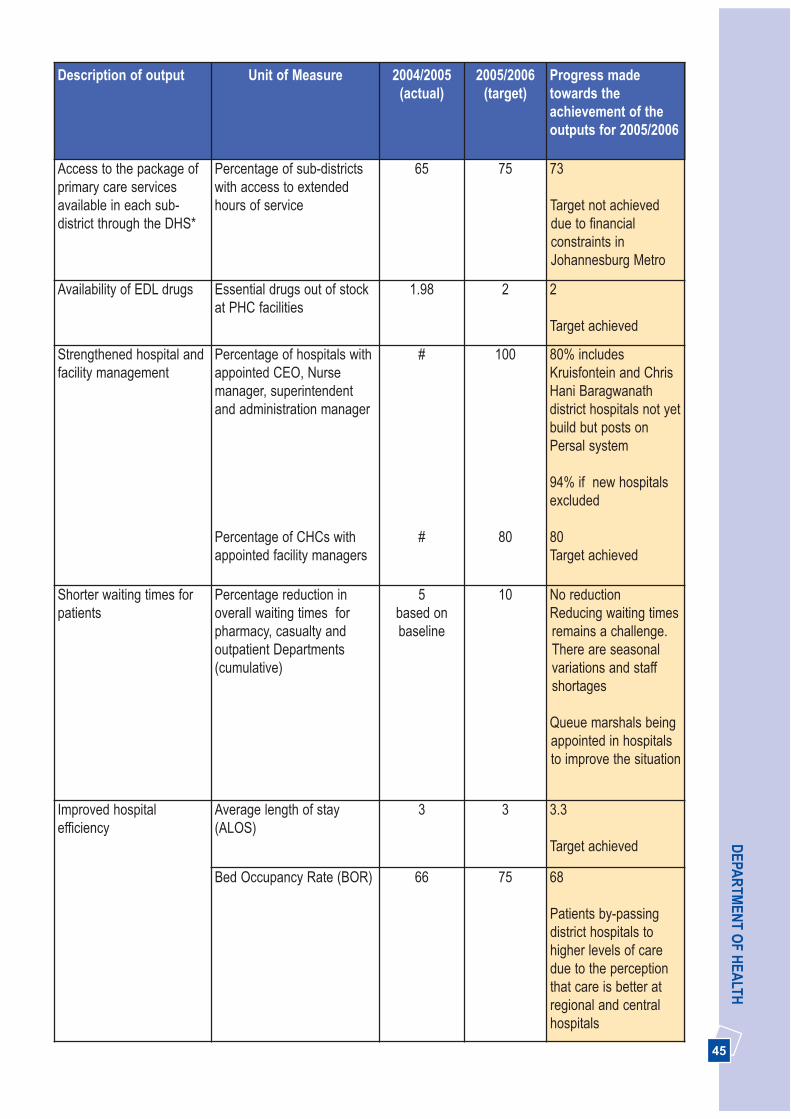
45
DEPA
RTM
ENT O
F HEA
LTHDescription of output Unit of Measure 2004/2005
(actual)2005/2006
(target)Progress madetowards theachievement of theoutputs for 2005/2006
Access to the package ofprimary care servicesavailable in each sub-district through the DHS*
Percentage of sub-districtswith access to extendedhours of service
65 75 73
Target not achieveddue to financialconstraints inJohannesburg Metro
Availability of EDL drugs Essential drugs out of stockat PHC facilities
1.98 2 2
Target achieved
Strengthened hospital andfacility management
Percentage of hospitals withappointed CEO, Nursemanager, superintendentand administration manager
Percentage of CHCs withappointed facility managers
#
#
100
80
80% includesKruisfontein and ChrisHani Baragwanathdistrict hospitals not yetbuild but posts onPersal system
94% if new hospitalsexcluded
80Target achieved
Shorter waiting times forpatients
Percentage reduction inoverall waiting times forpharmacy, casualty andoutpatient Departments(cumulative)
5based onbaseline
10 No reductionReducing waiting timesremains a challenge.There are seasonalvariations and staffshortages
Queue marshals beingappointed in hospitalsto improve the situation
Improved hospitalefficiency
Average length of stay(ALOS)
3 3 3.3
Target achieved
Bed Occupancy Rate (BOR) 66 75 68
Patients by-passingdistrict hospitals tohigher levels of caredue to the perceptionthat care is better atregional and centralhospitals
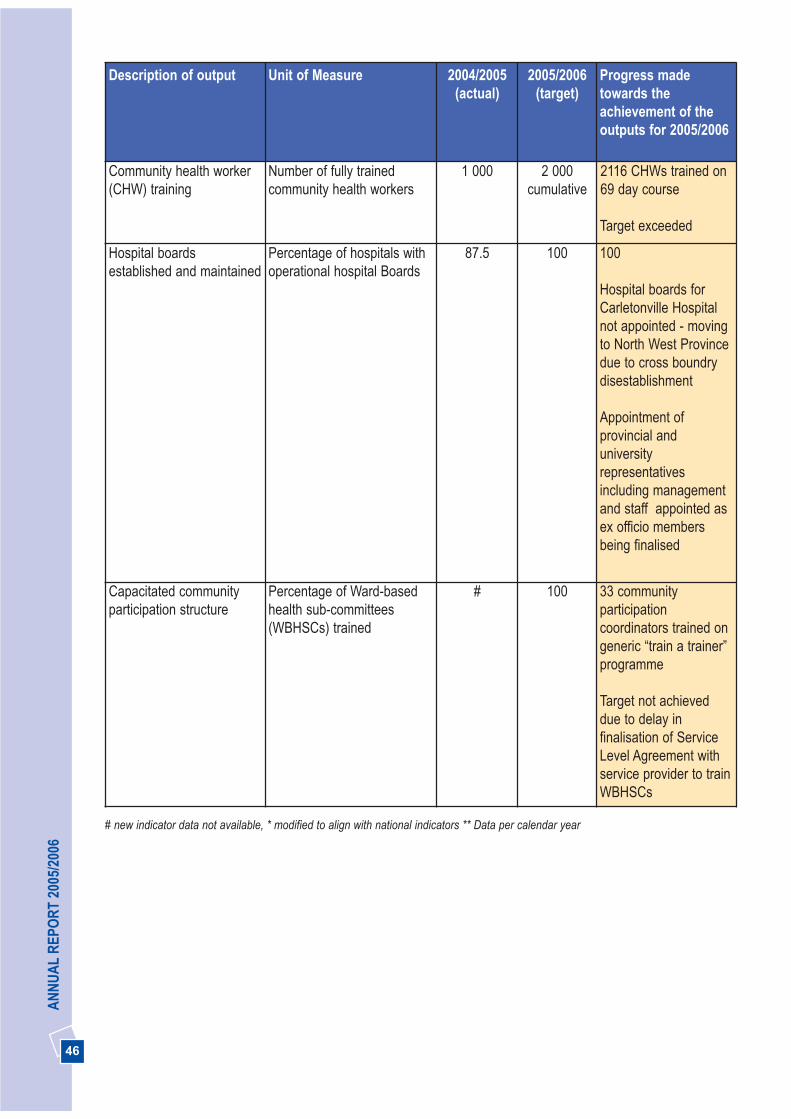
46
AN
NU
AL
REP
OR
T 20
05/2
006
Description of output Unit of Measure 2004/2005(actual)
2005/2006(target)
Progress madetowards theachievement of theoutputs for 2005/2006
Community health worker(CHW) training
Number of fully trainedcommunity health workers
1 000 2 000cumulative
2116 CHWs trained on69 day course
Target exceeded
Hospital boardsestablished and maintained
Percentage of hospitals withoperational hospital Boards
87.5 100 100
Hospital boards forCarletonville Hospitalnot appointed - movingto North West Provincedue to cross boundrydisestablishment
Appointment ofprovincial anduniversityrepresentativesincluding managementand staff appointed asex officio membersbeing finalised
Capacitated communityparticipation structure
Percentage of Ward-basedhealth sub-committees(WBHSCs) trained
# 100 33 communityparticipationcoordinators trained ongeneric “train a trainer”programme
Target not achieveddue to delay infinalisation of ServiceLevel Agreement withservice provider to trainWBHSCs
# new indicator data not available, * modified to align with national indicators ** Data per calendar year

47
DEPA
RTM
ENT O
F HEA
LTH
StrategicObjectives
MeasurableObjective
Indicator 2003/2004(actual)
2004/2005(actual)
2005/2006(target)
2005/2006(actual)
Ensureappropriateplanning andmonitoring ofdistrict healthservices at sub-district level
Develop high-levelbusiness plan forstrengthening ofthe District Healthsystem throughSenior DHS forum
Availability ofhigh-levelbusiness plan
# # 1 1
Train districtmanagers on useof information forplanning anddecision making
Percentagedistrict andprogrammemanagerstrained oninformationmanagement
# # 65 80
Ensure functionalintegrationbetween localgovernment andprovince
Percentage ofsub-districtsthat arefunctionallyintegrated
40 55 60 55 No increasedue tochange ofpolicy interms of theNationalHealth Act
Conduct DistrictHealth ExpenditureReview (DHER) inall districts
Number ofDHER perDistrictavailableannually
# 6 6 6 werecompleted for2004/2005 Commencedprocess for2005/2006DHER
Improve thequality andefficiency ofprimary healthcare serviceprovision
Conduct PHCservice auditannually
Percentage ofsub-districtswith PHCservicesaudited
100 100 100 Notconducted in2005/2006.AwaitingNationalrevised tool
Develop anintegrated DistrictService Plan(DHP)
Percentagedistricts with aformal plan
62 100 100 100
Implementprovisions of theMemorandum ofUnderstandingwith LocalGovernment
Percentage ofMOUobjectivesimplemented
# 50 80 80
Table 8. Performance against Provincial targets from 2005-08 strategic plan for District Health Servicesprogramme
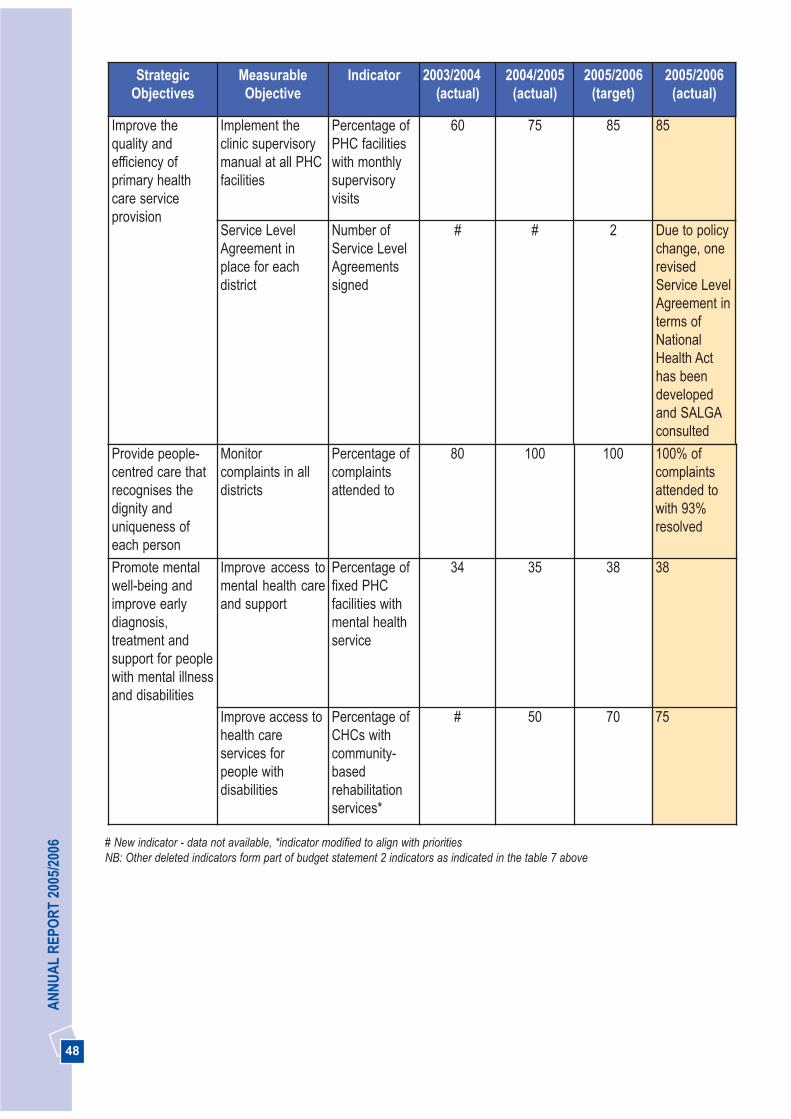
48
AN
NU
AL
REP
OR
T 20
05/2
006
StrategicObjectives
MeasurableObjective
Indicator 2003/2004(actual)
2004/2005(actual)
2005/2006(target)
2005/2006(actual)
Improve thequality andefficiency ofprimary healthcare serviceprovision
Implement theclinic supervisorymanual at all PHCfacilities
Percentage ofPHC facilitieswith monthlysupervisoryvisits
60 75 85 85
Service LevelAgreement inplace for eachdistrict
Number ofService LevelAgreementssigned
# # 2 Due to policychange, onerevisedService LevelAgreement interms ofNationalHealth Acthas beendevelopedand SALGAconsulted
Provide people-centred care thatrecognises thedignity anduniqueness ofeach person
Monitorcomplaints in alldistricts
Percentage ofcomplaintsattended to
80 100 100 100% ofcomplaintsattended towith 93%resolved
Promote mentalwell-being andimprove earlydiagnosis,treatment andsupport for peoplewith mental illnessand disabilities
Improve access tomental health careand support
Percentage offixed PHCfacilities withmental healthservice
34 35 38 38
Improve access tohealth careservices forpeople withdisabilities
Percentage ofCHCs withcommunity-basedrehabilitationservices*
# 50 70 75
# New indicator - data not available, *indicator modified to align with prioritiesNB: Other deleted indicators form part of budget statement 2 indicators as indicated in the table 7 above
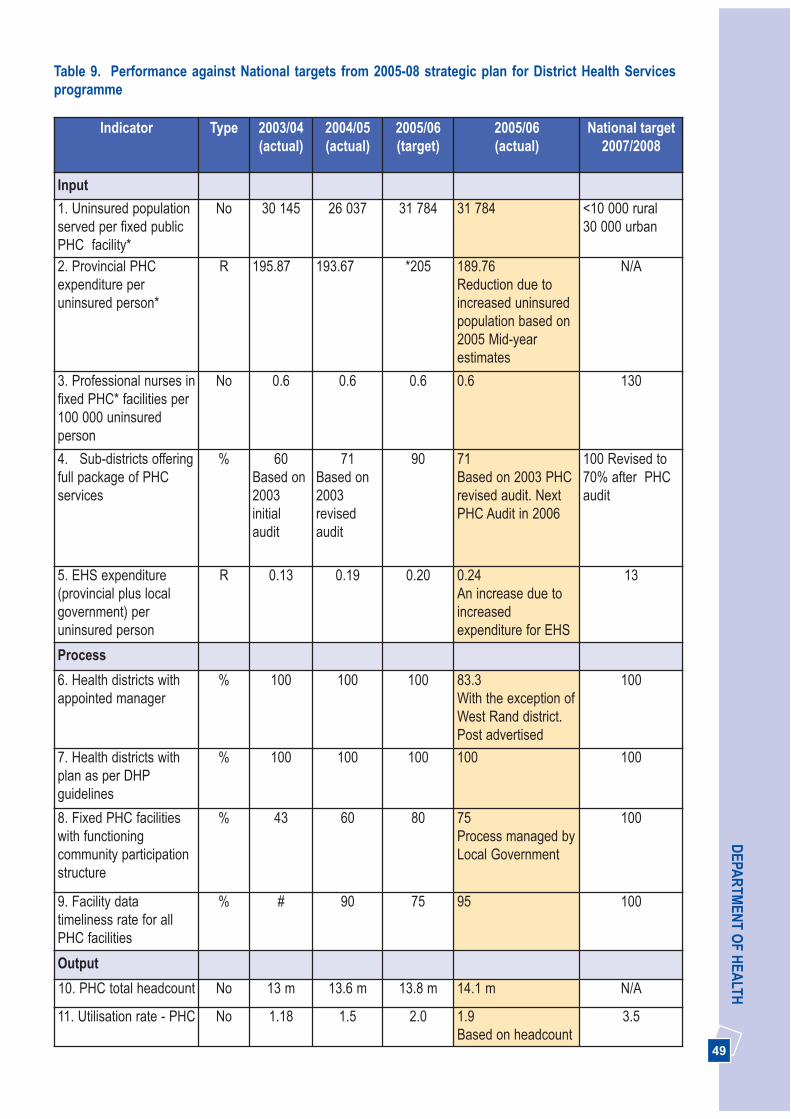
49
DEPA
RTM
ENT O
F HEA
LTHTable 9. Performance against National targets from 2005-08 strategic plan for District Health Servicesprogramme
Indicator Type 2003/04(actual)
2004/05(actual)
2005/06(target)
2005/06(actual)
National target2007/2008
Input
1. Uninsured populationserved per fixed publicPHC facility*
No 30 145 26 037 31 784 31 784 <10 000 rural 30 000 urban
2. Provincial PHCexpenditure peruninsured person*
R 195.87 193.67 *205 189.76Reduction due toincreased uninsuredpopulation based on2005 Mid-yearestimates
N/A
3. Professional nurses infixed PHC* facilities per100 000 uninsuredperson
No 0.6 0.6 0.6 0.6 130
4. Sub-districts offeringfull package of PHCservices
% 60Based on2003initialaudit
71Based on2003revisedaudit
90 71Based on 2003 PHCrevised audit. NextPHC Audit in 2006
100 Revised to70% after PHCaudit
5. EHS expenditure(provincial plus localgovernment) peruninsured person
R 0.13 0.19 0.20 0.24An increase due toincreasedexpenditure for EHS
13
Process
6. Health districts withappointed manager
% 100 100 100 83.3 With the exception ofWest Rand district.Post advertised
100
7. Health districts withplan as per DHPguidelines
% 100 100 100 100 100
8. Fixed PHC facilitieswith functioningcommunity participationstructure
% 43 60 80 75Process managed byLocal Government
100
9. Facility datatimeliness rate for allPHC facilities
% # 90 75 95 100
Output
10. PHC total headcount No 13 m 13.6 m 13.8 m 14.1 m N/A
11. Utilisation rate - PHC No 1.18 1.5 2.0 1.9 Based on headcount
3.5
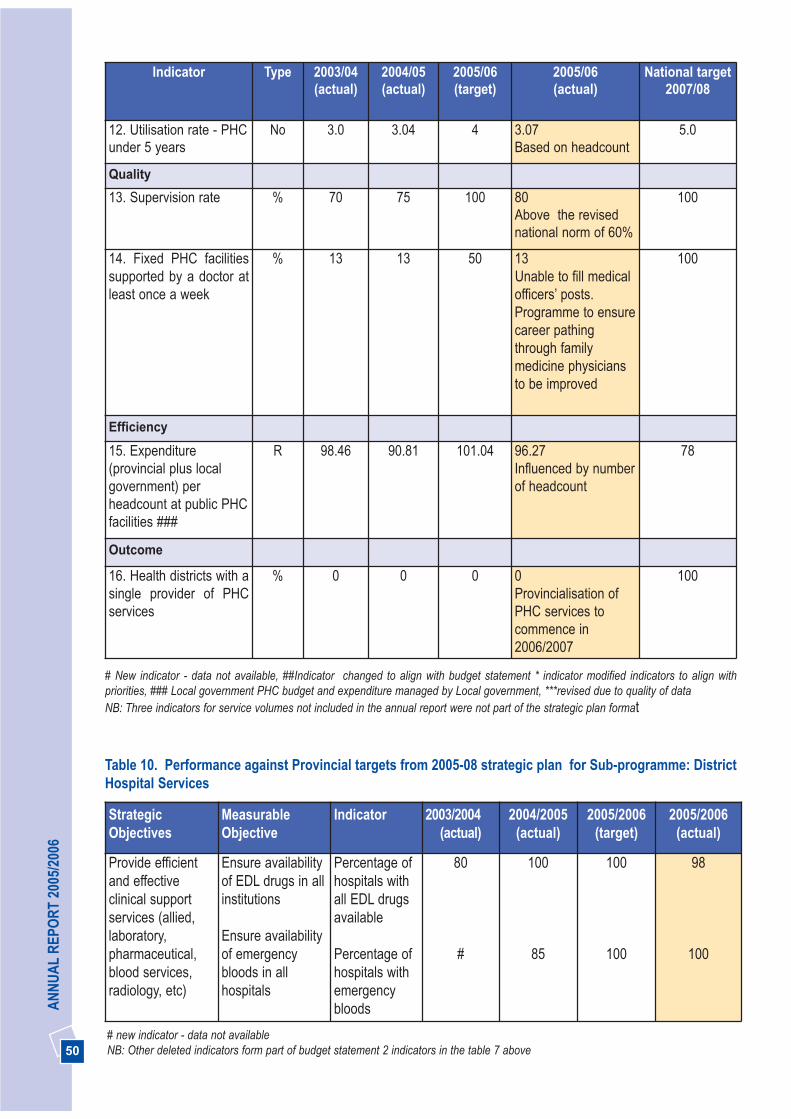
50
AN
NU
AL
REP
OR
T 20
05/2
006
Indicator Type 2003/04(actual)
2004/05(actual)
2005/06(target)
2005/06(actual)
National target2007/08
12. Utilisation rate - PHCunder 5 years
No 3.0 3.04 4 3.07Based on headcount
5.0
Quality
13. Supervision rate % 70 75 100 80 Above the revisednational norm of 60%
100
14. Fixed PHC facilitiessupported by a doctor atleast once a week
% 13 13 50 13Unable to fill medicalofficers’ posts.Programme to ensurecareer pathingthrough familymedicine physiciansto be improved
100
Efficiency
15. Expenditure(provincial plus localgovernment) perheadcount at public PHCfacilities ###
R 98.46 90.81 101.04 96.27 Influenced by numberof headcount
78
Outcome
16. Health districts with asingle provider of PHCservices
% 0 0 0 0Provincialisation ofPHC services tocommence in2006/2007
100
# New indicator - data not available, ##Indicator changed to align with budget statement * indicator modified indicators to align withpriorities, ### Local government PHC budget and expenditure managed by Local government, ***revised due to quality of dataNB: Three indicators for service volumes not included in the annual report were not part of the strategic plan format
Table 10. Performance against Provincial targets from 2005-08 strategic plan for Sub-programme: DistrictHospital Services
StrategicObjectives
MeasurableObjective
Indicator 2003/2004(actual)
2004/2005(actual)
2005/2006(target)
2005/2006(actual)
Provide efficientand effectiveclinical supportservices (allied,laboratory,pharmaceutical,blood services,radiology, etc)
Ensure availabilityof EDL drugs in allinstitutions
Ensure availabilityof emergencybloods in allhospitals
Percentage ofhospitals withall EDL drugsavailable
Percentage ofhospitals withemergencybloods
80
#
100
85
100
100
98
100
# new indicator - data not availableNB: Other deleted indicators form part of budget statement 2 indicators in the table 7 above

51
DEPA
RTM
ENT O
F HEA
LTH
Indicator Type 2003/2004(actual)
2004/2005(actual)
2005/2006(target)
2005/2006(actual)
Input
1. Expenditure on hospitalstaff as a % of district hospitalexpenditure
% 66.6 67.88 68.3 65.3
Decrease due to vacantposts
2. Expenditure on drugs forhospital use as of % districthospital expenditure
% 10.2 8.38 9.0 10
3. Expenditure by districthospitals per uninsuredperson
R 38.49 53.01 55.67 60.78Increase due toexpenditure increase inopening new Tshwanedistrict hospital andFolateng facilities
Process
4. District hospitals withoperational hospital boards
% 87.5 87.5 100 100Hospital boards forCarletonville Hospital notappointed - moving toNorth West Province dueto cross boundrydisestablishment
Appointment ofprovincial and universityrepresentatives,management and staffas ex-officio membersbeing finalised
5. *District hospitals withappointed CEOs AD: Nursing,AD: Admin and MedicalSuperintendents (not Acting)in the post
% 87 100 Only CEOs
100 80% includesKruisfontein and ChrisHani Baragwanathdistrict hospitals not yetbuild but posts on Persalsystem
94% if new hospitalsexcluded
Table 11. Performance against National targets from 2005-08 strategic plan for Sub-programme: District Hospital Services

52
AN
NU
AL
REP
OR
T 20
05/2
006
Indicator Type 2003/2004(actual)
2004/2005(actual)
2005/2006(target)
2005/2006(actual)
6. Facility data timelines ratefor district hospitals
% # 80 100 100
Output
7. Caesarean section rate fordistrict hospitals
% 10.2 12.27 11 12% is based on electiveand emergency surgery
Quality
8. District hospitals withpatient satisfaction surveyusing DoH template
% 75(based on
othersystems)
85(based on
othersystems)
100 All hospitals measurepatient satisfaction usingother systems. To startusing DoH template in2006/2007
9. District hospitals withclinical audit (M & M) meetingevery month
% 100 100 100 100
Efficiency
10. Average length of stay inthe district hospitals
Days 3.1 3 3 3.3
11. Bed utilisation rate (basedon usable beds) in the districthospitals
% 67 66 75 68
Patients by-passingdistrict hospitals tohigher levels of care dueto the perception thatcare is better at regionaland central hospitals
12. Expenditure per patientday equivalent (PDE) in thedistrict hospitals
R 778 750 750 R860 is above thenational target of R814due to reduced PDEs fordistrict hospitals andexpenditure increase inopening the newTshwane DistrictHospital and Folatengfacilities
Outcome
13. Case fatality rate in thedistrict hospitals for surgeryseparations
% 0.3 5.2 2.0 2.9
Clinical audit beingconducted to identify thecause
# New indicator - data not available, *Indicator modified to align with priorities or modified by National Health, NB: Service volume indicators in annual report not included as they are not part of strategic plan format
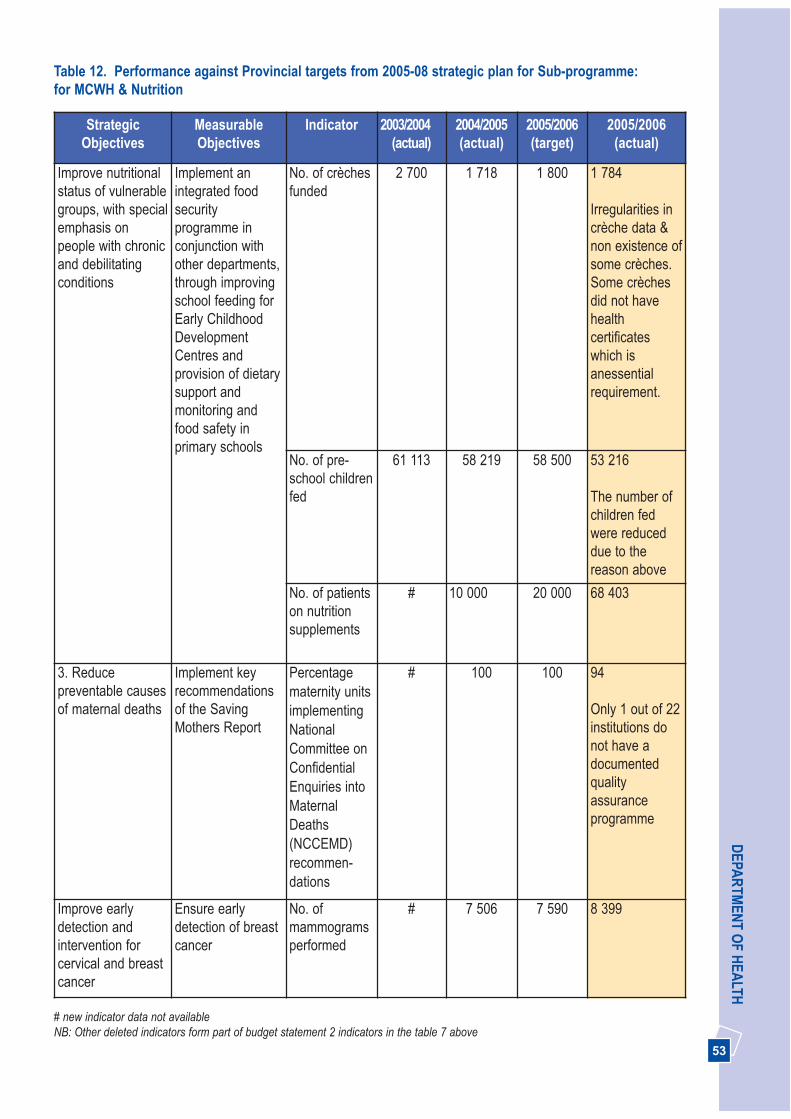
53
DEPA
RTM
ENT O
F HEA
LTH
StrategicObjectives
MeasurableObjectives
Indicator 2003/2004(actual)
2004/2005(actual)
2005/2006(target)
2005/2006(actual)
Improve nutritionalstatus of vulnerablegroups, with specialemphasis onpeople with chronicand debilitatingconditions
Implement anintegrated foodsecurityprogramme inconjunction withother departments,through improvingschool feeding forEarly ChildhoodDevelopmentCentres andprovision of dietarysupport andmonitoring andfood safety inprimary schools
No. of crèchesfunded
2 700 1 718 1 800 1 784
Irregularities incrèche data &non existence ofsome crèches.Some crèchesdid not havehealthcertificateswhich isanessentialrequirement.
No. of pre-school childrenfed
61 113 58 219 58 500 53 216
The number ofchildren fedwere reduceddue to thereason above
No. of patientson nutritionsupplements
# 10 000 20 000 68 403
3. Reducepreventable causesof maternal deaths
Implement keyrecommendationsof the SavingMothers Report
Percentagematernity unitsimplementingNationalCommittee onConfidentialEnquiries intoMaternalDeaths(NCCEMD)recommen-dations
# 100 100 94
Only 1 out of 22institutions donot have adocumentedqualityassuranceprogramme
Improve earlydetection andintervention forcervical and breastcancer
Ensure earlydetection of breastcancer
No. ofmammogramsperformed
# 7 506 7 590 8 399
Table 12. Performance against Provincial targets from 2005-08 strategic plan for Sub-programme: for MCWH & Nutrition
# new indicator data not availableNB: Other deleted indicators form part of budget statement 2 indicators in the table 7 above
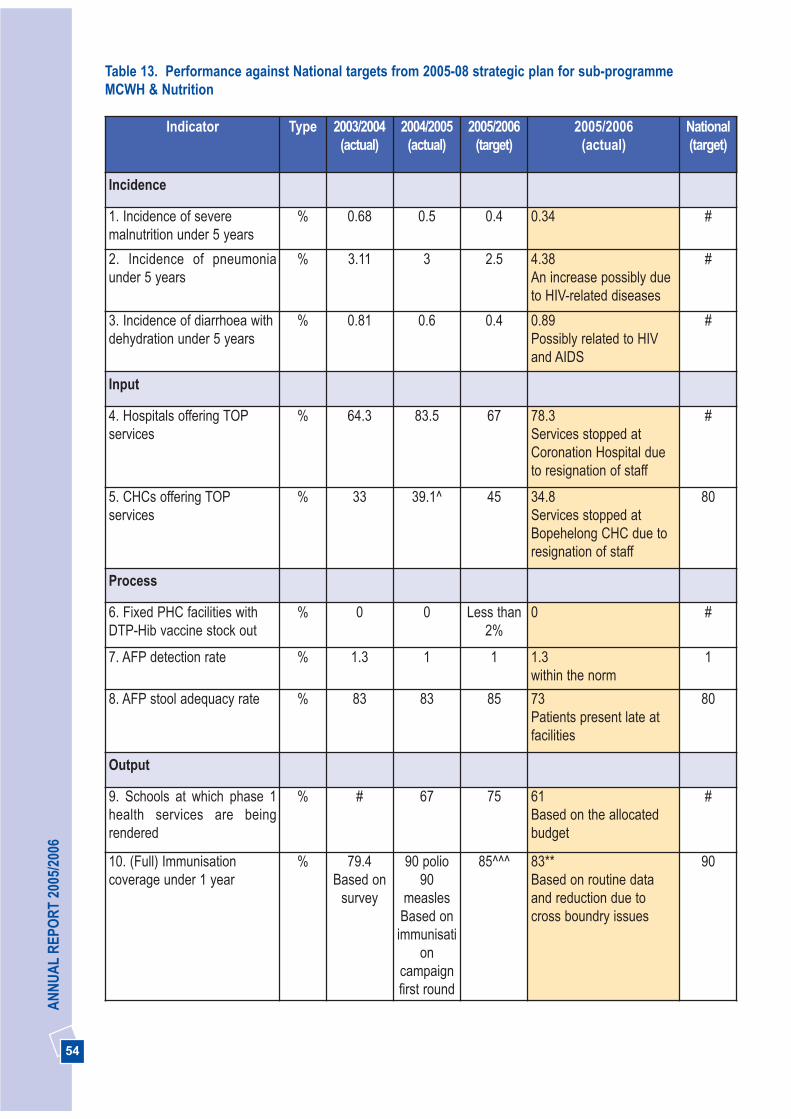
54
AN
NU
AL
REP
OR
T 20
05/2
006
Indicator Type 2003/2004(actual)
2004/2005(actual)
2005/2006(target)
2005/2006(actual)
National(target)
Incidence
1. Incidence of severemalnutrition under 5 years
% 0.68 0.5 0.4 0.34 #
2. Incidence of pneumoniaunder 5 years
% 3.11 3 2.5 4.38 An increase possibly dueto HIV-related diseases
#
3. Incidence of diarrhoea withdehydration under 5 years
% 0.81 0.6 0.4 0.89Possibly related to HIVand AIDS
#
Input
4. Hospitals offering TOPservices
% 64.3 83.5 67 78.3 Services stopped atCoronation Hospital dueto resignation of staff
#
5. CHCs offering TOPservices
% 33 39.1^ 45 34.8Services stopped atBopehelong CHC due toresignation of staff
80
Process
6. Fixed PHC facilities withDTP-Hib vaccine stock out
% 0 0 Less than2%
0 #
7. AFP detection rate % 1.3 1 1 1.3 within the norm
1
8. AFP stool adequacy rate % 83 83 85 73Patients present late atfacilities
80
Output
9. Schools at which phase 1health services are beingrendered
% # 67 75 61 Based on the allocatedbudget
#
10. (Full) Immunisationcoverage under 1 year
% 79.4Based on
survey
90 polio90
measlesBased onimmunisati
oncampaignfirst round
85^^^ 83**Based on routine dataand reduction due tocross boundry issues
90
Table 13. Performance against National targets from 2005-08 strategic plan for sub-programme MCWH & Nutrition
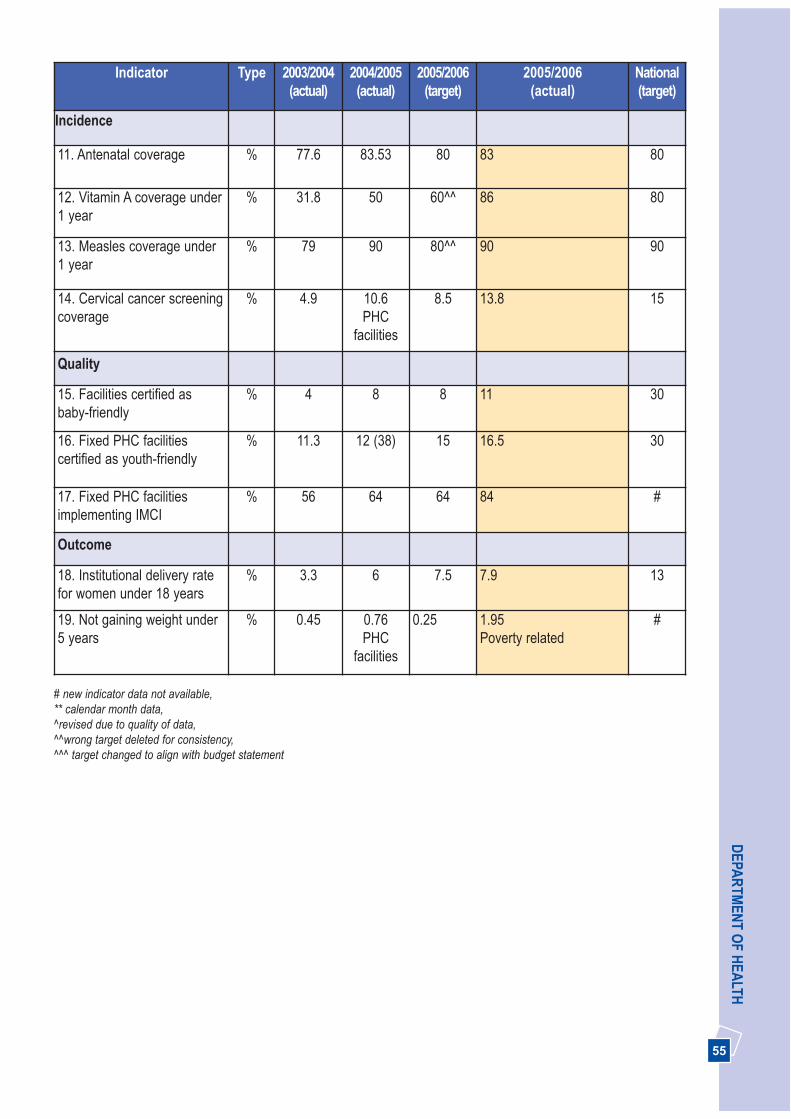
55
DEPA
RTM
ENT O
F HEA
LTHIndicator Type 2003/2004
(actual)2004/2005(actual)
2005/2006(target)
2005/2006(actual)
National(target)
Incidence
11. Antenatal coverage % 77.6 83.53 80 83 80
12. Vitamin A coverage under1 year
% 31.8 50 60^^ 86 80
13. Measles coverage under1 year
% 79 90 80^^ 90 90
14. Cervical cancer screeningcoverage
% 4.9 10.6PHC
facilities
8.5 13.8 15
Quality
15. Facilities certified asbaby-friendly
% 4 8 8 11 30
16. Fixed PHC facilitiescertified as youth-friendly
% 11.3 12 (38) 15 16.5 30
17. Fixed PHC facilitiesimplementing IMCI
% 56 64 64 84 #
Outcome
18. Institutional delivery ratefor women under 18 years
% 3.3 6 7.5 7.9 13
19. Not gaining weight under5 years
% 0.45 0.76PHC
facilities
0.25 1.95 Poverty related
#
# new indicator data not available, ** calendar month data, ^revised due to quality of data, ^^wrong target deleted for consistency, ^^^ target changed to align with budget statement

56
AN
NU
AL
REP
OR
T 20
05/2
006
StrategicObjective
MeasurableObjective
Indicator 2003/2004(actual)
2004/2005(actual)
2005/2006(target)
2005/2006(actual)
Prevent andreduce new HIVinfections
Reduce newinfections amongantenatal carewomen
Antenatalsero-prevalencerate (%)
29.6(2003)
33.1(2004)
Maintain27.1-32.1
32.4 (2005)Above the limit
HIVprevalencerate for under20yrs (15-24)
# 15 (2004) 14.6 18.5 (2005)Above the target
Percentageinfants tested
# 20 25 38
Number ofmale condomsdistributed permonth
8m 8.5m 8.5m 10.9m
Number offemalecondomssupplied permonth
25 000 15 000 25 000 43 375
Percentage ofprovincialhospitals andfixed clinicsoffering VCT
60 80 90 89 Lack ofinfrastructure toprovide VCT.However VCT isprovided throughmobile services inpartnership withSociety for FamilyHealth
Improve integratedcollaborationbetween HIV andAIDS and TBprogrammes
Number of subdistricts withTB/HIV training
# 12 16 25
Table 14. Performance against Provincial targets from 2005-08 strategic plan for Sub-programme: HIV andAIDS, STI and TB control
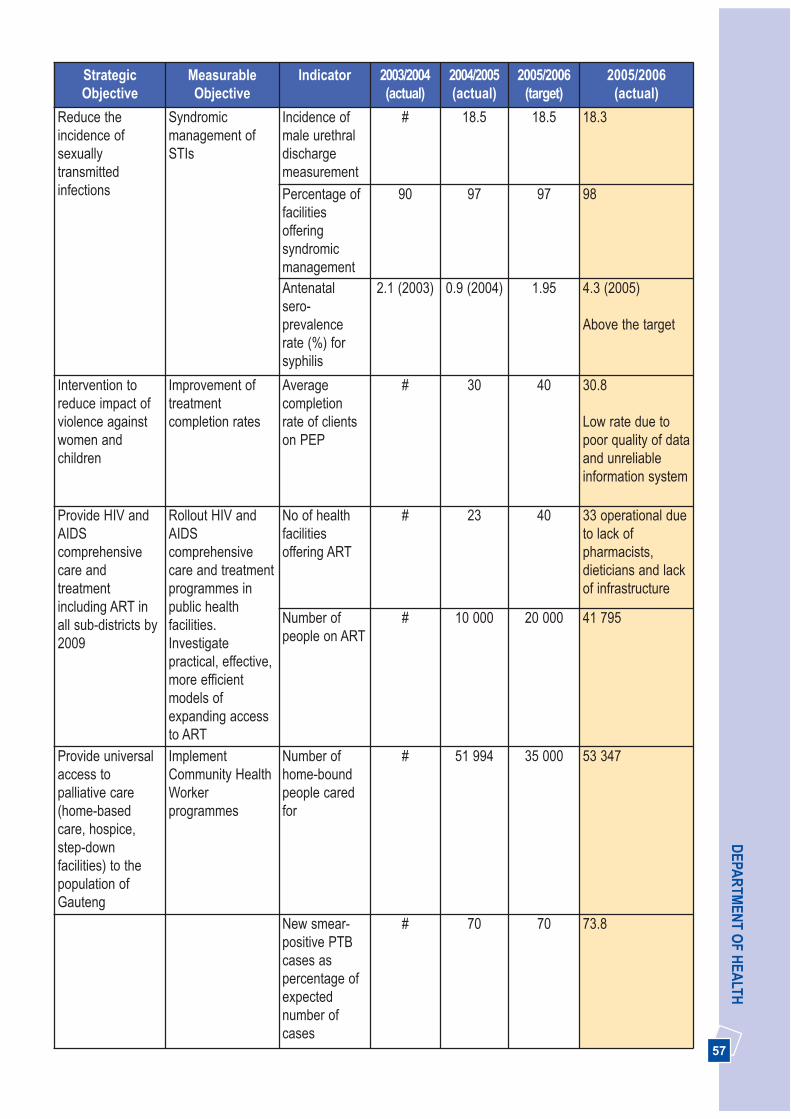
57
DEPA
RTM
ENT O
F HEA
LTHStrategicObjective
MeasurableObjective
Indicator 2003/2004(actual)
2004/2005(actual)
2005/2006(target)
2005/2006(actual)
Reduce theincidence ofsexuallytransmittedinfections
Syndromicmanagement ofSTIs
Incidence ofmale urethraldischargemeasurement
# 18.5 18.5 18.3
Percentage offacilitiesofferingsyndromicmanagement
90 97 97 98
Antenatalsero-prevalencerate (%) forsyphilis
2.1 (2003) 0.9 (2004) 1.95 4.3 (2005)
Above the target
Intervention toreduce impact ofviolence againstwomen andchildren
Improvement oftreatmentcompletion rates
Averagecompletionrate of clientson PEP
# 30 40 30.8
Low rate due topoor quality of dataand unreliableinformation system
Provide HIV andAIDScomprehensivecare andtreatmentincluding ART inall sub-districts by2009
Rollout HIV andAIDScomprehensivecare and treatmentprogrammes inpublic healthfacilities.Investigatepractical, effective,more efficientmodels ofexpanding accessto ART
No of healthfacilitiesoffering ART
# 23 40 33 operational dueto lack ofpharmacists,dieticians and lackof infrastructure
Number ofpeople on ART
# 10 000 20 000 41 795
Provide universalaccess topalliative care(home-basedcare, hospice,step-downfacilities) to thepopulation ofGauteng
ImplementCommunity HealthWorkerprogrammes
Number ofhome-boundpeople caredfor
# 51 994 35 000 53 347
New smear-positive PTBcases aspercentage ofexpectednumber ofcases
# 70 70 73.8

58
AN
NU
AL
REP
OR
T 20
05/2
006
StrategicObjective
MeasurableObjective
Indicator 2003/2004(actual)
2004/2005(actual)
2005/2006(target)
2005/2006(actual)
Percentage ofTB cases whoare re-treated
9 10 8 8
PTB smearconversionrates at 3months for re-treated cases
62 70 80 65Reduction due tocomplicated systemto calculate andwrong nationaldefinition ofindicator
Percentage ofTB cases thatare MDR
2 1 1 1
# New indicator - information not availableNB: Other deleted indicators form part of budget statement 2 indicators in table 7 above
Table 15. Performance against National targets from 2005-08 strategic plan for sub-programme: HIV andAIDS, STI and TB control
Indicator Type 2003/2004(actual)
2004/2005(actual)
2005/2006(target)
2005/2006(actual)
National(target)
Input
1. ARV treatment servicepoints compared to plan
% # 100 100 100 100
2. Fixed PHC facilitiesoffering PMTCT (offeringANC and MOU)
% # # 100 76 Lack of space for VCT.Patients are referred tonearest facility
100
3. Fixed PHC facilitiesoffering VCT
% 30 65 80 89 100
4. Hospitals offering PEP foroccupational HIV exposure
% 100 100 100 100 100
5. Hospitals offering PEP forsexual abuse
% 100 100 100 100 100
Process
6. TB cases with a DOTsupporter
% 93 89 100 90 10% of patients prefer tobe self supervised
100
7. Male condom distributionrate from public sectorhealth facilities
No 8m 8.5m 8.5m 10.9 million 11
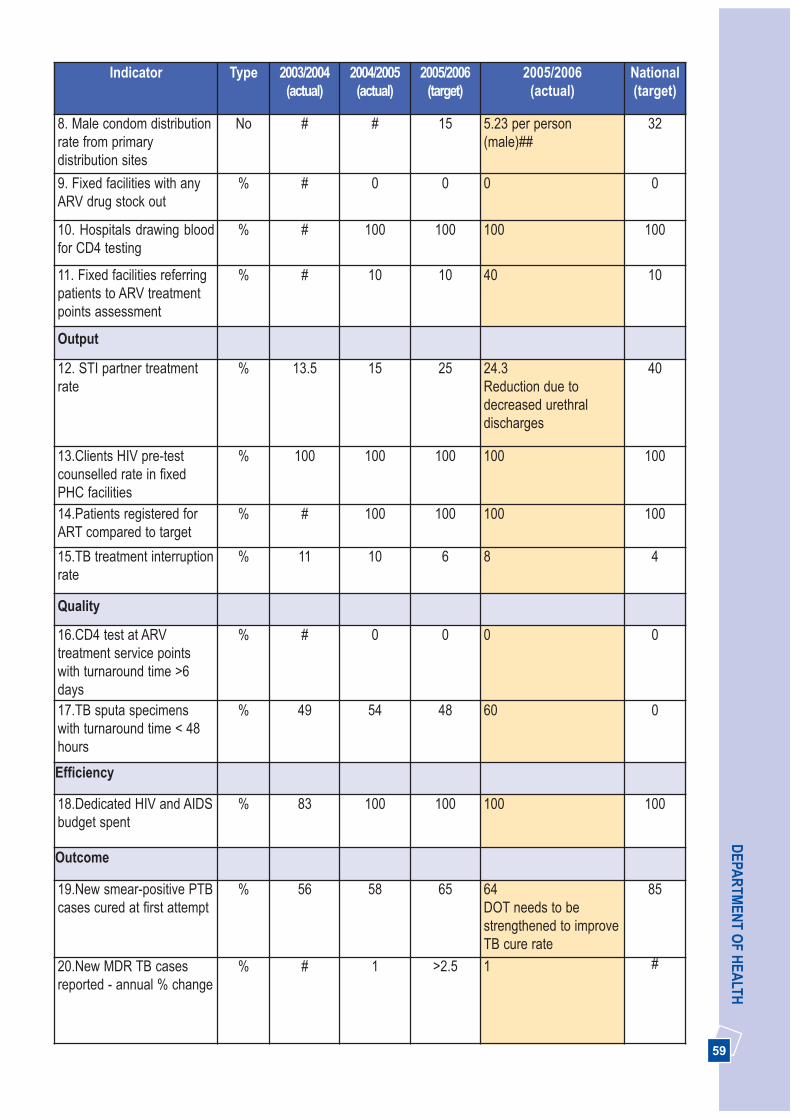
59
DEPA
RTM
ENT O
F HEA
LTHIndicator Type 2003/2004
(actual)2004/2005(actual)
2005/2006(target)
2005/2006(actual)
National(target)
8. Male condom distributionrate from primarydistribution sites
No # # 15 5.23 per person(male)##
32
9. Fixed facilities with anyARV drug stock out
% # 0 0 0 0
10. Hospitals drawing bloodfor CD4 testing
% # 100 100 100 100
11. Fixed facilities referringpatients to ARV treatmentpoints assessment
% # 10 10 40 10
Output
12. STI partner treatmentrate
% 13.5 15 25 24.3 Reduction due todecreased urethraldischarges
40
13.Clients HIV pre-testcounselled rate in fixedPHC facilities
% 100 100 100 100 100
14.Patients registered forART compared to target
% # 100 100 100 100
15.TB treatment interruptionrate
% 11 10 6 8 4
Quality
16.CD4 test at ARVtreatment service pointswith turnaround time >6days
% # 0 0 0 0
17.TB sputa specimenswith turnaround time < 48hours
% 49 54 48 60 0
Efficiency
18.Dedicated HIV and AIDSbudget spent
% 83 100 100 100 100
Outcome
19.New smear-positive PTBcases cured at first attempt
% 56 58 65 64DOT needs to bestrengthened to improveTB cure rate
85
20.New MDR TB casesreported - annual % change
% # 1 >2.5 1 #
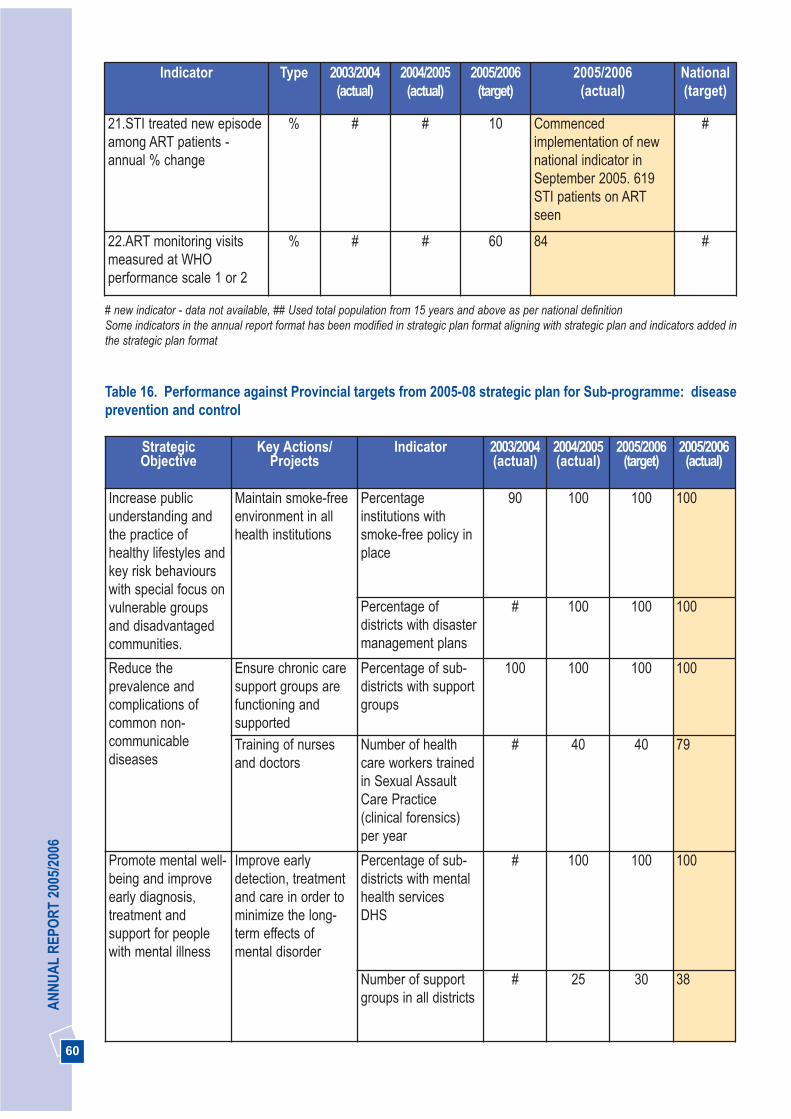
60
AN
NU
AL
REP
OR
T 20
05/2
006
Indicator Type 2003/2004(actual)
2004/2005(actual)
2005/2006(target)
2005/2006(actual)
National(target)
21.STI treated new episodeamong ART patients -annual % change
% # # 10 Commencedimplementation of newnational indicator inSeptember 2005. 619STI patients on ARTseen
#
22.ART monitoring visitsmeasured at WHOperformance scale 1 or 2
% # # 60 84 #
# new indicator - data not available, ## Used total population from 15 years and above as per national definitionSome indicators in the annual report format has been modified in strategic plan format aligning with strategic plan and indicators added inthe strategic plan format
Table 16. Performance against Provincial targets from 2005-08 strategic plan for Sub-programme: diseaseprevention and control
StrategicObjective
Key Actions/Projects
Indicator 2003/2004(actual)
2004/2005(actual)
2005/2006(target)
2005/2006(actual)
Increase publicunderstanding andthe practice ofhealthy lifestyles andkey risk behaviourswith special focus onvulnerable groupsand disadvantagedcommunities.
Maintain smoke-freeenvironment in allhealth institutions
Percentageinstitutions withsmoke-free policy inplace
90 100 100 100
Percentage ofdistricts with disastermanagement plans
# 100 100 100
Reduce theprevalence andcomplications ofcommon non-communicablediseases
Ensure chronic caresupport groups arefunctioning andsupported
Percentage of sub-districts with supportgroups
100 100 100 100
Training of nursesand doctors
Number of healthcare workers trainedin Sexual AssaultCare Practice(clinical forensics)per year
# 40 40 79
Promote mental well-being and improveearly diagnosis,treatment andsupport for peoplewith mental illness
Improve earlydetection, treatmentand care in order tominimize the long-term effects ofmental disorder
Percentage of sub-districts with mentalhealth servicesDHS
# 100 100 100
Number of supportgroups in all districts
# 25 30 38
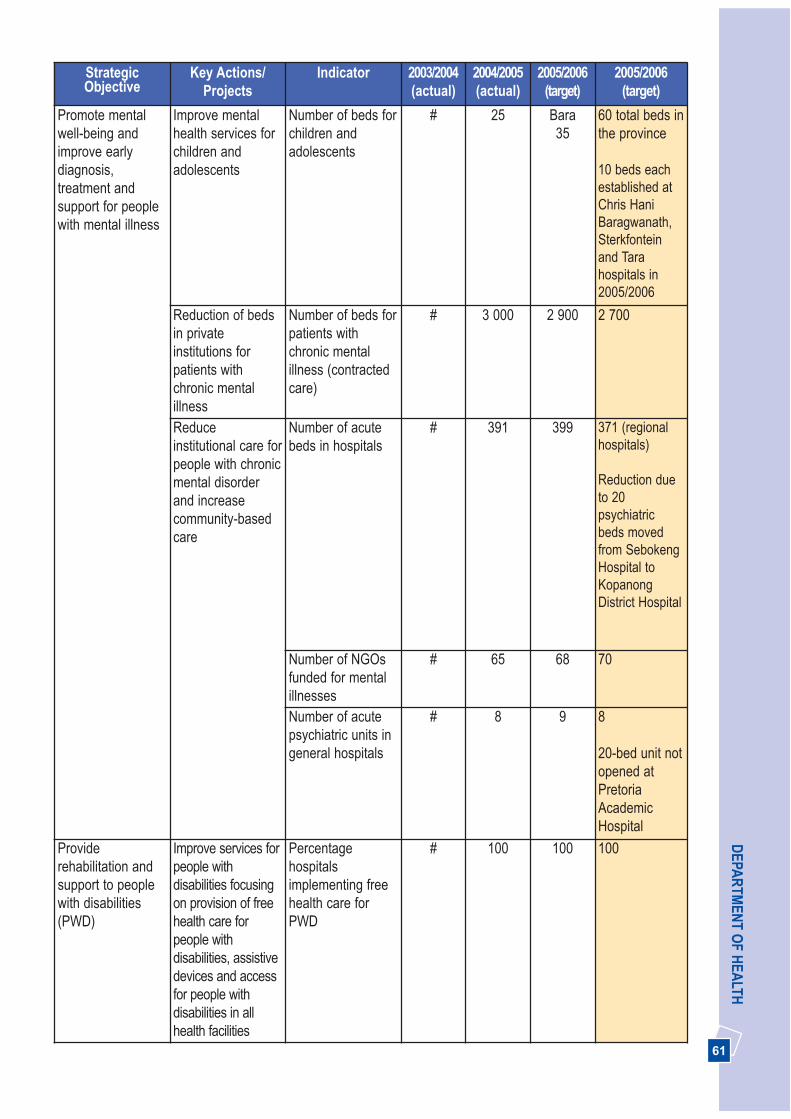
61
DEPA
RTM
ENT O
F HEA
LTHStrategicObjective
Key Actions/Projects
Indicator 2003/2004(actual)
2004/2005(actual)
2005/2006(target)
2005/2006(target)
Promote mentalwell-being andimprove earlydiagnosis,treatment andsupport for peoplewith mental illness
Improve mentalhealth services forchildren andadolescents
Number of beds forchildren andadolescents
# 25 Bara35
60 total beds inthe province
10 beds eachestablished atChris HaniBaragwanath,Sterkfonteinand Tarahospitals in2005/2006
Reduction of bedsin privateinstitutions forpatients withchronic mentalillness
Number of beds forpatients withchronic mentalillness (contractedcare)
# 3 000 2 900 2 700
Reduceinstitutional care forpeople with chronicmental disorderand increasecommunity-basedcare
Number of acutebeds in hospitals
# 391 399 371 (regionalhospitals)
Reduction dueto 20psychiatricbeds movedfrom SebokengHospital toKopanongDistrict Hospital
Number of NGOsfunded for mentalillnesses
# 65 68 70
Number of acutepsychiatric units ingeneral hospitals
# 8 9 8
20-bed unit notopened atPretoriaAcademicHospital
Providerehabilitation andsupport to peoplewith disabilities(PWD)
Improve services forpeople withdisabilities focusingon provision of freehealth care forpeople withdisabilities, assistivedevices and accessfor people withdisabilities in allhealth facilities
Percentagehospitalsimplementing freehealth care forPWD
# 100 100 100

62
AN
NU
AL
REP
OR
T 20
05/2
006
StrategicObjective
Key Actions/Projects
Indicator 2003/2004(actual)
2004/2005(actual)
2005/2006(target)
2005/2006(target)
Providerehabilitation andsupport to peoplewith disabilities(PWD)
Number ofvocational rehabassessments doneof PWD
# 100 150 150
Number of patientsreceiving Orthotic& Prostheticservices
# 10 000 11 000 6 951 fromJanuary toDecember2005
Target not metdue toshortage ofmedicalorthotists andprostetists
Number of fundedNGOs providingservices for PWD
# 3 3 3
#new indicator-data not available
Table 17. Performance against National targets from strategic plan 2005-08 for sub-programme: DiseasePrevention and Control
StrategicIndicator
Type 2003/2004(actual)
2004/2005(actual)
2005/2006(target)
2005/2006(actual)
National(target)
2007/2008
Input
1. Trauma centres forvictims of violence
No 26 26 6 26 1 per district
Process
2. CHCs with fast queuesfor older persons
% 23 41 30 58 20
Output
3. Health districts withhealth care wastemanagement planimplemented
No 6 6 6 6 All districts
4. Hospitals providingoccupational healthprogrammes
% # 100Part of
IntegratedWellness
programme
61(estimate)
##
100
Part of IntegratedWellness programme
100

63
DEPA
RTM
ENT O
F HEA
LTHIndicator Type 2003/2004
(actual)2004/2005
(actual)2005/2006
(target)2005/2006
(actual)National(target)
2007/2008
5. Schools implementingHealth PromotingSchools Programme(HPSP)
% # 6 12 12 #
6. Integrated epidemicpreparedness andresponse plansimplemented
Y/N Y Y Y Y Yes
7. Integratedcommunicable diseasecontrol plansimplemented
Y/N Y Y Y Y Yes
Quality
8. Schools complyingwith quality indexrequirements for HPSP
% # 6 12 This indicator has beendiscontinued byNational HealthDepartment.
#
9. Outbreak responsetime
Days 2 1 1 1 1
Outcome
10. Cataract surgeryrate
No 5 684 10 882 8 000 9 122 ** 1 000
#new indicator- data not available, ## target not determined, based on 5006/2006 estimate in 2006/2007 strategic plan ** data per calendaryear excluding cataract surgery performed by private sector, no systems to collect data for four indicators not included. NB: Some indicators in annual report format has been revised in strategic plan format
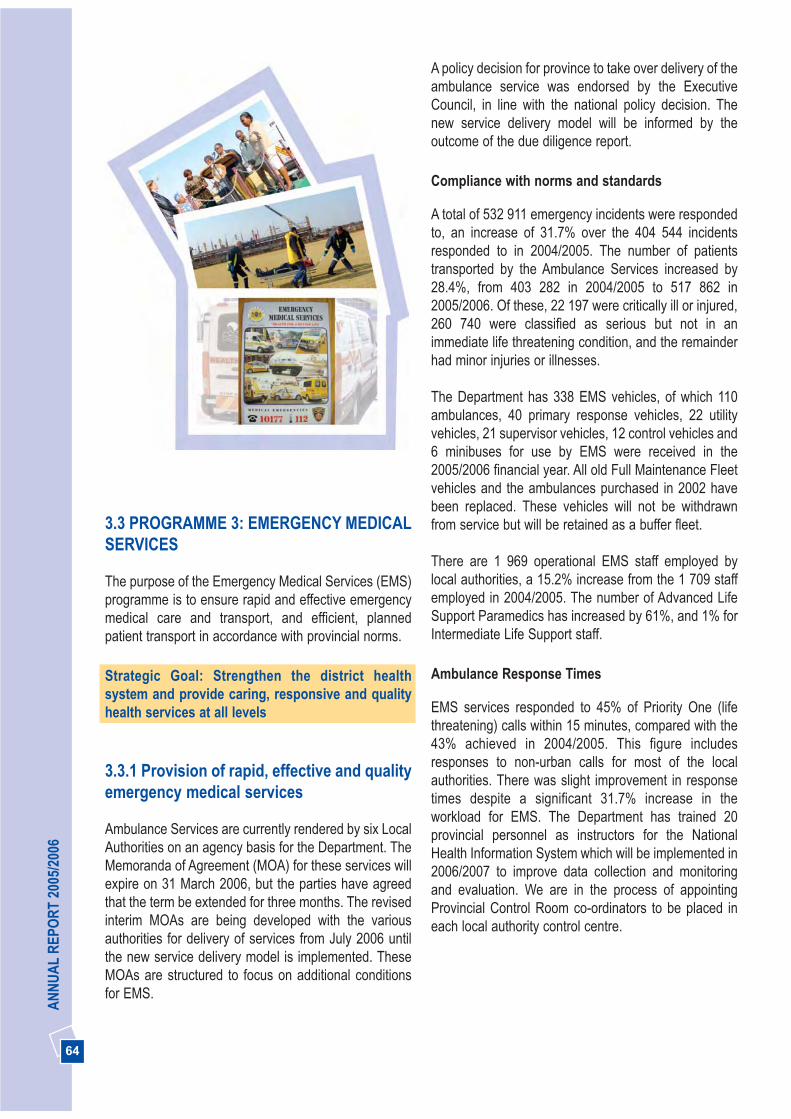
64
AN
NU
AL
REP
OR
T 20
05/2
006
A policy decision for province to take over delivery of theambulance service was endorsed by the ExecutiveCouncil, in line with the national policy decision. Thenew service delivery model will be informed by theoutcome of the due diligence report.
Compliance with norms and standards
A total of 532 911 emergency incidents were respondedto, an increase of 31.7% over the 404 544 incidentsresponded to in 2004/2005. The number of patientstransported by the Ambulance Services increased by28.4%, from 403 282 in 2004/2005 to 517 862 in2005/2006. Of these, 22 197 were critically ill or injured,260 740 were classified as serious but not in animmediate life threatening condition, and the remainderhad minor injuries or illnesses.
The Department has 338 EMS vehicles, of which 110ambulances, 40 primary response vehicles, 22 utilityvehicles, 21 supervisor vehicles, 12 control vehicles and6 minibuses for use by EMS were received in the2005/2006 financial year. All old Full Maintenance Fleetvehicles and the ambulances purchased in 2002 havebeen replaced. These vehicles will not be withdrawnfrom service but will be retained as a buffer fleet.
There are 1 969 operational EMS staff employed bylocal authorities, a 15.2% increase from the 1 709 staffemployed in 2004/2005. The number of Advanced LifeSupport Paramedics has increased by 61%, and 1% forIntermediate Life Support staff.
Ambulance Response Times
EMS services responded to 45% of Priority One (lifethreatening) calls within 15 minutes, compared with the43% achieved in 2004/2005. This figure includesresponses to non-urban calls for most of the localauthorities. There was slight improvement in responsetimes despite a significant 31.7% increase in theworkload for EMS. The Department has trained 20provincial personnel as instructors for the NationalHealth Information System which will be implemented in2006/2007 to improve data collection and monitoringand evaluation. We are in the process of appointingProvincial Control Room co-ordinators to be placed ineach local authority control centre.
3.3 PROGRAMME 3: EMERGENCY MEDICALSERVICES
The purpose of the Emergency Medical Services (EMS)programme is to ensure rapid and effective emergencymedical care and transport, and efficient, plannedpatient transport in accordance with provincial norms.
Strategic Goal: Strengthen the district healthsystem and provide caring, responsive and qualityhealth services at all levels
3.3.1 Provision of rapid, effective and qualityemergency medical services
Ambulance Services are currently rendered by six LocalAuthorities on an agency basis for the Department. TheMemoranda of Agreement (MOA) for these services willexpire on 31 March 2006, but the parties have agreedthat the term be extended for three months. The revisedinterim MOAs are being developed with the variousauthorities for delivery of services from July 2006 untilthe new service delivery model is implemented. TheseMOAs are structured to focus on additional conditionsfor EMS.

65
DEPA
RTM
ENT O
F HEA
LTHPlanned Patient Transport
The Planned Patient Transport initiative will beimplemented in the 2006/2007 financial year to reducethe number of emergency calls received, and to assistin the transportation of patients to and from hospitalsand clinics. Twenty one vehicles for this initiative werepurchased in the year under review, and will bedelivered to the relevant districts in the 2006/2007financial year.
3.3.2 Access to ambulance services forobstetric emergencies
A pilot dedicated Obstetric Ambulance Service hasbeen implemented in the Sedibeng district with greatsuccess. This vehicle transported 2 628 maternitypatients during the past year and the waiting time forthis service was reduced significantly. This system willbe expanded to other districts in the next financial year.Five ambulances were purchased for this purposeduring the year under review and will be distributed toall the districts in the next financial year.
Strategic Goal: Promote health, prevent andmanage illnesses or conditions with emphasis onpoverty, lifestyle, trauma and violence andpsychosocial factors
3.3.3 Promote mental well-being andimprove early diagnosis, treatment andsupport of people with mental illness
All provincial Advanced Life Support Paramedics havebeen trained on the provisions of the Mental Health Act.Standard Operating Procedures and Guidelines havebeen established to assist paramedics on how to dealwith patients exhibiting aggressive behaviour due tomental illness or acute drug intoxication.
3.3.4 Outputs and Outcomes
The outputs and outcomes for the budget statement,national indicators, including provincial-specific outputshave been outlined separately to ensure compliancewith Legislative, National Health and National Treasuryrequirements. This process will enhance the monitoringof performance at different levels.
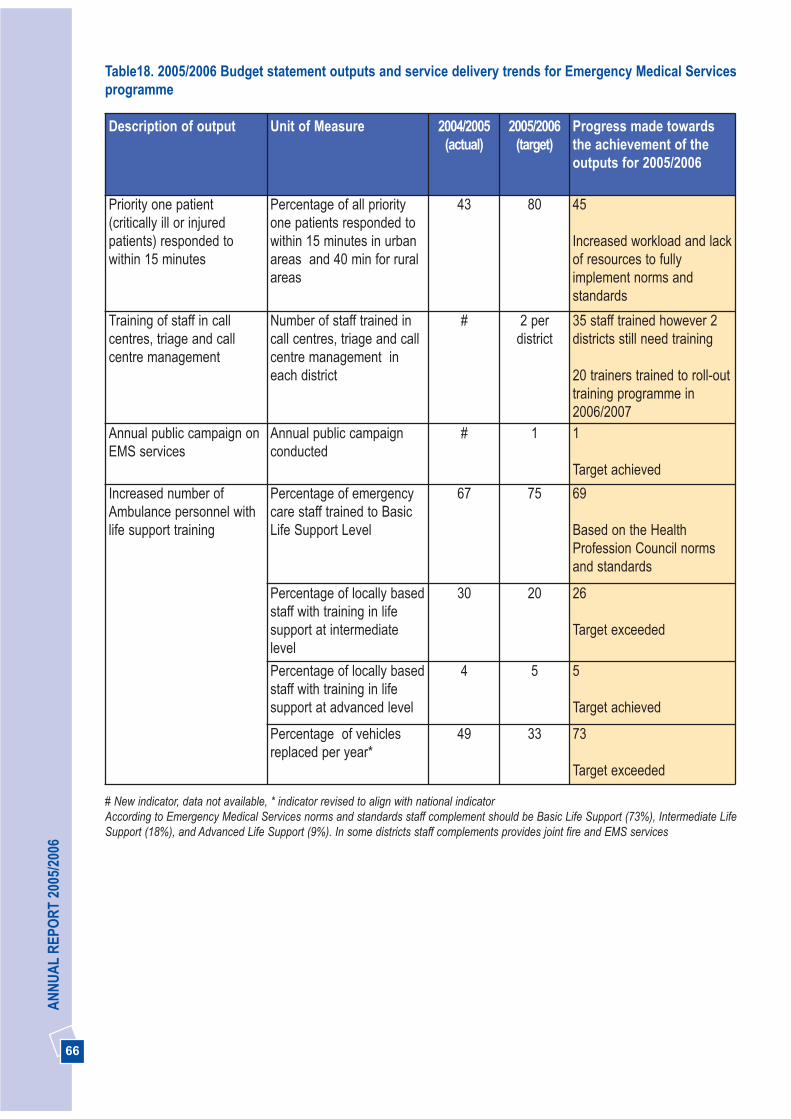
66
AN
NU
AL
REP
OR
T 20
05/2
006
Description of output Unit of Measure 2004/2005 (actual)
2005/2006(target)
Progress made towardsthe achievement of theoutputs for 2005/2006
Priority one patient(critically ill or injuredpatients) responded towithin 15 minutes
Percentage of all priorityone patients responded towithin 15 minutes in urbanareas and 40 min for ruralareas
43 80 45
Increased workload and lackof resources to fullyimplement norms andstandards
Training of staff in callcentres, triage and callcentre management
Number of staff trained incall centres, triage and callcentre management ineach district
# 2 perdistrict
35 staff trained however 2districts still need training
20 trainers trained to roll-outtraining programme in2006/2007
Annual public campaign onEMS services
Annual public campaignconducted
# 1 1
Target achieved
Increased number ofAmbulance personnel withlife support training
Percentage of emergencycare staff trained to BasicLife Support Level
67 75 69
Based on the HealthProfession Council normsand standards
Percentage of locally basedstaff with training in lifesupport at intermediatelevel
30 20 26
Target exceeded
Percentage of locally basedstaff with training in lifesupport at advanced level
4 5 5
Target achieved
Percentage of vehiclesreplaced per year*
49 33 73
Target exceeded
Table18. 2005/2006 Budget statement outputs and service delivery trends for Emergency Medical Servicesprogramme
# New indicator, data not available, * indicator revised to align with national indicatorAccording to Emergency Medical Services norms and standards staff complement should be Basic Life Support (73%), Intermediate LifeSupport (18%), and Advanced Life Support (9%). In some districts staff complements provides joint fire and EMS services
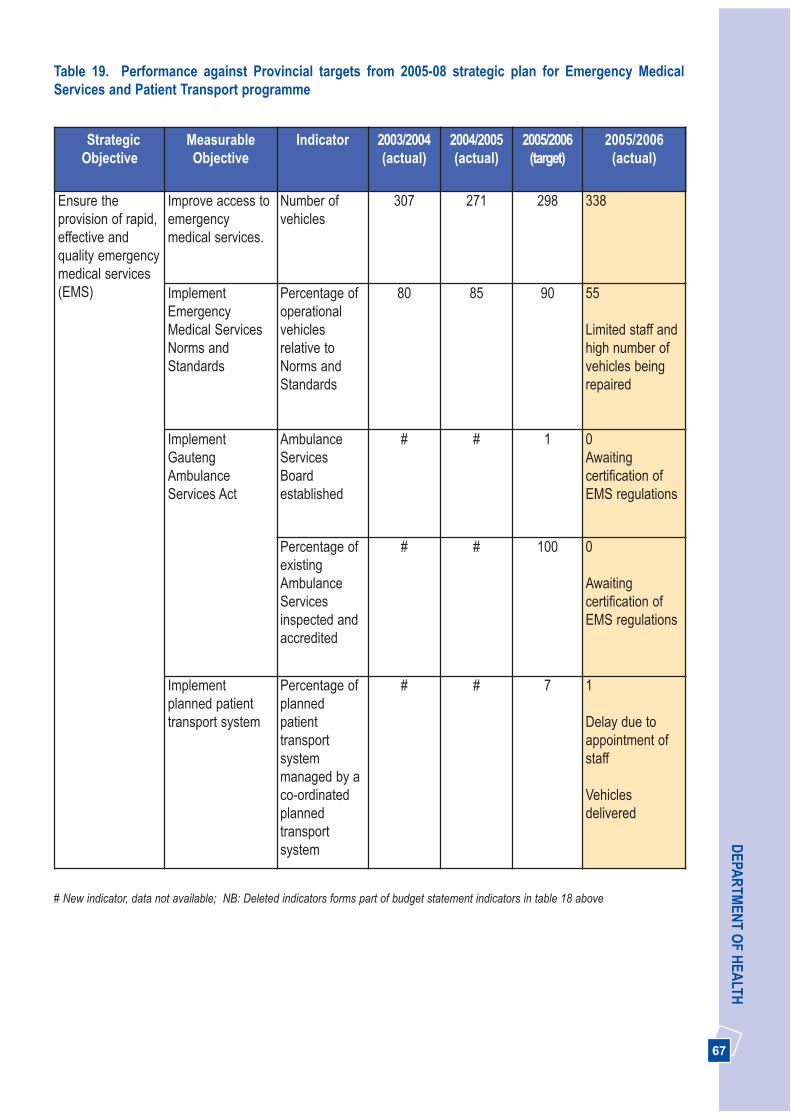
67
DEPA
RTM
ENT O
F HEA
LTHTable 19. Performance against Provincial targets from 2005-08 strategic plan for Emergency MedicalServices and Patient Transport programme
StrategicObjective
MeasurableObjective
Indicator 2003/2004(actual)
2004/2005(actual)
2005/2006(target)
2005/2006(actual)
Ensure theprovision of rapid,effective andquality emergencymedical services(EMS)
Improve access toemergencymedical services.
Number ofvehicles
307 271 298 338
ImplementEmergencyMedical ServicesNorms andStandards
Percentage ofoperationalvehiclesrelative toNorms andStandards
80 85 90 55
Limited staff andhigh number ofvehicles beingrepaired
ImplementGautengAmbulanceServices Act
AmbulanceServicesBoardestablished
# # 1 0 Awaitingcertification ofEMS regulations
Percentage ofexistingAmbulanceServicesinspected andaccredited
# # 100 0
Awaitingcertification ofEMS regulations
Implementplanned patienttransport system
Percentage ofplannedpatienttransportsystemmanaged by aco-ordinatedplannedtransportsystem
# # 7 1
Delay due toappointment ofstaff
Vehiclesdelivered
# New indicator, data not available; NB: Deleted indicators forms part of budget statement indicators in table 18 above

68
AN
NU
AL
REP
OR
T 20
05/2
006
Indicator Type 2003/2004(actual)
2004/2005(actual)
2005/2006(target)
2005/2006(actual)
National(target)
2007/2008
Input
1. Number of Ambulancevehicles per 1 000people2. Hospitals with patienttransporters
No
%
0.039
22
0.027
22
0.024
30
0.026
30
0.3
100
Process
3. Kilometres travelledper ambulance (perannum)
Km 53 515 66 000 66 000 64 474
Improved due toincreased number ofvehicles
#
4. Percentage of locallybased staff with trainingin life support at basiclevel
% 67 69 75 69
Based on the HealthProfessions Councilnorms and standards
100
5. Percentage of locallybased staff with trainingin life support atintermediate level
% 34 30 20 26 #
6. Percentage of locallybased staff with trainingin life support atadvanced level
% 5 4 5 5 #
Quality
7. Percentage ofresponse times withincurrent national urbantargets (15 min)
% 53.65 43 80 45
Increased workload andlack of resources tofully implement normsand standards
100
8. Percentage ofresponse times withincurrent national ruraltargets (40 min)
% # Difficult toseparaterural andurban calls
80 Difficult to separaterural and urban calls
100
9. Percentage of call-outs answered by singleperson crew
% 0 0 0 0 0
Table 20. Performance against National targets from 2005-08 strategic plan for Emergency MedicalServices and Patient Transport Programme
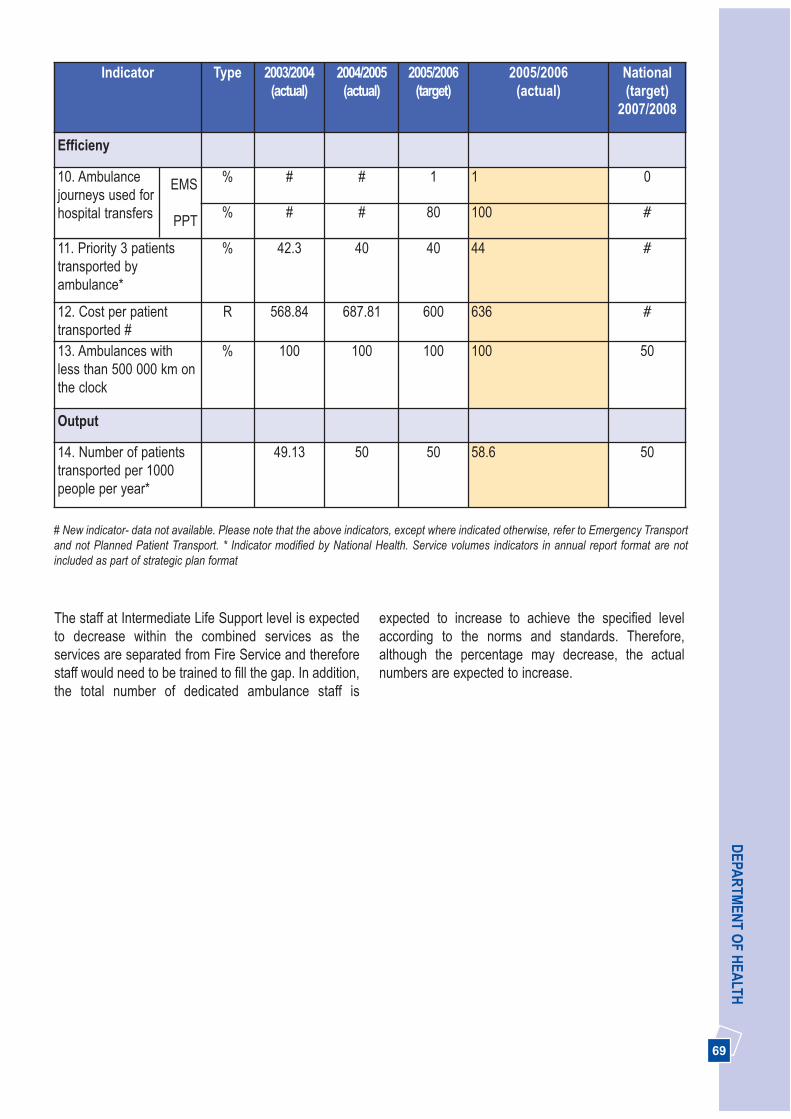
69
DEPA
RTM
ENT O
F HEA
LTH
11. Priority 3 patientstransported byambulance*
% 42.3 40 40 44 #
12. Cost per patienttransported #
R 568.84 687.81 600 636 #
13. Ambulances withless than 500 000 km onthe clock
% 100 100 100 100 50
Output
14. Number of patientstransported per 1000people per year*
49.13 50 50 58.6 50
Indicator Type 2003/2004(actual)
2004/2005(actual)
2005/2006(target)
2005/2006(actual)
National(target)
2007/2008
Efficieny
10. Ambulance journeys used forhospital transfers
% # # 1 1 0
% # # 80 100 #
EMS
PPT
# New indicator- data not available. Please note that the above indicators, except where indicated otherwise, refer to Emergency Transportand not Planned Patient Transport. * Indicator modified by National Health. Service volumes indicators in annual report format are notincluded as part of strategic plan format
The staff at Intermediate Life Support level is expectedto decrease within the combined services as theservices are separated from Fire Service and thereforestaff would need to be trained to fill the gap. In addition,the total number of dedicated ambulance staff is
expected to increase to achieve the specified levelaccording to the norms and standards. Therefore,although the percentage may decrease, the actualnumbers are expected to increase.
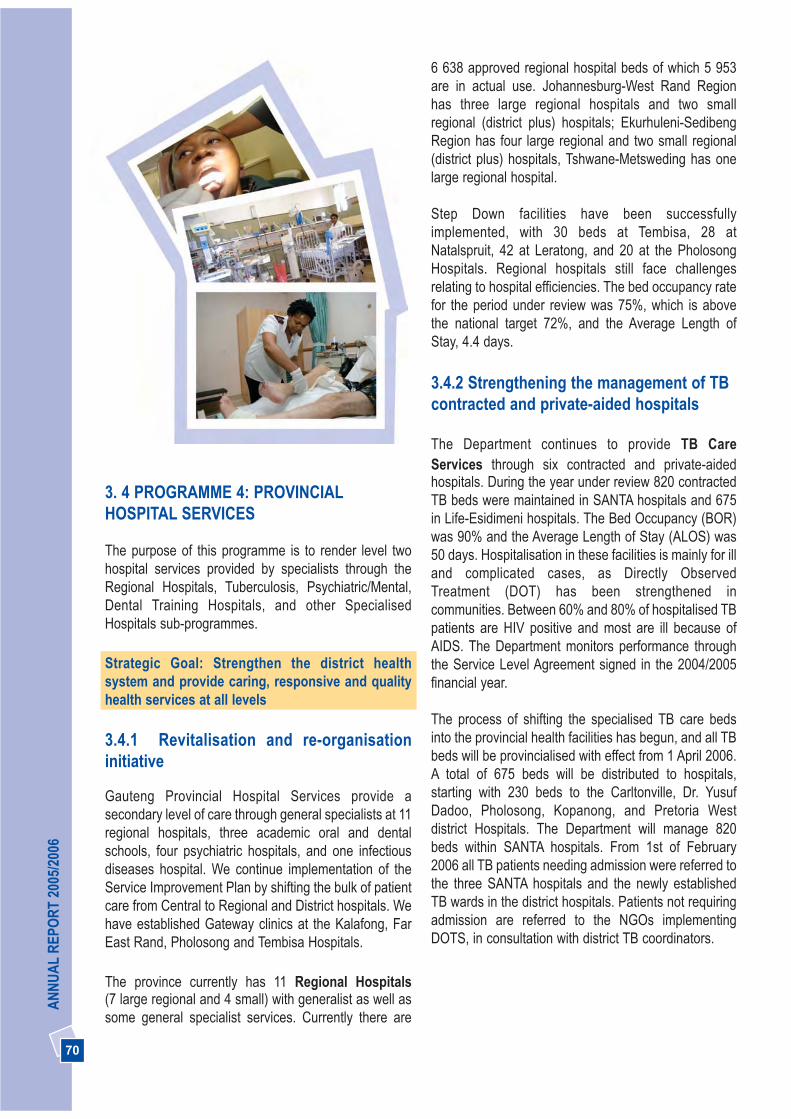
70
AN
NU
AL
REP
OR
T 20
05/2
006
THREE PICTURES
3. 4 PROGRAMME 4: PROVINCIALHOSPITAL SERVICES
The purpose of this programme is to render level twohospital services provided by specialists through theRegional Hospitals, Tuberculosis, Psychiatric/Mental,Dental Training Hospitals, and other SpecialisedHospitals sub-programmes.
Strategic Goal: Strengthen the district healthsystem and provide caring, responsive and qualityhealth services at all levels
3.4.1 Revitalisation and re-organisationinitiative
Gauteng Provincial Hospital Services provide asecondary level of care through general specialists at 11regional hospitals, three academic oral and dentalschools, four psychiatric hospitals, and one infectiousdiseases hospital. We continue implementation of theService Improvement Plan by shifting the bulk of patientcare from Central to Regional and District hospitals. Wehave established Gateway clinics at the Kalafong, FarEast Rand, Pholosong and Tembisa Hospitals.
The province currently has 11 Regional Hospitals(7 large regional and 4 small) with generalist as well assome general specialist services. Currently there are
6 638 approved regional hospital beds of which 5 953are in actual use. Johannesburg-West Rand Regionhas three large regional hospitals and two smallregional (district plus) hospitals; Ekurhuleni-SedibengRegion has four large regional and two small regional(district plus) hospitals, Tshwane-Metsweding has onelarge regional hospital.
Step Down facilities have been successfullyimplemented, with 30 beds at Tembisa, 28 atNatalspruit, 42 at Leratong, and 20 at the PholosongHospitals. Regional hospitals still face challengesrelating to hospital efficiencies. The bed occupancy ratefor the period under review was 75%, which is abovethe national target 72%, and the Average Length ofStay, 4.4 days.
3.4.2 Strengthening the management of TBcontracted and private-aided hospitals
The Department continues to provide TB CareServices through six contracted and private-aidedhospitals. During the year under review 820 contractedTB beds were maintained in SANTA hospitals and 675in Life-Esidimeni hospitals. The Bed Occupancy (BOR)was 90% and the Average Length of Stay (ALOS) was50 days. Hospitalisation in these facilities is mainly for illand complicated cases, as Directly ObservedTreatment (DOT) has been strengthened incommunities. Between 60% and 80% of hospitalised TBpatients are HIV positive and most are ill because ofAIDS. The Department monitors performance throughthe Service Level Agreement signed in the 2004/2005financial year.
The process of shifting the specialised TB care bedsinto the provincial health facilities has begun, and all TBbeds will be provincialised with effect from 1 April 2006.A total of 675 beds will be distributed to hospitals,starting with 230 beds to the Carltonville, Dr. YusufDadoo, Pholosong, Kopanong, and Pretoria Westdistrict Hospitals. The Department will manage 820beds within SANTA hospitals. From 1st of February2006 all TB patients needing admission were referred tothe three SANTA hospitals and the newly establishedTB wards in the district hospitals. Patients not requiringadmission are referred to the NGOs implementingDOTS, in consultation with district TB coordinators.
71
DEPA
RTM
ENT O
F HEA
LTH
3.4.3 Provision of Clinical Support Services
Gauteng’s Oral and Dental Training Hospitals provideundergraduate and postgraduate training and assist inrendering services at the secondary and tertiary levels,including tertiary services in the specialised disciplinesof dentistry. These hospitals are Medunsa Oral HealthCentre, Pretoria Oral and Dental and Wits DentalHospitals.
In addition these hospitals also develop and supportprimary oral health care outreach programmes andrender a consultancy service to the health professions,as well providing continuing education programmes. Allthree have established effective referral and academiclinks with the district oral health services in Gautengand neighbouring provinces.
The Oral and Dental Training Hospitals providedservices to 98 504 out-patients with 41 680 at PretoriaOral and Dental Hospital, 30 047 at Medunsa OralHealth Centre and 26 777 at Wits Dental Hospital. Thewaiting list for dentures has been reduced by 30%through additional funding allocated to providespecialised services in 2005/2006.
Senior appointments finalised in 2005/2006 includedthe appointment of a Chief Executive Officer/ Dean forthe Wits Dental Hospital in November 2005 and theappointment of a Chief Specialist/ Head of Departmentin Prosthetics at Medunsa Oral Health Centre.The most significant challenge now facing the dentalhospitals is to re-configure their organisational structureto better align their operations with the Department’sstrategic objectives.
3.4.4 Promoting mental wellbeing andimprove early diagnosis, treatment andsupport for people with mental illness
Gauteng psychiatric services are provided in line withthe new Mental Health Care Act 17 of 2002. Hospitalsdesignated to provide psychiatric services in terms ofthe Act, as outlined in Annexure C (B), were identifiedby the Department in September 2005, namely:
• Twelve health care establishments including the fourpsychiatric/mental hospitals have been designatedas psychiatric hospitals or care and rehabilitationcentres in terms of Section 5 of the Act;
• Weskoppies and Sterkfontein Hospitals have beendesignated to care, treat and provide rehabilitationservices to state patients and mentally ill prisoners interms of Sections 41 and 49 of the Act; and
• Eight hospitals in the Johannesburg/Westrandregion, nine in Ekurhuleni/Sedibeng and five in theTshwane/Metsweding region have been designatedto provide assessment of mental health status interms of regulation 12 of the Act.
Chronic psychiatric care services are still beingprovided by the six contracted psychiatric hospitalsoperated by Life Esidemeni.
A total of 30 new beds were opened for child andadolescent mental health services. There are 10 bedseach at Chris Hani Baragwanath and Tara Hospitals forchildren and 10 beds at Sterkfontein, for maleadolescent forensic care.
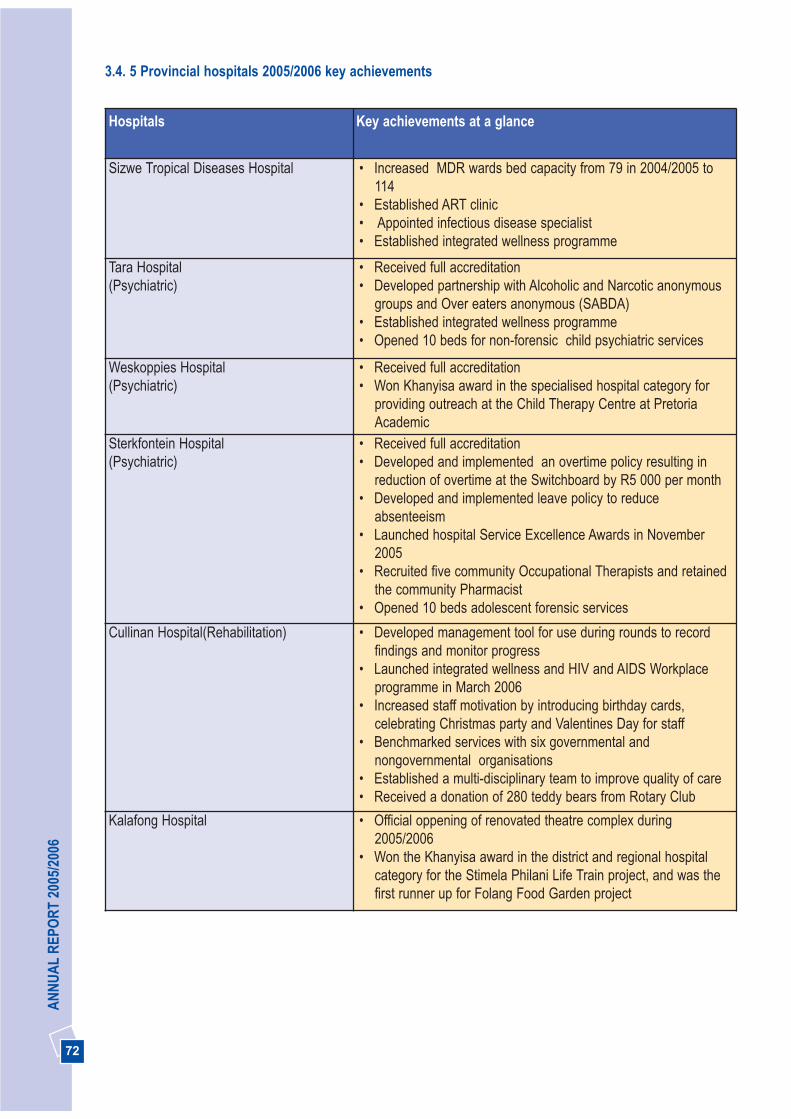
72
AN
NU
AL
REP
OR
T 20
05/2
006
3.4. 5 Provincial hospitals 2005/2006 key achievements
Hospitals Key achievements at a glance
Sizwe Tropical Diseases Hospital • Increased MDR wards bed capacity from 79 in 2004/2005 to114
• Established ART clinic • Appointed infectious disease specialist• Established integrated wellness programme
Tara Hospital(Psychiatric)
• Received full accreditation• Developed partnership with Alcoholic and Narcotic anonymous
groups and Over eaters anonymous (SABDA)• Established integrated wellness programme• Opened 10 beds for non-forensic child psychiatric services
Weskoppies Hospital(Psychiatric)
• Received full accreditation• Won Khanyisa award in the specialised hospital category for
providing outreach at the Child Therapy Centre at PretoriaAcademic
Sterkfontein Hospital(Psychiatric)
• Received full accreditation• Developed and implemented an overtime policy resulting in
reduction of overtime at the Switchboard by R5 000 per month• Developed and implemented leave policy to reduce
absenteeism • Launched hospital Service Excellence Awards in November
2005 • Recruited five community Occupational Therapists and retained
the community Pharmacist • Opened 10 beds adolescent forensic services
Cullinan Hospital(Rehabilitation) • Developed management tool for use during rounds to recordfindings and monitor progress
• Launched integrated wellness and HIV and AIDS Workplaceprogramme in March 2006
• Increased staff motivation by introducing birthday cards,celebrating Christmas party and Valentines Day for staff
• Benchmarked services with six governmental andnongovernmental organisations
• Established a multi-disciplinary team to improve quality of care• Received a donation of 280 teddy bears from Rotary Club
Kalafong Hospital • Official oppening of renovated theatre complex during2005/2006
• Won the Khanyisa award in the district and regional hospitalcategory for the Stimela Philani Life Train project, and was thefirst runner up for Folang Food Garden project
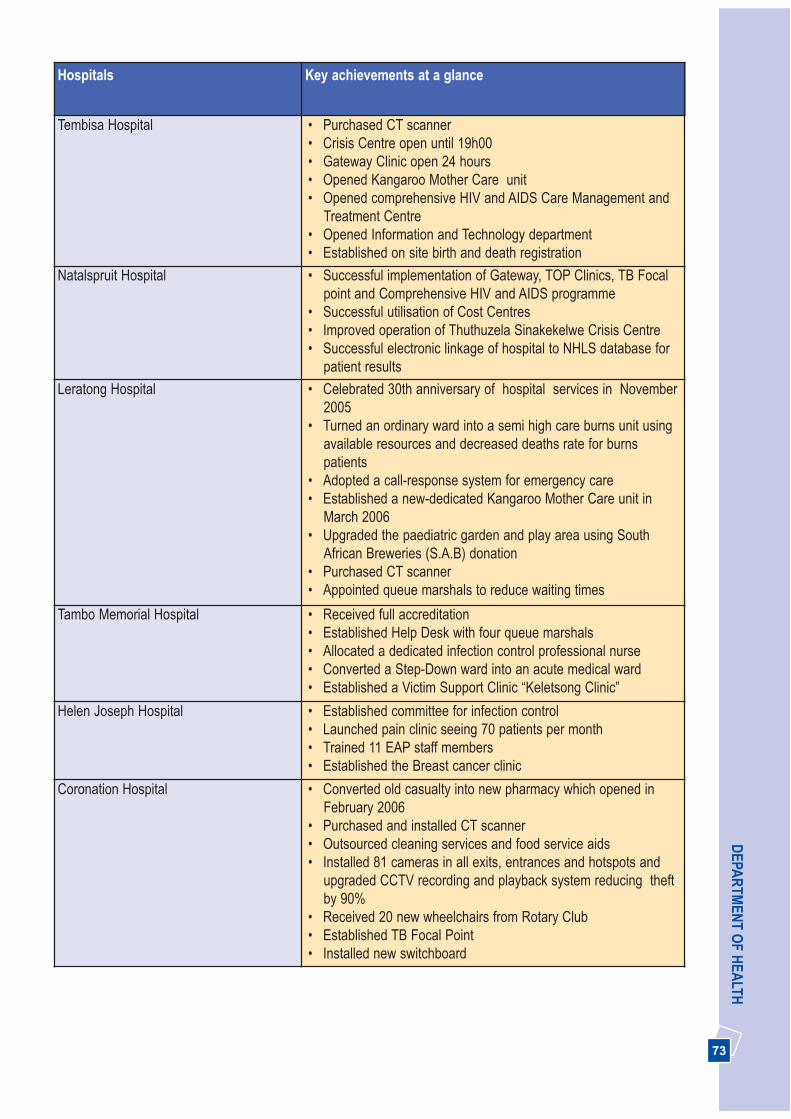
73
DEPA
RTM
ENT O
F HEA
LTHHospitals Key achievements at a glance
Tembisa Hospital • Purchased CT scanner • Crisis Centre open until 19h00• Gateway Clinic open 24 hours• Opened Kangaroo Mother Care unit• Opened comprehensive HIV and AIDS Care Management and
Treatment Centre• Opened Information and Technology department • Established on site birth and death registration
Natalspruit Hospital • Successful implementation of Gateway, TOP Clinics, TB Focalpoint and Comprehensive HIV and AIDS programme
• Successful utilisation of Cost Centres• Improved operation of Thuthuzela Sinakekelwe Crisis Centre• Successful electronic linkage of hospital to NHLS database for
patient results
Leratong Hospital • Celebrated 30th anniversary of hospital services in November2005
• Turned an ordinary ward into a semi high care burns unit usingavailable resources and decreased deaths rate for burnspatients
• Adopted a call-response system for emergency care• Established a new-dedicated Kangaroo Mother Care unit in
March 2006• Upgraded the paediatric garden and play area using South
African Breweries (S.A.B) donation • Purchased CT scanner • Appointed queue marshals to reduce waiting times
Tambo Memorial Hospital • Received full accreditation• Established Help Desk with four queue marshals • Allocated a dedicated infection control professional nurse• Converted a Step-Down ward into an acute medical ward• Established a Victim Support Clinic “Keletsong Clinic”
Helen Joseph Hospital • Established committee for infection control• Launched pain clinic seeing 70 patients per month• Trained 11 EAP staff members• Established the Breast cancer clinic
Coronation Hospital • Converted old casualty into new pharmacy which opened inFebruary 2006
• Purchased and installed CT scanner• Outsourced cleaning services and food service aids• Installed 81 cameras in all exits, entrances and hotspots and
upgraded CCTV recording and playback system reducing theftby 90%
• Received 20 new wheelchairs from Rotary Club• Established TB Focal Point• Installed new switchboard
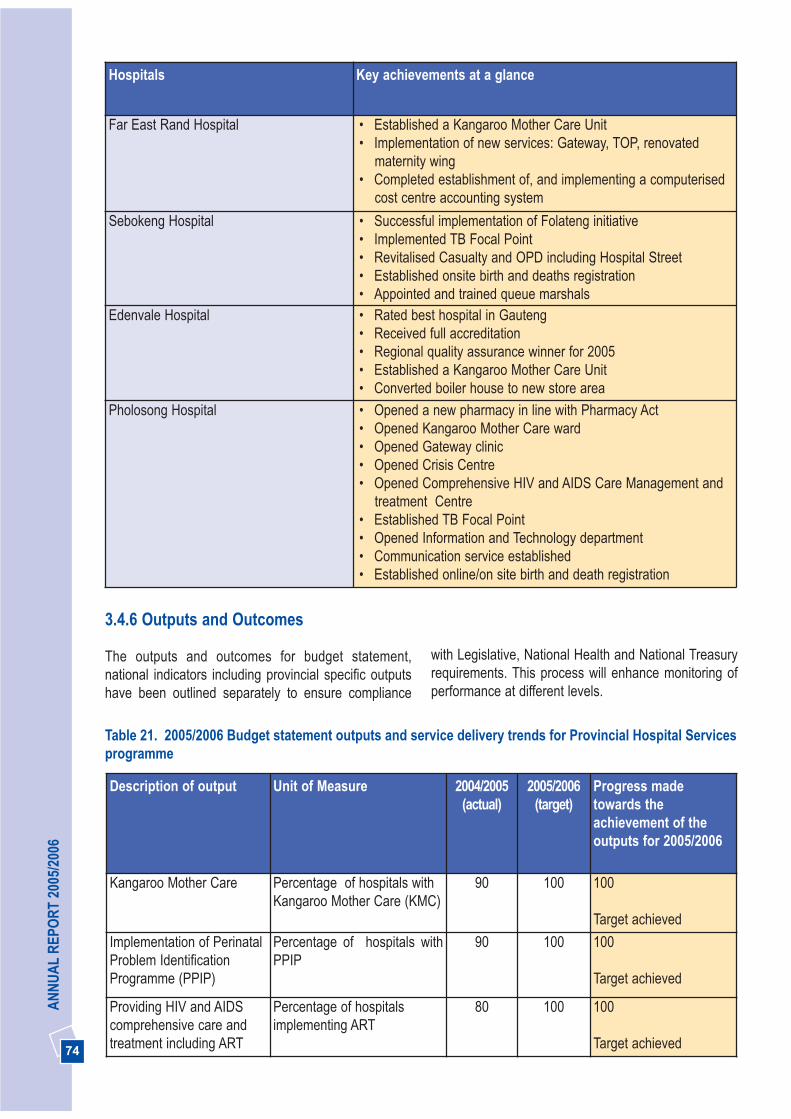
74
AN
NU
AL
REP
OR
T 20
05/2
006
Hospitals Key achievements at a glance
Far East Rand Hospital • Established a Kangaroo Mother Care Unit • Implementation of new services: Gateway, TOP, renovated
maternity wing• Completed establishment of, and implementing a computerised
cost centre accounting system
Sebokeng Hospital • Successful implementation of Folateng initiative• Implemented TB Focal Point• Revitalised Casualty and OPD including Hospital Street • Established onsite birth and deaths registration • Appointed and trained queue marshals
Edenvale Hospital • Rated best hospital in Gauteng• Received full accreditation • Regional quality assurance winner for 2005• Established a Kangaroo Mother Care Unit • Converted boiler house to new store area
Pholosong Hospital • Opened a new pharmacy in line with Pharmacy Act• Opened Kangaroo Mother Care ward• Opened Gateway clinic • Opened Crisis Centre • Opened Comprehensive HIV and AIDS Care Management and
treatment Centre • Established TB Focal Point• Opened Information and Technology department • Communication service established• Established online/on site birth and death registration
Table 21. 2005/2006 Budget statement outputs and service delivery trends for Provincial Hospital Servicesprogramme
3.4.6 Outputs and Outcomes
The outputs and outcomes for budget statement,national indicators including provincial specific outputshave been outlined separately to ensure compliance
with Legislative, National Health and National Treasuryrequirements. This process will enhance monitoring ofperformance at different levels.
Description of output Unit of Measure 2004/2005(actual)
2005/2006(target)
Progress madetowards theachievement of theoutputs for 2005/2006
Kangaroo Mother Care Percentage of hospitals withKangaroo Mother Care (KMC)
90 100 100
Target achieved
Implementation of PerinatalProblem IdentificationProgramme (PPIP)
Percentage of hospitals withPPIP
90 100 100
Target achieved
Providing HIV and AIDScomprehensive care andtreatment including ART
Percentage of hospitalsimplementing ART
80 100 100
Target achieved
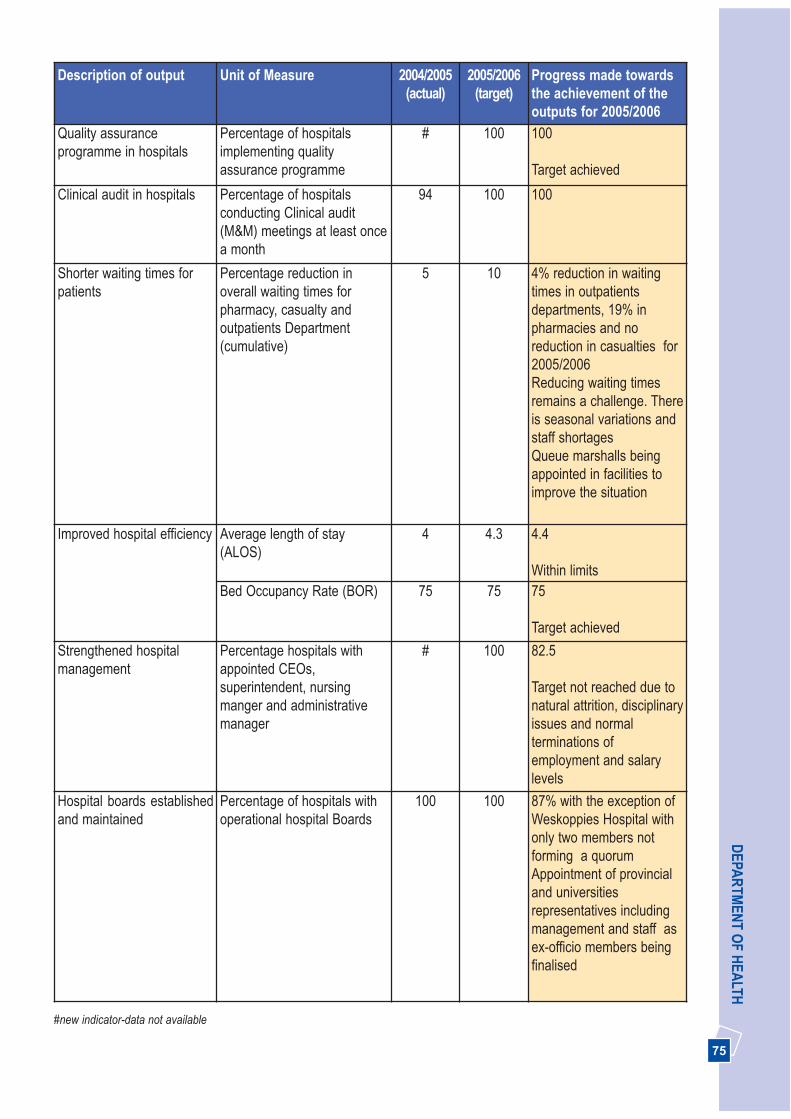
75
DEPA
RTM
ENT O
F HEA
LTHDescription of output Unit of Measure 2004/2005
(actual)2005/2006
(target)Progress made towardsthe achievement of theoutputs for 2005/2006
Quality assuranceprogramme in hospitals
Percentage of hospitalsimplementing qualityassurance programme
# 100 100
Target achieved
Clinical audit in hospitals Percentage of hospitalsconducting Clinical audit(M&M) meetings at least oncea month
94 100 100
Shorter waiting times forpatients
Percentage reduction inoverall waiting times forpharmacy, casualty andoutpatients Department(cumulative)
5 10 4% reduction in waitingtimes in outpatientsdepartments, 19% inpharmacies and noreduction in casualties for2005/2006Reducing waiting timesremains a challenge. Thereis seasonal variations andstaff shortagesQueue marshalls beingappointed in facilities toimprove the situation
Improved hospital efficiency Average length of stay(ALOS)
4 4.3 4.4
Within limitsBed Occupancy Rate (BOR) 75 75 75
Target achieved
Strengthened hospitalmanagement
Percentage hospitals withappointed CEOs,superintendent, nursingmanger and administrativemanager
# 100 82.5
Target not reached due tonatural attrition, disciplinaryissues and normalterminations ofemployment and salarylevels
Hospital boards establishedand maintained
Percentage of hospitals withoperational hospital Boards
100 100 87% with the exception ofWeskoppies Hospital withonly two members notforming a quorumAppointment of provincialand universitiesrepresentatives includingmanagement and staff asex-officio members beingfinalised
#new indicator-data not available

76
AN
NU
AL
REP
OR
T 20
05/2
006
StrategicObjective
MeasurableObjective
Indicator 2003/2004(target)
2004/2005(target)
2005/2006(target)
2005/2006(actual)
Implement aneffectivePerformanceManagementsystem
Developperformance workplans for allhospital CEOs
Percentage ofhospital CEOswithperformancework plans
# 100 100 91
Awaitingappointment ofHelen JosephHospital CEO
Provide people-centred care thatrecognises thedignity anduniqueness ofeach person
Ensurecoordination ofqualitymanagement inhospitals
Percentage ofhospitalsimplementingqualityassuranceprogramme
# # 100 100
Provide efficientand effectiveclinical supportservices (allied,laboratory,pharmaceuticals,blood services,radiology etc)
Ensure availabilityof drugs on EDL inall institutions
Percentage ofhospitals withall EDL drugsavailable
# 98 100 100
Table 22. Performance against Provincial targets from 2005-08 strategic plan for sub programme general(regional) hospitals
# new indicator - data not available, NB: Deleted indicators forms part of the budget statement indicators as indicators in table 21 above
Table 23. Performance against National targets from 2005-08 strategic plan sub-programmes: for general(regional) hospitals
Indicator Type 2003/2004(actual)
2004/2005(actual)
2005/2006(target)
2005/2006(actual)
National(target)
2003/2004
Input
1. Expenditure onhospital staff as % ofregional hospitalexpenditure
% 67 65.55 66.7 62.4Decrease due to vacantposts
66
2. Expenditure on drugsfor hospital use as % ofregional hospital expend
% 7.7 8.4 8.1 8.7 12
3. Expenditure byregional hospitals peruninsured person
R 273.61 255.11 295.29 289.48Based on increaseduninsured populationbased on 2005 Mid-year populationestimates
#

77
DEPA
RTM
ENT O
F HEA
LTHIndicator Type 2003/2004
(actual)2004/2005
(actual)2005/2006
(target)2005/2006
(actual)National(target)
2003/2004
Process
4. Regional hospitalswith operationalhospital board
% 100 100 100 100 80
5. Regional hospitalswith appointed (notacting) CEO in post
% 80 89 100 91Awaiting appointmentof Helen JosephHospital CEO
75
6. Facility datatimeliness rate forregional hospitals
% # 75 60 100 43
Output
7. Caesarean sectionrate for regionalhospitals
% 18.2 19.3 18.5 20.5Based on elective andemergency surgery
18
Quality
8. Regional hospitalswith patient satisfactionsurvey using DoHtemplate
% # 10
( based onother survey
systems)
25 All hospitals measuresatisfaction surveyusing other systems.To start using DoHtemplate in 2006/2007
100
9. Regional hospitalswith clinical audit(M&M) meetings everymonth
% 60 94 100 100 100
Efficiency
10. Average length ofstay in regionalhospitals
Days 4.8 4 4.3 4.4Within limits
4.8
11. Bed utilisation rate(based on usable beds)in regional hospitals
% 88 75 75 75 72
12. Expenditure perpatient day equivalentin regional hospitals
R 818.32 827 1 128 880Reduction due todifferent levels of carenot separated
1 128
# New indicato - information not availableNo systems to collect data for one indicator not included. Service volumes indicators in annual report format are not included as they don’tform part of strategic plan format

78
AN
NU
AL
REP
OR
T 20
05/2
006
StrategicObjective
MeasurableObjective
Indicator 2003/2004(actual)
2004/2005(actual)
2005/2006(target)
2005/2006(actual)
Strengthen themanagement ofstate aidedhospitals andmonitorcompliance withSLAs
Improvemonitoring ofSANTA and LifeCare hospitals
Number ofservice levelagreementssigned
# 6 6 6
Modernise, re-organise and re-vitalise all publichospitals into costeffective referralcentres accordingto the service plan
Provincialise TBBeds across theprovince
Number of TBbedsmaintained
1 495 1 495 1 435 1 495
Maintainednumber ofbeds due todecision toprovincialisebeds from 01April 2006
Ensure hospitalefficiency
AverageLength of stay(ALOS)Days
55 53 50 52 days
BedOccupancyRate (BOR)
90 90 90 90
Table 24. Performance against Provincial targets from 2005-08 strategic plan for sub-programmeTuberculosis (TB) hospitals
Table 25. Performance against Provincial targets from 2005-08 strategic plan for sub-programme:Psychiatric hospitals
Measurable Objective Indicator 2003/2004(actual)
2004/2005(actual)
2005/2006(target)
2005/2006(actual)
Improve early detection,treatment and care to limitlong-term effects of mentaldisorders
Detection rate (%) ofacute mental disorderin PHC clinics
<1 2 3 3
Percentage of chronicstable patient withmental illness seen inPHC service for followup treatment
1.6 3 5 5
Bed ratio: acutebeds/100 000 pop.
25 25 25 25
Reduction of beds in privateinstitutions for patients withchronic mental illness
Number of beds forpatients with chronicmental illness(contracted institutions)
3 300 3 000 2 850 2 550
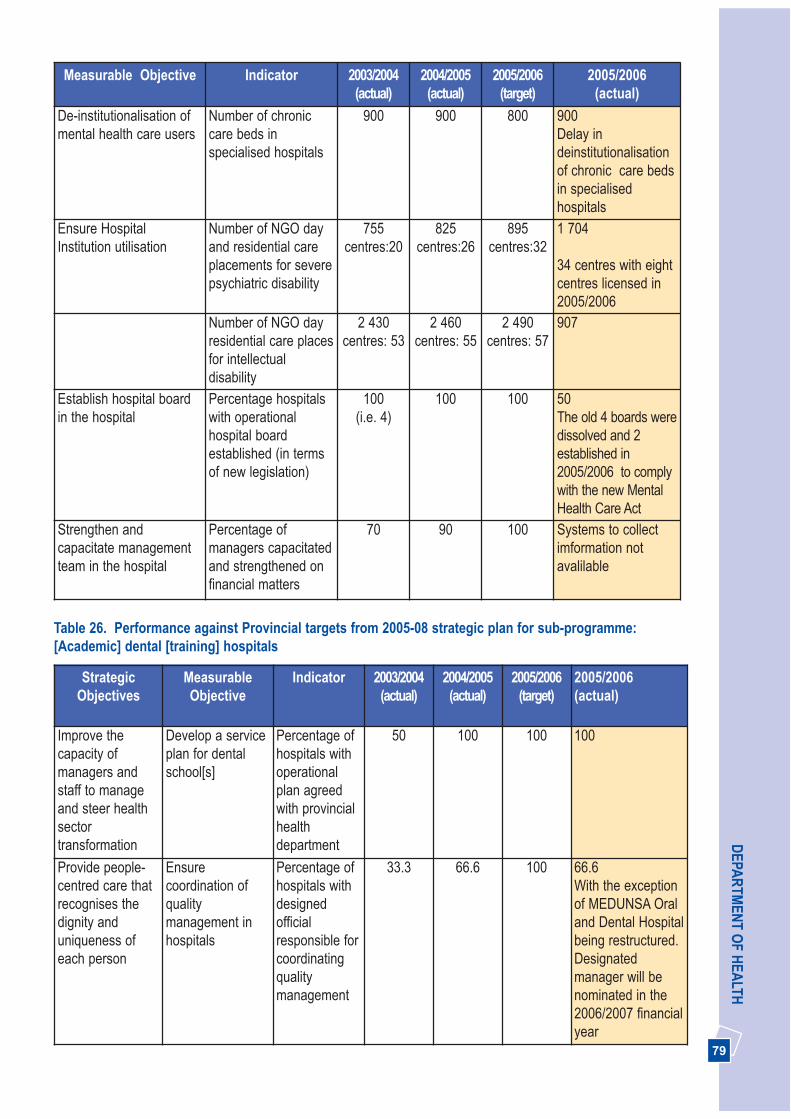
79
DEPA
RTM
ENT O
F HEA
LTHMeasurable Objective Indicator 2003/2004
(actual)2004/2005(actual)
2005/2006(target)
2005/2006(actual)
De-institutionalisation ofmental health care users
Number of chroniccare beds inspecialised hospitals
900 900 800 900Delay indeinstitutionalisationof chronic care bedsin specialisedhospitals
Ensure HospitalInstitution utilisation
Number of NGO dayand residential careplacements for severepsychiatric disability
755centres:20
825centres:26
895centres:32
1 704
34 centres with eightcentres licensed in2005/2006
Number of NGO dayresidential care placesfor intellectualdisability
2 430centres: 53
2 460centres: 55
2 490centres: 57
907
Establish hospital boardin the hospital
Percentage hospitalswith operationalhospital boardestablished (in termsof new legislation)
100(i.e. 4)
100 100 50 The old 4 boards weredissolved and 2established in2005/2006 to complywith the new MentalHealth Care Act
Strengthen andcapacitate managementteam in the hospital
Percentage ofmanagers capacitatedand strengthened onfinancial matters
70 90 100 Systems to collectimformation notavalilable
Table 26. Performance against Provincial targets from 2005-08 strategic plan for sub-programme:[Academic] dental [training] hospitals
StrategicObjectives
MeasurableObjective
Indicator 2003/2004(actual)
2004/2005(actual)
2005/2006(target)
2005/2006(actual)
Improve thecapacity ofmanagers andstaff to manageand steer healthsectortransformation
Develop a serviceplan for dentalschool[s]
Percentage ofhospitals withoperationalplan agreedwith provincialhealthdepartment
50 100 100 100
Provide people-centred care thatrecognises thedignity anduniqueness ofeach person
Ensurecoordination ofqualitymanagement inhospitals
Percentage ofhospitals withdesignedofficialresponsible forcoordinatingqualitymanagement
33.3 66.6 100 66.6With the exceptionof MEDUNSA Oraland Dental Hospitalbeing restructured.Designatedmanager will benominated in the2006/2007 financialyear
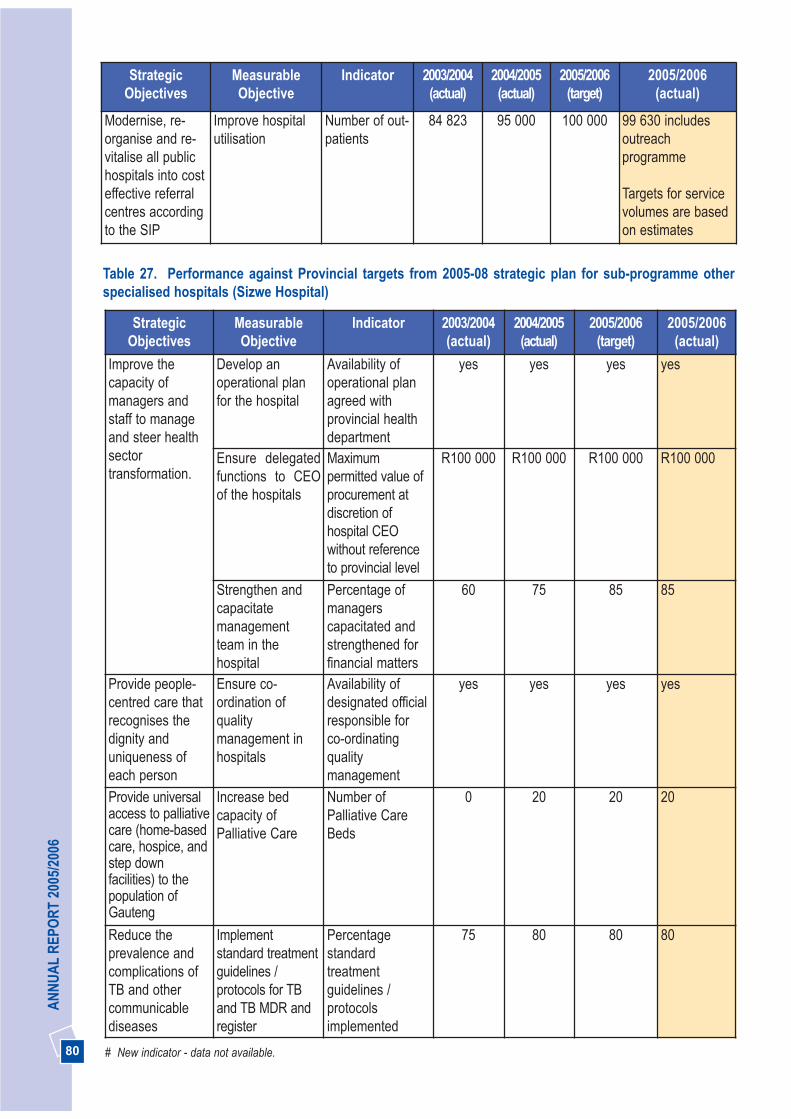
80
AN
NU
AL
REP
OR
T 20
05/2
006
StrategicObjectives
MeasurableObjective
Indicator 2003/2004(actual)
2004/2005(actual)
2005/2006(target)
2005/2006(actual)
Modernise, re-organise and re-vitalise all publichospitals into costeffective referralcentres accordingto the SIP
Improve hospitalutilisation
Number of out-patients
84 823 95 000 100 000 99 630 includesoutreachprogramme
Targets for servicevolumes are basedon estimates
Table 27. Performance against Provincial targets from 2005-08 strategic plan for sub-programme otherspecialised hospitals (Sizwe Hospital)
StrategicObjectives
MeasurableObjective
Indicator 2003/2004(actual)
2004/2005(actual)
2005/2006(target)
2005/2006(actual)
Improve thecapacity ofmanagers andstaff to manageand steer healthsectortransformation.
Develop anoperational planfor the hospital
Availability ofoperational planagreed withprovincial healthdepartment
yes yes yes yes
Ensure delegatedfunctions to CEOof the hospitals
Maximumpermitted value ofprocurement atdiscretion ofhospital CEOwithout referenceto provincial level
R100 000 R100 000 R100 000 R100 000
Strengthen andcapacitatemanagementteam in thehospital
Percentage ofmanagerscapacitated andstrengthened forfinancial matters
60 75 85 85
Provide people-centred care thatrecognises thedignity anduniqueness ofeach person
Ensure co-ordination ofqualitymanagement inhospitals
Availability ofdesignated officialresponsible forco-ordinatingqualitymanagement
yes yes yes yes
Provide universalaccess to palliativecare (home-basedcare, hospice, andstep downfacilities) to thepopulation ofGauteng
Increase bedcapacity ofPalliative Care
Number ofPalliative CareBeds
0 20 20 20
Reduce theprevalence andcomplications ofTB and othercommunicablediseases
Implementstandard treatmentguidelines /protocols for TBand TB MDR andregister
Percentagestandardtreatmentguidelines /protocolsimplemented
75 80 80 80
# New indicator - data not available.

81
DEPA
RTM
ENT O
F HEA
LTH
THREE PICTURES
3.5 PROGRAMME 5: CENTRAL HOSPITALSERVICES
The purpose of this programme is to provide highlyspecialised health care services, a platform for thetraining of health workers and research and to serve asa specialist referral centres for regional hospitals andneighbouring provinces through Dr George Mukhari,Pretoria Academic, Chris Hani Baragwanath andJohannesburg Hospitals sub-programmes.
Strategic Goal: Strengthen the district healthsystem and provide caring, responsive and qualityhealth services at all levels
3.5.1 Modernisation, revitalisation and re-organisation initiative
Gauteng’s four central hospitals continue to providehighly specialised services, training and research andto serve as referral centres for many African countries.These hospitals have 6 774 approved beds, a bedoccupancy rate of 78% and an Average Length of Stayof 5.1 days. They provide services for the provincialpopulation and neighbouring provinces.
The implementation of the Service Improvement Planhas been strengthened in central hospitals through the
de-linking of level one beds. Pretoria Academic Hospitalprovides a level two and three services. Level onepatients from Johannesburg and Chris HaniBaragwanth Hospitals are being referred to the privateservice provider. The above measures will ensure thatthe central hospitals admit only level two and threepatients according to the Service Improvement Plan.
The new Pretoria Academic hospital wascommissioned during the year under review, boastinghighly specialised services and high tech equipment. Allpatients were relocated to the new hospital site by theend of March 2006.
The expansion of centres of excellence in theprovince is also being continued. The new hand surgeryunit at the Chris Hani Baragwanath Hospital waslaunched in partnership with leading mining andengineering companies in 2004/2005 and has nowbeen completed. The breast diseases services havebeen consolidated and a centre of excellence has beenestablished at Helen Joseph Hospital, backed by theprocurement of new, specialised equipment. The clinicwill be officially opened in the 2006/2007 financial year.In addition, a new oncology centre of excellencecommissioned at Johannesburg Hospital will providecancer treatment for the population of Gauteng, as wellas surrounding provinces and will also be officiallyopened during 2006/2007 financial year.
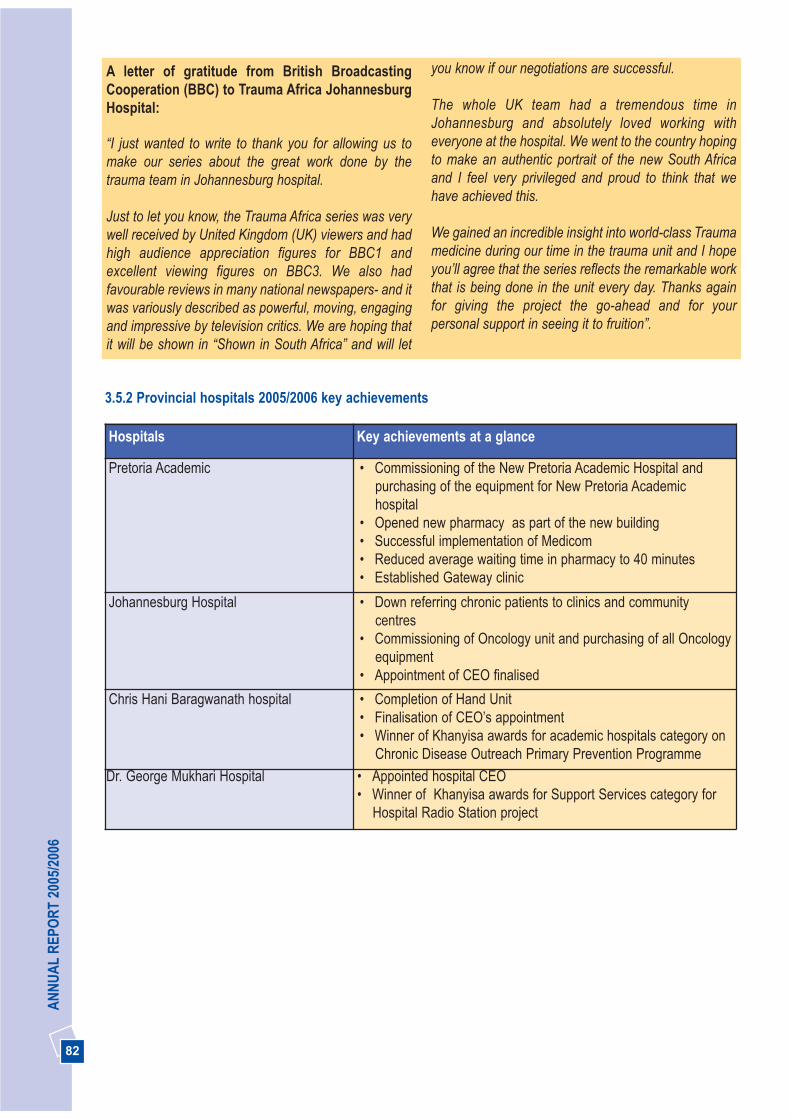
82
AN
NU
AL
REP
OR
T 20
05/2
006
A letter of gratitude from British BroadcastingCooperation (BBC) to Trauma Africa JohannesburgHospital:
“I just wanted to write to thank you for allowing us tomake our series about the great work done by thetrauma team in Johannesburg hospital.
Just to let you know, the Trauma Africa series was verywell received by United Kingdom (UK) viewers and hadhigh audience appreciation figures for BBC1 andexcellent viewing figures on BBC3. We also hadfavourable reviews in many national newspapers- and itwas variously described as powerful, moving, engagingand impressive by television critics. We are hoping thatit will be shown in “Shown in South Africa” and will let
you know if our negotiations are successful.
The whole UK team had a tremendous time inJohannesburg and absolutely loved working witheveryone at the hospital. We went to the country hopingto make an authentic portrait of the new South Africaand I feel very privileged and proud to think that wehave achieved this.
We gained an incredible insight into world-class Traumamedicine during our time in the trauma unit and I hopeyou’ll agree that the series reflects the remarkable workthat is being done in the unit every day. Thanks againfor giving the project the go-ahead and for yourpersonal support in seeing it to fruition”.
3.5.2 Provincial hospitals 2005/2006 key achievements
Hospitals Key achievements at a glance
Pretoria Academic • Commissioning of the New Pretoria Academic Hospital andpurchasing of the equipment for New Pretoria Academichospital
• Opened new pharmacy as part of the new building• Successful implementation of Medicom• Reduced average waiting time in pharmacy to 40 minutes• Established Gateway clinic
Johannesburg Hospital • Down referring chronic patients to clinics and communitycentres
• Commissioning of Oncology unit and purchasing of all Oncologyequipment
• Appointment of CEO finalised
Chris Hani Baragwanath hospital • Completion of Hand Unit• Finalisation of CEO’s appointment • Winner of Khanyisa awards for academic hospitals category on
Chronic Disease Outreach Primary Prevention Programme
Dr. George Mukhari Hospital • Appointed hospital CEO• Winner of Khanyisa awards for Support Services category for
Hospital Radio Station project
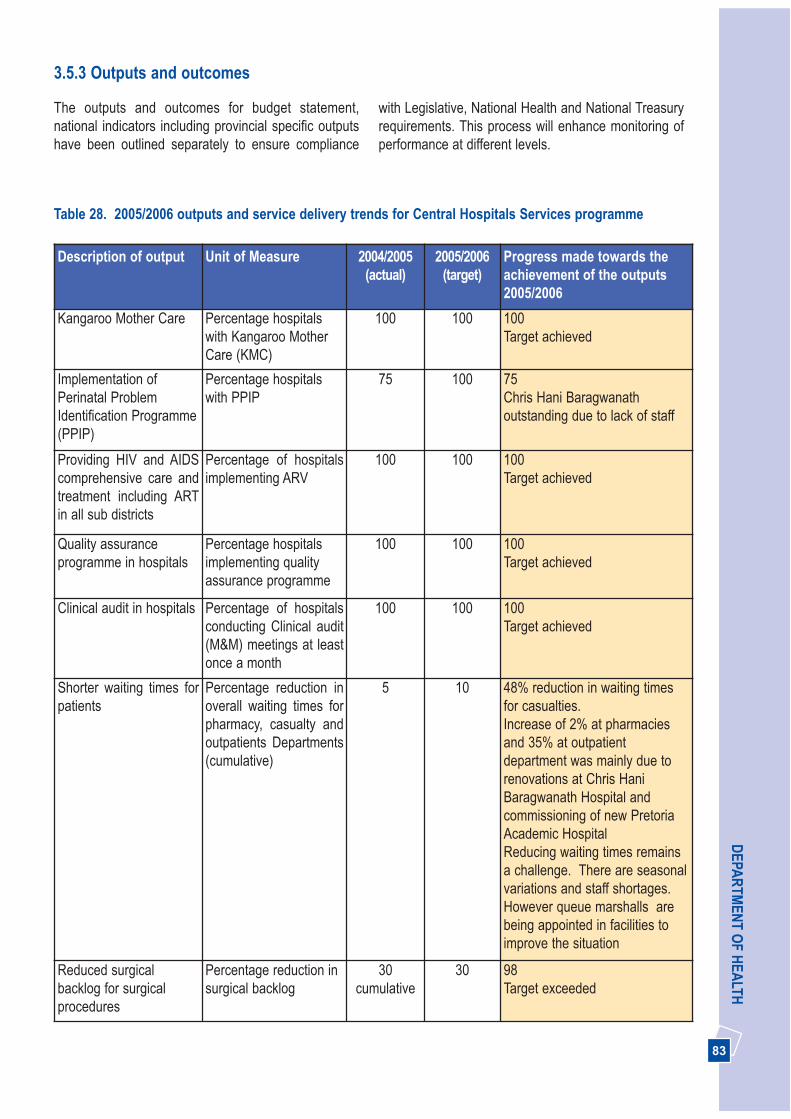
83
DEPA
RTM
ENT O
F HEA
LTH
with Legislative, National Health and National Treasuryrequirements. This process will enhance monitoring ofperformance at different levels.
3.5.3 Outputs and outcomes
The outputs and outcomes for budget statement,national indicators including provincial specific outputshave been outlined separately to ensure compliance
Table 28. 2005/2006 outputs and service delivery trends for Central Hospitals Services programme
Description of output Unit of Measure 2004/2005(actual)
2005/2006(target)
Progress made towards theachievement of the outputs2005/2006
Kangaroo Mother Care Percentage hospitalswith Kangaroo MotherCare (KMC)
100 100 100Target achieved
Implementation ofPerinatal ProblemIdentification Programme(PPIP)
Percentage hospitalswith PPIP
75 100 75Chris Hani Baragwanathoutstanding due to lack of staff
Providing HIV and AIDScomprehensive care andtreatment including ARTin all sub districts
Percentage of hospitalsimplementing ARV
100 100 100Target achieved
Quality assuranceprogramme in hospitals
Percentage hospitalsimplementing qualityassurance programme
100 100 100Target achieved
Clinical audit in hospitals Percentage of hospitalsconducting Clinical audit(M&M) meetings at leastonce a month
100 100 100Target achieved
Shorter waiting times forpatients
Percentage reduction inoverall waiting times forpharmacy, casualty andoutpatients Departments(cumulative)
5 10 48% reduction in waiting timesfor casualties.Increase of 2% at pharmaciesand 35% at outpatientdepartment was mainly due torenovations at Chris HaniBaragwanath Hospital andcommissioning of new PretoriaAcademic HospitalReducing waiting times remainsa challenge. There are seasonalvariations and staff shortages.However queue marshalls arebeing appointed in facilities toimprove the situation
Reduced surgicalbacklog for surgicalprocedures
Percentage reduction insurgical backlog
30cumulative
30 98Target exceeded
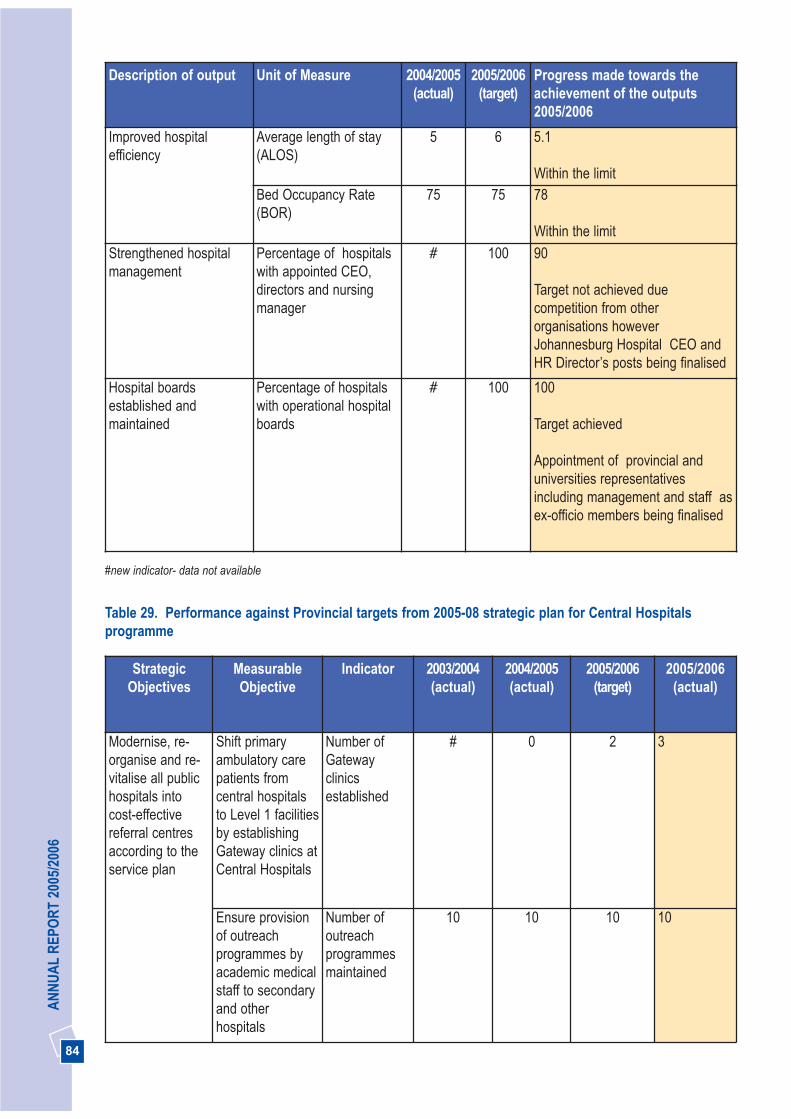
84
AN
NU
AL
REP
OR
T 20
05/2
006
Description of output Unit of Measure 2004/2005(actual)
2005/2006(target)
Progress made towards theachievement of the outputs2005/2006
Improved hospitalefficiency
Average length of stay(ALOS)
5 6 5.1
Within the limitBed Occupancy Rate(BOR)
75 75 78
Within the limit
Strengthened hospitalmanagement
Percentage of hospitalswith appointed CEO,directors and nursingmanager
# 100 90
Target not achieved duecompetition from otherorganisations howeverJohannesburg Hospital CEO andHR Director’s posts being finalised
Hospital boardsestablished andmaintained
Percentage of hospitalswith operational hospitalboards
# 100 100
Target achieved
Appointment of provincial anduniversities representativesincluding management and staff asex-officio members being finalised
#new indicator- data not available
Table 29. Performance against Provincial targets from 2005-08 strategic plan for Central Hospitalsprogramme
StrategicObjectives
MeasurableObjective
Indicator 2003/2004(actual)
2004/2005(actual)
2005/2006(target)
2005/2006(actual)
Modernise, re-organise and re-vitalise all publichospitals intocost-effectivereferral centresaccording to theservice plan
Shift primaryambulatory carepatients fromcentral hospitalsto Level 1 facilitiesby establishingGateway clinics atCentral Hospitals
Number ofGatewayclinicsestablished
# 0 2 3
Ensure provisionof outreachprogrammes byacademic medicalstaff to secondaryand otherhospitals
Number ofoutreachprogrammesmaintained
10 10 10 10

85
DEPA
RTM
ENT O
F HEA
LTHStrategic
ObjectivesMeasurableObjective
Indicator 2003/2004(actual)
2004/2005(actual)
2005/2006(target)
2005/2006(actual)
Provide efficientand effectiveclinical supportservices (allied,laboratory,pharmaceuticals,blood services,radiology etc)
Ensure availabilityof drugs on EDLin all institutions
Percentage ofhospitals withall EDL drugsavailable allthe time
# 98 100 100
Develop anoperational planfor the hospital
Availability ofoperationalplan agreedwith provincialhealthdepartment
# 100 100 100
Implement aneffectivePerformanceManagementSystem
Performanceagreements for allhospital CEOs
Percentage ofhospital CEOswithperformanceagreements
# 75 100 75Awaitingcommencment ofJohannesburgHospital CEO
# new indicator, data not available, NB: Deleted indicators form part of budget statement indicators as indicated in table 28 above
Table 30. Performance against National targets from 2005-08 strategic plan for Central Hospitalsprogramme
Indicator Type 2003/2004(actual)
2004/2005(actual)
2005/2006(estimate)
2005/2006(actual)
National(target)
2003/2004
Input
1. Expenditure on hospitalstaff as % of hospitalexpenditure
% 58.6 58.12 53 49.6 Decreased due tovacant posts
70
2. Expenditure on drugs forhospital use as % of hospitalexpenditure
% 9.8 10.87 10.8 10.2 Reduction due toincreased equipmenttotal expenditure
13
Process
3. Operational hospital board % 100 100 100 100 Yes
4. Appointed (not acting)CEO in place
% 100 75 75 75Appointment ofJohannesburg CEOfinalised
Yes
5. Individual hospital datatimeliness rate
% 75 75 75 100 Yes

86
AN
NU
AL
REP
OR
T 20
05/2
006
Indicator Type 2003/2004(actual)
2004/2005(actual)
2005/2006(estimate)
2005/2006(actual)
National(target)
2003/2004
Output
6. Caesarean section rate % 35 32.58 33 32.1 Based on electedsurgery
32
Quality
7.Patient satisfaction surveyusing DoH template
Y/N Y Y(based on
othersurvey
systems)
Y All hospitalsmeasure satisfactionsurvey using othersystems. We willstart using DoHtemplate in2006/2007
Yes
8. Clinical audit (M&M)meetings at least once amonth
Y/N Y Y Y Y Yes
Efficiency
9. Average length of stay Days 6.1 5 6 5.1 Within limit
6.8
10. Bed utilisation rate(based on usable beds)
% 76 75 75 78Within limits
75
11. Expenditure per patientday equivalent
R 1 401.42 1 336 1 343 1 544 1 877
Outcome
12.Case fatality rate forsurgery separations
% 4.0 4.4 4.3 4.5Clinical auditconducted to identifythe cause
3.6
# New indicator, data not availableEstimates for 2005/2006 are based on 2006-09 Annual Performance Plan- No consolidated table for all central hospitals in 2005-
08 Annual Performance Plan as only individual hospitals tables were consideredNB: No systems established yet to collect data for one indicator not included. Efficiency indicators not included as part of annual reportformat
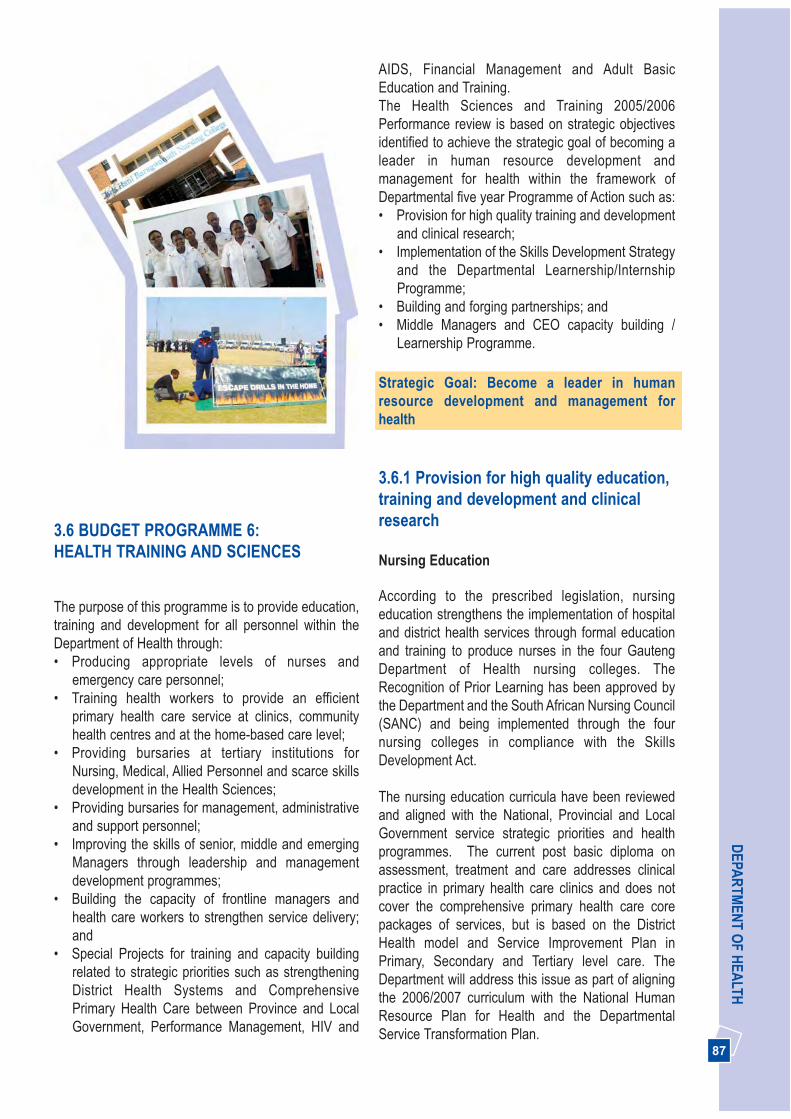
87
DEPA
RTM
ENT O
F HEA
LTH
THREE PICTURES
3.6 BUDGET PROGRAMME 6: HEALTH TRAINING AND SCIENCES
The purpose of this programme is to provide education,training and development for all personnel within theDepartment of Health through:• Producing appropriate levels of nurses and
emergency care personnel; • Training health workers to provide an efficient
primary health care service at clinics, communityhealth centres and at the home-based care level;
• Providing bursaries at tertiary institutions forNursing, Medical, Allied Personnel and scarce skillsdevelopment in the Health Sciences;
• Providing bursaries for management, administrativeand support personnel;
• Improving the skills of senior, middle and emergingManagers through leadership and managementdevelopment programmes;
• Building the capacity of frontline managers andhealth care workers to strengthen service delivery;and
• Special Projects for training and capacity buildingrelated to strategic priorities such as strengtheningDistrict Health Systems and ComprehensivePrimary Health Care between Province and LocalGovernment, Performance Management, HIV and
AIDS, Financial Management and Adult BasicEducation and Training.The Health Sciences and Training 2005/2006Performance review is based on strategic objectivesidentified to achieve the strategic goal of becoming aleader in human resource development andmanagement for health within the framework ofDepartmental five year Programme of Action such as: • Provision for high quality training and development
and clinical research;• Implementation of the Skills Development Strategy
and the Departmental Learnership/InternshipProgramme;
• Building and forging partnerships; and• Middle Managers and CEO capacity building /
Learnership Programme.
Strategic Goal: Become a leader in humanresource development and management forhealth
3.6.1 Provision for high quality education,training and development and clinicalresearch
Nursing Education
According to the prescribed legislation, nursingeducation strengthens the implementation of hospitaland district health services through formal educationand training to produce nurses in the four GautengDepartment of Health nursing colleges. TheRecognition of Prior Learning has been approved bythe Department and the South African Nursing Council(SANC) and being implemented through the fournursing colleges in compliance with the SkillsDevelopment Act.
The nursing education curricula have been reviewedand aligned with the National, Provincial and LocalGovernment service strategic priorities and healthprogrammes. The current post basic diploma onassessment, treatment and care addresses clinicalpractice in primary health care clinics and does notcover the comprehensive primary health care corepackages of services, but is based on the DistrictHealth model and Service Improvement Plan inPrimary, Secondary and Tertiary level care. TheDepartment will address this issue as part of aligningthe 2006/2007 curriculum with the National HumanResource Plan for Health and the DepartmentalService Transformation Plan.

88
AN
NU
AL
REP
OR
T 20
05/2
006
In 2005/2006 the four nursing colleges successfullyadmitted 3 651 student nurses of all categories into theeducation programme, exceeding the target of 3 020. Inaddition, 1 249 new graduates were placed in GautengDepartment of Health hospitals and clinics to fulfilcontractual obligations. A further 62 enrolled andauxiliary nurses exited from the diploma course and arefulfilling contractual obligations in public health facilities.A total of 988 nurses were admitted into the four yeardiploma course through the four nursing colleges, ascompared to 828 for 2004/2005 financial year asindicated in figure 8. The attrition rate among first yearstudents dropped to 8.5% in 2005/2006 as compared to11.8% in 2004/2005 financial year. The high tutorturnover has resulted in a critical shortage of clinicaltutors and limited relief capacity in clinical facilities. Thispresents major challenges in provision of nursingeducation in the province.
The Department will increase the number of nursesgraduating from nursing colleges by 20% per annum asa key priority over the next three years. We will re-openone nursing college in 2006/2007 with the objective ofdoubling the number of nurses we are producing by2009.
0
500
1000
1500
2000
2500
3000
3500
4000
New nursingentrants
Nursing studentsall years
Nursinggraduates
2004/2005
2005/2006
Fig.8. Nursing education students intake and graduates 2004/2005-2005/2006
89
DEPA
RTM
ENT O
F HEA
LTHIn 2002, 227 tutors attended the assessor training and35 nursing education managers and tutors attended themoderator training. In addition 35 Mental HealthAuxiliary/Enrolled Nurses were successfully placed inprovincial posts after six months training.
Emergency Medical Services (EMS) TrainingCollege
The Lebone College of Emergency Care is the onlyGauteng Ambulance Training College training EMSpersonnel to provide emergency medical services forthe province.
During the 2005/2006 financial year the Collegeachieved great success in this endeavour, and trained100 EMS staff on basic life support, 48 on intermediatelife support and 13 on advanced life support. TheCollege was unable to reach its advanced life supporttraining targets for the year under review due to themajor challenge of retaining trained paramedic staff inthe face of resignations, and competition with localgovernment and the private sector. The staff shortageresulted in the Health Professions Council of SouthAfrica (HPCSA) reducing the student intake for theadvanced life support course in the 2005/2006 financialyear, so that College would be in line with the prescribedstudent-instructor ratio of one instructor to six studentsset by the Health Professions Council of South Africa.
Appointment of additional staff during 2005/2006financial year resulted in the College maintaining itsaccreditation status and obtaining an approval from theHPCSA to double the student intake of Intermediate LifeSupport and Advanced Life Support courses in2006/2007 financial year, making it among the highestintakes in EMS Colleges in South Africa.
The HPCSA plans to replace the current advanced lifesupport and intermediate life support courses withcourses on the Higher Education and Training bands onthe National Qualification Framework (NQF), which areoffered by tertiary institutions only.
Health Profession Training/ProfessionalDevelopment
We continue to liaise with higher education traininginstitutions offering health science training. To date 2 446 health professionals have completed thedispensing course to comply with the Pharmacy Act.Registration of these personnel will take place in the2006/2007 financial year.
A further 2 400 health professionals received Anti-retroviral training. Other and training in various clinicalpractice areas was provided to 2 723 healthprofessionals through an approved service provider.
Training of mid-level workers remains a priority in theDepartment: 163 Pharmacy Assistants are being trainedand will complete the Health and Welfare SETA(HWSETA) Learnership in April 2006. A total of 129Diagnostic Radiographers are enrolled in a three yearstudy programme.
The professional services support manages 933 personnel in areas of foreign health professionals,community service placements, medical interns andSouth African students studying in Cuba. Of these, 220 are medical interns, 240 Medical communityservice placements and 278 allied community serviceplacements. Eighteen South African Medical studentsthat have studied in Cuba are currently completing their6th year in South African Academic Hospitals.
Bursaries
The Department continues to implement the BursarySupport Programme for all categories of healthprofessionals, especially the scarce skills categoriessuch as Orthotics and Prosthetics. The purpose ofbursaries is to increase the knowledge and scarce skillsavailable to the Department with the aim of redressingrace, gender, and disability inequalities and providingfinancial assistance to those economicallydisadvantaged persons, who would not otherwise beable to enter the health care professions.
In 2005/2006 the Department allocated R11 million forbursaries, of which R3 million was for the maintenanceof current bursary holders, R5 million for a new fulltimeand part-time bursary intake and R3 million for SouthAfrican Medical students studying in Cuba and thosecompleting their 6th year in South African Universities.
The Bursary Support Programme maintained or granteda total of 1 513 fulltime and part-time bursaries of which378 were new applicants (123 fulltime students and 255 part-time) for study at various tertiary institutions.We currently train 129 Diagnostic Radiographers jointlyfunded with the HWSETA. This training is a three yearLearnership Programme which commenced in thisfinancial year.

90
AN
NU
AL
REP
OR
T 20
05/2
006
Management and Skills Development
Provision of education, training and development for allpersonnel within the Department of Health in order toequip them with relevant skills to meet the needs andstrategic goals of the Department continues. Thisincludes management development, generic skillsdevelopment for all categories of staff as well asfunctional training for support and administrative staff.Training is provided by the Department with supportfrom selected service providers who were awarded athree year training contract that commenced in the2005/2006 financial year.
• 384 people were trained on integrated wellnessprogramme;
• 91 people attended financial management training;• 3 227 staff members were trained in the
Performance Management and DevelopmentSystem (PMDS);
• 10 995 staff members attended generic skillsdevelopment programmes; and
• 1 847 people were trained in customer care.
A dedicated CEO Management DevelopmentProgramme has been developed in collaboration withthe Office of the Premier. The programme will focus ondeveloping competencies of hospital CEOs inleadership, management development, operations andwill be implemented in the 2006/2007 financial year.
In the year under review, 23%, (1 510) of frontline,middle and senior managers attended managementdevelopment programmes, exceeding the target of12.5% (744). This training was provided in variousmanagement development programmes includingFundamentals of Management, Primary health CareService Management, Hospital Management, FinancialManagement, Customer Care, Monitoring andEvaluation and Situational Leadership. In addition amentorship programme for managers has commencedfor participants attending the Fundamentals ofManagement Training Programme to ensure theapplication of theoretical learning in the workplace andto improve training effectiveness and return ininvestment. This is a significant milestone formanagement development in the Department. A video providing an overview of Gauteng Departmentof Health has been developed to support thedepartmental orientation and induction programme; 200new staff members attended the programme in the2005/2006 financial year and the video was also used
for other educational and promotional departmentalactivities.
Skills Development and Learnership/InternshipProgramme
Skills Development
Implementation of the Skills Development Act has beenmainstreamed to achieve the performance targetsthrough implementing the National Skills Developmentstrategy in the Department. A Provincial skills audit hasbeen conducted to determine the skills needs of theprovincial health sector in general, and individualperformance-related skills needs in particular. Trainingcommittees have been established in each region and aprovincial training committee ensures effectivecoordination and implementation of the skills audit andtraining needs analysis.
The Department paid R4.8 million to cover SkillsDevelopment Levies to the Health and Welfare SectorEducation and Training (HWSETA) in the year underreview, and received R7 million to fund learnerships andbursary support. A Memorandum of Agreement hasbeen signed with the HWSETA and related public sectorSETAS for implementation of the skills developmentstrategy. The Department thus complies with thelegislative and statutory imperative to achieving skillsdevelopment, including implementing the provincialhealth sector skills programme, submitting an annualtraining report and workplace skills plan, and appointinga skills development facilitator.

91
DEPA
RTM
ENT O
F HEA
LTHLearnership/internship programme
The Department has successfully implemented alearnership/internship programme since 2004/2005and has exceeded the target for implementation asindicated in table 31. The programme has benefited 4800 people since its inception in 2004/2005, of whom1 050 underwent learnerships and 3 750 internships.As indicated in figure 9 below, the clinical and non-clinical learnerships and internships providedincreased by over 60% in 2005/2006. The Department
pays a monthly stipend of R1 000 per learner/intern,with no guarantee for employment. However 500successful graduates from the internship andlearnership programmes have been employed by theDepartment in the year under review, including 348interns to permanent posts.
The Department has been widely recognised forachieving the highest participation in the Learnershipand Internship programme in South Africa.
0
500
1000
1500
2000
2500
3000
3500
4000
4500
5000
Internship
Learnerships
Total
1338
502
1840
2004/05
2412
548
2960
2005/06
3750
1050
4800
Total
Fig.9 Gauteng Department of Health Learnership/Internship Programme 2004/2005 -2005/2006
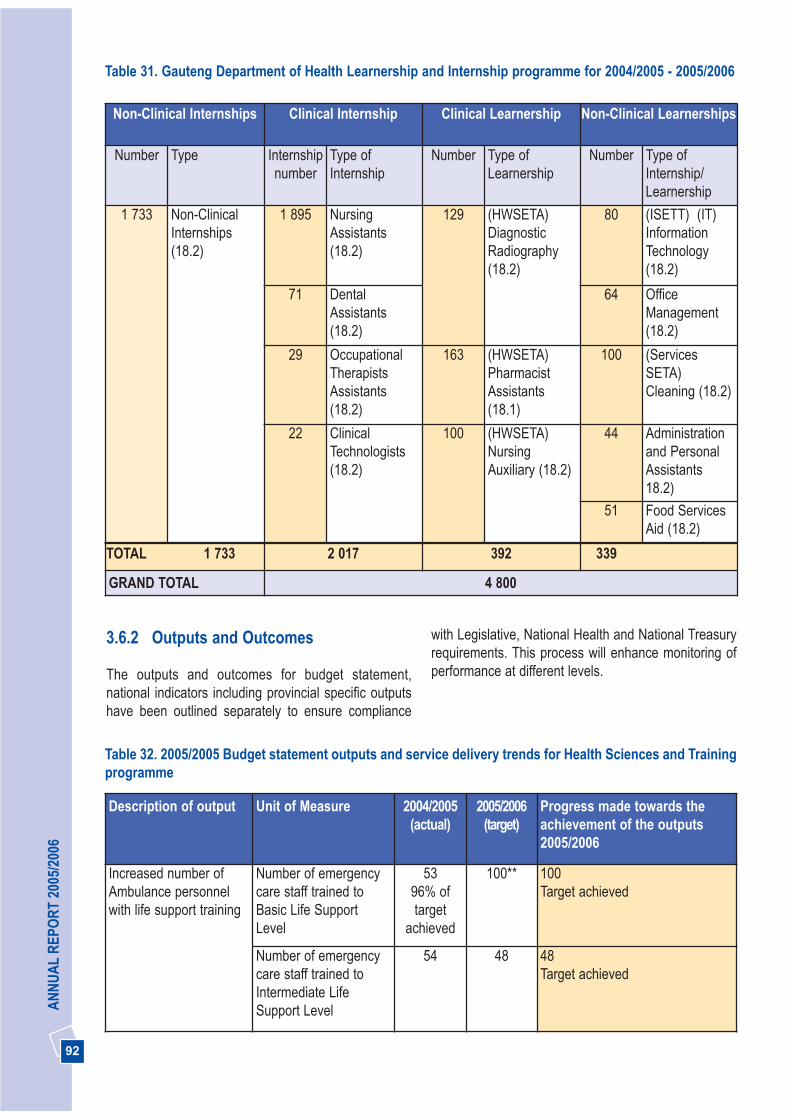
92
AN
NU
AL
REP
OR
T 20
05/2
006
3.6.2 Outputs and Outcomes
The outputs and outcomes for budget statement,national indicators including provincial specific outputshave been outlined separately to ensure compliance
with Legislative, National Health and National Treasuryrequirements. This process will enhance monitoring ofperformance at different levels.
Non-Clinical Internships Clinical Internship Clinical Learnership Non-Clinical Learnerships
Number Type Internshipnumber
Type ofInternship
Number Type ofLearnership
Number Type ofInternship/Learnership
1 733 Non-ClinicalInternships(18.2)
1 895 NursingAssistants (18.2)
129 (HWSETA)DiagnosticRadiography(18.2)
80 (ISETT) (IT)InformationTechnology(18.2)
71 DentalAssistants(18.2)
64 OfficeManagement(18.2)
29 OccupationalTherapistsAssistants(18.2)
163 (HWSETA)PharmacistAssistants(18.1)
100 (ServicesSETA)Cleaning (18.2)
22 ClinicalTechnologists(18.2)
100 (HWSETA)NursingAuxiliary (18.2)
44 Administrationand PersonalAssistants18.2)
51 Food ServicesAid (18.2)
TOTAL 1 733 2 017 392 339
GRAND TOTAL 4 800
Table 31. Gauteng Department of Health Learnership and Internship programme for 2004/2005 - 2005/2006
Table 32. 2005/2005 Budget statement outputs and service delivery trends for Health Sciences and Trainingprogramme
Description of output Unit of Measure 2004/2005(actual)
2005/2006(target)
Progress made towards theachievement of the outputs2005/2006
Increased number ofAmbulance personnelwith life support training
Number of emergencycare staff trained toBasic Life SupportLevel
5396% oftarget
achieved
100** 100Target achieved
Number of emergencycare staff trained toIntermediate LifeSupport Level
54 48 48Target achieved
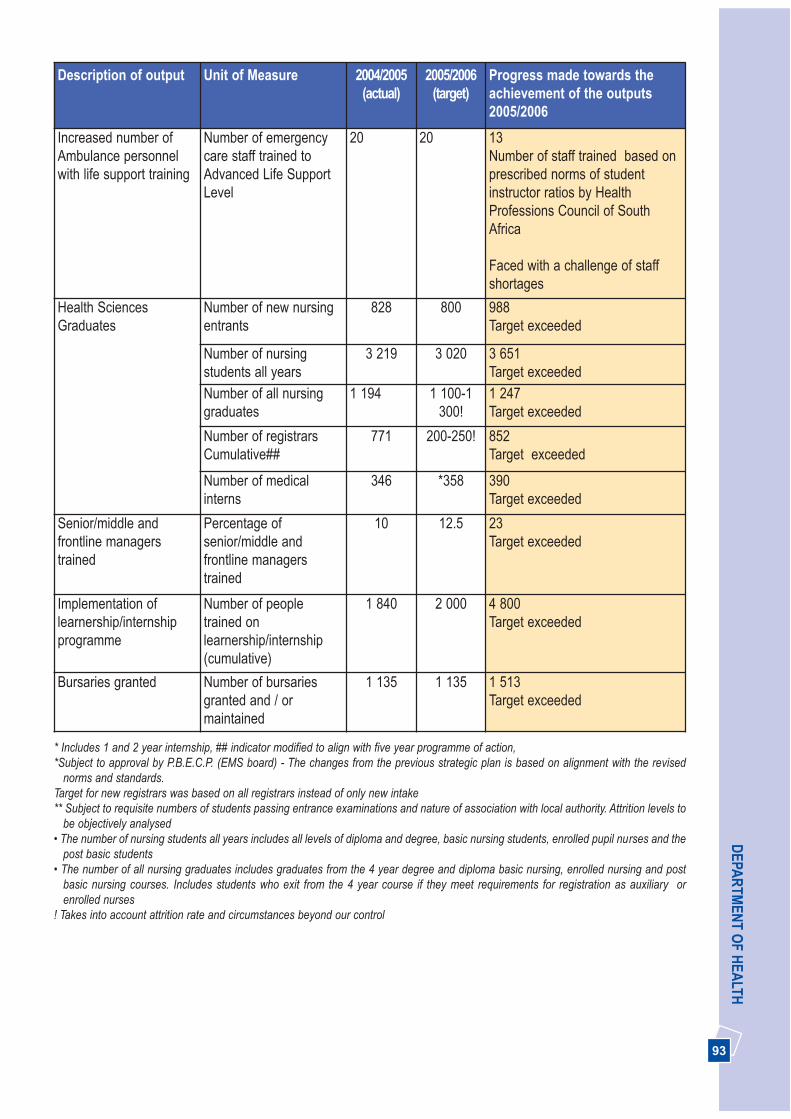
93
DEPA
RTM
ENT O
F HEA
LTHDescription of output Unit of Measure 2004/2005
(actual)2005/2006
(target)Progress made towards theachievement of the outputs2005/2006
Increased number ofAmbulance personnelwith life support training
Number of emergencycare staff trained toAdvanced Life SupportLevel
20 20 13Number of staff trained based onprescribed norms of studentinstructor ratios by HealthProfessions Council of SouthAfrica
Faced with a challenge of staffshortages
Health SciencesGraduates
Number of new nursingentrants
828 800 988Target exceeded
Number of nursingstudents all years
3 219 3 020 3 651Target exceeded
Number of all nursinggraduates
1 194 1 100-1 300!
1 247Target exceeded
Number of registrars Cumulative##
771 200-250! 852Target exceeded
Number of medicalinterns
346 *358 390Target exceeded
Senior/middle andfrontline managerstrained
Percentage ofsenior/middle andfrontline managerstrained
10 12.5 23Target exceeded
Implementation oflearnership/internshipprogramme
Number of peopletrained onlearnership/internship(cumulative)
1 840 2 000 4 800Target exceeded
Bursaries granted Number of bursariesgranted and / ormaintained
1 135 1 135 1 513Target exceeded
* Includes 1 and 2 year internship, ## indicator modified to align with five year programme of action, *Subject to approval by P.B.E.C.P. (EMS board) - The changes from the previous strategic plan is based on alignment with the revised
norms and standards.Target for new registrars was based on all registrars instead of only new intake** Subject to requisite numbers of students passing entrance examinations and nature of association with local authority. Attrition levels to
be objectively analysed • The number of nursing students all years includes all levels of diploma and degree, basic nursing students, enrolled pupil nurses and the
post basic students• The number of all nursing graduates includes graduates from the 4 year degree and diploma basic nursing, enrolled nursing and post
basic nursing courses. Includes students who exit from the 4 year course if they meet requirements for registration as auxiliary orenrolled nurses
! Takes into account attrition rate and circumstances beyond our control

94
AN
NU
AL
REP
OR
T 20
05/2
006
StrategicObjectives
MeasurableObjective
Indicator 2003/2004(actual)
2004/2005(actual)
2005/2006(target)
2005/2006(actual)
Provide HIV andAIDScomprehensivecare andtreatmentincluding ART inall sub districts by2009
Provide HIV andAIDScomprehensivecare training to allclinicalpractitioners
Number ofClinicalpractitionerstrained incomprehensiveHIV/AIDS/ARVcare
1 000 1 078 1 560 2 400
Provideprofessionalservices forforeign healthprofessionals
Number of healthprofessionalsassisted
180 200 240 240
Table 33. Performance against Provincial targets from 2005-08 strategic plan for Health Sciences andTraining programme
NB: Deleted indicators form part of budget statement indicators as indicated in table 28 above
Indicator Type 2003/2004(actual)
2004/2005(actual)
2005/2006(estimate)
2005/2006(actual)
National(target)
2007/2008
Input1. Intake of nurse student No 894 828 850 988 #
2. Students with bursariesfrom the province
No 627 1135 1 269 1 513 #
Process3. Attrition rates in first yearof nursing school
% 11.2 10 10 8.5Attrition rate reduced
10
Output4. Basic nurse studentsgraduating
No 600 600 609 742 #
5. Post Basic No 602 619 621 505The number fortraining is determinedby the budgetallocated
#
Efficiency6. Average training cost perbasic nursing graduate
R 59 588 63 461 64 123 64 123 #
7. Development componentof HPT & D grant spent
% # # # No development fundreceived by theDepartment on this grant
100
Table 34. Performance against National targets from 2005-08 strategic plan for Health Sciences andTraining programme
# New indicator data not availableNB: Four indicators related to medical students not included in 2005-08 strategic plan and annual report due to lack of proper system tocollect data from universities
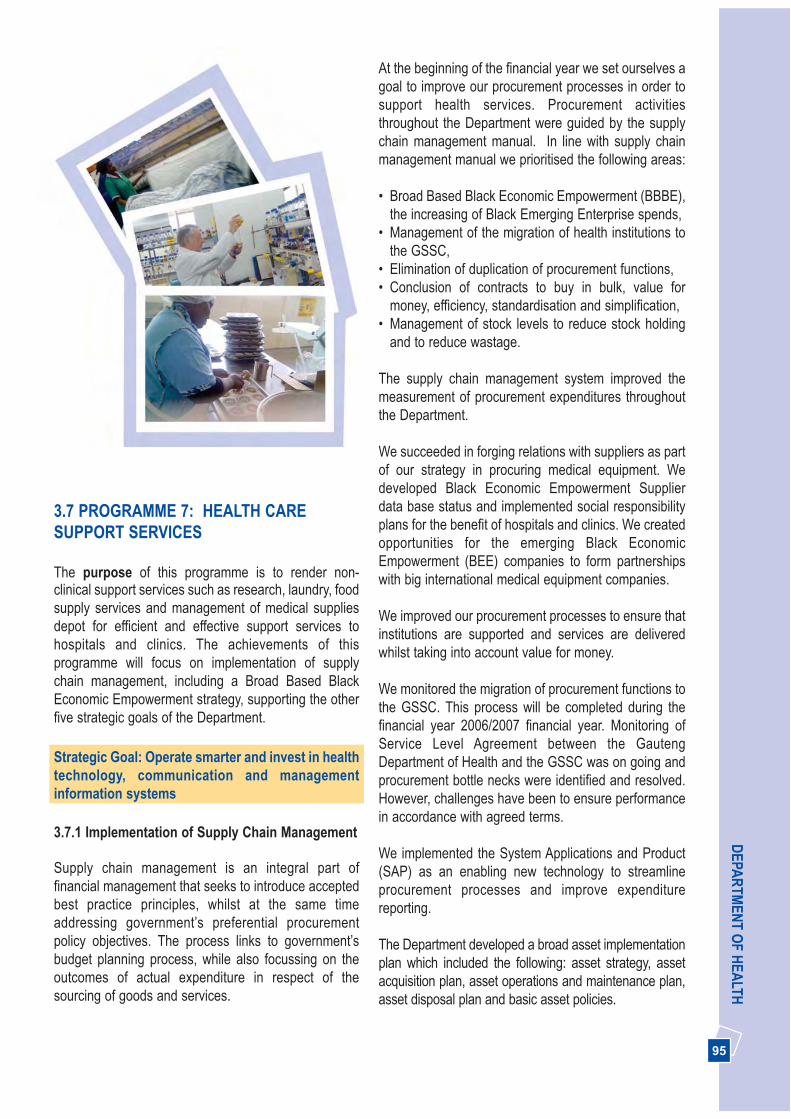
95
DEPA
RTM
ENT O
F HEA
LTH
THEE PICTURES
3.7 PROGRAMME 7: HEALTH CARESUPPORT SERVICES
The purpose of this programme is to render non-clinical support services such as research, laundry, foodsupply services and management of medical suppliesdepot for efficient and effective support services tohospitals and clinics. The achievements of thisprogramme will focus on implementation of supplychain management, including a Broad Based BlackEconomic Empowerment strategy, supporting the otherfive strategic goals of the Department.
Strategic Goal: Operate smarter and invest in healthtechnology, communication and managementinformation systems
3.7.1 Implementation of Supply Chain Management
Supply chain management is an integral part offinancial management that seeks to introduce acceptedbest practice principles, whilst at the same timeaddressing government’s preferential procurementpolicy objectives. The process links to government’sbudget planning process, while also focussing on theoutcomes of actual expenditure in respect of thesourcing of goods and services.
At the beginning of the financial year we set ourselves agoal to improve our procurement processes in order tosupport health services. Procurement activitiesthroughout the Department were guided by the supplychain management manual. In line with supply chainmanagement manual we prioritised the following areas:
• Broad Based Black Economic Empowerment (BBBE),the increasing of Black Emerging Enterprise spends,
• Management of the migration of health institutions tothe GSSC,
• Elimination of duplication of procurement functions,• Conclusion of contracts to buy in bulk, value for
money, efficiency, standardisation and simplification,• Management of stock levels to reduce stock holding
and to reduce wastage.
The supply chain management system improved themeasurement of procurement expenditures throughoutthe Department.
We succeeded in forging relations with suppliers as partof our strategy in procuring medical equipment. Wedeveloped Black Economic Empowerment Supplierdata base status and implemented social responsibilityplans for the benefit of hospitals and clinics. We createdopportunities for the emerging Black EconomicEmpowerment (BEE) companies to form partnershipswith big international medical equipment companies.
We improved our procurement processes to ensure thatinstitutions are supported and services are deliveredwhilst taking into account value for money.
We monitored the migration of procurement functions tothe GSSC. This process will be completed during thefinancial year 2006/2007 financial year. Monitoring ofService Level Agreement between the GautengDepartment of Health and the GSSC was on going andprocurement bottle necks were identified and resolved.However, challenges have been to ensure performancein accordance with agreed terms.
We implemented the System Applications and Product(SAP) as an enabling new technology to streamlineprocurement processes and improve expenditurereporting.
The Department developed a broad asset implementationplan which included the following: asset strategy, assetacquisition plan, asset operations and maintenance plan,asset disposal plan and basic asset policies.
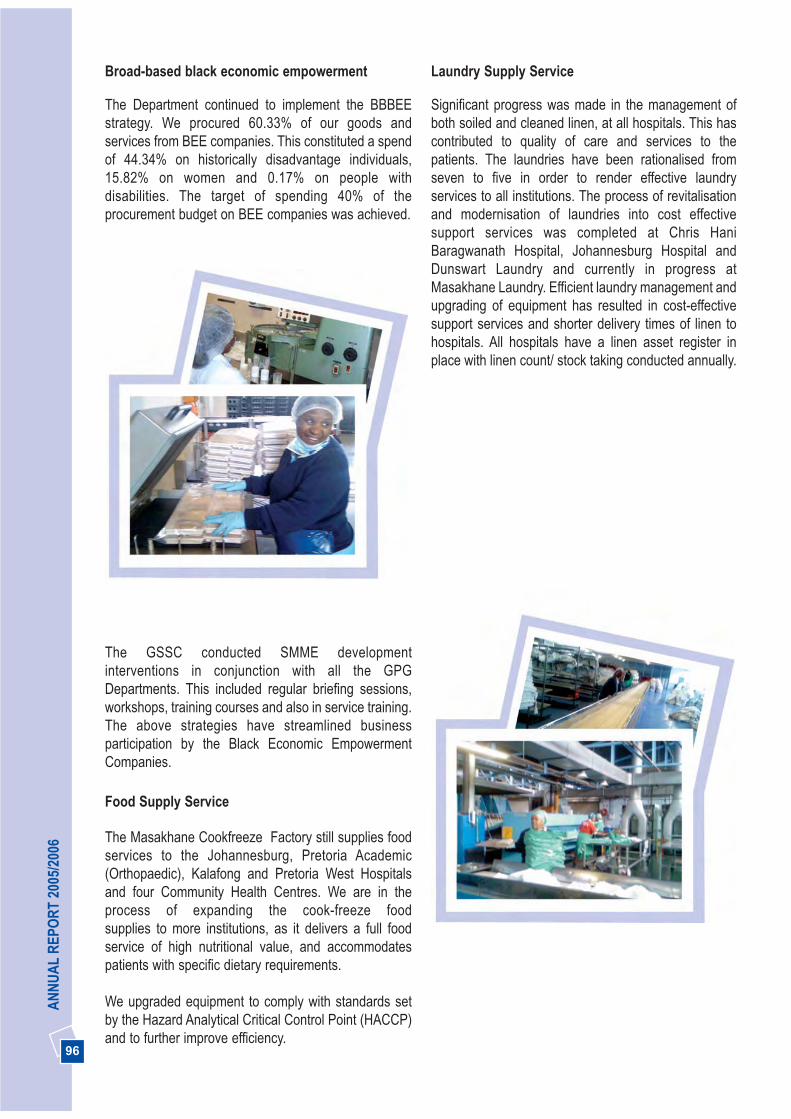
96
AN
NU
AL
REP
OR
T 20
05/2
006
Broad-based black economic empowerment
The Department continued to implement the BBBEEstrategy. We procured 60.33% of our goods andservices from BEE companies. This constituted a spendof 44.34% on historically disadvantage individuals,15.82% on women and 0.17% on people withdisabilities. The target of spending 40% of theprocurement budget on BEE companies was achieved.
The GSSC conducted SMME developmentinterventions in conjunction with all the GPGDepartments. This included regular briefing sessions,workshops, training courses and also in service training.The above strategies have streamlined businessparticipation by the Black Economic EmpowermentCompanies.
Food Supply Service
The Masakhane Cookfreeze Factory still supplies foodservices to the Johannesburg, Pretoria Academic(Orthopaedic), Kalafong and Pretoria West Hospitalsand four Community Health Centres. We are in theprocess of expanding the cook-freeze foodsupplies to more institutions, as it delivers a full foodservice of high nutritional value, and accommodatespatients with specific dietary requirements.
We upgraded equipment to comply with standards setby the Hazard Analytical Critical Control Point (HACCP)and to further improve efficiency.
Laundry Supply Service
Significant progress was made in the management ofboth soiled and cleaned linen, at all hospitals. This hascontributed to quality of care and services to thepatients. The laundries have been rationalised fromseven to five in order to render effective laundryservices to all institutions. The process of revitalisationand modernisation of laundries into cost effectivesupport services was completed at Chris HaniBaragwanath Hospital, Johannesburg Hospital andDunswart Laundry and currently in progress atMasakhane Laundry. Efficient laundry management andupgrading of equipment has resulted in cost-effectivesupport services and shorter delivery times of linen tohospitals. All hospitals have a linen asset register inplace with linen count/ stock taking conducted annually.
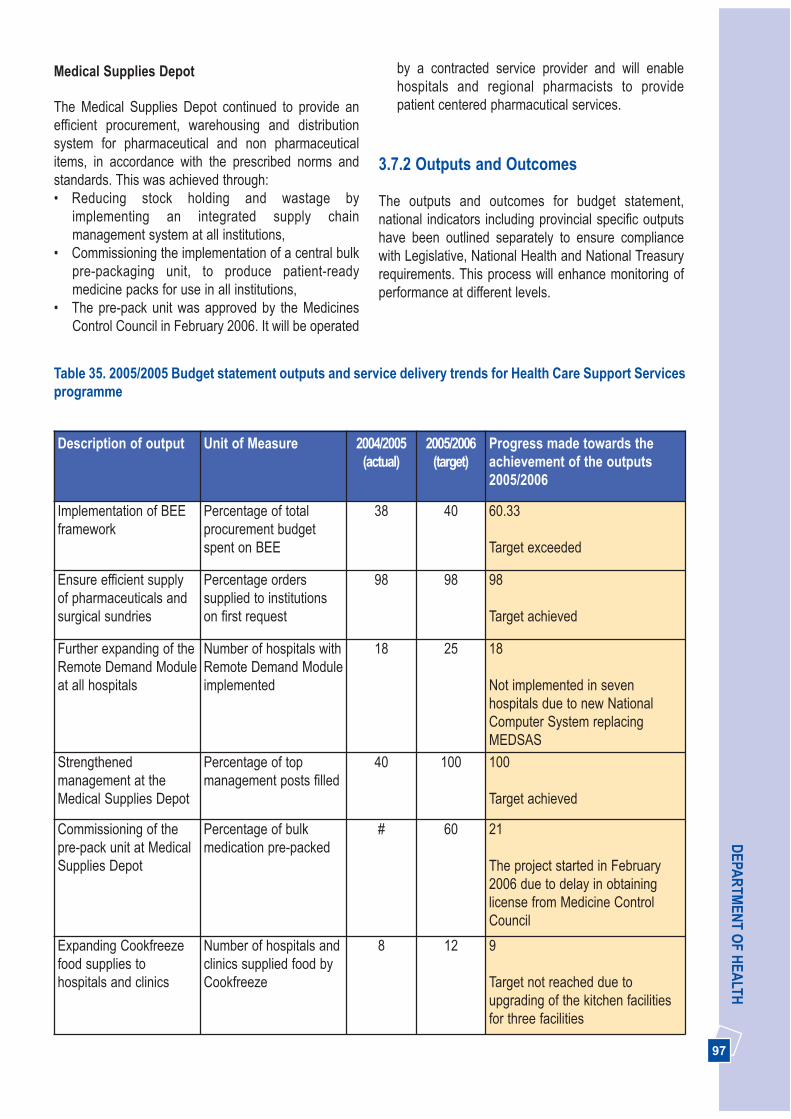
97
DEPA
RTM
ENT O
F HEA
LTHMedical Supplies Depot
The Medical Supplies Depot continued to provide anefficient procurement, warehousing and distributionsystem for pharmaceutical and non pharmaceuticalitems, in accordance with the prescribed norms andstandards. This was achieved through:• Reducing stock holding and wastage by
implementing an integrated supply chainmanagement system at all institutions,
• Commissioning the implementation of a central bulkpre-packaging unit, to produce patient-readymedicine packs for use in all institutions,
• The pre-pack unit was approved by the MedicinesControl Council in February 2006. It will be operated
by a contracted service provider and will enablehospitals and regional pharmacists to providepatient centered pharmacutical services.
3.7.2 Outputs and Outcomes
The outputs and outcomes for budget statement,national indicators including provincial specific outputshave been outlined separately to ensure compliancewith Legislative, National Health and National Treasuryrequirements. This process will enhance monitoring ofperformance at different levels.
Table 35. 2005/2005 Budget statement outputs and service delivery trends for Health Care Support Servicesprogramme
Description of output Unit of Measure 2004/2005(actual)
2005/2006(target)
Progress made towards theachievement of the outputs2005/2006
Implementation of BEEframework
Percentage of totalprocurement budgetspent on BEE
38 40 60.33
Target exceeded
Ensure efficient supplyof pharmaceuticals andsurgical sundries
Percentage orderssupplied to institutionson first request
98 98 98
Target achieved
Further expanding of theRemote Demand Moduleat all hospitals
Number of hospitals withRemote Demand Moduleimplemented
18 25 18
Not implemented in sevenhospitals due to new NationalComputer System replacingMEDSAS
Strengthenedmanagement at theMedical Supplies Depot
Percentage of topmanagement posts filled
40 100 100
Target achieved
Commissioning of thepre-pack unit at MedicalSupplies Depot
Percentage of bulkmedication pre-packed
# 60 21
The project started in February2006 due to delay in obtaininglicense from Medicine ControlCouncil
Expanding Cookfreezefood supplies tohospitals and clinics
Number of hospitals andclinics supplied food byCookfreeze
8 12 9
Target not reached due toupgrading of the kitchen facilitiesfor three facilities
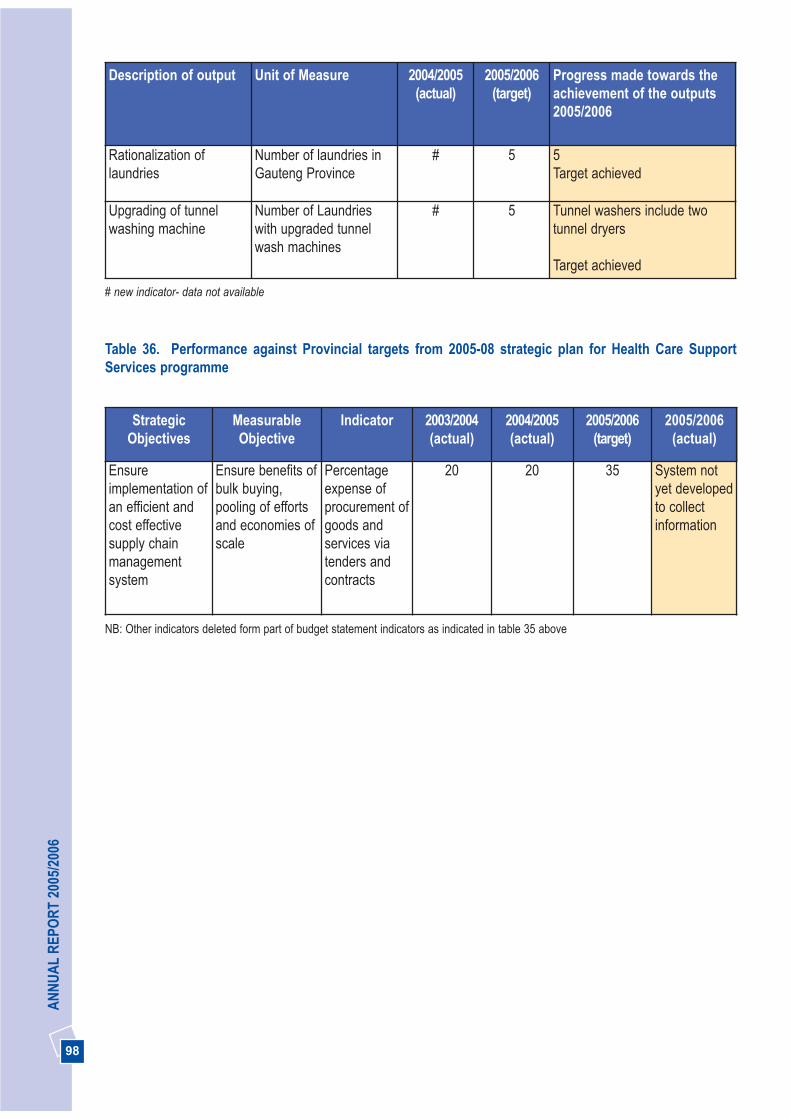
98
AN
NU
AL
REP
OR
T 20
05/2
006
Description of output Unit of Measure 2004/2005(actual)
2005/2006(target)
Progress made towards theachievement of the outputs2005/2006
Rationalization oflaundries
Number of laundries inGauteng Province
# 5 5Target achieved
Upgrading of tunnelwashing machine
Number of Laundrieswith upgraded tunnelwash machines
# 5 Tunnel washers include twotunnel dryers
Target achieved
# new indicator- data not available
Table 36. Performance against Provincial targets from 2005-08 strategic plan for Health Care SupportServices programme
StrategicObjectives
MeasurableObjective
Indicator 2003/2004(actual)
2004/2005(actual)
2005/2006(target)
2005/2006(actual)
Ensureimplementation ofan efficient andcost effectivesupply chainmanagementsystem
Ensure benefits ofbulk buying,pooling of effortsand economies ofscale
Percentageexpense ofprocurement ofgoods andservices viatenders andcontracts
20 20 35 System notyet developedto collectinformation
NB: Other indicators deleted form part of budget statement indicators as indicated in table 35 above

99
DEPA
RTM
ENT O
F HEA
LTH
3.8 PROGRAMME 8: HEALTH FACILITY MANAGEMENT
The purpose of this programme is to plan, provide andequip new facilities/assets, and to upgrade, rehabilitateand maintain community health centres, clinics, district,provincial, specialised and academic hospitals andother health- related facilities. This programme isimplemented through the strategic goal of operatingsmarter including provision of support to strengtheningthe district health system goal.
Strategic Goal: Operate smarter and invest in healthtechnology, communication and managementinformation systems
3.8.1 Constructing, renovating orrehabilitating the infrastructure
The Department, in collaboration with the Departmentof Public Transport, Roads and Works (DPTR&Wimplemented a number of initiatives to ensureappropriate utilisation of allocated funds and speedydelivery of infrastructure projects. These included:
• Appointment of Project Management ResourceGroups (PMRG) by the Department of PublicTransport, Roads and Works to increase capacity tomonitor, manage and expedite capital projects on site;
• Alignment of the Department’s projects and prioritieswith DPTR&W project lists and cash flowprojections;
• Implementation of an early warning system toidentify problems on site at an early stage;
• Identification of flagship projects which meritedspecial attention by both Departments;
• Fast tracking the finalisation of the Service LevelAgreement (SLA) between the two departments.This SLA will be finalised in the next financial yearand will assist to expedite planning of projects;
• Planning of projects to tender documentation stagethat could be initiated at short notice if cash flowtrends demanded expedited expenditure; and
• Reporting formats that were aligned betweenDepartment of Health and DPTR&W in order tofacilitate monitoring, cash flow projections andreporting.
We continued to award labour-intensive projects, andcreated job opportunities for Small, Medium and MicroEnterprises (SMME) and Previously DisadvantagedIndividuals (PDI) contractors. A number of day-to-dayprojects at institutions are given to contractors from thesurrounding areas to promote a sense of ownership intheir community institution.
Construction of new hospitals and clinics
We completed the construction of capital project asindicated in the Accounting Officer’s Report. Further,three new hospitals are work in progress. The tender forthe Natalspruit Hospital bulk site work in the Kathorusarea was advertised. Planning for the Zola Level 1Hospital is far advanced and the contractor is expectedto be on site in June 2006, and the upgrading of the newMamelodi Hospital is progressing according toschedule.
Our commitment to build ten new clinics is well withinschedule. We have completed construction ofSoshanguve Block L Community Health Centre (CHC);the needs list and narrative for Bophelong is beingfinalised; project implementation plans were receivedfor Randfontein, Bristlecone, Boikhutsong and CullinanCHCs; project implementation plans for Eldorado Parkhave been approved, the tender for the Mandela SisuluCHC was advertised and the contractor for Johan Deoand Eesterus CHCs is on site.
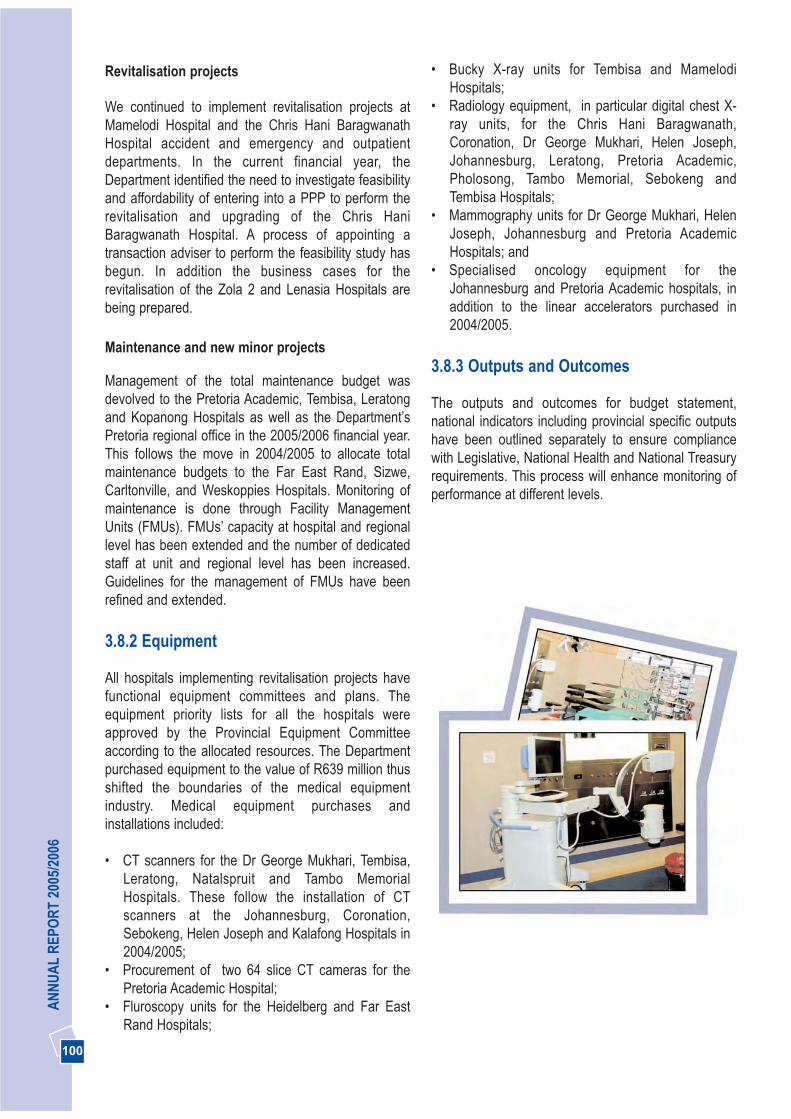
100
AN
NU
AL
REP
OR
T 20
05/2
006
Revitalisation projects
We continued to implement revitalisation projects atMamelodi Hospital and the Chris Hani BaragwanathHospital accident and emergency and outpatientdepartments. In the current financial year, theDepartment identified the need to investigate feasibilityand affordability of entering into a PPP to perform therevitalisation and upgrading of the Chris HaniBaragwanath Hospital. A process of appointing atransaction adviser to perform the feasibility study hasbegun. In addition the business cases for therevitalisation of the Zola 2 and Lenasia Hospitals arebeing prepared.
Maintenance and new minor projects
Management of the total maintenance budget wasdevolved to the Pretoria Academic, Tembisa, Leratongand Kopanong Hospitals as well as the Department’sPretoria regional office in the 2005/2006 financial year.This follows the move in 2004/2005 to allocate totalmaintenance budgets to the Far East Rand, Sizwe,Carltonville, and Weskoppies Hospitals. Monitoring ofmaintenance is done through Facility ManagementUnits (FMUs). FMUs’ capacity at hospital and regionallevel has been extended and the number of dedicatedstaff at unit and regional level has been increased.Guidelines for the management of FMUs have beenrefined and extended.
3.8.2 Equipment
All hospitals implementing revitalisation projects havefunctional equipment committees and plans. Theequipment priority lists for all the hospitals wereapproved by the Provincial Equipment Committeeaccording to the allocated resources. The Departmentpurchased equipment to the value of R639 million thusshifted the boundaries of the medical equipmentindustry. Medical equipment purchases andinstallations included:
• CT scanners for the Dr George Mukhari, Tembisa,Leratong, Natalspruit and Tambo MemorialHospitals. These follow the installation of CTscanners at the Johannesburg, Coronation,Sebokeng, Helen Joseph and Kalafong Hospitals in2004/2005;
• Procurement of two 64 slice CT cameras for thePretoria Academic Hospital;
• Fluroscopy units for the Heidelberg and Far EastRand Hospitals;
• Bucky X-ray units for Tembisa and MamelodiHospitals;
• Radiology equipment, in particular digital chest X-ray units, for the Chris Hani Baragwanath,Coronation, Dr George Mukhari, Helen Joseph,Johannesburg, Leratong, Pretoria Academic,Pholosong, Tambo Memorial, Sebokeng andTembisa Hospitals;
• Mammography units for Dr George Mukhari, HelenJoseph, Johannesburg and Pretoria AcademicHospitals; and
• Specialised oncology equipment for theJohannesburg and Pretoria Academic hospitals, inaddition to the linear accelerators purchased in2004/2005.
3.8.3 Outputs and Outcomes
The outputs and outcomes for budget statement,national indicators including provincial specific outputshave been outlined separately to ensure compliancewith Legislative, National Health and National Treasuryrequirements. This process will enhance monitoring ofperformance at different levels.

101
DEPA
RTM
ENT O
F HEA
LTHTable 37. Budget statement outputs and service delivery trends for Health Facilities Management
Description of output Unit of Measure 2004/2005(actual)
2005/2006(target)
Progress made towards theachievement of the outputs2005/2006
Construction ofRandfontein CommunityHealth Centre
Percentagecompleted
5 30 30
Planning completed
Target achieved
Construction of StanzaBopape Community HealthCentre: Phase 2
Percentagecompleted
90 100 100
Target achieved
Construction ofSoshanguve Block LCommunity Health Centre
Percentagecompleted
90 100 100
Target achieved
Construction of StretfordCommunity Health Centre:Phase 2
Percentagecompleted
80 100 100
Target achieved
Construction of Zola newdistrict hospital*
Percentagecompleted
30 50 30
Original plan was to upgrade ZolaCHC to a level 1 hospital, a new sitewas identified at Jabulani forconstruction of new district hospital
Upgrading of Lilian NgoyiCHC to level 1 hospital *
Percentagecompleted
10 50 25
Delayed due to revised requirementsto approve business case
Upgrading of Lenasia CHCto Level 1 hospital
Percentagecompleted
10 50 20
Delay due to review of strategicrequirement. A business case isbeing developed
Relocation of NatalspruitHospital
Percentagecompleted
10 40 30
Delayed due to revised requirementsto approve business case
Upgrading of GermistonHospital
Percentagecompleted
20 40 25
Possibilities of relocating the hospitalto alternate site delayedconstruction. Currently planning ahospital for multi-story building
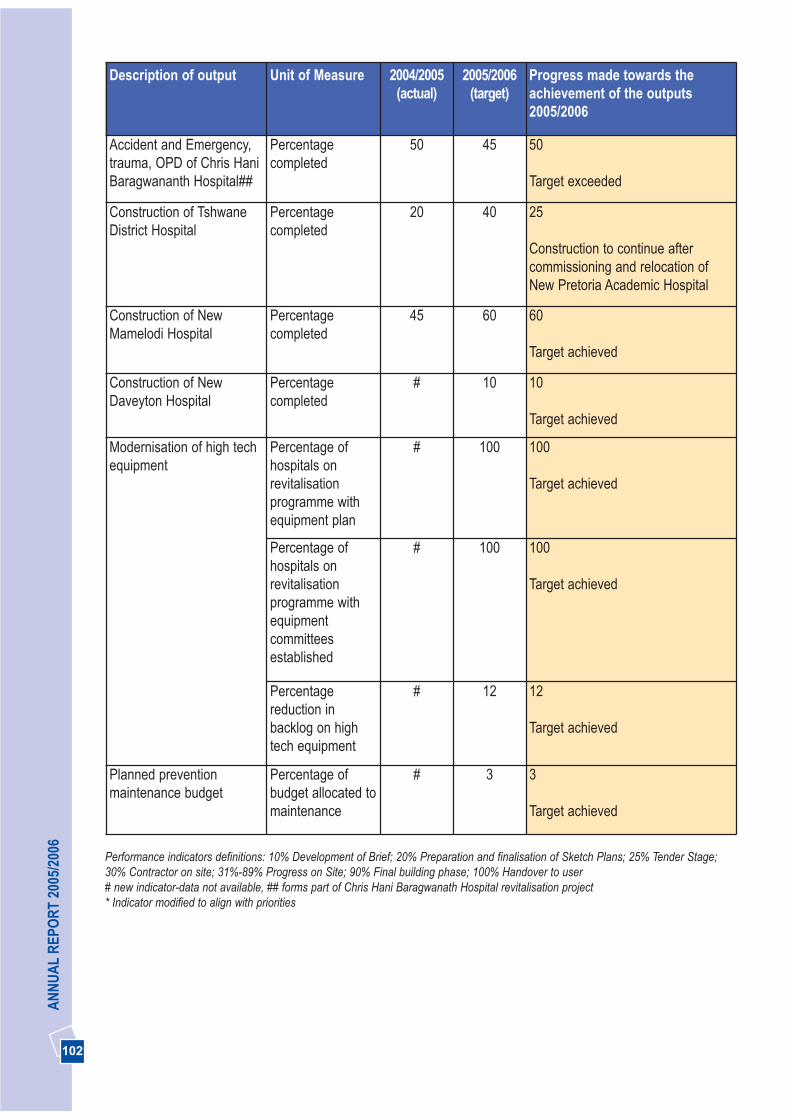
102
AN
NU
AL
REP
OR
T 20
05/2
006
Description of output Unit of Measure 2004/2005(actual)
2005/2006(target)
Progress made towards theachievement of the outputs2005/2006
Accident and Emergency,trauma, OPD of Chris HaniBaragwananth Hospital##
Percentagecompleted
50 45 50
Target exceeded
Construction of TshwaneDistrict Hospital
Percentagecompleted
20 40 25
Construction to continue aftercommissioning and relocation ofNew Pretoria Academic Hospital
Construction of NewMamelodi Hospital
Percentagecompleted
45 60 60
Target achieved
Construction of NewDaveyton Hospital
Percentagecompleted
# 10 10
Target achieved
Modernisation of high techequipment
Percentage ofhospitals onrevitalisationprogramme withequipment plan
# 100 100
Target achieved
Percentage ofhospitals onrevitalisationprogramme withequipmentcommitteesestablished
# 100 100
Target achieved
Percentagereduction inbacklog on hightech equipment
# 12 12
Target achieved
Planned preventionmaintenance budget
Percentage ofbudget allocated tomaintenance
# 3 3
Target achieved
Performance indicators definitions: 10% Development of Brief; 20% Preparation and finalisation of Sketch Plans; 25% Tender Stage;30% Contractor on site; 31%-89% Progress on Site; 90% Final building phase; 100% Handover to user# new indicator-data not available, ## forms part of Chris Hani Baragwanath Hospital revitalisation project* Indicator modified to align with priorities
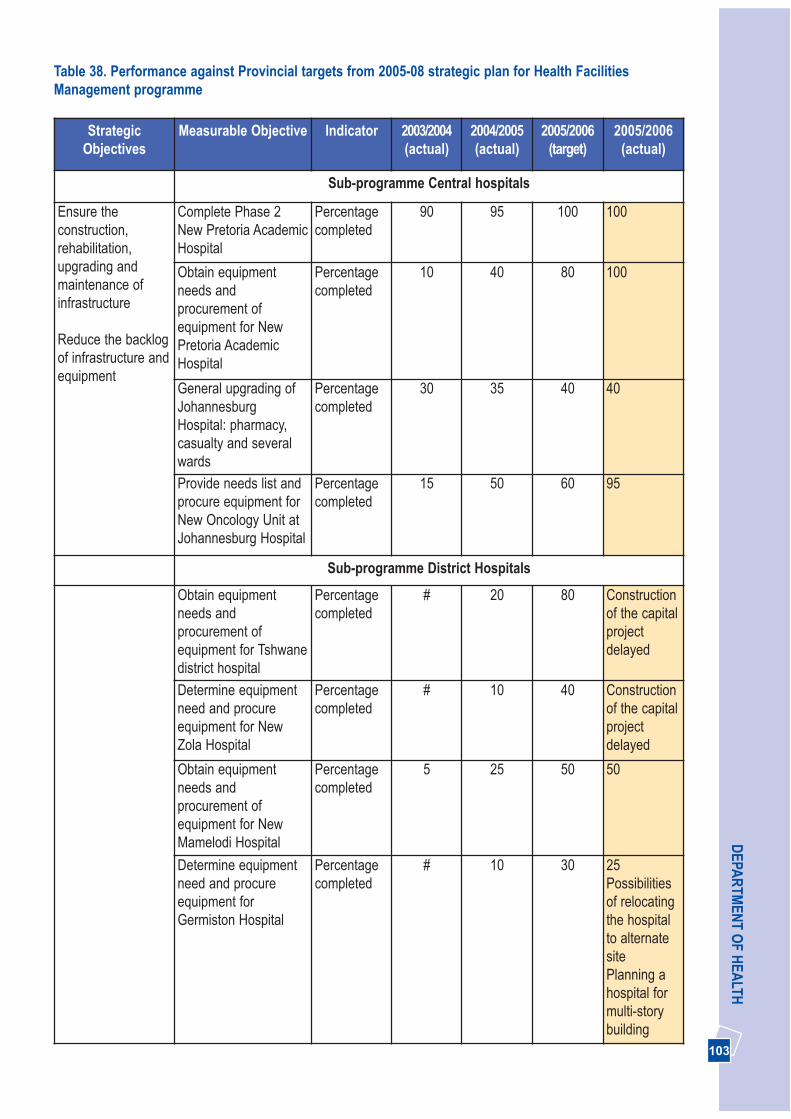
103
DEPA
RTM
ENT O
F HEA
LTH
StrategicObjectives
Measurable Objective Indicator 2003/2004(actual)
2004/2005(actual)
2005/2006(target)
2005/2006(actual)
Sub-programme Central hospitals
Ensure theconstruction,rehabilitation,upgrading andmaintenance ofinfrastructure
Reduce the backlogof infrastructure andequipment
Complete Phase 2New Pretoria AcademicHospital
Percentagecompleted
90 95 100 100
Obtain equipmentneeds andprocurement ofequipment for NewPretoria AcademicHospital
Percentagecompleted
10 40 80 100
General upgrading ofJohannesburgHospital: pharmacy,casualty and severalwards
Percentagecompleted
30 35 40 40
Provide needs list andprocure equipment forNew Oncology Unit atJohannesburg Hospital
Percentagecompleted
15 50 60 95
Sub-programme District Hospitals
Obtain equipmentneeds andprocurement ofequipment for Tshwanedistrict hospital
Percentagecompleted
# 20 80 Constructionof the capitalprojectdelayed
Determine equipmentneed and procureequipment for NewZola Hospital
Percentagecompleted
# 10 40 Constructionof the capitalprojectdelayed
Obtain equipmentneeds andprocurement ofequipment for NewMamelodi Hospital
Percentagecompleted
5 25 50 50
Determine equipmentneed and procureequipment forGermiston Hospital
Percentagecompleted
# 10 30 25Possibilitiesof relocatingthe hospitalto alternatesite Planning ahospital formulti-storybuilding
Table 38. Performance against Provincial targets from 2005-08 strategic plan for Health FacilitiesManagement programme
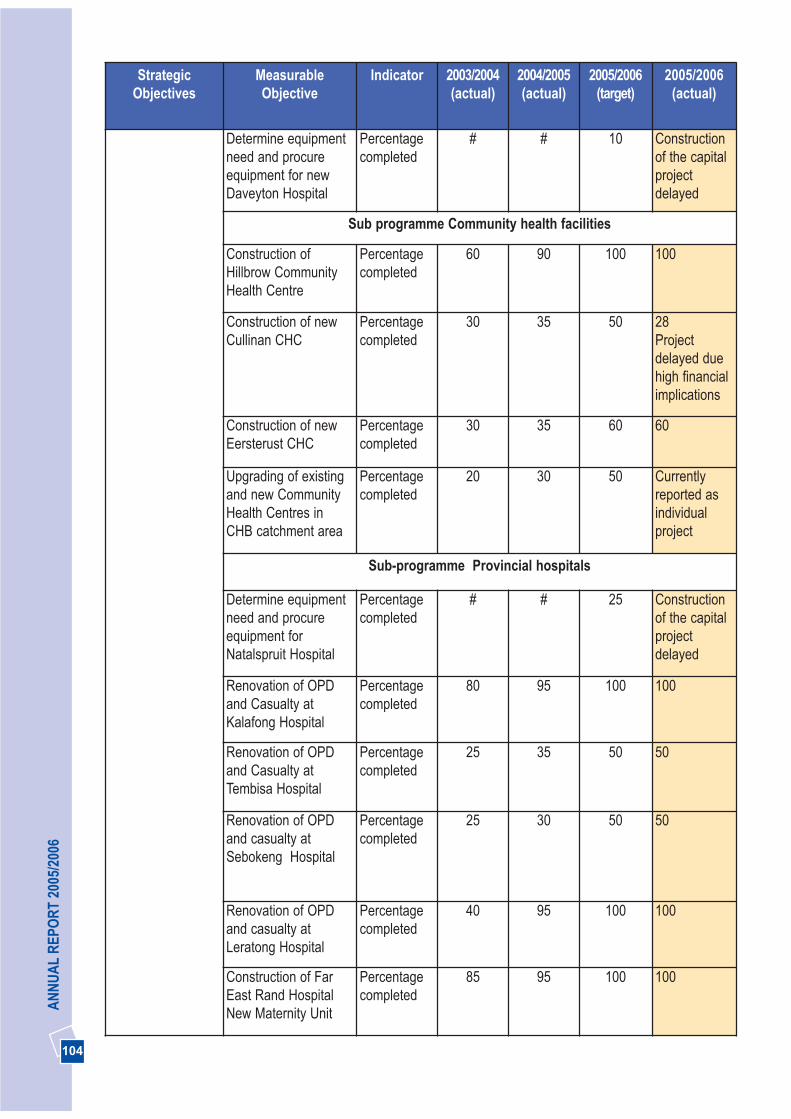
104
AN
NU
AL
REP
OR
T 20
05/2
006
StrategicObjectives
MeasurableObjective
Indicator 2003/2004(actual)
2004/2005(actual)
2005/2006(target)
2005/2006(actual)
Determine equipmentneed and procureequipment for newDaveyton Hospital
Percentagecompleted
# # 10 Constructionof the capitalprojectdelayed
Sub programme Community health facilities
Construction ofHillbrow CommunityHealth Centre
Percentagecompleted
60 90 100 100
Construction of newCullinan CHC
Percentagecompleted
30 35 50 28Projectdelayed duehigh financialimplications
Construction of newEersterust CHC
Percentagecompleted
30 35 60 60
Upgrading of existingand new CommunityHealth Centres inCHB catchment area
Percentagecompleted
20 30 50 Currentlyreported asindividualproject
Sub-programme Provincial hospitals
Determine equipmentneed and procureequipment forNatalspruit Hospital
Percentagecompleted
# # 25 Constructionof the capitalprojectdelayed
Renovation of OPDand Casualty atKalafong Hospital
Percentagecompleted
80 95 100 100
Renovation of OPDand Casualty atTembisa Hospital
Percentagecompleted
25 35 50 50
Renovation of OPDand casualty atSebokeng Hospital
Percentagecompleted
25 30 50 50
Renovation of OPDand casualty atLeratong Hospital
Percentagecompleted
40 95 100 100
Construction of FarEast Rand HospitalNew Maternity Unit
Percentagecompleted
85 95 100 100
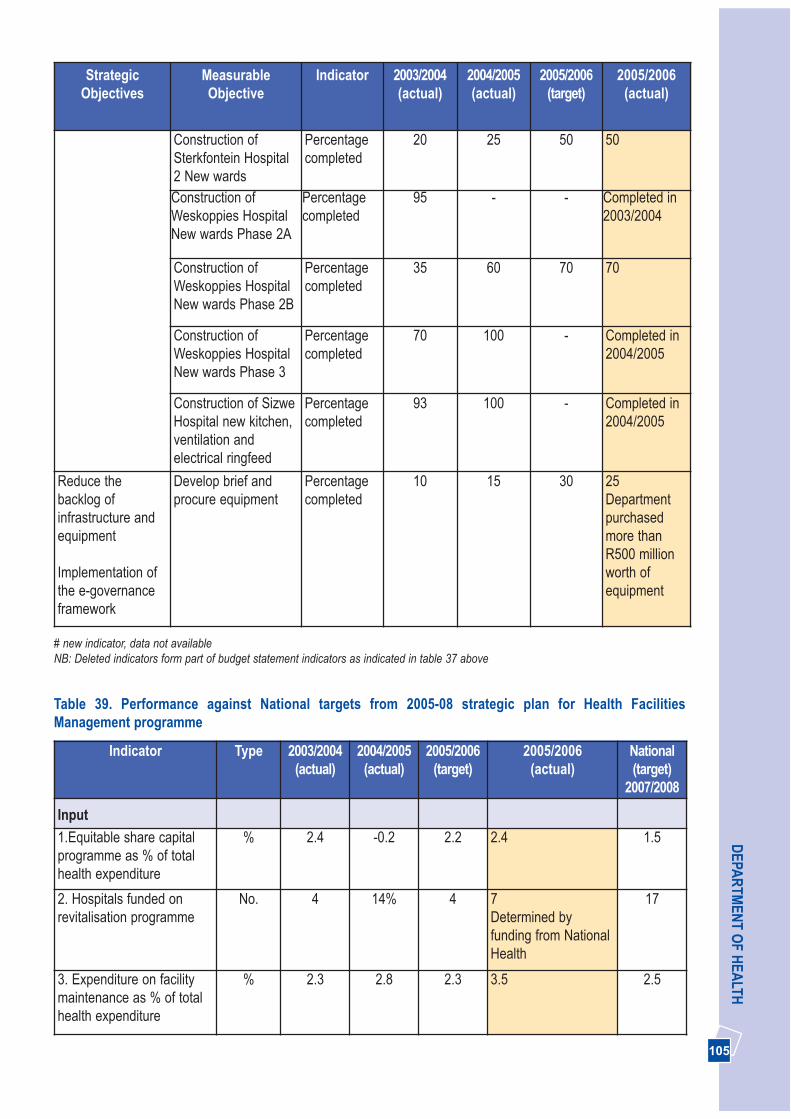
105
DEPA
RTM
ENT O
F HEA
LTHStrategic
ObjectivesMeasurableObjective
Indicator 2003/2004(actual)
2004/2005(actual)
2005/2006(target)
2005/2006(actual)
Construction ofSterkfontein Hospital2 New wards
Percentagecompleted
20 25 50 50
Construction ofWeskoppies HospitalNew wards Phase 2A
Percentagecompleted
95 - - Completed in2003/2004
Construction ofWeskoppies HospitalNew wards Phase 2B
Percentagecompleted
35 60 70 70
Construction ofWeskoppies HospitalNew wards Phase 3
Percentagecompleted
70 100 - Completed in2004/2005
Construction of SizweHospital new kitchen,ventilation andelectrical ringfeed
Percentagecompleted
93 100 - Completed in2004/2005
Reduce thebacklog ofinfrastructure andequipment
Implementation ofthe e-governanceframework
Develop brief andprocure equipment
Percentagecompleted
10 15 30 25Departmentpurchasedmore thanR500 millionworth ofequipment
# new indicator, data not availableNB: Deleted indicators form part of budget statement indicators as indicated in table 37 above
Table 39. Performance against National targets from 2005-08 strategic plan for Health FacilitiesManagement programme
Indicator Type 2003/2004(actual)
2004/2005(actual)
2005/2006(target)
2005/2006(actual)
National(target)
2007/2008
Input
1.Equitable share capitalprogramme as % of totalhealth expenditure
% 2.4 -0.2 2.2 2.4 1.5
2. Hospitals funded onrevitalisation programme
No. 4 14% 4 7Determined byfunding from NationalHealth
17
3. Expenditure on facilitymaintenance as % of totalhealth expenditure
% 2.3 2.8 2.3 3.5 2.5

106
AN
NU
AL
REP
OR
T 20
05/2
006
Indicator Type 2003/2004(actual)
2004/2005(actual)
2005/2006(target)
2005/2006(actual)
National(target)
2007/2008
4. Expenditure onequipment maintenanceas % of total healthexpenditure
% 3.3 0.94 3.5 0.72Purchased lot of newequipment in2005/2006.Maintenanceexpenditure for theseequipment will beincurred from2006/2007
2
Process
5. Hospitals with up todate asset register
% 85 100 100 100 100
6. Health Regions with upto date PHC asset register(excl hospitals)
% 100 100 100 100 100
Quality
7. Fixed PHC facilitieswith access to piped water
% 100 100 100 100 100
8. Fixed PHC facilitieswith access to mainselectricity
% 100 100 100 100 100
9. Fixed PHC facilitieswith access to fixed linetelephones
% 100 100 100 100 100
10. Average backlog ofservice platform in fixedPHC facilities
% 22 25 11.6 14.9 30
11. Average backlog ofservice platform in DistrictHospitals
% 15 18 18.6 25 30
12. Average backlog ofservice platform inRegional hospitals
% 20 68.049 28.8 20.6Reduction due tobudgetaryconstraints
30
13. Average backlog ofservice platform inSpecialised Hospitals
% 10 21.626 14.9 5Reduction due tobudgetaryconstraints
30
14. Average backlog ofservice platform in Tertiaryand Central Hospitals
% 30 32 35.9 30Reduction due tobudgetaryconstraints
30
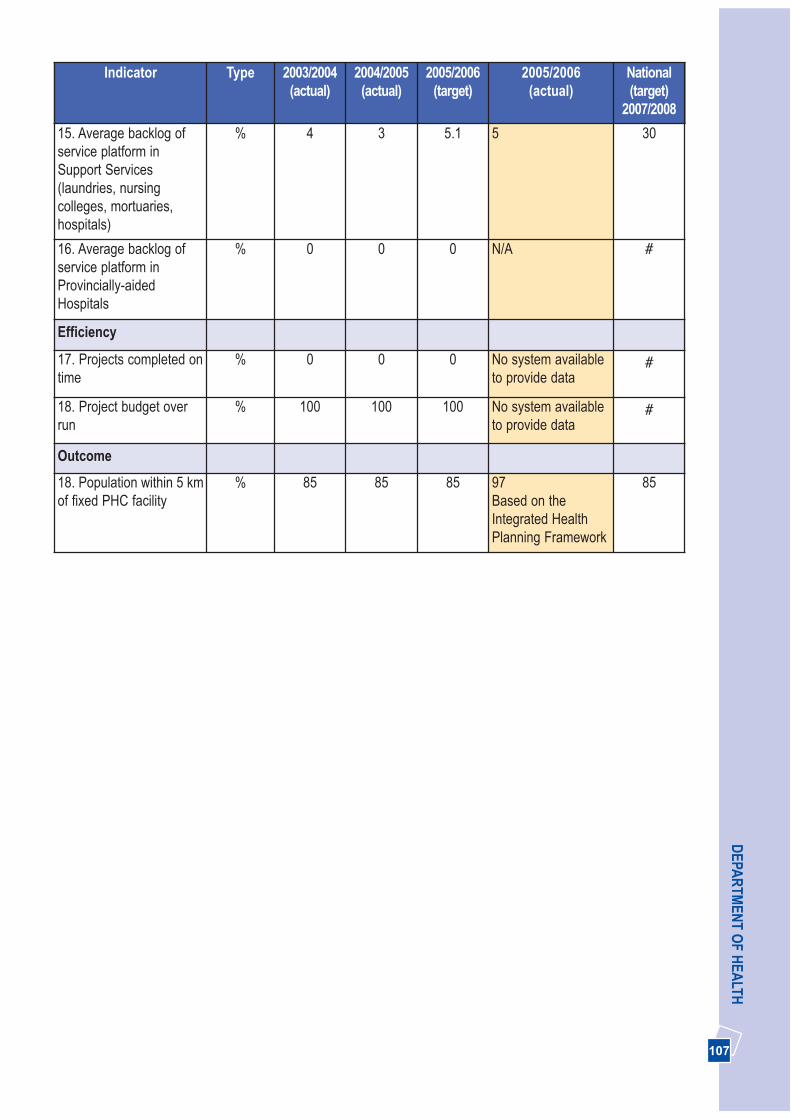
107
DEPA
RTM
ENT O
F HEA
LTHIndicator Type 2003/2004
(actual)2004/2005
(actual)2005/2006
(target)2005/2006
(actual)National(target)
2007/2008
15. Average backlog ofservice platform inSupport Services(laundries, nursingcolleges, mortuaries,hospitals)
% 4 3 5.1 5 30
16. Average backlog ofservice platform inProvincially-aidedHospitals
% 0 0 0 N/A #
Efficiency
17. Projects completed ontime
% 0 0 0 No system availableto provide data
#
18. Project budget overrun
% 100 100 100 No system availableto provide data
#
Outcome
18. Population within 5 kmof fixed PHC facility
% 85 85 85 97Based on theIntegrated HealthPlanning Framework
85

108
AN
NU
AL
REP
OR
T 20
05/2
006
3.9 FINANCIAL INFORMATION 2005/2006 FINANCIAL YEAR
Table 40. Expenditure by budget sub-programme
2003/2004 2004/2005 2005/2006 2005/2006Variance - %under/ (over-expenditure)
Exp Exp Exp Budget
R’000 R’000 R’000 R’000
Programme 1 263 212 264 087 239 996 250 325 4.1%
Programme 2 1 743 927 1 922 347 2 152 883 2 154 358 0.1%
DistrictManagement
444 855 448 485 218 288 218 288 –
Clinics 324 627 361 662 585 806 585 806 –
CommunityHealth Centres
233 126 277 443 375 448 375 448 –
District Hospitals 370 534 386 731 433 011 433 011 –
CommunityBased Services
168 991 132 655 143 842 143 842 –
HIV/AIDS 118 043 288 252 367 958 367 958 –
Nutrition 82 544 26 035 28 342 29 817 5.0%
Theft and Losses 1 207 1 084 188 188 –
Programme 3 247 900 278 350 329 451 329 451 –
EmergencyTransport
244 537 278 126 329 449 329 449 –
Planned patienttransport
3 363 169 – – –
Theft and Losses 55 2 2
Programe 4: 2 292 408 2 415 992 2 645 825 2 645 825 –
General hospitals(regional)
1 752 119 1 867 510 2 062 442 2 062 442 –
Other specialisedhospitals
35 832 36 779 34 233 34 233 –
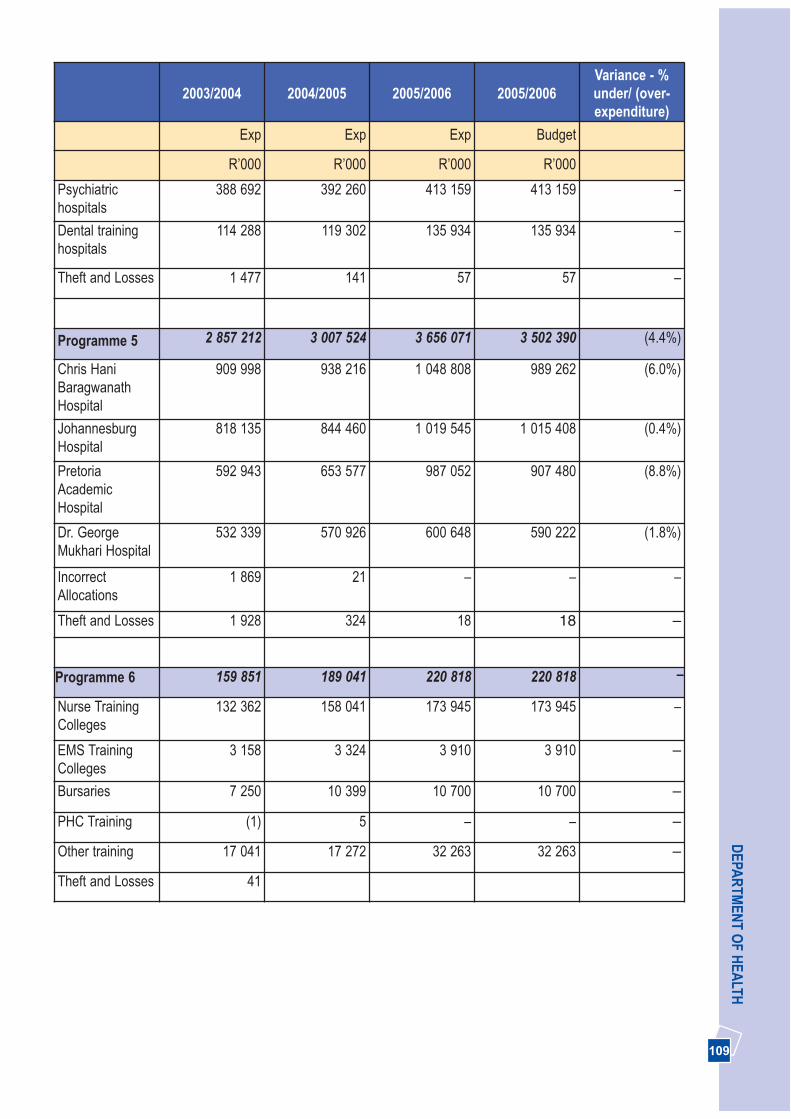
109
DEPA
RTM
ENT O
F HEA
LTH
2003/2004 2004/2005 2005/2006 2005/2006Variance - %under/ (over-expenditure)
Exp Exp Exp Budget
R’000 R’000 R’000 R’000
Psychiatrichospitals
388 692 392 260 413 159 413 159 –
Dental traininghospitals
114 288 119 302 135 934 135 934 –
Theft and Losses 1 477 141 57 57 –
Programme 5 2 857 212 3 007 524 3 656 071 3 502 390 (4.4%)
Chris HaniBaragwanathHospital
909 998 938 216 1 048 808 989 262 (6.0%)
JohannesburgHospital
818 135 844 460 1 019 545 1 015 408 (0.4%)
PretoriaAcademicHospital
592 943 653 577 987 052 907 480 (8.8%)
Dr. GeorgeMukhari Hospital
532 339 570 926 600 648 590 222 (1.8%)
IncorrectAllocations
1 869 21 – – –
Theft and Losses 1 928 324 18 18 –
Programme 6 159 851 189 041 220 818 220 818 –
Nurse TrainingColleges
132 362 158 041 173 945 173 945 –
EMS TrainingColleges
3 158 3 324 3 910 3 910 –
Bursaries 7 250 10 399 10 700 10 700 –
PHC Training (1) 5 – – –
Other training 17 041 17 272 32 263 32 263 –
Theft and Losses 41
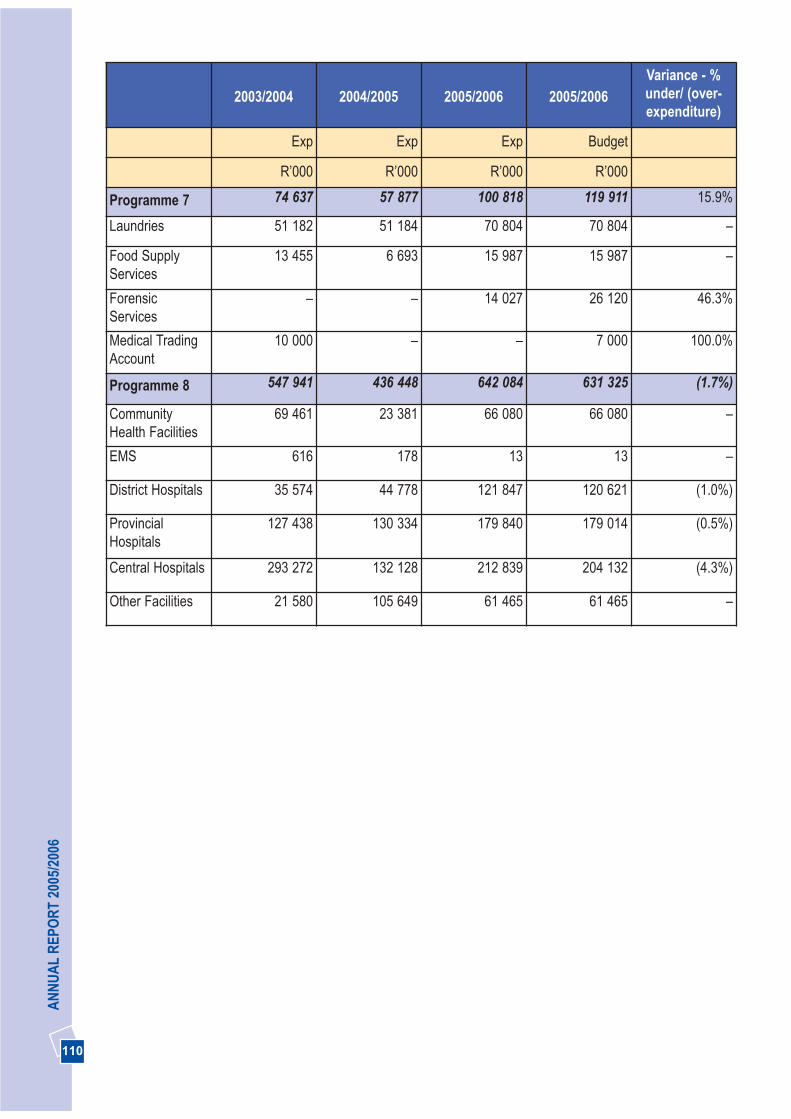
AN
NU
AL
REP
OR
T 20
05/2
006
110
2003/2004 2004/2005 2005/2006 2005/2006Variance - %under/ (over-expenditure)
Exp Exp Exp Budget
R’000 R’000 R’000 R’000
Programme 7 74 637 57 877 100 818 119 911 15.9%
Laundries 51 182 51 184 70 804 70 804 –
Food SupplyServices
13 455 6 693 15 987 15 987 –
ForensicServices
– – 14 027 26 120 46.3%
Medical TradingAccount
10 000 – – 7 000 100.0%
Programme 8 547 941 436 448 642 084 631 325 (1.7%)
CommunityHealth Facilities
69 461 23 381 66 080 66 080 –
EMS 616 178 13 13 –
District Hospitals 35 574 44 778 121 847 120 621 (1.0%)
ProvincialHospitals
127 438 130 334 179 840 179 014 (0.5%)
Central Hospitals 293 272 132 128 212 839 204 132 (4.3%)
Other Facilities 21 580 105 649 61 465 61 465 –

DEPA
RTM
ENT O
F HEA
LTH
111
Table 41. Evolution of expenditure by budget per capita sub-programme constant 2004/2005 prices)
2003/2004 2004/2005 2005/2006
Population 8 837 142 9 549 731 9 807 981
%insured 72.5 76.4 79
Uninsured population 6 409 160 7 295 141 7 748 304
Conversion to constant 2005/06 prices 1.05% 1.0 1.00
Exp per capitaUninsured
Exp per capitaUninsured
Exp per capitaUninsured
Programme
Administration 43.12 35.91 30.97
District Health Services 285.51 263.36 277.85
Emergency Medical Services 40.06 38.12 42.52
Provincial Hospital Services 375.56 331.16 341.47
Central Hospital Services 467.47 412.46 471.85
Health Training and Sciences 26.19 25.91 28.50
Health Care Support Services 12.23 7.69 13.01
Health Facility Management 89.77 59.83 82.87

112
AN
NU
AL
REP
OR
T 20
05/2
006
THREE PICTURES
SECTION 4: SUMMARY ONDEPARTMENTAL KEY PERFORMANCE ATA GLANCE
Our achievements as indicated below have taken intoaccount achievements for the 2004/2005 and2005/2006 financial years.
Promote health, prevent and manage illnesses orconditions with emphasis on poverty, lifestyle,trauma and violence and psychosocial factors
• Increased sites for Mindset Health Channel from 40in 2004/2005 to 112 in 2005/2006 across theprovince.
• The Expanded Programme on Immunisationremains a high priority. The impact of the 2004 massimmunisation campaign and a campaign in thedistricts called “Every Day an immunisation Day”has resulted in increased immunisation coverage to83% in the 2005/2006 financial year. TheDepartment was awarded a certificate from theNational Department as the province with the bestimmunisation coverage.
• Vitamin A supplement provided to all children andpost-partum women in all facilities in the provinceimproved coverage for under 1 year olds to 86%.
• Hospitals implementing Kangaroo Mother Careincreased from 19 in 2004/2005 to 21 in 2005/2006.
• Youth friendly services were expanded from 38 in2004/2005 to 52 in the 2005/2006 financial year.
• Implementing the post-exposure-prophylaxis(PEP) for victims of sexual violence was started in55 facilities with 24-hour service provided in 56% offacilities. More than 36 000 clients benefited sincethe inception of the programme in 2002.
• A continuous effort in the implementation of TBadvocacy interventions, TB/HIV collaboration andDirectly Observed Treatment (DOT) programmeshave contributed in the increase of the TB cure ratefrom 58% in 2004 to 64% in 2005.
• Department has exceeded the target by more than 3 800 through the provision of 6 344 assistivedevices. In 2005, the Department was awarded thedisability trophy from the National Department ofHealth for providing the highest number ofwheelchairs and hearing aids per capita and thenumber of staff that participated in continuingeducation activities.
Effective implementation of the comprehensive HIVand AIDS strategy
• We increased the number of male condomsdistributed from 8.5 million per month in 2004 toabout 10.9 million per month in 2005.
• A comprehensive treatment and care programme,including anti-retroviral treatment (ART)commenced in April 2004 is now implemented in 33health facilities with more than 350 000 clientsassessed and more than 41 795 patients ontreatment.
Strengthen the district health system and providecaring, responsive and quality health services at alllevels
• Stanza Bopape, Stretford and Maria RanthoCommunity Health Centres including RamokonopiMaternity Obstetric Units (MOUs) were opened to

113
DEPA
RTM
ENT O
F HEA
LTHimprove access to Primary Health Care. We haveextended hours of service to 73% of sub districts,and 100% of all districts.
• Successful implementation of dedicated obstetricambulance service in the Sedibeng district.
• Reduced the cardiac, orthopaedics and cataractsurgical backlog significantly. The Department hasreceived cataract surgery achievement certificatefrom National Health for exceeding the 2004 target.
• Twelve hospitals received full accreditation since2004/2005 with Laudium Community Health Centrebeing the first Community Health Centre to receivefull accreditation in the 2005/2006 financial year.
Implement the people’s contract through effectiveleadership and governance
• Established the Provincial Health Council in terms ofthe National Health Act, including TechnicalCommittees to support the Council structures.
• Trained more than 2 000 Community HealthWorkers on 69 day course since the inception of theprogramme in 2004.
Become a leader in human resource developmentand management for health
• Appointed 2 950 health professionals of which 1 188 were medical practitioners, 245 interns, 935nurses and 582 allied health professionals, includingpharmacists.
• Upgraded posts for registrars, specialists,pharmacists and allieds professionals.
• The Department has successfully implemented alearnership/internship programme since 2004/2005,which benefited 4 800 people and exceeded the2005/2006 target by 2 800.
• We have successfully implemented an IntegratedWellness Programme in all health facilities and100% of our staff had access to the departmerntalEmployee Assistance Programme with a 11%utilisation rate. The Department of Public Serviceand Administration (DPSA) has recognised theDepartment’s wellness programme as a best
practice site.
Operate smarter and invest in health technology,communication and management informationsystems
• Spending on goods and services procured from theBlack Economic Empowerment companiesincreased from 38% in 2004/2005 to 60.33% in the2005/2006 financial year.
• Purchased equipment worth more than R639 million, which include high-tech medicalequipment such as MRIs and CT Scanners, Gammacameras, digital mammography units, multi-functional digital x-ray machines, Linearaccelerators.
• National Treasury registered revitalisation project atChris Hani Baragwanath Hospital, as a proposedPublic Private Partnership (PPP).
• Completed construction of Soshanguve Block L,Hillbrow, Stretford, Stanza Bopape CommunityHealth Centres, Breast Care Centre at HelenJoseph Hospital and six new pharmacies.
• Commissioned the Johannesburg HospitalOncology unit and the new Pretoria AcademicHospital.
114
AN
NU
AL
REP
OR
T 20
05/2
006
THREE PICTURES
SECTION 5: OUTLOOK FOR THE COMINGYEAR
During 2004/2005, the Department has identifiedpriorities for the coming 10 years including its 5-yearpriorities through a 2014 visioning process. The 2007-10 Annual Performance Plan that form a basis forbudget statement was developed based on the keyactions and projects of Departmental StrategicProgramme of Action.
Promote health, prevent and manage illnesses orconditions with emphasis on poverty, lifestyle,trauma and violence and psychosocial factors
The Department will continue the implementation ofstrategies for reducing potentially avoidable deathsfocusing on Maternal and Neonatal care, Healthimplementation of the Bana Pele programme,immunisation and implementation of the WHO modelfor integrated diseases surveillance and response;Enhancing youth programmes to include prevention ofteenage pregnancy, smoking, alcohol and drug abuse;HIV and AIDS, STIs, focus will continue in partnershipwith other government departments and stakeholders.
Special attention will be paid to improving the TB curerate through the provision of additional capacity, HIV/TBcollaboration and social mobilisation. Health promotion
and prevention of illnesses will continue with specialfocus on non-communicable diseases and healthylifestyles. Improving the completion rate for post-exposure-prophylaxis (PEP) for victims of sexualviolence will be continued. Community-based care forpeople with chronic mental disorders will be a specialfocus during 2006/2007.
The provision of assistive devices and free healthservices in all health facilities to people with disabilitieswill continue.
Effective implementation of the comprehensive HIVand AIDS strategy
The comprehensive HIV and AIDS strategy is a majorpriority. Special efforts to reduce HIV new infections, theexpansion of comprehensive HIV and AIDS includingART, the implementation of strategies to reduce theimpact of HIV and AIDS in hospitals and clinics and theimplementation of Step Down beds and monitoring theimplementation of the AIDS strategy and its objectiveswill be embarked on.
Strengthen the district health system and providecaring, responsive and quality health services at alllevels
The modernisation of tertiary services, strengthening ofPrimary Health Care services, improving efficiencyindicators and establishment of gateway clinics willcontinue. A particular focus will be on the extension ofhours of PHC service delivery and support from FamilyMedicine Physicians. The model of primary health careservice provision will be changed throughprovincialisation commencing with District Councils in2006/2007. Cross boundary areas will be incorporatedinto Gauteng. Special focus will also be on theprovincialisation of Emergency Medical Services.Emphasis on improving quality of care through theimplementation of quality assurance programmesfocusing on service excellence, improving frontlineservices, improving clinical care, reducing the unequalpower relations between service users and providers,accreditation of all facilities and enhanced managementaccountability will continue. The process of transferringforensic mortuary services from the South AfricanPolice Services will commence in April 2006.
Implement the people’s contract through effectiveleadership and governance
Special focus will be on the rollout of the CEO trainingand development programme (including training of
115
DEPA
RTM
ENT O
F HEA
LTHmiddle managers), improving functioning and support ofNGOs, CBOs and of community participation structures,community health workers (CHWs) expansionprogramme, building partnerships (including PublicPrivate Partnerships (PPPs) and ensuring compliancewith the Pharmacy, Mental Health Care and NationalHealth Acts).
Become a leader in human resource developmentand management for health
Human resource practices will be strengthened throughstrategies for the recruitment, retention and training ofpersonnel. The recruitment and retention strategy willfocus on health professionals, primarily the reduction ofattrition rates of doctors and nurses and retention ofcommunity service professionals. The Department willcontinue the mainstreaming of Gender and Disability aspart of the Employment Equity Plan with emphasis onrecruitment and retention of black medicalprofessionals, recruitment of staff with disability and anincrease in women in clinical management positions.Effective leadership and management developmentsystems will be put in place and District Health Services(DHS) strengthened through training and development.
The Department will focus on building partnerships withuniversities for Emergency Medical Services andincreasing the production of nurses by 20 per cent ineach year of the MTEF period. The teaching platformwill be expanded to include Family Medicine in districthealth services. By 2009, the learnerships and
internships programme should have benefited 5 100beneficiaries. The strengthening of the implementationof a Performance Management and DevelopmentSystem and the expansion of the Employee WellnessProgramme will continue.
Operate smarter and invest in health technology,communication and management informationsystems
The Department will achieve more from its resourcebase and invest in systems through:• Enhanced control and management of budget and
expenditure including conditional grants;• Strengthening institutional capacity on financial
management; • Improved revenue collection and strategies; • Implementation of capital programmes focusing on
the revitalisation of health infrastructureimprovement, equipment strengthening, monitoringof capital projects through SLAs and the alignmentof budget with expenditure for revitalisation andcapital projects;
• Supportive implementation of the BBBEE strategy; • Monitoring and implementation of Supply Chain
Management guidelines; • Implementation of the ICT strategy and roll out of
electronic information system;• enhanced external and internal communication; and• Alignment of planning, implementation monitoring
and evaluation systems.

116
AN
NU
AL
REP
OR
T 20
05/2
006

117
Report of the Audit Committee 118
Report of the Accounting Officer 120
Report of the Auditor-General 140
Accounting Policies 145
Appropriation Statement 151
Notes to the Appropriation Statement 163
Statement of Financial Performance 165
Statement of Financial Position 166
Statement of Changes in Net Assets 167
Cash Flow Statement 168
Notes to the Annual Financial Statements 169
Disclosures Notes to the Annual Financial
Statements 182
Annexures 188

118
AN
NU
AL
REP
OR
T 20
05/2
006
The Audit Committee also reports that it has adoptedappropriate formal terms of reference as its auditcommittee charter, has regulated its affairs incompliance with this charter and has discharged all it’sresponsibilities as contained therein.
The effectiveness of internal control
The system of internal control was not entirely effectivefor the year under review as compliance with prescribedpolicies and procedures were lacking in certaininstances. During the year under review severalinstances of non compliance were reported by internaland external auditors that resulted from a breakdown inthe functioning of controls. The audit report has beenqualified and several significant weaknesses have beenreported by the Auditor-General under emphasis ofmatter and in the management letter.
GAUTENG DEPARTMENT OF HEALTHVOTE 4
REPORT OF THE AUDIT COMMITTEE
We are pleased to present our report for the financial year ended 31 March 2006.
Audit Committee Members and Attendance
The audit committee consists of the members listed hereunder and meets regularly according to its approvedterms of reference. During the current year 3 meetings were held.
Name of Member Number of Meetings Attended
Barry Ackers (Chairperson) 3Zola Fihlani 1Jenitha John 0
Audit Committee Responsibility
The Audit Committee reports that it has complied with its responsibilities arising from section 38(1)(a) of thePFMA and Treasury Regulation 3.1.13.
S38(1)(a)
(PFMA)
S38(1)(a)(ii) of the PFMA state the following:
(1) “The accounting officer for a department,...
a) must ensure that that department,.... has
(ii) a system of internal audit under the control and direction of an auditcommittee complying with and operating in accordance with regulationsand instructions prescribed in terms of sections 76 and 77”
The quality of in year management and quarterlyreports submitted in terms of the PFMA and theDivision of Revenue Act.
The Audit Committee is satisfied with the content andquality of quarterly reports prepared and issued by theAccounting Officer and the Department during the yearunder review. It was however noted that necessaryreconciliations were not always timeously done.
Evaluation of Financial Statements
The Audit Committee has
• Reviewed and discussed the audited annualfinancial statements to be included in the annualreport with the Auditor-General and the AccountingOfficer;
• Reviewed the Auditor-General’s management letter and management’s response thereto; and
• Reviewed changes in accounting policies and practices.
The Audit Committee concurs and accepts the Auditor-General’s conclusions on the annual financial statementsand is of the opinion that the audited annual financial statements be accepted and read together with the reportof the Auditor-General.
................................................Barry AckersAudit Committee Chair
Date: 3 August 2006
119
DEPA
RTM
ENT O
F HEA
LTHGAUTENG DEPARTMENT OF HEALTH
VOTE 4
REPORT OF THE AUDIT COMMITTEE
120
AN
NU
AL
REP
OR
T 20
05/2
006
Report by the Accounting Officer to the ExecutiveAuthority and Gauteng Provincial Legislature of theRepublic of South Africa
1. GENERAL REVIEW OF THE STATE OF FINANCIAL AFFAIRS
1.1 Important Policy decisions and strategic issues facing the Department
This report sets out progress made by the Departmentin the 2005/06 financial year. Our services aim atreaching the public through a range of interventions thatinclude health promotion and public healthprogrammes, influencing lifestyles and behaviourchange, primary health care, hospital and emergencymedical services and a vast range of clinical and non-clinical support services.
In the year under review the department continued toimplement strategic objectives and key projects whichwere identified in the strategic plan and the five yearProgramme of Action. A tremendous amount of effortwas put into aligning priorities with the Medium TermExpenditure Framework (MTEF) and the Programme ofAction, with the objective of effectively allocatingresources.
The year has been characterised by both successesand challenges, successes in that we have been able toimplement identified priorities and objectives that wereset during the year as outlined in Section 3 of the reportwhilst striving to ensure that health services areprovided cost effectively. Challenges of implementingpolicy decisions that impact on resources financial andhuman as well as providing services with the allocatedbudget. All these in an environment where population isincreasing, poverty related illnesses, communicablediseases such as HIV and AIDS, tuberculosis, acuterespiratory syndrome, trauma and violence areprevalent.
1.2 The Policy Context is summarised below
Gauteng as the economic hub of the country attractspeople from other provinces, countries as well asAfrican states. This in-migration puts strain on the
health resources and services and challenges ourvision of providing health for all. The following are theareas that drive our strategic context.
Health status
• Complex and wide burden of conditions or illnessessuch as poverty related illnesses, emerging and re-emerging communicable diseases such as HIV andAIDS, tuberculosis, severe acute respiratorysyndrome; trauma and violence and chronicdiseases of lifestyle.
• Strengthening TB advocacy and improving TB curerate, improving child health and reducing maternaldeaths.
Health Services and Demographic factors
• Increased service demand and greater emphasis onquality care, patient load as a result of higher thanaverage growth in the Gauteng population and HIVand AIDS.
• Implementation of legislation such as the NationalHealth, Mental Health, Medicines and RelatedSubstances Control Acts.
• Change in the model of rendering personal PrimaryHealth Care services according to the NationalHealth Act including extension of after-hour servicesat primary health care clinics to take patient load offthe hospitals.
• Decision endorsed by the Executive Council toprovincialise ambulance services in line withNational policy.
• Implementation of Service Improvement Plan toensure appropriate utilisation of services.
• Strengthening hospital management, accountabilityand responsibility.
• Implementation of Batho Pele principles andsignificantly reducing waiting times at hospitals andclinics.
• The transfer of forensic pathology services (medico-legal mortuaries) from the South African PoliceServices (SAPS) to the Department of Health.
Human Resources
The World Health Organisation focus is on Health
GAUTENG DEPARTMENT OF HEALTHVOTE 4
REPORT OF THE ACCOUNTING OFFICERfor the year ended 31 March 2006
121
DEPA
RTM
ENT O
F HEA
LTHGAUTENG DEPARTMENT OF HEALTH
VOTE 4
REPORT OF THE ACCOUNTING OFFICERfor the year ended 31 March 2006
Professionals in 2006. Human capital is the most criticalasset in the labour intensive health system. A HumanResource Plan will be launched in April 2006. It is withinthis context that the human resource strategic focus inthe department includes: • Mainstreaming of gender and disability as part of the
employment equity plan.• Retention and recruitment of scarce and highly
skilled professionals in public sector to effectivelyaddress the needs of the poor and vulnerablegroups.
• Ensuring the desired return on training investment(including from academic institutions).
• Implementation of learner ship and internshipprogrammes.
• Implementation of an integrated Health andWellness programme.
Systems and Infrastructure
Gauteng’s positioning as a smart province seeks toachieve the following:
• Implementing infrastructure programmes andaccelerating equipment replacement.
• Implementation of an Integrated ManagementInformation System (MIS) to support decision-making, monitoring and clinical care.
• Re-gearing communication strategies to beresponsive to the needs of the poor.
• Implementing cost centre management strategy toreinforce equitable and appropriate budgetallocation.
1.3 Departmental strategic priorities and corresponding strategic objectives
Promote health, prevent and manage illnesses orconditions with emphasis on poverty, lifestyle,trauma and violence and psychological factors
• Increase public understanding and the practice ofhealthy lifestyles and key risk behaviors with aspecial focus on vulnerable groups anddisadvantaged communities.
• Improve the health and wellbeing of children undersix years and those at risk due to poverty.
• Improve the nutritional status of vulnerable groups,with special emphasis on people with chronic anddebilitating conditions.
• Reduce preventable causes of maternal deaths.• Improve early detection and intervention for cervical
and breast cancer.• Reduce high risk behaviour among youth with a
focus on teenage pregnancy, smoking, alcohol anddrug abuse.
• Reduce the prevalence and complications ofTuberculosis (TB) and other communicablediseases.
• Reduce the prevalence and complications ofcommon non-communicable diseases.
• Promote mental well-being and improve earlydiagnosis, treatment and support for people withmental illness.
• Provide rehabilitation and support to people withdisabilities.
• Interventions to reduce impact of violence againstwomen and children.
Effective implementation of the comprehensive HIVand AIDS strategy
• Prevent and reduce new HIV infections. • Reduce the incidence of sexually transmitted
infections (STIs).• Provide HIV and AIDS comprehensive care and
treatment including ART in all sub districts by 2009.• Implement effective HIV and AIDS workplace
programme in 100% of service delivery units.• Provide universal access to palliative care (home
based care, hospice, step down facilities) to thepopulation of Gauteng.
Strengthen the district health system and providecaring, responsive and quality health services at alllevels
• Ensure appropriate planning and monitoring ofdistrict health services at sub-district level.
• Improve the quality and efficiency of primary healthcare service provision.
• Provide 24 hour access to PHC and emergencymedical services in all sub-districts.
• Re-organise the District Health System for improved
122
AN
NU
AL
REP
OR
T 20
05/2
006
GAUTENG DEPARTMENT OF HEALTHVOTE 4
REPORT OF THE ACCOUNTING OFFICERfor the year ended 31 March 2006
efficiencies and health outcomes.• Provide people centred care that recognises the
dignity and uniqueness of each person.• Specific interventions to reduce waiting times at
pharmacies and out-patient departments.• Ensure all hospitals and clinics have full
accreditation. • Position public emergency medical services as the
preferred service provider for the 2010 games.• Ensure the provision of rapid, effective and quality
emergency medical services.• Ensure 100% access to ambulance services for
obstetric emergencies. • Modernisation, re-organisation and re-vitalisation of
all public hospitals into cost effective referral centresaccording to the service plan.
• Strengthen the management of state aided hospitalsand monitor compliance with SLA’s.
• Provide efficient and effective clinical supportservices (allied, laboratory, pharmaceuticals, bloodservices, radiology etc).
• Monitor compliance with norms and standards.
Implement the people’s contract through effectiveleadership and governance
• Improve the capacity of managers and staff tomanage and steer health sector transformation.
• Build a broad coalition for change and forgepartnerships between the department and academicinstitutions, the health professional councils, unions,hospital boards, ward committees, non-governmental and community based organisations,the private sector, etc.
• Implementation of a comprehensive communityhealth worker programme.
• Strengthen community participation at all levels ofthe health system.
• Ensure responsiveness to the Legislature.• Ensure implementation of relevant policies and
legislative framework.
Become a leader in human resource developmentand management for health
• Revised staff establishment to respond to the needsimperatives of health services.
• Ensure the recruitment and retention of humanresources.
• Provide the service platform for high quality trainingand development and clinical research that isresponsive to the needs of the country.
• Implementation of the learnership / internshipprogramme.
• Implement an effective Performance ManagementSystem.
• Ensure adherence to recognised human resourceand labour relations management standards.
• Implement strategies to achieve employment equityand to manage a diverse work force.
• Implementation of the Gauteng health integratedwellness programme (EAP, HIV and AIDS workplace and Occupational health and safetyprogrammes).
• Building capacity of frontline managers.
Operate smarter and invest in health technology,communication and management informationsystems
• Establish an integrated Management InformationSystem (MIS).
• Ensure the implementation of an effective internalcommunication strategy to encourage staffparticipation, support and commitment.
• Ensure the implementation of an effective externalcommunication strategy that achieves communityparticipation, and engagement of poor andvulnerable groups.
• Improve financial management.• Ensure implementation and management of an
efficient and cost effective supply chainmanagement system.
• Ensure the construction, rehabilitation, upgradingand maintenance of infrastructure.
• Reduce the backlog of infrastructure and equipment.
1.4 Significant key achievements for the 2005/2006financial year
Promote health, prevent and manage illnesses orconditions with emphasis on poverty, lifestyle,trauma and violence and psychosocial factors
123
DEPA
RTM
ENT O
F HEA
LTHGAUTENG DEPARTMENT OF HEALTH
VOTE 4
REPORT OF THE ACCOUNTING OFFICERfor the year ended 31 March 2006
Immunisation coverage has been among our priorities,and this programme was expanded to increase itsimpact in communities. The impact of the 2004 massimmunisation campaign and the introduction of “everyday an immunisation day” has resulted in increasedimmunisation coverage to 83% compared to theprevious financial year. The Department received acommendation certificate from National Department forthe most improved immunisation coverage.
Continuous effort to improve TB cure rate through theimplementation of TB advocacy interventions, TB/HIVcollaboration and Directly Observed Treatment (DOT)programme has yielded good results as demonstratedin the increased TB cure rate from 58% in 2004 to 64%in 2005.
Improving healthy lifestyles remained our key focus. Amulti-lingual education Health Channel wasimplemented in partnership with the NationalDepartment of Health and Mindset to deliverinformation on a mass scale to the general public andhealth care workers. Sites increased from 40 in2004/2005 financial year to 112 in 2005/2006. Theprogramme is aired on DSTV channel 82.
We continued to improve the nutritional status of thevulnerable groups in the province. Vitamin Asupplement provided to all children and post-partumwomen in all facilities in the province improvedcoverage for under 1 year old to 86%.
Improving youth access to health services and reducinghigh risk behaviour among youth has been expandedfrom 38 in 2004/2005 to 52 covering all districts.
We supplied 6 344 assistive devices to people withdisability, of which 2 070 were wheelchairs, 374 artificiallimbs, 2 416 walking aids, 1 484 hearing aids and 144visual impaired aids. We were awarded a disabilitytrophy from the National Department of Health forproviding the highest number of wheelchairs andhearing aids per capita and the number of staff thatparticipated in continuing education activities.
Effective implementation of the comprehensive HIVand AIDS strategy
The 2005 HIV sero-prevalence rate amongst pregnantwomen in Gauteng was approximately 32.4%, adecrease of 0.7% from 2004 and higher than thenational prevalence rate of 30.2%. The epidemicseemed to be increasing steadily over the last eightyears. Syphilis has increased dramatically from 0.9% in2004 to 4.3% in 2005.
In our effort to prevent HIV infection across theprovince, we increased the distribution of malecondoms from 8.5 million per month in the previousfinancial year to approximately 11 million per month inthe year under review.
A comprehensive treatment and care programme,including anti-retroviral treatment (ART) is nowimplemented in 33 health facilities; this is lower than thetarget of 40 operational sites planned. However forty(40) ART sites have been accredited and since theinception of the programme in 2004, more than 350 000people have been assessed and 41 795 patients wereput on treatment. Our target for the 2005/2006 financialyear was 25 000.
Strengthen the district health system and providecaring, responsive and quality health services at alllevels
As part of improving access to primary health care andmother to child health care services as well as reducingmaternal deaths, Stanza Bopape, Stretford and MariaRantho Community Health Centres were opened. TheRamokonopi Maternity and Obstetric Unit (MOU)became operational and will be officially opened in the2006/2007 financial year. A pilot dedicated to obstetricambulance service is operational in the Sedibengdistrict to ensure quick response time for emergencytransport and also contribute in the reduction ofmaternal deaths.
Since the inception of the reduction of surgical backlogprogramme in January 2004, (3 870 operations on thewaiting list at the time), the backlog has since beenreduced to 3 081, a 20% improvement. However, abacklog is still experienced in cardiac surgery. Othersurgical operations performed during the year were, 1531 orthopaedic operations, 1 030 cardiac operations
124
AN
NU
AL
REP
OR
T 20
05/2
006
professionals of which 1 188 were medical practitioners,245 medical interns, 935 nursing and 582 allied healthprofessionals and pharmacists were appointed.
The retention of critical staff members can amongstother things be attributed to the revision of remunerationstructures through notch and level increments that wereimplemented for targeted health professionals,procurement of state of the art equipment, and paymentof recognition awards to deserving employees and theimproved positive profile of the department as preferredemployer.
Implementation of retention strategy remains a majorpriority. We upgraded posts for registrars, specialists,pharmacists and allied professionals, implementeduniform allowance for nurses and provided high techmedical equipment to improve working environment aspart of retention strategy for health professionals
The Department has successfully implemented alearnership/internship programme and 4 800 peoplehave benefited since the inception of the programme in2004. We exceeded our target by 2 800, our programmehas been recognised by the Province as a best practice.
Our integrated wellness programme which includesEmployee Assistance Programme (EAP), HIV and AIDSwork place and Occupational Health and Safety whichwas launched in 2004/2005 has been successfullyimplemented in all health facilities and all staff membershave access. Utilisation rate is at 11% and this is abovethe international norm/best practice of 4%. Our wellnessprogramme was recognised by the Department ofPublic Service and Administration (DPSA) as the bestpractice site. We commenced with the implementationof the Violence in the Workplace Programme as a pilotin partnership with the International LabourOrganisation (ILO), International Council of Nurses(ICN), World Health Organisation (WHO) and PublicService International (PSI). The ILO visited Gauteng toextend personal congratulations to the Department forthe implementation of the pilot programme.
GAUTENG DEPARTMENT OF HEALTHVOTE 4
REPORT OF THE ACCOUNTING OFFICERfor the year ended 31 March 2006
and more than 11 000 cataract operations. TheDepartment received a cataract surgery achievementcertificate from National Health for exceeding the 2004target.
We continued to improve quality of care through theaccreditation process which resulted in 12 hospitalsreceiving full accreditation in a period of two years.Laudium Community Health Centre is the firstCommunity Health Centre to receive full accreditation inthe current financial year.
Implement the people’s contract through effectiveleadership and governance
The MEC for Health established a Provincial HealthCouncil in terms of the National Health Act. DistrictHealth Councils are being established and TechnicalCommittees have been established to support theCouncil structures.
Functioning and capacitated hospital boards are the keyto the structured participation of communities in themanagement of hospitals. The MEC for Healthappointed new hospital board members for the newterm of office with effect from January 2006. Boardmembers include provincial and universityrepresentatives associated with hospitals includingmanagement and staff as ex-officio members. Anorientation and induction training programme for all newhospital board members commenced and will becompleted in June 2006.
Community Health Worker programme has beenrunning for the past financial year and since its inception2 116 Community Health Workers (CHW’s) have beentrained.
Become a leader in human resource developmentand management for health
The concerted and focused effort in addressing staffshortages included placement of block advertisementsfor 1 500 health professionals and other recruitmentinitiatives. This resulted in significant gains inappointments and consequently improved the staffingrate. By the end of the financial year, 2 950 health

125
DEPA
RTM
ENT O
F HEA
LTH
has had an impact in the public health industry andultimately contributed to economic growth.
1.5 Major projects undertaken or completed during the year
A detailed report on capital expenditure will be providedin the main section of the annual report. The followingare the projects that were implemented and completedor in the process of completion. The following new andupgraded infra-structural projects:• Construction of Soshanguve Block L, Hillbrow,
Stretford, Stanza Bopape Community HealthCentres (CHC’s) has been completed
• Six new pharmacies were completed at Dr YusufDadoo, Kopanong, Edenvale, Pholosong,Weskoppies and Coronation Hospitals
• Johannesburg Hospital oncology unit and the newPretoria Academic Hospital were commissioned
• The breast clinic at Helen Joseph Hospital has beencompleted
• Contractor is on site for the construction of EersterusCommunity Health Centres and Johan Deo clinic
• A tender for Eldorado Community Health Centre wasadvertised
• Construction of the New Accident Emergency andTrauma, Outpatients department at Chris HaniBaragwanath Hospital, and the upgrading of themain complex at Mamelodi Hospital (phase 4) isprogressing according to the schedule.
GAUTENG DEPARTMENT OF HEALTHVOTE 4
REPORT OF THE ACCOUNTING OFFICERfor the year ended 31 March 2006
Operate smarter and invest in health technology,communication and management informationsystems
We prioritised and strengthened strategic partnershipswith major stakeholders to enhance service delivery. Tothis end a Memorandum of understanding (MOU) wasreviewed with the Department of Public Works, Roadsand Transport outlining the relationship andresponsibilities between the two departments to facilitateand implement capital and maintenance programmes onan agency basis. A strategic decision was taken to fasttrack the revitalisation of Chris Hani Baragwanathhospital, a process to appoint a Transaction Advisor toconduct a feasibility study into the establishment of aPublic Private Partnership (PPP) was undertaken.
Implementation of the Broad Based Black EconomicEmpowerment (BBBEE) strategy remains a key priorityin the Department, spending on goods and servicesprocured from the Black Economic Empowermentcompanies increased from 38% in 2004/2005 to 60.33%in 2005/2006 financial year.
We purchased equipment to the value of R639 million,this include high-tech medical equipment such as MRIscanners, CT Scanners, Gamma cameras, Digitalmammography units, multifunctional digital x-rays,Linear accelerators. We believe this substantialincrease in capital expenditure especially equipment
1.6 SPENDING TRENDS
1.6.1 Expenditure trends over three years are indicated in the table below and show how the departmenthas progressed in the implementation of its programmes and how budgets have been prioritisedwithin the different programmes.
Description of Programme Audited2003/04R’000
Audited2004/05R’000
ActualExpenditure
2005/06R’000
1. Health Administration 263 215 264 087 239 996
2. District Health Services 1 743 927 1 922 347 2 152 883
3. Emergency Medical Services 247 900 278 350 329 451
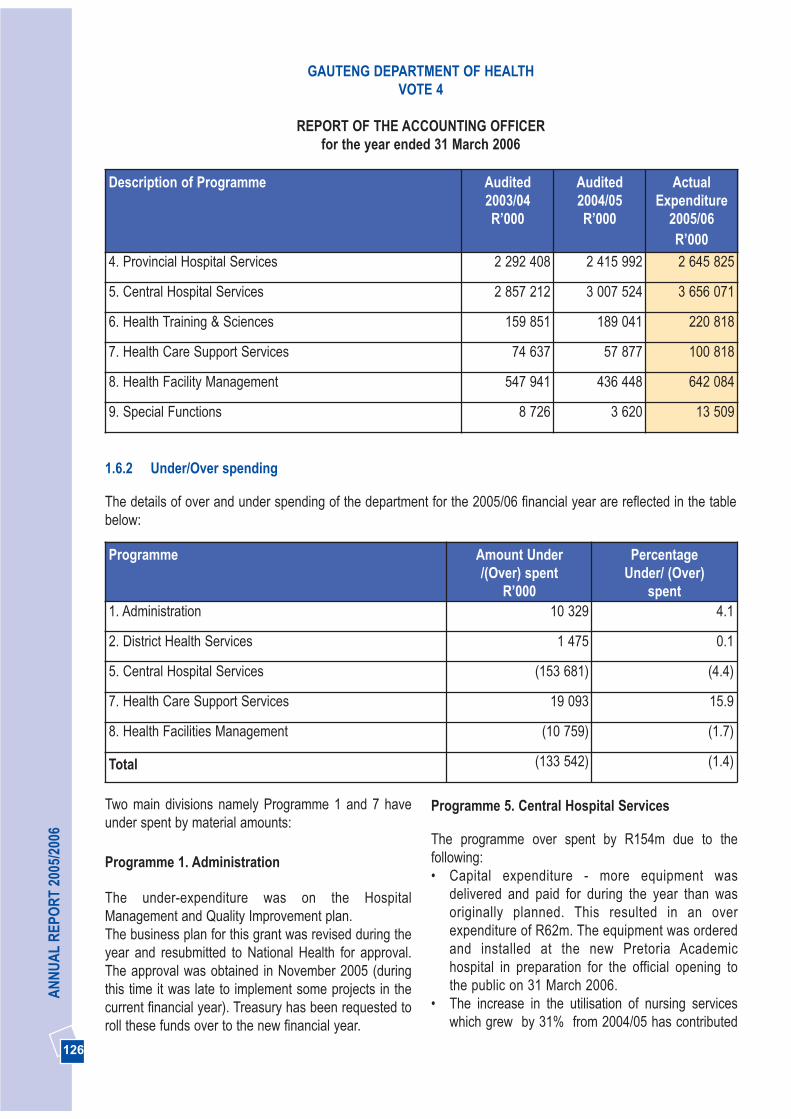
126
AN
NU
AL
REP
OR
T 20
05/2
006
Description of Programme Audited2003/04R’000
Audited2004/05R’000
ActualExpenditure
2005/06R’000
4. Provincial Hospital Services 2 292 408 2 415 992 2 645 825
5. Central Hospital Services 2 857 212 3 007 524 3 656 071
6. Health Training & Sciences 159 851 189 041 220 818
7. Health Care Support Services 74 637 57 877 100 818
8. Health Facility Management 547 941 436 448 642 084
9. Special Functions 8 726 3 620 13 509
Two main divisions namely Programme 1 and 7 haveunder spent by material amounts:
Programme 1. Administration
The under-expenditure was on the HospitalManagement and Quality Improvement plan. The business plan for this grant was revised during theyear and resubmitted to National Health for approval.The approval was obtained in November 2005 (duringthis time it was late to implement some projects in thecurrent financial year). Treasury has been requested toroll these funds over to the new financial year.
Programme 5. Central Hospital Services
The programme over spent by R154m due to thefollowing:• Capital expenditure - more equipment was
delivered and paid for during the year than wasoriginally planned. This resulted in an overexpenditure of R62m. The equipment was orderedand installed at the new Pretoria Academichospital in preparation for the official opening tothe public on 31 March 2006.
• The increase in the utilisation of nursing serviceswhich grew by 31% from 2004/05 has contributed
1.6.2 Under/Over spending
The details of over and under spending of the department for the 2005/06 financial year are reflected in the tablebelow:
Programme Amount Under/(Over) spent
R’000
PercentageUnder/ (Over)
spent1. Administration 10 329 4.1
2. District Health Services 1 475 0.1
5. Central Hospital Services (153 681) (4.4)
7. Health Care Support Services 19 093 15.9
8. Health Facilities Management (10 759) (1.7)
Total (133 542) (1.4)
GAUTENG DEPARTMENT OF HEALTHVOTE 4
REPORT OF THE ACCOUNTING OFFICERfor the year ended 31 March 2006
127
DEPA
RTM
ENT O
F HEA
LTHGAUTENG DEPARTMENT OF HEALTH
VOTE 4
REPORT OF THE ACCOUNTING OFFICERfor the year ended 31 March 2006
to the overspending. Nursing professionals arerecruited to provide nursing services in place ofpermanent staff to ensure that services are notcompromised.
• The expenditure on tests provided by the NationalHealth Llaboratory Services has increased by 32%from the previous financial year
Programme 7. Health Care Support Services
The under-expenditure in this programme relates to theForensic Pathology Services grant of which only 46,5%of the grant budget was spent. This service will betransferred to the Department of Health from the SouthAfrican Police Services with effect from 1 April 2006. Inpreparation for taking over the function National Healththrough the adjustment budget process allocated anamount of R16,4m to the department to set upstructures, systems, processes and infrastructure(equipment). Funds could not be fully utilised due to thefollowing: • Equipment ordered during the year could not be
delivered by the supplier as they did not have stockin the country. Delivery will take place in the 2006/07financial year.
• The process of transferring staff from the SouthAfrican Police Services was slow due to lack ofcapacity within the department and the fact thatappointments were put on hold by the NationalDepartment of Health until the minister ofDepartment of Public Service Administration’sapproval. The process was completed in January2006. The plan is to transfer the staff to thedepartment in the first quarter of 2006/2007.
• An amount of R7m was allocated to the Departmentfor a newly established pre-pack unit at theAuckland Park Medical Supplies Depot. Although aService Level Agreement was signed with thesupplier in September 2005 the building needed tobe renovated to make it compliant with requirementsof the Medicines Control Council (MCC). This wasfinalised in February 2006. The depot will startspending in the new financial year.
1.6.3 Impact on Programmes and Service delivery
The under spending in programme 1 had minimal
impact on service delivery. Projects that wereearmarked for funding have an indirect impact onservice delivery and these were the purchasing ofequipment to run a pilot project in Natalspruit for theimplementation of cost effective nursing care,improvement of pressure care management, andimprovement of the quality of maternity services.
Reasons for under expenditure in programme 7 havebeen dealt with in paragraph 1.6.2. The under spending had no impact on service delivery.
The over-expenditure in Programme 5 is a reflection ofefforts and interventions put in place to ensure that thepurchase of equipment is speeded up so that thePretoria Academic Hospital is opened to public asplanned. Further infrastructure projects implemented bythe Department of Public Works, Roads and Transporton our behalf were fast tracked to ensure that delaysare minimised and projects completed according toplan.
1.6.4 Actions taken and planned to avoid recurrence
Equipment
Monitoring and reporting systems have beenstrengthened to ensure that in future no overexpenditure occurs on capital expenditure (equipment).A dedicated Deputy Director has been tasked with theresponsibility of managing equipment needs andacquisitions centrally as well as ensures that there aresufficient funds for the purchase of equipment.
Goods and Services
The department has appointed staff to manage,evaluate and analyse the accounts of the NationalHealth Laboratory Services in order to ensureappropriate and cost effective utilisation of the service.
1.6.5 Material Matters
The department has overspent on the voted budget byR133,5 million. The over expenditure was incurred inCentral Hospital Services and Health Facilities
128
AN
NU
AL
REP
OR
T 20
05/2
006
Management programmes. Reasons for the overexpenditure have been discussed in paragraph 1.6.2.
2. SERVICES RENDERED BY THE DEPARTMENT
2.1 Services rendered
The Department renders the following services:
• Primary health care (PHC) is rendered through thedistrict health system. A network of provincial clinicsand community health centres provide ambulatorycare provided by doctors, nurses and otherprofessionals; and local government clinics are alsosubsidized to render care.
• Ambulance services throughout the province • Secondary health care services are rendered
through regional hospitals that provide outpatientand in-patient care at general specialist level.
• Specialised health care services providespecialised inpatient care for psychiatric andinfectious diseases, while the provision oftuberculosis and chronic psychiatric care isoutsourced to agencies who receive subsidies fromthe department.
• Academic health care services are renderedthrough our four central hospitals as well as thethree Dental hospitals. Teaching also takes placewithin other service levels.
• Health sciences teaching colleges providetraining for future health care professionals.
These services are supported through human resourcedevelopment, management and support services (suchas laundries, facility management, cook freeze andmedical and pharmaceutical supplies).
2.2.1 Tariff Policy
Patients Fees tariff
The department charges Uniform Patients Schedule(UPFS) tariffs for all patients using public hospitals. TheUPFS Steering committee that consists of NationalDepartments of Health and all nine provincesdetermines these tariffs. These tariffs are reviewed and
revised annually in accordance with section 7.3.1 of theTreasury Regulations.
Meals and Crëche Fees Tariffs
The tariffs for meals and crëches are reviewed andrevised annually in accordance with section 7.3.1 of theTreasury Regulations. Tariff adjustments are alsonegotiated and agreed upon with the employeeorganizations.
Other Tariffs
Other tariffs such as parking, accommodation etc. aredetermined externally involving relevant departments.
Medical Supplies Depot
Tariffs for stock issued from the medical supply depotare revised on a regular basis throughout the year.These increases take into account the prices at whichstock is bought. A separate management report dealingspecifically with the Auckland Park Medical Supply(MSD) Trading Account is included towards the end ofthis statement.
2.3 Free services
Free health care for people with disabilities wasintroduced in 2003. All free services provided are in linewith the National and Provincial policies, and no newfree services were introduced in the 2005/2006 financialyear. The following free services are provided by theDepartment:• Primary Health Care Services including free health
services rendered to children under 6 years,pregnant women, social pensioners, personsreceiving social grants and formally unemployed
• Mental Health Services• Tuberculosis (TB) services• Voluntary Counselling and Testing for HIV• Prevention of Mother to Child Transmission of HIV
and AIDS• Cervical Cancer Screening at Primary Health Care
services• Medico Legal service for survivors of sexual assault• Services to formally unemployed
GAUTENG DEPARTMENT OF HEALTHVOTE 4
REPORT OF THE ACCOUNTING OFFICERfor the year ended 31 March 2006
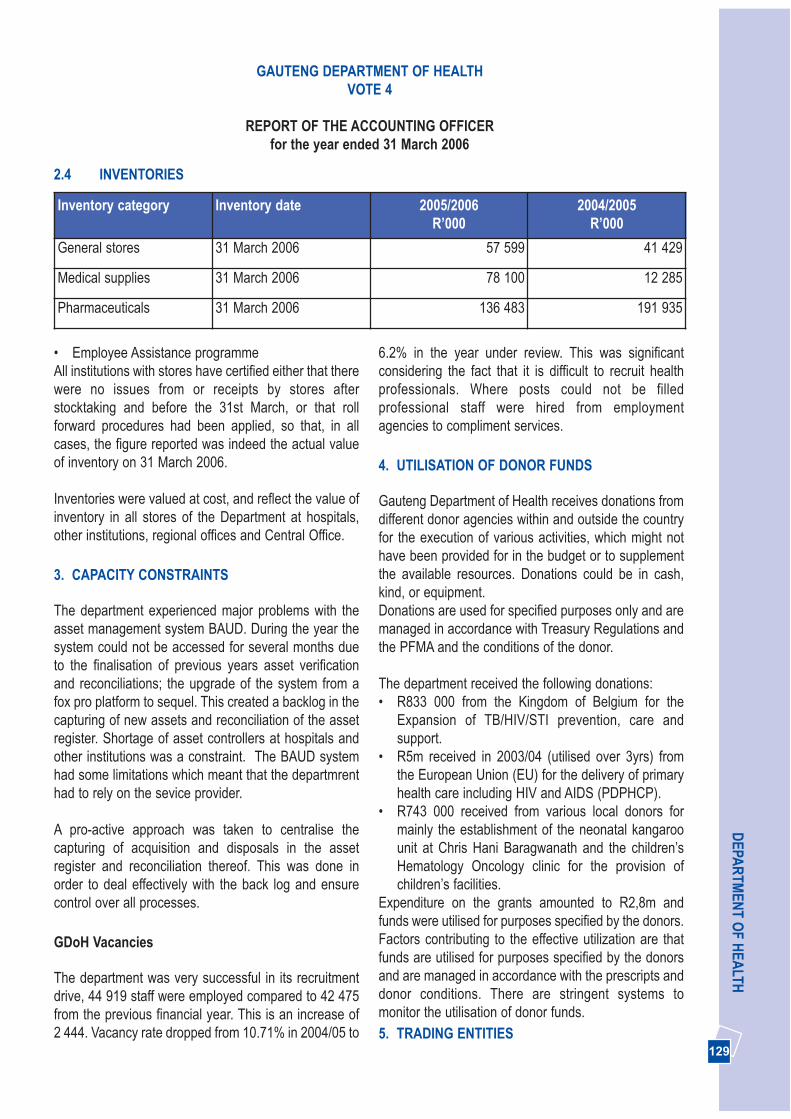
129
DEPA
RTM
ENT O
F HEA
LTHGAUTENG DEPARTMENT OF HEALTH
VOTE 4
REPORT OF THE ACCOUNTING OFFICERfor the year ended 31 March 2006
2.4 INVENTORIES
Inventory category Inventory date 2005/2006R’000
2004/2005R’000
General stores 31 March 2006 57 599 41 429
Medical supplies 31 March 2006 78 100 12 285
Pharmaceuticals 31 March 2006 136 483 191 935
• Employee Assistance programmeAll institutions with stores have certified either that therewere no issues from or receipts by stores afterstocktaking and before the 31st March, or that rollforward procedures had been applied, so that, in allcases, the figure reported was indeed the actual valueof inventory on 31 March 2006.
Inventories were valued at cost, and reflect the value ofinventory in all stores of the Department at hospitals,other institutions, regional offices and Central Office.
3. CAPACITY CONSTRAINTS
The department experienced major problems with theasset management system BAUD. During the year thesystem could not be accessed for several months dueto the finalisation of previous years asset verificationand reconciliations; the upgrade of the system from afox pro platform to sequel. This created a backlog in thecapturing of new assets and reconciliation of the assetregister. Shortage of asset controllers at hospitals andother institutions was a constraint. The BAUD systemhad some limitations which meant that the departmrenthad to rely on the sevice provider.
A pro-active approach was taken to centralise thecapturing of acquisition and disposals in the assetregister and reconciliation thereof. This was done inorder to deal effectively with the back log and ensurecontrol over all processes.
GDoH Vacancies
The department was very successful in its recruitmentdrive, 44 919 staff were employed compared to 42 475from the previous financial year. This is an increase of2 444. Vacancy rate dropped from 10.71% in 2004/05 to
6.2% in the year under review. This was significantconsidering the fact that it is difficult to recruit healthprofessionals. Where posts could not be filledprofessional staff were hired from employmentagencies to compliment services.
4. UTILISATION OF DONOR FUNDS
Gauteng Department of Health receives donations fromdifferent donor agencies within and outside the countryfor the execution of various activities, which might nothave been provided for in the budget or to supplementthe available resources. Donations could be in cash,kind, or equipment.Donations are used for specified purposes only and aremanaged in accordance with Treasury Regulations andthe PFMA and the conditions of the donor.
The department received the following donations:• R833 000 from the Kingdom of Belgium for the
Expansion of TB/HIV/STI prevention, care andsupport.
• R5m received in 2003/04 (utilised over 3yrs) fromthe European Union (EU) for the delivery of primaryhealth care including HIV and AIDS (PDPHCP).
• R743 000 received from various local donors formainly the establishment of the neonatal kangaroounit at Chris Hani Baragwanath and the children’sHematology Oncology clinic for the provision ofchildren’s facilities.
Expenditure on the grants amounted to R2,8m andfunds were utilised for purposes specified by the donors.Factors contributing to the effective utilization are thatfunds are utilised for purposes specified by the donorsand are managed in accordance with the prescripts anddonor conditions. There are stringent systems tomonitor the utilisation of donor funds. 5. TRADING ENTITIES

130
AN
NU
AL
REP
OR
T 20
05/2
006
The Medical Supplies Depot was the only trading entityfor Health in operation during the 2005/2006 financialyear. The Medical Supplies Depot is responsible for thepurchase, storage and distribution of pharmaceuticaland disposable surgical sundry items to approximately70 delivery points.
The annual financial statements as well as operationaldetail appear in Addendum A of this report.
6. OTHER ORGANISATIONS TO WHOM TRANSFER PAYMENTS HAVE BEEN MADE
The department utilises other agencies or organisationsto provide health services to the communities in order toachieve its objectives, funds are transferred to theseorganisations to enable them to implement healthprogrammes and assist in the strengthening ofcommunity participation and intersectoral collaboration.Funds are transferred to these organisations on aquarterly basis based on the claims submitted to thedepartment and the submission of monthly reportswhich give account of how the funds were expended.
MunicipalitiesJohannesburg City Metropolitan MunicipalityWest Rand District MunicipalityEkurhuleni Metropolitan MunicipalitySedibeng District MunicipalityCity of Tshwane Metropolitan MunicipalityMetsweding District Municipality
Private entitiesAlexandra Health ServicesPhillip Moyo Community Health CentreWitkoppen ClinicLifecare Mental Health HospitalsLifecare Tuberculosis HospitalsSANTA Tuberculosis Hospitals
Universities University of the WitwatersrandUniversity of PretoriaUniversity of LimpopoUniversity of JohannesburgNon-Governmental and Community based
organisations (NGOS, CBOS)
These organisations provide the following services:• Community Based Nutrition • Mental Health care• Home based care
The department made transfer payments to 389 NGOsto enable them to provide health services to thecommunities. These organizations assist to strengthencommunity participation and intersectoral collaborationand are involved in HIV and AIDS and Mental Healthprogrammes.
All organisations receiving funds through transferpayments are accountable to the department by meansof reporting as required by the Division of Revenue Act(DORA), contracts and other departmental prescriptsgoverning the transfers and are monitored by ContractManagement Sub-Directorate and District coordinators.
7. PUBLIC PRIVATE PARTNERSHIPS (PPP)
A Public Private Partnership was proposed withNational Treasury for the revitalisation and upgrading ofChris Hani Baragwanath Hospital.
8. CORPORATE GOVERNANCE ARRANGEMENTS
Risk Management Approach
The Public Finance Management Act (PFMA) requiresthe accounting officer to have and maintain a system ofrisk management for the department. Furthermanagement is required to take positive steps toidentify and mitigate risks to which the department maybe exposed. Senior management is accountable for theprocess of risk management and the systems of internalcontrol. This premise forms the basis for theDepartment’s approach to risk management.
The processes of identifying, assessing, managing andmonitoring known risks have been on going in the yearunder review. These were performed by both theGauteng Audit Services (GAS) and the internal controlunit of the department. The internal control unit is
GAUTENG DEPARTMENT OF HEALTHVOTE 4
REPORT OF THE ACCOUNTING OFFICERfor the year ended 31 March 2006
131
DEPA
RTM
ENT O
F HEA
LTH
entrusted with the responsibility of ensuring generalcompliance with laws, prescripts, policies and internalcontrols. Appropriate risk and control instructions in aform of circulars and policies are communicatedthroughout the department.
The Department of Health through its Internal Audit(GAS) conducted a control self risk assessment in the2005/06 financial year; this will be followed by a processto identify and evaluate potential risks. The results ofwhich will be used to revise the risk management planfor the coming financial year and this will further informthe audit plan.The Risk Management Committee oversees andmonitors risk management and is supported by a RiskManager whose task it is to support the committee, tomanage the relationship between the Department andGAS in ensuring that risk assessments are done andreported on, and to ensure the necessarycommunication which will make risk management partof the culture of the Department.
Fraud Prevention Policies
The fraud prevention policy of the Department is one of“Zero Tolerance”. It is contained in the aforementionedFraud Prevention Plan which defines corruption andincorporates or makes reference to inter alia securitymeasures, the code of conduct for Public Servants,disciplinary action and loss prevention and recovery, allof which are actively managed by the Department. Withthe assistance and cooperation of GAS ForensicServices, numerous cases of fraud and corruptioninvolving officials and/or outside parties such as privatefirms are pursued in civil or criminal courts, losses arerecovered and disciplinary action taken.
Effectiveness of Internal Audit
In accordance with GPG policy, internal audit servicesare provided by GAS who plan their audits on the basisof priorities determined by risk assessments. During thefinancial year under review 45 internal audit reportswere received from GAS, and the Directorate RiskManagement and Internal Control assisted heads ofinstitutions to rectify the shortcomings identified and putin place preventive measures. Internal audit system hasbeen effective in relation to a range of matters arising in
the department.
The Audit Committee
The Audit Committee, chaired by a member fromoutside the public sector, was established in the year2001 and functioned well during 2005/06. The AuditCommittee services a cluster of Departments, viz.Department of Health, Office of the Premier and theGauteng Shared Services Centre. The committeeconsists of three members from the private sector andone representative from each of the three departmentsnamely the HOD. The Audit committee is effective inthat it provides valuable support and oversight to theDepartment in relation to financial management andaccountability. During the year, the Audit Committeeconvened three meetings.
Other governance structures
Departmental Acquisition Council (DAC):
The Departmental Acquisition Council (DAC) fulfils veryadequately its role of enabling the accounting officer toensure that procurement is fair, equitable, transparent,competitive and cost-effective. It meets on averageonce per week and deals with all cases involvingprocurement in excess of delegated limits, includingRequests for Information (RFI) and Requests forProposals (RFP), or where it is in the best interest ofthe Department to deviate, within prescribed limits, fromnormal procurement procedures.
Executive Committee (EXCOM)
The Executive Committee chaired by the MEC of Healthis the highest governance structure in the Departmentconsisting of the Head of Department and DeputyDirectors General. Excom normally meets once everymonth and provides the forum for formal interactionbetween the Executive Management of the Departmentand the MEC as Executing Authority.
Senior Management Meetings
The Department has always had a participativeapproach to management at the highest level, andencourages this style of management at all levels in the
GAUTENG DEPARTMENT OF HEALTHVOTE 4
REPORT OF THE ACCOUNTING OFFICERfor the year ended 31 March 2006
132
AN
NU
AL
REP
OR
T 20
05/2
006
Department. The fortnightly Senior ManagementMeetings are the forum at which important issuesrequiring thorough and inclusive interaction anddeliberation, leading to sound management decisionsreflecting the inputs and concerns of all relevantmanagement role players, are considered by the Headof Department, Deputy Directors General and ChiefDirectors.
Hospital Boards
Chapter III of the Hospitals Ordinance, 1956 (Ord. 14 of1958), as amended, provides for the establishment andcontrol of Hospital Boards by the MEC for Health, andprescribes the rights, powers duties and functions ofboards. These include limited but clearly defined dutiesof oversight regarding such matters as annualestimates of revenue and expenditure, financialstatements and reports of the Auditor-General, erection,expansion and maintenance of facilities, complaints bypatients and the public, issues of economy andefficiency and the general activities of the hospital. TheHospital Board also has specified powers and duties ofmanagement and control relating to the Hospital BoardFund.
Nursing College Councils
The four nursing colleges under the control of theDepartment were established in terms of Chapter IIA ofthe abovementioned Ordinance. Each College isgoverned by a Council which has defined duties andpowers of oversight and control, particularly in relationto the funds and accounts administered in the name ofthe College Council.
Implementation of Code of Conduct, and conflict ofinterest
The Code of Conduct for Public Servants, as containedin the Public Service Regulations is, along with theBatho Pele principles, well communicated to staff interalia as part of induction training and whenever trainingis given by Internal Control and Risk ManagementDirectorate. Specific codes of conduct also exist, e.g. for membersof the Departmental Acquisition Council (DAC), and
both they and the members of Bid EvaluationCommittees sign a declaration of interest before eachmeeting. Interests are declared annually by members ofSenior Management, as required by law, and all staff,including supply chain management staff, is aware ofthe need to declare interests and potential conflict ofinterest whenever they become aware of it as requiredby Regulation 16A8.3(a) of the Treasury Regulations.
Safety, Health and Environment issues.
The Department has continued to create a healthyworking environment for its employees by ensuringthrough progressive human resource development andmanagement practices, good work ethics anddiscipline. The employee assistance programme whichwas introduced during this year has contributed towardscreating a caring ethos culture.
While numerous challenges still confront institutionsregarding overall compliance with some aspects ofenvironmental, occupational health and safetymanagement, the Department has succeeded inestablishing active occupational health and safetycommittees in most institutions. A process of developingan Environmental Management Plan has been initiated.The Department has, on its staff establishment,environmental health officers to ensure environmentalprogrammes as defined in the new National Health Actas well as to coordinate the activities of Local - andMetro Governments to ensure compliance to thelegislated functions. The environmental healthprogramme targets as an internal service theenvironmental health conditions at all Health facilities.They also ensure safe food supply to our staff andpatients and have programmes in place to ensureimproved service as part of the quality assuranceprogrammes.
9. ACTIVITIES DISCONTINUED/TO BE DISCONTINUED
No activities were discontinued during 2005/2006.There are also no plans to discontinue services duringthe 2006/2007 financial year.
GAUTENG DEPARTMENT OF HEALTHVOTE 4
REPORT OF THE ACCOUNTING OFFICERfor the year ended 31 March 2006

133
DEPA
RTM
ENT O
F HEA
LTH
11. ASSET MANAGEMENT
Progress with regard to capturing assets in the register
The department has made tremendous effort to improveasset management. BAUD is the asset system used tocapture assets. Assets acquired during the year with avalue of R639m were captured.
Establishment of asset Management Units
An asset management unit was established in August2005 at central office and consists of a Deputy Directorreporting to the Director Supply Chain Management,Assistant Director, 3 Asset Controllers and 2 AssetClerks. All institutions have been instructed to formalisetheir structures and appoint dedicated assetmanagers/controllers.
Indication of the extent of compliance with theminimum requirements
The department has a draft asset managementstrategy, policy and procedures in place. Assetcontrollers were trained on the use of BAUD, manualregisters and other forms that were introduced to helpinstitutions to better manage and control assets. Thereare Regional Forums held on a monthly basis, this is aplatform used to share experiences on assetmanagement and communicate latest developments.
12. EVENTS AFTER THE ACCOUNTING DATE
Payments to the value of R283m were made during April2006 and these related to services rendered and goodspurchased during the 2005/2006 financial year.Commitments incurred during the 2005/2006 financialyear amounted to R3,7 billion of which R3,4 billionrepresents infrastructure projects spanning over 3 years and are managed under the facilities component.Unauthorised expenditure amounting to R159 999 017was approved by Provincial Legislature (Act. No.8 of2005) during the 2005/06 financial year, however thefunds were received in the post balance sheet period onthe 8th June 2006.
10. NEW/PROPOSED ACTIVITIES
New proposed activities are contained in budgetstatement 1, 2 and 3. The proposed new activities forthe department which commenced in the year underreview or will commence during the 2006/2007 financialyear are:• Taking over TB services (820 TB beds) from SANTA
hospitals and incorporate them into the departmentwith effect from 1 April 2006. The cost of the serviceis estimated at R89m.
• The transfer of forensic pathology services (medico-legal mortuaries) from the South African PoliceServices (SAPS) to Health commencing 1st April2006. In the current year R16,4m in conditionalgrant was transferred to start up systems, processesand infrastructure. Approximately R230m will betransferred to the department over the MTEF as anational conditional grant to fund this service.
• A change in the model for rendering personalPrimary Health Care (PHC) services according tothe National Health Act which defines municipalservices as providing environmental care andassigns personal primary health care functions tothe provincial government. District Municipalitiesdiscontinued providing the services in the 2005/06financial year. Due diligence will be undertaken inthe 2006/07 financial year to determine the cost ofproviding primary health care.
• Incorporating cross boundary areas betweenGauteng and the North West and Mpumalangaprovinces has commenced based on nationallegislation
• Provincialisation of ambulance services is a policydecision endorsed by the Executive Council in linewith the National policy decision
Taking over these services is driven by governmentpolicies, decisions of the Gauteng Executive Counciland National government. The impact on thedepartment is that additional funding will be required.Where functions are shifted budget followed thefunction.
GAUTENG DEPARTMENT OF HEALTHVOTE 4
REPORT OF THE ACCOUNTING OFFICERfor the year ended 31 March 2006
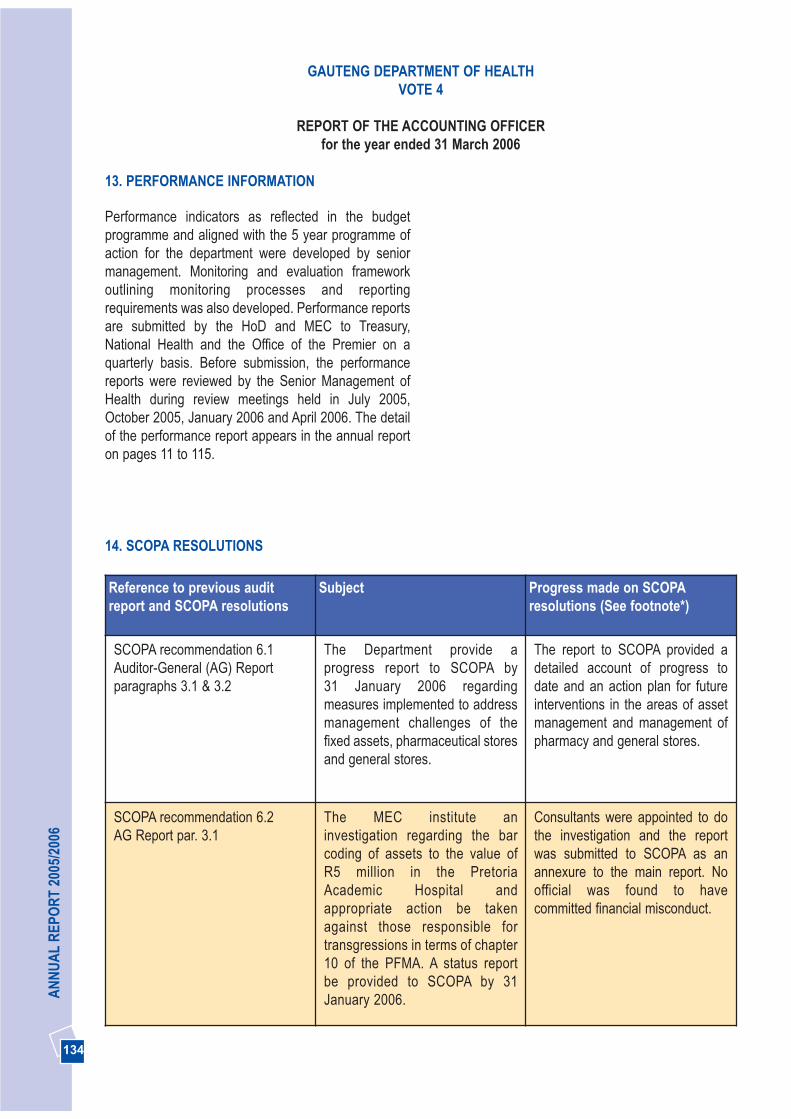
134
AN
NU
AL
REP
OR
T 20
05/2
006
13. PERFORMANCE INFORMATION
Performance indicators as reflected in the budgetprogramme and aligned with the 5 year programme ofaction for the department were developed by seniormanagement. Monitoring and evaluation frameworkoutlining monitoring processes and reportingrequirements was also developed. Performance reportsare submitted by the HoD and MEC to Treasury,National Health and the Office of the Premier on aquarterly basis. Before submission, the performancereports were reviewed by the Senior Management ofHealth during review meetings held in July 2005,October 2005, January 2006 and April 2006. The detailof the performance report appears in the annual reporton pages 11 to 115.
GAUTENG DEPARTMENT OF HEALTHVOTE 4
REPORT OF THE ACCOUNTING OFFICERfor the year ended 31 March 2006
14. SCOPA RESOLUTIONS
Reference to previous auditreport and SCOPA resolutions
Subject Progress made on SCOPAresolutions (See footnote*)
SCOPA recommendation 6.1Auditor-General (AG) Reportparagraphs 3.1 & 3.2
The Department provide aprogress report to SCOPA by 31 January 2006 regardingmeasures implemented to addressmanagement challenges of thefixed assets, pharmaceutical storesand general stores.
The report to SCOPA provided adetailed account of progress todate and an action plan for futureinterventions in the areas of assetmanagement and management ofpharmacy and general stores.
SCOPA recommendation 6.2AG Report par. 3.1
The MEC institute aninvestigation regarding the barcoding of assets to the value of R5 million in the PretoriaAcademic Hospital andappropriate action be takenagainst those responsible fortransgressions in terms of chapter10 of the PFMA. A status reportbe provided to SCOPA by 31January 2006.
Consultants were appointed to dothe investigation and the reportwas submitted to SCOPA as anannexure to the main report. Noofficial was found to havecommitted financial misconduct.
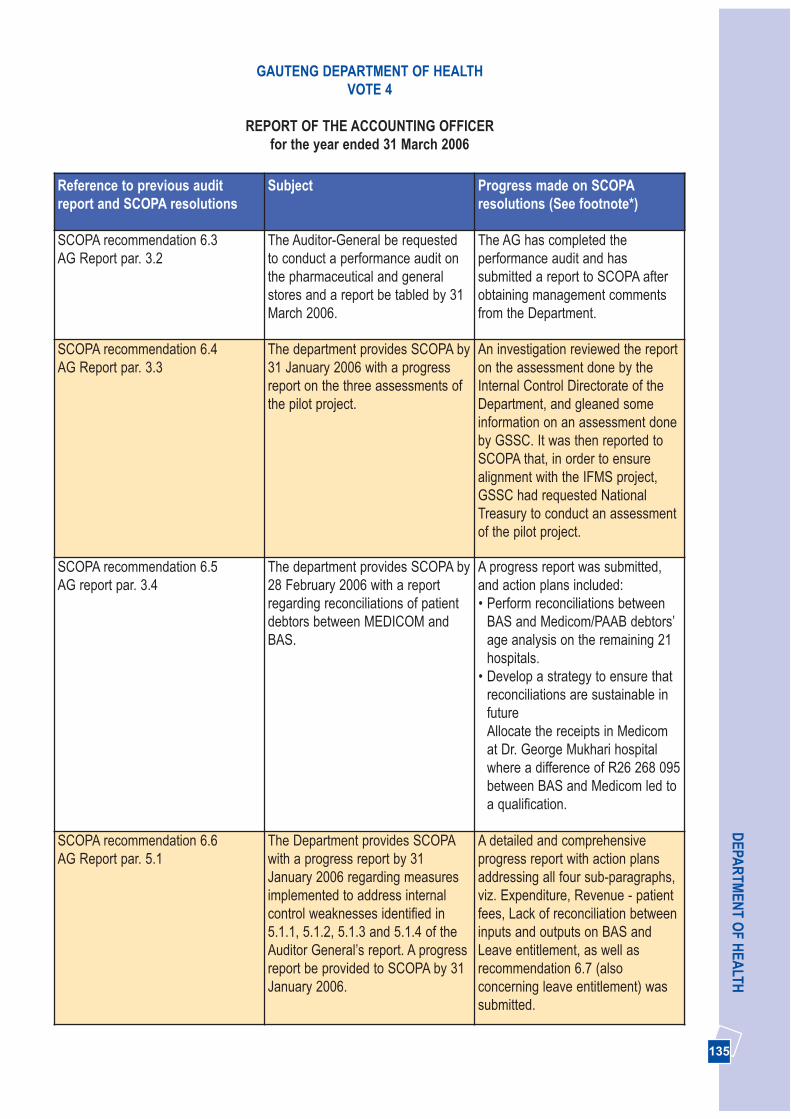
135
DEPA
RTM
ENT O
F HEA
LTHGAUTENG DEPARTMENT OF HEALTH
VOTE 4
REPORT OF THE ACCOUNTING OFFICERfor the year ended 31 March 2006
Reference to previous auditreport and SCOPA resolutions
Subject Progress made on SCOPAresolutions (See footnote*)
SCOPA recommendation 6.3 AG Report par. 3.2
The Auditor-General be requestedto conduct a performance audit onthe pharmaceutical and generalstores and a report be tabled by 31March 2006.
The AG has completed theperformance audit and hassubmitted a report to SCOPA afterobtaining management commentsfrom the Department.
SCOPA recommendation 6.4AG Report par. 3.3
The department provides SCOPA by31 January 2006 with a progressreport on the three assessments ofthe pilot project.
An investigation reviewed the reporton the assessment done by theInternal Control Directorate of theDepartment, and gleaned someinformation on an assessment doneby GSSC. It was then reported toSCOPA that, in order to ensurealignment with the IFMS project,GSSC had requested NationalTreasury to conduct an assessmentof the pilot project.
SCOPA recommendation 6.5AG report par. 3.4
The department provides SCOPA by28 February 2006 with a reportregarding reconciliations of patientdebtors between MEDICOM andBAS.
A progress report was submitted,and action plans included:• Perform reconciliations between
BAS and Medicom/PAAB debtors’age analysis on the remaining 21hospitals.
• Develop a strategy to ensure thatreconciliations are sustainable infutureAllocate the receipts in Medicomat Dr. George Mukhari hospitalwhere a difference of R26 268 095between BAS and Medicom led toa qualification.
SCOPA recommendation 6.6AG Report par. 5.1
The Department provides SCOPAwith a progress report by 31January 2006 regarding measuresimplemented to address internalcontrol weaknesses identified in5.1.1, 5.1.2, 5.1.3 and 5.1.4 of theAuditor General’s report. A progressreport be provided to SCOPA by 31January 2006.
A detailed and comprehensiveprogress report with action plansaddressing all four sub-paragraphs,viz. Expenditure, Revenue - patientfees, Lack of reconciliation betweeninputs and outputs on BAS andLeave entitlement, as well asrecommendation 6.7 (alsoconcerning leave entitlement) wassubmitted.
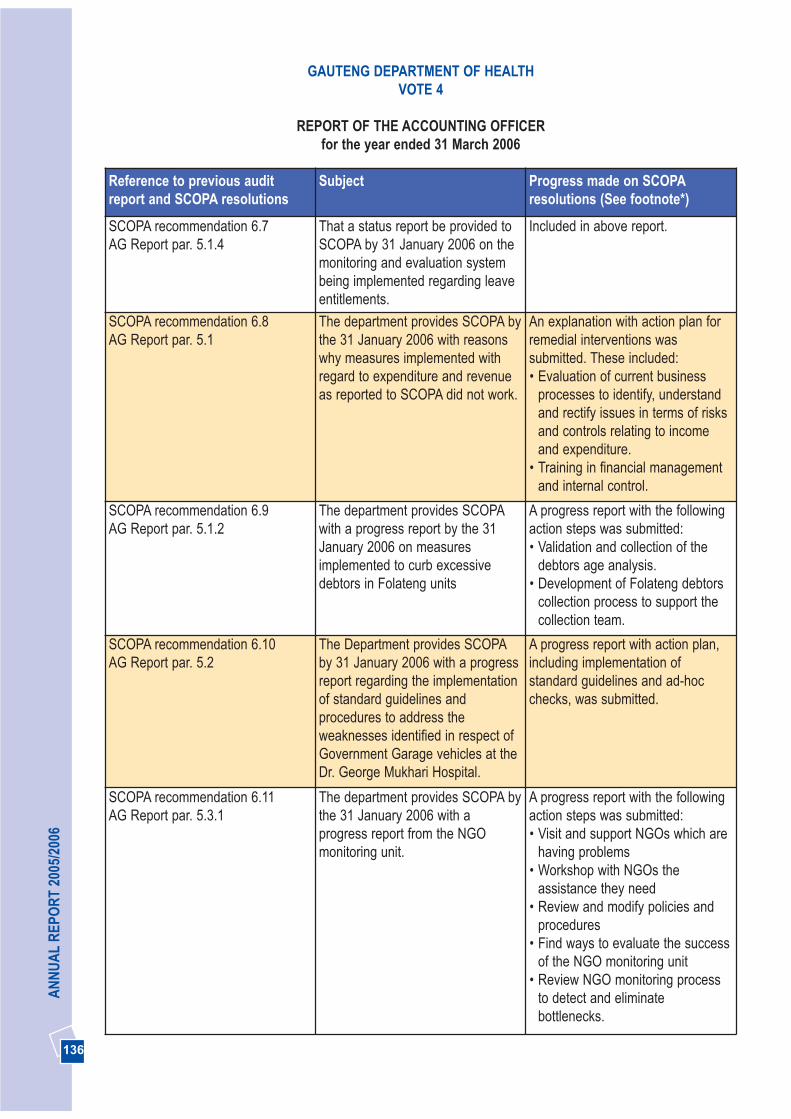
136
AN
NU
AL
REP
OR
T 20
05/2
006
Reference to previous auditreport and SCOPA resolutions
Subject Progress made on SCOPAresolutions (See footnote*)
SCOPA recommendation 6.7AG Report par. 5.1.4
That a status report be provided toSCOPA by 31 January 2006 on themonitoring and evaluation systembeing implemented regarding leaveentitlements.
Included in above report.
SCOPA recommendation 6.8AG Report par. 5.1
The department provides SCOPA bythe 31 January 2006 with reasonswhy measures implemented withregard to expenditure and revenueas reported to SCOPA did not work.
An explanation with action plan forremedial interventions wassubmitted. These included:• Evaluation of current business
processes to identify, understandand rectify issues in terms of risksand controls relating to incomeand expenditure.
• Training in financial managementand internal control.
SCOPA recommendation 6.9AG Report par. 5.1.2
The department provides SCOPAwith a progress report by the 31January 2006 on measuresimplemented to curb excessivedebtors in Folateng units
A progress report with the followingaction steps was submitted:• Validation and collection of the
debtors age analysis.• Development of Folateng debtors
collection process to support thecollection team.
SCOPA recommendation 6.10AG Report par. 5.2
The Department provides SCOPAby 31 January 2006 with a progressreport regarding the implementationof standard guidelines andprocedures to address theweaknesses identified in respect ofGovernment Garage vehicles at theDr. George Mukhari Hospital.
A progress report with action plan,including implementation ofstandard guidelines and ad-hocchecks, was submitted.
SCOPA recommendation 6.11AG Report par. 5.3.1
The department provides SCOPA bythe 31 January 2006 with aprogress report from the NGOmonitoring unit.
A progress report with the followingaction steps was submitted:• Visit and support NGOs which are
having problems• Workshop with NGOs the
assistance they need• Review and modify policies and
procedures• Find ways to evaluate the success
of the NGO monitoring unit• Review NGO monitoring process
to detect and eliminatebottlenecks.
GAUTENG DEPARTMENT OF HEALTHVOTE 4
REPORT OF THE ACCOUNTING OFFICERfor the year ended 31 March 2006

137
DEPA
RTM
ENT O
F HEA
LTH
Reference to previous auditreport and SCOPA resolutions
Subject Progress made on SCOPAresolutions (See footnote*)
SCOPA recommendation 6.12AG Report par. 5.3.2
The Department to provide SCOPAby 31 January 2006 with a progressreport on measures implementedregarding Anti-retroviral (ARV),Voluntary Counselling and Testing(VCT) and Prevention of Mother toChild Transmission (PMCT) Sites.
A progress report with action planwas submitted. The plan is toanalyse the current status ofinventory management for ARVsand RTKs at sites and implementremedial action.
SCOPA recommendation 6.13AG Report par. 5.3.3
The MEC institute an investigationin terms of chapter 10 of the PFMAregarding additional cost incurreddue to the delay in completion of therevitalization programmes at thePretoria Academic Hospital and thenon submission of business plans. Areport be submitted to SCOPA by31 January 2006.
The issue was investigated and areport with explanation and actionplan for remedial interventionssubmitted. These include:• Regular progress reports, with
budgets, for all revitalisationprojects to be prepared to ensurethey are on track.
• A procurement policy to bedeveloped to ensure assets do notbecome obsolete before beingused.
SCOPA recommendation 6.14AG Report par. 5.4
The Department provides SCOPAby 31 January 2006 with reasonswhy measures implemented toavoid increases in financial lossesthrough the negligent treatment ofpatients did not work.
The report detailed the manyproactive and remedial interventionsalready in place. An action plan forfuture interventions included:• Refocusing radio broadcasts to
increase the Department’sunderstanding of the role of thehealth professionals and AIDSrelated problems.
• Expand the role of the managerresponsible for patient safety, fromrecord keeping and pressure care,to patient care, and broadenhis/her knowledge of SAE.
• Develop a system of updatingclinical knowledge of assessment,diagnosis and treatment intargeted areas of clinical practice.
• Seminar to be held to addressadvances in clinical care fordoctors and develop clinicalguidelines.
GAUTENG DEPARTMENT OF HEALTHVOTE 4
REPORT OF THE ACCOUNTING OFFICERfor the year ended 31 March 2006
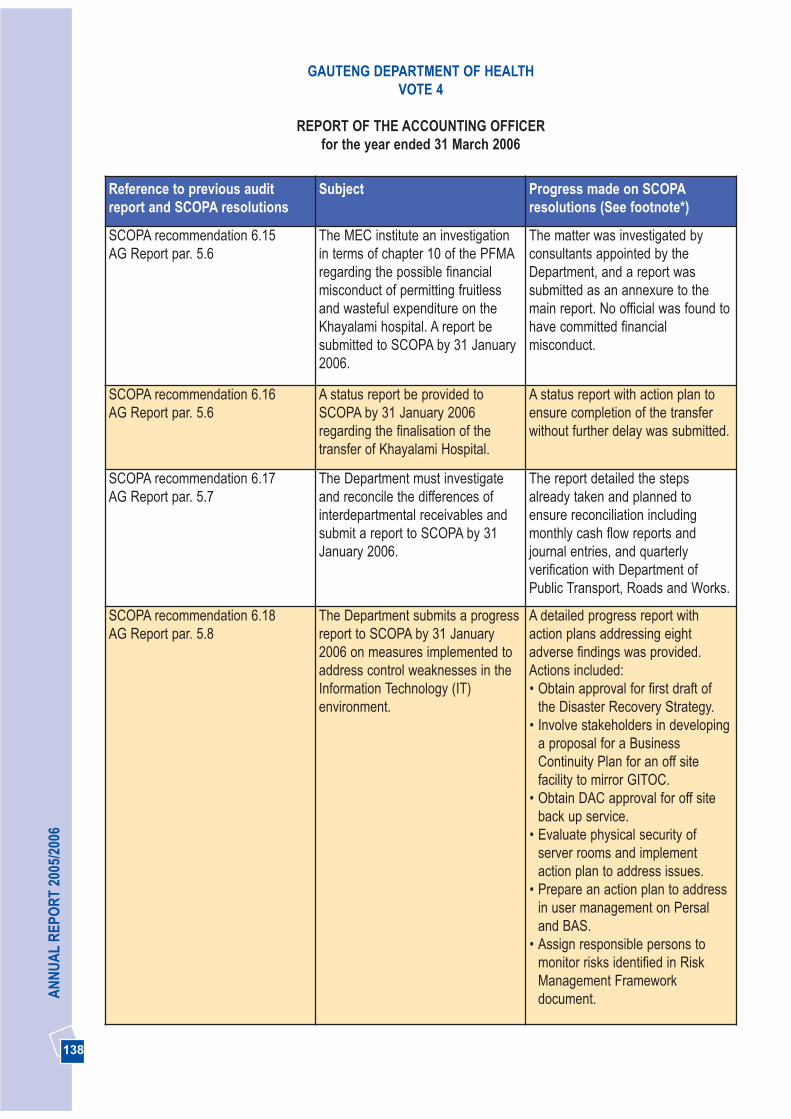
138
AN
NU
AL
REP
OR
T 20
05/2
006
GAUTENG DEPARTMENT OF HEALTHVOTE 4
REPORT OF THE ACCOUNTING OFFICERfor the year ended 31 March 2006
Reference to previous auditreport and SCOPA resolutions
Subject Progress made on SCOPAresolutions (See footnote*)
SCOPA recommendation 6.15AG Report par. 5.6
The MEC institute an investigationin terms of chapter 10 of the PFMAregarding the possible financialmisconduct of permitting fruitlessand wasteful expenditure on theKhayalami hospital. A report besubmitted to SCOPA by 31 January2006.
The matter was investigated byconsultants appointed by theDepartment, and a report wassubmitted as an annexure to themain report. No official was found tohave committed financialmisconduct.
SCOPA recommendation 6.16AG Report par. 5.6
A status report be provided toSCOPA by 31 January 2006regarding the finalisation of thetransfer of Khayalami Hospital.
A status report with action plan toensure completion of the transferwithout further delay was submitted.
SCOPA recommendation 6.17AG Report par. 5.7
The Department must investigateand reconcile the differences ofinterdepartmental receivables andsubmit a report to SCOPA by 31January 2006.
The report detailed the stepsalready taken and planned toensure reconciliation includingmonthly cash flow reports andjournal entries, and quarterlyverification with Department ofPublic Transport, Roads and Works.
SCOPA recommendation 6.18AG Report par. 5.8
The Department submits a progressreport to SCOPA by 31 January2006 on measures implemented toaddress control weaknesses in theInformation Technology (IT)environment.
A detailed progress report withaction plans addressing eightadverse findings was provided.Actions included:• Obtain approval for first draft of
the Disaster Recovery Strategy.• Involve stakeholders in developing
a proposal for a BusinessContinuity Plan for an off sitefacility to mirror GITOC.
• Obtain DAC approval for off siteback up service.
• Evaluate physical security ofserver rooms and implementaction plan to address issues.
• Prepare an action plan to addressin user management on Persaland BAS.
• Assign responsible persons tomonitor risks identified in RiskManagement Frameworkdocument.
139
DEPA
RTM
ENT O
F HEA
LTH
15. OTHER
Revenue
The department generated R254m in revenue during 2005/2006 compared to the R264m collected in 2004/2005.Patient fees remain the main source of revenue making up 90% of total revenue collected. During the year underreview R224m in patient fees was collected, this is 11,6% higher than the previous financial year (R245 394adjusted down by R45 000). Patient debt as at 31 March 2006 amounted to R296m.
APPROVAL
The annual financial statements set out on pages 145 to 202 have been approved by the Accounting Officer.
..........................................Name: Dr Abdul Rahman
Title: Acting Head of Department
Date: 31/05/2006
GAUTENG DEPARTMENT OF HEALTHVOTE 4
REPORT OF THE ACCOUNTING OFFICERfor the year ended 31 March 2006
Reference to previous auditreport and SCOPA resolutions
Subject Progress made on SCOPAresolutions (See footnote*)
SCOPA recommendation 6.19AG Report par. 5.9
The department should implementcontrol measures to ensurecompliance with National Treasuryguidelines and prescribedaccounting practices regarding theAnnual Financial Statements. Astatus report should be provided toSCOPA by 31 January 2006.
The report detailed steps taken toensure compliance, including hiringof staff and appointment ofconsultants to assist with thecompilation of the 2005/2006 AFS,and timely submission to the A-G.
* All the recommendations of SCOPA were addressed in detail, with action plans, in a 50 page report entitled“Gauteng Department of Health - Response to the Standing Committee on Public Accounts”, which wassubmitted to SCOPA on 31 January 2006. The Department is managing the action plans to ensure that allmatters receive attention by correcting past errors where possible, and preventing recurrences.
140
AN
NU
AL
REP
OR
T 20
05/2
006
1. AUDIT ASSIGNMENT
The financial statements as set out on pages 145 to 202 for the year ended 31 March 2006,have been audited in terms of section 188 of theConstitution of the Republic of South Africa, 1996(Act No. 108 of 1996), read with sections 4 and20 of the Public Audit Act, 2004 (Act No. 25 of2004). The fixed assets opening balances havenot been audited because of the timing ofguidance from National Treasury to thedepartments relating to the treatment, valuationand disclosure of fixed assets. These financialstatements are the responsibility of theaccounting officer. My responsibility is to expressan opinion on these financial statements, basedon the audit.
2. SCOPE
The audit was conducted in accordance with theInternational Standards on Auditing read withGeneral Notice 544 of 2006, issued inGovernment Gazette No. 28723 of 10 April 2006and General Notice 808 of 2006, issued inGovernment Gazette No. 28954 of 23 June 2006.Those standards require that I plan and performthe audit to obtain reasonable assurance that thefinancial statements are free of materialmisstatement.
An audit includes:
• examining, on a test basis, evidencesupporting the amounts and disclosures in thefinancial statements;
• assessing the accounting principles used andsignificant estimates made by management;
• evaluating the overall financial statementpresentation.
I believe that the audit provides a reasonablebasis for my opinion.
3. BASIS OF ACCOUNTING
The department’s policy is to prepare financialstatements on the modified cash basis ofaccounting determined by the National Treasury,
REPORT OF THE AUDITOR-GENERAL TO THE GAUTENG PROVINCIAL LEGISLATURE ON THE FINANCIAL STATEMENTS OF VOTE 4 - DEPARTMENT OF HEALTH
FOR THE YEAR ENDED 31 MARCH 2006
as described in note 1.1 to the financialstatements.
4. QUALIFICATION
4.1 Inaccurate and incomplete fixed asset register
The following weaknesses were identified duringthe audit of the fixed asset register:a) The reconciliation between the asset
acquisitions as per the Basic AccountingSystem (BAS) and the additions on the BAUDfixed asset register indicated a netunexplained difference of R1,6 million. Thisdifference was made up of several materialindividual differences, such as, a difference ofR52,5 million for Head Office, a difference ofR34 million for Johannesburg Hospital and adifference of R26,2 million for Chris HaniBaragwanath Hospital. These individualdifferences were not explained.
b) A significant number of fixed assets could notbe found at the locations indicated on thefixed asset register during the physicalverification procedures.
c) A significant number of fixed assets selectedfrom various institutions could not be traced tothe fixed assets register.
d) In some instances the department procuredand paid for assets using the SAP system.This information interfaces with BAS. Areconciliation for the interface was notperformed.
e) Assets identified for disposal were still notdisposed of at year-end. These assets werenot properly safeguarded which increased therisk of misappropriation and a decrease in themarket value of these assets.
As a result of the above findings, thecompleteness, accuracy and existence of thefixed assets additions during the year could notbe verified. These also resulted in non-compliance with sections 38(1)(a)(i), (b) and (d)of the Public Finance Management Act, 1999(Act No. 1 of 1999) (PFMA) and TreasuryRegulations 10.1.1 (a) and 10.1.2.
141
DEPA
RTM
ENT O
F HEA
LTHREPORT OF THE AUDITOR-GENERAL TO THE GAUTENG PROVINCIAL LEGISLATURE
ON THE FINANCIAL STATEMENTS OF VOTE 4 - DEPARTMENT OF HEALTH FOR THE YEAR ENDED 31 MARCH 2006
4.2 Journals
A total of approximately R6 billion non-routinejournals (excluding programmatic, month andyear-end journals) were processed during theyear under review. Based on the sampleselected, a total amount of R260 918 035 wasnot always adequately supported by thenecessary documentation. Due to lack of an audittrail, the validity, completeness and accuracy ofthese journals could not be verified. This ismainly due to a lack of policies and procedures tocontrol journals.
4.3 Patient debtors
Due to a lack of integration between the BAS andthe stand alone debtor systems of the hospitals adifference of R79 803 846 existed on 31 March2006. The debtors total on the hospitals standalone debtor systems was R375 954 246 andR296 150 400 on BAS. The department wasaware of these differences and embarked on aproject to reconcile the balances. However, as at31 March 2006 these differences were not yetresolved.
5 QUALIFIED AUDIT OPINION
In my opinion, except for the effect on thefinancial statements of the matters referred toin paragraph 4, the financial statementspresent fairly, in all material respects, thefinancial position of the Department of Health at31 March 2006 and the results of its operationsand its cash flows for the year then ended, inaccordance with the modified cash basis ofaccounting determined by the NationalTreasury of South Africa, as described in note1.1 to the financial statements, and in themanner required by the Public FinanceManagement Act, 1999 (Act No. 1 of 1999) asamended.
6. EMPHASIS OF MATTER
Without further qualifying the audit opinion,attention is drawn to the following matters:
6.1 Internal control
Accounting internal control systems are designedto ensure that the financial information produced bythe accounting system is complete, accurate andvalid. This generally includes controls such asauthorisation procedures, segregation of duties,reconciliations and internal audit. The followinginternal control weaknesses were identified:
6.1.1 Expenditure
a) Reconciliations of creditor statements were notchecked for accuracy.
b) Creditors were not always settled within 30 daysfrom receipt of invoice.
c) The motivations for items classified asemergency purchases were not always available.These purchases should not have been classifiedas such.
6.1.2 Revenue - patient fees
a) Discharge dates were not timeously captured onMedicom.
b) Identity numbers were not always recorded onpatient files.
c) Files did not always contain sufficient informationfor revenue classification of patients.
d) Invoices for services rendered were not alwaysfiled.
e) Lack of segregation of duties between personnelreceiving money from patients and the capturing ofpatient details on the accounting system.
f) Access controls on the Medicom system appearedto be weak as the same user can be logged in onmore than one computer in different locations.
6.1.3 Leave entitlement
In many instances differences existed betweenthe applications for leave forms in the individualpersonnel files to that of the leave records on thePersonnel and Salary Administration System(PERSAL).
Controls did not exist to confirm that all leave forms were correctly captured on the PERSAL system. This could lead to an
142
AN
NU
AL
REP
OR
T 20
05/2
006
REPORT OF THE AUDITOR-GENERAL TO THE GAUTENG PROVINCIAL LEGISLATURE ON THE FINANCIAL STATEMENTS OF VOTE 4 - DEPARTMENT OF HEALTH
FOR THE YEAR ENDED 31 MARCH 2006
overstatement/understatement of leave balanceson PERSAL and a possible correspondingoverpayment/underpayment in respect of leaveentitlements upon retirement or resignation of anemployee.
6.1.4 Completeness of accruals, commitments andlease commitments
A lack of adequate controls over year-endclosure accounts and processes to identify,collate and report on accruals, commitments andleasehold commitments existed.
6.1.5 Pharmacy and stores
a) Unused stock items issued from stores towards were not included in the year end stockcounts.
b) Accounting records were not always updatedwith shortages and surpluses identified duringstock counts.
c) Physical inventory was not always reconciledwith theoretical records.
d) In some instances, a bin card control systemwas not used. In other instances, the bincards were not updated accurately and/ortimeously.
e) Reconciliations between the pre-pack andbulk stores were not always performed.
f) Minimum and maximum inventory levels werenot always adhered to.
g) Expired stock was not always regularlydisposed of and inadequate controls existedover the disposal of expired stock.
h) Differences were identified between inventoryunit prices on year-end stock listings andsupporting documentation.
i) Supporting documentation, i.e. invoices, werenot readily available due to inadequatedocumentation safeguarding procedures.
6.2 Asset management
6.2.1 Additions captured on BAUD after year-end
The asset register was not available for extendedperiods of time at various institutions. As a resultadditions had to be maintained on spread sheets
and were not subject to the same controls as thefixed asset register. These additions werecaptured onto the fixed asset register at year-end. Furthermore, a support service agreementor a service level agreement with the supplier ofthe BAUD system was not in place during theyear.
6.2.2 Low value assets
The closing balance of capital tangible assets asdisclosed in annexure 3 included a significantnumber of assets captured with a value of R1 orwith no value as the original cost of these assetscould not be established.
6.3 Government garage (GG) vehicles
The following weaknesses were identified inrespect of GG vehicles:
a) Log sheets were not always submitted fortrips taken.
b) There were multiple fuel intakes per vehicle inone day and fuel capacity was exceeded oncertain vehicles.
c) Exception reports from the electronic logsystem were not always followed up.
6.4 Division of Revenue Act (DoRA)
The following weaknesses and non-compliancewith DoRA were identified:
6.4.1 Revitalisation
a) The final allocation for revitalisation wasexceeded by R4,3 million (11,6 per cent).
b) Building sites were handed over tocontractors before medical waste, sharps,expired medicine and assets were removed.
c) Evidence of timeous submission of monthlyand quarterly reports was not always kept.
6.4.2 HIV/AIDS
a) Objectives as per business plans were notalways met and/or evidence to substantiate
143
DEPA
RTM
ENT O
F HEA
LTHREPORT OF THE AUDITOR-GENERAL TO THE GAUTENG PROVINCIAL LEGISLATURE
ON THE FINANCIAL STATEMENTS OF VOTE 4 - DEPARTMENT OF HEALTH FOR THE YEAR ENDED 31 MARCH 2006
compliance could not be submitted in allcases.
b) Shortages of qualified personnel resulted ininstances where procedures were notfollowed and the impact on service deliverywas negatively affected.
c) Not all institutions performed qualityassurance procedures and/or were notconsistent in the application of the proceduresdesigned for voluntary counselling andtesting.
d) The standard operating procedure, draft ARV7, was not consistently applied and Anti-RetroViral (ARV) medication control could notsubstantiate that the medication did in factreach the patient.
6.4.3 Non-Governmental Organisations (NGOs)
a) Lack of control over lay councillors’ workinghours and the accountability of the claimedworking hours.
b) NGO staff records did not always includeproof of stipends paid.
c) The financial reporting and accountabilityduring audit visits indicated that the NGOs didnot always possess adequate skills andunderstanding of the financial implicationsand responsibility of the services.
d) Inadequate budget control and allocationexisted over funds received and spent bycertain NGOs.
6.5 Negligent treatment of patients
During the year under review, compensation ofR10 989 996 was paid for 38 cases of negligenttreatment of patients in provincial hospitals.
6.6 Current and Ex-staff debtors
The current staff debtors balance of R8 906 229at 31 March 2006, included current debtors of R2 423 024 that were outstanding for more thanthree years. The ex-staff debtors balance of R11 308 638 at 31 March 2006 was included inother debtors of which R2 075 165 wereoutstanding for more than three years.
6.7 Kyalami hospital - running cost
As reported in sub-paragraph 5.6 on page 138 ofmy previous report [PR142/2005], this hospitalwas vacant since 1997. The security costs for thepast five years was approximately R3 946 492.Other costs (including maintenance) for the sameperiod amounted to approximately R1 331 305.For the 2005/06 financial year a budget of R1 221 702 was allocated for the running andother costs of the building.
6.8 Environmental, occupational health and safety management
The regularity audit was extended to includeenvironmental, occupational health and safetymanagement.
During visits to certain hospitals, serious risksregarding environmental management wereidentified. Material waste management,occupational health and safety, facilitymanagement principles as well as infectioncontrol were not always adhered to. Furthermore,the department did not have an environmentalmanagement plan in place. Details of theseshortcomings have been brought to the attentionof the department by way of an auditmanagement letter.
These shortcomings are in contravention withsections 8 and 9 of the Occupational Health andSafety Act, 1993 (Act No. 85 of 1993) and sections12, 13 and 14 of the National EnvironmentalManagement Act, 1998 (Act No. 107 of 1998).
6.9 Contingent liabilities
Various differences between the disclosedhousing loan guarantees and PERSAL existed.Furthermore, not all supporting documentationcould be submitted.
6.10 Capital projects
Capital projects amounting to R8,1 million wasincurred while no budget was allocated for theseprojects. This irregular expenditure was incurred
144
AN
NU
AL
REP
OR
T 20
05/2
006
in an attempt by the department to prevent anegative impact on service delivery.
6.11 Payments withheld
The accruals amounting to R283 million includedR18 million that was intentionally withheld forpayment due to budgetary constraints. Thisimplicated that expenditure was understated bythis amount, while unauthorised expenditurecould also be understated.
6.12 Financial systems
In terms of section 40(1)(a) and (b) of the PFMA,departments are required to keep full and properrecords of financial affairs in accordance with theprescribes standards and prepare financialstatements in accordance with generallyrecognised accounting practice prescribed by theNational Treasury. The reporting and disclosurerequirements were based on the modified cashprinciples while BAS only provides for the cashprinciples. Manual interventions were required toalign portions of the accounting system with thereporting framework. These interventionsincreased control risk, errors and inefficiencies.
The controls over assets, salary administration,pharmacy and stores, patient administration andvarious other critical components were managedthrough stand-alone supporting systems thatalso required numerous manual reconciliationsand journals to integrate with BAS and theaccounting framework.
The systems used were limited to thoseprescribed by National Treasury. The limitation insystems resulted in a number of challenges forthe accounting officer in complying with section38 of the PFMA.
7. APPRECIATION
The assistance rendered by the staff of theDepartment of Health during the audit is sincerelyappreciated.
.........................................................Ms M.A. Masemola for Auditor-General
Johannesburg
31 July 2006
REPORT OF THE AUDITOR-GENERAL TO THE GAUTENG PROVINCIAL LEGISLATURE ON THE FINANCIAL STATEMENTS OF VOTE 4 - DEPARTMENT OF HEALTH
FOR THE YEAR ENDED 31 MARCH 2006
145
DEPA
RTM
ENT O
F HEA
LTHGAUTENG DEPARTMENT OF HEALTH
VOTE 4
ACCOUNTING POLICIESfor the year ended 31 March 2006
The Annual Financial Statements have been preparedin accordance with the following policies, which havebeen applied consistently in all material aspects, unlessotherwise indicated. However, where appropriate andmeaningful, additional information has been disclosedto enhance the usefulness of the Annual FinancialStatements and to comply with the statutoryrequirements of the Public Finance Management Act,Act 1 of 1999 (as amended by Act 29 of 1999), theTreasury Regulations issued in terms of the Act and theDivision of Revenue Act, Act 1 of 2005.
1. Presentation of the Annual Financial Statements
1.1 Basis of preparationThe Annual Financial Statements have beenprepared on a modified cash basis ofaccounting, except where stated otherwise.The modified cash basis constitutes the cashbasis of accounting supplemented withadditional disclosure items. Under the cashbasis of accounting transactions and otherevents are recognised when cash is receivedor paid when the final authorisation is effectedon the system (by no later than 31 March of theyear).
1.2 Presentation currencyAll amounts have been presented in thecurrency of the South African Rand (R), whichis also the functional currency of thedepartment.
1.3 RoundingUnless otherwise stated all financial figureshave been rounded to the nearest onethousand Rand (R’000).
1.4 Comparative figuresPrior period comparative information has beenpresented in the current year’s FinancialStatements. Where necessary figuresincluded in the prior period FinancialStatements have been reclassified to ensurethat the format in which the information ispresented is consistent with the format of thecurrent year’s Financial Statements.
A comparison between actual and budgetedamounts per major classification ofexpenditure is included in the appropriationstatement.
2. Revenue
2.1 Appropriated fundsAppropriated funds are recognised in thefinancial records on the date the appropriationbecomes effective. Adjustments to theappropriated funds made in terms of theadjustments budget process are recognised inthe financial records on the date theadjustments become effective.
Total appropriated funds are presented in thestatement of financial performance.
Unexpended appropriated funds aresurrendered to the Provincial Revenue Fund,unless approval has been given by theProvincial Treasury to rollover the funds to thesubsequent financial year. These rolloverfunds form part of retained funds in the annualfinancial statements. Amounts owing to theProvincial Revenue Fund at the end of thefinancial year are recognised in the statementof financial position.
2.2 Departmental revenueAll departmental revenue is paid into theProvincial Revenue Fund when received,unless otherwise stated. Amounts owing to theProvincial Revenue Fund at the end of thefinancial year are recognised in the statementof financial position.
2.2.1 Tax revenueTax revenue consists of all compulsoryunrequited amounts collected by thedepartment in accordance with laws and orregulations (excluding fines, penalties &forfeits).
Tax receipts are recognised in the statement offinancial performance when received.
146
AN
NU
AL
REP
OR
T 20
05/2
006
GAUTENG DEPARTMENT OF HEALTHVOTE 4
ACCOUNTING POLICIESfor the year ended 31 March 2006
2.2.2 Sales of goods and services other than capital assetsThe proceeds received from the sale of goodsand/or the provision of services is recognisedin the statement of financial performance whenthe cash is received.
2.2.3 Fines, penalties & forfeitsFines, penalties & forfeits are compulsoryunrequited amounts, which were imposed by acourt or quasi-judicial body and collected bythe department. Revenue arising from fines,penalties and forfeits is recognised in thestatement of financial performance when thecash is received.
2.2.4 Interest, dividends and rent on landInterest, dividends and rent on land isrecognised in the statement of financialperformance when the cash is received.
2.2.5 Sale of capital assetsThe proceeds received on sale of capitalassets are recognised in the statement offinancial performance when the cash isreceived.
2.2.6 Financial transactions in assets and liabilitiesRepayments of loans and advances previouslyextended to employees and publiccorporations for policy purposes arerecognised as revenue in the statement offinancial performance on receipt of the funds.Amounts receivable at the reporting date aredisclosed as part of the disclosure notes to theAnnual Financial Statements.
Cheques issued in previous accountingperiods that expire before being banked isrecognised as revenue in the statement offinancial performance when the chequebecomes stale. When the cheque is reissuedthe payment is made from Revenue.
2.2.7 Gifts, donations and sponsorship (transfer payments)All cash gifts, donations and sponsorships arepaid into the Provincial Revenue Fund andrecorded as revenue in the statement offinancial performance when received.Amounts receivable at the reporting date aredisclosed as part of the disclosure notes to theannual financial statements.
All in-kind gifts, donations and sponsorshipsare disclosed at fair value in the annexures tothe Annual Financial Statements.
2.3 Local and foreign aid assistanceLocal and foreign aid assistance is recognisedin the financial records when notification of thedonation is received from the NationalTreasury or when the department directlyreceives the cash from the donor(s). The totalcash amounts received during the year isreflected in the statement of financialperformance as revenue.
All in-kind local and foreign aid assistance aredisclosed at fair value in the annexures to theAnnual Financial Statements
The cash payments made during the yearrelating to local and foreign aid assistanceprojects are recognised as expenditure in thestatement of financial performance. Areceivable is recognised in the statement offinancial position to the value amountsexpensed prior to the receipt of the funds.
A payable is raised in the statement of financialposition where amounts have beeninappropriately expensed using local andforeign aid assistance, unutilised amounts arerecognised in the statement of financialposition.
3. Expenditure
3.1 Compensation of employeesSalaries and wages comprise payments to

147
DEPA
RTM
ENT O
F HEA
LTHGAUTENG DEPARTMENT OF HEALTH
VOTE 4
ACCOUNTING POLICIESfor the year ended 31 March 2006
employees. Salaries and wages arerecognised as an expense in the statement offinancial performance when the finalauthorisation for payment is effected on thesystem (by no later than 31 March of eachyear). Capitalised compensation forms part ofone or all of the expenditure for capital assetscategories in the statement of financialperformance.
All other payments are classified as currentexpense.
Social contributions include the entities’contribution to social insurance schemes paidon behalf of the employee. Social contributionsare recognised as an expense in the Statementof Financial Performance when the finalauthorisation for payment is effected on thesystem.
3.1.1 Short term employee benefitsShort-term employee benefits comprise of leaveentitlements (capped leave), thirteenth chequesand performance bonuses. The cost of short-term employee benefits is expensed as salariesand wages in the statement of financialperformance when the final authorisation forpayment is effected on the system (by no laterthan 31 March of each year).
Short-term employee benefits that give rise toa present legal or constructive obligation aredisclosed in the notes to the financialstatements. These amounts are notrecognised in the statement of financialperformance.
3.1.2 Long-term employee benefits
3.1.2.1 Termination benefitsTermination benefits such as severancepackages are recognised as an expense in thestatement of financial performance as atransfer when the final authorisation forpayment is effected on the system (by no laterthan 31 March of each year).
3.1.2.2 Post employment retirement benefitsThe department provides retirement benefits(pension benefits) for certain of its employeesthrough a defined benefit plan for governmentemployees. These benefits are funded by bothemployer and employee contributions.Employer contributions to the fund areexpensed when the final authorisation forpayment to the fund is effected on the system(by no later than 31 March of each year). Noprovision is made for retirement benefits in thefinancial statements of the department. Anypotential liabilities are disclosed in the financialstatements of the National/Provincial RevenueFund and not in the statements of the employerdepartment.
The department provides medical benefits forcertain of its employees. Employercontributions to the medical funds areexpensed when the final authorisation forpayment to the fund is effected on the system(by no later than 31 March of each year).
3.2 Goods and servicesPayments made for goods and/or services arerecognised as an expense in the statement offinancial performance when the finalauthorisation for payment is effected on thesystem (by no later than 31 March of eachyear). The expense is classified as capital if thegoods and services were used on a capitalproject.
3.3 Interest and rent on landInterest and rental payments are recognised asan expense in the statement of financialperformance when the final authorisation forpayment is effected on the system (by no laterthan 31 March of each year). This itemexcludes rental on the use of buildings or otherfixed structures.
3.4 Financial transactions in assets and liabilitiesDebts are written-off when identified asirrecoverable. Debts written-off are limited to
148
AN
NU
AL
REP
OR
T 20
05/2
006
GAUTENG DEPARTMENT OF HEALTHVOTE 4
ACCOUNTING POLICIESfor the year ended 31 March 2006
the amount of savings and/or under spendingof appropriated funds. The write off occurs atyear-end or when funds are available. Noprovision is made for irrecoverable amountsbut amounts are disclosed as a disclosurenote.
All other losses are recognised whenauthorisation has been granted for therecognition thereof.
3.5 Unauthorised expenditureWhen discovered unauthorised expenditureis recognised as an asset in the statement offinancial position until such time as theexpenditure is either approved by therelevant authority, recovered from theresponsible person or written off asirrecoverable in the statement of financialperformance.
Unauthorised expenditure approved withfunding is recognised in the statement offinancial performance when the unauthorisedexpenditure is approved and the related fundsare received. Where the amount is approvedwithout funding it is recognised as expenditure,subject to availability of savings, in thestatement of financial performance on the dateof approval.
3.6 Fruitless and wasteful expenditureFruitless and wasteful expenditure isrecognised as an asset in the statement offinancial position until such time as theexpenditure is recovered from the responsibleperson or written off as irrecoverable in thestatement of financial performance.
3.7 Irregular expenditureIrregular expenditure is recognised asexpenditure in the statement of financialperformance. If the expenditure is notcondoned by the relevant authority it is treatedas a current asset until it is recovered or writtenoff as irrecoverable.
3.8 Transfers and subsidiesTransfers and subsidies are recognised as anexpense when the final authorisation forpayment is effected on the system (by no laterthan 31 March of each year).
3.9 Expenditure for capital assetsPayments made for capital assets arerecognised as an expense in the statement offinancial performance when the finalauthorisation for payment is effected on thesystem (by no later than 31 March of each year).
4. Assets
4.1 Cash and cash equivalentsCash and cash equivalents are carried in thestatement of financial position at cost.
For the purposes of the cash flow statement,cash and cash equivalents comprise cash onhand, deposits held, other sort-term highlyliquid investments and bank overdrafts.
4.2 Prepayments and advancesAmounts prepaid or advanced are recognisedin the statement of financial position when thepayments are made.
4.3 ReceivablesReceivables included in the statement offinancial position arise from cash paymentsthat are recoverable from another party, whenthe payments are made.
Revenue receivable not yet collected isincluded in the disclosure notes. Amounts thatare potentially irrecoverable are included in thedisclosure notes.
4.4 InvestmentsCapitalised investments are shown at cost inthe statement of financial position. Any cashflows such as dividends received or proceedsfrom the sale of the investment are recognisedin the statement of financial performance.

149
DEPA
RTM
ENT O
F HEA
LTHGAUTENG DEPARTMENT OF HEALTH
VOTE 4
ACCOUNTING POLICIESfor the year ended 31 March 2006
Investments are tested for an impairment losswhenever events or changes in circumstancesindicate that the investment may be impaired.Any impairment loss is included in thedisclosure notes.
4.5 LoansLoans are recognised in the statement offinancial position at the nominal amount.Amounts that are potentially irrecoverable areincluded in the disclosure notes.
4.6 InventoryInventories on hand at the reporting date aredisclosed at cost in the disclosure notes.
4.7 Asset RegistersAssets are recorded in an asset register, atcost, on receipt of the item. Cost of an asset isdefined as the total cost of acquisition. Assetsprocured in previous financial periods, may bestated at fair value, where determinable, or R1,in instances where the original cost ofacquisition or fair value cannot be established.No revaluation or impairment of assets iscurrently recognised in the asset register.Projects (of construction/development)running over more than one financial yearrelating to assets, are only brought into theasset register on completion of the project andat the total cost incurred over the duration ofthe project.
Annexure 3 of the disclosure notes, reflect thetotal movement in the asset register of assetswith a cost equal to and exceeding R5 000(therefore capital assets only) for the currentfinancial year. The movement is reflected atthe cost as recorded in the asset register andnot the carrying value, as depreciation is notrecognised in the financial statements underthe modified cash basis of accounting. Theopening balance as reflected on Annexure 3will include items procured in prior accountingperiods and the closing balance will representthe total cost of capital assets on hand.
5. Liabilities
5.1 PayablesRecognised payables mainly comprise ofamounts owing to other governmental entities.These payables are recognised at theirnominal amounts in the statement of financialposition.
5.2 Lease commitmentsLease commitments represent amounts owingfrom the reporting date to the end of the leasecontract. These commitments are notrecognised in the statement of financialposition as a liability or as expenditure in thestatement of financial performance but areincluded in the disclosure notes.
Operating and finance lease commitments areexpensed when the payments are made.Assets acquired in terms of finance leaseagreements are disclosed in the annexures tothe financial statements.
5.3 AccrualsAccruals represent goods/services that havebeen received, but where no invoice has beenreceived from the supplier at the reporting date,or where an invoice has been received but finalauthorisation for payment has not beeneffected on the system.
Accruals are not recognised in the statement offinancial position as a liability or as expenditurein the statement of financial performance butare included in the disclosure notes.
5.4 Contingent liabilitiesA contingent liability is a possible obligationthat arises from past events and whoseexistence will be confirmed only by theoccurrence or non-occurrence of one or moreuncertain future events not wholly within thecontrol of the department; orA contingent liability is a present obligation thatarises from past events but is not recognisedbecause:
150
AN
NU
AL
REP
OR
T 20
05/2
006
GAUTENG DEPARTMENT OF HEALTHVOTE 4
ACCOUNTING POLICIESfor the year ended 31 March 2006
• It is not probable that an outflow of resourcesembodying economic benefits or servicepotential will be required to settle theobligation; or
• The amount of the obligation cannot bemeasured with sufficient reliability.
Contingent liabilities are included in thedisclosure notes.
5.5 CommitmentsCommitments represent goods/services thathave been approved and/or contracted, butwhere no delivery has taken place at thereporting date.
Commitments are not recognised in thestatement of financial position as a liability oras expenditure in the statement of financialperformance but are included in the disclosurenotes.
6. Net Assets
6.1 Capitalisation reserveThe capitalisation reserve comprises offinancial assets and/or liabilities originating in aprior reporting period but which are recognisedin the statement of financial position for the firsttime in the current reporting period. Amountsare transferred to the Provincial Revenue Fundon disposal, repayment or recovery of suchamounts.
6.2 Recoverable revenueAmounts are recognised as recoverablerevenue when a payment made andrecognised in a previous financial yearbecomes recoverable from a debtor.
7. Related Party transactionsRelated parties are departments that control orsignificantly influence the department inmaking financial and operating decisions.Specific information with regards to relatedparty transactions is included in the disclosurenotes.
8. Key management personnelKey management personnel are those personshaving the authority and responsibility forplanning, directing and controlling the activitiesof the department.
Compensation paid to key managementpersonnel including their family memberswhere relevant, are included in disclosurenotes.
9. Public private partnershipA public private partnership (PPP) is acommercial transaction between thedepartment and a private party in terms ofwhich the private party:• Performs an institutional function on behalf of
the institution; and/or• acquires the use of state property for its own
commercial purposes; and• assumes substantial financial, technical and
operational risks in connection with theperformance of the institutional functionand/or use of state property; and
• receives a benefit for performing theinstitutional function or from utilizing the stateproperty, either by way of:
o consideration to be paid by thedepartment which derives from aRevenue Fund;
o charges fees to be collected by theprivate party from users or customers ofa service provided to them; or
o a combination of such considerationand such charges or fees.
A description of the PPP arrangement, thecontract fees and current and capitalexpenditure relating to the PPP arrangement isincluded in the disclosure notes.
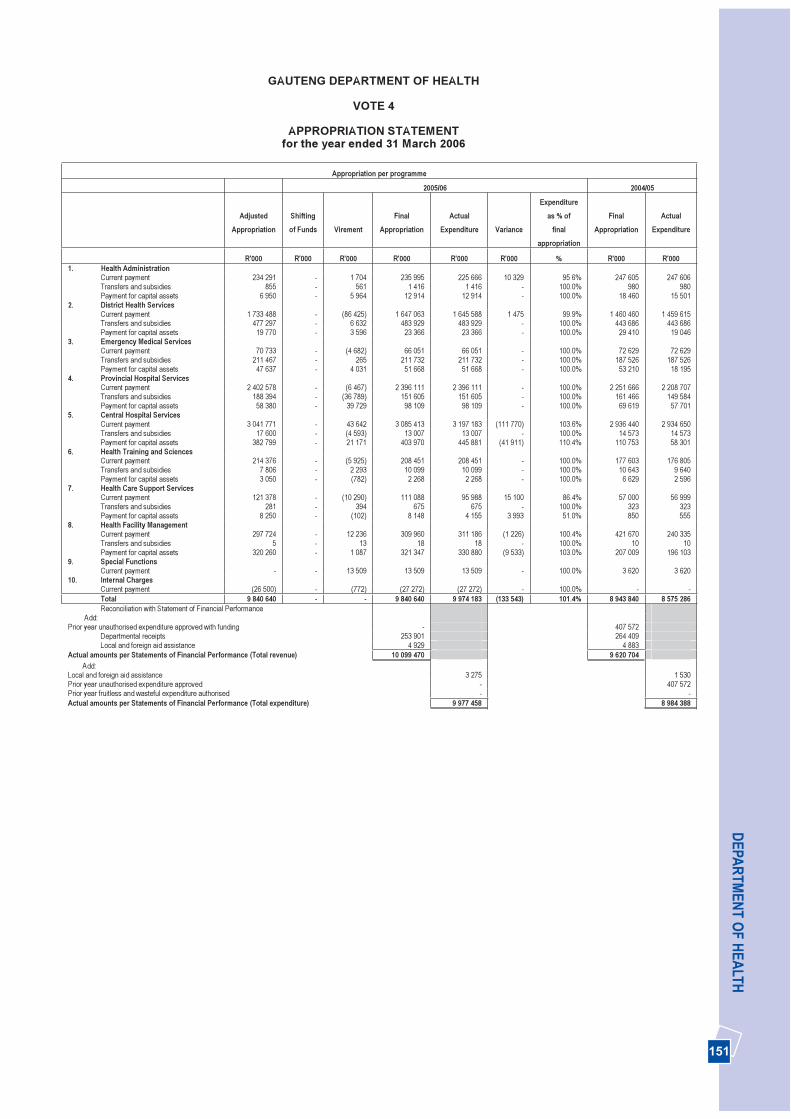
151
DEPA
RTM
ENT O
F HEA
LTH
GAUTENG DEPARTMENT OF HEALTH
VOTE 4
APPROPRIATION STATEMENTfor the year ended 31 March 2006
Appropriation per programme
2005/06 2004/05
AdjustedAppropriation
Shifting of Funds Virement
Final Appropriation
Actual Expenditure Variance
Expenditureas % of
finalappropriation
Final Appropriation
Actual Expenditure
R'000 R'000 R'000 R'000 R'000 R'000 % R'000 R'000 1. Health Administration
Current payment 234 291 - 1 704 235 995 225 666 10 329 95 6% 247 605 247 606 Transfers and subsidies 855 - 561 1 416 1 416 - 100.0% 980 980 Payment for capital assets 6 950 - 5 964 12 914 12 914 - 100.0% 18 460 15 501
2. District Health ServicesCurrent payment 1 733 488 - (86 425) 1 647 063 1 645 588 1 475 99.9% 1 460 460 1 459 615 Transfers and subsidies 477 297 - 6 632 483 929 483 929 - 100.0% 443 686 443 686 Payment for capital assets 19 770 - 3 596 23 366 23 366 - 100.0% 29 410 19 046
3. Emergency Medical ServicesCurrent payment 70 733 - (4 682) 66 051 66 051 - 100.0% 72 629 72 629 Transfers and subsidies 211 467 - 265 211 732 211 732 - 100.0% 187 526 187 526 Payment for capital assets 47 637 - 4 031 51 668 51 668 - 100.0% 53 210 18 195
4. Provincial Hospital ServicesCurrent payment 2 402 578 - (6 467) 2 396 111 2 396 111 - 100.0% 2 251 666 2 208 707 Transfers and subsidies 188 394 - (36 789) 151 605 151 605 - 100.0% 161 466 149 584 Payment for capital assets 58 380 - 39 729 98 109 98 109 - 100.0% 69 619 57 701
5. Central Hospital ServicesCurrent payment 3 041 771 - 43 642 3 085 413 3 197 183 (111 770) 103.6% 2 936 440 2 934 650 Transfers and subsidies 17 600 - (4 593) 13 007 13 007 - 100.0% 14 573 14 573 Payment for capital assets 382 799 - 21 171 403 970 445 881 (41 911) 110.4% 110 753 58 301
6. Health Training and SciencesCurrent payment 214 376 - (5 925) 208 451 208 451 - 100.0% 177 603 176 805 Transfers and subsidies 7 806 - 2 293 10 099 10 099 - 100.0% 10 643 9 640 Payment for capital assets 3 050 - (782) 2 268 2 268 - 100.0% 6 629 2 596
7. Health Care Support ServicesCurrent payment 121 378 - (10 290) 111 088 95 988 15 100 86.4% 57 000 56 999 Transfers and subsidies 281 - 394 675 675 - 100.0% 323 323 Payment for capital assets 8 250 - (102) 8 148 4 155 3 993 51.0% 850 555
8. Health Facility ManagementCurrent payment 297 724 - 12 236 309 960 311 186 (1 226) 100.4% 421 670 240 335 Transfers and subsidies 5 - 13 18 18 - 100.0% 10 10 Payment for capital assets 320 260 - 1 087 321 347 330 880 (9 533) 103.0% 207 009 196 103
9. Special FunctionsCurrent payment - - 13 509 13 509 13 509 - 100.0% 3 620 3 620
10. Internal ChargesCurrent payment (26 500) - (772) (27 272) (27 272) - 100.0% - -Total 9 840 640 - - 9 840 640 9 974 183 (133 543) 101.4% 8 943 840 8 575 286 Reconciliation with Statement of Financial Performance
Add: Prior year unauthorised expenditure approved with funding - 407 572
Departmental receipts 253 901 264 409 Local and foreign aid assistance 4 929 4 883
Actual amounts per Statements of Financial Performance (Total revenue) 10 099 470 9 620 704 Add: Local and foreign aid assistance 3 275 1 530 Prior year unauthorised expenditure approved - 407 572 Prior year fruitless and wasteful expenditure authorised - -Actual amounts per Statements of Financial Performance (Total expenditure) 9 977 458 8 984 388
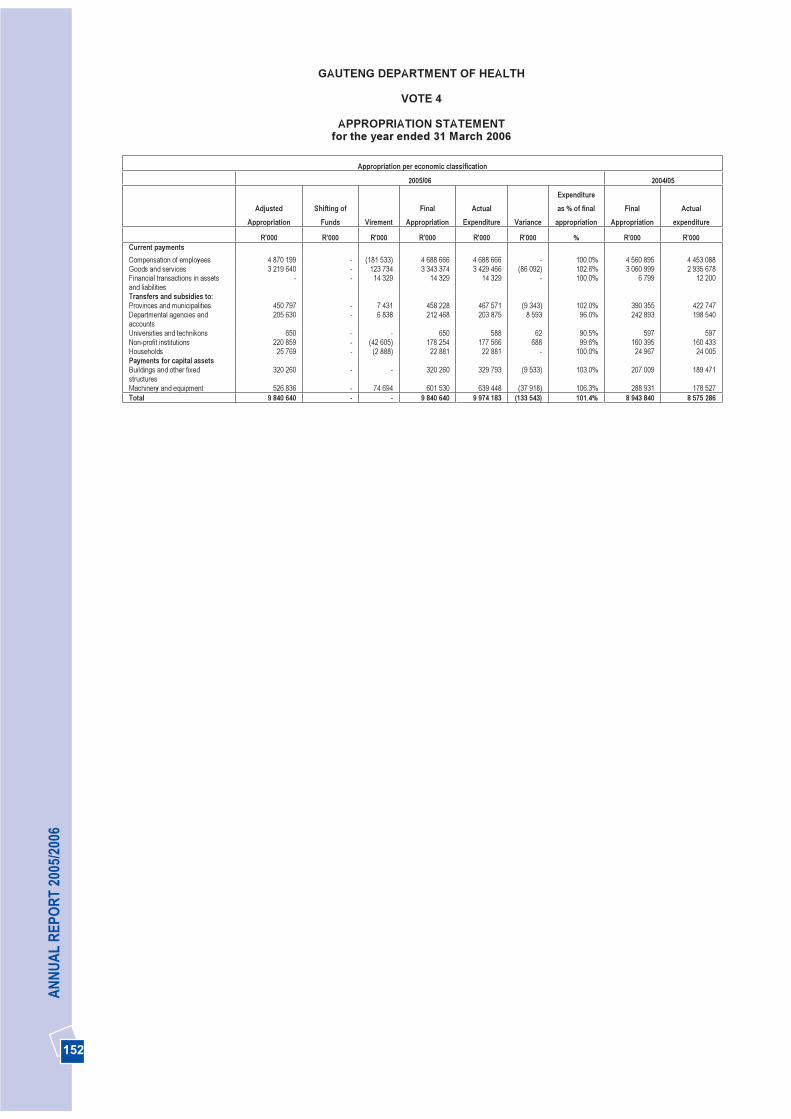
152
AN
NU
AL
REP
OR
T 20
05/2
006
GAUTENG DEPARTMENT OF HEALTH
VOTE 4
APPROPRIATION STATEMENTfor the year ended 31 March 2006
Appropriation per economic classification
2005/06 2004/05
AdjustedAppropriation
Shifting of Funds Virement
Final Appropriation
Actual Expenditure Variance
Expenditureas % of final
appropriation Final
Appropriation Actual
expenditure
R'000 R'000 R'000 R'000 R'000 R'000 % R'000 R'000 Current paymentsCompensation of employees 4 870 199 - (181 533) 4 688 666 4 688 666 - 100.0% 4 560 895 4 453 088 Goods and services 3 219 640 - 123 734 3 343 374 3 429 466 (86 092) 102.6% 3 060 999 2 935 678 Financial transactions in assetsand liabilities
- - 14 329 14 329 14 329 - 100.0% 6 799 12 200
Transfers and subsidies to:Provinces and municipalities 450 797 - 7 431 458 228 467 571 (9 343) 102.0% 390 355 422 747 Departmental agencies and accounts
205 630 - 6 838 212 468 203 875 8 593 96.0% 242 893 198 540
Universities and technikons 650 - - 650 588 62 90.5% 597 597 Non-profit institutions 220 859 - (42 605) 178 254 177 566 688 99.6% 160 395 160 433 Households 25 769 - (2 888) 22 881 22 881 - 100.0% 24 967 24 005 Payments for capital assets Buildings and other fixed structures
320 260 - - 320 260 329 793 (9 533) 103.0% 207 009 189 471
Machinery and equipment 526 836 - 74 694 601 530 639 448 (37 918) 106.3% 288 931 178 527 Total 9 840 640 - - 9 840 640 9 974 183 (133 543) 101.4% 8 943 840 8 575 286
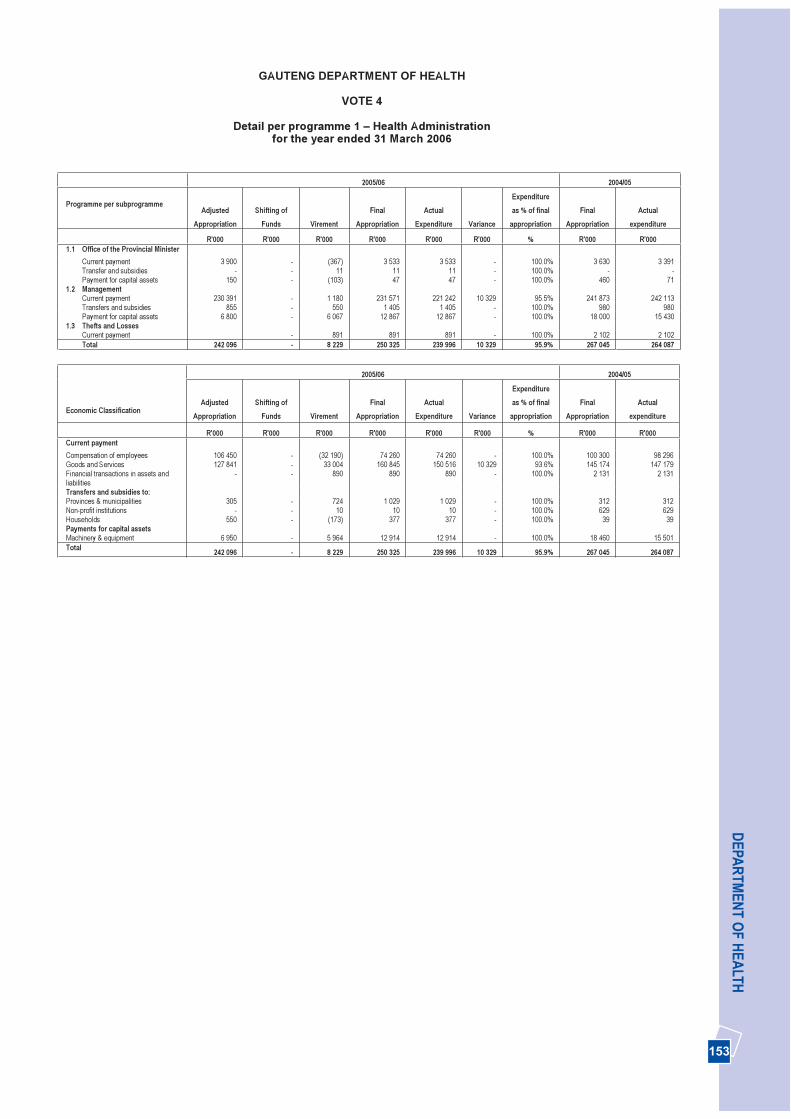
153
DEPA
RTM
ENT O
F HEA
LTHGAUTENG DEPARTMENT OF HEALTH
VOTE 4
Detail per programme 1 – Health Administration for the year ended 31 March 2006
2005/06 2004/05
Programme per subprogrammeAdjusted
Appropriation Shifting of
Funds VirementFinal
Appropriation Actual
Expenditure Variance
Expenditureas % of final
appropriation Final
Appropriation Actual
expenditure
R'000 R'000 R'000 R'000 R'000 R'000 % R'000 R'000 1.1 Office of the Provincial Minister
Current payment 3 900 - (367) 3 533 3 533 - 100.0% 3 630 3 391 Transfer and subsidies - - 11 11 11 - 100.0% - -Payment for capital assets 150 - (103) 47 47 - 100.0% 460 71
1.2 Management Current payment 230 391 - 1 180 231 571 221 242 10 329 95.5% 241 873 242 113 Transfers and subsidies 855 - 550 1 405 1 405 - 100.0% 980 980 Payment for capital assets 6 800 - 6 067 12 867 12 867 - 100.0% 18 000 15 430
1.3 Thefts and Losses Current payment - 891 891 891 - 100.0% 2 102 2 102 Total 242 096 - 8 229 250 325 239 996 10 329 95.9% 267 045 264 087
2005/06 2004/05
Economic Classification Adjusted
Appropriation Shifting of
Funds VirementFinal
Appropriation Actual
Expenditure Variance
Expenditureas % of final
appropriation Final
Appropriation Actual
expenditure
R'000 R'000 R'000 R'000 R'000 R'000 % R'000 R'000 Current paymentCompensation of employees 106 450 - (32 190) 74 260 74 260 - 100.0% 100 300 98 296 Goods and Services 127 841 - 33 004 160 845 150 516 10 329 93.6% 145 174 147 179 Financial transactions in assets and liabilities
- - 890 890 890 - 100.0% 2 131 2 131
Transfers and subsidies to:Provinces & municipalities 305 - 724 1 029 1 029 - 100.0% 312 312 Non-profit institutions - - 10 10 10 - 100.0% 629 629 Households 550 - (173) 377 377 - 100.0% 39 39 Payments for capital assets Machinery & equipment 6 950 - 5 964 12 914 12 914 - 100.0% 18 460 15 501 Total 242 096 - 8 229 250 325 239 996 10 329 95.9% 267 045 264 087
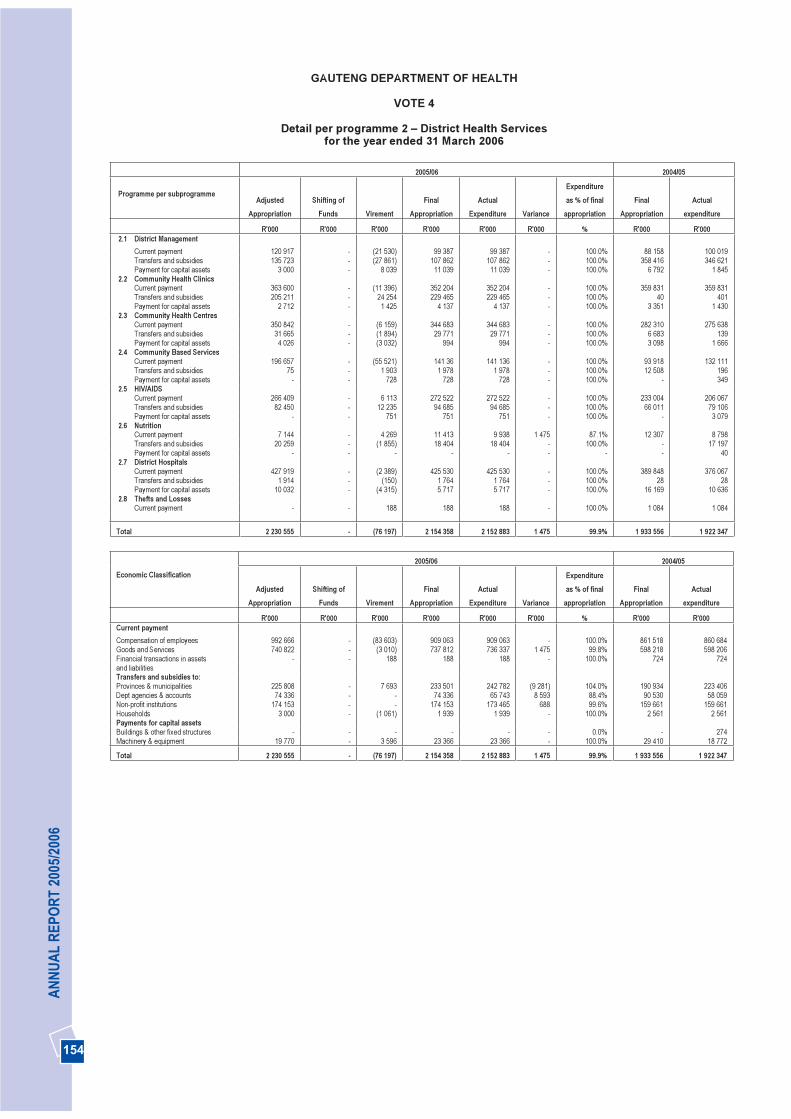
154
AN
NU
AL
REP
OR
T 20
05/2
006
GAUTENG DEPARTMENT OF HEALTH
VOTE 4
Detail per programme 2 – District Health Services for the year ended 31 March 2006
2005/06 2004/05
Programme per subprogrammeAdjusted
Appropriation Shifting of
Funds VirementFinal
Appropriation Actual
Expenditure Variance
Expenditureas % of final
appropriation Final
Appropriation Actual
expenditure
R'000 R'000 R'000 R'000 R'000 R'000 % R'000 R'000 2.1 District Management
Current payment 120 917 - (21 530) 99 387 99 387 - 100.0% 88 158 100 019 Transfers and subsidies 135 723 - (27 861) 107 862 107 862 - 100.0% 358 416 346 621 Payment for capital assets 3 000 - 8 039 11 039 11 039 - 100.0% 6 792 1 845
2.2 Community Health Clinics Current payment 363 600 - (11 396) 352 204 352 204 - 100.0% 359 831 359 831 Transfers and subsidies 205 211 - 24 254 229 465 229 465 - 100.0% 40 401 Payment for capital assets 2 712 - 1 425 4 137 4 137 - 100.0% 3 351 1 430
2.3 Community Health Centres Current payment 350 842 - (6 159) 344 683 344 683 - 100.0% 282 310 275 638 Transfers and subsidies 31 665 - (1 894) 29 771 29 771 - 100.0% 6 683 139 Payment for capital assets 4 026 - (3 032) 994 994 - 100.0% 3 098 1 666
2.4 Community Based ServicesCurrent payment 196 657 - (55 521) 141 36 141 136 - 100.0% 93 918 132 111 Transfers and subsidies 75 - 1 903 1 978 1 978 - 100.0% 12 508 196 Payment for capital assets - - 728 728 728 - 100.0% - 349
2.5 HIV/AIDSCurrent payment 266 409 - 6 113 272 522 272 522 - 100.0% 233 004 206 067 Transfers and subsidies 82 450 - 12 235 94 685 94 685 - 100.0% 66 011 79 106 Payment for capital assets - - 751 751 751 - 100.0% - 3 079
2.6 NutritionCurrent payment 7 144 - 4 269 11 413 9 938 1 475 87.1% 12 307 8 798 Transfers and subsidies 20 259 - (1 855) 18 404 18 404 - 100.0% - 17 197 Payment for capital assets - - - - - - - - 40
2.7 District HospitalsCurrent payment 427 919 - (2 389) 425 530 425 530 - 100.0% 389 848 376 067 Transfers and subsidies 1 914 - (150) 1 764 1 764 - 100.0% 28 28 Payment for capital assets 10 032 - (4 315) 5 717 5 717 - 100.0% 16 169 10 636
2.8 Thefts and LossesCurrent payment - - 188 188 188 - 100.0% 1 084 1 084
Total 2 230 555 - (76 197) 2 154 358 2 152 883 1 475 99.9% 1 933 556 1 922 347
2005/06 2004/05 Economic Classification
AdjustedAppropriation
Shifting of Funds Virement
Final Appropriation
Actual Expenditure Variance
Expenditureas % of final
appropriation Final
Appropriation Actual
expenditure
R'000 R'000 R'000 R'000 R'000 R'000 % R'000 R'000 Current paymentCompensation of employees 992 666 - (83 603) 909 063 909 063 - 100.0% 861 518 860 684 Goods and Services 740 822 - (3 010) 737 812 736 337 1 475 99.8% 598 218 598 206 Financial transactions in assets - - 188 188 188 - 100.0% 724 724 and liabilities Transfers and subsidies to:Provinces & municipalities 225 808 - 7 693 233 501 242 782 (9 281) 104.0% 190 934 223 406 Dept agencies & accounts 74 336 - - 74 336 65 743 8 593 88.4% 90 530 58 059 Non-profit institutions 174 153 - - 174 153 173 465 688 99.6% 159 661 159 661 Households 3 000 - (1 061) 1 939 1 939 - 100.0% 2 561 2 561 Payments for capital assets Buildings & other fixed structures - - - - - - 0.0% - 274 Machinery & equipment 19 770 - 3 596 23 366 23 366 - 100.0% 29 410 18 772
Total 2 230 555 - (76 197) 2 154 358 2 152 883 1 475 99.9% 1 933 556 1 922 347
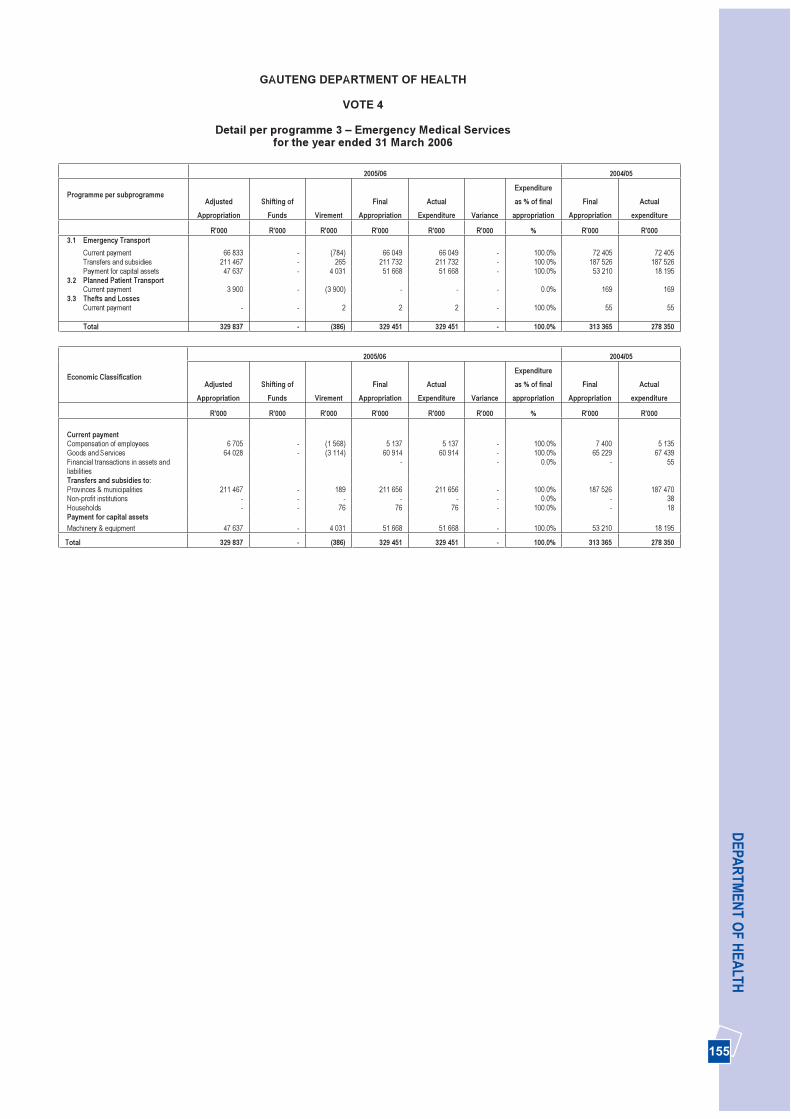
155
DEPA
RTM
ENT O
F HEA
LTH
GAUTENG DEPARTMENT OF HEALTH
VOTE 4
Detail per programme 3 – Emergency Medical Services for the year ended 31 March 2006
2005/06 2004/05
Programme per subprogrammeAdjusted
Appropriation Shifting of
Funds VirementFinal
Appropriation Actual
Expenditure Variance
Expenditureas % of final
appropriation Final
Appropriation Actual
expenditure
R'000 R'000 R'000 R'000 R'000 R'000 % R'000 R'000 3.1 Emergency Transport
Current payment 66 833 - (784) 66 049 66 049 - 100.0% 72 405 72 405 Transfers and subsidies 211 467 - 265 211 732 211 732 - 100.0% 187 526 187 526 Payment for capital assets 47 637 - 4 031 51 668 51 668 - 100.0% 53 210 18 195
3.2 Planned Patient Transport Current payment 3 900 - (3 900) - - - 0.0% 169 169
3.3 Thefts and Losses Current payment - - 2 2 2 - 100.0% 55 55
Total 329 837 - (386) 329 451 329 451 - 100.0% 313 365 278 350
2005/06 2004/05
Economic Classification Adjusted
Appropriation Shifting of
Funds VirementFinal
Appropriation Actual
Expenditure Variance
Expenditureas % of final
appropriation Final
Appropriation Actual
expenditure
R'000 R'000 R'000 R'000 R'000 R'000 % R'000 R'000
Current paymentCompensation of employees 6 705 - (1 568) 5 137 5 137 - 100.0% 7 400 5 135 Goods and Services 64 028 - (3 114) 60 914 60 914 - 100.0% 65 229 67 439 Financial transactions in assets and liabilities
- - 0.0% - 55
Transfers and subsidies to:Provinces & municipalities 211 467 - 189 211 656 211 656 - 100.0% 187 526 187 470 Non-profit institutions - - - - - - 0.0% - 38 Households - - 76 76 76 - 100.0% - 18 Payment for capital assets Machinery & equipment 47 637 - 4 031 51 668 51 668 - 100.0% 53 210 18 195
Total 329 837 - (386) 329 451 329 451 - 100.0% 313 365 278 350
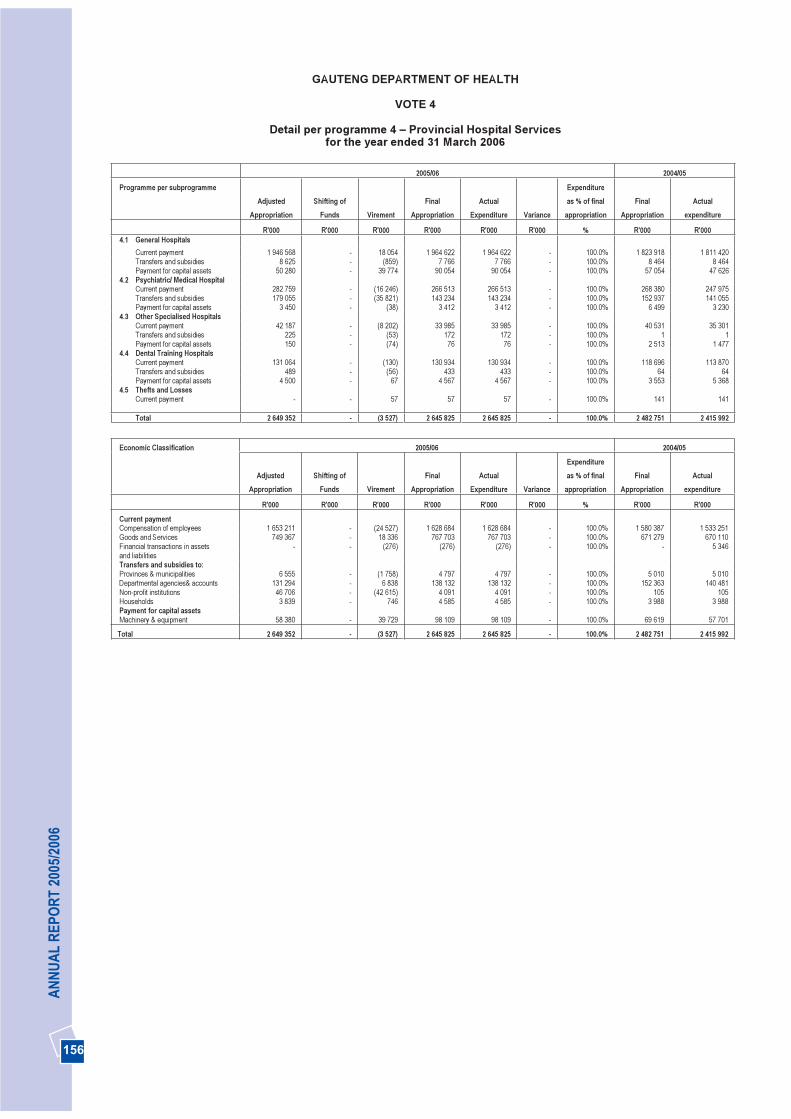
156
AN
NU
AL
REP
OR
T 20
05/2
006
GAUTENG DEPARTMENT OF HEALTH
VOTE 4
Detail per programme 4 – Provincial Hospital Services for the year ended 31 March 2006
2005/06 2004/05
Programme per subprogrammeAdjusted
Appropriation Shifting of
Funds VirementFinal
Appropriation Actual
Expenditure Variance
Expenditureas % of final
appropriation Final
Appropriation Actual
expenditure
R'000 R'000 R'000 R'000 R'000 R'000 % R'000 R'000 4.1 General Hospitals
Current payment 1 946 568 - 18 054 1 964 622 1 964 622 - 100.0% 1 823 918 1 811 420 Transfers and subsidies 8 625 - (859) 7 766 7 766 - 100.0% 8 464 8 464 Payment for capital assets 50 280 - 39 774 90 054 90 054 - 100.0% 57 054 47 626
4.2 Psychiatric/ Medical Hospital Current payment 282 759 - (16 246) 266 513 266 513 - 100.0% 268 380 247 975 Transfers and subsidies 179 055 - (35 821) 143 234 143 234 - 100.0% 152 937 141 055 Payment for capital assets 3 450 - (38) 3 412 3 412 - 100.0% 6 499 3 230
4.3 Other Specialised Hospitals Current payment 42 187 - (8 202) 33 985 33 985 - 100.0% 40 531 35 301 Transfers and subsidies 225 - (53) 172 172 - 100.0% 1 1 Payment for capital assets 150 - (74) 76 76 - 100.0% 2 513 1 477
4.4 Dental Training HospitalsCurrent payment 131 064 - (130) 130 934 130 934 - 100.0% 118 696 113 870 Transfers and subsidies 489 - (56) 433 433 - 100.0% 64 64 Payment for capital assets 4 500 - 67 4 567 4 567 - 100.0% 3 553 5 368
4.5 Thefts and LossesCurrent payment - - 57 57 57 - 100.0% 141 141
Total 2 649 352 - (3 527) 2 645 825 2 645 825 - 100.0% 2 482 751 2 415 992
2005/06 2004/05 Economic Classification
AdjustedAppropriation
Shifting of Funds Virement
Final Appropriation
Actual Expenditure Variance
Expenditureas % of final
appropriation Final
Appropriation Actual
expenditure
R'000 R'000 R'000 R'000 R'000 R'000 % R'000 R'000
Current paymentCompensation of employees 1 653 211 - (24 527) 1 628 684 1 628 684 - 100.0% 1 580 387 1 533 251 Goods and Services 749 367 - 18 336 767 703 767 703 - 100.0% 671 279 670 110 Financial transactions in assets - - (276) (276) (276) - 100.0% - 5 346 and liabilities Transfers and subsidies to:Provinces & municipalities 6 555 - (1 758) 4 797 4 797 - 100.0% 5 010 5 010 Departmental agencies& accounts 131 294 - 6 838 138 132 138 132 - 100.0% 152 363 140 481 Non-profit institutions 46 706 - (42 615) 4 091 4 091 - 100.0% 105 105 Households 3 839 - 746 4 585 4 585 - 100.0% 3 988 3 988 Payment for capital assets Machinery & equipment 58 380 - 39 729 98 109 98 109 - 100.0% 69 619 57 701
Total 2 649 352 - (3 527) 2 645 825 2 645 825 - 100.0% 2 482 751 2 415 992
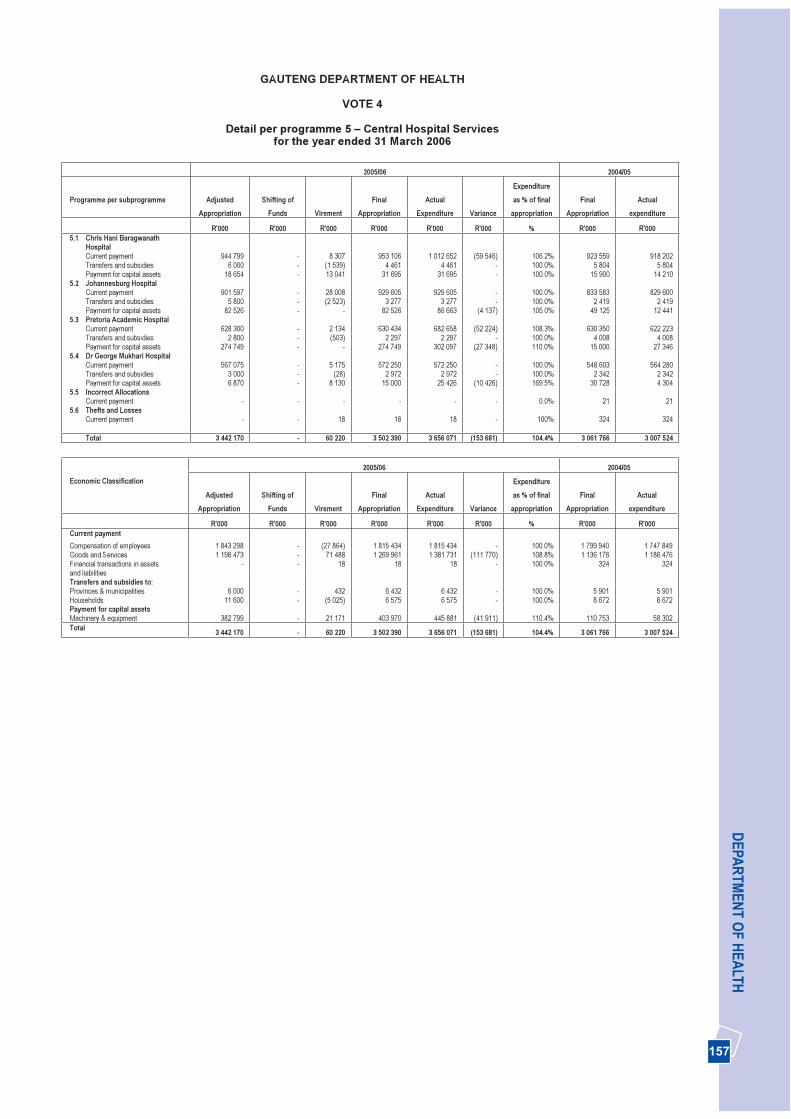
157
DEPA
RTM
ENT O
F HEA
LTH
GAUTENG DEPARTMENT OF HEALTH
VOTE 4
Detail per programme 5 – Central Hospital Services for the year ended 31 March 2006
2005/06 2004/05
Programme per subprogramme AdjustedAppropriation
Shifting of Funds Virement
Final Appropriation
Actual Expenditure Variance
Expenditureas % of final
appropriation Final
Appropriation Actual
expenditure
R'000 R'000 R'000 R'000 R'000 R'000 % R'000 R'000 5.1 Chris Hani Baragwanath
Hospital Current payment 944 799 - 8 307 953 106 1 012 652 (59 546) 106.2% 923 559 918 202 Transfers and subsidies 6 000 - (1 539) 4 461 4 461 - 100.0% 5 804 5 804 Payment for capital assets 18 654 - 13 041 31 695 31 695 - 100.0% 15 900 14 210
5.2 Johannesburg HospitalCurrent payment 901 597 - 28 008 929 605 929 605 - 100.0% 833 583 829 600 Transfers and subsidies 5 800 - (2 523) 3 277 3 277 - 100.0% 2 419 2 419 Payment for capital assets 82 526 - - 82 526 86 663 (4 137) 105.0% 49 125 12 441
5.3 Pretoria Academic Hospital Current payment 628 300 - 2 134 630 434 682 658 (52 224) 108.3% 630 350 622 223 Transfers and subsidies 2 800 - (503) 2 297 2 297 - 100.0% 4 008 4 008 Payment for capital assets 274 749 - - 274 749 302 097 (27 348) 110.0% 15 000 27 346
5.4 Dr George Mukhari HospitalCurrent payment 567 075 - 5 175 572 250 572 250 - 100.0% 548 603 564 280 Transfers and subsidies 3 000 - (28) 2 972 2 972 - 100.0% 2 342 2 342 Payment for capital assets 6 870 - 8 130 15 000 25 426 (10 426) 169.5% 30 728 4 304
5.5 Incorrect AllocationsCurrent payment - - - - - - 0.0% 21 21
5.6 Thefts and LossesCurrent payment - - 18 18 18 - 100% 324 324
Total 3 442 170 - 60 220 3 502 390 3 656 071 (153 681) 104.4% 3 061 766 3 007 524
2005/06 2004/05 Economic Classification
AdjustedAppropriation
Shifting of Funds Virement
Final Appropriation
Actual Expenditure Variance
Expenditureas % of final
appropriation Final
Appropriation Actual
expenditure
R'000 R'000 R'000 R'000 R'000 R'000 % R'000 R'000 Current paymentCompensation of employees 1 843 298 - (27 864) 1 815 434 1 815 434 - 100.0% 1 799 940 1 747 849 Goods and Services 1 198 473 - 71 488 1 269 961 1 381 731 (111 770) 108.8% 1 136 176 1 186 476 Financial transactions in assets - - 18 18 18 - 100.0% 324 324 and liabilities Transfers and subsidies to:Provinces & municipalities 6 000 - 432 6 432 6 432 - 100.0% 5 901 5 901 Households 11 600 - (5 025) 6 575 6 575 - 100.0% 8 672 8 672 Payment for capital assets Machinery & equipment 382 799 - 21 171 403 970 445 881 (41 911) 110.4% 110 753 58 302 Total 3 442 170 - 60 220 3 502 390 3 656 071 (153 681) 104.4% 3 061 766 3 007 524

158
AN
NU
AL
REP
OR
T 20
05/2
006
GAUTENG DEPARTMENT OF HEALTH
VOTE 4
Detail per programme 6 – Health Training and Sciences for the year ended 31 March 2006
2005/06 2004/05
Programme per subprogramme AdjustedAppropriation
Shifting of Funds Virement
Final Appropriation
Actual Expenditure Variance
Expenditureas % of final
appropriation Final
Appropriation Actual
expenditure
R'000 R'000 R'000 R'000 R'000 R'000 % R'000 R'000 6.1 Nurse Training Colleges
Current payment 189 162 - (17 384) 171 778 171 778 - 100.0% 158 087 155 302 Transfers and subsidies 550 - 77 627 627 - 100.0% 1 723 738 Payment for capital assets 2 250 - (710) 1 540 1 540 - 100.0% 5 779 2 001
6.2 EMS Training collegeCurrent payment 4 708 - (1 483) 3 225 3 225 - 100.0% 2 771 2 771 Transfers and subsidies 2 - 5 7 7 - 100.0% 45 45 Payment for capital assets 700 - (22) 678 678 - 100.0% 450 508
6.3 Bursaries Current payment 4 400 - (2 322) 2 078 2 078 - 100.0% 2 124 2 124 Transfers and subsidies 6 600 - 2 022 8 622 8 622 - 100.0% 8 275 8 275
6.4 Primary Health CareCurrent payment - - - - - - 0.0% 21 21 Transfers and subsidies - - - - - - 0.0% - (16)
6.5 Other TrainingCurrent payment 16 106 - 15 264 31 370 31 370 - 100.0% 14 600 16 587 Transfers and subsidies 654 - 189 843 843 - 100.0% 600 598 Payment for capital assets 100 - (50) 50 50 - 100.0% 400 87
Total 225 232 - (4 414) 220 818 220 818 - 100.0% 194 875 189 041
2005/06 2004/05 Economic Classification
AdjustedAppropriation
Shifting of Funds Virement
Final Appropriation
Actual Expenditure Variance
Expenditureas % of final
appropriation Final
Appropriation Actual
expenditure
R'000 R'000 R'000 R'000 R'000 R'000 % R'000 R'000 Current paymentCompensation of employees 189 164 - (4 168) 184 996 184 996 - 100.0% 151 720 150 923 Goods and Services 25 212 - (1 757) 23 455 23 455 - 100.0% 25 883 25 883 Transfers and subsidies to:Provinces & municipalities 540 - 28 568 630 (62) 110.9% 510 487 Universities & technikons 650 - - 650 588 62 90.5% 597 597 Households 6 616 - 2 265 8 881 8 881 - 100.0% 9 536 8 556 Payment for capital assets Machinery & equipment 3 050 - (782) 2 268 2 268 - 100.0% 6 629 2 595
Total 225 232 - (4 414) 220 818 220 818 - 100.0% 194 875 189 041
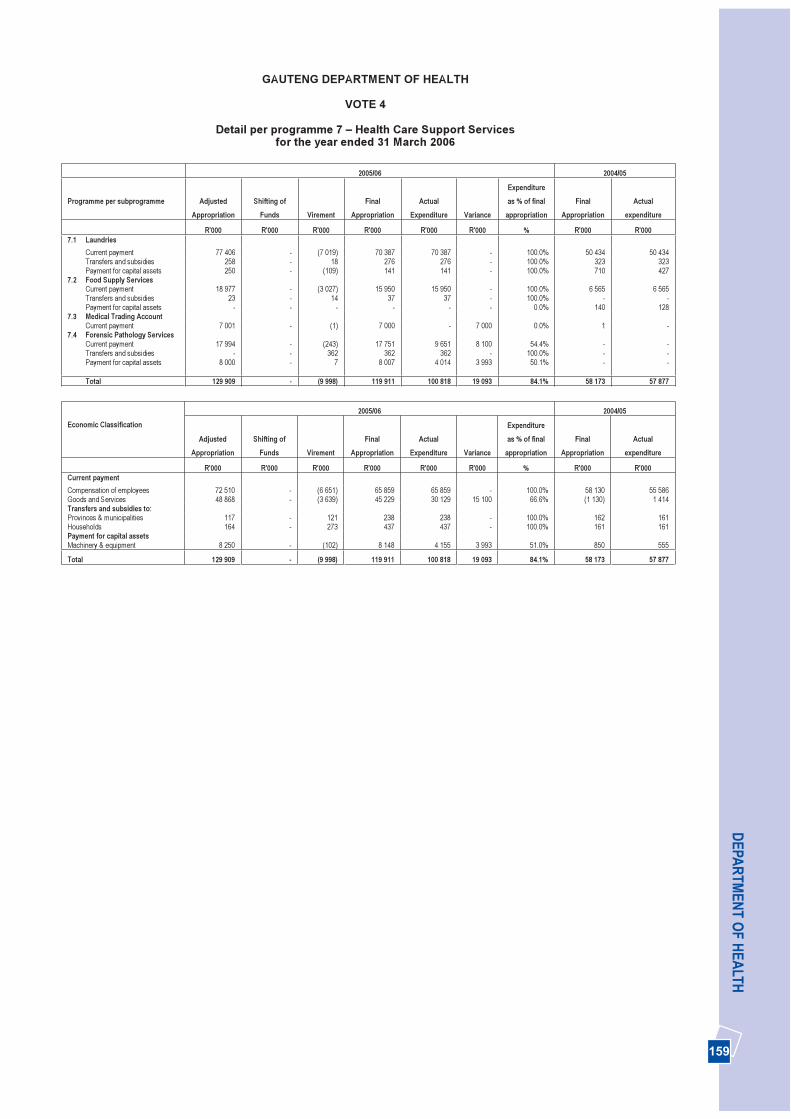
159
DEPA
RTM
ENT O
F HEA
LTH
GAUTENG DEPARTMENT OF HEALTH
VOTE 4
Detail per programme 7 – Health Care Support Services for the year ended 31 March 2006
2005/06 2004/05
Programme per subprogramme AdjustedAppropriation
Shifting of Funds Virement
Final Appropriation
Actual Expenditure Variance
Expenditureas % of final
appropriation Final
Appropriation Actual
expenditure
R'000 R'000 R'000 R'000 R'000 R'000 % R'000 R'000 7.1 Laundries
Current payment 77 406 - (7 019) 70 387 70 387 - 100.0% 50 434 50 434 Transfers and subsidies 258 - 18 276 276 - 100.0% 323 323 Payment for capital assets 250 - (109) 141 141 - 100.0% 710 427
7.2 Food Supply Services Current payment 18 977 - (3 027) 15 950 15 950 - 100.0% 6 565 6 565 Transfers and subsidies 23 - 14 37 37 - 100.0% - -Payment for capital assets - - - - - - 0.0% 140 128
7.3 Medical Trading Account Current payment 7 001 - (1) 7 000 - 7 000 0.0% 1 -
7.4 Forensic Pathology ServicesCurrent payment 17 994 - (243) 17 751 9 651 8 100 54.4% - -Transfers and subsidies - - 362 362 362 - 100.0% - -Payment for capital assets 8 000 - 7 8 007 4 014 3 993 50.1% - -
Total 129 909 - (9 998) 119 911 100 818 19 093 84.1% 58 173 57 877
2005/06 2004/05 Economic Classification
AdjustedAppropriation
Shifting of Funds Virement
Final Appropriation
Actual Expenditure Variance
Expenditureas % of final
appropriation Final
Appropriation Actual
expenditure
R'000 R'000 R'000 R'000 R'000 R'000 % R'000 R'000 Current paymentCompensation of employees 72 510 - (6 651) 65 859 65 859 - 100.0% 58 130 55 586 Goods and Services 48 868 - (3 639) 45 229 30 129 15 100 66.6% (1 130) 1 414 Transfers and subsidies to:Provinces & municipalities 117 - 121 238 238 - 100.0% 162 161 Households 164 - 273 437 437 - 100.0% 161 161 Payment for capital assets Machinery & equipment 8 250 - (102) 8 148 4 155 3 993 51.0% 850 555
Total 129 909 - (9 998) 119 911 100 818 19 093 84.1% 58 173 57 877
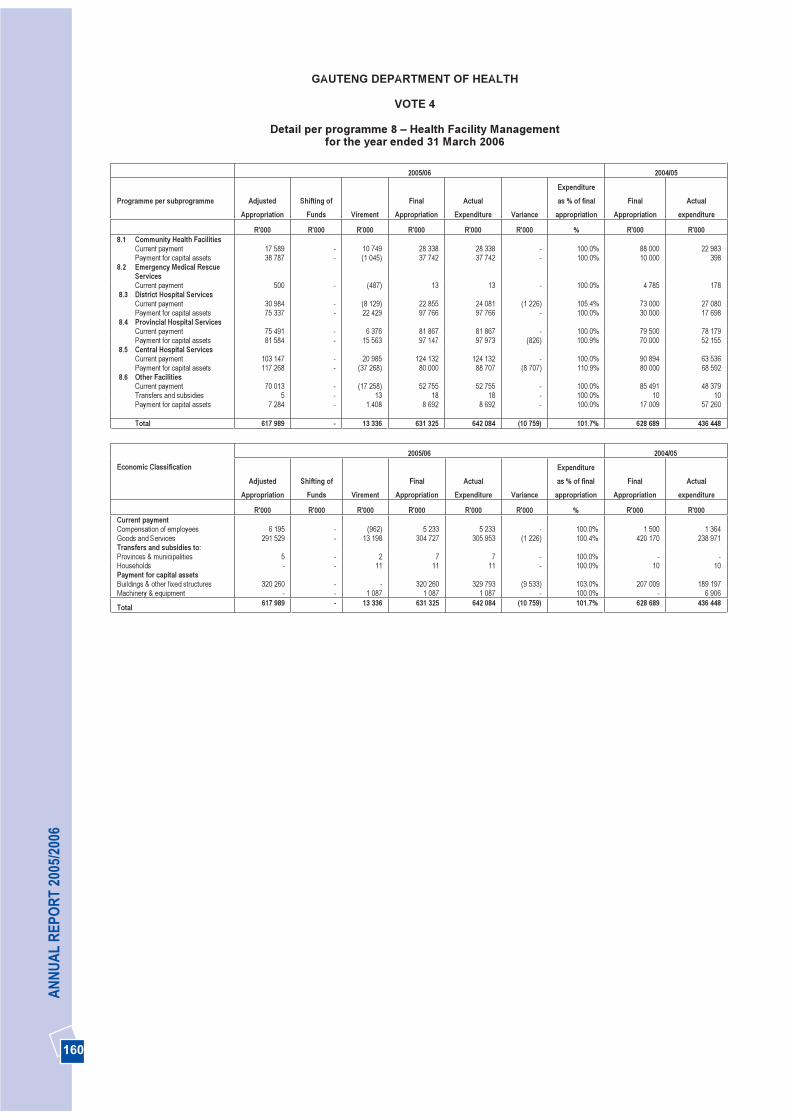
160
AN
NU
AL
REP
OR
T 20
05/2
006
GAUTENG DEPARTMENT OF HEALTH
VOTE 4
Detail per programme 8 – Health Facility Management for the year ended 31 March 2006
2005/06 2004/05
Programme per subprogramme AdjustedAppropriation
Shifting of Funds Virement
Final Appropriation
Actual Expenditure Variance
Expenditureas % of final
appropriation Final
Appropriation Actual
expenditure
R'000 R'000 R'000 R'000 R'000 R'000 % R'000 R'000 8.1 Community Health Facilities
Current payment 17 589 - 10 749 28 338 28 338 - 100.0% 88 000 22 983 Payment for capital assets 38 787 - (1 045) 37 742 37 742 - 100.0% 10 000 398
8.2 Emergency Medical Rescue Services Current payment 500 - (487) 13 13 - 100.0% 4 785 178
8.3 District Hospital Services Current payment 30 984 - (8 129) 22 855 24 081 (1 226) 105.4% 73 000 27 080 Payment for capital assets 75 337 - 22 429 97 766 97 766 - 100.0% 30 000 17 698
8.4 Provincial Hospital ServicesCurrent payment 75 491 - 6 376 81 867 81 867 - 100.0% 79 500 78 179 Payment for capital assets 81 584 - 15 563 97 147 97 973 (826) 100.9% 70 000 52 155
8.5 Central Hospital ServicesCurrent payment 103 147 - 20 985 124 132 124 132 - 100.0% 90 894 63 536 Payment for capital assets 117 268 - (37 268) 80 000 88 707 (8 707) 110.9% 80 000 68 592
8.6 Other FacilitiesCurrent payment 70 013 - (17 258) 52 755 52 755 - 100.0% 85 491 48 379 Transfers and subsidies 5 - 13 18 18 - 100.0% 10 10 Payment for capital assets 7 284 - 1.408 8 692 8 692 - 100.0% 17 009 57 260
Total 617 989 - 13 336 631 325 642 084 (10 759) 101.7% 628 689 436 448
2005/06 2004/05 Economic Classification
AdjustedAppropriation
Shifting of Funds Virement
Final Appropriation
Actual Expenditure Variance
Expenditureas % of final
appropriation Final
Appropriation Actual
expenditure
R'000 R'000 R'000 R'000 R'000 R'000 % R'000 R'000 Current paymentCompensation of employees 6 195 - (962) 5 233 5 233 - 100.0% 1 500 1 364 Goods and Services 291 529 - 13 198 304 727 305 953 (1 226) 100.4% 420 170 238 971 Transfers and subsidies to:Provinces & municipalities 5 - 2 7 7 - 100.0% - -Households - - 11 11 11 - 100.0% 10 10 Payment for capital assets Buildings & other fixed structures 320 260 - - 320 260 329 793 (9 533) 103.0% 207 009 189 197 Machinery & equipment - - 1 087 1 087 1 087 - 100.0% - 6 906
Total 617 989 - 13 336 631 325 642 084 (10 759) 101.7% 628 689 436 448
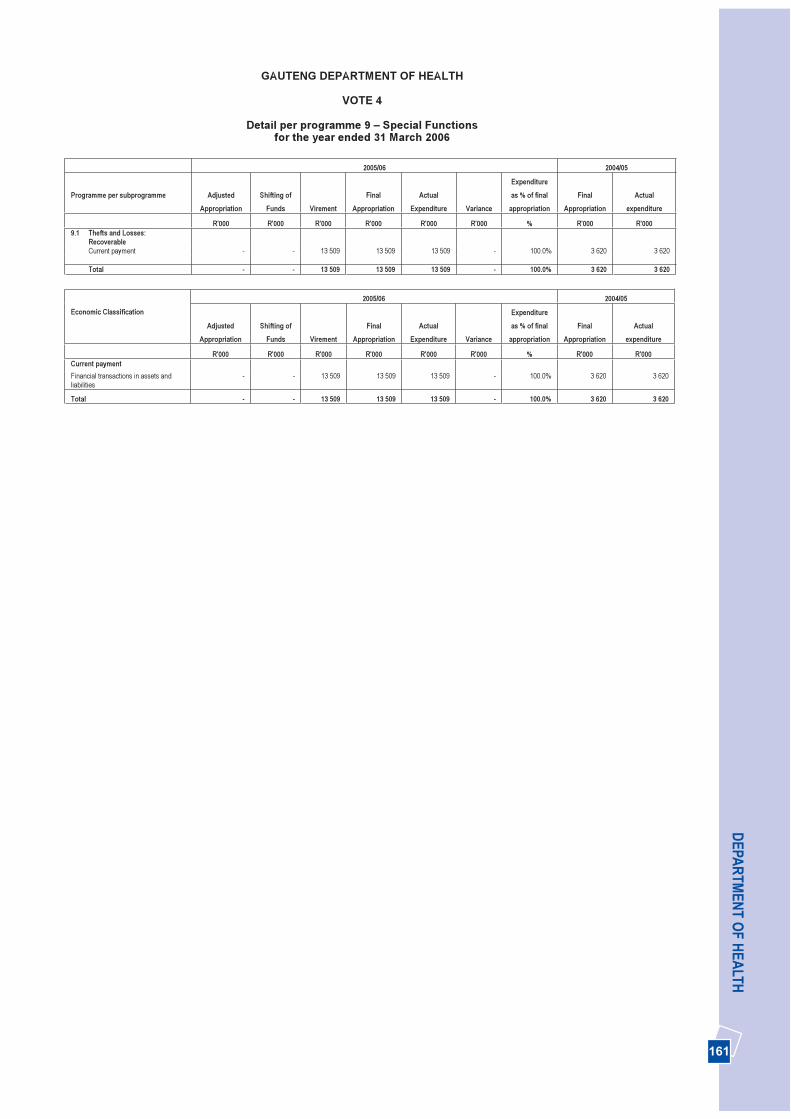
161
DEPA
RTM
ENT O
F HEA
LTHGAUTENG DEPARTMENT OF HEALTH
VOTE 4
Detail per programme 9 – Special Functionsfor the year ended 31 March 2006
2005/06 2004/05
Programme per subprogramme AdjustedAppropriation
Shifting of Funds Virement
Final Appropriation
Actual Expenditure Variance
Expenditureas % of final
appropriation Final
Appropriation Actual
expenditure
R'000 R'000 R'000 R'000 R'000 R'000 % R'000 R'000 9.1 Thefts and Losses:
Recoverable Current payment - - 13 509 13 509 13 509 - 100.0% 3 620 3 620
Total - - 13 509 13 509 13 509 - 100.0% 3 620 3 620
2005/06 2004/05 Economic Classification
AdjustedAppropriation
Shifting of Funds Virement
Final Appropriation
Actual Expenditure Variance
Expenditureas % of final
appropriation Final
Appropriation Actual
expenditure
R'000 R'000 R'000 R'000 R'000 R'000 % R'000 R'000 Current paymentFinancial transactions in assets and liabilities
- - 13 509 13 509 13 509 - 100.0% 3 620 3 620
Total - - 13 509 13 509 13 509 - 100.0% 3 620 3 620

162
AN
NU
AL
REP
OR
T 20
05/2
006
GAUTENG DEPARTMENT OF HEALTH
VOTE 4
Detail per programme 10 – Internal Charges for the year ended 31 March 2006
2005/06 2004/05
Programme per subprogramme AdjustedAppropriation
Shifting of Funds Virement
Final Appropriation
Actual Expenditure Variance
Expenditureas % of final
appropriation Final
Appropriation Actual
expenditure
R'000 R'000 R'000 R'000 R'000 R'000 % R'000 R'000 10.1 Internal Charges
Current payment (26 500) - (772) (27 272) (27 272) - 100.0% - -
Total (26 500) - (772) (27 272) (27 272) - 100.0% - -
2005/06 2004/05 Economic Classification
AdjustedAppropriation
Shifting of Funds Virement
Final Appropriation
Actual Expenditure Variance
Expenditureas % of final
appropriation Final
Appropriation Actual
expenditure
R'000 R'000 R'000 R'000 R'000 R'000 % R'000 R'000 Current paymentGoods and Services (26 500) - (772) (27 272) (27 272) - 100.0% - -
Total (26 500) - (772) (27 272) (27 272) - 100.0% - -
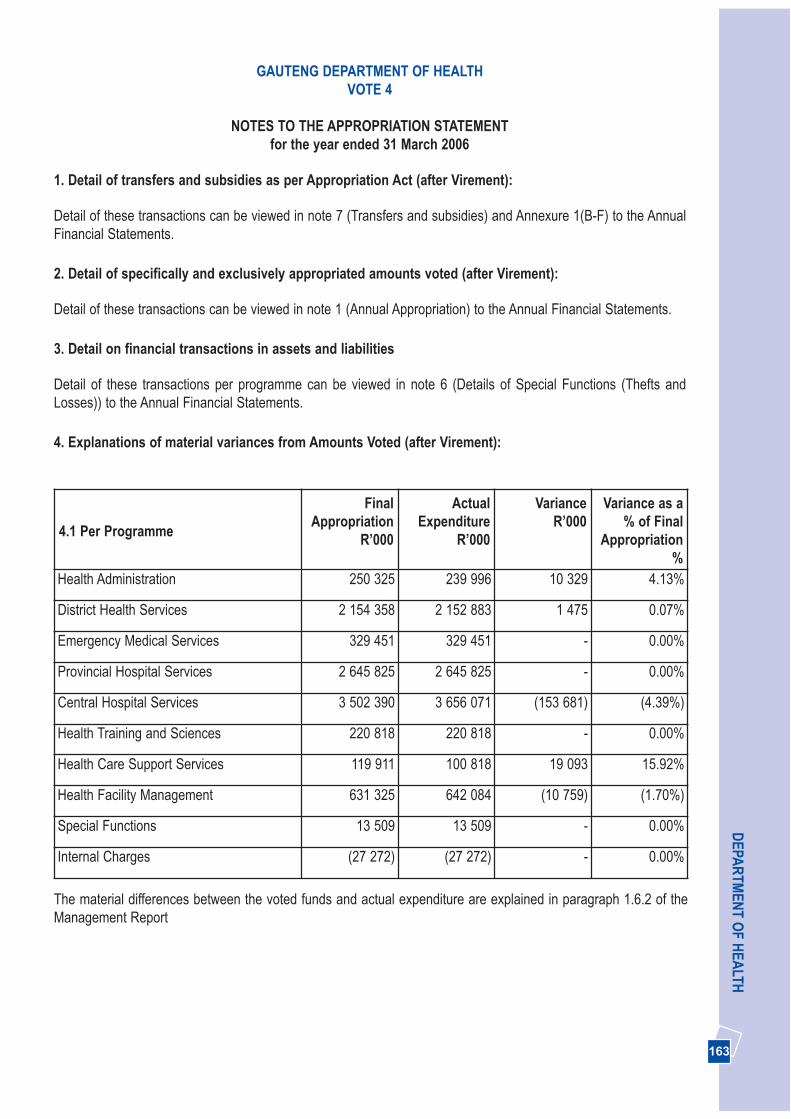
163
DEPA
RTM
ENT O
F HEA
LTHGAUTENG DEPARTMENT OF HEALTH
VOTE 4
NOTES TO THE APPROPRIATION STATEMENTfor the year ended 31 March 2006
1. Detail of transfers and subsidies as per Appropriation Act (after Virement):
Detail of these transactions can be viewed in note 7 (Transfers and subsidies) and Annexure 1(B-F) to the AnnualFinancial Statements.
2. Detail of specifically and exclusively appropriated amounts voted (after Virement):
Detail of these transactions can be viewed in note 1 (Annual Appropriation) to the Annual Financial Statements.
3. Detail on financial transactions in assets and liabilities
Detail of these transactions per programme can be viewed in note 6 (Details of Special Functions (Thefts andLosses)) to the Annual Financial Statements.
4. Explanations of material variances from Amounts Voted (after Virement):
4.1 Per Programme
FinalAppropriation
R’000
ActualExpenditure
R’000
VarianceR’000
Variance as a% of Final
Appropriation%
Health Administration 250 325 239 996 10 329 4.13%
District Health Services 2 154 358 2 152 883 1 475 0.07%
Emergency Medical Services 329 451 329 451 - 0.00%
Provincial Hospital Services 2 645 825 2 645 825 - 0.00%
Central Hospital Services 3 502 390 3 656 071 (153 681) (4.39%)
Health Training and Sciences 220 818 220 818 - 0.00%
Health Care Support Services 119 911 100 818 19 093 15.92%
Health Facility Management 631 325 642 084 (10 759) (1.70%)
Special Functions 13 509 13 509 - 0.00%
Internal Charges (27 272) (27 272) - 0.00%
The material differences between the voted funds and actual expenditure are explained in paragraph 1.6.2 of theManagement Report
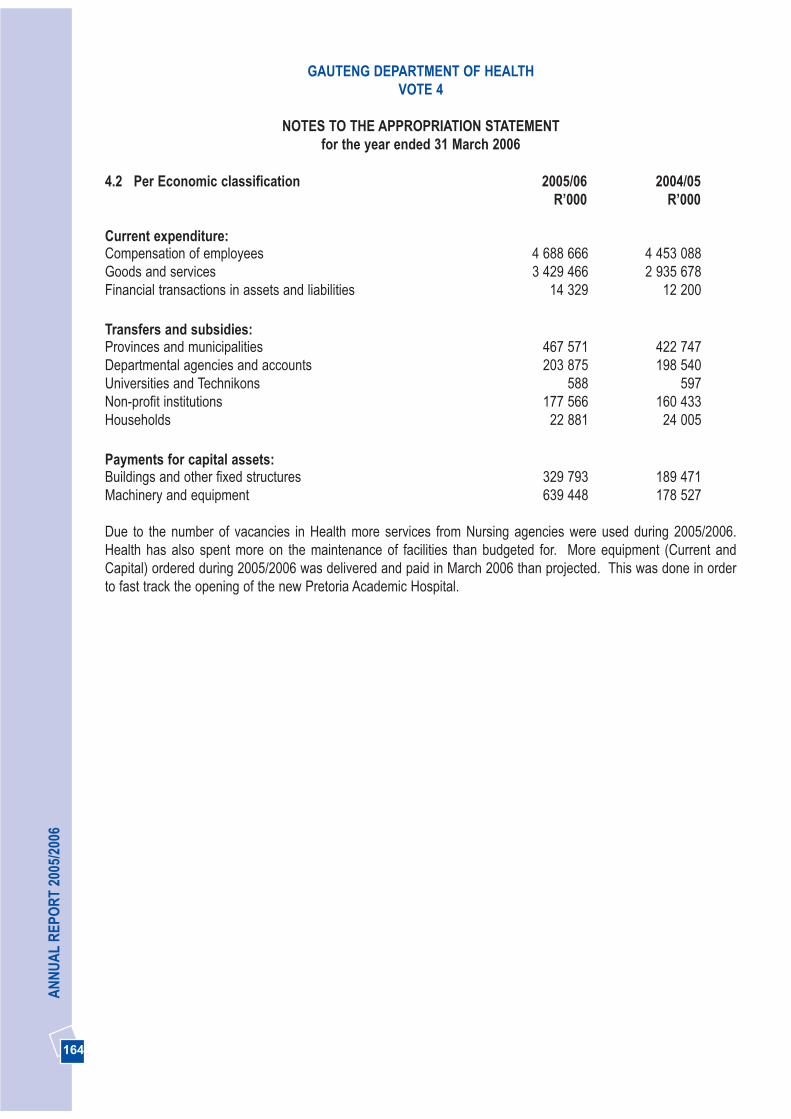
164
AN
NU
AL
REP
OR
T 20
05/2
006
4.2 Per Economic classification 2005/06 2004/05R’000 R’000
Current expenditure:Compensation of employees 4 688 666 4 453 088Goods and services 3 429 466 2 935 678Financial transactions in assets and liabilities 14 329 12 200
Transfers and subsidies:Provinces and municipalities 467 571 422 747Departmental agencies and accounts 203 875 198 540Universities and Technikons 588 597Non-profit institutions 177 566 160 433Households 22 881 24 005
Payments for capital assets:Buildings and other fixed structures 329 793 189 471Machinery and equipment 639 448 178 527
Due to the number of vacancies in Health more services from Nursing agencies were used during 2005/2006.Health has also spent more on the maintenance of facilities than budgeted for. More equipment (Current andCapital) ordered during 2005/2006 was delivered and paid in March 2006 than projected. This was done in orderto fast track the opening of the new Pretoria Academic Hospital.
GAUTENG DEPARTMENT OF HEALTHVOTE 4
NOTES TO THE APPROPRIATION STATEMENTfor the year ended 31 March 2006
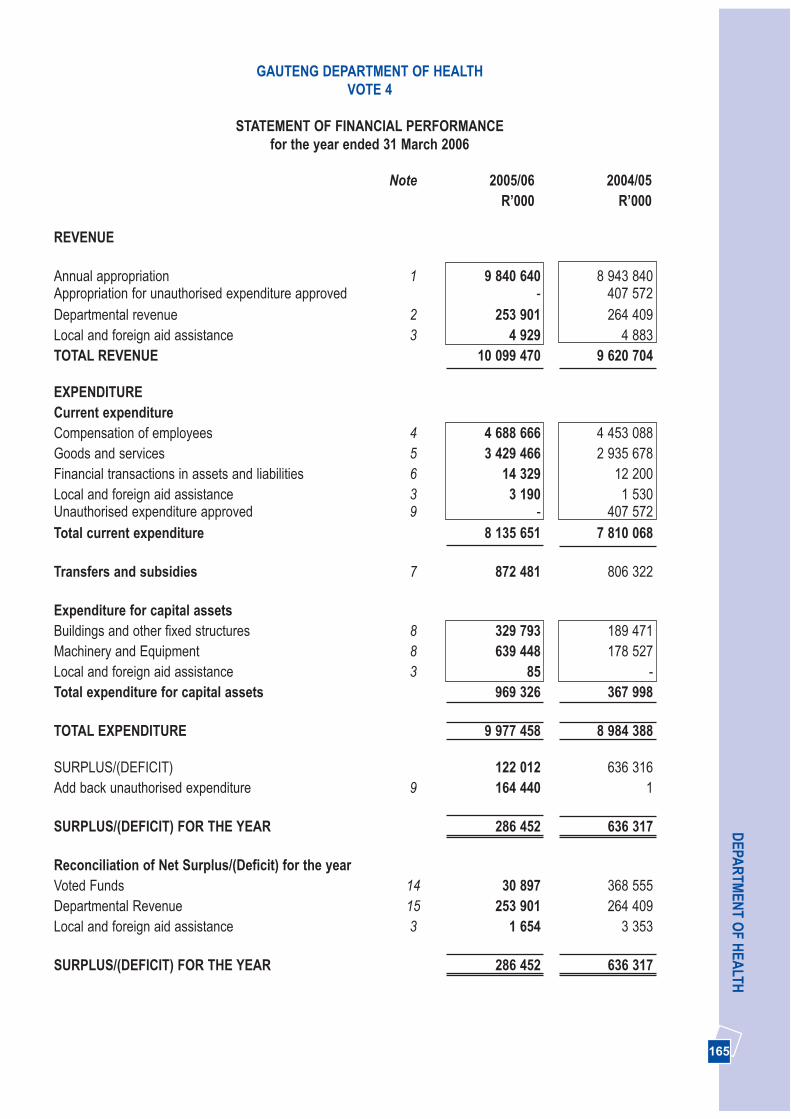
165
DEPA
RTM
ENT O
F HEA
LTH
Note 2005/06 2004/05R’000 R’000
REVENUE
Annual appropriation 1 9 840 640 8 943 840Appropriation for unauthorised expenditure approved - 407 572Departmental revenue 2 253 901 264 409Local and foreign aid assistance 3 4 929 4 883TOTAL REVENUE 10 099 470 9 620 704
EXPENDITURECurrent expenditureCompensation of employees 4 4 688 666 4 453 088Goods and services 5 3 429 466 2 935 678Financial transactions in assets and liabilities 6 14 329 12 200Local and foreign aid assistance 3 3 190 1 530Unauthorised expenditure approved 9 - 407 572Total current expenditure 8 135 651 7 810 068
Transfers and subsidies 7 872 481 806 322
Expenditure for capital assetsBuildings and other fixed structures 8 329 793 189 471Machinery and Equipment 8 639 448 178 527Local and foreign aid assistance 3 85 -Total expenditure for capital assets 969 326 367 998
TOTAL EXPENDITURE 9 977 458 8 984 388
SURPLUS/(DEFICIT) 122 012 636 316Add back unauthorised expenditure 9 164 440 1
SURPLUS/(DEFICIT) FOR THE YEAR 286 452 636 317
Reconciliation of Net Surplus/(Deficit) for the yearVoted Funds 14 30 897 368 555Departmental Revenue 15 253 901 264 409Local and foreign aid assistance 3 1 654 3 353
SURPLUS/(DEFICIT) FOR THE YEAR 286 452 636 317
GAUTENG DEPARTMENT OF HEALTHVOTE 4
STATEMENT OF FINANCIAL PERFORMANCEfor the year ended 31 March 2006

166
AN
NU
AL
REP
OR
T 20
05/2
006
GAUTENG DEPARTMENT OF HEALTHVOTE 4
STATEMENT OF FINANCIAL POSITIONfor the year ended 31 March 2006
Note 2005/06 2004/05R’000 R’000
ASSETS
Current assets 437 943 498 547Unauthorised expenditure 9 324 440 160 000Cash and cash equivalents 10 16 372 275 227Prepayments and advances 11 903 12 676Receivables 12 96 228 50 644
Non Current assetsInvestments 13 54 000 54 000
TOTAL ASSETS 491 943 552 547
LIABILITIES
Current liabilities 437 943 498 547Voted funds to be surrendered to the Revenue Fund 14 30 897 368 555Departmental revenue to be surrendered to the 15 22 596 79 053Revenue FundBank overdraft 16 357 308 -Payables 17 25 488 47 586Local and foreign aid assistance unutilised 3 1 654 3 353
TOTAL LIABILITIES 437 943 498 547
NET ASSETS 54 000 54 000
Represented by:Capitalisation Reserves 54 000 54 000
TOTAL 54 000 54 000
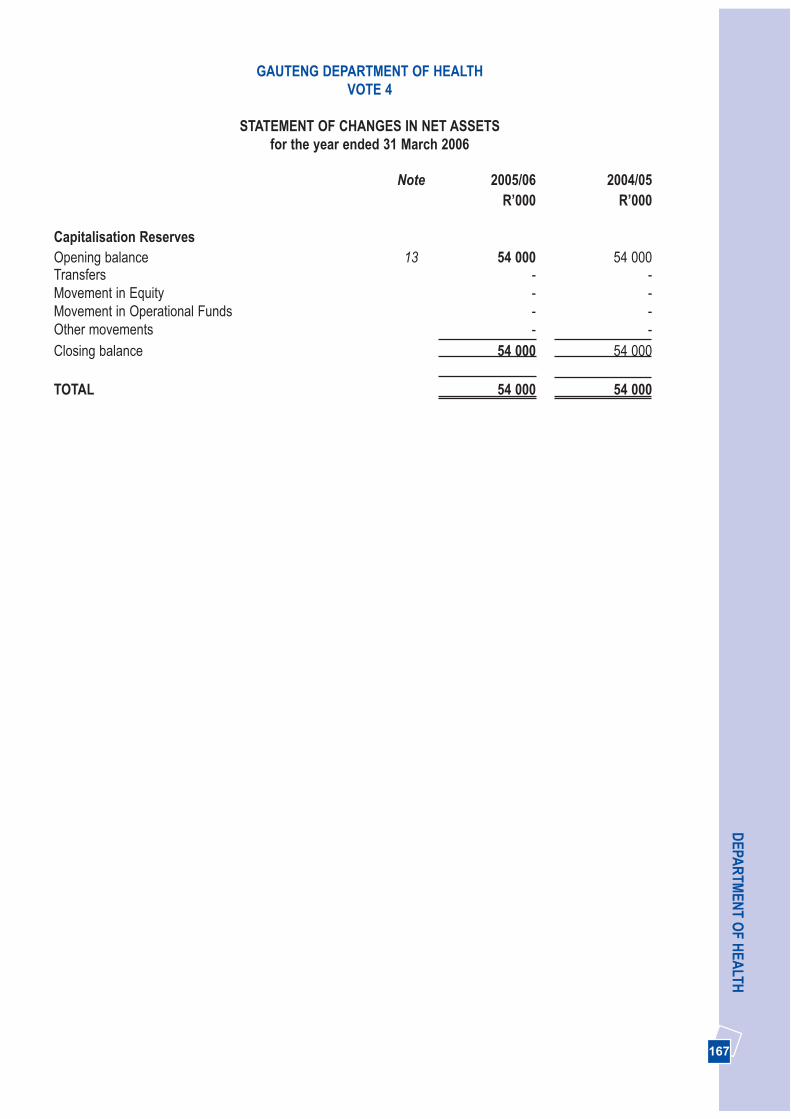
167
DEPA
RTM
ENT O
F HEA
LTH
Note 2005/06 2004/05R’000 R’000
Capitalisation ReservesOpening balance 13 54 000 54 000Transfers - -Movement in Equity - -Movement in Operational Funds - -Other movements - -Closing balance 54 000 54 000
TOTAL 54 000 54 000
GAUTENG DEPARTMENT OF HEALTHVOTE 4
STATEMENT OF CHANGES IN NET ASSETSfor the year ended 31 March 2006
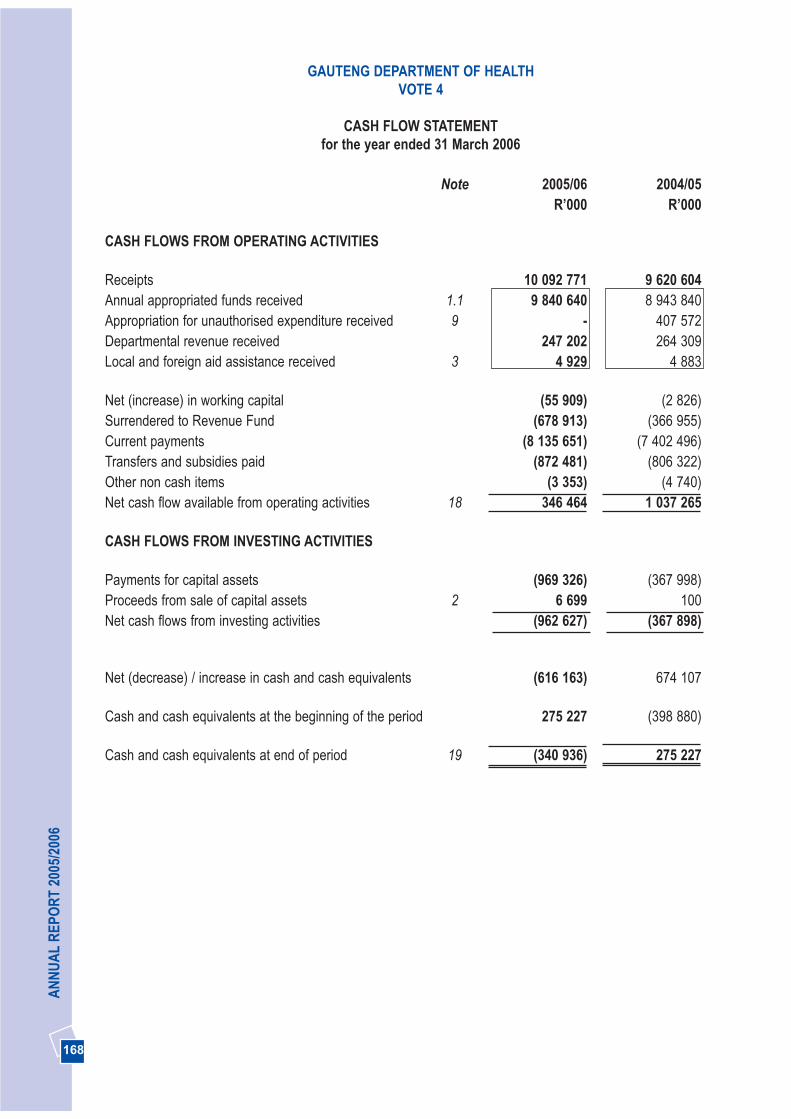
168
AN
NU
AL
REP
OR
T 20
05/2
006
GAUTENG DEPARTMENT OF HEALTHVOTE 4
CASH FLOW STATEMENT for the year ended 31 March 2006
Note 2005/06 2004/05R’000 R’000
CASH FLOWS FROM OPERATING ACTIVITIES
Receipts 10 092 771 9 620 604Annual appropriated funds received 1.1 9 840 640 8 943 840Appropriation for unauthorised expenditure received 9 - 407 572Departmental revenue received 247 202 264 309Local and foreign aid assistance received 3 4 929 4 883
Net (increase) in working capital (55 909) (2 826)Surrendered to Revenue Fund (678 913) (366 955)Current payments (8 135 651) (7 402 496)Transfers and subsidies paid (872 481) (806 322)Other non cash items (3 353) (4 740)Net cash flow available from operating activities 18 346 464 1 037 265
CASH FLOWS FROM INVESTING ACTIVITIES
Payments for capital assets (969 326) (367 998)Proceeds from sale of capital assets 2 6 699 100Net cash flows from investing activities (962 627) (367 898)
Net (decrease) / increase in cash and cash equivalents (616 163) 674 107
Cash and cash equivalents at the beginning of the period 275 227 (398 880)
Cash and cash equivalents at end of period 19 (340 936) 275 227
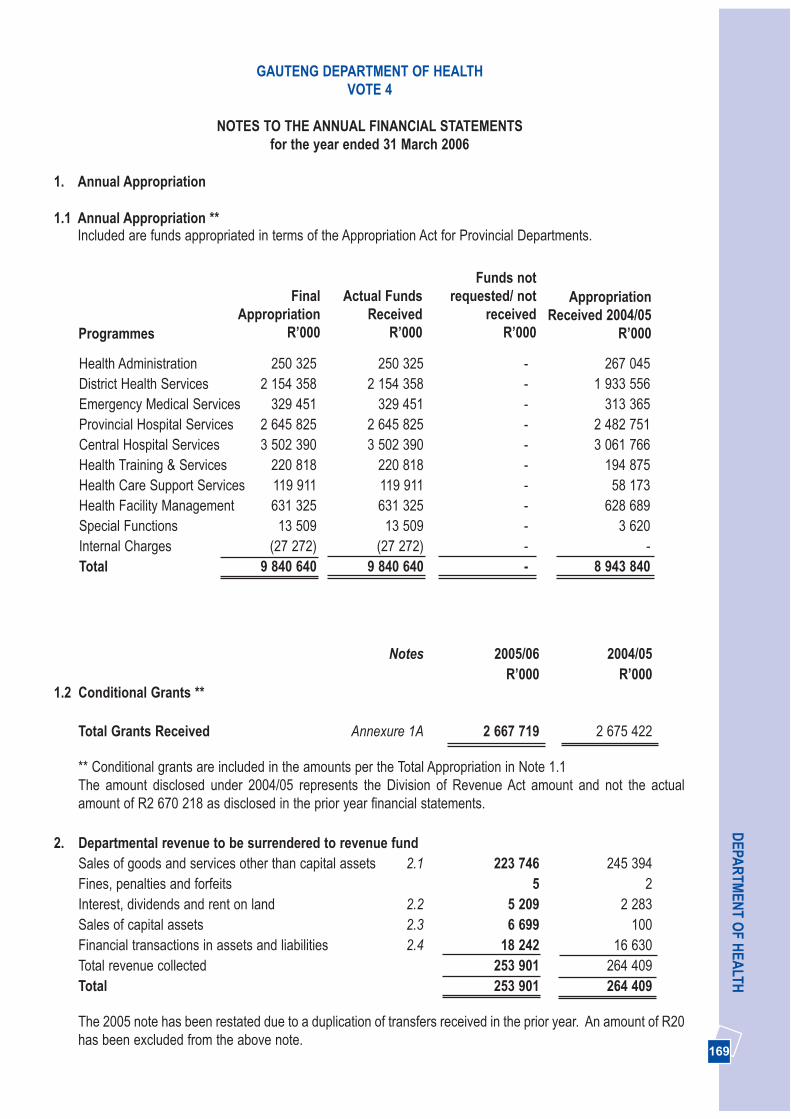
169
DEPA
RTM
ENT O
F HEA
LTH
Notes 2005/06 2004/05R’000 R’000
1.2 Conditional Grants **
Total Grants Received Annexure 1A 2 667 719 2 675 422
** Conditional grants are included in the amounts per the Total Appropriation in Note 1.1The amount disclosed under 2004/05 represents the Division of Revenue Act amount and not the actualamount of R2 670 218 as disclosed in the prior year financial statements.
2. Departmental revenue to be surrendered to revenue fundSales of goods and services other than capital assets 2.1 223 746 245 394Fines, penalties and forfeits 5 2Interest, dividends and rent on land 2.2 5 209 2 283Sales of capital assets 2.3 6 699 100Financial transactions in assets and liabilities 2.4 18 242 16 630Total revenue collected 253 901 264 409Total 253 901 264 409
The 2005 note has been restated due to a duplication of transfers received in the prior year. An amount of R20has been excluded from the above note.
GAUTENG DEPARTMENT OF HEALTHVOTE 4
NOTES TO THE ANNUAL FINANCIAL STATEMENTSfor the year ended 31 March 2006
Programmes
1. Annual Appropriation
1.1 Annual Appropriation **Included are funds appropriated in terms of the Appropriation Act for Provincial Departments.
Health Administration 250 325 250 325 - 267 045District Health Services 2 154 358 2 154 358 - 1 933 556Emergency Medical Services 329 451 329 451 - 313 365Provincial Hospital Services 2 645 825 2 645 825 - 2 482 751Central Hospital Services 3 502 390 3 502 390 - 3 061 766Health Training & Services 220 818 220 818 - 194 875Health Care Support Services 119 911 119 911 - 58 173Health Facility Management 631 325 631 325 - 628 689Special Functions 13 509 13 509 - 3 620Internal Charges (27 272) (27 272) - -Total 9 840 640 9 840 640 - 8 943 840
FinalAppropriation
R’000
Actual FundsReceived
R’000
Funds notrequested/ not
receivedR’000
AppropriationReceived 2004/05
R’000
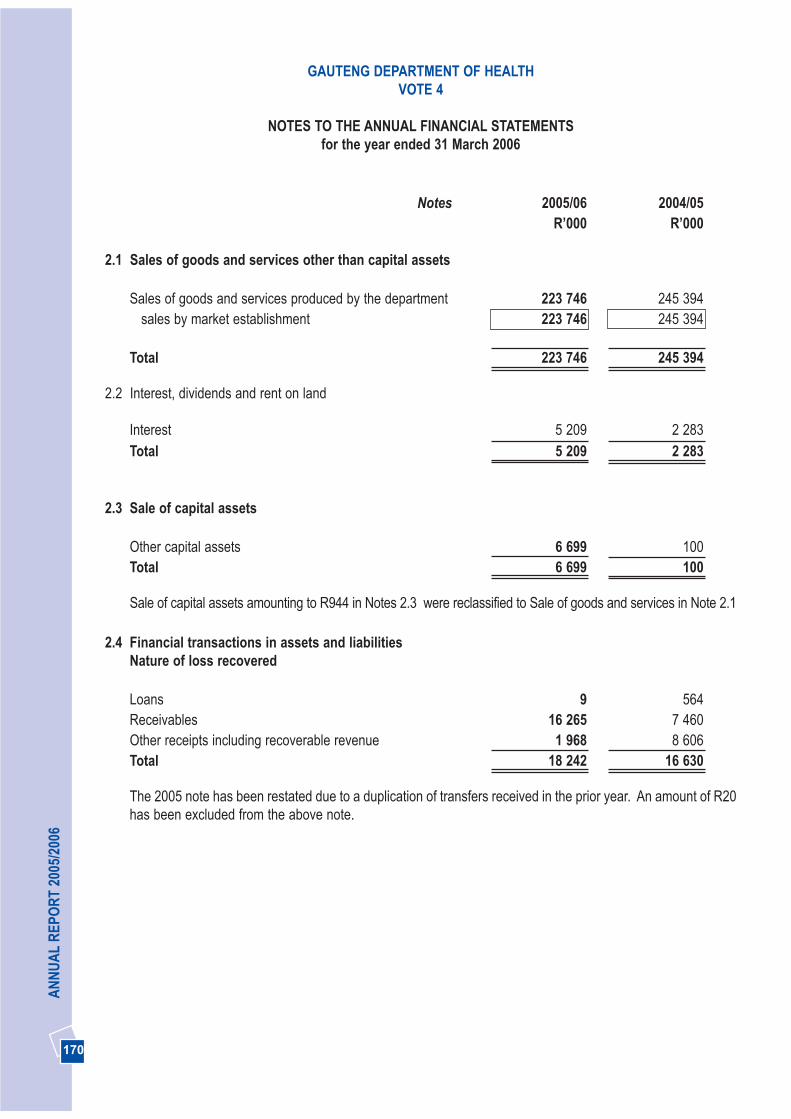
170
AN
NU
AL
REP
OR
T 20
05/2
006
GAUTENG DEPARTMENT OF HEALTHVOTE 4
NOTES TO THE ANNUAL FINANCIAL STATEMENTSfor the year ended 31 March 2006
Notes 2005/06 2004/05R’000 R’000
2.1 Sales of goods and services other than capital assets
Sales of goods and services produced by the department 223 746 245 394sales by market establishment 223 746 245 394
Total 223 746 245 394
2.2 Interest, dividends and rent on land
Interest 5 209 2 283Total 5 209 2 283
2.3 Sale of capital assets
Other capital assets 6 699 100Total 6 699 100
Sale of capital assets amounting to R944 in Notes 2.3 were reclassified to Sale of goods and services in Note 2.1
2.4 Financial transactions in assets and liabilities Nature of loss recovered
Loans 9 564Receivables 16 265 7 460Other receipts including recoverable revenue 1 968 8 606Total 18 242 16 630
The 2005 note has been restated due to a duplication of transfers received in the prior year. An amount of R20has been excluded from the above note.
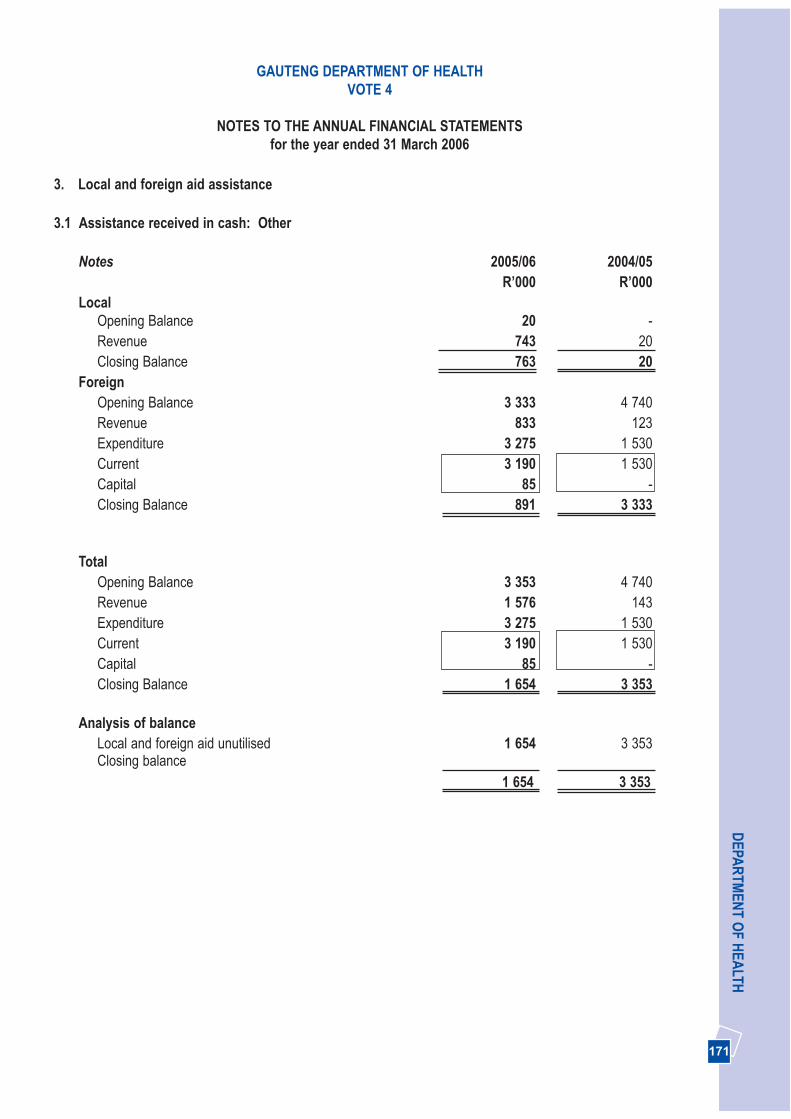
171
DEPA
RTM
ENT O
F HEA
LTH
3. Local and foreign aid assistance
3.1 Assistance received in cash: Other
Notes 2005/06 2004/05R’000 R’000
LocalOpening Balance 20 -Revenue 743 20Closing Balance 763 20
ForeignOpening Balance 3 333 4 740Revenue 833 123Expenditure 3 275 1 530Current 3 190 1 530Capital 85 -Closing Balance 891 3 333
TotalOpening Balance 3 353 4 740Revenue 1 576 143Expenditure 3 275 1 530Current 3 190 1 530Capital 85 -Closing Balance 1 654 3 353
Analysis of balanceLocal and foreign aid unutilised 1 654 3 353Closing balance
1 654 3 353
GAUTENG DEPARTMENT OF HEALTHVOTE 4
NOTES TO THE ANNUAL FINANCIAL STATEMENTSfor the year ended 31 March 2006
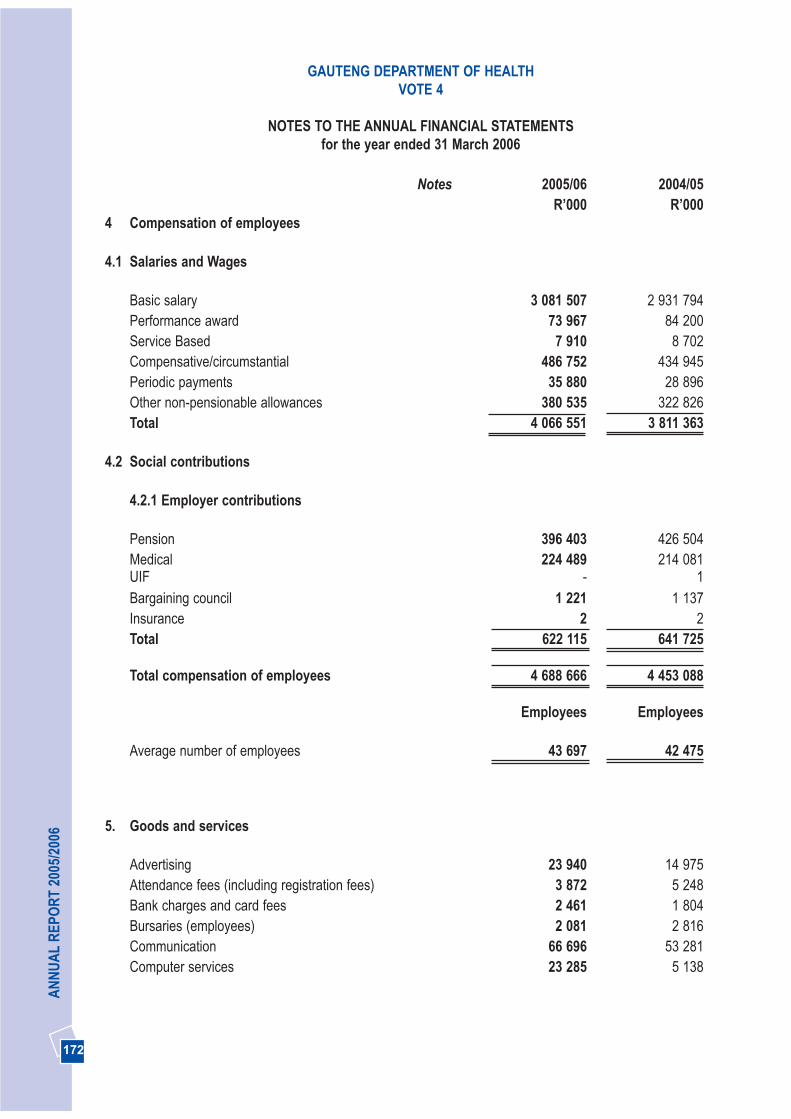
172
AN
NU
AL
REP
OR
T 20
05/2
006
GAUTENG DEPARTMENT OF HEALTHVOTE 4
NOTES TO THE ANNUAL FINANCIAL STATEMENTSfor the year ended 31 March 2006
Notes 2005/06 2004/05R’000 R’000
4 Compensation of employees
4.1 Salaries and Wages
Basic salary 3 081 507 2 931 794Performance award 73 967 84 200Service Based 7 910 8 702Compensative/circumstantial 486 752 434 945Periodic payments 35 880 28 896Other non-pensionable allowances 380 535 322 826Total 4 066 551 3 811 363
4.2 Social contributions
4.2.1 Employer contributions
Pension 396 403 426 504Medical 224 489 214 081UIF - 1Bargaining council 1 221 1 137Insurance 2 2Total 622 115 641 725
Total compensation of employees 4 688 666 4 453 088
Employees Employees
Average number of employees 43 697 42 475
5. Goods and services
Advertising 23 940 14 975Attendance fees (including registration fees) 3 872 5 248Bank charges and card fees 2 461 1 804Bursaries (employees) 2 081 2 816Communication 66 696 53 281Computer services 23 285 5 138
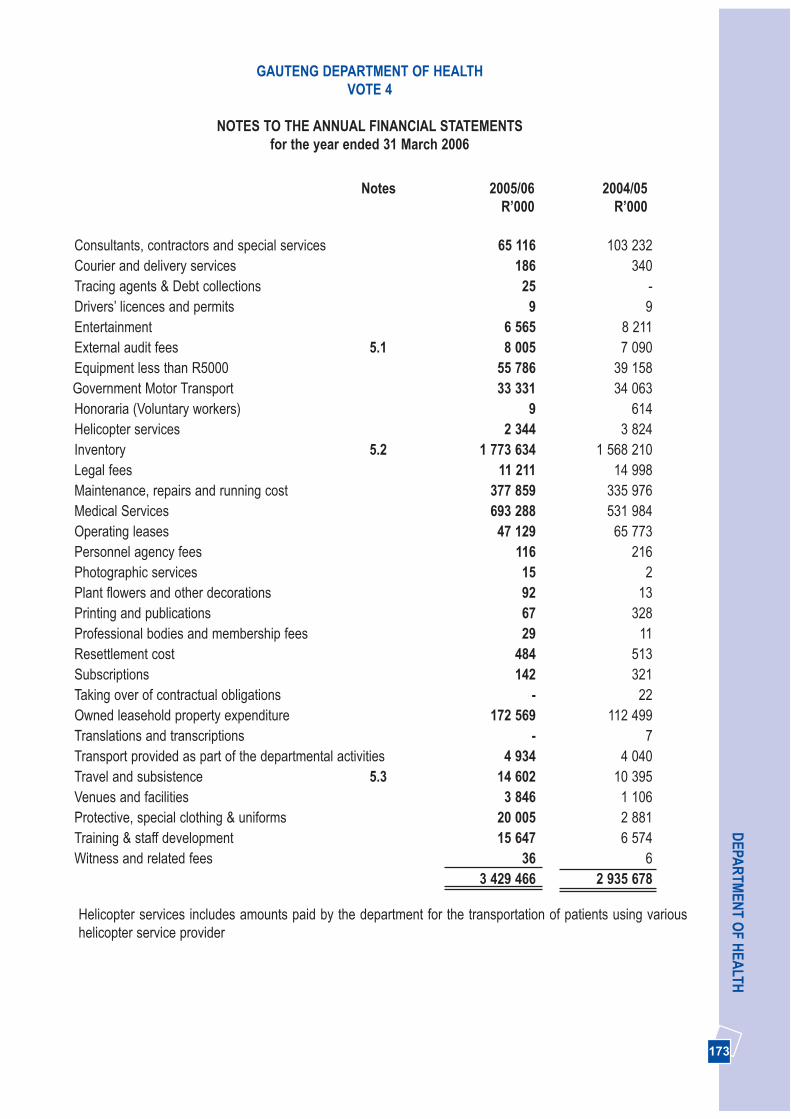
173
DEPA
RTM
ENT O
F HEA
LTHGAUTENG DEPARTMENT OF HEALTH
VOTE 4
NOTES TO THE ANNUAL FINANCIAL STATEMENTSfor the year ended 31 March 2006
Notes 2005/06 2004/05R’000 R’000
Consultants, contractors and special services 65 116 103 232Courier and delivery services 186 340Tracing agents & Debt collections 25 -Drivers’ licences and permits 9 9Entertainment 6 565 8 211External audit fees 5.1 8 005 7 090Equipment less than R5000 55 786 39 158Government Motor Transport 33 331 34 063Honoraria (Voluntary workers) 9 614Helicopter services 2 344 3 824Inventory 5.2 1 773 634 1 568 210Legal fees 11 211 14 998Maintenance, repairs and running cost 377 859 335 976Medical Services 693 288 531 984Operating leases 47 129 65 773Personnel agency fees 116 216Photographic services 15 2Plant flowers and other decorations 92 13Printing and publications 67 328Professional bodies and membership fees 29 11Resettlement cost 484 513Subscriptions 142 321Taking over of contractual obligations - 22Owned leasehold property expenditure 172 569 112 499Translations and transcriptions - 7Transport provided as part of the departmental activities 4 934 4 040Travel and subsistence 5.3 14 602 10 395Venues and facilities 3 846 1 106Protective, special clothing & uniforms 20 005 2 881Training & staff development 15 647 6 574Witness and related fees 36 6
3 429 466 2 935 678
Helicopter services includes amounts paid by the department for the transportation of patients using varioushelicopter service provider
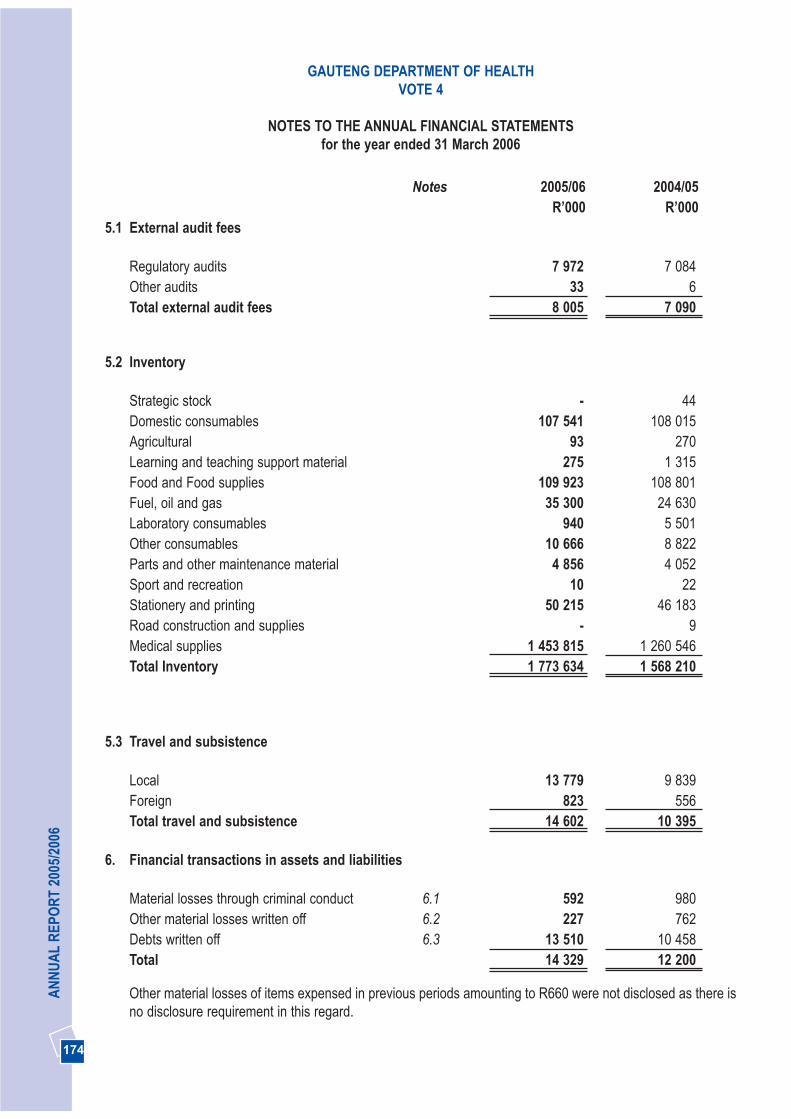
174
AN
NU
AL
REP
OR
T 20
05/2
006
GAUTENG DEPARTMENT OF HEALTHVOTE 4
NOTES TO THE ANNUAL FINANCIAL STATEMENTSfor the year ended 31 March 2006
Notes 2005/06 2004/05R’000 R’000
5.1 External audit fees
Regulatory audits 7 972 7 084Other audits 33 6Total external audit fees 8 005 7 090
5.2 Inventory
Strategic stock - 44Domestic consumables 107 541 108 015Agricultural 93 270Learning and teaching support material 275 1 315Food and Food supplies 109 923 108 801Fuel, oil and gas 35 300 24 630Laboratory consumables 940 5 501Other consumables 10 666 8 822Parts and other maintenance material 4 856 4 052Sport and recreation 10 22Stationery and printing 50 215 46 183Road construction and supplies - 9Medical supplies 1 453 815 1 260 546Total Inventory 1 773 634 1 568 210
5.3 Travel and subsistence
Local 13 779 9 839Foreign 823 556Total travel and subsistence 14 602 10 395
6. Financial transactions in assets and liabilities
Material losses through criminal conduct 6.1 592 980Other material losses written off 6.2 227 762Debts written off 6.3 13 510 10 458Total 14 329 12 200
Other material losses of items expensed in previous periods amounting to R660 were not disclosed as there isno disclosure requirement in this regard.
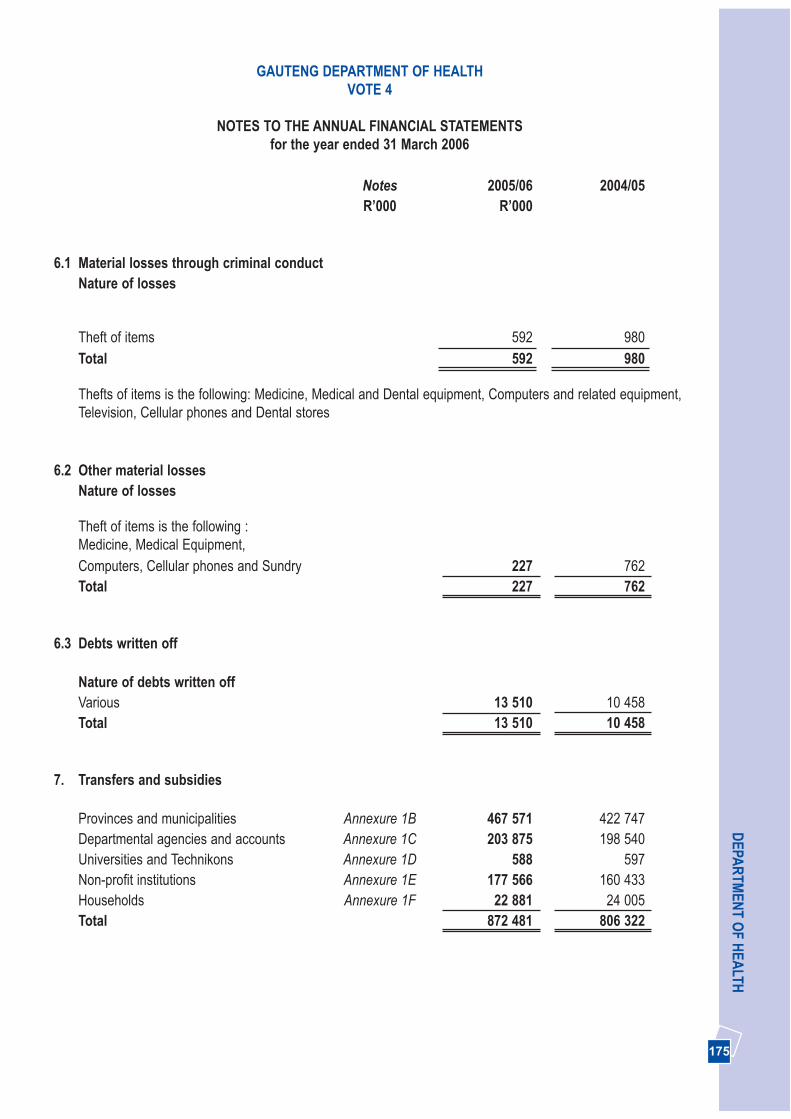
175
DEPA
RTM
ENT O
F HEA
LTH
Notes 2005/06 2004/05R’000 R’000
6.1 Material losses through criminal conductNature of losses
Theft of items 592 980Total 592 980
Thefts of items is the following: Medicine, Medical and Dental equipment, Computers and related equipment, Television, Cellular phones and Dental stores
6.2 Other material losses Nature of losses
Theft of items is the following :Medicine, Medical Equipment,Computers, Cellular phones and Sundry 227 762Total 227 762
6.3 Debts written off
Nature of debts written offVarious 13 510 10 458Total 13 510 10 458
7. Transfers and subsidies
Provinces and municipalities Annexure 1B 467 571 422 747Departmental agencies and accounts Annexure 1C 203 875 198 540Universities and Technikons Annexure 1D 588 597Non-profit institutions Annexure 1E 177 566 160 433Households Annexure 1F 22 881 24 005Total 872 481 806 322
GAUTENG DEPARTMENT OF HEALTHVOTE 4
NOTES TO THE ANNUAL FINANCIAL STATEMENTSfor the year ended 31 March 2006
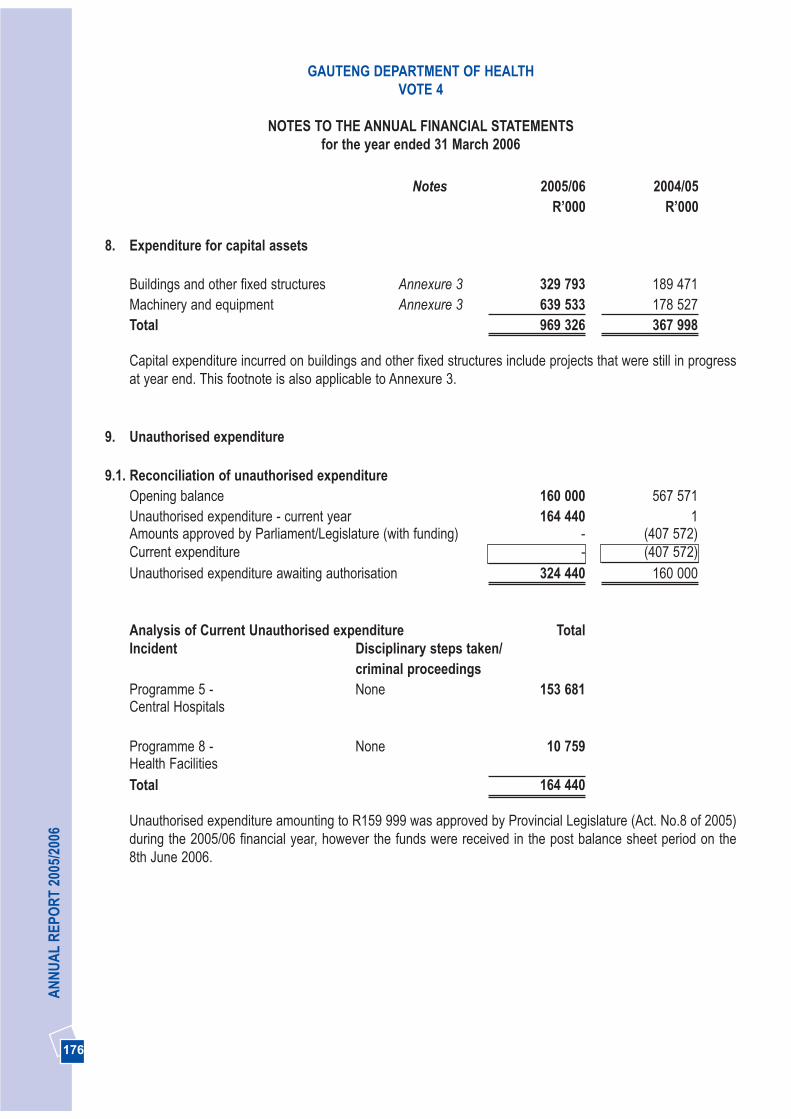
176
AN
NU
AL
REP
OR
T 20
05/2
006
GAUTENG DEPARTMENT OF HEALTHVOTE 4
NOTES TO THE ANNUAL FINANCIAL STATEMENTSfor the year ended 31 March 2006
Notes 2005/06 2004/05R’000 R’000
8. Expenditure for capital assets
Buildings and other fixed structures Annexure 3 329 793 189 471Machinery and equipment Annexure 3 639 533 178 527Total 969 326 367 998
Capital expenditure incurred on buildings and other fixed structures include projects that were still in progressat year end. This footnote is also applicable to Annexure 3.
9. Unauthorised expenditure
9.1. Reconciliation of unauthorised expenditureOpening balance 160 000 567 571Unauthorised expenditure - current year 164 440 1Amounts approved by Parliament/Legislature (with funding) - (407 572)Current expenditure - (407 572)Unauthorised expenditure awaiting authorisation 324 440 160 000
Analysis of Current Unauthorised expenditure TotalIncident Disciplinary steps taken/
criminal proceedingsProgramme 5 - None 153 681Central Hospitals
Programme 8 - None 10 759Health FacilitiesTotal 164 440
Unauthorised expenditure amounting to R159 999 was approved by Provincial Legislature (Act. No.8 of 2005)during the 2005/06 financial year, however the funds were received in the post balance sheet period on the 8th June 2006.
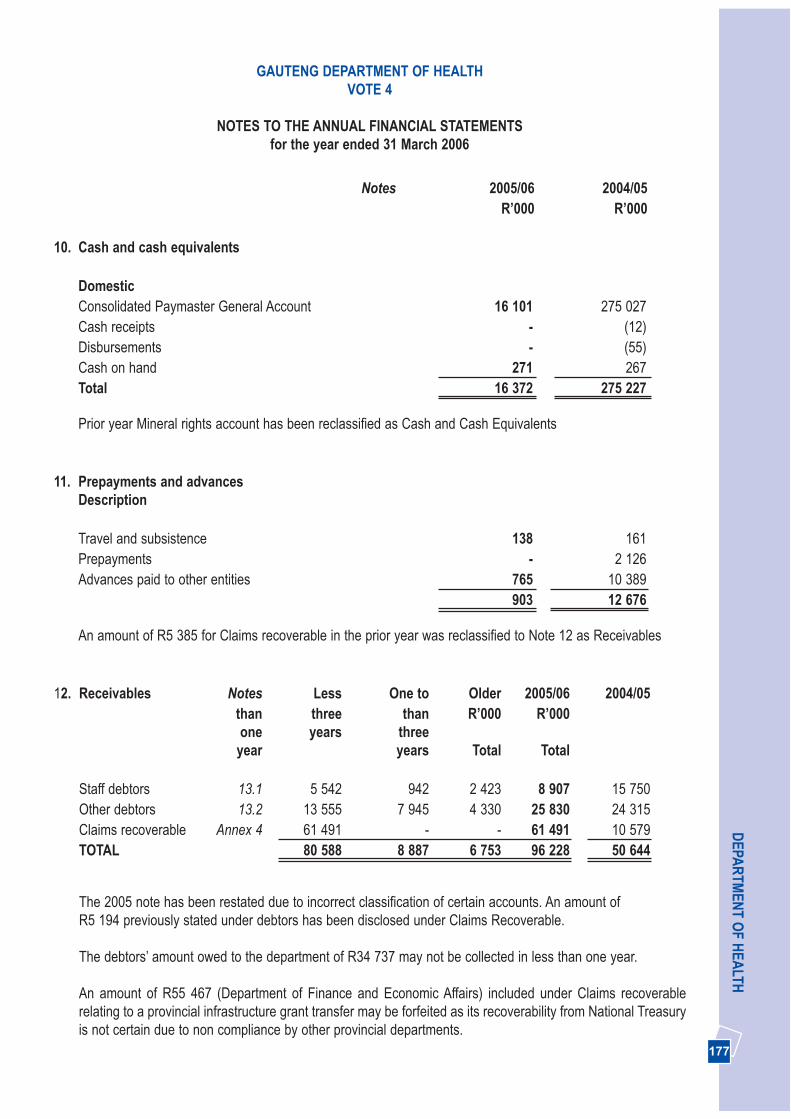
177
DEPA
RTM
ENT O
F HEA
LTHGAUTENG DEPARTMENT OF HEALTH
VOTE 4
NOTES TO THE ANNUAL FINANCIAL STATEMENTSfor the year ended 31 March 2006
Notes 2005/06 2004/05R’000 R’000
10. Cash and cash equivalents
DomesticConsolidated Paymaster General Account 16 101 275 027Cash receipts - (12)Disbursements - (55)Cash on hand 271 267Total 16 372 275 227
Prior year Mineral rights account has been reclassified as Cash and Cash Equivalents
11. Prepayments and advancesDescription
Travel and subsistence 138 161Prepayments - 2 126Advances paid to other entities 765 10 389
903 12 676
An amount of R5 385 for Claims recoverable in the prior year was reclassified to Note 12 as Receivables
12. Receivables Notes Less One to Older 2005/06 2004/05than three than R’000 R’000one years three
year years Total Total
Staff debtors 13.1 5 542 942 2 423 8 907 15 750Other debtors 13.2 13 555 7 945 4 330 25 830 24 315Claims recoverable Annex 4 61 491 - - 61 491 10 579TOTAL 80 588 8 887 6 753 96 228 50 644
The 2005 note has been restated due to incorrect classification of certain accounts. An amount of R5 194 previously stated under debtors has been disclosed under Claims Recoverable.
The debtors’ amount owed to the department of R34 737 may not be collected in less than one year.
An amount of R55 467 (Department of Finance and Economic Affairs) included under Claims recoverablerelating to a provincial infrastructure grant transfer may be forfeited as its recoverability from National Treasuryis not certain due to non compliance by other provincial departments.

178
AN
NU
AL
REP
OR
T 20
05/2
006
GAUTENG DEPARTMENT OF HEALTHVOTE 4
NOTES TO THE ANNUAL FINANCIAL STATEMENTSfor the year ended 31 March 2006
Notes 2005/06 2004/05R’000 R’00
12.1 Staff Debtors
Breach of contract 2 551 6 873Employee 4 424 4 404Fraud 78 149GG Accident 31 27Other 69 1 469State guarantee 802 2 027Subsidised transport 19 -Supplier 692 504Telephones (10) (15)Travel and subsistence 251 312Total 8 907 15 750
The prior year actuals have been restated to conform with current year disclosures and as result of a prior yearmisstatement.
12.2 Other debtors
Debt Account 12 765 15 540Disallowance miscellaneous 192 -Private telephone 26 64Disallowance payment fraud 458 872Disallowance dishonoured cheque - 3Subsidised Transport Insurance 1 -Salary : Deduction disallowance - 1 365Salary : Financial Institution study loan 5 -Salary : Disallowance account 58 -Salary : Reversal control 564 -Health and Welfare SETA 4 191 -OBP investment, current - 15Salary : Medical Aid 14 40Salary : Housing - 2Salary : Bargaining councils - 289Disallowance damages and losses 272 488Debtors with credit balances included in Debt Account 7 284 5 637Total 25 830 24 315
An amount of R47 658 for Mineral Rights Claim Licence relating to the prior year was reclassified to Note 10.Cash and Cash Equivalents.
Balance of voted funds not received in the prior year amounting to R5 194 was reclassified to Receivables(Annexure 4 - Inter Governmental Receivables)

179
DEPA
RTM
ENT O
F HEA
LTHGAUTENG DEPARTMENT OF HEALTH
VOTE 4
NOTES TO THE ANNUAL FINANCIAL STATEMENTSfor the year ended 31 March 2006
Notes 2005/06 2004/05R’000 R’00
13. Investments
Non-currentInvestment in Medsas 54 000 54 000
Analysis of Non-current InvestmentsOpening Balance 54 000 54 000Additions in Cash - -Disposals for Cash - -Closing Balance 54 000 54 000
14. Voted funds to be surrendered to the Revenue Fund
Opening balance 368 555 151 959Transfer from Statement of Financial Performance 30 897 368 555Paid during the year (368 555) (151 959)Closing balance 30 897 368 555
15. Departmental revenue to be surrendered to the Revenue Fund
Opening balance 79 053 29 640Transfer from Statement of Financial Performance 253 901 264 409Paid during the year (310 358) (214 996)Closing balance 22 596 79 053
Transfers amounting to R20 for Local and Foreign Aid have been incorrectly surrended to the revenue fund inthe 2005 year.
16. Bank overdraft
Consolidated Paymaster General Account 357 364 -Cash receipts 4 -Disbursements (60) -Total 357 308 -

180
AN
NU
AL
REP
OR
T 20
05/2
006
GAUTENG DEPARTMENT OF HEALTHVOTE 4
NOTES TO THE ANNUAL FINANCIAL STATEMENTSfor the year ended 31 March 2006
Notes 2005/06 2004/05R’000 R’00
17. Payables - current
Description
30 Days 30+Days Total TotalAmounts owing to other entities Annexure 5 969 - 969 -Clearing accounts 17.1 - - - 388Other payables 17.2 6 032 18 487 24 519 47 198
7 001 18 487 25 488 47 586
An amount of R11 099 in the prior year was reclassified to Note 11. Cash and Cash Equivalents
17.1 Clearing accounts
Salary : Disallowance account - 44Telephone control account - 239Telephone erroneous interface account - 105Total - 388
17.2. Other payables
Disallowance miscellaneous - 19 381Salary : Regional Services Council 14 2Medsas : Claims Recoverable 2 776 -Salary : ACB recalls 735 117Salary : Deduction disallowance 49 -Salary : Advances : Domestic 6 -Salary : Garnishee order 6 41Salary : Finance other institution - 59Salary : Income tax 2 186 1 162Salary : Insurance deductions - 3Salary : Official unions - 2Salary : Pension fund 537 101Salary : Financial institution study loans - 1Debt receivable income 4 405 7 498Debt receivable interest 5 700 10 407Housing loan guarantees 149 1 499Salary : Bargaining council 15 -Housing key deposits 598 435Salary : Tax debt 59 481OBP investment capital - 3Investment account : MDF NCA - 369Debtors with credit balances included in Debt Account 7 284 5 637Total 24 519 47 198

181
DEPA
RTM
ENT O
F HEA
LTH
Notes 2005/06 2004/05R’000 R’00
18. Net cash flow available from operating activities
Net surplus as per Statement of Financial Performance 286 452 636 317(Increase)/decrease in receivables - current (45 584) 46 816Decrease/(Increase) in prepayments and advances 11 773 (6 594)(Increase)/decrease in other current assets (164 440) 407 571(Decrease) in payables - current (22 098) (43 048)Proceeds from sale of capital assets (6 699) (100)Surrenders to Revenue Fund (678 913) (366 955)Expenditure on capital assets 969 326 367 998Other non-cash items (3 353) (4 740)Net cash flow generated by operating activities 346 464 1 037 265
The 2004/5 note has been restated due to the reclassification of certain debtor and creditor balances and forthe balance brought forward for Local and Foreign aid from the prior year
19. Reconciliation of cash and cash equivalents for cash flowPurposes
Consolidated Paymaster General account (341 263) 275 027Cash and cash receipts (4) (12)Disbursements 60 (55)Cash on hand 271 267Total (340 936) 275 227
GAUTENG DEPARTMENT OF HEALTHVOTE 4
NOTES TO THE ANNUAL FINANCIAL STATEMENTSfor the year ended 31 March 2006
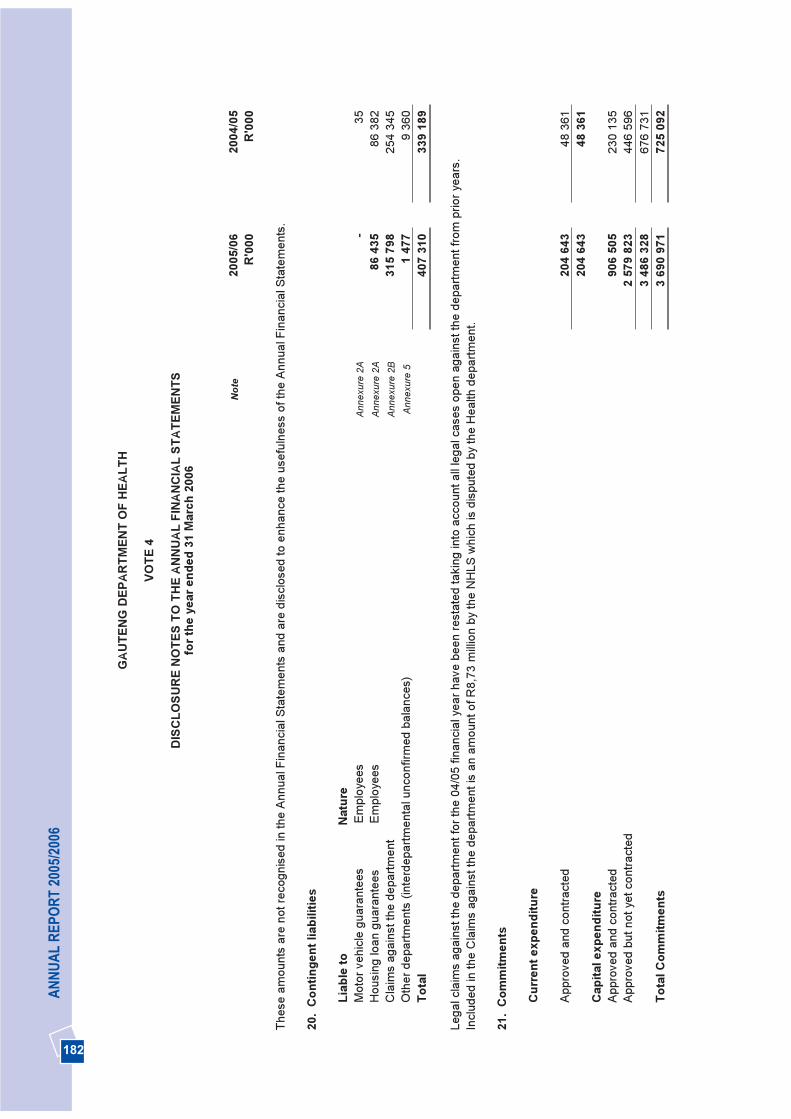
182
AN
NU
AL
REP
OR
T 20
05/2
006
GAU
TEN
G D
EPAR
TMEN
T O
F H
EALT
H
VOTE
4
DIS
CLO
SUR
E N
OTE
S TO
TH
E AN
NU
AL F
INAN
CIA
L ST
ATEM
ENTS
for t
he y
ear e
nded
31
Mar
ch 2
006
Not
e 20
05/0
620
04/0
5 R
'000
R'0
00
Thes
e am
ount
s ar
e no
t rec
ogni
sed
in th
e An
nual
Fin
anci
al S
tate
men
ts a
nd a
re d
iscl
osed
to e
nhan
ce th
e us
eful
ness
of t
he A
nnua
l Fin
anci
al S
tate
men
ts.
20.
Con
tinge
nt li
abili
ties
Liab
le to
N
atur
e M
otor
veh
icle
gua
rant
ees
Empl
oyee
sA
nnex
ure
2A-
35
Hou
sing
loan
gua
rant
ees
Empl
oyee
sA
nnex
ure
2A86
435
86 3
82
Cla
ims
agai
nst t
he d
epar
tmen
t A
nnex
ure
2B31
5 79
825
4 34
5 O
ther
dep
artm
ents
(int
erde
partm
enta
l unc
onfir
med
bal
ance
s)A
nnex
ure
5 1
477
9 36
0 To
tal
407
310
339
189
Lega
l cla
ims
agai
nst t
he d
epar
tmen
t for
the
04/0
5 fin
anci
al y
ear h
ave
been
rest
ated
taki
ng in
to a
ccou
nt a
ll le
gal c
ases
ope
n ag
ains
t the
dep
artm
ent f
rom
prio
r yea
rs.
Incl
uded
in th
e C
laim
s ag
ains
t the
dep
artm
ent i
s an
am
ount
of R
8,73
milli
on b
y th
e N
HLS
whi
ch is
dis
pute
d by
the
Hea
lth d
epar
tmen
t.
21.
Com
mitm
ents
Cur
rent
exp
endi
ture
Appr
oved
and
con
tract
ed
204
643
48 3
61
204
643
48 3
61
Cap
ital e
xpen
ditu
reAp
prov
ed a
nd c
ontra
cted
90
6 50
523
0 13
5 Ap
prov
ed b
ut n
ot y
et c
ontra
cted
2
579
823
446
596
3 48
6 32
867
6 73
1 To
tal C
omm
itmen
ts3
690
971
725
092
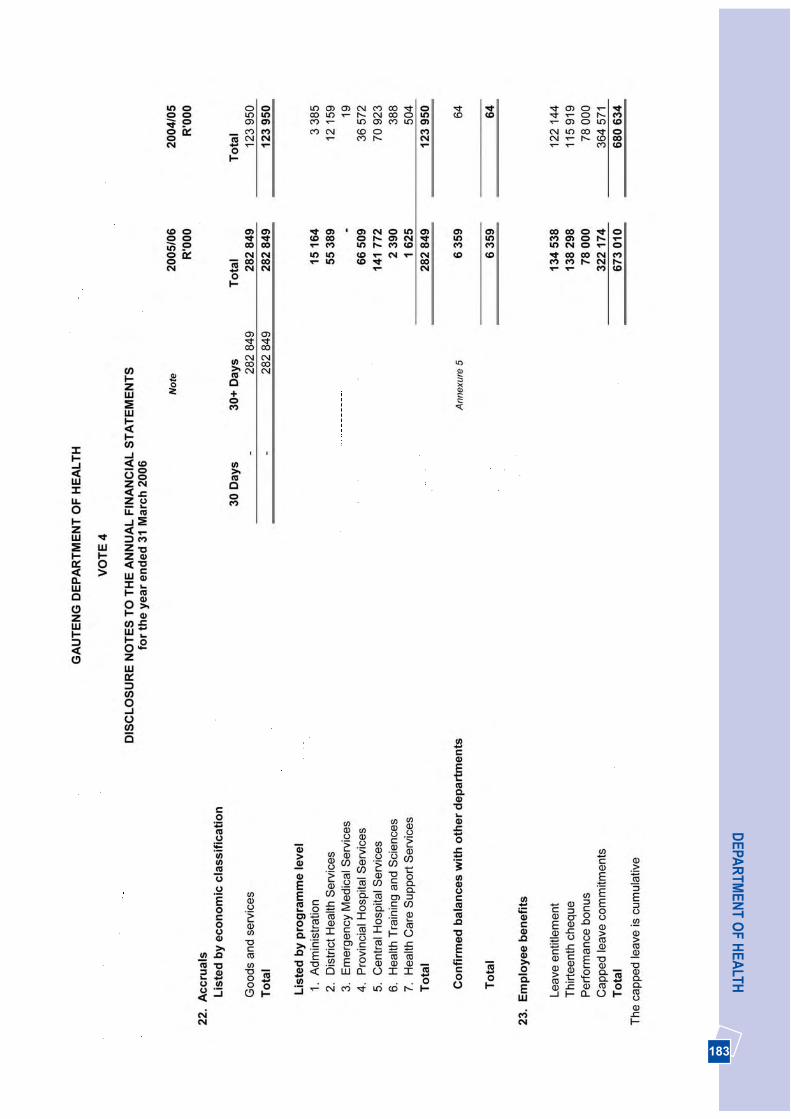
183
DEPA
RTM
ENT O
F HEA
LTH
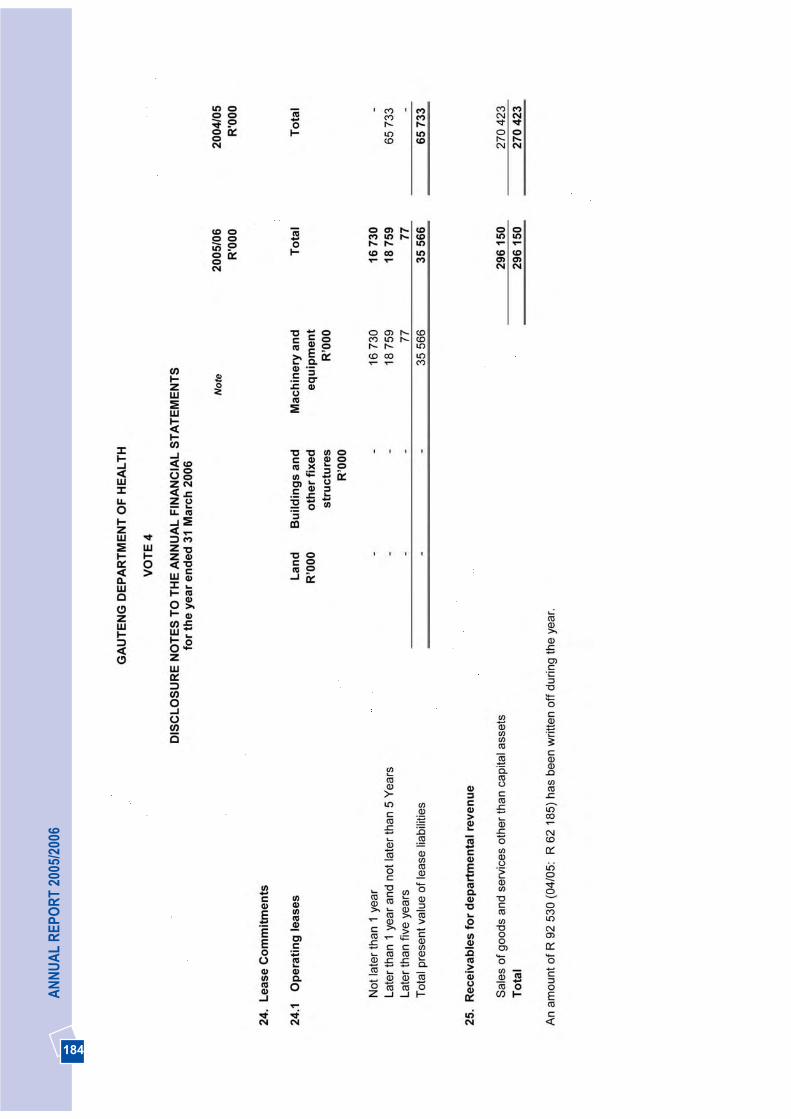
184
AN
NU
AL
REP
OR
T 20
05/2
006

185
DEPA
RTM
ENT O
F HEA
LTH

186
AN
NU
AL
REP
OR
T 20
05/2
006
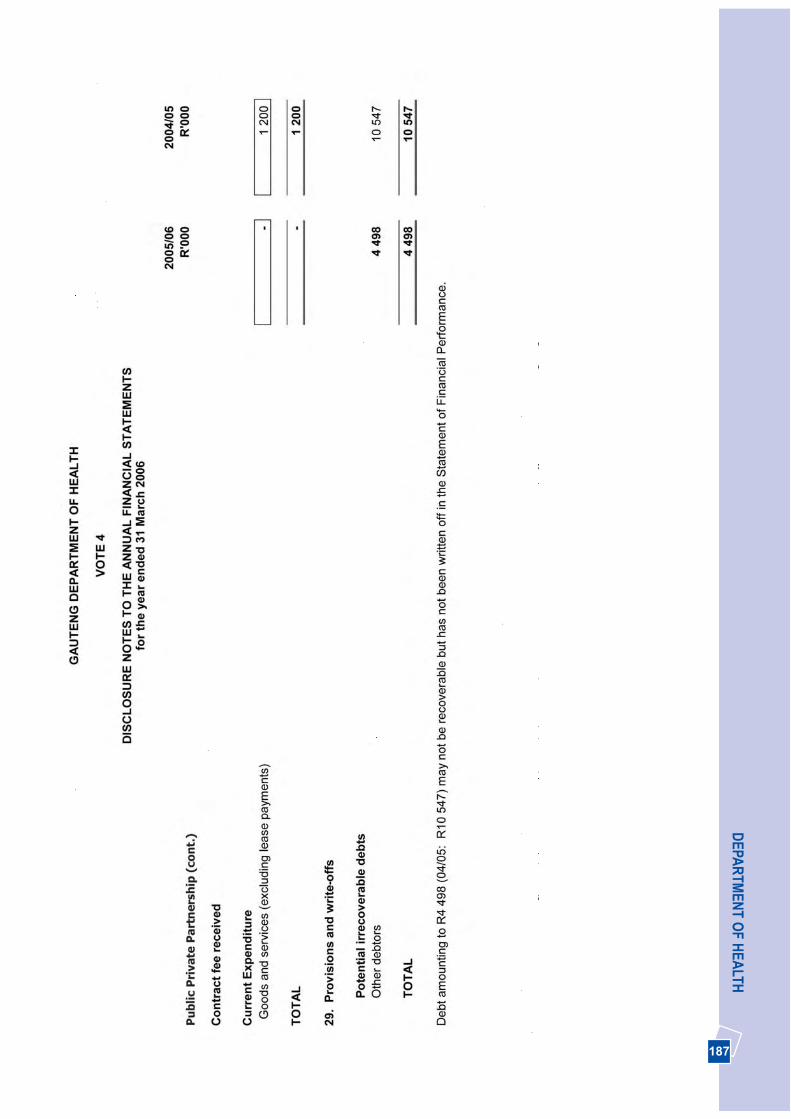
187
DEPA
RTM
ENT O
F HEA
LTH

188
AN
NU
AL
REP
OR
T 20
05/2
006
GAU
TEN
G D
EPAR
TMEN
TO
F H
EALT
H
VOTE
4
ANN
EXU
RES
TO
TH
E AN
NU
AL F
INAN
CIA
L ST
ATEM
ENTS
for t
he y
ear e
nded
31
Mar
ch 2
006
ANN
EXU
RE
1AST
ATEM
ENT
OF
CO
ND
ITIO
NAL
GR
ANTS
REC
EIVE
D
GR
ANT
ALL
OC
ATI
ON
SPEN
T20
04/0
5 D
ivis
ion
ofR
even
ueA
ct/
Prov
inci
alG
rant
s
Rol
lO
vers
D
OR
AA
djus
tmen
tsO
ther
Adj
ustm
ents
Tota
lA
vaila
ble
Am
ount
rece
ived
byde
part
men
t
Amou
nt s
pent
byde
part
men
t
% o
fav
aila
ble
fund
ssp
ent b
yde
part
men
t
Div
isio
nof
Rev
enue
Act
Am
ount
spe
nt b
yde
part
men
t
NA
ME
OF
DEP
AR
TMEN
T
R’0
00
R’0
00R
'000
R
'000
R
’000
R
'000
R'0
00%
R’0
00
R’0
00
Div
isio
n of
Rev
enue
Act
Terti
ary
Serv
ices
1 76
0 46
5 -
--
1 76
0 46
51
760
465
1 76
0 46
510
0.0%
1 72
7 73
61
727
736
Hea
lth P
rofe
ssio
nsTr
aini
ng a
nd
Dev
elop
men
t
554
039
--
-55
4 03
9 55
403
955
4 03
910
0.0%
560
788
560
788
Hos
pita
l Rev
italis
atio
nG
rant
17 9
553
222
-71
000
92
177
10
289
110
2 89
111
1.6%
155
126
61 2
04
Com
preh
ensi
ve H
IV/A
IDS
185
048
--
-18
5 04
818
5 04
8 18
5 15
110
0.1%
134
231
134
000
Inte
grat
ed N
utrit
ion
Pro
gram
me
11 3
33-
--
11 3
33
1133
39
858
87.0
%10
307
9
848
Hos
pita
l Man
agem
ent a
nd
Qua
lity
Impr
ovem
ent
18 5
10(1
92)
--
18 3
18
1851
08
019
43.8
%20
776
20
526
Fore
nsic
Pat
holo
gy
Serv
ices
16 9
44
--
-16
944
1694
4 7
879
46.5
%-
-
Prov
inci
al G
rant
sP
rovi
ncia
l Inf
rast
ruct
ure
73 9
558
826
--
82 7
81
1848
982
781
100.
0%66
458
57
632
2
638
249
11 8
56
71 0
002
721
105
2 66
7 71
9 2
711
083
2 67
5 42
22
571
734
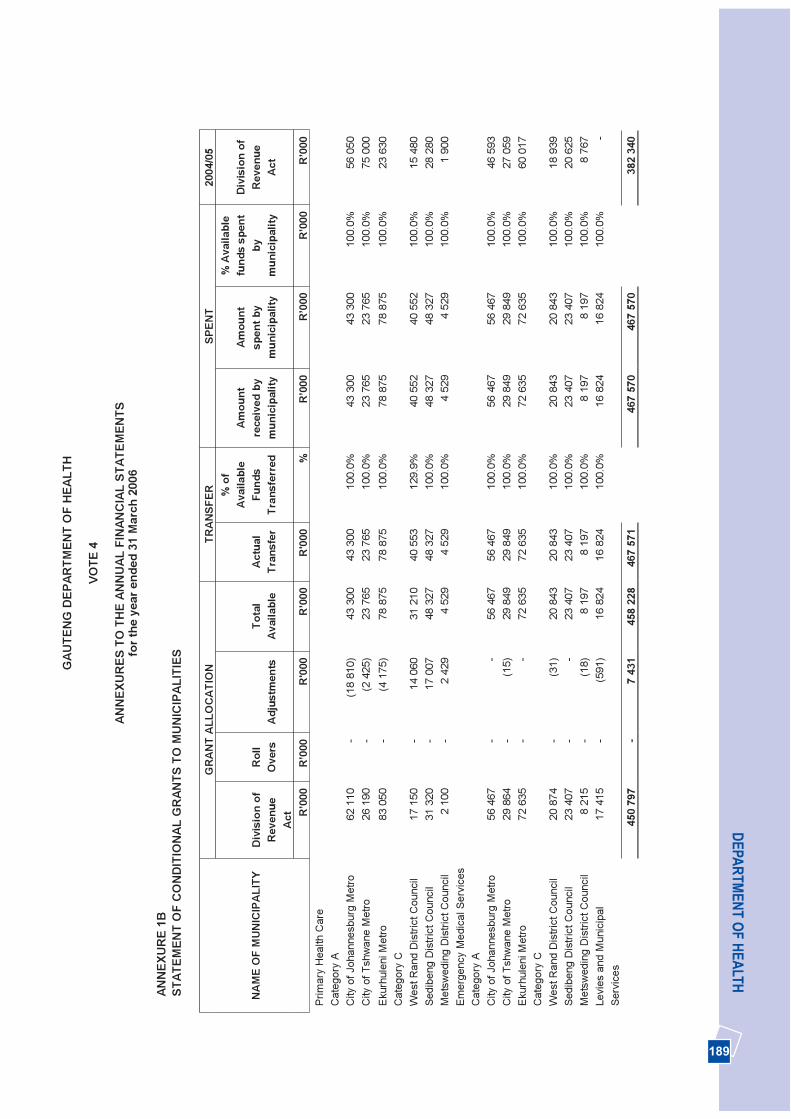
189
DEPA
RTM
ENT O
F HEA
LTHG
AUTE
NG
DEP
ARTM
ENT
OF
HEA
LTH
VOTE
4
ANN
EXU
RES
TO
TH
E AN
NU
AL F
INAN
CIA
L ST
ATEM
ENTS
for t
he y
ear e
nded
31
Mar
ch 2
006
ANN
EXU
RE
1B
STAT
EMEN
T O
F C
ON
DIT
ION
AL G
RAN
TS T
OM
UN
ICIP
ALIT
IES
GR
AN
T A
LLO
CA
TIO
NTR
AN
SFER
SPEN
T20
04/0
5
Div
isio
n of
Rev
enue
A
ct
Rol
lO
vers
A
djus
tmen
tsTo
tal
Ava
ilabl
eA
ctua
lTr
ansf
er
% o
fA
vaila
ble
Fund
sTr
ansf
erre
d
Am
ount
rece
ived
by
mun
icip
ality
Am
ount
spen
t by
mun
icip
ality
% A
vaila
ble
fund
s sp
ent
bym
unic
ipal
ity
Div
isio
n of
Rev
enue
Ac
tN
AM
E O
FM
UN
ICIP
ALI
TY
R’0
00
R’0
00
R'0
00
R’0
00R
'000
%
R’0
00R
’000
R
’000
R’0
00
Prim
ary
Hea
lth C
are
Cat
egor
y A
C
ity o
f Joh
anne
sbur
gM
etro
62 1
10
-(1
8 81
0)43
300
43
300
100.
0%43
300
43
300
100.
0%56
050
City
of T
shw
ane
Met
ro26
190
-
(2 4
25)
23 7
65
23 7
6510
0.0%
23 7
65
23 7
6510
0.0%
7500
0E
kurh
ulen
iMet
ro83
050
-
(4 1
75)
78 8
75
78 8
7510
0.0%
78 8
75
78 8
7510
0.0%
2363
0C
ateg
ory
CW
est R
and
Dis
trict
Cou
ncil
17 1
50-
14 0
60
31 2
1040
553
12
9.9%
40 5
5240
552
10
0.0%
1548
0 Se
dibe
ng D
istri
ct C
ounc
il31
320
-17
007
48
327
48 3
27
100.
0%48
327
48 3
27
100.
0%28
280
Met
swed
ing
Dis
trict
Cou
ncil
2 10
0 -
2 42
94
529
4 52
910
0.0%
4 52
9 4
529
100.
0%1
900
Emer
genc
y M
edic
al S
ervi
ces
Cat
egor
y A
City
of J
ohan
nesb
urg
Met
ro56
467
-
-56
467
56 4
67
100.
0%56
467
56 4
67
100.
0%46
593
City
of T
shw
ane
Met
ro29
864
-
(15)
29 8
49
29 8
4910
0.0%
29 8
49
29 8
4910
0.0%
2705
9E
kurh
ulen
iMet
ro72
635
-
-72
635
72
635
100.
0%72
635
72
635
100.
0%60
017
Cat
egor
y C
Wes
t Ran
dD
istri
ct C
ounc
il20
874
-
(31)
20 8
43
20 8
4310
0.0%
20 8
43
20 8
4310
0.0%
1893
9Se
dibe
ng D
istri
ct C
ounc
il23
407
--
23 4
0723
407
10
0.0%
23 4
0723
407
10
0.0%
2062
5 M
etsw
edin
g D
istri
ct C
ounc
il8
215
-(1
8)8
197
8 19
710
0.0%
8 19
7 8
197
100.
0%8
767
Levi
es a
nd M
unic
ipal
Serv
ices
17 4
15
-(5
91)
16 8
24
16 8
2410
0.0%
16 8
24
16 8
2410
0.0%
-
450
797
-7
431
458
228
467
571
467
570
467
570
382
340
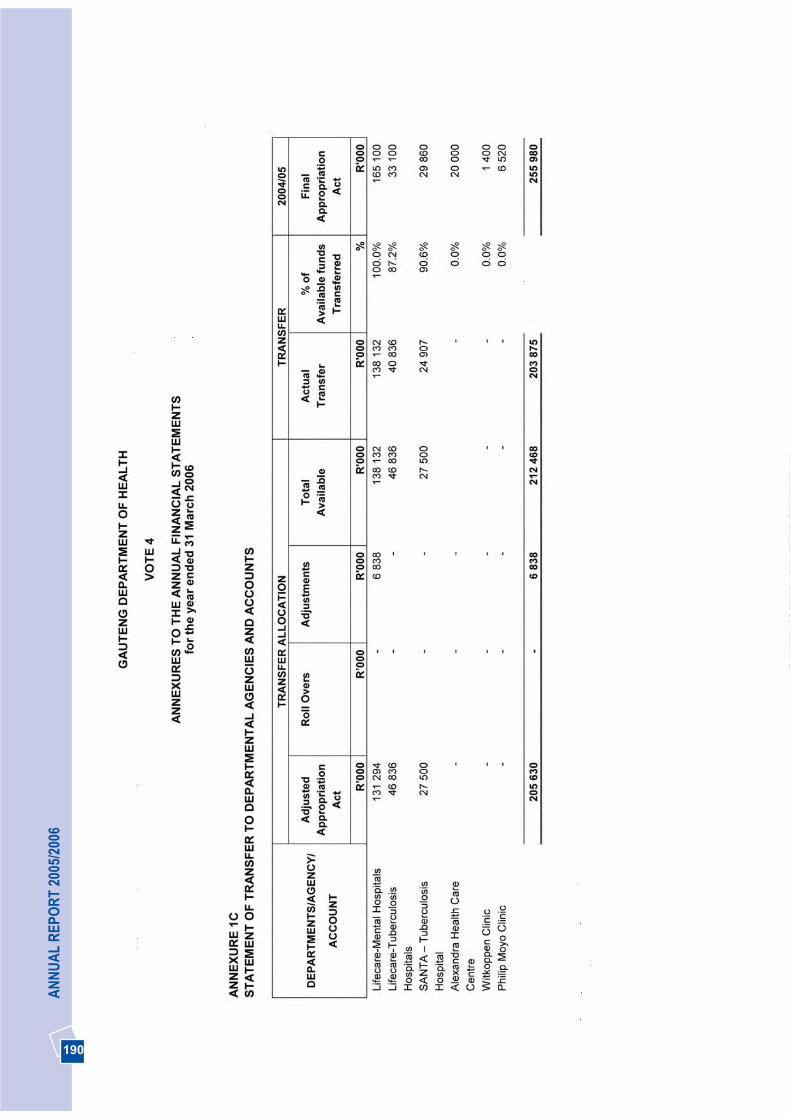
190
AN
NU
AL
REP
OR
T 20
05/2
006

191
DEPA
RTM
ENT O
F HEA
LTH
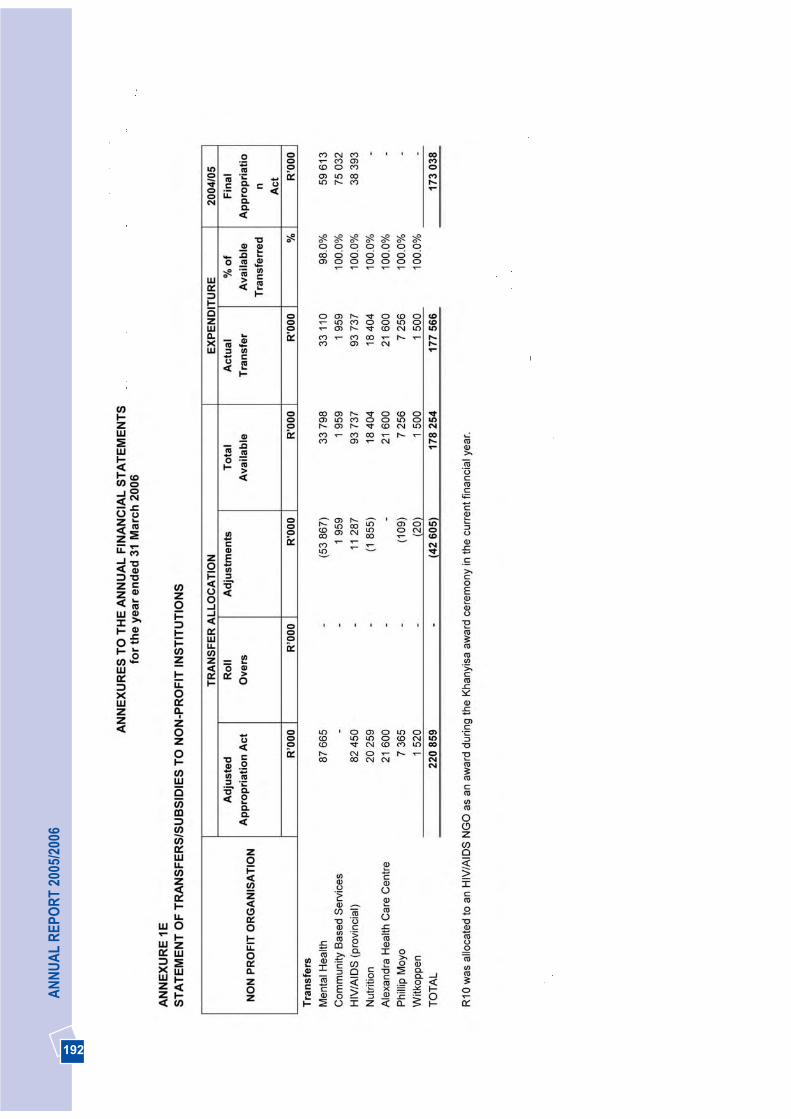
192
AN
NU
AL
REP
OR
T 20
05/2
006
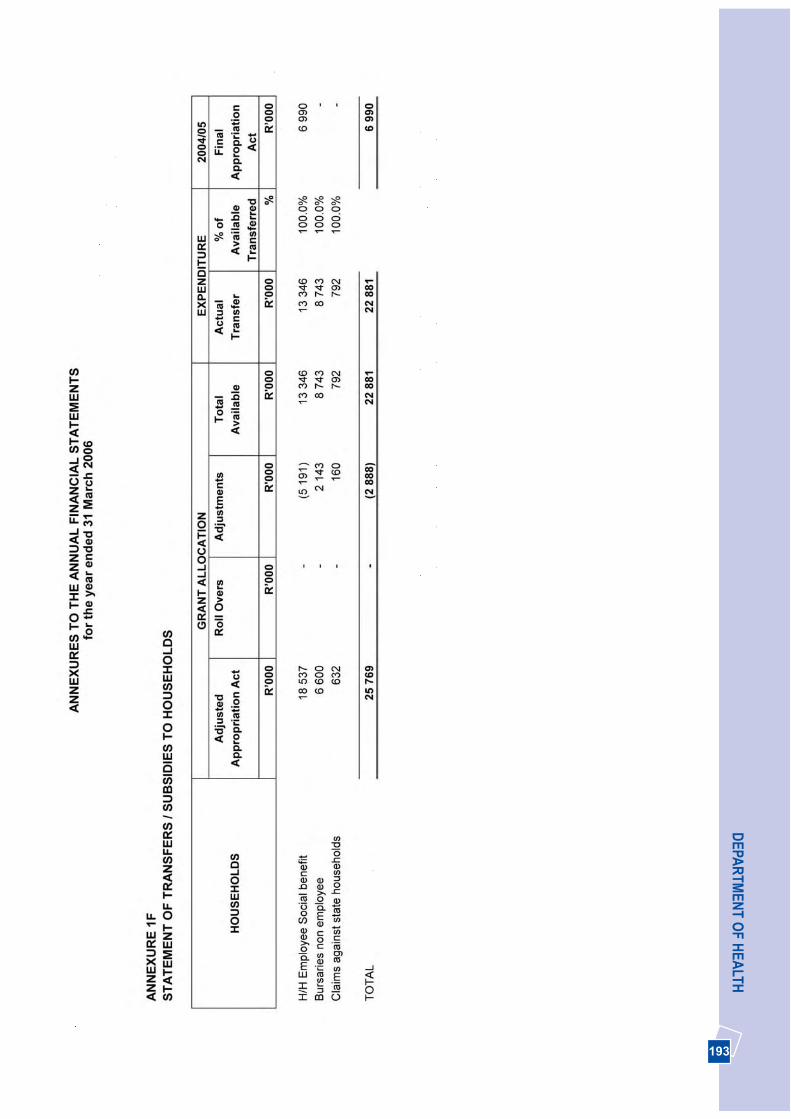
193
DEPA
RTM
ENT O
F HEA
LTH

194
AN
NU
AL
REP
OR
T 20
05/2
006

195
DEPA
RTM
ENT O
F HEA
LTH
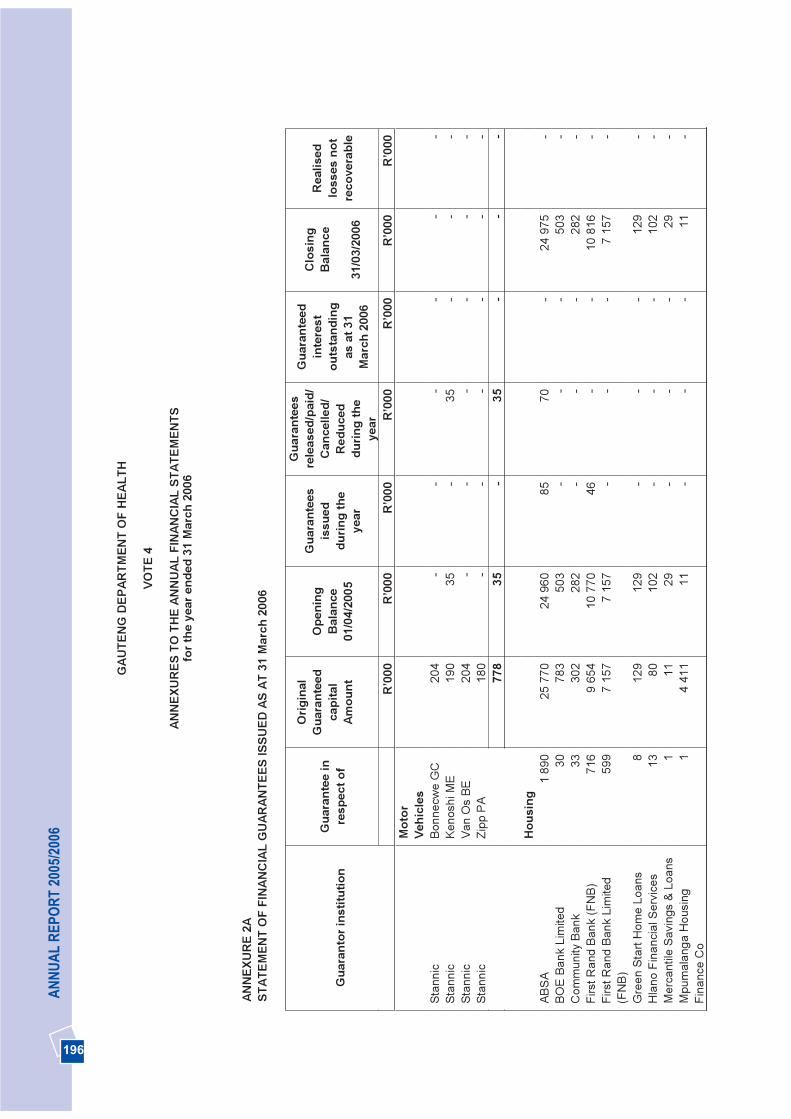
196
AN
NU
AL
REP
OR
T 20
05/2
006
GAU
TEN
G D
EPAR
TMEN
TO
F H
EALT
H
VOTE
4
ANN
EXU
RES
TO
TH
E AN
NU
AL F
INAN
CIA
L ST
ATEM
ENTS
for t
he y
ear e
nded
31
Mar
ch 2
006
ANN
EXU
RE
2AST
ATEM
ENT
OF
FIN
ANC
IAL
GU
ARAN
TEES
ISSU
ED A
S AT
31
Mar
ch 2
006
Gua
rant
ee in
resp
ect o
f
Orig
inal
Gua
rant
eed
capi
tal
Amou
nt
Ope
ning
B
alan
ce01
/04/
2005
Gua
rant
ees
issu
eddu
ring
the
year
Gua
rant
ees
rele
ased
/pai
d/C
ance
lled/
Red
uced
durin
g th
eye
ar
Gua
rant
eed
inte
rest
ou
tsta
ndin
g as
at 3
1M
arch
200
6
Clo
sing
B
alan
ce
31/0
3/20
06
Rea
lised
loss
es n
otre
cove
rabl
e G
uara
ntor
inst
itutio
n
R
’000
R’0
00R
’000
R
’000
R’0
00R
’000
R’0
00
M
otor
Vehi
cles
St
anni
c Bo
nnec
we
GC
204
--
--
--
Stan
nic
Keno
shi M
E 19
035
-35
--
-St
anni
c Va
nO
sBE
204
--
--
--
Stan
nic
Zipp
PA
180
--
--
--
778
35-
35-
--
Hou
sing
AB
SA1
890
25 7
7024
960
85
70-
24 9
75-
BOE
Bank
Lim
ited
3078
350
3-
--
503
-C
omm
unity
Ban
k33
302
282
--
-28
2-
Firs
t Ran
dBa
nk (F
NB)
716
9 65
410
770
46
--
10 8
16-
Firs
t Ran
dBa
nk L
imite
d(F
NB
) 59
97
157
715
7-
--
7 15
7-
Gre
en S
tart
Hom
e Lo
ans
812
912
9-
--
129
-H
lano
Fin
anci
al S
ervi
ces
1380
102
--
-10
2-
Mer
cant
ile S
avin
gs &
Loa
ns1
1129
--
-29
-M
pum
alan
ga H
ousi
ng
Fina
nce
Co
14
411
11-
--
11-
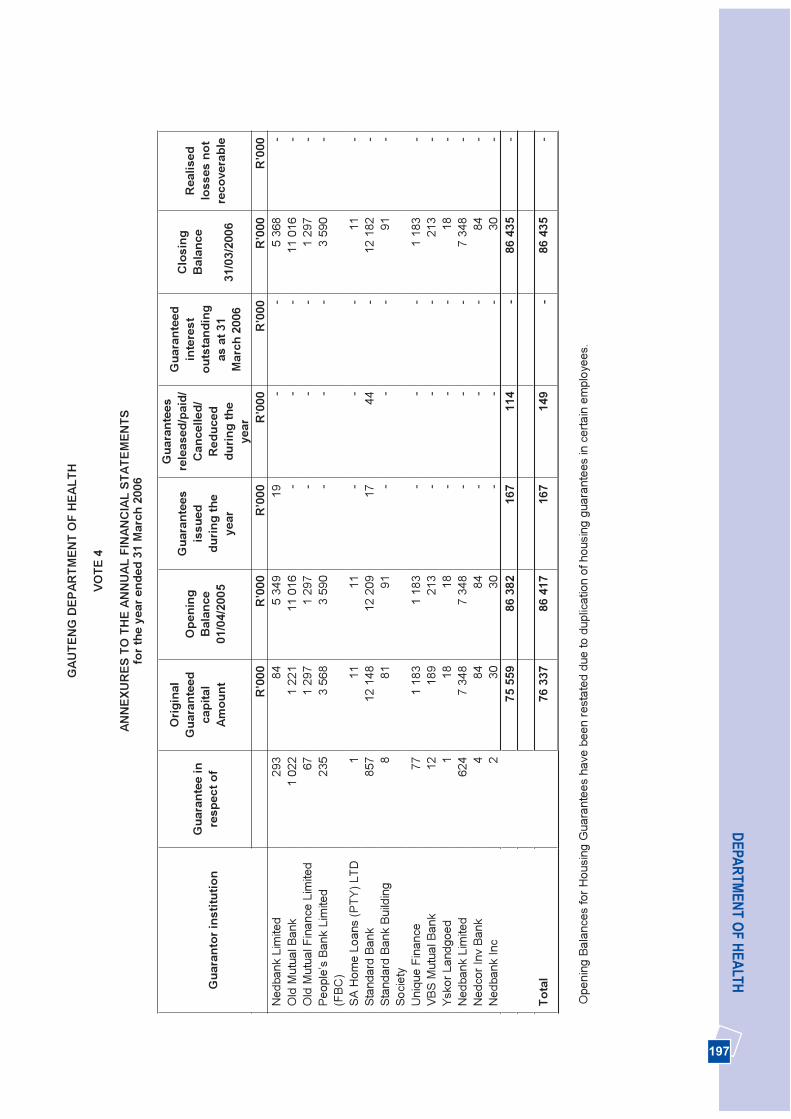
197
DEPA
RTM
ENT O
F HEA
LTHG
AUTE
NG
DEP
ARTM
ENT
OF
HEA
LTH
VOTE
4
ANN
EXU
RES
TO
TH
E AN
NU
AL F
INAN
CIA
L ST
ATEM
ENTS
for t
he y
ear e
nded
31
Mar
ch 2
006
Gua
rant
ee in
resp
ect o
f
Orig
inal
Gua
rant
eed
capi
tal
Amou
nt
Ope
ning
B
alan
ce01
/04/
2005
Gua
rant
ees
issu
eddu
ring
the
year
Gua
rant
ees
rele
ased
/pai
d/C
ance
lled/
Red
uced
durin
g th
eye
ar
Gua
rant
eed
inte
rest
ou
tsta
ndin
g as
at 3
1M
arch
200
6
Clo
sing
B
alan
ce
31/0
3/20
06
Rea
lised
loss
es n
otre
cove
rabl
e G
uara
ntor
inst
itutio
n
R
’000
R’0
00R
’000
R
’000
R’0
00R
’000
R’0
00
Ned
bank
Lim
ited
293
845
349
19
--
5 36
8-
Old
Mut
ual B
ank
1 02
21
221
11 0
16-
--
11 0
16-
Old
Mut
ual F
inan
ce L
imite
d 67
1 29
71
297
--
-1
297
-Pe
ople
’s B
ank
Lim
ited
(FB
C)
235
3 56
83
590
--
-3
590
-
SA H
ome
Loan
s (P
TY) L
TD1
1111
--
-11
-St
anda
rd B
ank
857
12 1
4812
209
17
44-
12 1
82-
Stan
dard
Ban
kBu
ildin
g So
ciet
y8
8191
- -
-91
-
Uni
que
Fina
nce
771
183
118
3-
--
1 18
3-
VBS
Mut
ualB
ank
1218
921
3-
--
213
-Ys
kor L
andg
oed
118
18-
--
18-
Ned
bank
Lim
ited
624
734
87
348
--
-7
348
-N
edco
r Inv
Ban
k4
8484
--
-84
-N
edba
nk In
c 2
3030
--
-30
-75
559
8638
216
711
4-
86 4
35-
Tota
l76
337
8641
716
714
9-
86 4
35-
Ope
ning
Bal
ance
s fo
r Hou
sing
Gua
rant
ees
have
bee
nre
stat
ed d
ueto
dup
licat
ion
ofho
usin
g gu
aran
tees
in c
erta
in e
mpl
oyee
s.
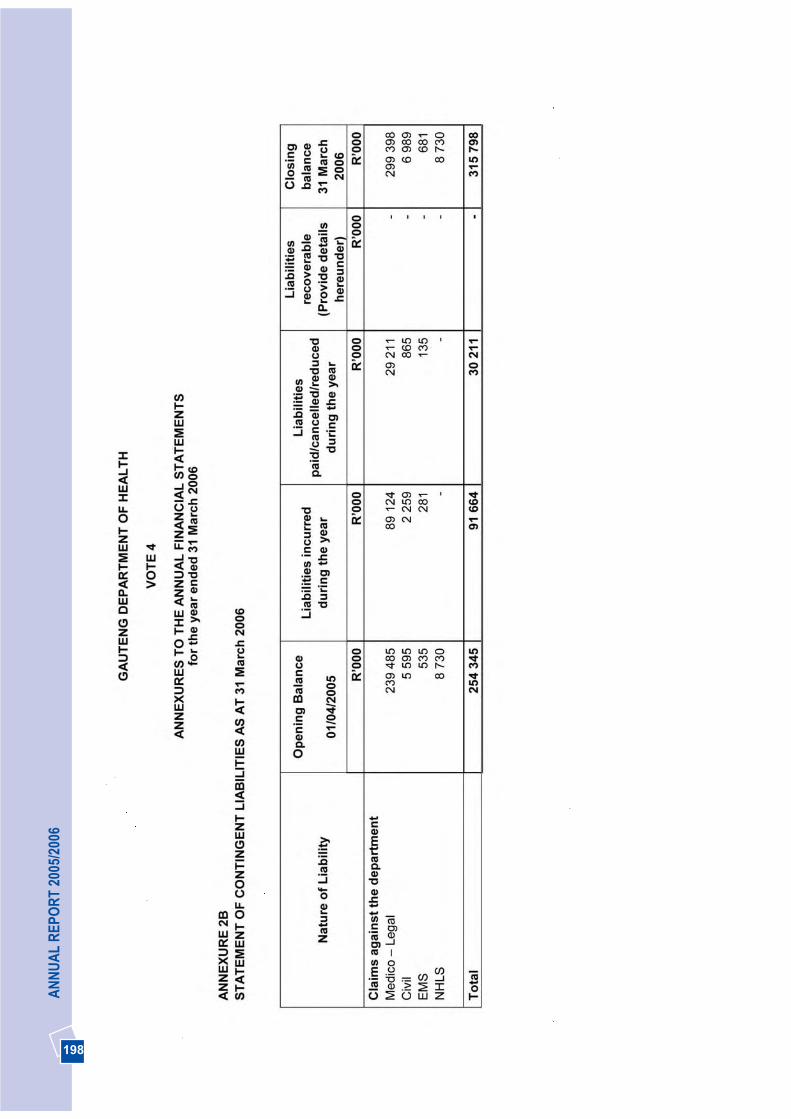
198
AN
NU
AL
REP
OR
T 20
05/2
006
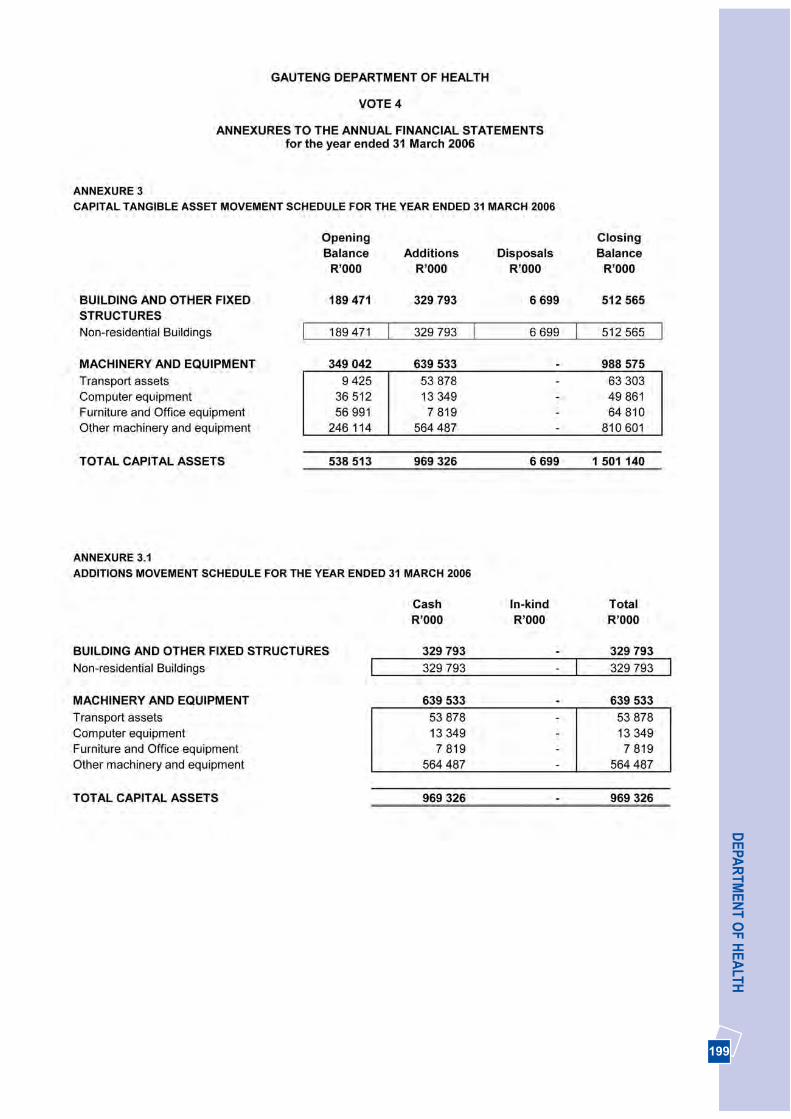
199
DEPA
RTM
ENT O
F HEA
LTH
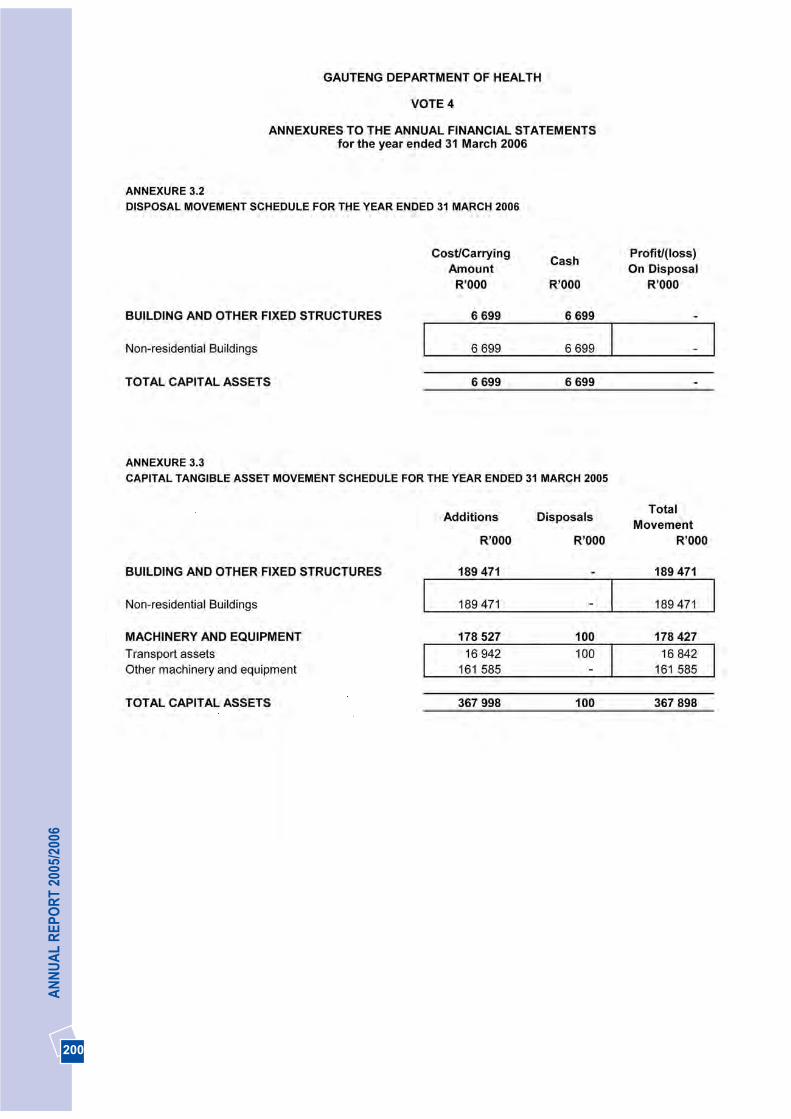
200
AN
NU
AL
REP
OR
T 20
05/2
006
-
-
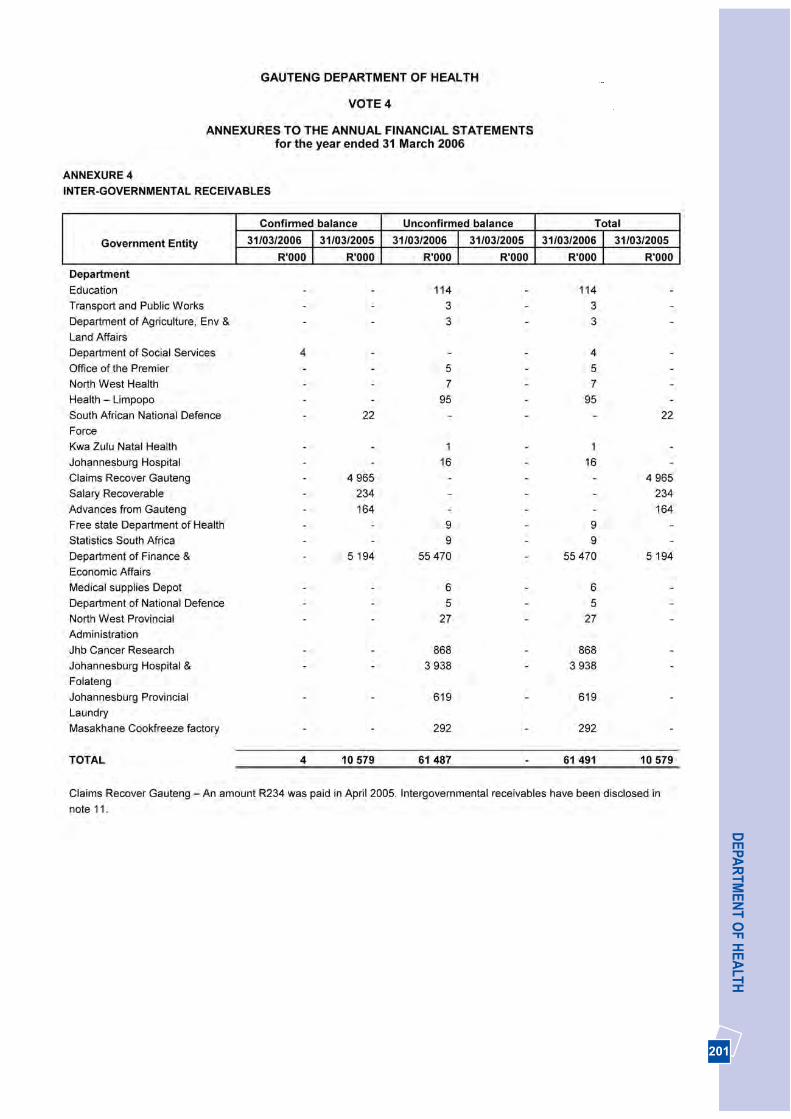
201
DEPA
RTM
ENT O
F HEA
LTH
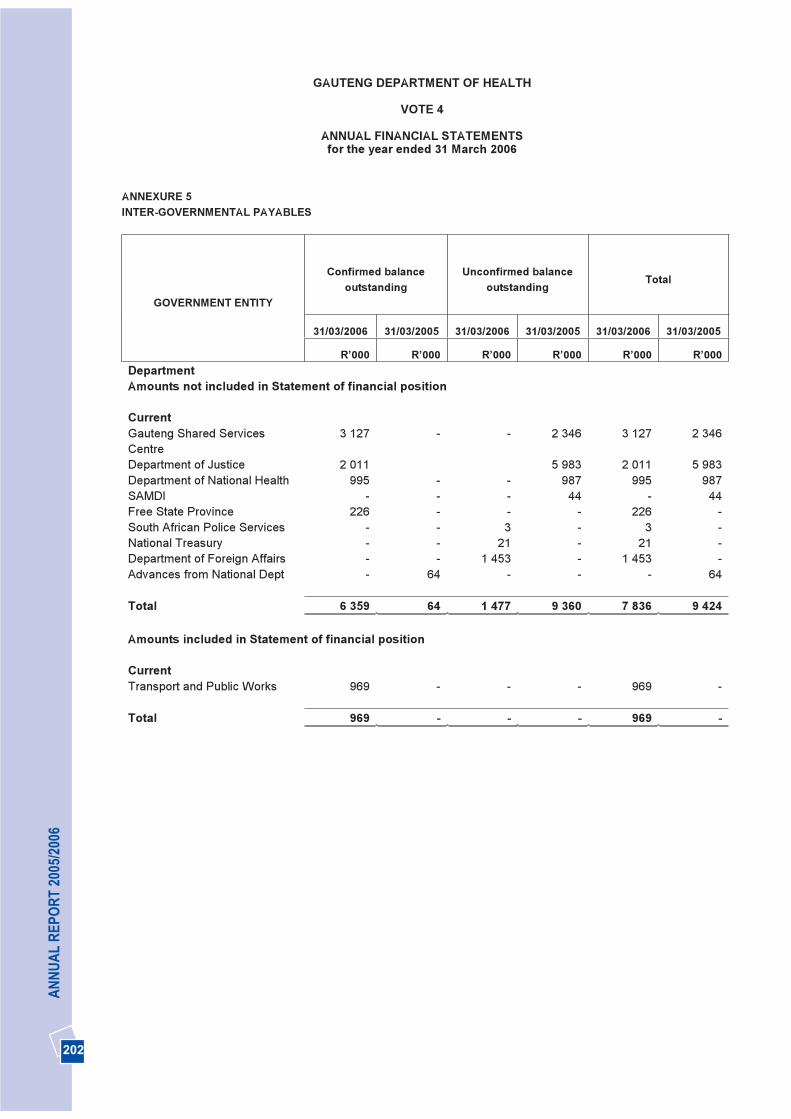
202
AN
NU
AL
REP
OR
T 20
05/2
006
GAUTENG DEPARTMENT OF HEALTH
VOTE 4
ANNUAL FINANCIAL STATEMENTSfor the year ended 31 March 2006
ANNEXURE 5INTER-GOVERNMENTAL PAYABLES
Confirmed balance outstanding
Unconfirmed balance outstanding
Total
31/03/2006 31/03/2005 31/03/2006 31/03/2005 31/03/2006 31/03/2005
GOVERNMENT ENTITY
R’000 R’000 R’000 R’000 R’000 R’000 Department Amounts not included in Statement of financial position
CurrentGauteng Shared ServicesCentre
3 127 - - 2 346 3 127 2 346
Department of Justice 2 011 5 983 2 011 5 983Department of National Health 995 - - 987 995 987SAMDI - - - 44 - 44Free State Province 226 - - - 226 -South African Police Services - - 3 - 3 -National Treasury - - 21 - 21 -Department of Foreign Affairs - - 1 453 - 1 453 -Advances from National Dept - 64 - - - 64
Total 6 359 64 1 477 9 360 7 836 9 424
Amounts included in Statement of financial position
CurrentTransport and Public Works 969 - - - 969 -
Total 969 - - - 969 -
203
Management Report 204
Report of the Auditor-General 212
Balance Sheet 214
Income Statement 215
Statement of Changes in Equity 216
Cash Flow Statement 217
Notes to the Financial Statements 218

204204
AN
NU
AL
REP
OR
T 20
05/2
006
The Accounting Officer of the Gauteng Department ofHealth hereby submits the annual report for the MedicalSupplies Depot, to the Executive Authority of theDepartment of Health, and the Gauteng ProvincialLegislature of the Republic of South Africa.
1. General review of the state of affairs
The Medical Supplies Depot is responsible for thesupply of essential medicines and disposablesurgical sundry items to Provincial Health CareFacilities in Gauteng. The Depot operates as atrading entity and charges a levy of 5 per cent onstock issues to the Provincial Health Care Facilities.
The Depot operates as a trading entity and preparesfinancial statements for each financial year inaccordance with generally recognized accountingpractice (GRAP). Sections 40(1)(b) and 89(1)(a) ofthe Public Finance Management Act prescribesgenerally recognized accounting practice. Thisprescribed practice can be found in chapter 18.4 ofthe Treasury Regulations and the approved GRAP 1,where it is stated that annual financial statements fortrading entities must conform to Generally AcceptedAccounting Practice (GAAP). The financial report isprepared and reported accordingly. Refer to note 2of the financial statements.
The pre-packing function is outsourced and sitehandover occurred on 8 February 2006.Management still needs to consider an appropriateincrease in the levy to recover these additional pre-packing expenses. It is expected that a trend tocalculate expected income and expenses by meansof regression analysis will only be available towardsthe end of February 2007 as monthly expansion ofline items for repacking occur. To accommodate forthe repacking expenses the Department has set outan amount of R7 million for the 2006/2007 financialyear. Refer to paragraphs 2 and 8 for more detail. Toaccommodate the expected changes in recordingexpenses relating to the pre-packing of items for thestore, the depot has started with the identification ofcost centres. Managers for each cost centre havebeen identified and procedures to ensure the
completeness of stock requisitioning and receivinghave been designed. The cost centreimplementation will be further enhanced with themonitoring of some expense items through a budgetprocess in the next financial year.
The Depot procures medicine and medical relateditems on contract, and either stock these items at theDepot, or orders are placed with suppliers on behalfof institutions for direct delivery to the variousinstitutions. Accurate usage of items, as well asmoney spent by hospitals, can be obtained fromMedsas, the Economic Order Quantity (EOQ)system is applied which ensures that correct stocklevels are maintained.
The Medicines and Related Substances Control Actcame into effect on 1 July 2005, and hence adecision was taken to review the key performanceareas of the post of a Depot manager and tostrengthen pharmaceutical services in the wholeprovince. The Director: Clinical Support Serviceswas appointed as the chief executive officer of theDepot. The chief executive officer’s duties are time-apportioned in an equal split (50:50). Thedepartment carries the compensation expenses ofthe chief executive officer. Refer to note 14 of thefinancial statements.
A summary of major spending trends indicates thatmedicines increase at a rate higher than theconsumer price index (CPI). This has the effect thatrevenue increases at a higher rate and has afavourable influence on the net profit of the depot.
DEPARTMENT OF HEALTHMEDICAL SUPPLIES DEPOT
MANAGEMENT REPORTFor the year ended 31 MARCH 2006
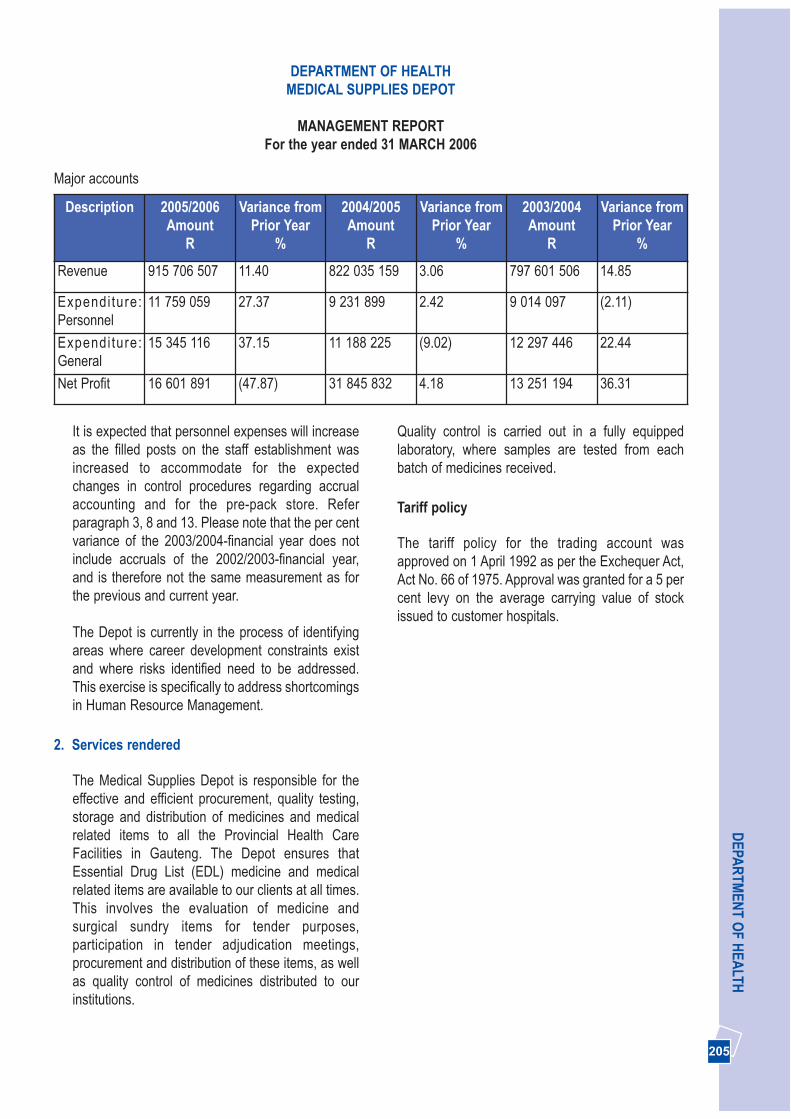
205 205
DEPA
RTM
ENT O
F HEA
LTH
It is expected that personnel expenses will increaseas the filled posts on the staff establishment wasincreased to accommodate for the expectedchanges in control procedures regarding accrualaccounting and for the pre-pack store. Referparagraph 3, 8 and 13. Please note that the per centvariance of the 2003/2004-financial year does notinclude accruals of the 2002/2003-financial year,and is therefore not the same measurement as forthe previous and current year.
The Depot is currently in the process of identifyingareas where career development constraints existand where risks identified need to be addressed.This exercise is specifically to address shortcomingsin Human Resource Management.
2. Services rendered
The Medical Supplies Depot is responsible for theeffective and efficient procurement, quality testing,storage and distribution of medicines and medicalrelated items to all the Provincial Health CareFacilities in Gauteng. The Depot ensures thatEssential Drug List (EDL) medicine and medicalrelated items are available to our clients at all times.This involves the evaluation of medicine andsurgical sundry items for tender purposes,participation in tender adjudication meetings,procurement and distribution of these items, as wellas quality control of medicines distributed to ourinstitutions.
Quality control is carried out in a fully equippedlaboratory, where samples are tested from eachbatch of medicines received.
Tariff policy
The tariff policy for the trading account wasapproved on 1 April 1992 as per the Exchequer Act,Act No. 66 of 1975. Approval was granted for a 5 percent levy on the average carrying value of stockissued to customer hospitals.
DEPARTMENT OF HEALTHMEDICAL SUPPLIES DEPOT
MANAGEMENT REPORTFor the year ended 31 MARCH 2006
Major accounts
Description 2005/2006Amount
R
Variance fromPrior Year
%
2004/2005Amount
R
Variance fromPrior Year
%
2003/2004Amount
R
Variance fromPrior Year
%
Revenue 915 706 507 11.40 822 035 159 3.06 797 601 506 14.85
Expendi ture:Personnel
11 759 059 27.37 9 231 899 2.42 9 014 097 (2.11)
Expendi ture:General
15 345 116 37.15 11 188 225 (9.02) 12 297 446 22.44
Net Profit 16 601 891 (47.87) 31 845 832 4.18 13 251 194 36.31

206206
AN
NU
AL
REP
OR
T 20
05/2
006
3. Capacity constraints
The Medical Supplies Depot delivers a vital serviceto all the Health Care Institutions in Gauteng.
Currently the Medical Supplies Depot has 190 postson the approved staff establishment, with 65 vacant.The vacancies are as a result of the need to complywith Resolution 7 of 2003 of the Public ServiceBargaining Council. Measures have been taken tostrengthen the operations of the Depot andmanagement.
The average service level of stock availability anddistribution to clients for the 2005/2006-financialyear was 84.72 per cent. The decrease from 89.8per cent when compared with the previous year canbe attributed to international raw material shortages,as well as the lack of finalised national and provincialcontracts.
A constraint to ensure effective, economical andefficient reporting exists in that information fromvarious systems needs to be manually collated.Information from the following systems is used andinvolves time-consuming reconciliation proceduresto enable compliance with GAAP for disclosurepurposes:
• Basic Accounting System (BAS)• Personnel and Salary Administration System
(Persal)• Medical Stock Administration System (Medsas)• Asset Management System (BAUD)• Manual systems to perform reconciliation
procedures and accrual based accounting
This hampers the corporate governancearrangements and financial managementimprovement process as mentioned in paragraph 7and 10.
DEPARTMENT OF HEALTHMEDICAL SUPPLIES DEPOT
MANAGEMENT REPORTFor the year ended 31 MARCH 2006
Free Service
The Depot does not provide any free service. The quality control of the medicines performed by the laboratory onsite is part of the administration expenses of the depot.
Inventory
The valuation method used by the Medical Supplies Depot is the moving weighted average method as per theMedsas system:
Medicine and related items2005/2006 2004/2005 2003/2004
R R RClosing stock 75 915 277 44 855 208 29 009 238
Please note that no provision for obsolete stock is made. Refer to note 1.11 and 8 of the financial statements. Thevalue of breakages and expired stock for the 2005/2006-financial year combined represents 15/1000 of a per cent(0.015%) of turnover.
Medicine and related items2005/2006 2004/2005
R RBreakages 7 611 15 004Expire stock 130 819 263 593

207 207
DEPA
RTM
ENT O
F HEA
LTHDEPARTMENT OF HEALTH
MEDICAL SUPPLIES DEPOT
MANAGEMENT REPORTFor the year ended 31 MARCH 2006
The current market value of the donation received isapproximately R65 490 537 for the tablets, solutionand suspension. This medicine was issued andcharged at a value of one-hundredth of one cent(R0.0001) to all clients of the depot. The total chargeto health institutions for donations receivedamounted to R3.06.
Please note that the Depot does not account for theeconomic benefit received in the income statement,as the Depot is considered to be only a conduit forhospitals and to control the receipt of donations forthe department. Refer to note 1.2 of the financialstatements.
5. Trading entities
The Medical Supplies Depot operates as a tradingentity, known as “The Central Medical TradingAccount” since 1 April 1992. The trading entity actsas shared supply chain for the procurement and
provisioning of pharmaceutical and surgical sundryitems to the department’s Health Care Institutions inGauteng.
Accountability arrangements
Special delegations, approved by the Head ofDepartment are in place for the authorisation ofpayments. Appropriate segregation of related duties,delegations and policies ensure security of functionsin both finance and procurement. System access toMEDSAS, PERSAL and BAS is restricted viaprofiles and passwords, which further enhances thecontrol measures.
The safekeeping of stock is achieved by limitingaccess to storage areas to authorized personnelonly. This is controlled by means of a computerisedsystem monitored by own security personnel. Inaddition extensive security by an outsourcedcompany is in place throughout the Depot property.
4. Utilisation of donor funds
The Depot receives a donation of NevirapineSolution and Tablets from Boehringer Ingelheim forthe Prevention of Mother-to-Child Transmission ofHIV, and a further donation of Fluconazole fromPfizer Laboratories for use by AIDS patients withOesophagael Candidiasis and Cryptococcal
Meningitis. This type of donor funding is received ona continuous basis.
The quantity of medicine, received and issued, andthe approximate value of the donations for thefinancial year under review are as follows:
Description Issuemeasurement/
Dosage
QuantityReceived/
Issued
Current Market Valueper Unit (Single Exit
Price) R
Total ValueReceived
R
Nevirapine Solution50mg/5ml
20ml Bottles 720 29.47 21 218
Nevirapine Tablets60’s/200mg
60’s Bottles 210 636.71 133 709
Diflucan Suspension50mg/5ml
35ml Bottles 418 596.15 249 191
Diflucan Tablets28’s/200mg
28’s Bottles 29 238 2 226.09 65 086 419
TOTAL 30 586 65 490 537

208208
AN
NU
AL
REP
OR
T 20
05/2
006
The implementation of approved tenders occursmuch quicker to compensate for the limitations inthe Medsas-system regarding backdated priceincreases. Refer to paragraph 13. The summary ofthe financial performance of the trading entity isoutlined in the attached Financial Statements - seethe Balance Sheet, Income Statement, Statement ofChanges in Equity, Cash Flow Statement and Notesto the Financial Statements.
6. Public/Private Partnership (PPP)
No Public Private Partnership has been entered intoby the Depot in this financial year.
The following non-core services have beenoutsourced to the private sector:
• Maintenance and support of the MEDSAScomputer system
• Distribution of stock to health care institutions.• Security of the property and vehicle access
control.• Maintenance, pest control and minor landscaping
of the garden at the Depot. • General maintenance contracts, such as lifts, air
conditioners, stand-by generator, fire equipmentand access control mechanisms.
• The repacking of bulk medicine into patient readypacks. Refer paragraph 8 for detail.
Refer to note 13 of the financial statements foroperating lease and commitments detail.
7. Corporate governance arrangements
Management, with the objective of safeguarding theassets of the Depot and ensuring a high quality ofservice delivery, did a risk assessment. Thefollowing financial risks were prioritised:
• A system was developed to reconcile creditorsand to ensure that no over- or under- paymentswere made (Refer to note 11 of the financialstatements)
• Debtors control was introduced to ensure thatrevenue is collected timeously and outstanding
orders are cleared. (Refer to note 8.1 of thefinancial statements)
• A reconciliation procedure was implementedwhereby hospitals reconcile stock received, withcharges on their accounting system (BAS) andMEDSAS (Budget Expenditure Report).
• The BAUD asset management was implementedand all assets were recorded and capitalized.(Refer to note 6 of the financial statements)
Management uses risk assessments and reports ofboth internal and external audit on a monthly basisin order to identify areas for improvement of theoperations of the Depot. Updated reports madeavailable are being used to strengthen theimplementation of risk management and fraudprevention plans at the Medical Supplies Depot. Anupdated risk assessment for all operations at theDepot was completed on 8 April 2006. This riskassessment with implemented procedures willfurther enhance controls and operations at theDepot.
8. New/proposed activities
Pre-pack unit
Bulk packed medicine is repacked into patient readypacks by this unit. The Department has finalised thetender process and a service level agreement wassigned with a contractor for the outsourcing of thisfunction in September 2005. The registrationrequirements of the Medicine Control Council (MCC)have been updated resulting in improved equipmentand premises that is required to ensure that theregistration requirements of the Medicine ControlCouncil are adhered to. The Medicine ControlCouncil has granted a preliminary licence for thecurrent facilities. The level of operation at the end ofthe 2005/2006-financial year was approximately 21per cent. The business plan of the Depot indicatedthat the level of operation at the end of the2005/2006 financial year is 60 per cent, and by theend of the 2006/2007 financial year it will be 100 percent. The business plan for the achievement of100% level of operations at the end of the
DEPARTMENT OF HEALTHMEDICAL SUPPLIES DEPOT
MANAGEMENT REPORTFor the year ended 31 MARCH 2006
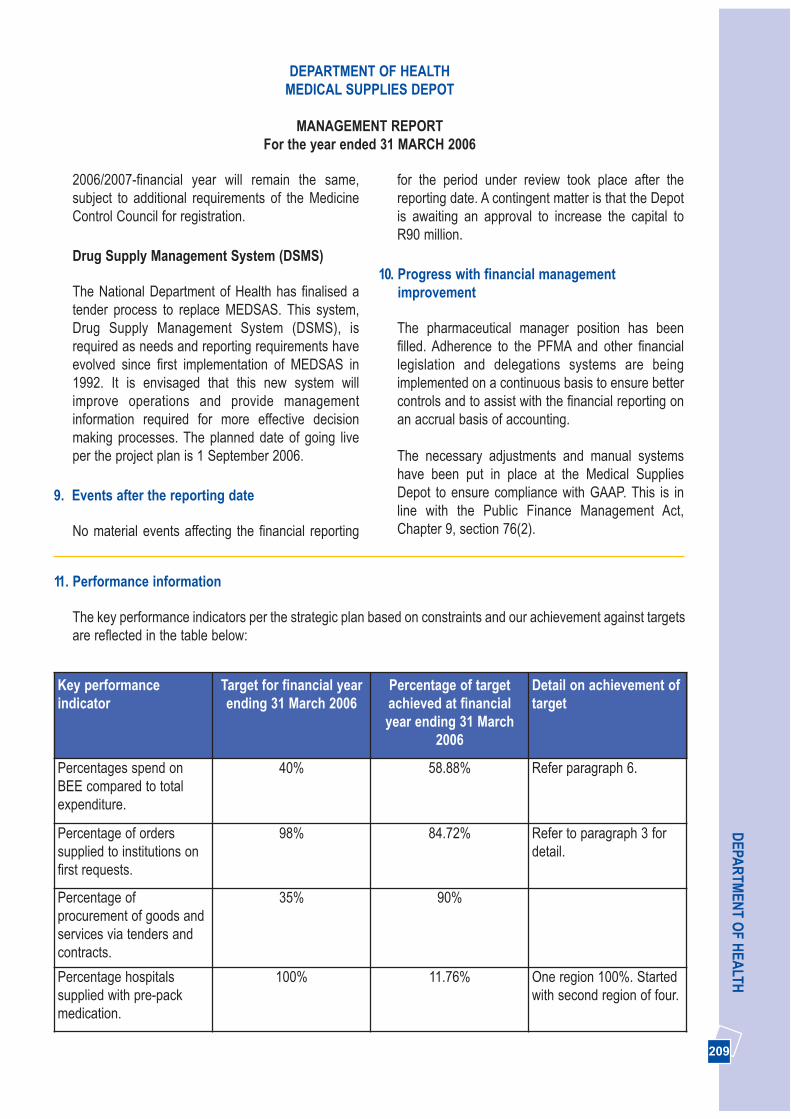
209 209
DEPA
RTM
ENT O
F HEA
LTH
2006/2007-financial year will remain the same,subject to additional requirements of the MedicineControl Council for registration.
Drug Supply Management System (DSMS)
The National Department of Health has finalised atender process to replace MEDSAS. This system,Drug Supply Management System (DSMS), isrequired as needs and reporting requirements haveevolved since first implementation of MEDSAS in1992. It is envisaged that this new system willimprove operations and provide managementinformation required for more effective decisionmaking processes. The planned date of going liveper the project plan is 1 September 2006.
9. Events after the reporting date
No material events affecting the financial reporting
for the period under review took place after thereporting date. A contingent matter is that the Depotis awaiting an approval to increase the capital toR90 million.
10. Progress with financial managementimprovement
The pharmaceutical manager position has beenfilled. Adherence to the PFMA and other financiallegislation and delegations systems are beingimplemented on a continuous basis to ensure bettercontrols and to assist with the financial reporting onan accrual basis of accounting.
The necessary adjustments and manual systemshave been put in place at the Medical SuppliesDepot to ensure compliance with GAAP. This is inline with the Public Finance Management Act,Chapter 9, section 76(2).
DEPARTMENT OF HEALTHMEDICAL SUPPLIES DEPOT
MANAGEMENT REPORTFor the year ended 31 MARCH 2006
11. Performance information
The key performance indicators per the strategic plan based on constraints and our achievement against targetsare reflected in the table below:
Key performanceindicator
Target for financial yearending 31 March 2006
Percentage of targetachieved at financialyear ending 31 March
2006
Detail on achievement oftarget
Percentages spend onBEE compared to totalexpenditure.
40% 58.88% Refer paragraph 6.
Percentage of orderssupplied to institutions onfirst requests.
98% 84.72% Refer to paragraph 3 fordetail.
Percentage ofprocurement of goods andservices via tenders andcontracts.
35% 90%
Percentage hospitalssupplied with pre-packmedication.
100% 11.76% One region 100%. Startedwith second region of four.
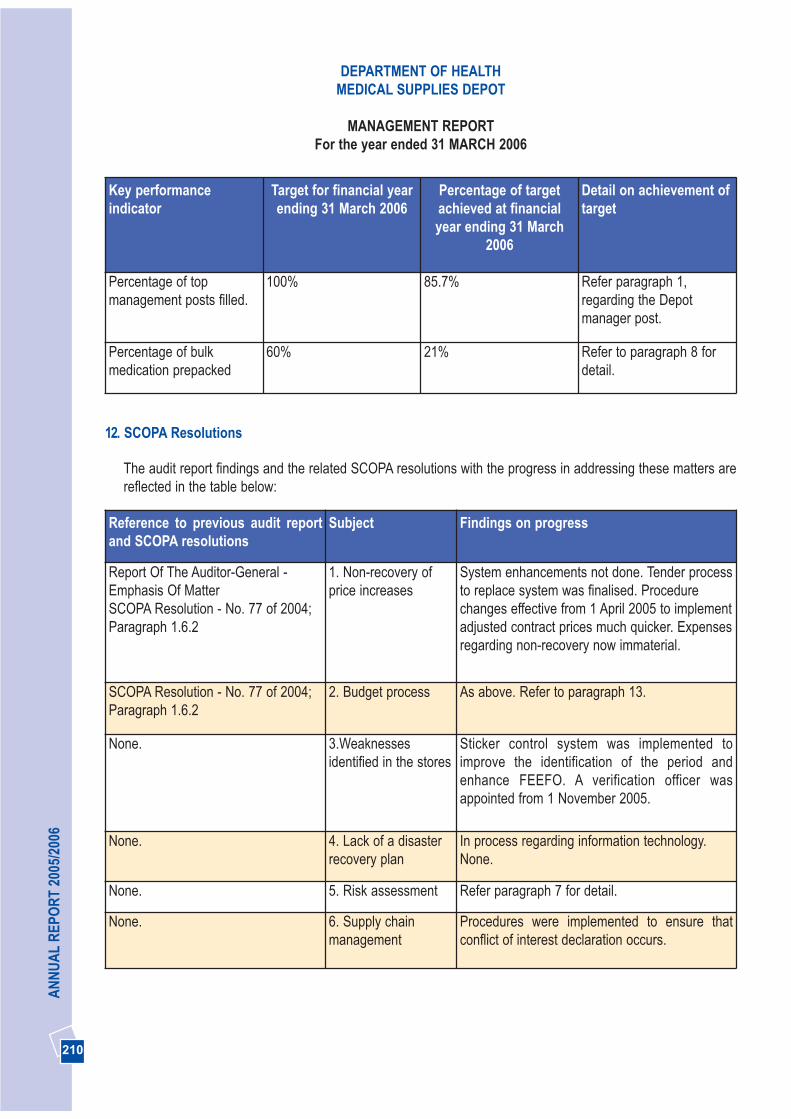
210210
AN
NU
AL
REP
OR
T 20
05/2
006
Key performanceindicator
Target for financial yearending 31 March 2006
Percentage of targetachieved at financialyear ending 31 March
2006
Detail on achievement oftarget
Percentage of topmanagement posts filled.
100% 85.7% Refer paragraph 1,regarding the Depotmanager post.
Percentage of bulkmedication prepacked
60% 21% Refer to paragraph 8 fordetail.
12. SCOPA Resolutions
The audit report findings and the related SCOPA resolutions with the progress in addressing these matters arereflected in the table below:
Reference to previous audit reportand SCOPA resolutions
Subject Findings on progress
Report Of The Auditor-General -Emphasis Of MatterSCOPA Resolution - No. 77 of 2004;Paragraph 1.6.2
1. Non-recovery ofprice increases
System enhancements not done. Tender processto replace system was finalised. Procedurechanges effective from 1 April 2005 to implementadjusted contract prices much quicker. Expensesregarding non-recovery now immaterial.
SCOPA Resolution - No. 77 of 2004;Paragraph 1.6.2
2. Budget process As above. Refer to paragraph 13.
None. 3.Weaknessesidentified in the stores
Sticker control system was implemented toimprove the identification of the period andenhance FEEFO. A verification officer wasappointed from 1 November 2005.
None. 4. Lack of a disasterrecovery plan
In process regarding information technology.None.
None. 5. Risk assessment Refer paragraph 7 for detail.
None. 6. Supply chainmanagement
Procedures were implemented to ensure thatconflict of interest declaration occurs.
DEPARTMENT OF HEALTHMEDICAL SUPPLIES DEPOT
MANAGEMENT REPORTFor the year ended 31 MARCH 2006
211 211
DEPA
RTM
ENT O
F HEA
LTH
13. Other
The procedure changes that was implemented effective from 1 April 2005 has resulted in price increases of onlyR4 939 not being recovered in the year under review. The new DSMS will be able to accommodate priceadjustments that are backdated and provide improved management information.
14. Approval
The annual financial statements set out on pages 214 to 226 have been approved by the Accounting Officer.
............................................................DR. A. RAHMANACTING: HEAD OF DEPARTMENT31 MAY 2006
DEPARTMENT OF HEALTHMEDICAL SUPPLIES DEPOT
MANAGEMENT REPORTFor the year ended 31 MARCH 2006

212212
AN
NU
AL
REP
OR
T 20
05/2
006
REPORT OF THE AUDITOR-GENERAL TO THE GAUTENG PROVINCIAL LEGISLATURE ON THEFINANCIAL STATEMENTS OF THE MEDICAL SUPPLIES DEPOT FOR THE YEAR ENDED 31 MARCH 2006
1. AUDIT ASSIGNMENT
The financial statements as set out on pages 214 to 226 for the year ended 31 March 2006 have been auditedin terms of section 188 of the Constitution of the Republic of South Africa, 1996 (Act No. 108 of 1996), read withsections 4 and 20 of the Public Audit Act, 2004 (Act No. 25 of 2004) and section 40(2) of the Public FinanceManagement Act, 1999 (Act No. 1 of 1999) as amended. These financial statements are the responsibility of theaccounting officer. My responsibility is to express an opinion on these financial statements, based on the audit.
2. SCOPE
The audit was conducted in accordance with the International Standards on Auditing read with General Notice544 of 2006, issued in Government Gazette No. 28723 of 10 April 2006 and General Notice 808 of 2006, issuedin Government Gazette No. 28954 of 23 June 2006. Those standards require that I plan and perform the auditto obtain reasonable assurance that the financial statements are free of material misstatement.
An audit includes:
• examining, on a test basis, evidence supporting the amounts and disclosures in the financial statements;• assessing the accounting principles used and significant estimates made by management;• evaluating the overall financial statement presentation.
I believe that the audit provides a reasonable basis for my opinion.
3. AUDIT OPINION
In my opinion, the financial statements present fairly, in all material respects, the financial position of the MedicalSupplies Depot (MSD) at 31 March 2006 and the results of its operations and cash flows for the year thenended, in accordance with South African Statements of Generally Accepted Accounting Practice and in themanner required by the Public Finance Management Act, 1999 (Act No. 1of 1999) (PFMA) as amended.
4. EMPHASIS OF MATTER
Without qualifying the audit opinion, attention is drawn to the following matters:
4.1 Internal control - Leave
The following internal control weaknesses in respect of leave were identified:
• Leave records were not always timeously captured on the Personnel and Salary Administration System(PERSAL)
• In some instances vacation leave was approved after the leave was taken.• Leave was not always approved.
213 213
DEPA
RTM
ENT O
F HEA
LTH4.2 Environmental matters
MSD did not have an environmental plan in place. Furthermore, waste management, occupational health andsafety as well as facility management principles were not always adhered to.
4.3 Financial systems
In terms of section 40(1)(b) of the PFMA, trading entities are required to report on the accrual basis ofaccounting. The current accounting system utilised is Basic Accounting System (BAS) which is based on cashprinciples. Manual interventions were required to align the accounting reporting framework with the accountingsystem used. These manual interventions increased control risk and inefficiencies.
5. APPRECIATION
The assistance rendered by the staff of the Medical Supplies Depot during the audit is sincerely appreciated.
Ms M. A. Masemola for Auditor-General
Johannesburg
28 July 2006

214214
AN
NU
AL
REP
OR
T 20
05/2
006
DEPARTMENT OF HEALTHMEDICAL SUPPLIES DEPOT
BALANCE SHEETAs at 31 MARCH 2006
Note 2005/2006 2004/2005R R
ASSETS
Non-current assets
Property, plant and equipment 6 1 793 838 2 247 006
Current assets
Inventories 7 75 915 277 44 855 208Trade and other receivables 8.1 47 396 670 43 248 768Cash and cash equivalents 9 84 135 791 69 526 604
207 447 738 157 630 580
Total assets 209 241 576 159 877 586
EQUITY AND LIABILITIES
Capital and reserves
Medsas capital account 10 54 000 000 54 000 000Retained earnings 77 899 329 61 297 439Total equity 131 899 329 115 297 439
Current liabilities
Provisions 8.2 958 010 641 065Trade and other payables 11 76 384 237 43 939 083
Total liabilities 77 342 247 44 580 147
Total equity and liabilities 209 241 576 159 877 586
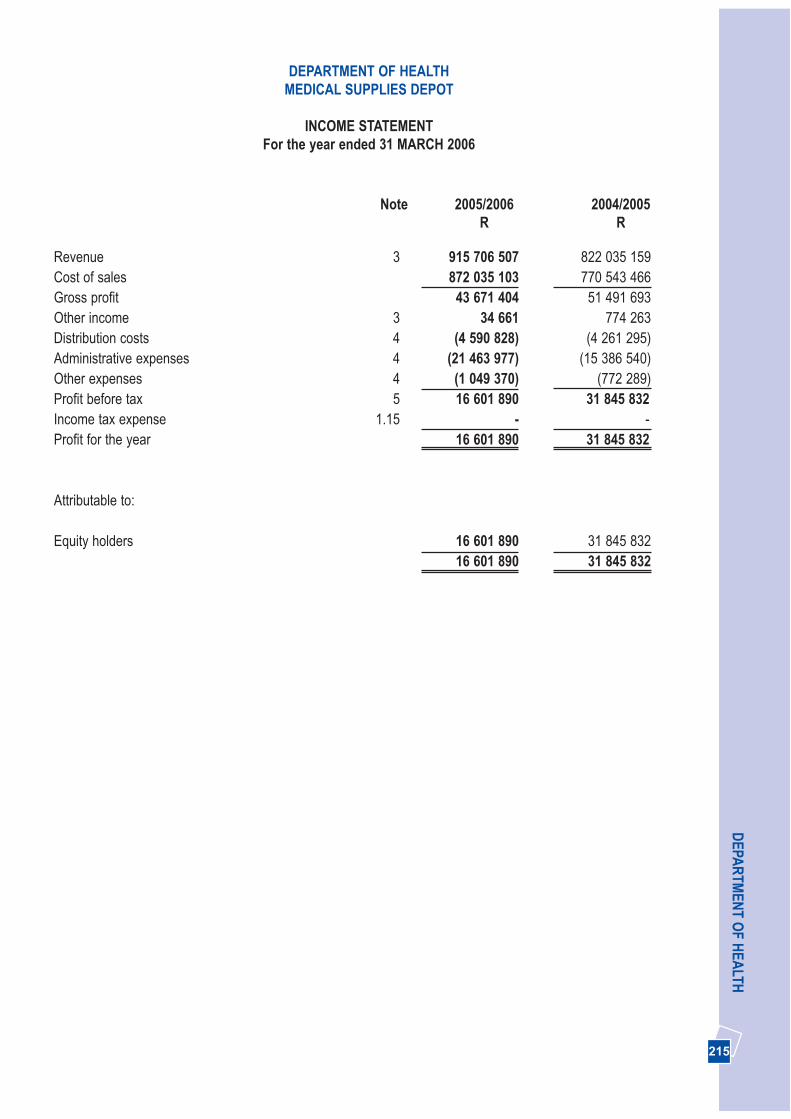
Revenue 3 915 706 507 822 035 159 Cost of sales 872 035 103 770 543 466 Gross profit 43 671 404 51 491 693Other income 3 34 661 774 263Distribution costs 4 (4 590 828) (4 261 295)Administrative expenses 4 (21 463 977) (15 386 540)Other expenses 4 (1 049 370) (772 289)Profit before tax 5 16 601 890 31 845 832Income tax expense 1.15 - -Profit for the year 16 601 890 31 845 832
Attributable to:
Equity holders 16 601 890 31 845 832 16 601 890 31 845 832
215 215
DEPA
RTM
ENT O
F HEA
LTH
Note 2005/2006 2004/2005R R
DEPARTMENT OF HEALTHMEDICAL SUPPLIES DEPOT
INCOME STATEMENTFor the year ended 31 MARCH 2006
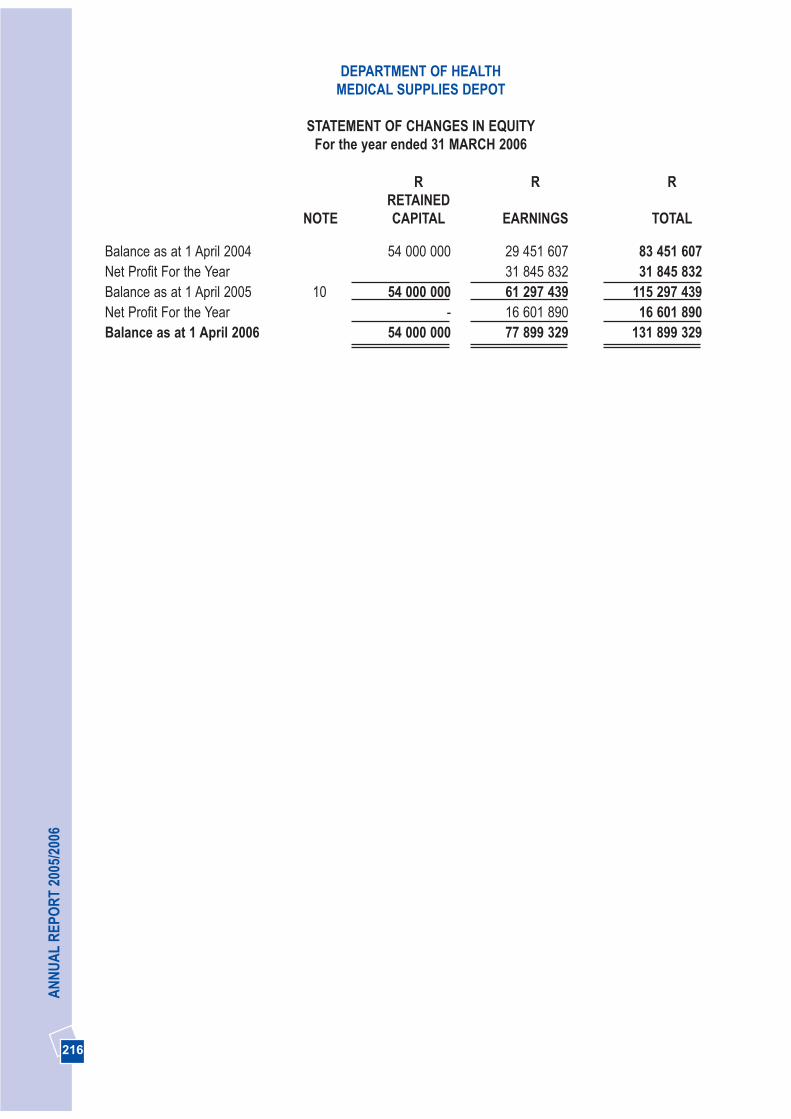
216216
AN
NU
AL
REP
OR
T 20
05/2
006
DEPARTMENT OF HEALTHMEDICAL SUPPLIES DEPOT
STATEMENT OF CHANGES IN EQUITYFor the year ended 31 MARCH 2006
R R RRETAINED
NOTE CAPITAL EARNINGS TOTAL
Balance as at 1 April 2004 54 000 000 29 451 607 83 451 607Net Profit For the Year 31 845 832 31 845 832Balance as at 1 April 2005 10 54 000 000 61 297 439 115 297 439Net Profit For the Year - 16 601 890 16 601 890Balance as at 1 April 2006 54 000 000 77 899 329 131 899 329

Cash flows from operating activitiesProfit before taxation 16 601 890 31 845 832Adjustments for:
Depreciation 12 957 291 685 993Provisions 8.2 316 945 89 986
17 876 126 32 621 811(Increase) / Decrease in inventories (31 060 069) (15 845 970) (Increase) / Decrease in trade and other receivables (4 147 902) 84 132Increase / (Decrease) in trade and other payables 32 445 154 (26 896 863)
Cash (utilised) / generated from operations (2 762 817) (10 036 890)Net cash from operating activities 15 113 309 (10 036 890)Cash flows from investing activitiesPurchase of property, plant and equipment 6 (504 122) (488 779)Leave paid from provision 8.2 - (2 688)Net cash used in investing activities (504 122) (491 467)Net cash used in financing activities -Net (decrease) / increase in Cash and Cash Equivalents 14 609 187 (10 528 357)Cash and cash equivalents at beginning of the year 69 526 604 80 054 961 Cash and cash equivalents at end of the year 84 135 791 69 526 604
217 217
DEPA
RTM
ENT O
F HEA
LTHDEPARTMENT OF HEALTH
MEDICAL SUPPLIES DEPOT
CASH FLOW STATEMENTFor the year ended 31 MARCH 2006
Note 2005/2006 2004/2005R R
218218
AN
NU
AL
REP
OR
T 20
05/2
006
DEPARTMENT OF HEALTHMEDICAL SUPPLIES DEPOT
NOTES TO THE FINANCIAL STATEMENTSFor the year ended 31 MARCH 2006
1. ACCOUNTING POLICIES
The annual financial statements have beenprepared in accordance with Statements ofGenerally Accepted Accounting Practice.
The following are the principle accounting policies ofthe Depot which are, in all material respects,consistent with those applied in the previous year,except as otherwise indicated:
1.1 Basis of preparation
The financial statements have been prepared on thehistorical cost basis, except as modified for thecapitalization of furniture and equipment.
1.2 Revenue recognition
Revenue is recognised when it is probable thatfuture economic benefits will flow to the enterpriseand these benefits can be measured reliably.
Revenue from the sale of goods is recognised whensignificant risks and rewards of ownership of thegoods have been transferred to the buyer.
Interest income is not recognised as revenue, assurplus cash is kept for the account of the ProvincialGovernment (Department of Finance).
Donations received are not recognized as anincrease in economic benefit as items are chargedat R0.0001 per item to clients.
1.3 Irregular and fruitless and wasteful expenditure
Irregular expenditure means expenditure incurred incontravention of, or not in accordance with, arequirement of any applicable legislation, including:
• The PFMA, or• Any provincial legislation providing for
procurement procedures in that provincialgovernment.
Fruitless and wasteful expenditure means expenditure that was made in vain and would havebeen avoided had reasonable care been exercised.
All irregular and fruitless and wasteful expenditure ischarged against income in the period in which theyare incurred.
1.4 Short-term employee benefits
The cost of short-term employee benefits isexpensed in the income statement in the reportingperiod when the payment is made. Short-termemployee benefits, that give rise to a present legalor constructive obligation, are deferred until theycan be reliably measured and then expensed.Details of these benefits and the potential liabilitiesare disclosed as a disclosure note to the financialstatements where applicable and are notrecognised in the income statement.
1.5 Termination benefits
Termination benefits are recognised and expensedonly when the payment is made.
1.6 Retirement benefit costs
The depot provides retirement benefits for itsemployees through a defined benefit plan forgovernment employees. These benefits are fundedby both employer and employee contributions.Employer contributions to the fund are expensedwhen money is paid to the fund. No provision ismade for retirement benefits in the financialstatements.
1.7 Medical benefits
The depot provides medical benefits for itsemployees through defined benefit plans. Thesebenefits are funded by employer and employeecontributions. Employer contributions to the fundare expensed when money is paid to the fund. Noprovision is made for medical benefits in thefinancial statements.
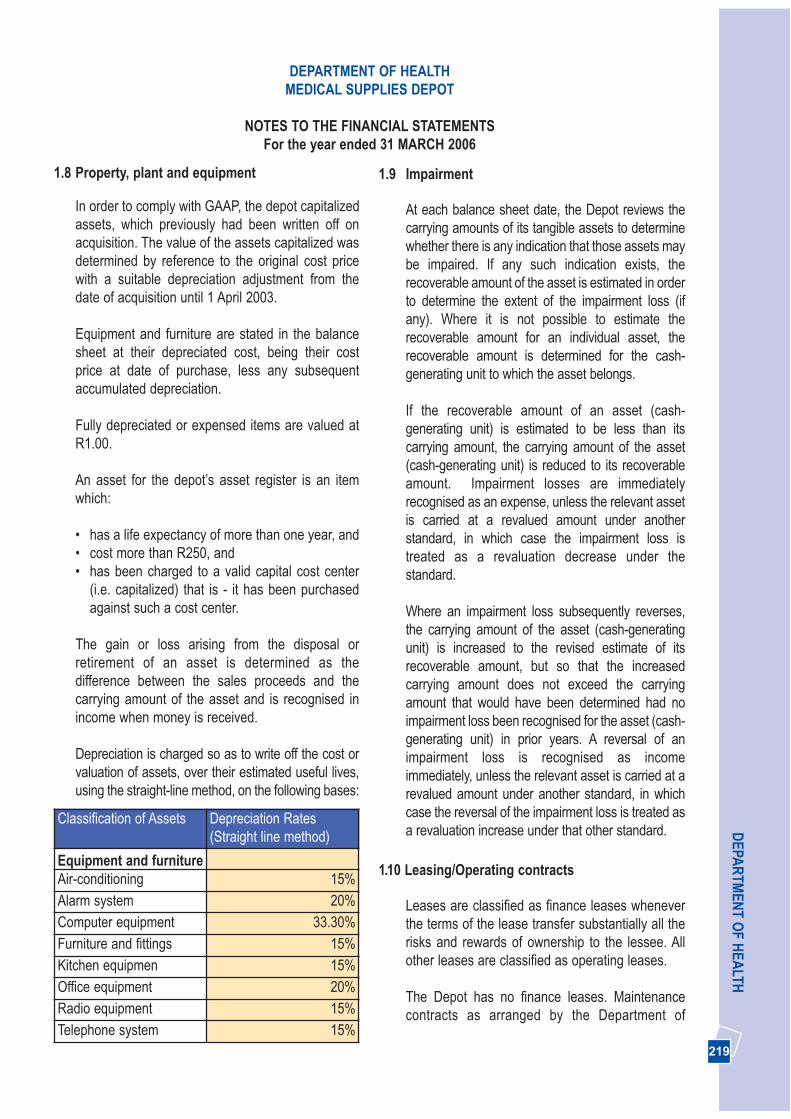
219 219
DEPA
RTM
ENT O
F HEA
LTH
1.9 Impairment
At each balance sheet date, the Depot reviews thecarrying amounts of its tangible assets to determinewhether there is any indication that those assets maybe impaired. If any such indication exists, therecoverable amount of the asset is estimated in orderto determine the extent of the impairment loss (ifany). Where it is not possible to estimate therecoverable amount for an individual asset, therecoverable amount is determined for the cash-generating unit to which the asset belongs.
If the recoverable amount of an asset (cash-generating unit) is estimated to be less than itscarrying amount, the carrying amount of the asset(cash-generating unit) is reduced to its recoverableamount. Impairment losses are immediatelyrecognised as an expense, unless the relevant assetis carried at a revalued amount under anotherstandard, in which case the impairment loss istreated as a revaluation decrease under thestandard.
Where an impairment loss subsequently reverses,the carrying amount of the asset (cash-generatingunit) is increased to the revised estimate of itsrecoverable amount, but so that the increasedcarrying amount does not exceed the carryingamount that would have been determined had noimpairment loss been recognised for the asset (cash-generating unit) in prior years. A reversal of animpairment loss is recognised as incomeimmediately, unless the relevant asset is carried at arevalued amount under another standard, in whichcase the reversal of the impairment loss is treated asa revaluation increase under that other standard.
1.10 Leasing/Operating contracts
Leases are classified as finance leases wheneverthe terms of the lease transfer substantially all therisks and rewards of ownership to the lessee. Allother leases are classified as operating leases.
The Depot has no finance leases. Maintenancecontracts as arranged by the Department of
DEPARTMENT OF HEALTHMEDICAL SUPPLIES DEPOT
NOTES TO THE FINANCIAL STATEMENTSFor the year ended 31 MARCH 2006
Classification of Assets Depreciation Rates(Straight line method)
Equipment and furnitureAir-conditioning 15%
Alarm system 20%
Computer equipment 33.30%
Furniture and fittings 15%
Kitchen equipmen 15%
Office equipment 20%
Radio equipment 15%
Telephone system 15%
1.8 Property, plant and equipment
In order to comply with GAAP, the depot capitalizedassets, which previously had been written off onacquisition. The value of the assets capitalized wasdetermined by reference to the original cost pricewith a suitable depreciation adjustment from thedate of acquisition until 1 April 2003.
Equipment and furniture are stated in the balancesheet at their depreciated cost, being their costprice at date of purchase, less any subsequentaccumulated depreciation.
Fully depreciated or expensed items are valued atR1.00.
An asset for the depot’s asset register is an itemwhich:
• has a life expectancy of more than one year, and• cost more than R250, and• has been charged to a valid capital cost center
(i.e. capitalized) that is - it has been purchasedagainst such a cost center.
The gain or loss arising from the disposal orretirement of an asset is determined as thedifference between the sales proceeds and thecarrying amount of the asset and is recognised inincome when money is received.
Depreciation is charged so as to write off the cost orvaluation of assets, over their estimated useful lives,using the straight-line method, on the following bases:
220220
AN
NU
AL
REP
OR
T 20
05/2
006
Transport, Roads and Public Works is recognized ascommitments, but not as payables. Refer to note 13.
Rentals payable under operating leases arecharged to the income statement on a straight-linebasis over the term of the relevant lease.
1.11 Inventories
Inventories are stated at the weighted averagemoving basis. No provision is made for obsoletestock, as it will be a contravention of chapter 9 ofthe Treasury Regulations. Refer to note 1.3.
1.12 Financial instruments
a Recognition
Financial assets and financial liabilities arerecognised on the Depot’s balance sheet whenthe Depot becomes a party to the contractualprovisions of the instrument.
b Financial assets
The depot’s principle financial assets areaccounts receivable and cash and cashequivalents.
c Trade receivables
Trade receivables are stated at their nominalvalue as reduced by appropriate allowances forestimated irrecoverable amounts.
d Cost and amortized cost are inclusive of anyimpairment loss recognised to reflectirrecoverable amounts. The financial assets aresubject to review for impairment at eachbalance sheet date.
e Trade payables
Trade and other payables are stated at theirnominal value.
1.13 Provisions
Provisions are recognised when the Depot has apresent obligation as a result of a past event and itis probable that this will result in an outflow ofeconomic benefits that can be estimated reliably.
The Depot is not exposed to environmentalliabilities relating to its operations.
1.14 Comparative figures
Where necessary, comparative figures have beenadjusted to conform to changes in presentation inthe current year, limited to audited figures.Reasonably, calculated, comparative figures aredisclosed in the notes to the Annual FinancialStatements for better understanding of changesthat have occurred in presentation.
1.15 Taxation
In terms of section 10.1 of the Income Tax Act, ActNumber 59 of 1962, the Depot as a governmentinstitution, does not pay any normal taxation overto the South African Revenue Service. Employeetax is paid over by the Gauteng Shared ServiceCenter at the time when the employee expensesare programmatically recognised.
2. ADOPTION OF SOUTH AFRICANACCOUNTING STANDARDS
During the financial year under review the Depothas adopted the following Generally AcceptedAccounting Standards, which has beenincorporated from the relevant InternationalAccounting Standards:
AC 111 (IAS 18) - RevenueAC 116 (IAS 19) - Employee benefitsAC 118 (IAS 7) - Cash flow statementsAC 128 (IAS 36) - Impairment of assetsAC 130 (IAS 37) - Provisions, contingent liabilitiesand contingent assets
DEPARTMENT OF HEALTHMEDICAL SUPPLIES DEPOT
NOTES TO THE FINANCIAL STATEMENTSFor the year ended 31 MARCH 2006

221 221
DEPA
RTM
ENT O
F HEA
LTHDEPARTMENT OF HEALTH
MEDICAL SUPPLIES DEPOT
NOTES TO THE FINANCIAL STATEMENTSFor the year ended 31 MARCH 2006
3. REVENUE
An analysis of the depot’s revenue
2005/2006 2004/2005R R
Other Revenue 34 661 774 263Medsas Revenue - Sale of medical supplies 915 706 507 822 035 159Total revenue 915 741 168 822 809 422
There were no discontinued operations for the period under review.
4. OPERATING EXPENSES
An analysis of the Depot’s expense is as follows:
Distribution costs: 4 590 828 4261 295- Fees for distribution costs 4 487 543 4204 581- Rental of vehicles 103 285 56 714Administrative expenses: 21 463 977 15 386 540Compensation of employees: Medsas 11 759 059 9 231 899 Communication 402 638 284 024 Maintenance and repairs 3 446 052 1 556 779Stationery and printing 492 279 276 651Other administrative expenses 223 032 1 200 790Fees for services: - Lease rentals of equipment 54 649 61 701- Audit 565 794 482 706- Technical 3 331 927 993 458- Security 1 188 547 1 298 532Other expenses: 1 049 370 772 289- Depreciation 957 290 685 993- External training 88 880 13 133- Thefts and losses - 42 760- Staff entertainment 3 200 30 403Total 27 104 175 20 420 124
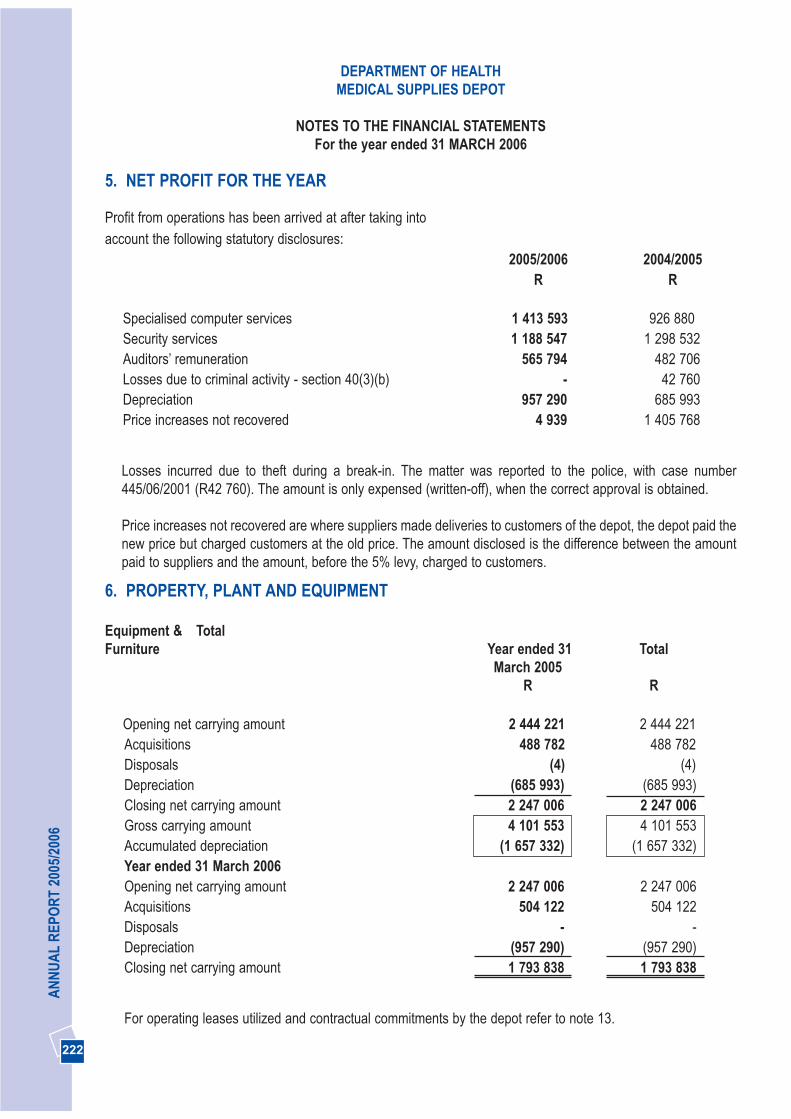
6. PROPERTY, PLANT AND EQUIPMENT
Equipment & Total Furniture Year ended 31 Total
March 2005R R
Opening net carrying amount 2 444 221 2 444 221 Acquisitions 488 782 488 782Disposals (4) (4)Depreciation (685 993) (685 993)Closing net carrying amount 2 247 006 2 247 006 Gross carrying amount 4 101 553 4 101 553 Accumulated depreciation (1 657 332) (1 657 332)Year ended 31 March 2006Opening net carrying amount 2 247 006 2 247 006 Acquisitions 504 122 504 122Disposals - -Depreciation (957 290) (957 290)Closing net carrying amount 1 793 838 1 793 838
For operating leases utilized and contractual commitments by the depot refer to note 13.
222222
AN
NU
AL
REP
OR
T 20
05/2
006
5. NET PROFIT FOR THE YEAR
Profit from operations has been arrived at after taking into account the following statutory disclosures:
2005/2006 2004/2005R R
Specialised computer services 1 413 593 926 880Security services 1 188 547 1 298 532Auditors’ remuneration 565 794 482 706Losses due to criminal activity - section 40(3)(b) - 42 760Depreciation 957 290 685 993Price increases not recovered 4 939 1 405 768
Losses incurred due to theft during a break-in. The matter was reported to the police, with case number445/06/2001 (R42 760). The amount is only expensed (written-off), when the correct approval is obtained.
Price increases not recovered are where suppliers made deliveries to customers of the depot, the depot paid thenew price but charged customers at the old price. The amount disclosed is the difference between the amountpaid to suppliers and the amount, before the 5% levy, charged to customers.
DEPARTMENT OF HEALTHMEDICAL SUPPLIES DEPOT
NOTES TO THE FINANCIAL STATEMENTSFor the year ended 31 MARCH 2006
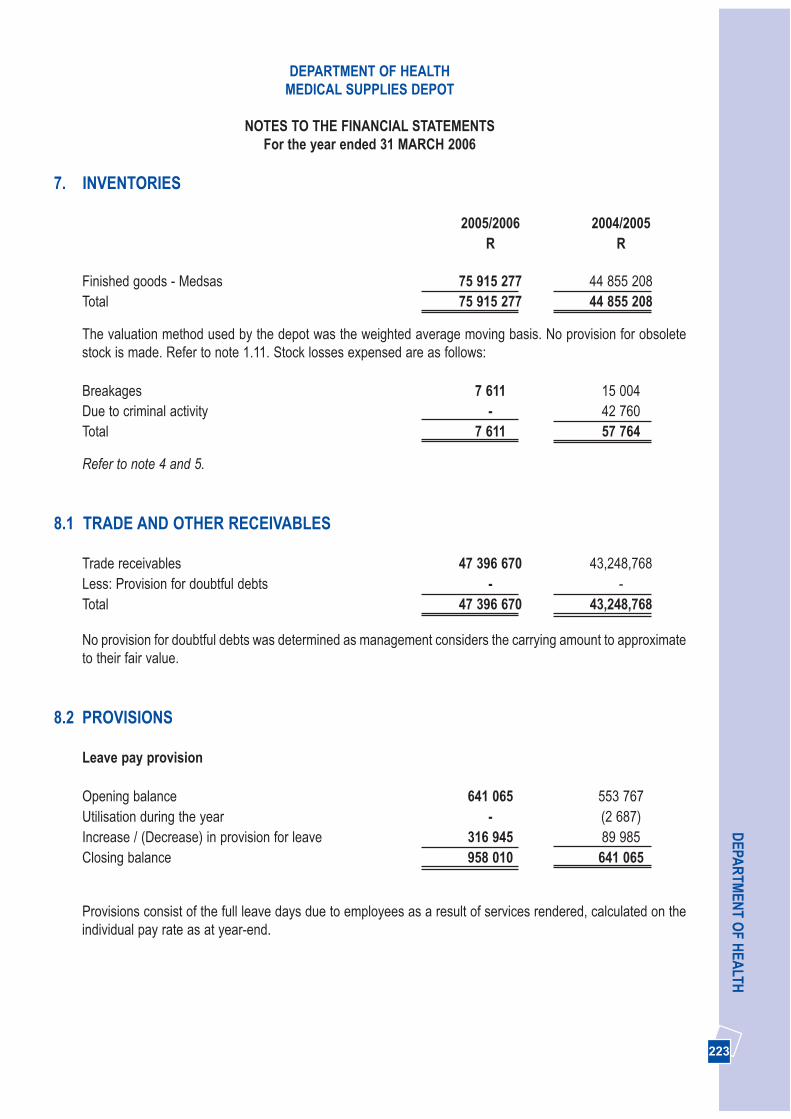
223 223
DEPA
RTM
ENT O
F HEA
LTHDEPARTMENT OF HEALTH
MEDICAL SUPPLIES DEPOT
NOTES TO THE FINANCIAL STATEMENTSFor the year ended 31 MARCH 2006
7. INVENTORIES
2005/2006 2004/2005R R
Finished goods - Medsas 75 915 277 44 855 208Total 75 915 277 44 855 208
The valuation method used by the depot was the weighted average moving basis. No provision for obsoletestock is made. Refer to note 1.11. Stock losses expensed are as follows:
Breakages 7 611 15 004Due to criminal activity - 42 760Total 7 611 57 764
Refer to note 4 and 5.
8.1 TRADE AND OTHER RECEIVABLES
Trade receivables 47 396 670 43,248,768 Less: Provision for doubtful debts - - Total 47 396 670 43,248,768
No provision for doubtful debts was determined as management considers the carrying amount to approximateto their fair value.
8.2 PROVISIONS
Leave pay provision
Opening balance 641 065 553 767Utilisation during the year - (2 687) Increase / (Decrease) in provision for leave 316 945 89 985Closing balance 958 010 641 065
Provisions consist of the full leave days due to employees as a result of services rendered, calculated on theindividual pay rate as at year-end.

2005/2006 2004/2005R R
9. CASH AND CASH EQUIVALENTS
Bank balance 84 134 291 69 526 604Petty cash 1 500 -Total 84 135 791 69 526 604
Cash and cash equivalents comprise cash at a registered banking institution and petty cash.
The carrying amount of these assets approximates to their fair value.
10. CAPITAL ACCOUNT
The depot operated on a capital account of R54, 000,000.
Capital is used for operating expenses and the purchasing of inventory. The Gauteng Department of Healthprovided the capital, after Treasury approval was obtained.
11. TRADE AND OTHER PAYABLES
Trade payables 46 463 463 43 897 510Supplier payment control 27 683 996 41 573Sundry 2 236 778 -Total 76 384 237 43 939 083
Management considers the carrying amount of trade and other payables to approximate their fair value.
12. RECONCILIATION OF PROFIT FOR THE YEAR TO CASH GENERATED FROMOPERATIONS
Net profit per income statement 16 601 890 31 845 832Adjusted for:
Fixed assets acquisition expensed in the year -Depreciation on property, plant and equipment 957 291 685 993Increase / (Decrease) in provision for leave 316 945 89 986
17 876 126 32 621 811
224224
AN
NU
AL
REP
OR
T 20
05/2
006
DEPARTMENT OF HEALTHMEDICAL SUPPLIES DEPOT
NOTES TO THE FINANCIAL STATEMENTSFor the year ended 31 MARCH 2006
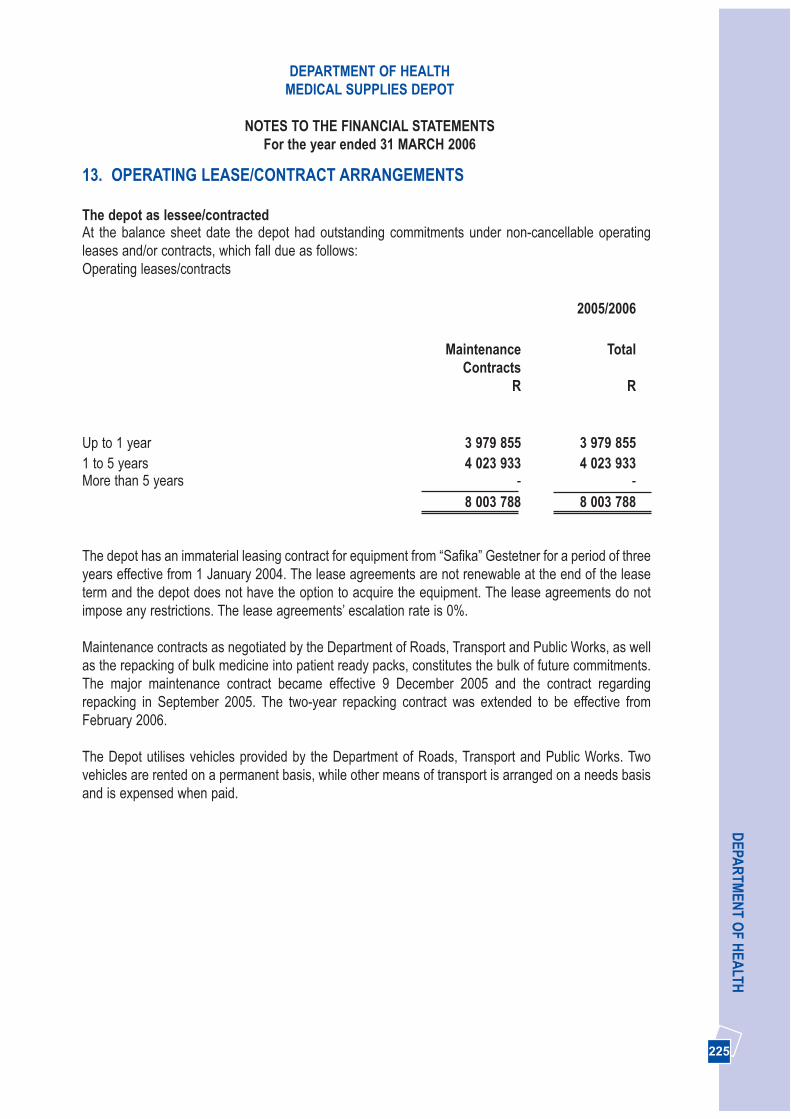
13. OPERATING LEASE/CONTRACT ARRANGEMENTS
The depot as lessee/contractedAt the balance sheet date the depot had outstanding commitments under non-cancellable operatingleases and/or contracts, which fall due as follows:Operating leases/contracts
2005/2006
Maintenance TotalContracts
R R
Up to 1 year 3 979 855 3 979 8551 to 5 years 4 023 933 4 023 933More than 5 years - -
8 003 788 8 003 788
The depot has an immaterial leasing contract for equipment from “Safika” Gestetner for a period of threeyears effective from 1 January 2004. The lease agreements are not renewable at the end of the leaseterm and the depot does not have the option to acquire the equipment. The lease agreements do notimpose any restrictions. The lease agreements’ escalation rate is 0%.
Maintenance contracts as negotiated by the Department of Roads, Transport and Public Works, as wellas the repacking of bulk medicine into patient ready packs, constitutes the bulk of future commitments.The major maintenance contract became effective 9 December 2005 and the contract regardingrepacking in September 2005. The two-year repacking contract was extended to be effective fromFebruary 2006.
The Depot utilises vehicles provided by the Department of Roads, Transport and Public Works. Twovehicles are rented on a permanent basis, while other means of transport is arranged on a needs basisand is expensed when paid.
225 225
DEPA
RTM
ENT O
F HEA
LTHDEPARTMENT OF HEALTH
MEDICAL SUPPLIES DEPOT
NOTES TO THE FINANCIAL STATEMENTSFor the year ended 31 MARCH 2006
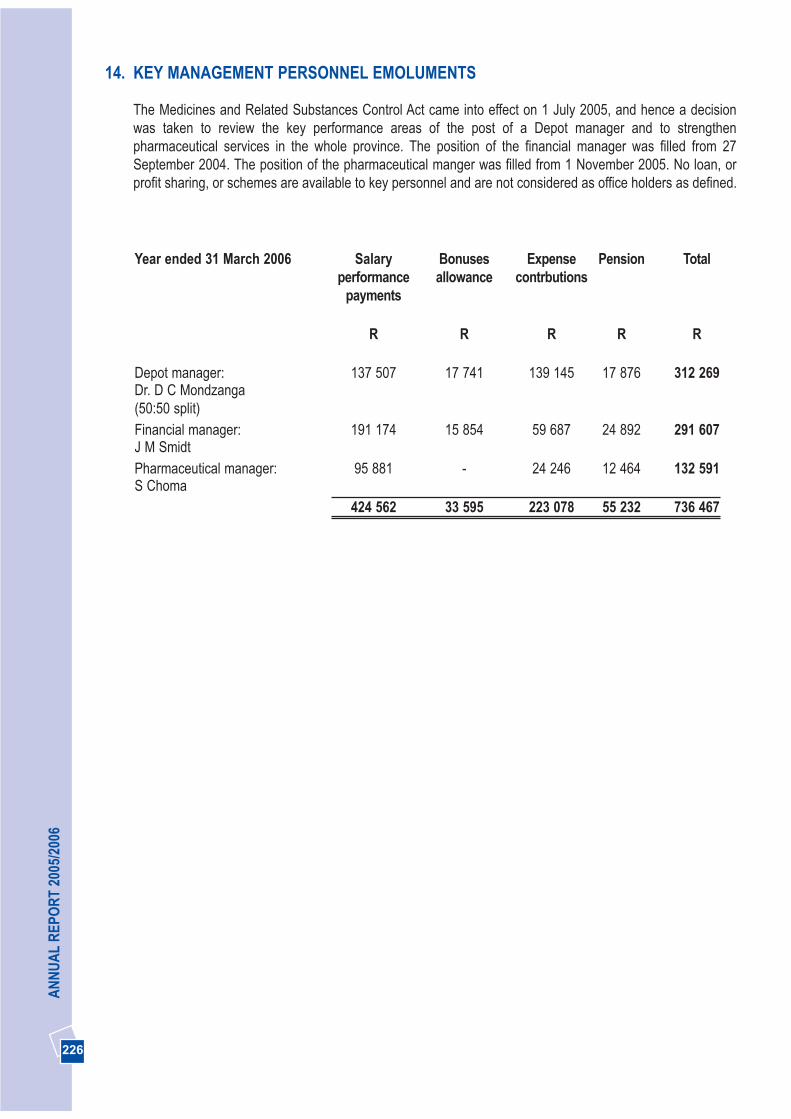
226226
AN
NU
AL
REP
OR
T 20
05/2
006
14. KEY MANAGEMENT PERSONNEL EMOLUMENTS
The Medicines and Related Substances Control Act came into effect on 1 July 2005, and hence a decisionwas taken to review the key performance areas of the post of a Depot manager and to strengthenpharmaceutical services in the whole province. The position of the financial manager was filled from 27September 2004. The position of the pharmaceutical manger was filled from 1 November 2005. No loan, orprofit sharing, or schemes are available to key personnel and are not considered as office holders as defined.
Year ended 31 March 2006 Salary Bonuses Expense Pension Totalperformance allowance contrbutions
payments
R R R R R
Depot manager: 137 507 17 741 139 145 17 876 312 269Dr. D C Mondzanga(50:50 split)Financial manager: 191 174 15 854 59 687 24 892 291 607J M SmidtPharmaceutical manager: 95 881 - 24 246 12 464 132 591S Choma
424 562 33 595 223 078 55 232 736 467

227
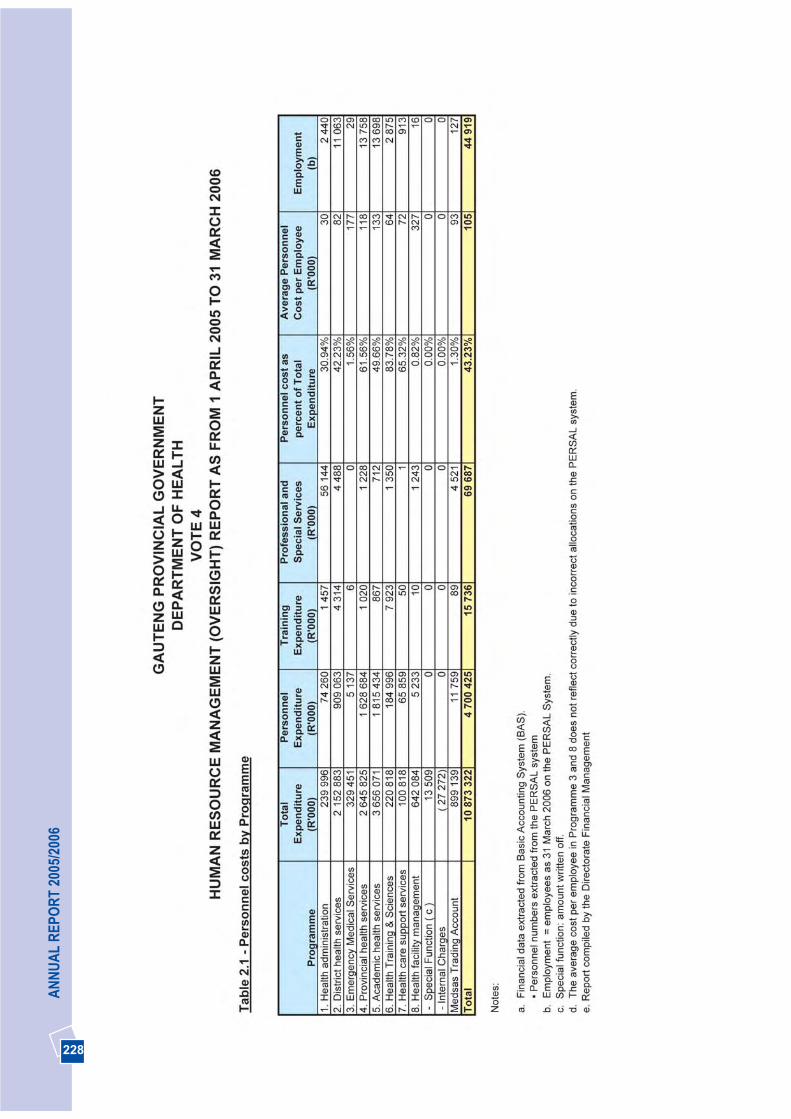
228
AN
NU
AL
REP
OR
T 20
05/2
006
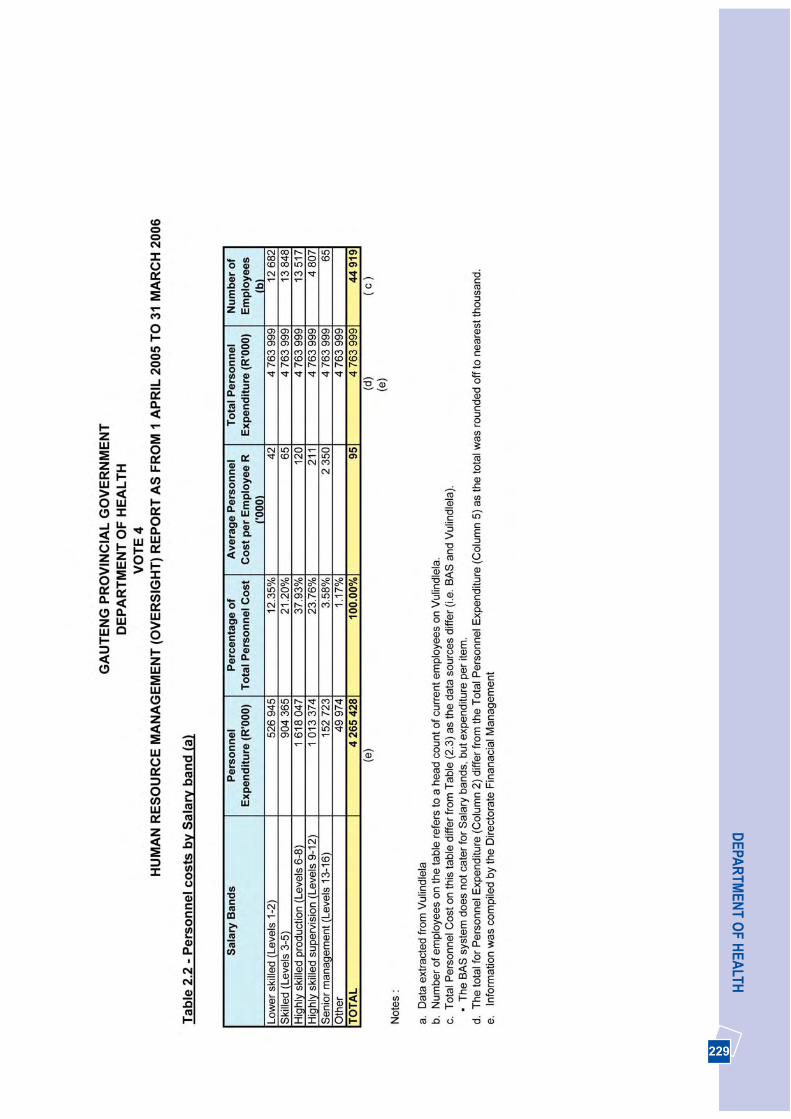
229
DEPA
RTM
ENT O
F HEA
LTH
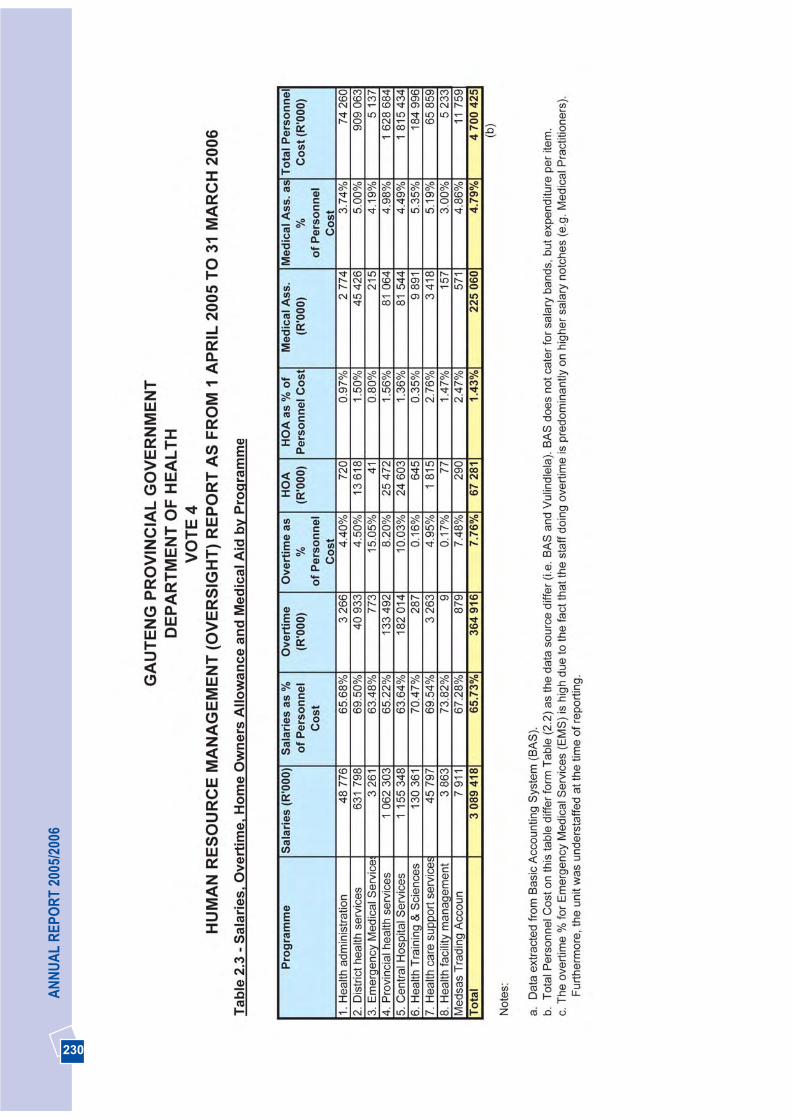
230
AN
NU
AL
REP
OR
T 20
05/2
006
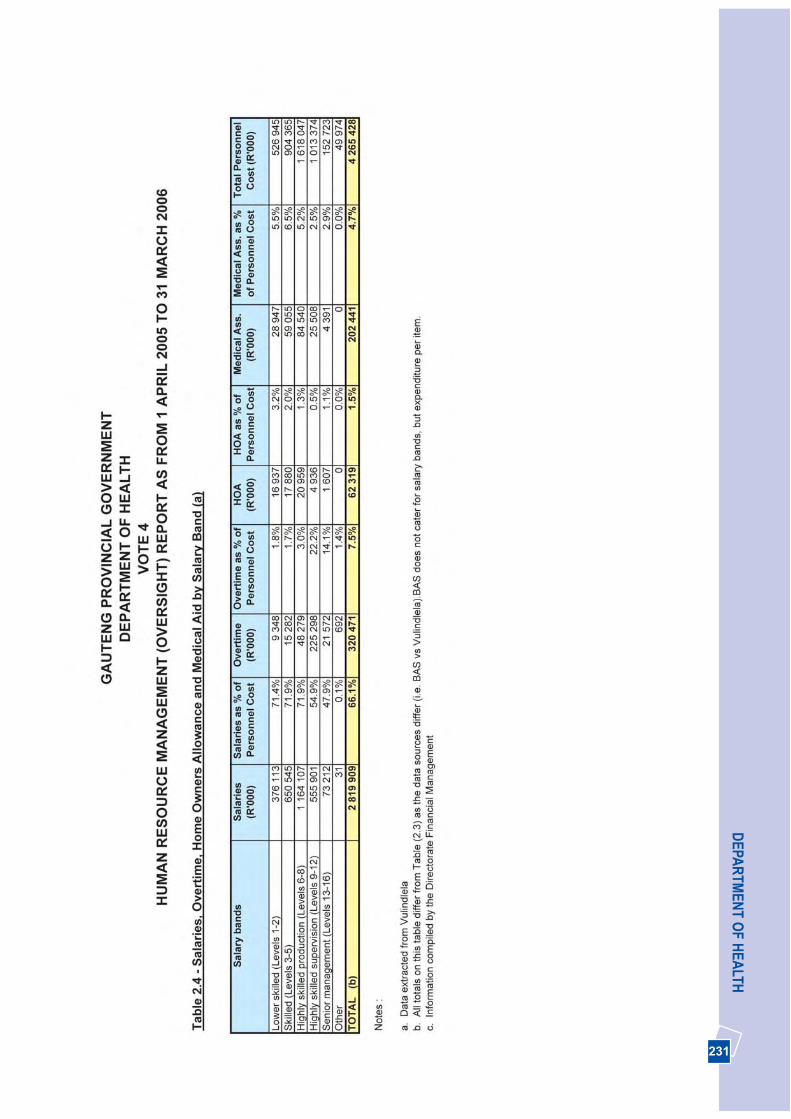
231
DEPA
RTM
ENT O
F HEA
LTH
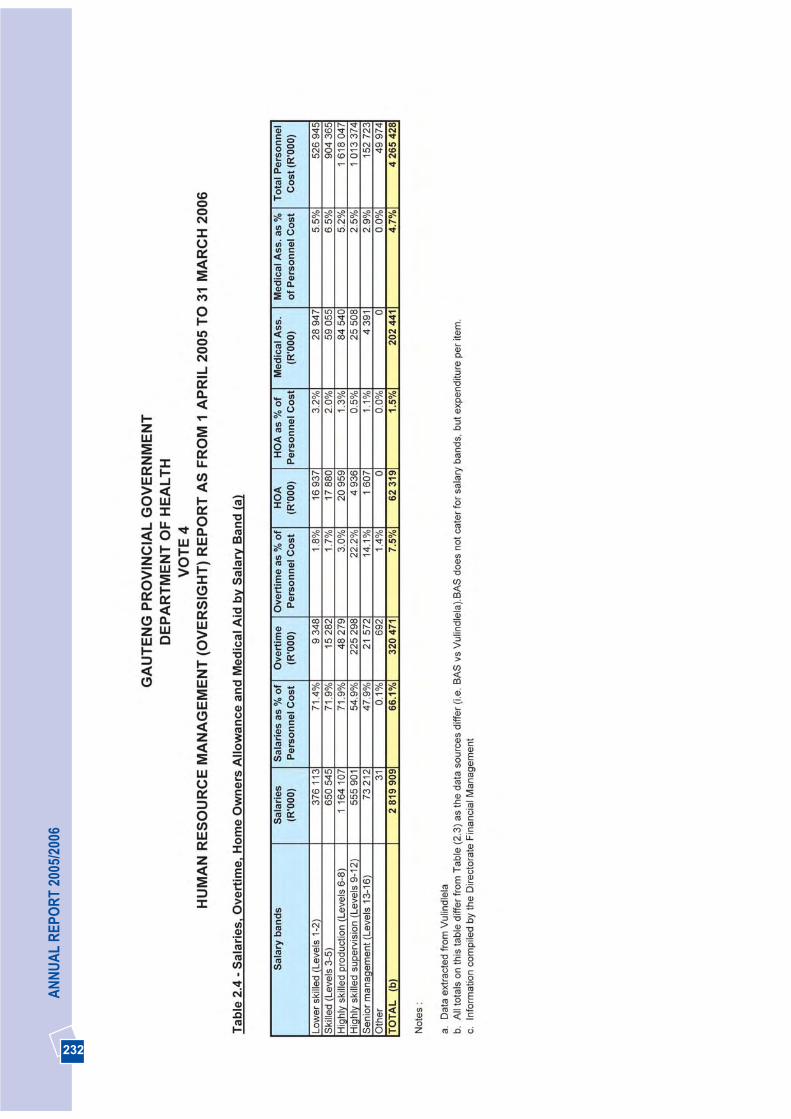
232
AN
NU
AL
REP
OR
T 20
05/2
006
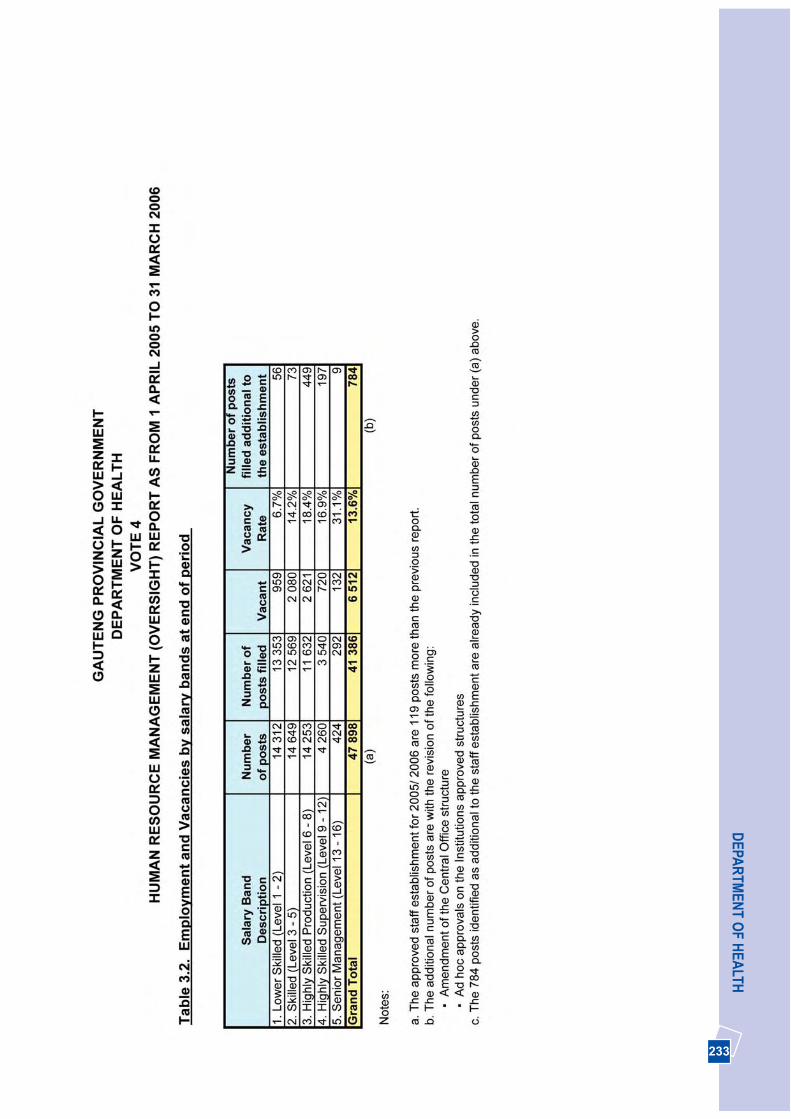
233
DEPA
RTM
ENT O
F HEA
LTH
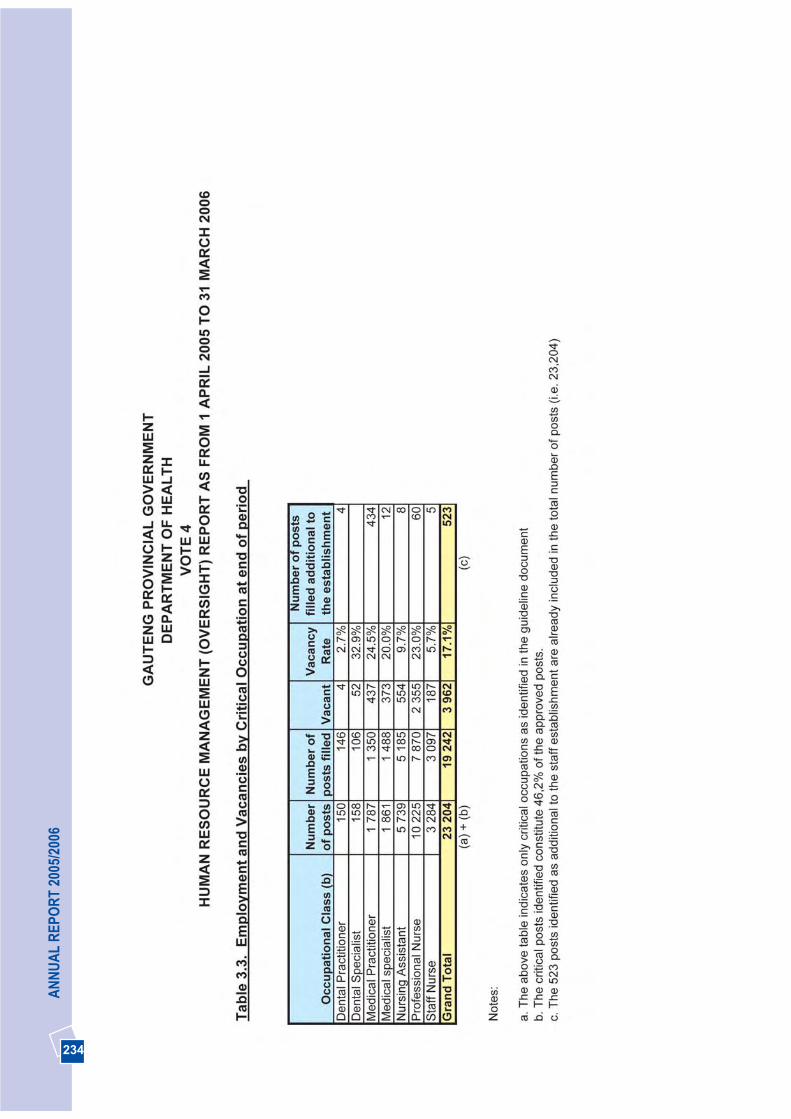
234
AN
NU
AL
REP
OR
T 20
05/2
006
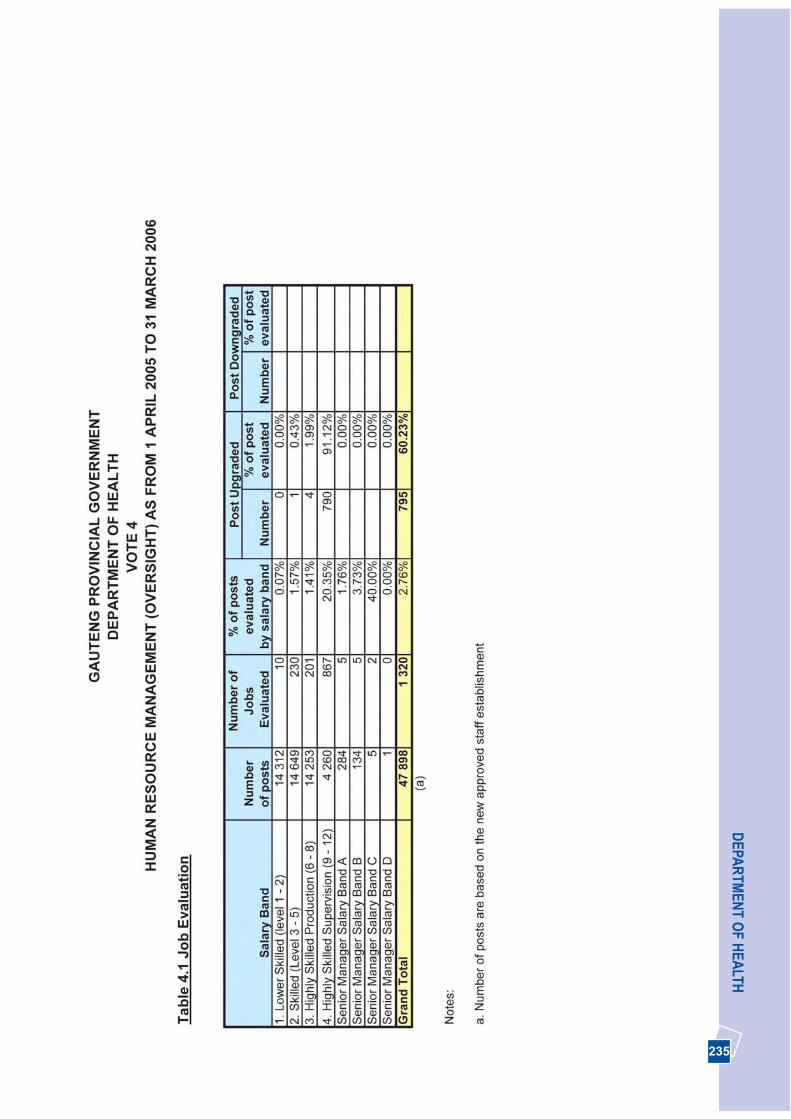
235
DEPA
RTM
ENT O
F HEA
LTH
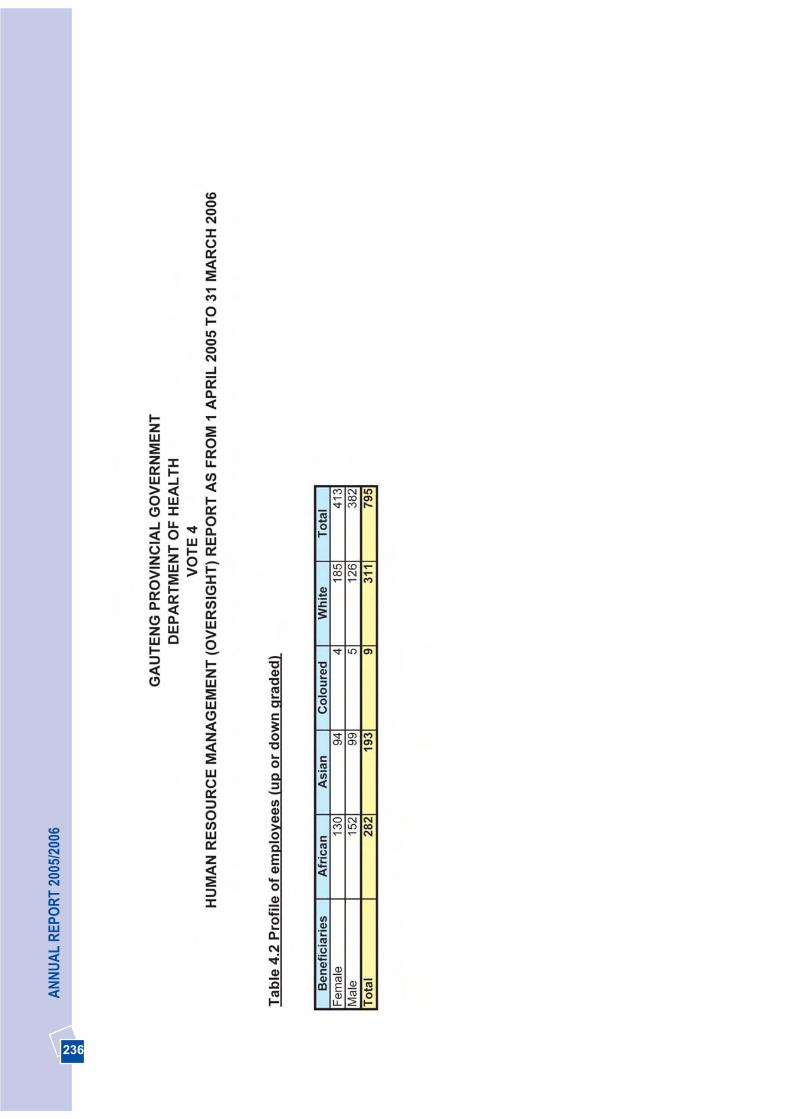
236
AN
NU
AL
REP
OR
T 20
05/2
006
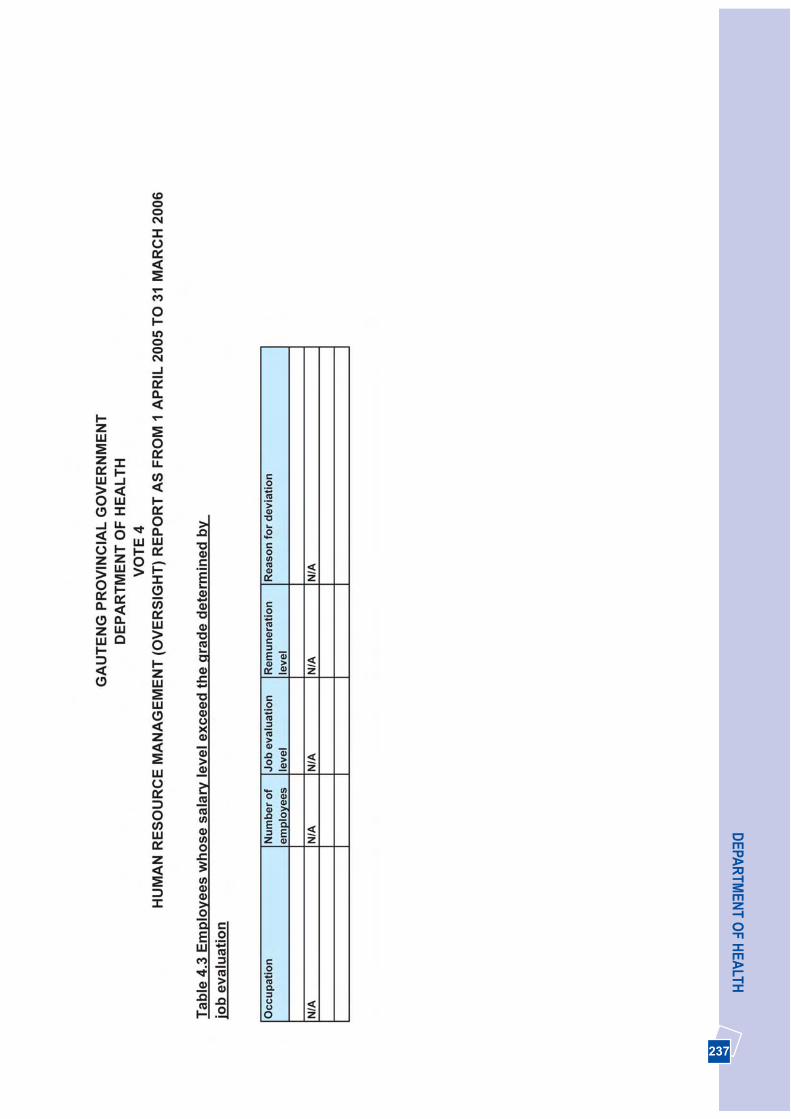
237
DEPA
RTM
ENT O
F HEA
LTH
238
AN
NU
AL
REP
OR
T 20
05/2
006
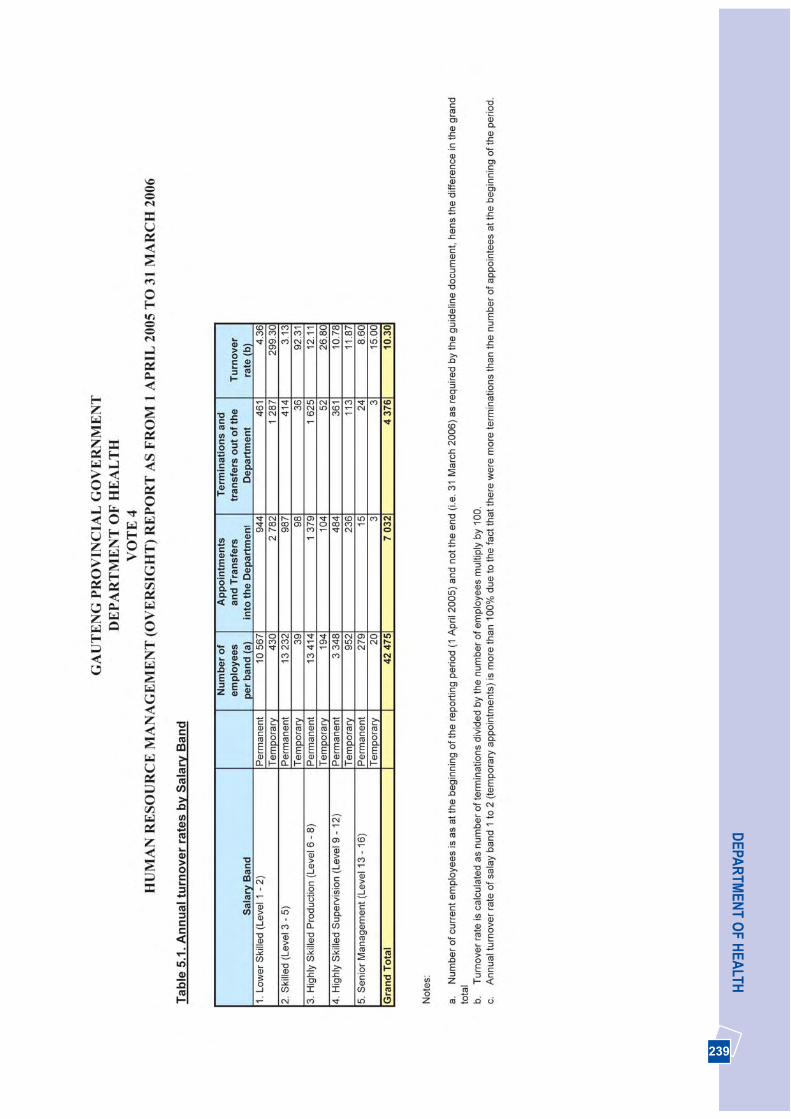
239
DEPA
RTM
ENT O
F HEA
LTH

240
AN
NU
AL
REP
OR
T 20
05/2
006

241
DEPA
RTM
ENT O
F HEA
LTH

242
AN
NU
AL
REP
OR
T 20
05/2
006
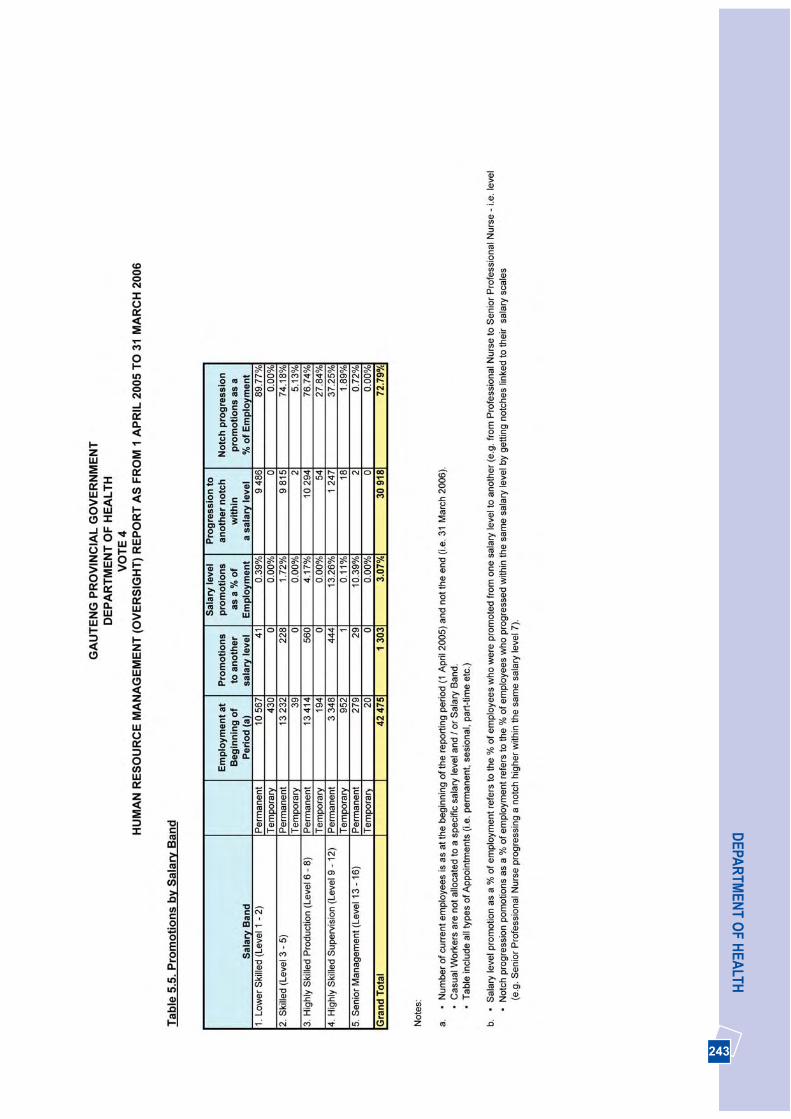
243
DEPA
RTM
ENT O
F HEA
LTH
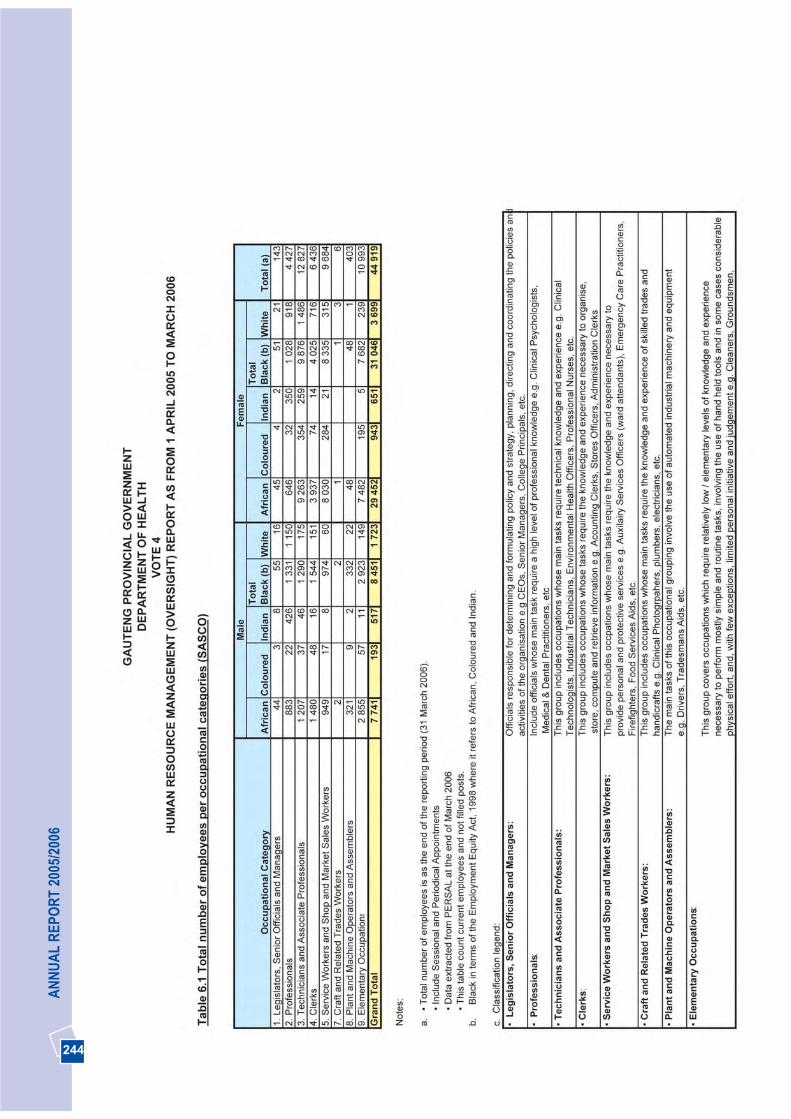
244
AN
NU
AL
REP
OR
T 20
05/2
006
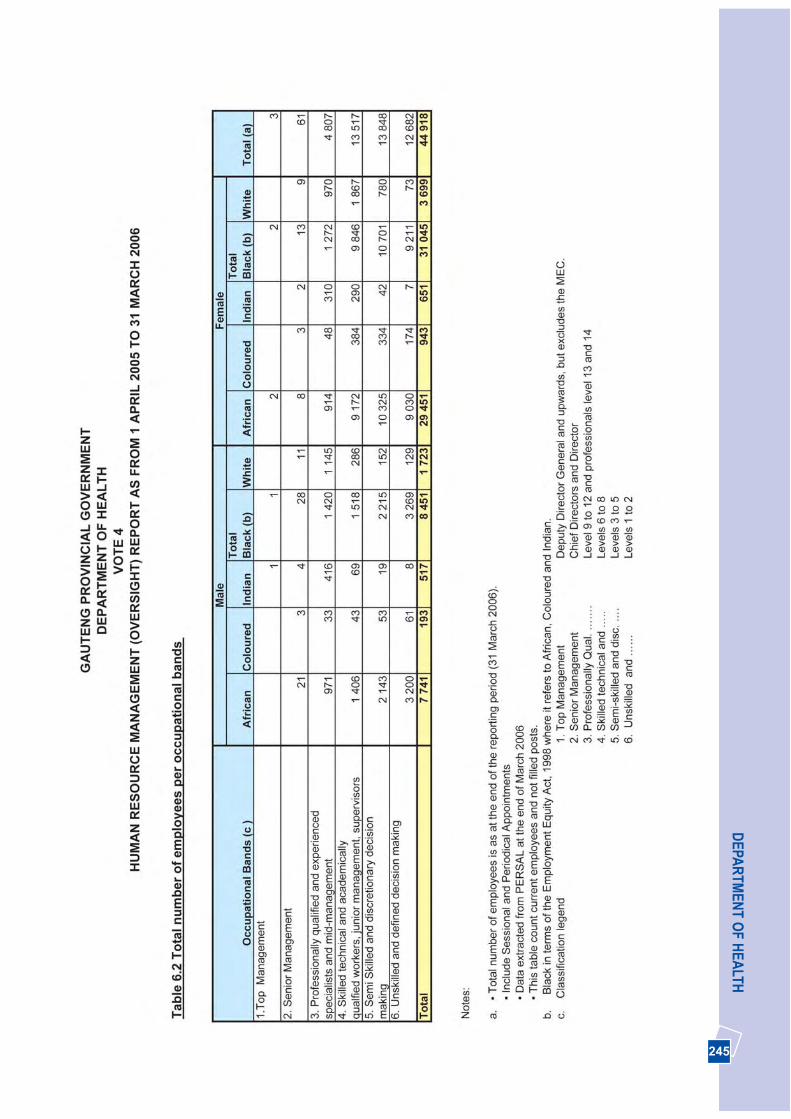
245
DEPA
RTM
ENT O
F HEA
LTH
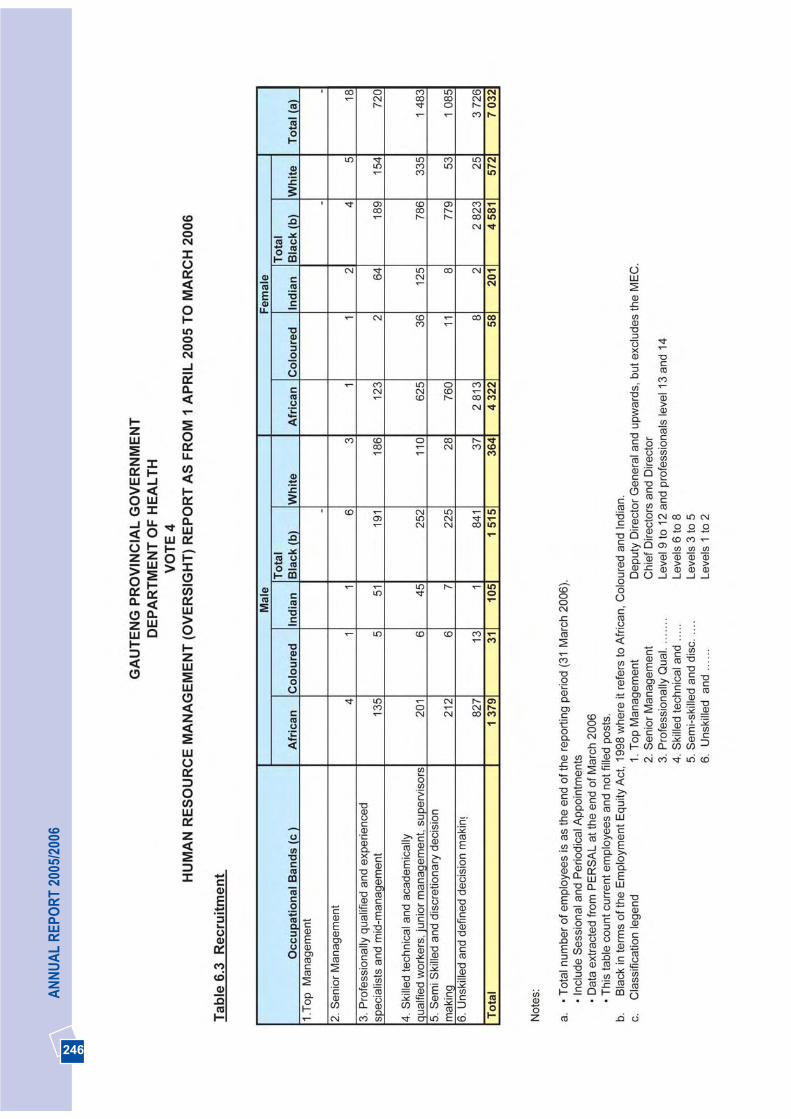
246
AN
NU
AL
REP
OR
T 20
05/2
006

247
DEPA
RTM
ENT O
F HEA
LTH
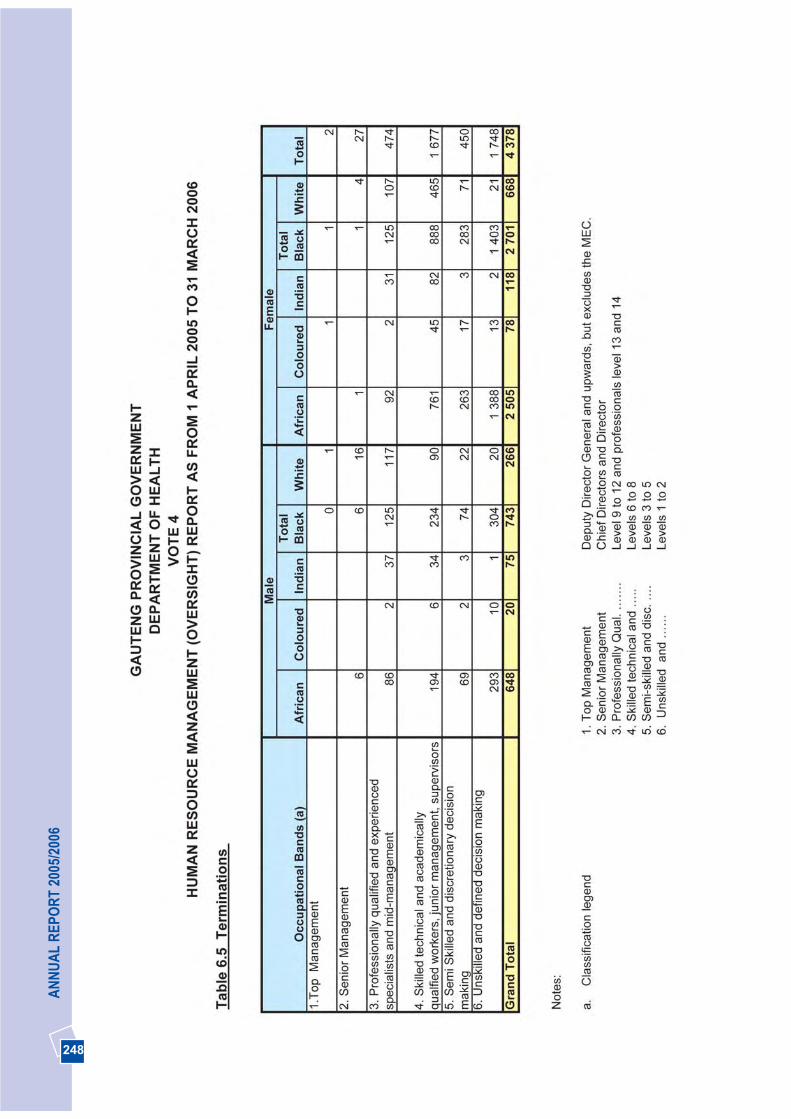
248
AN
NU
AL
REP
OR
T 20
05/2
006
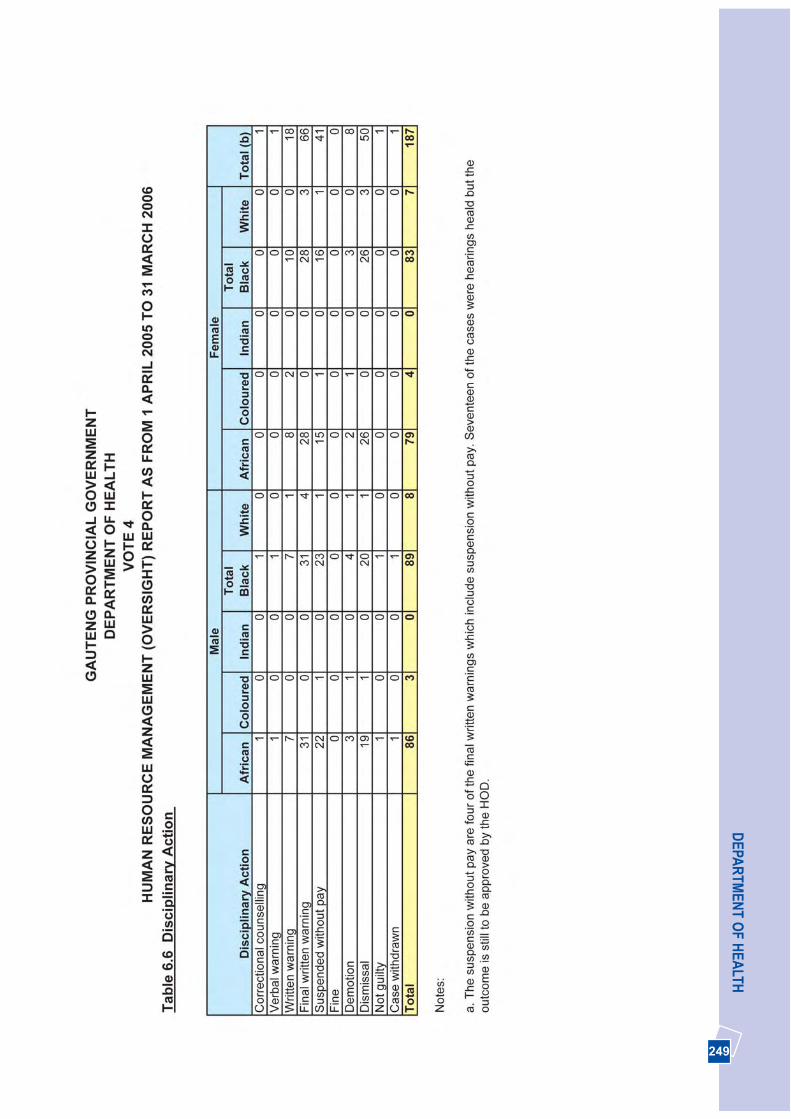
249
DEPA
RTM
ENT O
F HEA
LTH

250
AN
NU
AL
REP
OR
T 20
05/2
006
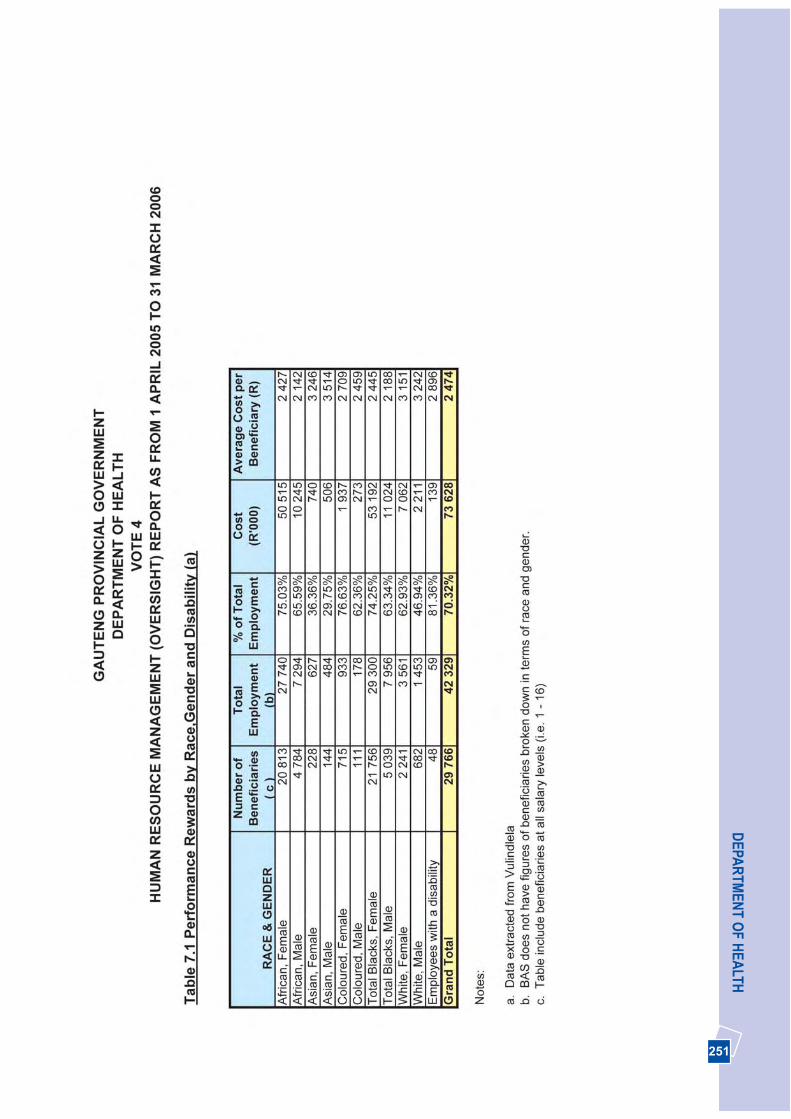
251
DEPA
RTM
ENT O
F HEA
LTH
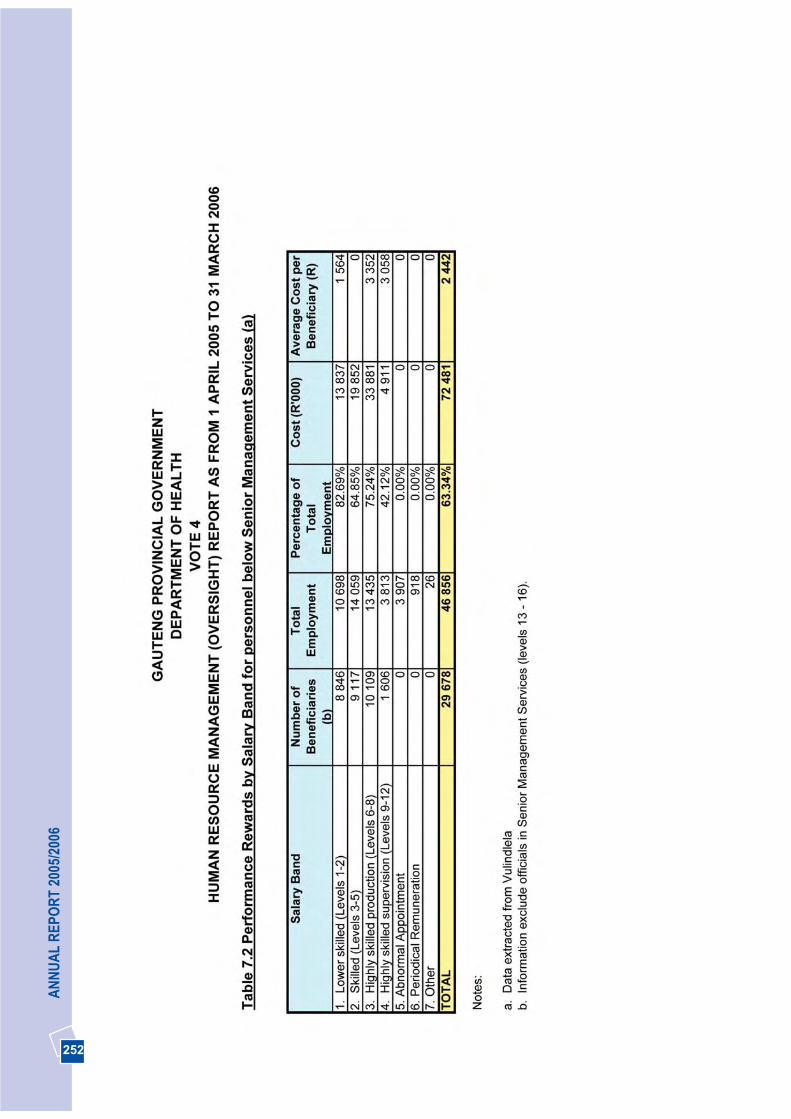
252
AN
NU
AL
REP
OR
T 20
05/2
006

253
DEPA
RTM
ENT O
F HEA
LTH
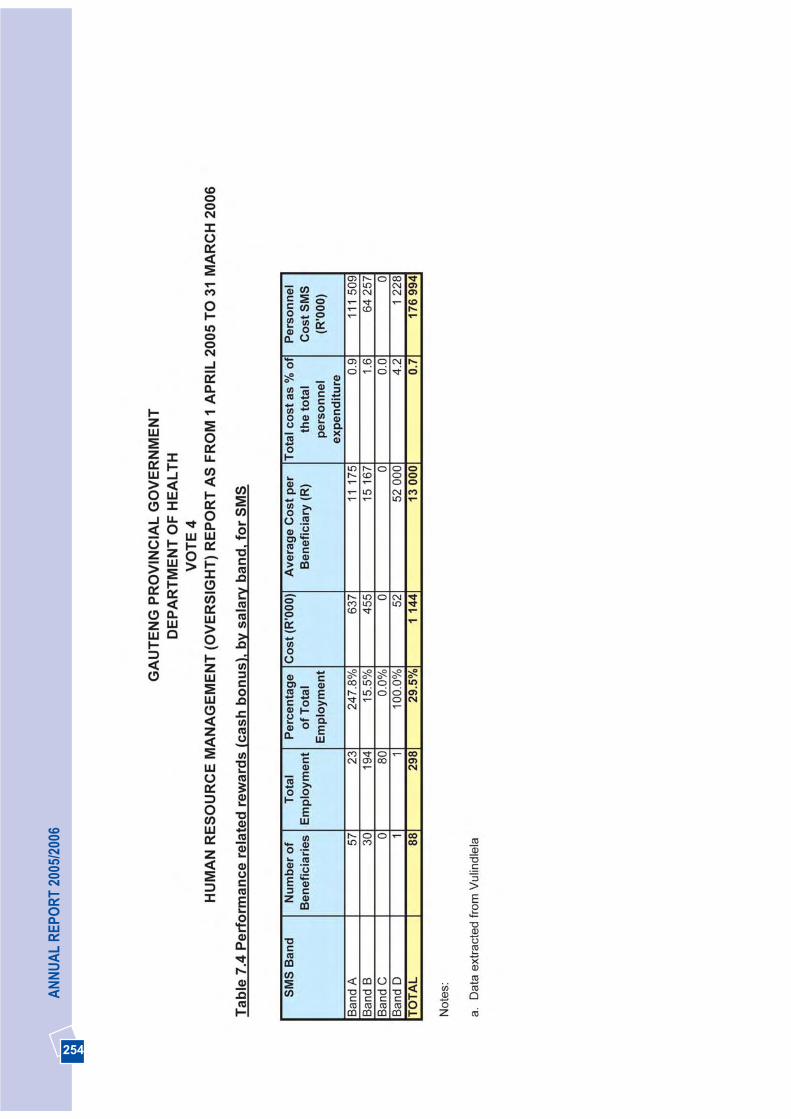
254
AN
NU
AL
REP
OR
T 20
05/2
006

255
DEPA
RTM
ENT O
F HEA
LTH

256
AN
NU
AL
REP
OR
T 20
05/2
006
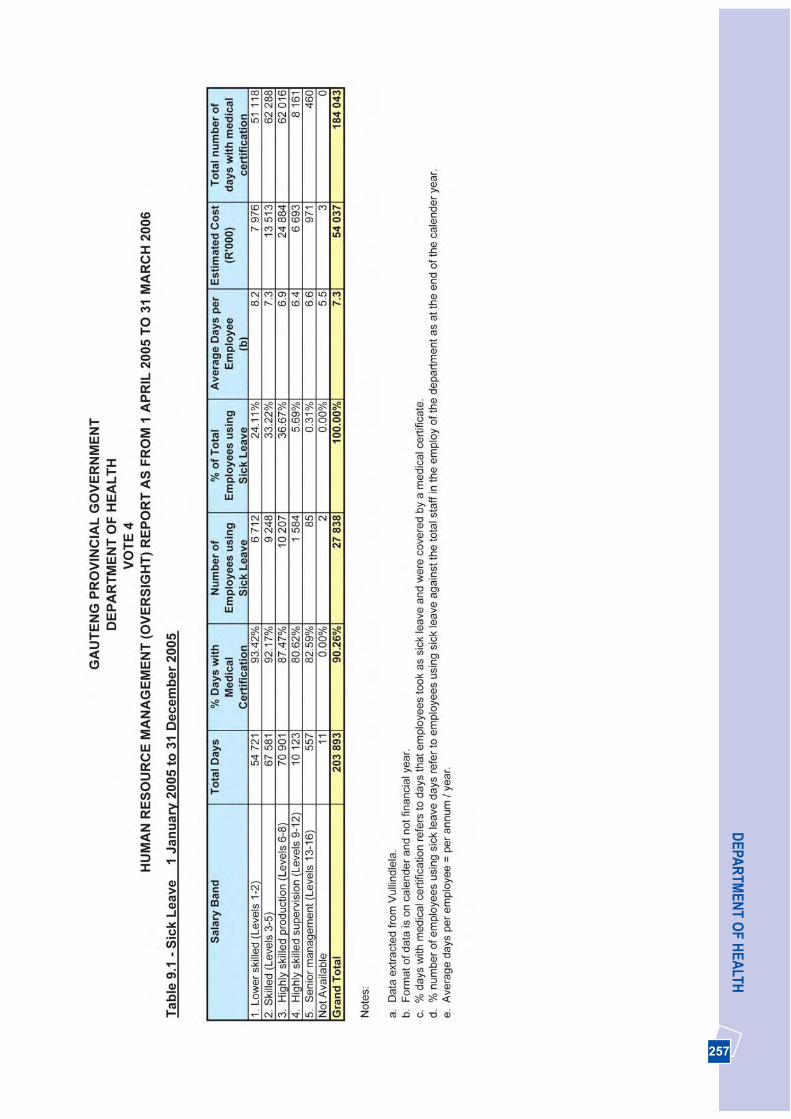
257
DEPA
RTM
ENT O
F HEA
LTH
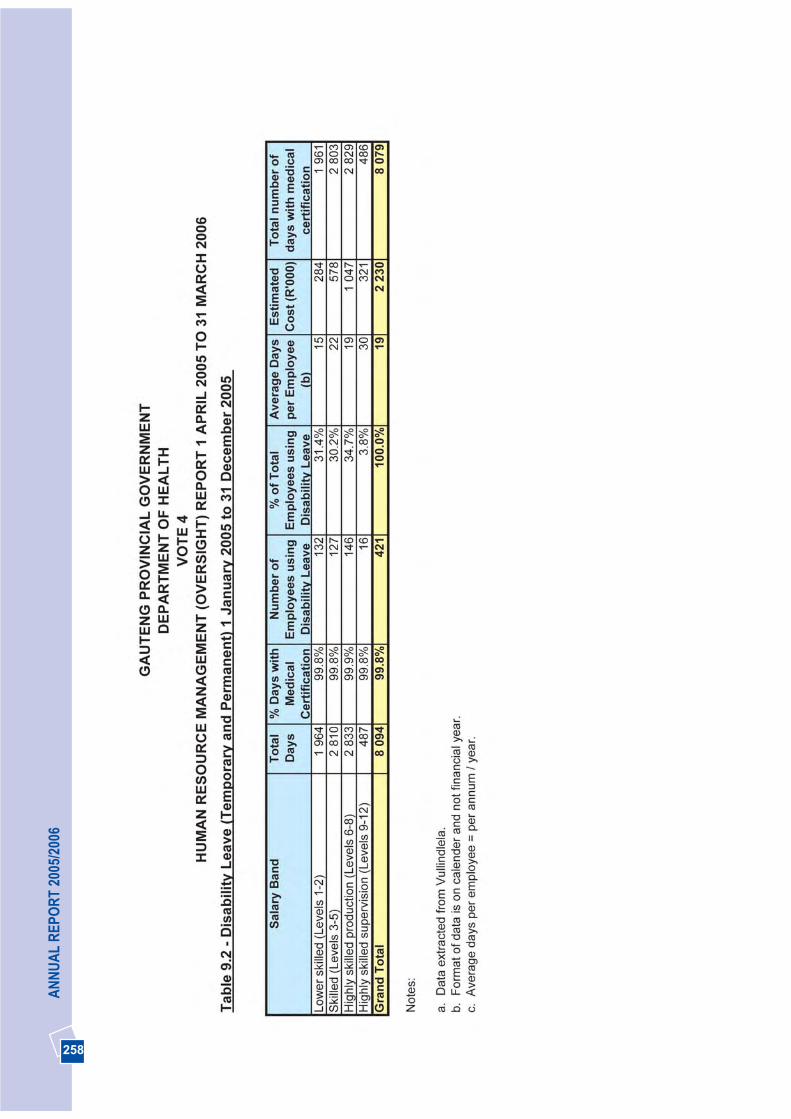
258
AN
NU
AL
REP
OR
T 20
05/2
006

259
DEPA
RTM
ENT O
F HEA
LTH
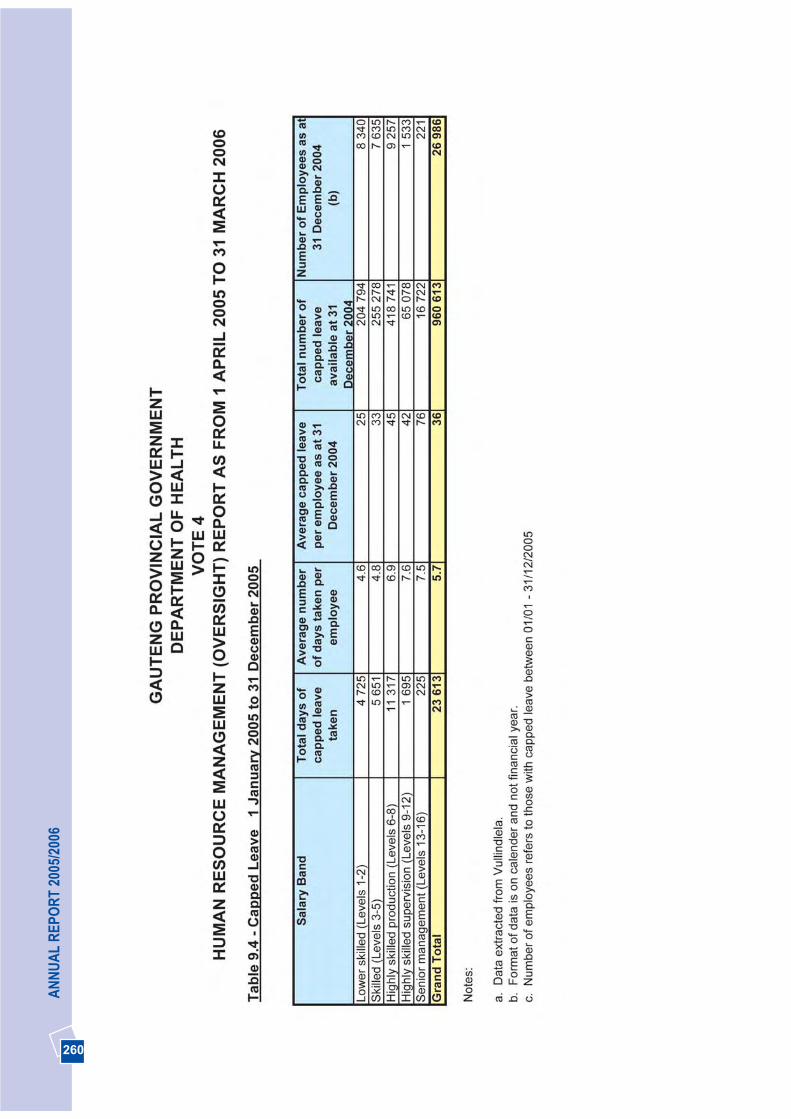
260
AN
NU
AL
REP
OR
T 20
05/2
006
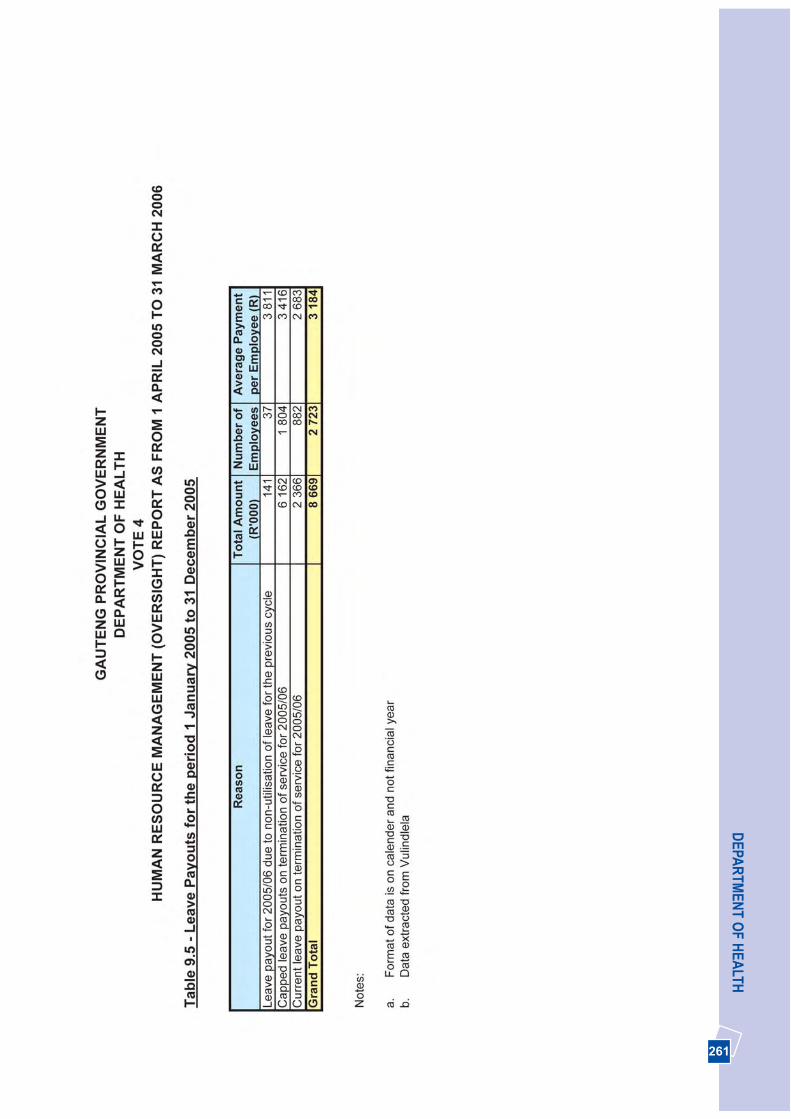
261
DEPA
RTM
ENT O
F HEA
LTH
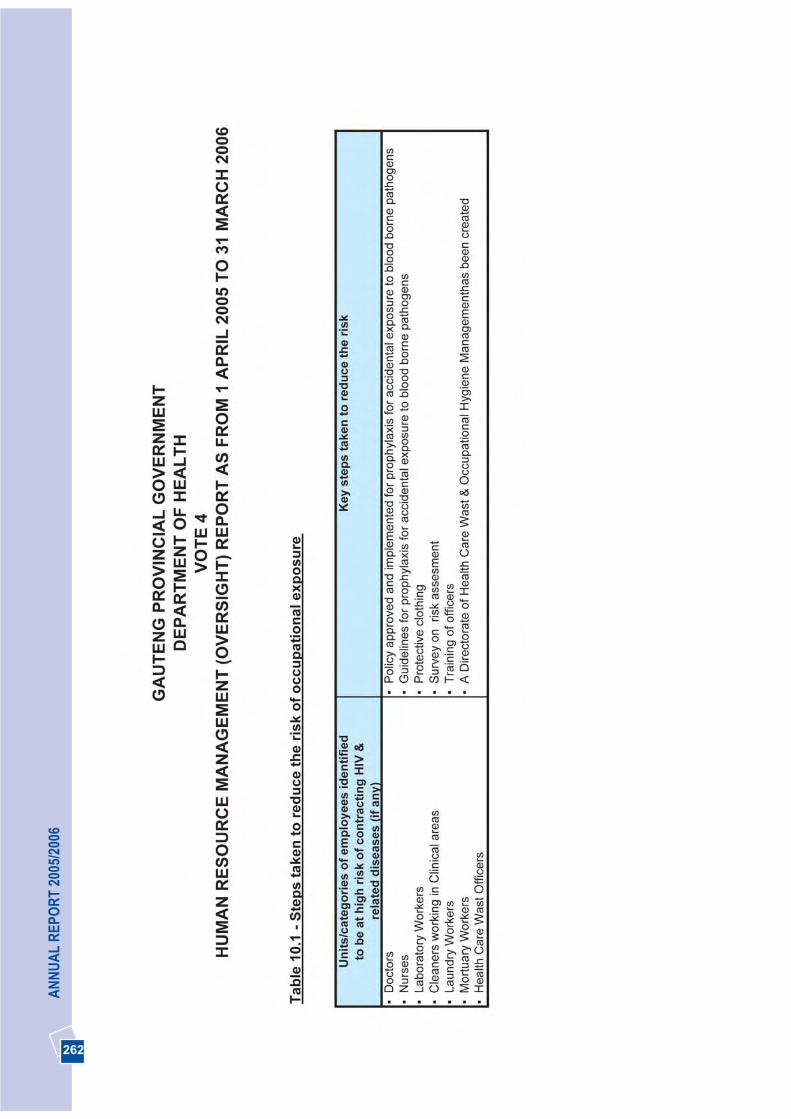
262
AN
NU
AL
REP
OR
T 20
05/2
006
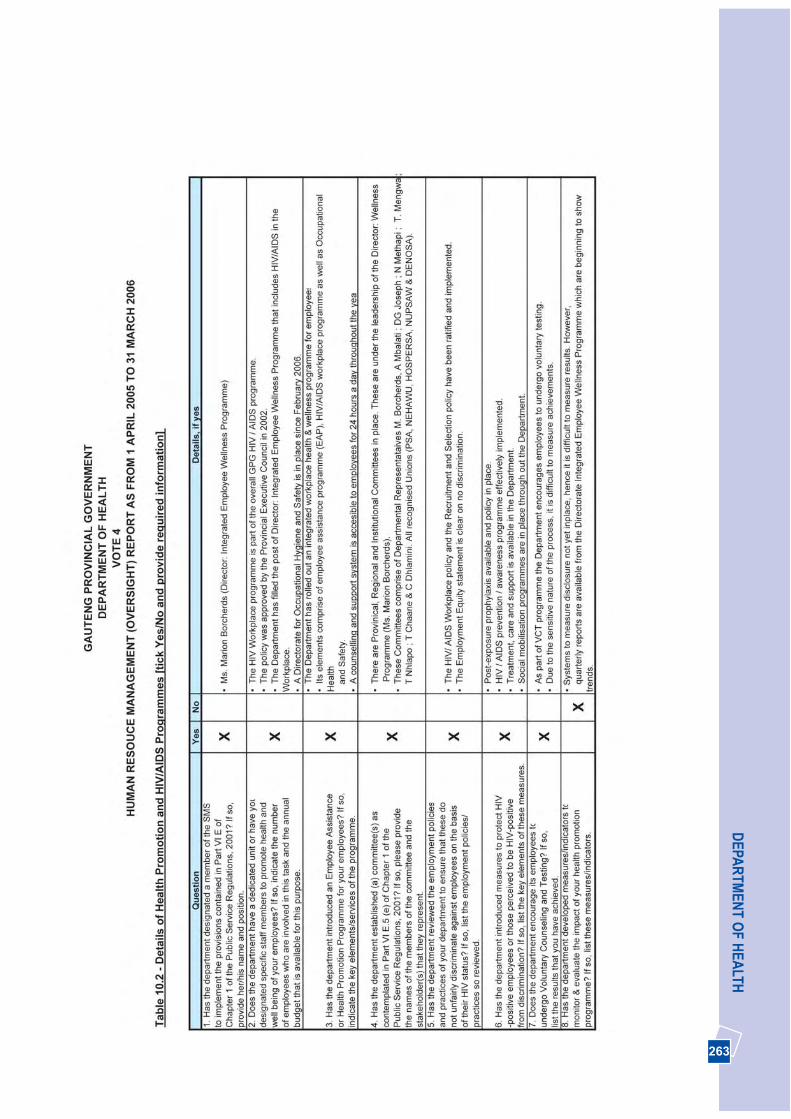
263
DEPA
RTM
ENT O
F HEA
LTH

264
AN
NU
AL
REP
OR
T 20
05/2
006
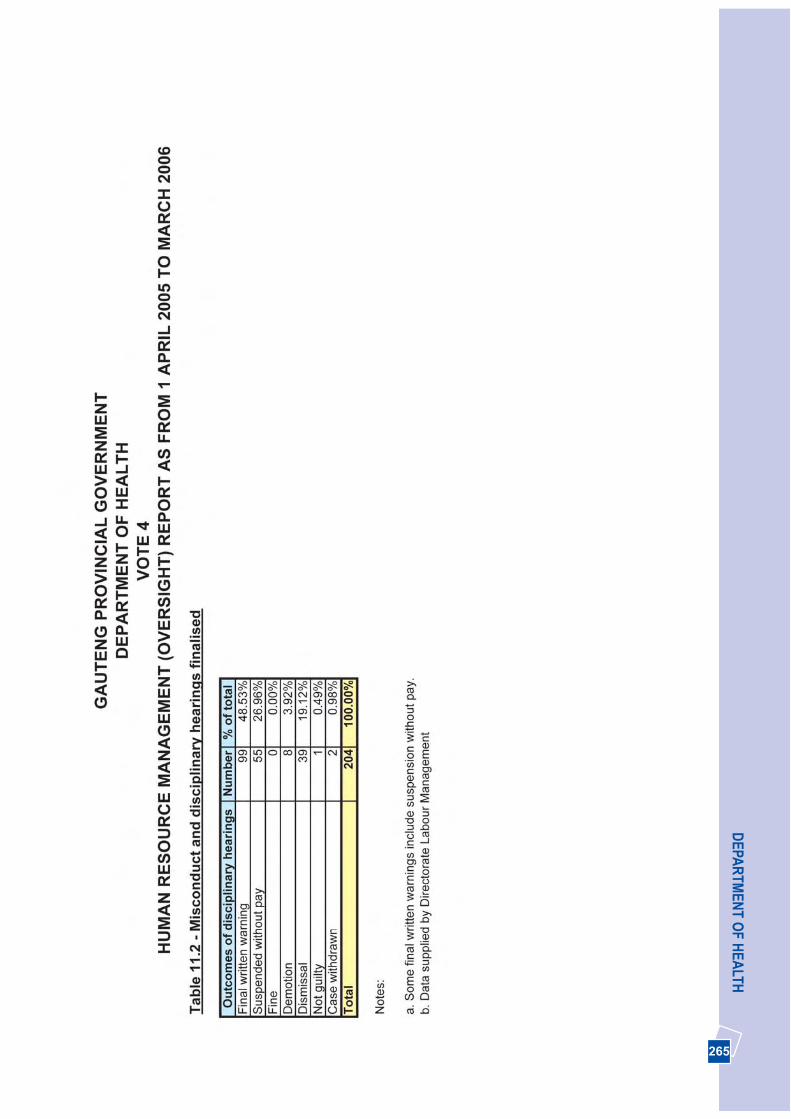
265
DEPA
RTM
ENT O
F HEA
LTH
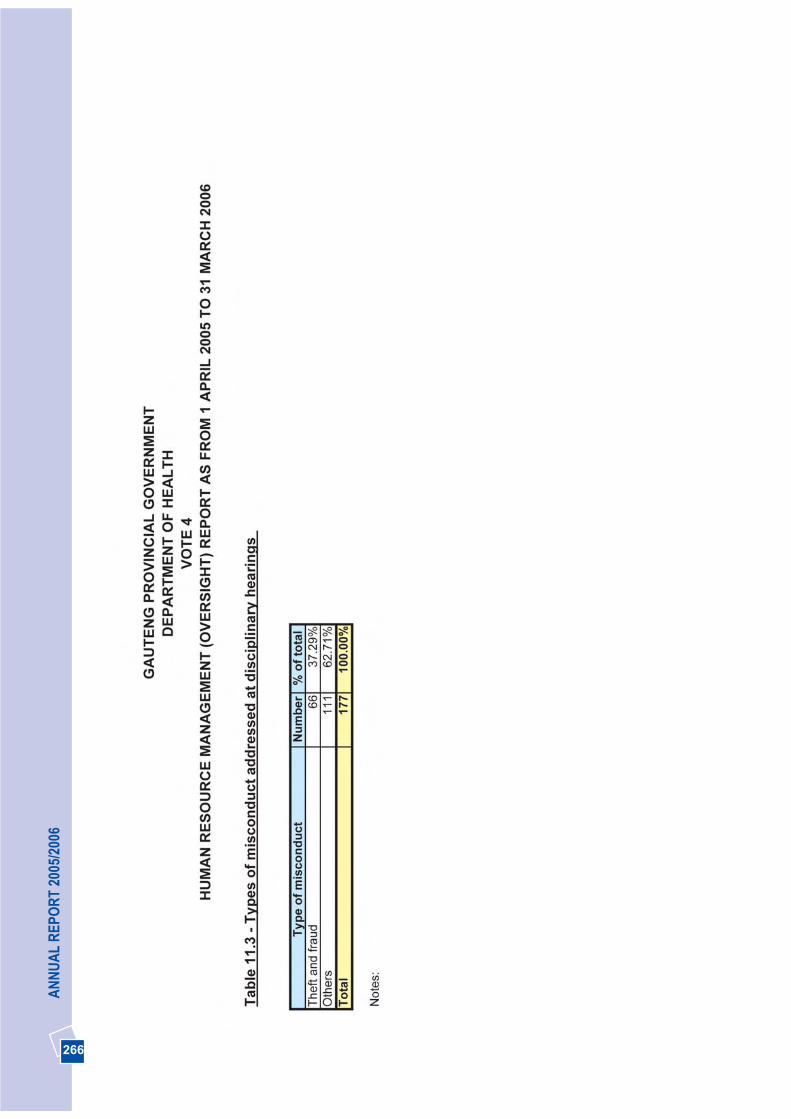
266
AN
NU
AL
REP
OR
T 20
05/2
006
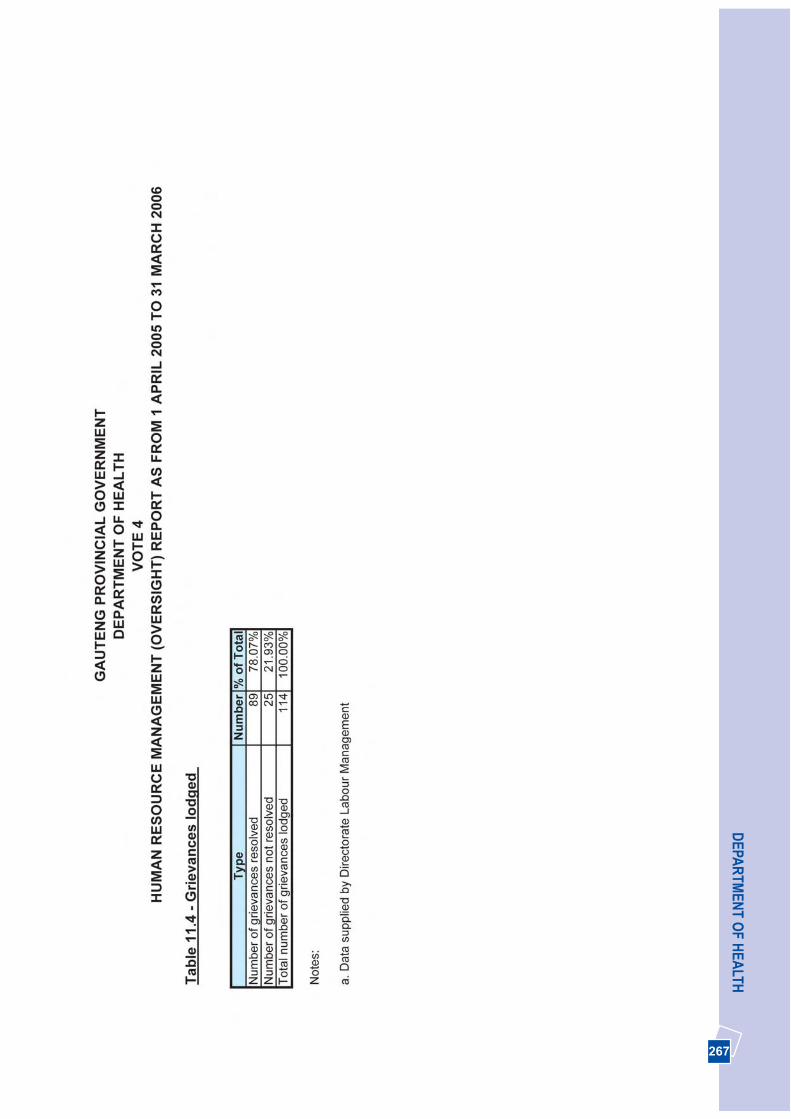
267
DEPA
RTM
ENT O
F HEA
LTH
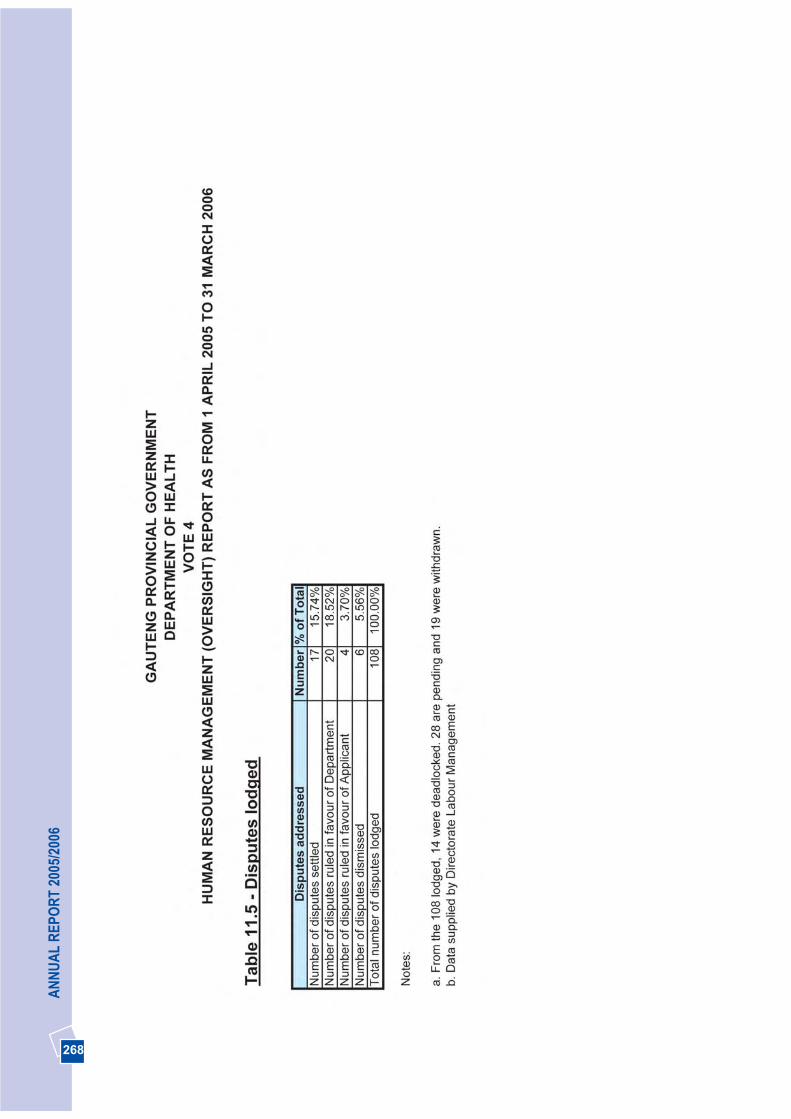
268
AN
NU
AL
REP
OR
T 20
05/2
006
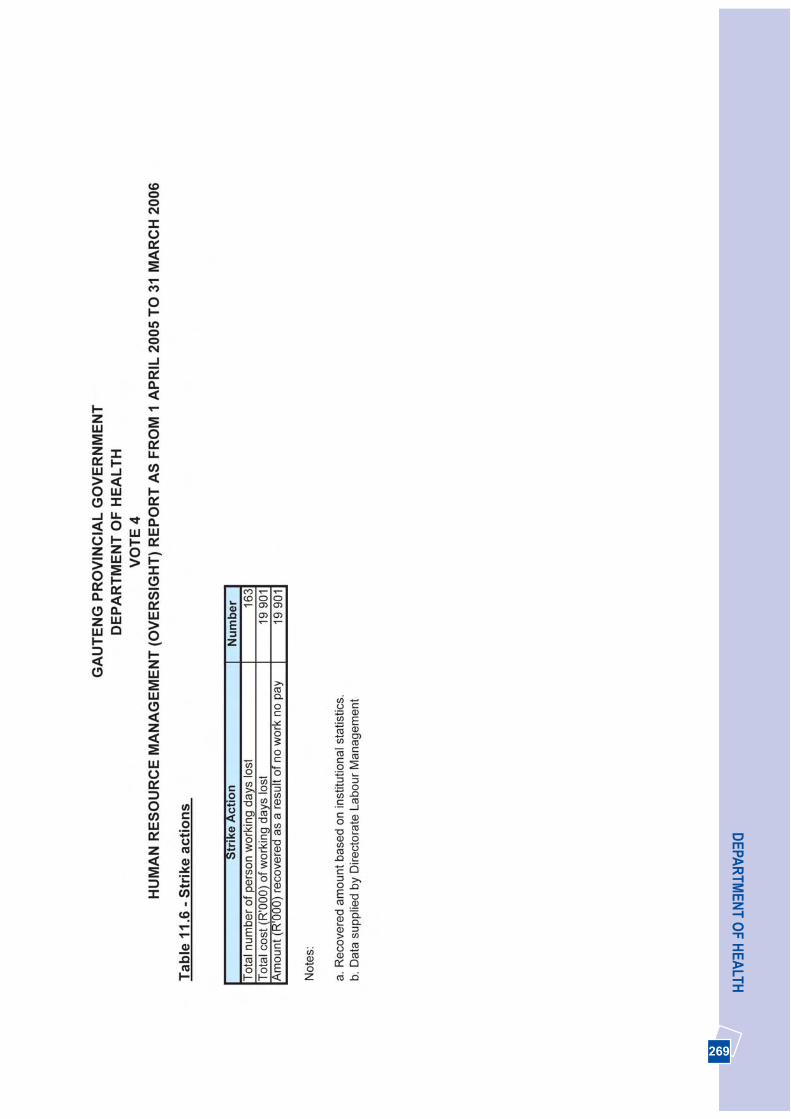
269
DEPA
RTM
ENT O
F HEA
LTH
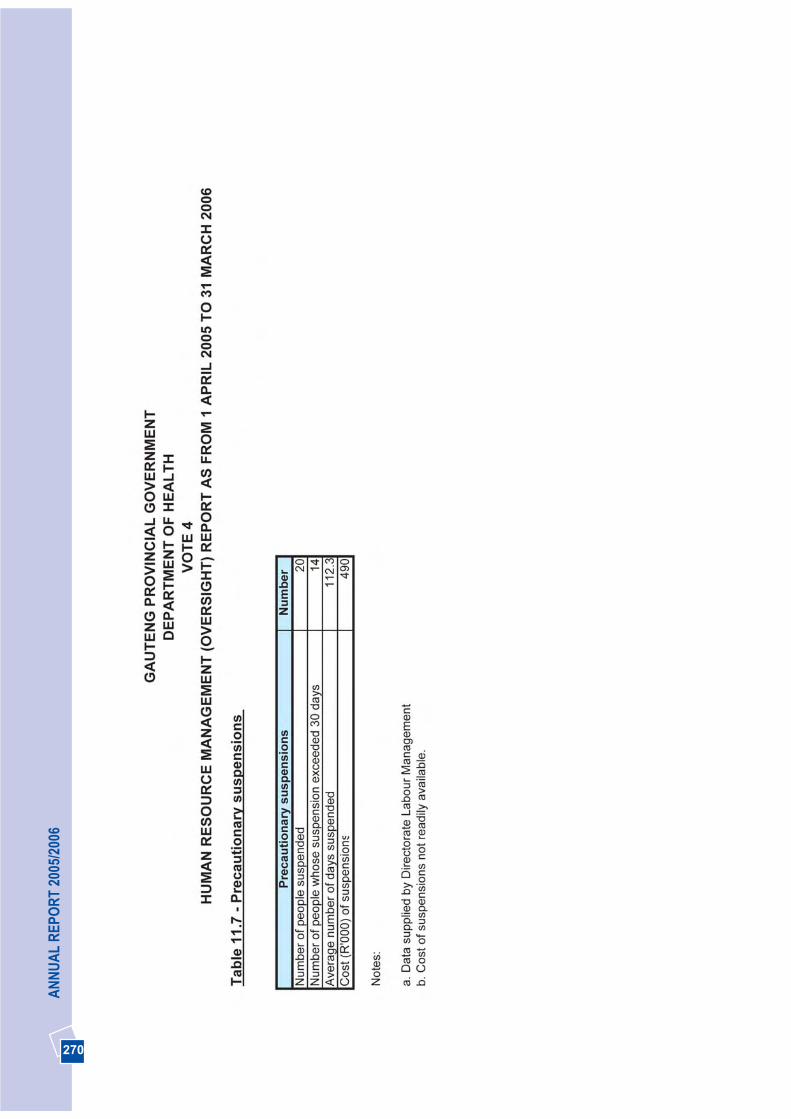
270
AN
NU
AL
REP
OR
T 20
05/2
006
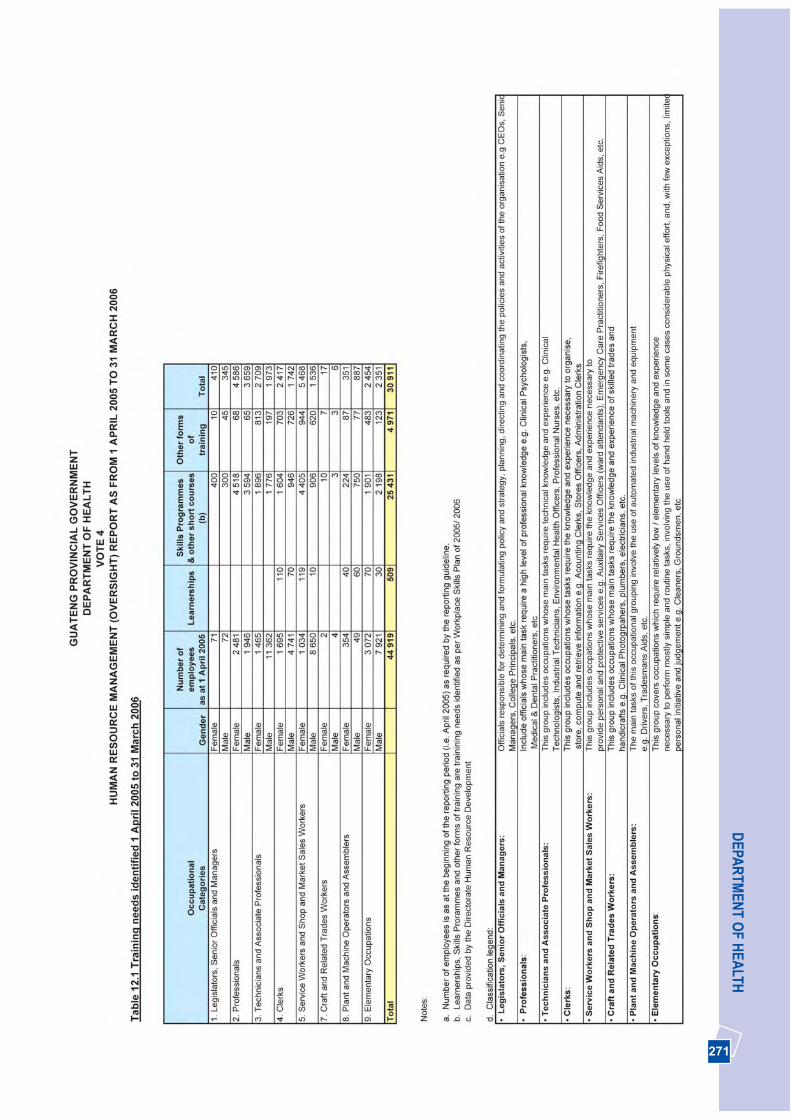
271
DEPA
RTM
ENT O
F HEA
LTH
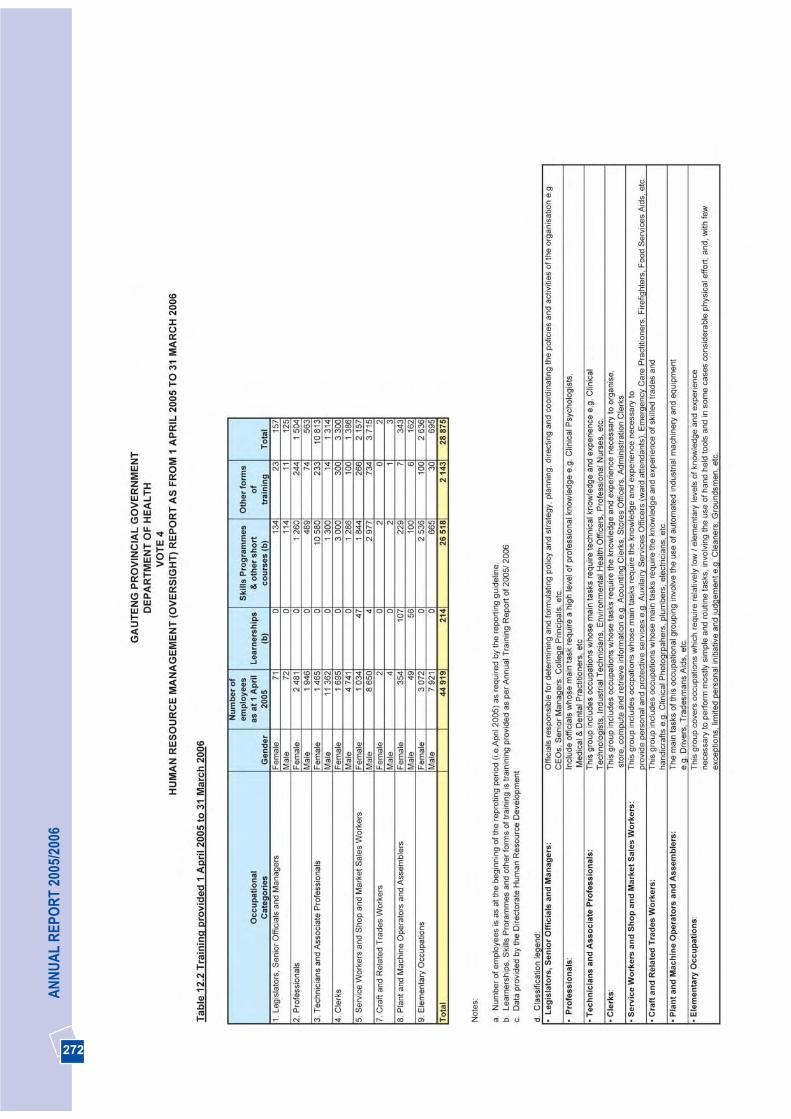
272
AN
NU
AL
REP
OR
T 20
05/2
006

273
DEPA
RTM
ENT O
F HEA
LTH
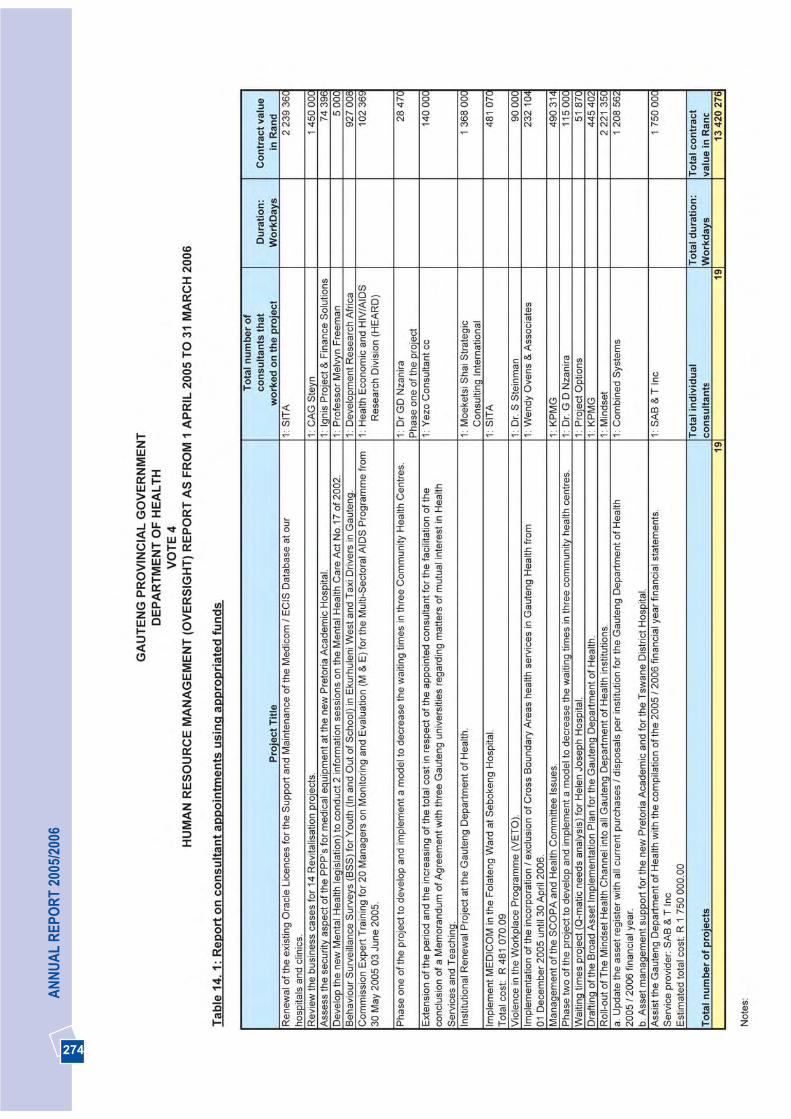
274
AN
NU
AL
REP
OR
T 20
05/2
006

275
DEPA
RTM
ENT O
F HEA
LTH
276
AN
NU
AL
REP
OR
T 20
05/2
006
277
DEPA
RTM
ENT O
F HEA
LTH

278
AN
NU
AL
REP
OR
T 20
05/2
006
279
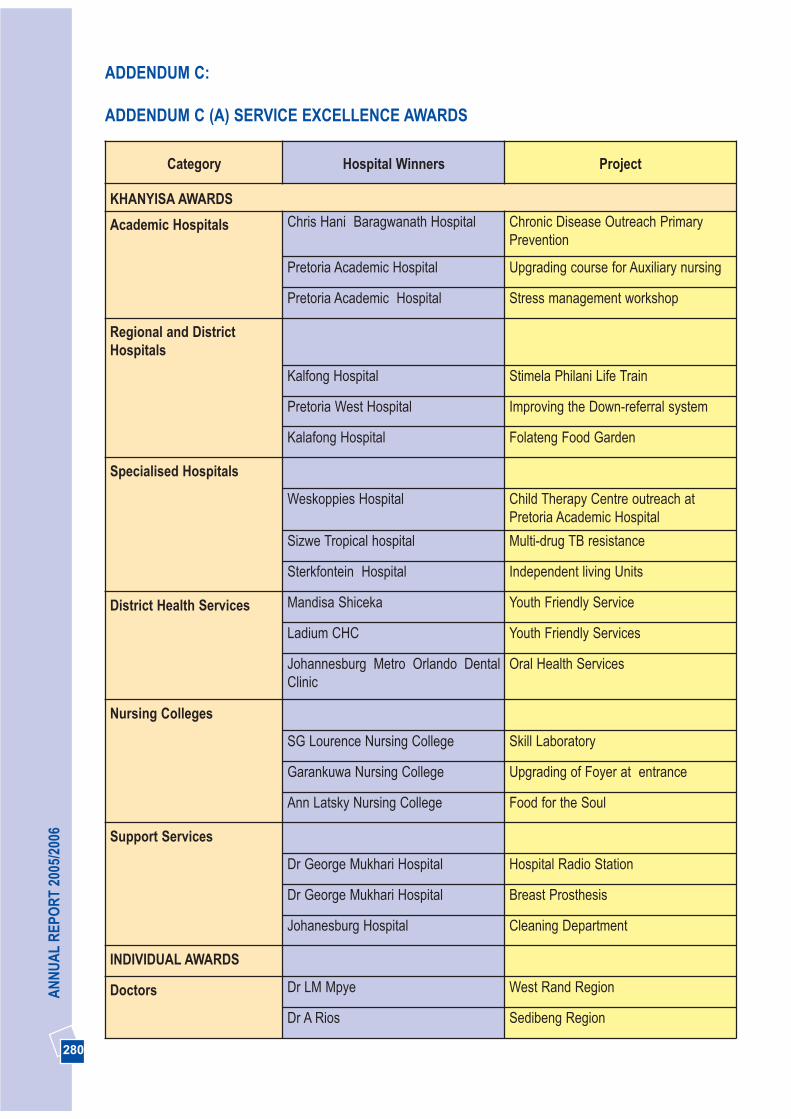
280
AN
NU
AL
REP
OR
T 20
05/2
006
ADDENDUM C:
ADDENDUM C (A) SERVICE EXCELLENCE AWARDS
Category Hospital Winners Project
KHANYISA AWARDS
Academic Hospitals Chris Hani Baragwanath Hospital Chronic Disease Outreach PrimaryPrevention
Pretoria Academic Hospital Upgrading course for Auxiliary nursing
Pretoria Academic Hospital Stress management workshop
Regional and DistrictHospitals
Kalfong Hospital Stimela Philani Life Train
Pretoria West Hospital Improving the Down-referral system
Kalafong Hospital Folateng Food Garden
Specialised Hospitals
Weskoppies Hospital Child Therapy Centre outreach atPretoria Academic Hospital
Sizwe Tropical hospital Multi-drug TB resistance
Sterkfontein Hospital Independent living Units
District Health Services Mandisa Shiceka Youth Friendly Service
Ladium CHC Youth Friendly Services
Johannesburg Metro Orlando DentalClinic
Oral Health Services
Nursing Colleges
SG Lourence Nursing College Skill Laboratory
Garankuwa Nursing College Upgrading of Foyer at entrance
Ann Latsky Nursing College Food for the Soul
Support Services
Dr George Mukhari Hospital Hospital Radio Station
Dr George Mukhari Hospital Breast Prosthesis
Johanesburg Hospital Cleaning Department
INDIVIDUAL AWARDS
Doctors Dr LM Mpye West Rand Region
Dr A Rios Sedibeng Region
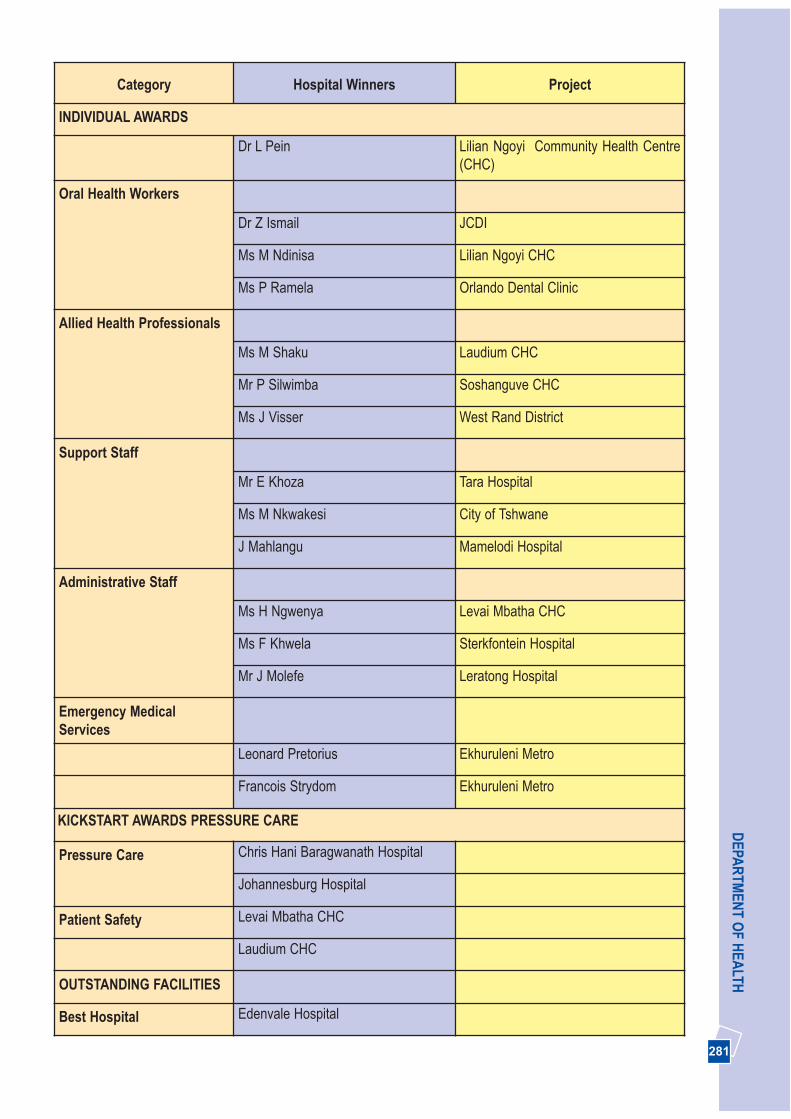
281
DEPA
RTM
ENT O
F HEA
LTH
Category Hospital Winners Project
INDIVIDUAL AWARDS
Dr L Pein Lilian Ngoyi Community Health Centre(CHC)
Oral Health Workers
Dr Z Ismail JCDI
Ms M Ndinisa Lilian Ngoyi CHC
Ms P Ramela Orlando Dental Clinic
Allied Health Professionals
Ms M Shaku Laudium CHC
Mr P Silwimba Soshanguve CHC
Ms J Visser West Rand District
Support Staff
Mr E Khoza Tara Hospital
Ms M Nkwakesi City of Tshwane
J Mahlangu Mamelodi Hospital
Administrative Staff
Ms H Ngwenya Levai Mbatha CHC
Ms F Khwela Sterkfontein Hospital
Mr J Molefe Leratong Hospital
Emergency MedicalServices
Leonard Pretorius Ekhuruleni Metro
Francois Strydom Ekhuruleni Metro
KICKSTART AWARDS PRESSURE CARE
Pressure Care Chris Hani Baragwanath Hospital
Johannesburg Hospital
Patient Safety Levai Mbatha CHC
Laudium CHC
OUTSTANDING FACILITIES
Best Hospital Edenvale Hospital
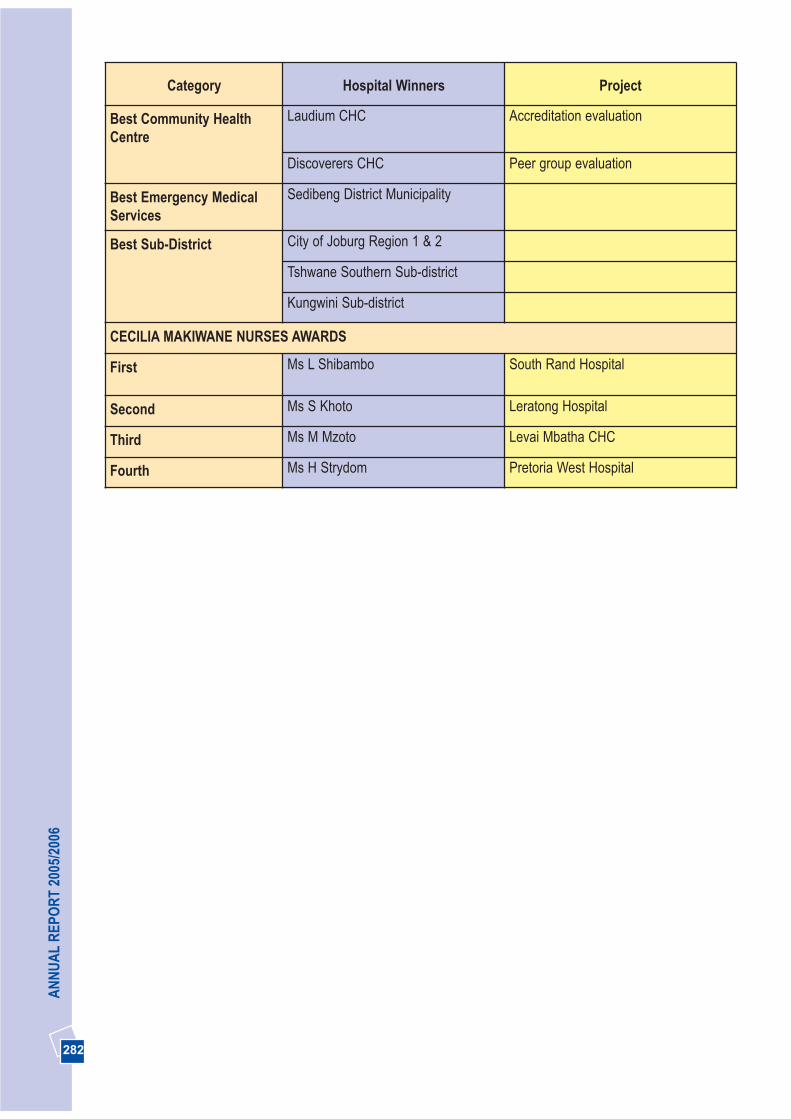
282
AN
NU
AL
REP
OR
T 20
05/2
006
Category Hospital Winners Project
Best Community HealthCentre
Laudium CHC Accreditation evaluation
Discoverers CHC Peer group evaluation
Best Emergency MedicalServices
Sedibeng District Municipality
Best Sub-District City of Joburg Region 1 & 2
Tshwane Southern Sub-district
Kungwini Sub-district
CECILIA MAKIWANE NURSES AWARDS
First Ms L Shibambo South Rand Hospital
Second Ms S Khoto Leratong Hospital
Third Ms M Mzoto Levai Mbatha CHC
Fourth Ms H Strydom Pretoria West Hospital
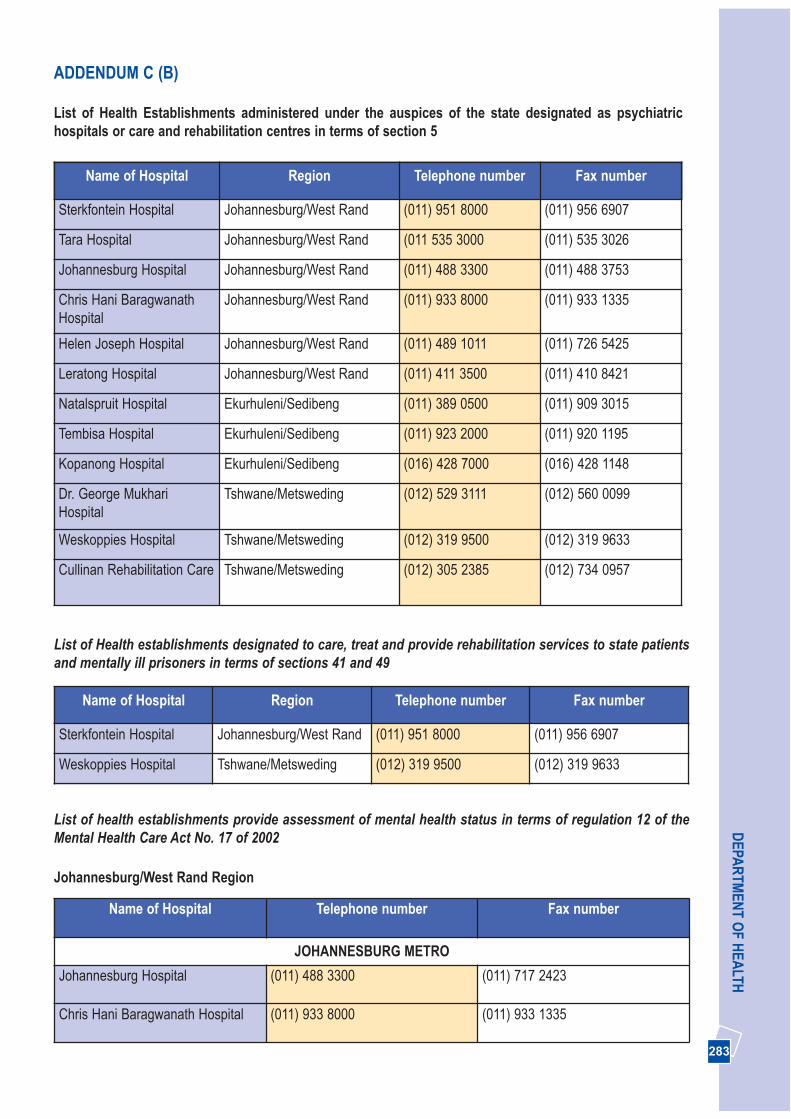
283
DEPA
RTM
ENT O
F HEA
LTHADDENDUM C (B)
List of Health Establishments administered under the auspices of the state designated as psychiatrichospitals or care and rehabilitation centres in terms of section 5
Name of Hospital Region Telephone number Fax number
Sterkfontein Hospital Johannesburg/West Rand (011) 951 8000 (011) 956 6907
Tara Hospital Johannesburg/West Rand (011 535 3000 (011) 535 3026
Johannesburg Hospital Johannesburg/West Rand (011) 488 3300 (011) 488 3753
Chris Hani BaragwanathHospital
Johannesburg/West Rand (011) 933 8000 (011) 933 1335
Helen Joseph Hospital Johannesburg/West Rand (011) 489 1011 (011) 726 5425
Leratong Hospital Johannesburg/West Rand (011) 411 3500 (011) 410 8421
Natalspruit Hospital Ekurhuleni/Sedibeng (011) 389 0500 (011) 909 3015
Tembisa Hospital Ekurhuleni/Sedibeng (011) 923 2000 (011) 920 1195
Kopanong Hospital Ekurhuleni/Sedibeng (016) 428 7000 (016) 428 1148
Dr. George MukhariHospital
Tshwane/Metsweding (012) 529 3111 (012) 560 0099
Weskoppies Hospital Tshwane/Metsweding (012) 319 9500 (012) 319 9633
Cullinan Rehabilitation Care Tshwane/Metsweding (012) 305 2385 (012) 734 0957
Name of Hospital Region Telephone number Fax number
Sterkfontein Hospital Johannesburg/West Rand (011) 951 8000 (011) 956 6907
Weskoppies Hospital Tshwane/Metsweding (012) 319 9500 (012) 319 9633
List of Health establishments designated to care, treat and provide rehabilitation services to state patientsand mentally ill prisoners in terms of sections 41 and 49
List of health establishments provide assessment of mental health status in terms of regulation 12 of theMental Health Care Act No. 17 of 2002
Johannesburg/West Rand Region
Name of Hospital Telephone number Fax number
JOHANNESBURG METRO
Johannesburg Hospital (011) 488 3300 (011) 717 2423
Chris Hani Baragwanath Hospital (011) 933 8000 (011) 933 1335

284
AN
NU
AL
REP
OR
T 20
05/2
006
Name of Hospital Telephone number Fax number
Helen Joseph Hospital (011) 489 1011 (011) 726 5425
Edenvale Hospital (011) 321 6157 (011) 433 6162
South Rand Hospital (011) 681 2003 (011) 681 2140
WEST RAND DISTRICT
Leratong Hospital (011) 411 3500 (011) 410 8421
Carletonville Hospital (018) 787 2111 (018) 788 2726
Yusuf Dadoo Hospital (011) 951 6132 (011) 953 4726
Name of Hospital Telephone number Fax number
Dr. George Mukhari Hospital (012) 529 3111 (012) 560 0099
Kalafong Hospital (012) 318 65 01 (012) 373 4710
Mamelodi Hospital (012) 841 8302 (012) 841 8412
Pretoria Academic Hospital (012) 354 2222 (012) 354 1548
Pretoria- West Hospital (012) 380 1205 (012) 386 3720
Name of Hospital Telephone number Fax number
EKURHULENI METRO
Natalspruit Hospital (011) 389 0500 (011) 909 3015
Far East Rand Hospital (011) 812 8311 (011) 813 1411
Tembisa Hospital (011) 923 2000 (011) 920 1195
Germiston Hospital (011) 345 1267/69 (011) 825 5425
Pholosong Hospital (011) 812 5155 (011) 738 3000
Tambo Memorial Hospital (011) 898 9318 (011) 892 2719
SEDIBENG DISTRICT
Kopanong Hospital (016) 428 7000 (016) 428 1148
Heidelburg Hospital (016) 341 1201 (016) 349 5907/5259
Sebokeng Hospital (016) 903 3306 (016) 988 1964
Ekurhuleni/Sedibeng Region
Tshwane/Metsweding Region
Johannesburg/West Rand Region (cont.)

285
DEPA
RTM
ENT O
F HEA
LTHADDENDUM C (C): CONSTITUTIONAL, NATIONAL AND PROVINCIAL LEGISLATIVE MANDATES
The following national legislation and policy documents form the legal and policy framework for thework of the Gauteng Department of Health:
- The department receives its mandate from Section 27 of the Constitution
- The Health Act (63 of 1977), currently under revision, defines in more detail the role of the various spheres ofgovernment in health service provision.
- The National Health Act 61 of 2003
- The Public Service Act 14 of 1994
- The Labour Relations Act 65 , 1995 as amended
- The Public Finance Management Act 1 of 1999
- The Employment Equity Act 55 of 1998
- The Skills Development Act, Act No 99 of 1998
- The Access to Information Act, Act No 2 of 2000
- The Criminal Procedure Act 51 of 1977
- The Inquest Act 58 of 1959
- The Mental Health Act 17 of 2002
- The Medical, Dental and Supplementary Health Services Professions Act 87 of 1995
- The Child Care amendment Act 96 of 1996
- Domestic Violence Act, 116 of 1998
- The Human Tissue Act 21 of 1983
- The Sterilisation Act, Act 44 of 1988
- The Choice of Termination of Pregnancy Act 92 of 1996
- The Nursing Act 5 of 1995
- The Medicines and Related Substance Control Act 101 of 1965 as amended in 1997
- The Pharmacy Act 53 of 1953 as amended in 1997
- The Medical Schemes Act 131 of 1998
- The Patients’ Rights Charter, 2000
- The White Paper on the Transformation of the Health Sector.
- The Batho Pele principles of social service delivery
- Preferential Procurement Policy Framework No 5 of 2000

Notes
286
AN
NU
AL
REP
OR
T 20
05/2
006

Notes
287
DEPA
RTM
ENT O
F HEA
LTH

Notes
288
AN
NU
AL
REP
OR
T 20
05/2
006