glycosyltransferase and sulfotransferase gene expression profiles in human monocytes, dendritic...
TRANSCRIPT
Glycosyltransferase and sulfotransferase gene expressionprofiles in human monocytes, dendritic cells and macrophages
François Trottein1,2,3,4, Lana Schaffer5, Stoyan Ivanov2,3,4, Christophe Paget2,3,4,Catherine Vendeville2,3,4, Sophie Groux-Degroote6,7, Suzanna Lee5, Marie-AngeKrzewinski-Recchi6,7, Steven R Head5, Philippe Gosset2,3,8, and Philippe Delannoy6,72 Inserm, U547, Lille, F-59019 France3 Institut Pasteur de Lille, Lille, F-59019 France4 Université de Lille 2, IFR17, Lille, F-59019 France5 The Scripps Research Institute, La Jolla CA, USA6 CNRS, UMR 8576, Villeneuve d'Ascq, F-59655 France7 Université des Sciences et Technologie de Lille I, Villeneuve d'Ascq, F-59655 France8 Inserm, U774, Lille, F-59019 France
AbstractUsing a focused glycan-gene microarray, we compared the glycosyltransferase (GT) andsulfotransferase gene expression profile of human monocytes relative to immature and maturedendritic cells (DCs) or macrophages (Mφs). Microarray analysis indicated that monocytes expresstranscripts for a full set of enzymes involved in the biosynthesis of N- and O-glycans potentiallyelongated by poly-LacNAc chains with type II terminal sequences. Monocytes also express genesencoding enzymes involved in glycosaminoglycan biosynthesis but have a limited capacity forglycolipid synthesis. Among genes significantly expressed in monocytes (90 out of 175), 39 aremodulated in DCs and/or Mφ, a large proportion being increased in both cell types. This change inGT and sulfotransferase genes might potentially enforce the capacity of differentiated cells tosynthesize branched N-glycans and mucin-type O-glycans, and to remodel of cell surfaceproteoglycans during the differentiation process. Stimulation of DCs and Mφs withlipopolysaccharide caused a decrease in gene expression mainly affecting genes found to bepositively modulated during the differentiation steps. Validation of this analysis was provided byquantitative real-time PCR and flow cytometry of cell surface glycan epitopes. Collectively, thisstudy implies an important modification of the pattern of glycosylation in DCs and Mφs undergoingdifferentiation and maturation with potential biological consequences.
Keywordsdendritic cells; glycosyltransferases; monocytes; macrophages; microarray
1To whom correspondence should be addressed: Tel: +33 320 877 885; Fax: +33 320 877 888; [email protected] of interest statement: None declared
NIH Public AccessAuthor ManuscriptGlycoconj J. Author manuscript; available in PMC 2010 November 1.
Published in final edited form as:Glycoconj J. 2009 December ; 26(9): 1259–1274. doi:10.1007/s10719-009-9244-y.
NIH
-PA Author Manuscript
NIH
-PA Author Manuscript
NIH
-PA Author Manuscript

IntroductionGlycosylation of proteins and lipids plays a crucial role in numerous biological processesincluding the regulation of immune and inflammatory responses (for reviews, (Arnold, J.N.,Wormald, M.R., et al. 2007, Collins, B.E. and Paulson, J.C. 2004, Daniels, M.A., Hogquist,K.A., et al. 2002, Rudd, P.M., Elliott, T., et al. 2001, Spiro, R.G. 2002)). During physiologicalconditions, glycans exert diverse functions on the immune system. By serving as ligands forglycan-binding proteins, such as classical adhesion molecules and lectins, they mediateimmune cell differentiation, survival, adhesion, and trafficking (Crocker, P.R. 2002, Esko, J.D.and Selleck, S.B. 2002, Lau, K.S., Partridge, E.A., et al. 2007, Lowe, J.B. 2002, Moody, A.M.,Chui, D., et al. 2001, Rabinovich, G.A., Baum, L.G., et al. 2002, Toscano, M.A., Bianco, G.A.,et al. 2007). During stress or infection, glycans also play a pivotal role by triggering orcontrolling immune cell signalling, migration, expansion and/or effector functions (Blander,J.M., Visintin, I., et al. 1999, Collins, B.E., Blixt, O., et al. 2006, Feizi, T. 2000, Lowe, J.B.2002, Moody, A.M., North, S.J., et al. 2003, Morgan, R., Gao, G., et al. 2004, Pappu, B.P. andShrikant, P.A. 2004, van Kooyk, Y. and Rabinovich, G.A. 2008). Glycans exposed on thesurface of professional antigen (Ag) presenting cells (APCs) are likely to be critical in manyaspects of immune responses. They mediate host-pathogen interactions, influence their tropismand emigration and shape their biological functions after cell-to-cell contact. For instance,glycans play a part in the cross-talk between dendritic cells (DCs), the most potent APCs, andconventional T lymphocytes to modulate the strength and the quality of the acquired immuneresponse (Demetriou, M., Granovsky, M., et al. 2001). Moreover, interactions of APCs withcells of the innate system, including natural killer cells, are supported by glycan/counter-receptor interactions (for review, (Moretta, L., Bottino, C., et al. 2006). More recently, a newconcept has emerged showing that the production of glycolipids (glycosphingolipids, GSLs)by CD1d-expressing APCs is critical to activate Natural Killer T cells, a sub-population ofinnate/memory non-conventional T lymphocytes (for reviews, (Bendelac, A., Savage, P.B., etal. 2007, Godfrey, D.I. and Kronenberg, M. 2004)). So far, although differentiation andactivation of APCs, including monocytes, DCs and macrophages (Mφs), are accompanied byprogrammed remodelling of cell surface (glycosylated) molecules with potentially biologicallyimportant consequences, no comparative analysis of the expression of genes involved in glycanbiosynthesis (essentially glycosyltransferases, GTs) and modification (mainlysulfotransferases) has been reported in these cells.
The mononuclear phagocyte system is composed by monocytes, DCs and Mφs whichcontribute to tissue remodelling and homeostasis, inflammation and immune defence.Circulating monocytes, which constitute ~ 5–10% of peripheral blood leukocytes in humans,give rise to tissue-resident Mφs as well as to other specialized cells such as osteoclasts andmyeloid DCs (Gordon, S. and Taylor, P.R. 2005, Hume, D.A., Ross, I.L., et al. 2002, Randolph,G.J., Beaulieu, S., et al. 1998, Randolph, G.J., Inaba, K., et al. 1999). Dendritic cells are criticalin the induction, expansion and regulation of immune responses (for reviews, (Banchereau, J.and Steinman, R.M. 1998, Kapsenberg, M.L. 2003, Reis e Sousa, C. 2006, Rossi, M. andYoung, J.W. 2005)). Immature DCs principally locate at sites of Ag entry, where they arepoorly immunogenic but efficient at capturing Ags through receptor-mediated endocytosis,macropinocytosis and phagocytosis. Upon activation by inflammatory factors and/or microbialcomponents, DCs undergo a complex process of maturation allowing their traffic to T-cellareas of lymphoid tissues through modification of adhesion molecule and chemokine receptorexpression. Dendritic cell maturation is also associated with high surface expression of Agpresenting and co-stimulatory molecules and with secretion of chemokines and bioactivemediators such as immuno-stimulatory cytokines. These factors are important to thedownstream activation of numerous bystander innate immune cells, such as Natural killer (T)cells, and to promote T and B cell stimulation, expansion and polarisation (Banchereau, J. andSteinman, R.M. 1998, Kapsenberg, M.L. 2003, Reis e Sousa, C. 2006, Rossi, M. and Young,
Trottein et al. Page 2
Glycoconj J. Author manuscript; available in PMC 2010 November 1.
NIH
-PA Author Manuscript
NIH
-PA Author Manuscript
NIH
-PA Author Manuscript

J.W. 2005). Although Mφs are much less potent in inducing primary immune response relativeto DCs, they are crucial players in innate/acquired responses, in particular in immediate earlydefence against bacterial infection. The most prominent functions of Mφs are phagocytosis ofintruding micro-organisms and necrotic/apoptotic cells, bactericidal activity and rapidsecretion of pro-inflammatory cytokines (for review, (Gordon, S. and Taylor, P.R. 2005). LikeDCs, activation/maturation of Mφs is mediated by engagement of various innate sensors,including Toll-like receptors (TLRs) (for reviews, (Iwasaki, A. and Medzhitov, R. 2004,Takeda, K. and Akira, S. 2005).
In the present study, we aimed to obtain global information relating to the expression of genesencoding GTs and sulfotransferases in human monocytes, DCs and Mφs isolated ordifferentiated from the same donor. We also aimed to compare the expression profile of thesegenes in immature versus mature (immuno-stimulatory phenotype) DCs and Mφs. To this end,we took advantage of a focused gene microarray (glycogene-chip v3, Consortium forFunctional Glycomics) using the Affymetrix technology. The glyco-gene-chip v3 is a customdesigned GeneChip expression array that utilizes 21 probes for each targeted transcript, 10more than are found on the commercially available GeneChip arrays such as the Hu133 Plus2.0 array from Affymetrix. The additional probes used on this focused array increase thesensitivity for detection of low abundant transcripts (unpublished results, SRH). In the presentstudy, we report that the differentiation and maturation processes affected the gene expressionprofiles of GTs and sulfotransferases in DCs and Mφs. Potential functional consequences forthese changes are discussed.
ResultsExpression profile of GT and sulfotransferase genes in monocytes
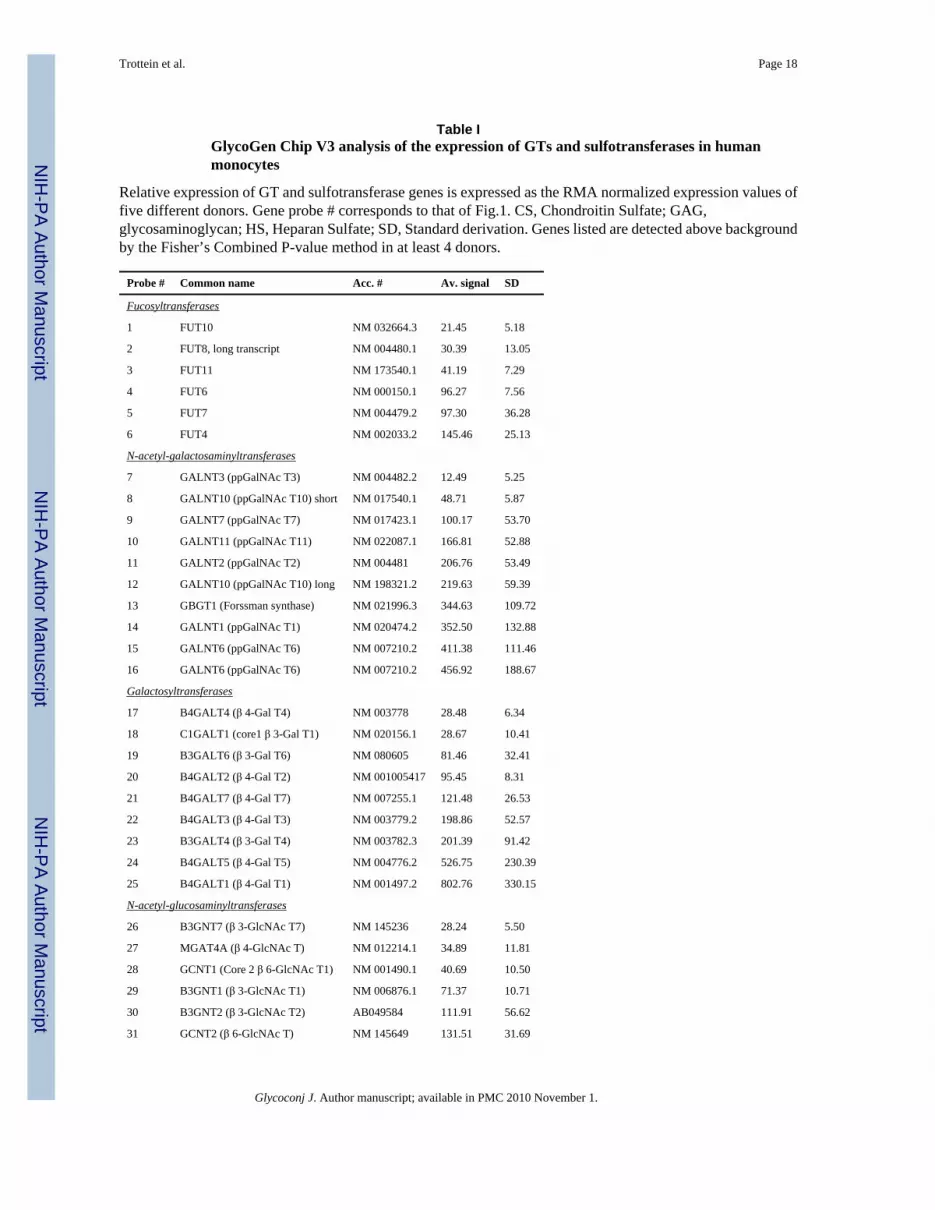
We first analyzed the expression pattern of GT and sulfotransferase genes involved in thebiosynthesis of N-glycans, mucin-type O-glycans, glycosaminoglycans (GAGs), andglycolipids in circulating peripheral blood monocytes. We found that, among the 175 analyzedgenes (100 probe sets), 90 are significantly expressed in human monocytes (5 donors). TableI shows the average expression signals of these genes, which are clustered according to thespecificities of the enzymes that they encode. As shown in Fig. 1, transcripts forfucosyltransferases (FucT), and to a lesser extent for glucosyltransferases (GlcTs),glucuronosyltransferases (GlcAT) and mannosyltransferases (ManT) are expressed at a lowerlevel compared to those of the other subfamilies. Interestingly, several genes involved in thefirst steps of N-glycosylation, in particular in the formation of the oligosaccharidyltransferasecomplex such as DAD1, RNP1, RNP2 and DDOST (probes #92/93, 94, 95, 96), are highlyexpressed in monocytes. Concomitantly, genes encoding enzymes involved in both N-glycanbranching (i.e. MGAT5B, MGAT2, MGAT4B & MGAT1, #34, 36, 37/38/41, 40) and poly-N-acetyl-lactosamine chain elongation (i.e. B3GNT1, B3GNT2, B3GNT8, IGNT2, B4GALT3 andB4GALT4 and #29, 30, 35, 31, 22, 17) are also well expressed, suggesting that monocytessynthesize N-glycans carrying bi, tri, and tetra-antennary structures, possibly elongated bypoly-N-acetyl-lactosamine chains. In parallel, monocytes also highly express B4GALT5 (#24)and B4GALT1 (#25), two genes encoding type 2 disaccharide (Galβ 1-4GlcNAc) synthesisingenzymes, together with fucosyltransferases (FUT4 and FUT7, #6, 5) and sialyltransferases(ST3GAL6 and ST3GAL3, #58, 60) using type 2 disaccharide as acceptor substrate. Thisindicates that monocytes possess a full set of enzymes for the biosynthesis of Lex and sialyl(s)Lex in terminal position of oligosaccharide chains. In agreement with (Elbim, C., Hakim,J., et al. 1998,Skacel, P.O., Edwards, A.J., et al. 1991), FACS analysis revealed expression ofsLex, but not Lex, on monocytes (Table II). The synthesis of sLex on monocytes might beimportant in the extravasation and infiltration of these cells into peripheral sites where DCsand Mφs differentiate (Gordon, S. and Taylor, P.R. 2005). At the opposite, the β 1,3-
Trottein et al. Page 3
Glycoconj J. Author manuscript; available in PMC 2010 November 1.
NIH
-PA Author Manuscript
NIH
-PA Author Manuscript
NIH
-PA Author Manuscript

galactosyltransferases (β 3-Gal T1,β 3-Gal T2, β 3-Gal T5 and β 3-Gal T7) involved in thebiosynthesis of type I disaccharide unit (Galβ 1-3GlcNAc) are not significantly expressed inmonocytes. This correlates with the absence of type I derived blood group Ags, such as Lea,sLea, Leb or Ley, as revealed by FACS analysis (Table II). Polypeptide GalNAc-transferases,the mucin-type O-glycan initiating enzymes, are also well produced in monocytes. Sevendifferent enzymes (i.e. ppGalNAc T3, T10, T7, T11, T2, T1, T6, #7, 8/12, 9, 10, 11, 14) arefairly or highly expressed, suggesting a very good capacity for monocytes to synthesise O-glycan chains. In parallel, monocytes also express the Core 1 β 3-Gal T1 (#18), the Core 2 β6-GlcNAc T1 (GCNT1, #28) and several core 1-specific sialyltransferases (i.e. ST6GalNAcIV, ST6GalNAc II, and ST3Gal I, # 59, 61, 65), but other core-specific enzymes such as Core2 β 6-GlcNAc T3, Core 2 and 4 β 6-GlcNAc T4 or Core 3 β 3-GlcNAc T6 are not detected.Moreover, monocytes do not express transcript for ST6GalNAc I, the enzyme responsible forthe synthesis of sialyl-Tn (NeuAcα 2-6GalNAcα 1-O-Ser/Thr). These data, together with theabsence of Tn (GalNAcα 1-O-Ser/Thr) or sialyl-Tn Ags (FACS analysis, data not shown),suggest that monocyte O-glycan chains are mainly Core 1 and Core 2 sialylated glycans. Thisis in line with mass spectrometry O-glycan profiling of monocytes (Julien, S., Grimshaw, M.J.,et al. 2007). Besides N-glycan and mucin-type O-linked glycan genes, monocytes express afull set of genes encoding for enzymes involved in GAG biosynthesis, including thoseimplicated in the tetrasaccharide linker, chondroitin sulphate and heparan sulphatecopolymerases, and for modification enzymes such as 5-epimerase and numeroussulfotransferases (Table I). Finally, although the expression level of the two key GTscontrolling the first step of GSL synthesis (glucosylceramide synthase UGCG, #43) andlactosylceramide synthase) is low or undetectable, monocytes transcribe several genesencoding enzymes involved in GSL glycosylation. For instance, in the Globo series of GSLs,the Gb4 synthase (GBGT1, #13), but not the Gb3 synthase, is highly expressed in monocytes.In the Ganglio series, the GM3 synthase (ST3Gal V, #64) is highly expressed but both GD3synthase (ST8Sia I), GT3 synthase (ST8Sia V) and GM2 synthase (β 4-GalNAc T1) are notdetected. Together, this indicates that ganglioside biosynthesis is rather limited to the a-seriesof gangliosides in monocytes.
Comparison of GT and sulfotransferase gene expression in DCs and Mφs relative tomonocytes
In humans, monocytes have the capacity to differentiate into Mφs in response to Mφ colonystimulating factor (M-CSF) and into CD11c+ MHC class II+ DCs in the presence of granulocyteMφ CSF (GM-CSF) (Becker, S., Warren, M.K., et al. 1987, Inaba, K., Inaba, M., et al. 1992,Sallusto, F. and Lanzavecchia, A. 1994). We investigated whether in vitro differentiation ofDCs or Mφs from monocytes leads to changes in the level of GT and sulfotransferase transcriptexpression. The quality of the differentiated cells was assessed after selection anddifferentiation by flow cytometry. As shown in Table II, clear phenotypic differences betweenmonocytes, DCs and Mφs was observed. Unlike Mφs and monocytes, immature DCs expressthe canonical markers CD1a and DC-SIGN (CD209). At the opposite, Mφs, but not DCs,produce CD16 and RFD7. Monocytes are strongly positive for CD14, a marker lost duringtheir differentiation, and some cells are also positive for CD16. Furthermore, transcriptomicanalysis confirmed that cell-specific markers are expressed by DCs, such as the lectinsDEC-205, DC-SIGN (CD209) and DC immunoreceptor (DCIR), and by Mφs, such as thescavenger receptors collectin 12 and LOX-1 or are common to both cell types such as themacrophage mannose receptor (CD206) (data not shown).
As shown in heat map representation (Fig. 2), in both DCs and Mφs, a significant number ofGT and sulfotransferase genes (31/90 (34 %) and 27/90 (30 %), respectively) are significantly(P < 0.05) changed in their expression levels (fold change > 1.4). Of note, the majority of themare increased compared to monocytes. Indeed, 21 GT and sulfotransferase transcripts are
Trottein et al. Page 4
Glycoconj J. Author manuscript; available in PMC 2010 November 1.
NIH
-PA Author Manuscript
NIH
-PA Author Manuscript
NIH
-PA Author Manuscript

increased and only 10 are decreased in DCs, whilst in Mφs, 22 GT and sulfotransferase mRNAsare increased and 5 are decreased. Most of these variations of expression were confirmed byquantitative real-time PCR (qPCR) using biological samples (3 to 5) independent of those usedin the gene chips analysis (Table. III). Strikingly, DCs and Mφs exhibit similarities in theirpattern of GT and sulfotransferase transcript expression, indicating that the majority of thesegenes are modulated in the same direction during the differentiation processes (Fig. 2). Amongthem, several genes coding for enzymes involved in the first steps of N-glycan biosynthesisare increased (albeit moderately) in differentiated cells, such as those directly associated to thebiosynthesis of the lipid-linked precursor of Asn-linked glycans, the dolichol-PP-oligosaccharide (ALG1, ALG2, ALG5, ALG8 and ALG9, # 53, 54, 47, 46 and 51) and to thetransfer of the oligosaccharide onto the nascent protein (DAD1 and DDOST # 93 and 96).Variation of gene transcripts are also observed for GTs that selectively act in the Golgiprocessing of N-glycans, such as the N-acetyl- glucosaminyltransferase MGAT2 (# 36),MGAT4A (# 27), and particularly the β 3-GlcNAc T1 (# 29), the latter being essential for thesynthesis of poly-N-acetyllactosamine chains (Sasaki, K., Kurata-Miura, K., et al. 1997). Theseenzymes might contribute to an enforced capacity of differentiated cells to synthesise highlybranched poly-N-acetyllactosamine N-glycans chains. Interestingly, the polysialyltransferaseST8Sia IV (# 57), which mediates the biosynthesis of α 2-8-linked polysialic acid (PSA) chainsusually found on neural cell adhesion molecule (NCAM) (Weinhold, B., Seidenfaden, R., etal. 2005), is over-expressed in DCs. However, FACS analysis failed to reveal NCAM, or itsisoform CD56, expression on monocytes, DCs or Mφs (not shown) suggesting the involvementof other PSA-carrier protein(s). In line with this hypothesis, a recent report indicated that apolysialylated form of neuropilin-2 is expressed on the surface of human DCs (Curreli, S.,Arany, Z., et al. 2007). Differentiation is also accompanied to changes in the expression ofGTs involved in O-linked glycan synthesis. Compared to monocytes, the gene encoding thepolypeptide N-acetylgalactosaminyltransferase 6 (ppGalNAcT6 or GALNT6, # 16), isincreased in both DCs and Mφs. In parallel, ppGalNAcT10 (GALNT10, # 12) is decreased inboth differentiated cells, and ppGalNAcT3 (GALNT3, # 7) in DCs. This indicates that, alongwith an enforced N-type glycosylation, the mucin-type O-linked glycosylation might also bemodified during DC and Mφ differentiation. FUT11, the gene encoding the α1,3/4-fucosyltransferase 11 (# 3) is also increased in both DCs and Mφs. This might explain theincreased expression of sLex in immature DCs (~27 fold compared to monocytes), as indicatedby FACS analysis (Table II), although the expression of other enzymes implicated in sLex
synthesis (FUT7, ST3Gal III, IV or VI) remains unchanged. Major changes are also found forgenes encoding enzymes implicated in proteoglycan synthesis, in particular in the sulfatationof GAGs. Indeed, the HS sulfotransferase HS2ST1 (# 70) is increased in both DCs and Mφs,whilst the chondroitin 4- sulfotransferase CHST12 (# 72) is increased only in DCs. Conversely,transcripts for the N-acetylgalactosamine-4-sulfate 6-O-sulfotransferase (GalNAc4S6ST, #80), the N-acetylglucosamine 6-O-sulfotransferase 2 (CHST2, # 77) and the chondroitin sulfateN-acetylgalactosaminyltransferase 1 (CHGN, # 82) are decreased in differentiated cells,relative to monocytes. Finally, transcript for exostosin-like 2 (EXTL2, # 81), a copolymerasethat transfers GlcNAc and GlcA to the common GAG-protein linkage region to initiate HSsynthesis (Kitagawa, H., Shimakawa, H., et al. 1999), is increased in both DCs and Mφs, whilstthe heparan sulfate copolymerase EXT1 (# 87) is decreased in Mφs. In parallel, within theproteoglycan family, a group of genes including agrin, bamacan, glypican 4, decorin andsyndecan 2, 3 and 4 are upregulated in both DCs and Mφs, as revealed by our micro-arrayanalysis (not shown). Altogether, in agreement with Wegrowski et al. (Wegrowski, Y., Milard,A.L., et al. 2006), DCs and Mφs probably exhibit an important remodelling of proteoglycanson their surface, potentially giving new counter-receptors relative to monocytes.
Comparison of gene expression between DCs and Mφs also indicates that a limited number ofGT and sulfotransferase genes are cell specific (12 in DCs and 8 in Mφs, Fig. 2B and C). Inagreement with a recent study reporting a high α2,6-linked sialic acid density in immature DCs
Trottein et al. Page 5
Glycoconj J. Author manuscript; available in PMC 2010 November 1.
NIH
-PA Author Manuscript
NIH
-PA Author Manuscript
NIH
-PA Author Manuscript
(Jenner, J., Kerst, G., et al. 2006), ST6Gal I (# 63) is over-expressed in DCs. The enhanced(~3-fold) exposure of α2,6-linked sialic acid on differentiated cells, relative to monocytes, wasconfirmed by flow cytometry using the SNA lectin (Table. II). The lactotriaosylceramide (Lc3)synthase (B3GNT5, #24) and the Forssman synthase (GBGT1, #13), the enzyme that convertsthe Pk Ag into the Forssman Ag, are significantly increased in DCs, but not in Mφs. Theselatter observations suggest potential differences in the synthesis of globo and (neo)lacto seriesof GSLs between DCs and Mφs, which could have important consequences on the fine tuningof membrane microdomain organization and cell signalling.
Comparison of GT and sulfotransferase gene expression in mature DCs and Mφs, relative toimmature cells
As a next step, we compared the expression levels of GT and sulfotransferase transcripts inimmature versus mature DCs or Mφs. To this end, cells were stimulated for 18 hrs with thecanonical TLR4 agonist lipopolysaccharide (LPS). As expected, LPS strongly increases theexpression of CD80 and CD86 in DCs, and at a lower level in Mφs, whilst that of HLA-DRand CD83 was only induced in mature DCs (Table II). Microarray analysis revealed that theexpression of lectins, which are upregulated during the differentiation, is mainly repressed aftermaturation (not shown), as confirmed by flow cytometry for DC-SIGN (CD209) (Table II).Thus, LPS treatment results in dramatic changes in DC and Mφ phenotype.
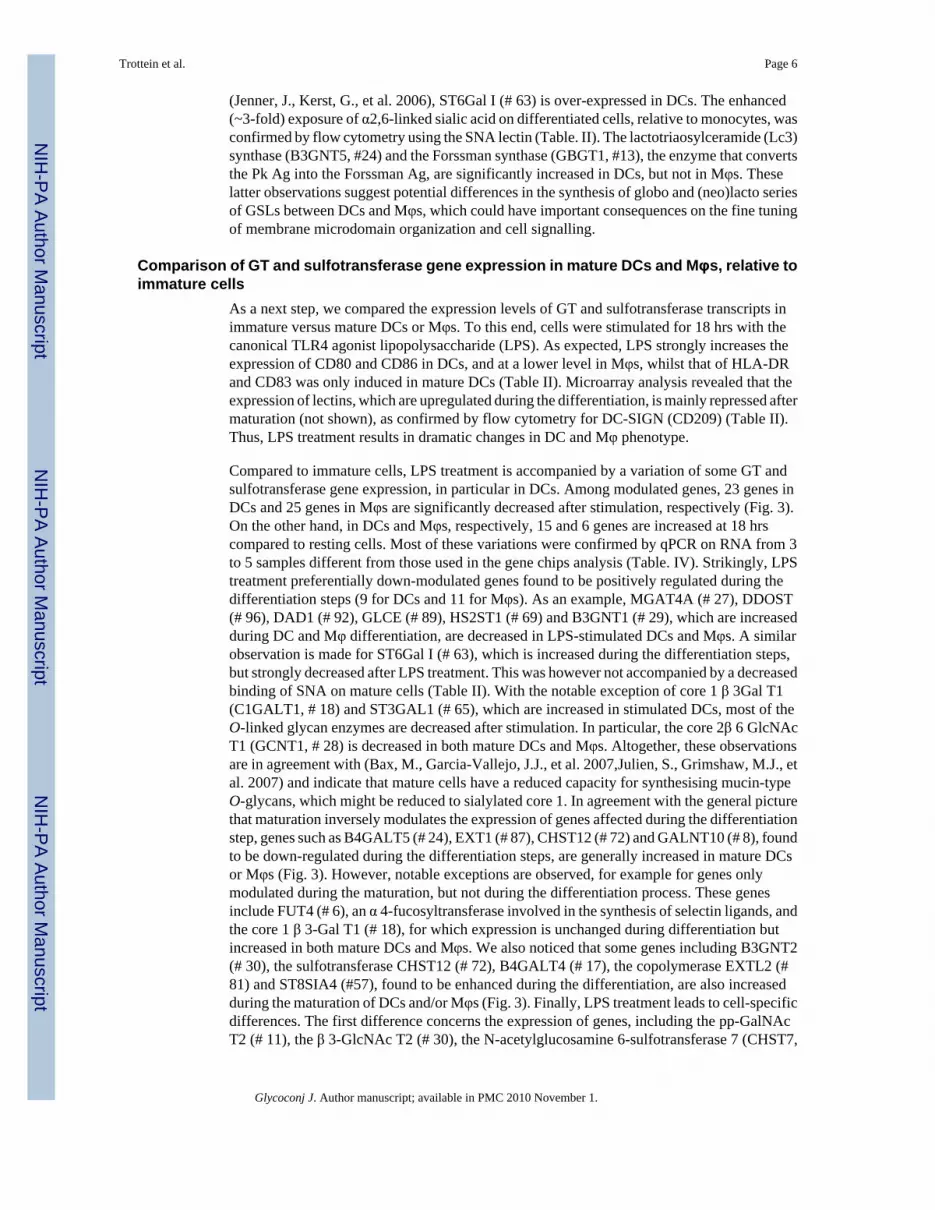
Compared to immature cells, LPS treatment is accompanied by a variation of some GT andsulfotransferase gene expression, in particular in DCs. Among modulated genes, 23 genes inDCs and 25 genes in Mφs are significantly decreased after stimulation, respectively (Fig. 3).On the other hand, in DCs and Mφs, respectively, 15 and 6 genes are increased at 18 hrscompared to resting cells. Most of these variations were confirmed by qPCR on RNA from 3to 5 samples different from those used in the gene chips analysis (Table. IV). Strikingly, LPStreatment preferentially down-modulated genes found to be positively regulated during thedifferentiation steps (9 for DCs and 11 for Mφs). As an example, MGAT4A (# 27), DDOST(# 96), DAD1 (# 92), GLCE (# 89), HS2ST1 (# 69) and B3GNT1 (# 29), which are increasedduring DC and Mφ differentiation, are decreased in LPS-stimulated DCs and Mφs. A similarobservation is made for ST6Gal I (# 63), which is increased during the differentiation steps,but strongly decreased after LPS treatment. This was however not accompanied by a decreasedbinding of SNA on mature cells (Table II). With the notable exception of core 1 β 3Gal T1(C1GALT1, # 18) and ST3GAL1 (# 65), which are increased in stimulated DCs, most of theO-linked glycan enzymes are decreased after stimulation. In particular, the core 2β 6 GlcNAcT1 (GCNT1, # 28) is decreased in both mature DCs and Mφs. Altogether, these observationsare in agreement with (Bax, M., Garcia-Vallejo, J.J., et al. 2007,Julien, S., Grimshaw, M.J., etal. 2007) and indicate that mature cells have a reduced capacity for synthesising mucin-typeO-glycans, which might be reduced to sialylated core 1. In agreement with the general picturethat maturation inversely modulates the expression of genes affected during the differentiationstep, genes such as B4GALT5 (# 24), EXT1 (# 87), CHST12 (# 72) and GALNT10 (# 8), foundto be down-regulated during the differentiation steps, are generally increased in mature DCsor Mφs (Fig. 3). However, notable exceptions are observed, for example for genes onlymodulated during the maturation, but not during the differentiation process. These genesinclude FUT4 (# 6), an α 4-fucosyltransferase involved in the synthesis of selectin ligands, andthe core 1 β 3-Gal T1 (# 18), for which expression is unchanged during differentiation butincreased in both mature DCs and Mφs. We also noticed that some genes including B3GNT2(# 30), the sulfotransferase CHST12 (# 72), B4GALT4 (# 17), the copolymerase EXTL2 (#81) and ST8SIA4 (#57), found to be enhanced during the differentiation, are also increasedduring the maturation of DCs and/or Mφs (Fig. 3). Finally, LPS treatment leads to cell-specificdifferences. The first difference concerns the expression of genes, including the pp-GalNAcT2 (# 11), the β 3-GlcNAc T2 (# 30), the N-acetylglucosamine 6-sulfotransferase 7 (CHST7,
Trottein et al. Page 6
Glycoconj J. Author manuscript; available in PMC 2010 November 1.
NIH
-PA Author Manuscript
NIH
-PA Author Manuscript
NIH
-PA Author Manuscript

# 74) and 14 (CHST14, # 73), the sialyltransferases ST6GalNAc II and ST3Gal VI (# 61 and58, respectively) and the chondrotin GalNActransferase 2 (CSGALNACT2, # 83), which arestrongly modified (positively or negatively) in LPS-treated DCs (Fig. 3B), but unchanged instimulated Mφs (Fig. 3C). Similarly, compared to Mφs, transcripts for some GSL-specific GTsare enhanced in mature DCs, but not Mφs. These include the glucosylceramide synthase UGCG(# 43) and the GM3 synthase (ST3GAL5, # 64) involved in the synthesis of ganglio series ofGSLs. Flow cytometry analysis however revealed no significant increase of GM3 cell surfaceexpression after LPS stimulation and no GD3 synthesis, in correlation with the low expressionof ST8SIA1. Although not fully GSL specific, ST3Gal I (# 65), which is also implicated in thesynthesis of gangliosides (GM1b/GD1a/GT1b/GQ1c) is also increased in DCs, but not inMφs.
DiscussionBecause differentiation of DCs and Mφs is be accompanied by programmed remodelling ofcell surface glycans with biologically important consequences, we first compared GT andsulfotransferase gene expression in in vitro differentiated cells, relative to monocytes. Previousreports have shown that monocyte-to-Mφ, and possibly monocyte-to-DC differentiation, isassociated with modulation of ~1 to 2 % of the global transcriptome (Martinez, F.O., Gordon,S., et al. 2006). Here, using a highly sensitive array gathering probes for 175 genes involvedin the biosynthesis of N-glycans, O-glycans, GAG and glycolipids, we found that 90 GTs andsulfotransferases are significantly expressed in human monocytes and that ~30 % of them aremodulated (mostly increased) in both DCs and Mφs. These gene array data were validated bytwo different approaches: the use of qPCR and an increase in sample. This suggests that GTand sulfotransferase genes are relatively sensitive to the differentiation steps and that DCs andMφs present an enhanced capacity to produce glycans compared to monocytes. Amongbiosynthetic pathways, it seems that, globally, transcripts for enzymes involved in N-glycosylation pathway, as well as in mucin-type O-glycan and GAG synthesis, are mainlyaffected. In particular, GT genes involved in N-glycan synthesis are generally increased indifferentiated cells. The general picture is that transcripts encoding enzymes involved in bothinitiation and elongation of N- and O-glycan chains are enhanced during differentiation. Genesencoding endoplasmic reticulum enzymes involved in dolichol cycle or encodingoligosaccharidyltransferase subunits are increased in differentiated cells. In the same time,enzymes involved in both branching and elongation of poly-N-acetyllactosamine chains of N-glycans, are also augmented. MALDI-TOF analysis of N-glycans in DCs has previously shownthe presenceof sialylated tri- and tetra-antennary N-glycans, potentially elongated with poly-N-acetyllactosamine and decorated with Lewis-type epitopes (Bax, M., Garcia-Vallejo, J.J., etal. 2007). Similarly, several genes encoding polypeptide N-acetylgalactosaminyltransferasesare increased in differentiated cells suggesting an enhanced synthesis of O-glycans. Micro-array analysis also shows the preferential expression of several enzymes involved in type II(Galβ 1-4GlcNAc) terminal unit biosynthesis in monocytes derived-cells. Altogether, thesedata indicate an enforced capacity of differentiated cells to synthesize type II blood groupepitopes exposed at the surface that fits well with the highest sLex expression in immature DCsand Mφs, as indicated by FACS analysis. It is possible that, through selectin memberinteractions, sLex might be involved in the migration of DCs and Mφs and/or in theirinteractions with immune cell types (including T cells) (Suzuki, A., Yamakawa, M., et al.2001). Interestingly enough, specific enzymes involved in the synthesis of other glycandeterminants potentially exposed on the cell surface to interact with counter-receptors arepositively modulated in differentiated cells. For instance, over-expression of ST6GAL1transcript in immature DCs, an enzyme that elaborates the terminal sequence NeuAcα2-6Galβ 1-4GlcNAc on N-linked (such as CD45) and O-linked glycoproteins, is an agreementwith the high α2,6-linked sialic acid density in immature DCs (Jenner, J., Kerst, G., et al.2006) and could be important in many situations. Indeed, this sialylated sequence represents
Trottein et al. Page 7
Glycoconj J. Author manuscript; available in PMC 2010 November 1.
NIH
-PA Author Manuscript
NIH
-PA Author Manuscript
NIH
-PA Author Manuscript
the glycan ligand for CD22 (Siglec-2), a molecule known to negatively regulate signallingevents (Collins, B.E., Blixt, O., et al. 2006), and is implicated in regulation of Siglec-mediatedcell death (Crocker, P.R. 2005). Collectively, although monocytes, DCs and Mφs all belongto the mononuclear phagocyte system, they display a distinct profile of GT and sulfotransferaseexpression as a result of cell differentiation. Micro-array analysis has revealed clear analogiesbetween DCs and Mφs in terms of GT and sulfotransferase transcript expression, without areal clear gene expression signature. Whether the few differences in gene expression betweenDCs and Mφs could account for functional differences is an open question that deserves furtherinvestigations.
Since glycosylation-related genes are modulated during stress conditions (Campbell, B.J., Yu,L.G., et al. 2001, Coulouarn, C., Lefebvre, G., et al. 2004, Van Dijk, W., Brinkman- Van derLinden, E.C., et al. 1998), we next investigated whether GT and sulfotransferase transcriptscould be modulated in DCs and Mφs in response to LPS. Maturation/activation of DCs andMφs results in a profound remodelling of cell surface markers (chemokine receptors, co-stimulatory molecules) with important functional consequences. However, the impact ofmaturation/activation on glycan synthesis in these cells has only been recently investigated forDCs (Bax, M., Garcia-Vallejo, J.J., et al. 2007, Julien, S., Grimshaw, M.J., et al. 2007). Toaddress this question more in depth, cells were stimulated with LPS, one of the most potentTLR activator. Compared to immature cells, LPS treatment was accompanied by a generaldecrease of GT and sulfotransferase gene expression in both DCs and Mφs and mainly affectsgenes that were found to be modulated during DC and Mφ differentiation. In DCs, ~40 % ofgenes increased during differentiation are decreased during maturation. In parallel, severalgenes are increased during DC maturation. Several genes involved in GAG biosynthesis,including sulfotransferases and co-polymerases, are enhanced, suggesting an enhancedsynthesis of HS in mature cells cells that can be implicated in signaling functions of heparin-binding growth factors and chemokines (Kim, B.T., Kitagawa, H., et al. 2003, Kitagawa, H.,Shimakawa, H., et al. 1999). Transcripts for enzymes implicated in the production of globo-series (B3GALNT1, GBGT1) and ganglio-series of GSLs (ST3GAL5, ST3GAL1) arespecifically enhanced in mature DCs, relative to Mφs. This, and the enhanced expression ofceramide glucosyltransferase (UGCG) in DCs, strongly suggests that a profound change ofGSL metabolism operates in DCs undergoing maturation. The relevance of this finding is stillunknown and deserves further investigations. Glycolipids have been clearly demonstrated tobe involved in differentiation, proliferation and migration of neural cells in mammalian centralnervous system, and changes in GSL expression at the cell surface of mature DCs should alsohave similar effects. Interestingly, TLR-stimulated DCs have recently been shown to generatenew or increasing amounts of glycolipid Ags able to activate different subsets of lipid-reactiveinnate/memory cells, via the CD1 molecules (Brigl, M., Bry, L., et al. 2003, De Libero, G.,Moran, A.P., et al. 2005, Mattner, J., Debord, K.L., et al. 2005, Paget, C., Mallevaey, T., et al.2007, Salio, M., Speak, A.O., et al. 2007). This pathway is believed to play an important rolein innate responses to pathogens and to polarize acquired responses (Bendelac, A., Savage,P.B., et al. 2007, Tupin, E., Kinjo, Y., et al. 2007). Altogether, these data suggest that, byaffecting certain enzymes of the GSL pathway, TLR triggering in DCs could play an importantpart in innate/acquired responses.
In conclusion, we herein report for the first time a GT and sulfotransferase gene expressionprofiling in DCs and Mφs, both in basal and stress conditions. We show that both cell typesglobally express a comparable pattern of enzymes with minor differences that may sustainfunctional specificities.
Trottein et al. Page 8
Glycoconj J. Author manuscript; available in PMC 2010 November 1.
NIH
-PA Author Manuscript
NIH
-PA Author Manuscript
NIH
-PA Author Manuscript

Materials and methodsReagents
Human recombinant GM-CSF was purchased from Peprotech (Rocky Hill, NJ) and IL-4 werefrom R&D systems (Abingdon, UK). Lipopolysaccharide (LPS) (type 055B5) was purchasedfrom Sigma-Aldrich (St Louis, MI). Anti-CD14-microbeads (Miltenyi Biotech, BergischGladbach, Germany) were used for magnetic cell separation. The FITC-conjugated mouse anti-CD1a, anti-CD16, anti-CD209 (DC-SIGN) and anti-HLA-DR mAbs were obtained fromBecton Dickinson (San Diego, CA). The APC-conjugated anti-CD11c and anti-CD86 mAbsas well as the PE-conjugated mouse anti-CD80 and anti-CD14 mAbs were purchased by BectonDickinson whereas the anti-CD83 mAb was from Coulter (Miami, Flo). The anti-Mφ mAb(clone RFD7) was furnished by AbD-Serotec (Abingdon,UK). The anti-GM3 (clone GMR6),anti-GD3 (clone S2-566), anti-Lea (clone 7LE), anti-Leb (clone 2-25L), anti-Ley (clone H18A)and anti-Lewisx (Lex, clone 73-30) mAbs were from Seikagaku Corporation (Tokyo, Japan).The anti-sialyl Tn (clone HB-STn1), anti-sLea (clone 2D3) and anti-Tn Ag (clone M0896)were from Dako (Glostrup, Denmark) and the anti-sialyl Lex (sLex, clone CSLEX1) fromBecton Dickinson. The anti-PSA Ab (clone 735) was kindly provided by Pr. R. Gerardy-Schahn(Medizinische Hochschule, Hannover, Germany). The FITC-conjugated Sambucus nigraagglutinin (SNA) lectin was from Vector Laboratories (Burlingame, CA).
Preparation and stimulation of human DCs and MφsBlood monocytes were purified by positive selection over a MACS column using anti-CD14-conjugated microbeads. This purified cell population contained at least 95% CD14+ cells. Analiquot containing about 3–5 x 10⁶ monocytes was immediately frozen to prepare RNA.Monocytes were then differentiated into DCs (Gosset, P., Bureau, F., et al. 2003, Sallusto, F.and Lanzavecchia, A. 1994) or into Mφs (Young, D.A., Lowe, L.D., et al. 1990) by standardprocedures. Briefly, monocytes were cultivated at 106 cells/ml for 6 days in RPMI 1640 with10% heat-inactivated FCS (Invitrogen, Paisley, UK) containing 10 ng /ml IL-4 and 25 ng /mlGM-CSF or GM-CSF alone to obtain myeloid DCs (Turville, S.G., Cameron, P.U., et al.2002, van Kooyk, Y. and Geijtenbeek, T.B. 2003) or proinflammatory type I Mφs (Fleetwood,A.J., Lawrence, T., et al. 2007, Verreck, F.A., de Boer, T., et al. 2004), respectively. At day 3,half of the culture medium was renewed by addition of fresh complete medium containingcytokines. At day 5, DCs and Mφs (at least 95% pure, as revealed by flow cytometry) werestimulated or not with LPS (100 ng/ml). Cells were collected after 4 and 18 h stimulation toprepare RNA or after 24 h for FACS analysis. Cell death was assessed by trypan blue exclusionand measurement of MTT oxydo-reduction (Sigma) in all culture conditions and neitherexceeded 10%.
Microarray analysis of gene expressionAnalysis of gene expression was conducted using a custom genemicroarray (GLYCOv3 chip)produced by Affymetrix for the Consortium for Functional Glycomics(www.functionalglycomics.org), and containing probe sets for over 1000 human genesincluding 199 human GTs and sulfotransferases. In this study, we focused our analysis on theexpression of the 175 genes involved in the biosynthesis of N-glycans, mucin-type O-glycans,glycosaminoglycans, and glycolipids. Five to six independent experiments were performed foreach condition. Total RNA was extracted using the Qiagen Mini kit according to themanufacturer’s suggested protocol (Qiagen, Inc., Valencia, CA). The quality of the sampleswas checked with an Agilent Bioanalyzer (Agilent Technologies, Palo Alto, CA). For GT andsulfotransferase expression analysis,total RNA (1 μg) was amplified and biotin-labelled usingthe Bioarray MessageAmp II-Biotin Enhanced Kit from Ambion and then hybridized to theGLYCOv3 array. Hybridization and scanning of samples was performed using standardAffymetrix protocols for GeneChip expression arrays based on methods originally described
Trottein et al. Page 9
Glycoconj J. Author manuscript; available in PMC 2010 November 1.
NIH
-PA Author Manuscript
NIH
-PA Author Manuscript
NIH
-PA Author Manuscript

in (Lockhart, D.J., Dong, H., et al. 1996) (protocol available at http://affymetrix.com). Chipswere scanned using the Affymetrix ScanArray 3000 using default settings and a target intensityof 250 for scaling.
The transcriptional profile was evaluated in independent cell preparations, each derived froma different donor and one chip per biological sample was run. Expression calls indicate whethera gene is detected above background using the GC-matched bins as background measurement.For this purpose the Fisher’s Combined P Method (Hess, A. and Iyer, H. 2007) wasimplemented in the R program software (R is available as Free Software under the terms ofthe Free Software Foundation's GNU General Public License). The Fisher’s Combined Pmethod threshold was adjusted so that the expression calls were consistent with the presentand absent calls as implemented in the Affymetrix Microarray Suite V5. Intensity values werenormalized using Robust Multichip Average (RMA) (Bolstad, B.M., Irizarry, R.A., et al.2003, Irizarry, R.A., Bolstad, B.M., et al. 2003). The Limma package in the R software wasused for the Anova analysis. The fold changes and standard errors were estimated by fitting alinear model for each gene and empirical Bayes smoothing was applied to the standard errorsfor all the samples at the same time. Statistics were obtained for transcripts with the multipletesting adjusted (Benjamini-Hochberg) p-values to a level of 0.05. Filtering was performed sothat probe-sets were eliminated from the results with a fold change of <1.4. Heatmaps weregenerated by dChip (http://biosun1.harvard.edu/complab/dchip/). Raw data files for each ofthe experiments performed are available at the consortium for Functional Glycomics website(www.functionalglycomics.org/fg) under Resource Request no. 268.
Gene expression analysis by qPCRChanges in gene expression observed by microarray analyses were verified by qPCR for somegenes. Briefly, DNA were synthesized from 1 μg of total RNA with random hexamer primersand Superscript reverse transcriptase (Invitrogen, Cergy Pontoise, France) using standardprocedures. cDNAs were used as templates for PCR amplification using the SYBRR GreenPCR Master Mix (Molecular Probes, Leiden, The Netherlands) and the ABI PRISM 7700Sequence Detector (Applied Biosystems, Foster City, CA). Primers listed in Table. V weredesigned by the Primer Express Program (Applied Biosystems) and used for amplification intriplicate assays. PCR amplification of GAPDH was performed to control for sample loadingand to allow normalization between samples. Δ Ct values were obtained by deducting the rawcycle threshold (Ct values) obtained for β-actin mRNA, the internal standard, from the Ctvalues obtained for investigated genes. Data are expressed as fold mRNA level increase ordecrease compared to the mRNA expression level in non-differentiated (immature DCs orimmature Mφs vs monocytes) cells or to non-stimulated cells (mature DCs or mature Mφs vsimmature DCs or immature Mφs, respectively).
Flow cytometry analysisCells were collected in PBS containing 2 mM EDTA at 4°C and labelled as previouslydescribed (Gosset, P., Bureau, F., et al. 2003). Cells were incubated for 30 min in aliquotsof 2x 10⁵ cells in 50 μl of PBS containing 2% FCS with or without Abs (10 μg/ml) or the lectinSNA (40 μg/ml). After washing, cells were directly analyzed for the conjugated mAbs. In somecases, cells were incubated with Phycoerythrin-conjugated goat IgG anti-mouse IgG or IgM(Southern Biotechnology, Birmingham, Al). After 30 min incubation, labelled cells werewashed and analyzed. Flow cytometry data were acquired on viability-gated cells using aFACSCalibur flow cytometer and analyzed with the CellQuest software system (BDBiosciences). Results are expressed as the mean fluorescence intensity (MFI) obtained withspecific mAbs or lectins minus the value obtained with the isotype control (Δ MFI).
Trottein et al. Page 10
Glycoconj J. Author manuscript; available in PMC 2010 November 1.
NIH
-PA Author Manuscript
NIH
-PA Author Manuscript
NIH
-PA Author Manuscript

AcknowledgmentsWe acknowledge Dr Juan J. Garcia-Vallejo (VU Medical Center, Amsterdam, The Netherlands) for the gift of someoligonucleotides used for the Q-PCR analysis. We also thank Pr. R. Gerardy-Schahn (Medizinische Hochschule,Hannover, Germany) for the gift of the anti-PSA Ab.
This work was supported by the Institut National de la Santé et de la Recherche Médicale, the Pasteur Institute ofLille, the University of Lille 2, the Contrat de Plan Etat Région 2000–2006 (CPER)/FEDER (Fonds Européen deDéveloppement Régional) and l’Agence Nationale de la Recherche (ANR) (grant 06006EEA). This work was alsosupported by Consortium for Functional Glycomics Grant GM-62116 from the National Institutes of Health. CP wasrecipient of a doctoral fellowship from the Conseil Régional Nord Pas de Calais/Inserm. FT is supported by the CentreNational de la Recherche Scientifique, PG by the Inserm and SGD, MAKR and PD by the University of Lille I.
Abbreviations
APC antigen presenting cell
DC dendritic cell
Ag antigen
GSL glycosphingolipid
GT glycosyltransferase
Mφ macrophage
TLR Toll-like receptor
sLex sialyl Lex
GAG glycosaminoglycan
ST sialyltransferase
PSA polysialic acid
HS heparan sulphate
qPCR quantitative real-time PCR
LPS lipopolysaccharide
MFI mean fluorescence intensity
M- CSF Mφ colony stimulating factor
GM-CSF granulocyte Mφ CSF
ReferencesArnold JN, Wormald MR, et al. The impact of glycosylation on the biological function and structure of
human immunoglobulins. Annu Rev Immunol 2007;25:21–50. [PubMed: 17029568]Banchereau J, Steinman RM. Dendritic cells and the control of immunity. Nature 1998;392:245–252.
[PubMed: 9521319]Bax M, Garcia-Vallejo JJ, et al. Dendritic cell maturation results in pronounced changes in glycan
expression affecting recognition by siglecs and galectins. J Immunol 2007;179:8216–8224. [PubMed:18056365]
Becker S, Warren MK, et al. Colony-stimulating factor-induced monocyte survival and differentiationinto macrophages in serum-free cultures. J Immunol 1987;139:3703–3709. [PubMed: 2824612]
Bendelac A, Savage PB, et al. The biology of NKT cells. Annu Rev Immunol 2007;25:297–336.[PubMed: 17150027]
Trottein et al. Page 11
Glycoconj J. Author manuscript; available in PMC 2010 November 1.
NIH
-PA Author Manuscript
NIH
-PA Author Manuscript
NIH
-PA Author Manuscript
Blander JM, Visintin I, et al. Alpha(1,3)-fucosyltransferase VII and alpha(2,3)-sialyltransferase IV areup-regulated in activated CD4 T cells and maintained after their differentiation into Th1 and migrationinto inflammatory sites. J Immunol 1999;163:3746–3752. [PubMed: 10490970]
Bolstad BM, Irizarry RA, et al. A comparison of normalization methods for high density oligonucleotidearray data based on variance and bias. Bioinformatics 2003;19:185–193. [PubMed: 12538238]
Brigl M, Bry L, et al. Mechanism of CD1d-restricted natural killer T cell activation during microbialinfection. Nat Immunol 2003;4:1230–1237. [PubMed: 14578883]
Campbell BJ, Yu LG, et al. Altered glycosylation in inflammatory bowel disease: a possible role in cancerdevelopment. Glycoconj J 2001;18:851–858. [PubMed: 12820718]
Collins BE, Blixt O, et al. High-affinity ligand probes of CD22 overcome the threshold set by cis ligandsto allow for binding, endocytosis, and killing of B cells. J Immunol 2006;177:2994–3003. [PubMed:16920935]
Collins BE, Paulson JC. Cell surface biology mediated by low affinity multivalent protein-glycaninteractions. Curr Opin Chem Biol 2004;8:617–625. [PubMed: 15556405]
Coulouarn C, Lefebvre G, et al. Altered gene expression in acute systemic inflammation detected bycomplete coverage of the human liver transcriptome. Hepatology 2004;39:353–364. [PubMed:14767988]
Crocker PR. Siglecs: sialic-acid-binding immunoglobulin-like lectins in cell-cell interactions andsignalling. Curr Opin Struct Biol 2002;12:609–615. [PubMed: 12464312]
Crocker PR. Siglecs in innate immunity. Curr Opin Pharmacol 2005;5:431–437. [PubMed: 15955740]Curreli S, Arany Z, et al. Polysialylated neuropilin-2 is expressed on the surface of human dendritic cells
and modulates dendritic cell-T lymphocyte interactions. J Biol Chem 2007;282:30346–30356.[PubMed: 17699524]
Daniels MA, Hogquist KA, et al. Sweet 'n' sour: the impact of differential glycosylation on T cellresponses. Nat Immunol 2002;3:903–910. [PubMed: 12352967]
De Libero G, Moran AP, et al. Bacterial infections promote T cell recognition of self-glycolipids.Immunity 2005;22:763–772. [PubMed: 15963790]
Demetriou M, Granovsky M, et al. Negative regulation of T-cell activation and autoimmunity by Mgat5N-glycosylation. Nature 2001;409:733–739. [PubMed: 11217864]
Elbim C, Hakim J, et al. Heterogeneity in Lewis-X and sialyl-Lewis-X antigen expression on monocytesin whole blood: relation to stimulus-induced oxidative burst. Am J Pathol 1998;152:1081–1090.[PubMed: 9546369]
Esko JD, Selleck SB. Order out of chaos: assembly of ligand binding sites in heparan sulfate. Annu RevBiochem 2002;71:435–471. [PubMed: 12045103]
Feizi T. Carbohydrate-mediated recognition systems in innate immunity. Immunol Rev 2000;173:79–88. [PubMed: 10719669]
Fleetwood AJ, Lawrence T, et al. Granulocyte-macrophage colony-stimulating factor (CSF) andmacrophage CSF-dependent macrophage phenotypes display differences in cytokine profiles andtranscription factor activities: implications for CSF blockade in inflammation. J Immunol2007;178:5245–5252. [PubMed: 17404308]
Garcia-Vallejo JJ, Gringhuis SI, et al. Gene expression analysis of glycosylation-related genes by real-time polymerase chain reaction. Methods Mol Bio 2006;347:187–209. [PubMed: 17072012]
Godfrey DI, Kronenberg M. Going both ways: immune regulation via CD1d-dependent NKT cells. J ClinInvest 2004;114:1379–1388. [PubMed: 15545985]
Gordon S, Taylor PR. Monocyte and macrophage heterogeneity. Nat Rev Immunol 2005;5:953–964.[PubMed: 16322748]
Gosset P, Bureau F, et al. Prostaglandin D2 affects the maturation of human monocyte-derived dendriticcells: consequence on the polarization of naive Th cells. J Immunol 2003;170:4943–4952. [PubMed:12734337]
Groux-Degroote S, Krzewinski-Recchi MA, et al. IL-6 and IL-8 increase the expression ofglycosyltransferases and sulfotransferases involved in the biosynthesis of sialylated and/or sulfatedLewisx epitopes in the human bronchial mucosa. Biochem J 2008;410:213–223. [PubMed:17944600]
Trottein et al. Page 12
Glycoconj J. Author manuscript; available in PMC 2010 November 1.
NIH
-PA Author Manuscript
NIH
-PA Author Manuscript
NIH
-PA Author Manuscript

Hess A, Iyer H. Fisher's combined p-value for detecting differentially expressed genes using Affymetrixexpression arrays. BMC Genomics 2007;8:96. [PubMed: 17419876]
Hume DA, Ross IL, et al. The mononuclear phagocyte system revisited. J Leukoc Biol 2002;72:621–627. [PubMed: 12377929]
Inaba K, Inaba M, et al. Generation of large numbers of dendritic cells from mouse bone marrow culturessupplemented with granulocyte/macrophage colony-stimulating factor. J Exp Med 1992;176:1693–1702. [PubMed: 1460426]
Irizarry RA, Bolstad BM, et al. Summaries of Affymetrix GeneChip probe level data. Nucleic Acids Res2003;31:e15. [PubMed: 12582260]
Iwasaki A, Medzhitov R. Toll-like receptor control of the adaptive immune responses. Nat Immunol2004;5:987–995. [PubMed: 15454922]
Jenner J, Kerst G, et al. Increased alpha2,6-sialylation of surface proteins on tolerogenic, immaturedendritic cells and regulatory T cells. Exp Hematol 2006;34:1212–1218. [PubMed: 16939814]
Julien S, Grimshaw MJ, et al. Sialyl-Lewis(x) on P-selectin glycoprotein ligand-1 is regulated duringdifferentiation and maturation of dendritic cells: a mechanism involving the glycosyltransferasesC2GnT1 and ST3Gal I. J Immunol 2007;179:5701–5710. [PubMed: 17947642]
Kapsenberg ML. Dendritic-cell control of pathogen-driven T-cell polarization. Nat Rev Immunol2003;3:984–993. [PubMed: 14647480]
Kim BT, Kitagawa H, et al. In vitro heparan sulfate polymerization: crucial roles of core protein moietiesof primer substrates in addition to the EXT1-EXT2 interaction. J Biol Chem 2003;278:41618–41623.[PubMed: 12907685]
Kitagawa H, Shimakawa H, et al. The tumor suppressor EXT-like gene EXTL2 encodes an alpha1, 4-N-acetylhexosaminyltransferase that transfers N-acetylgalactosamine and N-acetylglucosamine to thecommon glycosaminoglycan-protein linkage region. The key enzyme for the chain initiation ofheparan sulfate. J Biol Chem 1999;274:13933–13937. [PubMed: 10318803]
Lau KS, Partridge EA, et al. Complex N-glycan number and degree of branching cooperate to regulatecell proliferation and differentiation. Cell 2007;129:123–134. [PubMed: 17418791]
Lockhart DJ, Dong H, et al. Expression monitoring by hybridization to high-density oligonucleotidearrays. Nat Biotechnol 1996;14:1675–1680. [PubMed: 9634850]
Lowe JB. Glycosyltransferases and glycan structures contributing to the adhesive activities of L-, E- andP-selectin counter-receptors. Biochem Soc Symp 2002:33–45. [PubMed: 12655772]
Martinez FO, Gordon S, et al. Transcriptional profiling of the human monocyte-to-macrophagedifferentiation and polarization: new molecules and patterns of gene expression. J Immunol2006;177:7303–7311. [PubMed: 17082649]
Mattner J, Debord KL, et al. Exogenous and endogenous glycolipid antigens activate NKT cells duringmicrobial infections. Nature 2005;434:525–529. [PubMed: 15791258]
Moody AM, Chui D, et al. Developmentally regulated glycosylation of the CD8alphabeta coreceptorstalk modulates ligand binding. Cell 2001;107:501–512. [PubMed: 11719190]
Moody AM, North SJ, et al. Sialic acid capping of CD8beta core 1-O-glycans controls thymocyte-majorhistocompatibility complex class I interaction. J Biol Chem 2003;278:7240–7246. [PubMed:12459555]
Moretta L, Bottino C, et al. Surface NK receptors and their ligands on tumor cells. Semin Immunol2006;18:151–158. [PubMed: 16730454]
Morgan R, Gao G, et al. N-acetylglucosaminyltransferase V (Mgat5)-mediated N-glycosylationnegatively regulates Th1 cytokine production by T cells. J Immunol 2004;173:7200–7208. [PubMed:15585841]
Paget C, Mallevaey T, et al. Activation of invariant NKT cells by toll-like receptor 9-stimulated dendriticcells requires type I interferon and charged glycosphingolipids. Immunity 2007;27:597–609.[PubMed: 17950005]
Pappu BP, Shrikant PA. Alteration of cell surface sialylation regulates antigen-induced naive CD8+ Tcell responses. J Immunol 2004;173:275–284. [PubMed: 15210785]
Rabinovich GA, Baum LG, et al. Galectins and their ligands: amplifiers, silencers or tuners of theinflammatory response? Trends Immunol 2002;23:313–320. [PubMed: 12072371]
Trottein et al. Page 13
Glycoconj J. Author manuscript; available in PMC 2010 November 1.
NIH
-PA Author Manuscript
NIH
-PA Author Manuscript
NIH
-PA Author Manuscript

Randolph GJ, Beaulieu S, et al. Differentiation of monocytes into dendritic cells in a model oftransendothelial trafficking. Science 1998;282:480–483. [PubMed: 9774276]
Randolph GJ, Inaba K, et al. Differentiation of phagocytic monocytes into lymph node dendritic cells invivo. Immunity 1999;11:753–761. [PubMed: 10626897]
Reis e Sousa C. Dendritic cells in a mature age. Nat Rev Immunol 2006;6:476–483. [PubMed: 16691244]Rossi M, Young JW. Human dendritic cells: potent antigen-presenting cells at the crossroads of innate
and adaptive immunity. J Immunol 2005;175:1373–1381. [PubMed: 16034072]Rudd PM, Elliott T, et al. Glycosylation and the immune system. Science 2001;291:2370–2376.
[PubMed: 11269318]Salio M, Speak AO, et al. Modulation of human natural killer T cell ligands on TLR-mediated antigen-
presenting cell activation. Proc Natl Acad Sci U S A 2007;104:20490–20495. [PubMed: 18077358]Sallusto F, Lanzavecchia A. Efficient presentation of soluble antigen by cultured human dendritic cells
is maintained by granulocyte/macrophage colony-stimulating factor plus interleukin 4 anddownregulated by tumor necrosis factor alpha. J Exp Med 1994;179:1109–1118. [PubMed: 8145033]
Sasaki K, Kurata-Miura K, et al. Expression cloning of cDNA encoding a human beta-1,3-N-acetylglucosaminyltransferase that is essential for poly-N-acetyllactosamine synthesis. Proc NatlAcad Sci U S A 1997;94:14294–14299. [PubMed: 9405606]
Skacel PO, Edwards AJ, et al. Enzymic control of the expression of the X determinant (CD15) in humanmyeloid cells during maturation: the regulatory role of 6-sialytransferase. Blood 1991;78:1452–1460.[PubMed: 1679356]
Spiro RG. Protein glycosylation: nature, distribution, enzymatic formation, and disease implications ofglycopeptide bonds. Glycobiology 2002;12:43R–56R.
Suzuki A, Yamakawa M, et al. The adhesion molecules, l-selectin and sialyl lewis x, relate to theformation of the follicular dendritic cell-lymphocyte cluster in the mantle zone. Immunol Lett2001;79:181–187. [PubMed: 11600196]
Takeda K, Akira S. Toll-like receptors in innate immunity. Int Immunol 2005;17:1–14. [PubMed:15585605]
Toscano MA, Bianco GA, et al. Differential glycosylation of TH1, TH2 and TH-17 effector cellsselectively regulates susceptibility to cell death. Nat Immunol 2007;8:825–834. [PubMed: 17589510]
Tupin E, Kinjo Y, et al. The unique role of natural killer T cells in the response to microorganisms. NatRev Microbiol 2007;5:405–417. [PubMed: 17487145]
Turville SG, Cameron PU, et al. Diversity of receptors binding HIV on dendritic cell subsets. NatImmunol 2002;3:975–983. [PubMed: 12352970]
Van Dijk W, Brinkman-Van der Linden EC, et al. Occurrence and possible function of inflammation-induced expression of sialyl Lewis-x on acute-phase proteins. Adv Exp Med Biol 1998;435:145–150. [PubMed: 9498073]
van Kooyk Y, Geijtenbeek TB. DC-SIGN: escape mechanism for pathogens. Nat Rev Immunol2003;3:697–709. [PubMed: 12949494]
van Kooyk Y, Rabinovich GA. Protein-glycan interactions in the control of innate and adaptive immuneresponses. Nat Immunol 2008;9:593–601. [PubMed: 18490910]
Verreck FA, de Boer T, et al. Human IL-23-producing type 1 macrophages promote but IL-10-producingtype 2 macrophages subvert immunity to (myco)bacteria. Proc Natl Acad Sci U S A 2004;101:4560–4565. [PubMed: 15070757]
Wegrowski Y, Milard AL, et al. Cell surface proteoglycan expression during maturation of humanmonocytes-derived dendritic cells and macrophages. Clin Exp Immunol 2006;144:485–493.[PubMed: 16734618]
Weinhold B, Seidenfaden R, et al. Genetic ablation of polysialic acid causes severe neurodevelopmentaldefects rescued by deletion of the neural cell adhesion molecule. J Biol Chem 2005;280:42971–42977. [PubMed: 16267048]
Young DA, Lowe LD, et al. Comparison of the effects of IL-3, granulocyte-macrophage colony-stimulating factor, and macrophage colony-stimulating factor in supporting monocyte differentiationin culture. Analysis of macrophage antibody-dependent cellular cytotoxicity. J Immunol1990;145:607–615. [PubMed: 2142182]
Trottein et al. Page 14
Glycoconj J. Author manuscript; available in PMC 2010 November 1.
NIH
-PA Author Manuscript
NIH
-PA Author Manuscript
NIH
-PA Author Manuscript

Fig. 1. Representation of GT and sulfotransferase gene expression in monocytesGene probes are classified in each enzyme family according to their RMA normalizedexpression values (Table I). The mean values of expression signal intensity and standarddeviation of five different donors are represented. Gene probe # corresponds to that of TableI. FucT, fucosyltransferases; GalNAcT, N-acetyl-galactosaminyltransferases; GalT,galactosyltransferases; GlcNAcT, N-acetyl-glucosaminyltransferases; GlcT,glucosyltransferases; GlcAT, glucuronosyltransferases; ManT, mannosyltransferases; SiaT,sialyltransferases; SulfoT, sulfotransferases; GAG, glycosaminoglycan copolymerases.
Trottein et al. Page 15
Glycoconj J. Author manuscript; available in PMC 2010 November 1.
NIH
-PA Author Manuscript
NIH
-PA Author Manuscript
NIH
-PA Author Manuscript

Fig. 2. Heatmaps showing differential regulation of GT and sulfotransferase gene expression duringthe differentiation of monocytes into DCs and MφsMonocytes were cultured to differentiate into either DCs (GM-CSF plus IL-4) or Mφs (usingGM-CSF). (A) Profiles for transcripts differentially expressed in both DCs and Mφs, (B)profiles for transcripts differentially expressed only in DCs and (C) profiles for transcriptsdifferentially expressed only in Mφs. Heatmap colors represent relative log2 expression valuesmedian scaled across the samples for each transcript, red showing increased and blue showingdecreased expression. Common names and probe #’s from Table I are indicated beside theheatmaps. Details for determining these significant differentially transcripts are presented inthe Methods section.
Trottein et al. Page 16
Glycoconj J. Author manuscript; available in PMC 2010 November 1.
NIH
-PA Author Manuscript
NIH
-PA Author Manuscript
NIH
-PA Author Manuscript

Fig. 3. Heatmaps showing differential regulation of GT and sulfotransferase gene expression duringthe LPS-induced maturation of DCs or MφsResting DCs or Mφs were stimulated with LPS for 18 hrs. (A) Profiles for transcriptsdifferentially expressed in both DCs and Mφs (B) profiles for transcripts differentiallyexpressed only in DCs and (C) profiles for transcripts differentially expressed only in Mφs.For details see legend for Figure 2.
Trottein et al. Page 17
Glycoconj J. Author manuscript; available in PMC 2010 November 1.
NIH
-PA Author Manuscript
NIH
-PA Author Manuscript
NIH
-PA Author Manuscript
NIH
-PA Author Manuscript
NIH
-PA Author Manuscript
NIH
-PA Author Manuscript
Trottein et al. Page 18
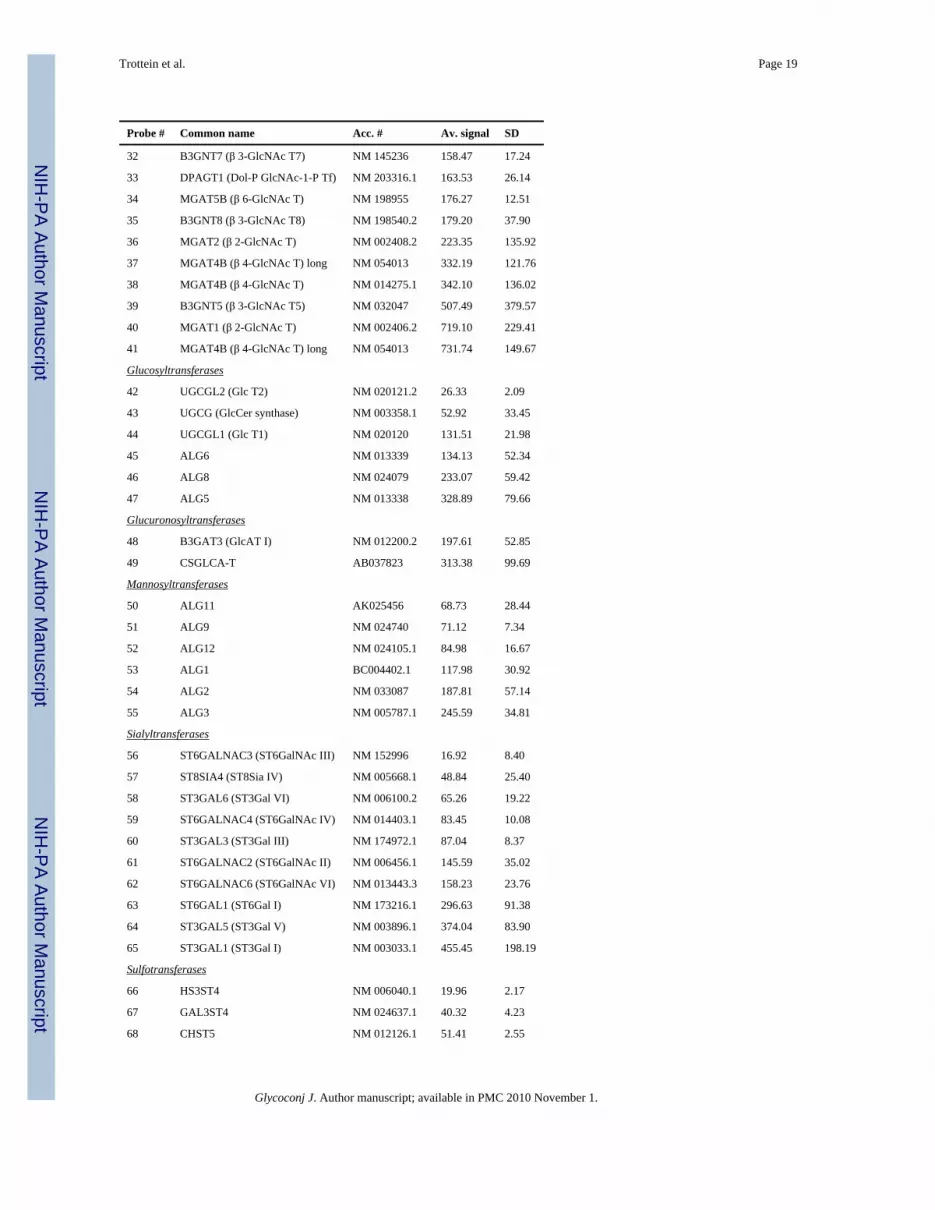
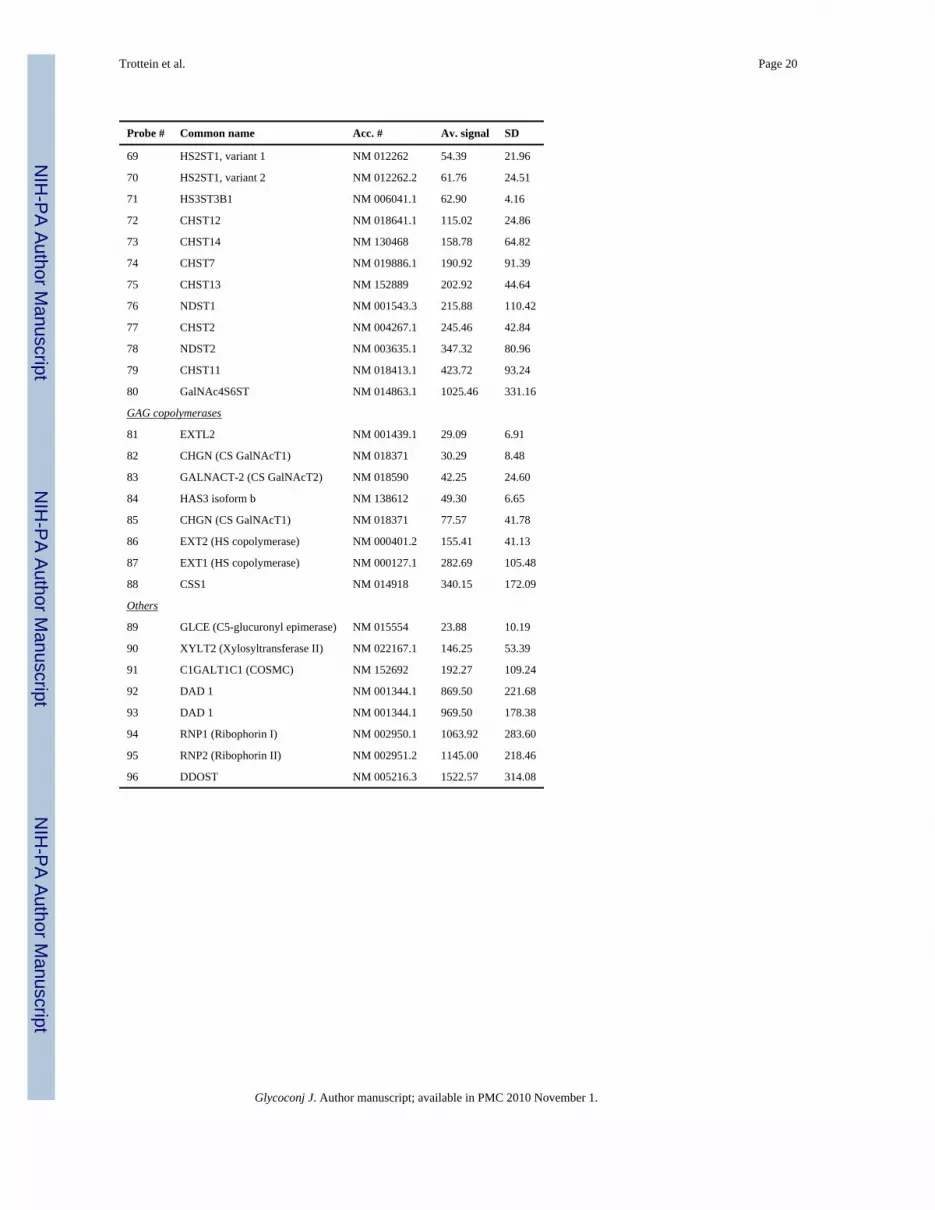
Table IGlycoGen Chip V3 analysis of the expression of GTs and sulfotransferases in humanmonocytes
Relative expression of GT and sulfotransferase genes is expressed as the RMA normalized expression values offive different donors. Gene probe # corresponds to that of Fig.1. CS, Chondroitin Sulfate; GAG,glycosaminoglycan; HS, Heparan Sulfate; SD, Standard derivation. Genes listed are detected above backgroundby the Fisher’s Combined P-value method in at least 4 donors.
Probe # Common name Acc. # Av. signal SD
Fucosyltransferases
1 FUT10 NM 032664.3 21.45 5.18
2 FUT8, long transcript NM 004480.1 30.39 13.05
3 FUT11 NM 173540.1 41.19 7.29
4 FUT6 NM 000150.1 96.27 7.56
5 FUT7 NM 004479.2 97.30 36.28
6 FUT4 NM 002033.2 145.46 25.13
N-acetyl-galactosaminyltransferases
7 GALNT3 (ppGalNAc T3) NM 004482.2 12.49 5.25
8 GALNT10 (ppGalNAc T10) short NM 017540.1 48.71 5.87
9 GALNT7 (ppGalNAc T7) NM 017423.1 100.17 53.70
10 GALNT11 (ppGalNAc T11) NM 022087.1 166.81 52.88
11 GALNT2 (ppGalNAc T2) NM 004481 206.76 53.49
12 GALNT10 (ppGalNAc T10) long NM 198321.2 219.63 59.39
13 GBGT1 (Forssman synthase) NM 021996.3 344.63 109.72
14 GALNT1 (ppGalNAc T1) NM 020474.2 352.50 132.88
15 GALNT6 (ppGalNAc T6) NM 007210.2 411.38 111.46
16 GALNT6 (ppGalNAc T6) NM 007210.2 456.92 188.67
Galactosyltransferases
17 B4GALT4 (β 4-Gal T4) NM 003778 28.48 6.34
18 C1GALT1 (core1 β 3-Gal T1) NM 020156.1 28.67 10.41
19 B3GALT6 (β 3-Gal T6) NM 080605 81.46 32.41
20 B4GALT2 (β 4-Gal T2) NM 001005417 95.45 8.31
21 B4GALT7 (β 4-Gal T7) NM 007255.1 121.48 26.53
22 B4GALT3 (β 4-Gal T3) NM 003779.2 198.86 52.57
23 B3GALT4 (β 3-Gal T4) NM 003782.3 201.39 91.42
24 B4GALT5 (β 4-Gal T5) NM 004776.2 526.75 230.39
25 B4GALT1 (β 4-Gal T1) NM 001497.2 802.76 330.15
N-acetyl-glucosaminyltransferases
26 B3GNT7 (β 3-GlcNAc T7) NM 145236 28.24 5.50
27 MGAT4A (β 4-GlcNAc T) NM 012214.1 34.89 11.81
28 GCNT1 (Core 2 β 6-GlcNAc T1) NM 001490.1 40.69 10.50
29 B3GNT1 (β 3-GlcNAc T1) NM 006876.1 71.37 10.71
30 B3GNT2 (β 3-GlcNAc T2) AB049584 111.91 56.62
31 GCNT2 (β 6-GlcNAc T) NM 145649 131.51 31.69
Glycoconj J. Author manuscript; available in PMC 2010 November 1.
NIH
-PA Author Manuscript
NIH
-PA Author Manuscript
NIH
-PA Author Manuscript
Trottein et al. Page 19
Probe # Common name Acc. # Av. signal SD
32 B3GNT7 (β 3-GlcNAc T7) NM 145236 158.47 17.24
33 DPAGT1 (Dol-P GlcNAc-1-P Tf) NM 203316.1 163.53 26.14
34 MGAT5B (β 6-GlcNAc T) NM 198955 176.27 12.51
35 B3GNT8 (β 3-GlcNAc T8) NM 198540.2 179.20 37.90
36 MGAT2 (β 2-GlcNAc T) NM 002408.2 223.35 135.92
37 MGAT4B (β 4-GlcNAc T) long NM 054013 332.19 121.76
38 MGAT4B (β 4-GlcNAc T) NM 014275.1 342.10 136.02
39 B3GNT5 (β 3-GlcNAc T5) NM 032047 507.49 379.57
40 MGAT1 (β 2-GlcNAc T) NM 002406.2 719.10 229.41
41 MGAT4B (β 4-GlcNAc T) long NM 054013 731.74 149.67
Glucosyltransferases
42 UGCGL2 (Glc T2) NM 020121.2 26.33 2.09
43 UGCG (GlcCer synthase) NM 003358.1 52.92 33.45
44 UGCGL1 (Glc T1) NM 020120 131.51 21.98
45 ALG6 NM 013339 134.13 52.34
46 ALG8 NM 024079 233.07 59.42
47 ALG5 NM 013338 328.89 79.66
Glucuronosyltransferases
48 B3GAT3 (GlcAT I) NM 012200.2 197.61 52.85
49 CSGLCA-T AB037823 313.38 99.69
Mannosyltransferases
50 ALG11 AK025456 68.73 28.44
51 ALG9 NM 024740 71.12 7.34
52 ALG12 NM 024105.1 84.98 16.67
53 ALG1 BC004402.1 117.98 30.92
54 ALG2 NM 033087 187.81 57.14
55 ALG3 NM 005787.1 245.59 34.81
Sialyltransferases
56 ST6GALNAC3 (ST6GalNAc III) NM 152996 16.92 8.40
57 ST8SIA4 (ST8Sia IV) NM 005668.1 48.84 25.40
58 ST3GAL6 (ST3Gal VI) NM 006100.2 65.26 19.22
59 ST6GALNAC4 (ST6GalNAc IV) NM 014403.1 83.45 10.08
60 ST3GAL3 (ST3Gal III) NM 174972.1 87.04 8.37
61 ST6GALNAC2 (ST6GalNAc II) NM 006456.1 145.59 35.02
62 ST6GALNAC6 (ST6GalNAc VI) NM 013443.3 158.23 23.76
63 ST6GAL1 (ST6Gal I) NM 173216.1 296.63 91.38
64 ST3GAL5 (ST3Gal V) NM 003896.1 374.04 83.90
65 ST3GAL1 (ST3Gal I) NM 003033.1 455.45 198.19
Sulfotransferases
66 HS3ST4 NM 006040.1 19.96 2.17
67 GAL3ST4 NM 024637.1 40.32 4.23
68 CHST5 NM 012126.1 51.41 2.55
Glycoconj J. Author manuscript; available in PMC 2010 November 1.
NIH
-PA Author Manuscript
NIH
-PA Author Manuscript
NIH
-PA Author Manuscript
Trottein et al. Page 20
Probe # Common name Acc. # Av. signal SD
69 HS2ST1, variant 1 NM 012262 54.39 21.96
70 HS2ST1, variant 2 NM 012262.2 61.76 24.51
71 HS3ST3B1 NM 006041.1 62.90 4.16
72 CHST12 NM 018641.1 115.02 24.86
73 CHST14 NM 130468 158.78 64.82
74 CHST7 NM 019886.1 190.92 91.39
75 CHST13 NM 152889 202.92 44.64
76 NDST1 NM 001543.3 215.88 110.42
77 CHST2 NM 004267.1 245.46 42.84
78 NDST2 NM 003635.1 347.32 80.96
79 CHST11 NM 018413.1 423.72 93.24
80 GalNAc4S6ST NM 014863.1 1025.46 331.16
GAG copolymerases
81 EXTL2 NM 001439.1 29.09 6.91
82 CHGN (CS GalNAcT1) NM 018371 30.29 8.48
83 GALNACT-2 (CS GalNAcT2) NM 018590 42.25 24.60
84 HAS3 isoform b NM 138612 49.30 6.65
85 CHGN (CS GalNAcT1) NM 018371 77.57 41.78
86 EXT2 (HS copolymerase) NM 000401.2 155.41 41.13
87 EXT1 (HS copolymerase) NM 000127.1 282.69 105.48
88 CSS1 NM 014918 340.15 172.09
Others
89 GLCE (C5-glucuronyl epimerase) NM 015554 23.88 10.19
90 XYLT2 (Xylosyltransferase II) NM 022167.1 146.25 53.39
91 C1GALT1C1 (COSMC) NM 152692 192.27 109.24
92 DAD 1 NM 001344.1 869.50 221.68
93 DAD 1 NM 001344.1 969.50 178.38
94 RNP1 (Ribophorin I) NM 002950.1 1063.92 283.60
95 RNP2 (Ribophorin II) NM 002951.2 1145.00 218.46
96 DDOST NM 005216.3 1522.57 314.08
Glycoconj J. Author manuscript; available in PMC 2010 November 1.

NIH
-PA Author Manuscript
NIH
-PA Author Manuscript
NIH
-PA Author Manuscript
Trottein et al. Page 21
Tabl
e II
Exp
ress
ion
of c
ell s
urfa
ce m
arke
rs a
nd g
lyca
n A
gs in
mon
ocyt
es, D
Cs a
nd M
φs
Uns
timul
ated
(NS)
and
LPS
-act
ivat
ed D
Cs a
nd M
φs w
ere
anal
yzed
by
FAC
S. R
esul
ts e
xpre
ssed
in Δ
MFI
are
the
mea
n +/−
SEM
of 4
–6 e
xper
imen
ts.
Ags
Mon
ocyt
esD
Cs
Mφs
Med
ium
Med
ium
LPS
Med
ium
LPS
Cell
Mar
kers
CD
1445
.4 ±
4.8
1.4
± 0.
242.
2 ±
0.58
3.2
± 0.
582.
4 ±
0.51
CD
1a1.
2 ±
0.5
451.
6 ±
99.7
218.
4 ±
53.8
1.8
± 0.
372
± 0.
55
CD
209
1.25
± 0
.631
3 ±
42.7
172.
3 ±
35.3
2.25
± 0
.63
2.75
± 0
.44
CD
160.
5 ±
1.1
1 ±
0.2
1 ±
0.3
30.5
± 9
.329
± 1
0.01
RFD
72.
1 ±
0.1
0.6
± 0.
40.
05 ±
0.1
31.3
± 2
6.9
9.7
± 2.
5
CD
805.
7 ±
2.2
31.3
± 5
.718
3.5
± 30
.311
.33
± 2.
776
± 1
2.4
CD
862.
3 ±
0.9
8.71
± 1
.57
276.
1 ±
35.0
517
.3 ±
3.6
587
.9 ±
21.
25
HLA
-DR
3.7
± 1.
180
± 8
.123
2.7
± 21
.966
.5 ±
9.6
74.7
± 1
3.5
CD
830.
9 ±
0.4
2.1
± 0.
8522
.5 ±
4.7
0.75
± 0
.48
1 ±
0.71
Gly
can
Ag
LeX
5 ±
4.8
1 ±
0.8
0.5
± 0.
41.
3 ±
0.6
2 ±
1
sLeX
53 ±
515
09 ±
643
565
± 18
162
1 ±
303
224
± 12
8
Lea
3.5
± 1.
42.
2 ±
1.4
1.8
± 1.
622
.5 ±
17.
524
.3 ±
28.
9
sLea
1.2
± 0.
490.
3 ±
0.2
0.4
± 0.
21.
7 ±
1.5
1.1
± 0.
9
Leb
1.25
± 0
.63
1.7
± 1.
52.
7 ±
2.5
8.5
± 5.
55.
7 ±
3.1
Ley
2.4
± 1.
45.
7 ±
4.7
5.4
± 2.
921
.8 ±
19.
323
.5 ±
19.
6
SNA
577
± 19
515
14 ±
447
1756
± 5
8515
31 ±
714
1422
± 5
24
GM
34.
2 ±
313
.2 ±
4.2
19 ±
11
11 ±
6.2
23 ±
3.6
GD
30.
17 ±
0.1
51.
4 ±
0.8
0.8
± 1.
12.
1 ±
2.2
3 ±
5.2
Glycoconj J. Author manuscript; available in PMC 2010 November 1.

NIH
-PA Author Manuscript
NIH
-PA Author Manuscript
NIH
-PA Author Manuscript
Trottein et al. Page 22
Tabl
e III
mR
NA
exp
ress
ion
of G
T a
nd su
lfotr
ansf
eras
e ge
nes d
urin
g th
e di
ffere
ntia
tion
of D
Cs a
nd M
φs, a
s ana
lyze
d by
qPC
R
RN
As f
rom
rest
ing
mon
ocyt
es o
r fro
m u
nstim
ulat
ed D
Cs o
r Mφs
wer
e ha
rves
ted
afte
r diff
eren
tiatio
n an
d m
RN
A c
opy
num
bers
wer
e m
easu
red
by q
PCR
.D
ata
are
norm
aliz
ed to
exp
ress
ion
of β
-act
in a
nd a
re e
xpre
ssed
as f
old
incr
ease
ove
r ave
rage
gen
e ex
pres
sion
in m
onoc
ytes
. Dat
a re
pres
ent t
he m
ean
+/−
SEM
of t
hree
to fi
ve in
depe
nden
t don
ors.
# in
Tab
le I
Com
mon
nam
eG
ene
Acc
essi
on N
umbe
rD
C/M
onoc
yte
Mφ/
Mon
ocyt
e
7pp
Gal
NA
c T3
GAL
NT3
NM
004
482.
20.
18 ±
0.2
80.
55 ±
0.2
5
13Fo
rssm
an sy
ntha
seG
BGT1
NM
021
996.
30.
06 ±
0.0
10.
53 ±
0.3
0
24β
4-G
al T
5B4
GAL
T5N
M 0
0477
60.
44 ±
0.1
60.
91 ±
0.3
2
26β
3-G
lcN
Ac
T7B3
GN
T7N
M 1
4523
61.
74 ±
0.7
58.
58 ±
6.4
0
27β
4-G
lcN
Ac
T4a
MG
AT4A
NM
012
214
7.02
± 4
.79
4.08
± 0
.78
30β
3-G
lcN
Ac
T2B3
GN
T2A
B 0
4958
41.
32 ±
0.8
94.
54 ±
3.8
6
39β
3-G
lcN
Ac
T5B3
GN
T5N
M 0
3204
74.
29 ±
2.0
10.
70 ±
0.4
6
57ST
8SIA
IVST
8SIA
4N
M 0
0566
8.1
4.81
± 1
.72
1.42
± 0
.4
63ST
6Gal
IST
6GAL
1N
M 1
7321
62.
50 ±
1.5
61.
10 ±
0.4
6
77C
hond
roiti
n-6-
kera
tan-
Sulfo
T2
CH
ST2
NM
004
267
0.10
± 0
.08
0. 5
2 ±
0.27
80C
hond
rotin
Gal
NA
c-4-
O-s
ulfa
te 6
-G
ALN
AC4S
6ST
NM
014
863
0.25
± 0
.24
0.76
± 0
.46
O-s
ulfo
T
89C
5-gl
ucur
onyl
epi
mer
ase
GLC
EN
M 0
1555
42.
57 ±
0.9
62.
52 ±
1.0
7
Glycoconj J. Author manuscript; available in PMC 2010 November 1.

NIH
-PA Author Manuscript
NIH
-PA Author Manuscript
NIH
-PA Author Manuscript
Trottein et al. Page 23
Tabl
e IV
mR
NA
exp
ress
ion
of G
T a
nd su
lfotr
ansf
eras
e ge
nes d
urin
g th
e m
atur
atio
n of
DC
s and
Mφs
, as a
naly
zed
by q
PCR
RN
As f
rom
uns
timul
ated
or L
PS-s
timul
ated
DC
s or M
φs w
ere
harv
este
d af
ter 1
8 hr
s stim
ulat
ion
and
mR
NA
cop
y nu
mbe
rs w
ere
mea
sure
d by
qPC
R. D
ata
are
norm
aliz
ed to
exp
ress
ion
of β
-act
in a
nd a
re e
xpre
ssed
as f
old
incr
ease
ove
r ave
rage
gen
e ex
pres
sion
in u
nstim
ulat
ed D
Cs o
r Mφs
. Dat
a re
pres
ent t
hem
ean
+/−
SEM
of t
hree
to fi
ve in
depe
nden
t don
ors.
# in
Tab
le I
Com
mon
nam
eG
ene
Acc
essi
on N
umbe
rD
C L
PS/D
C N
SMφ
LPS
/Mφ
NS
6FU
T4FU
T4N
M 0
0203
33.
70 ±
1.3
24.
89 ±
1.7
3
18co
re1 β
3-G
al T
1C
1GAL
T1N
M 0
2015
6.1
0.87
± 0
.12
3.93
± 1
.23
24β
4-G
al T
5B4
GAL
T5N
M 0
0477
63.
62 ±
1.9
75.
90 ±
1.8
9
27β
4-G
lcN
Ac
T4a
MG
AT4A
NM
012
214
0.38
± 0
.23
0.84
± 0
.26
28C
ore
2 β
6-G
lcN
Ac
T1G
CN
T1N
M 0
0149
0.1
0.44
± 0
.05
0.69
± 0
.27
30β
3-G
lcN
Ac
T2B3
GN
T2A
B04
9584
4.05
± 1
.27
0.96
± 0
.56
39β
3-G
lcN
Ac
T5B3
GN
T5N
M 0
3204
70.
28 ±
0.1
30.
40 ±
0.3
8
43G
luco
sylc
eram
ide
synt
hase
UG
CG
NM
003
358
2.50
± 0
.82
2.39
± 0
.70
57ST
8Sia
IVST
8SIA
4N
M 0
0566
8.1
2.15
± 1
.86
3.81
± 1
.34
58ST
3Gal
VI
ST3G
AL6
NM
006
100.
23.
80 ±
1.6
51.
78 ±
1.1
1
61ST
6Gal
NA
c2ST
6GAL
NAC
2N
M 0
0645
6.1
0.48
± 0
.41
2.14
± 1
.11
63ST
6Gal
IST
6GAL
1N
M 1
7321
60.
22 ±
0.1
60.
59 ±
0.4
4
64ST
3Gal
VST
3GAL
5N
M 0
0389
6.1
2.33
± 0
.75
1.42
± 0
.50
65ST
3Gal
IST
3GAL
1N
M 0
0303
3.1
2 ±
0.42
2.91
± 0
.83
74N
-ace
tylg
luco
sam
ine-
6-O
-Sul
fo T
7C
HST
7N
M 0
1988
67.
73 ±
3.6
21.
72 ±
0.1
4
77C
hond
roiti
n-6-
kera
tan-
Sulfo
T2
CH
ST2
NM
004
267
1.73
± 0
.99
2.42
± 1
.63
89C
5-gl
ucur
onyl
epi
mer
ase
GLC
EN
M 0
1555
40.
18 ±
0.0
60.
43 ±
0.0
8
Glycoconj J. Author manuscript; available in PMC 2010 November 1.

NIH
-PA Author Manuscript
NIH
-PA Author Manuscript
NIH
-PA Author Manuscript
Trottein et al. Page 24
Table V
Oligonucleotides for qPCR
Gene (Accession #)Sense Primers (5′ → 3′)Antisense Primers (5′ → 3′) Reference
B-actin (NM_001101) TCC TCA CCC TGA AGT ACC CCAAGC CAC ACG CAG CTC ATT GT
this studya
GALNT3 (NM 004482.2) CAC GGC TGT CGT AAG TCC AGA TGAA GCG ACT CCC AGC CAA AT
this study
GBGT1 (NM 021996.3) GCA GGT GGC CAG GGT ATA TGAGC ACC TTG GAC GGC TTG T
Garcia-Vallejo et al., 2006
B4GALT5 (NM 004776.2) TCT CTC GTC CTC GCT GCT GTA CCCG AAG CAC CTG CTC ATA AAC C
Garcia-Vallejo et al., 2006
B3GNT7 (NM 145236) TCA AAG GCG ACG ATG ACG TTTT GTT GTC TTT CCT GCG AAT G
this study
MGAT4A NM 012214.1) CTG TGG AAG TTT TGC CTT TTA AGA GTGA AAT GGG ATT GAG ACT TGG A
Garcia-Vallejo et al., 2006
B3GNT2 (AB049584) GCT GGA CCT CAT CGG GAT AATGC ATA GGG TGG GTA GAG GC
Garcia-Vallejo et al., 2006
B3GNT5 (NM 032047) GTG GTG CCC CTC CCA TTA GGCT CCG GCT GTG TAG TCA GG
Garcia-Vallejo et al., 2006
ST8SIA4 (NM 005668.1) GAG CAC CAG GAG ACG CAA CTGAG CCA GCC TTT CGA ATG ATT
this study
ST6GAL1 (NM 173216.1) GGG CTC CAA ACT AAC CAT CTCAAA TCC AGG CTT TCT CAC TCC
Groux-Degroote et al., 2008
CHST2 (NM 004267.1) TCT CTA CGA GCC AGT GTG GCAGAG AGG TCG CAG CGG TAA AGA
Groux-Degroote et al., 2008
GALNAC4S6ST (NM 014863.1) TGA TTA TTC ACT GCG CGC CTGCT TGT CAA AAA CGC TGA GCC
this study
GLCE (NM 015554) TCA TGG AGC ACA GTT ACC ATTG TCG AGG AAT CCC TTA C
this study
FUT4 (NM 002033.2) GAG CTA CGC TGT CCA CAT CAC CGA CCAG CTG GCC AAG TTC CGT ATG
Groux-Degroote et al., 2008
C1GALT1 (NM 020156.1) CAT CCC TTT GTG CCA GAA CAC CGCA AGA TCA GAG CAG CAA CCA G
Garcia-Vallejo et al., 2006
GCNT1 (NM 001490.1) AGG ACG TTG CTG CGA AGG AGA CCCC AGC AAG CTC CAA GTG TCT G
Garcia-Vallejo et al., 2006
UGCG (NM 003358.1) TGG AGG GAA TGG CCG TCT TTTG CCT TCT TGT TGA GGT GTA AT
this study
ST3GAL6 (NM 006100.2) TTT TGA GGA GGA TAT TTG GCTACAAC AAA CAC TGC CTT CAT TGTAC
Groux-Degroote et al., 2008
ST6GALNAC2 (NM 006456.1) TCA CCA AGT CAT CGC CTC CTTG GCA CTC TCT GAG CCG T
Garcia-Vallejo et al., 2006
ST3GAL5 (NM 003896.1) ATC GGT GTC ATT GCC GTT GTTTC ATA GCA GCC ATG CAT TGA
Garcia-Vallejo et al., 2006
ST3GAL1 (NM 003033.1) AGA CGC TCA GGG AAA GGT TGTT ATC ACG CCA AGC AAG
Groux-Degroote et al., 2008
CHST7 (NM 019886.1) CAC CCG GAC GTT TTC TAC TTGAAG AGC GAA CGC AGC ATG T
Garcia-Vallejo et al., 2006
aGenerated from human genomic databases by PrimerExpress (Applied Biosystems)
Glycoconj J. Author manuscript; available in PMC 2010 November 1.