global purchasing power parities and real expenditures
TRANSCRIPT
Global Purchasing Power Parities and
Real Expenditures
2005 International Comparison Program
Methodological Handbook
Preface
What is the ICP?
1. The International Comparisons Program, or ICP, is an international program in which surveys of prices are carried out in different countries in order to compare the purchasing powers of their currencies. Once the prices have been collected standard index number theory can be applied to measure the Purchasing Power Parities, or PPPs, between pairs of currencies. The PPP is the rate of currency conversion that would make the purchasing power of a given amount of money equal in the two countries concerned.
1
2. International quantity (or volume) indices may be derived by deflating expenditures in national currencies by the corresponding PPPs. The resulting quantity indices make it possible to compare living standards and productivity levels between countries. The possibility of making valid quantity comparisons between countries that are soundly based in economic and statistical theory is the main justification for the Program for many users. It should be noted that the quantity indices depend only on the actual prices and quantities in the various countries and are independent of market exchange rates. 3. An international price index between a pair of countries can be obtained by dividing the PPP by the market exchange rate. It shows the average percentage amount by which the prices in one country exceed, or fall below, those in the other country when prices are converted at the exchange rate. In practice, there tend to be persistent differences in price levels between countries.
4. It is appropriate for an international agency to assume responsibility for organising and managing a set of international comparisons. In the case of ICP 2003 – 2006, the World Bank has taken on this role. However, the ICP also depends on the active co-operation and support of national statistical agencies as they have to organise and carry out the price surveys. The price collectors are often the same as those used to collect prices for national price indices, such as official Consumer Price Indices.
5. Worldwide, a total of 146 countries and their national statistical agencies participated in ICP 2005 together with a number of regional international organisations. The ICP is a major collaborative statistical Program at a world level that is uniquely large in the scale and scope of its operations. More information about the governance and organisation of the Program is given in Chapter 2 of this Handbook.
The origins and history of the ICP
6. The ICP was established at the end of the 1960s with the stated objective of filling an important gap in the world’s statistical system, namely the lack of data enabling price and quantity comparisons to be made between different countries. Under the auspices of the United Nations and the World Bank an International Comparisons Unit headed by Irving Kravis was established in 1968 and located partly in the University of Pennsylvania and partly in the United Nations Statistical Office. The first phase of the Program covered 10 countries in 1970.
7. The results of Phase I of the ICP were published in a major report entitled A System of International Comparisons of Gross Product and Purchasing Power, Kravis, Kenessey, Heston, Summers (1975) 1. One of the main conclusions of was that prices tend to be lower in countries with low per capita GDPs. It follows that if per capita GDPs are compared using exchange rates the relative levels of the per capita GDPs do not measure the quantity differences between countries.
1 Chapter 1 starts as follows: “The lack of data on comparative levels of output and income in different countries is an important gap in the knowledge of the world economy.”
2
This finding has been repeatedly endorsed by subsequent investigations and underlines the continuing need to construct proper international price and quantity indices that do not depend on exchange rates.
8. Phase II of the ICP referred to 1973 and extended the coverage of countries to 16 . The results were published in Kravis, Heston, Summers (1978). Phase III referred to 1975 and extended the coverage further to 34 countries. The results were published in Kravis, Heston, Summers (1982). After Phase III, the ICP was regionalised. Different regions conducted their own comparisons, the global results being obtained by linking the various sets of regional comparisons. In the last ICP round (1993-1996) the regions were linked by means of binary comparisons between selected pairs of countries belonging to different regions. 9. The Statistical Office of the European Communities participated in the ICP in from the outset. During the mid-1970’s the EC built up its own international comparisons program because reliable price and quantity indices between all its member countries were needed by the EU on a continuing and regular basis for purposes of economic and social policy. A permanent PPP program was established with the intention of calculating PPPs every year based on major price surveys every five years with smaller surveys in between. A detailed account of the methodology developed by SOEC is given in Eurostat (1977). 10. In the early 1980’s the OECD started its own permanent PPP program to complement that of Eurostat. Working in close collaboration with Eurostat, the OECD calculated PPPs for those OECD member countries that were not already covered by the Eurostat program. The joint Eurostat-OECD program has been described in a series of publications over the last two decades: see, for example, OECD (1985) and Eurostat-OECD (2004).
11. In 1970’s and 1980’s PPPs were also calculated between a group of east European countries and Austria. As Austria also participated in the Eurostat program it could act as the ‘bridge’ country between eastern and western Europe. During the 1990’s these countries together with several of the countries that made up the former Soviet Union opted to participate directly in the joint Eurostat-OECD program. The joint Eurostat-OECD program has continued to expand and develop to the point that it now covers over 40 countries worldwide.
12. Interest in the economic and statistical theory underlying international comparisons continued to grow throughout the 1980s and 1990s. A number of international seminars and conferences on the methodology and practice of international comparisons were held with significant contributions from the academic community as well as from the staff of international and national statistical agencies. Many articles on PPP methodology were published in academic journals.
13. During the 1990’s there was increasing concern about the absence of up to date and reliable PPP data at a world level. An investigation was commissioned by the United Nations Statistics Division, the World Bank and the International Monetary Fund (IMF) into the reasons why there had been no systematic follow-up to the earlier phases of the ICP at a world level. The subsequent report
3
presented in 1998 known as the “Ryten Report” identified several factors including the difficulties of funding, organising, managing and staffing an ICP program large enough to cover most of the countries in the world.
14. The Ryten Report identified the international community as the main source of funds for the program, reflecting the status of PPPs as international “public goods”. It also urged development agencies and national policymakers to widen the use made of PPP data to ensure that the demand justified the investment. At its meeting held on 1–2 March 2000, the thirty-second session of the United Nations Statistical Commission discussed and accepted the report. It then asked the World Bank, working with other concerned agencies, to prepare an implementation plan laying out practical steps towards developing a comprehensive program. ICP 2005
15. The World Bank presented a proposal for taking forward the global program to the UNSC at its thirty-third session held in March 2002. The proposed strategic framework was based on the premise that there was an immediate need to rebuild confidence in the ICP at a world level and to promote the wider acceptance and use of PPP data. By rectifying problems in past rounds, and planning and executing the ICP successfully, the long-term aim of the ICP was to build an international constituency that supports the program as a continuing exercise with a secure and sustained financing base. In brief the framework proposed:
• Establishing the ICP Governance Framework at the regional and national
levels for effective management and coordination; • Mobilizing funding to provide a secure base for the new ICP round; • Improving data quality by building on current best practice and
implementing improved technical and procedural standards and guidelines; • Motivating participating countries through an inclusive and participatory
approach, training, national statistical capacity building and incentives; • Establishing the greatest possible synergy between the ICP data collection
efforts and regular national statistical programs on price and national accounts statistics;
• Involving stakeholders and users in building the image and credibility of ICP, in fund raising and in developing the strategy.
16. The UN Statistical Commission welcomed the proposal and:
• Supported moving ahead as soon as possible but in a time frame that allowed for the need for high-quality data to be produced;
• While supporting the first option for implementation, stressed, however, that
(i) a balanced approach was needed between the geographic coverage and scope of aggregates, on the one hand, and the credibility, quality and timeliness of results on the other, and (ii) consideration should be given at the first stage to giving first priority to collecting purchasing power parity data on consumption
4
items in order to successfully re-establish confidence in purchasing power parity data;
• Endorsed the selection of the World Bank as the most appropriate location for the international secretariat for the global coordination and management of ICP.
17. The 2005 ICP was organized on a regional basis with an ICP regional office in each of four regions. The group of countries covered by the ongoing Eurostat-OECD program is also treated as if it were a fifth region. Each ICP regional office implements the ICP at the regional level by conducting its own price surveys and calculating the PPPs between the countries within its own region, while respecting the general standards, concepts, classifications, methodology and timetable established and agreed at a global level. At the same time, the global office carries out additional price surveys at a world level for a group of 18‘Ring’ countries that include at least two countries from each of the regions. The prices collected from the Ring countries are then used to estimate a set of transitive multilateral PPPs between the regions themselves that can be used to link the various sets of within-region PPPs to obtain a global set of PPPs covering all 146 countries.
18. The regionalization of the ICP has a profound impact on the program. It is likely to lead to an overall improvement in the quality of the results. Each region can assume responsibility for the funding, management and execution of the program within its own region. For methodological as well as practical reasons it does not seem to be desirable to try to process as many as 150 countries simultaneously and treat them symmetrically. Instead, countries within the same region are treated symmetrically while the regions themselves are treated symmetrically at the global level. The institutional arrangements between the global office and the regional offices are explained in detail in Chapter 2. The methodology used to link the regional PPPs is explained in Chapters 13, 14 and 15.
The purpose of the Handbook
19. This Handbook is the centre piece of a range of documentation prepared for ICP 2005. Its purpose is to explain the methods used at each successive stage of the ICP from the drawing up of the detailed product specifications and the product lists used for price collection through to the calculation of the final global set of PPPs at the GDP level.
20. It builds upon on the knowledge and experience gained in earlier rounds of the ICP and also in the Eurostat-OECD program. It is intended mainly for all those involved in, or with responsibilities for, the compilation of PPPs, especially professional economists and statisticians working in National Statistical Offices and the various international and regional agencies taking part in the program. Supplementary manuals (‘Operational Manual for Regional Coordinators’ and ‘Manual for Price Collectors’) are also available to help the staff of National Statistical Offices and Regional Coordinating Offices engaged in price collection to organize their work in a consistent and efficient manner.
5
21. However, this Handbook also meets other needs. It serves as a reference document for the benefit of users as well as compilers. It provides a record that shows exactly how the PPPs were produced It contains a large amount of new material that cannot be found in the existing economic and statistical literature or other published sources. As with other kinds of economic statistics such as national accounts or CPIs, the underlying theory, concepts, methodology and procedures used have to be made available to users in a transparent manner in order to establish and maintain confidence in the quality, reliability and integrity of the results.
22. The manual is also intended to guide and facilitate the conduct of future ICP rounds. It will need to be updated and revised to take account of further improvements or innovations in methodology that may occur.
Summary of the chapters
23. This section provides a brief summary of the contents of the 15 chapters of the Handbook. It provides a quick guide of the contents of the Manual and the range of topics covered.
Chapter 1. Overview of the ICP 24. This chapter provides a summary description of the whole ICP program. It explains briefly how products were specified and selected and how the prices were collected and validated. It also explains how the PPPs are calculated. The chapter is meant to provide sufficient general information about the ICP to enable the contents of particular chapters to be understood without necessarily having a detailed knowledge of the entire program or the Handbook.
Chapter 2. Organization and governance 25. This chapter describes the planning and execution strategy prepared for the ICP and the organization and governance structure put in place for its execution. It deals with issues such as the ownership and control of the ICP and its funding. It explains the roles and responsibilities of the ICP Executive Board and its Technical Advisory Group. It also explains the institutional relationships and division of labour between the ICP’s global office and its regional offices.
Chapter 3: GDP and Main Expenditure Aggregates 26. PPPs are applied to GDP and its final expenditure components as defined in the System of National Accounts, or SNA. This chapter explains the concepts, classifications and methods of valuation used to define the expenditures aggregates of the SNA. The concept of the basic heading is introduced as the lowest aggregate for which expenditure data can be obtained. The chapter describes the data sources commonly used to break down final expenditures in the national accounts to the level of the detailed basic headings needed for ICP purposes. Annex 1. Spreadsheet for Weights
6
Annex 2. Expenditure Weights Diagnostic Module Annex 3. Weights Diagnostic Module
Chapter 4: Price Concepts and Quality 27. This chapter and the following chapter are concerned mainly with how to draw up the lists of products for pricing in different countries. Chapter 4 addresses basic topics such as price concepts, representativity, comparability, brands, quality and methods of quality adjustment, etc. It also includes a summary description of how elementary PPPs are calculated at the level of the basic heading, as an understanding of the methodology used helps elucidate the role of representativity and comparability in drawing up lists of products.
Chapter 5: Product Lists, Specifications and the Pre-Survey 28. This chapter describes how the lists of products to be priced by countries are drawn up. The first part of the chapter explains how the Structured Product Descriptions, or SPDs, are constructed and how the detailed Product Specifications, or PSs, which are used by the price collectors in the field are derived from the SPDs. Subsequent sections describe the nature and function of the Pre-Surveys carried out before the actual price surveys and the collaborative process by which countries and regional offices build up the final lists of products to be priced. Annex. Examples of Structured Product Descriptions
Chapter 6: Sampling and Price Collection 29. This chapter is concerned with the sampling survey procedures used to collect the prices of household consumption goods and services. The chapter has two annexes. The first deals with the estimation of target PPP indices from samples of price observations. The annex also addresses the issue of missing prices. The second annex deals with the sizes of the samples of outlets needed for price collection purposes. It shows how to calculate the minimum sample sizes needed to achieve certain required levels of precision in the estimated average prices.
Chapter 7: Editing and Validation 30. This chapter contains guidelines for the validation and editing of ICP data at national and regional levels using the Tool Pack software developed by the ICP global office for both ICP and CPI purposes. It addresses issues such as distribution of responsibilities at the national level, organization of ICP price collection within a country, the exact matching approach and exceptions to it, numeric checking of preliminary input data, outliers and statistical inference, validation steps at the regional level, the iterative revision of prices, etc. It describes how the Quaranta Tables developed in Eurostat-OECD program can be used for diagnostic purposes during the process of validation. The final section of the chapter describes the Dikhanov Table, a new tool for price diagnostics and data validation included in the ICP Tool Pack software.
Chapter 8: Government Services
7
31. Most government services are valued in national accounts at their costs of production because they are not sold and have no market prices. For ICP purposes it is therefore necessary to compare unit costs between countries instead of prices. This chapter describes the kind of information on government services that is required. A large part of the costs of producing government services consists of labour costs and the chapter focuses mainly on the kinds of data needed to make accurate comparisons of the rates of compensation of government employees in different countries. Annex. Worksheet for Annual Compensation
Chapter 9: Gross Capital Formation 32. This chapter explains how price comparisons are made for capital goods. It provides a description of the price surveys carried out for machinery, equipment, buildings and other structures classified as gross capital formation in the national accounts. It explains the difficulties of ensuring that the capital goods priced are representative and comparable and how Baskets of Construction Components may be used to estimate PPPs for construction. Annex. Use of Exchange Rates as Approximate PPPs for Machinery and Equipment
Chapter 10: Dwelling Services 33. Dwellings are a special case because so many of them are owner-occupied. Both the expenditures and the prices (rents) for the dwelling services consumed by owner-occupiers have to be imputed. This chapter explains: (a) the methods that may be used to estimate the value of the final consumption of dwelling services by owner-occupiers; (b) the information required on rents; and (c) the data on dwelling services that participating countries are required to submit. It also contains a questionnaire on dwellings. Annex 1. Dwelling Services Questionnaires and Guidelines Annex 2. Housing Questionnaires
Chapter 11: Estimation of PPPs for Basic Headings Within a Region 34. This chapter refers to the calculation of PPPs for countries within a single region. It explains how the national average prices emerging from the price collection and validation processes described in the preceding chapters may be used to estimate PPPs for a basic heading. The recommended method is an extension of the Country-Product-Dummy, or CPD method, developed in Phase I of the ICP to include a further dummy variable that indicates whether a product is representative or not.
Chapter 12: Aggregation Methods 35. This chapter describes the methods that may be used within a region to calculate PPPs for higher level expenditure aggregates, including GDP, obtained by combining two or more basic headings. The required inputs into the calculation are the basic heading PPPs and the expenditures within each basic heading expressed in national currencies. The two main methods of aggregation
8
considered are the Geary-Khamis, or GK, method of aggregation used in earlier phases of the ICP and the EKS method which has been the preferred method in recent rounds of the Eurostat-OECD program although use continues to be made of the GK method as well. Annex. Reference PPPs
Chapter 13: The Ring Comparison 36. This chapter describes the Ring program. The Ring consists of a group of 19 countries across the world with at least 2 countries selected from each region. The purpose of the Ring program is to estimate PPPs between the regions rather than between the Ring countries themselves. The Ring program was carried out by the global office independently of the regional programs, the regional affiliation of each Ring country being ignored. A special product list was created for the Ring countries who were asked to collect prices for products on the list in addition to the prices they collected for the regions. The chapter explains how the Ring product list was compiled, how the price surveys were carried out and how the prices were edited and validated
Chapter 14: Estimation of Between-Region PPPs for a Basic Heading 37. A between-region PPP compares prices in different regions after the prices in every country in a region have been converted into a single common currency, the regional numeraire currency. The conversion into a common currency is made using the PPPs between countries within the same region calculated by the regional ICP office. The chapter explains how between-region PPPs may be estimated for a basic heading using the prices collected by the Ring countries. A modified version of the CPRD method is used in which the dummy variables for the countries are replaced by dummy variables for the regions. Once the between-region PPPs have been estimated for a basic heading they may be used to link the various sets of basic heading PPPs within regions to obtain a global set of PPPs.
Chapter 15: Linking PPPs and Real Expenditures for Higher Level Aggregates 38. This chapter explains how between-region PPPs for a higher level aggregate such as total household consumption or GDP may be calculated from the between-region PPPs for the basic headings that make up the aggregate. The aggregation methods used are the same as those described in Chapter 12. The between-region PPPs for an aggregate may be used to the link the various sets of within-region PPPs for that aggregate to obtain a global set of PPPs for the aggregate.
Acknowledgements 39. The World Bank wishes to acknowledge and thank institutions and individuals who have helped develop and improve the methodology of ICP 2003-2006 described in this Handbook. Many individuals with considerable knowledge and experience of international comparisons made their expertise available to ICP 2003-2006. The Technical Advisory Group
9
40. The Technical Advisory Group, or TAG, was set up evaluate and offer advice on all aspects of the methodology used in ICP 2005, ranging from the design and conduct of the price surveys to the types of index formulae used to measure PPPs. The TAG met on numerous occasions, but also communicated effectively via virtual communications The members of the TAG are as follows: Alan Heston, University of Pennsylvania, Philadelphia, United States, Chairman Angus Deaton, Princeton University, New Jersey, United States Erwin Diewert, University of British Columbia, Vancouver, Canada Prasada Rao, University of Queensland, Brisbane, Australia David Roberts, OECD, Paris, France Sergey Sergeev, Austrian Statistical Office, Vienna, Austria and consultant to Eurostat Silke Stapel, Eurostat, Luxembourg, Position later assumed by Paul Konijn. Paul McCarthy, Australian Bureau of Statistics Kim Zieschang, IMF, Washington DC, United States Some of the papers discussed at the TAG meetings were prepared by ICP staff; some were prepared by members of the TAG and others by outside experts or consultants. A significant paper that shaped the ring comparison used to link the regions was “On the Stochastic Approach to Linking Regions in the ICP” by Erwin Diewert. Papers by Alan Heston formed the basis for linking housing and government expenditures. Angus Deaton and Prasada Rao and served on the Poverty Advisory and provided guidance on the estimation of poverty PPPs. Paul McCarthy also contributed to the effort to improve housing PPPs. Kim Zieschang was a principle architect of the development of the Structured Product Definitions. The methodology used for equipment and construction came from papers prepared by consultants; equipment by Stephen Burdette, and the Basket of Construction Components by Kenneth Walsh and Anil Sawhney. 41. Through the TAG and other personal contacts, ICP 2005 has been able to capitalize fully on the knowledge and experience gained in PPP projects over the last three decades. The methodology used in ICP 2005 builds not only on that developed in the first three phases of the ICP but on that used more recently in the Eurostat-OECD program. Links with the earlier phases of the ICP have been strengthened by the fact that Alan Heston, the Chairman of the TAG, was one of the original ICP team. Links with the Eurostat-OECD program have been strengthened by the participation in the TAG of Silke Stapel of Eurostat, David Roberts of the OECD and Sergey Sergeev of the Austrian Statistical Office. In addition, Eurostat and OECD have kindly made available to the ICP detailed information about their current methods and practices in a series of meetings between their staff and ICP staff. The Staff of the Global Office
42. The global office housed in the World Bank provided the overall technical support, worked closely with the regional coordinators, and collaborated with the Eurostat and OECD regarding their comparison. The global office staff evolved during the course of the program, all who served for all or a portion of the time are listed.
10
Frederic A. Vogel, Global Manager Yonas Biru, Deputy Global Manager Yuri Dikhanov Nada Hamadeh, Jinsook Lee, Farah Hussain Giuliana Cane Siew Hua Lee Virginia Romand Olga Akcadag
Contributors to the Handbook 43 .Peter Hill was the editor and also the principal author for many of the chapters. Derek Blades was also the primary author of several chapters. Members of the ICP Global Office, the TAG, and regional coordinators also contributed to the Handbook.
Some innovations in ICP 2005 44. The purpose of this section is to acknowledge some major methodological innovations that were made in ICP 2003-2006.
• Structured product descriptions and product lists. Chapter 5 describes how the ICP global office and each of the regional offices were able to create entirely new product lists for price collection purposes using new detailed Product Specifications made possible through the creation of new Structured Product Descriptions. The creation of the SPDs, the PSs, and the resulting product lists was a major investment undertaken by the staff of the global office [name?] and the regional offices. The existence of the new PSs and product lists will greatly benefit future ICP work. The SPDs and PSs can also be used by countries for their own Consumer Price Indices.
• The checking and validation of prices. Chapter 7 describes the
procedures used to check and validate the prices collected by countries. These procedures are modeled on those developed by Eurostat but they also include a new diagnostic tool developed by Yuri Dikhanov of the ICP staff. Dikhanov tables are explained in Chapter 7.
• Computer software and the ICP Toolpack. New software was developed
by the World Bank. In covered a wide range of activities from data validation, to the estimation of PPPs. Other supporting software was provided to streamline the preparation of product specifications for the Ring program, review national account aggregates, and validation of equipment and construction data.
• The Ring program. The most appropriate way to link the various sets of
PPPs calculated by the regions posed a major methodological challenge
11
which was solved by calculating PPPs between the regions themselves. The concept of a between-region PPP was proposed by Erwin Diewert (2004). The way in which the PPPs for different regions may be linked by means of between region PPPs is explained in Chapters 14 and 15 for basic headings and higher level aggregates respectively.
• Basket of Construction Components A new method to use construction
components as a basis to estimate PPPs for construction and described in more detail in Chapter 9.
References
Diewert, W. E. (2004) On the Stochastic Approach to Linking the Regions in the ICP, Discussion Paper No. 04-16, Department of Economics, University of British Columbia, Vancouver. Commission of European Communities, IMF, OECD, UN, World Bank, (1993), System of National Accounts 1993. Eurostat, (1977) Comparisons in Real Values of the Aggregates of ESA, 1975, Statistical Office of the European Communities, Luxembourg, Eurostat-OECD, (2004) Purchasing Power Parities and Real Expenditures, 2002 Benchmark Year, Statistical Office of the European Communities, Luxembourg, Organisation for Economic Co-operation and Development, Paris. OECD, (1985) Purchasing Power Parities and Real Expenditures, 1985, Organisation for Economic Co-operation and Development, Paris. ILO, IMF, OECD, Eurostat, UNECE and the World Bank, (2004), Consumer Price Index Manual: Theory and Practice. Kravis I. B., Kenessey Z., Heston A. and Summers R. (1975), A System of International Comparisons of Gross Product and Purchasing Power, Phase I of the United Nations International Comparison Project, published for the World Bank by The Johns Hopkins University Press, Baltimore and London. Kravis I. B., Heston A. and Summers R. (1978), International Comparisons of Real Product and Purchasing Power, Phase II of the United Nations International Comparison Project, published for the World Bank by The Johns Hopkins University Press, Baltimore and London. Kravis, I. B., Heston A. and Summers R. (1982), World Product and Income: International Comparisons of Real Gross Product, Phase III of the United Nations International Comparison Project, published for the World Bank by The Johns Hopkins University Press, Baltimore and London.
12
Chapter 1
Overview of the International Comparison Program Introduction
1. The International Comparison Program (ICP) is a global statistical initiative that supports inter-country comparisons of Gross Domestic Product (GDP) and its components, using Purchasing Power Parities (PPPs) as a currency converter. The GDP is the measure most often used to represent the size of a country’s economy. The GDP for any country can be thought of as the summation of the prices multiplied by their quantities, for all products and services consumed over a year’s time. The GDP is also used on a per capita basis to represent the flow of goods and services available to countries to contribute to their economic well-being. Through an effort led by the United Nations, the 1993 System of National Accounts (SNA) provides a common international framework that ensures economies are measured the same way across countries.
2. It is also important to examine the share or contribution of various economies to the global economy. The GDP and its aggregate components are the primary basis for comparing the relative sizes of various economies in different regions. Measures across countries of investment as a share of total GDP are used to evaluate and compare its impact on economic growth. For example, one-third of the world’s population, represented by China and India, has been growing rapidly in the past 10 years and their contribution to world economic growth is roughly 3 times higher at PPPs than exchange rates. So it is very important to measure them correctly.
3. A problem that has challenged economists comparing economies across national boundaries is that the GDP of a country is expressed in its national currency. This requires that national levels of GDP be converted to a common currency before the comparisons can be made. While exchange rates can be used for this conversion, analysts find these to be deficient because of the effect of non-traded goods and services, capital movements, and exchange market interventions.
4. The relationship between the US and Euro dollars provides a good example. In 2002, it took US$0.91 to purchase a Euro, while in 2004 it took US$1.21. This has occurred during a period when both regions experienced low rates of inflation and moderate growth rates. This means roughly that a Euro country such as France had an exchange rate converted GDP relative to the US that was 1/3 (1.21/.91) higher in 2004 than in 2002. Clearly, the use of exchange rates gets both the level and changes of the productive capacity of countries wrong.
5. Further, many ratios to GDP are likely to be distorted when exchange rates are used. For example, a comparison of energy use between countries can be done by
13
calculating a ratio of a physical measure (such as tons of coal consumed) to GDP. Energy use as a unit of GDP makes poor countries look very wasteful at exchange rates and tends to bias forecasts of future energy use upward, as compared to use of PPPs. Likewise, comparisons of shares of GDP in national currencies (which are the same at exchange rates) across countries tend to distort our understanding of the world economy. For example, the share of health and investment expenditure in rich countries in national currencies overstates their real health services and understates their investment compared to poor countries, when account is taken of their relative prices, which is the task of the ICP.
6. The longstanding recognition of these deficiencies led to the development of Purchasing Power Parities (PPP) as a more appropriate currency converter to compare the GDP and its components across countries. The Purchasing Power Parity between two countries is the rate at which the currency of one country needs to be converted into that of a second country to represent the same volume of goods and services in both countries.
7. The World Bank generates poverty data based on a simple concept of a poverty line set at $1 or $2 a day of income per person. These measures are of considerable value when seeking to highlight efforts related to poverty alleviation. In order to make these comparisons across countries, national expenditures have to be converted to a common currency, in this case the US dollar.
8. The need for PPPs led to the development of the International Comparison Program in 1968 as a joint venture of the United Nations and the University of Pennsylvania, with contributions from the Ford Foundation and the World Bank. Purchasing Power Parities generated by the ICP are based upon actual price data collected for 1,000-plus items on a periodic basis in participating countries. The recognition of the importance and role of PPPs to make international comparisons has led to a steady increase in the number of countries participating in the program, from 10 in the first round of the ICP to the current 147 countries (including those under the OECD/Eurostat PPP program), thus raising the status of the ICP to that of a truly global program.
9. As a result, the ICP has become one of the most comprehensive and complex international statistical undertakings today, involving harmonization of methodologies, concepts and definitions for price data collection, data validation, and estimation. An effective management and coordination structure has been put into place at the national, regional and international levels. A Global Office in the World Bank is providing overall coordination for the current global effort with five regional organizations providing the oversight of the countries in their regions. The Statistical Office of the European Communities (Eurostat) and the Organization for Economic Cooperation and Development (OECD) conduct separate comparison programs for their member countries. The global results will include the five ICP regions plus the Eurostat and OECD countries.
14
Defining PPPs
10. A Purchasing Power Parity is a form of exchange rate based upon a comparison of prices between countries. The Big Mac Index compiled and published by the Economist is a widely known example of a PPP based on a single consumption item. The Big Mac Index is based on the comparison of its cost between countries compared to its cost in the US. A Big Mac in the Philippines, for example, cost 68 pesos in July 2004 compared to $2.90 in the US. In the Big Mac index, the ratio of the price in pesos divided by the US price is 23.5, and this figure is a basic example of a Purchasing Power Parity between the Philippines and the US. The ratio, 23.5, implies that 23.5 pesos have the same purchasing power as one US dollar.
11. If one wanted to compare the Philippines economy with the US, the first step would be to convert the level of its GDP to the US dollar. If one were to use exchange rates, the procedure would be to divide the Philippines GDP by 55.3. If the PPP based on the Big Mac Index were used, the GDP of the Philippines would be divided by 23.5 which would nearly double the size of its economy compared to the exchange rate derived level.
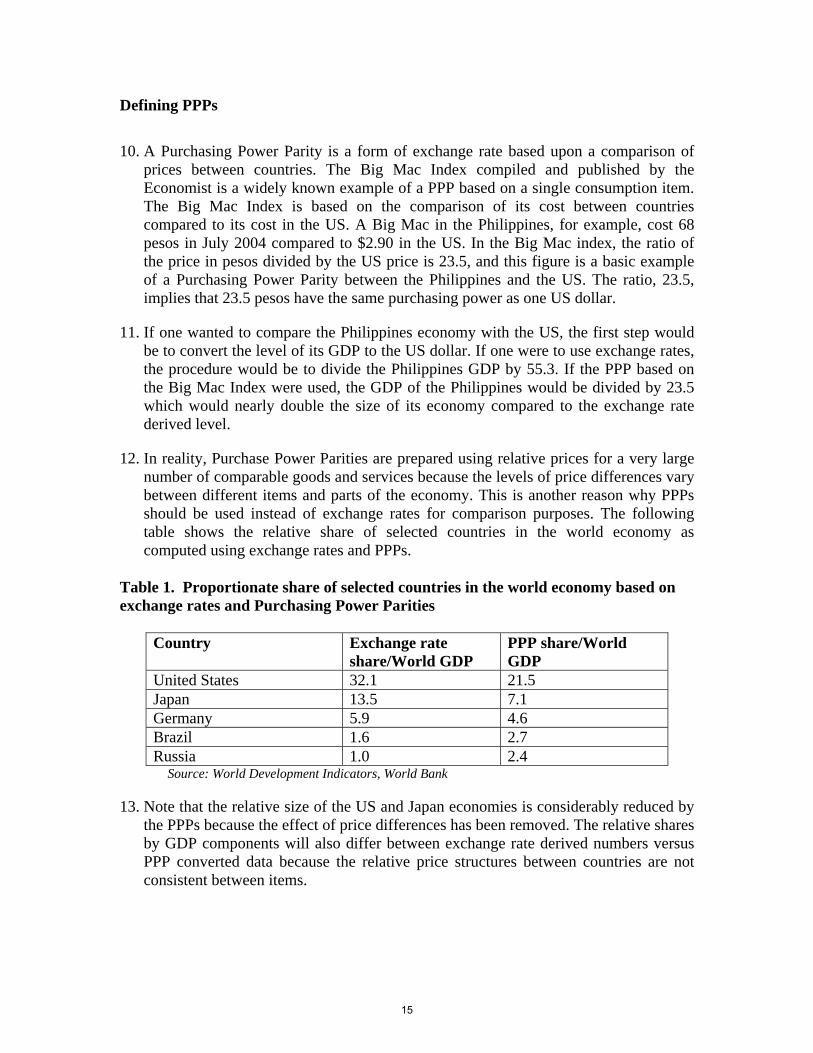
12. In reality, Purchase Power Parities are prepared using relative prices for a very large number of comparable goods and services because the levels of price differences vary between different items and parts of the economy. This is another reason why PPPs should be used instead of exchange rates for comparison purposes. The following table shows the relative share of selected countries in the world economy as computed using exchange rates and PPPs.
Table 1. Proportionate share of selected countries in the world economy based on exchange rates and Purchasing Power Parities
Country Exchange rate share/World GDP
PPP share/World GDP
United States 32.1 21.5 Japan 13.5 7.1 Germany 5.9 4.6 Brazil 1.6 2.7 Russia 1.0 2.4
Source: World Development Indicators, World Bank
13. Note that the relative size of the US and Japan economies is considerably reduced by the PPPs because the effect of price differences has been removed. The relative shares by GDP components will also differ between exchange rate derived numbers versus PPP converted data because the relative price structures between countries are not consistent between items.
15
How PPPs are Used
14. The ICP data are of particular interest to regional and international development organizations as an unbiased means of measuring relative levels of development across countries, and to provide policy advice to member countries related to structural adjustment and poverty alleviation. Price levels of basic consumption items or total consumption are used to assess the incidence of poverty and to monitor progress of policies targeted to poverty alleviation.
15. The World Bank uses PPPs to establish the US$1/day and US$2/day international poverty lines. The poverty comparison between countries is based on PPPs for the private consumption aggregate of the GDP. The ICP framework can also be used to investigate the incidence and distribution of poverty in various regions of the same country.
16. The World Bank also uses PPPs to compare living standards in different countries by comparing PPP-based per capita expenditures of household consumption or components of household consumption. At the country level, sub-national PPPs can be used to compare living standards within a country.
17. The European Union allocates structural funds to member states based on PPP conversion factors. However, PPPs are not used by other international organizations for calculating member countries’ contributions or for assessing their eligibility for aid grants or access to loans on favorable terms.
18. The International Monetary Fund reports the size of economies and aggregate growth rates in PPP terms. A key measure of the potential for economic growth is the ratio of investment to the GDP. Where economic growth is related to the amount of investment, it is appropriate to make these comparisons between countries using PPP-based measures.
19. PPPs are estimated sector by sector, allowing comparisons of price levels for components of GDP. For instance, the World Health Organization and UNESCO use PPPs to measure health and education expenditures.
20. Rapid globalization and increasing integration of international markets have also increased the demand for PPP data. Multinational corporations are increasingly demanding reliable and timely data to obtain information to compare relative market size, assess costs of production, and analyze international competitiveness.
21. Multiple academic studies dealing with international aspects of pricing, growth or structural convergence have also relied on PPPs.
22. The results of the ICP also address a very common concern for tourists, compensation administrators, and traders — namely how expensive is my country compared to a neighbor or a country to be visited. This concern can only be addressed by knowing
16
the prices of goods and services to be bought or sold in each country as generated by the ICP along with the price of currency, the exchange rate.
23. Price levels for components of the GDP can be compared across countries, especially for trading partners. Policy makers can use this information to determine if its prices are in line with its trading partners to prevent imbalances in international trade.
PPPs versus Exchange Rates
24. Exchange rates can be misleading. Since market exchange rates are based on short-term factors and are subject to substantial distortions from speculative movements and government interventions, comparisons based on exchange rates, even when averaged over a period of time such as a year, yield and misleading results.
25. Such currency speculation and short-term capital movements may cause exchange rates to fluctuate severely, so that some countries appear “richer” or “poorer” almost overnight.
26. On the other hand, exchange rates are fixed by policy in some countries and not subject to market movements. This rigidity also artificially causes some countries to appear richer or poorer than other countries.
27. Exchange rates do not measure differences in the relative price levels between countries. Even within countries, price levels differ across components of GDP.
28. Hence, PPPs are more appropriate currency converters than exchange rates to compare the GDP across countries. By establishing purchasing power equivalence, where one dollar purchases the same quantity of goods and services in all countries, PPP conversions allow cross-country comparisons of economic aggregates on the basis of physical levels of output, free of price and exchange rate distortions.
Historical Participation
29. Such shortcomings associated with the use of exchange rate conversion factors and also the problems of comparing indicators of social and economic development across countries have been known for some time. Indeed it was the recognition of these problems by the international community in the Sixties that first gave rise to the ICP, with a view to generating PPP data.
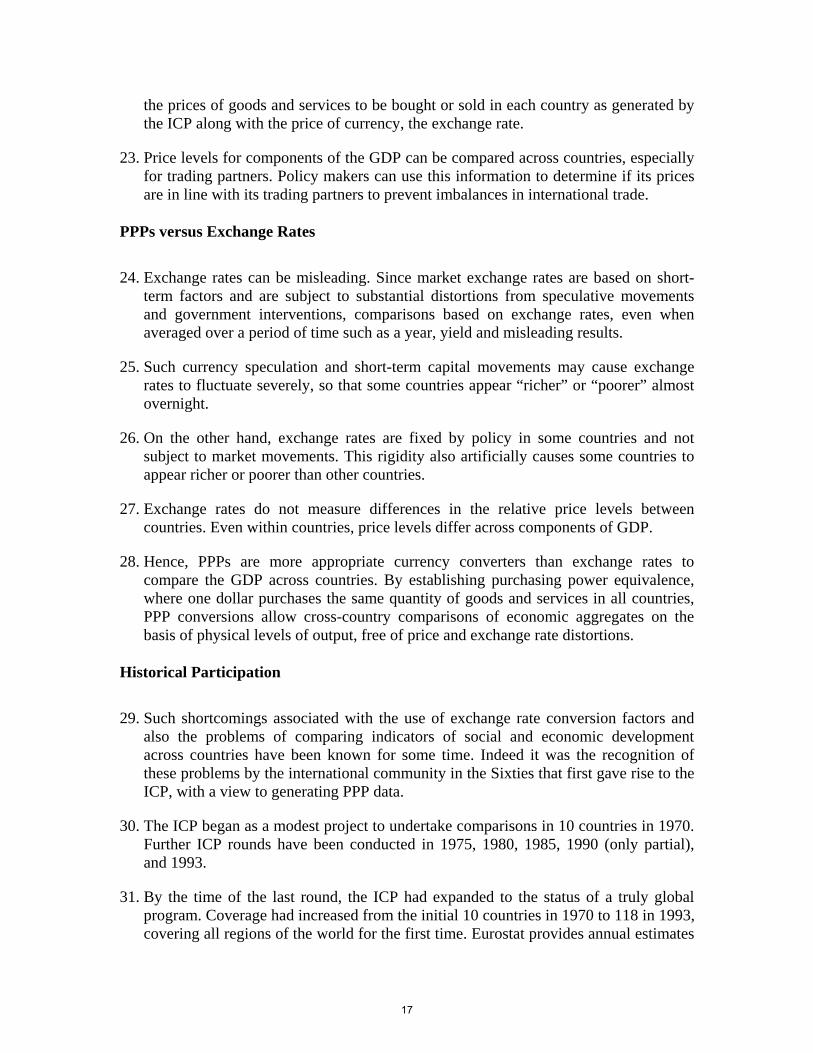
30. The ICP began as a modest project to undertake comparisons in 10 countries in 1970. Further ICP rounds have been conducted in 1975, 1980, 1985, 1990 (only partial), and 1993.
31. By the time of the last round, the ICP had expanded to the status of a truly global program. Coverage had increased from the initial 10 countries in 1970 to 118 in 1993, covering all regions of the world for the first time. Eurostat provides annual estimates
17
for its member countries. The OECD, in collaboration with the Statistical Office of the European Union (Eurostat), has continued to collect price data to estimate PPPs in its member states and currently operates on a three-year cycle.
32. The current round brings 147 countries under the ICP fold from six regions. The global program is run in close collaboration with the OECD/Eurostat program, which is run independently from the global ICP management structure.
33. The chart below illustrates the historical pattern of participation in the ICP.
Figure 1: Historical Participation in the ICP
Estimating PPPs: The Steps
34. Purchasing Power Parities are averages of price ratios between countries. Each country participating in the ICP provides national average prices for 1,000-plus closely specified items. Tremendous efforts go into specifying the characteristics of each item to be priced to ensure that countries are measuring similar items and products for the sake of comparison. Item prices are collected on average four times a year in many markets and outlets — rural and urban, formal and informal — to obtain the national annual average prices. The PPPs are computed by obtaining average ratios of average prices between countries for comparable items.
35. The process starts by each country subdividing its GDP into 155 expenditure categories called Basic Headings. A basic heading is the lowest level of detail for
18
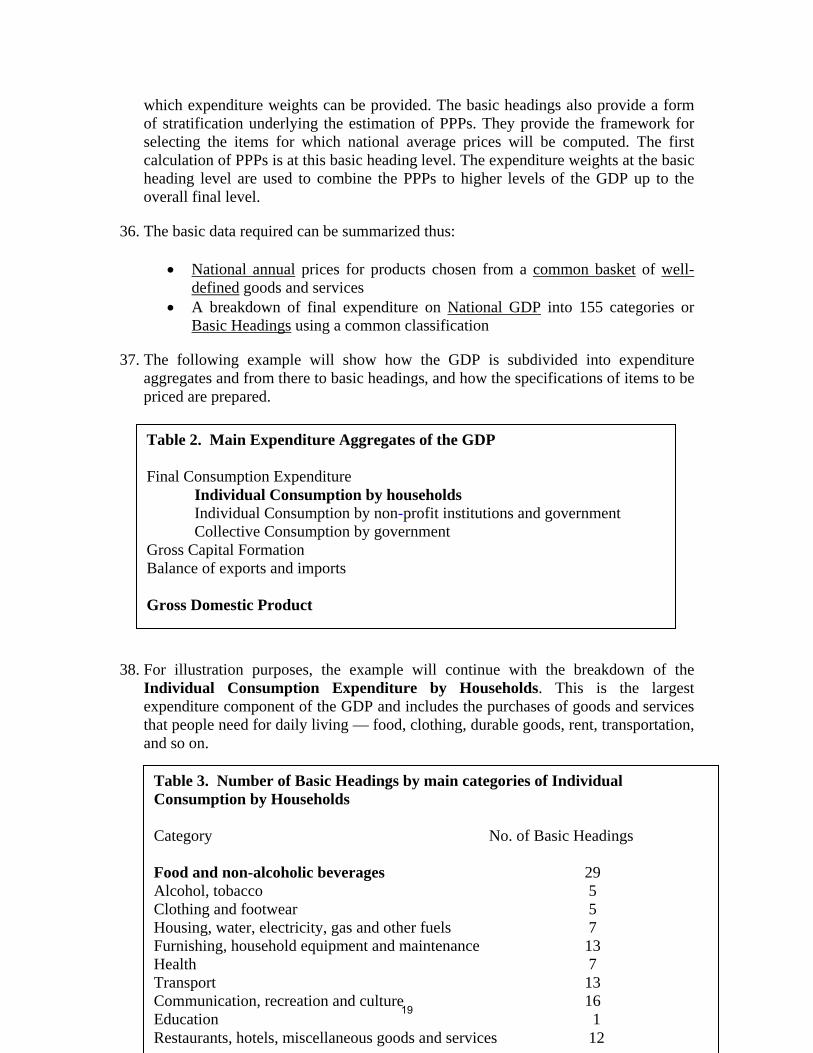
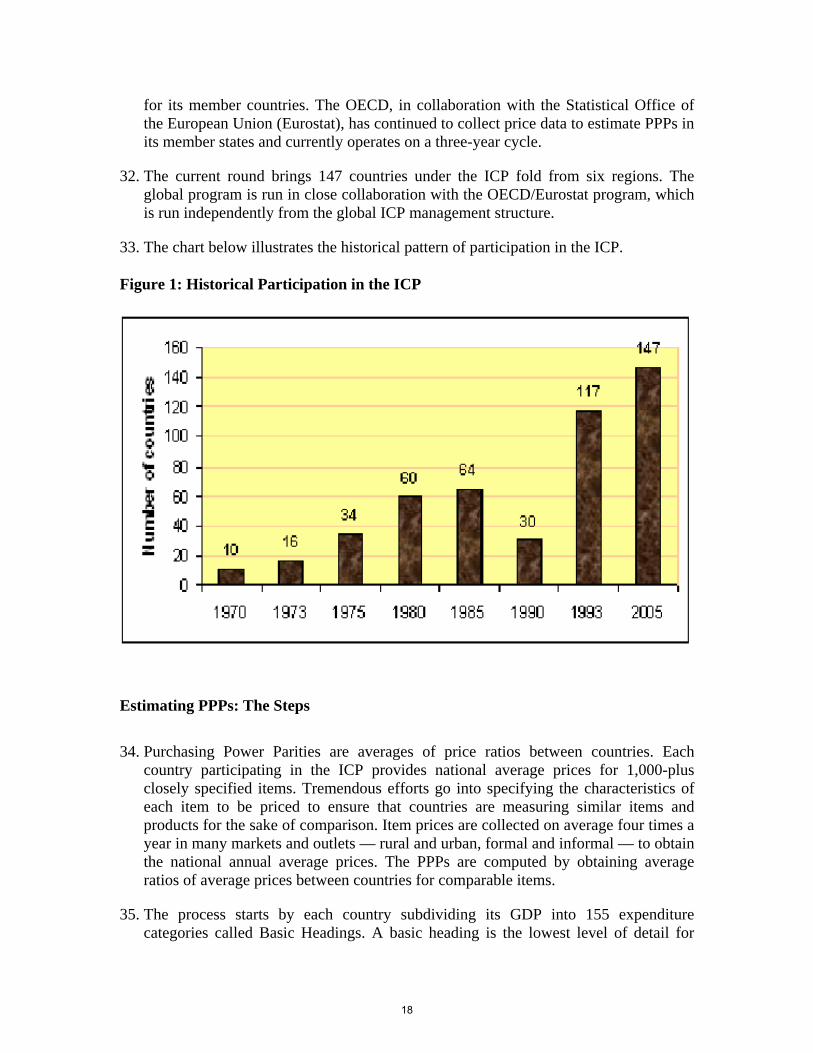
Table 2. Main Expenditure Aggregates of the GDP Final Consumption Expenditure Individual Consumption by households Individual Consumption by non-profit institutions and government Collective Consumption by government Gross Capital Formation Balance of exports and imports Gross Domestic Product
which expenditure weights can be provided. The basic headings also provide a form of stratification underlying the estimation of PPPs. They provide the framework for selecting the items for which national average prices will be computed. The first calculation of PPPs is at this basic heading level. The expenditure weights at the basic heading level are used to combine the PPPs to higher levels of the GDP up to the overall final level.
36. The basic data required can be summarized thus:
• National annual prices for products chosen from a common basket of well-defined goods and services
• A breakdown of final expenditure on National GDP into 155 categories or Basic Headings using a common classification
37. The following example will show how the GDP is subdivided into expenditure aggregates and from there to basic headings, and how the specifications of items to be priced are prepared.
38. For illustration purposes, the example will continue with the breakdown of the Individual Consumption Expenditure by Households. This is the largest expenditure component of the GDP and includes the purchases of goods and services that people need for daily living — food, clothing, durable goods, rent, transportation, and so on.
Table 3. Number of Basic Headings by main categories of Individual Consumption by Households Category No. of Basic Headings Food and non-alcoholic beverages 29 Alcohol, tobacco 5 Clothing and footwear 5 Housing, water, electricity, gas and other fuels 7 Furnishing, household equipment and maintenance 13 Health 7 Transport 13 Communication, recreation and culture 16 Education 1 Restaurants, hotels, miscellaneous goods and services 12
19
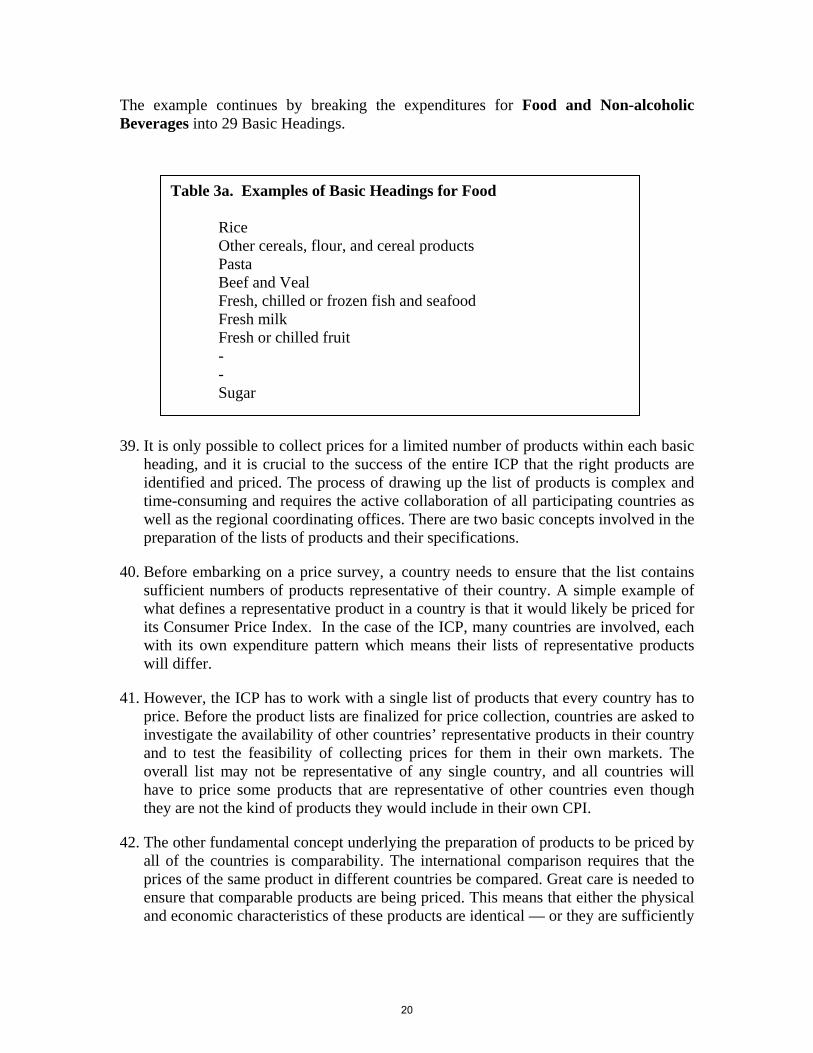
The example continues by breaking the expenditures for Food and Non-alcoholic Beverages into 29 Basic Headings.
39. It is only possible to collect prices for a limited number of products within each basic heading, and it is crucial to the success of the entire ICP that the right products are identified and priced. The process of drawing up the list of products is complex and time-consuming and requires the active collaboration of all participating countries as well as the regional coordinating offices. There are two basic concepts involved in the preparation of the lists of products and their specifications.
40. Before embarking on a price survey, a country needs to ensure that the list contains sufficient numbers of products representative of their country. A simple example of what defines a representative product in a country is that it would likely be priced for its Consumer Price Index. In the case of the ICP, many countries are involved, each with its own expenditure pattern which means their lists of representative products will differ.
41. However, the ICP has to work with a single list of products that every country has to price. Before the product lists are finalized for price collection, countries are asked to investigate the availability of other countries’ representative products in their country and to test the feasibility of collecting prices for them in their own markets. The overall list may not be representative of any single country, and all countries will have to price some products that are representative of other countries even though they are not the kind of products they would include in their own CPI.
42. The other fundamental concept underlying the preparation of products to be priced by all of the countries is comparability. The international comparison requires that the prices of the same product in different countries be compared. Great care is needed to ensure that comparable products are being priced. This means that either the physical and economic characteristics of these products are identical — or they are sufficiently
Table 3a. Examples of Basic Headings for Food Rice Other cereals, flour, and cereal products Pasta Beef and Veal Fresh, chilled or frozen fish and seafood Fresh milk Fresh or chilled fruit - - Sugar
20
similar so that consumers are indifferent, showing no preferences when choosing from this pool of products.
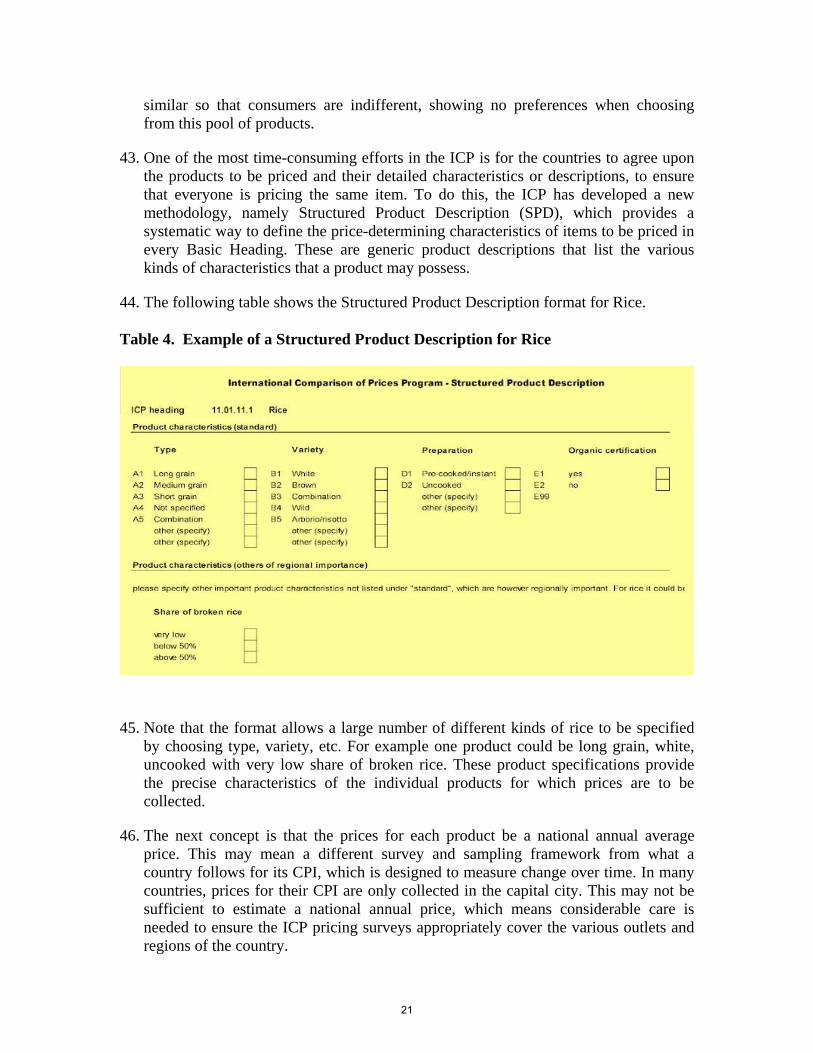
43. One of the most time-consuming efforts in the ICP is for the countries to agree upon the products to be priced and their detailed characteristics or descriptions, to ensure that everyone is pricing the same item. To do this, the ICP has developed a new methodology, namely Structured Product Description (SPD), which provides a systematic way to define the price-determining characteristics of items to be priced in every Basic Heading. These are generic product descriptions that list the various kinds of characteristics that a product may possess.
44. The following table shows the Structured Product Description format for Rice.
Table 4. Example of a Structured Product Description for Rice
45. Note that the format allows a large number of different kinds of rice to be specified by choosing type, variety, etc. For example one product could be long grain, white, uncooked with very low share of broken rice. These product specifications provide the precise characteristics of the individual products for which prices are to be collected.
46. The next concept is that the prices for each product be a national annual average price. This may mean a different survey and sampling framework from what a country follows for its CPI, which is designed to measure change over time. In many countries, prices for their CPI are only collected in the capital city. This may not be sufficient to estimate a national annual price, which means considerable care is needed to ensure the ICP pricing surveys appropriately cover the various outlets and regions of the country.
21
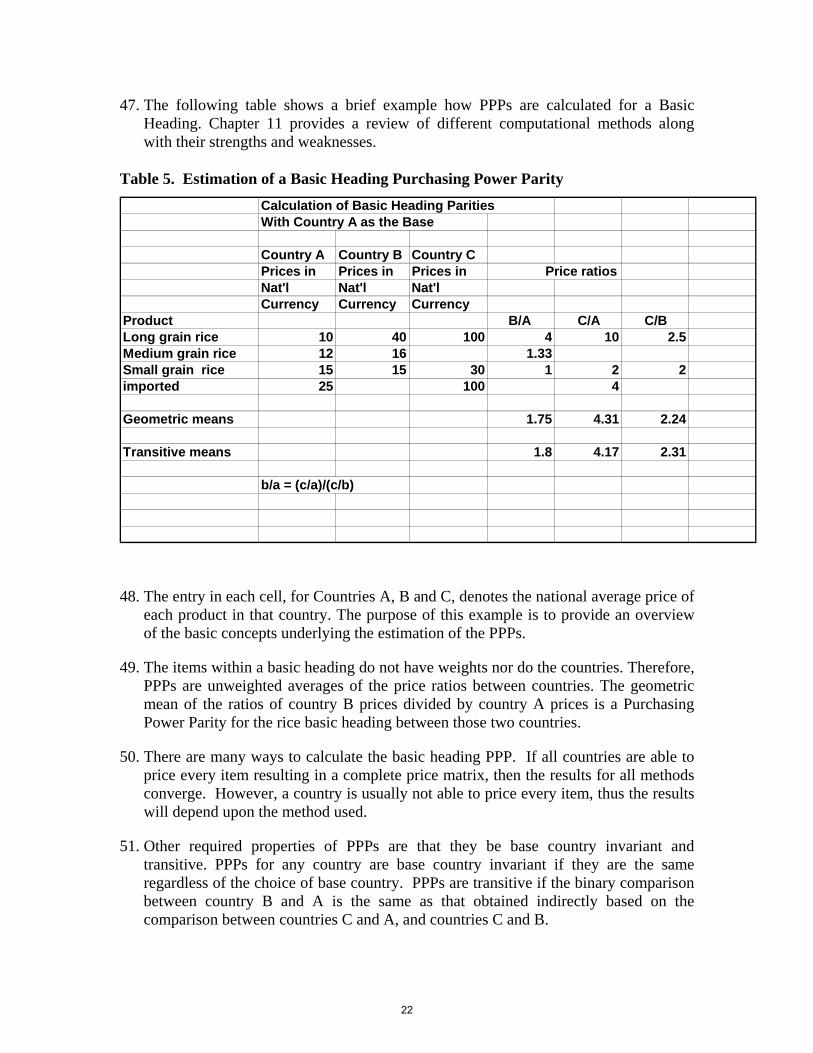
47. The following table shows a brief example how PPPs are calculated for a Basic Heading. Chapter 11 provides a review of different computational methods along with their strengths and weaknesses.
Table 5. Estimation of a Basic Heading Purchasing Power Parity Calculation of Basic Heading ParitiesWith Country A as the Base
Country A Country B Country CPrices in Prices in Prices in Price ratiosNat'l Nat'l Nat'l Currency Currency Currency
Product B/A C/A C/BLong grain rice 10 40 100 4 10 2.5Medium grain rice 12 16 1.33Small grain rice 15 15 30 1 2 2imported 25 100 4
Geometric means 1.75 4.31 2.24
Transitive means 1.8 4.17 2.31
b/a = (c/a)/(c/b)
48. The entry in each cell, for Countries A, B and C, denotes the national average price of each product in that country. The purpose of this example is to provide an overview of the basic concepts underlying the estimation of the PPPs.
49. The items within a basic heading do not have weights nor do the countries. Therefore, PPPs are unweighted averages of the price ratios between countries. The geometric mean of the ratios of country B prices divided by country A prices is a Purchasing Power Parity for the rice basic heading between those two countries.
50. There are many ways to calculate the basic heading PPP. If all countries are able to price every item resulting in a complete price matrix, then the results for all methods converge. However, a country is usually not able to price every item, thus the results will depend upon the method used.
51. Other required properties of PPPs are that they be base country invariant and transitive. PPPs for any country are base country invariant if they are the same regardless of the choice of base country. PPPs are transitive if the binary comparison between country B and A is the same as that obtained indirectly based on the comparison between countries C and A, and countries C and B.
22
52. The computations to ensure results are base country invariant and transitive means the existence of a third country will affect the PPPs between pairs of countries. As the number of countries being compared increases, the greater the effect of other countries on the PPPs between any two countries — thus the resulting indices are called multilateral comparisons.
53. It is important to note that there are several different methods to compute the Basic Heading parities including the Elteto, Koves, and Szulc (EKS) procedure. The Country-Product-Dummy (CPD) is a multilateral method in which regression analysis is used to obtain parities for each basic heading. The two procedures differ mainly in how PPPs are computed when some data are missing; the results converge when the matrix is full.
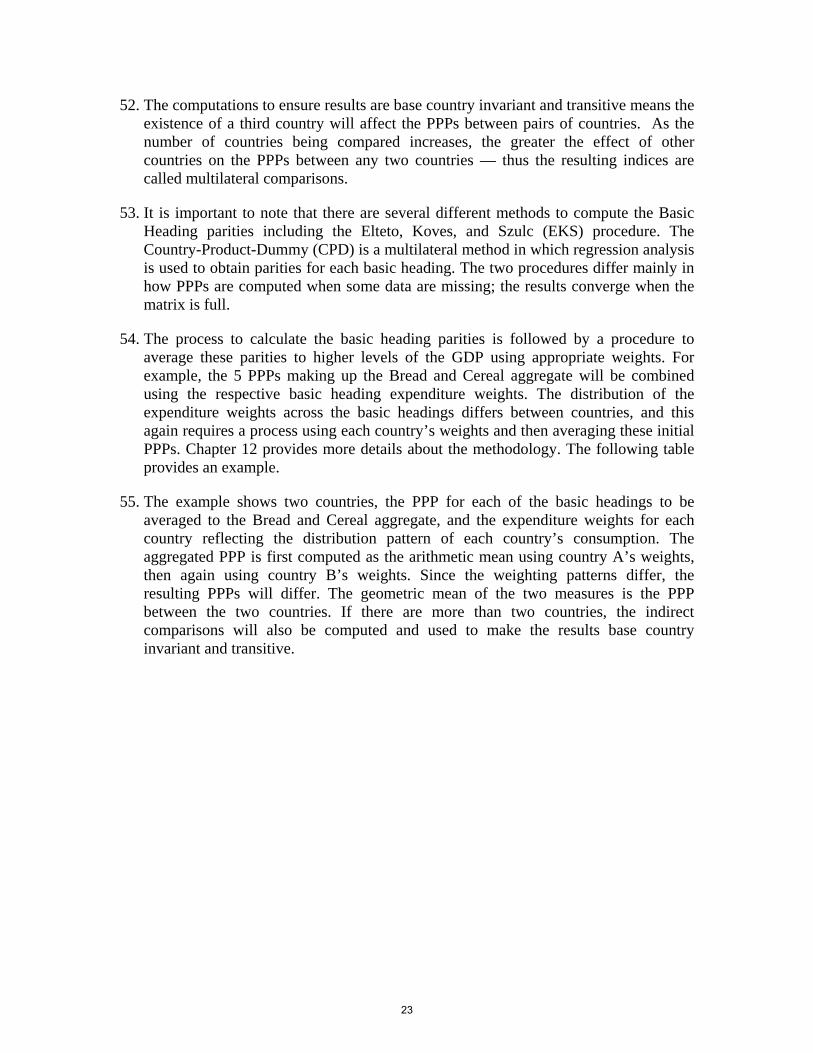
54. The process to calculate the basic heading parities is followed by a procedure to average these parities to higher levels of the GDP using appropriate weights. For example, the 5 PPPs making up the Bread and Cereal aggregate will be combined using the respective basic heading expenditure weights. The distribution of the expenditure weights across the basic headings differs between countries, and this again requires a process using each country’s weights and then averaging these initial PPPs. Chapter 12 provides more details about the methodology. The following table provides an example.
55. The example shows two countries, the PPP for each of the basic headings to be averaged to the Bread and Cereal aggregate, and the expenditure weights for each country reflecting the distribution pattern of each country’s consumption. The aggregated PPP is first computed as the arithmetic mean using country A’s weights, then again using country B’s weights. Since the weighting patterns differ, the resulting PPPs will differ. The geometric mean of the two measures is the PPP between the two countries. If there are more than two countries, the indirect comparisons will also be computed and used to make the results base country invariant and transitive.
23
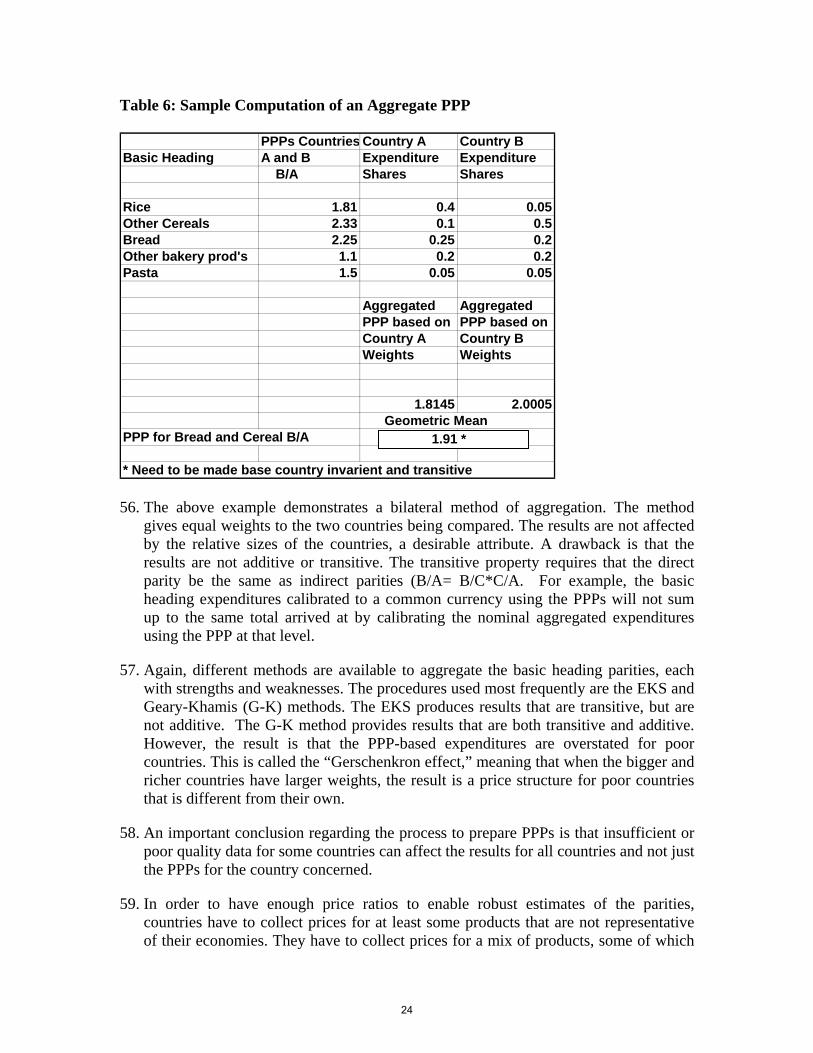
Table 6: Sample Computation of an Aggregate PPP
PPPs Countries Country A Country BBasic Heading A and B Expenditure Expenditure
B/A Shares Shares
Rice 1.81 0.4 0.05Other Cereals 2.33 0.1 0.5Bread 2.25 0.25 0.2Other bakery prod's 1.1 0.2 0.2Pasta 1.5 0.05 0.05
Aggregated Aggregated PPP based on PPP based on
Country A Country BWeights Weights
1.8145 2.0005 Geometric Mean
PPP for Bread and Cereal B/A
* Need to be made base country invarient and transitive
1.91 *
56. The above example demonstrates a bilateral method of aggregation. The method gives equal weights to the two countries being compared. The results are not affected by the relative sizes of the countries, a desirable attribute. A drawback is that the results are not additive or transitive. The transitive property requires that the direct parity be the same as indirect parities (B/A= B/C*C/A. For example, the basic heading expenditures calibrated to a common currency using the PPPs will not sum up to the same total arrived at by calibrating the nominal aggregated expenditures using the PPP at that level.
57. Again, different methods are available to aggregate the basic heading parities, each with strengths and weaknesses. The procedures used most frequently are the EKS and Geary-Khamis (G-K) methods. The EKS produces results that are transitive, but are not additive. The G-K method provides results that are both transitive and additive. However, the result is that the PPP-based expenditures are overstated for poor countries. This is called the “Gerschenkron effect,” meaning that when the bigger and richer countries have larger weights, the result is a price structure for poor countries that is different from their own.
58. An important conclusion regarding the process to prepare PPPs is that insufficient or poor quality data for some countries can affect the results for all countries and not just the PPPs for the country concerned.
59. In order to have enough price ratios to enable robust estimates of the parities, countries have to collect prices for at least some products that are not representative of their economies. They have to collect prices for a mix of products, some of which
24
are representative of their own countries and others that are representative of other countries.
Linking Regions
60. Regionalization was the most important change introduced to the ICP since 1980. Countries are now grouped by regions, and global comparisons are carried out in two stages.
61. First, regional surveys are conducted on the basis of region-specific baskets of goods and services, and regional PPPs are computed from the regional average prices. The regional PPPs are expressed in regional currencies, for example, Argentinean peso for Latin America and Hong Kong dollar for Asia. The second stage involves linking regional results to estimate a globally consistent set of PPPs expressed in a common international currency, often the US dollar.
62. These issues are very important in improving the quality of purchasing power comparisons. Research was commissioned to address both micro and macro linkage problems. The research focus was a search for methods to link regions, making it possible to approximate the results that would be obtained from a world comparison of prices of comparable-quality items across all countries.
63. To link countries between regions for a robust multilateral comparison, a new Ring Comparison methodology has been developed. A selected subset of “Ring Countries” from each region collects prices in capital cities, using a global basket of 1,000-plus items that reflect the world as a whole. These countries are deemed as representative of their region and, at the same time, have available a wide range of goods and services found in countries outside of their region.
64. The criteria for selecting Ring Countries for this round include:
• Relatively open economies • Market structures comparable to countries in other regions • Participation in the full GDP comparison • Good statistical capabilities
65. To produce global PPPs, the same procedure used to compute PPPs between countries within regions is also used to compute PPPs between regions. The result is a set of regional scalars to convert regional PPPs to global PPPs. The methodology is provided in detail in chapters 13-15.
Governance
66. The program is owned and managed by a consortium of national, regional and international organizations, under the general auspices of an ICP Executive Board, which is accountable to the United Nations Statistical Commission.
25
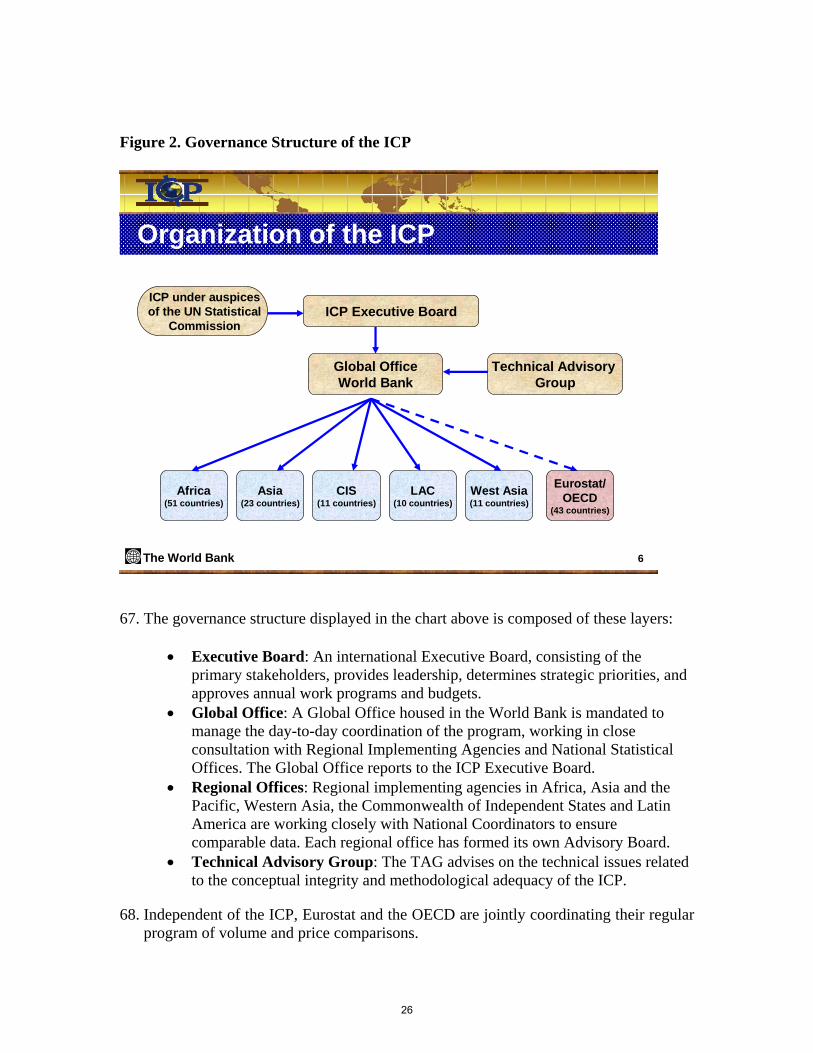
Figure 2. Governance Structure of the ICP
The World Bank 6
Organization of the ICP
Africa(51 countries)
Asia(23 countries)
CIS(11 countries)
LAC(10 countries)
West Asia(11 countries)
Eurostat/OECD
(43 countries)
ICP Executive Board
Technical Advisory Group
Global OfficeWorld Bank
ICP under auspicesof the UN Statistical
Commission
67. The governance structure displayed in the chart above is composed of these layers:
• Executive Board: An international Executive Board, consisting of the primary stakeholders, provides leadership, determines strategic priorities, and approves annual work programs and budgets.
• Global Office: A Global Office housed in the World Bank is mandated to manage the day-to-day coordination of the program, working in close consultation with Regional Implementing Agencies and National Statistical Offices. The Global Office reports to the ICP Executive Board.
• Regional Offices: Regional implementing agencies in Africa, Asia and the Pacific, Western Asia, the Commonwealth of Independent States and Latin America are working closely with National Coordinators to ensure comparable data. Each regional office has formed its own Advisory Board.
• Technical Advisory Group: The TAG advises on the technical issues related to the conceptual integrity and methodological adequacy of the ICP.
68. Independent of the ICP, Eurostat and the OECD are jointly coordinating their regular program of volume and price comparisons.
26
69. For the 2003-2006 global comparison, the results for the ICP regions (except the CIS) will be combined with those of the Eurostat-OECD program using linking factors derived from the Ring Comparison program. Russia in the CIS region priced both the CIS and OECD lists. These results will be used to link the CIS to the OECD region, and then to the global level. Global data linking ICP and OECD/Eurostat results for over 140 benchmark countries will be published in 2007.
70. The Evaluation of the ICP considered by the Thirtieth Session of the UN Statistical Commission spelled out the deficiencies of previous rounds and the actions needed to ensure the continuation of the program. As a result, many aspects of the program have been re-engineered using new methods and procedures to address the weaknesses detected by the evaluation.
71. The ICP provides a unique opportunity to improve and harmonize statistical methodology around the world. The ICP shares a common technical language and conceptual framework related to national-level statistical programs supporting the CPI and output of national accounts. The very essence of the ICP is based on comparability of results between countries, strict adherence to time schedules, and a common understanding of data sharing and confidentiality requirements. There is no other statistical program requiring so much cooperation between national, regional and international organizations.
72. The fundamental concept underlying the estimation of PPPs is that the prices of products to be compared are based on the principles of representativity and comparability. The products selected should be simultaneously representative of what each country’s consumers purchase and also have characteristics comparable across countries.
73. For these reasons, the procedure to determine the product specifications was re-engineered by developing the Structured Product Description (SPD) procedure, allowing each region to develop its own specifications, and fully engaging countries in the process.
74. The detailed coding structure of the Eurostat/OECD classification of expenditures on the GDP was integrated with the Classification of Individual Consumption by Purpose (COICOP), which is an international standard adopted by the National Accounts for the compilation and analysis of consumption expenditures.
75. The long-term benefit is that the coding structure will allow a connection between products across ICP rounds. Countries can use it to harmonize the ICP list with their CPI products, thus integrating these activities. Many countries are planning to use the SPD approach to improve their CPI product specifications.
76. A new approach to compare the construction component of the GDP was developed and implemented. The new procedure requires pricing a smaller list of construction components rather than a complete set of building inputs.
27
77. The concepts in the SPD process were used to define specifications for equipment to be priced to improve the equipment comparison. Data collection forms were developed that allow countries to price either the targeted product or an alternate. If neither product was available, the form allowed the country to price something comparable, and then to complete a coding structure defining the product
78. While previous paragraphs provided specific examples where capacity building took place, it also occurs indirectly. The need for countries to agree on a product list brings national-level price statisticians together to agree about how the products should be defined; this can lead to application of the same concepts to their CPIs. Training provided on sampling and survey methods, data validation, and estimation of average prices and PPPs adds to country-level knowledge to improve their price statistics.
79. When countries have to subject their GDP numbers to an international comparison, problems are exposed requiring them to take some action. Problems related to the difficult-to-compare components of the GDP such as housing, government and capital formation are shared across countries, with them jointly sharing knowledge and experience. The ICP Handbook went through several revisions as methodology and procedures evolved to improve the data quality. The final additions to the ICP Tool Pack suite of software to support data collection also contributed to data quality improvements.
28
Chapter 2
Governance and Execution of ICP 2003-2006 1. Chapter 2 of the ICP Handbook looks at the Governance and Operational
arrangements made to ensure the successful execution of the ICP 2003-2006 round. Improvements which build upon experience gleaned through previous rounds are introduced in this chapter.
2. This round marks a turning point in the ICP which aims to resolve problems
encountered in previous rounds, improve the quality of its data and widen the use made of its results. In particular, it builds upon recommendations made both within the 1998 “Ryten Report” on the program, commissioned by the United Nations Statistics Division, the World Bank and the International Monetary Fund (IMF), and by the wider international community and experts. In this way the long-term sustainability of the ICP will be ensured.
3. As already explained in the Preface, the Ryten Report identified the international
community as the main source of funds for the program, reflecting the status of PPP data as an international “public good”. In March 2000, the UN Statistical Commission accepted the report and asked the World Bank, working with other concerned agencies, to prepare an implementation plan. At the next meeting of the UNSC in March 2002, the World Bank presented a strategic framework for taking forward the global program while also establishing an ICP governance framework at the regional and national levels.
4. The rest of this Chapter looks at the arrangements set up for ICP 2003-2006 based on
these frameworks.
Ownership
5. The ICP is a huge and complex statistical undertaking, requiring the cooperation and coordination of a large number of countries with varying abilities and statistical capacity. While efforts to integrate the ICP with existing data collection activities are core to the current round of the program, new and additional work has to take place in most countries to guarantee that data are comprehensive and of high quality. To promote “ownership” of the program within each country and to ensure their commitment, technical application and resource allocation, countries need to see the potential and usefulness of the ICP and purchasing power parity data to their economies, investment markets and well-being of the populace.
Funding
6. A global PPP database that monitors change over time is the goal of the ICP, rather than one-off comparative databases that reflect a single round of the ICP. Thus,
29
funding the ICP requires sufficient resources to set up a secure base for the long-term execution of the program. In previous rounds a project financing basis has been used. For 2003 and onwards program financing has been proposed, whereby costs are shared on an equitable and sustained basis.
7. Previous problems with the ICP have been attributed to a lack of finance, inherent in
many exercises where the output is considered a “public good” with little or no profit to be made from its production. The value of PPP data lies in them being widely disseminated and used and there is little to be gained by limiting their use through extensive charging. Resources need to be raised through a cost-sharing arrangement amongst the international community over the long term.
8. An evaluation of ICP 2003-2006 will be carried out after the publication of final
results. Following this, recommendations for cost-sharing on an on-going basis will be made. As the ICP becomes increasingly integrated with national data collections it is envisaged that the costs for each round will decrease.
Organization and Governance
Rationale 9. The ICP’s success depends on properly run and coordinated operations at the global
level, within regions and in participating countries. Many of the problems arising in previous rounds were attributed to a lack of coordination, responsibility and uniformity of processes worldwide. The governance structure implemented for the current round of the ICP addresses these issues. Since the ICP is a global program that aims to produce consistent and comparable PPP data for all countries, global management must establish standards, provide guidance to the regions, resolve conflicting regional objectives, allocate scarce resources fairly and productively and rule on technical issues that arise naturally from the complexity of the data collected. This requires both wisdom and evenhandedness. Users will place their trust in data quality and methodological excellence if they can be persuaded that a strong management team, accountable to the project’s sponsors and stakeholders, is in charge. Such a team will:
• Coordinate regional efforts while recognizing regional differences; • Develop and promulgate all necessary standards to ensure ICP data
consistency and quality without appearing to micro-manage the project; • Provide technical guidance, training and overall quality control without
interfering in day-to-day management; • Ensure that the project’s management is in firm hands and that foresight
and good judgment are continually exercised; and • Work alongside the OECD/Eurostat teams to ensure coordination with
their exercise and output and take advantage of their expertise.
10. Governance at the regional level will require regional agencies to display a much keener and intimate involvement with national efforts, an involvement comparable to
30

what is already in place in Eurostat and at the OECD whose relations with their respective member countries are intimate and intense. This involvement requires that in addition to providing the necessary regional coordination and technical guidance, regional agencies also provide:
• Venues, support, materials, and guides to ensure that participants are
properly trained in the exercise they are to undertake; • Mechanisms to ensure the participating countries take full ownership of
their portion of the program and play their role professionally and without reservations;
• Effective resource management; and • Clear and thoughtful management and a regular exchange of information
with the global level to support the project’s overall management and direction.
11. Ownership of the project at national level can only be secured if substantial
responsibilities and discretion are handed over to national executing agencies. But such discretion must be tempered by insisting on coherence and consistency with agreed standards, without which the ICP cannot be successfully implemented. Nationally, the ICP must be run by the agency or agencies responsible respectively for national accounts and for price data collection and index number compilation. These interests are not always represented by the same institution. Nonetheless, the success of the ICP demands that they be combined and harmonized in the person of a national coordinator who takes responsibility for organizing the data collection process on prices and expenditure weights and liaising with the regional coordinating agency.
12. If overall governance is to be effective, all levels will need to exercise prudent and
responsible management of their share of the project’s resources. Moreover, that management must be demonstrably transparent and accountable to stakeholders. The governance arrangements in place for the 2003-2006 round will:
• Lead to coordinated activities in all regions and participating countries and
ensure the collection, compilation and dissemination of high quality data in a timely manner;
• Provide for an open and transparent way of deciding on priorities and for allocating resources in a balanced manner to different ICP activities; and
• Ensure that resources are used as efficiently and effectively as possible.
13. The measures adopted include: • Installing and using an effective management system so that all people
working on the program are clear about their roles and responsibilities, what is expected of them and how their performance will be assessed;
• Making sure that stakeholders are kept adequately informed about progress throughout the duration of the project and are warned of surprising outcomes in time to take suitable counter action; and
31
• Keeping bureaucratic requirements to the sensible minimum consistent with the principles of open and transparent governance.
Stakeholders 14. The transparent nature of the governance framework is dictated in part by the
stakeholder constituencies of the ICP which are many and varied. They comprise:
• The international sponsoring agencies (World Bank, IMF, UNDP); • National governments and agencies providing funding (donors, other
funding agencies and foundations); • Current and potential users of the data (international agencies, national
governments, other users) and researchers of PPP methodology; • Participating countries, especially the staff and management of the
implementing agencies; • Regional coordinating offices; • Staff employed by the ICP global and regional offices.
15. Some individuals and agencies may fall into more than one category, but all have
some interest in how the ICP is managed, what progress is being made and how the final results may affect their work or their outlook.
Overview of structure
16. Figure 1 illustrates the structure of governance for the 2003-2006 round of the ICP.
The ICP Executive Board is responsible for the successful implementation of the program. The Global Office, headed by the Global Manager, manages the ICP on a day-to-day basis. It reports to the Executive Board and prepares annual work programs and budgets for its approval. The Technical Advisory Group (TAG) provides guidance on technical issues and monitors the use of appropriate methodology. Regional Coordinating Offices are responsible for setting up the structures required to implement and monitor the program at the regional level. Each regional ICP office is headed by a Regional Coordinator. Within participating countries, the ICP is carried out by a National Implementing Agency, otherwise known as Country Office, headed by a National ICP Coordinator.
The ICP Executive Board
Roles and responsibilities
17. The ICP Executive Board is the decision-making and strategic body of the ICP. As
such it is responsible for ensuring that the program is completed on time, within budget and that it provides high quality PPP data for dissemination. The ICP Executive Board has the following roles and responsibilities:
• Provide leadership and determining strategic priorities; • Promulgate ICP standards; • Approve annual work programs and budgets;
32

• Play a role in resource mobilization; • Oversee the activities of the ICP Global Office on the basis of timely
progress reports; • Commission evaluations of the ICP; • Act to resolve any conflicts both within the program and between the
program and its external environment.
Size and composition 18. The ICP Executive Board is small enough to work as an effective decision-making
body and is sensitive to conflicting perspectives and points of view. It consists of 16 members, who are eminent economists/statisticians and experienced statistical managers. Many are Chief Statisticians or managers of statistical operations with skills and experience of direct relevance to ICP. The Global Manager attends Board meetings, acts as secretary and participates in discussions. At the invitation of the Chair of the ICP Executive Board, members of the Technical Advisory Group may attend meetings to provide technical advice, though it is expected that such attendance will be the exception rather than the general rule.
Appointment of members
19. Members of the Executive Board were initially appointed by the “Friends of the
Chair” group of the United Nations Statistical Commission. Membership of the Board reflects the global nature of the program. The Director of the World Bank’s Development Data Group within the Development Economics Vice-Presidency is an ex-officio Board Member. The Executive Board is able to co-opt new members if and when the need arises, subject to the overall size limit.
Management of business
20. The ICP Executive Board meets physically twice a year, but day to day business is
mostly conducted virtually. It provides leadership and guidance, but it also reviews critically the annual report, work programs and budgets prepared by the Global office before approving them. While the Board is the final authority on matters of policy, personnel, priorities, standards, and timetable for the ICP, it limits its interventions so as not to interfere with the Global Manager’s scope for effective management.
21. The Board rules in matters where there is no consensus regarding methods and
standards and draws on the advice of the Technical Advisory Group whose functions and responsibilities are described below. The Chair is elected by the members.
Reporting and accountability
22. The ICP Executive Board is the key element in the program’s governance structure. It
upholds the program’s integrity and professionalism without which confidence in the quality of its output cannot be regained. The Executive Board is formally responsible for the publication of regular progress reports and for the final dissemination of the PPP data and other results.
33

Technical Advisory Group (TAG)
Status, roles and responsibilities
23. The role of this body is to resolve technical issues comprising conceptual integrity
and methodological adequacy. It carries out two main functions. First, it advises on issues involving the standards, methods and procedures required by the program. These may arise because of disagreements between participants, ambiguities in the procedures and guidelines, or as a result of previously unforeseen circumstances. It provides advice on request from either the Executive Board or the Global Manager. Second, the TAG may propose research or analysis that it believes is necessary if the ICP is to continue evolving in the face of changing circumstances and providing better answers to its users’ concerns.
24. Requests for technical advice coming from regional coordinators is forwarded to
TAG through the Global Manager. To ensure coordination and consistency in technical issues, all requests to and communications from TAG are sent through the Global Manager.
25. The TAG reviews the issues presented to them and takes one of several actions.
• Resolve the issue and submit recommendation to the Global Office; • Assign one of the members to do a more in-depth review of the issue and
provide recommendations to the full membership; or • Recommend to the Global Office a research proposal for additional work
to resolve the issue.
26. The TAG provides an independent assessment of the ICP technical program and advises the Global Office of issues affecting the integrity of the program.
Appointment of members
27. Members of the TAG are appointed by the Executive Board. The TAG is led by a
Chair who is the direct link to the Global Office. The Chair is responsible for documenting the conclusions of the Group, and providing recommendations for additional consultancies if required. Size and composition
28. The Technical Advisory Group’s membership comprises of individual experts in
various topics. After consideration of the range of skills and experience needed to make this group effective, eight members in addition to the Chair are named.
ICP Global Office
Role and location
34

The ICP Global Office is located at the World Bank’s headquarters in Washington DC. Its activities are financed from the ICP Global Trust Fund established at the World Bank and follows World Bank administrative and fiduciary rules and regulations. The Global Office reports, through the ICP Global Manager, to the Director of Development Data Group (DECDG) in the World Bank. On matters related to the execution and implementation of the ICP mission, its policy, programs, priorities and standards, the Global Manager acts within the directives provided by the Executive Board and within the framework of the work programs and budgets approved by the Board.
29. Under the direction of the ICP Global Manager, the Global Office carries out the
day-to-day work required to implement the ICP at the international level. Its functions include:
• Overall coordination and implementation of the ICP; • Preparation of annual budgets and work programs; • Provision of secretariat functions to the Executive Board; • Development of ICP standards to be promulgated by the Board; • Liaison with and technical backstopping for the regional implementing
agencies; • Global data aggregation, analysis and dissemination; • Networking and coordination with TAG and other agencies such as
Eurostat and OECD; • Preparing and distributing quarterly progress reports to the Executive
Board; • Financial management, accounting and reporting.
Size and composition
The Global Office consists of the Global Manager and Deputy Global Manager, supported by a team of professional and administrative staff.
Recruitment and appointment
30. The ICP Global Manager was appointed in November 2002 by the World Bank on the
recommendation of a selection committee chosen by the Friends of the Chair of the UNSC and chaired by the Director, Development Data Group, World Bank. Other staff are recruited in line with World Bank procedures and appointments are made on the basis of an assessment by a selection panel.
Reporting and accountability
31. The Global Office prepares timely progress reports to both the Executive Board and
other interested parties such as the UN SC. The principle is that as far as possible, all reports, once approved, are public documents and are accessible to anyone wishing to inspect them. Accounts of expenditure are kept according to World Bank rules and procedures and all accounts will be subject to an official audit.
35
Overview of regional arrangements
35. The ICP is organized on a regional basis. In each of five regions covering: Africa, Asia and the Pacific, the Commonwealth of Independent States, Latin America and the Caribbean, and Western Asia1, regional coordinating offices take responsibility for the execution of the program and provide the mechanism to coordinate activities and to liaise with participating countries. Regional ICP Offices provide appropriate staffing and other resources to implement and monitor the program at the regional level.
36. The ICP Regional Offices carry out the work required to implement the ICP at the
regional level. Their responsibilities are similar, but not identical, to the ICP Global Office. In particular, the ICP Regional Office under the direction of the Regional Coordinator and in consultation with the Regional Committee:
• Maintain a close relationship with the ICP Global Office including regular
and extensive sharing of information; • Design and implement regional programs, database management,
standards, guidelines and procedures as agreed with the ICP Global Office;
• Coordinate the efforts of the participating countries in the region through the dissemination of information, training, and promoting ICP standards and guidelines, including the use of specialist ICP software;
• Strike a workable compromise with national participants on the list of items (goods and services) to be priced and expenditure weights to be supplied;
• Ensure that all national participants share the same understanding about how prices for comparable and representative items ought to be collected, the circumstances of collection, the outlets from which the prices must be obtained, the standards of recording and documentation, and the overall timetable for the program;
• Ensure that Ring countries carry out their agreed duties; • Provide technical guidance and effective leadership to participating
countries to settle questions, doubts, ambiguities and inconsistencies, where necessary obtaining advice from the Technical Advisory Group through the ICP Global Manager;
• Monitor implementation of the program in order to signal, if necessary, possible delays, budgetary overshoots or major technical flaws to take preventive or remedial action if required;
• Carry out the aggregation of national results to calculate PPP indices and subsequently apply them to GDP expenditure breakdowns for calculating volume measures;
1 For Africa, the African Development Bank; for Latin America and the Caribbean, the United Nations Economic Commission for Latin America and the Caribbean; for Asia, the Asian Development Bank and the United Nations Economic and Social Commission for Asia and the Pacific; for Western Asia, the United Nations Economic and Social Commission for Western Asia; and for the Commonwealth of Independent States, the Statistical Committee of the Commonwealth of Independent States.
36
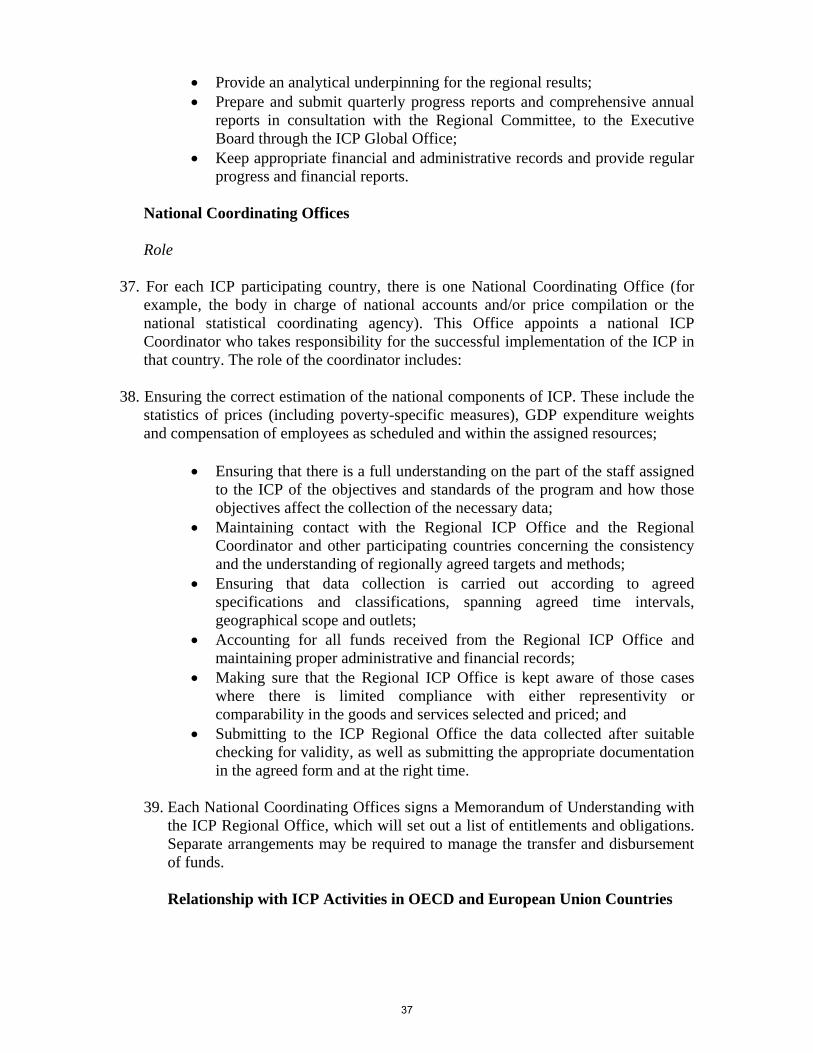
• Provide an analytical underpinning for the regional results; • Prepare and submit quarterly progress reports and comprehensive annual
reports in consultation with the Regional Committee, to the Executive Board through the ICP Global Office;
• Keep appropriate financial and administrative records and provide regular progress and financial reports.
National Coordinating Offices Role
37. For each ICP participating country, there is one National Coordinating Office (for
example, the body in charge of national accounts and/or price compilation or the national statistical coordinating agency). This Office appoints a national ICP Coordinator who takes responsibility for the successful implementation of the ICP in that country. The role of the coordinator includes:
38. Ensuring the correct estimation of the national components of ICP. These include the
statistics of prices (including poverty-specific measures), GDP expenditure weights and compensation of employees as scheduled and within the assigned resources;
• Ensuring that there is a full understanding on the part of the staff assigned
to the ICP of the objectives and standards of the program and how those objectives affect the collection of the necessary data;
• Maintaining contact with the Regional ICP Office and the Regional Coordinator and other participating countries concerning the consistency and the understanding of regionally agreed targets and methods;
• Ensuring that data collection is carried out according to agreed specifications and classifications, spanning agreed time intervals, geographical scope and outlets;
• Accounting for all funds received from the Regional ICP Office and maintaining proper administrative and financial records;
• Making sure that the Regional ICP Office is kept aware of those cases where there is limited compliance with either representivity or comparability in the goods and services selected and priced; and
• Submitting to the ICP Regional Office the data collected after suitable checking for validity, as well as submitting the appropriate documentation in the agreed form and at the right time.
39. Each National Coordinating Offices signs a Memorandum of Understanding with
the ICP Regional Office, which will set out a list of entitlements and obligations. Separate arrangements may be required to manage the transfer and disbursement of funds.
Relationship with ICP Activities in OECD and European Union Countries
37
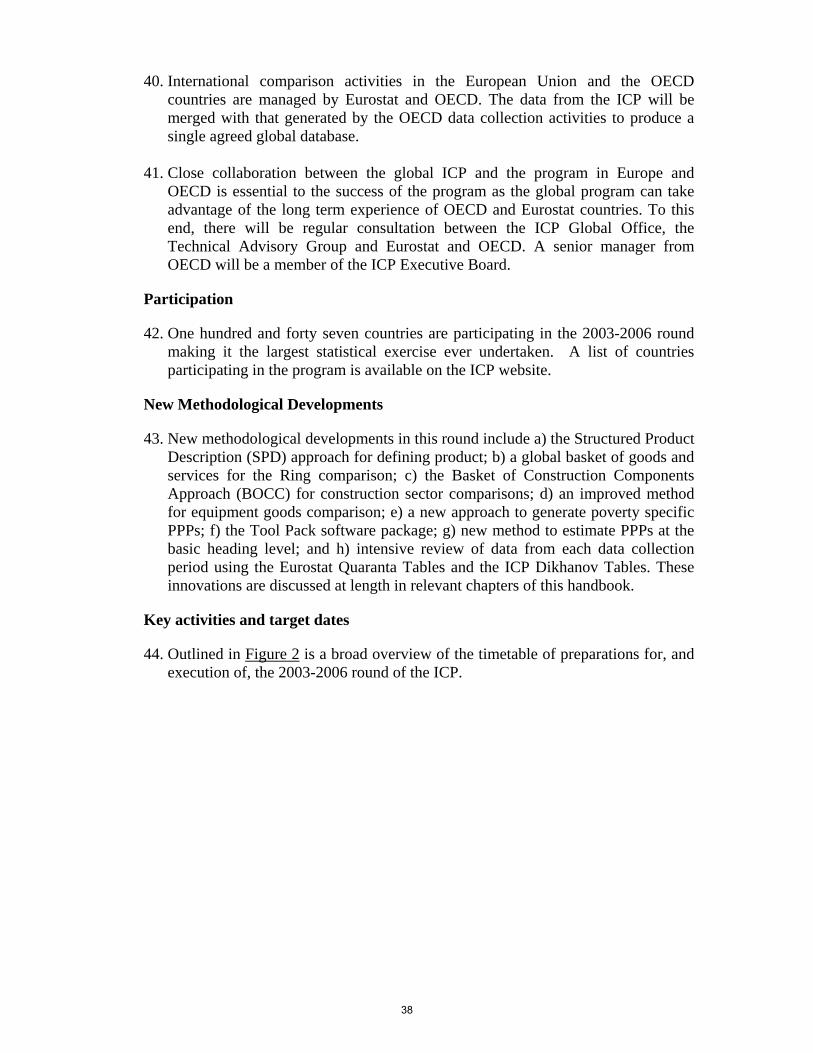
40. International comparison activities in the European Union and the OECD countries are managed by Eurostat and OECD. The data from the ICP will be merged with that generated by the OECD data collection activities to produce a single agreed global database.
41. Close collaboration between the global ICP and the program in Europe and
OECD is essential to the success of the program as the global program can take advantage of the long term experience of OECD and Eurostat countries. To this end, there will be regular consultation between the ICP Global Office, the Technical Advisory Group and Eurostat and OECD. A senior manager from OECD will be a member of the ICP Executive Board.
Participation
42. One hundred and forty seven countries are participating in the 2003-2006 round making it the largest statistical exercise ever undertaken. A list of countries participating in the program is available on the ICP website.
New Methodological Developments
43. New methodological developments in this round include a) the Structured Product Description (SPD) approach for defining product; b) a global basket of goods and services for the Ring comparison; c) the Basket of Construction Components Approach (BOCC) for construction sector comparisons; d) an improved method for equipment goods comparison; e) a new approach to generate poverty specific PPPs; f) the Tool Pack software package; g) new method to estimate PPPs at the basic heading level; and h) intensive review of data from each data collection period using the Eurostat Quaranta Tables and the ICP Dikhanov Tables. These innovations are discussed at length in relevant chapters of this handbook.
Key activities and target dates
44. Outlined in Figure 2 is a broad overview of the timetable of preparations for, and execution of, the 2003-2006 round of the ICP.
38
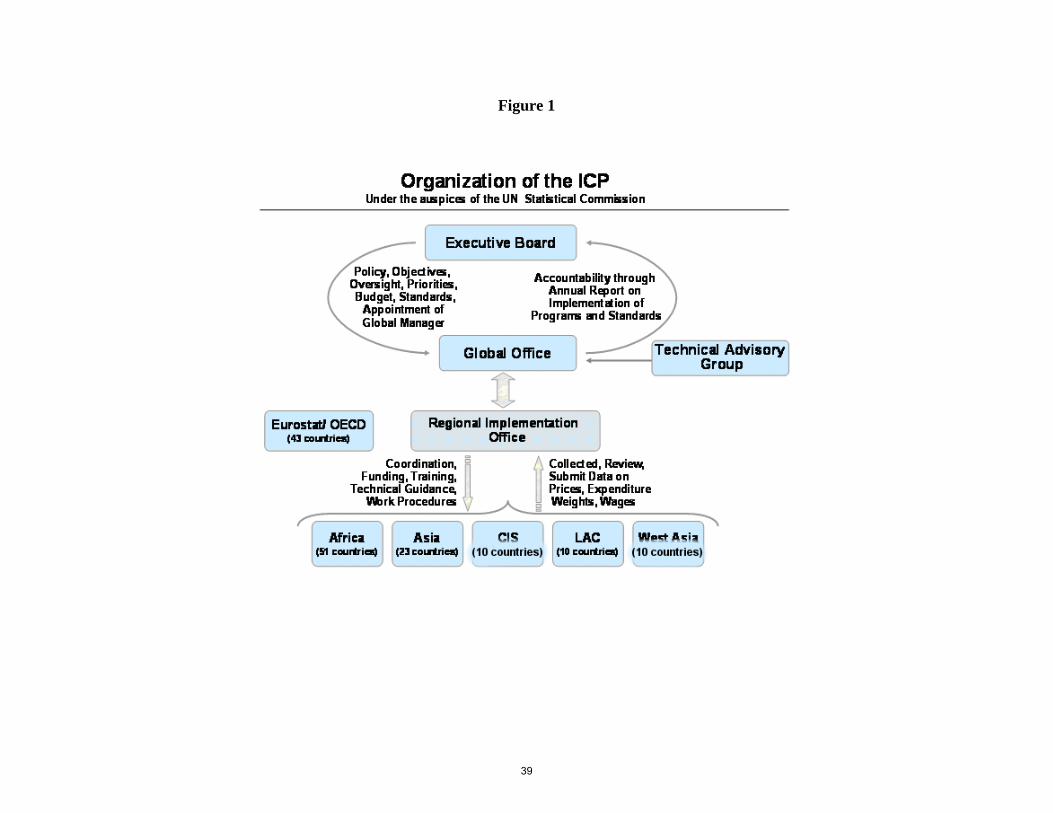
Figure 1
39
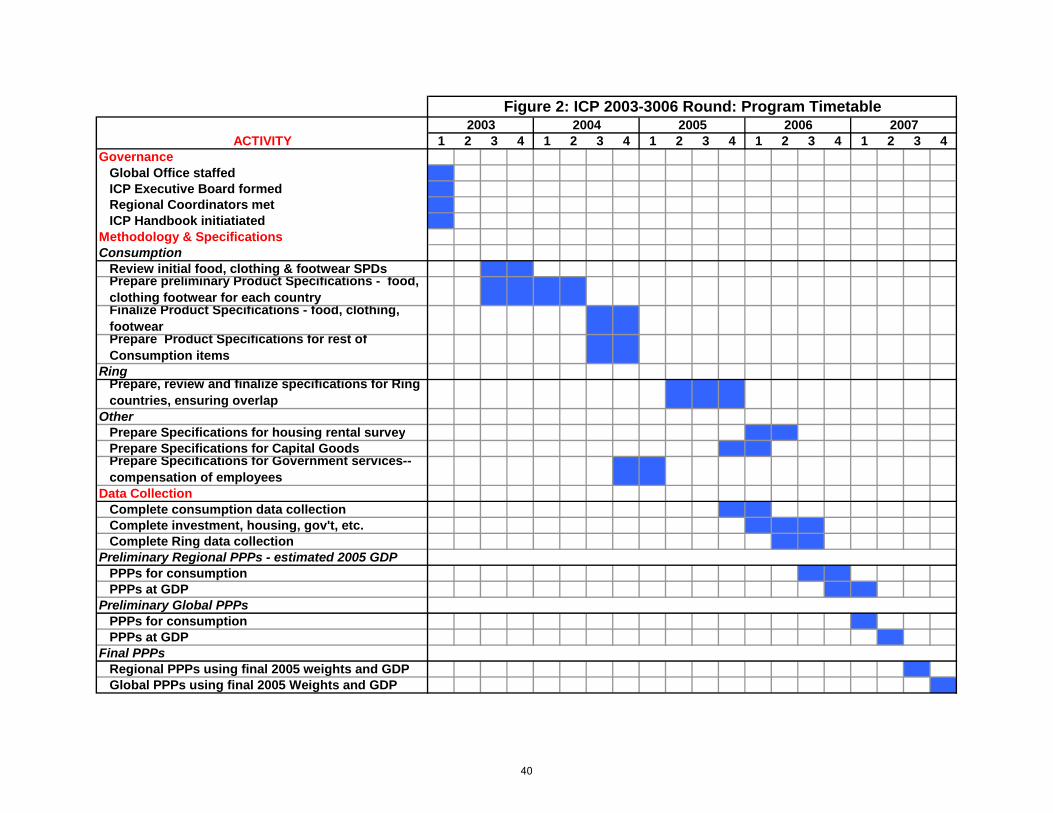
ACTIVITY 1 2 3 4 1 2 3 4 1 2 3 4 1 2 3 4 1 2 3 4Governance
Global Office staffed ICP Executive Board formed Regional Coordinators met ICP Handbook initiatiatedMethodology & SpecificationsConsumption
Review initial food, clothing & footwear SPDsPrepare preliminary Product Specifications - food, clothing footwear for each countryFinalize Product Specifications - food, clothing, footwearPrepare Product Specifications for rest of Consumption items
RingPrepare, review and finalize specifications for Ring countries, ensuring overlap
OtherPrepare Specifications for housing rental surveyPrepare Specifications for Capital GoodsPrepare Specifications for Government services--compensation of employees
Data CollectionComplete consumption data collectionComplete investment, housing, gov't, etc.Complete Ring data collection
Preliminary Regional PPPs - estimated 2005 GDPPPPs for consumptionPPPs at GDP
Preliminary Global PPPsPPPs for consumptionPPPs at GDP
Final PPPsRegional PPPs using final 2005 weights and GDP Global PPPs using final 2005 Weights and GDP
2003Figure 2: ICP 2003-3006 Round: Program Timetable
2004 2005 2006 2007
40
Training of ICP Practitioners
45. The ICP depends on many players from around the globe. Besides the core team within the Global Office at the World Bank in Washington, DC, a wealth of field data collectors, data processors, team managers, statisticians, economists and coordinators are employed in the countries and regions. While many of these have experience of price surveys and data analysis, some aspects of the ICP are new for this round, such as more detailed lists of items to be priced and new software to facilitate this, and thus some training for staff is necessary.
46. Consistent and thorough training of all staff in the techniques required is
fundamental to the program. Activities must be executed in a uniform manner across all countries and regions to ensure that the data collected by each are of the highest quality and compatible with that collated by others. To this end, workshops take place at every level, and are designed to allow a “trickle-down” of consistent information to ICP practitioners. The Global Office provides training to regional coordinators through week-long workshops in a variety of locations held at suitable periods to anticipate forthcoming work. These workshops invite a number of experts to explain procedures for different aspects of the ICP such as price collection and GDP weights and expenditure for example. Training for the development of lists of Specific Product Descriptions for each region has been necessarily intense to ensure the comparability of products priced across the world.
47. Regional Coordinators then pass on this information to National Coordinators
through regional workshops. The execution of the program in the region and individual countries and methods used to ensure consistency both internationally and regionally are discussed.
48. Besides these formal sessions, constant and continuing discussion takes places
between all the coordinators regularly on technical, managerial and conceptual issues. The following section below outlines the strategies in place for this.
Documentation and Communications
49. The complexity of the ICP and the diversity, both geographically and in skills background, of its practitioners calls for robust and transparent documentation and communications.
50. Internet technology allows enhanced and instant communication between
coordinators around the world. It also provides a mechanism for the casual user and the public to keep abreast of progress made on the program and the use of purchasing power parities. A re-designed website (www.worldbank.org/data/icp) for the ICP provides up-to-date information on all topics of interest. The policy for placing material on the global website is to allow transparency whenever possible.
41
51. Advocacy materials in the form of a regular newsletter and brochures have been published to increase the awareness of stakeholders about ICP activities. The quarterly newsletter ‘ICPNews’ is published in Arabic, English, French, Russian and Spanish.
Guidelines and Policies for Data Access, Analysis, and Dissemination
Overview
52. Good data quality is essential to the wide acceptance and use of the ICP and its sustainability. Considerable attention must be given to the determination of what is to be priced, the pricing sources, and data editing to ensure comparable items were priced across countries and unusual or outlier price reports were handled consistently within as well as between countries.
53. One fundamental issue is the application of consistent data editing that provides
robust international data sets. Country statisticians know how to review data from their national surveys and can identify “outliers” and how prices can vary across regions of their country. They are ultimately responsible for the quality of the data and the resulting official estimates and have to defend departures from expected levels. However, the ICP takes data quality to another level that requires data editing, analysis and estimation across countries. A dataset in Country A may contain data that satisfied its domestic edit and analysis requirements and provides consistent measures of change and level over time for that country. However, when compared with Country B’s dataset, price levels for some products may not be comparable for several reasons ranging from interpretation of product definitions to the identification of “international outliers”, i.e. prices that were reasonable from a national sense, but not when viewed across countries.
54. One criticism of previous rounds was that when countries finished data collection
and submitted their results, they were out of the loop as far as any further work was concerned on data aggregation through to dissemination. That added fuel to the belief there was little in the exercise for the countries themselves.
Integration of the ICP with National Statistical Systems
55. Whilst most countries carry out price collection for the calculation of national
consumer price indices, the sophistication of these and the size and diversity of sampling frame used differ widely. The requirements of the ICP in terms of geographic coverage and the number of products to be priced mean that some countries are stretched beyond their normal capacity. In order for the ICP to establish itself as a sustainable and worthwhile program it must integrate with
42
national statistical practices and help to improve them, through statistical capacity building, wherever possible.
56. The Tool-Pack software (see below), designed to facilitate the collection of high-
quality price data on goods and services for the ICP, will also be of use to countries in other data collection exercises, such as consumer price indices. In many developing countries this software will vastly improve on existing methods and provide a much more robust and representative database.
57. Training of local staff in data collection and editing techniques for the ICP will
also help to enhance the skills base of personnel. These techniques can be applied to many surveys and statistical exercises.
58. National statistical systems are driven by the needs of their users. As illustrated
elsewhere in this handbook Purchasing Power Parities are fundamental to establishing and monitoring many poverty alleviation policies, such as those exemplified by countries own Poverty Reduction Strategies and the global Millennium Development Goals. PPP data are also used in economic analyses assessing market and investment potential. They are also used to determine the allocation of funds between regions in the European Union. As the use of PPPs continues to accelerate, the demands of users will be reflected in the investment made by statistical systems in the ICP. The aim of the program is to become fully integrated into the cycle of statistical activities for each country.
New Data Collection Software
59. The ICP Tool-Pack software aims to strengthen key areas of data management, including supporting national price collection efforts, standardizing price collection, permitting data validation, ensuring data collection consistency over time and space, improving data quality and timeliness, and facilitating data analysis. The software allows regional stratification and geographic weighting (including urban and rural). It also has the capability to store and display pictures of products, particularly capital goods, to ensure collectors are recording data on comparable items.
60. Another feature of the software is that it facilitates the calculation of national
average prices for ICP purposes. This significantly reduces the data processing time by allowing primary data processing work to be done at the country level. It also shortens the duration of the regional comparison which will improve the overall timeliness of obtaining data from the ICP. Data collected for national consumer price indices (CPI) which are also suitable for the ICP can be imported directly with minimum alterations in the format of the original data. This would facilitate the integration of CPI and ICP price data.
43
Annex 1
Memorandum of Understanding
Between
The World Bank
And
The African Development Bank
For
Management and Implementation of the
International Comparison Programme in Africa
February 2003-December 2005
I. Background
Under a mandate from the United Nations Statistical Commission (UNSC), the World Bank, in close collaboration with numerous national and international organizations, is preparing to launch a revamped round of the International Comparison Program (ICP) during a 2003 to 2006 timeframe. The ICP is global statistical exercise designed to collect and disseminate purchasing power parity (PPP) data. These data measure and compare the performance of economies throughout the world and the socio-economic status of different groups of people. In particular, PPP data are essential to the management and monitoring of progress made towards the Millennium Development Goals (MDGs). The data are also used by multilateral corporations to determine market sizes and assess investment conditions. In addition, there is a substantial, but as yet largely untapped, demand for the data at the national level to monitor macroeconomic conditions and integration with international markets.
44
Increasing use of PPP data has highlighted longstanding data quality issues. Subsequently, a new ICP strategic framework has been developed through a consultative process, with a remit to improve the methodology and implementation of the ICP exercise, and enhance the quality of its outputs. The UNSC has endorsed this new strategic framework and it has the widespread support of the broader ICP community, including data users and experts.
The framework’s highest priority is the development of price statistics and national accounts: in this respect, it aims at maximizing the synergy between the ICP and domestic statistical programs through national statistical capacity building.
On the organizational front, the framework puts particular emphasis on establishing effective management structures at all three levels: global, regional and national.
As highlighted in the global governance framework2 management and coordination of the ICP is needed at three levels: global, regional and national. Overall coordination and accountability of the global program will be achieved through an Executive Board who will represent the ICP’s main stakeholders, including international organizations, regional agencies, and national statistical offices. It will be responsible for setting out the strategic framework for the global ICP, taking into consideration the statistical needs of regional agencies and countries, and for approving global annual work programs. The Board will be supported by a Secretariat based in the Global Office, located in the World Bank headquarters in Washington D.C, whose role will cover the day-to-day management of the global program, ensuring consistency and data quality in all participating regions and countries, and the preparation of the aforementioned annual work programs.
In keeping with previous ICP rounds, the proposed exercise will be carried out in six independent regions. The regional programs are developed with sufficient flexibility to meet regional statistical priorities and requirements. However, this arrangement is preceded by an understanding that meeting the requirements of the global program is the primary goal of the exercise. The regional ICP work in Africa (ICP-Africa) will be coordinated and managed by the African Development Bank. The data collection and processing work at the country level will be administered by national statistical agencies.
2 International Comparison Programme: Governance Framework, World Bank 2002
45
The ICP is a huge and complex global statistical exercise, involving many players. For it to be a success, the framework for the 2003-2006 round calls for:
(i) effective coordination and management;
(ii) concerted and continuous efforts in resource mobilization;
(iii) standardization of concepts and definitions in data collection;
(iv) harmonization of methodologies in data processing; and
(v) collective commitment to quality assurances.
In support of this, the ICP handbook sets out guidelines for data collection, verification and processing to assist implementation at all levels. In addition, Memorandums of Understanding between the Global Office and each region set out modalities and timetables jointly agreed upon.
II. Summary
This Memorandum is made between the African Development Bank and the World Bank concerning their collaboration for the successful completion of ICP-Africa under the general framework of the ICP. This Memorandum sets out the activities and responsibilities required of the African Development Bank and the World Bank for the ensuing round of the ICP to be implemented during 2003-2006 timeframe, with 2005 as a base year.
III. Roles and Responsibilities of the Global Office and Secretariat
The Global Office and Secretariat will be responsible for the following:
1. Foster regional participation, mobilize resources, and coordinate the global program
• Establish a global ICP office with appropriate staff and resources to implement and monitor the program at the global level;
• Foster participation of different regions, and provide assistance for the recruitment of participating countries;
• Mobilize resources for financing the global coordination component of the program and other contingencies, and assist regional agencies in their fund-raising efforts to cover both regional coordination, and national data collection costs;
46
• Coordinate the overall ICP work across regions, including promoting minimum standards for regional programs, and ensuring a timely global comparison;
• Determine data collection, analysis, aggregation and dissemination timetables in collaboration with regional organizations;
• Prepare and submit global quarterly progress reports and a comprehensive annual status report to the ICP Executive Board with input from regional agencies;
• Keep appropriate financial and administrative records and provide regular progress and financial reports to the ICP Executive Board; and
• Provide secretarial support to the ICP Executive Board and the ICP Council.
2. Conduct research and establish standards for data collection and aggregation procedures
• Conduct research in close consultation with the Technical Advisory Group, an independent panel established to provide guidance on technical issues and to monitor the use of appropriate methodology (see International Comparison Programme: Governance Framework);
• Develop and promulgate all necessary standards to ensure ICP data consistency and quality, including standards for product definition, price collection and verification, and data processing and aggregation through the preparation of ICP Handbook;
• Provide comprehensive and integrated software for price collection, data analysis and aggregation in six languages, including English, French and Portuguese;
• Ensure the regional coordinator and staff receive training in the preparation of product lists, price collection, data analysis and aggregation; and
• Coordinate communications regarding technical issues between the Technical Advisory Group, and the regional coordinating agencies, as specified in the global governing draft;
3. Establish international data sharing and dissemination procedures
• Provide guidelines and policies on data sharing between countries within a region, between countries and the regional office, and between the regional office and the Global Office; See Appendix A.
47
• Ensure reasonable adherence to the internationally recommended standards in respect of the presentation of ICP results before they are made public for their final use.
4. Link regional results and produce global PPPs and reports
• Ensure the development of an effective bridging methodology for linking the African regional comparison to the work undertaken at the international level, and to the similar work undertaken elsewhere on a regional or sub-regional basis;
• Identify the inter-regional link (ring) countries, prepare their product lists, and coordinate this collection effort with the various regional programs;
• Assist the African Development Bank in preparing harmonized survey guidelines and the list of core commodities for regional linking;
• Establish reporting requirements between the regional and global offices;
• Link regional results and compile global PPPs;
• Prepare and disseminate a global report; and
• Promote the uses of the data for policy-oriented analysis.
IV. Roles and responsibilities of the regional agency
As the regional administrator for Africa, the African Development Bank, in collaboration with the Global Office, will handle daily operational matters, including coordination, project development, preparation and implementation of the regional comparison. The key tasks of the regional coordinating body are as follows:
1. Foster country participation, mobilize resources, and coordinate the national programs
• Establish a regional ICP office with appropriate staff and resources to implement and monitor the program at the regional level;
• Recruit countries to take part in ICP-Africa, and coordinate the efforts of the participating countries through information sharing, training, assistance, and ensure that global ICP standards and timetables are met;
48
• Mobilize resources to finance the regional coordination component of the program and to provide financial support to countries to help cover data collection and processing costs;
• Prepare timetables of activities and due dates for participating countries and establish monitoring criteria to signal possible delays, budget shortfalls, or technical issues requiring attention.
• Organize and conduct regional workshops;
• Provide venues, support, materials, and guides to ensure that participants are properly trained;
• Help participating countries to design their ICP plan of action, which will include the benchmark comparison tasks and follow-up activities deemed necessary to ensure the sustainability of the ICP;
2. Provide mechanisms to ensure countries take full ownership of the program
• Form regional committees, representing all stakeholders, in order to fully involve participating countries in the management of the ICP, to ensure that effective communication takes place, to promote the use of the ICP and to guide the dissemination of the results;
• Keep appropriate financial and administrative records and provide regular progress and financial reports to the Regional Governing Board and the Global Office;
• Provide secretarial support to the Regional Governing Board;
3. Ensure countries observe standard data collection and processing guidelines established by the Global Office
• Develop a list of regional classifications maintaining adequate overlaps with other regions;
• Ensure uniform standards in the participating countries, regarding comparable and representative items, price collection and outlets from where they are obtained, recording and documentation, and the overall timetable for the program;
• Assist countries in the adoption of survey methods and compilation of average prices and GDP expenditure weights;
• Supervise all technical and managerial aspects of the regional program;
49
4. Establish international data sharing and dissemination procedures
• Ensure that the data sharing procedures established by the Global Office are observed per Appendix A
• Ensure reasonable adherence to the internationally recommended standards in the presentation of the ICP results before they are made public for their final use.
5. Liaise with the global coordinator and the other regional coordinators
• Liaise with the global coordinator and the other regional coordinators on a continuous basis to share information and best practices, and meet annually to discuss any outstanding issues;
• Provide effective management and a regular exchange of technical information with the Global Office to support the project’s overall management and direction;
• Inform the Global Office of technical matters requiring the attention of the Technical Advisory Group;
• Prepare and submit regional quarterly progress reports and a comprehensive annual status report to the Global Office with input from national agencies.
6. Compile regional PPPs and prepare analysis of the data and reports
• Process and analyze data from each country and calculate regional PPPs;
• Publish and disseminate the report; and
• Promote policy-oriented uses of the data.
V. Timeframe and Work Programs
This Memorandum will continue from the date of signature until December 31, 2005. It is understood that additional areas of collaboration may be identified during the lifetime of this Memorandum and successive activities would be supported by a more specific activity agreement that would be signed by both parties to this Memorandum.
50
VI. Other Parties
Other Parties may join this collaboration and can be signatories to a revised form of this Memorandum provided that the original signatories consent.
VIII. Implementation
The individuals with overall responsibility for implementation of this Memorandum of Understanding are:
For the Bank
For the AfDB
IX. Termination
This Memorandum may be modified at any time by joint agreement of the parties. It shall remain in effect until the global aggregates and PPPs have been published.
Signatures
World Bank
African Development Bank
Chairman, ICP Executive Board
51
Annex 2 Requirements for Participation in the International Comparison Program Overview: The International Comparison Program has unique features that set it apart from other international statistical endeavors — a country cannot compute a Purchasing Power Parity (PPP) by itself. A second feature of the program is that it cannot produce a satisfactory outcome unless all countries and regions that take part in it adhere to the same methodology and procedures. A third feature, which is often neglected, is that the program cannot yield satisfactory results unless all participants are convinced that their neighbor has abided by general agreements regarding the probity of the data an d the professionalism with which it has been estimated. An extensive review of the shortcomings and problems that damaged severely the results of the previous round singled out the following:
• Inflexible list of items to price • Insufficient documentation • Lack of standards and procedures • Distrust among countries, regions, and Global coordinators.
The governance structure and procedures put into place for this round were designed to address these problems. Countries took part in the preparation of the product specifications and jointly agreed upon the content of the list to be priced and the collection timetable. ICP Handbook and operational manuals were written documenting standards and procedures developed by international experts and guided by a Technical Advisory Group. The roles and responsibilities of the national, regional, and global coordinators are also described. The material in these manuals has been reviewed and accepted by the regional coordinators. The ICP’s governance structure ranging from the countries, to the regions, to the Global Office was implemented under the auspices of an Executive Board fully conscious of the need to establish mutual trust. Trust is built on the principle of transparency. Transparency requires that countries within a region be given the opportunity to see the average prices submitted by each other and be able to make sure that the same products were priced, the selection and coverage of outlets, is sufficiently comparable, etc. Beyond inter-country transparency, each regional coordinator needs to see and understand the average prices estimated by other regions to ensure they are following the same methodology and collection principles so as not to bias the global comparison that marks the conclusion of the ICP. The Global Office was created to ensure that regional activities take place in the context of a transparent process built upon trust and to take ultimate responsibility for the quality of the final data. But it can only do so effectively if it can review the regional data for internal consistency and overall quality while data collection is underway and once it is completed.
52
Although participation in the ICP is entirely voluntary, all ICP partners became committed to the basic principles once they agreed to participate. Once a country has decided to take part, it cannot hold the overall program hostage by opting out on any of the necessary principles upon which the success of the program depends. The following paragraphs summarize the basic requirements for countries and regions as a whole since they are part of the global comparison. Countries: A minimum of two quarters of data collection preceded by substantial pilot surveys is required. Where countries started data collection at mid year and are collecting data monthly, July should be considered to be the pilot survey period. Exceptions are for goods and services the prices of which have known seasonal fluctuations. Their prices will have to be captured both in the on and the off seasons. As well in cases such as housing and government, it is sufficient to conduct data collection once, so long as it can be shown that the data were collected in accordance with the established and agreed methodology Data collection can be limited to the Capital City and surrounding area if auxiliary data (such as expenditure weights and prices derived from the CPI, for example) are available to extrapolate the ICP data to national averages. It is preferable that countries provide individual price observations to the regional coordinator. If countries cannot provide individual price observations because of confidentiality requirements, average prices by item must be provided to the regional coordinator for the preliminary regional reviews accompanied by the following statistical measures:
• Number of price observations • Variance coefficient • Representativity indicator
Final national annual average prices must be provided to the regional coordinator at the end of the data collection process with the above statistical measures. For purposes of the ICP, each country’s Gross Domestic Product will be subdivided into the 155 basic headings for each of which price data will be provided. Each country will participate in the review of national submissions and regional results by inspecting the corresponding Quaranta tables and detailed PPPs. After an appropriate review countries will sign off on the results of these reviews. In other words, a country cannot wait to the end of the exercise to decide whether or not its PPPs will be published. Regions:
53

Regions must hold at least two preliminary data review workshops to be scheduled after each cycle of data collection. These workshops must include all participating countries and engage in detailed data analysis based on Quaranta tables (example below). There will regional workshops organized by the Global Office. Prior to each workshop each region will submit preliminary average prices, variance coefficients, and number of observations by item by basic heading by country to the Global Office. Final national annual average prices, variance coefficients, and number of observations by item, by basic heading, by country will be submitted to the Global Office at the end of data collection. General rules The Global Office will only allow authorized access to its data base according to the modalities of access as previously agreed with the countries and regions taking part in the ICP. Basic heading parities will be computed using the CPRD method. This is the methodology adopted for the calculation of basic parities that in turn will underlie the calculation of official results. This in no way preempts the calculation for analytical purposes of results using alternative approaches. The methodologies adopted respectively for the collection of prices for housing, construction, government and equipment are those that have been reviewed and endorsed by TAG. Deviations from these methodologies require approval from the Global Office. Individual price observations resulting from the Ring country data collection will be submitted to the Global Office.
54
Chapter 3
GDP and the Main Expenditure Aggregates Introduction 1. Countries participating in ICP 2003-2006 will be required to provide a very detailed
breakdown of the final expenditure categories of Gross Domestic Product (GDP). The Classification of Expenditure on GDP, which provides the guidelines for classifying expenditure for this round, is on the ICP website: www.worldbank.org/data/icp. This classification, from here on referred to as the Expenditure Classification, contains 155 detailed expenditure sub-classes or Basic Headings. A detailed breakdown is needed to provide the weights that are used to calculate PPPs for expenditure aggregates above the level of the Basic Heading. The prices of goods and services that account for large shares in final expenditure must be given more importance in calculating the aggregate PPPs than prices of goods and services that have only small shares.
2. The purposes of this Chapter are to:
• Define the final expenditure components of GDP and explain the prices used to value them;
• Introduce the classifications to be used for the different expenditure components; and
• Describe the data sources commonly used to break down final expenditures in the necessary detail.
3. In particular, this Chapter covers:
The main aggregates, their definition and their valuation GDP and the main final expenditure aggregates (paragraph 9) Individual versus collective consumption (paragraph 10) Individual consumption expenditure by households (paragraph 14) Individual consumption expenditure by NPISHs (paragraph 17) Individual consumption expenditure by government (paragraph 22) Collective consumption expenditure by government (paragraph 25) Gross fixed capital formation (paragraph 27) Change in inventories (paragraph 30) Acquisitions less disposals of valuables (paragraph 33) Exports of goods and services (plus) (paragraph 36) Imports of goods and services (minus) (paragraph 37) Valuation (paragraph 38)
55
Classifications The Classification of Expenditure on GDP (paragraph 56) Regional versions of the Expenditure Classification (paragraph 66) Basic Headings (paragraph 71) Government final consumption expenditure (paragraph 78) Data sources Introduction (paragraph 80) Individual consumption expenditure by households (paragraph 85) Individual and collective consumption expenditure by government (paragraph 98) Individual consumption expenditure by NPISHs (paragraph 99) Gross fixed capital formation (paragraph 100) Change in inventories (paragraph 101) Fallback procedures (paragraph 102) The need for timely expenditure data to calculate PPPs (paragraph 104) 4. The expenditure weights have to be supplied by the national accounts experts in
each participating country, but this is not the only contribution that the national accounts experts are required to make to the ICP. A main purpose of the ICP is to generate measures of final expenditure on GDP that can be compared across countries and these comparisons will be made in terms of the expenditure components of GDP provided by the national accounts experts in participating countries. Another important link between the national accounts and the ICP concerns the price data because the prices reported by the participating countries must be strictly consistent with the prices underlying the national accounts. To an important extent, therefore, the success of the ICP 2003-2006 round depends not only on the quality and relevance of the price data that are fed into the PPP calculations but also on the quality of the underlying national accounts estimates. Participation in the ICP 2003-2006 round will be a collective undertaking in which price statisticians and national accounts experts play equal roles.
5. This chapter describes the expenditure components of GDP strictly according to the 1993 System of National Accounts1 (1993 SNA). The ICP organizers recognize that many countries are not yet able to implement the 1993 SNA in all details. Participating countries are not required to make a special set of “SNA-consistent” GDP estimates for the 2004 reference year. The expenditure statistics supplied by countries should be consistent with each country’s regular, official annual
•
1. System of National Accounts 1993, Commission of the European Communities, International Monetary Fund, Organisation for Economic Co-operation and Development, United Nations, World Bank, 1993. The System of National Accounts 1993 is here abbreviated to 1993 SNA. Note that the European System of Accounts 1995, (Eurostat, Luxembourg, 1996.) is fully consistent with the 1993 SNA. Reference to the 1993 SNA applies equally to the 1995 ESA.
56
estimates of GDP. These should respect the SNA guidelines as far as possible but they may be deficient in minor respects. Differences from the 1993 SNA can be considered minor if they do not seriously affect the level and growth rate of total GDP or the relative shares of household consumption, government consumption and capital formation.
6. One of the main objectives of the ICP 2003-2006 round is to compare real GDP across all participating countries. For these comparisons to be meaningful it is essential that the GDP estimates provided by participating countries for the reference year should cover the full range of economic activities and transactions that are included in the national accounts “production boundary.” In particular, the national accounts must cover the following:
• Consumption of crops and livestock products that households have produced for themselves.
• Food, clothing and household goods sold by street traders or in village markets.
• Goods and services that are provided to households by “informal” or “unregistered” producers. Examples here may include food and drinks sold on the street by itinerant vendors; services of unregistered taxi drivers; plumbing, electrical and other household maintenance services; house-cleaning and child-minding; private teaching lessons; and personal services such as hair-cutting and shoe-cleaning.
• Goods that have been smuggled into the country from abroad without payment of customs duties and without being recorded in the foreign trade statistics.
• All government expenditures, including expenditures on the military forces, expenditures by municipal and local authorities, and expenditures by the head of state.
• Dwellings that people build for themselves. These may be constructed with traditional materials such as sun-baked rather than fired bricks and with palm-fronds and similar thatching materials. They nevertheless constitute gross fixed capital formation and they also provide dwelling services to the owner-occupiers which are included in household consumption.
7. Not all of these items are necessarily important in all countries, but the national accounts statisticians must carefully review their basic source data to ensure that, if they are significant, they are adequately covered in the estimates of final expenditure on the GDP.
57
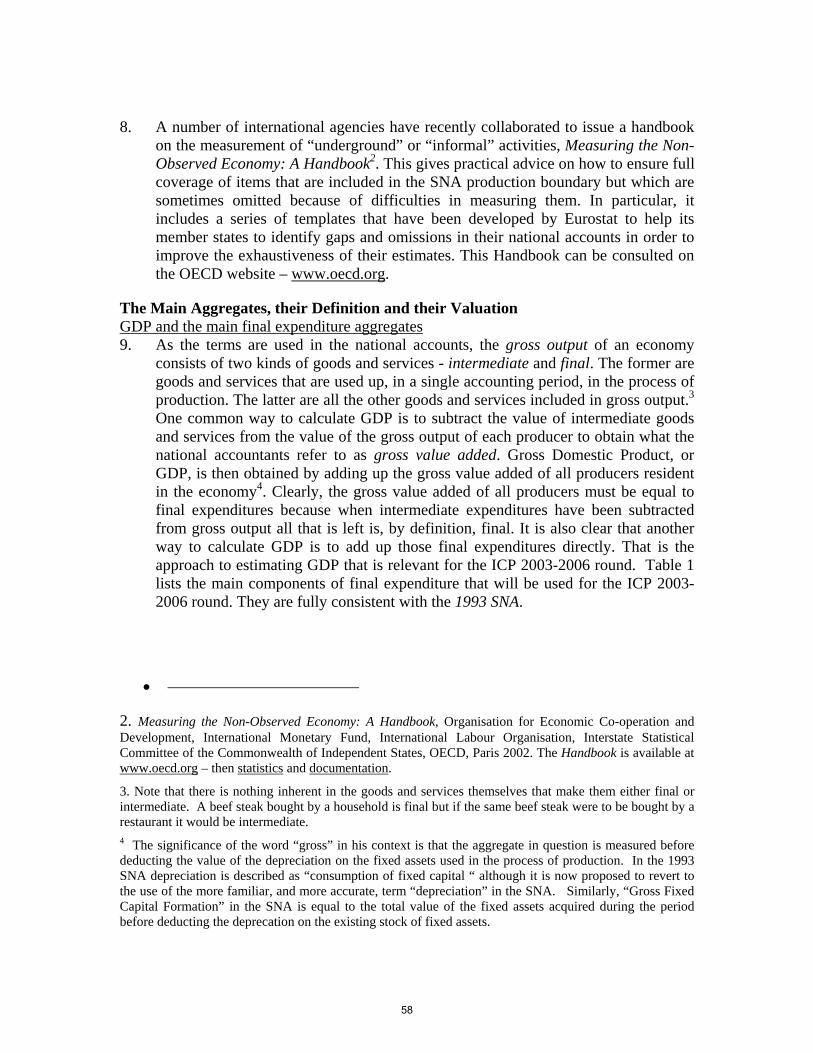
8. A number of international agencies have recently collaborated to issue a handbook on the measurement of “underground” or “informal” activities, Measuring the Non-Observed Economy: A Handbook2. This gives practical advice on how to ensure full coverage of items that are included in the SNA production boundary but which are sometimes omitted because of difficulties in measuring them. In particular, it includes a series of templates that have been developed by Eurostat to help its member states to identify gaps and omissions in their national accounts in order to improve the exhaustiveness of their estimates. This Handbook can be consulted on the OECD website – www.oecd.org.
The Main Aggregates, their Definition and their Valuation GDP and the main final expenditure aggregates 9. As the terms are used in the national accounts, the gross output of an economy
consists of two kinds of goods and services - intermediate and final. The former are goods and services that are used up, in a single accounting period, in the process of production. The latter are all the other goods and services included in gross output.3 One common way to calculate GDP is to subtract the value of intermediate goods and services from the value of the gross output of each producer to obtain what the national accountants refer to as gross value added. Gross Domestic Product, or GDP, is then obtained by adding up the gross value added of all producers resident in the economy4. Clearly, the gross value added of all producers must be equal to final expenditures because when intermediate expenditures have been subtracted from gross output all that is left is, by definition, final. It is also clear that another way to calculate GDP is to add up those final expenditures directly. That is the approach to estimating GDP that is relevant for the ICP 2003-2006 round. Table 1 lists the main components of final expenditure that will be used for the ICP 2003-2006 round. They are fully consistent with the 1993 SNA.
•
2. Measuring the Non-Observed Economy: A Handbook, Organisation for Economic Co-operation and Development, International Monetary Fund, International Labour Organisation, Interstate Statistical Committee of the Commonwealth of Independent States, OECD, Paris 2002. The Handbook is available at www.oecd.org – then statistics and documentation.
3. Note that there is nothing inherent in the goods and services themselves that make them either final or intermediate. A beef steak bought by a household is final but if the same beef steak were to be bought by a restaurant it would be intermediate. 4 The significance of the word “gross” in his context is that the aggregate in question is measured before deducting the value of the depreciation on the fixed assets used in the process of production. In the 1993 SNA depreciation is described as “consumption of fixed capital “ although it is now proposed to revert to the use of the more familiar, and more accurate, term “depreciation” in the SNA. Similarly, “Gross Fixed Capital Formation” in the SNA is equal to the total value of the fixed assets acquired during the period before deducting the deprecation on the existing stock of fixed assets.
58
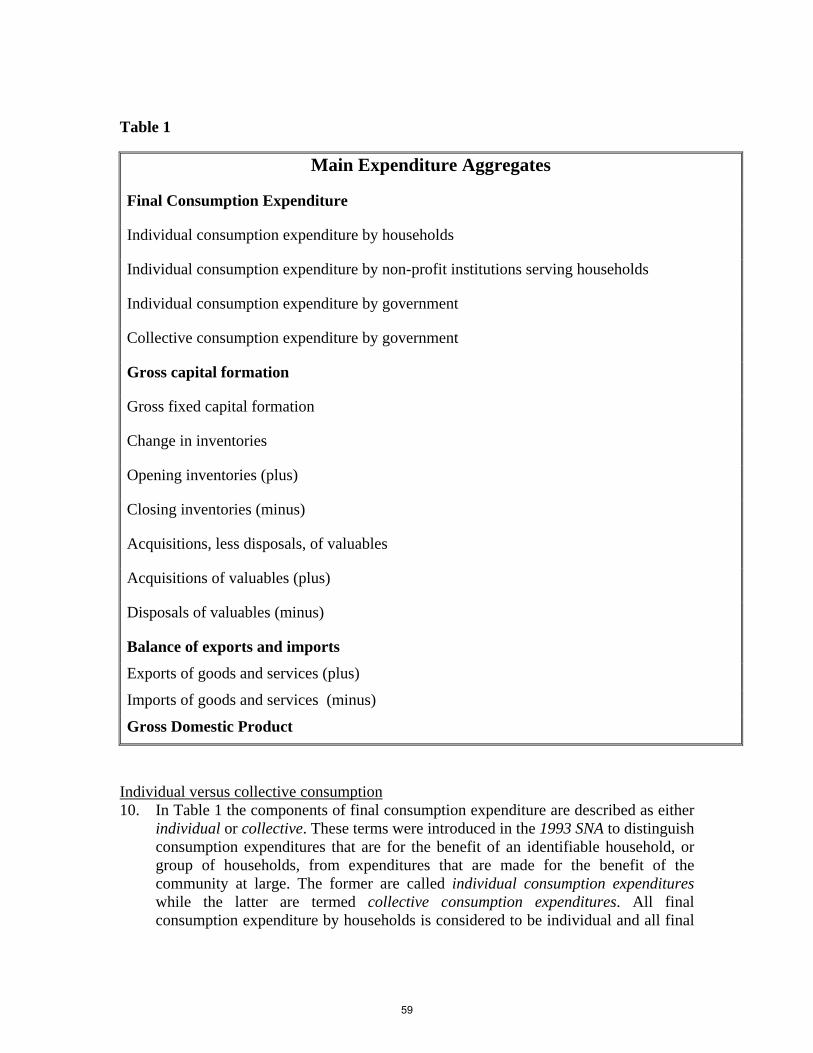
Table 1
Main Expenditure Aggregates
Final Consumption Expenditure
Individual consumption expenditure by households
Individual consumption expenditure by non-profit institutions serving households
Individual consumption expenditure by government
Collective consumption expenditure by government
Gross capital formation
Gross fixed capital formation
Change in inventories
Opening inventories (plus)
Closing inventories (minus)
Acquisitions, less disposals, of valuables
Acquisitions of valuables (plus)
Disposals of valuables (minus)
Balance of exports and imports
Exports of goods and services (plus)
Imports of goods and services (minus)
Gross Domestic Product
Individual versus collective consumption 10. In Table 1 the components of final consumption expenditure are described as either
individual or collective. These terms were introduced in the 1993 SNA to distinguish consumption expenditures that are for the benefit of an identifiable household, or group of households, from expenditures that are made for the benefit of the community at large. The former are called individual consumption expenditures while the latter are termed collective consumption expenditures. All final consumption expenditure by households is considered to be individual and all final
59
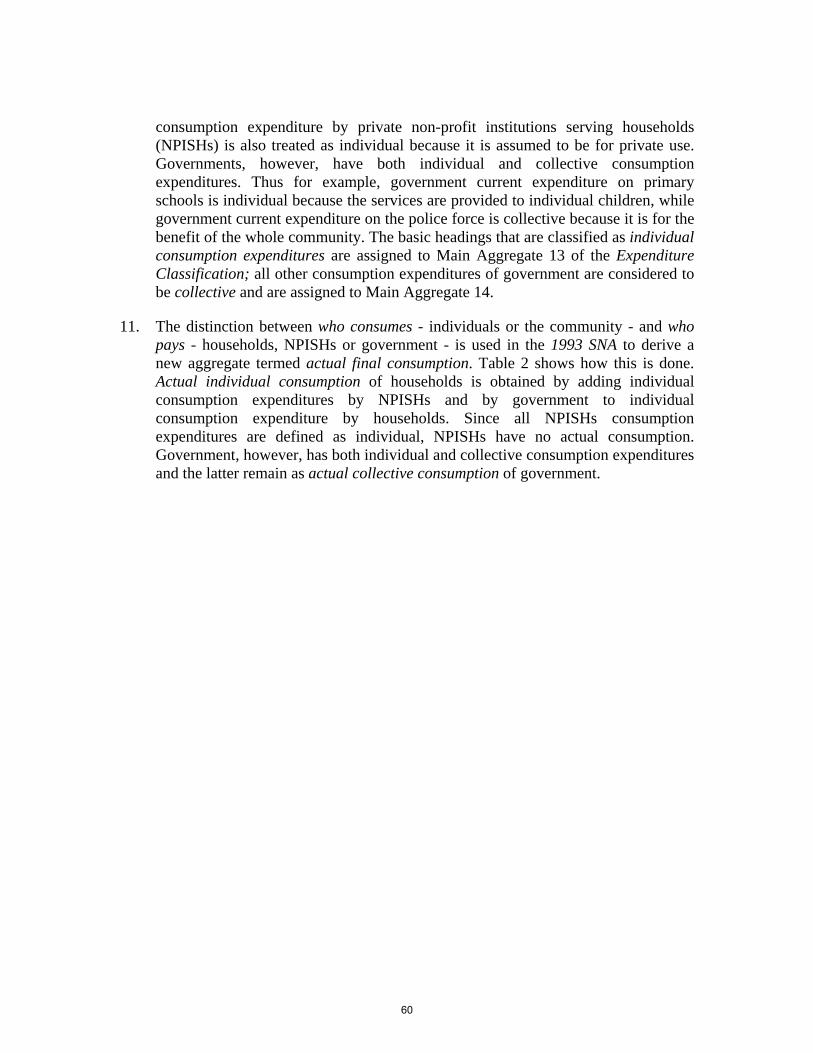
consumption expenditure by private non-profit institutions serving households (NPISHs) is also treated as individual because it is assumed to be for private use. Governments, however, have both individual and collective consumption expenditures. Thus for example, government current expenditure on primary schools is individual because the services are provided to individual children, while government current expenditure on the police force is collective because it is for the benefit of the whole community. The basic headings that are classified as individual consumption expenditures are assigned to Main Aggregate 13 of the Expenditure Classification; all other consumption expenditures of government are considered to be collective and are assigned to Main Aggregate 14.
11. The distinction between who consumes - individuals or the community - and who pays - households, NPISHs or government - is used in the 1993 SNA to derive a new aggregate termed actual final consumption. Table 2 shows how this is done. Actual individual consumption of households is obtained by adding individual consumption expenditures by NPISHs and by government to individual consumption expenditure by households. Since all NPISHs consumption expenditures are defined as individual, NPISHs have no actual consumption. Government, however, has both individual and collective consumption expenditures and the latter remain as actual collective consumption of government.
60
Table 2
Moving from final consumption expenditure to actual final consumption
Final consumption expenditure Actual final consumption
Households Individual consumption expenditure by households
Actual individual consumption
equals individual consumption expenditure by households,
plus individual consumption expenditure by NPISHs
plus individual consumption expenditure by government
NPISHs Individual consumption expenditure by NPISHs
None
Government Individual consumption expenditure by government
Collective consumption expenditure by government
Actual collective consumption
equals collective consumption expenditure by government
12. In international comparisons it is customary to use the concept of actual final consumption and not that of final consumption expenditure when presenting the results of the comparison. In other words, the PPPs and the associated price and volume indices will be calculated for the aggregates shown in the third column of Table 2. This is done because there are differences between countries in the relative importance of individual consumption expenditures by NPISHs and, especially, by government. For example, in some countries, the government provides most health and education services and so they are included in final consumption expenditure by government. In other countries, households purchase most health and education services from market producers - and so they are included in final consumption expenditure by households. If ICP 2003-2006 were to use the expenditure concept, it would give misleading comparisons of the volumes of the different kinds of goods and services actually being consumed by households in different countries.
13. Note, however, that countries participating in ICP 2003-2006 will be required to provide final consumption expenditures as listed in the second column of Table 2. The ICP coordinators, in collaboration with the national statisticians, will make the conversion from final consumption expenditure to actual final consumption.
61
Individual consumption expenditure by households 14. This is the largest final expenditure component of the GDP. It covers:
• The purchases of goods and services that people need for daily living – food, clothing, consumer durable goods, rent, transport, personal services and so on;
• Payments for goods and services that are provided by government or NPISHs at low (“not economically significant”5) prices; and
• Wages paid to domestic servants including food and other goods provided to them as part of their compensation.
15. Individual consumption expenditure by households includes a number of imputed expenditures. These are “expenditures” that did not actually take place but for which values are assigned – or “imputed” – in order to improve comparability between countries. The imputations are:
• Imputed rents of owner-occupiers. People who live in their own dwellings are regarded as selling dwelling services to themselves. Expenditures on rents are therefore estimated both for those who really do pay rents to the owners of their dwellings and for those who own their own houses or apartments. In most countries, this is the most important imputation included in individual consumption expenditure by households.
• Consumption of own-produced goods. Persons who consume goods that they have produced themselves are considered to be selling the goods to themselves. The most important examples are crops and livestock products that farmers produce for themselves and their families. In some countries, beer, wines, spirits, textiles, pottery, furniture and farm tools may also be produced for own-consumption in significant quantities. Note that, by convention, imputations are made only for goods. With the exception of dwelling services produced by owner occupiers, no imputations are made for any of the other services such as cooking, child care and cleaning services that are produced and consumed within households.
• Income in kind. Employees may receive goods and services free or at very low prices as part of their compensation. For example, railway workers often have the right to free train travel, coal miners may receive a regular ration of coal, and members of the armed forces usually get meals free. In the national accounts, goods and services provided as income-in-kind are
•
5. See paragraph 15 below for a definition of “economically significant.”
62
part of compensation of employees, and the same amount is included in individual consumption expenditure by households.
• Financial services indirectly measured. (FISIM). Banks usually provide their clients with some services free or at prices below their cost of production and cover the rest of the costs of production by charging higher interest on loans than they pay on deposits. These services are referred to as “FISIM” in the 1993 SNA and are measured by the difference between interest received on loans and the interest paid on deposits. The SNA recommends that FISIM should be shown as an imputed expenditure by the sector that benefits from the free services. Households are one of these sectors so that in countries that follow this recommendation, FISIM will be an imputed component of individual final expenditure by households.
• Barter transactions. Barter is the exchange of goods or services for other goods and services without money changing hands. In principle, final consumption expenditure by households should include barter transactions.
16. Individual consumption expenditure by households refers to expenditures by resident households. This means that it includes purchases of goods and services by resident households when they are traveling abroad (direct purchases abroad) and excludes purchases of goods and services in the domestic market by non-resident households (direct purchases in the domestic market). In practice, it is usually impossible to include direct purchases abroad and to exclude direct purchases in the domestic market for the detailed expenditure estimates. For the ICP 2003-2006 round, therefore, weights for basic headings will cover expenditures in the domestic market by both resident and non-resident households and will exclude purchases by resident households abroad. A one-line adjustment for net purchases abroad (total direct purchases abroad less total direct purchases in the domestic market) is then made to individual consumption expenditure of households to obtain the correct total.
Individual consumption expenditure by NPISHs 17. NPISHs are institutional units that have been set up by a group of households to
provide services, and occasionally goods, on a non-profit basis. There are two special features of NPISHs:
18. First, they provide their services (and sometimes goods) on a non-market basis. Non-market means that the services or goods are provided free or at prices that are not “economically significant”, that is at prices which do not have a significant influence on the amounts that producers are willing to supply or on the amounts that purchasers wish to buy. A convenient rule of thumb for identifying whether a price is “economically significant” is whether the price covers more than half of the normal cost of production. If it does not, the prices are considered to be not
63
economically significant and so the service or good is being provided on a non-market basis.
19. Second, they are mainly financed by donations or regular subscriptions from households. NPISHs may also finance part of their operations from interest and dividends earned on investments made from donations and subscriptions from an earlier period, and they may also receive some funds from government or from enterprises. The important point is that households – rather than government or enterprises - provide the main financial support for NPISHs.
20. There are two kinds of NPISHs. There are those that are created by associations of persons to provide services (and possibly goods) for the benefit of the members themselves. Common examples are political parties, trade unions, sporting, cultural and recreational cubs and religious organizations. Note that religious organizations also cover schools, clinics and hospitals run by religious organizations as well as mosques, churches, temples and other places of worship. A second group consists of charities, relief and aid agencies that are created for philanthropic purposes rather than to provide services to the members financing the NPISHs. Their resources may come from foreign as well as domestic sources. If externally funded NPISHs – such as UNICEF, OXFAM, Médécins sans Frontières, the Red Crescent - are expected to operate in a country for more than twelve months, they become resident NPISHs for national accounts purposes.
21. All expenditures by NPISHs are considered to be of benefit to individual households and are, therefore, defined as individual consumption expenditures.
Individual consumption expenditure by government 22. In most countries, there are several different levels of government, such as
municipal, local, state, provincial, federal. For the ICP 2003-2006 round, data are required only for the total of these different levels, which is termed general government in the 1993 SNA. Thus, for example, expenditure on education or health services must be the total of expenditures on education or health services by all levels of government.
23. The Expenditure Classification identifies those government expenditures that are defined as individual. They fall under the broad functions of housing, health, recreation and culture, education and social protection and include government activities such as providing low-cost housing, operating sports facilities, museums, theatre companies and botanical gardens, running schools, universities, hospitals, clinics, first-aid centers, employment offices, shelters for homeless people and bureaux that provide advice and material assistance to people in need.
24. Individual consumption expenditure by government is of two kinds:
64
• First, the production of services by government for the benefit of individual households. Examples are running schools and hospitals. Here the government is itself organizing and financing the production of services for consumption by individual households.
• Second, the purchase of goods and services by government from other producers which are then passed on to households, either free or at prices below the costs of production, without any further processing by government. Examples are the provision to households of medicines and medical services for outpatients. In some cases, households get these goods and services free or at very low prices at the point of sale, while in other cases households pay the full price at the point of sale and are later reimbursed, in part or in full, by government. For the ICP 2003-2006 round, the purchase by government of goods and services for delivery to households is relevant for two functions – health and education.
• The difference is important because different methods are used to collect prices for them as explained in paragraph 50.
Collective consumption expenditure by government 25. Government current expenditure that is not individual is termed collective. Again,
the Expenditure Classification shows what kinds of current expenditures are collective. They mainly fall under the broad headings of general public services, defense, public order and safety, economic affairs and environment protection but they also include certain expenditures under housing, health, recreation and culture, education and social protection that are considered to be for the benefit of the community at large. These are expenditures on the formulation and administration of government policy at the national level, the setting up and enforcement of public standards, and on research and development.
26. By contrast with individual consumption expenditures, collective consumption expenditures are of one kind only, namely the production of services by government. Collective consumption does not involve the purchase of goods and services for delivery to households.
Gross fixed capital formation 27. Gross fixed capital formation (GFCF) consists of net acquisitions (acquisitions less
disposals) of fixed assets. Capital assets are goods that are intended for use in a production process and that are expected to last for more than one year.
28. The 1993 SNA introduced a number of changes to the definition of capital assets. The most important are that purchases of computer software and mineral exploration are now treated as fixed capital formation. Note that GFCF in software includes both purchases of ready-made software and the cost of developing software “in house”. GFCF in mineral exploration is the total expenditure incurred
65
by mining companies on searching for new mineral deposits or on testing the extent of known deposits regardless of success. Expenditures that produce no new discoveries are included on equal terms with expenditures on successful exploration.
29. GFCF is always measured after deducting receipts from sales of existing assets. The assets concerned may be sold as second hand assets to other producers either within the country or abroad, they may be sold for their scrap value or, in the case of livestock, they may be sold to abattoirs at the end of their productive lives. In all cases receipts from sales are counted as negative capital formation and are deducted from outlays on the purchase of new or second-hand assets.
Change in inventories 30. Inventories can conveniently be considered under two headings – goods and work-
in-progress. Goods include raw materials and supplies which will be used up as intermediate consumption as well as finished goods that are awaiting delivery to customers. This heading also includes goods acquired for resale by wholesalers and retailers and all goods stored by government as strategic reserves, such as food and fuel.
31. Work-in-progress consists of goods on which some processing has taken place but which are not yet in a finished form suitable for delivery to customers. In agriculture, work-in-progress consists of the natural growth of vineyards, orchards, plantations and timber tracts and the natural growth in livestock that are being raised for slaughter. In construction, work-in-progress will include unfinished buildings and civil engineering works and there may be substantial differences in construction work-in-progress from year to year.
32. The ICP requires participants to report the levels of inventories at the beginning and end of the year. Participants will therefore need to report the value of goods in inventories – raw materials, finished goods, government food and fuel stocks, etc. - plus the value of work in progress - uncompleted buildings, livestock raised for slaughter, manufacturing work-in-progress, etc. – at the beginning of January and the end of December of the reference year.
Acquisitions less disposals of valuables 33. Valuables are goods that are expected to appreciate, or at least not to decline, in
value and that do not deteriorate over time under normal conditions. Valuables are acquired primarily as stores of value rather than for consumption or for use in production. They include precious metals and stones, jewelry, works of art, and collections of coins, stamps, medals and similar objects for which there is an established market.
66
34. Valuables may be held by corporations, households, NPISHs or government. In practice the most important type of valuable is gold and other precious metals held by financial corporations.
35. For ICP 2003-2006, participants are requested to report both purchases of valuables (acquisitions) and sales (disposals).
Exports of goods and services (plus) 36. This consists of three items – merchandise exports, exports of services and direct
purchases in the domestic market by non-residents.
Imports of goods and services (minus) 37. This consists of three items – merchandise imports, imports of services and direct
purchases abroad by residents.
Valuation 38. The general rule in the 1993 SNA is that transactions are valued at the actual prices
agreed upon by the transactors. Such prices are commonly referred to as market prices although the 1993 SNA prefers the term purchasers’ prices. Purchasers’ prices include any non-deductible VAT and other taxes on products. Purchasers’ prices also include any transport charges that must be incurred to take delivery of the goods even when the transport charges are separately invoiced. For the large majority of the goods and services that enter into the expenditure aggregates, purchasers’ prices are readily available. They are the prices used to calculate consumer and retail price indices. However, there are some problem areas where additional guidance may be helpful.
39. Transaction prices are measured net of discounts or rebates i.e. they are lower by the amount of any reduction in price granted by the seller to the customer. The price reduction may have come about through bargaining or the reduction may have been spontaneously offered by the seller to promote sales. In general, these price reductions do not cause any special problems for estimating the expenditure weights because estimates of final expenditures in the national accounts are almost always valued at the correct, net-of-discount, prices. Provided the national accounts estimates are based on the value of sales reported by producers or on the value of purchases reported by the customer, they will automatically reflect the fact that some of those sales have been made at discounted prices. They may, however, cause problems for price collection because the prices reported by countries for the ICP 2003-2006 round must be consistent with the prices underlying the expenditure weights and they must, therefore, take account of any discounts and rebates that are commonly granted to purchasers.
40. The staff responsible for collecting the price information will, therefore, need to consult with the national accounts staff to determine what kinds of prices have been
67
used for the national accounts. There are two particular areas where special care needs to be taken:
• Some kinds of services customarily involve payment of “tips” (or “gratuities”) in addition to the advertised price. Common examples are restaurant meals, taxi rides, haircutting and similar personal services. The correct procedure for the national accounts is to value the output of these services at the advertised price plus the usual amount of tips. For these services the national accounts staff will need to tell the price collectors what percentages have been added in respect of tips so that they can add the same amounts in reporting prices for the ICP 2003-2006 round.
• In many countries, expenditure on motor vehicles is estimated by multiplying the number of new vehicle registrations by average vehicle prices. People buying motor-cars usually bargain with the car salesmen and end up paying less than the official “list-price”. The price collectors will again need to consult with the national accounts staff so that they can report for the ICP 2003-2006 round the same kinds of prices as have been used for the national accounts.
41. As noted above, individual consumption expenditure of households includes a number of imputed expenditures where, by definition, no purchases or sales take place so that purchasers’ prices cannot be observed.
42. Imputed rents of owner-occupiers. The general rule is that rents of dwellings occupied by their owners should be imputed by reference to rents actually paid for similar dwellings. “Similarity” in the case of dwellings is usually judged by considering type of dwelling (single family or multi-family), location (city centre, suburban or rural), and facilities (floor-space, running water, indoor toilet, electricity, central heating, etc.). The recommended approach is to complete a matrix such as in Table 3 showing the average rents actually paid for each type of dwelling. The number of owner-occupied dwellings of that type is then distributed over the same matrix to obtain, by multiplication, the total imputed rents of owner-occupiers.
Table 3. Illustrative matrix for imputing rents of owner-occupied dwellings.
Facilities
Floor space under 30 M2 Floor space 30 – 70 M2 Floor space over 70 M2
Location
Running wat
No running wat
Running wat
No running wat
Running wat
No running wat
Capital city
Central location
Suburb
68
Other large cities Central location
Suburb
Rural areas
43. Tables similar to the above are required for each type of dwelling that is separately distinguished. Note that Table 3 is purely illustrative. Only two aspects of “facilities” are shown – floor space and water supply. Additional facilities such as indoor toilet, electricity supply, central heating, air-conditioning, etc., will usually need to be included as cross-classifications. For example, dwellings with less than 30 m2 of floor space and with running water may need to be further divided into those with and without indoor toilets. In many countries it will be important to distinguish between dwellings constructed from traditional materials (e.g. sun-baked bricks) as opposed to modern materials (e.g. furnace-fired bricks). The classification by location and by facilities should be determined by the extent to which these various factors influence the level of rents and this will vary from one country to another. Equally important is the availability of data. Clearly the matrix cannot be more detailed than the information that is available on the characteristics both of owner-occupied and of rented dwellings.
44. The statistics on average rents for Table 3 will usually come from observations on rents actually paid for dwellings that correspond to the characteristics defined by each cell of the table. An alternative could be to use rents estimated by hedonic regression techniques. An advantage of these techniques is that they can provide estimates of what the average rents would be for dwellings that fall in cells for which there are no actual observations. Hedonic methods will usually be feasible only for countries with extensive data bases.
45. Imputation based on the rents actually paid for similar dwellings is not practical in some countries because so few dwellings are actually rented. In other cases the method can be applied in large cities but cannot be used for dwellings in other areas. When it cannot be used, the alternative is to value the rents of owner-occupied dwellings as the total of costs i.e. consumption of fixed capital (depreciation), net return on the owner’s capital, the costs of insuring the dwelling from fire, other damage and natural catastrophes, and the costs of regular repairs and maintenance. Consumption of fixed capital will usually be the largest cost component. It should be calculated from the current market value of the dwelling and not the original or “acquisition” price and in order to do this it will usually be necessary to use the perpetual inventory method. The net return on the owners’ capital can be estimated by applying an interest rate to the estimated value of dwellings; the interest rate should be what the owners could realistically earn if,
69
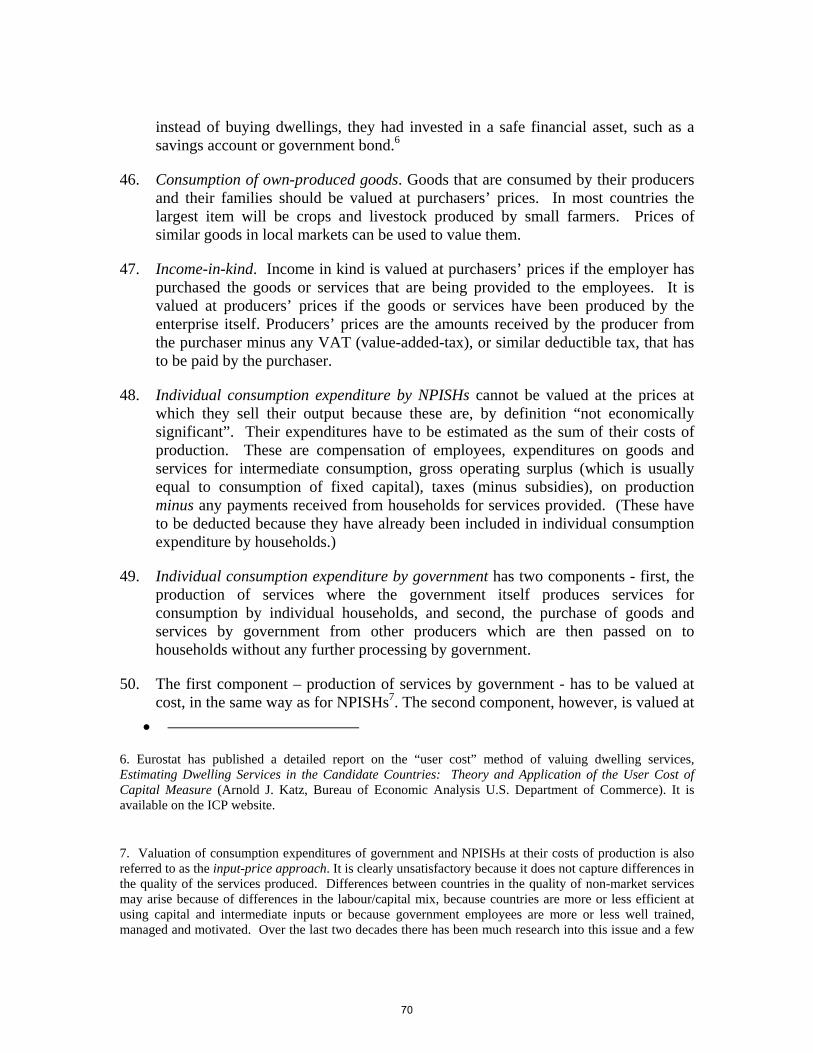
instead of buying dwellings, they had invested in a safe financial asset, such as a savings account or government bond.6
46. Consumption of own-produced goods. Goods that are consumed by their producers and their families should be valued at purchasers’ prices. In most countries the largest item will be crops and livestock produced by small farmers. Prices of similar goods in local markets can be used to value them.
47. Income-in-kind. Income in kind is valued at purchasers’ prices if the employer has purchased the goods or services that are being provided to the employees. It is valued at producers’ prices if the goods or services have been produced by the enterprise itself. Producers’ prices are the amounts received by the producer from the purchaser minus any VAT (value-added-tax), or similar deductible tax, that has to be paid by the purchaser.
48. Individual consumption expenditure by NPISHs cannot be valued at the prices at which they sell their output because these are, by definition “not economically significant”. Their expenditures have to be estimated as the sum of their costs of production. These are compensation of employees, expenditures on goods and services for intermediate consumption, gross operating surplus (which is usually equal to consumption of fixed capital), taxes (minus subsidies), on production minus any payments received from households for services provided. (These have to be deducted because they have already been included in individual consumption expenditure by households.)
49. Individual consumption expenditure by government has two components - first, the production of services where the government itself produces services for consumption by individual households, and second, the purchase of goods and services by government from other producers which are then passed on to households without any further processing by government.
50. The first component – production of services by government - has to be valued at cost, in the same way as for NPISHs7. The second component, however, is valued at
•
6. Eurostat has published a detailed report on the “user cost” method of valuing dwelling services, Estimating Dwelling Services in the Candidate Countries: Theory and Application of the User Cost of Capital Measure (Arnold J. Katz, Bureau of Economic Analysis U.S. Department of Commerce). It is available on the ICP website.
7. Valuation of consumption expenditures of government and NPISHs at their costs of production is also referred to as the input-price approach. It is clearly unsatisfactory because it does not capture differences in the quality of the services produced. Differences between countries in the quality of non-market services may arise because of differences in the labour/capital mix, because countries are more or less efficient at using capital and intermediate inputs or because government employees are more or less well trained, managed and motivated. Over the last two decades there has been much research into this issue and a few
70
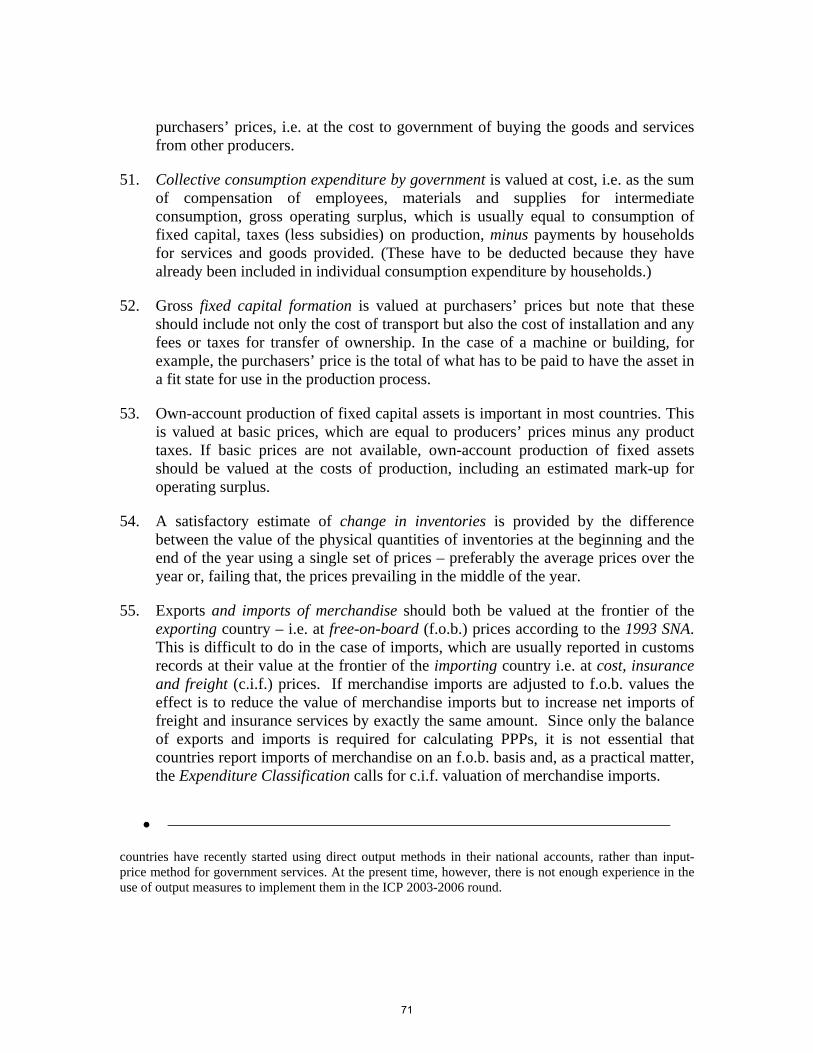
purchasers’ prices, i.e. at the cost to government of buying the goods and services from other producers.
51. Collective consumption expenditure by government is valued at cost, i.e. as the sum of compensation of employees, materials and supplies for intermediate consumption, gross operating surplus, which is usually equal to consumption of fixed capital, taxes (less subsidies) on production, minus payments by households for services and goods provided. (These have to be deducted because they have already been included in individual consumption expenditure by households.)
52. Gross fixed capital formation is valued at purchasers’ prices but note that these should include not only the cost of transport but also the cost of installation and any fees or taxes for transfer of ownership. In the case of a machine or building, for example, the purchasers’ price is the total of what has to be paid to have the asset in a fit state for use in the production process.
53. Own-account production of fixed capital assets is important in most countries. This is valued at basic prices, which are equal to producers’ prices minus any product taxes. If basic prices are not available, own-account production of fixed assets should be valued at the costs of production, including an estimated mark-up for operating surplus.
54. A satisfactory estimate of change in inventories is provided by the difference between the value of the physical quantities of inventories at the beginning and the end of the year using a single set of prices – preferably the average prices over the year or, failing that, the prices prevailing in the middle of the year.
55. Exports and imports of merchandise should both be valued at the frontier of the exporting country – i.e. at free-on-board (f.o.b.) prices according to the 1993 SNA. This is difficult to do in the case of imports, which are usually reported in customs records at their value at the frontier of the importing country i.e. at cost, insurance and freight (c.i.f.) prices. If merchandise imports are adjusted to f.o.b. values the effect is to reduce the value of merchandise imports but to increase net imports of freight and insurance services by exactly the same amount. Since only the balance of exports and imports is required for calculating PPPs, it is not essential that countries report imports of merchandise on an f.o.b. basis and, as a practical matter, the Expenditure Classification calls for c.i.f. valuation of merchandise imports.
•
countries have recently started using direct output methods in their national accounts, rather than input-price method for government services. At the present time, however, there is not enough experience in the use of output measures to implement them in the ICP 2003-2006 round.
71
Classifications The Classification of Expenditure on GDP 56. The Expenditure Classification for ICP 2003-2006 is included in Annex XXX. It is
structured by type of final expenditure with GDP broken down into seven main aggregates. These main aggregates are subsequently split into 26 Categories, 61 Groups, 126 Classes and 155 Basic Headings as shown in Table 4.
Table 4: Number of Categories, Groups, Classes and Basic Headings by Main Aggregates
Categories Categories Groups Classes
Basic Headings
11.00 Individual consumption expenditure by households 13 43 90 110
- .01 Food and non-alcoholic beverages 2 11 29 - .02 Alcoholic beverages, tobacco and narcotics 3 5 5 - .03 Clothing and footwear 2 5 5 - .04 Housing, water, electricity, gas and other fuels 4 7 7 - .05 Furnishings, household equipment and maintenance 6 12 13 - .06 Health 3 7 7 - .07 Transport 3 13 13
- .08 Communication 3 3 3- .09 Recreation and culture 6 13 13- .10 Education 1 1 1- .11 Restaurants and hotels 2 2 2 - .12 Miscellaneous goods and services 7 10 10 - .13 Net purchases abroad 1 1 2 12.00 Individual consumption expenditure by NPISHs 1 1 1 1
13.00 Individual consumption expenditure by government 5 7 16 21
- .01 Housing 1 1 1 - .02 Health 2 7 12 - .03 Recreation and culture 1 1 1 - .04 Education 2 6 6 - .05 Social protection 1 1 1 14.00 Collective consumption expenditure by government 1 1 5 5
15.00 Gross fixed capital formation 3 6 11 12
- .01 Machinery and equipment 2 7 8 - .02 Construction 3 3 3 - .03 Other products 1 1 1 16.00 Change in inventories and acquisitions less disposals
of valuables 2 2 2 4
72
-.01 Change in inventories 1 1 2 -.02 Acquisitions less disposals of valuables 1 1 2 18.00 Balance of exports and imports 1 1 1 2
GDP 26 61 126 155
57. Individual consumption expenditure by households is broken down into 90 Classes according to the Classification of Individual Consumption According to Purpose (COICOP) 8. Each class is linked to a five-digit code in COICOP and most classes are further sub-divided into 110 Basic Headings. There are no COICOP codes corresponding to Basic Headings as these go beyond the level of detail in COICOP.
58. Individual consumption expenditure by NPISHs is treated as a single Basic Headings.
59. Individual consumption expenditure by government is broken down into 21 Basic Headings. Each Basic Heading is linked to a five-digit code in the Classification of the Functions of Government (COFOG 98)9. The breakdown into Basic Headings is made first according to purpose - housing, health, recreation and culture, education, social protection - and then, in the case of health and education, by whether the expenditure is for the purchase of health or education services from other producers or whether it is for the production of health and education services by government itself. The expenditure on government-produced health and education services (as opposed to those which they buy from other producers) is broken down into Basic Headings consisting of the cost components required for the input-price approach. These cost components are shown in Table 7.
60. Collective consumption expenditure by government is defined by reference to five-digit codes in COFOG 98 and is then broken down into five Basic Headings consisting of the cost components as required for the input-price approach. The breakdown is shown in Table 7.
61. Note that the purpose breakdowns used in COICOP, COPNI and COFOG are consistent between the three classifications and have been designed so that individual consumption expenditures by households, NPISHs and government can be added together to obtain actual consumption by households.
•
8. “Classification of Individual Consumption According to Purpose (COICOP)”, Classification of Expenditure According to Purpose, United Nations, New York, 2000.
9. “Classification of the Functions of Government (COFOG)”, Classification of Expenditure According to Purpose, United Nations, New York, 2000.
73
62. Gross fixed capital formation is broken down by type of product in line with Statistical Classification of Products by Activity (CPA) 9610 into 12 Basic Headings: eight for machinery and equipment, three for construction and one for “other products”, namely “products of agriculture, forestry, fisheries and aquaculture”, “computer software” “other products n.e.c.” “Other products n.e.c.” covers expenditures on land improvement, such as fencing, leveling, irrigation and land drainage, mineral exploration and creation of entertainment, literary and artistic originals.
63. Change in inventories is broken down into two basic headings: opening value of inventories and closing value of inventories.
64. Acquisitions less disposals of valuables are broken down into acquisitions of valuables and disposals of valuables.
65. Balance of exports and imports is also broken down into two basic headings: exports of goods and services and imports of goods and services.
Regional versions of the Expenditure Classification 66. The Expenditure Classification for ICP 2003-2006 round gives the basic headings
for which all countries must provide expenditure weights in order to participate in the ICP 2003-2006 round. Some regions may decide to use a more detailed classification. The OECD-Eurostat region, for example, will use an expenditure classification consisting of more than 220 basic headings. The Expenditure Classification in Annex XXX shows the additional detail that will be used by the OECD-Eurostat countries. The additional OECD-Eurostat items are marked by an asterisk. Consider, as an example, “Garments” which is basic heading 11.03.12.0 in the Expenditure Classification. The OECD Eurostat classification breaks this down into:
• Men’s clothing (OECD 11.03.12.1)
• Women’s clothing (OECD 11.03.12.2)
• Children’s and infants’ clothing ( OECD 11.03.12.3)
67. Regions that decide to use the Expenditure Classification without the extra OECD breakdowns may nevertheless find it helpful to be reminded that, in selecting items to be priced under this basic heading, they will need to identify a number of items representing each of these three sub-groups.
•
10. Statistical Classification of Products by Activity (CPA), Eurostat, Luxembourg, 1996. At the aggregated level used here, the CPA is consistent with the Combined Product Classification (CPC) of the United Nations.
74
68. Some regions may find that the Expenditure Classification does not adequately reflect expenditure patterns in their countries. For example, class 11.01.11.0 Bread and cereals contains the following basic headings:
• Rice
• Other cereals, flour and other cereal products
• Bread
• Other bakery products
• Pasta products
69. In some regions, rice may be relatively unimportant compared to, say, maize (American corn). For these regions it may be useful to divide the second basic heading “Other cereals, flour and other cereal products” into:
• Maize
• Other cereals, flour and other cereal products (excluding maize).
70. Note that it is not permissible to simply replace “rice” by “maize” so that rice then becomes a part of “other cereals, flour and other cereal products”. Basic headings can be split into more detailed items but they cannot be merged with other basic headings
Basic Headings 71. The most detailed level of the classification – the Basic Headings - are important
for four reasons:
72. The national accounts staff will need to provide expenditure weights for each basic heading.
73. The Basic Headings are the starting point for participating countries to draw up regional lists of products, i.e. the specific goods and services for which they agree to collect prices. For example, all the countries in each region will have to agree on what kinds of bread are to be priced for the basic heading 11.01.11.3. Should the bread be wrapped or unwrapped, sliced or unsliced, white or brown, what weight, and what type of flour is it made from?
74. As explained in Chapter 7, the basic headings provide the framework for editing the reported prices. For example, the editors will compare the bread prices reported by each country in order to detect exceptionally high or low prices. This may indicate
75
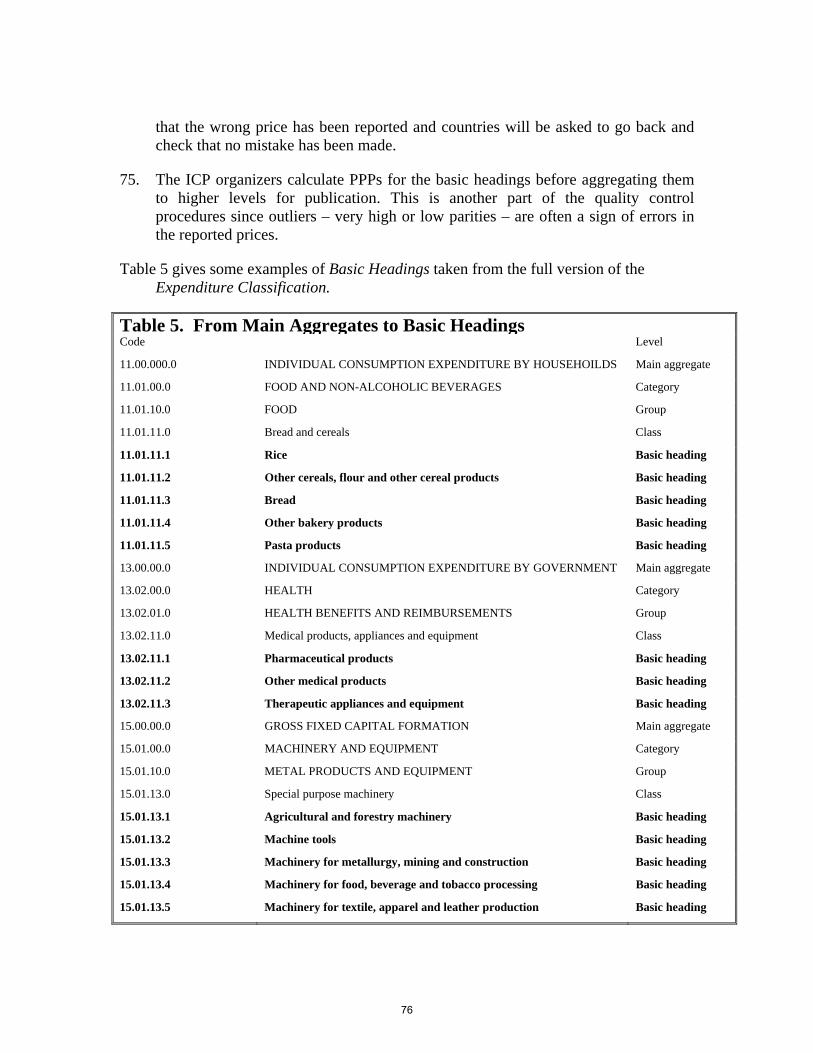
that the wrong price has been reported and countries will be asked to go back and check that no mistake has been made.
75. The ICP organizers calculate PPPs for the basic headings before aggregating them to higher levels for publication. This is another part of the quality control procedures since outliers – very high or low parities – are often a sign of errors in the reported prices.
Table 5 gives some examples of Basic Headings taken from the full version of the Expenditure Classification.
Table 5. From Main Aggregates to Basic HeadingsCode Level
11.00.000.0 INDIVIDUAL CONSUMPTION EXPENDITURE BY HOUSEHOILDS Main aggregate
11.01.00.0 FOOD AND NON-ALCOHOLIC BEVERAGES Category
11.01.10.0 FOOD Group
11.01.11.0 Bread and cereals Class
11.01.11.1 Rice Basic heading
11.01.11.2 Other cereals, flour and other cereal products Basic heading
11.01.11.3 Bread Basic heading
11.01.11.4 Other bakery products Basic heading
11.01.11.5 Pasta products Basic heading
13.00.00.0 INDIVIDUAL CONSUMPTION EXPENDITURE BY GOVERNMENT Main aggregate
13.02.00.0 HEALTH Category
13.02.01.0 HEALTH BENEFITS AND REIMBURSEMENTS Group
13.02.11.0 Medical products, appliances and equipment Class
13.02.11.1 Pharmaceutical products Basic heading
13.02.11.2 Other medical products Basic heading
13.02.11.3 Therapeutic appliances and equipment Basic heading
15.00.00.0 GROSS FIXED CAPITAL FORMATION Main aggregate
15.01.00.0 MACHINERY AND EQUIPMENT Category
15.01.10.0 METAL PRODUCTS AND EQUIPMENT Group
15.01.13.0 Special purpose machinery Class
15.01.13.1 Agricultural and forestry machinery Basic heading
15.01.13.2 Machine tools Basic heading
15.01.13.3 Machinery for metallurgy, mining and construction Basic heading
15.01.13.4 Machinery for food, beverage and tobacco processing Basic heading
15.01.13.5 Machinery for textile, apparel and leather production Basic heading
76
15.01,13.6 Other special purpose machinery Basic heading
76. In principle, a basic heading should consist of a set of very similar goods or services. However, countries are required to estimate expenditure weights for each basic heading and there is a trade-off between the theoretical need for close similarity within the basic heading and the practical difficulty of assigning expenditure weights to very detailed basic headings. Hence, the basic headings in the classification can cover a broader range of goods or services than is theoretically desirable. In Table 5 for example, rice is a very homogeneous basic heading but agricultural and forestry machinery is much less so.
77. Note that although countries will have to estimate expenditure weights for all basic headings there are some for which no price data will be collected. For example, no prices will be collected for the basic headings covering the acquisitions and disposals of valuables nor for expenditures of NPISHs. Reference PPPs – i.e. PPPs calculated for other, similar goods and services – will be used for these, and several other, basic headings. But even basic headings for which no price data will be collected still need expenditure weights in order to correctly apply the reference PPPs.
Government final consumption expenditure 78. Part of government consumption expenditure consists of the purchase of goods and
services from other producers which are passed on to households without any further processing. In the Expenditure Classification these are described as health benefits and reimbursements and as education benefits and reimbursements. The prices of these goods and services can be collected and used to calculate PPPs in exactly the same way as for other goods and services. For all other government consumption expenditure, however, the input price approach will be used. The basic headings for these expenditures uses the following cost structure - compensation of employees, intermediate consumption, gross operating surplus, net taxes on production and receipts from sales. The item, receipts from sales, is deducted from gross output to obtain government final consumption expenditure. The items, gross operating surplus and net taxes on production, are included for completeness. Gross operating surplus will, in effect, be equal to consumption of fixed capital since net operating surplus is expected to be negligible and governments do not usually levy taxes on their own activities.
79. For all other basic headings, the weights will be obtained from the expenditure side of the national accounts. But when the input approach is used for government services, the information comes from the production accounts for government. Table 6 shows the basic headings for government final consumption expenditure.
77
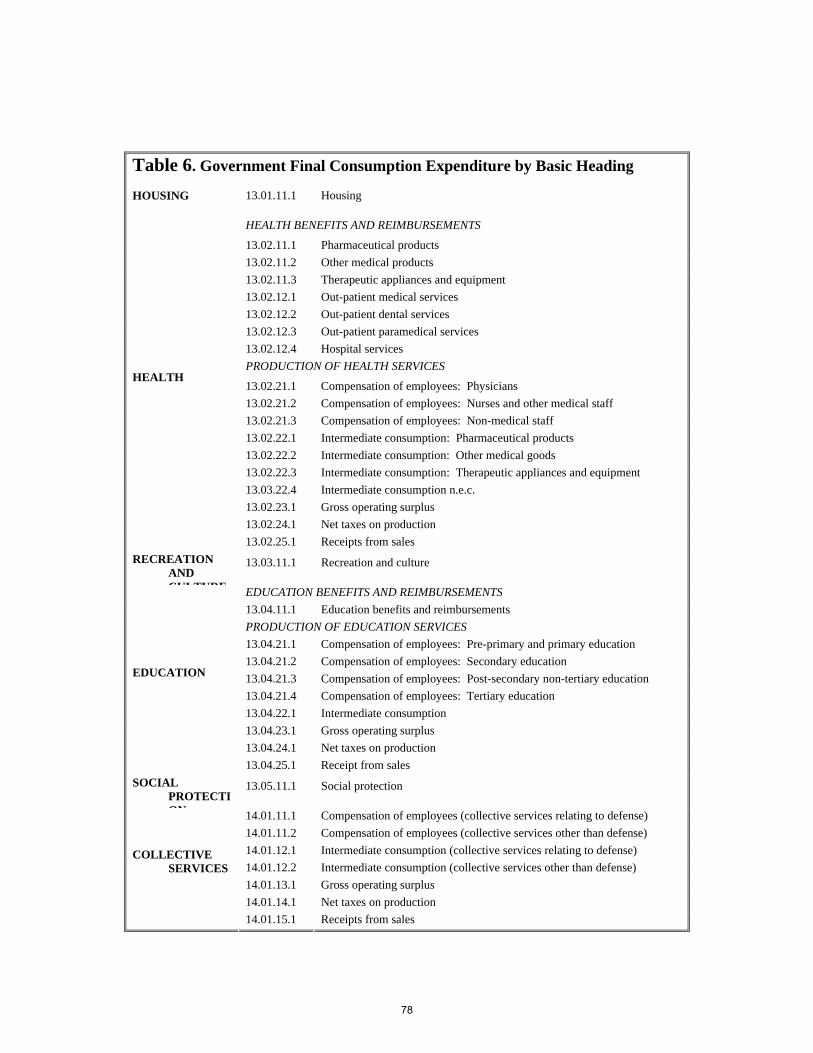
Table 6. Government Final Consumption Expenditure by Basic Heading
HOUSING 13.01.11.1 Housing
HEALTH BENEFITS AND REIMBURSEMENTS
13.02.11.1 Pharmaceutical products 13.02.11.2 Other medical products 13.02.11.3 Therapeutic appliances and equipment 13.02.12.1 Out-patient medical services 13.02.12.2 Out-patient dental services 13.02.12.3 Out-patient paramedical services 13.02.12.4 Hospital services PRODUCTION OF HEALTH SERVICES
13.02.21.1 Compensation of employees: Physicians 13.02.21.2 Compensation of employees: Nurses and other medical staff 13.02.21.3 Compensation of employees: Non-medical staff 13.02.22.1 Intermediate consumption: Pharmaceutical products 13.02.22.2 Intermediate consumption: Other medical goods 13.02.22.3 Intermediate consumption: Therapeutic appliances and equipment 13.03.22.4 Intermediate consumption n.e.c. 13.02.23.1 Gross operating surplus 13.02.24.1 Net taxes on production
HEALTH
13.02.25.1 Receipts from sales RECREATION
AND CULTURE
13.03.11.1 Recreation and culture
EDUCATION BENEFITS AND REIMBURSEMENTS 13.04.11.1 Education benefits and reimbursements PRODUCTION OF EDUCATION SERVICES 13.04.21.1 Compensation of employees: Pre-primary and primary education 13.04.21.2 Compensation of employees: Secondary education 13.04.21.3 Compensation of employees: Post-secondary non-tertiary education 13.04.21.4 Compensation of employees: Tertiary education 13.04.22.1 Intermediate consumption 13.04.23.1 Gross operating surplus 13.04.24.1 Net taxes on production
EDUCATION
13.04.25.1 Receipt from sales SOCIAL
PROTECTION
13.05.11.1 Social protection
14.01.11.1 Compensation of employees (collective services relating to defense) 14.01.11.2 Compensation of employees (collective services other than defense) 14.01.12.1 Intermediate consumption (collective services relating to defense) 14.01.12.2 Intermediate consumption (collective services other than defense) 14.01.13.1 Gross operating surplus 14.01.14.1 Net taxes on production
COLLECTIVE SERVICES
14.01.15.1 Receipts from sales
78
Data Sources Introduction 80. The initial breakdown of GDP into the seven main aggregates should be based on
the regular national accounts estimates. Some countries may not have information on all seven aggregates and there will often be at least three gaps.
81. First, expenditure by NPISHs may be combined with household expenditures. It is quite common for countries to derive a combined aggregate by subtracting government consumption expenditure, gross capital formation and the balance of exports and imports from an estimate of GDP obtained by the production side. This is not a major problem for the ICP 2003-2006 round. because PPPs will be calculated for actual individual consumption and this involves adding consumption expenditures by NPISHs with those of households. Nevertheless, countries which have not hitherto made separate estimates for NPISHs should examine the NPISHs known to be operating in their countries and make their best estimate about the likely size of their expenditures and the main purposes that they serve.
82. Second, some countries do not have explicit estimates of changes in inventories. They use a version of the method just described but subtract only gross fixed capital formation (rather than gross capital formation) so that their residual consumption figure includes the change in inventories as well as consumption expenditures by household and NPISHs. For the ICP 2003-2006 round, participating countries will need to make explicit estimates of the change in inventories. These estimates do not need to be comprehensive but should try to cover the main kinds of inventories, such as oil stocks, strategic reserves held by government, agricultural produce held by state marketing boards and inventories held by large enterprises.
83. Third, very few countries have so far attempted to estimate net acquisitions of valuables. This may be an important item for countries where banks hold stocks of precious metals but, for most countries, net acquisitions of valuables for the economy as a whole will usually be trivial. Acquisitions and disposals between residents cancel out and net acquisitions from abroad may be so small that they can safely be ignored.
84. Assuming that a country has arrived at a plausible breakdown of GDP into the seven main aggregates (or six excluding valuables), the following paragraphs describe the data sources that can be used to go from there to the Basic Headings. Some participating countries already have detailed breakdowns of final expenditures based on household surveys, retail trade statistics, capital expenditure surveys and the like, but it is clear that most countries taking part in the ICP 2003-2006 round will not be in this position. The fact that they do not publish detailed expenditure statistics is precisely because they have no regular, comprehensive source data. For these countries, going beyond the main aggregates will involve
79

recourse to irregular data sources and innovative estimation methods. Some suggestions are given in the following paragraphs.
Individual consumption expenditure by households 85. This is the largest component of final expenditure and it is also the one for which
participating countries are required to provide the most detail. There are various sources and methods for estimating the expenditure weights and each country will need to decide how to proceed in view of the data sources that are available. Note that no single source will ever provide information on all the items included in individual consumption expenditure by households. Household budget surveys and retail trade statistics may be quite comprehensive in some countries but even so both sources will need to be supplemented by estimates of the various imputed items.
86. Some countries carry out household budget (or expenditure) surveys on a regular basis; others may have carried out such a survey in the last few years and the results may be sufficiently recent that they can be used for the ICP 2003-2006 round. Ideally, the household budget survey will cover all areas of the country and all types of households and will provide estimates of expenditure over a full twelve months, but in practice the survey data may be deficient in several respects. Even if household budget data are quite old and even if they cover only part of the population they can provide useful information for estimating expenditure weights.
87. If the most recent budget survey is quite old – say five years or more – it may be possible to update at least some parts of it by using more recent information from other sources. These might include foreign trade statistics, food balances, data from nutrition surveys, sales tax data and information from administrative sources – electricity sales, vehicle registrations, etc. Some experts have suggested updating the weights from household budget surveys by using the price changes recorded in the Consumer Price Index (CPI). The effect of doing this is to increase the weights of items that have become relatively more expensive and reduce the weights of those that have become relatively cheaper. This may be appropriate if the budget survey was quite recent, but if the last budget survey is two or three years old it is likely that consumers will have adjusted their expenditure patterns by shifting from more expensive to less expensive items. Updating an out of date budget survey using the CPI may therefore produce an unrealistic expenditure pattern.
88. Retail trade statistics are another important data source. Their usefulness depends on the degree of commodity detail that they provide and in some countries this may only be enough to provide weights for main commodity groups such as food, clothing, furniture etc. Some retail trade surveys collect broad commodity detail from most respondents but ask for more detailed information from a sub-sample of outlets. Retail trade statistics can be particularly useful for estimating expenditure on expensive consumer durable goods that are purchased infrequently and so have high sampling errors in household budget surveys.
80
89. In the last few years some statistical offices have started using electronic data records that are stored as “scanner data” in the databases of sellers. Scanner data sets include the quantities sold and the corresponding value. The cash register receipts usually give the following information: name of the outlet, date and time of purchase, description of items bought, quantity, price and value, form of payment and, where relevant VAT amount. One problem is that scanner data are commercial property and have to be purchased by statistical offices. In addition, scanner data will usually only be available for sales by large stores and will cover only a small part of all the goods and services that households buy.
90. While household budget surveys and retail trade statistics are the most obvious sources, there are several other possibilities for countries that have neither. For example:
• Production statistics from industrial and agricultural censuses and surveys;
• Surveys of restaurants and hotels;
• Information from customs and excise authorities on sales of tobacco and alcohol products;
• Records of motor vehicle registrations, distinguishing between freight and passenger vehicles;
• Reports on sales to households by utility companies and state monopolies - water, gas and electricity, posts and communications, rail and air travel, broadcasting, etc.;
• Statistics on VAT (Value-Added-Taxes) or other sales taxes classified according to the goods and services taxed;
• Import and export statistics classified by commodity.
91. Finally, the Food and Agriculture Organization (FAO) can be a valuable data source for expenditure on food. The FAO Food Balances Database11 gives detailed information on consumption of a wide range of animal and vegetable products for most member countries. Data are in volume terms and must be converted to values using retail prices. Although the basic data used to construct these food balances come from the countries themselves, the balancing procedures used by the FAO to ensure consistency between the supply and use of commodities are designed to improve the reliability of the basic data.
•
11. The FAO database can be accessed through www.FAO.org, then Statistical Databases and FAOSTAT Food Balances
81
92. A supply/use framework is useful for organizing the information available from the various sources described above. A supply/use table lists the various goods and services that enter into household consumption. These will be the Basic Headings that have been defined for the regional comparison in which the country is participating. The supply/use table starts by showing, in the first part of the table, the value of domestic production and imports. Product taxes and trade and transport margins are then added to obtain the total value of supply at purchasers’ prices. The second part of the table shows the various uses to which they may be put – intermediate consumption, capital formation, exports and, in the final column, household consumption expenditure. The columns are filled in using whatever firm or partial information is available on these various items from surveys, foreign trade statistics and the other sources suggested above. The task is then to provide a coherent picture of the passage from total supply to household consumption. In this process both the supply and the uses parts of the table are likely to be modified and improved.
93. Table 7 illustrates how a simple supply/use table might be constructed for four Basic Headings. The essential feature of the table is that the total value of the supply columns must equal the total value of the uses columns.
82
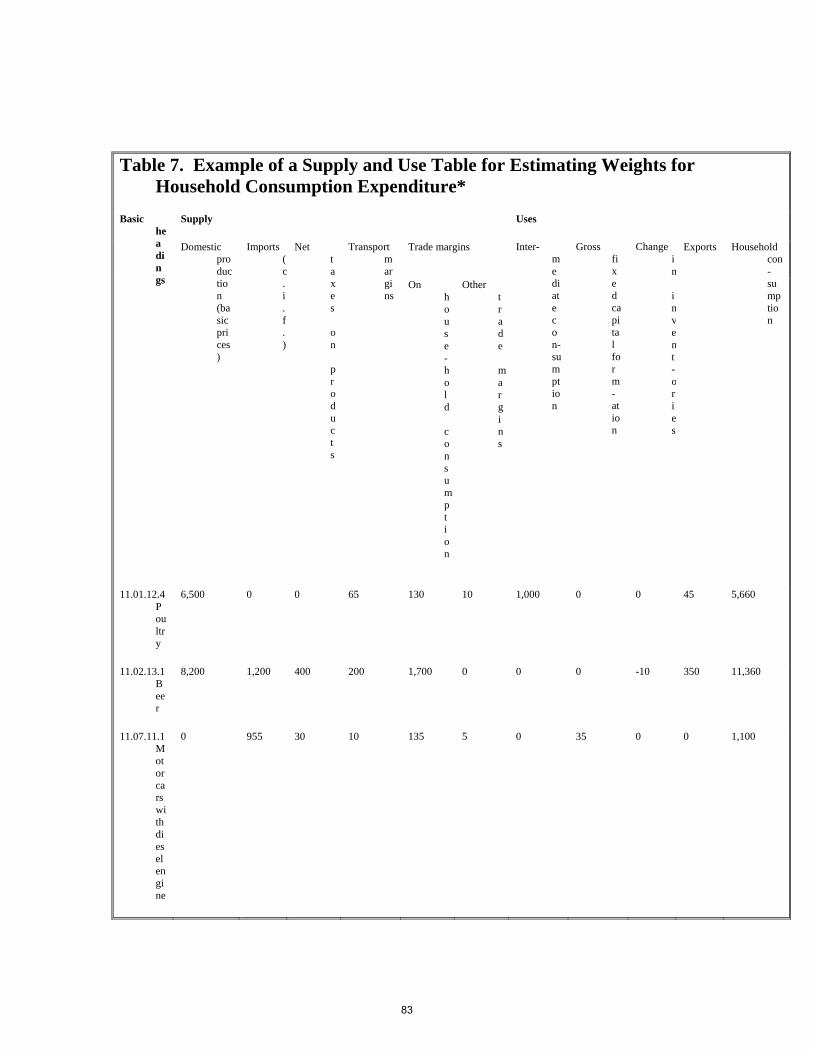
Table 7. Example of a Supply and Use Table for Estimating Weights for Household Consumption Expenditure*
Supply Uses
Trade margins
Basic headings
Domestic production (basic prices)
Imports (c.i.f.)
Net taxes on products
Transport margins
On house-hold consumption
Other trade margins
Inter-mediate con-sumption
Gross fixed capital form-ation
Change in invent-ories
Exports Household con-sumption
11.01.12.4 Poultry
6,500 0 0 65 130 10 1,000 0 0 45 5,660
11.02.13.1 Beer
8,200 1,200 400 200 1,700 0 0 0 -10 350 11,360
11.07.11.1 Motor cars with diesel engine
0 955 30 10 135 5 0 35 0 0 1,100
83
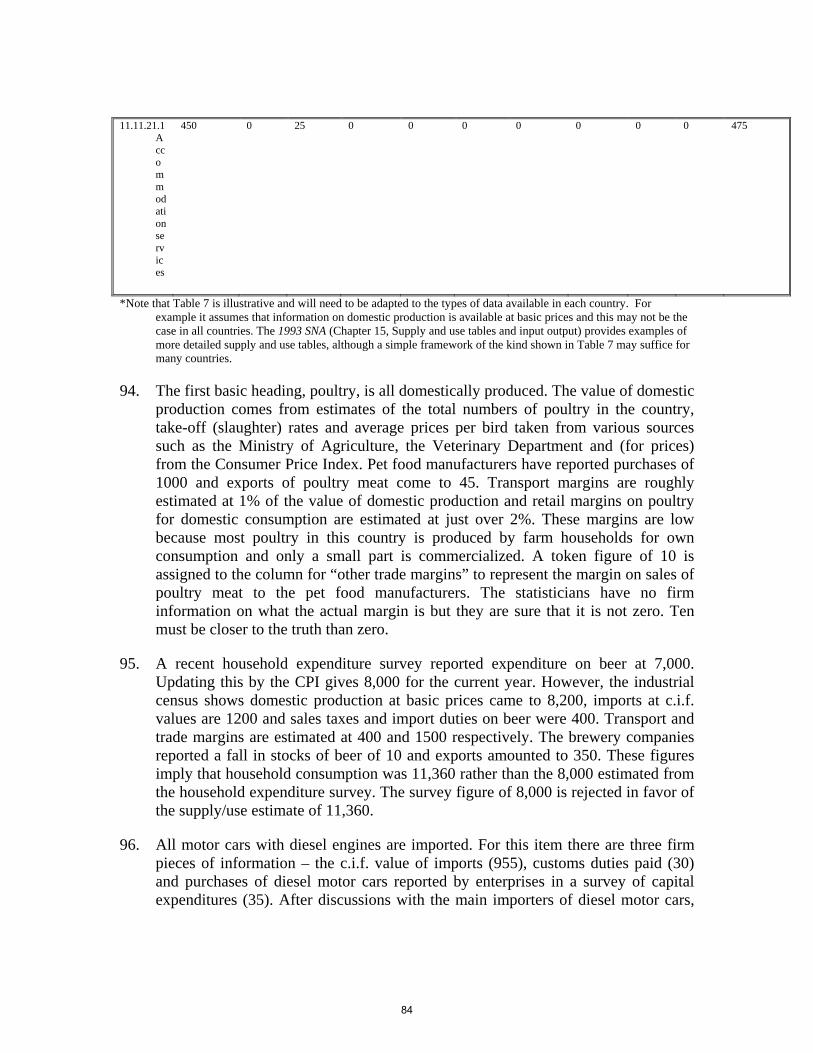
11.11.21.1 Accommodation services
450 0 25 0 0 0 0 0 0 0 475
*Note that Table 7 is illustrative and will need to be adapted to the types of data available in each country. For example it assumes that information on domestic production is available at basic prices and this may not be the case in all countries. The 1993 SNA (Chapter 15, Supply and use tables and input output) provides examples of more detailed supply and use tables, although a simple framework of the kind shown in Table 7 may suffice for many countries.
94. The first basic heading, poultry, is all domestically produced. The value of domestic production comes from estimates of the total numbers of poultry in the country, take-off (slaughter) rates and average prices per bird taken from various sources such as the Ministry of Agriculture, the Veterinary Department and (for prices) from the Consumer Price Index. Pet food manufacturers have reported purchases of 1000 and exports of poultry meat come to 45. Transport margins are roughly estimated at 1% of the value of domestic production and retail margins on poultry for domestic consumption are estimated at just over 2%. These margins are low because most poultry in this country is produced by farm households for own consumption and only a small part is commercialized. A token figure of 10 is assigned to the column for “other trade margins” to represent the margin on sales of poultry meat to the pet food manufacturers. The statisticians have no firm information on what the actual margin is but they are sure that it is not zero. Ten must be closer to the truth than zero.
95. A recent household expenditure survey reported expenditure on beer at 7,000. Updating this by the CPI gives 8,000 for the current year. However, the industrial census shows domestic production at basic prices came to 8,200, imports at c.i.f. values are 1200 and sales taxes and import duties on beer were 400. Transport and trade margins are estimated at 400 and 1500 respectively. The brewery companies reported a fall in stocks of beer of 10 and exports amounted to 350. These figures imply that household consumption was 11,360 rather than the 8,000 estimated from the household expenditure survey. The survey figure of 8,000 is rejected in favor of the supply/use estimate of 11,360.
96. All motor cars with diesel engines are imported. For this item there are three firm pieces of information – the c.i.f. value of imports (955), customs duties paid (30) and purchases of diesel motor cars reported by enterprises in a survey of capital expenditures (35). After discussions with the main importers of diesel motor cars,
84
transport and trade margins are estimated at 140 and household consumption is residually derived as 1,100.
97. Information on accommodation services comes from a recent survey of restaurants and hotels. The Revenue Department reports receipts of 25 for hotel taxes so that total household expenditure is estimated at 475. Note that this includes expenditure on accommodation services by non-residents. Expenditure by non-residents will be deducted, together with their other expenditures, in the single adjustment item “net purchases abroad”.
Individual and collective consumption expenditure by government 98. Estimates of government consumption expenditure are based on government
expenditure records. Many countries now classify government expenditures according to COFOG and for these countries it will be relatively easy to apply the Expenditure Classification at least to the extent of identifying the principal functions. Distinguishing individual from collective consumption will often present problems. One solution is to assume that all (or a high proportion such as 90%) of government expenditure on the functions housing, health, recreation and culture, education and social protection are individual.
Individual consumption expenditure by NPISHs 99. Countries that do not regularly make explicit estimates in respect of NPISHs will
need to do so for the ICP 2003-2006 round. These do not need to be comprehensive or very detailed but should cover, where relevant, political parties, trade unions, religious organizations including hospitals, clinics and schools organized by them, large-scale sporting and recreational clubs. In some participating countries, foreign-based charitable organizations, including those under the United Nations umbrella, may also be important.
Gross fixed capital formation 100. There are two main sources for private (i.e. non-government) GFCF – investment
surveys of enterprises and “commodity flow” methods. The latter involves estimating the total supply - domestic production plus imports - of goods used for GFCF. Margins for labor costs, profits and product taxes are then added to obtain the estimated value of GFCF in purchasers’ prices. The commodity flow approach will be particularly useful for estimating the 8 basic headings needed for machinery and equipment in countries where most of these assets are imported. For government GFCF, the usual source is the government accounts.
Change in inventories 101. Industry and farm surveys are the main source to estimate changes in inventories
other than those held by government and state enterprises. Governments may themselves hold stocks of food, fuel and strategic materials or they may supervise public bodies, such as farm marketing boards, that are responsible for managing strategic inventories. The latter must be included in the estimates of changes in
85
inventories and will be based on government records. It will never be possible to cover all inventory changes and the national accountants should concentrate on covering changes in the most important kinds of inventories.
Fallback procedures 102. It is certain that all countries participating in the ICP 2003-2006 round will
experience some difficulties in providing estimates of final expenditure for all the basic headings required for their regional expenditure classification. Suppose that a country has followed the procedures suggested above (including construction of a supply/use table) but is still only able to provide expenditure weights at the Group or Class levels of the classification.
103. In this situation, it is important to realize that the ICP organizers must have weights for all the basic headings used for each regional comparison. If a country supplies only weights at the Group or Class levels for certain items, the organizers will themselves be forced to allocate those weights among the Basic Headings. This will necessarily be an unsatisfactory way of proceeding because the organizers will always have less information than will the statisticians working in the countries concerned. Participating countries should, therefore, assign weights to all basic headings even if this can only be done in a rather arbitrary and subjective fashion. Some possibilities, in order of preference:
• An expenditure breakdown may be available for an earlier year – for example when the country participated in a previous round of the ICP. That breakdown could be at least partially updated.
• A weighting pattern developed by a neighboring country could be used if consumption patterns are thought to be similar in the two countries.
• Expert opinion can be enlisted. At its best, this might involve consulting retailers, manufacturers, marketing experts, chambers of commerce and other government departments. At worst it might only involve informal discussions within the statistical office but even this is likely to be better than leaving the decision to the ICP organizers.
• Weights estimated for a higher level of the classification could be evenly divided among the basic headings. This is probably the least satisfactory solution although it is what the ICP organizers might have to do if left to themselves.
The need for timely expenditure data to calculate PPPs 104. Firm estimates of the main expenditure aggregates for ICP 2003-2006 do not
become available in most countries until the latter part of 2007 at the earliest. However, estimation of the detailed expenditure weights cannot wait until then. Participating countries have to start as early as possible on the estimation of
86
expenditure weights at the basic heading for the latest year for which they have firm GDP estimates. The latest year may be anything from 1999 to 2001 but, clearly, the more recent the year the better.
105. Ideally, participating countries should first supply, as soon as possible, a complete set of expenditure weights for the latest available year and should then recalculate the weights, at the same level of detail, for the reference year 2005 when GDP estimates for that year have been finalized. In practice, few countries will have the resources to make two separate, comprehensive estimates of basic heading weights. In these circumstances, a short-cut method can be accepted:
• First, the weights for basic headings calculated for the earlier year are updated using whatever information is available on changes in expenditure patterns. The pattern of GFCF can change significantly in the short term so that updating of basic headings within GFCF will need to be done in some detail. Expenditure patterns within household and government consumption, on the other hand, tend to be stable over periods of three or four years so that only minor adjustments may be needed to the weights from the earlier year.
• The weights for basic headings are next adjusted mechanically (i.e. pro-rata) to match the estimated weights of the main aggregates in the reference year. There can be significant shifts in the relative weights of the main aggregates because the level of gross capital formation - particularly GFCF and changes in inventories - can be quite volatile from year to year. Care must therefore be taken to ensure that the weights for the main aggregates are accurate for the reference year.
87
Chapter 4
Concepts and Definitions
Introduction
The purpose of this chapter is to define and clarify a number of basic concepts used in international comparisons. The concept of a purchasing power parity is explained with the help of a numerical example. Some alternative methods of calculating PPPs are described, but only briefly, as they are explained in detail in Chapter 11. Some target PPPs that might be calculated if there were complete information on prices and expenditures are also examined. Other fundamental concepts that are explained in this chapter include transitivity, representativity and comparability, all of which are particularly important for a set of multilateral PPPs for a group of countries. The nature of a balanced list of products for pricing within a basic headings is also explained. As in the case of temporal price indices, it is impossible to include every product in basic heading and prices can be collected only for a limited selection of products. Drawing up suitable lists of products for international price comparisons is more difficult and complex than selecting a sample of products for a temporal price index within a single country. The resulting PPPs are also more sensitive than temporal price indices to the selection of products. The selection of appropriate lists of products, and also the preparation of detailed descriptions of the products, are key factors on which the success of the entire ICP depends. PPPs are essentially international price indices. They are more complex than the more familiar temporal price indices such as Consumer Price Indices (CPIs) or Producer Price Indices (PPIs). They share some common problems, in particular the difficulty of measuring pure price differences and distinguishing them from apparent price differences that are due to differences in quality. The treatment of differences in the quality of goods and services in different countries is difficult both in theory and in practice. This topic is examined in some detail.
This chapter and the following are closely linked. This chapter focuses on conceptual and theoretical issues while Chapter 5 focuses on more practical issues. Chapter 5 explains how Structured Product Descriptions, or SPDs, are constructed and how the detailed Product Specifications, or PSs, which are used by the price collectors in the field are derived from the SPDs. A large part of Chapter 5 is devoted to the elaborate and complex process known as the pre-survey whereby the product lists and product specifications are slowly built up and tested over a period of time by continual interaction between the regional coordinators and national statistical offices.
PPPs for individual products and for basic headings A PPP is a price index that compares prices in two different countries, or more generally two different locations, in the same period of time. Prices in different countries are usually denominated in different units of currency, but not necessarily
88
so. For example, Eurostat calculates PPPs between those member countries of the European Economic Union that use a common currency as well as between those that do not. PPPs can also be calculated between different cities or regions within the same country.
PPPs depend on the sets of goods and services whose prices are being compared. They vary according to the type of economic aggregate covered. In practice, it is not possible to obtain expenditure data for individual products. The most detailed expenditure available always refer to groups of products. As explained in the previous chapter, in the case of international comparisons the lowest level aggregates for which all countries are able to provide expenditure data are called basic headings. In temporal indices, such as Consumer Price Indices, the lowest level aggregate is called an elementary aggregate. Conceptually, basic headings are the same as elementary aggregates although the latter differ from country to country whereas countries participating in international comparisons must use the same set of basic headings. The purpose of this section is to explain the concept of a PPP at the level of a basic heading with the help of a simple numerical example. As there are no data on the expenditures on the individual products within a basic heading, a basic heading PPP has to be calculated from price data only. In price index theory, an index that is a function of the prices only and does not make use of quantities or expenditures is described as an elementary index1. A basic heading PPP is therefore an elementary international price index. When all the basic heading PPPs have been calculated they can then be aggregated, or averaged, to obtain PPPs for higher level aggregates up to and including GDP using the basic heading expenditures as weights. The methodology use to calculate PPPs for higher level aggregates is therefore fundamentally different from that used to calculate the basic heading PPPs which has to rely solely on price observations. PPPs for individual products
Suppose initially that the entire universe of products within a basic heading consists of just six products. Suppose also that there are only three countries, A, B and C, in the group. Finally, suppose that all six products are found in each of the countries and that their national average prices in their own currencies are as shown in columns 2 to 4 in Table 1.
1 See Diewert (2004) and Hill (2004)
89
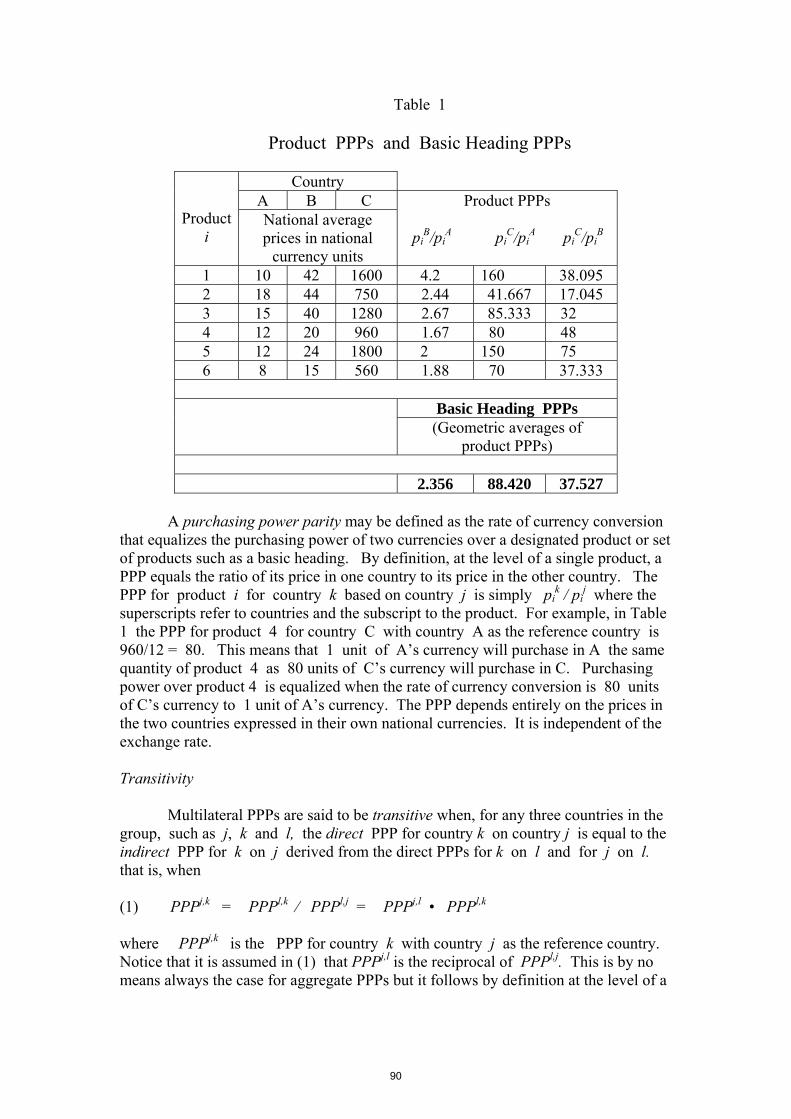
Table 1
Product PPPs and Basic Heading PPPs
Country A B C
Product i
National average prices in national
currency units
Product PPPs pi
B/piA pi
C/piA pi
C/piB
1 10 42 1600 4.2 160 38.095 2 18 44 750 2.44 41.667 17.045 3 15 40 1280 2.67 85.333 32 4 12 20 960 1.67 80 48 5 12 24 1800 2 150 75 6 8 15 560 1.88 70 37.333
Basic Heading PPPs
(Geometric averages of product PPPs)
2.356 88.420 37.527
A purchasing power parity may be defined as the rate of currency conversion
that equalizes the purchasing power of two currencies over a designated product or set of products such as a basic heading. By definition, at the level of a single product, a PPP equals the ratio of its price in one country to its price in the other country. The PPP for product i for country k based on country j is simply pi
k / pij where the
superscripts refer to countries and the subscript to the product. For example, in Table 1 the PPP for product 4 for country C with country A as the reference country is 960/12 = 80. This means that 1 unit of A’s currency will purchase in A the same quantity of product 4 as 80 units of C’s currency will purchase in C. Purchasing power over product 4 is equalized when the rate of currency conversion is 80 units of C’s currency to 1 unit of A’s currency. The PPP depends entirely on the prices in the two countries expressed in their own national currencies. It is independent of the exchange rate. Transitivity Multilateral PPPs are said to be transitive when, for any three countries in the group, such as j, k and l, the direct PPP for country k on country j is equal to the indirect PPP for k on j derived from the direct PPPs for k on l and for j on l. that is, when (1) PPPj,k = PPPl,k ⁄ PPPl,j = PPPj,l • PPPl,k where PPPj,k is the PPP for country k with country j as the reference country. Notice that it is assumed in (1) that PPPj,l is the reciprocal of PPPl,j. This is by no means always the case for aggregate PPPs but it follows by definition at the level of a
90
single product. As shown in (2) product PPPs between different pairs of countries are clearly transitive by definition. (2) pi
k / pij ≡ pi
k / pil ⁄ pi
j / pil ≡ pi
k / pil • pi
l / pij
For example, in the case of product 1 in Table 1
(3) PPPA,B = PPPA.C ⁄ PPPB,C = PPPA.C • PPPC,B The PPP for country B on country A, i.e., 4.2 is equal to the PPP for C on A, i.e., 160, divided by the direct PPP for B on C, i.e., 38.095 , or, alternatively, by the PPP for C on A multiplied by the PPP for C on B, i.e., 0.0263. As PPPs are transitive at the level of a single product there are only m-1 independent product PPPs among a group of m countries. Thus, although for convenience three columns of PPPs are shown in Table 1 the PPPs in any one of the three column can be derived from the PPPs in the other two columns.
Patterns of relative prices tend to vary significantly from country to country for a variety of economic, social, environmental and other reasons. As a result, the product PPPs also tend to vary from product to product within the basic heading, as illustrated in Table 1. In order to obtain a PPP for the basic heading as a whole some kind of average of the product PPPs is needed. The question is what is the most appropriate type of average to take and what weights, if any, should be attached to the individual product PPPs. These are the kinds of question that are addressed in index number theory.
As PPPs are transitive at the level of an individual product, it might be
expected that they would continue to be so at higher levels of aggregation. However, as ahown below, it turns out that averages of product PPPs are transitive only in certain special cases. Basic heading PPPs
A simple, transparent and meaningful measure of a PPP at the level of the
basic heading is given by the geometric mean of all the individual product PPPs within the basic heading. This is a type of elementary price index that is widely favoured in temporal indices such as CPIs and PPIs. It was named the Jevons index in the Consumer Price Index Manual (2004). Jevons indices may be weighted or unweighted. As explained in Chapters 1 and 20 of the CPI Manual, the Jevons index has a number of attractive properties that have led to its becoming the preferred type of elementary index for CPI purposes.
Let pi
j denote the national average price of product i in country j and let JEVPPPA,B denote the simple, or unweighted, Jevons PPP for country B based on country A. Then, (3) JEVPPPA,B = ∏ {pi
B / piA}1/n = ∏ {pi
B}1/n / ∏ {piA}1/n i = 1, 2, … n
91
As a simple geometric average of the individual product PPPs a Jevons PPP has a clear meaning and simple interpretation. It can be seen from (3) that the Jevons PPP is also equal to the ratio of the geometric means of the individual prices in the two countries. The Jevons could therefore be viewed as measuring the ratio of the price levels in the two countries However, a price level is not a magnitude that can be objectively measured as the prices of different products expressed in different quantity units are not commensurate with each other so that their average for an individual country on its own is not a meaningful number.
From an international perspective, Jevons indices have the highly desirable
property of being transitive provided that the weight attached to each individual price ratio, or product PPP, is the same in the Jevons index between each pair of countries. This implies that if a product PPP is included in the Jevons between one pair of countries it must be included in the Jevons for every other pair of countries. A complete set of product PPPs is needed for every country to ensure transitivity. There must be no missing product PPPs and hence no missing prices EKS and CPD Basic heading PPPs In practice, countries do not usually report national average prices for every product. It is possible that a particular product may not be found in a particular country but an average price may also be missing because the product is so uncommon that it may be too difficult and expensive to collect prices for it. As just explained, when some prices are missing for some countries, the Jevons indices cease to be transitive. However, Jevons indices can be adjusted to make them transitive by applying the EKS formula. The EKS formula uses the traditional least squares criterion. It identifies the set of transitive PPPs such that the sum of the squares of the deviations between the original PPPs and the transitive PPPs is minimised. The EKS formula dates back to Gini (1931) and is explained in detail in Chapter 11: see also Kravis, Kennessy, Heston and Summers (1975) and Eurostat – OECD (2006). Previous phases of the ICP have preferred to use a different approach to the calculation of basic heading PPPs, namely the Country Product Dummy method, or CPD method, based on the stochastic approach to price indices2. The simple model underlying the CPD is that
(4) pij = κ αj βi νij i = 1, 2, … n : j = 1, 2, … c where κ is a constant, αj is a parameter for country j, βi is a parameter for product i and νij is a random error term. After taking logarithms of the terms on both sides of (4), the parameters may be estimated by means of least squares regression using dummy variables. The estimated country parameters provide a set of transitive PPPs. It is not necessary to enter into details about the method at this point. The CPD method is fully described in various sources including Summers (1973), Kravis, Kennessy, Heston and Summers, (1975) and Chapter 11 of this Handbook. Conceptually, there is a close underlying similarity between CPD PPPs and Jevons PPPs. As already noted, unweighted Jevons PPPs are transitive when there is
2 See Diewert (2004) and (2004a) and Rao (2004)
92
a complete set of product PPPs for each pair of countries and it is easy to show that in these circumstances the unweighted CPD PPPs reduce to unweighted Jevons indices.3 More generally, if weights are attached to the various products in different countries, the weighted Jevons indices are transitive provided the weight attached to the PPP for a given product is the same in each Jevons index. In this case, the estimated PPPs from a weighted CPD regression which uses the same set of product weights for each country coincide with the weighted Jevons indices. Conversely, it should be noted that when the elementary price indices are weighted Jevons but the weights vary from one Jevons index to another, as in the method currently used by Eurostat and the OECD, the Jevons indices are not transitive even if there are no missing prices. Transitivity has to be imposed using the EKS formula. Despite the fact that there may be no missing prices the resulting EKS/Jevons PPPs do not coincide with the unweighted CPD PPPs, as explained in some detail in Chapter 11. Drawing up the product lists and representativity Most basic headings contain very many individual products. In practice, it is possible to collect prices for only a small number of them for purposes of international comparisons. In order to be able to calculate product PPPs countries obviously have to collect prices of the same products so that it is necessary for regional coordinators to draw up an agreed list of products for pricing. To ensure comparability, i.e., that the products priced in different countries are exactly the same, the characteristics of the products have to be specified in considerable detail using the product specifications described in Chapter 5. The list of products can have a major impact on the estimated PPP for a basic heading because patterns of relative prices tend to vary between countries. The more relative prices diverge between countries, the greater the variation in the individual product PPPs and the more critical the choice of products to be included on the basic heading list becomes. The list is effectively a sample of the products within a basic heading. In international comparisons the samples are both small and purposive
There are two different types of missing price therefore. One is the kind discussed in the previous section in which countries do not report prices for all the products on the agreed lists. The other consists of the prices that are missing because the products to which they refer are not included on the list. The exclusion of many products from the list can introduce bias into the estimate basic heading PPPs even if countries report a complete set of prices for the products on the list. This may be illustrated using the prices in Table 1.
Table 2
3 The same result in the context of the design and analysis of experiments has been well known for more then half a century. It is often asserted that EKS PPPs coincide with CPD PPPs when there are no missing prices but in fact the CPD PPPs coincide with Jevons. When there are no missing prices the Jevons PPPs are already transitive and the EKS formula is neither required nor used. The EKS formula plays no part in this result. It should also be noted that when the elementary price indices are not Jevons, the EKS PPPs do not coincide with the CPD PPPs even when there are no missing prices.
93
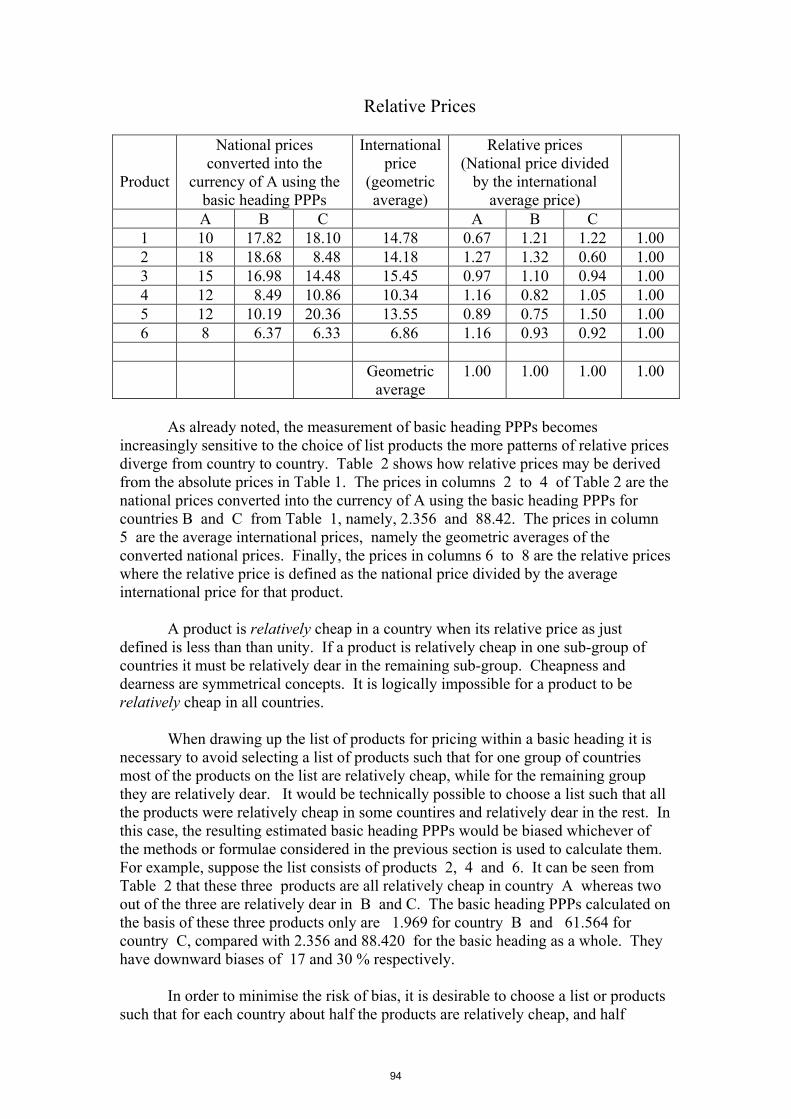
Relative Prices
Product
National prices converted into the
currency of A using the basic heading PPPs
International price
(geometric average)
Relative prices (National price divided
by the international average price)
A B C A B C 1 10 17.82 18.10 14.78 0.67 1.21 1.22 1.00 2 18 18.68 8.48 14.18 1.27 1.32 0.60 1.00 3 15 16.98 14.48 15.45 0.97 1.10 0.94 1.00 4 12 8.49 10.86 10.34 1.16 0.82 1.05 1.00 5 12 10.19 20.36 13.55 0.89 0.75 1.50 1.00 6 8 6.37 6.33 6.86 1.16 0.93 0.92 1.00 Geometric
average 1.00 1.00 1.00 1.00
As already noted, the measurement of basic heading PPPs becomes
increasingly sensitive to the choice of list products the more patterns of relative prices diverge from country to country. Table 2 shows how relative prices may be derived from the absolute prices in Table 1. The prices in columns 2 to 4 of Table 2 are the national prices converted into the currency of A using the basic heading PPPs for countries B and C from Table 1, namely, 2.356 and 88.42. The prices in column 5 are the average international prices, namely the geometric averages of the converted national prices. Finally, the prices in columns 6 to 8 are the relative prices where the relative price is defined as the national price divided by the average international price for that product.
A product is relatively cheap in a country when its relative price as just
defined is less than than unity. If a product is relatively cheap in one sub-group of countries it must be relatively dear in the remaining sub-group. Cheapness and dearness are symmetrical concepts. It is logically impossible for a product to be relatively cheap in all countries.
When drawing up the list of products for pricing within a basic heading it is
necessary to avoid selecting a list of products such that for one group of countries most of the products on the list are relatively cheap, while for the remaining group they are relatively dear. It would be technically possible to choose a list such that all the products were relatively cheap in some countires and relatively dear in the rest. In this case, the resulting estimated basic heading PPPs would be biased whichever of the methods or formulae considered in the previous section is used to calculate them. For example, suppose the list consists of products 2, 4 and 6. It can be seen from Table 2 that these three products are all relatively cheap in country A whereas two out of the three are relatively dear in B and C. The basic heading PPPs calculated on the basis of these three products only are 1.969 for country B and 61.564 for country C, compared with 2.356 and 88.420 for the basic heading as a whole. They have downward biases of 17 and 30 % respectively.
In order to minimise the risk of bias, it is desirable to choose a list or products
such that for each country about half the products are relatively cheap, and half
94
relatively dear. Such a list may be described as balanced. An unbalanced list is one in which the proportion of relatively cheap products is higher for some countries than others.
A balanced list serves as a target. Even if it cannot be achieved, knowing the
target can guide and influence the process by which the products are selected. It has always been realised in international comparisons that it is desirable to avoid a situation in which the list is dominated by products that are relatively cheap in one country or sub-group of countries.
The practical problem is that the price information needed to draw up a balanced list is not available not only at the time the lists have to be drawn up but even afterwards because prices are not collected for products not on the list. It is therefore necessary to resort to indirect or roundabout methods of identifying which products are likely to be relatively cheap (or dear).
Economic theory suggests that relative quantities and relative prices are likely
to be negatively correlated because purchasers tend to buy relatively more of products that are relatively cheap in their country. In fact, there is overwhelming evidence from previous rounds of the ICP that relative quantities and relative prices in different countries are indeed negatively correlated. Products that are purchased in relatively large quantities may therefore be presumed to have relatively low prices.
A list that is balanced from the price side may also be expected to be balanced
from the quantity side. A particular product is purchased in relatively large quantities in a country when the ratio of quantity of that product to the average quantity for all countries in the group is above the average ratio for all products in the basic heading. For each country about half the products on a balanced list should be purchased in relatively large quantities.
The advantage of switching from prices to quantities is that it is usually easier
for the price experts within a country to identify products that are purchased in relatively large quantities than to identify products whose prices are relatively low. Products purchased in relatively large quantities would usually be described as popular products that are typical of the country.
Another factor needs to be taken into consideration. Within any country
roughly half the products within a basic heading will be purchased in relatively large quantities and half in relatively small quantities. There will generally be far too many popular products for them all to be included and only a sample can be included. From a sampling perspective it is best to select the popular products which account for the largest shares of expenditures within the basic heading. Products that are both relatively popular compared with other countries and also account for a large share of the expenditures may be described as being representative. It should be noted that products purchased in relatively large quantities do not necessarily account for a large share of expenditures as their prices are likely to be relatively low. Conversely, products with large expenditures shares are not necessarily relatively popular.
The process by which lists of products are drawn up in the ICP is known as
the pre-survey. It is described in detail in Chapter 5. During the pre-survey country
95
price experts are asked to identify a number of products that they consider to be representative. They are also asked to propose a number of their own representative products for inclusion on the common product list. It is not necessary to propose unrepresentative products as they will find their way on to the list as products that are representative of other countries. The important thing is to ensure that the list contains some of each country’s representative products and is not dominated by the representative products of one country or sub-group of countries. The purpose is to reduce the risk of bias resulting from an unbalanced product list, given that representative products may be expected to have relatively low prices.
The concept or representativity was introduced into the international
comparison by the Eurostat in the 1980s and adopted by the OECD. The Eurostat–OECD 2004 Report on Purchasing Power Parities and Real Expenditures remarks p. 19 “Price levels of representative products are usually lower than the price levels of unrepresentative products. A comparison based on products that are not equally representative of all participating countries will result in biased price relatives. Price levels for countries pricing a smaller number of representative products will be overestimated, while price levels for countries pricing a larger number of representative products will be underestimated.”
In the Eurostat-OECD PPP program, the prices of products that are believed
to be representative for a country are flagged by an asterisk. This information can then be exploited in the process of estimating the basic heading PPPs, as explained in Chapter 11. The 2006 Eurostat - OECD Methodological manual on purchasing power parities remarks p. 5 “Representative products normally have a lower price level than unrepresentative products and, if this is not taken into account when calculating the PPPs for a basic heading, the PPPs will be biased.” Instead of calculating simple Jevons indices, it is possible to use the information on representativity to construct weighted Jevons indices that are believed to provide superior estimates of the basic heading PPP between a pair of countries. Tansitivity is then imposed on the weighted Jevons indices using the EKS formula. In this way it is possible to correct for any imbalances in the product lists. Similarly, as explained in Chapter 11. it is possible to introduce representativity into the CPD method to improve the estimates.
It is necessary to end this section on a note of caution. Representativity is not a very clear cut concept and different countries may interpret it in rather different ways, especially countries and regions outside the Eurostat-OECD group who have no previous experience of using it. In any case, identifying representative products involves an element of judgement on the part of the price experts concerned. The distinction between a representative and unrepresentative product is inevitably partly subjective in practice. For these reasons it is possible that the distinction may not be implemented consistently even by different countries within the same region. In this case it may be necessary to ignore the distinction when calculating the basic heading PPPs because of the errors associated with it. Price concepts
96
The purpose of this section is to describe the kinds of prices that are to be collected and recorded for ICP purposes. As the PPPs are intended to be used to convert, or deflate, expenditure data from the national accounts, the prices used must be the same as those used in the System of National Accounts, or SNA. As already noted in Chapter 3, the SNA values expenditure data from the perspective of the purchasers. A ‘purchaser’s price’ in the SNA is the amount actually paid by the purchaser to acquire the good or service, including any delivery or installation charges incurred by the purchaser, whether paid to the seller or some third party. Such charges may be substantial for large goods, especially capital goods.
The purchaser’s price includes any taxes on the products payable by the purchaser, whether itemized separately or not. The purchaser’s price payable on final consumption goods and services therefore includes any value added tax, or VAT, payable by households. On the other hand, the purchaser’s price payable by a business does not include any deductible VAT: that is, invoiced VAT on intermediate and capital goods that the business is subsequently entitled to deduct from its own VAT liability.
In practice, however, the prices used to calculate both CPIs and PPPs are usually collected from sellers, and not the purchasers. Households do not usually keep complete records of the prices they pay and, in general, it would be impractical and too costly to try to collect price data directly from the purchasing households. The prices collected are usually the prices at which goods and services are offered for sale in retail outlets rather than actual transactions prices. However, when goods are purchased through electronic points of sale where both the prices and quantities are ‘scanned’ it may be possible to collect information about the actual transactions prices paid by households.
Most sellers display the prices at which they are prepared to sell. The prices may be listed in the shop or advertised in magazines or elsewhere. These prices should be treated as ‘offer’ prices. They are not necessarily the prices at which the actual transactions take place. In many cases, the transaction prices are lower. The transaction price is the list price less any discounts that may be offered or negotiated. For example, discounts may be made for bulk purchases or cash purchases. Discounts may be offered to all purchasers for limited periods of time in order to promote sales. They may also be offered to dispose of perishable goods quickly. In every case, the purchaser’s price need for ICP purposes is the price actually paid by the purchaser, irrespectively of the price at which the good or service may have been previously listed or offered for sale. This is the price at which the purchase will be recorded in the expenditure data of the national accounts.
In the case of services, the purchaser’s price includes any service charge payable in restaurants or hotels. Similarly, if a tip or gratuity is normally expected, it should be included in the purchaser’s price even if not shown on the bill presented to the customer. Tips may be payable in a wide variety of circumstances and should be included in the purchaser’s price.
Although the prices collected for CPI or ICP purposes must rely heavily on the prices observed in retail outlets or similar establishments, adjusted as necessary for discounts etc., there may be exceptional cases where it may be difficult to ascertain
97
the purchaser’s price without approaching the purchasers directly. For example, some prices may be individually negotiated as the outcome of some bargaining process. Sellers may well be selling the same goods or services to different purchasers at different prices. Some sellers may not display any prices, all prices being negotiated. This happens in both developed and developing countries. In many local or informal markets, especially in rural areas in developing countries, it is customary for the price paid to be determined by a process of bargaining between the buyers and the sellers. The prices paid may vary from one transaction to another depending on the bargaining skills of the buyers and sellers who frequent such markets. Bargaining, as such, does not create a conceptual problem. The relevant purchaser’s price is simply the price eventually paid by the purchaser. The problem is to ascertain the price actually paid. In some cases it may be possible to obtain this information from the purchasers after the transactions have been completed.
In developed as well as developing countries, buyers and sellers frequently bargain over the price of expensive durables, including automobiles. The extent of such bargaining may depend on general economic conditions. When the general level of sales is falling, purchasers may be able to negotiate considerable discounts off some notional list price, the discounts possibly varying significantly from customer to customer.
In the case of expensive purchases, the seller commonly provides credit or arranges for a third party, some kind of financial institution, to provide credit. There are two distinct transactions involved here: the purchase of the good or service in question and a financial transaction in which the purchaser borrows an amount equal to the purchaser’s price actually paid. Even if it is the seller who provides the loan or credit, the transaction price is the price excluding any interest charges. Obviously, the total interest payable depends on the period over which the payments are made as well as the price paid. The loan or credit is irrelevant for ICP purposes.
Given that it is necessary, in practice, to rely heavily on prices collected from retail outlets and similar establishments, price collectors need to be given clear guidance about what kind of prices they should be trying to collect and how they may differ from the advertised prices on display which are easier to collect. Price collectors should approach the proprietors or managers of the outlets in order to obtain the necessary information about discounts, promotional prices and sales prices. Price variation and average prices
The expenditure flows in the national accounts are the aggregate values of transactions taking place during a period of time, usually a year, and within a particular area, namely the economic territory of the country, as defined in the SNA. There are therefore two dimensions of price variation: over time and over space.
The price at which any single good or service is purchased is liable to vary considerably during the course of a year and also between different locations, especially in large countries. In these circumstances, the PPPs for individual products have to be defined as ratios of average prices. Given that the PPPs are used to make quantity comparisons, the requisite target price is the average obtained by dividing the
98
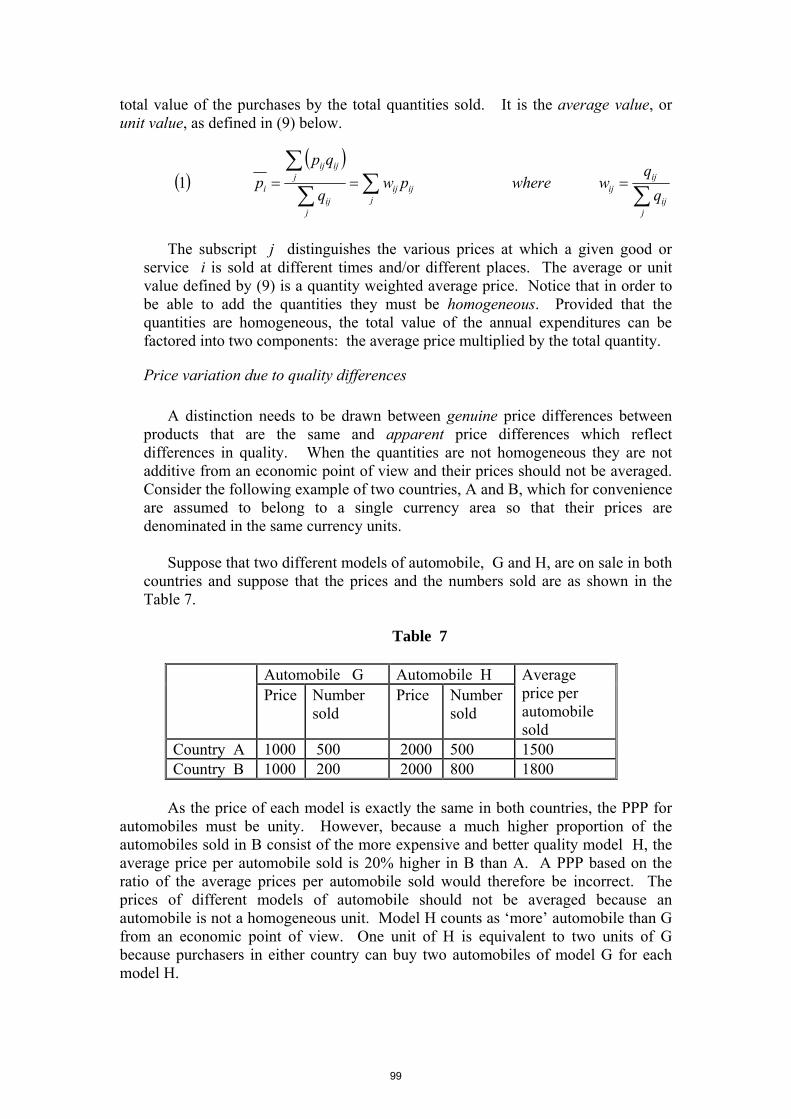
total value of the purchases by the total quantities sold. It is the average value, or unit value, as defined in (9) below.
The subscript j distinguishes the various prices at which a given good or
service i is sold at different times and/or different places. The average or unit value defined by (9) is a quantity weighted average price. Notice that in order to be able to add the quantities they must be homogeneous. Provided that the quantities are homogeneous, the total value of the annual expenditures can be factored into two components: the average price multiplied by the total quantity.
Price variation due to quality differences
A distinction needs to be drawn between genuine price differences between products that are the same and apparent price differences which reflect differences in quality. When the quantities are not homogeneous they are not additive from an economic point of view and their prices should not be averaged. Consider the following example of two countries, A and B, which for convenience are assumed to belong to a single currency area so that their prices are denominated in the same currency units.
Suppose that two different models of automobile, G and H, are on sale in both
countries and suppose that the prices and the numbers sold are as shown in the Table 7.
Table 7
Automobile G Automobile H Price Number
sold Price Number
sold
Average price per automobile sold
Country A 1000 500 2000 500 1500 Country B 1000 200 2000 800 1800
As the price of each model is exactly the same in both countries, the PPP for
automobiles must be unity. However, because a much higher proportion of the automobiles sold in B consist of the more expensive and better quality model H, the average price per automobile sold is 20% higher in B than A. A PPP based on the ratio of the average prices per automobile sold would therefore be incorrect. The prices of different models of automobile should not be averaged because an automobile is not a homogeneous unit. Model H counts as ‘more’ automobile than G from an economic point of view. One unit of H is equivalent to two units of G because purchasers in either country can buy two automobiles of model G for each model H.
( )( )
∑∑∑∑
===
jij
ijij
jijij
jij
jijij
i qq
wwherepwq
qpp1
99
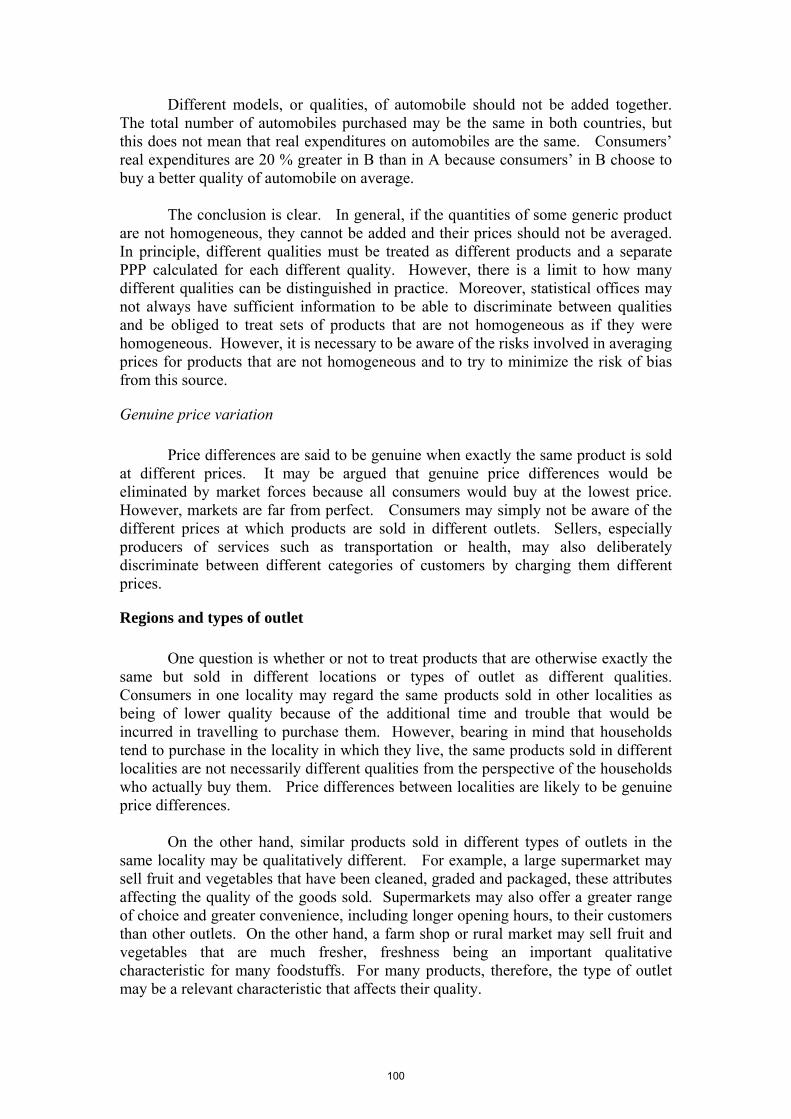
Different models, or qualities, of automobile should not be added together. The total number of automobiles purchased may be the same in both countries, but this does not mean that real expenditures on automobiles are the same. Consumers’ real expenditures are 20 % greater in B than in A because consumers’ in B choose to buy a better quality of automobile on average.
The conclusion is clear. In general, if the quantities of some generic product are not homogeneous, they cannot be added and their prices should not be averaged. In principle, different qualities must be treated as different products and a separate PPP calculated for each different quality. However, there is a limit to how many different qualities can be distinguished in practice. Moreover, statistical offices may not always have sufficient information to be able to discriminate between qualities and be obliged to treat sets of products that are not homogeneous as if they were homogeneous. However, it is necessary to be aware of the risks involved in averaging prices for products that are not homogeneous and to try to minimize the risk of bias from this source.
Genuine price variation
Price differences are said to be genuine when exactly the same product is sold at different prices. It may be argued that genuine price differences would be eliminated by market forces because all consumers would buy at the lowest price. However, markets are far from perfect. Consumers may simply not be aware of the different prices at which products are sold in different outlets. Sellers, especially producers of services such as transportation or health, may also deliberately discriminate between different categories of customers by charging them different prices.
Regions and types of outlet
One question is whether or not to treat products that are otherwise exactly the same but sold in different locations or types of outlet as different qualities. Consumers in one locality may regard the same products sold in other localities as being of lower quality because of the additional time and trouble that would be incurred in travelling to purchase them. However, bearing in mind that households tend to purchase in the locality in which they live, the same products sold in different localities are not necessarily different qualities from the perspective of the households who actually buy them. Price differences between localities are likely to be genuine price differences.
On the other hand, similar products sold in different types of outlets in the same locality may be qualitatively different. For example, a large supermarket may sell fruit and vegetables that have been cleaned, graded and packaged, these attributes affecting the quality of the goods sold. Supermarkets may also offer a greater range of choice and greater convenience, including longer opening hours, to their customers than other outlets. On the other hand, a farm shop or rural market may sell fruit and vegetables that are much fresher, freshness being an important qualitative characteristic for many foodstuffs. For many products, therefore, the type of outlet may be a relevant characteristic that affects their quality.
100
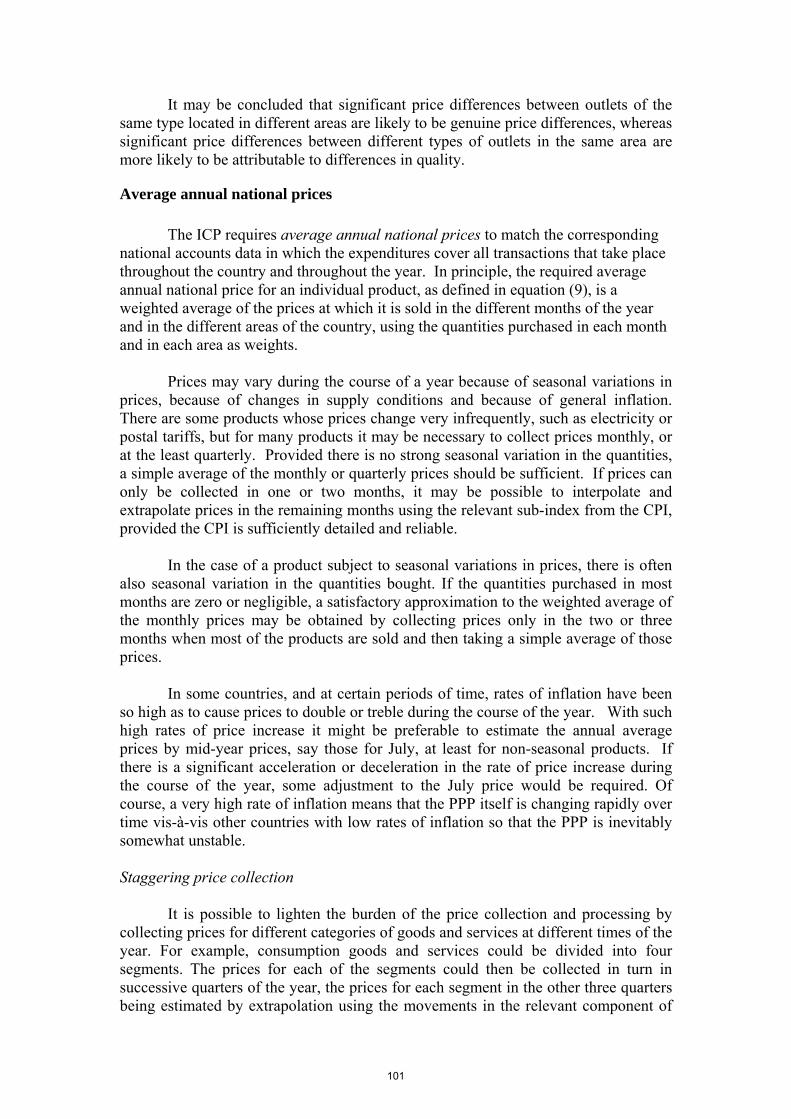
It may be concluded that significant price differences between outlets of the same type located in different areas are likely to be genuine price differences, whereas significant price differences between different types of outlets in the same area are more likely to be attributable to differences in quality.
Average annual national prices
The ICP requires average annual national prices to match the corresponding national accounts data in which the expenditures cover all transactions that take place throughout the country and throughout the year. In principle, the required average annual national price for an individual product, as defined in equation (9), is a weighted average of the prices at which it is sold in the different months of the year and in the different areas of the country, using the quantities purchased in each month and in each area as weights.
Prices may vary during the course of a year because of seasonal variations in
prices, because of changes in supply conditions and because of general inflation. There are some products whose prices change very infrequently, such as electricity or postal tariffs, but for many products it may be necessary to collect prices monthly, or at the least quarterly. Provided there is no strong seasonal variation in the quantities, a simple average of the monthly or quarterly prices should be sufficient. If prices can only be collected in one or two months, it may be possible to interpolate and extrapolate prices in the remaining months using the relevant sub-index from the CPI, provided the CPI is sufficiently detailed and reliable.
In the case of a product subject to seasonal variations in prices, there is often also seasonal variation in the quantities bought. If the quantities purchased in most months are zero or negligible, a satisfactory approximation to the weighted average of the monthly prices may be obtained by collecting prices only in the two or three months when most of the products are sold and then taking a simple average of those prices.
In some countries, and at certain periods of time, rates of inflation have been so high as to cause prices to double or treble during the course of the year. With such high rates of price increase it might be preferable to estimate the annual average prices by mid-year prices, say those for July, at least for non-seasonal products. If there is a significant acceleration or deceleration in the rate of price increase during the course of the year, some adjustment to the July price would be required. Of course, a very high rate of inflation means that the PPP itself is changing rapidly over time vis-à-vis other countries with low rates of inflation so that the PPP is inevitably somewhat unstable. Staggering price collection
It is possible to lighten the burden of the price collection and processing by collecting prices for different categories of goods and services at different times of the year. For example, consumption goods and services could be divided into four segments. The prices for each of the segments could then be collected in turn in successive quarters of the year, the prices for each segment in the other three quarters being estimated by extrapolation using the movements in the relevant component of
101
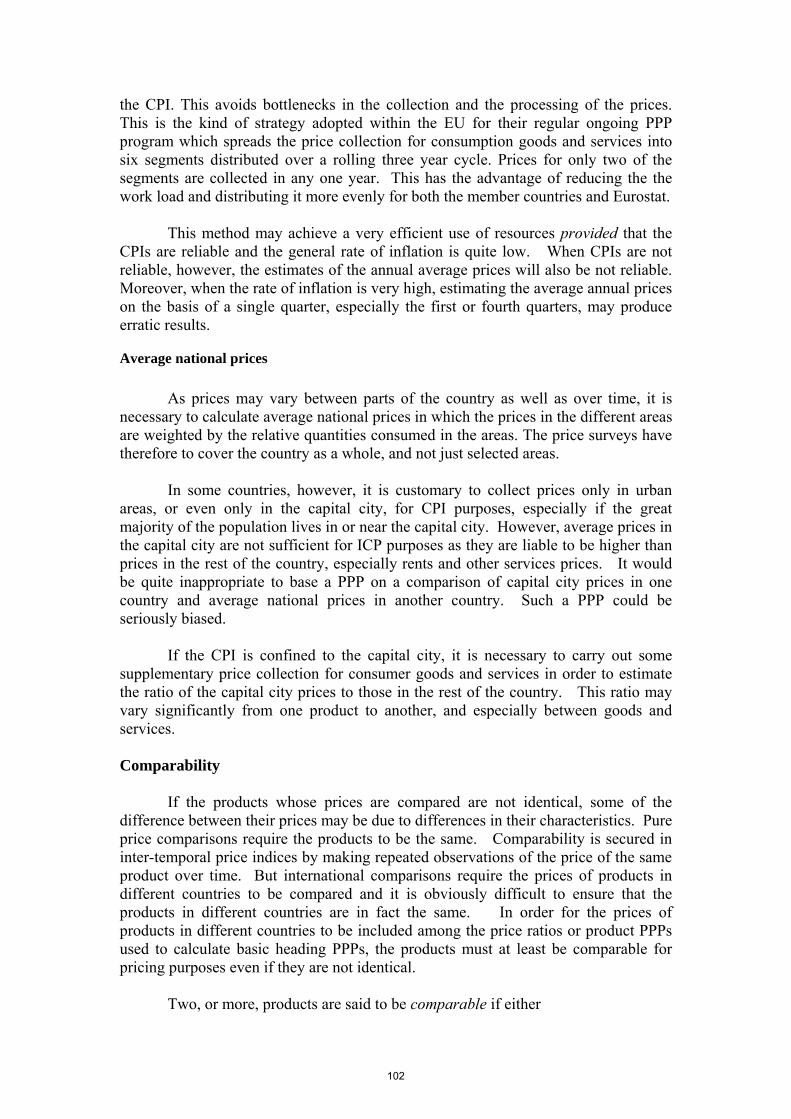
the CPI. This avoids bottlenecks in the collection and the processing of the prices. This is the kind of strategy adopted within the EU for their regular ongoing PPP program which spreads the price collection for consumption goods and services into six segments distributed over a rolling three year cycle. Prices for only two of the segments are collected in any one year. This has the advantage of reducing the the work load and distributing it more evenly for both the member countries and Eurostat.
This method may achieve a very efficient use of resources provided that the CPIs are reliable and the general rate of inflation is quite low. When CPIs are not reliable, however, the estimates of the annual average prices will also be not reliable. Moreover, when the rate of inflation is very high, estimating the average annual prices on the basis of a single quarter, especially the first or fourth quarters, may produce erratic results.
Average national prices
As prices may vary between parts of the country as well as over time, it is necessary to calculate average national prices in which the prices in the different areas are weighted by the relative quantities consumed in the areas. The price surveys have therefore to cover the country as a whole, and not just selected areas.
In some countries, however, it is customary to collect prices only in urban areas, or even only in the capital city, for CPI purposes, especially if the great majority of the population lives in or near the capital city. However, average prices in the capital city are not sufficient for ICP purposes as they are liable to be higher than prices in the rest of the country, especially rents and other services prices. It would be quite inappropriate to base a PPP on a comparison of capital city prices in one country and average national prices in another country. Such a PPP could be seriously biased.
If the CPI is confined to the capital city, it is necessary to carry out some supplementary price collection for consumer goods and services in order to estimate the ratio of the capital city prices to those in the rest of the country. This ratio may vary significantly from one product to another, and especially between goods and services. Comparability
If the products whose prices are compared are not identical, some of the difference between their prices may be due to differences in their characteristics. Pure price comparisons require the products to be the same. Comparability is secured in inter-temporal price indices by making repeated observations of the price of the same product over time. But international comparisons require the prices of products in different countries to be compared and it is obviously difficult to ensure that the products in different countries are in fact the same. In order for the prices of products in different countries to be included among the price ratios or product PPPs used to calculate basic heading PPPs, the products must at least be comparable for pricing purposes even if they are not identical.
Two, or more, products are said to be comparable if either
102
• their physical and economic characteristics are identical, or • they are sufficiently similar that consumers are indifferent between them.
Two similar products are comparable if consumers are indifferent as to which of the two they consume. This implies that consumers are not prepared to pay more for one than the other.
Product descriptions used for CPI and ICP purposes consist of listings of the various physical and economic characteristics that the products possess. Some examples are given in the next chapter. Not all of a product’s characteristics are necessarily price determining. When a characteristic is price determining the absence or presence of that characteristic will affect the price that consumers are prepared to pay for the product. For example, the possession, or absence, of air conditioning will usually affect the price of an automobile. Consumers in most countries will pay more to obtain it. The size of a packet of rice is price determining as consumers will pay more for a kilo than half a kilo. And so on: there are innumerable examples of price determining characteristics.
On the other hand, the colour of an automobile, or the make of its tyres, may not be price determining. Some consumers may prefer one colour and other consumers another colour, but they may not be prepared to pay more to obtain their colour. Some standardised goods may be produced by a number of different manufacturers. Consumers may be indifferent as to the manufacturer even though the goods they produce may not be identical.
Two products that differ in respect of some price determining characteristic cannot be comparable for ICP purposes as, by definition, consumers would be prepared to pay more for one or the other. On the other hand, products that differ only in respect of one or more non-price determining characteristics may be treated as comparable. Thus, products in different countries do not necessarily have to be completely identical for their price ratios to be treated as product PPPs.
Price collectors have to be provided with a product specification -- that is, a list of characteristics -- that enables them to identify any particular product in retail outlets in their own countries. The way in which the ICP product specifications are determined is explained in some detail in the following chapter. In the present context, it may be noted that one way to achieve comparability is to make the descriptions, or specifications, of the products so precise and exhaustive that the price collectors in different countries must choose the same products, assuming of course that the products can be found in their countries. The price collectors themselves are not in a position to check whether the products they price are the same as the corresponding products being priced by other collectors in other countries, but if the specification of the product is tight enough all collectors must choose the same product.
Price collectors are likely to have some experience of collecting prices for CPIs or other intertemporal price indices, but CPI price collectors need to be aware that there is an important difference between inter-temporal and international comparisons. Product definitions and specifications are often loose in CPIs, so that
103
price collectors are left with some latitude about exactly which particular products in an outlet to select for pricing. Inter-temporal comparability is then achieved by the individual price collectors themselves who stick with the same products over time, repeatedly pricing the same products from period to period. However, the price collectors are not in a position to ensure comparability in international comparisons as they cannot see what price collectors in other countries are doing. They must be provided with such precise product descriptions and instructions that every price collector, working independently of the others, is bound to select the same product.
Although price collectors should be provided with a tight product specification, it is also possible to give them some discretion to choose close substitutes if they cannot find the exact product specified. In this way, the number of prices actually reported may be significantly increased. In this case, the price collectors must also record and report in exactly which way the characteristics of the product priced differ from the target specification. With this information, it may be possible to adjust the price collected for the difference between the actual and the target specifications: in other words, to make a quality adjustment. After adjusting for the difference in quality the price may provide a satisfactory estimate of the price of the product targeted. Comparability is achieved ex post. The next section considers the types of quality adjustment that may be made. Quality differences
Economic theory shows that the relative prices of two products, or different qualities of the same kind of product, should reflect both their relative costs of production and their relative utilities from the perspective of the purchaser or user. In practice, it is easier to quantify and measure relative costs of production than relative utilities.
In an ICP context, if two non-identical products i and j are judged to be comparable for pricing purposes, they must be of the same quality. This means that if the two products were to be offered for sale side by side on the same market, consumers would be indifferent between them. Consumers would not be prepared to pay more for one than the other. On the other hand, if consumers are prepared to pay more for i than j, then i is of higher quality than j. The difference in their prices on the same market measures the value of the difference in their qualities. When i and j are on sale in two different countries the price of one or other of them has to be adjusted for the difference in their qualities before the two prices can be compared for PPP purposes. Estimating the value of the quality difference is difficult but may be possible in some circumstances if enough information is collected about the physical and economic characteristics of the products.
Characteristics and quality
There are various kinds of characteristics that affect the quality of a product
and its utility from the consumer’s viewpoint. They may be used to help define a generic product more precisely. In the case of goods, the following kinds of physical characteristics are relevant:
104
• Types of materials used as inputs; e.g., ingredients for foodstuffs or drinks; fibres or other materials for clothing; type of wood, plastic or other materials used for furniture etc.;
• Styling, finishing and craftsmanship; • Weight, length, cubic capacity or other dimensions; • Type of container or packaging; • Purity, strength or durability; • Method of production; • Power of electric or electronic goods; • Capacity and speed of engines or processors.
The above list is illustrative and is not meant to be exhaustive. Clearly, the
kinds of characteristics may vary considerably from product to product, depending on whether the good is a simple product such as a particular kind of food or a complex product such as a consumer durable. In addition to these physical characteristics, the quality of product may be affected by the location and type of outlet in which it is sold and the terms and conditions of sale. It may also be affected by the time of year at which the good was purchased. Consumers’ perceptions of the quality of a product may also be affected by advertising and brand imaging.
In the case of services, the following kinds of characteristics affect the quality of the services such as repairs, housing, transportation, entertainment, recreation, health and education:
• Skill, qualifications and experience of the service provider(s); • Equipment used by the provider; • Type of outlet, premises or establishment in which the service is provided; • Timeliness, reliability and frequency with which the service is provided; • Accessibility of the service provider; • Time of day or day of the week.
For example, the quality of a journey from X to Y depends on the frequency
with which it may be available, the reliability and safety of the equipment used, the furnishing of the vehicle and the comfort of the traveller, and so on. The price of a ticket from X to Y may vary greatly depending upon these factors, so that the distance travelled is an inadequate specification of the product. A passenger mile is only a crude generic unit of quantity.
Quality adjustment based on hedonics
The most general approach to the treatment of quality is the so-called hedonic approach. This method is not widely used in practice because it requires a lot of detailed data, but from a conceptual point of view it is extremely important and for this reason it is considered first. All methods of quality adjustment use the same underlying logic as the hedonic method. The hedonic method uses a simple economic model and classic statistical estimation procedures. It is objective and replicable.
105
A product is specified by the characteristics it possesses. It can be viewed as possessing a bundle of characteristics that identify the product. Each characteristic is assumed to affect the amount of utility derived by the consumer and therefore exerts an influence on the price the consumer is prepared to pay. The price of the product is therefore assumed to be a function of the particular set, or mix, of characteristics it possesses.
If one of the characteristics varies between otherwise identical products, say the power of electric light bulbs, the prices may be expected also to differ. Hedonic analysis seeks to estimate by how much an increase in the power may be expected to change the market price of a bulb. This can be estimated by observing the prices of electric light bulbs on the same market at the same time and then calculating a least squares regression of the price on the wattage. Notice that the relationship need not be a simple linear one. In particular, there is no presumption that price is proportional to power of the bulb. On the basis of the estimated relationship, it is then possible to predict by how much the price of a 100 watt bulb may be expected to exceed a 60 or 40 watt bulb on the sale on the market at the same time. In an ICP context, a situation might arise in which the average price reported by one country is the average price of a 40 watt bulb while the target price, and hence presumably the prices collected in other countries, refers to a 100 watt bulb. In this case, the price of the 40 watt bulb may be adjusted to that of a 100 watt bulb on the basis of the estimated hedonic relationship. The resulting quality adjusted price may then be compared with the prices of 100 watt bulbs in other countries to obtain a price ratio for PPP purposes.
This approach can be generalised to deal with several characteristics simultaneously. In order to estimate the contribution of each characteristic to the price, multiple regression may be used in which the observed market prices of products of different qualities are the dependent variables and the characteristics are the explanatory variables. In order to obtain robust estimates of the coefficient of the characteristics, a sufficiently large number of different qualities, or models, of the product need to be for sale on the market at the same time. The estimated partial regression coefficients of the various characteristics are then interpreted as providing estimates of the marginal contribution of each characteristic to the price. Some characteristics such as weight or power may be represented by continuous variables. Characteristics in the form of non-numerical attributes, such as being manufactured out of leather rather than synthetic materials, can be represented by dummy variables that take the value of unity or zero.
It may be concluded, therefore, that it may not be necessary for the products whose prices are collected in different countries to be perfectly matched for their prices to be usable. The characteristics of the products may differ somewhat provided it is possible to predict by how much the prices may be expected to differ as a result of the differences in the characteristics. The predicted difference can be used to adjust one or other of the two prices to obtain a quality adjusted price which can then be treated as being comparable with the other price for PPP purposes.
If the estimated coefficient of some characteristic is zero, that characteristic is not price determining. As already suggested, this might happen for a characteristic such as colour. Characteristics that are not price determining can be ignored.
106
As already noted, it may not be feasible to make much use of hedonics in ICP 2005, but still they provide the most widely accepted conceptual or theoretical framework for analysing quality differences. Hedonic coefficients are estimated from prices observed on the market using objective statistical methods. It is the market’s assessment of the contributions of the various characteristics to the price that provides the means for adjusting for quality differences, as distinct from intuitive subjective judgements about the effects of quality on price. The method has recently attracted widespread interest and attention because it has been used successfully to deal with the very rapid and substantial improvement in the quality of computers over time. Simpler methods of quality adjustment may be developed that rely on the same underlying principles and these methods are described in the following sections.
Quality adjustments in the ICP
As explained in the next chapter, the price collectors for ICP 2005 are provided with tight product specifications: that is, very precise product descriptions that are intended to leave little or no room for variation in the characteristics of the products selected. These tight specifications serve as targets for the price collectors. If all the characteristics of the products priced in different countries actually match the target specifications, then it can be assumed that the products in different countries are really comparable.
It often happens that price collectors are unable to find the exact product specified but can price another product that has most, but not all, of the required characteristics: in other words, a close substitute for the target product. In this case, price collectors are advised to collect the price of the substitute while at the same time noting exactly how its characteristics differ from those of the target product. As explained in the next chapter, the forms provided to price collectors are designed in such a way as to make it easy for price collectors to take note of the characteristics of the product actually priced. Of course, price collectors should be advised not to abandon the search for the target product too quickly by pricing a replacement product, but in many cases the target product may simply not be available.
Thus, provided price collectors take proper note of the characteristics, statistical offices should have the necessary information about any differences between the actual and the target characteristics. This information may make it possible for the statistical office to adjust the price for the difference in quality between the product priced and the target product. If the price can be adjusted to the target specifications then it becomes comparable with prices collected in other countries. Of course, other countries are also expected to make quality adjustments whenever their products do not match the target specifications.
The methodology used to make quality adjustments must be agreed with the regional coordinators. RCs also need to maintain tight control over the methods used. This may require visiting the countries to discuss methods or to review the adjustments actually made by statistical offices.
There are a number of fairly simple methods of making adjustments for quality differences that are summarized in the following sections. The first question, however, is how large the difference between an actual characteristic and a target
107
characteristic has to be in order to make worthwhile any adjustment, given that quality adjustments are often rather crude and subject to error. For example, if the quality adjustment changes the price by less than 5% it may not be worth making, given that any adjustment is subject to error. The product could be treated as being sufficiently comparable with the target product as to make its price acceptable without any adjustment. Inevitably, some judgment enters into this decision, much depending on how much confidence can be placed on the particular quality adjustment in question.
Quality adjustments based on relative costs
One method commonly used in inter-temporal price indices is to use the actual, or estimated, relative costs of production as a measure of the relative qualities of two products. Quite simply, if Y is the substitute product actually priced and product X is the target specification, and Y is estimated to have cost 25% more to produce than X, then the price of Y should be reduced by 20% to provide an estimate of the price of X that can be compared with the actual or estimated prices of X in other countries. As stated above, such an adjustment can be made within the national statistical office concerned, in collaboration with the regional coordinator.
Conceptually, the method uses the same underlying rationale for quality adjustment as the hedonic method. As relative prices are expected to reflect both the relative costs of production and the relative utilities of the two products, relative costs of production may often be expected to provide an acceptable approximation to the relative prices of different qualities. Like any other method of quality adjustment, however, the method based on relative costs needs to be used carefully.
Adjustments based on size, weight, dimensions or capacity
The product priced may differ from the required product specified on the product list simply because it is sold in a different size of package or it has rather different dimensions or capacity from the specified product. For example, rice may be sold in packets of 750 grams rather 500 grams. The cubic capacity of a refrigerator may 20% larger or smaller than that specified on the product list. The size of a television screen may be 40 rather than 30 centimetres. And so on. Weight, length, area, volume, etc are straightforward physical characteristics that are easily measurable and well suited to be used as characteristics in hedonic regressions. They also offer the possibility of relatively simple direct adjustments for quality differences.
If the characteristic is a major one, such as the quantity of some foodstuff, it may be reasonable to assume that the price is a simple function of the relevant characteristic. For example, if the target specification is a packet of 500 grams of a particular kind of rice, whereas the price collected refers to a packet of 750 grams, it may be assumed that the price of a 500 gram packet would be two thirds of the price of a 750 gram packet. The price of the 750 gram packet is simply reduced by a third to obtain an estimate of the price of a 500 gram packet.
However, simply adjusting the price in proportion to the size of the relevant characteristic is not always appropriate, especially if the difference is large. The relationship between price and quantity may not even be linear. As the size of the
108
package or quantity sold increases, the market price may increase but at decreasing rate. A package containing ten kilos usually sells for significantly less that ten times the price of a one kilo package.
When the market is accepted as the arbiter of quality, the fact that the price per unit of quantity typically falls as the quantity sold increases means that quantities sold in bulk are lower quality than the same quantities sold in small packets. The ‘quality’ of rice in a 10 kilo packet may be less than the ‘quality’ of rice in a 1 kilo packet, even though the rice is physically the same. First, looked at from the production side, a 10 kilo packet will usually not cost 10 times as much to produce and market as a 1 kilo packet. Second, consumers will not generally not be indifferent between one 10 kilo packet and ten 1 kilo packets. Consumers may prefer to buy in smaller packets because they do not have the physical capacity to carry or store large quantities and they may also not have the financial resources to make bulk purchases. If therefore the target specification is a 1 kilo packet of rice and a price is reported for a 10 kilo packet, it is not feasible on the basis of this information alone to estimate what the price of a 1 kilo packet would be. Quality adjustment may not possible and the price of the 10 kilo packet may have to be rejected.
These arguments apply to a wide range of products and characteristics. For example, a refrigerator may be of the required type but have twice the cubic capacity of the target specification. However, halving its price would not be an appropriate quality adjustment. It will not have cost twice as much to produce, while most consumers would not rate it as providing twice as much utility, especially if they have limited space to house their durables. Similarly, while the quality of a computer may an increasing function of characteristics such as speed and memory size, this relationship is also unlikely to be linear.
For some products, adjustments based on simple physical characteristics may not be at all straightforward. For example, the quality of milk is not proportional to its fat content. Some consumers want rich milk with high fat content while others want skimmed or semi-skimmed milk with a low fat content. It may even cost more to reduce the fat content. A similar argument applies to alcoholic drinks such as beer or wine whose quality cannot be assumed to vary in any simple way with their alcohol content.
One special problem is that very poor people are obliged to buy in small quantities because of lack of resources. The quantities may often be inconveniently small necessitating inconveniently frequent purchases. In effect, the very poor may be obliged to buy at prices that are high per unit of quantity.
Brands
A brand is the advertised name for a specific kind of product. The brand name may be legally protected by means of copyright or a registered trademark to prevent other producers from using the same name. Brands may be international, national or local: that is, the products may be advertised, recognised and sold in many countries or only in a single country or area. The owner of a brand name tries to create and foster an image by advertising and publicity designed to convince consumers that the product has distinctive or unique qualities that other products do not possess. In many
109
cases, other competing products that do have the same physical characteristics may be on sale: for example, non-proprietary drugs that have exactly the same composition and properties as the corresponding proprietary drugs. In such cases, some consumers may regard the branded goods as being more reliable or trustworthy than the unbranded ones and the producers of branded goods will try to exploit the fact that consumers are not well informed about the properties of all the various different products on sale.
International brands are particularly attractive for PPP purposes because the same international branded goods may be presumed to be comparable when they are sold in different countries. In fact, producers may sometimes modify the branded products to suit local tastes or conform with local regulations or laws, but such differences tend to be small.
Through sustained advertising campaigns, producers of branded products try to present their products as being intrinsically superior or more reliable and trustworthy than equivalent unbranded ones. In practice, producers of branded goods attach importance to their brand image and, for this reason, they may take care to ensure that their products do continue to meet certain standards that consumers may rely on. Some branded goods may therefore actually be superior and more reliable and trustworthy than some competing unbranded goods, being made of better materials or ingredients. However, the advertising is designed to convince consumers that the differences in quality are much greater than any genuine differences in their characteristics.
To the extent that producers of branded goods succeed in convincing most consumers that their products are superior, the brand name becomes a characteristic that has value in itself. People may be persuaded to buy branded products, such as proprietary drugs, at high prices because consumers perceive them to be superior even if they are not materially different from equivalent non-branded goods.
In the case of fashion goods, the brand itself may be the principal attraction to the consumer. The main satisfaction derived by some purchasers of branded goods is to display the branded goods to other people. This applies not only to high fashion and haute couture but to goods such as jeans or trainers for school children and others. There may be considerable incentives to buy named brands as a result of pressure from peer groups
Thus, a brand may become a major characteristic in its own right even though it is only a name rather than any kind of physical characteristic. It can become an economic characteristic that is price determining. In this case it is essential that it should be treated as one of the characteristics that enter into the target specification.
The relative prices of branded and unbranded goods are unlikely to reflect both their relative costs of production and their relative utilities to consumers. On the contrary, the brand is often deliberately designed to drive a wedge between relative production costs and relative utilities by exploiting market imperfections, especially consumer’s lack of information. It is worth noting that this implies that adjusting for quality differences on the basis of relative costs of production may be quite inappropriate when dealing with branded and unbranded products. If consumers
110
willingly and knowingly purchase branded and unbranded products at different prices on the same market at the same time, they must be treated as qualitatively different products even though the products may be physically identical in all other respects. It is also possible, of course, that the branded product does not sell at a significantly higher price if the objective of the producer is to expand the branded product’s share of the market at the expense of the unbranded products.
Given the hypothesis, or assumption, that consumers are prepared to pay a higher price, possibly a much higher price, for branded goods than otherwise identical unbranded goods when confronted with a choice between them, it follows that branded goods in country A should not be treated as if they were the same as unbranded goods in country B even if their physical characteristics are otherwise identical. To do so would introduce a bias into the product PPP. Products should be stratified on the basis of their brand status and comparisons made only between goods in the same strata. At least four strata can be distinguished: international brands, national brands, local brands and no brands. In practice, it may be difficult to separate national from local brands.
Brands are therefore important for ICP purposes for two main reasons. First, international brands are useful because they can effectively tighten the specification considerably and make it possible to identify exactly the same goods in different countries. However, it should be noted that producers may sometimes modify the branded products to suit local tastes or conform to local regulations or laws, but such differences tend to be small. Second, and much more important, as brand status may be a major price determining characteristic it is necessary to include it in the specification of every product that may be liable to be branded. Comparability requires that products should have the same characteristics, which implies that products with different brand status are not comparable. There is no suggestion that the selection of products to be priced should be biased in favour of international brands simply because they help to ensure comparability. The recommendation is that the brand status of the goods compared should be the same in different countries. Extensive use may be made of unbranded goods so long as they are only compared with unbranded goods in other countries. In practice, representative goods in poorer countries are often unbranded goods.
In practice, it may happen that the product specification requires the possession of a certain brand status but no goods with that brand status can be found in a country: only unbranded goods. In this case, if the unbranded goods have all the other required characteristics, it is clearly preferable to collect their prices than no prices. In general, in the ICP, it is recommended that the prices of close substitutes should be collected if the required products cannot be found at all. The question then is how to adjust the prices for the difference in quality between branded and unbranded goods.
The only way to evaluate the relative qualities of branded and unbranded products is to look for countries in which both kinds of products are on sale at the same time on the same markets. This may be perfectly possible for drugs or jeans, for example, where it is common for branded and generic products to be on sale in competition with each other. The relative prices at which the branded and unbranded products are sold provide a measure of their relative qualities which can then be used
111
to adjust the price of an unbranded product in one country to make it comparable with that of a branded product in another country. The feasibility of making quality adjustments depends on branded and unbranded products being on sale side by side in at least some countries in order to obtain some estimate of their relative prices.
Fake Brands
As already noted, international brand names are normally legally protected by copyright or registered as trademarks. Similarly, major national or local brands are likely to be trademarked. It is well known, however, that even though they may be effective in the country where they were registered, patents, copyrights and trademarks may be difficult to enforce at a world level. Producers in some countries may copy both the product and the brand name and not only sell in their own country but export their products to other countries. Fake international brands may be found in any country but seem to be more common in some developing countries. .
If consumers and the price collectors cannot recognize a fake as a fake, the product must be treated as if it were genuine. In practice, there is obviously no alternative if it cannot be recognized as a fake. If the physical characteristics of a fake product are the same as the genuine article and it cannot be distinguished from the latter, it must be comparable with the latter for ICP purposes. If, on the other hand, both the buyer and the price collector know it to be a fake, it must be treated as a different product. Its price should not be compared with that of the genuine article in another country. However, if the price collector cannot find and price the genuine article anywhere, the price of the fake may be collected on the general principle that it must be a close substitute for the genuine article and it is better to collect the price of a close substitute than no price at all. Obviously, it is imperative that the price collector note the fact that it is known to be fake on the product specification for the product. It may then be possible to make a quality adjustment for the difference between the genuine article and the fake. As explained in the previous section, the quality adjustment must be based on the market’s evaluation of the two kinds of products and not on some subjective assessment made by the price collector, national statistical office or regional coordinator. This requires both kinds of product to be on sale side by side in at least some countries. The relative prices of genuine and fake articles provide the necessary information.
In effect, fake brands constitute an additional brand stratum. Comparisons between genuine and fake brands have to be treated in the same way as comparisons between branded and unbranded goods, as explained above. The price of fake brands can be compared with those of genuine brands provided some adjustment can be made for the difference in quality based on their observed relative prices on some markets. This may not always be possible, of course.
Another reason for collecting the prices of known fakes when the required genuine article cannot be found is the fact that if enough such prices are reported by enough countries, their price ratios can be used for ICP purposes without attempting to compare them with genuine brands. A new product is created in which the possession of a fake international brand is actually part of the specification. It must be remembered that a detailed, precise specification of all the characteristics of the products is required in any case, whether or not a brand is included in the
112
specification. Comparing the prices of fake brands which are known to be comparable in respect of all their other characteristics is perfectly acceptable for ICP purposes.
A situation may arise in which the price collector suspects the brand is fake but does not know for certain. This may apply to the purchasers also. The same principles apply as for known fakes. If the genuine article cannot be found and priced, the price of the suspected fake is should be collected and the fact that it is suspected to be a fake recorded. In this case, the regional coordinator must decide whether to classify it as genuine or a fake and process it accordingly. Much may depend on the number of countries reporting suspected fakes.
Internationally known brands that are sold in many countries, such as Coca Cola or Sony, can be useful for ICP purposes because the products should be comparable between many countries. They are likely to be included on the product list. However, in order to have a balanced product list, some national brands or unbranded goods that are representative in other countries must also be included on the list. The product list must not be confined to international brands that may be representative in more rich than poor countries. It is possible that some international brands, especially extremely expensive and ostentatious luxury fashion goods, may be purchased by such a minute proportion of consumers as not to be worth including on any product list. Such esoteric products should not be used for ICP purposes, even for comparisons between relatively rich developed countries.
Conditions of sale, type of outlet and location
The terms and conditions of sale attached to the purchase of a good or service can affect its quality. For example, the possession of a guarantee, or delivering the goods, tends to improve the quality of the goods concerned. Customers also tend to attach importance to the range and variety of choice that the outlet offers as well as the number of hours it is open. The location of an outlet, as between rural areas, large towns or cities and the capital city may be a relevant characteristic, but most customers have little choice but to purchase in outlets in their own locality.
The type of establishment in which certain kinds of goods and services are provided can be important from the consumer’s point of view. A drink or a meal served in pleasant, comfortable surroundings is of better quality than one served in less pleasant surroundings. The price of a branded drink, such as a Coca Cola or a Heineken, can vary greatly depending on the kind of bar, café or restaurant in which it is provided. A high price may simply reflect the additional costs of providing more comfort and facilities, so that the consumer is effectively buying more rather than paying a higher price. The consumer purchases a composite product consisting of the drink plus a variable amount of additional services. If drinks or meals served in bars or restaurants are included on the lists of products to be priced for ICP purposes, the specification must stipulate the type of establishment in which it is served, including its location, as well as the type of the drink or meal.
Location is obviously extremely important for housing services. The rents payable for a given type of accommodation, and also the prices paid to purchase dwellings, can vary greatly between locations, especially between capital cities and
113
the rest of the country. Location is therefore included as one of the most important characteristics when specifying the type of housing services to be included on the product lists.
References Commission of European Communities, IMF, OECD, UN, World Bank, (1993), System of National Accounts 1993. Diewert, W.E. 1976. “Exact and Superlative Index Numbers”. Journal of Econometrics, Vol.4, pp. 114-145. Diewert, W. E, 2004, “Elementary Indices”, Chapter 20 of the CPI Manual (2004), pp. 353-371 Diewert, W. E, 2004a, “The Aximatic and Stochastic Approaches to Index Number Theory”, Chapter 17 of the CPI Manual (2004), pp. 289-311. Diewert, W. E. 2004b, “On the Stochastic Approach to Linking the Regions in the ICP”, Discussion Paper No.04-16, Department of Economics, University of British Columbia, Vancouver. Commission of European Communities, IMF, OECD, UN, World Bank, (1993), System of National Accounts 1993. ILO, IMF, OECD, Eurostat, UNECE and the World Bank, (2004), Consumer Price Index Manual: Theory and Practice. Eurostat – OECD 2004 Report on Purchasing Power Parities and Real Expenditures Eurostat – OECD, 2006, Methodological manual on purchasing power parities, Luxembourg, . Gini, C. 1931. “On the Circular Test of Index Numbers”, International Review of Statistics, Vol. 9 No. 2, pp. 3-25, 1931. Hill, R.J. 1997, “A Taxonomy of Multilateral Methods for Making International Compariosn of Price sand Quantities”, The Review of Income and Wealth, Series 43, Number 1. Hill, T.P. 2004, “An Introduction to Consumer Price Index Methodology” , Chapter 1 of the CPI Manual (2004), pp. 1-32. ILO, IMF, OECD, Eurostat, UNECE and the World Bank, (2004), Consumer Price Index Manual: Theory and Practice.
114
Kravis, I.B., Z. Kenessy, A.W. Heston and R. Summers, 1975: A System of International Comparisons of Gross Product and Purchasing Power, published for The World Bank by Johns Hopkins University Press, Baltimore and London. Rao, D.S. Prasada 2001. Weighted EKS and Generalized Country Product Dummy Methods for Aggregation at Basic Heading Level and Above Basic Heading Level, Seminar on PPPs, World Bank Washington, Jan/Feb 2001. Rao, D.S. Prasada 2004: “The Country-Product –Dummy-Method: A Stochastic Approach to the Computation of Purchasing Power Parities in the ICP”, SSHRC Conference on Index Numbers and Productivity Measurement, Vancouver, July 2004. Statistical Office of the European Communities (Eurostat) Luxembourg, 1983: Comparison in Real Values of the Aggregates of ESA: 1980; Statistical Office of the European Communities Luxembourg,. Summers, R. 1973. “International Comparisons with Incomplete Data”, The Review of Income and Wealth, March 1973, pp. 1 – 16.
115
Chapter 5
Product Lists, Specifications and the Pre-Survey Introduction
1. This chapter describes the methods used in the ICP to draw up product lists for the price surveys. It is only possible to collect prices for a limited number of products within each basic heading, and it is crucial to the success of the entire ICP that the right products are selected. Whereas CPI baskets represent consumer goods and services purchased by households in individual countries, the goods and services on the ICP’s list have to be widely available in regional markets around the world. The lack of region-specific product lists based on market realities in different countries proved to be problematic for the ICP in the past when slightly modified lists originally meant for OECD countries were used in worldwide surveys. The ICP global comparison is built up by linking individual regional comparisons. .Therefore the challenge for implementers of ICP is to draw up a tightly defined product list that takes account of representativity and comparability. These concepts have already been defined in Chapter 4.
2. A new approach for product classification and identification was developed for ICP 2005.
This approach uses a new international product coding system and a list of price-determining characteristics called the Structured Product Description (SPD). The objective is to simplify and standardize the process of defining products in close consultation with the regional coordinating offices and participating countries.
3. The first step in the process is the establishment of a set of Structured Product
Descriptions, or SPDs. These are generic descriptions that list the characteristics relevant to a particular narrow cluster of products. The next step is to use these generic descriptions to create detailed Product Specifications, or PSs, that specify the precise characteristics of the individual products for which prices are to be collected. The transition from the SPDs to the PSs takes place during the Pre-Survey. Before conducting any actual price surveys, however, countries need to ensure that the list contains a sufficient number of their own representative products. For ICP purposes, enough countries also have to price the representative products of other countries so that prices can be compared across national borders. Accordingly, during the Pre-Survey countries are asked to investigate the availability of other countries’ representative products in their countries and to test the feasibility of collecting prices for them on their own markets.
4. The first part of this chapter is devoted to the SPDs and the related PSs. Subsequent
sections describe the Pre-Survey and the process of building up the final lists of products to be priced.
116
Structured Product Descriptions (SPDs)
5. The SPDs are intended to facilitate the work of all those involved in setting up the product lists and collecting the prices – the Regional Coordinators, National Statistical Institutes or Country Coordinators and Price Collectors. Each SPD requires some expert knowledge of all the relevant characteristics of the products within that cluster. The first set of SPDs made use of detailed information on product characteristics on file in the US Bureau of Labor Statistics, but this information only provided a point of departure. The final SPDs actually used in the 2003-2006 round drew upon the expertise of Regional Coordinators and National Coordinators and their knowledge about products gained from conducting CPI price surveys in the countries of each region. In this way, lists of characteristics that best reflect the products in each region were developed.
6. ICP’s product classification and coding system harmonizes three established classification
systems: • OECD-EUROSTAT Classification of Expenditure on GDP; • COICOP - HBS1; • US Bureau of Labor Statistics Elementary Level Items codes.
The classification of final expenditure on GDP used for the OECD-Eurostat European Comparison Programme served as the base classification structure for ICP 2005. The COICOP-HBS classification structure was mapped to the OECD structure so that countries using the COICOP-HBS system can easily be integrated with the ICP process if necessary. The BLS checklist is designed in such a way that it contains lists of characteristics that describe families of products in a consistent way. This checklist format was deemed as very useful for the ICP. In order to use that format, the ICP Global Office mapped the BLS checklist with the merged-OECD-COICOP-HBS structure.
7. Mapping COICOP-HBS with OECD structure
The first step in the process was to compare the OECD structure with the COICOP-HBS structure and match COICOP-HBS’s five-digit category2 with OECD’s seven-digit basic heading3. In the process, the ICP Global Office either extended or condensed various COICOP levels to fit into the OECD classification structure. For instance, OECD has one seven-digit basic heading for Fresh, chilled or frozen fish and seafood (11.01.13.1), whereas COICOP has three five-digit basic headings for Fresh, chilled or frozen fish (01.1.3.1); Fresh, chilled or frozen seafood (01.1.3.2); and Other preserved or processed fish and seafood and fish and seafood preparations (01.1.3.4A). In such cases, the ICP Global Office scaled up the COICOP levels to fit into the broader OECD level.
1 Classification of Individual Consumption According to Purpose – Household Budget Survey; 2 The COICOP-HBS is structured into four levels: Level 1: Divisions (two-digit); Level 2: Groups (three-digit);Level 3: Classes (four-digit); Level 4: Category (five-digit).
3 Basic headings were defined and explained in Chapter 3. They are the lowest level of expenditure distinguished within a given classification.
117
8. On the other hand, there were cases when one COICOP five-digit basic heading matched with more than one OECD Basic Heading. For instance, Other products (01.1.1.5) under Bread and cereals in COICOP-HBS matched with both Other cereals, flours and other cereal products (11.01.11.2) and Other bakery products (11.01.11.4) in the OECD structure. In such cases, the Global Office matched Other products (01.1.1.5) with both OECD basic headings and assigned the following codes to them - 01.1.1.5A and 01.1.1.5B.
9. The OECD classification uses 222 basic headings. For ICP purposes, the 222 basic
headings were considered too detailed, especially for developing countries. As a result, some of the basic headings from the original 222 OECD classification have been combined to form the ICP’s 155 basic heading structure.
10. Mapping US BLS to merged-OECD- COICOP-HBS
Each BLS checklist contains a list of characteristics describing a product family. The Global Office matched the BLS products with merged OECD-COICOP-HBS at the product level first. Then the characteristics related to each product family were adopted from BLS to form SPDs for each product family. Ultimately, about 800 SPDs were created for household consumption (excluding health) from the BLS checklist.
11. Harmonized classification structure for ICP 2003-2006 round
The ICP classification structure that emerged from mapping the OECD, COICOP-HBS and BLS structures can be thought of as a harmonized classification structure. In this structure, each ICP basic heading has a 7 digit code (for example, Fresh milk 11.01.14.1; Shoes and other footwear 11.03.21.1) and is grouped into smaller clusters. These clusters are more homogeneous than the basic heading itself but still permit some variation in the characteristics possessed by the products within the cluster. For example:
• Bread is a basic heading, while white bread and Bread other than white are
product clusters; • Women’s footwear is a basic heading while Women’s athletic footwear and
Women's Dress and Casual Shoes, Boots and Sandals constitute a product cluster.
12. Each product cluster (for example, Bread) has a SPD form devoted to it. The SPD form lists generic descriptions relevant to the products within the cluster. In order to identify individual products within the cluster, it is necessary to specify the particular characteristics possessed by the product in question. Specifying the detailed characteristics allows the user to move from a product cluster to a single product. The resulting PS provides such a precise specification, or tight product description, that different price collectors working independently of each other in different countries using the same PS are likely to select the same product (or one that is almost the same). Comparability is thus ensured. Pre-coded characteristics are listed in the SPD form with accompanying boxes. A particular alternative or characteristic can then be identified, or specified, simply by checking, or ticking, the relevant box. For this reason, SPDs are sometimes described as check lists.
118
13. Example of SPDs The actual contents of an SPD are best explained by working through an example. An example of an SPD form is given in Annex 1 accompanying this chapter.
14. Each SPD has the following nine sections.
• ICP heading • ICP cluster • Quantity and packaging • Source • Seasonal availability and representativity • Product characteristics • Brand • Other product features • Comments
15. The contents of each of these sections are as follows:
Header: The information in the header is pre-entered and consists of the following:
• ICP basic heading code and name; • ICP cluster code and name.
16. Quantity and packaging: This section describes the units in which the item is sold. For
example, the SPD for rice lists 12 different types of possible package. The actual type of package can be identified simply by ticking, or checking, the box corresponding to the package type. When relevant, the number of units per package is requested and also the size of the units. The size may be measured by weight or by volume in the case of milk, but for other products other dimensions such as length may be appropriate. Boxes are provided corresponding to the different possible units of measurement. Depending on the product and the nature of the packaging, it also may contain certain other information about the package such as whether the contents are labeled.
17. Source of product: This section contains check boxes to indicate whether the product is
produced domestically or imported, and also the country of origin when imported.
18. Seasonal availability: This section contains check boxes for the twelve months of the year, and the year as a whole, to indicate the times of the year when the product is, or is not, available for sale.
19. Product characteristics: The contents of this section can vary greatly depending on the
nature of the products that make up the cluster. It can be seen from the three examples in Annex 1 that the relevant characteristics may be quite different from one SPD to another. Many of the characteristics refer to materials used or to the method of production which may have almost nothing in common between product clusters. Some of the characteristics may be continuously variable, such as the percentage of cotton or other fiber used in
119
clothing. In these cases, numbers may be entered in the boxes instead of simple checks or ticks.
20. In addition to the physical characteristics of the products, this section makes provision for
the recording of the type of brand if any -- exclusive, national, regional, etc. -- where relevant, as in the case of women’s clothing. It may also record whether the good or service satisfies certain official standards, as in the case of milk.
21. Brand/Label name: This merely requires the brand name, if any.
22. Other item features: This section enables the regional or national coordinators to enter
further information about the product or the price collector to report back further information.
23. Comments: This section allows the regional or national coordinators to record any
comments that they see as important for that SPD.
24. The SPD Software SPDs are initially prepared at the global level. These global SPDs contain characteristics that may not be relevant to all regions. The ICP Global Office sends the global SPDs to Regional Offices. New software was developed for ICP 2005 to expedite the process. The software, known as the SPD Software, allows the Regional Coordinator to select those characteristics that are relevant for the region’s countries and create a regional SPD. Regional Offices and participating countries are able to exchange product related information through the software. The software has a data transfer module that transfers finalized product specifications to the Tool Pack. The software is distributed among Regional and Country Offices free of charge by the World Bank. The manuals relevant to the software are available on the ICP website. A screenshot from the software is shown in Annex 3 accompanying this chapter.
25. The SPD Software Process
Firstly, the Regional Coordinator reviews the global SPDs in the SPD software and selects the characteristics that are meaningful for the region.
26. Secondly, a preliminary set of PSs is created. There are 2 ways to accomplish this:
A. The Regional Office creates the first set of PSs and forwards them to Country Offices.
Countries record whether these PSs are one of three things: • Representative; • Available but not representative; or • Not available. • If necessary a Country can also create new PSs and send them to the Regional
Office as an electronic file through the SPD software.
120
B. The Regional Office creates regional SPDs out of the global SPDs and sends them to the Country Offices. The Country Offices create the first set of PSs and forward an electronic file to the Regional Office. The country records whether the product is
• Representative; or • Available but not representative.
27. The Regional Coordinator then reviews the PSs sent in by various countries using a
Comparison Table report. Based on this review, the Regional Office revises the PSs and creates the preliminary regional product list.
28. Finally, Regional Offices organize workshops to review and finalize the preliminary
regional product list with all the Countries.
29. A flowchart showing the SPD Software process is available in Annex 2 accompanying this chapter.
Concepts Underlying the Preparation of Product Specifications, or PSs
30. Target specifications with substitutes
Much depends upon the feasibility of adjusting prices for quality differences. If it is possible to make some adjustments for differences in quality, a number of options open up that can improve the reliability of the final results by increasing the number of usable price observations.
31. The first is to use tight specifications but to treat these as targets. Specifications giving a
range in terms of size or dimension are also considered “tight specifications”. If products cannot be found that provide exact matches with the target specifications, price collectors can be instructed to select and price close substitutes instead. Of course, the price collector must record the fact that a close substitute, and not the exact product specified, has been priced. Close substitutes are products that possess all except one or two of the specified characteristics. In deciding on what constitutes a close substitute, it is not just the number of characteristics that do not match that have to be taken into consideration but the extent to which the characteristics deviate from the target ones.
32. For the price of a close substitute to be usable for ICP purposes, one of the 2 conditions
below must be met:
• The difference in quality between the substitute and the target is so trivial that its impact on the price is judged to be so small that it can be ignored; the product is deemed to be comparable with products that do meet the target specifications; or
• It must be feasible to make a simple quality adjustment.
In either case, it is essential that the price collector check the actual characteristics of the product priced on the SPD so that the differences between its characteristics and those of the targeted product are recorded and reported back to the national supervisor. The quality
121
adjustment should be made by the National Coordinator in consultation with the Regional Coordinator. In order for supervisors to be able to maintain control and ensure comparability between countries, it is imperative that individual price collectors should not be permitted to make their own subjective adjustments for quality differences and then report back the resulting price as if perfect matches had been obtained with the target specifications.
33. The advantage of instructing price collectors to price close substitutes when perfectly
matching products cannot be found is obviously that it may significantly increase the number of prices collected and hence the number of price comparisons that can be fed into the PPP calculations. However, price collectors should also be instructed not to abandon the search for the targeted products too quickly by pricing substitutes instead.
34. A variant on the above strategy is to loosen the target specification slightly by leaving the
specification of one or two characteristics open. For example, in the case of a product such as rice which is otherwise tightly specified, it might be decided not to pre-specify the type of packaging or size of unit. Of course, price collectors would still have to report the actual type of packaging, or size of unit observed. Similarly, in the case of clothing the type of fibre used might not be pre-specified.
35. While this strategy would increase the number of prices collected if substitutes were not
permitted, no advantage may be gained as compared with specifying precise target specifications but allowing price collectors to choose substitutes. For example, if there are two or three types of package in common use, it is desirable at least to try to minimise the need for quality adjustments by encouraging all price collectors to select the same type. If it turns out that there is no preponderant type of packet, prices for other types of packet should still be reported as they are obviously close substitutes. Adjustments can then be made subsequently for the differences in packaging or package size as these are precisely the kinds of quality differences for which it should be feasible to make quality adjustments. In general, there seems to be nothing lost and potentially something to be gained by specifying all the characteristics.
36. Creating an additional product specification
Suppose that for one particular type characteristic there are two main variants in practice. For example, a particular type of clothing is made either out of cotton or out of polyester. Only one, say cotton, can be chosen as the target. In this case, as the two fibres are close substitutes price collectors may be expected to report prices for both. If it turns out that the number of prices collected are about the same for both fibres, it may be appropriate to treat them as two different products as enough price observations may be generated for each of them separately. In this case, there would be no need to adjust for the difference in quality between cotton and polyester clothing, each being treated as a separate product specification.
37. It is possible when there are two variants that the ‘wrong’ variant is pre-selected as the
target and most countries report back prices for the other variant (although the pre-survey is designed to prevent this situation occurring). In this case, the target can be redefined ex
122
post to be the latter. This kind of possibility underlines the need to encourage price collectors to select close substitutes.
38. When there is a rapid turnover of models of consumer durables, it may happen that a
particular model is chosen as the target specification but is superseded by another before the price collection actually takes place. If most countries report prices for the later model, it should replace the earlier model as the target.
39. Loose specifications and hedonics
A completely different pricing strategy from that used in ICP 2005 would be to provide each price collector with a very loose specification, possibly even a blank SPD, and then permit the price collector to choose one particular product out of the cluster of products covered by the specification or SPD. For example, price collectors might simply be instructed to select a woman’s dress for pricing without imposing any further restrictions on the characteristics that it should possess. As already noted, this method is used by some countries for their CPIs, although once the price collector has made a selection, exactly the same product is tracked in subsequent periods.
40. If loose specifications are used in international comparisons, however, it is clear the
products selected by different price collectors in different countries will be different. Short cotton dresses may be priced in one country and long woollen ones in another, etc. As the products would not be comparable, their prices could not be entered directly into the price ratios from which the PPPs are estimated. At the present time, therefore, this method cannot be treated as a practical possibility for the vast majority of basic headings in the ICP.
41. However, by combining loose specifications with hedonics, it is possible that they might
be usefully employed for a few special basic headings such as certain kinds of consumer durables or housing rents. As already noted, the advantage of using loose specifications is that the number of price observations collected may be greatly increased. With very large sets of price observations it may be feasible to adjust for quite substantial differences in quality by employing hedonics.
42. One promising development is the combination of hedonics with the country product
dummy method, or CPD, of estimating the parities for the basic heading, as both use the same type of multiple regression analysis. The combined hedonic CPD method is explained in Heravi, Heston and Silver (2003)4 with a practical example based on scanner data for television sets. By using scanner data very large numbers of observations were available. The use of loose specifications is therefore a real possibility that needs to be further researched for ICP purposes, but as yet there is little experience or evidence to demonstrate how well it works in practice and how robust the estimates are.
Exclusive reliance on tight specifications may result in the basic heading PPPs being based on quite restricted sets of prices. The sample of products generated by the matched
4 See Saaed Heravi, Alan Heston and Mick Silver: “Using Scanner Data to Estimate Country Price Parities: A Hedonic Regression Approach”, Review of Income and Wealth, Series 49, Number 1, March 2003, pp. 1 – 21.
123
product approach based on tight specifications is far from random. There is a risk that unknown biases may be introduced5.
43. The role of brands in product specifications
Brands can play an important part in the specification of a product. In some cases, international brands and model numbers may be sufficient to enable individual products to be identified. However, even when such brands form part of the specification it is essential that a detailed product specification is completed using the relevant SPD in the same way as for a product without any brand name. Many products with the same brand name are sold in different sizes or models or with different designs so that the brand name alone does not enable the product to be identified. For example, Coca Cola is sold in different size bottles, diet and non-diet, etc. In general, a brand may be viewed as an additional characteristic that is superimposed on an otherwise complete product specification and in no way diminishes the need for the latter.
44. In order to clarify the role of brands in the product specifications a simple classification
of brand types is given in Table 1. Products are divided into three broad groups or strata:
• Products with brands which are advertised and widely recognized internationally and are found in most or all countries: for example Coca Cola;
• Products with national or local brands that are advertised and widely recognized
within a country or locality but may not be found in other countries or areas;
• Products without any brand name: although the name of the manufacturer may appear somewhere on the product, it is not advertised and widely recognized and it does not enhance the status of the product in the eyes of the purchaser.
45. When dealing with the first group, there are two options when drawing up the
specification. The first is to specify one unique international brand. The other is to specify that the product must be one out of a small number of competing international brands with the same kind of status. For example, the specification for a particular type of television set may require that it be manufactured by Sony, Toshiba or Sanyo without specifying which. This implies that it is permitted to compare the price of a Sony television with a Toshiba television whose specifications are the same in other respects, but not to compare a Sony in one country with a national or local brand of television in another, even if their specifications are otherwise the same.
5 In the paper by Heravi, Heston and Silver it is concluded: “… methods based on matching run the risk in many product areas of excluding unmatched items. Silver and Heravi (2002) have shown for CPI analysis that such excluded prices are quite different from the matched prices and their exclusion leads to significant bias.” Op cit., p. 19.
124
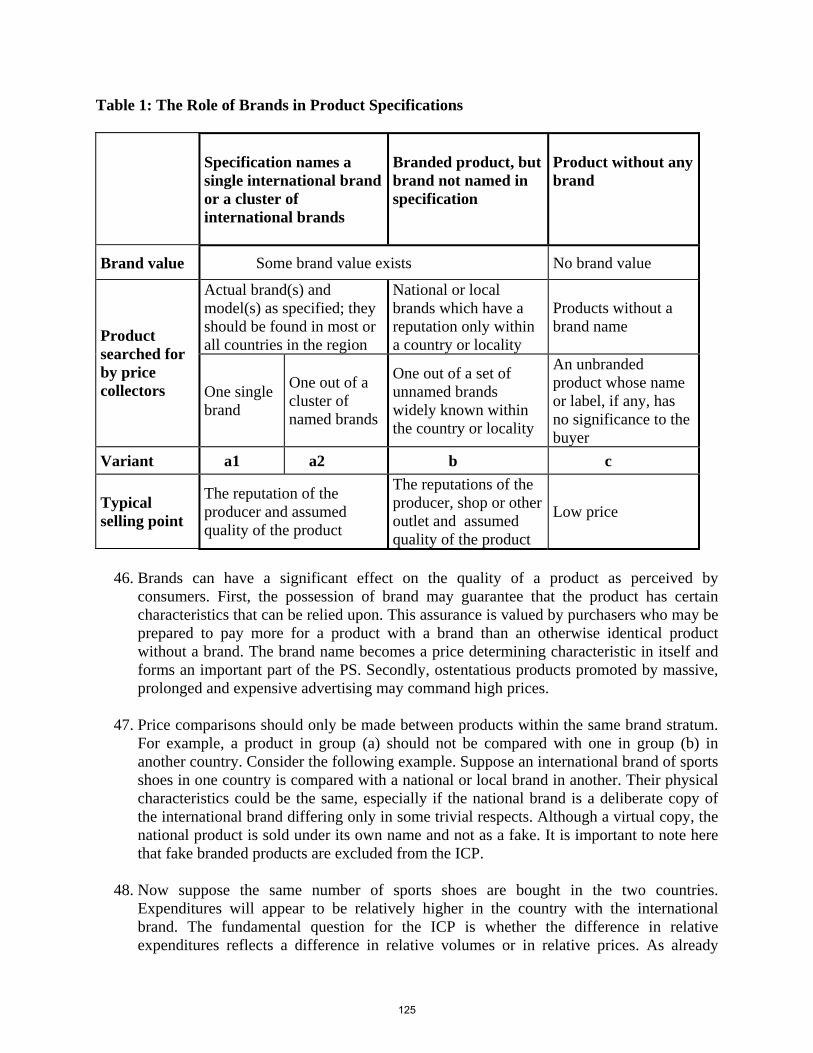
Table 1: The Role of Brands in Product Specifications
Specification names a single international brand or a cluster of international brands
Branded product, but brand not named in specification
Product without any brand
Brand value Some brand value exists No brand value
Actual brand(s) and model(s) as specified; they should be found in most or all countries in the region
National or local brands which have a reputation only within a country or locality
Products without a brand name Product
searched for by price collectors One single
brand
One out of a cluster of named brands
One out of a set of unnamed brands widely known within the country or locality
An unbranded product whose name or label, if any, has no significance to the buyer
Variant a1 a2 b c
Typical selling point
The reputation of the producer and assumed quality of the product
The reputations of the producer, shop or other outlet and assumed quality of the product
Low price
46. Brands can have a significant effect on the quality of a product as perceived by
consumers. First, the possession of brand may guarantee that the product has certain characteristics that can be relied upon. This assurance is valued by purchasers who may be prepared to pay more for a product with a brand than an otherwise identical product without a brand. The brand name becomes a price determining characteristic in itself and forms an important part of the PS. Secondly, ostentatious products promoted by massive, prolonged and expensive advertising may command high prices.
47. Price comparisons should only be made between products within the same brand stratum.
For example, a product in group (a) should not be compared with one in group (b) in another country. Consider the following example. Suppose an international brand of sports shoes in one country is compared with a national or local brand in another. Their physical characteristics could be the same, especially if the national brand is a deliberate copy of the international brand differing only in some trivial respects. Although a virtual copy, the national product is sold under its own name and not as a fake. It is important to note here that fake branded products are excluded from the ICP.
48. Now suppose the same number of sports shoes are bought in the two countries.
Expenditures will appear to be relatively higher in the country with the international brand. The fundamental question for the ICP is whether the difference in relative expenditures reflects a difference in relative volumes or in relative prices. As already
125
explained, the only way to resolve the issue is to observe what happens when the two products are on sale side by side in the same country. If the international brand sells at a higher price than the local brand consumers must prefer it. The two products are not identical in the eyes of the consumers. The international brand is perceived to be a better quality product and is therefore ‘more’ trainer from the consumers’ perspective. The two products are not the same. Their prices cannot be comparable between countries if the two products would not sell at the same price within the same country.
49. Some part of the difference in relative expenditures must therefore be attributed a
difference in volume. Real consumption of sports shoes is higher in the country in which the international brand is bought even though the number of sports shoes may be the same in both countries. The same argument applies, but with even greater force, if an international brand is compared with an unbranded product.
50. Unbranded products are more likely to be found in markets or outlets patronised by
relatively poor households. They are also more likely to be representative in developing countries than developed ones.
51. The PS must contain a complete set of detailed specifications for all relevant
characteristics whether or not brand status is one of them. The purpose of requiring a product to be a named international brand is not to remove, or even reduce, the need to provide a complete set of specifications but to try to improve and strengthen the comparability of the products whose prices are compared. A named brand is an extra characteristic that can be used to tighten the specification one notch further. It should also be remembered that detailed information about the characteristics of branded products may prove to be extremely useful at a later stage for purposes of hedonic analysis.
52. However, care must be exercised to avoid selecting international brands for inclusion on
the product lists purely because they may be comparable between countries. If some internationally branded good, especially an expensive luxury or fashion good, is consumed by only a tiny number of households in every country it should not get on to the product list.
53. Examples of product specifications
A tight definition is intended to provide a precise description that is sufficient to identify the product and to distinguish it clearly from other similar products. The PS should provide a comprehensive list of all the relevant characteristics which are thought to have a significant impact on the price of the product. The Regional Coordinator responsible for the product descriptions needs to be well informed about the products themselves, the industries that produce them and the markets on which they are sold. The description has to be understood by price collecting staff in a number of different countries with whom the Regional Coordinator may have no personal contact.
54. A picture can often tell more than a thousand words. It also does not need to be translated.
Whenever appropriate and possible, price collectors should be provided with pictures to help them identify the products. The definition of the product should indicate whether a
126
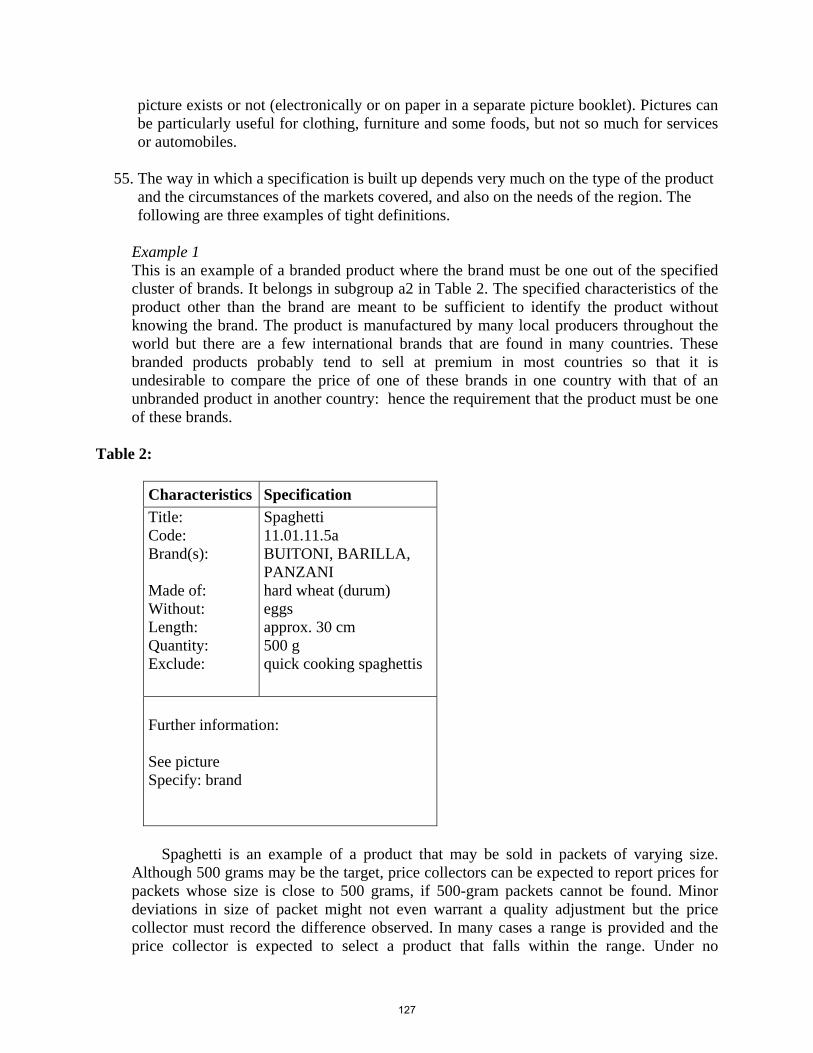
picture exists or not (electronically or on paper in a separate picture booklet). Pictures can be particularly useful for clothing, furniture and some foods, but not so much for services or automobiles.
55. The way in which a specification is built up depends very much on the type of the product
and the circumstances of the markets covered, and also on the needs of the region. The following are three examples of tight definitions.
Example 1
This is an example of a branded product where the brand must be one out of the specified cluster of brands. It belongs in subgroup a2 in Table 2. The specified characteristics of the product other than the brand are meant to be sufficient to identify the product without knowing the brand. The product is manufactured by many local producers throughout the world but there are a few international brands that are found in many countries. These branded products probably tend to sell at premium in most countries so that it is undesirable to compare the price of one of these brands in one country with that of an unbranded product in another country: hence the requirement that the product must be one of these brands.
Table 2:
Characteristics Specification Title: Code: Brand(s): Made of: Without: Length: Quantity: Exclude:
Spaghetti 11.01.11.5a BUITONI, BARILLA, PANZANI hard wheat (durum) eggs approx. 30 cm 500 g quick cooking spaghettis
Further information: See picture Specify: brand
Spaghetti is an example of a product that may be sold in packets of varying size.
Although 500 grams may be the target, price collectors can be expected to report prices for packets whose size is close to 500 grams, if 500-gram packets cannot be found. Minor deviations in size of packet might not even warrant a quality adjustment but the price collector must record the difference observed. In many cases a range is provided and the price collector is expected to select a product that falls within the range. Under no
127
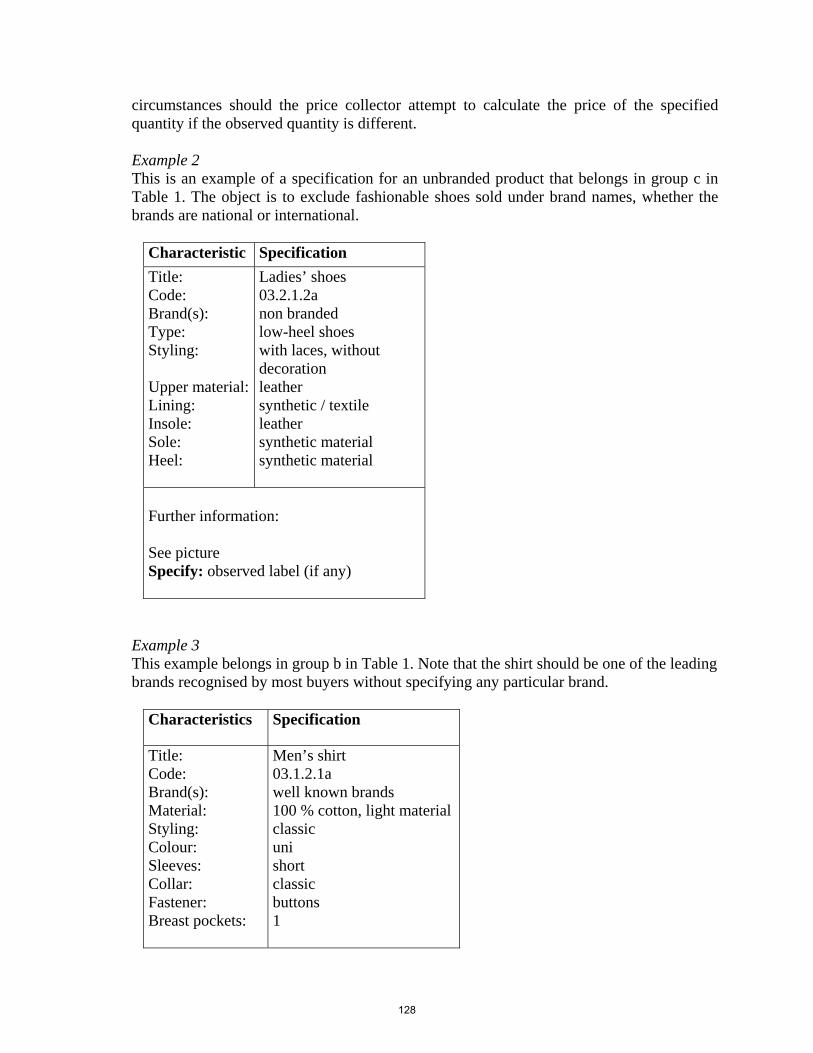
circumstances should the price collector attempt to calculate the price of the specified quantity if the observed quantity is different.
Example 2
This is an example of a specification for an unbranded product that belongs in group c in Table 1. The object is to exclude fashionable shoes sold under brand names, whether the brands are national or international.
Characteristic Specification Title: Code: Brand(s): Type: Styling: Upper material: Lining: Insole: Sole: Heel:
Ladies’ shoes 03.2.1.2a non branded low-heel shoes with laces, without decoration leather synthetic / textile leather synthetic material synthetic material
Further information: See picture Specify: observed label (if any)
Example 3 This example belongs in group b in Table 1. Note that the shirt should be one of the leading brands recognised by most buyers without specifying any particular brand.
Characteristics Specification
Title: Code: Brand(s): Material: Styling: Colour: Sleeves: Collar: Fastener: Breast pockets:
Men’s shirt 03.1.2.1a well known brands 100 % cotton, light materialclassic uni short classic buttons 1
128
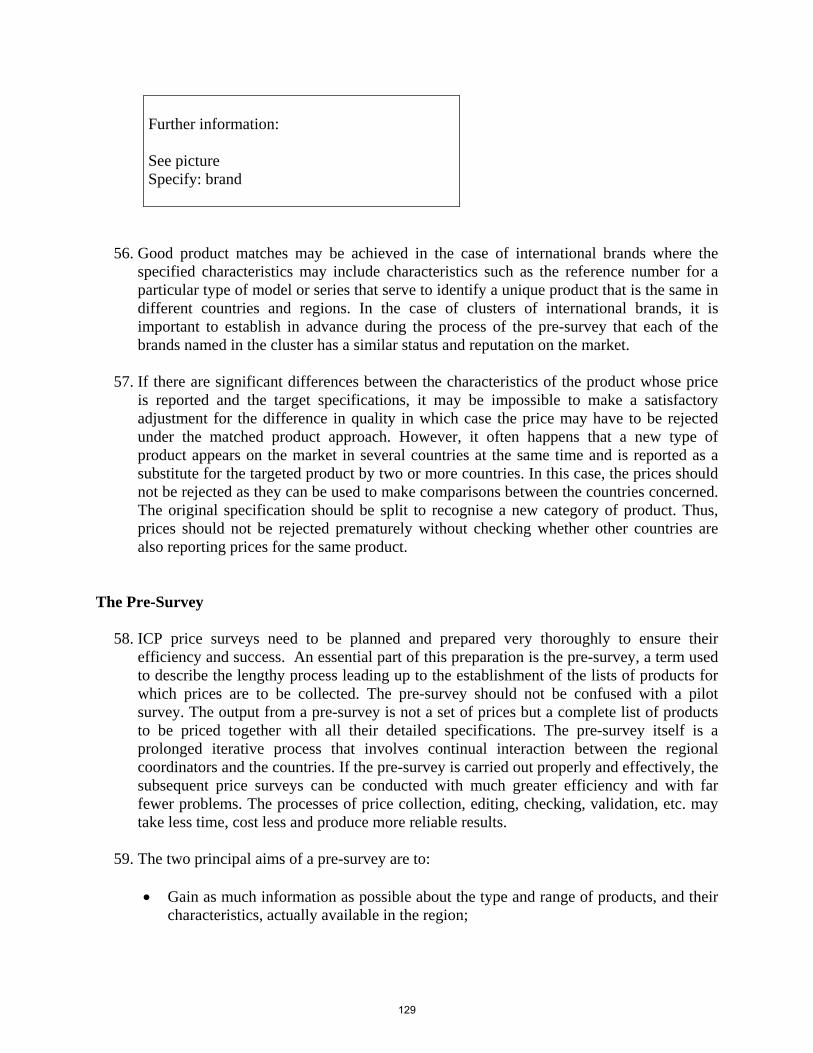
Further information: See picture Specify: brand
56. Good product matches may be achieved in the case of international brands where the specified characteristics may include characteristics such as the reference number for a particular type of model or series that serve to identify a unique product that is the same in different countries and regions. In the case of clusters of international brands, it is important to establish in advance during the process of the pre-survey that each of the brands named in the cluster has a similar status and reputation on the market.
57. If there are significant differences between the characteristics of the product whose price
is reported and the target specifications, it may be impossible to make a satisfactory adjustment for the difference in quality in which case the price may have to be rejected under the matched product approach. However, it often happens that a new type of product appears on the market in several countries at the same time and is reported as a substitute for the targeted product by two or more countries. In this case, the prices should not be rejected as they can be used to make comparisons between the countries concerned. The original specification should be split to recognise a new category of product. Thus, prices should not be rejected prematurely without checking whether other countries are also reporting prices for the same product.
The Pre-Survey
58. ICP price surveys need to be planned and prepared very thoroughly to ensure their
efficiency and success. An essential part of this preparation is the pre-survey, a term used to describe the lengthy process leading up to the establishment of the lists of products for which prices are to be collected. The pre-survey should not be confused with a pilot survey. The output from a pre-survey is not a set of prices but a complete list of products to be priced together with all their detailed specifications. The pre-survey itself is a prolonged iterative process that involves continual interaction between the regional coordinators and the countries. If the pre-survey is carried out properly and effectively, the subsequent price surveys can be conducted with much greater efficiency and with far fewer problems. The processes of price collection, editing, checking, validation, etc. may take less time, cost less and produce more reliable results.
59. The two principal aims of a pre-survey are to:
• Gain as much information as possible about the type and range of products, and their
characteristics, actually available in the region;
129
• Ensure that the product list includes some representative products for each of the countries.
60. Deciding on which products to include in the product list, and hence which prices are
eventually reported by a country, is crucial to the success of the price comparisons. The logistics of setting up the product lists are quite complicated as they involve continual interaction between the regional coordinators and the national statistical institutes, or NSIs. This type of collaborative work is unfamiliar to countries that have not previously participated in the ICP and the various steps involved need to be spelled out in some detail. The complexity and magnitude of the tasks involved may easily be underestimated.
61. From the outset, countries need to be aware that they will not be required to price all the
products on the common product list. It must be made clear to each country during the pre-survey phase that it has only to price all its own representative products plus a selection of products representative of other countries. It must price enough of the latter to ensure that an adequate number of price comparisons can be made between itself and other countries.
62. A general overview of the Pre-Survey
The task for each Regional Coordinator is to move from the general structured product descriptions contained in the SPDs to a set of detailed PSs, appropriate for the region in question. Whereas different regions may start from a common set of SPDs, the eventual PSs to be used for pricing differ from region to region. The PSs for the different regions depend upon the representativity and availability of the products within the individual countries of the region. For each cluster of products described by an SPD, it is necessary to identify some products that are currently on sale on markets within the countries of the region and then to list their detailed characteristics to arrive at a PS. By observing the characteristics of the products actually on sale in outlets they can be specified in as much detail as required. For this reason a Pre-Survey is necessary.
63. The pre-survey itself may be divided into three main stages. In the first stage, each
Regional Coordinator working in consultation and collaboration with other Regional Coordinators and the Global Office has to draw up a first tentative list of products for pricing within each basic heading. In the process, the Regional Coordinator visits a sample of countries, including the largest countries with the most diverse markets. The Regional Coordinators seek the advice of countries about what they consider to be their representative products and also seeks to familiarise themselves with the markets in those countries. At the same time, all countries, and not merely the countries visited, are invited to submit a list of representative products for each basic heading. This phase may take about three or four months.
64. In the second stage, the first tentative list of products for each basic heading is sent to
countries using the SPD Software. Note that countries are not asked to collect prices at this point, but merely to test the adequacy of the specifications and, especially, to investigate the availability of the products listed on their own markets. If there are not enough of their own representative products on the list, the country is asked to propose
130
some new ones to be added. This phase is expected to take about a further three or four months, during which time the Regional Coordinator continues to visit countries.
65. In the third stage, the product lists are revised in the light of the responses from countries.
The revised lists are then distributed to countries. The exchange of information between the Regional Office and the Country Office regarding the product list takes place using the SPD Software. After allowing a further month for countries to study the revised lists, all countries participate in a collective discussion of the lists at a regional workshop. Countries have to ensure that their own representative products are adequately covered. After the workshop, the Regional Coordinator prepares the final product lists which are then sent to countries to enable them to start price collection. This phase is expected to take about a further three or four months.
66. The preparation of a good set of product lists is a prerequisite for a successful ICP
program. There is no counterpart to this elaborate process when compiling inter-temporal price indices. It can take between nine months and a year, roughly as much time as the actual collection and processing of the price data. It has therefore to be built into the planned timetable. The pre-survey requires careful planning and execution as there as so many parties involved. Sufficient time has to be allowed, and sufficient resources have to be allocated, for the various inter-related stages of work.
67. The ICP timetable sets deadlines for the completion of selected stages of the work which
should be respected by all the regions in order to achieve worldwide results in parallel. If the documents circulated by the Regional Coordinator – and the subsequent feedback and materials returned by the national participants – need to be translated into languages other than English, plans must be made in advance to ensure the facilities will be available at the required times. If translations are not available on time, subsequent steps including the start of the price collection may have to be delayed.
68. Sources of information about products
In order to move from the SPDs to the PSs actually used for ICP purposes it is necessary to obtain information about products actually on sale in the region in question. One obvious source consists of the baskets of goods and services used in the CPIs in the different countries of the region. They should be exploited to the fullest extent possible. There may be some overlap between the price surveys conducted for CPI and ICP purposes. However, many CPIs are restricted in their coverage of households and may also exclude certain types of products. The CPI basket may also be out of date as a result of being based on an expenditure survey conducted some years previously. Thus, while the CPI baskets should be exploited, they may be far from sufficient for ICP purposes. Some CPI products may not be appropriate for ICP purposes, while others that are not in the CPI basket may have to be added. If a country does not actually compile a CPI, it would not be included in the ICP as its statistical infrastructure would not be adequate for ICP purposes and its staff may not have enough expertise and experience to carry out the ICP price collection.
131
69. It is important for the Regional Coordinator to gain first hand experience of the products purchased on markets in the region. The Regional Coordinator should take every opportunity to visit markets in the different countries, preferably in the company of national experts who can assist in drawing up the product lists. The experts may include not only CPI statisticians but also local experts on particular markets or types of products. It is important to try to identify products that are representative of the country and to note their characteristics using the SPD format. In any case, the Regional Coordinator should visit markets in order to build up a general overview of the kinds of products and their characteristics that are commonly found in the various countries of the region.
70. Visiting outlets also provides an opportunity to test the continuing validity of any product
specifications that may already be available (e.g., from the CPI or previous ICP rounds). The life expectancy of some products and their specifications is quite short. Some standard food products may not change very much over time, but CPI investigations have shown that less than half of the models of some kinds of consumer durables on sale at any point of time may still be on sale one year later. Field visits to outlets can help to establish which products are still representative and which items have become unrepresentative, or have disappeared altogether. Obviously, only a small sample of the outlets which may be involved in the subsequent price collection can be visited by the Regional Coordinator.
71. Other sources of information about products consist of data collected by agencies such as
market research organizations, trade associations, other commercial organizations or consumer organizations. This information may not be available without charge, however. Interviews may be undertaken with experts such as the managers of large retail outlets, including supermarkets or department stores, the owners of small shops, sales managers, producers, importers, marketing experts, etc. Interviews may be time consuming. On the other hand, comprehensive information obtained at an early stage can save time and money later in the ICP round. In certain areas, it may be advisable for the Regional Coordinator to undertake such interviews rather than local experts.
72. Reference may be made to consumer magazines, trade magazines, catalogs, the internet,
marketing documentation, brochures, advertisements and the like. In particular, in some countries, the catalogs for ‘discount’ and mail order outlets often provide very extensive, comprehensive, detailed and up to date information about hundreds of products and their characteristics. Visits may also be undertaken to trade fairs.
73. It may also be helpful to check other statistical databases such as those resulting from
household budget or expenditure surveys or retail sales surveys.
74. Establishing a first provisional product list When they exist, product specifications taken from the current CPI basket, or possibly from a previous ICP/ECP surveys6, may serve as a useful starting point. They have to be systematically reviewed in the light of the goods and services currently on sale on markets. There are three possibilities:
6 E.g. for large parts of the African region a product list from the 1993 round was available.
132
• The product may still be representative and its definition still valid, in which case
the product can be retained on the provisional product list; • The product may still be representative, but its specifications need amending or
updating, after which it can also be retained; • The product is found to be unrepresentative, or to have disappeared. It is deleted.
75. During the course of these investigations into the status of the existing specifications,
other products not on the CPI or previous ICP lists will be observed and examined. If a product is considered to be representative, its characteristics can be checked using the relevant SPD and the resulting PS can be included on the provisional list. NSIs have a responsibility to ensure that enough products that are representative in their own countries are included on the list of products. The process of drawing up the list and the product specifications within a region is a common responsibility that is shared between the RC and the countries. Participating NSIs cannot play a passive role.
76. The Regional Coordinator establishes a provisional product list by actually visiting as
soon as possible markets within a small number of the largest and most diversified countries of the region. This should ensure that the products are fairly representative of the region as a whole. As noted in the previous chapter, however, the common list assembled from such provisional lists cannot be representative of the expenditure pattern in each and every individual country, given that expenditure patterns vary between countries.
77. New goods and services are continually appearing on markets that may not be on the
initial product lists prepared by the regional coordinators. If countries consider that such products are sufficiently important in their own market they must propose them to the Regional Coordinator for inclusion on the list and provide a detailed specification accompanied by relevant information such as catalogues, pictures and technical printed matter. Photographs of products can be extremely useful in addition to written specifications, especially for products that are sensitive to fashion and design.
78. Numbers of products per basic heading
When drawing up the product lists, a rough target has to be set for the number of products within each basic heading for which prices are to be collected. This figure depends on a combination of factors.
79. The first step is to determine for, household consumption as a whole, the total number of
products for which it is feasible to collect prices, taking account of the constraints imposed by the total ICP resources available and the timetable. This number may range from about 400 to 800 depending on the country and region.
80. The total number is then divided among the basic headings in proportion to the shares of
their expenditures in total household consumption expenditures.
133
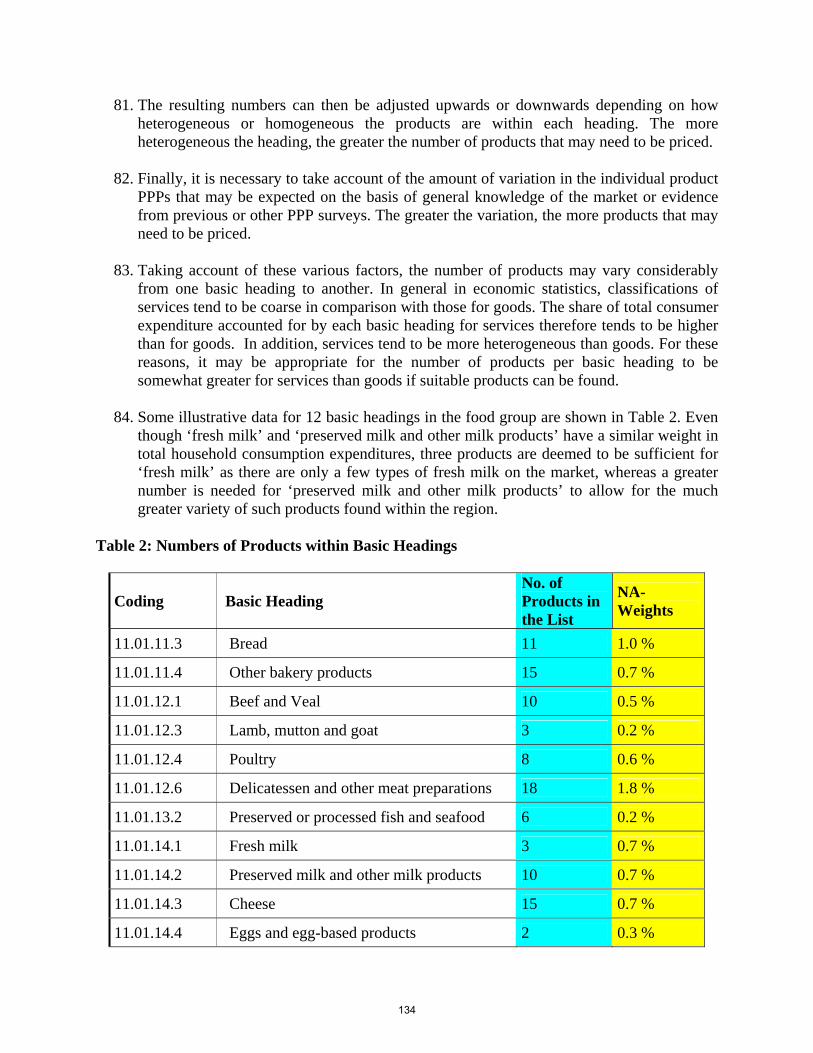
81. The resulting numbers can then be adjusted upwards or downwards depending on how heterogeneous or homogeneous the products are within each heading. The more heterogeneous the heading, the greater the number of products that may need to be priced.
82. Finally, it is necessary to take account of the amount of variation in the individual product
PPPs that may be expected on the basis of general knowledge of the market or evidence from previous or other PPP surveys. The greater the variation, the more products that may need to be priced.
83. Taking account of these various factors, the number of products may vary considerably
from one basic heading to another. In general in economic statistics, classifications of services tend to be coarse in comparison with those for goods. The share of total consumer expenditure accounted for by each basic heading for services therefore tends to be higher than for goods. In addition, services tend to be more heterogeneous than goods. For these reasons, it may be appropriate for the number of products per basic heading to be somewhat greater for services than goods if suitable products can be found.
84. Some illustrative data for 12 basic headings in the food group are shown in Table 2. Even
though ‘fresh milk’ and ‘preserved milk and other milk products’ have a similar weight in total household consumption expenditures, three products are deemed to be sufficient for ‘fresh milk’ as there are only a few types of fresh milk on the market, whereas a greater number is needed for ‘preserved milk and other milk products’ to allow for the much greater variety of such products found within the region.
Table 2: Numbers of Products within Basic Headings
Coding Basic Heading No. of Products in the List
NA-Weights
11.01.11.3 Bread 11 1.0 %
11.01.11.4 Other bakery products 15 0.7 %
11.01.12.1 Beef and Veal 10 0.5 %
11.01.12.3 Lamb, mutton and goat 3 0.2 %
11.01.12.4 Poultry 8 0.6 %
11.01.12.6 Delicatessen and other meat preparations 18 1.8 %
11.01.13.2 Preserved or processed fish and seafood 6 0.2 %
11.01.14.1 Fresh milk 3 0.7 %
11.01.14.2 Preserved milk and other milk products 10 0.7 %
11.01.14.3 Cheese 15 0.7 %
11.01.14.4 Eggs and egg-based products 2 0.3 %
134
11.01.15.1 Butter and Margarine 3 0.2 %
85. First provisional product list The first provisional product list is a list of products and their specifications that is sent to countries together with requests for comments, suggestions and proposals. It is designed to:
• Test the adequacy and clarity of the product specifications; • Establish whether the products are representative, unrepresentative or non-existent; • Establish whether countries will be able to provide prices; • Encourage countries to make proposals for additional representative products that
countries may wish to add to the list and elicit information about them; • Receive any suggestions, criticisms or comments on any of the PSs.
86. The provisional product list is prepared after the Regional Coordinator has had an
opportunity to visit a few of the largest countries with the most diversified markets. During the course of these visits, the Regional Coordinator, in collaboration with the national experts, draws up provisional product lists for the countries drawing upon the kind of source material discussed earlier. The product list is a synthesis of these lists. The more information that has been accumulated in advance by the Regional Coordinator from own experience and information and impressions gained on country visits, the more constructive and detailed the questions that can be posed in the questionnaire. The Regional Coordinator circulates the provisional product list to all participating countries and not just to the ones already visited.
87. It can be particularly difficult to ensure that certain types of consumer goods (e.g.
furniture or clothing) are comparable between countries because the products tend to be specific to particular national markets and vary a lot between countries. There may be a fairly high number of national brands in each country, each with only a small share of the national market and without any exports. Further, internal technical characteristics may not be visible and cannot therefore be observed by the price collector. Even the retailers may not be able to provide all the desired information (e.g. on the interiors and quality of sofas).
88. Two approaches can be used. The approach chosen depends, among other things, on the
basic heading:
89. Model A The PSs proposed by the Regional Coordinator are as precise and detailed as possible. All the characteristics are checked off on the SPD, on the basis of the most recent observations on the market and all the other sources of information described earlier. Additional information and questions at the basic heading level are also entered. Special requests (e.g. to specify dimensions) are marked. NSIs are asked to make an initial assessment of the availability and representativity of the products.
135
90. This approach has the advantage that countries are provided with detailed PSs which collectively provide a good overview of the product list as a whole. NSIs can concentrate on answering fairly clear and straightforward questions. Experience from previous comparisons suggests that NSIs prefer this type of questionnaire.
91. The downside is the risk that NSIs get the impression that the PSs are already close to
being final and that it is unnecessary for them to react. They may even feel that changes and additions of new products may not be welcome and be inhibited from making proposals and taking initiatives. If they fail to react, the Regional Coordinator’s own personal expertise and impressions may exert too strong an influence on the product lists. NSIs may fail to provide the inputs that are needed to ensure that the overall product list is contains enough of their own representative products.
92. Model B
This approach requires the countries to take a more active role and to undertake more intensive pre-survey work since not all the characteristics listed on the SPDs are checked off in advance. Because of its exploratory nature, Model B may encourage more active participation by countries and lead them to make more proposals.
93. It may be necessary to use Model B for the more dynamic sectors of consumption where
the goods or services on the market are continually changing because of technological progress, fashion or other factors. Countries should be encouraged to propose products, even if the descriptions they supply do not include all the relevant characteristics and are not complete and exhaustive.
94. A possible disadvantage of the second approach containing rather loose generic
specifications is that the Regional Coordinator may have difficulty in identifying the most appropriate products for inclusion on the list. If numerous different models have been suggested and reported back by the countries – e.g. for cars or household durables – each model having somewhat different features, it may become very difficult to identify those that are best suited for inclusion in the basket. For such types of products, it may be preferable, and more practical, for the regional coordinator to make fairly precise proposals in the first place accompanied by some specific questions. Another risk is that open questions often lead to no response from the countries.
95. More reliance may have to be placed on Model B when an ICP survey is being first
established and there is not much prior information about the market situations in the countries of the region, whereas more reliance may be placed on Model A in subsequent rounds.
96. Responding to the provisional list through the SPD Software
Countries are given about two months to complete the provisional list and return it to the Regional Coordinator. To respond properly NSIs have to undertake a certain amount of fieldwork by visiting retail outlets to check on the availability of the products. During the period when countries are completing the pre-survey the Regional Coordinator should take the opportunity to visit as many additional countries as possible. Such visits enable the
136
Regional Coordinator to gain more experience about markets in the region and to revise or extend the existing PSs on the basis of the new information gained. They also provide an opportunity for the Regional Coordinator to visit countries with limited resources that may require some assistance.
97. For various reasons, such as limited resources, time or capacity, a country may not be able
to conduct a full pre-survey. In this case, it is better to undertake a limited survey than to do nothing at all. At least the basic headings with the largest expenditures should be dealt with. The amount of fieldwork could also be scaled back by confining the visits to only a few of the larger and more popular outlets selling a wide range of goods. However, it must be impressed on countries that they have to check that enough of their own representative products are included on the list. If not, they must propose a number of their own representative products for inclusion on the list. The role and responsibilities of the NSIs should be emphasised by the RC to ensure that, even if resources are scarce, at least some proposals come from the NSIs. If NSIs consider that finding new products and drafting new descriptions is too time consuming or complicated, the Regional Coordinator may suggest to the NSIs that they sub-contract the work to specialist market agencies.
98. The category ‘food’ accounts for a large share of total consumption and GDP in the
majority of developing countries: on average, about one half of household final consumption or one third of GDP. Moreover, food products are generally more comparable between countries and regions than other types of consumption goods or services (e.g. clothing, furniture). If, for any reason, only a limited pre-survey can be conducted by some country it should be concentrated on food.
99. The roles of the different parties in the Pre-Survey
Establishing the product lists for multilateral comparisons is a task that has to rely on active contribution and collaboration of all the parties involved -- the NSIs, the Regional Coordinators and the Global Office.
100. The role of the NSIs in the Pre-Survey
Within a NSI, there needs to be a clear understanding about the objectives of the ICP by all the staff involved in the survey work, whether office or field staff. The national ICP coordinator has to keep the staff who actually carry out the price collection fully informed and briefed. It is particularly important to establish and maintain good communications between the various staff involved. As already noted, experts working on the national CPI will have to be involved with the ICP program. The benefits can cut both ways. Not only can the ICP draw upon material assembled for CPI purposes but the participation in the ICP can strengthen the CPI data base. The ICP will want to exploit existing information about the products that make up the basket used in the CPI. However, as already noted, CPI product specifications in some countries may be rather loose and they may need to be modified, tightened and updated for ICP purposes.
101. At an international level, NSIs should be encouraged to take an active part in the
scheduled meetings with RC and the other countries of the region in order to achieve a
137
common understanding of objectives, approaches, methods, deadlines, etc. They also need to maintain a dialogue with the Regional Coordinators.
102. During the Pre-Survey, countries have to assess the general structure of the initial
provisional list from the view point of their own country and to check that the specifications are appropriate and up to date. The feedback to the Regional Coordinators in the form of proposals for new products, amendments, or deletions is important to ensure that the final product list contains enough of the representative products of each country. However NSIs may not propose finished, properly articulated product specifications. They may only make rather vague proposals or just express general wishes for certain types of product to be included. In this case, the Regional Coordinators has an indispensable role to play in developing detailed usable specifications out of vague ideas. Sometimes, the initiative may have to be taken by the Regional Coordinators on behalf of a country on the basis of market information gained while visiting the country.
103. The role of the Regional Coordinators in the Pre-Survey
Each Regional Coordinator has to ensure that all participating countries are properly informed and share a common understanding about how to conduct the successive stages of the Pre-Survey. The Regional Coordinator has to prepare the regional timetable while ensuring that it is consistent with that overall timetable laid down by the Global Office. The Regional Coordinators has also to ensure that work on the Pre-Survey keeps in phase with those in other regions. The Regional Coordinator has to be prepared to assist in clarifying questions relating to the product lists and removing ambiguities and potential inconsistencies. As already noted, the Regional Coordinator has to visit as many countries as possible during the pre-survey phase, to engage in bilateral discussions and exchanges with NSIs and become familiar with the markets in the region.
104. The Regional Coordinator is the main driving force in the development of the product list
for the region. The Regional Coordinator produces the first provisional product list and circulates it to the NSIs. After studying and analyzing the countries’ responses, the Regional Coordinators prepares a revised product list for discussion at the regional workshop, following which the final product list is distributed. Special instructions and picture booklets may be needed by the price collectors. Such documents have to be developed in time by the Regional Coordinators in conjunction with the Global Office, as general methodological issues may be involved.
105. To facilitate communications and an efficient exchange of electronic information, the
Regional Coordinators should check that the PCs used in the countries and the SPD software are compatible. Successful cooperation requires an efficient working communications infrastructure.
106. The Regional Coordinator has also to decide whether the countries of a region should be
split into subgroups. This depends not only on the number of participating countries but on how similar or dissimilar they are. Drawing up product lists is painstaking practical work involving interactions between the countries in the group. Detailed technical characteristics are important and have frequently to be discussed collectively in order to
138
produce a realistic, relevant and up to date set of specifications. The number of countries involved in the day to day work of developing a common product list should not be too large for practical reasons.
107. Experience suggests that a group of about 10 to 15 countries works well. If 20 or more
countries have to agree on a single common list and discuss details at meetings, lengthy discussions are liable to ensue, sometimes on minor points which are not very relevant for the great majority of participants. Such discussions risk becoming unproductive and wasteful.
108. Creating sub-regions can reduce the burden on the participating countries, as the
countries are confronted with a sub-regional product list that is shorter than the overall regional list and better adapted to the needs of the sub-region. On the other hand, forming sub-regions creates the need for another layer of communications between the sub-regional coordinators and requires more management from the Regional Coordinator’s office. The sub-regions have eventually to be integrated into a single region and this may not be straightforward.
109. The role of the Global Office in the Pre-Survey
General principles and methodological issues are settled by the ICP Global Manager with the help and advice of the Technical Advisory Group. The ICP Global Office must retain overall control over the ways in which the product lists are established and the descriptions and specifications are formulated, and also over the methods used to select the products.
110. The Regional Coordinators need to collaborate and interact with each other as well as
with the NSIs. The Global Manager must act as a facilitator by organising periodic meetings of the Regional Coordinators and promoting the exchange of lists and specifications. The work in each region can benefit from the work in other regions as product specifications developed in one region may be useful elsewhere. This can have a positive impact on all the different lists and increase the homogeneity of the ICP at a world level.
The Use of SPDs
111. SPDs can be used both for ICP and CPI purposes. An SPD is a generic description for a cluster of products. A blank SPD is one in which none of the boxes have been checked, or ticked. The generic description may be converted into a tight PS simply by checking, or ticking off, one particular box for each successive characteristic (some basic headings allow the user to select more than one box). Each time a box is checked, all the products in the cluster whose characteristics belong in one of the other boxes are eliminated. The set of products in the cluster can, in principle, be progressively narrowed down to a single product by working through a carefully prepared SPD and checking all the boxes.
112. SPDs for CPIs
For CPI purposes, SPDs can be used in two different ways. One possibility is to allow the price collector to use a blank SPD when visiting a particular outlet for the first time to
139
select a product that falls within the product cluster covered by the SPD. The product might be selected at random, on the advice of the shop owner or manager, or by some other process. At that point, however, the price collector must complete the SPD by checking off all the characteristics of the product selected. In this way, the SPD is converted into a precise product specification, or PS. This tight specification is then used to ensure that exactly the same product can be identified in subsequent visits and inter-temporal comparability is secured. The products priced in different periods are still perfectly matched even though a price collector may have been provided with a loose specification initially.
113. The alternative extreme is for the statistical office responsible for the CPI to check off all
of the characteristics in advance. If all the characteristics are pre-specified, the price collector is provided with a precise PS from the start. The price collector only has to go out and look for that specific product. Comparability is ensured by using the same tight specification repeatedly. The advantage of using tight specifications is that the statistical office has more control over the selection of the products. The disadvantage is that the tighter the specification, the greater the risk that the product will not be found in the designated outlet or outlets so that no price may be recorded.
114. A third possibility is for the statistical office to narrow down the choice of products by
checking off some characteristics but not all. The resulting specification is intermediate between a loose and a tight specification. In this case, the price collector has a limited amount of discretion over the choice of product and must check off all the characteristics which were not pre-selected by the statistical office. This may well be an appropriate strategy in some situations. A tight specification is still needed for pricing in subsequent periods.
115. It should be noted that the matched product approach is used whether the initial
specification is loose, partly loose, or tight. The ultimate objective is to secure tight specifications for the products actually priced, whichever approach is used initially.
116. SPDs for ICP purposes
In contrast to CPIs, the use of loose specifications is not a realistic option for ICP purposes. If price collectors in different countries are given discretion to choose different products within a cluster, there may be no matches between countries. The products whose prices are collected may simply not be comparable. In order to achieve comparability, it is necessary for the ICP to work with tight specifications. The Regional Coordinators, in collaboration with the National Statistical Institutes (NSIs), have to specify all the individual characteristics in advance of the price collection.
117. As in the case of CPIs, the problem with using tight specifications is that the tighter the
specification, the greater the risk that a particular product will not be found. There is obviously a trade off between the tightness of the specifications and the number of price observations collected. With tight specifications, there is a risk that not enough price matches will be obtained to secure a robust set of international price comparisons. There may be too many prices missing in some countries to generate a reliable set of PPPs.
140
118. This poses a major challenge for the planning of the price collection in the various
participating countries. The lists of products and product specifications must be drawn up in such a way as to ensure that exactly the same products are priced in different countries while at the same time ensuring that enough price matches are going to be generated. Preliminary investigations must be carried out in advance of the actual price surveys to ensure that products that are representative of particular countries are available in sufficient quantities in the other countries of the region. One of the main purposes of the pre-survey is to arrive at lists of tightly specified products that include enough of the representative products of every country in the region.in advance of the actual price surveys themselves. This involves a great deal of careful investigation, preparation and planning.
141
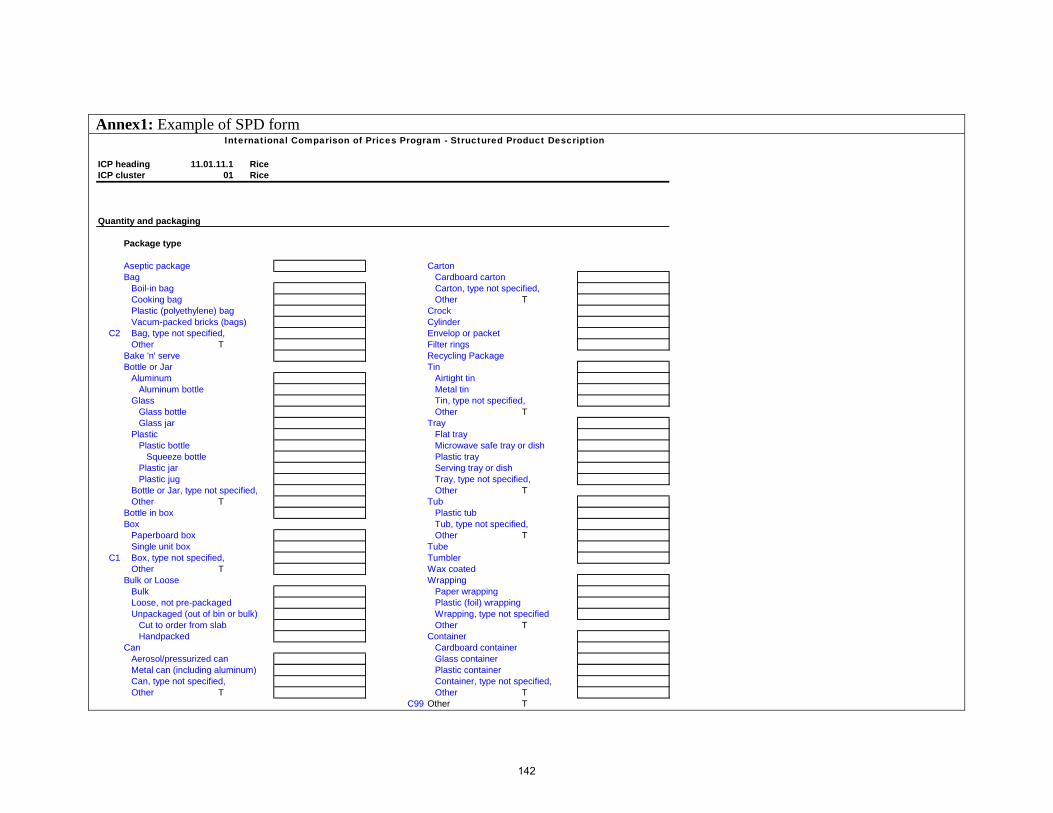
Annex1: Example of SPD form
International Comparison of Prices Program - Structured Product Description
ICP heading 11.01.11.1 RiceICP cluster 01 Rice
Quantity and packaging
Package type
Aseptic package CartonBag Cardboard carton
Boil-in bag Carton, type not specified,Cooking bag Other TPlastic (polyethylene) bag CrockVacum-packed bricks (bags) Cylinder
C2 Bag, type not specified, Envelop or packetOther T Filter rings
Bake 'n' serve Recycling PackageBottle or Jar Tin
Aluminum Airtight tinAluminum bottle Metal tin
Glass Tin, type not specified,Glass bottle Other TGlass jar Tray
Plastic Flat trayPlastic bottle Microwave safe tray or dish
Squeeze bottle Plastic trayPlastic jar Serving tray or dishPlastic jug Tray, type not specified,
Bottle or Jar, type not specified, Other TOther T Tub
Bottle in box Plastic tubBox Tub, type not specified,
Paperboard box Other TSingle unit box Tube
C1 Box, type not specified, TumblerOther T Wax coated
Bulk or Loose WrappingBulk Paper wrappingLoose, not pre-packaged Plastic (foil) wrappingUnpackaged (out of bin or bulk) Wrapping, type not specified
Cut to order from slab Other THandpacked Container
Can Cardboard containerAerosol/pressurized can Glass containerMetal can (including aluminum) Plastic containerCan, type not specified, Container, type not specified,Other T Other T
C99 Other T
142
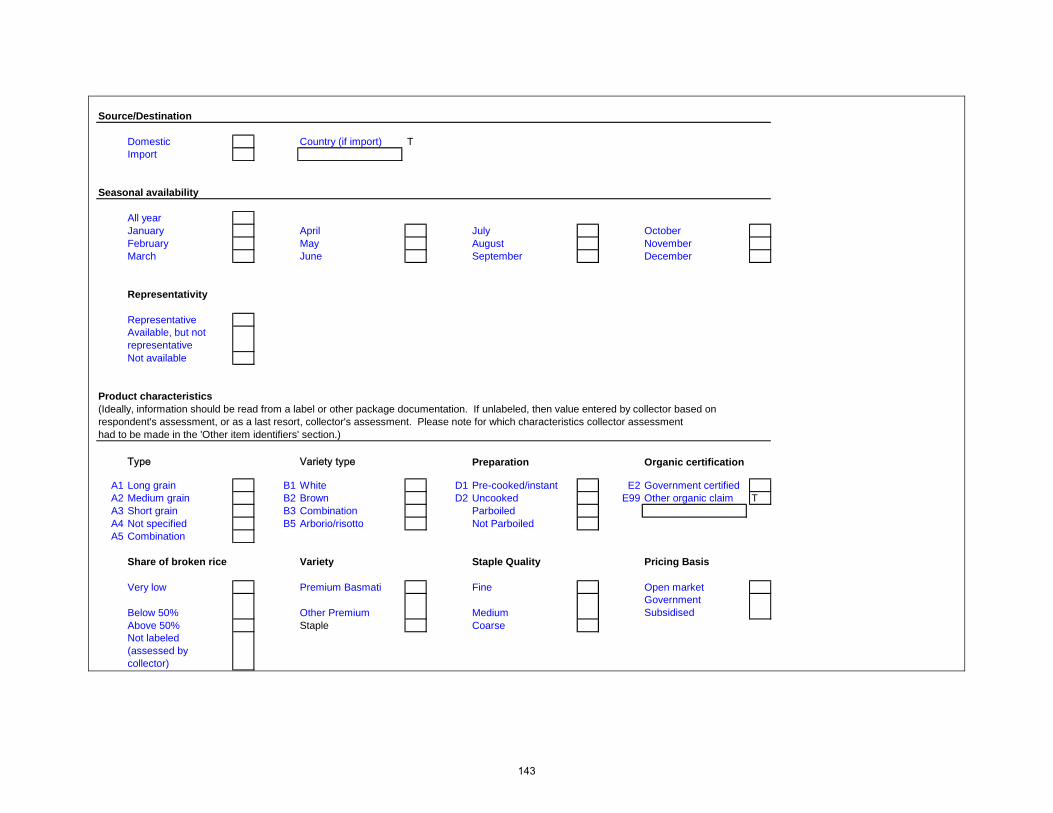
Source/Destination
Domestic Country (if import) TImport
Seasonal availability
All yearJanuary April July OctoberFebruary May August NovemberMarch June September December
Representativity
RepresentativeAvailable, but not representativeNot available
Product characteristics (Ideally, information should be read from a label or other package documentation. If unlabeled, then value entered by collector based on respondent's assessment, or as a last resort, collector's assessment. Please note for which characteristics collector assessment had to be made in the 'Other item identifiers' section.)
Type Variety type Preparation Organic certification
A1 Long grain B1 White D1 Pre-cooked/instant E2 Government certifiedA2 Medium grain B2 Brown D2 Uncooked E99 Other organic claim TA3 Short grain B3 Combination ParboiledA4 Not specified B5 Arborio/risotto Not ParboiledA5 Combination
Share of broken rice Variety Staple Quality Pricing Basis
Very low Premium Basmati Fine Open market
Below 50% Other Premium MediumGovernment Subsidised
Above 50% Staple CoarseNot labeled (assessed by collector)
143
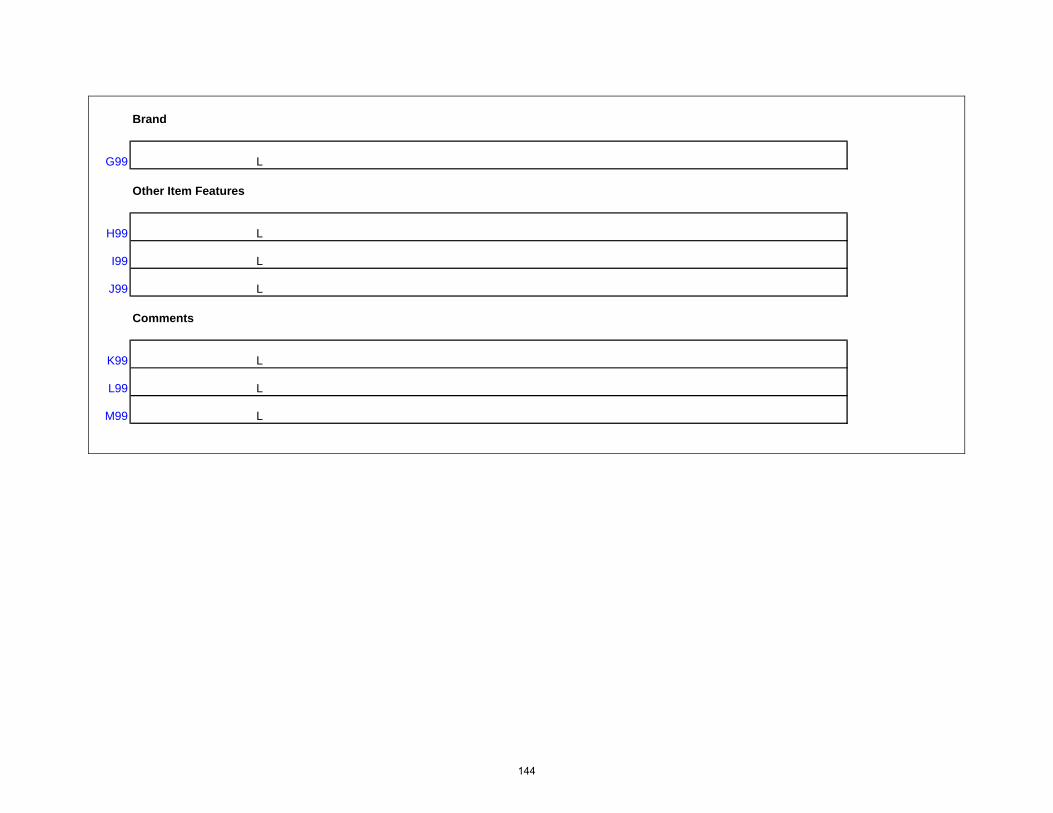
Brand
G99 L
Other Item Features
H99 L
I99 L
J99 L
Comments
K99 L
L99 L
M99 L
144
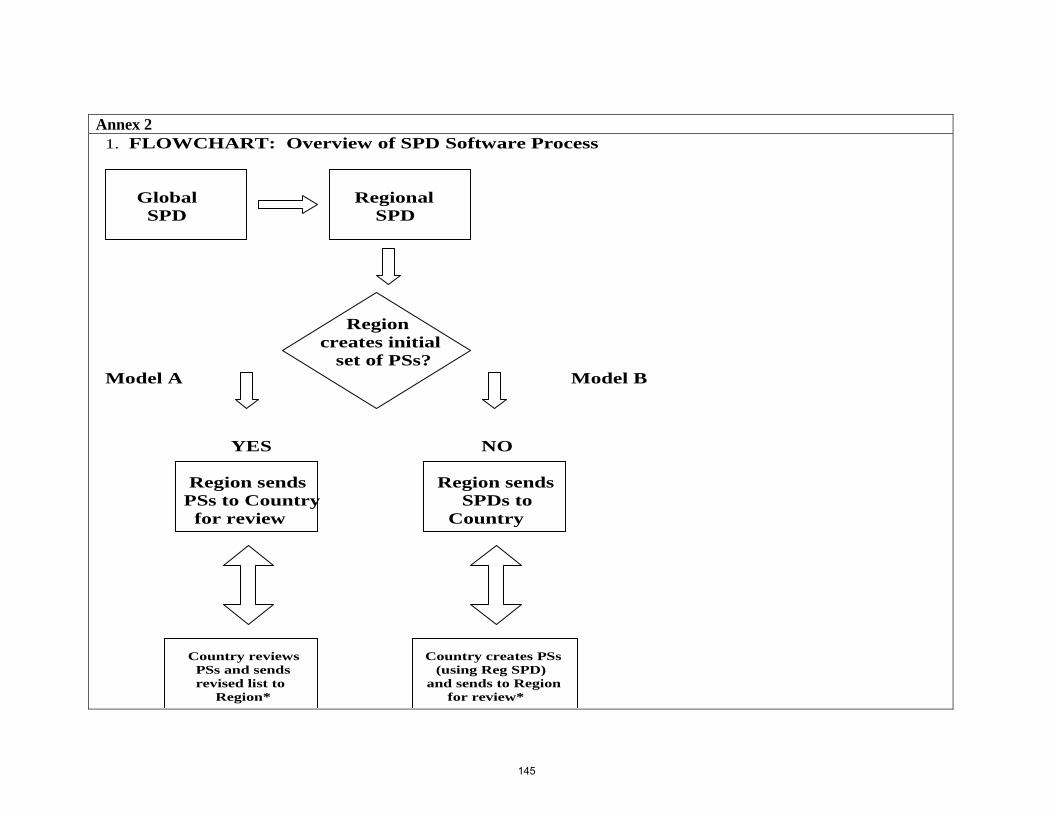
Annex 2
1. FLOWCHART: Overview of SPD Software Process Global Regional SPD SPD Region creates initial set of PSs? Model A Model B YES NO Region sends Region sends PSs to Country SPDs to for review Country Country reviews Country creates PSs PSs and sends (using Reg SPD) revised list to and sends to Region Region* for review*
145
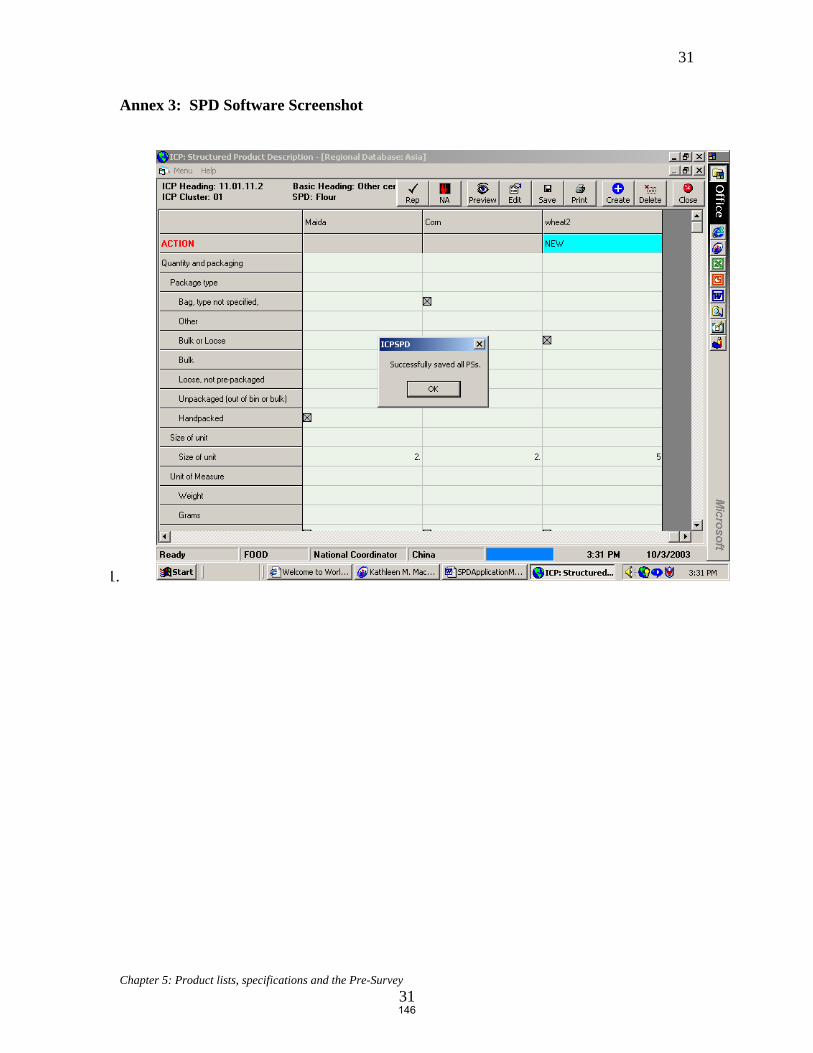
Chapter 5: Product lists, specifications and the Pre-Survey 31
31
Annex 3: SPD Software Screenshot
1.
146
Chapter 6
Sampling and Price Collection Introduction 1. This chapter is concerned with the sampling survey procedures to be used to collect
the prices of household consumption goods and services. The preceding two chapters have described how the regional lists of products for which prices are to be collected are determined through the process of the pre-survey carried out in each region. The existence of a specified list of products for each basic heading is therefore the point of departure for this chapter.
2. The next step for each participating country is to conduct sample surveys of prices in order to estimate average prices for the products on the list, or at least for as many of the products on the list as possible. In general, not all the products on any given list are to be found in all countries, but counties are expected to collect prices for all those that are actually available on their markets.
3. The chapter has an annex that deals with the question of the sizes of the samples of
outlets needed for price collection purposes. It shows how to calculate the minimum sample sizes needed to achieve certain levels of precision in the estimated average prices.
4. Because the price surveys are part of an international program of price collection,
they have a number of special or unusual features which distinguish them from price surveys conducted by statistical offices for their own purely national purpose.
5. First, in contrast to a CPI or any other national price index, each country does not
have to select a sample of products for pricing. The list of products to be priced is fixed in advance by the pre-survey. It is the same for each country. In the interests of securing as many price matches between countries as possible, each country is asked to collect prices for all the products on the lists which are actually available on the country’s markets. The numbers of products on the ICP lists are typically already small compared with the total numbers of products on their markets and countries are asked to collect prices for as many products on the ICP list as possible. The success of the ICP program depends on countries making a real effort to price products that are representative of other countries and not just their own representative products, even though it may be unrealistic to expect a country to price all products.
6. PPPs require estimates of average annual national prices. The price of the same
product may vary between different locations or outlets at the same point of time and the price in any single location or outlet may also vary between different times of the
147
year. For most products, therefore, it is necessary to take samples consisting of observations on the price of the same product taken in different locations and at different times of the year. This usually requires samples of outlets to be taken and also repeated visits to be made to the same outlet. The samples should be designed and conducted so as to provide unbiased estimates of the average annual national prices. They should also be large enough to ensure that the average prices are estimated with sufficient precision. Some examples are given in Annex 2. The required sample sizes will depend on the variability of the individual prices over space and time. The amount of price variation will itself vary between one kind of product to another so that different sizes of samples may be appropriate for different kinds of products.
7. International comparability requires the scope of the price surveys to be the same in
every country. This again contrasts with CPIs whose scope is often narrower and typically varies from country to country. As the purpose of the ICP price surveys is to provide estimates of the average annual national prices for the products on the ICP lists, the surveys should cover the whole country, including rural as well as urban areas, and they should also cover the whole year. If the scope of the surveys were to vary between countries the resulting averages would not be comparable and bias would be introduced into the resulting PPPs.
8. The ICP price surveys must make use of the statistical infrastructure already in place
in a country to the maximum extent possible. In particular, the ICP should make use of the survey organization used to collect prices for the CPI. This does not mean that the ICP has to rely on prices already being collected for the CPI. On the contrary, the products on the international ICP lists for which prices have to be collected may well differ from those used for the CPI. However, the ICP may wish to use the same samples of outlets, the same price collectors and same data transmission and processing procedures, and so on. The ICP price collection may take place simultaneously with the CPI price collection so that the price collector can collect both kinds of prices during the same visit to the same outlet. However, as the scope of the CPI may not be as extensive as that of the ICP, some additional price collection may be needed to cover outlets in areas omitted from the CPI. In this way, the ICP may strengthen a country’s CPI program and lead to improvements in the CPI in due course.
The need for consistency and comparability between countries 9. An over-riding consideration for the ICP is to collect estimates of average prices for
products whose specifications are identical from country to country. The need for international consistency and comparability imposes some rules or constraints on the data collection procedures carried out in different countries. These rules must be respected if the estimated average prices are to be internationally comparable.
148
10. International comparability requires that each statistical office takes care to ensure that the specifications of the products for which prices are actually collected do coincide with the product specifications, or PSs, on the ICP lists. Price collectors must be instructed not to replace the products on the ICP lists by other similar products because they consider them to be more typical of their own countries, or more popular in a particular locality. Such replacements may sometimes be acceptable for CPI purposes but not for ICP purposes. As was repeatedly stressed in the previous chapter, the way for a country to ensure that its own typical or representative products are included in the ICP is to ensure that they are included in the ICP product lists developed during the pre-survey. Thus, price collectors need to be fully briefed on the importance of respecting the ICP specifications. They should not replace products on the ICP lists by products that they judge to be more suitable or appropriate, even though there may be circumstances in which they may be permitted, or even expected, to do so for CPI purposes. In any case, price collectors also need to be fully aware of the necessity to report any minor deviations in the characteristics of the products they price if they do not coincide exactly with the required ICP PSs. Minor deviations may be sometimes acceptable if it is possible to quality adjust for them, but price collectors need to appreciate the importance of sticking to the ICP specifications.
11. Similarly, the fact that a country’s CPI may be confined to urban areas, or even just
the capital city, is no justification for similarly restricting the scope of price collection for the ICP. If prices in the capital city are higher than the average for the country as a whole, which is typically the case for most countries, comparing average capital city prices in one country with average national prices in another country clearly introduces a bias into the estimated PPP between the two countries. Thus, countries may have to modify or extend their customary CPI price collection practices to ensure that the scope of the price surveys conforms to ICP requirements.
The Questionnaires, Checking and Validation 12. This chapter focuses on sampling and price collection. Some relevant topics are not
dealt with in this chapter because they are covered in other chapters of the Manual. One is the preparation of the survey questionnaires. Each price collector has to be provided with a questionnaire that enables the price collector to identify in a particular outlet the exact product for which a price has to be collected. The characteristics of the product have to be specified in sufficient detail for there to be no doubt about whether a product does, or does not meet, the specification. The product specification, or PS, itself is determined during the pre-survey as described in the previous chapter. As already explained, the PS can easily be expressed in a form in which it can be used for price collection purposes. When appropriate the questionnaire should contain a photograph of the product, this being an essential part of the specification for most goods. Thus, each country is provided not only with a list of products to be priced but also with a set of questionnaires. Of course, each individual statistical office has to enter certain amount of information on the questionnaire such as the name of the price collector and the name and address of the
149
outlet to be visited together with instructions as to how to find the outlet, if necessary. As explained below, assuming the ICP price collection is integrated with CPI price collection as closely as possible, most, or all, of the price collectors should be trained price collectors with previous experience of CPI or other similar kinds of price collection. Proper training of price collectors is essential, but this manual does not provide training materials for price collectors as such training should be given by the competent staff of statistical offices.
13. This chapter also does not deal with the storing and transmission of the prices
collected by the collectors as this is one of the topics dealt with in the following chapter. Similarly, the checking and validation of the data at the different stages of the price collection process is dealt with in the following chapter. Such checking and validation is particularly important for the ICP, again not merely to ensure that the right prices are collected but also because of the need to ensure that data collected in different countries are strictly comparable.
Scope of Price Surveys 14. The scope of the ICP price collection is determined by the fact that the primary
purpose of the PPPs is to derive internationally comparable volume measures of GDP and its main components. The PPPs are used to convert final expenditure aggregates expressed in their own national currencies into a common currency and at a common price level. It follows that the average prices used to estimate the PPPs must cover the same sets of transactions that are covered by GDP and its components. The scope of the price surveys is therefore determined by the coverage of the relevant aggregates as defined in the System of National Accounts, or SNA. These were discussed in Chapter 3.
15. In the present context, the relevant aggregate is household consumption as defined in
the SNA. Assuming the national accounts are annual, household consumption expenditures are defined as all expenditures on consumption goods and services incurred by households resident in the economic territory of the country over the course of the accounting year. This set of transactions defines the scope of the price surveys, as the PPPs need to be calculated from average product prices covering the same set of transactions. If all countries estimate average prices for this set of transactions, the scope of the surveys is the same in all countries and comparability is achieved.
16. The ICP actually prefers to make use of households’ actual consumption as defined in
the SNA, as distinct from their consumption expenditures. As explained in Chapter 3, actual consumption consists of households’ consumption expenditures plus the imputed values of the social transfers in kind (mostly health education and housing services provided free, or at nominal prices, by governments) received by households. However, as there are no market prices for the social transfers, the ICP price surveys are designed to cover only households’ market expenditures. In general, in order to construct PPPs for any kind of household consumption whose values have been
150
imputed in the national accounts, including the consumption of own produce as well as social transfers in kind, the ICP needs to ascertain from the national accountants exactly how the imputations were made and what prices were used by the national accountants. No new price collection should be needed.
17. Two further points affecting the scope of the price collection should be mentioned.
First, many households run their own businesses, such as a farm or shop. Any expenditures made by such households for business purposes are outside the scope of households’ consumption expenditures and should therefore be outside the scope of the corresponding price surveys. In practice, however, it may not be possible to separate business from consumption transactions. In any case, as exactly the same kinds of goods and services may be purchased either for business or personal use, the exclusion of business purchases affects the weighting of the various products concerned rather than the coverage of the price surveys.
18. Second, in principle, the consumption expenditures covered are those made by
households that are resident1 within the country. Most of the consumption expenditures made by resident households will take place within the economic territory of the country, but a few may take place abroad. In practice, the ICP calculates PPPs relating to all household consumption expenditures taking place within the economic territory, whether by residents or foreign households (tourists). In this case, the price surveys only have to cover the market prices within the country.
19. Thus, the ICP price surveys are meant to be comprehensive. They are intended to
cover the prices of all the goods and services purchased by households for purposes of their own personal consumption during the year in question. If the surveys were fully comprehensive in all countries, they would be comparable in their scope. However, it is important to note that, in practice, most CPIs are far from being comprehensive in their scope and are therefore not internationally comparable in this respect. To the extent that ICP price collection is linked in with CPI price collection, national coordinators need to take action to ensure that additional price collection takes place to cover those expenditures excluded from the scope of their CPIs. This point is considered in more detail later.
20. It is useful to indicate those categories of expenditure that are liable be deliberately
excluded from CPIs, either as a matter of policy or simply to cut costs.
• The expenditures made by certain types of households may be excluded: for example, it is common to exclude households with very high of very low incomes, or to confine the expenditures to those made households headed by manual workers. The exclusion of certain categories of households, such as rich households, may have the effect of excluding certain types of goods and services such as luxury goods and services.
1 Residence is not the same as nationality, as some foreign nationals may be resident in a country while some nationals may be resident abroad.
151
• Expenditures on certain categories of goods and services may be excluded because they are illegal or considered to be undesirable or frivolous. Such arbitrary exclusions are not condoned in international standards, especially since they make it easy to manipulate the CPI for political or other reasons.
• Expenditures in certain types of areas or regions of the country may be
excluded, presumably to cut the costs of price collection in most cases. Expenditures, and price collection, may be confined to urban areas or simply the capital city. Given that there may be significant differences in levels of prices between urban and rural areas and between different regions of a country, these exclusions are particularly important from an ICP perspective where the objective is to estimate average national prices.
21. When the scope of the CPI is significantly narrower than the full range of household
consumption expenditures, it is essential that the coverage of the ICP price collection should be extended beyond that of the CPI. This point is taken up later.
Transaction Prices, Outlet Prices and Average Prices Transaction prices 22. During the course of a year and over the entire economic territory of a country, the
number of individual units of the same good or service purchased by households may be extremely large, running into millions and bordering on the infinite for all practical purposes. The purchase of each separate unit of quantity constitutes a separate transaction for which a separate price may be observed and recorded. Transactions are the elementary units from which national accounts are built up, the expenditure aggregates of the national accounts being the summations of the values of all the relevant transactions throughout the country during the period in question.
23. Each individual product on the ICP lists has its own population of transactions, or
transactions universe. The relevant transaction price for ICP purposes is the ‘purchaser’s price’ as defined in Chapter 4. It should be noted that a transaction price is the actual price paid by a purchaser to obtain one unit of some product. Advertised prices or prices displayed in outlets are not transaction prices, as the actual price paid when an actual purchase is made may be differ from the displayed price for a number of reasons such as discounts, sales, bargaining, etc. Different purchasers may pay different prices even when purchasing from the same outlet. The expenditure aggregates in the national accounts to which the PPPs are applied are the total values of the amounts actually paid to acquire the goods or services in question. The purchasers’ prices embedded in these aggregates are transactions prices as just defined.
24. Each individual transaction can be factored into its price component p and its
quantity component q. Within the universe of transactions relating to a single
152
product on the ICP lists, the unit of quantity q is constant for each transaction2, but the price paid may vary considerably from transaction to transaction. The price may vary from region to region, from outlet to outlet, from day to day, from morning to evening, from region to region, from purchaser to purchaser, etc., etc. Let pi denote a particular level of price and let ni denote the number of units of quantity sold at price pi. For each individual product on the ICP lists, the target price π for PPP purposes is the arithmetic average price for the universe of transactions for that product. It may be written as follows:
25. The summation is over all units purchased throughout the country during the year in question. ∑ pi ni denotes the total value of all the transactions in the product. This is the value that will be recorded in the national accounts. ∑ ni can denote the total number of units, or total quantities, sold. π is obviously a weighted average of all the different prices paid for the product, each separate price being weighted by the number of units bought and sold at that price. The target price as just defined is synonymous with the average annual national price. The ratio of the average annual national prices of the same product in two different countries is the product PPP. If the ratio of the aggregate values of the expenditures on the product in the two countries is divided by the product PPP the ratio of the quantities is obtained. This is the desired international volume measure at the level of a single product..
26. In practice, it is not customary to observe individual transactions and to collect
individual transaction prices, either for purposes of the ICP or a CPI. Monitoring millions of individual transactions would be a prohibitively costly and virtually impossible task. Neither the purchasers nor the sellers, i.e., the households and the outlets, usually keep records of every individual purchase made3. Instead of trying to take samples of transaction prices, the procedure usually followed in both CPIs and the ICP is to take samples of outlets and to collect price information from the outlets.
Outlet prices and average annual national prices
27. Given that the overall objective is to measure the average transactions price for the
country as a whole, the price recorded for each outlet should, ideally, be the average price paid by purchasers in that outlet over the relevant period of time. The length of the time period depends on the frequency with which prices are collected from the outlet. For example, if prices are collected monthly, the target outlet price should be the average price paid by all households purchasing the product in that outlet during a
2 If a household purchases k units simultaneously, the purchase should be treated as consisting of k separate transactions. 3 It may, however, become possible in the future, at least for some products, as increasing use of electronic points of sale at which each individual transaction is ‘scanned’ and recorded.
∑∑
≡
ii
iii
n
npη
153
particular month. Most outlets are unable to provide such average prices but it might be possible for outlets with electronic points of sale using scanner data.
28. In practice, the prices collected from most outlets are very unlikely to be the average
outlet prices as just defined. The price collected may simply be a price displayed in the outlet that the price collector observes and records. Alternatively, it may be a price that the owner or manager of the outlet quotes to the price collector, or possibly even a price obtained from a customer of the outlet. These different methods of collecting outlet prices are considered in more detail in a later section. If the price collected is simply the price at which the product is offered for sale in the outlet at some point of time, it may not always provide a satisfactory estimate of the outlet average price.
29. Identifying the average outlet price as the target does, however, provide guidance to
price collectors about what they should actually be searching for, or aiming at, when they visit outlets or otherwise contact outlets. It is important for the price collector to try to establish the extent to which the price charged by the outlet is likely to vary between different purchasers or over time. If it is known, or reasonable to assume, that the price does not vary between customers or over the short periods of time, a single price observation may provide a satisfactory estimate of the outlet price. On the other hand, if it is known for example that the price of the good has been, or will be, reduced for a limited period of time, say one week within a particular month, the target outlet price is a weighted average of the normal price and the reduced price, the weights being the relative quantities purchased at each price. If this information is not available precisely, a very rough estimate of the relative quantities will have to suffice, bearing in mind that although the reduced price may only be on offer for a relatively short period, the quantities sold at that price may be relatively large.
30. Often there is no price displayed in an outlet, each individual transaction price being
determined by bargaining. Alternatively, there may be a ‘token’ displayed price but little attention may be paid to it by the purchasers, the actual transaction price again being determined by a process of bargaining. There are two problems created by bargaining. First, it is difficult to find out the price resulting from any individual process of bargaining. Second, the prices resulting from bargaining may vary significantly from purchaser to purchaser. The price collector needs to find out, or estimate, the average bargained price paid by the customers at some outlet. This is not just a problem for purchases made on informal markets in developing countries, as it can equally well be a problem for certain kinds of purchases in developed countries such as purchases of durable goods, including large durables such as automobiles.
31. Collecting the prices from the outlets shifts the sampling process away from
transactions to outlets. The number of outlets selling the same product within the same country may be extremely large so that, in general, it is necessary to take a sample from the population of outlets existing within the country. Various alternative sampling frames may be used, although they are usually not very satisfactory or
154
comprehensive. The various possible sampling frames are considered in a separate section below.
32. If a random sample of outlets is taken, then in order to estimate the ICP’s target
average national price in some time period, the outlet prices should be weighted by the relative quantities sold in the different outlets. The relevant variance for the estimating the sampling error of the national average price is a weighted variance of the outlet prices. The weighted variance could be much smaller than the unweighted variance in markets dominated by a small number of very large sellers, such as chains of department stores, petrol stations or super-markets, selling at very similar prices, while the small outlets serving more restricted or isolated markets tend to sell at much higher prices. The organization or structure of retail markets may itself vary greatly not only between different countries but even between different products in the same country. It has to be taken into account in designing the sample.
33. In developing countries, there may be less variation in outlet size so that the
weighting of outlet prices may not be quite so important. However, the sizes of the outlets may still be significantly larger in urban than in rural areas with many of the latter consisting of single traders, often itinerant traders, with very small sales.
34. In general, any information available about the relative sizes of the outlets ought to be
utilized to improve on simple random sampling. Outlets can be stratified by size if the sampling frame contains the necessary information. Outlets can also be selected with probabilities proportional to size. Of course, detailed prior information about the quantities of individual products sold by outlets will not generally be available in practice, but other variables may be used as proxies. The quantities of different kinds of products sold by the same outlets are likely to be highly correlated with each other and with total sales. Thus, total sales or even the total numbers of workers in the outlets may be used as proxies for the quantities of individual products sold. Information about type of outlet should also be utilized in designing and selecting the sample of outlets, especially as the outlet prices are likely to differ between the different kinds of outlets.
35. In order to estimate the target average national prices consistent with the aggregate
consumption expenditures in the national accounts, the sample of outlets needs to cover all areas of the country. This is also necessary if a country wishes to make comparisons of price levels between different regions of the country. As information about the location of outlets should be available in whatever sampling frames are used, outlets should be stratified by region and by type of area – rural, urban and metropolitan. When combining the estimated average prices for the different regions or areas, they should be weighted by the estimated quantities purchased in the different regions or areas.
The Reliability of Basic Heading PPPs
155
36. The reliability of the estimated PPP for a basic heading depends on two sets of factors: the size and composition of the sample, or selected list, of products to be priced and the sizes of the samples of prices collected in the various countries for each of the products on the sample list.
37. To enable price comparisons to be made between countries, the same list of
products must be priced by all countries in the group. The number of products on the common list may be quite small relatively to the basic heading as a whole. As explained in Chapter 4, to minimize the risk of bias the list should contain some representative products for each country and should not consist of products most of which are representative only in a particular sub-group of countries, such as the richer countries, and unrepresentative in the rest. As explained in Chapter 5, the list must be determined and agreed collectively by all countries with the assistance of the regional or global coordinator.
38. The estimated annual national average prices used to estimate the PPPs for each of
the products on the common list are inevitably subject to sampling error. Estimating each individual average price is a matter of statistical inference and does not involve index number theory. With simple random sampling, the sample average provides the best unbiased estimate of the universe average. However, countries typically do not report average prices for all the products on the common list. Some products may not be found in some countries or may be so unrepresentative, i.e., consumed in such relatively small quantities, that it may not be feasible or cost effective to collect enough prices to enable a satisfactory estimate to be made of their annual national average price.
39. Estimating the product PPP, i.e., the ratio of the estimated average prices for the
same product in two different countries is more difficult than the estimating the average of the price changes, or ratios, for the same product in two time periods for CPI purposes within a single country. CPIs deal with a single universe of transactions, albeit a dynamic one, whereas the ICP has to deal with a different universe in each country.
40. The reliability of an estimated basic heading PPPs depends on both the number of
products on the common list and the sizes of the samples of prices collected per product in the various participating countries.
• The number of products on the list for which prices need to be collected
depends on the the extent to which the patterns of relative prices in different countries differ from each other. If the patterns of relative prices were to be all the same, the individual product PPPs beween a given pair of countries would all be equal. In principle, it would then be sufficient, to collect prices for only a single product. In practice relative prices do differ. The more dissimilar they are they greater the variation in the individual product PPPs and the larger the number of products that need to be selected for pricing. A measure of the dissimilarity of the relative prices is provided by the variance of the relative price indices
156
described in Chapter 4. If relative prices tend to be very similar the relative price indices will tend to be clustered around unity, their variance increasing as patterns of relative prices diverge. As relative prices diverge, not only is it necessary to increase the number of prices in the product sample by extending the list of products, but the more sensitive the basic heading PPPs become to the index formulae and methodology used4.
• The size of the sample or prices that needs to be taken within each country
for each of the products on the list depends on the extent to which prices vary between different outlets. In order to achieve a given degree of precision in the estimated average price for a product the size of the sample of outlets needs to increase as the variance of the outlets prices increases. The variance may depend on factors such as how retail distribution is structured, the geographical size of the country and the extent to which incomes vary between regions, especially between the capital and the rest of the country. Different countries may well need to take samples of different sizes in order to achieve the same precision.
41. In ICP 2005, the product lists are decided collectively and purposively during the
course of the pre-survey. Individual countries have little influence over the sizes of the lists of products, except to the extent that they should make sure that some of their own representative products are included on the list. In general, the more heterogeneous the group of countries, the greater the variation in relative prices is likely to be and the larger the list of products that is likely be needed. Of course, if counries have limited resources for price collection, extending the list of products may not increase the number of reported prices proportionately and may simply lead to an increase in the number of missing prices.
42. As explained in Chapter 11, there are some robust ways of dealing with missing
prices when estimating basic heading PPPs. However, there is no escaping the fact that missing prices reduce the reliabibity of the estimates. Regional coordinators need to to persuade and encourage countries to collect enough prices for products that are not representative in their own countries.
Utilizing Existing Survey Capability and Statistical Infrastructure 43. Every national statistical office is engaged on the collection and processing of data
and should have staff with experience of conducting sample surveys of one kind or another. Some maintain their own survey units with professional staff who work full time on sample surveys while others may rely more on contracting work out to specialized survey agencies. Each statistical office participating in the ICP must have some in-house knowledge of, and expertise in, the management and conduct of sample surveys. This Manual does not therefore go into subjects such as the basic
4 It is worth noting that the absolute variation in the average prices of the different kinds of products within the same country is irrelevant. Indeed, the absolute variance can be an arbitrary, almost meaningless, statistic as it depends on the arbitrary choice of the units of quantity in which the products are measured.
157
elementary principles of sampling, including survey design, or the kinds of basic training or instructions that need to be given to interviewers. The ICP has to build on existing statistical capabilities, although resources may be limited in smaller statistical offices.
44. As a general strategy the ICP aims to make the maximum use of the statistical
infrastructure that is already in place in statistical offices, and of existing price surveys already being conducted for CPI purposes. The objectives of the ICP, at least with respect to household consumption, have much in common with those of the CPI within a country. Both programs aim to construct price indices relating to consumption expenditures. Both deal with the same universes of consumption transactions and the same kinds of outlets and products even though the types of indices compiled, and their coverage, are different. The ICP should not therefore be in a position in which it has to develop from scratch completely new surveys covering the whole of household consumption even though, as will become clear later, it may have to conduct some additional surveys in parallel with ongoing CPI price collection.
45. In any case, the ICP has to be able to count on the skills and experience of the staff in
national statistical offices. The success of the pre-survey, as described in the previous chapter, relies on inputs from national experts with experience of the goods and services sold on local markets, experience that is likely to be acquired mainly through working on the CPI. The national coordinator for the ICP does not necessarily have to be someone with responsibility for CPI work, but the national coordinator must be fully familiar with the country’s CPI program. So far as possible the staff engaged to work on the ICP price surveys should be persons with previous CPI experience. This applies to all the different categories of staff in the NSI, or under contract to the NSI, from the national coordinator through to the price collectors working in the field. It is part of the general memorandum of understanding between NSIs and the ICP that the collective expertise of the NSI should be put the disposal of the ICP.
46. Although ICP price collection should be linked to CPI price collection as closely as
possible, it is necessary to establish at the outset what ICP prices cannot be collected during the course of ongoing CPI price collection and what additional price collection has to be undertaken for ICP purposes. The set of ICP products is bound to differ from the set of products used by a country for its own CPI although there should be some overlap between the two sets. Countries are under an obligation to ensure that at least some of the products that are relatively popular in their own country are included on the common ICP product lists developed at a regional level. However, the extent to which the ICP is able to make use of products already being collected for CPI purposes is likely to be limited, especially given the tight specifications of the products on the ICP lists.
47. The gain from integrating ICP and CPI price collection is not to be measured by the
extent to which exactly the same prices are used for both purposes. The gain may
158
come from the fact that the products needed for ICP purposes may be found in outlets from which prices are already being collected for CPI purposes. The sample of outlets used for the CPI may well be equally suitable for the ICP. Thus, the ICP may not have to go back to the beginning to select a fresh sample of outlets from whatever sampling frames are available and can simply use the same sample of outlets as the CPI. The additional prices collected for ICP purposes can be collected at the same time as the price collector visits, or contacts, the outlet to collect the CPI prices. There are obviously considerable economies to be gained by doing so. These refer not only to savings on current traveling and labor costs but to all the prior investment costs of building up the CPI outlet sample and the training and equipping of the price collectors.
48. On the other hand, as already explained, there are bound to be a significant number of
products on the ICP’s regional product lists that are outside the scope of the CPI and whose prices cannot be collected from the existing CPI sample of outlets. In this case, the CPI’s sample of outlets needs to be expanded to include some additional outlets, even in localities in which CPI price collection is taking place. If so, the sample of additional outlets needs to be taken in advance so that the CPI price collectors can visit such outlets in the same vicinity when conducting the regular CPI price surveys.
49. The CPI sample of outlets may also need to be expanded to include outlets in areas
that are outside the geographical scope of the CPI. For example, if the CPI is confined to the capital city, the ICP needs to take a sample of outlets in the other regions. The sizes of such additional samples may have to be small because of limited resources, but there needs to be at least some information collected about differences in price levels between the capital city and the rest of the country for ICP purposes. Similarly, even if the scope of the CPI extends beyond the capital but is still confined to urban areas, an additional sample of outlets in rural areas needs to be taken. Differences in outlet prices between urban and rural areas become particularly important when comparing countries in which the shares of the population living in rural and urban areas differ significantly. In these circumstances, the PPPs may be seriously biased if based only on outlet prices in urban areas, or worse still, in capital cities. For ICP purposes, the average prices must be national and not average urban or capital city prices.
50. Statistical offices may have to engage some additional price collectors to carry out the
additional price collection just mentioned, and possibly other staff to work on the ICP, but any training in basic statistics, survey methods or interviewing techniques that may be required can be given by the competent staff in the national statistical office.
51. While extending the collection of prices to include additional products not already
covered by the CPI or extending price collection into geographical areas outside the scope of the CPI may require additional resources, it should be noted that the
159
additional price collection is very likely to be of benefit to the CPI in the longer run when some or all of it may well be incorporated into the CPI. Similarly, the staff of statistical offices who actually work on the ICP are bound to benefit from the additional experience gained. This additional expertise will tend to reinforce and strengthen the existing CPI program and is expected to be a valuable by-product of the ICP.
Sources for Prices 52. While the ICP should exploit the existing CPI price collection program to the fullest
extent possible, some additional price collection will be necessary. It is therefore necessary to consider the various possible sources from which the prices of consumption goods and services might be collected. Within any given country, the potential sources of price information for the ICP are likely to be the same as those for the CPI. CPI experts familiar with the various possible sources should not merely be consulted but directly involved in the ICP program in any case. It may also be appropriate to consult other kinds of experts as well, such as market research or consumer organizations.
53. The prices of most of the products on the ICP list are likely to be obtained by price
collectors visiting a sample of outlets located in specific areas. Outlets do not only consist of conventional market stalls, retail shops or stores selling goods such as food and clothing but also service providers such as clinics or schools selling health and education services, hairdressing and beauty salons, law firms, electricians, plumbers, etc. They also include itinerant traders and service providers.
54. Many local outlets form part of a regional or national chain of shops, stores or
supermarkets that are owned and managed centrally. The prices in such outlets may also be fixed centrally, although this does not mean that the prices in all local outlets have to be the same. When prices are fixed centrally, they could be collected directly from the central office without taking a sample of the local outlets or visiting the outlets, although it needs to be checked periodically that the prices in the local outlets are in fact the same as those provided by the head office. Of course, if a central office supplies a price which holds for a large number of local outlets, it must be given an appropriately high weight when estimating the national average price. Information is needed about the share of the chain in the total national sales of that product or group of products. One advantage of collecting prices directly from the central office of some large chain is that the office may be able to provide several of the required ICP prices at the same time.
55. Apart from observing prices in local outlets or consulting central offices, information
about prices may be obtained from the various sources listed below:
160
• Mail catalogues: Prices may be obtained from up to date catalogues for certain kinds of products, especially some kinds of durables, supplied by regional or national chains of retail outlets, or discount warehouses, operating a uniform pricing policy. Such prices may change frequently so that there must be some mechanism to ensure that new catalogues are received as they appear.
• Internet: Prices may be obtained over the Internet when major stores
advertise their prices on the Internet, possibly also offering home deliveries. Some types of goods are increasingly, and possible exclusively, sold over the Internet, e.g. some kinds of books or computers, so that many outlets are effectively located on the Internet. Some airline tickets are only available for purchase over the Internet. When home deliveries are made, the purchaser’s price must include all delivery charges.
• Telephone/fax: Prices may be obtained over the telephone or by fax if the
product being priced is standard and the contractor will quote a standard price or charge. For example, service providers such as electricians or plumbers may be telephoned for charges for providing a new single electricity socket or other standard jobs or repairs.
• Government: Prices may be obtained from other government agencies or
regulatory authorities who can act as intermediaries in the price collection process (e.g. in some countries this would be the case for electricity prices);
• Secondary sources: In some cases, secondary sources including consumer
organizations can provide data on the prices of specific goods such as are airline fares and used vehicles. For example, in the US CPI a sample of scheduled airline flights is selected using detailed ticket data from the U.S Department of Transportation.
56. When using sources such as catalogues or the Internet for prices, special care must be
taken to ensure the products priced match the precise specifications required for ICP purposes and that their prices are correctly recorded including any sales taxes and also including any delivery charges. Checks should also be made to ensure that the prices apply to the index period. It is important to remember that all the usual price collection principles are still relevant for prices collected from the internet, including the need for detailed descriptions, immediate availability of the item for purchase, treatment of special offers, etc.
57. It will often be necessary to collect prices for a product in more than one way to
ensure that all transactions relating to that particular product are covered by the sample of outlets. For example, a wide range of goods and services, such as books or household durables, maybe bought from retail shops or stores and from catalogues and through the Internet. In these circumstances, the sample of outlets has to cover all the different outlet types through which purchases are made. It is also necessary to
161
ensure that the prices from different kinds of outlets are appropriately weighted when calculating the annual national average price for the product.
58. While there may be savings to be achieved by collecting prices from the kinds of
sources listed above instead of sending price collectors out into the field, several of the sources listed above are likely to be more useful in developed than developing countries. In rural areas of developing countries, most of the prices can only be obtained by taking samples of outlets and sending price collectors to visit those outlets.
Sampling Frames for Outlets 59. The sample of outlets that already exists for CPI purposes can be used for the ICP
although, it may be necessary to select a number of outlets that sell ICP products that are not on the CPI product lists. It may also be necessary to select completely new samples of outlets in areas outside the scope of the CPI, especially rural areas.
60. Not many suitable sampling frames may exist at a national level in most countries,
but there usually exist a number of possible frames at a local level. The following types of lists may possibly be used as sampling frames.
• Some countries carry out periodic retail trade censuses, although the lists of
outlets may not be kept up to date. Such censuses should contain information about the outlets which could be useful for sampling purposes: for example, for probability proportional to size, or pps, sampling.
• Some countries conduct surveys of retail sales which provide potential
sampling frames. • In many countries, Value Added Tax, or VAT, records could provide a good
up to date sampling frame which may be accessible to national statistical offices for statistical purposes and which also should permit some form of pps sampling.
• Business registers exist in many, but by no means all, countries. These should
include the locations of retail outlets together with addresses and be updated regularly. If a size measure (sales or number of employees) is included in the register it can be exploited to carry out pps sampling. Business registers are likely to provide good sampling frames when they exist.
• Telephone directories (“yellow pages”). These usually do not include size
measures so that pps is not possible. Simple random sampling or systematic sampling can still be used, however.
162
• At a local level, lists of outlets may be compiled by agencies such as:
o Local government administrations for property tax or regulatory purposes;
o Local chambers of commerce or trade associations; o Employers’ organizations.
61. These lists can be useful for local markets. It may be difficult to find sampling frames
for small outlets trading on informal markets, especially in developing countries. It will obviously be difficult to find lists of traders, especially service providers, operating in the in the ‘hidden’ economy in countries at every level of development. It will also be difficult to collect realistic prices from such traders.
62. Prior information is usually available about the location and type of outlet in the
various sampling frames listed above. Information may also be available about size. These factors can be used to define strata. For example, strata may be defined by cross- classifying by:
• Size of sales or employment; • Type of outlet: supermarket, specialist shop, small general store, market stall,
etc.; • Population density: rural, urban, metropolitan area, capital city; • Geographical or administrative region.
63. The strata will be defined differently from country to country depending on the size
of the country, its level of development, economic and political structure, and so on. The weights to be attached to each stratum probably cannot be estimated precisely. In principle, they should be measured by the shares of the total quantities purchased in that stratum. It will not be possible to estimate such weights accurately at the level of individual products, but even rough weights can be useful and preferable to no weighting. For example, the weights to be used for combining the results for different geographical strata may have to be based on the relative sizes of the population in the strata.
Informal Markets and Bargaining 64. Not all outlets have a permanent location which can be listed in some sampling
frame. In some cases, the outlet may be an itinerant trader who continually travels around. It is also common for some sellers to occupy a stall in a market that is shared by different sellers who occupy it at different times of the week or month or possibly even different times of the day. In such cases, it may not be possible to select a sample of sellers directly. Instead, it may be necessary to take a sample of the locations in which such sellers operate and instruct the price collectors to visit the locations at the appropriate times. The price collectors can then choose specific sellers while taking a detailed note of the outlet or outlets selected
163
65. In some countries, household expenditure surveys reveal that many households do most of their shopping once a week on the day of the weekly market or bazaar, at least for certain types of products. Periodic markets held weekly or at other frequencies, also provide an opportunity for local producers, especially agricultural producers, to bring their produce to market it and sell it directly to households. Price collectors must therefore carry out their price collection on the appropriate market days.
66. Collecting prices for CPIs and the ICP can sometimes be costly and labor intensive.
For example, when collecting prices for purchases made on informal markets, there is often no listed outlet price or the listed price is irrelevant, the price paid depending entirely on the outcome of a bargaining process between the buyer and the seller. Collecting such prices is evidently difficult, time consuming and costly. The price collector may actually have to purchase the good in question, but even in this case the price collector may not pursue the bargaining process with the same vigor as a real purchaser, or even as the price collector would if purchasing out of his or her own resources. Unless great care is exercised the prices reported for such markets may be biased. In these kinds of situation, it is preferable to collect a small number of reliable prices using intensive interviewing methods rather than a larger number of dubious prices based on rather superficial or casual observations. Another possibility might be to try to collect the price information from the purchasers by interviewing them after they have made their purchases and left the market, but this may often not be practical.
67. The prices may vary in a predictable manner throughout the day in informal periodic
markets, especially if the goods are perishable, as in the case of many kinds of foodstuffs. The ICP does not call for all the products on sale to be priced, however: only for the relatively small number of products that are on the ICP product list. The product specifications for such goods will stipulate that they must be of a certain type and quality. If the products are perishable and those sold late in the day are already beginning to deteriorate, their prices would have to be ignored for ICP purposes because they would not meet the product specifications. On the other hand, if the products have not deteriorated and the seller is merely anxious to get rid of surplus stocks, then the relevant price for ICP purposes is the average price for the day, the different prices being weighted by the quantities sold at those prices.
Location and traveling costs 68. In those cases where the only way in which to collect the prices is by sending price
collectors to the outlets, the time and costs involved are important considerations. In general, it is preferable for price collectors to collect prices close to where they live or normally work. Statistical offices may be confronted with a choice between obtaining a good geographical coverage by sending price collectors to a set of outlets dispersed over a wide area or sending them to a larger number of outlets that are more concentrated. If probability sampling throws up a number of isolated outlets, or locations, that are distant from most of the other outlets visited by a given price
164
collector, it may be preferable to replace them by a larger number of closer or more accessible outlets. In this way, the number of sampled prices may be increased for the same time and cost as compared with a strict probability sample. It then becomes a matter of judgment which strategy is best. In this way, some purposive selection may enter into an otherwise pure probability sample.
69. The normal locations of the price collector(s) themselves are a relevant factor.
Statistical offices or survey agencies may maintain panels of professional interviewers distributed throughout the country. In this case, it may be possible to collect price data over large geographical areas without the price collectors incurring large costs. Otherwise, new price collectors may have to be recruited and trained to obtain a wide geographical coverage and the costs of this have to be taken into account.
Sampling 70. It is necessary to distinguish between the selection of products and the selection of
outlets. The two selection processes are fundamentally different. The sample of products is settled purposively and collectively at a regional level through the complex and costly process of the pre-survey described in the previous chapter. On the other hand, the selection of outlets has to be made by the individual country in question. Moreover, it is a process in which it is desirable to use probability sampling methods to the fullest extent possible.
71. By using probability sampling for the outlets it should be possible to attach sampling
errors to the estimated national average prices for the products included on the ICP lists. It also makes it possible to ensure that the estimated average prices meet certain standards of precision. On the other hand, the average prices are themselves only inputs into the estimation of the PPPs. Even at the level of a single individual product, the precision of an estimated PPP between a single pair of countries depends on the precision of the estimated prices in both the countries concerned, the PPP being the ratio of two estimated averages. Its sampling error will be greater than that of the two individual averages of which it is composed.
72. It is also difficult to attach sampling errors to PPPs at higher levels of aggregation. It
is significant that no country attaches a sampling error to its published CPI, even though the sampling error for a CPI may be easier to estimate than that for an aggregate PPP. Margins of error are also not published for national accounts aggregates including GDP.
Random, or probability, sampling versus purposive sampling 73. Probability sampling should be used to select outlets. When probability sampling is
used, the units in the sample are selected in such a way that each unit has a known probability of selection. In a simple random sample each unit has an equal probability of selection. When prior information is available about the individual
165
units in the universe from which the sample is being drawn, it is possible to utilize techniques such as stratification and sampling with probabilities proportional to size (pps). With pps, the probability of selection is made proportional to the size of some auxiliary variable that is known in advance. In the CPI, it is common for outlets to be selected using pps sampling and the ICP can follow when it selects supplementary samples of its own. Ideally, pps for ICP purposes would use quantities sold as the size measure, but it may be necessary to use some other variable such as total sales or even numbers of staff as proxies for the quantities.
74. The advantages of random, or probability, sampling are well known and generally
accepted. By choosing appropriate estimators, the resulting estimates are usually unbiased, or at least asymptotically unbiased, and also efficient, that is with minimum variance. Conversely, when the sampling is not random, there is the possibility of an unknown amount of bias. Moreover, it is not possible to attach sampling errors and confidence intervals to the results. Modern statistical theory focuses on probability sampling. The use of probability sampling is generally strongly recommended.
75. Sampling is purposive when the units in the sample are selected subjectively by some
person or agency. The persons or agencies involved may try to exercise judgment to obtain a balanced or ‘representative’ sample or to achieve some other objective. Despite the desirability of using probability sampling, purposive sampling is in fact used extensively both in the ICP and CPIs. More precisely, the normal practice in both cases is to use a mixture of both purposive and probability sampling. As already explained, the products are selected purposively (in the CPI as well as the ICP), while the outlets are selected using some form of probability sampling.
76. In the case of CPIs, it is interesting to note that it is possible to select products as well
as outlets using probability sampling, despite the lack of a sampling frame for products. Instead of selecting products first and outlets afterwards, the order can be reversed. Outlets are selected first using probability sampling, and price collectors are then instructed to take a probability sample of the products on sale within each individual outlet they visit. In this case, the price collectors are only provided with very loose or general specifications of the types of products they are to select. On the other hand, the price collectors must, of course, record the precise specifications of the products they do actually select and price.5
77. Only one country uses this methodology. One reason is that unless the price collectors
are well trained and well versed in statistics, it may be difficult for them to carry out proper probability sampling on the spot within the outlet. Most statistical offices have serious reservations about the capability of their price collectors to do this. They are also extremely reluctant to lose control over the actual selection of products and delegate it completely to their staff in the field. They prefer to choose them within the statistical office. They therefore provide their price collectors with tight product specifications similar to those that are provided to ICP price collectors.
5 This is the method actually used by the US Bureau of Labor Statistics to estimate the US CPI. The overall US sample is a probability sample.
166
78. Selecting individual products at random within outlets would not be workable in an
ICP context. Different products would be selected in different outlets so that it would not be possible to calculate national average prices or to match products and prices between countries. International comparability requires that a particular set of products must be pre-specified for pricing. The selection of products for pricing within outlets has to be purposive in order to ensure international comparability.
Frequency of Price Collection 79. The frequency prices are collected is an important issue. The universe of transactions
to which the prices refer is spread over a year, given that the objective of the ICP is to use the PPPs to convert or deflate annual expenditure data from the national accounts. Average annual national prices are needed. Up to this point, attention has been focused mainly on the spatial dimension: the need to obtain average national prices covering expenditures throughout the economic territory of the country. However, it is also necessary to average these national prices throughout the year as a whole.
80. There are three main options for price collecting: to collect once per month, once per
quarter, or once a year. The target price in each case is the quantity weighted average transactions price within the period in question. It is not the price at a single point of time. The frequency with prices have to be collected obviously depends on the extent to which the prices vary over time. Some prices may change only once a year, at least when the general rate of inflation is very low. Many service prices may change relatively infrequently compared with goods prices, especially if they are subject to some kind of annual review or regulatory supervision: for example, school fees and other kinds of professional fees, rail and bus fares, postal charges, etc. Charges for utilities such as electricity or water may also change only once a year. Clearly, prices need to be collected once only for those goods or services whose prices change only once per year
81. The prices of most goods, however, are liable to change at any time and may also
change several times during the course of the year. Even when the general rate of inflation is low, prices may not be stable. Zero inflation means that price increases tend to be cancelled out by price reductions. It does not mean that individual prices do not change. The greater the known or assumed variability in a particular price, the more frequently it has to be collected if a reliable estimate is to be made of the average annual price.
Monthly versus quarterly price collection 82. In recent years inflation has been low in many countries throughout the world with
prices increasing by less than one per cent from one quarter to the next, on average, and by only a fraction of one per cent from month to month. Very low rates of inflation brings into question whether the repeated collection of prices from the same
167
outlets month after month, or even quarterly, is justified or optimal, except for some seasonal products.
83. Strongly seasonal products are products that are only available at particular times of
the year and whose prices are also subject to seasonal variation. The prices of strongly seasonal products can only be collected in those months in which they are on sale on the market. Strongly seasonal products include some services as well as goods: for example, some recreational services. The prices of seasonal products need to be collected in each of the months in which significant quantities are sold. The monthly prices ought to be weighted by the monthly quantities sold.
84. Apart from strongly seasonal products, quarterly price collection may be frequent
enough for ICP purposes when the annual percentage rate of general inflation is low or moderate, say a single digit rate. The improvement in the accuracy and reliability of the annual averages achieved by collecting prices monthly rather than quarterly will often not justify the cost of collecting and processing three times as many prices. The prices for the same product collected in successive months or quarters are obviously not independent. On the contrary, they are likely to be very highly correlated serially. The reduction in sampling error of the annual average from collecting monthly rather than quarterly may sometimes be negligible despite collecting and processing three times as many price observations. Careful consideration may need to be given as to whether the additional resources involved in collecting prices monthly might not be better spent on increasing the sample size by increasing the number of outlets from which prices are collected.
85. Even the quarterly collection of prices may not be justified if a country has a reliable
CPI. An annual average price can be estimated from that for a single month or quarter by extrapolating it backwards and forwards to other periods using the relevant sub-indices from the CPI. This is the current strategy adopted in the joint EU-OECD PPP program for countries with very low rates of inflation. On the other hand, for those countries which have significant inflation, quarterly price collection is planned. Thus, the existence of a satisfactory ongoing CPI program and a reliable CPI is a highly relevant and critical factor. With a reliable CPI and low rate of inflation, a single price collection may be sufficient for ICP purposes. Resources can then be concentrated on trying to ensure that the average prices for that one period of time are as reliable as possible.
86. On the other hand, much depends on the circumstances and statistical infrastructure in
place within a country. Once the ICP price collection process has been set in motion, it could be the case that the marginal costs of collecting prices monthly rather than quarterly may be negligible. This may happen if the ICP data collection is closely linked in with the regular ongoing monthly CPI. The resources released by not collecting prices every month may not be easily transferable to other activities. Because of bottlenecks, it may not be possible to achieve much increase in the amount of price information collected at any one single period time by cutting back on price collection at other times. Thus, decisions about frequency have ultimately to
168
be left to the competent authorities within the region and the country. The optimal strategy may vary from country to country.
87. It should also be noted that repeatedly collecting the price for the same item means
that checks are needed to ensure that exactly the same product is being priced from month to month. This is obviously very important for CPIs that are tracking prices of the same products over time. However, as the ICP product specifications are meant to be very tight (and tighter than the specifications used in many CPIs) tracking the same product over time should not be difficult. It is essential to impress on price collectors collecting for the ICP that they must price products that fit the tight ICP specifications exactly in order to ensure international comparability. It may be necessary to institute checks to see that these instructions are followed.
88. When the annual percentage rate of inflation reaches double digits, the case for
monthly collection becomes much stronger and quite compelling. Unless prices are collected frequently it may become difficult to estimate the average annual price with any precision. If inflation proceeds at a steady rate, it might be possible to estimate the average prices satisfactorily from quarterly data. However, if the pace of inflation is uneven, quarterly data may not be adequate. If the annual rate of inflation exceeds 100% monthly prices are clearly required.
Hyper inflation
89. However, there must come a point at which the rate of inflation is so high that it
becomes questionable whether it is practically possible to estimate annual average prices with sufficient precision for ICP purposes. With hyper inflation, a somewhat different approach may be needed as it may be preferable to try to estimate national prices at a single point of time, say the middle of the year, and calculate PPPs at that point. Annual PPPs not only may be unreliable but have little meaning under hyper inflation. It is important to note that the annual national accounts data to which the PPPs are meant to be applied are also of doubtful validity and analytic usefulness under hyper inflation as the annual data may be completely dominated by the high price data for the last quarter. Under hyper inflation the accounting period needs to be shortened to obtain meaningful data. Similarly, the period for time to which the PPPs relate need to be shortened, possibly to a single month.
The timing of price collection 90. The timing of price collection needs to be distinguished from the frequency of price
collection. Timing refers to the point, or points, of time within the month or quarter in question when the prices are actually collected. The key question is the extent to which prices may vary from day to day during the month or quarter, or even during the course of a single day. For example, the prices of the goods sold on informal markets may vary systematically during the course of the day.
169
91. The monthly or quarterly price is intended to be an average of the all the transaction prices within the month or quarter. In practice, this means that when most transactions are made on one day a week at a weekly market or bazaar, the prices should be collected at the times when most transactions are known, or believed, to take place. If purchases are distributed fairly evenly between different days of the week, prices can be collected from different outlets on different days. Much may depend on factors such as administrative convenience and the proximity to each other of the outlets from which the prices are collected. In any case, it is desirable that the price collection procedures should follow the same timetable or pattern from one period to the next.
92. As the qualities of some goods vary over time, most obviously in the case of
perishable goods, it is necessary to ensure that the prices collected at different times do in fact continue to refer to exactly the same product as specified in the ICP Product Specifications. For example, if sellers cut prices to get rid of their stocks, the lower prices are only acceptable for ICP purposes provided that the goods are of unchanged quality. If the goods sold off at the end of a market day are deteriorating and of lower quality than the PS requires, their prices are not acceptable.
93. A similar issue arises with fashion goods, such as clothing and footwear, whose
prices of tend to fall at the end of the fashion season. To ensure comparability between countries, the prices of such goods should be compared when the goods are still in fashion in both countries. Out of fashion goods should be treated as lower quality goods that no longer meet the ICP specifications. An average should not be taken of the prices of the goods when they are in and out of fashion, as the goods in and out of fashion are essentially two different kinds or qualities of goods even though their physical characteristics may be similar.
94. Price collection days need to take account of factors that affect prices and shopping
patterns. Holidays and weekends should be avoided except for products with large sales at these times, such as petrol and entertainment, recreational and restaurant services. Normal shop opening and closing hours have also to be taken into account. These can vary greatly from one country to another.
95. Price collection dates (and sometimes times) need to be set in advance for both the
ICP and CPIs. When prices are collected monthly or quarterly, the interval between successive price observations at each outlet should be held constant by visiting that outlet during a fixed time period each month or quarter. However, in some countries or economies, it may be desirable to set up checks to ensure that some sellers, such as major chains of stores or even government sellers, do not adjust their prices for collection days in order to try to conceal the prices at which they actually sell most of their products.
Summary and Conclusions
170
96. This chapter has not dealt with all aspects of price collection as some important topics are covered in other chapters. In particular, Chapter 5 deals with the selection of the common lists of products and the development of the standard product descriptions and product specifications. It explains how the detailed specifications can be translated into questionnaire format for price collection purposes. Chapter 7 deals with the processes of data checking and validation at all levels from the price collectors through the national offices to the regional coordinators, together with the associated processes of data transmission.
97. The present chapter has focused mainly on the estimation of average national prices.
It does not explain basic sampling survey methods as these are covered in many standard texts. The ICP counts on the statistical experience and expertise, and advice, of the staff in national statistical offices, especially with regard to the selection of products for pricing and the selection of outlets from which to collect prices. It is recommended that ICP price collection should be integrated as closely as possible into the existing regular ongoing CPI price surveys and should exploit the existing statistical infrastructure to the maximum extent possible.
98. With this strategy it is important to highlight the differences between ICP and CPI
objectives and price collection programs. One major difference is that the ICP has to estimate the average price for a product across all outlets in the country in the period in question. Its objective is not to record movements in the price of the same product in the same outlet, although when ICP prices are collected several times during the course of the year it is also necessary to ensure that the same product is priced each period. Averaging the prices of products in different outlets requires the products to be tightly specified to ensure that they are the same. Price collectors must make sure that the products for which they collect prices actually satisfy the detailed specifications. Supervisors must check that they do this. The need for international comparability is reinforced by the need for strict comparability between products in different outlets in the same country. The questionnaires must provide precise detailed descriptions of the products to be priced, including photographs when possible.
99. Assuming adequate sampling frames exist classical probability sampling methods
can be employed to select outlets both for the CPI and ICP. The types of sampling frames that may be used are the same as those used for CPI purposes. Indeed, assuming that the two data collection processes are closely integrated, the ICP may be using the same samples of outlets as the CPI. However, the scope of most CPIs is typically more restricted than that of the ICP. For example, the CPI might cover only urban areas or even only the capital city. In general, therefore, it will be necessary for the ICP to select some additional outlets, especially in rural areas, using appropriate probability sampling methods so far as possible.
100. The determination of the appropriate sizes of the samples of outlets is examined in
some detail in the Annex. The relevant factors influencing sample size are the required degree of precision in the estimated national average price and the variation
171
in the prices in the transactions in which the product is purchased. As the prices collected are outlet prices as distinct from transaction prices, all that can be observed is the variation in outlet prices. The target price is a weighted average of the outlet prices in which the prices are weighted by the quantities sold, so that the corresponding measure of price dispersion has to be the weighted variance of the outlet prices.
101. As the target price for the ICP is an annual national average price price collection
needs to be undertaken more than once of year for most types of product, but especially for strongly seasonal products. Some countries may collect prices quarterly while some may collect prices monthly, at least for some products. Repeated price collection may not be so costly if it is closely integrated with ongoing CPI price collection. An alternative that is used by some countries is to collect prices in one period only and then to estimate the annual averages by using the relevant sub-indices of the CPI to extrapolate the prices to other periods. This method may be acceptable when there is a reliable CPI with reliable sub-indices and the rate of inflation is not too high. If there is hyper inflation it may not be appropriate even to try to estimate an average price for a period as long as a year, especially as the national accounts at current price covering a period as long as a year may not be useful anyway under hyper inflation.
172
Annex
Sample Sizes, Numbers of Outlets and Reliability
1. The overall reliability of the PPPs at the level of the basic heading and higher levels aggregation depends on the interaction of three factors:
• The numbers of products on the ICP lists; • The numbers of the listed products for which countries prices actually collect
prices, or the country response rate; • The numbers of outlet prices collected for each product for which price
surveys are actually undertaken.
2. In the present context, the ICP lists of products may be treated as given. It is determined collectively in the pre-survey. This annex focuses mainly on third factor. There may be a trade-off between the second and third in practice assuming the resources available are limited. The difficulty and costs of collecting an outlet price could vary significantly between different types of product. When it is difficult to collect prices for a particular type of product, say because the product is not very common and found only in a very few widely dispersed outlets, it may be judged to be cost effective not to try to collect any prices for that product and concentrate on collecting prices for products that are more representative and readily available. Such a strategy may increase the total number of price observations but risks introducing bias. This topic is discussed further below.
3. The main purpose of this annex is to examine the relationship between the size of
the sample and the probable margin of error, or precision, attached to the average price estimated from the sample. It draws on classic sampling theory. The central limit theorem states that if a population has a finite variance σ2 and an arithmetic mean μ then the distribution of the sample mean in repeated random samples drawn from that population approaches the normal distribution with a variance of σ2 / n and a mean μ as the sample size n increases. For reasonably large samples of 50 or more the approximation to the normal is likely to be good but not for very small samples of, say, 15 or less. The sample mean provides an unbiased estimate of the population mean. The probability of the sample mean not deviating from the population mean by more than a certain amount can then be derived from the area under the normal curve. In this way, probable margins of error can be attached to sample means. An explanation of sampling errors and confidence intervals be found in any textbook on probability and statistical theory.
4. In practice, the population standard deviation, σ, will not be known but may be
estimated from the sample itself, from other samples drawn from the same population, or in other ways, as explained below. It is convenient to replace the
173
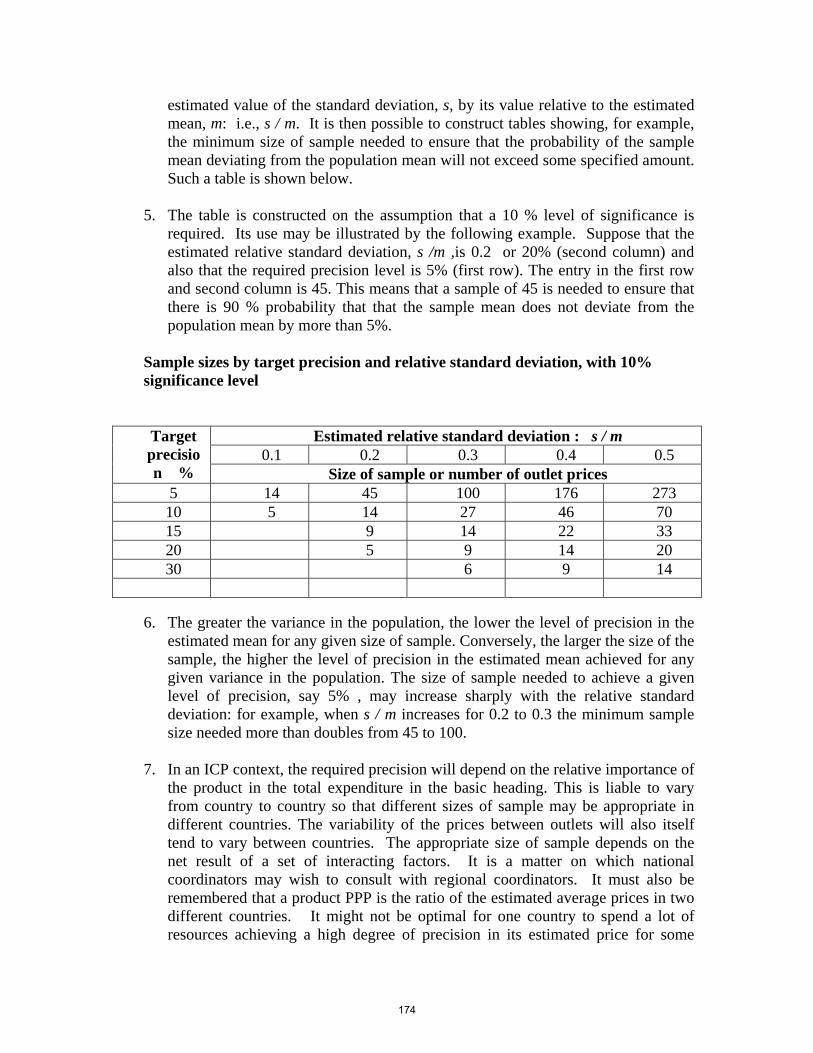
estimated value of the standard deviation, s, by its value relative to the estimated mean, m: i.e., s / m. It is then possible to construct tables showing, for example, the minimum size of sample needed to ensure that the probability of the sample mean deviating from the population mean will not exceed some specified amount. Such a table is shown below.
5. The table is constructed on the assumption that a 10 % level of significance is
required. Its use may be illustrated by the following example. Suppose that the estimated relative standard deviation, s /m ,is 0.2 or 20% (second column) and also that the required precision level is 5% (first row). The entry in the first row and second column is 45. This means that a sample of 45 is needed to ensure that there is 90 % probability that that the sample mean does not deviate from the population mean by more than 5%.
Sample sizes by target precision and relative standard deviation, with 10% significance level
Estimated relative standard deviation : s / m 0.1 0.2 0.3 0.4 0.5
Target precision % Size of sample or number of outlet prices
5 14 45 100 176 273 10 5 14 27 46 70 15 9 14 22 33 20 5 9 14 20 30 6 9 14
6. The greater the variance in the population, the lower the level of precision in the estimated mean for any given size of sample. Conversely, the larger the size of the sample, the higher the level of precision in the estimated mean achieved for any given variance in the population. The size of sample needed to achieve a given level of precision, say 5% , may increase sharply with the relative standard deviation: for example, when s / m increases for 0.2 to 0.3 the minimum sample size needed more than doubles from 45 to 100.
7. In an ICP context, the required precision will depend on the relative importance of
the product in the total expenditure in the basic heading. This is liable to vary from country to country so that different sizes of sample may be appropriate in different countries. The variability of the prices between outlets will also itself tend to vary between countries. The appropriate size of sample depends on the net result of a set of interacting factors. It is a matter on which national coordinators may wish to consult with regional coordinators. It must also be remembered that a product PPP is the ratio of the estimated average prices in two different countries. It might not be optimal for one country to spend a lot of resources achieving a high degree of precision in its estimated price for some
174
particular product if other countries do not, or cannot. This is a matter which may call for some collective discussion and some general guidelines at a regional level. Such guidelines would have to be specific to a particular set of countries and particular set of products.
Estimating the Standard Deviation
8. Some estimate of the standard deviation is needed prior to conducting the sample
in order to estimate the required sample size. Estimates of the variation in outlet prices may be made on the basis of price data collected for CPI purposes. They may also be available from previous ICP programs. If no other estimates are available, a rough estimate of the standard deviation can be made by observing the difference between the maximum and minimum outlet prices on the market. The standard deviation is likely to be equal to about one fourth of the difference.
9. As the absolute sizes of the outlet samples are likely to be constrained by the total
resources available, the relative sizes of the samples taken for different kinds of products may be more relevant than the absolute sizes of the samples. In deciding on relative samples sizes, the critical factor is the variability of the prices of different kinds of products relative to each other. In order to assess the relative variabilities for different kinds of products, fairly crude measures of dispersion, such as the range, may be acceptable.
Sample Sizes, Outlet Sizes and Weights
10. The ICP average national price is the average price over all transactions or
purchases of the product made in some period. As explained elsewhere in the chapter, this is a weighted average of the outlet prices, the weights being the quantities purchased in the outlets. The price variation that is relevant to determining the precision of the estimated national average price is therefore a weighted variance of the outlet prices. There can be a considerable difference between the weighted and unweighted variances in situations in which the market for some product is dominated by one or two large sellers.
11. Suppose half the quantities of some product are purchased from one large
supermarket, all at the same price, and the rest purchased from n other outlets selling at different prices. A situation of this kind clearly calls for the outlets to be stratified by type of outlet. Suppose the supermarket is defined to be one stratum, while the other n outlets constitute the other stratum. The mean price is known with certainty for the half of the population transactions that take place at the same price in the supermarket stratum. The sampling error is entirely attributable to the other stratum and will depend on the number of outlets sampled in that stratum. As there is no sampling error for the supermarket stratum and as it accounts for half of all the transactions taking place, the sampling variance of the overall weighted mean covering both strata will be about a half of the sampling variance for the estimated mean of the other stratum. In this case, an unweighted
175
variance of all the outlet prices, including the supermarket, will significantly overestimate the variance in the transactions prices and therefore lead to an overestimate of the size of sample needed to achieve a given level of precision if used in the table above.
12. Although the example just give may be somewhat artificial, it will be not uncommon for a large proportion of the total purchases of some product to be made from a very small number of sellers, such as chains of stores, including department stores, service stations or supermarkets. In such cases, the outlets must be stratified by size of outlet, which will be equivalent to stratification by outlet type. There should be little difficulty in identifying large chains of outlets even if the sampling frames for the large number of small outlets may not be so good. Prices should then be collected from all the large chains, if possible, with a sample of other outlets. It must be checked whether all outlets belonging to the same chain in fact sell at the same price. If not, the individual outlets belonging to the same chain may have to be sampled if the head office is unable to provide details about the outlet prices. The sampling strategy will generally vary from product to product depending on the structure of the market.
Missing Prices
13. If a particular product does not exist anywhere in a country, its price cannot be collected. However, as already argued, this may not always be the reason for not collecting a price. There may be cases where statistical offices may not try to collect prices because they consider that there are too few outlets selling the product for its average price to be estimated with sufficient precision: or, alternatively, because the costs of searching out enough outlets to obtain enough prices to be able to estimate a sufficiently reliable average price are considered to be too high.
14. Statistical offices may be confronted with a choice between estimating average
prices for a small number of products on the ICP lists with acceptable level of precision or estimating average prices for a larger number of products with lower precision. In other words, they may be confronted with a choice between having large enough samples for a small number of products and having samples which may not be regarded as large enough but for a larger number of products. When resources are limited the choice between the two is not obvious. A statistical office seeking to maintain high standards may regard the first option as preferable. However, this means that fewer average prices are supplied to regional coordinators. Implicitly, the number of missing prices must be higher when statistical offices do not wish to report prices that they consider are not sufficiently reliable.
15. The ICP may therefore be confronted with a choice between having reliable
product PPPs for a smaller number of products or less reliable PPPs for a larger number of products. The problem with reducing the number of products is that
176
products do not get dropped off the lists of products at random. The products that a country drops are likely to be unrepresentative ones that are on the list because they are representative of other countries. Such products are purchased in relatively small quantities in the country in question at prices that tend to be relatively high. There is a risk of bias being introduced by not collecting such prices. If the incidence of missing prices were about the same for all countries, the potential biases might tend to cancel out. However, if some countries have many more missing prices than others, the biases may not cancel. Countries have to be persuaded by regional coordinators that it is not acceptable to report prices only for their own representative products. They must report prices for at least some products representative of other countries even if the resulting average prices cannot be estimated with the level of precision that might be considered desirable for purely internal purposes within a country.
177
Chapter 7
Editing and Validation Introduction 1. This chapter deals with the editing and validation of price data collected by countries for
ICP purposes. As part of the process of editing, annual national average prices are calculated for the products included in the ICP price surveys. These average prices are then used to estimate PPPs for the basic headings.
2. First, it is useful to distinguish non-sampling errors from sampling errors attached to
parameter estimates, such as the estimated average prices and PPPs. This chapter is concerned only with the first type of error: non-sampling error. Non-sampling errors affect individual units or observations. The objective of the editing and validation procedures described in this chapter is to eliminate or, at least, to reduce the incidence of non-sampling errors and also to correct them when they are successfully detected.
3. Sampling errors, on the other hand, cannot be avoided. They occur even if each sampled
unit is measured without error. They depend on the sizes of the samples taken and the variability in the population. When random samples are taken it may be possible to estimate the standard errors of the sample estimates, as explained in the Annex to Chapter 6.
4. The ICP price surveys are designed to collect product prices from outlets. A non-
sampling error occurs when the price observation collected and used for ICP purposes differs from the true outlet price of the product specified on the ICP product list. There are two main types of non-sampling errors.
• A price error occurs when the product for which the price is to be collected is
correctly identified in the right outlet, but the price actually collected is incorrect, or alternatively the price collected is correct initially but an error is subsequently introduced into the price somewhere in the process of recording, transmitting or editing the price.
• A product error occurs when the product for which the price is collected is not in fact the product specified on the ICP list. When the product is wrong, its price may be correctly recorded and processed, but it is still an incorrect price for ICP purpose. Of course, a price error may be super-imposed on a product error.
5. A product error occurs when the price collector accidentally, or deliberately, substitutes
another product for the one specified on the product list without recording that its characteristics are different from those of specified product. Substitution, in itself, does not introduce error provided it is clearly noted and flagged. Indeed, price collectors are usually instructed to collect the price of a close substitute if they are unable to find the product on the
178
ICP list. So long as the substitution is properly documented and the national coordinator is fully informed, it is then the responsibility of the national and regional coordinators to decide what use can be made of the price. It may be possible to adjust the price for the difference in quality between the product priced and the product specified. Alternatively, if some other countries also report prices for the same substitute price comparisons can be made for the substitute as well as for the original product specification. In effect, the substitute can be treated as a new product specification and added to the list of ICP products. This could happen, for example, when the product specification refers to a particular model that is in the process of being replaced by a later model in a number of countries.
6. The object is to compare like with like. Loose specifications may introduce product errors
because the products whose prices are compared may not be the same. For example, if a generic product specification is used, it may embrace a wider range of products than was intended when the specification was drawn up. In this case, errors may be introduced into the estimated PPPs because the products differ significantly in their characteristics. Errors due to loose specifications cannot be attributed to the data of any particular country. Preventing and Detecting Errors
7. Prevention is better than correction. One of the objectives of good survey design and management is to minimize the incidence of non-sampling errors. Price surveys need to be carefully planned and carried out efficiently with proper supervision. The ICP product specifications must be sufficiently precise to enable the products to be identified unambiguously. Price collectors must be well trained and briefed. They must be provided with clear instructions and clear questionnaires. Their fieldwork should be closely monitored and checked to ensure that the prices recorded are the required prices. Similarly, the staff engaged in processing, checking and editing the prices should be well trained and properly supervised. These are all matters of good survey practice that apply to all kinds of price surveys and not just the ICP.
8. It often happens that the price reported refers to a different unit of quantity from that requested and specified on the product list. The price reported may refer to the wrong weight: For example, to 250 or 500 grams instead of the required quantity unit of a kilo: or, it may be the price per egg instead of per dozen eggs, or per pint or gallon instead of per liter. However, price collectors are obliged always to report the actual unit of quantity, whether or not it coincides with the quantity requested. Thus, the use of different quantity should not introduce an error as it will be recorded and known. Either the price collected can be adjusted to convert it into the price for the quantity requested, or if this is not feasible the price may have to be deleted. This point is discussed in more detail later.
9. A standard approach to error detection in surveys of all kinds is to identify extreme observations or outliers. These are observations that diverge so much from the average as to be treated as prima facie implausible and therefore requiring further investigation and verification. It should be noted that the policy is not to reject outliers automatically but to investigate whether or not they are genuine extreme observations. An element of judgement
179
is still required. The amount of divergence that triggers further verification depends largely on the variance of the price observations. For example, it may be decided on the basis of the ‘t ratio’, i.e., the divergence between an individual price observation and the average price for that product divided by the standard deviation of the price observations. As 95% of a normal distribution lies within the range of the mean plus or minus 2 standard deviations, it may be decided that if the t ratio exceeds 2, the observation is sufficiently improbable as to require checking. The methodology is similar to the techniques of quality control used to screen for faulty goods in production processes. 10. It is not advisable to rely too heavily on the screening of outliers because only large
errors cam be detected this way. Smaller errors remain undetected if the resulting price observations remain within the specified bounds of acceptability. Thus, the use of automatic screening methods does not remove the need for efficient management and editing procedures.
11. The screening of outliers is used in the ICP at more than one level. The ICP uses a
hierarchy of checking and validation procedures.
• First, outliers can be identified and screened in a sample of individual prices collected for a single product within a single country.
• Second, outliers can be identified and screened in average prices for the sample of the different products within the same basic heading within a single country.
• Third, additional checks can be instituted at an international level in the ICP by confronting the estimated average prices for the same product in different countries with each other. Although it may not be possible to compare individual prices between countries because of confidentiality restrictions, average prices for the same product in different countries can usually be compared with each. The ICP has set up procedures to make such comparisons in a systematic manner in order to look for outliers. For this purpose, the average prices have to be converted into a common currency using exchange rates or PPPs, or both.
The ICP/CPI Tool Pack 12. The ICP/CPI Tool Pack is a software package developed by the World Bank and
designed for purposes of storing and processing price and expenditure data at each successive stage of the ICP program from the collection of the individual price observations through to the calculation of PPPs at the level of the basic heading and higher levels of aggregation. The Tool Pack may also be used for CPI purposes. It is distributed free of charge by the Bank to countries participating in the ICP program.
13. One of the main functions of the Tool Pack is to facilitate carrying out the kinds of
checks described above. The Tool Pack may be used for checking at each of the levels distinguished above.
180
• First, it is used by the national coordinator to carry out the initial checks on the individual price observations for each product within a single price collection center where the PCM is deployed.
• Second, it is used by the national coordinator to check both the average prices and individual price observations of different products in a single country.
• Third, it is used by the national coordinators and the regional coordinator working in collaboration to check the average prices of the same product in different countries when converted into a common currency using exchange rates or PPPs.
14. The procedures involved at each of the three levels are described in some detail in the
remaining sections of this chapter. Overview of the Editing and Validation Process 15. The editing and validation procedures recommended here are based on those used in the
Eurostat-OECD comparisons. They have been developed over many years during the course of a number of rounds of PPP comparisons. The methods have therefore been tried and tested in practice. They may continue to evolve and improve as more experience is gained.
16. Running the full sequence of editing and validation procedures takes about half a year.
The procedures therefore must be carefully planned and tightly scheduled. This section gives a general overview and summary of the various steps involved before they are described in more detail in the remaining sections of the chapter. The whole process is depicted in Table 1.
181
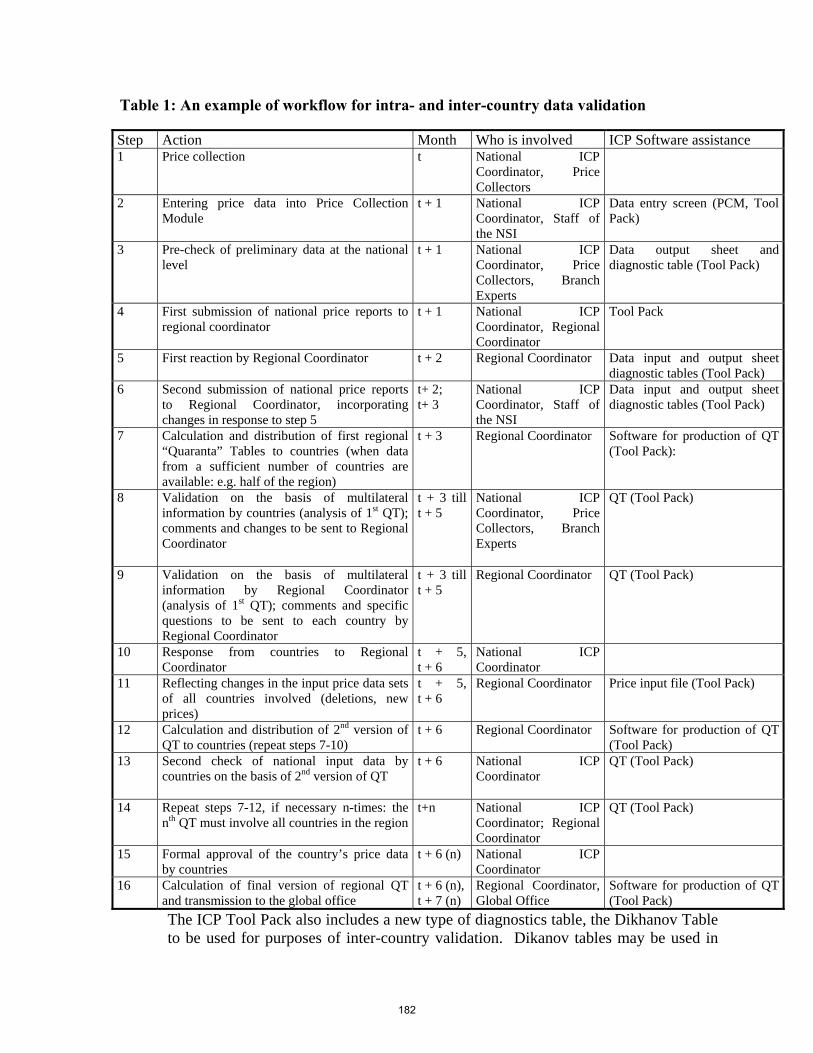
Table 1: An example of workflow for intra- and inter-country data validation Step Action Month Who is involved ICP Software assistance 1 Price collection t National ICP
Coordinator, Price Collectors
2
Entering price data into Price Collection Module
t + 1 National ICP Coordinator, Staff of the NSI
Data entry screen (PCM, Tool Pack)
3 Pre-check of preliminary data at the national level
t + 1 National ICP Coordinator, Price Collectors, Branch Experts
Data output sheet and diagnostic table (Tool Pack)
4 First submission of national price reports to regional coordinator
t + 1 National ICP Coordinator, Regional Coordinator
Tool Pack
5 First reaction by Regional Coordinator
t + 2 Regional Coordinator Data input and output sheet diagnostic tables (Tool Pack)
6 Second submission of national price reports to Regional Coordinator, incorporating changes in response to step 5
t+ 2; t+ 3
National ICP Coordinator, Staff of the NSI
Data input and output sheet diagnostic tables (Tool Pack)
7 Calculation and distribution of first regional “Quaranta” Tables to countries (when data from a sufficient number of countries are available: e.g. half of the region)
t + 3 Regional Coordinator Software for production of QT (Tool Pack):
8 Validation on the basis of multilateral information by countries (analysis of 1st QT); comments and changes to be sent to Regional Coordinator
t + 3 tillt + 5
National ICP Coordinator, Price Collectors, Branch Experts
QT (Tool Pack)
9 Validation on the basis of multilateral information by Regional Coordinator (analysis of 1st QT); comments and specific questions to be sent to each country by Regional Coordinator
t + 3 tillt + 5
Regional Coordinator QT (Tool Pack)
10 Response from countries to Regional Coordinator
t + 5,t + 6
National ICP Coordinator
11 Reflecting changes in the input price data sets of all countries involved (deletions, new prices)
t + 5,t + 6
Regional Coordinator Price input file (Tool Pack)
12 Calculation and distribution of 2nd version of QT to countries (repeat steps 7-10)
t + 6 Regional Coordinator Software for production of QT (Tool Pack)
13 Second check of national input data by countries on the basis of 2nd version of QT
t + 6 National ICP Coordinator
QT (Tool Pack)
14 Repeat steps 7-12, if necessary n-times: the nth QT must involve all countries in the region
t+n National ICP Coordinator; Regional Coordinator
QT (Tool Pack)
15 Formal approval of the country’s price data by countries
t + 6 (n) National ICP Coordinator
16 Calculation of final version of regional QT and transmission to the global office
t + 6 (n), t + 7 (n)
Regional Coordinator, Global Office
Software for production of QT (Tool Pack)
The ICP Tool Pack also includes a new type of diagnostics table, the Dikhanov Table to be used for purposes of inter-country validation. Dikanov tables may be used in
182
addition to Quaranta tables. Both types of table have similar structures and serve similar purposes, but whereas a Quaranta tables is intended to serve as a diagnostic tool at the basic heading level, a Dickanov table can be applied at any level of aggregation from the basic heading up to total GDP. Dickhanov tables may be constructed and used in parallel with Quaranta tables so that they fit into the above timetable in the same way as Quaranta tables even though they are not shown explicitly. Dickhanov tables are explained in the final section of this chapter after the Quaranta tables have been explained.
Summary of the Validation Process 17. The process requires close cooperation and collaboration between the National Statistical
Offices, or NSIs, and the ICP Regional Office: that is, between the national coordinators and the regional coordinator. There are two distinct stages. The first is the intra-country validation process in which the individual price observations are edited and checked and also the first checks are carried out on the average prices. The second is the inter-country validation process in which the average prices for the same products in different countries are checked against each other. The two processes overlap and are interdependent. The whole procedure is an iterative one in which data are passed backwards and forwards between the national coordinators, or NSIs, and the regional coordinator.
Some preliminary considerations A. Confidentiality 18. The validation process works most effectively when not only the average prices but the
individual price observations can be transmitted to the regional coordinator so that they can be subjected to review and scrutiny at a regional level. Such openness and transparency promotes mutual trust and confidence among countries in the reliability of other countries’ underlying data. However, some NSIs may be prevented by confidentiality restrictions or legislation from disclosing individual price observations, even when names are removed and there is no way of identifying the individual observations. In this case, countries should at least provide the regional coordinator with the diagnostic statistical information about their average prices per product so that the Regional Coordinator has confidence in the data submitted and can query inconsistencies where necessary. Another possibility may be for the regional coordinator to be granted the special legal status of a temporary government employee subject to the same rules and sanctions about the disclosure of information to third parties as ordinary employees of the country.
19. In any case, as part of the inter-country validation process, not only the regional
coordinator but the other countries of the region should be able to see each country’s average prices. The inter-country validation process is meant to be a collaborative one in which countries collectively endorse the average prices used to calculate the PPPs. If some countries do not disclose their average prices, this collective endorsement is not possible. Confidence in the results is then weakened and may possibly be undermined. Of
183
course, countries have at least to be prepared to disclose their average prices to the regional coordinator or else they cannot participate in the ICP program. It would be technically possible for the inter-country editing and validation to be carried out by the regional coordinator alone without countries actively participating themselves, but this has severe disadvantages. First, the quality of validation process would suffer because it not be able to benefit from the considerable collective expertise possessed by the national experts of the countries. Second, conducting the ICP under conditions of secrecy would raise doubts about the reliability and credibility of the whole exercise.
B. Repeated price collections 20. Price collection for some products in some countries may be carried out more frequently
than once during the year, usually quarterly. In this case, a separate editing and validation process should be set in motion as soon as each set of data has been collected. There is bound to be some interaction between the successive processes. Clearly, steps should be taken to avoid errors detected in the early rounds of price collection from being repeated in later rounds. Editing and validation procedures should be started as soon as data have been collected without waiting for any data that may be collected subsequently. The later rounds of data collection can benefit from the experience gained in the earlier rounds.
C. Collection by areas 21. A large country may be divided into different areas (the term ‘region’ is not used to avoid
confusion with ICP regions) with separate data collections being carried out in the different areas. In this case, it is recommended that a separate editing and validation process should be carried out in each area. The relationship of the areas to the country as a whole then resembles that between the countries and the ICP region. Additional steps have to be built into the whole process. The editing and validation process within the country is divided between an intra-area stage and an inter-area stage. The NSI and national coordinator for the country as a whole can take on the functions of the regional coordinator for an ICP region. As it will still be necessary for the national coordinator to liaise with the regional coordinator and the other countries, the total amount of editing and validation required is greater. However, this may be entirely appropriate for a large and diverse country with significant differences in prices between the different parts of the country.
D. The illustrative data used 22. The editing and validation procedures in this chapter are described using an example.
The data, although illustrative, are based on a real survey of food prices carried out by Eurostat in 2002. The errors in the data are all of a kind that are found to occur frequently in the collection and processing of data from price surveys. Some of the errors are such that they should be detected by countries themselves in the first intra-country stage of the editing and validation process. Others are of a kind that can only be detected when the data for individual countries are confronted with similar data from other countries in the Quaranta and Dikhanov tables in the inter-country stage of the process.
184
23. The first part of the example refers to the individual price observations collected within a single country. Some errors have been deliberately introduced into the data in order to make it possible to illustrate all the editing and validation methods in action. Thus, although the data are based on an actual survey, some additional errors have been super-imposed for purposes of the example. In practice, it is unlikely all the errors illustrated would be committed by the countries concerned in the course of a single price survey.
24. The process of intra-country editing and validation can be satisfactorily illustrated by
using data for only one country. In order to keep the example manageable, it is restricted to three products only. The products chosen are “pre-packed cultivated mushrooms”, “mushrooms sold loose” and “garlic”. They fall within the same basic heading “fresh vegetables other than fresh potatoes”.
25. The inter-country validation is illustrated using data for several countries, including the
one already used for the intra-country validation.
The Timeframe 26. It can be seen from Table 1 that the editing and validation process is quite a complex
operation to plan, manage and carry out. It can to take at least six months from the time the price data are collected. In practice, and especially when the process is carried out for the first time, it may well take longer if there have to be several exchanges of data between the regional coordinator and the national coordinators. In the ICP, data are collected and sent to regional coordinators on a quarterly basis, so it is assumed that processing the first quarter will take more time, with other quarters requiring less. The two main stages may be summarized as follows
Stage 1: intra-country validation 27. Immediately after the prices have been collected, the first checks are carried out within
the NSI under the general supervision of the national coordinator. After this preliminary checking, the individual price observations are forwarded to the regional coordinator for first checking at the regional level. The regional checks are carried out using a standard format and tables described in some detail in later sections. The regional coordinator then returns the data to the country, indicating which observations appear to be erroneous and require further investigation. This first set of checks at the national and regional level should be completed by about two months after the data are collected.
28. One reason for moving quickly with these first checks is that if data have to be referred
back to the price collectors, it is better to do so as soon as possible after the price collection took place when the price collectors, and any others directly involved in recording or transmitting the price data, still have a clear recollection of what happened earlier. In any case, as the editing and validation is a lengthy and time consuming process, no time should be wasted.
185
29. The NSIs respond to the regional coordinator’s first queries and send the revised data back to the regional coordinator for a second time. This point should be reached two or three months after the data have been collected. The data should then be ready to enter into the second stage of the validation process, but it is possible that the regional coordinator might have to refer some data back for a second time with further queries.
Stage 2: inter-country validation
30. The inter-country validation stage starts as soon as the average prices for a sufficient
number of countries have passed the initial intra-country validation process. Inter-country validation is a collective process involving the regional coordinator and a group of countries. It imposes responsibilities on the individual countries and their national coordinators as well as the regional coordinator. In this process, the average prices for the same products are compared between countries after conversion into a common currency unit using exchange rates, PPPs, or both. The validation makes use of Quaranta Tables, named after Vincenzo Quaranta who first proposed them for use in the European PPP program in 1990 and also Dikhanov Tables named after Yuri Dikhanov who first proposed them for use during the course of ICP 2005. These tables require provisional estimates of PPPs calculated using one or other the methods described in Chapters 11 and 12 of this Manual. The methods are not described in any detail in this chapter.
31. The Quaranta Tables are prepared by the regional coordinator but they are circulated to
all countries. Countries are expected to make their own assessments of their data relative to other countries independently of the regional coordinator. The regional coordinator may refer doubtful prices back to the countries for clarification or further investigation. The countries may then revise or correct their data, or seek to justify the data as reflecting the market situation in their countries. If the regional coordinator is still not fully satisfied the whole process may have to be repeated. In practice, the inter-country validation may have to go though several iterations before all the various parties are satisfied that the data are acceptable.
32. When the first Quaranta Tables are produced not all countries may have finished their
intra-country validation so that the tests are based only a sub-set of countries. The inter-country validation cannot be finalized until all countries have reported acceptable average prices, so that the Quaranta Tables may have to be revised several times as the inter-country data set is expanded to include all countries.
33. The inter-country validation is liable to take at least three or four months so the entire
editing and validation process takes at least six or seven months. Thus, it is essential not only to get the process started as soon as possible after the prices have been collected but to keep up the momentum by working through the various stages as expeditiously as possible.
Intra-Country Validation
186
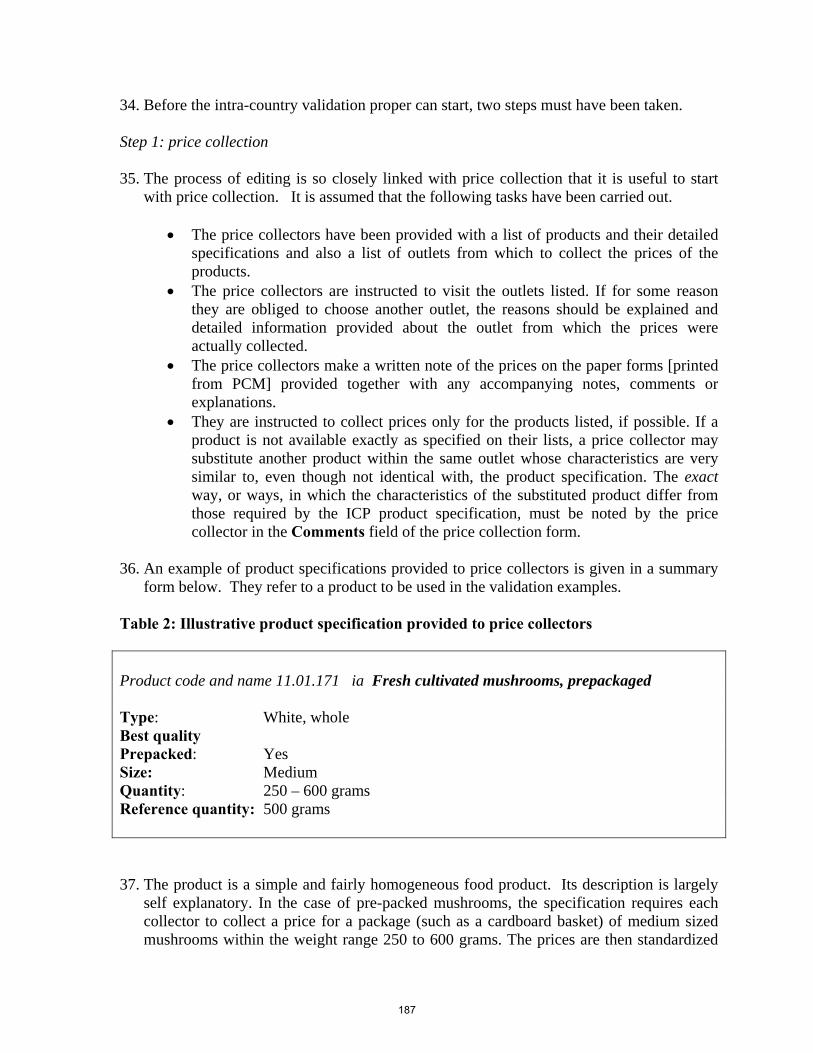
34. Before the intra-country validation proper can start, two steps must have been taken. Step 1: price collection 35. The process of editing is so closely linked with price collection that it is useful to start
with price collection. It is assumed that the following tasks have been carried out.
• The price collectors have been provided with a list of products and their detailed specifications and also a list of outlets from which to collect the prices of the products.
• The price collectors are instructed to visit the outlets listed. If for some reason they are obliged to choose another outlet, the reasons should be explained and detailed information provided about the outlet from which the prices were actually collected.
• The price collectors make a written note of the prices on the paper forms [printed from PCM] provided together with any accompanying notes, comments or explanations.
• They are instructed to collect prices only for the products listed, if possible. If a product is not available exactly as specified on their lists, a price collector may substitute another product within the same outlet whose characteristics are very similar to, even though not identical with, the product specification. The exact way, or ways, in which the characteristics of the substituted product differ from those required by the ICP product specification, must be noted by the price collector in the Comments field of the price collection form.
36. An example of product specifications provided to price collectors is given in a summary
form below. They refer to a product to be used in the validation examples. Table 2: Illustrative product specification provided to price collectors Product code and name 11.01.171 ia Fresh cultivated mushrooms, prepackaged Type: White, whole Best quality Prepacked: Yes Size: Medium Quantity: 250 – 600 grams Reference quantity: 500 grams 37. The product is a simple and fairly homogeneous food product. Its description is largely
self explanatory. In the case of pre-packed mushrooms, the specification requires each collector to collect a price for a package (such as a cardboard basket) of medium sized mushrooms within the weight range 250 to 600 grams. The prices are then standardized
187
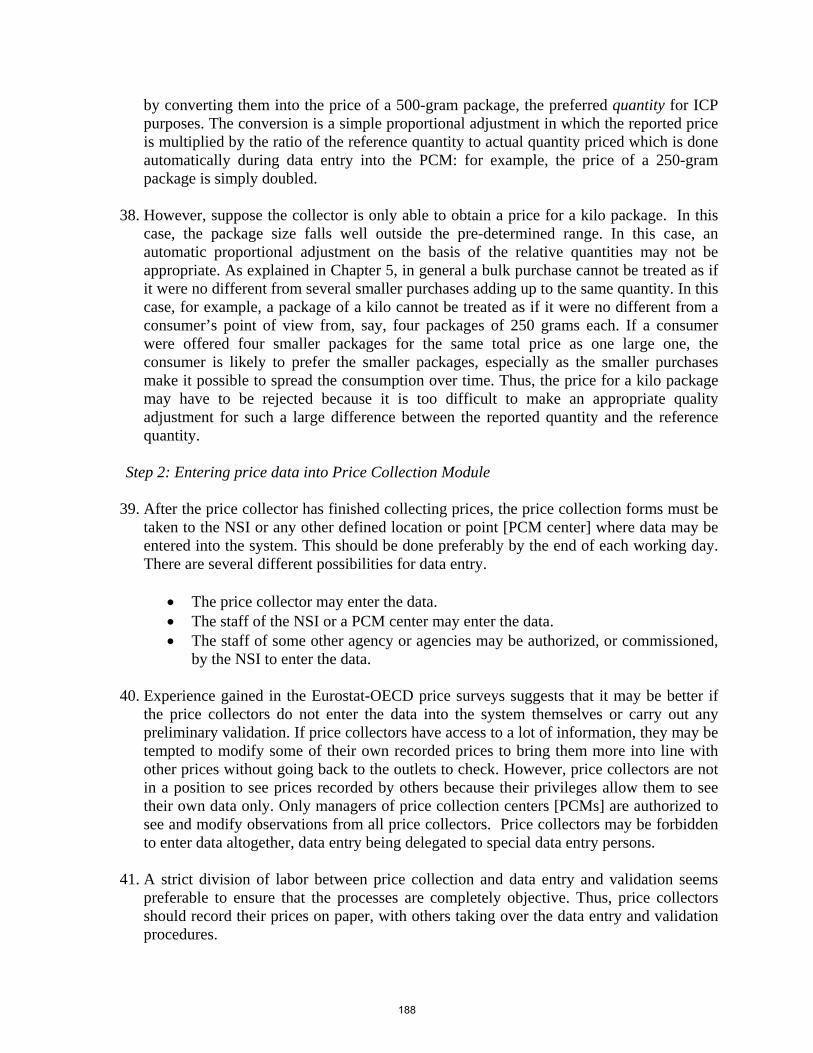
by converting them into the price of a 500-gram package, the preferred quantity for ICP purposes. The conversion is a simple proportional adjustment in which the reported price is multiplied by the ratio of the reference quantity to actual quantity priced which is done automatically during data entry into the PCM: for example, the price of a 250-gram package is simply doubled.
38. However, suppose the collector is only able to obtain a price for a kilo package. In this
case, the package size falls well outside the pre-determined range. In this case, an automatic proportional adjustment on the basis of the relative quantities may not be appropriate. As explained in Chapter 5, in general a bulk purchase cannot be treated as if it were no different from several smaller purchases adding up to the same quantity. In this case, for example, a package of a kilo cannot be treated as if it were no different from a consumer’s point of view from, say, four packages of 250 grams each. If a consumer were offered four smaller packages for the same total price as one large one, the consumer is likely to prefer the smaller packages, especially as the smaller purchases make it possible to spread the consumption over time. Thus, the price for a kilo package may have to be rejected because it is too difficult to make an appropriate quality adjustment for such a large difference between the reported quantity and the reference quantity.
Step 2: Entering price data into Price Collection Module
39. After the price collector has finished collecting prices, the price collection forms must be
taken to the NSI or any other defined location or point [PCM center] where data may be entered into the system. This should be done preferably by the end of each working day. There are several different possibilities for data entry.
• The price collector may enter the data. • The staff of the NSI or a PCM center may enter the data. • The staff of some other agency or agencies may be authorized, or commissioned,
by the NSI to enter the data. 40. Experience gained in the Eurostat-OECD price surveys suggests that it may be better if
the price collectors do not enter the data into the system themselves or carry out any preliminary validation. If price collectors have access to a lot of information, they may be tempted to modify some of their own recorded prices to bring them more into line with other prices without going back to the outlets to check. However, price collectors are not in a position to see prices recorded by others because their privileges allow them to see their own data only. Only managers of price collection centers [PCMs] are authorized to see and modify observations from all price collectors. Price collectors may be forbidden to enter data altogether, data entry being delegated to special data entry persons.
41. A strict division of labor between price collection and data entry and validation seems
preferable to ensure that the processes are completely objective. Thus, price collectors should record their prices on paper, with others taking over the data entry and validation procedures.
188

Step 3: Pre-check of preliminary data at the national level 42. After the entry of price data into the Tool Pack’s PCM , Country X will transfer (Export)
the date to the Price Administration Module (PAM). The National Coordinator will then run Diagnostic Reports in the PAM. Tables 3.1 shows, for example, Country X’s price observations as they appear in the Diagnostic Reports for Prepackaged Mushrooms. Each product will have a separate diagnostic report.
189
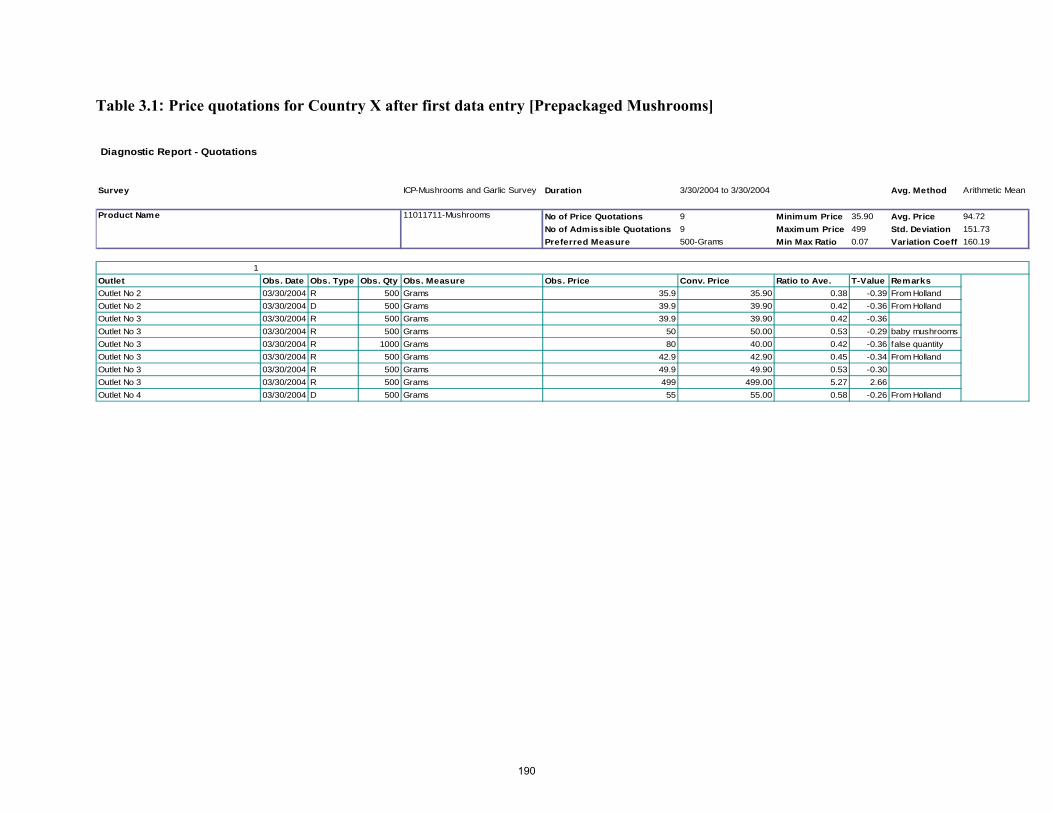
Table 3.1: Price quotations for Country X after first data entry [Prepackaged Mushrooms] Diagnostic Report - Quotations
Survey ICP-Mushrooms and Garlic Survey Duration 3/30/2004 to 3/30/2004 Avg. Method Arithmetic Mean
Product Name 11011711-Mushrooms No of Price Quotations 9 Minimum Price 35.90 Avg. Price 94.72No of Admissible Quotations 9 Maximum Price 499 Std. Deviation 151.73Preferred Measure 500-Grams Min Max Ratio 0.07 Variation Coeff 160.19
1Outlet Obs. Date Obs. Type Obs. Qty Obs. Measure Obs. Price Conv. Price Ratio to Ave. T-Value RemarksOutlet No 2 03/30/2004 R 500 Grams 35.9 35.90 0.38 -0.39 From HollandOutlet No 2 03/30/2004 D 500 Grams 39.9 39.90 0.42 -0.36 From HollandOutlet No 3 03/30/2004 R 500 Grams 39.9 39.90 0.42 -0.36Outlet No 3 03/30/2004 R 500 Grams 50 50.00 0.53 -0.29 baby mushroomsOutlet No 3 03/30/2004 R 1000 Grams 80 40.00 0.42 -0.36 false quantityOutlet No 3 03/30/2004 R 500 Grams 42.9 42.90 0.45 -0.34 From HollandOutlet No 3 03/30/2004 R 500 Grams 49.9 49.90 0.53 -0.30Outlet No 3 03/30/2004 R 500 Grams 499 499.00 5.27 2.66Outlet No 4 03/30/2004 D 500 Grams 55 55.00 0.58 -0.26 From Holland
190
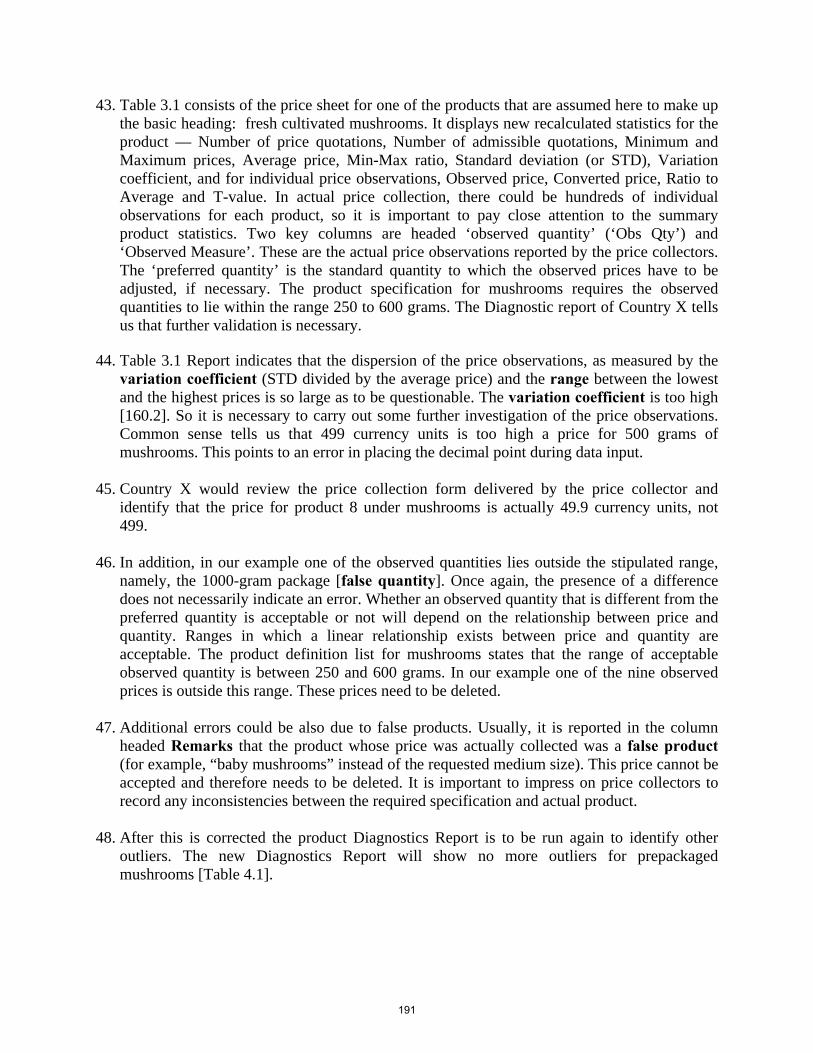
43. Table 3.1 consists of the price sheet for one of the products that are assumed here to make up the basic heading: fresh cultivated mushrooms. It displays new recalculated statistics for the product — Number of price quotations, Number of admissible quotations, Minimum and Maximum prices, Average price, Min-Max ratio, Standard deviation (or STD), Variation coefficient, and for individual price observations, Observed price, Converted price, Ratio to Average and T-value. In actual price collection, there could be hundreds of individual observations for each product, so it is important to pay close attention to the summary product statistics. Two key columns are headed ‘observed quantity’ (‘Obs Qty’) and ‘Observed Measure’. These are the actual price observations reported by the price collectors. The ‘preferred quantity’ is the standard quantity to which the observed prices have to be adjusted, if necessary. The product specification for mushrooms requires the observed quantities to lie within the range 250 to 600 grams. The Diagnostic report of Country X tells us that further validation is necessary.
44. Table 3.1 Report indicates that the dispersion of the price observations, as measured by the
variation coefficient (STD divided by the average price) and the range between the lowest and the highest prices is so large as to be questionable. The variation coefficient is too high [160.2]. So it is necessary to carry out some further investigation of the price observations. Common sense tells us that 499 currency units is too high a price for 500 grams of mushrooms. This points to an error in placing the decimal point during data input.
45. Country X would review the price collection form delivered by the price collector and
identify that the price for product 8 under mushrooms is actually 49.9 currency units, not 499.
46. In addition, in our example one of the observed quantities lies outside the stipulated range,
namely, the 1000-gram package [false quantity]. Once again, the presence of a difference does not necessarily indicate an error. Whether an observed quantity that is different from the preferred quantity is acceptable or not will depend on the relationship between price and quantity. Ranges in which a linear relationship exists between price and quantity are acceptable. The product definition list for mushrooms states that the range of acceptable observed quantity is between 250 and 600 grams. In our example one of the nine observed prices is outside this range. These prices need to be deleted.
47. Additional errors could be also due to false products. Usually, it is reported in the column
headed Remarks that the product whose price was actually collected was a false product (for example, “baby mushrooms” instead of the requested medium size). This price cannot be accepted and therefore needs to be deleted. It is important to impress on price collectors to record any inconsistencies between the required specification and actual product.
48. After this is corrected the product Diagnostics Report is to be run again to identify other
outliers. The new Diagnostics Report will show no more outliers for prepackaged mushrooms [Table 4.1].
191
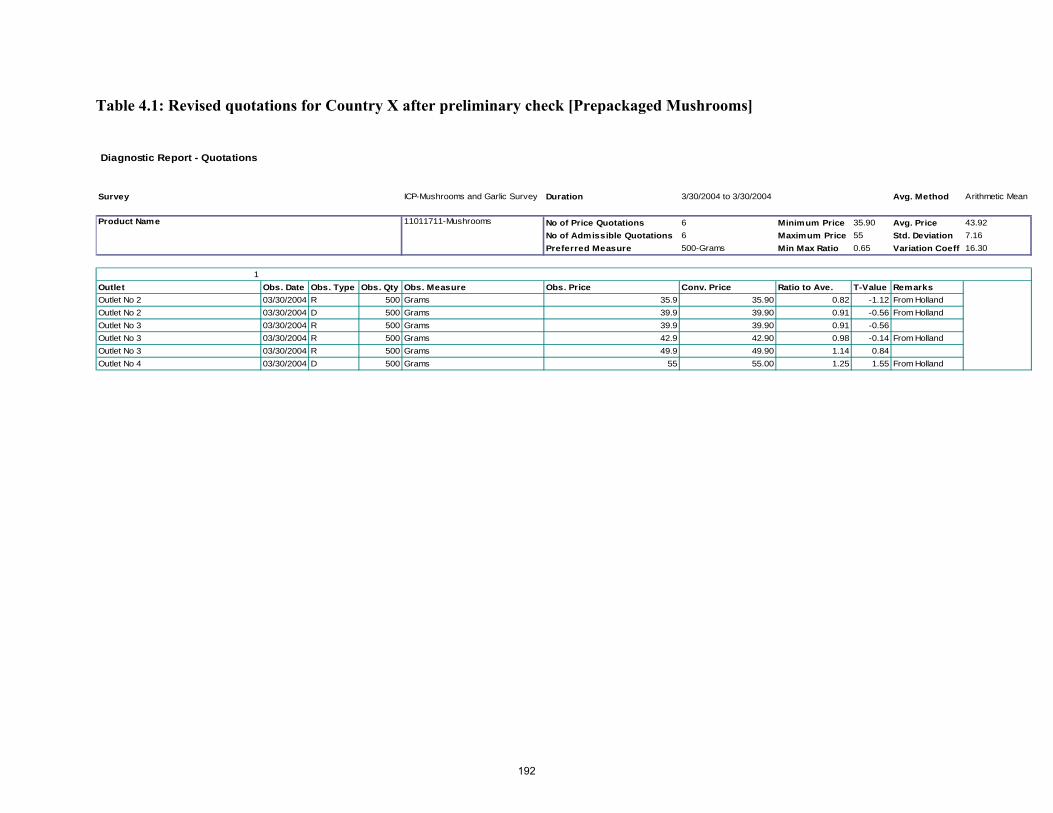
Table 4.1: Revised quotations for Country X after preliminary check [Prepackaged Mushrooms] Diagnostic Report - Quotations
Survey ICP-Mushrooms and Garlic Survey Duration 3/30/2004 to 3/30/2004 Avg. Method Arithmetic Mean
Product Name 11011711-Mushrooms No of Price Quotations 6 Minimum Price 35.90 Avg. Price 43.92No of Admissible Quotations 6 Maximum Price 55 Std. Deviation 7.16Preferred Measure 500-Grams Min Max Ratio 0.65 Variation Coeff 16.30
1Outlet Obs. Date Obs. Type Obs. Qty Obs. Measure Obs. Price Conv. Price Ratio to Ave. T-Value RemarksOutlet No 2 03/30/2004 R 500 Grams 35.9 35.90 0.82 -1.12 From HollandOutlet No 2 03/30/2004 D 500 Grams 39.9 39.90 0.91 -0.56 From HollandOutlet No 3 03/30/2004 R 500 Grams 39.9 39.90 0.91 -0.56Outlet No 3 03/30/2004 R 500 Grams 42.9 42.90 0.98 -0.14 From HollandOutlet No 3 03/30/2004 R 500 Grams 49.9 49.90 1.14 0.84Outlet No 4 03/30/2004 D 500 Grams 55 55.00 1.25 1.55 From Holland
192
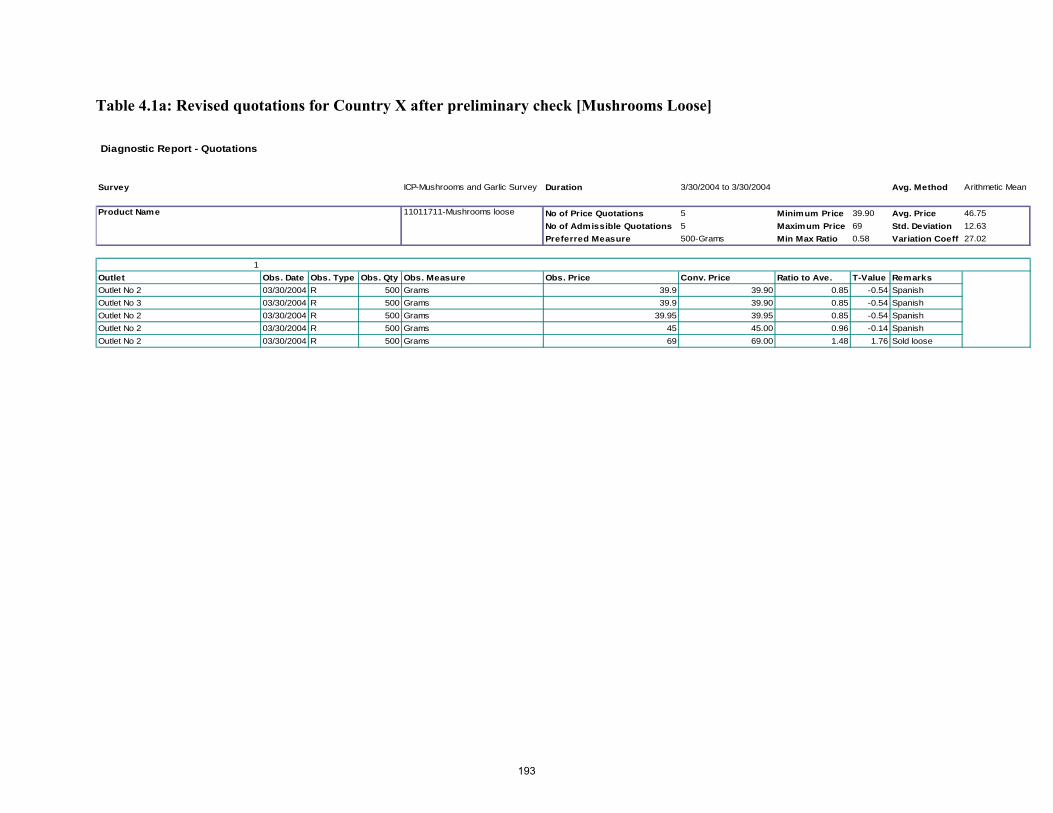
Table 4.1a: Revised quotations for Country X after preliminary check [Mushrooms Loose]
Diagnostic Report - Quotations
Survey ICP-Mushrooms and Garlic Survey Duration 3/30/2004 to 3/30/2004 Avg. Method Arithmetic Mean
Product Name 11011711-Mushrooms loose No of Price Quotations 5 Minimum Price 39.90 Avg. Price 46.75No of Admissible Quotations 5 Maximum Price 69 Std. Deviation 12.63Preferred Measure 500-Grams Min Max Ratio 0.58 Variation Coeff 27.02
1Outlet Obs. Date Obs. Type Obs. Qty Obs. Measure Obs. Price Conv. Price Ratio to Ave. T-Value RemarksOutlet No 2 03/30/2004 R 500 Grams 39.9 39.90 0.85 -0.54 SpanishOutlet No 3 03/30/2004 R 500 Grams 39.9 39.90 0.85 -0.54 SpanishOutlet No 2 03/30/2004 R 500 Grams 39.95 39.95 0.85 -0.54 SpanishOutlet No 2 03/30/2004 R 500 Grams 45 45.00 0.96 -0.14 SpanishOutlet No 2 03/30/2004 R 500 Grams 69 69.00 1.48 1.76 Sold loose
193
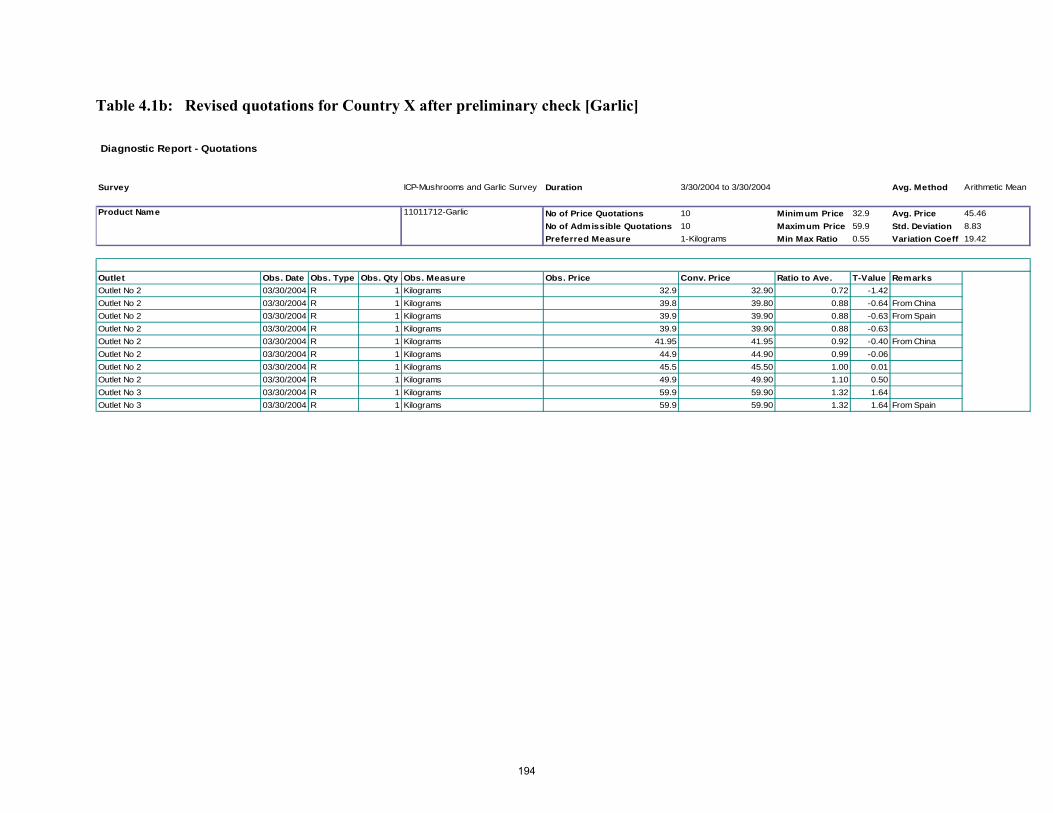
Table 4.1b: Revised quotations for Country X after preliminary check [Garlic]
Diagnostic Report - Quotations
Survey ICP-Mushrooms and Garlic Survey Duration 3/30/2004 to 3/30/2004 Avg. Method Arithmetic Mean
Product Name 11011712-Garlic No of Price Quotations 10 Minimum Price 32.9 Avg. Price 45.46No of Admissible Quotations 10 Maximum Price 59.9 Std. Deviation 8.83Preferred Measure 1-Kilograms Min Max Ratio 0.55 Variation Coeff 19.42
Outlet Obs. Date Obs. Type Obs. Qty Obs. Measure Obs. Price Conv. Price Ratio to Ave. T-Value RemarksOutlet No 2 03/30/2004 R 1 Kilograms 32.9 32.90 0.72 -1.42Outlet No 2 03/30/2004 R 1 Kilograms 39.8 39.80 0.88 -0.64 From ChinaOutlet No 2 03/30/2004 R 1 Kilograms 39.9 39.90 0.88 -0.63 From SpainOutlet No 2 03/30/2004 R 1 Kilograms 39.9 39.90 0.88 -0.63Outlet No 2 03/30/2004 R 1 Kilograms 41.95 41.95 0.92 -0.40 From ChinaOutlet No 2 03/30/2004 R 1 Kilograms 44.9 44.90 0.99 -0.06Outlet No 2 03/30/2004 R 1 Kilograms 45.5 45.50 1.00 0.01Outlet No 2 03/30/2004 R 1 Kilograms 49.9 49.90 1.10 0.50Outlet No 3 03/30/2004 R 1 Kilograms 59.9 59.90 1.32 1.64Outlet No 3 03/30/2004 R 1 Kilograms 59.9 59.90 1.32 1.64 From Spain
194
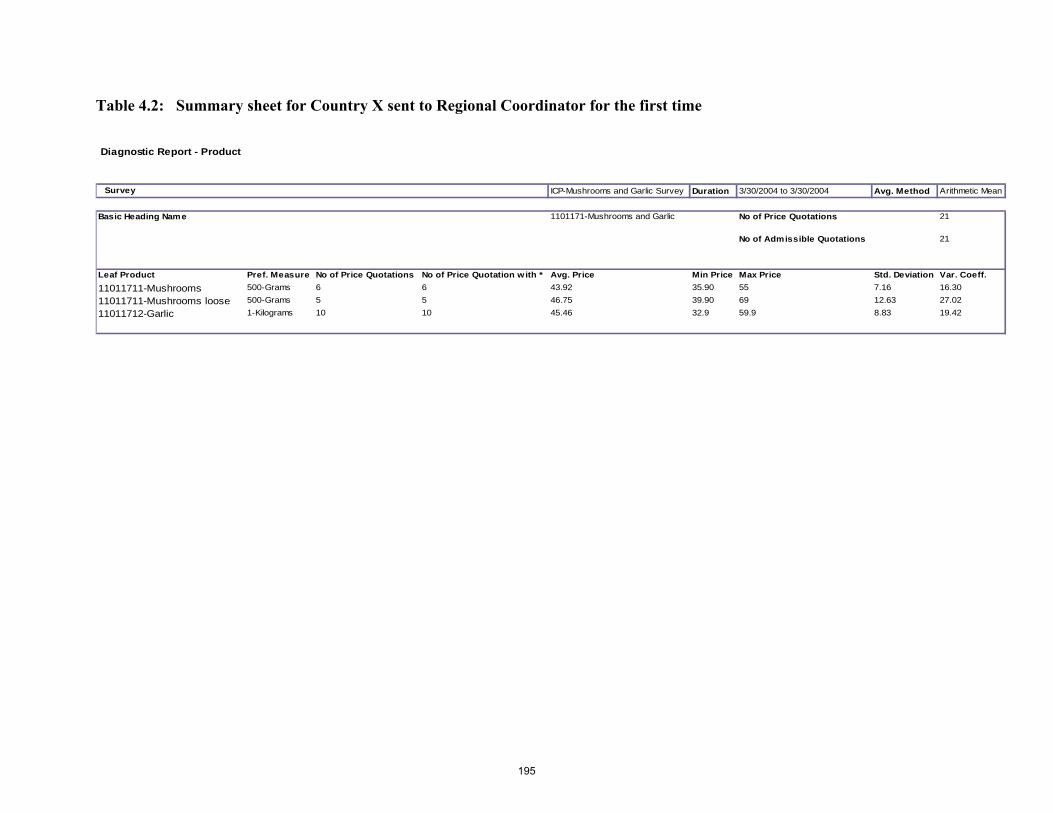
Table 4.2: Summary sheet for Country X sent to Regional Coordinator for the first time Diagnostic Report - Product
Survey ICP-Mushrooms and Garlic Survey Duration 3/30/2004 to 3/30/2004 Avg. Method Arithmetic Mean
Basic Heading Name 1101171-Mushrooms and Garlic No of Price Quotations 21
No of Admissible Quotations 21
Leaf Product Pref. Measure No of Price Quotations No of Price Quotation with * Avg. Price Min Price Max Price Std. Deviation Var. Coeff.11011711-Mushrooms 500-Grams 6 6 43.92 35.90 55 7.16 16.30
11011711-Mushrooms loose 500-Grams 5 5 46.75 39.90 69 12.63 27.02
11011712-Garlic 1-Kilograms 10 10 45.46 32.9 59.9 8.83 19.42
195
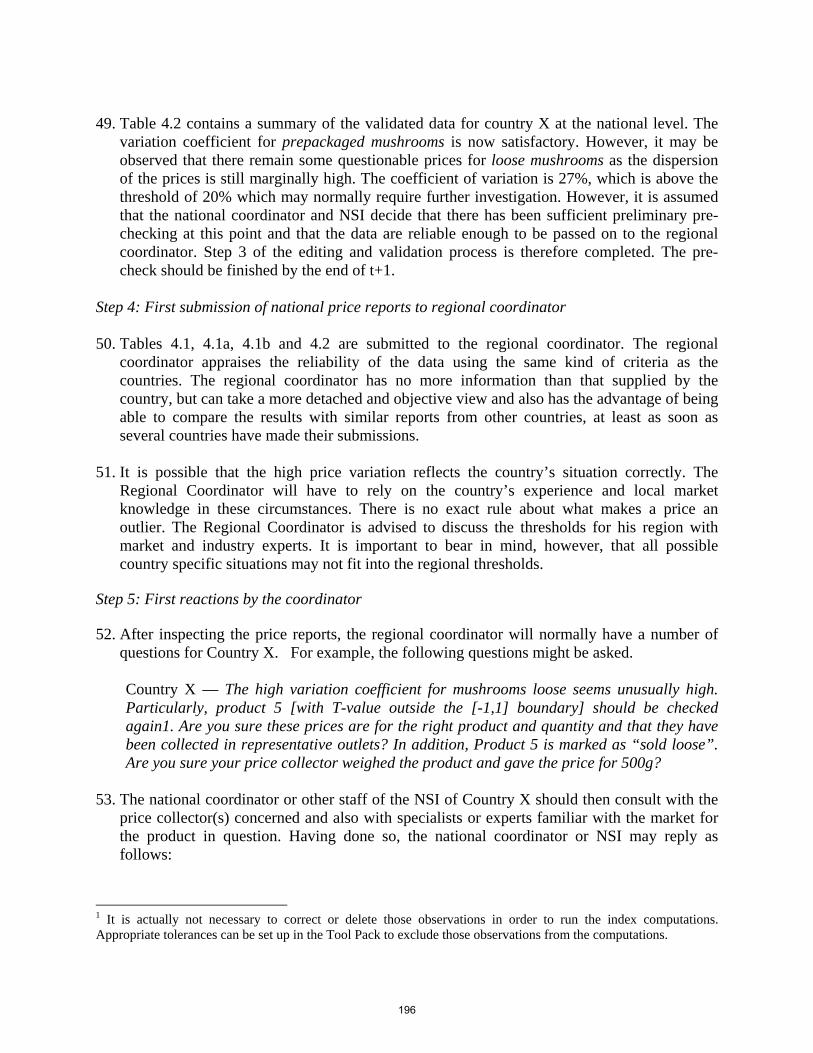
49. Table 4.2 contains a summary of the validated data for country X at the national level. The
variation coefficient for prepackaged mushrooms is now satisfactory. However, it may be observed that there remain some questionable prices for loose mushrooms as the dispersion of the prices is still marginally high. The coefficient of variation is 27%, which is above the threshold of 20% which may normally require further investigation. However, it is assumed that the national coordinator and NSI decide that there has been sufficient preliminary pre-checking at this point and that the data are reliable enough to be passed on to the regional coordinator. Step 3 of the editing and validation process is therefore completed. The pre-check should be finished by the end of t+1.
Step 4: First submission of national price reports to regional coordinator 50. Tables 4.1, 4.1a, 4.1b and 4.2 are submitted to the regional coordinator. The regional
coordinator appraises the reliability of the data using the same kind of criteria as the countries. The regional coordinator has no more information than that supplied by the country, but can take a more detached and objective view and also has the advantage of being able to compare the results with similar reports from other countries, at least as soon as several countries have made their submissions.
51. It is possible that the high price variation reflects the country’s situation correctly. The
Regional Coordinator will have to rely on the country’s experience and local market knowledge in these circumstances. There is no exact rule about what makes a price an outlier. The Regional Coordinator is advised to discuss the thresholds for his region with market and industry experts. It is important to bear in mind, however, that all possible country specific situations may not fit into the regional thresholds.
Step 5: First reactions by the coordinator 52. After inspecting the price reports, the regional coordinator will normally have a number of
questions for Country X. For example, the following questions might be asked.
Country X — The high variation coefficient for mushrooms loose seems unusually high. Particularly, product 5 [with T-value outside the [-1,1] boundary] should be checked again1. Are you sure these prices are for the right product and quantity and that they have been collected in representative outlets? In addition, Product 5 is marked as “sold loose”. Are you sure your price collector weighed the product and gave the price for 500g?
53. The national coordinator or other staff of the NSI of Country X should then consult with the
price collector(s) concerned and also with specialists or experts familiar with the market for the product in question. Having done so, the national coordinator or NSI may reply as follows:
1 It is actually not necessary to correct or delete those observations in order to run the index computations. Appropriate tolerances can be set up in the Tool Pack to exclude those observations from the computations.
196
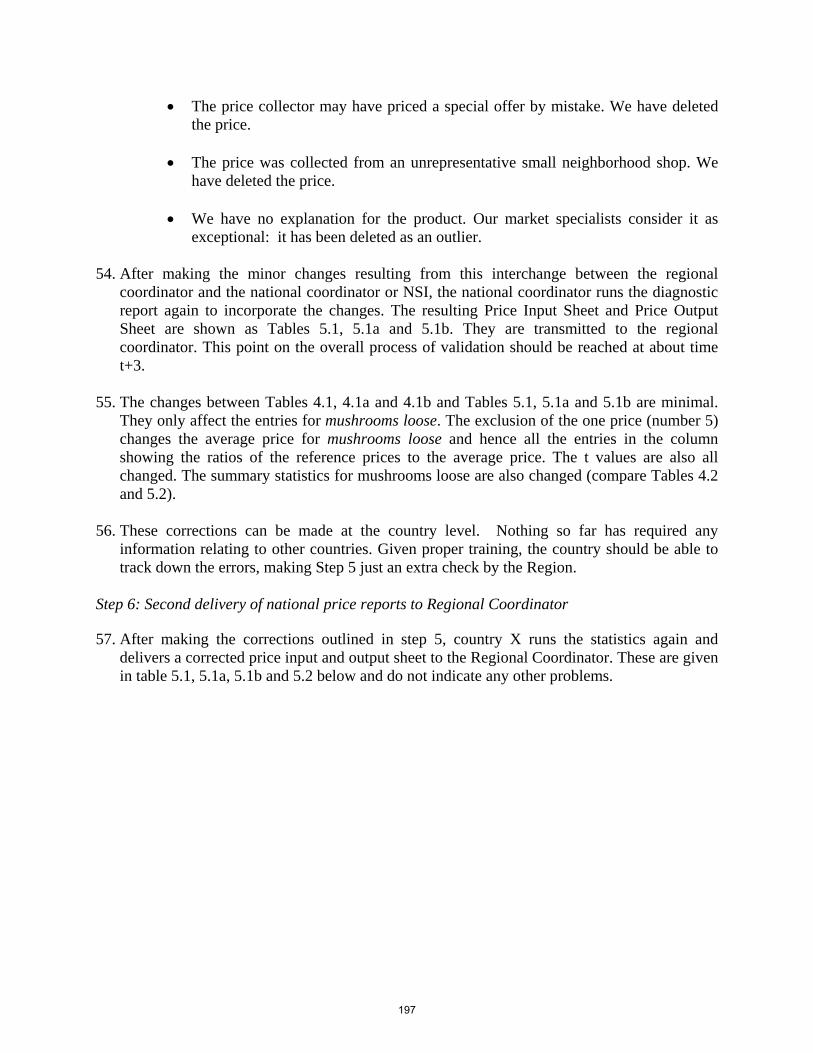
• The price collector may have priced a special offer by mistake. We have deleted the price.
• The price was collected from an unrepresentative small neighborhood shop. We
have deleted the price.
• We have no explanation for the product. Our market specialists consider it as exceptional: it has been deleted as an outlier.
54. After making the minor changes resulting from this interchange between the regional
coordinator and the national coordinator or NSI, the national coordinator runs the diagnostic report again to incorporate the changes. The resulting Price Input Sheet and Price Output Sheet are shown as Tables 5.1, 5.1a and 5.1b. They are transmitted to the regional coordinator. This point on the overall process of validation should be reached at about time t+3.
55. The changes between Tables 4.1, 4.1a and 4.1b and Tables 5.1, 5.1a and 5.1b are minimal.
They only affect the entries for mushrooms loose. The exclusion of the one price (number 5) changes the average price for mushrooms loose and hence all the entries in the column showing the ratios of the reference prices to the average price. The t values are also all changed. The summary statistics for mushrooms loose are also changed (compare Tables 4.2 and 5.2).
56. These corrections can be made at the country level. Nothing so far has required any
information relating to other countries. Given proper training, the country should be able to track down the errors, making Step 5 just an extra check by the Region.
Step 6: Second delivery of national price reports to Regional Coordinator 57. After making the corrections outlined in step 5, country X runs the statistics again and
delivers a corrected price input and output sheet to the Regional Coordinator. These are given in table 5.1, 5.1a, 5.1b and 5.2 below and do not indicate any other problems.
197
Table 5.1 Quotations for Country X after responding to Regional Coordinator’s first questions [Mushrooms Prepackaged] Diagnostic Report - Quotations
Survey ICP-Mushrooms and Garlic Survey Duration 3/30/2004 to 3/30/2004 Avg. Method Arithmetic Mean
Product Name 11011711-Mushrooms No of Price Quotations 6 Minimum Price 35.90 Avg. Price 43.92No of Admissible Quotations 6 Maximum Price 55 Std. Deviation 7.16Preferred Measure 500-Grams Min Max Ratio 0.65 Variation Coeff 16.30
1Outlet Obs. Date Obs. Type Obs. Qty Obs. Measure Obs. Price Conv. Price Ratio to Ave. T-Value RemarksOutlet No 2 03/30/2004 R 500 Grams 35.9 35.90 0.82 -1.12 From HollandOutlet No 2 03/30/2004 D 500 Grams 39.9 39.90 0.91 -0.56 From HollandOutlet No 3 03/30/2004 R 500 Grams 39.9 39.90 0.91 -0.56Outlet No 3 03/30/2004 R 500 Grams 42.9 42.90 0.98 -0.14 From HollandOutlet No 3 03/30/2004 R 500 Grams 49.9 49.90 1.14 0.84Outlet No 4 03/30/2004 D 500 Grams 55 55.00 1.25 1.55 From Holland
198
Table 5.1a: Quotations for Country X after responding to Regional Coordinator’s first questions [Mushrooms Loose]
Diagnostic Report - Quotations
Survey ICP-Mushrooms and Garlic Survey Duration 3/30/2004 to 3/30/2004 Avg. Method Arithmetic Mean
Product Name 11011711-Mushrooms loose No of Price Quotations 4 Minimum Price 39.90 Avg. Price 41.19No of Admissible Quotations 4 Maximum Price 45 Std. Deviation 2.54Preferred Measure 500-Grams Min Max Ratio 0.89 Variation Coeff 6.17
Outlet Obs. Date Obs. Type Obs. Qty Obs. Measure Obs. Price Conv. Price Ratio to Ave. T-Value RemarksOutlet No 2 03/30/2004 R 500 Grams 39.9 39.90 0.97 -0.51 SpanishOutlet No 3 03/30/2004 R 500 Grams 39.9 39.90 0.97 -0.51 SpanishOutlet No 2 03/30/2004 R 500 Grams 39.95 39.95 0.97 -0.49 SpanishOutlet No 2 03/30/2004 R 500 Grams 45 45.00 1.09 1.50 Spanish
199
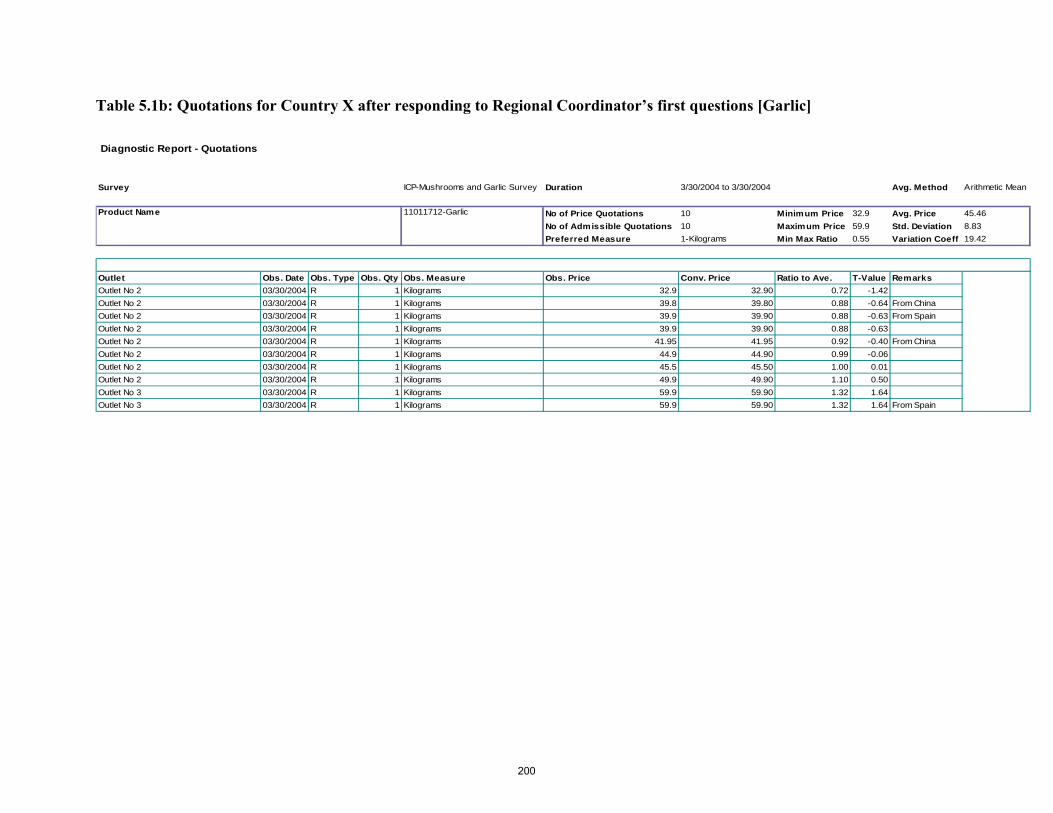
Table 5.1b: Quotations for Country X after responding to Regional Coordinator’s first questions [Garlic]
Diagnostic Report - Quotations
Survey ICP-Mushrooms and Garlic Survey Duration 3/30/2004 to 3/30/2004 Avg. Method Arithmetic Mean
Product Name 11011712-Garlic No of Price Quotations 10 Minimum Price 32.9 Avg. Price 45.46No of Admissible Quotations 10 Maximum Price 59.9 Std. Deviation 8.83Preferred Measure 1-Kilograms Min Max Ratio 0.55 Variation Coeff 19.42
Outlet Obs. Date Obs. Type Obs. Qty Obs. Measure Obs. Price Conv. Price Ratio to Ave. T-Value RemarksOutlet No 2 03/30/2004 R 1 Kilograms 32.9 32.90 0.72 -1.42Outlet No 2 03/30/2004 R 1 Kilograms 39.8 39.80 0.88 -0.64 From ChinaOutlet No 2 03/30/2004 R 1 Kilograms 39.9 39.90 0.88 -0.63 From SpainOutlet No 2 03/30/2004 R 1 Kilograms 39.9 39.90 0.88 -0.63Outlet No 2 03/30/2004 R 1 Kilograms 41.95 41.95 0.92 -0.40 From ChinaOutlet No 2 03/30/2004 R 1 Kilograms 44.9 44.90 0.99 -0.06Outlet No 2 03/30/2004 R 1 Kilograms 45.5 45.50 1.00 0.01Outlet No 2 03/30/2004 R 1 Kilograms 49.9 49.90 1.10 0.50Outlet No 3 03/30/2004 R 1 Kilograms 59.9 59.90 1.32 1.64Outlet No 3 03/30/2004 R 1 Kilograms 59.9 59.90 1.32 1.64 From Spain
200
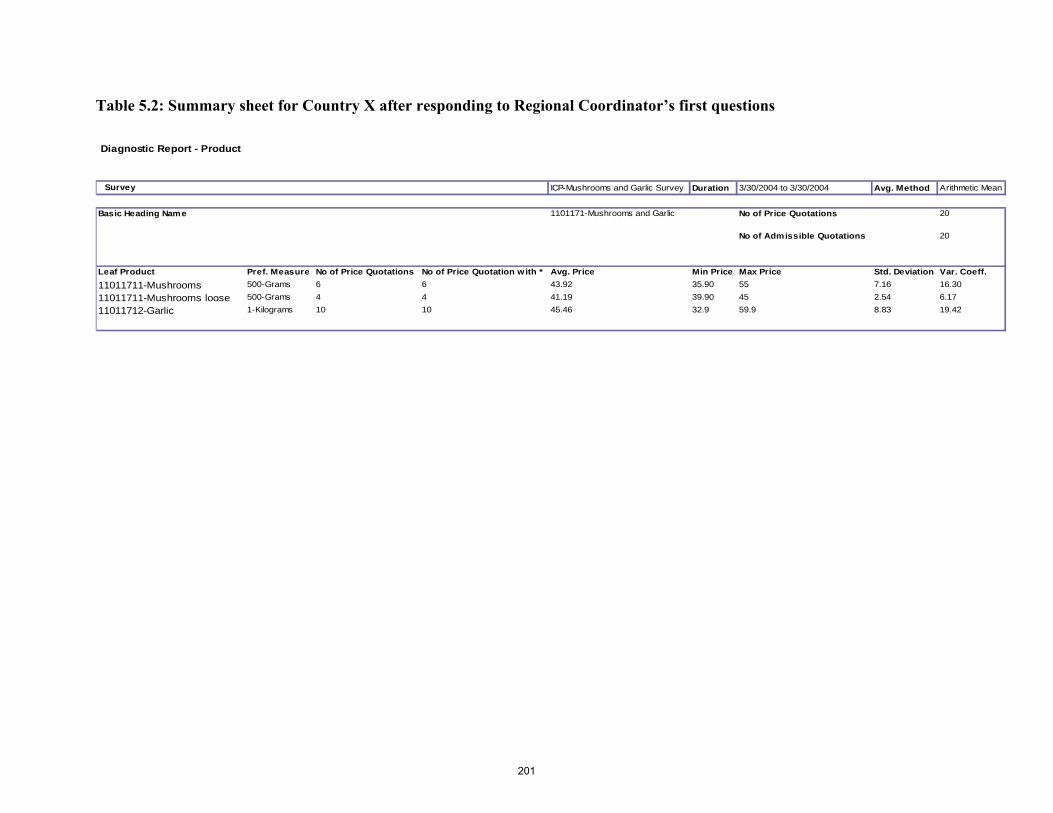
Table 5.2: Summary sheet for Country X after responding to Regional Coordinator’s first questions
Diagnostic Report - Product
Survey ICP-Mushrooms and Garlic Survey Duration 3/30/2004 to 3/30/2004 Avg. Method Arithmetic Mean
Basic Heading Name 1101171-Mushrooms and Garlic No of Price Quotations 20
No of Admissible Quotations 20
Leaf Product Pref. Measure No of Price Quotations No of Price Quotation with * Avg. Price Min Price Max Price Std. Deviation Var. Coeff.11011711-Mushrooms 500-Grams 6 6 43.92 35.90 55 7.16 16.30
11011711-Mushrooms loose 500-Grams 4 4 41.19 39.90 45 2.54 6.17
11011712-Garlic 1-Kilograms 10 10 45.46 32.9 59.9 8.83 19.42
201
The introduction of other countries 58. At the same time that Country X is working on the editing and validation of its price data,
other countries in the region should be in the process of validating their own data and inter-acting with the regional coordinator. The regional coordinator should therefore be dealing with a number of different countries simultaneously. As several countries are needed for the process of the inter-country validation, it is necessary to introduce two other countries into the example at this point. To keep the example manageable and as simple as possible, only two more countries, Y and Z, are introduced, although in practice many more could be involved.
59. It is assumed that countries Y and Z have completed Step 3 of the process described above.
They have carried out their own initial checking and validation and have reached the point at which they submit their Price Sheets to the regional coordinator for the first time. After which the regional coordinator reviewed their submissions, sent his/her comments and received replies from the countries.
Inter-country Data Validation 60. The intra-country validation could, in principle, be carried out entirely by the country itself
without the assistance or intervention of the regional coordinator, although the regional coordinator can, and should, provide a valuable second opinion about doubtful or marginal cases. In any case, the regional coordinator has to check whether the intra-country validation has been properly carried out. It is possible that some countries may do little and try to shift the burden of validation on to the regional coordinator. All the Price Input and Output Tables have to be carefully scrutinized by the regional coordinator to ensure that the editing and intra-country validation has been carried out satisfactorily. Eventually, the point is reached at which the data for each country have been validated to the maximum extent possible without taking into account the data for other countries. It then becomes possible for the regional coordinator to calculate the Quaranta and Dikhanov Tables for the first time. The inter-country validation described in the present section refers to that based on the Quaranta tables. Inter-country validation using the Dikhanov tables is described in the final section of this chapter.
Step 7: Calculation of the first regional Quaranta Tables 61. The calculation of the first Quaranta Tables may take place as soon as validated data are
ready for a sufficient number of countries. In fact, the Quaranta Tables can be run for a sub-region or a group of countries of similar development. This could be any time from period t+3 onwards. It is certainly not advisable to wait until validated data are ready for all, or even almost all, countries as the pace of the whole validation process cannot be dictated by the slowest countries. Eventually, all countries have to be included in the Quaranta Tables but the inter-country validation can be usefully started before every country has completed its intra-country validation. It follows that the Quaranta Tables themselves and associated
202
validation procedures have to go through several versions or iterations as the number of countries reporting validated data increases.
The Quaranta Tables 62. Before going into details of the inter-country validation based on the Quaranta Tables, it is
useful to give a general description of these tables. The Quaranta Tables consist of a set of tables for a basic heading, one for each product within the basic heading. However, the first table in the set is different from the rest. It is an introductory summary table containing general information relating to the basic heading as a whole such as the exchange rate, basic heading PPP and price level.
63. In the main set of tables, there is one table for each of the products within the basic heading
for which prices have been collected and used. The tables all have the same format, with the countries in the rows. The table for each product shows the average price of that product in each of the countries expressed in national currency and then converted into a selected common unit of currency using first the official exchange rate then the PPP for the basic heading. Once converted into a common currency, the average prices in different countries can be compared with each other. This enables outliers to be identified using the same kind of criteria, or thresholds, as were used in the Price Input and Output tables.
64. Whereas the purpose of the earlier intra-country validation was to screen individual prices for
possible errors using the Price Input and Output Tables, the purpose of the Quaranta Tables used for the inter-country validation is to screen the estimated national average prices for possible errors by comparing the average prices for the same product in different countries, and also by examining the dispersion of the average prices. This can only be done, of course, after they have been converted into a common unit of currency.
65. The Quaranta Tables require the PPPs for the basic heading. However, the purpose of the
Quaranta Tables is to validate the average prices that are to be used as inputs into the calculation the basic heading PPP. The Quaranta Tables have therefore to start by using provisional PPPs calculated from the unvalidated average prices. The methodology used to calculate the basic heading PPPs is described in Chapter 11. The necessary programs are incorporated in the Tool Pack, which permits a choice of formulae for calculating the PPPs.
66. In general, it is likely that some of the original unvalidated average prices will subsequently
be revised as a result of the inter-country validation process, in which case the Quaranta Tables have to be recalculated using revised PPPs based on the revised average prices. Clearly, the revisions might trigger further revisions, so that several rounds of calculation may be required. In any case, the first Quaranta Tables to be calculated may not include all the countries in the region so that the number of countries in the Tables may increase over time, thereby generating further revisions to the PPPs and average prices converted using the PPPs. The whole process is an iterative one that may go through several cycles before the inter-country validation process is concluded.
203
67. For simplicity, the Quaranta Tables used here to illustrate the inter-country validation procedures are based on only three countries and three products, the same as those used earlier for the Price Input and Output Tables. The Quaranta Tables are thus a continuation of the previous example.
The First Quaranta Tables for the Region 68. The first set of Quaranta Tables for a particular basic heading can be calculated by the
regional coordinator, by running the relevant programs in the Tool Pack, as soon as validated data have been received from a sufficiently large number of countries, say five or more. This could be any time from t+3 onwards. An illustrative set of tables is shown as Table 6. Once the meanings of the various abbreviations or acronyms used in the Tables are explained and understood, it is a straightforward matter to explain the use of the tables. Figure 1 shows the same set of tables with an explanation of the computational flows. Arithmetic operations are shown with geometric symbols.
204
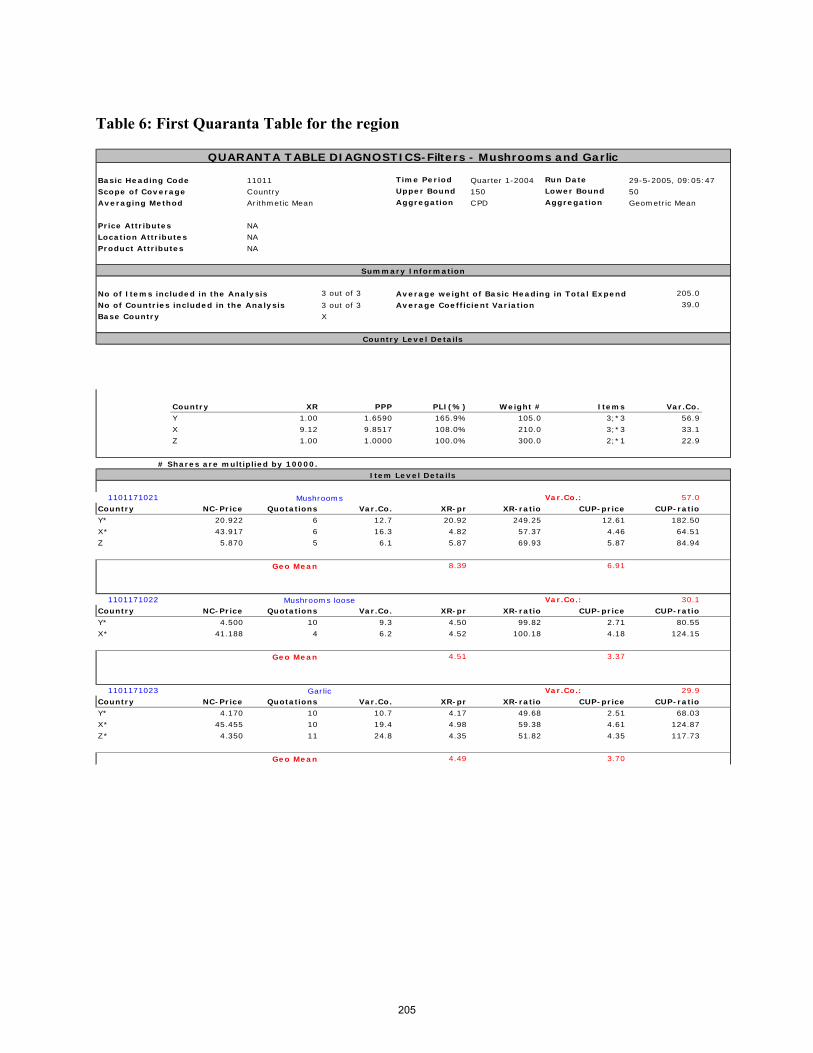
Table 6: First Quaranta Table for the region
11011 Time Period Quarter 1-2004 Run Date 29-5-2005, 09:05:47Upper Bound 150 Lower Bound 50Aggregation CPD Aggregation Geometric Mean
3 out of 3 205.0
3 out of 3 39.0
Country XR PPP PLI(%) Weight # Items Var.Co.
Y 1.00 1.6590 165.9% 105.0 3;*3 56.9
X 9.12 9.8517 108.0% 210.0 3;*3 33.1
Z 1.00 1.0000 100.0% 300.0 2;*1 22.9
1101171021 Var.Co.: 57.0
Country NC-Price Quotations Var.Co. XR-pr XR-ratio CUP-price CUP-ratio
Y* 20.922 6 12.7 20.92 249.25 12.61 182.50
X* 43.917 6 16.3 4.82 57.37 4.46 64.51
Z 5.870 5 6.1 5.87 69.93 5.87 84.94
8.39 6.91
1101171022 Var.Co.: 30.1
Country NC-Price Quotations Var.Co. XR-pr XR-ratio CUP-price CUP-ratio
Y* 4.500 10 9.3 4.50 99.82 2.71 80.55
X* 41.188 4 6.2 4.52 100.18 4.18 124.15
4.51 3.37
1101171023 Var.Co.: 29.9
Country NC-Price Quotations Var.Co. XR-pr XR-ratio CUP-price CUP-ratio
Y* 4.170 10 10.7 4.17 49.68 2.51 68.03
X* 45.455 10 19.4 4.98 59.38 4.61 124.87
Z* 4.350 11 24.8 4.35 51.82 4.35 117.73
4.49 3.70
Garlic
Geo Mean
Geo Mean
Mushrooms loose
Geo Mean
# Shares are multiplied by 10000.
Item Level Details
Mushrooms
Country Level Details
No of Countries included in the Analysis Average Coefficient Variation
Base Country X
Summary Information
No of Items included in the Analysis Average weight of Basic Heading in Total Expend
Location Attributes NA
Product Attributes NA
Averaging Method Arithmetic Mean
Price Attributes NA
QUARANTA TABLE DIAGNOSTICS-Filters - Mushrooms and Garlic
Basic Heading Code
Scope of Coverage Country
205
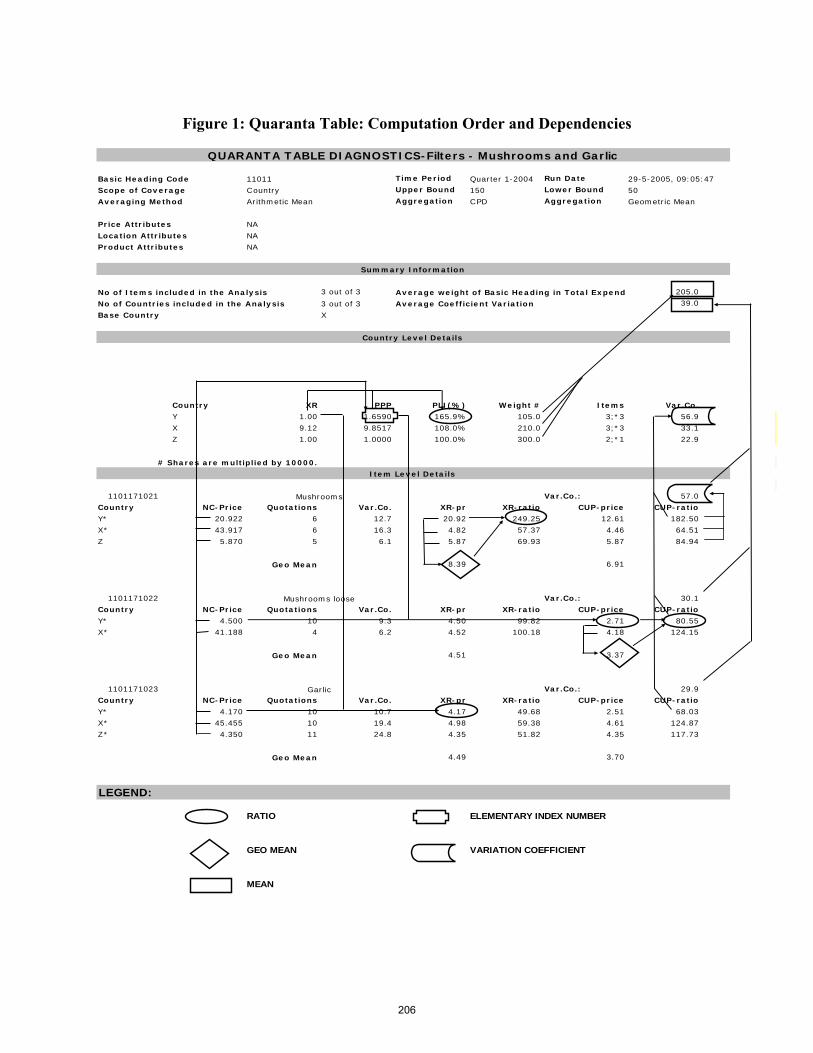
Figure 1: Quaranta Table: Computation Order and Dependencies
11011 Time Period Quarter 1-2004 Run Date 29-5-2005, 09:05:47Upper Bound 150 Lower Bound 50Aggregation CPD Aggregation Geometric Mean
3 out of 3 205.0
3 out of 3 39.0
Country XR PPP PLI(%) Weight # Items Var.Co.
Y 1.00 1.6590 165.9% 105.0 3;*3 56.9
X 9.12 9.8517 108.0% 210.0 3;*3 33.1
Z 1.00 1.0000 100.0% 300.0 2;*1 22.9
1101171021 Var.Co.: 57.0
Country NC-Price Quotations Var.Co. XR-pr XR-ratio CUP-price CUP-ratio
Y* 20.922 6 12.7 20.92 249.25 12.61 182.50
X* 43.917 6 16.3 4.82 57.37 4.46 64.51
Z 5.870 5 6.1 5.87 69.93 5.87 84.94
8.39 6.91
1101171022 Var.Co.: 30.1
Country NC-Price Quotations Var.Co. XR-pr XR-ratio CUP-price CUP-ratio
Y* 4.500 10 9.3 4.50 99.82 2.71 80.55
X* 41.188 4 6.2 4.52 100.18 4.18 124.15
4.51 3.37
1101171023 Var.Co.: 29.9
Country NC-Price Quotations Var.Co. XR-pr XR-ratio CUP-price CUP-ratio
Y* 4.170 10 10.7 4.17 49.68 2.51 68.03
X* 45.455 10 19.4 4.98 59.38 4.61 124.87
Z* 4.350 11 24.8 4.35 51.82 4.35 117.73
4.49 3.70
LEGEND:
RATIO ELEMENTARY INDEX NUMBER
GEO MEAN VARIATION COEFFICIENT
MEAN
QUARANTA TABLE DIAGNOSTICS-Filters - Mushrooms and Garlic
Basic Heading Code
Scope of Coverage Country
Averaging Method Arithmetic Mean
Price Attributes NA
Location Attributes NA
Product Attributes NA
Summary Information
No of Items included in the Analysis Average weight of Basic Heading in Total Expend
No of Countries included in the Analysis Average Coefficient Variation
Base Country X
Country Level Details
# Shares are multiplied by 10000.
Item Level Details
Mushrooms
Garlic
Geo Mean
Geo Mean
Mushrooms loose
Geo Mean
206
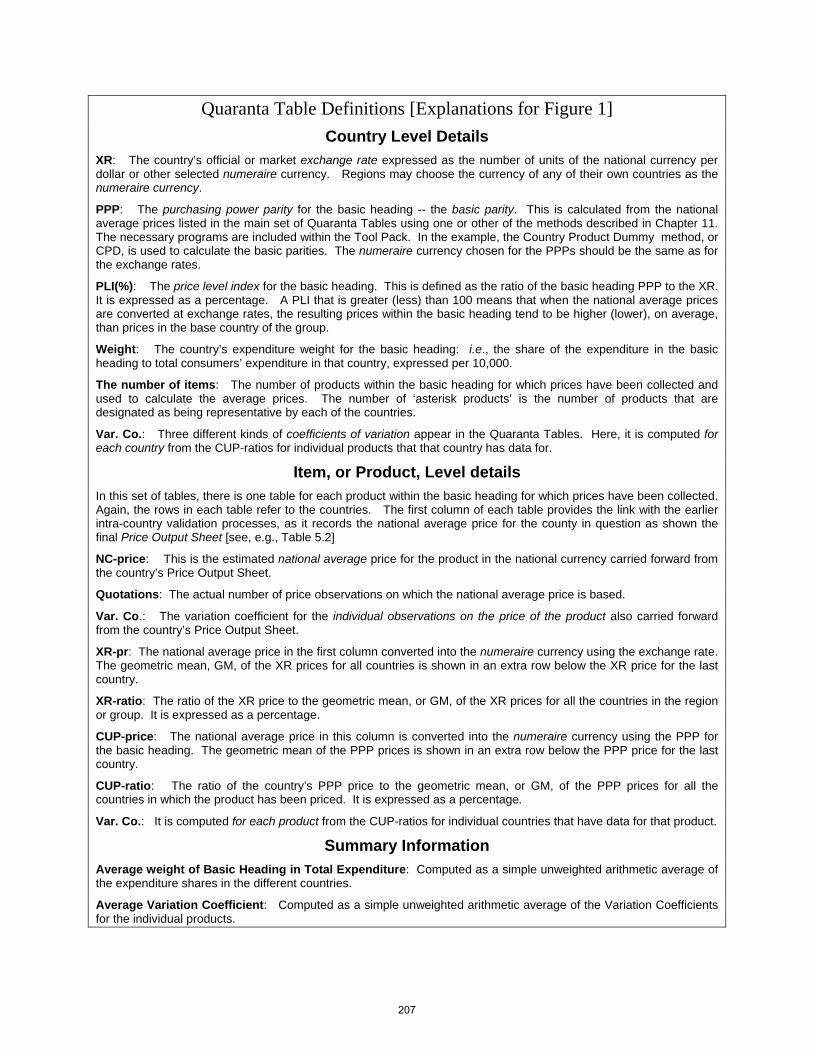
Quaranta Table Definitions [Explanations for Figure 1] Country Level Details
XR: The country’s official or market exchange rate expressed as the number of units of the national currency per dollar or other selected numeraire currency. Regions may choose the currency of any of their own countries as the numeraire currency.
PPP: The purchasing power parity for the basic heading -- the basic parity. This is calculated from the national average prices listed in the main set of Quaranta Tables using one or other of the methods described in Chapter 11. The necessary programs are included within the Tool Pack. In the example, the Country Product Dummy method, or CPD, is used to calculate the basic parities. The numeraire currency chosen for the PPPs should be the same as for the exchange rates.
PLI(%): The price level index for the basic heading. This is defined as the ratio of the basic heading PPP to the XR. It is expressed as a percentage. A PLI that is greater (less) than 100 means that when the national average prices are converted at exchange rates, the resulting prices within the basic heading tend to be higher (lower), on average, than prices in the base country of the group.
Weight: The country’s expenditure weight for the basic heading: i.e., the share of the expenditure in the basic heading to total consumers’ expenditure in that country, expressed per 10,000.
The number of items: The number of products within the basic heading for which prices have been collected and used to calculate the average prices. The number of ‘asterisk products’ is the number of products that are designated as being representative by each of the countries.
Var. Co.: Three different kinds of coefficients of variation appear in the Quaranta Tables. Here, it is computed for each country from the CUP-ratios for individual products that that country has data for.
Item, or Product, Level details In this set of tables, there is one table for each product within the basic heading for which prices have been collected. Again, the rows in each table refer to the countries. The first column of each table provides the link with the earlier intra-country validation processes, as it records the national average price for the county in question as shown the final Price Output Sheet [see, e.g., Table 5.2]
NC-price: This is the estimated national average price for the product in the national currency carried forward from the country’s Price Output Sheet.
Quotations: The actual number of price observations on which the national average price is based.
Var. Co.: The variation coefficient for the individual observations on the price of the product also carried forward from the country’s Price Output Sheet.
XR-pr: The national average price in the first column converted into the numeraire currency using the exchange rate. The geometric mean, GM, of the XR prices for all countries is shown in an extra row below the XR price for the last country.
XR-ratio: The ratio of the XR price to the geometric mean, or GM, of the XR prices for all the countries in the region or group. It is expressed as a percentage.
CUP-price: The national average price in this column is converted into the numeraire currency using the PPP for the basic heading. The geometric mean of the PPP prices is shown in an extra row below the PPP price for the last country.
CUP-ratio: The ratio of the country’s PPP price to the geometric mean, or GM, of the PPP prices for all the countries in which the product has been priced. It is expressed as a percentage.
Var. Co.: It is computed for each product from the CUP-ratios for individual countries that have data for that product.
Summary Information Average weight of Basic Heading in Total Expenditure: Computed as a simple unweighted arithmetic average of the expenditure shares in the different countries.
Average Variation Coefficient: Computed as a simple unweighted arithmetic average of the Variation Coefficients for the individual products.
207
Use of XR and PPP Price Ratios 69. The XR and the PPP price ratios provide valuable information for screening the national
average prices. Each of these ratios refers to a particular product in a particular country. A high (low) XR or PPP ratio means that the national average price for the product in question is high (low) compared with the prices of the same product in other countries when they are all converted into the common numeraire currency using the XR or basic heading PP. Using the same logic as that underlying the screening of individual price observations within a country, there comes a point at which the XR or PPP price is so high or low as to raise the question whether the price may be erroneous. Experience suggests that appropriate thresholds for the individual XR or PPP price ratios are 50 and 150. These recommended thresholds are shown at the top of the summary Quaranta Table.
70. An XR price ratio that lies outside these limits may signal a questionable observation.
However, it must be remembered that the principal reason for calculating PPPs is the fact that when the prices of a given product are converted into a common currency unit using exchange rates, they are not in fact equal in all countries. The general level of prices tends to be systematically higher or lower in some countries than others. Thus, a high or low XR price for an individual product in one country may be largely due to the fact that the general price level for that country is high or low when exchange rates are used. It may not signal any abnormality in that particular price. For this reason, XR price ratios are less useful than PPP price ratios for validation purposes.
71. On the other hand, PPPs are the rates of currency conversion that are designed to equalize
price levels for the products covered. The PPPs for a basic heading such as ‘fresh or chilled vegetables other than potatoes’ are the rates of currency conversion that should enable a given amount of currency to purchase the same basket of vegetables in all countries. Thus, if the patterns of relative prices for the different products within the basic heading were to be similar in different countries, the PPP prices for the same product in different countries would tend to be bunched together and the PPP price ratios (i.e., the ratios of the individual PPP prices to the geometric mean of the PPP prices for all the countries) would cluster around 100. There would be little dispersion between countries in either the PPP prices or the PPP price ratios derived from them2.
72. Conversely, a high level of dispersion in the PPP prices of the PPP price ratios for the same
product in different countries implies that the relative price of the product tends to vary a lot from country to country. This could happen, but on the other hand it might signal the fact that one or more of the PPP prices is wrong. Thus, the dispersion in the PPP prices or price ratios for the same product in different countries becomes a key indicator for purposes of inter-country validation. It can be measured by calculating the variation coefficients for the PPP prices or the PPP price ratios. In this particular case, it does not matter which is used as the PPP prices and PPP ratios for the same product in different countries differ only by a scalar.
2 As already explained in Chapter 4, the PPP price ratios are essentially measures of the relative prices of products in different countries. A PPP price ratio is described as a relative product PPP, or simply a relative PPP, in Chapter 4.
208
The PPP price ratios are derived by dividing the PPP prices by a constant, their geometric mean. As the variation coefficient (i.e., the standard deviation divided by the arithmetic mean) is essentially a measure of relative dispersion, it is the same for vectors of observations that differ only by a scalar.
73. It may be concluded that if the variation coefficient for the PPP prices or price ratios for the
same product in different countries exceeds some pre-determined threshold, fixed at 33% for ICP purposes, the national average prices for that product become questionable and require further investigation. At this point, it is convenient to bring into consideration all the coefficients of variation recorded in the Quaranta Tables.
Variation Coefficients in Quaranta Tables 74. There are three different kinds of variation coefficients recorded in the Quaranta Tables.
Those shown in the third column of the product tables are the coefficients for the individual price observations on which each national average price is based. They are taken directly from the Price Output Tables. They provide useful background information but do not require further comment in this context.
75. The second type of variation coefficient is that just discussed in the previous section. It is a
product variation coefficient as it measures the relative dispersion of the PPP prices, or alternatively, the PPP price ratios, for the same product in different countries. Consider, for example, the first product in the Table 6, mushrooms prepackaged. Their PPP ratios (CUP-ratios) are as follows:-
Country Y 183 Country X 65 Country Z 85
76. The resulting variation coefficient is 57 and it is shown in the heading above the table for mushrooms prepackaged in Table 6. As noted above, the same coefficient is obtained for the three PPP prices, 12.6, 4.5 and 5.9, as the vector of PPP price ratios differs from the vector of PPP prices only by a scalar.
77. The product variation coefficient is a useful screening device. With an upper threshold of
33.0, a coefficient of 57 for mushrooms prepackaged clearly requires further investigation. It is clearly overpriced in country Y [CUP-ratio is 183]. This could conceivably be an economic fact, or it could flag that something is wrong with the data. Prima facie, it seems implausible for a product like mushrooms. In general, patterns of relative prices are unlikely to differ so much between countries in the same region, so that a high product coefficient of variation is likely to signal a possible error.
78. This product variation coefficient for three products in the Quaranta Table (Table 6) is as
follows. Pre-packed mushrooms 57 Loose mushrooms 30 Garlic 30
209
----------------------------------------- Average 39
79. The average provides a useful measure of the relative dispersion of the PPP prices, or PPP price ratios, in the basic heading as a whole. It is shown in the Quaranta Table (Table 6), in the heading of the first summary table. A figure as high as 39 suggests that some of the PPP prices and price ratios in the basic heading may be suspect. When one of the product variation coefficients is very high, as in the case of prepackaged mushrooms here, those for the other products are also likely to be high.
80. A third type of variation coefficient is a country variation coefficient. It measures the
dispersion in the PPP price ratios for the different products within a single country. For example, the PPP price ratios for country Y in Table 6 are as follows:-
Pre-packed mushrooms 183 Loose mushrooms 81 Garlic 68
The resulting country coefficient of variation is 57 and it is shown in the row for country Y in the summary Quaranta Table.
81. The country variation coefficients are based on exactly the same set of PPP price ratios for
the basic heading as a whole as were used above to calculate the product variation coefficients. Thus, they are unlikely to convey much general information over and above what has been deduced already. The difference is one of focus. Assuming that there are some errors in the underlying national average prices on which the whole analysis is based, focusing on countries rather than products may help to detect which countries’ data may be suspect. Looking at the country variation coefficients in the summary table, it can be seen that the coefficient for country Y is about twice the size of the coefficients for countries X and Z. This suggests that country Y’s pattern of relative prices is well out of line with the pattern in the other two countries.
82. In the case of the country coefficients of variation, it does make a difference whether the PPP
prices or the PPP price ratios are used. The reason is the vector of PPP price ratios for different products is not a scalar multiple of the vector of PPP prices. The PPP price for each product is divided by a different geometric mean price in order to obtain the PPP price ratio. As all the diagnostic tests proposed here ultimately depend on the degree of similarity or dissimilarity in the observed patterns of relative prices in the various countries, it is more convenient to work with the PPP price ratios throughout.
83. Another indication of a problem is a very high PLI for country Y – 166%. It signals that one
or more products of that country are overpriced. Steps 8 to 10: The distribution of the first Quaranta Tables and the action of the regional coordinator 84. Assuming the regional coordinator is confronted with the data in Table 6, what action should
be taken? Inspection of the coefficients of variation in the Quaranta Tables indicates that
210
there appear to be errors in the underlying data. However, the regional coordinator must scrutinize the individual data and not merely summary statistics in the form of variation coefficients. Inspection of the individual PPP prices and price ratios immediately shows that the price of mushrooms prepackaged is apparently extremely high in country Y, with a CUP-ratio of 183. The regional coordinator has therefore to establish definitely one way or the other whether this does reflect a major abnormality in the pattern of relative prices in country Y or whether there is a mistake.
85. The regional coordinator should first refer back to the price input and output sheets for
country Y. The regional coordinator did not find anything wrong with the data and accepted the price [variance coefficient of 13%]. However, once the data for other countries are introduced, the average price for prepackaged mushrooms in country Y begins to look extremely unlikely and implausible, as the product appears to be about almost three times as expensive in Y as in the other two countries.
86. It must be repeated that inter-country validation is by no means the sole responsibility of the
regional coordinator. On the contrary it is a collective responsibility to be shared between all the national coordinators and NSIs and the regional coordinator. Inter-country validation should be carried out by the countries in parallel with, as well as in collaboration with, the regional coordinator. Countries receive the Quaranta Tables and should make their own judgments in order to assist and reinforce the work of the regional coordinator.
87. Thus, while in this example, the regional coordinator may have some special questions to
take up with Country Y, there is no reason to delay the distribution of the Quaranta Tables to all of the countries to obtain their reactions. The regional coordinator therefore distributes the first Quaranta Tables to all the countries, but with the following specific question addressed to Country Y.
88. Country Y: Your exchange rate and PPP converted prices for prepackaged mushrooms in the
first Quaranta Tables are both extremely high, even though you reported earlier that there did not appear to be any problems. Would you please check them carefully again? Are you certain that the prices forwarded refer to the product specified?
89. Country Y then goes back to check the price sheets delivered by the price collectors and the
prices entered on the price input sheets. This check reveals that a mistake has indeed been made. Instead of 500 grams, all prices were collected for 2-kilogram packages. Similar errors could happen due to misspecification, recording wrong product, errors in UOM or errors in product description.
90. This example is designed to highlight the differences between intra- and inter-country
validations. The mistake in the prepackaged mushrooms remained undetected during the intra-country validation precisely because it was made consistently and systematically. The entire set of prices reported was internally consistent and did not display any significant abnormalities or irregularities. No outliers emerged during the country’s own checking process. The fact the entire set were wrong could not be detected by the kind of mechanical internal consistency checks employed during the intra-country validation process.
211
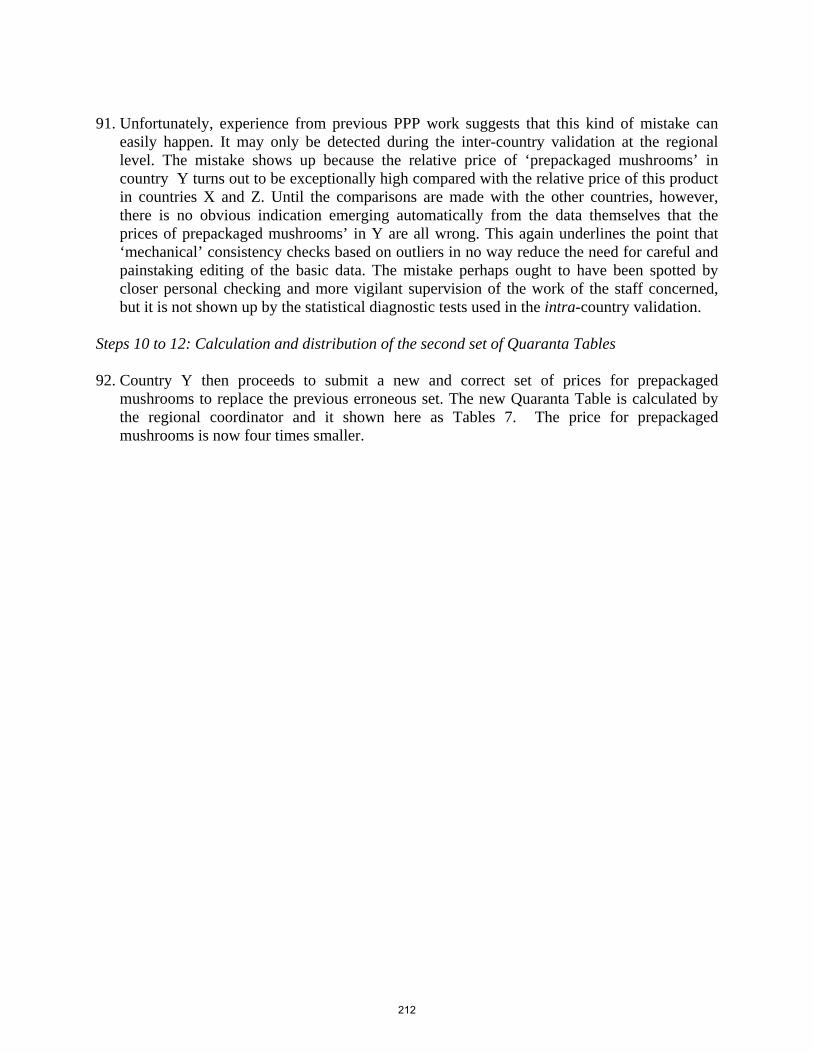
91. Unfortunately, experience from previous PPP work suggests that this kind of mistake can
easily happen. It may only be detected during the inter-country validation at the regional level. The mistake shows up because the relative price of ‘prepackaged mushrooms’ in country Y turns out to be exceptionally high compared with the relative price of this product in countries X and Z. Until the comparisons are made with the other countries, however, there is no obvious indication emerging automatically from the data themselves that the prices of prepackaged mushrooms’ in Y are all wrong. This again underlines the point that ‘mechanical’ consistency checks based on outliers in no way reduce the need for careful and painstaking editing of the basic data. The mistake perhaps ought to have been spotted by closer personal checking and more vigilant supervision of the work of the staff concerned, but it is not shown up by the statistical diagnostic tests used in the intra-country validation.
Steps 10 to 12: Calculation and distribution of the second set of Quaranta Tables 92. Country Y then proceeds to submit a new and correct set of prices for prepackaged
mushrooms to replace the previous erroneous set. The new Quaranta Table is calculated by the regional coordinator and it shown here as Tables 7. The price for prepackaged mushrooms is now four times smaller.
212
Table 7: The second Quaranta Tables for the region
11011 Time Period Quarter 1-2004 Run Date 29-5-2005, 09:05:47Upper Bound 150 Lower Bound 50Aggregation CPD Aggregation Geometric Mean
3 out of 3 205.0
3 out of 3 6.6
Country XR PPP PLI(%) Weight # Items Var.Co.
Y 1.00 0.9310 93.1% 105.0 3;*3 3.3
X 9.12 8.7768 96.2% 210.0 3;*3 10.1
Z 1.00 1.0000 100.0% 300.0 2;*1 9.6
1101171021 Var.Co.: 8.1
Country NC-Price Quotations Var.Co. XR-pr XR-ratio CUP-price CUP-ratio
Y* 5.230 8 12.7 5.23 98.91 5.62 102.42
X* 43.917 6 16.3 4.82 91.07 5.00 91.23
Z 5.870 5 6.1 5.87 111.01 5.87 107.02
5.29 5.48
1101171022 Var.Co.: 2.1
Country NC-Price Quotations Var.Co. XR-pr XR-ratio CUP-price CUP-ratio
Y* 4.500 10 9.3 4.50 99.82 4.83 101.49
X* 41.188 4 6.2 4.52 100.18 4.69 98.53
4.51 4.76
1101171023 Var.Co.: 9.6
Country NC-Price Quotations Var.Co. XR-pr XR-ratio CUP-price CUP-ratio
Y* 4.170 10 10.7 4.17 78.86 4.48 96.21
X* 45.455 10 19.4 4.98 94.26 5.18 111.24
Z* 4.350 11 24.8 4.35 82.27 4.35 93.44
4.49 4.66
QUARANTA TABLE DIAGNOSTICS-Filters - Mushrooms and Garlic
Basic Heading Code
Scope of Coverage Country
Averaging Method Arithmetic Mean
Price Attributes NA
Location Attributes NA
Product Attributes NA
Summary Information
No of Items included in the Analysis Average weight of Basic Heading in Total Expend
No of Countries included in the Analysis Average Coefficient Variation
Base Country X
Country Level Details
# Shares are multiplied by 10000.
Item Level Details
Mushrooms
Garlic
Geo Mean
Geo Mean
Mushrooms loose
Geo Mean
93. Comparing the first and second sets of Quaranta Tables it can be seen that the correction of
the prepackaged mushrooms prices has a substantial effect not only on the data for Country Y and for prepackaged mushrooms but also on the PPP prices for the other two countries and products. This illustrates the high degree of inter-dependency of PPP results. All three basic heading PPPs are radically revised as a result of major change in Country Y’s mushroom prices, especially the PPPs for countries X and Y. These changes affect the inter-country relativities of the PPP price ratios for all three products. It is to be expected that the relative sizes of the PPP price ratios for countries X, Y and Z for ‘prepackaged mushrooms’ would be
213
substantially revised, but it can be seen by comparing Tables 6 and 7 that the relative sizes of the PPP price ratios for loose mushrooms and garlic are also changed significantly. Thus, errors in the price of prepackaged mushrooms for country Y introduce substantial distortions affecting all the PPP price ratios.
94. The revision of Y’s prepackaged mushrooms price has a dramatic effect on both the product
and the country variation coefficients for the PPP ratios. Instead of variation coefficients ranging between 23 and 57, all six of the variation coefficients fall within the range 2 to 10. After the revision, all the coefficients are sending the message that the data are very well behaved whereas previously they were collectively signaling a major error somewhere. Confronted with Table 7, both the regional coordinator and the countries would be justified in accepting the data and signing off from the validation process.
95. The numerical example, although based on real data, may be regarded as extreme. However,
there are some important lessons to be learned from it. As already noted it provides a vivid illustration of the inter-dependency of PPP results and the sensitivity of all the results to major errors. Countries must realize that errors in other countries’ data can distort their own PPPs. Inter-country validation is a collective process and responsibility for all the countries and is not something that can be devolved entirely on to the regional coordinator.
Steps 13 onwards 96. In practice, there may have to be more than two versions of the Quaranta Tables. First, all the
doubtful cases and queries are unlikely to be completely resolved by a single revision. The regional coordinator may have to re-circulate the Tables several times over a period two or three months. National coordinators or NSIs may have to refer back to check their Price Input and Output Sheets several times.
97. Another reason for having to distribute the Quaranta Tables several times is that the first set
of tables is unlikely to be based on all of the countries. As countries who report their Price Input and Output Sheets late are added, all the PPPs have to be revised and hence all the PPP prices and price ratios in the Quaranta Tables are revised in consequence.
• When the later countries eventually submit their data, the inter-country validation
process may throw up errors in the data they report. In this case, the Quaranta Tables have to be revised and re-circulated.
• Less obviously, when the set of countries is expanded, the additional data may throw up errors in the data for the countries whose data have already been validated. In this case, further investigations may be necessary leading to further revisions in the data.
98. Thus, the whole process of inter-country validation is an iterative one that may have to go
through several rounds before the entire set of national average prices submitted by the countries is regarded as acceptable to the regional coordinator and the countries. The process eventually ends in a meeting of all the countries with the regional coordinator convened for the purpose of finalizing the national average prices. During the meeting any country may query any price in any other country. By the end of the meeting, collective agreement should
214
be reached on the prices to be used to calculate the final PPPs. Assuming all countries in the region collect prices at the same time, the final meeting should take place about six months after the price collection. It requires careful planning and the active cooperation of countries to meet this deadline. The timetable for the whole validation process was given in Table 1 earlier.
Dikhanov Tables
1. A second and complementary form of inter-country validation uses Dikhanov Tables.
Whereas the Quaranta Table is intended to serve as a diagnostic tool for prices at the basic heading level, the Dikhanov Table is geared toward an analysis of the whole tableau of price data in a compact form. Dikhanov Tables, like Quaranta Tables, are included in the ICP Tool Pack. Both sets of tables use a similar approach and start off with similar concepts: studying product price deviations for each country in a two-dimensional space: that of products and countries3.
2. Even though both types of table show measures of price variations by product and
country, the Quaranta Table is limited to the basic heading level in its analysis4, whereas the Dikhanov Table can be processed at any level from total GDP down to the basic heading. The Dikhanov Table can also be processed for intermediate aggregates, such as goods, services etc.). Whereas the Quaranta Table shows some additional information about product prices within a basic heading, such as the number of quotations, the price variance and average prices, as well as the exchange-rate ratios5 (see Table 6 or Figure 1 in the previous section); the Dikhanov Table adds an emphasis on the between basic heading validation, adding facilities to detect anomalies across both countries and basic headings.
3. In the Quaranta Tables PPPs are computed using one of the four methods described in Chapter 11: EKS, EKS-*, CPD or CPRD. However, in the Dikhanov Table, only the
3 In the Quaranta Table, the methodology in summarizing product price deviations does not exactly correspond to the one in the country dimension (see Figure 1, the average CV at the basic heading level presented in the Summary Information section is calculated as a simple average of the CVs for individual products). The Dikhanov table is consistent in this respect using the same principles in computing standard errors by row (product level) and by column (country level). 4 This is the case for the Quaranta tables described in the previous sectioin and included in the ICP Tool Pack. It is possible, however, to extend the Quaranta table to include processing above the basic heading level, as shown by S. Sergeev (Statistics Austria. 5 The exchange rate ratios in the Quaranta Tables serve to establish a common denominator for prices across basic headings, due to the fact that the Quaranta Table produces PPPs only within the basic heading. On the other hand, the Dikhanov Table uses other ways to obtain a common denominator across basic headings as it explicitly computes PPPs at the GDP level.
215
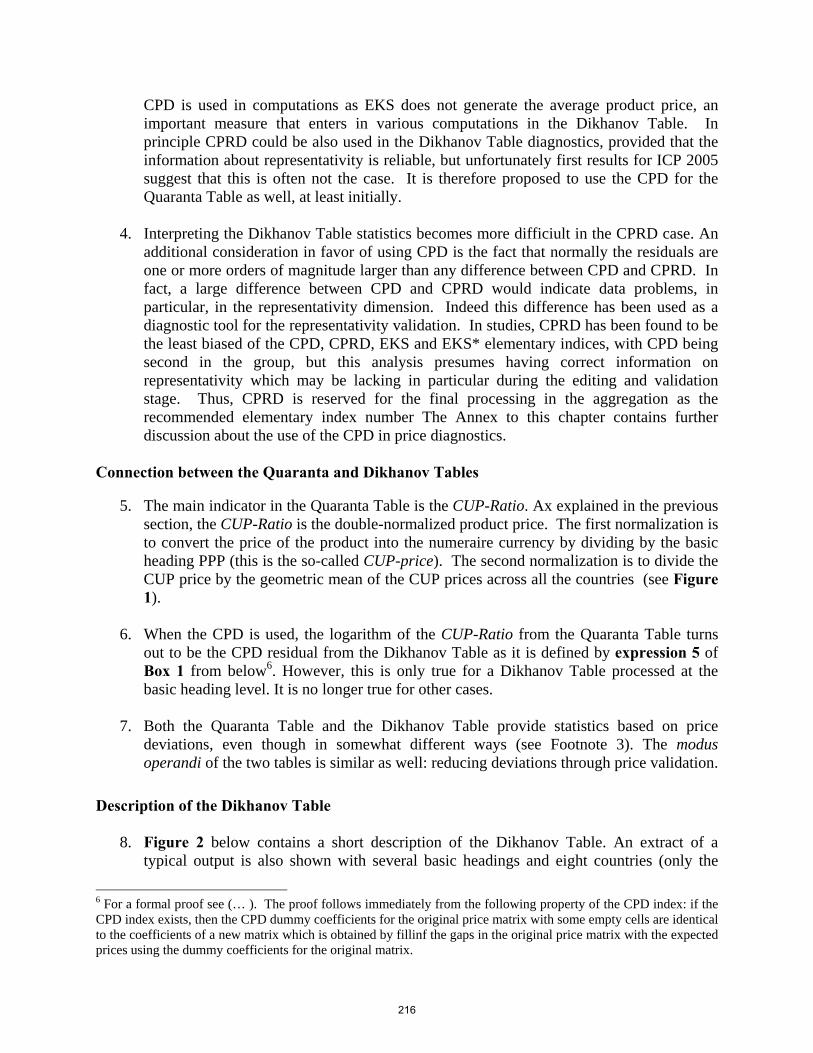
CPD is used in computations as EKS does not generate the average product price, an important measure that enters in various computations in the Dikhanov Table. In principle CPRD could be also used in the Dikhanov Table diagnostics, provided that the information about representativity is reliable, but unfortunately first results for ICP 2005 suggest that this is often not the case. It is therefore proposed to use the CPD for the Quaranta Table as well, at least initially.
4. Interpreting the Dikhanov Table statistics becomes more difficiult in the CPRD case. An
additional consideration in favor of using CPD is the fact that normally the residuals are one or more orders of magnitude larger than any difference between CPD and CPRD. In fact, a large difference between CPD and CPRD would indicate data problems, in particular, in the representativity dimension. Indeed this difference has been used as a diagnostic tool for the representativity validation. In studies, CPRD has been found to be the least biased of the CPD, CPRD, EKS and EKS* elementary indices, with CPD being second in the group, but this analysis presumes having correct information on representativity which may be lacking in particular during the editing and validation stage. Thus, CPRD is reserved for the final processing in the aggregation as the recommended elementary index number The Annex to this chapter contains further discussion about the use of the CPD in price diagnostics.
Connection between the Quaranta and Dikhanov Tables
5. The main indicator in the Quaranta Table is the CUP-Ratio. Ax explained in the previous section, the CUP-Ratio is the double-normalized product price. The first normalization is to convert the price of the product into the numeraire currency by dividing by the basic heading PPP (this is the so-called CUP-price). The second normalization is to divide the CUP price by the geometric mean of the CUP prices across all the countries (see Figure 1).
6. When the CPD is used, the logarithm of the CUP-Ratio from the Quaranta Table turns
out to be the CPD residual from the Dikhanov Table as it is defined by expression 5 of Box 1 from below6. However, this is only true for a Dikhanov Table processed at the basic heading level. It is no longer true for other cases.
7. Both the Quaranta Table and the Dikhanov Table provide statistics based on price
deviations, even though in somewhat different ways (see Footnote 3). The modus operandi of the two tables is similar as well: reducing deviations through price validation.
Description of the Dikhanov Table
8. Figure 2 below contains a short description of the Dikhanov Table. An extract of a typical output is also shown with several basic headings and eight countries (only the
6 For a formal proof see (… ). The proof follows immediately from the following property of the CPD index: if the CPD index exists, then the CPD dummy coefficients for the original price matrix with some empty cells are identical to the coefficients of a new matrix which is obtained by fillinf the gaps in the original price matrix with the expected prices using the dummy coefficients for the original matrix.
216
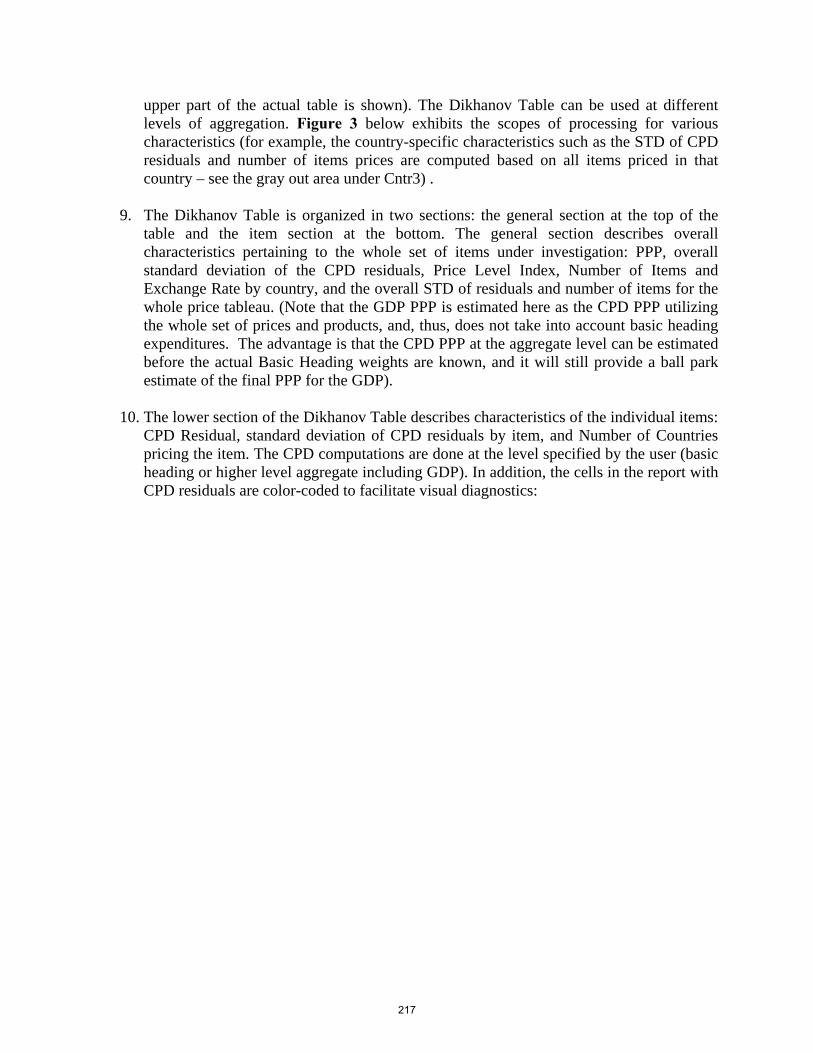
upper part of the actual table is shown). The Dikhanov Table can be used at different levels of aggregation. Figure 3 below exhibits the scopes of processing for various characteristics (for example, the country-specific characteristics such as the STD of CPD residuals and number of items prices are computed based on all items priced in that country – see the gray out area under Cntr3) .
9. The Dikhanov Table is organized in two sections: the general section at the top of the
table and the item section at the bottom. The general section describes overall characteristics pertaining to the whole set of items under investigation: PPP, overall standard deviation of the CPD residuals, Price Level Index, Number of Items and Exchange Rate by country, and the overall STD of residuals and number of items for the whole price tableau. (Note that the GDP PPP is estimated here as the CPD PPP utilizing the whole set of prices and products, and, thus, does not take into account basic heading expenditures. The advantage is that the CPD PPP at the aggregate level can be estimated before the actual Basic Heading weights are known, and it will still provide a ball park estimate of the final PPP for the GDP).
10. The lower section of the Dikhanov Table describes characteristics of the individual items:
CPD Residual, standard deviation of CPD residuals by item, and Number of Countries pricing the item. The CPD computations are done at the level specified by the user (basic heading or higher level aggregate including GDP). In addition, the cells in the report with CPD residuals are color-coded to facilitate visual diagnostics:
217
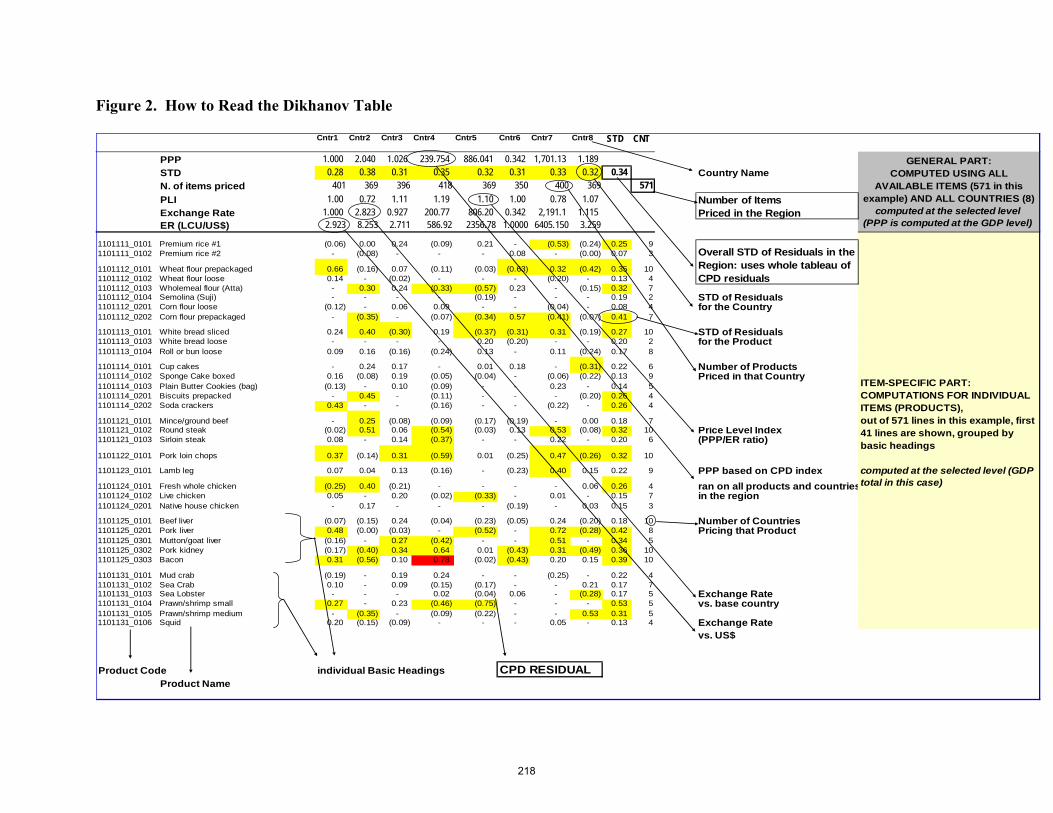
Figure 2. How to Read the Dikhanov Table
Cntr1 Cntr2 Cntr3 Cntr4 Cntr5 Cntr6 Cntr7 Cntr8 STD CNT
PPP 1.000 2.040 1.026 239.754 886.041 0.342 1,701.13 1.189 STD 0.28 0.38 0.31 0.35 0.32 0.31 0.33 0.32 0.34 Country NameN. of items priced 401 369 396 418 369 350 400 369 571PLI 1.00 0.72 1.11 1.19 1.10 1.00 0.78 1.07 Number of ItemsExchange Rate 1.000 2.823 0.927 200.77 806.20 0.342 2,191.1 1.115 Priced in the RegionER (LCU/US$) 2.923 8.253 2.711 586.92 2356.78 1.0000 6405.150 3.259
1101111_0101 Premium rice #1 (0.06) 0.00 0.24 (0.09) 0.21 - (0.53) (0.24) 0.25 91101111_0102 Premium rice #2 - (0.08) - - - 0.08 - (0.00) 0.07 3
1101112_0101 Wheat flour prepackaged 0.66 (0.16) 0.07 (0.11) (0.03) (0.63) 0.32 (0.42) 0.35 101101112_0102 Wheat flour loose 0.14 - (0.02) - - - (0.20) - 0.13 41101112_0103 Wholemeal flour (Atta) - 0.30 0.24 (0.33) (0.57) 0.23 - (0.15) 0.32 71101112_0104 Semolina (Suji) - - - - (0.19) - - - 0.19 2 STD of Residuals1101112_0201 Corn flour loose (0.12) - 0.06 0.09 - - (0.04) - 0.08 4 for the Country1101112_0202 Corn flour prepackaged - (0.35) - (0.07) (0.34) 0.57 (0.41) (0.07) 0.41 7
1101113_0101 White bread sliced 0.24 0.40 (0.30) 0.19 (0.37) (0.31) 0.31 (0.19) 0.27 10 STD of Residuals1101113_0103 White bread loose - - - - 0.20 (0.20) - - 0.20 2 for the Product1101113_0104 Roll or bun loose 0.09 0.16 (0.16) (0.24) 0.13 - 0.11 (0.24) 0.17 8
1101114_0101 Cup cakes - 0.24 0.17 - 0.01 0.18 - (0.31) 0.22 6 Number of Products1101114_0102 Sponge Cake boxed 0.16 (0.08) 0.19 (0.05) (0.04) - (0.06) (0.22) 0.13 9 Priced in that Country1101114_0103 Plain Butter Cookies (bag) (0.13) - 0.10 (0.09) - - 0.23 - 0.14 51101114_0201 Biscuits prepacked - 0.45 - (0.11) - - - (0.20) 0.26 41101114_0202 Soda crackers 0.43 - - (0.16) - - (0.22) - 0.26 4
1101121_0101 Mince/ground beef - 0.25 (0.08) (0.09) (0.17) (0.19) - 0.00 0.18 71101121_0102 Round steak (0.02) 0.51 0.06 (0.54) (0.03) 0.13 0.53 (0.08) 0.32 10 Price Level Index1101121_0103 Sirloin steak 0.08 - 0.14 (0.37) - - 0.22 - 0.20 6 (PPP/ER ratio)1101122_0101 Pork loin chops 0.37 (0.14) 0.31 (0.59) 0.01 (0.25) 0.47 (0.26) 0.32 10
1101123_0101 Lamb leg 0.07 0.04 0.13 (0.16) - (0.23) 0.40 0.15 0.22 9 PPP based on CPD index1101124_0101 Fresh whole chicken (0.25) 0.40 (0.21) - - - - 0.06 0.26 4 ran on all products and countries1101124_0102 Live chicken 0.05 - 0.20 (0.02) (0.33) - 0.01 - 0.15 7 in the region1101124_0201 Native house chicken - 0.17 - - - (0.19) - 0.03 0.15 3
1101125_0101 Beef liver (0.07) (0.15) 0.24 (0.04) (0.23) (0.05) 0.24 (0.20) 0.18 10 Number of Countries1101125_0201 Pork liver 0.48 (0.00) (0.03) - (0.52) - 0.72 (0.28) 0.42 8 Pricing that Product1101125_0301 Mutton/goat liver (0.16) - 0.27 (0.42) - - 0.51 - 0.34 51101125_0302 Pork kidney (0.17) (0.40) 0.34 0.64 0.01 (0.43) 0.31 (0.49) 0.36 101101125_0303 Bacon 0.31 (0.56) 0.10 0.78 (0.02) (0.43) 0.20 0.15 0.39 10
1101131_0101 Mud crab (0.19) - 0.19 0.24 - - (0.25) - 0.22 41101131_0102 Sea Crab 0.10 - 0.09 (0.15) (0.17) - - 0.21 0.17 71101131_0103 Sea Lobster - - - 0.02 (0.04) 0.06 - (0.28) 0.17 5 Exchange Rate1101131_0104 Prawn/shrimp small 0.27 - 0.23 (0.46) (0.75) - - - 0.53 5 vs. base country1101131_0105 Prawn/shrimp medium - (0.35) - (0.09) (0.22) - - 0.53 0.31 51101131_0106 Squid 0.20 (0.15) (0.09) - - - 0.05 - 0.13 4 Exchange Rate
vs. US$
Product Code individual Basic Headings CPD RESIDUALProduct Name
GENERAL PART:COMPUTED USING ALL
AVAILABLE ITEMS (571 in this example) AND ALL COUNTRIES (8)
computed at the selected level(PPP is computed at the GDP level)
ITEM-SPECIFIC PART:COMPUTATIONS FOR INDIVIDUAL ITEMS (PRODUCTS),out of 571 lines in this example, first 41 lines are shown, grouped by basic headings
computed at the selected level (GDP total in this case)
Overall STD of Residuals in the Region: uses whole tableau of CPD residuals
218
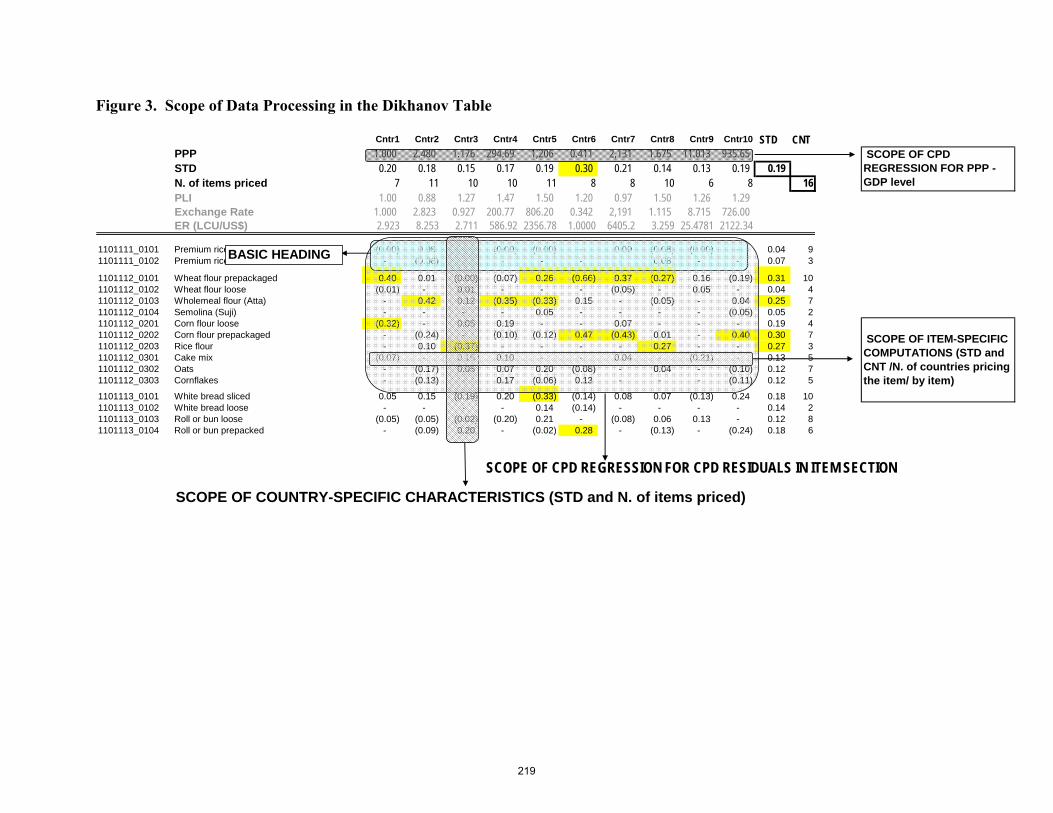
Figure 3. Scope of Data Processing in the Dikhanov Table
Cntr1 Cntr2 Cntr3 Cntr4 Cntr5 Cntr6 Cntr7 Cntr8 Cntr9 Cntr10 STD CNTPPP 1.000 2.480 1.176 294.69 1,206 0.411 2,131 1.675 11.013 935.65 STD 0.20 0.18 0.15 0.17 0.19 0.30 0.21 0.14 0.13 0.19 0.19 N. of items priced 7 11 10 10 11 8 8 10 6 8 16PLI 1.00 0.88 1.27 1.47 1.50 1.20 0.97 1.50 1.26 1.29 Exchange Rate 1.000 2.823 0.927 200.77 806.20 0.342 2,191 1.115 8.715 726.00 ER (LCU/US$) 2.923 8.253 2.711 586.92 2356.78 1.0000 6405.2 3.259 25.4781 2122.34
1101111_0101 Premium rice #1 (0.00) 0.08 - (0.00) (0.00) - 0.00 (0.08) (0.00) - 0.04 91101111_0102 Premium rice #2 - (0.08) - - - - - 0.08 - - 0.07 3
1101112_0101 Wheat flour prepackaged 0.40 0.01 (0.00) (0.07) 0.26 (0.66) 0.37 (0.27) 0.16 (0.19) 0.31 101101112_0102 Wheat flour loose (0.01) - 0.01 - - - (0.05) - 0.05 - 0.04 41101112_0103 Wholemeal flour (Atta) - 0.42 0.12 (0.35) (0.33) 0.15 - (0.05) - 0.04 0.25 71101112_0104 Semolina (Suji) - - - - 0.05 - - - - (0.05) 0.05 21101112_0201 Corn flour loose (0.32) - 0.05 0.19 - - 0.07 - - - 0.19 41101112_0202 Corn flour prepackaged - (0.24) - (0.10) (0.12) 0.47 (0.43) 0.01 - 0.40 0.30 71101112_0203 Rice flour - 0.10 (0.37) - - - - 0.27 - - 0.27 31101112_0301 Cake mix (0.07) - 0.15 0.10 - - 0.04 - (0.21) - 0.13 51101112_0302 Oats - (0.17) 0.05 0.07 0.20 (0.08) - 0.04 - (0.10) 0.12 71101112_0303 Cornflakes - (0.13) - 0.17 (0.06) 0.13 - - - (0.11) 0.12 5
1101113_0101 White bread sliced 0.05 0.15 (0.19) 0.20 (0.33) (0.14) 0.08 0.07 (0.13) 0.24 0.18 101101113_0102 White bread loose - - - - 0.14 (0.14) - - - - 0.14 21101113_0103 Roll or bun loose (0.05) (0.05) (0.02) (0.20) 0.21 - (0.08) 0.06 0.13 - 0.12 81101113_0104 Roll or bun prepacked - (0.09) 0.20 - (0.02) 0.28 - (0.13) - (0.24) 0.18 6
SCOPE OF CPD REGRESSION FOR CPD RESIDUALS IN ITEM SECTION
SCOPE OF COUNTRY-SPECIFIC CHARACTERISTICS (STD and N. of items priced)
SCOPE OF CPD REGRESSION FOR PPP - GDP level
SCOPE OF ITEM-SPECIFIC COMPUTATIONS (STD and CNT /N. of countries pricing the item/ by item)
BASIC HEADING
219
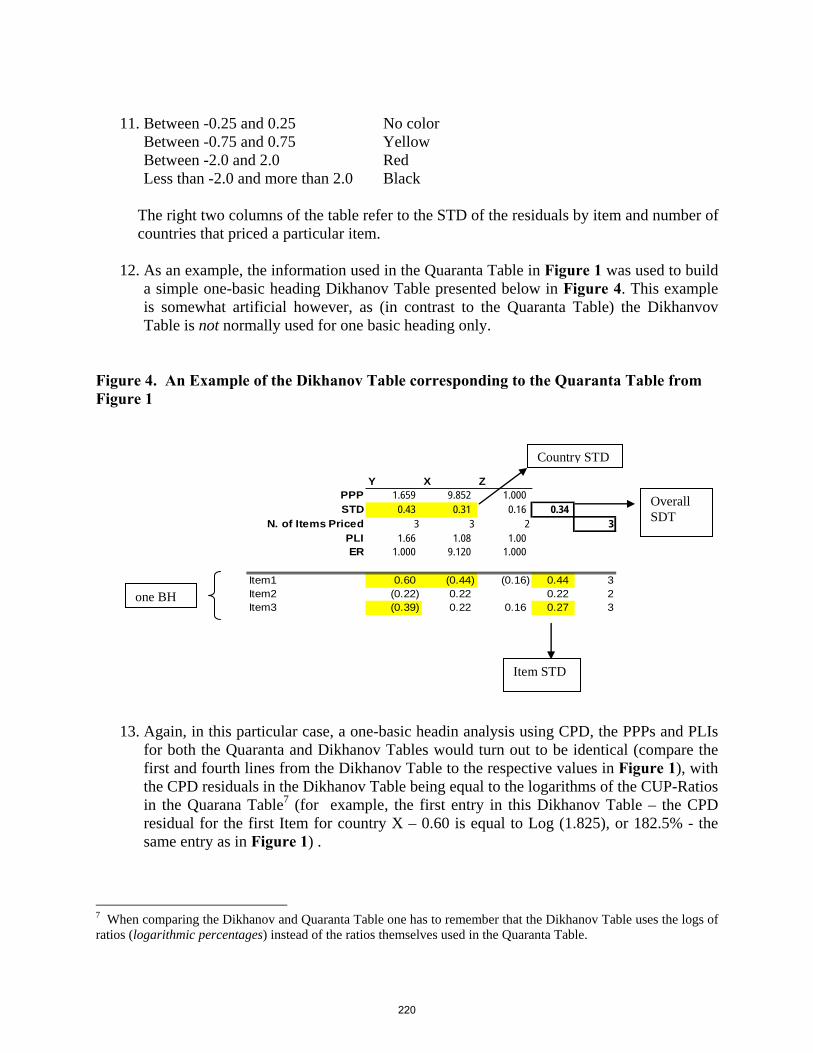
11. Between -0.25 and 0.25 No color
Between -0.75 and 0.75 Yellow Between -2.0 and 2.0 Red Less than -2.0 and more than 2.0 Black
The right two columns of the table refer to the STD of the residuals by item and number of countries that priced a particular item.
12. As an example, the information used in the Quaranta Table in Figure 1 was used to build
a simple one-basic heading Dikhanov Table presented below in Figure 4. This example is somewhat artificial however, as (in contrast to the Quaranta Table) the Dikhanvov Table is not normally used for one basic heading only.
Figure 4. An Example of the Dikhanov Table corresponding to the Quaranta Table from Figure 1
Y X Z
PPP 1.659 9.852 1.000 STD 0.43 0.31 0.16 0.34
N. of Items Priced 3 3 2 3PLI 1.66 1.08 1.00 ER 1.000 9.120 1.000
Item1 0.60 (0.44) (0.16) 0.44 3Item2 (0.22) 0.22 0.22 2Item3 (0.39) 0.22 0.16 0.27 3
one BH
Overall SDT
Item STD
Country STD
13. Again, in this particular case, a one-basic headin analysis using CPD, the PPPs and PLIs
for both the Quaranta and Dikhanov Tables would turn out to be identical (compare the first and fourth lines from the Dikhanov Table to the respective values in Figure 1), with the CPD residuals in the Dikhanov Table being equal to the logarithms of the CUP-Ratios in the Quarana Table7 (for example, the first entry in this Dikhanov Table – the CPD residual for the first Item for country X – 0.60 is equal to Log (1.825), or 182.5% - the same entry as in Figure 1) .
7 When comparing the Dikhanov and Quaranta Table one has to remember that the Dikhanov Table uses the logs of ratios (logarithmic percentages) instead of the ratios themselves used in the Quaranta Table.
220

14. Deviation measures (the overall STDs of residuals and CVs) will differ somewhat due to the differences in computation (0.34 in the Dikhanov Table8 vs. 39% in the Quaranta Table for the overall measure). Overall deviations for Item 1 and Country Y are:
(1) in the Quaranta Table – 57% and 56.9%, respectively, and (2) in the Dikhanov Table – 0.44 and 0.43, respectively.
15. Thus, in this particular single basic heading case, the diagnostics coming from the two
tables are very similar. The differences will be more obvious once the scope of analysis extends beyond a single basic heading, as explained in the next section.
8 The overall STD of CPD residuals in the Dikhanov Table is computed on the whole tableau of the CPD residuals in the item section of the table.
221
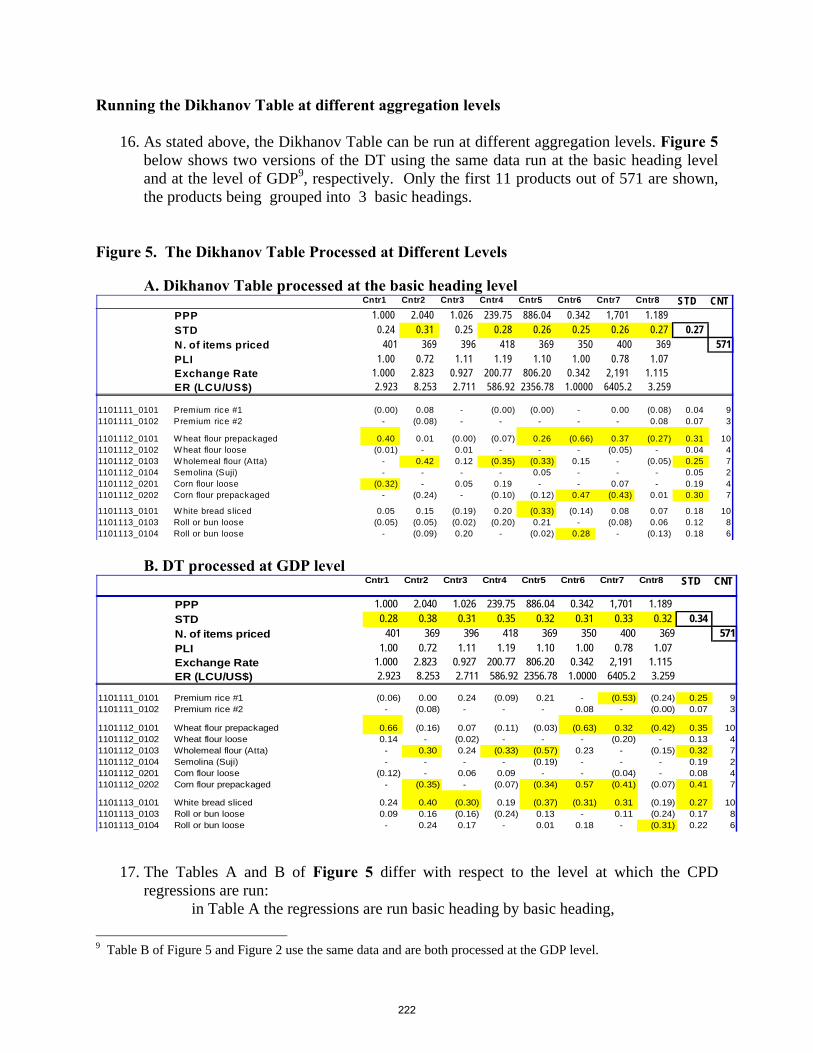
Running the Dikhanov Table at different aggregation levels
16. As stated above, the Dikhanov Table can be run at different aggregation levels. Figure 5 below shows two versions of the DT using the same data run at the basic heading level and at the level of GDP9, respectively. Only the first 11 products out of 571 are shown, the products being grouped into 3 basic headings.
Figure 5. The Dikhanov Table Processed at Different Levels
A. Dikhanov Table processed at the basic heading level Cntr1 Cntr2 Cntr3 Cntr4 Cntr5 Cntr6 Cntr7 Cntr8 STD CNT
PPP 1.000 2.040 1.026 239.75 886.04 0.342 1,701 1.189 STD 0.24 0.31 0.25 0.28 0.26 0.25 0.26 0.27 0.27 N. of items priced 401 369 396 418 369 350 400 369 571PLI 1.00 0.72 1.11 1.19 1.10 1.00 0.78 1.07 Exchange Rate 1.000 2.823 0.927 200.77 806.20 0.342 2,191 1.115 ER (LCU/US$) 2.923 8.253 2.711 586.92 2356.78 1.0000 6405.2 3.259
1101111_0101 Premium rice #1 (0.00) 0.08 - (0.00) (0.00) - 0.00 (0.08) 0.04 91101111_0102 Premium rice #2 - (0.08) - - - - - 0.08 0.07 3
1101112_0101 W heat flour prepackaged 0.40 0.01 (0.00) (0.07) 0.26 (0.66) 0.37 (0.27) 0.31 101101112_0102 W heat flour loose (0.01) - 0.01 - - - (0.05) - 0.04 41101112_0103 W holemeal flour (Atta) - 0.42 0.12 (0.35) (0.33) 0.15 - (0.05) 0.25 71101112_0104 Semolina (Suji) - - - - 0.05 - - - 0.05 21101112_0201 Corn flour loose (0.32) - 0.05 0.19 - - 0.07 - 0.19 41101112_0202 Corn flour prepackaged - (0.24) - (0.10) (0.12) 0.47 (0.43) 0.01 0.30 7
1101113_0101 W hite bread sliced 0.05 0.15 (0.19) 0.20 (0.33) (0.14) 0.08 0.07 0.18 101101113_0103 Roll or bun loose (0.05) (0.05) (0.02) (0.20) 0.21 - (0.08) 0.06 0.12 81101113_0104 Roll or bun loose - (0.09) 0.20 - (0.02) 0.28 - (0.13) 0.18 6
B. DT processed at GDP level Cntr1 Cntr2 Cntr3 Cntr4 Cntr5 Cntr6 Cntr7 Cntr8 STD CNT
PPP 1.000 2.040 1.026 239.75 886.04 0.342 1,701 1.189 STD 0.28 0.38 0.31 0.35 0.32 0.31 0.33 0.32 0.34 N. of items priced 401 369 396 418 369 350 400 369 571PLI 1.00 0.72 1.11 1.19 1.10 1.00 0.78 1.07 Exchange Rate 1.000 2.823 0.927 200.77 806.20 0.342 2,191 1.115 ER (LCU/US$) 2.923 8.253 2.711 586.92 2356.78 1.0000 6405.2 3.259
1101111_0101 Premium rice #1 (0.06) 0.00 0.24 (0.09) 0.21 - (0.53) (0.24) 0.25 91101111_0102 Premium rice #2 - (0.08) - - - 0.08 - (0.00) 0.07 3
1101112_0101 Wheat flour prepackaged 0.66 (0.16) 0.07 (0.11) (0.03) (0.63) 0.32 (0.42) 0.35 101101112_0102 Wheat flour loose 0.14 - (0.02) - - - (0.20) - 0.13 41101112_0103 Wholemeal flour (Atta) - 0.30 0.24 (0.33) (0.57) 0.23 - (0.15) 0.32 71101112_0104 Semolina (Suji) - - - - (0.19) - - - 0.19 21101112_0201 Corn flour loose (0.12) - 0.06 0.09 - - (0.04) - 0.08 41101112_0202 Corn flour prepackaged - (0.35) - (0.07) (0.34) 0.57 (0.41) (0.07) 0.41 7
1101113_0101 White bread sliced 0.24 0.40 (0.30) 0.19 (0.37) (0.31) 0.31 (0.19) 0.27 101101113_0103 Roll or bun loose 0.09 0.16 (0.16) (0.24) 0.13 - 0.11 (0.24) 0.17 81101113_0104 Roll or bun loose - 0.24 0.17 - 0.01 0.18 - (0.31) 0.22 6
17. The Tables A and B of Figure 5 differ with respect to the level at which the CPD regressions are run:
in Table A the regressions are run basic heading by basic heading, 9 Table B of Figure 5 and Figure 2 use the same data and are both processed at the GDP level.
222
in Table B the whole tableau of price data (i.e., all products from all basic headings) is processed at once.
Thus, in the first case all statistics in the general section of the table reflect the within-basic heading variation only, whereas in the second case the global variation is shown.
18. As shown in Box 1, the residuals from CPD regressions are presented as follows
pccpcpcpcp DpDcpxp −−=−= lnln βε . where Dcc and Dpp are the country and product dummies. The difference between the residuals run at different levels of processing such as the basic heading (BH) and GDP can therefore be expressed as:
)()()()()()( GDPDpGDPDcBHDpBHDcGDPBH pcpccpcp ++−−=− εε 19. As the country dummy is the log of the PPP the difference between the CPD residuals in
tables A and B can be broken down into two parts as follows:
{ } { })()())(ln())(ln()()( BHDpBHDpBHPPPGDPPPPGDPBH ppcccpcp −+−=− εε
20. The first component is the difference between the basic heading PPP and the GDP PPP (the relative price level of the basic heading vis-à-vis the overall price level at the GDP level) while the second component is the difference between the logs of the average prices10 of the product as computed with the CPD regression on all products and those as computed on the products within the basic heading only. Usually, the second component is insignificant.
21. Looking at the first group of products (the first basic heading), it can be seen that Table A
does not provide any useful information for some countries, because all entries with one product in a basic heading will be shown with zero CPD residuals. On the other hand, Table B shows. for example, that Country 7 has a -0.53 residual value, which implies that the price is 77% less than expected, a deviation which deserves further investigation.
22. For the second group of products (the second basic heading), Tables A and B in general
show a similar picture, with some additional products flagged as problematic in Table B, as that table’s entries reflect within and between basic heading deviations.
23. Not every problem can be observed when the CPD is run only at the basic heading level
(Table A). For example, if a country erroneously priced all their beverages in gallons instead of liters, its basic heading level data on their own could be very consistent (as everything is priced in gallons), but inconsistent with everyone else (who priced in liters). Table A would have the same problem for that basic heading as the Quaranta Table. However, Table B would explicitly show that inconsistency.
10 The product dummy pDp can be interpreted as the log of average product price for all the countries in the comparison.
223
24. In fact, it is useful to run the Dikhanov Table at different levels of aggregation: for example, at the basic heading level, for a higher aggregate level (such as Food), and at the GDP level. Processing the Dikhanov Table at a level higher than the basic heading can help analyze price points for “bad” basic headings with partially erroneous price entries. These “bad” basic headings would be distorted which would make the processing impossible at the basic heading level. However, processing at a higher level would help identify prices that are consistent within a broader set of products.
25. It is important to study the overall STD of residuals (the upper right corner of the table):
Table A predictably shows a smaller value than Table B (0.27 vs. 0.34). (Again, the overall STD of residuals is run on the whole country-product tableau of the CPD residuals). However, the difference is not large (and it is even smaller for cases with data of poorer quality in which case the within basic heading deviations would dominate the between basic heading ones). The overall STD of residuals for larger regions with more variety tends to be larger than that for smaller and more uniform ones.
26. It is informative to study STDs of residuals by country and by product as well. The same
overall picture can be observed here as well: the STD values in Table B are greater than those in Table A.
27. In practice, the overall SDT of CPD residuals cannot go much below the values shown in
Tables A and B, and, certainly, will never approach zero. This is due to various factors, such as the substitution effect, the effects of taxes and subsidies, transportation and climate differences, etc. The substitution effect can be particularly strong, and it works both within and without basic heading. Individual economies may have very particular pricing policies, for example, very low fuel prices in some of the oil-producing countries. This may show up as high residuals, but the prices would be not erroneous.
28. The process of data validation with the Dikhanov Table would start thus with checking
entries with largest deviations, trying to investigate and resolve all issues. Some of the deviations, even very large ones, can be legitimate. For example, the price of gasoline in Venezuela is very low compared to other Latin American countries, so the large deviation (CPD residual) for the product as shown in the Dikhanov Table at the GDP level is not a mistake in data. It is important to run the Dikhanov Table after each iteration of the data editing process.
29. The Dikhanov Table can be run on sub-regions and subsets of products as well, as some
countries may be slow in providing their data on time. However, it would still be important for the regions to validate the available data. Large regions, such as Africa, may also find it convenient to run sub-regional tables.
30. It is important to compare results of running the Dikhanov Table over time, e.g., quarter
to quarter, looking for suspicious changes in price patterns.
31. In general, the overall STD by country should reflect the quality of price data. The goal of the regional coordinator in collaboration with national price statisticians would be to
224

reduce the overall STD with the understanding that there are limits to its reduction, and that many large CPD residuals may be quite legitimate. However, each large residual needs to be investigated.
225
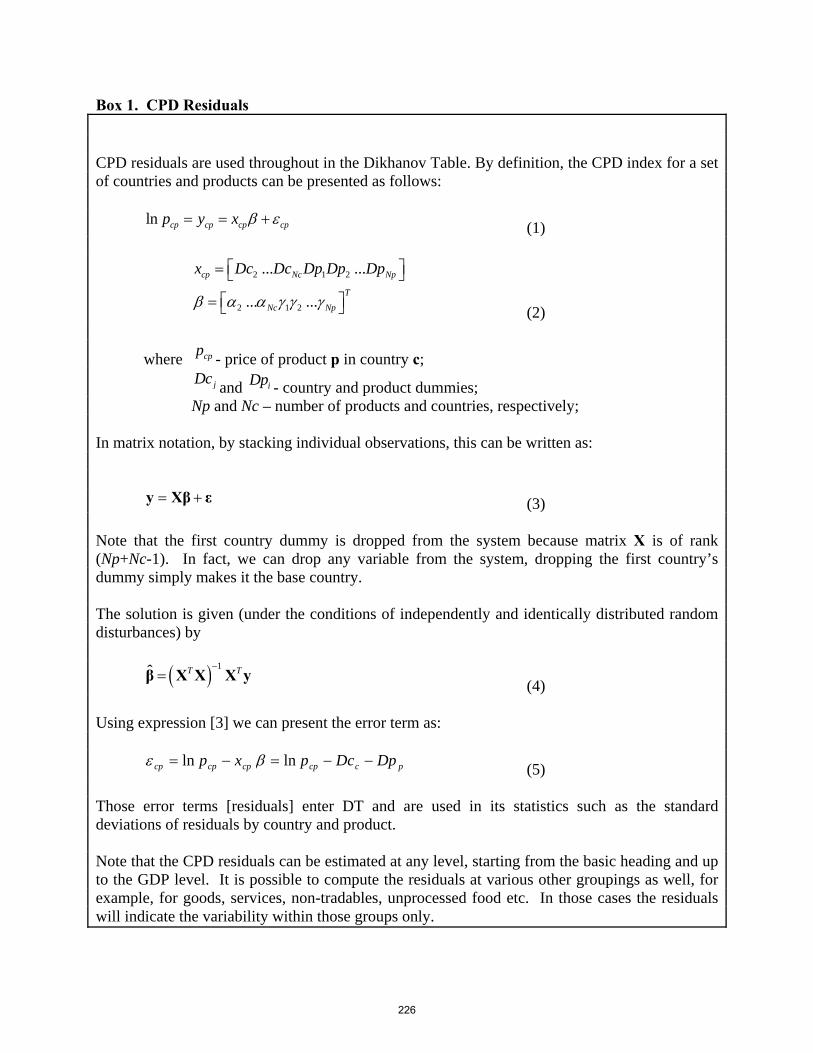
Box 1. CPD Residuals CPD residuals are used throughout in the Dikhanov Table. By definition, the CPD index for a set of countries and products can be presented as follows:
ln cp cp cp cpp y x β ε= = + (1)
2 1 2
2 1 2
... ...
... ...
cp Nc Np
T
Nc Np
x Dc Dc Dp Dp Dp
β α α γ γ γ
⎡ ⎤= ⎣ ⎦
⎡ ⎤= ⎣ ⎦ (2)
where cpp - price of product p in country c;
jDc and iDp - country and product dummies; Np and Nc – number of products and countries, respectively;
In matrix notation, by stacking individual observations, this can be written as:
= +y Xβ ε (3)
Note that the first country dummy is dropped from the system because matrix X is of rank (Np+Nc-1). In fact, we can drop any variable from the system, dropping the first country’s dummy simply makes it the base country. The solution is given (under the conditions of independently and identically distributed random disturbances) by
( ) 1ˆ T T−=β X X X y
(4) Using expression [3] we can present the error term as:
pccpcpcpcp DpDcpxp −−=−= lnln βε (5)
Those error terms [residuals] enter DT and are used in its statistics such as the standard deviations of residuals by country and product. Note that the CPD residuals can be estimated at any level, starting from the basic heading and up to the GDP level. It is possible to compute the residuals at various other groupings as well, for example, for goods, services, non-tradables, unprocessed food etc. In those cases the residuals will indicate the variability within those groups only.
226
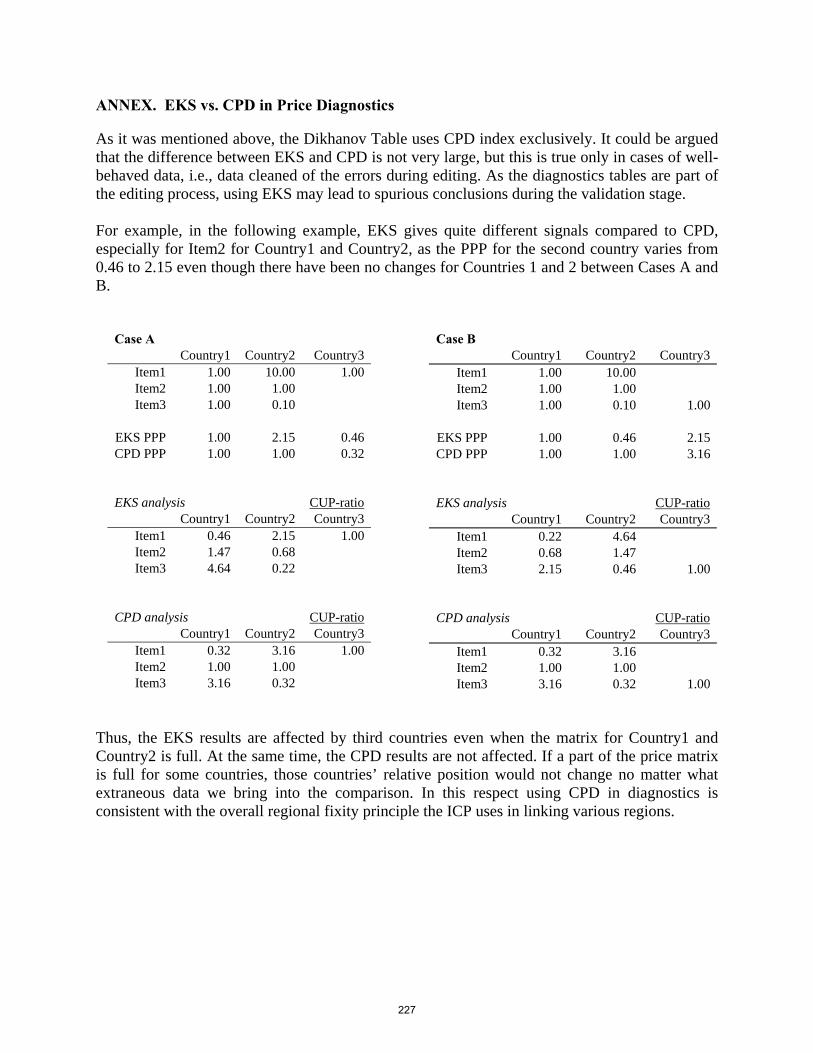
ANNEX. EKS vs. CPD in Price Diagnostics As it was mentioned above, the Dikhanov Table uses CPD index exclusively. It could be argued that the difference between EKS and CPD is not very large, but this is true only in cases of well-behaved data, i.e., data cleaned of the errors during editing. As the diagnostics tables are part of the editing process, using EKS may lead to spurious conclusions during the validation stage. For example, in the following example, EKS gives quite different signals compared to CPD, especially for Item2 for Country1 and Country2, as the PPP for the second country varies from 0.46 to 2.15 even though there have been no changes for Countries 1 and 2 between Cases A and B.
Case A Country1 Country2 Country3
Item1 1.00 10.00 1.00 Item2 1.00 1.00 Item3 1.00 0.10
EKS PPP 1.00 2.15 0.46 CPD PPP 1.00 1.00 0.32
EKS analysis CUP-ratio Country1 Country2 Country3
Item1 0.46 2.15 1.00 Item2 1.47 0.68 Item3 4.64 0.22
CPD analysis CUP-ratio Country1 Country2 Country3
Item1 0.32 3.16 1.00 Item2 1.00 1.00 Item3 3.16 0.32
Case B Country1 Country2 Country3
Item1 1.00 10.00 Item2 1.00 1.00 Item3 1.00 0.10 1.00
EKS PPP 1.00 0.46 2.15 CPD PPP 1.00 1.00 3.16
EKS analysis CUP-ratio Country1 Country2 Country3
Item1 0.22 4.64 Item2 0.68 1.47 Item3 2.15 0.46 1.00
CPD analysis CUP-ratio Country1 Country2 Country3
Item1 0.32 3.16 Item2 1.00 1.00 Item3 3.16 0.32 1.00
Thus, the EKS results are affected by third countries even when the matrix for Country1 and Country2 is full. At the same time, the CPD results are not affected. If a part of the price matrix is full for some countries, those countries’ relative position would not change no matter what extraneous data we bring into the comparison. In this respect using CPD in diagnostics is consistent with the overall regional fixity principle the ICP uses in linking various regions.
227
Chapter 8
Government Services
Introduction
1. This chapter describes the information on government services that is required for ICP 2005. Chapter 3 deals with the expenditure weights that are required for government consumption expenditure and this material is not repeated here. The main focus of the chapter is on the price information needed for government and in particular on the data needed on compensation of government employees.
Definition of General Government
2. “General government” is the term used in the 1993 SNA 1 to describe the institutional sector that consists of central, regional, state and local government units together with the social security funds controlled by these units. Non-profit institutions engaged in non-market production that are controlled and mainly financed by government units or social security funds are also included in the general government sector. The kinds of non-profit organisations that are included in general government vary from country to country but they often include hospitals, clinics, schools and universities.
3. The 1993 SNA provides for sub-sectoring of general government into central, state
and local governments and social security funds. However, for the 1CP, no sub-sectoring is called for. Both expenditure and price information refer to general government as a whole. For convenience, “government” rather than “general government” is used in this Chapter.
Individual and Collective Services
4. Two types of government final consumption expenditure are distinguished in the Expenditure Classification used by the 1CP, namely, expenditures on individual and collective services. Individual services are provided to, and consumed by, individual households whereas collective services are provided to the community as a whole2.
1 System of National Accounts 1993, Commission of the European Communities, International Monetary
Fund, Organisation for Economic Co-operation and Development, United Nations, World Bank, 1993. The detailed definition of government is given in paragraphs 4.101 to 4.131.
2 In the literature on economic welfare and public finance, collective services are usually described as ‘public goods’.
228
5. As shown in Table 2 of Chapter 3, a fundamental distinction is drawn in the SNA and ICP between who actually consumes – individual households or the community - and who pays for the consumption – households, non-profit institutions serving households (NPISHs) and government. The government pays for some of the services consumed by individual households and not only for the collective services consumed by the community. The actual individual consumption of households is equal to the sum of the following three components 1. individual consumption expenditure incurred by the households themselves, 2. individual consumption expenditure incurred by government, 3. individual consumption expenditure incurred by NPISHs.
Households’ actual individual consumption is a comprehensive measure of what households actually consume, and not just their expenditures on consumption. It is the appropriate measure of consumption when comparing standards of living in different countries and is used by the ICP for this reason. .
Individual services 6. Individual consumption expenditure by government consists of expenditures on
individual services that government provides to specific identifiable households – that is, services, such as health and education, which are consumed by individual households. The precise boundary between individual and collective services may be clarified by reference to the COFOG 1998 classification3. Box 1 shows which functions of government are treated in the SNA as individual. They are denoted by “IS”.
7. Individual consumption expenditure by government is of two kinds:
• First, the expenditures incurred when government itself engages in the production of services which they provide to individual households. Examples are the costs incurred in the production of free educational and health services by publicly owned and controlled schools and hospitals. The government itself organises and finances the production of these services for consumption by individual households.
• Second, the purchase of goods and services by government from other producers which are then passed on to households, either free or at prices below the costs of production, without any further processing by government. Examples are the provision to households of medicines and medical services for outpatients. In some cases, households get these goods and services free or at very low prices at the point of delivery, while in other cases households pay the full price at the point of delivery and are later reimbursed, in part or in full, by government. In the 1CP, the purchase by government of goods and
3 “Classification of the Functions of Government (COFOG)”, in Classification of Expenditure According to
Purpose, United Nations, New York, 2000.
229
services for delivery to households is relevant for two functions – health and education. In the Expenditure Classification they are described as Health benefits and reimbursements and as Education benefits and reimbursements.
Collective services
8. Government current expenditure that is not individual is termed collective. Again, Box 1 shows what kinds of government expenditures are collective. They mainly fall under the broad headings of general public services, defence, public order and safety, economic affairs and environment protection but they also include certain expenditures under housing, health, recreation and culture, education and social protection that are considered to be for the benefit of the community at large. These are expenditures on the formulation and administration of government policy at the national level, the setting up and enforcement of public standards, and on research and development. In Box 1 all the COFOG groups highlighted in grey are collective services and are denoted by “CS”.
9. By contrast with individual consumption expenditures, collective consumption
expenditures are all incurred in the production of services by government. Collective consumption expenditure does not include any purchases of goods and services for delivery to households.
10. Most of the individual and collective services produced by government are non-
market services. They are either provided free to individual households or the community as a whole or they are sold at artificially low prices that do not reflect their costs of production. As there are no market prices the value of the government’s current expenditures on non-market services has to be estimated in the national accounts by the current value of the inputs used to produce them. Similarly, as there are no market prices the PPPs also have to be estimated indirectly using other data. The same problem arises when trying to measure changes in the prices of government services over time within a single country.
The solution usually adopted in both international and intertemporal price and volume indices is to compare the prices and volumes of the inputs used in the production of non-market services instead of the prices and volumes of the outputs. When the PPPs compare input prices the resulting expenditure data when converted into a common currency compare the volumes of the inputs used up in the production of non-market services in different countries. Input volume indices inputs can provide close approximations to output volume indices but only if the ratios of outputs to inputs, i.e., productivity levels, are the same in different countries. This may often not be case. PPPs based on input prices are therefore second best measures that are necessitated by the lack of output prices4. One
4 As already noted the same problem occurs when trying to measure the rate of inflation for government
services within a country. Paragraph 16,139 of the 1993 SNA observes: “In practice, it may not
230

consequence of using input prices is that the basic headings have to refer to different kinds of inputs used rather then different kinds of outputs. .
be feasible to avoid using changes in the volumes of inputs into such services as proxies for changes in the volume of outputs … .”
231
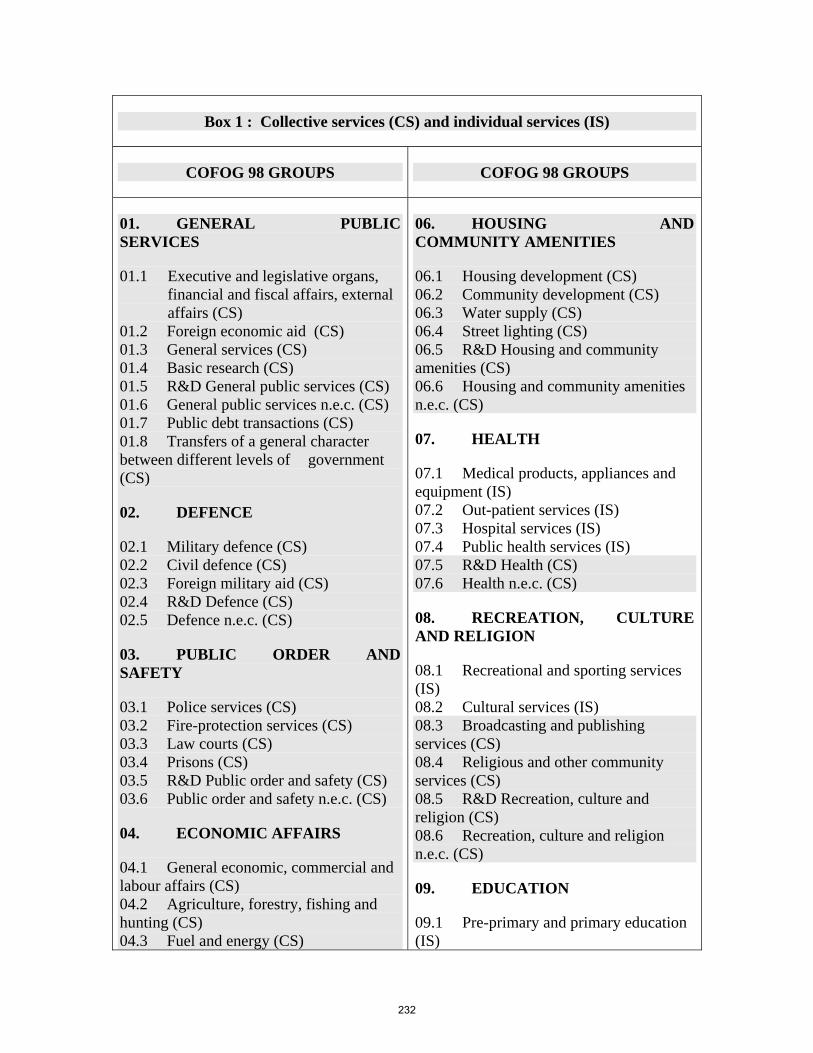
Box 1 : Collective services (CS) and individual services (IS)
COFOG 98 GROUPS COFOG 98 GROUPS
01. GENERAL PUBLIC SERVICES
01.1 Executive and legislative organs, financial and fiscal affairs, external affairs (CS)
01.2 Foreign economic aid (CS) 01.3 General services (CS) 01.4 Basic research (CS) 01.5 R&D General public services (CS) 01.6 General public services n.e.c. (CS) 01.7 Public debt transactions (CS) 01.8 Transfers of a general character between different levels of government (CS)
02. DEFENCE
02.1 Military defence (CS) 02.2 Civil defence (CS) 02.3 Foreign military aid (CS) 02.4 R&D Defence (CS) 02.5 Defence n.e.c. (CS)
03. PUBLIC ORDER AND SAFETY
03.1 Police services (CS) 03.2 Fire-protection services (CS) 03.3 Law courts (CS) 03.4 Prisons (CS) 03.5 R&D Public order and safety (CS) 03.6 Public order and safety n.e.c. (CS)
04. ECONOMIC AFFAIRS
04.1 General economic, commercial and labour affairs (CS) 04.2 Agriculture, forestry, fishing and hunting (CS) 04.3 Fuel and energy (CS)
06. HOUSING AND COMMUNITY AMENITIES
06.1 Housing development (CS) 06.2 Community development (CS) 06.3 Water supply (CS) 06.4 Street lighting (CS) 06.5 R&D Housing and community amenities (CS) 06.6 Housing and community amenities n.e.c. (CS)
07. HEALTH
07.1 Medical products, appliances and equipment (IS) 07.2 Out-patient services (IS) 07.3 Hospital services (IS) 07.4 Public health services (IS) 07.5 R&D Health (CS) 07.6 Health n.e.c. (CS)
08. RECREATION, CULTURE AND RELIGION
08.1 Recreational and sporting services (IS) 08.2 Cultural services (IS) 08.3 Broadcasting and publishing services (CS) 08.4 Religious and other community services (CS) 08.5 R&D Recreation, culture and religion (CS) 08.6 Recreation, culture and religion n.e.c. (CS)
09. EDUCATION
09.1 Pre-primary and primary education (IS)
232
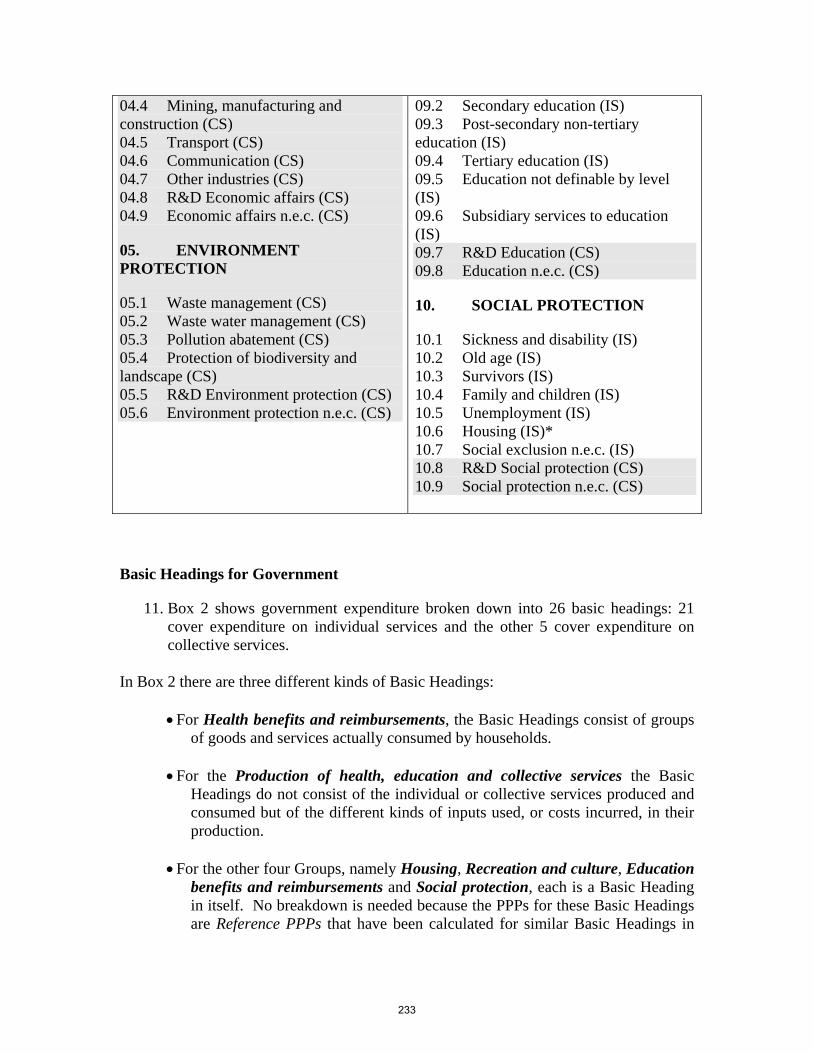
04.4 Mining, manufacturing and construction (CS) 04.5 Transport (CS) 04.6 Communication (CS) 04.7 Other industries (CS) 04.8 R&D Economic affairs (CS) 04.9 Economic affairs n.e.c. (CS)
05. ENVIRONMENT PROTECTION
05.1 Waste management (CS) 05.2 Waste water management (CS) 05.3 Pollution abatement (CS) 05.4 Protection of biodiversity and landscape (CS) 05.5 R&D Environment protection (CS) 05.6 Environment protection n.e.c. (CS)
09.2 Secondary education (IS) 09.3 Post-secondary non-tertiary education (IS) 09.4 Tertiary education (IS) 09.5 Education not definable by level (IS) 09.6 Subsidiary services to education (IS) 09.7 R&D Education (CS) 09.8 Education n.e.c. (CS)
10. SOCIAL PROTECTION
10.1 Sickness and disability (IS) 10.2 Old age (IS) 10.3 Survivors (IS) 10.4 Family and children (IS) 10.5 Unemployment (IS) 10.6 Housing (IS)* 10.7 Social exclusion n.e.c. (IS) 10.8 R&D Social protection (CS) 10.9 Social protection n.e.c. (CS)
Basic Headings for Government
11. Box 2 shows government expenditure broken down into 26 basic headings: 21 cover expenditure on individual services and the other 5 cover expenditure on collective services.
In Box 2 there are three different kinds of Basic Headings:
• For Health benefits and reimbursements, the Basic Headings consist of groups of goods and services actually consumed by households.
• For the Production of health, education and collective services the Basic
Headings do not consist of the individual or collective services produced and consumed but of the different kinds of inputs used, or costs incurred, in their production.
• For the other four Groups, namely Housing, Recreation and culture, Education
benefits and reimbursements and Social protection, each is a Basic Heading in itself. No breakdown is needed because the PPPs for these Basic Headings are Reference PPPs that have been calculated for similar Basic Headings in
233

other parts of the Expenditure Classification. Reference PPPs are explained in a later section.
234

Box 2: Basic Headings for Individual services and Collective services
INDIVIDUAL SERVICES
Housing13.01.11.1 Housing
Health benefits and reimbursements13.02.11.1 Pharmaceutical products13.02.11.2 Other medical products13.02.11.3 Therapeutic appliances and equipment 13.02.12.1 Out-patient medical services13.02.12.2 Out-patient dental services13.02.12.3 Out-patient paramedical services13.02.12.4 Hospital services
Production of health services13.02.21.1 Compensation of employees 13.02.22.1 Intermediate consumption 13.02.23.1 Gross operating surplus13.02.24.1 Net taxes on production13.02.25.1 Receipts from sales
Recreation and culture13.03.11.1 Recreation and culture
Education benefits and reimbursements13.04.11.1 Education benefits and reimbursements
Production of education services13.04.21.1 Compensation of employees13.04.22.1 Intermediate consumption13.04.23.1 Gross operating surplus13.04.24.1 Net taxes on production13.04.25.1 Receipts from sales
Social protection13.05.11.1 Social protection
COLLECTIVE SERVICES
14.01.11.1 Compensation of employees 14.01.12.1 Intermediate consumption 14.01.13.1 Gross operating surplus14.01.14.1 Net taxes on production14.01.15.1 Receipts from sales
Price Data
Health benefits and reimbursements 12. Governments in many countries purchase health services, pharmaceutical and
other medical goods from market producers, and then pass them on to particular groups of households either free or at much reduced prices. This activity is financed differently from country to country. In some cases the government may buy the goods or services direct from the producers and provide them without
235
charge to households; in other cases governments reimburse households, in full or in part, after the households themselves have made the purchase.
13. The prices paid for these goods and services are collected and used to calculate
PPPs in the same way as PPPs for other goods and services. Note however that the prices to be collected are “total prices”. In countries where households pay the whole purchasers’ price to the market producer prior to being either completely or partially reimbursement by the government, the total price is the price that households pay before reimbursement. In countries where households pay only a portion of the purchasers’ price to the market producer and the remainder is paid to the market producer by government, the total price is the sum of the non-reimbursable part paid by households and the part paid by government. Suppose, for example, that the quantity of a pharmaceutical product purchased is 1000 units and that the price per unit is 10 € of which households pay 2 € and government 8 €. In the national accounts, 2000 € will be recorded as household expenditure and 8000 € will be recorded as government expenditure. If the prices actually paid – that is, 2 € by households and 8 € by government – are used to deflate these expenditures, it will seem that both households and government have each purchased 1000 units or 2000 units in total. But if the total amount paid – that is 10 € – is used, households will be shown, correctly, as having purchased 200 units and government 800 units - a total of 1000 units.
14. In Box 2, the last item shown under Health benefits and reimbursements is Hospital services. This covers the provision of medical services, pharmaceuticals, etc. that are provided to patients who stay overnight in hospitals during the course of their treatment. The quality of, and the ways in which, these services are provided differ greatly from country to country and in the past it has proved very difficult to collect internationally comparable prices for hospital services. For that reason, in 1CP 2005, reference PPPs are used for Hospital services. (See below for details).
15. To summarise, prices are required only for the following basic headings:
13.02.11.1 Pharmaceutical products 13.02.11.2 Other medical products 13.02.11.3 Therapeutic appliances and equipment 13.02.12.1 Out-patient medical services 13.02.12.2 Out-patient dental services 13.02.12.3 Out-patient paramedical services
These goods and services are also Basic Headings under household final consumption expenditure (Basic Headings 11.06.11.0 to 11.06.23.1) so that the same prices can be used to calculate PPPs for both household and government expenditure. Production of health, education and collective services
16. Government services are generally provided free or at low prices that are termed not economically significant. For this reason government services have to be
236
valued in the national accounts at their costs of production and the same approach is used in the 1CP to calculate the PPPs. The PPPs compare the costs of producing the services and not the prices at which they are sold.
The costs of producing government services are:
• Compensation of employees, • intermediate consumption • net taxes on production • gross operating surplus, and • (as a negative figure) receipts from sales.
17. Intermediate consumption covers a wide range of inputs of goods and services
such as printing supplies, office rent, computer services, office cleaning, electricity, and so on. Intermediate consumption of defence services includes the purchase of weapons. In the case of the production of hospital services prices are used to calculate PPPs for three items of intermediate consumption – namely pharmaceutical products, other medical goods and therapeutic appliances and equipment.. For other goods and services used up in the production of hospital services (intermediate consumption n.e.c.) Reference PPPs are used.
18. Net taxes on production consist of taxes on products payable when they are
produced, taxes and duties on imports, taxes on the ownership of land, buildings or other assets used in production, and taxes on the labour used in production. Subsidies on production are considered to be negative taxes and so are deducted. In most countries, net taxes on production of government services are insignificant or zero and are included in Box 2 mainly for completeness. For 1CP 2005, Reference PPPs are used for this item.
19. Gross operating surplus consists of the net operating surplus plus depreciation or
consumption of fixed capital5. The net operating surplus is generally assumed to be zero for government production so that the gross operating surplus consists only of depreciation/consumption of fixed capital. Depreciation should be calculated in respect of government-owned buildings and other structures and machinery and equipment. In ICP 2005, Reference PPPs are used for this item.
Receipts from sales 20. Receipts from sales cover things such as partial charges for education and health
services, passport fees, entrance charges for museums, etc. These expenditures are recorded under household final consumption expenditure and, in a few cases, under the intermediate consumption of enterprises. They must therefore be deducted from government consumption expenditure. Receipts from sales is shown as a Basic Heading in Box 1 for both Individual and Collective Services.
5 It is proposed to replace the expression ‘consumption of fixed capital’ by ‘depreciation’ in the current
revision of the SNA.
237
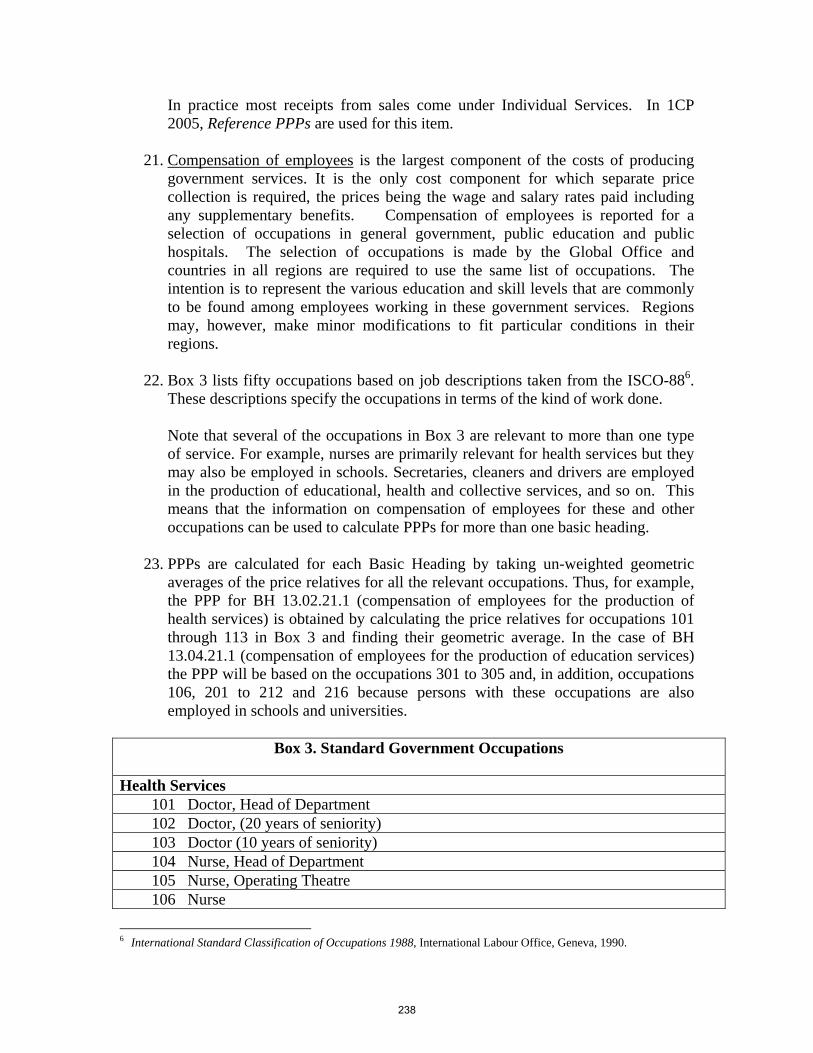
In practice most receipts from sales come under Individual Services. In 1CP 2005, Reference PPPs are used for this item.
21. Compensation of employees is the largest component of the costs of producing
government services. It is the only cost component for which separate price collection is required, the prices being the wage and salary rates paid including any supplementary benefits. Compensation of employees is reported for a selection of occupations in general government, public education and public hospitals. The selection of occupations is made by the Global Office and countries in all regions are required to use the same list of occupations. The intention is to represent the various education and skill levels that are commonly to be found among employees working in these government services. Regions may, however, make minor modifications to fit particular conditions in their regions.
22. Box 3 lists fifty occupations based on job descriptions taken from the ISCO-886.
These descriptions specify the occupations in terms of the kind of work done.
Note that several of the occupations in Box 3 are relevant to more than one type of service. For example, nurses are primarily relevant for health services but they may also be employed in schools. Secretaries, cleaners and drivers are employed in the production of educational, health and collective services, and so on. This means that the information on compensation of employees for these and other occupations can be used to calculate PPPs for more than one basic heading.
23. PPPs are calculated for each Basic Heading by taking un-weighted geometric
averages of the price relatives for all the relevant occupations. Thus, for example, the PPP for BH 13.02.21.1 (compensation of employees for the production of health services) is obtained by calculating the price relatives for occupations 101 through 113 in Box 3 and finding their geometric average. In the case of BH 13.04.21.1 (compensation of employees for the production of education services) the PPP will be based on the occupations 301 to 305 and, in addition, occupations 106, 201 to 212 and 216 because persons with these occupations are also employed in schools and universities.
Box 3. Standard Government Occupations
Health Services 101 Doctor, Head of Department 102 Doctor, (20 years of seniority) 103 Doctor (10 years of seniority) 104 Nurse, Head of Department 105 Nurse, Operating Theatre 106 Nurse
6 International Standard Classification of Occupations 1988, International Labour Office, Geneva, 1990.
238
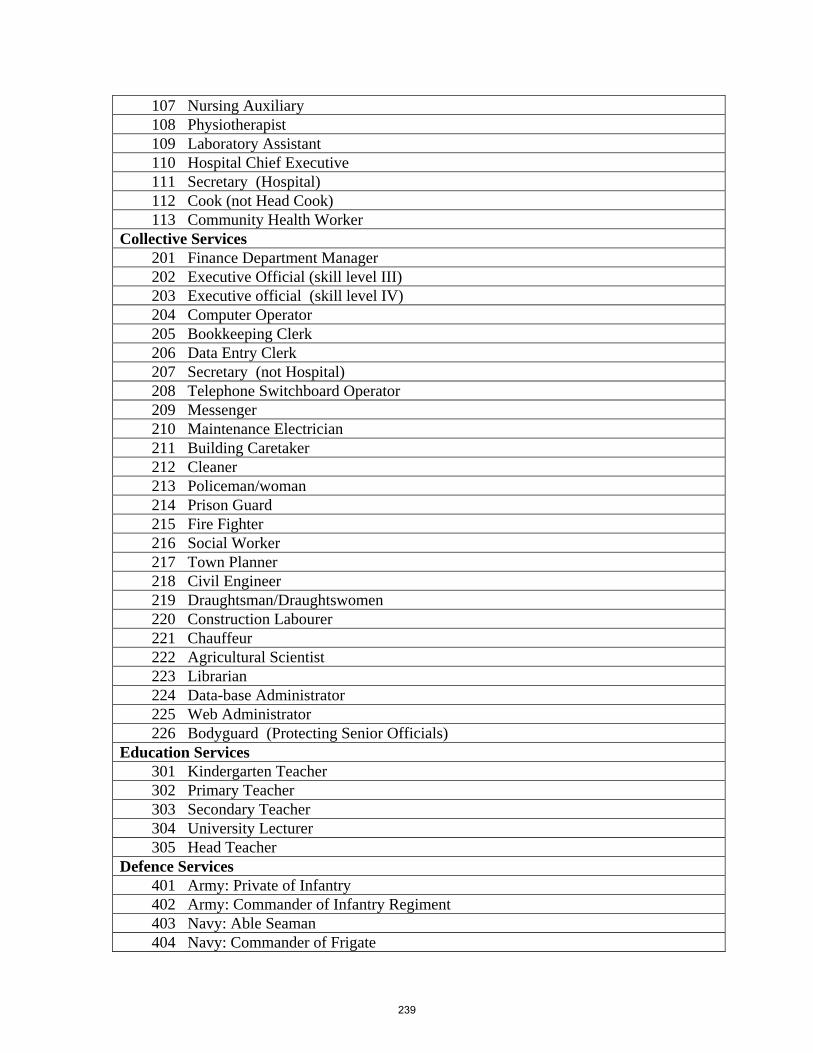
107 Nursing Auxiliary 108 Physiotherapist 109 Laboratory Assistant 110 Hospital Chief Executive 111 Secretary (Hospital) 112 Cook (not Head Cook) 113 Community Health Worker Collective Services 201 Finance Department Manager 202 Executive Official (skill level III) 203 Executive official (skill level IV) 204 Computer Operator 205 Bookkeeping Clerk 206 Data Entry Clerk 207 Secretary (not Hospital) 208 Telephone Switchboard Operator 209 Messenger 210 Maintenance Electrician 211 Building Caretaker 212 Cleaner 213 Policeman/woman 214 Prison Guard 215 Fire Fighter 216 Social Worker 217 Town Planner 218 Civil Engineer 219 Draughtsman/Draughtswomen 220 Construction Labourer 221 Chauffeur 222 Agricultural Scientist 223 Librarian 224 Data-base Administrator 225 Web Administrator 226 Bodyguard (Protecting Senior Officials) Education Services 301 Kindergarten Teacher 302 Primary Teacher 303 Secondary Teacher 304 University Lecturer 305 Head Teacher Defence Services 401 Army: Private of Infantry 402 Army: Commander of Infantry Regiment 403 Navy: Able Seaman 404 Navy: Commander of Frigate
239
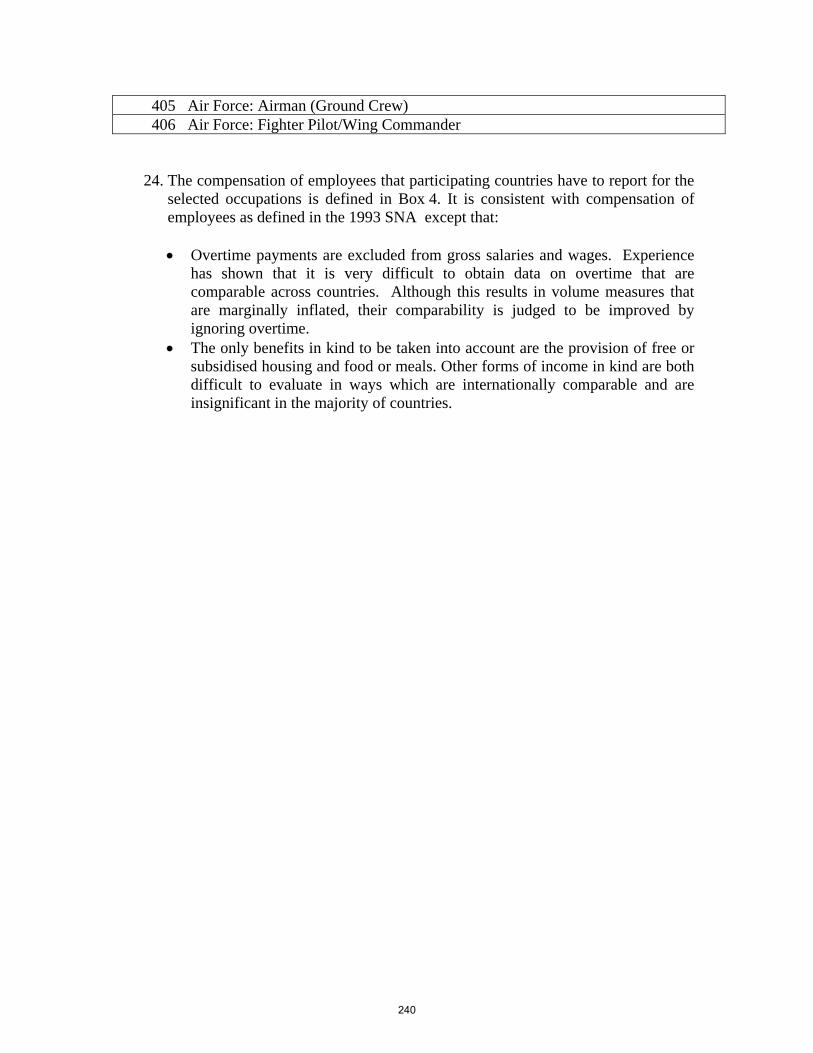
405 Air Force: Airman (Ground Crew) 406 Air Force: Fighter Pilot/Wing Commander
24. The compensation of employees that participating countries have to report for the selected occupations is defined in Box 4. It is consistent with compensation of employees as defined in the 1993 SNA except that:
• Overtime payments are excluded from gross salaries and wages. Experience
has shown that it is very difficult to obtain data on overtime that are comparable across countries. Although this results in volume measures that are marginally inflated, their comparability is judged to be improved by ignoring overtime.
• The only benefits in kind to be taken into account are the provision of free or subsidised housing and food or meals. Other forms of income in kind are both difficult to evaluate in ways which are internationally comparable and are insignificant in the majority of countries.
240
Box 4: Compensation of Employees
Compensation of employees includes all payments in cash and kind made by general government in a year. These payments in cash and kind comprise:
• Gross salaries and wages in cash (before deduction of taxes and social contributions payable by employees) cover:
o Basic salaries and wages as laid down in the salary scales;
o Other payments, over and above the basic salary or wage, such as: housing or residence allowance, passage or leave allowance, family allowance, special duty allowance or acting allowance, 13th month pay and other cash payments except overtime payments. (As noted above it is very difficult to obtain data on overtime that are comparable across countries and so overtime payments are excluded.)
• Benefits in kind cover things such as free or subsidised housing, meals, transport allowance, reimbursement of medical expenses and the like. Many of these benefits are difficult to evaluate, as they can vary from one general government institution to another. However income in kind in the form of housing and food or meals is important in many countries and must be included in compensation of employees. According to the 1993 SNA, income in kind is valued at the costs of production when the items concerned are produced by the employer and at purchasers’ prices when they are bought by the employer and passed on to the employee.
• Employers' actual social contributions are payments made by general government for the benefit of their employees and cover contributions for old age pensions, and for insurance against sickness, accident and disability. They are calculated on the basis of the schemes in operation in the various countries.
• Imputed social contributions represent the counterpart to social benefits paid directly by general government institutions without participating in, or establishing a fund, reserve or other special scheme for this purpose. Since these contributions do not involve actual cash flows, they have to be imputed. The imputations have to be done in line with the corresponding imputations made in the national account.
25. The compensation of employees to be reported for the selected occupations
should not be extracted from government payrolls. Dividing the total compensation of employees paid to employees in a selected occupation by the total number of employees in the selected occupation gives an average that is representative of the country, but it does not give an average that is comparable across countries. This is because the distribution of the employees in the selected occupation over the various grades, categories and steps that make up the pay scale for the occupation will differ from country to country. Instead, the compensation of employees should be derived by a less representative but more
241
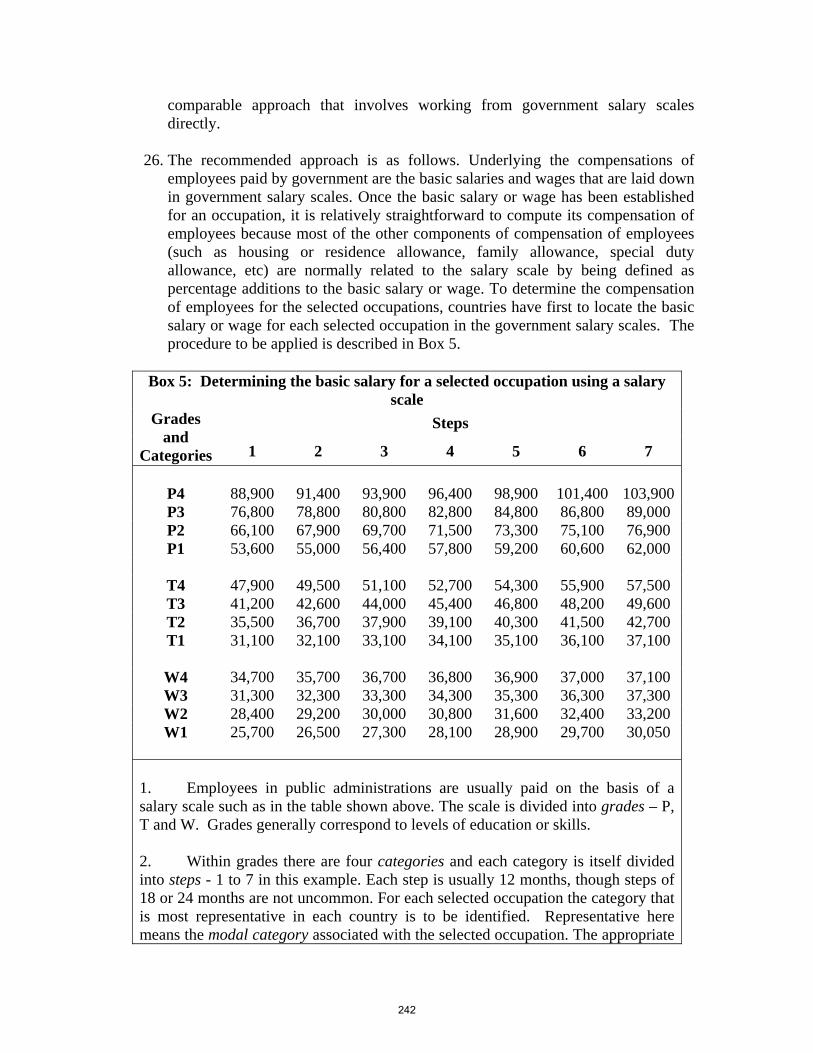
comparable approach that involves working from government salary scales directly.
26. The recommended approach is as follows. Underlying the compensations of
employees paid by government are the basic salaries and wages that are laid down in government salary scales. Once the basic salary or wage has been established for an occupation, it is relatively straightforward to compute its compensation of employees because most of the other components of compensation of employees (such as housing or residence allowance, family allowance, special duty allowance, etc) are normally related to the salary scale by being defined as percentage additions to the basic salary or wage. To determine the compensation of employees for the selected occupations, countries have first to locate the basic salary or wage for each selected occupation in the government salary scales. The procedure to be applied is described in Box 5.
Box 5: Determining the basic salary for a selected occupation using a salary
scale Steps Grades
and Categories 1 2 3 4 5 6 7
P4 88,900 91,400 93,900 96,400 98,900 101,400 103,900P3 76,800 78,800 80,800 82,800 84,800 86,800 89,000 P2 66,100 67,900 69,700 71,500 73,300 75,100 76,900 P1 53,600 55,000 56,400 57,800 59,200 60,600 62,000
T4 47,900 49,500 51,100 52,700 54,300 55,900 57,500 T3 41,200 42,600 44,000 45,400 46,800 48,200 49,600 T2 35,500 36,700 37,900 39,100 40,300 41,500 42,700 T1 31,100 32,100 33,100 34,100 35,100 36,100 37,100
W4 34,700 35,700 36,700 36,800 36,900 37,000 37,100 W3 31,300 32,300 33,300 34,300 35,300 36,300 37,300 W2 28,400 29,200 30,000 30,800 31,600 32,400 33,200 W1 25,700 26,500 27,300 28,100 28,900 29,700 30,050
1. Employees in public administrations are usually paid on the basis of a salary scale such as in the table shown above. The scale is divided into grades – P, T and W. Grades generally correspond to levels of education or skills. 2. Within grades there are four categories and each category is itself divided into steps - 1 to 7 in this example. Each step is usually 12 months, though steps of 18 or 24 months are not uncommon. For each selected occupation the category that is most representative in each country is to be identified. Representative here means the modal category associated with the selected occupation. The appropriate
242
step within the category is determined by the seniority specified for the selected occupation. 3. Take, for example, a Draughtsman–occupation number 219 in Box 3. If the distribution of Draughtsmen is 15 per cent T1, 25 per cent T2, 35 per cent T3, 20 per cent T4 and 5 per cent P1, then T3 is selected as the modal category. If 5 years seniority has been specified for this particular occupation and if each step is 12 months, the salary for category T3 with five years seniority will be 46,800 (equivalent to five steps). But if each step was 18 months or 24 months, five years seniority would be equivalent to four steps and a salary of 45,400 in the case of 18 month steps and to three steps and a salary of 44,000 in the case of 24 month steps. 4. It can happen that the distribution of employees over the categories associated with a particular occupation is bimodal, or approximately bimodal. In such cases the salary of both categories should be determined and an arithmetic average taken of the two. For example, if in the distribution of executive officials in the previous paragraph categories T2 and T3 were both 30 per cent, the salary – assuming steps of 12 months - would be 40,300 for T2 and 46,800 for T3. In this case the basic salary for an executive official with skill level III would be the arithmetic average of the basic salaries established for these two categories – which is, (40,300 + 46,800) / 2 or 43,550.
27. The compensation of employees reported for each selected occupation must be
annual. This is not a particularly difficult requirement. Salary scales usually show annual amounts and any revisions to the salary scales that take place during the reference year are relatively straightforward to accommodate. When there are revisions, a weighted average needs to be calculated. This can be illustrated by returning to the example of the Draughtsman in Box 5. If a five per cent increase in salaries came into effect in October of the reference year, then for the first nine months the salary for category T3 would be 46,800 and for the last three months it would be 49,140. The weighted average of the two – ([46,800 x 9] + [49,140 x 3]) / 12 – provides the basic salary required, namely: 47,385.
28. The compensation of employees should also be the national average taking into
account the differences in compensation which may arise both between various levels of government – that is, between central, regional, state and local governments - and within the same level of government – that is, between different ministries and departments of central government or between different regional governments, state governments or local governments. Unless there are national salary scales, this can be a problem because information on the various salary scales that need to be consulted may not be readily available. Even if it is available, there is still the question of how to combine them. In principle some form of weighted average should be used.
243
29. One solution that may be used in the absence of national salary scales is to use only the salary scales of central government. The validity of this approach depends on the extent to which the wages and salaries paid by central government are representative of those paid by general government. Some adjustments may be necessary to make them more representative such as excluding the allowance paid to compensate for the higher costs associated with working in the capital city. But it is not a complete solution because there are occupations – such as teachers or doctors in some countries – that are only employed by regional, state or local governments and not by the central government. For the selected occupations that fall into this group, the need to refer to the salary scales of the appropriate level of government remains.
30. For international comparisons, the compensation of employees reported for the
selected occupations needs to be adjusted for differences in the numbers of hours actually worked in the different countries. In addition to compensation of employees, countries are therefore required to report the number of hours regularly worked per week – excluding overtime – and the number of weeks worked per year. The latter is obtained by deducting all paid holidays including annual leave and public holidays. This information is to be supplied on the reporting form in Box 7 below.
Reference PPPs
31. Box 2 showed 26 Basic Headings for government. Of these, prices are collected for six health goods and services and information on compensation of three types of employees. No price data are collected for the remaining 17 Basic Headings. The PPPs for these Basic Headings are calculated from price data that have been collected for other Basic Headings. Such PPPs are called Reference PPPs. The reference PPPs are listed in Box 6.
244
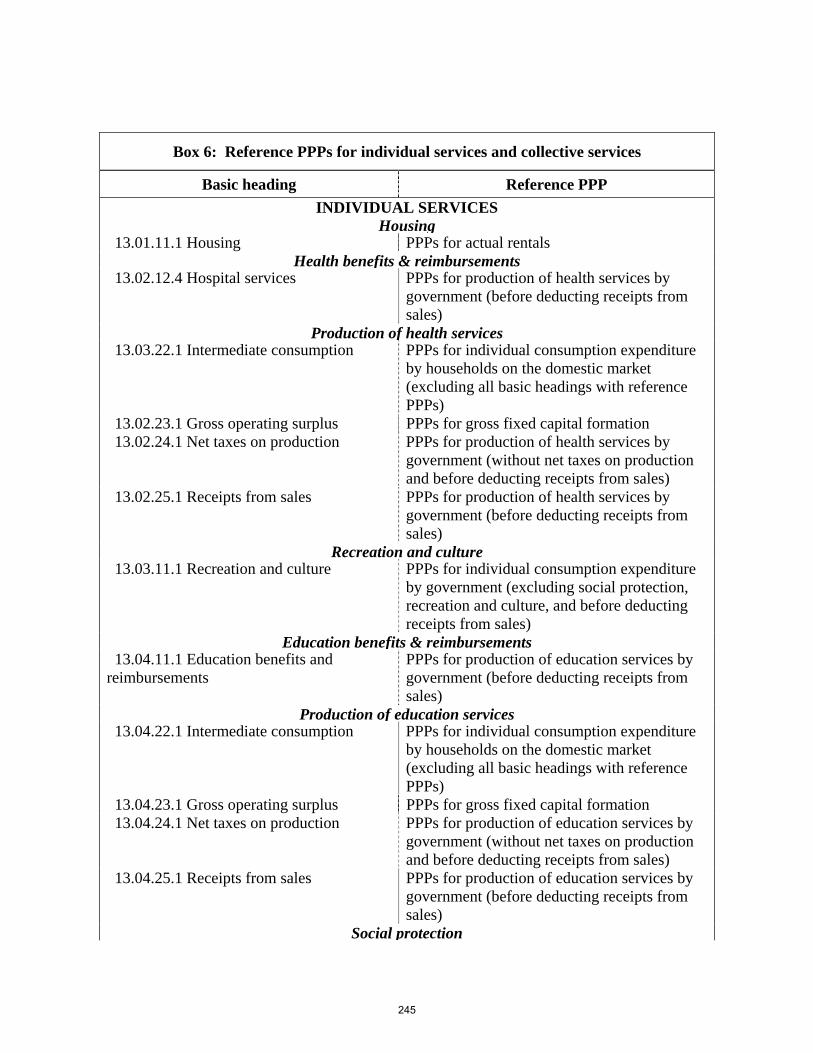
Box 6: Reference PPPs for individual services and collective services
Basic heading Reference PPP INDIVIDUAL SERVICES
Housing 13.01.11.1 Housing PPPs for actual rentals
Health benefits & reimbursements 13.02.12.4 Hospital services PPPs for production of health services by
government (before deducting receipts from sales)
Production of health services 13.03.22.1 Intermediate consumption PPPs for individual consumption expenditure
by households on the domestic market (excluding all basic headings with reference PPPs)
13.02.23.1 Gross operating surplus PPPs for gross fixed capital formation 13.02.24.1 Net taxes on production PPPs for production of health services by
government (without net taxes on production and before deducting receipts from sales)
13.02.25.1 Receipts from sales PPPs for production of health services by government (before deducting receipts from sales)
Recreation and culture 13.03.11.1 Recreation and culture PPPs for individual consumption expenditure
by government (excluding social protection, recreation and culture, and before deducting receipts from sales)
Education benefits & reimbursements 13.04.11.1 Education benefits and reimbursements
PPPs for production of education services by government (before deducting receipts from sales)
Production of education services 13.04.22.1 Intermediate consumption PPPs for individual consumption expenditure
by households on the domestic market (excluding all basic headings with reference PPPs)
13.04.23.1 Gross operating surplus PPPs for gross fixed capital formation 13.04.24.1 Net taxes on production PPPs for production of education services by
government (without net taxes on production and before deducting receipts from sales)
13.04.25.1 Receipts from sales PPPs for production of education services by government (before deducting receipts from sales)
Social protection
245
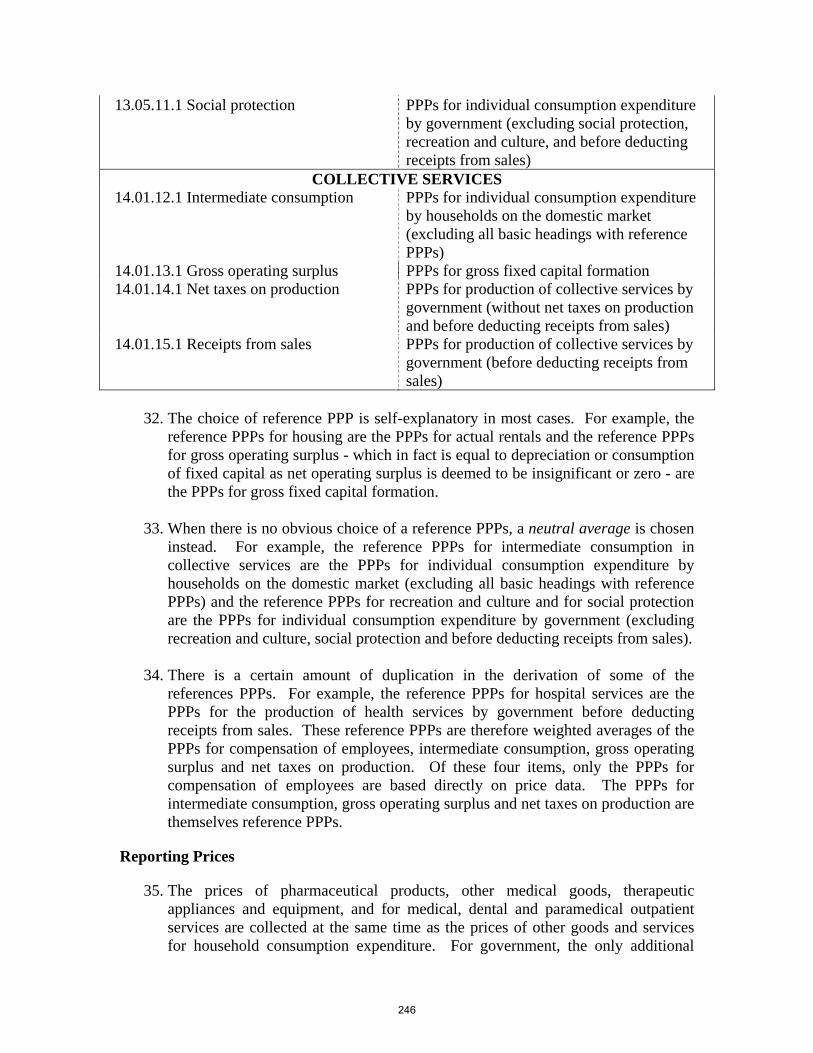
13.05.11.1 Social protection PPPs for individual consumption expenditure by government (excluding social protection, recreation and culture, and before deducting receipts from sales)
COLLECTIVE SERVICES 14.01.12.1 Intermediate consumption PPPs for individual consumption expenditure
by households on the domestic market (excluding all basic headings with reference PPPs)
14.01.13.1 Gross operating surplus PPPs for gross fixed capital formation 14.01.14.1 Net taxes on production PPPs for production of collective services by
government (without net taxes on production and before deducting receipts from sales)
14.01.15.1 Receipts from sales PPPs for production of collective services by government (before deducting receipts from sales)
32. The choice of reference PPP is self-explanatory in most cases. For example, the
reference PPPs for housing are the PPPs for actual rentals and the reference PPPs for gross operating surplus - which in fact is equal to depreciation or consumption of fixed capital as net operating surplus is deemed to be insignificant or zero - are the PPPs for gross fixed capital formation.
33. When there is no obvious choice of a reference PPPs, a neutral average is chosen
instead. For example, the reference PPPs for intermediate consumption in collective services are the PPPs for individual consumption expenditure by households on the domestic market (excluding all basic headings with reference PPPs) and the reference PPPs for recreation and culture and for social protection are the PPPs for individual consumption expenditure by government (excluding recreation and culture, social protection and before deducting receipts from sales).
34. There is a certain amount of duplication in the derivation of some of the
references PPPs. For example, the reference PPPs for hospital services are the PPPs for the production of health services by government before deducting receipts from sales. These reference PPPs are therefore weighted averages of the PPPs for compensation of employees, intermediate consumption, gross operating surplus and net taxes on production. Of these four items, only the PPPs for compensation of employees are based directly on price data. The PPPs for intermediate consumption, gross operating surplus and net taxes on production are themselves reference PPPs.
Reporting Prices
35. The prices of pharmaceutical products, other medical goods, therapeutic appliances and equipment, and for medical, dental and paramedical outpatient services are collected at the same time as the prices of other goods and services for household consumption expenditure. For government, the only additional
246

price collection relates to compensation of employees. Box 7 shows the information required for each of the selected occupations.
247
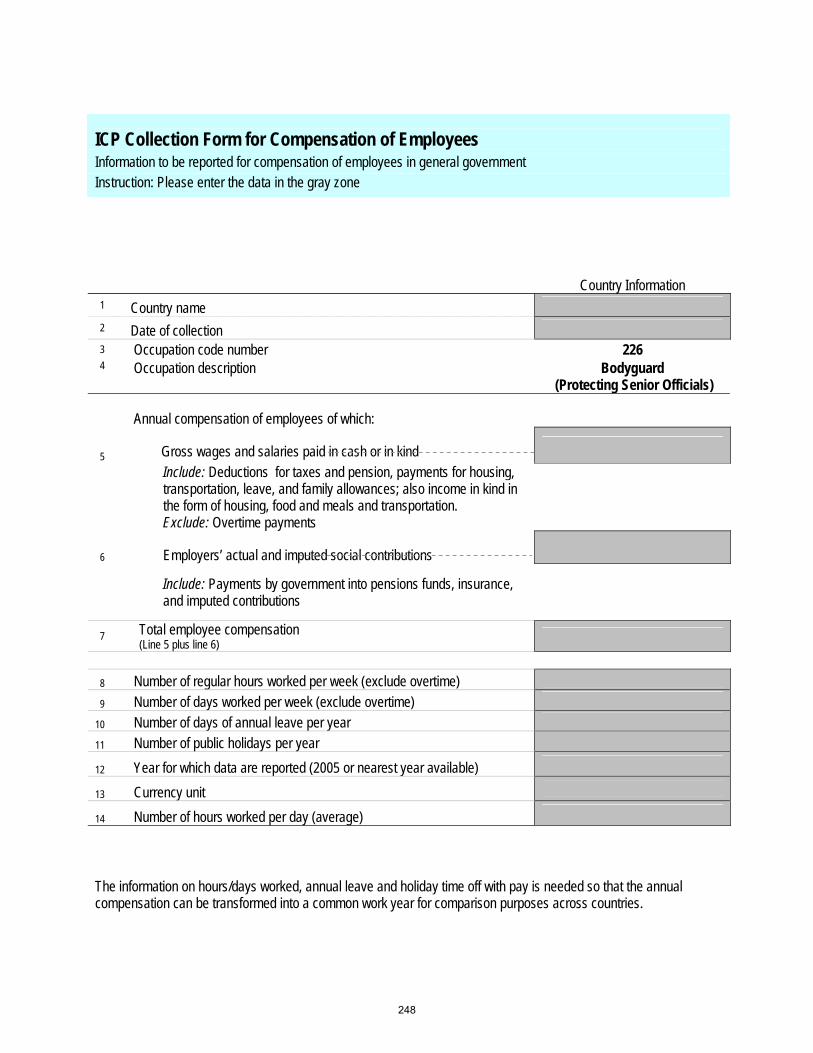
ICP Collection Form for Compensation of Employees Information to be reported for compensation of employees in general government Instruction: Please enter the data in the gray zone
Country Information 1 Country name 2 Date of collection 3 Occupation code number 226 4 Occupation description Bodyguard
(Protecting Senior Officials)
Annual compensation of employees of which:
5
Gross wages and salaries paid in cash or in kind
Include: Deductions for taxes and pension, payments for housing,
transportation, leave, and family allowances; also income in kind in the form of housing, food and meals and transportation.
Exclude: Overtime payments
6
Employers’ actual and imputed social contributions
Include: Payments by government into pensions funds, insurance,
and imputed contributions
7 Total employee compensation (Line 5 plus line 6)
8 Number of regular hours worked per week (exclude overtime) 9 Number of days worked per week (exclude overtime)
10 Number of days of annual leave per year 11 Number of public holidays per year
12 Year for which data are reported (2005 or nearest year available)
13 Currency unit
14 Number of hours worked per day (average)
The information on hours/days worked, annual leave and holiday time off with pay is needed so that the annual compensation can be transformed into a common work year for comparison purposes across countries.
248
Validation of Prices
36. Before reporting compensation of employees on the above form, participating countries should look at the internal coherency of the data set. For example, it is usually the case that: doctors earn more than nurses; head teachers earn more than other teachers; officers in the armed forces earn more than privates, able seamen and airmen; executive officials earn more than drivers; and drivers earn more than messengers. Income differentials between occupations that are contrary to expectations should be verified and errors identified in this way should be corrected.
249
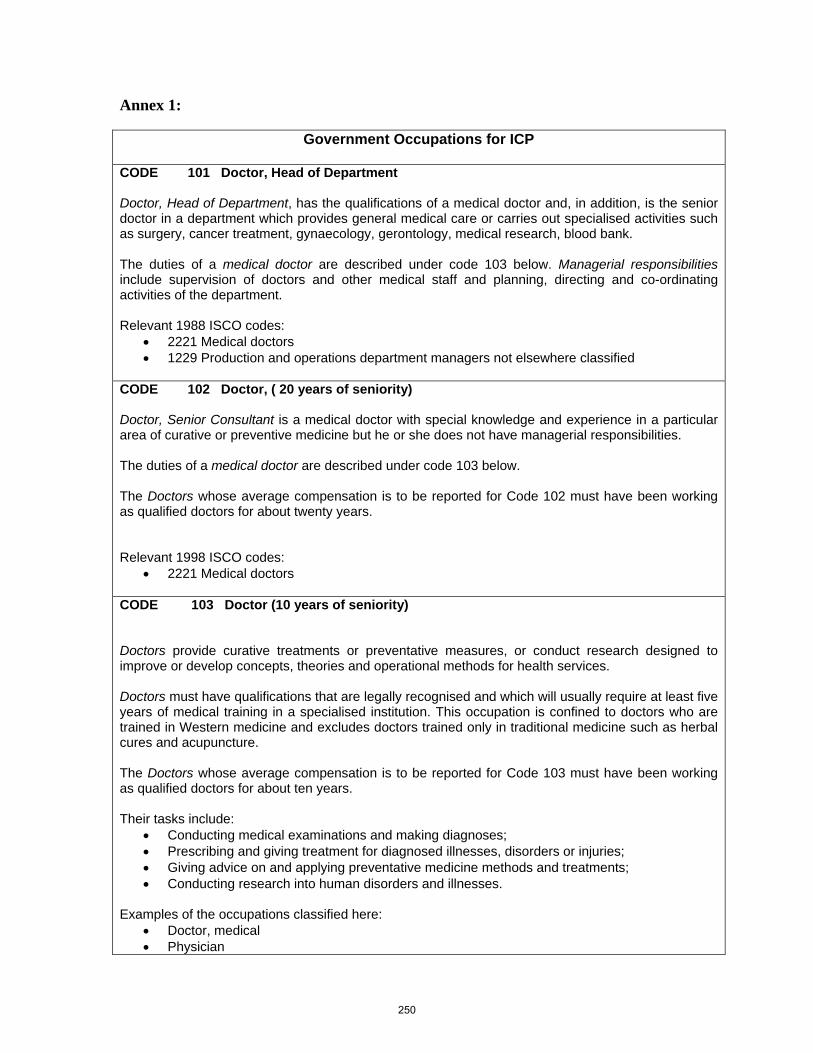
Annex 1:
Government Occupations for ICP
CODE 101 Doctor, Head of Department Doctor, Head of Department, has the qualifications of a medical doctor and, in addition, is the senior doctor in a department which provides general medical care or carries out specialised activities such as surgery, cancer treatment, gynaecology, gerontology, medical research, blood bank. The duties of a medical doctor are described under code 103 below. Managerial responsibilities include supervision of doctors and other medical staff and planning, directing and co-ordinating activities of the department. Relevant 1988 ISCO codes:
• 2221 Medical doctors • 1229 Production and operations department managers not elsewhere classified
CODE 102 Doctor, ( 20 years of seniority) Doctor, Senior Consultant is a medical doctor with special knowledge and experience in a particular area of curative or preventive medicine but he or she does not have managerial responsibilities. The duties of a medical doctor are described under code 103 below. The Doctors whose average compensation is to be reported for Code 102 must have been working as qualified doctors for about twenty years. Relevant 1998 ISCO codes:
• 2221 Medical doctors CODE 103 Doctor (10 years of seniority) Doctors provide curative treatments or preventative measures, or conduct research designed to improve or develop concepts, theories and operational methods for health services. Doctors must have qualifications that are legally recognised and which will usually require at least five years of medical training in a specialised institution. This occupation is confined to doctors who are trained in Western medicine and excludes doctors trained only in traditional medicine such as herbal cures and acupuncture. The Doctors whose average compensation is to be reported for Code 103 must have been working as qualified doctors for about ten years. Their tasks include:
• Conducting medical examinations and making diagnoses; • Prescribing and giving treatment for diagnosed illnesses, disorders or injuries; • Giving advice on and applying preventative medicine methods and treatments; • Conducting research into human disorders and illnesses.
Examples of the occupations classified here:
• Doctor, medical • Physician
250
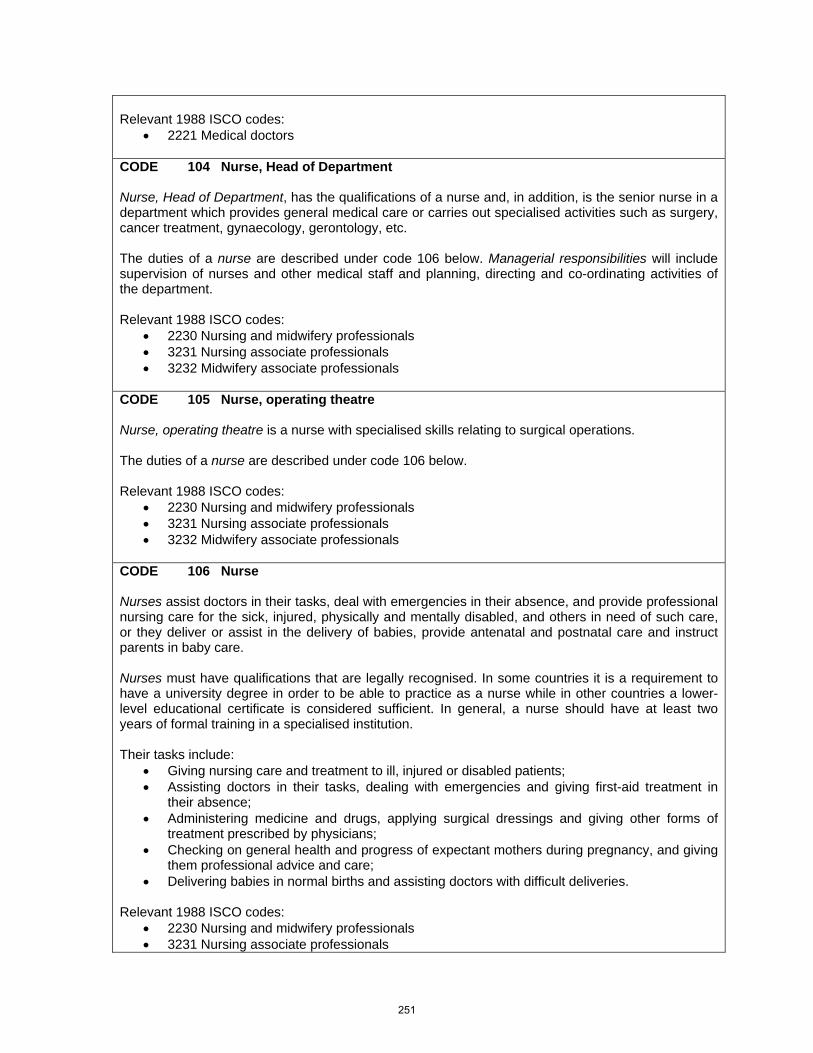
Relevant 1988 ISCO codes:
• 2221 Medical doctors CODE 104 Nurse, Head of Department Nurse, Head of Department, has the qualifications of a nurse and, in addition, is the senior nurse in a department which provides general medical care or carries out specialised activities such as surgery, cancer treatment, gynaecology, gerontology, etc. The duties of a nurse are described under code 106 below. Managerial responsibilities will include supervision of nurses and other medical staff and planning, directing and co-ordinating activities of the department. Relevant 1988 ISCO codes:
• 2230 Nursing and midwifery professionals • 3231 Nursing associate professionals • 3232 Midwifery associate professionals
CODE 105 Nurse, operating theatre Nurse, operating theatre is a nurse with specialised skills relating to surgical operations. The duties of a nurse are described under code 106 below. Relevant 1988 ISCO codes:
• 2230 Nursing and midwifery professionals • 3231 Nursing associate professionals • 3232 Midwifery associate professionals
CODE 106 Nurse Nurses assist doctors in their tasks, deal with emergencies in their absence, and provide professional nursing care for the sick, injured, physically and mentally disabled, and others in need of such care, or they deliver or assist in the delivery of babies, provide antenatal and postnatal care and instruct parents in baby care. Nurses must have qualifications that are legally recognised. In some countries it is a requirement to have a university degree in order to be able to practice as a nurse while in other countries a lower-level educational certificate is considered sufficient. In general, a nurse should have at least two years of formal training in a specialised institution. Their tasks include:
• Giving nursing care and treatment to ill, injured or disabled patients; • Assisting doctors in their tasks, dealing with emergencies and giving first-aid treatment in
their absence; • Administering medicine and drugs, applying surgical dressings and giving other forms of
treatment prescribed by physicians; • Checking on general health and progress of expectant mothers during pregnancy, and giving
them professional advice and care; • Delivering babies in normal births and assisting doctors with difficult deliveries.
Relevant 1988 ISCO codes:
• 2230 Nursing and midwifery professionals • 3231 Nursing associate professionals
251
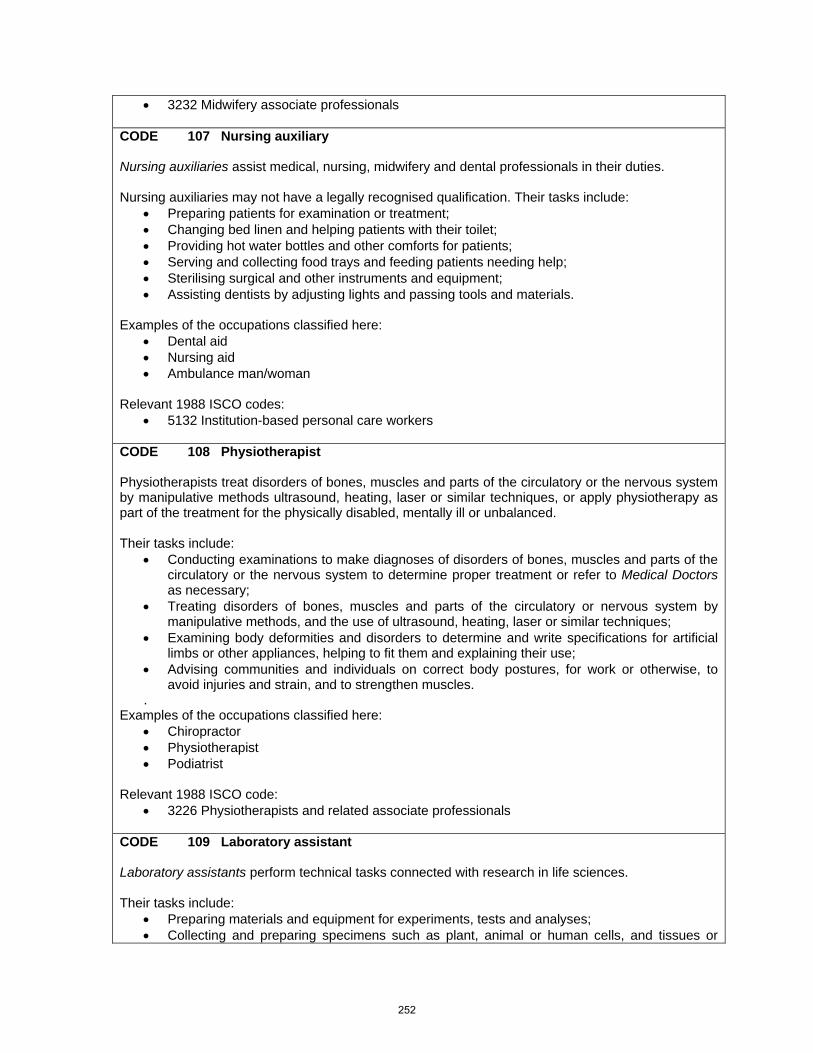
• 3232 Midwifery associate professionals CODE 107 Nursing auxiliary Nursing auxiliaries assist medical, nursing, midwifery and dental professionals in their duties. Nursing auxiliaries may not have a legally recognised qualification. Their tasks include:
• Preparing patients for examination or treatment; • Changing bed linen and helping patients with their toilet; • Providing hot water bottles and other comforts for patients; • Serving and collecting food trays and feeding patients needing help; • Sterilising surgical and other instruments and equipment; • Assisting dentists by adjusting lights and passing tools and materials.
Examples of the occupations classified here:
• Dental aid • Nursing aid • Ambulance man/woman
Relevant 1988 ISCO codes:
• 5132 Institution-based personal care workers CODE 108 Physiotherapist Physiotherapists treat disorders of bones, muscles and parts of the circulatory or the nervous system by manipulative methods ultrasound, heating, laser or similar techniques, or apply physiotherapy as part of the treatment for the physically disabled, mentally ill or unbalanced. Their tasks include:
• Conducting examinations to make diagnoses of disorders of bones, muscles and parts of the circulatory or the nervous system to determine proper treatment or refer to Medical Doctors as necessary;
• Treating disorders of bones, muscles and parts of the circulatory or nervous system by manipulative methods, and the use of ultrasound, heating, laser or similar techniques;
• Examining body deformities and disorders to determine and write specifications for artificial limbs or other appliances, helping to fit them and explaining their use;
• Advising communities and individuals on correct body postures, for work or otherwise, to avoid injuries and strain, and to strengthen muscles.
. Examples of the occupations classified here:
• Chiropractor • Physiotherapist • Podiatrist
Relevant 1988 ISCO code:
• 3226 Physiotherapists and related associate professionals CODE 109 Laboratory assistant Laboratory assistants perform technical tasks connected with research in life sciences. Their tasks include:
• Preparing materials and equipment for experiments, tests and analyses; • Collecting and preparing specimens such as plant, animal or human cells, and tissues or
252

parts or organs for experiments and analyses; • Assisting with and performing experiments and analyses; • Estimating quantities and costs of materials and labour required for projects; • Organising maintenance and repairs of research equipment.
Examples of the occupations classified here:
• Technician, bacteriology • Technician, biochemistry • Technician, blood bank • Technician, pharmacology • Technician, serology
Relevant 1988 ISCO code:
• 3211 Life science technicians CODE 110 Hospital Chief Executive Hospital Chief Executives determine and formulate policies and plan, direct and co-ordinate the general functioning of the hospital within guidelines set by a board of directors or a governing body, to whom they are answerable for the operations undertaken and results obtained. They may not have any medical qualifications. Their tasks include:
• Determining and formulating policies of the hospital; • Planning, directing and co-ordinating the general functioning of the hospital; • Determining and directing a particular policy, through consultation with subordinate
managers; • Reviewing the operations and results of the hospital, and reporting to governing bodies; • Representing the hospital in its dealings with outside bodies, including government or other
authorities. Relevant 1988 ISCO code:
• 1210 Directors and chief executives CODE 111 Secretary (hospital) Secretary (Hospital) carries out the duties described under Code 207 below but works in a hospital. He or she may have received formal training as a medical or hospital secretary or have acquired the necessary skills through on-the-job training Relevant 1988 ISCO codes:
• 4115 Secretaries • 4111 Stenographers and typists • 4112 Word processor and related operators
CODE 112 Cook (not Head Cook) Cook (not Head Cook) prepares and cooks food in hospitals, schools and government offices. Head of Kitchen and Head Cooks are excluded. Relevant 1988 ISCO codes:
• 5122 Cook .
CODE 113 Community Health Worker
253
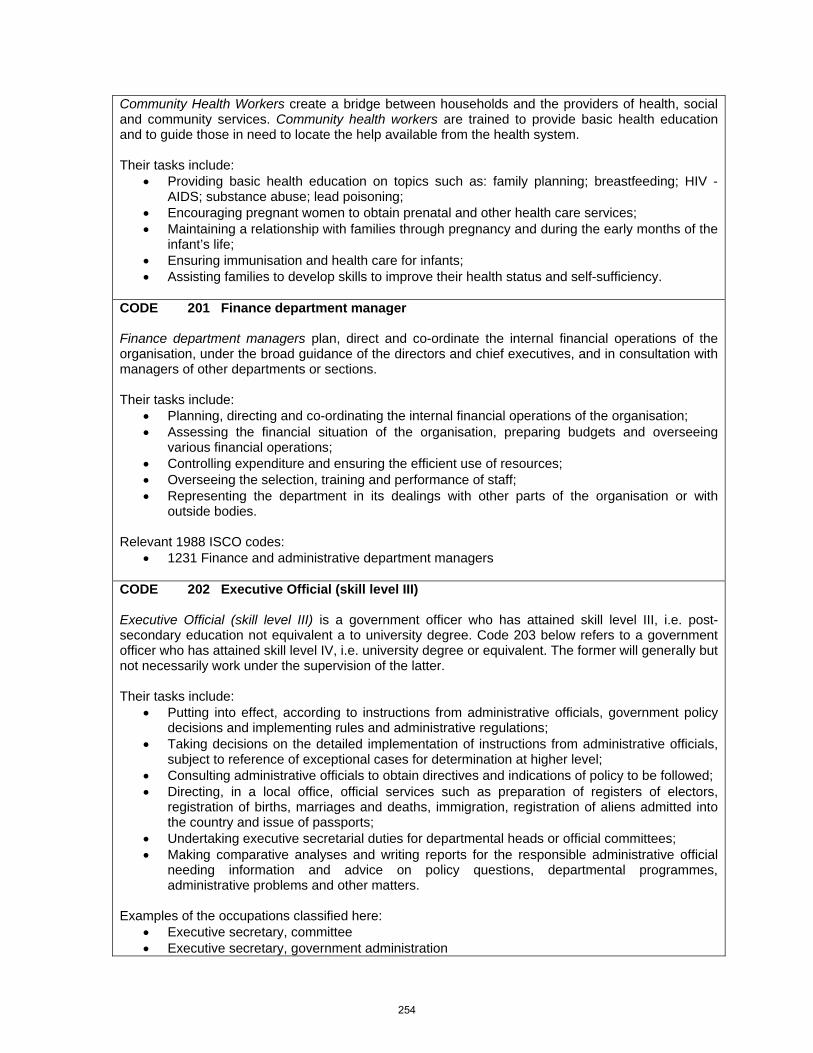
Community Health Workers create a bridge between households and the providers of health, social and community services. Community health workers are trained to provide basic health education and to guide those in need to locate the help available from the health system. Their tasks include:
• Providing basic health education on topics such as: family planning; breastfeeding; HIV - AIDS; substance abuse; lead poisoning;
• Encouraging pregnant women to obtain prenatal and other health care services; • Maintaining a relationship with families through pregnancy and during the early months of the
infant’s life; • Ensuring immunisation and health care for infants; • Assisting families to develop skills to improve their health status and self-sufficiency.
CODE 201 Finance department manager Finance department managers plan, direct and co-ordinate the internal financial operations of the organisation, under the broad guidance of the directors and chief executives, and in consultation with managers of other departments or sections. Their tasks include:
• Planning, directing and co-ordinating the internal financial operations of the organisation; • Assessing the financial situation of the organisation, preparing budgets and overseeing
various financial operations; • Controlling expenditure and ensuring the efficient use of resources; • Overseeing the selection, training and performance of staff; • Representing the department in its dealings with other parts of the organisation or with
outside bodies. Relevant 1988 ISCO codes:
• 1231 Finance and administrative department managers CODE 202 Executive Official (skill level III) Executive Official (skill level III) is a government officer who has attained skill level III, i.e. post-secondary education not equivalent a to university degree. Code 203 below refers to a government officer who has attained skill level IV, i.e. university degree or equivalent. The former will generally but not necessarily work under the supervision of the latter. Their tasks include:
• Putting into effect, according to instructions from administrative officials, government policy decisions and implementing rules and administrative regulations;
• Taking decisions on the detailed implementation of instructions from administrative officials, subject to reference of exceptional cases for determination at higher level;
• Consulting administrative officials to obtain directives and indications of policy to be followed; • Directing, in a local office, official services such as preparation of registers of electors,
registration of births, marriages and deaths, immigration, registration of aliens admitted into the country and issue of passports;
• Undertaking executive secretarial duties for departmental heads or official committees; • Making comparative analyses and writing reports for the responsible administrative official
needing information and advice on policy questions, departmental programmes, administrative problems and other matters.
Examples of the occupations classified here:
• Executive secretary, committee • Executive secretary, government administration
254

• Administrative secretary • Official, consular • Officer, excise • Officer, tax • Officer, pensions • Officer, social benefits • Officer, social security claims • Inspector, prices • Inspector, sanitary • Inspector, wages • Inspector, weights and measures
Relevant 1988 ISCO codes:
• 3431 Administrative secretaries and related associate professionals • 3439 Administrative associate professional not elsewhere classified • 3442 Tax and customs official • 3443 Government social benefits officials • 3449 Customs, tax and related government associate professionals not elsewhere classified
CODE 203 Executive official (skill level IV) Executive Official (skill level IV) is a government officer who has attained skill level IV, i.e. university degree or equivalent. The tasks performed by an Executive Official (skill level IV) are similar to those described above under code 202. They will usually be supervising one or more executive officials of skill level III and will be able to answer questions about technical or policy issues that are referred to them by executive officials of skill level III. Relevant 1988 ISCO codes:
• 3431 Administrative secretaries and related associate professionals • 3439 Administrative associate professional not elsewhere classified • 3442 Tax and customs official • 3443 Government social benefits officials • 3449 Customs, tax and related government associate professionals not elsewhere classified
CODE 204 Computer operator Computer operators operate computers and peripheral equipment and/or they provide assistance to users of desk top computers. They may work with main-frame computers or with distributed computing systems in which desk-top computers are linked to central server units. Their tasks include:
• Operating and controlling peripheral and related computer equipment which is used to record, store, transmit and process digital data;
• Organising computer jobs as specified by users to ensure timely, safe and efficient execution; • Keeping log of computing operators; • Performing back-up operations according to regular procedures; • Assisting users of micro-computers and standard software systems when problems occur; • Installing new peripheral units and making necessary parameter adjustments; • Installing, maintaining and updating computer programs by making minor changes and
adjustments to them under the guidance of Computing professionals; • Maintaining and updating documentation of computer programs and installations.
255
Examples of the occupations classified here: • Operator, computer peripheral equipment • Assistant, computer/systems analysis • Assistant, computer/user services • Assistant, computer/programming
Relevant 1988 ISCO codes:
• 3121 Computer assistants • 3122 Computer equipment operators
CODE 205 Bookkeeping Clerk Bookkeeping Clerk works under the supervision of Bookkeepers. Responsibility for maintaining records is generally restricted to one phase of an undertaking’s activities (e.g. accounts receivable; accounts payable; wages). Work typically involves verifying accuracy of relevant documents and performing necessary calculations, and may involve making and checking entries in ledgers, including balancing them at regular intervals. May make physical checks of stocks. Their tasks include:
• Making entries in accounting and bookkeeping records; • Performing other limited accounting and bookkeeping functions; • Calculating wages due from records of hours worked, or work performed by individual
employees; • Taking charge of cash and keeping records of cash transactions incidental to the business; • Make physical checks of stocks; • Preparing wage packets and pay wages.
Examples of the occupations classified here:
• Clerk, accounts • Clerk, bookkeeping • Clerk, cost computing • Clerk, wages
Relevant 1988 ISCO codes:
• 4121 Accounting and bookkeeping clerks
CODE 206 Data entry clerk Data entry clerks enter numerical and other data into electronic equipment for processing and transmission. Data entry may be done directly from a key board into a desk-top computer and they may also enter data on tapes or cards using punching machines. Their tasks include:
• Entering numerical and other data from source material into computer-compatible storage and processing devices;
• Carrying out standard editing checks and correcting entered data as necessary. Examples of the occupations classified here:·
• Clerk, data entry/computer • Clerk, data entry/converter (card-to-tape) • Clerk, data entry/electronic mail • Clerk, data entry/punching machine (card and tape)
Relevant 1988 ISCO codes:
256

• 4113 Data entry operator CODE 207 Secretary (not hospital) Secretaries use desk-top computers, word-processing equipment or typewriters to check and transcribe correspondence and other documents, deal with incoming and outgoing mail, screen requests for meetings or appointments, record and screen leave and other staff entitlements, organise and supervise filing systems, and deal with routine correspondence on their own initiative. Their tasks include:
• Checking and transcribing correspondence, minutes and reports from dictation, or written drafts to conform to office standards;
• Dealing with incoming or outgoing mail; • Scanning, recording and distributing mail, correspondence and documents; • Screening requests for meetings or appointments and helping to organise meetings; • Screening and recording leave and other staff member entitlements; • Organising and supervising filing systems; • Dealing with routine correspondence on their own initiative; • Performing related tasks.
Examples of the occupations classified here:
• Secretary • Secretary, stenography/typing • Secretary, typing • Secretary, word-processing
Relevant 1988 ISCO codes:
• 4115 Secretaries • 4111 Stenographers and typists • 4112 Word processor and related operators
CODE 208 Telephone switchboard operator Telephone switchboard operators operate a telephone switchboard or a section thereof, and deal with local or long distance calls and various telephone inquiries. Their tasks include:
• Establishing contact between caller and person called; • Making connections for outgoing calls and routing long distance calls; • Recording charges; • Dealing with telephone inquiries and recording messages.
Relevant 1988 ISCO codes:
• 4223 Telephone switchboard operators CODE 209 Messenger Messengers carry and deliver messages, packages and other items within an establishment or between establishments. They deliver messages either on foot or using vehicles such as bicycles and motor scooters. Their main task is delivery of items as requested by employer but they may carry out other errands. They may keep records and obtain receipts for articles delivered. Relevant 1988 ISCO codes:
• 9151 Messengers, package and luggage porters and deliverers
257

CODE 210 Maintenance electrician Maintenance electricians install, maintain and repair electrical wiring systems and related equipment in hospitals, schools or government buildings. Their tasks include:
• Installing, maintaining and repairing electrical wiring systems; • Installing, maintaining and repairing electrical equipment.
Examples of the occupations classified here:
• Electrician • Electrician, building repairs
Relevant 1988 ISCO codes:
• 7137 Building and related electricians CODE 211 Building Caretaker Building caretakers take care of schools, hospitals or government buildings and maintain them in a clean and orderly condition. Their tasks include:
• Regulating conduct of office-workers and visitors in such matters as noise abatement or misuse of property;
• Participating in cleaning, simple repairs and maintenance of building interiors; • Tending furnaces and boilers to ensure provision of heat and hot water; • Providing services such as accepting deliveries or providing requested information to callers.
Examples of the occupations classified here:
• Caretaker, building/cleaning • Concierge, building • Janitor
Relevant 1988 ISCO codes:
• 9141 Building caretakers
CODE 212 Cleaner Cleaners in schools, hospitals and government offices perform various cleaning tasks in order to keep the interiors and fixtures of buildings clean and tidy. Their tasks include:
• Sweeping or vacuum-cleaning, washing and polishing floors, furniture and other fixtures; • Cleaning bathrooms, supplying towels, soap and related items; • Cleaning kitchens.
Relevant 1988 ISCO codes:
• 9132 Helpers and cleaners in offices, hotels and other establishments CODE 213 Policeman/woman Policemen/women maintain law and order and enforce laws and regulations. Work typically involves gaining familiarity with an area and the persons living in it, noting suspicious activities, patrolling assigned area, rendering first aid, making investigations, maintaining logs of their activities and giving evidence in legal proceedings. They generally work under supervision of police inspectors or
258

detectives. Their tasks include:
• Maintaining law and order; • Protecting persons and property from hazards and unlawful acts; • Arresting persons for contraventions of the law; • Directing traffic and assuming authority in the case of accidents. • Giving evidence in court; • Maintaining records of their activities.
Examples of the occupations classified here:
• Constable • Patrolman, police • Patrolwoman, police • Police officer • River policeman/woman • Harbour policeman/women
Relevant 1988 ISCO codes:
• 5162 Police officers CODE 214 Prison Guard Prison guards watch over and maintain discipline among inmates of prisons, reformatories or penitentiaries. Their tasks include:
• Searching arriving prisoners, putting their valuables in safekeeping, escorting prisoners to cells and locking them in;
• Making periodic inspection tours of cells; • Supervising prisoners at work, meals, or during walks and patrolling prison areas to prevent
escape. Examples of the occupations classified here:
• Guard, prison • Warder, prison
Relevant 1988 ISCO codes:
• 5163 Prison guards CODE 215 Fire fighter Fire fighters prevent and fight fires, rescue persons and salvage property and goods during and after fires and major accidents. Their tasks include:
• Preventing and fighting fires; • Fighting special types of fires and using special equipment in industrial establishments; • Preventing and extinguishing fires in crashed or damaged aircraft and rescuing crew and
passengers; • Rescuing persons and salvaging property and goods during and after fires and major
accidents; • Preventing or limiting the spread of dangerous substances in case of fires or accidents.
259

Examples of the occupations classified here: • Fire-fighter • Fire-fighter, aircraft accidents • Fire-fighter, forest • Salvageman, fire • Salvagewoman, fire
Relevant 1988 ISCO codes:
• 5161 Firefighters CODE 216 Social worker Social workers provide guidance to clients in social and related matters to enable them to find and use resources to overcome difficulties and achieve particular goals. In some countries it is a legal requirement to have a university degree in order to be able to practise as a social worker while in other countries a lower-level educational certificate is considered sufficient. Their tasks include:
• Helping individuals and families with personal and social problems; • Collecting information relevant to clients’ needs and advising them on their rights and
obligations; • Analysing the clients’ situation and presenting alternative approaches to resolving problems; • Compiling case records or reports for courts and other legal proceedings; • Planning, evaluating, improving and developing welfare services; • Preventing delinquency or rehabilitating delinquents by organising social, recreational and
educational activities; • Helping physically and mentally handicapped persons to obtain adequate treatment and
improve their ability to function in society; • Planning, organising or providing home help services.
Examples of the occupations classified here:
• Social worker, professional • Social worker, associate professional • Welfare worker, professional • Welfare worker, associate professional
Relevant 1988 ISCO codes:
• 2446 Social work professionals • 3460 Social work associate professionals
CODE 217 Town planner Town planners advise on the layout of towns, landscape and traffic systems, and plan and monitor their construction, maintenance and rehabilitation. Their tasks include:
• Planning layout and co-ordinating development of urban areas; • Planning and designing the development of land areas for parks, schools, airports, roadways
and related projects, and for commercial, industrial and residential sites; • Planning and advising on routing and control of road and other traffic.
Examples of the occupations classified here:
• Planner, traffic • Planner, urban
260

Relevant 1988 ISCO codes:
• 2141 Architects, town and traffic planners CODE 218 Civil engineer Civil engineers design structures such as bridges, dams, docks, roads, airports, railways, waste disposal and flood control systems and industrial and other large buildings, and plan, organise and supervise their construction, maintenance and repair. Their tasks include:
• Studying projects, assessing broad requirements, examining sites and determining most suitable location for structure;
• Calculating stresses and strains implicit in proposed structure, taking account of such factors as estimated load, water pressures, wind resistance, temperature fluctuations and nature of building materials to be used;
• Consulting with other specialists, such as mechanical, electrical and chemical engineers and building and landscape architects, regarding technical and aesthetic requirements;
• Designing structures and preparing costs estimates, working plans and specifications, indicating types of materials, earth-moving, hoisting and other equipment required;
• Preparing work schedules and directs operations as work proceeds; • Planning, organising and supervising maintenance and repair work on existing structures.
Examples of the occupations classified here:
• Engineer, civil • Engineer, civil/aerodrome construction • Engineer, civil/bridge construction • Engineer, civil/building construction • Engineer, civil/highway and street construction • Engineer, structural
Relevant 1988 ISCO codes:
• 2142 Civil engineer CODE 219 Draughtsman/draughtswomen Draughtspersons prepare technical drawings, maps and illustrations from sketches, measurements and other data. Their tasks include:
• Preparing working drawings from specifications prepared by engineers and designers for the manufacture and installation of machinery and equipment or for the construction of buildings, dams, bridges, roads and other civil engineering projects;
• Operating computer-assisted drawing equipment to create, modify and generate hard copy and digital representations of working drawings.
Examples of the occupations classified here:
• Draughtsperson, architectural • Draughtsperson, cartographic • Draughtsperson, engineering/civi;
Relevant 1988 ISCO codes:
• 3118 Draughtsperson
261
CODE 220 Construction labourer Construction labourers perform simple and routine tasks in connection with the construction and maintenance of buildings roads, dams and similar constructions. Tasks include:
• Digging and filling holes and trenches; • Spreading gravel and related materials; • Carrying bricks and mortar; • Cleaning used building bricks and doing other simple work on demolition sites.
Examples of the occupations classified here:
• Labourer, construction • Labourer, maintenance/dams • Labourer, construction/buildings • Labourer, demolition
Relevant 1988 ISCO codes:
• 9312 Construction and maintenance labourers : roads, dams and similar • 9313 Building construction labourers
CODE 221 Chauffeur Drivers are chauffeurs for senior government officials. Their tasks include:
• Driving passenger cars to convey senior officials on government business, without charge; • Cleaning and simple maintenance of their vehicles.
Relevant 1988 ISCO codes:
• 8322 Car, taxi and van drivers CODE 222 Agricultural Scientist Agricultural Scientists conduct research relating to crops and animal husbandry. Field Crops and Horticultural specialists provide both new and improved methods of cultivation and develop new and improved genetic varieties; Animal Husbandry specialists develop new and improved methods of feeding, nutrition, and develop new breeds of animals
• • Their research may concern: • field crops and grasses and developing new or improved cultivation methods; • horticultural crops and developing new or improved cultivation methods; • animal husbandry and developing new or improved breeding methods; • tree propagation and culture; • productivity of soils and reducing soil erosion; • methods for wildlife conservation; • reducing the impact of agriculture on the environment.
Examples of the occupations classified here:
• Agronomist • Animal scientist • Forestry scientist • Horticulturist
262
• Soil scientist Relevant 1988 ISCO codes:
• 2213 Agronomists and related professionals CODE 223 Librarian Librarians collect and store recorded or published material, and retrieve and provide information as requested.
Their tasks include: • Organising, developing and maintaining a systematic collection of books, periodicals and
other printed or audio-visually recorded material ; • Selecting and recommending acquisitions of books and other printed or audio-visually
recorded material ; • Organising, classifying and cataloguing library material ; • Organising and administering loan systems and information networks ; • Retrieving material and providing information to business and other users based on the
collection itself or on library and information-network systems ; • Conducting researching and analysing or modifying library and information services in
accordance with changes in user’s needs. Examples of the occupations classified here :
• Information scientist • Librarian
Relevant 1988 ISCO codes:
• Librarians and related information professionals CODE 224 Data-base Administrator Data-base Administrators set-up and/or maintain computerised data bases containing statistics or text or both. The data-bases may relate to a wide variety of topics such as demographic or economic statistics, property ownership, births and deaths, personnel records, vehicle registrations, hospital admissions, police arrests and convictions, etc. Their tasks include:
• Identifying user requirements; • Designing and implementing security measures to prevent unauthorised access; • Establishing and operating back-up systems to avoid loss of records in the event of computer
failure; • Performing, or arranging for, entry of new data; • Editing data to detect errors and making the necessary corrections; • Creating and maintaining documentation on the content of the data base; • Advising users on the correct exploitation of the data-base; • Extracting data or text in the form of tables or graphs for use in analytic reports and
publications. Examples of the occupations classified here:
263

• Data-base administrator; • Data-base manager;
CODE 225 Web Administrator Web Administrators are responsible for maintaining the pages of Internet Sites owned by government departments, universities, hospitals etc. A Web Administrator is not a Web Designer (or Web Master); the latter creates Internet Sites using specialised software while the former is responsible for the content of the site. Their tasks include:
• Updating web pages by, for example, adding information on new services or publications that have become available;
• Consulting staff in various parts of the organisation to ensure that all relevant activities and services are listed on the internet site;
• Editing texts to ensure their accuracy and that they conform to common standards; • Keeping statistics on the frequency of use of the site; • Keeping records of problems encountered by users; • Liaising with the Web Designer to resolve problems of access and search-engines.
Examples of the occupations classified here:
• Web administrator • Web manager • Web developer • Internet developers
CODE 226 Bodyguard (protecting senior officials) Bodyguards (protecting senior officials) are responsible for ensuring the personal safety of high ranking officials in government, such as ministers or senior civil servants. They do this mainly by keeping close to officials during public engagements so as to shield them from physical attacks. Bodyguards will normally have received training in martial arts, in the use of close-range weapons and in other security procedures. CODE 301 Kindergarten teacher Kindergarten teachers teach children below primary school age. Primary education typically begins at age 5, 6 or 7. In some countries it is a legal requirement to have a university degree in order to be able to practise these occupations while in other countries a lower-level educational certificate is considered sufficient. Teachers of children with special-needs are excluded. Their tasks include:
• Planning and organising activities designed to facilitate the children’s development of physical and social skills;
• Promoting language development through story-telling, role-play, songs, rhymes and informal conversations and discussions;
• Observing children in order to evaluate and discuss progress and possible problems with parents;
• Supervising children’s activities to ensure safety and resolve conflicts. Examples of the occupations classified here:
• Teacher, pre-primary education/professional • Teacher, pre-primary education/associate professional • Teacher, nursery/associate professional
264

Relevant 1988 ISCO codes:
• 2332 Pre-primary education teaching professionals • 3320 Pre-primary education teaching associate professionals
CODE 302 Primary teacher Primary teachers teach a range of subjects at the primary education level. Primary education typically begins at age 5, 6 or 7 and lasts about 5 years. In some countries it is a legal requirement to have a university degree in order to be able to practise these occupations while in other countries a lower-level educational certificate is considered sufficient. Teachers of children with special-needs are excluded. Their tasks include:
• Supervising pupils in classroom and in other areas of the school; • Preparing a programme of learning and giving instruction in areas such as reading, writing,
arithmetic and other subjects, within a prescribed curriculum; • Preparing, administering and marking tests, projects and assignments to train pupils and to
evaluate their progress; • Organising and supervising pupils’ extra-curricular activities; • Discussing their progress with parents and head teacher.
Examples of the occupations classified here:
• Teacher, primary education/professional • Teacher, primary education/associate professional.
Relevant 1988 ISCO codes:
• 2331 Primary education teaching professional • 3310 Primary education teaching associate professional
CODE 303 Secondary teacher Secondary teachers teach one or more subjects for educational or vocational purposes at some or all levels between the termination of primary education and the beginning of studies at colleges or universities. Teaching children with special-needs and teaching reading, writing and other primary subjects to adults are excluded. Their tasks include:
• Giving lessons in their subjects and supervising pupils’ class work and discipline; • Preparing, assigning and correcting exercises; • Administering and marking tests and examinations to evaluate pupils’ progress; • Preparing reports about pupils’ work and conferring with other teachers and parents; • Organising or assisting with extra-curricular activities such as debating societies or hobby
clubs; • Designing and modifying curricula and preparing educational and vocational courses of
study. Examples of the occupations classified here:
• Teacher, secondary education • Teacher, secondary education/vocational training.
Relevant 1988 ISCO codes:
• 2320 Secondary education teaching professionals
265

CODE 304 University lecturer University lecturers teach at universities and similar institutions of higher learning. Their students have completed secondary education and may be undergraduates or post-graduates. They also carry out research and prepare scholarly papers and books. Their tasks include:
• Designing and modifying curricula and preparing courses of study in accordance with requirements;
• Delivering lectures and conducting tutorials, seminars and laboratory experiments; • Supervising experimental and practical work undertaken by students; • Administering , evaluating and marking examination papers and tests; • Directing research of post-graduates students.
Examples of the occupations classified here:
• Lecturer, college • Lecturer, university
Relevant 1988 ISCO codes:
• 2310 College, university and higher education teaching professionals CODE 305 Head teacher A Head Teacher is the senior teacher with managerial responsibilities for the school. Includes Head Teachers at kindergarten, primary and secondary schools. Their tasks include:
• Managing the budget; • Recruitment and staff training; • Liaison with the parents; • Designing and adapting the curriculum in accordance with government guidelines; • Fund-raising; • Teaching (the tasks of a teacher are described under codes 301 to 303 above).
Examples of the occupations classified here:
• Head teacher; • Headmistress; • Headmaster.
Relevant 1988 ISCO codes:
• 1229 Production and operations department managers not elsewhere classified
CODE 401 Army: Private of Infantry The occupation Private of Infantry refers to regular members of the armed forces who have voluntarily joined the army; it excludes conscripts who are enrolled for military service on a compulsory basis. This occupation excludes privates of specialist regiments such as: artillery; cavalry; sappers; engineers; parachutists; signallers; tank corps; pay corps; supply corps. This occupation corresponds to the rank OR-2 in the International/NATO military ranking code. The OR-1 rank is the entry or recruitment rank and a Private of Infantry of rank OR-2 will have completed basic training in the use of rifles and other infantry weapons, parade-ground drill, marching and
266

fighting under simulated battle-field conditions, and maintenance of personal and military equipment. CODE 402 Army: Commander of Infantry Regiment The occupation Commander of Infantry Regiment refers to regular members of the armed forces who have voluntarily joined the army; it excludes conscripts who are enrolled for military service on a compulsory basis. This occupation excludes commanders of specialist regiments such as: artillery; cavalry; sappers; engineers; parachutists; signallers; tank corps; pay corps; supply corps. This occupation corresponds to the rank OF-4 in the International/NATO military ranking code. Equivalent terms are: Lieutenant Colonel in America and Britain, Teniente coronel in Spain, Lieutenant-Colonel in France, Oberstleutnant in Germany and Podpolkovnik in Russia. See http://en.wikipedia.org/wiki/Comparative_military_ranks for equivalent ranks in other countries. CODE 403 Navy: Able Seaman The occupation Able Seaman refers to regular members of the armed forces who have voluntarily joined the armed forces; it excludes conscripts who are enrolled for military service on a compulsory basis. This occupation corresponds to the rank OR-2 in the International/NATO military ranking code. The OR-1 rank is the entry or recruitment rank and an Able Seaman of rank OR-2 will have undergone a period of training during which he or she will have learned to keep watches at sea, to handle mooring lines, to steer the ship under instructions, to perform deck and hull cleaning and painting. Training may also include the operation of anti-submarine or anti-aircraft weapons, torpedoes or surface-to-surface guns or missiles. CODE 404 Navy: Commander of Frigate The occupation Commander of Frigate refers to regular members of the armed forces who have voluntarily joined the armed forces; it excludes conscripts who are enrolled for military service on a compulsory basis. A frigate is a warship that is larger than a corvette and smaller than a destroyer. It will usually be equipped with one or more of the following types of weapons: guns or missiles for anti-aircraft or surface-to-surface use; anti-submarine devices; torpedoes. This occupation corresponds to the rank OF-4 in the International/NATO military ranking code. Equivalent terms are: Commander in America and Britain, Capitán de fragata in Spain, Capitaine de Fregate in France, Lieutenant Colonel in Singapore, Fregattenkapitän in Germany and Kapitan vtorogo ranga in Russia. See http://en.wikipedia.org/wiki/Comparative_military_ranks for the equivalent terms in other countries. CODE 405 Air Force: Airman (ground crew) The occupation Airman (ground crew) refers to regular members of the armed forces who have voluntarily joined the armed forces; it excludes conscripts who are enrolled for military service on a compulsory basis. This occupation corresponds to the rank OR-2 in the International/NATO military ranking code. The OR-1 rank is the entry or recruitment rank and an Airman (ground grew) of rank OR-2 will have been trained in one or more of the following skills: fitting, examining, testing and servicing aircraft engines; replacing engine components or complete engines; servicing and arming guns and air-to-air or air-to-
267

surface missiles; maintenance of navigation, radar and other detection devices. CODE 406 Air Force: Fighter Pilot/Wing Commander The occupation Wing Commander refers to regular members of the armed forces who have voluntarily joined the armed forces; it excludes conscripts who are enrolled for military service on a compulsory basis. A Wing Commander will be a qualified pilot and will have received training in aircraft weapons systems and detection devices as well as in navigation and control of the aircraft. A Wing Commander leads and directs two or more squadrons of combat aircraft. This occupation corresponds to the rank OF-4 in the International/NATO military ranking code. Equivalent terms are: Lieutenant Colonel in America, Wing Commander in Britain, Teniente Coronel in Spain, Lieutenant Colonel in Singapore, Oberstleutnant in Germany, and Podpolkovnik in Russia . See http://en.wikipedia.org/wiki/Comparative_military_ranks for the equivalent ranks in other countries.
268

Annex 2:
Questionnaire on Compensation of Employees in Government (Country _____________________)
The information from this questionnaire is used to calculate Purchasing Power Parities for Government Final Consumption Expenditure. In a separate attachment you will find descriptions of ten occupations for which you are requested to provide the following information on compensation of employees and the numbers of hours and days worked by employees in these occupations.
Questionnaire on Compensation of Employees in Government
Occupation code number
Occupation description
Gross wages and salaries in cash
plus Employers’ actual social contributions
plus Employers’ imputed social contributions
plus Income in kind: housing
plus Income in kind: food and meals
equals Annual compensation of employees
Number of regular hours actually worked per week
Number of days of annual leave per year
Number of public holidays per year
Year for which data are reported
Currency unit
269
Explanatory notes This questionnaire refer to employees of central government and should be national averages of compensation of employees for the persons in each occupation who are paid from the central government budget in the capital city and in other cities or rural areas. In some countries certain types of employees – e.g. teachers or the police – may be paid only from state or local government budgets; in this case you should provide compensation of employees for persons employed from these budgets.
Occupation code number and occupation description are taken from the list of Government Occupations for ICP.
Gross salaries and wages in cash are to be reported before deduction of taxes and social contributions payable by employees. They consist of two components:
• Basic salaries as laid down in the salary scale. The Box below explains how salary scales are used to obtain basic salaries.
• Other payments, over and above the basic salary, such as: housing or residence allowance, passage or leave allowance, family allowance, special duty allowance or acting allowance, 13th month pay and other cash payments, but not overtime payments. These payments over and above the basic salary are usually a fixed percentage of the basic salary.
Employers' actual social contributions are payments made by general government for the benefit of their employees and cover contributions for old age pensions, and for insurance against sickness, accident and disability.
Imputed social contributions represent the counterpart to social benefits paid directly by general government institutions without participating in, or establishing a fund, reserve or other special scheme for this purpose. Since these contributions do not involve actual cash flows, they have to be imputed. The imputations have to be done in line with the corresponding imputations made in the national account.
Income in kind: housing is the cost to the employer of providing free or subsidised housing to employees.
Income in kind: food and meals is the cost to the employer of providing free or subsidised food or meals to employees.
Number of regular hours actually worked per week.
• The number of regular hours excludes overtime.
• The number of hours worked excludes time allowed for lunch or prayer breaks.
• In some countries government employees are paid such low wages that they are allowed to work less hours than are stipulated in their contracts in order that they can earn extra money in a second job. In such cases, please record the usual number of hours actually worked.
Number of days of annual leave per year refers to paid leave. It excludes days that may be allowed for paid sick leave, maternity leave, compassionate leave, or public holidays.
270

Number of public holidays per year refers to the number of public holidays such as bank holidays, religious festival days, independence days, and any other regular holidays that are declared to commemorate special events.
271
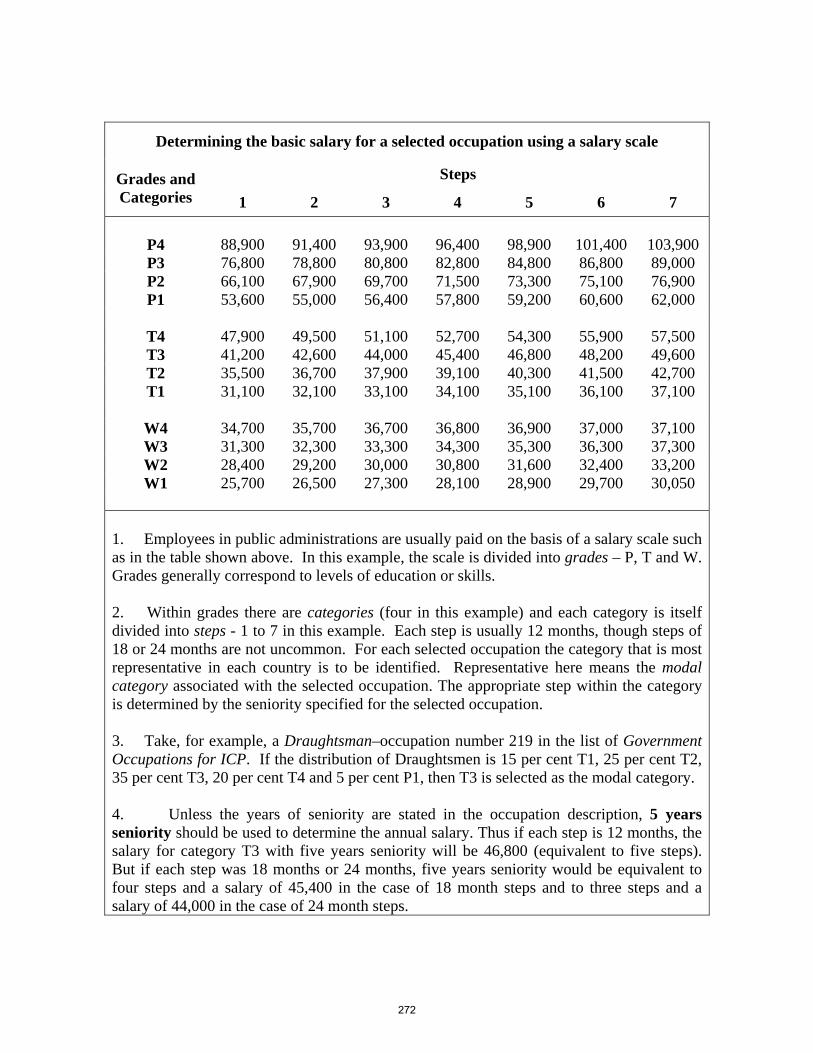
Determining the basic salary for a selected occupation using a salary scale
Steps Grades and Categories 1 2 3 4 5 6 7
P4 88,900 91,400 93,900 96,400 98,900 101,400 103,900 P3 76,800 78,800 80,800 82,800 84,800 86,800 89,000 P2 66,100 67,900 69,700 71,500 73,300 75,100 76,900 P1 53,600 55,000 56,400 57,800 59,200 60,600 62,000
T4 47,900 49,500 51,100 52,700 54,300 55,900 57,500 T3 41,200 42,600 44,000 45,400 46,800 48,200 49,600 T2 35,500 36,700 37,900 39,100 40,300 41,500 42,700 T1 31,100 32,100 33,100 34,100 35,100 36,100 37,100
W4 34,700 35,700 36,700 36,800 36,900 37,000 37,100 W3 31,300 32,300 33,300 34,300 35,300 36,300 37,300 W2 28,400 29,200 30,000 30,800 31,600 32,400 33,200 W1 25,700 26,500 27,300 28,100 28,900 29,700 30,050
1. Employees in public administrations are usually paid on the basis of a salary scale such as in the table shown above. In this example, the scale is divided into grades – P, T and W. Grades generally correspond to levels of education or skills. 2. Within grades there are categories (four in this example) and each category is itself divided into steps - 1 to 7 in this example. Each step is usually 12 months, though steps of 18 or 24 months are not uncommon. For each selected occupation the category that is most representative in each country is to be identified. Representative here means the modal category associated with the selected occupation. The appropriate step within the category is determined by the seniority specified for the selected occupation. 3. Take, for example, a Draughtsman–occupation number 219 in the list of Government Occupations for ICP. If the distribution of Draughtsmen is 15 per cent T1, 25 per cent T2, 35 per cent T3, 20 per cent T4 and 5 per cent P1, then T3 is selected as the modal category. 4. Unless the years of seniority are stated in the occupation description, 5 years seniority should be used to determine the annual salary. Thus if each step is 12 months, the salary for category T3 with five years seniority will be 46,800 (equivalent to five steps). But if each step was 18 months or 24 months, five years seniority would be equivalent to four steps and a salary of 45,400 in the case of 18 month steps and to three steps and a salary of 44,000 in the case of 24 month steps.
272

Comments. Questionnaire completed by:
Mr/ Mrs/ Ms________________________________________
Job title ____________________________________________
e-mail _____________________________________________
Telephone __________________________________________
Address ____________________________________________
___________________________________________________
Country_____________________________________________
Date _______________________________________________
273
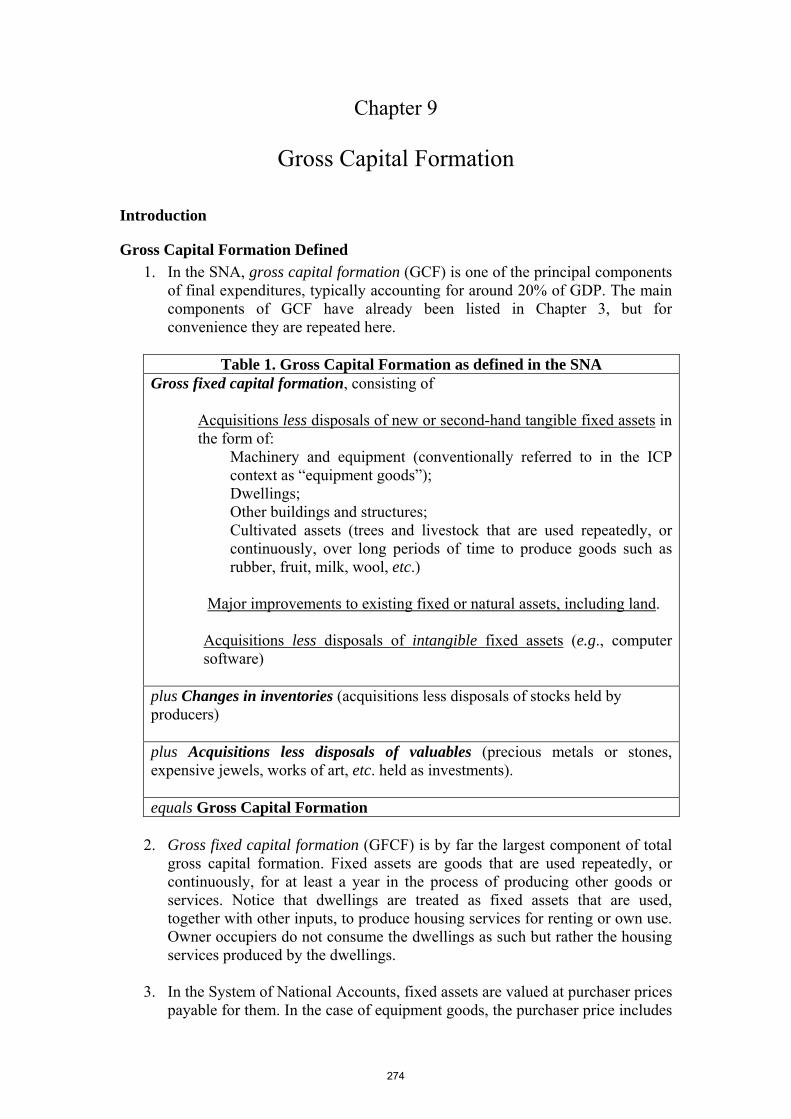
Chapter 9
Gross Capital Formation
Introduction
Gross Capital Formation Defined 1. In the SNA, gross capital formation (GCF) is one of the principal components
of final expenditures, typically accounting for around 20% of GDP. The main components of GCF have already been listed in Chapter 3, but for convenience they are repeated here.
Table 1. Gross Capital Formation as defined in the SNA
Gross fixed capital formation, consisting of
Acquisitions less disposals of new or second-hand tangible fixed assets in the form of:
Machinery and equipment (conventionally referred to in the ICP context as “equipment goods”);
Dwellings; Other buildings and structures;
Cultivated assets (trees and livestock that are used repeatedly, or continuously, over long periods of time to produce goods such as rubber, fruit, milk, wool, etc.)
Major improvements to existing fixed or natural assets, including land. Acquisitions less disposals of intangible fixed assets (e.g., computer
software) plus Changes in inventories (acquisitions less disposals of stocks held by producers) plus Acquisitions less disposals of valuables (precious metals or stones, expensive jewels, works of art, etc. held as investments). equals Gross Capital Formation
2. Gross fixed capital formation (GFCF) is by far the largest component of total
gross capital formation. Fixed assets are goods that are used repeatedly, or continuously, for at least a year in the process of producing other goods or services. Notice that dwellings are treated as fixed assets that are used, together with other inputs, to produce housing services for renting or own use. Owner occupiers do not consume the dwellings as such but rather the housing services produced by the dwellings.
3. In the System of National Accounts, fixed assets are valued at purchaser prices
payable for them. In the case of equipment goods, the purchaser price includes
274
all the transportation or other costs incurred in delivering and installing the asset in the desired location. The purchaser price includes any (non-deductible) taxes payable on the assets and also includes the costs of any professional services incurred, such as the fees payable to surveyors, architects, lawyers, etc. As explained below, there are occasions when, for practical or cost reasons, it is necessary to depart from the strict SNA definition of purchaser prices in reporting prices of fixed assets for the ICP.
4. GFCF consists of the value of both new and existing (i.e. used or second hand)
fixed assets acquired less the value of any existing assets sold to another enterprise for use in production or sold as scrap. Imports of second hand machinery and equipment can be a major component of GFCF in certain countries and there is extensive international trade in used assets such asy road vehicles, ships and aircraft.
5. Changes in inventories consist of the value of the raw materials, semi-finished
or finished goods put into inventories (or stocks) by producers less the value of the goods disposed of. The semi-finished goods include work-in-progress, which can be particularly important for production processes with long gestation periods, such as construction projects or forests. See paragraphs 26 to 29 of Chapter 3 for further details.
6. Valuables consist of goods held as stores of value or in the expectation of
capital gains. They include gold and other precious metals or stones, works of art, and expensive jewelry. Acquisitions less disposals of valuables constitute a form of investment or gross capital formation. See also paragraphs 29 and 30 of Chapter 3.
Price Surveys for Gross Capital Formation 7. Two kinds of price surveys are conducted for ICP purposes. One is a survey of
the prices of equipment goods and of computer software. The second is a survey of the prices of a set of construction components – i.e. the elementary parts that are assembled by a construction firm to make dwellings, non-residential buildings and civil engineering works. This chapter deals with the methods used in these two surveys. Price surveys are not carried out for the other components of GCF. The procedure followed for the other two components, changes in inventories and net acquisitions of valuables is to impute a PPP on the basis of the PPPs calculated for other categories of expenditure. These are usually referred to as “reference PPPs”.
Some Special Problems 8. Capital goods can be much more complex and variable than consumer goods.
For this reason, it maybe more difficult to obtain perfect matches between the capital goods purchased in different countries than for consumer goods. Brands have an important role to play, but characteristics of a capital good with the same international brand and serial or model number are actually liable to differ from country to country because of variations in local tastes, conditions, climates, regulations or the marketing strategy adopted by the
275
producer. The characteristics of buildings and other structures can also be extremely complex and highly variable from country to country. Many structures are unique without any comparable or matching products in any other country, or even in any other time period within the same country.
9. The complexity of many capital goods is so great that the expertise required to
draw up appropriate specifications for the products to be priced and to obtain average prices for them are not to be found within most statistical offices. Building engineers, architects, quantity surveyors or other experts have to draw up the specifications and determine the appropriate prices. In some countries these specialists can be found in government departments such as public works departments, construction ministries or other government agencies responsible for building regulations or for purchasing equipment for government use. In other countries this work has to be contracted out to consultancy firms specializing in engineering and/or construction. These consultancies can be expensive and may use up a lot of the total resources available for PPP work. Contracting out the work to professional consultancy firms also means that there is no equivalent to the pre-survey for consumer goods involving prolonged interaction between the regional coordinators and the national statistical offices.
II. Pricing Equipment Goods
General approach 10. The approach adopted for equipment goods is similar to that followed for
consumer goods and services in that it starts with the creation of a set of Standard Product Descriptions (SPDs) by the Global Office. (See “Equipment Goods Survey” by Stephen Burdette, ICP website)
11. However, there is an important difference compared with consumer goods and
services in that the Global Office has partly converted the SPDs to Product Specifications (PSs) in the following manner:
• For each SPD the Global Office has identified the manufacturers and model
numbers of the equipment to be priced. At least two manufacturers and model numbers are specified for each SPD.
• Countries are requested to provide prices for these in the order of preference in which they are listed. In other words, the first model listed is the preferred one and should be priced by countries provided that it is available and in common use. If it is not, then the next model in the list should be priced, and so on.
• If two or more of the listed models are available and in common use, countries are requested to provide prices for all of them.
• If none of the models listed are available and in common use, countries should price an equivalent model that is commonly used in their country. An equivalent model is one that meets the same needs with equal efficiency.
• If countries decide to price an equivalent model rather than one of those specified in the SPD, they must also provide the information on Product
276
Characteristics that is listed below the photograph on the second page of the SPD. This part of the SPD does not need to be completed if prices are reported for one of the specified items of equipment.
• The Product Characteristics listed in this part of the SPD are of two kinds – key characteristics and other characteristics. Key characteristics are shaded and must always be completed. Countries are requested to provide information on the other (non-shaded) characteristics to the extent possible.
Layout of the SPDs and Reporting Forms 12. The SPDs are also the forms on which countries will report the prices and
related information. Box 1 below is a sample SPD for a “Utility Tractor”. This is a general purpose tractor used primarily on farms.
13. The SPD first gives a general description of the piece of equipment and its
usual purpose. This is followed by its principal specifications which, in this case, are the engine power, drive configuration (two-wheel drive) and type of roll-over protection provided for the tractor-driver.
14. Three utility tractors are specified. The Kubota M6800 is identified as the
preferred model but there are two alternates a Massey-Ferguson and a Mahindra. Provision is also made for an unspecified alternate in the event that none of the three listed models are available and in common use in the country.
15. The next part of the SPD requests information on the terms and conditions of
the sale – specifically whether installation and transportation costs are included and about product taxes. Prices are requested for mid-2005 if possible but provision is also made for reporting the 2006 price. (See below for further information on the timing of data collection.)
16. Information is next requested on the source of the price data, after which there
is a picture of the piece of equipment. It is generic image and is not necessarily a picture of the preferred or alternate pieces of equipment specified in the SPD.
17. After the picture there is a list of product specifications. These are only to be
filled in by countries that have priced an unspecified alternate. The product specifications are of two kinds – key characteristics and other characteristics, with the key characteristics identified by shading. For example, in the case of a utility tractor, shipping weight is a key-characteristic whereas fuel-type is not. It is compulsory to provide information on key characteristics while countries are requested to provide information on other characteristics if they can do so easily.
Box 1. Sample SPD for Equipment Goods
Basic Heading: Special Purpose Machinery Basic Heading Code: 11.01.13.3 Product Name: UTILITY TRACTOR Product Code: 02
277
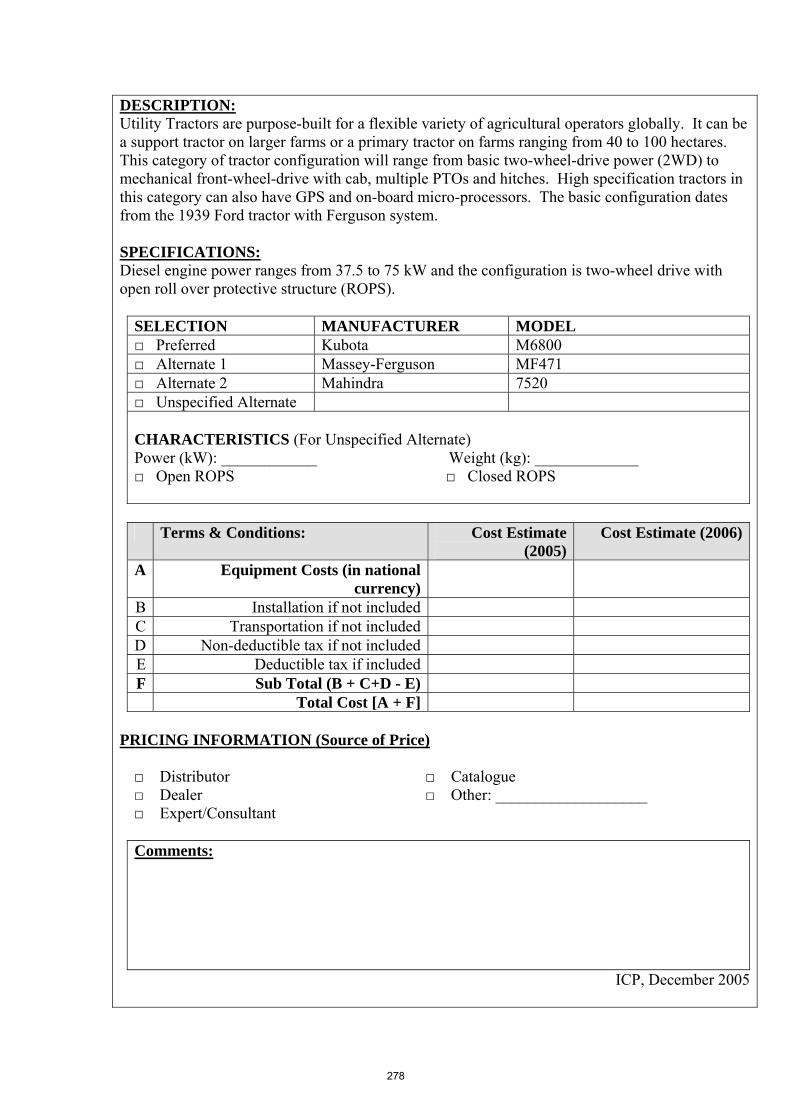
DESCRIPTION: Utility Tractors are purpose-built for a flexible variety of agricultural operators globally. It can be a support tractor on larger farms or a primary tractor on farms ranging from 40 to 100 hectares. This category of tractor configuration will range from basic two-wheel-drive power (2WD) to mechanical front-wheel-drive with cab, multiple PTOs and hitches. High specification tractors in this category can also have GPS and on-board micro-processors. The basic configuration dates from the 1939 Ford tractor with Ferguson system. SPECIFICATIONS: Diesel engine power ranges from 37.5 to 75 kW and the configuration is two-wheel drive with open roll over protective structure (ROPS).
SELECTION MANUFACTURER MODEL □ Preferred Kubota M6800 □ Alternate 1 Massey-Ferguson MF471 □ Alternate 2 Mahindra 7520 □ Unspecified Alternate CHARACTERISTICS (For Unspecified Alternate) Power (kW): ____________ Weight (kg): _____________ □ Open ROPS □ Closed ROPS
Terms & Conditions: Cost Estimate
(2005) Cost Estimate (2006)
A Equipment Costs (in national currency)
B Installation if not included C Transportation if not included D Non-deductible tax if not included E Deductible tax if included F Sub Total (B + C+D - E)
Total Cost [A + F] PRICING INFORMATION (Source of Price) □ Distributor □ Catalogue □ Dealer □ Other: ___________________ □ Expert/Consultant
Comments:
ICP, December 2005
278
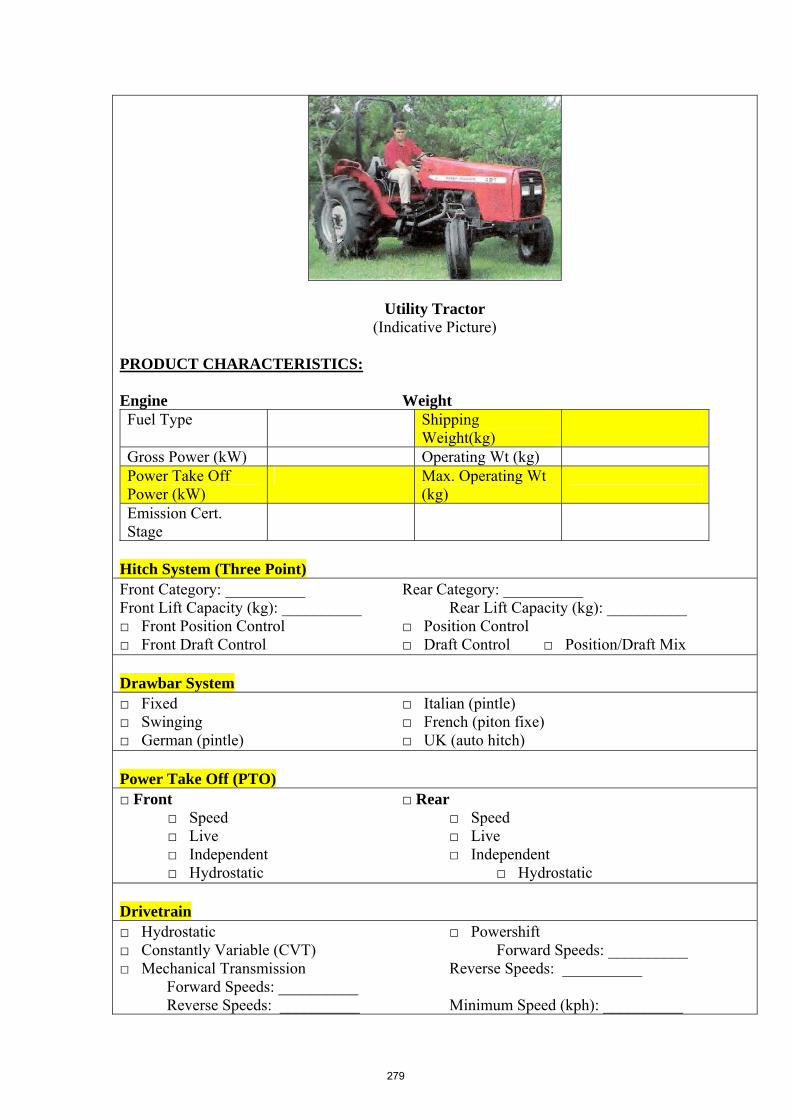
Utility Tractor (Indicative Picture)
PRODUCT CHARACTERISTICS: Engine Weight Fuel Type Shipping
Weight(kg)
Gross Power (kW) Operating Wt (kg) Power Take Off Power (kW)
Max. Operating Wt (kg)
Emission Cert. Stage
Hitch System (Three Point) Front Category: __________ Rear Category: __________ Front Lift Capacity (kg): __________ Rear Lift Capacity (kg): __________ □ Front Position Control □ Position Control □ Front Draft Control □ Draft Control □ Position/Draft Mix Drawbar System □ Fixed □ Italian (pintle) □ Swinging □ French (piton fixe) □ German (pintle) □ UK (auto hitch) Power Take Off (PTO) □ Front □ Rear
□ Speed □ Speed □ Live □ Live □ Independent □ Independent □ Hydrostatic □ Hydrostatic
Drivetrain □ Hydrostatic □ Powershift □ Constantly Variable (CVT) Forward Speeds: __________ □ Mechanical Transmission Reverse Speeds: __________ Forward Speeds: __________ Reverse Speeds: __________ Minimum Speed (kph): __________
279
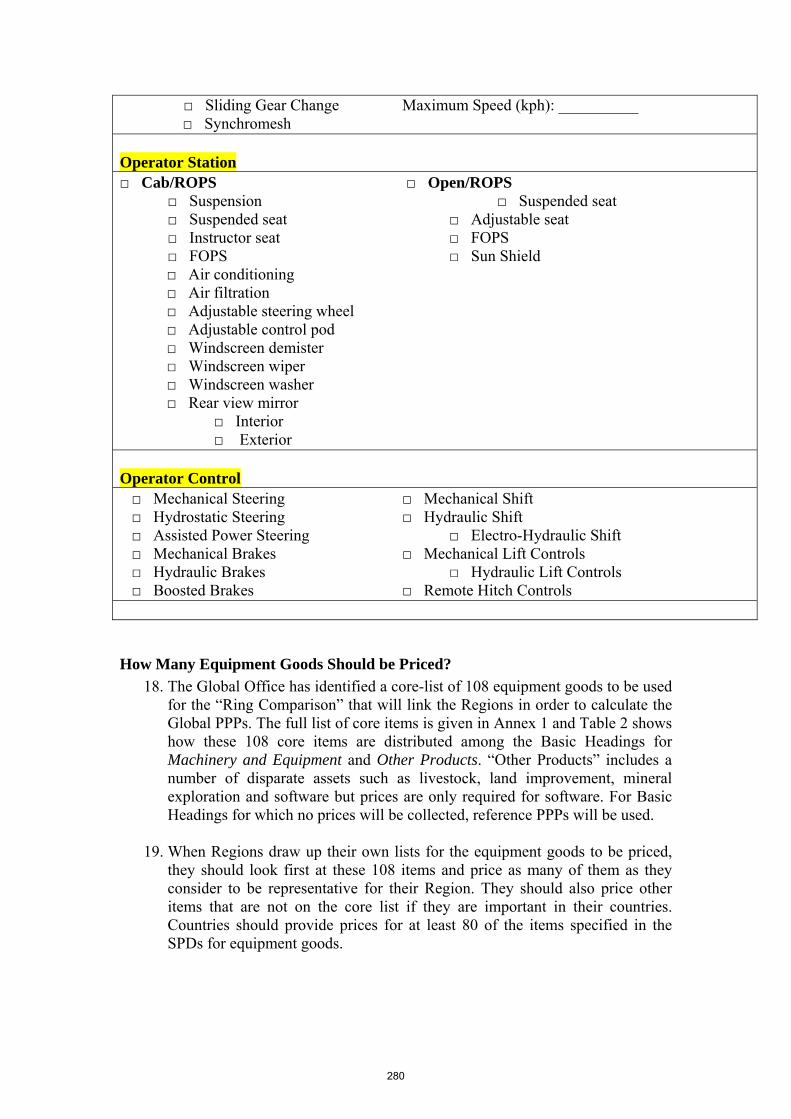
□ Sliding Gear Change Maximum Speed (kph): __________ □ Synchromesh Operator Station □ Cab/ROPS □ Open/ROPS □ Suspension □ Suspended seat
□ Suspended seat □ Adjustable seat □ Instructor seat □ FOPS □ FOPS □ Sun Shield
□ Air conditioning □ Air filtration □ Adjustable steering wheel □ Adjustable control pod □ Windscreen demister □ Windscreen wiper □ Windscreen washer □ Rear view mirror □ Interior □ Exterior Operator Control □ Mechanical Steering □ Mechanical Shift □ Hydrostatic Steering □ Hydraulic Shift □ Assisted Power Steering □ Electro-Hydraulic Shift □ Mechanical Brakes □ Mechanical Lift Controls □ Hydraulic Brakes □ Hydraulic Lift Controls □ Boosted Brakes □ Remote Hitch Controls
How Many Equipment Goods Should be Priced? 18. The Global Office has identified a core-list of 108 equipment goods to be used
for the “Ring Comparison” that will link the Regions in order to calculate the Global PPPs. The full list of core items is given in Annex 1 and Table 2 shows how these 108 core items are distributed among the Basic Headings for Machinery and Equipment and Other Products. “Other Products” includes a number of disparate assets such as livestock, land improvement, mineral exploration and software but prices are only required for software. For Basic Headings for which no prices will be collected, reference PPPs will be used.
19. When Regions draw up their own lists for the equipment goods to be priced,
they should look first at these 108 items and price as many of them as they consider to be representative for their Region. They should also price other items that are not on the core list if they are important in their countries. Countries should provide prices for at least 80 of the items specified in the SPDs for equipment goods.
280
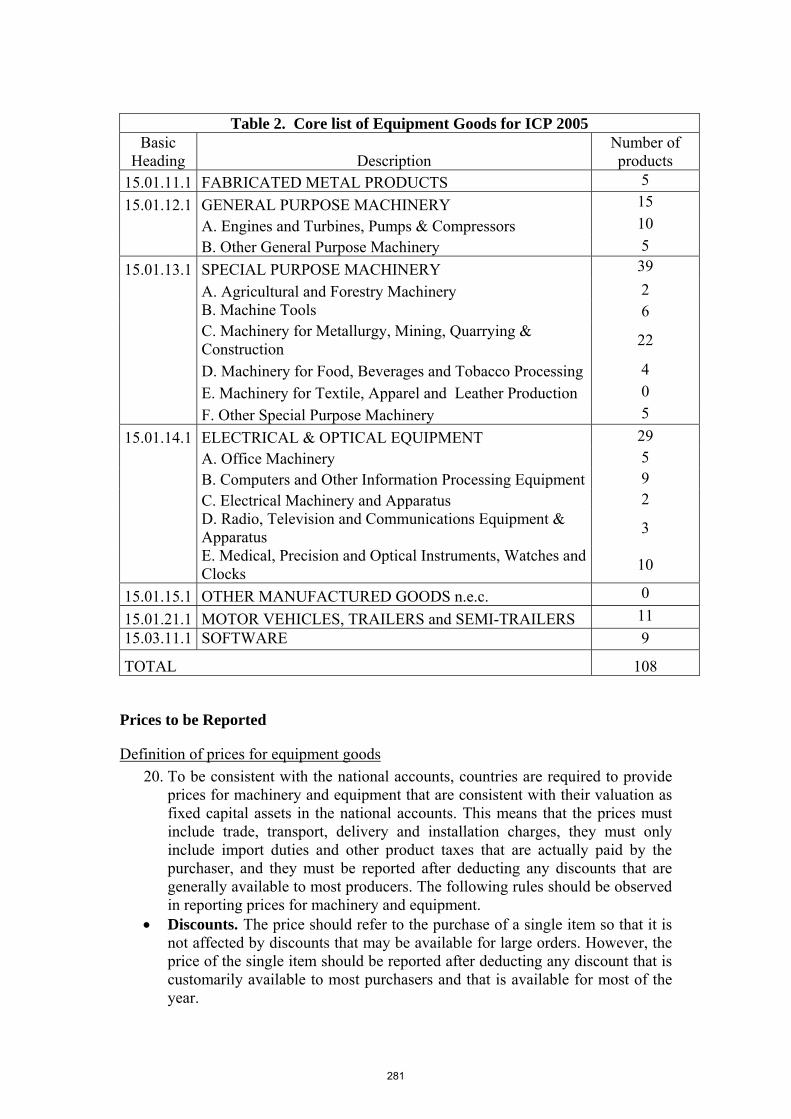
Table 2. Core list of Equipment Goods for ICP 2005
Basic Heading Description
Number of products
15.01.11.1 FABRICATED METAL PRODUCTS 5 15.01.12.1 GENERAL PURPOSE MACHINERY 15 A. Engines and Turbines, Pumps & Compressors 10 B. Other General Purpose Machinery 5 15.01.13.1 SPECIAL PURPOSE MACHINERY 39 A. Agricultural and Forestry Machinery 2 B. Machine Tools 6
C. Machinery for Metallurgy, Mining, Quarrying & Construction 22
D. Machinery for Food, Beverages and Tobacco Processing 4 E. Machinery for Textile, Apparel and Leather Production 0 F. Other Special Purpose Machinery 5 15.01.14.1 ELECTRICAL & OPTICAL EQUIPMENT 29 A. Office Machinery 5 B. Computers and Other Information Processing Equipment 9 C. Electrical Machinery and Apparatus 2
D. Radio, Television and Communications Equipment & Apparatus 3
E. Medical, Precision and Optical Instruments, Watches and Clocks 10
15.01.15.1 OTHER MANUFACTURED GOODS n.e.c. 0
15.01.21.1 MOTOR VEHICLES, TRAILERS and SEMI-TRAILERS 11 15.03.11.1 SOFTWARE 9
TOTAL 108
Prices to be Reported
Definition of prices for equipment goods 20. To be consistent with the national accounts, countries are required to provide
prices for machinery and equipment that are consistent with their valuation as fixed capital assets in the national accounts. This means that the prices must include trade, transport, delivery and installation charges, they must only include import duties and other product taxes that are actually paid by the purchaser, and they must be reported after deducting any discounts that are generally available to most producers. The following rules should be observed in reporting prices for machinery and equipment.
• Discounts. The price should refer to the purchase of a single item so that it is not affected by discounts that may be available for large orders. However, the price of the single item should be reported after deducting any discount that is customarily available to most purchasers and that is available for most of the year.
281
• Transport and delivery costs. When prices of equipment goods do not include transport and delivery costs, these should be estimated by countries selecting their own average distance over which the items are transported and delivered.
• Installation costs. There are usually costs associated with the installation of fixed equipment and these are included as part of gross fixed capital formation in the national accounts. Installation charges include not only any charges that the purchaser pays for the item to be physically installed at the factory or other site but also any costs for testing, running-in or calibrating the equipment. In the case of transport equipment there are usually no installation costs.
• Product taxes. Finally, the price should only include non-deductible product taxes. Countries that levy value added taxes normally allow purchasers to deduct the full amount of tax on capital goods. Sales and other product taxes and sometimes import duties may also be fully or partly deductible on capital goods.
21. The transaction characteristics have to be respected since countries are
required to report actual transaction prices and not list or catalogue prices. List or catalogue prices may be the initial source of price data but these prices must be adjusted to meet the transaction characteristics noted above.
National prices 22. The prices required are the national average prices. Country experts should
decide how these are to be collected following these guidelines: • In some small countries it may be sufficient to collect prices in only a single
location – namely the capital city or the largest commercial or industrial town. • In larger countries where there are several centres of significant industrial and
commercial activity, prices will need to be collected in several of these centers in order to calculate ah average national price.
Number of price observations 23. In many countries there will be a single dealer with the rights to sell the
specified type of equipment and in this case a single price observation will be sufficient. In other countries, however, there may be several distributors of the specified type of equipment and in this case several price observations will be required to establish the average national price. The decision as to whether one or more price observations are necessary is left to the national experts.
Timing of data collection 24. The prices reported should be average prices for the year 2005 and, in
principle, these should be the average of prices collected at regular intervals throughout the year. However, experience shows that provided all countries price equipment goods at approximately the same period, there is no need to collect prices throughout the year. Price collection in mid-year is recommended.
282
25. For this round of the ICP, countries are being asked to collect data for equipment goods in mid year 2006. Unless inflation is 5 percent or larger, the prices will be used ‘as is” for the price comparisons. If inflation exceeds 5 percent, appropriate adjustments will be made.
Used Equipment 26. All the products specified for the equipment goods survey are for new items.
For a number of countries, however, a significant proportion of their GFCF in equipment goods consists of imports of second-hand goods, some of which may have been reconditioned. Experimental pricing of second-hand equipment goods shows that there is considerable variation in the quality of the goods priced by different countries. It is very difficult to find second-hand goods that are comparable for pricing purposes. Substantial quality adjustments may be necessary to make the prices comparable and such quality adjustments are not feasible in practice at the present time. In ICP 2005, therefore, price collection is confined to new equipment goods. Prices of second-hand goods are not acceptable, even when second-hand equipment goods are more representative than new goods.
Sources of price information 27. The prices of equipment goods can be obtained directly from producers,
importers or distributors or from their catalogues. They may even be obtained from actual purchasers - which is preferable in principle, but difficult in practice. The prices can be collected by whichever method, or combination of methods, countries find the most convenient - personal visit, telephone, letter, internet, etc. The prices must however be adjusted to conform to the valuation principles outlined above with regard to discounts, transport and delivery charges, installation costs and product taxes.
28. These are the sources most likely to be used for obtaining the price
information: • Within a National Statistical Office:
Those who compile a producer price, a wholesale price, or an import price index are most likely to have familiarity with the types of goods being compared for these basic headings. For some items, like automobiles or computers, the comparisons used for consumption are also relevant for equipment although prices collected for household consumption expenditure will need to be adjusted by subtracting value added taxes and other product taxes which are payable by households but which can be deducted by enterprises.
• Within the Country:
Distributors and dealers in equipment in a country will have the knowledge of the models and their detailed characteristics and price. It is important in obtaining prices from dealers to make sure all local taxes and any other charges are included.
• Outside the Country:
283
A separate listing of websites is provided as Annex 2 to this document that should be of value to both country and regional staff. Websites are often available in more than one language, and usually give all the technical information called for in the PS/SPDs that the Global Office has provided. Websites may be tailored to regions of the world and often provide names and contact information for dealers and distributors. In smaller countries, there may be regional distributors covering adjacent countries.
• Local Purchasers:
Departments of government, especially Public Works, purchase equipment on a regular basis. They may buy directly from manufacturers, but in many cases they will also have contacts with dealers and distributors.
Editing prices 29. Countries which have collected multiple prices for each specified type of
equipment can carry editing procedures in the same way as for consumer goods and services. Other countries will have reported the transaction prices in the largest city for a single point in time and the price reported will usually come from a single outlet. In this case, the editing procedure cannot be used by the country, although they can still be used by the Regional Office to compare prices across countries with a view to detecting outliers.
30. Editing the prices of equipment goods simply by examining and comparing
their prices alone is not sufficient because of the complexity of the items priced. The fact that the prices for some specification appear plausible and consistent across countries does not mean that the goods priced are comparable across countries. The technical characteristics of the items that are not outliers still need to be checked against each other and any mismatches discovered must be treated in the same manner as outliers identified by the editing procedure.
31. Outliers identified by the Quaranta editing procedure by the regional
coordinators should have their technical characteristics checked against the technical characteristics of the items priced by other countries. There are two possible outcomes: either the technical characteristics of the outlier match the technical characteristics of the items priced by at least some of the other countries, or the technical characteristics do not match the technical characteristics of any of the items priced by the other countries. In the first case, it is necessary to refer the outlier back to the reporting country asking it to confirm the price. In the second case, it is necessary to ask the country to provide a price for an equipment good whose technical characteristics do match the technical characteristics of the goods priced by some of the other countries. Depending on the country’s response the price of the outlier will be retained, replaced or dropped.
32. The main responsibility for editing the technical characteristics of the goods
that countries have priced for the equipment goods survey rests with the Regional Coordinators. Countries, however, are responsible for making sure that the regional coordinator is in a position to be able to identify matches and
284
mismatches among the goods priced. Before sending their prices to the regional coordinator, countries are required to verify that the reporting forms are complete with the name and number of the make and model priced and the technical characteristics that are indicated as important characteristics on the reporting form. It is in the interest of countries to provide this information from the beginning as it will reduce the subsequent response burden that editing imposes.
III. Pricing Construction Projects
General approach 33. There are three main methods of calculating PPPs for construction goods: • The first involves collecting the prices of a basket of inputs consisting of
different kinds of labor (unskilled laborer, bricklayer, carpenter, plumber, etc.), standard building materials (cement, sand, plywood, etc.) and plant and equipment (hire of trucks, excavators, cranes, etc.).
• The second, entails pricing a set of standard components or operations such as “constructing so many square metres of brick wall” or “laying so many square metres of roofing tiles” or “constructing a supporting column of specified size and load-bearing capacity”.
• The third approach is to price model construction projects. The prices obtained for the model projects include all cost components so that the prices compared using this approach are purchaser prices and so are consistent with the prices used in the national accounts. This is an advantage of the system but a disadvantage is that since the model projects are the same for all countries, some of the projects may be representative in some countries but not in others.
34. The standard method for use in ICP is referred to as the Basket of Construction
Components approach or BOCC and is a combination of the first and second methods listed above. The standard BOCC approach, described below, will be used by the African, Asian and Pacific, Latin American and West Asia Regions. 1 (see “An Implementation Framework for the Basket of Construction Components Approach, Kenneth Walsh and Anil Sawhney, ICP Website)
35. In the BOCC method 34 “components” are defined and these are listed in
Table 3. The table also shows which components are relevant for calculating PPPs for the three Basic Headings under Construction.
Note that the 34 components are of two kinds:
• Composite components such as a round bridge pier or a concrete airfield pavement,
1 The OECD-Eurostat group will continue to use the third approach described above (model construction projects) and the CIS countries will continue to use a modified version of the BOCC approach which they have developed over several previous comparison.
285
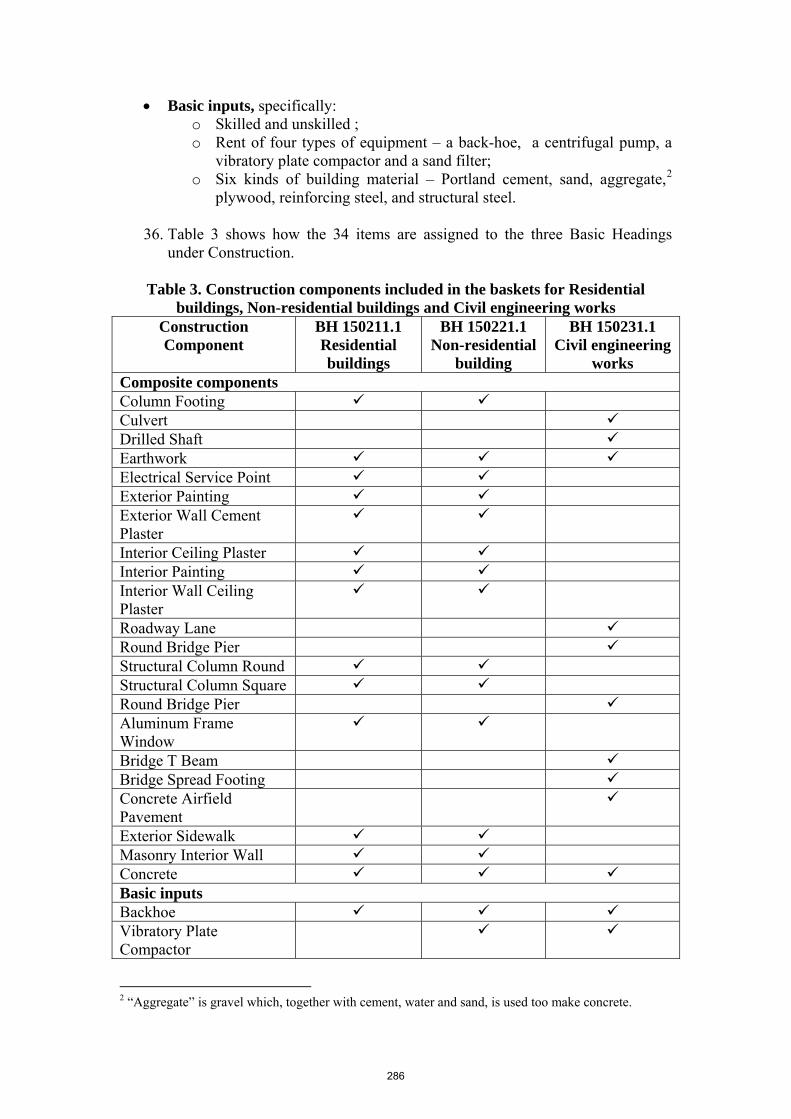
• Basic inputs, specifically: o Skilled and unskilled ; o Rent of four types of equipment – a back-hoe, a centrifugal pump, a
vibratory plate compactor and a sand filter; o Six kinds of building material – Portland cement, sand, aggregate,2
plywood, reinforcing steel, and structural steel.
36. Table 3 shows how the 34 items are assigned to the three Basic Headings under Construction.
Table 3. Construction components included in the baskets for Residential
buildings, Non-residential buildings and Civil engineering works Construction Component
BH 150211.1 Residential buildings
BH 150221.1 Non-residential
building
BH 150231.1 Civil engineering
works Composite components Column Footing Culvert Drilled Shaft Earthwork Electrical Service Point Exterior Painting Exterior Wall Cement Plaster
Interior Ceiling Plaster Interior Painting Interior Wall Ceiling Plaster
Roadway Lane Round Bridge Pier Structural Column Round Structural Column Square Round Bridge Pier Aluminum Frame Window
Bridge T Beam Bridge Spread Footing Concrete Airfield Pavement
Exterior Sidewalk Masonry Interior Wall Concrete Basic inputs Backhoe Vibratory Plate Compactor
2 “Aggregate” is gravel which, together with cement, water and sand, is used too make concrete.
286
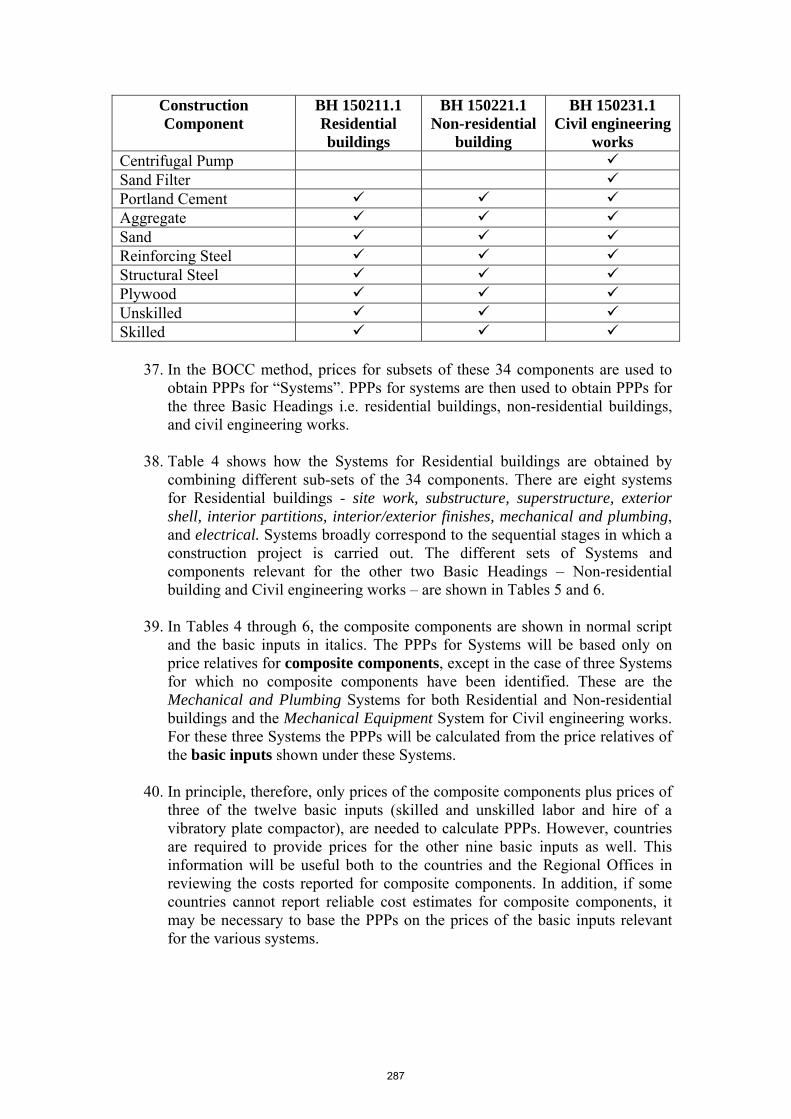
Construction Component
BH 150211.1 Residential buildings
BH 150221.1 Non-residential
building
BH 150231.1 Civil engineering
works Centrifugal Pump Sand Filter Portland Cement Aggregate Sand Reinforcing Steel Structural Steel Plywood Unskilled Skilled
37. In the BOCC method, prices for subsets of these 34 components are used to obtain PPPs for “Systems”. PPPs for systems are then used to obtain PPPs for the three Basic Headings i.e. residential buildings, non-residential buildings, and civil engineering works.
38. Table 4 shows how the Systems for Residential buildings are obtained by
combining different sub-sets of the 34 components. There are eight systems for Residential buildings - site work, substructure, superstructure, exterior shell, interior partitions, interior/exterior finishes, mechanical and plumbing, and electrical. Systems broadly correspond to the sequential stages in which a construction project is carried out. The different sets of Systems and components relevant for the other two Basic Headings – Non-residential building and Civil engineering works – are shown in Tables 5 and 6.
39. In Tables 4 through 6, the composite components are shown in normal script
and the basic inputs in italics. The PPPs for Systems will be based only on price relatives for composite components, except in the case of three Systems for which no composite components have been identified. These are the Mechanical and Plumbing Systems for both Residential and Non-residential buildings and the Mechanical Equipment System for Civil engineering works. For these three Systems the PPPs will be calculated from the price relatives of the basic inputs shown under these Systems.
40. In principle, therefore, only prices of the composite components plus prices of
three of the twelve basic inputs (skilled and unskilled labor and hire of a vibratory plate compactor), are needed to calculate PPPs. However, countries are required to provide prices for the other nine basic inputs as well. This information will be useful both to the countries and the Regional Offices in reviewing the costs reported for composite components. In addition, if some countries cannot report reliable cost estimates for composite components, it may be necessary to base the PPPs on the prices of the basic inputs relevant for the various systems.
287
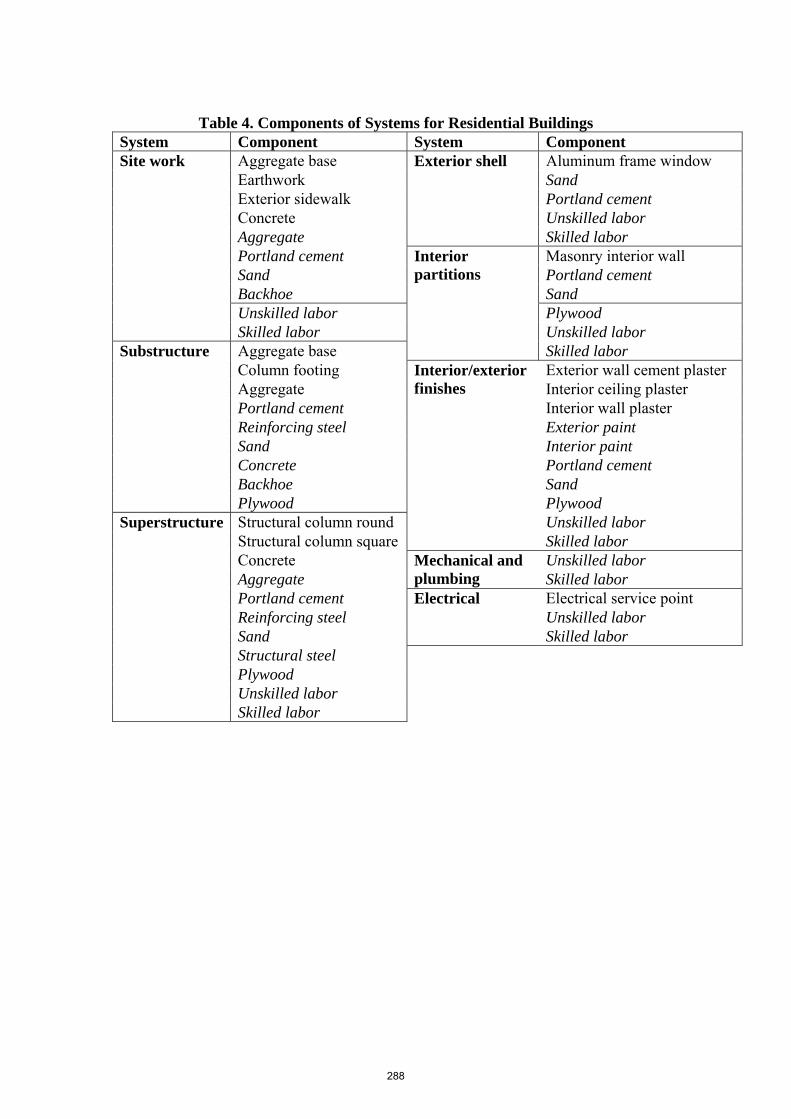
Table 4. Components of Systems for Residential Buildings
System Component System Component Aggregate base Aluminum frame window Earthwork Sand Exterior sidewalk Portland cement Concrete Unskilled labor Aggregate
Exterior shell
Skilled labor Portland cement Masonry interior wall Sand Portland cement Backhoe Sand Unskilled labor Plywood
Site work
Skilled labor Unskilled labor Aggregate base
Interior partitions
Skilled labor Column footing Exterior wall cement plaster Aggregate Interior ceiling plaster Portland cement Interior wall plaster Reinforcing steel Exterior paint Sand Interior paint Concrete Portland cement Backhoe Sand
Substructure
Plywood Plywood Structural column round Unskilled labor Structural column square
Interior/exterior finishes
Skilled labor Concrete Unskilled labor Aggregate
Mechanical and plumbing Skilled labor
Portland cement Electrical service point Reinforcing steel Unskilled labor Sand
Electrical
Skilled labor Structural steel Plywood Unskilled labor
Superstructure
Skilled labor
288
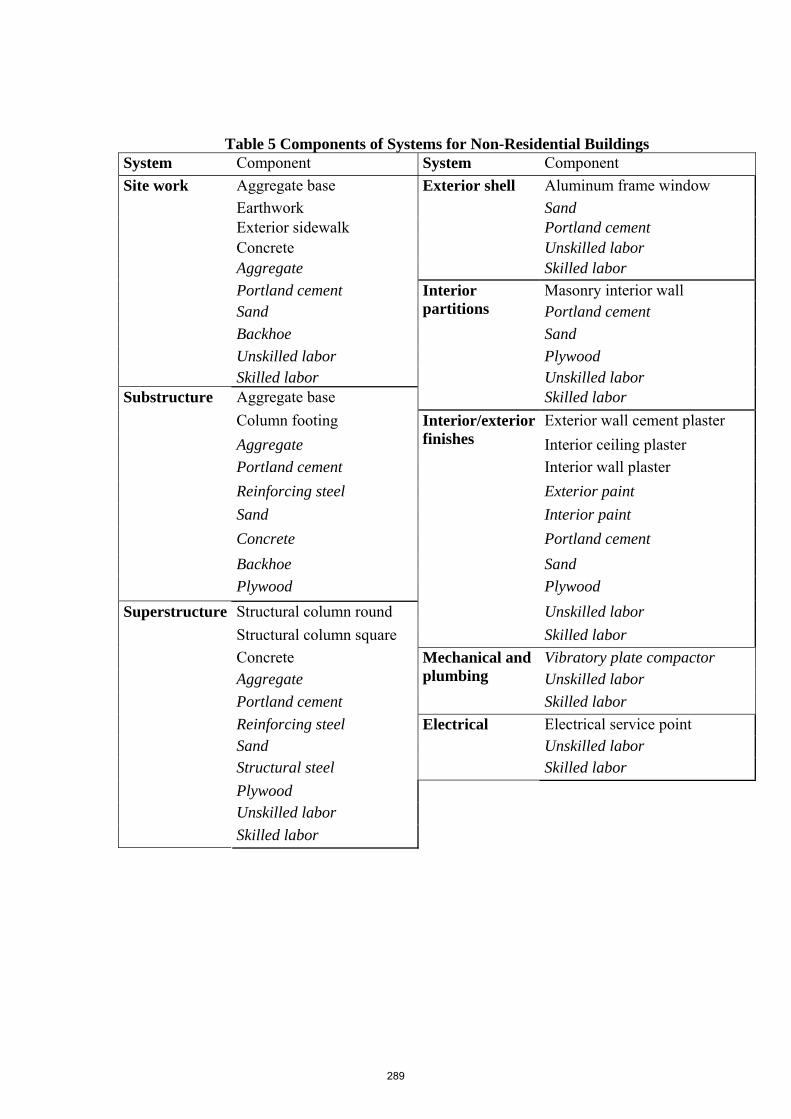
Table 5 Components of Systems for Non-Residential Buildings System Component System Component
Aggregate base Aluminum frame window Earthwork Sand Exterior sidewalk Portland cement Concrete Unskilled labor Aggregate
Exterior shell
Skilled labor Portland cement Masonry interior wall Sand Portland cement Backhoe Sand Unskilled labor Plywood
Site work
Skilled labor Unskilled labor Aggregate base
Interior partitions
Skilled labor Column footing Exterior wall cement plaster Aggregate Interior ceiling plaster Portland cement Interior wall plaster Reinforcing steel Exterior paint Sand Interior paint Concrete Portland cement Backhoe Sand
Substructure
Plywood Plywood Structural column round Unskilled labor Structural column square
Interior/exterior finishes
Skilled labor Concrete Vibratory plate compactor Aggregate Unskilled labor Portland cement
Mechanical and plumbing
Skilled labor Reinforcing steel Electrical service point Sand Unskilled labor Structural steel
Electrical
Skilled labor Plywood Unskilled labor
Superstructure
Skilled labor
289
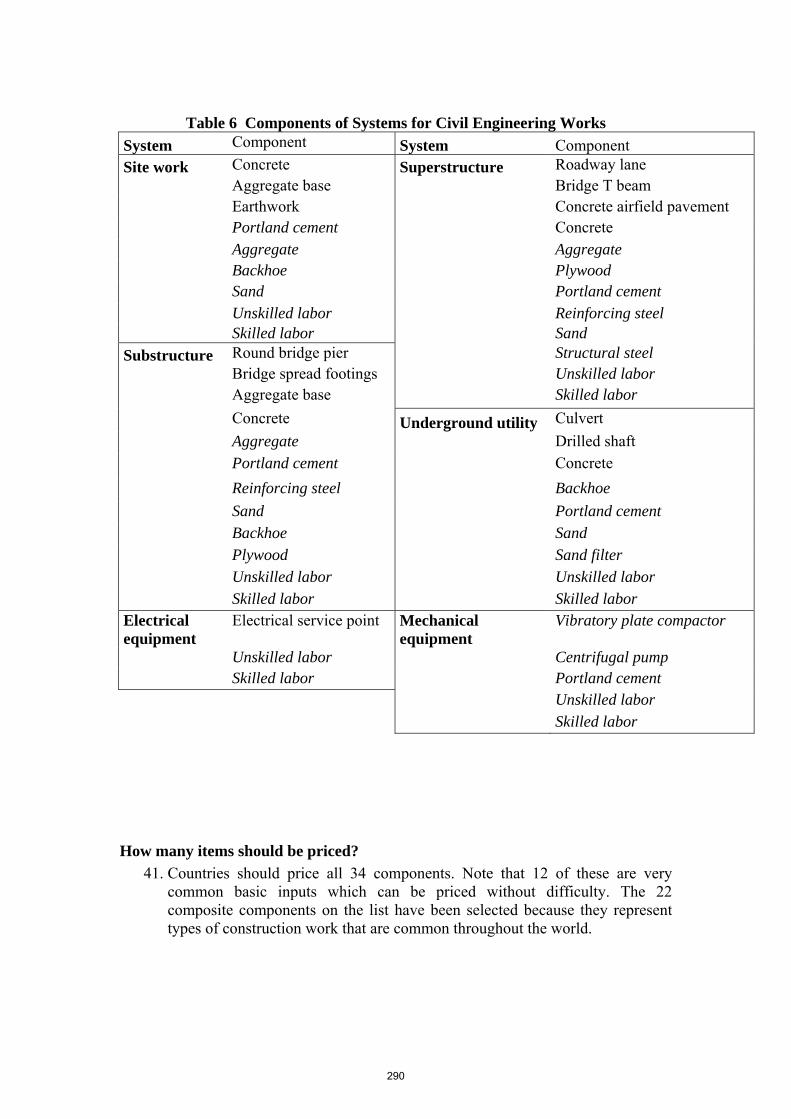
Table 6 Components of Systems for Civil Engineering Works
System Component System Component Site work Concrete Superstructure Roadway lane Aggregate base Bridge T beam Earthwork Concrete airfield pavement Portland cement Concrete Aggregate Aggregate Backhoe Plywood Sand Portland cement Unskilled labor Reinforcing steel Skilled labor Sand Substructure Round bridge pier Structural steel Bridge spread footings Unskilled labor Aggregate base Skilled labor
Concrete Underground utility Culvert
Aggregate Drilled shaft
Portland cement Concrete
Reinforcing steel Backhoe
Sand Portland cement Backhoe Sand Plywood Sand filter Unskilled labor Unskilled labor Skilled labor Skilled labor Electrical equipment
Electrical service point Mechanical equipment
Vibratory plate compactor
Unskilled labor Centrifugal pump Skilled labor Portland cement Unskilled labor Skilled labor
How many items should be priced? 41. Countries should price all 34 components. Note that 12 of these are very
common basic inputs which can be priced without difficulty. The 22 composite components on the list have been selected because they represent types of construction work that are common throughout the world.
290
Prices to be reported
Definition of the prices for construction 42. The prices to be reported are as follows:
• For the 22 composite components, the price is the total of the cost, at purchaser prices, of the materials, labor and hire of any necessary equipment. Note the following points.
o The price reported for completed components does not include any profit margin or any fees for architects, quantity surveyors and other construction specialists. It consists only of the direct costs of materials, labor and hire of equipment.
o The purchaser prices of the materials and hire of equipment includes only non-deductible product taxes. Value added taxes are often fully deductible for goods and services that are considered to be investments and so will usually be excluded from the purchaser price.
o For labor, compensation of employees is to be reported. See the definition in the next paragraph.
• For skilled and unskilled labor, compensation of employees is to be reported and not just cash wages and salaries. Compensation of employees consists of:
o Wages and salaries paid in cash before deduction of income taxes, social security contributions that are paid by the employee and, where relevant, union dues;
o Employers’ contributions to social security schemes; and o The cost to the employer of income in kind provided to the
employees in the form of free or subsidized housing and food. In many countries, construction workers are usually employed on a temporary basis and employers do not make any payments on their behalf into a social security system nor provide income in kind. In such cases compensation of employees will equal wages and salaries before deduction of income taxes, social security contributions that are paid by the employee and union dues. • For rent of equipment purchaser prices are to be reported. These include
non-deductible product taxes and the costs of transporting the equipment to the construction site. If the owner of the equipment also supplies a specialized operator for the equipment, these labor costs will also be included in the purchaser price.
• For building materials purchaser prices are to be reported. Purchaser prices include non-deductible product taxes and the costs of delivering the materials to the construction site.
National prices 43. For composite components, countries are required to supply average national
prices. These should be weighted averages of the costs of the materials, labor and hire of equipment required to construct the component in different regions of the country with the weights proportional to the value of construction work being carried out in those different regions. In small countries, it may be
291
sufficient to estimate the cost of the completed component in a single location – e.g. the capital city – but in many countries it will be necessary to take account of regional variations in calculating national average costs for completed components.
44. The same reasoning applies for building materials, hire of equipment and
labor. National prices should be weighted averages of prices in all the parts of the country where construction activity is significant. In small countries this may be a single location but in most countries, prices will have to be collected in a number of different locations.
Number of price observations
45. For composite components, a single estimate of the national average is required.
46. For building materials and for hire of equipment, prices should be collected
from at least five outlets in each part of the country where construction activity is significant.
47. For skilled and unskilled labor the number of observations required depends
on the data sources used and these are discussed below.
Timing of data collection 48. The prices reported should be average prices for the year 2005 and in
principle, these should be the average of prices collected at regular intervals throughout the year. However, provided all countries price equipment goods at approximately the same period, there is no need to collect prices throughout the year. Price collection in mid-year is recommended.
49. For this round of the ICP, countries are being asked to collect data in 2006 and
use the data directly to compute PPPs unless inflation is 5 percent or greater in which case appropriate adjustments will be required.
Product specifications and reporting forms 50. Box 2 gives an example of a reporting form for one of the 22 composite
components - namely Earthwork which appears in all three Basic Headings.
Hire of all kinds of equipment, purchase of all kinds of building materials and payments for all kinds of skilled labor are to be reported and not only those kinds of equipment, building materials, and skilled labor that are included in the list of basic inputs. For example, in most countries crawler-dozers and dump trucks would be used for the type of earthwork specified. The cost of hiring both kinds of equipment must be included in the cost of this composite component.
292
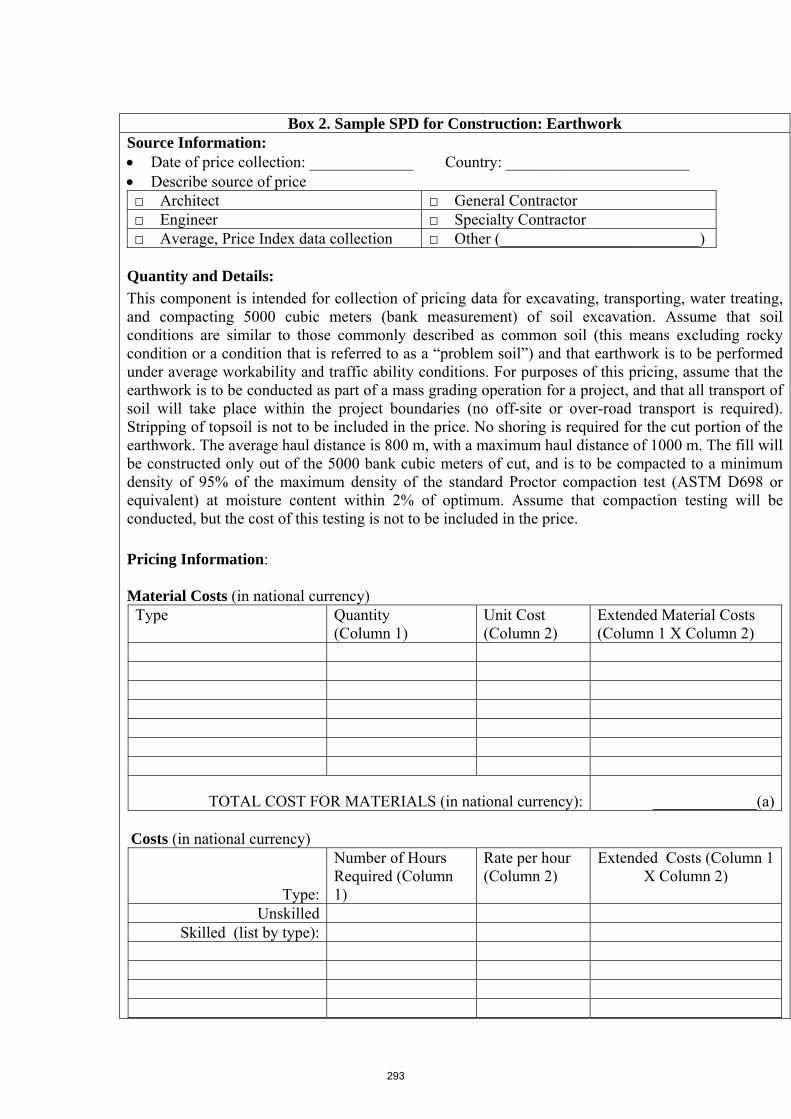
Box 2. Sample SPD for Construction: Earthwork
Source Information: • Date of price collection: _____________ Country: _______________________ • Describe source of price □ Architect □ General Contractor □ Engineer □ Specialty Contractor □ Average, Price Index data collection □ Other (_________________________)
Quantity and Details: This component is intended for collection of pricing data for excavating, transporting, water treating, and compacting 5000 cubic meters (bank measurement) of soil excavation. Assume that soil conditions are similar to those commonly described as common soil (this means excluding rocky condition or a condition that is referred to as a “problem soil”) and that earthwork is to be performed under average workability and traffic ability conditions. For purposes of this pricing, assume that the earthwork is to be conducted as part of a mass grading operation for a project, and that all transport of soil will take place within the project boundaries (no off-site or over-road transport is required). Stripping of topsoil is not to be included in the price. No shoring is required for the cut portion of the earthwork. The average haul distance is 800 m, with a maximum haul distance of 1000 m. The fill will be constructed only out of the 5000 bank cubic meters of cut, and is to be compacted to a minimum density of 95% of the maximum density of the standard Proctor compaction test (ASTM D698 or equivalent) at moisture content within 2% of optimum. Assume that compaction testing will be conducted, but the cost of this testing is not to be included in the price. Pricing Information: Material Costs (in national currency)
Type Quantity (Column 1)
Unit Cost (Column 2)
Extended Material Costs (Column 1 X Column 2)
TOTAL COST FOR MATERIALS (in national currency): _____________(a) Costs (in national currency)
Type:
Number of Hours Required (Column 1)
Rate per hour (Column 2)
Extended Costs (Column 1 X Column 2)
Unskilled Skilled (list by type):
293
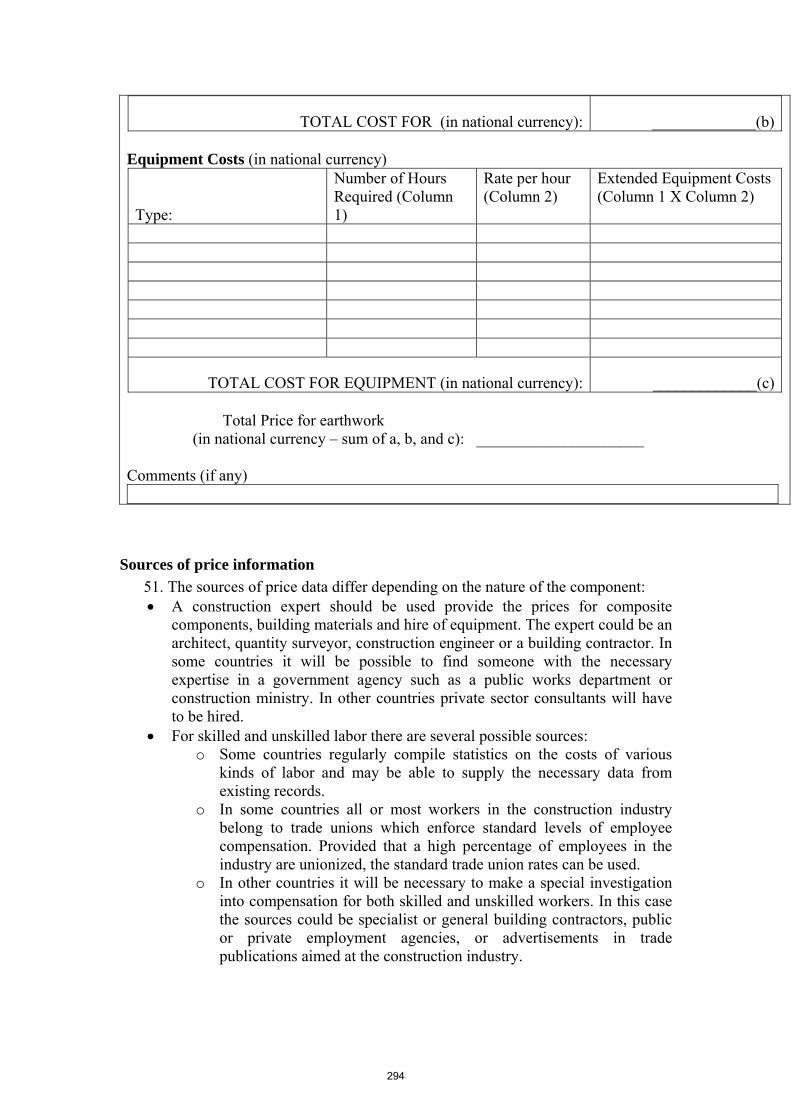
TOTAL COST FOR (in national currency): _____________(b) Equipment Costs (in national currency)
Type:
Number of Hours Required (Column 1)
Rate per hour (Column 2)
Extended Equipment Costs (Column 1 X Column 2)
TOTAL COST FOR EQUIPMENT (in national currency): _____________(c)
Total Price for earthwork (in national currency – sum of a, b, and c): _____________________
Comments (if any)
Sources of price information 51. The sources of price data differ depending on the nature of the component: • A construction expert should be used provide the prices for composite
components, building materials and hire of equipment. The expert could be an architect, quantity surveyor, construction engineer or a building contractor. In some countries it will be possible to find someone with the necessary expertise in a government agency such as a public works department or construction ministry. In other countries private sector consultants will have to be hired.
• For skilled and unskilled labor there are several possible sources: o Some countries regularly compile statistics on the costs of various
kinds of labor and may be able to supply the necessary data from existing records.
o In some countries all or most workers in the construction industry belong to trade unions which enforce standard levels of employee compensation. Provided that a high percentage of employees in the industry are unionized, the standard trade union rates can be used.
o In other countries it will be necessary to make a special investigation into compensation for both skilled and unskilled workers. In this case the sources could be specialist or general building contractors, public or private employment agencies, or advertisements in trade publications aimed at the construction industry.
294
Editing prices 52. Methods used to edit price data for BOCC will again depend on the type of
component: • For completed components there will be only a single price observation per
country. The Quaranta Tables can be applied by the Regional Offices but not by national statistical offices.
• For building materials, and for plant hire countries should make multiple price observations so the full editing procedures can be used both by countries and by the Regional Offices.
• For compensation of employees some countries will make multiple observations so that the editing procedures can be used both by the countries and by the Regional Offices. The Regional Office will perform a Quaranta edit.
Weights 53. The BOCC approach uses three types of weights:
• W1—for aggregation of the three Basic Headings – Residential and Non-residential and Civil engineering works - to obtain GDP;
• W2—for aggregation of Systems to obtain Basic Headings;
• W3—for aggregation of composite component and/or basic inputs to obtain Systems.
W1 weights are Basic Heading weights and come from the national accounts.
54. Unweighted geometric averages are used to obtain price relatives for Systems from the composite components or basic inputs. In other words the W3 weights are set at unity. Note, however that weights are still implicitly being used because in constructing composite components different combinations of labor, materials and plant hire will be used in different countries depending on relative prices.3
55. Special calculations are required for the W2 weights. Two broad strategies for
calculating W2 can be adopted by National Statistical Offices (NSO). • Strategy 1: Under the first strategy the NSO retains the service of a
construction expert to determine the values of W2. If the NSO has hired an outside expert to cost the composite components, this same person may be able to provide the W2 Weights.
• Strategy 2: Under this strategy NSO performs all the W2 calculations in house. This approach is only advisable where the NSO can request help from the country’s public works department or ministry of construction.
56. . The procedure for calculating W2 Weights involves the following steps:
3 However, in the case of the three Systems for which only basic inputs are used there are neither implicit nor explicit weights.
295
Step 1: Collect priced Bills of Quantity (BOQs) from past projects for the three Basic Headings.
• For the Residential buildings BOQs for single-family dellings and apartment buildings and the like are required.
• For Non-residential buildings, BOQs for farm buildings, office buildings, industrial buildings, hospitals, schools and buildings for cultural and religious purposes should be collected.
• For the Civil engineering works, BOQs for roads, highways, airports, water and sewer systems, telecommunication structures, marine structures, power generation and transmission infrastructure are to be collected.
The larger the sample, obviously the more reliable the overall result will be. However, at a minimum one project of each type within each Basic Heading should be used, and preferably at least three. Note that the BOQs to be collected are for past project and there is no need to generate new data for this process.
Step 2: Every item in the priced BOQ needs to be classified as belonging to one of the systems. For someone with expertise in construction or engineering it is not difficult to map each line item in the BOQ to a particular system. It is not necessary to have an extremely detailed BOQ for this purpose. A summary or “roll-up” BOQ which lists only the principal divisions and a few major categories within each division is both sufficient and somewhat easier to work with. With a “roll-up” BOQ, the mapping of the line items to the appropriate systems can be accomplished in a few minutes.
Table 7 illustrates this step. Columns 1 through 5 are already available; Column 6 is completed in Step 2.
296
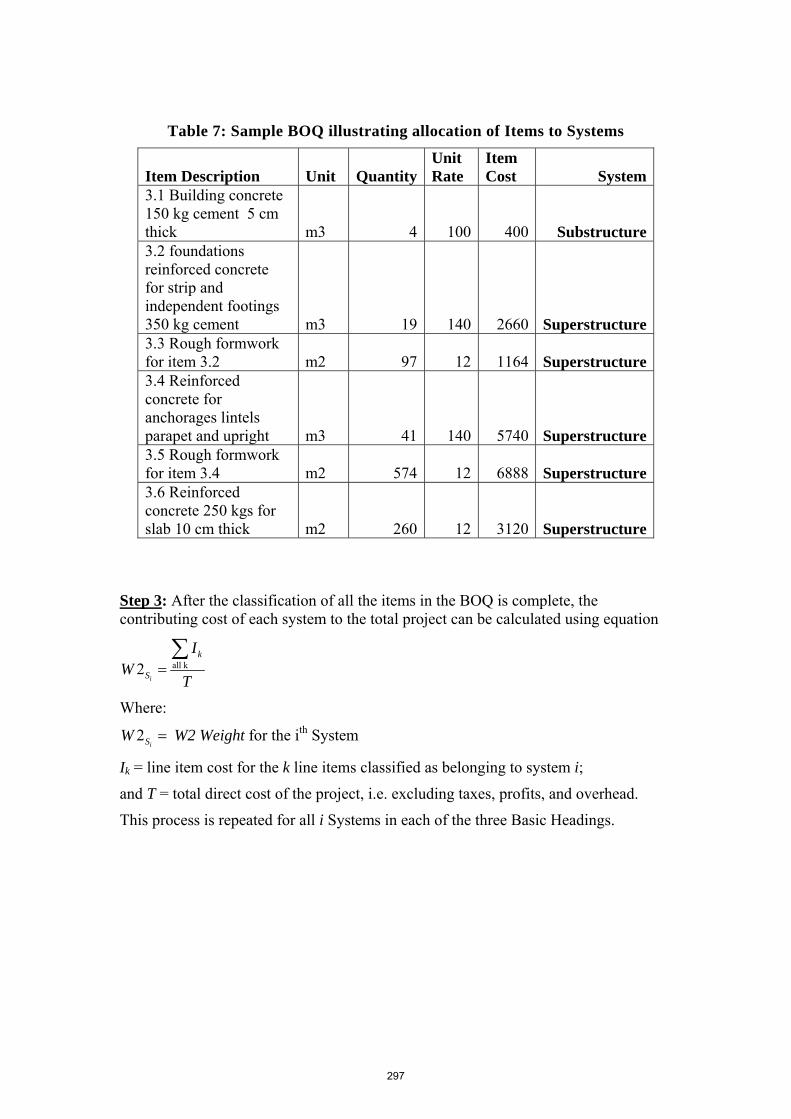
Table 7: Sample BOQ illustrating allocation of Items to Systems
Item Description Unit QuantityUnit Rate
Item Cost System
3.1 Building concrete 150 kg cement 5 cm thick m3 4 100 400 Substructure 3.2 foundations reinforced concrete for strip and independent footings 350 kg cement m3 19 140 2660 Superstructure 3.3 Rough formwork for item 3.2 m2 97 12 1164 Superstructure 3.4 Reinforced concrete for anchorages lintels parapet and upright m3 41 140 5740 Superstructure 3.5 Rough formwork for item 3.4 m2 574 12 6888 Superstructure 3.6 Reinforced concrete 250 kgs for slab 10 cm thick m2 260 12 3120 Superstructure
Step 3: After the classification of all the items in the BOQ is complete, the contributing cost of each system to the total project can be calculated using equation
all k2i
k
S
IW
T=∑
Where:
2iSW = W2 Weight for the ith System
Ik = line item cost for the k line items classified as belonging to system i;
and T = total direct cost of the project, i.e. excluding taxes, profits, and overhead.
This process is repeated for all i Systems in each of the three Basic Headings.
297

Annex 1. ICP Equipment Ring List
BH Code Basic Heading Title Product Name Pr. Code
No. of
Prodts
15.01.11.1 FABRICATED METAL PRODUCTS
Horizontal Cylindrical Storage Tank (5,000 Liters)
1
Horizontal Cylindrical Storage Tank 10,.000 Liters) 2
Tank for Storing Liquid Food & Beverage Products (1,000 Liters)
3
Tank for Storing Liquid Food & Beverage Products (5,000 Liters)
4
Pressurized Gas StorageTank 5 5 15.01.12.1 GENERAL PURPOSE MACHINERY
A. Engines & Turbines, Pumps & Compressors Air Compressor - Small 1 Air Compressor - Towed 2
Industrial Diesel Engine (Heavy Duty) -Tier2 Stage2
3
Industrial Diesel Engine (Heavy Duty) - Tier3 Stage3A
4
Light Industrial Diesel Engine 5 Marine Diesel Engine (Commercial) 6 Marine Diesel Engine (Pleasure) 7
On-Highway Commercial Diesel Engine (Heavy Duty)
8
Water Pump - Centrifugal 9 Water Pump - Jet 10 10 B. Other General Purpose Machinery Air Conditioner - Residential 11 Air Conditioner - Room 12
Rough Terrain Forklift - Extendable Boom
13
Rough Terrain Crane – Hydraulic Extendable Boom
14
Rough Terrain Crane 15 5 15.01.13.1 SPECIAL PURPOSE MACHINERY
A. Agricultural & Forestry Machinery Compact Tractor 1
298
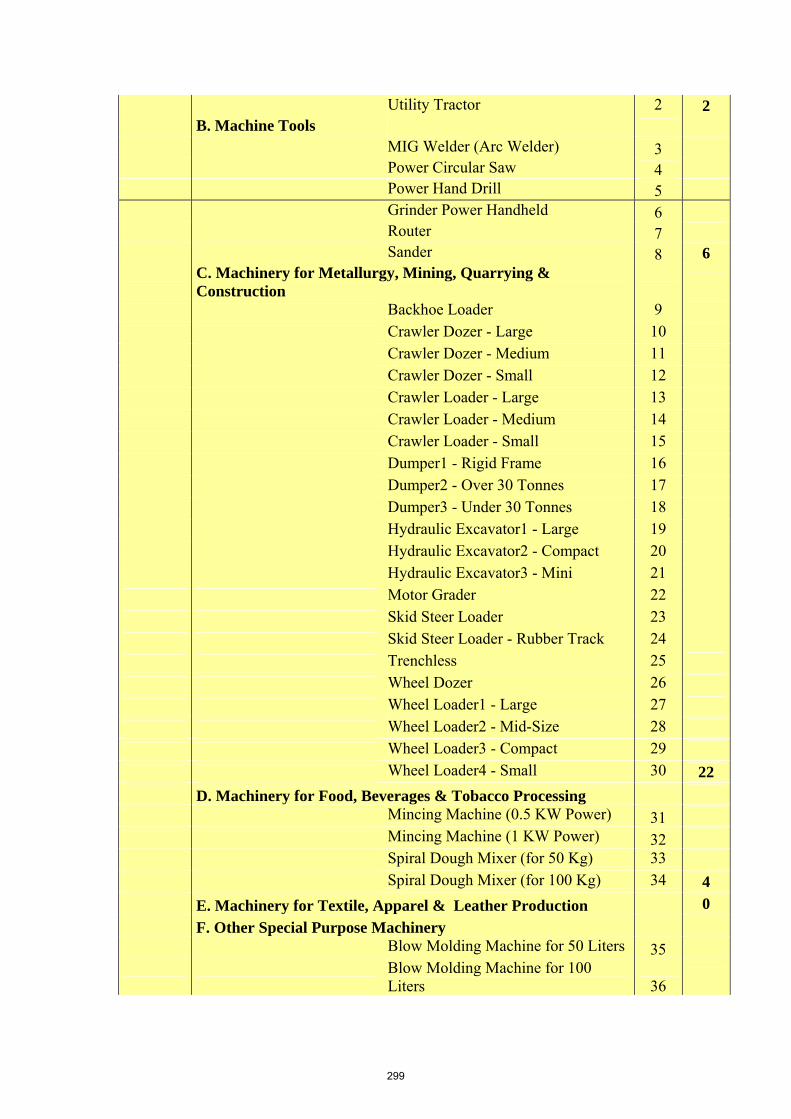
Utility Tractor 2 2 B. Machine Tools MIG Welder (Arc Welder) 3 Power Circular Saw 4 Power Hand Drill 5 Grinder Power Handheld 6 Router 7 Sander 8 6
C. Machinery for Metallurgy, Mining, Quarrying & Construction
Backhoe Loader 9 Crawler Dozer - Large 10 Crawler Dozer - Medium 11 Crawler Dozer - Small 12 Crawler Loader - Large 13 Crawler Loader - Medium 14 Crawler Loader - Small 15 Dumper1 - Rigid Frame 16 Dumper2 - Over 30 Tonnes 17 Dumper3 - Under 30 Tonnes 18 Hydraulic Excavator1 - Large 19 Hydraulic Excavator2 - Compact 20 Hydraulic Excavator3 - Mini 21 Motor Grader 22 Skid Steer Loader 23 Skid Steer Loader - Rubber Track 24 Trenchless 25 Wheel Dozer 26 Wheel Loader1 - Large 27 Wheel Loader2 - Mid-Size 28 Wheel Loader3 - Compact 29 Wheel Loader4 - Small 30 22 D. Machinery for Food, Beverages & Tobacco Processing Mincing Machine (0.5 KW Power) 31 Mincing Machine (1 KW Power) 32 Spiral Dough Mixer (for 50 Kg) 33 Spiral Dough Mixer (for 100 Kg) 34 4 E. Machinery for Textile, Apparel & Leather Production 0 F. Other Special Purpose Machinery Blow Molding Machine for 50 Liters 35
Blow Molding Machine for 100 Liters 36
299

Injection Molding Machine for 50 Tonnes (Low-end) 37
Injection Molding Machine for 1,000 Tonnes (High-end) 38
Extruder 39 5 15.01.14.1 ELECTRICAL & OPTICAL EQUIPMENT
A. Office Machinery Copier 1 Fax Machine 2 Digital Projector 3 Overhead Projector 4 Paper Shredder 5 5 B. Computers & Other Information Processing Equipment Desktop Computer - Compaq 6 Desktop Computer - Dell 7 Laptop Computer 8 Inkjet Printer 9 Laser Printer 10 Multifunction Printer 11 PDA 12 Scanner 13 Server 14 9 C. Electrical Machinery & Apparatus Electric Motor 15 Generator 16 2
D. Radio, Television & Communications Equipment & Apparatus
2-Way Radio 17 DVD Player 18 Security Camera 19 3
E. Medical, Precision & Optical Instruments, Watches & Clocks
Anesthesia Unit 20 Chemistry Analyzer 21 CT Scanner 22 Infant Incubator 23 Infusion Pump 24 Mammography Unit 25 MRI 26 Patient Monitor 27 Ultrasound 28 X-Ray Machine 29 10 15.01.15.1 OTHER MANUFACTURED GOODS n.e.c.
0
300

15.01.21.1 MOTOR VEHICLES, TRAILERS & SEMI-TRAILERS
Commercial Vehicle - 28 Passengers 1 Diesel Minibus - 8 Passengers 2 Diesel Minibus - 15 Passengers 3 Diesel Minibus - 21 Passengers 4 Intra-City Bus - 26 to 44 Passengers 5 Inter-City Bus - 45 Passengers 6 Lorry Cab Chassis 5 Tonnes 7 Lorry Cab Chassis 10 Tonnes 8 Lorry Cab Chassis 15 Tonnes 9 Pickup Truck 10 Van Truck 11 11 15.03.11.
1 SOFTWARE
Graphic Design Software 1 1 Graphic Design Software 2 2 Office Software Suite 1 3 Office Software Suite 2 4 Operating System Software 1 5 Operating System Software 2 6 Anti-Virus Software 1 7 Anti-Virus Software 2 8 Statistical Software 9 9
TOTAL 108
301

Annex 2. Web-sites that can be used for identifying & pricing equipment goods
Fabricated Metal Products www.alcoa.com (aluminum extrusions)
General Purpose Machinery www.ingersol-rand.com (cranes, compressors)
www.volvo.com (cranes) www.kawasaki.com (gas turbines) www.cat.com (engines, gas turbines) www.johndeere.com (diesel engines) www.komatsu.com (diesel engine, forklift) www.cummins.com (engines) www.liebherr.com (cranes) www.lindelifttruck.com (forklift) www.linkbelt.com (cranes) www.manitowoccranes.com (cranes) www.jlg.com (cranes, forklift) www.manitou-na.com (cranes, forklift) www.mit-lift.com (forklift) www.mustangmfg.com (forklift) www.pettibone-mi.com (cranes) www.towercranes-usa.com (tower cranes) www.snorkelusa.com (truck mounted cranes) www.tadanoamerica.com (cranes) www.technocrane.com (cranes) www.terex-crane.com (cranes) www.yale.com (forklift) www.airtechnical.com (crane) www.demag-us.com (crane) www.noellcrane.com (crane) www.mantiscranes.com (cranes) www.badgerequipment.com (cranes) www.kobelcoamerica.com (cranes) www.palfinger.com (crane) www.positech-solutions.com (cranes) www.stellarindustries.com (cranes) www.altec.com (cranes) www.lenox.com (HVAC) www.carrier.com (HVAC) www.rheem.com (HVAC) www.americanstandard.com (HVAC)
www.granger.com (HVAC, tools. electrical, lighting, welders, generators, motors)
www.groveworldwide.com (cranes)
302
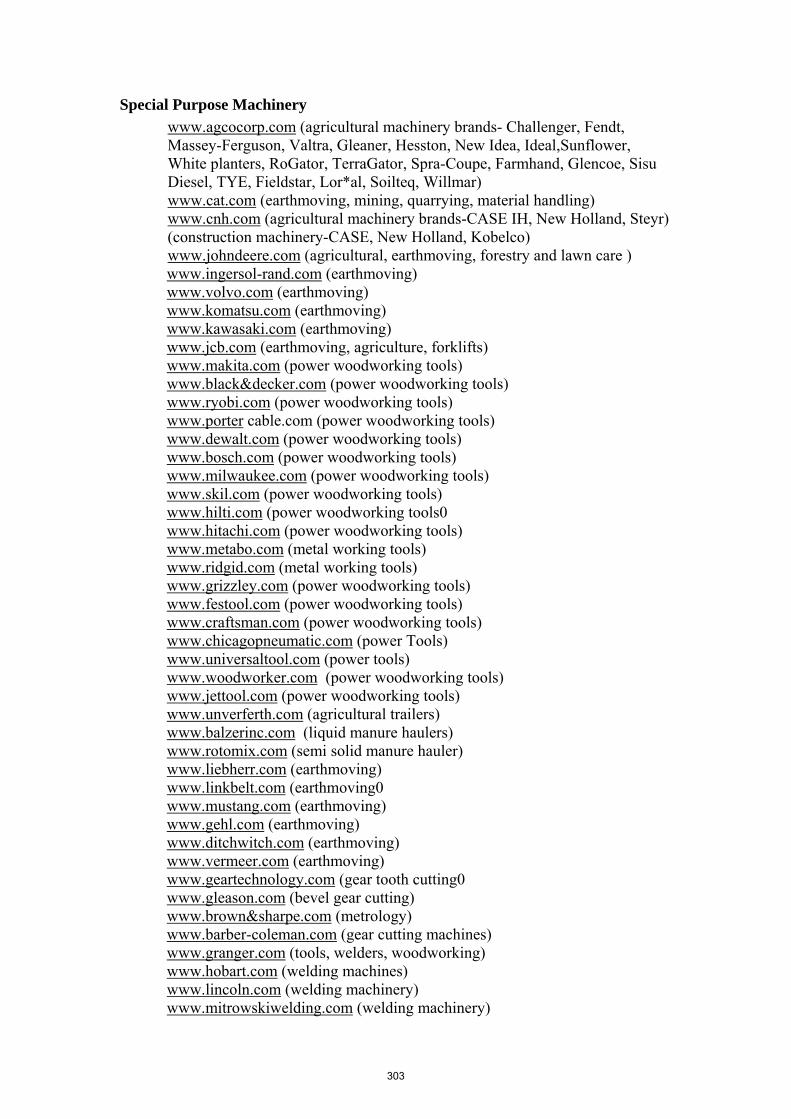
Special Purpose Machinery www.agcocorp.com (agricultural machinery brands- Challenger, Fendt, Massey-Ferguson, Valtra, Gleaner, Hesston, New Idea, Ideal,Sunflower, White planters, RoGator, TerraGator, Spra-Coupe, Farmhand, Glencoe, Sisu Diesel, TYE, Fieldstar, Lor*al, Soilteq, Willmar) www.cat.com (earthmoving, mining, quarrying, material handling) www.cnh.com (agricultural machinery brands-CASE IH, New Holland, Steyr) (construction machinery-CASE, New Holland, Kobelco) www.johndeere.com (agricultural, earthmoving, forestry and lawn care )
www.ingersol-rand.com (earthmoving) www.volvo.com (earthmoving) www.komatsu.com (earthmoving) www.kawasaki.com (earthmoving) www.jcb.com (earthmoving, agriculture, forklifts) www.makita.com (power woodworking tools) www.black&decker.com (power woodworking tools) www.ryobi.com (power woodworking tools) www.porter cable.com (power woodworking tools) www.dewalt.com (power woodworking tools) www.bosch.com (power woodworking tools) www.milwaukee.com (power woodworking tools) www.skil.com (power woodworking tools) www.hilti.com (power woodworking tools0 www.hitachi.com (power woodworking tools) www.metabo.com (metal working tools) www.ridgid.com (metal working tools) www.grizzley.com (power woodworking tools) www.festool.com (power woodworking tools) www.craftsman.com (power woodworking tools) www.chicagopneumatic.com (power Tools) www.universaltool.com (power tools) www.woodworker.com (power woodworking tools) www.jettool.com (power woodworking tools) www.unverferth.com (agricultural trailers) www.balzerinc.com (liquid manure haulers) www.rotomix.com (semi solid manure hauler) www.liebherr.com (earthmoving) www.linkbelt.com (earthmoving0 www.mustang.com (earthmoving) www.gehl.com (earthmoving) www.ditchwitch.com (earthmoving) www.vermeer.com (earthmoving) www.geartechnology.com (gear tooth cutting0 www.gleason.com (bevel gear cutting) www.brown&sharpe.com (metrology) www.barber-coleman.com (gear cutting machines) www.granger.com (tools, welders, woodworking) www.hobart.com (welding machines) www.lincoln.com (welding machinery) www.mitrowskiwelding.com (welding machinery)
303
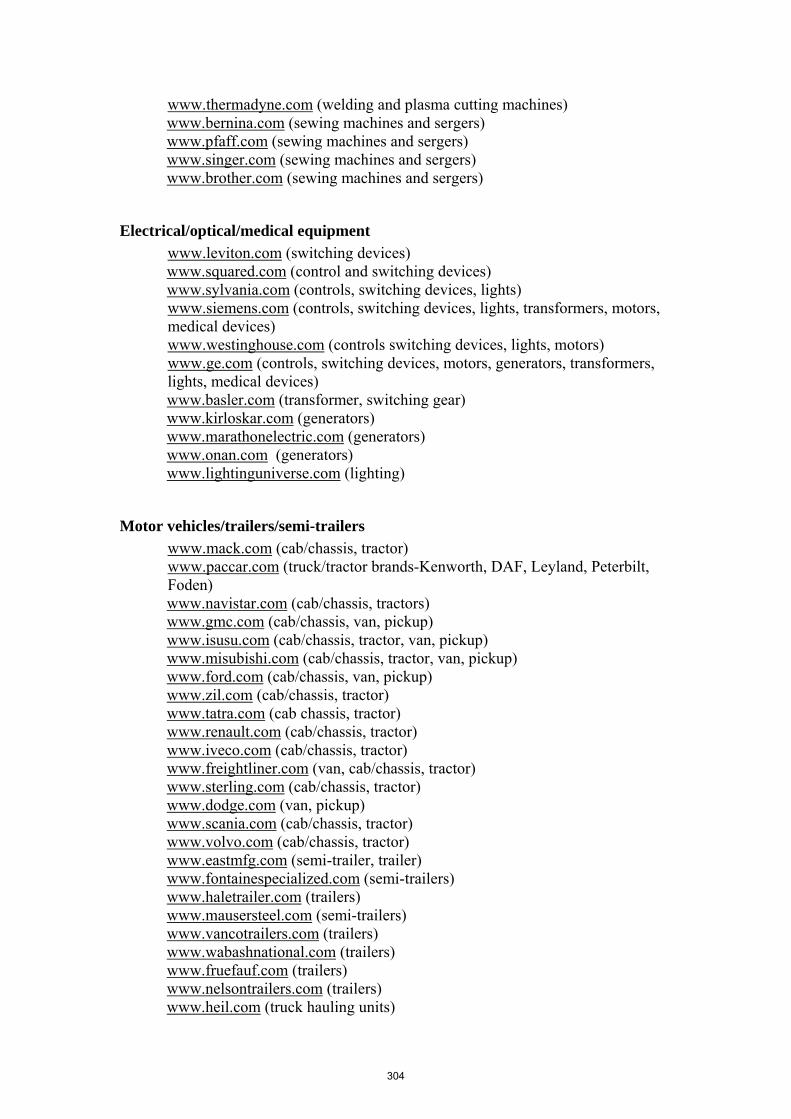
www.thermadyne.com (welding and plasma cutting machines) www.bernina.com (sewing machines and sergers) www.pfaff.com (sewing machines and sergers) www.singer.com (sewing machines and sergers) www.brother.com (sewing machines and sergers)
Electrical/optical/medical equipment www.leviton.com (switching devices)
www.squared.com (control and switching devices) www.sylvania.com (controls, switching devices, lights)
www.siemens.com (controls, switching devices, lights, transformers, motors, medical devices) www.westinghouse.com (controls switching devices, lights, motors) www.ge.com (controls, switching devices, motors, generators, transformers, lights, medical devices)
www.basler.com (transformer, switching gear) www.kirloskar.com (generators) www.marathonelectric.com (generators) www.onan.com (generators) www.lightinguniverse.com (lighting)
Motor vehicles/trailers/semi-trailers www.mack.com (cab/chassis, tractor) www.paccar.com (truck/tractor brands-Kenworth, DAF, Leyland, Peterbilt, Foden)
www.navistar.com (cab/chassis, tractors) www.gmc.com (cab/chassis, van, pickup) www.isusu.com (cab/chassis, tractor, van, pickup) www.misubishi.com (cab/chassis, tractor, van, pickup) www.ford.com (cab/chassis, van, pickup) www.zil.com (cab/chassis, tractor) www.tatra.com (cab chassis, tractor) www.renault.com (cab/chassis, tractor) www.iveco.com (cab/chassis, tractor) www.freightliner.com (van, cab/chassis, tractor) www.sterling.com (cab/chassis, tractor) www.dodge.com (van, pickup) www.scania.com (cab/chassis, tractor) www.volvo.com (cab/chassis, tractor) www.eastmfg.com (semi-trailer, trailer) www.fontainespecialized.com (semi-trailers) www.haletrailer.com (trailers) www.mausersteel.com (semi-trailers) www.vancotrailers.com (trailers) www.wabashnational.com (trailers) www.fruefauf.com (trailers) www.nelsontrailers.com (trailers) www.heil.com (truck hauling units)
304

www.johsontruckbodies.com (truck hauling units) www.knapheide.com (truck hauling units)
305
Chapter 10
Dwelling Services
I. Introduction
Layout of the Chapter 1. There are three main parts to this chapter:
• The first part explains the methods that may be used to estimate expenditure on dwellings as part of final consumption expenditure of households. Separate sections cover the estimates for “modern” and “traditional” dwellings. (See below for the distinction between modern and traditional dwellings.)
• The second part describes the information required on rents. This part also describes the quantity approach which is a method of directly estimating the relative volumes of dwelling services. No information on rents is required and PPPs are derived indirectly by comparing the volumes with the expenditure figures.
• The third part summarises the data on dwelling services that participating countries are required to submit for the ICP 2003-2006 round.
Scope of Rents 2. The scope of rents for dwellings (Basic heading 11.04.10.0) is explained in the
Classification of Final Expenditures on GDP.1 The main points to bear in mind are that:
• Rents are payments for the use of a dwelling, the land on which it is situated
and a garage or parking space in connection with the dwelling. • Rents do not include payments for the following goods or services, all of which
are shown as separate expenditure items under final consumption expenditure of households: (The correct basic headings are shown in brackets.)
o Charges for water supply (11.04.41.1); o Refuse collection and sewerage collection (11.04.42.1); o Co-proprietor charges in multi-occupied buildings for caretaking,
gardening, cleaning stairwells, heating, lighting, maintenance of lifts and refuse disposal chutes, etc. (11.04.42.1);
o Charges for electricity (11.04.51.1) and gas (11.04.52.1); o Charges for heating and hot water supplied by district heating plants
(11.04.55.1). • Rents include the costs incurred by the owner of the dwelling for current
repairs and maintenance such as replacing that which is broken, painting the exterior woodwork, replacing damaged roof tiles, etc. They do not include
1 The Classification of Final Expenditures on GDP uses the term “rentals for housing”. In this chapter, the term “dwellings” is used to make it clear that apartments (flats) are included as well as houses.
306
expenditures for major renovations, reconstruction, or enlargements of dwellings; these expenditures are treated as gross fixed capital formation.
Modern and Traditional Dwellings 3. The measurement of dwelling services is made more difficult in some countries
because many households live in what are here referred to as “traditional”, as opposed to “modern”, dwellings.
• Modern dwellings are generally built by professional building companies. The
walls are made of durable materials such as concrete, ceramic brick, cement blocks or wooden planking, and the roofs are covered in tiles, wooden shingles or metal sheeting. Most dwellings in urban areas will be classified as modern.
• Traditional dwellings are generally built by family members. The walls are made of less durable materials such as dried clay, sun dried bricks, bamboo or latticework, and the roofs are made from reeds, straw or palm fronds. Traditional dwellings are generally located in rural areas and the families that occupy them are most likely to be engaged in agriculture.
4. Traditional dwellings present particular difficulties for the national accounts and for
international comparisons because there are almost no explicit costs involved in their construction. Family members collect the materials themselves and provide their labor free of charge. In addition, traditional dwellings are rarely if ever sold or rented to third parties.
5. Different measurement methods usually have to be used for modern and traditional
dwellings. For this reason, in countries where there are substantial numbers of both traditional and modern dwellings, the basic heading for actual and imputed rentals for housing (11.04.10.0) must be split into:
• Actual and imputed rentals for modern housing (1.04.10.0/A); and • Actual and imputed rentals for traditional housing (11.04.10.0/B).
6. In some countries there will be no traditional dwellings, and in others traditional
dwellings may form only a small part of the dwelling stock. As a rule of thumb, if less than 5% of dwellings are of traditional construction, it will not usually be worthwhile to make estimates in respect of such dwellings. They will be omitted from the estimates of expenditure on dwelling services and no PPPs will be estimated for them.
II. Expenditure on Dwelling Services
Modern Dwellings
1. Standard procedure
7. Expenditure on dwelling services consists of two components: actual rents paid by households that rent their apartment or houses from another person who owns the
307
dwelling - and rents that are imputed for households that live in dwellings that they themselves own.
8. Information on rents actually paid may be obtained directly from a household expenditure survey. An alternative is to calculate the average rents for various types of dwellings and multiply the numbers of rented dwellings of each type by their average rents. The source for information about rents will often be a special rent survey carried out to meet the needs of the consumer price index. The numbers of rented dwellings may come from a population or housing census or, in most industrialised countries, from administrative records on dwellings which are maintained by local authorities for tax purposes.
9. In practice the straightforward procedure described above is more complicated in some
countries because employers provide housing below cost to their employees or because rents are subsidised or controlled by government.
• If employees are provided with free or cheap accommodation by their employers, the difference between what they pay and the market rent for that type of accommodation is treated in the 1993 SNA as income in kind. It becomes a component of compensation of employees and the same amount is added to expenditure on rents in household final consumption expenditure. In this case, the rents reported by the employees in the household expenditure or rents survey must be adjusted to the estimated market rent in calculating actual expenditure on dwelling services. The market rent is obtained by adding the estimated income in kind to the rent actually paid.
• In some countries, governments provide subsidised accommodation for low-income households. In this case, the 1993 SNA treats the subsidy as a social transfer in kind to the households concerned and not as income in kind. The subsidy is treated as government expenditure on dwelling services and not as final consumption expenditure of households. As a result, the rents reported by these households do not need any adjustment; the (subsidised) rents actually paid by these households are the correct ones to use in calculating actual expenditure on dwelling services.
• Another common practice is for governments to impose controls either on the level of rents or on the annual increases that owners can impose. Usually the regulations on annual increases apply only to sitting tenants and owners are free to set rent levels for new tenants. This can result in a situation where a range of rents are paid for similar dwellings – very low for long-sitting tenants and substantially higher for new tenants. This is one example among many where governments interfere with the functioning of the market but no special adjustments are called for. Expenditure on rents will be the sum of all these different rents.
10. The standard procedure for the measurement of imputed expenditure on dwelling
services was explained in Chapter 3 (Final Expenditures). For convenience the relevant section is included here:
11. The general rule is that rents of dwellings occupied by their owners should be imputed
by reference to rents actually paid for similar dwellings. “Similarity” in the case of dwellings is usually judged by considering type of dwelling (single family or multi-family), location (city centre, suburban or rural), and facilities (floor-space, running water, indoor toilet, electricity, central heating, etc.). The recommended approach is to complete a matrix such as in the table below showing the average rents actually paid for each type of dwelling. The number of owner-occupied dwellings of that type is
308
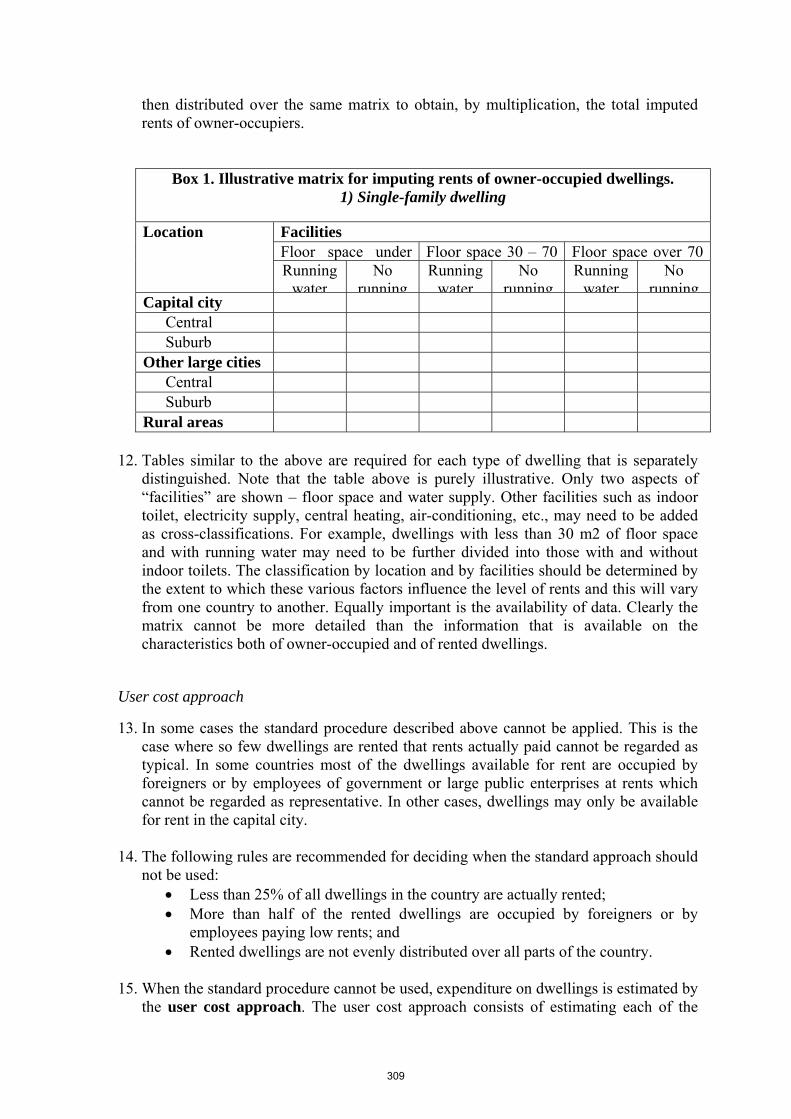
then distributed over the same matrix to obtain, by multiplication, the total imputed rents of owner-occupiers.
Box 1. Illustrative matrix for imputing rents of owner-occupied dwellings. 1) Single-family dwelling
Facilities Floor space under Floor space 30 – 70 Floor space over 70
Location
Running water
No running
Running water
No running
Running water
No running
Capital city Central Suburb
Other large cities Central Suburb
Rural areas
12. Tables similar to the above are required for each type of dwelling that is separately distinguished. Note that the table above is purely illustrative. Only two aspects of “facilities” are shown – floor space and water supply. Other facilities such as indoor toilet, electricity supply, central heating, air-conditioning, etc., may need to be added as cross-classifications. For example, dwellings with less than 30 m2 of floor space and with running water may need to be further divided into those with and without indoor toilets. The classification by location and by facilities should be determined by the extent to which these various factors influence the level of rents and this will vary from one country to another. Equally important is the availability of data. Clearly the matrix cannot be more detailed than the information that is available on the characteristics both of owner-occupied and of rented dwellings.
User cost approach
13. In some cases the standard procedure described above cannot be applied. This is the case where so few dwellings are rented that rents actually paid cannot be regarded as typical. In some countries most of the dwellings available for rent are occupied by foreigners or by employees of government or large public enterprises at rents which cannot be regarded as representative. In other cases, dwellings may only be available for rent in the capital city.
14. The following rules are recommended for deciding when the standard approach should
not be used: • Less than 25% of all dwellings in the country are actually rented; • More than half of the rented dwellings are occupied by foreigners or by
employees paying low rents; and • Rented dwellings are not evenly distributed over all parts of the country.
15. When the standard procedure cannot be used, expenditure on dwellings is estimated by
the user cost approach. The user cost approach consists of estimating each of the
309
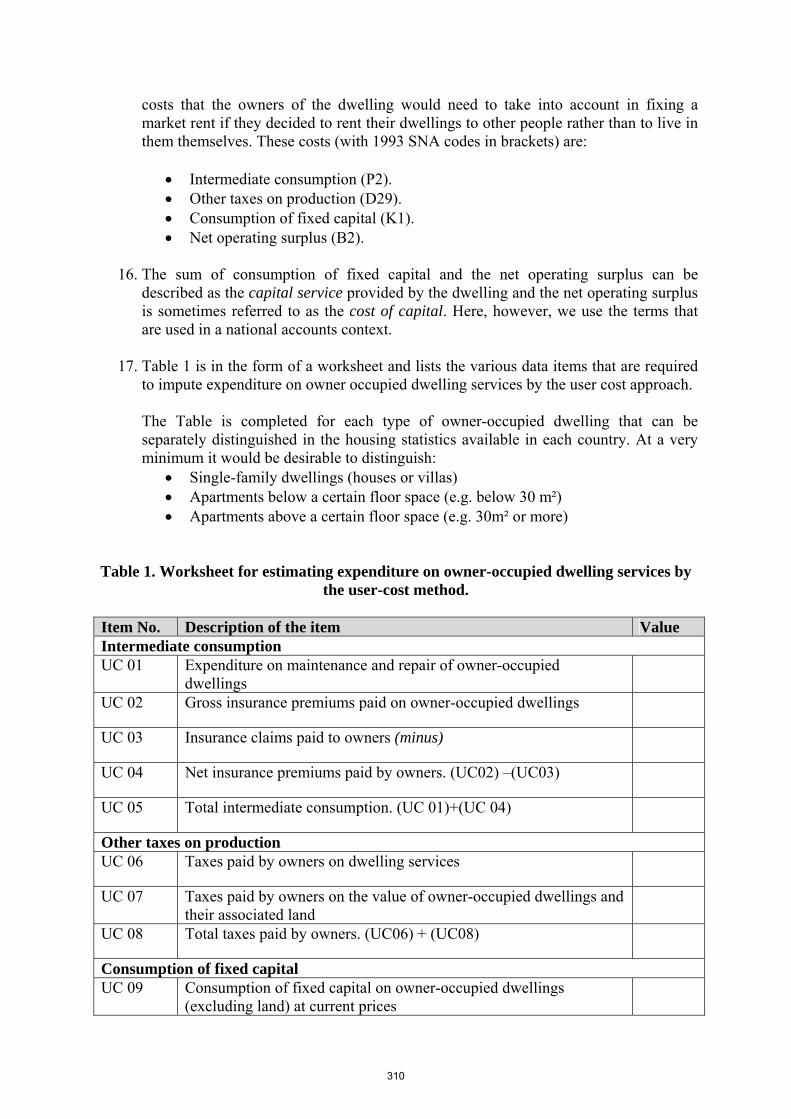
costs that the owners of the dwelling would need to take into account in fixing a market rent if they decided to rent their dwellings to other people rather than to live in them themselves. These costs (with 1993 SNA codes in brackets) are:
• Intermediate consumption (P2). • Other taxes on production (D29). • Consumption of fixed capital (K1). • Net operating surplus (B2).
16. The sum of consumption of fixed capital and the net operating surplus can be
described as the capital service provided by the dwelling and the net operating surplus is sometimes referred to as the cost of capital. Here, however, we use the terms that are used in a national accounts context.
17. Table 1 is in the form of a worksheet and lists the various data items that are required
to impute expenditure on owner occupied dwelling services by the user cost approach.
The Table is completed for each type of owner-occupied dwelling that can be separately distinguished in the housing statistics available in each country. At a very minimum it would be desirable to distinguish:
• Single-family dwellings (houses or villas) • Apartments below a certain floor space (e.g. below 30 m²) • Apartments above a certain floor space (e.g. 30m² or more)
Table 1. Worksheet for estimating expenditure on owner-occupied dwelling services by the user-cost method.
Item No. Description of the item Value Intermediate consumption UC 01 Expenditure on maintenance and repair of owner-occupied
dwellings
UC 02 Gross insurance premiums paid on owner-occupied dwellings
UC 03 Insurance claims paid to owners (minus)
UC 04 Net insurance premiums paid by owners. (UC02) –(UC03)
UC 05 Total intermediate consumption. (UC 01)+(UC 04)
Other taxes on production UC 06 Taxes paid by owners on dwelling services
UC 07 Taxes paid by owners on the value of owner-occupied dwellings and their associated land
UC 08 Total taxes paid by owners. (UC06) + (UC08)
Consumption of fixed capital UC 09 Consumption of fixed capital on owner-occupied dwellings
(excluding land) at current prices
310
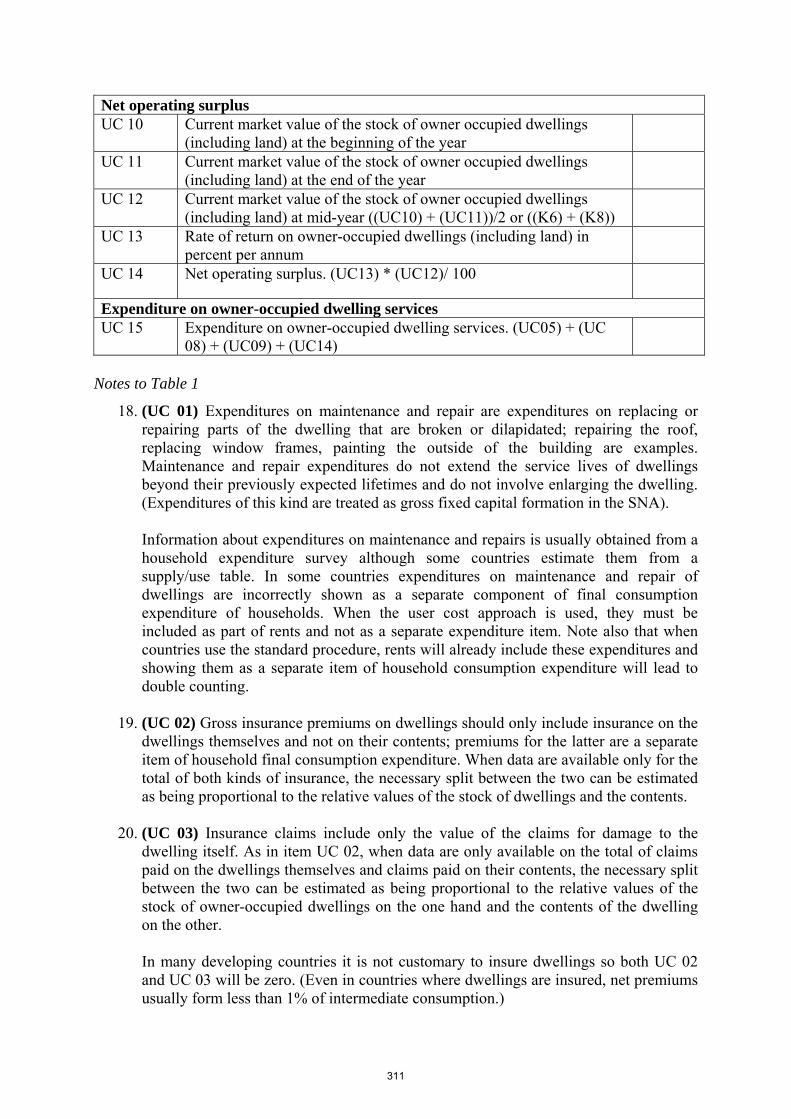
Net operating surplus UC 10 Current market value of the stock of owner occupied dwellings
(including land) at the beginning of the year
UC 11 Current market value of the stock of owner occupied dwellings (including land) at the end of the year
UC 12 Current market value of the stock of owner occupied dwellings (including land) at mid-year ((UC10) + (UC11))/2 or ((K6) + (K8))
UC 13 Rate of return on owner-occupied dwellings (including land) in percent per annum
UC 14 Net operating surplus. (UC13) * (UC12)/ 100
Expenditure on owner-occupied dwelling services UC 15 Expenditure on owner-occupied dwelling services. (UC05) + (UC
08) + (UC09) + (UC14)
Notes to Table 1
18. (UC 01) Expenditures on maintenance and repair are expenditures on replacing or repairing parts of the dwelling that are broken or dilapidated; repairing the roof, replacing window frames, painting the outside of the building are examples. Maintenance and repair expenditures do not extend the service lives of dwellings beyond their previously expected lifetimes and do not involve enlarging the dwelling. (Expenditures of this kind are treated as gross fixed capital formation in the SNA).
Information about expenditures on maintenance and repairs is usually obtained from a household expenditure survey although some countries estimate them from a supply/use table. In some countries expenditures on maintenance and repair of dwellings are incorrectly shown as a separate component of final consumption expenditure of households. When the user cost approach is used, they must be included as part of rents and not as a separate expenditure item. Note also that when countries use the standard procedure, rents will already include these expenditures and showing them as a separate item of household consumption expenditure will lead to double counting.
19. (UC 02) Gross insurance premiums on dwellings should only include insurance on the
dwellings themselves and not on their contents; premiums for the latter are a separate item of household final consumption expenditure. When data are available only for the total of both kinds of insurance, the necessary split between the two can be estimated as being proportional to the relative values of the stock of dwellings and the contents.
20. (UC 03) Insurance claims include only the value of the claims for damage to the
dwelling itself. As in item UC 02, when data are only available on the total of claims paid on the dwellings themselves and claims paid on their contents, the necessary split between the two can be estimated as being proportional to the relative values of the stock of owner-occupied dwellings on the one hand and the contents of the dwelling on the other.
In many developing countries it is not customary to insure dwellings so both UC 02 and UC 03 will be zero. (Even in countries where dwellings are insured, net premiums usually form less than 1% of intermediate consumption.)
311
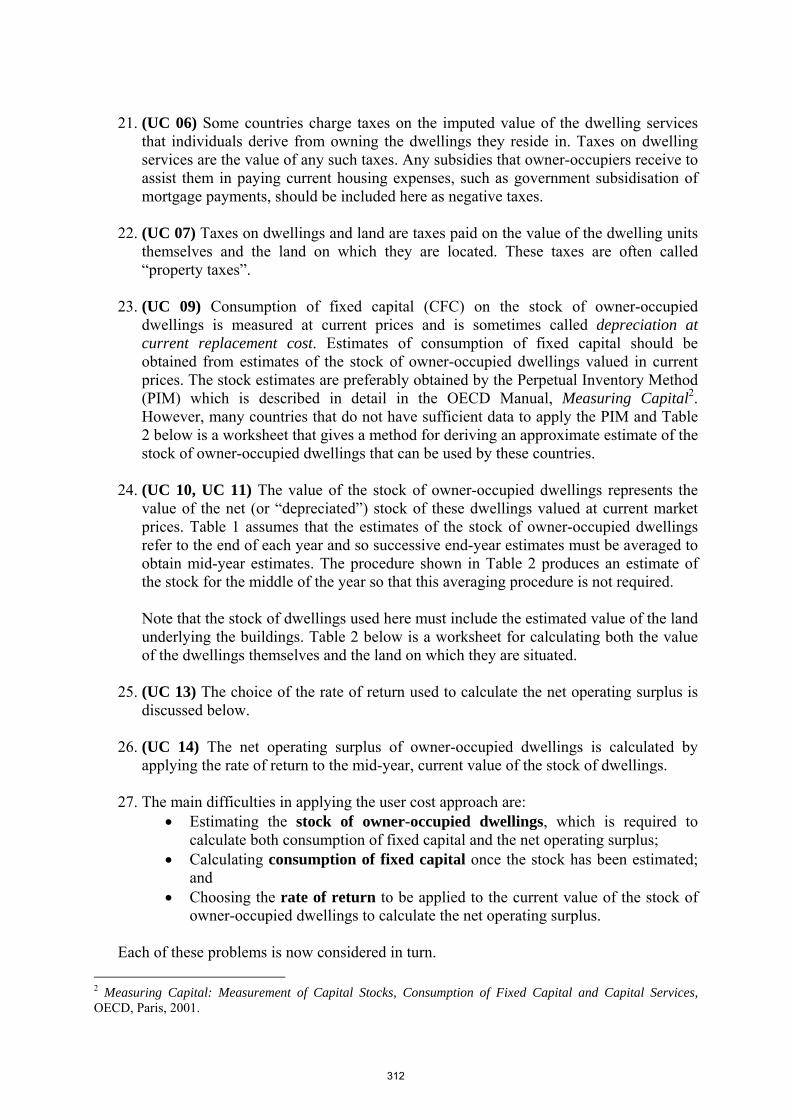
21. (UC 06) Some countries charge taxes on the imputed value of the dwelling services
that individuals derive from owning the dwellings they reside in. Taxes on dwelling services are the value of any such taxes. Any subsidies that owner-occupiers receive to assist them in paying current housing expenses, such as government subsidisation of mortgage payments, should be included here as negative taxes.
22. (UC 07) Taxes on dwellings and land are taxes paid on the value of the dwelling units
themselves and the land on which they are located. These taxes are often called “property taxes”.
23. (UC 09) Consumption of fixed capital (CFC) on the stock of owner-occupied
dwellings is measured at current prices and is sometimes called depreciation at current replacement cost. Estimates of consumption of fixed capital should be obtained from estimates of the stock of owner-occupied dwellings valued in current prices. The stock estimates are preferably obtained by the Perpetual Inventory Method (PIM) which is described in detail in the OECD Manual, Measuring Capital2. However, many countries that do not have sufficient data to apply the PIM and Table 2 below is a worksheet that gives a method for deriving an approximate estimate of the stock of owner-occupied dwellings that can be used by these countries.
24. (UC 10, UC 11) The value of the stock of owner-occupied dwellings represents the
value of the net (or “depreciated”) stock of these dwellings valued at current market prices. Table 1 assumes that the estimates of the stock of owner-occupied dwellings refer to the end of each year and so successive end-year estimates must be averaged to obtain mid-year estimates. The procedure shown in Table 2 produces an estimate of the stock for the middle of the year so that this averaging procedure is not required.
Note that the stock of dwellings used here must include the estimated value of the land underlying the buildings. Table 2 below is a worksheet for calculating both the value of the dwellings themselves and the land on which they are situated.
25. (UC 13) The choice of the rate of return used to calculate the net operating surplus is
discussed below.
26. (UC 14) The net operating surplus of owner-occupied dwellings is calculated by applying the rate of return to the mid-year, current value of the stock of dwellings.
27. The main difficulties in applying the user cost approach are:
• Estimating the stock of owner-occupied dwellings, which is required to calculate both consumption of fixed capital and the net operating surplus;
• Calculating consumption of fixed capital once the stock has been estimated; and
• Choosing the rate of return to be applied to the current value of the stock of owner-occupied dwellings to calculate the net operating surplus.
Each of these problems is now considered in turn.
2 Measuring Capital: Measurement of Capital Stocks, Consumption of Fixed Capital and Capital Services, OECD, Paris, 2001.
312
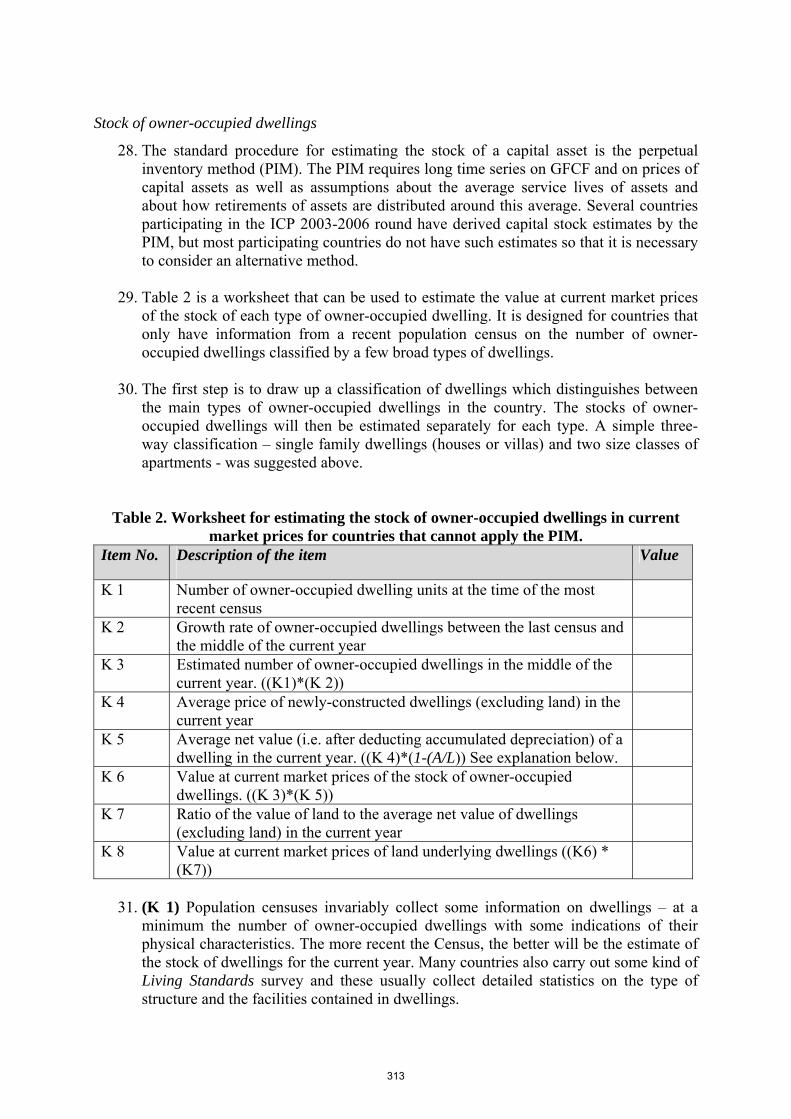
Stock of owner-occupied dwellings
28. The standard procedure for estimating the stock of a capital asset is the perpetual inventory method (PIM). The PIM requires long time series on GFCF and on prices of capital assets as well as assumptions about the average service lives of assets and about how retirements of assets are distributed around this average. Several countries participating in the ICP 2003-2006 round have derived capital stock estimates by the PIM, but most participating countries do not have such estimates so that it is necessary to consider an alternative method.
29. Table 2 is a worksheet that can be used to estimate the value at current market prices
of the stock of each type of owner-occupied dwelling. It is designed for countries that only have information from a recent population census on the number of owner-occupied dwellings classified by a few broad types of dwellings.
30. The first step is to draw up a classification of dwellings which distinguishes between
the main types of owner-occupied dwellings in the country. The stocks of owner-occupied dwellings will then be estimated separately for each type. A simple three-way classification – single family dwellings (houses or villas) and two size classes of apartments - was suggested above.
Table 2. Worksheet for estimating the stock of owner-occupied dwellings in current market prices for countries that cannot apply the PIM.
Item No. Description of the item Value
K 1 Number of owner-occupied dwelling units at the time of the most recent census
K 2 Growth rate of owner-occupied dwellings between the last census and the middle of the current year
K 3 Estimated number of owner-occupied dwellings in the middle of the current year. ((K1)*(K 2))
K 4 Average price of newly-constructed dwellings (excluding land) in the current year
K 5 Average net value (i.e. after deducting accumulated depreciation) of a dwelling in the current year. ((K 4)*(1-(A/L)) See explanation below.
K 6 Value at current market prices of the stock of owner-occupied dwellings. ((K 3)*(K 5))
K 7 Ratio of the value of land to the average net value of dwellings (excluding land) in the current year
K 8 Value at current market prices of land underlying dwellings ((K6) * (K7))
31. (K 1) Population censuses invariably collect some information on dwellings – at a
minimum the number of owner-occupied dwellings with some indications of their physical characteristics. The more recent the Census, the better will be the estimate of the stock of dwellings for the current year. Many countries also carry out some kind of Living Standards survey and these usually collect detailed statistics on the type of structure and the facilities contained in dwellings.
313
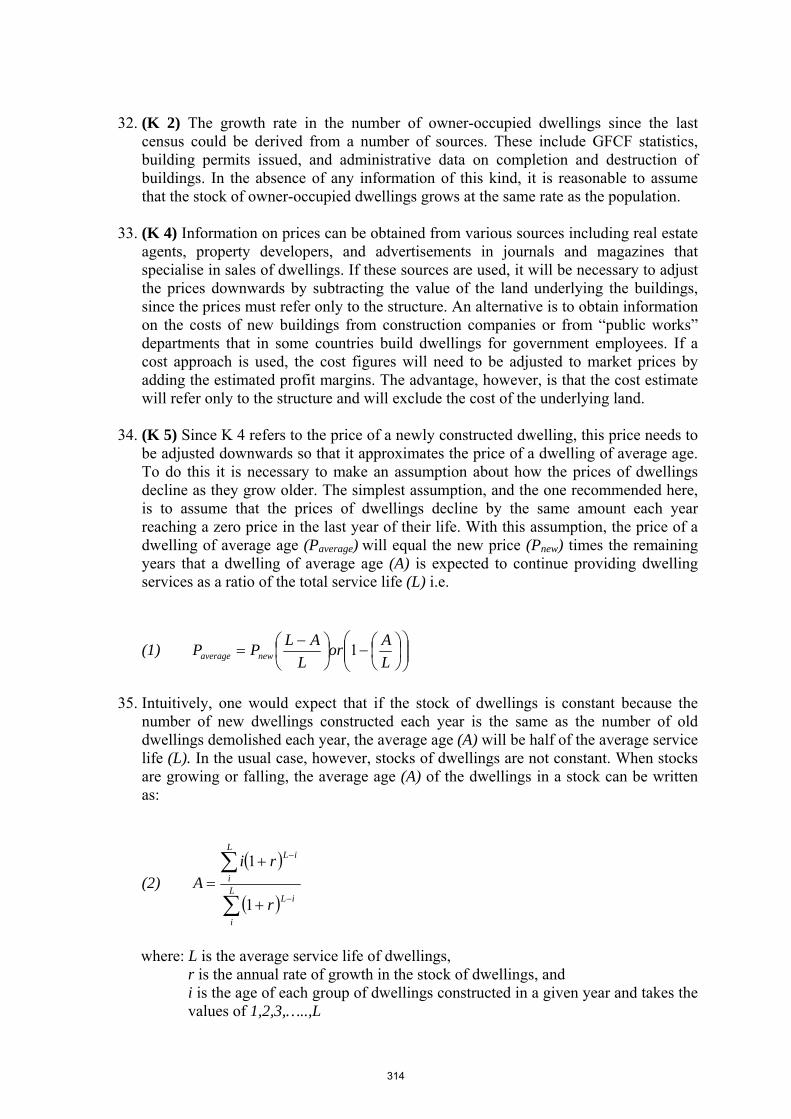
32. (K 2) The growth rate in the number of owner-occupied dwellings since the last
census could be derived from a number of sources. These include GFCF statistics, building permits issued, and administrative data on completion and destruction of buildings. In the absence of any information of this kind, it is reasonable to assume that the stock of owner-occupied dwellings grows at the same rate as the population.
33. (K 4) Information on prices can be obtained from various sources including real estate
agents, property developers, and advertisements in journals and magazines that specialise in sales of dwellings. If these sources are used, it will be necessary to adjust the prices downwards by subtracting the value of the land underlying the buildings, since the prices must refer only to the structure. An alternative is to obtain information on the costs of new buildings from construction companies or from “public works” departments that in some countries build dwellings for government employees. If a cost approach is used, the cost figures will need to be adjusted to market prices by adding the estimated profit margins. The advantage, however, is that the cost estimate will refer only to the structure and will exclude the cost of the underlying land.
34. (K 5) Since K 4 refers to the price of a newly constructed dwelling, this price needs to
be adjusted downwards so that it approximates the price of a dwelling of average age. To do this it is necessary to make an assumption about how the prices of dwellings decline as they grow older. The simplest assumption, and the one recommended here, is to assume that the prices of dwellings decline by the same amount each year reaching a zero price in the last year of their life. With this assumption, the price of a dwelling of average age (Paverage) will equal the new price (Pnew) times the remaining years that a dwelling of average age (A) is expected to continue providing dwelling services as a ratio of the total service life (L) i.e.
(1) ⎟⎟⎠
⎞⎜⎜⎝
⎛⎟⎠⎞
⎜⎝⎛−⎟
⎠⎞
⎜⎝⎛ −
=LAor
LALPP newaverage 1
35. Intuitively, one would expect that if the stock of dwellings is constant because the
number of new dwellings constructed each year is the same as the number of old dwellings demolished each year, the average age (A) will be half of the average service life (L). In the usual case, however, stocks of dwellings are not constant. When stocks are growing or falling, the average age (A) of the dwellings in a stock can be written as:
(2) ( )
( )∑
∑−
−
+
+= L
i
iL
L
i
iL
r
riA
1
1
where: L is the average service life of dwellings,
r is the annual rate of growth in the stock of dwellings, and i is the age of each group of dwellings constructed in a given year and takes the values of 1,2,3,…..,L
314
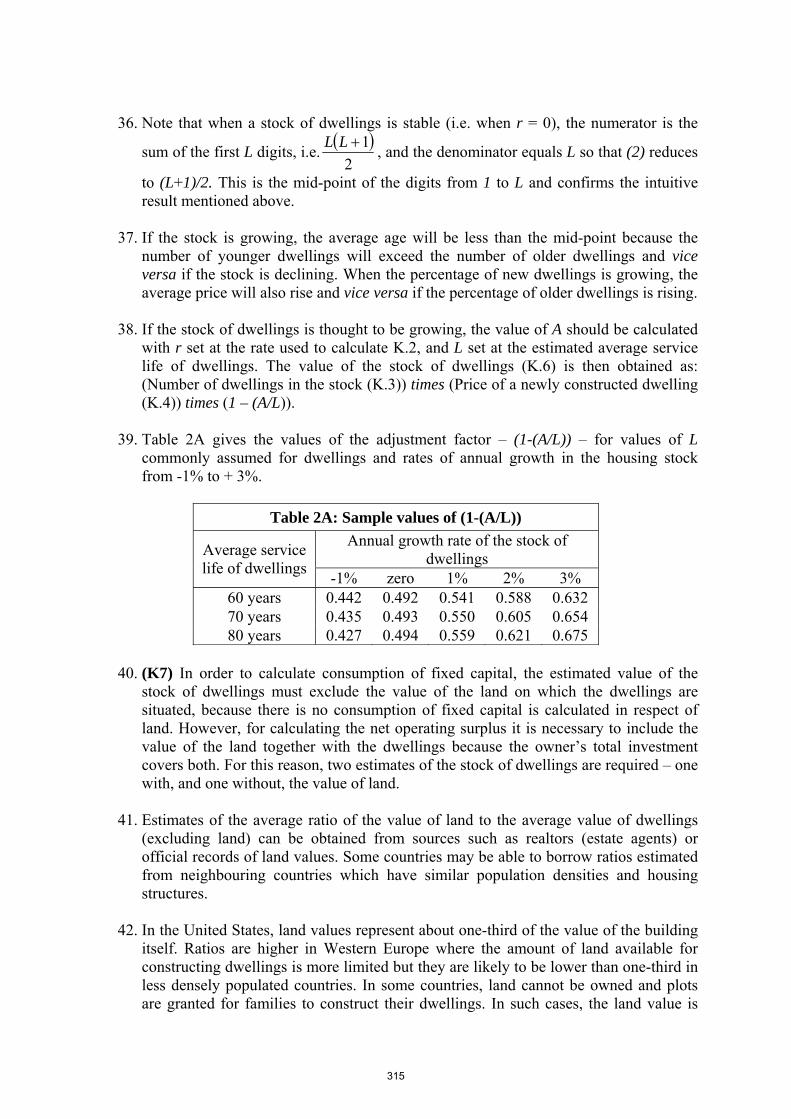
36. Note that when a stock of dwellings is stable (i.e. when r = 0), the numerator is the
sum of the first L digits, i.e. ( )2
1+LL , and the denominator equals L so that (2) reduces
to (L+1)/2. This is the mid-point of the digits from 1 to L and confirms the intuitive result mentioned above.
37. If the stock is growing, the average age will be less than the mid-point because the
number of younger dwellings will exceed the number of older dwellings and vice versa if the stock is declining. When the percentage of new dwellings is growing, the average price will also rise and vice versa if the percentage of older dwellings is rising.
38. If the stock of dwellings is thought to be growing, the value of A should be calculated
with r set at the rate used to calculate K.2, and L set at the estimated average service life of dwellings. The value of the stock of dwellings (K.6) is then obtained as: (Number of dwellings in the stock (K.3)) times (Price of a newly constructed dwelling (K.4)) times (1 – (A/L)).
39. Table 2A gives the values of the adjustment factor – (1-(A/L)) – for values of L
commonly assumed for dwellings and rates of annual growth in the housing stock from -1% to + 3%.
Table 2A: Sample values of (1-(A/L))
Annual growth rate of the stock of dwellings Average service
life of dwellings -1% zero 1% 2% 3% 60 years 0.442 0.492 0.541 0.588 0.632 70 years 0.435 0.493 0.550 0.605 0.654 80 years 0.427 0.494 0.559 0.621 0.675
40. (K7) In order to calculate consumption of fixed capital, the estimated value of the
stock of dwellings must exclude the value of the land on which the dwellings are situated, because there is no consumption of fixed capital is calculated in respect of land. However, for calculating the net operating surplus it is necessary to include the value of the land together with the dwellings because the owner’s total investment covers both. For this reason, two estimates of the stock of dwellings are required – one with, and one without, the value of land.
41. Estimates of the average ratio of the value of land to the average value of dwellings
(excluding land) can be obtained from sources such as realtors (estate agents) or official records of land values. Some countries may be able to borrow ratios estimated from neighbouring countries which have similar population densities and housing structures.
42. In the United States, land values represent about one-third of the value of the building
itself. Ratios are higher in Western Europe where the amount of land available for constructing dwellings is more limited but they are likely to be lower than one-third in less densely populated countries. In some countries, land cannot be owned and plots are granted for families to construct their dwellings. In such cases, the land value is
315
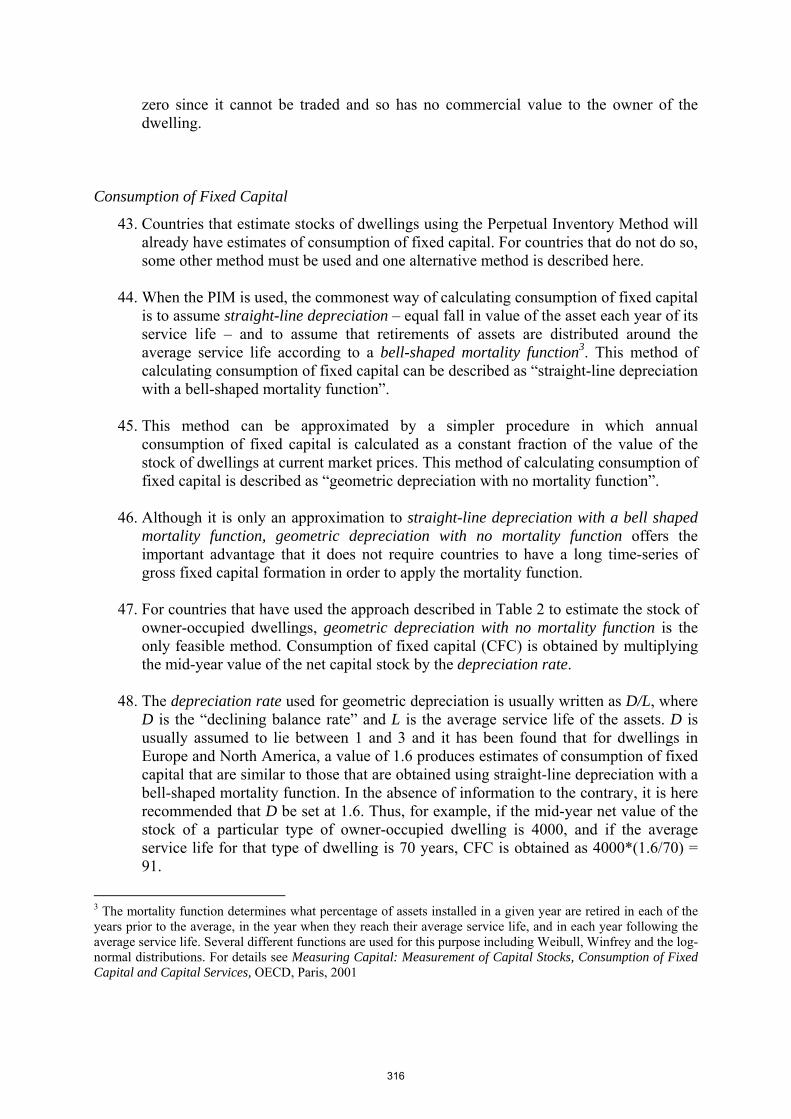
zero since it cannot be traded and so has no commercial value to the owner of the dwelling.
Consumption of Fixed Capital
43. Countries that estimate stocks of dwellings using the Perpetual Inventory Method will already have estimates of consumption of fixed capital. For countries that do not do so, some other method must be used and one alternative method is described here.
44. When the PIM is used, the commonest way of calculating consumption of fixed capital
is to assume straight-line depreciation – equal fall in value of the asset each year of its service life – and to assume that retirements of assets are distributed around the average service life according to a bell-shaped mortality function3. This method of calculating consumption of fixed capital can be described as “straight-line depreciation with a bell-shaped mortality function”.
45. This method can be approximated by a simpler procedure in which annual
consumption of fixed capital is calculated as a constant fraction of the value of the stock of dwellings at current market prices. This method of calculating consumption of fixed capital is described as “geometric depreciation with no mortality function”.
46. Although it is only an approximation to straight-line depreciation with a bell shaped
mortality function, geometric depreciation with no mortality function offers the important advantage that it does not require countries to have a long time-series of gross fixed capital formation in order to apply the mortality function.
47. For countries that have used the approach described in Table 2 to estimate the stock of
owner-occupied dwellings, geometric depreciation with no mortality function is the only feasible method. Consumption of fixed capital (CFC) is obtained by multiplying the mid-year value of the net capital stock by the depreciation rate.
48. The depreciation rate used for geometric depreciation is usually written as D/L, where
D is the “declining balance rate” and L is the average service life of the assets. D is usually assumed to lie between 1 and 3 and it has been found that for dwellings in Europe and North America, a value of 1.6 produces estimates of consumption of fixed capital that are similar to those that are obtained using straight-line depreciation with a bell-shaped mortality function. In the absence of information to the contrary, it is here recommended that D be set at 1.6. Thus, for example, if the mid-year net value of the stock of a particular type of owner-occupied dwelling is 4000, and if the average service life for that type of dwelling is 70 years, CFC is obtained as 4000*(1.6/70) = 91.
3 The mortality function determines what percentage of assets installed in a given year are retired in each of the years prior to the average, in the year when they reach their average service life, and in each year following the average service life. Several different functions are used for this purpose including Weibull, Winfrey and the log-normal distributions. For details see Measuring Capital: Measurement of Capital Stocks, Consumption of Fixed Capital and Capital Services, OECD, Paris, 2001
316
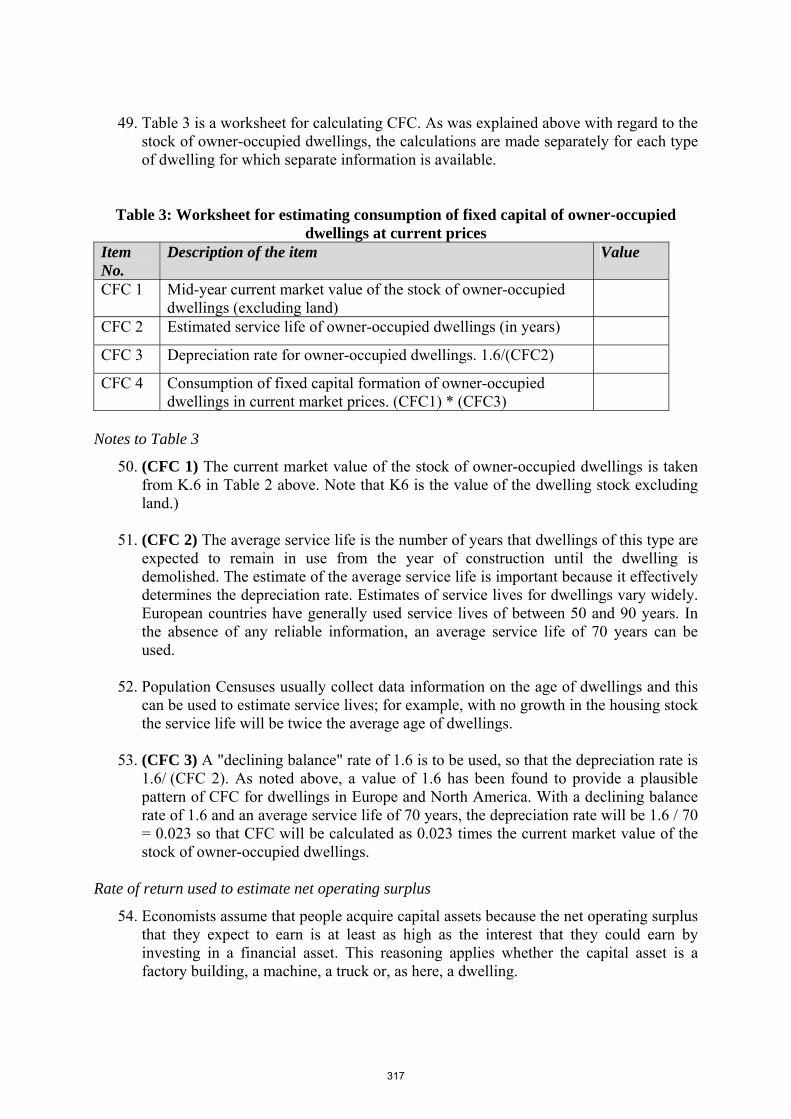
49. Table 3 is a worksheet for calculating CFC. As was explained above with regard to the
stock of owner-occupied dwellings, the calculations are made separately for each type of dwelling for which separate information is available.
Table 3: Worksheet for estimating consumption of fixed capital of owner-occupied dwellings at current prices
Item No.
Description of the item Value
CFC 1 Mid-year current market value of the stock of owner-occupied dwellings (excluding land)
CFC 2 Estimated service life of owner-occupied dwellings (in years)
CFC 3 Depreciation rate for owner-occupied dwellings. 1.6/(CFC2)
CFC 4 Consumption of fixed capital formation of owner-occupied dwellings in current market prices. (CFC1) * (CFC3)
Notes to Table 3
50. (CFC 1) The current market value of the stock of owner-occupied dwellings is taken from K.6 in Table 2 above. Note that K6 is the value of the dwelling stock excluding land.)
51. (CFC 2) The average service life is the number of years that dwellings of this type are
expected to remain in use from the year of construction until the dwelling is demolished. The estimate of the average service life is important because it effectively determines the depreciation rate. Estimates of service lives for dwellings vary widely. European countries have generally used service lives of between 50 and 90 years. In the absence of any reliable information, an average service life of 70 years can be used.
52. Population Censuses usually collect data information on the age of dwellings and this
can be used to estimate service lives; for example, with no growth in the housing stock the service life will be twice the average age of dwellings.
53. (CFC 3) A "declining balance" rate of 1.6 is to be used, so that the depreciation rate is
1.6/ (CFC 2). As noted above, a value of 1.6 has been found to provide a plausible pattern of CFC for dwellings in Europe and North America. With a declining balance rate of 1.6 and an average service life of 70 years, the depreciation rate will be 1.6 / 70 = 0.023 so that CFC will be calculated as 0.023 times the current market value of the stock of owner-occupied dwellings.
Rate of return used to estimate net operating surplus
54. Economists assume that people acquire capital assets because the net operating surplus that they expect to earn is at least as high as the interest that they could earn by investing in a financial asset. This reasoning applies whether the capital asset is a factory building, a machine, a truck or, as here, a dwelling.
317

55. In practice, there are many interest rates that could reasonably be used as the rate of return to estimate the net operating surplus. In countries where there is a well established and widely used system of housing loans, the rate charged on these loans is the best one to use. Where there is no such system in place, the rate on long term (8 years or more) corporate or government bonds could be used. Note that all rates should be on newly issued debt and not the average rate paid on outstanding debt, which reflects rates existing in prior years.
56. In countries where financial markets are less developed, none of these alternatives may
be feasible. In this case it is recommended that a standard annual rate of return of 2.5% should be used. This means that the net operating surplus will be calculated as 0.025 times the current market value of the stock of owner-occupied dwellings.
Traditional Dwellings
57. Traditional dwellings are rarely if ever rented so that, in most countries, the standard procedure cannot be used to impute rents for owner-occupied dwellings.
58. Several developing countries periodically carry out surveys of living standards often
with support from the World Bank or the United Nations Development Programme. These surveys collect a good deal of information on dwellings and some of the surveys ask the owners to estimate the annual rental values of their dwellings. In a situation where dwellings are rarely if ever rented, the owners’ estimates of rental values must be highly unreliable and it is not recommended that they be used to estimate imputed expenditure on dwelling services. For traditional dwellings the recommended approach is to apply the user cost method.
Tables 1 through 3 can be used for traditional dwellings with the following modifications.
Table 1
59. Intermediate consumption. For traditional dwellings, maintenance and repair will
usually be the only item of intermediate consumption as such dwellings are not usually insured. Traditional dwellings may require extensive maintenance as they are constructed from natural materials that may need to be frequently replaced. Since the maintenance work is carried out by family members without charge, the value of such work has to be estimated by the imputed cost of labor inputs. This requires first an estimate of the number of hours spent per year on repair and maintenance and second, an estimate of the hourly or daily wage rate.
60. The estimated hourly or daily wage plays a key role in applying the user cost approach
to traditional dwellings. The wage rate should be the market rate for unskilled agricultural employees; this can be considered as the opportunity cost of labor devoted to repairing or building dwellings because the next best use of this labor is working as an unskilled agricultural laborer. In many countries there are legal minimum wages for agricultural workers and these could be used provided that they are set at a realistic
318
level. In some cases it may be necessary to adjust minimum wages downwards to the wage levels actually prevailing in rural areas.
61. Other taxes on production. Government in some countries levy “hut taxes”. These
are usually flat rate taxes that are levied as a substitute for income tax. If they are not related to the services provided by dwellings, they should not be included in UC 06 or UC 07. In most countries the entry for other taxes on production will be zero for traditional dwellings.
62. Net operating surplus. A net operating surplus is included in the rent of modern
dwellings because owners are assumed to have a choice between acquiring a dwelling or investing the equivalent amount in a financial asset. However, traditional dwellings are built by their owners and family members, mainly using natural materials that they have collected themselves. For such buildings the rate of return is very low and in practice it can be taken as zero. This means that no operating surplus will be included in imputed rents for traditional dwellings.
Estimation of consumption of fixed capital is discussed in connection with Table 3 below.
Table 2
63. The Table 2 worksheet is applicable for traditional dwellings but there is a problem in
estimating the costs of construction because the materials for the building are generally collected by the family members and the building itself is erected by them without any payment. As in the case of repair and maintenance work, the costs will have to be obtained by estimating the hours or days of work required both for assembling the materials and the actual construction of the dwelling and multiplying these by the wage rate for unskilled agricultural workers.
Table 3
64. Service lives for traditional dwellings will certainly be much shorter than for modern
dwellings. Country estimates range from 5 to 15 years. Using geometric depreciation with no mortality function, the annual rate of depreciation (1.6/T) will range from 0.32 to 0.10. In the absence of firm information, it is recommended that service lives are assumed to be 10 years; as a result the depreciation rate becomes 0.16. Note that this is much higher than the depreciation rate that will generally be used for modern dwellings (0.023) because traditional dwellings have shorter service lives.
III. PPPs for Dwellings
Modern Dwellings 65. There are three methods by which PPPs can be calculated for modern dwellings once
the expenditure weights have been calculated:
319
• The Standard SPD Approach: PPPs are calculated for a selection of very detailed types of dwellings. With this approach, dwellings are being treated in exactly the same way as most other consumer goods and services – “like compared with like”.
• The Modified SPD Approach: PPPs are calculated from already existing statistics drawn from comprehensive Rent Surveys. With this approach, the dwellings have to specified more broadly because the basic information in the Rent Surveys will vary between countries with regard to the types of dwellings covered.
• The Quantity Approach: PPPs are obtained indirectly. Volume relatives are calculated by comparing the volume of dwellings in each country and these are divided into value relatives (ratios of expenditures on dwelling services) to obtain the PPPs.
The Standard SPD Approach
66. The SPD for rents of dwellings is in Appendix 1. Note that the SPD contains more options than are used in SPDs for most other goods and services. It covers in detail the type of construction, the facilities provided and the physical location of dwellings. Location covers the type of neighbourhood (affluent, middle-class, poor, etc.), type of area (urban, rural etc.) as well as proximity to highways, shopping, public transportation, etc. The location of a dwelling is one of the most important factors that determine rents. A large variety of facilities are also listed in the SPD covering cooking arrangements, number and types of rooms, washing and toilet facilities, heating, types of fuel used for heating and cooking, air-conditioning, etc. Again, these are all known to be significant determinants of the rental value of a dwelling.
67. The Standard SPD Approach (SSA) has been tried in earlier international comparisons
but it has now been abandoned and it is not used for the ICP 2003-2006 round. The main reason for this is the extreme variability of rents due to the large number of factors that influence them. Because of this variability it would be necessary to collect rents for an impossibly large number of specific types of dwellings in order to calculate reliable PPPs. The number of price observations that would be required could be reduced somewhat if countries were able to provide weights for each of the detailed types of dwellings but this has not proved feasible to date.
The Modified SPD Approach
68. The Modified SPD Approach (MSA) can be used in countries where there is comprehensive information on rents. Comprehensive here means that the information covers all or most types of dwellings and all or most locations within the country. Many countries that have a substantial rental market for dwellings do in fact carry out comprehensive Rent Surveys because the data are needed for their Consumer Price Indices.
69. There are no agreed standards for conducting Rent Surveys and the information
available on the types of rented dwellings varies considerably between countries. As a result, when a group of countries use the MSA it is necessary to reduce the degree of detail in which dwellings are described in order to accommodate differences in the types of dwellings for which rent data can be provided. When the MSA is used the SPD is modified by ignoring many of the characteristics that would be used for the Standard SPD Approach. In practice, even the rather broad definitions of dwellings that have commonly been used for the MSA still require countries to make some
320
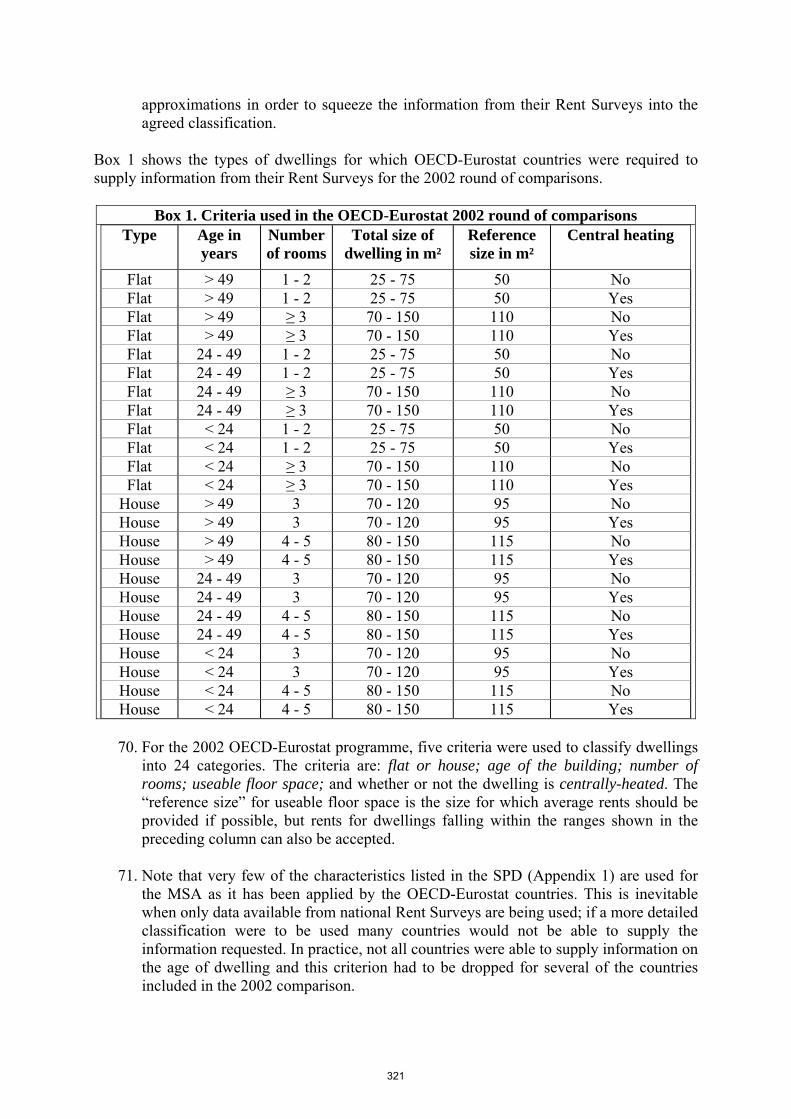
approximations in order to squeeze the information from their Rent Surveys into the agreed classification.
Box 1 shows the types of dwellings for which OECD-Eurostat countries were required to supply information from their Rent Surveys for the 2002 round of comparisons.
Box 1. Criteria used in the OECD-Eurostat 2002 round of comparisons Type Age in
years Number of rooms
Total size of dwelling in m²
Reference size in m²
Central heating
Flat > 49 1 - 2 25 - 75 50 No Flat > 49 1 - 2 25 - 75 50 Yes Flat > 49 ≥ 3 70 - 150 110 No Flat > 49 ≥ 3 70 - 150 110 Yes Flat 24 - 49 1 - 2 25 - 75 50 No Flat 24 - 49 1 - 2 25 - 75 50 Yes Flat 24 - 49 ≥ 3 70 - 150 110 No Flat 24 - 49 ≥ 3 70 - 150 110 Yes Flat < 24 1 - 2 25 - 75 50 No Flat < 24 1 - 2 25 - 75 50 Yes Flat < 24 ≥ 3 70 - 150 110 No Flat < 24 ≥ 3 70 - 150 110 Yes
House > 49 3 70 - 120 95 No House > 49 3 70 - 120 95 Yes House > 49 4 - 5 80 - 150 115 No House > 49 4 - 5 80 - 150 115 Yes House 24 - 49 3 70 - 120 95 No House 24 - 49 3 70 - 120 95 Yes House 24 - 49 4 - 5 80 - 150 115 No House 24 - 49 4 - 5 80 - 150 115 Yes House < 24 3 70 - 120 95 No House < 24 3 70 - 120 95 Yes House < 24 4 - 5 80 - 150 115 No House < 24 4 - 5 80 - 150 115 Yes
70. For the 2002 OECD-Eurostat programme, five criteria were used to classify dwellings
into 24 categories. The criteria are: flat or house; age of the building; number of rooms; useable floor space; and whether or not the dwelling is centrally-heated. The “reference size” for useable floor space is the size for which average rents should be provided if possible, but rents for dwellings falling within the ranges shown in the preceding column can also be accepted.
71. Note that very few of the characteristics listed in the SPD (Appendix 1) are used for
the MSA as it has been applied by the OECD-Eurostat countries. This is inevitable when only data available from national Rent Surveys are being used; if a more detailed classification were to be used many countries would not be able to supply the information requested. In practice, not all countries were able to supply information on the age of dwelling and this criterion had to be dropped for several of the countries included in the 2002 comparison.
321

72. Note too that although location – a key characteristic in determining rents – is not specified in Box 1, the information supplied for each cell is taken from comprehensive Rent Surveys and are therefore averages of the rents paid in all locations. PPPs derived by the MSA will therefore take account of differences in rents that arise because dwellings are in more or less desirable locations.
73. The classification in Box 1 covers the large majority of dwellings in the countries
taking part in the comparison although it excludes houses and flats with more than 150 m² of useable floor space and houses with less than 3 rooms. In addition, for the OECD-Eurostat comparison, rents are only requested for dwellings equipped with electricity and running water although, in practice, this is a minor omission because very few dwellings in OECD countries do not have these facilities. Regions that use the MSA may, of course, select different criteria from those shown in Box 1 (in particular, central heating may not be relevant or may need to be replaced by air-conditioning), but the important point is that the classification should cover most of the stock of dwellings.
74. In Part 1 it was explained that when employers provide free or cheap accommodation
to their employees, these rents must be adjusted to market levels in calculating final expenditure on dwelling services. This means that rents paid by such employees should not be used in estimating rents for specified types of dwellings. The same consideration applies to rents that are subsidised by government. Subsidised rents should not be reported as rents for specified types of dwellings unless they can be adjusted to full market prices (i.e. rent actually paid plus the subsidy).
75. Note too that the MSA should only be used when rents actually paid can be considered
to be representative of the entire stock of dwellings i.e. of both rented and owner-occupied dwellings. The rules for deciding whether rents actually paid can be considered representative are as follows:
• At least more than 25% of all dwellings in the country are actually rented; • Less than half of the rented dwellings are either rented to foreigners or to
employees at low rents ; and • Rented dwellings are evenly distributed over all parts of the country.
When these conditions do not apply, PPPs cannot be reliably estimated by comparing rents between countries and the Quantity Approach described below should be used.
76. Rent Surveys are carried out in different ways. In some countries they are based on
household budget/expenditure surveys but more commonly the information on rents will come from enquiries addressed to real estate agents. It is also possible to use information from classified advertisements in the general press or specialised publications. Initiating, testing and validating a Rent Survey may require several years and it is not expected that such surveys will be set up specifically for the ICP 2003-2006 round. If a country does not already have an ongoing Rent Survey that provides comprehensive information on rents, it will not be able to use the MSA. In this case it will need to use the Quantity Approach.
Quantity Approach
77. The quantity approach does not require any information on rents. Instead the total volumes of dwelling services, both rented and owner-occupied, are compared between
322
all the countries in each region that have decided to use this method. Note that countries using the quantity approach still need to provide information on expenditure on dwelling services; these weights will be the sum of actual rents plus rents for owner-occupied dwellings that have been estimated by the user-cost method.
78. With the quantity approach, PPPs are derived indirectly by dividing volume relatives
(ratios of the volumes of dwelling services in each country) into value relatives (ratios of expenditure on dwelling services in each country).4 It is commonly found that the PPPs derived in this way are of poor quality; they may vary by large amounts from one period to another and they may seem implausible when they are compared with PPPs for other consumer goods and services. This may be because the quantities that are explicitly or implicitly used to calculate expenditures on dwelling services are different from those that have been used for the quantity approach, or it may be because the prices explicitly or implicitly used to calculate the expenditures are wrong. The important point to bear in mind, however, is that the primary objective of the ICP is to make reliable volume comparisons between countries rather than to estimate PPPs. In the absence of reliable information on rents, the quantity approach is the best way of obtaining good volume comparisons.
79. The quantity approach uses both quantitative and qualitative data to construct a
volume index. • The quantitative data are, in order of preference: the useable surface of dwellings;
the number of rooms; the number of dwellings. One or other of these quantities is taken as the quantity index.
• The qualitative data are the percentages of dwellings with facilities such as electricity, inside water supply, inside toilets, air-conditioning or central heating. The percentages of dwellings with these various facilities are averaged to produce a quality index
• The quantity index is multiplied by the quality index to obtain the volume index and this is used to measure the relative volumes of dwelling services provided in each country.
80. Box 2 shows the information that is requested from countries in order to apply the
quantity approach. Note that the information to be provided refers to the entire stock of dwellings, both rented and owner-occupied.
4 An alternative is to calculate the average rent by dividing the numbers of dwellings into estimated expenditures on rents and calculate price relatives between countries. The PPPs will be exactly the same whichever approach is used.
323

Box 2. Data needed for the Quantity Approach
Modern dwellings Houses or
villas Flats or apartments
All dwellings
Traditional Dwellings
Quantity Indicators Number of dwellings (thousands) Number of rooms ( thousands) Useable floor space (thousand square metres) Specify here if a measure other than square metres has been used ______________________)
Quality indicators Number of dwellings with: (thousands)
Electricity Inside water supply Inside toilet Total number of dwellings
Expenditures in national currency Actual and imputed rentals
Notes for Box 2
81. Houses or villas include detached houses, houses joined to one or more other houses, terrace houses, town houses, etc. What distinguishes a house or villa from a flat or apartment is that the owner of a house or villa is responsible for maintaining and repairing the roof and exterior walls.
82. Flats or apartments are usually in multi-story buildings and responsibility for
maintaining roofs and exterior walls is shared among the owners.
83. Useable surface is the floor area of the living room, kitchen, hall, bathroom and all adjoining rooms minus the wall thickness and door and window recesses. Stairs, open balconies and terraces, cellars and lofts (when not equipped as useable premises) are not included. In the case of attics, only the section with a ceiling height of at least 1.7 metres is included. In practice, few countries have housing statistics that use precisely these definitions but approximations can be accepted.
84. Rooms include bed-rooms, sitting rooms, dining rooms, study rooms, play rooms, etc.
but exclude kitchens, halls, shower rooms, bathrooms and toilets.
85. The mechanics of the quantity approach are explained by means of a worked example in Box 3. In this example, the quantity index consists of the useable surface of dwelling and the quality index is the average of the percentages of dwellings which have one of the three facilities shown - electricity, inside water and inside toilet. Note that a dwelling which, for example, has electricity and inside water will be included twice – i.e. once as a dwelling with electricity and once as a dwelling with inside water.
324
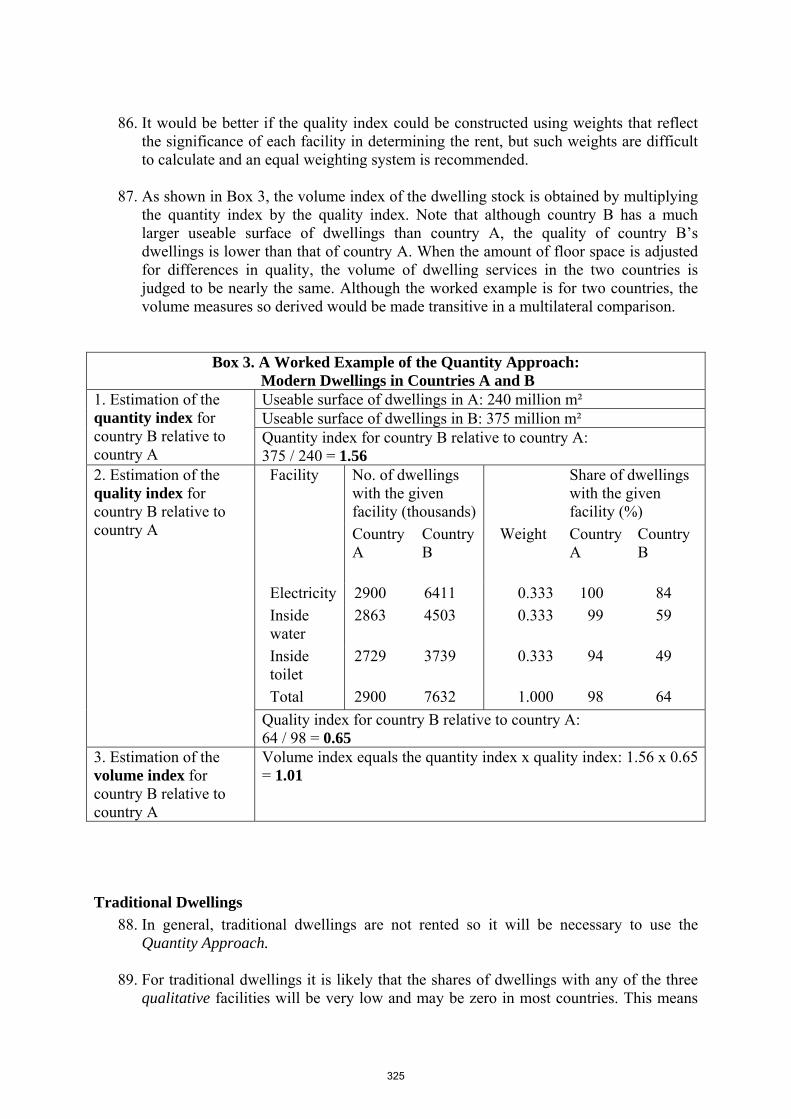
86. It would be better if the quality index could be constructed using weights that reflect
the significance of each facility in determining the rent, but such weights are difficult to calculate and an equal weighting system is recommended.
87. As shown in Box 3, the volume index of the dwelling stock is obtained by multiplying
the quantity index by the quality index. Note that although country B has a much larger useable surface of dwellings than country A, the quality of country B’s dwellings is lower than that of country A. When the amount of floor space is adjusted for differences in quality, the volume of dwelling services in the two countries is judged to be nearly the same. Although the worked example is for two countries, the volume measures so derived would be made transitive in a multilateral comparison.
Box 3. A Worked Example of the Quantity Approach: Modern Dwellings in Countries A and B Useable surface of dwellings in A: 240 million m² Useable surface of dwellings in B: 375 million m²
1. Estimation of the quantity index for country B relative to country A
Quantity index for country B relative to country A: 375 / 240 = 1.56 Facility No. of dwellings
with the given facility (thousands)
Share of dwellingswith the given facility (%)
Country A
Country B
Weight Country A
Country B
Electricity 2900 6411 0.333 100 84 Inside water
2863 4503 0.333 99 59
Inside toilet
2729 3739 0.333 94 49
Total 2900 7632 1.000 98 64
2. Estimation of the quality index for country B relative to country A
Quality index for country B relative to country A: 64 / 98 = 0.65
3. Estimation of the volume index for country B relative to country A
Volume index equals the quantity index x quality index: 1.56 x 0.65 = 1.01
Traditional Dwellings 88. In general, traditional dwellings are not rented so it will be necessary to use the
Quantity Approach.
89. For traditional dwellings it is likely that the shares of dwellings with any of the three qualitative facilities will be very low and may be zero in most countries. This means
325
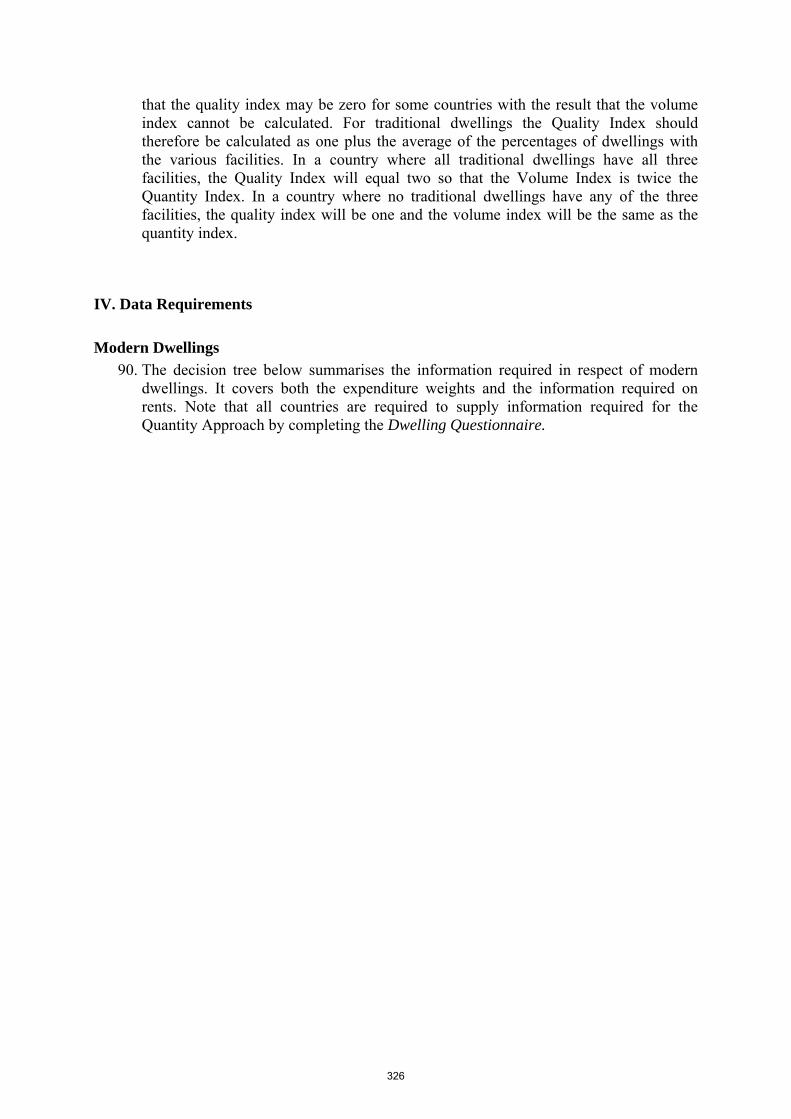
that the quality index may be zero for some countries with the result that the volume index cannot be calculated. For traditional dwellings the Quality Index should therefore be calculated as one plus the average of the percentages of dwellings with the various facilities. In a country where all traditional dwellings have all three facilities, the Quality Index will equal two so that the Volume Index is twice the Quantity Index. In a country where no traditional dwellings have any of the three facilities, the quality index will be one and the volume index will be the same as the quantity index.
IV. Data Requirements
Modern Dwellings 90. The decision tree below summarises the information required in respect of modern
dwellings. It covers both the expenditure weights and the information required on rents. Note that all countries are required to supply information required for the Quantity Approach by completing the Dwelling Questionnaire.
326
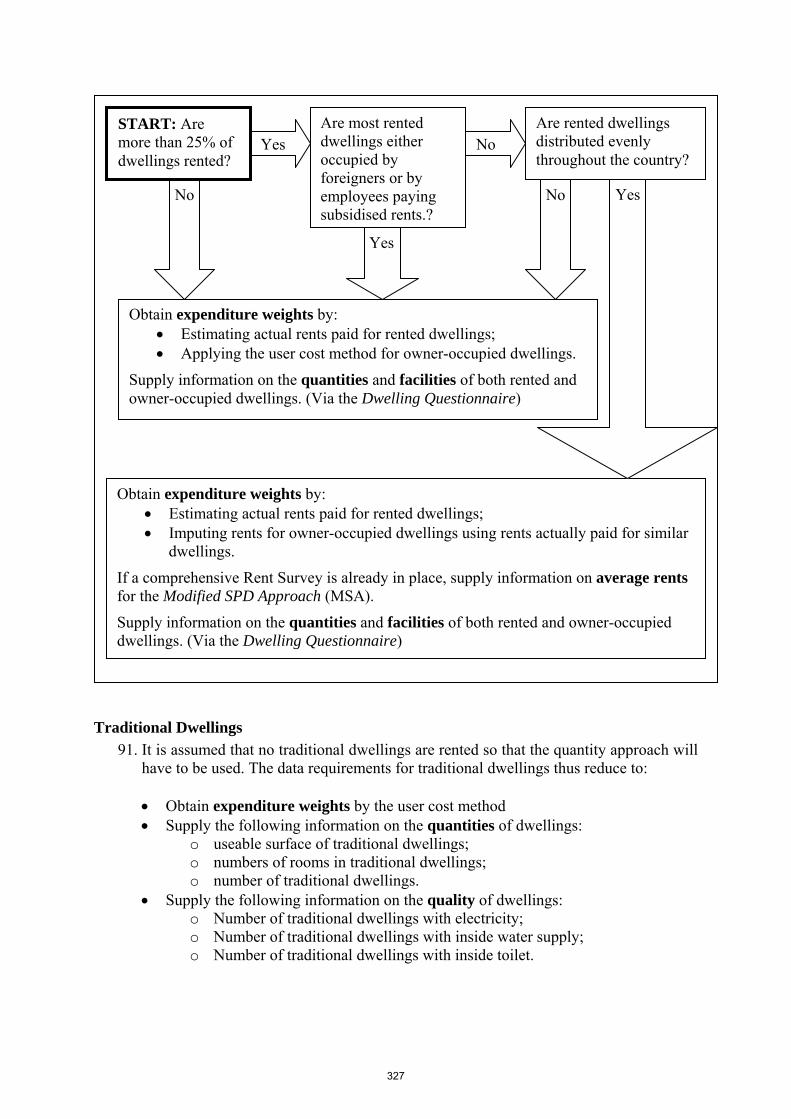
Traditional Dwellings 91. It is assumed that no traditional dwellings are rented so that the quantity approach will
have to be used. The data requirements for traditional dwellings thus reduce to:
• Obtain expenditure weights by the user cost method • Supply the following information on the quantities of dwellings:
o useable surface of traditional dwellings; o numbers of rooms in traditional dwellings; o number of traditional dwellings.
• Supply the following information on the quality of dwellings: o Number of traditional dwellings with electricity; o Number of traditional dwellings with inside water supply; o Number of traditional dwellings with inside toilet.
Yes Are most rented dwellings either occupied by foreigners or by employees paying subsidised rents.?
No Are rented dwellings distributed evenly throughout the country?
No
Obtain expenditure weights by: • Estimating actual rents paid for rented dwellings; • Imputing rents for owner-occupied dwellings using rents actually paid for similar
dwellings.
If a comprehensive Rent Survey is already in place, supply information on average rents for the Modified SPD Approach (MSA).
Supply information on the quantities and facilities of both rented and owner-occupied dwellings. (Via the Dwelling Questionnaire)
Obtain expenditure weights by: • Estimating actual rents paid for rented dwellings; • Applying the user cost method for owner-occupied dwellings.
Supply information on the quantities and facilities of both rented and owner-occupied dwellings. (Via the Dwelling Questionnaire)
Yes
No Yes
START: Are more than 25% of dwellings rented?
327
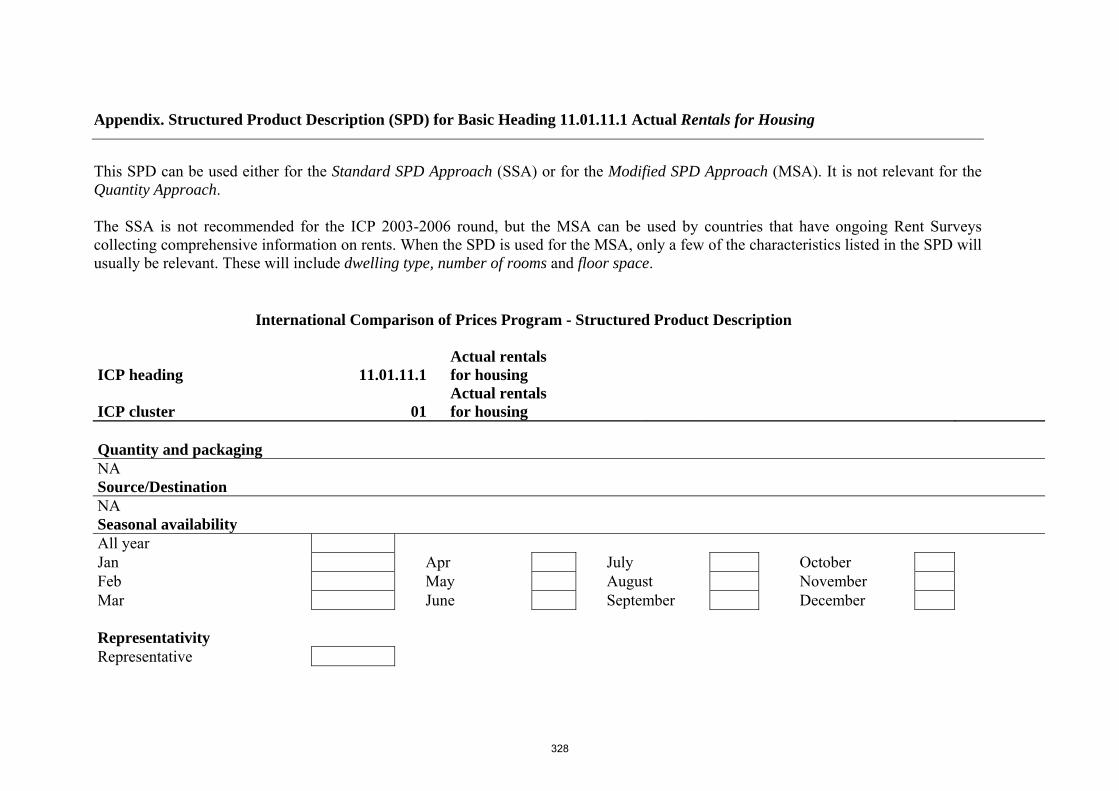
Appendix. Structured Product Description (SPD) for Basic Heading 11.01.11.1 Actual Rentals for Housing
This SPD can be used either for the Standard SPD Approach (SSA) or for the Modified SPD Approach (MSA). It is not relevant for the Quantity Approach. The SSA is not recommended for the ICP 2003-2006 round, but the MSA can be used by countries that have ongoing Rent Surveys collecting comprehensive information on rents. When the SPD is used for the MSA, only a few of the characteristics listed in the SPD will usually be relevant. These will include dwelling type, number of rooms and floor space.
International Comparison of Prices Program - Structured Product Description
ICP heading 11.01.11.1 Actual rentals for housing
ICP cluster 01 Actual rentals for housing
Quantity and packaging NA Source/Destination NA Seasonal availability All year Jan Apr July October Feb May August November Mar June September December Representativity Representative
328
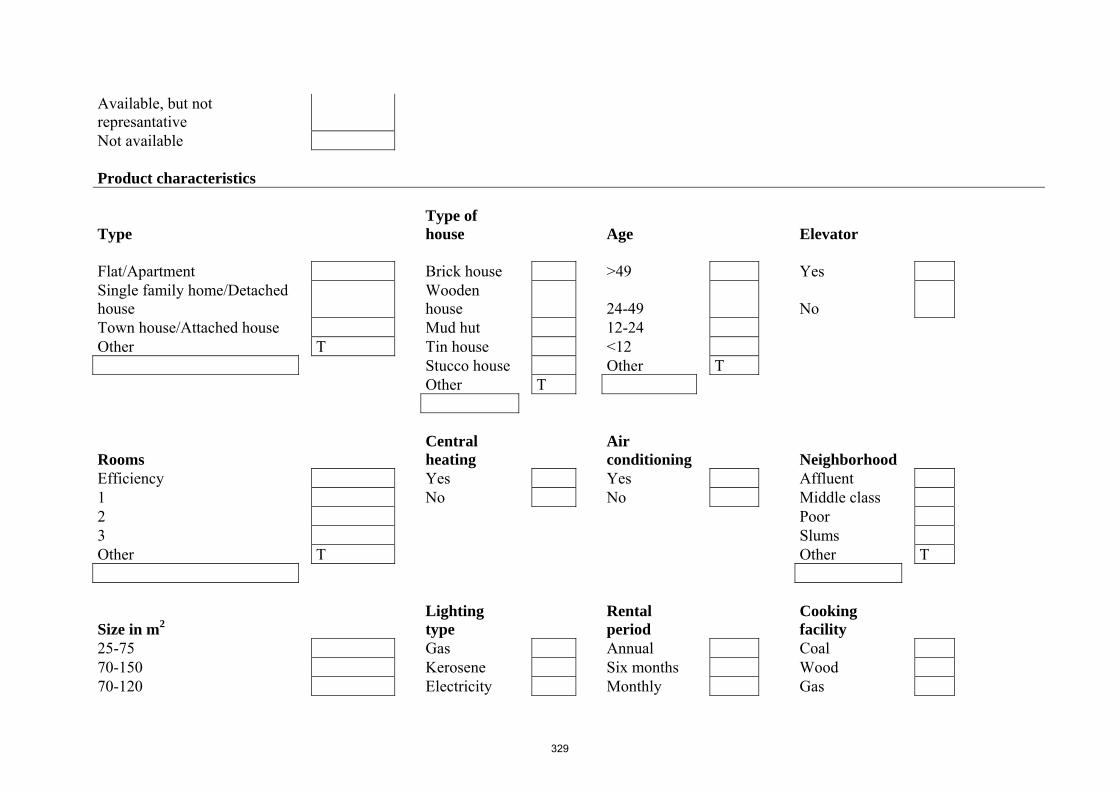
Available, but not represantative Not available Product characteristics
Type Type of house Age Elevator
Flat/Apartment Brick house >49 Yes Single family home/Detached house
Wooden house 24-49 No
Town house/Attached house Mud hut 12-24 Other T Tin house <12 Stucco house Other T Other T
Rooms Central heating
Air conditioning Neighborhood
Efficiency Yes Yes Affluent 1 No No Middle class 2 Poor 3 Slums Other T Other T
Size in m2 Lighting type
Rental period
Cooking facility
25-75 Gas Annual Coal 70-150 Kerosene Six months Wood 70-120 Electricity Monthly Gas
329
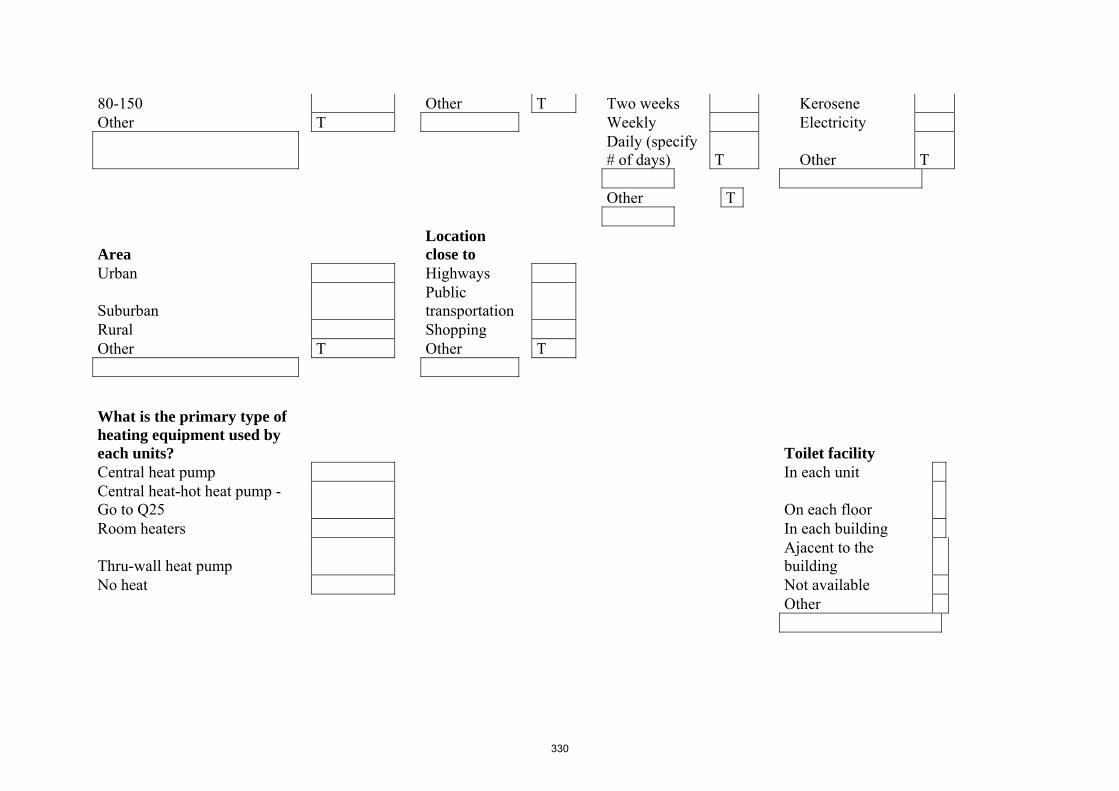
80-150 Other T Two weeks Kerosene Other T Weekly Electricity
Daily (specify # of days) T Other T
Other T
Area Location close to
Urban Highways
Suburban Public transportation
Rural Shopping Other T Other T
What is the primary type of heating equipment used by each units? Toilet facility Central heat pump In each unit Central heat-hot heat pump - Go to Q25 On each floor Room heaters In each building
Thru-wall heat pump Ajacent to the building
No heat Not available Other
330
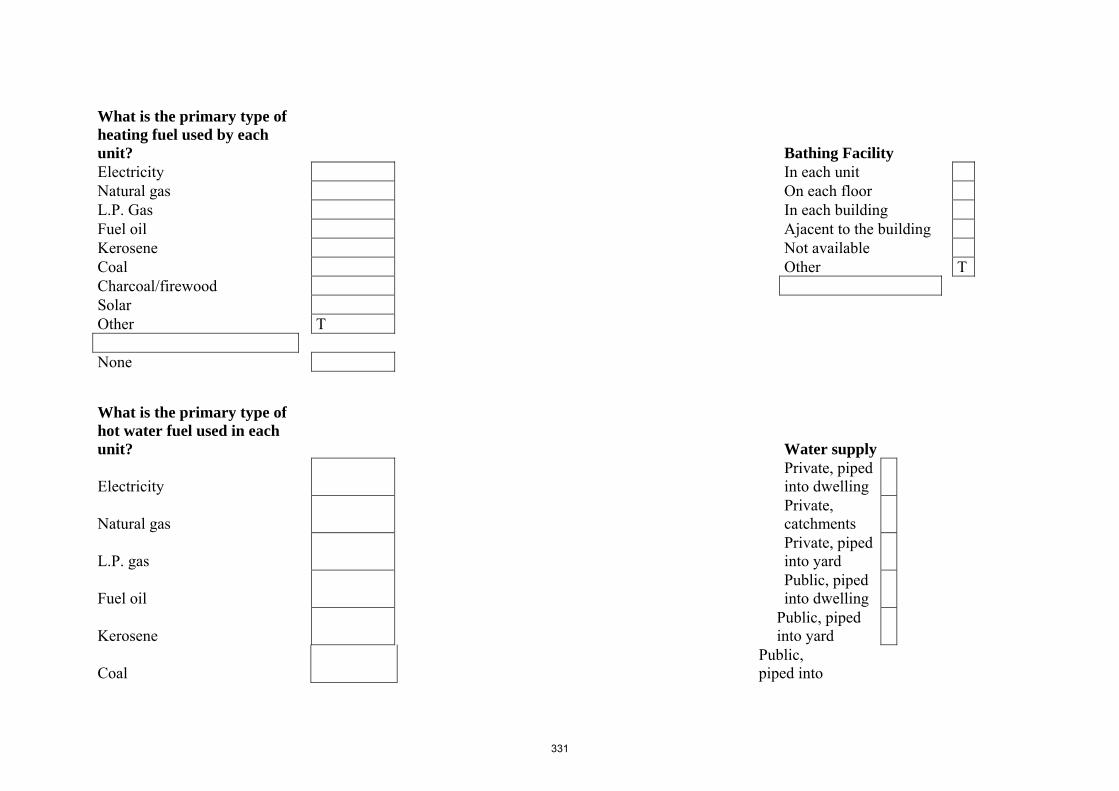
What is the primary type of heating fuel used by each unit? Bathing Facility Electricity In each unit Natural gas On each floor L.P. Gas In each building Fuel oil Ajacent to the building Kerosene Not available Coal Other TCharcoal/firewood Solar Other T None
What is the primary type of hot water fuel used in each unit? Water supply
Electricity Private, piped into dwelling
Natural gas Private, catchments
L.P. gas Private, piped into yard
Fuel oil Public, piped into dwelling
Kerosene Public, piped into yard
Coal Public, piped into
331
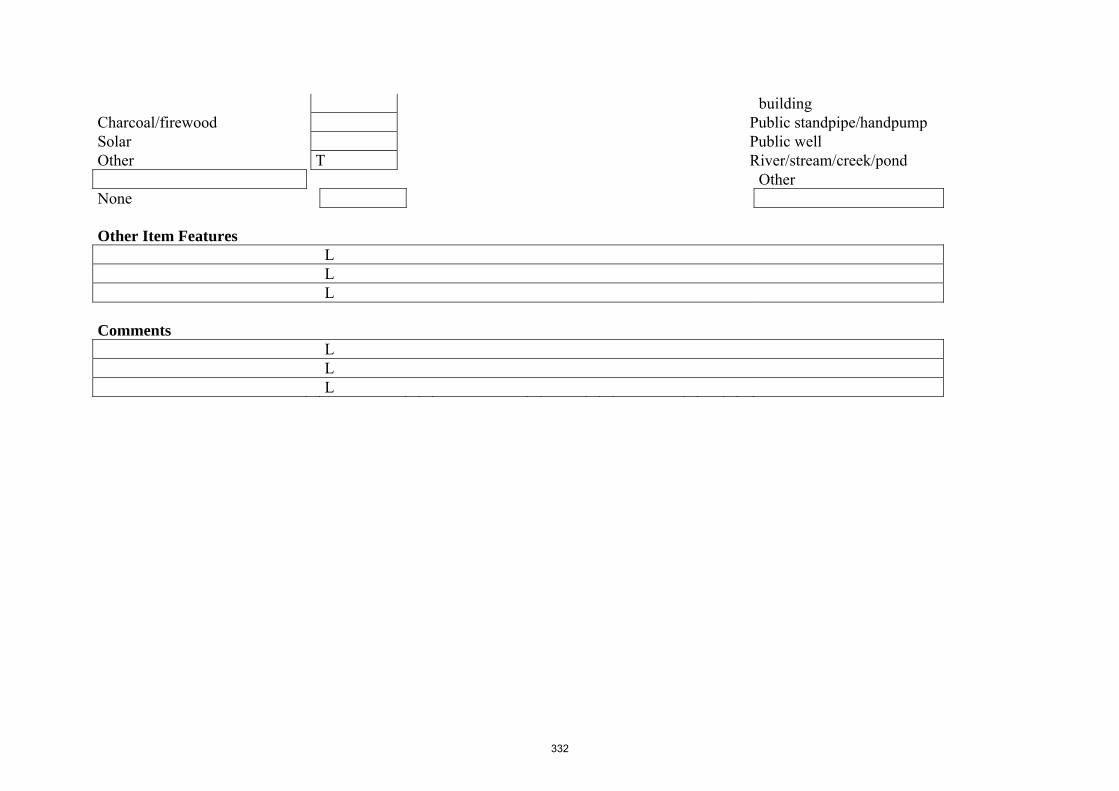
building Charcoal/firewood Public standpipe/handpump Solar Public well Other T River/stream/creek/pond Other None Other Item Features L L L Comments L L L
332
Chapter 11
Estimation of PPPs for Basic Headings Within Regions
Introduction
1. This chapter describes the methods that may be used to estimate purchasing power parities at the level of a basic heading for a specified group of countries. Each country in the group is accorded equal status and is treated in the same way. In ICP 2005 countries are grouped into regions so that this chapter is concerned with the methods that may be used to calculate basic heading PPPs within a single region, independently of countries in other regions.
2. In order to obtain a global set of basic heading PPPs covering all 155
countries participating in the ICP, the sets of PPPs for the different regions have to be linked. Chapter 14 below describes how the various sets of within-region basic heading PPPs may be linked together by means of PPPs between entire regions. These between-region PPPs compare prices in different regions after the prices within each region have been converted into a common currency, the regional numeraire currency, using the within-region PPPs.
3. The inputs into the estimation of basic heading PPPs consist of the national
average prices of the selected products within each basic heading. The national average prices are those emerging from the price collection and validation processes described in the preceding chapters.
4. In general, no precise information is available about either quantities or
expenditures within a basic heading. The individual product PPPs cannot be weighted by expenditures. In a CPI context, indices of this kind that are calculated exclusively from price data, without the use of explicit expenditure weights, are described as elementary indices. Basic heading PPPs can be viewed as elementary international price indices.1
5. PPPs for most basic heading have to be estimated on the basis of a sample of
products and prices. As explained in earlier chapters, the number of products on the ICP product list which countries use for price collection purposes may
1 Chapter 20 of the international Consumer Price Index Manual (2004) is devoted to Elementary Indices. This chapter was written by Erwin Diewert. The properties and behaviour of elementary indices are explained in some detail in the context of CPIs. Much of the chapter is equally relevant to basic heading PPPs and could usefully be read in conjunction with this chapter. For a summary account of elementary indices, see paras. 1.120 – 1.146 of Chapter 1 of the CPI Manual by Peter Hill,.
333
be only a small fraction of the total number of products that make up a basic heading. The ICP list of products is not a random sample. It is a purposive selection that is worked out collectively by the regional coordinator and the countries of each region during the course of the pre-survey. Although countries are asked to collect prices for all the products on the regional ICP list they usually fail to report prices for some products on list.
Representativity
6. The distinction between representative and unrepresentative products was
explained in Chapter 4. It affects both the selection of products for inclusion on the ICP product lists and the subsequent estimation of PPPs at the basic heading level. Chapter 5 explains how the identification of representative products to be included on the regional product lists is one of the key functions of the pre-survey conducted within each region. The present chapter explains how the distinction can be used to reduce potential biases in the estimated PPPs when the product lists are unbalanced. The distinction was introduced by Eurostat into the calculation of the basic heading parities in its PPP Programme in the late 1970’s. It has been introduced into the global ICP program for the first time in ICP 2005.
7. A representative product is one that is purchased in relatively large quantities
in a country. Let qij denote the quantity of product i in country j.
Quantities of the same product can be summed across countries to obtain the share of each country in the total for the group of countries as a whole. For product i, the share of country j, denoted by si
j, is defined as qij / Σj qi
j where the summation is across countries. Product i is said to representative in country j if si
j is above average: that is, if sij > Σi si
j/m where the summation is over all m products in the basic heading. As explained in Chapter 5, when the product list is being drawn up for a basic heading, countries are asked to ensure that some of their representative products get included on the list, preferably the ones with the largest expenditures. Although actual data on and expenditures will generally not be available in practice, price experts in each country should be able to use their knowledge and market experience to select a few products that they believe to be representative.
8. The reason for distinguishing representative from unrepresentative products
is that their relative prices should be different. Products may be purchased in relatively large (small) quantities precisely because their relative prices are low (high). This conclusion is not merely a theoretical inference, as there is ample empirical evidence to support it from both temporal and international comparisons. When drawing up a list of products the ideal situation would be one in which roughly half of the products on the list are representative for each country. This is feasible bearing in mind that any given product could be representative in about half the countries in the group.
334
9. A list is unbalanced when most of the products on the list are representative for one sub-group of countries only and unrepresentative for the remainder. As shown in Chapter 4, an unbalanced list is likely to introduce serious bias into the estimated PPPs.
10. Whether the product list is balanced or not, information about
representativity can be utilized in the process of estimating the basic heading PPPs after the prices have been collected. If it is known that some of the prices collected by a country are likely to be relatively low and others relatively high, this information ought to be exploited when calculating the basic heading PPPs. For this reason representativity enters into several of the methods considered in this chapter.
11. Distinguishing representative from unrepresentative products has to rely on
the knowledge and judgment of local price experts. The distinction is inevitably partly subjective in practice. Experts in different countries may interpret the distinction differently, especially if the distinction is new for them. If this happens and the resulting data are not comparable, distinguishing representative from unrepresentative products may not make any useful contribute the estimation of the PPPs for that particular set of data.
Binary versus group approaches
12. There are two different approaches to the estimation of a set of multilateral PPPs. The binary approach derives the multilateral PPPs from the binary PPPs between all possible pairs of countries. The binary PPP between two countries obtained by using data for those two countries only is assumed to provide the best estimate of the PPP between them2. The coverage of each binary PPP typically varies from one binary to another so that the binaries re typically not transitive. They can be subsequently transformed into the set of transitive parties that fits them as closely as possible by using the EKS formula3. EKS minimizes the sum of the squared logarithmic deviations between the original intransitive PPPs and the transitive PPPs.
13. The properties of the transformed transitive PPPs depend at least as much on
the nature and properties of the original binary PPPs to which the EKS formula is applied as on the EKS formula itself. Several different sets of EKS type PPPs can be generated for a group of countries by changing the
2 A binary PPP that is based exclusively on data for the two countries compared is sometimes described as the PPP that is most characteristic for that particular comparison. . 3 The EKS formula is named after three individuals, Elteto, Koves and Sculz, who independently advocated its use. It was named “EKS” in the paper by Lazlo Drechsler (1973). It was used in the 1960’s for comparisons between the centrally planned economies of Eastern Europe. However, the formula was actually proposed 40 years earlier by Gini (1931).
335
type of binary index to which the EKS formula is applied. For this reason, when referring to EKS type PPPs it is also necessary to specify the type of index to which the EKS formula is applied. The term ‘EKS PPP’ on its own is not sufficient or very informative. For example, Eurostat has used the binary approach in its PPP Programme for over the three decades. However, the type of binary index used has changed during his period. The type of binary index which it now uses is radically different from the type of index that it used originally. The distinction between representative and unrepresentative products plays a key role in the calculation of the binary PPPs currently calculated by Eurostat.
14. The group approach is to estimate a set of transitive parities for a group of
countries simultaneously using data for all countries in the group. At the level of the basic heading, the County Product Dummy method, or CPD, that was used in the first round of the ICP in 1970 is the prime example of the group approach 4. It has been repeatedly used in later rounds of the ICP over the last three decades. In the ICP 2005, the CPD method is used in all regions except the group of countries participating in the joint Eurostat-OECD PPP Programme. The CPD method may be extended to include representativity as an additional explanatory variable.
15. Both the binary and the group approaches are explained in this chapter using
a series of numerical examples. The examples are intended not only to illustrate how the various methods may be implemented but also to compare and contrast the results generated. .The ICP Tool Pack contains the programs needed to implement any of the methods.
16. The binary approach is considered first for ease of presentation. Binary
indices are less complicated than multilateral indices. Most index number theory and the theorems derived from it refer to binary indices. Moreover, it is necessary to be able to refer to the properties and behavior of binary indices in order to explain those of multilateral indices.
The choice of binary index at the basic heading level
17. When the binary approach is used, the choice of binary index is obviously the key question. As data on quantities or expenditures are not available within a basic heading some kind of elementary price index must be selected.. In the case of temporal indices such as CPIs and PPIs it has been shown that the choice of elementary index formula can have a major impact on the movements of the overall index. After a detailed and exhaustive
4 See Chapter 5 of A System of International Comparisons of Gross Product and Purchasing Power, by Irving Kravis, Zoltan Kenessy. Alan Heston and Robert Summers (1975). The CPD method was developed in a paper by Robert Summers (1973).
336
study of various possible kinds of elementary index5 the 2004 CPI Manual concludes (in paragraph 1.145) that the Jevons is the preferred type of elementary index whether the economic or the axiomatic approach to index number theory is adopted, . The Jevons index is defined as the geometric average of the price ratios (see equation (3) below). It can be weighted or unweighted.
18. The Jevons index is also preferred for international comparisons. At the
level of an individual product, a PPP is, by definition, the ratio of the prices in the two countries. The Jevons PPP is the geometric average of all the individual product PPPs. It is a simple and transparent statistic.
19. When simple Jevons PPPs all have the same product coverage – that is when
every country reports a complete set of prices and there are no missing prices -- the simple binary Jevons indices are transitive. This makes them additionally attractive for purposes of multilateral international comparisons. There is no need for the EKS formula.
20. This result is, however, only a special case of a more general one. Suppose
that the simple Jevons PPPs are replaced by weighted Jevons PPPs. Let wijk
denote the weight attached to the product PPP for product i in the binary Jevons between countries j and k where wi
jk ≥ 0 and Σi wijk = 1, the
summation being over the products. Next suppose the weights are the same for every pair of countries: that is wi
jk = wi for every j and k . When the weighted Jevons indices all use the same set of weights in this way, they must be transitive. Again, there is no need for the EKS formula.
21. Eurostat has used Jevons indices as their elementary binary indices since the
start of their PPP Programme in 19706. At first they were simple Jevons PPPs but in the early 1980’s they were replaced by weighted Jevons indices in which the weights were derived from information about the representativity (not from data on quantities or expenditures).
22. The current joint Eurostat-OECD PPP Programme continues to use weighted
Jevons. The weights are quite complex and are liable to vary substantially from one binary Jevons to the next. The weighting differences stem from differences in the distributions of representative and unrepresentative products between countries. As the weights vary the elementary Jevons PPPs cease to be transitive. Transitivity has to be imposed by using the EKS formula. The exact way in which Eurostat-OECD calculate their Jevons
5 See Chapter 20 of the CPI Manual (Diewert 2004) for a thorough and detailed discussion of the properties and behavior of elementary indices.
6 Of course, they were not described as ‘Jevons’ indices because the name ‘Jevons’ was first introduced into index number literature in the 2004 CPI Manual.
337
indices is explained in the following sections. First it is necessary to explain the EKS formula.
The EKS Formula
23. EKS is not a type of index or PPP. It is a formula that can be used to impose transitivity on an existing set of intransitive binary indices. The indices themselves can be either elementary indices or aggregate indices. Any index formula can be used for the binaries
24. The objective is to find the set of transitive PPPs that fits a set of intransitive
PPPs as closely as possible. Suppose there are C countries in the group. There are only C-1 transitive PPPs connecting the countries whereas there are C(C-1) / 2 possible pairs of countries each with its own intransitive PPP. The set of transitive PPPs is derived by minimizing the sum of the squares of the logarithmic differences between the original intransitive PPPs and the transitive PPPs. The resulting EKS PPPs can be calculated using the formula given in (2) below.
25. The EKS formula may be explained by using the concepts of direct and indirect PPPs as defined in Chapter 4 above. The direct binary PPP between two countries j and k is calculated from data for these two countries only. An indirect PPP between two countries is one obtained by calculating it indirectly via a third country. Let the three countries be j, k and l. Denote the direct binary PPP for k on j as PPPj,k . The indirect PPP for k on j via country l, namely lPPPj,k, is then defined as follows:
(1) lPPPj,k
≡ PPPj,l ⁄ PPPk,l
The indirect PPP, lPPPj,k , does not equal the direct PPP, PPPj,k , when the PPPs are not transitive,
26. Given that there are C countries in the group, the transitive EKS PPP for
country k based on country j is given by the following expression:
( 2 ) CC
l
kjlCC
llk
ljkj
EKS PPPPPPPPPPPP
1
1
,
1
1,
,.
⎭⎬⎫
⎩⎨⎧
=⎭⎬⎫
⎩⎨⎧
= ∏∏==
27. When l = j the ratio of the two PPPs equals 1 / PPPk,j , while when l = k
the ratio equals PPPj,k. Provided the direct PPPs satisfy the country reversal test, the EKS PPP for k on j is equal to the geometric mean of the direct PPP for k on j and all the indirect PPPs for k on j , the direct PPP carrying twice the weight of each of the indirect PPPs.
338
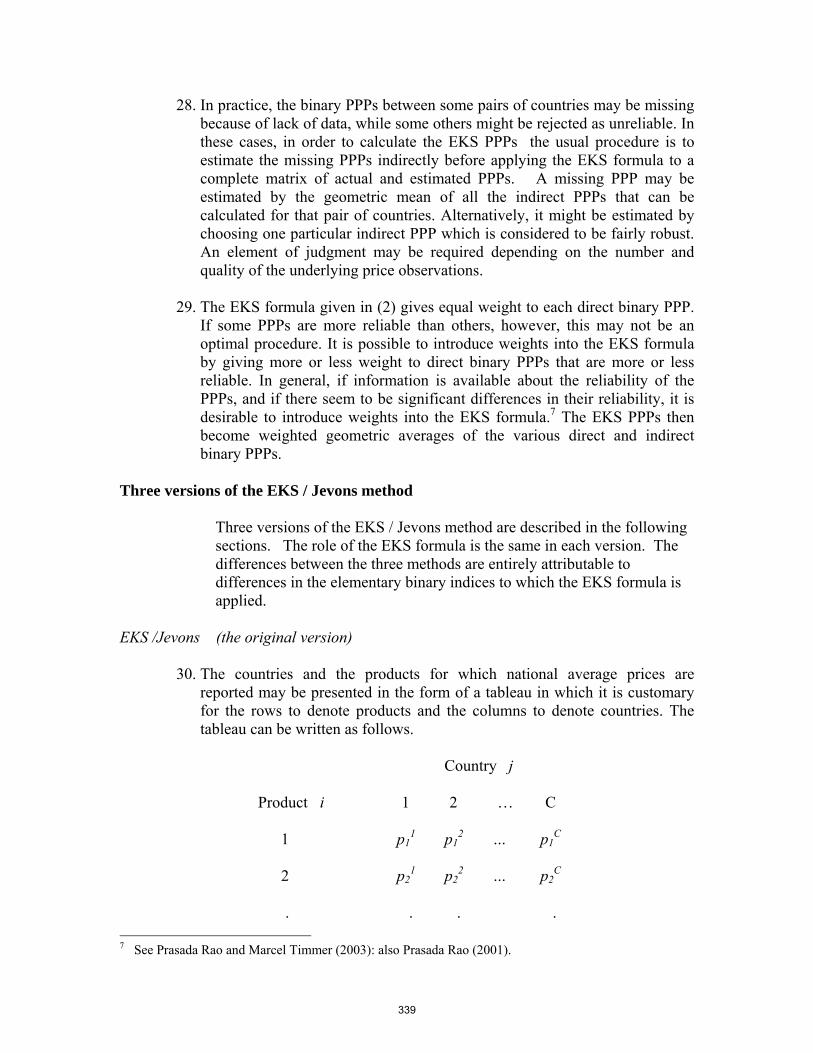
28. In practice, the binary PPPs between some pairs of countries may be missing because of lack of data, while some others might be rejected as unreliable. In these cases, in order to calculate the EKS PPPs the usual procedure is to estimate the missing PPPs indirectly before applying the EKS formula to a complete matrix of actual and estimated PPPs. A missing PPP may be estimated by the geometric mean of all the indirect PPPs that can be calculated for that pair of countries. Alternatively, it might be estimated by choosing one particular indirect PPP which is considered to be fairly robust. An element of judgment may be required depending on the number and quality of the underlying price observations.
29. The EKS formula given in (2) gives equal weight to each direct binary PPP.
If some PPPs are more reliable than others, however, this may not be an optimal procedure. It is possible to introduce weights into the EKS formula by giving more or less weight to direct binary PPPs that are more or less reliable. In general, if information is available about the reliability of the PPPs, and if there seem to be significant differences in their reliability, it is desirable to introduce weights into the EKS formula.7 The EKS PPPs then become weighted geometric averages of the various direct and indirect binary PPPs.
Three versions of the EKS / Jevons method
Three versions of the EKS / Jevons method are described in the following sections. The role of the EKS formula is the same in each version. The differences between the three methods are entirely attributable to differences in the elementary binary indices to which the EKS formula is applied.
EKS /Jevons (the original version)
30. The countries and the products for which national average prices are reported may be presented in the form of a tableau in which it is customary for the rows to denote products and the columns to denote countries. The tableau can be written as follows.
Country j
Product i 1 2 … C
1 p1
1 p12 … p1
C
2 p21 p2
2 … p2C
. . . .
7 See Prasada Rao and Marcel Timmer (2003): also Prasada Rao (2001).
339
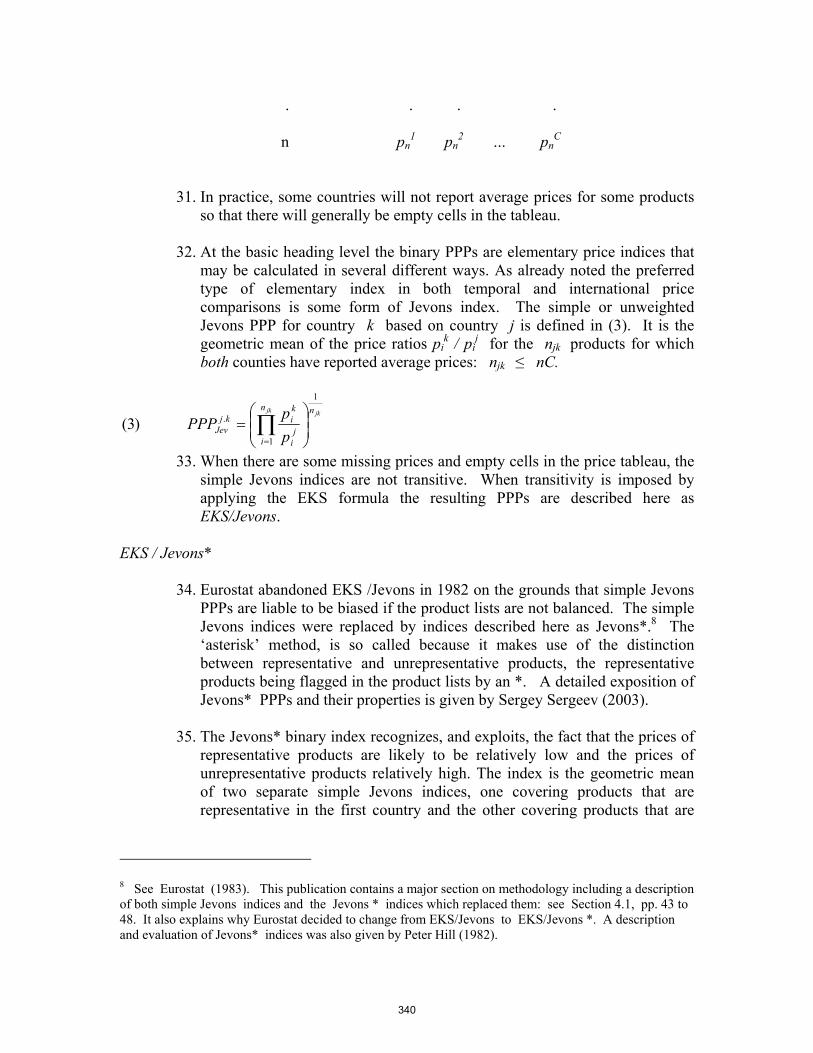
. . . .
n pn1 pn
2 … pnC
31. In practice, some countries will not report average prices for some products so that there will generally be empty cells in the tableau.
32. At the basic heading level the binary PPPs are elementary price indices that
may be calculated in several different ways. As already noted the preferred type of elementary index in both temporal and international price comparisons is some form of Jevons index. The simple or unweighted Jevons PPP for country k based on country j is defined in (3). It is the geometric mean of the price ratios pi
k / pij for the njk products for which
both counties have reported average prices: njk ≤ nC.
33. When there are some missing prices and empty cells in the price tableau, the simple Jevons indices are not transitive. When transitivity is imposed by applying the EKS formula the resulting PPPs are described here as EKS/Jevons.
EKS / Jevons*
34. Eurostat abandoned EKS /Jevons in 1982 on the grounds that simple Jevons PPPs are liable to be biased if the product lists are not balanced. The simple Jevons indices were replaced by indices described here as Jevons*.8 The ‘asterisk’ method, is so called because it makes use of the distinction between representative and unrepresentative products, the representative products being flagged in the product lists by an *. A detailed exposition of Jevons* PPPs and their properties is given by Sergey Sergeev (2003).
35. The Jevons* binary index recognizes, and exploits, the fact that the prices of
representative products are likely to be relatively low and the prices of unrepresentative products relatively high. The index is the geometric mean of two separate simple Jevons indices, one covering products that are representative in the first country and the other covering products that are
8 See Eurostat (1983). This publication contains a major section on methodology including a description of both simple Jevons indices and the Jevons * indices which replaced them: see Section 4.1, pp. 43 to 48. It also explains why Eurostat decided to change from EKS/Jevons to EKS/Jevons *. A description and evaluation of Jevons* indices was also given by Peter Hill (1982).
jkjk nn
ij
i
kikj
Jev pp
PPP
1
1
.)3( ⎟⎟⎠
⎞⎜⎜⎝
⎛= ∏
=
340
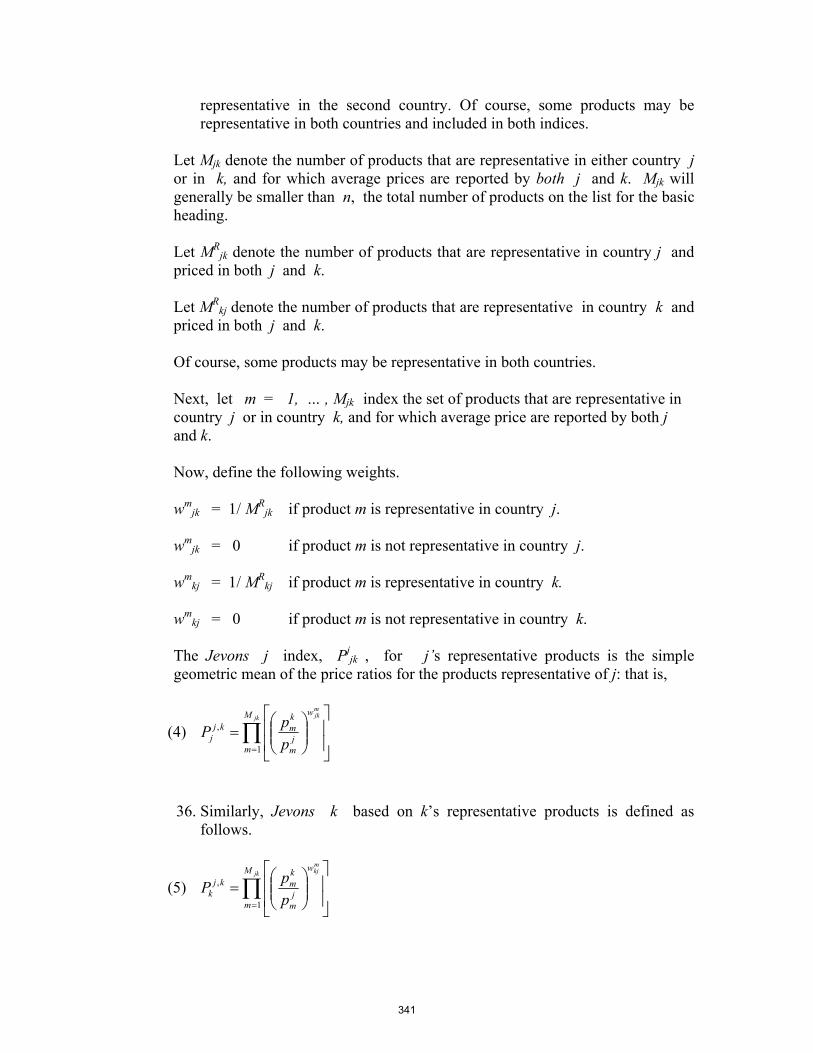
representative in the second country. Of course, some products may be representative in both countries and included in both indices.
Let Mjk denote the number of products that are representative in either country j or in k, and for which average prices are reported by both j and k. Mjk will generally be smaller than n, the total number of products on the list for the basic heading.
Let MR
jk denote the number of products that are representative in country j and priced in both j and k.
Let MR
kj denote the number of products that are representative in country k and priced in both j and k.
Of course, some products may be representative in both countries.
Next, let m = 1, … , Mjk index the set of products that are representative in country j or in country k, and for which average price are reported by both j and k.
Now, define the following weights. wm
jk = 1/ MRjk if product m is representative in country j.
wm
jk = 0 if product m is not representative in country j. wm
kj = 1/ MRkj if product m is representative in country k.
wm
kj = 0 if product m is not representative in country k. The Jevons j index, Pj
jk , for j’s representative products is the simple geometric mean of the price ratios for the products representative of j: that is,
(4) ∏= ⎥
⎥
⎦
⎤
⎢⎢
⎣
⎡⎟⎟⎠
⎞⎜⎜⎝
⎛=
jkmjkM
m
w
jm
kmkj
j ppP
1
,
36. Similarly, Jevons k based on k’s representative products is defined as follows.
(5) ∏= ⎥
⎥
⎦
⎤
⎢⎢
⎣
⎡⎟⎟⎠
⎞⎜⎜⎝
⎛=
jkmkjM
m
w
jm
kmkj
k ppP
1
,
341
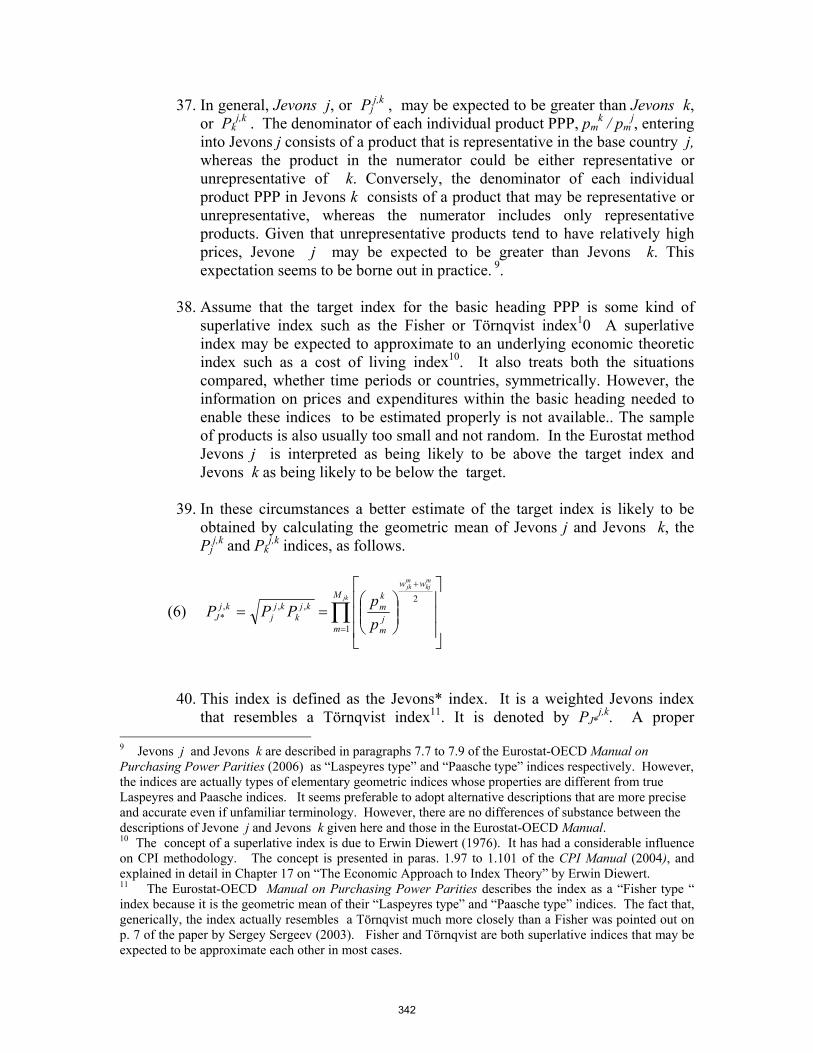
37. In general, Jevons j, or Pjj,k , may be expected to be greater than Jevons k,
or Pkj,k . The denominator of each individual product PPP, pm
k / pmj, entering
into Jevons j consists of a product that is representative in the base country j, whereas the product in the numerator could be either representative or unrepresentative of k. Conversely, the denominator of each individual product PPP in Jevons k consists of a product that may be representative or unrepresentative, whereas the numerator includes only representative products. Given that unrepresentative products tend to have relatively high prices, Jevone j may be expected to be greater than Jevons k. This expectation seems to be borne out in practice. 9.
38. Assume that the target index for the basic heading PPP is some kind of
superlative index such as the Fisher or Törnqvist index10 A superlative index may be expected to approximate to an underlying economic theoretic index such as a cost of living index10. It also treats both the situations compared, whether time periods or countries, symmetrically. However, the information on prices and expenditures within the basic heading needed to enable these indices to be estimated properly is not available.. The sample of products is also usually too small and not random. In the Eurostat method Jevons j is interpreted as being likely to be above the target index and Jevons k as being likely to be below the target.
39. In these circumstances a better estimate of the target index is likely to be
obtained by calculating the geometric mean of Jevons j and Jevons k, the Pj
j,k and Pkj,k indices, as follows.
(6) ∏=
+
⎥⎥⎥
⎦
⎤
⎢⎢⎢
⎣
⎡
⎟⎟⎠
⎞⎜⎜⎝
⎛==
jk
mkj
mjk
M
m
ww
jm
kmkj
kkj
jkj
J pp
PPP1
2,,,
*
40. This index is defined as the Jevons* index. It is a weighted Jevons index that resembles a Törnqvist index11. It is denoted by PJ*
j,k. A proper 9 Jevons j and Jevons k are described in paragraphs 7.7 to 7.9 of the Eurostat-OECD Manual on Purchasing Power Parities (2006) as “Laspeyres type” and “Paasche type” indices respectively. However, the indices are actually types of elementary geometric indices whose properties are different from true Laspeyres and Paasche indices. It seems preferable to adopt alternative descriptions that are more precise and accurate even if unfamiliar terminology. However, there are no differences of substance between the descriptions of Jevone j and Jevons k given here and those in the Eurostat-OECD Manual. 10 The concept of a superlative index is due to Erwin Diewert (1976). It has had a considerable influence on CPI methodology. The concept is presented in paras. 1.97 to 1.101 of the CPI Manual (2004), and explained in detail in Chapter 17 on “The Economic Approach to Index Theory” by Erwin Diewert. 11 The Eurostat-OECD Manual on Purchasing Power Parities describes the index as a “Fisher type “ index because it is the geometric mean of their “Laspeyres type” and “Paasche type” indices. The fact that, generically, the index actually resembles a Törnqvist much more closely than a Fisher was pointed out on p. 7 of the paper by Sergey Sergeev (2003). Fisher and Törnqvist are both superlative indices that may be expected to be approximate each other in most cases.
342
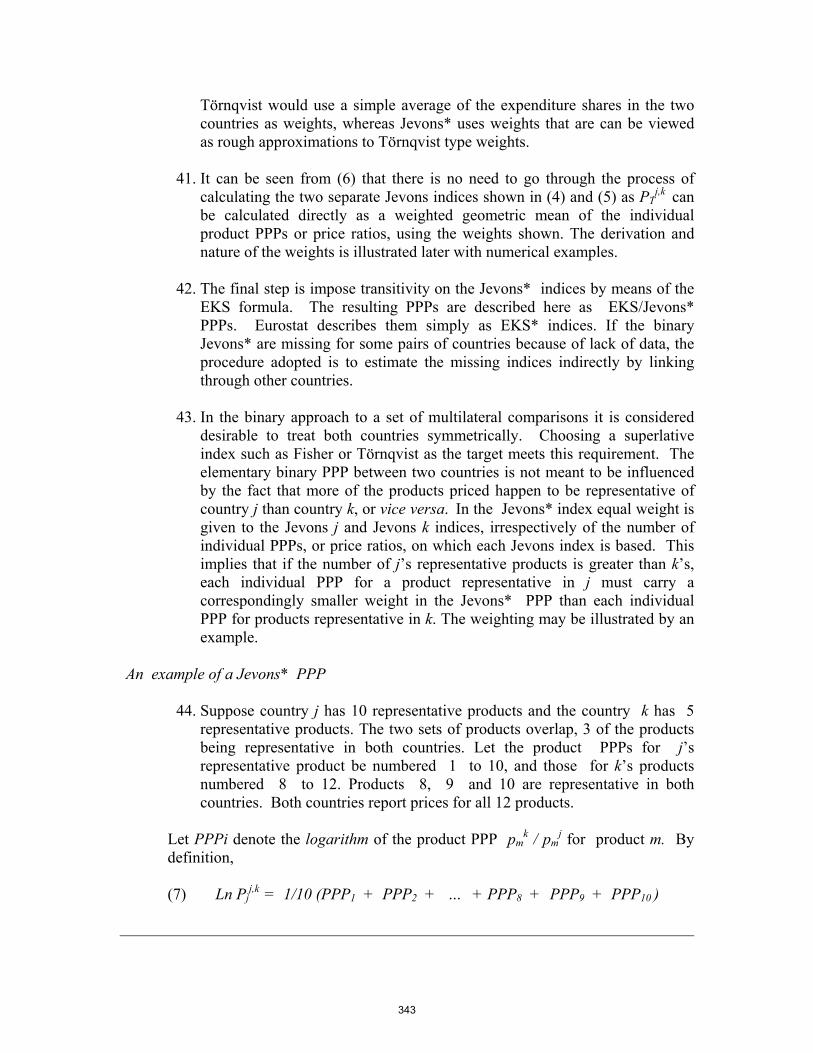
Törnqvist would use a simple average of the expenditure shares in the two countries as weights, whereas Jevons* uses weights that are can be viewed as rough approximations to Törnqvist type weights.
41. It can be seen from (6) that there is no need to go through the process of
calculating the two separate Jevons indices shown in (4) and (5) as PTj,k
can be calculated directly as a weighted geometric mean of the individual product PPPs or price ratios, using the weights shown. The derivation and nature of the weights is illustrated later with numerical examples.
42. The final step is impose transitivity on the Jevons* indices by means of the
EKS formula. The resulting PPPs are described here as EKS/Jevons* PPPs. Eurostat describes them simply as EKS* indices. If the binary Jevons* are missing for some pairs of countries because of lack of data, the procedure adopted is to estimate the missing indices indirectly by linking through other countries.
43. In the binary approach to a set of multilateral comparisons it is considered
desirable to treat both countries symmetrically. Choosing a superlative index such as Fisher or Törnqvist as the target meets this requirement. The elementary binary PPP between two countries is not meant to be influenced by the fact that more of the products priced happen to be representative of country j than country k, or vice versa. In the Jevons* index equal weight is given to the Jevons j and Jevons k indices, irrespectively of the number of individual PPPs, or price ratios, on which each Jevons index is based. This implies that if the number of j’s representative products is greater than k’s, each individual PPP for a product representative in j must carry a correspondingly smaller weight in the Jevons* PPP than each individual PPP for products representative in k. The weighting may be illustrated by an example.
An example of a Jevons* PPP
44. Suppose country j has 10 representative products and the country k has 5 representative products. The two sets of products overlap, 3 of the products being representative in both countries. Let the product PPPs for j’s representative product be numbered 1 to 10, and those for k’s products numbered 8 to 12. Products 8, 9 and 10 are representative in both countries. Both countries report prices for all 12 products.
Let PPPi denote the logarithm of the product PPP pm
k / pmj for product m. By
definition, (7) Ln Pj
j,k = 1/10 (PPP1 + PPP2 + … + PPP8 + PPP9 + PPP10 )
343
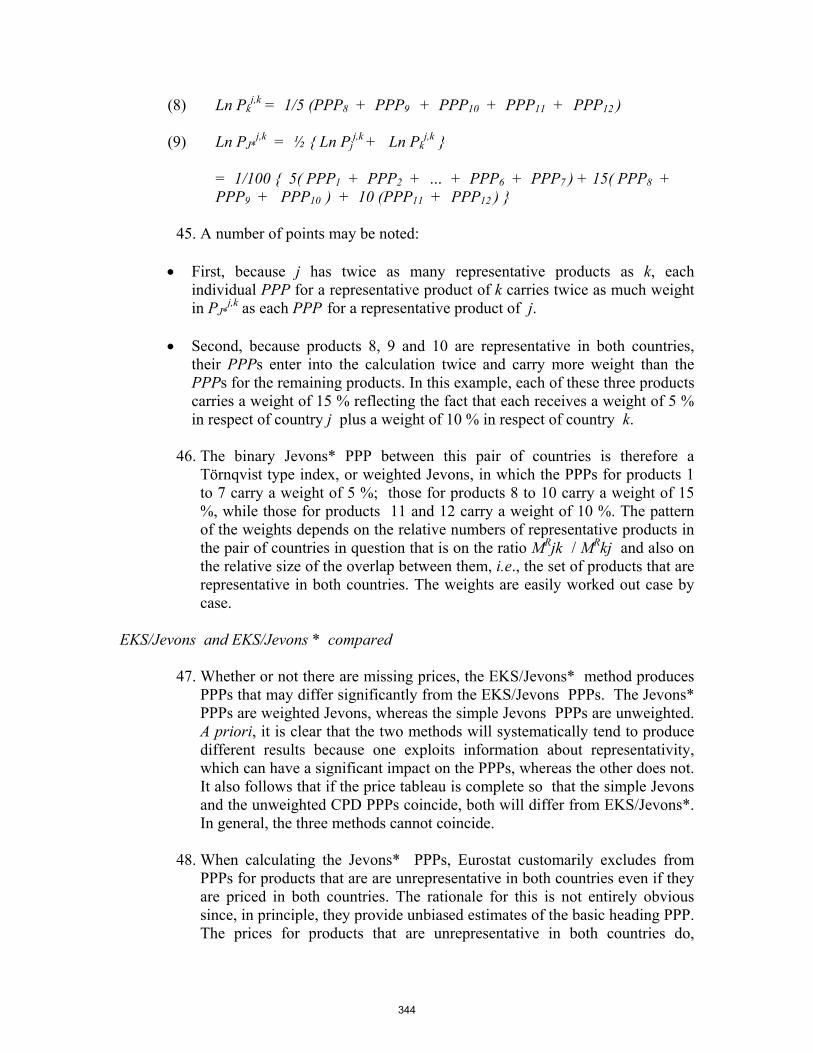
(8) Ln Pkj,k = 1/5 (PPP8 + PPP9 + PPP10 + PPP11 + PPP12 )
(9) Ln PJ*
j,k = ½ { Ln Pjj,k
+ Ln Pkj,k }
= 1/100 { 5( PPP1 + PPP2 + … + PPP6 + PPP7 ) + 15( PPP8 + PPP9 + PPP10 ) + 10 (PPP11 + PPP12 ) }
45. A number of points may be noted:
• First, because j has twice as many representative products as k, each
individual PPP for a representative product of k carries twice as much weight in PJ*
j,k as each PPP for a representative product of j.
• Second, because products 8, 9 and 10 are representative in both countries, their PPPs enter into the calculation twice and carry more weight than the PPPs for the remaining products. In this example, each of these three products carries a weight of 15 % reflecting the fact that each receives a weight of 5 % in respect of country j plus a weight of 10 % in respect of country k.
46. The binary Jevons* PPP between this pair of countries is therefore a
Törnqvist type index, or weighted Jevons, in which the PPPs for products 1 to 7 carry a weight of 5 %; those for products 8 to 10 carry a weight of 15 %, while those for products 11 and 12 carry a weight of 10 %. The pattern of the weights depends on the relative numbers of representative products in the pair of countries in question that is on the ratio MRjk / MRkj and also on the relative size of the overlap between them, i.e., the set of products that are representative in both countries. The weights are easily worked out case by case.
EKS/Jevons and EKS/Jevons * compared
47. Whether or not there are missing prices, the EKS/Jevons* method produces PPPs that may differ significantly from the EKS/Jevons PPPs. The Jevons* PPPs are weighted Jevons, whereas the simple Jevons PPPs are unweighted. A priori, it is clear that the two methods will systematically tend to produce different results because one exploits information about representativity, which can have a significant impact on the PPPs, whereas the other does not. It also follows that if the price tableau is complete so that the simple Jevons and the unweighted CPD PPPs coincide, both will differ from EKS/Jevons*. In general, the three methods cannot coincide.
48. When calculating the Jevons* PPPs, Eurostat customarily excludes from
PPPs for products that are are unrepresentative in both countries even if they are priced in both countries. The rationale for this is not entirely obvious since, in principle, they provide unbiased estimates of the basic heading PPP. The prices for products that are unrepresentative in both countries do,
344
however, exert an indirect influence on the final multilateral EKS/Jevons* PPP between them after transitivity is imposed via the EKS formula.
49. Ideally, a complete set of C(C – 1 ) / 2 binary Jevons* PPPs should be
calculated between every pair of countries, but some of the PPPs may be missing or deemed to be too unreliable to be acceptable. One criterion that has been used by Eurostat to flag possibly unreliable Jevons* PPPs is the ratio of the two Jevons indices, Pj
j,k / Pkj,k, given in (4) and (5) above. This
ratio is described as the ‘Laspeyres-Paasche’ spread, but the Jevons spread might be more appropriate terminology. It is possible to designate an upper limit to the ratio, such as 1.5, above which that particular Jevons* PPP is rejected. This screening device can be built in as an integral part of the EKS / Jevons * method.
50. PPPs can be estimated in various ways for binary comparisons for which the
original Jevons* PPPs are missing or rejected as unreliable. One common procedure has been to estimate the missing PPP by the geometric mean of all the possible indirect Jevons* PPPs via third countries. This is the method preferred by Eurostat. Alternatively, one or more indirect Jevons* PPPs that are considered to be particularly reliable might be selected and a geometric mean taken of these.
51. There are also other ways of dealing with the problem of missing Jevins*
PPPs. The EKS formula can be applied in an iterative fashion to an incomplete matrix of binary Jevons* PPPs to obtain a complete matrix. It is also possible to use a weighted version of the EKS formula.12 Using weighted EKS, the weights assigned to the Jevons* PPPs can reflect their reliability, missing Jevons* receiving zero weights.
52. The existing Eurostat EKS method is described as making use of the
principle of graduality. Sergey Sergeev (2003, p. 4) writes: “The principle of graduality means that it is not necessary to compare bilaterally each country with each country. The countries with (very) different consumption patterns (without common priced items) can be compared indirectly via third or more similar countries.” While the rationale for the principle of graduality is clear, it cannot be implemented in a wholly objective manner. For example, different countries might be chosen as link countries by different agencies.
53. Finally, it has recently been proposed by Sergey Sergeev that Jevons* should
be superseded by another type of Jevons PPP. The reason is that Jevons* does not necessarily lead to ‘balanced’ or ‘unbiased’ estimates in all circumstances. This has lead to the proposal to replace it by a third type of Jevons PPP, described as Jevons-S. It is designed to address the variation between countries in both the absolute and relative numbers of prices that are reported for representative and unrepresentative products. Suppose, for
12 See Prasada Rao (2001).
345
example, the set of MRkj products that are representative of k and priced in
both countries is entirely contained within the set of MRjk products that are
representative of j and also priced in both countries. In other words, all the products for which j reports price are representative in j, whereas k reports a mixture of representative and unrepresentative products. It may be argued that in this case Pk
j,k provides an unbiased estimate of the target index because all MR
kj products are representative in j as well as k. On the other hand, PJ*
j,k still has some upward bias because (MRjk - MR
kj) products are representative in j but unrepresentative in k. PJ*
j,k still contains some residual upward bias therefore. Jevons-S is designed to correct for this kind of bias.
EKS /Jevons-S
54. The index described in this section is a modified version of Jevons* which has certain theoretical advantages over Jevons*. The index was developed by Sergey Sergeev and the method that uses it has been labeled ‘EKS-S’ by Eurostat. It is described on pages 9 to 13 of Sergeev (2003) referred to earlier.
55. Reverting to the numerical example used in the previous section, it is clear
from equation (9) that the Jevons* PPP can be regarded as a weighted average of the product PPPs in three, rather than two, groups of products: namely, those for
• Products that are representative in A but not in B: (products 1 to 7) • Products that are representative in both countries: (products 8 to 10) • Products that are representative in B but not in A: (products 11 and 12).
56. As already shown, when Jevons* is used the weights for individual product
PPPs in groups 1, 2 and 3 are 5 %, 15 % and 10 % respectively in the numerical example.
57. However, the Jevons* can also be viewed as a weighted geometric mean of
the simple Jevons PPPs for each of the three groups, instead of a weighted average of the individual product PPPs. In the above example, the total weights for the three groups are:
Group 1: 35 % Group 2: 45 % Group 3: 20 %
58. The geometric mean of the product PPPs in the second group should provide
an unbiased estimate of the target basic heading PPP because representative products are being compared with representative products. The geometric mean for the first group is likely to have an upward bias compared with the target, while the geometric mean for the third is likely to have a downward
346
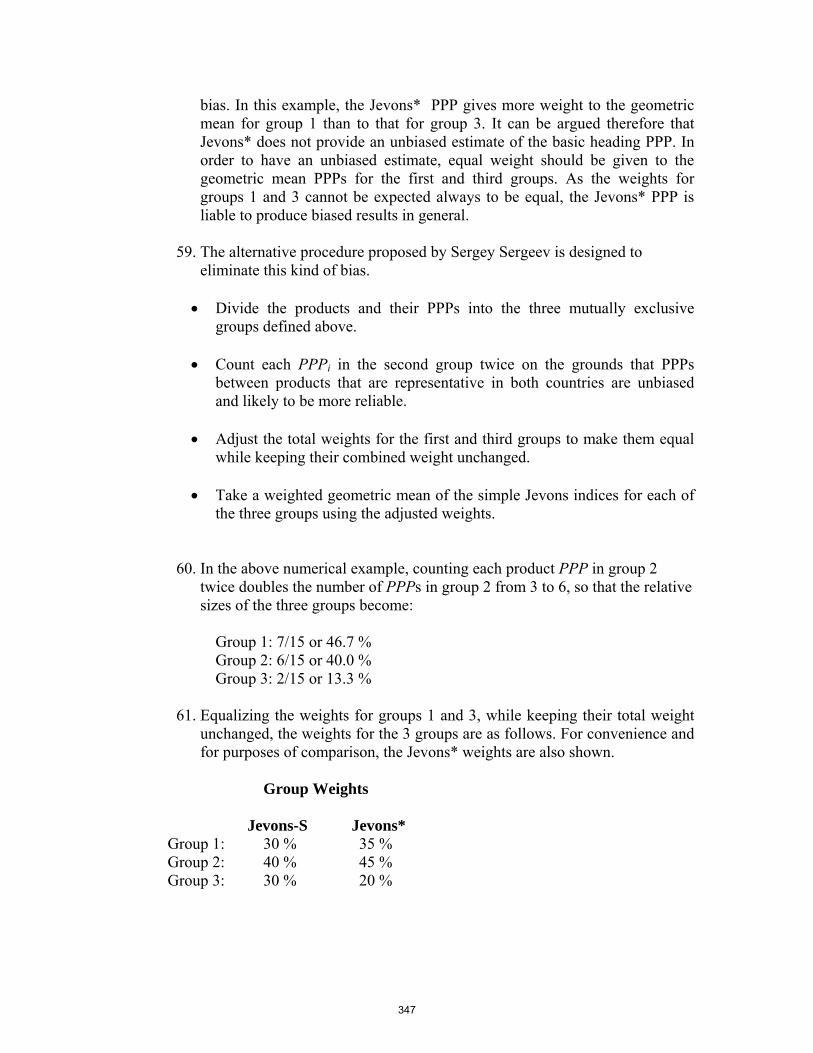
bias. In this example, the Jevons* PPP gives more weight to the geometric mean for group 1 than to that for group 3. It can be argued therefore that Jevons* does not provide an unbiased estimate of the basic heading PPP. In order to have an unbiased estimate, equal weight should be given to the geometric mean PPPs for the first and third groups. As the weights for groups 1 and 3 cannot be expected always to be equal, the Jevons* PPP is liable to produce biased results in general.
59. The alternative procedure proposed by Sergey Sergeev is designed to
eliminate this kind of bias.
• Divide the products and their PPPs into the three mutually exclusive groups defined above.
• Count each PPPi in the second group twice on the grounds that PPPs
between products that are representative in both countries are unbiased and likely to be more reliable.
• Adjust the total weights for the first and third groups to make them equal
while keeping their combined weight unchanged.
• Take a weighted geometric mean of the simple Jevons indices for each of the three groups using the adjusted weights.
60. In the above numerical example, counting each product PPP in group 2 twice doubles the number of PPPs in group 2 from 3 to 6, so that the relative sizes of the three groups become:
Group 1: 7/15 or 46.7 % Group 2: 6/15 or 40.0 % Group 3: 2/15 or 13.3 %
61. Equalizing the weights for groups 1 and 3, while keeping their total weight
unchanged, the weights for the 3 groups are as follows. For convenience and for purposes of comparison, the Jevons* weights are also shown.
Group Weights Jevons-S Jevons* Group 1: 30 % 35 % Group 2: 40 % 45 % Group 3: 30 % 20 %
347
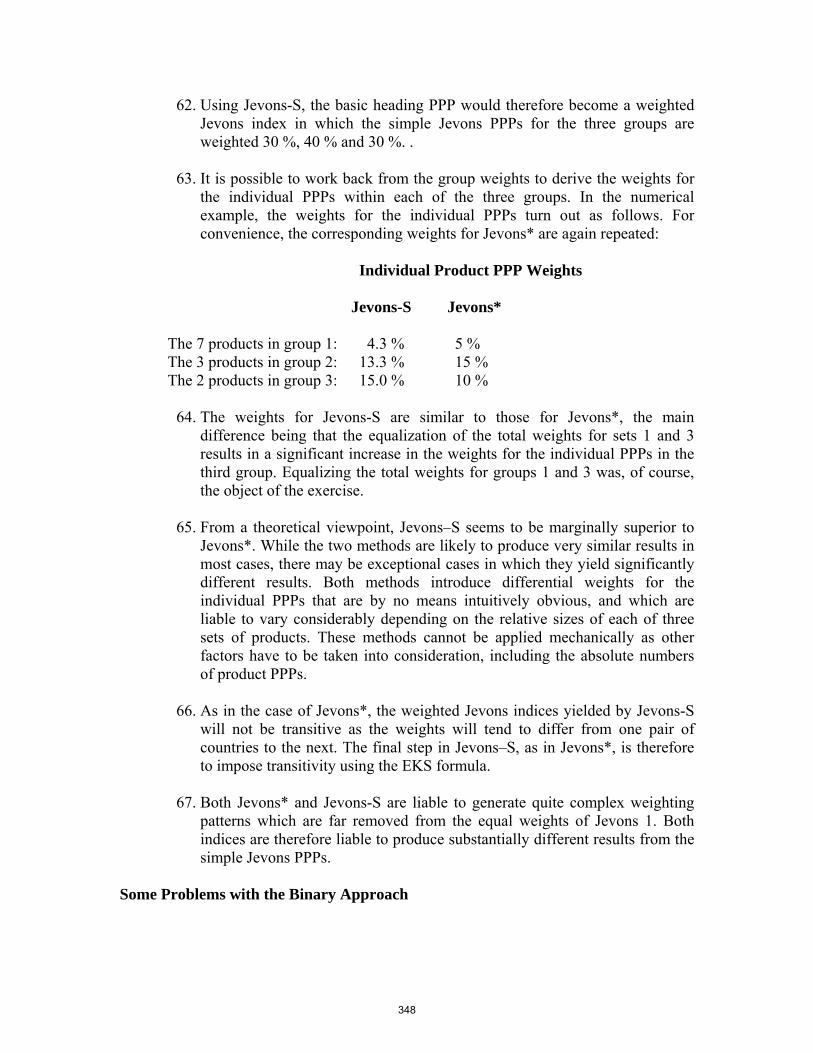
62. Using Jevons-S, the basic heading PPP would therefore become a weighted Jevons index in which the simple Jevons PPPs for the three groups are weighted 30 %, 40 % and 30 %. .
63. It is possible to work back from the group weights to derive the weights for
the individual PPPs within each of the three groups. In the numerical example, the weights for the individual PPPs turn out as follows. For convenience, the corresponding weights for Jevons* are again repeated:
Individual Product PPP Weights Jevons-S Jevons* The 7 products in group 1: 4.3 % 5 % The 3 products in group 2: 13.3 % 15 % The 2 products in group 3: 15.0 % 10 %
64. The weights for Jevons-S are similar to those for Jevons*, the main
difference being that the equalization of the total weights for sets 1 and 3 results in a significant increase in the weights for the individual PPPs in the third group. Equalizing the total weights for groups 1 and 3 was, of course, the object of the exercise.
65. From a theoretical viewpoint, Jevons–S seems to be marginally superior to
Jevons*. While the two methods are likely to produce very similar results in most cases, there may be exceptional cases in which they yield significantly different results. Both methods introduce differential weights for the individual PPPs that are by no means intuitively obvious, and which are liable to vary considerably depending on the relative sizes of each of three sets of products. These methods cannot be applied mechanically as other factors have to be taken into consideration, including the absolute numbers of product PPPs.
66. As in the case of Jevons*, the weighted Jevons indices yielded by Jevons-S
will not be transitive as the weights will tend to differ from one pair of countries to the next. The final step in Jevons–S, as in Jevons*, is therefore to impose transitivity using the EKS formula.
67. Both Jevons* and Jevons-S are liable to generate quite complex weighting
patterns which are far removed from the equal weights of Jevons 1. Both indices are therefore liable to produce substantially different results from the simple Jevons PPPs.
Some Problems with the Binary Approach
348
68. There can be some difficulties with both the Jevons* and Jevons-S PPPs if the absolute numbers of products in any of the three groups become very small or zero. For example, suppose the number of products in group 3 in the above example were to be reduced from 2 to 1. When calculating the Jevons-S PPP the simple Jevons PPP for group 3 has to be based on a single product PPP. Obviously, a geometric average based on a single observation has to be very erratic. When Jevons-S PPPs are calculated, it may be argued that it would not be optimal to reduce the 7 PPPi s in set 1 to an average and then to give this average no more weight than the single PPPi in set 3. If there are no products in set 3 then the question arises of what use, if any, can be made of the Pi s in set 1 when there are no counter-balancing Pi s for them in set 3. The problem remains even if the Jevons* PPP is used, although it may not be so acute as for Jevons-S.
69. Several possible scenarios need to be considered. Groups 1, 2 and 3 continue
to be as defined above: namely,
Group 1 contains products that are representative of A but not B. Group 2 contains products that are representative of both A and B. Group 3 contains products that are representative of B but not A.
• If groups 1 and 3 are both empty, the basic heading PPP can be estimated
using the PPP s for group 2 alone. As the products are representative in both countries, their geometric mean provides an unbiased estimate of the basic heading PPP.
• If there are PPP s for group 1 but none for group 3 (or vice versa), the
group 1 PPPs would have to be ignored in Jevons-S, the basic heading PPP being estimated using the PPPs for group 2 alone. However, it must be a matter of concern if the PPPs in group 1 are discarded and not utilized. They would not have to discarded using Jevons*, but it can be argued that Jevons* produces biased results in these circumstances (as indeed would a simple unweighted Jevons PPP).
• If group 2 is empty, but there are product PPPs for both groups 1 and 3,
the basic heading can be estimated by giving the geometric means for groups 1 and 3 equal weight.
• If PPPi s are available only for group 1 or group 3 with no observations
for group 2 either, the basic heading PPP cannot be estimated using either Jevons* or Jevons-S. Again, there has to be concern if data are not utilized.
In principle, the fourth scenario is unlikely to occur as it implies that one of the countries has not provided prices for any of its own representative products.
349
Binary PPPs within a multilateral program
70. One of the advantages of the binary approach is that a proper binary comparison conducted between two countries on their own is capable of providing a reliable and robust estimate of the basic heading PPP between them. The product list can be composed entirely of products that are representative in one or other (or both) of the two countries compared. A PPP estimated on the basis of such a product list is sometimes described as being most ‘characteristic’ of the two countries concerned.
71. However, a binary PPP calculated within the framework of a multilateral
PPP program will not be the same as the binary PPP that would be calculated for a pair of countries taken on their own. Binary comparisons made within the framework of a multilateral program are not conducted independently of other countries and do not have maximum characteristicity. The PPPs have to be calculated using a product list that will include many products that are unrepresentative of both the countries compared. It will contain fewer of the products that are representative in one or other, or both, of the two countries compared than would a product list of the same size drawn up specifically for the purposes of a binary comparison between them. Because of the needs of the multilateral program, the two countries will have to devote resources to the collection of prices that they would not collect if they were conducting a binary comparison between themselves independently of other countries.
72. The binary PPPs calculated using a common multilateral list of products
need therefore to be distinguished from genuine binary PPPs. For a given size of list, the more countries that are included in the multilateral program, the fewer the products that are likely to be representative of any particular country and the less reliable the binary PPPs between individual pairs of countries are liable to become. Given that the resources that can be devoted to price collection are limited, the number of countries which have to share the same common product list may also have to be restricted in order to ensure that individual PPPs between pairs of countries do not become too unreliable. This is effectively an argument for regionalization, the need for which is now generally recognized.
73. Another multilateral method that uses the binary approach is the spanning
tree method. Assuming there are C countries, it may be possible to find an optimal set of C-1 weighted Jevons PPPs that link together all the countries covered. For example, the optimal set could be defined as the set that is collectively the most reliable. As the method is more appropriate for linking aggregate PPPs than basic heading PPPs, it is not elaborated further here. A summary of the method is given in the following chapter.
The Country Product Dummy, or CPD, Method
350
74. The CPD method is an example of the group approach to the estimation of PPPs at the basic heading level in which the elementary PPPs for the entire group of countries are estimated simultaneously. . As already noted, the CPD method was proposed by Robert Summers (1973). It uses the stochastic approach to price indices13. The model underlying the traditional CPD is that
(10) pij = κ αj βi νij i = 1, 2, … n : j = 1, 2, … c (11) α1 = β1 = 1
where κ is a constant, αj is a parameter for country j, βi is a parameter for product i and νij is a random error term. As the model is concerned with price ratios, there are only n+c-1 parameters to estimate. Equation (11) is needed to determine the absolute levels of the prices. When both i =1 and j = 1, the expected value of pij = κ. In effect, product 1 in country 1 becomes the ‘reference’ product, all prices being measured relatively to its price. Country 1 therefore acts as the reference country for the PPPs. 14
Taking natural logarithms of both sides of (10) and (11) we have:
(12) ln pij = ln κ + lnαj + ln βi + εij
(13) ln α1 = ln β1 = 0
Equation (13) can be rewritten as follows using two sets of dummy variables Xij and Yij that take the values of either unity or zero:
(14) ln pij = ln κ + ln α2 xii2 + ln α3 xi3 + …ln αc xic + ln β2 y2j + ln β3 y3j + ln βc y2c + εij
75. The parameters of equation (14) can then be estimated by least squares or
multiple regression15. The number of parameters to be estimated, including 13 See Chapter 16 by Erwin Diewert of the CPI Manual (2004) on The Axiomatic and Stochastic Approaches to Index Number Theory. For a discussion of the stochastic approach below the basic heading level in a time series context, see the section on A Simple Stochastic Approach to Elementary Indices, paras. 20.100 to 20.111 of Chapter 20, also by Erwin Diewert, in the CPI Manual. See also Prasada Rao (2004) and Erwin Diewert (2004) 14 Most presentations of the CPD model have no constant term, in which case normalization can be achieved simply by letting α1 = 1 without requiring β1 = 1. However, when a third type of variable, representativity, is introduced into the model, an additional constraint has to be imposed anyway, in which case the approach adopted here is more convenient and symmetrical. For a simple exposition of regression with dummy variables, see David Huang (1970). He remarks, p. 166 that: “The rule of thumb is that , whenever there are two or more dummy systems, drop one variable from each system (preserving the constant, say) for OLS estimation.” When representativity is introduced into the CPD, there are three or more dummy systems, depending on whether interaction terms are included. 15 The use of regressions with dummy variables originated in the analysis of experimental data where the variables are often non-numerical or qualitative attributes such as location or plant variety. See, for
351
the constant κ, is equal to n + c – 1. The number of simultaneous equations to be solved therefore also equals n + c – 1. It can be very large depending on the number of countries and number of products on the common ICP list for that basic heading.
76. The least squares estimate of ln κ can be interpreted as the log of the
expected price of the reference product: i.e., of ln p11. Denoting the least squares estimates of the parameters lnαj and ln βi by ln aj and ln bi , ln aj measures the expected logarithm of the price ratio pij / pi1, both prices being measured in their own currencies, this ratio being assumed to be a constant, αj , for all products. Similarly, ln bi measures the expected logarithm of the ratio pij / p1j this ratio being assumed to be constant for all countries. aj is the estimated PPP of country j with reference to country 1. The reference country can be changed from country 1 to any other country, such as country j simply by dividing all the estimated PPPs by aj. The estimated PPPs are transitive. One advantage gained by using the CPD method is that sampling errors can be estimated for all the coefficients, including the PPPs.
77. In principle, weights could be attached to the prices in a CPD regression. In
general, weighted regressions are preferable to unweighted regressions provided that the weights are economically appropriate and reliable. The practical problem is that more or less by definition there are no data on quantities or expenditure within a basic heading that can be used to provide weights. In practice, therefore, CPD regressions are almost invariably unweighted and may be assumed to be so here unless stated to the contrary. Weighted CPD regressions are also discussed briefly in a later section.
78. Consider first a situation in which there are only two countries, j and k both
of which report a complete set of prices for the agreed common list of products. In this case, the simple unweighted CPD estimate of the PPP between them is identical with the simple unweighted Jevons PPP.
79. Next consider a situation in which there are several countries all of which
report a complete set of prices for the agreed list of products. As already noted, in these circumstances the simple Jevons PPPs must be transitive. It can easily be shown that in these circumstances the CPD PPPs also coincide with the Jevons PPPs.16. .
80. This coincidence has created the widespread impression that all the various
methods of calculating elementary PPPs give the same, or roughly the same, results whenever the price tableau is complete. However, this is not the case. The Jevons* and Jevons-S PPPs have been developed precisely because they provide different, and better, estimates of the binary PPPs at the basic
example, Oskar Kempthorne (1952) chapters 5 and 7. For an early large scale application of dummy variables to economic data, see Peter Hill (1959). 16 See Prasada Rao (2004) op cit. p. 6 , for a formal proof.
352
heading level than simple Jevons PPPs whether or not the price tableau is complete. As the CPD PPPs coincide with the simple Jevons PPPs when the price tableau is complete it follows that if the Jevons* and Jevons-S PPPs are better than the simple Jevons PPPs they should also provide better estimates than the CPD in these circumstances.
81. However, this does not show that the binary approach is inherently better
than the CPD. The presumed superiority of the Jevons* and Jevons-S PPPs over the simple Jevons PPPs stems from the fact that they utilize information about the relative prices of representative and unrepresentative products that the simple Jevons (and CPD) do not. Assuming that the products identified as representative do in fact have relatively low prices, this is valuable information that ought to be exploited whatever method is used to calculate the basic heading PPPs. As explained in a later section, when reliable information about representativity is available the CPD method should be extended to include representativity, R, as an additional dummy variable. In this case, the relative merits of EKS/Jevons* and EKS/Jevons-S PPPs versus CPRD PPPs are not so clear. As explained later, data simulations suggest that the CPRD method may actually provide better estimates than EKS/Jevons* and EKS/Jevons-S.
Estimating missing prices
82. When there are missing prices, the country and product coefficients estimated by the CPD method can be used to estimate each missing price in order to obtain a complete price tableau 17. If all the empty cells in the price tableau are filled in this way, Jevons indices can be calculated for each pair of countries using the complete tableau of actual and estimated prices. The resulting Jevons indices must be transitive because they all have exactly the same coverage, whatever estimated prices are plugged into empty cells of the price tableau.
83. If an extra observation is added to a set of observations for which some
regression equation has already been calculated and if the extra observation is the one predicted by the regression equation itself, the regression equation is not changed. The residual for the extra observation is zero. Any number of extra predicted observations can be added without changing the coefficients of the original regression. It follows that the country coefficients, the PPPs, remain unchanged by filling in all the empty cells with prices estimated by the CPD itself. On the other hand, the Jevons PPP between a pair of countries is changed each time a price is added to that particular binary PPP. In effect, filling in the empty cells gradually adjusts all the Jevons PPP in such a way as not merely to make them transitive but to coincide with the PPPs estimated by the CPD.
17 This use was emphasised by Robert Summers in his original 1973 paper advocating the CPD.
353
84. While this gives useful insights into the CPD method, it should not be interpreted as implying that the purpose of the CPD method is to estimate missing prices in order to fill gaps in the price tableau in order to be able estimate the PPPs. This cannot be the purpose when the country coefficients, the PPPs, must have already been estimated in order to estimate the missing prices. The purpose of the CPD is to estimate country and product coefficients, not to predict missing prices.
An alternative approach to the CPD
85. An alternative approach to the estimation of basic heading parities that leads to the same estimates as the CPD has been proposed by Sergey Sergeev (1982). This method has a close affinity with the Geary-Khamis method used to aggregate basic parities which is discussed in the following chapter. First, an ‘international price’ πi is defined for product i as follows:
86. PPPj is the purchasing parity for country j as defined in (16) below. qij is an implicit quantity weight for product i in country j where qij = 1 if product i was actually priced in country j and qij = 0 if it was not priced. The ni is the number of countries that actually provided prices for product i (i.e., the sum of the qij ‘s for product i). The qij ‘s are the equivalents of the dummy variables in (14). The PPPs are defined as follows:
cj is the number of products actually priced in country j (i.e., the sum of the qij ‘s for country j).
87. (15) and (16) generate a system of n + c -1 equations that make it possible to estimate both the international prices and the PPPs simultaneously. The estimated PPPs are identical with those obtained by using the simple unweighted CPD method.
88. (16) is a weighted Jevons index of the ratios of the prices in country j to the
international prices. The weights are the implicit weights described earlier in which prices that are actually available in country j receive a weight of 1 and prices that are not available receive a weight of 0. If the price tableau is complete both (15) and (16) simplify, (16) becoming a simple unweighted Jevons index of the ratios of the national to the international prices.
iij nc
j
q
j
iji PPP
p1
1
)15( ⎟⎟
⎠
⎞
⎜⎜
⎝
⎛
⎪⎭
⎪⎬⎫
⎪⎩
⎪⎨⎧
= ∏=
π
jij cn
j
q
i
ijj
pPPP
1
1
)16(⎟⎟
⎠
⎞
⎜⎜
⎝
⎛
⎭⎬⎫
⎩⎨⎧
= ∏= π
354
89. (16) already incorporates a system of implicit weights derived from the
dummy variables. Suppose, however, that information were available not simply about the availability or non-availability of products but about the relative expenditures on the various products within the basic heading. (15) and (16) could then be generalized to incorporate such weights. The resulting equations are then those defined in the Rao (1990) system of PPPs. As these are similar to the Geary-Kamis system of equations used at higher levels of aggregation where expenditure data are available, they are considered in the following chapter.
Weighted CPD regressions
90. In the simple CPD model considered up to now, each average price has been accorded equal weight. However, it is generally preferable to attach weights to the average prices whenever economically relevant weights are available. As suggested by Prasada Rao (2004, pp. 17 - 20) weights can reflect:
• The reliability of the different average prices: for example, average prices
based on larger number of individual price observations have smaller sampling errors.
• The importance of the products as measured by the expenditures shares
associated with them. Representative products are not necessarly more important in this sense because, although they should be purchased in relatively large quantities, they also have relatively low prices.
91. Weights are easily incorporated into regression equations in general, and
therefore also into the CPD regressions, as shown by Prasada Rao (2004, pp. 17 and 18).
92. Provided that the data cover the entire universe of products and transactions
within the basic heading in all the countries covered, Erwin Diewert (2004) has argued that, an expenditure weighted CPD provides “a reasonable target index” to aim at. The product weights are the expenditures shares within each country and therefore sum to unity for each country. This ensures that each country carries equal weight irrespective of its size. However, when the data consist of a small purposive sample of products a weighted regression based only on the products in the sample may not provide a reasonable target because the sample itself may be unbalanced. The sample of products may include far more of the representative products of some countries than others.
93. The pattern of the weights is important. Suppose the weights are
expenditure shares as proposed by Diewert. Let the expenditure on product i in country j be denoted by eij . The weight wij is
355
(17) wij = eij / ∑i eij Now, suppose that the weights are the same within every country.
(18) wij = wi for every country j.
As already noted earlier, weighted Jevons indices that use the same set of weights must be transitive. In this case, they also coincide with the estimated PPPs from a weighted CPD using the same weights.
94. Thus, if ajk denotes the least-squares estimate of the PPP between countries j and k obtained from a weighted CPD regression that uses the set of weights specified in (18) it follows that
95. Each ajk can be estimated independently of the prices in other countries..
The PPPs are also independent of the estimated product parameters because whatever the effects of products on prices, their net effect on the price level in each country must be the same, given that the pattern of the product weights is the same. The net product effects therefore cancel each other out in each CPD PPP. Of course, the coincidence between an unweighted CPD and the simple Jevons when the prices tableau is complete is just a special case of (18) and (19)
96. Finally, it should be noted that the assumption of fixed weights is not very
realistic or attractive from an economic point of view. Most index number problems arise because patterns of expenditure vary from time period to time period or country to country. Fixed weights assume all these problems away.
The Extended CPD Method, or CPRD Method
97. In the ICP 2005, information about the representativity is meant to be collected in all the regions of the ICP, and also in the ring program designed to link the regions. Assuming that representativity exerts an influence on the price of a product in the same way that the type of product or the country in which it is sold influences its price, it ought to be included as an additional variable in the CPD. In contrast to the product characteristics that are included in hedonic regressions, however, representativity is not a characteristic that is possessed by all products of a given type. The same product may be representative in one country but not in another. Thus, the price of the same product may be relatively low in one country but relatively
∏=
⎟⎟⎠
⎞⎜⎜⎝
⎛=
n
i
w
ij
ikjk
i
pp
a1
)19(
356
high in another country depending on whether or not it is representative. In the traditional CPD method the product parameters reflect the pattern of relative prices which is assumed to be the same in all countries. The inclusion of representativity enables this unrealistic assumption to be relaxed somewhat
98. The extension of the CPD model to include representativity was first
proposed by James and Margeret Cuthbert (1988, p. 55) who argued as follows: “The standard CPD technique makes no allowance for characteristic / non-characteristic bias. It is not difficult however to see how the basic CPD model could be extended to allow for the possibility of a differential price between characteristic and non-characteristic products, if information on the characteristic / non-characteristic classification of items is available.” ‘Characteristicity’ is used to mean the same thing as ‘representativity’ here.
Let γk denote the degree of representativity. Only two degrees are distinguished
here: namely, representative denoted by γ1 and unrepresentative denoted by γ2. However, in principle, more than two different degrees of representativity could be recognized: for example, very representative, moderately representative and unrepresentative.
The basic model is now written as: (20) pij = κ αi βj γk νijk i = 1, 2, … n : j = 1, 2, … m
(21) α1 = β1 = γ1 = 1 k = 1, 2.
Taking natural logarithms of both sides of (20) and (21) we have:
(22) ln pij = ln κ + lnαj + ln βi + ln γk + εij
(23) ln α1 = ln β1 = ln γ1 = 0
The regression equation now requires three sets of dummy variables Xijk, Yijk and Zijk . It becomes: (24) ln pij = ln κ + ln α2 xii2 + ln α3 xi3 + …ln αc xic + ln β2 y2j + ln β3 y3j + ln βc y2c + ln γ2 zij2 + εij
99. The expected price depends on the combined effect of three factors: the
country, the product and its representativity. Given that the coefficient of a representative product is fixed at unity, the coefficient of an unrepresentative product may be expected to be greater than unity. The price of a product is expected to be higher relatively to the reference product 1 in a country in which it is unrepresentative than in a country in which it is representative. The improvement over the traditional CPD method comes from the partial
357
relaxation of the unrealistic assumption that the pattern of relative prices is the same in all countries.
100. Consider two products. The traditional CPD model assumes that the ratio
of their prices is the same in every country. The extended CPD model allows the ratio of their prices to vary between two countries depending on whether the products are representative (or unrepresentative) in both countries, or whether one is representative in one country and the other is representative in the other country. The inclusion of the dummy for representativity introduces some flexibility into the CPD model by permitting a limited amount of variation in the pattern of expected relative prices between countries. All the effort made to identify representative products in the pre-survey and to exploit this information in building up the product lists was made on the assumption that representativity influences price.
101. The addition of the new variable, representativity, does not simply add another parameter to be estimated. It adds another dimension to the analysis. As there are three types of explanatory variables in the regression -- country, product and representativity -- the extended regression is described as the CPRD method.
102. In Chapter Six of the OECD Working Paper by James and Margaret
Cuthbert, they use actual data from the OECD PPP program to test for the significance of representativity. They conclude, p. 79:
“(a) There is evidence of a significant positive differential effect on the
prices of non-characteristic items. (b) The magnitude is such that, for some basic headings, it could
potentially have a very serious effect in distorting inter-country PPP comparisons.”
103. The extent of the potential bias in the CPD depends on the extent to which
the balance between representative and non-representative varies between countries. It will not be the same for all basic headings. The Cuthberts note p. 79: “These examples illustrate that the effect of differential prices can indeed be of potentially major importance for particular basic headings. For most of the basic headings considered, however, the apparent effect is much smaller.” If representativity has no effect on prices, the estimated coefficient for representativity should be zero, in which case the PPPs estimated by the CPRD coincide with those for the CPD. Nothing is lost by including representativity in the model provided the products flagged as representative are actually representative. This may not be easy for countries that have no previous experience of working with the distinction between representative and unrepresentative products.
358
104. If it were possible to distinguish more than two degrees of representativity,
each degree could have its own dummy variable. For example, products might be divided into three groups, very representative, representative and unrepresentative. This does not appear feasible at the present time, however.
105. A second improvement might be to introduce product/representativity
interaction terms into the model. These allow the effect of representativity to vary from product to product. In principle, the introduction of interaction terms has the potential to introduce more flexibility into the model, but it would seem to be premature without further research.
Some Numerical Examples of the Results Obtained by Alternative Methods18 Introduction
106. The following sections contain a series of numerical examples using artificial data. They are intended to illustrate how the various methods work in different situations. Examples of this kind cannot establish the superiority of one method over another. However, they can provide useful insights into the ways the methods perform under certain conditions.
107. There seems to be evidence to suggest that the different methods give very
similar results in most situations. The may possibly be the case, but there can be circumstances in which they can give significantly different results. Examples of the kind given below are intended to show what these circumstances are and why the different methods yield different results.
108. Data sets can be constructed which are designed to simulate the
circumstances in which the different methods yield different results. They can throw light on the factors responsible, and by so doing make it possible for better informed decisions to be made about which method to use.
The data sets
109. Five illustrative sets of data are used. There are 4 countries and 10
products although not all countries and products are used in each example. There are two degrees of representativity: representative and unrepresentative. The products flagged as representative tend to have low relative prices. For each data set, five different types of PPPs are calculated: namely,
Simple Jevons
18 All the CPD and CPRD regressions for the numerical examples presented in this chapter were very kindly calculated by Daniel Melser then of the University of New South Wales, Sydney.
359
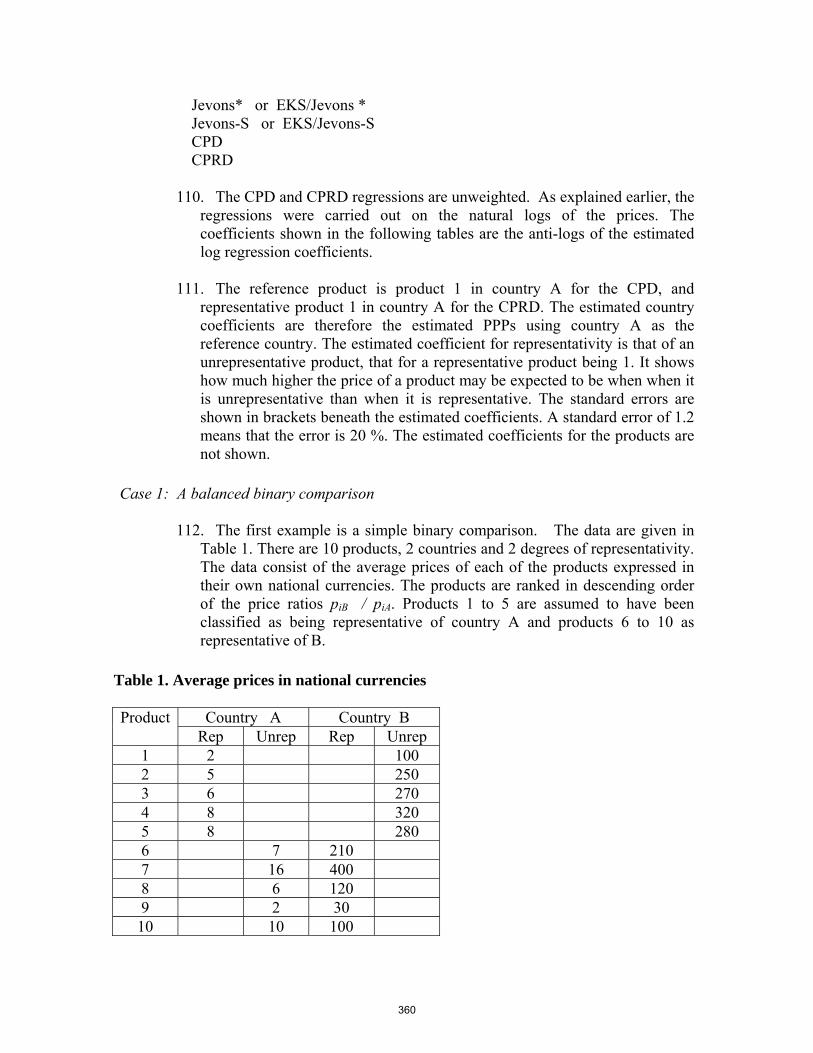
Jevons* or EKS/Jevons * Jevons-S or EKS/Jevons-S CPD CPRD
110. The CPD and CPRD regressions are unweighted. As explained earlier, the
regressions were carried out on the natural logs of the prices. The coefficients shown in the following tables are the anti-logs of the estimated log regression coefficients.
111. The reference product is product 1 in country A for the CPD, and
representative product 1 in country A for the CPRD. The estimated country coefficients are therefore the estimated PPPs using country A as the reference country. The estimated coefficient for representativity is that of an unrepresentative product, that for a representative product being 1. It shows how much higher the price of a product may be expected to be when when it is unrepresentative than when it is representative. The standard errors are shown in brackets beneath the estimated coefficients. A standard error of 1.2 means that the error is 20 %. The estimated coefficients for the products are not shown.
Case 1: A balanced binary comparison
112. The first example is a simple binary comparison. The data are given in Table 1. There are 10 products, 2 countries and 2 degrees of representativity. The data consist of the average prices of each of the products expressed in their own national currencies. The products are ranked in descending order of the price ratios piB / piA. Products 1 to 5 are assumed to have been classified as being representative of country A and products 6 to 10 as representative of B.
Table 1. Average prices in national currencies
Country A Country B Product
Rep Unrep Rep Unrep 1 2 100 2 5 250 3 6 270 4 8 320 5 8 280 6 7 210 7 16 400 8 6 120 9 2 30 10 10 100
360
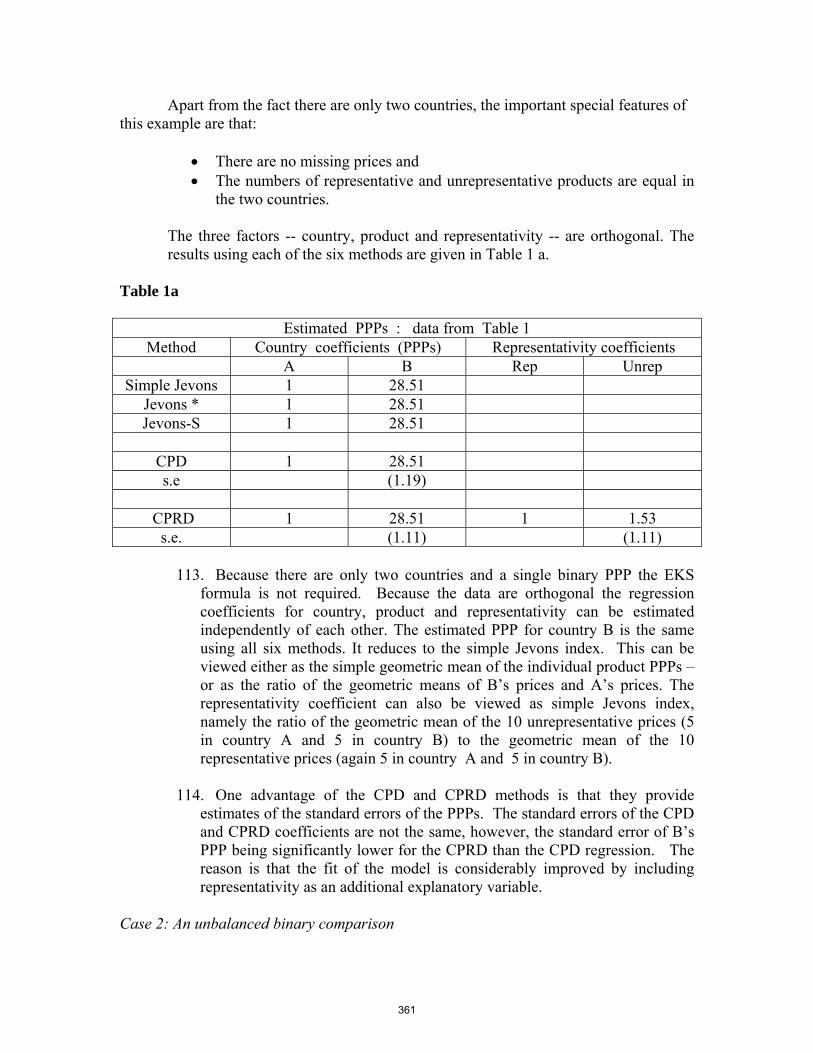
Apart from the fact there are only two countries, the important special features of this example are that:
• There are no missing prices and • The numbers of representative and unrepresentative products are equal in
the two countries. The three factors -- country, product and representativity -- are orthogonal. The results using each of the six methods are given in Table 1 a.
Table 1a
Estimated PPPs : data from Table 1
Method Country coefficients (PPPs) Representativity coefficients A B Rep Unrep
Simple Jevons 1 28.51 Jevons * 1 28.51 Jevons-S 1 28.51
CPD 1 28.51 s.e (1.19)
CPRD 1 28.51 1 1.53
s.e. (1.11) (1.11)
113. Because there are only two countries and a single binary PPP the EKS formula is not required. Because the data are orthogonal the regression coefficients for country, product and representativity can be estimated independently of each other. The estimated PPP for country B is the same using all six methods. It reduces to the simple Jevons index. This can be viewed either as the simple geometric mean of the individual product PPPs – or as the ratio of the geometric means of B’s prices and A’s prices. The representativity coefficient can also be viewed as simple Jevons index, namely the ratio of the geometric mean of the 10 unrepresentative prices (5 in country A and 5 in country B) to the geometric mean of the 10 representative prices (again 5 in country A and 5 in country B).
114. One advantage of the CPD and CPRD methods is that they provide
estimates of the standard errors of the PPPs. The standard errors of the CPD and CPRD coefficients are not the same, however, the standard error of B’s PPP being significantly lower for the CPRD than the CPD regression. The reason is that the fit of the model is considerably improved by including representativity as an additional explanatory variable.
Case 2: An unbalanced binary comparison
361
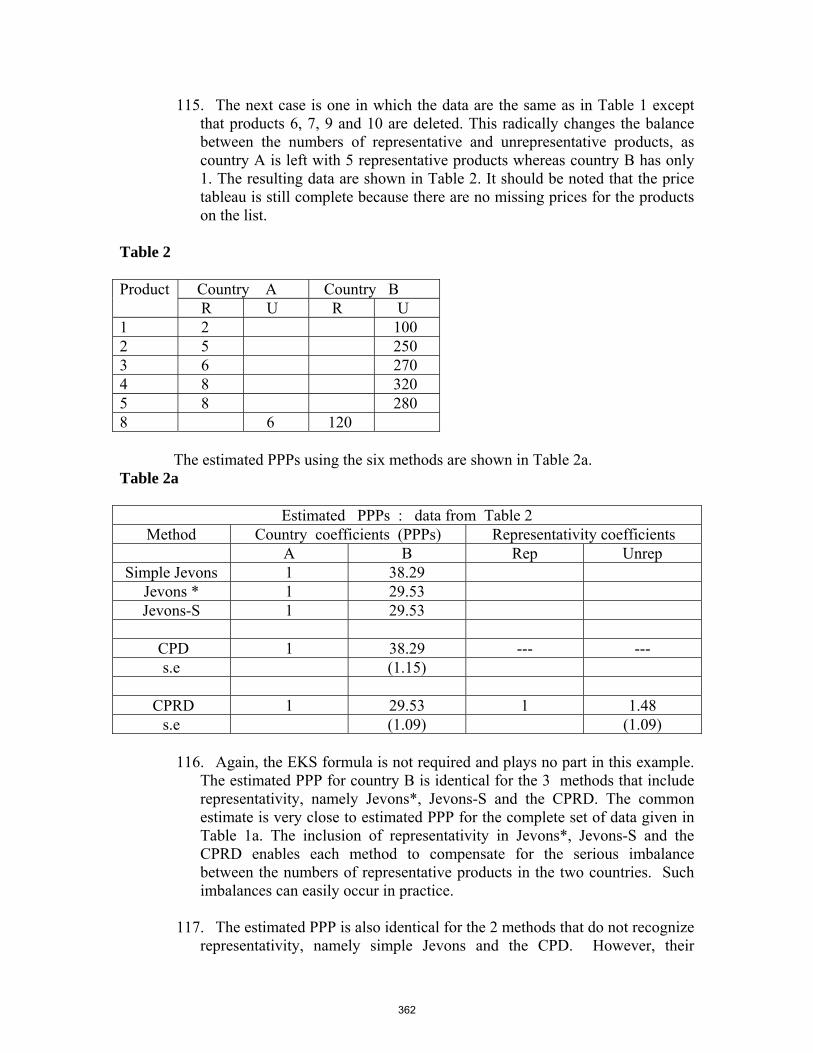
115. The next case is one in which the data are the same as in Table 1 except that products 6, 7, 9 and 10 are deleted. This radically changes the balance between the numbers of representative and unrepresentative products, as country A is left with 5 representative products whereas country B has only 1. The resulting data are shown in Table 2. It should be noted that the price tableau is still complete because there are no missing prices for the products on the list.
Table 2
Country A Country B Product R U R U
1 2 100 2 5 250 3 6 270 4 8 320 5 8 280 8 6 120
The estimated PPPs using the six methods are shown in Table 2a. Table 2a
Estimated PPPs : data from Table 2
Method Country coefficients (PPPs) Representativity coefficients A B Rep Unrep
Simple Jevons 1 38.29 Jevons * 1 29.53 Jevons-S 1 29.53
CPD 1 38.29 --- ---
s.e (1.15)
CPRD 1 29.53 1 1.48 s.e (1.09) (1.09)
116. Again, the EKS formula is not required and plays no part in this example.
The estimated PPP for country B is identical for the 3 methods that include representativity, namely Jevons*, Jevons-S and the CPRD. The common estimate is very close to estimated PPP for the complete set of data given in Table 1a. The inclusion of representativity in Jevons*, Jevons-S and the CPRD enables each method to compensate for the serious imbalance between the numbers of representative products in the two countries. Such imbalances can easily occur in practice.
117. The estimated PPP is also identical for the 2 methods that do not recognize
representativity, namely simple Jevons and the CPD. However, their
362
common estimate of 38.29 is considerably higher than that for the complete data set in Table 1, namely, 28.51.
118. Although highly simplified this example does illustrate a number of
important points. In particular, the estimated PPPs are not all the same, or even roughly the same, even though there is a complete price tableau and no missing prices. The CPD and simple Jevons PPPs coincide but there are substantial differences between these estimates and those of the methods that take representativity into account. What the example suggests is that when the list is unbalanced the important distinction is not between the binary and the group approaches, i.e., between Jevons or EKS /Jevons and CPD, but between methods that do and do not make use of representativity. This conclusion is borne out by later examples.
119. Suppose that the data in Table 1 represent the universe of products within
the basic heading while those in Table 2 represent a sample. The fact that 5 out of the 6 products on the sample list are unrepresentative in B while they are representative in A means that the product list is heavily biased towards the pattern of consumption in A. In the case, the simple Jevons and CPD PPPs that ignore the imbalance in the product list have a substantial upward bias. On the other hand, as the Jevons*, Jevons-S and CPRD PPPs are deliberately designed to compensate for the imbalance, the bias is negligible for them.
120. The sensitivity of the simple Jevons and CPD estimates to the composition
of the product list may be illustrated by changing the example. Instead of dropping products 6, 7, 9 and 10 from Table 1, suppose products 1, 2, 4 and 5 are dropped. This means that the list of products is now dominated by B’s representative products. The simple Jevons and CPD PPP for B drops from 38.29 to 21.76. It now has a substantial downward bias. However, the Jevons* and Jevons-S PPPs, and also the CPRD PPP, turn out to be quite robust in response to changes in the product list. Their common PPP barely changes, moving from 29.53 to 28.96, and remains close to the PPP of 28.51 for the universe of products.
121. The Jevons * and Jevons-S binary PPPs assume that the expected ratio
between the price of the same product in the two countries depends partly on how representative it is in each of the two countries. If the assumption is correct and if information about representativity is available, it must be utilized. Similarly, it must also be incorporated into the CPD model. This transforms it into the CPRD model.
Case 3: multilateral comparisons based on complete data
363
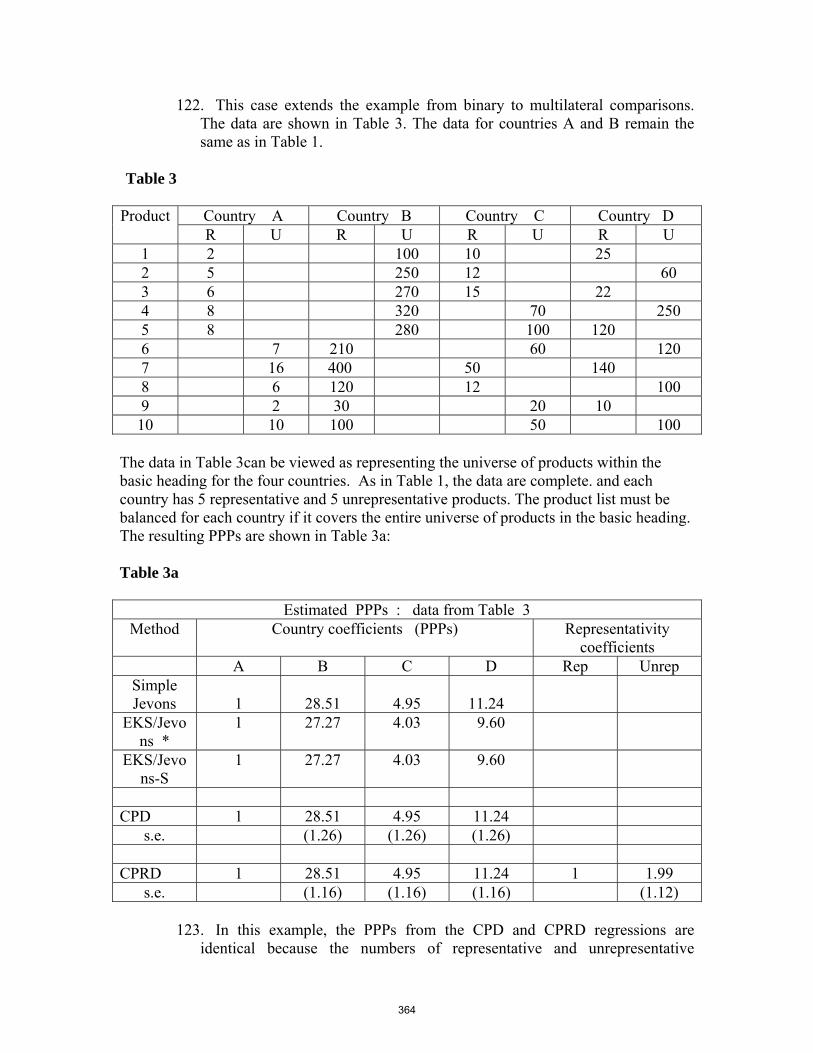
122. This case extends the example from binary to multilateral comparisons. The data are shown in Table 3. The data for countries A and B remain the same as in Table 1.
Table 3
Country A Country B Country C Country D Product R U R U R U R U
1 2 100 10 25 2 5 250 12 60 3 6 270 15 22 4 8 320 70 250 5 8 280 100 120 6 7 210 60 120 7 16 400 50 140 8 6 120 12 100 9 2 30 20 10 10 10 100 50 100
The data in Table 3can be viewed as representing the universe of products within the basic heading for the four countries. As in Table 1, the data are complete. and each country has 5 representative and 5 unrepresentative products. The product list must be balanced for each country if it covers the entire universe of products in the basic heading. The resulting PPPs are shown in Table 3a:
Table 3a
Estimated PPPs : data from Table 3
Method Country coefficients (PPPs) Representativity coefficients
A B C D Rep Unrep Simple Jevons
1
28.51
4.95
11.24
EKS/Jevons *
1 27.27 4.03 9.60
EKS/Jevons-S
1 27.27 4.03 9.60
CPD 1 28.51 4.95 11.24
s.e. (1.26) (1.26) (1.26) CPRD 1 28.51 4.95 11.24 1 1.99
s.e. (1.16) (1.16) (1.16) (1.12)
123. In this example, the PPPs from the CPD and CPRD regressions are identical because the numbers of representative and unrepresentative
364
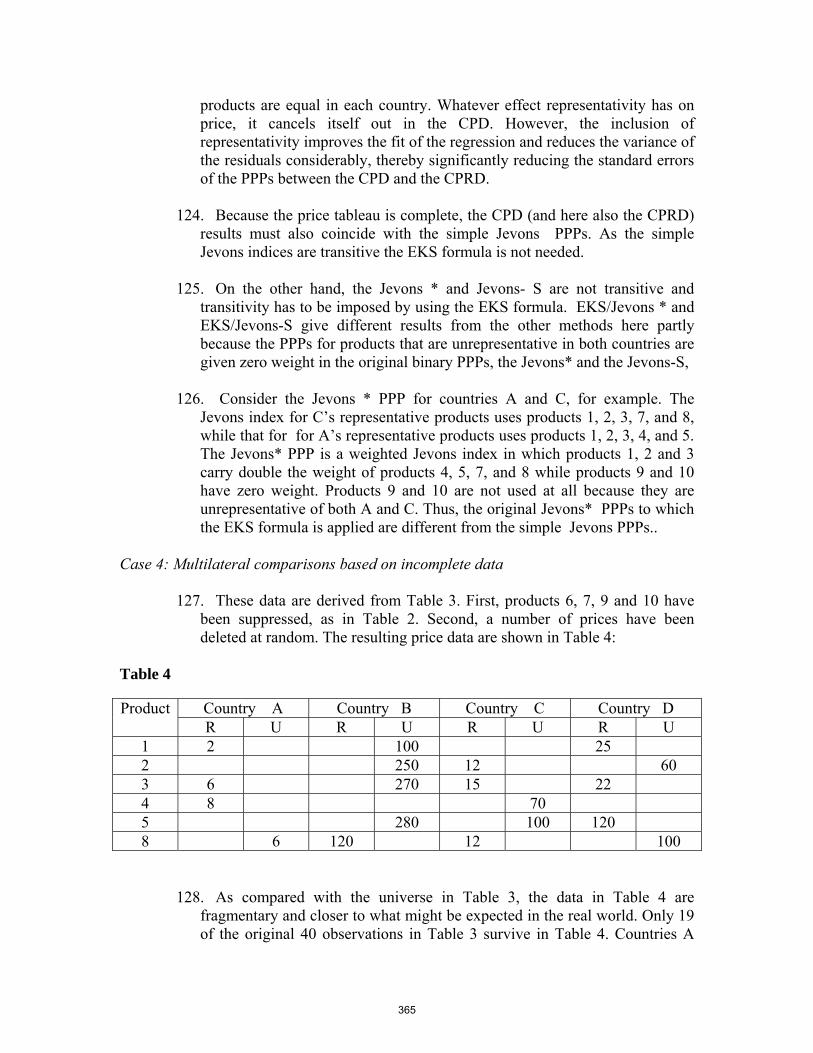
products are equal in each country. Whatever effect representativity has on price, it cancels itself out in the CPD. However, the inclusion of representativity improves the fit of the regression and reduces the variance of the residuals considerably, thereby significantly reducing the standard errors of the PPPs between the CPD and the CPRD.
124. Because the price tableau is complete, the CPD (and here also the CPRD)
results must also coincide with the simple Jevons PPPs. As the simple Jevons indices are transitive the EKS formula is not needed.
125. On the other hand, the Jevons * and Jevons- S are not transitive and
transitivity has to be imposed by using the EKS formula. EKS/Jevons * and EKS/Jevons-S give different results from the other methods here partly because the PPPs for products that are unrepresentative in both countries are given zero weight in the original binary PPPs, the Jevons* and the Jevons-S,
126. Consider the Jevons * PPP for countries A and C, for example. The
Jevons index for C’s representative products uses products 1, 2, 3, 7, and 8, while that for for A’s representative products uses products 1, 2, 3, 4, and 5. The Jevons* PPP is a weighted Jevons index in which products 1, 2 and 3 carry double the weight of products 4, 5, 7, and 8 while products 9 and 10 have zero weight. Products 9 and 10 are not used at all because they are unrepresentative of both A and C. Thus, the original Jevons* PPPs to which the EKS formula is applied are different from the simple Jevons PPPs..
Case 4: Multilateral comparisons based on incomplete data
127. These data are derived from Table 3. First, products 6, 7, 9 and 10 have
been suppressed, as in Table 2. Second, a number of prices have been deleted at random. The resulting price data are shown in Table 4:
Table 4
Country A Country B Country C Country D Product R U R U R U R U
1 2 100 25 2 250 12 60 3 6 270 15 22 4 8 70 5 280 100 120 8 6 120 12 100
128. As compared with the universe in Table 3, the data in Table 4 are fragmentary and closer to what might be expected in the real world. Only 19 of the original 40 observations in Table 3 survive in Table 4. Countries A
365
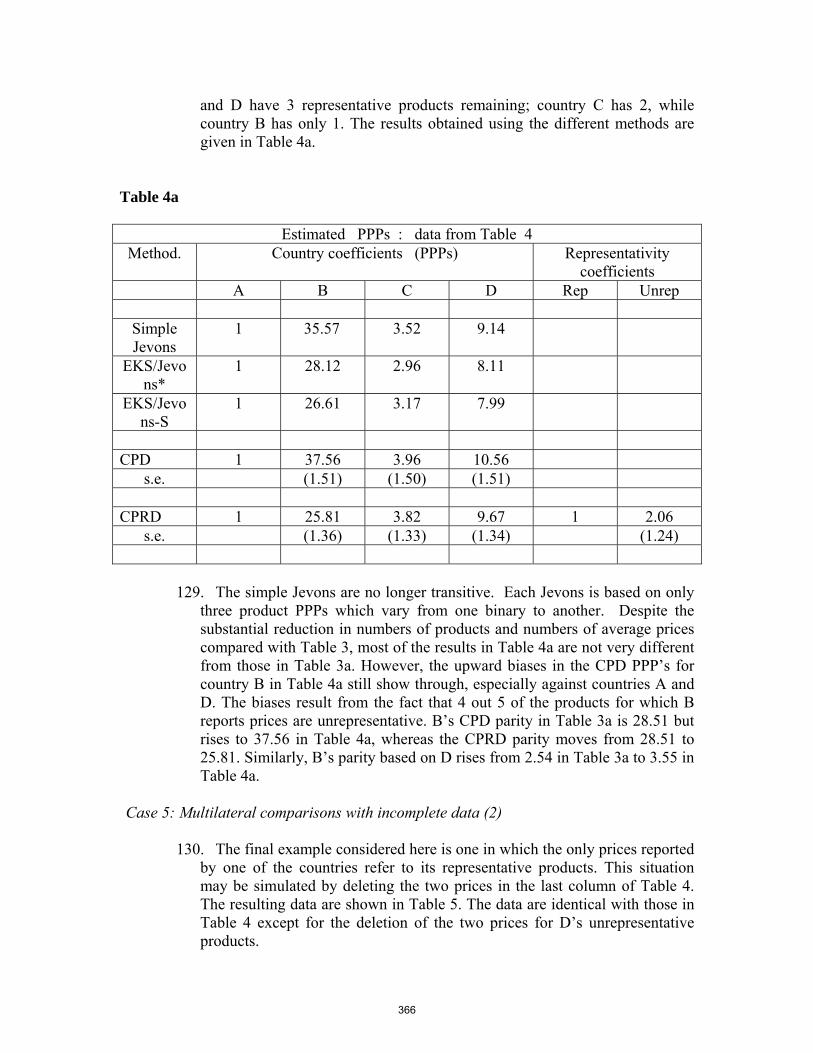
and D have 3 representative products remaining; country C has 2, while country B has only 1. The results obtained using the different methods are given in Table 4a.
Table 4a
Estimated PPPs : data from Table 4 Method. Country coefficients (PPPs) Representativity
coefficients A B C D Rep Unrep
Simple Jevons
1 35.57 3.52 9.14
EKS/Jevons*
1 28.12 2.96 8.11
EKS/Jevons-S
1 26.61 3.17 7.99
CPD 1 37.56 3.96 10.56
s.e. (1.51) (1.50) (1.51)
CPRD 1 25.81 3.82 9.67 1 2.06 s.e. (1.36) (1.33) (1.34) (1.24)
129. The simple Jevons are no longer transitive. Each Jevons is based on only three product PPPs which vary from one binary to another. Despite the substantial reduction in numbers of products and numbers of average prices compared with Table 3, most of the results in Table 4a are not very different from those in Table 3a. However, the upward biases in the CPD PPP’s for country B in Table 4a still show through, especially against countries A and D. The biases result from the fact that 4 out 5 of the products for which B reports prices are unrepresentative. B’s CPD parity in Table 3a is 28.51 but rises to 37.56 in Table 4a, whereas the CPRD parity moves from 28.51 to 25.81. Similarly, B’s parity based on D rises from 2.54 in Table 3a to 3.55 in Table 4a.
Case 5: Multilateral comparisons with incomplete data (2)
130. The final example considered here is one in which the only prices reported
by one of the countries refer to its representative products. This situation may be simulated by deleting the two prices in the last column of Table 4. The resulting data are shown in Table 5. The data are identical with those in Table 4 except for the deletion of the two prices for D’s unrepresentative products.
366
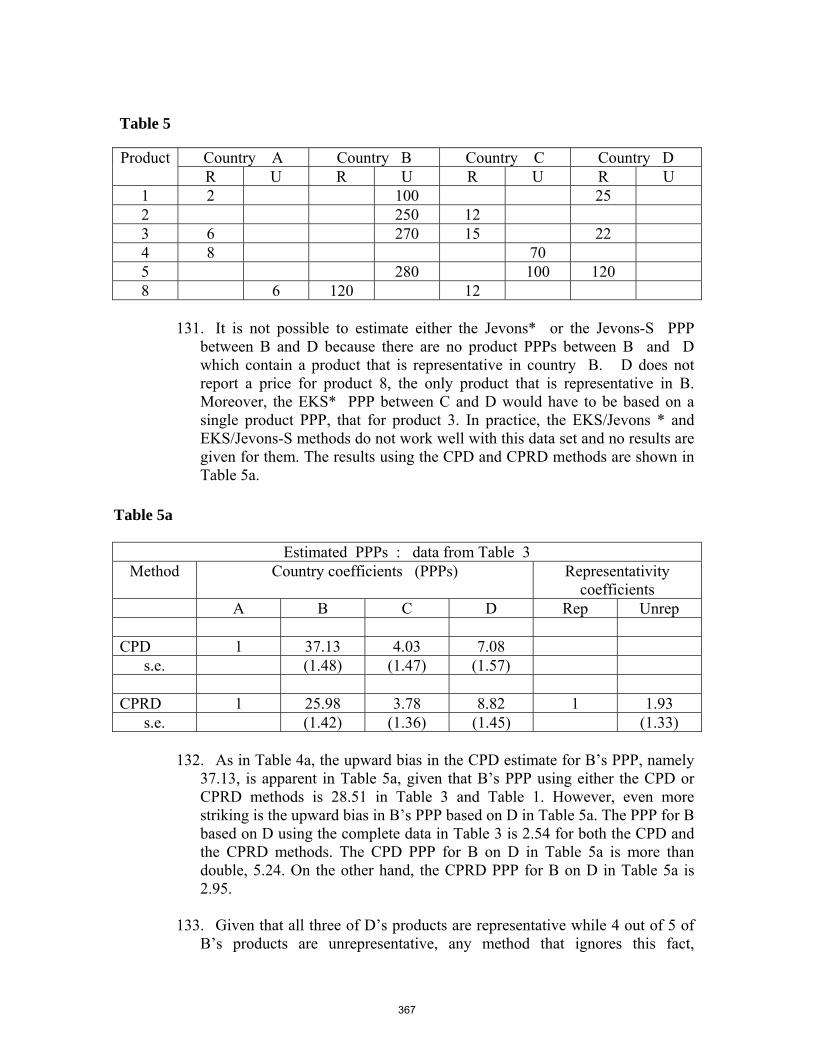
Table 5
Country A Country B Country C Country D Product R U R U R U R U
1 2 100 25 2 250 12 3 6 270 15 22 4 8 70 5 280 100 120 8 6 120 12
131. It is not possible to estimate either the Jevons* or the Jevons-S PPP
between B and D because there are no product PPPs between B and D which contain a product that is representative in country B. D does not report a price for product 8, the only product that is representative in B. Moreover, the EKS* PPP between C and D would have to be based on a single product PPP, that for product 3. In practice, the EKS/Jevons * and EKS/Jevons-S methods do not work well with this data set and no results are given for them. The results using the CPD and CPRD methods are shown in Table 5a.
Table 5a
Estimated PPPs : data from Table 3
Method Country coefficients (PPPs) Representativity coefficients
A B C D Rep Unrep
CPD 1 37.13 4.03 7.08 s.e. (1.48) (1.47) (1.57)
CPRD 1 25.98 3.78 8.82 1 1.93
s.e. (1.42) (1.36) (1.45) (1.33)
132. As in Table 4a, the upward bias in the CPD estimate for B’s PPP, namely 37.13, is apparent in Table 5a, given that B’s PPP using either the CPD or CPRD methods is 28.51 in Table 3 and Table 1. However, even more striking is the upward bias in B’s PPP based on D in Table 5a. The PPP for B based on D using the complete data in Table 3 is 2.54 for both the CPD and the CPRD methods. The CPD PPP for B on D in Table 5a is more than double, 5.24. On the other hand, the CPRD PPP for B on D in Table 5a is 2.95.
133. Given that all three of D’s products are representative while 4 out of 5 of
B’s products are unrepresentative, any method that ignores this fact,
367
including the CPD, is liable to seriously over-estimate the PPP for B on D. The CPRD allows for the fact that the prices reported for B are likely to be relatively high in relation to the general price level in B whereas the prices reported for D are likely to be relatively low compared to D’s general price level. It is able to compensate for this because an estimate of the price differential between unrepresentative and representative products as measured by the representativity coefficient can be calculated for the data set as a whole. The CPD estimate of the PPP for B on D is subject to a significant upward bias whereas the CPRD estimate is not. The CPRD is able to produce an acceptable estimate for the PPP for B on D, whereas the binary Jevons* between B and D cannot even be calculated.
An appraisal of the different methods
134. At the meeting of the ICP Technical Advisory Group in September 2004, a paper was presented by Yuri Dikhanov on “Assessing the Efficiency of Elementary Indices with Monte Carlo Simulations.” Using simulated data, the results obtained from various methods described in this chapter were evaluated. The conclusion reached was that “the CPRD was found to be superior to the other CPD and EKS style indices.” It was also concluded that: “In general, CPRD index is found to be the most robust, especially with sparse price and representativity matrices.”
135. At this meeting, the TAG recommended that regions should use the CPRD
method to estimate basic heading PPPs. Of coursed, the method can only be implemented satisfactorily if the countries within a region are able to identify representative products correctly. It was also proposed to use the CPRD method to estimate the between-region PPPs that are needed to link together the results obtained for the different regions to obtain a complete set of transitive basic heading PPPs at a global level. The way in which the within-region basic heading PPPs may be linked is explained in Chapter 14
References Cuthbert, J. and M. Cuthbert 1988. “On Aggregation Methods of Purchasing Power Parities”, OECD Working Paper, OECD, Paris. Diewert, W.E. 1976. “Exact and Superlative Index Numbers”. Journal of Econometrics, Vol.4, pp. 114-145. Diewert, W.W.2002: Similarity and Dissimilarity Indexes: An Axiomatic Approach, Discussion Paper No 02-10, Department of Economics, (University of British Columbia, Vancouver).
368
Diewert, W. E. 2004. “On the Stochastic Approach to Linking the Regions in the ICP”, Discussion Paper No.04-16, Department of Economics, University of British Columbia, Vancouver. Dikhanov, Y. “Assessing the Efficiency of Elementary Indices with Monte Carlo Simulations.” A paper presented at the meeting of the ICP Technical Advisory Group in September 2004. Drechsler, L. 1973. “Weighting of Index Numbers in Multilateral Comparisons”, The Review of Income and Wealth, March 1973, pp. 17-34. Gini, C. 1931. “On the Circular Test of Index Numbers”, International Review of Statistics, Vol. 9 No. 2, pp. 3-25, 1931. Huang, D. 1970. Regression and Econometric Methods, (Wiley, New York) section 7.3, pp. 163 – 171. Hill, T.P. 1959: “An Analysis of the Distribution of Wages and Salaries in Great Britain”, Econometrica, Vol 27, No. 3, pp. 355 – 380. Hill, T.P. 1982. Multilateral Measurements of Purchasing Power and Real GDP, Eurostat, Luxembourg. Kempthorne, O. 1952. The Design and Analysis of Experiments, (Wiley, New York), chapters 5 and 7. Kravis, I.B., Z. Kenessy, A.W. Heston and R. Summers, 1975: A System of International Comparisons of Gross Product and Purchasing Power, published for The World Bank by Johns Hopkins University Press, Baltimore and London. Rao, D.S. Prasada 1990. “A System of Log-Change Index Numbers for Multilateral Comparisons”, in Comparisons of Prices and Real Products in Latin America (eds. Salazar-Carillo and Rao, Contributions to Economic Analysis Series (Amsterdam North-Holland Publishing Company). Rao, D.S. Prasada 2001. Weighted EKS and Generalized Country Product Dummy Methods for Aggregation at Basic Heading Level and Above Basic Heading Level, Seminar on PPPs, World Bank Washington, Jan/Feb 2001. Rao, D.S. Prasada and M. Timmer 2003. “Purchasing Power Parities for Industry Comparisons Using Weighted EKS Methods”, The Review of Income and Wealth, series 49, no. 4, Dec. 2003, pp. 500 – 504. Rao, D.S. Prasada 2004: “The Country-Product –Dummy-Method: A Stochastic Approach to the Computation of Purchasing Power Parities in the ICP”, SSHRC Conference on Index Numbers and Productivity Measurement, Vancouver, July 2004.
369
Sergeev, S. 1982. “Multilateral Methods for International Comparisons”, thesis submitted to the Central Statistical Committee of the Soviet Union, Moscow. Sergeev S. 2003. Equi-representativity and Some Modifications of the EKS Method as the Basic Heading Level, paper presented at the Joint Consultation on the European Comparison Programme, ECE, Geneva 31 March-2 April 2003. Statistical Office of the European Communities (Eurostat) Luxembourg, 1983: Comparison in Real Values of the Aggregates of ESA: 1980; Statistical Office of the European Communities Luxembourg,. Summers, R. 1973. “International Comparisons with Incomplete Data”, The Review of Income and Wealth, March 1973, pp. 1 – 16.
370
Chapter 12
Aggregation Methods Introduction
1. The chapter describes the methods that may be used to calculate PPPs and quantity indices for higher level expenditure aggregates for a specified group of countries such as an ICP region. A higher level aggregate is an expenditure class, group or category obtained by combining two or more basic headings. The nominal value of an expenditure aggregate, expressed in its own national currency, is obtained simply by summing the values of the expenditures for the set of basic headings of which it is composed. Quantity indices may be converted into real expenditures by multiplying them by the corresponding expenditures in the base country.
2. Expenditure classes, groups and categories and the various expenditure
classifications on which they are based are explained in Chapter 3. Table 4 of Chapter 3 provides a listing of the 26 expenditure categories used in the ICP. Table 6 of Chapter 3 provides some examples of the hierarchy of expenditures aggregates from the detailed classes up to main aggregates of the System of National Accounts.
3. In order to calculate PPPs and real expenditures for aggregates above the level
of the basic heading, two sets of data are needed for the basic heading themselves.
• The first consists of a complete set of basic heading expenditures in
national currencies.
• The second consists of the corresponding basic heading PPPs, with country 1 acting as the reference country and its currency as the numeraire.
The procedures followed are similar to those used in temporal indices where the inputs into the calculation of price indices for higher level aggregates are elementary price indices together with the associated expenditures on the elementary aggregates.
4. The basic heading PPPs are assumed to have been calculated using the CPRD or one of the EKS methods described in Chapters 11. They are transitive.
5. The first section of the chapter gives an overview of the various formulae that
may be used to calculate aggregate binary PPPs or quantity indices between pairs of countries. There is some demand for aggregate binary indices because one country may wish to compare itself with another country independently of other countries. However, there are advantages in considering binary indices first anyway because there exists a considerable amount of economic and
371
statistical theory underpinning binary indices and this theory can help explain the properties and behaviour of multilateral indices. This theory has been developed mainly with reference to temporal indices, such as CPIs, but most of it is equally applicable to inter-spatial indices.
6. In the binary approach to multilateral comparisons, the procedure is to
calculate a set of independent binary PPPs first and then to derive a set of transitive multilateral PPPs from the binary indices. There are various ways of doing this. One is to apply the EKS formula presented in the previous chapter to aggregate binary PPPs. However, there are other ways, such as chaining binary indices across spanning trees, including star methods. The binary approach is considered in the second section of the chapter.
7. The third section presents the group or multilateral approach to aggregate
PPPs. In the group approach, the characteristics of the group of countries as a whole enter into the calculation of the PPPs. For example, some multilateral methods use the average prices in the group of countries as a whole to construct a set of transitive multilateral quantity indices. Aggregate PPPs are associated with these quantity indices. Other methods use the average quantities in the group of countries as a whole. These kinds of multilateral methods proceed directly to the calculation of a set of transitive multilateral PPPs and quantity indices and make no use of the binary PPPs or quantity indices between individual pairs of countries. This group of methods include the Geary-Khamis, or GK, method that has been used in previous rounds of the ICP.
8. The chapter is not meant to provide a comprehensive review and evaluation of
of all the wide range of possible methods that have been proposed in the literature on PPPs. It focuses mainly on the two methods that have been the most used in practice, either in the European Comparisons Programmes or in previous rounds of the ICP. The first is the application of the EKS formula to aggregate superlative binary indices, such as Fisher or Törnqvist. The other is the GK method.
9. This chapter is concerned with the aggregation methods that may be used
within a single group of countries such as an ICP region. The methods that may be used to link aggregate within-region PPPs to obtain a global set of aggregate PPPs at a world level are explained in Chapter 15.
Aggregate Binary Indices
10. There is a strong formal similarity between price comparisons between pairs of countries and price comparisons between two periods of time for the same country. Both kinds of comparison can draw upon the same underlying index number theory, which is explained in some detail in the international Consumer Price Index Manual (2004). In particular, chapters 1 and 15 of the Manual contain comprehensive, rigorous and up-to-date explanations of the behaviour and properties of the indices considered in this section. For convenience, a number of the more commonly used index formulae are
372
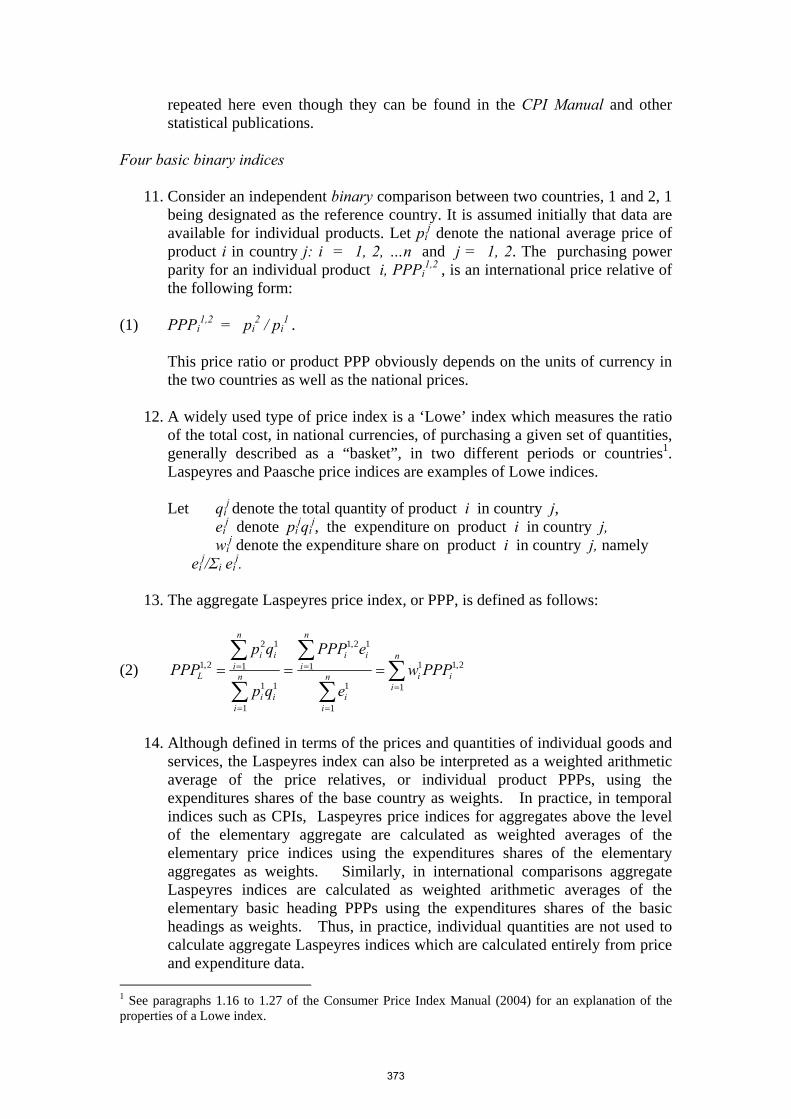
repeated here even though they can be found in the CPI Manual and other statistical publications.
Four basic binary indices
11. Consider an independent binary comparison between two countries, 1 and 2, 1 being designated as the reference country. It is assumed initially that data are available for individual products. Let pi
j denote the national average price of product i in country j: i = 1, 2, …n and j = 1, 2. The purchasing power parity for an individual product i, PPPi
1,2 , is an international price relative of the following form:
(1) PPPi
1,2 = pi2 / pi
1 .
This price ratio or product PPP obviously depends on the units of currency in the two countries as well as the national prices.
12. A widely used type of price index is a ‘Lowe’ index which measures the ratio
of the total cost, in national currencies, of purchasing a given set of quantities, generally described as a “basket”, in two different periods or countries1. Laspeyres and Paasche price indices are examples of Lowe indices.
Let qi
j denote the total quantity of product i in country j, ei
j denote pijqi
j, the expenditure on product i in country j, wi
j denote the expenditure share on product i in country j, namely ei
j/Σi eij.
13. The aggregate Laspeyres price index, or PPP, is defined as follows:
(2) ∑∑
∑
∑
∑=
=
=
=
= ===n
iiin
ii
n
iii
n
iii
n
iii
L PPPwe
ePPP
qp
qpPPP
1
2,11
1
1
1
12,1
1
11
1
12
2,1
14. Although defined in terms of the prices and quantities of individual goods and
services, the Laspeyres index can also be interpreted as a weighted arithmetic average of the price relatives, or individual product PPPs, using the expenditures shares of the base country as weights. In practice, in temporal indices such as CPIs, Laspeyres price indices for aggregates above the level of the elementary aggregate are calculated as weighted averages of the elementary price indices using the expenditures shares of the elementary aggregates as weights. Similarly, in international comparisons aggregate Laspeyres indices are calculated as weighted arithmetic averages of the elementary basic heading PPPs using the expenditures shares of the basic headings as weights. Thus, in practice, individual quantities are not used to calculate aggregate Laspeyres indices which are calculated entirely from price and expenditure data.
1 See paragraphs 1.16 to 1.27 of the Consumer Price Index Manual (2004) for an explanation of the properties of a Lowe index.
373
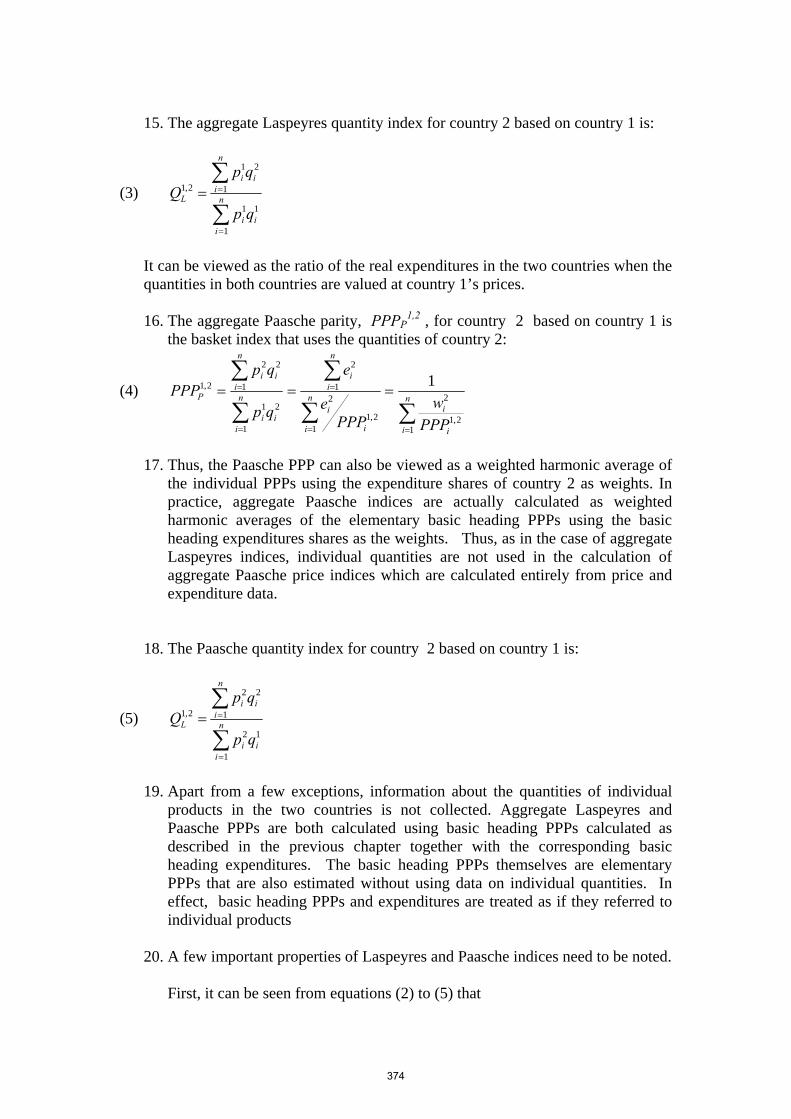
15. The aggregate Laspeyres quantity index for country 2 based on country 1 is:
(3) ∑
∑
=
== n
iii
n
iii
L
qp
qpQ
1
11
1
21
2,1
It can be viewed as the ratio of the real expenditures in the two countries when the quantities in both countries are valued at country 1’s prices.
16. The aggregate Paasche parity, PPPP
1,2 , for country 2 based on country 1 is the basket index that uses the quantities of country 2:
(4) ∑∑
∑
∑
∑
==
=
=
= === n
i i
in
i i
i
n
ii
n
iii
n
iii
P
PPPw
PPPe
e
qp
qpPPP
12,1
2
12,1
21
2
1
21
1
22
2,1 1
17. Thus, the Paasche PPP can also be viewed as a weighted harmonic average of
the individual PPPs using the expenditure shares of country 2 as weights. In practice, aggregate Paasche indices are actually calculated as weighted harmonic averages of the elementary basic heading PPPs using the basic heading expenditures shares as the weights. Thus, as in the case of aggregate Laspeyres indices, individual quantities are not used in the calculation of aggregate Paasche price indices which are calculated entirely from price and expenditure data.
18. The Paasche quantity index for country 2 based on country 1 is:
(5) ∑
∑
=
== n
iii
n
iii
L
qp
qpQ
1
12
1
22
2,1
19. Apart from a few exceptions, information about the quantities of individual
products in the two countries is not collected. Aggregate Laspeyres and Paasche PPPs are both calculated using basic heading PPPs calculated as described in the previous chapter together with the corresponding basic heading expenditures. The basic heading PPPs themselves are elementary PPPs that are also estimated without using data on individual quantities. In effect, basic heading PPPs and expenditures are treated as if they referred to individual products
20. A few important properties of Laspeyres and Paasche indices need to be noted.
First, it can be seen from equations (2) to (5) that
374
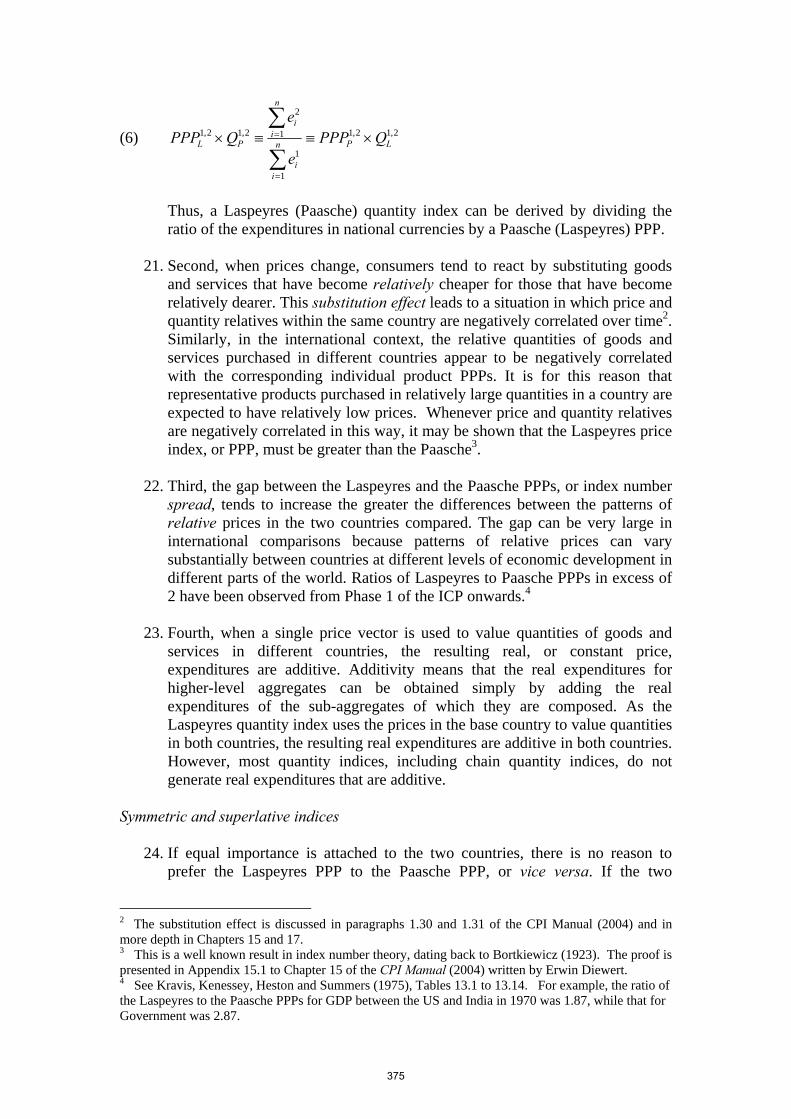
(6) 2,12,1
1
1
1
2
2,12,1LPn
ii
n
ii
PL QPPPe
eQPPP ×≡≡×
∑
∑
=
=
Thus, a Laspeyres (Paasche) quantity index can be derived by dividing the ratio of the expenditures in national currencies by a Paasche (Laspeyres) PPP.
21. Second, when prices change, consumers tend to react by substituting goods
and services that have become relatively cheaper for those that have become relatively dearer. This substitution effect leads to a situation in which price and quantity relatives within the same country are negatively correlated over time2. Similarly, in the international context, the relative quantities of goods and services purchased in different countries appear to be negatively correlated with the corresponding individual product PPPs. It is for this reason that representative products purchased in relatively large quantities in a country are expected to have relatively low prices. Whenever price and quantity relatives are negatively correlated in this way, it may be shown that the Laspeyres price index, or PPP, must be greater than the Paasche3.
22. Third, the gap between the Laspeyres and the Paasche PPPs, or index number
spread, tends to increase the greater the differences between the patterns of relative prices in the two countries compared. The gap can be very large in international comparisons because patterns of relative prices can vary substantially between countries at different levels of economic development in different parts of the world. Ratios of Laspeyres to Paasche PPPs in excess of 2 have been observed from Phase 1 of the ICP onwards.4
23. Fourth, when a single price vector is used to value quantities of goods and
services in different countries, the resulting real, or constant price, expenditures are additive. Additivity means that the real expenditures for higher-level aggregates can be obtained simply by adding the real expenditures of the sub-aggregates of which they are composed. As the Laspeyres quantity index uses the prices in the base country to value quantities in both countries, the resulting real expenditures are additive in both countries. However, most quantity indices, including chain quantity indices, do not generate real expenditures that are additive.
Symmetric and superlative indices
24. If equal importance is attached to the two countries, there is no reason to prefer the Laspeyres PPP to the Paasche PPP, or vice versa. If the two
2 The substitution effect is discussed in paragraphs 1.30 and 1.31 of the CPI Manual (2004) and in more depth in Chapters 15 and 17. 3 This is a well known result in index number theory, dating back to Bortkiewicz (1923). The proof is presented in Appendix 15.1 to Chapter 15 of the CPI Manual (2004) written by Erwin Diewert. 4 See Kravis, Kenessey, Heston and Summers (1975), Tables 13.1 to 13.14. For example, the ratio of the Laspeyres to the Paasche PPPs for GDP between the US and India in 1970 was 1.87, while that for Government was 2.87.
375
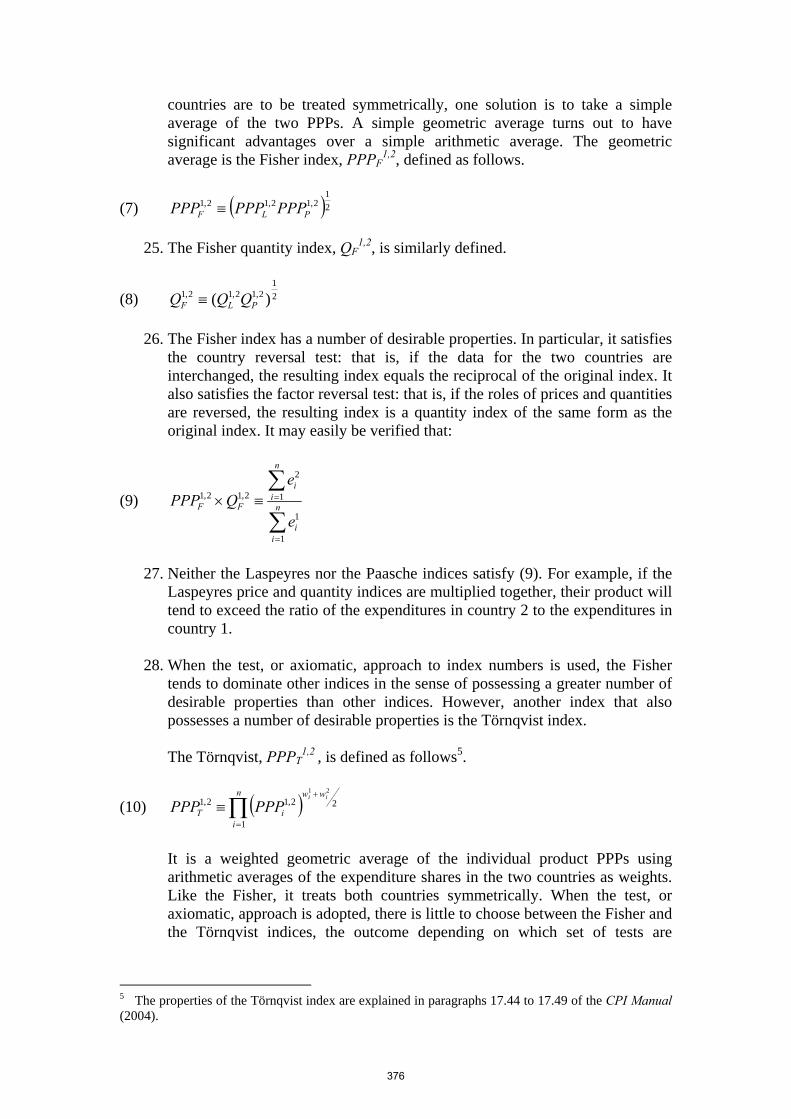
countries are to be treated symmetrically, one solution is to take a simple average of the two PPPs. A simple geometric average turns out to have significant advantages over a simple arithmetic average. The geometric average is the Fisher index, PPPF
1,2, defined as follows.
(7) ( )21
2,12,12,1PLF PPPPPPPPP ≡
25. The Fisher quantity index, QF
1,2, is similarly defined.
(8) 21
2,12,12,1 )( PLF QQQ ≡
26. The Fisher index has a number of desirable properties. In particular, it satisfies the country reversal test: that is, if the data for the two countries are interchanged, the resulting index equals the reciprocal of the original index. It also satisfies the factor reversal test: that is, if the roles of prices and quantities are reversed, the resulting index is a quantity index of the same form as the original index. It may easily be verified that:
(9) ∑
∑
=
=≡× n
ii
n
ii
FF
e
eQPPP
1
1
1
2
2,12,1
27. Neither the Laspeyres nor the Paasche indices satisfy (9). For example, if the
Laspeyres price and quantity indices are multiplied together, their product will tend to exceed the ratio of the expenditures in country 2 to the expenditures in country 1.
28. When the test, or axiomatic, approach to index numbers is used, the Fisher
tends to dominate other indices in the sense of possessing a greater number of desirable properties than other indices. However, another index that also possesses a number of desirable properties is the Törnqvist index. The Törnqvist, PPPT
1,2 , is defined as follows5.
(10) ( )∏=
+
≡n
i
ww
iT
ii
PPPPPP1
22,12,121
It is a weighted geometric average of the individual product PPPs using arithmetic averages of the expenditure shares in the two countries as weights. Like the Fisher, it treats both countries symmetrically. When the test, or axiomatic, approach is adopted, there is little to choose between the Fisher and the Törnqvist indices, the outcome depending on which set of tests are
5 The properties of the Törnqvist index are explained in paragraphs 17.44 to 17.49 of the CPI Manual (2004).
376
invoked and on how much importance is attached to the individual tests applied.6
29. The Fisher and Törnqvist indices also emerge as desirable indices when the
economic approach to index numbers is adopted. Both are examples of a superlative index: that is, a type of index that may generally be expected to provide a close approximation to an underlying economic theoretic index, such as a cost of living index.7 One characteristic feature of superlative indices is that they treat both the situations compared symmetrically, whether different time periods or different countries.
30. It may be concluded that a symmetric superlative index such as a Fisher or a
Törnqvist is the best type of index for a bilateral comparison between a pair of countries. However, the objective of the ICP is to estimate a set of multilateral indices. A binary comparison within the framework of a set of multilateral comparisons is not the same as an unconstrained binary comparison conducted by two countries on their own. This point is elaborated further below.
The Binary Approach to Aggregate Multilateral PPPs and Quantity Indices Introduction
31. A set of multilateral PPPs and quantity indices for a given group of countries must be transitive. However, not even superlative aggregate binary indices, such as Fisher and Törnqvist, are transitive in practice8. When a binary approach to multilateral comparisons is adopted, the starting point is a set of aggregate binary indices, usually Fishers. If there are C countries in the countries and they are all to be accorded equal treatment, all C(C-1) / 2 possible binary indices must be taken into account. Ways have to be found to convert or reduce them to a set of C-1 transitive multilateral PPPs and quantity indices.
32. There is more than one way in which this may be done. The usual way is to adjust the values of the aggregate binary indices in order to transform them into a set of transitive PPPs or indices. The EKS formula explained in the previous chapter can be used for this purpose. It has been used for the last 30 years in the European Comparisons program.
33. Another solution is to identify out of the C(C-1) / 2 possible aggregate binary
indices the collectively strongest set of transitive C-1 binaries that link the C countries. This is the minimum spanning tree method. Alternatively, if it is decided to drop the requirement that all countries must be accorded equal treatment, a particular set of C-1 binaries may be selected in advance on other
6 Chapter 16 of the CPI Manual (2004) contains a thorough and detailed explanation of the axiomatic approach to index numbers in a time series context. See also Diewert (1999) for a discussion of the axiomatic and economic approaches to international comparisons. 7 See Chapter 17 of the CPI Manual (2004) for a thorough and detailed explanation of the economic approach to price indices. The concept of a superlative index was developed by Diewert (1976). 8 There are certain special cases in which they would be transitive, but not in general in practice.
377
grounds. An example is provided by the star method which was used in the past in Eastern Europe.
Transitivity imposed by the EKS formula
34. As explained in the previous chapter, transitivity requires that any indirect PPP between a pair of countries should equal the direct PPP. Consider three countries j, k and l. Denote the direct binary PPP for k on j by PPPj,k . The indirect PPP for k on j via country l, denoted by lPPPj,k, is then defined as follows:
(11) lPPPj,k ≡ PPPj,l / PPPk,l
When a set of parities is transitive, the following equality holds for every j, k and l.
(12) lPPPj,k = PPPj,k
35. Any set of non-transitive binary indices can be transformed into a transitive set by applying the EKS formula. The EKS formula was given in Chapter 11, but for convenience it is repeated here. If there are C countries in the group, the multilateral EKS PPP for country k based on country j, PPPEKS
j,k, is defined as follows.
(13) CC
llk
ljkj
EKS PPPPPPPPP
1
1,
,,
⎭⎬⎫
⎩⎨⎧
= ∏=
36. When l = j, the ratio of the two PPPs equals 1 / PPPk,j, while when l = k the
ratio equals PPPj,k. Provided the binary indices satisfy the country reversal test therefore, as Fisher indices do, the EKS PPP can be interpreted as the geometric mean of the direct PPP of k on j and all C-2 indirect PPPs between country k and country j via third countries, the direct PPP carrying twice the weight of each indirect PPP. The EKS formula is derived by minimizing the sum of the squares of the logarithmic differences between the original intransitive parities and the transformed transitive parities.
37. The EKS formula can be applied to any type of binary index and not just
Fisher indices. Caves, Christiensen and Diewert (1982) applied the EKS formula to Törnqvist indices, the resulting indices being usually referred to as CCD indices. In practice, CCD indices tend to be very similar to EKS indices that use the Fisher formula, which is to be expected since both are superlative indices with very similar properties9. The EKS formula is extensively discussed in the literature.10
38. The EKS formula reduces the original set of C(C-1)/2 intransitive direct
binary parities to a set of C-1 transitive parities. They constitute the set of 9 See, for example, Neary (2004) who applied both formulae to a set of data covering 60 countries taken from ICP Phase III and found that in general “the CCD index is very close to the EKS.” 10 See, for example, Van Ijzeren (1987), Prasada Rao (1990), Balk (1996), Hill (1997), Diewert (1999), Cuthbert (2000), and Neary (2004).
378
transitive PPPs that are collectively closest to the original set of intransitive PPPs. The C-1 transitive PPPs are sufficient to determine the PPPs between every possible pair of countries. When publishing transitive PPPs, for example, it is sufficient to choose a reference country and list only the C-1 PPPs with the reference country. Transitive parities are invariant to the choice of reference country.
39. Eurostat and the OECD apply the EKS formula to Fisher indices to calculate
the official aggregate PPP results for their member countries. 11 The benchmark figures for 2002 cover a total of 52 countries. They include a number of countries, including the Russian Federation, that are not members of either the EU or the OECD but wished to participate in the joint Eurostat-OECD PPP program.
40. The matrix of binary Fishers may sometimes be incomplete. For some pairs of
countries, there might not be sufficient data to calculate direct Fishers between them. In other cases, the direct Fishers might be deemed to be too unreliable and rejected on these grounds. In order to obtain a complete matrix of binary parities, the missing Fishers can be estimated indirectly. One procedure that has been used is to estimate a missing PPP by the geometric mean of all the indirect PPPs that can be calculated for that pair of countries. Alternatively, a missing PPP might be estimated by choosing the indirect PPP which is considered to be most reliable. The EKS formula can then be applied to the complete matrix of actual and estimated parities.
41. The EKS formula given in (13) gives equal weight to each direct binary
Fisher. However, as some of the Fishers may be subject to greater error than others, this may not be an optimal procedure. It is possible to introduce weights into the EKS formula by giving more weight to direct binary parities that are more reliable. In general, if information is available about the reliability of the indices, and if there seem to be significant differences in their reliability, it is desirable to introduce weights into the EKS formula.12 The EKS PPPs then become weighted geometric averages of the various direct and indirect binary PPPs.
Transitivity and characteristicity
42. Transitivity is necessary for a set of multilateral PPPs to be mutually consistent. Transitivity requires that each multilateral PPP should depend to a greater or lesser degree on the prices or quantities in all the countries in the group.13 This is illustrated in the case of the EKS formula (13) which includes all the Fishers between every pair of countries in the group. Whatever method is used, a transitive multilateral PPP between a pair of countries will depend to some extent or other on the prices and quantities in all countries in the group to which it belongs. It is liable to change when new countries are added to the group or existing countries are withdrawn.
11 See Eurostat and OECD (2004) pp. 31 to 35. 12 See Prasada Rao and Timmer (2003) and also Prasada Rao (2001) 13 See Balk (2001), pp. 3-6, for a proof of this statement.
379
43. There is a conflict between the requirements of transitivity and characteristicity. A PPP is fully characteristic of a pair of countries when it depends only on the prices and quantities for those two countries.14 A multilateral transitive PPP between a pair of countries cannot be fully characteristic therefore. As the size of a group of countries increases, a transitive multilateral PPP will become progressively less characteristic of the pair of countries in question as it becomes increasingly dependent on prices or quantities in third countries.
44. The concept of characteristicity can be adapted to apply to regions as well as
to pairs of countries. Maximal regional characteristicity is achieved when the transitive PPPs within a region depend only on the prices and quantities of the countries within the region. When the countries that make up an individual region are merged with countries in other regions to form a larger group, the PPPs between countries within the region become gradually less characteristic of that region. If the group is enlarged to the point that it consists of the world as a whole, then some loss of regional characteristicity is inevitable. If regional characteristicity is to be preserved, the global set of PPPs has to be obtained by linking the separate sets of regional PPPs and not by merging the regions.
Binary PPPs within the framework of a set of multilateral comparisons
45. A binary comparison between a pair of countries conducted independently of other countries can, and presumably should, be fully characteristic. The product list for a basic heading should consist only of products that are found in both countries. However, when the two countries participate in a set of multilateral comparisons, a common product list has to be drawn up for each basic heading to accommodate all countries in the group. This list will include products that would not be on the list for a separate binary comparison and also exclude products that would be on the binary list. The product list will be neither characteristic nor optimal for purposes of individual binary comparisons. If the group of countries is large and diverse, the common list could be very different from that which would be constructed for purposes of a binary comparison between a specific pair of countries. For these reasons, the estimated PPP for a basic heading between a pair of countries emerging from a multilateral comparison will tend to be different from, and less reliable than, one based on a separate independent binary comparison.
46. Thus, the basic heading PPPs that are used to calculate aggregate binary
Fishers within the framework of a set of multilateral comparisons cannot be treated as if they had emerged from independent binary comparisons that are fully characteristic of the various pairs of countries. The resulting aggregate Fishers will tend to be less reliable, especially for comparisons between countries that are economically dissimilar. They cannot necessarily be expected to have the same properties as proper Fishers.
14 See the Report on Phase I of the ICP (Kravis, et al. 1975) pp. 46, 54 and 55. The concept of ‘characteristicity’ was introduced by Drechsler (1973).
380
Star methods, chains and spanning trees
47. The binary approach to multilateral comparisons also includes methods that do not use the full set of all possible binary PPPs but achieve transitivity by restricting the number of binaries to C-1 selected pairs of countries. These methods include the star method described in the following paragraphs.
The Star method
48. In the star method, one country is selected as the base country and every other country in the group makes a direct binary comparison with it. No direct comparisons are made between other countries in the group. Comparisons between the other countries are all made indirectly via the base country. The method may be illustrated by a graph in which the base country appears as the centre of a star: hence, the name of the method.
49. Suppose the base country is country x. The parity for country k on country j,
denoted by xPPPj,k, is an indirect parity defined as follows:
(14) xPPPj,k ≡ PPPj,x / PPPk,x
50. Only the C-1 binary PPPs between the base country and each of the other countries are calculated, all other PPPs being derived indirectly.
51. The results obtained by the star method will tend to vary depending on the
choice of the reference country. This introduces an arbitrary element into the results which may render the star method unacceptable to many users. Nevertheless, the method was used to make comparisons among the Group 2 countries of Eastern Europe in the 1960’s, 1970’s and 1980’s with Austria being the reference country at the centre of the star. Austria also participated in the Eurostat and OECD comparisons and was viewed as providing a suitable link between Eastern and Western Europe. The Austrian Statistical Office was also willing to invest a large amount of resources in the project. In this case, political factors influenced the choice of methodology.
52. From a methodological viewpoint, the star method can be used to provide
interesting insights into the nature of both the EKS/Fisher and GK aggregation methods. The star method is generally considered to be unacceptable if one country is selected arbitrarily and placed at the centre of the star. This clearly does not accord all countries equal status and treat them symmetrically. However, equality of treatment may be achieved if each country in the group is allowed to take its turn as the base country at the centre of the star. Each time the base country is changed a different set of star PPPs is generated. If every country takes its turn as the base country, C different sets of star PPPs are generated. If a geometric average taken of the resulting sets of PPPs, all C countries are treated equally. When the binary PPPs are Fishers the resulting average PPPs are algebraically identical with those obtained by applying the EKS formula to a complete set of binary Fisher PPPs15. This provides further
15 See Hill (1997) pp. 62-65.
381
insight into the nature of EKS/Fisher PPPs. It could be argued that less weight should be given to stars in which the base country is very small or atypical of the group. In this case, different weights could be assigned to the different stars leading to the equivalent of a weighted EKS.
53. Instead of choosing an actual country to act as the base country at the centre of the star, it would be possible to place the group of countries as whole, or an average country representing the group, at the centre and compare each country in turn with the group or average country. This can be done by aggregating the quantities in the different countries at the average prices of the group. If each country in the group is compared with the group as a whole, every country is treated in the same way. This removes the main objection to the star method, namely the arbitrary selection of an actual country to act as the point of comparison. As shown later, the GK method can be viewed as a star method of this kind. By introducing the group as the point of comparison, the method ceases to be strictly binary. Thus, not only the EKS method but also the GK method can be interpreted as special applications of the star method.
Chain indices and spanning trees
54. An alternative binary approach would be to place the countries in order and to calculate the C-1 aggregate binary PPPs between each successive pair of countries. The result would an international chain index. As in the star method, PPPs between pairs of countries not directly linked in the chain are obtained indirectly. The difficulty with chaining is that, as the binary PPPs are not transitive, the results depend on the way in which the countries are ordered. There is no objective natural way in which to order countries.
55. Temporal prices indices are also not transitive, but nevertheless chain indices
are widely used for time series and recommended by international Manuals both for national accounts and official price indices. The reason is not simply that there is a natural ordering for time periods, namely chronological order. Direct binary indices between consecutive time periods are known to be generally much more reliable and robust than direct binary indices between periods that are far apart. There are several contributory factors:
• The universe of products is gradually changing over time: the overlap of products is greater between consecutive periods than between periods that are far apart, so that the number of products for which direct price comparisons can be made is maximized;
• Changes in quality take place cumulatively over time: adjusting for them is easier between consecutive periods;
• Patterns of relative prices and consumption are also gradually changing over time; index number spread tends to be least between consecutive periods.
56. All these factors combine to make the successive links in a temporal chain
index as strong as possible. The results are not only widely accepted for this reason but widely used for analytical and policy purposes. A chain index
382
between two time periods that are far apart is likely to give more reliable results than the direct index between them.
57. In order to find the international equivalent of an inter-temporal chain index,
countries need to be ordered in such a way that each link in the chain is as strong as possible so that the chain as a whole is also as strong as possible.
58. Chains and stars are special cases of spanning trees. A spanning tree is a graph
that connects all the countries in the group in such a way that there is one, and only one, path linking each pair of countries.16 Parts of spanning trees may take the form of a chain and parts the form of a star.
59. A spanning tree connecting C countries has only C-1 links. In the present
context, each link represents a binary index. The preferred type of binary index is a superlative index such as Fisher. The indices between countries that are not directly linked in the tree are derived indirectly by linking along the tree.
60. The reliability of the binary indices that form the links in a spanning tree will greatest if the pairs of countries that are linked are as economically similar as possible. Economic similarity may be measured by the similarity of the patterns of relative prices in the two countries or by the index number spread between the Laspeyres and Paasche indices, bearing in mind that the spread diminishes the more similar the countries are. Both measures of similarity or dissimilarity have been proposed. Once the measure is agreed the target spanning tree is the one for which the total of amount of dissimilarity between the pairs of countries selected is minimized over the length of the tree. The resulting tree is called a minimum spanning tree.
61. Algorithms have been developed that make it possible to search through all the
possible orderings of countries to find such a chain. In order to find the minimum spanning tree it is necessary to scan through all the C(C-1) / 2 possible binaries. The method therefore accords each country equal status and all countries are treated symmetrically. The method is relatively new and more experience is needed of how it performs compared with the established EKS/Fisher and GK methods.
The Group Approach to Aggregate PPPs and Quantity Indices
62. The methods considered in the previous section derive a set of multilateral transitive PPPs or quantity indices from a set of binary indices. The multilateral methods considered in this section take account of the characteristics of the group of countries as a whole. The group is recognized as an entity in itself. The methods make use either of the average prices throughout the group of countries as a whole or of the total, or average, quantities in the group. The first group of methods may be described as
16 See Hill (1999) for a detailed explanation of the concept of a spanning tree and also the concept of a minimum spanning tree.
383
average price methods17 and the second as average quantity methods. Binary comparisons between individual pairs of countries are not used.
The Geary Khamis, or GK, method
63. The method was proposed by Geary (1958). Subsequently, Khamis (1972) provided proofs of the existence and uniqueness of the Geary results. The method has been used in all the previous phases of the ICP program. A full description of the GK method, together with a discussion of possible alternative multilateral methods, including EKS, is given in Chapter 5 of the Report on Phase 1 of the ICP program (Kravis, Kenessey, Heston and Summers, 1975). The method has also been described, analyzed and evaluated in many subsequent papers and publications.18
64. The idea underlying Geary’s proposals is simple. The main objective of
international PPP programs has always been to achieve a set of quantity indices, or real expenditures, which enable international comparisons to be made of living standards and productivity. If the quantities in the different countries are all valued at the same set of prices, it is possible to construct a set of conceptually simple quantity indices which have the additional advantage of being transitive. Clearly, there are very many possible price vectors that might be chosen, giving rise to a range of potential index numbers, but it is desirable to choose one that is characteristic of the group of countries as a whole. In this case, the obvious choice is a vector of average prices for the group. In order to calculate the average price for a product across a group of countries, each with its own currency, the prices in the individual countries can be converted into a common numeraire currency using PPPs.
65. In the GK method, the average prices for the group and the PPPs are jointly
determined. The average price for product i is defined as follows.
(15) ∑∑=
=⎟⎟⎟⎟
⎠
⎞
⎜⎜⎜⎜
⎝
⎛
=C
jC
j
ji
ji
jG
jiG
i
q
qPPP
pp1
1
, i = 1, 2, … n
pi
j represents the national average price of product i within country j. Each national average price is converted into the common numeraire currency by dividing by the country’s PPP and then averaged across all C countries in the group. The resulting international average price is denoted by pi
G where the
suffix G is used to indicate that this is the average price for the group, G, denominated in the numeraire currency. It is a weighted arithmetic average of the converted national average prices using the quantity shares as weights. pi
G equals the total value of the transactions in product i throughout the group of countries, converted into the numeraire currency, divided by the total
17 See, for example, Kravis, Heston and Summers (1982), p. 78. 18 In addition to the Reports on the first three phases of the ICP, see, for example, Van Ijzeren (1987), Prasada Rao (1990), Balk (1996), Hill (1997), Diewert (1999), and Cuthbert (2000).
384
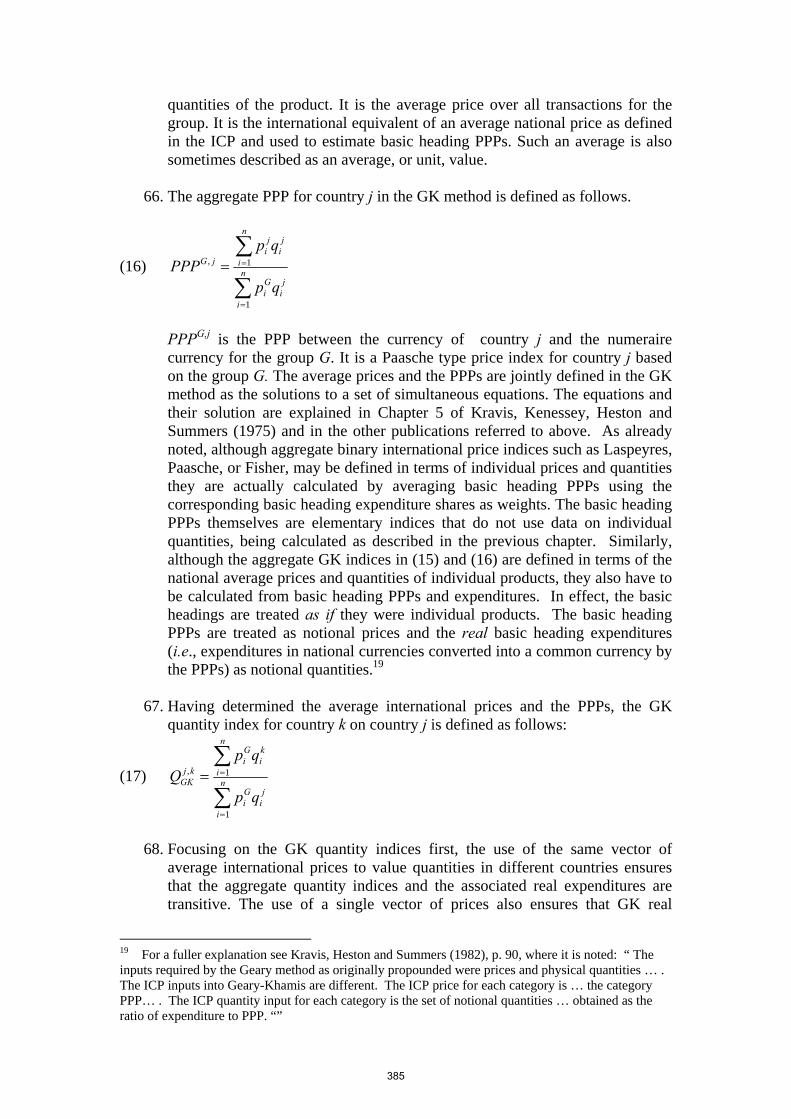
quantities of the product. It is the average price over all transactions for the group. It is the international equivalent of an average national price as defined in the ICP and used to estimate basic heading PPPs. Such an average is also sometimes described as an average, or unit, value.
66. The aggregate PPP for country j in the GK method is defined as follows.
(16) ∑
∑
=
== n
i
ji
Gi
n
i
ji
ji
jG
qp
qpPPP
1
1,
PPPG,j is the PPP between the currency of country j and the numeraire currency for the group G. It is a Paasche type price index for country j based on the group G. The average prices and the PPPs are jointly defined in the GK method as the solutions to a set of simultaneous equations. The equations and their solution are explained in Chapter 5 of Kravis, Kenessey, Heston and Summers (1975) and in the other publications referred to above. As already noted, although aggregate binary international price indices such as Laspeyres, Paasche, or Fisher, may be defined in terms of individual prices and quantities they are actually calculated by averaging basic heading PPPs using the corresponding basic heading expenditure shares as weights. The basic heading PPPs themselves are elementary indices that do not use data on individual quantities, being calculated as described in the previous chapter. Similarly, although the aggregate GK indices in (15) and (16) are defined in terms of the national average prices and quantities of individual products, they also have to be calculated from basic heading PPPs and expenditures. In effect, the basic headings are treated as if they were individual products. The basic heading PPPs are treated as notional prices and the real basic heading expenditures (i.e., expenditures in national currencies converted into a common currency by the PPPs) as notional quantities.19
67. Having determined the average international prices and the PPPs, the GK
quantity index for country k on country j is defined as follows:
(17) ∑
∑
=
== n
i
ji
Gi
n
i
ki
Gi
kjGK
qp
qpQ
1
1,
68. Focusing on the GK quantity indices first, the use of the same vector of
average international prices to value quantities in different countries ensures that the aggregate quantity indices and the associated real expenditures are transitive. The use of a single vector of prices also ensures that GK real
19 For a fuller explanation see Kravis, Heston and Summers (1982), p. 90, where it is noted: “ The inputs required by the Geary method as originally propounded were prices and physical quantities … . The ICP inputs into Geary-Khamis are different. The ICP price for each category is … the category PPP… . The ICP quantity input for each category is the set of notional quantities … obtained as the ratio of expenditure to PPP. “”
385
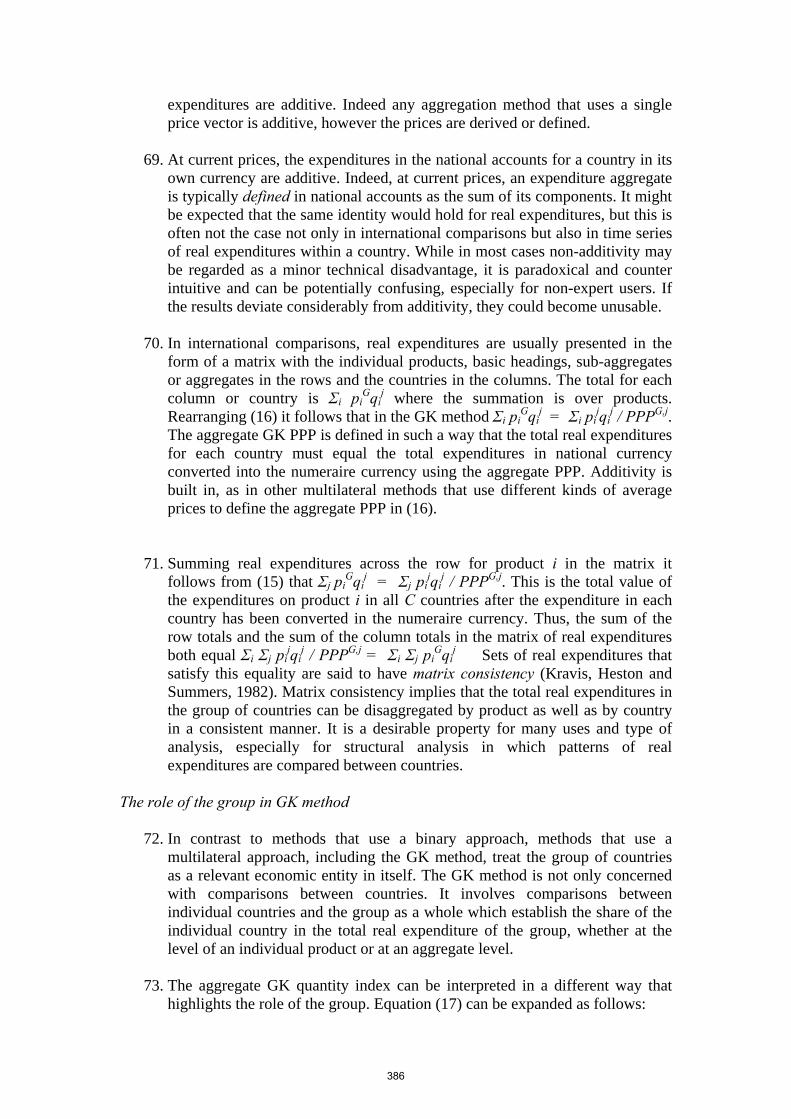
expenditures are additive. Indeed any aggregation method that uses a single price vector is additive, however the prices are derived or defined.
69. At current prices, the expenditures in the national accounts for a country in its
own currency are additive. Indeed, at current prices, an expenditure aggregate is typically defined in national accounts as the sum of its components. It might be expected that the same identity would hold for real expenditures, but this is often not the case not only in international comparisons but also in time series of real expenditures within a country. While in most cases non-additivity may be regarded as a minor technical disadvantage, it is paradoxical and counter intuitive and can be potentially confusing, especially for non-expert users. If the results deviate considerably from additivity, they could become unusable.
70. In international comparisons, real expenditures are usually presented in the
form of a matrix with the individual products, basic headings, sub-aggregates or aggregates in the rows and the countries in the columns. The total for each column or country is Σi pi
Gqij where the summation is over products.
Rearranging (16) it follows that in the GK method Σi piGqi
j = Σi pijqi
j / PPPG,j. The aggregate GK PPP is defined in such a way that the total real expenditures for each country must equal the total expenditures in national currency converted into the numeraire currency using the aggregate PPP. Additivity is built in, as in other multilateral methods that use different kinds of average prices to define the aggregate PPP in (16).
71. Summing real expenditures across the row for product i in the matrix it follows from (15) that Σj pi
Gqij = Σj pi
jqij / PPPG,j. This is the total value of
the expenditures on product i in all C countries after the expenditure in each country has been converted in the numeraire currency. Thus, the sum of the row totals and the sum of the column totals in the matrix of real expenditures both equal Σi Σj pi
jqij / PPPG,j = Σi Σj pi
Gqij Sets of real expenditures that
satisfy this equality are said to have matrix consistency (Kravis, Heston and Summers, 1982). Matrix consistency implies that the total real expenditures in the group of countries can be disaggregated by product as well as by country in a consistent manner. It is a desirable property for many uses and type of analysis, especially for structural analysis in which patterns of real expenditures are compared between countries.
The role of the group in GK method
72. In contrast to methods that use a binary approach, methods that use a multilateral approach, including the GK method, treat the group of countries as a relevant economic entity in itself. The GK method is not only concerned with comparisons between countries. It involves comparisons between individual countries and the group as a whole which establish the share of the individual country in the total real expenditure of the group, whether at the level of an individual product or at an aggregate level.
73. The aggregate GK quantity index can be interpreted in a different way that
highlights the role of the group. Equation (17) can be expanded as follows:
386
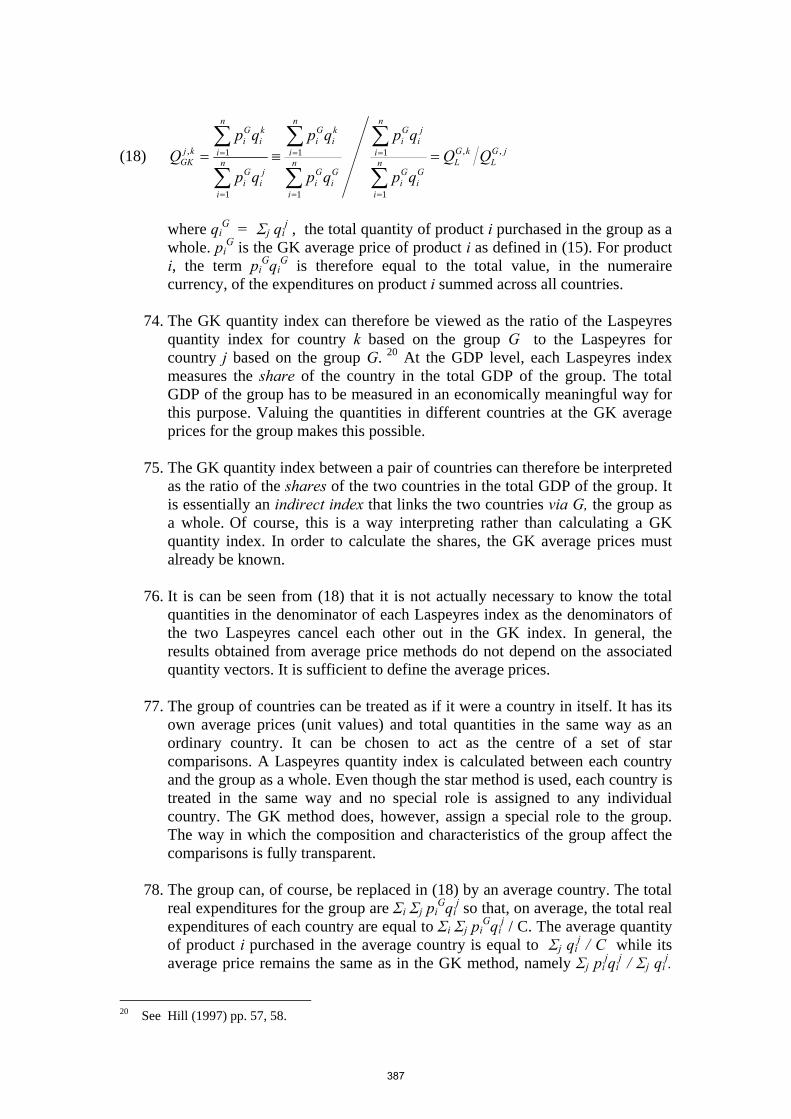
(18) jGL
kGLn
i
Gi
Gi
n
i
ji
Gi
n
i
Gi
Gi
n
i
ki
Gi
n
i
ji
Gi
n
i
ki
Gi
kjGK QQ
qp
qp
qp
qp
qp
qpQ ,,
1
1
1
1
1
1, =≡=
∑
∑
∑
∑
∑
∑
=
=
=
=
=
=
where qi
G = Σj qij , the total quantity of product i purchased in the group as a
whole. piG is the GK average price of product i as defined in (15). For product
i, the term piGqi
G is therefore equal to the total value, in the numeraire currency, of the expenditures on product i summed across all countries.
74. The GK quantity index can therefore be viewed as the ratio of the Laspeyres
quantity index for country k based on the group G to the Laspeyres for country j based on the group G. 20 At the GDP level, each Laspeyres index measures the share of the country in the total GDP of the group. The total GDP of the group has to be measured in an economically meaningful way for this purpose. Valuing the quantities in different countries at the GK average prices for the group makes this possible.
75. The GK quantity index between a pair of countries can therefore be interpreted
as the ratio of the shares of the two countries in the total GDP of the group. It is essentially an indirect index that links the two countries via G, the group as a whole. Of course, this is a way interpreting rather than calculating a GK quantity index. In order to calculate the shares, the GK average prices must already be known.
76. It is can be seen from (18) that it is not actually necessary to know the total quantities in the denominator of each Laspeyres index as the denominators of the two Laspeyres cancel each other out in the GK index. In general, the results obtained from average price methods do not depend on the associated quantity vectors. It is sufficient to define the average prices.
77. The group of countries can be treated as if it were a country in itself. It has its
own average prices (unit values) and total quantities in the same way as an ordinary country. It can be chosen to act as the centre of a set of star comparisons. A Laspeyres quantity index is calculated between each country and the group as a whole. Even though the star method is used, each country is treated in the same way and no special role is assigned to any individual country. The GK method does, however, assign a special role to the group. The way in which the composition and characteristics of the group affect the comparisons is fully transparent.
78. The group can, of course, be replaced in (18) by an average country. The total
real expenditures for the group are Σi Σj piGqi
j so that, on average, the total real expenditures of each country are equal to Σi Σj pi
Gqij / C. The average quantity
of product i purchased in the average country is equal to Σj qij / C while its
average price remains the same as in the GK method, namely Σj pijqi
j / Σj qij.
20 See Hill (1997) pp. 57, 58.
387
Replacing the total quantities qiG by the average quantities qi
G / C in the denominators of the Laspeyres indices in (18) obviously does not change the GK quantity index QGK
G,j.
79. Thus, each Laspeyres index could equally well be based on the average country. The GK method can therefore also be viewed as a star system in which the average country is placed at the centre of the star.21 The GK quantity index between any pair of countries in the group is an indirect Laspeyres index that links the two countries concerned via the average country for the group.
The Gershenkron effect
80. As noted earlier, a Laspeyres index will be greater than the corresponding Paasche index, and hence also greater than a symmetric superlative index such as Fisher or Törnqvist, whenever there is a negative correlation between the quantity relative and the price relatives. A negative correlation is to be expected when substitution occurs in response to price changes or differences. The Laspeyres Paasche gap will tend to be greater, the greater the divergence between the patterns of relative prices in the two countries.
81. In the present context, assuming a negative correlation between the quantity
and price relatives, if the individual quantities in every country are held constant, the Laspeyres quantity index for a country based on the group will tend to increase (decrease) the more the country’s own relative prices diverge from (converge on) the relative international prices for the group as a whole. In other words, a country’s aggregate quantity share in the group as measured by the GK method will tend to be greater the more the pattern of its national average prices diverges from the pattern of the GK average international prices. This effect is often described as the Gerschenkron effect. The quantity shares vary with the choice of international price vector, just as in a simple binary comparison the quantity index between a pair of countries varies according to which price vector is used.
82. It should be noted that the Gershenkron effect is not confined to the GK method. It occurs whenever the same vector of prices is used to value the quantities in different countries. Changing the average prices, say from weighted to unweighted averages, may change the countries that diverge most from the average, but the Gershenkron effect will still be operative.
83. When GK average prices are used, however, it is possible to predict which
countries will have relative prices that are likely to deviate the most from the relative GK prices. The GK method attaches equal importance to the quantities of the same good or service wherever in the world they are purchased. The GK average prices are therefore quantity weighted averages of the national average prices. GK method does not attach equal importance to the national
21 See Hill (1997), p. 53, who defines methods that place an artificial average country at the center of the star as “Symmetric Star methods”. See also Neary (2004), p. 1413, who observes; “Thus, the Geary method is a star system with the hypothetical country whose prices are π as center.” π is the vector of average prices as defined in the GK method.
388
average price of each country because some national average prices cover many more transactions than others. The national average prices of countries with large populations will therefore carry more weight in the GK average international prices than those in small countries. In addition, national average prices in rich countries which have the largest quantities purchased per head will tend to carry more weight than those in poor countries. Other things being equal,the national average prices of large rich countries will tend to carry more weight in the GK average prices than the national average prices of small poor countries. The GK average international prices will therefore tend to resemble the average national prices in large rich countries more than those in small poor countries do. This does not mean that the GK method gives more weight to prices in large rich countries than prices in small poor counries. On the contrary, a basic principle underlying the GK method is that it gives equal weight to an individual price wherever in the world the transaction occurs22. The GK method gives more weight to the national average prices of large rich countries because more transactions occur in large rich countries than in small poor countries. This does not imply giving more weight to the individual prices in large rich countries.
84. Using the GK method, the quantity shares of small poor countries tend to be
greater than they would be using a price vector that is less dominated by the national average prices in rich countries. It is argued that the GK method tends to overstate real expenditures in poor countries relatively to rich countries and therefore to understate the gap in real expenditures between rich and poor countries. The fact that the gap tends to be greater using the EKS method than the GK method is generally interpreted as evidence to this effect. It is also often interpreted as showing that the GK results are biased.
Some theoretic considerations
85. Bias means that the results obtained from a method tend to deviate
systematically from some underlying theoretical index or indices. In the context of a set of multilateral comparisons, however, the nature of the theoretical indices is not so clear as in temporal price indices..
86. EKS results are often assumed to be unbiased because the binary Fisher, or
Törnqvist, indices from which they are derived are superlative indices that may be expected to be unbiased in individual binary comparisons. However, it is by no means certain to what extent the optimal properties of these indices carry over into the actual EKS/Fisher indices used a multilateral context. On a practical level, it was noted earlier that in a multilateral context, Fisher indices estimated using a single multilateral product list cannot be treated as if they were Fishers estimated in separate binary comparisons using binary product lists tailor-made to the pair of countries in question. On a theoretical level, it can be shown that a binary Fisher is optimal in the sense of coinciding with an underlying economic theoretic index, the cost of living index, when the consumer’s preferences take a particular form that can be represented by a
22 This is described as the principle of ‘transactions equality’ in Kravis. Heston and Summers (1982).
389
homogeneous quadratic utility function23. In this case, the Fisher would also be transitive so that it would be unnecessary to make use of the EKS formula in a set of multilateral comparisons. Thus, it has been argued that the only circumstances in which the EKS/Fisher indices would be optimal would be when the EKS/Fisher and the Fisher results coincide. As Fishers are not transitive in practice, “the only conditions known to justify the EKS index do not hold” (Neary, 2004, p.1415). Neary concludes that “it is suggestive that in all cases where the Fisher or Törnqvist indices are known to have desirable properties, the corresponding multilateral indices are either redundant or systematically biased.” If the Fishers were all transitive, not only would there be no need to apply the EKS formula, there would be no need to calculate the Fishers between all possible pairs of countries. A simple spanning tree such as a star or chain consisting of C-1 selected binary Fishers connecting all C countries would be sufficient.
87. On the other hand, Neary remarks (p. 1414) that “as far as the Geary method is
concerned, the consensus appears to be that it has no basis in economic theory.” The GK method seems likely to be affected by the kind of bias that affects binary Laspeyres indices. When comparing GK and EKS results, however, the difference between them should not automatically be entirely attributed to bias in the GK index. Given the difficulty in establishing firm general theoretical conclusions about multilateral indices, some caution needs to be exercised when trying to justify the use of one kind of multilateral index rather then another by appealing to the presumed theoretical properties of the indices.
Some other multilateral indices
88. Several other multilateral methods that use a set of average prices to calculate quantity indices have been proposed in the literature. They include the Gerardi, Iklé and Van IJzeren methods.
89. The Gerardi method is described in Gerardi (1982). Its distinctive feature is
that the average price is defined as the geometric mean of the national prices expressed in their own national currencies. When a geometric mean is used, the pattern of relative average prices is the same whether or not the national prices are converted into a common currency. Conversion into a common currency is therefore not necessary.
90. The Iklé (1972) method is an average price method that has been described as a de-weighted version of GK. It is designed to prevent prices in countries with large expenditures dominating the average prices for the group. The properties and behavior of Iklé indices are described in Dikhanov (1994).
91. The average prices in the Van IJzeren method are simple averages of relative
national prices: see Van IJzeren (1987). It has the interesting property that when there are only two countries, it is equivalent to Fisher.
23 See the 2004 CPI Manual paras. 1.96 and 17.27 to 17.32.
390

92. Like the GK method, the Gerardi, Iklé and Van IJzeren methods are star methods in which the group acts as the centre of the star. The inter-country quantity indices are indirect indices that link countries through the group. The average prices are meant to be characteristic of the group rather than individual countries but different kinds of average are selected in each method. The resulting quantity indices are transitive and additive as they are all methods that use a common set of prices to value quantities in different countries.
391
REFERENCES
Balk, B. M., (1996), “A Comparison of Ten Methods for Multilateral International Price and Volume Comparisons,” Journal of Official Statistics, 12, 199-222. Balk, B. M., (2001), Aggregation Methods in International Comparisons: What Have We Learned?, Joint World Bank - OECD Seminar on Purchasing Power Parities, Washington, D.C. Caves, D.W., L. R. Christensen and W. E. Diewert, (1982) “Multilateral Comparisons of Output, Input and Productivity using Superlative Index Numbers”, Economic Journal 92, 73-87, March 1982. Cuthbert, J. R., (2000) “Theoretical and Practical Issues in Purchasing Power Parities Illustrated with Reference to the 1993 OECD Data”, Journal of the Royal Statistical Society, A, 163, 424-444. Diewert, W. E. (1976) “Exact and Superlative Index Numbers”, Journal of Econometrics, Vol. 4 114-145 Diewert, W. E. (1999), “Axiomatic and Economic Approaches to International Comparisons”, in International and Interarea Comparison of Income, Output, and Prices, ed. A Heston and R, Lipsey, Studies in Income and Wealth, Vol. 61, NBER, Univ. of Chicago Press. Dikhanov, Y., (1994) Sensitivity of PPP Based Income Estimates to Choice of Aggregation Procedures, the 23rd General Conference of the IARIW, St. Andrews, New Brunswick Canada. Drechsler, L. (1973) “Weighting of Index Numbers in Multilateral Comparisons”, The Review of Income and Wealth, March 1973, 17-34. Eurostat and OECD, (2004), Purchasing Power Parities and Real Expenditures: 2002 Benchmark Year, Eurostat Luxembourg and OECD Paris. Gerardi, D., (1982) “Selected Problems of Inter-Country Comparison on the Basis of the Experience of the EEC”, Review of Income and Wealth, 28, 381-405. Gini, C. (1931), “On the Circular Test of Index Numbers”, International Review of Statistics, Vol. 9 No. 2, 3-25. Heston, A., Summers, R., and Aten., (2001), Price Structures, the Quality Factor and Chaining, Joint World Bank - OECD Seminar on Purchasing Power Parities, Washington, D.C. Hill, R. J., (1997) “A Taxonomy of Multilateral Methods for Making International Comparison of Prices and Quantities”, Review of Income and Wealth, 43, 49-70.
392
Hill, R. J., (1999), “Comparing Price Levels Across Countries Using Minimum Spanning Trees”, Review of Economic and Statistics, 81, No 1. ILO, IMF, OECD, Eurostat, UNECE and the World Bank, (2004), Consumer Price Index Manual: Theory and Practice. Kravis, I. B., Z. Kenessey, A. Heston and R. Summers (1975), A System of International Comparisons of Gross Product and Purchasing Power, Baltimore, Johns Hopkins Press. Kravis, I. B., A. Heston and R. Summers (1982), World Product and Income International Comparisons of Real Gross Domestic Product, Baltimore, Johns Hopkins Press. IJzeren, J. van (1987), Bias in International Index Numbers: A Mathematical Elucidation, Dissertation, Hungarian Academy of Sciences (Private Edition). Iklé, D. M., (1972), “A New Approach to Index Number Theory”, Quarterly Journal of Economics, 86, 188-211. Neary, J. P., (2004), “Rationalizing the Penn World Table: True Multilateral Indices for International Comparisons of Real Income”, The American Economic Review, Vol. 94, No.5, Dec. 2004. Prasada Rao, D. S. and K. S. Banerjee, (1986), “A Multilateral Index Number System Based on the Factorial Approach”, Statistiche Hefte, 27 297- 313. Prasada Rao, D. S. (1990), “A System of Log-Change Index Numbers for Multilateral Comparisons” in Comparisons of Prices and Real Products in Latin America, ed. J. Salazar-Carrillo and D. S. Prasada Rao, (North Holland, Amsterdam. Prasada Rao, D. S. (2001), Weighted EKS and Generalized Country Product Dummy Methods for Aggregation at Basic Heading Level and Above Basic Heading Level, Joint World Bank - OECD Seminar on Purchasing Power Parities, Washington, D.C. Prasada Rao, D. S. and M. Timmer (2003): “Purchasing Power Parities for Industry Comparisons Using Weighted EKS Methods”, The Review of Income and Wealth, series 49, no. 4, 500 – 504. Walsh, C. M., (1901), The Measurement of General Exchange Value, Macmillan, New York.
393
Chapter 13
The Ring Program: Linking the Regions
Introduction
1. In ICP 2003-2006, responsibility for calculating PPPs for household consumption expenditures was devolved onto the regions although the Global Office retained responsibility for general methodology, concepts and classifications. Each region prepared its own product list based on the availability of products and patterns of consumption within its own region. As a result, the samples of prices collected by the different regions mostly referred to different products.
2. In order to obtain a global set of PPPs for households’ consumption expenditures
covering all countries participating in ICP 2003-2006, the various blocks of within-region PPPs have to be linked together. The problem becomes how to calculate PPPs between entire regions rather than how to calculate PPPs between individual countries in different regions.
3. This chapter and the following two chapters explain how sets of within-region PPPs
may be linked. In the case of household consumption expenditures, the Global Office was obliged to supplement the prices collected by the regions by conducting its own price collection program covering a selected number of countries located in different regions. A small sample of countries, called “Ring Countries,” was drawn from each of the regions. Ring Countries were asked to collect a second set of prices for household consumption expenditures using a common global product list designed to ensure that price matches could be obtained between countries in different regions as well as between countries of the same region. The main purpose of the present chapter is to describe how this “Ring” price collection program was organized and carried out.
4. The situation is somewhat different for government consumption expenditures and
gross capital formation. Although the regions calculate their own sets of within-region PPPs for these categories of expenditure as well as for household consumption expenditures, countries in all regions were asked to price the same products using common lists supplied to the regional offices by the Global Office. The use of the same lists by all regions means that from a methodological point of view, there may be more options open because price matches should be found between countries in different regions and not only between countries within the same region. For example, the use of common lists might make it possible to calculate a global set of PPPs directly without calculating the PPPs within each region separately first. However, as the regions actually choose to calculate within-region PPPs for all categories of expenditure, including GDP, and not just for households’ consumption expenditures, the resulting sets of within-region PPPs still have to be linked at the global level. However, the prices collected by the regions for government consumption expenditures and gross capital formation can also be used by the Global
394
Office to calculate PPPs between regions so that Ring Countries were not asked to collect additional prices for these categories.
Households’ consumption expenditures versus households’ actual consumption
5. In the 1993 SNA, a distinction is drawn between households’ consumption
expenditures and households’ actual consumption1. Households’ consumption expenditures consist mainly of consumption goods and services purchased by households in retail outlets or service establishments. They do not include consumption goods and services supplied to households free, or at a nominal charge, by governments or non-profit institutions as social transfers in kind — for example, free health or education services. The expenditures on social transfers in kind are incurred by the agencies that supply them and not by the households that benefit from them. Households’ actual consumption consists of their own consumption expenditures plus the imputed value of the goods and services they receive as social transfers in kind. Actual consumption is a comprehensive measure of consumption that has generally been preferred for ICP purposes because it is invariant to the extent to which services such as health and education are publicly or privately provided.
6. The Ring price collection program, however, is confined to households’ consumption
expenditures. The products covered are those that households can purchase for purposes of consumption from retail outlets or service establishments. The prices may be collected from a sample of market outlets, but this is not always necessary as some prices are fixed nationally and may be obtained from head offices, especially for services such as transport and communications.
7. Households’ consumption expenditures typically account for over 80 per cent of
households’ actual consumption or well over half of total GDP, the shares tending to vary inversely with the level of real income. PPPs for household consumption expenditures are extremely important in their own right and not just as a component of GDP.
Linking Sets of Within-Region PPPs
8. As already noted, in ICP 2003-2006 the product lists for households’ consumption expenditures were compiled by each regional office separately using the procedures described in Chapter 5 above. Each list consists of products that are representative in one or more of the countries of the region but does not include products that may be representative in countries outside the region, unless they are also representative within the region. Even when similar kinds of products are found in more than one region, different regions tend to choose different varieties or qualities for pricing. As a result, the prices collected by the regions did not provide sufficient matches with prices in other regions to enable reliable PPPs to be calculated between countries belonging to different regions. In order to link the various sets of regional PPPs, it was necessary to set up an additional price collection program, the Ring program.
1 The distinction is explained in some detail in paragraphs 10 to 20 and Table 2 of Chapter 3.
395
9. If N countries participate in the global program, the total number of PPPs to be estimated for each basic heading at the global level is N-1. If the N countries are divided into C regions, a total of N-C PPPs are actually calculated by the regions. In order to arrive at the complete set of global PPPs, only C-1 additional PPPs are needed. For ICP purposes, the group of countries covered by the Eurostat-OECD program is equivalent to a region so that the ICP has 5 regions. The basic objective of the Ring program is therefore to estimate only 4 PPPs for each basic heading. These PPPs have to compare prices between entire regions, however, rather than between individual countries.
10. In ICP 2003-2006, a between-region PPP is defined as a PPP that compares the prices
in two regions after the prices in each region have been converted into a common currency.2 For convenience, the prices may be converted into the regional numeraire currency using the within-region PPPs calculated by the regions themselves. The basic heading PPP between two countries located in two different regions may be obtained by using a between-region PPP to link two within-region PPPs. For example, the PPP between country t located in region B and country s located in region A may be written as follows:
(1) PPPs,t = PPPs,A1 • PPPA1,B1 • PPPB1,t
• PPPs,A1 is the within-region basic heading PPP between the regional reference country A1 whose currency is used as the regional numeraire and country s as calculated by the region A.
• PPPA1,B1 is the basic heading PPP between regions A and B expressed in
terms of the two regional numeraire currencies, those of the regional reference countries A1 and B1. This between-region PPP is calculated by the Global Office using prices collected in the Ring program.
• PPPB1,t is the within-region PPP between country t and the reference
country B1 as calculated by region B.
11. The basic heading PPP between s and t is therefore a chain PPP in which the two within-region PPPs are linked by means of the between-region PPP. If countries s and t were to belong to the same region, (1) would reduce to the within-region PPP between them.
12. A basic requirement for PPPs is that they should be invariant to the choice of the
reference country and numeraire currency. When the countries belong to two different regions, the PPP between them must be invariant to the choice of reference country and numeraire currency in both the regions. The method used in the ICP to calculate between-region basic heading PPPs satisfies this fundamental requirement, as explained in the following chapter.
13. The PPP between regions A and B in equation (1) should be clearly distinguished
from a binary PPP between countries A1 and B1. The PPP between two regions has to
2 The concept of a between-region PPP as just defined was proposed by Erwin Diewert (2004)
396
be expressed in terms of a currency from each of the regions and, for convenience, PPPA1,B1 is denominated using the two regional numeraire currencies, those of the two reference countries A1 and B1. However, the PPP itself compares prices in the two regions as a whole and not just the prices in countries A1 and B1. Prices in the reference countries carry no more weight than those in other countries.
14. It would be technically possible, of course, to link two sets of regional PPPs simply
by selecting an individual country from each region and calculating the binary PPP between them. For example, the between-region PPP in equation (1), PPPA1,B1 , could be replaced by the direct binary PPP between countries A1 and B1. However, the PPPs between countries in A and B would then depend on the fact that countries A1 and B1 happen to have been selected rather than some other pair of countries. When a binary link is used, the PPPs between countries in different regions are not invariant to the choice of the link3, a choice which is inevitably arbitrary. In other words, there are as many possible sets of PPPs between countries in different regions as there are possible pairs of link countries, many thousands in the case of the ICP. Another problem is that too much weight is placed on the accuracy and reliability of a single binary, bearing in mind that, in practice, PPPs are inevitably estimates subject to errors of various kinds. Linking sets of within-region PPPs by means of a single binary is neither satisfactory nor acceptable and this method was ruled out for ICP 2003-2006.
15. Another simple way to link two regions would be to have one country participate in
both sets of regional comparisons. Suppose country k participates in the programs for both regions A and B. The PPP between any other country t located in region B and any country s located in region A can then be derived indirectly as follows:
(2) PPPs,t = PPPs,k • PPPk,t
16. The problem is that the PPP between s and t will change if a country other than k is used as the bridge country. The use of a bridge country, like the use of a binary link, produces arbitrary results that are dependent on the subjective choice of the bridge country and places too much weight on the PPPs for a single country. The number of possible alternative sets of PPPs between countries belonging to two different regions is equal to the total number of countries in the two regions. This method was therefore also ruled out for ICP 2003-2006.
17. Nevertheless, it has happened in previous international comparisons that the use of a
binary link or a single bridge country could not be avoided because there was no alternative in practice. For example, in the last ICP round (1993-1996), Japan was used as the bridge to link PPP results for Asian and the OECD regional programs because it was the only country to participate in both sets of regional comparisons. For the same reasons, Mexico was used to bridge Latin America with the OECD. Without the use of these bridge countries, there would have been no possibility of linking the regions concerned and hence no results at a global level. However, this method of linking remains arbitrary and inherently unsatisfactory.
3 This results from the fact that independent binary PPPs are not transitive.
397
18. The Ring program was devised to avoid a repetition of a situation in which regions have to be linked through arbitrarily selected binary PPPs or individual bridge countries. The prices collected in the Ring program are used to estimate a set of transitive multilateral PPPs between regions that provide an objective method of linking the various sets of within-region PPPs. In principle, between-region PPPs compare prices in the two regions as a whole and therefore utilize the prices in every country in each region. However, it is not feasible to include all countries in the Ring program for a variety of reasons, not least the sheer scale of such a program which would duplicate the existing ICP regional programs. The solution adopted in the ICP is to estimate the between-region PPPs from a stratified sample of countries containing about four countries per region on average, with a minimum of two countries per region.
19. Of course, the reliability and robustness of the estimated between-region PPPs
depends on the size and composition of the sample, as in all fields of statistics. The size of the Ring program is inevitably limited not only by the resources available at the global level but also by potential Ring Countries’ ability and willingness to participate in the Ring program as well as their regional program. Even so, 18 countries participated4, more than the total number of countries that participated in Phases I and II of the ICP.
Selection of the Ring Countries
20. The selection of the Ring Countries was purposive rather than random. The criteria used to select the Ring Countries include the following:
• Each country has to have a sufficiently wide range of goods and services available that include some products that can to be found in other regions as well as products found in other countries in the same region;
• Each country must be capable of participating in the full GDP comparisons, including government consumption expenditures and gross capital formation as well as household consumption expenditures;
• Each country must have reliable price data and be capable of deriving annual national average prices;
• Each country must have the required national expenditure data; • Each country must be willing to act as Ring Country.
Development of the Global Product List
21. A Ring product list is meant to be suitable for price collection purposes by countries in all parts of the world. The regional lists are not suitable because each list is specific to the region in question. If a particular product is not representative in any of the countries of a region, it will not be included on the list for that region, even though it may be representative in countries in other regions. Each of the regional product lists is therefore liable to exclude many products that are important in other parts of the world. Thus, from a global perspective, the problem is not simply that the sets of goods and services available and patterns of consumption vary between regions but
4 See Annex 1 for the list of Ring Countries for ICP 2003-2006.
398
that the way the regional lists have been constructed means that countries may not have been asked to price products that may be representative in other regions even though they may be able and willing to do so.
22. It is not possible to derive a satisfactory global list simply by merging the existing
regional lists. It turns out that very few exact matches are to be found between the regional lists in practice. Even when the same type of product is to be found in different regions, the regional offices tend to choose different specifications or qualities of that product.
23. The use of common product quality identifiers such as high/medium/low brand
stratum may be helpful to build a list in a homogenous region, or sub-region, such as the European Union. Its usefulness is limited, however, once the group of countries is expanded to include countries in different parts of the world, as in the Ring program. What may be considered a high-range brand in one region is often regarded as a medium range brand in another. Similarly, a price-determining characteristic in one region is often found to be non price-determining in another region. It is also common to see similar products described differently in different regional lists. The situation is further complicated by the fact that some regions use very detailed products specifications including size, packaging, brand, etc., whereas some regions use broad specifications that do not include these details.
24. It was therefore necessary to construct a global list of products specifically for use in
the Ring program. The approach adopted was basically similar to that used by the regions and described in Chapter 5 above. The construction of the global list was facilitated by the existence of the set of Structured Product Descriptions, or SPDs, and Product Specifications, or PSs, already developed in the course of building up the regional lists.
25. The task of constructing the global list was undertaken by the ICP Global Office
working in close collaboration with regional and country experts. It required continual interaction between the Global Office and the regional offices and individual countries over a long period of time. Two different approaches were adopted, depending on the type of products concerned. The products purchased by households were split into two groups. The first group, called Group (a) here, consists of all consumption goods, including household durables, plus a few services of a recreational and cultural nature. Consumption goods are typically purchased in retail outlets such as shops, market stalls, department stores, supermarkets, etc. The second group, Group (b), consists mostly of services, including transport, communications, health, education, restaurants and hotels. The products covered by the two groups can be defined more precisely by listing the corresponding categories of households’ individual consumption expenditures as given in Table 4 of Chapter 3.
399
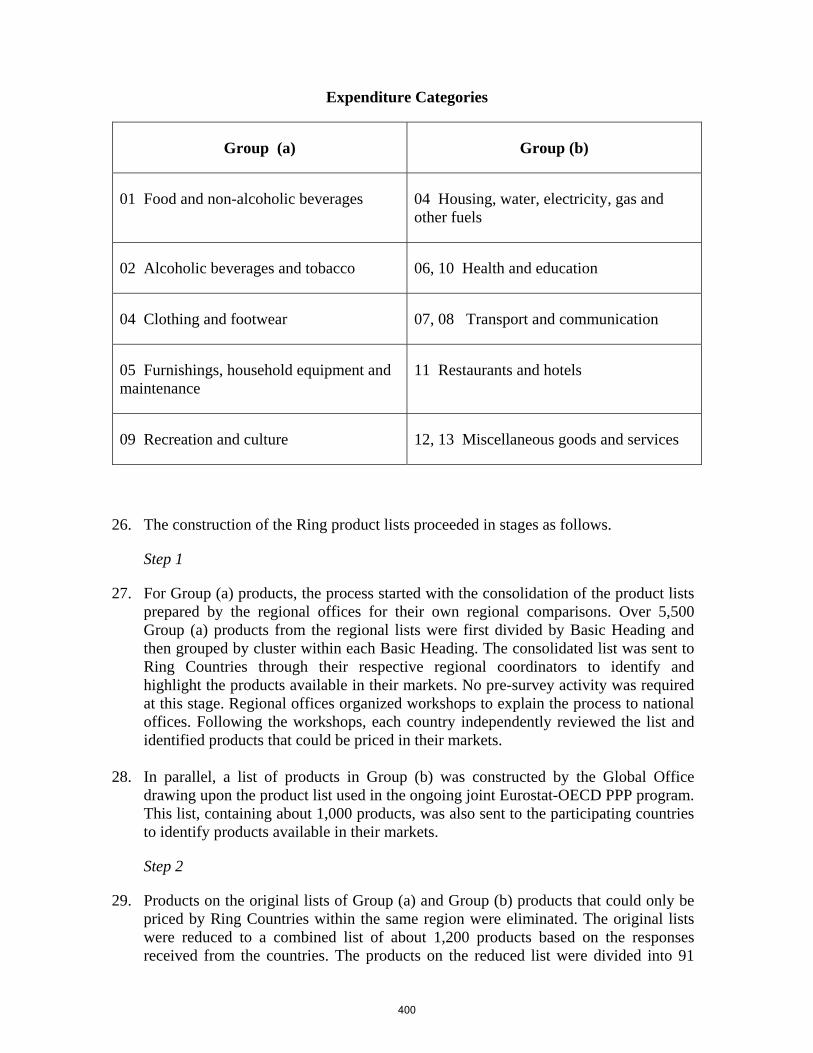
Expenditure Categories
Group (a) Group (b)
01 Food and non-alcoholic beverages 04 Housing, water, electricity, gas and other fuels
02 Alcoholic beverages and tobacco 06, 10 Health and education
04 Clothing and footwear 07, 08 Transport and communication
05 Furnishings, household equipment and maintenance
11 Restaurants and hotels
09 Recreation and culture 12, 13 Miscellaneous goods and services
26. The construction of the Ring product lists proceeded in stages as follows.
Step 1
27. For Group (a) products, the process started with the consolidation of the product lists prepared by the regional offices for their own regional comparisons. Over 5,500 Group (a) products from the regional lists were first divided by Basic Heading and then grouped by cluster within each Basic Heading. The consolidated list was sent to Ring Countries through their respective regional coordinators to identify and highlight the products available in their markets. No pre-survey activity was required at this stage. Regional offices organized workshops to explain the process to national offices. Following the workshops, each country independently reviewed the list and identified products that could be priced in their markets.
28. In parallel, a list of products in Group (b) was constructed by the Global Office
drawing upon the product list used in the ongoing joint Eurostat-OECD PPP program. This list, containing about 1,000 products, was also sent to the participating countries to identify products available in their markets.
Step 2
29. Products on the original lists of Group (a) and Group (b) products that could only be priced by Ring Countries within the same region were eliminated. The original lists were reduced to a combined list of about 1,200 products based on the responses received from the countries. The products on the reduced list were divided into 91
400
Basic Headings. The relative numbers of products allotted to each Basic Heading depended on the:
(1) Expenditure share of the Basic Heading in question;
(2) Homogeneity of the products in the Basic Heading; and
(3) Expected price variation of the products within each Basic Heading.
30. Basic Headings with relatively large shares of total household expenditure were assigned more products. Relatively homogenous Basic Headings such as “Eggs and egg-based products” received fewer products. Basic Headings with large price variation got relatively more products.
Step 3
31. The third step was to harmonize the product descriptions that originated from different regions. To describe all products within a Basic Heading in a consistent manner was a great challenge. Product names were occasionally modified to better correspond to the products. A draft product catalog was prepared containing the selected products and their pictures (where available). The catalog was sent to the Ring Countries for review. The countries were asked to:
(1) Provide detailed comments;
(2) Propose changes, additions and deletions; and
(3) Highlight products that are representative of their patterns of consumption (marking them with “R”) and those that are available but not representative (marking them with “A”).
Step 4
32. The fourth step was for the regional offices to organize regional meetings to scrutinize and review the pruned list. Each regional coordinator met with the region’s Ring Countries to discuss the list. Their consolidated comments were sent to the Global Office. The comments included specific country responses as well as the consensus of the participating countries in each region. The consolidated comments included modification of size, packaging and delivery conditions and the proposed addition or deletion of products based on their relevance to consumption in the region. In some cases, new products were proposed and in others products were merged or duplicates dropped.
Step 5
33. The fifth step was to revise the list by incorporating regional comments and reducing it to about 1,000 products. The Global Office analyzed the country responses, Basic Heading by Basic Heading, to determine which products should be kept and which should be dropped from the list. Products were selected taking account of the number of regions and countries within each region able to price them. The products thus chosen were once again analyzed to eliminate duplicates and to ensure that the
401
distribution of products across Basic Headings respected the criteria listed in Step 2 above. The draft catalog was revised to reflect these changes and sent back to Ring Countries for their final check and review.
Step 6
34. The Global Office organized a workshop in Washington, D.C. for regional coordinators and selected national experts to finalize the list. The workshop once again resulted in some revisions to the list, including the addition of some products and the deletion of others.
Step 7
35. The final catalog was prepared in color in both electronic format and hard copy and distributed to national price collectors via regional offices. Ring survey guidelines were also prepared to accompany the catalog.
The final list
36. The end result is a global list of household consumption goods and services together with the accompanying Product Specifications, or PSs. The final list, which is shown in a summary form in Annex 2, contains 1,095 products distributed over 95 basic headings. The number of products per heading ranged from 1 (water transport and appliance repairs) to 96 (pharmaceutical products), an average of nearly 12 per basic heading. Although constructed for the Ring program, the final list of products is a general list that can serve other purposes. Together with the associated SPDs and PSs, it represents a significant addition to the stock of intellectual capital available to price statisticians working on national CPIs as well as on international comparisons. The existence of a comprehensive core list of products with accompanying documentation will reduce the time and resources needed in future comparisons. It should only be necessary to revise and update the list marginally in response to changing consumption patterns or other factors.
Support Elements
The Ring Product Catalog
37. A Ring Product Catalog containing descriptions and pictures of the goods and services to be priced for the Ring Comparison has been prepared by the ICP Global Office. The product catalog has been made available to price collectors in national offices via the regional ICP offices to help price collectors in all regions identify products easily so that they all collect prices for the same products.
The Ring Administration Module (RAM)
38. The RAM is an Excel-based application developed by the World Bank It helps countries that are participating in the global Ring Comparison to provide the ICP Global Office with information about products that can be priced in their countries. The responses are captured in a structured manner allowing the Global Office to
402
analyze and create a common Ring product list efficiently. The RAM displays a list of products priced by each of the six ICP regions, and the specifications to help identify these products. It also displays pictures of products. Its objective is to help Ring Countries identify the products correctly, indicate whether each item is available in their market and provide comments when a positive or negative answer does not suffice. The RAM system does not need any installation on a user's computer. It can be run from a CD on which it is distributed.
Structured Product Description (SPD) Module
39. The foundation of the ICP is the list of well-defined products for which prices are collected in each country, and comparisons made, to calculate the Purchasing Power Parities. The task of building a list of Product Specifications (PSs) has been simplified and facilitated by using software tools developed by the Global Office. The specifications have also been significantly improved as a result. The software also serves as documentation of the methods used. The software is based on the conceptual framework of the Structured Product Description (SPD) which has been developed from the US Bureau of Labor Statistics checklist methodology, as explained in Chapter 5.
The Ring Comparison Survey Guidelines
40. The guidelines for the Ring Comparison price collection are intended to supplement those prepared for the regional price collections. Most of the basic concepts that guide the regional data collection are unchanged5, but there are some areas where procedures differ. First, the list of product specifications was developed to reflect the world, not a region. This required that many terms and definitions be revised or harmonized so that there is only a single description for a product across all regions. For example, the Ring Countries and price collectors have to become familiar with the use of brands in the descriptions. Second, because the purpose of the Ring Comparison is to compare prices between regions of the world, there are products on the Ring list that were not on some regional lists. This coupled with the fact that price collection for the Ring Comparison is limited to capital or major cities may require some Ring Countries to supplement their survey frame with additional outlets. As prices are collected only at one point in time, some specific guidelines are needed about pricing “sale items.”6
Data Validation
41. The price data collected for the Ring Countries have to be subject to the same stringent editing controls, diagnostic tests and validation procedures as the prices collected by the regions. These tests and procedures have already been described in considerable detail in Chapter 7. The present section therefore simply describes how
5 See the “ICP Manual for Price Collectors,” available on the ICP website (www.worldbank.org/data/icp). 6 For more information on the general guidelines, see the Ring Comparison Survey Guidelines, Consumer Price Survey, December 2005.
403
the tests and validation procedures are applied within the context of the Ring program and the global program. Some additional tests can also be applied to test the consistency of the Ring data with the corresponding data collected by the regions.
42. The diagram in Annex 3 provides an overview of the steps involved in the derivation
of the global set of PPPs from the various sets of within-region PPPs together with the associated validation procedures carried at each step. The within-region prices and PPPs are checked and validated by the regional offices using the procedures and tests described in Chapter 7. Although the regional offices work independently of each other, they all work in close collaboration with the Global Office which exercises a watching brief over the entire operation and provides technical support. The Global Office also signs off on the final results for each region.
43. As noted earlier, ICP 2003-2006 effectively has only 5 regions. In order to link the 5
sets of within-region PPPs, only 4 between-region PPPs are therefore needed at each level of aggregation from the basic heading upwards. As the between-region PPPs are calculated from the prices collected by the Ring Countries, the validation of their prices and PPPs is a key element in the whole validation process. The various steps involved are summarized below.
Step 1: Validation of prices within the regions
44. The first stage in the validation process takes place within each region. The Ring Countries within a region engage in two separate price collections, one to provide prices to the regional office and one to provide prices to the Global Office. The Ring Countries have to check the individual prices submitted to the Global Office in the same way that they check the prices supplied to the regional offices. The various tests are described in the early sections of Chapter 7. Although the regional and global product lists are not the same, countries have to check that the two sets of prices and basic heading PPPs derived from them are broadly consistent with each other. The basic heading PPPs for the Ring Countries within a particular region should not deviate excessively from the corresponding ones calculated from prices supplied to the regional office. The two sets of PPPs cannot be expected to be the same, but large discrepancies may require investigation and explanation as they may flag errors of various kinds such as pricing the wrong products.
Step 2: Validation within the group of 18 Ring Countries
45. The second stage takes place using the data for all 18 Ring Countries. The Ring Countries as a group can be treated in the same way as the group of countries that make up a region. Thus, the price data can be subjected to exactly the same tests and diagnostic procedures as are applied to the data within a region, as described in Chapter 7. Quaranta tables and Dikhanov tables can be constructed that cover all 18 Ring Countries. As explained in Chapter 7, these tests are very detailed, exhaustive and time-consuming and may have to go through several iterations so that the whole process needs to be carefully planned and scheduled.
Step 3: Validation within the group of 5 regions
404
46. Although it is essential to go through Step 2, it must be remembered that the prime
purpose of the Ring program is to calculate PPPs between the 5 ICP regions rather than PPPs between individual Ring Countries. After Step 2 has been completed, it is possible to apply further checks by validating the regional average prices for the Ring Countries. The regional average prices can be calculated after the national average prices provided by the Ring Countries have been converted into the common numeraire currency for each region using the within-region PPPs. The Quaranta and Dikhanov diagnostic tests may then be applied to the regional average prices and between-region PPPs.
47. Given that the data have already been validated in Step 2, Step 3 may not throw up
many further anomalies. Nevertheless, it is prudent to carry out Step 3 given the key role played by the between-region PPPs in establishing the global set of PPPs.
Step 4: Validation of the global PPPs
48. A global set of PPPs can be assembled at any level of aggregation from the basic heading to GDP by using the between-region PPPs to link the various sets of within-region PPPs. Each global set can then be subjected to the same kinds of diagnostic tests as were used on the component sets of within- and between-region PPPs. Quaranta tables and Dikhanov tables can be constructed covering all countries participating in ICP 2003-2006. The nature of these diagnostic tests is to highlight anomalous PPPs that deviate significantly from the average or expected results. Anomalous results must either be rejected as being due to errors of some kind and the data revised, or they must be accepted because they can be explained by unusual or exceptional economic circumstances. In the latter case, they must be economically defensible if they are challenged at a later date by users or others as being improbable or even erroneous.
49. Finally, although the Global Office takes responsibility for the validation of the PPPs
for the Ring Countries and the overall set of global PPPs, the process of validation must be carried out in a transparent manner that also actively involves the regional offices as much as possible. Accordingly, the diagnostic tables at each step of the process are sent to the regional offices and to Eurostat-OECD for their review, comments and suggestions so that they can make a positive contribution to the validation process.
References Diewert, W. E. (2004) On the Stochastic Approach to Linking the Regions in the ICP, Discussion Paper No.04-16, Department of Economics, University of British Columbia, Vancouver.
405

Annex 1. List of Ring Countries for the 2003-2006 Round
Brazil; Cameroon; Chile; Egypt; Estonia; Hong Kong, China; Japan; Jordan; Kenya; Malaysia; Oman; Philippines; Senegal; Slovenia; South Africa; Sri Lanka; United Kingdom; and Zambia.
406
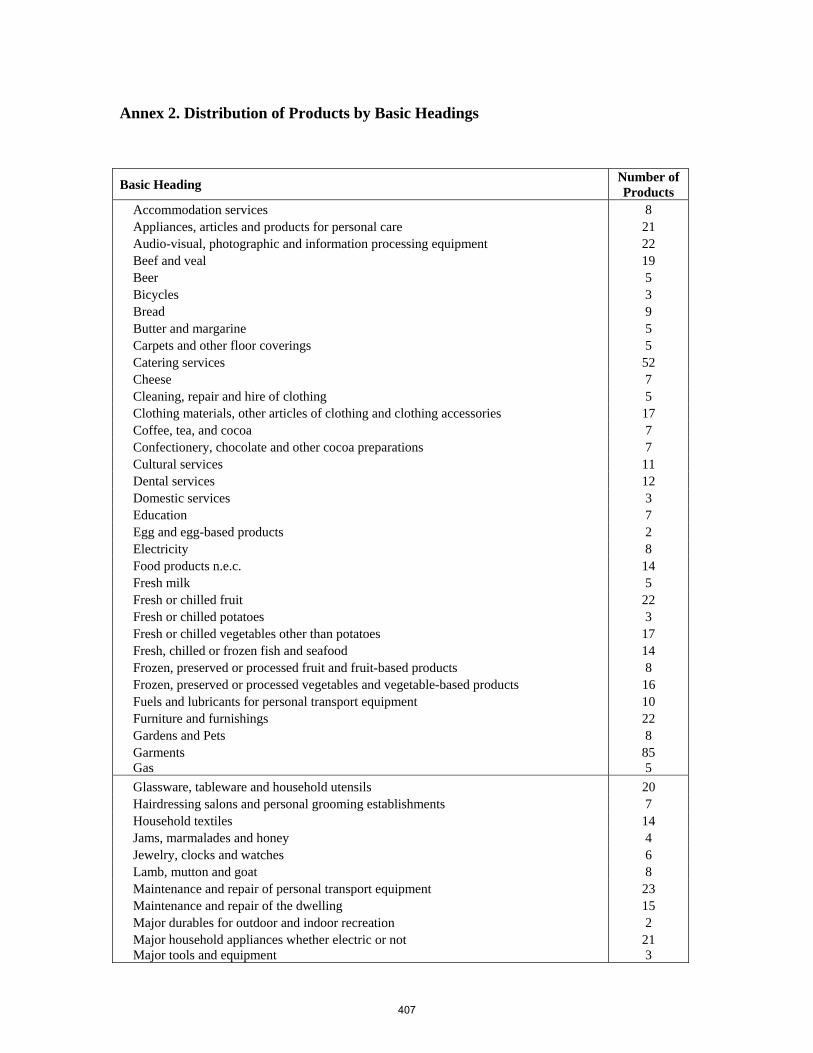
Annex 2. Distribution of Products by Basic Headings
Basic Heading Number of Products
Accommodation services 8 Appliances, articles and products for personal care 21 Audio-visual, photographic and information processing equipment 22 Beef and veal 19 Beer 5 Bicycles 3 Bread 9 Butter and margarine 5 Carpets and other floor coverings 5 Catering services 52 Cheese 7 Cleaning, repair and hire of clothing 5 Clothing materials, other articles of clothing and clothing accessories 17 Coffee, tea, and cocoa 7 Confectionery, chocolate and other cocoa preparations 7 Cultural services 11 Dental services 12 Domestic services 3 Education 7 Egg and egg-based products 2 Electricity 8 Food products n.e.c. 14 Fresh milk 5 Fresh or chilled fruit 22 Fresh or chilled potatoes 3 Fresh or chilled vegetables other than potatoes 17 Fresh, chilled or frozen fish and seafood 14 Frozen, preserved or processed fruit and fruit-based products 8 Frozen, preserved or processed vegetables and vegetable-based products 16 Fuels and lubricants for personal transport equipment 10 Furniture and furnishings 22 Gardens and Pets 8 Garments 85 Gas 5 Glassware, tableware and household utensils 20 Hairdressing salons and personal grooming establishments 7 Household textiles 14 Jams, marmalades and honey 4 Jewelry, clocks and watches 6 Lamb, mutton and goat 8 Maintenance and repair of personal transport equipment 23 Maintenance and repair of the dwelling 15 Major durables for outdoor and indoor recreation 2 Major household appliances whether electric or not 21 Major tools and equipment 3
407
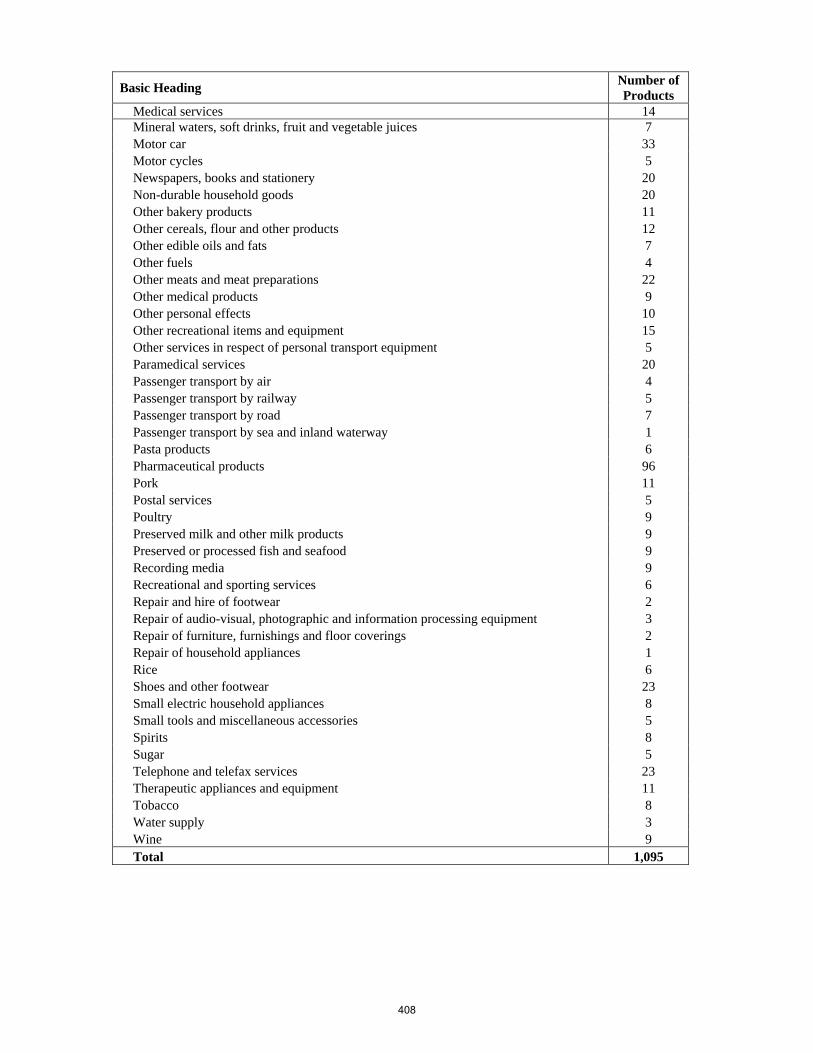
Basic Heading Number of Products
Medical services 14 Mineral waters, soft drinks, fruit and vegetable juices 7 Motor car 33 Motor cycles 5 Newspapers, books and stationery 20 Non-durable household goods 20 Other bakery products 11 Other cereals, flour and other products 12 Other edible oils and fats 7 Other fuels 4 Other meats and meat preparations 22 Other medical products 9 Other personal effects 10 Other recreational items and equipment 15 Other services in respect of personal transport equipment 5 Paramedical services 20 Passenger transport by air 4 Passenger transport by railway 5 Passenger transport by road 7 Passenger transport by sea and inland waterway 1 Pasta products 6 Pharmaceutical products 96 Pork 11 Postal services 5 Poultry 9 Preserved milk and other milk products 9 Preserved or processed fish and seafood 9 Recording media 9 Recreational and sporting services 6 Repair and hire of footwear 2 Repair of audio-visual, photographic and information processing equipment 3 Repair of furniture, furnishings and floor coverings 2 Repair of household appliances 1 Rice 6 Shoes and other footwear 23 Small electric household appliances 8 Small tools and miscellaneous accessories 5 Spirits 8 Sugar 5 Telephone and telefax services 23 Therapeutic appliances and equipment 11 Tobacco 8 Water supply 3 Wine 9 Total 1,095
408
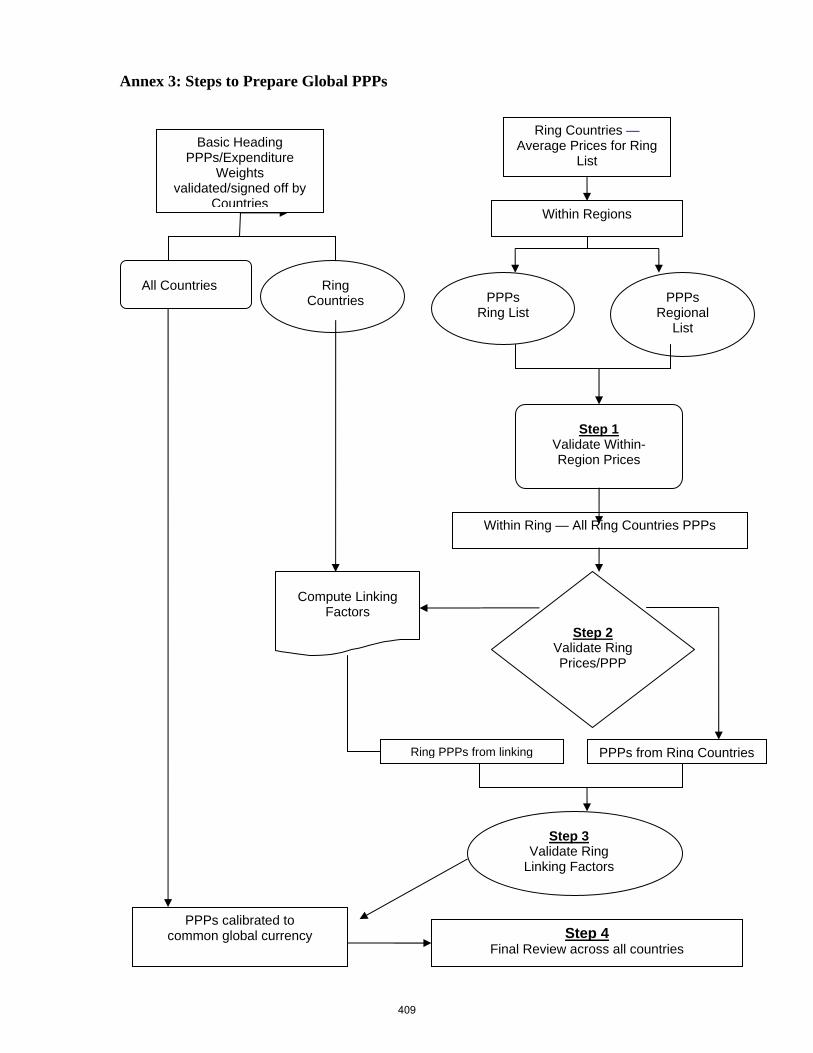
Annex 3: Steps to Prepare Global PPPs
Basic Heading PPPs/Expenditure
Weights validated/signed off by
Countries
All Countries Ring Countries
Compute Linking Factors
Step 2 Validate Ring Prices/PPP
Ring Countries — Average Prices for Ring
List
Within Regions
PPPs Ring List
PPPs Regional
List
Step 1 Validate Within-Region Prices
Within Ring — All Ring Countries PPPs
Ring PPPs from linking PPPs from Ring Countries
Step 4 Final Review across all countries
PPPs calibrated to common global currency
Step 3 Validate Ring
Linking Factors
409
Chapter 14
Ring Comparison - Linking Within-Region PPPs Using Between-Region PPPs1
Introduction
1. The purpose of this chapter is to explain how within-region basic heading PPPs – that is, PPPs between countries within the same region – can be linked to obtain a global set of transitive PPPs covering all the countries participating in ICP 2005. For various reasons, including institutional, organizational, administrative, and financial reasons, the current round has had to be organized on a regional basis, as explained in Chapter 2.
2. Each region calculates the basic heading PPPs between the countries within its
own region using one of the methods described in Chapter 11. Most regions use the CPRD or CPD method2, but Eurostat and OECD use their own EKS/Jevons* or EKS/Jevons-S method for the group of countries covered by rheir own joint PPP Programme. Once the within-region basic heading PPPs have been calculated for all the regions, each set of regional PPP has to be linked to the other sets in order to obtain a global set of basic heading PPPs covering all ICP countries at a world level.
3. The method used in the current ICP round to link the various sets of within-
region PPPs is to calculate PPPs between the regions themselves. Conceptually, a between-region PPP compares the prices in two regions when the prices within each region are all expressed in the same currency, the regional numeraire. They can be converted into the regional numeraire using the within-region PPPs calculated by the regions themselves.
4. The prices collected by the regions, however, are not suitable for calculating PPPs between countries in different regions. When drawing up its product list, each region focuses on products that are representative of one or more countries within its own region and pays little attention to products that may be representative of countries in other parts of the world. Thus, as explained in the previous chapter, when the product lists by the different regions are
1 The insight that basic heading PPPs within regions can be linked by estimating PPPs between regions is due to Erwin Diewert: see Diewert (2004) sections 13 and 14. A similar proposal was made in the presentation by Alan Heston and Bettina Aten at the meeting of the TAG in September, 2004. Comments on earlier versions of this chapter were made by Yuri Dikhanov, David Roberts, Francette Koechlin and Sergey Sergeev, who also kindly carried out the calculations for the numerical examples presented in this chapter. 2 Although the CPRD method is the preferred method there may be circumstances in which the data on representativity may be incomplete or unreliable in which case it may be necessary to fall back on the CPD method as used in previous rounds of the ICP
410
combined or merged, not many products are to be found on the lists of more than one region. Similar kinds of products are to be found in different regions, of course, but the ICP requires products to be tightly defined in order to ensure international comparability. The precise specifications of the products actually selected for inclusion on the regional product lists tend to vary from region to region so that few exact price matches can be found between countries in different regions.
5. As also explained in the previous chapter, the Ring program was set up to enable price comparisons to be made between countries in different regions. This required a separate product list to be established for the Ring Countries in addition to the product lists set up by each of the regions. Such a list has to include products that are representative of one or more Ring Countries but which can also be priced by countries in two or more regions. In order to establish the Ring product list it was necessary to carry out a pre-survey among the Ring Countries similar to that conducted within each region by the regions themselves. Separate price collections were also carried out in each of the Ring Countries in addition to the price collections undertaken for the regions.
6. A set of multilateral basic heading PPPs can be calculated for the group of Ring Countries using the same method as is used to calculate the basic heading PPPs for the countries within a region. However, as already noted, the purpose of the Ring program is rather different. The objective is to calculate a set of multilateral basic heading PPPs between the regions themselves, rather than between individual countries in different regions.
Linking sets of within-region basic heading PPPs
7. If there were only two regions, the simplest way in which to link the two sets of within-region PPPs would be to select a country from each region to act as a bridge country and to calculate a binary PPP between the two bridge countries3. A single link would be sufficient to make it possible to calculate the PPPs between pairs of countries in different regions.
8. Provided there is only a single link, the two sets of within-region PPPs remain
intact. Regional characteristicity is preserved for each set of regional PPPs. Moreover, the set of PPPs obtained by linking two sets of transitive PPPs with a single link must also be transitive. PPPs between countries in different regions are indirect PPPs that use the PPP between the pair of bridge countries as the link.
3 In the Report on Phase 1 of the ICP (Kravis, et al. 1975) pp. 50-53, the term ‘bridge country’ is used in a different sense from here. The ‘bridge country method’ is used there to describe what has subsequently come to be known as the ‘star country method’. There were no regions in Phase 1 of the ICP so that the linking issue discussed here did not arise.
411
9. There is, however, an obvious and serious objection to selecting a bridge country from each region, namely that the selection is inevitably arbitrary and the linked results vary depending on which particular pair of countries happens to have been selected. Another problem is that the PPP between the bridge countries might turn out to be unreliable and biased, which would introduce bias into all the PPPs between countries in different regions. The burden of responsibility placed on the two bridge countries would be too great. For these reasons, the use of an arbitrarily selected pair of bridge countries is generally not regarded as an appropriate, or acceptable, way in which to link two sets of regional PPPs.
10. On the other hand, a single link between two sets of within-region PPPs is
necessary if the within-region PPPs in each region are to be preserved. Maintaining the within-region PPPs intact has come to be known as preserving fixity. Preserving fixity implies that each set of within-region PPPs retains maximal regional characteristicity, a property to which considerable importance is usually attached by users of the PPPs within a region.
11. If fixity is to be preserved, it might appear that the use of bridge countries is unavoidable. However, while the use of a single link between a pair of regions may be necessary to preserve fixity, that link does not have to take the form of a binary PPP between an arbitrarily selected pair of countries. Instead of a binary between-country PPP, the link can consist of a between-region PPP.
12. The prices in national currencies for countries within the same region can be
converted into the numeraire currency for the region using the within-region basic heading PPPs calculated by the region itself. From a methodological point of view, once all the prices within a region are expressed in the same currency, each region can be treated as if it were a country. A CPRD or CPD can then be applied to the prices in the different regions in order to estimate the between-region basic heading PPPs. The ‘C’ in CPRD and CPD has to be understood to refer to a region rather than an individual country. One of the regions has to serve as the world reference region and its numeraire currency serves as the world numeraire currency.
13. A between-region PPP compares the purchasing power of the two numeraire
currencies in their respective regions. The comparison is based on prices in all the countries in each region expressed in their own numeraire currency and not just on the prices in the two reference countries. This is one important advantage over the bridge country method that simply compares prices in two selected countries. Another advantage is that when there are several regions a multilateral method can be used to produce a set of transitive between-region PPPs. The final global set of PPPs at a world level obtained by using between-region PPPs to link the within-region PPPs are also invariant to the choice of the reference country within each region and to the choice of region to act as the reference region at a world level. The choice of reference countries and
412
reference region is a matter of convenience. These points are explained in more detail in the main section of the chapter.
14. Eurostat and the OECD have always used their own method to preserve the fixity of the basic heading PPPs for EU countries and other countries covered by their joint PPP Programme. The method can be shown to be equivalent to estimating between-region PPPs between the various blocs of countries. It seems likely to produce very similar results to the CPRD method. The method is explained later with the help of a numerical example.
The Estimation of Between-Region Basic Heading PPPs using the CPRD Method
15. For reasons given above, the estimation of the between-region basic heading PPPs is made using prices collected by the Ring Countries using the Ring product list. The number of countries per region in the Ring program ranges from 2 to 5, the total number of Ring Countries for all 6 ICP regions being 184. The estimation of between-region PPPs for a basic heading requires within-region PPPs to be available for the Ring Countries in each region. The best estimates of PPPs between countries within the same region are those calculated by the regions themselves. Accordingly, these are the within-region PPPs used in the process of estimating the between-region PPPs. The within-region PPPs will have been calculated using the CPRD or CPD methods described in Chapter 10. The within-region PPPs could also be calculated by using the EKS/Jevons * or EKS/Jevons-S method used in the joint Eurostat-OECD Programme.
16. Between-region PPPs may be estimated by using a modified version of the CPRD or CPD method in which the country parameters are replaced by regional parameters. A reference country is selected in each region and its currency is used as the numeraire for the region. Prices in all countries within the same region are converted into the numeraire currency using the within-region basic heading PPPs calculated by the regions. The CPRD method can then be used to estimate the basic heading PPPs between the regions. It is important to retain representativity as a variable because there may be differences between regions in the shares of representative and unrepresentative products included in the samples of products priced and used in the regressions.
17. The regional version of the CPRD is given in equations (1) and (2)5. There are two differences from the version used to estimate PPPs between countries within the same region as given in equation (21) of Chapter 10:
4 Although the Ring Countries constitute a small sample from the 150 countries participating in the ICP 2003-2006 round, it is worth noting that Phase 1 of the ICP in 1970 covered only 10 countries in total, while Phase 2 in 1973 covered 16 countries. 5 A more detailed explanation of how regional parameters may be included in the CPRD or CPD models is given in Diewert (2004b).
413
• The prices in each region are denominated in the regional numeraire
currency and are denoted by upper case P’s. Pijkr is defined as pijkr / αj where the αj’s are the within region PPPs obtained using equation (24) of Chapter 10.
• The country parameters, the αj’s, in equation (20) of Chapter 10 are
replaced by region parameters, δr’s.
18. The CPRD model at the second stage is written as: (1) Pikr = κ βi γk δr νikr i = 1, 2, … n
(2) β1 = γ1 = δ1 = 1 k = 1, 2. r = 1, 2, … 6
The three sets of variables in the regional version of the CPRD are region, product and representativity, instead of country, product and representativity. Strictly, therefore, the regional version should be described as the ‘region, product, representativity model’, or RPRD method, but the CPRD is retained to avoid proliferation of abbreviations.
Taking natural logarithms of both sides of (1) and (2) we have:
(3) ln Pilr = ln κ + ln βi + ln γk + lnδl + εikr (4) ln β1 = ln γ1 = lnδ1 = 0
The regression equation used to estimate the various parameters requires an additional dummy variable for the regions denoted by Vikr. It becomes:
(5) ln Pikr = ln κ + ln β2 y2k + ln β3 y3k + … ln βn ynk + ln γ2 zi2r + ln δ2
Vik2 + ln δ3 Vik3 + … ln δ6 Vik6 + εikr
Each region can be viewed as if it were a single country. The national average prices of different countries denominated in the regional numeraire currency can be treated as if they were different observations on the price of the same product within the same country. Within each region, the prices no longer need to be identified by country.
A numerical example
19. Table 1 presents illustrative price data in national currencies for 10 countries, 10 products and 3 regions. In the present context, the countries should be viewed as hypothetical Ring Countries. Countries A, E and H are designated as the reference countries whose currencies serve as the regional numeraires.
414
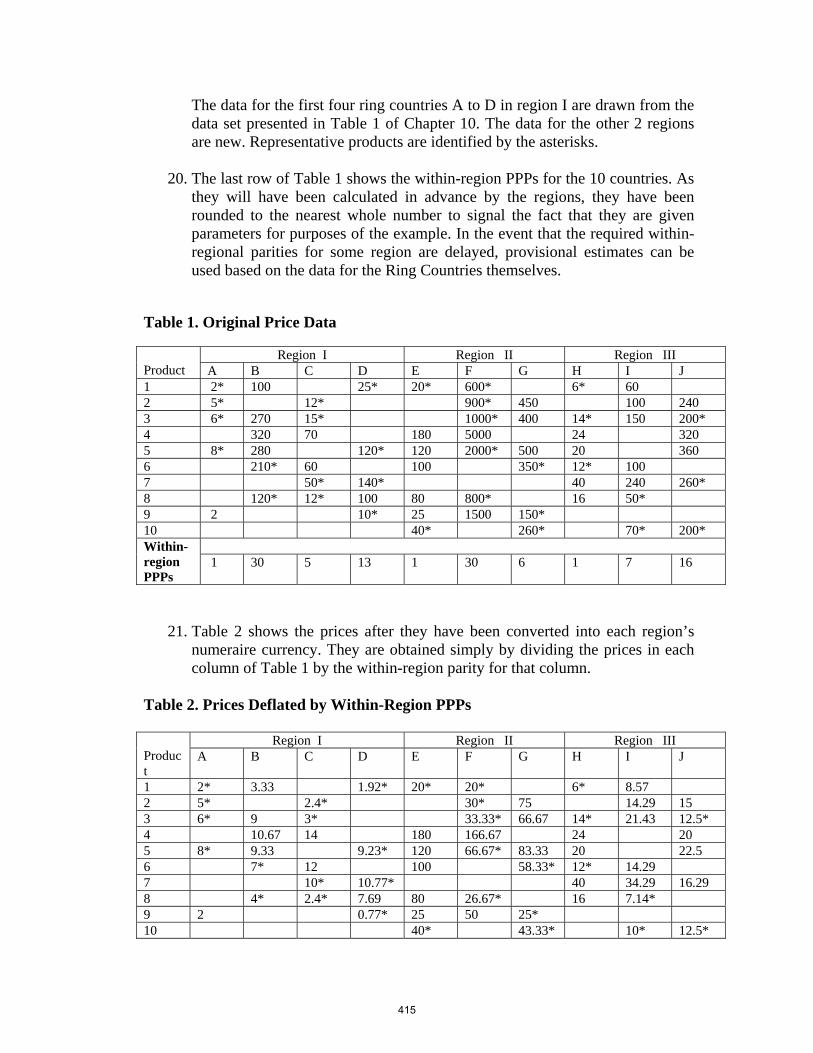
The data for the first four ring countries A to D in region I are drawn from the data set presented in Table 1 of Chapter 10. The data for the other 2 regions are new. Representative products are identified by the asterisks.
20. The last row of Table 1 shows the within-region PPPs for the 10 countries. As
they will have been calculated in advance by the regions, they have been rounded to the nearest whole number to signal the fact that they are given parameters for purposes of the example. In the event that the required within-regional parities for some region are delayed, provisional estimates can be used based on the data for the Ring Countries themselves.
Table 1. Original Price Data
Region I Region II Region III Product A B C D E F G H I J 1 2* 100 25* 20* 600* 6* 60 2 5* 12* 900* 450 100 240 3 6* 270 15* 1000* 400 14* 150 200* 4 320 70 180 5000 24 320 5 8* 280 120* 120 2000* 500 20 360 6 210* 60 100 350* 12* 100 7 50* 140* 40 240 260* 8 120* 12* 100 80 800* 16 50* 9 2 10* 25 1500 150* 10 40* 260* 70* 200*
Within- region PPPs
1 30 5 13 1 30 6 1 7 16
21. Table 2 shows the prices after they have been converted into each region’s numeraire currency. They are obtained simply by dividing the prices in each column of Table 1 by the within-region parity for that column.
Table 2. Prices Deflated by Within-Region PPPs
Region I Region II Region III Product
A B C D E F G H I J
1 2* 3.33 1.92* 20* 20* 6* 8.57 2 5* 2.4* 30* 75 14.29 15 3 6* 9 3* 33.33* 66.67 14* 21.43 12.5* 4 10.67 14 180 166.67 24 20 5 8* 9.33 9.23* 120 66.67* 83.33 20 22.5 6 7* 12 100 58.33* 12* 14.29 7 10* 10.77* 40 34.29 16.29 8 4* 2.4* 7.69 80 26.67* 16 7.14* 9 2 0.77* 25 50 25* 10 40* 43.33* 10* 12.5*
415
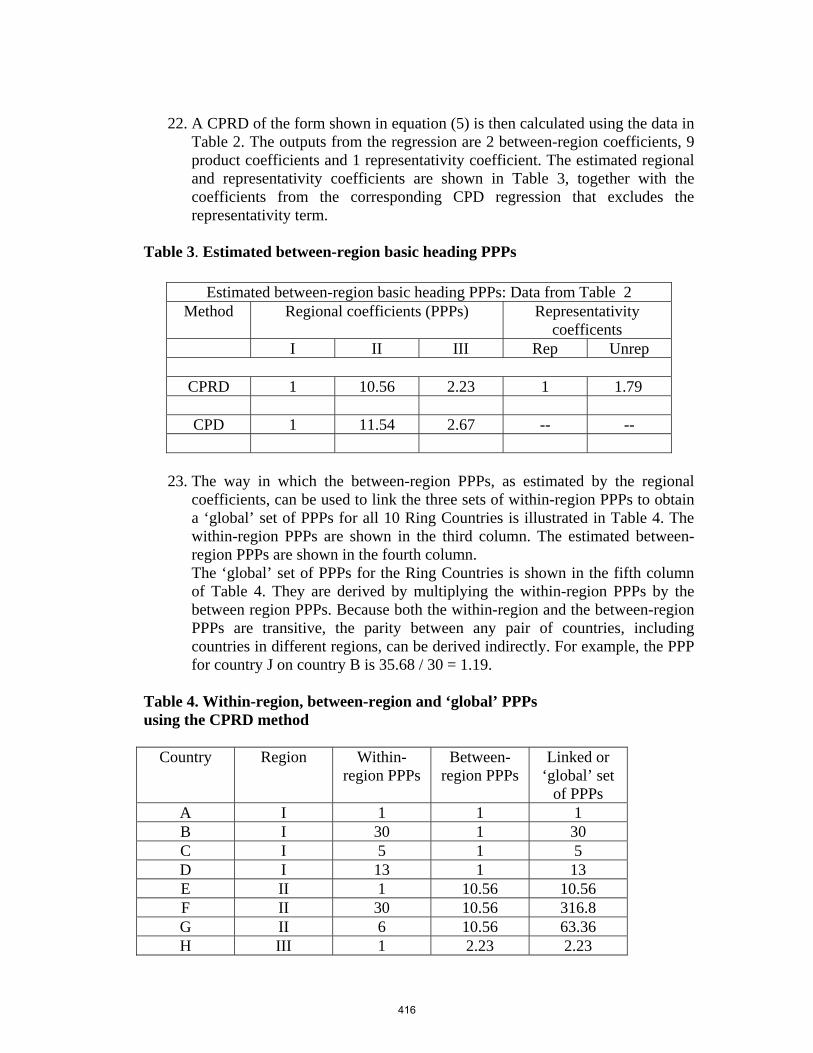
22. A CPRD of the form shown in equation (5) is then calculated using the data in
Table 2. The outputs from the regression are 2 between-region coefficients, 9 product coefficients and 1 representativity coefficient. The estimated regional and representativity coefficients are shown in Table 3, together with the coefficients from the corresponding CPD regression that excludes the representativity term.
Table 3. Estimated between-region basic heading PPPs
Estimated between-region basic heading PPPs: Data from Table 2
Method Regional coefficients (PPPs) Representativity coefficents
I II III Rep Unrep
CPRD 1 10.56 2.23 1 1.79
CPD 1 11.54 2.67 -- --
23. The way in which the between-region PPPs, as estimated by the regional
coefficients, can be used to link the three sets of within-region PPPs to obtain a ‘global’ set of PPPs for all 10 Ring Countries is illustrated in Table 4. The within-region PPPs are shown in the third column. The estimated between-region PPPs are shown in the fourth column. The ‘global’ set of PPPs for the Ring Countries is shown in the fifth column of Table 4. They are derived by multiplying the within-region PPPs by the between region PPPs. Because both the within-region and the between-region PPPs are transitive, the parity between any pair of countries, including countries in different regions, can be derived indirectly. For example, the PPP for country J on country B is 35.68 / 30 = 1.19.
Table 4. Within-region, between-region and ‘global’ PPPs using the CPRD method
Country Region Within-
region PPPs Between-
region PPPs Linked or
‘global’ set of PPPs
A I 1 1 1 B I 30 1 30 C I 5 1 5 D I 13 1 13 E II 1 10.56 10.56 F II 30 10.56 316.8 G II 6 10.56 63.36 H III 1 2.23 2.23
416
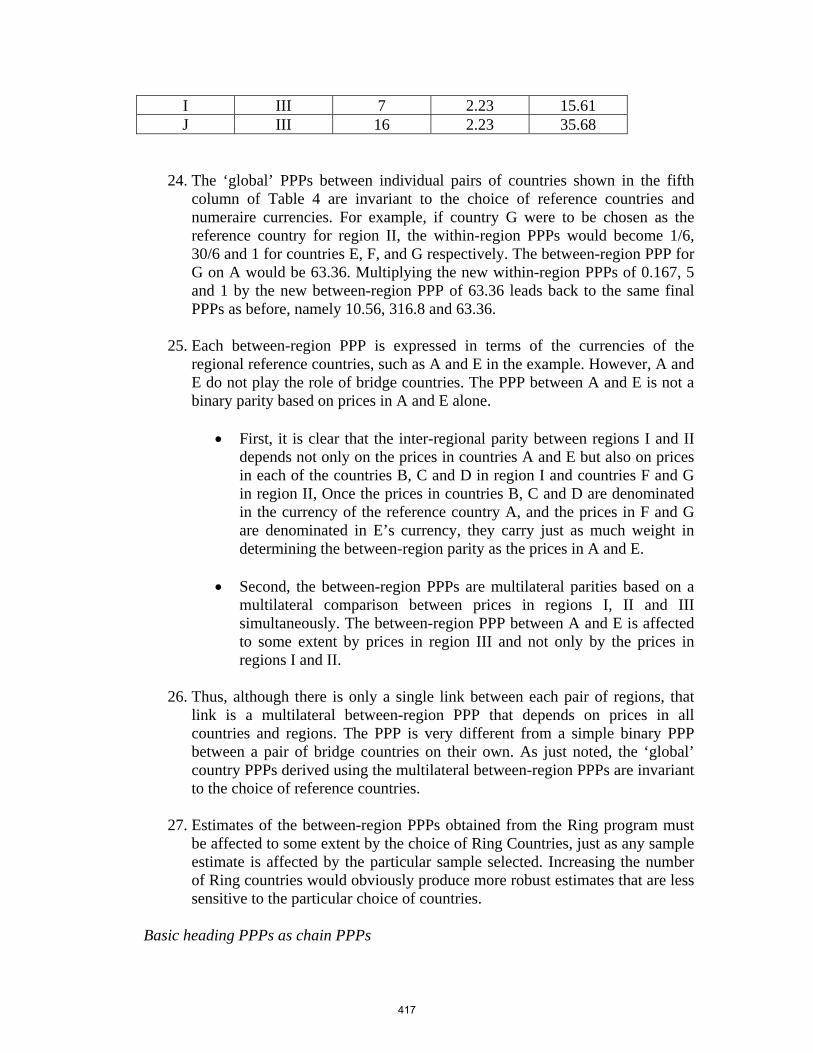
I III 7 2.23 15.61 J III 16 2.23 35.68
24. The ‘global’ PPPs between individual pairs of countries shown in the fifth column of Table 4 are invariant to the choice of reference countries and numeraire currencies. For example, if country G were to be chosen as the reference country for region II, the within-region PPPs would become 1/6, 30/6 and 1 for countries E, F, and G respectively. The between-region PPP for G on A would be 63.36. Multiplying the new within-region PPPs of 0.167, 5 and 1 by the new between-region PPP of 63.36 leads back to the same final PPPs as before, namely 10.56, 316.8 and 63.36.
25. Each between-region PPP is expressed in terms of the currencies of the
regional reference countries, such as A and E in the example. However, A and E do not play the role of bridge countries. The PPP between A and E is not a binary parity based on prices in A and E alone.
• First, it is clear that the inter-regional parity between regions I and II
depends not only on the prices in countries A and E but also on prices in each of the countries B, C and D in region I and countries F and G in region II, Once the prices in countries B, C and D are denominated in the currency of the reference country A, and the prices in F and G are denominated in E’s currency, they carry just as much weight in determining the between-region parity as the prices in A and E.
• Second, the between-region PPPs are multilateral parities based on a
multilateral comparison between prices in regions I, II and III simultaneously. The between-region PPP between A and E is affected to some extent by prices in region III and not only by the prices in regions I and II.
26. Thus, although there is only a single link between each pair of regions, that
link is a multilateral between-region PPP that depends on prices in all countries and regions. The PPP is very different from a simple binary PPP between a pair of bridge countries on their own. As just noted, the ‘global’ country PPPs derived using the multilateral between-region PPPs are invariant to the choice of reference countries.
27. Estimates of the between-region PPPs obtained from the Ring program must
be affected to some extent by the choice of Ring Countries, just as any sample estimate is affected by the particular sample selected. Increasing the number of Ring countries would obviously produce more robust estimates that are less sensitive to the particular choice of countries.
Basic heading PPPs as chain PPPs
417
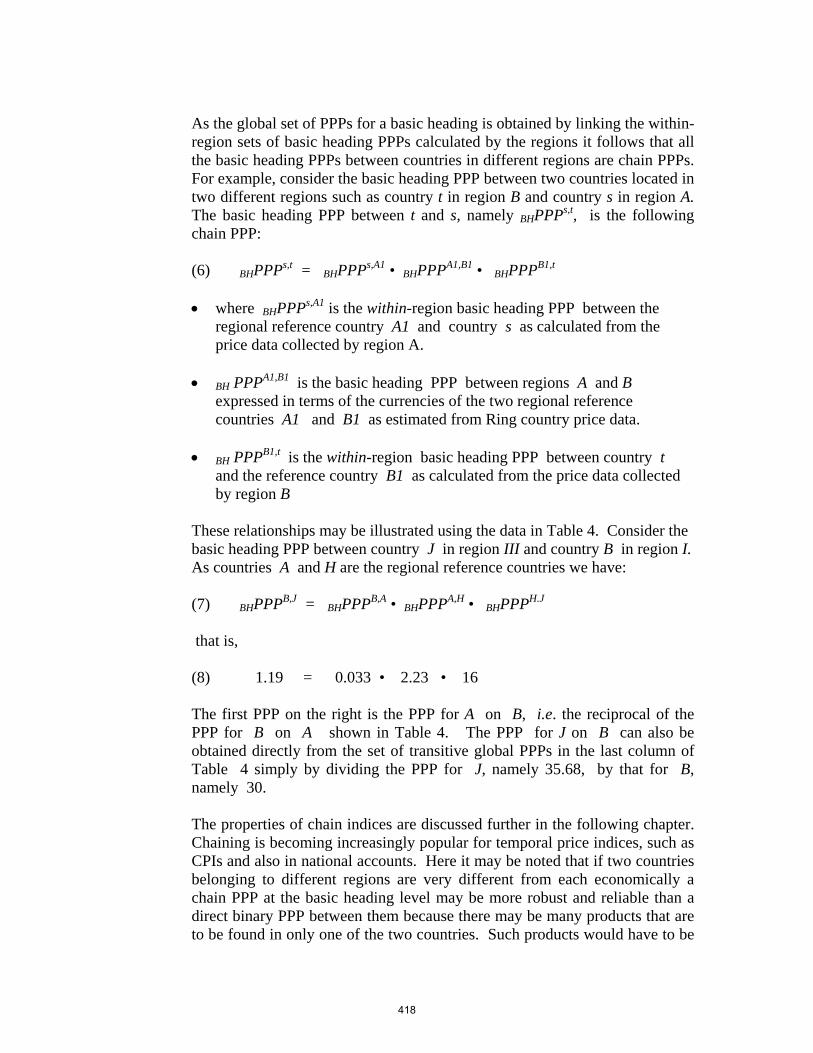
As the global set of PPPs for a basic heading is obtained by linking the within-region sets of basic heading PPPs calculated by the regions it follows that all the basic heading PPPs between countries in different regions are chain PPPs. For example, consider the basic heading PPP between two countries located in two different regions such as country t in region B and country s in region A. The basic heading PPP between t and s, namely BHPPPs,t, is the following chain PPP:
(6) BHPPPs,t = BHPPPs,A1 • BHPPPA1,B1 • BHPPPB1,t
• where BHPPPs,A1 is the within-region basic heading PPP between the
regional reference country A1 and country s as calculated from the price data collected by region A.
• BH PPPA1,B1 is the basic heading PPP between regions A and B
expressed in terms of the currencies of the two regional reference countries A1 and B1 as estimated from Ring country price data.
• BH PPPB1,t is the within-region basic heading PPP between country t
and the reference country B1 as calculated from the price data collected by region B
These relationships may be illustrated using the data in Table 4. Consider the basic heading PPP between country J in region III and country B in region I. As countries A and H are the regional reference countries we have:
(7) BHPPPB,J = BHPPPB,A • BHPPPA,H • BHPPPH.J
that is, (8) 1.19 = 0.033 • 2.23 • 16
The first PPP on the right is the PPP for A on B, i.e. the reciprocal of the PPP for B on A shown in Table 4. The PPP for J on B can also be obtained directly from the set of transitive global PPPs in the last column of Table 4 simply by dividing the PPP for J, namely 35.68, by that for B, namely 30. The properties of chain indices are discussed further in the following chapter. Chaining is becoming increasingly popular for temporal price indices, such as CPIs and also in national accounts. Here it may be noted that if two countries belonging to different regions are very different from each economically a chain PPP at the basic heading level may be more robust and reliable than a direct binary PPP between them because there may be many products that are to be found in only one of the two countries. Such products would have to be
418
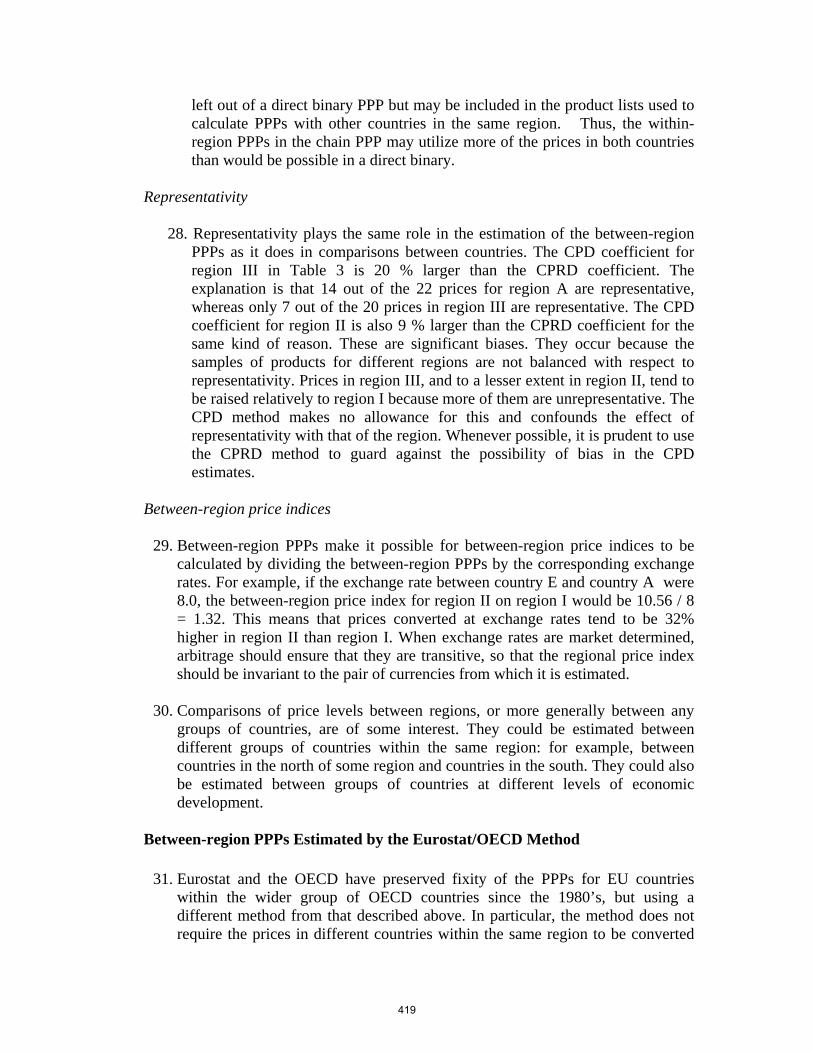
left out of a direct binary PPP but may be included in the product lists used to calculate PPPs with other countries in the same region. Thus, the within-region PPPs in the chain PPP may utilize more of the prices in both countries than would be possible in a direct binary.
Representativity
28. Representativity plays the same role in the estimation of the between-region PPPs as it does in comparisons between countries. The CPD coefficient for region III in Table 3 is 20 % larger than the CPRD coefficient. The explanation is that 14 out of the 22 prices for region A are representative, whereas only 7 out of the 20 prices in region III are representative. The CPD coefficient for region II is also 9 % larger than the CPRD coefficient for the same kind of reason. These are significant biases. They occur because the samples of products for different regions are not balanced with respect to representativity. Prices in region III, and to a lesser extent in region II, tend to be raised relatively to region I because more of them are unrepresentative. The CPD method makes no allowance for this and confounds the effect of representativity with that of the region. Whenever possible, it is prudent to use the CPRD method to guard against the possibility of bias in the CPD estimates.
Between-region price indices
29. Between-region PPPs make it possible for between-region price indices to be
calculated by dividing the between-region PPPs by the corresponding exchange rates. For example, if the exchange rate between country E and country A were 8.0, the between-region price index for region II on region I would be 10.56 / 8 = 1.32. This means that prices converted at exchange rates tend to be 32% higher in region II than region I. When exchange rates are market determined, arbitrage should ensure that they are transitive, so that the regional price index should be invariant to the pair of currencies from which it is estimated.
30. Comparisons of price levels between regions, or more generally between any
groups of countries, are of some interest. They could be estimated between different groups of countries within the same region: for example, between countries in the north of some region and countries in the south. They could also be estimated between groups of countries at different levels of economic development.
Between-region PPPs Estimated by the Eurostat/OECD Method
31. Eurostat and the OECD have preserved fixity of the PPPs for EU countries within the wider group of OECD countries since the 1980’s, but using a different method from that described above. In particular, the method does not require the prices in different countries within the same region to be converted
419
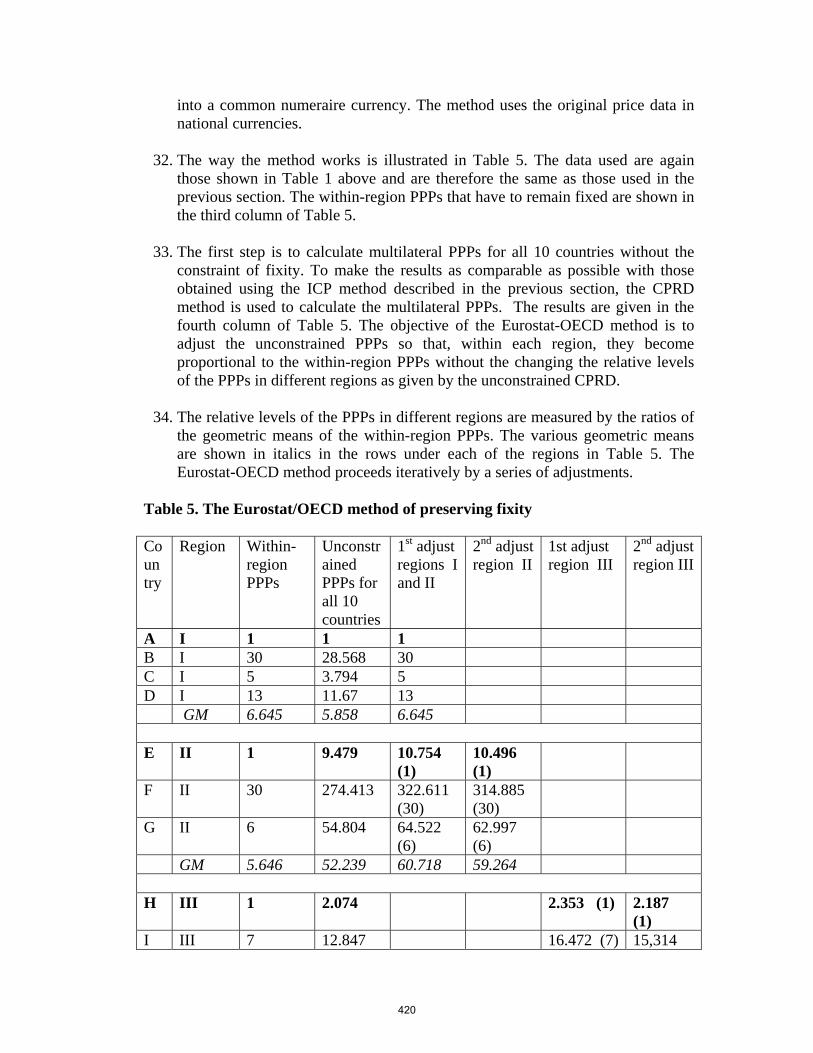
into a common numeraire currency. The method uses the original price data in national currencies.
32. The way the method works is illustrated in Table 5. The data used are again
those shown in Table 1 above and are therefore the same as those used in the previous section. The within-region PPPs that have to remain fixed are shown in the third column of Table 5.
33. The first step is to calculate multilateral PPPs for all 10 countries without the
constraint of fixity. To make the results as comparable as possible with those obtained using the ICP method described in the previous section, the CPRD method is used to calculate the multilateral PPPs. The results are given in the fourth column of Table 5. The objective of the Eurostat-OECD method is to adjust the unconstrained PPPs so that, within each region, they become proportional to the within-region PPPs without the changing the relative levels of the PPPs in different regions as given by the unconstrained CPRD.
34. The relative levels of the PPPs in different regions are measured by the ratios of
the geometric means of the within-region PPPs. The various geometric means are shown in italics in the rows under each of the regions in Table 5. The Eurostat-OECD method proceeds iteratively by a series of adjustments.
Table 5. The Eurostat/OECD method of preserving fixity Coun try
Region Within-region PPPs
Unconstrained PPPs for all 10 countries
1st adjust regions I and II
2nd adjust region II
1st adjust region III
2nd adjust region III
A I 1 1 1 B I 30 28.568 30 C I 5 3.794 5 D I 13 11.67 13 GM 6.645 5.858 6.645 E II 1 9.479 10.754
(1) 10.496 (1)
F II 30 274.413 322.611 (30)
314.885 (30)
G II 6 54.804 64.522 (6)
62.997 (6)
GM 5.646 52.239 60.718 59.264 H III 1 2.074 2.353 (1) 2.187
(1) I III 7 12.847 16.472 (7) 15,314
420
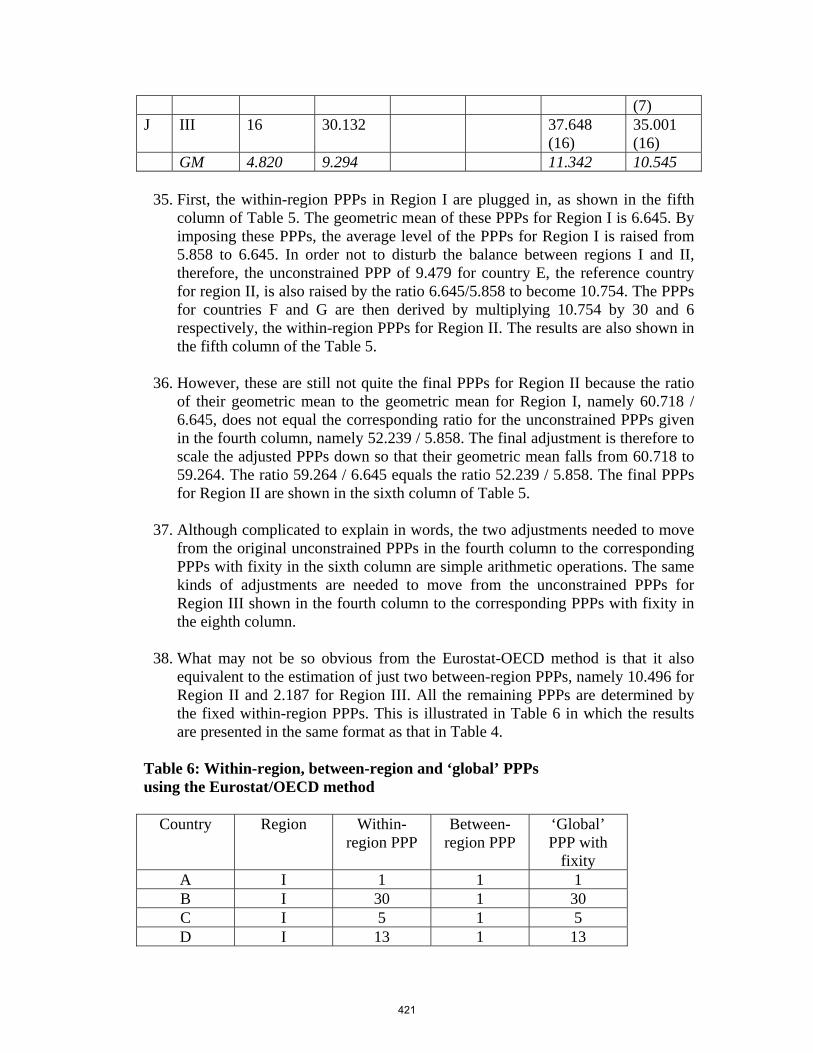
(7) J III 16 30.132 37.648
(16) 35.001 (16)
GM 4.820 9.294 11.342 10.545
35. First, the within-region PPPs in Region I are plugged in, as shown in the fifth column of Table 5. The geometric mean of these PPPs for Region I is 6.645. By imposing these PPPs, the average level of the PPPs for Region I is raised from 5.858 to 6.645. In order not to disturb the balance between regions I and II, therefore, the unconstrained PPP of 9.479 for country E, the reference country for region II, is also raised by the ratio 6.645/5.858 to become 10.754. The PPPs for countries F and G are then derived by multiplying 10.754 by 30 and 6 respectively, the within-region PPPs for Region II. The results are also shown in the fifth column of the Table 5.
36. However, these are still not quite the final PPPs for Region II because the ratio
of their geometric mean to the geometric mean for Region I, namely 60.718 / 6.645, does not equal the corresponding ratio for the unconstrained PPPs given in the fourth column, namely 52.239 / 5.858. The final adjustment is therefore to scale the adjusted PPPs down so that their geometric mean falls from 60.718 to 59.264. The ratio 59.264 / 6.645 equals the ratio 52.239 / 5.858. The final PPPs for Region II are shown in the sixth column of Table 5.
37. Although complicated to explain in words, the two adjustments needed to move
from the original unconstrained PPPs in the fourth column to the corresponding PPPs with fixity in the sixth column are simple arithmetic operations. The same kinds of adjustments are needed to move from the unconstrained PPPs for Region III shown in the fourth column to the corresponding PPPs with fixity in the eighth column.
38. What may not be so obvious from the Eurostat-OECD method is that it also
equivalent to the estimation of just two between-region PPPs, namely 10.496 for Region II and 2.187 for Region III. All the remaining PPPs are determined by the fixed within-region PPPs. This is illustrated in Table 6 in which the results are presented in the same format as that in Table 4.
Table 6: Within-region, between-region and ‘global’ PPPs using the Eurostat/OECD method
Country Region Within-
region PPP Between-
region PPP ‘Global’ PPP with
fixity A I 1 1 1 B I 30 1 30 C I 5 1 5 D I 13 1 13
421
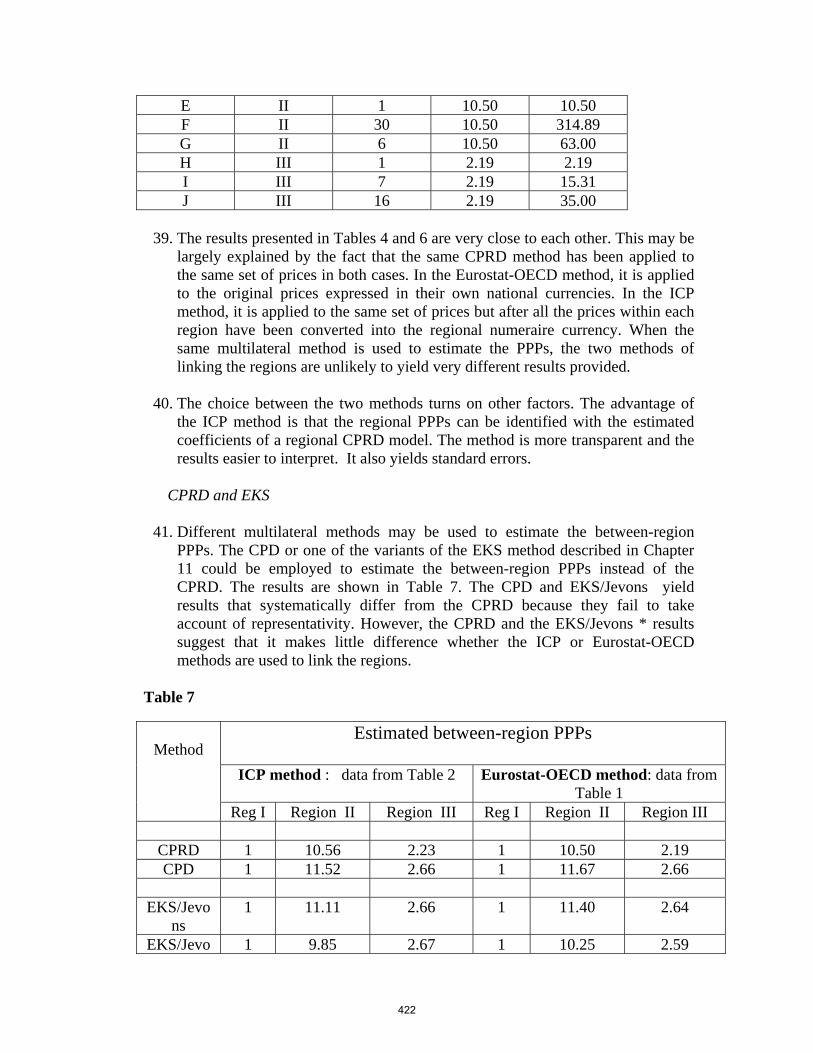
E II 1 10.50 10.50 F II 30 10.50 314.89 G II 6 10.50 63.00 H III 1 2.19 2.19 I III 7 2.19 15.31 J III 16 2.19 35.00
39. The results presented in Tables 4 and 6 are very close to each other. This may be
largely explained by the fact that the same CPRD method has been applied to the same set of prices in both cases. In the Eurostat-OECD method, it is applied to the original prices expressed in their own national currencies. In the ICP method, it is applied to the same set of prices but after all the prices within each region have been converted into the regional numeraire currency. When the same multilateral method is used to estimate the PPPs, the two methods of linking the regions are unlikely to yield very different results provided.
40. The choice between the two methods turns on other factors. The advantage of
the ICP method is that the regional PPPs can be identified with the estimated coefficients of a regional CPRD model. The method is more transparent and the results easier to interpret. It also yields standard errors.
CPRD and EKS
41. Different multilateral methods may be used to estimate the between-region
PPPs. The CPD or one of the variants of the EKS method described in Chapter 11 could be employed to estimate the between-region PPPs instead of the CPRD. The results are shown in Table 7. The CPD and EKS/Jevons yield results that systematically differ from the CPRD because they fail to take account of representativity. However, the CPRD and the EKS/Jevons * results suggest that it makes little difference whether the ICP or Eurostat-OECD methods are used to link the regions.
Table 7
Estimated between-region PPPs
ICP method : data from Table 2
Eurostat-OECD method: data from
Table 1
Method
Reg I Region II Region III Reg I Region II Region III
CPRD 1 10.56 2.23 1 10.50 2.19 CPD 1 11.52 2.66 1 11.67 2.66
EKS/Jevo
ns 1 11.11 2.66 1 11.40 2.64
EKS/Jevo 1 9.85 2.67 1 10.25 2.59
422
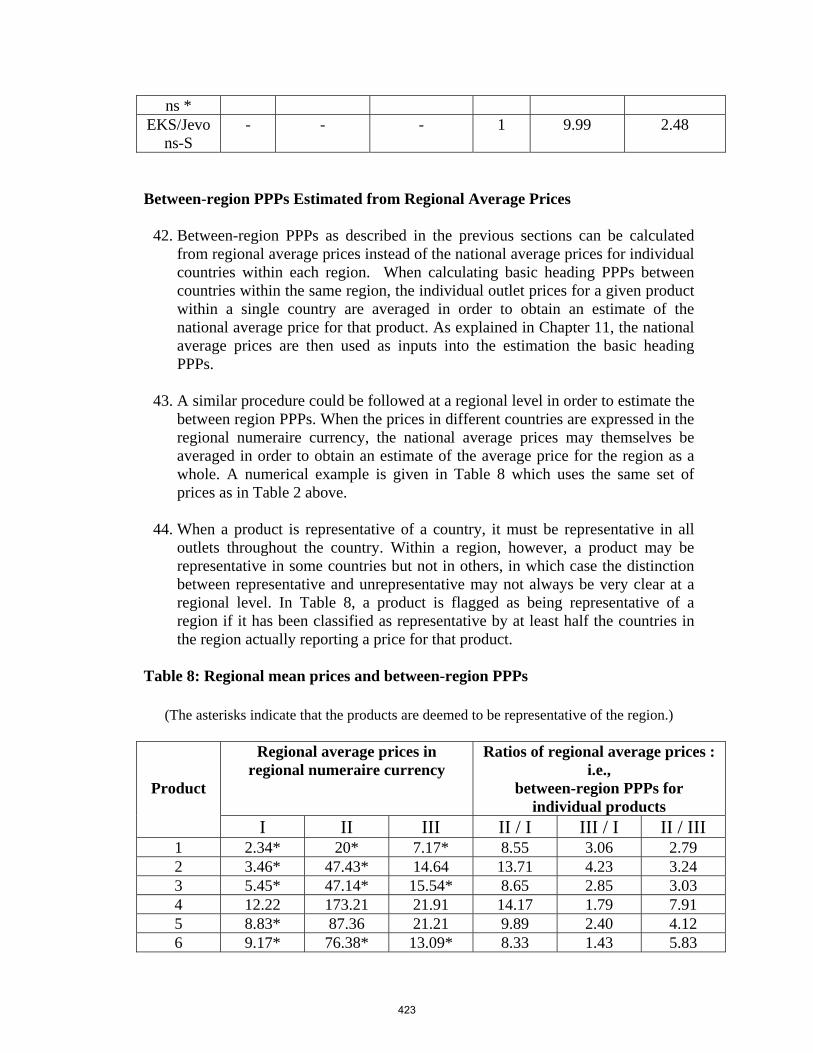
ns * EKS/Jevo
ns-S - - - 1 9.99 2.48
Between-region PPPs Estimated from Regional Average Prices
42. Between-region PPPs as described in the previous sections can be calculated from regional average prices instead of the national average prices for individual countries within each region. When calculating basic heading PPPs between countries within the same region, the individual outlet prices for a given product within a single country are averaged in order to obtain an estimate of the national average price for that product. As explained in Chapter 11, the national average prices are then used as inputs into the estimation the basic heading PPPs.
43. A similar procedure could be followed at a regional level in order to estimate the
between region PPPs. When the prices in different countries are expressed in the regional numeraire currency, the national average prices may themselves be averaged in order to obtain an estimate of the average price for the region as a whole. A numerical example is given in Table 8 which uses the same set of prices as in Table 2 above.
44. When a product is representative of a country, it must be representative in all
outlets throughout the country. Within a region, however, a product may be representative in some countries but not in others, in which case the distinction between representative and unrepresentative may not always be very clear at a regional level. In Table 8, a product is flagged as being representative of a region if it has been classified as representative by at least half the countries in the region actually reporting a price for that product.
Table 8: Regional mean prices and between-region PPPs
(The asterisks indicate that the products are deemed to be representative of the region.)
Regional average prices in
regional numeraire currency Ratios of regional average prices :
i.e., between-region PPPs for
individual products
Product
I II III II / I III / I II / III 1 2.34* 20* 7.17* 8.55 3.06 2.79 2 3.46* 47.43* 14.64 13.71 4.23 3.24 3 5.45* 47.14* 15.54* 8.65 2.85 3.03 4 12.22 173.21 21.91 14.17 1.79 7.91 5 8.83* 87.36 21.21 9.89 2.40 4.12 6 9.17* 76.38* 13.09* 8.33 1.43 5.83
423
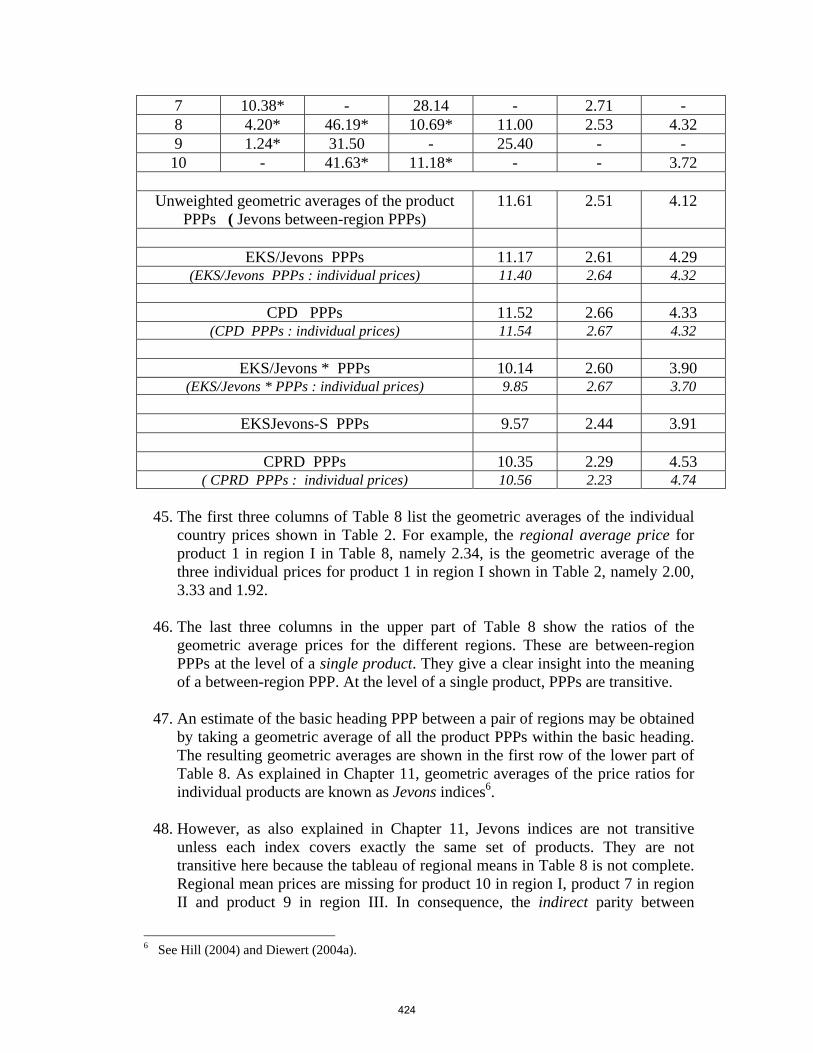
7 10.38* - 28.14 - 2.71 - 8 4.20* 46.19* 10.69* 11.00 2.53 4.32 9 1.24* 31.50 - 25.40 - - 10 - 41.63* 11.18* - - 3.72
Unweighted geometric averages of the product
PPPs ( Jevons between-region PPPs) 11.61 2.51 4.12
EKS/Jevons PPPs 11.17 2.61 4.29
(EKS/Jevons PPPs : individual prices) 11.40 2.64 4.32
CPD PPPs 11.52 2.66 4.33 (CPD PPPs : individual prices) 11.54 2.67 4.32
EKS/Jevons * PPPs 10.14 2.60 3.90
(EKS/Jevons * PPPs : individual prices) 9.85 2.67 3.70
EKSJevons-S PPPs 9.57 2.44 3.91
CPRD PPPs 10.35 2.29 4.53 ( CPRD PPPs : individual prices) 10.56 2.23 4.74
45. The first three columns of Table 8 list the geometric averages of the individual
country prices shown in Table 2. For example, the regional average price for product 1 in region I in Table 8, namely 2.34, is the geometric average of the three individual prices for product 1 in region I shown in Table 2, namely 2.00, 3.33 and 1.92.
46. The last three columns in the upper part of Table 8 show the ratios of the
geometric average prices for the different regions. These are between-region PPPs at the level of a single product. They give a clear insight into the meaning of a between-region PPP. At the level of a single product, PPPs are transitive.
47. An estimate of the basic heading PPP between a pair of regions may be obtained
by taking a geometric average of all the product PPPs within the basic heading. The resulting geometric averages are shown in the first row of the lower part of Table 8. As explained in Chapter 11, geometric averages of the price ratios for individual products are known as Jevons indices6.
48. However, as also explained in Chapter 11, Jevons indices are not transitive
unless each index covers exactly the same set of products. They are not transitive here because the tableau of regional means in Table 8 is not complete. Regional mean prices are missing for product 10 in region I, product 7 in region II and product 9 in region III. In consequence, the indirect parity between
6 See Hill (2004) and Diewert (2004a).
424
regions III and II derived from the Jevons PPPs for II on I and III on I, i.e., 11.61 / 2.51 = 4.63 is not equal to direct Jevons for II on III, i.e., 4.12. However, transitivity can be imposed on the Jevons PPPs by using the EKS formula.
49. In Table 8, the resulting EKS/Jevons PPPs are given in the row below that for
the Jevons indices. Because there are not many missing prices, the EKS/Jevons PPPs are very similar to the original Jevons PPPs. For comparison, Table 8 also show the earlier EKS/Jevons PPPs based on the national average prices for individual countries. Again, the results are very similar.
50. For completeness, the inter-regional parities calculated by EKS/Jevons *,
EKS/Jevons-S and the CPRD method are also given in Table 8, calculated both from the regional average prices and from the national average prices for individual countries. The CPRD results based on the regional average prices in Table 8 scarcely differ from those based on the more detailed price data in Table 2. The inclusion of representativity lowers the CPRD parities for both regions II and III based on I, as compared with the CPD and EKS/Jevons. The results reflect the differing proportions of representative products in the three regions.
51. Estimating between-region PPPs from regional average prices is clearly an
alternative to estimating them from the national average prices for individual countries. As there is only one regional average price per region, equal weight is given to each region. The concept of a between-region PPP is also easy to explain to users when based on regional mean prices.
52. On the other hand, it is generally not desirable to aggregate data unless the sheer
volume of data makes it necessary. Aggregation entails a loss of detail and of degrees of freedom which may detract from the reliability of estimates based on the data. In the present context, aggregating countries into regions may well lead to the loss of useful information about representativity.
53. On balance, it seems preferable to work with the national average prices of
individual countries rather than regional average prices. The within-region basic heading PPPs obviously have to be based on data for individual countries. The same data, after conversion into the regional numeraire currency, can be used to estimate the between-region PPPs following the same kind of methodology as used to estimate the within-region PPPs.
Some Conclusions
54. Two methods of linking sets of basic heading PPPs for different regions have been explained in the chapter. Both are multilateral methods that use only a single link between any given pair of regions. Each set of within-region PPPs is preserved intact so that each set of regional PPPs retains its own regional characteristicity.
425
55. The two methods are the Eurostat-OECD method and a modified version of the
CPRD used to estimate the PPPs between countries within the same region. Both methods appear likely to produce very similar links, although the results from a hypothetical numerical example obviously do not provide conclusive evidence. The CPRD method is preferred for ICP purposes because it is based on a model in which the role of the region is explicit and transparent. It can also provide standard errors.
56. The global set of PPPs for each basic heading covering all countries
participating in ICP 2005 round is obtained by linking the within-region PPPs calculated by the regions by means of the between-region PPPs calculated for the Ring Countries. The resulting global sets of PPPs for all the basic headings, together with the corresponding basic heading expenditure data from the national accounts, provide the data required to calculate a global set of PPPs for higher level expenditure aggregates. As explained in the next chapter, a variety of different methods may be used to calculate a global set of aggregate PPPs. However, as the basic heading PPPs are chain indices the aggregate PPPs at the global level must also be some form of chain indices, given that higher level aggregates are simply groups of basic headings.
57. The CPD method was used to compute between region PPPs. The
representativity concept was not applied uniformly across regions, thus; the CPRD method was not used.
REFERENCES CPI Manual (2004): Consumer price index manual: Theory and practice, ILO, IMF, OECD, UNECE, EU, The World Bank, Geneva: International Labour Office, 2004. Diewert, W. E, (2004a), “Elementary Indices”, Chapter 20 of the CPI Manual (2004), pp. 353-371 Diewert, W. E, (2004b), “On the Stochastic Approach to Linking the Regions in the ICP”, Discussion Paper No. 04-16, Department of Economics, The University of British Columbia, Vancouver, Canada, Oct. 2004. Hill, T. P. (2004), “An Introduction to Consumer Price Index Methodology”, Chapter 1 of the CPI Manual (2004), pp. 1-32.
426

Kravis I. B., Kennessy Z., Heston, A. and Summers R. (1975), A System ofIinternational Comparisons of Gross Product and Purchasing Power, The Johns Hopkins University Press, Baltimore and London, 1975.
427
Chapter 15
Linking PPPs and Real Expenditures for GDP and Lower Level Aggregates
Two-stage methods and scalar adjustments
Introduction
1. As explained in previous chapters, the calculation of the basic heading PPPs at the
global level is a two-stage procedure in ICP 2005. At the first stage, described in Chapter 11, a multilateral set of basic heading PPPs is calculated for the countries within each region using the CPRD method. Each set of within-region PPPs is calculated independently of each other using separate product lists. At the second stage, described in Chapter 14, transitive multilateral between-region basic heading PPPs are calculated, again using the CPRD method. These between-region PPPs are then used to link the sets of within-region PPPs together to obtain a global set of basic heading PPPs.
2. The global set of aggregate PPPs can be calculated by continuing this two-stage
procedure. At the first stage, a multilateral set of aggregate PPPs is calculated between the countries within each region using one or other of the aggregation methods described in Chapter 12. At the second stage, multilateral between-region aggregate PPPs are calculated and are then used to link the sets of within-region aggregate PPPs.
3. Whereas within-region PPPs compare prices between individual countries in the
same region, between-region PPPs compare prices between entire regions after the prices in the individual countries in each region have been converted into a common currency, the regional numeraire. Between-region PPPs may be calculated at any level of aggregation from the basic heading level up to GDP.
4. Two points may be noted about these two-stage procedures, whether applied at the
basic heading level or a higher level of aggregation.
• The global set of PPPs is invariant to the order in which in the sets of regional PPPs are arrayed for purposes of linking because the between-region PPPs are themselves transitive multilateral PPPs.
• Chaining sets of within-region PPPs does not disturb the PPPs between
individual countries within a region. At every level of aggregation from the basic heading up to GDP, the PPPs between countries within the same region are the same at the global level as they are at the regional level.
5. The last part of the chapter examines a related issue, namely how to decompose a
universal set of PPPs into sets of PPPs for different regions or sub-groups. A universal set is one in which all countries are treated in the same way
428
irrespectively of their location. There is a need for such a breakdown for the group of countries covered by the joint OECD-Eurostat PPP program. It is shown that chaining methods and decomposition methods have many points in common.
Chaining Aggregate Within-Region PPPs Using Aggregate Between-Region PPPs1 6. Given the regionalization of ICP 2005, the PPPs between countries of the same
region, whether for a basic heading or a higher level aggregate, are those calculated by the regions themselves. Whatever the level of aggregation, the global set of PPPs may be obtained by linking the regional sets of PPPs together by means of between-region PPPs. This section explains how the between-region PPPs for a higher level aggregate such as GDP may be calculated.
7. Whatever the aggregation formula used, the calculation of a set of aggregate PPPs
requires two sets of data: • A set of basic heading PPPs and • A matching set of basic heading expenditures.
8. To calculate aggregate between-region PPPs, the basic heading data have to refer
to entire regions as distinct from individual countries. It is therefore necessary to have the following data.
• A global set of between-region PPPs for each basic heading and • A matching set of basic heading expenditures for each region as a whole
denominated in the selected numeraire currency for the region.
9. The required between-region PPPs for the individual basic headings are those obtained by applying the method described in the previous chapter. They are used here as inputs into the calculation of aggregate between-region PPPs.
10. In order to obtain the matching set of regional expenditures, the national
expenditures in each country in the region have to be converted into the regional numeraire currency. Within-region basic heading PPPs may be used for this purpose. Once the expenditures within a given basic heading have been converted, they may be summed up across all the countries in the region to obtain the total regional expenditure for that heading.
11. The required between-region PPPs for a higher level aggregate may now be
calculated by applying one of the aggregation formulae given in Chapter 12 to the basic heading between-region PPPs and their associated regional expenditures. The aggregation formulae are exactly the same as those in Chapter 12 and do not need to be repeated.
12. As already noted, the global set of PPPs for any expenditure aggregate may be
obtained by linking together the various set of aggregate within-region PPPs by
1 The two-stage method described in this section was proposed by Erwin Diewert (2004)
429
means of aggregate between-region PPPs. The linked results are invariant to the order in which the various sets of aggregate within-region PPPs are linked because the aggregate between-region PPPs are themselves transitive. The results are also invariant to the choice of reference country and numeraire currency for each region
13. For example, consider the GDP PPP between two countries located in two
different regions such as country t in region B and country s in region A. The GDP PPP for t on s, denoted by GDPPPPs,t, is the following chain PPP:
(1) GDPPPPs,t = GDPPPPs,A1 • GDPPPPA1,B1 • GDPPPPB1,t
• where GDPPPPs,A1 is the within-region GDP PPP for country s on the
regional reference country A1 as calculated by region A.
• GDP PPPA1,B1 is the GDP PPP for region B on region A expressed in terms of the currencies of the two regional reference countries A1 and B1 as calculated at the global level.
• GDP PPPB1,t is the within-region PPP for country t on the reference
country B1 as calculated by region B. 14. In the ICP, the PPPs between countries within the same region, here GDPPPPs,A1
and GDP PPPB1,t, are based exclusively on data collected within the region in question. On the other hand, the between-region PPP, GDP PPPA1,B1, is an estimate based exclusively on prices collected by the Ring countries. The total regional expenditures used in conjunction with the between-region basic heading PPPs to calculate the GDP PPPs can be obtained by either by summing across all countries within each region or by summing across the Ring countries only.2
Use of Specific Between-Region PPPs 15. Each basic heading is itself actually an expenditure aggregate3 that has its own set
of between-region PPPs that serve as the links between the various sets of within-region PPPs. As higher level aggregates are obtained simply by combining or merging basic headings, each higher level aggregate also has its own set of between-region PPPs.
16. For example, the higher level aggregate for food consumption, is obtained by
combining all the basic headings referring to food expenditures. The PPP for country t on country s for an aggregate such as food is a chain PPP that has the same form as (1) but with the suffix F for food instead of GDP: thus,
(2) FPPPs,t = FPPPs,A1 • FPPPA1,B1 • FPPPB1,t
2 The aggregate between-region PPPs are not likely to be sensitive to which set of expenditures is used as weights, as the relative sizes of the basic headings at the regional level are likely to be very similar, whether expenditures in all countries or just in the Ring countries are used. 3 In Consumer Price Indices, basic headings are actually described as “elementary aggregates”. A basic heading is effectively the lowest aggregate for which expenditure data can be obtained.
430
17. Thus, the global PPPs at every level of aggregation from the basic heading up to
GDP are chain PPPs. Each aggregate has its own specific between-region PPPs that serve as the links between the various sets of within region PPPs.
18. In a time series context it has long been recognised that chain indices are not
additive.4 In a PPP context this implies that if the various expenditures in a country expressed in its own national currency are converted into the world numeraire currency by chain PPPs, the resulting converted expenditures will not be additive. Except for the region containing the world reference country, the sum of the converted expenditures for the components of a higher-level aggregate will not equal the converted expenditure for the aggregate as a whole even though in their original national currencies components must sum to the aggregates by definition.
19. In a time series context, chain indices are increasingly recognized and preferred
by users and compilers as providing better measures of price and quantity movements than fixed weight indices. The loss of additivity is generally considered to be a small price to pay to obtain superior measures of price and quantity movements for both components and aggregates5.
20. However, countries are not time periods that can be chronologically ordered6.
They cannot easily be grouped in the way that consecutive years can be grouped into runs of five or ten years. The regions into which countries are grouped in the ICP are to some extent arbitrary and may not be optimal for chaining purposes7.
21. At a world level, some countries differ greatly from others in respect of their
tastes, living standards and patterns of consumption and production. Direct comparisons between countries in different regions that are economically very different from each other may prove both difficult and unreliable because their patterns of relative prices and quantities diverge considerably and there may be only a small overlap between the sets of goods and services available in the two countries. As explained further in the next section, chaining such countries through the regions to which they belong is likely to provide more reliable estimates of their PPPs than direct binaries between them.
4 See, for example, Karmel (1954) who noted that chained indices of inputs and outputs are not additive. The 1993 SNA Manual observes, in paragraph 16.37, that in a time series context “when every series at each level of aggregation is individually linked, the resulting constant price data are not additively consistent after the linking has taken place.” The 2004 CPI Manual observes, in paragraph 9.113, that “Chaining leads to non-additivity. When the new series is chained onto the old, … , the higher-level indices after the link cannot be obtained as weighted arithmetic averages of individual indices using the new weights.” 5 The 1993 SNA Manual remarks, in paragraph 16.76, that “the underlying issue is not whether to chain or not but how often to rebase… Long runs of data … almost inevitably involve some form of chain indices.” Similarly, in the context of international comparisons, very large numbers of countries almost inevitably require countries to be grouped and the groups to be chained. 6 However, it is possible to arrange countries objectively to form a connected graph by constructing a Minimum Spanning Tree in which countries are linked on the basis of some objective criterion such as the similarity of their price structures: see Hill (1997). 7 Kravis, Heston and Summers discuss the problems of identifying homogeneous sets of countries given that they may be grouped in different ways on the basis of different criteria, such as geographical propinquity or similarity of price structures. See Kravis, Heston and Summers (1982), pp. 104-111.
431
Two-Stage GK 22. In the Diewert method described in the previous section, the choice of aggregation
method is left open. Any aggregation method may be used. The use of the Geary-Khamis, or GK, method of aggregation is examined in this section as it is well suited to two-stage procedures.
23. At the first stage, each region uses the GK method to calculate the aggregate PPPs
between the countries within its own region. As explained in Chapter 12, the GK method values the quantities in the different countries at the average international prices for the region as a whole. The national average prices are averaged after they have been converted into the numeraire currency for the region using the GDP PPPs generated by the GK method itself. The PPPs and the average prices are simultaneously determined.
24. At the second stage, the GK method is applied to the regions themselves to
estimate the between-region PPPs at each level of aggregation above the basic heading up to, and including, GDP. As already stated, two sets of data are required for this purpose:
• A set of between-region PPPs for each basic heading and • The total expenditure in the region within each basic heading expressed in
the region’s numeraire currency. 25. In the Diewert method, within-region basic heading PPPs are used to convert from
national currencies to the regional numeriare. However, when the GK method is used at the first stage to calculate the aggregate PPPs within the region, the total expenditure for each region at average GK prices is automatically generated by the GK method itself. The expenditures in the different countries are converted into the regional numeraire using the GK’s own PPPs rather than the basic heading PPPs. Given that the GK method is being used to calculate both the within- and the between-region aggregate PPPs, the total regional expenditures used at the second stage should be those generated at the first stage by the GK method itself.
26. In the case of the GK method, it is convenient to focus on the quantity indices
rather than the PPPs as the quantity indices have a particularly simple form. GK quantity indices are examples of Lowe quantity indices which use the same set of prices to value the quantities of goods and services in two different situations.8 As explained in Chapter 12, the GK quantity index is a Lowe index in which the quantities in two different countries are valued at the average prices of the group
8 The concept of a Lowe price index was introduced in the 2004 CPI Manual (see Chapters 1 and 15). A Lowe price index measures the change in the total cost of purchasing a fixed basket of goods and services between two time periods. The basket does not have to be that purchased in one or other of the two periods compared and any basket may be chosen.
432
of countries to which they belong.9 It can be decomposed into the ratio of the Laspeyres indices for the two countries based on the group as a whole10. Thus, the within-region GK quantity index for country k on country j in region A, or QGK
j,k , may be written as follows:
(3) jALA
kALA
n
i
Ai
Ai
n
i
ji
Ai
n
i
Ai
Ai
n
i
ki
Ai
n
i
ji
Ai
n
i
ki
Ai
kjGK Q
Q
Qp
qp
Qp
qp
qp
qpQ ,
,
1
1
1
1
1
1, ===
∑
∑
∑
∑
∑
∑
=
=
=
=
=
=
pi
A is the average price of product i in region A while QiA
is the total quantity of product i in region A. The term QLA
A,k denotes the Laspeyres quantity index for
country k based on region A. The term ΣpiAQi
A is the total GDP for region A measured at the average prices for the region. However, it is not actually necessary to know the total quantities in the region as the term Σpi
AQiA in the two denominators in
(3) cancel each other out. 27. Alternatively, the GK quantity index for k on j can be expressed as a chain index,
as follows.
(4) kALA
AjPAn
i
Ai
Ai
n
i
ki
Ai
n
i
ji
Ai
n
i
Ai
Ai
kjGK QQ
Qp
qp
qp
QpQ ,,
1
1
1
1, ⋅=⋅=
∑
∑
∑
∑
=
=
=
=
where QPA
j,A is the Paasche quantity index for region A based on country j, while QLA
A,k is the Laspeyres quantity index for country k based on region A. Thus, QGKj,k
can be interpreted as a chain index in which k is linked to j via region A as a whole. 28. It is necessary to have the GK average prices for region A to be able to calculate
the Paasche and Laspeyres indices in (4) so that the full GK system of equations still has to be solved. Equation (4) is intended to throw light on the properties of GK quantity indices. It is not an alternative way of calculating them.
29. As noted in the previous chapter, if countries j and k are very different there may
be only a small overlap between the sets of products available in the two countries. In this case, a direct Laspeyres, Paasche or Fisher quantity index between the two countries will be obliged to ignore many of the quantities in one or other country because they are not to be found in the other. This means that a direct index will have poor coverage and be liable to bias. However, the GK quantity index is able to include all products in both countries because it is a chain index using the region as a whole as a link. For the region as a whole, there must
9 The GK method therefore belongs to the class of methods described as average price methods. See Kravis, Heston and Summers (1982) pp.77-79 and Hill (1997) pp. 54-62. It should be noted, however, that in the GK method the average prices are determined simultaneously with the PPPs as the solution to a set of simultaneous equations. 10 See Hill (1997) pp. 54-60.
433
be an average price and total quantity for every product in every country. Every product in both j and k can be included in the GK quantity index even though there may be only a limited overlap between the sets of products available in the two countries.11
30. When the two-stage GK method is used, the between-region PPPs calculated as
described above can be used to convert the total expenditures for the various regions expressed in their regional numeraire currencies into the world numeraire currency to obtain the real expenditures of the regions at average world prices. The ‘world’ is the union of all the regions. The GK world average prices at the second stage are quantity weighted averages of the GK regional average prices calculated in the first stage of two-stage GK. World prices are expressed in the selected world numeraire currency which will usually be one of the regional numeraire currencies.
31. The ratios of the real regional expenditures for two regions at GK world prices
constitute between-region GK quantity indices. In the two-stage GK method the quantity index for an aggregate such as GDP between two countries located in two different regions, such as country t in region B and country s in region A, namely QGK
s,t, is a chain index of the following form:
(5) QGKs,t = QGK
s,A • QGKA,B • QGK
B,t
where
• GDPQGKs,A is the within-region GK quantity index for region A on
country s calculated at the average prices of region A.
• GDPQGKA,B is the between-region GK quantity index for region B on
region A calculated at average world prices.
• GDPQGKB,t is the within-region GK quantity index for country t based on
region A calculated at the average prices of region B. 32. The middle term in (5), the GK quantity index for region B on region A, can be
factored into the product of a Paasche and a Laspeyres index as follows:
(6) QGKA,B = QPA
A,W · QLAW.B
33. where W denotes the world: i.e., the union of all the regions. In order to obtain the
GK average world prices needed to calculate the Paasche and Laspeyres indices the full GK system of equations for the regions at the second stage of the two-stage GK has to be solved.
34. Thus, equation (5) can be rewritten as a chain index in terms of Paasche and
Laspeyres indices as follows:
(7) QGKs,t = QPA
s,A • QPAA,W • QLA
W,B • QLAB,t
11 See Hill (2006).
434
35. When the two-stage GK method is used, the GK quantity index between two
countries belonging to different regions can be viewed as a chain index with three links. First, the size of country t relatively to region B, the region to which it belongs, is established at the average prices of B. Second, the size of B relatively to the world W is established at average world prices. Third, the size of A relatively to W is established at average world prices. Finally, the size of country s relatively to region A is established at the average prices of A. The various indices are either Paasche or Laspeyres and hence have a simple interpretation.
36. At the first stage of a two-stage GK, the share of each country’s real expenditures
in the total for the region is measured at the GK average prices for the region. At the second stage, the share of each region’s real expenditures in the world total is measured at the GK average prices for the world. For any aggregate, the share of an individual country’s expenditures in total world expenditures can be obtained by multiplying the two shares. The results are transitive with the shares summing to unity both within a region and within the world as a whole.
The Binary Approach and Two-Stage EKS 37. It is also possible to use a binary approach and the EKS formula as the
aggregation method within the framework of the two-stage methodology proposed by Diewert. At the first stage, the regions can use EKS/Fishers as their aggregate PPPs between countries within their own region12. At the second stage, the EKS/Fishers can be used as the aggregate PPPs between regions at a world level. The data required at the second stage are exactly the same as for the GK method, namely the total expenditures in each region for each basic heading together with the between-region PPPs for each basic heading. Once the aggregate between-region EKS/Fisher PPPs have been calculated, they can be used to link the aggregate within-region EKS/Fisher PPPs calculated by the regions.
38. As in the two-stage GK method, the aggregate EKS/Fisher PPPs between
countries in different regions are chain indices of the same kind as the basic heading PPPs on which they are based. The aggregate EKS/Fisher PPP for country t in region B on country s in region A is as follows
(8) PPPEKS
s,t = PPPEKSs,A1 • PPPEKS
A1,B1 • PPPEKSB1,t
where countries A1 and B1 are the selected reference countries whose currencies serve as the regional numeraires. The first and third terms in (8) are the within region EKS/Fisher PPPs between countries s and t and their respective reference countries, while the middle term PPPEKS
A1,B1 is the aggregate EKS/Fisher between-region PPP between the two reference countries.
39. Each aggregate above the level of the basic heading has its own set of aggregate
between-region EKS/Fisher PPPs in the same way that each basic heading has its own set of between-region PPPs. As the PPPs for both the basic headings and the
12 EKS/Fishers are Fisher PPPs on which transitivity has been imposed using the EKS formula.
435
higher level aggregates are chain PPPs, the associated real expenditure data are not additive. However, the EKS/Fisher real expenditures for countries within the same region are not additive, even before they are linked. The loss of additivity caused by chaining regional sets of PPPs is immaterial for the EKS/Fisher method as Fisher is not an additive index anyway, either before or after transitiviy has been imposed by the EKS formula.
40. The difference between a one-stage, or universal, method in which regions are
ignored and a two stage method is thrown into sharp relief when the EKS/Fisher method is used. Suppose there are 150 countries, and 6 regions each containing 25 countries. In this case, a universal EKS/Fisher would require 150•149/2 = 11,175 binary Fishers to be calculated. Of these, 1,800 would be Fishers between countries within the same region and 9,375 would be Fishers between countries in different regions.
41. In the two-stage EKS/Fisher method, however, the 1,800 within-region Fishers
would still have to be calculated at the first stage. But at the second stage, only 15 binary Fishers have to be calculated between the 6 regions. The 300 Fishers within each region would be reduced to 24 transitive EKS/Fisher PPPs by applying the EKS formula, while the 15 between-region Fishers would be reduced to 5 transitive between-region EKS/Fisher PPPs. The 6 sets of EKS/Fisher within-region PPPs would then be linked by means of the 5 EKS/Fisher between-region PPPs.
42. Thus, the thousands of Fishers between individual countries in different regions
that would be required for a universal EKS play no part in the two-stage EKS. A large number of them would be between countries with very different relative prices whose goods and services do not overlap much. As already noted, it is difficult to calculate reliable binary indices in these circumstances even with good price data. In ICP 2005, however, the product lists for the different regions have been drawn up independently, creating a situation in which there may be very few price matches between some countries from different regions. It may be impossible to estimate reliable direct between-region binary PPPs for very many pairs of countries using the price data collected by the regions. In the circumstances, it is probable that a universal EKS may not be a viable option at the global level. Indeed, the Ring program was created in recognition of these kinds of difficulties. In the two-stage EKS method, the thousands of binaries between individual countries from different regions are replaced by a small number of binary Fishers between entire regions based on price data collected by the Ring countries using product lists specifically designed to ensure sufficient price matches between the regions.
An Alternative Two-Stage EKS/Fisher Method 43. The EKS/Fisher method uses the binary approach to international comparisons in
which binary Fisher PPPs are calculated between all possible pairs of countries and are then reduced to a set of transitive multilateral PPPs by applying the EKS formula. A key feature of the two-stage Diewert method is that the real expenditures have to be summed across the countries of a region to obtain the total
436
expenditures for each region in the regional numeraire currency. Such summation is a natural procedure for an average price method, such as GK, in which quantities in different countries are valued at the same prices, but combining countries is not consistent with the binary approach which underlies the EKS method.
44. It is possible, however, to maintain a strictly binary approach to the calculation of
a set of transitive aggregate PPPs between entire regions in which they are derived from the binary PPPs between all possible pairs of individual countries belonging to different regions. A method of calculating aggregate between-region PPPs in this way has been proposed by Robert Hill (2005)13. In the ICP context, the method has to be applied to the binaries between Ring countries only, just as the aggregate PPPs in the Diewert method explained above are calculated from the prices and basic heading PPPs for the Ring countries only. Once the aggregate between-region EKS/Fisher PPPs have been calculated using Hill’s method, they are used to link the within-region EKS/Fisher PPPs in exactly the same way as in the Diewert method.
Universal Methods and Scalar Adjustments 45. In the Report on Phase III of the ICP, ‘universality’ is described as a one-stage
approach in which regions are ignored and all countries are treated symmetrically14. The concept of universality is further elaborated in Chapter 4 of the Report, where it is stated (p. 162) that “universality requires that all countries, regardless of location, income level, social system, or any other consideration, be compared by a common standard”.
46. To satisfy the criterion of universality, however, it is not sufficient merely to
adopt a one-stage method of calculation. A universal approach requires that all countries should be treated in the same way at all stages of the program. A common product list should be used and all countries should have actively participated in the compilation of the product list during the pre-survey to ensure that it is equi-representative so far as possible. As the number of countries grows and the group becomes more heterogeneous, it obviously becomes increasingly difficult to satisfy the criterion of universality for a variety of reasons, including costs and organizational difficulties.
47. In ICP 2005, each region adopts a universal approach to the calculation of PPPs
for all the countries within its own region. The PPPs both at the basic heading level and at higher levels of aggregation are calculated using a one-stage procedure in which the location of the country within a region has no influence on the results.
48. At the global level in ICP 2005, however, it is not feasible to calculate PPPs that
satisfy the criterion of universality. Because of the regionalization of the ICP, the region to which a country belongs does have an influence on the PPP between that
13 The method was proposed in a note circulated to members of the ICP Technical Advisory Group in August 2005. 14 See Kravis, Heston and Summers (1982) p. 7.
437
country and other countries, whether they are in the same region or other regions. This point is discussed further later.
49. Consider a situation in which it is possible to calculate a universal set of PPPs for
a group of countries, such as a region within the ICP. Suppose that there is interest in the PPPs for certain sub-groups within the group as a whole. It may then be desired to decompose the universal set of PPPs into sets of PPPs for various sub-groups which preserve the PPPs for different countries within the sub-groups, while at the same time preserving the relationships between the sub-groups as determined by the universal results. Form a methodological viewpoint, breaking down a universal set of PPPs in this way is of interest because it produces results that are very similar to those obtained by chaining.
50. In practice, the OECD and Eurostat decompose the universal set of PPPs for the
group of countries covered by their joint program in such a way that the PPPs between the countries of the EU are the same as the universal set of PPPs for the EU countries on their own. This is described as maintaining the fixity of the EU PPPs. The methods described in the following section are based on those developed by the OECD and Eurostat.
The Decomposition of Universal Results for GDP by means of Scalar Adjustments
51. For ease of comparison with the chaining methods discussed earlier in this
chapter, it is convenient to refer to the group as the world and the sub-groups as regions. It is also convenient to work with real expenditures rather than PPPs, as preserving the fixity of a set of PPPs implies preserving the fixity of the real expenditures associated with them, and vice versa.
52. The objective is to find a method by which the set of real GDPs for a particular
region as given in the universal world results may be replaced by the set of within-region real GDPs as calculated by the region, while not changing the share of the total real GDP for the region in total world GDP. A simple way to do this is to scale the within-region real GDPs up or down by a constant in such a way as to ensure that the total real GDP for the region is equal to that given in the universal results. Of course, scaling the set of real GDPs for a region up or down by a constant leaves the relative sizes of the real GDPs for countries within the same region unchanged.
53. The constant is described as the scalar adjustment. It is equal to the total GDP for
the region expressed in the world numeraire currency as given by the global results divided by the total GDP for the region expressed in the regional numeraire as calculated by the region.
54. Denote the regions by A, B, C, etc. For convenience, country 1 in each region is
selected to serve as the reference country for that region. Country A1 is also selected to serve as the world reference country W1 in the global comparisons. WI and AI are the same. The currencies of the reference countries serve as the numeraire currencies for the regions, with the currency of country A1 also serving as the world numeraire.
438
Let GDPj denote the GDP of country j in region R in its own national currency, where j = 1, 2, … n(R) and n(R) is the total number of countries in R.
Let PPPW1,j denote the global GDP PPP for country j based on country W1 as the world reference country.
Let PPPR1,j denote the regional GDP PPP for country j in region R based on country R1 as the regional reference country
55. The scalar adjustment for region R, denoted by SR, is as follows.
(9) SR =
( )
( )
∑
∑
=
=Rn
jjR
j
Rn
jjW
j
PPPGDP
PPPGDP
1,1
1,1
56. Equation (9) may be rearranged to give the following expression.
(10)
( )
( )
jR
jWRn
jRn
j
jRj
jRjR
PPPPPP
PPPGDP
PPPGDPS,1
,1
1
1
,1
,111
∑∑=
= ⎭⎬⎫
⎩⎨⎧
=
57. Thus, the scalar is a weighted harmonic average of the ratios PPPR1,j/ PPPW1.j
where the weights are the shares of each country’s real GDP in the total real GDP of the region as calculated by the region.15
58. Consider the individual ratios PPPR1,j/ PPPW1,j country by country. The ratio for
country 1 is PPPR1,1/ PPPW1,1 which equals 1 / PPP1,W1 given that country 1 is the reference country for region R. Thus, the ratio is the reciprocal of the PPP between the regional numeraire currency and the world numeraire currency.
59. Now, consider the ratio PPPR1,2/ PPPW1,2 for country 2. This provides a second
indirect estimate of the PPP between the two numeraire currencies via country 2. The ratio for each country in region R provides its own separate indirect estimate of the between-region PPP between the two numeraire currencies.
60. Equation (10) shows that the scalar adjustment is a weighted harmonic average of
the direct and all the indirect estimates of the between-region GDP PPP between region B and the world as a whole. Thus, the scalar adjustment can interpreted as an average between-region PPP between the regional numeraire currency and the
15 This result is given in a note on fixity by Francette Koechlin and Paul Schreyer circulated to members of the ICP Technical Advisory Group in Nov. 2005. This scalar adjustment is the one originally used by the OECD from the mid-1980s onwards to impose fixity on the PPPs and real expenditures of EU countries within a set of universal results for the entire group of countries covered by the joint OECD/Eurostat program. The OECD now uses a slightly different adjustment, as explained below.
439
world numeraire currency. Imposing fixity by multiplying by a scalar adjustment is equivalent to linking by means of a between-region GDP PPP.
61. Other types of average might be used instead of weighted harmonic mean. The
OECD now prefers to use an unweighted geometric mean16. As the geometric mean of a set of ratios is equal to the ratio of their geometric means, the current scalar adjustment (or between-region PPP) can also be interpreted as the ratio of the geometric mean the GDP PPPs for EU countries as calculated over the set of EU countries to the geometric mean of the same PPPs as calculated over the set of OECD countries. This scalar adjustment is applied to the GDP PPPs for non-EU countries to obtain an adjusted set of GDP PPPs for non-EU countries, the PPPs for EU countries remaining unchanged.
62. When regional fixity is imposed on a universal set of real GDPs, the relative sizes
of the real GDPs between countries within the same region become those determined by the regions and not those determined by the universal results. This is the object of the exercise. If fixity is imposed for all regions, all the original universal real GDPs are replaced. The entire set of universal GDPs is discarded. The only purpose served by the universal GDPs is to determine the relative sizes of the total real GDPs of the regions. This is, of course, a very important function at a global level.
Complete Fixity and Partial Fixity 63. Suppose it is decided to impose fixity not only at the GDP level but also on the
entire matrix of real expenditures for each region as determined by the region. The matrix is a table of real expenditures in which the rows refer to basic headings or higher level aggregates while the columns refer to countries. A global matrix of real expenditures exists for all countries in the world based on the universal PPPs while in addition each region has its own matrix of real expenditures based on the within-region PPPs. The objective is to insert each regional matrix into the global matrix after ensuring that the total real GDP of each region remains the same as in the global matrix.
64. This can be achieved by multiplying the entire matrix of real expenditures for a
region by its scalar adjustment for GDP. Fixity is preserved both within the rows and the columns of the matrix of real expenditures because the relative sizes of the real expenditures on a given aggregate in different countries and the relative sizes of different types of expenditure or aggregates within the same country are unchanged. When fixity is preserved in both the rows and the columns in this way, there is said to be complete fixity.
65. The ratios of the real expenditures for two countries in the same row of a matrix of
real expenditures are quantity indices. When complete fixity has been imposed on a set of universal results, the ratios of the real expenditures for two countries belonging to different regions become chain quantity indices. At the GDP level,
16 See Koechlin and Schreyer (2005).
440
the ratio of the real GDPs of country t in region B and country s region A, denoted by GDPQs,t, is a chain quantity index of the following form:
(11) GDPQs,t = GDPQR
s,A · GDPQWA,B · GDPQR
B,t
where GDPQRA,s is the ratio of the total real GDP of region A to the real GDP of
country s as calculated within the region.
GDPQWA,B denotes the between-region GDP quantity index for region B on region
A. This is equal to the ratio of the total real GDPs of the two regions as calculated in the universal results.
GDPQR
B,k denotes the ratio of the real GDP of country t to the total real GDP of region B as calculated within the region: i.e., the share of country t in the total GDP of B.
66. If the two countries were both to belong to the same region, the right side of (11)
would collapse to the within-region GDP quantity index for t on s. 67. If the entire set of real expenditures for a region at the global level is replaced by
the corresponding set as calculated at the regional level, there can be only a single scalar adjustment applied to each set of regional expenditures. However, if only a single adjustment is applied, the between-region quantity indices for all the basic headings and other aggregates below the level of GDP become distorted.
68. Consider the quantity index between two countries s and t belonging to two
different regions for a lower level aggregate, such as food expenditure, when the same scalar adjustment based on GDP is applied to all types of expenditure. The ratio of the real expenditures for the two countries in the food row of the real expenditure matrix is
(12) FQs.t = FQR
s,A · GDPQWA,B · FQR
B,t 69. With a single scalar adjustment, the food quantity indices within each of the
regions are linked using the GDP quantity index. However, the link should be the relative sizes of the total real expenditures on food in the two regions not the relative sizes of their GDPs. The appropriate link for food is the between-region food quantity index and not the GDP quantity index.
70. The scalar adjustment to be applied to the real expenditures on food in the various
countries within the same region should therefore be the ratio of the total real expenditures on food in the two regions, not the ratio of their real GDPs. Each type of expenditure from a basic heading up to GDP requires its own specific link or scalar adjustment. The scalar adjustments must vary from row to row in the matrix of real expenditures.
71. When the scalar adjustments or links vary from row to row in this way, the
relative sizes of different types of real expenditures within the same country are no longer the same after adjustment as they were before. Fixity is no longer preserved within the columns of the matrix of real expenditures. This also implies
441
that if the original real expenditures were additive, they will no longer be additive when each type of expenditures has is own specific link or scalar adjustment.
72. If complete fixity is imposed by using the same GDP scalar adjustment for all
types of expenditure, the quantity indices between countries in different regions for expenditure aggregates below the level of GDP are distorted. This defeats the main purpose of an international comparisons program, which is to make volume comparisons between countries. Complete fixity is not an acceptable option therefore.
73. On the other hand, when the scalar adjustments vary from one type of expenditure
to another, the relative sizes of real expenditures in an individual country as calculated at the regional level are not preserved in the linked global results. Fixity is preserved within the rows of the matrix of real expenditures but not in the columns. This may be described as partial fixity.17
74. Even if high priority is attached to maintaining regional fixity, partial fixity should
be sufficient. Partial fixity preserves the relative sizes of the real expenditures in different countries in the same region as determined by that region. The loss of vertical fixity is just another manifestation of the fact that chain indices are not additive, a fact that does not prevent chain indices from being widely used for policy and analytic purposes
Partial Fixity and Chaining 75. With partial fixity, the quantity indices between countries in different regions are
chain indices, as shown in equations (11) and (12) above. These equations are of exactly the same type as equation (5). For example, if the GK method of aggregation were to be used both within regions and at the global level, the first and third terms in (11) and (12) would be identical with those in (5). The difference between the two-stage methods and the scalar adjustment method lies in the nature of the between-region link, the middle term in the equations. As already noted, a scalar adjustment is actually a between-region PPP.
76. The big difference between the scalar adjustment methods and the two-stage
methods is that the scalar adjustment methods require an already existing universal global set of PPPs, or real expenditures, to start with. The global PPPs are used as inputs into the scalar adjustment methods. It is possible to calculate such a ‘global’ set of PPPs for all the countries covered by the Eurostat-OECD joint program. On the other hand the two-stage methods are designed to be used in a situation in which a global set of PPPs does not exist and the only way to arrive at the global set is by chaining the various sets of independently calculated regional results. Fixity is an automatic consequence of chaining. On the other hand, the objective of the scalar adjustment methods is to impose fixity.
17 The fact that it is not possible to preserve fixity in both the row and the columns of the matrix of real expenditures in a satisfactory way was noted by Kravis, Heston and Summers (1982). They remark p. 123: “Since it is not possible to make the individual countries’ quantities consistent with both the column totals and the row totals -- requiring conformity with either necessarily is distorting the other -- a choice must be made.”
442
Semi-Universal PPPs 77. As already noted, it is not feasible to calculate a global set of PPPs in ICP 2005
that satisfy the criterion of universality. The regionalization of the program means that countries in different regions are treated in different ways.
78. For example, countries in different regions use different product lists and collect
prices for different products. The product lists drawn up by the different regions are designed to provide good estimates of the PPPs between countries within the same region. They are drawn up independently of those in other regions and no systematic attempt is made to include products that may be representative of countries in other regions. The products selected for pricing within the same basic heading therefore tend to differ from region to region and most of the prices collected are not suitable for estimating PPPs between countries in different regions. Even when products appear to be the same, their detailed specifications tend to differ so that they are not really comparable between regions. Few price matches can be obtained using the data collected by the different regions.
79. The estimation of the PPPs between countries in different regions, whether at the
level of the basic heading or at an aggregate level, has to rely on prices collected by the Ring countries using a global list of products drawn up specially for the purpose, as described in Chapter 12. In practice, PPPs between countries in different regions have to be chain PPPs in which the links are based on prices collected by the Ring countries.
80. The closest that it possible to get to a universal set of aggregate PPPs at a global
level in the ICP is to calculate a ‘semi-universal’ set of aggregate PPPs. A semi-universal set is one in which the PPPs for all the basic headings are chain indices and are thus far from universal, but the PPPs for aggregates above the level of the basic heading are calculated using a one-stage aggregation method that ignores the region to which a country belongs.
81. Given the existence of a complete global set of basic heading PPPs (however they
are derived) together with a complete set of basic heading expenditures in national currencies, it is possible to calculate a set of aggregate PPPs at the global level using a one stage-method aggregation method which ignores the region to which a country belongs18. The resulting aggregate PPPs may resemble universal aggregate PPPs but for the PPPs to be genuinely universal it is necessary to have a universal set of PPPs at every level of aggregation including the basic headings. Because of the strong and pervasive influence of regionalization in the ICP, the basic heading PPPs in the ICP could be significantly different from those that would have been obtained if it had been possible to adopt a universal approach at the basic heading level.
18 Erwin Diewert (2005) notes that this method is a possible alternative to the use of a two-stage aggregation procedure.
443
82. The imposition of one-stage aggregation method on a two-stage method at the basic heading level is methodologically inconsistent. The meaning of the aggregate PPPs or real GDPs is also not clear as a result. The use of a universal aggregation method is liable to obscure the fact that the aggregate PPPs between countries in different regions rely heavily on chaining however the basic heading PPPs are aggregated. Semi-universal aggregate PPPs are likely to be confused with universal aggregate PPPs, even though the two sets of PPPs could differ significantly.
83. If partial fixity has to be subsequently imposed on a set of semi-universal PPPs,
the calculation of a set of semi-universal PPPs becomes rather pointless. After fixity is imposed, the within-region PPPs at every level of aggregation for every country in every region are exactly the same as when the regional PPPs are chained using a two-stage aggregation procedure.
84. As in the case of universal PPPs, if fixity is imposed on a set of semi-universal
PPPs, the only purpose served by the semi-universal PPPs is to provide the scalar adjustments needed to link the sets of within-region PPPs. The question is then whether these aggregate between-region links are better than the aggregate between-region PPPs obtained using a two-stage method. The links between regions at a global level are crucial for the ICP. They must be soundly based methodologically. The use of a two-stage aggregation method provides transparent between-region links and produces sets of chained results whose status and meaning are quite clear at every level of aggregation.
444
References Diewert, W. E. (2004) On the Stochastic Approach to Linking the Regions in the ICP, Discussion Paper No. 04-16, Department of Economics, University of British Columbia, Vancouver. Commission of European Communities, IMF, OECD, UN, World Bank, (1993), System of National Accounts 1993. Hill, R. J. (2005) A Note on the Linking of Regions in the ICP, unpublished note circulated in August, 2005. Hill, T. P. (2006) Lowe Indices. ILO, IMF, OECD, Eurostat, UNECE and the World Bank, (2004), Consumer Price Index Manual: Theory and Practice. Karmel, P. H. “The Relations between Chained Indexes of Input, Gross Output and Net Output, Journal of the Royal Statistical Society, Series A, Vol.117, Part IV, 1953, pp. 441-458. Koechlin, F. and Schreyer, P. (2005) Fixity, unpublished note circulated in Nov. 2005. Kravis, I. B., Heston A. and Summers, R. (1982), World Product and Income: International Comparisons of Real Gross Product, Phase III of the United Nations International Comparison Project, published for the World Bank by The Johns Hopkins University Press, Baltimore and London.
445