gini country report for greece
TRANSCRIPT

1
Country Report for Greece
Margarita Katsimi, Thomas Moutos, George Pagoulatos, & Dimitri Sotiropoulos
Acknowledgments: We wish to thank Manolis Chrysakis, Theo Mitrakos, and Panos
Tsakloglou for sharing with us some of the data used in this report.

2
Contents
List of Figures 3
List of Tables 7
EXECUTIVE SUMMARY 10
Chapter 1 INTRODUCTION 15
Chapter 2 THE NATURE OF INEQUALITY AND ITS DEVELOPMENT OVER TIME 20
2.1 Has inequality grown? 20
2.1.1 Household income inequality 20
2.1.1.1 Structure of inequality 25
2.1.1.2 The effect of incomes in-kind 28
2.1.1.3 Consumption Inequality 31
2.1.2 Wealth & debt inequality 34
2.1.3 Labour market inequality 35
2.1.4 Educational inequality 40
2.2 Whom has it affected? 44
2.3 Interdependence between inequalities over time 46
2.4 Why has inequality declined in Greece? 47
2.5 Inequality and Poverty Developments since the start of Greece’s Great
Depression 48
Chapter 3 THE SOCIAL IMPACTS OF INEQUALITY 51
3.1. Introduction 51
3.2. Material deprivation 51
3.3 Cumulative disadvantage and multidimensional measures of poverty and social
exclusion 55
3.4 Social cohesion and social isolation 58
3.5 Family formation and breakdown 60
3.6 Health inequalities 65

3
3.7. Housing tenure 68
3.8 Crime and punishment 74
3.9 Subjective measures of well-being, satisfaction, “happiness” 77
3.10 Intergenerational mobility 79
3.11 Conclusion 84
Chapter 4 POLITICAL AND CULTURAL IMPACTS 85
4.1 Introduction 85
4.2 Political and civic participation 86
4.3 Trust in others and in institutions 90
4.4 Political values and legitimacy 94
4.5 Values about social policy and welfare state 100
4.6 Conclusions: the ‘national story’ of inequality drivers and their cultural and
political impacts 102
Chapter 5 EFFECTIVENESS OF POLICIES IN COMBATING INEQUALITY 104
5.1 Introduction 104
5. 2 Minimum wages and collective labour agreements 104
5.3 Taxation 108
5.4 Social expenditure 112
5.5 Education 115
5.6 Causes and Consequences of (Social) Policy Activism in Greece 118
References 121
Appendix (Log Tables) 125
List of figures:
Figure 1.1: GDP per capita relative to eu15 (1970-2001) and relative to ea12 (1991-2012)
Figure 1.2: Real compensation per employee (private consumption deflator, 2000=100)
Figure 1.3: Adjusted Wage Share as percentage of GDP (1970-2011)
Figure 1.4: Gross national saving and gross capital formation

4
Figure 1.5: Gross and net national saving (% GDP)
Figure 1.6: Balance on current transactions, net foreign borrowing, balance on goods and services (% of GDP, 1970-2011) Figure 2.1: Evolution of Income Inequality Indices, 1974-2008
Figure 2.2: Comparison of the evolution of the Gini Index for disposable income (1995-2009) across sources (HBS, ECHP, EU-SILC)
Figure 2.3: Income-based inequality indices Figure 2.4: Poverty rate 1994-2009, distribution of disposable income, ECHP/EUSILC και HBS Figure 2.5: Change in poverty indexes in absolute terms 1974-2008: distribution of total income (poverty line 1999 in terms or real purchasing power) Figure 2.6: Composition of augmented income by quintile
Figure 2.7: The impact of imputed rent on income inequality: % decrease in inequality due to imputed rent and disposable income inequality
Figure 2.8: Decline in inequality including non-monetary sources of augmented income
Figure 2.9 Evolution of Consumption Inequality Indices, 1974-2008
Figure 2.10: Poverty Indices defined over consumption spending Figure 2.11: Change in poverty indexes in absolute terms 1974-2008: distribution of consumption expenditure (poverty line 1999 in terms or real purchasing power) Figure 2.12: Population Shares Across Wealth Classes Figure 2.13: Employment and participation rates (15-64 year old), by gender
Figure 2.14: Employment rates, by sex and education
Figure 2.15: Trends in unemployment rates, by gender and educational attainment (25-64 yrs)
Figure 2.16: Part-time employment as percentage of all employment
Figure 2.17 Inter-temporal trends in hourly earnings inequality (Mean log deviation) Figure 2.18: Inequality indicators (I.I)j for first year students in Tertiary Education (A.E.I.) by father's occupational status Figure 2.19: Inequality indicators (I.I)j for first year students in Tertiary Education (T.E.I.) by father's occupational status (1984-2004) Figure 2.20a: Educational achievement and unemployment rate, 2004-2007 average

5
Figure 2.20b: Educational achievement and participation rate, 2004-2007 average
Figure 3.1: Severely materially deprived people, percentage of total population
Figure 3.2 : Proportion of population classified as deprived and relative ranking of Greece compared to 14 EU countries (ECHP, 1996) Figure 3.3 : Deprivation in terms of ownership of five consumer durables Figure 3.4 : Assessments by household members about their ability to cover basic household needs Figure 3.5 : Share of the population which reports deprivation with respect to housing needs Figure 3.6 Cumulative Inter-Temporal Deprivation (percentage of population deprived) Figure 3.7 : Relative risk of social exclusion and contribution to total deprivation Figure 3.8 : Distribution of Cumulative Inter-Temporal Disadvantage, by Employment Status Figure 3.9: Distribution of Cumulative Inter-Temporal Disadvantage, by Educational achievement of the head of household Figure 3.10: Distribution of Cumulative Inter-Temporal Disadvantage, by regions Figure 3.11 Percentage share of respondents not able to ask any relative friend or neighbour for help, 2006. Figure 3.12 Frequency of getting together with friends, 2006 Figure 3.13 Ratio of those with no friends by age groups compared by total population,2006 Figure 3.14 Crude Marriage Rate in Greece, 1975-2007 Figure 3.15 Trends in total fertility rate in OECD and Greece, 1991-2009 Figure 3.16 Life births outside marriage as percentage share of total births, 1999-2010. Figure 3.17 Divorce rate in Greece, 1992-2009 Figure 3.18: Living arrangements for children under 18 in Greece and the EU, 2008 Figure 3.19 : Healthy life years at birth by sex Figure 3. 20: Self-perceived health (%) Figure 3.21: Self-perceived health (bad/very bad) by income quintile (%, equivalised income) Figure 3.22: Self-perceived health(bad/very bad), by education (ISCED 1997) Figure 3.23: People having a long-standing illness or health problem, by education

6
Figure 3.24: Mortgages and consumer credit as percentage of GDP Figure 3.25: Distribution of population by tenure status, (Source: SILC) Figure 3.26: Distribution of population by tenure status, above 60% of median equivalised income Figure 3.27: Distribution of population by tenure status, below 60% of median equivalised income Figure 3.28: Housing cost overburden rate by income quintile, % of total population Figure 3.29: Prices of dwellings (percentage change in average prices) Figure 3.30 Trends in the number of criminal offences in Greece, 1995-2007
Figure 3.31: Trends in the number of (completed) homicides in Greece, 1995-2007 Figure 3.32: Trends in the number of robberies in Greece, 1995-2007 Figure 3.33: Trends in the number of burglaries in Greece, 1995-2007 Figure 3.34: Trends in the number of motor vehicle theft in Greece, 1995-2007 Figure 3.35: Trends in the number of drug offences in Greece, 1995-2007 Figure 3.36: The evolution of prison population in Greece, 2003-2009 Figure 3.37: Life satisfaction, yearly average Figure 3.38: Inequality-adjusted life satisfaction, yearly average
Figure 3.39: Sense of personal happiness
Figure 3.40: Satisfaction from the economy
Figure 4.1: Voter turnout
Figure 4.2: Participation (%) in an Association or Organized Voluntary Activity (1994/1998/2006)
Figure 4.3: Evolution of trade union density in Southern European countries
Figure 4.4: Evolution of trust towards the parliament in Greece in comparison with the EU average, 2003-2011(% tend to trust)
Figure 4.5: Evolution of trust towards the government in Greece in comparison with the EU average, 2003-2011 (% tend to trust) Figure 4.6: Evolution of trust towards political parties in Greece in comparison with the EU average, 2003-2011(% tend to trust)

7
Figure 4.7 Evolution of trust towards the legal system in Greece, 2003-2010 (% tend to trust) Figure 4.8: Trust in political institutions in Southern Europe, 2003 and 2010 (percentage share of respondents showing a lot or some trust) Figure 4.9.: Voting for extreme left/right parties
Figure 4.10: What should be done with illegal immigrants living in Greece (2008-9)
Figure 4.11: EU membership approval score (yearly average)
Figure 4.12: EU membership a 'good thing' (yearly average)
Figure 4.13: EU membership 'a bad thing' (yearly average)
Table 4.14 Perceived Causes of Poverty in Greece and in EU-15, 2002 and 2007
Figure 5.1: Evolution of real minimum wages and business sector labour productivity in Greece (1970=100)
Figure 5.2 Minimum Wages and Bargained Wages, % changes, Greece, 1995-2007
Figure 5.3 Ratio of Minimum Wages to Average Wages
Figure 5.4 Trade union density (Greece, 1977-2008)
Figure 5.5 Total government revenue (% of GDP): Greece and EU15
Figure 5.6: Structure of Greek tax revenue (shares of total government revenue)
Figure 5.7 Total Government Expenditure (% Of GDP)
Figure 5.8: Public social expenditure as percentage of GDP and of total government spending Figure 5.9 : Public expenditure by type as percentage of GDP Figure 5.10 : Public social expenditure by transfers/cash as percentage of GDP Figure 5.11: Social expenditure (means-tested/non means-tested) as percentage of GDP Figure 5.12: Public expenditure on Active Labour Market Programmes as percentage of GDP
Figure 5.13: Total public expenditure on education as a % of GDP
Figure 5.14: Gross enrolment ratio, preprimary education
List of tables:
Table 2.1A: Estimates of income shares by population deciles
Table 2.1A: Decile ratios (D9/D1, D5/D1, D9/D5) /D1, D5/D1, D9/D5)

8
Table 2.2: Percentage of total inequality attributed to differences "within" groups based on consumption expenditure distribution and Mean Log Deviation (second Τheil index) Table 2.3: The impact of tax-transfer policies on income inequality Table 2.4: Distribution of Monthly Average Incomes per Decile Components (Effects of 2005 Tax-Transfer Policies) Table 2.5: Share of Household Income and Income Components Received/Paid by Each Decile Group Table 2.6: Effects of Public transfers and Private incomes
Table 2.7A Estimates of consumption shares by population deciles
Table 2.7B: Decile ratios (D9/D1, D5/D1, D9/D5) Table 2.8: Income inequality components and inequality elasticities by income source Table 2.9: Educational inequality indices Table 2.10 Selected high risk groups for poverty: distribution of total income Foster et al (a=2) Table 2.11 Percentage contribution of different factors to the total change in inequality from 1974 to 2008 Table 3.1: Cohabiting unions in Greece and the EU as percent of all unions, 2007 Table 3.2: Educational qualifications of the labor force (by age group) Table 3.3: Participation in education and private spending per upper secondary education student per quintile of household income, 1993/94 Table 3.4: Poverty by educational level of the father of the head of household Table 3.5: Poverty by occupation of the father of the head of household Table 3.6: Households by educational level of the heads of household and the educational level of their fathers Table 3.7: Households by respondent’s father occupation and respondent’s educational level Table 4.1: Number of Memberships in Voluntary Organizations (%) Table 4.2: Forms of Participation in Voluntary Organizations (%) Table 4.3: Forms of Political Participation (%) Table 4.4: Policy for Individuals of Different Race or Nationality

9
Table 4.5: “In your opinion, out of the following, which are the 2 most important things for getting ahead in life” Table 4.6 Perceptions of government’s role in income redistribution and of the necessity of income inequalities in economic development Table 5.1: Decomposition of tax receipts by main tax components
Table 5.2: Top marginal personal incomes tax rates for employees (single, no dependents)
Table 5.3: Trends in intergenerational educational mobility: Educational mobility measures from father's to childrens generation %
Table 5.4. Distribution of beneficiaries of third-level education by household income quintile
Table 5.5 : Percentage point reduction in at-risk-of-poverty rate due to social transfers

10
Executive Summary
The aim of this country report for Greece is to present and examine key patterns and trends
in the inequality ‘drivers’, highlight their potential impacts in the social, political and cultural
spheres and the available evidence in that regard, and point to the role that various interest
groups have played in shaping the institutions and policies that both created and sought to
ameliorate the various inequalities and their socio-economic manifestations.
Greece represents a topical case study in light of the politico-economic developments which
the country went through over the last four decades. Starting with the transition to
democracy in 1974, Greece began its long, still incomplete, and as of lately precarious, socio-
economic convergence towards the advanced European countries. The first phase, which
lasted from 1974 to 1981, involved fast (economic) growth rates, low (and declining)
unemployment rates, but slow progress regarding the social emancipation and integration of
the disadvantaged groups of the population. The second phase, 1982-1994, showed
considerable progress towards increasing the capacity of disadvantaged individuals and
groups to make choices and to transform those choices into desired actions and outcomes.
Central to this process was the large expansion of the public sector. This period started with
the rise of PASOK (the Panhellenic Socialist Party) to power (October 1981), EEC entry (as the
EU was then called), and ended with Greece’s decision to aim for accession to the EMU. The
rather haphazard way in which the expansion of the public sector took place, along with the
careless macroeconomic management which characterized (most) of this period, led to
economic stagnation, rise in the unemployment rate, and culminated with a rise of the
public debt (which was still predominantly held by domestic agents) to dangerously high
levels. The third phase, 1994-2009, saw a further expansion (along with some
rationalization) of the welfare state, fast growth rates, and, after an initial rise, significant
declines in the unemployment rate. With the benefit of hindsight we know that the “growth
model” of this period was seriously flawed, as it was predicated on excessive borrowing
from abroad. The global financial crisis put the tombstone to this phase, and ushered-in the
Greek Great Depression, taking the unemployment rate to 25.1% (as of July 2012).
Income Inequality: trends and drivers
The fast rising living standards during the first phase produced a large decline in inequality in
Greece – the Gini coefficient was reduced by 19%. This reduction in inequality, albeit from a
high level relative to the richer European countries, was underpinned by minimum wages
increases of about 20% in real terms from 1974 to 1981, business-sector productivity
increases by about 17%, and of unemployment rates below 4%. The rising tide of economic
activity seems to have lifted the boats of middle-and-lower-income households by more
than the affluent ones. During the second phase the economy stagnated, minimum wages in
real terms were in 1994 about 20% lower than in 1982, whereas the unemployment rate had
risen to 9%. Inequality remained roughly constant during this period –despite the decline in
real minim wages – due to the expansion of an idiosyncratic welfare state. During the third
phase growth resumed, minimum wages started increasing again, the welfare state started
acquiring a more efficient institutional structure, and unemployment after 2000 started
declining. During this phase inequality decreased as well –but not nearly as much as during

11
the first phase. Since 2010, GDP has plummeted, the real value of the minimum wage has
dropped by more than 25%, unemployment has soared, and social welfare spending has
been seriously curtailed. Adding to these the large increases in VAT rates – especially on
basic goods - it is rather improbable that inequality will not have risen substantially –
possibly taking it back to the level it was three decades ago.
Educational inequalities in Greece are strongly linked with income inequalities, with higher
levels of educational attainment strongly associated with higher earnings and household
income. This link has been mediated through increasingly differentiated employment and
participation rates across educational groups; indeed, unlike the economy-wide trends of
rising employment rates, persons with less than a high-school diploma did not experience
rising employment rates. Similarly, the declines in the unemployment rates for persons
(females, especially) with upper secondary and post-secondary education was far more
pronounced than for persons of lower-educational achievement – a result of the re-
orientation of economic activity away from agricultural (and industrial) activities, and
towards the service sector who was in need of a medium-skill workforce. The vicious circle
that linkages between income and educational inequalities may create (i.e. income
inequality, in the absence of equal education opportunities, reinforces educational
inequality, which, in turn, leads to higher income inequality) has been kept in check in
Greece through a significant expansion of educational opportunities, especially through the
large expansion of the publicly-funded tertiary sector. Nevertheless, since this expansion did
not manage to reduce inequality in accessing higher-educational institutions (especially
Universities) for lower-income groups (e.g. farmers and blue-collar workers), and education
is an important factor in the intergenerational transmission of economic status, the
reduction in inequality observed during the last four decades may not be sustainable once
some of the other factors behind the decline in inequality exhaust their influence.
Social Impacts
The absence of sufficiently long time-series on relevant variables in Greece does not allow us
to identify with confidence many of the social impacts of changes in income inequality. Yet,
the available evidence is suggestive that levels of material deprivation have moved broadly
in line with average income (or better, real compensation per employee), and naturally, are
dependent on economic status. The close linkage between the labour market and the risk of
social exclusion is made apparent by the fact that, compared with household heads which
are full-time employees, the risk of social exclusion is about two and a half times larger for
household heads which are part-time employees, and about four times larger for
unemployed household heads; the regional differentiation of such risk is far smaller.
The rates of family formation and breakdown have moved closer to the EU15 average
(through a rise in the divorce rate and a decrease in the marriage rate) - these changes have
reflected more the expansion of tertiary education opportunities than the inequality trends.
The declines in the total fertility rate which lasted until the early 2000s were reversed later -
but they still remain significantly below most EU countries – probably due to the influx of
immigrants but also due to the rise in labour incomes which started again in the late 1990s.
In contrast to other European societies, however, births out of wedlock did not increase and

12
lone parenthood was still a rather rare instance. Greece remains a relatively traditional
society as far as family formation and family structure are concerned. The same holds true
with respect to the intergenerational mobility of income, since paternal occupation and
education exercise a strong influence on the poverty risk of the children when they become
adults.
The rising life expectancy in Greece reduced, but it did not eradicate, the difference in self-
perceived health status across income quintiles, with members of the bottom quintile still
(2008) being three times as likely to report a very bad/ bad health status as members of the
top quintile. The differences in health status across educational groups became wider, with
persons of only primary education being between two and eight times as likely in 2008 to
report a very bad/ bad health status as persons with more education. The high rate of
owner-occupier status among the poor in Greece has not prevented the existence of the
highest severe housing deprivation rate among the EU15, which despite declining from 8.2%
in 2004 to 7.6% in 2010, it was still the highest among the EU15, and higher than a few of
the New Member States of the EU. Crime has also increased since the mid-1990s, partly
reflecting the influx of undocumented migrants, but also the social transformation of Greek
society, namely its urbanization, as crime is less frequent when people live in rural areas.
Reported levels of overall life satisfaction in Greece have remained below the EU average,
have been very responsive to the economic cycle, and, naturally, have plummeted to
unprecedented levels since 2008.
Political and Cultural Impacts
The large decline of (income) inequality in Greece from 1974 to 1982 helped to keep political
participation in Greece quite high despite the high level of inequality. Extended participation
was fueled by the high polarization between two political parties, representing the centre-
right and the centre-left which were consolidated a few years after Greece’s 1974
democratic transition from the Colonels’ regime ; by the legacies of political conflict which in
the twentieth century included a Civil War (1946-1949) and three short-lived dictatorships
(1925, 1936-1940 and 1967-1974); and by the expansion of secondary and tertiary education
which particularly since the late 1960s offered increasing opportunities to young adults from
rural areas and the poorer strata as well as to women to obtain public, free, higher
education and enjoy social and political integration into the Greek society and politics. Last
but not least, extended political participation was incited by an electoral system of
Reinforced Proportional Representation, which actually favored the party that came first-
past-the post. This system led to fierce electoral battles between the two largest contenders
for power (ND, PASOK) and also stimulated party-led political participation, not only in
elections, but also in other institutions, such as universities, trade unions and professional
associations. However, extended participation in elections was not translated in a positive
appraisal of the functioning of democratic institutions, which with the exception of the legal
system, did not enjoy the stable confidence of citizens and lost this confidence altogether by
the start of the crisis in Greece (2010). In contrast to many other advanced democracies,
post-authoritarian Greece has had a party system in which, until the elections of 2012 which
were preceded by the economic crisis, the extreme right was negligible and did not obtain
parliamentary representation (with the exception of the short-lived ‘National Faction’ party

13
in the 1977 elections). The extreme left, however, was comparatively stronger (section 4.4).
The Greek party system stills includes one of the last remaining pro-Soviet communist
parties in Western Europe, while other extreme left factions have been visibly present in
universities and some public sector unions.
Attachment to traditional institutions, such as the extended family, went hand in hand with
xenophobia, aggravated by the uncontrollable inflow of unregistered immigrants over 1991-
2011. Contradictions abound also with regard to values about social policy and the welfare
state. Traditional Greek atomism, manifested in low trust in interpersonal relations and low
levels of voluntarism, coexists with the highest propensity in the EU-27 to call on the
government to redistribute wealth in a fair way to all citizens and the lowest in the EU-27
agreement with the idea that people, rather than the government, should take responsibility
to provide for themselves.
While other EU societies have experienced high income inequalities, which had a negative
political and cultural impact, in Greece income inequality is not clearly associated to political
participation, levels of institutional trust, political values and values about social policy and
welfare. Rather the contradictions of high participation, negative levels of trust and
endurance of somewhat authoritarian values in a European consolidated democracy must
be interpreted in a different light: recent Greek political history has been rife with acute
party conflict; the role of the state in economy and society has remained preponderant even
to this day; and the value system has been a mixture of traditionalism and modernity,
reflecting Greece’s position in the periphery of the family of advanced European nations.
Policy context
Successive Greek governments have responded to the timeless wishes of the electorate for
the government to redistribute wealth in a fair way to all citizens by “throwing money” at
the problem. By the late 1990s both sides of the government budget (expenditures more so
than taxes) had increased to levels observed in the rest of the EU15 countries. The same is
also true of public social expenditure; however the rise in social spending in Greece has
failed to reach the categories of the population which receive minimum or no social
protection. The Greek welfare system has created “insiders” (such as the relatively well-
protected members of liberal professions, employees of state-owned enterprises and civil
servants) and “outsiders” (e.g., private sector employees, particularly those working in Small
and Medium Enterprises or employed on fixed-term contracts or on other types of
temporary employment). Among the outsiders those who fare worst are: a) young people
who always suffer the most from unemployment ( unemployment rates in excess of 25%
have been typical – currently standing at over 50% - for the 18-24 years old);b) the long-term
unemployed who are left on their own after the 12-month long period of unemployment
benefits expires; c) women who are hired last and fired first and who also leave the labour
market after they get married or after they bear their first child; and d) migrants who are
employed by business owners paying them under the table and also refraining from paying
social insurance contributions.
Labour market institutions do not reduce the various types of income inequality either.
None of the categories of outsiders noted above are represented in Greece’s trade unions

14
which mostly defend the interests of the civil servants or the employees of state-owned
enterprises and the larger private businesses. It is also telling that Greece still remains one of
the only two among the EU15 countries (the other is Italy) that does not have a minimum
income guarantee programme either at the national or at the regional level.

15
1. INTRODUCTION
Some Key Macroeconomic Developments, 1970-2011
The level and evolution of various economic and social inequalities in Greece have been
shaped by the peculiar characteristics of the Greek “development” model. We describe some
salient features of these developments to serve as a helpful background for understanding the
trends in various inequality drivers. Further reference to macroeconomic developments is
made in the report when it is needed to illustrate the evolution of inequalities’ various
impacts.
Greece experienced its fastest convergence, in terms of (real) GDP per-capita, during the
1960s, when its GDP per-capita increased from 43.9% of that prevailing in the EU15
(countries) in 1960, to 63.6% in 1970.1 The fast catching-up process was maintained during
the 1970s, and by 1978 the ratio had increased to 72.0%. The divergence which followed in
the next twelve years took the ratio to 57.6% in 1990, effectively reversing the convergence
process, and bringing the country back to 1968 as far as relative GDP per-capita is concerned.
(We note that the absolute value of Greece’s GDP per-capita was in 1990 about 75% higher
than in 1968.) Greece resumed its convergence with the (rest of) EA12 in 1995, when its GDP
per-capita was 57.7% of the (rest of) EA122; by 2009 it had reached 70.1%, and, following
Greece’s Great Depression, the country’s GDP per-capita relative to the EA12 is expected to
return in 2012 back to what was in the 1960s (less than 60%). In terms of absolute levels,
Greece’s GDP per-capita is expected to be in 2012 at about the same level as it was in 2001.
Figure 1.1: GDP per capita relative to EU15 (1970-2001) and relative to EA12 (1991-
2012)
Source: AMECO
1 The EU15 aggregate includes Greece; given Greece’s small size relative to the rest of the EU15, the
numbers would not be substantially different if we exclude Greece. We follow this practice for all aggregate groups in which Greece is (as of August 2012) a member (e.g. EA17). 2 We use the euro area average after 1991, since there is a break in the EU15 series due to the
German re-unification.

16
The large gyrations in Greece’s economic activity were reflected in large fluctuations in real
compensation per employee (deflator: private consumption). Using 2000 as the base year (see
Figure 1.2), from 1970 to 2000 there was an increase in real compensation per employee by
58.7%. From 2000 to 2009 it increased further by 18.5%. However, it is expected to drop in
2012 to levels that were previously experienced even as far back as the late 1970s. What is
important from our perspective of inequality trends is that there were two periods in which
there was a clear upward trend in real compensation per employee: from the mid-1970s to the
mid-1980s, and from the mid-1990s to 2009. (As will become clear later on, the movements
in the real value of the minimum wage were of even greater significance.)
Figure 1.2: Real compensation per employee (private consumption deflator, 2000=100)
Source: AMECO
These developments in employee compensation were also reflected in the movements of the
adjusted wage share (i.e. compensation per employee as percentage of GDP at market prices
per person employed). As displayed in Figure 1.3, during the last years of the colonel’s
regime the wage share was declining fast – at 56.0% in 1973 it was 8 percentage points less
than the EU15 – and it started reversing after the restoration of democracy, reaching its
highest level in 1983 (at 66.0%).3 After 1983 it started declining towards the 55% mark –
where it hovered around until 2009, falling sharply with the Great Depression, first to 52.4%
in 2010, and later to 48.5% in 2011. The rise in real compensation per employee and in the
adjusted wage share from the mid-1970s to the early 1980s, were principal factors behind the
large decrease in income inequality during this period.
Figure 1.3: Adjusted Wage Share as percentage of GDP (1970-2011)
3 During the 1960s, the adjusted wage share in Greece declined from an unbelievably high level of
86% in 1960, to 65% in 1970.

17
Source: AMECO
The early catch-up face for the Greek economy – which lasted until the late 1970s – was
mainly investment-driven, associated with large increases in labour productivity. The
investment rate was 33.4% of GDP in the 1970s, and it declined first to 25.1% in the 1980s,
and then to 22.3% in the 1990s. There was a small rise to 23.9% in the 2000s, and it tanked to
15.4% in the first two years of the bailout period (2010-2011). The decline in the investment
rate from the 1970s can possibly be understood as a natural response of an economy
approaching developed-country status; in any case, until 2009 the investment rate was above
the EU15 average. It could also reflect the decline in profitability of Greek industry as the
large (effective) protection under which operated was gradually eliminated after the country’s
admission to the EEC in 1981. What is more difficult to understand is the negligence shown
by policymakers to the large, and continuous, decline in the gross national saving rate, from
28.8% in the 1970s to 9.8% in the 2000s, and to 3.5% in 2010-2011.
The decline in saving has been far more pronounced and pernicious: the gross national saving
rate declined from 28.8% in the 1970s to 9.8% in the 2000s, and to 3.5% in 2010-2011. This
huge decline in the gross saving rate meant that in the 2000s net national saving (equal to
gross national saving minus depreciation) became negative, i.e. (in the absence of valuation
changes) national wealth started decreasing. We note that the huge drop in the national saving
rate has (since 1988) not been associated with a rise in government borrowing, but it is wholly
attributable to the decline in the private sector’s gross saving rate (from 27% in 1988 to 11%
in 2008). In fact, as portrayed in Figure 1.5, it appears that the private sector reduced its
saving rate at the same time as the government was trying to decrease its own dis-saving from
the early 1990s to the mid-2000s (see, Moutos and Tsitsikas (2010) for more details).
Figure 1.4: Gross national saving and gross capital formation
0
5
10
15
20
25
30
35
40
70-99 80-89 90-99 2000-09 2010-11gross national saving gross capital formation
Source: AMECO
Among the likely causes of the decline in the private sector’s saving rate in Greece is the
continuous decline of the share of agricultural employment (since farmers face greater income
uncertainty than wage earners – especially government employees), the gradual extension of
unfunded pension benefits to a larger part of the population, the rise in social protection
expenditure, and since the mid-1990s the excessive credit expansion. The latter was
facilitated by domestic banks who found it profitable to borrow from abroad, and extend to
domestic households (in fact, all too often actively push) loans that with the benefit of
hindsight should not be given. These loans were used to expand consumption spending, part

18
of which fell on domestically-produced goods and services, and part on foreign-produced
ones, leading to an expansion of the import share from 25% of GDP in 1994 to 38% in 2000.
Consistent with these facts, the net borrowing requirements of the Greek economy (the sum of
the balance on current transactions and capital transfers in the Ameco database) as a
proportion of GDP from EMU entry (2001) until 2009 were on average 11.8%. During the
same period, the average budget deficit was 7.3% (according to the data revised by Eurostat
in November 2010), implying that the private sector not only was unable to finance the
government’s budget deficit, but was also an equally significant net contributor to the rise in
the country’s net foreign indebtedness (Katsimi and Moutos, 2010). In addition to the very
large trade deficits, the rise in foreign indebtedness was also fuelled by the gradual decrease
in the balance on current and capital transfers, which Greece was receiving (mainly) from the
EU, and in net primary income. In 1995, the balance on these transfers was equal to 3.6
percent of GDP (2.9 on current transfers, and 0.7 on capital transfers). In 2009, the magnitude
for the sum of these transfers had dropped to just 0.3 percent of GDP. The deterioration in net
(income) receipts was even larger; in 1995 there was a surplus of 2.8 percent of GDP, which
by 2009 had turned to a deficit of 2.9 percent; this just reflects and feeds on the country’s
rising net foreign indebtedness.
Figure 1.5: Gross and net national saving (% GDP)
Source: AMECO
The upshot of the large current account deficits incurred after 1997 was Greece’s net foreign
debt position as a proportion of GDP from 3% of GDP in 1997 to 86% by the end of 2009
(IMF, 2010). At that point foreign investors started to question the ability (and/or willingness)
of the government to generate the resources required for debt service to foreigners, since it
became clear that the Greek government faced a mission-impossible; on the one hand, to
make government debt sustainable, the economy should grow so as to increase tax revenue;
on the other hand, to make (the) net foreign debt sustainable, the economy should contract so
as to eliminate the huge current account deficit. Under these conditions, foreign creditors
started demanding interest rates that embodied a high probability of default; this, in turn,
forced the Greek government to seek official help, since paying the higher interest rates
demanded by the foreign creditors made default in the near future a foregone conclusion.

19
This brought an end to the large expansion of Greek living standards (since 1995) - an
expansion which was based on the availability of private foreign credit to both government
and the private sector.4 This growth-on-(credit) steroids allowed government spending on
public employee compensation to rise from 8.3% of GDP in 1976, to 12.7% in 2009.5 While
up to 2000, the Greek government was spending less (as a percentage of GDP) than the EA12
average on wages and salaries, the inexorable rise in government spending on employee
compensation is now higher than the EA12 average. Between 1976 and 2009, the number of
government employees increased by about 150% (from about 282 thousand to 768 thousand ),
while private sector employment during the same period increased by about 34% (from 2.95
million to 3.96 million); thus, general government employment increased from 8.7% of total
employment in 1976 to about 15% in 2009. Real wages of civil servants got a very large
boost in the 1980s. In 1982 alone, the central government’s wage bill increased by 33%. The
growth in public sector compensation costs was renewed in the 1990s under different guises.
Wages in public enterprises have grown significantly faster than wages in other sectors. The
cumulative increase over the 1994-2009 period in (gross) nominal private sector wages
(excluding the banking sector) was 137%, whereas the cumulative increase in public sector
wages was 291%, and in publicly owned enterprises 356% (see, Fotoniata and Moutos, 2010).
In economies unable to borrow excessively from abroad –something which being part of the
euro area allowed Greece to do – such increases in public employment and wages would be
associated with higher tax rates, thus crowding-out private employment (Malley and Moutos,
1996).
Figure 1.6: Balance on current transactions, net foreign borrowing, balance on goods
and services (% of GDP, 1970-2011)
Source: AMECO
The seemingly unlimited access to credit which the Greek economy enjoyed until 2008,
allowed the private sector to develop along with the public sector, thus enabling private-sector
employees to experience after-tax real wage increases as well. The increasing elimination of
the “soft budget constraints” in the post-2009 era has produced unprecedented declines in
private employment and wages (of all employees), thus setting the stage for large
(unrecorded, as yet) increases in inequality.
4 Greece’s net receipts from the EU budget declined from 3.8% of GDP in 1995, to 3.2% in 2000, to
2.2% in 2005, to 1.3% in 2009. 5 The corresponding figure for the EA12 average was 11% in 2009. The public sector comprises the
general government sector plus all public corporations including the central bank, but it does not include the former publicly owned utilities which had been privatized.

20
2. THE NATURE OF INEQUALITY AND ITS DEVELOPMENT OVER TIME
2.1 Has inequality grown?
In this chapter we examine the nature and evolution of different inequality measures in Greece
in order to provide a basis for our discussion of the social, cultural, and political impacts of
these inequality developments in the rest of the report.
Unlike most of the rest-of-the-OECD countries, Greece experienced a decline in almost all
inequality indices during the last three decades. However, as is well known, broad trends in
inequality measures may mask differential developments for various groups of households
which, in turn, may have affected in diverse and non-linear ways the impacted variables under
study.
In the rest of the chapter we distinguish between various dimensions of inequality and poverty,
including among household incomes and consumption, labour market earnings, and how they
have been affected by various socio-economic developments (i.e. education, age, mode of
labour market participation). Given the lack of high-quality data for some dimensions of
inequality in Greece, the focus is on understanding the trends in various aspects of inequality
through time, and not on the absolute inequality levels.
2.1.1 Household income inequality
Since income is the most commonly focused aspect of inequality, we start our discussion by
looking at how household income inequality has changed during the last four decades and how
tax and benefit policy shape the distribution and redistribution of household income.
Data on income inequality in Greece come from the Greek Household Budget Survey (HBS)
which have been conducted by the National Statistical Agency of Greece (ESYE, recently
renamed as ELSTAT). The surveys were conducted in 1974, 1981/82, 1987/88, 1993/94,
1998/99, 2004/05, and 2008. These HBS collect information about incomes, consumption
spending (actual and presumptive), household amenities and durable consumer goods
ownership, and the socioeconomic status of the households and their members. All of the HBS
covered the entire country, but the sample has gradually decreased from about 7.500
households in 1974, to between 6.000-6.800 for the next five, and finally to 3.460 households
in 2008. For all surveys, the interviews were spread throughout the whole year in which they
had been conducted.
An important feature of the Greek HBS is that it contains data about the presumptive
spending of households (mainly house rent and consumption of own-produced agricultural
products). This property of the surveys is particularly valuable in Greece, since (i) owner-
occupied housing is more common in Greece among low-income than among high-income
households, and (ii) consumption of own-produced agricultural goods is a substantial part of
total consumption for many poor agrarian households. As a result, the surveys, by accounting
for these features of Greek society do not necessarily lead to an overestimation of the level of
inequality.
In what follows we follow standard practice and take into account the existence of economies
of scale in household consumption needs, as well as the existence of different needs between
adults and children. We thus report equivalised inequality measures according to the modified
OECD scale, which gives a weight of 1.0 to the head of the household, 0.5 to all other
members above 13 years old, and 0.3 to children up to the age of 13. We thus report on the
evolution of equivalised income and consumption distributions, in which the income and
spending of each household is divided by the equivalised number of its members, and the
resulting number is attributed to each member of the household.

21
The aggregate inequality indices we present in Figure 2.1 are the Gini coefficient and the
Atkinson index for values of the parameter capturing the aversion to inequality equal to ε=0.5
and ε=2.0. To make comparisons easier, all indices have been converted to a constant base of
1974=100. These indices portray a significant reduction in inequality between 1974
(following the return of democracy in Greece) and 1982. During this period household
income inequality declined between 19 percent (Gini) and 36 percent (Atkinson, ε=0.5). From
1982 to 1999 income inequality has remained roughly at the same level, displaying small
upward and downward movements. Ιt is reassuring that these movements are similar across
the three indices. The next significant decline in inequality took place between 1999 and
2004, and it declined very little –in effect, it remained constant – from 2004 to 2008. (As we
shall see later, this small decline in income inequality during the last period is to be contrasted
with a small rise in consumption inequality during the same period.) The indices which show
the biggest drop in income inequality during this period are those that are more sensitive to
changes at the extremes of the distribution (i.e. the Atkinson indices).
By way of comparison between the Greek HBS, the European Community Household Panel
(ECHP) –available for the period 1995-2001, and the European Union Study of Income and
Living Conditions (EU-SILC) – available for the period 2003-2009, in Figure 2.2 we present
the corresponding Gini indices for household disposable income. In order to make the
comparison meaningful, we present estimates from the HBS in which imputed sources of
income are excluded from the definition of income. The general trends are similar across the
three sources; however, the estimated level of inequality is higher from ECHP and EU-SILC
data, relative to the Greek HBS. We also note that the estimates arising from the EU-SILC
data do not register a decline in income inequality from 2004 to 2008.
Figure 2.1: Evolution of Income Inequality Indices, 1974-2008
Source: EU-SILC, Mitrakos and Tsakloglou (2012)
The decline in income inequality has also been reflected in the rise of proportion of total
income accruing to the poorest decile, according to the Greek HBS. Table 2.1a reveals that
the poorest population decile increased its share of total income from 2.3% in 1974 to 3.7% in
2008. In contrast, the share of the richest decile declined from 29.7% in 1974 to 23.3% in
2008. We note that the rise in income shares from 1974 to 2008 was experienced by the
seven lowest deciles, whereas only the two highest deciles had any discernible fall in their
income shares.

22
Figure 2.2: Comparison of the evolution of the Gini Index for disposable income (1995-
2009) across sources (HBS, ECHP, EU-SILC)
Source: EU-SILC, Mitrakos and Tsakloglou (2012)
Table 2.1A: Estimates of income shares by population deciles
Decile 1974 1982 1988 1994 1999 2004 2008
1 (poorest 10%) 2.3 3.2 3.0 3.1 3.0 3.5 3.7
2 4.0 4.9 4.8 4.8 4.7 5.1 5.2
3 5.1 6.0 6.0 5.9 5.9 6.1 6.2
4 6.1 7.0 7.0 7.0 6.8 7.1 7.1
5 7.2 8.0 8.0 8.1 7.9 8.1 8.2
6 8.4 9.1 9.1 9.3 9.0 9.3 9.3
7 9.9 10.4 10.5 10.6 10.4 10.6 10.5
8 12.0 12.2 12.3 12.3 12.1 12.2 12.1
9 15.3 14.8 15.0 14.9 15.0 14.7 14.6
10 (richest 10%) 29.7 24.3 24.4 24.0 25.1 23.2 23.3
Source: Mitrakos and Tsakloglou (2012)
Table 2.1b (derived from 2.1a) reveals also that the ratio of income accruing to the second
richest decile to the income of the lowest decile (D9/D1) declined from 6.7 in 1974 to 4.6 in
1982. This large drop in the D9/D1 ratio tallies well with Gini’s decline during the same
period. This ratio hovered around 5 until 1998, and then declined to 4.2 in 2004, and to 3.9 in
2008. The same qualitative movements are observed for the D5/D1 and D9/D5 ratios as well.
This implies that the poorest registered gains in their relative income standing not only
relative to the rich, but relative to middle incomes as well. OECD (2011) calculates that the
growth in real household incomes for the bottom decile from the mid-1980s to the late 2000s
were in Greece equal to 3.4% per annum, while the corresponding growth rate for the top
decile was 1.8%. In contrast, for the OECD as a whole, the corresponding growth rates were
1.3% for the bottom decile and 1.9% for the top decile, with 19 of the 27 countries
conforming to the same pattern.

23
Table 2.1B: Decile ratios (D9/D1, D5/D1, D9/D5)
Ratios 1974 1982 1988 1994 1999 2004 2008
D9/D1 6.7 4.6 5.0 4.8 5.0 4.2 3.9
D5/D1 3.1 2.5 2.7 2.6 2.6 2.3 2.2
D9/D5 2.1 1.9 1.9 1.8 1.9 1.8 1.8
Source: Mitrakos and Tsakloglou (2012) and authors’ calculations
The evolution of poverty has followed a similar pattern to the evolution of income inequality.
In what follows we will concentrate on Eurostat’s relative poverty line, which corresponds to
60% of median equivalised income according to the utilized HBS. According to this
definition, 15.6% of the Greek population was below the relative poverty line in 2008, i.e. the
poverty rate was 15.6%. At the same year, the poverty gap –defined as the income that would
be needed to raise the incomes of all persons classified as poor to the relative poverty line was
3.4% of aggregate augmented income. In Figure 2.3 we depict the percentage changes in
relative poverty, the poverty gap, and in the Foster-Greer-Thorbecke (a=2) index (FGT2,
hereafter) index, with respect to income. Comparing Table 2.1 and Figure 2.3 we observe a
similar pattern in the evolution of inequality and poverty indices. Between 1974 and 2008, the
drop in the poverty rate was 23.3%, the drop in the poverty gap was 47.6%, whereas the drop
in the FGT2 index was 63.8%. The largest drop in the FGT2 index, which is sensitive to
situations of extreme poverty, indicates that considerable progress was made in reducing
extreme poverty. The biggest drop in poverty (much as in the case of inequality) took place
between 1974 and 1982, with the largest drop been for the FGT2 index, which declined by
45.7%. Poverty remained roughly constant from 1982 to 1999, and it declined again
considerably from 1999 to 2008, which the percentage decline in the FGT2 index being
45.2% during this latter period.
As a way of comparison between the poverty measures based on the Greek HBS, and the ones
resulting from the ECHP and the EU-SILC – which cover the period 1994-2008, in Figure 2.4
we present the poverty rate on the basis of disposable income. (We do this since in the ECHP
and EU-SILC surveys there exist data only for disposable income.) On the basis of the ECHP
and EU-SILC surveys, the poverty rate declined marginally from 1994 to 2009. This stands in
contrast with the considerable decline on the basis of the Greek HBS, which shows a decline
of 3 percentage points (from 19.8% to 16.8%) in the poverty rate from 2004 to 2008.
Despite the general importance of relative poverty indices, for countries making the transition
from middle-income to developed-country status (as Greece seems to have done during the
last four decades), of interest are also changes in the poverty rate in absolute terms. This is
done by keeping the poverty line fixed in terms of real purchasing power, according to the
HBS of 1998/99 and the evolution of the consumer price index. Once this is done, the
percentage drop in poverty indices becomes impressive – especially for the period 1974-1982
(see Figure 2.5). The percentage drop from 1974 to 2008 in the poverty rate is 88.6%, for the
poverty gap, 94.3%, and for the FGT2 index, 96.4%. The fact that the poverty gap and the
FGT2 index have shown a larger drop than the poverty rate indicates that not only the poor
were far fewer in 2008 than in 1974, but that there is a reduction in income inequality among
the poor. This indicates that the reduction in poverty observed during this period was not just
a straightforward implication of faster GDP growth (i.e., “a rising tide lifts all boats”), but an
outcome testifying to the structural transformation of Greek economy and society.

24
Figure 2.3: Income-based poverty indices
Source: Mitrakos and Tsakloglou (2012)
Figure 2.4: Poverty rate 1994-2009, distribution of disposable income,
ECHP/EUSILC και HBS
Source: EU-SILC, Mitrakos and Tsakloglou (2012)
Figure 2.5: Change in poverty indexes in absolute terms 1974-2008: distribution of total income
(poverty line 1999 in terms or real purchasing power)
Source: EU-SILC, Mitrakos and Tsakloglou (2012).

25
2.1.1.1 Structure of Inequality
What factors are responsible for the evolution of aggregate inequality in Greece between 1974
and 2008? In this section we present results due to Tsakloglou and Mitrakos (2012), who have
used the Mean Logarithmic Deviation index of inequality (Theil’s second index) and
decomposed it in order to estimate the contribution of various factors. This index allows the
separation of aggregate inequality into “between group inequality” and “within group
inequality”, when the population is split into non-overlapping groups. The part of inequality
due to inequality “between” groups can be defined as the inequality index that results from a
hypothetical distribution in which every person within a group has income equal to the
group’s average; similarly, the part of inequality due to inequality “within” groups is defined
as the inequality index that results from a hypothetical distribution in which the mean income
of each group is equal to the aggregate mean.
Table 2.2 presents the proportional contribution of inequality “between” different socio-
economic groups to aggregate inequality. It appears that during the whole period (1974-2008)
the contribution of differences “between” groups did not contribute more than 26% to
aggregate inequality. For the first four categories (region of residence, urbanization index,
demographic type of household, employment category of household head), the contribution of
inequality “between” groups to aggregate inequality was never more than 17%, implying that
most of the inequality can be explained by differences which exist “within” these socio-
economic groups. The contribution of the last categorization (according to the educational
achievement of household head) increases the contribution of the “between” groups
component to 25.2%, still implying that the overwhelming “cause” of inequality must be
attributed to inequality within each educational group. The last line of Table 2.2 shows a
multidimensional decomposition of inequality in which the population is separated into 109
relatively homogeneous groups. It is interesting that even in this case, the “between” groups
inequality can “explain” only up to one-third of aggregate inequality.
Table 2.2: Percentage of total inequality attributed to differences "within" groups based
on consumption expenditure distribution and Mean Log Deviation (second Τheil index)
Criterion of grouping Number
of groups 1974 1982 1988 1994 1999 2004 2008
Region of residence 11 14.0 8.2 7.4 6.9 7.2 6.2 6.2
Degree of urbanization 4 13.3 9.8 10.2 6.5 10.0 6.8 7.1
Demographic type 9 3.7 5.6 6.8 6.4 7.2 7.0 5.8
Professional status 9 17.0 12.5 13.5 11.5 13.8 15.8 13.9
Education (Head of Household) 5
25.2 17.7
*
20.8 21.0 19.9 21.1 24.4
Multivariate decomposition of
inequality 109
33.3 26.4 30.5 28.8 32.8 29.4 32.9
* Only 4 education levels
Source: Mitrakos and Tsakloglou (2012)
We turn now to an examination of equivalised estimates for income inequality, as provided by
EUROMOD (2011). These estimates are based on a tax-benefit micro-simulation model using
EU-SILC data, and which calculates direct tax and social contribution liabilities and
entitlements to cash benefits on the basis of the tax-benefit rules which actually have been in
place from 2005 to 2008 in Greece.
26
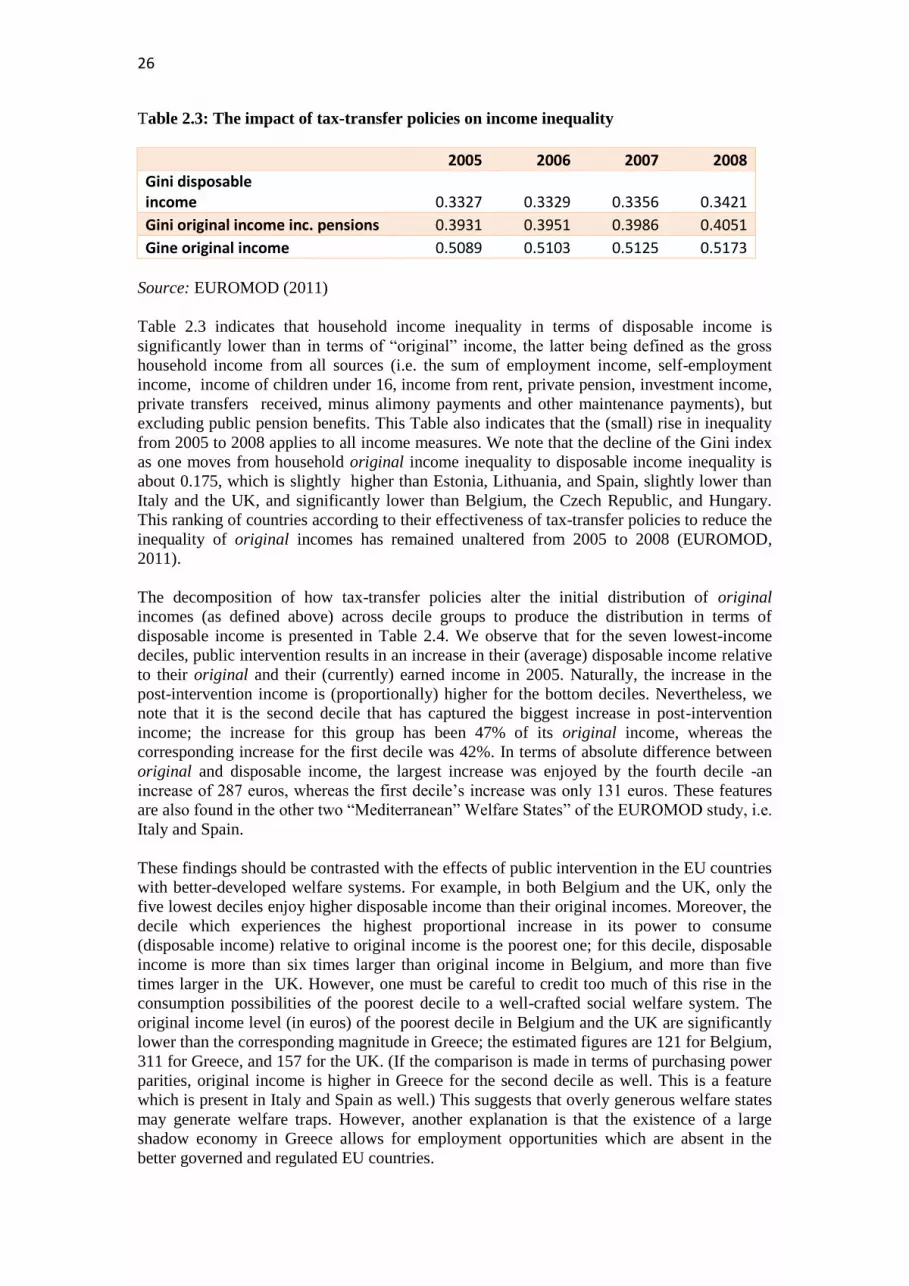
Table 2.3: The impact of tax-transfer policies on income inequality
2005 2006 2007 2008
Gini disposable income 0.3327 0.3329 0.3356 0.3421
Gini original income inc. pensions 0.3931 0.3951 0.3986 0.4051
Gine original income 0.5089 0.5103 0.5125 0.5173
Source: EUROMOD (2011)
Table 2.3 indicates that household income inequality in terms of disposable income is
significantly lower than in terms of “original” income, the latter being defined as the gross
household income from all sources (i.e. the sum of employment income, self-employment
income, income of children under 16, income from rent, private pension, investment income,
private transfers received, minus alimony payments and other maintenance payments), but
excluding public pension benefits. This Table also indicates that the (small) rise in inequality
from 2005 to 2008 applies to all income measures. We note that the decline of the Gini index
as one moves from household original income inequality to disposable income inequality is
about 0.175, which is slightly higher than Estonia, Lithuania, and Spain, slightly lower than
Italy and the UK, and significantly lower than Belgium, the Czech Republic, and Hungary.
This ranking of countries according to their effectiveness of tax-transfer policies to reduce the
inequality of original incomes has remained unaltered from 2005 to 2008 (EUROMOD,
2011).
The decomposition of how tax-transfer policies alter the initial distribution of original
incomes (as defined above) across decile groups to produce the distribution in terms of
disposable income is presented in Table 2.4. We observe that for the seven lowest-income
deciles, public intervention results in an increase in their (average) disposable income relative
to their original and their (currently) earned income in 2005. Naturally, the increase in the
post-intervention income is (proportionally) higher for the bottom deciles. Nevertheless, we
note that it is the second decile that has captured the biggest increase in post-intervention
income; the increase for this group has been 47% of its original income, whereas the
corresponding increase for the first decile was 42%. In terms of absolute difference between
original and disposable income, the largest increase was enjoyed by the fourth decile -an
increase of 287 euros, whereas the first decile’s increase was only 131 euros. These features
are also found in the other two “Mediterranean” Welfare States” of the EUROMOD study, i.e.
Italy and Spain.
These findings should be contrasted with the effects of public intervention in the EU countries
with better-developed welfare systems. For example, in both Belgium and the UK, only the
five lowest deciles enjoy higher disposable income than their original incomes. Moreover, the
decile which experiences the highest proportional increase in its power to consume
(disposable income) relative to original income is the poorest one; for this decile, disposable
income is more than six times larger than original income in Belgium, and more than five
times larger in the UK. However, one must be careful to credit too much of this rise in the
consumption possibilities of the poorest decile to a well-crafted social welfare system. The
original income level (in euros) of the poorest decile in Belgium and the UK are significantly
lower than the corresponding magnitude in Greece; the estimated figures are 121 for Belgium,
311 for Greece, and 157 for the UK. (If the comparison is made in terms of purchasing power
parities, original income is higher in Greece for the second decile as well. This is a feature
which is present in Italy and Spain as well.) This suggests that overly generous welfare states
may generate welfare traps. However, another explanation is that the existence of a large
shadow economy in Greece allows for employment opportunities which are absent in the
better governed and regulated EU countries.

27
Table 2.4: Distribution of Monthly Average Incomes per Decile Components (Effects of
2005 Tax-Transfer Policies)
Decile Disposable Original of which Means Non Public All All Social
group Income Income Cur.
Earned Tested Means Pensions Benefits Taxes Ins.
Incl. Benefits Test. Ben.
Contrib.
1 442 311 294 35 27 146 209 5 73
2 780 531 483 36 26 287 349 9 91
3 975 717 682 40 23 335 398 16 124
4 1,101 814 777 44 27 390 461 30 143
5 1,306 1,085 1,018 22 28 416 465 60 184
6 1,598 1,412 1,347 17 21 480 517 89 243
7 1,831 1,637 1,551 13 29 553 596 135 266
8 2,182 2,284 2,185 10 22 468 500 245 356
9 2,668 2,996 2,804 6 13 510 529 406 451
10 4,535 5,874 5,489 3 21 690 714 1,495 557
All 1,716 1,729 1,628 23 24 425 472 240 245
Poor 610 417 393 37 27 220 284 7 83
Source: EUROMOD (2011)
EUROMOD (2011) provides also estimates of the shares of income accruing to each decile.
What Table 2.5 reveals is that the government’s tax-transfer policies have resulted in a rise of
the share of disposable income of the poorest decile (relative to their original income) by 0.8
percentage points, a smaller percentage point increase than for the next 6 deciles (which can
be as high as 1.9 percentage points for the fourth decile). In contrast, in Belgium and the UK,
the corresponding increases for the poorest three deciles were about 3.7-3.9 and 2.6-2.9
percentage points, respectively; in both countries these increases were significantly higher
than for the next three deciles. Again, the situation in Italy and Spain in this respect appears
closer to the Greek experience than to the Belgian, or the UK, one.

28
Table 2.5: Share of Household Income and Income Components Received/Paid by Each
Decile Group
Decile Disposable Original of which Means Non Public All All Social
group Income Income Cur.
Earned Tested Means Pensions Benefits Taxes Ins.
Incl. Benefits Test. Ben.
Contrib.
1 2.6% 1.8% 1.8% 15.4% 11.4% 3.4% 4.4% 0.2% 3.0%
2 4.6% 3.1% 3.0% 15.7% 11.0% 6.8% 7.5% 0.4% 3.8%
3 5.8% 4.3% 4.3% 18.0% 9.9% 8.1% 8.6% 0.7% 5.2%
4 6.9% 5.0% 5.1% 20.4% 12.1% 9.8% 10.4% 1.3% 6.2%
5 8.0% 6.6% 6.5% 10.0% 12.3% 10.2% 10.3% 2.6% 7.8%
6 9.1% 8.0% 8.1% 7.2% 8.4% 11.0% 10.7% 3.6% 9.7%
7 10.6% 9.4% 9.4% 5.7% 12.3% 12.9% 12.5% 5.6% 10.8%
8 12.5% 12.9% 13.1% 4.1% 8.9% 10.8% 10.4% 10.0% 14.2%
9 15.0% 16.7% 16.6% 2.4% 5.4% 11.6% 10.8% 16.3% 17.8%
10 25.1% 32.3% 32.0% 1.2% 8.2% 15.4% 14.4% 59.3% 21.6%
Poor 6.9% 4.6% 4.6% 30.8% 22.0% 10.0% 11.6% 0.5% 6.6%
Source: EUROMOD (2011)
2.1.1.2 The effect of incomes in-kind
As is well known (e.g. Smeeding et al., 1993), ignoring the influence of non-monetary
incomes in the calculation of inequality indices can produce a distorting picture of inequality
– this is a consequence of the fact that incomes in-kind are usually distributed in a different
way than monetary incomes. For countries like Greece – with a high proportion of owner-
occupied housing, especially among the lower-income households, and a large agricultural
sector, it is essential to examine the contribution of different non-monetary factors to income
inequality.
Using data from the HBS of 2004/05, Koutsabelas and Tsakloglou (2012), have calculated
that only 19.3% of households/dwellers were paying rent. Moreover, as Figure 2.6 details, the
importance of incomes in-kind (consisting of the sum of imputed rent, education-related and
health-related public transfers, and other in-kind incomes), is far more important for the lower
quintiles, than for the higher quintiles of the distribution. For the lowest quintile, disposable
income represents only 51.4% of augmented income (which includes the incomes-in kind),
whereas for the top quintile, disposable income is 84.4% of total income.6 We note also that
for the poorest quintile, whose non-monetary income is about half of the total, most of this
income is due to public transfers (29.1% of the total), whereas private incomes in-kind
represent 19.6% of the total. As we climb up the income distribution, the relative importance
of public transfers becomes smaller; indeed, for the richest quintile, private incomes in-kind
represent 8.5% of augmented income, whereas public transfers in-kind represent only 7.1% of
augmented income.
6 Augmented income is calculated by attributing value to the different sources of incomes in-kind, and
adding them to disposable income. For details regarding these calculations, see Koutsampelas and Tsakloglou (2012). The concept of augmented income must be distinguished from gross income, since the former is net of taxes.

29
The effects of the public transfers, in-kind, and private incomes, in-kind (we use the term
non-monetary incomes for these incomes, thereafter), on inequality are presented in Table
2.6. Koutsambelas and Tsakloglou (2012) have calculated these by comparing the distribution
of disposable income (which does not include non-monetary incomes) with the distribution
which includes non-monetary incomes (defined as augmented income). The provision of free
(publicly-funded) health services appears to be the factor with the strongest influence in
reducing inequality for the three indices; the percentage reduction in inequality ranges from
10.9 (for the Gini index) to 23.3% (for the Atkinson index with e=1.5). Imputed rent and
publicly-funded education have also exercised considerable inequality reducing power, with
the percentage reduction in inequality ranging between 5.3 and 13.3% for the first, and
between 6.4 and 12.1% for the second. The joint influence of the above non-monetary sources
of income (including private incomes and transfers in-kind, consisting of own-consumption of
agricultural and non-agricultural goods, in-kind employment benefits, and in-kind private
transfer) is impressive, resulting in percentage reductions in the inequality indices between
22.1 and 41.8%.
Figure 2.6: Composition of augmented income by quintile
Source: Koutsampelas and Tsakloglou (2012)
0%
10%
20%
30%
40%
50%
60%
70%
80%
90%
100%
1 2 3 4 5Quintiles
Disposable income Imputed rents Other income in kind
Public education Public health

30
Table 2.6: Effects of Public transfers and Private incomes
Descriptive
Statistics Indices of inequality and poverty (%)
% of disposable
income Gini Atkinson(e=0.5) Atkinson(e=1.5) FGT(0) FGT(1) FGT(2)
Imputed rents 11.7 -5.3 -11.1 -13.3 -14.0 -20.5 -29.8
Other in-kind income 3.6 -3.4 -7.1 -8.5 -10.2 -14.2 -20.0
Public education 8.8 -6.4 -12.1 -10.8 -13.3 -10.2 -12.7
Public health 10.9 -10.9 -20.8 -23.3 -27.3 -38.2 -47.7
Total 35.1 -22.1 -39.6 -41.8 -49.0 -66.4 -77.0
Source: Koutsampelas and Tsakloglou (2012)
Given the lack of estimates through time for how the existence of non-monetary incomes has
altered the inequality of disposable incomes, it is helpful to see whether their importance for
reducing inequality is higher in Greece than in other EU countries. Figure 2.7 shows the
importance of taking imputed rent into account for three inequality indices in Belgium,
Germany, Greece, Italy, and the UK. For each country, the figure depicts the disposable
income level of inequality as well as the percentage decrease in inequality as a result of
adding imputed rent in the definition of income. As expected, due to the high incidence of
owner-occupied housing among the poorest households in Greece, the decline across all
indices is relatively high (about as high as for the UK).
Figure 2.7: The impact of imputed rent on income inequality: % decrease in inequality
due to imputed rent and disposable income inequality
Source: Frick et al ( 2010), EU-SILC 2004 for Belgium and Italy, SOEP 2002 for Germany, HBS
2004/05 for Greece, FRS 2003/04 for UK.

31
Figure 2.8: Decline in inequality including non-monetary sources of augmented income
Source: Koutsampelas and Tsakloglou (2012)
However, this relatively large decline in inequality is not observed once all non-monetary
sources of augmented income (the sum of imputed rent, education-related and health-related
public transfers, and other in-kind incomes) are taken into account. Indeed, as can be seen
from Figure 2.84, the decline in inequality is lower in Greece than in the rest of the countries
examined. As a result, Greece’s relative inequality ranking does not improve – it even
deteriorates with respect to the Gini and Atkinson (e=1.5) indices (see, Koutsampelas and
Tsakloglou, 2012).
2.1.1.3 Consumption Inequality
The evolution of consumption inequality has followed a similar pattern as income inequality.
This is shown in Figure 2.9, which indicates that the indices showing the largest drop in
inequality are the ones depended on changes at the tails of the distribution. The largest drop in
consumption inequality has taken place from 1974 to 1982 (-13,3%, -25,3% and -21,1% for
the Gini and Atkinson - for ε=0.5 και ε=2 – indices, respectively). From 1982 to 1999 the
indices remain roughly constant, whereas a significant drop takes place between 1999 and
2004, the estimated decline being between 9,4% and 19,8%. The last period (2004 to 2008)
shows a very small rise in consumption inequality.
Comparing Tables 2.1a with Table 2.7A we see that, as expected, consumption inequality has
always been smaller than income inequality. For example, whereas the D10/D1 ratio with
respect to income was 12.9 in 1974 and 6.3 in 2008, the D10/D1 ratio with respect to
consumption was “only” 9.8 in 1974 and 6.1 in 2008. Nevertheless, the patterns related to the
evolution of decile shares for consumption through time are similar to the ones for income;
large increases in the relative shares of both the poorest and middle deciles from 1974 to
1982, near constancy from 1982 to 1999, a further significant rise again to 2004, with the new
higher level remaining about the same through to 2008.
-60.00
-50.00
-40.00
-30.00
-20.00
-10.00
0.00
Belgium Germany Greece Ireland Italy Netherlands UK
Gini Atkinson0.5 Atkinson1.5

32
Figure 2.9: Evolution of Consumption Inequality Indices, 1974-2008
Source: Mitrakos and Tsakloglou (2012)
Table 2.7A Estimates of consumption shares by population deciles
Decile 1974 1982 1988 1994 1999 2004 2008
1 (poorest 10%) 2.7 3.3 3.1 3.4 3.3 3.8 3.7 2 4.2 4.8 4.7 5.0 4.8 5.2 5.3 3 5.4 5.9 5.9 6.1 5.9 6.3 6.4 4 6.4 7.0 7.0 7.2 7.0 7.3 7.3 5 7.5 8.0 8.1 8.2 8.0 8.2 8.3 6 8.7 9.2 9.3 9.3 9.2 9.3 9.3 7 10.3 10.6 10.7 10.6 10.6 10.6 10.6 8 12.5 12.5 12.5 12.4 12.5 12.3 12.1 9 15.9 15.5 15.3 15.0 15.0 14.8 14.6
10 (richest 10%) 26.4 23.2 23.3 22.9 23.8 22.2 22.4
Table 2.7B reveals that whereas the poorest have done relative better throughout the entire
period, the middle decile has made only marginal gains relative to the top deciles since 1982.
Table 2.7B: Decile ratios (D9/D1, D5/D1, D9/D5)
Ratios 1974 1982 1988 1994 1999 2004 2008
D9/D1 5.9 4.7 4.9 4.4 4.5 3.9 3.9
D5/D1 2.8 2.4 2.6 2.4 2.4 2.2 2.2
D9/D5 2.1 1.9 1.9 1.8 1.9 1.8 1.8 Source: Mitrakos and Tsakloglou (2012) and authors’ calculations
Similar developments were registered with respect to declines in poverty indices when
consumption is the yardstick over which poverty is defined. Figure 2.10 shows how the
poverty rate, the poverty gap, and the FGT2 index have evolved defined on the basis of
consumption spending. From 1974 to 2008 all three poverty indices have registered
considerable decreases; the poverty rate by 27.1% (from 20,4% of the population to 15.0%),
the poverty gap by 43.3%, and the FGT2 index by 53.2%. These decreases were smaller than

33
the corresponding decreases when income was the yardstick, but were also concentrated over
two periods: from 1974 to 1982, and from 1999 to 2004.
Figure 2.10: Poverty Indices defined over consumption spending
Source: Mitrakos and Tsakloglou (2012)
Keeping the poverty line fixed in terms of real purchasing power – we do this by keeping the
level of the relative poverty line according to the HBS of 1998/99 fixed in real terms by
adjusting it in accordance with the evolution of the consumer price index, we see in Figure
2.11 that the decline in the poverty rate (defined over consumption spending) has been
impressive; the poverty rate declined over the whole period by 87.8%, the poverty gap by
93.3%, and the FGT2 index by 95.8%. Almost all of these declines happened in two batches:
the first from 1974 to 1982, and the second from 1999 to 2004.
Figure 2.11: Change in poverty indexes in absolute terms 1974-2008: distribution of
consumption expenditure (poverty line 1999 in terms or real purchasing power)
Source: Mitrakos and Tsakloglou (2012) and authors’ calculations

34
2.1.2 Wealth Inequality
The distribution of wealth in Greece is a very under-researched topic, due to the lack of
available data. The only data available come from the Credit Suisse’s (2011) Global Wealth
Databook 2011. These data suggest that the personal distribution of wealth in Greece is more
equitable than in most European countries. Figure 2.12 shows the distribution of wealth in
2011, for Greece and for Europe as a whole, across wealth classes (defined in US dollars).
The proportion of Greek adults with wealth less than 1,000 USD is only 1.6%, whereas the
European average is 20.4%. The high European average is obviously a result of the low
wealth levels of some of the post-communist countries. Yet, there exist some high-income
European countries for which a high proportion of their adult population has wealth below
1,000 USD; e.g. in Germany 13.6% of the adult population belongs to this category, 12.5% in
the Netherlands, and 7.1% in the UK. Of interest is also that in Greece 48.3% of adults have
wealth between 10.000 and 100.000 USD, whereas the corresponding figure in Europe is
28.2%. Again, the relatively low European average is partly due to the post-communist
countries, but also due to the fact that the Global Wealth Databook reveals that if one focuses
only on the high-income countries (i.e., the EU15 plus Norway and Switzerland, rather than
Europe as a whole), more adults belong to the group with wealth above 100.000 USD, than in
any other wealth class.
Figure 2.12: Population Shares Across Wealth Classes
Source: Credit Suisse (2011)
The above described data imply that wealth inequality is relatively low in Greece relative to
most European countries. Credit Suisse (2011) calculates that in 2011 the Gini for wealth
inequality among adults to be 70.3 in Greece against a European average of 82.9. Similarly,
the ratio of mean to median wealth was 9.4 for Europe as a whole, and 2.4 in Greece. We note
that the higher wealth inequality in the rest of the European countries is not only a result of
high wealth inequality in the post-communist countries, which, with the exception of the
Russian Federation and Ukraine, have far lower wealth inequality than the European average.
It is also due to the relatively high wealth inequality estimated for countries like Denmark,
The Netherlands, Sweden, Switzerland, as well as, France and Germany. In contrast, the less-
developed welfare states of the European South (Italy, Portugal, and Spain) have low wealth
inequality, possibly due to the higher need to “save for a rainy day”. Another plausible
explanation of the relatively low wealth inequality of these countries (plus Greece) is their
large agricultural sectors and widely spread holdings of agricultural land and home ownership
(see Chapter 3).

35
How reliable are the data for Greece appearing in the Global Wealth Databook? Although no
other comparable data exist, there is some information regarding the median wealth of
households headed by persons aged more than 50, independently of the age of their spouses.
These data are assembled by Christelis et al. (2005) on the basis of a sample of 1478
households, and indicate that the median household wealth of the “elderly” in Greece was
€95,300.00 in 2004. Credit Suisse (2011) reports a value of wealth per adult of 100,900.00
USD in 2004. Although there is no easy way to compare the figure for mean wealth of adults
appearing in the Global Wealth Databook with the median household wealth of the “elderly”
appearing in Christelis et al., there is no a-priori reason why the two figures are incompatible
with each other.
Christelis et al. (2005) provide also information about the median household gross financial
assets for the “elderly”, which they calculate at €2,000.00 in 2004. This is similar to what
they find for Italy (€2,300.00) and Spain (€1,900.00), and significantly lower than the
corresponding magnitudes for the other countries in their sample (Austria, Denmark, France,
Germany, Italy, Netherlands, Spain, Sweden, and Switzerland). The portfolio composition
across financial assets and liabilities is also substantially different in Greece; the proportion of
households with bank accounts stood at 56%, whereas the average for the other countries in
the sample was above 80%; similarly, the proportion of Greek households holding bonds,
stocks, and life insurance policies were 1.1%, 5.3%, and 2.2% (respectively), figures that are
well below the rest of the countries average. By analogy, the proportion of wealth in the form
of real assets (mainly housing) was far above in Greece, than in the rest of the countries (with
the exception of Italy and Spain).
2.1.3 Labour market inequality
One of the salient features of the Greek economy is the differential labour market outcomes
between males and females. Figure 2.13 shows the employment and participation rates for
both genders, as well as the total values for these variables, for persons aged 15-64, during the
last three decades. The differences between the sexes in employment and participation rates
were enormous up to the early 1990s: in 1992, the participation rate for males was 76.4%,
whereas for females it was only 41.8%; the difference in employment rates was also large in
1992 – 72.3% for males, and only 36.2% for females. These differences were far larger than
the ones observed in the Northern European market economies, but very close to the ones
observed in the Southern European market economies. By 2008, both the employment and
participation gaps between the genders had closed considerably, mainly by increasing female
participation and employment rates, which had increased to 55.1% and 48.7%, respectively,
thus bringing the participation gap to 24 percentage points (it was 34.6 percentage points in
1992), and the employment gap to 24.6 percentage points (36.1 in 1992).
The improvements in the integration of females in market activities went in tandem with a
large expansion of employment rates for persons with upper secondary and post-secondary
non-tertiary education level qualifications. The employment rate for these persons rose from
52.3% in 1992 to 61.2% in 2008, but it still remained far lower than the employment rate for
persons with tertiary education, which was 82.1% in 2008 (see Figure 2.14). On the other side
of the educational spectrum, persons with less than a high-school diploma did not experience
rising employment rates, possibly a result of the economy shifting from agricultural activities
to the more skill-intensive service sector.

36
Figure 2.13: Employment and participation rates (15-64 year old), by gender
Source: Eurostat
Figure 2.14: Employment rates, by sex and education
Source: Eurostat
The decline in income inequality observed in Greece from 1999 to 2008 went in tandem with
the large reduction in the unemployment rate for females with upper secondary and post-
secondary education, from 23.8% in 1999 to 13.2% in 2008 (Figure 2.15). The more than 10
percentage points reduction in the unemployment rate for this group was the largest drop
among the unemployment rates for all groups during this period, and it was brought about by
the expansion of a service sector in need of a medium-skill workforce. (The second-biggest
reduction in the unemployment rate was for males of the same educational category.) In
contrast, the decline in the unemployment rate for females with below upper secondary
education was only 3.7 percentage points (from 16.2% to 12.5%) during the same period, as

37
the manufacturing and agricultural sectors, where they were mainly employed, started to
decline.
We note that the rise in female employment rates cannot be attributed to any increases in part-
time employment (whose incidence is higher among female employees). Figure 2.16 shows
that in 2008 part-time employment as percentage of total employment was 5.4% - a figure
which is significantly lower than in most European countries, with the incidence of part-time
employment being higher among females (at 9.8%) than among males (2.5%). However,
there was no significant rise in part-time employment from the early 1980s to 2008, as the
share of part-time employment ranged from 4% to 6% during this period. More importantly,
the incidence of part-time employment among females also showed no upward trend from the
early 1980s to 2008. Thus, the rise in female employment rates must be attributed to the
expansion of the service sector (from the demand side) and the growing need for two-earner
households7, rise in marrying age of women, and much-increased educational attainment of
women (from the supply side).
Figure 2.15: Trends in unemployment rates, by gender and educational attainment (25-
64 yrs)
0
5
10
15
20
25
30
19
92
19
93
19
94
19
95
19
96
19
97
19
98
19
99
20
00
20
01
20
02
20
03
20
04
20
05
20
06
20
07
20
08
20
09
20
10
20
11
MALES Below upper secondary
MALES Upper secondary and post-secondary, non-tertiary
MALES Tertiary
FEMALES Below upper secondary
FEMALES Upper secondary and post-secondary, non-tertiaryFEMALES Tertiary
Source: Eurostat
The significance of labour incomes for shaping-up income inequality is shown in Table 2.8,
which decomposes overall income inequality by income source, for the seven Greek HBS.
This inequality decomposition by factor components takes into account the level of inequality
7 According to Eurostat, the proportion of two-earner couples in which both partners are working full-
time was 21% of all households (excluding students and those aged more than 65) in 2010 in Greece; the corresponding EA12 average was 16.5%. In contrast, the proportion of couples, in which one partner was working full-time and the other part-time, was 3% in Greece and 11.5% for the EA12 average. The proportion of two, full-time-earner couples, was rising until 2008 in Greece, and has since declined due to the depression.

38
(as determined by the Gini coefficient) for each income source, the degree of correlation
between each source of income and total income, and the importance (share) of each income
source in total income (for details see, Mitrakos and Tsakloglou, 2010). The table also shows
the elasticity of the Gini coefficient to changes in the income from each source, i.e. the ratio
of the percentage change of the Gini coefficient for total income to the percentage change of
mean income from each source. (The sum of these elasticities for all income sources equals
zero given the independence of the Gini coefficient from mean income.) Wages and salaries
remain throughout the period the most important factor in the formation of aggregate
inequality, their trendless contribution ranging from 34.7% to 46.9%. This is due to the fact
that labour income is the single most important source of income in the aggregate (equal to
34.7% of total income – the self-employed are included in a different category), but also to
the large correlation coefficient between this source and total income. The contribution of
incomes from self-employment (excluding agricultural income) and from capital ownership
were (each) around one-quarter in 2008; however, the trend of the importance to total
inequality of these two sources of income were different, with capital income increasing its
importance, whereas the importance of income from self-employment, after an initial fall
from 1974 to 1982, remained constant. The rise of the importance of income from pensions
during this period (from 8.4% in 1974 to 13.2% in 2008) reflects mostly its rise as a share of
total income (from 8.6% in 1974 to 18.3% in 2008). Of particular interest is that the elasticity
of the Gini coefficient to income from dependent employment (wages and salaries) became
negative in the 2008 HBS. This implies that a rise in income from dependent employment
will result in a reduction in overall income inequality – a result which is at variance with all
previous HBS.
Figure 2.16: Part-time employment as percentage of all employment
0
2
4
6
8
10
12
Total
Males
Females
Source: Eurostat

39
Table 2.8: Income inequality components and inequality elasticities by income
source
Source: Mitrakos and Tsakloglou (2012)
The available evidence suggests that in Greece the inequality in the distribution of net hourly
earnings is rather high relative to other European countries. Based on the 7th and 8
th ECHP
data (2000 and 2001), Cholezas and Tsakloglou (2007) find that, with the exception of
Portugal, Greece has –among the thrirteen countries examined - the most unequal distribution
of hourly earnings according to all indices (Gini, Theil, Mean Logarithmic Deviation,
Variance of Logarithms)8, followed closely by the UK and Luxembourg. Proceeding with a
one-way decomposition of earnings inequality, by splitting wage and salary earners in each
country’s sample according to (i) Education (3 groups: “Less than upper secondary”, “Upper
secondary” and “Tertiary”), (ii) Age (5 groups: “18-24”, “25-34”, “35-44”, “45-54” and “55-
64”), (iii) Sex (2 groups: “Males” and “Females”), and, (iv) Sector (2 groups: “Industry”
(including employment in construction and public utilities such as electricity, gas and water)
and “Services”), Cholezas and Tsakloglou (2007) estimate the proportion of hourly earnings
inequality emanating from disparities “between groups”. They find that, again, along with
Portugal and Luxembourg, Greece is a country in which differences between just three
educational groups account for a large part of the total earnings inequality (25.3% according
to the Theil index, 26.1% according to the Mean Logarithmic Deviation, and 22.5% according
to the Variance of Logarithms). They also find that differences between “Age” groups are far
important an influence on earnings inequality in Greece than in other countries, accounting
for up to 22.3% of measured earnings inequality. To some extent, “Age” can be considered as
a proxy for potential experience or seniority, variables which in the Greek context are very
important due to the importance of seniority in the wage-bargaining system for private-sector
employees and in the civil service pay scales.
8 The corresponding numbers for the four indices for Greece are: 0.289, 0.147, 0.136, and 0.254.
Income Source
Percentage contribution to inequality Elasticity of inequality with respect to the source of income
1974 1982 1988 1994 1999 2004 2008 1974 1982 1988 1994 1999 2004 2008
Wages 0.347 0.469 0.366 0.390 0.392 0.412 0.348 0.000 0.075 0.033 0.044 0.046 0.032 -0.028
Incomes from self-employment
excl. agricultural
sector
0.343 0.255 0.235 0.246 0.197 0.248 0.252 0.104 0.082 0.067 0.078 0.041 0.100 0.094
Incomes from agriculture 0.024 0.035 0.025 0.011 0.018 0.017 0.000 -0.127 -0.121 -0.082 -0.060 -0.035 -0.026 -0.030
Income from capital 0.166 0.163 0.246 0.230 0.245 0.225 0.266 0.030 0.024 0.049 0.025 0.032 0.013 0.061
Pensions 0.084 0.062 0.110 0.084 0.091 0.086 0.132 -0.001 -0.049 -0.039 -0.063 -0.068 -0.080 -0.049
Others social transfers 0.036 0.017 0.020 0.039 0.056 0.012 0.002 -0.005 -0.011 -0.028 -0.024 -0.016 -0.039 -0.047
TOTAL 1.000 1.000 1.000 1.000 1.000 1.000 1.000 0.000 0.000 0.000 0.000 0.000 0.000 0.000

40
Figure 2.17 Inter-termporal trends in hourly earnings inequality (Mean log deviation)
Source: Cholezas and Tsakloglou (2007)
The inter-temporal changes in hourly net earnings inequality in Greece on the basis of the
Greek HBS from 1974 to 1999 are shown in Figure 2.17. The Mean Logarithmic Deviation
index declined from 0.161 in 1974 to 0.106 in 1988, and then it increased to 0.183 in 1999.
The initial decline and subsequent rise in hourly earnings inequality can be explained by (i)
the initial rise (up to 1984) and subsequent decline of the real value of the minimum wage in
Greece, and (ii) the wage-compression policies which were followed by the Greek
government until the mid-1980s.
2.1.4 Educational Inequality
During the last four decades there has been a large increase in educational attainment in
Greece. This was a result of a latent demand in Greek society (expressed more openly after
junta’s fall in 1974) for further democratization of higher education (university and non-
university), linking it to the need for a less uneven and therefore a more just distribution of
educational goods (Fountedaki and Sarafianos, 2000). Most of the demands were
concentrated on the restrictive admissions policy (numerus clausus) which rationed the
demand for, publicly provided and funded, tertiary education in Greece. This demand was
partly met as the proportion of students admitted to tertiary education rose from about 15% of
the high-school graduates in 1974 to about 40% in 2008.
The synthetic indices of education level and dispersion, reported by Meschi and Scervini
(2010), and which draw on the EES and EU-SILC surveys, indicate a large rise in the
percentage of population with tertiary education and a significant fall in educational
inequality. As shown in Table 2.10, less than 6% of the population born between 1920 and
1924 in the EES sample has attained tertiary education whereas this percentage increases to
over 43% for individuals born in 1982-1984 period. The Gini index for these two birth
cohorts falls from 0.299 (for the 20-24 birth cohort) to 0.117 (for the 82-84 birth cohort).

41
Table 2.9: Educational inequality indices
Educational attainment
(percentage of population, EU-SILC) Educational inequality indices
(years of education, EES)
Birth cohort
Primary Secondary Upper
Secondary Tertiary Gini MLD Theil
1920-24 0.299 0.140 0.135
1925-29 0.305 0.150 0.138
1930-34 69.01 26.98 21.24 5.74 0.332 0.165 0.159
1935-39 80.72 31.29 24.84 9.21 0.314 0.172 0.156
1940-44 87.09 33.70 27.19 10.94 0.276 0.120 0.115
1945-49 95.31 43.49 33.59 15.17 0.247 0.103 0.099
1950-54 98.08 57.98 48.19 25.27 0.228 0.088 0.084
1955-59 98.30 68.45 59.28 26.49 0.199 0.068 0.064
1960-64 99.11 74.22 60.21 25.69 0.189 0.075 0.063
1965-69 99.44 84.93 69.56 32.47 0.163 0.052 0.046
1970-74 99.72 88.55 76.02 35.94 0.156 0.049 0.043
1975-79 99.65 91.49 80.09 40.57 0.153 0.045 0.040
1980-84 99.63 94.31 85.27 43.29 0.117 0.025 0.023
Source: Meschi and Scervini (2010).
Yet, despite the significant expansion of tertiary education, which lessened the competition
for the available places, lower-income families still faced considerable hurdles to gaining
access to higher education (Moutos and Tsitsikas, 2010). This is due to the fact that private
spending on crammer schools preparing students for the national exams has increased;
Kanellopoulos et al. (2003) estimate that the share of education expenditures in household
budgets (mainly on crammer schools and private tutors) rose from 2.15 % in 1974 to 4.41% in
1999. Recent studies (KANEP, 2009) estimate that in 2005 this figure had risen to 5.09% of
household budgets. As a proportion of household spending for families with children in
secondary school this can reach to more than 20% of household income for lower-income
families (Psacharopoulos and Papakonstantinou, 2005). This rise in spending on crammer
schools and on hiring of private tutors reflects the widespread perception among parents (and
teachers) of a continuing deterioration in the quality of publicly-provided secondary
education, which in turn makes access to the much sought-after fields of study (e.g. medicine)
much harder for children of low-income families.
Figures 2.18 and 2.19 depict the evolution of an index (odds ratio) of educational inequality in
accessing publicly-funded-and-provided tertiary education, which is based on the father’s
occupational status. This index is constructed as follows (see, Chrysakis et al., 2009, for
more details): First, we construct five occupational categories for the fathers of children being
first-year students at Universities (AEI) and Technological Educational Institutions (TEI); the
categories are (i) white – collar employees, (ii) blue - collar workers, (iii) farmers, (iv)
unemployed, and (v) non-active population (mainly pensioners). Second, we divide the share
of each category’s first-year students in the population of first-year students, to the share that
each category represents in the aggregate population of males aged 45-64. The resulting
inequality indicator is a (relative) population-weighted presence of each category among first-
year students a score above (below) 1 indicates that a particular category is over(under)-
represented in tertiary education. We thus see that, from 1984 to 2004, the children of white-
collar employees enjoyed a slight increase in their over-representation as first-year students in

42
Greek Universities; the inequality indicator for this group went from 2.01 in 1984 to 2.18 in
2004. In contrast, the inequality indicator for students whose father was a blue-collar workers
suffered a drop, going from 0.90 in 1984 to 0.62 in 2004, whereas for farmers’ children the
indicator went from 0.53 in 1984 to 0.32 in 2004. During the same period, first-year
university students with an unemployed father are continuously and significantly under-
represented in the student body, despite the improvement observed in the indicator, from 0.07
in 1984 to 0.26 in 2004.
It appears that the worsening prospects of children, whose fathers are either blue-collar
workers or farmers, with respect to University education, were not reflected in better access
opportunities in the (lower-ranked) Technological Educational Institutes. Daughters and sons
of blue-collar workers or farmers became progressively less likely to attend TEI’s than in the
past; for blue-collar workers, the Inequality Indicator dropped from 1.21 in 1984 to 1.00 in
2004, whereas for farmers it went from 0.75 to 0.50 during the same period. Again,
surprisingly, the relative access of children with unemployed fathers improved, with the
indicator rising from 0.07 in 1984 to 0.47 in 2004. A possible explanation for this
improvement in the relative position of children whose fathers are unemployed may be the
gradual emergence of a two-earner family in Greece – thus enabling families with
unemployed fathers to be able to finance the expenses needed to succeed in the entrance
examinations with the mother’s earnings.
Figure 2.18: Inequality indicators (I.I)j for first year students in Tertiary Education
(A.E.I.*) by father's occupational status
*A.E.I.: Universities. Source: Chrysakis et al. (2009)

43
Figure 2.19: Inequality indicators (I.I)j for first year students in Tertiary Education
(T.E.I.*) by father's occupational status (1984-2004)
*T.E.I.: Technological Educational Institutions. Source: Chrysakis et al. (2009)
Access to higher education appears to influence a number of labour market variables. Figures
2.20a and 2.20b show the unemployment and participation rates (persons aged 15-64) for
different education levels according to the Labour Force Survey conducted between 2004 and
2007. With an economy-wide unemployment rate of 10.7%, the data seem to suggest an
inverse U-shaped relationship between educational attainment and unemployment. Persons
with only primary education faced an unemployment rate of only 9.1%, persons with lower-
secondary education had an unemployment rate of 11.1%, which rose further to 11.7% for
high-school (Lyceum) graduates, and still further to 12.3% for TEI graduates, dropping to
7.9% for University graduates, and to 4.9% for doctorate-holders. However, the relationship
between educational achievement and labour force participation is rather positive, as the
participation rate rises from 59.6% for primary education, to 65.1 for Lyceum graduates to
97.1% for doctorate holders.
Figure 2.20a: Educational achievement and unemployment
rate (vertical axis), 2004-2007 average
Source: Bank of Greece

44
Figure 2.20b: Educational achievement and participation rate
(vertical axis), 2004-2007 average
Source: Bank of Greece
The overwhelming importance of educational inequality for determining differences in
income inequality between groups was noted earlier (see, Table 2.2). It suffices here to
mention that whereas the importance of all other factors (region of residence, urbanization
index, demographic type of household, employment category of household head) as an
“explanation” of the inequality between groups has either declined (or remained small) from
1974 to 2008, the education of the household head has retained its large influence relative to
the other categorizations. A possible explanation for this outcome may be due to assortative
mating and the high participation rate of educated spouses.
2.2 Whom has it affected?
The fact that the fast growth experienced by the Greek economy from 1974 up to the start of
the global financial crisis was accompanied by significant reductions in various inequality and
poverty indices may lead us to conclude that the benefits of economic growth were spread
evenly among various socio-economic groups. Let us then examine whether this is indeed the
case regarding the exposure to the “risk at poverty” faced by different groups.
In Table 2.10 we depict the changing structure of poverty risk (in terms of augmented
income) for a number of groups which are usually considered to be at high poverty risk. On
the left side of the table the relative poverty risk (based on the FGT2 index) of each group is
presented – a number greater than one indicates that the group faces a higher risk of poverty
than the population as a whole. On the right side of the table, the percentage contribution of
each group to the aggregate poverty rate is shown. We see that the poverty risk of all these
groups, with the exception of households headed by a pensioner and couples without children,
were facing a relatively high poverty risk in 2008. The table reveals that the relative poverty
risk of these groups changed dramatically from 1974 to 2008; for persons aged more than 65
and living alone, as well as for households headed by a pensioner, the relative poverty risk
declined considerably – from 4.36 to 1.39 for the first group, and from 1.93 to 0.49 for the
second. In contrast, for households with 3 or more children under the age of 18, the relative
poverty risk increased from 1.50 to 3.64, making this group the one with the highest poverty
risk in 2008; it is important that this group’s contribution to the aggregate poverty is not large,
hovering around 10% during the entire period. It is residents of agricultural areas that have
always been, as a group, the one with the largest contribution to aggregate poverty – yet, this
contribution declined steadily from 56.9% in 1974, to 28.7% in 2008; this group’s relative
poverty risk has remained roughly constant during this period. Of interest is also that
members of single-parent families, a group that is at high risk of poverty in many European
countries, did experience a rise in its poverty risk – especially since 1982, but the group’s

45
contribution to the aggregate poverty rate remains small (0.9% in 2008). Of possibly more
importance is the rise in poverty risk for members of households headed by a farmer, whose
poverty risk increased continuously, and reached 2.91 in 2008; this group’s contribution to
total poverty declined throughout the whole period (due to the declining share of farmers in
the population), but it retained its importance for aggregate poverty, i.e., contributing 18.5%.
Thus, as far as risk of poverty is concerned, the population groups with the two higher
contributions to aggregate poverty (residents of agricultural areas, and farmer-headed
household members) experience either a rise or a constancy in their relative poverty risk,
whereas the group with the third-highest contribution (household members headed by primary
school dropout) did experience a decline in relative poverty risk (from 2.11 in 1974 to 1.64 in
2008).
Table 2.10: Selected high risk groups for poverty: distribution of total income Foster et
al (a=2) Relative poverty risk (Greece: 1.00) Contribution in total poverty (%)
Population group 1974 1982 1988 1994 1999 2004 2008 1974 1982 1988 1994 1999 2004 2008
Non-urban areas 1.67 1.63 1.82 2.15 1.77 1.73 1.56 56.9 53.8 51.8 53.4 38.6 35.2 28.7
Singles over 65 years 4.36 5.38 3.42 2.92 2.06 1.38 1.39 7.0 10.2 8.2 11.1 7.4 5.8 4.9
Couples no children (at least one
over 65 years)
2.42 2.86 2.27 2.10 1.74 1.09 0.62 11.3 18.0 15.4 18.9 18.6 11.5 5.5
Couples with 3 or more children up
to 18 years
1.50 0.72 1.12 1.93 2.43 2.07 3.64 11.2 5.8 6.9 11.5 11.8 12.3 9.0
Singles with children 1.38 0.64 1.16 1.44 1.73 3.03 1.47 2.7 0.9 2.8 2.1 2.6 3.8 1.4
Head of household farmer 1.31 1.26 1.52 1.50 1.54 2.24 2.91 30.9 27.9 25.7 18.6 15.0 15.4 18.5
Head of household inactive 5.91 4.01 3.80 2.22 2.65 1.39 3.22 5.6 4.7 6.6 6.0 9.7 3.2 10.7
Head of household pensioner 1.93 2.37 1.49 1.71 1.26 0.87 0.49 26.4 39.2 33.4 41.3 33.4 24.2 13.6
Head of household with pre-
primary education
2.11 2.14 2.60 2.42 2.60 1.79 1.64 56.6 43.1 43.0 42.8 27.6 17.2 14.8
Source: Mitrakos and Tsakloglou (2010)
Unfortunately, the above findings hold also for consumption-based relative poverty risk.
Mitrakos and Tsakloglou (2010) have calculated that, for household members headed by a
primary-school dropout and for residents of agricultural areas, relative poverty risk increased
- from 1.92 in 1974 to 2.18 in 2008 for the first group, and from 2.36 to 4.22 (respectively)
for the second group. These two groups continue to contribute substantially to aggregate
poverty - by 38.3% and 40.3%, respectively. For households headed by a pensioner, the
relative (consumption-based) poverty risk declined, and this is a welcome development in the
fight against poverty since this group contributed 42.4% to aggregate poverty in 2008.
We now examine how the reduction in income and consumption inequality decomposes
across various socio-economic groups. Given that Greece experienced during the last four
decades rapid changes in population structure, we rely on Mitrakos and Tsakloglou’s (2010)
calculations of additive separable indices (proposed by Mookherjee and Shorrocks, 1982)
which attribute (inter-temporal) changes in aggregate inequality to changes “within” groups,
to changes in the size of each group, and to changes in the average income (or, consumption)
of each group. Table 2.11 presents the results of this analysis, using as inequality indices the
Theil index, the mean logarithmic deviation, and the variance of logarithms. If a particular
variable has contributed to a rise in inequality, then this is denoted with a negative sign.
Leaving aside the results of demographic changes -which appear to have a relatively small
influence on the evolution of aggregate inequality, and which contributed to the rise of
inequality (with the exception of the rise of urbanization) – the reduction in aggregate
(income, and consumption) inequality was accompanied by a reduction in within-group
inequality. For all socio-economic groups, the reduction in overall income (and,
consumption) inequality was accompanied by far larger reductions in within-group inequality,
than in inequality between groups. Given that in Greece the largest part of aggregate

46
inequality is “determined” from differences that exist within different socio-economic groups
(rather than, between groups) this has been a welcome development.
Table 2.11 Percentage contribution of different factors to the total change in
inequality from 1974 to 2008
Consumption expenditure distribution
Income distribution
Factor
Number
Of sub-groups
Theil Index
Mean Log Deviation
Log Variance
Theil Index
Mean Log Deviation
Log Variance
Degree of urbanization
Δ(α) 4 74.7% 74.8% 72.8% 82.4% 82.4% 73,0%
Δ(β) 6.6% 5.9% 9.3% -0.4% -0.3% 2,2%
Δ(γ) 18.7% 19.2% 18.0% 17.9% 17.9% 24,8%
Demographic type
Δ(α) 9 102.9% 103.9% 101.8% 102.8% 101.7% 96,9%
Δ(β) -6.3% -6.7% -9.6% -6.1% -5.4% -4,4%
Δ(γ) 3.4% 2.7% 7.7% 3.3% 3.6% 7,4%
Professional status
Δ(α) 9 88.0% 90.9% 91.9% 80.8% 88.3% 93,9%
Δ(β) -8.3% -12.5% -12.2% -10.6% -15.9% -19,4%
Δ(γ) 20.2% 21.6% 20.3% 29.8% 27.5% 25,6%
Level of education
Δ(α) 5 64.4% 67.1% 65.8% 70.6% 70.4% 67,5%
Δ(β) 20.0% -7.5% -7.0% 6.7% -18.6% -21,3%
Δ(γ) 15.5% 40.4% 41.2% 22.7% 48.2% 53,8%
Absolute change in total inequality -0.076 -0.079 -0.164 -0.125 -0.117 -0.232
Percentage change in total inequality -36.6% -38.1% -39.2% -45.6% -45.6% -46.7%
Δ(α) Effect of within-group changes
Δ(β) Effect of population shares changes
Δ(γ) Effect of changes in average income or consumption
Source: Mitrakos and Tsakloglou (2010)
2.3 Interdependence between inequalities over time
The decline of income inequality in Greece from 1974 to 1982 appears to be mostly the result
of declines in inequality “within” various socio-economic groups, the only exception being
the linkages between educational inequalities and income (and consumption) inequalities. The
vicious circle that such a linkage may create (i.e. income inequality, in the absence of equal
education opportunities, reinforces educational inequality, which, in turn, leads to higher
income inequality) has been kept in check in Greece through a significant expansion of
educational opportunities, especially through the large expansion of the publicly-funded
tertiary sector. Nevertheless, since this expansion did not manage to reduce inequality in
accessing higher-educational institutions (especially Universities) for lower-income groups
(e.g. farmers and blue-collar workers), and education is an important factor in the
intergenerational transmission of economic status, the reduction in inequality observed during

47
the last four decades may not be sustainable once some of the other factors behind the decline
in inequality exhaust their influence.
2.4 Why has inequality declined in Greece?
From 1974 to 1982, inequality in Greece has declined considerably; various measures of
inequality and poverty (e.g., Gini, Atkinson, poverty rate, poverty gap) show declines ranging
between 20% and 60% of their initial value in 1974. Despite the large decreases in these
measures, and the rise in the corresponding measures in most of the EU15 countries, Greece
had a Gini coefficient of disposable income in 2008 which was higher than the EU15 average;
the disposable income Gini coefficient in that year was 0.3065, and it was lower than the
Gini’s for Italy, Portugal, Spain, and the UK. Regarding inequality of extended income
(which includes in-kind benefits from public services, the Gini coefficient in Greece in 2008
was 0.288, with Portugal being the only country among the EU15 which had a higher Gini
coefficient. Similar declines were also observed in the S90/S10 ratio of disposable incomes,
and in 2008 the ratio in Greece stood at 7.4 (the fifth-highest among the EU15), down from its
value of 10.2 in the mid-1980s (OECD, 2011). We note that this value in the mid-1980s was
the highest among the EU15. We may thus conclude that as far as inequality is concerned
Greece has successfully converged towards the EU15 average.
As one may expect in such cases, the initial improvements in the inequality front were larger
than the latter. Indeed, about two-thirds of the total decline in inequality between 1974 and
2008 took place in the first eight years (1974-1982). Between the mid-1980s and 2008, the
decline in the Gini coefficient of disposable income was “only” about 9%; the same holds for
other inequality measures like the S90/S10 for the working-age population, where the initial
declines in the ratio were more impressive than the more recent ones.
It appears that the large decline in inequality between 1974 and 1982 was strongly connected
with the cumulative rise in the real value of the minimum wage (for more details about the
institutional structure and the evolution of the minimum wage see Chapter 5). The cumulative
rise in the real value of the minimum wage was 52% from 1974 to 1982 - during the same
period the cumulative rise in real compensation per employee was 39%. In order to appreciate
just how large this increase was we note that the real value of the minimum wage started
declining since 1984, and its subsequent rise did not return it to its 1982 level until 2009 (this
was still a year that hardly anybody understood the dismal state of the Greek economy),
subsequently dropping to levels that prevailed in the second half of the 1970s. Unlike the
minimum wage, real compensation per employee did not suffer from a strong and protracted
fall since 1982, and was 28% higher in 2008 than in 1982. Between 1982 and 1999, when
income inequality increased slightly, real compensation per employee increased by 6%, but
the real value of the minimum wage declined by 15%. Between 1999 and 2008, when
inequality declined again, both the real minimum wage and real compensation per employee
rose by 17% and 21%, respectively. The above observations suggest that rises in real
compensation per employee are not, by themselves, able to explain the evolution of income
inequality in Greece. In contrast, the behavior of the minimum wage appears more able to do
so. Increases in the real value of the minimum wage (l974-1982 and 1999-2008) have been
associated with declines in inequality. Declines in the real value of the minimum wage (1982-
1999), which went in tandem with increases in real compensation per employee, have been
associated with (albeit small) increases in inequality.
Another way to appreciate the importance of the minimum wage for the large decline in
inequality from 1974 to 1982 is to compare the monthly minimum wage with the poverty line
(equivalised disposable income) for 1974 and 1982. The monthly minimum wage (the
minimum “wage” is set at an hourly rate for blue-collar workers and at a monthly rate for
white-collar workers), was 3,543 drachmas in 1974, and it rose to 19,627 drachmas in 1982.

48
The (monthly) poverty line was 2,765 drachmas in 1974, and 13,714 drachmas in 1982. These
numbers imply that a minimum wage employee was earning 28% more than the poverty line
in 1974; by 1982, the minimum wage employee was earning 43% more than the poverty line.
Since no significant changes in taxation took place between 1974 and 1982, this rise in the
“premium” of the minimum wage over the poverty line appears to have contributed to the
significant decreases in inequality and poverty that took place during this period.9
The apparent significance of macroeconomic developments for inequality is also testified by
the behavior of the unemployment rate, i.e. periods of low, or falling, unemployment rates are
associated with declines in inequality, whereas periods of high, or rising, unemployment rates
have put a break to the downward trend in inequality. These macroeconomic developments
have, of course, been shaped by the constraints and opportunities which the external
environment created for the Greek economy. Leaving aside the emergence of the East-Asian
countries as powerful shapers of the international division of labour, EEC entry in 1981, euro-
area entry in 2001, and the eastward expansion of the EU in 2004, have been equally
important factors as domestic political developments for the evolution of aggregate
inequality. The first and third (1981 and 2004) of these developments had intensified
international competition for industrial firms and workers, whereas the third (2001) allowed
an unsustainable influx of capital flows to mask the pressing need for economic and political
restructuring. Nevertheless, the likely detrimental effect of these forces on inequality was
thwarted by the large rise of social protection expenditures as a proportion of GDP, which
reflected the wish of the majority of citizens for a “Europeanization” of social policy (albeit
more on the expenditure than on the revenue side).
Another factor which has contributed to the decline in inequality is the increasing prevalence
of two-earner families, as females entered massively the labour market in the 1980s – partly
as a result of changes in family attitudes, and partly as a result of the expansion of
employment opportunities in the public sector. Not only the conditions of public-sector
employment were less demanding on female employees - which had also to fulfill their
traditional household duties, they were also more lucrative (in both current wages and future
benefits) than private-sector jobs, thus providing an added incentive for labour market
participation. Of crucial importance in this expansion of employment opportunities for
females was the fact that it did not take the form of part-time jobs – although sometimes the
actual tasks performed could be accomplished by a part-time employee. In OECD countries
the share of part-time employment in total employment increased from 11% in the mid-1990s
to about 16% by the late 2000s - with the strongest increases observed in European countries
like Germany, Ireland, the Netherlands, and Spain (OECD, 2010), While offering suitable
employment opportunities for traditionally under-represented groups, part-time work also
contributed to widening gaps in the distribution of wages. Indeed, adding part-time workers to
the full-time gross earnings distribution increases the Gini coefficient of inequality by more
than five percentage points on average and by another two points when self-employed
workers are also included. In contrast, in Greece there was no rise in part-time employment,
whose share of total employment was hovering between 4% and 6%, with female-part time
employment being in 2008 lower than in 1983.
2.5 Inequality and Poverty Developments since the start of Greece’s Great Depression
By September 2012 it was evident that the slowdown in economic activity experienced by
Greece in 2008 and 2009 would turn out to be, in both GDP and unemployment terms,
9 The rise in minimum wages has also been important in reducing within-group inequality, since
changes in minimum wages acted as a benchmark for the lower-paid employees of many categories of workers, and not just the unskilled ones (see chapter 5 for more details about the institutional structure of wage-setting in Greece).

49
comparable in magnitude (if not larger) than the depression experienced by the US in the
1930s. (Compared with the present crisis, the Greek economy suffered a “mild” recession
between 1929 and 1932, with the cumulative GDP drop being “just” 9%.)
Before we proceed with any discussion of the crisis’ impact on inequality, we provide a brief
background of change in macroeconomic aggregates. According to ELSTAT, the (seasonally
adjusted) unemployment rate for the month of July rose from 7.4% in 2008, to 9.5% in 2009,
to 12.5% in 2010, to 17.8% in 2011, and it reached 25.1% in 2012. The accelerated rise in the
unemployment rate was accompanied by a rise in the proportion of jobless households (i.e.
those without any employed members) to 16.9% in the first quarter of 2012. Since 2010, the
nominal value of minimum wages has declined by more than 22%, and their real value by
almost 30%. These unfavourable labour market developments went in tandem with an 18%
decline of GDP between the first half of 2008 and the first half of 2012, and significant cuts in
social welfare spending.
Given the absence of any survey data for developments since 20l0 (for example, the EU-SILC
household budget surveys for 2010 will not be available until 2013), the only available
method for gauging the effects of the crisis (as well as the policies which were adopted in
response to the crisis) are the micro-simulations provided by the tax-benefit model
EUROMOD, as applied in the Greek case by Matsaganis and Leventi (2012). Their
simulations of the combined effect of some of the changes in the economic environment from
2009 to 2010 predict essentially no changes in inequality (i.e. the Gini coefficient “changes”
from 0.349 in 2009 to 0.350 in 2010, the coefficient variation from 0.800 to 0.786, and the
S80/S20 ratio from 6.109 to 6.193). With respect to income deciles, the model predicts that
the lowest deciles (1-3) will suffer some small declines, deciles 5 to 9, will experience small
gains, and richest decile small losses. The simulations suggest a bigger influence on the
poverty rate, if the poverty line for 2009 is adopted for 2010 (adjusted for inflation); the
poverty rate for the population as a whole rises from 20.06 in 2009 to 25.45 for 2010. (Using
the unadjusted poverty line for 2010, the predicted poverty rate for 2010 is 20.88.)
To what extent these simulation results for changes in inequality and poverty can provide a
guide for the likely consequences of the intensifying efforts at budget consolidation and
current account adjustment in Greece? The very small rise in inequality predicted by
Matsaganis and Leventi (2012) for 2010 is to a large extent predicated on the relatively small
deterioration in the economic environment between 2009 and 2010, relatively to what has
happened since then. Nevertheless, the significant rise in the adjusted poverty rate is an
unwelcome portent given the accelerated deterioration in practically every economic
magnitude which impacts directly on household welfare since 2010. The decision taken by
decree in February 2012 to reduce the minimum wage by 22% for those aged more than 25,
and by 32% for the rest, along with the doubling of the unemployment rate since 2010, and
the large (and still ongoing) reductions in real compensation per employee, will, most likely,
lead to a dramatic rise in poverty rates if previous patterns re-emerge and the social welfare
budget is increasingly starved of funds (as is planned to be).
A key development of the labour market since the start of the crisis has been the dramatic rise
in the number of unemployed men. While in the past the unemployment rate for men was
close to four-tenths of the unemployment rate of women (in July 2007: males, 5.1%; females,
12.5%), in July 2012, the male unemployment rate was more than three-quarters of the female
rate (males:22.3%, females: 29.0%). Given the far larger labour force participation of males
relative to females in Greece, this implied that the number of unemployed males became
larger than the corresponding number for females. This development implies that households
which were relying on a male breadwinner (a common thing in Greece) will have been hit

50
particularly hard from the crisis, and this development is very likely to exacerbate the rise in
the poverty rate in Greece.10
10
Preliminary evidence suggests that females (the “secondary” earners) have been entering the labour force as the unemployment rate was rising (in contrast to the “discouraged worker” effect) in the hope of finding employment. The dramatic rise in the number of jobless households suggests that this effort by the females was not , in the aggregate, successful.

51
CHAPTER 3: THE SOCIAL IMPACTS OF INEQUALITY
3.1 Introduction
Wilkinson and Pickett (2009) have systematically surveyed a large body of research and
argued that there is a relationship between income inequality and social problems among
countries over a certain income threshold. Their argument was that even among relatively
high-income countries those with greater levels of income inequality fare worse on a range of
social indicators. The purpose of this chapter is to examine to what extent one can discern any
beneficial social effects from the reduction in income inequality in Greece during the last four
decades.
3.2 Material Deprivation
It has long been observed (Sen, 1985) that household incomes are a key determinant of living
standards, but adequately capturing living standards, and in particular deprivation and social
exclusion, requires going beyond income to incorporate non-monetary indicators. A key
concept in this respect is material deprivation, which refers to the inability for individuals or
households to afford those consumption goods and activities that are typical in a society at a
given point in time, irrespective of people’s preferences with respect to these items (OECD,
2007).
The material deprivation rate is an indicator in EU-SILC that expresses the inability to afford
some items considered by most people to be desirable or even necessary to lead an adequate
life. The indicator distinguishes between individuals who cannot afford a certain good or
service, and those who do not have this good or service for another reason, e.g. because they
do not want or do not need it. The indicator measures the percentage of the population that
cannot afford at least three of the following nine items: (1) to pay their rent, mortgage or
utility bills; (2) to keep their home adequately warm; (3) to face unexpected expenses; (4) to
eat meat or proteins regularly; (5) to go on holiday; (6) a television set; (7) a washing
machine; (8) a car; (9) a telephone. Severe material deprivation rate is defined as the enforced
inability to pay for at least four of the above-mentioned items. Figure 3.1 plots the share of
population in Greece and the euro area facing severe material deprivation, which shows a
significant fall from 2003 to 2009.
Figure 3.1: Severely materially deprived people, percentage of total population
Source: Eurostat

52
Papadopoulos and Tsakloglou (2002) have constructed four static deprivation indicators using
third-wave (1996) ECHP data for a number of European countries. These indicators cover the
domains of Income (Poverty), Living Conditions, Necessities of Life and Social Relations,
and the relevant results for Greece are shown in Figure 3.2. Regarding the first deprivation
indicator, we note that household income in the ECHP includes only monetary incomes and
ignores incomes in-kind from either private or public sources and, thus, it is not a satisfactory
approximation of the concept of ‘command over resources’. Nevertheless, setting the poverty
line at 60% of the median equivalised income per capita, and using the ‘modified OECD
equivalence scales’, the poverty rate for Greece is calculated at 22.7%. This poverty rate is
along with Portugal and the UK (23% and 22.3%, respectively) the highest among the 14
countries (EU15 minus Sweden) examined, indicating that relative poverty tends to be higher
in countries with higher levels of aggregate inequality. The second deprivation indicator
(Living Conditions) summarizes, by weighing appropriately, information on 22 items related
to the availability of certain household amenities (separate kitchen, bath, etc.), the existence
of particular problems in the accommodation (lack of space, environmental problems, etc.)
and the inability to acquire a number of durable goods (car, dishwasher, etc.) Greece’s
position remains second-worst on this indicator as well, with 10.6% of the population being
deprived - Portugal (19.6%) and Ireland (9.7%) are the other two countries with high
deprivation rates. The third deprivation indicator (Necessities of Life) is based on answers
that households of the ECHP gave about their ability to afford (if they wanted to) a number of
activities considered as quite basic (for example, to keep their homes adequately warm, pay
for a week’s annual holiday away from home, etc.). On this indicator, Greeks had the highest
deprivation rate (32.1%) of the 14 countries, with the UK (16.9%), Italy (16%), and Portugal
(15.9%) being the other three countries with high deprivation rates. The fourth indicator deals
with deprivation in the domain of Social Relations, and it classifies as deprived those
population members aged 16 or above who reported that they talk to their neighbours ‘once or
twice a month’ or less frequently and, in addition, they meet friends ‘once or twice a month’
or less frequently and, further, they are not members of a club or organisation (such as a sport
club, a local group, a political party, etc.). Ireland (0.6%), the UK (1.7%), and Greece (2.0%)
score particularly well on this deprivation index. In fact, the highest aggregate levels of
deprivation according to this indicator are reported in some of the higher-income EU
countries (e.g., Belgium: 8.7%) - this is not surprising since there is no link between this
indicator and monetary incomes.
Figure 3.2 : Proportion of population classified as deprived and relative ranking of
Greece compared to 14 EU countries (ECHP, 1996)
Source: Papadopoulos and Tsakloglou (2002) and authors' calculations

53
We note that Greece fares worst if the concept of ‘cumulative disadvantage’ is used, which
measures the number of indicators according to which each population member is classified
as deprived. In all countries examined by Papadopoulos and Tsakloglou (2002), the majority
of the population is not classified as deprived according to any of the four deprivation
indicators (mentioned above). The proportion of the population classified as deprived
according to at least one indicator varies between 21.6% in Luxembourg, to 41.5% in
Portugal, and to 43.5% in Greece.
Given that for a person to be classified as deprived according to one criterion only, may be
due to a chance factor, whereas limiting the group of people suffering from cumulative
disadvantage to those classified as deprived according to three or four criteria could not be
regarded as due to chance, we can regard the latter group of people as seriously
disadvantaged. According to this criterion, the population share of this group varies between
1.07% in The Netherlands to 5.8% in Portugal (5.8%), with Greece and Ireland having the
second-highest proportion of seriously disadvantaged persons (both at 4.4%).
Some further evidence regarding material deprivation in Greece is given in Figure 3.3, which
concerns deprivation in terms of ownership of five consumer durables (telephone, colour TV,
personal computer, washing machine, and car). On the basis of EU-SILC data, Andriopoulou,
Papadopoulos, and Tsakloglou (2010) have calculated the proportion of the Greek population
deprived of these goods for four consecutive years (waves). The proportion of the population
deprived of these goods declined, especially for personal computers and cars. Also, as
expected, the balanced sample of 2006 indicates that the deprivation rate in the ownership of
consumer durables is significantly lower among the non-poor than among the poor.
Nevertheless, for cars and personal computers the deprivation rate even among the non-poor
is significant (7.0% and 12.4%).
Figure 3.3 : Deprivation in terms of ownership of five consumer durables
Source: Andriopoulou, Papadopoulos, and Tsakloglou (2010)
In contrast with the “objective” measures of material deprivation discussed above, in Figure
3.4 we present the (“subjective”) assessments by household members whether they are able to
cover basic household needs. It appears that for all four types of needs there was a decline in
the share of population declaring inability to cover their needs. Yet, about 50% of households
thought that they could not afford a week’s vacations per year, about one-third of the
households declared that they lack the means to cover unexpected financial obligations, about
one-in-four that they are unable to pay the bills for utilities (although the proportion declined

54
to about one-in-six by 2007), and just less than 10% cannot afford to eat meat or fish every
second day. As expected, the deprivation indicators are larger for the poor than for the non-
poor, but it still strains credibility to believe that 42.6% among the non-poor could not afford
a week’s vacation per year. (A possible explanation for the apparent larger percentage of non-
poor that did actually have a week’s vacation per year maybe that they indeed they could not
afford it, but irresponsible borrowing/lending made it possible.)
Figure 3.4 : Assessments by household members about their ability to cover basic
household needs
Source: Andriopoulou, Papadopoulos, and Tsakloglou (2010)
Figure 3.5 presents EU-SILC based estimates about the share of the population in Greece
which reports that they are deprived with respect to their housing needs. The proportion of
people whose dwellings do not have an adequate number of rooms shows a small rise from
2004 to 2007 (from 29.9% to 32.1%); this cannot be explained on the basis of greater
aspirations as it is based on the objective assessment of the surveyors. What is notable is that
in the balanced sample of 2006, about one-third of the non-poor are deemed as deprived in
this respect. For all other variables there was a discernible decline in the deprivation rate, but
still, 13.8% of the poor did not possess an in-house bathroom in 2006, whereas 24.1% of them
felt that their heating was inadequate.
Figure 3.5 : Share of the population which reports deprivation with respect to housing
needs
Source: Andriopoulou, Papadopoulos, and Tsakloglou (2010)

55
3.3 Cumulative Disadvantage and Multidimensional Measures of Poverty and Social
Exclusion
The concept of social exclusion is transcending economists’ traditional focus on monetary
incomes. Unlike poverty, which is a distributional outcome, social exclusion refers to a
process of declining participation, solidarity, and access. For some, exclusion is a broader
term encompassing poverty; for others, it is a cause or a consequence of poverty (Heady and
Room, 2002). Social exclusion refers to a “rupture of the social bond” or “solidarity”, since
the social contract is not supposed to leave individuals to fend for themselves, unprotected by
the vagaries of the market. Society owes its citizens the means to a livelihood, and citizens in
turn have obligations to the larger society. European welfare states were supposed to do away
with “charity” for “the poor,” providing basic social assistance, and, hence, as a right of
citizenship, eliminating absolute material deprivation. Atkinson et al. (2002) considers the
term social exclusion to be “shorthand for a range of concerns considered to be important in
setting the European social agenda”. In contrast to poverty, which is exclusively economic,
material, or resource-based, social exclusion is (i) multidimensional, and encompasses
collective as well as individual resources, (ii) dynamic or process-oriented, (iii) relational, in
that exclusion entails social distance or isolation, rejection, humiliation, lack of social support
networks, and denial of participation, (iii) active, in that there is a clear agency doing the
excluding – e.g. even the welfare state can exclude some citizens from protection or trap
them in unemployment, and (iv) relative to context. In short, social exclusion relates to being
unable to enjoy levels of economic, political, or cultural participation that most persons of a
given society take for granted.
Given the potentially dynamic nature of social exclusion it is important to examine whether
exclusion today creates the seeds for exclusion tomorrow. In Figure 3.6 we present the results
of such an analysis by Andriopoulou et al. (2010), in which the deprivation rates of each the
three categories presented in the previous section are first aggregated into a single cumulative
deprivation index, and then these are used to form a Multidimensional Cumulative
Deprivation index, in which the weights used in various stages reflect the proportion of the
sample that “owns” the various goods. The numbers in Figure 3.6 refer to the proportion of
persons experiencing Multidimensional Cumulative Deprivation for one, two, or three
consecutive years; the cutoff point below which a person is considered facing deprivation is
set at 85% of the median “welfare score” constructed on the basis of “ownership” of the
different goods in the three categories above – see, Andriopoulou et al. (2010) for further
details regarding the calculations. For the balanced sample of 6563 persons, the percentage
not facing Multidimensional Cumulative Deprivation in none of the three waves (years) is
75.5%, whereas 24.5% faced such deprivation in at least one over these three years, and 9.2%
faced it throughout the three years. The latter group may be considered as facing a high risk
of severe social exclusion. A more inclusive measure of Cumulative Inter-Temporal
Deprivation may be one in which persons experience Multidimensional Cumulative
Deprivation in at least two of the three years examined, in which case the proportion of
people with high risk of social exclusion is 15.3% - in what follows we use this index.
Considering the poor and non-poor as distinct groups, the proportion of poor people with high
risk of social exclusion is 35.0%, whereas for the non-poor 10.0%. The latter figure is high
enough to justify the notion that poverty and social exclusion are not tightly linked, as more
than half of the people considered to be of high risk of social exclusion are not poor (i.e. earn
more than 60% of median income).
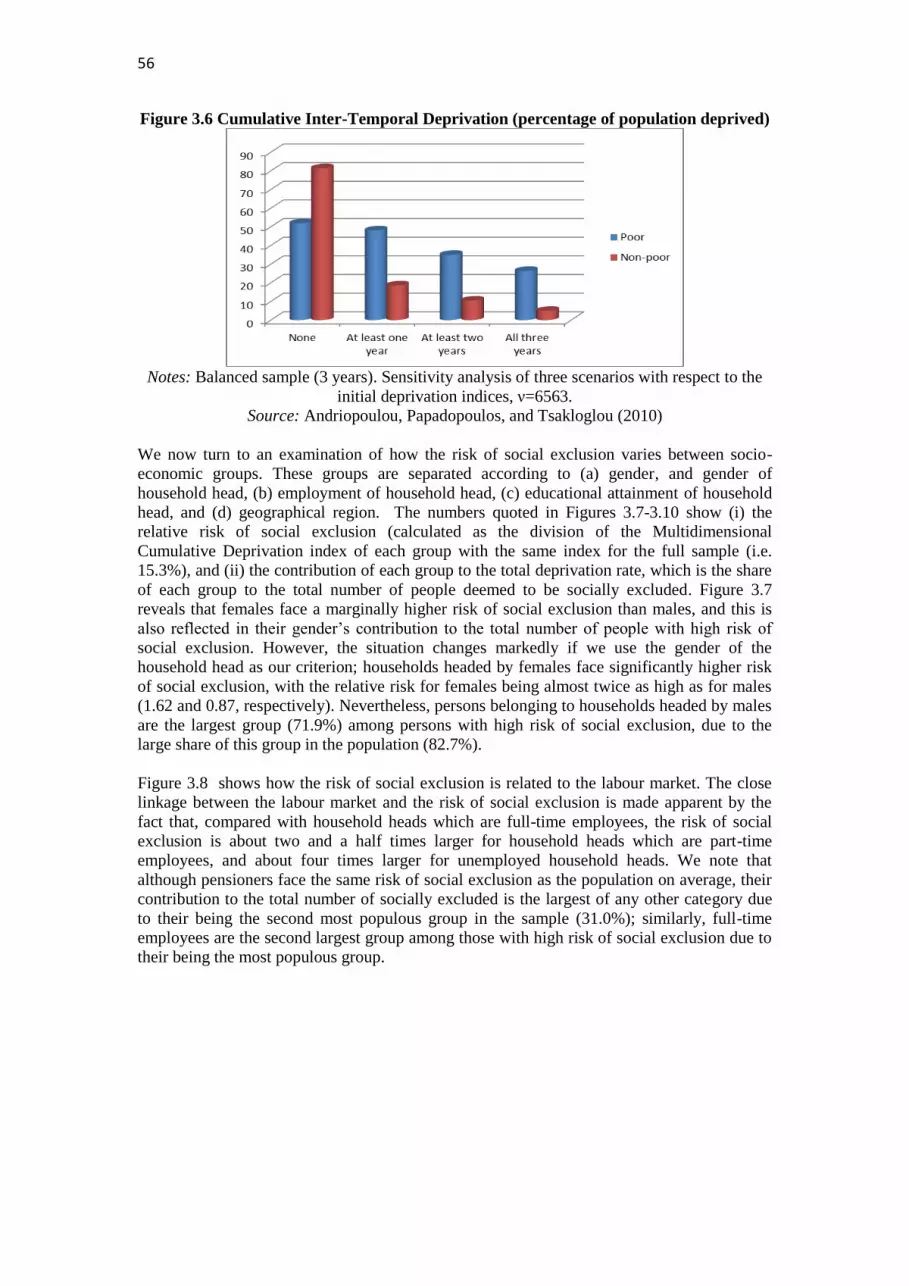
56
Figure 3.6 Cumulative Inter-Temporal Deprivation (percentage of population deprived)
Notes: Balanced sample (3 years). Sensitivity analysis of three scenarios with respect to the
initial deprivation indices, ν=6563.
Source: Andriopoulou, Papadopoulos, and Tsakloglou (2010)
We now turn to an examination of how the risk of social exclusion varies between socio-
economic groups. These groups are separated according to (a) gender, and gender of
household head, (b) employment of household head, (c) educational attainment of household
head, and (d) geographical region. The numbers quoted in Figures 3.7-3.10 show (i) the
relative risk of social exclusion (calculated as the division of the Multidimensional
Cumulative Deprivation index of each group with the same index for the full sample (i.e.
15.3%), and (ii) the contribution of each group to the total deprivation rate, which is the share
of each group to the total number of people deemed to be socially excluded. Figure 3.7
reveals that females face a marginally higher risk of social exclusion than males, and this is
also reflected in their gender’s contribution to the total number of people with high risk of
social exclusion. However, the situation changes markedly if we use the gender of the
household head as our criterion; households headed by females face significantly higher risk
of social exclusion, with the relative risk for females being almost twice as high as for males
(1.62 and 0.87, respectively). Nevertheless, persons belonging to households headed by males
are the largest group (71.9%) among persons with high risk of social exclusion, due to the
large share of this group in the population (82.7%).
Figure 3.8 shows how the risk of social exclusion is related to the labour market. The close
linkage between the labour market and the risk of social exclusion is made apparent by the
fact that, compared with household heads which are full-time employees, the risk of social
exclusion is about two and a half times larger for household heads which are part-time
employees, and about four times larger for unemployed household heads. We note that
although pensioners face the same risk of social exclusion as the population on average, their
contribution to the total number of socially excluded is the largest of any other category due
to their being the second most populous group in the sample (31.0%); similarly, full-time
employees are the second largest group among those with high risk of social exclusion due to
their being the most populous group.

57
Figure 3.7 : Relative risk of social exclusion and contribution to total deprivation
Source: Andriopoulou, Papadopoulos, and Tsakloglou (2010)
Figure 3.8 : Distribution of Cumulative Inter-Temporal Disadvantage, by Employment
Status
Source: Andriopoulou, Papadopoulos, and Tsakloglou (2010)
The relationship between personal educational attainment and social exclusion is negative, as
testified by Figure 3.9. We thus see that the risk of social exclusion is about eight times larger
for household heads with primary education than for graduates of tertiary institutions. Persons
with the lowest educational qualifications make up more than 60% of the population with
high risk of social exclusion.

58
Figure 3.9: Distribution of Cumulative Inter-Temporal Disadvantage, by Educational
achievement of the head of household
Source: Andriopoulou, Papadopoulos, and Tsakloglou (2010)
Finally, Figure 3.10 shows the differentiation in the degree of social exclusion across regions.
The four regions examined are Northern Greece (comprising of Macedonia, Thessaly, and
Thrace), Central Greece (Epirus, Sterea Ellada, Peloponnese, and the Ioanian Islands), Attika
(including Greater Athens), and Aegean Islands plus Crete. Attika is the region in which the
population faces the lowest risk of social exclusion, with residents of the Aegean Islands plus
Crete facing about twice as high risk as those in Attika.
Figure 3.10: Distribution of Cumulative Inter-Temporal Disadvantage, by regions
Source: Andriopoulou, Papadopoulos, and Tsakloglou (2010)
3.4 Social cohesion and social isolation
In Greece there is a traditional pattern of social life that involves members of the nuclear and
extended family, neighbors and colleagues from work. It is often the case that family
members of more than two generations live under the same roof (grandparents, parents and
children). Owing to the rising unemployment which particularly hits the young, there are
obvious pressures to young adults who used to have a job but are now unemployed to return
to the household of their family of origin. In brief, tradition and unemployment create
conditions favorable to closely-knit social relations rather than social isolation.
As Figure 3.11 shows, few Greeks consider themselves isolated in the sense that they are

59
unable to ask anyone close to them (relative, friend or neighbor) for help at times of need. In
this respect Greece fares better than the EU average and belongs to the group of Netherlands,
Denmark, Sweden and Spain, where social isolation is low. Among South European
countries, there is a stark contrast between Greece and Spain on the one hand and Italy on the
other, where social isolation is the highest among the EU27.
Figure 3.11 Percentage share of respondents not able to ask any relative friend or
neighbour for help, 2006
Source: Eurostat (2011)
Note: EL stands for Greece. The blue horizontal like marks the EU average.
This picture is corroborated by the fact that compared to other European nations those Greeks
who meet with friends, do so very frequently. As Figure 3.12 shows, the relative majority of
Greeks (over 40 per cent) get together with friends on a daily basis. This is a pattern common
in other South European countries, such as Portugal and Cyprus (and less so, Spain), where
people meet friends daily at a frequency which is double the EU average, which is a little over
20 per cent.
As Figure 3.13 shows, social isolation is larger among the old age people (65+) and this is
particularly true for old people in Slovakia, the Baltic states, Denmark, Cyprus and Greece. In
Greece this result may be interpreted in the light of the traditional family structure and the
lack of adequate state-provided social care for the elderly. As noted above, grandparents, very
often live in the same house with their progeny. In other words old people may socialize more
with family members than friends. Notably, in Greece, Cyprus and Portugal family contacts
remain important: over 70% of the population get together at least once a week with both
family and friends (Eurostat 2011).

60
Figure 3.12 Frequency of getting together with friends, 2006
0%
10%
20%
30%
40%
50%
60%
70%
80%
90%
100%
FR AT
LV DK PL
SE EE DE
BE SI CZ E
HU IT UK LT SK LU ES FI
MT
BG PT EL CY IS
Once amonth
Severaltimes amonthEveryweek
Daily
Source: Eurostat (2011)
Note: EL stands for Greece.
Figure 3.13 Ratio of those with no friends by age groups compared by total population,
2006
0
1
2
3
4
5
DE
MT
BE
UK PT IT FR
EU-2
7
BG
HU LU LV FI SI PL
SE ES CZ
AT EL EE DK LT CY
SK IS
Between 18 and 64 years 65 years and more
Source: Eurostat (2011)
Note: EL stands for Greece.
To sum up, Greeks are among the least socially isolated people in Europe. Social cohesion is
based on the extended family networks, where closely-knit relationships are formed among
family members of different generations.
3.5 Family formation and breakdown
Marriages
As Figure 3.14 shows, the number of marriages per 1,000 inhabitants declined in Greece

61
between the end of the 1970s and the end of the 1990s and stabilized afterwards (at about 5.2
marriages per 1,000 inhabitants). The evolution of the marriage rate does not seem to be
linked with the evolution of income inequality. The decline of crude marriage rate is
associated with the postponement of the time of first marriage and with rising enrollment
rates in tertiary education.
Between 1996 and 2001 the number of students in Greece almost doubled, because the Greek
government increased both the number of available places in universities and the number of
new universities particularly in isolated regions. As a result in 2001, “the percentage of young
people in the age cohort between 18 and 21 years registered in higher education institutions in
Greece exceeded 58%” (report of the Greek Ministry of Education, available at
http://www.ehea.info/Uploads/Documents/GREECE_2003.PDF, accessed on 4
August 2012). While in the context of a still predominant traditional value system, Greek
families continue to highly value the marriage of their offspring, they also value higher
education. The expansion of higher education has meant that men and women who have
obtained higher education have postponed the time of first marriage, until they enter the
labour market or until they finish their postgraduate education as well.
It is telling that between 1980 and 2008 the mean age at first marriage for Greek men
increased from 27 to 32 years and for Greek women from 22 to 29 years (United Nations
data, available at http://w3.unece.org/pxweb/dialog/Saveshow.asp?lang=1, accessed on 4
August 2012).
Figure 3.14 Crude Marriage Rate in Greece (4-year moving average), 1975-2007
Source: Hellenic Statistical Agency (ELSTAT)
The traditional character of the Greek family is also indicated in the type of family structure.
As Table 3.1 shows, the share of couples cohabitating is much smaller in Greece than in the
rest of the EU, even in the younger age groups, i.e., among people in their twenties and their
thirties. The difference is more pronounced for couples with children, in which case
cohabiting unions represent only 0.3% for younger age groups in Greece, and about 21% in
the EU27.

62
Table 3.1 Cohabiting unions in Greece and the EU as percent of all unions, 2007
Source: Eurostat (2010)
Childbearing
In Greece, the total fertility rate is throughout the years far below the OECD average and
despite its increase in 2002-2009 it is far below the reproduction level too (Figure 3.15). The
total fertility rate declined until the early 2000s, but rose afterwards.
Trends in the total fertility rate in Greece are not linked to trends in income inequality.
Particularly after 2000 the rise of fertility rate did not follow the ebb and flow of income
inequality but kept rising. However, the observed rising trend in the 2000s may be owed first,
to the rise of living standards among Greeks in the second half of the 1990s and the first half
of the 2000s and, second, to the large inflow of irregular migrants into Greece. Measured
against the basis of EU-27=100, Greek GDP per capita in purchasing power parities (PPS)
grew from 83 in 1996 to 94 in 2004 (Eurostat data,
http://epp.eurostat.ec.europa.eu/tgm/table.do?tab=table&plugin=1&language=en&pcode=tec0
0114, accessed on 4 August 2012). On the other hand, the inflow of migrants had started in
the early 1990s, continued throughout the 2000s and is still going on. According to the local
mission of FRONTEX, the EU’s agency monitoring EU’s borders, the inflow of irregular
migrants from the Turkish border increased even in 2011, in the wake of the economic crisis:
“migratory pressure on the Greek-Turkish border remained high with over 55,000 detections
by the end of 2011. This was an increase of approximately 17 per cent compared to 2010”
(FRONTEX data, http://www.frontex.europa.eu/news/greek-turkish-land-border-jo-poseidon-
land-situational-update-january-2012-DWvKc6, accessed on 3 August 2012). Migrant
women, be they irregural migrants or not, give birth to children in the maternity wards of
Greek public hospitals, which allows for the newborn children to be counted.
Figure 3.15 Trends in total fertility rate in OECD and Greece, 1991-2009
Twenties
Thirties
Forties
Fifties
No
children
Children No
children
Children No
children
Children No
children
Children
Greece
25.2
0.3
6.9
0.3
5.0
0.8
4.4
0.5
EU-25
62.9
28.4
38.4
13.8
22.5
7.1
8.2
3.1
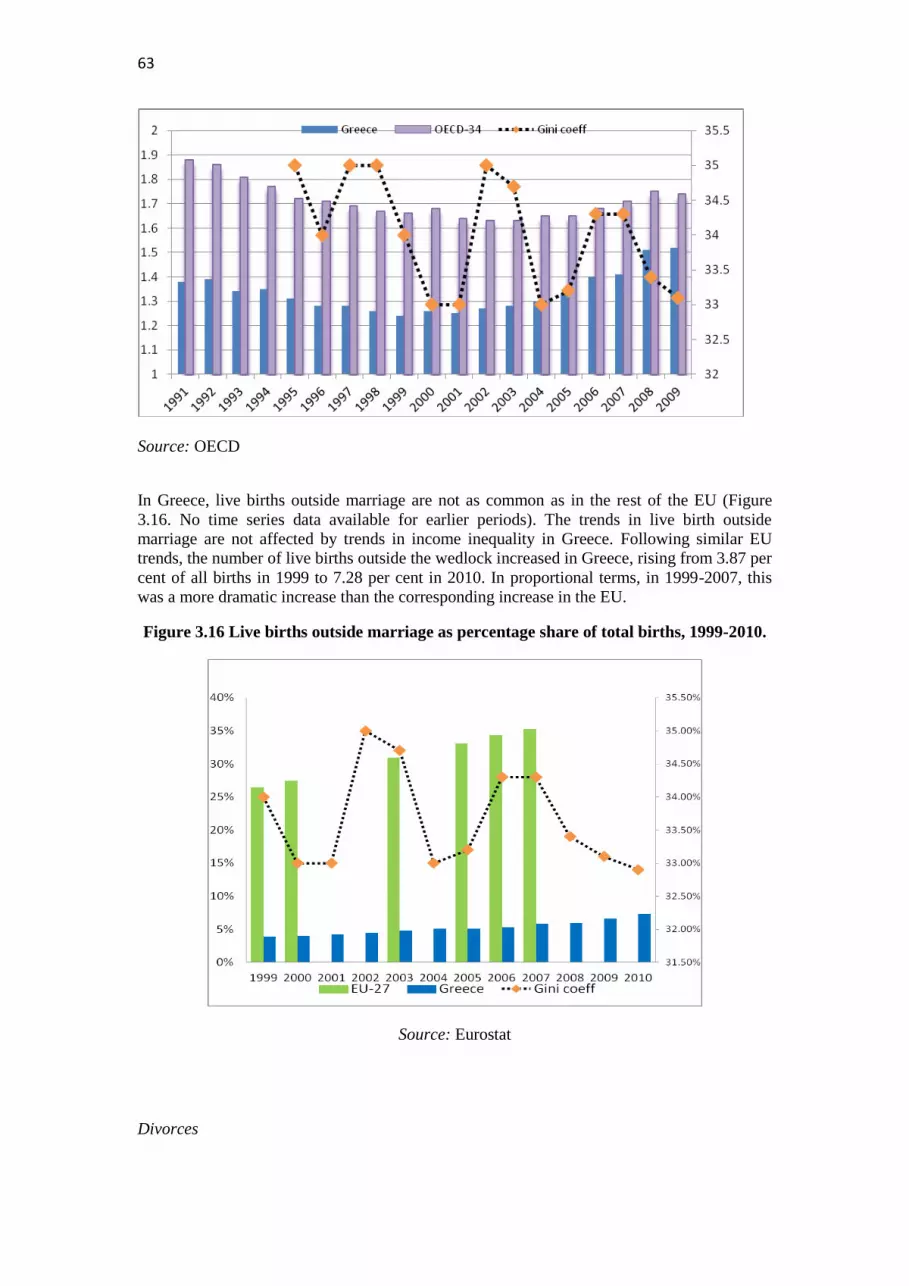
63
Source: OECD
In Greece, live births outside marriage are not as common as in the rest of the EU (Figure
3.16. No time series data available for earlier periods). The trends in live birth outside
marriage are not affected by trends in income inequality in Greece. Following similar EU
trends, the number of live births outside the wedlock increased in Greece, rising from 3.87 per
cent of all births in 1999 to 7.28 per cent in 2010. In proportional terms, in 1999-2007, this
was a more dramatic increase than the corresponding increase in the EU.
Figure 3.16 Live births outside marriage as percentage share of total births, 1999-2010.
Source: Eurostat
Divorces

64
There was a sharp rise in divorces, particularly in the 1990s and the 2000s. This rise took
place regardless of fluctuations in income inequality. The number of divorces was only 6,156
in 1992, but soared to 13,607 in 2009 (Hellenic Statistical Agency data, www.statistics.gr).
As Figure 3.17 indicates, the number of divorces per 1,000 population fluctuated between
1992 and 1998 but has been on a constant rise ever since. The long term increasing trend of
the divorce rate reflects the gradual modernization of social and cultural values of Greek
society. While once being divorced carried a stigma, particularly for divorced women, today
divorce is widely accepted as a possible outcome of married life and does not contribute to
stigmatization.
Figure 3.17 Divorce Rate in Greece
Source: Hellenic Statistical Agency (ELSTAT)
Lone parent families
Greek family patterns remain traditional: couples get married and have children. This is
indicated in the distribution of patterns of living arrangements for children under 18 in 2008
(Figure 3.18). The share of children living with co-habitating parents is five times smaller
than the corresponding EU-27 mean and the share of lone parent families in Greece is three
times smaller than the corresponding average in the EU-27.
Figure 3.18: Living arrangements for children under 18 in Greece and the EU, 2008
Source:Eurostat
To sum up this section, fluctuations in income inequality do not seem to be linked with
patterns of family formation and dissolution or patterns of fertility and living arrangements

65
for children. In Greece, as in other modern European societies, fertility and the crude birth
rate declined over the past decades. Divorces also rose over the last two decades. In contrast
to other European societies, however, births out of wedlock did not increase and lone
parenthood was still a rather rare instance. Greece remains a relatively traditional society as
far as family formation and family structure are concerned.
3.6 Health Inequalities
The health status of the Greek population, as measured by healthy life years at birth seems to
have improved in the recent years (see Figure 3.19). This is also true for life expectancy (at
birth), which increased markedly since the 1980s. Life expectancy for males increased from
73.5 years in 1985 to 78.1 years in 2010, whereas the corresponding rise for females was from
78.4 years to 82.8. (All data quoted in this section are from Eurostat.) These figures are close
to the average life expectancy among the EU15 countries; however, Greece’s relative position
has deteriorated during the last decade vis-à-vis the other EU15 countries. Regarding life
expectancy at 65 (i.e. the number of years still to be lived by a person aged 65), Greek males
in 2010 were expected to live a further 18.5 years (the third highest among the EU15),
whereas Greek females were expected to live a further 20.4 years (a figure which is the
second lowest among the EU15). Infant mortality (i.e. the number of deaths of infants under
one year old per 1,000 live births) in Greece fell significantly, from 9.71 in 1990 to 3.80 in
2010. There were only two countries among the EU15 with higher infant mortality than
Greece in 2010 (Austria and the UK); however, Greece’s relative position improved since
2000, when it had the highest infant mortality rate among the EU15.
Figure 3.19 : Healthy life years at birth by sex
Source: Eurostat
A particularly unwelcome development for Greece during the last four decades has been the
large fall in the (total) fertility rate (defined as the average number of children that would be
born to a woman over her lifetime if (i) she were to experience the exact current age-specific
fertility rates (ASFRs) through her lifetime, and (ii) she were to survive from birth through
the end of her reproductive life). It dropped continuously from 2.33 in 1975 to 1.25 in 2001,
and it has since then partially recovered to 1.51 in 2010 (but still well below the replacement

66
fertility rate of about 2.1), mainly due to the influx of (legal) migrants whose fertility rate is
significantly higher than the indigenous population. Although one can generate various
hypotheses connecting the evolution of income inequality and fertility, we are not aware of
any serious efforts to disentangle the direction of causality in the Greek context.
A question that is often asked in health surveys relates to self-perceived health status, and is
usually similar to: "How is your health in general?" Despite the subjective nature of answers
to these questions, with cultural factors affecting responses, indicators of perceived general
health have been found to be a good predictor of people's future health care use and mortality
(see Miilunpalo et al., 1997). However, cross-country differences in perceived health status
may be difficult to interpret. Figure 3.20 is a case in point. Since 2004, more than 50% of
Greeks perceive their health status to be “very good”; the corresponding figure for the EU27
has never been more than 25% during the same period. It is difficult not to attribute such a
large discrepancy to cultural factors. Nevertheless, Figure 3.20 remains useful as it reveals a
decline in the share of Greeks reporting their health status to be “very good”, from 58.4% in
2004, to 52.32% in 2009 (before hardly any Greek felt any anxiety about the unfolding
economic crisis), and to 51.1% in 2010. We note that during the same period the share of
people perceiving their health to be either “bad” or “very bad” was about the same in Greece
and in the EU27 (the sum hovering around 10%).
Figure 3.20: Self-perceived health (%)
Source: Eurostat (EU-SILC)
We turn now to an examination of how self-perceived health status varies across (equivalised)
income quintiles. As expected (see Figure 3.21 ), the proportion of respondents stating that
their health status is either “bad” or “very bad” is inversely related to their income. In 2010,
the proportion of persons replying that their health status is either “bad” or “very bad” was
three and a half times larger for the first income quintile than for the fifth quintile. This gap in
self-reported health status between the top-income and the lowest-income groups was
however smaller than in 2004, when members of the poorest quintile were more than four
times as likely to report “bad” or “very bad” health status than members of the richest
quintile.

67
Inequalities in self-perceived health status exist also across education groups. This is evident
in Figure 3.22, where we see that the disparity in self-perceived health status is very large,
with the incidence of “bad/very bad” health status among persons who have not proceeded
beyond primary education being about nine times larger than among those that are graduates
of post-secondary and first-level tertiary institutions. This gap in self-perceived health status
had declined between 2004 and 2008, but with the arrival of the global financial crisis, and its
deleterious effects among the less-skilled, the gap had widened again by 2010.
Figure 3.21: Self-perceived health (bad/very bad) by income quintile (%, equivalised
income)
Source: Eurostat (EU-SILC)
Figure 3.22: Self-perceived health(bad/very bad), by education (ISCED 1997)
Source: Eurostat (EU-SILC)

68
Differences in health status, in the form of long-standing illness or health problem, are also
largely shaped by education. In Figure 3.23, the incidence of such problems was between two
and a half and eight times as large among persons with only primary education, than for the
other education groups. Another notable feature of Figure 3.23 is that although there was a
continuing rise in the aggregate share of people with health problems (from 34% in 2004 to
42% in 2010), this upward trend was not experienced by people with post-secondary and first-
level tertiary education. Interestingly, persons with post-graduate education not only
experienced an increased incidence of health problems (2004: 6.1%, 2010: 9.5%), but also
faced significantly higher incidence than persons who had attained only post-secondary level
education (5.6% in 2010).
Figure 3.23: People having a long-standing illness or health problem, by education
Source: Eurostat (EU-SILC)
3.7 Housing tenure
The process of monetary convergence and towards Eurozone participation implied a very
significant expansion in the credit supply for consumption and housing. Housing loans
represented only 4% of GDP in the 1980's. This share rose sharply - following the fall in
interest rates at the end of the 1990s attributed to the adoption of the Euro- to 34% of GDP in
2010 (Figure 3.24).

69
Figure 3.24 : Mortgages and consumer credit as percentage of GDP
Source: Bank of Greece
Housing tenure is increasingly seen by social scientists (e.g., Kurz and Blossfeld, 2004) not
only as an outcome of one’s labour market position, but also as an important factor in shaping
social inequality. This is largely because housing circumstances are dependent upon
socioeconomic status, but also because home ownership interacts with various structural,
cultural, and political factors to determine intergenerational wealth transfers. These issues are
particularly pertinent in the case of Greece since family assistance and wealth transfers have
been all too important in the achievement of home ownership. In the Greek case this has not
been limited to inheritance and the common practice of a cash help in the downpayment
towards a loan, but also through the direct transfer of a house or a land plot to the family’s
offspring – all too often well before the parents reach old age. Although these practices have
been associated with the institution of dowry, their prevalence was almost equally important
for sons as for daughters.
These practices, along with the socially acceptable practice of young people staying in their
parents’ home until marriage (too often in their thirties), produced for Greece –despite the
lack of a functioning market for housing loans – a very high rate of owner-occupation. Figure
3.25 shows that until 2001, owner-occupiers were 90% of all dwellers, but since then their
proportion had dropped to 76% in 2007 and to 77% in 2010. This is still a large rate by
European standards, and its fall during the last decade probably reflects the steadily
decreasing unemployment rate (until 2008) for persons up to 34 years old (see Chapter 2),
which allowed them to move to rented accommodation. The importance of high
intergenerational wealth transfers is also evident in that 60% of all dwellers had no
outstanding mortgage or housing loan until 2010.

70
Figure 3.25 : Distribution of population by tenure status, (Source: SILC)
Source: Eurostat (EU-SILC)
Greece’s high rate of owner-occupied housing relative to EU countries is more pronounced
when the comparison is made among the poor (income less than 60% of median equivalised
income) than among the non-poor. In 2010, 79.0% of the non-poor were owner-occupiers in
Greece, compared to 70.7% in the EU27 – a difference of 8.3 percentage points; moreover,
the time-trend (2004-2010) was upward for Greece and downward for the EU27 (Figure
3.26.). In Greece, 60% of the non-poor had no outstanding mortgage or housing loan
obligations (in 2010), compared to 35% in the EU27. The percentage point difference in
owner-occupier status among the poor between Greece and the EU27 was 23 percentage
points in 2010 (Greece: 70.1%, EU27: 47.1%) – see Figure 3.27. The relative small difference
in owner-occupied status between poor and non-poor in Greece (9 percentage points higher
for the non-poor) is, probably, a recent phenomenon, since in the middle 1990s more than
90% among the poor in Greece were owner-occupiers. Although no data are available for the
non-poor in the 1990s, it is safe to assume that even if a higher proportion of the non-poor
were owner-occupiers, the difference with the poor would have been smaller. In any case, the
(still) very high rate of home ownership among the poor in Greece explains the relative small
wealth inequality in Greece (see chapter 2).

71
Figure 3.26: Distribution of population by tenure status, above 60% of median
equivalised income
Source: Eurostat (EU-SILC)
The high rate of owner-occupier status among the poor in Greece has not prevented the
existence of the highest severe housing deprivation rate among the EU15. Severe housing
deprivation rate is defined as the percentage of population living in a dwelling which is
considered as overcrowded, while also exhibiting at least one of the housing deprivation
measures (i.e. houses with a leaking roof, no bath/shower and no indoor toilet, or a dwelling
considered too dark). Greece had a severe housing deprivation rate of 8.2% in 2004, which
was the second highest (Italy: 9.0) among the EU15. By 2010, the deprivation rate had
dropped to 7.6, which was the highest among the EU15, and higher than a few of the New
Member States of the EU.

72
Figure 3.27: Distribution of population by tenure status, below 60% of median
equivalised income
Source: Eurostat (EU-SILC)
Greece had also one of the highest housing cost overburden rates (i.e. the percentage of the
population living in households where the total housing costs represent more than 40 % of
disposable income) in 2009. Figure 3.28 shows the housing cost overburden rates by tenure
status and for the population as a whole, for Greece, the euro area, and the EU27. At an
overall overburden rate of 22.1%, Greece had in 2009 the second highest rate among the
EU27 (Denmark: 24.4, euro area: 11.8, EU27: 12.1). What produces this surprisingly high
overburden rate for Greece is that the overburden rate among tenants is 67%, far above any
EU27 country -second highest is Romania at 56.5, while Portugal, a country which has many
characteristics close to the Greek ones, had an overburden rate of 19.8%. It is also surprising
that the overburden rate in Greece among owners-occupiers without mortgage or housing loan
is higher (at 13.6%) than among those with mortgage or loan (at 10.5%); the corresponding
figures for the EU27 are 5.7% and 8.8%, and for the euro area, 3.1% and 7.8%. A possible
explanation for this paradox in Greece is that the housing stock of owners-occupiers without
mortgages is older, and in need of more repairs to keep it functional, than the housing stock of
mortgage indebted owners-occupiers, a vast majority of which acquired their newly-built
homes during the credit boom that started in the mid-1990s.

73
Figure 3.28: Housing cost overburden rate by income quintile, % of total population
Source: Eurostat (EU-SILC)
Prices of dwellings which rose significantly in the first years of Eurozone participation have,
as expected, fallen significantly since 2009 (Figure 3.29)
Figure 3.29 : Prices of dwellings (percentage change in average prices)
Source: Bank of Greece
In 2009 Greece had also a higher overcrowding rate (i.e., the proportion of people living in an
overcrowded dwelling, as defined by the number of rooms available to the household, the
household’s size, as well as its members’ ages and family situation) than all other EU15

74
countries. Again, what differentiates Greece from the other EU15 countries is that there was
not much difference between the overcrowding rates for the poor and the non-poor – a result
also of the high owner-occupation of old and small dwellings by the poor.
3.8 Crime and punishment
While in the 1990s and the 2000s the risk of poverty in Greece remained stable, at the 20 per
cent level, and income inequality slightly declined, there was an upward shift in crime trends,
with only a slight decrease in the mid-2000s. As shown in the graphs of this section, between
1995 and 2007 (the period for which data are available), trends in the number of criminal
offences against the person (e.g., homicide and against property (e.g., robbery, motor vehicle
theft and burglary do not follow trends in income inequality. Trends in the size of prison
population do not correspond to shifts in inequality either.
Recorded crimes
As Figure 3.30 shows, the total number of recorded crimes in Greece was below 3200 in 1995
but by 2002 the number had reached 4400. For this analysis, EU rather than Greek sources are
used. This is because Greek authorities provide EU sources with data which are then
standardized for cross-national comparisons.
Figure 3.30 Trends in the number of criminal offences in Greece, 1995-2007
Source: 1995-2000: http://www.europeansourcebook.org/esb2_Full.pdf

75
Figure 3.31: Trends in the number of (completed)
homicides in Greece, 1995-2007
Figure 3.32: Trends in the number of robberies
in Greece, 1995-2007
Figure 3.33: Trends in the number of burglaries
in Greece, 1995-2007

76
Figure 3.34: Trends in the number of motor vehicle theft
in Greece, 1995-2007
Figure 3.35: Trends in the number of drug offences
in Greece, 1995-2007
Source 1995-2000: http://www.europeansourcebook.org/esb2_Full.pdf
Source 2000-2003: http://www.europeansourcebook.org/esb3_Full.pdf
Source 2003-2007: http://europeansourcebook.org/ob285_full.pdf
Figures 3.31-3.35 above show the evolution of various types of crimes. With regard to violent
crimes, there is a dramatic increase in robbery over 1995-2007, while the number of
homicides declined after 2001. There is not enough data on motor vehicle theft which,
however, was on the rise in the 1990s. By contrast, the number of burglaries declined in 1995-
2005. Notably, drug offences increased substantially over 1995-2003 and declined afterwards.
Prison population
As Figure 3.36 shows, Greece’s prison population also increased, probably following the
upward trends of some of the types of crimes noted above. The increase was more evident
between 2004 and 2009. After this period, the Greek government took measures to release
prisoners incarcerated for less serious crimes, because prisons had reached maximum
capacity.
What are the causes of above trends? The public opinion and the press in Greece tend to
associate the rise in crime with the inflow of unregistered migrants which started after the fall
of state socialism in neighboring Balkan countries (1989-1991). Such inflow has continued
unabated ever since, with the addition of migrants from South Asia and Sub-Saharan Africa in
the more recent years. Indeed, in Greece the share of foreign offenders among all those
arrested for all types of criminal offence rose from 1.1 per cent in 1990 to 19.8 per cent in
2007 (research by the Greek National Centre for Social Research, summarized in the
newspaper He Kathimerini, 2 May 2009).
However, arrested migrants are over-represented among all those arrested only for specific

77
types of crimes, such as theft, robbery and forgery of official papers. The share of foreigners
among arrested robbers climbed from 3 per cent in 1990 to 37 per cent in 2007; and in the
case of arrests for intended homicide, the share rose from 5.4 per cent in 1990 to 32.5 per cent
in 2007. However, as those figures show, it is Greek nationals who commit the bulk of crimes.
Also the participation of non-Greeks in economic crimes and corruption is small (He
Kathimerini, 2 May 2009). In short, the inflow of migrants explains only part of the rise in
criminality.
Figure 3.36 The evolution of prison population
in Greece, 2003-2009
Source: Greek Ministry of Justice
The rise in total crime is probably related to the increase in drug trafficking and in
consumption of illegal drugs. Drug-related crimes almost quadrupled between 1995 and 2003,
but declined in 2004-2005 (Figure 3.35). In contrast to most other EU Member-States,
Greece’s geographical position makes it a ‘natural’ gateway for smuggling drugs into Western
Europe. Cannabis and heroin are smuggled from the Middle East and South West Asia to
Europe through the northern regions of Greece bordering on Turkey. The latter country has
never taken adequate measures to stop the tide of drug trafficking.
Another plausible explanation for the rise in crime has to do with the social transformation of
Greek society, namely its urbanization and modernization over the last decades. Crime is less
frequent when people live in rural areas. In Greece the population living in urban centres
(over 10,000 inhabitants) rose from 43 per cent of the total in 1961 to 59 per cent in 2001.
Moreover, the Greek life-style changed, as Greeks started consuming more and more. Owing
to tax evasion, it is difficult to estimate how much the income available for private
consumption rose in Greece in the 1990s and 2000s, up until the onset of the current crisis
(2010).
3.9 Subjective measures of well-being, satisfaction, “happiness”
Subjective measures of well-being are important because they capture the actual perceptions
citizens hold about their life. Figure 3.37 tracks the Eurobarometer survey responses to the
question “On the whole are you very satisfied, fairly satisfied, not very satisfied or not at all
satisfied with the life you lead?” Among the older South European EU member states listed
here, Greeks register the lowest rate of life satisfaction, except for certain sub-periods when
Portugal scores lower. Out of all the countries traced in Figure 3.37, Greece appears to have
the strongest positive correlation with Spain. It is correlated with the EU average during
1981-90, after which the EU trend moves upward and the Greek downward. They become
correlated again after 1998, and move in parallel until the 2008 crisis, after which the EU

78
average trend is stabilized while that of Greece collapses to the lowest levels recorded. There
are six local peaks of life satisfaction (1986, 1989, 1997, 1999, 2004 and 2006) all more or
less corresponding to sub-periods when the economy was doing well in terms of GDP growth.
Figure 3.37: Life satisfaction, yearly average
Source: Eurobarometer
Figure 3.38 (inequality-adjusted life satisfaction) is an index denoting the degree to which a
country combines a high average level of life satisfaction with low inequality in life
satisfaction. Theoretically ranging between 0 and 100, the index gives equal weight to level
and inequality of happiness. It is measured as a linear combination of the mean and the
standard deviation of the distribution of life satisfaction or happiness in a nation. Over 1981-
2007 we see an overall long-term upward convergence trend towards the EU average, after
which Greece begins to steeply diverge from the EU, reaching (after 2010) the lowest levels
recorded.
Figure 3.38: Inequality-adjusted life satisfaction, yearly average
Source: Eurobarometer
The final Figures (3.39 and 3.40) display findings from the European Social Survey, Rounds
1, 2 and 4 (Greece did not participate in Round 3), completed for Greece in 2003, 2005, and
2009 respectively. They display the total scale of responses, from 0 (fully dissatisfied) to 10
(fully satisfied), allowing a more detailed picture of the distribution of responses.

79
Figure 3.39: Sense of Personal Happiness
Figure 3.40: Satisfaction from the Economy
Source: National Centre for Social Research (EKKE)
In accordance to what we saw in the previous graphs, the greatest divergence from the
European average (not EU but average of ESS participating European countries) occurs in the
4th ESS round of 2009, where the non-satisfaction rates for Greece are much higher the
European average than they are in the previous rounds. It is finally worth noting that
respondents declare a very low degree of satisfaction from the economy while at the same
time scoring relatively high on their own subjective account of personal happiness. The
importance of the economy notwithstanding, it seems that other, far more subjective factors,
also play a crucial role in determining one’s individual count of personal happiness.
3.10: Intergenerational mobility
Very limited empirical research has been carried out regarding intergenerational mobility in
Greece, and it concerns mainly the role of education. Standard literature shows that in both
developed and developing countries, better education tends to ensure workers higher wages,
lower unemployment and better prospects of career development. In line with existing
literature, Tsakloglou and Cholezas (2005) find that education appears to be the single most
important factor that shapes the overall distribution of income and influences the probability
of poverty.

80
Considering its level of development, Greece has had a relatively well-educated population,
with high rates of tertiary education among the younger generations. The educational
qualifications of the Greek labour force have steadily improved over the recent decades
(Table 3.2).
Table 3.2. Educational qualifications of the labour force (by age group)
1974 1988 1999
Educational level Below 36– Over Below 36– Over Below 36– Over
35 49 50 35 49 50 35 49 50
Tertiary
7.3
8.3 5.3 16.5 15.3 8.0 23.6 25.6 14.1
Upper secondary 21.3 13.0 7.5 37.4 18.4 9.5 48.2 33.1 14.4
Lower secondary 9.1 5.3 4.1 14.1 7.5 4.4 15.0 11.9 7.6
Primary 55.5 43.8 47.6 30.8 50.6 45.4 12.2 27.7 49.9
Primary not completed
6.7 29.5 35.6 1.3 8.2 32.6 1.0 1.7 13.9
Source: Tsakloglou and Cholezas (2005)
Table 3.2 shows the significant improvement of educational qualifications of the labour force
in all age groups between 1974 and 1999. In 1974, for example, 7,3% of the age group below
35 were tertiary education graduates and 62,2% had completed less than lower education; by
1999 the percentages were 23,6% and 13,2% respectively (Tsakloglou and Cholezas, 2005).
State-provided education, however, has coexisted with high levels of private spending in
education (private schools, tutorials and cram schools, and one of the highest percentages of
tertiary student emigration in the world). Success in the public university entry exams is
easier for students with a higher educational and income family background as compared to
those from lower socioeconomic strata.11
Table 3.3 shows that students from a poorer
socioeconomic family background are heavily overrepresented among those not continuing
their studies in the post-compulsory stages of secondary education, and overrepresented in
technical rather than university tertiary education. Students from a wealthier family
background have a much higher probability of attending cram school and private tuition, and
when they do they devote a higher budget. Students from wealthier family backgrounds are
overrepresented in university education.
11
For example, Psacharopoulos and Tassoulas (2004), Katsikas and Kavvadias (1994).

81
Table 3.3 Participation in education and private spending
per upper secondary education student per quintile of household income, 1993/94
Quintile
Bottom
Lower middle
Middle
Upper middle
Top
Proportion of persons aged 15–17
not in education, %
31.51
11.16
10.05
9.18
2.50
Proportion of upper secondary education students in technical
education, %
23.62
21.67
18.97
24.85
12.53
Proportion of households with upper- secondary education students with
expenditures on fees for cram schools and private tuition (%)
22.00
42.33
52.51
57.87
62.82
Monthly mean private spending per upper-secondary education student
attending a cram school or taking private tuition (in drachmas)
9,226
15,096
19,218
26,318
33,875
Ratio of tertiary education to upper secondary education
students
0.3068
0.3644
0.5264
0.6179
0.4989
Ratio of university to general upper secondary education
students
0.2769
0.2760
0.3850
0.5501
0.3632
Source: Antoninis and Tsakloglou (2001)
In one of the few studies to examine the distributional impact of Greek public education
transfers-in-kind, and using data from the 1993/94 Household Budget Survey, Antoninis and
Tsakloglou (2001) find that transfers to primary and secondary education students reduce
inequality substantially, while transfers to tertiary education, and especially University
students, are regressive, increasing inequality.
A number of empirical studies agree on the importance of family background (parents
occupation and education) with regard to the poverty and exclusion risk of the individual in
their adult life. Papatheodorou (1997) and Tsakloglou and Papadopoulos (2002) find that the
parents education is a significant factor in explaining whether the individual, in their adult
life, will be located above or below the poverty line or risk social exclusion.
No cross-temporal study is available comparing outcomes of intergenerational mobility over
the recent decades. We thus rely on studies using microdata from specific surveys on Greek
households.
Papatheodorou (1997) uses microdata from a survey carried out in 1988 by the Greek
National Centre for Social Research (EKKE). He finds that the father's education is associated
with father's occupation but does not have a significant direct effect on the individual's
poverty independently of other variables. Rather, the father's education influences the

82
individual's probability of falling below the poverty line indirectly, through the significant
effect on the individual's education and the association with the father's occupation. But the
father's occupation has a strong direct effect on the individual's poverty independently of
other variables. The children of fathers who are professionals, administrative executives,
clerical, tradesmen or salesmen are less likely to fall below the poverty line compared to those
whose fathers were craftsmen, labourers or service workers, and even less likely than those
whose fathers were farmers (Papatheodorou, 1997: 27).
Table 3.4: Poverty by educational level of the father of the head of household
Educational Level of the Father of the Head of Household
No Primary
Education
Primary
Education
Secondary
Education
Higher
Education
(College)
Total
Poor (%) 30.2 18.6 9.7 1.3 23.0
Not Poor (%) 69.8 81.4 90.3 98.7 77.0
Total 100.0 100.0 100.0 100.0 100.0
(N) (1130) (1094) (124) (79) (2427)
X2 = 78.089 DF: 3 Significance 0.000
Source: Papatheodorou (1997)
Table 3.4 shows that the father's level of education affects poverty rates. 61% of households
below the poverty line have a household head with a paternal background of "no primary"
education. A household head with a paternal background of "no primary" education is 33,7
times more likely to be poor than one with a paternal background of tertiary education.
Table 3.5: Poverty by occupation of the father of the head of household
Occupation of the Father of the Respondent
I II III Total
Poor (%) 9.0 18.0 29.3 23.0
Not Poor (%) 91.0 82.0 70.7 77.0
TOTAL 100.0 100.0 100.0 100.0
(N) (389) (651) (1.387) (2.427)
X2 = 83.187 DF: 3 Significance 0.000
I: Professionals, Administrative Executives, Clerical, Tradesmen and Salesmen.
II: Craftsmen, Labourers, Service Workers
III: Farmers
Source: Papatheodorou (1997).
Table 3.5 shows the strong association between paternal occupation and poverty risk.
Households where the father of the household head is a farmer are 3,2 times more likely to be
poor than those whose father’s occupation belongs to category I, and 1,6 times more likely
than those belonging to category II.

83
Table 3.6: Households by educational level of the heads of household and the
educational level of their fathers
Educational Level of the Father of the Respondent
Educational
Level of
Respondent
No Primary
Education
Primary
Education
Secondary
Education
Higher
Education
(College)
Total
No Primary
Education (%) 27.3 6.5 0.0 0.0 15.6
Primary
Education (%) 57.7 51.2 17.7 10.1 51.2
Secondary
Education (%) 10.6 26.0 39.5 32.9 19.7
Higher
Education (%) 4.4 16.4 42.7 57.0 13.5
Total 100.0 100.0 100.0 100.0 100.0
(N) (1.130) (1.094) (124) (79) (2.427)
X2 = 616.359 DF: 3 Significance 0.000
Gamma = 0.64902
Source: Papatheodorou (1997)
Table 3.6 illustrates a picture of considerable upward intergenerational educational mobility.
In all educational levels, the majority of respondents have done better or (in the secondary
and higher educational levels) at least as well as their fathers. However, only a small
percentage of respondents whose fathers possess no primary education or just primary
education make it to secondary or even more to higher education. This suggests that
educational (and thus also occupational) development remains constrained by unequal starting
conditions related to family background.
Table 3.7: Households by respondent’s father occupation and respondent’s educational
level
Occupation of the Father of the Respondent
Educational
Level of
Respondent
I II III Total
No Primary
Education (%) 4.6 10.1 21.3 15.6
Primary
Education (%) 31.1 45.9 59.3 51.2
Secondary
Education (%) 31.6 28.1 12.5 19.7
Higher
Education (%) 32.6 15.8 7.0 13.5
TOTAL 100.0 100.0 100.0 100.0
(N) (389) (651) (1.387) (2.427)
X2 = 362.905 DF: 6 Significance 0.000
I: Professionals, Administrative Executives, Clerical, Tradesmen and Salesmen.
II: Craftsmen, Labourers, Service Workers
III: Farmers
Source: Papatheodorou (1997)

84
Table 3.7 shows that educational development is influenced by paternal occupation. 80,6% of
respondents whose fathers were farmers stop in primary education, whereas 32,6% of
respondents whose fathers were occupied under category I receive higher education.
In another study, Papatheodorou and Papanastasiou (2010) use microdata drawn from the
2005 EU-SILC project. They find the father’s occupation to be statistically significant for the
poverty risk of children in their adult life for Greece, France, and the United Kingdom, but
not for Denmark. For Greece, France and the UK they find a strong association between an
individual’s poverty risk and their father’s occupation, regardless of the child’s occupation.
The father’s occupation is moderately associated to that of the children in all four countries
examined.
Papatheodorou and Papanastasiou (2010) show that, for Greece, as well as the United
Kingdom, the direct impact of the father’s occupation on the poverty risk of their adult
children remains strong even after controlling for individual variables (such as the children’s
occupation). On the contrary, after controlling for such variables, the impact of the father’s
occupation disappears for France, whereas for Denmark, paternal occupation carries no
impact on the poverty risk of adult children (Papatheodorou and Papanastasiou, 2010: 42).
They find that, for all 4 countries, family background has a significant influence on the
occupational level of individuals even after controlling for individual variables like the
individual’s education. Children whose fathers held a higher occupational status have stronger
chances of moving higher themselves in the occupational hierarchy.
In conclusion, Greece, over the recent decades, is a country characterized by relatively low
intergenerational mobility of income. Paternal occupation and education exercise a strong
influence on the poverty risk of the children when they become adults. This can be, among
others, attributed, to the low effectiveness of social and educational policies in curbing
inequalities. In some areas, such as higher education, public spending is regressive. However,
there is significant intergenerational upward mobility of education. Postwar generations
attached a premium on their children’s education, among others in order to raise their chances
of a safe job in the public sector. Tertiary education has been important in order to respond to
the rapid changes in the occupational structure and the transformation of an erstwhile
developing, late-late industrializing economy into a middle-income service-based economy,
into an opening economy subject to far-reaching changes under the European single market.
3.11 Conclusion
As indicated in chapter 2, most of the decrease in inequality in Greece took place from the
mid-1970s to the early 1980s, with only small declines in inequality taking place in the 2000s.
On this account it is not surprising that we have not seen improvements in many of the socio-
economic indicators examined in this chapter, since most of the available data on social
outcomes cover only the last 10 years. (The declines observed The appearance of upward
intergenerational educational mobility mentioned in the previous section is certainly a
positive outcome, but one wonders to what extent it is simply an artifact of the expansion of
tertiary education, since periods of expansion will necessarily have more children going to
University than their parents. Indeed, other aspects of educational mobility examined in the
previous section are not congruent with high intergenerational mobility.)
To some extent the failure of inequality decreases to impact positively on social outcomes has
to do with the failures of social policy in Greece (see chapter 5). But it also reflects the
changes in social and economic structure that took place during the last two decades; chief
among them has been the movement of the population from rural areas to urban centres, and
the large influx of immigrants.

85
4. POLITICAL AND CULTURAL IMPACTS
4.1 Introduction
In Greece income inequality does not directly impact on political participation, which is quite
extended and must be interpreted in the context of the Greek party system and political
culture. In 1974-2011, two parties, the socialist PASOK and the conservative New
Democracy (ND) alternated in power, forming single-party majority governments. Coalitions
were extremely rare (e.g. a coalition government was formed for less than a year in 1989-
1990). The two parties structured the political system in a highly polarized fashion which
pressed the electorate to take sides, choosing one or the other party, before each election. The
PASOK – ND polarization was compounded by the polarization between these two parties,
on the one hand, and the Left (primarily the Communist Party, but recently the radical left
party Syriza as well), on the other. Such polarization fueled political participation which
remained quite high in the 1990s and the 2000s, up until 2009 (section 4.2, below). While
democracy was consolidated just after Greece’s transition from the Colonels’ regime (1974),
the legacies of political conflict which in the twentieth century included a Civil War (1946-
1949) and three short-lived dictatorships (1925, 1936-1940 and 1967-1974), did not allow for
the emergence of new collective actors (parties, unions) representing the poorer vs. the richer
income groups.
Political party identification was so strong that high and low income earners voted on the
basis of family tradition (whose side the voter’s family was on during the Civil War) and
personal political socialization (e.g. whether the voter had shaped his or her value system in
the post-war period or during the Colonels’ regime or the transition from authoritarian rule
that followed). Political participation was also positively affected by the expansion of
secondary and tertiary education. Particularly since the late 1960s the Greek state offered
increasing opportunities to young adults from rural areas and the poorer strata as well as to
women to obtain public, free, higher education and enjoy social and political integration into
society and politics.
Extended political participation was also the result of what was only nominally an electoral
system of Reinforced Proportional Representation. In practice, the electoral law promoted the
chances of the party that came first-past-the post by granting this part a large number of
additional parliamentary seats (e.g. 40 additional seats in a 300-seat parliament) far above
what the party’ share of the vote would normally allow.
Owing to this tradition of conflict and polarization, extended participation in elections was
not reflected in patterns of trust towards democratic institutions (section 4.3). Except for the
legal system, i.e. the courts, which were relatively trusted by Greeks, the parliament, the
government and the political parties did not enjoy the stable confidence of citizens and lost
this confidence altogether by the start of the crisis in Greece (2010).
Until recently, in contrast to other European systems which had witnessed the rise of the far
right in the 1990s, the Greek party system leaned more to the left than to the right. In 2012, in
the wake of the economic crisis, the Golden Dawn party obtained 7 per cent of the vote and
entered the parliament, but until then the extreme right was negligible (with the exception of
the short-lived ‘National Faction’ party in the 1977 elections). The rise of extreme right
should be interpreted also in the context of attachment to traditional institutions, such as the
extended family. Attachment to traditional institutions went hand in hand with xenophobia,
aggravated by the uncontrollable inflow of unregistered immigrants from Eastern Europe,
South Asia and Sub-Saharan Africa over 1991-2011. The extreme left, however, was
comparatively stronger (section 4.4). The left, including the pro-Soviet communist left, has
been able to influence the student and labour movements.

86
Traditional attachment to the family has coexisted with atomism, manifested in low trust in
interpersonal relations and low levels of voluntarism, coexists with the highest propensity in
the EU-27 to call on the government to redistribute wealth in a fair way to all citizens and the
lowest in the EU-27 agreement with the idea that people, rather than the government, should
take responsibility to provide for themselves (section 4.5).
In brief, income inequality is not clearly associated to political participation, levels of
institutional trust, political values and values about social policy and welfare. Instead of the
usual income-group based political cleavages, divisions in Greece reflected, first, party
conflict between the right and the left which was associated with past dramatic moments of
political history (Civil War, breakdown of democracy); second, political contests to ‘colonize’
the state, a preponderant actor in the Greek economy and society; and, third, a contradictory
value system containing modern and traditional aspects which reflected Greece’s position in
the periphery of Europe. It is in the light of these patterns that Greece’s high political
participation, negative levels of trust, and endurance of traditional values can be better
understood.
4.2 Political and civic participation
Greeks turn up to vote in elections in relatively high numbers. Voting is mandatory, though
administrative sanctions for not voting have very rarely been enforced. Since the 1974
transition to democracy and until roughly 2007, the participation rate in the general elections
has ranged in the 75-80% area (Figure 4.1). From the 1990s, the intense politicization and
party polarization of the earlier period gradually began to subside, as Greek society became
subject to increasing cultural openness and “Europeanization”. Depoliticization spread:
between 1985 and 1996, the percentage of people declaring “limited or no interest in politics”
rose from 42% to 59%, out of which those “not at all interested” went from 15% to 27%.12
Scattered opinion data over the years since the 1990s and up to the late 2010s show that
younger age groups tended to be depoliticized and to abstain from voting.
Voter turnout declined in the elections of 2007 and 2009 and even more so in the elections of
2012. The high voter turnout until then had been sustained by certain crucial features of the
post-1974 political system: the dominance of the two party system (the centre-right ND and
the centre-left PASOK up to the 2009 elections typically gathered well over 75% of the
popular vote), the ability of the two parties to mobilize their supporters and ensure a mass
turnout in the elections, and a relatively high level of acceptance and legitimacy of the
political party system that led voters to the voting booth. These main preconditions of a high
voter turnout were severely weakened: an avalanche of political scandals tarnished the record
of the 2007 government; soon followed the 2009 economic crisis, which rapidly delegitimized
the two-party political system in the eyes of their traditional voting groups. The total vote
received by ND and PASOK in the twin elections of 2012 (May and June) was just 32% and
42% respectively, compared to 77% in 2009. Rising electoral abstention post-2009 is a
demonstration of intensifying political discontent and system delegitimization.
There is no visible evidence of an association between voter turnout and inequality, which
does not appear to have an effect on the voting behavior of Greeks. Other factors underlined
above (notably party identification and politicization, which despite their relative decline after
the 1990s are still high compared to West European levels) are more significant in
determining voting behavior. It is too early to examine the implications of the new post-crisis
landscape that has emerged after 2012.
12
See, for example, Pappas (2002).

87
Figure 4.1: Voter turnout
Sources: http://www.idea.int/vt/countryview.cfm?CountryCode=GR; Ministry of
Interior and European Parliament.
Ever since Greece’s accession to the EC/EU in 1981, turnout in the EP elections has been
consistently well above the EU average, always higher than the percentages for Spain and
Portugal, very close to those of Italy until 1999, but lower than Italy for 2004 and 2009. From
the 1994 elections onwards, the Greek participation rate follows a clear downward trend,
reaching 63,2% in 2004 and 52,6% in 2009, still remaining above the 43% EU average.
As with other EU countries, the European Parliament elections have predominantly operated
as second-order national elections, where voters express (dis)approval of the government or
preference of a national political party rather than choosing between competing European
party platforms. However the decline of participation in European elections correlates less
with the participation rate in national elections (where no such parallel decline is evidenced),
and more with the declining confidence in the EU over the same period (see Graphs 4.4-4.6).
Figure 4.2: Participation (%) in an Association or Organized Voluntary Activity
(1994/1998/2006)
Source: EU-SILC

88
High rates of political participation have co-existed with relatively low rates of civic
participation. Associational activity and the autonomy of civil society in Greece have been
traditionally underdeveloped under a pervasive state and party system.13
High levels of party-
political partisanship have crowded out participation in civic organizations. By the same
token, the declining rates of party politicization since the 1990s have opened way to higher
levels of civic participation.
National-level data on associational activity are discontinued and incomplete, and suffer lack
of cross-national comparability. We use EU-level data. The European Values Survey includes
Greece for only 2 years, and the European Social Survey has a significant overlap with the
Eurobarometer survey. We rely on Eurobarometer, as well as on Eurostat data. According to
Eurostat, in 1994 only 10% of the Greek population was estimated to participate in an
association or in organized voluntary activity, compared to an EU average of 34%. The Greek
levels of associational and voluntary participation were lower than those of Spain, Portugal
and Italy. By 1998 the percentage of associational participation had more than doubled, rising
to 24%, half the EU average of 48% and still lower than the other Southern European EU
member states. By 2006, after thousands had volunteered for the 2004 Olympic Games, the
percentage had risen to 50% (Figure 4.2). According to the 2004 Eurobarometer, 74% of
Greeks were not members in any voluntary organization, compared to a EU15 average of
49% (EU25: 53%). 23% of Greeks were members of 1 or 2 voluntary organizations,
compared to an EU15 average of 40% and EU25 average of 37% (Table 4.1). Table 4.2
shows a consistently lower record in all forms of participation in voluntary organizations.
Table 4.1: Number of Memberships in Voluntary Organizations (%)
Country N No membership
at all 1 2 3 4 5
6 or more
memberships
Greece 74 18 5 1 0 0 0
EU15 49 27 13 6 3 1 1
EU25 53 25 12 5 2 1 1
Source: Eurobarometer 62.2 (2004). Agricultural Policy, Development Aid, Social Capital,
Information & Communication Technology.
Table 4.2: Forms of Participation in Voluntary Organizations (%)
Country
Activities in Any Organizations
No activity in Any
Organization
Member of any
Organization
Donor to any
Organization
Participant in any
Organization
Greece 57 26 33 22
EU25 40 47 44 29
Source: Eurobarometer 62.2 (2004). Agricultural Policy, Development Aid, Social Capital,
Information & Communication Technology. November.
13
N. Mouzelis and G. Pagoulatos, “Civil Society and Citizenship in Postwar Greece”, in F. Birtek and Th. Dragona (eds) Citizenship and the Nation State in Greece and Turkey, Abington and New York: Routledge, 2005, pp. 87-103.

89
Table 4.3: Forms of Political Participation (%)
Country Voted
Signed
a
petitio
n
Boycotted
products
Products
for
political
reasons
Contacte
d a
politician
Participated
in public
demonstratio
n
Worked
in
interest
group
Participated
in strikes
Wore
political
campaig
n badge
Worked
in party
Participate
d in illegal
protest
activities
Greece 75 4 5 2 11 7 3 4 3 5 0
EU15 41 19 10 9 8 6 5 5 3 2 1
EU25 41 17 9 8 8 6 5 4 3 2 1
Source: Eurobarometer 62.2 (2004) Agricultural Policy, Development Aid, Social Capital,
Information & Communication Technology, November.
Forms of political participation remain skewed towards using the channels of the party
system. This is demonstrated on Table 4.3, which draws on Eurobarometer (2004). Apart
from the high voting turnout rate, which we already discussed, a higher than EU-average
participation rate is posted in the forms of participation that are more closely associated with
the traditional repertoire of political party activities: contact with politicians, participation in
public demonstrations, work for political party. On the contrary, novel forms of political
participation associated with civic activism and new social movements (petition signing,
product boycotting) have remained relatively underdeveloped.
Of all types of associations, participation rates in trade unions are not greatly divergent from
the EU and OECD average. One reason for that is the close ties of labor unions with the
political parties. A second reason is the strong presence of unions in the wider state-controlled
and sheltered sectors of the economy, and their role in obtaining selective benefits for their
members, who have been typically insiders of a well-protected (until 2010) labor market.
Figure 4.3 shows the evolution of trade union density, that is the percent of wage and salary
earners that are trade union members over the total number of wage and salary earners,
according to the OECD Labour Force Statistics. (Chapter 5 provides a longer time-series for
trade union density in Greece.) Between 1999 and 2008, trade union density slightly declined
from 27% to 24%, levels that are still higher than the OECD average, Spain, and Portugal, but
lower than Italy, Ireland, let alone the Scandinavian countries, Austria, Belgium and
Luxemburg. No visible association is established between trade union density and inequality.
Figure 4.3: Evolution of trade union density in Southern European countries
Source: OECD Labour Force Statistics.

90
Until July 2010, Greece was among the strictest OECD countries in terms of employment
legislation. A rigid labour market protected insiders at the expense of outsiders, failing to
catch up with societal changes such as the massive entry of women in the employment
market. Correlated with the over-regulation of the “official” employment sector was the
regulatory anarchy and lack of social protection of employees in the very extensive informal
sector, altogether amounting to a polarized duality of the labour market. Institutional rigidity
was among the main reasons why Greece over the 2000s posted one of the highest rates of
female unemployment, youth unemployment and long-term unemployment in the EU15. The
labour market reforms introduced in 2010-12 liberalized labour relations, but unemployment
rose further as a result of severe austerity policies.
The relatively small share of salariat in the total workforce (65% compared to 86% EU-27
average), given the large percentage of the self-employed, limits the influence of trade unions.
With a very limited presence in the private sector, trade unions have been confined to their
traditional bastions of the government and public enterprise sector and formerly state-
controlled banks. Unionization has been absent in the vast majority of private sector
enterprises, largely because of the small size and family structure of Greek businesses. Unions
have not been able to penetrate and organize in large business concerns such as shopping
malls, large business groups, etc, businesses that extensively rely on precarious employment.
The recently expanding categories of flexible and part-time employment, as well as
immigrants, are heavily underrepresented in national-level unions. Issues of
representativeness notwithstanding, the acceptance of the need for strong trade unions has
been broadly shared in the population. In 2003 Greece registered one of the highest cross-
European rates of agreement with the statement that strong unions are needed to protect the
working conditions and wages of working people, with a total 85,4% agreeing/ strongly
agreeing, and only 2,6% disagreeing (European Social Survey/ EKKE, 2003).
4.3. Trust in others and in institutions
Trust in institutions
Greeks turn out to vote in elections in high numbers (with the voter turn-out ranging from
65.1 to 76.5 per cent in national elections in 1996-2012). Yet, Greeks show relatively little
trust towards political institutions. More precisely, they accord little legitimacy to the
functioning of the parliament, government and opposition, and the legal (i.e., the justice)
system. They do not challenge the institutions per se, but have low trust towards the
performance of institutions, as the following Tables indicate. However, as the three following
Figures show, after the mid-2000s, i.e. in 2005-2010, the fluctuations in trust towards the
parliament, the government and political parties do not follow the comparatively small GINI
fluctuations.
In detail, since 2003 trust in Greek parliament has started falling (Figure 4.4). Trust dropped
from 61 per cent in October 2003 to just above 10 per cent in 2012. This was a dramatic fall
which however mostly occurred in 2010-2011, owing to the crisis in Greece. Before 2010, in
Greece trust in parliament was higher than the EU-average, particularly in 2003-2008 and
equal to the EU average in 2008-2009. The large decline of trust in parliament in Greece after
2008 cannot be accounted for only by the global financial problems and the Greek economic
crisis. It is probably the result of, on the one hand, the long rising political cynicism and
alienation in the Greek political system, the signs of which were first reported in the late
1980s, and, on the other hand, the disillusionment of Greek citizens with the political class of
their country, the performance of which had been marred by incidents of corruption since the
late 1990s.

91
Figure 4.4 Evolution of trust towards the parliament in Greece in comparison
with the EU average, 2001-2012
Source: Eurobarometer surveys, various years.
Similar but more prolonged trends are shown in Figure 4.5. Trust in the Greek government
fell from 50 per cent in 2004 to below 10 per cent in 2012. Before the crisis in Greece, i.e. in
2003-2009, trust towards the Greek government declined rapidly in-between national
elections, but rose after each election. The time points at which there was a resurge of trust in
government (October 2004, October 2007 and November 2009) coincided with the first
months after the parliamentary elections of 2004, 2007 and 2009, out of which a new single-
party majority government was formed (New Democracy in 2004 and 2007 and PASOK in
2009). By contrast, in the EU, with the exception of May 2007, when it increased to 41 per
cent, trust in government on the average ranged between 29 per cent and 35 per cent in 2003-
2011.
Figure 4.5: Evolution of trust towards the government in Greece in comparison with the
EU average, 2001-2012 (% tend to trust)
Source: Eurobarometer surveys, various years
How do Greeks see opposition parties? There is no data on trust in opposition, but there is a
survey of satisfaction from the functioning of the single-majority government (of the centre-
right New Democracy, ND) and the largest party of the opposition (the centre-left PASOK) in
2004 – 2007 (V-PRC; 2008, Table 4, p. 60). The survey, conducted by a private polling
company, showed that satisfaction from the functioning of the government ranged between 28

92
and 37 per cent, while satisfaction from the opposition ranged from 16 to 27 per cent. In other
words, opposition fared worse than the government and this can be explained by the contours
of the Greek party system. The 2004-2007 period was the first term of PASOK in opposition
after this party had remained in power for more than a decade (1993-2004). As a result,
attitudes towards the opposition party in 2004-2007 probably reflected an evaluation of
PASOK’s inability to formulate a credible political programme. Low trust in opposition also
reflected PASOK’s lack of a coherent opposition strategy after its fall from power in 2004,
rather than any general opinion trend towards opposition parties.
A proxy of the missing data on trust in opposition is trust towards political parties, as in
Greece coalition governments are very rare and most parties most of the time are in
opposition rather than in government. Figure 4.6 below shows a clearly falling trend of trust
in political parties, which becomes sharp after 2006. Trust in Greek parties fell from 25 per
cent in 2006 to 5 per cent in 2011. The impact of the crisis on this trend is obvious. The trust
towards parties in Greece, which was already very low in the 2003, dropped further in 2010
and 2011, as the two last surveys were made after May 2010, i.e., after the Greek government
had agreed on the first bailout package with the ‘troika’ of EC, ECB and IMF. In the EU, trust
in parties also declined after 2008, i.e., after the onset of the global crisis. However the EU
average of trust in parties never fell as lowly as in the case in Greece. Before 2011, the EU
average of trust in parties ranged between 15 and 22 per cent. Comparing across institutions,
we note that the EU average of trust in parties was lower than trust in government or
parliament, a pattern also true for Greece. This was probably an indication of the
dissatisfaction of European citizens with the way the political class manages democracy
today.
Figure 4.6: Evolution of trust towards political parties in Greece in comparison
with the EU average, 2001-2012(% tend to trust)
Source: Eurobarometer surveys, various years.
A similar, but somewhat less pronounced tendency is shown in Figure 4.7. In 2010, 41 per
cent of Greeks trusted the legal system, which was a far better level of trust than the 9 per
cent of Greeks trusting political parties. Nevertheless, trust towards the legal system also fell
dramatically from 68 per cent in 2003 to 41 per cent in 2010. Importantly, this decline was
gradual and was not necessarily linked to the more recent period of economic crisis.
Moreover, the Greek pattern of Table 4.3.4 differs from the pattern of the EU average of trust
in the legal system. The latter has fluctuated between 50 per cent and 43 per cent, but fell after
the onset of the global crisis, i.e. after 2008.

93
Figure 4.7: Evolution of trust towards the legal (i.e., the justice) system in Greece in
comparison with the EU average, 2001-2010 (% tend to trust)
Source: Eurobarometer surveys, various years.
What probably explains the decline of trust in the legal system is a set of developments innate
to the justice system and the relations between the government and the justice system. First, in
the 2000s the administration of justice in Greece slowed down as court cases piled up, while
lawyers exploited loopholes in civil and criminal procedure to delay the processing of cases in
which their clients were on the loosing side. Second, judges themselves resorted to the courts
against the Greek Ministry of Finance (literally against their employer, i.e., the Greek state) in
order to demand salary and pension increases for their profession. Judges naturally obtained
favorable court decisions improving on or protecting their income levels, while the rest of
civil servants and the population were subjected to the meanders of income policies of
successive governments. Third, even though after 2009 the politicization of the justice system
subsided, incoming Greek governments used to hand pick higher judges on less than
meritocratic criteria and appoint them to the presidency of high courts. Finally, judges were
implicated in cases of corruption, many of which were not cleared up (still, in a highly
publicized case two judges received prison sentences). In short, administrative inefficiency,
economic privilege, political interference and doubts cast on the integrity of judges have
depressed trust towards the legal system in Greece.
To sum up this section, in Greece there is very high distrust towards political institutions and
such distrust has grown over time. In fact, as Figure 4.8 shows, even compared to the high
drop in trust in Portuguese, Spanish and Italian political institutions, between 2003 and 2010,
the decrease in trust in Greek political institutions was so dramatic, that we can claim that
political trust in Greece collapsed in the late 2000s.

94
Figure 4.8: Trust in political institutions in Southern Europe, 2003 and 2010 (percentage
share of respondents showing a lot or some trust)
Source: Standard Eurobarometer surveys 2003 and 2010.
Trust in other people
Greeks are only periodically included in samples comparative surveys of attitudes.
Consequently, there is sparse evidence on whether Greeks trust other people. In the World
Value Survey of 1999 only 20.5 per cent of Greek respondents answered that most people can
be trusted, while the average for Italy, Portugal and Spain on the same question was 27.8 per
cent (available at http://www.wvsevsdb.com/wvs/WVSAnalizeQuestion.jsp). .
The first wave of the European Social Survey, conducted in 2003, measured trust in most
other people in terms of the scale 0.0 (low trust).-10.0 (high trust). On the average Greek
respondents scored a low 3.6. This was even lower than the corresponding scores of Spaniards
(4.9) and Portuguese (4.0), while the EU average was 5.0. Greece was included in two more
waves of the same survey, i.e., in 2005 and in 2009, in which there was very little change. In
both years, the score for Greeks was 3.9 on the aforementioned scale, while the EU average
was 4.9 (National Centre for Social Research “Greece – Europe”, results of the ESS, June
2010, Table 1, p. 28, available at
http://www.ekke.gr/html/gr/NewsEvents/ESS4_results.pdf ).
The Eurobarometer survey no. 62.2 of 2004 showed that in Greece there is comparatively low
interpersonal trust. Only 18 per cent of Greek respondents answered that most people can be
trusted (EU-15: 33 per cent, EU-25: 30 percent; Eurobarometer 62.2, 2004). In 2007, the
European Quality of Life Survey, conducted by the European Foundation for Working and
Living Conditions, showed that in the scale 0.0-10.0. Greeks on the average scored a low 4.2
(EU-15: 5.3, EU-27: 5.2). Even if the question asked in the all those surveys noted above was
the same, it is not feasible to construct a Table of changes in attitudes across time, because the
samples were different and the scale of values of the variables varied. However, it is clear that
compared to other European nations Greeks on the average do not trust most other people.
4.4. Political values and legitimacy
For 35 years between 1974 and 2009, under the Third Republic, political extremism has been
marginal in the Greek two-party political system, assisted by an electoral system of reinforced
proportional representation. The orthodox Communist Party (KKE) has been the only
significant force in the extreme left, its national vote share usually ranging around the 10%
area until 1990, and between 8,5% and 4,5% during 1993-2012. The extreme right was
insignificant until 2007, when the right-wing populist LAOS entered Parliament.

95
There have been two main push factors of political extremism from the second half of the
2000s. The first has been provided by the large inflows of illegal immigration, an issue that
since the second half of the 2000s has acquired growing salience in the public debate.
Widespread insecurity and rising criminality rates attributed to immigrants, especially in the
less affluent inner-city neighborhoods, have bred xenophobic and racist stances. The second
push factor is the ongoing deep economic crisis that erupted in 2010. This has also been
received as a failure of the party-political status quo, fuelling anti-systemic sentiment, and
multiplying the unemployed, the precarious and the poor. Available data, however, so far do
not demonstrate any clear association of the fluctuating rates of inequality with political
extremism.
The main beneficiary of the aforementioned developments has not been the extreme left or
KKE, apart from a spectacular electoral rise of the radical left Syriza party from 4,6% of the
national vote in 2009 to 26,9% in June 2012 (we do not include Syriza in the extreme left);
the extreme right has been the main winner. In June 2012, one new right-wing populist and
one neo-nazi party (Chryssi Avgi -Golden Dawn) entered Parliament, the latter receiving
6,9% of the national vote. In 2012, younger voters in their 20s and 30s voted overwhelmingly
for Syriza, extreme left parties, or the extreme right. Chryssi Avgi came second after Syriza in
the voter group aged 18-34 (Public Issue,
http://www.publicissue.gr/2043/koinwniko_profil_6_2012/ ). So after decades of “normal”
political development in the post-1974 Republic, the Greek political system and society are,
in the 2010s, faced with momentous transformations (Figure 4.9).
Figure 4.9: Voting for extreme left/right parties14
Source: Ministry of Interior.
14 Extreme left parties: K.K.E , K.K.E. M-L, M-L K.K.E., ,ANT.AR.SY.A E.E.K. TROTSIKISTES, , O.A.K.K.E., A.S.K.E., ME.R.A , A.K.E.P., MACHOMENI ARISTERA, EN.ANTI.A. Extreme right parties: LA.O.S, , CHRYSSI AVGI, ANEKSARTITOI ELLHNES , E.P.EN., KOMMA ELLINISMOU, ETHIKI SYMMAXIA, PRWTI GRAMMI, DHMOKRATIKI ANAGENNHSH, ETHIKI ELPIDA.

96
Immigration became an issue for Greek society after the 1989 collapse of the communist bloc.
The first massive wave of immigration originated from Eastern Europe (mainly Albania) and
former USSR countries. Mass waves from Africa and Asia followed during the 2000s. The
Eurobarometer public opinion survey shows immigration retaining a relatively low single-
digit percentage score as “one of the two most important issues facing our country” until
2008, always lower the EU average. In June 2009 however, it rises to 16% (EU: 9%) and in
November 2011 to 39% (EU: 26%)
(http://ec.europa.eu/public_opinion/cf/showchart_column.cfm?keyID=2212&nationID=16,4,
&startdate=2003.11&enddate=2012.05).
There are very few surveys tracking public opinion stances towards immigration in a
consistent and comparable manner over the last two decades. Into the 1990s, there was a
growing public sentiment that the country had reached its limits as to the number of
immigrants it can host. In the special 1997 Eurobarometer survey (Eurobarometer 47.1, spring
1997, p.7 http://ec.europa.eu/public_opinion/archives/ebs/ebs_113_en.pdf) Greece displays
the highest percentage (85% vs 65% EU15) of positive responses to the question “Our
country has reached its limits; if there were to be more people belonging to these minority
groups we would have problems”. This motto has reverberated in the public debate with
growing intensity over the 2000s and 2010s.
Table 4.4: Policy for Individuals of Different Race or Nationality
“…for people who belong to different race or nationality, the … (country) should …?”
1st
Round (2002/3) 2nd
Round (2004/5) 4th
Round (2008/9)
Greece
(N=2566)
Sum of European Countries (N=42359)
Greece (N=2406)
Sum of European Countries (N=47537)
Greece (N=2072)
Sum of European Countries (N=43099)
Allow many people to come
and live here 3.0 9.4 4.4 11.6 4.2 12.5
Allow some people to come
and live here 10.7 37.4 14.8 35.7 11.1 35.6
Allow only few people to come
and live here 58.1 36.6 54.2 32.8 54.5 33.9
Allow no one to come and live
here 24.6 11.6 25.6 16.1 28.5 14.5
N/A 3.6 4.9 0.9 3.8 1.6 3.5
Sum 100.0 100.0 100.0 100.0 100.0 100.0
Source: National Centre for Social Research (EKKE) Greece - Europe, Results of the
European Social Survey.

97
On Table 4.4 we see the results of the three rounds of the European Social Survey in which
Greece participated. Through the 2000s, the percentage of people responding that Greece
should allow very few or no foreigners to come to live in the country ranges steadily in the
80-83% area, a very high rate compared to an average European response of 48-49%. In the
same survey for 2003, Greece again displays one of the highest percentages of agreement
with the statement that “if a country wants to reduce social tensions it should stop
immigration”: 65.1% agree/ strongly agree vs 7.7% who disagree (Spain: 23.3% agree/
strongly agree vs 42.5% disagree; Portugal: 42.5% vs 24.4%; UK: 42.8% vs 34%). (European
Social Survey/ EKKE, Greece - Europe: Society, Politics, Values, November 2003, p.49 [in
Greek]).
A Greek opinion survey (Public Issue, 2009) offers no surprise in the large percentage of
Greeks who believe that the country has reached its limits as to the immigrants it can accept
(70%). However, on the question regarding the legalization of existing illegal immigrants,
responses appear remarkably balanced, with only 15% suggesting that no one should be
legalized (Figure 4.10).
Figure 4.10: What should be done with illegal immigrants living in Greece (2008-09)
Source: Public Issue, Immigration Survey, 2009.
This latter finding is indicative of the tension between, on the one hand, the progressive
Europeanization of the Greek public debate over issues concerning social values and civil
rights, and on the other hand the growing societal fears and insecurity vis-à-vis the rapidly
growing waves of illegal immigration.

98
Figure 4.11: EU membership approval score (yearly average)
Figure 4.12: EU membership 'a good thing' (yearly average)
Figure 4.13: EU membership 'a bad thing' (yearly average)
Source: Eurobarometer

99
Since the country’s 1981 accession to the EC, Greeks, on average, have always liked the
European Union. Between 1988 and 2007, Greek approval rates of EU membership have been
higher than the EU average, indeed among the highest in the Union. At the peak points, those
who thing EU membership is a “good thing” exceed those who see it as a “bad thing” by 60,
70 or even 80 percentage points. A crucial factor in the 1980s is the gradual transition of the
ruling PASOK under Andreas Papandreou from a half-hearted acceptance to an increasingly
positive embrace of the EU. Greek approval rates of the EU are usually positively correlated
to the EU average. During the halcyon days of European integration and a booming European
economy, from the launch of the single market program until Maastricht, positive views peak
both in Greece and the EU. The economic slowdown of the early 1990s mitigates the positive
sentiment. Then, between 1996 and 2007, a new sub-period of pro-EU stance evolves,
associated with the rising national self-confidence, bred by a booming economy, EMU-
accession and the 2004 Olympic Games. The domestic economic climate seems to be a key
factor affecting the public approval of EU membership, given the widespread understanding
of the close interdependence with the EU. A demonstrated commitment by Greek political
leaders to the European Union project and values (as expressed after 1996 by the Simitis
government) also seems to play a positive role in enhancing the public approval of the
European Union. The economic crisis after 2009 is a turning point. Between 2009 and 2011,
the difference between positive and negative views falls from 39% to just 5%, the lowest rate
of EU membership approval for 30 years. The Greek public registers its dissatisfaction with
the way in which the EU has handled the severe economic crisis (Figures 4.11, 4.12, 4.13). At
first sight there appears to be some weak association of negative views of the EU with
declining rates of inequality, which appears paradoxical; however, the short-term duration of
this fluctuation makes us reluctant to venture any interpretation.
When it comes to societal values regarding the factors of individual progress in society,
Greece does not significantly diverge from the EU average. Table 4.5 tracks the responses
given to the question “Getting ahead in life depends on…”. Getting a good education and
working hard are seen as the two most important things for getting ahead in life; such is also
the case throughout the European Union. Notably, in Greece (as well as Hungary) working
hard comes before getting a good education; in all other EU27 countries, a good education is
ranked higher than working hard. Spain and Italy (but not Portugal) also tend to attribute
almost equal importance to hard work as compared to a good education. Probably the upward
social mobility of the postwar decades still reverberates in Greek society, when people from
poor village backgrounds joined the middle class through their hard work. Knowing the right
people also gets a slightly higher score compared to the EU average.
Table 4.5: “In your opinion, out of the following,
which are the 2 most important things for getting ahead in life”
Countries Getting a good education
Working hard
Knowing the right people
Being lucky
Being smart
Coming from a wealthy family
Being a man
Greece 54% 57% 29% 25% 17% 10% 1%
Spain 50% 50% 18% 36% 21% 9% 2%
Italy 46% 44% 32% 26% 7% 18% 4%
Hungary 33% 40% 29% 31% 22% 31% 2%
Netherlands 61% 36% 22% 38% 26% 2% 1%
Portugal 67% 37% 20% 28% 24% 14% 3%
EU-25 62% 45% 26% 24% 17% 9% 2%
Source: Special Eurobarometer 273, Wave 66.3, European Social Reality, February 2007.

100
4.5 Values about social policy and social welfare
Compared to the rest of European societies, Greece has high income inequality, since the Gini
index hovers around 0.31-0.34 in the 0.0-100.00 scale (see introduction to this chapter). One
may assume that if income inequalities are high in a certain country, then citizens would not
tolerate income differences. They would demand that the state intervenes in order to make
income distribution fairer. In other words, if income inequality is acute, one expects that
egalitarian views will predominate in public opinion. This of course presupposes that people
believe that those who belong to the low-income groups or are poor do not have an individual
responsibility for their condition or that they have ended up in the low-income brackets or in
poverty because of situations beyond their control (e.g., social causes of poverty, such as
entrenched injustice in society or a particular structure of the labour market)
Greeks by far exceed other Europeans in their belief that the government should actively
engage in redistribution (Table 4.6, below). In the special Eurobarometer survey 321,
conducted in 2009, on the average 82 per cent of Europeans (EU-27) agreed that the
“Government should ensure that the wealth of the country is redistributed in a fair way to all
citizens”. Greeks agreed to this statement by 97 per cent, which was the highest in EU-27.
They were followed by the Hungarians (94 per cent), Portuguese (92 per cent), the Maltese
(91 per cent), the Spaniards and the Cypriots (both 90 per cent). When this survey was
repeated in 2010 (special Eurobarometer survey 355), Greeks again agreed by 95 per cent that
the government should ensure a fairer redistribution of wealth.
In the same survey of 2009 only 19 per cent of Greeks agreed with the statement that “income
inequalities are necessary for economic development”, which was by far the lowest score in
all Europe (EU-27 average: 44 per cent; after Greeks, the next lowest were Cypriots agreeing
by 24 per cent and Bulgarians by 28 per cent). When this survey was repeated in 2010, 24 per
cent of Greeks agreed with the aforementioned statement, attaining again the lowest score in
EU-27 (Table 4.11). Additional evidence to corroborate the conclusion that Greeks are the
most ‘interventionists’ with regard to the government’s role in redistribution is offered by the
Luxembourg Income Study (wave no. 6, 2009). According to this study, 78.5 per cent of
Greeks agree that the “government should reduce differences in income levels” (Greeks are
followed by Hungarians agreeing to that statement by 73.4 per cent and Cypriots by 68 per
cent).
The above set of attitudes can be explained by looking whether respondents attribute the
blame for the condition of poverty to the poor people themselves or to social causes. In 2007
21 per cent of Greeks thought that the poor are lazy (EU-27 average: 18 per cent), down from
31 per cent who thought the same in 1989 (Table 4.12). Further on, the majority of Greeks
(57 per cent) thought that the causes of poverty are social (EU-15: 49 per cent), namely that
“there is much injustice in society” and that “poverty is an inevitable part of progress” (Figure
4.14). There is some change over time in 2002-2007, but with regard to the perceived causes
of poverty Greeks do not differ substantially from the rest of Europeans. In Greece and in EU-
15, more people think that the causes of poverty are social rather than personal.
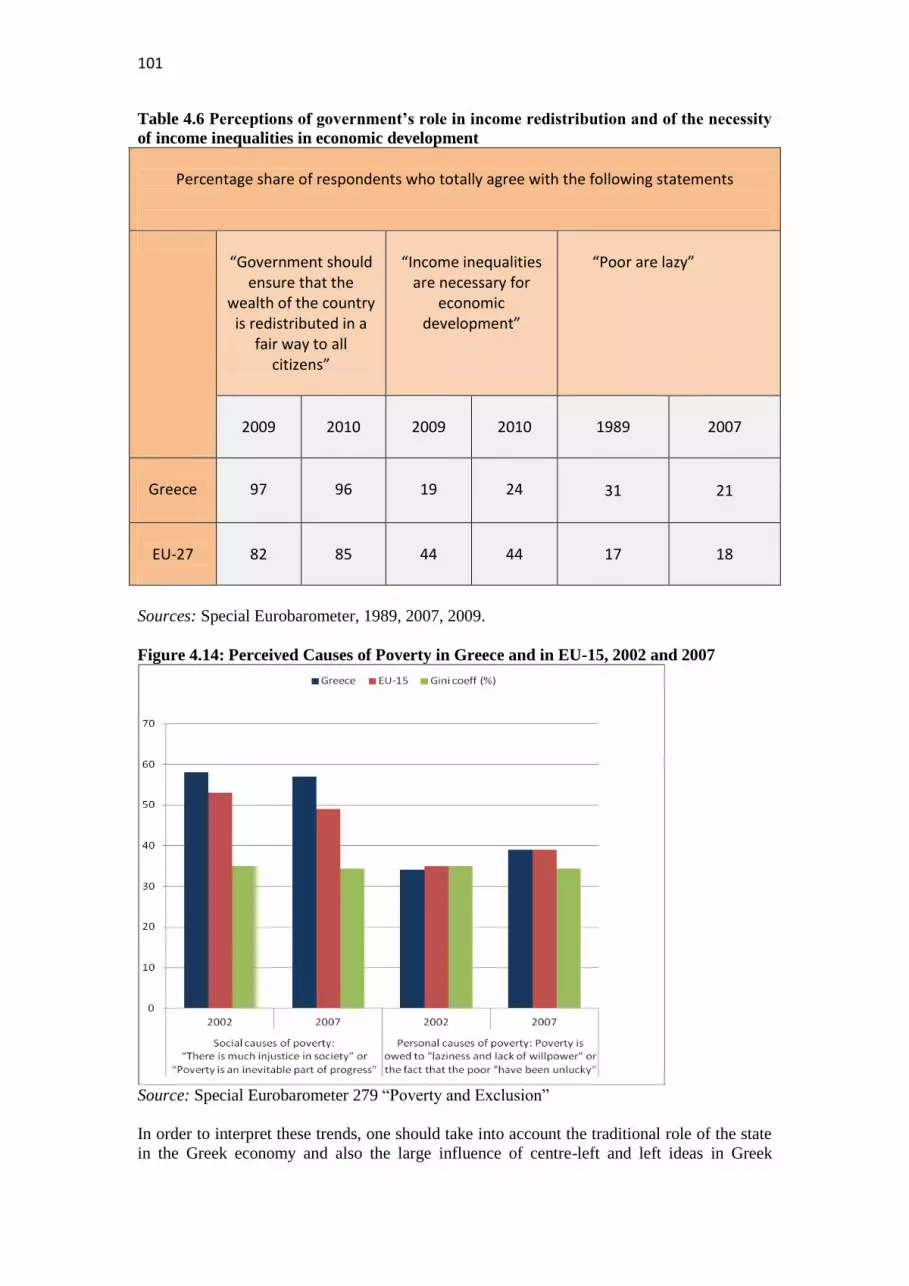
101
Table 4.6 Perceptions of government’s role in income redistribution and of the necessity
of income inequalities in economic development
Percentage share of respondents who totally agree with the following statements
“Government should
ensure that the wealth of the country
is redistributed in a fair way to all
citizens”
“Income inequalities
are necessary for economic
development”
“Poor are lazy”
2009
2010
2009
2010 1989 2007
Greece
97
96
19
24 31 21
EU-27
82
85
44
44 17 18
Sources: Special Eurobarometer, 1989, 2007, 2009.
Figure 4.14: Perceived Causes of Poverty in Greece and in EU-15, 2002 and 2007
Source: Special Eurobarometer 279 “Poverty and Exclusion”
In order to interpret these trends, one should take into account the traditional role of the state
in the Greek economy and also the large influence of centre-left and left ideas in Greek

102
society after the 1974 transition to democracy. In contrast to many other EU Member-States,
the Greek state still intervenes extensively in the economy. It has a monopoly in various
sectors of the economy (e.g., energy, urban transport, railways, armaments industry) and
employs about one-fifth of the Greek labour force. Also the sway of interventionist ideas in
Greek society has been large and stable. The Greek socialists (PASOK) ruled, forming single
majority governments, for a total of 20 out of the last 30 years (1981-2011). Moreover,
Greece, along with Portugal, is the last remaining West European democracy in which a
traditional communist party (KKE) is still represented in parliament. KKE’s share of the
national vote fluctuates between 5 and 8 per cent, while the radical left coalition (SYRIZA)
obtained an impressive 27 per cent of the vote in the parliamentary elections of June 2012.
To sum up this section, compared to the rest of Europeans, Greeks are by far the strongest
supporters of government’s intervention to accomplish a fairer distribution of income and to
ensure that everyone is provided for. This stance should be seen interpreted in the light of
Greeks’ perception of the causes of poverty as social rather than personal, the traditional role
of the Greek state and the preponderance of statist political values in post-authoritarian
Greece.
4.6 Conclusions: the ‘national story’ of inequality drivers and their cultural and political
impacts
In Greece there are multiple, criss-crossing types of income inequality. First, there is income
inequality between groups which, ranging between 0.31 and 0.34 (GINI coefficient), is quite
high by West European standards. Second, there is inequality within groups, i.e., large
discrepancies of income among members of the same profession (Mitrakos and Tsakloglou;
2012). Finally, there is inequality between ‘insiders’, such as the relatively well-protected
members of liberal professions, employees of state owned enterprises (SOEs) and civil
servants, on the one hand, and the much less protected ‘outsiders’, consisting of private sector
employees, particularly those working in Small and Medium Enterprises (SMEs) or employed
on fixed-term contracts or on other types of temporary employment.
The Greek social protection system does not curb income inequalities and poverty. By
contrast, the aforementioned types of income inequality are exacerbated by the
ineffectiveness of the Greek welfare state. As is the case with other European welfare
systems, the bulk of social expenditures is devoted to pensions for the elderly. However, in
Greece the vast majority of government social expenditure goes to pensions. In Greece
between 1980 and 2007 the total government expenditure on old-age pensions as share of
GDP more than doubled, as it increased from 4.6 per cent to 10.0 per cent of the GDP (OECD
data available at http://stats.oecd.org/Index.aspx?QueryId=4549)). Expenditures on
unemployment, active labour market policies, housing, social care and social assistance are
compressed, while non-monetized social services are minimal.
Moreover, while in the 2000s Greece managed to catch up with the rest of EU Member-States
as far as social spending is concerned, it has been unable to tilt its social policy towards the
categories of the population which receive minimum or no social protection. Among the
‘outsiders’ of the welfare system mentioned above, those who fare the worst are a) young
people who suffer the most from unemployment in the current crisis (over 50 per cent
unemployment in the 18-24 age group in the first trimester of 2012); b) the long-term
unemployed who are left on their own after the 12-month long period of unemployment
benefits expires; c) women who are hired last and fired first and who also leave the labour
market after they get married or after they bear their first child; and d) migrants who are
employed by business owners paying them under the table and also refraining from paying
social insurance contributions.

103
Labour market institutions do not reduce the various types of income inequality either. None
of the categories of ‘outsiders’ noted above are represented in Greece’s unions which mostly
defend the interests of civil servants or the employees of SOEs and the larger private
businesses. It is also telling that Greece is still the only EU Member-State in EU-15 that does
not have a minimum income guarantee (MIG) programme either at the national or at the
regional level.
No independent variable can explain the total of income inequalities but the impact of
educational attainment is the largest. Research shows that in Greece differences in educational
levels of individuals account for income inequalities more than gender, rural-urban or age
differences (Dafermos and Papatheodorou; 2010, Tables 2.3, 2.4 and 2.5, available at
http://www.ineobservatory.gr/dhmosieuseis/episthmonikes-ektheseis/domh-kai-taseis-ths-
oikonomikhs-anisothtas-kai-ths-ftwcheias-sthn-ellada-kai-thn-ee-1995-2008/, accessed on 7
August 2012). Despite the regressive nature of public spending on higher education in
Greece, the expansion of state-owned higher education has opened up educational
opportunities for previously excluded categories of the population, such as young adults (18-
24 years old) from rural areas as well as women who have massively entered Greek
universities since the 1970s."
Income inequality does not seem to be notably associated with trends of civic and political
participation. Party political identification and relatively high (compared to other West
European countries) levels of politicization remain strong factors, that override the impact of
inequality. In general, the short-term span of the inequality data as registered in the Gini
coefficient for Greece makes us reluctant to venture any association and interpretation.

104
5. EFFECTIVENESS OF POLICIES IN COMBATING INEQUALITY
5.1 Introduction
In this chapter we examine to what extent the policies pursued by successive Greek
governments are responsible for the fall in income inequality observed during the last four
decades. In particular, we consider to what extent the large and sustained expansion of the
Welfare State in Greece since the mid-1970s interacted with the changing economic structure
and gradually increasing outward orientation of the economy to shape the socio-economic
developments. Given the importance of labour market outcomes for the evolution of various
inequalities, we start with an examination of the institutional framework under which the
labour market operates (e.g., minimum wages, structure of wage bargaining, employment
protection legislation), and then move on to examine the structure and parameters of the tax
and social transfer systems and the level and pattern of social expenditures (e.g. spending on
unemployment benefits, health, education, old age pensions, housing, family benefits). The
chapter concludes with a discussion of how economic and social forces influenced the
particular policy trajectory which Greece followed until the unsustainable “Greek Welfare
State” met its nemesis in the form of the global financial crisis.
5.2 Labour Market Institutions
Minimum wage (MW) legislation was first introduced in Greece in 1953, and it has, in effect,
through the years substituted for the lack of a well-developed welfare state (Fotoniata and
Moutos, 2010). Figure 5.1 portrays the evolution of the real (gross) value of the MW and of
the productivity of labour in the business sector (per hour worked) from 1974 to 2008. We
observe that following the restoration of democracy in Greece in 1974, the real value of the
MW increased substantially until 1978 (the cumulative increase from 1974 to 1978 was about
25%), and then declined by about 5% until 1981. The next large increase in the MW took
place when the socialists (PASOK) came to power in October 1981; the real value of the MW
increased by about 27% from 1981 to 1982, followed by further increases in 1983. The
cumulative increase in the real value of the MW over the period 1981-84 was about 30%.
After 1984, there was a sustained decrease in the real value of the MW, and by 1993 it was
below its 1978 level, and only 2% higher than in 1981. These changes in the real value of the
MW are contrasted with the change in labour productivity. We observe that both the
cumulative increase in productivity and in the real value of the MW was substantial from
1970 to 1980 (although the rise in the MW was only half as large as the rise in productivity),
whereas during the 1980s the (real value of the) MW kept rising, while labour productivity
fell. Since the early 1990s, there has been a significant rise in labour productivity (by about
40% up to 2005), while most recent increases in the real value of the MW have failed to
match the rise in labour productivity. It is hard to avoid making the connection between the
large increase in the real value of the MW between 1974 and 1982 and the substantial decline
in income inequality during the same period.

105
Figure 5.1: Evolution of real minimum wages and business sector labour productivity in
Greece (1970=100)
Source: INE GSEE (real gross minimum wages - http://www.inegsee.gr), OECD Statistical
Compendium 2004 (labour productivity in the business sector).
The MW in Greece is determined at the national level and sets the floor for all wage
settlements in the country (independently of regional, sectoral, or firm level), with the
exception of wages in the public sector (policy determined). The level of the minimum wage
used to be (until 2010) the outcome of negotiations between the social partners, represented
by third-tier organizations of employees and employers. These are the General Confederation
of Greek Workers (GSEE), the Federation of Greek Industries (SEV), the General
Confederation of Professionals, Craftsmen and Merchants (GSEVEE), and the National
Confederation of Greek Trade (ESEE). The resulting National General Collective Agreement
(EGSSE) was given legal force by the government and it covered all workers independently
of age (must be at least 15 years old), sex, or employment status, and it is legally binding for
all workers in the private sector, in state-owned enterprises, as well as for non-permanent
civil servants. (Until the late 1970s MWs were differentiated according to gender, with
females earning less than males; this change may have also contributed to the reduction in
inequality from 1974 to 1982.) The negotiations used to take place every two years and allow
for bi-annual wage adjustments in line with inflation. It must, however, be mentioned that the
value of the MW varied according to the employee’s length of service and marital status;
there were also different rates applied to blue- and white-collar workers. (The normal
averaging period for complying with the MW legislation is the (6:40 hours) day for blue-
collar workers and the month for white-collar workers).
In the pre-bailout framework, the bi-annual round of wage negotiations started with the
EGSSE, and was followed by:
Sectoral or occupational agreements at the national level (involving bargaining
between second-tier employer and employee organizations)
Sectoral or occupational agreements at the local level (involving bargaining between
first-tier employer and employee organizations)
Enterprise agreements covering workers in a single enterprise, which are conducted
between employers and company trade union organizations covering workers in the
specific enterprise.
Such a wage coordination scheme involving mixed industry and economy-wide bargaining
places Greece on par with Central European countries like Austria and Germany. These
countries receive scores equal to 4 on a 1-5 scale, with high-coordination countries like

106
Sweden receiving 5, and low-coordination countries like the US and the UK (since 1980)
receiving 1 (Amsterdam Institute for Advanced Labour Studies, ICTWSS database).
The EGSSE which was signed in 2010 after the first bailout (covering the years 2010-2012),
provided for no (nominal) wage increases for 2010, whereas for 2011 and 2012, the wage
increases would be equal to the euro-area’s inflation rate in the previous year. However, the
Greek government in February 2012, in compliance with the terms of the second bailout,
directly intervened and reduced the legally binding minimum levels of pay freely negotiated
by the social partners in the 2010 agreement. The stipulated reduction in pay would be equal
to 32% for employees less than 25 years old, and 22% for persons more than 25 years old; as
a result the (liable to employee social security contributions) monthly minimum for the first
group was set at €510.95, and for the second group at €586.08 - if the employee had no work
experience and was not married. These rates could go to as high as €820.51, if the employee
had nine years of tenure and was married.
The importance of the MW as a benchmark for sectoral or occupational wage increases can be
gleaned from Figure 5.2, where we present the percentage change in bargained wages in three
sectors (clothing, restaurants, and the retail trade) as well as in the MW from 1995 to 2007.
We note that for the restaurants and retail trade sectors, the bargained wage increases were
(with the exception of two years) above those of the MW, whereas the opposite is true
regarding the comparison between the clothing sector and the MW; the cumulative increase in
the MW was about 7 percentage points higher than the bargained wage increases in the
clothing sector, whereas the restaurants and the retail trade sectors had cumulative increases
about 3 percentage points higher than the MW. This is understandable since from the three
sectors mentioned above, only the clothing sector faces fierce competition from imports.
Nevertheless, we must remind the reader that the level of the bargained wages in all sectors
remains higher than the MW.
Figure 5.2 Minimum Wages and Bargained Wages, % changes, Greece, 1995-2007
Source: Fotoniata and Moutos (2010)

107
The usually higher (than the minimum wage) increases in bargained wages resulted in a
continuous fall in the ratio of ratio of minimum to average wages from 1995 to 2004 – a trend
which was reversed afterwards. Nevertheless, the continuous rise in the real value of the MW,
along with the rise of participation and employment rates for women of lower educational
attainment, appears to have succeeded in lowering inequality during this period.
Figure 5.3 Ratio of Minimum Wages to Average Wages
Source: ELSTAT and Bank of Greece
It also bears noting that the reduction in the ratio of minimum to average wage – a reversal of
the wage compression policies which were followed in the early 1980s – was happening
during a period of protracted reductions in trade union density, from 39% in the early 1980s
to 24% in 2008 (Figure 5. 4). More important, than the decline in trade union density in
Greece (which was a general trend among many OECD countries), was the changing structure
of trade union membership. Almost all of the decline in membership took place in the non-
banking private sector, while there was hardly any fall in the banking sector, the state-owned
enterprises, and in the public sector (these are unofficial estimates of the main private-sector
and public-sector unions). The effects of these changes in the structure of trade-union
membership were reinforced by the disproportional representation of employees in the banks
and in state-owned enterprises among the governing councils of the GSEE – while the
employees of these sectors were only 8% of the total number of employees (excluding the
civil servants) their representatives had the absolute majority in the governing bodies, and
almost always the President of GSEE. Given the increasing gross under-representation of
manufacturing-sector workers in the top positions of the trade union movement, it is natural to
assume that the sectoral wage negotiations (in banking and state-owned enterprises) took
precedence over the minimum-wage ones, the latter being of less importance for the white-
collar employees but of crucial importance for blue-collar workers.

108
Figure 5.4 Trade union density (Greece, 1977-2008)
Source: Amsterdam Institute for Advanced Labour Studies, ICTWSS database, and OECD
5.3 Structure of Taxation
The size of government expanded rapidly in Greece during the last four decades, with both
sides of the government budget approaching levels close to those observed in other EU
countries. Figure 5.5 shows the evolution of government revenue relative to GDP in Greece
(since 1988) and the EU15 (since 1995). The rise of the share of government revenue in GDP
in Greece in the 1980s lagged behind the rise in government spending. While government
spending relative to GDP rose by 18 percentage points in the 1980s, government revenue rose
by only 5 percentage points (from 26% in 1980 to 31% in 1990). More adjustment in
government revenue occurred in the 1990s, when its GDP share rose by 11 percentage points
(from 31% of GDP in 1990 to 43% in 2000). This brought Greece’s general government
revenue less than 3 percentage points below the EU15 average (and above the average for
Ireland, Italy, Portugal, and Spain), but by 2009 total government receipts in Greece (at
38.2% of GDP) had again fallen way below the EU15 (which stood at 44.7%) and even the
peripheral 4 (Ireland, Italy, Portugal, and Spain) average (which stood at 39.3%).
Figure 5.5: Total government revenue (% of GDP): Greece and EU15
Note: The above figures include non-tax receipts as well. Non-tax receipts consist of property
income (including dividends and other transfers from public enterprises and the ECB), fees,
charges, sales, fines, capital tranfers received by the general government, etc. Non-tax
receipts in the case of Greece have recently been around 7 percent of GDP.
Source: AMECO

109
The changing structure of tax revenue is depicted in Figure 5.6, which shows the declining
importance of indirect taxes in total government revenue; the significance of indirect taxes
declined from 40% of government revenue in 1988 to 30% in 2011. Given the non-
progressive nature of these taxes, it is not surprising that the decline in their relative
significance was followed by reductions in both income and consumption inequality.
Figure 5.6: Structure of Greek tax revenue (shares of total government revenue)
Source: AMECO and authors’ calculations
Social security contributions, which provided 26% of government revenue in 1976 (Moutos
and Tsitsikas, 2010), rose to represent 35% of revenue in 1989, and had dropped to 31% in
2011. This rise in the importance of social security contributions in government revenue came
about through large rises in statutory tax rates. In 1981, the rate for employer social security
contributions stood at 18.75%, whereas the employee rate was 10.25%. By 2008, these rates
had risen to 28% for employers and 16% for employees. The relevant figures for the EU15
average in 2008 were 24% and 11.4%, respectively (OECD, 2008).
The Greek state has traditionally relied on consumption taxes, than on taxes on labour, or on
capital to support its functions. Table 5.1 portrays this information, by comparing Greece with
the EA17. From 1995 to 2005, there has been a decrease in the share of consumption taxes to
total tax revenue in Greece, bringing it closer to the EA17 average. This trend had been
reversed by 2010, as the bailout of the Greek government in May 2010 involved significant
increases in VAT tax rates. Tax revenue which are sourced from labour incomes have also
been raised from 1995 to 2010 - both as share of GDP and of total tax revenue; this stands in
contrast to EA17 developments. We note that the stagnation/recession which was plaguing
most EA17 countries in 2010 resulted in far larger declines in the reliance on capital incomes,
and more so in Greece than in the EA17.

110
Table 5.1: Decomposition of tax receipts by main tax components
% of GDP % of total taxation
1995 2000 2005 2010 1995 2000 2005 2010
Taxes on consumption Taxes on consumption
Euro area 10.9 11.1 10.8 10.7 27.4 27.1 27.3 27.5
Greece 12 12.4 11.3 12.1 41.3 36 35 38.9
Taxes on labour Taxes on labour
Euro area 21.5 21.3 20.5 20.8 54.1 52 51.9 53.4
Greece 10.5 12.4 13.1 12.4 36.1 35.9 40.5 39.9
Taxes on capital Taxes on capital
Euro area 7.5 8.7 8.3 7.6 18.8 21.1 21 19.5
Greece 6.6 9.8 7.9 6.5 22.6 28.3 24.5 21.1
Source: Eurostat
The information provided in Table 5.2 shows that the worldwide trend in reducing the top
statutory tax rates was observed in Greece as well. From 2000 until 2002 the top statutory
income tax rate decreased from 45% to 40%, and it remained at that level until 2009. The
bailout of 2010 forced the Greek government to raise this rate back to the 45% level. These
gyrations of the top statutory tax rate produced similar changes in the combined central
government and sub-central government marginal personal income tax rate at the earnings
threshold where the top statutory personal income tax rate first applies; these changes are also
apparent if in the calculation includes (All-in) the relevant social security contributions.

111
Table 5.2: Top marginal personal incomes tax rates for employees (single, no
dependents)
Year Top marginal rates Top
statutory
income
tax rate
Threshold
(multiple
AW)
AW AW in
$ using
PPP
Combined All-in
2000 37.8% 53.7% 45.0% 6.0
9,496 14,005
2001 35.7% 51.6% 42.5% 3.8
17,108 14,515
2002 33.6% 49.5% 40.0% 1.7
20,134 16,436
2003 33.6% 49.6% 40.0% 1.6
22,448 18,809
2004 33.6% 49.6% 40.0% 1.4 20,863 19,875
2005 33.6% 49.6% 40.0% 1.3
21,029 19,891
2006 33.6% 49.6% 40.0% 1.2
22,707 21,874
2007 33.6% 49.6% 40.0% 3.7
23,407 23,031
2008 33.6% 49.6% 40.0% 3.7
23,934 23,823
2009 33.6% 49.6% 40.0% 4.8
18,541 26,089
2010 37.8% 53.8% 45.0% 5.8
20,457 28,930
2011 37.6% 54.1% 45.0% n.a
n.a n.a
Source: OECD
Explanatory note: Combined is calculated as the additional central and sub-central
government personal income tax resulting from a unit increase in gross wage earnings, and it
takes into account the effects of tax credits, the deductibility of sub-central taxes in central
government taxes, etc. All-in includes the relevant employee social security contribution as
well. The statutory tax rates are the combined central and sub-central governments. The
threshold at which the top statutory rate first applies, is measured as a multiple of the average
wage. Average wage is the average annual gross wage earnings of adult full-time manual and
non-manual workers.
The outline of the Greek tax system shows that Greece has significantly lower tax revenue
(including social security contributions) than the other EU 15 countries and even lower ones
than the other countries in the periphery (with the exception of Ireland). In comparison to the
former, the lack of total government revenue, and of tax revenue, relative to GDP has been in
the range of 6 or 7 percent of GDP in recent years. In addition, the Greek tax system remains
replete with serious drawbacks. These have arisen as the tax system has been changing
frequently in ad-hoc fashion to comply with EU regulations, to generate additional revenue,
and to reverse (or, sometimes foster) real or perceived inequities of the tax system.
Both the issues of equity and efficiency are adversely affected by the main issue bedevilling
Greek public finances, i.e. tax evasion. This issue is particularly pertinent among those
owning small businesses and the self-employed (from plumbers and electricians to medical
doctors and lawyers), and it is exacerbated by the fact the share of self-employed in total
employment is so high in Greece. That the self-employed are more likely to tax evade than
those on dependent employment is well established in the literature. For example, using US

112
tax audit data Slemrod and Yitzhaki (2002) calculated that the rate of under-reporting of
income from dependent employment was less than 1 percent, whereas the rate at which the
self-employed under-reported their income was close to 58 percent. Assuming that the
behaviour of the self-employed in Greece regarding tax evasion is similar to that in the US,
the difference in the shares of self-employment in the two countries (Greece: 30 percent, US:
7 percent) would explain most of the difference (about 20 percentage points) in the estimated
size of the shadow economy in the two countries. 15
The distributional implications of tax evasion in Greece have been found to largely offset
some of the progressive elements of the tax system. Matsaganis and Flevotomou (2010) have
compared the tax reported incomes of a large sample of income tax returns in 2004/05, with
those observed in the household budget survey of that year. They found that tax evasion
causes the poverty rate and the poverty gap to rise above what would have been under full tax
compliance, in spite of the fact that in their calculations the poverty line was allowed to rise
to reflect higher disposable incomes with tax evasion.
In addition to the large rates of income tax evasion, Greece faces very high rates of payroll
tax evasion. As is to be expected in such cases, the estimates vary widely. Studies conducted
by the Social Insurance Foundation (IKA) estimate that payroll tax evasion has increased
through the years; the early 1990s estimates were around 13% of revenues, whereas more
recent estimates raise this figure from about 16% in 2003, to 20% in 2005 (POKOPK, 2005).
IKA estimated that employers in 10% of all firms inspected in 2008 failed to pay social
contributions, while 27% of all workers remained unregistered (Matsaganis et al, 2010). A
weak connection between individual contributions and benefits has created incentives for
collusion between employer and employee in order to minimize their social security
contributions.
Successive Greek governments have tried to implement reforms aimed at increasing the
efficiency of tax collection, mainly through efforts to curb tax evasion. Yet, these measures
have not had much effect on tax evasion. A reason for that is the measures are most of the
time piecemeal and do not take into account all other pieces of existing legislation. Another
reason is that recurring tax amnesties have eroded the credibility of the system by providing
incentives to taxpayers to delay and eventually evade the payment of taxes. A further
incentive for tax-evading behaviour is provided by the existence of deadlines that permit
taxpayers to be absolved of their tax obligations if the state has not managed to collect the
owed taxes in time. In 2007 alone, around €3.5 billion (about 1.5% of GDP) in taxes were
written off, mainly to lapses in time for the collection of the owed tax revenue (State Audit
Report, 2008).
5.4 Social Expenditure
Up until 1980, government spending in Greece was significantly smaller than the average for
the EA12 countries. In 1970, government spending as a proportion of GDP was 23% in
Greece and 34% in EA12, whereas in 1980 the corresponding figures were 30% for Greece
and 43% for the EA12. After a huge expansion of the public sector in Greece in the 1980s,
government reached 44% of GDP in Greece in 1999 (EA12: 48%). It appears that after
gaining entry in the Eurozone, Greek policymakers stopped became even less vigilant in their
efforts to curb government spending, and by 2008 (before the global crisis hit Greece),
government spending stood at 48%, climbing to 53% of GDP in 2009.
15
Schneider and Enste (2000) and Schneider (2006) estimate the size of the shadow economy in Greece to be the largest (as a proportion of GDP) among 21 OECD countries. Their estimates hover between 25 and 30 percent of GDP.

113
Figure 5.7 Total Government Expenditure (% Of GDP)
Source: AMECO
The growth in government spending in Greece is largely accounted by the growth in social
transfers, which rose from 8% of GDP in 1970 to 21% of GDP in 2009, and in the
compensation of public employees, from 8% in 1976 to 12.7% of GDP in 2009 (Moutos and
Tsitsikas, 2010) . The growth in transfers (mainly to households) can be partly explained by
the fact that as late as 1980 Greece spent only 11% of its GDP on income transfers, whereas
the average for the EU15 was 17%.
Figure 5.8: Public social expenditure as percentage of GDP and of total government
spending
Source: OECD SOCX database
The most important category among income transfers in Greece is old-age benefits. This is
the fastest growing category of social spending, and the biggest risk regarding the
sustainability of public finances in Greece. Government spending on old-age benefits (of
which pension payments represent more than 95% of total spending in this category) rose
from 9.5% of GDP in 1995 to 11.3% in 2009 (Figure 5.9). Significant rise was also observed
during the same period in public expenditure on sickness/health care, which rose from 5.0%
of GDP in 1995 to 8.0% of GDP in 2009. All other categories of social spending (i.e.,
invalidity payments, unemployment benefits, family/children benefits, housing benefits)
remained below 2% of GDP during the period 1995-2009. We note that with the exception of
old-age benefits (i.e. essentially pensions), for all other categories of public social expenditure
Greece spends less (as percentage of GDP) than, on average, the EA17 countries.

114
Figure 5.9 : Public expenditure by type as percentage of GDP
Source: OECD SOCX database
From 1980 to 2007, the growth in cash payments and in payments in kind was large – both
types of public social expenditure doubled as percentage of GDP (from 6.9% to 13.9%, and
from 3.6% to 7.3%, respectively). This increase has brought government spending on these
items close to what the EU15 countries spend on average. Thus, whereas in 1995 total public
spending on social protection (as percentage of GDP) was 7.2 percentage points lower in
Greece than in the EU15, by 2009 the difference was only 1.8 percentage points (Greece:
27.3%, EU15: 29.1%).
Figure 5.10 : Public social expenditure by transfers/cash as percentage of GDP
Source: OECD SOCX database
Regarding the allocation of social expenditure between means-tested and non means- tested,
the importance of non-means tested social expenditure has increased, whereas means-tested
expenditure has remained roughly constant as percentage of GDP. Thus, the total of non
means-tested benefits increased from 18.1% in 1995 to 25.4% in 2009 (Figure 5.11). We note
that most of the increase in non means-tested benefits during this period was in benefits in
kind -from 5.2% in 1995 to 9.0% in 2009. It is also worth mentioning that although means-
tested benefits were still in 2009 significantly lower in Greece than in the EU15
(Greece:1.9%, EU15:3.4%), the pan-European trend in the rising (relative) importance of
means-tested benefits was also observed in Greece (the relevant figure was 1.1% in 1995).

115
Figure 5.11: Social expenditure (means-tested/non means-tested) as percentage of GDP
Source: Eurostat
The type of government expenditure where Greece still lags significantly behind other
European countries is on active labour market programmes. Although Greece had during the
last three decades higher unemployment rates than most of the EU15, its public expenditure
on active labour market programmes never exceeded 0.4% of GDP, and it was most of the
time less than 0.25%. In contrast, many of the EU15 spent on such programmes more than
0.8% of their GDP, whereas some countries (e.g. Denmark, Netherlands) spent regularly more
than 1.2%.
Figure 5.12: Public expenditure on Active Labour Market Programmes as percentage
of GDP
Source: OECD SOCX database
5.5 Education
Education has been a most important route to social mobility in Greece. The idea that one’s
family background should be no barrier to economic success was widely accepted and
policymakers tried to implement it through an expansion of publicly-provided education –
especially of tertiary education – during the last three decades. Figure 5.13 shows public
expenditure on education as percentage of GDP in Greece and the EU27. Despite the
increased public spending on education in Greece - from 2.9% in 1993, to 4.1% in 2005 – it
remained significantly lower than the EU27 average which hovered around 5%.

116
Figure 5.13: Total public expenditure on education as a % of GDP
Source: Eurostat
Despite the increased public spending on education in Greece during the last two decades, the
gross enrolment ratio in preprimary education has not shown any marked improvement; but,
for a brief period in the late 1990s, it has remained roughly constant at about 67% (Figure
5.14). This compares poorly with other EU15 countries where the average ratio was above
80% in the late 1990s and has increased significantly ever since reaching 93% in 2007.(
http://www.stats.uis.unesco.org/unesco). It appears that part of the increased spending was
used to lower the students to teacher ratios in primary and secondary education – from 11.4 in
2001 to 8.6 in 2007. These ratios were the lowest in the EU15 (where ratios close to 15 are
not the exception), and may reflect, in addition to geography (i.e., a lot of small islands), the
inefficiency in which resources are allocated in the education sector.
Figure 5.14: Gross enrolment ratio, preprimary education
Source: UNESCO Institute of Statistics (UIS)
The expansion in the number of students in tertiary education from 1999 to 2010 was very
large in Greece – from 387.9 to 641.8 thousand, an increase of 65.5%. During the same
period, the number of students in tertiary education in the EU27 expanded by 27.5%.
According to Eurostat, Greece appears to have had in 2010 the highest number of students in
tertiary education per capita among the EU15 countries.16
Given the relatively low public
expenditure on education, it is hard to avoid the obvious conclusion that this expansion in
tertiary education compromised the quality of provided education – it was mostly driven by
the willingness of political parties to satisfy the demands of local communities for a boost to
16
To some extent this is due to the exceedingly large number of years Greek students take to complete their studies.

117
the local economy through a publicly funded influx of staff and students.17
As a result, there
exist some Technological Educational Institutes which register less than 100 students per
year. This is also evidenced by the very low public spending per student in tertiary education
(even when normalized by GDP per capita) in Greece relative to all of the EU15 countries.
The Greek HBS of 2004/05 provide us with some information regarding intergenerational
educational mobility in Greece. Table 5.3 shows measures of such mobility classified
according to the household’s income status. Among the poor (defined as those with income
less than 60% of the median equivalised income), the proportion of those which achieved the
same level of education as their father was 31.5%, whereas the corresponding proportion
among the non-poor was 22.4%. (We note that due to assortative matching the relative
proportions if the mother’s education was the reference point were similar.) Upward
educational mobility (i.e., a person’s educational achievement is higher than his/her father)
was experienced by 62.5% among the poor, and by 72.3% among the non-poor. The high
proportion of upward educational mobility among the poor may just reflect the previous
generation’s high proportion of very low educational achievement (less than primary, or just
primary education).
Table 5.3: Trends in intergenerational educational mobility: Educational mobility
measures from father's to childrens generation %
Measures of educ. mobility Poor Non-poor
Educational stagnation 31.5 22.4
Upward trend in educational mobility 62.5 72.3
Downward trend in educational mobility 6.2 5.0
Source: ELSTAT
In many European countries about half of welfare state transfers consist of in-kind benefits
such as education, health insurance, child care, elderly care and other services. Regarding
tertiary education, Callan et al. (2008) have estimated that, in Greece, the proportion of
beneficiaries of (publicly-funded) tertiary education do not vary greatly across household
income quintiles, ranging between 17.3% (of the total population) for the top-income quintile
to 24.8% of the second-from-the-bottom income quintile. (This is common across many
European countries, with Netherlands being the exception, where 39% of the total number of
beneficiaries comes from the lowest-income quintile.) However, the distribution of
beneficiaries changes markedly if the sample excludes students living away from the parental
home. In this case, the beneficiaries belonging to the lowest-income quintile are only 9.2% of
the total. The proportion of beneficiaries rises gradually as we move to higher-income
quintiles, with those belonging to the highest-income quintile representing 25.8% of the total
number of beneficiaries. Given that in Greece most of tertiary education students live with
their parents (and are thus counted as part of their parents’ household in the HBS), the
distribution excluding students living away from the parental home is a more appropriate
metric for the incidence of in-kind educational transfers. It thus appears that the incidence of
these transfers is regressive.
17
As a result, there exist university and TEI departments which are very small, based in relatively isolated locations and face major problems in reaching economies of scale in numbers and qualifications of academic staff, equipment (especially for the TEIs) and essential academic, student, and administrative support services.

118
Table 5.4. Distribution of beneficiaries of third-level education by household income
quintile
Quintile
Bottom 2nd
3rd
4th Top
All beneficiaries 17.6 24.8 20.7 19.6 17.3
Excl. students living away from parental home 9.2 17.0 22.3 25.7 25.8
Source: Callan et al (2008)
5.6 Causes and Consequences of (Social) Policy Activism in Greece
This chapter has presented the broad outlines of policies which could, either directly or
indirectly, affect the evolution of driver inequalities in Greece. Before commenting on the
politico-economic environment which allowed the emergence of these policies, we take a
brief look at their ability to alter market outcomes.
Leaving aside the effects of tax/transfer schemes on the Gini coefficient discussed in Table
2.2, we focus here on the effects of social transfers on poverty risk since they demonstrate
both the inefficiency and inter-generational character of Greek social policy. Table 5.5,
which is based on EU-SILC data, shows the average effect of social transfers in Greece
during the period 2004-2010.18
We thus see that the average reduction in the at-risk-of-
poverty-rate was 3.0 percentage points for the whole population, and 4.9 percentage points for
those aged more than 65. During the same period, among the EU15 countries, the average
reduction in the at-risk-of-poverty-rate for the total population was 10.0 percentage points,
and 4.0 percentage points for those aged more than 65. These data not only underscore the
inability of the Greek state to use social policy effectively (Greece does spend on social
policy comparable sums to the EU15 average), but they also reflect the willingness of Greek
policymakers to cater to special interest groups.
Table 5.5 : Percentage point reduction in at-risk-of-poverty rate due to social transfers
Total population
2003 2004 2005 2006 2007 2008 2009 2010
Before Social
Transfers 23.7 22.5 22.6 23.4 23.7 23.3 22.7 23.8
After Social Transfers
20.8 20.2 19.5 20.8 19.2 20.1 19.7 20.1
Difference 2.9 2.3 3.1 2.6 4.5 3.2 3.0 3.7
Aged 65+
Before Social Transfers
32.8 32.2 30.0 28.0 26.6 26.7 27.5
After Social Transfers
29.3 28.4 27.8 25.5 22.0 22.3 21.4 21.3
Difference 4.4 4.4 4.5 6.0 4.3 5.3 6.2
Source: Eurostat and authors’ calculations
18
Pensions are counted as income (before social transfers) and are not included in the definition of social transfers.

119
The overwhelming attention given to older persons by Greek policymakers cannot be
explained by just pointing to the fact that this group is a large, and fast increasing, share of the
electorate. After all, this is also true other EU15 countries. It is rather a reflection of the fact
that, before social transfers, the at-risk-of-poverty-rate was 6 percentage points (average for
2004-2010) higher for those older than 65 than for the total population. In contrast, for the
EU15, the corresponding rate was lower by 3 percentage points for the older than for the total
population. In order to understand these differences, we must also take into account some
salient characteristics of post-war Greece, which have exercised considerable influence in the
development of the Greek economy and society.
A purely structural/economic explanation would point to the very large share of agricultural
employment in Greece relative to the other EU15 countries. Agricultural workers (i.e. small-
scale farmers) were receiving, until the 1990s, a very low pension for which they had not paid
any contributions. Since 1998 a proper pension fund (OGA) has been created which uses
public funds to still pay 340 euros per month to persons not having made any contributions;
this sum can more than double for persons which opted to pay contributions. Nevertheless,
the bulk of OGA pensioners receive less than the poverty line threshold and this fact can be
part of the explanation why the incidence of poverty risk is higher among older citizens in
Greece relative to the total population. However, this fact begs the question: Why did it take
so long for Greece to develop a proper pension fund for agricultural workers? The answer
must be sought in the contradictory role played by the state. On the one hand, a liberal
ideology was assigning a prominent role to the entrepreneurial spirit, but, on the other hand,
most of the variables influencing market outcomes were controlled by the state, which was, in
turn, a prize which feuding groups (aka political parties) were trying to capture. As a result,
instead of rational bureaucratic structures which embody the idea of universal social rights,
what developed in Greece was a discretionary (and, often in practice, a clientilistic) system of
welfare provision, which favoured particular groups while at the same time ignoring basic
social needs of large segments of the population. An effort to redress some of these
shortcomings took place in the early 1980s. While in many Western European countries the
recession following the second oil shock was leading to cuts in welfare expenditure, in Greece
there was a significant rise in social spending. Unfortunately, this rise was not associated with
the appropriate changes in the institutional environment to secure an efficient allocation of
social welfare spending. Although social security coverage widened, neither the composition
of welfare spending nor the distribution of social benefits could be considered a rational
response to pressing welfare needs. A particular case which illustrates the haphazard way in
which the disbursement of social welfare was administered is old-age pensions. From the
mid-1970s to the mid-1980s the pensions-to-GDP ratio almost doubled. The lowest pensions
increased considerably, uninsured old-age persons started receiving a social-assistance
benefit, and pensions (along with social security coverage) was granted even to groups that
had not paid any contributions (e.g. to Greek repatriates from the former Soviet Union and
other Eastern European countries). Yet, the system remained fragmented, with pension funds
serving “special-interest” groups managing to maintain their privileged position – usually
achieved by receiving indirect subsidies by the government (often by imposing taxes on third
parties). To give an example of differential treatment consider the following example
(Matsaganis, 2011): The same amount of contributions would give a pensioner of IKA, which
is the main social insurance fund catering to private-sector employees, a pension of €500 at
65, while it would give a pensioner of TAP-OTE (a fund catering to a telecom firm which
was, until recently, publicly owned), €1,500 at 55. Such unequal treatment of pensioners,
which was underpinned through the use of public funds, was also responsible for the higher
incidence of poverty among pensioners than for the population as a whole. It is thus ironic
that social transfers (excluding pensions) in Greece were very effective in reducing the high
(relative to EU15) at-risk-of-poverty-rate for persons older than 65, while at the same time
government policy was responsible for creating the high poverty risk among pensioners by
over-subsidizing through scarce public funds the more “affluent” pension funds.

120
The inequities of social protection in Greece are not restricted to just old-age pensions; they
permeate all aspects of it. For example, blind people receive €362 (per month) if they students
or employees, and €697 if they are lawyers; the low-income family benefit is €25 (per month)
if the parents are private-sector employees, and €236 if they work in wider public sector or in
a bank (Matsaganis, 2011). These examples, which demonstrate that social protection benefits
are not disbursed according to some widely accepted, and just, principles, have been
weakening the trust of citizens
Some efforts at improving some of the inequities and inefficiencies of the social welfare
system were made in the 1990s and in the first decade of the new millennium. These efforts,
most of the times underpinned by the belief (or, the pretext) that social and economic reform
should be the result of social dialogue, did not produce the hoped-for social concertation and
successive governments had to abandon them.

121
References
Andriopoulou, E., F. Papadopoulos, and P. Tsakloglou (2010), "The portrait of social
exclusion in Greece: Analysis and determinants, mimeo (in Greek).
Atkinson, T., B. Cantillon, E. Marlier, and B. Nolan (2002). Social Indicators:
The EU and Social Inclusion, Oxford University Press, Oxford.
Antoninis M. and P. Tsakloglou (2001), “Who benefits from public education in Greece?
Evidence and policy implications”, Education Economics 9, 197–222.
Callan T., T. Smeeding and P. Tsakloglou (2008), "Short-run distributional effects of public
education transfers to tertiary education students in seven European countries," Education
Economics, vol. 16(3), 2008, pages 275-288.
Cholezas I. and P. Tsakloglou (2007), “Earnings inequality in Europe: Structure and patterns
of inter-temporal changes”, IZA Discussion Paper,
Chrysakis, M., D. Balourdos and A. Capella (2009), “Inequalities in Access to Tertiary
Education in Greece: An Approach Based on the Official Statistics (1984 – 2004)”, Social
Cohesion Bulletin 2/2009, National Center for Social Research, INSPO.
Dafermos, Y. and C. Papatheodorou (2010), “Structure and Trends in Economic Inequality
and Poverty in Greece 1995-2008”, GSEE Institute of Labour, Athens.
Eurobarometer (1989), “The Perception of Poverty in Europe”,
http://ec.europa.eu/public_opinion/archives/eb_special_120_100_en.htmProgramme Poverty
III.
Eurobarometer (1997), Special issue, 47.1, Spring 1997.
Eurobarometer (2004), Agricultural Policy, Development Aid, Social Capital, Information &
Communication Technology, Wave 62.2, November.
Eurobarometer (2007a), Special, 273, Wave 66.3, European Social Reality, February 2007.
Eurobarometer (2007b), Special, 279, “Poverty and Exclusion”.
Eurobarometer (2009), Special, 321, Poverty and social exclusion report, available at:
http://ec.europa.eu/public_opinion/archives/ebs/ebs_321_en.pdf.
Eurobarometer (2010), Special, 355, Poverty and social exclusion report, available at:
http://ec.europa.eu/public_opinion/archives/ebs/ebs_355_en.pdf.
Eurobarometer (2011), available at
http://ec.europa.eu/public_opinion/cf/showtable.cfm?keyID=5&nationID=16,4,&startdate=19
81.05&enddate=2011.05
EUROMOD (2011), Distribution and Decomposition of Disposable Income, available at
http://www.iser.essex.ac.uk/euromod/statistics/ using EUROMOD version no. F3.0, April.

122
European Social Survey/ EKKE (2003), Greece - Europe: Society, Politics, Values,
November 2003 (in Greek).
European Social Survey/ EKKE (2010), Greece - Europe: Society, Politics, Values,
November 2010 (in Greek).
Eurostat (2010) , Household structure in the EU, available at:
http://epp.eurostat.ec.europa.eu/cache/ITY_OFFPUB/KS-RA-10-024/EN/KS-RA-10-024-
EN.PDF .
Eurostat (2011), Social participation and social isolation, available at
http://epp.eurostat.ec.europa.eu/statistics_explained/index.php/Social_participation_statistics .
Fotoniata, E. and T. Moutos (2010), “Greece: Neglect and Resurgence of Minimum Wage
Policy”, in D. Vaughan-Whitehead (ed.), The Minimum Wage Revisited in the Enlarged EU,
Edward Elgar and International Labour Office: Geneva.
Fountedaki, P. and D. Sarafianos (2000), Administration Issues in Universities,
Panepistimio, 1/2000, University of Athens, Athens .
Frick, J., M. Grabka, T. Smeeding, and P. Tsakloglou (2010) "Distributional effects of
imputed rents in five European countries," Journal of Housing Economics, Elsevier, vol.
19(3), pages 167-179, September, 2010.
Heady, C. and G. Room, “Patterns of Social Exclusion: Implications for Policy and
Research.” in Poverty and Social Exclusion in Europe, ed. Matt Barnes et al., 146–54.
Northampton, MA: Edward Elgar, 2002
Kanellopoulos, C., T. Mitrakos, and K. Mavromaras (2003), Education and Labour Market.
Center of Planning and Economic Research, Athens (in Greek).
KANEP-GSEE (2009), “ Main figures of Greek education”, Center for the Development of
Education Policy, GSEE, Athens.
Katsikas, C. and G. Kavvadias (1994), Inequities in Greek education, Gutenberg, Athens, (in
Greek).
Katsimi, M. and T. Moutos (2010), “EMU and the Greek crisis: The political-economy
perspective”, European Journal of Political Economy, 26, 568-576.
K. Kurz and H.-P. Blossfeld (2004), Home Ownership and Social Inequality in Comparative
Perspective, . Stanford University Press. Stanford, CA.
C. Koutsampelas and P. Tsakloglou ( 2012), "The Distribution of Full Income in Greece"
IZA Discussion Papers 6396, Institute for the Study of Labor.
Kurz , K. and Blossfeld, H-P., Home Ownership and Social Inequality in Comparative
Perspective, Studies in social inequality, Stanford University Press, 2004.
Malley, J. and Moutos, T. (1996), “Does Government Employment Crowd-Out Private
Employment?”, Scandinavian Journal of Economics, 123-137.
Matsaganis, M. and M. Flevotomou (2010), “Distributional implications of tax evasion in
Greece”, Hellenic Observatory Papers on Greece and Southeast Europe, Paper No. 31, The
Hellenic Observatory, LSE, London.

123
Matsaganis, M., D. Benedek, M. Flevotomou, O. Lelkes, D. Mantovani, and S. Nienadowska
(2010), “Distributional Implications of Income Tax Evasion in Greece, Hungary and
Italy”,MPRA Paper 21465, Munich Personal RePEc Archive.
Matsaganis, M. and C. Leventi (2011), “The Distributional Impact of the Crisis in Greece”, in
V. Monastiriotis, ed., The Greek crisis in focus: Austerity, Recession and Paths to Recovery ,
Hellenic Observatory, LSE, London.
Matsaganis, M. , Social Policy in Hard Times, Athens, Kritiki, 2011, (in Greek).
Matsaganis, M. and C. Leventi (2012), “The Distributional Consequences of the Crisis for
Income Distribution”” in Bank of Greece, Social Policy and Social Cohesion in Greece under
Conditions of Economic Crisis, Athens, ( in Greek).
Meschi, E. and F. Scervini, F. (2010) "A new dataset on educational inequality", GINI
Discussion Paper 3, Amsterdam Institute for Advanced Labour Studies (AIAS), University of
Amsterdam.
Mitrakos T. and P.Tsakloglou ( 2006), “Inequality and poverty in Greece in the last quarter
of the twentieth century”, in E. Mossialos and M. Petmesidou, eds, Social Policy in Greece,
Ashgate, Aldershot, pp. 126-143.
Mitrakos, T. and P. Tsakloglou (2010), “Poverty and Inequality in Greece: What the
Available Data Tell Us”, in S. Koniordos and N. Fotopoulos (eds.), . Poverty, Inequality, and
Education under the Globalization Framework, INE-GSEE, Athens (in Greek).
Mitrakos T. and P. Tsakloglou (2012), “Inequality, Poverty and Material Welfare: From
Regime Transition to the Current Crisis” in Bank of Greece, Social Policy and Social
Cohesion in Greece under Conditions of Economic Crisis, Athens, ( in Greek).
Miilunpalo, S., I. Vuori, P. Oja, M. Pesanes, and H. Urponen (1997), "Self-rated health
status as a health measure: The predictive value of self-reported health status on the use of
physician services and on mortality in the working-age population" , Journal of Clinical
Epidemiology, 50, pp. 517-528.
Moutos, T. and C. Tsitsikas (2010), "Whither Public Interest: The Case of Greece's Public
Finances," FinanzArchiv: Public Finance Analysis, vol. 66(2), pp. 170-206.
Mouzelis N. and G. Pagoulatos (2005), “Civil Society and Citizenship in Postwar Greece”, in
F. Birtek and Th. Dragona (eds) Citizenship and the Nation State in Greece and Turkey,
Abington and New York: Routledge, 2005, pp. 87-103.
OECD, 2007, 2011, Society at a Glance: OECD Social Indicators, 2007 and 2011 edition,
OECD, Paris.
National Centre for Social Research (2010), Greece - Europe, Results of the European Social
Survey,EKKE, Athens.
Papatheodorou, C. (1997). “Poverty and family background in Greece: The role of father’s
occupation and education”, Welfare State Programme 133, LSE-STICERD, LSE.
Papatheodorou C. and S. Papanastasiou (2010), Intergenerational Transmission of Poverty in
Greece and the EU: Theoretical Approaches and Empirical Analysis, INE/GSEE Studies, 7,
(in Greek).

124
Pappas, T.S. (2002) ‘Party System and Political Competition in Greece, 1981-2001’, Greek
Review of Political Science, 17:71-102 (in Greek).
POPOKP (2005), “4 Billion Euro Social Security Tax Evasion, More than 1 Million the
Uninsured”, May-June Issue of the Journal, pp. 10-15 (in Greek).
Psacharopoulos, G. and S. Tassoulas (2004), Achievement at the higher education entry
examinations in Greece: A Procrustean approach, Higher Education, 47, 241– 252.
Psacharopoulos, G. and G. Papakonstantinou (2005), The real university cost in a “free”
higher education country, Economics of Education Review, 24, pp. 103-108.
Public Issue (2009), Immigration Survey, 2009, http://www.publicissue.gr/wp-
content/uploads/2009/07/immigration-survey-2009.pdf (in Greek).
Public Issue (2012), http://www.publicissue.gr/2043/koinwniko_profil_6_2012/ (in Greek).
Schneider, F. and D. Enste (2000), “ Shadow economies: Size, causes, and consequences”,
Journal of Economic Literature, 38/1, pp. 77-114.
Schneider, F. (2006), “Shadow Economies and Corruption All Over the World: What Do We
Really Know?” IZA Discussion Paper No. 2315, Institute for the Study of Labor.
Sen, A.K. (1985), Commodities and capabilities, North-Holland, Amsterdam.
Slemrod, J. and Yitzhaki, S. (2002), ‘Tax avoidance, evasion, and administration’, in A.J.
Auerbach and M. Feldstein (eds) Handbook of Public Economics, Elsevier.
Smeeding, T.M., P. Saunders, J. Coder, S.P. Jenkins, J. Fritzell, J., A.J.M. Hagenaars, R.
Hauser, and M. Wolfson (1993), “Poverty, inequality and living standard impacts across
seven nations: The effects of non-cash subsidies for health, education and housing”, Review
of Income and Wealth, 1993, pp. 229-256.
State Audit Council (2008), State Audit Council Report, November (in Greek).
Tsakloglou, P. and F. Papadopoulos (2002), Aggregate level and determining factors of social
exclusion in twelve European countries, Journal of European Social Policy, 12, 209–223.
Tsakloglou, P. and I. Cholezas (2005), “Education and Inequality in Greece”, IZA Discussion
Paper No. 1582.
Tsakloglou P. and T. Mitrakos (2012), “Inequality and poverty in Greece: myths, realities and
the crisis”, in O. Anastasakis and D. Singh, eds., Reforming Greece, Southeast European
Studies, St. Antony’s College, Oxford.
V-PRC (2008), Public Opinion in Greece, Livanis, Athens (in Greek).
Wilkinson, R. and K. Pickett (2009), The Spirit Level: Why More Equal Societies Almost
Always Do Better, Penguin, London
World Values Survey, http://www.wvsevsdb.com/wvs/WVSAnalizeQuestion.jsp

125
Appendix
Log Table Chapter 3
1974-1982 1982-1999 1999-2008
Income Inequality
Real Income
Material deprivation N/A N/A
Family formation
Family breakdown N/A
Health inequalities N/A N/A
Housing tenure N/A
Crime N/A
Punishment N/A N/A
Life satisfaction N/A

126
Log Table Chapter 4
1974-1982 1982-1999 1999-2008
Income Inequality
Real Income
Political participation
Civic participation N/A
Trust in others N/A N/A
Trust in institutions N/A N/A
Voting for extreme N/A
EU membership approval N/A
Blame social causes for poverty N/A N/A
Values about the welfare state N/A N/A