ghana's labor market (1987-92)
TRANSCRIPT

POLICY RESEARCH WORKING PAPER 1752
Ghana's Labor Market The rate of return toeducation in Ghana increases
(198 7-92) with higher education and
work experience. The return
for each additional year of
SudThomarsh Canagara jabschooling ranges from 4 to 6Saji Thomas percent, quite high for a Sub-
Saharan African country.
Private and social returns to
education are greater for
primary than for secondary or
postsecondary education.
The World Bank
Africa Technical Families
Human Development 3
April 1997
Pub
lic D
iscl
osur
e A
utho
rized
Pub
lic D
iscl
osur
e A
utho
rized
Pub
lic D
iscl
osur
e A
utho
rized
Pub
lic D
iscl
osur
e A
utho
rized

POLICY RESEARCH WORKING PAPER 1752
Summary findings
Using the household survey and other data sources, formal sector (in which most workers have middle orCanagarajah and Thomas analyze returns to education secondary schooling).and other aspects of Ghana's labor market profile from Unemployment is pervasive in urban areas, and is less1987 to 1991. visible in rural areas. Labor productivity may not have
The labor force grew slower than the population did increased and is possibly declining.between 1980 and 1990, but the supply of labor is Between 1987 and 1992, there was reverse migration,expected to increase as the population of youth is with many people moving from urban to rural areas,expected to grow faster from 1990 to 2000. And labor mostly for family reasons. Employment-related migrationforce participation rates for 26- to 45-year-olds have has also been on the increase.been increasing rapidly. As is true elsewhere, the level of education affects
Over time, the average labor force participation rates participation in the labor force. Literacy rates for womenof women have become equal to men's; that of children are lower than those for men, which is one reason menyounger than 15 has remained unchanged at 38 percent. dominate the private formal sector. The rate of return toMore than half of Ghana's child laborers are employed education increases with higher education and workin agriculture. experience. The return for each additional year of
The formal sector's share of employment is on the schooling ranges from 4 percent to 6 percent in Ghana,decline, while the private informal sector's share has quite high for a Sub-Saharan African country. Private andincreased, especially in urban areas. Over time, the social returns to education are greater for primary thaninformal sector (in which most workers have a primary for secondary or postsecondary education.education or less) has absorbed more labor than the
This paper - a product of Human Development 3, Africa Technical Families - is part of a larger effort in the region toanalyze the links between education and employment. Copies of the paper are available free from the World Bank, 1818H Street NW, Washington, DC 20433. Please contact Betty Casely-Hayford, roomJ8-270, telephone 202-473-4672, fax202-473-8065, Internet address [email protected]. April 1997. (50 pages)
The Policy Research Working Paper Series disseminates the findings of Dork in progress to encourage the excaange of ideas aboutdevelopment issues. An objective of the series is to get the findings out quickly, even if the presentations are less than fully polished. Thepapers carry the names of the authors and should be cited accordingly. The findings, interpretations, and conclusions expressed in thispaper are entirely tbose of the autbors. They do not necessarily represent the vieur of the World Bank, its Executive Directors, or thecountries they represent.
Produced by the Policy Research Dissemination center

GHANA'S LABOR MARKET(1987-92)
Sudharshan Canagarajah and Saji Thomas'
i The authors are with the World Bank.


TABLE OF CONTENTS
1. Introduction 5
2. Supply of Labor 8
2.1 Determination of labor participation I 1
3. The absorption of labor 13
3.1 Sectoral employment 13
3.2 Child labor 23
3.3 Turnover rates. 25
3.4 Trends in Earnings and Employment. 26
3.5 Unemployment. 34
3.6 Migration. 36
4. Education and Employment. 39
4.1 Literacy rates by gender and region in Ghana 40
4.2 Dropouts and repetition 40
4.3 University graduates 43
5. Returns to Education 44
5.1 Private and Social returns to education 47
6. Summary and Conclusions 49
7 Bibliography 51
3

INDEX OF TABLES
Table 1 Macro indicators in Ghana, 1984-94 7
Table 2 Main population indicators and trends, 1990-2005 9
Table 3 Labor force participation rates by age-group, gender and sector,1987-91 (in percent) 11
Table 4 Probit estimates of labor force participation model 12
Table 5 Employment by urban and rural sectors (in percent) 14
Table 6 Employment by broad sectors, education and gender 15
Table 7 Characteristics of male and female wage workers 17
Table 8 Characteristics of male and female self-employed workers 18
Table 9 Characteristics of wage workers in the informal sector 19
Table 10 Source of income for wage workers by locality 20
Table 11 The characteristics of civil service workers in Ghana 21
Table 12 Characteristics of child labor by sector, education level, gender
and occupation 23
Table 13 Quit rates by education level and gender, 1991 25
Table 14 Share of different sectors in the total GDP (in percent) 26
Table 15 Employment and locality (1987) 30
Table 16 Industry and Locality (1987) 30
Table 17 Employment and locality (1988) 31
Table 18 Industry and Locality (1988) 31
Table 19 Employment and locality (1991) 32
Table 20 Industry and Locality (1991) 32
Table 21 Unemployment rates by sector, locality, age-groups, gender
and education level 34
Table 22 Sectoral migration in Ghana 36
Table 23 Regional migration in Ghana 36
Table 24 Major reasons for migration, 1987-91 36
Table 25 The characteristics of migrant workers in Ghana 37
Table 26 Progress in adult literacy 40
Table 27 Education level by age-groups for those currently enrolled 41
4

Table 28 Charcateristics of university graduates 42
Table 29 Mean earnings by educational level in Ghana. 43
Table 30 Basic Earnings function by years of schooling. 44
Table 31 Extended earnings function by levels of education, in Ghana 45
Table 32 Marginal returns to education 45
Table 33 Unit costs of public education by levels 46
Table 34 Private and social returns to education, using the
short-cut method. 47
Table 35 Returns to education by four levels of education using 47
the full method
INDEX OF FIGURES
Figure 1 Labor force participation rates in Ghana 10
Figure 2 Estimated quit rates among wage workers in Ghana 24
Figure 3 The trend of real monthly earnings per employee in public and
private sector in Ghana 27
Figure 4 The trend in employment by sectors in Ghana 27
Figure 5a The trend of employment and real GDP in the agricultural sector 28
Figure 5b The trend of employment and real GDP in the industrial sector 28
Figure 5c The trend of employment and real GDP in the services sector 29
S


1. INTRODUCTION
Since 1983, the Government of Ghana has implemented a gradual but sustainedadjustment strategy under the Economic Recovery Program (ERP), under the belief thatthe changes in the relative prices, which are central to any adjustment program will inciteeconomic agents to allocate resources based on market signals. The reforms under theERP have successfully turned the economy around. During the period 1983-93, thegrowth rate of real GDP averaged around 5 percent per annum. A large part of the growthin per capita GDP reflected the larger growth in per capita private consumption, whichincreased by an average amount of 3% per annum over the period 1987-92. Average percapita income growth rate has increased during the sarne period from -5 percent to 2percent per annum. Inflation has come down from a peak of 123 percent in 1983 to 10percent in 1992. The year 1991 was the high point in Ghana's ERP; inflation was down,a budget surplus equivalent to 1.5 percent of the GDP, real GDP growth rate at 5.3percent, the growth in money supply high-but falling. However, in 1992 a fiscal shockresulted in a break in the otherwise sustained progress in terms of inflation, fiscal balance,private investment and current account balance (World Bank, 1995).
The success of any adjustment program depends on a well functioning andflexible labor market, in which labor is allocated through the market mechanism, andwhich creates sufficient incentives for human capital investment. Labor markets havethree kinds of effects on the allocative efficiency between the micro- andmacroeconomies. First, they match labor supply and demand between workers andemployers through the wage rate. Secondly, they allocate workers among sectors bymatching skills with job requirements through relative wages, and finally they provideinformation about incentives for the allocation of resources over a time period, i.e., forhuman resource development through education and training. Evidence indicates -someanecdotal and some empirical- that a large public sector impedes the competitivefunctioning of labor markets and of the overall economy (Stevenson, 1992). The role ofthe public sector is particularly salient in light of the renewed emphasis on efficient labormarkets as critical to sustainable growth2 .
The likely presence of wage rigidity or labor mobility raises the fundamentalquestions regarding the effectiveness of macroeconomic policies and the extent to whichthe supply response needed for adjustment will be forthcoming. The conventional viewassumes that macroeconomic policies such as those emphasizing demand restrictions viafiscal and/or monetary policies to control inflation or exchange rate policies aimed atraising the relative price of traded goods - reduce nominal wage increases and therebylower real wages. These policies rely heavily on the "transitory" nature of the increasedunemployment induced in order to "discipline" the labor market. Real wage flexibility is
2 In Ghana, the public sector is an important concern for policy makers because it employs a large share of the formalsector work force (over 62% in 1992), absorbs a large portion of the government recurrent expenditure, andaffects the private labor markets (see Aldermann et al, 1995).
6

a necessary condition to attain macroeconomic adjustment. Although often complicatedby labor market regulations, the labor allocation between tradable and non-tradableindustries is the fundamental ingredient to achieve structural adjustment. The presence offormal mechanisms of wage indexation has been usually mentioned as a deterrent of thewage flexibility needed for structural adjustment. In particular, the dynamic role ofunions and minimum wages in pushing the entire wage structure ( and inflation) has alsobeen pointed out as a crucial mechanism for creating wage rigidity in many countries. Itis in this context that we examine whether the ERP was helped or hindered by the labormarket and whether the reliance on market forces to reallocate and absorb labor wasindeed justifiable.
This labor market study uses the Ghana Living Standards Survey (GLSS) datawhich provided sufficient information to monitor the trend in employment patterns,unemployment, migration, earnings, and the demand for labor. The study uses all threerounds of the GLSS data sets. The available data relate to the periods from September1987-August 1988 (GLSS 1), October 1988-September 1989 (GLSS 2), and September1991-September 1992 (GLSS 3)3.
This paper provides an overview of characteristics of labor markets in Ghana.Section 1 deals with the Supply of labor, labor force participation and its determinants.Section 2 is concerned with the absorption of labor- the sectoral pattern of employment,characteristics of the wage and non-wage workers, their sources of income- wages andearnings, characteristics of child labor, turnover rates and trends in earnings andemployment. Section 3 deals with unemployment rates and its distribution by region.Section 4 deals with migration and the characteristics of migrant workers, while Section 5deals with literacy rates, drop outs, characteristics of university graduates, returns toschooling and private and social returns to education. Section 6 concludes with asummary of major findings and implications.
3 One of the main issue with these three rounds of survey is the that of comparability, since the format of thequestionnaire has changed slightly in GLSS 3, rnaking some of the modules incompatible with the earlierformats of GLSS l& GLSS 2.
7

Table 1: Macro Indicators in Ghana, 1984-94.
Indicator 1984 1985 1986 1987 1988 1989 1990 1991 1992 1993 1994 Kenya Cote D'Ivoire
GNP per capita 1.1 1.4 1.0 2.5 2.2 0.7 2.3 1.0 1.7 0.6 0.2 -4.7(percent growth) (1980-92) (1980-92)Gross Domestic Income 2.9 6.3 4.5 5.1 3.3 2.7 5.4 3.3 3.5 5.2(percent growth)Terms oftrade 100 91 105 101 96 81 75 77 71 62 73 67 65(1984=100) (1987-100) (1987=100)Nominal exchange rate 36 54.5 106.4 162.4 202.4 270 330 375 437 649 956.6 32.22 264.7(domestic currency/dollar) (1992) (1992)Debt service (percent of exports) 21.6 23.5 28.5 45.8 56.0 51.8 34.7 28.3 24.6 35.1 26.6Inflation (percent growth) 10.4 24.6 39.7 31.4 25.2 37.2 17.9 10.1 25.0 24.8 9.3 1.9
(1980-92) (1980-92)Trade balance( millions USD) -66.6 -44.7 -0. 1 -114.0 -117.2 -202.4 -303.4 -315.3 -470.8 -664.1 -350.5 -374 -873
(1992) (1992)Life expectancy at birth (years) 56.0 59.0 56.0Illiteracy rate (in percent) 40.0 31.0 46.0Population growth rate 2.2 3.2 3.6 3.8
(in percent p.a) (1970-80) (1980- (1980-92) (1980-92)92)
Labor force growth rate 2.4 2.7 3.5 2.6(percent p.a) (1970-80) (1980- (1980-92) (1980-92)
92)Infant mortality rate 111 82 66 91
(per live 1000 births) (1970) (1992) (1992) (1992)Source: Ghana private sector growth and poverty reduction: A country Economics Memorandum, The World Bank, 1995; World Development Report, 1994.

2. Supply of Labor
In the 1 970s and early 1 980s the labor force growth rate has been slower than thepopulation growth rate (Table 1), but projections for 1990s and beyond show that thelabor force is expected to grow at a faster rate than the population growth rate (Table 2).These increased labor force growth rates will be brought about by an increased growthrate of the youth population, which is expected to grow faster than the overall labor forcegrowth rates in the 1 990s. This means that labor markets have to become more efficientto absorb the increase in active population. The growth rate in labor force has beenbrought about mainly by change in the age composition of population (the populationpyramid) and age specific participation rates (Table 3). In fact the contribution to laborforce participation of the group of workers between 26-45, which tend to have higherrates of labor force participation have increased.
Labor force participation rates are defined as the proportion of the total number ofeconomically active persons in the working age group (those between the ages 15-64); Aperson is defined as economically active if he/she is employed (either on a weekly oryearly basis). This definition differs slightly from the definition of Beaudry and Sowa(1994), whose economically active group, also includes the unemployed persons who arenot too young or old and who are not actively searching for a job, a group that is currentlynot being rewarded by the labor market.
Table 3 shows the trends in participation rates in Ghana by age groups, genderand rural/urban sectors. The table indicates that the overall participation rates haveincreased from 55.8% in 1987 to 65.4% in 1991. The rates were higher for men than forwomen in 1987, but the participation rates of women have increased during this periodand in 1991 the rates for men and women were almost equal. The rates are especiallyhigher (about 95%) in the 25-60 year age group for males. The participation rates forboth men and women have increased during this period in all the age groups. The issue ofchild labor (ages 7-16) can also be pictured from Table 3. In the rural areas, 47% of thechildren in the 7-16 age group participate in the labor market. In the 7-16 age group, theparticipation rate for male is 37% while the same is 31% for females (probably anunderestimate), which indicates that almost one-third of the children in 7-16 year agegroup are economically active and participate in the labor market. It is also possible thatthe increased female participation in the labor force has come form expandingemployment opportunities in the public sector (Table 6); the percentage of female publicsector workers have increased from 24% in 1987 to 28% in 1991.
Eventhough the male participation rates are higher than the females, the change inthe female participation rates are more impressive, as the gap between the male andfemale participation rates have narrowed during this period. Even though the overallparticipation rates have become more or l1ss same, the rates are higher for males in theprime age-groups (26-60 years). One of the reasons for the low participation rates forfemales is the difference in education between men and women. Over 26% of the males

Table 2: Main population indicators and trends (1990-2035).
1990 1995 2000 2005 2010 2015 2020 2025 2030 2035
Total population 14.8 17.2 20.0 23.0 26.2 29.6 32.7 35.9 38.8 41.6
Active population (15-64 yrs) 7.5 8.8 10.4 12.3 14.4 16.8 19.4 22.2 25.0 27.5
Active population 50.32 51.3 52.2 53.7 54.8 56.8 59.3 61.9 64.4 66.3
(as % of total population)
Youth population (15-25 yrs) 2.8 3.3 4.0 4.71 5.4 6.0 6.8 7.5 7.9 8.4
Youth population 18.9 19.2 20.0 20.5 20.6 20.3 20.8 20.9 20.4 20.2
(as % of total population)
Growth Rate 1990-95 1995-2000 2000-05 2005-10 2010-15 2015-20 2020-25 2025-30 2030-35
(in percent)
Total population 2.96 2.99 2.82 2.65 2.38 2.03 1.82 1.59 1.35
Active population 3.37 3.41 3.45 3.06 3.15 2.95 2.72 2.39 1.96
youth population 3.3 3.9 3.3 2.77 2.13 2.53 1.97 1.04 1.23
Source: World population projections 1994-95.

are literate(people who can read and write) in Ghana, while only 16% of the females areliterate. Women on average have received less years of education than men. Among theliterate over 50% of men have education beyond the primary level, only 30 percent of thewomen have received primary schooling (Table 10). Wage differentials between maleand female could also lead to lower female participation rates, if the way individual'sproductive characteristics are rewarded in the labor market depends on whether it is amale or female.
Fig 1: Labor force participation rates by age-groups,1987-91.
1 00
80 - --60 -
~. 40
20
<16 17-25 26-45 46-60 >60
age-groups
1987 - -x-- 1991
Source: GLSS 1,,3.
The increased rates have been brought about by women in the 26-45 year age-group whose participation rate has increased from 72% in 1987 to 92% in 1991.Naturally, younger and older women have lower participation rates than prime agewomen (Figure 1). This is a commonly observed pattern in many developing countries,and Ghana is no different in that aspect. The main argument being school enrollment foryounger groups and the existence of pensions/savings for the older groups. The increasedrates for females of prime age could be due to a variety of reasons ranging from increasedhourly wages/earnings, increased levels of education, and lower fertility rates (issueswhich will be discussed in the later sections). The participation rates have increasedsubstantially in the rural areas from 62% in 1987 to 75% in 1991.
One of the features of the this increasing labor force is that it is an educated laborforce, with most of the workers having middle or secondary education. The increase inthe stocks of educated labor (primary and above) and increased enrollment rates have alsocontributed to an increased supply of educated labor force.

Table 3: Labor force participation rates by age-group, gender and sector,
1987-91(in percent).
Age-groups Rural Urban Male Female Total
1987
7-16 43.77 14.81 36.72 30.58 33.74
17-25 66.26 46.58 60.26 58.01 59.08
26-45 78.18 71.02 79.81 72.00 75.51
46-60 76.90 70.84 78.60 71.73 74.86
> 60 61.61 42.64 66.19 46.63 56.31
Total 62.00 44.45 58.23 53.59 55.80
1988
7-16 32.40 13.48 28.46 24.29 26.45
17-25 66.49 48.85 63.04 57.67 60.14
26-45 80.75 76.76 86.82 72.81 79.27
46-60 75.46 75.25 82.59 69.83 75.39
> 60 60.72 50.82 68.00 49.10 58.35
Total 57.87 47.49 57.70 51.39 54.33
1991
7-16 47.54 6.30 36.78 30.54 33.78
17-25 81.29 36.26 60.31 67.44 63.99
26-45 97.05 86.25 94.50 91.93 93.01
46-60 94.17 86.09 95.64 88.60 91.79
> 60 76.45 54.66 82.45 59.47 71.00
Total 75.02 47.27 65.41 65.42 65.41
Source: Authors calculations from GLSSI, 2, 3.
Note: Labor force participation is defined as the ratio of Individuals who are either wageworkers or self-employed to the working population ( i.e. those between 15-64 yrs of age)
Source: GLSS 1,2,3
2.1. Determinants of Labor force participation
Table 4 presents the results from the estimates of the labor force participationequation using maximum likelihood probit model. Age is included in the participationequation to reflect the effects of human capital investments on wages which will effectparticipation. As expected, age has a positive effect on work in all the three years. Aninterpretation is that as age increases, the level of human capital acquired increases andthe offered wage goes up. An increasing wage, holding all else constant will increase theprobability of participation. Age-squared is included as a regressor to pick up the possiblenon-linearities in this relationship. The significance of the squared terms in all the threeperiods supports the hypothesis of non-linear effects of age on the probability ofparticipation. Education variable has mixed results. In fact, a person with no schooling
12

Table 4: Probit estimates of labor force participation model.
Variables 1987 1988 1991
Intercept -6.9 -6.64 -6.67
(-24.75) (-26.5) (-13.81)
age 0.388 0.40 0.34
(32.4) (21.95) (17.4)
age-squared -0.004 -0.004 -0.004
(-35.97) (-20.01) (-17.86)
exp 0.047 0.05 0.012
(5.4) (3.61) (0.72)
primary 0.84 0.32 -0.295
(4.5) (2.13) (0.86)
middle 1.00 0.41 0.004
(5.8) (2.51) (0.2)
secondary 0.395 0.09 -0.28
(2.14) (0.45) (-1.1 i1)
higher 0.299 0.64 0.31
(1.08) (2.26) (2.01)
income -0.0001 0.0003 -0.003
(-2.53) (-1.43) (-1.24)
hhsize -0.009 -0.002 -0.03
(-1.6) (-0.44) (-5.34)
rural/urban 0.57 0.56 1.02
(12.3) (11.89) (22.16)
N 7357 7293 8428
Log Likelihood -2225.65 -2160.73 -2522.45
Pseudo-R2 0.56 0.56 0.57
is not likely to participate, while the probability of a person with higher level education toparticipate should be high. In 1987 and 1988, participation was higher for primary andsecondary school leavers, while in 1992, participation was higher for those with higherthan primary and secondary levels of education, which indicates that labor market isbecoming more responsive to education and skilled employment. The household sizevariable could have positive or negative result. If there are a large number of childrenunder 10 years of age then participation rates could be low, since the parent may have tostay home and look after the child; however if there are a number of adult children in thehousehold then older children can reduce childcare costs of labor force participation bytaking care of their siblings while the parents are at work. In our analysis, we find that thehousehold size has a negative effect, but is significant only in 1992. Similarly, theincome variable as expected, have negative effects on participation, but is only significantin 1987. Being in a rural area significantly increases the probability of participation.
13
Thus human capital variables, such as age education and experience and householdvariables such as income and household size effects an individuals participation decision.
3. The Absorption of Labor
3.1 Sectoral Employment
The growing labor force was absorbed in the different segments of Ghana's labormarket. In this section we analyze the distribution of formal and informal workers, thepublic-private composition of wage workers-especially the formal workers. The questionsone would like to ask is: Is public sector the main provider of wage jobs? Does femaleemployment distribution differ from that of male employment distributions? What is themain source of wage employment for females? Does public employment depend oneducational level? Are most of the wage jobs in the rural or urban areas? Is agriculturestill the main source of employment in the rural areas or has there been a decline in theagricultural sector employment. The objective here is to identify the important sectors ofemployment and changes -if any -in the relative importance of sectors during this period.A related issue will be to find out to what extent are the employment differentials -occupational or industrial- justified? Another broad distinction is the difference betweenprivate and public wage employment. The GLSS data set allows us to make thisdistinction within the formal labor4 market.
Looking at the broad employment distribution we find that agriculture is still themain form of employment for the labor force as a whole. In terms of formal and informalemployment, in 1992, 21% of the workers were wage workers, of which 13% worked inthe public sector; in 1987, 24% of the workers were wage workers, of which 14% wereformal sector workers. Over 74% of the workers were self employed, of which 48% wereengaged in agriculture (a decline from 49% in 1987). Among the wage workers, 62%were formal sector workers and 38% were informal sector workers. In terms of male andfemale workers, over 49% of the male workers and 47% of the female workers wereengaged in agriculture (Table 6). These figures indicate that formal sector is still the mainprovider of wage jobs although its share has declined during this period. Interestingly,among the formal wage workers, 71% were males and the only 29% were females.Similar pattern was observed among the informal sector wage workers. Thus most of thewage jobs are taken up by males. Only in the self employed category were the proportionof females greater than those of the males. During 1992, in the urban areas, 43% were selfemployed doing business and 24% were public sector workers, while in the rural areas64% were engaged in agriculture. Over 39% of the urban workers were wage workerswhile only 14% of the rural workers were wage workers, perhaps an indication that mostof the wage jobs exist in the urban areas (Table 5).
4 A person is classifed as employed in the formal sector if he is a wage worker, is not self-employed and gets fringebenefits such as health insurance, leave, pension etc.
14

Table 5: Employment by urban and rural sectors (Figures in percent).
1987 1988 1991
Sector Rural Urban Total Rural Urban Total Rural Urban Total
Government 9.67 23.87 14.06 10.21 23.77 14.09 8.70 23.49 12.97
private-formal 2.93 14.15 6.92 4.70 14.04 7.89 2.45 9.10 4.51
Private-infornal 2.43 5.22 3.37 3.03 5.58 3.87 2.71 6.36 3.91
Self-employed 68.71 14.06 49.24 59.88 11.84 43.57 64.34 11.98 47.0agriculture
Self-employed 15.92 39.17 21.54 21.93 42.39 28.80 20.41 43.24 27.46business
Non-working 0.34 3.54 2.14 0.25 2.37 1.74 1.39 5.82 4.13
100.0 100.00 100.0 100.0 100.0 100.0 100.0 100.0 100.0
Source: Authors calculations using GLSS 1,2,3
In terms of education and employment we find that most of the wage workers hadmiddle school education (Table 6). Over 70% of the private sector wage workers hadmiddle school education. Of those with post-secondary school education, in 1992, 52%were employed in the public sector and 16% in agriculture, implying that education paysin the public sector. Among the self employed in agriculture 52% only had primaryschool education. Thus public sector seems to be attracting workers with highereducation, while those with little or no education are self employed. However, the shareof formal employment has decreased during this period, while the share of privateinformal has increased especially in the urban areas. Females are predominantly engagedin self-employed business/trading activity, a sector which has been growing in Ghana inthe last decade.
In summary, we find that formal sector share of employment has decreased overtime. Most people are still self employed in agriculture, even though its share isdeclining. On the other hand, the self employed business category has increased, whichindicates that trade and commerce is absorbing more labor. Most of the educated workersare in the formal sector, with a majority of them having middle or secondary schooling. Ifinformal sector has more potential of growth and labor absorption it may indicate that thepresent education system does not seem relevant for the informal sector. Over half of thepost-secondary educated are employed in the public sector- an indication that educationpays in the public sector. The public sector is dominated by males, but the share offemales in the public sector has also increased over time.
15

Table 6: Employment by broad sectors, education and gender in Ghana , Ages 7-64.
(figures in percent).
Education Gender
Sectors Primary Middle Secondary Post-sec Males Females
198 Government 4.8 63.54 17.90 13.76 75.22 24.227
(2.58) (10.28) (16.77) (52.27) (11.58) (3.38)
private-formal 12.24 71.43 15.51 0.82 82.37 17.63
(3.52) (6.18) (7.77) (1.82) (7.00) (1.33)
Private-informal 24.42 70.35 4.65 0.58 64.90 35.10
(4.93) (4.28) (1.64) (0.91) (4.33) (2.07)
Self employed agriculture 25.7 66.21 6.77 1.32 47.45 52.55
(54.81) (42.51) (25.15) (21.82) (51.54) (50.54)
Self-employed business 22.25 68.54 8.01 1.20 24.83 75.17
(21.83) (20.25) (13.70) (9.09) (9.75) (26.15)
Non-working 15.41 60.38 22.97 1.26 45.24 54.76
(11.50) (13.57) (29.86) (7.27) (13.84) (14.84)
198 Government 6.42 59.34 18.29 15.95 76.95 23.05
(3.07) (10.46) (17.67) (73.87) (13.03) (3.32)
private-formal 12.94 69.26 16.83 0.97 82.18 17.82
(3.72) (7.34) (9.77) (2.70) (8.50) (1.57)
Private-informal 21.72 72.40 5.43 0.45 63.96 36.04
(4.46) (5.49) (2.26) (0.90) (4.98) (2.39)
Self employed agriculture 30.94 61.05 7.46 0.55 46.63 53.37
52.04 37.89 25.38 9.01 47.62 (46.35)
Self-employed business 25.79 66.26 7.20 0.75 24.90 75.10
(25.65) (24.31) (14.47) (7.21) (11.93) (30.61)
Non-working 16.73 59.49 22.78 1.11 42.93 57.07
(11.05) (14.50) (30.45) (6.31) (13.94) (15.76)
199 Government 5.07 59.96 32.07 2.90 71.27 28.73
(2.90) (8.29) (22.96) (51.61) (10.87) (3.75)
private-formal 5.67 70.85 23.08 0.40 80.34 19.66
(1.45) (4.38) (7.39) (3.23) (4.96) (1.04)
Private-informal 14.80 70.41 14.80 0.00 63.12 36.88
(3.01) (3.46) (3.76) (0.00) (4.04) (2.02)
Self employed agriculture 23.63 71.31 4.83 0.24 47.45 52.55
(51.71) (37.73) (13.23) (16.13) (49.68) (47.09)
Self-employed business 17.23 75.35 7.33 0.09 24.26 75.74
(20.21) (21.37) (10.77) (3.23) (9.98) (26.66)
Non-working 13.16 65.07 21.25 0.53 47.39 52.61
(20.73) (24.77) (41.89) (25.81) (20.47) (19.45)
Note: The first row in each sector gives the row percentage, while figures in parenthesis gives the column percentage.
16

In order to better understand the characteristics of wage workers, we break downthe wage workers by age-groups, education, place of residence and the type of industrywhere the person is employed. The wage worker group is predominantly young; majorityof both the male and female workers belong to under 40 years age group. Only 10% ofthe female workers and 19% of the male workers are over 50 years old (Table 7).However, between 79-81% of the workers had recently migrated to the place of work asthey had a period of residence less than 1 year. As mentioned earlier, 64% of the femaleworkers had middle schooling and 28% had secondary schooling. Similar pattern wasfound among the males also. In terms of type of employment, 60% of the female workersand 49% of the male workers were involved in public services and finance, while amongthe self employed between 64-85% were engaged in agriculture. Thus, the wage workersare relatively young, recent immigrants, with a middle to secondary level education andworking predominantly in the services sector.
If we look at the characteristics of the self-employed, we find that it is a younggroup like the wage workers, recent immigrants and with primary to middle school leveleducation. In terms of employment, most of the self employed are engaged in agricultureor in trade and commerce, such as retail and wholesale trade (Table 8). If we look at thecharacteristics of the workers in the informal sector we find that almost 77% have eithera primary or middle school level of education. In the rural areas 46% of the femaleworkers have primary education, while in the urban areas 44% of the female workershave middle school education. In the urban areas the female workers have almost thesame level of education as male workers. In terms of occupation agriculture is the mainoccupation of most of the informal sector workers, Eventhough its share has gone downfrom 65% in 1987 to 60% in 1991. At the same time the share of services has gone upfrom 25% in 1987 to 31% in 1991. In the rural localities agriculture is the main source ofincome( between 78-89%) for workers, while in the urban areas most of the workers earntheir income from sales, a sector dominated by females (Table 9). Also, among theinformal wage workers, the share of those with no education has increased form 1.7% in1987 to 15% in 1991.
17

Table 7: Characteristics of male and female wage workers, 1987-91.F
(in percent)
Characteristics 1987 1988 1991
Male Female Male Female Male Female
Age
under 30 36.00 57.38 36.90 54.01 26.12 35.83
30-40 29.03 27.52 27.62 27.78 28.59 36.90
40-49 19.43 10.07 21.07 11.42 25.91 17.38
over 50 15.54 5.03 14.42 6.79 19.38 9.89
Period of residence
less than I yr 95.28 95.94 91.12 92.88 79.98 81.40
2-4 yr 2.57 2.67 4.63 3.73 4.35 3.77
5-9 yr 1.24 0.76 2.27 1.02 3.48 3.50
10-19 yr 0.58 0.19 1.61 1.69 6.53 8.89
over 20 yrs 0.33 0.38 0.38 0.68 5.66 2.43
Education
None 0.15 0.43 0.62 0.00 0.50 0.3
Primary 12.59 13.62 11.85 14.55 7.51 6.23
Middle 67.62 59.15 65.34 60.07 64.87 64.36
Secondary 14.39 13.62 14.96 14.93 25.64 28.37
Post-secondary 5.25 13.19 7.23 10.45 1.98 1.04
Industry
Agri/forestry 11.00 10.00 11.48 6.95 8.70 11.60
Mining/Manufact. 14.76 16.67 13.35 20.85 14.04 11.60
Elec./Water/Const. 10.03 2.08 12.06 5.02 8.00 1.93
Wholesale/retail 5.57 15.42 4.57 11.58 5.80 11.33
Transportation 12.67 1.25 11.48 1.16 14.97 2.76
Finance/Community 45.96 54.58 47.07 54.44 48.49 60.77
Source: Authors' own calculations using GLSS 1,2,3.
18

Table 8: Characteristics of male and female self-employed workers, 1987-91.
(in percent)
Characteristics 1987 1988 1991
Male Female Male Female Male Female
Age
under30 58.54 51.55 57.29 49.09 43.51 39.01
30-40 14.01 17.66 14.51 19.23 20.79 25.26
40-49 10.19 13.03 9.73 12.32 15.19 17.23
over50 17.26 17.76 18.47 19.36 20.51 18.49
Period of residence
less than I yr 93.71 93.90 92.11 92.35 84.09 83.36
2-4 yr 3.31 2.00 3.29 3.67 2.95 3.35
5-9 yr 1.99 2.66 2.48 1.87 3.81 3.77
10-19 yr 0.87 0.78 1.06 1.29 5.25 5.57
over 20 yrs 0.17 0.67 1.06 0.83 3.89 3.95
Education
None 1.98 1.08 1.99 1.42 2.41 2.60
Primary 37.68 43.30 39.32 43.49 16.90 25.91
Middle 51.60 52.31 49.87 51.26 73.01 67.40
Secondary 7.31 2.94 8.11 3.56 7.38 4.02
Post-secondary 1.42 0.36 0.71 0.27 0.31 0.06
Industry
Agri/forestry 87.34 69.37 82.45 61.07 84.82 64.00
Mining/Manufact. 5.00 8.94 6.28 12.37 5.46 8.73
Elec./Water/Const. 0.58 0.01 1.45 0.03 0.98 0.02
Wholesale/retail 3.96 20.82 5.08 25.19 4.37 25.96
Transportation 0.81 0.03 1.07 0.07 1.19 0.02
Finance/Community 2.31 0.84 3.67 1.26 3.18 1.26
Source: Authors' own calculations using GLSS 1,2,3.
19

Table 9: Characteristics of wage workers in the informal sector
Years 1987 1988 1991
Sector urban Rural All urban Rural All Urban Rural All
Sex Male Female Male Female Male Female Male Female Male Female Male Female
Educ. level
No education 0.88 1.79 1.42 2.69 1.76 0.64 0.29 0.67 1.3 0.77 12.32 12.37 15.98 17.85 15.09
primary 25.83 31.98 33.32 41.68 34.00 14.12 23.21 26.03 39.26 26.74 32.99 32.61 39.39 46.42 38.65
middle 55.78 54.97 56.02 52.43 54.71 68.70 65.19 65.64 57.49 63.99 39.29 44.07 39.25 33.59 38.60
secondary 11.40 9.51 6.23 2.07 6.75 11.96 9.89 6.52 1.86 6.92 14.21 10.04 4.21 1.74 6.76
Higher 0.77 0.28 0.80 0.22 0.51 0.01 0.14 0.27 0.01 0.12 0.32 0.12 0.34 0.18 0.25
TTA/koranic 5.34 1.46 2.21 0.91 2.26 4.58 1.29 0.87 0.09 1.46 0.85 0.79 0.83 0.21 0.66
Occupation
Professional/technical 0.08 0.15 0.01 0.23 0.14 0.0 0.27 0.09 0.12 0.12 0.75 0.20 0.14 0.10 0.17
Admin./managerial 0.25 0.25 0.50 0.39 0.38 0.61 0.72 0.14 0.93 0.59 2.24 0.30 0.09 0.14 0.27
clerical 7.05 3.28 1.18 0.35 1.83 7.48 4.83 1.94 0.19 2.54 2.49 0.40 0.23 0.01 0.29
sales 13.33 53.38 4.24 11.71 17.58 14.34 48.08 3.96 13.97 16.32 23.88 58.85 1.95 13.20 17.12
service 9.59 3.64 2.10 1.23 2.81 12.50 6.26 2.79 1.93 4.41 4.73 4.25 0.73 0.75 1.53
agricultural 69.69 37.93 91.94 85.66 76.82 64.96 37.21 90.99 82.43 75.38 58.21 18.30 94.23 79.57 73.72
production 0.0 1.36 0.04 0.43 0.45 0.10 2.68 (.(9 0.43 0.64 7.71 17.71 2.64 6.24 6.89
Type of Industry
Agriculture 29.45 24.47 86.57 82.96 64.79 25.20 22.94 81.53 79.82 62.53 20.72 16.19 80.56 77.38 59.29
Industry 40.79 17.77 5.27 6.17 10.22 21.12 20.96 6.83 7.53 11.62 17.5 17.41 6.21 6.37 9.91
Services 29.77 57.76 8.15 10.87 24.99 53.68 56.10 11.63 12.64 25.84 61.78 66.39 13.23 16.25 30.8

Table 10: Source of income for wage workers by locality (in percent).
1987 1988 1991
Occupation Accra Other Rural Rural Rural Accra Other Rural Rural Rural Accra Other Rural Rural Ruralurban coastal forest savannah urban coastal forest savannah urban coast forest savanna
Professional 2.32 0.73 0.69 0.47 0.45 2.89 1.16 1.05 0.04 0.17 7.11 1.43 0.27 0.26 0.07
technical
Admin./ 5.24 4.10 1.50 2.56 1.80 4.63 4.76 2.17 3.69 1.70 6.28 5.65 1.46 1.96 1.11managerial
clerical 7.49 4.15 0.34 0.87 0.34 12.96 4.48 1.12 0.94 0.28 14.05 5.46 0.38 0.55 0.26
sales 48.39 34.40 16.68 6.84 5.74 38.95 34.96 14.72 11.26 7.52 38.68 39.10 11.97 5.91 5.76
service 5.02 7.33 0.82 1.69 1.66 8.80 5.72 3.26 1.51 1.02 7.93 5.08 1.95 1.56 0.95
agricultural 30.64 48.22 79.49 87.39 89.92 30.56 47.05 76.67 82.43 89.32 1.49 33.3 77.68 85.92 88.54
production 0.90 1.06 0.47 0.18 0.08 1.21 1.86 1.01 0.13 0.01 24.46 9.98 6.28 3.83 3.31
Source: Authors own calculations.

In Table 10 we discuss the source of income for wage workers. It is apparent thatin Accra and other urban areas, most of the workers are engaged in trading activities(39% in 1991), while in the rural areas it is predominantly agriculture. If we look at thecivil service workers, most of them are males located in the urban areas, with middle orsecondary level education, and most of them (83% in 1991) are non-poor.
Table 11: The characteristics of civil service workers in Ghana.
Characteristics 1987 1988 1991
Sex
male 75.22 76.95 68.97
female 24.22 23.05 31.03
Education level
primary 4.8 6.42 5.07
middle 63.54 59.34 59.96
secondary 17.90 18.29 32.07
higher 13.76 15.95 2.90
locality
urban 60.8 58.1 61.0
rural 39.2 41.9 39.0
Poverty
poor 14.9 14.7 17.0
non-poor 85.1 85.3 83.0
3.2 Child Labor
Child labor is perceived to be a problem in developing countries and Ghana is nodifferent. Child labor is especially prevalent in the rural areas where the capacity toenforce minimum age requirement for schooling and work is lacking. Children work for avariety of reasons, the most important being poverty. Though children are not well paid,they still serve as major contributors to family income in developing countries.Schooling problems also contribute to child labor. Many times children seek employmentsimply because there is no access to school. When there is access, the low quality ofeducation often makes attendance a waste of time for the students. As a result parentsmay find no use in sending their children to school when they could be home learning askill (trade or agriculture) and supplementing the family income.
The concept of child labor is problematic, since it can apply to a range ofactivities which children do. They can range from domestic work to wage work. It couldbe light artisan work to heavy physical work. A key element is whether the arrangementis exploitative- in the extreme case this can take the form of bonded labor or feudalrelationships. The International Labor Organization (ILO) defines child labor as an
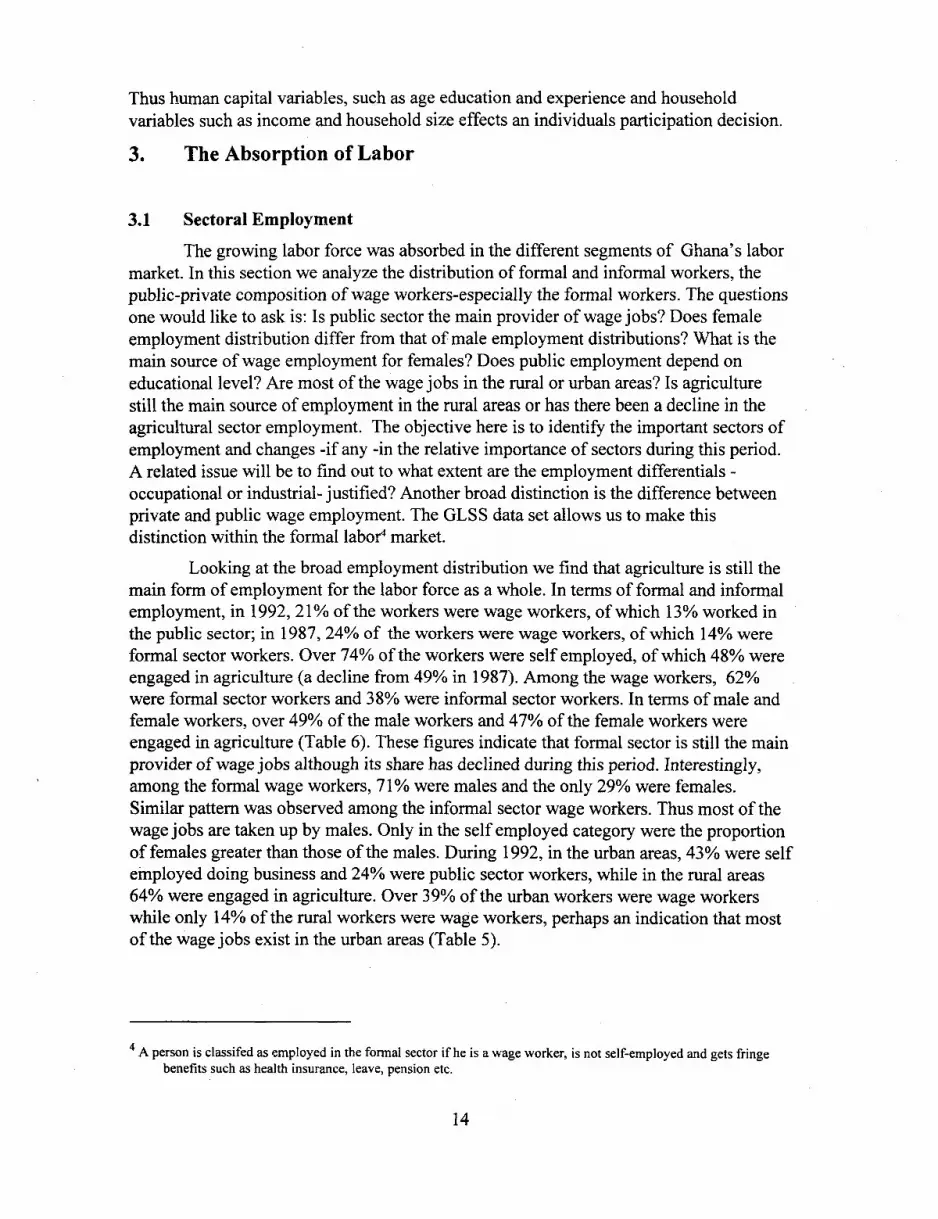
economically active population under the age of 15. Based on this definition, it estimatesa participation rate among 10-14 years old in Africa at 22%. For West Africa the numberis 24.2%. In Ghana the child labor force participation rate was 39% in 1992.
Table 12: Characteristics of child labor by sector, education level, gender andoccupation (Figures in percent).
1987 1988 1991
Sector
Urban 18.50 16.45 14.84
Rural 81.51 83.55 85.16
Education level
No education 15.50 19.50 27.65
Primary 62.83 61.58 52.44
Middle 20.32 17.00 18.49
Secondary 1.15 1.92 1.41
Gender
Male 48.00 53.34 53.0
Female 52.00 47.00 47.0
Occupation
Agriculture related 82.55 78.99 67.55
Non-agriculture 17.45 16.83 32.45
Industry of work
Agriculture 82.75 70.61 59.21
Mining 5.22 8.43 9.01&Manufact.
Elec. const, water 0.00 1.66 0.90
Wholesale &trade 9.58 13.98 20.39
Finance and 0.66 0.65 1.54transport
Services 1.78 4.68 8.95
Sample size 1677 1526 3732
Participation rate 38.0 32.8 39.0
( in percent)
Cote d' Ivoire 54-55%
Nigeria 27-50%
Source: Authors calculations from GLSS 1,2,3.
Note: Child labor is defined as any child who is below 15 years of age and is working, either as awage worker or through self employment
23

This is based on the above mentioned ILO definition. Estimates from other west-Africancountries range from 27-50% in Nigeria to 54% in Cote d' Ivoire (Kanbur and Grootaert,1995).
Since the child labor force participation is high in Ghana, we would like tounderstand the characteristics of the child labor. As seen in Table 12, most of the childlabor is concentrated in the rural areas (almost 85%). Almost 28 percent do not have anyeducation ( an increase from 16% in 1987), while almost 52% have primary leveleducation. This also explains the dropout rate from primary to secondary being high. Ongender basis, boys contribute more to the child labor pool than females. With regards tooccupation and type of industry of work, it is not surprising to find that most of the childlabor is engaged in agriculture related activities, and small portion in trade andcommerce.
3.3 Turnover rates
An issue related to the absorption of labor is the stability of the labor force. Thiscan be seen from the data on turnover rates for different years estimated from the GLSSdata sets. We find that the quit rates have increased during this period, perhaps anindication that the labor market is very dynamic and active. However, the labor market ismore stable in 1991, compared to 1987 and 1988. Perhaps the quit rates were kept low bythe high wages in the formal sector, while the economic reform program undertaken inthe recent years have resulted in a large movement of workers from the formal toinformal sector during 1992, as seen in Figure 2. Also, the quit rates are lower for thosewith higher levels of education (Table 13) and highest for those with no education.
Fig 2: The estimated quit rates among wage workers inGhana.
12 _ .---------
4) 1D , X
4) 2
00-1 3-4 6-7 9-yr yr length of service yr 10
yr
-- x- 1987 1988 -0 _ 1991
Source: Authors' own calculations using GLSS 1,2,3.
Note: Quit rates are estimated using the years of experience. The quit rates for those withexperience t, to t2 is estimated as the percentage of the labor force with atleast t, experienceminus the percentage with atleast t, experience divided by the percentage with atleast t,experience.
24

Table 13: Quit rates by educational level and gender, 1991.
Years of work Level of education Genderexp.
no educ. primary second. higher male female
0-1 1.51 0.27 1.60 2.33 0.26 0.49
1-2 13.55 13.29 14.59 8.33 8.56 9.17
2-3 18.0 18.52 15.19 5.19 10.11 11.12
3-4 16.1 14.39 16.42 8.33 9.78 10.28
4-5 13.37 14.60 16.96 7.81 9.40 9.40
5-6 12.75 15.72 11.83 8.47 9.69 11.39
6-7 11.54 9.84 9.76 12.96 7.88 8.44
7-8 14.78 8.18 16.22 6.38 6.08 6.23
8-9 10.2 7.67 11.29 4.55 6.64 6.28
9-10 15.92 10.72 10.91 4.29 8.00 7.19
3.4 Trends in earnings and employment
Confronted with the lack of reliable data on the evolution of employment inGhana, trends in employment can be assessed by labor demand alone, primarily throughthe analysis of trend in production growth (GDP). It is well recognized that demand forlabor is deternined by two factors: production growth and labor productivity, with thelatter being influenced by technical advances, elasticities of substitution, labor intensityand variances in labor costs. In the absence of reliable data on these factors we rely onproduction growth to see if growth in production in different sectors is being matched bya growth in employment in those sectors. As seen in Table 14, agriculture contributedabout 47% of the GDP in 1991, while 56% of the population was absorbed in that sector(Tables 15-20). Similar pattern was observed in other sectors also. This means increase inproduction was perhaps obtained by increase in employment. In Ghana, there exists adual economy, which features a urban modem economy and a rural subsistence economy.The pattern has remained the same during this period, except that the share of urban self-employed business has increased.
25

Table 14: Share of different sectors in the total GDP (in percent).
Sectors 1988 1989 1990 1991 1992 1993 1994
Agriculture 49.6 49.0 47.9 48.6 48.6 47.8 47.3
Agriculture & livestock 34.9 33.2 33.3 33.9 33.5 33.1 33.0
Cocoa production & Mktg. 8.8 9.7 9.1 9.5 9.8 9.3 9.0
Industry 16.6 16.7 15.9 16.0 16.2 16.0 16.2
Mining 2.0 1.9 1.8 1.8 1.9 2.0 1.8
Manufact. 9.6 10.0 9.2 8.7 8.7 9.1 9.0
Construction 2.9 3.0 3.1 3.5 3.5 3.2 3.3
Services 33.6 33.4 35.8 35.3 34.9 35.7 36.1
transport,storage &Comm. 4.2 4.3 4.4 4.5 4.4 4.3 4.4
wholesaleandretailtrade 18.9 18.7 19.0 17.2 18.3 19.0 19.2
Finance and insurance 2.7 2.7 3.9 4.2 3.6 3.8 3.8
Govt.services 6.9 6.9 7.5 8.2 7.5 7.5 7.5
Community, social services 0.7 0.8 1.0 1.1 1.0 1.0 1.1
Total 100.0 100.0 100.0 100.0 100.0 100.0 100.0
Source: Ghana Statistical service, Ghana.
The trends in the real average monthly earnings per wage worker in the publicand private sector are shown in Figure 3. It is apparent from the graph that the realearnings have some resemblance to the rate of growth of GDP over the years. Thedominant picture is that of a steady increase in real earnings in the early l 980s with asomewhat decline in the late 1 980s, more so in the public sector than in the private sector(Fig 3). While the real earnings in the private sector have remained flat in the 1980s, thesame in the public sector have been very unstable, with the real earnings having fallen inthe late 1980s. Does the fall in earnings in the formal sector imply that the large wagedifferential in favor of the formal sector observed in the 1 970s and early 1 980s haslargely disappeared. In other words is the labor market closer to an equilibrium situationin which the formal sector wages are more in line with the supply price or alternateearnings of labor? This question has to be addressed in terms of the urban informal andrural sectors.
Another related issue is whether the fall in real earnings was caused by a fall inreal wages or by a fall in employment or both. The data analysis tells us that there hasbeen a fall in employment in the formal sector, but we don't have the wage informationof the self-employed. Similarly, secondary data (Ghana Statistical Yearbook) alsoprovides the evidence that there has been a fall in overall employment, more so in thepublic sector (Fig 4). Thus, we can say that fall in employment was one of the factorresulting in the fall in real earnings. The effect of the trend of real wages on the trend ofreal earnings also depend on the wage determination process in the formal sector-throughunions or the government. Government labor market policies either through minimum
26

wages or the wages set by the government in the formal sector have added substantial
importance to wages and employment matters in the formal sector. On the other handeven though there has been a decline in the aggregate employment, the real GDP has
increased during this period (Figure 5), which means that increase in labor productivity
was one of the factors that made this possible. It is not clear whether formal sector leads
the wage determination process, an issue which needs further investigation.
Fig 3: Trend of real monthly earnings per employee inpublic and private sector in Ghana.
120
100 -_
X 60 _X - X
8 20O 6. . ::=. .o - -. r ,:..= .r..
1984 1985 1986 1987 1988 1989 1990
Year
--C * -Public - -X - Private Ail
Source: Ghana Statistical Service.
Fig 4: The Trend in Employment by sectors in Ghana, 1981-
500 U .
450
3 150
1000…-
50 X _ X- - - X- - - X- - - Xv - X- X-
1981 1982 1983 1984 1985 1986 1987 1988 1989 1990
ALL -.o--PUBLIC - -X - PRIVATE
Source: Ghana Statistical Service.
27

Fig 5a: The trend of employment and real GDP in theagriculture sector.
60 150
18 1 9 145.2
year
i 40 <- = 80 o 140 LO)E530 .0-*
2 o 60 ' o o 135 °13 20 130 ,
10~~~~~~~~~~~~~~
0 1251984 1985 1986 1987 1988 1989 1990
years
agri. emp - -o - agri GDP
Fig 5b: The trend of employment and Real GDP inthe industrial sector
14 20 150.
120 .2
0- o 80C, .
E S~p 60 0 0 3
40 C
S 20 3 0 -- ~~~~~~~~~~~~25
1984 1985 1986 1987 1988 1989 1990
years
- - O- .ind-ermp -.-- ind. GDP
Fig 5c: The trend of employment and real GDP in theservices sector in Ghana.
400 200350 0300 - 150.2
250-~S200 -1 00 o :E 150 -- 0- -0
w 100 50 *R
50 0 0
1984 1985 1986 1987 1988 1989 1990
Years
- -o - serv. emp -- serv. GOP
28

Table 15: Employment and locality (1987)
Category Accra Other Urban Rural-coast Rural-Forest Rural-Savannah ALL
urban Total urban total rural Total rural Total rural Total
Government 23.88 80 22.47 191 6.92 33 11.89 109 5.62 33 14.08
Priv-formal 26.27 88 8.94 76 5.66 27 1.74 16 2.04 12 6.9
Pri-Informal 4.78 16 5.41 46 3.56 17 2.51 23 0.85 5 3.38
Self-Agri 2.09 7 19.76 168 51.57 246 72.96 669 79.9 469 49.24
Self-Buss 37.91 127 39.65 337 30.61 146 10.25 94 10.73 63 24.2
Unemp-Inact 2.69 9 3.06 26 1.68 8 0.65 6 0.68 4 1.67
Unemp-Act 2.39 8 0.71 6 0.00 0 0.0 0 0.17 1 0.47
Total 100.0 335 100.00 850 100.0 477 100.0 917 100.0 587 100.0
Table 16: Industry and locality (1987)
Category Accra Other Urban Rural-coast Rural-Forest Rural-Savannah All
urban total urban total rural total rural Total rural Total
Agr/forestry 4.4 12 23.11 156 54.24 211 77.35 632 82.52 392 63.56
Mining&Mfg. 17.60 47 14.96 101 17.73 69 6.24 51 3.78 18 8.77
Elec., Const. 7.49 20 3.41 23 1.23 5 0.85 7 1.05 5 1.74
Wholesale/retail 29.58 79 28.88 195 14.39 56 5.87 48 5.47 26 16.18
Transport 7.86 21 6.07 41 1.03 4 0.24 2 0.42 2 1.71
Services&fin. 32.95 88 23.55 159 11.31 44 9.42 77 7.16 34 8.03
Total 100.0 267 100.00 675 100.0 389 100.0 817 100.0 475 100.0
Source: Authors' own calculations using GLSS 1,2,3.

Table 17: Employment and locality (1988)
Category Accra Other Urban Rural-coast Rural-Forest Rural-Savannah ALL
urban Total urban total rural Total rural Total rural Total
Government 28.8 110 19.88 171 9.51 50 10.13 108 7.51 45 14.88
Priv-formal 20.68 79 11.16 96 7.03 37 4.41 47 2.00 12 7.89
Pri-Informal 4.97 19 5.70 49 3.04 16 3.85 41 1.34 8 3.87
Self-Agri 1.57 6 17.67 152 42.78 225 62.38 665 74.79 448 43.6
Self-Buss 38.22 146 43.95 378 36.31 191 17.92 191 13.86 83 28.8
Unemp-Inact 3.93 15 1.40 12 1.33 7 1.31 14 0.50 3 1.48
Unemp-Act 1.83 7 0.23 2 0.00 0 0.0 0 0.00 0 0.26
Total 100.0 382 100.00 860 100.0 526 100.0 1066 100.0 599 100.0
Table 18: Industry and locality (1988)
Category Accra Other Urban Rural-coast Rural-Forest Rural-Savannah All
urban total urban total rural total rural Total rural Total
Agr/forestry 2.25 7 22.72 160 52.28 195 67.96 628 77.07 380 53.15
Mining&Mfg. 15.11 47 14.35 101 19.30 72 9.52 88 7.30 36 11.51
Elec., Const. 11.57 36 4.12 29 3.21 12 2.16 20 2.03 10 2.98
Wholesale/retail 27.65 86 27.98 197 22.25 83 8.76 81 4.26 21 16.33
Transport 7.71 24 6.39 45 2.95 11 0.54 5 1.01 5 2.72
Services&fin. 35.69 111 24.43 172 15.55 58 11.04 102 8.31 41 13.30
Total 100.0 311 100.00 704 100.0 373 100.0 924 100.0 493 100.0
Source: Authors' own calculations using GLSS 1,2,3.
30

Table 19: Employment arid locality (1991)
Category Accra Other Urban Rural-coast Rural-Forest Rural-Savannah ALL
urban Total urban total rural Total rural Total rural Total
Government 24.18 111 21.72 243 6.14 44 10.14 139 5.83 50 12.98
Priv-formal 14.60 67 6.43 72 3.63 26 2.26 31 0.93 8 4.51
Pri-Informal 8.50 39 5.27 59 3.63 26 2.84 39 1.63 14 3.91
Self-Agri 0.44 2 17.07 191 54.11 388 64.54 885 77.01 660 47.0
Self-Buss 40.74 187 43.61 488 29.85 214 17.58 241 13.07 112 27.46
Non-working 11.55 53 5.90 66 2.65 19 2.63 36 1.52 13 4.13
Total 100.0 459 100.00 1119 100.0 717 100.0 1371 100.0 857 100.0
Table 20: Industry and locality (1991)
Category Accra Other Urban Rural-coast Rural-Forest Rural-Savannah ALL
urban total urban total rural total rural Total rural Total
Agr/forestry 1.22 5 20.19 207 59.05 401 69.95 922 81.23 671 55.78
Mining&Mfg. 22.30 91 13.75 141 11.34 77 8.19 108 3.26 27 9.69
Elec., Const. 5.88 24 3.22 33 2.06 14 1.36 18 0.60 5 1.38
Wholesale/retail 27.20 111 32.48 333 18.41 125 9.63 127 8.35 69 19.24
Transport 6.13 25 7.32 75 1.62 11 1.21 16 0.48 4 2.26
Services&fin. 37.25 152 23.02 236 7.51 51 9.63 127 6.05 50 11.65
Total 100.0 408 100.00 1025 100.0 679 100.0 1318 100.0 826 100.0
Source: Authors' own calculations using CLSS 1,2,3.
31

3. Unemployment
Defining unemployment can be a particular challenge, as the conventionalsubdivision of the economically active population between employed and unemployeddoes not capture the large number of those falling in neither of these categories. In manyinstances it is difficult to determnine the size of the labor force because of the prevalenceof subsistence activities in the rural areas and the informal sector labor force comprisingthe self-employed, casual and unpaid workers in the urban areas. Basically, three broadcategories of unemployed can be distinguished. First, there are the unemployed per se.those out of a job and actively looking for work. Second, there are the underemployed,those who are working voluntarily less than full-time, or those who are working longhours but earning less than the minimum living standards income. Third there are the"discouraged" unemployed, who are unemployed but not actively looking for work. Inour analysis, we define the unemployeds as those who are between 15-64 years of ageand are actively looking for work; and the discouraged workers as those not activelysearching for work.
We see on the basis of GLSS data, that the overall unemployment rate for activepersons has decreased slightly from 1.9 to 1.5 percent. The unemployment rates for theinactive persons, though of higher order has also declined from 14% to 8%. A closeinspection of the data reveals that unemployment rates tend to decrease with age.Eventhough the total unemployment rates have declined the composition of theunemployed have changed with more younger people (age 15-24 yrs) in the category(Table 9). Overall, young people's stock of unemployed is about 25% higher than theirshare of labor force. Also most of the unemployed are females compared to males,eventhough the female labor force participation rates have increased dramatically over theyears. The unemployment rates also vary by educational levels, and tend to decrease witheducation. In 1992, over 54% of the unemployed only had middle school level educationand 16% had secondary education, while only 10% of the unemployed had primaryschooling. It appears that those who are educated but not having acquired specific skillsare disadvantaged in the labor market. This would suggest a mis-match between theirtraining and job expectations and the characteristics of the jobs available in the economy.On the other hand, unemployment among the illiterates is the lowest of all (0.8 % in1992), and open employment seem to increase with education level. A possibleexplanation for this could be that in the context of general shortage of jobs, unskilledworkers with low expectations are better prepared to accept available jobs in the informalsector which are low paid and less secure. This points to the issue of the relevancy of thecurrent educational system which raises the student expectations without providing theskills that are in demand in the economy. The incidence of unemployment also seems tobe a urban phenomenon. In 1992, more than 80% of the unemployed belonged to theurban areas up from 75% in 1987. However, this needs to be interpreted with caution,because in rural areas many workers may be just engaged in farming as a part-timeworker since he/she has nothing else to do. Eventhough the worker is not working full-time he/she can be classified as employed as per our definition. As a result theunemployment rates may be artificially low in the rural areas than in urban areas.

Table 21: Unemployment rates by sector, locality, age-groups, gender and educationlevel, 1987-91 (figures in percent).
1987 1988 1991
Category Unemp. Unemp. Unemp. Unemp. Unemp. Unemp.
(active) ( Inactive) (active) ( Inactive) (active) ( Inactive)
Urban 79.50 55.40 89.32 52.05 84.52 60.65
Rural 20.50 44.61 10.68 47.95 15.48 39.35
Gender
Male 49.07 45.8 45.63 44.12 42.75 46.55
Female 50.93 54.2 54.37 55.88 57.25 53.55
Age-groups
15-19 24.84 47.97 40.78 53.10 11.76 55.97
20-24 35.40 18.90 32.04 17.26 33.33 20.15
25-44 26.09 20.28 21.36 18.48 43.53 15.28
45-49 0.62 2.07 1.94 2.01 3.14 3.49
50-54 4.97 3.45 2.91 2.44 4.31 7.12
55-59 5.59 3.62 0.97 2.62 2.75 7.34
60-64 2.48 3.71 0.00 4.10 1.18 12.01
Educ. level
No education 0.00 1.73 0.00 2.18 0.78 3.83
primary 9.32 16.65 10.68 19.09 9.80 11.61
middle 55.28 39.60 58.25 43.07 53.73 45.89
secondary 4.35 8.98 6.80 8.20 16.08 14.79
Higher 0.62 0.52 0.00 0.52 0.00 0.38
others 30.43 32.53 24.27 26.94 19.61 23.49
Poverty
Poor 20.94 36.07 16.83 36.08 21.57 30.18
Non-poor 79.06 63.93 83.17 63.92 78.43 69.82
Locality
Accra 37.27 24.29 46.60 26.32 23.81 18.65
Urban 42.24 19.66 42.72 16.64 60.71 42.00
R.Coastal 8.07 7.94 2.91 9.26 3.57 9.38
R.forest 9.94 11.89 6.80 11.82 7.54 16.23
R.Savanah 2.48 8.37 0.97 7.90 4.37 13.74
All 1.93 13.92 1.21 13.44 1.56 8.23
Kenya 6.1 6.9
(1978) (1986)
Source: Authors' own calculations using GLSS 1,2,3.
33

The major results are summarized below:
1. Unemployment rates (for those actively searching) has declined during this period.
2. The share of male unemployment rates has declined while that of femaleunemployment has increased.
3. The decline in male unemployment is mainly brought about by the 15-24 age groupswhose share has declined in the total number of unemployed.
4. There is no direct relation between formal levels of education and unemployment. Theshare of secondary school educated have gone up in the total number of unemployed.
5. Unemployment is lower in the rural areas than in the urban areas. Perhaps an artifactbecause, in the rural areas even though a person is underemployed, he may still identifyhimself as being employed. The urban unemployement figures may be more close toreality.
3.6 Migration
The GLSS data sets contain a small amount of information about migration inGhana. This section examines the pattern of migration to get a broad picture of migrationflows to different regions in Ghana. From the data a few observations can be maderegarding the pattern of migration. First, there is a reverse pattern of migration-most ofthe migration is from urban to rural than from rural to urban (Table 22). Second, there isregional segmentation in migration-migration to high growth regions, such as GreaterAccra, Ashanti and Western regions (Table 23); there is more between migration thanwithin migration to these regions. Third, Eventhough most of the migration is familybased, employment related migration has increased substantially during this period,especially in the last period (Table 24).
34

Table 22: Sectoral Migration in Ghana, 19897-88 (in percent).
Sectors 1987 1988 1991
From Rural Urban Rural Urban Rural Urban
Rural 33.46 11.56 34.68 10.97 58.37 30.24
Urban 32.21 22.77 31.91 22.44 6.63 4.76
All 65.67 34.33 66.58 33.42 65.00 35.00
Sample size 4948 2587 4359 3660 3765 6991
Table 23: Regional Migration in Ghana, 1987-91 (in percent).
Regions 1987 1988 1991
Within Between Within Between Within Between
Western 53.78 46.22 48.03 51.97 36.46 63.54
Central 50.86 49.14 55.16 44.84 42.37 57.63
Gr.Accra 39.82 60.18 35.28 64.72 15.38 84.62
Eastern 60.46 39.54 62.78 37.22 52.52 47.48
Volta 61.50 38.50 60.43 39.57 43.97 56.03
Ashanti 61.72 38.28 60.41 39.59 47.97 52.03
Brong-Ahafo 54.45 45.55 61.01 38.99 47.17 52.83
Northern 76.91 23.09 73.76 26.24 50.00 50.00
U/West 72.21 27.79 58.04 41.96 26.76 73.24
U/East 54.25 45.75 42.74 57.26 4.89 95.11
Source: Authors' own calculations using GLSS 1,2,3.
Table 24: Major reasons for migration, 1987-91.(in percent)
Reasons for Migration 1987 1988 1991
Moving with family 54.35 56.15 43.3
Work-related 14.84 14.01 19.6
Marriage 13.54 10.44 23.1
school 7.02 6.54 6.1
Adventure 3.65 2.71
Others 6.37 10.15 7.8
Source: Authors' own calculations using GLSS 1,2,3.
Since most of the migration is towards the high growth regions-Ashanti, GreaterAccra and Western, it would be interesting to look at the characteristics of the migrantworkers- their educational levels, age, occupation and kind of industry in which they find
35
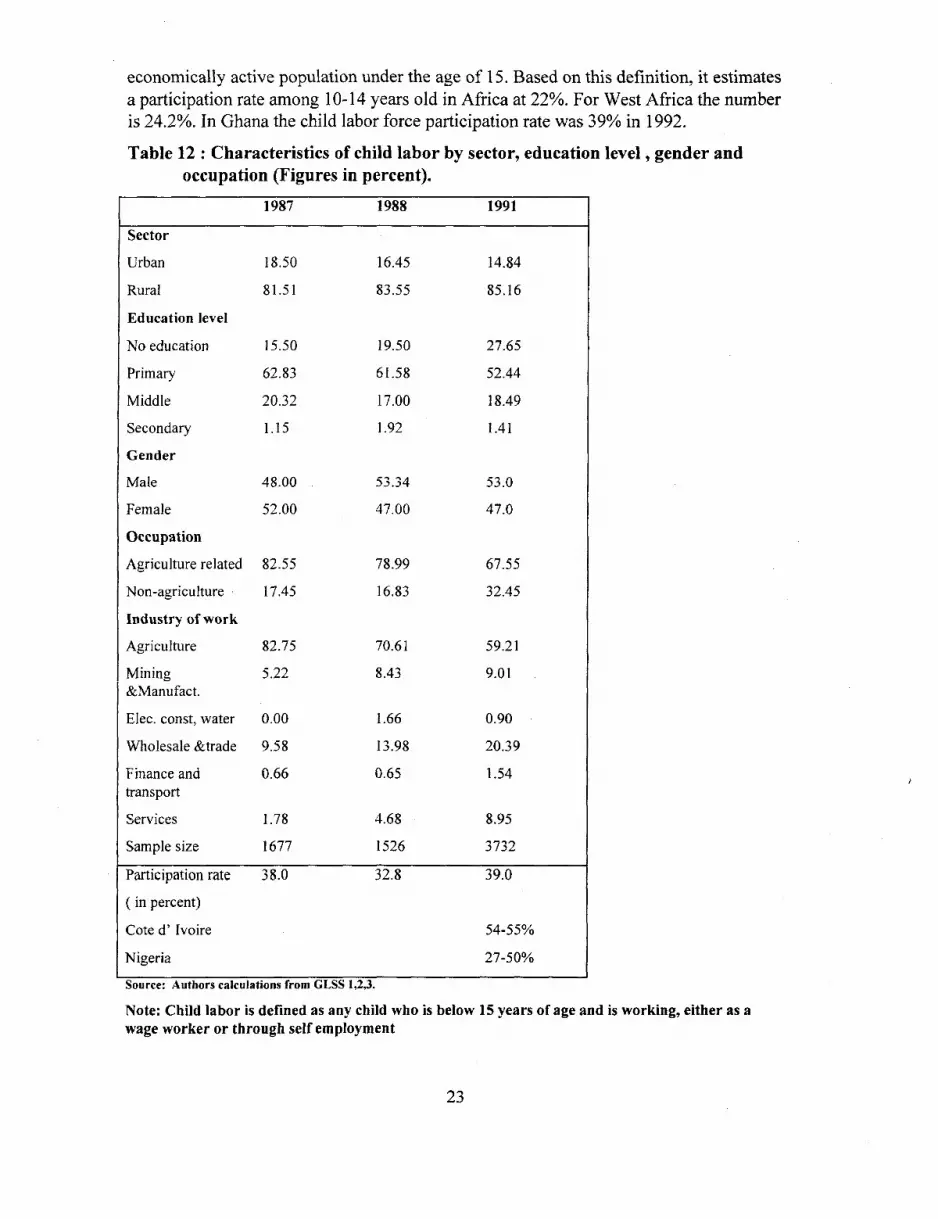
employment . As seen in Table 25, most of the migrant workers are females migratingmainly for family reasons (Table 24), Eventhough their share has declined during thisperiod, most of them have a primary to middle school level education, but the share ofthose with secondary and higher level education has also increased. Most of the migrantsare engaged in agriculture related activities, Eventhough the share has declined. Most ofthem migrate from rural forest areas followed by other urban areas.
Table 25: The characteristics of migrant workers in Ghana (in percent).
1987 1988 1991
Sex
male 36.12 47.49 48.68
female 63.88 52.51 51.32
Educ. level
no education 1.74 1.00 14.6
primary 22.34 22.83 30.5
middle 63.20 60.95 40.3
secondary 8.41 9.32 7.1
higher 0.82 0.95 2.3
TTA/Others 3.49 4.96 5.1
Occupation
Professional/ 0.76 0.97 1.04
technical
Admin./ managerial 3.51 4.91 3.31
clerical 2.60 3.77 2.63
sales 18.76 17.37 15.97
service 3.69 4.69 3.31
agricultural 70.24 67.53 66.93
production 0.44 0.76 6.81
Locality(5)
Accra 12.21 14.26 11.75
Other Urban 29.48 28.40 27.57
Rural coast 13.75 14.95 14.28
Rural forest 33.39 32.24 35.26
Rural Savannah 11.17 10.14 11.14
36

4. Education and Employment
The potential contribution of education to improving labor productivity, loweringincome inequality and promoting growth and development is well recognized, andvirtually all governments set aside a substantial portion of their public expenditure budgetfor education. Since independence, the nations of sub-Saharan Africa have investedheavily in the education sector. The achievements in the sector have been impressive bothin absolute terms and in relation to other sectors. However, primary enrollments havestagnated or even declined recently, and the quality of education has apparently declined.These reversals have occurred in an era of mounting fiscal austerity, population growthand strained political climate, all of which have hurt the education sector, and thedeterioration in educational services have exacerbated the regions' economic and socialproblems. Between 1970 and 1980, while the world's population grew at an averageannual rate of 1.9 percent, Africa's population grew at 2.9 percent (World Bank, 1993,P. 18), and is projected to grow even faster at a rate of 3.2 percent a year, while growthrates are declining in other parts of the world. Africa's rapid population growth createsserious problems for education. To keep pace with the growth of school-age children,more schools, teachers, books etc. are required.
Extensive experience from Africa and elsewhere provide strong evidence thatincreased investment in education can yield broad economic benefits-including higherincomes and lower fertility. It can accelerate the growth process, and act as a complementto other growth inducing factors. However, public expenditure on education, bothabsolutely and as a percentage of GNP has fallen in many countries. The economicevidcnce based on micro and macro-level data indicate significant returns to education.The micro-level analysis examine the relation between an individuals education level andhis/her productivity in the labor market as a wage worker or self-employed worker; or bylinking the education of individuals to the outcomes of household behavior, such asfertility, child mortality etc. The macroeconomic evidence relates to the growth ofnational economies to prior investments in education controlling for other factors. Eventhough there is an enormous literature on estimating rates of return to schooling and onthe job training, there are few empirical studies from sub-Saharan Africa (Ghana, Kenya).This paper build on the earlier paper on returns to education in Ghana (Glewwe, 1988).While Glewwe's (1988) work was based on GLSS 2, we look at the returns to educationduring the period 1987-91. This survey includes two time periods, before and after theeducational reforms in Ghana, and can help us better understand whether education paysin the labor market..

4.1 Literacy rates by region and gender in Ghana
Literacy raises the productivity and earning potential of the population, andimproves their quality of life. However, low literacy rates continue to be a problem inmost of sub-Saharan African countries. Most of the educational systems with highenrollment rates are often plagued by high dropout rates. Even though there is no clearcut definition of literacy, we define a person to be "literate" if he can read and write. Ofcourse this definition is very subjective. A person is considered to be "read literate" if hecan read the newspaper, "write literate" if he can write a letter and "math literate" if hecan do simple calculations. This section will examine the status of literacy in Ghana,based on the GLSS survey. This will help us better understand the extent of differencesacross such social lines as gender, region and age groups. Table 26 shows the literacyrates for the whole population. Literacy rates(read&write) have increased from 37% in1987 to 49% in 199 15. Literacy rates are higher in the urban areas(65%) than in therural(40%) in 1991. Also, the male literacy rates are higher than the female literacy rates.Looking at literacy rates within the age groups cohorts, we find that younger the agecohort, the more literates. Higher literacy rates in the younger age groups is an indicationof advancement in the primary and secondary schooling, while lower literacy ratesamong age cohort 25 and above is an indication of lower access to primary education inthe past. The main results are: The adult Literacy rates(read and write) is about 49%;Government estimates around 44% in the 1984 census. Male literacy is higher thanfemale literacy. Urban literacy is higher than rural literacy and by age-cohort, the literacyrates are higher for younger people.
4.2 Dropouts and repetition:
The GLSS data sets do not provide much information on dropouts and repetition,therefore one has to rely on indirect sources to ascertain information on this aspect. Onesuch way is to look at the educational level by age groups. Obviously, one would thinkthat age 5-10 yr children would be predominantly in primary, 11 -15 yr olds in middle, 16-20 yr olds in secondary and 21-25 yr olds in higher level education. As seen in Table 27,most of the 11-15 yr old are still in primary level, when one would expect them to be inmiddle level, and similarly in the age group 16-20 year olds, most of the students are stillin middle, when they are supposed to be in secondary. These numbers would suggest thatthe dropouts/repetition are higher in the 11-20 year age category.
5The GLSS3 is not fully compatible to the GLSSI & 2, in terms of literacy measures since the survey questions areslightly different. In the GLSS I&2 the question asked is: Can you read a newspaper or can you write a letter,while in GLSS3 the asked question is: "Can you read a newspaper in your langauage or in English"; and "canyou write in your native language or in English".
38

Table 26: Progress in Adult literacy (figures in percent).
.Items 1987 1988 1991
read literacy 38.70 39.40
Read&Write literacy 36.61 37.03 48.8
Read, Write & Maths literacy 36.20 36.84
Read and Write Literacy
Male 48.18 48.51 60.8
Female 25.44 25.97 38.5
Age-group (by cohort)
15-19 yrs 36.64 34.57
20-24 yrs 50.46 47.26
25-44 yrs 44.33 47.86
> 44 yrs 19.06 19.71
Urban 48.54 54.29 65.0
Rural 29.73 27.94 40.0
Source: Authors' own calculations using GLSS 1,2,3.
Note: A person is defined as "Literate" if he is able to read and write.
39

Table 27: Educational level by age-groups for those currently enrolled.
1987 1988 1991
Age-group Pri Mid. Sec. Hligh. Pri Mid. Sec. High. Pri Mid. Sec. High.
5-10 28.03 0.48 0.0 0.58 35.79 0.79 0. J6 0.35 32.28 0.37 0.71 0.96
11-15 20.50 16.10 14.24 10.56 27.36 10.25 7.53 8.76 31.74 11.17 4.96 6.71
16-20 15.56 22.83 27.71 14.33 9.24 21.79 28.19 7.86 10.04 22.22 27.62 6.27
20-25 9.94 18.89 23.53 11.20 6.69 16.18 19.69 11.95 6.16 15.62 21.67 19.70
over25 25.76 59.34 34.52 75.51 20.91 51.07 43.44 71.38 19.78 50.62 45.04 67.36

4.3 University graduates:
Among the university graduates in the sample, we find that the proportion offemales have increased during this period. At the regional level, most of the graduatescome from Accra and other urban areas, but the number of graduates coming from ruralareas has increased during this period. Most of them come from smaller households,perhaps an indication that they are becoming independent from the nuclear family. Eventhough most of the graduates are non-poor, the share of poor graduates has increasedduring this period, which is also reflected in the increased unemployment rates foruniversity graduates.
Table 28: Characteristics of University graduates (in percent).
Characteristics 1987 1988 1991
Gender
Male 85.11 85.00 81.75
Female 14.89 15.00 18.25
Sector
Rural 19.15 8.51 25.00
Urban 80.85 91.49 75.00
Hhsize
1-5 persons 57.45 59.57 55.36
6-10 persons 40.43 40.43 37.51
10-15 persons 2.13 0.00 7.13
> 15 persons 0.00 0.00 0.00
Poverty status
poor 10.64 2.13 16.90
Non-poor 89.36 97.87 83.04
Unemployment rate 0.55 0.54 1.51
Locality-5
Accra 27.66 40.43 34.82
Other Urban 53.19 51.06 40.18
Rural.coastal 2.13 0.00 7.14
Rural forest 14.89 8.51 10.71
Rural Savanah 2.13 0.00 7.14
Source: Authors' own calculations using GLSS 1,2,3.

5. Returns to Education
The returns to education can be estimated using the human capital model (Becker,1975 and Mincer, 1974), wherein one can estimate the returns to additional years ofschooling by using the wage data collected from persons who have different levels ofeducation. The model assumes that wage earners are paid according to their marginalproduct, which rises as more human capital is accumulated. Using the earnings functionapproach, we can write the wage earnings (W), a function of years of schooling(S), yearsof experience(E) and other factors.
ln(wi) =aO+CClSi+ Uc2 Ei+cx3E2 +E (1)
Years of schooling can be interpreted as an aggregate measure of human capital obtainedfrom formal schooling, while experience is an indicator of human capital acquired whileemployed (or on the job training). One can interpret Cal as the private rate of return toschooling, based on mincer's earnings function. If we assume that the cost of additionalschooling is simply the wages foregone (Ws-,), then the private rate of return (CC ) can beshown to be equal to the annual increase in income (W, - Ws-,) divided by the cost ofinvestment (which is the wages foregone, W,_l). A more general variant of (1) allowsdifferent levels of schooling (e.g. primary, secondary and higher) to have different privatereturns, and can be written as:
ln(wi)= co+acpSpi +aSs,±i+C,Si +a2 Ei+ 3 E E+ui (2)
where Sp;, S,i and Std are the number of years in primary, secondary and tertiary educationithrespectively for the i individual.
Table 29: Mean Wage Earnings by Educational level in Ghana (in cedis).
Education level 1987 1991
Earnings mean earnings meanschooling schooling
No education 72398.36 213786.6
Primary 57152.43 3.1 200805.01 6.1
Middle 62512.13 6.0 264004.8 9.2
Secondary 90653.82 11.1 357161.7 13.6
Higher 141900.6 .20.9 591255.8 19.7
All 84462.72 7.0 297584.9 7.1
Mean earnings estimates by educational level are presented in Table 29. It showssignificant earnings differential by level of education. In 1991, workers who havecompleted tertiary level education earned 2.7 times more than do illiterate workers. Inan attempt to explain the earnings variance of the sample we estimate earnings function,as shown in Table 30. As discussed earlier, the model is of the Mincerian type withcontinuos years of schooling and experience as the independent variable. The signs of the
42

coefficients conform with the human capital theory. As expected, both years of schoolingand experience have positive and significant effects on earnings, indicating that earningsincrease with schooling and experience. The results are more or less same for the threesurveys.
Table 30: Basic Earnings function by years of schooling, in Ghana.
Variable 1987 1991school 0.035 0.061
(7.04) (13.3)Age 0.11 0.08
(6.8) (4.5)Age-squared -0.001 -0.007
(-5.2) (-3.1)Log hours worked -0.24 -0.34
(-8.25) (-7.6)female 0.11 -0.06
(1.76) (-1.04)Other urban 0.09 -0.27
(1.4) (-4.4)Rural coastal 0.12 -0.12
(1.2) (-1.33)Rural forest 0.07 -0.22
(0.8) (-3.03)Rural Savannah 0.16 -0.14
(0.8) (-1.26)Constant 2.75 4.9
(8.40) (10.9)R-squared 0.24 0.29Sample size 765 1021
Earnings function using the dummy variables for the different levels of educationare given in Table 31. The results corroborate the findings described earlier. Instead ofusing the years of schooling we use the highest attained level of education. However, wedon't have information whether the individual has completed that level or not. Thisspecification enables one to analyze the earnings premium associated with each level ofeducation. Clearly, the earnings premium increases significantly with the level ofeducation (Psacharapoulos, 1981). This is particularly the case for those with secondaryand higher level education, and especially higher level.
43

Table 31 Extended earnings function by levels of education, in Ghana.
Variable 1987 1991below Primary -0.07 -0.07
(-0.58) (-0.57)Primary -0.2 -0.02
(-1.1) (-0.1)Middle 0.09 0.42
(0.8) (5.2)Secondary 0.27 0.77
(3.8) (8.6)Higher 0.87 1.18
(7.4) (10.8)Age 0.11 0.09
(7.4) (5.3)Age-squared -0.001 -0.008
(-5.7) (-3.7)Log hours worked -0.29 -0.31
(-10.4) (-7.25)Other urban 0.13 -0.27
(1.99) (-4.3)Rural coastal 0.15 -0.08
(1.5) (-0.9)Rural forest 0.05 -0.19
(0.58) (-2.5)Rural Savannah 0.08 -0.18
(0.8) (-1.7)Constant 3.23 4.73
(10.3) (10.9)R-squared 0.24 0.27Sample size 919 1140
Table 32: Marginal returns to additional years of schooling in Ghana.
Variable 1987 1991
schooling 0.13 0.063
Schooling-squared -0.0021 -0.0005
experience 0.02 0.03
urban -0.68 0.07
hours -0.34 -0.46
constant 4.94 7.66
R-square 0.29 0.28
Sample size 512 797
44

5.1 Private and Social returns to education
On the basis of the earnings profiles of the individuals, one can estimate theprivate rate of return by using the short cut method (Psacharopoulos, 1995):
Private rate of return = Yb - Y, / S * Y,
where the mean earnings by level of education are used. Yh refers to the mean earnings atthe higher level of education and Y, the mean earnings at the lower level of education. Sis the number of years spent at the higher level of education. Thus Yh-yl is the earningsdifferential between the two levels of education, and Y, refers to the student's foregoneearnings or indirect costs.
In order to estimate the social returns to education we have to include the fullresource cost of investment (direct cost and foregone earnings). These costs will be addedto the denominator so that the formula becomes:
Social rate of return = (Yh - y4) / S * (Yj + Ch)
Where Ch is the annual direct cost of the higher level of education. Since the costs arehigher in a social rate of return calculation relative to the private rate of return, the socialreturns are lower than the private returns. The difference between the private and socialrates reflect the degree of public subsidization of education.
Table 33: Unit costs of public education by levels, in Ghana (in cedis)
Educational Level 1987-88 1991
primary 3199 17071
middle 4561 27648
Secondary 12624.5 53979
Higher 178954 554000
Note: The costs are per student by level.
Source: Staff appraisal report, No. , West Africa Department, The Worldbank.
As elsewhere, primary education exhibits the highest private and social rates ofreturn than any other level of education. In 1991 the return to higher education is almostthe same as that of the primary level. Also, we can see that higher education is mostheavily subsidized, with a public subsidization of index ( the percent by which the privaterate exceeds the social rate) of 255.1 as opposed to 125.8 for primary education. Theresults are similar to those found elsewhere (Psacharapoulos et al, 1994)
45

Table 34: Private and Social returns to education by levels using the short-cutmethod (in percent).
1987 1991
Educational Level Private Social Private Social
Secondary (vs. primary) 7.3 5.9 10.3 8.2
Higher (vs secondary) 6.2 2.1 10.9 4.2
The "Full method" which discounts the actual net age-earnings profiles is themost appropriate method of estimating the returns to education because it takes intoaccount the most important part of the early earning history of the individual. The privaterate of return to educational investment in such a case can be estimated by finding the rateof discount that equalizes the stream of discounted benefits to the stream of costs at agiven point in time. However, it requires more comprehensive data on age-educationalearnings for constructing a "well behaved" (non-intersecting) age-earnings profiles. Table35 shows the private and social rates of return using the full method.
Table 35: Returns to education by four levels of education using full method, 1991.
(in percent)
Educational Level Private Social
Primary (vs. no education) 19.4 11.2
Junior Sec. (vs. Primary) 13.5 10.6
Senior Sec. (vs Junior Sec.) 19.5 14.0
Higher (vs Senior sec.) 9.1 7.2
46

6. Summary and Conclusions
We have seen that labor force growth rate being slower than the population.growth rate in Ghana during 1980-90, but the pattern has reversed ever since. Hence thereis going to be an increased supply of labor, and this is very true of the youth populationof this country which is expected to grow at an even faster rate during 1990-2000. Inorder to cope with this increased young labor force the labor markets have to becomemore efficient and be able to absorb the increase in active population. The labor forceparticipation rates of those between 26-45 years have been increasing rapidly and havingits pressure on increasing labor force. Although on average female participation rateshave become equal to males during this period, still there is wide dispersions betweenfemales and males when looked at by sector of employment. Women are mostly in theself-employed group while wage employment is unduly over represented by men. Theincrease in female LFP has increased the participation rates in rural areas from 62 percentin 1987 to 75 percent in 1992. However, one of the worrying features of increasing laborforce and those unemployed is that they are on average highly educated than those of adecade ago.
The share of formal employment is on decline while private infornal sector sharehas been increasing, especially in urban areas. Self employed trade category has beenabsorbing more labor during this period with majority of them having primary educationor less. Formal sector employs most of the educated labor with a majority of them havingmiddle or secondary schooling. Most of the post-secondary qualified are in the publicsector and most of them are males. The share of females has been increasing but onlymarginally. Unemployment is a pervasive problem in urban areas while visibleunemployment is much smaller in rural areas. The latter may be due to large hiddenunderemployment in rural areas as has been shown elsewhere (Alderman et al, 1993).
The production figures by broad sectors show that increases in GDP share hasbeen corresponded by larger number of people employed. This indicates that laborproductivity may have not been increasing and possibly declining. This, among otherthings, definitely has implications for the profitability of most economic activities andtheir absorptive capacity in the long-run and require further analysis.
Between 1987-92 the survey figures indicate that there has been reverse migrationwith large number of people moving from urban to rural areas. Apart from few growthpoles, such as Greater Accra, Ashanti and Western regions, all other urban centers havebeen displaying out migration. In terms of reasons most migration has been for familyreasons; employment related migration has been on the increase. This indicates that labormobility has been increasing, but it is difficult to establish how many of them weremoving with lucrative employment.
Literacy rates have been showing an interesting picture. Female literacy rates havebeen lower than males and this seem to have had an impact on employment opportunitiesin the informal sector, making it a male dominated sector. The proportion of femalegraduates is on the increase although the rates of return are still low. Most of the
47

graduates continue to come from urban centers and nuclear families. Most of thegraduates have been able to escape from poverty in the past although recently this trendhas been changing.
The rate of return to schooling increases with higher education and jobexperience. It is observable that in the wage sector primary education without skills hasnot been very rewarding. The return to an additional year of schooling has been varyingbetween 4-6 percent in Ghana which is quite high for a Sub-Saharan African country.However, it is very important to note that the sectoral wage differences and public sectordoes reward formal sector better on average. Also, there has been the concern that thequality of education is declining. This is an issue which needs further investigation andmight be useful in understanding the relevance of present education system for emergingnew employment opportunities in Ghana. The returns to education analysis based onwage workers show that private and social returns to education are higher for primarythan secondary or post-secondary. However, it is worth noting that higher educationcarries the larger amount of public subsidization compared to primary and might beuseful for designing educational reform and policies in Ghana. This again is an issuewhich needs further investigation. Also, the rate of returns to education from self-employment might have a different story to tell and one needs to explore this beforemaking broad inferences about education-employment mismatch (Vijverberg, 1995).
The present overview paper has elaborated some interesting hypothesis and broadrelationships which can be further analyzed and used for policy design and sectorinvestment. The current state of knowledge although useful does not give robust results tomake causal links. Also, the GLSS data itself does not lend itself to meaningful analysisand one needs to see other sources of information and methodologies. Female education,female employment and self-employment sector are currently very weak in terms ofcausal links and until one has some firm findings it is not easy to be useful for policydesign or even poverty alleviation in this country. A country with more than one third ofits population below poverty level and almost 70 percent in agriculture and self-employment, any useful analysis has to give due weight to the various sectoralcompositions of employment in the economy. This has to be a high priority in the futureanalytical work on labor markets and poverty in Ghana.
48

7. Bibliography
Alderman, H, Sudharshan Canagarajah and Stephen Younger. 1995. A comparison ofGhanaian Civil Servant's Earnings Before and After Retrenchment. Journal ofAfrican Economies, Volume 4, No.2, pp 259-88.
Beaudry, P and N.K.Sowa. 1994. "Ghana". In Labor markets in an ara of adjustment, bySusan Horton, Ravi Kanbur and Dipak Mazumdar (Eds.), The World Bank,Washington, D.C
Cohen, Barney and William House. 1994. Education, Experience and Earnings in thelabor market of a developing Economy: The case of Urban Khartoum. WorldDevelopment, Vol. 22, No. 10, pp 1549-1565.
Glewwe, Paul. 1988. Schooling, skills and returns to government investment ineducation, LSMS working paper No. 76, The World Bank.
Heckman, James. 1979. Sample Selection as a specification error. Econometrica, Vol.46, No 2, pp 153-61.
Horton, S, Ravi Kanbur and Dipak Mazumdar. 1994. Labor Markets in an era ofadjustment, The World Bank.
Kanbur, R and C.Grootaert. 1995. Child Labor: A review. Working paper No. 1454, TheWorld Bank.
Mazumdar, Dipak. 1991. Labor Markets in Kenya. Mimeo, Africa Region, The WorldBank, Washington, D.C.
Mincer, J. 1974. Schooling, Experience and Earnings. National Bureau of EconomicResearch. New York.
Psacharapoulos, George, Eduardo Valdez and Harry A. Patrinos. 1994. Education andEarnings in Paraguay, Economics of Education Review, Vol.13, No.4,
pp 321-327.
Psacharapoulos, George. 1981. Returns to Education: an updated internationalcomparison. Comparative Education, Volume 17, No. 3, pp 321-341.
Riveros, Luis and Lawrence Bouton. 1991. Efficiency wage theory, labor markets andadjustment, WPS No. 731, The World Bank, Washington, D.C
Stevenson, Gail. 1992. How public sector pay and employment affect labor markets.WPS No. 944, The World Bank, Washington, D.C
Van Adams, Arvil, John Middleton and Adrian Ziderman. 1992. Manpower planning in amarket economy with labor market signals, WPS No. 837, The World Bank,Washington, D.C
Vijverberg, W.P.M. 1995. Measuring income from Family Enterprises with HouseholdSurveys, LSMS working paper no. 84. The World Bank.
49

World Bank. 1995. Ghana:Poverty, private sector and structural Adjustment. WestCentral Africa Department, The World Bank, Washington, D.C.
------------, 1993. World Development Report, The World Bank.
------------, 1995. World Development Report, The World Bank.
-----------, 1991. Youth Unemployment in Mali. West Africa Department, The WorldBank, Washington, D.C.
50


Policy Research Working Paper Series
ContactTitle Author Date for paper
WPS1732 Agricultural Trade and Rural Dean A. DeRosa February 1997 J. NgaineDevelopment in the Middle East 37959and North Africa: Recent Developmentsand Prospects
WPS1733 The Usefulness of Private and Public Yuko Konoshita February 1997 R. ReffInformation for Foreign Investment Ashoka Mody 34815Decisions
WPS1734 Are Markets Learning? Behavior in Luca Barbone February 1997 L. Barbonethe Secondary Market for Brady Lorenzo Forni 32556Bonds
WPS1735 Competition Policy and the Global Bernard Hoekman March 1997 J. NgaineTrading System: A Developing-Country 37949Perspective
WPS1736 Creating Incentives for Private Ian Alexander March 1997 R. SchneidermanInfrastructure Companies to Become Colin Mayer 30191More Efficient
WPS1737 Ownership and Corporate Stijn Claessens March 1997 F. HatabGovernance: Evidence from the Simeon Djankov 35835Czech Republic Gernard Pohl
WPS1738 Some Aspects of Poverty in Sri Gaurav Datt March 1997 A. RamirezLanka: 1985-90 Dileni Gunewardena 85734
WPS1739 Safe and Sound Banking in Gerard Caprio, Jr. March 1997 B. MooreDeveloping Countries: We're Not 38526in Kansas Anymore
WPS1740 When is Foreign Aid Policy Credible? Jakob Svensson March 1997 R. MartinAid Dependence and Conditionality 39026
WPS1741 Privatization, Public Investment, and Harry Huizinga March 1997 P. Sintim-AboagyeCapital Income Taxation Soren Bo Nielsen 38526
WPS1742 Transport Costs and "Natural" Azita Amjadi March 1997 J. NgaineIntegration in Mercosur L. Alan Winters 37947
WPS1743 How China's Government and State Lixin Colin Xu March 1997 P. Sintim-AboagyeEnterprises Partitioned Property 37644and Control Rights
WPS1 744 Moving to Greener Pastures? Gunnar S. Eskeland March 1997 C. BernardoMultinationals and the Pollution- Ann E. Harrison 31148haven Hypothesis
WPS1745 How Foreign Investment Affects Host Magnus Blomstrom March 1997 J. NgaineCountries Ari Kokko 37947

Policy Research Working Paper Series
ContactTitle Author Date for paper
WPS1746 The Role of Long-Term Finance: Gerard Caprio, Jr. April 1997 P. Sintim-AboagyeTheory and Evidence Asli DemirgOg-Kunt 38526
WPS1747 Protection and Trade in Services: Bemard Hoekman April 1997 J. NgaineA Survey Carlos A. Primo Braga 37947
WPS1 748 Has Agricultural Trade Liberalization Merlinda D. Ingco April 1997 J. NgaineImproved Welfare in the Least-Developed 37947Countries? Yes
WPS1749 Applying Economic Analysis to Gary McMahon April 1997 C. BernardoTechnical Assistance Projects 37699
WPS1750 Regional Integration and Foreign Magnus Bl6mstrom April 1997 J. NgaineDirect Investment: A Conceptual Ari Kokko 37947Framework and Three Cases
WPS1751 Using Tariff Indices to Evaluate Eric Bond April 1997 J. NgainePreferential Trading Arrangements: 37947An Application to Chile
WPS1 752 Ghana's Labor Market (1987-92) Sudharshan Canagarajah April 1997 B. Casely-HayfordSaji Thomas 34672