getting it the second time around: student classroom experience in chicago's summer bridge...
TRANSCRIPT

Getting It the Second Time Around:
Student Classroom Experience in
Chicago’s Summer Bridge Program
SUSAN I. STONE
University of California at Berkeley
MIMI ENGEL
Northwestern University
JENNY NAGAOKAMELISSA RODERICK
University of Chicago
Increased use of high-stakes testing has been accompanied by an expansion of summerschool programming. Few investigations focus on student experience within theseprograms. Using multiple methods, we examined how low-performing students at-tending the Chicago Public Schools’ Summer Bridge program perceived their summerlearning environments. Students reported substantial increases in academic press andpersonalism between the school year and summer. Qualitative analysis revealed thatover half of the students characterized their experience as substantively better in thesummer than in the school year. They particularly focused on exposure to new content,increased attention from teachers, and an improved classroom climate that helped inthe mastery of material.
Schools and districts across the nation increasingly utilize remedial summerprogramming to bolster student achievement. In part, this expansion is dueto the use of summer school as a core programmatic component of ‘‘high-stakes’’ testing initiatives (Borman 2000, 2001; Chmelynski 1998; Harring-ton-Lueker 2000). The Chicago Public Schools’ (CPS’) Summer Bridgeprogram has garnered much attention as one of the first and largest of theseinitiatives.
Summer Bridge offers third, sixth, and eighth graders not meetingminimum test score cutoffs on the Iowa Tests of Basic Skills (ITBS) a second
Teachers College Record Volume 107, Number 5, May 2005, pp. 935–957Copyright r by Teachers College, Columbia University0161-4681

chance to do so following intensive instruction in reading and mathematics.In general, students who fail to meet the promotional cutoffs on the ITBSafter participating are retained. The program, in place since 1997, consistsof six weeks of instruction for three hours a day for third and sixth graders,with eighth graders attending for four hours a day over seven weeks. Acentral characteristic of Summer Bridge is its small class size: an average of16 compared with 30 during the regular school year (Roderick et al. 2003).Many classrooms also have tutors and aides to support teachers inproviding instruction. Teachers are provided with a centrally developedmandatory curriculum that is aligned with the reading and mathematicstopics covered on the ITBS. In addition to daily lesson plans, teachersare supplied with all of the materials needed to teach the class (e.g.,Science Research Associates, Inc. [SRA] kits, manipulative kits, textbooks).Monitors visit classrooms regularly to ensure that teachers are usingthe curriculum and maintaining the prescribed pace and to provide tech-nical assistance.
A recent evaluation of Summer Bridge found that many students in theprogram achieve substantial test score gains. On average, between 1997 and2000, third graders gained about .20 grade equivalents in reading (ap-proximately two months of learning), sixth graders gained .40, and eighthgraders gained .60. This evaluation estimates that Chicago’s sixth- andeighth-grade students’ learning rates in Summer Bridge are between twoand three times higher than during the regular school year (Roderick et al.2003; Roderick, Jacob, and Bryk 2001). These results are consistent with arecent meta-analysis of 41 studies of remedially based summer programsthat demonstrated positive and robust academic benefits of participation forstudents (Cooper et al. 2000). This meta-analysis also found that studentsfrom socioeconomically disadvantaged backgrounds generally achieve lessin summer school than those from middle-class backgrounds. One mightexpect relatively modest results from Summer Bridge, given that the CPSserve a student population 85 percent of which are low income (ChicagoPublic Schools 2005). In fact, the Chicago evaluation found that SummerBridge test score gains exceeded the overall effects reported by Cooper andhis colleagues.
In short, there is accumulating evidence that summer programming canbe an effective tool in raising student achievement. This article adds twodimensions to the existing body of literature on summer school. First, itmoves beyond achievement test scores to examine classroom processes inChicago’s Summer Bridge program (see Cooper et al. 2000). Second, itprovides much-needed insight into how summer school programs operatewithin a high-stakes testing context (Borman 2001). It does this, moreover,from the perspective of students, whose perceptions and experiences areoften overlooked in the research literature.
936 Teachers College Record
What might we expect student responses to a program like SummerBridge to be? On the one hand, Summer Bridge is supported with sub-stantial resources (e.g., reduced class sizes, a remedially focused and highlystructured curriculum focused on reading and math as well as monitors toensure program coherence and fidelity). These are precisely the program-matic characteristics that have previously been linked to student achieve-ment (Cooper et al. 2000). From an instructional perspective, the small classsizes may facilitate strong student-teacher relationships and a high degreeof individualized instruction. From a student perspective, the focused cur-riculum may provide students with clear signals and expectations about thecontent to be learned and, implicitly, set a clear short-term goal for stu-dents: that is, meeting test score cutoffs by the end of summer.
On the other hand, Summer Bridge also possesses attributes associatedwith less than optimal learning environments. A core set of concerns centerson the emphasis the program places on student attainment of a single testscore by the close of the program to avoid retention. Critics worry thatprograms such as Summer Bridge encourage ‘‘teaching to the test’’ at theexpense of deepening student understanding of the material (Corbett &Wilson 1991; Sheldon & Biddle 1998; Smith 1991). Some critics argue thatthe high-stakes context of Summer Bridge might also erode intrinsic stu-dent motivational processes and produce negative test-related affective re-sponses such as student anxiety, anger, or boredom. Moreover, theyquestion the implicit assumption underlying the Chicago policy that allstudents will respond uniformly, in terms of both motivation and effort, tothe second-chance opportunity to meet test cutoffs (Wheelock, Bedell, andHaney 2000a, 2000b).
These alternative perspectives led us to take an intensive look inside theSummer Bridge program to examine students’ perceptions of and expe-riences in the learning environment. Increasingly, researchers highlight theimportance of attending to student experiences of and the meanings as-signed to their learning environments and how these affect student mo-tivation, engagement, attachment to school, and, ultimately, academicoutcomes (e.g., Ames 1992; Roeser, Midgley, and Urdan 1996; Ryan andGrolnick 1986). In particular, two attributes of class climateFacademic press(i.e., the extent to which teachers set high expectations for academic for allstudents) and personalism (i.e., the extent of teacher caring and sup-port)Fare viewed as critical components of well-functioning classroomsand, ultimately, schools (Sebring et al. 1996). Recent research reveals thatclassrooms and schools that foster student motivation, engagement, andachievement possess a combination of these attributes (Lee and Smith 1999;Sebring et al. 1996; Shouse, 1996).
Academic press refers to several dimensions (see Middleton and Midgley2002; Phillips 1997). One dimension relates to overall academic norms (e.g.,
Getting It the Second Time Around 937

attendance, homework completion) and standards (McDill, Natriello, andPallas 1986). This dimension also refers to the extent to which instruction isorganized, focused, and goal-oriented (Phillips 1997). Another dimensionfocuses on the degree to which students are pushed for high performance,usually in terms of grades and achievement tests. A third dimension isconcerned with mastery and understanding and taps the extent to whichstudents are expected to continually put forth high levels of effort, aredeeply questioned for understanding of material, and are given progres-sively more challenging tasks. Shouse (1996) summarizes that high levels ofpress occur when
[t]eachers . . . establish objective and challenging, knowledge-basedstandards for student performance . . . maximize content coverage inways which promote student understanding and desire to learnmore and . . . regularly assign and review homework and provideuseful feedback about behavior and performance to students andparents. (178)
Academic press, measured at both student and school levels, positively re-lates to student achievement (Lee and Smith 1999; Lee et al. 1999; Phillips1997; Shouse 1996).
Personalism refers to the nature and quality of student-teacher relation-ships. Relationships characterized by high levels of personalism are re-sponsive, supportive, and closely matched to students’ developmental needs(Lee and Smith 1999; Phillips 1997; Roeser, Midgley, and Urdan 1996).Positive teacher-student relationships relate to school adjustment andachievement, especially for students at risk for school failure (Esposito 1999;Muller 2001; Roeser, Midgley, and Urdan 1996).
This article investigates how a group of low-achieving students experi-enced their classrooms in Chicago’s Summer Bridge Program. Using stu-dent survey results from the school year and Summer Bridge in 1999, aswell as semistructured interviews with Summer Bridge students, the articleexplore three broad questions: (1) How do students describe academicpress and personalism in Summer Bridge? (2) To what extent do thesedescriptions differ from those of the school year? and (3) How do theseperceptions vary by student demographic and performance characteristics?
DATA SOURCES AND METHODS
This research draws on two data sources: surveys of sixth- and eighth-gradestudents who attended Summer Bridge in 1999 and semistructured inter-views with students who attended Summer Bridge in that same year. Data
938 Teachers College Record

were generated as a part of a multiyear evaluation of Chicago’s initiativesaimed at ending social promotion.1
DATA SOURCE 1: STUDENT SURVEYS AND SAMPLES (SCHOOL YEAR AND
SUMMER BRIDGE, 1999)
The first data source includes 1999 results from sixth and eighth graderscollected as part of a regular series of biannual attitudinal surveys of stu-dents, teachers, and principals in the Chicago Public Schools. Overall, 56percent of sixth and eighth graders responded to the survey. That sameyear, an additional set of surveys were administered to sixth- and eighth-grade Summer Bridge students and teachers. Summer student surveyswere collected from 88 percent of schools that had sixth- and eighth-gradeclassrooms. This summer sample encompasses 4,829 sixth graders and4,225 eighth graders, yielding response rates of 65 and 68 percent of sixthand eighth graders, respectively. Of the schools that participated in thesummer school survey, over 80 percent also participated in the school yearsurvey. In these schools, we were able to obtain spring student surveys forroughly half of sixth (n5 2,519) and eighth (n5 2,203) graders. We referto this resultant sample as the ‘‘matched’’ sample. Table 1 describes thedemographic and achievement composition of students who attendedSummer Bridge in 1999, students who completed summer surveys, andstudents who completed both summer and school year surveys. The sam-ples underrepresent African American students, as schools with high (great-er than 80 percent) enrollments of African American students African wereless likely to complete surveys during both the school year and summer.
Table 1. Summer Bridge Survey student and response characteristics
Sixth graders Eighth graders
Tested SurveysMatchedsample Tested
Summersurveys
Matchedsample
Number of students 7,265 4,829 2,519 6,128 4,225 2,303Number of schools 321 289 240 280 247 207Percentage AfricanAmerican
64.3% 60.7% 53.1% 61.3% 57.2% 50.1%
Percentage Latino 30.8% 33.4% 40.5% 33.7% 36.8% 44.2%Age 12.6 12.5 12.5 14.5 14.5 14.5Percentage eligible forfree lunch
92.6% 92.3% 94.0% 89.0% 88.8% 90.2%
Spring ITBS reading 4.8 4.8 4.8 6.8 6.8 6.9Summer Bridge ITBSreading
5.2 5.3 5.3 7.5 7.5 7.5
Getting It the Second Time Around 939

Summer Survey Items and Measures of Academic Press and Personalism
The summer survey repeated two item banks from the regular school yearsurvey that were meant to assess the academic orientation of classrooms andthe level of personal support students received from teachers. For eachmeasure, responses to questions were combined into a single Rasch scalethat ranges from 0 to 10 and were placed on a common metric in order toallow for comparison between the regular school year and SummerBridge.2 The summer survey also queried students about their experiencein Summer Bridge, their attitudes toward testing, and their perception ofsupport from teachers and parents and asked them to compare their Sum-mer Bridge classrooms to those they had during the regular school year.Measure content and survey items are presented in the appendix.
DATA SOURCE 2: FIELD STUDY AND SAMPLE
In 1999, as part of the evaluation, a group of 102 low-achieving AfricanAmerican and Latino sixth and eighth graders from five elementary schoolsbegan participating in a longitudinal field study. The study collected infor-mation from students, their families, and their teachers in preparing forand taking the ITBS and followed the students over the summer andthrough the year after they were retained or promoted. The baseline in-terview was conducted in the spring prior to testing. Students were theninterviewed immediately after taking the ITBS and once during the sum-mer. Retained students were interviewed twice during their retained year,and those who were promoted were interviewed once.
Students were selected for this study by their neighborhood, their school,and their performance characteristics. We first constrained ourselves to twoof five neighborhoods (one African American and one mixed AfricanAmerican and Latino) with the highest retention rates (i.e., those in which atleast one-third of students were being retained) in the school system. Withineach neighborhood, we identified two schools for participation (one withbetter and one with worse than average retention rates). A fifth, predom-inantly Latino school with a large bilingual education program was added toexamine how Latino immigrant families and students in bilingual educationwere affected by the system’s retention policy. Within each of the fiveschools, we selected students who were at risk of retention. In this case,students were defined as at risk if, at the end of fifth or seventh grade, theirreading and/or math scores on the ITBS were at least a year below the testcutoff for sixth or eighth grade, respectively. At the end of the school year,39 (38 percent) of the 102 students met the test score cutoffs and werepromoted, and four were waived to the next grade without having met thepromotional test score cutoffs. The remaining 59 were required to attend
940 Teachers College Record

summer school. Of those, we interviewed 48.3 Table 2 presents demo-graphic and achievement characteristics of the field sample.
We draw on student interview data from the first, second, and thirdstudent interviews during Summer Bridge, which were conducted prior tothe test, just after the test, and during Summer Bridge, respectively. Weexamined student interviews in order to assess the nature and quality ofstudents’ learning experiences in summer school and the extent to whichstudents believed they received support from their teachers over the sum-mer. Using the concepts of academic press and personalism as a conceptualguide, we grouped students into categories that represented the themesthat ran across the interviews. The themes and patterns of behavior were
Table 2. Field study sample demographic and achievement characteristics
Summerschool
Passed orwaived Incomplete
(n5 48) (n5 43) (n5 11)
Demographic characteristicsRace
African-American 23 (48%) 24 (56%) 7 (64%)Latino 25 (52%) 19 (44%) 4 (36%)
GenderMale 27 (56%) 23 (54%) 5 (46%)Female 21 (44%) 20 (46%) 6 (54%)
GradeSixth 26 (54%) 17 (40%) 8 (73%)Eighth 22 (46%) 26 (60%) 3 (27%)
Retained in a prior grade 12 (25%) 3 (7%) 1 (9%)Schoola
African American, low retention rate 8 (17%) 12 (28%) 1 (9%)African American, high retention rate 9 (18%) 9 (21%) 2 (18%)Latino 14 (29%) 5 (12%) 1 (9%)Mixed-race, low retention rate 7 (15%) 12 (30%) 2 (18%)Mixed-race, high retention rate 10 (21%) 5 (12%) 5 (46%)
Distance from reading cutoffs (sixth and eighth grade) and distance from grade-level norms (fifth and seventh grade) using latentb reading scores for 1998From cutoff From grade
Over 1.5 years Over 2.0 years 20 (43%) 6 (14%) 2 (18%)1.0 year 1.5 years 19 (40%) 12 (29%) 6 (55%)0.5 years 1 year 7 (15%) 14 (33%) 1 (9%)at cutoff 0.5 years or less 1 (2%) 10 (24%) 2 (18%)
aRetention rate refers to the overall school retention rate in 1998.bLatent or predicted test scores are used to provide a more accurate assessment of astudent’s actual achievement than using a single year’s test score. Latent scores arederived from a statistical model that estimates individual students’ test scores basedon their test score growth trajectory over all of the years they have been tested.
Getting It the Second Time Around 941
identified jointly by two raters. Raters cross-checked each other’s groupingsand found almost perfect agreement across all students on all codes.
RESULTS
STUDENT PERCEPTIONS OF SUMMER LEARNING ENVIRONMENTS
Our first step was to investigate single survey items that asked students tocompare Summer Bridge and the school year. This provides a general senseof how students perceived their summer school experience relative to theschool year. Approximately three-quarters of students (78 percent of sixthgraders and 74 percent of eighth graders) reported that they liked summerschool better than the regular school year. Students were even more likelyto report working harder in summer school than during the regular schoolyear (84 percent of eighth graders and 81 percent of sixth graders), andapproximately three-quarters of sixth and eighth graders reported learningmore in summer school than they had during the regular school year (73percent of sixth graders and 76 percent of eighth graders). Students’ sensethat they worked harder and learned more in Summer Bridge may havebeen bolstered by the fact that they also felt that their teachers were moreavailable during Summer Bridge than they were during the school year.Eighty-eight percent of eighth graders and 86 percent of sixth graders feltthat their teachers had more time to help them during the summer thanduring the regular year.
Interviews of students drawn from the field study corroborate theselarger survey findings. Of the 48 students in the Summer Bridge sample, 29(60 percent) reported liking summer school. These students stated that theyenjoyed the program, found it interesting, and generally had fun duringclass sessions. Javier, a sixth-grade student at the predominately Latinoschool, described his summer school experience:
Interviewer: Now that you’ve been here a while, would you say sum-mer school’s a good idea or no?
Javier: Yes.
Interviewer: Yes? Why?
Javier: To pass the test. They give two opportunities to pass the test incase you fail one.
Interviewer: So you’re happy to have another chance?
Javier: Yes.
Interviewer: And in general do you like summer school?
Javier: Yes. . . . It’s fun.
942 Teachers College Record

In reading Javier’s interview, it is apparent that his appreciation for sum-mer school is connected to the second chance that he was given to try tomeet the test cutoff for promotion.
A second group (19 out of 48) was less enthusiastic about SummerBridge. Most students reported that summer school was ‘‘okay.’’ Othersmentioned that they liked the program a little bit, and some mentioned thatthey were bored. We found only three students (6 percent) who reported anextreme dislike for Summer Bridge.
Although these single-item indicators and interview questions reveal thata majority of students were generally positive about their experiences inSummer Bridge, they represent only a cross-sectional perspective. They donot allow for direct comparison with students’ reports on their school yearexperiences.
ACADEMIC PRESS AND PERSONALISM: LONGITUDINAL RESULTS FROM
SURVEY DATA
Comparing students’ scores on academic press and personalism measuresduring the 1999 school year with those collected during Summer Bridgeallows us to explore to what extent students did have more positive learningexperiences in Summer Bridge. Summer Bridge students are, as a group,very low performing. Perhaps it is not surprising to note that in addition tolower test scores, students who attended Summer Bridge in 1999 had lowerschool year scores on academic press and personalism than their higher-achieving peers. The median score on academic press for sixth graders whomet the test score cutoffs during the school year was 4.76, whereas theschool year score for students who attended Summer Bridge the followingsummer was 4.4. After completing Summer Bridge, their median scoreincreased to 5.99. Notably, over three-quarters of sixth-grade SummerBridge students had scores on the academic press measure that were higherthan the average sixth grader’s score during the school year. Eighth-graderesults followed a similar pattern. For personalism, we see a similar increase(median shift from 4.6 to 6.4 for eighth graders). These marked changesin the distribution of student responses suggest that Summer Bridge pro-vided a very different learning environment for the students who partic-ipated in it.
STUDENT ASSESSMENTS OF THEIR LEARNING EXPERIENCES IN
SUMMER BRIDGE
The increases in academic press and personalism scores are strong evidencethat Summer Bridge provides a different learning environment than whatstudents experience in the school year. At the same time, however, they
Getting It the Second Time Around 943

provide only limited insight into how students perceived their classroomenvironments in Summer Bridge. What does it mean when a child reportsmore academic press and personalism? To answer this question, we turnour attention to the qualitative interviews we conducted with students dur-ing the school year and in Summer Bridge of 1999. We rated students’descriptions of their learning experiences, with a focus on what they re-ported gaining from Summer Bridge, whether they perceived differencesbetween summer school and the school year, and the nature of those dif-ferences.
We found three primary patterns in how students described their sum-mer learning experiences. The first group of 25 students (52 percent),whom we will refer to as having a ‘‘positive experience,’’ reported that theirSummer Bridge experiences were better than those during the school year.In interviews, students frequently touched on four themes. First, studentsreported that their teachers covered more or different content and pre-sented material in ways that improved their understanding (e.g., providingstep-by-step instructions) and that this instruction stood out as more pos-itive than many of their past school experiences. Second, these studentscommented that teachers slowed the pace of instruction to make sure thatmost, if not all, students were understanding the material. Students indi-cated that this slowed pace was crucial to their understanding of the ma-terial. Third, students reported getting substantial one-on-one time withtheir teachers and cited this individualized attention as extremely helpful.Finally, these students noticed that their skills were improving, frequently inareas in which they felt they had been deficient. A distinct subgroup of 13students were very articulate and insightful in regard to the qualities oftheir summer classrooms that shaped their experiences. Darius, an eighthgrader from the predominantly African American school with a higher thanaverage retention rate, provides an example of the experience of thesestudents. At the end of eighth grade, Darius’s reading score was two yearsbelow the cutoff for promotion. He describes his school year classroomexperiences while preparing for the test:
Interviewer: What are you doing to get ready for the test?
Darius: Reading long passages, answer questions . . . when we don’tunderstand, we go over it.
Interviewer: Are your teachers doing anything to get you ready forthe test? What? Is it in class?
Darius: Yeah.
Interviewer: Like what?
944 Teachers College Record

Darius: I told you, if we don’t understand, they’re going over it. That’sthe things we don’t understand.
Interviewer: Are they talking a lot about it? . . . What do they say?
Darius: Y’all better be ready for the test. Pass this test, it determines ifyou, where you go next year.
While he isn’t negative about his school year experience, his summer in-terview provides a sharp contrast:
Interviewer: What’s different about your reading class this summerthan your reading class during the year?
Darius: Because this summer I get a better understanding . . . than Ido at the regular school year.
Interviewer: OK. Why do you think you’re getting a better under-standing?
Darius: Because Mr. B he breaks stuff down for us. Nope, he won’tstop till everybody’s doing it. Mr. B is doing it now.
In addition to appreciating the slowed pace of instruction, Darius perceivedthat his teacher really monitored students to confirm that they were grasp-ing the material.
Interviewer: How does he do it different?
Darius: He makes sure you understand. If you say you understandand you really don’t, he’ll start asking you questions about the story.
Darius also indicated that the way his teacher structured the classroom,students experienced large amounts of individualized support, as well asfrequent peer support:
Interviewer: So what’s it like for you, like just now in the classroomwhen you understand something but another student doesn’t and he’staking time to make sure that other student understands it, what’s thatlike for you?
Darius: I just sit and wait. Most of the time he’ll tell us to help. Partnernext to us do they got it.
Interviewer: OK. Um, it doesn’t get boring when you have to wait forother students?
Getting It the Second Time Around 945

Darius: No ‘cause, well vice versa it turns around, what if they waitingon me?
In examining their experiences in terms of the constructs of academic pressand personalism, we find that students respond to teachers’ efforts to makematerial attainable to them. Teacher efforts include both meticulous expla-nations as well as pacing instruction to ensure that all students understandconcepts and steps in problem solving. This implicitly sends the messagethat mastery of the material is essential to success. Teacher support, more-over, is manifested in the ways in which teachers enact this slowing of thecurriculum in a nonstigmatizing manner and encouraging a peer-support-ive culture.
The dissonance between the school year and summer was even moredramatic for Lupe, a student at the mixed-race school with higher thanaverage retention rates. Lupe entered eighth grade almost two years belowthe cutoffs in reading and math.
Interviewer: Have you learned more or less than other years?
Lupe: Well, like in this eighth grade, I don’t know any more thanbefore, so the other grades I knew more but in eighth grade I reallydidn’t learn a lot.
Interviewer: So you think you learned more in the others?
Lupe: Yeah. ‘Cause the other grades were more easier and they ex-plained it more, but in eighth grade it’s like, hard and they don’t tellyou nothing ‘cause you’re supposed to already know it.
Like Darius, Lupe views the summer learning environment as different.She also mentions that in eighth grade she felt a lack of attention fromteachers and felt that the expectations that teachers had were beyond thescope of her knowledge. She contrasts her mathematics class work in Sum-mer Bridge:
Interviewer: How do you spend the day in math?
Lupe: Um, he reads the questions and stuff and then he explains whatwe supposed to do, and then when we start doing the work he told wecan raise our hands and he comes to our desks and helps us under-stand it, and then when we answering the questions, before we answer,he says what problem we having trouble with and then he help us withthat problem with the whole class and then he starts giving us theanswers.
946 Teachers College Record

Interviewer: How is summer school different from school during theregular year?
Lupe: Easier. It’s easier work than they gave us and umm, it’s moreeasier to talk to the teacher to raise your hand if you need help. . .‘Cause when you’re in the regular school year there’s like a wholebunch of people in the classroom and you’re supposed to ask ques-tions if you need help, but then you think they’ll make fun of you.
Lupe’s interviews highlight both what was lacking in her school year en-vironment and what changed for her in Summer Bridge. During the schoolyear, Lupe perceived that she was expected to have already mastered ma-terial that she felt was beyond her reach. She also speaks specifically abouthow the smaller class size in Summer Bridge allowed for detailed expla-nation and individual attention from her teacher.
Our second group, whom we will refer to as having a ‘‘neutral expe-rience,’’ included students who reported that their experience in SummerBridge was similar to that during the school year. These 17 students (35percent) generally reported that Summer Bridge was helpful, but not sub-stantially different in terms of content covered or in terms of the supportsthey received. Consuelo, who entered sixth grade reading about a year anda half below the standard, attended the predominantly Latino school. Shedescribes her preparation for the test during the school year:
Interviewer: Do you think you are prepared for this test?
Consuelo: A little.
Interviewer: Are you doing anything to get ready?
Consuelo: I listen more to the teacher. I always listen and the home-works I do, I turn in. And my work, the notebooks I hand them in tobe checked the stuff I already studied so I can know it because theIowa is coming, to know it for that.
Interviewer: Are your teachers doing anything to get you ready forthe test? What? Is it in class?
Consuelo: They help us more with the work that they see we arestruggling with.
Interviewer: Are they talking a lot about it?
Consuelo: Yes . . . that it is going to come quickly and that we have topay more attention sometimes they are explaining things and they tellus to pay more attention because we are the one who are going tosuffer if we repeat a year, not them.
Getting It the Second Time Around 947

Interviewer: Has your teacher talked to you one on one about thistest?
Consuelo: No.
Consuelo met the standard for mathematics at the end of the school year.While she improved in reading, her scores still remained nearly a yearbelow the cutoff. Consuelo does not characterize her summer experience asdifferent from that of the school year:
Interviewer: How is summer school different from school during theregular year?
Consuelo: We get out earlier and it ends earlier than regular schoolbecause we are in regular school for one year and in summer schoolonly two months.
Interviewer: Are there any other differences?
Consuelo: No.
Interviewer: Are you learning the same stuff?
Consuelo: Almost the same things, yes everything is the same, thereading, the math. Only in math they have taught us different things.
Interviewer: In math you have learned different things?
Consuelo: Yes.
Interviewer: But not in reading?
Consuelo: No.
Interviewer: Would you say that your summer school teacher is help-ing you a lot?
Consuelo: Yes, a lot, because I am learning more things for, and theyare preparing me for, since the first day that I entered summer school,they were preparing me for the Iowa test.
Interviewer: Is he/she helping more or less than your teacher duringthe school year?
Consuelo: I think about the same . . . because we practice the examand then we correct it and we do the same things. Only that they aregiving us more things that are on the Iowa . . . and in regular schoolthey don’t give as much.
Interviewer: Do you think your summer school teacher cares abouthow you do on the Iowa in August?
948 Teachers College Record
Consuelo: Yes because if we don’t pass, maybe they are going to feelbad that they didn’t teach us well and that we didn’t pass.
Consuelo’s interview indicates that her experiences of academic press andpersonalism did not substantially vary across the two classroom settings.Moreover, she reports receiving little support in reading, the only subject inwhich she needed to improve.
A small group of students (n5 6, 13 percent), whom we will refer to ashaving a ‘‘negative experience,’’ reported that Summer Bridge was nothelpful. Among these students, two did not regularly attend and thereforereported gaining little from the program. The other four generally report-ed finding classes to be boring and did not report learning much of any-thing. Tamara, who attended the predominantly African American schoolwith a higher than average retention rate, barely missed test score cutoffs inher eighth-grade year:
Interviewer: And again, why do you think summer school is not agood idea?
Tamara: Because they teach . . . just like reading books and mathbooks, or catch, or catch up you know listen more. You’re notsupposed to approach it in the same as you approach it in theregular school year. But that’s exactly what we doing, the same thing.I mean they teach it out of a, like a school bridge programbooklet. That booklet, I mean it’s like the teacher don’t have no sayso they just go by what somebody just typed out in the book. And it’slike it’s not helping us because it’s the same stuff that we did in regularschool.
Tamara expresses frustration with the slowed pace and repetition of con-tent. She further indicates that she was not challenged by the material andcomments that the teacher lingered on topics unnecessarily:
Interviewer: Would you say that summer school is helping you getready for the Iowa test?
Tamara: (Shakes head no)
Interviewer: You don’t think so? Why?
Tamara: It’s really boring it’s like supposed to be teachin’ us, it hasnothin’ to do with the Iowa test. I basically remember everything thatwas on the Iowa test . . . and if we mention it to him, he’ll spend thewhole freak of the day on that, and it’s like, it don’t matter, he gonnado what he gonna do.
Getting It the Second Time Around 949

It is interesting to note that Tamara and Darius (who was part of the pos-itive-experience group) are talking about the same teacher. Whereas Dariusfound the slowed pace extremely helpful and matched to his needs, theexperience did not work well for Tamara. The differences between thesestudents’ accounts of their classroom underscores that individual students,even in the same classroom, have radically different perceptions of the pressand support of the environments.
Exploring Determinants and Effects of Student Learning Experiences
Do students like Darius, who describe extremely constructive experiencesin Summer Bridge, differ from those who do not? Table 3 compares stu-dents in the three groups described above by gender, grade, prior level ofrisk for not meeting the cutoff in reading and math, race, prior work effort,and extenuating problems. We find that students who had a positive ex-perience with Summer Bridge were more likely to be eighth graders, but noother demographic or achievement characteristics distinguished this group.
Table 3. Types of learning experiences by student background and prior
characteristics
Positiveexperience
Neutralexperience
Negativeexperience
(n5 25) (n5 17) (n5 6)
Gender Male 16 8 3Female 9 9 3
Gradea Sixth 10 13 3Eighth 15 4 3
Race AfricanAmerican
14 5 4
Latino 11 12 2Prior effort High 12 11 1
Low 13 6 5External problems Yes 2 5 4Need to meet cutoffs in bothsubjects
Yes 17 10 4
Distance of May reading scorefrom test cutoffb
Within 0.5year
4 1 1
0.5–1.0 year 11 6 2Greater than1.0 year
10 10 3
aChi-squared5 5.46, po.05.bOne student’s May test score was missing.
950 Teachers College Record
As this is a longitudinal data set, we have baseline information on studentwork effort during the school year. Therefore, we are able to investigatewhether there is evidence that work effort in the prior year had an impacton students’ summer school experiences. Sample students were coded intoseveral groups representing their work effort in sixth or eighth grade priorto having to meet the promotional cutoff. For the purposes of this article,we have simplified those groupings into two primary groups: students withhigh work effort and students with low or no work effort (Roderick andEngel 2001). Of the 25 students in our positive-experience category, 13 putforth low work effort during the school year.
A final distinguishing characteristic among students with a positive ex-perience is that they did not appear to have any major problems or ex-tenuating circumstances interfering with their ability to participate fully inSummer Bridge. In addition to exploring student work effort, Roderickand Engel (2001) examined whether students appeared to have significantproblems that interfered with their ability to engage in school (e.g., psy-chiatric hospitalizations, parental illness, recent parental death). Of the 48students who attended Summer Bridge, 11 had been characterized as hav-ing significant external problems. We found that only two students in thepositive-experience group had any of these significant difficulties, versusnine students across the other categories.
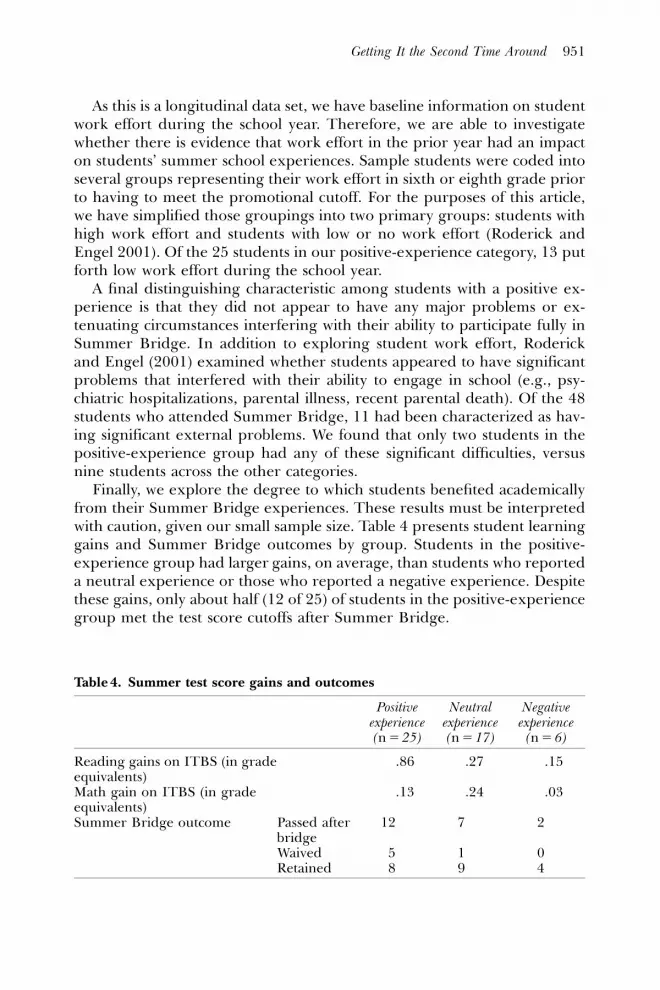
Finally, we explore the degree to which students benefited academicallyfrom their Summer Bridge experiences. These results must be interpretedwith caution, given our small sample size. Table 4 presents student learninggains and Summer Bridge outcomes by group. Students in the positive-experience group had larger gains, on average, than students who reporteda neutral experience or those who reported a negative experience. Despitethese gains, only about half (12 of 25) of students in the positive-experiencegroup met the test score cutoffs after Summer Bridge.
Table 4. Summer test score gains and outcomes
Positiveexperience
Neutralexperience
Negativeexperience
(n5 25) (n5 17) (n5 6)
Reading gains on ITBS (in gradeequivalents)
.86 .27 � .15
Math gain on ITBS (in gradeequivalents)
.13 .24 .03
Summer Bridge outcome Passed afterbridge
12 7 2
Waived 5 1 0Retained 8 9 4
Getting It the Second Time Around 951

CONCLUSIONS
In this article, we drew upon both quantitative and qualitative data fromstudents to investigate three key questions: (1) How do students describeacademic press and personalism in Summer Bridge? (2) To what extent dothese descriptions differ from those of the school year? and (3) How dothese perceptions vary by student demographic and performance charac-teristics? Students, on average, reported substantial increases in academicpress and personalism between the school year and summer. When wefurther analyzed students’ experiences, we identified three distinct group-ings of student classroom experiences. Over half of the 48 students in thequalitative sample characterized their experiences as substantively morepositive in the summer than in the school year. These students reportedexposure to new content, increased attention from their teachers, and alearning environment geared to ensuring that all students mastered ma-terial. About a third of the sample (35 percent) characterized the summerprogram as similar in content and structure to that of the school year.Notably, only a small proportion of students indicated that their learningexperiences in the summer were negative. These findings indicate thatconcerns raised about the nature of learning in mandatory, high-stakesprograms like Summer Bridge may be unwarranted. Rather, it seemsthat the small class size, standardized curriculum, and relatively uniformability levels of these classrooms are well-matched to low-performingstudents’ needs.
Our findings are also congruent with other recent analyses, using bothclassroom observations and teacher surveys, of Chicago’s Summer Bridgeprogram (e.g., Roderick et al. 2003). Classroom observations indicated thatthe quality of instruction in Summer Bridge was driven by the extent towhich teachers worked to meet individual students’ needs and that theclassrooms in which teachers made such efforts had larger average learninggains. Similarly, analysis of teacher survey data linked high levels of indi-vidualized instruction to larger student learning gains, controlling for bothteacher and school characteristics. One interpretation of these findingsis that certain structural aspects of Summer Bridge support an academicclimate characterized by high levels of academic press and personalism.What is particularly encouraging is that this climate is apparently a goodmatch for the needs of the lowest-achieving students in the school system.
At the same time, the qualitative data indicate that within this environ-ment, there is still substantial variation in how students perceive theirclassrooms (Wheelock, Bebell, and Haney 2001a, 2001b). As we noted be-fore, one difference we found was that eighth graders were more likely toreport having different learning experiences in Summer Bridge. The factthat eighth graders were more likely to report these experiences suggests
952 Teachers College Record

the possibility of developmental or incentive effects (Summer Bridge is theirlast opportunity to stay on track and go directly to high school). Anotherpotential source of variation includes the match between students’ abilitylevel and their Summer Bridge classrooms. Darius, who entered SummerBridge with reading scores over two years below the cutoff, had a morepositive experience than Tamara, who had just missed the cutoff at the endof the school year. Although all students who failed to meet the test scorecutoffs are low-achieving in comparison to the general population, there isstill variation within this subgroup.
The qualitative findings also may provide increasing clarification of theconcepts of academic press and personalism. Our results suggest that stu-dents experience caring and support from teachers when they feel that theyare receiving academic help tailored to their learning capacities and needs.Our findings are consistent with a growing body of research that documentsthe importance of matching between student developmental and learningneeds and the academic and psychological climate of their classrooms(Roeser, Eccles, and Sameroff 1998).
Although students who had positive learning experiences in SummerBridge, on average, had substantial learning gains in the program, thesegains were not always sufficient to help them reach test score cutoffs.Therefore, an important question is whether cumulative failed attempts tomeet test score cutoffs erode students’ sense of efficacy. Will students con-tinue to put forth a strong effort in light of what will likely be framed as yetanother failure? Moreover, what will a retained yearFa second dose of thesame or similar instructionFdo for students who have been making pro-gress but simply fail to reach the designated cutoff on a standardized test?
A related issue concerns the extent to which students experience stigma,given that they have been labeled as needing to attend Summer Bridge.Weinstein (2002), for example, persuasively demonstrates that children arehighly aware of their relative abilities and achievement. To what extent doesparticipation in Summer Bridge cause a student to be labeled as having lessability than his peers? Although the current study was unable to addressthese questions, they remain important ones to address in the context ofhigh-stakes testing associated with No Child Left Behind policies.
On a final note, as summer programming increasingly becomes a strat-egy for remedial programming, school administrators should consider thepotential costs of expansion of summer programs. The students who de-scribed the most substantive learning experiences in Summer Bridge al-most always talked about the individualized attention and tailored pacingthey received. Increasing the size and scope of these programs could po-tentially undermine their effectiveness by reducing the capacity for differ-entiated instruction and strong personalized support that plays such animportant role in Chicago’s Summer Bridge program.
Getting It the Second Time Around 953

APPENDIX
SUMMER BRIDGE AND SCHOOL YEAR SURVEY ITEMS
Academic Press
To what extent do you [strongly disagree, disagree, agree, strongly agree]that your regular school year teacher [summer school teacher]
Encourages me to do extra work when I don’t understand something
Praises my efforts when I work hard
Cares if I don’t do my work in the class
Expects me to do my best all the time
Expects me to do my homework every night
Thinks it is very important that I do well
Cares if I get bad scores on the Iowa [summer only]
Personalism
To what extent do you [strongly disagree, disagree, agree, strongly agree]that your teacher [summer school teacher]
Really listens to what I have to say
Helps me catch up if I am behind
Notices if I have trouble learning something
Is willing to give extra help on schoolwork if I need it
Believes I can do well in school
Single-Item Indicators Tapping General Assessment of Summer Bridge
Students were asked to respond to the following statements by choosingeither No, A Little, or A Lot.
I liked summer school better than school in the regular year.
I worked harder in summer school than the regular year.
954 Teachers College Record

I learned more in summer school than the regular year.
My teacher had more time to help me in summer school.
The kids in my class helped me more in summer school.
The reading we did in summer school was too hard for me.
The math we did in summer school was too hard for me.
Summer school was boring.
Summer school was fun.
I was mad I had to go to summer school.
I hated summer school.
Notes
1 This multiyear evaluation, conducted by the Consortium on Chicago School Research,includes an analysis of official school records and longitudinal survey and field data to examinethe impact of Chicago’s Ending Social Promotion policy on student achievement, instruction,and high school performance. Throughout, the evaluation focuses on three critical time points:(1) the year before promotion/retention, (2) the Summer Bridge program, and (3) the progressof retained students.
2 Rasch analysis, a component of item response latent-trait models, uses one ability pa-rameter for each person and one difficulty parameter for each item. The parameters representthe positions of the persons and items on a single scale of the latent variable they represent.The measure of the person’s attitude on the scale is in the logit metric, but for reportingpurposes, these are converted to a 10-point scale. The Summer Bridge measures for academicpress and personalism use the same set of items as measures made from the 1999 studentsurvey given to sixth- and eighth-grade students in the CPS. To make the Summer Bridge andschool year measures comparable, the Summer Bridge measures were anchored on the itemand step difficulties from the school year measures. Because the school year measures hadseparate questions for math and reading class, we used the mean of these step and itemdifficulties.
3 Of the 11 students from whom we could not collect usable information during thesummer, 4 moved prior to the interview, 4 refused to be interviewed during the summer, and 3students simply could not be located over the summer. Three of the 4 students who refused tobe interviewed indicated that they were too anxious to participate in an interview in which theyhad to talk about the possibility of being retained. Among the 11 students, all but 4 participatedin subsequent interviews.
References
Ames, Carole. 1992. Classrooms, Goal Structures, and Student Motivation. Journal of Educa-tional Psychology 84: 261–271.
Borman, Geoffrey. 2000. The Effects of Summer School: Questions Answered, QuestionsRaised. Monographs of the Society for Research in Child Development 65 (No. 260): 119–127.
Borman, Geoffrey. 2001. Summers Are for Learning. Principal 80: 26–29.
Getting It the Second Time Around 955

Chemelynski, Carol. 1998. Summer School for Meeting Higher Standards. Education Digest 63:47–50.
Chicago Public Schools. 2005. CPS At A Glance. Available online at http://www.cps.k12.il.us/AtAGlance.html.
Cooper, Harris, Karen Charton, Jeff Valentine, and Lynn Muhlenbruck. 2000. Making theMost of Summer School: A Meta-Analytic and Narrative Review. Monographs of the Society forResearch in Child Development 65 (No. 260).
Corbett, H. Dickson, and Bruce L. Wilson. 1991. Testing, Reform and Rebellion. Norwood, NY:Ablex.
Esposito, Cynthia. 1999. Learning in Urban Blight: School Climate and Its Effect on the SchoolPerformance of Urban, Minority, Low Income Children. School Psychology Review 28:365–377.
Harrington-Lueker, Donna. 2000. Summer Learners. American School Board Journal 187: 20–25.Lee, Valerie, and Julie Smith. 1999. Social Support and Achievement for Young Adolescents
in Chicago: The Role of School Academic Press. American Educational Research Journal 36:907–945.
Lee, Valerie, Julie Smith, Tamara Perry, and Mark Smylie. 1999. Social Support, Academic Press,and Student Achievement: A View from the Middle Grades in Chicago. Chicago: Consortium onChicago School Research.
McDill, Edward, Gary Natriello, and Aaron Pallas. 1986. A Population at Risk: Potential Con-sequences of Tougher School Standards for Student Dropouts. American Journal of Education94: 135–181.
Middleton, Michael, and Carol Midgley. 2002. Beyond Motivation: Middle School Students’Perceptions of Press and Understanding in Math. Contemporary Educational Psychology 27:373–391.
Muller, Chandra. 2001. The Role of Caring in the Teacher Student Relationship for At-RiskStudents. Sociological Inquiry 71: 241–255.
Phillips, Meredith. 1997. What Makes Schools Effective? A Comparison of the Relationship ofCommunitarian Climate and Academic Climate to Mathematics Achievement and Attend-ance during Middle School. American Educational Research Journal 34: 633–662.
Roderick, Melissa, and Mimi Engel. 2001. The Grasshopper and the Ant: The MotivationalResponses of Low Achieving Students to High Stakes Testing. Educational Evaluation andPolicy Analysis 23: 197–227.
Roderick, Melissa, Mimi Engel, and Jenny Nagaoka with Brian Jacob, Sophie Degener, AlexOrfei, Susan Stone, and Jen Bacon. 2003. Ending Social Promotion in Chicago: Results fromSummer Bridge. Chicago: Consortium on Chicago School Research.
Roderick, Melissa, Brian Jacob, and Anthony Bryk. 2001. Summer in the City: AchievementGains in Chicago’s Summer Bridge Program. In Summer Learning: Research, Policies, andPrograms, edited by Geoffrey Borman and Matthew Boulay, 73–102. Mahwah, NJ: Erlbaum.
Roeser, Robert, Jacquelynne Eccles, and Arnold Sameroff. 1998. Academic and EmotionalFunctioning in Early Adolescence: Longitudinal Relations, Patterns, and Prediction by Ex-perience in Middle School. Development and Psychopathology 10: 321–352.
Roeser, Robert, Carol Midgley, and Tim Urdan. 1996. Perceptions of the School PsychologicalClimate and Early Adolescents Psychological Functioning: The Mediating Role of Goals andBelonging. Journal of Education Psychology 88: 408–422.
Ryan, Richard, and Wendy Grolnick. 1986. Origins and Pawns in the Classroom: Self-Reportand Projective Assessments of Individual Differences in Children’s Perceptions. Journal ofPersonality and Social Psychology 50: 550–558.
Sebring, Penny, Anthony Bryk, Melissa Roderick, Eric Camburn, Yeow Meng Thum, Betsy AnnSmith, and James Kahne. 1996. Charting Reform in Chicago: The Students Speak. Chicago:Consortium on Chicago School Research.
956 Teachers College Record

Sheldon, Kennon, and Bruce Biddle. 1998. Standards, Accountability, and School Reform:Perils and Pitfalls. Teachers College Record 100: 164–180.
Shouse, Roger. 1996. Academic Press and Sense of Community: Conflict, Congruence, andImplications for Student Achievement. Social Psychology of Education 1: 47–68.
Smith, M. 1991. Put to the Test: The Effects of External Testing on Students. EducationalResearcher 20: 8–12.
Weinstein, Rhona. 2002. Reaching Higher: The Power of Expectations in Schooling. Cambridge, MA:Harvard University Press.
Wheelock, Anne, Damian Bebell, and Walt Haney. 2000a. What Can Student Drawings Tell Usabout High-Stakes Testing in Massachusetts? Teachers College Record. Available online athttp://www.tcrecord.org.
Wheelock, Anne, Damian Bebell, and Walt Haney. 2000b. Student Self-Portraits as Test-Takers:Variations, Contextual Differences, and Assumptions about Motivation. Teachers CollegeRecord. Available on-line at http://www.tcrecord.org.
SUSAN STONE is an assistant professor in the School of Social Welfare atthe University of California at Berkeley. She is interested in intersectionsbetween social welfare and education policies. She recently completed, withRobin Tepper Jacob and Melissa Roderick, a study of the impact of theChicago Public Schools’ Ending Social Promotion policy on academic in-struction (a downloadable version of this study is available at http://www.consortium-chicago.org/publications/p68.html).
MIMI ENGEL is a doctoral student in the Human Development and SocialPolicy Program at Northwestern University. She is interested in educationpolicy. She was a lead author of a study evaluating Chicago’s SummerBridge program (a downloadable version of this study is available at http://www.consortium-chicago.org/publications/p59.html).
JENNY NAGAOKA is project director of the Consortium on ChicagoSchool Research’s ongoing study of the postsecondary outcomes of ChicagoPublic Schools graduates. She recently completed an evaluation of the Chi-cago Public Schools’ retention policies (a downloadable version of this eval-uation is available at http://www.consortium-chicago.org/publications/p70.html).
MELISSA RODERICK is an associate professor in the School of SocialService Administration at the University of Chicago and a director of theConsortium on Chicago School Research. She recently completed an eval-uation of the Chicago Public Schools’ retention policies (a downloadableversion of this evaluation is available at http://www.consortium-chicago.org/publications/p70.html).
Getting It the Second Time Around 957