direct and indirect energy consumption by chicago's urban
TRANSCRIPT
20
3. 30-min mean duration.
Minimum space requirements may be estimated based on the above data. However, it is important to recognize that each site may have significantly different requirements due to particular functions contained, size of facility, and other factors.
For planning purposes it should be assumed that at least one-third of the vehicles will be semitrailers. A minimum of one dock space should be provided for such vehicles, with 1 of 3 dock spaces designed for semitrailers in larger facilities.
The survey also suggests the following planning guidelines for federal warehouse facilities:
1 . o.15 truck trips/day per 1000 ft 2 ,
2 . 25 percent peak-hour factor, and 3 . 80-mir"t duration.
':'he same qua·lifications in regard to the application of these data to facility planning as were mentioned for office facilities should be recognized. At least one-half of the dock spaces should be designed
for semitrailers. The guidelines above relate to design of the fa-
cility. Impact of truck traffic on adjacent streets is a function of the number of trips that occur during the peak hour of on-street traffic. AS noted, truck activity prior to 8:00 a.m. is quite low.
Transportation Research Record 834
However, for certain locations pick-up and delivery activity between 8:00 and 9:00 a.m. may conflict with adjacent street traffic. "'he guidelines for these analyses are 12.5 percent for 8:00-9:00 a.m. deliveries and 0.8 vehicles/1000 employees for office and 0. 025 vehicles/1000 ft 2 for warehousetype facilities.
CONCJ,USIONS
The data obtained in the survey and presented in this paper relate to a specific type of facility-federal employment sites in the Washington, D .c., area. The findings, therefore, are most applicable to these operations. However, federal government facilities in Washington have characteristics similar to those found in many large office centers, particularl~l those of state goverrunent 5 To this extent the findings will provide assistance to those involved in planning similar facilities.
ACKNOWLEDGMENT
We would like to express our appreciation to Bob Harris of the NCPC for his guidance in performing the study reported on in this paper.
Publication of this paper sponsored by Committee on Urban Goods Movement.
Direct and Indirect Energy Consumption by Chicago's
Urban Trucking Industry
FRANK SOUTHWORTH, BRUCE JANSON, EVANGELOS PAPATHANASSOPOULOS, AND D.AVID ZAVATTERO
A procedure for establishing a set of urban truck movement energy accounts is described. Direct energy consumption, in the form of truck fuei consumption, and indirect energy consumption on terminal , vehicle, roadway and fuel operation, maintenance, and construction are discussed. Another form of indirect energy consumption is the passenger vehicle fuel consumed due to truck-induced traffic congestion. The procedures are applied to an empirical study of the urban trucking industry in Chicago. Estimates are provided for the total direct and indirect energy consumed on an annual basis. By using a marginal approach to indirect energy accounting, both direct and indirect energy can be specified on a vehicle-kilometer or ton-freight kilometer of travel basis. Direct fuel energy consumption rates are compared across truck sizes, fuel, carrier and commodity types, time of day, and by base terminal district. Emphasis is given to the effects of truck route circuity on fuel consumption.
To date, very little work has been done to quantify the energy consumed by urban goods movement systems, despite the findings of the few studies available that indicate the potential for considerable energy savings in the urban trucking industry. In this paper we present an accounting framework for estimating such energy consumption and present the results from an application of the accounting procedure to the urban trucking industry in Chicago • The results are taken from a study by Southworth and others (1) for the Illinois Institute of Natural Resourcesl," in cooperation with the Chicago Area Transport-.at-.ion ~t:udy (C:T\'T'R). Since trucks move some 90 percent of all urban freight within our cities,
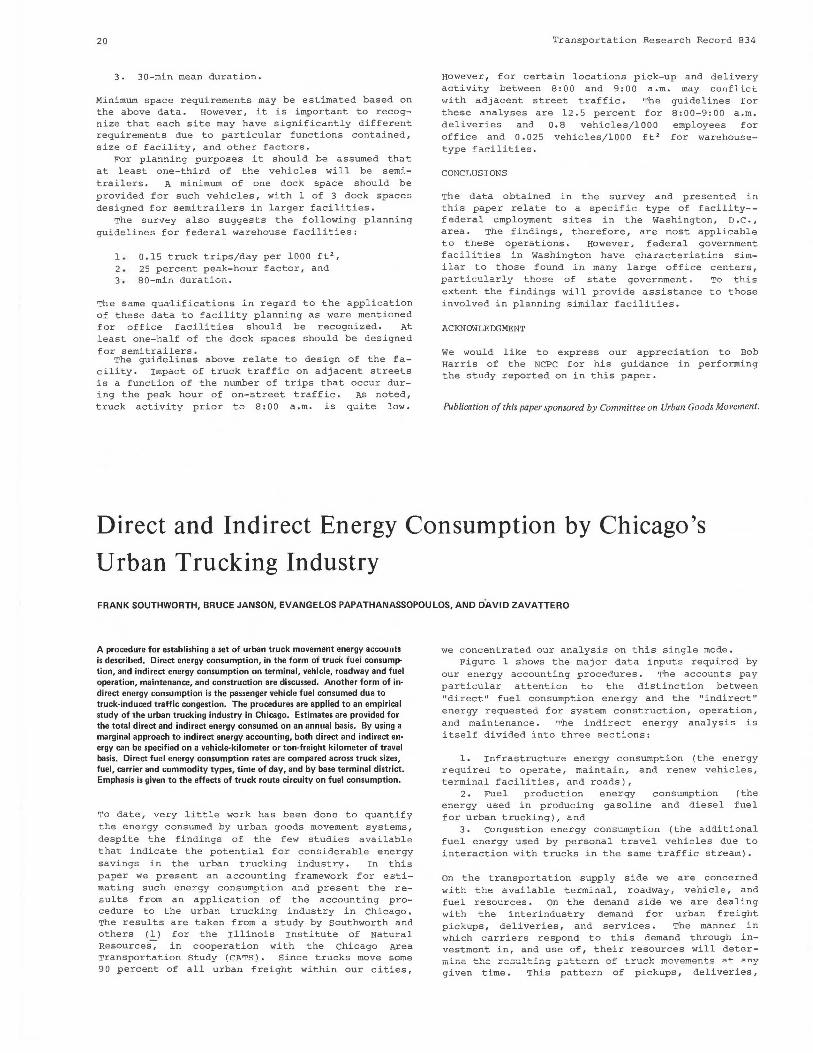
we concentrated our analysis on this single mode. Figure 1 shows the major data inputs required by
our energy accounting procedures. The accounts pay particular attention to the distinction between 11 direct 11 fuel consumption energy and the "indirectu energy requested for system construction, operation, and maintenance. The indirect energy analysis is itself divided into three sections:
1. Infrastructure energy consumption (the energy required to operate, maintain, and renew vehicles, terminal facilities, and roads),
2. Fuel production energy consumption (the energy used in producing gasoline and diesel fuel for urban trucking), and
3. congestion energy consumption (the additional fuel energy used by personal travel vehicles due to interaction with trucks in the same traffic stream).
on the transportation supply side we are concerned with the available terminal, roadway, vehicle, and fuel resources. On the demand side we are dealing with the interindustry demand for urban freight pickups, deliveries, and services. The manner in which carriers respond to this demand through investment in, and use of, their resources will deter-mine the resulting given time. This
p.:::.ttcrn of truck moveme!lts ~t ·~tny
pattern of pickups, deliveries,
Tr ansportation Research Record 834
and service calls in turn determines the energy consumed by urban truck freight movements.
DIRECT ENERGY ACCOUNTS
Truck Travel Data
The data base used was the CATS internal commodities and commercial vehicles survey (2). This survey sampled some 5000 trucks that oper;-te local and Interstate Commerce Commission IICC) regulated contract and common carriage within the 800-km 2
Chicago standard consolidated statistical area (SCSA)· ~he data constitute a 1.8 percent sample of trucks less than 8181-kg unloaded weight, rising to a 7. 1 percent sample of heavy-truck trailers more than 16 363 kg. The complete survey provided 25 831 separate truck trip records, each factored for aggregate predictions by expansion factors based on the number of registered vehicles in the Chicago
Figure 1. Urban freight energy accounts.
TERMINAL OPERATIONS
'----.... TRUCK FLEET
I INDIRECT
2. INFRASTRUCTURE ENERGY
TSM PLAN
i ROAD
NETl!ORK DATA
INDIRECT y / 3. FUEL TRUCK
PRODUCTION EtlERGV FUEL USE f COEFFICIENTS
INPUT-DUTPUT J TRAFFIC ROUTING
i ENERGY ANALYSIS 1. DIRECT
f ET6V
UHER-INDUSTRY INPUT-OUTPUT ANALYSIS
TRUCK VKT DATA
INDIRECT q . CONGEST! ON
ENrnGV
t PERSON VKT
DATA
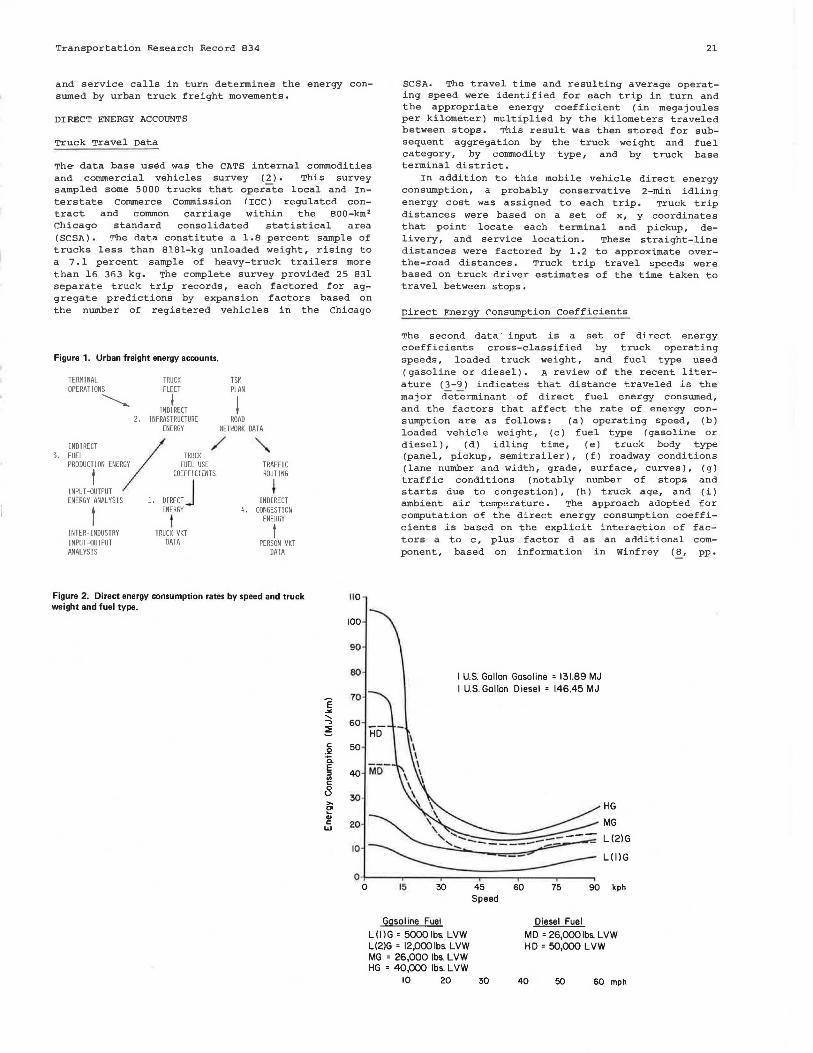
Figure 2. Direct energy consumption rates by speed and truck weight and fuel type,
11 0
100
90
80
e 70
""' ' "") 60 ~
c 50 0 a E
40 ::J
"' c 8 30 >-a> Q; c 20 lJJ
IO
21
SCSA. The travel time and resulting average operating speed were identified for each trip in turn and the appropriate energy coefficient (in megajoules per kilometer) multiplied by the kilometers traveled between stops. This result was then stored for subsequent aggregation by the truck weight and fuel category, by commodity type, and by truck base terminal district.
In addition to this mobile vehicle direct energy consumption, a probably conservative 2-min idling energy cost was assigned to each trip. Truck trip distances were based on a set of x, y coordinates that point locate each terminal and pickup, delivery, and service location. These straight-line distances were factored by 1. 2 to approximate overthe-road distances. Truck trip travel speeds were based on truck driver estimates of the time taken to travel between stops.
Direct Energy Consumption coefficients
~he second data· input is a set of direct energy coefficients cross-classified by truck operating speeds, loaded truck weight, and fuel type used (gasoline or diesel). A review of the recent literature (3-9) indicates that distance traveled is the major determinant of direct fuel energy consumed, and the factors that affect the rate of energy consumption are as follows: (a) operating speed, ( b) loaded vehicle weight, ( c) fuel type (gasoline or diesel), (d) idling time, (e) truck body type (panel, pickup, semitrailer), (f) roadway conditions (lane number and width, grade, surface, curves), (g) traffic conditions (notably number of stops and starts due to congestion), (h) truck age, and (i) ambient air temperature. The approach adopted for computation of the direct energy consumption coefficients is based on the explicit interaction of factors a to c, plus factor d as an additional component, based on information in Winfrey (!, pp.
15
Gasoline Fuel
I U.S. Gallon Gasoline = 131.89 MJ I U.S. Gallon Diesel = 146.45 MJ
HG
MG
L(2)G
L(l)G
45 60 75 90 kph Speed
Diesel Fuel L(l)G = 50001bs. LVW L(2)G = 12,000lbs. LVW MG = 26,000 lbs. L VW HG = 40,000 lbs. L VW
MD= 26,000lbs. LVW HD= 50,000 LVW
10 20 30 40 50 60 mph
22 Transportation Research Record 834
Table 1. Daily weekday direct energy consumption statistics by commodity class.
Commodity Class
Empty Farm, tobacco, fresh fish, and marine products Food and kindred products Metallic ores and ordinance Nonmetallic minerals Energy products Forest products Fabricated metals Primary metals Mixed shipments Retail and wholesale products Total
8Round figure.
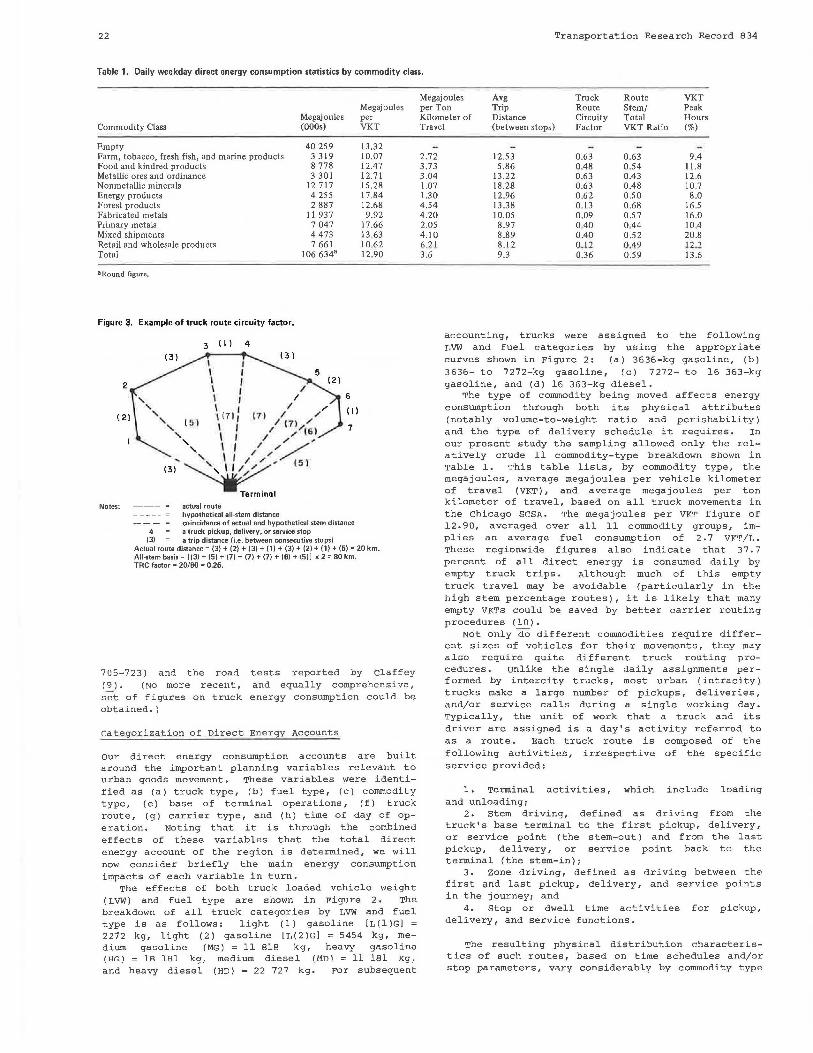
Figure ;j, Example of truck route circuity factor.
2
(2) ( ~l
3 ( 1 l 4
I I I I I I I I I f I l I (7l 1
(3 l
Megajoules (OOOs)
40 259 3 319 8 778 3 301
12 717 4 255 2 887
11 937 7 047 4 473 7 661
106 634"
I I I J I "' (SI / ,
, I I /,, / ... ' \I / /'/. _, (3)~- (5)
Terminal Notes: actual route
hypothetical all-stem distance
6
(I)
7
coincidence of actual and hypothetical stem distance 4 a truck pickup, delivery, or service stop
(3) a trip distance (i.e. between consecutive stops)
Megajoules per VKT
13.32 10.07 12.47 12.71 15.28 17.84 12.68 9.92
17.66 13.63 10.6? 12.90
Actual route distance= (3) + (2) + (3) + (1) + (3) + (2) + (1) + (5) = 20 km. All-stem basis= [(3) + (5) + (7) + (7) + (7) + (6) + (5)] x 2 = 80 km. TRC factor = 20/80 = 0.25.
705-723) and the road tests reported by Claffey (9). (No more recent, and equally comprehensive, s-;t of figures on truck energy consumption could be obtained.)
categorization of Direct Energy Accounts
our direct energy consumption accounts are built around the important planning variables relevant to urban goods movement, These variables were identified as (a) truck type, (b) fuel type, (c) commodity type, (e) base of terminal operations, (f) truck route, ( g) carrier type, and ( h) time of day of operation. Noting that it is through the combined effects of these variables that the total direct energy account of the region is determined, we will now consider briefly the main energy consumption impacts of each variable in turn.
The effects of both truck loaded vehicle weight ( LVW) and fuel type are shown in Figure 2. The breakdown of all truck categories by LVW and fuel type is as follows: light (1) gasoline [L(l)G] = 2272 kg, light (2) gasoline [I,(2)G] = 5454 kg, medium gasoline (MG) = 11 818 kg, heavy gasoline (HG) = 18 1Al kg, medium diesel {MD) = 11 181 kg, and heavy diesel (HD) = 22 727 kg. For subsequent
Megajoules Avg Truck Route VKT per Ton Trip Route Stem/ Peak Kilometer of Distance Circuity Total Hours Travel {between stops) Factor VKT Ratio (%)
2.72 3.73 3.04 1.07 1.30 4.54 4.20 2.05 4.10 6 .21 3.6
12.53 0.63 0.63 9.4 5.86 0.48 0.54 11.8
13.22 0.63 0.43 12.6 18.28 0.63 0.48 10.7 12.96 0.62 0.50 8.0 13.38 0.13 0.68 16.5 10.05 0.09 0.57 16.0
8.97 0.40 0.44 10.4 8.89 0.40 0.52 20.8 8.12 0. 12 D.49 12.2 9.3 0.36 0.59 13.6
accounting, trucks were assigned to the following r.vw and fuel categories by using the appropriate curves shown in Figure 2: (a) 3636-kg gasoline, (b) 3636- to 7272-kg gasoline, (c) 7272- to 16 363-kg gasoline, and (d) 16 363-kg diesel.
The type of commodity being moved affects energy consumption through both its physical attributes (notably volume-to-weight ratio and perishability) and the type of deli very schedule it requires. In our present study the sampling allowed only the relatively crude 11 commodity-type breakdown shown in Table 1. This table lists, by commodity type, the megajoules, average megajoules per vehicle kilometer of travel (VKT), and average megajoules per ton kilometer of travel, based on all truck movements in the Chicago SCSA. The megajoules per VKT figure of 12.90, averaged over all 11 commodity groups, implies an average fuel consumption of 2. 7 VKT/I., These regionwide figures also indicate that 37,7 percent of all direct energy is consumed daily by empty truck trips. Although much of this empty truck travel may be avoidable (particularly in the high stem percentage routes), it is likely that many empty VKTs could be saved by better carrier routing procedures (10).
Not only do different commodities require different sizes of vehicles for their movements, they may alGo require quite different truck routing pre= cedures. unlike the single daily assignments performed by intercity trucks, most urban (intracity) trucks make a large number of pickups, deliveries, and/or service calls during a single working day. Typically, the unit of work that a truck and its driver are assigned is a day's activity referred to as a route. Each truck route is composed of the following activities, irrespective of the specific service provided:
1. Terminal activities, which include loading and unloading;
2. Stem driving, defined as driving from the truck's base terminal to the first pickup, delivery, or service point (the stem-out) and from the last pickup, delivery, or service point back to the terminal (the stem-in);
3. Zone driving, defined as driving between the first <;lnd last pickup, delivery, and service points in the journey; and
4. Stop or dwell time activities for pickup, delivery, and service functions.
The resulting physical distribution characteristics of such routes, based on time schedules and/or stop parameters, vary considerably by commodity type
Transportation Research Record 834
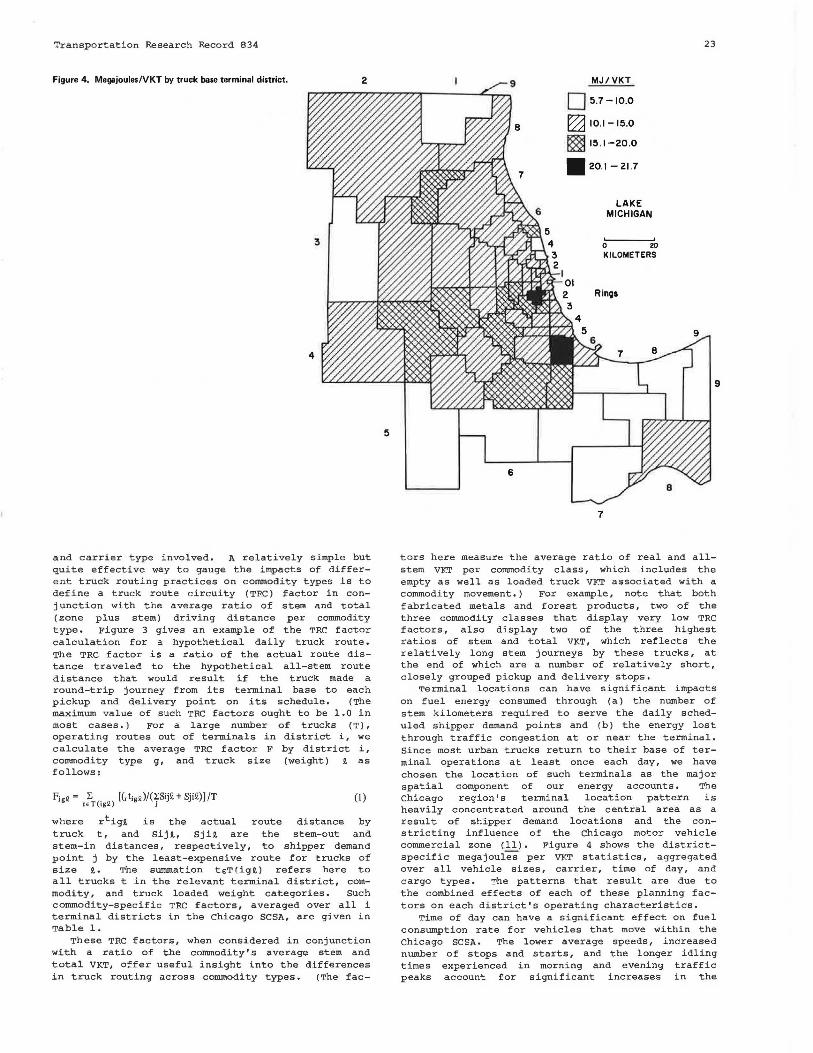
Figure 4 . Megajoules/VKT by truck base terminal district.
3
and carrier type involved. A relatively simple but quite effective way to gauge the impacts of different truck routing practices on commodity types is to define a truck route circuity (TP.C) factor in conjunction with the average ratio of stem and total (zone plus stem) driving distance per commodity type. Figure 3 gives an example of the TRC factor calculation for a hypothetical daily truck route. The TRC factor is a ratio of the actual route distance traveled to the hypothetical all-stem route distance that would result if the truck made a round-trip journey from its terminal base to each pickup and delivery point on its schedule. (The maximum value of such TRC factors ought to be 1.0 in most cases. ) For a large number of trucks ( T) , operating routes out of terminals in district i, we calculate the average TRC factor F by district i, commodity type g, and truck size (weight) l as follows:
(1)
where rtigl is the actual route distance by truck t, and Sijl, Sjit are the stem-out and stem-in distances, respectively, to shipper demand point j by the least-expensive route for trucks of size t. The summation tgT(igl) refers here to all trucks t in the relevant terminal district, commodity, and truck loaded weight categories. Such commodity-specific TRC factors, averaged over all i terminal districts in the Chicago SCSA, are given in Table 1.
These TRC factors, when considered in conjunction with a ratio of the commodity's average stem and total VKT, offer useful insight into the differences in truck routing across commodity types. (The fac-
6
MJ/VKT
o 5.1-10.0
~ 10.1-15.0
~ 15.1-20.0
.20.1-21.7
LAKE MICHIGAN
0 20 KILOMETERS
Rings
7
23
9
tors here measure the average ratio of real and allstem VF'I' per commodity class, which includes the empty as well as loaded truck VKT associated with a commodity movement.) For example, note that both fabricated metals and forest products, two of the three commodity classes that display very low TRC factors, also display two of the three highest ratios of stem and total VKT, which reflects the relatively long stem journeys by these trucks, at the end of which are a number of relatively short, closely grouped pickup and delivery stops.
Terminal locations can have significant impacts on fuel energy consumed through (a) the number of stem kilometers required to serve the daily scheduled shipper demand points and (b) the energy lost through traffic congestion at or near the terminal. Since most urban trucks return to their base of terminal operations at least once each day, we have chosen the location of such terminals as the major spatial component of our energy accounts. The Chicago region's terminal location pattern is heavily concentrated around the central area as a result of shipper demand locations and the constricting influence of the Chicago motor vehicle commercial zone (11). Figure 4 shows the districtspecific megajoules per VKT statistics, aggregated over all vehicle sizes, carrier, time of day, and cargo types. '!'he patterns that result are due to the combined effects of each of these planning f actors on each district's operating characteristics.
Time of day can have a significant effect on fuel consumption rate for vehicles that move within the Chicago SCSA. The lower average speeds, increased number of stops and starts, and the longer idling times experienced in morning and evening traffic peaks account for significant increases in the
24
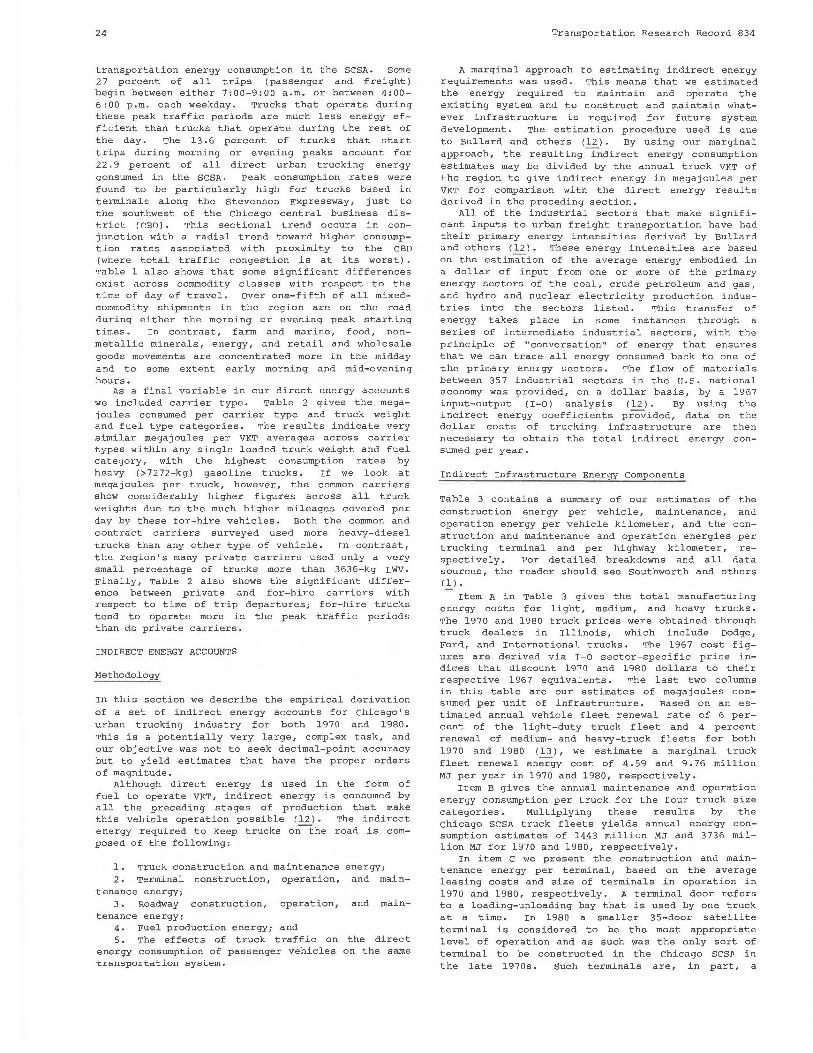
transportation energy consumption in the SCSA. Some 27 percent of all trips (passenger and freight) begin between either 7:00-9:00 a.m. or between 4:00-6 :00 p.m. each weekday. Trucks that operate during these peak traffic periods are much less energy efficient than trucks that operate during the rest of the day. The 13.6 percent of trucks that start trips during morning or evening peaks account for 22.9 percent of all direct urban trucking energy consumed in the SCSA. Peak consumption rates were found to be particularly high for trucks based in terminals along the Stevenson Expressway, just to the southwest of the Chicago central business district (CBD). This sectional trend occurs in conjunction with a radial trend toward higher consumption rates associa~ed wi~n proximity to the CBD (where total traffic congestion is at its worst). '!'able 1 also shows that some significant differences exist across commodity classes with respect to the time of day 0f travel. over one-fifth of all mixedcommodity shipments in the region are on the road during either the morning or evening peak starting times. In contrast, farm and marine, food, nonmetallic minerals, energy, and retail and wholesale goods movements are concentrated more in the midday and to some extent early morning and mid-evening hours.
As a final variable in our direct energy accounts we included carrier type. Table 2 gives the megajoules consumed per carrier type and truck weight and fuel type categories. The results indicate very similar megajoules per VKT averages across carrier types within any single loaded truck weight and fuel category, with the highest consumption rates by heavy (>7272-kg) gasoline trucks. If we look at megajoules per truck, however, the common carriers show considerably higher figures across all truck weights due to the much higher mileages covered per day by these for-hire vehicles. Both the common and contract carriers surveyed used more heavy-diesel trucks than any other type of vehicle. In contrast, the region's many private carriers used only a very small percentage of trucks more than 3636-kg LWV. Finally, Table 2 also shows the significant difference between private and for-hire carriers with respect to time of trip departures; for-hire trucks tend to operate more in the peak traffic periods than do private carriers.
INDIRECT ENERGY ACCOUNTS
Methodology
In this section we describe the empirical derivation of a set of indirect energy accounts for Chicago's urban trucking industry for both 1970 and 1980. This is a potentially very large, complex task, and our objective was not to seek decimal-point accuracy but to yield estimates that have the proper orders of magnitude.
Al though direct energy is used in the form of fuel to operate VKT, indirect energy is consumed by all the preceding stages of production that make this vehicle operation possible (12). The indirect energy required to keep trucks o;-the road is composed of the following:
1. Truck construction and maintenance energy; 2. Terminal construction, operation, and main
tenance energy; 3. Roadway construction, operation, and main
tenance energy; 4. Fuel production energy; and 5. The effects of truck traffic on the direct
energy consumption of passenger vehicles on the same ~ransportation system.
Transportation Research Record 834
A marginal approach to estimating indirect energy requirements was used. This means that we estimated the energy required to maintain and operate the existing system and to construct and maintain whatever infrastructure is required for future system development. The estimation procedure used is due to Bullard and others ( 12). By using our marginal approach, the resulting indirect energy consumption estimates may be divided by the annual truck VKT of t-.he region to give indi rP.r.t. P.nergy in mP.gajonlP.R per VKT for comparison with the direct energy results derived in the preceding section.
All of the industrial sectors that make significant inputs to urban freight transportation have had their primary energy intensities derived by Bullard and others (12). -These energy intensities are based on the esti~ion of the average energy embodied in a dollar of input from one or more of the primary energy sectors of the coal, crude petroleum and gas, and hydro and nuclear electricity production industries into the sectors listed. "'his transfer of energy takes place in some instances through a series of intermediate industrial sectors, with the principle of 11 conversation 11 of energy that ensures that we can trace all energy consumed back to one of the primary energy sectors. 'T'he flow of materials between 357 industrial sectors in the u.s. national economy was provided, on a dollar basis, by a 1967 input-output (I-0) analysis (12). By using the indirect energy coefficients provided, data on the dollar costs of trucking infrastructure are then necessary to obtain the total indirect energy consumed per year.
Indirect Infrastructure Energy components
Table 3 contains a summary of our estimates of the construction energy per vehicle, maintenance, and operation energy per vehicle kilometer, and the construction and maintenance and operation energies per trucking terminal and per highway kilometer, respectively. For detailed breakdowns and all data sources, the reader should see Southworth and others (1).
Item A in Table 3 gives the total manufacturing energy costs for light, medium, and heavy trucks. The 1970 and 1980 truck prices were obtained through truck dealers in Illinois, which include Dodge, Ford, and International trucks. The 1967 cost fig-ures are derived via I-0 sector-specific price in-dices that discount 1970 and 1980 dollars to their respective 1967 equivalents. 'T'he last two columns in this table are our estimates of megajoules consumed per unit of infrastructure. Rased on an estimated annual vehicle fleet renewal rate of 6 percent of the light-duty truck fleet and 4 percent renewal of medium- and heavy-truck fleets for both 1970 and 1980 (13), we estimate a marginal truck fleet renewal energy cost of 4. 59 and 9. 76 million MJ per year in 1970 and 1980, respectively.
Item B gives the annual maintenance and operation energy consumption per truck for the four truck size categories. Multiplying these results by the Chicago SCSA truck fleets yields annual energy consumption estimates of 1443 million MJ and 3736 million MJ for 1970 and 1980, respectively.
In item c we present the construction and maintenance energy per terminal, based on the average leasing costs and size of terminals in operation in 1970 and 1980, respectively. A terminal door refers to a loading-unloading bay that is used by one truck at a time. In 1980 a smaller 35-door satellite terminal is considered to be the most appropriate level of operation and as such was the only sort of terminal to be constructed in the Chicago SCSJI in the late 1970s. Such terminals are, in part, a
Transportation Research Record 834 25
Table 2. Direct energy consumption statistics by carrier, truck weight, and fuel types.
For-Hire
Private Common Contract
Truck LVW Megajoules Megajoules Megajoules Megajoules Megajoules Megajoules and Fuel Megajoules per per Megajoules per per Megajoules per per Type (OOOs) VKT Truck (OOOs) VKT Truck (OOOs) VKT Truck
L(l)G 18 877 7.9 456 720 9.1 832 661 7.9 580 L(2)G 13 890 15.0 918 1 606 15.0 1134 1258 15.6 1554 MG 23 907 25.0 2068 6 766 26.I 2482 2842 29.8 1962 HG 26 382 35.5 3690 10 848 37.2 3692 5280 36.5 3902 MD 1 830 21.2 2679 2 324 18.0 3218 941 23.5 2923 HD 2 297 28. l 3880 16 936 26.5 4233 7231 28.4 4180
Note : Percentage of VKT in peak hours= 10.2, private; 17.2, common; and 16.l contract.
Table 3. Summary of infrastructure energy consumption. Item Category 1970 1980
A Vehicle construction energy (MJ OOOs) Light and medium trucks 569 662 Heavy trucks 1738 1880
B Vehicle maintenance and operation energy (MJ/vehicle-km) 2 272 kg, panel 1.29 1.78 5 45 4 kg, single unit 1.90 2.45
18 181 kg 2.27 2.88 22 72 7 kg, 2-5 2 trailer 2.64 3.56
c Terminal construction and maintenance and operation energy per typical terminal (MJ OOOs)
Construction 26 653 15 624 Maintenance and operation 4198 3163 Administration 3597 2104 Insurance 1484 939
D Highway construction and maintenance energy per lane-kilometer (MJ OOOs/km)
Expressway construction 66 006 99 440 Expressway maintenance 280.0 227.8 Arterial construction 22 428 9353 Arterial maintenance 81.0 62.3
response to the industry's recognition that diseconomies of scale may manifest themselves with increased terminal size.
A cost breakdown for a typical local trucking industry is estimated in Wilson ( 14) • This breakdown gives the terminal maintenanc-;-cost (rent plus upkeep costs) as 5.5 percent of the total cost, while administration costs and insurance costs of freight and equipment are 7.5 percent and 4 percent of the total budget, respectively, Combining these figures with the $84 000 maintenance cost assigned to sector 73.01 (miscellaneous business services) and $61 090 as the annual insurance cost (sector 70.06), for 1980 these administrative and insurance costs are calculated to be $148 910 and $79 418, respectively. By multiplying our findings by the 297 terminals in the Chicago SCSA in 1970, we get an annual 1970 terminal maintenance and operation energy cost of nearly 2776 million MJ. For 1980, with an estimated 272 terminals, our annual estimate is 1685 million MJ. New constructions do not enter our marginal accounts.
If we wish to calculate the energy required to construct and maintain highways for urban trucks, we must face the same conceptual problem as the transport economist who faces an equitable road pricing policy decision. That is, we need to know how much is the ad.ditional expense of allowing trucks to use highways that were built essentially to serve the private automobile.. This additional expense (and its resulting energy costs) results from the potentially excessive pavement damage that a heavy truck may cause. Without the heavier truck traffic, our highways would last longer and need less repair. Recognizing the essential nature of urban goods
movements by trucks, the problem is then one of determining how much this freight traffic adds to pavement wear.
The typical approach to highway traffic pricing ( 15, pp. 461-4 73) is to calculate the cost of constructing and maintaining an automobile-only road for an assumed known level of traffic, and to set a rate for operating such vehicles (through the roadfund tax on fuel, for example). The additional expense of upgrading the road to take a certain volume of heavier (truck and bus) traffic may then be calculated--for the same assumed road life and level of maintenance as the automobile-only road. By applying the same rationale to energy consumption, we obtained figures for the construction and maintenance of a typical lane-kilometer of urban highway in Chicago from the Illinois Department of Transportation, Highways Division. The results in Table 3, item D, used these 1970 and 1980 prices as discounted to their 1967 equivalents (16,17). Only urban expressways and primary and secondarY-arterial roads are included in the analysis. Local road construction and maintenance energy are assumed to be attributable entirely to Chicago's passenger transportation modes.
Boyce and others ( 18), in a study of passenger transportation energy Cc;°nsumption within the Chicago SCSA, estimate that trucks and buses account for 50 percent of the region• s annual roadway (expressways plus arterials) maintenance costs and 38. 4 percent of new roadway construction costs. The rest is attributable to automobile traffic. Reducing the megajoules per lane-kilometer figures in item D by one-half and multiplying by the number of lane-kilometers in the SCSA give the annual roadway mainte-
26 Transportation Research Record 834
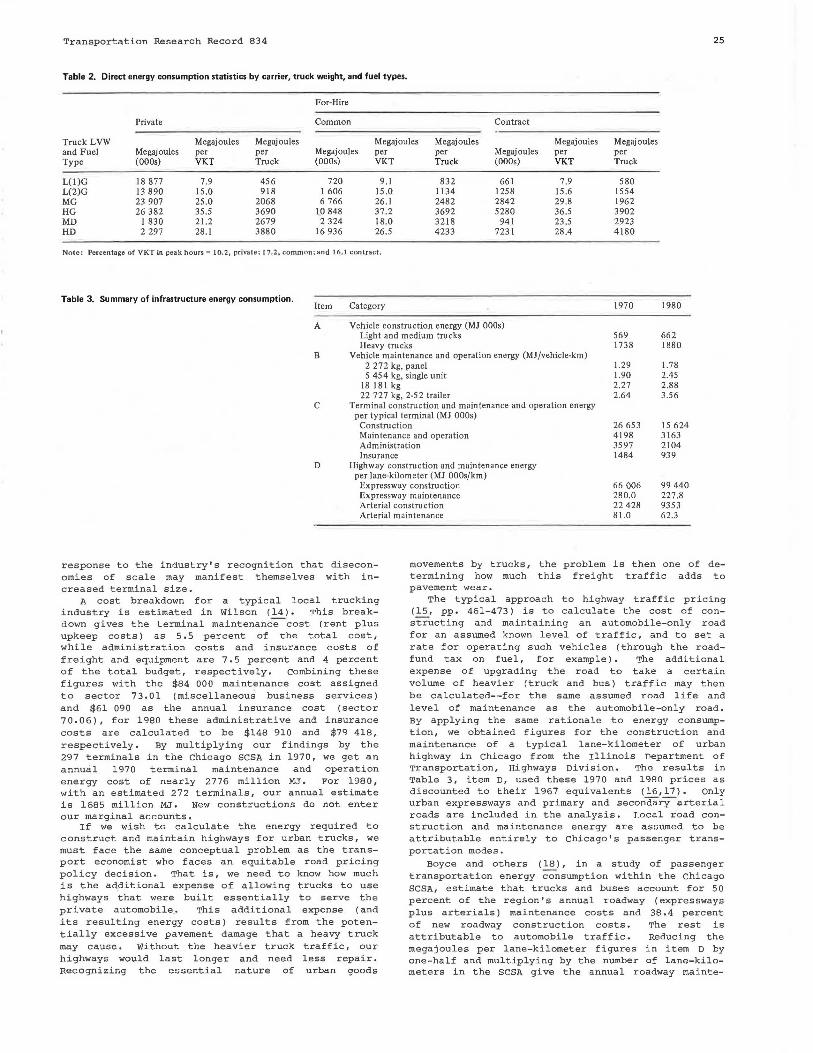
Table 4. Energy consumption due to urban trucking. Equivalent 1970 Equivalent 1980 in Chicago SCSA (major components). U.S. Gallons U.S. Gallons of Gasoline MJ Total of Gasoline MJ Total
Item (000 OOOs) (000 OOOs) (%) (000 OOOs) (000 OOOs) (%)
Direct energy 231.0 30485.l 62.3 437.2 57 709.28 64.2 Indirect energy
Infrastructure 66.4 8 771.3 17.9 105.4 13 910.7 15.5 Fuel production 61.0 8 048.1 16.5 115 .4 15 235.2 16.9 Congestion 12.3 1 629.9 3.3 23.3 3 071.1 3.4 Subtotal 139.7 18 444.3 37.7 244.0 32217.0 35.8
Total 370.7 48 929.4 681.2 89 926.2
aeased on estimated increases in truck VKT derived from Knorr and Millar (!.!_).
nance figures shown (in megajoules). Combining expressway and arterial results gives an annual roadway maintenance energy consumption total of 928.75 million MJ for 1970, which is attributable to truck traffic. Prorating this maintenance cost on a truck kilometer basis and recalling that 77 percent of all SCSA truck VKT in 1970 was due to urban trucking give us an urban trucking energy consumption estimate of 715 .13 million MJ. Assuming the same ratio of urban and interurban truck VKT, the 1980 figure is estimated to be lower, at 565.24 million MJ (77 percent of 734.07 million MJ for all 1980 truck movements in the SCSA).
construction costs for highway lane-kilometers are not included in our marginal accounts, although forecasts of energy consumption per planned lanekilometer can easily be derived by using the information in item D and remembering to multiply by the appropriate automobile and regional truck percentages.
Indirect Fuel Production Energy for Chicago SCSA
The operation of a truck consumes gasoline that contains 131.89 MJ of combustible energy per u.s. gallon. This is direct energy consumption. However, the industry that produces refined petroleum products itself consumes, on average, an additional 0.227 MJ for each megajoule of gasoline used in direct energy consumption (12). This equals 29.94 MJ of indirect energy consumption per u.s. gallon of gasoline fuel, if we assume that gasoline represents an average product of the oil-refining industry. In addition, energy is required to transport gasoline and diesel from refineries to highway filling stations. Thus, energy consumed by wholesale and retail transactions equals approximately 4 .87 MJ/U. S. gal. Recognizing that most of this last figure is consumed on intercity transportation (plus use of pumping machinery) , we include it here to be added to our accounts.
Congestion Analysis
For estimation of the energy cost due to truck-induced traffic congestion, we used the approach developed by A.T. Kearney, Inc., f4, Appendix D), but instead used Chicago-specific?" VKT figures. Briefly, the analysis consists of the following steps:
1. calculate automobile-equivalent daily VKT by (a) peak, midday, and night; (b) central area and noncentral area; (c) expressway and arterial crossclassifications (a truck was set equal to 2.0 automobiles and a bus to 1.6 automobiles based on American Association of State Highway and Transportation Officials passenger car equivalents).
2. By using information provided by the then Highway Research Board !.!1l and the Urban Mass Trau.sportation Ad.iuinistration ( 20} \.JU. the relation
between vehicle speeds (V/C) ratios, calculate time-of-day, area, and all traffic.
and roadway volume/capacity an average speed for each roadway classification for
3, Based on the percentage reduction in V/C ratios caused by removing the daily automobileequi valent ( x2) truck VKT from each area, roadway, and time-of-day category, calculate the new average traffic speeds.
4. Multiply the total nontruck VK'T' by the appropriately determined average speed and automobile direct energy consumption coefficients (9) to obtain the additional fuel energy lost because of truckinduced traffic congestion by time-of-day, area, and roadway category.
5. Sum all categories and multiply by 312 to obtain the annual congestion energy losses due to trucks (for an assumed 6-day week).
'T'he results of this analysis for the Chicago SCSA in 1970 suggest an additional automobile fuel consumption of 1630 million MJ/year. This represents 12.3 percent of the total annual indirect energy consumption of the region.
SUMMARY AND CONCLUSIONS
Table 4 contains a summary of the estimated total annual regional energy consumption for 1970 and 1980. The 83 .8 percent increase over the decade is attributable to an estimated 89. 3 percent increase in truck VKT, based on national projections (~-~).
The results of our direct energy analysis suggest that more research should look into the combined effects of truck size and fuel type, its base of terminal operations, and the type of firm (private and for-hire) operating it. Such investigations must be commodity-specific (with far more detailed breakdowns than our 11 commodity groups). A potentially fruitful line of research would be to seek to incorporate such truck-routing statistics as average trip lengths, TRC, and ratios of stem to total driving distance within terminal- and commodity-specific equations of average fuel consumption rates. This means extending the sort of speed and vehicle fuel and weight equations derivable from Winfrey 18) and Claffey (9) to incorporate such spatial factors. we also note- here that extensive work is needed into the effects of truck age and ambient air temperature on the fuel consumption rates of different size trucks [in addition to the limited evidence in Morral and others (24) and the Tri-State Transportation Commission (£).for example] •
Finally, scrutiny of our individual truck trip records suggests that further research should investigate the impacts of carrier type on average fuel consumption rates, paying particular attention to the frequency of mismatches between truck and cargo size and to the opportunities for savings through more mixed commodity carriage. Certainly, where sample size precludes extensive and detailed
Transportation Research Record 834
commodity-type breakdowns, average tion rates by carrier type provide gate measure (as in Table 2).
ACKNOWLEDGMENT
energy consumpa useful surro-
This research was funded by the Illinois Institute of Natural Resources, Springfield. However, we are responsible for its content.
REFERFNCES
1. F. Southworth, B.N. ,Tanson, and r:. Papathanassopoulos. Energy Accounts for Urban Truck Freight Movements in the Chicago Region. Illinois Institute of Natural Resources, Springfield, Document 80/21, 1980.
2. commodities and commercial vehicles Survey, 1970 Travel Characteristics. Chicago Area Transportation Study, Chicago, 1977.
3. A.T. Kearney, Inc. Urban Goods Movement Demonstration Project Design Study, Final Report on Phases I to v. UMTA, 1975.
4. A.T. Kearney, Inc. Urban Goods Movement Demonstration Project Design Study, Appendices A-E. UMTA, 1975.
5. J. Faucett and Associates. Trucking Activity and Fuel Consumption--1973, 1980, 1985, and 1990. Federal Energy Administration, 1976.
6. n.L. Christiansen. Urban Transportation Planning for Goods and Services--A Reference Guide. FHWA; Texas '!'ransportation Institute, Texas A&M Univ., College Station, 1979.
7. mransport Canada. Urban Goods Movement Report Series, Volumes 1 to 9. Urban Transportation Research Branch, Canadian Surface Transportation Administration, Montreal, Quebec, 1979.
8. R. Winfrey. Economic Analysis for Highways. International Text-Book Company, Scranton, PA, 1969.
9. P.J. Claffey and Associates. Running costs of Motor Vehicles as Affected by Road Design and Traffic. NCHRP, Rept. 111, 1971.
10. A. French. Energy and Freight Movements. In Measuring Energy Efficiency in Freight Transportation, FHWA, 1976.
11. U.S. General Accounting Office. ICC's Expansion of unregulated Motor carrier commercial zones Has Had Little or No Effect on Carriers and Shippers. Report to the congress by the comptroller General, Rept. CED-78-124, 1978.
12. c.w. Bullard, P. Renner, and D. Pilati. Net Energy Analysis: Handbook for combining Process and Input-output Analysis. Center for Advanced Computation, tmiv. of Illinois, Urbana, CAC Document 214, 1976.
27
13. Mobile Source F.missions Factors for Low-Altitude Areas Only--Pinal Document. U.S. Environmental Protection Agency, 1978.
14. R. Wilson. American Trucking "'rends 1977-1978. American Trucking Associations, Inc., Washington, DC, 1978.
15. E.K. Morlok. Introduction to Transportation Engineering and Planning. McGraw Hill, New york, 1978.
16. B.M. Hannon, B. Segal, R. Stern, and D. Serber. Energy use for Building Construction. center for Advanced Computation, Univ. of Illinois, Urbana, CAC Document 228, 1977.
17. D.B. Sanders and T. Reyden. Characteristics of Urban Transportation Systems. U.S. Department of Transportation, 1975.
18. D. Boyce, M. Romanos, B. Janson, M. Ferris, P. Prastacos, and R. Eash. Urban Transportation Energy Accounts, Vol. 2. Department of Ci vi 1 Engineering, univ. of Illinois at urbanaChampaign, Urbana, 1980.
19. Highway capacity Manual. HRB, Special Rept. 86, 1973.
20. Characteristics of Urban Transportation Systems--A Handbook for Transportation Planners. UMTA, 1974.
21. R.E. Knorr and M. Millar. Projections of Direct Energy Consumption by Mode, 1975-2000 Baseline. Argonne National Laboratory, Argonne, IL, 1979.
22. Motor Vehicle Facts and Figures. American Motor Manufacturer's Association, Detroit, MI, 1979.
23. M. Millar and M.J. Bernard. Transportation Energy Scenario Analysis, Technical Memorandum No. 2: Historical Rates of change in the Transportation Stock. Argonne National Laboratory, Argonne, IL, 1979.
24. J. Morral, M. Sargious, R. Thompson, and G. Wood. A Study of Potential Energy Conservation in urban Goods commodity Flow: A Preliminary Perspective. Road and Transportation As sociation of Canada, R"'AC Forum, Vol. 2.2, 1979, pp. 4-15.
2 5. The Fconomics of a Rational urban Pickup and Delivery System. Tri-State Transportation commission, New York, Interim Tech. Rept., 1970.
Publication of this paper sponso~ed by Committee on Urban Goods Movement.