geophysical survey at talos dome, east antarctica: the search for a new deep-drilling site
TRANSCRIPT

1
GEOPHYSICAL SURVEY AT TALOS DOME (EAST ANTARCTICA): THE SEARCH FOR A NEW DEEP-DRILLING SITE
Frezzotti M.1, G. Bitelli2, P. De Michelis3, A. Deponti5, A. Forieri4, 6, S. Gandolfi2, V. Maggi5, F.
Mancini2, F. Rémy7, E.I. Tabacco4, S. Urbini3, L. Vittuari2, A. Zirizzotti3
1 ENEA Progetto Clima, Italy 2 Dipartimento di Ingegneria delle Strutture, dei Trasporti, delle Acque, del Rilevamento, del
Territorio, Bologna, Italy 3 Istituto Nazionale Geofisica e Vulcanologia, Rome, Italy 4 Dipartimento Scienze della Terra, Milan, Italy 5 Dipartimento Scienze Ambientali e del Territorio, Milan Bicocca, Italy 6 Dipartimento Scienze della Terra, Siena, Italy 7 LEGOS (CNRS-CNES-UPS), TOULOUSE, France
Abstract
Talos Dome is an ice dome on the edge of the East Antarctic plateau; it is adjacent to the
Victoria Land mountains and overlies the eastern margin of the Wilkes Subglacial Basin. As
part of the ITASE project, two traverse surveys were carried out in the Talos Dome area in
November 1996 and January 2002. Airborne radar surveys were conducted in 1995, 1997,
1999 and 2001. Analysis of ERS-1 Radar Altimeter data allowed the positioning of Talos
Dome about 50 km South of the 1960s location. A new plano-altimetric map of the Talos
Dome area locates the dome culmination (159°04'21” E, 72°47'14” S, 2318.5 m) about 1.5 km
north of the previous ERS-1 position. A surface strain network of nine stakes was measured
using GPS in 1996, 1998 and 2002. Data indicates that ice at the TD site moves SSE a few
centimetres per year. The other stakes move with radial velocities of 0.11 to 0.34 m a-1. The
higher velocities are recorded in the steeper S-SW and E-NE slopes. Airborne radar
measurements were carried out on 4320 km2 in the Dome area. Results indicate that the
bedrock at the Talos Dome summit is about 400 m in elevation (WGS84) and that it is
covered by about 1900 m of ice. Three hundred kilometres of snow radar (GPR) and GPS
surveys show that the internal layering is continuous and horizontal up to 15 km from the
2
dome, and highlight variations in the elevation of internal layers. The depth distribution
analysis of layers reveals that accumulation decreases downwind of the dome (N-NE) and
increases upwind (SSW). The palaeo-summit positions of the 4 layers are coherent and
indicate that, over the past 500 years, the culmination of Talos Dome moved NNE at an
average rate of about 1 m a-1. In order to calculate a preliminary age vs. depth profile for
Talos Dome, a simple one-dimensional steady-state model was formulated; this model
predicts that the ice 100 meters above the bedrock may cover more than one
glacial/interglacial period (160-240 kyr).
INTRODUCTION
Ice cores provide seasonal to millennial resolution records of climate. Isotope and
chemical variations in the deposited snow and gases within trapped bubbles provide proxy
records for many aspects of the palaeoenvironment, including temperature, snow
accumulation rates, moisture sources, atmospheric dust loading, greenhouse-gas
concentrations, and bioproductivity. The records from inland East and West Antarctica (Byrd,
Dome C, Dome Fuji, Dome B and Vostok) and from the eastern coastal site (Law Dome) are
very similar and show a deglacial pattern very different from that registered in Greenland
cores. In contrast, the records from Taylor Dome and Siple Dome, two near-coastal sites in
the Ross Sea Sector, show Greenland-like features indicative of climate change synchronous
with the North Atlantic (Morgan and others, 2003; Watanabe and others, 2003; and
references therein). The synchrony or asynchrony of climate change during the last glacial
transition in Antarctica and Greenland, and within Antarctica, is a crucial test for theories and
models regarding the causes of rapid climate change. High-resolution Holocene climate and
environmental records of the Ross Sea area are needed to characterise interglacial variability
and understand the significance of modern changes. Since the high inland plateau of the
Antarctic ice sheet is isolated by distance from local sources of aerosol, chemical-isotopic
signals in ice cores from this area are considered to reflect the global environment. Ice cores
from the margin of the continent can better provide a record of the deglaciation process and
of environmental conditions in coastal areas and the surrounding ocean.
There are currently only a few ice cores from coastal sites that record Holocene and
recent climate change, or the recent retreat of the ice sheet. An accurate understanding of
3
deglaciation in Antarctica and of environmental conditions (sea ice extension, snow
accumulation, temperature, etc.) since the Last Glacial Maximum (LGM) is important for
understand the past, present and future behaviour of Antarctic mass balance and hence the
cause of Holocene and 20th century sea-level rises. The investigation of Antarctic deglaciation
over millennial time scales, from the LGM through the Holocene to the present, with decadal
resolution should reveal the relative influence of sea level change (from northern hemisphere
deglaciation), and changes in the Antarctic climate (the ice accumulation regime) and
Southern Ocean (sea ice extension, ENSO) recorded in ice core records. Defining the natural
variability of climate under Holocene conditions, more or less similar to present conditions,
requires high resolution records over a large area.
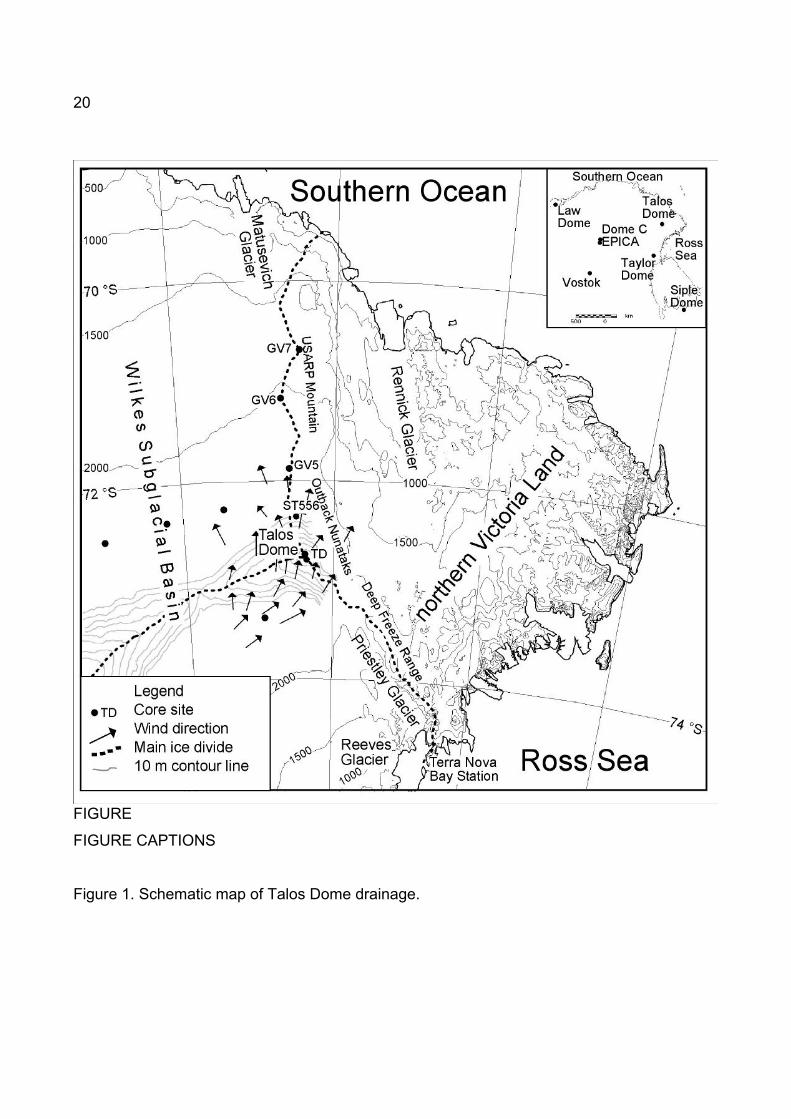
Talos Dome is an ice dome on the edge of the East Antarctic plateau; it is adjacent to
the Victoria Land mountains and overlies the eastern margin of the Wilkes Subglacial Basin
(Fig. 1). As part of the ITASE project, two traverse surveys were carried out in the Talos
Dome area in November 1996 (Frezzotti and others, 1998) and January 2002 (Frezzotti and
others, 2003). Airborne radar surveys were conducted in 1997, 1999 and 2001. Research
aimed to better understand the latitudinal (North-South) and longitudinal (East-West)
environmental gradient along two East-West (Talos Dome - D66) and North-South (GV7 -
Talos Dome - Taylor Dome) transepts, documenting climatic, atmospheric and surface
conditions in the Talos Dome area and in northern Victoria Land throughout the last 200-1000
years. The northwestern drainage area of Talos Dome base is mostly below sea level (Wilkes
Subglacial Basin). For this reason, this drainage area is more sensitive to climatic and
eustatic fluctuations than other sectors of the East Antarctic Ice Sheet (Warner and Budd,
1998). Research on Talos Dome aimed to characterise the area and find the best location to
extract an ice core down to the bedrock.
GEOGRAPHICAL and CLIMATIC CHARACTERISTICS
Talos Dome is an ice dome on the edge of the East Antarctic plateau (Fig.1), about
290 km from the Southern Ocean, 250 km from the Ross Sea, 275 km from the Italian Station
(Terra Nova Bay), 550 km North of Taylor Dome, 1500 km NW of Siple Dome, and 1100 km
East of Dome C.
An ice saddle (2260 m) West of Talos Dome separates the dome from an ice ridge
coming from Dome C. Ice flows SE from this ridge into outlet glaciers (Priestley and Reeves),
4
which drain into the Ross Sea, and NW into the Rennick and Matusevich Glaciers, which
drain into the Southern Ocean. Another ice divide trends North from Talos Dome, passing
behind the USARP Mountain and SE of the Deep Freeze Range.
The dome features were delineated for the first time in the USGS Welcome Mountain
map (1968) on the basis of the US Victoria Land traverse altimetric profile (Stuart and Heine,
1961). Drewry (1983) delineated and named Talos Dome morphological features (at 158°E
and 73°S) with data from the SPRI-NSF-TUD airborne radio echo sounding programme
(1967-79). ERS-1 Radar Altimeter data (Rémy and others, 1999) located the dome at
159°04’E 72°46’S. The new position is 50 km South of the USGS map position and 42 km
East of the Drewry position.
Six shallow snow-firn cores (two in 1996 and four in 2001-02), up to 89 m deep (TD),
were drilled in the Talos Dome area (Stenni and others, 2002; Magand and others, this
volume). Firn temperature was measured using ten “Pt 100 ohm at 0 °C” probes after 15-24
hour stabilisation, at 1, 3, 5, 7, 10, 13, 15, 20, 25 and 30-m depths (for boreholes deeper than
30 m) and at the bottom for 12-15 m boreholes. The tops of the holes were carefully closed
with a foam rubber stopper to prevent air from flowing down the hole. Two cores, TD (89 m)
and TDC (55 m), were drilled 5 km apart close to the summit of Talos Dome. A temperature of
-41.0°C was recorded at a depth of 15 m at the TD core during the 1996 expedition (Frezzotti
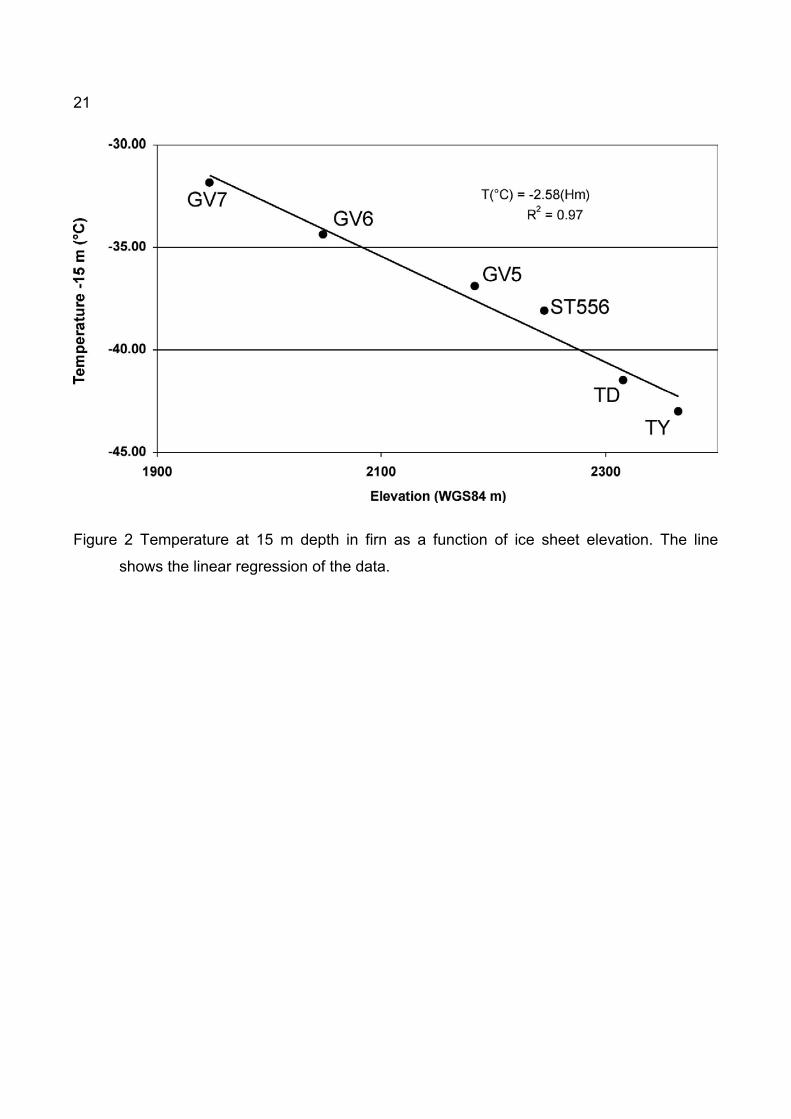
and others, 1998) and of –41.5 °C at a depth of 15 m at TDC in 2002. Temperature strongly
correlates with surface elevation (Fig. 2), and the decrease in temperature with elevation
shows a super-adiabatic lapse rate (2.5°C 100 m-1) along the ice divide between Talos Dome
and the Southern Ocean coast (GV7). The -10 m temperature at Taylor Dome follows the
same super adiabatic lapse rate between GV7 and TD. These data are quite different from
the sub-adiabatic lapse rate (0.5°C 100 m-1) calculated by Stenni et al. (2000) using 10 m
core temperatures for the close mountainous regions of Victoria Land, and from the near-dry-
adiabatic lapse rate (about 1.0°C 100 m-1) observed along the traverses from Terra Nova and
Dumont d’Urville to Dome C (Frezzotti and Flora, 2002). The super-adiabatic lapse rate
calculated along the Talos Dome ice divide suggests prevailing calm conditions, with a strong
temperature inversion during the winter season.
The prevalent wind direction and aeolian morphology at Talos Dome was described on
the basis of integrated field observations and remotely sensed data (Frezzotti and others,
2002; Mancini and Frezzotti, 2003). Aeolian surface microrelief is mostly due to redistribution
5
(sastrugi), with South, SSW and ESE directions at the dome; the wind blows mainly from
SSW in the windward area and changes direction (South, SSW and ESE) at the ice divide
and in the downwind area (Fig. 1). These observations generally agree with streamline results
from the katabatic wind-field model simulation of Paris and Bromwich (1991). Satellite data
show that the prevalent winds on the windward side blow from the South and SE (5°-10°);
they climb the dome topography and, on the downwind side, blow ENE and North along the
Rennick Glacier valley (35°) and the North ice divide (5°). Continental-scale simulation of the
wind field surface (Parish and Bromwich, 1991) shows that the Talos Dome area is
characterised by constant katabatic winds, with speeds lower than 6 m s-1. Wind speeds less
than 15 m s-1 produce transverse features such as ripples, waves and barchans (depositional
features), whereas greater speeds produce longitudinal features such as dunes and sastrugi
(Kobayashi and Ishida, 1979). A surface microrelief survey performed in November 1996
identified sastrugi of up to 20 cm. The presence of longitudinal features (sastrugi) indicates
that the threshold wind velocity of 15 m s-1 is sometimes exceeded at Talos Dome. The SSW
winds blowing at Talos Dome have a negative gradient of 1-2 m km-1, from about 2150 m up
to the summit of the dome (2318 m); the distance between the lower elevation and summit is
about 100 km. The wind that reaches Talos Dome blows to the NNE and forms the blue ice
areas of Roberts Butte (2828 m), Miller Butte (2610 m) and Frontier Mountain (2804), 40 km
in the distance. The Frontier Mountain blue ice area is characterised by a mean sublimation
rate of 65 mm a –1, with winds capable of moving stones of up to 200 g along the flattish
surface at speeds of 1 to 10 m a-1 (Folco and others, 2002).
SURFACE TOPOGRAPHY and ACCUMULATION RATE VARIABILITY
Three hundred kilometres of snow radar or GPR (Ground Penetration Radar) and 450
km of kinematic GPS (Global Position System) surveys were performed in order to link core
sites and obtain detailed information on the spatial variability of snow accumulation and
topography (Fig.s 3 and 4).
Geodetic Trimble 4000 ssi and 5700 dual-frequency receivers were used for kinematic
surveys, using high sampling rates to allow a detailed survey of altimetric profiles.
GPR data acquisition was performed with a GSSI Sir10B unit equipped with one
monostatic antenna with a central frequency of 200 MHz. The GPR unit was mounted inside
6
the vehicle (Pisten Bully 330D) cabin together with a Geodetic GPS instrument, while the
antenna was pulled on a small wooden sledge. GPR principal acquisition parameters were
750 ns for the vertical investigation range (60-70 m) and 1 scan s-1 for the acquisition rate.
GPS receiver (master and rover) sampling rates were also set to 1 second. Vehicle, and thus
antenna speed oscillated from about 12 to 16 km h-1, equivalent to one scan every 3-4 m.
GPS data processing was performed using GeoGenius 2000 (TerraSat GmbH)
software, which can process both static and kinematic GPS data using precise orbits and
models for phase centre variations of GPS geodetic antennae. The master station was
installed at the TDC site, and the absolute position of this site was measured using the
permanent GPS station at Terra Nova Bay. The accuracy of the altimetric profile is mainly
determined by the distance between master and rover and by the penetration of the vehicle
into the ice between one passage and the other. The reliability of the kinematic survey was
tested analysing the difference in height at intersections between different profiles, or in
portions of profiles covered twice; heights were found to vary from 5 to a maximum of 20
centimetres. A preliminary analysis of data was performed in the field; by identifying the
culmination, it was possible to increase the density of surveyed points in the summit area.
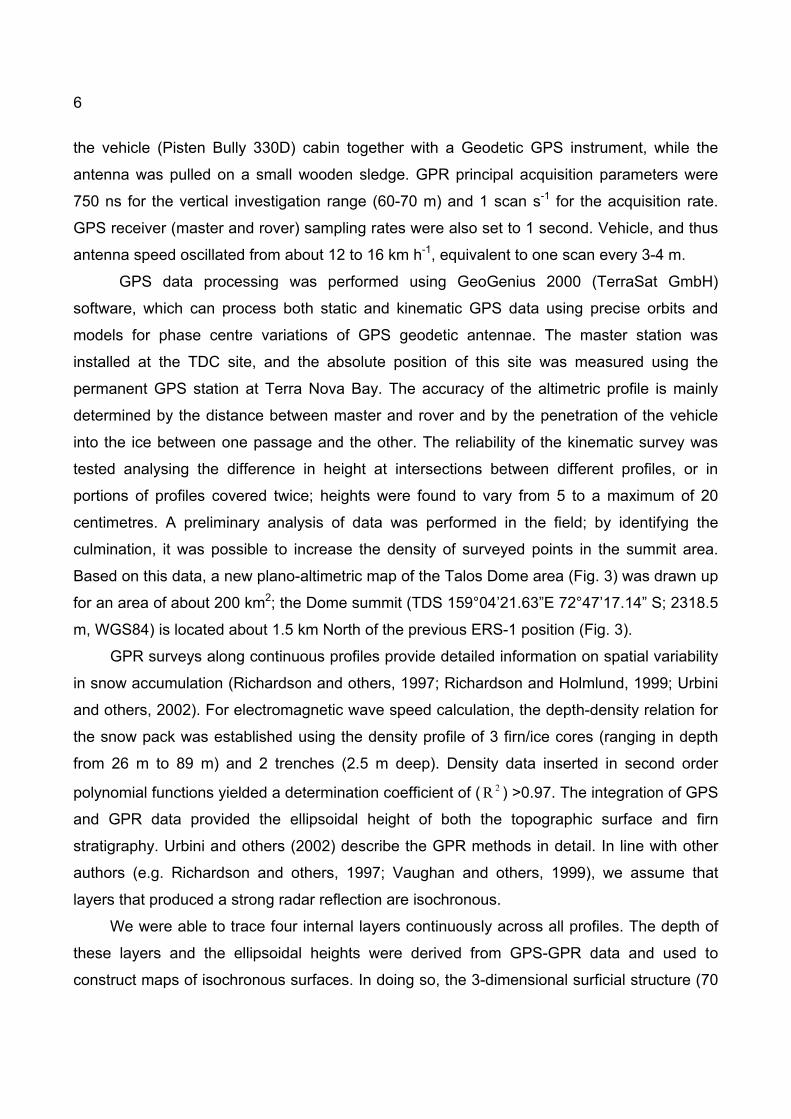
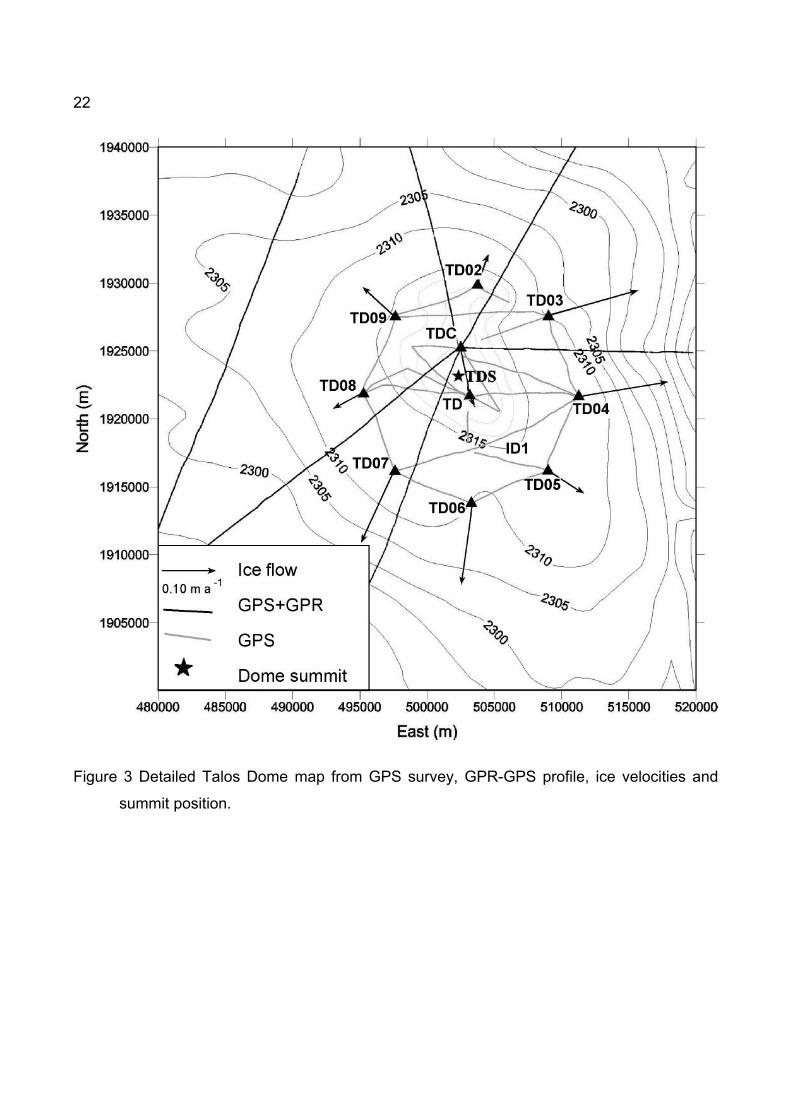
Based on this data, a new plano-altimetric map of the Talos Dome area (Fig. 3) was drawn up
for an area of about 200 km2; the Dome summit (TDS 159°04’21.63”E 72°47’17.14” S; 2318.5
m, WGS84) is located about 1.5 km North of the previous ERS-1 position (Fig. 3).
GPR surveys along continuous profiles provide detailed information on spatial variability
in snow accumulation (Richardson and others, 1997; Richardson and Holmlund, 1999; Urbini
and others, 2002). For electromagnetic wave speed calculation, the depth-density relation for
the snow pack was established using the density profile of 3 firn/ice cores (ranging in depth
from 26 m to 89 m) and 2 trenches (2.5 m deep). Density data inserted in second order
polynomial functions yielded a determination coefficient of ( 2R ) >0.97. The integration of GPS
and GPR data provided the ellipsoidal height of both the topographic surface and firn
stratigraphy. Urbini and others (2002) describe the GPR methods in detail. In line with other
authors (e.g. Richardson and others, 1997; Vaughan and others, 1999), we assume that
layers that produced a strong radar reflection are isochronous.
We were able to trace four internal layers continuously across all profiles. The depth of
these layers and the ellipsoidal heights were derived from GPS-GPR data and used to
construct maps of isochronous surfaces. In doing so, the 3-dimensional surficial structure (70
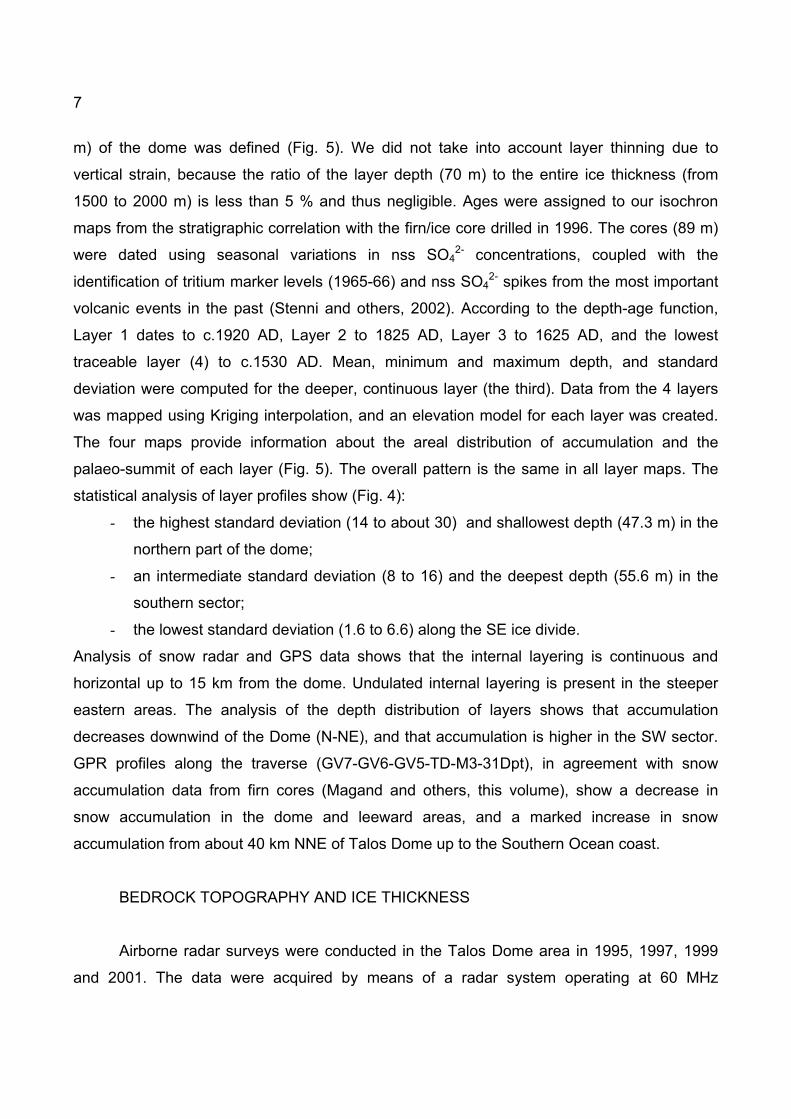
7
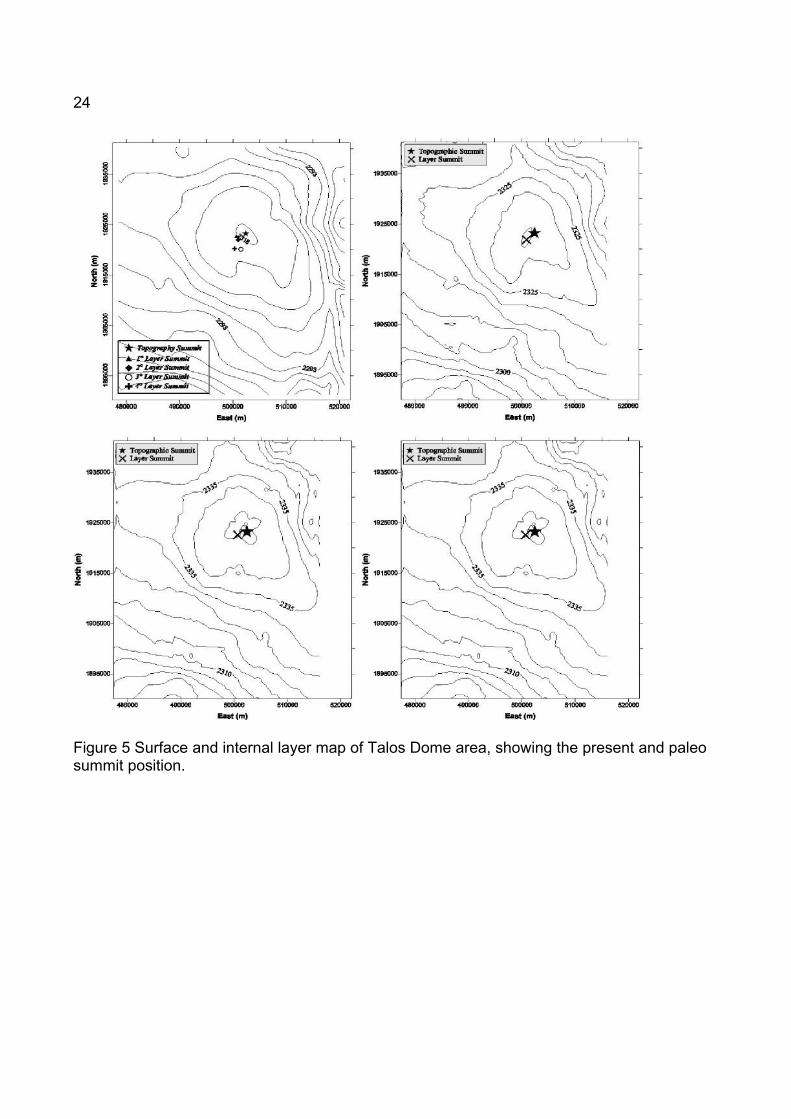
m) of the dome was defined (Fig. 5). We did not take into account layer thinning due to
vertical strain, because the ratio of the layer depth (70 m) to the entire ice thickness (from
1500 to 2000 m) is less than 5 % and thus negligible. Ages were assigned to our isochron
maps from the stratigraphic correlation with the firn/ice core drilled in 1996. The cores (89 m)
were dated using seasonal variations in nss SO42- concentrations, coupled with the
identification of tritium marker levels (1965-66) and nss SO42- spikes from the most important
volcanic events in the past (Stenni and others, 2002). According to the depth-age function,
Layer 1 dates to c.1920 AD, Layer 2 to 1825 AD, Layer 3 to 1625 AD, and the lowest
traceable layer (4) to c.1530 AD. Mean, minimum and maximum depth, and standard
deviation were computed for the deeper, continuous layer (the third). Data from the 4 layers
was mapped using Kriging interpolation, and an elevation model for each layer was created.
The four maps provide information about the areal distribution of accumulation and the
palaeo-summit of each layer (Fig. 5). The overall pattern is the same in all layer maps. The
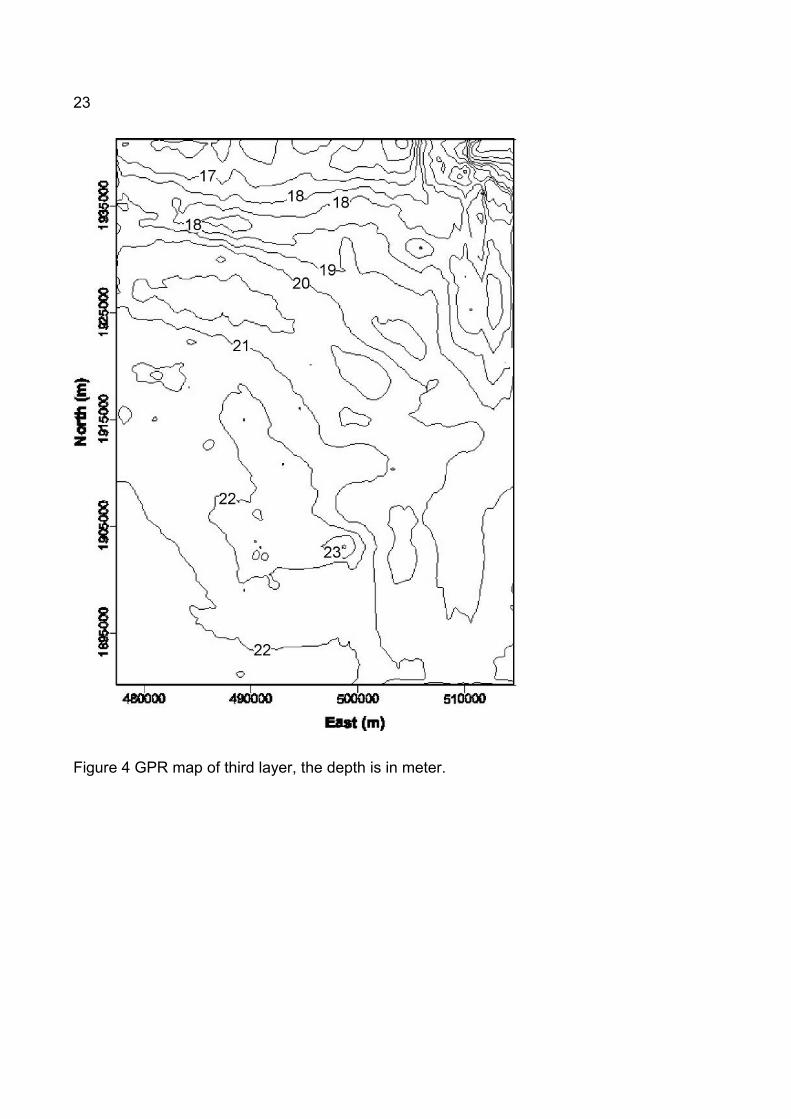
statistical analysis of layer profiles show (Fig. 4):
- the highest standard deviation (14 to about 30) and shallowest depth (47.3 m) in the
northern part of the dome;
- an intermediate standard deviation (8 to 16) and the deepest depth (55.6 m) in the
southern sector;
- the lowest standard deviation (1.6 to 6.6) along the SE ice divide.
Analysis of snow radar and GPS data shows that the internal layering is continuous and
horizontal up to 15 km from the dome. Undulated internal layering is present in the steeper
eastern areas. The analysis of the depth distribution of layers shows that accumulation
decreases downwind of the Dome (N-NE), and that accumulation is higher in the SW sector.
GPR profiles along the traverse (GV7-GV6-GV5-TD-M3-31Dpt), in agreement with snow
accumulation data from firn cores (Magand and others, this volume), show a decrease in
snow accumulation in the dome and leeward areas, and a marked increase in snow
accumulation from about 40 km NNE of Talos Dome up to the Southern Ocean coast.
BEDROCK TOPOGRAPHY AND ICE THICKNESS
Airborne radar surveys were conducted in the Talos Dome area in 1995, 1997, 1999
and 2001. The data were acquired by means of a radar system operating at 60 MHz
8
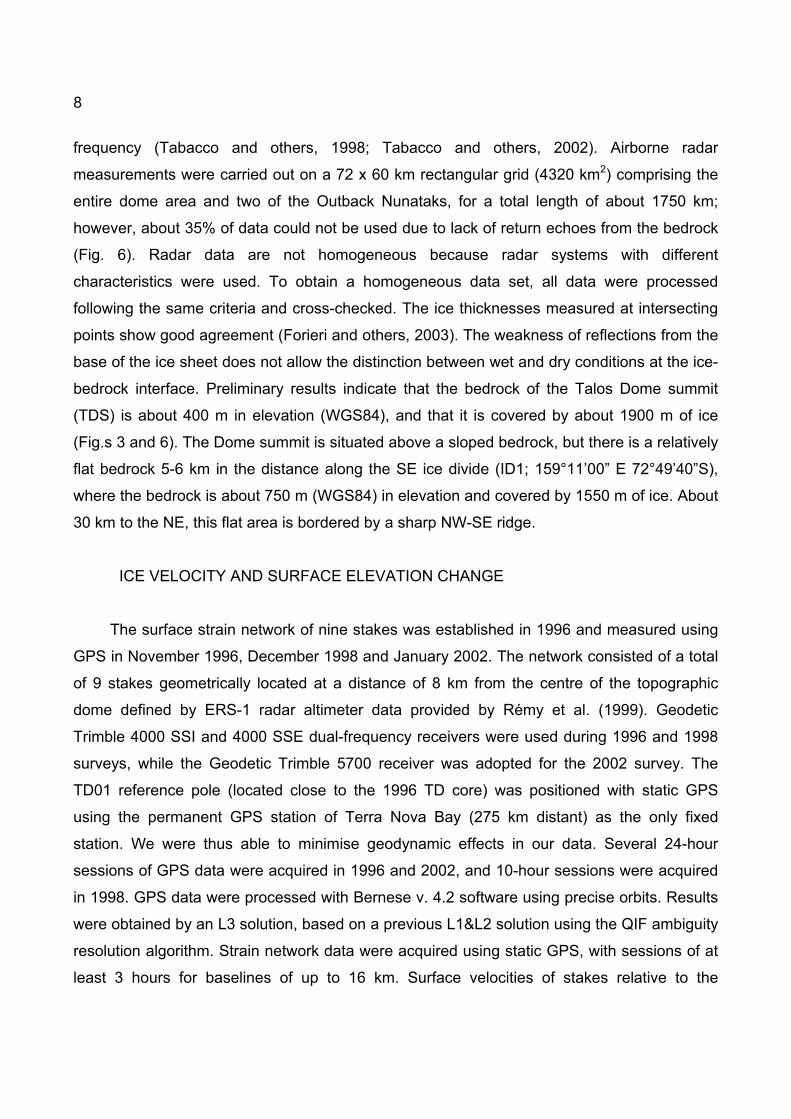
frequency (Tabacco and others, 1998; Tabacco and others, 2002). Airborne radar
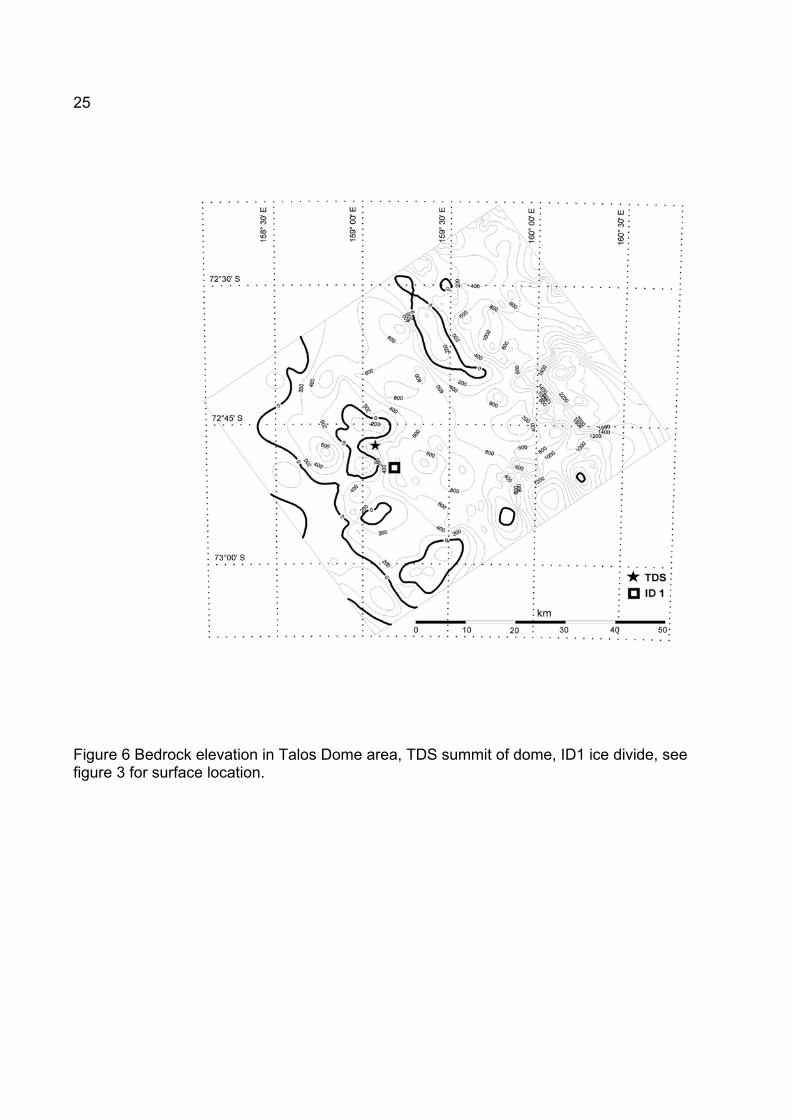
measurements were carried out on a 72 x 60 km rectangular grid (4320 km2) comprising the
entire dome area and two of the Outback Nunataks, for a total length of about 1750 km;
however, about 35% of data could not be used due to lack of return echoes from the bedrock
(Fig. 6). Radar data are not homogeneous because radar systems with different
characteristics were used. To obtain a homogeneous data set, all data were processed
following the same criteria and cross-checked. The ice thicknesses measured at intersecting
points show good agreement (Forieri and others, 2003). The weakness of reflections from the
base of the ice sheet does not allow the distinction between wet and dry conditions at the ice-
bedrock interface. Preliminary results indicate that the bedrock of the Talos Dome summit
(TDS) is about 400 m in elevation (WGS84), and that it is covered by about 1900 m of ice
(Fig.s 3 and 6). The Dome summit is situated above a sloped bedrock, but there is a relatively
flat bedrock 5-6 km in the distance along the SE ice divide (ID1; 159°11’00” E 72°49’40”S),
where the bedrock is about 750 m (WGS84) in elevation and covered by 1550 m of ice. About
30 km to the NE, this flat area is bordered by a sharp NW-SE ridge.
ICE VELOCITY AND SURFACE ELEVATION CHANGE
The surface strain network of nine stakes was established in 1996 and measured using
GPS in November 1996, December 1998 and January 2002. The network consisted of a total
of 9 stakes geometrically located at a distance of 8 km from the centre of the topographic
dome defined by ERS-1 radar altimeter data provided by Rémy et al. (1999). Geodetic
Trimble 4000 SSI and 4000 SSE dual-frequency receivers were used during 1996 and 1998
surveys, while the Geodetic Trimble 5700 receiver was adopted for the 2002 survey. The
TD01 reference pole (located close to the 1996 TD core) was positioned with static GPS
using the permanent GPS station of Terra Nova Bay (275 km distant) as the only fixed
station. We were thus able to minimise geodynamic effects in our data. Several 24-hour
sessions of GPS data were acquired in 1996 and 2002, and 10-hour sessions were acquired
in 1998. GPS data were processed with Bernese v. 4.2 software using precise orbits. Results
were obtained by an L3 solution, based on a previous L1&L2 solution using the QIF ambiguity
resolution algorithm. Strain network data were acquired using static GPS, with sessions of at
least 3 hours for baselines of up to 16 km. Surface velocities of stakes relative to the
9
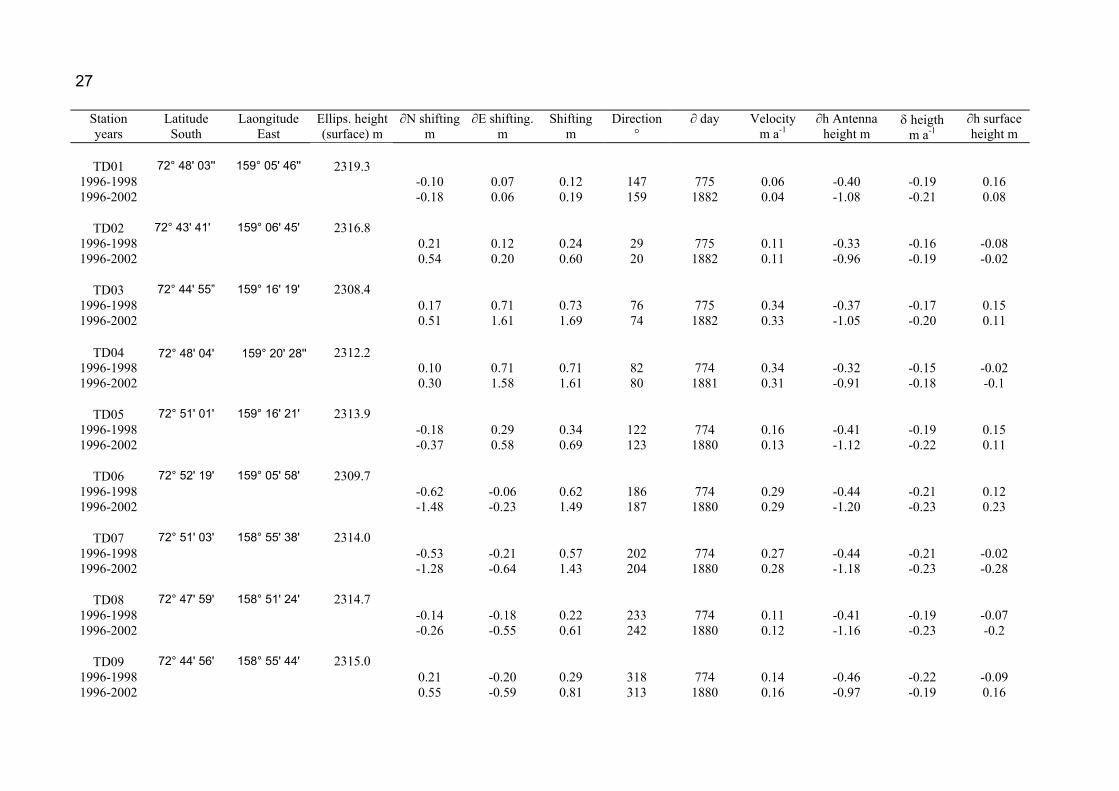
reference pole TD01 were determined through repeated measurements. The estimated
uncertainty in velocity measurements is 0.02 m a-1 for the horizontal component of ice flow at
the surface, and 0.03 m a-1 for the vertical component. The observed movement over the
years was corrected for the length of the measurement period in order to obtain annual
movement over 365 days (Table 1).
Surface velocities are perpendicular to the surface contour lines; site TD01 (TD in figure
3) moves SSE at a rate of four centimetres per year, and the other stakes move with radial
velocities of 0.11 to 0.34 m a-1. The higher horizontal velocities are recorded in the steeper
South-SW (TD06 and TD07) and East-NE (TD04 and TD03) slopes. The lowest horizontal
velocities, besides TD01, are recorded to the North (TD02), NW (TD09) and West (TD08),
about 6-7 km from the summit, and to the SE (TD05), about 9.5 km from the dome summit
along the SE ice divide (Fig. 3).
The absolute elevation of the stakes, measured by GPS, decreased with an average
value of 0.21 m a-1 and standard deviation of 0.02 m a-1 during the 1996-2002 period. An
average snow accumulation value of 1.08 m, with a standard deviation of 0.19 m, and a
surface mass balance of 83 kg m2 a-1, with a standard deviation of 15 kg m2 a-1, were
measured during the 1996-2002 period. The accumulation value is qualitatively comparable
with that (779 years, 80.5 kg m2 a-1) determined on the basis of long term core marker
analysis (Stenni and others, 2002). The decrease in elevation with respect to the snow
accumulation value indicates that the stakes were anchored to the bottom. Snow
accumulation values derived from stakes and from vertical velocities are in good agreement
with higher values in the West-South sector and lower values in NE-East sector (Figs. 3 and
4). Intermediate values are present close to the summit (TD01) and along the SE ice divide
(TD05). The absolute elevation of snow surfaces shows an irregular pattern due to the
presence of sastrugi.
AGE VS. DEPTH MODELLING
For a preliminary estimate of time scales, we used the mean accumulation rate (80.5 kg m2 a –1) and firn/ice density profile (89 m) obtained from 1996 core sampling (Stenni and others,
2002). The close-off value of 830 kg m-3 was measured at a depth of about 66 m (1460 AD,
∆ages about 535 years), and a density of 910 kg m-3 was recorded at 89 m.
We evaluated the age profile along a vertical line t(z):
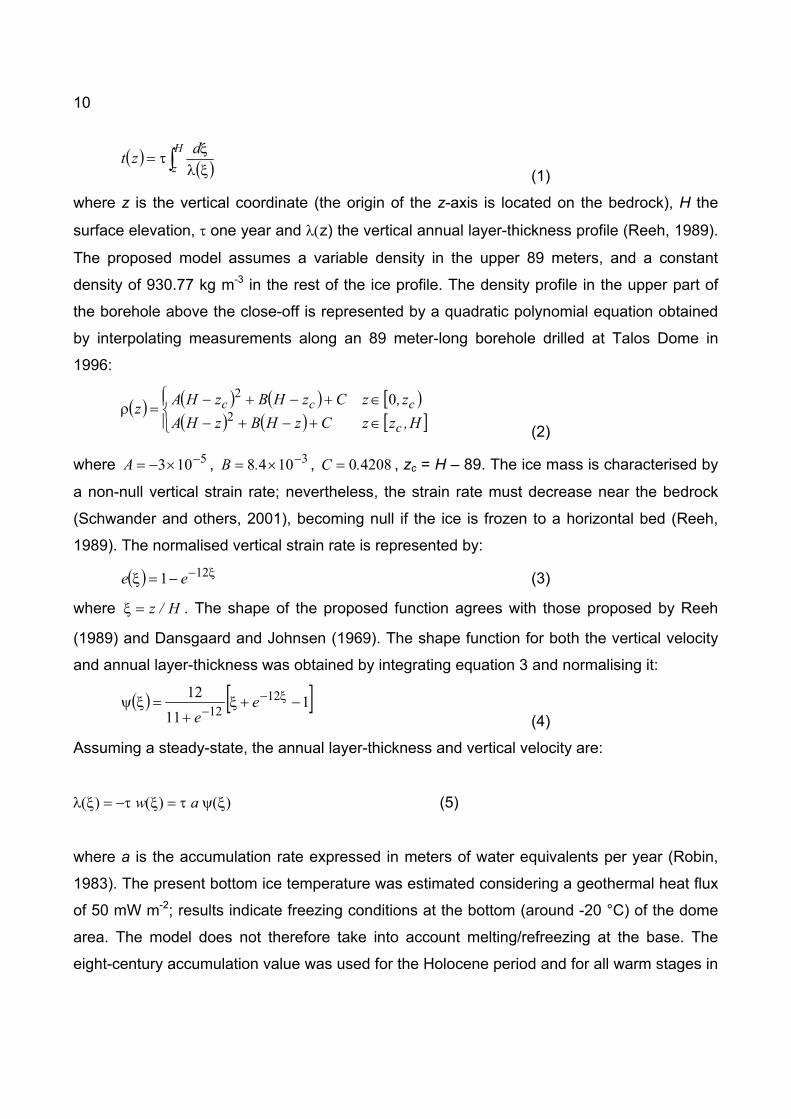
10
( ) ( )∫ ξλ
ξτ=H
zdzt
(1)
where z is the vertical coordinate (the origin of the z-axis is located on the bedrock), H the
surface elevation, τ one year and λ(z) the vertical annual layer-thickness profile (Reeh, 1989).
The proposed model assumes a variable density in the upper 89 meters, and a constant
density of 930.77 kg m-3 in the rest of the ice profile. The density profile in the upper part of
the borehole above the close-off is represented by a quadratic polynomial equation obtained
by interpolating measurements along an 89 meter-long borehole drilled at Talos Dome in
1996:
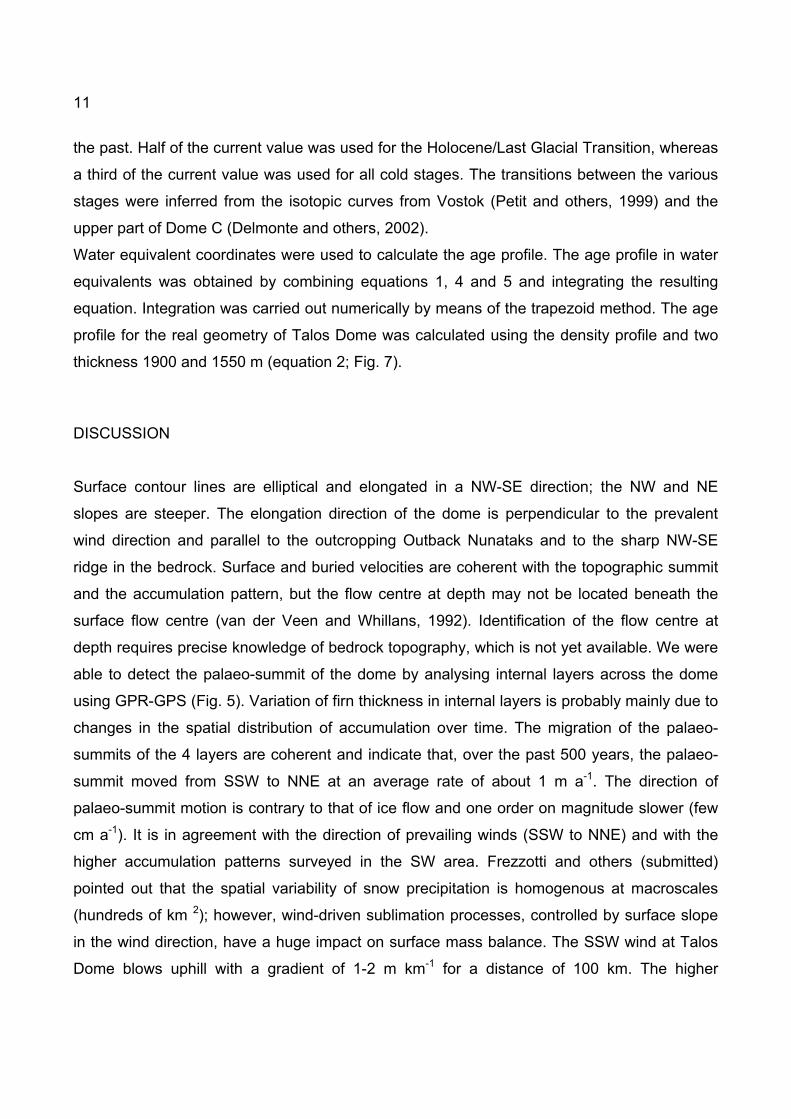
( ) ( ) ( ) [ )
( ) ( ) [ ]
∈+−+−∈+−+−=ρ
H,zzCzHBzHAz,zCzHBzHAzc
ccc2
2 0
(2)
where 5103 −×−=A , 31048 −×= .B , 42080.C = , zc = H – 89. The ice mass is characterised by
a non-null vertical strain rate; nevertheless, the strain rate must decrease near the bedrock
(Schwander and others, 2001), becoming null if the ice is frozen to a horizontal bed (Reeh,
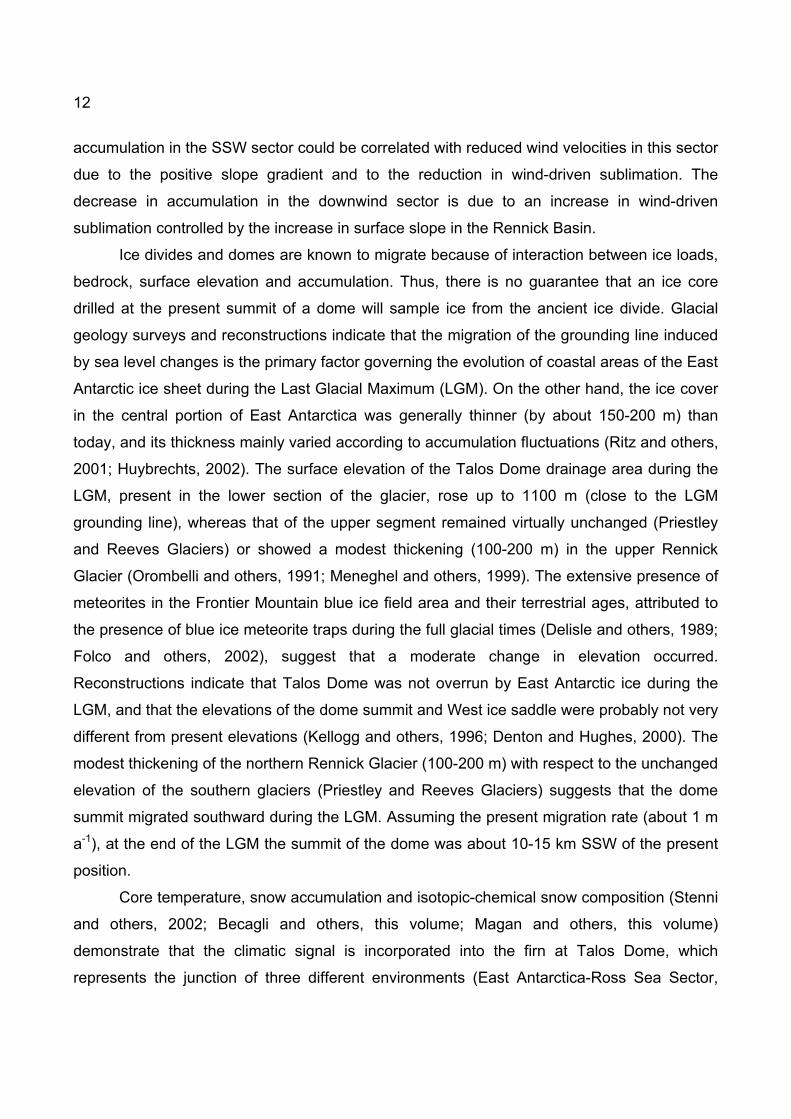
1989). The normalised vertical strain rate is represented by:
( ) ξ−−=ξ 121 ee (3)
where H/z=ξ . The shape of the proposed function agrees with those proposed by Reeh
(1989) and Dansgaard and Johnsen (1969). The shape function for both the vertical velocity
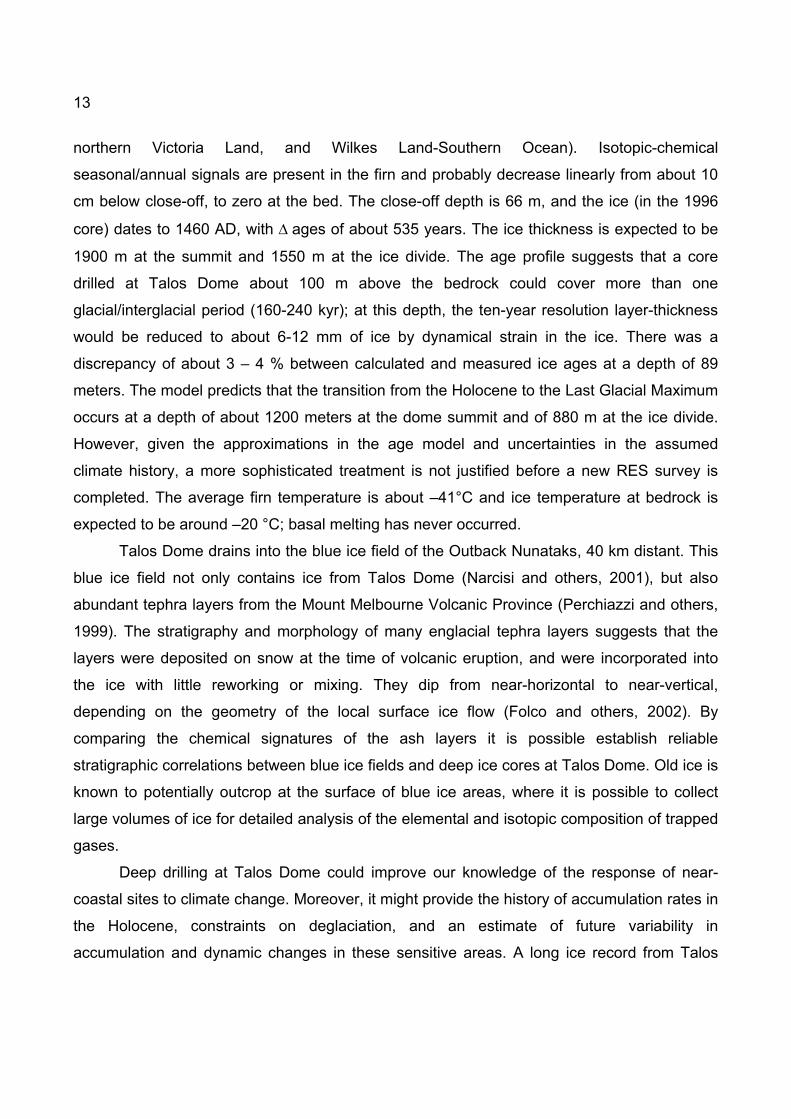
and annual layer-thickness was obtained by integrating equation 3 and normalising it:
( ) [ ]111
12 1212 −+ξ
+=ξψ ξ−
−e
e (4)
Assuming a steady-state, the annual layer-thickness and vertical velocity are:
λ(ξ) = −τ w(ξ) = τ a ψ(ξ) (5)
where a is the accumulation rate expressed in meters of water equivalents per year (Robin,
1983). The present bottom ice temperature was estimated considering a geothermal heat flux
of 50 mW m-2; results indicate freezing conditions at the bottom (around -20 °C) of the dome
area. The model does not therefore take into account melting/refreezing at the base. The
eight-century accumulation value was used for the Holocene period and for all warm stages in
11
the past. Half of the current value was used for the Holocene/Last Glacial Transition, whereas
a third of the current value was used for all cold stages. The transitions between the various
stages were inferred from the isotopic curves from Vostok (Petit and others, 1999) and the
upper part of Dome C (Delmonte and others, 2002).
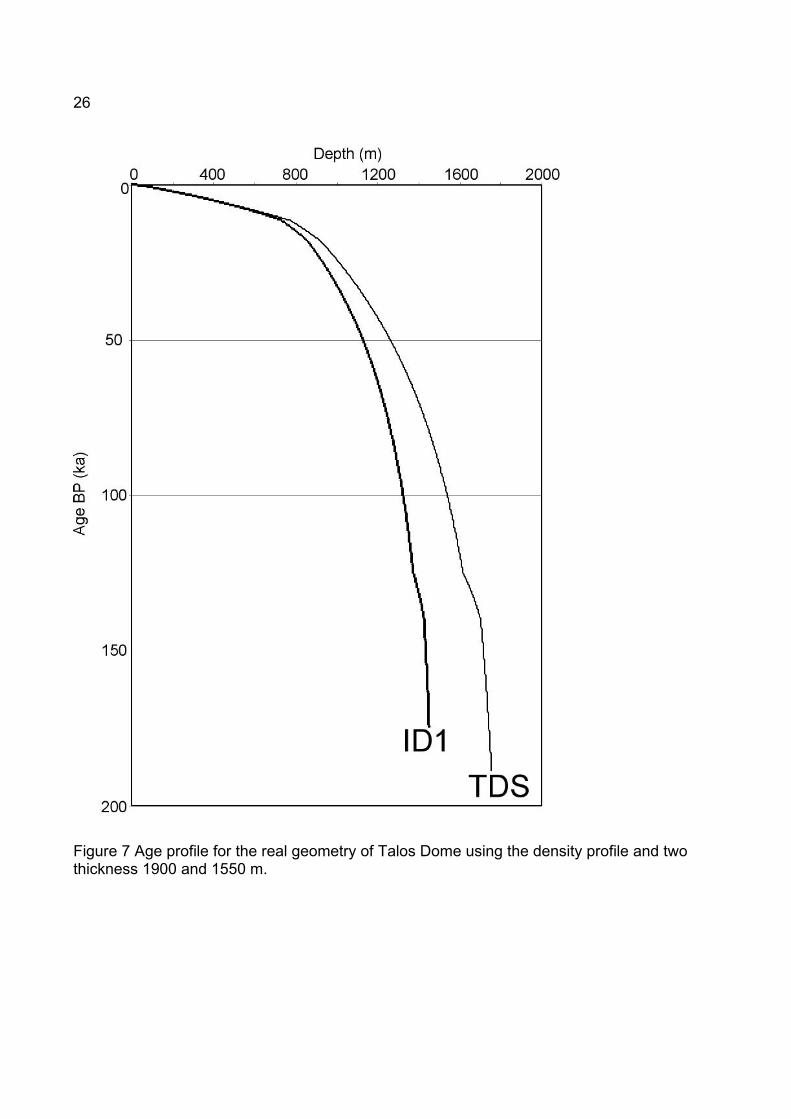
Water equivalent coordinates were used to calculate the age profile. The age profile in water
equivalents was obtained by combining equations 1, 4 and 5 and integrating the resulting
equation. Integration was carried out numerically by means of the trapezoid method. The age
profile for the real geometry of Talos Dome was calculated using the density profile and two
thickness 1900 and 1550 m (equation 2; Fig. 7).
DISCUSSION
Surface contour lines are elliptical and elongated in a NW-SE direction; the NW and NE
slopes are steeper. The elongation direction of the dome is perpendicular to the prevalent
wind direction and parallel to the outcropping Outback Nunataks and to the sharp NW-SE
ridge in the bedrock. Surface and buried velocities are coherent with the topographic summit
and the accumulation pattern, but the flow centre at depth may not be located beneath the
surface flow centre (van der Veen and Whillans, 1992). Identification of the flow centre at
depth requires precise knowledge of bedrock topography, which is not yet available. We were
able to detect the palaeo-summit of the dome by analysing internal layers across the dome
using GPR-GPS (Fig. 5). Variation of firn thickness in internal layers is probably mainly due to
changes in the spatial distribution of accumulation over time. The migration of the palaeo-
summits of the 4 layers are coherent and indicate that, over the past 500 years, the palaeo-
summit moved from SSW to NNE at an average rate of about 1 m a-1. The direction of
palaeo-summit motion is contrary to that of ice flow and one order on magnitude slower (few
cm a-1). It is in agreement with the direction of prevailing winds (SSW to NNE) and with the
higher accumulation patterns surveyed in the SW area. Frezzotti and others (submitted)
pointed out that the spatial variability of snow precipitation is homogenous at macroscales
(hundreds of km 2); however, wind-driven sublimation processes, controlled by surface slope
in the wind direction, have a huge impact on surface mass balance. The SSW wind at Talos
Dome blows uphill with a gradient of 1-2 m km-1 for a distance of 100 km. The higher
12
accumulation in the SSW sector could be correlated with reduced wind velocities in this sector
due to the positive slope gradient and to the reduction in wind-driven sublimation. The
decrease in accumulation in the downwind sector is due to an increase in wind-driven
sublimation controlled by the increase in surface slope in the Rennick Basin.
Ice divides and domes are known to migrate because of interaction between ice loads,
bedrock, surface elevation and accumulation. Thus, there is no guarantee that an ice core
drilled at the present summit of a dome will sample ice from the ancient ice divide. Glacial
geology surveys and reconstructions indicate that the migration of the grounding line induced
by sea level changes is the primary factor governing the evolution of coastal areas of the East
Antarctic ice sheet during the Last Glacial Maximum (LGM). On the other hand, the ice cover
in the central portion of East Antarctica was generally thinner (by about 150-200 m) than
today, and its thickness mainly varied according to accumulation fluctuations (Ritz and others,
2001; Huybrechts, 2002). The surface elevation of the Talos Dome drainage area during the
LGM, present in the lower section of the glacier, rose up to 1100 m (close to the LGM
grounding line), whereas that of the upper segment remained virtually unchanged (Priestley
and Reeves Glaciers) or showed a modest thickening (100-200 m) in the upper Rennick
Glacier (Orombelli and others, 1991; Meneghel and others, 1999). The extensive presence of
meteorites in the Frontier Mountain blue ice field area and their terrestrial ages, attributed to
the presence of blue ice meteorite traps during the full glacial times (Delisle and others, 1989;
Folco and others, 2002), suggest that a moderate change in elevation occurred.
Reconstructions indicate that Talos Dome was not overrun by East Antarctic ice during the
LGM, and that the elevations of the dome summit and West ice saddle were probably not very
different from present elevations (Kellogg and others, 1996; Denton and Hughes, 2000). The
modest thickening of the northern Rennick Glacier (100-200 m) with respect to the unchanged
elevation of the southern glaciers (Priestley and Reeves Glaciers) suggests that the dome
summit migrated southward during the LGM. Assuming the present migration rate (about 1 m
a-1), at the end of the LGM the summit of the dome was about 10-15 km SSW of the present
position.
Core temperature, snow accumulation and isotopic-chemical snow composition (Stenni
and others, 2002; Becagli and others, this volume; Magan and others, this volume)
demonstrate that the climatic signal is incorporated into the firn at Talos Dome, which
represents the junction of three different environments (East Antarctica-Ross Sea Sector,
13
northern Victoria Land, and Wilkes Land-Southern Ocean). Isotopic-chemical
seasonal/annual signals are present in the firn and probably decrease linearly from about 10
cm below close-off, to zero at the bed. The close-off depth is 66 m, and the ice (in the 1996
core) dates to 1460 AD, with ∆ ages of about 535 years. The ice thickness is expected to be
1900 m at the summit and 1550 m at the ice divide. The age profile suggests that a core
drilled at Talos Dome about 100 m above the bedrock could cover more than one
glacial/interglacial period (160-240 kyr); at this depth, the ten-year resolution layer-thickness
would be reduced to about 6-12 mm of ice by dynamical strain in the ice. There was a
discrepancy of about 3 – 4 % between calculated and measured ice ages at a depth of 89
meters. The model predicts that the transition from the Holocene to the Last Glacial Maximum
occurs at a depth of about 1200 meters at the dome summit and of 880 m at the ice divide.
However, given the approximations in the age model and uncertainties in the assumed
climate history, a more sophisticated treatment is not justified before a new RES survey is
completed. The average firn temperature is about –41°C and ice temperature at bedrock is
expected to be around –20 °C; basal melting has never occurred.
Talos Dome drains into the blue ice field of the Outback Nunataks, 40 km distant. This
blue ice field not only contains ice from Talos Dome (Narcisi and others, 2001), but also
abundant tephra layers from the Mount Melbourne Volcanic Province (Perchiazzi and others,
1999). The stratigraphy and morphology of many englacial tephra layers suggests that the
layers were deposited on snow at the time of volcanic eruption, and were incorporated into
the ice with little reworking or mixing. They dip from near-horizontal to near-vertical,
depending on the geometry of the local surface ice flow (Folco and others, 2002). By
comparing the chemical signatures of the ash layers it is possible establish reliable
stratigraphic correlations between blue ice fields and deep ice cores at Talos Dome. Old ice is
known to potentially outcrop at the surface of blue ice areas, where it is possible to collect
large volumes of ice for detailed analysis of the elemental and isotopic composition of trapped
gases.
Deep drilling at Talos Dome could improve our knowledge of the response of near-
coastal sites to climate change. Moreover, it might provide the history of accumulation rates in
the Holocene, constraints on deglaciation, and an estimate of future variability in
accumulation and dynamic changes in these sensitive areas. A long ice record from Talos
14
Dome might allow a better understanding of atmospheric and oceanic circulation and ocean
teleconnections in the Southern Hemisphere.
To improve our knowledge of the Talos Dome area, several studies are in progress. A
stake farm (40 poles) was installed in 2002 and an Automatic Weather Station was installed
during the 2002-2003 season in order to characterise climatic conditions and the spatial-
temporal variability of snow precipitation on local and seasonal scales. In order to accurately
determine the growth or shrinkage of the Dome, a submerge velocity system (Hamilton and
others, 1998) was installed in 2002 and measured using GPS at the TDC core, with maker
embedded 54 m deep in firn (density 780 kg m3). A new RES survey will be performed in the
dome area during the 2003-2004 season to survey the internal layering, large-scale flow
disturbances and detailed bedrock topography. The new survey will be used to test the
accuracy of ice flow models, used to calculate the age of ice at the summit or along the ice
divide and to survey the pattern of buried former ice sheet surfaces throughout the dome
ACKNOWLEDGEMENTS. Research was carried out within the framework of a Project on
Glaciology of the Programma Nazionale di Ricerche in Antartide (PNRA) and was financially
supported by ENEA through a co-operation agreement with the Università degli Studi di
Milano Bicocca. This work is an Italian contribution to the ITASE project.
REFERENCES
Becagli S., Proposito M., Benassai S., Flora O., Genoni L., Gragnani R., Largiuni O., Pili S.L.,
Severi M., Stenni B., Traversi R., Udisti R., Frezzotti M. this volume. Chemical and
isotopic snow variability in East Antarctica along the 2001/02 ITASE traverse. Ann.
Glaciol. 39.
Dansgaard W., Johnsen S.J. 1969. A flow model and a time scale for the ice core from Camp
Century, Greenland. J. Glaciol. 8(53), 215-223. 1969.
Delisle G., Schultz L., Spettel B., Willi Weber H., Wlotzka F., Höfle H. C., Thierbach R., Vogt
S., Herpers U., Bonani G., Suter M. and Wölfi W. 1989. Meteorite finds near the
Frontier Mountain Range in North Victoria Land. Geologisches Jahrbuch E38, 483-513.
Delmonte B., Petit J.R., Maggi V., 2002. Glacial to Holocene Implications of the New 27000-
years Dust Record from the EPICA Dome C (East Antarctica) Ice Core. Climate
Dynamics, 18, 647-660.
15
Denton , G.H. and Hughes T.J. 2000. Reconstruction of the Ross ice drainage system,
Antarctica, at glacial maximum. Geografiska Annaler, 82A, 143-166.
Drewry, D.J. ed., 1983. Antarctica: glaciological and geophysical folio. Cambridge, Scott Polar
Research Institute.
Folco L., Capra A., Chiappini M., Frezzotti M., Mellini M., Tabacco I.E. 2002. The Frontier
Mountain meteorite trap (Antarctica). Meteoritics & Planetary Science, 37, 209-228.
Forieri A., Tabacco I., Della Vedova A., Zirizzotti A., De Michelis P., 2003. Bedrock
Topography of Talos Dome and Frontier Mountain Area. Geophys. Res. Abstr., Vol. 5,
09951.
Frezzotti M., Bitelli G., Gandolfi S., De Michelis P., Mancini F., Urbini S., Vittuari L., Zirizzotti
A. 2003. Geophysical survey at Talos Dome (East Antarctica). Proceedings of the 4th
Italian Meeting on Antarctic Glaciology Ed. Frezzotti M. & Maggi V. Terra Antartica
Reports No 8, 117-120.
Frezzotti M. and Flora O. 2002. Ice dynamics and climatic surface parameters in East
Antarctica from Terra Nova Bay to Talos Dome and Dome C: ITASE Italian Traverses.
Terra Antartica, 9(1), 47-54.
Frezzotti M., Gandolfi S., La Marca F. and Urbini S. 2002. Snow dune and glazed surface in
Antarctica: new field and remote sensing data. Ann. Glaciol, 34, 81-88.
Frezzotti M., Flora O. & Urbini S., 1998 The Italian ITASE Expedition from Terra Nova Station
to Talos Dome. Terra Antartica Reports, 2, 105-108.
Hamilton, G.S., Whillns I.M. and Morgan P.J. 1998. First point measurements of ice-sheet
thickness change in Antarctica. Ann. Glaciol., 27, 125-129. 1998
Huybrechts, P. 2002. Sea-level changes at the LGM from ice-dynamic reconstructions of the
Greenland and Antarctic ice sheets during the glacial cycles. Quat. Science Rev., 21,
203-231.
Kellogg T.B., Hughes T. and Kellogg D. 1996 Late Pleistocene interactions of East and West
Antarctic ice-flow regimes: evidence from the McMurdo Ice Shelf. J. Glaciol., 42, 486-
500.
Kobayashi, S., and Ishida T.. 1979. Interaction between wind and snow surface, Boundary
Layer Meteorol., 16, 35-47.
16
Magand O., Frezzotti M., Pourchet M., Stenni B., Genoni L., Fily M. this volume. Climate
variability along latitudinal and longitudinal transepts in East Antarctica. Ann. Glaciol.,
39.
Mancini M. & Frezzotti M. (2003) Surface wind Field along IT-ITASE traverse (East
Antarctica). Proceedings of the 4th Italian Meeting on Antarctic Glaciology Ed. Frezzotti
M. & Maggi V. Terra Antartica Reports, 8, 57-59.
Meneghel M., Bondesan A., Salvatore M.C. and Orombelli G. 1999. A model of the glacial
retreat of upper rennick Glacier, Victoria Land Antarctica. Ann. Glaciol., 29, 225-230.
Morgan V., Delmotte M., van Ommen T., Jouzel J., Chappellaz J., Woon S., Masson-
Delmotte V. and Raynaud D. 2002. Relative timing of deglacial climate events in
Antarctica and Greenland. Science, 297, 1862-1864.
Narcisi B., Proposito M. & Frezzotti M., 2001. Ice record of a 13th century explosive eruption
of a Northern Victoria Land volcano (East Antarctica). Antarctic Science, 13(2), 174-
181.
Orombelli G., Baroni C. and Denton, G.H. 1990. Late Cenozoic glacial history of the Terra
Nova Bay region, northern Victoria Land, Antarctica. Geografia Fisica e Dinamica
Quaternaria, 13(2), 139-163.
Paris. T.R. and Bromwich D.H.. 1991. Continental- scale of the Antarctic Katabatic Wind
Regime. J. Climate, 4(2), 135-146.
Perchiazzi N., Folco L. and Mellini M. 1999. Volcanic ash bands in the Frontier Mountain and
Lichen Hills blue-ice fields, northern Victoria Land. Antarctic Science 11, 353-361.
Petit J.R. and eighteen others, 1999. Climate and Atmospheric History of the Past 420,000
Years from Vostok Ice Core, Antarctica. Nature, 399, 429–436.
Reeh N., 1989. Dating by ice flow modelling: a useful tool or an exercise in applied
mathematics?. In The Environmental Record in Glaciers and Ice Sheets. Eds. H.
Oeschger and C.C. Langway, Jr., John Wiley and Sons Limited, 141-159,1998.
Remy F., P. Shaeffer and B. Legresy. 1999. Ice flow processes derived from the ERS-1 high
resolution map of the Antarctica and Greenland ice sheets. Geophys. J. Int., 139, 645-
656.
Ritz C., Rommelaere V., Dumas C. 2001. Modelling the evolution of Antarctic ice sheet over
the last 420,000 years: Implications for the altitude changes in the Vostok region. J.
Geophys. Res., 106, 31,943-31,964.
17
Richardson C., E. Aarholt, S.E. Hamran, P. Holmlund, and E. Isaksson 1997. Spatial snow
distribution mapped by radar, J. Geophys. Res., 102, 343-20,353.
Richardson C. and P. Holmlund. 1999. Regional and local variability in shallow snow-layer
depth from a 500 km continuos radar traverse on the polar plateau, central Dronning
Maud Land, east Antarctica. Ann. Glaciol., 29, 10-16.
Robin G. de Q., 1983. Ice sheets: isotopes and temperatures. In The climatic record in polar
ice sheets, eds. Robin G. de Q., Cambridge University Press, 1-18.
Schwander J., Jouzel J., Hammer C.U., Petit J.R., Udisti R., Wolff E., 2001. Geophys. Res.
Lett., 28, 4243-4246.
Stenni, B., Serra F., Frezzotti M., Maggi V., Traversi R., Becagli S., & Udisti R. 2000. Snow
accumulation rates in Northern Victoria Land (Antarctica) by firn core analysis, J.
Glaciol., 46 (155), 541-552.
Stenni B., Proposito M., Gragnani R., Flora O., Jouzel J., Falourd S., Frezzotti M. 2002. Eight
centuries of volcanic signal and climate change at Talos Dome (East Antarctica). J.
Geophys. Res, 10, 1-13.
Stuart, A.W. & Heine A.J., 1961. Glaciological work of the 1959-1960 U.S. Victoria Land
Traverse. J. Glaciol., 997-1002.
Tabacco E.I, Passerini A., Corbelli F. & Gorman M. 1998. Determination of the surface and
bed topography at Dome C, East Antarctica. J. Glaciol. 44 (146), 185-191.
Tabacco I.E., Bianchi C., Zirizzotti A., Zuccheretti E., Forieri A. and Della Vedova A. 2002.
Airborne radar survey above Vostok region, east-central Antarctica: ice thickness and
Lake Vostok geometry. J. Glaciol., 48, 62-69.
Urbini S., Gandolfi S. & Vittuari L. 2001. GPR and GPS data integration: examples of
application in Antarctica Annali di Geofisica, 44 (4), 687-702.
van der Veen C.J. and Whillans I.M. 1992. Determination of a flow center on an ice cap. J.
Glaciol., 38, 412-416.
Vaughan D.G., H. J.F. Corr, C.S.M. Doake and E.D. Waddington. 1999. Distortion of
isochronous layers in ice revealed by ground-penetrating radar. Nature, 398 (6725),
323 – 326.
Warner R. C.and Budd W.F. 1998. Modelling the long-term response of the Antarctic ice
sheet to global warming. Ann. Glaciol., 27, 161-168.

18
Watanabe O., Jouzel J., Johnsen S., Parrein F., Shoji H., Yoshida N. 2003. Homogeneous
climate variability across East Antarctica over the past three glacial cycles. Nature,
422, 509-512.

19
20
FIGURE
FIGURE CAPTIONS
Figure 1. Schematic map of Talos Dome drainage.
21
Figure 2 Temperature at 15 m depth in firn as a function of ice sheet elevation. The line
shows the linear regression of the data.
22
Figure 3 Detailed Talos Dome map from GPS survey, GPR-GPS profile, ice velocities and
summit position.
23
Figure 4 GPR map of third layer, the depth is in meter.
24
Figure 5 Surface and internal layer map of Talos Dome area, showing the present and paleo summit position.
25
Figure 6 Bedrock elevation in Talos Dome area, TDS summit of dome, ID1 ice divide, see figure 3 for surface location.
26
Figure 7 Age profile for the real geometry of Talos Dome using the density profile and two thickness 1900 and 1550 m.
27
Station years
Latitude South
Laongitude East
Ellips. height (surface) m
∂N shiftingm
∂E shifting.m
Shifting m
Direction °
∂ day Velocity m a-1
∂h Antenna height m
δ heigth m a-1
∂h surface height m
TD01 72° 48' 03'' 159° 05' 46'' 2319.3
1996-1998 -0.10 0.07 0.12 147 775 0.06 -0.40 -0.19 0.16 1996-2002 -0.18 0.06 0.19 159 1882 0.04 -1.08 -0.21 0.08
TD02 72° 43' 41' 159° 06' 45'
2316.8
1996-1998 0.21 0.12 0.24 29 775 0.11 -0.33 -0.16 -0.08 1996-2002 0.54 0.20 0.60 20 1882 0.11 -0.96 -0.19 -0.02
TD03 72° 44' 55” 159° 16' 19'
2308.4
1996-1998 0.17 0.71 0.73 76 775 0.34 -0.37 -0.17 0.15 1996-2002 0.51 1.61 1.69 74 1882 0.33 -1.05 -0.20 0.11
TD04 72° 48' 04' 159° 20' 28'' 2312.2
1996-1998 0.10 0.71 0.71 82 774 0.34 -0.32 -0.15 -0.02 1996-2002 0.30 1.58 1.61 80 1881 0.31 -0.91 -0.18 -0.1
TD05 72° 51' 01' 159° 16' 21'
2313.9
1996-1998 -0.18 0.29 0.34 122 774 0.16 -0.41 -0.19 0.15 1996-2002 -0.37 0.58 0.69 123 1880 0.13 -1.12 -0.22 0.11
TD06 72° 52' 19' 159° 05' 58'
2309.7
1996-1998 -0.62 -0.06 0.62 186 774 0.29 -0.44 -0.21 0.12 1996-2002 -1.48 -0.23 1.49 187 1880 0.29 -1.20 -0.23 0.23
TD07 72° 51' 03' 158° 55' 38'
2314.0
1996-1998 -0.53 -0.21 0.57 202 774 0.27 -0.44 -0.21 -0.02 1996-2002 -1.28 -0.64 1.43 204 1880 0.28 -1.18 -0.23 -0.28
TD08 72° 47' 59' 158° 51' 24'
2314.7
1996-1998 -0.14 -0.18 0.22 233 774 0.11 -0.41 -0.19 -0.07 1996-2002 -0.26 -0.55 0.61 242 1880 0.12 -1.16 -0.23 -0.2
TD09 72° 44' 56' 158° 55' 44'
2315.0
1996-1998 0.21 -0.20 0.29 318 774 0.14 -0.46 -0.22 -0.09 1996-2002 0.55 -0.59 0.81 313 1880 0.16 -0.97 -0.19 0.16
28
Table 1. Position (2002) of the reference pole at Talos Dome and shifting and annual movement. The height is measured as the height above the World Geodetic System 1984 (WGS84) ellipsoid.