geographic distribution and characteristics of international emigration from scotland
TRANSCRIPT
BRIEFINGGeographical Distribution and Characteristics of International Emigration from Scotland
www.migrationobservatory.ox.ac.uk
AUTHOR: WILLIAM ALLENPUBLISHED: 18/09/2013
BRIEFING: Geographical Distribution and Characteristics of International Emigration from Scotland BRIEFING: Geographical Distribution and Characteristics of International Emigration from Scotland
THE MIGRATION OBSERVATORY | WWW.MIGRATIONOBSERVATORY.OX.AC.UK PAGE 2
Key points
In 2011-2012, 12,574 emigrants to overseas (non-UK) destinations were residents of Glasgow, Edinburgh, Aberdeen, or Fife. This amounts to 54% of total overseas emigration from Scotland.
The majority (61%) of emigrants in 2011-2012 were aged 16-34. The majority of emigrants from Scotland since 2004-2005 come from this age group.
In 2011, an estimated 12,000 emigrants from Scotland to overseas destinations were female and12,000 were male.
This briefing focuses on emigrants leaving Scotland for overseas destinations. It examines where they come from in Scotland as well as their characteristics.
Understanding the evidenceThis briefing presents data on emigrants from Scotland to overseas destinations during a given time period. In this
briefing, the term ‘emigrants’ refers to people going to overseas destinations, not those moving within Scotland or
elsewhere within the UK. Data used in this briefing are based on two estimates: the UK’s Office for National Statistics
(ONS) estimates for total emigration from Scotland to destinations outside the UK, and estimates made by Scotland’s
National Records of Scotland (NRS) of how those emigrants are distributed across council areas and age groups in
Scotland. The ONS emigration figures come from its Long Term International Migration (LTIM) estimates. These in turn are
based on the International Passenger Survey (IPS), as well as incorporating information from other sources including Home
Office data on asylum seekers. Then, the NRS begins from LTIM estimates of total emigration, and then uses information
from the National Health Service Central Register (NHSCR) and the Community Health Index (CHI) to estimate the age
and gender distribution of emigrants and where they come from across Scotland.
To determine who counts as an emigrant, the ONS uses the current United Nations standard definition of a long-term
international migrant—a person moving to another country for at least one year. People moving from Scotland to the rest
of the UK are not considered international migrants. For further discussion, see ‘Evidence gaps and limitations’ at the end
of this briefing.
BRIEFING: Geographical Distribution and Characteristics of International Emigration from Scotland BRIEFING: Geographical Distribution and Characteristics of International Emigration from Scotland
THE MIGRATION OBSERVATORY | WWW.MIGRATIONOBSERVATORY.OX.AC.UK PAGE 3
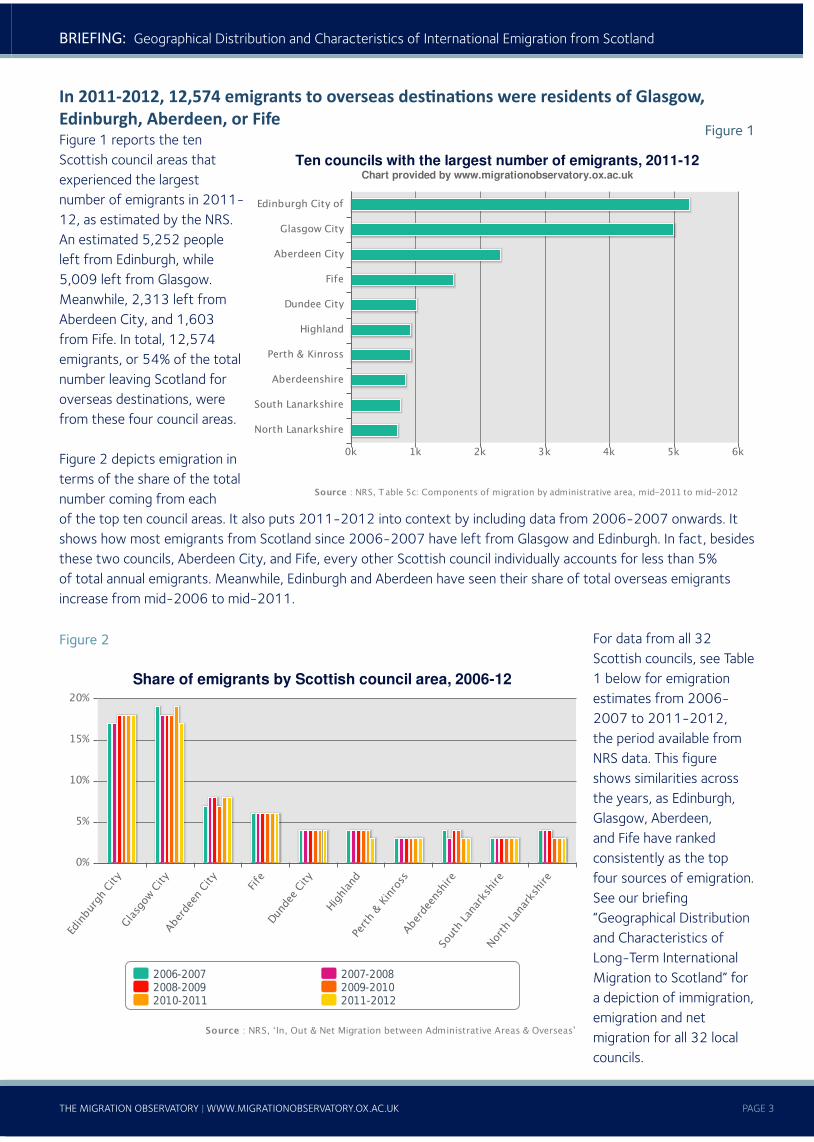
In 2011-2012, 12,574 emigrants to overseas destinations were residents of Glasgow, Edinburgh, Aberdeen, or FifeFigure 1 reports the ten Scottish council areas that experienced the largest number of emigrants in 2011-12, as estimated by the NRS. An estimated 5,252 people left from Edinburgh, while 5,009 left from Glasgow. Meanwhile, 2,313 left from Aberdeen City, and 1,603 from Fife. In total, 12,574 emigrants, or 54% of the total number leaving Scotland for overseas destinations, were from these four council areas.
Figure 2 depicts emigration in terms of the share of the total number coming from each of the top ten council areas. It also puts 2011-2012 into context by including data from 2006-2007 onwards. It shows how most emigrants from Scotland since 2006-2007 have left from Glasgow and Edinburgh. In fact, besides these two councils, Aberdeen City, and Fife, every other Scottish council individually accounts for less than 5% of total annual emigrants. Meanwhile, Edinburgh and Aberdeen have seen their share of total overseas emigrants increase from mid-2006 to mid-2011.
For data from all 32 Scottish councils, see Table 1 below for emigration estimates from 2006-2007 to 2011-2012, the period available from NRS data. This figure shows similarities across the years, as Edinburgh, Glasgow, Aberdeen, and Fife have ranked consistently as the top four sources of emigration. See our briefing “Geographical Distribution and Characteristics of Long-Term International Migration to Scotland” for a depiction of immigration, emigration and net migration for all 32 local councils.
Tencouncilswiththelargestnumberofemigrants,2011-12Chartprovidedbywww.migrationobservatory.ox.ac.uk
Edinburgh City of
Glasgow City
Aberdeen City
Fife
Dundee City
Highland
Perth & Kinross
Aberdeenshire
South Lanarkshire
North Lanarkshire
0k 1k 2k 3k 4k 5k 6k
Source : NRS, Table 5c: Components of migration by administrative area, mid-2011 to mid-2012
Figure 1
Figure 2
ShareofemigrantsbyScottishcouncilarea,2006-12
2006-2007 2007-2008
2008-2009 2009-2010
2010-2011 2011-2012
Edin
bur
gh C
ity
Gla
sgow
City
Aber
deen
City
Fife
Dun
dee
City
Hig
hlan
dPe
rth
& K
inro
ssAber
deen
shire
Sout
h La
nark
shire
Nor
th Lan
arks
hire
0%
5%
10%
15%
20%
Source : NRS, ʻIn, Out & Net Migration between Administrative Areas & Overseasʼ
BRIEFING: Geographical Distribution and Characteristics of International Emigration from Scotland BRIEFING: Geographical Distribution and Characteristics of International Emigration from Scotland
THE MIGRATION OBSERVATORY | WWW.MIGRATIONOBSERVATORY.OX.AC.UK PAGE 4
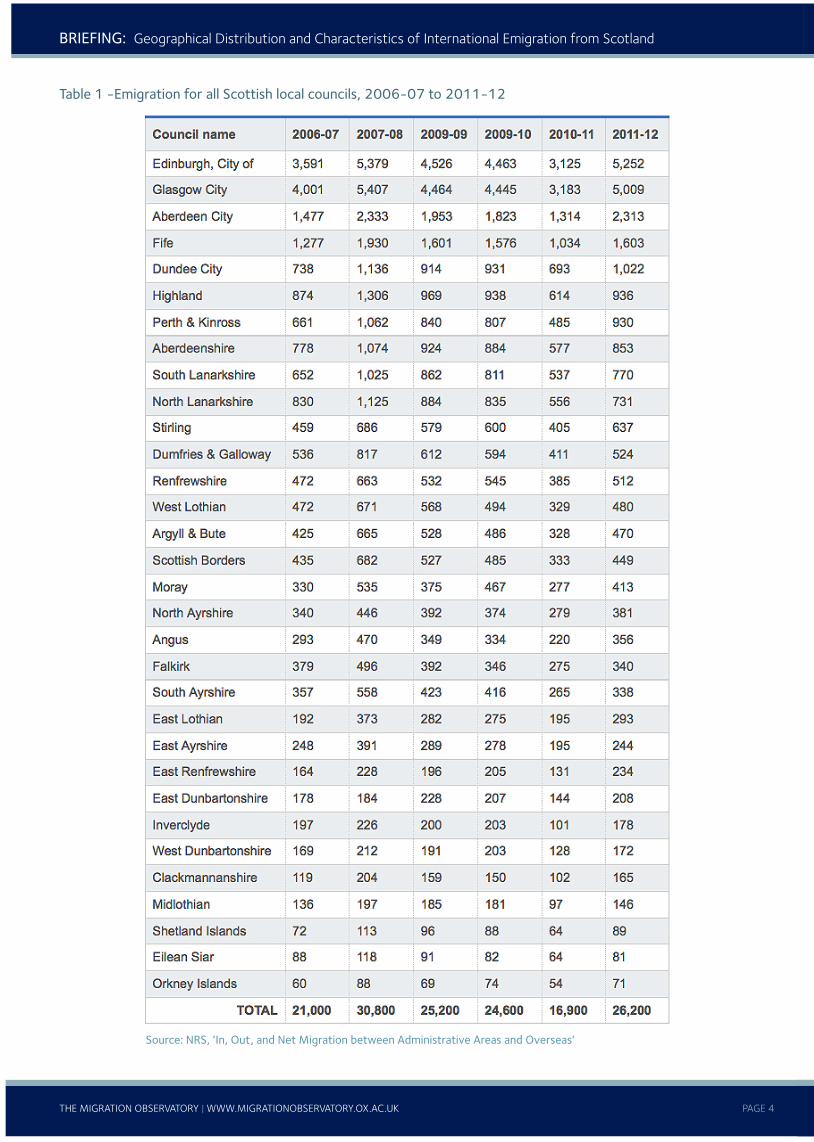
Table 1 -Emigration for all Scottish local councils, 2006-07 to 2011-12
Source: NRS, ‘In, Out, and Net Migration between Administrative Areas and Overseas’
BRIEFING: Geographical Distribution and Characteristics of International Emigration from Scotland BRIEFING: Geographical Distribution and Characteristics of International Emigration from Scotland
THE MIGRATION OBSERVATORY | WWW.MIGRATIONOBSERVATORY.OX.AC.UK PAGE 5
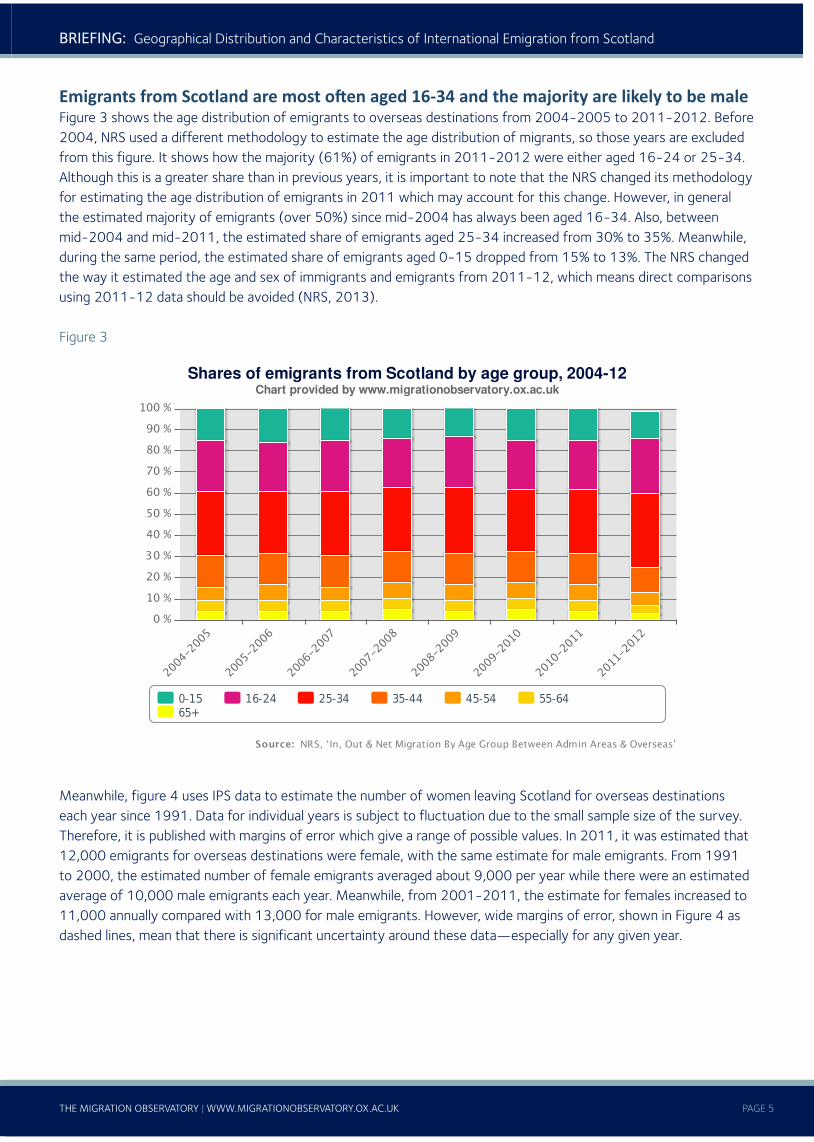
Emigrants from Scotland are most often aged 16-34 and the majority are likely to be maleFigure 3 shows the age distribution of emigrants to overseas destinations from 2004-2005 to 2011-2012. Before 2004, NRS used a different methodology to estimate the age distribution of migrants, so those years are excluded from this figure. It shows how the majority (61%) of emigrants in 2011-2012 were either aged 16-24 or 25-34. Although this is a greater share than in previous years, it is important to note that the NRS changed its methodology for estimating the age distribution of emigrants in 2011 which may account for this change. However, in general the estimated majority of emigrants (over 50%) since mid-2004 has always been aged 16-34. Also, between mid-2004 and mid-2011, the estimated share of emigrants aged 25-34 increased from 30% to 35%. Meanwhile, during the same period, the estimated share of emigrants aged 0-15 dropped from 15% to 13%. The NRS changed the way it estimated the age and sex of immigrants and emigrants from 2011-12, which means direct comparisons using 2011-12 data should be avoided (NRS, 2013).
Figure 3
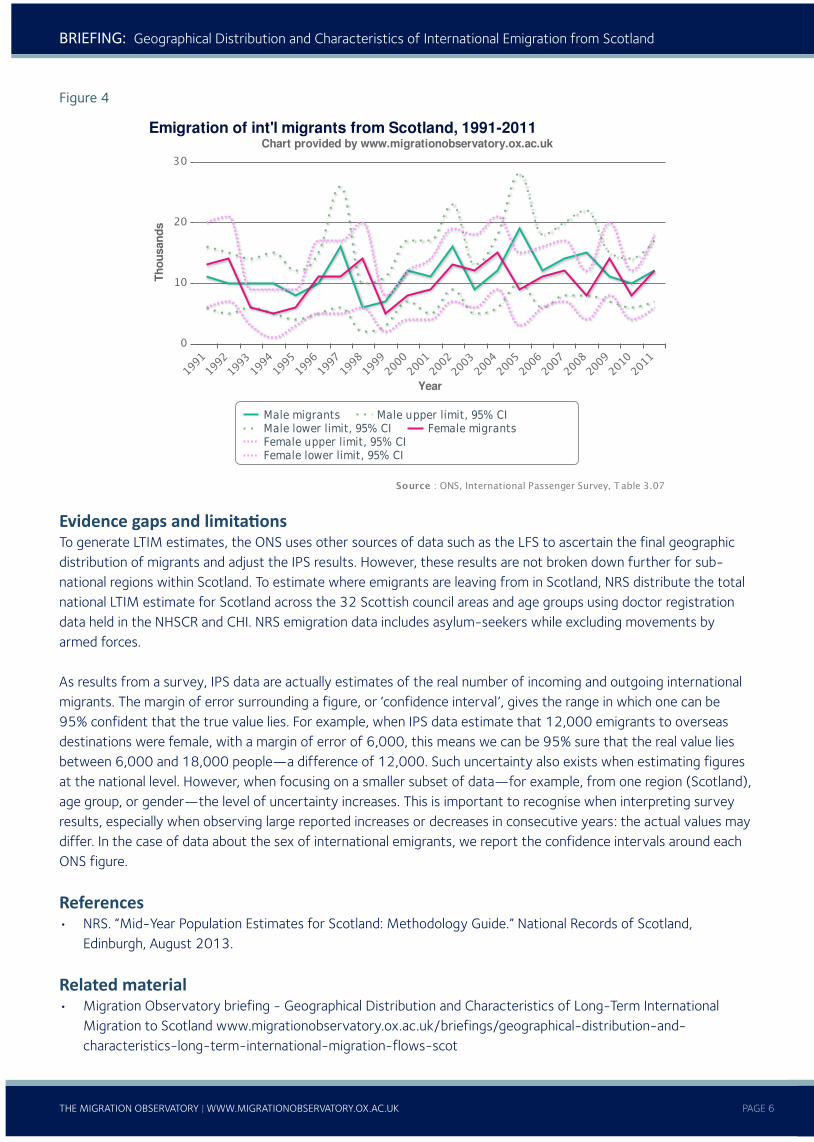
Meanwhile, figure 4 uses IPS data to estimate the number of women leaving Scotland for overseas destinations each year since 1991. Data for individual years is subject to fluctuation due to the small sample size of the survey. Therefore, it is published with margins of error which give a range of possible values. In 2011, it was estimated that 12,000 emigrants for overseas destinations were female, with the same estimate for male emigrants. From 1991 to 2000, the estimated number of female emigrants averaged about 9,000 per year while there were an estimated average of 10,000 male emigrants each year. Meanwhile, from 2001-2011, the estimate for females increased to 11,000 annually compared with 13,000 for male emigrants. However, wide margins of error, shown in Figure 4 as dashed lines, mean that there is significant uncertainty around these data—especially for any given year.
SharesofemigrantsfromScotlandbyagegroup,2004-12Chartprovidedbywww.migrationobservatory.ox.ac.uk
0-15 16-24 25-34 35-44 45-54 55-64
65+
2004
-200
5
2005
-200
6
2006
-200
7
2007
-200
8
2008
-200
9
2009
-201
0
2010
-201
1
2011
-201
2
0 %
10 %
20 %
30 %
40 %
50 %
60 %
70 %
80 %
90 %
100 %
Source: NRS, ʻIn, Out & Net Migration By Age Group Between Admin Areas & Overseasʼ
BRIEFING: Geographical Distribution and Characteristics of International Emigration from Scotland
THE MIGRATION OBSERVATORY | WWW.MIGRATIONOBSERVATORY.OX.AC.UK PAGE 6
Figure 4
Evidence gaps and limitationsTo generate LTIM estimates, the ONS uses other sources of data such as the LFS to ascertain the final geographic distribution of migrants and adjust the IPS results. However, these results are not broken down further for sub-national regions within Scotland. To estimate where emigrants are leaving from in Scotland, NRS distribute the total national LTIM estimate for Scotland across the 32 Scottish council areas and age groups using doctor registration data held in the NHSCR and CHI. NRS emigration data includes asylum-seekers while excluding movements by armed forces.
As results from a survey, IPS data are actually estimates of the real number of incoming and outgoing international migrants. The margin of error surrounding a figure, or ‘confidence interval’, gives the range in which one can be 95% confident that the true value lies. For example, when IPS data estimate that 12,000 emigrants to overseas destinations were female, with a margin of error of 6,000, this means we can be 95% sure that the real value lies between 6,000 and 18,000 people—a difference of 12,000. Such uncertainty also exists when estimating figures at the national level. However, when focusing on a smaller subset of data—for example, from one region (Scotland), age group, or gender—the level of uncertainty increases. This is important to recognise when interpreting survey results, especially when observing large reported increases or decreases in consecutive years: the actual values may differ. In the case of data about the sex of international emigrants, we report the confidence intervals around each ONS figure.
References• NRS. “Mid-Year Population Estimates for Scotland: Methodology Guide.” National Records of Scotland,
Edinburgh, August 2013.
Related material• Migration Observatory briefing - Geographical Distribution and Characteristics of Long-Term International
Migration to Scotland www.migrationobservatory.ox.ac.uk/briefings/geographical-distribution-and-characteristics-long-term-international-migration-flows-scot
Emigrationofint'lmigrantsfromScotland,1991-2011Chartprovidedbywww.migrationobservatory.ox.ac.uk
Malemigrants Maleupperlimit,95%CIMalelowerlimit,95%CI FemalemigrantsFemaleupperlimit,95%CIFemalelowerlimit,95%CI
1991
1992
1993
1994
1995
1996
1997
1998
1999
2000
2001
2002
2003
2004
2005
2006
2007
2008
2009
2010
2011
Year
0
10
20
30T
ho
usan
ds
Source : ONS, International Passenger Survey, Table 3.07
BRIEFING: Geographical Distribution and Characteristics of International Emigration from Scotland
PAGE 7THE MIGRATION OBSERVATORY | WWW.MIGRATIONOBSERVATORY.OX.AC.UK
BRIEFING: Geographical Distribution and Characteristics of International Emigration from Scotland
The Migration ObservatoryBased at the Centre on Migration, Policy and Society (COMPAS) at the University of Oxford, the Migration Observatory provides independent, authoritative, evidence-based analysis of data on migration and migrants in the UK, to inform media, public and policy debates, and to generate high quality research on international migration and public policy issues. The Observatory’s analysis involves experts from a wide range of disciplines and departments at the University of Oxford.
COMPASThe Migration Observatory is based at the ESRC Centre on Migration, Policy and Society (COMPAS) at the University of Oxford. The mission of COMPAS is to conduct high quality research in order to develop theory and knowledge, inform policy-making and public debate, and engage users of research within the field of migration.www.compas.ox.ac.uk
Press contactRob McNeil Senior Media [email protected] + 44 (0)1865 274568 + 44 (0)7500 970081
Recommended citationAllen, William. “Geographical Distribution and Characteristics of International Emigration from Scotland.” Migration Observatory briefing, COMPAS, University of Oxford, UK, September 2013.
About the authorWilliam AllenResearch [email protected]