genetic testing, adverse selection, and the demand for life insurance
TRANSCRIPT
Genetic Testing, Adverse Selection, and theDemand for Life Insurance
Cathleen D. Zick,1* Ken R. Smith,1 Robert N. Mayer,1 and Jeffery R. Botkin2
1Department of Family and Consumer Studies, University of Utah, Salt Lake City, Utah2Department of Pediatrics, University of Utah, Salt Lake City, Utah
The dramatic increase in genetic testing foradult-onset diseases has created a debateregarding whether or not insurance compa-nies should be able to use genetic test re-sults in underwriting. We use data fromwomen who have been tested for the BRCA1gene mutation along with data from other-wise comparable untested women to assessthe potential for adverse selection in the lifeinsurance market when tested individualsknow their genetic test results but insurersdo not. Our analyses show that women whotest positive for the BRCA1 gene mutationdo not capitalize on their informational ad-vantage by purchasing more life insurancethan those women who have not undergonegenetic testing. Am. J. Med. Genet. 93:29–39,2000. © 2000 Wiley-Liss, Inc.
KEY WORDS: genetic test results; life in-surance; BRCA1 testing; ad-verse selection
INTRODUCTION
The human genome project is rapidly fueling the de-velopment of genetic tests for inherited diseases [USDepartment of Energy, 1999]. In turn, a variety of pub-lic and private interest groups are raising questionsabout what individuals and society should do with suchgenetic information. Within the life and health insur-ance markets, ethical concerns regarding the potentialfor genetic discrimination are clashing with the under-writing concerns of insurance companies. Consumersfear that if insurance companies gain access to genetictest results some insurers will use this information todeny coverage or raise rates to individuals who carry
particularly serious gene mutations—even when theindividuals in question are asymptomatic. At the sametime, insurance companies worry that if consumers areallowed to keep information regarding genetic test re-sults to themselves, then known carriers for disease-related gene mutations will be able to obtain high lev-els of insurance protection at prices that are belowactuarially justified values. In essence, each group wor-ries that the other will exploit new genetic informationto gain some advantage in the insurance market.
Both sides of the insurance and genetic testing de-bate have made assertions without extensive support-ing data. In this paper, we capitalize on survey infor-mation from two groups of women to assess insurers’claims regarding consumer behavior. Specifically, weexamine whether or not consumers exploit the infor-mation asymmetry created when genetic test resultsare kept private. The first group in our study is com-prised of women in a large kindred whose members areat risk of carrying a specific mutation of the BRCA1gene that dramatically increases their lifetime risk ofdeveloping breast and ovarian cancer. These womenhave been tested for this mutation and they know theirgenetic test results. Their insurance companies do nothave this information unless these women choose toreveal their test results to them. We separate thetested women into two sub-samples: those who testedpositive for the mutation (carriers) and those whotested negative (non-carriers). The second group ofwomen in the study is a sample of the general publicwho have not undergone testing for the BRCA1 genemutation. The demand for life insurance among thetested and non-tested groups of women is estimated.Comparisons across the tested and non-tested womenallow us to assess the potential behavioral implicationsof asymmetric information in the life insurance marketattributable to a genetic test for a BRCA1 gene muta-tion.
MATERIALS AND METHODSBackground
Adverse selection in insurance markets refers to thetendency for consumers who have an elevated risk ofexperiencing an event (e.g., someday being diagnosedwith breast cancer) to use information about which in-surers are unaware to obtain greater levels of insur-
Grant sponsors: National Cancer Institute (NIH); Grant num-ber: CA70669; Grant number: CA63681.
*Correspondence to: Cathleen D. Zick, Ph.D., Department ofFamily and Consumer Studies, University of Utah, 225 South1400 East, Rm. 228, Salt Lake City, UT 84112.E-mail: [email protected]
Received 13 October 1999; Accepted 29 February 2000
American Journal of Medical Genetics 93:29–39 (2000)
© 2000 Wiley-Liss, Inc.
ance protection (per unit cost) than if no informationasymmetry existed. Although the role of adverse selec-tion in insurance markets has been a topic of theoret-ical research within economics for over thirty years(see Pauly, 1986, for a review), empirical investigationsthat test for evidence of this phenomenon have beenrather limited. The empirical studies have focused pri-marily on the health insurance market. They demon-strate that individuals typically seek coverage that re-flects their perceived level of risk, but the studies donot adequately document the extent that consumersexploit any information asymmetries that may exist[Browne, 1992; Frank and McGuire, 1986; Marquis andPhelps, 1987].
There are key differences between the markets forlife and health insurance that may affect both firms’and consumers’ behavior as well as policy makers’ re-sponses to the concerns that are being raised regardingthe use of new genetic test information in these mar-kets. First, the full (or nearly full) price of life insur-ance is typically paid by the consumer even if it is ob-tained through an employer. In contrast, employersoften bear a large portion of the costs of many healthinsurance policies as part of their employee benefitpackages. Second, the life insurance market containsconsiderable fluidity compared to the health insurancemarket. That is, consumers generally have choice overa wide range of life insurance policies and they neednot wait for an “open enrollment” period to change cov-erage. Thus, adverse selection induced by learning ge-netic test results, if present, may reveal itself ratherquickly. Finally, although consumers may have an in-centive to reveal positive genetic test results voluntar-ily to their health insurers in certain situations,1 con-sumers have no incentive to share positive test resultswith their life insurance companies.2 These three fac-tors work in combination to suggest that there is realpotential for adverse selection in the life insurancemarket. At the same time, because life insurance (asopposed to health insurance) is typically not viewed asan economic necessity, policy makers may be moresympathetic to industry demands regarding the needto know genetic test results and to underwrite policiesbased on these results [Pokorski, 1997]. As a conse-quence, it is imperative that we learn more about con-sumers’ behavior in the life insurance market once theyacquire information about genetic test results.
In general, several conditions must be met for ad-verse selection to occur: (1) there must be heterogeneityof risk among consumers; (2) insurers must not be ableto detect (and appropriately price) this risk; (3) con-sumers must have access to information that allowsthem to predict their personal risk better than insur-ers; and (4) consumers must seek and obtain additionalinsurance coverage based on this information. Theseconditions, in combination, imply that high-risk con-sumers (i.e., asymptomatic individuals who test posi-tive for a gene mutation associated with a serious ill-ness) will have greater demand for life insurance thanlow-risk consumers (i.e., those who test negative for agene mutation associated with a serious illness) and inthe analysis that follows, we test this proposition.
The Participants
We assess the potential impact of the informationasymmetry in the market for life insurance created bygenetic testing through comparisons between andwithin two groups. The first group is drawn from alarge kindred residing in Utah and Idaho whose mem-bers have been extensively studied by investigators atthe University of Utah. Some relatives were found tohave a specific BRCA1 gene mutation on the long armof chromosome 17. This kindred, known as K2082, isthe largest family studied to date with a BRCA1 mu-tation. Women in K2082 who test positive for theBRCA1 gene mutation are estimated to have a 58%risk of developing breast cancer by age 70, a 67% risk ofdeveloping ovarian cancer by age 70, and an 88% com-bined risk of developing either breast or ovarian cancerby age 70 [Botkin et al. 1996]. As such, the women whotest positive have an excess risk of contracting a dis-ease that could substantially shorten their lives. Non-carrier women in this kindred have the risk of womenin the general population, that is one-in-eight forbreast cancer [National Cancer Institute, 1993] andone-in-seventy for ovarian cancer if the woman has nofirst degree relatives who have been diagnosed withovarian cancer [“Ovarian cancer...”, 1994].
Four hundred and ten adult women and men (allCaucasian) in K2082 have been recruited into a longi-tudinal study funded by the National Cancer Institute(NCI) that examines the behavioral and psychosocialconsequences of genetic testing. Recruitment of thesesubjects began in October 1994 and ended in March1997. When these individuals were initially ap-proached, they were told that they were part of an ex-tended family whose female members have an elevatedrisk of developing breast or ovarian cancer. Each indi-vidual was then invited to participate in the study andgiven extensive informed consent documents to review.
If an individual agreed to participate in the study, abaseline survey was scheduled and completed by tele-phone. Next, the individual met with genetic and fam-ily counselors at the University of Utah Health Sci-ences Center to discuss the advantages anddisadvantages of being tested for the BRCA1 gene mu-tation. Subjects were told that their test results wereconfidential and members of the research team wouldnot share the subjects’ test results with any third par-
1For example, if a woman tests positive for the gene mutationthat is associated with breast/ovarian cancer, she may want herhealth insurance company to know her test results, if in turn, thecompany would then cover the cost of a prophylactic double mas-tectomy, a radical and costly procedure that has nonetheless beendocumented as reducing the risk of breast cancer for women inhigh risk families [Haney, 1997; Hartmann et al., 1999].
2It is the case that a consumer who tests negative for a genemutation may have an economic incentive to share his/her testresults with his/her life insurance company voluntarily. If thecompany has been using family history information about a ge-netically linked disease to place the individual in a high risk pool,then the individual may be able to use information about his/hernegative test results to gain a reduction in life insurance premi-ums for a given level of coverage.
30 Zick et al.
ties, including insurers. If, after counseling, the indi-vidual still wished to be tested, a blood sample wastaken and the test conducted. The individual then re-turned to the University of Utah to meet again with agenetic counselor to learn his/her test results and toreceive non-directive counseling regarding the meaningof these results.
The post-test study protocol began with a telephoneinterview one week after the individual learned her/hisgenetic test results. The next interview occurred 4–6months after the subjects learned their test results.This was followed by one-year and two-year post-testtelephone interviews. Topics covered on the post-testsurveys range from assessments of psycho-social func-tioning to life and health insurance purchasing deci-sions. Letters confirming upcoming interviews that in-cluded insurance questions also asked participants tolocate life insurance documents in advance so thatthese forms might be consulted when answering spe-cific survey questions.3
There are 189 women in K2082 who know their testresults and who have also completed the one-year fol-low-up survey. Among these women, there are 129 whoare between the ages of 18 and 55 (the age range whereconsumer demand for life insurance is typically high).We restrict this sample of 18 to 55 year-old respondentsto those who have no personal cancer history (n 4 124),who have no missing data on the insurance questions(n 4 115), and who did not carry life insurance thatwas paid for entirely by their employer (n 4 105).Among the 105 women who meet all of these restric-tions, 44 of them (42%) have at least one first degreefemale relative who has been diagnosed with breast orovarian cancer (the criterion we use to identify some-one as “having a family history” of breast/ovarian can-cer). Twenty-eight (27%) of these 105 women testedpositive for the BRCA1 gene mutation and 77 testednegative. All insurance information for these womenwas obtained from the one-year post-test interview.
The women in the second group were interviewed aspart of an NCI-funded project that focused specificallyon life insurance purchasing behavior among womenwith a family history of breast/ovarian cancer. Theoriginal sample of 234 women between the ages of 18and 55 who have not been tested for the BRCA1 genemutation was drawn from a sub-sample of women, age18–55, who participated in a state-wide health inter-view survey that was conducted in Utah during thesummer of 1996. Women who participated in the state-wide, random sample survey who said that they wouldbe willing to be re-contacted formed the eligible pool ofrespondents. From that pool, we over-sampled those
women who reported having at least one first or seconddegree female relative affected with breast or ovariancancer. We restrict this initial sample of 234 women tothose who have no personal cancer history (n 4 209),who have no missing data on the insurance questions(n 4 197), and who did not carry life insurance thatwas paid for entirely by their employer (n 4 177).Among the 177 women who met all of these criteria, 34(19%) are classified as having a family history ofbreast/ovarian cancer (i.e., one or more first degree fe-male relatives having breast or ovarian cancer) and143 (81%) are not.
Women in the non-tested sample were recruited bytelephone. If they agreed to participate in the surveythey were sent a consent form that they signed andreturned. In the cover letter accompanying the consentform, they were also asked to locate insurance docu-ments so that they too could refer to them when an-swering insurance questions during the telephone in-terview.4
At the beginning of the interview for both groups, theinterviewer reminded the interviewee to have their in-surance documents close at hand so that she could referto them if necessary when answering the life insurancequestions. Both groups were asked identical questionsregarding insurance coverage. These questions appearin Appendix I.
Assessing the Potential for Adverse Selection
Standard economic models of life insurance marketspresume that consumers know more about their ownrisks than do insurers. Life insurers respond to thisinformation asymmetry by categorizing insurance ap-plicants into risk pools based on observable character-istics that are highly correlated with actual mortalityrisk. Thus, when completing life insurance applica-tions, consumers must typically provide information onsuch attributes as age, occupation, marital status, per-sonal and family health histories, and personal smok-ing history. Consumers classified in the higher riskgroups are then charged higher prices for a given levelof coverage than are consumers in lower risk groups.The premium difference reflects the higher risk of mor-tality that members of these former groups face. In thiscontext, life insurance company representatives arguethat consumer knowledge of genetic predisposition topotentially life-threatening diseases must be sharedwith insurance companies so that policies may be ap-propriately underwritten.5
In the context of our study, a rather straightforwardtest for evidence of adverse selection is to compare the
3Specifically, each participant was asked to locate and reviewinformation regarding the number of life insurance policies shecurrently held, the total amount of life insurance coverage shecurrently carried, the amount of coverage provided by her pri-mary policy, and the amount of out-of-pocket premiums per yearshe paid for the primary policy before the scheduled time of theinterview. If the respondent had not located and reviewed thisinformation by the time of the interview, the interview was re-scheduled to allow the respondent time to do so.
4See footnote 3.5Insurance company representatives argue that if they are de-
nied access to such information, consumers who test positive fora gene mutation that elevates their risk of mortality may use thisinformation to purchase large amounts of insurance at premiumrates that are not actuarially fair. To cover the additional lossesincurred in this scenario, the insurer would then need to raisepremiums for all consumers in the risk pool (i.e., those who hadtested positive, those who had tested negative, and those who hadnot been tested for the gene mutation) or see profits decline.
Genetic Testing and Life Insurance 31
demand for life insurance among otherwise comparablerespondents who test positive, respondents who testnegative, and respondents who are not tested for theBRCA1 gene mutation. We estimate five different mod-els that examine how knowledge of genetic test resultsinfluences life insurance demand where demand ismeasured by: (1) the likelihood of having life insurance;(2) the number of life insurance policies purchased; (3)the amount of life insurance carried in the respondent’sprimary policy; (4) the total amount of life insurancecarried; and (5) a combination of the likelihood of hav-ing insurance and the amount of insurance carriedamong those who choose to purchase a policy.
Typically, life insurance purchases are thought to bea function of: (1) household income; (2) age; (3) the pres-ence or absence of minor children in the home; (4) mari-tal status; (5) education; and (6) employment status.The predictions regarding these standard insurance re-gressors are detailed in Appendix II.
We include three key regressors in our model to testfor the presence of adverse selection. They are familyhistory of breast or ovarian cancer, genetic test status,and involvement in the early BRCA1 research. A fam-ily history of breast or ovarian cancer raises the risk ofmortality and thereby the demand for life insurance.But the relationship between family history and thedemand for life insurance may be tempered if the pre-miums charged to such high risk individuals are ad-justed upward by insurers (that in turn would decreasethe quantity purchased). If the insurance companydoes not use family history in its underwriting proce-dures, then the potential for adverse selection will con-tinue to exist and we would predict that the coefficientassociated with family breast/ovarian cancer historywould be positive and statistically significant with re-spect to the demand for life insurance.
Testing positive for the BRCA1 gene mutation alsoincreases mortality risk. But, in our sample, a testedrespondent knows the result whereas the insurancecompany does not. As a consequence, there is the po-tential for consumers to exploit this information asym-metry and purchase additional life insurance at ratesthat are below what would be actuarially justified. Ifwe find a positive statistically significant coefficientassociated with testing positive relative to the untestedgroup, this would be supportive of the adverse selectionhypothesis. If we find that individuals who test nega-tive have lower insurance coverage than the untestedgroup, this would further support the adverse selectionhypothesis.
Finally, some individuals in the high risk branches ofthe K2082 kindred were contacted and asked to giveblood samples as part of the original research in theearly 1990s that was conducted to identify the BRCA1gene. As a result of their participation in this earlygenetic research, these women may have suspectedthat they carried the BRCA1 gene mutation for severalyears before learning their test results. Again, insurersdid not know that some of these women participated inthe original genetic study and so there is a potential forthese women to profit from this information asymme-try by purchasing additional insurance at prices thatdo not reflect their elevated risk of mortality. If we
observe a positive, statistically significant coefficientassociated with participating in the early genetic re-search this would further support the adverse selectionhypothesis.
Three different types of models are estimated. Thefirst set of models focuses on the probability of havinglife insurance and the number of life insurance policiesheld. The second set of models examines the dollaramount of life insurance coverage purchased and thetotal amount of coverage purchased across all life in-surance policies. Finally, we estimate a model of thedemand for life insurance among only those respon-dents who have life insurance correcting for possiblesample selection bias created by examining the non-random subset of women who have purchased life in-surance.
Estimation of the three different types of multivari-ate models is challenging because none of the depen-dent variables are normally distributed. The probabil-ity of having life insurance is assessed using a probitestimation technique because the dependent variableis dichotomous. A tobit estimation procedure is usedwhen the number of life insurance policies or the dollaramount of policies held is the dependent variable be-cause these dependent variables are censored at zero.Both probit and tobit estimation techniques generateregression coefficients that are informative but notstraightforward to interpret [Pudney, 1989]. As a con-sequence, we calculate marginal effects that are pre-sented along side the estimated coefficients in each ofthe tables. In the case of the probit equations, marginaleffects should be interpreted as the estimated changein the probability of holding life insurance for a oneunit change in the respective covariate, holding allother covariates at their mean values. In the case of thetobit equations, marginal effects should be interpretedas the estimated change in the number of policies (ordollar value of life insurance) for a one unit change inthe respective covariate, holding all other covariates attheir mean values.
RESULTS
Descriptive information is presented for the fullsample as well as the K2082 and the population-based(i.e., non-tested) sub-groups in Table I. Table I showsthat the two sub-groups are similar on all of the keyrisk dimensions with the exception family cancer his-tory.6 Although it is difficult to find comparative state-wide data on women between the ages of 18 and 55 forall of the variables of interest, the statistics we are ableto obtain suggest that our sample is representative ofthe larger Utah population.7 Of particular interest in
6The modest mean differences in income and the presence ofminor children between the two samples are not statistically sig-nificant.
7The median household income in Utah in 1996 was $37,038[US Bureau of the Census, 1998: Table 744]. We report a meanhousehold income of $44,331. Seventy-one percent of all womenage 18 and older were married in Utah in 1996 [Utah State De-partment of Health, 1996] whereas in our sample of women aged
32 Zick et al.
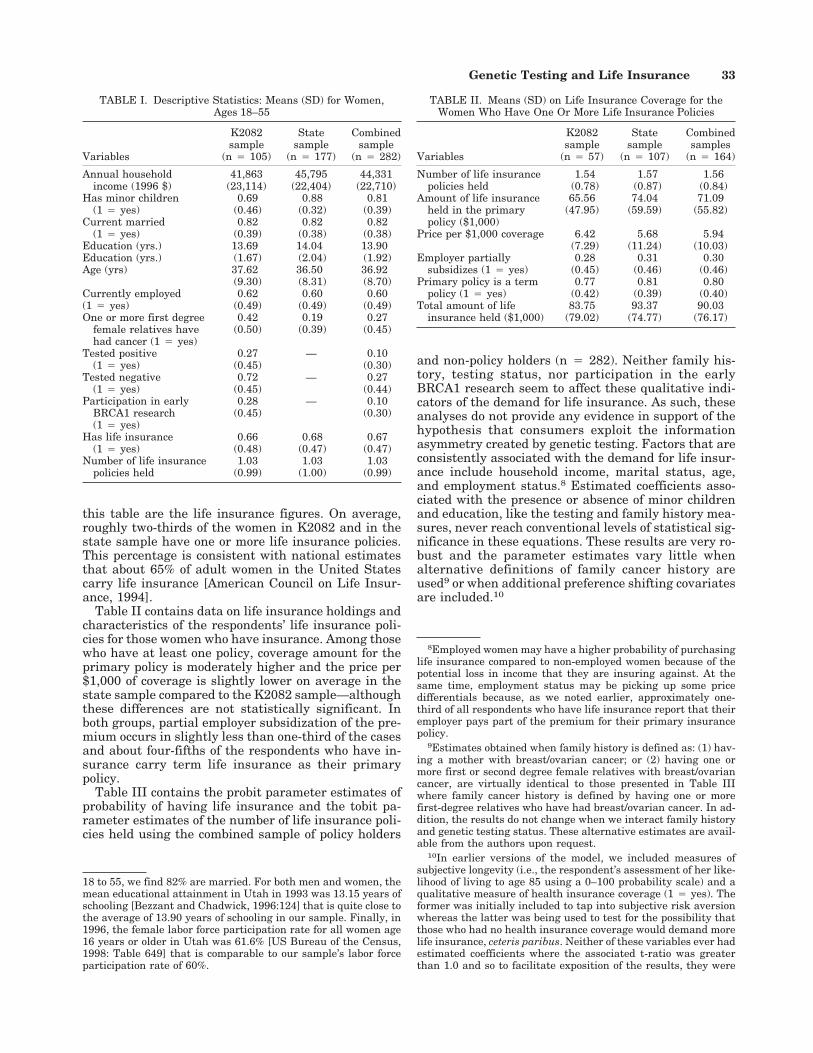
this table are the life insurance figures. On average,roughly two-thirds of the women in K2082 and in thestate sample have one or more life insurance policies.This percentage is consistent with national estimatesthat about 65% of adult women in the United Statescarry life insurance [American Council on Life Insur-ance, 1994].
Table II contains data on life insurance holdings andcharacteristics of the respondents’ life insurance poli-cies for those women who have insurance. Among thosewho have at least one policy, coverage amount for theprimary policy is moderately higher and the price per$1,000 of coverage is slightly lower on average in thestate sample compared to the K2082 sample—althoughthese differences are not statistically significant. Inboth groups, partial employer subsidization of the pre-mium occurs in slightly less than one-third of the casesand about four-fifths of the respondents who have in-surance carry term life insurance as their primarypolicy.
Table III contains the probit parameter estimates ofprobability of having life insurance and the tobit pa-rameter estimates of the number of life insurance poli-cies held using the combined sample of policy holders
and non-policy holders (n 4 282). Neither family his-tory, testing status, nor participation in the earlyBRCA1 research seem to affect these qualitative indi-cators of the demand for life insurance. As such, theseanalyses do not provide any evidence in support of thehypothesis that consumers exploit the informationasymmetry created by genetic testing. Factors that areconsistently associated with the demand for life insur-ance include household income, marital status, age,and employment status.8 Estimated coefficients asso-ciated with the presence or absence of minor childrenand education, like the testing and family history mea-sures, never reach conventional levels of statistical sig-nificance in these equations. These results are very ro-bust and the parameter estimates vary little whenalternative definitions of family cancer history areused9 or when additional preference shifting covariatesare included.10
18 to 55, we find 82% are married. For both men and women, themean educational attainment in Utah in 1993 was 13.15 years ofschooling [Bezzant and Chadwick, 1996:124] that is quite close tothe average of 13.90 years of schooling in our sample. Finally, in1996, the female labor force participation rate for all women age16 years or older in Utah was 61.6% [US Bureau of the Census,1998: Table 649] that is comparable to our sample’s labor forceparticipation rate of 60%.
8Employed women may have a higher probability of purchasinglife insurance compared to non-employed women because of thepotential loss in income that they are insuring against. At thesame time, employment status may be picking up some pricedifferentials because, as we noted earlier, approximately one-third of all respondents who have life insurance report that theiremployer pays part of the premium for their primary insurancepolicy.
9Estimates obtained when family history is defined as: (1) hav-ing a mother with breast/ovarian cancer; or (2) having one ormore first or second degree female relatives with breast/ovariancancer, are virtually identical to those presented in Table IIIwhere family cancer history is defined by having one or morefirst-degree relatives who have had breast/ovarian cancer. In ad-dition, the results do not change when we interact family historyand genetic testing status. These alternative estimates are avail-able from the authors upon request.
10In earlier versions of the model, we included measures ofsubjective longevity (i.e., the respondent’s assessment of her like-lihood of living to age 85 using a 0–100 probability scale) and aqualitative measure of health insurance coverage (1 4 yes). Theformer was initially included to tap into subjective risk aversionwhereas the latter was being used to test for the possibility thatthose who had no health insurance coverage would demand morelife insurance, ceteris paribus. Neither of these variables ever hadestimated coefficients where the associated t-ratio was greaterthan 1.0 and so to facilitate exposition of the results, they were
TABLE I. Descriptive Statistics: Means (SD) for Women,Ages 18–55
Variables
K2082sample
(n 4 105)
Statesample
(n 4 177)
Combinedsample
(n 4 282)
Annual household 41,863 45,795 44,331income (1996 $) (23,114) (22,404) (22,710)
Has minor children 0.69 0.88 0.81(1 4 yes) (0.46) (0.32) (0.39)
Current married 0.82 0.82 0.82(1 4 yes) (0.39) (0.38) (0.38)
Education (yrs.) 13.69 14.04 13.90Education (yrs.) (1.67) (2.04) (1.92)Age (yrs) 37.62 36.50 36.92
(9.30) (8.31) (8.70)Currently employed 0.62 0.60 0.60(1 4 yes) (0.49) (0.49) (0.49)One or more first degree 0.42 0.19 0.27
female relatives have (0.50) (0.39) (0.45)had cancer (1 4 yes)
Tested positive 0.27 — 0.10(1 4 yes) (0.45) (0.30)
Tested negative 0.72 — 0.27(1 4 yes) (0.45) (0.44)
Participation in early 0.28 — 0.10BRCA1 research (0.45) (0.30)(1 4 yes)
Has life insurance 0.66 0.68 0.67(1 4 yes) (0.48) (0.47) (0.47)
Number of life insurance 1.03 1.03 1.03policies held (0.99) (1.00) (0.99)
TABLE II. Means (SD) on Life Insurance Coverage for theWomen Who Have One Or More Life Insurance Policies
Variables
K2082sample
(n 4 57)
Statesample
(n 4 107)
Combinedsamples
(n 4 164)
Number of life insurance 1.54 1.57 1.56policies held (0.78) (0.87) (0.84)
Amount of life insurance 65.56 74.04 71.09held in the primary (47.95) (59.59) (55.82)policy ($1,000)
Price per $1,000 coverage 6.42 5.68 5.94(7.29) (11.24) (10.03)
Employer partially 0.28 0.31 0.30subsidizes (1 4 yes) (0.45) (0.46) (0.46)
Primary policy is a term 0.77 0.81 0.80policy (1 4 yes) (0.42) (0.39) (0.40)
Total amount of life 83.75 93.37 90.03insurance held ($1,000) (79.02) (74.77) (76.17)
Genetic Testing and Life Insurance 33
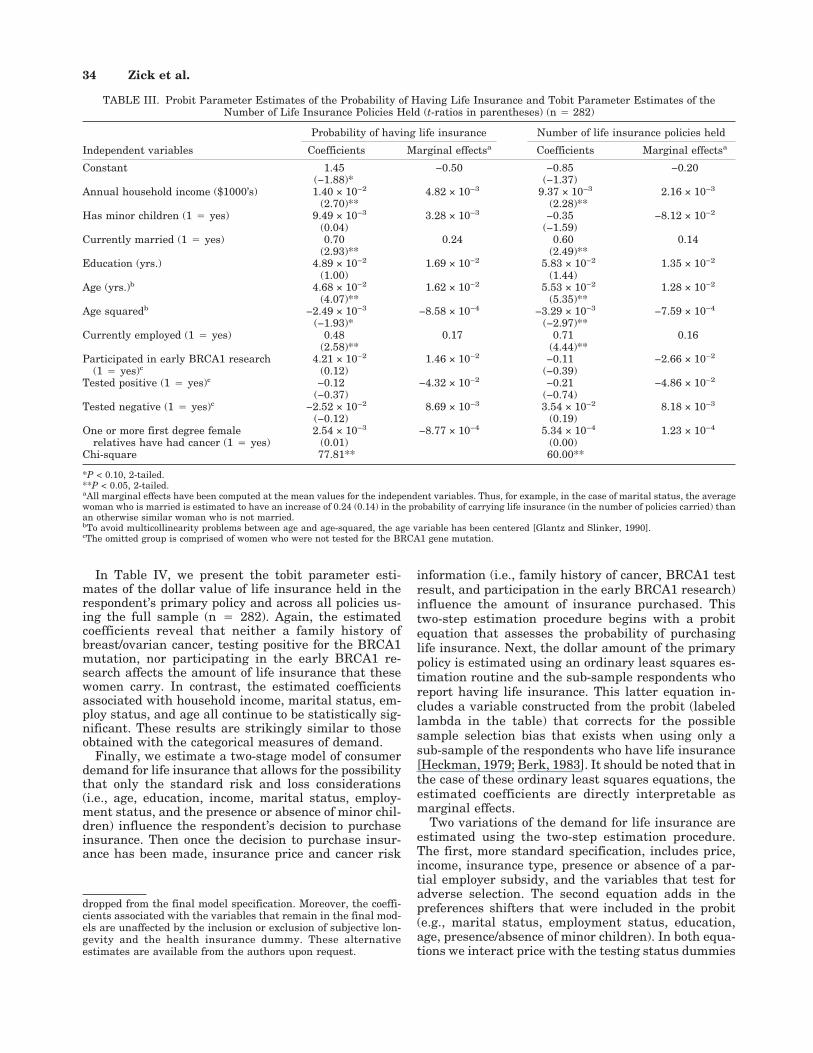
In Table IV, we present the tobit parameter esti-mates of the dollar value of life insurance held in therespondent’s primary policy and across all policies us-ing the full sample (n 4 282). Again, the estimatedcoefficients reveal that neither a family history ofbreast/ovarian cancer, testing positive for the BRCA1mutation, nor participating in the early BRCA1 re-search affects the amount of life insurance that thesewomen carry. In contrast, the estimated coefficientsassociated with household income, marital status, em-ploy status, and age all continue to be statistically sig-nificant. These results are strikingly similar to thoseobtained with the categorical measures of demand.
Finally, we estimate a two-stage model of consumerdemand for life insurance that allows for the possibilitythat only the standard risk and loss considerations(i.e., age, education, income, marital status, employ-ment status, and the presence or absence of minor chil-dren) influence the respondent’s decision to purchaseinsurance. Then once the decision to purchase insur-ance has been made, insurance price and cancer risk
information (i.e., family history of cancer, BRCA1 testresult, and participation in the early BRCA1 research)influence the amount of insurance purchased. Thistwo-step estimation procedure begins with a probitequation that assesses the probability of purchasinglife insurance. Next, the dollar amount of the primarypolicy is estimated using an ordinary least squares es-timation routine and the sub-sample respondents whoreport having life insurance. This latter equation in-cludes a variable constructed from the probit (labeledlambda in the table) that corrects for the possiblesample selection bias that exists when using only asub-sample of the respondents who have life insurance[Heckman, 1979; Berk, 1983]. It should be noted that inthe case of these ordinary least squares equations, theestimated coefficients are directly interpretable asmarginal effects.
Two variations of the demand for life insurance areestimated using the two-step estimation procedure.The first, more standard specification, includes price,income, insurance type, presence or absence of a par-tial employer subsidy, and the variables that test foradverse selection. The second equation adds in thepreferences shifters that were included in the probit(e.g., marital status, employment status, education,age, presence/absence of minor children). In both equa-tions we interact price with the testing status dummies
dropped from the final model specification. Moreover, the coeffi-cients associated with the variables that remain in the final mod-els are unaffected by the inclusion or exclusion of subjective lon-gevity and the health insurance dummy. These alternativeestimates are available from the authors upon request.
TABLE III. Probit Parameter Estimates of the Probability of Having Life Insurance and Tobit Parameter Estimates of theNumber of Life Insurance Policies Held (t-ratios in parentheses) (n 4 282)
Independent variables
Probability of having life insurance Number of life insurance policies held
Coefficients Marginal effectsa Coefficients Marginal effectsa
Constant 1.45 −0.50 −0.85 −0.20(−1.88)* (−1.37)
Annual household income ($1000’s) 1.40 × 10⁻² 4.82 × 10⁻³ 9.37 × 10⁻³ 2.16 × 10⁻³
(2.70)** (2.28)**Has minor children (1 4 yes) 9.49 × 10⁻³ 3.28 × 10⁻³ −0.35 −8.12 × 10⁻²
(0.04) (−1.59)Currently married (1 4 yes) 0.70 0.24 0.60 0.14
(2.93)** (2.49)**Education (yrs.) 4.89 × 10⁻² 1.69 × 10⁻² 5.83 × 10⁻² 1.35 × 10⁻²
(1.00) (1.44)Age (yrs.)b 4.68 × 10⁻² 1.62 × 10⁻² 5.53 × 10⁻² 1.28 × 10⁻²
(4.07)** (5.35)**Age squaredb −2.49 × 10⁻³ −8.58 × 10⁻⁴ −3.29 × 10⁻³ −7.59 × 10⁻⁴
(−1.93)* (−2.97)**Currently employed (1 4 yes) 0.48 0.17 0.71 0.16
(2.58)** (4.44)**Participated in early BRCA1 research 4.21 × 10⁻² 1.46 × 10⁻² −0.11 −2.66 × 10⁻²
(1 4 yes)c (0.12) (−0.39)Tested positive (1 4 yes)c −0.12 −4.32 × 10⁻² −0.21 −4.86 × 10⁻²
(−0.37) (−0.74)Tested negative (1 4 yes)c −2.52 × 10⁻² 8.69 × 10⁻³ 3.54 × 10⁻² 8.18 × 10⁻³
(−0.12) (0.19)One or more first degree female 2.54 × 10⁻³ −8.77 × 10⁻⁴ 5.34 × 10⁻⁴ 1.23 × 10⁻⁴
relatives have had cancer (1 4 yes) (0.01) (0.00)Chi-square 77.81** 60.00**
*P < 0.10, 2-tailed.**P < 0.05, 2-tailed.aAll marginal effects have been computed at the mean values for the independent variables. Thus, for example, in the case of marital status, the averagewoman who is married is estimated to have an increase of 0.24 (0.14) in the probability of carrying life insurance (in the number of policies carried) thanan otherwise similar woman who is not married.bTo avoid multicollinearity problems between age and age-squared, the age variable has been centered [Glantz and Slinker, 1990].cThe omitted group is comprised of women who were not tested for the BRCA1 gene mutation.
34 Zick et al.
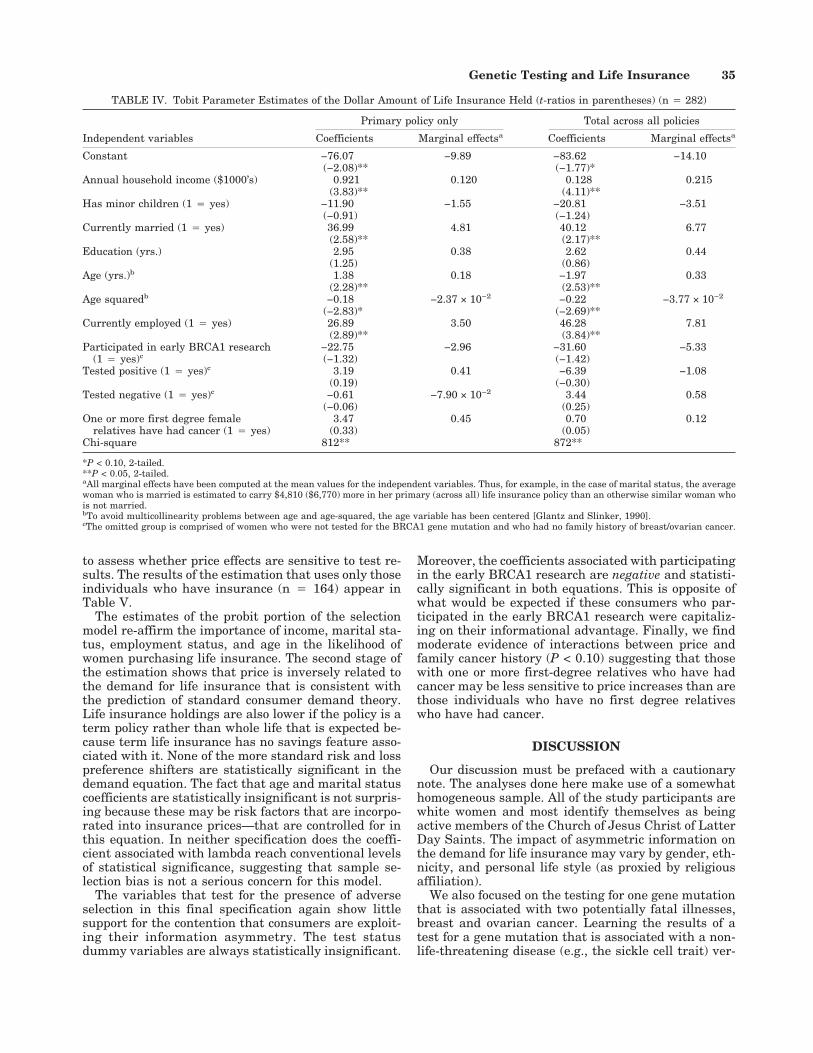
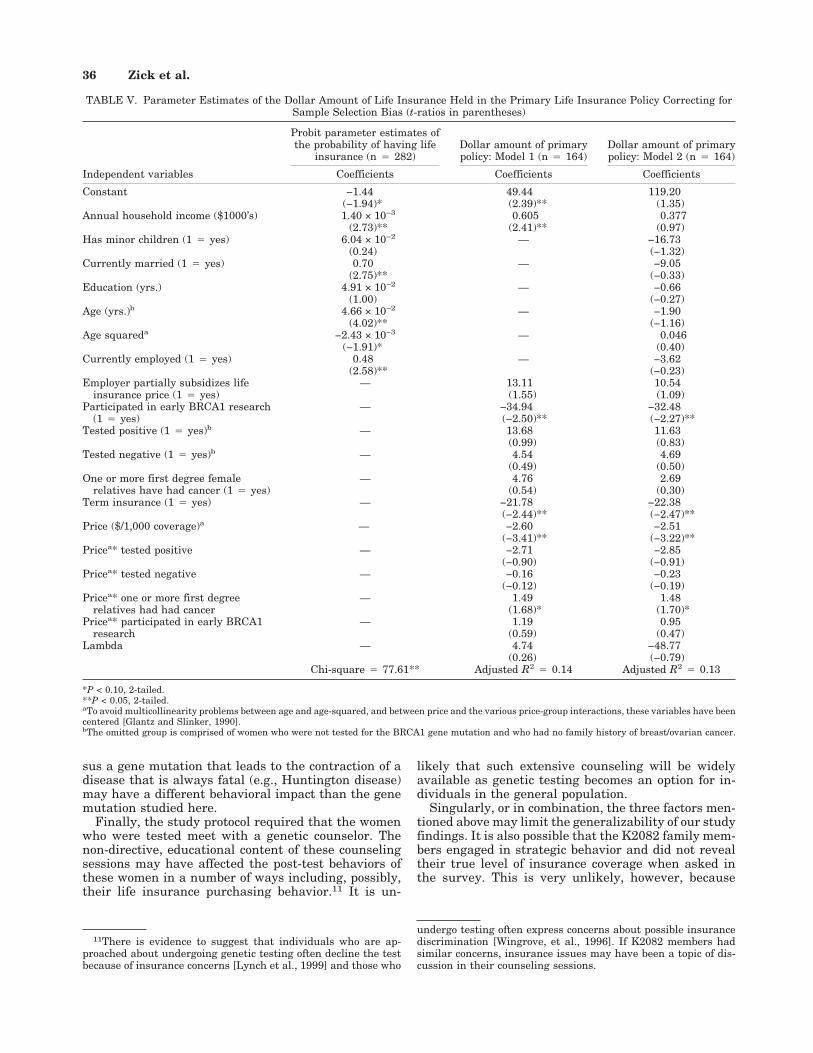
to assess whether price effects are sensitive to test re-sults. The results of the estimation that uses only thoseindividuals who have insurance (n 4 164) appear inTable V.
The estimates of the probit portion of the selectionmodel re-affirm the importance of income, marital sta-tus, employment status, and age in the likelihood ofwomen purchasing life insurance. The second stage ofthe estimation shows that price is inversely related tothe demand for life insurance that is consistent withthe prediction of standard consumer demand theory.Life insurance holdings are also lower if the policy is aterm policy rather than whole life that is expected be-cause term life insurance has no savings feature asso-ciated with it. None of the more standard risk and losspreference shifters are statistically significant in thedemand equation. The fact that age and marital statuscoefficients are statistically insignificant is not surpris-ing because these may be risk factors that are incorpo-rated into insurance prices—that are controlled for inthis equation. In neither specification does the coeffi-cient associated with lambda reach conventional levelsof statistical significance, suggesting that sample se-lection bias is not a serious concern for this model.
The variables that test for the presence of adverseselection in this final specification again show littlesupport for the contention that consumers are exploit-ing their information asymmetry. The test statusdummy variables are always statistically insignificant.
Moreover, the coefficients associated with participatingin the early BRCA1 research are negative and statisti-cally significant in both equations. This is opposite ofwhat would be expected if these consumers who par-ticipated in the early BRCA1 research were capitaliz-ing on their informational advantage. Finally, we findmoderate evidence of interactions between price andfamily cancer history (P < 0.10) suggesting that thosewith one or more first-degree relatives who have hadcancer may be less sensitive to price increases than arethose individuals who have no first degree relativeswho have had cancer.
DISCUSSION
Our discussion must be prefaced with a cautionarynote. The analyses done here make use of a somewhathomogeneous sample. All of the study participants arewhite women and most identify themselves as beingactive members of the Church of Jesus Christ of LatterDay Saints. The impact of asymmetric information onthe demand for life insurance may vary by gender, eth-nicity, and personal life style (as proxied by religiousaffiliation).
We also focused on the testing for one gene mutationthat is associated with two potentially fatal illnesses,breast and ovarian cancer. Learning the results of atest for a gene mutation that is associated with a non-life-threatening disease (e.g., the sickle cell trait) ver-
TABLE IV. Tobit Parameter Estimates of the Dollar Amount of Life Insurance Held (t-ratios in parentheses) (n 4 282)
Independent variables
Primary policy only Total across all policies
Coefficients Marginal effectsa Coefficients Marginal effectsa
Constant −76.07 −9.89 −83.62 −14.10(−2.08)** (−1.77)*
Annual household income ($1000’s) 0.921 0.120 0.128 0.215(3.83)** (4.11)**
Has minor children (1 4 yes) −11.90 −1.55 −20.81 −3.51(−0.91) (−1.24)
Currently married (1 4 yes) 36.99 4.81 40.12 6.77(2.58)** (2.17)**
Education (yrs.) 2.95 0.38 2.62 0.44(1.25) (0.86)
Age (yrs.)b 1.38 0.18 −1.97 0.33(2.28)** (2.53)**
Age squaredb −0.18 −2.37 × 10⁻² −0.22 −3.77 × 10⁻²
(−2.83)* (−2.69)**Currently employed (1 4 yes) 26.89 3.50 46.28 7.81
(2.89)** (3.84)**Participated in early BRCA1 research −22.75 −2.96 −31.60 −5.33
(1 4 yes)c (−1.32) (−1.42)Tested positive (1 4 yes)c 3.19 0.41 −6.39 −1.08
(0.19) (−0.30)Tested negative (1 4 yes)c −0.61 −7.90 × 10⁻² 3.44 0.58
(−0.06) (0.25)One or more first degree female 3.47 0.45 0.70 0.12
relatives have had cancer (1 4 yes) (0.33) (0.05)Chi-square 812** 872**
*P < 0.10, 2-tailed.**P < 0.05, 2-tailed.aAll marginal effects have been computed at the mean values for the independent variables. Thus, for example, in the case of marital status, the averagewoman who is married is estimated to carry $4,810 ($6,770) more in her primary (across all) life insurance policy than an otherwise similar woman whois not married.bTo avoid multicollinearity problems between age and age-squared, the age variable has been centered [Glantz and Slinker, 1990].cThe omitted group is comprised of women who were not tested for the BRCA1 gene mutation and who had no family history of breast/ovarian cancer.
Genetic Testing and Life Insurance 35
sus a gene mutation that leads to the contraction of adisease that is always fatal (e.g., Huntington disease)may have a different behavioral impact than the genemutation studied here.
Finally, the study protocol required that the womenwho were tested meet with a genetic counselor. Thenon-directive, educational content of these counselingsessions may have affected the post-test behaviors ofthese women in a number of ways including, possibly,their life insurance purchasing behavior.11 It is un-
likely that such extensive counseling will be widelyavailable as genetic testing becomes an option for in-dividuals in the general population.
Singularly, or in combination, the three factors men-tioned above may limit the generalizability of our studyfindings. It is also possible that the K2082 family mem-bers engaged in strategic behavior and did not revealtheir true level of insurance coverage when asked inthe survey. This is very unlikely, however, because
11There is evidence to suggest that individuals who are ap-proached about undergoing genetic testing often decline the testbecause of insurance concerns [Lynch et al., 1999] and those who
undergo testing often express concerns about possible insurancediscrimination [Wingrove, et al., 1996]. If K2082 members hadsimilar concerns, insurance issues may have been a topic of dis-cussion in their counseling sessions.
TABLE V. Parameter Estimates of the Dollar Amount of Life Insurance Held in the Primary Life Insurance Policy Correcting forSample Selection Bias (t-ratios in parentheses)
Independent variables
Probit parameter estimates ofthe probability of having life
insurance (n 4 282)Dollar amount of primarypolicy: Model 1 (n 4 164)
Dollar amount of primarypolicy: Model 2 (n 4 164)
Coefficients Coefficients Coefficients
Constant −1.44 49.44 119.20(−1.94)* (2.39)** (1.35)
Annual household income ($1000’s) 1.40 × 10⁻³ 0.605 0.377(2.73)** (2.41)** (0.97)
Has minor children (1 4 yes) 6.04 × 10⁻² — −16.73(0.24) (−1.32)
Currently married (1 4 yes) 0.70 — −9.05(2.75)** (−0.33)
Education (yrs.) 4.91 × 10⁻² — −0.66(1.00) (−0.27)
Age (yrs.)b 4.66 × 10⁻² — −1.90(4.02)** (−1.16)
Age squareda −2.43 × 10⁻³ — 0.046(−1.91)* (0.40)
Currently employed (1 4 yes) 0.48 — −3.62(2.58)** (−0.23)
Employer partially subsidizes life — 13.11 10.54insurance price (1 4 yes) (1.55) (1.09)
Participated in early BRCA1 research — −34.94 −32.48(1 4 yes) (−2.50)** (−2.27)**
Tested positive (1 4 yes)b — 13.68 11.63(0.99) (0.83)
Tested negative (1 4 yes)b — 4.54 4.69(0.49) (0.50)
One or more first degree female — 4.76 2.69relatives have had cancer (1 4 yes) (0.54) (0.30)
Term insurance (1 4 yes) — −21.78 −22.38(−2.44)** (−2.47)**
Price ($/1,000 coverage)a — −2.60 −2.51(−3.41)** (−3.22)**
Pricea* tested positive — −2.71 −2.85(−0.90) (−0.91)
Pricea* tested negative — −0.16 −0.23(−0.12) (−0.19)
Pricea* one or more first degree — 1.49 1.48relatives had had cancer (1.68)* (1.70)*
Pricea* participated in early BRCA1 — 1.19 0.95research (0.59) (0.47)
Lambda — 4.74 −48.77(0.26) (−0.79)
Chi-square 4 77.61** Adjusted R2 4 0.14 Adjusted R2 4 0.13
*P < 0.10, 2-tailed.**P < 0.05, 2-tailed.aTo avoid multicollinearity problems between age and age-squared, and between price and the various price-group interactions, these variables have beencentered [Glantz and Slinker, 1990].bThe omitted group is comprised of women who were not tested for the BRCA1 gene mutation and who had no family history of breast/ovarian cancer.
36 Zick et al.
throughout this longitudinal study, respondents havebeen repeatedly told that all information they gavewould be kept strictly confidential and thus they wouldhave no reason to engage in such strategic behavior.
Our study also has several noteworthy strengths. Inparticular, the current analyses present a strong test ofthe adverse selection hypothesis as it applies to genetictesting and the market for life insurance because weknow that respondents in our sample have access toinformation regarding their mortality risk that insur-ers do not know. In addition, our sample is relativelylarge compared to others that have been used to ad-dress the behavioral implications of genetic testing.12
As such, our sample contains considerable variation inits socio-demographic and economic circumstances thatenhance our ability to undertake a rigorous test of theadverse selection hypothesis. Finally, we estimate arange of demand models and we find a consistent set ofresults across them all, and this enhances our confi-dence in the robustness of these study findings.
Our research shows that the women who test posi-tive for the BRCA1 gene mutation do not capitalize ontheir informational advantage by purchasing more lifeinsurance than those women who have not undergonegenetic testing. Thus, life insurers’ claims that consum-ers will use information about their genetic test resultsto engage in adverse selection is not supported here.
Why are women who carry the potentially life threat-ening BRCA1 gene mutation not exploiting their infor-mational advantage in the market for life insurance?One possible answer is that positive genetic test resultsmay simply serve to confirm something that thesewomen and their insurers have known all along basedon their family histories. If learning that they havetested positive simply confirms the suspicions of manyof these women, it may have little behavioral impact ontheir life insurance purchasing behavior. Consistentwith this argument is the research finding that womenwho test positive for the BRCA1 mutation experiencelittle short-run change in psychological distress be-tween the pre- and post-test interviews because formany it only serves to affirm what they already sus-pected [Croyle et al., 1997].
Alternatively, the reason we observe little evidenceof adverse selection may be because our follow-up pe-riod of one-year is too short. Women who have learnedthat they carry the BRCA1 mutation may be pre-occupied with more immediate concerns such as whatthey can do to reduce their risk of breast or ovariancancer. Indeed, we find that 87% of the women inK2082 who test positive are contemplating undergoingsurgery to remove their ovaries (17% for breasts) toreduce their cancer risk one year after testing. Behav-ioral changes regarding life insurance may be delayedwhile these women work through the more immediateand very serious health care choices that they face.
The absence of any evidence of adverse selection dueto genetic testing has implications for policy makersworking in the legislative arena. Proposals regardinghow policy makers should deal with insurance issuesrelated to genetic testing range from allowing anony-mous testing (where consumer privacy would be com-pletely protected) to creating a new market for pre-testgenetic insurance to mute any effects of sharing geneticinformation with insurance providers [Tabarrok,1993]. We need to have a debate informed by empiricalresearch on the questions of (1) who should have accessto genetic test results, and (2) how can we insure thatthis information is used in a responsible manner. Cur-rent evidence regarding insurers’ use of genetic testinginformation is sketchy and inconclusive at this point.13
Yet, current legislative protections against genetic dis-crimination are weak and patchwork at best,14 andthere are no legislative provisions regarding coercion intesting (e.g., situations where an employer or insurermight require someone to undergo genetic testing be-fore hiring or issuing an insurance policy). Wider ac-cess to genetic information is certain to spark the needfor detailed articulation of what constitutes legitimateand ethically responsible use of such tests and the ge-netic information they reveal.
Policymakers should be cautious as they move for-ward with the legislative debate on genetic testing andlife insurance underwriting practices. They shouldview with some skepticism the contention that the de-nial of access to genetic test results (and hence thedenial of their use in underwriting) will threaten theinsurance industry’s economic viability in the immedi-ate future [Pokorski, 1997]. We find no evidence to sup-port this position. Indeed, our findings suggest that ifinsurers continue to use family cancer history in theirunderwriting process, they have little need to worry
12For example, Wahlin et al., [1997] have a sample of four in-dividuals, Croyle et al. [1997] have a sample of 60 women, Quaidand Wesson [1995] use a sample of 25 couples, and Wiggins et al.[1992] have 135 respondents.
13On the one hand, the Council for Responsible Genetics [1995]has documented a number of cases of coercion or genetic discrimi-nation in employment and insurance [McGoodwin, 1997]. Also, ina recent survey of genetic support group members (a clearly self-selected group), it was reported that 22% had been refused healthinsurance coverage, 25% had been refused life insurance, and13% had been denied employment because of a genetic condition[Lampham et al., 1996]. In contrast, a recent study of healthinsurance practices finds almost no documented cases of insurersusing pre-symptomatic genetic test result information [Hall andRich, 2000].
14At the federal level, the 1995 revision to the compliancemanual for the Americans with Disabilities Act clarifies that ge-netic discrimination in employment should be considered underthis act. This provision has not yet been tested in the courts,however. The 1996 Health Insurance Portability and Account-ability Act also provides some protection within the health insur-ance domain by forbidding health insurance companies fromidentifying genetic information as a pre-existing condition unlessthe person has been diagnosed with an illness that is caused bythis genetic condition. But, it says nothing about the price anemployee must pay for such insurance if an individual’s medicalrecords reveal that she or he has tested positive for a gene mu-tation associated with a serious disease. Discussion of the widerrange of public policy issues associated with genetic testing fromthe states’ perspective can be found in a report put together by theCouncil of State Governments [1993].
Genetic Testing and Life Insurance 37
about the impact that genetic tests for cancer-relatedgene mutations will have on consumer demand for lifeinsurance.
ACKNOWLEDGMENTS
Diana Lane, Antoinette Stroup, Jean Nash, andDebra Dutson provided invaluable survey and datamanagement support for this project.
REFERENCES
American Council of Life Insurance. 1994. The need for genetic informationin risk classification. Washington, DC.
Berk RA. 1983. An introduction to sample selection bias in sociologicaldata. Am Soc Rev 48:386–398.
Bezzant EM, Chadwick BA. 1996. Education. In: TB Heaton, TA Hirschl,BA Chadwick, editors. Utah in the 1990s—A demographic perspective.Salt Lake City: Signature Books. p 119–138.
Botkin JR, Croyle RT, Smith KR, Baty BJ, Lerman C, Goldgar DE, WardJW, Flick BJ, Nash JE. 1996. A model protocol for evaluating the be-havioral and psychosocial effects of BRCA1 testing. J Natl Canc Inst88:872–882.
Browne MJ. 1992. Evidence of adverse selection in the individual healthinsurance market. J Risk Ins 59:13–33.
Council for Responsible Genetics. 1995. Testimony to the National Asso-ciation of Insurance Commissioners’ Genetic Testing Working Group.March 12th.
Council of State Governments. 1993. Advances in genetic information—Aguide for state policy makers. Lexington, KY: Iron Works Pike.
Croyle R, Smith KR, Botkin J, Baty B, Nash JE. 1997. Psychological re-sponses to BRCA1 mutation testing: preliminary findings. Health Psy-chol 16:63–72.
Frank RG, McGuire TG. 1986. Adverse selection in insurance markets: aselective survey. In: Dionne G, editor. Contributions to insurance eco-nomics. Boston, MA: Kluwer Academic Publishers. p 97–140.
Glantz SA, Slinker BK. 1990. Primer of applied regression and analysis ofvariance. San Francisco: McGraw-Hill, Inc.
Hall MA, Rich SS. 2000. Laws restricting health insurers’ use of geneticinformation: impact on genetic discrimination. Am J Hum Genet 66:293–307.
Haney DQ. 1997. Double mastectomy radical, effective. Wisconsin StateJournal. April 14, p 1A.
Hartmann LC, Schaid DJ, Woods JE, Crotty TP, Myers JL, Arnold PG,Petty PM, Sellers TA, Johnson JL, McDonnell SK, Frost MH, JenkinsRB. 1999. Efficacy of bilateral prophylactic mastectomy in women witha family history of breast cancer. New Eng J Med 340:77–84.
Heckman JJ. 1979. Sample selection bias as a specification error. Econo-metrica 45:153–161.
Lapham EV, Kozma C, Weiss JO. 1996. Genetic discrimination: perspec-tives of consumers. Science 274:621–624.
Lynch HT, Watson P, Tinley S, Snyder C, Durham C, Lynch J, KirnarskyY, Serova O, Lenoir G, Lerman C, Narod SA. 1999. An update onDNA-based BRCA1/BRCA2 genetic counseling in hereditary breastcancer. Can Gen Cytogen 109:91–98.
Marquis MS, Phelps CE. 1987. Price elasticity and adverse selection in thedemand for supplementary health insurance. Econ Inq 25:299–313.
McGoodwin W. 1997. Biotechnology and the consumer. Esther PetersonConsumer Policy Forum Speech at the American Council on ConsumerInterests’ annual conference, April 5, National Association of InsuranceCommissioners. 1996. Report of the Genetic Testing Working Group tothe Life Insurance (A) Committee.
National Cancer Institute. 1993. Life-time probability of breast cancer inAmerican women. Cancer Facts [Online]. Available: http://www.acor.org/nci/cancernet/6/600056.html.
Ovarian cancer: screening, treatment, and followup. 1994. NIH ConsensusStatement 12:1–30 [Online]. Available: http://text.nlm.nih.gov/nih/cdc/www/96txt.html.
Pauly MV. 1986. Taxation, health insurance, and market failure in themedical economy. J Econ Lit 24:629–675.
Pokorski RJ. 1997. Insurance underwriting in the genetic era. Am J HumGenet 60:205–216.
Pudney S. 1989. Modelling individual choice—The econometrics of corners,kinks and holes. New York: Basil Blackwell, Ltd.
Quaid KA, Wesson MK. 1995. Exploration of the effects of predictive test-ing for Huntington disease on intimate relationships. Am J Med Genet57:46–51.
Tabarrok A. 1993. Genetic testing: an economic and contractarian analysis.J Health Econ 13:75–91.
US Bureau of the Census. 1998. Statistical abstract of the United States.(118th edition). Washington, DC.
US Congressional Office of Technology Assessment. 1988. Mapping ourgenes: how big, how fast? OTA-BA-373. Government Printing Office,Washington, DC.
US Department of Energy. 1999. Frequently asked questions. In: HumanGenome Project Information [Online]. Available: http://www.ornl.gov/hgmis/faq/faqsl.html.
Utah State Department of Health. 1996. Utah’s 1996 health status surveycodebook. Bureau of Surveillance and Analysis, Salt Lake City, UT.
Waite LJ. 1995. Does marriage matter? Demography 32:483–507.
Wahlin TB, Lundin A, Backman L, Almqvist E, Haegermark A, Winblad B,Anvret M. 1997. Reactions to predictive testing in Huntington disease:case reports of coping with a new genetic status. Am J Med Genet73:356–365.
Wiggins SP, Whyte M, Huggins S, Adam J, Theilmann M, Bloch SB, ShepsMT, Schechter ??, Hayden MR. 1992. The psychological consequencesof predictive testing for Huntington disease. New Eng J Med 327:1449–1451.
Wingrove KJ, Norris J, Barton PL, Hagerman R. 1996. Experiences andattitudes concerning genetic testing and insurance in a Colorado popu-lation: a survey of families diagnosed with fragile X syndrome. Am JMed Genet 64:378–81.
Zick CD, Smith KR. 1991. Marital transitions, poverty, and gender differ-ences in mortality. J Mar Fam 53:459–487.
Zick CD, Mayer RN. 1996. Consumption in the land of milk and (home-baked) cookies. In: Heaton TB, Hirschl TA, Chadwick B, editors. Utahin the 19908s—A demographic perspective. Salt Lake City: SignatureBooks. p 139–154.
APPENDIX I
The insurance data used in our analyses were con-structed from respondents’ answers to the following se-ries of insurance questions. These questions wereasked of both the tested and non-tested respondents.For reasons of parsimony, response sets and skip se-quences have been omitted here but they are availablefrom the authors upon request. The questions were:
[Q212] Do you currently have any life insurance onyourself?(PROBE: Any life insurance policy that covers you,whether purchased by you or someone else.)
[Q213] How many life insurance policies do you carryon yourself?(PROBE: Any life insurance policy that covers you,whether purchased by you or someone else.)
[Q214] Overall, about how much life insurance cover-age do you currently carry on yourself?
38 Zick et al.
(PROBE: Any life insurance policy that covers you,whether purchased by you or someone else.)
[Q215] For your primary life insurance policy, abouthow much life insurance coverage do you carry onyourself?(PROBE: Any life insurance policy that covers you,whether purchased by you or someone else.)
[Q216] Is your primary life insurance policy a termpolicy that only provides life insurance protection?(PROBE: Other kinds of policies typically have somesort of savings or investment fund. Examples includewhole life and universal life insurance policies.)
[Q217] Does an employer pay for all, some, or none ofyour primary life insurance policy?
[Q218] About how much do you pay per year in out-of-pocket premiums, including payroll deductions, foryour primary life insurance coverage?
APPENDIX II
Women who are employed have a greater potentialeconomic loss to insure against and hence they shouldhave a higher probability of carrying life insurance orpurchasing more life insurance compared to womenwho are not employed. Likewise, women who are morehighly educated (and thus have greater earnings po-tential), or who have higher household incomes are hy-pothesized to have a greater demand for life insurance,ceteris paribus. Finally, women who have minor chil-dren in the home should have a greater demand for lifeinsurance than women who do not have minor chil-dren, other factors held constant, because these womenhave dependents who would experience an economicloss if they were to die prematurely.
In the case of age and marital status, we hypothesizethat these factors may affect both insurers’ assess-ments of the costs of providing insurance as well as
consumers’ demand.15 In the case of age, if insurerscapitalize on the fact that older women have highermortality risks, then age should be positively corre-lated with premium price (omitted from all but one ofthe estimated models) and negatively related to thedemand for life insurance. At the same time, olderwomen may assess their relative need for insurance tobe greater (e.g., they are more likely to have a homeand want enough insurance to cover the remainingmortgage balance if they were to die), thus raising theirdemand for life insurance. On balance then, no predic-tion about the effect of age can be made. To allow forthe possibility that age effects are nonlinear, we in-clude both age and age-squared among the regressors.
Similar to the situation with age, if insurers capital-ize on the fact that married individuals have lowermortality rates than single individuals [Waite, 1995;Zick and Smith, 1991], then married women should befacing lower life insurance premiums than singlewomen. In those models where premium price is omit-ted, this argument suggests that married womenwould purchase more insurance than single women. Atthe same time, married women should assess theirneed for life insurance to be greater than that of singlewomen because their husbands would experience aneconomic loss should they die prematurely. This argu-ment regarding consumer demand works in consortwith the hypothesis based on cost considerations andas a consequence we predict that in our equations,marital status (1 4 married) should be positively re-lated to the quantity of insurance purchased.
15Personal smoking history is another consumer characteristicknown to the insurer that should affect insurance costs. We omitcontrols for personal smoking history from our estimating equa-tion because over 85% of our sample identify themselves as activemembers of the Church of Jesus Christ of Latter-Day Saints(Mormons) and the church prohibits smoking among its mem-bers. In Utah, where approximately 35–40% of the populationidentify themselves as active Mormons, the adult smoking rate isthe lowest of any state in the country (<16%) [Zick and Mayer,1996].
Genetic Testing and Life Insurance 39