genetic susceptibility to chagas disease cardiomyopathy: involvement of several genes of the innate...
TRANSCRIPT

Frade et al. BMC Infectious Diseases 2013, 13:587http://www.biomedcentral.com/1471-2334/13/587
RESEARCH ARTICLE Open Access
Genetic susceptibility to Chagas diseasecardiomyopathy: involvement of several genes ofthe innate immunity and chemokine-dependentmigration pathwaysAmanda Farage Frade1,2,7, Cristina Wide Pissetti3, Barbara Maria Ianni1, Bruno Saba4, Hui Tzu Lin-Wang4,Luciana Gabriel Nogueira1,2, Ariana de Melo Borges3, Paula Buck1, Fabrício Dias5, Monique Baron1,Ludmila Rodrigues Pinto Ferreira1, Andre Schmidt5, José Antonio Marin-Neto5, Mario Hirata4, Marcelo Sampaio4,Abílio Fragata4, Alexandre Costa Pereira1, Eduardo Donadi5, Jorge Kalil1,2,6, Virmondes Rodrigues3,Edecio Cunha-Neto1,2,6† and Christophe Chevillard7*†
Abstract
Background: Chagas disease, caused by the protozoan Trypanosoma cruzi is endemic in Latin America. Thirtypercent of infected individuals develop chronic Chagas cardiomyopathy (CCC), an inflammatory dilatedcardiomyopathy that is, by far, the most important clinical consequence of T. cruzi infection. The others remainasymptomatic (ASY). A possible genetic component to disease progression was suggested by familial aggregationof cases and the association of markers of innate and adaptive immunity genes with CCC development. Migrationof Th1-type T cells play a major role in myocardial damage.
Methods: Our genetic analysis focused on CCR5, CCL2 and MAL/TIRAP genes. We used the Tag SNPs basedapproach, defined to catch all the genetic information from each gene. The study was conducted on a largeBrazilian population including 315 CCC cases and 118 ASY subjects.
Results: The CCL2rs2530797A/A and TIRAPrs8177376A/A were associated to an increase susceptibility whereas theCCR5rs3176763C/C genotype is associated to protection to CCC. These associations were confirmed when werestricted the analysis to severe CCC, characterized by a left ventricular ejection fraction under 40%.
Conclusions: Our data show that polymorphisms affecting key molecules involved in several immune parameters(innate immunity signal transduction and T cell/monocyte migration) play a role in genetic susceptibility to CCCdevelopment. This also points out to the multigenic character of CCC, each polymorphism imparting a smallcontribution. The identification of genetic markers for CCC will provide information for pathogenesis as well astherapeutic targets.
Keywords: Chagas disease, Susceptibility, CCR5, CCL2, TIRAP
* Correspondence: [email protected]†Equal contributors7Aix-Marseille Université, INSERM, GIMP UMR_S906, Faculté de médecine, 27bd Jean Moulin, Marseille, cedex 05 13385, FranceFull list of author information is available at the end of the article
© 2013 Frade et al.; licensee BioMed Central Ltd. This is an Open Access article distributed under the terms of the CreativeCommons Attribution License (http://creativecommons.org/licenses/by/2.0), which permits unrestricted use, distribution, andreproduction in any medium, provided the original work is properly cited. The Creative Commons Public Domain Dedicationwaiver (http://creativecommons.org/publicdomain/zero/1.0/) applies to the data made available in this article, unless otherwisestated.

Frade et al. BMC Infectious Diseases 2013, 13:587 Page 2 of 17http://www.biomedcentral.com/1471-2334/13/587
BackgroundChagas disease (American trypanosomiasis) is caused bythe protozoan Trypanosoma cruzi and transmitted by thereduviid bug. It occurs exclusively in the Americas, particu-larly in poor, rural areas of Mexico, Central America, andSouth America. The disease remains endemic in LatineAmerica where the vector-based transmission is still activein some countries. Imported disease is increasingly recog-nized as an emerging problem in the USA and Europe dueto immigration from Latin America. It is estimated that asmany as 8–9 million people have Chagas disease. Approxi-mately, 40 million people are currently at risk of infection[1]. Decades after acute infection, approximately 30% of in-fected individuals develop Chronic Chagas cardiomyopathy(CCC), one of the most important consequence of T. cruziinfection. CCC is an inflammatory dilated cardiomyopathy,with a potentially fatal outcome. 5 to 10% of infected in-dividuals develop digestive disease. The remaining two-thirds of infected individuals remain asymptomatic (ASY)and free from heart disorders for life [2]. 20,000 deaths at-tributable to Chagas disease occur annually, typically dueto CCC [3]. Heart failure due to CCC has a worse progno-sis with 50% shorter survival when compared to other car-diomyopathies of different etiologies [4,5].The dynamics of the immune response to T. cruzi is
that of a persistent infection with an obligatory intracel-lular parasite. During acute T. cruzi infection, T. cruzipathogen-associated molecular patterns (PAMPs) triggerinnate immunity in multiple cell types [6], which releaseproinflammatory cytokines and chemokines, such as IL-1,IL-6, IL-12, IL-18, TNF-α, CCL2, CCL5, and CXCL9 acti-vating and mobilizing migration of cascades of inflam-matory cells [7,8]. Antigen-presenting cells subsequentlyelicit a strong T cell and antibody response against T.cruzi, where IL-12 and IL-18 drive the differentiation ofIFN-γ-producing T. cruzi–specific Th1 T cells which mi-grate to sites of T. cruzi-induced inflammation, includingthe myocardium, in response to locally produced chemo-kines [9,10]. Th1 T cell and antibody responses lead tocontrol but not complete elimination of tissue and bloodparasitism, establishing a low-grade chronic persistent in-fection by T. cruzi. As a result of persistent infection, bothCCC and ASY chronic Chagas disease patients show askewed Th1-type immune response [11,12], but thosewho develop Chagas cardiomyopathy display a particularlystrong Th1-type immune response with increased num-bers of IFN-γ-producing T cells in peripheral blood mono-nuclear cells (PBMC) [13] as well as plasma TNF-α incomparison with uninfected or ASY patients [14]. PBMCof CCC patients also display increased levels of IFN-γ- orTNF-α producing CCR5/CXCR3+ CD4+ T cells [15,16].In addition, CCC patients display a reduced number ofCD4+CD25highIL-10+ and CD4+CD25highFoxP3+ regulatoryT cells in their peripheral blood as compared to patients in
the ASY form of Chagas disease, suggesting such cells mayplay a role in the control of the intensity of inflammationin chronic Chagas disease [15,17]. Furthermore, PBMCfrom CCC patients displayed increased numbers of CD4+
CD25highFoxP3+CTLA-4+ T cells, and decreased numbersof as compared to ASY patients. These reports suggest thata smaller CD4+FoxP3+/CD25+ Treg compartment withdeficient suppressive activity exists in CCC patients, lead-ing to uncontrolled production of Th1 cytokines [18]. Cir-culating CD4+IL-17+ T cells appear in low frequency inPBMC from CCC patients as compared with ASY patientsand non-infected individuals [18,19]. On the whole, theseresults suggest that proinflammatory cells and cytokinesare markers associated with progression to CCC, whereasthe production of IL-10, IL-17 and increased numbers ofregulatory T cells are markers of protection from CCC de-velopment, indicating that failure to regulate Th1 responsesmay be the underlying immune defect of patients who pro-gress to CCC.The exacerbated Th1 response observed in the PBMC
of CCC patients is reflected on the Th1-rich myocardialinflammatory infiltrate, with mononuclear cells predomin-antly producing IFN-γ and TNF-α, with lower productionof IL-4, IL-6, IL-7, and IL-15 [7,20,21]. It has recently beenshown that CCL5+, CCXCL9+, CCR5+, CXCR3+ cellswere abundant in CCC myocardium, and mRNA levels ofthe Th1-chemoattracting chemokines CXCL9, CXCL10,CCL2 (also known as MCP-1), CCL3, CCL4, CCL5; alongwith CCL17, CCL19, CCL21 and their receptors werealso found to be upregulated in CCC heart tissue [12,22].Importantly, median expression of CCL5, a CCR5 ligand,was the highest among all chemokines tested (166-foldincrease over control). Significantly, the intensity of themyocardial infiltrate was positively correlated with CXCL9mRNA expression. Moreover, a single nucleotide poly-morphism in the CXCL9 gene, associated with a reducedrisk of developing severe CCC in a cohort study, was asso-ciated with reduced CXCL9 expression and intensity ofmyocarditis in CCC [22]. These results are consistent witha major role of locally produced Th1-chemoattractantchemokines in the accumulation of CXCR3/CCR5+ Th1T cells in CCC heart tissue [23].Familial aggregation of CCC has been described, suggest-
ing that there might be a genetic component to diseasesusceptibility [24]. Several genes were associated to an in-creased risk to develop cardiomyopathy (HLA, MHC, TNF,IL1A, IL1B, IL1RN, IL10, IL12B, TIRAP, CCL2, BAT1,LTA, IKBL, CCR5, MIF, IFNG, CXCL9, CXCL10) [25-50].So far, up to 30 case control studies were done (see for re-view [51-53]). These studies often led to inconclusive re-sults that may be explained in different ways: a) the use ofseronegative subjects as controls which are inadequatecontrols, since it is unknown whether they were exposedto the pathogen; b) the relatively small size of the study
Frade et al. BMC Infectious Diseases 2013, 13:587 Page 3 of 17http://www.biomedcentral.com/1471-2334/13/587
groups which affected the power (the probability) to detectan association; c) the number of tested SNPs; d) the highlyheterogeneous genetic background of the study populationdue to admixture; e) the sex ratio known to exist has notbeen taken in consideration [54].Among these susceptibility studies, putative implication
of genes crucially involved in the innate immunity-such asthe Toll like receptors (TLR) and some of its most relevantsignalling molecules like TIRAP was searched for. Twostudies on the TLR and TIRAP failed to identify diseaseassociations with TLR 1,2, 5, 6 and 9; in one of the reportsan association was found with a TLR4 SNP among Chileanchagasic patients [55], while in the second study – whichenrolled nearly double the number of Brazilian Chagasicindividuals - no association was found with TLR4, but in-stead with TIRAP S180L heterozygosity [41]. Chemokinesare key players in controlling migration of specific celltypes bearing their receptors to sites of tissue inflamma-tion, and associations between CCR5 –involved in T celland macrophage migration and CCL2 –involved in mono-cyte migration - with CCC were reported [42,47,48]. Bothprocesses, TLR signaling and chemokine-mediated cell mi-gration are of paramount importance in Chagas diseaseand are key to the pathogenesis of CCC. Here, we con-ducted a study focusing on TIRAP, CCL2 and CCL5.Thorough genetic analysis, testing multiple tag SNPs pergene and thus detecting any possible relevant genetic vari-ants in a large Brazilian population and ASY subjects ascontrols we could have a sensitive assessment of the con-tribution of genetic variants in prognosis to CCC eitherconfirming or finding additional associated SNPs in thementioned genes. This can be considered a candidate genereplication study, performed with a larger cohort of Chagaspatients and only comparing CCC to the asymptomaticseropositive (ASY) patient group. Significant associationswere found for CCR5, CCL2, and TIRAP genes.
MethodsEthical standardWritten informed consent was obtained from all the pa-tients, in accordance with the guidelines of the variousinternal review boards of all the involved institutions.The protocol was also approved by the INSERM InternalReview Board and the Brazilian National Ethics in Re-search Commission (CONEP). All the patients enrolledin this study were over 21 years old so paternal consentwas not required. In the case of samples from heart do-nors, written informed consent was obtained from theirfamilies. Investigations were conformed to the principlesoutlined in the declaration of Helsinki.
Diagnostic criteriaThe diagnostic criteria for Chagas disease included the de-tection of antibodies against T. cruzi in at least two of three
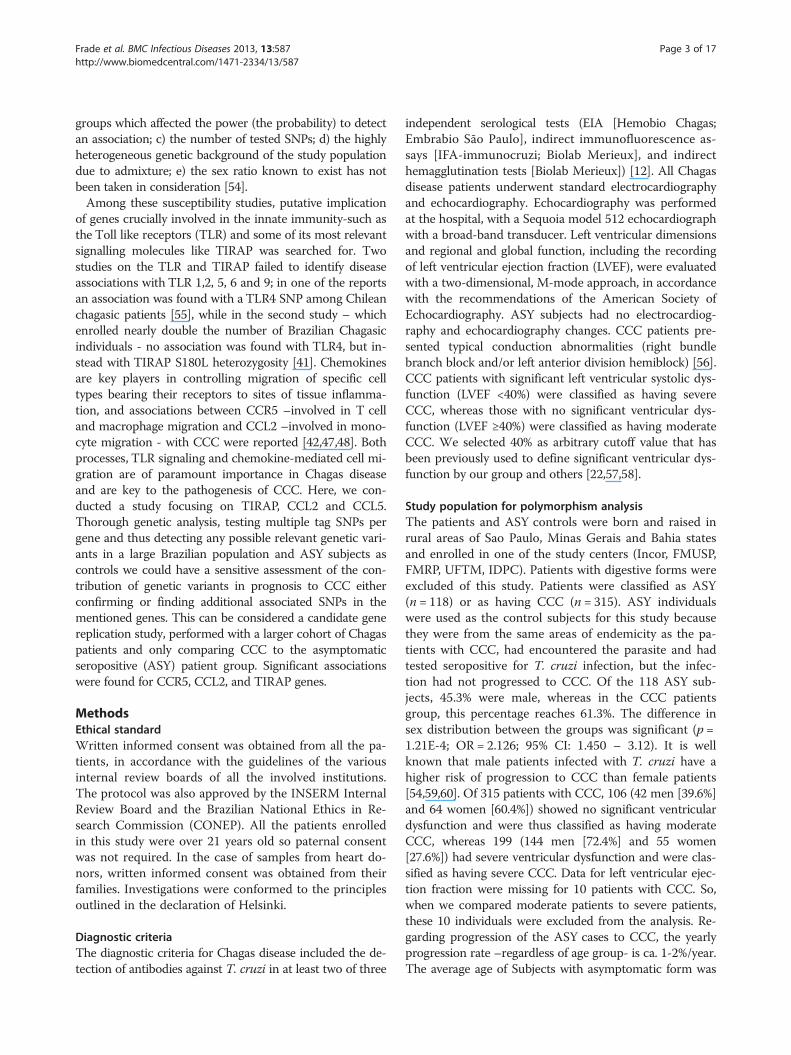
independent serological tests (EIA [Hemobio Chagas;Embrabio São Paulo], indirect immunofluorescence as-says [IFA-immunocruzi; Biolab Merieux], and indirecthemagglutination tests [Biolab Merieux]) [12]. All Chagasdisease patients underwent standard electrocardiographyand echocardiography. Echocardiography was performedat the hospital, with a Sequoia model 512 echocardiographwith a broad-band transducer. Left ventricular dimensionsand regional and global function, including the recordingof left ventricular ejection fraction (LVEF), were evaluatedwith a two-dimensional, M-mode approach, in accordancewith the recommendations of the American Society ofEchocardiography. ASY subjects had no electrocardiog-raphy and echocardiography changes. CCC patients pre-sented typical conduction abnormalities (right bundlebranch block and/or left anterior division hemiblock) [56].CCC patients with significant left ventricular systolic dys-function (LVEF <40%) were classified as having severeCCC, whereas those with no significant ventricular dys-function (LVEF ≥40%) were classified as having moderateCCC. We selected 40% as arbitrary cutoff value that hasbeen previously used to define significant ventricular dys-function by our group and others [22,57,58].
Study population for polymorphism analysisThe patients and ASY controls were born and raised inrural areas of Sao Paulo, Minas Gerais and Bahia statesand enrolled in one of the study centers (Incor, FMUSP,FMRP, UFTM, IDPC). Patients with digestive forms wereexcluded of this study. Patients were classified as ASY(n = 118) or as having CCC (n = 315). ASY individualswere used as the control subjects for this study becausethey were from the same areas of endemicity as the pa-tients with CCC, had encountered the parasite and hadtested seropositive for T. cruzi infection, but the infec-tion had not progressed to CCC. Of the 118 ASY sub-jects, 45.3% were male, whereas in the CCC patientsgroup, this percentage reaches 61.3%. The difference insex distribution between the groups was significant (p =1.21E-4; OR = 2.126; 95% CI: 1.450 – 3.12). It is wellknown that male patients infected with T. cruzi have ahigher risk of progression to CCC than female patients[54,59,60]. Of 315 patients with CCC, 106 (42 men [39.6%]and 64 women [60.4%]) showed no significant ventriculardysfunction and were thus classified as having moderateCCC, whereas 199 (144 men [72.4%] and 55 women[27.6%]) had severe ventricular dysfunction and were clas-sified as having severe CCC. Data for left ventricular ejec-tion fraction were missing for 10 patients with CCC. So,when we compared moderate patients to severe patients,these 10 individuals were excluded from the analysis. Re-garding progression of the ASY cases to CCC, the yearlyprogression rate –regardless of age group- is ca. 1-2%/year.The average age of Subjects with asymptomatic form was

Frade et al. BMC Infectious Diseases 2013, 13:587 Page 4 of 17http://www.biomedcentral.com/1471-2334/13/587
above 55 years. Taking into account that they were all bornin endemic areas before vector transmission was inter-rupted, it is likely that in most if not all cases vector-borneinfection occurred in early childhood. The odds that a sig-nificant number of such mature patients convert to CCC,and that this thwarts our statistical calculation is ratherlow; however, this is a pitfall of all cross sectional studieson diseases that display progression.
Blood samples and DNA preparationFor each subject, 5 to 15 ml of blood were collected inEDTA tubes. Genomic DNA was isolated on a silica-membrane according to the manufacturer’s protocol (QIAamp DNA Blood Max Kit, Qiagen, Hilden, Germany).
SNP selectionTag single nucleotide polymorphisms (SNPs) were se-lected on the basis of HapMap Data for the Caucasianand Yoruba reference populations. Tag SNPs were se-lected within a region extending 5 kb on either side ofthe candidate gene. The minor allele frequency (MAF)cut off value was arbitrarily set at 20% (so the markerscharacterized by a MAF < 20% were excluded from theanalysis by lack of power). In each reference population,the markers with MAF > 20% are included in differentblocks of correlation (based on the r2 values). One markerin each block was selected and considered as a Tag SNPs.Indeed, markers located in the same block of correlationgave the same genetic information in association studies.Tag SNPs characterised by a MAF over 20% on at leastone reference population were selected. These Tag SNPswere defined to catch all the genetic information from thecandidate gene. We selected three tag SNPs for CCR5, sixtag SNPs for CCL2 and six tag SNPs for MAL/TIRAPgenes. Taking into account a disease with a prevalence of30%, a cutoff for significant association of 0.05, for a geno-type relative risk of 1.3, the probability to detect a real as-sociation reaches 63% with 315 chronic cases and 118ASY controls. We decided to use a cut off of 20% insteadof 10% or 15%. For lower cut off, the number of Tag SNPswill increase and it will request a seriously large yourstudy population to have a good statistical power.
SNP genotypingMost of the genotyping was done with the Golden Gategenotyping assay (Illumina, San Diego, USA). In somecases, genotyping assays were performed with the Taq-Man system (Applied Biosystems, Foster City, USA) ac-cording to the manufacturer’s instructions.
Statistical analysisSPSS Statistics software v. 17.0 (IBM, Armonk, USA) wasused for statistical analyses. We performed stepwise binarylogistic regression analysis on the whole population, to
analyse the relationship between the probability of an indi-vidual to develop chronic Chagas cardiomyopathy and themain covariates (sex and polymorphisms). Sex was consid-ered as a binary covariate. In our stepwise binary logisticregression analysis, genotypes were considered as binarycovariates. Indeed, for each polymorphism we had two al-leles (A frequent one; a rare one). So, we obtained threegenotypes (AA, Aa and aa). In our stepwise binary logisticregression analysis, genotypes were considered as binarycovariates. So, we performed three different analyses (Ana-lysis 1: AA vs Aa + aa (we supposed that the a allele isdominant); Analysis 2: AA + aa vs Aa (we supposed thatthe heterozygote carriers are different from the homozy-gote ones); Analysis 3: AA +Aa vs aa (we supposed thatthe A allele is dominant)). The best results are indicated inTables 1, 2 and 3.In multivariates analyses, several polymorphisms and
gender were included as covariates. All the covariatesare analyzed in the same time. In a stepwise approach,the worse associated covariate (non significant) is re-moved and the analysis is run again up to keep only sig-nificant associated covariates.
Results and discussionFifteen Tag SNPs were genotyped successfully on ouroriginal cohort including ASY subjects (n = 118) andCCC patients (n = 315) (Table 4). The genotyping stepswere done successfully for all the Tag SNPs. The geno-type distribution of each SNP is summarized in Table 5.All the SNPs were in Hardy-Weinberg equilibrium onthe ASY individuals considered as control subjects (p >0,001) (Table 6).
Polymorphisms rs3176763C/A and rs11575815A/T, aroundthe CCR5 gene, are associated to an increased risk of CCCThree tag SNPs were genotyped for the CCR5 gene. Inthe CCC subjects group, 266 (84.4%) subjects carried thers3176763C/C genotype whereas 110 (94.0%) of the ASYcontrols carried this genotype. This difference was sig-nificant in an univariate analysis including also the gen-der as covariate (p = 0.006; OR = 1.79; 95% CI: 1.18-2.70)(see Table 1).For the rs11575815A/T polymorphism, 278 (90.3%) CCC
subjects carried the genotypes rs11575815A/A or rs11575815A/T versus 93 (82.3%) for the ASY controls. This dif-ference was significant (p = 0.030; OR = 1.41; 95% CI: 1.03-1.92) (see Table 1).We performed a multivariate analysis (binary regression,
stepwise procedure) to confirm the associations found pre-viously in univariate analysis. Similarly to the univariateanalysis, the genotypes were considered as binary variables.In this analysis, we included rs3176763C/A, rs11575815A/T and the gender as covariates. Polymorphism rs3176763C/A (p = 0.014; OR = 1.69; 95% CI: 1.11-2.57) and the

Table 1 Association studies between CCC and ASY including as covariates the gender and the polymorphism one by one
GENE Tag SNP Genotype groups Association test
CCR5 rs3176763 CC vs CA + AA p = 0.006; OR = 1.79; 95% CI: 1.18-2.70
rs3087253 AA vs AT + TT p = 0.640; OR = 1.06; 95% CI: 0.84-1.32
rs11575815 AA + AT vs TT p = 0.030; OR = 1.41; 95% CI: 1.03-1.92
CCL2 rs3760396 GG vs GA + AA p = 0.373; OR = 1.13; 95% CI: 0.87-1.46
rs2857656 CC vs CG + GG p = 0.440; OR = 1.09; 95% CI: 0.87-1.36
rs4586 TT vs TC + CC p = 0.032; OR = 1.30; 95% CI: 1.02-1.65
rs3917891 CC vs CT + TT p = 0.037; OR = 1.56; 95% CI: 1.03-2.37
rs2530797 AA vs AG + GG p = 0.028; OR = 1.28; 95% CI: 1.03-1.60
rs991804 CC vs CT + TT p = 0.493; OR = 1.17; 95% CI: 0.75-1.82
TIRAP rs11220437 TT vs TC + CC p = 0.155; OR = 1.21; 95% CI: 0.93-1.58
rs591163 GG + GA vs AA p = 0.237; OR = 1.01; 95% CI: 0.79-1.30
rs8177352 AA vs AG + GG p = 0.913; OR = 2.06; 95% CI: 0.45-9.55
rs8177375 AA vs AG + GG p = 0.203; OR = 1.21; 95% CI: 0.90-1.61
rs8177376 AA vs AC + CC p = 0.004; OR = 1.42; 95% CI: 1.12-1.80
rs17866704 TT vs TC + CC p = 0.023; OR = 1.31; 95% CI: 1.04-1.66
Frade et al. BMC Infectious Diseases 2013, 13:587 Page 5 of 17http://www.biomedcentral.com/1471-2334/13/587
gender (p = 0.002; OR = 2.04; 95% CI: 1.31-3.19) were stillsignificantly associated to CCC (see Table 7). A trend ofassociation was detected for rs11575815A/T (p = 0.077;OR = 1.33; 95% CI: 0.97-1.82).When we compared the ASY subjects to severe CCC
patients (left ventricular ejection fraction value under0.4%), only the association of rs3176763C/A was main-tained in univariate analysis (p = 0.005; OR = 1.88; 95% CI:1.20-2.94) (see Table 2). These two markers (rs3176763C/A and rs11575815A/T) did not discriminate moderateCCC from severe CCC (p > 0.5).
Table 2 Association studies between CCC with a left ventriculas covariates the gender and the polymorphism one by one
GENE Tag SNP Genoty
CCR5 rs3176763 CC vs C
rs3087253 AA vs A
rs11575815 AA + AT
CCL2 rs3760396 GG vs G
rs2857656 CC vs C
rs4586 TT vs TC
rs3917891 CC vs C
rs2530797 AA vs A
rs991804 CC vs C
TIRAP rs11220437 TT vs TC
rs591163 GG + GA
rs8177352 AA vs A
rs8177375 AA vs A
rs8177376 AA vs A
rs17866704 TT vs TC
Polymorphisms rs4586T/C, rs3917891C/T andrs2530797A/G, around the CCL2 gene, are associated toan increased risk of CCCSix tag SNPs were genotyped for the CCL2 gene. In theCCC subjects group, 74 (24.0%) carried the rs4586T/Tgenotype whereas 38 (34.5%) of the ASY controls carriedthis genotype. This difference was significant in an uni-variate analysis (p = 0.032; OR = 1.30; 95% CI: 1.02-1.65)(see Table 1).For the rs3917891C/T polymorphism, 264 (86.0%) CCC
subjects carried the rs3917891C/C genotype versus 107
ar ejection fraction value under 0.4% and ASY including
pe groups Association test
A + AA p = 0.005; OR = 1.88; 95% CI: 1.20-2.94
T + TT p = 0.861; OR = 1.02; 95% CI: 0.80-1.31
vs TT p = 0.138; OR = 1.29; 95% CI: 0.92-1.82
A + AA p = 0.920; OR = 1.02; 95% CI: 0.77-1.35
G + GG p = 0.514; OR = 1.08; 95% CI: 0.85-1.39
+ CC p = 0.034; OR = 1.34; 95% CI: 1.02-1.75
T + TT p = 0.053; OR = 1.55; 95% CI: 1.00-2.41
G + GG p = 0.005; OR = 1.42; 95% CI: 1.11-1.82
T + TT p = 0.824; OR = 1.06; 95% CI: 0.65-1.73
+ CC p = 0.181; OR = 1.22; 95% CI: 0.91-1.63
vs AA p = 0.188; OR = 1.39; 95% CI: 0.88-1.90
G + GG p = 0.858; OR = 1.02; 95% CI: 0.78-1.34
G + GG p = 0.174; OR = 1.25; 95% CI: 0.91-1.69
C + CC p = 0.005; OR = 1.46; 95% CI: 1.12-1.91
+ CC p = 0.087; OR = 1.25; 95% CI: 0.97-1.62
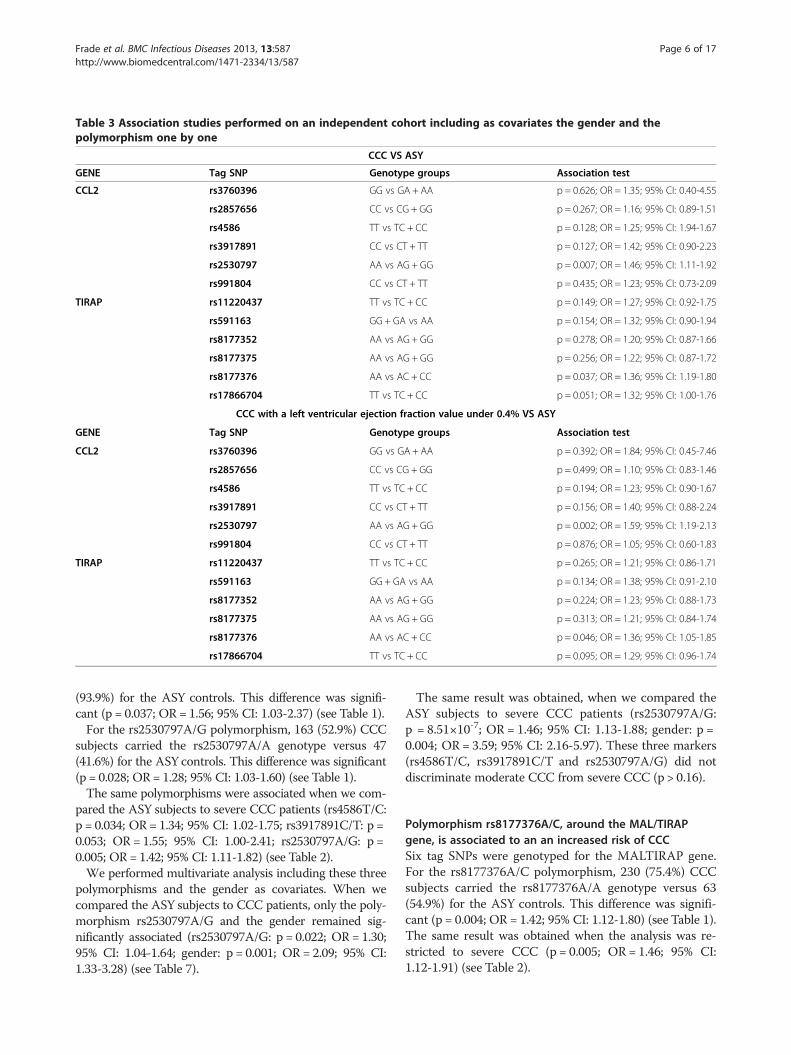
Table 3 Association studies performed on an independent cohort including as covariates the gender and thepolymorphism one by one
CCC VS ASY
GENE Tag SNP Genotype groups Association test
CCL2 rs3760396 GG vs GA + AA p = 0.626; OR = 1.35; 95% CI: 0.40-4.55
rs2857656 CC vs CG + GG p = 0.267; OR = 1.16; 95% CI: 0.89-1.51
rs4586 TT vs TC + CC p = 0.128; OR = 1.25; 95% CI: 1.94-1.67
rs3917891 CC vs CT + TT p = 0.127; OR = 1.42; 95% CI: 0.90-2.23
rs2530797 AA vs AG + GG p = 0.007; OR = 1.46; 95% CI: 1.11-1.92
rs991804 CC vs CT + TT p = 0.435; OR = 1.23; 95% CI: 0.73-2.09
TIRAP rs11220437 TT vs TC + CC p = 0.149; OR = 1.27; 95% CI: 0.92-1.75
rs591163 GG + GA vs AA p = 0.154; OR = 1.32; 95% CI: 0.90-1.94
rs8177352 AA vs AG + GG p = 0.278; OR = 1.20; 95% CI: 0.87-1.66
rs8177375 AA vs AG + GG p = 0.256; OR = 1.22; 95% CI: 0.87-1.72
rs8177376 AA vs AC + CC p = 0.037; OR = 1.36; 95% CI: 1.19-1.80
rs17866704 TT vs TC + CC p = 0.051; OR = 1.32; 95% CI: 1.00-1.76
CCC with a left ventricular ejection fraction value under 0.4% VS ASY
GENE Tag SNP Genotype groups Association test
CCL2 rs3760396 GG vs GA + AA p = 0.392; OR = 1.84; 95% CI: 0.45-7.46
rs2857656 CC vs CG + GG p = 0.499; OR = 1.10; 95% CI: 0.83-1.46
rs4586 TT vs TC + CC p = 0.194; OR = 1.23; 95% CI: 0.90-1.67
rs3917891 CC vs CT + TT p = 0.156; OR = 1.40; 95% CI: 0.88-2.24
rs2530797 AA vs AG + GG p = 0.002; OR = 1.59; 95% CI: 1.19-2.13
rs991804 CC vs CT + TT p = 0.876; OR = 1.05; 95% CI: 0.60-1.83
TIRAP rs11220437 TT vs TC + CC p = 0.265; OR = 1.21; 95% CI: 0.86-1.71
rs591163 GG + GA vs AA p = 0.134; OR = 1.38; 95% CI: 0.91-2.10
rs8177352 AA vs AG + GG p = 0.224; OR = 1.23; 95% CI: 0.88-1.73
rs8177375 AA vs AG + GG p = 0.313; OR = 1.21; 95% CI: 0.84-1.74
rs8177376 AA vs AC + CC p = 0.046; OR = 1.36; 95% CI: 1.05-1.85
rs17866704 TT vs TC + CC p = 0.095; OR = 1.29; 95% CI: 0.96-1.74
Frade et al. BMC Infectious Diseases 2013, 13:587 Page 6 of 17http://www.biomedcentral.com/1471-2334/13/587
(93.9%) for the ASY controls. This difference was signifi-cant (p = 0.037; OR = 1.56; 95% CI: 1.03-2.37) (see Table 1).For the rs2530797A/G polymorphism, 163 (52.9%) CCC
subjects carried the rs2530797A/A genotype versus 47(41.6%) for the ASY controls. This difference was significant(p = 0.028; OR = 1.28; 95% CI: 1.03-1.60) (see Table 1).The same polymorphisms were associated when we com-
pared the ASY subjects to severe CCC patients (rs4586T/C:p = 0.034; OR = 1.34; 95% CI: 1.02-1.75; rs3917891C/T: p =0.053; OR = 1.55; 95% CI: 1.00-2.41; rs2530797A/G: p =0.005; OR = 1.42; 95% CI: 1.11-1.82) (see Table 2).We performed multivariate analysis including these three
polymorphisms and the gender as covariates. When wecompared the ASY subjects to CCC patients, only the poly-morphism rs2530797A/G and the gender remained sig-nificantly associated (rs2530797A/G: p = 0.022; OR = 1.30;95% CI: 1.04-1.64; gender: p = 0.001; OR = 2.09; 95% CI:1.33-3.28) (see Table 7).
The same result was obtained, when we compared theASY subjects to severe CCC patients (rs2530797A/G:p = 8.51×10⁻⁷; OR = 1.46; 95% CI: 1.13-1.88; gender: p =0.004; OR = 3.59; 95% CI: 2.16-5.97). These three markers(rs4586T/C, rs3917891C/T and rs2530797A/G) did notdiscriminate moderate CCC from severe CCC (p > 0.16).
Polymorphism rs8177376A/C, around the MAL/TIRAPgene, is associated to an an increased risk of CCCSix tag SNPs were genotyped for the MALTIRAP gene.For the rs8177376A/C polymorphism, 230 (75.4%) CCCsubjects carried the rs8177376A/A genotype versus 63(54.9%) for the ASY controls. This difference was signifi-cant (p = 0.004; OR = 1.42; 95% CI: 1.12-1.80) (see Table 1).The same result was obtained when the analysis was re-stricted to severe CCC (p = 0.005; OR = 1.46; 95% CI:1.12-1.91) (see Table 2).
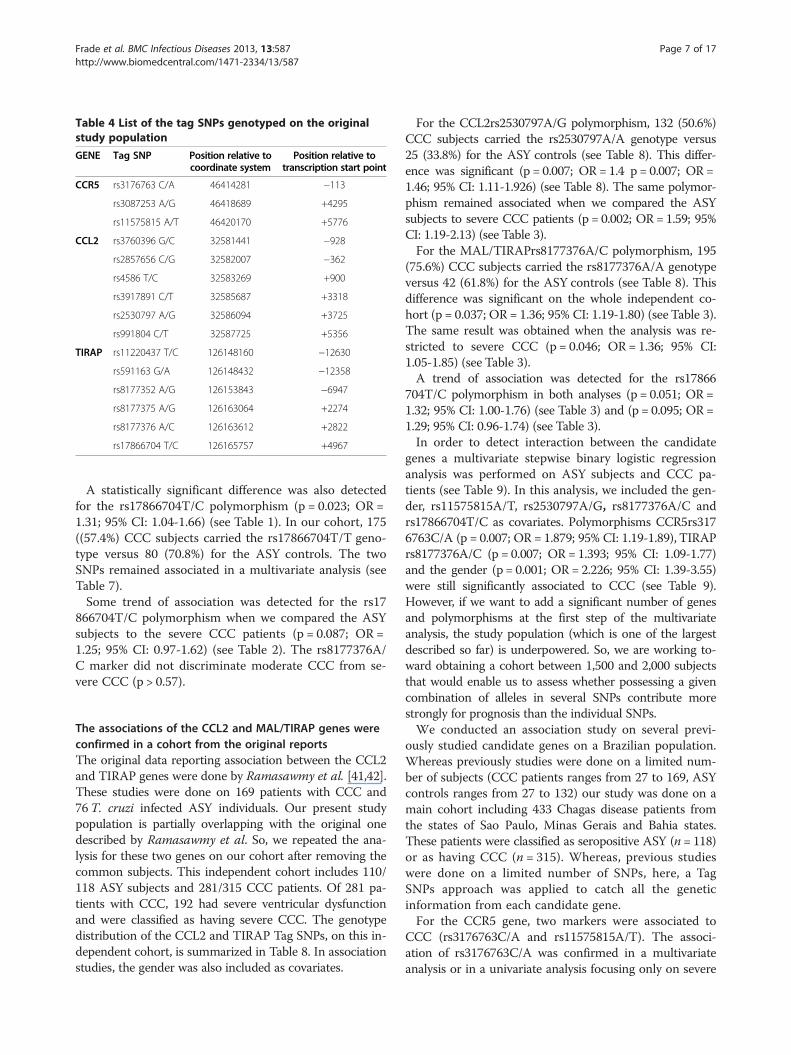
Table 4 List of the tag SNPs genotyped on the originalstudy population
GENE Tag SNP Position relative tocoordinate system
Position relative totranscription start point
CCR5 rs3176763 C/A 46414281 −113
rs3087253 A/G 46418689 +4295
rs11575815 A/T 46420170 +5776
CCL2 rs3760396 G/C 32581441 −928
rs2857656 C/G 32582007 −362
rs4586 T/C 32583269 +900
rs3917891 C/T 32585687 +3318
rs2530797 A/G 32586094 +3725
rs991804 C/T 32587725 +5356
TIRAP rs11220437 T/C 126148160 −12630
rs591163 G/A 126148432 −12358
rs8177352 A/G 126153843 −6947
rs8177375 A/G 126163064 +2274
rs8177376 A/C 126163612 +2822
rs17866704 T/C 126165757 +4967
Frade et al. BMC Infectious Diseases 2013, 13:587 Page 7 of 17http://www.biomedcentral.com/1471-2334/13/587
A statistically significant difference was also detectedfor the rs17866704T/C polymorphism (p = 0.023; OR =1.31; 95% CI: 1.04-1.66) (see Table 1). In our cohort, 175((57.4%) CCC subjects carried the rs17866704T/T geno-type versus 80 (70.8%) for the ASY controls. The twoSNPs remained associated in a multivariate analysis (seeTable 7).Some trend of association was detected for the rs17
866704T/C polymorphism when we compared the ASYsubjects to the severe CCC patients (p = 0.087; OR =1.25; 95% CI: 0.97-1.62) (see Table 2). The rs8177376A/C marker did not discriminate moderate CCC from se-vere CCC (p > 0.57).
The associations of the CCL2 and MAL/TIRAP genes wereconfirmed in a cohort from the original reportsThe original data reporting association between the CCL2and TIRAP genes were done by Ramasawmy et al. [41,42].These studies were done on 169 patients with CCC and76T. cruzi infected ASY individuals. Our present studypopulation is partially overlapping with the original onedescribed by Ramasawmy et al. So, we repeated the ana-lysis for these two genes on our cohort after removing thecommon subjects. This independent cohort includes 110/118 ASY subjects and 281/315 CCC patients. Of 281 pa-tients with CCC, 192 had severe ventricular dysfunctionand were classified as having severe CCC. The genotypedistribution of the CCL2 and TIRAP Tag SNPs, on this in-dependent cohort, is summarized in Table 8. In associationstudies, the gender was also included as covariates.
For the CCL2rs2530797A/G polymorphism, 132 (50.6%)CCC subjects carried the rs2530797A/A genotype versus25 (33.8%) for the ASY controls (see Table 8). This differ-ence was significant (p = 0.007; OR = 1.4 p = 0.007; OR =1.46; 95% CI: 1.11-1.926) (see Table 8). The same polymor-phism remained associated when we compared the ASYsubjects to severe CCC patients (p = 0.002; OR = 1.59; 95%CI: 1.19-2.13) (see Table 3).For the MAL/TIRAPrs8177376A/C polymorphism, 195
(75.6%) CCC subjects carried the rs8177376A/A genotypeversus 42 (61.8%) for the ASY controls (see Table 8). Thisdifference was significant on the whole independent co-hort (p = 0.037; OR = 1.36; 95% CI: 1.19-1.80) (see Table 3).The same result was obtained when the analysis was re-stricted to severe CCC (p = 0.046; OR = 1.36; 95% CI:1.05-1.85) (see Table 3).A trend of association was detected for the rs17866
704T/C polymorphism in both analyses (p = 0.051; OR =1.32; 95% CI: 1.00-1.76) (see Table 3) and (p = 0.095; OR =1.29; 95% CI: 0.96-1.74) (see Table 3).In order to detect interaction between the candidate
genes a multivariate stepwise binary logistic regressionanalysis was performed on ASY subjects and CCC pa-tients (see Table 9). In this analysis, we included the gen-der, rs11575815A/T, rs2530797A/G, rs8177376A/C andrs17866704T/C as covariates. Polymorphisms CCR5rs3176763C/A (p = 0.007; OR = 1.879; 95% CI: 1.19-1.89), TIRAPrs8177376A/C (p = 0.007; OR = 1.393; 95% CI: 1.09-1.77)and the gender (p = 0.001; OR = 2.226; 95% CI: 1.39-3.55)were still significantly associated to CCC (see Table 9).However, if we want to add a significant number of genesand polymorphisms at the first step of the multivariateanalysis, the study population (which is one of the largestdescribed so far) is underpowered. So, we are working to-ward obtaining a cohort between 1,500 and 2,000 subjectsthat would enable us to assess whether possessing a givencombination of alleles in several SNPs contribute morestrongly for prognosis than the individual SNPs.We conducted an association study on several previ-
ously studied candidate genes on a Brazilian population.Whereas previously studies were done on a limited num-ber of subjects (CCC patients ranges from 27 to 169, ASYcontrols ranges from 27 to 132) our study was done on amain cohort including 433 Chagas disease patients fromthe states of Sao Paulo, Minas Gerais and Bahia states.These patients were classified as seropositive ASY (n = 118)or as having CCC (n = 315). Whereas, previous studieswere done on a limited number of SNPs, here, a TagSNPs approach was applied to catch all the geneticinformation from each candidate gene.For the CCR5 gene, two markers were associated to
CCC (rs3176763C/A and rs11575815A/T). The associ-ation of rs3176763C/A was confirmed in a multivariateanalysis or in a univariate analysis focusing only on severe
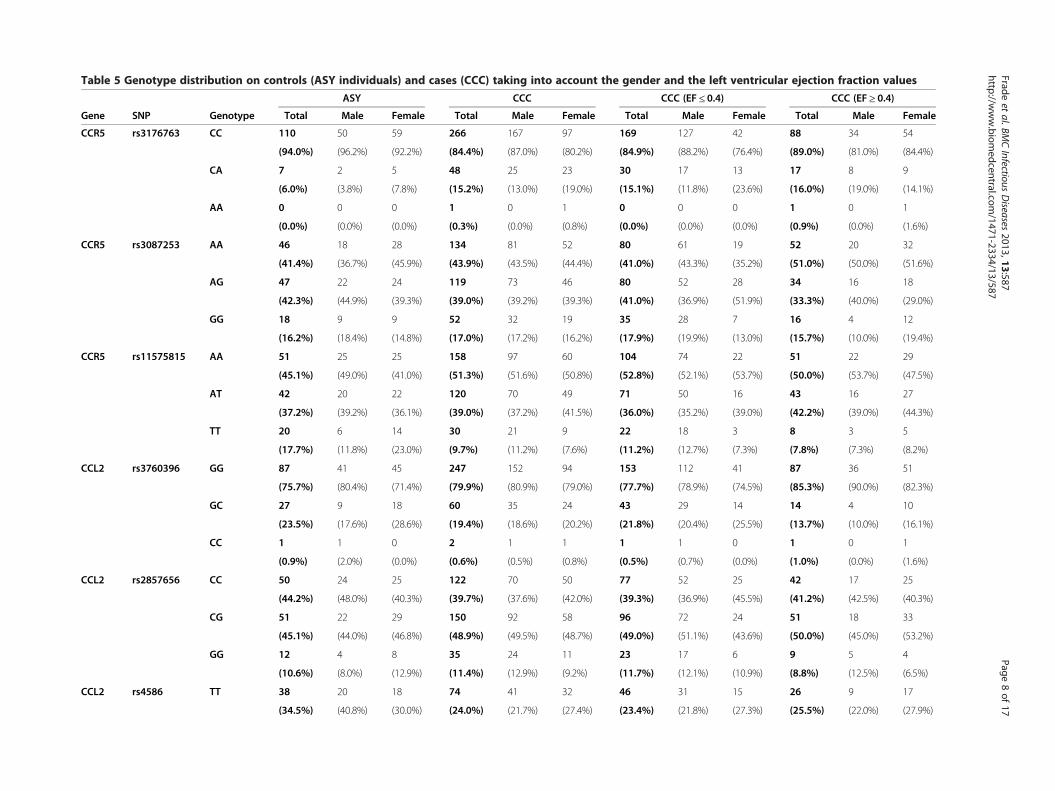
Table 5 Genotype distribution on controls (ASY individuals) and cases (CCC) taking into account the gender and the left ventricular ejection fraction values
ASY CCC CCC (EF ≤ 0.4) CCC (EF ≥ 0.4)
Gene SNP Genotype Total Male Female Total Male Female Total Male Female Total Male Female
CCR5 rs3176763 CC 110 50 59 266 167 97 169 127 42 88 34 54
(94.0%) (96.2%) (92.2%) (84.4%) (87.0%) (80.2%) (84.9%) (88.2%) (76.4%) (89.0%) (81.0%) (84.4%)
CA 7 2 5 48 25 23 30 17 13 17 8 9
(6.0%) (3.8%) (7.8%) (15.2%) (13.0%) (19.0%) (15.1%) (11.8%) (23.6%) (16.0%) (19.0%) (14.1%)
AA 0 0 0 1 0 1 0 0 0 1 0 1
(0.0%) (0.0%) (0.0%) (0.3%) (0.0%) (0.8%) (0.0%) (0.0%) (0.0%) (0.9%) (0.0%) (1.6%)
CCR5 rs3087253 AA 46 18 28 134 81 52 80 61 19 52 20 32
(41.4%) (36.7%) (45.9%) (43.9%) (43.5%) (44.4%) (41.0%) (43.3%) (35.2%) (51.0%) (50.0%) (51.6%)
AG 47 22 24 119 73 46 80 52 28 34 16 18
(42.3%) (44.9%) (39.3%) (39.0%) (39.2%) (39.3%) (41.0%) (36.9%) (51.9%) (33.3%) (40.0%) (29.0%)
GG 18 9 9 52 32 19 35 28 7 16 4 12
(16.2%) (18.4%) (14.8%) (17.0%) (17.2%) (16.2%) (17.9%) (19.9%) (13.0%) (15.7%) (10.0%) (19.4%)
CCR5 rs11575815 AA 51 25 25 158 97 60 104 74 22 51 22 29
(45.1%) (49.0%) (41.0%) (51.3%) (51.6%) (50.8%) (52.8%) (52.1%) (53.7%) (50.0%) (53.7%) (47.5%)
AT 42 20 22 120 70 49 71 50 16 43 16 27
(37.2%) (39.2%) (36.1%) (39.0%) (37.2%) (41.5%) (36.0%) (35.2%) (39.0%) (42.2%) (39.0%) (44.3%)
TT 20 6 14 30 21 9 22 18 3 8 3 5
(17.7%) (11.8%) (23.0%) (9.7%) (11.2%) (7.6%) (11.2%) (12.7%) (7.3%) (7.8%) (7.3%) (8.2%)
CCL2 rs3760396 GG 87 41 45 247 152 94 153 112 41 87 36 51
(75.7%) (80.4%) (71.4%) (79.9%) (80.9%) (79.0%) (77.7%) (78.9%) (74.5%) (85.3%) (90.0%) (82.3%)
GC 27 9 18 60 35 24 43 29 14 14 4 10
(23.5%) (17.6%) (28.6%) (19.4%) (18.6%) (20.2%) (21.8%) (20.4%) (25.5%) (13.7%) (10.0%) (16.1%)
CC 1 1 0 2 1 1 1 1 0 1 0 1
(0.9%) (2.0%) (0.0%) (0.6%) (0.5%) (0.8%) (0.5%) (0.7%) (0.0%) (1.0%) (0.0%) (1.6%)
CCL2 rs2857656 CC 50 24 25 122 70 50 77 52 25 42 17 25
(44.2%) (48.0%) (40.3%) (39.7%) (37.6%) (42.0%) (39.3%) (36.9%) (45.5%) (41.2%) (42.5%) (40.3%)
CG 51 22 29 150 92 58 96 72 24 51 18 33
(45.1%) (44.0%) (46.8%) (48.9%) (49.5%) (48.7%) (49.0%) (51.1%) (43.6%) (50.0%) (45.0%) (53.2%)
GG 12 4 8 35 24 11 23 17 6 9 5 4
(10.6%) (8.0%) (12.9%) (11.4%) (12.9%) (9.2%) (11.7%) (12.1%) (10.9%) (8.8%) (12.5%) (6.5%)
CCL2 rs4586 TT 38 20 18 74 41 32 46 31 15 26 9 17
(34.5%) (40.8%) (30.0%) (24.0%) (21.7%) (27.4%) (23.4%) (21.8%) (27.3%) (25.5%) (22.0%) (27.9%)
Fradeet
al.BMCInfectious
Diseases
2013,13:587Page
8of
17http://w
ww.biom
edcentral.com/1471-2334/13/587

Table 5 Genotype distribution on controls (ASY individuals) and cases (CCC) taking into account the gender and the left ventricular ejection fraction values(Continued)
TC 53 23 29 148 90 57 94 70 24 52 19 33
(48.2%) (49.9%) (48.3%) (48.1%) (47.6%) (48.7%) (47.7%) (49.3%) (43.6%) (51.0%) (46.3%) (54.1%)
CC 19 6 13 86 58 28 57 41 16 26 13 11
(17.3%) (12.2%) (21.7%) (27.9%) (30.7%) (23.9%) (28.9%) (28.9%) (29.1%) (25.5%) (31.7%) (18.0%)
CCL2 rs3917891 CC 107 47 59 264 161 101 166 120 46 91 37 54
(93.9%) (90.4%) (96.7%) (86.0%) (86.1%) (85.6%) (85.6%) (85.7%) (85.2%) (88.3%) (90.2%) (87.1%)
CT 7 5 2 41 25 16 26 19 7 12 4 8
(6.1%) (9.6%) (3.3%) (13.4%) (13.4%) (13.6%) (13.4%) (13.6%) (13.0%) (11.7%) (9.9%) (12.9%)
TT 0 0 0 2 1 1 2 1 1 0 0 0
(0.0%) (0.0%) (0.0%) (0.7%) (0.5%) (0.8%) (1.0%) (0.7%) (1.9%) (0.0%) (0.0%) (0.0%)
CCL2 rs2530797 AA 47 13 33 163 104 58 110 81 29 47 19 28
(41.6%) (25.5%) (54.1%) (52.9%) (55.6%) (48.7%) (55.8%) (57.0%) (52.7%) (45.6%) (47.5%) (44.4%)
AG 52 33 19 115 68 46 69 51 18 44 16 28
(46.0%) (64.7%) (31.1%) (37.3%) (36.4%) (38.7%) (35%) (35.9%) (32.7%) (42.7%) (40%) (44.4%)
GG 14 5 9 30 15 15 18 10 8 12 5 7
(12.4%) (9.8%) (14.8%) (9.7%) (8.0%) (12.6%) (9.1%) (7.0%) (14.5%) (11.7%) (12.5%) (11.1%)
CCL2 rs991804 CC 51 25 25 120 67 51 78 52 26 40 15 25
(45.5%) (48.1% (42.4%) (41.2%) (38.3%) (44.7%) (42.6%) (39.4%) (51.0%) (40.4%) (39.5%) (41.0%)
CT 53 24 29 148 92 56 88 67 21 54 20 34
(47.3%) (46.2%) (49.2%) (50.9%) (52.6%) (51.1%) (48.1%) (50.8%) (41.2%) (54.5%) (52.6%) (55.7%)
TT 8 3 5 23 16 7 17 13 4 5 3 2
(7.1%) (5.8%) (8.5%) (7.9%) (9.1%) (6.1%) (9.3%) (9.8%) (7.8%) (5.1%) (7.9%) (3.3%)
TIRAP rs11220437 TT 92 44 47 229 142 85 146 106 40 74 31 43
(80.0%) (84.6%) (75.8%) (73.9%) (74.7%) (72.0%) (73.7%) (73.6%) (74.1%) (71.8%) (75.6%) (69.4%)
TC 22 8 14 76 45 31 48 36 12 28 9 19
(19.1%) (15.4%) (22.6%) (24.5%) (23.7%) (26.3%) (24.2%) (25.0%) (22.2%) (27.2%) (22.0%) (30.6%)
CC 1 0 1 5 3 2 4 2 2 1 1 0
(9.0%) (0.0%) (1.6%) (1.6%) (1.6%) (1.7%) (2.0%) (1.4%) (3.7%) (1.0%) (2.4%) (0.0%)
TIRAP rs591163 GG 51 23 28 158 95 82 104 74 20 52 30 32
(46.4%) (46.9%) (46.7%) (51.5%) (50.5%) (53.0%) (53.1%) (52.1%) (50.0%) (51.5%) (55.6%) (52.5%)
GA 44 19 24 120 76 43 75 56 16 38 19 22
(40.0%) (38.8%) (40.0%) (39.1%) (40.4%) (36.8%) (38.3%) (39.4%) (40.0%) (37.6%) (35.2%) (36.1%)
Fradeet
al.BMCInfectious
Diseases
2013,13:587Page
9of
17http://w
ww.biom
edcentral.com/1471-2334/13/587
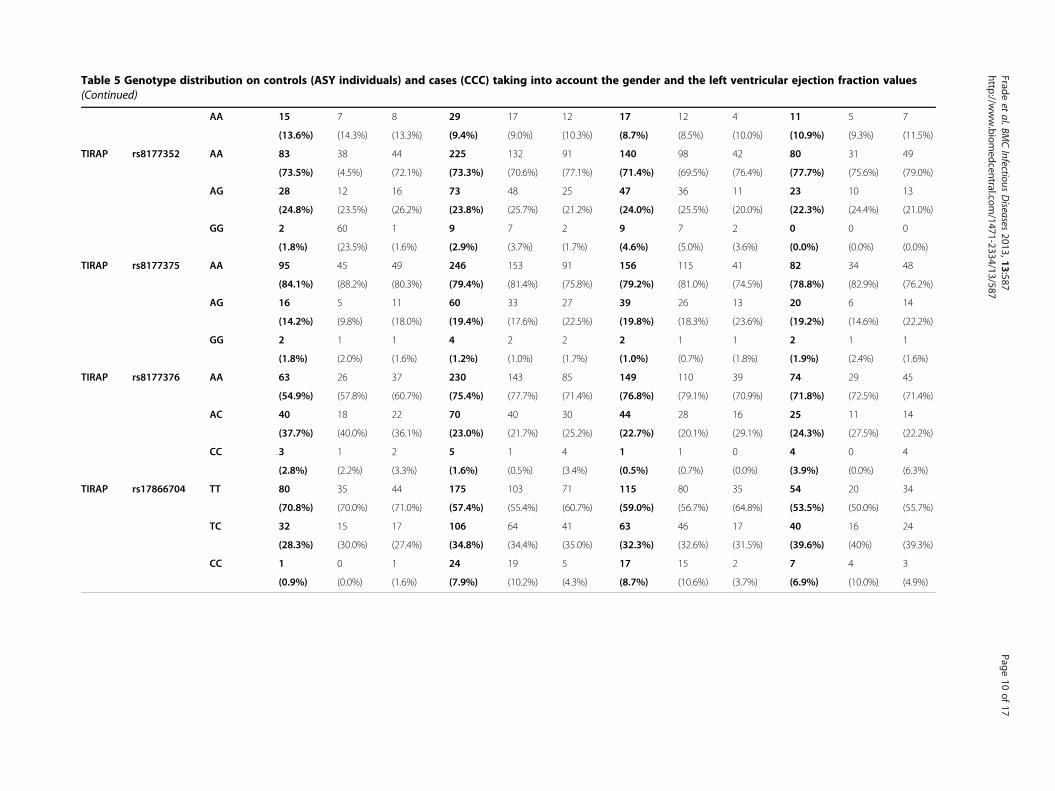
Table 5 Genotype distribution on controls (ASY individuals) and cases (CCC) taking into account the gender and the left ventricular ejection fraction values(Continued)
AA 15 7 8 29 17 12 17 12 4 11 5 7
(13.6%) (14.3%) (13.3%) (9.4%) (9.0%) (10.3%) (8.7%) (8.5%) (10.0%) (10.9%) (9.3%) (11.5%)
TIRAP rs8177352 AA 83 38 44 225 132 91 140 98 42 80 31 49
(73.5%) (4.5%) (72.1%) (73.3%) (70.6%) (77.1%) (71.4%) (69.5%) (76.4%) (77.7%) (75.6%) (79.0%)
AG 28 12 16 73 48 25 47 36 11 23 10 13
(24.8%) (23.5%) (26.2%) (23.8%) (25.7%) (21.2%) (24.0%) (25.5%) (20.0%) (22.3%) (24.4%) (21.0%)
GG 2 60 1 9 7 2 9 7 2 0 0 0
(1.8%) (23.5%) (1.6%) (2.9%) (3.7%) (1.7%) (4.6%) (5.0%) (3.6%) (0.0%) (0.0%) (0.0%)
TIRAP rs8177375 AA 95 45 49 246 153 91 156 115 41 82 34 48
(84.1%) (88.2%) (80.3%) (79.4%) (81.4%) (75.8%) (79.2%) (81.0%) (74.5%) (78.8%) (82.9%) (76.2%)
AG 16 5 11 60 33 27 39 26 13 20 6 14
(14.2%) (9.8%) (18.0%) (19.4%) (17.6%) (22.5%) (19.8%) (18.3%) (23.6%) (19.2%) (14.6%) (22.2%)
GG 2 1 1 4 2 2 2 1 1 2 1 1
(1.8%) (2.0%) (1.6%) (1.2%) (1.0%) (1.7%) (1.0%) (0.7%) (1.8%) (1.9%) (2.4%) (1.6%)
TIRAP rs8177376 AA 63 26 37 230 143 85 149 110 39 74 29 45
(54.9%) (57.8%) (60.7%) (75.4%) (77.7%) (71.4%) (76.8%) (79.1%) (70.9%) (71.8%) (72.5%) (71.4%)
AC 40 18 22 70 40 30 44 28 16 25 11 14
(37.7%) (40.0%) (36.1%) (23.0%) (21.7%) (25.2%) (22.7%) (20.1%) (29.1%) (24.3%) (27.5%) (22.2%)
CC 3 1 2 5 1 4 1 1 0 4 0 4
(2.8%) (2.2%) (3.3%) (1.6%) (0.5%) (3.4%) (0.5%) (0.7%) (0.0%) (3.9%) (0.0%) (6.3%)
TIRAP rs17866704 TT 80 35 44 175 103 71 115 80 35 54 20 34
(70.8%) (70.0%) (71.0%) (57.4%) (55.4%) (60.7%) (59.0%) (56.7%) (64.8%) (53.5%) (50.0%) (55.7%)
TC 32 15 17 106 64 41 63 46 17 40 16 24
(28.3%) (30.0%) (27.4%) (34.8%) (34.4%) (35.0%) (32.3%) (32.6%) (31.5%) (39.6%) (40%) (39.3%)
CC 1 0 1 24 19 5 17 15 2 7 4 3
(0.9%) (0.0%) (1.6%) (7.9%) (10.2%) (4.3%) (8.7%) (10.6%) (3.7%) (6.9%) (10.0%) (4.9%)
Fradeet
al.BMCInfectious
Diseases
2013,13:587Page
10of
17http://w
ww.biom
edcentral.com/1471-2334/13/587
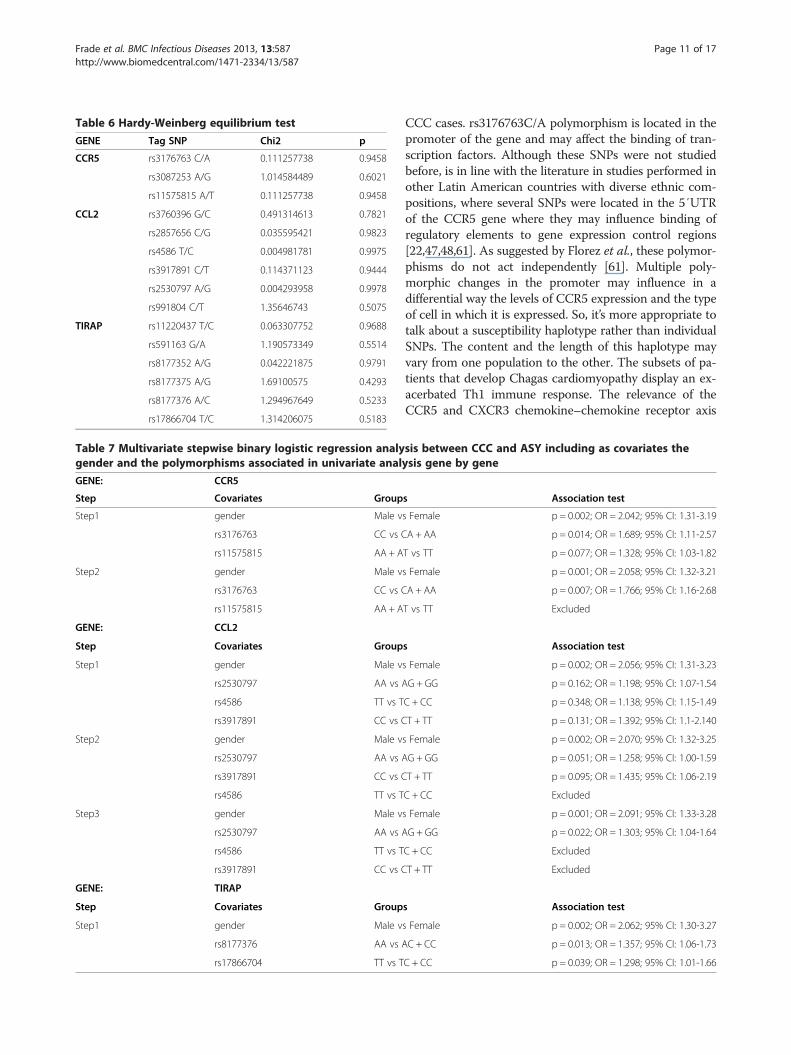
Table 6 Hardy-Weinberg equilibrium test
GENE Tag SNP Chi2 p
CCR5 rs3176763 C/A 0.111257738 0.9458
rs3087253 A/G 1.014584489 0.6021
rs11575815 A/T 0.111257738 0.9458
CCL2 rs3760396 G/C 0.491314613 0.7821
rs2857656 C/G 0.035595421 0.9823
rs4586 T/C 0.004981781 0.9975
rs3917891 C/T 0.114371123 0.9444
rs2530797 A/G 0.004293958 0.9978
rs991804 C/T 1.35646743 0.5075
TIRAP rs11220437 T/C 0.063307752 0.9688
rs591163 G/A 1.190573349 0.5514
rs8177352 A/G 0.042221875 0.9791
rs8177375 A/G 1.69100575 0.4293
rs8177376 A/C 1.294967649 0.5233
rs17866704 T/C 1.314206075 0.5183
Table 7 Multivariate stepwise binary logistic regression analygender and the polymorphisms associated in univariate anal
GENE: CCR5
Step Covariates Group
Step1 gender Male v
rs3176763 CC vs C
rs11575815 AA + A
Step2 gender Male v
rs3176763 CC vs C
rs11575815 AA + A
GENE: CCL2
Step Covariates Group
Step1 gender Male v
rs2530797 AA vs A
rs4586 TT vs T
rs3917891 CC vs C
Step2 gender Male v
rs2530797 AA vs A
rs3917891 CC vs C
rs4586 TT vs T
Step3 gender Male v
rs2530797 AA vs A
rs4586 TT vs T
rs3917891 CC vs C
GENE: TIRAP
Step Covariates Group
Step1 gender Male v
rs8177376 AA vs A
rs17866704 TT vs T
Frade et al. BMC Infectious Diseases 2013, 13:587 Page 11 of 17http://www.biomedcentral.com/1471-2334/13/587
CCC cases. rs3176763C/A polymorphism is located in thepromoter of the gene and may affect the binding of tran-scription factors. Although these SNPs were not studiedbefore, is in line with the literature in studies performed inother Latin American countries with diverse ethnic com-positions, where several SNPs were located in the 5′UTRof the CCR5 gene where they may influence binding ofregulatory elements to gene expression control regions[22,47,48,61]. As suggested by Florez et al., these polymor-phisms do not act independently [61]. Multiple poly-morphic changes in the promoter may influence in adifferential way the levels of CCR5 expression and the typeof cell in which it is expressed. So, it’s more appropriate totalk about a susceptibility haplotype rather than individualSNPs. The content and the length of this haplotype mayvary from one population to the other. The subsets of pa-tients that develop Chagas cardiomyopathy display an ex-acerbated Th1 immune response. The relevance of theCCR5 and CXCR3 chemokine–chemokine receptor axis
sis between CCC and ASY including as covariates theysis gene by gene
s Association test
s Female p = 0.002; OR = 2.042; 95% CI: 1.31-3.19
A + AA p = 0.014; OR = 1.689; 95% CI: 1.11-2.57
T vs TT p = 0.077; OR = 1.328; 95% CI: 1.03-1.82
s Female p = 0.001; OR = 2.058; 95% CI: 1.32-3.21
A + AA p = 0.007; OR = 1.766; 95% CI: 1.16-2.68
T vs TT Excluded
s Association test
s Female p = 0.002; OR = 2.056; 95% CI: 1.31-3.23
G + GG p = 0.162; OR = 1.198; 95% CI: 1.07-1.54
C + CC p = 0.348; OR = 1.138; 95% CI: 1.15-1.49
T + TT p = 0.131; OR = 1.392; 95% CI: 1.1-2.140
s Female p = 0.002; OR = 2.070; 95% CI: 1.32-3.25
G + GG p = 0.051; OR = 1.258; 95% CI: 1.00-1.59
T + TT p = 0.095; OR = 1.435; 95% CI: 1.06-2.19
C + CC Excluded
s Female p = 0.001; OR = 2.091; 95% CI: 1.33-3.28
G + GG p = 0.022; OR = 1.303; 95% CI: 1.04-1.64
C + CC Excluded
T + TT Excluded
s Association test
s Female p = 0.002; OR = 2.062; 95% CI: 1.30-3.27
C + CC p = 0.013; OR = 1.357; 95% CI: 1.06-1.73
C + CC p = 0.039; OR = 1.298; 95% CI: 1.01-1.66

Table 8 Genotype distribution on our independent cohort which included 110 ASY controls and 281 cases (CCC) taking into account the gender and the leftventricular ejection fraction values
ASY CCC CCC (EF ≤ 0.4) CCC (EF ≥ 0.4)
Gene SNP Genotype Total Male Female Total Male Female Total Male Female Total Male Female
CCL2 rs3760396 GG 61 30 30 208 128 79 140 99 41 76 28 36
(81.3%) (81.1%) (81.1%) (80.0%) (80.9%) (76.7%) (78.7%) (80.5%) (74.5%) (86.4%) (93.3%) (78.3%)
GC 13 6 7 50 26 23 37 23 14 11 2 9
(17.3%) (16.2%) (18.9%) (19.4%) (19.2%) (22.3%) (20.8%) (18.7%) (25.5%) (12.5%) (6.7%) (19.6%)
CC 1 1 0 2 1 1 1 1 0 1 0 1
(1.4%) (2.7%) (0.0%) (0.6%) (0.9%) (1.0%) (0.5%) (0.8%) (0.0%) (1.1%) (0.0%) (2.1%)
CCL2 rs2857656 CC 34 16 17 101 57 42 71 46 25 28 11 17
(46.6%) (44,4%) (47,2%) (38.7%) (36.8%) (42.0%) (39.9%) (37,4%) (45.5%) (36,4%) (36,7%) (36,2%)
CG 36 20 16 133 59 54 86 62 24 45 16 29
(49.3%) (55,6%) (44,4%) (51%) (51%) (51,9%) (48,3%) (50,4%) (43.6%) (58,4%) (53,3%) (61,7%)
GG 3 0 3 27 19 8 21 15 6 4 3 1
(4,1%) (0%) (8,3%) (10.3%) (12.3%) (7,7%) (11.8%) (12.2%) (10.9%) (5,2%) (10%) (2,1%)
CCL2 rs4586 TT 23 13 10 62 34 27 44 29 15 17 5 12
(32,4%) (37,1%) (28,6%) (23,8%) (21.8%) (26,5%) (24,6%) (23,4%) (27.3%) (22,4%) (16,7%) (26,1%)
TC 39 20 18 130 78 51 84 60 24 44 17 27
(54,9%) (57,1%) (51,4%) (50%) (50%) (50%) (46,9%) (48,4%) (43.6%) (57,9%) (56,7%) (58,7%)
CC 9 2 7 68 44 24 51 35 16 15 8 7
(12,7%) (5,7%) (20%) (22.2%) (28,2%) (23.5%) (28.5%) (28.2%) (29.1%) (19,7%) (26,7%) (15,2%)
CCL2 rs3917891 CC 69 34 34 220 132 86 150 104 46 66 27 39
(92%) (89,5%) (94,4%) (84.9%) (85,2%) (84,3%) (84,7%) (84,6%) (85.2%) (86,8%) (90%) (84,8%)
CT 6 4 2 37 22 15 25 18 7 10 3 7
(8%) (10,5%) (5,6%) (14,3%) (14,2%) (14,7%) (14,1%) (14.6%) (13.0%) (13,2%) (10%) (15,2%)
TT 0 0 0 2 1 1 2 1 1 0 0 0
(0%) (0%) (0.0%) (0.8%) (0.6%) (1%) (1.1%) (0.8%) (1.9%) (0.0%) (0.0%) (0.0%)
CCL2 rs2530797 AA 25 7 17 132 81 50 96 67 29 32 12 20
(33.8%) (18.9%) (47.2%) (50.6%) (51.9%) (48.5%) (53.6%) (54.0%) (52,7%) (41.6%) (40.0%) (42.6%)
AG 40 26 14 104 62 41 65 47 18 38 15 23
(54.1%) (70.3%) (38.9%) (39.8%) (39.7%) (39.8%) (36.3%) (37.9%) (32.7%) (49.4%) (50%) (48.9%)
GG 9 4 5 25 13 12 18 10 8 7 3 4
(12.2%) (10.8%) (13.9%) (9.6%) (8.3%) (11.7%) (10.1%) (8.1%) (14,5%) (9.1%) (10.0%) (8.5%)
Fradeet
al.BMCInfectious
Diseases
2013,13:587Page
12of
17http://w
ww.biom
edcentral.com/1471-2334/13/587

Table 8 Genotype distribution on our independent cohort which included 110 ASY controls and 281 cases (CCC) taking into account the gender and the leftventricular ejection fraction values (Continued)
CCL2 rs991804 CC 35 16 18 99 55 42 71 45 26 26 10 16
(47.6%) (42,1%) (50%) (40,9%) (38.7%) (42,9%) (43%) (39.5%) (51.0%) (36,1%) (37%) (35,6%)
CT 36 21 15 122 72 50 77 56 21 43 15 28
(48%) (55,3%) (41,7%) (50.4%) (50,7%) (51%) (46,7%) (49,1%) (41.2%) (59,7%) (55.6%) (62,2%)
TT 4 1 3 21 15 6 17 13 4 3 2 1
(5,3%) (2,6%) (8.3%) (8,7%) (10,6%) (6.1%) (10.3%) (11,4%) (7.8%) (4,2%) (7.4%) (2,2%)
TIRAP rs11220437 TT 61 30 30 189 114 73 132 92 40 51 20 31
(81,3%) (79,8%) (83,3%) (73.0%) (73,5%) (71,6%) (74,2%) (74,2%) (74.1%) (68%) (69%) (67,4%)
TC 13 8 5 65 38 27 42 30 12 23 8 15
(17,3%) (21,1%) (13,9%) (25,1%) (24,5%) (26.5%) (23,6%) (24,2%) (22.2%) (30,7%) (27,6%) (32,6%)
CC 1 0 1 5 3 2 4 2 2 1 1 0
(1,3%) (0.0%) (2,8%) (1.9%) (1.9%) (2%) (2.2%) (1.6%) (3.7%) (1.3%) (3.4%) (0.0%)
TIRAP rs591163 GG 27 14 13 132 77 54 91 61 30 40 16 24
(38%) (40%) (37,1%) (50,8%) (49,7%) (52,4%) (51,4%) (49,6%) (55,6%) (51.9%) (53,3%) (51,1%)
GA 33 15 17 103 63 39 70 51 19 29 11 18
(46,5%) (42,9%) (48,6%) (39.6%) (40,6%) (37,9%) (39,5%) (41,5%) (35,2%) (37.7%) (36,7%) (38,3%)
AA 11 6 5 25 15 10 16 11 5 8 3 5
(15,5%) (17,1%) (14,3%) (9.6%) (9.7%) (9,7%) (9%) (8.9%) (9,3%) (10.4%) (10%) (10,6%)
TIRAP rs8177352 AA 59 30 28 192 111 79 129 87 42 59 22 37
(80,8%) (81,1%) (80%) (74,1%) (71.6%) (77.5%) (72,5%) (70,7%) (76.4%) (77.6%) (73,3%) (80,4%)
AG 13 6 7 58 37 21 40 29 11 17 8 9
(17.8%) (16,2%) (20%) (22,4%) (23,9%) (20,6%) (22,5%) (23,6%) (20.0%) (22.4%) (26,7%) (19,6%)
GG 1 1 0 9 7 2 9 7 2 0 0 0
(1.4%) (2,7%) (0%) (3,5%) (4,5%) (2%) (5,1%) (5.7%) (3.6%) (0.0%) (0.0%) (0.0%)
TIRAP rs8177375 AA 61 32 28 203 124 77 140 99 41 58 24 34
(83,6%) (86,5%) (80%) (77,8%) (80%) (74%) (78,7%) (80,5%) (74.5%) (75,3%) (80%) (72,3%)
AG 10 4 6 54 29 25 36 23 13 17 5 12
(13,7%) (10,8%) (17,1%) (20,7%) (18,7%) (24%) (20,2%) (18.7%) (23.6%) (22,1%) (16,7%) (25,5%)
GG 2 1 1 4 2 2 2 1 1 2 1 1
(2,7%) (2,7%) (2,9%) (1.5%) (1.3%) (1.9%) (1.1%) (0.8%) (1.8%) (2,6%) (3,3%) (2,1%)
Fradeet
al.BMCInfectious
Diseases
2013,13:587Page
13of
17http://w
ww.biom
edcentral.com/1471-2334/13/587

Table 8 Genotype distribution on our independent cohort which included 110 ASY controls and 281 cases (CCC) taking into account the gender and the leftventricular ejection fraction values (Continued)
IRAP rs8177376 AA 42 19 23 195 121 72 134 95 39 56 24 32
(61,8%) (59,4%) (63,9%) (75,6%) (78,6%) (70,6%) (75,7%) (77,9%) (70.9%) (73,3%) (80%) (69,6%)
AC 25 13 12 60 32 28 42 26 16 18 6 12
(36,8%) (40.6%) (33,3%) (23.3%) (20,8%) (27,5%) (23,7%) (21,3%) (29.1%) (23,7%) (20%) (26,1%)
CC 1 0 1 3 1 2 1 1 0 2 0 2
(1,5%) (0%) (2,8%) (1.2%) (0.6%) (2%) (0.6%) (0.8%) (0.0%) (2,6%) (0.0%) (4.3%)
IRAP rs17866704 TT 54 27 26 150 85 71 105 70 35 41 14 27
(72%) (75%) (68,4%) (58,4%) (55,2%) (60.7%) (59,7%) (57,4%) (64.8%) (54,7%) (46,7%) (60%)
TC 20 9 11 88 55 41 59 42 17 27 12 15
(26,7%) (25%) (28,9%) (34,2%) (35,7%) (35.0%) (33,5%) (34,4%) (31.5%) (36%) (40%) (33,3%)
CC 1 0 1 19 14 5 12 10 2 7 4 3
(1,3%) (0.0%) (2.6%) (7,4%) (9,1%) (4.3%) (6,8%) (8,2%) (3.7%) (9,3%) (13,3%) (6,7%)
Fradeet
al.BMCInfectious
Diseases
2013,13:587Page
14of
17http://w
ww.biom
edcentral.com/1471-2334/13/587
T
T
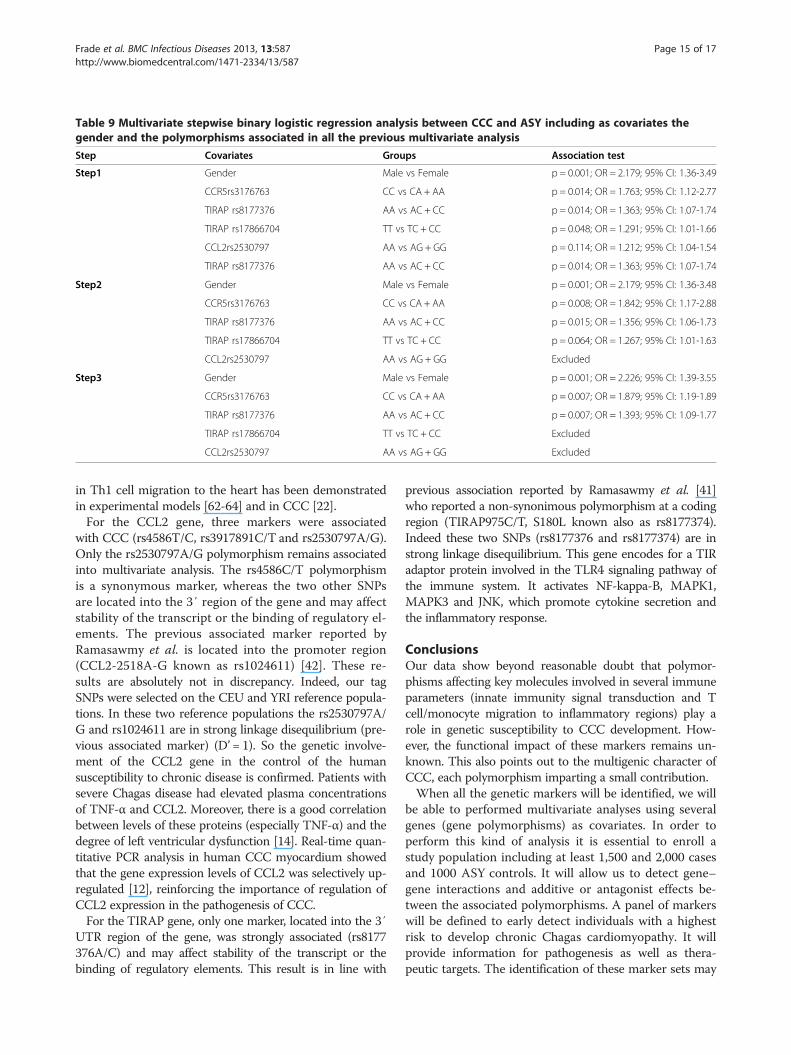
Table 9 Multivariate stepwise binary logistic regression analysis between CCC and ASY including as covariates thegender and the polymorphisms associated in all the previous multivariate analysis
Step Covariates Groups Association test
Step1 Gender Male vs Female p = 0.001; OR = 2.179; 95% CI: 1.36-3.49
CCR5rs3176763 CC vs CA + AA p = 0.014; OR = 1.763; 95% CI: 1.12-2.77
TIRAP rs8177376 AA vs AC + CC p = 0.014; OR = 1.363; 95% CI: 1.07-1.74
TIRAP rs17866704 TT vs TC + CC p = 0.048; OR = 1.291; 95% CI: 1.01-1.66
CCL2rs2530797 AA vs AG + GG p = 0.114; OR = 1.212; 95% CI: 1.04-1.54
TIRAP rs8177376 AA vs AC + CC p = 0.014; OR = 1.363; 95% CI: 1.07-1.74
Step2 Gender Male vs Female p = 0.001; OR = 2.179; 95% CI: 1.36-3.48
CCR5rs3176763 CC vs CA + AA p = 0.008; OR = 1.842; 95% CI: 1.17-2.88
TIRAP rs8177376 AA vs AC + CC p = 0.015; OR = 1.356; 95% CI: 1.06-1.73
TIRAP rs17866704 TT vs TC + CC p = 0.064; OR = 1.267; 95% CI: 1.01-1.63
CCL2rs2530797 AA vs AG + GG Excluded
Step3 Gender Male vs Female p = 0.001; OR = 2.226; 95% CI: 1.39-3.55
CCR5rs3176763 CC vs CA + AA p = 0.007; OR = 1.879; 95% CI: 1.19-1.89
TIRAP rs8177376 AA vs AC + CC p = 0.007; OR = 1.393; 95% CI: 1.09-1.77
TIRAP rs17866704 TT vs TC + CC Excluded
CCL2rs2530797 AA vs AG + GG Excluded
Frade et al. BMC Infectious Diseases 2013, 13:587 Page 15 of 17http://www.biomedcentral.com/1471-2334/13/587
in Th1 cell migration to the heart has been demonstratedin experimental models [62-64] and in CCC [22].For the CCL2 gene, three markers were associated
with CCC (rs4586T/C, rs3917891C/T and rs2530797A/G).Only the rs2530797A/G polymorphism remains associatedinto multivariate analysis. The rs4586C/T polymorphismis a synonymous marker, whereas the two other SNPsare located into the 3′ region of the gene and may affectstability of the transcript or the binding of regulatory el-ements. The previous associated marker reported byRamasawmy et al. is located into the promoter region(CCL2-2518A-G known as rs1024611) [42]. These re-sults are absolutely not in discrepancy. Indeed, our tagSNPs were selected on the CEU and YRI reference popula-tions. In these two reference populations the rs2530797A/G and rs1024611 are in strong linkage disequilibrium (pre-vious associated marker) (D’ = 1). So the genetic involve-ment of the CCL2 gene in the control of the humansusceptibility to chronic disease is confirmed. Patients withsevere Chagas disease had elevated plasma concentrationsof TNF-α and CCL2. Moreover, there is a good correlationbetween levels of these proteins (especially TNF-α) and thedegree of left ventricular dysfunction [14]. Real-time quan-titative PCR analysis in human CCC myocardium showedthat the gene expression levels of CCL2 was selectively up-regulated [12], reinforcing the importance of regulation ofCCL2 expression in the pathogenesis of CCC.For the TIRAP gene, only one marker, located into the 3′
UTR region of the gene, was strongly associated (rs8177376A/C) and may affect stability of the transcript or thebinding of regulatory elements. This result is in line with
previous association reported by Ramasawmy et al. [41]who reported a non-synonimous polymorphism at a codingregion (TIRAP975C/T, S180L known also as rs8177374).Indeed these two SNPs (rs8177376 and rs8177374) are instrong linkage disequilibrium. This gene encodes for a TIRadaptor protein involved in the TLR4 signaling pathway ofthe immune system. It activates NF-kappa-B, MAPK1,MAPK3 and JNK, which promote cytokine secretion andthe inflammatory response.
ConclusionsOur data show beyond reasonable doubt that polymor-phisms affecting key molecules involved in several immuneparameters (innate immunity signal transduction and Tcell/monocyte migration to inflammatory regions) play arole in genetic susceptibility to CCC development. How-ever, the functional impact of these markers remains un-known. This also points out to the multigenic character ofCCC, each polymorphism imparting a small contribution.When all the genetic markers will be identified, we will
be able to performed multivariate analyses using severalgenes (gene polymorphisms) as covariates. In order toperform this kind of analysis it is essential to enroll astudy population including at least 1,500 and 2,000 casesand 1000 ASY controls. It will allow us to detect gene–gene interactions and additive or antagonist effects be-tween the associated polymorphisms. A panel of markerswill be defined to early detect individuals with a highestrisk to develop chronic Chagas cardiomyopathy. It willprovide information for pathogenesis as well as thera-peutic targets. The identification of these marker sets may

Frade et al. BMC Infectious Diseases 2013, 13:587 Page 16 of 17http://www.biomedcentral.com/1471-2334/13/587
also have a combined prognostic value for disease pro-gression at the individual patient level, allowing close fol-low up and early treatment of those carrying high-riskgenetic signatures.
AbbreviationsCCC: Chronic Chagas cardiomyopathy; ASY: Asymptomatic; Th1: T helper 1;SNP: Single nucleotide polymorphism; T. cruzi: Trypanosoma cruzi;PAMPs: Pathogen-associated molecular patterns; IL: Interleukin; TNF: Tumornecrosis factor; LVEF: Left ventricular ejection fraction.
Competing interestsThe authors declare that they have no competing interests.
Authors’ contributionsContribution to conception and design: JK, ACP, ECN, CC. Performed theexperiments: AFF, MB. Analysis of the data: AFF PCT ECN CC. Contributedreagents materials analysis tools: CWP, BMI, BS, HTLW, LGN, ADMB, PB, FD, AS,ED, JAMN, MH, MS, AF, VR, ACP. Wrote the paper: ECN, CC. Review the drafts:ECN, CC, AFF, LRPF. All authors read and approved the final manuscript.
AcknowledgmentsThis work was supported by the Institut National de la Santé et de laRecherche Médicale (INSERM), Aix-Marseille University (Direction des Rela-tions Internationales), the USP-COFECUB program, the ARCUS II PACA Brésilprogram, CNPq (the Brazilian National Research Council), and FAPESP (SãoPaulo State Research Funding Agency-Brazil). ECN and CC were recipient foran international program funded either by the French ANR and the BrazilianFAPESP agencies. AFF MB and LGN hold fellowships from the São PauloState Research Funding Agency, FAPESP. ECN and JK have received a Councilfor Scientific and Technological Development - CNPq productivity award. CCis a recipient of a temporary professor position supported by the Frenchconsulate in Brazil and the University of São Paulo (USP). We thank for theaccess to the genotyping platform (Denis Milan, Cecile Donnadieu, andFrederic Martins).
Author details1Heart Institute (InCor), University of São Paulo School of Medicine (FMUSP),Av. Dr. Enéas de Carvalho Aguiar, 44 Bloco 2 9º andar, São Paulo, SP06504-000, Brazil. 2Institute for Investigation in Immunology (iii), INCT, SãoPaulo, SP, Brazil. 3Laboratory of Immunology, Universidade Federal doTriângulo Mineiro (UFTM), 40 Frei Paulino, Uberaba, MG 48036-180, Brazil.4Instituto de Cardiologia Dante Pazzanese (IDPC), Avenida Dante Pazzanese500 - Ibirapuera, Sâo Paulo, SP 04012-909, Brazil. 5School of Medicine ofRibeirão Preto (FMRP), University of São Paulo, Av. Bandeirantes, 4900 -Monte Alegre 15059-900, Ribeirão Preto, SP, Brazil. 6Division of ClinicalImmunology and Allergy, University of São Paulo School of Medicine, SãoPaulo, SP 06504-000, Brazil. 7Aix-Marseille Université, INSERM, GIMPUMR_S906, Faculté de médecine, 27 bd Jean Moulin, Marseille, cedex 0513385, France.
Received: 15 September 2013 Accepted: 4 December 2013Published: 12 December 2013
References1. Schofield CJ, Jannin J, Salvatella R: The future of Chagas disease control.
Trends Parasitol 2006, 22(12):583–588.2. Coura JR: Chagas disease: what is known and what is needed–a
background article. Mem Inst Oswaldo Cruz 2007, 102(Suppl 1):113–122.3. Kirchhoff LV, Weiss LM, Wittner M, Tanowitz HB: Parasitic diseases of the
heart. Front Biosci 2004, 9:706–723.4. Barbosa AP, Cardinalli Neto A, Otaviano AP, Rocha BF, Bestetti RB:
Comparison of outcome between Chagas cardiomyopathy andidiopathic dilated cardiomyopathy. Arq Bras Cardiol 2011, 97(6):517–525.
5. Bestetti RB, Muccillo G: Clinical course of Chagas’ heart disease: acomparison with dilated cardiomyopathy. Int J Cardiol 1997, 60(2):187–193.
6. Bafica A, Santiago HC, Goldszmid R, Ropert C, Gazzinelli RT, Sher A:Cutting edge: TLR9 and TLR2 signaling together account forMyD88-dependent control of parasitemia in Trypanosoma cruziinfection. J Immunol 2006, 177(6):3515–3519.
7. Reis MM, Higuchi Mde L, Benvenuti LA, Aiello VD, Gutierrez PS, Bellotti G,Pileggi F: An in situ quantitative immunohistochemical study ofcytokines and IL-2R + in chronic human chagasic myocarditis: correlationwith the presence of myocardial Trypanosoma cruzi antigens.Clin Immunol Immunopathol 1997, 83(2):165–172.
8. Bilate AM, Cunha-Neto E: Chagas disease cardiomyopathy: current conceptsof an old disease. Rev Inst Med Trop Sao Paulo 2008, 50(2):67–74.
9. Muller U, Kohler G, Mossmann H, Schaub GA, Alber G, Di Santo JP,Brombacher F, Holscher C: IL-12-independent IFN-gamma production byT cells in experimental Chagas’ disease is mediated by IL-18. J Immunol2001, 167(6):3346–3353.
10. Rocha Rodrigues DB, dos Reis MA, Romano A, Pereira SA, Teixeira Vde P,Tostes S Jr, Rodrigues V Jr: In situ expression of regulatory cytokines byheart inflammatory cells in Chagas’ disease patients with heart failure.Clin Dev Immunol 2013, 2012:361730.
11. Ribeirao M, Pereira-Chioccola VL, Renia L, Augusto Fragata Filho A, Schenkman S,Rodrigues MM: Chagasic patients develop a type 1 immune response toTrypanosoma cruzi trans-sialidase. Parasite Immunol 2000, 22(1):49–53.
12. Cunha-Neto E, Dzau VJ, Allen PD, Stamatiou D, Benvenutti L, Higuchi ML,Koyama NS, Silva JS, Kalil J, Liew CC: Cardiac gene expression profilingprovides evidence for cytokinopathy as a molecular mechanism inChagas’ disease cardiomyopathy. Am J Pathol 2005, 167(2):305–313.
13. Cunha-Neto E, Kalil J: Heart-infiltrating and peripheral T cells in thepathogenesis of human Chagas’ disease cardiomyopathy. Autoimmunity2001, 34(3):187–192.
14. Talvani A, Rocha MO, Barcelos LS, Gomes YM, Ribeiro AL, Teixeira MM:Elevated concentrations of CCL2 and tumor necrosis factor-alpha inchagasic cardiomyopathy. Clin Infect Dis 2004, 38(7):943–950.
15. Gomes JA, Bahia-Oliveira LM, Rocha MO, Martins-Filho OA, Gazzinelli G,Correa-Oliveira R: Evidence that development of severe cardiomyopathyin human Chagas’ disease is due to a Th1-specific immune response.Infect Immun 2003, 71(3):1185–1193.
16. Talvani A, Rocha MO, Ribeiro AL, Correa-Oliveira R, Teixeira MM:Chemokine receptor expression on the surface of peripheral bloodmononuclear cells in Chagas disease. J Infect Dis 2004, 189(2):214–220.
17. Araujo FF, Gomes JA, Rocha MO, Williams-Blangero S, Pinheiro VM, Morato MJ,Correa-Oliveira R: Potential role of CD4 + CD25HIGH regulatory T cells inmorbidity in Chagas disease. Front Biosci 2007, 12:2797–2806.
18. Guedes PM, Gutierrez FR, Silva GK, Dellalibera-Joviliano R, Rodrigues GJ,Bendhack LM, Rassi A Jr, Rassi A, Schmidt A, Maciel BC, et al: Deficientregulatory T cell activity and low frequency of IL-17-producing T cellscorrelate with the extent of cardiomyopathy in human Chagas’ disease.PLoS Negl Trop Dis 2012, 6(4):e1630.
19. Magalhaes LM, Villani FN, Nunes Mdo C, Gollob KJ, Rocha MO, Dutra WO:High interleukin 17 expression is correlated with better cardiac functionin human Chagas disease. J Infect Dis 2013, 207(4):661–665.
20. Abel LC, Rizzo LV, Ianni B, Albuquerque F, Bacal F, Carrara D, Bocchi EA,Teixeira HC, Mady C, Kalil J, et al: Chronic Chagas’ disease cardiomyopathypatients display an increased IFN-gamma response to Trypanosomacruzi infection. J Autoimmun 2001, 17(1):99–107.
21. Reis DD, Jones EM, Tostes S, Lopes ER, Chapadeiro E, Gazzinelli G, Colley DG,McCurley TL: Expression of major histocompatibility complex antigensand adhesion molecules in hearts of patients with chronic Chagas’disease. Am J Trop Med Hyg 1993, 49(2):192–200.
22. Nogueira LG, Santos RH, Ianni BM, Fiorelli AI, Mairena EC, Benvenuti LA,Frade A, Donadi E, Dias F, Saba B, et al: Myocardial Chemokine expressionand intensity of myocarditis in Chagas cardiomyopathy Are controlledby polymorphisms in CXCL9 and CXCL10. PLoS Negl Trop Dis 2012,6(10):e1867.
23. Gomes JA, Bahia-Oliveira LM, Rocha MO, Busek SC, Teixeira MM, Silva JS,Correa-Oliveira R: Type 1 chemokine receptor expression in Chagas’disease correlates with morbidity in cardiac patients. Infect Immun 2005,73(12):7960–7966.
24. Zicker F, Smith PG, Netto JC, Oliveira RM, Zicker EM: Physical activity,opportunity for reinfection, and sibling history of heart disease as riskfactors for Chagas’ cardiopathy. Am J Trop Med Hyg 1990, 43(5):498–505.
25. Llop E, Rothhammer F, Acuna M, Apt W: HLA antigens in cardiomyopathicChilean chagasics. Am J Hum Genet 1988, 43(5):770–773.
26. Llop E, Rothhammer F, Acuna M, Apt W, Arribada A: HLA antigens inChagas cardiomyopathy: new evidence based on a case–control study.Rev Med Chil 1991, 119(6):633–636.

Frade et al. BMC Infectious Diseases 2013, 13:587 Page 17 of 17http://www.biomedcentral.com/1471-2334/13/587
27. Fernandez-Mestre MT, Layrisse Z, Montagnani S, Acquatella H, Catalioti F,Matos M, Balbas O, Makhatadze N, Dominguez E, Herrera F, et al: Influenceof the HLA class II polymorphism in chronic Chagas’ disease.Parasite Immunol 1998, 20(4):197–203.
28. Layrisse Z, Fernandez MT, Montagnani S, Matos M, Balbas O, Herrera F,Colorado IA, Catalioti F, Acquatella H: HLA-C(*)03 is a risk factor forcardiomyopathy in Chagas disease. Hum Immunol 2000, 61(9):925–929.
29. Deghaide NH, Dantas RO, Donadi EA: HLA class I and II profiles of patientspresenting with Chagas’ disease. Dig Dis Sci 1998, 43(2):246–252.
30. Colorado IA, Acquatella H, Catalioti F, Fernandez MT, Layrisse Z: HLA class IIDRB1, DQB1, DPB1 polymorphism and cardiomyopathy due toTrypanosoma cruzi chronic infection. Hum Immunol 2000, 61(3):320–325.
31. Rodriguez-Perez JM, Cruz-Robles D, Hernandez-Pacheco G, Perez-Hernandez N,Murguia LE, Granados J, Reyes PA, Vargas-Alarcon G: Tumor necrosisfactor-alpha promoter polymorphism in Mexican patients with Chagas’disease. Immunol Lett 2005, 98(1):97–102.
32. Campelo V, Dantas RO, Simoes RT, Mendes-Junior CT, Sousa SM, Simoes AL,Donadi EA: TNF microsatellite alleles in Brazilian Chagasic patients.Dig Dis Sci 2007, 52(12):3334–3339.
33. Drigo SA, Cunha-Neto E, Ianni B, Mady C, Fae KC, Buck P, Kalil J, Goldberg AC:Lack of association of tumor necrosis factor-alpha polymorphisms withChagas disease in Brazilian patients. Immunol Lett 2007, 108(1):109–111.
34. Beraun Y, Nieto A, Collado MD, Gonzalez A, Martin J: Polymorphisms attumor necrosis factor (TNF) loci are not associated with Chagas’ disease.Tissue Antigens 1998, 52(1):81–83.
35. Drigo SA, Cunha-Neto E, Ianni B, Cardoso MR, Braga PE, Fae KC, Nunes VL,Buck P, Mady C, Kalil J, et al: TNF gene polymorphisms are associated withreduced survival in severe Chagas’ disease cardiomyopathy patients.Microbes Infect 2006, 8(3):598–603.
36. Florez O, Martin J, Gonzalez CI: Interleukin 4, interleukin 4 receptor-alphaand interleukin 10 gene polymorphisms in Chagas disease.Parasite Immunol 2011, 33(9):506–511.
37. Cruz-Robles D, Chavez-Gonzalez JP, Cavazos-Quero MM, Perez-Mendez O,Reyes PA, Vargas-Alarcon G: Association between IL-1B and IL-1RN genepolymorphisms and Chagas’ disease development susceptibility.Immunol Invest 2009, 38(3–4):231–239.
38. Costa GC, da Costa Rocha MO, Moreira PR, Menezes CA, Silva MR, Gollob KJ,Dutra WO: Functional IL-10 gene polymorphism is associated withChagas disease cardiomyopathy. J Infect Dis 2009, 199(3):451–454.
39. Moreno M, Silva EL, Ramirez LE, Palacio LG, Rivera D, Arcos-Burgos M:Chagas’ disease susceptibility/resistance: linkage disequilibrium analysissuggests epistasis between major histocompatibility complex andinterleukin-10. Tissue Antigens 2004, 64(1):18–24.
40. Zafra G, Morillo C, Martin J, Gonzalez A, Gonzalez CI: Polymorphism in the3′ UTR of the IL12B gene is associated with Chagas’ diseasecardiomyopathy. Microbes Infect 2007, 9(9):1049–1052.
41. Ramasawmy R, Cunha-Neto E, Fae KC, Borba SC, Teixeira PC, Ferreira SC,Goldberg AC, Ianni B, Mady C, Kalil J: Heterozygosity for the S180L variantof MAL/TIRAP, a gene expressing an adaptor protein in the Toll-likereceptor pathway, is associated with lower risk of developing chronicChagas cardiomyopathy. J Infect Dis 2009, 199(12):1838–1845.
42. Ramasawmy R, Cunha-Neto E, Fae KC, Martello FG, Muller NG, Cavalcanti VL,Ianni B, Mady C, Kalil J, Goldberg AC: The monocyte chemoattractantprotein-1 gene polymorphism is associated with cardiomyopathy inhuman chagas disease. Clin Infect Dis 2006, 43(3):305–311.
43. Ramasawmy R, Cunha-Neto E, Fae KC, Muller NG, Cavalcanti VL, Drigo SA,Ianni B, Mady C, Kalil J, Goldberg AC: BAT1, a putative anti-inflammatorygene, is associated with chronic Chagas cardiomyopathy. J Infect Dis2006, 193(10):1394–1399.
44. Ramasawmy R, Fae KC, Cunha-Neto E, Muller NG, Cavalcanti VL, Ferreira RC,Drigo SA, Ianni B, Mady C, Goldberg AC, et al: Polymorphisms in the genefor lymphotoxin-alpha predispose to chronic Chagas cardiomyopathy.J Infect Dis 2007, 196(12):1836–1843.
45. Pissetti CW, de Oliveira RF, Correia D, Nascentes GA, Llaguno MM, Rodrigues V Jr:Association between the lymphotoxin-alpha gene polymorphism andchagasic cardiopathy. J Interferon Cytokine Res 2013, 33(3):130–135.
46. Ramasawmy R, Fae KC, Cunha-Neto E, Borba SC, Ianni B, Mady C, Goldberg AC,Kalil J: Variants in the promoter region of IKBL/NFKBIL1 gene may marksusceptibility to the development of chronic Chagas’ cardiomyopathyamong Trypanosoma cruzi-infected individuals. Mol Immunol 2008,45(1):283–288.
47. Calzada JE, Nieto A, Beraun Y, Martin J: Chemokine receptor CCR5polymorphisms and Chagas’ disease cardiomyopathy. Tissue Antigens2001, 58(3):154–158.
48. Fernandez-Mestre MT, Montagnani S, Layrisse Z: Is the CCR5-59029-G/Ggenotype a protective factor for cardiomyopathy in Chagas disease?Hum Immunol 2004, 65(7):725–728.
49. Torres OA, Calzada JE, Beraun Y, Morillo CA, Gonzalez CI, Gonzalez A, Martin J:Association of the macrophage migration inhibitory factor -173G/Cpolymorphism with Chagas disease. Hum Immunol 2009, 70(7):543–546.
50. Torres OA, Calzada JE, Beraun Y, Morillo CA, Gonzalez A, Gonzalez CI, Martin J:Role of the IFNG +874 T/A polymorphism in Chagas disease in aColombian population. Infect Genet Evol 2010, 10(5):682–685.
51. Cunha-Neto E, Kalil J: Autoimmunity in Chagas’ heart disease.Sao Paulo Med J 1995, 113(2):757–766.
52. Teixeira PC, Frade AF, Nogueira LG, Kalil J, Chevillard C, Cunha-Neto E:Pathogenesis of Chagas disease cardiomyopathy. World J Clin Infect Dis2012, 2(3):39–53.
53. Vasconcelos RH, Montenegro SM, Azevedo EA, Gomes YM, Morais CN:Genetic susceptibility to chronic Chagas disease: an overview of singlenucleotide polymorphisms of cytokine genes. Cytokine 2012, 59(2):203–208.
54. Fae KC, Drigo SA, Cunha-Neto E, Ianni B, Mady C, Kalil J, Goldberg AC:HLA and beta-myosin heavy chain do not influence susceptibility toChagas disease cardiomyopathy. Microbes Infect 2000, 2(7):745–751.
55. Weitzel T, Zulantay I, Danquah I, Hamann L, Schumann RR, Apt W,Mockenhaupt FP: Mannose-binding lectin and Toll-like receptor polymor-phisms and Chagas disease in Chile. Am J Trop Med Hyg 2012, 86(2):229–232.
56. Jorge MT, Macedo TA, Janones RS, Carizzi DP, Heredia RA, Acha RE:Types of arrhythmia among cases of American trypanosomiasis,compared with those in other cardiology patients. Ann Trop Med Parasitol2003, 97(2):139–148.
57. van Veldhuisen DJ, Linssen GC, Jaarsma T, van Gilst WH, Hoes AW, Tijssen JG,Paulus WJ, Voors AA, Hillege HL: B-type natriuretic peptide and prognosis inheart failure patients with preserved and reduced ejection fraction.J Am Coll Cardiol 2013, 61(14):1498–1506.
58. Januzzi JL Jr: Natriuretic peptides, ejection fraction, and prognosis:parsing the phenotypes of heart failure. J Am Coll Cardiol 2013,61(14):1507–1509.
59. Barretto AC, Arteaga E, Mady C, Ianni BM, Bellotti G, Pileggi F: Male sex.Prognostic factor in Chagas’ disease. Arq Bras Cardiol 1993, 60(4):225–227.
60. Basquiera AL, Sembaj A, Aguerri AM, Omelianiuk M, Guzman S, Moreno Barral J,Caeiro TF, Madoery RJ, Salomone OA: Risk progression to chronic Chagascardiomyopathy: influence of male sex and of parasitaemia detected bypolymerase chain reaction. Heart 2003, 89(10):1186–1190.
61. Florez O, Martin J, Gonzalez CI: Genetic variants in the chemokines andchemokine receptors in Chagas disease. Hum Immunol 2012, 73(8):852–858.
62. Marino AP, da Silva A, dos Santos P, Pinto LM, Gazzinelli RT, Teixeira MM,Lannes-Vieira J: Regulated on activation, normal T cell expressed andsecreted (RANTES) antagonist (Met-RANTES) controls the early phase ofTrypanosoma cruzi-elicited myocarditis. Circulation 2004, 110(11):1443–1449.
63. Medeiros GA, Silverio JC, Marino AP, Roffe E, Vieira V, Kroll-Palhares K,Carvalho CE, Silva AA, Teixeira MM, Lannes-Vieira J: Treatment of chronicallyTrypanosoma cruzi-infected mice with a CCR1/CCR5 antagonist(Met-RANTES) results in amelioration of cardiac tissue damage.Microbes Infect 2009, 11(2):264–273.
64. Marino AP, Silva AA, Santos PV, Pinto LM, Gazinelli RT, Teixeira MM,Lannes-Vieira J: CC-chemokine receptors: a potential therapeutic targetfor Trypanosoma cruzi-elicited myocarditis. Mem Inst Oswaldo Cruz 2005,100(Suppl 1):93–96.
doi:10.1186/1471-2334-13-587Cite this article as: Frade et al.: Genetic susceptibility to Chagas diseasecardiomyopathy: involvement of several genes of the innate immunityand chemokine-dependent migration pathways. BMC Infectious Diseases2013 13:587.