genetic determinants of egfr-driven lung cancer growth
TRANSCRIPT

ReseaRch aRticle
Genetic Determinants of EGFR-Driven Lung Cancer Growth and Therapeutic Response In Vivo Giorgia Foggetti1, Chuan Li2, Hongchen Cai3, Jessica A. Hellyer4, Wen-Yang Lin3, Deborah Ayeni5, Katherine Hastings1, Jungmin Choi6,7, Anna Wurtz1, Laura Andrejka3, Dylan G. Maghini3, Nicholas Rashleigh1, Stellar Levy1, Robert Homer1,5,8, Scott N. Gettinger1,9, Maximilian Diehn10,11,12, Heather A. Wakelee4,12, Dmitri A. Petrov2, Monte M. Winslow3,12,13, and Katerina Politi1,5,9
Cancer Research. on November 10, 2021. © 2021 American Association forcancerdiscovery.aacrjournals.org Downloaded from
Published OnlineFirst March 11, 2021; DOI: 10.1158/2159-8290.CD-20-1385
JUly 2021 CANCER DISCOVERY | 1737
abstRact In lung adenocarcinoma, oncogenic EGFR mutations co-occur with many tumor suppressor gene alterations; however, the extent to which these contribute to
tumor growth and response to therapy in vivo remains largely unknown. By quantifying the effects of inactivating 10 putative tumor suppressor genes in a mouse model of EGFR-driven Trp53-deficient lung adenocarcinoma, we found that Apc, Rb1, or Rbm10 inactivation strongly promoted tumor growth. Unexpectedly, inactivation of Lkb1 or Setd2—the strongest drivers of growth in a KRAS-driven model—reduced EGFR-driven tumor growth. These results are consistent with mutational frequencies in human EGFR- and KRAS-driven lung adenocarcinomas. Furthermore, KEAP1 inactivation reduced the sensitivity of EGFR-driven tumors to the EGFR inhibitor osimertinib, and mutations in genes in the KEAP1 pathway were associated with decreased time on tyrosine kinase inhibitor treatment in patients. Our study highlights how the impact of genetic alterations differs across oncogenic contexts and that the fitness landscape shifts upon treatment.
SiGniFiCanCE: By modeling complex genotypes in vivo, this study reveals key tumor suppressors that constrain the growth of EGFR-mutant tumors. Furthermore, we uncovered that KEAP1 inactivation reduces the sensitivity of these tumors to tyrosine kinase inhibitors. Thus, our approach identifies genotypes of biological and therapeutic importance in this disease.
iNtRODUctiONDuring tumor evolution, cancer cells accumulate altera-
tions in oncogenes and tumor suppressor genes, which con-tribute to many of the hallmarks of cancer (1). Despite their extensive genomic complexity, tumors are frequently classi-fied based on the presence of oncogenic driver mutations,
whereas the function of coincident tumor suppressor gene alterations is largely ignored. There is emerging evidence that the interplay between oncogenic drivers and tumor suppres-sor genes may influence tumor fitness and alter treatment response (2). However, the combinatorially vast landscape of genomic alterations makes it difficult, except in the most extreme cases, to glean information about the epistatic inter-actions between tumor suppressor genes and oncogenes from human cancer sequencing data alone (3). This complex-ity makes inferring the relationship between genotype and therapy response even more tenuous.
Recently, high-throughput, tractable systems that combine autochthonous mouse modeling and genome editing have been developed to directly uncover the functional conse-quences of genetic alterations during tumorigenesis in vivo (4–10). However, very few studies have investigated the bio-logical consequences of inactivating tumor suppressor genes in the context of different oncogenic drivers in vivo, and exist-ing knowledge about the role of specific genetic alterations in tumor suppressor genes has been primarily inferred from correlative human studies (11–13).
In lung adenocarcinoma, EGFR and KRAS are the two most frequently mutated oncogenic driver genes, and they occur within a background of diverse putative tumor suppressor gene alterations (2, 11–14). Among these, TP53 is the most commonly mutated tumor suppressor gene in both onco-genic EGFR- and KRAS-driven lung adenocarcinoma, consist-ent with the importance of disrupting this pathway during lung cancer development (2, 13, 15–18). Interestingly, many other putative tumor suppressor genes are mutated at differ-ent frequencies in oncogenic EGFR- and KRAS-driven lung adenocarcinomas (2, 11–13, 15). Whether these differences are due to different fitness effects that depend on the oncogenic context has never been tested experimentally. Indeed, previous studies on tumor suppressor genes in lung cancer models in vivo have been primarily conducted in the context of oncogenic
1Yale Cancer Center, Yale School of Medicine, New Haven, Connecticut. 2Department of Biology, Stanford University, Stanford, California. 3Department of Genetics, Stanford University School of Medicine, Stan-ford, California. 4Division of Oncology, Department of Medicine, Stan-ford University School of Medicine, Stanford, California. 5Department of Pathology, Yale School of Medicine, New Haven, Connecticut. 6Department of Genetics, Yale School of Medicine, New Haven, Connecticut. 7Depart-ment of Biomedical Sciences, Korea University College of Medicine, Seoul, Korea. 8VA Connecticut Healthcare System, Pathology and Laboratory Medicine Service, West Haven, Connecticut. 9Section of Medical Oncology, Department of Internal Medicine, Yale School of Medicine, New Haven, Connecticut. 10Institute for Stem Cell Biology and Regenerative Medicine, Stanford University School of Medicine, Stanford, California. 11Depart-ment of Radiation Oncology, Stanford University School of Medicine, Stanford, California. 12Stanford Cancer Institute, Stanford University School of Medicine, Stanford, California. 13Department of Pathology, Stanford University School of Medicine, Stanford, California.note: Supplementary data for this article are available at Cancer Discovery Online (http://cancerdiscovery.aacrjournals.org/).G. Foggetti, C. Li, and H. Cai contributed equally to this article.Corresponding authors: Katerina Politi, Departments of Pathology and Internal Medicine (Section of Medical Oncology), Yale Cancer Center, Yale School of Medicine, 333 Cedar Street, SHM-I 234D, New Haven, CT 06510. Phone: 203-737-5921; Lab phone: 203-737-6215; Fax: 203-785-7531; E-mail: [email protected]; and Monte Winslow, Departments of Genetics and Pathology, Stanford University School of Medicine, 279 Campus Drive, B256, Stanford, CA 94305. Phone: 650-725-8696; E-mail: [email protected] Discov 2021;11:1736–53doi: 10.1158/2159-8290.CD-20-1385©2021 American Association for Cancer Research
Cancer Research. on November 10, 2021. © 2021 American Association forcancerdiscovery.aacrjournals.org Downloaded from
Published OnlineFirst March 11, 2021; DOI: 10.1158/2159-8290.CD-20-1385

Foggetti et al.RESEaRCH aRTiCLE
1738 | CANCER DISCOVERY JUly 2021 AACRJournals.org
KRAS-driven tumors, whereas the functional importance of different tumor suppressor genes in EGFR-driven lung tumors remains largely unstudied (Supplementary Fig. S1A).
In addition to driving growth, inactivation of tumor sup-pressor genes may affect therapeutic responses. In advanced EGFR-mutant lung adenocarcinomas, treatment with EGFR tyrosine kinase inhibitors (TKI) is the first line of therapy (19–22). Response rates to TKIs are high, but there is large vari-ability in the depth and duration of response among patients, and acquired resistance inevitably occurs (14). Genomic alter-ations, including those in RB1 and TP53, have been found to correlate with clinical outcomes to TKI treatment (13, 17, 23). However, given the complexity and diversity of genomic alterations in these tumors, the functional contribution of tumor suppressor genotypes to TKI sensitivity and drug resistance remains poorly understood.
To quantify the functional importance of a panel of 10 diverse putative tumor suppressor genes on oncogenic EGFR-driven lung tumor growth in vivo, we coupled multiplexed CRISPR/Cas9-mediated somatic genome editing and high-throughput barcode sequencing (Tuba-seq) with a novel genetically engineered mouse model of EGFRL858R-driven Trp53-deficient lung cancer. Through the comparison of tumor suppressor effects in oncogenic EGFR- and KRAS-driven lung cancer models, we uncovered prevalent epistasis between the oncogenic drivers and tumor suppressors, which explains the different mutational spectra of these tumor suppressor genes in oncogenic EGFR- and KRAS-driven human lung adenocar-cinomas. Moreover, we established a direct causal link between tumor suppressor genotypes and differential responses to osi-mertinib treatment in EGFR-driven lung adenocarcinoma that is supported by correlative human mutational datasets.
ResUltsDevelopment of a Lentiviral Cre-Based Mouse Model of Oncogenic EGFR-Driven Lung adenocarcinoma
The use of lentiviral vectors to initiate tumors in genetically engineered mouse models of human cancer enables control of tumor multiplicity, tumor barcoding to map clonality, and the delivery of lentivirus-encoded complementary DNAs, short hairpin RNAs (shRNA), and single guide RNAs (sgRNA) to modify neoplastic cells (6, 8, 24, 25). The simplicity of viral Cre-initiated models of oncogenic KRAS-driven lung cancer has enabled the analysis of many genes that cooperate to drive tumor growth within these autochthonous mouse models (Supplementary Fig. S1A; ref. 26). To permit the generation of virally initiated oncogenic EGFR-driven Trp53-deficient lung tumors, we bred mice with a reverse tetracycline- controlled transactivator (rtTA)/tetracycline-inducible transgene encoding the common lung adenocarcinoma–associated EGFRL858R mutant (TetO-EGFRL858R), a Cre-regulated rtTA transgene (Rosa26CAGs-LSL-rtTA3-IRES-mKate, abbreviated R26RIK), and homozygous Trp53 floxed alleles (p53flox/flox; refs. 27–29). In these TetO-EGFRL858R;Rosa26RIK;p53flox/flox (EGFR;p53) mice, lentiviral Cre transduction of lung epithelial cells leads to the production of rtTA and mKate, as well as the inactivation of Trp53. Coincident doxycycline treatment induces the expres-sion of oncogenic EGFR (Fig. 1A).
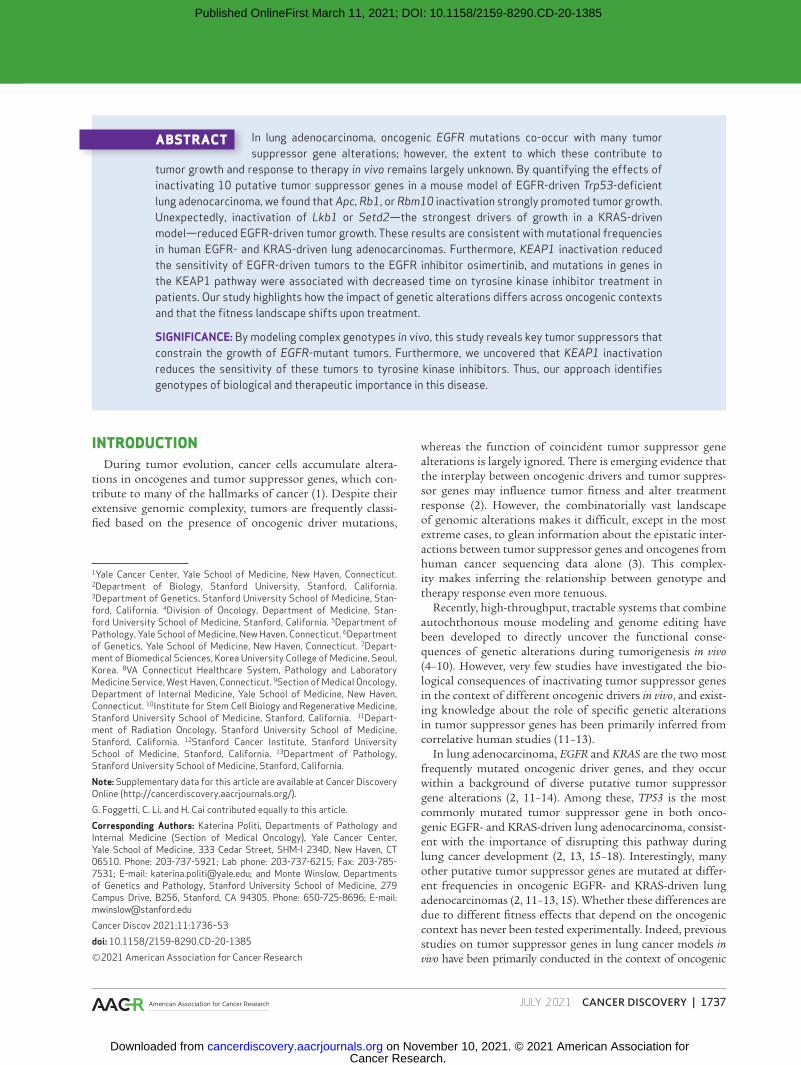
We initiated tumors with a lentiviral Cre vector (30) in EGFR;p53 mice and used magnetic resonance imaging (MRI) to monitor tumor development (Fig. 1B). Tumors were first detectable in EGFR;p53 mice 8 weeks after tumor initiation. Histologic analysis of lungs 11 weeks after tumor initiation confirmed the development of multifocal lung adenocarcinomas (Fig. 1B, bottom panels). Tumors stained positively for EGFRL858R and mKate, as well as sur-factant protein C (SFTPC) and the lung lineage–defining transcription factor NKX2-1/TTF1 (Fig. 1C, top panels; Supplementary Fig. S1B; refs. 31–33). Importantly, in this model, tumors were more focal than the diffuse tumors that rapidly develop in the previous CCSP-rtTA;TetO-EGFRL858R model (27), likely due to tumor initiation from fewer cells in the virally initiated model (Fig. 1B, top right panel). Lentivirus-induced tumors in EGFR;p53 mice were more poorly differentiated than those typically observed in the CCSP-rtTA;TetO-EGFRL858R model (Fig. 1B, bottom panels), as shown by increased prevalence of a micropapillary pattern that is highly aggressive in human adenocarcinoma (27). Thus, this new lentiviral Cre-initiated model recapitulates the genetic and histopathologic features of human oncogenic EGFR-driven TP53-deficient lung tumors.
Multiplexed Quantification of Tumor Suppressor Gene Function in EGFR-Driven Lung Tumors
To enable somatic genome editing in the EGFR;p53 model, we further incorporated a conditional Cas9 allele (Rosa26LSL-Cas9-GFP; ref. 4) to generate TetO-EGFRL858R; R26RIK/LSL-Cas9-GFP;p53flox/flox (EGFR;p53;Cas9) mice (Fig. 1A). Lentiviral Cre delivery to EGFR;p53;Cas9 mice initiated mul-tifocal lung adenomas and adenocarcinomas that expressed EGFRL858R, mKate, Cas9, and GFP (Fig. 1C and D). Tumors in EGFR;p53;Cas9 mice were histologically similar to those in EGFR;p53 mice (Fig. 1B and D).
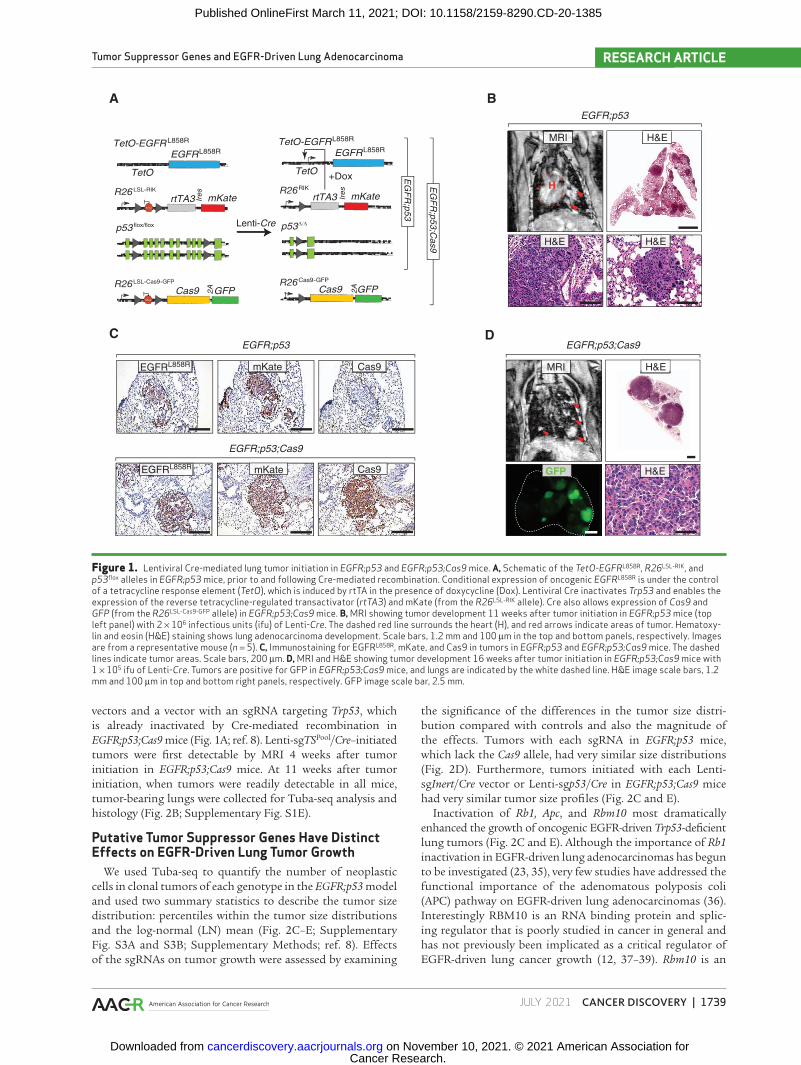
We used an improved version of our Tuba-seq approach to quantify tumor suppressor gene function in oncogenic EGFR-driven lung tumors (ref. 34; Supplementary Methods). Genomic integration of barcoded lentiviral vectors uniquely tags each transduced cell and all of the neoplastic cells within the resulting clonal tumors (8). Each barcode encodes an eight-nucleotide sgID region specific to the sgRNA followed by a random 15-nucleotide barcode (sgID-BC); thus, high-throughput sequencing of this sgID-BC region from bulk tumor–bearing lung can be used to quantify the number of cells in each tumor of each genotype (Supplementary Methods; ref. 8). The absolute number of neoplastic cells in each tumor is calculated by normalizing the number of reads of each unique barcode to the number of reads from benchmark control cells added to each sample (Fig. 2A; Supplementary Fig. S2A; Supplementary Methods). Thus, Tuba-seq enables the paral-lel analysis of the impact of multiple tumor suppressor gene alterations on tumor growth in vivo.
To assess the function of 10 diverse putative tumor suppres-sor genes that are frequently altered in human lung adenocar-cinoma, we initiated tumors in EGFR;p53 and EGFR;p53;Cas9 mice with a pool of barcoded Lenti-sgRNA/Cre vectors (Lenti-sgTSPool/Cre; Fig. 2A). In addition to Lenti-sgRNA/Cre vectors targeting each putative tumor suppressor gene, this pool con-tains negative control vectors, including four Lenti-sgInert/Cre
Cancer Research. on November 10, 2021. © 2021 American Association forcancerdiscovery.aacrjournals.org Downloaded from
Published OnlineFirst March 11, 2021; DOI: 10.1158/2159-8290.CD-20-1385
Tumor Suppressor Genes and EGFR-Driven Lung Adenocarcinoma RESEaRCH aRTiCLE
JUly 2021 CANCER DISCOVERY | 1739
Figure 1. Lentiviral Cre-mediated lung tumor initiation in EGFR;p53 and EGFR;p53;Cas9 mice. a, Schematic of the TetO-EGFRL858R, R26LSL-RIK, and p53flox alleles in EGFR;p53 mice, prior to and following Cre-mediated recombination. Conditional expression of oncogenic EGFRL858R is under the control of a tetracycline response element (TetO), which is induced by rtTA in the presence of doxycycline (Dox). Lentiviral Cre inactivates Trp53 and enables the expression of the reverse tetracycline-regulated transactivator (rtTA3) and mKate (from the R26LSL-RIK allele). Cre also allows expression of Cas9 and GFP (from the R26LSL-Cas9-GFP allele) in EGFR;p53;Cas9 mice. B, MRI showing tumor development 11 weeks after tumor initiation in EGFR;p53 mice (top left panel) with 2 × 10⁶ infectious units (ifu) of Lenti-Cre. The dashed red line surrounds the heart (H), and red arrows indicate areas of tumor. Hematoxy-lin and eosin (H&E) staining shows lung adenocarcinoma development. Scale bars, 1.2 mm and 100 μm in the top and bottom panels, respectively. Images are from a representative mouse (n = 5). C, Immunostaining for EGFRL858R, mKate, and Cas9 in tumors in EGFR;p53 and EGFR;p53;Cas9 mice. The dashed lines indicate tumor areas. Scale bars, 200 μm. D, MRI and H&E showing tumor development 16 weeks after tumor initiation in EGFR;p53;Cas9 mice with 1 × 10⁵ ifu of Lenti-Cre. Tumors are positive for GFP in EGFR;p53;Cas9 mice, and lungs are indicated by the white dashed line. H&E image scale bars, 1.2 mm and 100 μm in top and bottom right panels, respectively. GFP image scale bar, 2.5 mm.
B
D
EGFR;p53
H
MRI H&E
Lenti-Cre
EGFRL858R
TetO
Cas9R26LSL-Cas9-GFP
p53 flox/flox
GFP
rtTA3R26LSL-RIK
mKateIres
TetO-EGFRL858R
EGFRL858R
TetO
Cas9R26Cas9-GFP
p53∆/∆
GFP
rtTA3R26RIK
mKateIres
TetO-EGFRL858R
A2
A2
A
+Dox
EGFR;p53;Cas9
MRI
GFP
EGFR;p53
EGFR;p53;Cas9
EGFRL858R mKate Cas9
C
H&EEGFRL858R mKate Cas9
EG
FR
;p53
EG
FR
;p53;Cas9
H&E H&E
H&E
Stop
Stop
vectors and a vector with an sgRNA targeting Trp53, which is already inactivated by Cre-mediated recombination in EGFR;p53;Cas9 mice (Fig. 1A; ref. 8). Lenti-sgTSPool/Cre–initiated tumors were first detectable by MRI 4 weeks after tumor initiation in EGFR;p53;Cas9 mice. At 11 weeks after tumor initiation, when tumors were readily detectable in all mice, tumor-bearing lungs were collected for Tuba-seq analysis and histology (Fig. 2B; Supplementary Fig. S1E).
Putative Tumor Suppressor Genes Have Distinct Effects on EGFR-Driven Lung Tumor Growth
We used Tuba-seq to quantify the number of neoplastic cells in clonal tumors of each genotype in the EGFR;p53 model and used two summary statistics to describe the tumor size distribution: percentiles within the tumor size distributions and the log-normal (LN) mean (Fig. 2C–E; Supplementary Fig. S3A and S3B; Supplementary Methods; ref. 8). Effects of the sgRNAs on tumor growth were assessed by examining
the significance of the differences in the tumor size distri-bution compared with controls and also the magnitude of the effects. Tumors with each sgRNA in EGFR;p53 mice, which lack the Cas9 allele, had very similar size distributions (Fig. 2D). Furthermore, tumors initiated with each Lenti-sgInert/Cre vector or Lenti-sgp53/Cre in EGFR;p53;Cas9 mice had very similar tumor size profiles (Fig. 2C and E).
Inactivation of Rb1, Apc, and Rbm10 most dramatically enhanced the growth of oncogenic EGFR-driven Trp53-deficient lung tumors (Fig. 2C and E). Although the importance of Rb1 inactivation in EGFR-driven lung adenocarcinomas has begun to be investigated (23, 35), very few studies have addressed the functional importance of the adenomatous polyposis coli (APC) pathway on EGFR-driven lung adenocarcinomas (36). Interestingly RBM10 is an RNA binding protein and splic-ing regulator that is poorly studied in cancer in general and has not previously been implicated as a critical regulator of EGFR-driven lung cancer growth (12, 37–39). Rbm10 is an
Cancer Research. on November 10, 2021. © 2021 American Association forcancerdiscovery.aacrjournals.org Downloaded from
Published OnlineFirst March 11, 2021; DOI: 10.1158/2159-8290.CD-20-1385
Foggetti et al.RESEaRCH aRTiCLE
1740 | CANCER DISCOVERY JUly 2021 AACRJournals.org
Figure 2. Multiplexed somatic CRISPR/Cas9-mediated genome editing uncovers tumor suppressor gene effects on EGFR-driven lung tumors. a, Experi-mental strategy. Tumors were allowed to develop for either 11 weeks in EGFR;p53;Cas9 and EGFR;p53 mice or 19 weeks in EGFR;p53;Cas9 mice after intratracheal administration of Lenti-sgTSPool/Cre. Whole lungs were collected for Tuba-seq and histology. The number of neoplastic cells in each tumor (tumor size) was calculated from barcode sequencing of bulk tumor–bearing lungs. Barcode read numbers were normalized to benchmark control cells that have known barcodes and were added at a known number to each sample (Supplementary Methods). B, MRI, H&E, and GFP images showing tumor development in EGFR;p53;Cas9 mice 11 weeks after tumor initiation with 1 × 10⁶ infectious units (ifu) of Lenti-sgTSPool/Cre. H&E image scale bars, 1.2 mm and 100 μm in the top and bottom right panels, respectively. Lungs are indicated by the white dashed lines. GFP image scale bar, 2.5 mm. Images are from a representative mouse (n = 10). C, Relative LN mean size of tumors with each sgRNA in EGFR;p53 (n = 5) and EGFR;p53;Cas9 mice (n = 10) 11 weeks after tumor initiation (normalized to the tumors with inert sgRNAs). P values were calculated from bootstrapping. P values < 0.05 and their corresponding means are highlighted in EGFR;p53;Cas9 mice for sgRNAs that positively (red) and negatively (green) affect tumor growth when the effects are equal to or differ >10% compared with the size of tumors with inert sgRNAs. D, Relative size of tumors at the indicated percentiles of each genotype in EGFR;p53 mice 11 weeks after tumor initiation with the Lenti-sgTSPool/Cre. These mice lack the R26LSL-Cas9-GFP allele; therefore, all sgRNAs are functionally inert. The 95% confidence intervals (CI) are shown. Percentiles calculated from bootstrapping that are significantly different from the tumors with inert sgRNAs are in color. E, Relative size of tumors of each genotype in EGFR;p53;Cas9 mice 11 weeks after tumor initiation with the Lenti-sgTSPool/Cre. The relative sizes of tumors at the indicated percentiles were calculated from the tumor size distribution of all tumors from 10 mice. The 95% CIs are shown. Percentiles were calculated from bootstrapping and are in color if significantly different from the tumors with inert sgRNAs.
D E
0.5
1.0
2.0
4.0
8.0
sgNeo1
sgNeo2
sgNeo3
sgNT
sgLkb1
sgp53
sgAtm
sgArid1a
sgRb1
sgKeap1
sgApc
sgSmad4
sgSetd2
sgRbm
10
sgCdkn2a
Inert
506070809095
Percentiles
EGFR;p53;Cas9(11 weeks)
Mean
sgNeo1sgNeo2sgNeo3sgNT
sgLkb1sgp53
sgAtmsgArid1a
sgRb1
sgKeap1
sgApcsgSmad4
sgSetd2
sgRbm10
sgCdkn2a
Iner
t
P-value Mean P-value
0.941.071.020.99
0.800.93
1.131.05
4.02
1.08
2.111.30
0.82
2.17
0.95
0.010.040.510.49
0.0010.06
0.060.85
<10−4
0.67
<10−40.0004
0.01
<10−4
0.13
0.951.011.031.00
0.950.95
0.941.02
1.02
1.10
1.021.03
0.98
0.99
1.00
0.310.03<10−4
0.72
0.0030.29
0.050.68
0.05
0.23
0.590.38
0.27
0.75
0.75
EGFR;p53;Cas9EGFR;p53B
Tum
or s
ize
of s
gRN
A
Rel
ativ
e tu
mor
siz
e
Tum
or s
ize
of In
ert)
)
CresgRNA
sgID-BCsgNeo1sgNeo2sgNeo3sgNTsgLkb1sgp53sgAtmsgArid1asgRb1sgKeap1sgApcsgSmad4sgSetd2sgRbm10sgCdkn2a
Iner
tExtract DNA
PCR amplify sgID-BC region
Illumina sequencing
Digest entire lung& benchmark
controls
R
Tuba-seq
Quantify number and size of individual tumors
for each sgRNA relative to Inert
Lenti-sgTSPool/Cre
11 or 19 weeks
EGFR;p53;Cas9
EGFR;p53
H
A
CEGFR;p53;Cas9(1 × 10⁶ ifu; 11 weeks)
MRI H&E
GFP
TetO-EGFR L858R;p53flox/flox;R26 LSL-RIK
TetO-EGFRL858R;p53flox/flox;R26LSL-RIK;R26LSL-Cas9-GFP
H&E
Tum
or s
ize
of s
gRN
AR
elat
ive
tum
or s
ize
Tum
or s
ize
of In
ert)
)
0.5
1.0
2.0
4.0
8.0
sgNeo1
sgNeo2
sgNeo3
sgNT
sgLkb1
sgp53
sgAtm
sgArid1a
sgRb1
sgKeap1
sgApc
sgSmad4
sgSetd2
sgRbm
10
sgCdkn2a
Inert
EGFR;p53(11 weeks)
506070809095
Percentiles
X-linked gene; however, we did not uncover any sex-specific effects of Rbm10 inactivation on tumor size (Supplemen-tary Fig. S2B). More broadly, both the LN mean and the tumor size at the 95th percentile relative to tumors with inert sgRNAs were similar between male and female mice
across the tumor suppressor genes studied (Supplementary Fig. S2B).
Surprisingly, inactivation of either Lkb1 or Setd2, which are strong tumor suppressor genes in analogous oncogenic KRAS-driven lung tumor models, dramatically reduced
Cancer Research. on November 10, 2021. © 2021 American Association forcancerdiscovery.aacrjournals.org Downloaded from
Published OnlineFirst March 11, 2021; DOI: 10.1158/2159-8290.CD-20-1385
Tumor Suppressor Genes and EGFR-Driven Lung Adenocarcinoma RESEaRCH aRTiCLE
JUly 2021 CANCER DISCOVERY | 1741
tumor growth relative to sgInert tumors (8, 40, 41). These effects were consistent across multiple percentiles within the tumor size distribution and as assessed by the LN mean of tumor sizes (Fig. 2C and E). Other tumor suppressor genes (Atm, Arid1a, Cdkn2a, and Keap1) did not significantly alter tumor growth in the context of this experiment (Fig. 2C and E). Notably, the significant effects observed with sgSetd2, sgLkb1, sgSmad4, sgApc, sgRbm10, and sgRb1 were all recap-tured even after we simulated a 50% reduction in cutting efficiency of sgRNAs or when we used other strategies for subsampling underscoring the robustness of our findings (Supplementary Fig. S2C and S2D; Supplementary Fig. S4A and S4B).
To assess tumor suppressor gene function at a later time point of tumor growth, we initiated tumors in EGFR;p53;Cas9 mice with 10-fold less Lenti-sgTSPool/Cre and performed Tuba-seq after 19 weeks of tumor growth (Supplementary Fig. S1C–S1H). At this time point, the histology of the tumors was similar to that observed after 11 weeks of tumor initiation (Sup-plementary Fig. S1C and S1D). Tuba-seq analysis confirmed the tumor-suppressive function of Rbm10, Apc, and Rb1 (Sup-plementary Fig. S3A–S3D). Because we used a 10-fold lower viral titer for this experiment, there were proportionally fewer tumors (Supplementary Fig. S1F), which reduced the reso-lution of the Tuba-seq analysis. Thus, although inactivation of the other genes did not significantly affect tumor growth at this time point, we cannot exclude the possibility that these genes may influence tumor growth. Interestingly, despite the decreased statistical power, inactivation of Cdkn2a or Arid1a had a positive effect on tumor growth at this 19-week time point (but not at the 11-week time point), suggesting a potential role of these tumor suppressor genes during a later phase of tumori-genesis in this model (Supplementary Fig. S3A and S3B).
Validation of Apc- and Rbm10-Mediated Tumor Suppression
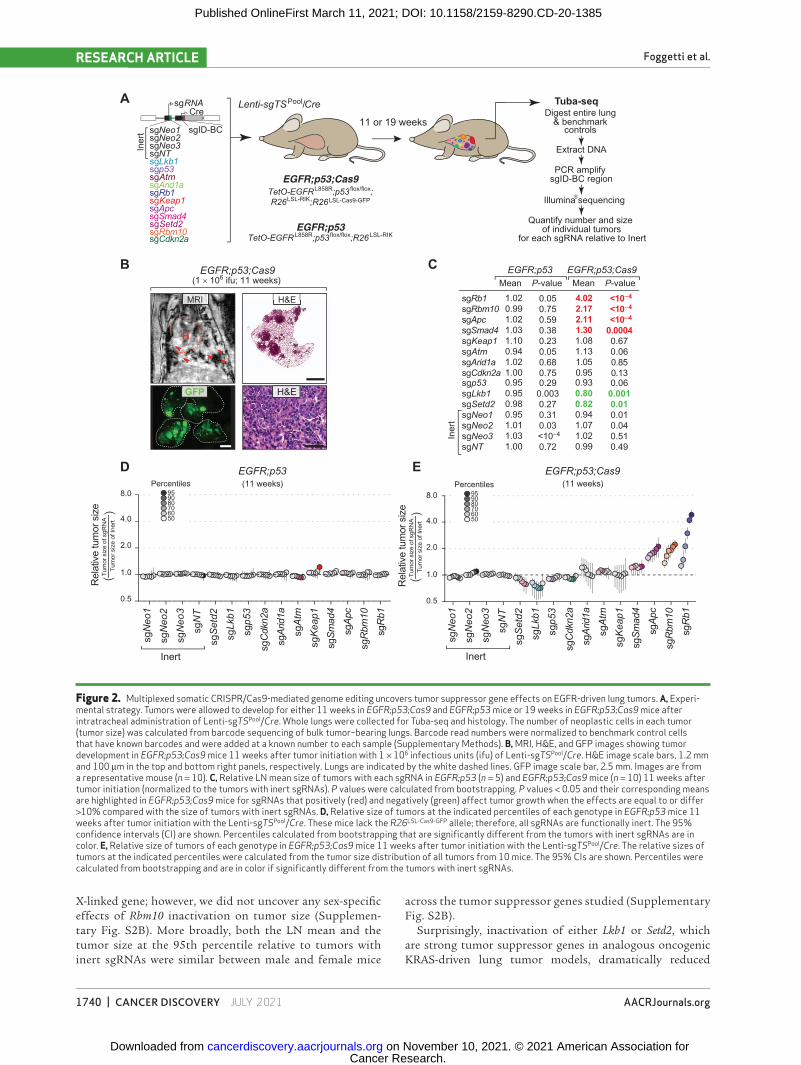
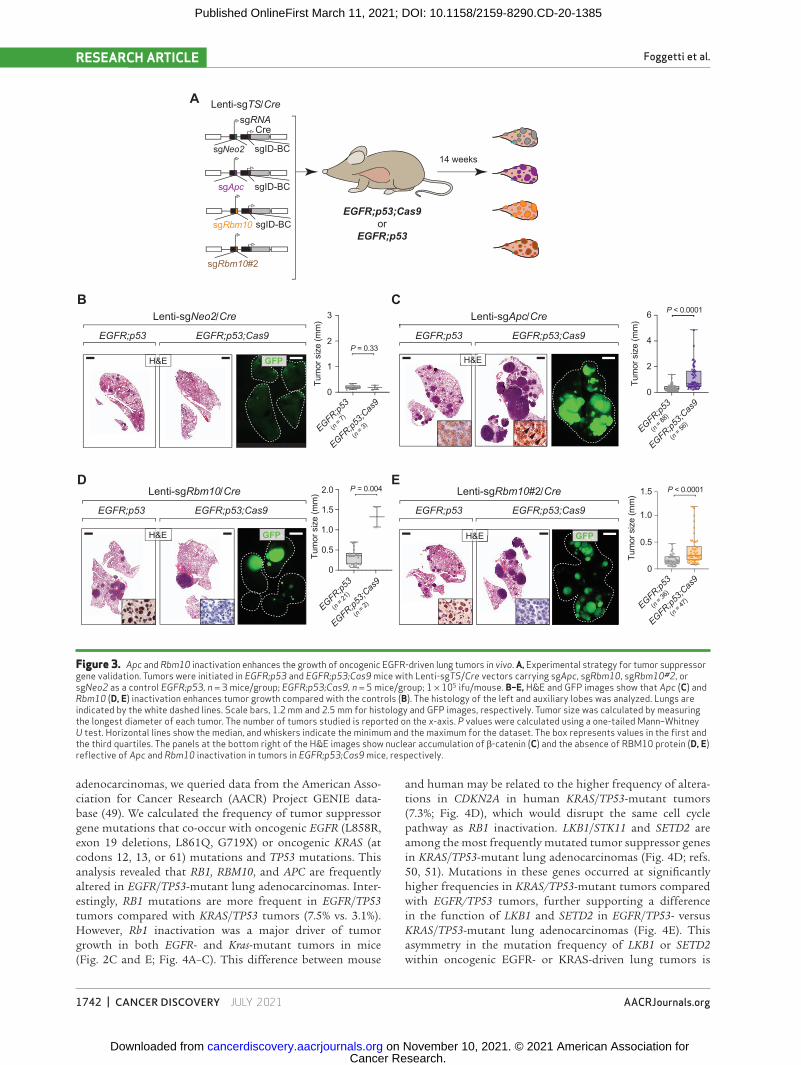
We performed further experiments to confirm the role of two less-well-studied tumor suppressors, Apc and Rbm10, on the growth of EGFR-driven tumors. We initiated lung tumors in EGFR;p53 and EGFR;p53;Cas9 mice with Lenti-sgApc/Cre, Lenti-sgNeo2/Cre (sgInert), and two Lenti-sgRbm10/Cre vectors each with a unique sgRNA targeting Rbm10 (n = 3 EGFR;p53 mice/group; n = 5 EGFR;p53;Cas9 mice/group; Fig. 3A). We used two sgRNAs targeting Rbm10 to increase the rigor of our findings and because the tumor suppres-sive role of RBM10 is largely uncharacterized in EGFR-driven lung cancer. Inactivation of either Apc or Rbm10 in EGFR;p53;Cas9 mice gave rise to tumors that were larger than control sgNeo2 tumors in EGFR;p53;Cas9 mice (Sup-plementary Fig. S5A and S5B). Moreover, by quantifying the size of individual sgApc or sgRbm10 tumors in histo-logic sections, we observed that EGFR;p53;Cas9 tumors were larger than tumors initiated with the same vectors in EGFR;p53 mice (Fig. 3B–E). Lenti-sgApc/Cre–initiated tumors in EGFR;p53;Cas9 mice had more cancer cells with stabiliza-tion and nuclear localization of β-catenin, as well as increased levels of SOX9, consistent with Apc inactivation (Supplemen-tary Fig. S5C and S5D; ref. 42). Furthermore, at least 50% of Lenti-sgRbm10/Cre–initiated tumors in EGFR;p53;Cas9 mice lacked or had lower RBM10 protein levels (Supplementary
Fig. S5E). Tumors with either Apc or Rbm10 inactivation were histologically similar to tumors in EGFR;p53 mice at this time point and had papillary/acinar or micropapillary structures with medium or high nuclear grade (Supplementary Fig. S6A and S6B). All tumors were positive for adenocarcinoma markers (NKX2-1/TTF1 and SFTPC) and were negative for the neuroendocrine markers synaptophysin (SYP) and ubiq-uitin C-terminal hydrolase L1 (UCHL1) and a squamous cell carcinoma marker (p63; Supplementary Fig. S7). Can-cer cells were highly proliferative, whereas apoptotic cells were rare in tumors in EGFR;p53;Cas9 mice initiated with either Lenti-sgApc/Cre or Lenti-sgRbm10/Cre (Supplementary Fig. S7). These results further confirm the importance of these tumor suppressor genes in constraining EGFR-driven tumor growth in vivo. Collectively, our findings underscore the value of coupling Tuba-seq and CRISPR/Cas9-mediated somatic genome editing with our virally induced mouse model to dissect gene function in oncogenic EGFR-driven lung cancer.
Oncogenic Drivers Shape the Fitness Landscape of Tumor Suppression
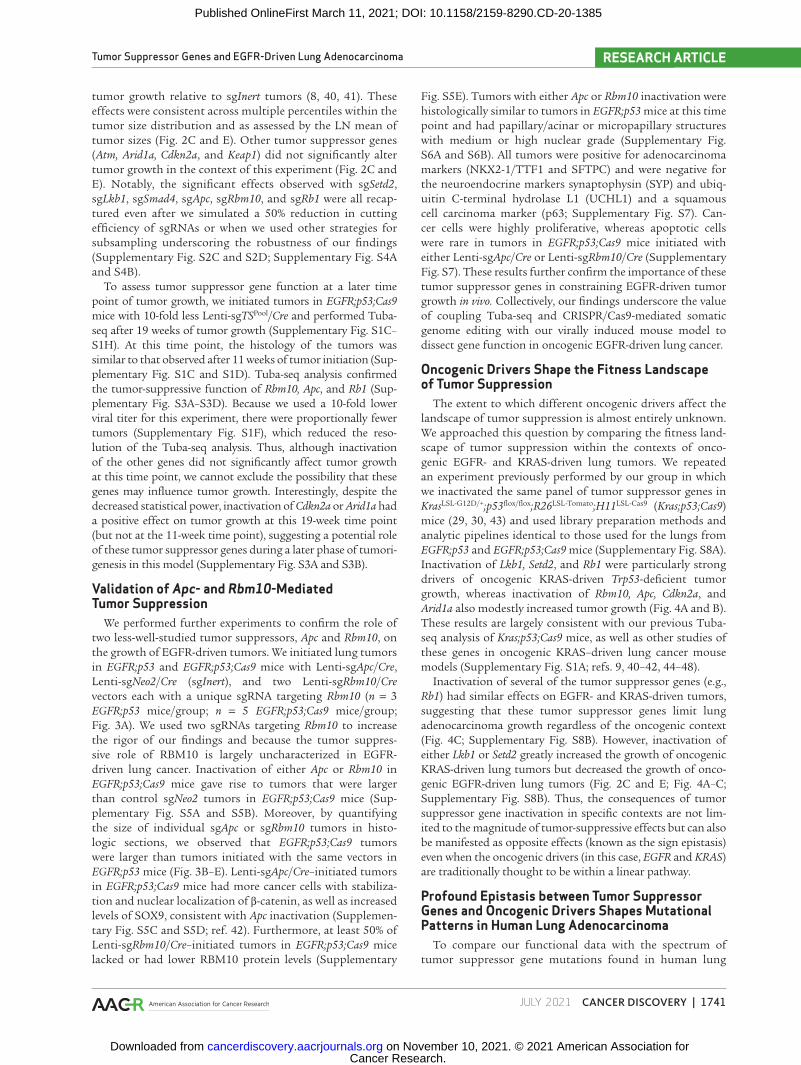
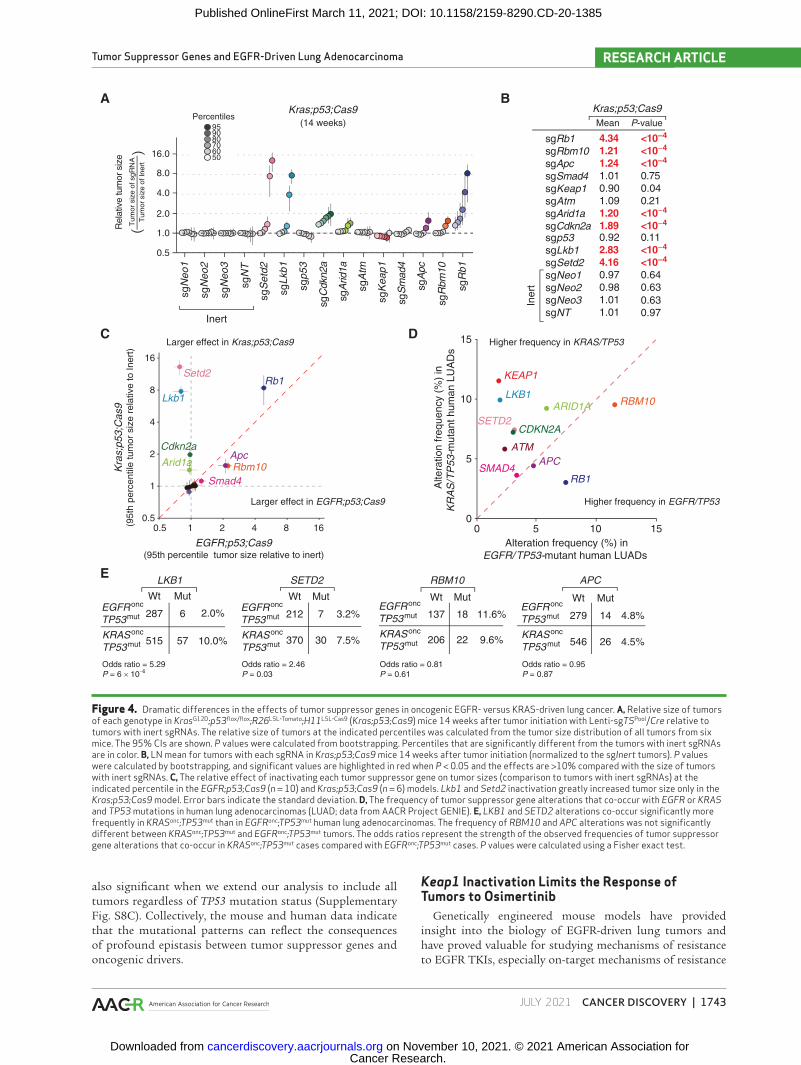
The extent to which different oncogenic drivers affect the landscape of tumor suppression is almost entirely unknown. We approached this question by comparing the fitness land-scape of tumor suppression within the contexts of onco-genic EGFR- and KRAS-driven lung tumors. We repeated an experiment previously performed by our group in which we inactivated the same panel of tumor suppressor genes in KrasLSL-G12D/+;p53flox/flox;R26LSL-Tomato;H11LSL-Cas9 (Kras;p53;Cas9) mice (29, 30, 43) and used library preparation methods and analytic pipelines identical to those used for the lungs from EGFR;p53 and EGFR;p53;Cas9 mice (Supplementary Fig. S8A). Inactivation of Lkb1, Setd2, and Rb1 were particularly strong drivers of oncogenic KRAS-driven Trp53-deficient tumor growth, whereas inactivation of Rbm10, Apc, Cdkn2a, and Arid1a also modestly increased tumor growth (Fig. 4A and B). These results are largely consistent with our previous Tuba-seq analysis of Kras;p53;Cas9 mice, as well as other studies of these genes in oncogenic KRAS–driven lung cancer mouse models (Supplementary Fig. S1A; refs. 9, 40–42, 44–48).
Inactivation of several of the tumor suppressor genes (e.g., Rb1) had similar effects on EGFR- and KRAS-driven tumors, suggesting that these tumor suppressor genes limit lung adenocarcinoma growth regardless of the oncogenic context (Fig. 4C; Supplementary Fig. S8B). However, inactivation of either Lkb1 or Setd2 greatly increased the growth of oncogenic KRAS-driven lung tumors but decreased the growth of onco-genic EGFR-driven lung tumors (Fig. 2C and E; Fig. 4A–C; Supplementary Fig. S8B). Thus, the consequences of tumor suppressor gene inactivation in specific contexts are not lim-ited to the magnitude of tumor-suppressive effects but can also be manifested as opposite effects (known as the sign epistasis) even when the oncogenic drivers (in this case, EGFR and KRAS) are traditionally thought to be within a linear pathway.
Profound Epistasis between Tumor Suppressor Genes and Oncogenic Drivers Shapes Mutational Patterns in Human Lung adenocarcinoma
To compare our functional data with the spectrum of tumor suppressor gene mutations found in human lung
Cancer Research. on November 10, 2021. © 2021 American Association forcancerdiscovery.aacrjournals.org Downloaded from
Published OnlineFirst March 11, 2021; DOI: 10.1158/2159-8290.CD-20-1385
Foggetti et al.RESEaRCH aRTiCLE
1742 | CANCER DISCOVERY JUly 2021 AACRJournals.org
Figure 3. Apc and Rbm10 inactivation enhances the growth of oncogenic EGFR-driven lung tumors in vivo. a, Experimental strategy for tumor suppressor gene validation. Tumors were initiated in EGFR;p53 and EGFR;p53;Cas9 mice with Lenti-sgTS/Cre vectors carrying sgApc, sgRbm10, sgRbm10#2, or sgNeo2 as a control EGFR;p53, n = 3 mice/group; EGFR;p53;Cas9, n = 5 mice/group; 1 × 10⁵ ifu/mouse. B–E, H&E and GFP images show that Apc (C) and Rbm10 (D, E) inactivation enhances tumor growth compared with the controls (B). The histology of the left and auxiliary lobes was analyzed. Lungs are indicated by the white dashed lines. Scale bars, 1.2 mm and 2.5 mm for histology and GFP images, respectively. Tumor size was calculated by measuring the longest diameter of each tumor. The number of tumors studied is reported on the x-axis. P values were calculated using a one-tailed Mann–Whitney U test. Horizontal lines show the median, and whiskers indicate the minimum and the maximum for the dataset. The box represents values in the first and the third quartiles. The panels at the bottom right of the H&E images show nuclear accumulation of β-catenin (C) and the absence of RBM10 protein (D, E) reflective of Apc and Rbm10 inactivation in tumors in EGFR;p53;Cas9 mice, respectively.
H&E
H&E
H&E
Lenti-sgRbm10/Cre
EGFR;p53 EGFR;p53;Cas9
Lenti-sgNeo2/Cre
GFP
H&E
Lenti-sgRbm10#2/Cre
B
EGFR;p53
(n = 3
6)
EGFR;p53;C
as9
(n = 4
7)
0
0.5
1.0
1.5
Tum
or s
ize
(mm
)
P < 0.0001
EGFR;p53;Cas9or
EGFR;p53
CresgRNA
sgID-BCsgNeo2
Lenti-sgTS/Cre
sgRbm10#2
sgApc
sgRbm10
14 weeks
A
EGFR;p53 EGFR;p53;Cas9
Lenti-sgApc/Cre
EGFR;p53 EGFR;p53;Cas9 EGFR;p53 EGFR;p53;Cas9
GFP GFP
C
D E
sgID-BC
sgID-BC
EGFR;p53
(n = 7
)
EGFR;p53;C
as9
(n = 3
)
Tum
or s
ize
(mm
)
0
1
2
3
P = 0.33
EGFR;p53
(n = 8
8)
EGFR;p53;C
as9
(n = 5
6)
Tum
or s
ize
(mm
)
P < 0.0001
0
2
4
6
EGFR;p53
(n = 2
1)
EGFR;p53;C
as9
(n = 2
)
0
0.5
1.0
1.5
P = 0.004
Tum
or s
ize
(mm
) 2.0
adenocarcinomas, we queried data from the American Asso-ciation for Cancer Research (AACR) Project GENIE data-base (49). We calculated the frequency of tumor suppressor gene mutations that co-occur with oncogenic EGFR (L858R, exon 19 deletions, L861Q, G719X) or oncogenic KRAS (at codons 12, 13, or 61) mutations and TP53 mutations. This analysis revealed that RB1, RBM10, and APC are frequently altered in EGFR/TP53-mutant lung adenocarcinomas. Inter-estingly, RB1 mutations are more frequent in EGFR/TP53 tumors compared with KRAS/TP53 tumors (7.5% vs. 3.1%). However, Rb1 inactivation was a major driver of tumor growth in both EGFR- and Kras-mutant tumors in mice (Fig. 2C and E; Fig. 4A–C). This difference between mouse
and human may be related to the higher frequency of altera-tions in CDKN2A in human KRAS/TP53-mutant tumors (7.3%; Fig. 4D), which would disrupt the same cell cycle pathway as RB1 inactivation. LKB1/STK11 and SETD2 are among the most frequently mutated tumor suppressor genes in KRAS/TP53-mutant lung adenocarcinomas (Fig. 4D; refs. 50, 51). Mutations in these genes occurred at significantly higher frequencies in KRAS/TP53-mutant tumors compared with EGFR/TP53 tumors, further supporting a difference in the function of LKB1 and SETD2 in EGFR/TP53- versus KRAS/TP53-mutant lung adenocarcinomas (Fig. 4E). This asymmetry in the mutation frequency of LKB1 or SETD2 within oncogenic EGFR- or KRAS-driven lung tumors is
Cancer Research. on November 10, 2021. © 2021 American Association forcancerdiscovery.aacrjournals.org Downloaded from
Published OnlineFirst March 11, 2021; DOI: 10.1158/2159-8290.CD-20-1385
Tumor Suppressor Genes and EGFR-Driven Lung Adenocarcinoma RESEaRCH aRTiCLE
JUly 2021 CANCER DISCOVERY | 1743
Figure 4. Dramatic differences in the effects of tumor suppressor genes in oncogenic EGFR- versus KRAS-driven lung cancer. a, Relative size of tumors of each genotype in KrasG12D;p53flox/flox;R26LSL-Tomato;H11LSL-Cas9 (Kras;p53;Cas9) mice 14 weeks after tumor initiation with Lenti-sgTSPool/Cre relative to tumors with inert sgRNAs. The relative size of tumors at the indicated percentiles was calculated from the tumor size distribution of all tumors from six mice. The 95% CIs are shown. P values were calculated from bootstrapping. Percentiles that are significantly different from the tumors with inert sgRNAs are in color. B, LN mean for tumors with each sgRNA in Kras;p53;Cas9 mice 14 weeks after tumor initiation (normalized to the sgInert tumors). P values were calculated by bootstrapping, and significant values are highlighted in red when P < 0.05 and the effects are >10% compared with the size of tumors with inert sgRNAs. C, The relative effect of inactivating each tumor suppressor gene on tumor sizes (comparison to tumors with inert sgRNAs) at the indicated percentile in the EGFR;p53;Cas9 (n = 10) and Kras;p53;Cas9 (n = 6) models. Lkb1 and Setd2 inactivation greatly increased tumor size only in the Kras;p53;Cas9 model. Error bars indicate the standard deviation. D, The frequency of tumor suppressor gene alterations that co-occur with EGFR or KRAS and TP53 mutations in human lung adenocarcinomas (LUAD; data from AACR Project GENIE). E, LKB1 and SETD2 alterations co-occur significantly more frequently in KRASonc;TP53mut than in EGFRonc;TP53mut human lung adenocarcinomas. The frequency of RBM10 and APC alterations was not significantly different between KRASonc;TP53mut and EGFRonc;TP53mut tumors. The odds ratios represent the strength of the observed frequencies of tumor suppressor gene alterations that co-occur in KRASonc;TP53mut cases compared with EGFRonc;TP53mut cases. P values were calculated using a Fisher exact test.
C
E
D
Rb1
Rbm10Apc
Smad4
Arid1a
Cdkn2a
Lkb1
aaaa
2
1
Setd2
0.5
1
2
4
8
16
0.5 1 2 4 8 16
(95th percentile tumor size relative to inert)
(95t
h pe
rcen
tile
tum
or s
ize
rela
tive
to In
ert)
Kra
s;p5
3;C
as9
EGFR;p53;Cas9
Larger effect in Kras;p53;Cas9
EGFRonc
TP53mut
KRASonc
TP53mut
Wt Mut
287 6
515 57
2.0%
10.0%
SETD2
Wt Mut
212 7
370 30
3.2%
7.5%
EGFRonc
TP53mut
KRASonc
TP53mut
EGFRonc
TP53mut
KRASonc
TP53mut
RBM10
Wt Mut
137 18
206 22
11.6%
9.6%
APC
Wt Mut
279 14
546 26
4.8%
4.5%
EGFRonc
TP53mut
KRASonc
TP53mut
Larger effect in EGFR;p53;Cas9
LKB1
Odds ratio = 5.29P = 6 × 10⁻⁶
Odds ratio = 2.46P = 0.03
Odds ratio = 0.81P = 0.61
Odds ratio = 0.95P = 0.87
0.5
1.0
2.0
4.0
8.0
16.0 506070809095
PercentilesMean P-value
sgNeo1sgNeo2sgNeo3sgNT
sgLkb1sgp53
sgAtmsgArid1a
sgRb1
sgKeap1
sgApcsgSmad4
sgSetd2
sgRbm10
sgCdkn2a
Iner
t
0.970.981.011.01
2.830.92
1.091.20
4.34
0.90
1.241.01
4.16
1.21
1.89
0.640.630.630.97
<10−40.11
0.21<10−4
<10−4
0.04
<10−4
0.75
<10−4
<10−4
<10−4
Kras;p53;Cas9(14 weeks)
Kras;p53;Cas9
sgN
eo1
sgN
eo2
sgN
eo3
sgN
T
sgLk
b1
sgp5
3
sgA
tm
sgA
rid1a
sgR
b1
sgK
eap1
sgA
pc
sgS
mad
4
sgS
etd2
sgR
bm10
sgC
dkn2
aInert
Tum
or s
ize
of s
gRN
A
Rel
ativ
e tu
mor
siz
e
Tum
or s
ize
of In
ert
)
)
BA
0 5 10 150
5
10
15
RBM10
RB1
ARID1A
APCSMAD4
SETD2CDKN2A
ATM
LKB1
KEAP1
Alte
ratio
n fr
eque
ncy
(%)
inK
RA
S/T
P53
-mut
ant h
uman
LU
AD
s
Alteration frequency (%) inEGFR/TP53-mutant human LUADs
Higher frequency in KRAS/TP53
Higher frequency in EGFR/TP53
also significant when we extend our analysis to include all tumors regardless of TP53 mutation status (Supplementary Fig. S8C). Collectively, the mouse and human data indicate that the mutational patterns can reflect the consequences of profound epistasis between tumor suppressor genes and oncogenic drivers.
Keap1 inactivation Limits the Response of Tumors to Osimertinib
Genetically engineered mouse models have provided insight into the biology of EGFR-driven lung tumors and have proved valuable for studying mechanisms of resistance to EGFR TKIs, especially on-target mechanisms of resistance
Cancer Research. on November 10, 2021. © 2021 American Association forcancerdiscovery.aacrjournals.org Downloaded from
Published OnlineFirst March 11, 2021; DOI: 10.1158/2159-8290.CD-20-1385

Foggetti et al.RESEaRCH aRTiCLE
1744 | CANCER DISCOVERY JUly 2021 AACRJournals.org
(27, 52–54). The TKI osimertinib was recently approved for the first-line treatment of EGFR-driven lung adenocarcino-mas. However, pathways involved in modulating the depth of response and mechanisms of resistance to osimertinib are still under investigation (55, 56). To determine how tumor suppressor genes influence the therapeutic response of lung tumors to EGFR inhibition, we treated EGFR;p53;Cas9 mice with Lenti-sgTSPool/Cre–initiated tumors with osimertinib for 2 weeks starting at 9 weeks after tumor initiation (Fig. 5A). Osimertinib treatment greatly reduced the overall tumor bur-den relative to vehicle-treated EGFR;p53;Cas9 mice (Supple-mentary Fig. S9A–S9D). Residual neoplastic cells were sparse, as determined by staining for EGFRL858R, and those cells were not proliferating (Supplementary Fig. S9E and S9F). The overall response was similar when the 2-week treatment was started 17 weeks after tumor initiation (Supplementary Fig. S9G–S9J). Residual tumors in EGFR;p53;Cas9 mice retained lung adenocarcinoma features and did not have evidence of phenotypic changes, such as small cell lung cancer (SCLC) transformation, after 2 weeks of osimertinib treatment (Sup-plementary Fig. S10A).
To quantify the impact of inactivating each tumor sup-pressor gene on the response to osimertinib in vivo, we per-formed Tuba-seq on the lungs from osimertinib-treated EGFR;p53;Cas9 mice 11 and 19 weeks after tumor initia-tion and compared the results to Tuba-seq results from vehicle-treated controls (Fig. 5B; Supplementary Fig. S11A and S11B). Consistent with the imaging data and histologic analysis, osimertinib treatment greatly reduced tumor bur-den as assessed by Tuba-seq (compare Fig. 2C and E, Fig. 5B, Supplementary Fig. S3A and S3B, and Supplementary Fig. S11A and S11B; Supplementary Methods).
After 2 weeks of osimertinib treatment, inactivation of Apc, Rb1, or Rbm10 was still associated with larger tumors, whereas the size distribution of tumors with inactivation of other tumor suppressor genes remained similar to that of tumors with inert sgRNAs (compare Fig. 5B and Fig. 2E; Fig. 2C and Supplementary Fig. S11A; Supplementary Fig. S11B and Supplementary Fig. S3A and S3B). The striking excep-tion was tumors with sgKeap1. In vehicle-treated mice, the size distribution of sgKeap1 tumors was almost identical to that of tumors with inert sgRNAs; however, in osimertinib-treated mice, sgKeap1 tumors were significantly larger than the tumors with inert sgRNAs. This suggests that inactivation of Keap1 limits responses to osimertinib (Fig. 5B). Osimertinib resistance conferred by Keap1 inactivation was also observed at 19 weeks after tumor initiation (Supplementary Fig. S11A and S11B).
We applied an analytic approach that we previously developed and validated to quantify the genotype-specific responses (Fig. 5C; Supplementary Fig. S11C–S11G; Sup-plementary Methods; ref. 34). By comparing the LN mean of the observed tumor size distributions in osimertinib-treated mice with the expected tumor size distribution based on the overall drug effects, we can estimate genotype-specific drug responses (ScoreRLM; Fig. 5C; Supplementary Fig. S11C). At 11 weeks after tumor initiation, following 2 weeks of osimertinib treatment, sgRb1 tumors were 25% smaller than expected (P = 0.04). Conversely, tumors with Keap1 inactivation were 48% larger than expected (P = 0.07;
Fig. 5C). The effect of Keap1 inactivation was even greater at 19 weeks after tumor initiation, when tumors were 274% larger than expected (P = 0.13; Supplementary Fig. S11C). Given the magnitude of the ScoreRLM for sgKeap1 at both time points (ScoreRLM = 0.57 and 1.90 after 2 weeks of treatment at 11 and 19 weeks after tumor initiation, respec-tively), we combined the two independent P values and confirmed that Keap1 inactivation significantly reduced the therapeutic response to osimertinib (Fisher method, P = 0.05). Other statistical measures of genotype-specific responses, including relative tumor number (ScoreRTN) and relative geometric mean (ScoreRGM), did not significantly differ between the treated and untreated groups (Supple-mentary Fig. S11D; Supplementary Methods). Our analytic methods allow us to uncover when effects are more pro-nounced on larger tumors (ScoreRTN and ScoreRGM have much lower sensitivity when the effects are greater on larger tumors; Supplementary Fig. S11E–S11G; Supplementary Methods). Thus, our data are consistent with resistance conferred by Keap1 inactivation being more pronounced in larger tumors.
KEaP1-Deficient Tumors Have Reduced Sensitivity to Osimertinib That Correlates with Clinical Outcomes
To further investigate these findings, we initiated tumors with Lenti-sgKeap1/Cre in EGFR;p53 and EGFR;p53;Cas9 mice followed by treatment with osimertinib or vehicle (Fig. 5D and E). Osimertinib treatment reduced the size and number of tumors in EGFR;p53 mice compared with vehicle-treated EGFR;p53 mice (Fig. 5D; Supplementary Fig. S12A and S12B). Conversely, osimertinib treatment of Lenti-sgKeap1/Cre– initiated tumors in EGFR;p53;Cas9 mice did not decrease tumor size or number compared with vehicle-treated EGFR;p53;Cas9 mice (Fig. 5D and E; Supplementary Fig. S12A and S12B). Consistent with the inefficiency of CRISPR/Cas9-mediated genome editing in somatic cells, some tumors initi-ated with Lenti-sgKeap1/Cre in EGFR;p53;Cas9 mice retained KEAP1 protein (Fig. 5E, top panels). However, the tumors that remained in osimertinib-treated EGFR;p53;Cas9 mice all had medium to low or negative KEAP1 levels (Fig. 5E). Together, these data indicate that, although Keap1 inactivation is not positively selected for during oncogenic EGFR-driven tumor growth, osimertinib treatment selects for cancer cells with low or absent KEAP1, thus reducing the therapeutic response to the drug.
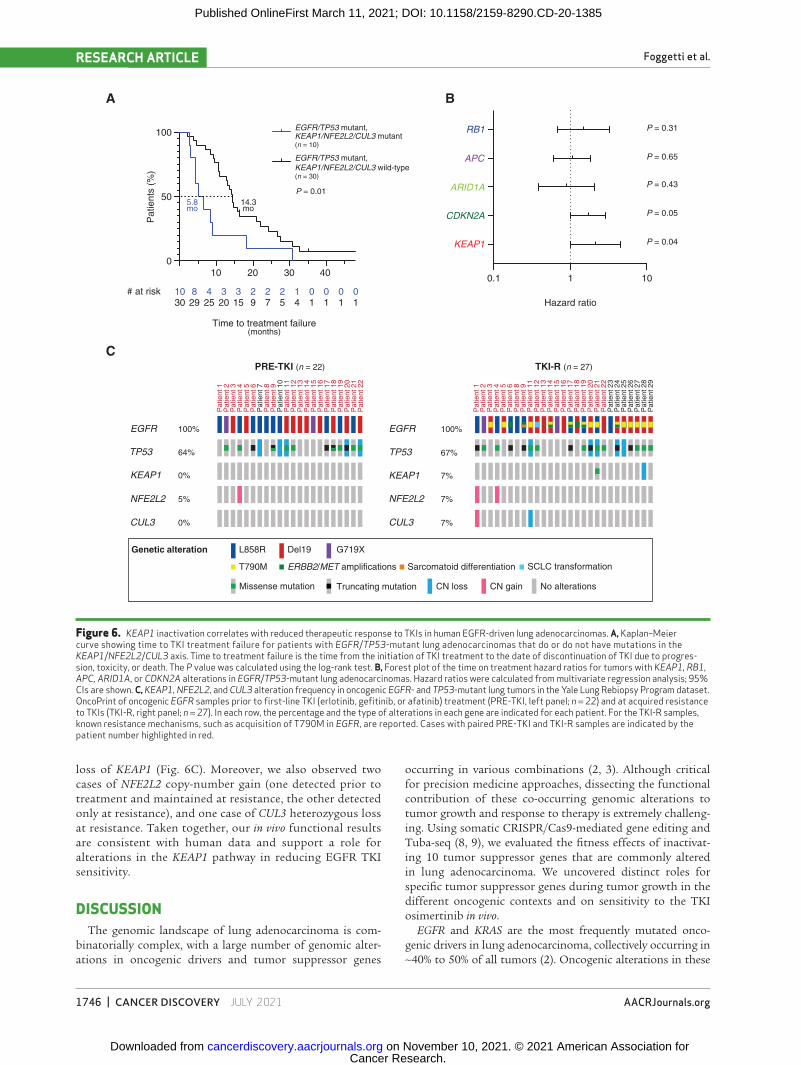
To correlate our findings with clinical data, we analyzed the effects of KEAP1 pathway alterations on patient out-comes to EGFR inhibition in EGFR/TP53-mutant lung adenocarcinomas. Oncogenic EGFR–driven tumors with mutations in genes in the KEAP1 pathway have been sug-gested to be less responsive to TKIs, and we confirmed this association in EGFR/TP53 tumors (Fig. 6A and B; ref. 57). Mutations in KEAP1/NFE2L2/CUL3 were associated with a significantly shorter time on EGFR TKI therapy in contrast to KEAP1/NFE2L2/CUL3 wild-type tumors (5.8 vs. 14.3 months; P = 0.01, log-rank test; Fig. 6A; Supplementary Tables S1 and S2). This remained significant even after adjustment for potential confounders such as age, sex, race, and smoking status (Supplementary Table S3). Among several other tumor
Cancer Research. on November 10, 2021. © 2021 American Association forcancerdiscovery.aacrjournals.org Downloaded from
Published OnlineFirst March 11, 2021; DOI: 10.1158/2159-8290.CD-20-1385

Tumor Suppressor Genes and EGFR-Driven Lung Adenocarcinoma RESEaRCH aRTiCLE
JUly 2021 CANCER DISCOVERY | 1745
Figure 5. Identification of genotype-specific responses to osimertinib treatment. a, Experimental strategy. Tumors were initiated with Lenti-sgTSPool/Cre in EGFR;p53;Cas9 mice, developed for 9 or 17 weeks, and then were treated for 2 weeks with either vehicle or osimertinib (25 mg/kg, 5 days/week). B, Relative size of the tumors at the indicated percentiles for each genotype in EGFR;p53;Cas9 mice after treatment with osimertinib. The 95% CIs are shown. P values were calculated from bootstrapping. Percentiles that are significantly different from the tumors with inert sgRNAs are in color. C, Estimate of the genotype-specific treatment response (ScoreRLM) calculated by comparing the LN mean of tumors treated with osimertinib to the LN mean of vehicle-treated tumors in EGFR;p53;Cas9 mice 11 weeks after tumor initiation (Supplementary Methods). Error bars indicate the standard deviation. P values were calculated from bootstrapping. D, H&E staining of tumor-bearing lungs in EGFR;p53 and EGFR;p53;Cas9 mice with Lenti-sgKeap1/Cre–initiated tumors (n = 8 mice/group). Scale bars, 1.2 mm. E, Immunostaining of Lenti-sgKeap1/Cre initiated tumors in EGFR;p53;Cas9 mice for EGFRL858R and KEAP1 after vehicle or osimertinib treatment (n = 4 mice/treated-group). Tumors are still detectable after 2 weeks of treatment with osimertinib and mostly express medium or low/negative levels of KEAP1 compared with tumors treated with vehicle in EGFR;p53;Cas9 mice (bar graph). The dashed lines indicate areas of tumors, and the level of KEAP1 is indicated with a label (high, medium, or low/negative). Scale bars, 200 μm. P values were calculated using a χ2 test.
A
B C
Lenti-sgTSPool/Cre
Tuba-seq
2 weeks
2 weeks
Osimertinib
Vehicle
9 or 17 weeks
EGFR;p53;Cas9
0.5
1.0
2.0
4.0
8.0
D
EGFR;p53;Cas9 + osimertinib (11 weeks)
sgN
eo1
sgN
eo2
sgN
eo3
sgN
T
sgLk
b1
sgp5
3
sgA
tm
sgA
rid1a
sgR
b1
sgK
eap1
sgA
pc
sgS
mad
4
sgS
etd2
sgR
bm10
sgC
dkn2
a
Inert
Tum
or s
ize
of s
gRN
A
Rel
ativ
e tu
mor
siz
e
Tum
or s
ize
of In
ert
)
)
EGFR;p53
Vehicle Osimertinib
EGFRL858R
H&E
H&E
EGFR;p53;Cas9
EGFR;p53;Cas9 + osimertinib
HighMediumLow/negative
Vehicle n = 67 Osimertinib n = 51
KEAP1 expression
% T
umor
s
Lent
i-sgK
eap1
/Cre
EGFR;p53;Cas9 + vehicle
EGFRL858R
Lenti-sgKeap1/CreE
−0.5
0.0
0.5
1.0
Est
imat
ed g
enot
ype-
spec
ific
resp
onse
to o
sim
ertin
ib(S
core
RLM
)
sgN
eo1
sgN
eo2
sgN
eo3
sgN
T
sgLk
b1sg
p53
sgA
tmsg
Arid
1a
sgR
b1
sgK
eap1
sgA
pcsg
Sm
ad4
sgS
etd2
sgR
bm10
sgC
dkn2
a
Inert
506070809095
Percentiles
P = 0.07
P = 0.04
0
50
100
Vehicl
e
Osimer
tinib
P < 0.0001
Vehicle Osimertinib
Relatively sensitive
Relatively resistant
n = 11
n = 29
n = 18
n = 33
n = 27
KEAP1
High
Low/negative
KEAP1
Low/negative
suppressor genotypes, KEAP1 pathway alterations were the most significant driver of limited sensitivity after correction for multiple hypothesis testing (Fig. 6B).
We also analyzed a dataset of oncogenic EGFR lung adeno-carcinoma patient samples collected through the Yale Lung Rebiopsy Program prior to first-line TKI treatment and after the development of resistance to TKIs (Fig. 6C; Supplementary
Table S4). Among 18 patients with EGFR and TP53 mutant tumors, two had KEAP1 alterations at relapse (TKI-R sam-ples). One case had an acquired missense mutation (Y206N) that lies in a domain of KEAP1 involved in forming the com-plex with Cullin3 to mediate ubiquitination and degradation of NRF2, which is encoded by NFE2L2 (58). The other tumor, which was analyzed only at resistance, had heterozygous
Cancer Research. on November 10, 2021. © 2021 American Association forcancerdiscovery.aacrjournals.org Downloaded from
Published OnlineFirst March 11, 2021; DOI: 10.1158/2159-8290.CD-20-1385
Foggetti et al.RESEaRCH aRTiCLE
1746 | CANCER DISCOVERY JUly 2021 AACRJournals.org
loss of KEAP1 (Fig. 6C). Moreover, we also observed two cases of NFE2L2 copy-number gain (one detected prior to treatment and maintained at resistance, the other detected only at resistance), and one case of CUL3 heterozygous loss at resistance. Taken together, our in vivo functional results are consistent with human data and support a role for alterations in the KEAP1 pathway in reducing EGFR TKI sensitivity.
DiscUssiONThe genomic landscape of lung adenocarcinoma is com-
binatorially complex, with a large number of genomic alter-ations in oncogenic drivers and tumor suppressor genes
occurring in various combinations (2, 3). Although critical for precision medicine approaches, dissecting the functional contribution of these co-occurring genomic alterations to tumor growth and response to therapy is extremely challeng-ing. Using somatic CRISPR/Cas9-mediated gene editing and Tuba-seq (8, 9), we evaluated the fitness effects of inactivat-ing 10 tumor suppressor genes that are commonly altered in lung adenocarcinoma. We uncovered distinct roles for specific tumor suppressor genes during tumor growth in the different oncogenic contexts and on sensitivity to the TKI osimertinib in vivo.
EGFR and KRAS are the most frequently mutated onco-genic drivers in lung adenocarcinoma, collectively occurring in ∼40% to 50% of all tumors (2). Oncogenic alterations in these
Figure 6. KEAP1 inactivation correlates with reduced therapeutic response to TKIs in human EGFR-driven lung adenocarcinomas. a, Kaplan–Meier curve showing time to TKI treatment failure for patients with EGFR/TP53-mutant lung adenocarcinomas that do or do not have mutations in the KEAP1/NFE2L2/CUL3 axis. Time to treatment failure is the time from the initiation of TKI treatment to the date of discontinuation of TKI due to progres-sion, toxicity, or death. The P value was calculated using the log-rank test. B, Forest plot of the time on treatment hazard ratios for tumors with KEAP1, RB1, APC, ARID1A, or CDKN2A alterations in EGFR/TP53-mutant lung adenocarcinomas. Hazard ratios were calculated from multivariate regression analysis; 95% CIs are shown. C, KEAP1, NFE2L2, and CUL3 alteration frequency in oncogenic EGFR- and TP53-mutant lung tumors in the Yale Lung Rebiopsy Program dataset. OncoPrint of oncogenic EGFR samples prior to first-line TKI (erlotinib, gefitinib, or afatinib) treatment (PRE-TKI, left panel; n = 22) and at acquired resistance to TKIs (TKI-R, right panel; n = 27). In each row, the percentage and the type of alterations in each gene are indicated for each patient. For the TKI-R samples, known resistance mechanisms, such as acquisition of T790M in EGFR, are reported. Cases with paired PRE-TKI and TKI-R samples are indicated by the patient number highlighted in red.
A
EGFR/TP53 mutant,KEAP1/NFE2L2/CUL3 mutant(n = 10)
EGFR/TP53 mutant,KEAP1/NFE2L2/CUL3 wild-type (n = 30)
5.8mo
14.3mo
B
P = 0.01
C
0.1 1 10
KEAP1
CDKN2A
ARID1A
APC
RB1
Hazard ratio
10 30
1030
829
425
320
315
29
27
25
14
01
01
01
01
0
50
100
Time to treatment failure(months)
Pat
ient
s (%
)
# at risk
P = 0.31
P = 0.65
P = 0.43
P = 0.05
P = 0.04
20 40
PRE-TKI (n = 22) TKI-R (n = 27)
EGFR
TP53
KEAP1 0%
67%
7%
64%
EGFR
TP53
100%
KEAP1
Pat
ient
1P
atie
nt 2
Pat
ient
3P
atie
nt 4
Pat
ient
5P
atie
nt 6
Pat
ient
7P
atie
nt 8
Pat
ient
9P
atie
nt 1
0P
atie
nt 1
1P
atie
nt 1
2P
atie
nt 1
3P
atie
nt 1
4P
atie
nt 1
5P
atie
nt 1
6P
atie
nt 1
7P
atie
nt 1
8P
atie
nt 1
9P
atie
nt 2
0P
atie
nt 2
1P
atie
nt 2
2
Pat
ient
1
Pat
ient
2
Pat
ient
3P
atie
nt 4
Pat
ient
5P
atie
nt 6
Pat
ient
8P
atie
nt 9
Pat
ient
11
Pat
ient
12
Pat
ient
13
Pat
ient
14
Pat
ient
15
Pat
ient
16
Pat
ient
17
Pat
ient
18
Pat
ient
19
Pat
ient
20
Pat
ient
21
Pat
ient
22
Pat
ient
23
Pat
ient
24
Pat
ient
25
Pat
ient
26
Pat
ient
27
Pat
ient
28
Pat
ient
29
Genetic alteration
Missense mutation CN loss No alterationsTruncating mutation
ERBB2/MET amplifications Sarcomatoid differentiationT790M
G719XL858R Del19
CN gain
SCLC transformation
NFE2L2 5% 7%NFE2L2
CUL3 0% 7%CUL3
100%
Cancer Research. on November 10, 2021. © 2021 American Association forcancerdiscovery.aacrjournals.org Downloaded from
Published OnlineFirst March 11, 2021; DOI: 10.1158/2159-8290.CD-20-1385
Tumor Suppressor Genes and EGFR-Driven Lung Adenocarcinoma RESEaRCH aRTiCLE
JUly 2021 CANCER DISCOVERY | 1747
two genes are mutually exclusive, consistent with them being in the same canonical receptor tyrosine kinase EGFR/RAS/MAPK signaling pathway (59, 60). For this reason, one might have anticipated that inactivating tumor suppressor pathways in EGFR-driven and KRAS-driven lung cancers would have similar biological consequences. It is tempting to make a sim-ple assumption that tumor suppressor genes have a constant marginal effect independent of other genomic alterations, or, in other words, that the fitness landscape of tumor suppres-sion is smooth and that epistatic interactions are infrequent and/or small in magnitude. Here, we tested this assumption by comparing the fitness landscape of tumor suppression in EGFR-driven Trp53-deficient and KRAS-driven Trp53-deficient lung adenocarcinoma and found distinct patterns of epistasis between tumor suppressor genes and oncogenes. Inactivation of Rb1, Rbm10, and Apc had a similar effect on EGFR- and KRAS-driven lung tumors (Fig. 2C and E; Fig. 4A–C; Supple-mentary Fig. S8B). In contrast, although Lkb1 and Setd2 were among the most potent tumor suppressor genes in Kras/p53 tumors, inactivation of Lkb1 or Setd2 led to reduced tumor growth of EGFR/p53 tumors (Fig. 2C and E; Fig. 4A and B). This observation is consistent with human data, where altera-tions in either LKB1 or SETD2 are much less common in lung tumors with oncogenic EGFR than in tumors with oncogenic KRAS (Fig. 4D and E; Supplementary Fig. S8C). Thus, we reveal a highly context-dependent fitness landscape of tumor sup-pression that depends on the nature of the oncogenic driver. Investigation of the mechanisms that underlie the sign epista-sis of LKB1 and SETD2 may uncover new biological insights and vulnerabilities of EGFR-mutant tumors. More broadly, sign epistasis within seemingly similar cancer contexts could help identify genetic interactions for further functional inves-tigation and should be considered when interpreting cancer genomic data.
Concurrent TP53 and RB1 mutations have been linked to the transformation of lung adenocarcinomas to SCLC that is observed in some EGFR-mutant tumors upon the emergence of TKI resistance (23, 61, 62). Additional histologic changes have also been described in TKI-resistant tumors, including squamous cell carcinoma differentiation (63). In our screen and validation studies, we found that the tumors had lung adenocarcinoma features and did not express neuroendocrine or squamous cell carcinoma markers (Supplementary Figs. S7 and S10A). We also examined a small cohort of EGFR;p53;Cas9 mice with tumors initiated using Lenti-sgRb1/Cre, and these tumors were positive for adenocarcinoma markers and nega-tive for neuroendocrine and squamous cell carcinoma mark-ers at baseline (Supplementary Fig. S10B). Long-term TKI treatment studies in these new models will provide us with the opportunity to determine how tumors on different tumor suppressor gene backgrounds evolve through TKI treatment and whether specific tumor suppressor genes contribute to altering the histologic properties of TKI resistant tumors.
A major advantage of autochthonous genetically engi-neered mouse models of human cancer is that they can be used to study the impact of inactivation of putative tumor suppressor genes on therapy responses in vivo (10, 34, 64). We found that inactivation of Keap1 decreases sensitivity to osi-mertinib in vivo (Fig. 5). This finding was supported in a clini-cal cohort of EGFR/TP53-mutated lung adenocarcinomas,
in which patients with tumors harboring mutations in KEAP1/NFE2L2/CUL3 had a significantly shorter time to treatment discontinuation with EGFR TKIs compared with matched controls (Fig. 6A and B; Supplementary Fig. S13A–S13D; refs. 17, 57). These results are consistent with inactiva-tion of this tumor suppressor gene limiting the response to therapy and explain the occasional presence of alterations in KEAP1 pathway genes in TKI-resistant human tumors.
The reduced sensitivity of tumors initiated with Lenti-sgKeap1 may be associated with the accumulation and trans-activation of genes regulated by NRF2 (65–67). Indeed, we found that KEAP1-deficient tumors had increased nuclear NRF2 and NQO1 expression relative to KEAP1-proficient tumors, suggesting the presence of enhanced NRF2 tran-scriptional activity (Supplementary Fig. S12C; refs. 65–67). Activation of both the MAPK and AKT/mTOR pathways downstream of EGFR were strongly decreased in both KEAP1-deficient and KEAP1-proficient tumors after 2 weeks of treatment with osimertinib, thus excluding the possibility that the reduced sensitivity could be due to sustained activa-tion of these pathways (Supplementary Fig. S12D). NRF2 is a pleiotropic transcription factor that can lead to increased production of antioxidants, regulate ferroptosis, and alter cellular metabolism (68). Which of the functional outputs of activation of the NRF2 pathway are responsible for the decreased sensitivity to osimertinib in EGFR-mutant tumors remains to be determined. Experiments in lung adenocarci-noma cell lines treated with targeted therapies against the EGFR/MAPK pathway suggest that KEAP1 loss leads to decreased levels of drug-induced reactive oxygen species and increased glutathione synthesis (66). A systematic analysis of the KEAP1 pathway in EGFR-mutant genetically engineered mouse models and patient-derived tumors will be necessary to fully elucidate how NRF2 mediates TKI resistance and reveal potential therapeutic vulnerabilities. Indeed, there are potential therapeutic avenues for treating KEAP1-deficient tumors that should be explored in EGFR-mutant tumors. In KRAS-driven lung tumors, KEAP1/NRF2-dependent meta-bolic reprogramming leads to a dependency on glutaminoly-sis, which can be targeted via glutaminase inhibition (69–73). Future studies will be important to establish whether similar metabolic rewiring occurs in KEAP1-deficient EGFR-mutant tumors that can be leveraged therapeutically.
Genetic alterations in KEAP1 occur in less than 2% of EGFR-mutant tumors at baseline and are found in less than 10% of TKI-resistant EGFR-mutant lung adenocarcinomas (Fig. 6C; Supplementary Fig. S13E; ref. 17). It is possible that non-genetic alterations that increase NRF2-dependent gene expres-sion also occur in EGFR-mutant tumors and that examination of the mutational status of the pathway underestimates the frequency with which it is disrupted (17, 74–78). Collectively, these results raise the possibility that NRF2 should be inves-tigated as a potential target to reduce or delay the onset of drug resistance in EGFR-driven lung adenocarcinomas. More broadly, our study demonstrates that our approach can be used to identify clinically relevant pathways that modulate response to therapy in vivo. By uncovering the driving forces of the heterogeneity of responses to therapy observed in patients, these types of studies could help define high-risk versus low-risk patient populations and guide therapeutic interventions.
Cancer Research. on November 10, 2021. © 2021 American Association forcancerdiscovery.aacrjournals.org Downloaded from
Published OnlineFirst March 11, 2021; DOI: 10.1158/2159-8290.CD-20-1385

Foggetti et al.RESEaRCH aRTiCLE
1748 | CANCER DISCOVERY JUly 2021 AACRJournals.org
This study provides insight into the complex interplay between tumor suppressor genes and other co-occurring muta-tions in EGFR-driven lung adenocarcinoma tumorigenesis and thus has significant clinical implications. Across many cancers, including lung adenocarcinoma, most tumor suppressors are mutated in a low percentage of tumors. Several of the tumor suppressor genes that we investigated were among the most fre-quently mutated genes in EGFR-driven TP53-mutant lung can-cer, such as RBM10 and RB1 (Fig. 4D; Supplementary Fig. S14A; refs. 79, 80). However, even the tumor suppressor genes that we found to have an effect on in vivo tumor growth are not as frequently altered in human tumors as might be expected from the experimental findings. This could be related to the overall higher mutation burden in human tumors versus mouse mod-els (81), with human tumors harboring alterations in geneti-cally redundant pathways (cell-cycle regulation, WNT pathway) or inactivation of tumor suppressor genes by epigenetic mecha-nisms (11, 36, 82, 83). Finally, the type of mutational process that gives rise to the mutations could also affect the frequency with which certain tumor suppressor genes are mutated (84, 85). Tuba-seq allows the analysis of genetic effects without being confounded by the frequency with which alterations in that gene are generated by natural processes in human tumors.
The lack of genomic complexity in the genetically engi-neered mouse models (81) allows us to evaluate interactions between co-occurring alterations by avoiding confounding factors pervasive in human genomic data (e.g., tumor muta-tion load, mutation frequency, additional mutations) and environmental factors such as smoking. Our data provide clear quantitative data on mutual exclusivity and synergistic biological effects of genetic alterations that mirror observa-tions in patient specimens, highlighting the strength of these interactions. Additional studies in models with a higher tumor mutation burden, more reflective of that present in human tumors, will be important to uncover the extent to which additional genetic alterations further modulate tumor growth and drug sensitivity in specific oncogenic driver/tumor suppressor gene contexts. Notably, tumors with other oncogenic drivers (e.g., ALK rearrangements) also have unique spectra of co-occurring tumor suppressor gene altera-tions, further suggesting widespread interactions between tumor suppressor gene pathways and oncogenic drivers (Sup-plementary Fig. S14B). Future in vivo Tuba-seq studies should investigate tumor models driven by other oncogenes to uncover a broader understanding of the genetic interactions between diverse oncogenes and large panels of tumor sup-pressor genes. Precise mapping of the fitness consequences of combinations of genetic alterations during tumor evolution will help uncover the biological and clinical relevance of spe-cific alterations during carcinogenesis and identify pathways that can be exploited as therapeutic targets to prevent or overcome resistance to targeted therapies.
MethODsMice and Tumor Initiation
TetO-EGFRL858R, p53flox/flox, Rosa26CAGs-LSL-rtTA3-IRES-mKate, Rosa26CAGs-LSL-
Cas9-GFP, KrasLSL-G12D, Rosa26LSL-Tomato, and H11LSL-Cas9 mice have been described (4, 25, 27–30, 43, 86, 87). EGFR;p53 and EGFR;p53;Cas9 were on a mixed BL6/129/FVB background and Kras;p53;Cas9 mice
were on a mixed BL6/129 background. Approximately equal num-bers of males and females were used for each experiment, and the number of mice used for each experiment is listed in each figure legend. Lung tumors were initiated by intratracheal administration of lentiviral Cre vectors as previously described (26). Tumor burden was assessed by MRI, fluorescence microscopy, lung weight, and histology, as indicated. Doxycycline was administered by feeding mice with doxycycline-impregnated food pellets (625 ppm; Harlan-Teklad). Osimertinib (AstraZeneca) was resuspended in 0.5% (w/v) methylcellulose (vehicle) and was administered orally (25 mg/kg 5 days a week). All animals were kept in pathogen-free housing under guidelines approved by either the Yale University Institutional Ani-mal Care or the Stanford University Institutional Animal Care and Use Committee (IACUC) guidelines.
Production, Purification, and Titering of LentivirusThe barcoded vectors in the Lenti-sgTSPool/Cre have been previ-
ously described (Supplementary Table S5; ref. 8). The second Lenti-sgRbm10/Cre vector used in the validation experiments was generated by site-directed mutagenesis (Supplementary Table S6). Briefly, len-tiviral U6-sgRNA/Cre vectors contain an eight-nucleotide defined sequence (sgID) that identifies the sgRNA followed by a 15-nucleo-tide random barcode (BC) to uniquely tag each tumor (8). To avoid BC–sgRNA uncoupling driven by lentiviral template switching dur-ing reverse transcription of the pseudo-diploid viral genome, each barcoded Lenti-sgRNA/Cre vector was generated separately (88, 89). We cultured HEK293T cells in Dulbecco’s Modified Eagle Medium with 10% fetal bovine serum and transfected them with individual barcoded Lenti-sgRNA/Cre plasmids (sgLkb1, sgp53, sgApc, sgAtm, sgArid1a, sgCdkn2a, sgKeap1, sgNeo1, sgNeo2, sgNeo3, sgNT1, sgRb1, sgRbm10, sgRbm10#2 unbarcoded, sgSetd2, or sgSmad4) along with pCMV-VSV-G (8454; Addgene) envelope plasmid and pCMV-dR8.2 dvpr (8455; Addgene) packaging plasmid using polyethylenimine. We treated the cells with 20 mmol/L sodium butyrate 8 hours after trans-fection, changed the culture medium 24 hours after transfection, and collected supernatants 36 and 48 hours after transfection. Subse-quently, we removed the cell debris with a 0.45 μm syringe filter unit (SLHP033RB; Millipore Sigma), concentrated each lentiviral vector by ultracentrifugation (25,000 g for 1.5 hours at 4°C), resuspended the virus in phosphate-buffered saline, and stored the virus at −80°C. To determine the titer of each vector, we transduced Rosa26LSL-YFP mouse embryonic fibroblasts (a gift from Dr. Alejandro Sweet-Cord-ero, University of California, San Francisco), determined the percent-age of yellow fluorescent protein–positive cells by flow cytometry, and normalized the titer to a lentiviral preparation of known titer. The cell line was authenticated at the University of California, San Francisco, and tested negative for Mycoplasma contamination. Lentiviral vectors were thawed and pooled immediately prior to delivery to mice. All of these plasmids are available at https://www.addgene.org/Monte_Winslow/.
Lentiviral Titers and Time of AnalysisAnticipated growth rates were determined by monitoring tumor
development through MRI in pilot experiments, and the analysis time points were selected to ensure that tumors were detectable by MRI such that their response to treatment could be evaluated. Viral titers used in the experiments were chosen to balance the total tumor burden across mice at the time of analysis after tumor initiation. For analysis of tumor growth 11 weeks after tumor initiation, the Lenti-sgTSPool/Cre titer administered to EGFR;p53 mice was 2 × 10⁶ infectious units/mouse, whereas for EGFR;p53;Cas9 mice we used 1 × 10⁶ infectious units/mouse. We reasoned that using a higher viral titer in the control EGFR;p53 mice would increase our confidence that any differences observed between EGFR;p53 and EGFR;p53;Cas9 mice were due to inactivation of tumor suppressor genes in the latter
Cancer Research. on November 10, 2021. © 2021 American Association forcancerdiscovery.aacrjournals.org Downloaded from
Published OnlineFirst March 11, 2021; DOI: 10.1158/2159-8290.CD-20-1385

Tumor Suppressor Genes and EGFR-Driven Lung Adenocarcinoma RESEaRCH aRTiCLE
JUly 2021 CANCER DISCOVERY | 1749
model. At the 19-week time point, in EGFR;p53;Cas9 mice we initiated tumors with 1 × 10⁵ infectious units/mouse. Two weeks before col-lection, mice were treated with either vehicle or osimertinib. For the validation experiments in which we used a single vector to initiate tumors—Lenti-sgApc/Cre, Lenti-sgRbm10/Cre, Lenti-sgRbm10#2/Cre, or Lenti-sgNeo2/Cre (sgInert)—we used 1 × 10⁵ infectious units/mouse and analyzed the mice after 14 weeks of tumor growth (Sup-plementary Table S6). For the validation with Lenti-sgKeap1/Cre virus (1 × 10⁵ infectious units/mouse), both EGFR;p53 and EGFR;p53;Cas9 mice were treated 15 weeks after tumor initiation, and lungs were collected after 2 weeks of treatment with either vehicle or osimerti-nib. Kras;p53;Cas9 were analyzed 14 weeks after tumor initiation with 2.2 × 10⁴ infectious units/mouse.
MRIAll procedures were performed in accordance with protocols
approved by the Yale University IACUC and in agreement with the National Institutes of Health Guide for the Care and Use of Laboratory Animals. Respiratory gated, gradient-echo MRI images of mice were collected with a 4T (31-cm bore) small-animal AVANCE horizontal- bore spectrometer (Bruker). All data were collected as previously described (52). Tumor volume was quantified by calculating the area of visible lung opacities present in each image sequence per mouse using BioImage Suite 3.01 (90). For the drug treatment studies, when tumors were detected using MRI, mice were assigned to different groups to ensure a comparable tumor volume distribution prior to treatment between the vehicle-treated and the osimertinib-treated group.
Isolation of Genomic DNA from Mouse Lungs and Preparation of sgID-BC Libraries
Genomic DNA was isolated from bulk tumor–bearing lung tissue from each mouse as previously described (8). Briefly, three bench-mark control cell lines (∼5 × 10⁵ cells per cell line) carrying unique sgID-BCs were added (“spiked-in”) to each sample prior to lysis to enable the calculation of the absolute number of neoplastic cells in each tumor from the number of sgID-BC reads. Following homog-enization and overnight protease K digestion, genomic DNA was extracted from the lung lysates using standard phenol–chloroform and ethanol precipitation.
sgID-BC sequencing libraries were prepared by polymerase chain reaction (PCR) amplifying the sgID-BC region from total genomic DNA. To enable the identification and subsequent computational elimination of index-hopped reads after high-throughput sequenc-ing, the sgID-BC region of the integrated Lenti-sgRNA-BC/Cre vec-tors was PCR amplified using unique dual-indexing primer pairs. To increase the sequence diversity, we added 6 to 9 Ns before the sequence-specific primers (34). For each mouse, we performed eight 100-μL PCR reactions per sample (4 μg DNA per reaction, 32 μg per mouse) using the Q5 High-Fidelity 2X Master Mix (M0494X; New England Biolabs). The PCR products were purified with Agencourt AMPure XP beads (A63881; Beckman Coulter) using a double-size selection protocol. The concentration and quality of the purified libraries were determined using the Agilent High Sensitivity DNA Kit (5067-4626; Agilent Technologies) on the Agilent 2100 Bioanalyzer (G2939BA; Agilent Technologies). The libraries were pooled based on lung weight (to have sequencing depth more evenly distributed across samples), cleaned up, size-selected using AMPure XP beads, and sequenced on the Illumina HiSeq 2500 platform to generate paired-end 150-bp reads (Admera Health). To increase the diversity at the beginning of sequencing reads and improve sequencing quality, 5% to 15% PhiX control DNA was added to the library.
Histology and ImmunohistochemistryThe auxiliary lobe of the right lung was collected for each experimental
mouse from the mice transduced with the Lenti-sgTSPool/Cre pool,
whereas both the auxiliary and left lobes were collected for the valida-tion experiments with individual sgRNAs (sgApc, sgRbm10, sgRbm10#2, and sgNeo2). Right and auxiliary lobes were collected for the experiment with Lenti-sgKeap1/Cre virus. Lung lobes were fixed in 4% paraform-aldehyde overnight at room temperature, placed in 70% ethanol, and paraffin-embedded and sectioned (Histology@Yale). Four-micrometer sections were used for hematoxylin and eosin (H&E) staining and immunohistochemistry. Tumor sizes were determined by measuring the longest diameter for each tumor in H&E-stained sections. Tumor size and tumor area were quantified using ImageJ (National Institutes of Health). The limited tissue collected for histologic analysis reduced the overall number of tumors that could be measured. P values were calculated from the Mann–Whitney U test. The following antibodies were used for immunohistochemistry: anti-EGFRL858R (1:200, 3197; Cell Sig-naling Technology), anti-SP-C (SFTPC; 1:200, ab40876; Abcam), anti-TTF1/NKX2–1 (1:200, ab76013; Abcam), anti–phospho-histone H3 (1:200, 9701; Cell Signaling Technology), anti–cleaved caspase-3 (1:300, 9664; Cell Signaling Technology), anti-mKate (1:2500, AB233; Evrogen), anti-Cas9 (1:500, 7A9-3A3 and NBP2-36440; Novus Biologicals), anti-β-catenin (1:500, 8814; Cell Signaling Technology), anti-RBM10 (1:200, ab224149; Abcam), anti-KEAP1 (1:500, ab227828; Abcam), anti-SOX9 (1:500, AB5535; Merck Millipore), anti-NRF2 (1:500, ab137550; Abcam), anti-NQO1 (1:500, AB28947; Abcam), anti-phospho-ERK (1:100, 4370; Cell Signaling Technology), anti-phospho-AKT (1:100, 4060; Cell Sig-naling Technology), anti-Phospho-S6 Ribosomal Protein (P-S6; 1:1000, 5364; Cell Signaling Technology), anti-UCHL1 (1:500, HPA005993; Sigma Millipore), anti-Synaptophysin (1:400, ab32127; Abcam), and anti-p63 (1:2500, ab124762; Abcam). Nuclear protein expression in tumors was binned as high (over 75% of positive nuclei in a tumor area), medium (between 25% and 75% of positive nuclei), or low/negative (posi-tive nuclear staining below 25%). Cytosolic protein levels were binned as high (more than 75% of positive cells), medium (between 25% and 75% of positive cells), or low/negative (positive staining below 25%). Statistical analyses were performed with GraphPad Prism 8 and QuPath.
Analysis of Human Lung Tumor Data Using GENIE DataThe AACR Project GENIE is a registry that contains Clinical
Laboratory Improvement Amendments– and International Organi-zation for Standardization–certified genomic data collected from the records of more than 9,000 patients who were treated at each of the consortium’s participating institutions (49). Data from GENIE 4.1-public were accessed through the Synapse Platform. We gener-ated a comprehensive list of all missense, nonsense, and frameshift mutations for all screened genes across all participating centers in the GENIE project, documenting these mutations at the gene and amino acid levels. Based on the sets of genes included in the differ-ent screening panels that contribute to Project GENIE, we annotated all lung adenocarcinomas within the database as being wild-type, mutated, or not screened for each gene. From this complete catalog of mutations in each tumor, we determined the rates of co-occur-rence of known oncogenic KRAS mutations (G12X, G13X, Q61X) or EGFR mutations (L858R, exon 19 deletions, L861Q, G719X) with missense, nonsense, or frameshift mutations in our set of 10 tumor suppressor genes. Furthermore, we determined the frequency of coincident tumor suppressor gene mutations in tumors with oncogenic KRAS and inactivating TP53 mutations (KRAS/TP53) and in tumors with oncogenic EGFR and inactivating TP53 mutations (EGFR/TP53) using GENIE 8.1 (Supplementary Fig. S14A). A similar analysis was also performed on tumors with ALK rearrangements and TP53 mutations using GENIE 8.1 (Supplementary Fig. S14B). The pipelines for these analyses are publicly available at www.github.com/dgmaghini/GENIE and https://github.com/lichuan199010/Tuba-seq-analysis-and-summary-statistics, and they allow users to input OncoTree codes of interest, generate mutational profiles for the corresponding GENIE tumors, and identify the co-occurrence of up to two background mutations (e.g., EGFR and TP53) with
Cancer Research. on November 10, 2021. © 2021 American Association forcancerdiscovery.aacrjournals.org Downloaded from
Published OnlineFirst March 11, 2021; DOI: 10.1158/2159-8290.CD-20-1385

Foggetti et al.RESEaRCH aRTiCLE
1750 | CANCER DISCOVERY JUly 2021 AACRJournals.org
mutations in other genes of interest. Analyses were performed using Phyton 3.6 and R 3.6.
Stanford Cohort of EGFR-Mutant Lung AdenocarcinomasPatients with lung cancer who were evaluated at the Stanford Can-
cer Center and had their tumors analyzed using the Stanford Solid Tumor Actionable Mutation Panel (STAMP; ref. 91) were included in the analysis after obtaining written informed consent. This ret-rospective study was conducted under a molecular analysis protocol approved by the Stanford University Institutional Review Board. All STAMP cases performed between 2015 and 2019 were included; during this time, there were two different assays used, with one cov-ering 198 genes (302 kb) and the other covering 130 genes (232 kb). STAMP was performed as the standard of care and thus at the discre-tion of the treating physician and could have occurred at the time of diagnosis or at the time of progression.
From the available STAMP cases, patients were selected if they had stage IV non–small cell lung cancer (NSCLC) and their tumor had a pathogenic EGFR and TP53 mutation. Patients were excluded if they had incomplete data or were lost to follow-up prior to analysis of the primary endpoint, if they elected not to receive treatment, or if they received adjuvant TKI therapy for early-stage disease. Within this cohort, patients were further selected for the presence of at least one of the tumor suppressor genes investigated in the preclinical setting (KEAP1, LKB1/STK11, SETD2, SMAD4, RB1, APC, ARID1A, and/or CDKN2A). To ensure that there was enough power to conduct an analysis, genes were analyzed individually if there were at least eight patients with tumors with a mutation of that gene who met the inclusion criteria. Due to the small numbers, patients with tumors with LKB1 (n = 1), SETD2 (n = 0), and SMAD4 (n = 1) mutations were not analyzed separately. How-ever, as two tumors harboring LKB1 and SMAD4 mutations were also EGFR/TP53 mutant, they were included as part of the control arm. Univariate analysis of time to treatment failure (TTF) was completed on cases with stage IV, EGFR/TP53-mutant NSCLC that were treated with a TKI (13) and had mutations in a KEAP1 pathway component (KEAP1, NFE2L2, CUL3), RB1, APC, ARID1A, or CDKN2A. Mutations that were significant on univariate analy-sis were identified and multivariate analyses accounting for (i) cofounding variables and (ii) comutations were run. Demographic data including sex, age at diagnosis, smoking history, and ethnic-ity were extracted (Supplementary Tables S1–S3). For each tumor suppressor, patients were matched 1:3 with a wild-type cohort on the basis of sex, smoking history, ethnicity, age, and treatment type. TTF was determined by subtracting the date of discontinuation of TKI due to progression, toxicity, or death from the date of initia-tion of TKI and is reported in months. Statistical analysis was per-formed using GraphPad Prism 8 and R studio. The Kaplan–Meier method was used to estimate TTF. Comparison of survival curves was made using the log-rank test. Significance was defined as P < 0.05. Hazard ratios (HR) were generated from multivariate regres-sion analysis performed in R and reported with a 95% CI.
Yale Cohort of EGFR-Mutant Lung AdenocarcinomasPatients with EGFR-mutant lung adenocarcinoma were enrolled
to a Yale University institutional review board–approved protocol after obtaining written informed consent allowing the collection and analysis of clinical data, use of archival and fresh tissue and blood, and the generation of patient-derived xenografts. This study was conducted in accordance with recognized ethical guidelines (Declaration of Helsinki, CIOMS, Belmont Report, U.S. Common Rule). Patients who received targeted therapy (erlotinib, gefitinib, or afatinib) as first-line therapy, either alone or in combination with other therapies, such as chemotherapy or cetuximab, were included (Supplementary Table S4). For genomic studies, formalin-fixed
paraffin-embedded tissue was macrodissected to enrich for tumor material. All of the tumor samples (n = 29) analyzed had matched normal tissue and cancer cell purity > 20% as assessed by the loss of heterozygosity (LOH) events from the whole-exome sequencing data.
Whole-Exome Sequencing. DNA was extracted and analyzed as previously described (92). Briefly, genomic DNA was captured on the Roche NimbleGen 2.1M human exome array and subjected to 74-bp paired-end reads on the Illumina HiSeq2000 instrument. The mean coverage for normal was 109.1×, and the mean coverage for tumor was 189×, with 92.78% and 95.56% for the bases covered by at least 20 independent sequence reads, respectively. Sequence reads were mapped to the human reference genome (GRCh37) using the Bur-rows–Wheeler Aligner-MEM (BWA-MEM) program. Sequence reads outside the targeted sequences were discarded, and the statistics on coverage were collected from the remaining reads using in-house per scripts.
Somatic Mutation Calling. For all matched tumor–normal pairs, somatic point mutations and indels were called by MuTect2 using Bayesian classifiers. For all somatic mutations called, we extracted base coverage information in all samples and considered the muta-tions that were supported by at least two independent sequence reads covering non-reference alleles and present in more than 5% of all sequencing reads. Identified variants were further filtered based on their presence in repositories of common variations (1000 Genomes, National Heart, Lung, and Blood Institute exome variant server, and 2,577 noncancer exomes sequenced at Yale) and annotated using the ANNOVAR program (93). All somatic indels were visually inspected to remove the false-positive calls.
Somatic Copy Number Variation Analysis. Copy-number analysis was performed as previously described (92). Briefly, copy-number variants were identified from the whole-exome sequencing data using EXCAVATOR software, which normalizes the nonuniform whole-exome sequencing data taking guanine-cytosine content, mappabil-ity, and exon size into account (94). The hidden Markov model was utilized to classify each copy number variant segment into five copy number states (homozygous deletion, heterozygous deletion, normal copy number, homozygous copy gain, or multiple copy gain). Tumor purity was estimated from LOH using in-house scripts.
Data and Code AvailabilityThe datasets generated during and/or analyzed in the current
study are available in the NCBI Gene Expression Omnibus database (GSE146550) and dbGAP (phs002334.v1.p1; https://www.ncbi.nlm.nih.gov/projects/gap/cgi-bin/study.cgi?study_id=phs002334.v1.p1). The GENIE genomic data analysis is publicly available at www.github.com/dgmaghini/GENIE. More GENIE analyses and other data supporting the findings are available at https://github.com/lichuan199010/Tuba-seq-analysis-and-summary-statistics or upon request.
authors’ DisclosuresG. Foggetti reports grants from the American-Italian Cancer
Foundation and non-financial support from AstraZeneca during the conduct of the study. H. Cai reports grants from the University of California during the conduct of the study. S.N. Gettinger reports grants from the National Cancer Institute–National Institutes of Health during the conduct of the study. M. Diehn reports grants and personal fees from AstraZeneca; personal fees from BioNTech, Genentech, Gritstone Oncology, Novartis, RefleXion, and Roche Sequencing Solutions; personal fees and non-financial support from Illumina; other support from CiberMed and Foresight Diagnostics outside the submitted work; and a patent for cancer biomarkers
Cancer Research. on November 10, 2021. © 2021 American Association forcancerdiscovery.aacrjournals.org Downloaded from
Published OnlineFirst March 11, 2021; DOI: 10.1158/2159-8290.CD-20-1385
Tumor Suppressor Genes and EGFR-Driven Lung Adenocarcinoma RESEaRCH aRTiCLE
JUly 2021 CANCER DISCOVERY | 1751
pending, issued, and with royalties paid from Roche. H.A. Wakelee reports grants and personal fees from AstraZeneca, Helsinn, and Xcovery; grants from ACEA Biosciences, Arrys Therapeutics, Bristol Myers Squibb, Celgene, Clovis Oncology, Genentech/Roche, Gilead, Merck, Novartis, Pharmacyclics, and Seattle Genetics; and personal fees from Blueprint, Daiichi Sankyo, Janssen, and Mirati outside the submitted work, as well as unpaid consultancy work with Genen-tech/Roche and Merck. D.A. Petrov reports other from D2G Oncol-ogy outside the submitted work and a patent for compositions and methods for multiplexed quantitative analysis of cell lineages issued, licensed, and with royalties paid from D2G Oncology. M.M. Winslow reports grants from the National Institutes of Health during the con-duct of the study and is the founder of, and an equity holder in, D2G Oncology. K. Politi reports grants from the National Cancer Institute– National Institutes of Health during the conduct of the study; grants and personal fees from AstraZeneca; grants from Kolltan, Roche/Genentech, Boehringer Ingelheim, and Symphogen; and personal fees from Dynamo Therapeutics, Halda, Maverick Therapeutics, and Tocagen outside the submitted work; and a patent for EGFRT790M mutation testing issued, licensed, and with royalties paid from Molec-ular Diagnostics/Memorial Sloan Kettering Cancer Center. No disclo-sures were reported by the other authors.
authors’ ContributionsG. Foggetti: Data curation, formal analysis, validation, investiga-
tion, visualization, methodology, writing–original draft, writing–review and editing. C. Li: Data curation, formal analysis, validation, investigation, visualization, methodology, writing–original draft, writing–review and editing. H. Cai: Data curation, validation, inves-tigation, methodology, writing–original draft, writing–review and editing. J.A. Hellyer: Data curation, formal analysis, investigation, methodology, writing–review and editing. W. Lin: Data curation, investigation, methodology, writing–review and editing. D. Ayeni: Investigation, methodology, writing–review and editing. K. Hastings: Investigation, methodology, writing–review and editing. J. Choi: Data curation, formal analysis, methodology, writing–review and editing. A. Wurtz: Data curation, methodology, writing–review and editing. L. Andrejka: Data curation, validation, methodology, writing–review and editing. D.G. Maghini: Data curation, formal analysis, investigation, methodology, writing–review and editing. N. Rashleigh: Methodology, writing–review and editing. S. Levy: Methodology, writing–review and editing. R. Homer: Formal analysis, validation, writing–review and editing. S.N. Gettinger: Data curation, writing–review and editing. M. Diehn: Data curation, writing–review and editing. H.A. Wakelee: Data curation, writing–review and edit-ing. D.A. Petrov: Conceptualization, resources, supervision, funding acquisition, writing–original draft, writing–review and editing. M.M. Winslow: Conceptualization, resources, supervision, funding acquisition, visualization, writing–original draft, writing–review and editing. K. Politi: Conceptualization, resources, supervision, funding acquisition, writing–original draft, writing–review and editing.
acknowledgmentsThe authors would like to acknowledge the American Association
for Cancer Research and its financial and material support in the development of the AACR Project GENIE registry, as well as members of the consortium for their commitment to data sharing. Interpreta-tions are the responsibility of study authors. We thank members of the Politi, Winslow, and Petrov laboratories for helpful feedback and support, particularly Jacqueline Starrett and Emily Forrest for editing and Fernando de Miguel for creating resources to help with the whole-exome sequencing analysis. We also thank Henning Stehr for provid-ing the sequencing data from the STAMP cohort and the Bosenberg Laboratory for sharing their Leica M205 FA stereomicroscope. G. Foggetti was supported by an American-Italian Cancer Foundation
postdoctoral fellowship. C. Li is a Connie and Bob Lurie Fellow of the Damon Runyon Cancer Research Foundation (DRG-2331). H. Cai was supported by a Tobacco-Related Disease Research Program Postdoctoral Fellowship (28FT-0019). D. Ayeni was supported by National Institutes of Health (NIH) F31 CA203488. K. Hastings was supported by NIH F32 CA210516. This work was supported by NIH R01 CA231253 and R01 CA234349 (M.M. Winslow and D.A. Petrov), NIH R01 CA120247 and P50 CA196530 (K. Politi), the Ginny and Kenneth Grunley Fund for Lung Cancer Research (K. Politi), and the Yale Cancer Center Class of ’61 Research Award (K. Politi). Gilead Sciences, Inc., supported the sequencing of a subset of the Yale Cancer Center specimens. Osimertinib is an agent developed by AstraZeneca.
The costs of publication of this article were defrayed in part by the payment of page charges. This article must therefore be hereby marked advertisement in accordance with 18 U.S.C. Section 1734 solely to indicate this fact.
Received September 25, 2020; revised December 23, 2020; accepted February 11, 2021; published first March 11, 2021.
REFEREnCES 1. Hanahan D, Weinberg RA. Hallmarks of cancer: the next generation.
Cell 2011;144:646–74. 2. Skoulidis F, Heymach JV. Co-occurring genomic alterations in non-
small-cell lung cancer biology and therapy. Nat Rev Cancer 2019;19: 495–509.
3. van de Haar J, Canisius S, Yu MK, Voest EE, Wessels LFA, Ideker T. Identifying epistasis in cancer genomes: a delicate affair. Cell 2019; 177:1375–83.
4. Platt RJ, Chen S, Zhou Y, Yim MJ, Swiech L, Kempton HR, et al. CRISPR-Cas9 knockin mice for genome editing and cancer modeling. Cell 2014;159:440–55.
5. Chen S, Sanjana NE, Zheng K, Shalem O, Lee K, Shi X, et al. Genome- wide CRISPR screen in a mouse model of tumor growth and metastasis. Cell 2015;160:1246–60.
6. Chuang CH, Greenside PG, Rogers ZN, Brady JJ, Yang D, Ma RK, et al. Molecular definition of a metastatic lung cancer state reveals a targetable CD109-Janus kinase-Stat axis. Nat Med 2017;23:291–300.
7. Winters IP, Chiou SH, Paulk NK, McFarland CD, Lalgudi PV, Ma RK, et al. Multiplexed in vivo homology-directed repair and tumor bar-coding enables parallel quantification of Kras variant oncogenicity. Nat Commun 2017;8:2053.
8. Rogers ZN, McFarland CD, Winters IP, Naranjo S, Chuang CH, Petrov D, et al. A quantitative and multiplexed approach to uncover the fitness landscape of tumor suppression in vivo. Nat Methods 2017; 14:737–42.
9. Rogers ZN, McFarland CD, Winters IP, Seoane JA, Brady JJ, Yoon S, et al. Mapping the in vivo fitness landscape of lung adenocarcinoma tumor suppression in mice. Nat Genet 2018;50:483–6.
10. Winters IP, Murray CW, Winslow MM. Towards quantitative and multiplexed in vivo functional cancer genomics. Nat Rev Genet 2018; 19:741–55.
11. Campbell JD, Alexandrov A, Kim J, Wala J, Berger AH, Pedamallu CS, et al. Distinct patterns of somatic genome alterations in lung adenocarcinomas and squamous cell carcinomas. Nat Genet 2016;48: 607–16.
12. Cancer Genome Atlas Research Network. Comprehensive molecular profiling of lung adenocarcinoma. Nature 2014;511:543–50.
13. Blakely CM, Watkins TBK, Wu W, Gini B, Chabon JJ, McCoach CE, et al. Evolution and clinical impact of co-occurring genetic alterations in advanced-stage EGFR-mutant lung cancers. Nat Genet 2017;49:1693–704.
14. Politi K, Herbst RS. Lung cancer in the era of precision medicine. Clin Cancer Res 2015;21:2213–20.
Cancer Research. on November 10, 2021. © 2021 American Association forcancerdiscovery.aacrjournals.org Downloaded from
Published OnlineFirst March 11, 2021; DOI: 10.1158/2159-8290.CD-20-1385
Foggetti et al.RESEaRCH aRTiCLE
1752 | CANCER DISCOVERY JUly 2021 AACRJournals.org
15. Jordan EJ, Kim HR, Arcila ME, Barron D, Chakravarty D, Gao J, et al. Prospective comprehensive molecular characterization of lung adenocarcinomas for efficient patient matching to approved and emerging therapies. Cancer Discov 2017;7:596–609.
16. Jamal-Hanjani M, Wilson GA, McGranahan N, Birkbak NJ, Watkins TBK, Veeriah S, et al. Tracking the evolution of non-small-cell lung cancer. N Engl J Med 2017;376:2109–21.
17. Yu HA, Suzawa K, Jordan E, Zehir A, Ni A, Kim R, et al. Concurrent alterations in EGFR-mutant lung cancers associated with resistance to EGFR kinase inhibitors and characterization of MTOR as a media-tor of resistance. Clin Cancer Res 2018;24:3108–18.
18. Scheffler M, Ihle MA, Hein R, Merkelbach-Bruse S, Scheel AH, Siemanowski J, et al. K-ras mutation subtypes in NSCLC and associ-ated co-occurring mutations in other oncogenic pathways. J Thorac Oncol 2019;14:606–16.
19. Lynch TJ, Bell DW, Sordella R, Gurubhagavatula S, Okimoto RA, Brannigan BW, et al. Activating mutations in the epidermal growth factor receptor underlying responsiveness of non-small-cell lung can-cer to gefitinib. N Engl J Med 2004;350:2129–39.
20. Paez JG, Janne PA, Lee JC, Tracy S, Greulich H, Gabriel S, et al. EGFR mutations in lung cancer: correlation with clinical response to gefi-tinib therapy. Science 2004;304:1497–500.
21. Pao W, Miller V, Zakowski M, Doherty J, Politi K, Sarkaria I, et al. EGF receptor gene mutations are common in lung cancers from “never smokers” and are associated with sensitivity of tumors to gefitinib and erlotinib. Proc Natl Acad Sci U S A 2004;101:13306–11.
22. Soria JC, Ohe Y, Vansteenkiste J, Reungwetwattana T, Chewaskulyong B, Lee KH, et al. Osimertinib in untreated EGFR-mutated advanced non-small-cell lung cancer. N Engl J Med 2018;378:113–25.
23. Offin M, Chan JM, Tenet M, Rizvi HA, Shen R, Riely GJ, et al. Concur-rent RB1 and TP53 alterations define a subset of EGFR-mutant lung cancers at risk for histologic transformation and inferior clinical outcomes. J Thorac Oncol 2019;14:1784–93.
24. DuPage M, Cheung AF, Mazumdar C, Winslow MM, Bronson R, Schmidt LM, et al. Endogenous T cell responses to antigens expressed in lung adenocarcinomas delay malignant tumor progression. Cancer Cell 2011;19:72–85.
25. Caswell DR, Chuang CH, Yang D, Chiou SH, Cheemalavagu S, Kim-Kiselak C, et al. Obligate progression precedes lung adenocarci-noma dissemination. Cancer Discov 2014;4:781–9.
26. DuPage M, Dooley AL, Jacks T. Conditional mouse lung cancer models using adenoviral or lentiviral delivery of Cre recombinase. Nat Protoc 2009;4:1064–72.
27. Politi K, Zakowski MF, Fan PD, Schonfeld EA, Pao W, Varmus HE. Lung adenocarcinomas induced in mice by mutant EGF receptors found in human lung cancers respond to a tyrosine kinase inhibitor or to down-regulation of the receptors. Genes Dev 2006;20:1496–510.
28. Dow LE, Nasr Z, Saborowski M, Ebbesen SH, Manchado E, Tasdemir N, et al. Conditional reverse tet-transactivator mouse strains for the efficient induction of TRE-regulated transgenes in mice. PLoS One 2014;9:e95236.
29. Jonkers J, Meuwissen R, van der Gulden H, Peterse H, van der Valk M, Berns A. Synergistic tumor suppressor activity of BRCA2 and p53 in a conditional mouse model for breast cancer. Nat Genet 2001;29:418–25.
30. Chiou SH, Kim-Kiselak C, Risca VI, Heimann MK, Chuang CH, Burds AA, et al. A conditional system to specifically link disruption of protein-coding function with reporter expression in mice. Cell Rep 2014;7:2078–86.
31. Puglisi F, Barbone F, Damante G, Bruckbauer M, Di Lauro V, Beltrami CA, et al. Prognostic value of thyroid transcription factor-1 in primary, resected, non-small cell lung carcinoma. Mod Pathol 1999; 12:318–24.
32. Tan D, Li Q, Deeb G, Ramnath N, Slocum HK, Brooks J, et al. Thyroid transcription factor-1 expression prevalence and its clinical implica-tions in non-small cell lung cancer: a high-throughput tissue microar-ray and immunohistochemistry study. Hum Pathol 2003;34:597–604.
33. Tanaka H, Yanagisawa K, Shinjo K, Taguchi A, Maeno K, Tomida S, et al. Lineage-specific dependency of lung adenocarcinomas on the lung development regulator TTF-1. Cancer Res 2007;67:6007–11.
34. Li C, Lin W, Rizvi H, Cai H, McFarland CD, Rogers ZN, et al. Quanti-tative in vivo analyses reveal a complex pharmacogenomic landscape in lung adenocarcinoma. BioRxiv2020.01.28.923912; https://doi.org/ 10.1101/2020.01.28.923912. Provisionally accepted by Cancer Research.
35. Zehir A, Benayed R, Shah RH, Syed A, Middha S, Kim HR, et al. Mutational landscape of metastatic cancer revealed from prospective clinical sequencing of 10,000 patients. Nat Med 2017;23:703–13.
36. Nakayama S, Sng N, Carretero J, Welner R, Hayashi Y, Yamamoto M, et al. β-catenin contributes to lung tumor development induced by EGFR mutations. Cancer Res 2014;74:5891–902.
37. Bechara EG, Sebestyen E, Bernardis I, Eyras E, Valcarcel J. RBM5, 6, and 10 differentially regulate NUMB alternative splicing to control cancer cell proliferation. Mol Cell 2013;52:720–33.
38. Hernandez J, Bechara E, Schlesinger D, Delgado J, Serrano L, Valcarcel J. Tumor suppressor properties of the splicing regulatory factor RBM10. RNA Biol 2016;13:466–72.
39. Zhao J, Sun Y, Huang Y, Song F, Huang Z, Bao Y, et al. Functional analysis reveals that RBM10 mutations contribute to lung adenocar-cinoma pathogenesis by deregulating splicing. Sci Rep 2017;7:40488.
40. Walter DM, Venancio OS, Buza EL, Tobias JW, Deshpande C, Gudiel AA, et al. Systematic in vivo inactivation of chromatin-regulating enzymes identifies Setd2 as a potent tumor suppressor in lung adeno-carcinoma. Cancer Res 2017;77:1719–29.
41. Ji H, Ramsey MR, Hayes DN, Fan C, McNamara K, Kozlowski P, et al. LKB1 modulates lung cancer differentiation and metastasis. Nature 2007;448:807–10.
42. Sanchez-Rivera FJ, Papagiannakopoulos T, Romero R, Tammela T, Bauer MR, Bhutkar A, et al. Rapid modelling of cooperating genetic events in cancer through somatic genome editing. Nature 2014;516:428–31.
43. Jackson EL, Willis N, Mercer K, Bronson RT, Crowley D, Montoya R, et al. Analysis of lung tumor initiation and progression using condi-tional expression of oncogenic K-ras. Genes Dev 2001;15:3243–8.
44. Schuster K, Venkateswaran N, Rabellino A, Girard L, Pena-Llopis S, Scaglioni PP. Nullifying the CDKN2AB locus promotes mutant K-ras lung tumorigenesis. Mol Cancer Res 2014;12:912–23.
45. Schmitt A, Knittel G, Welcker D, Yang TP, George J, Nowak M, et al. ATM deficiency is associated with sensitivity to PARP1- and ATR inhibitors in lung adenocarcinoma. Cancer Res 2017;77:3040–56.
46. Efeyan A, Murga M, Martinez-Pastor B, Ortega-Molina A, Soria R, Collado M, et al. Limited role of murine ATM in oncogene-induced senes-cence and p53-dependent tumor suppression. PLoS One 2009;4:e5475.
47. Ho VM, Schaffer BE, Karnezis AN, Park KS, Sage J. The retinoblas-toma gene Rb and its family member p130 suppress lung adenocarci-noma induced by oncogenic K-Ras. Oncogene 2009;28:1393–9.
48. Walter DM, Yates TJ, Ruiz-Torres M, Kim-Kiselak C, Gudiel AA, Deshpande C, et al. RB constrains lineage fidelity and multiple stages of tumour progression and metastasis. Nature 2019;569:423–7.
49. AACR Project GENIE Consortium. AACR Project GENIE: powering precision medicine through an International Consortium. Cancer Discov 2017;7:818–31.
50. Skoulidis F, Byers LA, Diao L, Papadimitrakopoulou VA, Tong P, Izzo J, et al. Co-occurring genomic alterations define major subsets of KRAS-mutant lung adenocarcinoma with distinct biology, immune profiles, and therapeutic vulnerabilities. Cancer Discov 2015;5:860–77.
51. Arbour KC, Jordan E, Kim HR, Dienstag J, Yu HA, Sanchez-Vega F, et al. Effects of co-occurring genomic alterations on outcomes in patients with KRAS-mutant non-small cell lung cancer. Clin Cancer Res 2018;24:334–40.
52. Pirazzoli V, Ayeni D, Meador CB, Sanganahalli BG, Hyder F, de Stanchina E, et al. Afatinib plus cetuximab delays resistance compared to single-agent erlotinib or afatinib in mouse models of TKI-naive EGFR L858R-induced lung adenocarcinoma. Clin Cancer Res 2016;22:426–35.
53. Pirazzoli V, Nebhan C, Song X, Wurtz A, Walther Z, Cai G, et al. Acquired resistance of EGFR-mutant lung adenocarcinomas to afatinib plus cetuximab is associated with activation of mTORC1. Cell Rep 2014;7:999–1008.
54. Starrett JH, Guernet AA, Cuomo ME, Poels KE, van Alderwerelt van Rosen-burgh IK, Nagelberg A, et al. Drug sensitivity and allele specificity of first-line osimertinib resistance EGFR mutations. Cancer Res 2020;80:2017–30.
Cancer Research. on November 10, 2021. © 2021 American Association forcancerdiscovery.aacrjournals.org Downloaded from
Published OnlineFirst March 11, 2021; DOI: 10.1158/2159-8290.CD-20-1385
Tumor Suppressor Genes and EGFR-Driven Lung Adenocarcinoma RESEaRCH aRTiCLE
JUly 2021 CANCER DISCOVERY | 1753
55. Ramalingam SS, Yang JC, Lee CK, Kurata T, Kim DW, John T, et al. Osimertinib as first-line treatment of EGFR mutation-positive advanced non-small-cell lung cancer. J Clin Oncol 2018;36:841–9.
56. Ramalingam SS, Vansteenkiste J, Planchard D, Cho BC, Gray JE, Ohe Y, et al. Overall survival with osimertinib in untreated, EGFR-mutated advanced NSCLC. N Engl J Med 2019;382:41–50.
57. Hellyer JA, Stehr H, Das M, Padda SK, Ramchandran K, Neal JW, et al. Impact of KEAP1/NFE2L2/CUL3 mutations on duration of response to EGFR tyrosine kinase inhibitors in EGFR mutated non-small cell lung cancer. Lung Cancer 2019;134:42–5.
58. Cleasby A, Yon J, Day PJ, Richardson C, Tickle IJ, Williams PA, et al. Structure of the BTB domain of Keap1 and its interaction with the triterpenoid antagonist CDDO. PLoS One 2014;9:e98896.
59. Gainor JF, Varghese AM, Ou SH, Kabraji S, Awad MM, Katayama R, et al. ALK rearrangements are mutually exclusive with mutations in EGFR or KRAS: an analysis of 1,683 patients with non–small cell lung cancer. Clin Cancer Res 2013;19:4273–81.
60. Unni AM, Lockwood WW, Zejnullahu K, Lee-Lin SQ, Varmus H. Evidence that synthetic lethality underlies the mutual exclusivity of oncogenic KRAS and EGFR mutations in lung adenocarcinoma. Elife 2015;4:e06907.
61. Zakowski MF, Ladanyi M, Kris MG, Memorial Sloan-Kettering Can-cer Center Lung Cancer OncoGenome Group. EGFR mutations in small-cell lung cancers in patients who have never smoked. N Engl J Med 2006;355:213–5.
62. Sequist LV, Waltman BA, Dias-Santagata D, Digumarthy S, Turke AB, Fidias P, et al. Genotypic and histological evolution of lung cancers acquiring resistance to EGFR inhibitors. Sci Transl Med 2011;3:75ra26.
63. Schoenfeld AJ, Chan JM, Kubota D, Sato H, Rizvi H, Daneshbod Y, et al. Tumor analyses reveal squamous transformation and off-target alterations as early resistance mechanisms to first-line osimertinib in EGFR-mutant lung cancer. Clin Cancer Res 2020;26:2654–63.
64. Kersten K, de Visser KE, van Miltenburg MH, Jonkers J. Genetically engineered mouse models in oncology research and cancer medicine. EMBO Mol Med 2017;9:137–53.
65. Yamadori T, Ishii Y, Homma S, Morishima Y, Kurishima K, Itoh K, et al. Molecular mechanisms for the regulation of Nrf2-mediated cell prolif-eration in non-small-cell lung cancers. Oncogene 2012;31:4768–77.
66. Krall EB, Wang B, Munoz DM, Ilic N, Raghavan S, Niederst MJ, et al. KEAP1 loss modulates sensitivity to kinase targeted therapy in lung cancer. Elife 2017;6:e18970.
67. Park SH, Kim JH, Ko E, Kim JY, Park MJ, Kim MJ, et al. Resistance to gefitinib and cross-resistance to irreversible EGFR-TKIs mediated by disruption of the Keap1-Nrf2 pathway in human lung cancer cells. FASEB J 2018:fj201800011R.
68. Wu WL, Papagiannakopoulos T. The pleiotropic role of the KEAP1/NRF2 pathway in cancer. Annu Rev Cancer Biol 2020;4:413–35.
69. DeNicola GM, Chen PH, Mullarky E, Sudderth JA, Hu Z, Wu D, et al. NRF2 regulates serine biosynthesis in non-small cell lung cancer. Nat Genet 2015;47:1475–81.
70. Romero R, Sayin VI, Davidson SM, Bauer MR, Singh SX, LeBoeuf SE, et al. Keap1 loss promotes Kras-driven lung cancer and results in dependence on glutaminolysis. Nat Med 2017;23:1362–8.
71. Galan-Cobo A, Sitthideatphaiboon P, Qu X, Poteete A, Pisegna MA, Tong P, et al. LKB1 and KEAP1/NRF2 pathways cooperatively pro-mote metabolic reprogramming with enhanced glutamine depend-ence in KRAS-mutant lung adenocarcinoma. Cancer Res 2019;79: 3251–67.
72. Romero R, Sánchez-Rivera FJ, Westcott PMK, Mercer KL, Bhutkar A, Muir A, et al. Keap1 mutation renders lung adenocarcinomas dependent on Slc33a1. Nat Cancer 2020;1:589–602.
73. Binkley MS, Jeon YJ, Nesselbush M, Moding EJ, Nabet BY, Almanza D, et al. KEAP1/NFE2L2 mutations predict lung cancer radiation resistance that can be targeted by glutaminase inhibition. Cancer Discov 2020;10:1826–41.
74. Fabrizio FP, Mazza T, Castellana S, Sparaneo A, Muscarella LA. Epi-genetic scanning of KEAP1 CpG sites uncovers new molecular-driven
patterns in lung adeno and squamous cell carcinomas. Antioxidants 2020;9:904.
75. Wang J, Lu Q, Cai J, Wang Y, Lai X, Qiu Y, et al. Nestin regulates cellular redox homeostasis in lung cancer through the Keap1-Nrf2 feedback loop. Nat Commun 2019;10:5043.
76. Jain A, Lamark T, Sjottem E, Larsen KB, Awuh JA, Overvatn A, et al. p62/SQSTM1 is a target gene for transcription factor NRF2 and creates a positive feedback loop by inducing antioxidant response element-driven gene transcription. J Biol Chem 2010;285:22576–91.
77. Wang Q, Ma J, Lu Y, Zhang S, Huang J, Chen J, et al. CDK20 interacts with KEAP1 to activate NRF2 and promotes radiochemoresistance in lung cancer cells. Oncogene 2017;36:5321–30.
78. Marcar L, Bardhan K, Gheorghiu L, Dinkelborg P, Pfaffle H, Liu Q, et al. Acquired resistance of EGFR-mutated lung cancer to tyrosine kinase inhibitor treatment promotes PARP inhibitor sensitivity. Cell Rep 2019;27:3422–32.
79. Sanchez-Vega F, Mina M, Armenia J, Chatila WK, Luna A, La KC, et al. Oncogenic signaling pathways in The Cancer Genome Atlas. Cell 2018;173:321–37.
80. Bailey MH, Tokheim C, Porta-Pardo E, Sengupta S, Bertrand D, Weerasinghe A, et al. Comprehensive characterization of cancer driver genes and mutations. Cell 2018;173:371–85.
81. McFadden DG, Politi K, Bhutkar A, Chen FK, Song X, Pirun M, et al. Mutational landscape of EGFR-, MYC-, and Kras-driven genetically engineered mouse models of lung adenocarcinoma. Proc Natl Acad Sci U S A 2016;113:E6409–E17.
82. Brabender J, Usadel H, Danenberg KD, Metzger R, Schneider PM, Lord RV, et al. Adenomatous polyposis coli gene promoter hyper-methylation in non-small cell lung cancer is associated with survival. Oncogene 2001;20:3528–32.
83. Usadel H, Brabender J, Danenberg KD, Jeronimo C, Harden S, Engles J, et al. Quantitative adenomatous polyposis coli promoter meth-ylation analysis in tumor tissue, serum, and plasma DNA of patients with lung cancer. Cancer Res 2002;62:371–5.
84. Alexandrov LB, Nik-Zainal S, Wedge DC, Aparicio SA, Behjati S, Biankin AV, et al. Signatures of mutational processes in human can-cer. Nature 2013;500:415–21.
85. Helleday T, Eshtad S, Nik-Zainal S. Mechanisms underlying mutational signatures in human cancers. Nat Rev Genet 2014;15: 585–98.
86. Madisen L, Zwingman TA, Sunkin SM, Oh SW, Zariwala HA, Gu H, et al. A robust and high-throughput Cre reporting and characterization system for the whole mouse brain. Nat Neurosci 2010;13:133–40.
87. Nakada D, Saunders TL, Morrison SJ. Lkb1 regulates cell cycle and energy metabolism in haematopoietic stem cells. Nature 2010;468: 653–8.
88. Hill AJ, McFaline-Figueroa JL, Starita LM, Gasperini MJ, Matreyek KA, Packer J, et al. On the design of CRISPR-based single-cell molecu-lar screens. Nat Methods 2018;15:271–4.
89. Annunziato S, Kas SM, Nethe M, Yucel H, Del Bravo J, Pritchard C, et al. Modeling invasive lobular breast carcinoma by CRISPR/Cas9-mediated somatic genome editing of the mammary gland. Genes Dev 2016;30:1470–80.
90. Papademetris X, Jackowski MP, Rajeevan N, DiStasio M, Okuda H, Constable RT, et al. BioImage Suite: an integrated medical image analysis suite: an update. Insight J 2006;2006:209.
91 Chuang JC, Stehr H, Liang Y, Das M, Huang J, Diehn M, et al. ERBB2-mutated metastatic non-small cell lung cancer: response and resist-ance to targeted therapies. J Thorac Oncol 2017;12:833–42.
92. Choi M, Scholl UI, Ji W, Liu T, Tikhonova IR, Zumbo P, et al. Genetic diagnosis by whole exome capture and massively parallel DNA sequencing. Proc Natl Acad Sci U S A 2009;106:19096–101.
93. Wang K, Li M, Hakonarson H. ANNOVAR: functional annotation of genetic variants from high-throughput sequencing data. Nucleic Acids Res 2010;38:e164.
94. Xu D, Olman V, Wang L, Xu Y. EXCAVATOR: a computer pro-gram for efficiently mining gene expression data. Nucleic Acids Res 2003;31:5582–9.
Cancer Research. on November 10, 2021. © 2021 American Association forcancerdiscovery.aacrjournals.org Downloaded from
Published OnlineFirst March 11, 2021; DOI: 10.1158/2159-8290.CD-20-1385
2021;11:1736-1753. Published OnlineFirst March 11, 2021.Cancer Discov Giorgia Foggetti, Chuan Li, Hongchen Cai, et al.
In Vivoand Therapeutic Response Genetic Determinants of EGFR-Driven Lung Cancer Growth
Updated version
10.1158/2159-8290.CD-20-1385doi:
Access the most recent version of this article at:
Material
Supplementary
http://cancerdiscovery.aacrjournals.org/content/suppl/2021/03/11/2159-8290.CD-20-1385.DC1
Access the most recent supplemental material at:
Cited articles
http://cancerdiscovery.aacrjournals.org/content/11/7/1736.full#ref-list-1
This article cites 92 articles, 29 of which you can access for free at:
Citing articles
http://cancerdiscovery.aacrjournals.org/content/11/7/1736.full#related-urls
This article has been cited by 3 HighWire-hosted articles. Access the articles at:
E-mail alerts related to this article or journal.Sign up to receive free email-alerts
Subscriptions
Reprints and
To order reprints of this article or to subscribe to the journal, contact the AACR Publications
Permissions
Rightslink site. Click on "Request Permissions" which will take you to the Copyright Clearance Center's (CCC)
.http://cancerdiscovery.aacrjournals.org/content/11/7/1736To request permission to re-use all or part of this article, use this link
Cancer Research. on November 10, 2021. © 2021 American Association forcancerdiscovery.aacrjournals.org Downloaded from
Published OnlineFirst March 11, 2021; DOI: 10.1158/2159-8290.CD-20-1385