generative design for dimensioning of retaining walls
TRANSCRIPT
mathematics
Article
Generative Design for Dimensioning of Retaining Walls
Gabriel Díaz 1, Rodrigo F. Herrera 1,* , Felipe Muñoz-La Rivera 1,2,3 and Edison Atencio 1
�����������������
Citation: Díaz, G.; Herrera, R.F.;
Muñoz-La Rivera, F.; Atencio, E.
Generative Design for Dimensioning
of Retaining Walls. Mathematics 2021,
9, 1918. https://doi.org/10.3390/
math9161918
Academic Editors: Róbert Szabolcsi
and Péter Gáspár
Received: 30 June 2021
Accepted: 10 August 2021
Published: 12 August 2021
Publisher’s Note: MDPI stays neutral
with regard to jurisdictional claims in
published maps and institutional affil-
iations.
Copyright: © 2021 by the authors.
Licensee MDPI, Basel, Switzerland.
This article is an open access article
distributed under the terms and
conditions of the Creative Commons
Attribution (CC BY) license (https://
creativecommons.org/licenses/by/
4.0/).
1 School of Civil Engineering, Pontificia Universidad Católica de Valparaíso, Av. Brasil 2147,Valparaíso 2340000, Chile; [email protected] (G.D.); [email protected] (F.M.-L.R.);[email protected] (E.A.)
2 International Centre for Numerical Methods in Engineering (CIMNE), C/Gram Capitán S/N UPC CambusNord, Edifici C1, 080034 Barcelona, Spain
3 School of Civil Engineering, Universitat Politècnica de Catalunya, Carrer de Jordi Girona, 1,080034 Barcelona, Spain
* Correspondence: [email protected]
Abstract: The design of retaining walls follows a classic structure. The engineer proposes certaindimensions that will be modified until they comply with the regulatory and site restrictions presentedby the project. This is an iterative process that can be optimized through a new method calledgenerative design. The designer codes the characteristics and restrictions of the project so that thesystem creates the most appropriate solutions to the problem presented. In this research, a computerprogram was created to build the dimensions of retaining walls using generative design. For thispurpose, Design Science Research (DSR) was used, complemented with the incremental softwaredevelopment method. A program that delivers multiple retaining wall design alternatives in a shorttime was constructed. The evaluation of this program was performed through usability tests, givingas main perceptions the program’s ease of use and the time savings concerning the traditional design.
Keywords: generative design; retaining walls; optimization; design science research (DSR)
1. Introduction
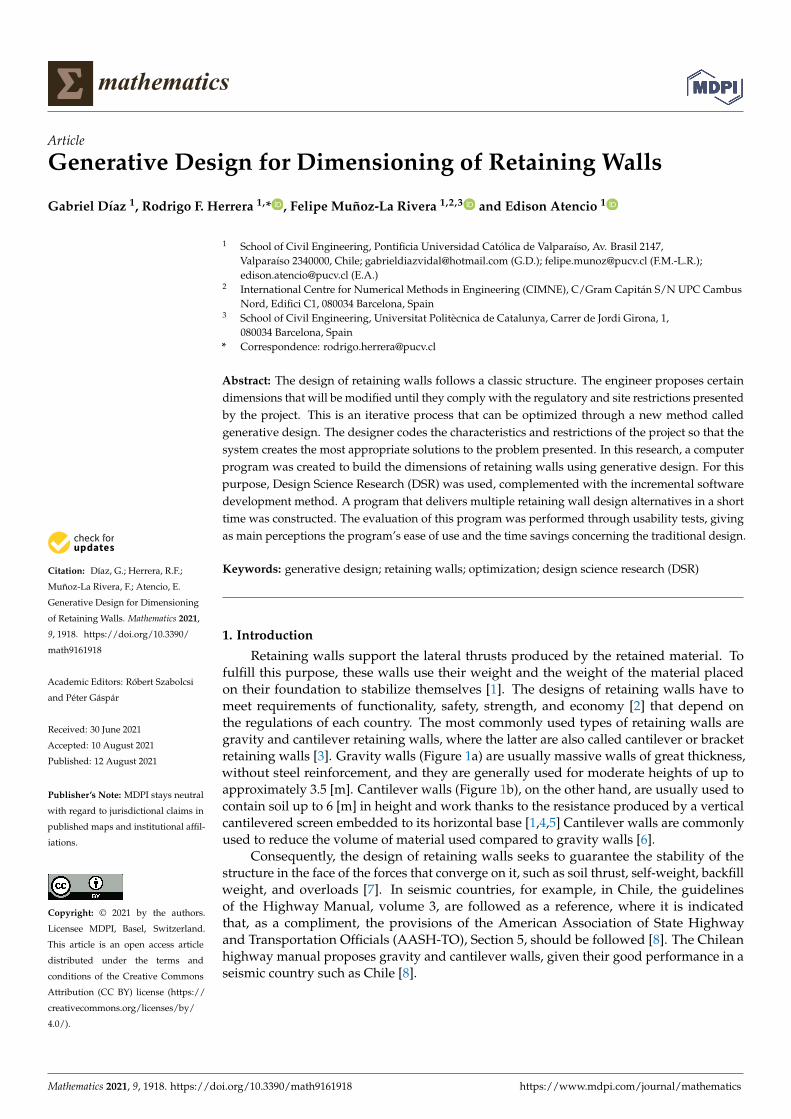
Retaining walls support the lateral thrusts produced by the retained material. Tofulfill this purpose, these walls use their weight and the weight of the material placedon their foundation to stabilize themselves [1]. The designs of retaining walls have tomeet requirements of functionality, safety, strength, and economy [2] that depend onthe regulations of each country. The most commonly used types of retaining walls aregravity and cantilever retaining walls, where the latter are also called cantilever or bracketretaining walls [3]. Gravity walls (Figure 1a) are usually massive walls of great thickness,without steel reinforcement, and they are generally used for moderate heights of up toapproximately 3.5 [m]. Cantilever walls (Figure 1b), on the other hand, are usually used tocontain soil up to 6 [m] in height and work thanks to the resistance produced by a verticalcantilevered screen embedded to its horizontal base [1,4,5] Cantilever walls are commonlyused to reduce the volume of material used compared to gravity walls [6].
Consequently, the design of retaining walls seeks to guarantee the stability of thestructure in the face of the forces that converge on it, such as soil thrust, self-weight, backfillweight, and overloads [7]. In seismic countries, for example, in Chile, the guidelinesof the Highway Manual, volume 3, are followed as a reference, where it is indicatedthat, as a compliment, the provisions of the American Association of State Highwayand Transportation Officials (AASH-TO), Section 5, should be followed [8]. The Chileanhighway manual proposes gravity and cantilever walls, given their good performance in aseismic country such as Chile [8].
Mathematics 2021, 9, 1918. https://doi.org/10.3390/math9161918 https://www.mdpi.com/journal/mathematics
Mathematics 2021, 9, 1918 2 of 22
Mathematics 2021, 9, x FOR PEER REVIEW 2 of 23
(a) (b)
Figure 1. Cross-section of some types of retaining walls: (a) Gravity wall; (b) Cantilever wall. Adapted from [4].
Consequently, the design of retaining walls seeks to guarantee the stability of the
structure in the face of the forces that converge on it, such as soil thrust, self-weight, back-
fill weight, and overloads [7]. In seismic countries, for example, in Chile, the guidelines of
the Highway Manual, volume 3, are followed as a reference, where it is indicated that, as
a compliment, the provisions of the American Association of State Highway and Trans-
portation Officials (AASH-TO), Section 5, should be followed [8]. The Chilean highway
manual proposes gravity and cantilever walls, given their good performance in a seismic
country such as Chile [8].
For designs to achieve compliance with all technical and regulatory requirements,
engineers need to assume the initial geometry of the wall (called dimensioning) and check
if the solution satisfies the established requirements. In case of non-compliance, the wall
geometry is modified and revised again [7]. This way of dimensioning corresponds to a
traditional design process, where the designer creates a solution (based on an idea) to
solve a problem. Subsequently, this solution is evaluated to decide whether it satisfies
what is expected. If it does not, the designer modifies it and evaluates it again until it
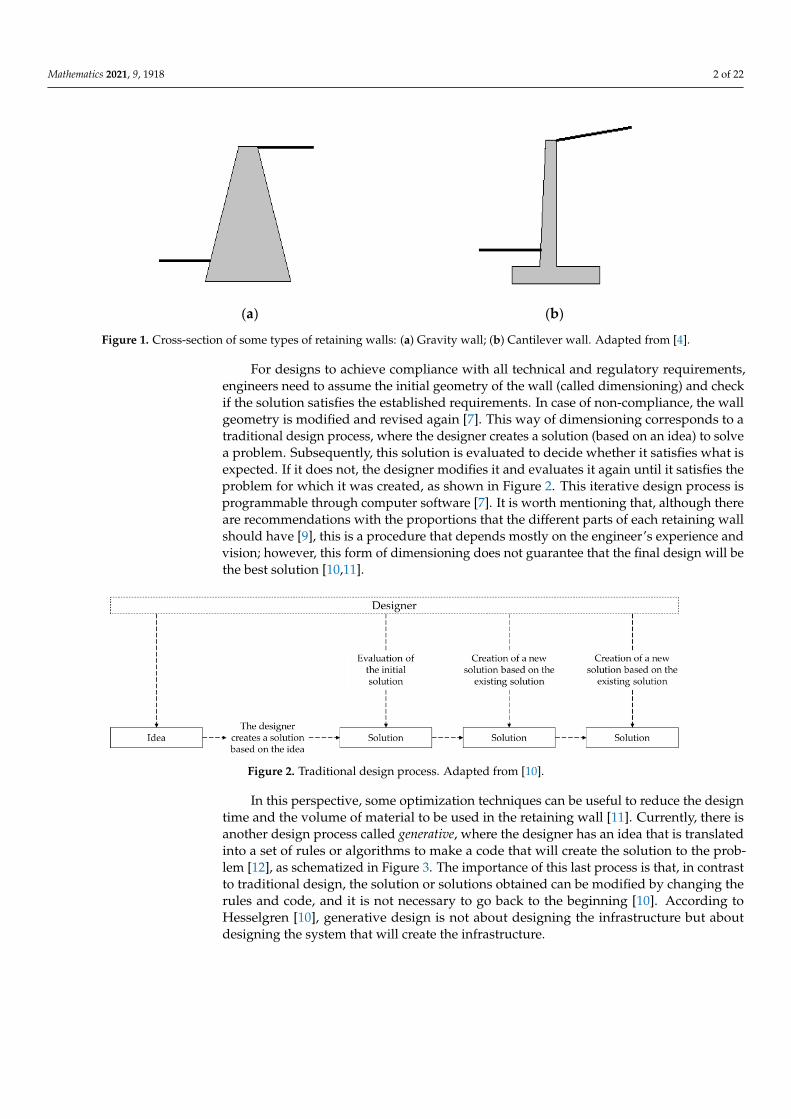
satisfies the problem for which it was created, as shown in Figure 2. This iterative design
process is programmable through computer software [7]. It is worth mentioning that, alt-
hough there are recommendations with the proportions that the different parts of each
retaining wall should have [9], this is a procedure that depends mostly on the engineer’s
experience and vision; however, this form of dimensioning does not guarantee that the
final design will be the best solution [10,11].
Figure 2. Traditional design process. Adapted from [10].
In this perspective, some optimization techniques can be useful to reduce the design
time and the volume of material to be used in the retaining wall [11]. Currently, there is
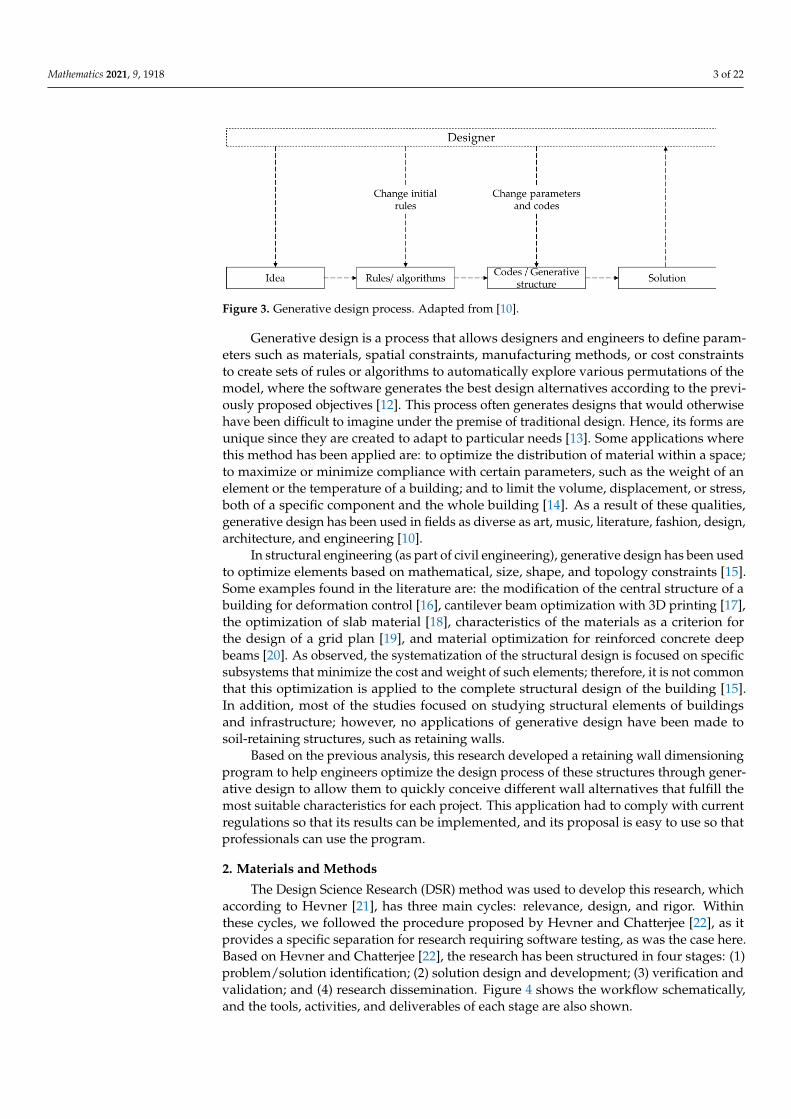
another design process called generative, where the designer has an idea that is translated
into a set of rules or algorithms to make a code that will create the solution to the problem
[12], as schematized in Figure 3. The importance of this last process is that, in contrast to
traditional design, the solution or solutions obtained can be modified by changing the
Figure 1. Cross-section of some types of retaining walls: (a) Gravity wall; (b) Cantilever wall. Adapted from [4].
For designs to achieve compliance with all technical and regulatory requirements,engineers need to assume the initial geometry of the wall (called dimensioning) and checkif the solution satisfies the established requirements. In case of non-compliance, the wallgeometry is modified and revised again [7]. This way of dimensioning corresponds to atraditional design process, where the designer creates a solution (based on an idea) to solvea problem. Subsequently, this solution is evaluated to decide whether it satisfies what isexpected. If it does not, the designer modifies it and evaluates it again until it satisfies theproblem for which it was created, as shown in Figure 2. This iterative design process isprogrammable through computer software [7]. It is worth mentioning that, although thereare recommendations with the proportions that the different parts of each retaining wallshould have [9], this is a procedure that depends mostly on the engineer’s experience andvision; however, this form of dimensioning does not guarantee that the final design will bethe best solution [10,11].
Mathematics 2021, 9, x FOR PEER REVIEW 2 of 23
(a) (b)
Figure 1. Cross-section of some types of retaining walls: (a) Gravity wall; (b) Cantilever wall. Adapted from [4].
Consequently, the design of retaining walls seeks to guarantee the stability of the
structure in the face of the forces that converge on it, such as soil thrust, self-weight, back-
fill weight, and overloads [7]. In seismic countries, for example, in Chile, the guidelines of
the Highway Manual, volume 3, are followed as a reference, where it is indicated that, as
a compliment, the provisions of the American Association of State Highway and Trans-
portation Officials (AASH-TO), Section 5, should be followed [8]. The Chilean highway
manual proposes gravity and cantilever walls, given their good performance in a seismic
country such as Chile [8].
For designs to achieve compliance with all technical and regulatory requirements,
engineers need to assume the initial geometry of the wall (called dimensioning) and check
if the solution satisfies the established requirements. In case of non-compliance, the wall
geometry is modified and revised again [7]. This way of dimensioning corresponds to a
traditional design process, where the designer creates a solution (based on an idea) to
solve a problem. Subsequently, this solution is evaluated to decide whether it satisfies
what is expected. If it does not, the designer modifies it and evaluates it again until it
satisfies the problem for which it was created, as shown in Figure 2. This iterative design
process is programmable through computer software [7]. It is worth mentioning that, alt-
hough there are recommendations with the proportions that the different parts of each
retaining wall should have [9], this is a procedure that depends mostly on the engineer’s
experience and vision; however, this form of dimensioning does not guarantee that the
final design will be the best solution [10,11].
Figure 2. Traditional design process. Adapted from [10].
In this perspective, some optimization techniques can be useful to reduce the design
time and the volume of material to be used in the retaining wall [11]. Currently, there is
another design process called generative, where the designer has an idea that is translated
into a set of rules or algorithms to make a code that will create the solution to the problem
[12], as schematized in Figure 3. The importance of this last process is that, in contrast to
traditional design, the solution or solutions obtained can be modified by changing the
Figure 2. Traditional design process. Adapted from [10].
In this perspective, some optimization techniques can be useful to reduce the designtime and the volume of material to be used in the retaining wall [11]. Currently, there isanother design process called generative, where the designer has an idea that is translatedinto a set of rules or algorithms to make a code that will create the solution to the prob-lem [12], as schematized in Figure 3. The importance of this last process is that, in contrastto traditional design, the solution or solutions obtained can be modified by changing therules and code, and it is not necessary to go back to the beginning [10]. According toHesselgren [10], generative design is not about designing the infrastructure but aboutdesigning the system that will create the infrastructure.
Mathematics 2021, 9, 1918 3 of 22
Mathematics 2021, 9, x FOR PEER REVIEW 3 of 23
rules and code, and it is not necessary to go back to the beginning [10]. According to Hes-
selgren [10], generative design is not about designing the infrastructure but about design-
ing the system that will create the infrastructure.
Figure 3. Generative design process. Adapted from [10].
Generative design is a process that allows designers and engineers to define param-
eters such as materials, spatial constraints, manufacturing methods, or cost constraints to
create sets of rules or algorithms to automatically explore various permutations of the
model, where the software generates the best design alternatives according to the previ-
ously proposed objectives [12]. This process often generates designs that would otherwise
have been difficult to imagine under the premise of traditional design. Hence, its forms
are unique since they are created to adapt to particular needs [13]. Some applications
where this method has been applied are: to optimize the distribution of material within a
space; to maximize or minimize compliance with certain parameters, such as the weight
of an element or the temperature of a building; and to limit the volume, displacement, or
stress, both of a specific component and the whole building [14]. As a result of these qual-
ities, generative design has been used in fields as diverse as art, music, literature, fashion,
design, architecture, and engineering [10].
In structural engineering (as part of civil engineering), generative design has been
used to optimize elements based on mathematical, size, shape, and topology constraints
[15]. Some examples found in the literature are: the modification of the central structure
of a building for deformation control [16], cantilever beam optimization with 3D printing
[17], the optimization of slab material [18], characteristics of the materials as a criterion for
the design of a grid plan [19], and material optimization for reinforced concrete deep
beams [20]. As observed, the systematization of the structural design is focused on specific
subsystems that minimize the cost and weight of such elements; therefore, it is not com-
mon that this optimization is applied to the complete structural design of the building
[15]. In addition, most of the studies focused on studying structural elements of buildings
and infrastructure; however, no applications of generative design have been made to soil-
retaining structures, such as retaining walls.
Based on the previous analysis, this research developed a retaining wall dimension-
ing program to help engineers optimize the design process of these structures through
generative design to allow them to quickly conceive different wall alternatives that fulfill
the most suitable characteristics for each project. This application had to comply with cur-
rent regulations so that its results can be implemented, and its proposal is easy to use so
that professionals can use the program.
2. Materials and Methods
The Design Science Research (DSR) method was used to develop this research, which
according to Hevner [21], has three main cycles: relevance, design, and rigor. Within these
cycles, we followed the procedure proposed by Hevner and Chatterjee [22], as it provides
a specific separation for research requiring software testing, as was the case here. Based
Figure 3. Generative design process. Adapted from [10].
Generative design is a process that allows designers and engineers to define param-eters such as materials, spatial constraints, manufacturing methods, or cost constraintsto create sets of rules or algorithms to automatically explore various permutations of themodel, where the software generates the best design alternatives according to the previ-ously proposed objectives [12]. This process often generates designs that would otherwisehave been difficult to imagine under the premise of traditional design. Hence, its forms areunique since they are created to adapt to particular needs [13]. Some applications wherethis method has been applied are: to optimize the distribution of material within a space;to maximize or minimize compliance with certain parameters, such as the weight of anelement or the temperature of a building; and to limit the volume, displacement, or stress,both of a specific component and the whole building [14]. As a result of these qualities,generative design has been used in fields as diverse as art, music, literature, fashion, design,architecture, and engineering [10].
In structural engineering (as part of civil engineering), generative design has been usedto optimize elements based on mathematical, size, shape, and topology constraints [15].Some examples found in the literature are: the modification of the central structure of abuilding for deformation control [16], cantilever beam optimization with 3D printing [17],the optimization of slab material [18], characteristics of the materials as a criterion forthe design of a grid plan [19], and material optimization for reinforced concrete deepbeams [20]. As observed, the systematization of the structural design is focused on specificsubsystems that minimize the cost and weight of such elements; therefore, it is not commonthat this optimization is applied to the complete structural design of the building [15].In addition, most of the studies focused on studying structural elements of buildingsand infrastructure; however, no applications of generative design have been made tosoil-retaining structures, such as retaining walls.
Based on the previous analysis, this research developed a retaining wall dimensioningprogram to help engineers optimize the design process of these structures through gener-ative design to allow them to quickly conceive different wall alternatives that fulfill themost suitable characteristics for each project. This application had to comply with currentregulations so that its results can be implemented, and its proposal is easy to use so thatprofessionals can use the program.
2. Materials and Methods
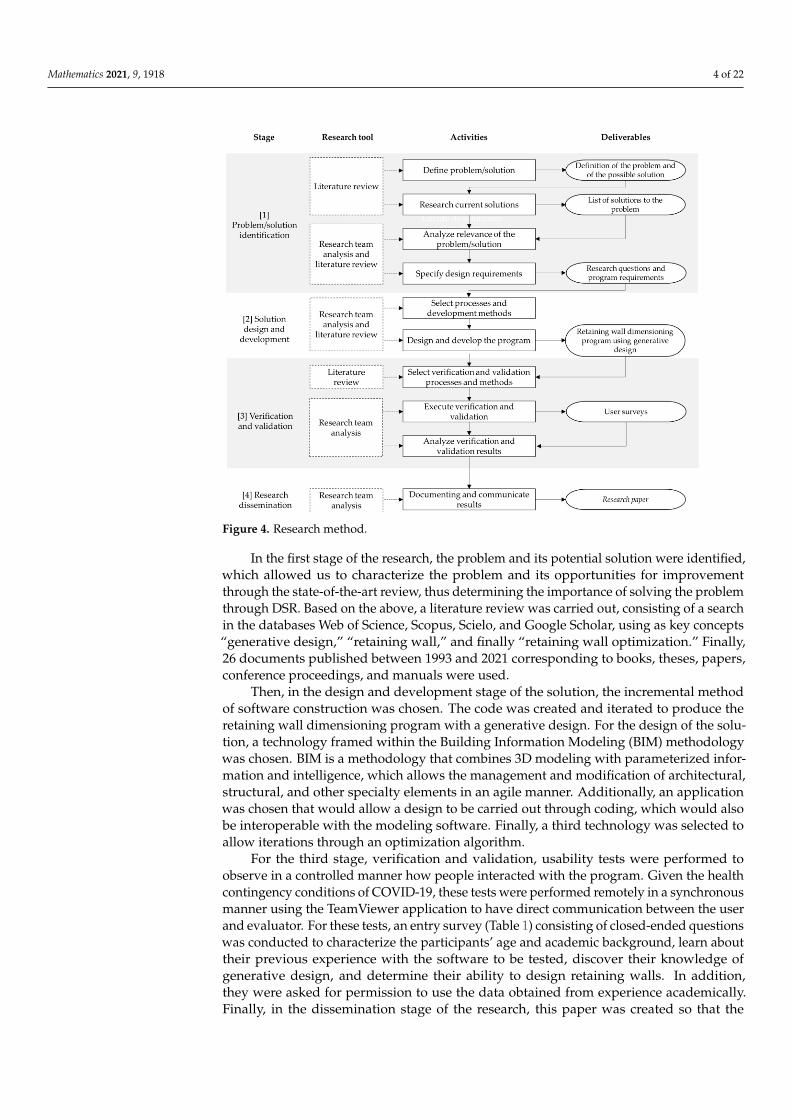
The Design Science Research (DSR) method was used to develop this research, whichaccording to Hevner [21], has three main cycles: relevance, design, and rigor. Withinthese cycles, we followed the procedure proposed by Hevner and Chatterjee [22], as itprovides a specific separation for research requiring software testing, as was the case here.Based on Hevner and Chatterjee [22], the research has been structured in four stages: (1)problem/solution identification; (2) solution design and development; (3) verification andvalidation; and (4) research dissemination. Figure 4 shows the workflow schematically,and the tools, activities, and deliverables of each stage are also shown.
Mathematics 2021, 9, 1918 4 of 22
Mathematics 2021, 9, x FOR PEER REVIEW 4 of 23
on Hevner and Chatterjee [22], the research has been structured in four stages: (1) prob-
lem/solution identification; (2) solution design and development; (3) verification and val-
idation; and (4) research dissemination. Figure 4 shows the workflow schematically, and
the tools, activities, and deliverables of each stage are also shown.
Figure 4. Research method.
In the first stage of the research, the problem and its potential solution were identi-
fied, which allowed us to characterize the problem and its opportunities for improvement
through the state-of-the-art review, thus determining the importance of solving the prob-
lem through DSR. Based on the above, a literature review was carried out, consisting of a
search in the databases Web of Science, Scopus, Scielo, and Google Scholar, using as key
concepts “generative design,” “retaining wall,” and finally “retaining wall optimization.”
Finally, 26 documents published between 1993 and 2021 corresponding to books, theses,
papers, conference proceedings, and manuals were used.
Then, in the design and development stage of the solution, the incremental method
of software construction was chosen. The code was created and iterated to produce the
retaining wall dimensioning program with a generative design. For the design of the so-
lution, a technology framed within the Building Information Modeling (BIM) methodol-
ogy was chosen. BIM is a methodology that combines 3D modeling with parameterized
information and intelligence, which allows the management and modification of architec-
tural, structural, and other specialty elements in an agile manner. Additionally, an appli-
cation was chosen that would allow a design to be carried out through coding, which
would also be interoperable with the modeling software. Finally, a third technology was
selected to allow iterations through an optimization algorithm.
For the third stage, verification and validation, usability tests were performed to ob-
serve in a controlled manner how people interacted with the program. Given the health
contingency conditions of COVID-19, these tests were performed remotely in a synchro-
nous manner using the TeamViewer application to have direct communication between
the user and evaluator. For these tests, an entry survey (Table 1) consisting of closed-
Figure 4. Research method.
In the first stage of the research, the problem and its potential solution were identified,which allowed us to characterize the problem and its opportunities for improvementthrough the state-of-the-art review, thus determining the importance of solving the problemthrough DSR. Based on the above, a literature review was carried out, consisting of a searchin the databases Web of Science, Scopus, Scielo, and Google Scholar, using as key concepts“generative design,” “retaining wall,” and finally “retaining wall optimization.” Finally,26 documents published between 1993 and 2021 corresponding to books, theses, papers,conference proceedings, and manuals were used.
Then, in the design and development stage of the solution, the incremental methodof software construction was chosen. The code was created and iterated to produce theretaining wall dimensioning program with a generative design. For the design of the solu-tion, a technology framed within the Building Information Modeling (BIM) methodologywas chosen. BIM is a methodology that combines 3D modeling with parameterized infor-mation and intelligence, which allows the management and modification of architectural,structural, and other specialty elements in an agile manner. Additionally, an applicationwas chosen that would allow a design to be carried out through coding, which would alsobe interoperable with the modeling software. Finally, a third technology was selected toallow iterations through an optimization algorithm.
For the third stage, verification and validation, usability tests were performed toobserve in a controlled manner how people interacted with the program. Given the healthcontingency conditions of COVID-19, these tests were performed remotely in a synchronousmanner using the TeamViewer application to have direct communication between the userand evaluator. For these tests, an entry survey (Table 1) consisting of closed-ended questionswas conducted to characterize the participants’ age and academic background, learn abouttheir previous experience with the software to be tested, discover their knowledge ofgenerative design, and determine their ability to design retaining walls. In addition,they were asked for permission to use the data obtained from experience academically.Finally, in the dissemination stage of the research, this paper was created so that the
Mathematics 2021, 9, 1918 5 of 22
interested community can learn about and use the program created and, consequently,receive specialized feedback.
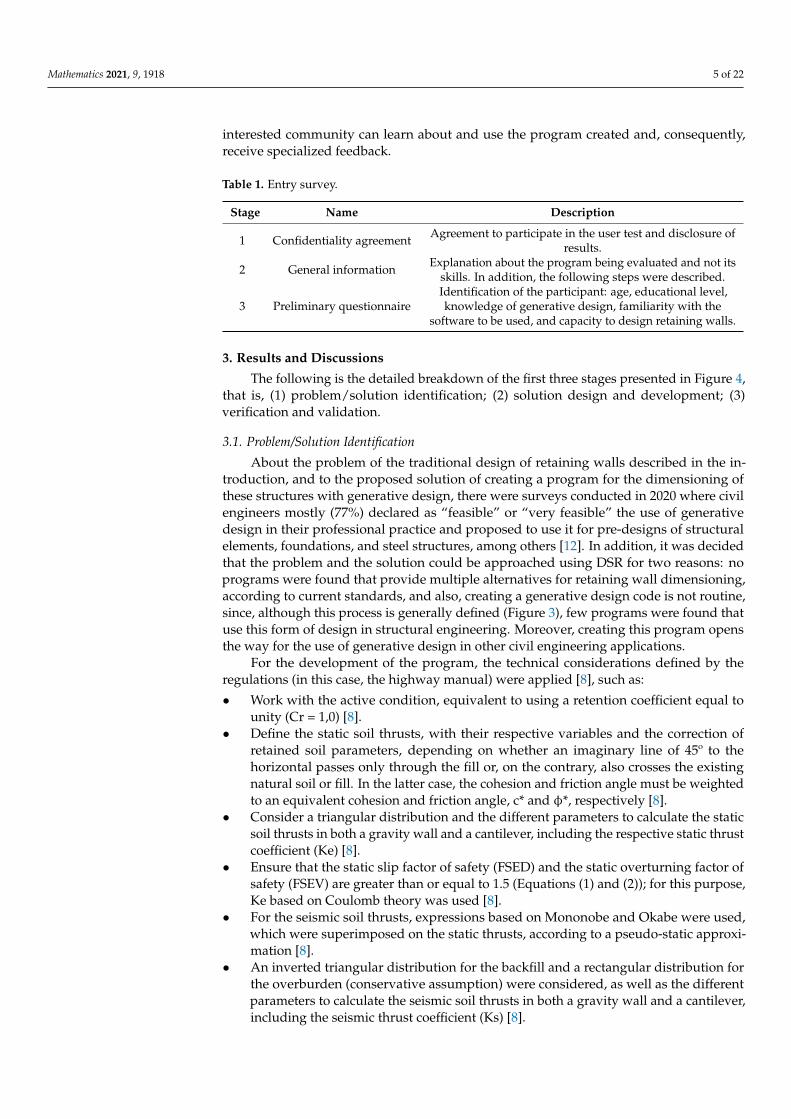
Table 1. Entry survey.
Stage Name Description
1 Confidentiality agreement Agreement to participate in the user test and disclosure ofresults.
2 General information Explanation about the program being evaluated and not itsskills. In addition, the following steps were described.
3 Preliminary questionnaireIdentification of the participant: age, educational level,knowledge of generative design, familiarity with the
software to be used, and capacity to design retaining walls.
3. Results and Discussions
The following is the detailed breakdown of the first three stages presented in Figure 4,that is, (1) problem/solution identification; (2) solution design and development; (3)verification and validation.
3.1. Problem/Solution Identification
About the problem of the traditional design of retaining walls described in the in-troduction, and to the proposed solution of creating a program for the dimensioning ofthese structures with generative design, there were surveys conducted in 2020 where civilengineers mostly (77%) declared as “feasible” or “very feasible” the use of generativedesign in their professional practice and proposed to use it for pre-designs of structuralelements, foundations, and steel structures, among others [12]. In addition, it was decidedthat the problem and the solution could be approached using DSR for two reasons: noprograms were found that provide multiple alternatives for retaining wall dimensioning,according to current standards, and also, creating a generative design code is not routine,since, although this process is generally defined (Figure 3), few programs were found thatuse this form of design in structural engineering. Moreover, creating this program opensthe way for the use of generative design in other civil engineering applications.
For the development of the program, the technical considerations defined by theregulations (in this case, the highway manual) were applied [8], such as:
• Work with the active condition, equivalent to using a retention coefficient equal tounity (Cr = 1,0) [8].
• Define the static soil thrusts, with their respective variables and the correction ofretained soil parameters, depending on whether an imaginary line of 45º to thehorizontal passes only through the fill or, on the contrary, also crosses the existingnatural soil or fill. In the latter case, the cohesion and friction angle must be weightedto an equivalent cohesion and friction angle, c* and φ*, respectively [8].
• Consider a triangular distribution and the different parameters to calculate the staticsoil thrusts in both a gravity wall and a cantilever, including the respective static thrustcoefficient (Ke) [8].
• Ensure that the static slip factor of safety (FSED) and the static overturning factor ofsafety (FSEV) are greater than or equal to 1.5 (Equations (1) and (2)); for this purpose,Ke based on Coulomb theory was used [8].
• For the seismic soil thrusts, expressions based on Mononobe and Okabe were used,which were superimposed on the static thrusts, according to a pseudo-static approxi-mation [8].
• An inverted triangular distribution for the backfill and a rectangular distribution forthe overburden (conservative assumption) were considered, as well as the differentparameters to calculate the seismic soil thrusts in both a gravity wall and a cantilever,including the seismic thrust coefficient (Ks) [8].
Mathematics 2021, 9, 1918 6 of 22
• In addition, it was verified that the seismic slip factor of safety (FSSD) was at least 1.1,and the seismic overturning factor of safety (FSSV) was greater than 1.15 times theFSSD [8].
• Finally, it was estimated that the area in compression of the foundation seal shouldexceed 80% [8].
FSED =∑ Resisting horizontal forces∑ Applying horizontal forces
≥ 1.5, (1)
FSEV =∑ Resisting overturning moments∑ Applying overturing moments
≥ 1.5, (2)
For the above calculations, the passive thrust generated by the soil at the front footof the wall was not considered since it is a force that cooperates with the stability of thewall, of which there is no certainty that the soil that generates it will remain there, so weworked more conservatively without it [23]. Considering the problem and its potentialsolution, at the end of this stage, the research questions that were used to evaluate the walldimensioning program with the generative design were planned:
• Does the program fulfill the design of retaining walls?• Does it deliver solutions that satisfy the requirements of the corresponding regulations?• Is the program user-friendly?• Does it work for people who are not familiar with generative design?• Does the program have advantages over traditional retaining wall design (according
to the users’ opinion)?
Complementarily and linked to the previous questions, the following requirements ofthe program were defined as: dimensioning the retaining walls, considering the regulatoryrequirements (in this case, those defined by the highway manual), and guiding the userwithin the same interface. Finally, the characteristics to evaluate the program were usersatisfaction, whether it meets the appropriate output data, and the speed with which theseusers obtained these results. The evaluation strategy was through usability testing.
3.2. Solution Design and Development
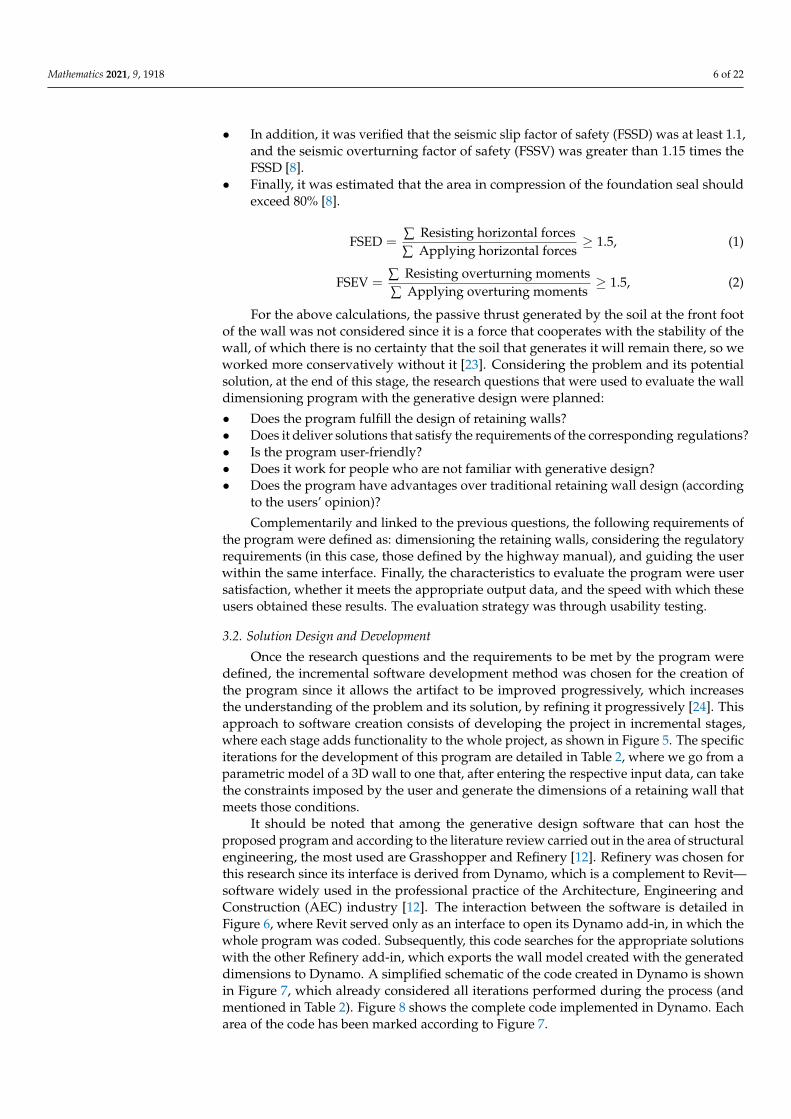
Once the research questions and the requirements to be met by the program weredefined, the incremental software development method was chosen for the creation ofthe program since it allows the artifact to be improved progressively, which increasesthe understanding of the problem and its solution, by refining it progressively [24]. Thisapproach to software creation consists of developing the project in incremental stages,where each stage adds functionality to the whole project, as shown in Figure 5. The specificiterations for the development of this program are detailed in Table 2, where we go from aparametric model of a 3D wall to one that, after entering the respective input data, can takethe constraints imposed by the user and generate the dimensions of a retaining wall thatmeets those conditions.
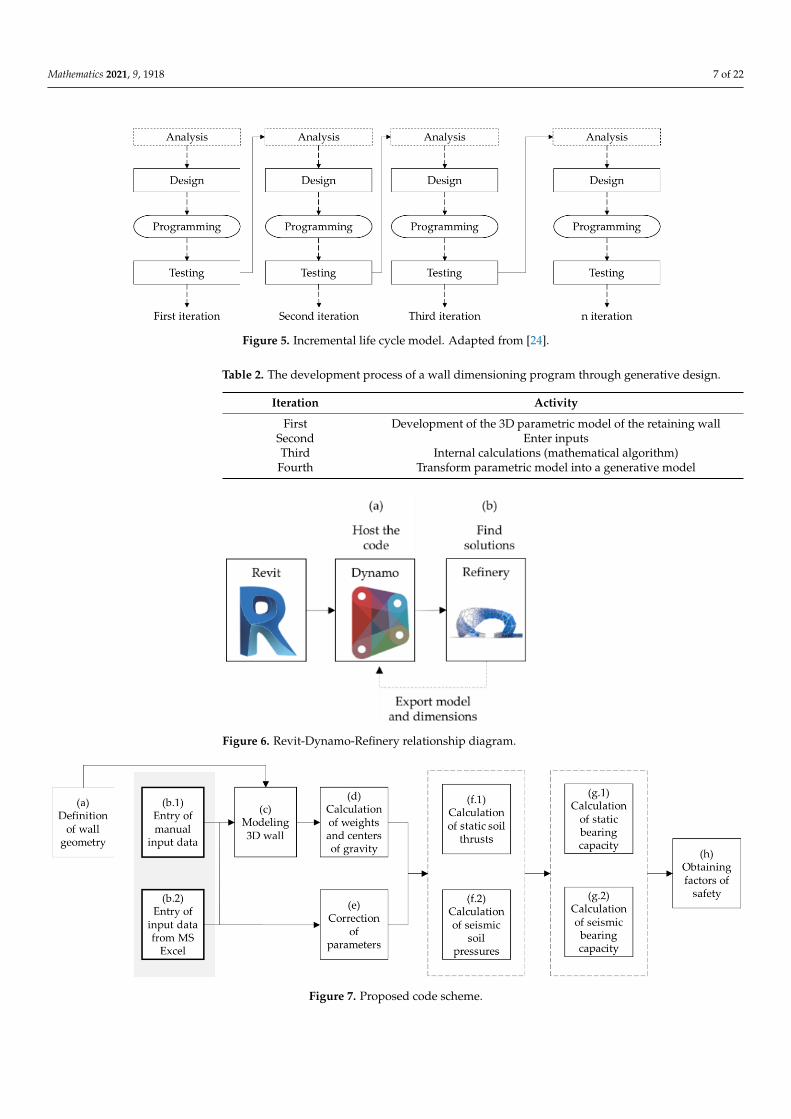
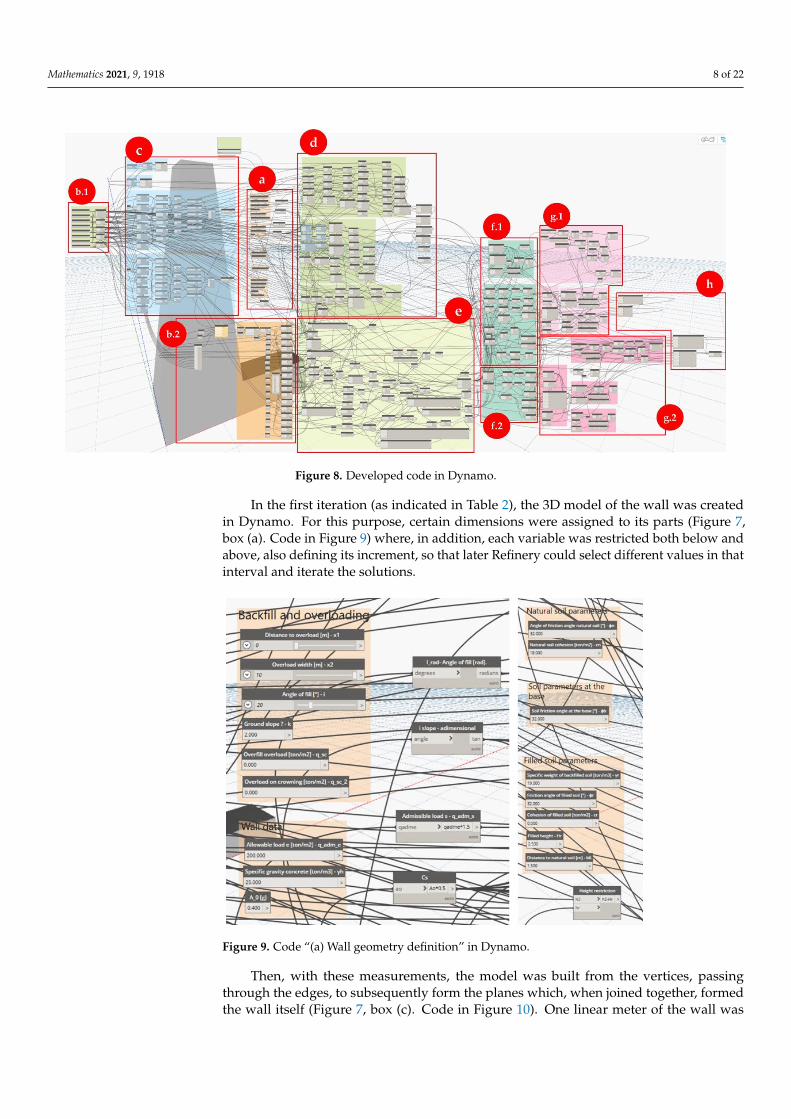
It should be noted that among the generative design software that can host theproposed program and according to the literature review carried out in the area of structuralengineering, the most used are Grasshopper and Refinery [12]. Refinery was chosen forthis research since its interface is derived from Dynamo, which is a complement to Revit—software widely used in the professional practice of the Architecture, Engineering andConstruction (AEC) industry [12]. The interaction between the software is detailed inFigure 6, where Revit served only as an interface to open its Dynamo add-in, in which thewhole program was coded. Subsequently, this code searches for the appropriate solutionswith the other Refinery add-in, which exports the wall model created with the generateddimensions to Dynamo. A simplified schematic of the code created in Dynamo is shownin Figure 7, which already considered all iterations performed during the process (andmentioned in Table 2). Figure 8 shows the complete code implemented in Dynamo. Eacharea of the code has been marked according to Figure 7.
Mathematics 2021, 9, 1918 7 of 22
Mathematics 2021, 9, x FOR PEER REVIEW 7 of 23
Table 2. The development process of a wall dimensioning program through generative design.
Iteration Activity
First Development of the 3D parametric model of the retaining wall
Second Enter inputs
Third Internal calculations (mathematical algorithm)
Fourth Transform parametric model into a generative model
Figure 5. Incremental life cycle model. Adapted from [24].
It should be noted that among the generative design software that can host the pro-
posed program and according to the literature review carried out in the area of structural
engineering, the most used are Grasshopper and Refinery [12]. Refinery was chosen for
this research since its interface is derived from Dynamo, which is a complement to Revit—
software widely used in the professional practice of the Architecture, Engineering and
Construction (AEC) industry [12]. The interaction between the software is detailed in Fig-
ure 6, where Revit served only as an interface to open its Dynamo add-in, in which the
whole program was coded. Subsequently, this code searches for the appropriate solutions
with the other Refinery add-in, which exports the wall model created with the generated
dimensions to Dynamo. A simplified schematic of the code created in Dynamo is shown
in Figure 7, which already considered all iterations performed during the process (and
mentioned in Table 2). Figure 8 shows the complete code implemented in Dynamo. Each
area of the code has been marked according to Figure 7.
Figure 6. Revit–Dynamo–Refinery relationship diagram.
Figure 5. Incremental life cycle model. Adapted from [24].
Table 2. The development process of a wall dimensioning program through generative design.
Iteration Activity
First Development of the 3D parametric model of the retaining wallSecond Enter inputsThird Internal calculations (mathematical algorithm)
Fourth Transform parametric model into a generative model
Mathematics 2021, 9, x FOR PEER REVIEW 7 of 23
Table 2. The development process of a wall dimensioning program through generative design.
Iteration Activity
First Development of the 3D parametric model of the retaining wall
Second Enter inputs
Third Internal calculations (mathematical algorithm)
Fourth Transform parametric model into a generative model
Figure 5. Incremental life cycle model. Adapted from [24].
It should be noted that among the generative design software that can host the pro-
posed program and according to the literature review carried out in the area of structural
engineering, the most used are Grasshopper and Refinery [12]. Refinery was chosen for
this research since its interface is derived from Dynamo, which is a complement to Revit—
software widely used in the professional practice of the Architecture, Engineering and
Construction (AEC) industry [12]. The interaction between the software is detailed in Fig-
ure 6, where Revit served only as an interface to open its Dynamo add-in, in which the
whole program was coded. Subsequently, this code searches for the appropriate solutions
with the other Refinery add-in, which exports the wall model created with the generated
dimensions to Dynamo. A simplified schematic of the code created in Dynamo is shown
in Figure 7, which already considered all iterations performed during the process (and
mentioned in Table 2). Figure 8 shows the complete code implemented in Dynamo. Each
area of the code has been marked according to Figure 7.
Figure 6. Revit–Dynamo–Refinery relationship diagram. Figure 6. Revit-Dynamo-Refinery relationship diagram.
Mathematics 2021, 9, x FOR PEER REVIEW 8 of 23
Figure 7. Proposed code scheme.
Figure 8. Developed code in Dynamo.
In the first iteration (as indicated in Table 2), the 3D model of the wall was created in
Dynamo. For this purpose, certain dimensions were assigned to its parts (Figure 7, box
(a). Code in Figure 9) where, in addition, each variable was restricted both below and
above, also defining its increment, so that later Refinery could select different values in
that interval and iterate the solutions.
Figure 7. Proposed code scheme.
Mathematics 2021, 9, 1918 8 of 22
Mathematics 2021, 9, x FOR PEER REVIEW 8 of 23
Figure 7. Proposed code scheme.
Figure 8. Developed code in Dynamo.
In the first iteration (as indicated in Table 2), the 3D model of the wall was created in
Dynamo. For this purpose, certain dimensions were assigned to its parts (Figure 7, box
(a). Code in Figure 9) where, in addition, each variable was restricted both below and
above, also defining its increment, so that later Refinery could select different values in
that interval and iterate the solutions.
Figure 8. Developed code in Dynamo.
In the first iteration (as indicated in Table 2), the 3D model of the wall was createdin Dynamo. For this purpose, certain dimensions were assigned to its parts (Figure 7,box (a). Code in Figure 9) where, in addition, each variable was restricted both below andabove, also defining its increment, so that later Refinery could select different values in thatinterval and iterate the solutions.
Mathematics 2021, 9, x FOR PEER REVIEW 9 of 23
Figure 9. Code “(a) Wall geometry definition” in Dynamo.
Then, with these measurements, the model was built from the vertices, passing
through the edges, to subsequently form the planes which, when joined together, formed
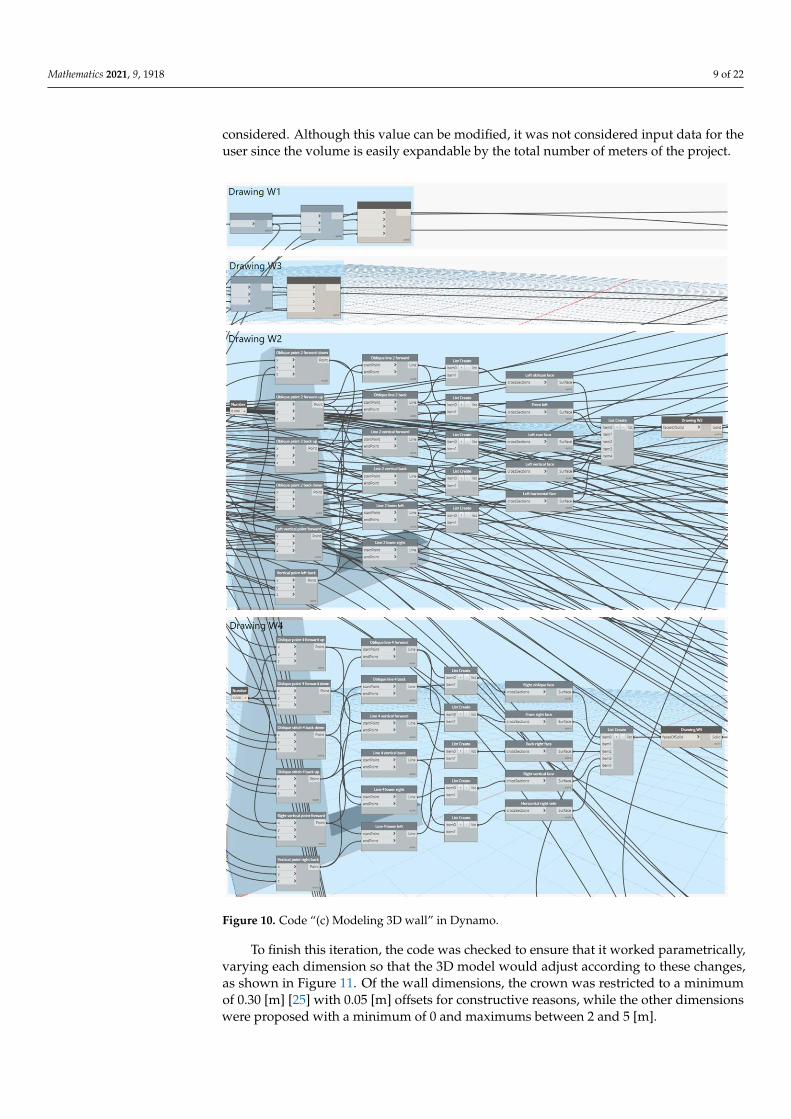
the wall itself (Figure 7, box (c). Code in Figure 10). One linear meter of the wall was con-
sidered. Although this value can be modified, it was not considered input data for the
user since the volume is easily expandable by the total number of meters of the project.
Figure 9. Code “(a) Wall geometry definition” in Dynamo.
Then, with these measurements, the model was built from the vertices, passingthrough the edges, to subsequently form the planes which, when joined together, formedthe wall itself (Figure 7, box (c). Code in Figure 10). One linear meter of the wall was
Mathematics 2021, 9, 1918 9 of 22
considered. Although this value can be modified, it was not considered input data for theuser since the volume is easily expandable by the total number of meters of the project.
Mathematics 2021, 9, x FOR PEER REVIEW 10 of 23
Figure 10. Code “(c) Modeling 3D wall” in Dynamo.
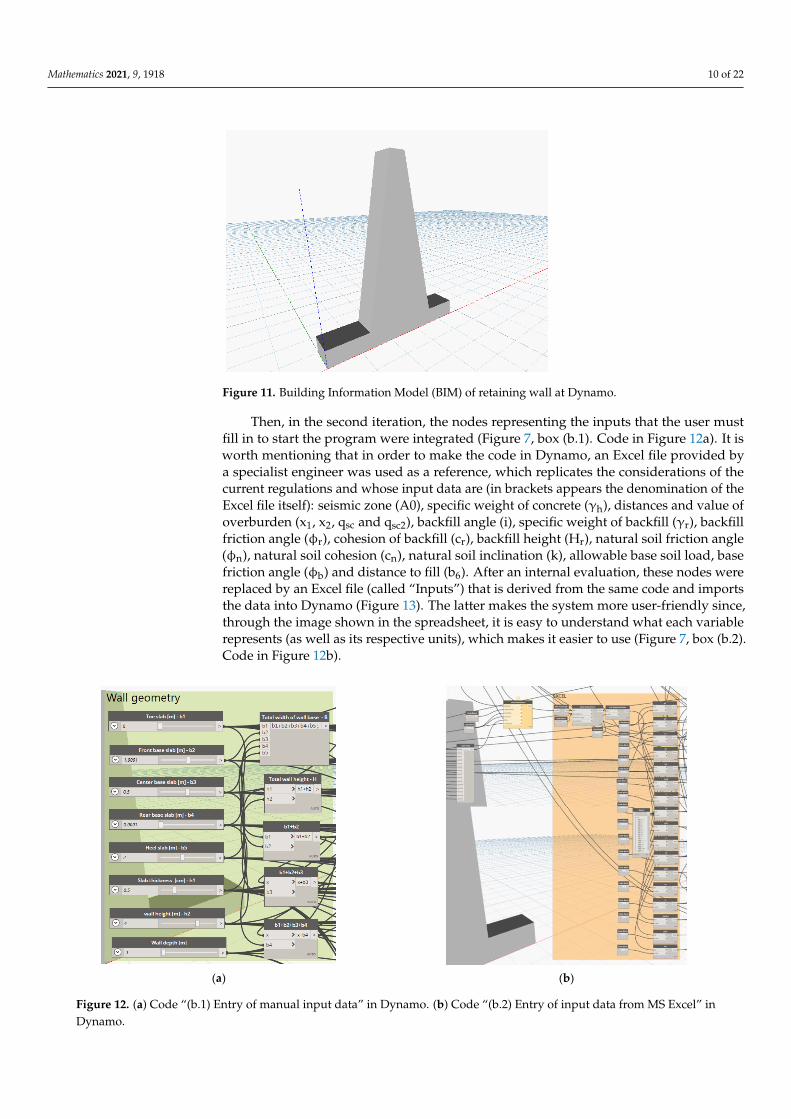
To finish this iteration, the code was checked to ensure that it worked parametrically,
varying each dimension so that the 3D model would adjust according to these changes, as
shown in Figure 11. Of the wall dimensions, the crown was restricted to a minimum of
0.30 [m] [25] with 0.05 [m] offsets for constructive reasons, while the other dimensions
were proposed with a minimum of 0 and maximums between 2 and 5 [m].
Figure 10. Code “(c) Modeling 3D wall” in Dynamo.
To finish this iteration, the code was checked to ensure that it worked parametrically,varying each dimension so that the 3D model would adjust according to these changes,as shown in Figure 11. Of the wall dimensions, the crown was restricted to a minimumof 0.30 [m] [25] with 0.05 [m] offsets for constructive reasons, while the other dimensionswere proposed with a minimum of 0 and maximums between 2 and 5 [m].
Mathematics 2021, 9, 1918 10 of 22Mathematics 2021, 9, x FOR PEER REVIEW 11 of 23
Figure 11. Building Information Model (BIM) of retaining wall at Dynamo.
Then, in the second iteration, the nodes representing the inputs that the user must fill
in to start the program were integrated (Figure 7, box (b.1). Code in Figure 12a). It is worth
mentioning that in order to make the code in Dynamo, an Excel file provided by a special-
ist engineer was used as a reference, which replicates the considerations of the current
regulations and whose input data are (in brackets appears the denomination of the Excel
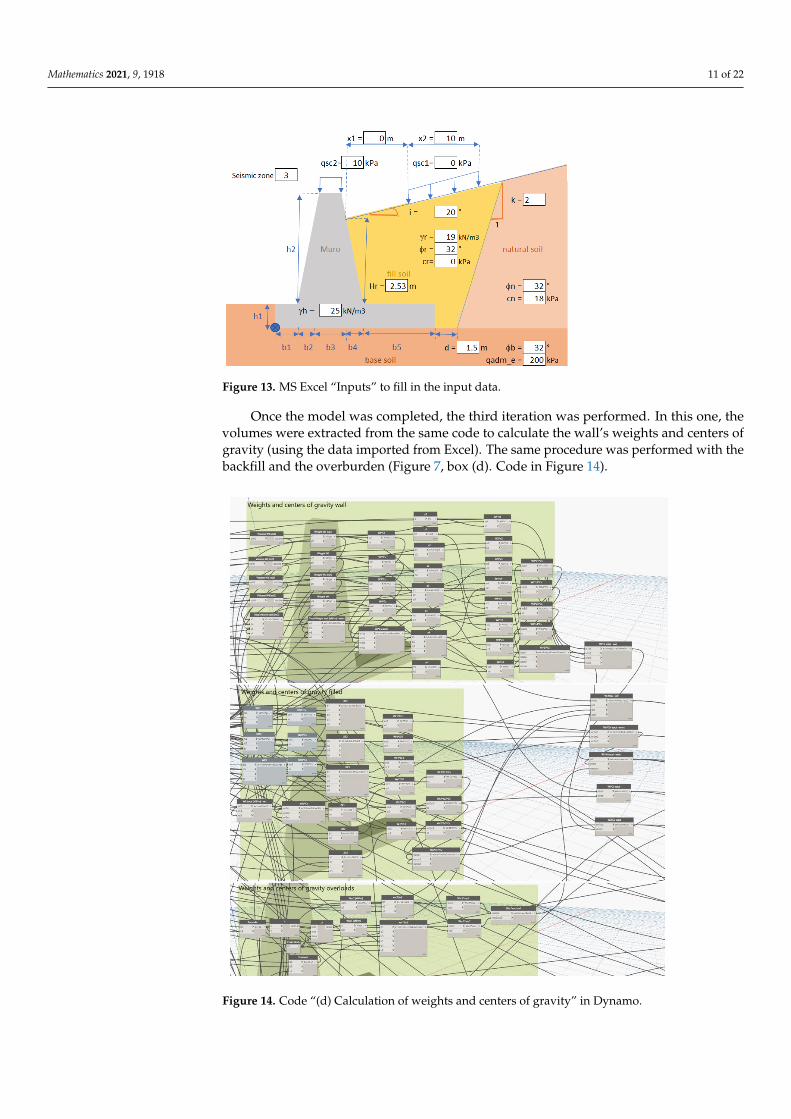
file itself): seismic zone (A0), specific weight of concrete (γh), distances and value of over-
burden (x1, x2, qsc and qsc2), backfill angle (i), specific weight of backfill (γr), backfill friction
angle (ϕr), cohesion of backfill (cr), backfill height (Hr), natural soil friction angle (ϕn), nat-
ural soil cohesion (cn), natural soil inclination (k), allowable base soil load, base friction
angle (ϕb) and distance to fill (b6). After an internal evaluation, these nodes were replaced
by an Excel file (called “Inputs”) that is derived from the same code and imports the data
into Dynamo (Figure 13). The latter makes the system more user-friendly since, through
the image shown in the spreadsheet, it is easy to understand what each variable represents
(as well as its respective units), which makes it easier to use (Figure 7, box (b.2). Code in
Figure 12b).
(a) (b)
Figure 12. (a) Code “(b.1) Entry of manual input data” in Dynamo. (b) Code “(b.2) Entry of input data from MS Excel” in
Dynamo.
Figure 11. Building Information Model (BIM) of retaining wall at Dynamo.
Then, in the second iteration, the nodes representing the inputs that the user mustfill in to start the program were integrated (Figure 7, box (b.1). Code in Figure 12a). It isworth mentioning that in order to make the code in Dynamo, an Excel file provided bya specialist engineer was used as a reference, which replicates the considerations of thecurrent regulations and whose input data are (in brackets appears the denomination of theExcel file itself): seismic zone (A0), specific weight of concrete (γh), distances and value ofoverburden (x1, x2, qsc and qsc2), backfill angle (i), specific weight of backfill (γr), backfillfriction angle (φr), cohesion of backfill (cr), backfill height (Hr), natural soil friction angle(φn), natural soil cohesion (cn), natural soil inclination (k), allowable base soil load, basefriction angle (φb) and distance to fill (b6). After an internal evaluation, these nodes werereplaced by an Excel file (called “Inputs”) that is derived from the same code and importsthe data into Dynamo (Figure 13). The latter makes the system more user-friendly since,through the image shown in the spreadsheet, it is easy to understand what each variablerepresents (as well as its respective units), which makes it easier to use (Figure 7, box (b.2).Code in Figure 12b).
Mathematics 2021, 9, x FOR PEER REVIEW 11 of 23
Figure 11. Building Information Model (BIM) of retaining wall at Dynamo.
Then, in the second iteration, the nodes representing the inputs that the user must fill
in to start the program were integrated (Figure 7, box (b.1). Code in Figure 12a). It is worth
mentioning that in order to make the code in Dynamo, an Excel file provided by a special-
ist engineer was used as a reference, which replicates the considerations of the current
regulations and whose input data are (in brackets appears the denomination of the Excel
file itself): seismic zone (A0), specific weight of concrete (γh), distances and value of over-
burden (x1, x2, qsc and qsc2), backfill angle (i), specific weight of backfill (γr), backfill friction
angle (ϕr), cohesion of backfill (cr), backfill height (Hr), natural soil friction angle (ϕn), nat-
ural soil cohesion (cn), natural soil inclination (k), allowable base soil load, base friction
angle (ϕb) and distance to fill (b6). After an internal evaluation, these nodes were replaced
by an Excel file (called “Inputs”) that is derived from the same code and imports the data
into Dynamo (Figure 13). The latter makes the system more user-friendly since, through
the image shown in the spreadsheet, it is easy to understand what each variable represents
(as well as its respective units), which makes it easier to use (Figure 7, box (b.2). Code in
Figure 12b).
(a) (b)
Figure 12. (a) Code “(b.1) Entry of manual input data” in Dynamo. (b) Code “(b.2) Entry of input data from MS Excel” in
Dynamo. Figure 12. (a) Code “(b.1) Entry of manual input data” in Dynamo. (b) Code “(b.2) Entry of input data from MS Excel” inDynamo.
Mathematics 2021, 9, 1918 11 of 22Mathematics 2021, 9, x FOR PEER REVIEW 12 of 23
Figure 13. MS Excel “Inputs” to fill in the input data.
Once the model was completed, the third iteration was performed. In this one, the
volumes were extracted from the same code to calculate the wall’s weights and centers of
gravity (using the data imported from Excel). The same procedure was performed with
the backfill and the overburden (Figure 7, box (d). Code in Figure 14).
Figure 14. Code “(d) Calculation of weights and centers of gravity” in Dynamo.
Figure 13. MS Excel “Inputs” to fill in the input data.
Once the model was completed, the third iteration was performed. In this one, thevolumes were extracted from the same code to calculate the wall’s weights and centers ofgravity (using the data imported from Excel). The same procedure was performed with thebackfill and the overburden (Figure 7, box (d). Code in Figure 14).
Mathematics 2021, 9, x FOR PEER REVIEW 12 of 23
Figure 13. MS Excel “Inputs” to fill in the input data.
Once the model was completed, the third iteration was performed. In this one, the
volumes were extracted from the same code to calculate the wall’s weights and centers of
gravity (using the data imported from Excel). The same procedure was performed with
the backfill and the overburden (Figure 7, box (d). Code in Figure 14).
Figure 14. Code “(d) Calculation of weights and centers of gravity” in Dynamo. Figure 14. Code “(d) Calculation of weights and centers of gravity” in Dynamo.
Mathematics 2021, 9, 1918 12 of 22
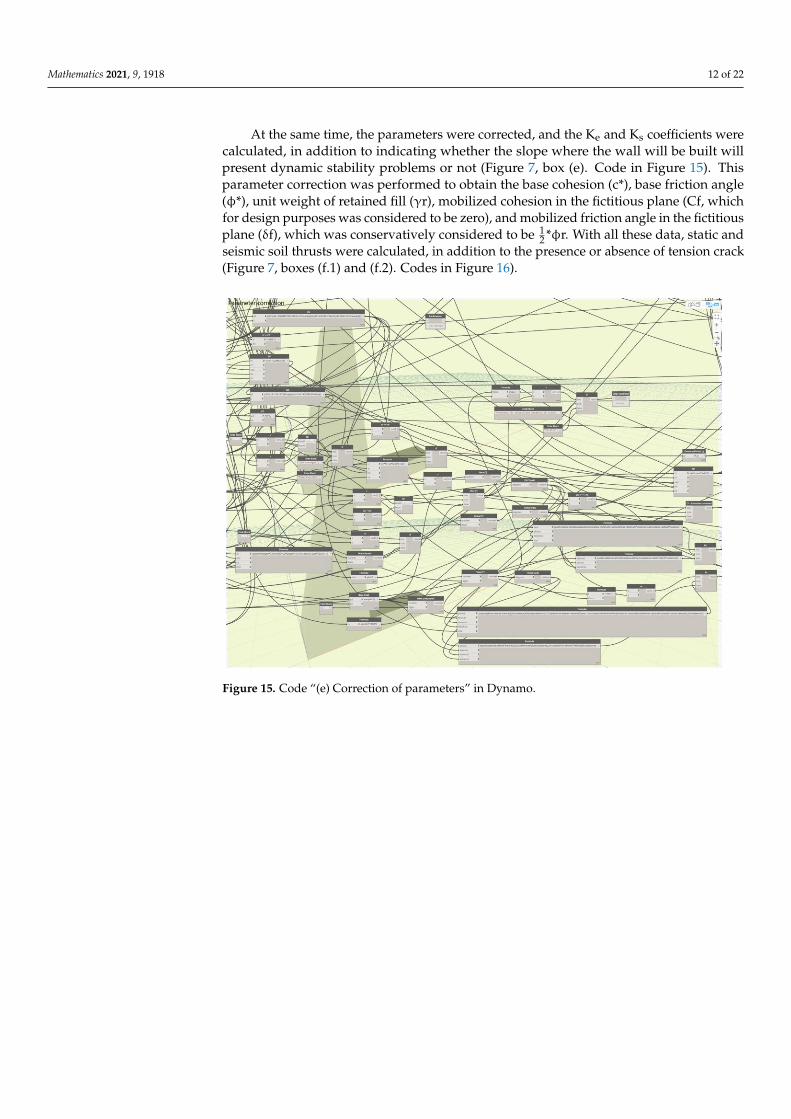
At the same time, the parameters were corrected, and the Ke and Ks coefficients werecalculated, in addition to indicating whether the slope where the wall will be built willpresent dynamic stability problems or not (Figure 7, box (e). Code in Figure 15). Thisparameter correction was performed to obtain the base cohesion (c*), base friction angle(φ*), unit weight of retained fill (γr), mobilized cohesion in the fictitious plane (Cf, whichfor design purposes was considered to be zero), and mobilized friction angle in the fictitiousplane (δf), which was conservatively considered to be 1
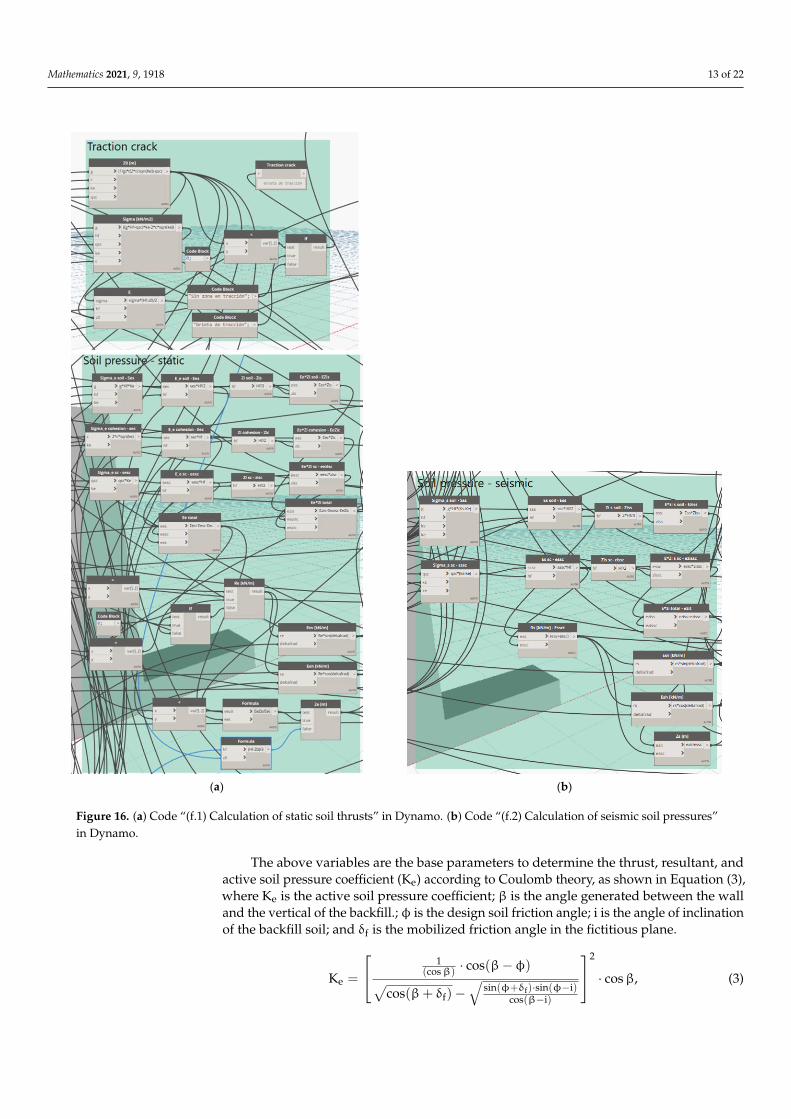
2 *φr. With all these data, static andseismic soil thrusts were calculated, in addition to the presence or absence of tension crack(Figure 7, boxes (f.1) and (f.2). Codes in Figure 16).
Mathematics 2021, 9, x FOR PEER REVIEW 13 of 23
At the same time, the parameters were corrected, and the Ke and Ks coefficients were
calculated, in addition to indicating whether the slope where the wall will be built will
present dynamic stability problems or not (Figure 7, box (e). Code in Figure 15). This pa-
rameter correction was performed to obtain the base cohesion (c*), base friction angle (ϕ*),
unit weight of retained fill (γr), mobilized cohesion in the fictitious plane (Cf, which for
design purposes was considered to be zero), and mobilized friction angle in the fictitious
plane (δf), which was conservatively considered to be ½*ϕr. With all these data, static and
seismic soil thrusts were calculated, in addition to the presence or absence of tension crack
(Figure 7, boxes (f.1) and (f.2). Codes in Figure 16).
Figure 15. Code “(e) Correction of parameters” in Dynamo. Figure 15. Code “(e) Correction of parameters” in Dynamo.
Mathematics 2021, 9, 1918 13 of 22Mathematics 2021, 9, x FOR PEER REVIEW 14 of 23
(a) (b)
Figure 16. (a) Code “(f.1) Calculation of static soil thrusts” in Dynamo. (b) Code “(f.2) Calculation of seismic soil pressures”
in Dynamo.
The above variables are the base parameters to determine the thrust, resultant, and
active soil pressure coefficient (Ke) according to Coulomb theory, as shown in Equation
(3), where Ke is the active soil pressure coefficient; β is the angle generated between the
wall and the vertical of the backfill.; ϕ is the design soil friction angle; i is the angle of
inclination of the backfill soil; and δf is the mobilized friction angle in the fictitious plane.
Ke =
[
1(cos β)
⋅ cos(β − ϕ)
√cos(β + δf) − √sin(ϕ + δf) ⋅ sin(ϕ − i)
cos(β − i)] 2
⋅ cos β, (3)
Figure 16. (a) Code “(f.1) Calculation of static soil thrusts” in Dynamo. (b) Code “(f.2) Calculation of seismic soil pressures”in Dynamo.
The above variables are the base parameters to determine the thrust, resultant, andactive soil pressure coefficient (Ke) according to Coulomb theory, as shown in Equation (3),where Ke is the active soil pressure coefficient; β is the angle generated between the walland the vertical of the backfill.; φ is the design soil friction angle; i is the angle of inclinationof the backfill soil; and δf is the mobilized friction angle in the fictitious plane.
Ke =
1(cosβ)
· cos(β−φ)√cos(β+ δf)−
√sin(φ+δf)·sin(φ−i)
cos(β−i)
2
· cosβ, (3)
Mathematics 2021, 9, 1918 14 of 22
The design soil friction angle (φ) is calculated through Equation (4), where φo is theequivalent friction angle for zero displacement condition, φ* is the equivalent base frictionangle, and Cr is the retention coefficient (if Cr > 1.0, we used in the equation Cr = 1.0).
φ = φ0 + Cr(φ∗ −φ0), (4)
Additionally, Ks was calculated according to the Mononobe–Okabe methodology, asshown in Equation (5), where Ks is the seismic thrust coefficient; β is the angle generatedbetween the wall and the vertical of the backfill.; φ is the design soil friction angle; i isthe angle of inclination of the backfill soil; and δf is the mobilized friction angle in thefictitious plane.
Ks =
cos2(φ− β− θ)
cos θ · cos2 β · cos(δf + β+ θ) ·[1 +
√sin(φ+δf)·sin(φ−i−θ)cos(δf+β+θ)·cos(i−β)
]
2
· cosβ, (5)
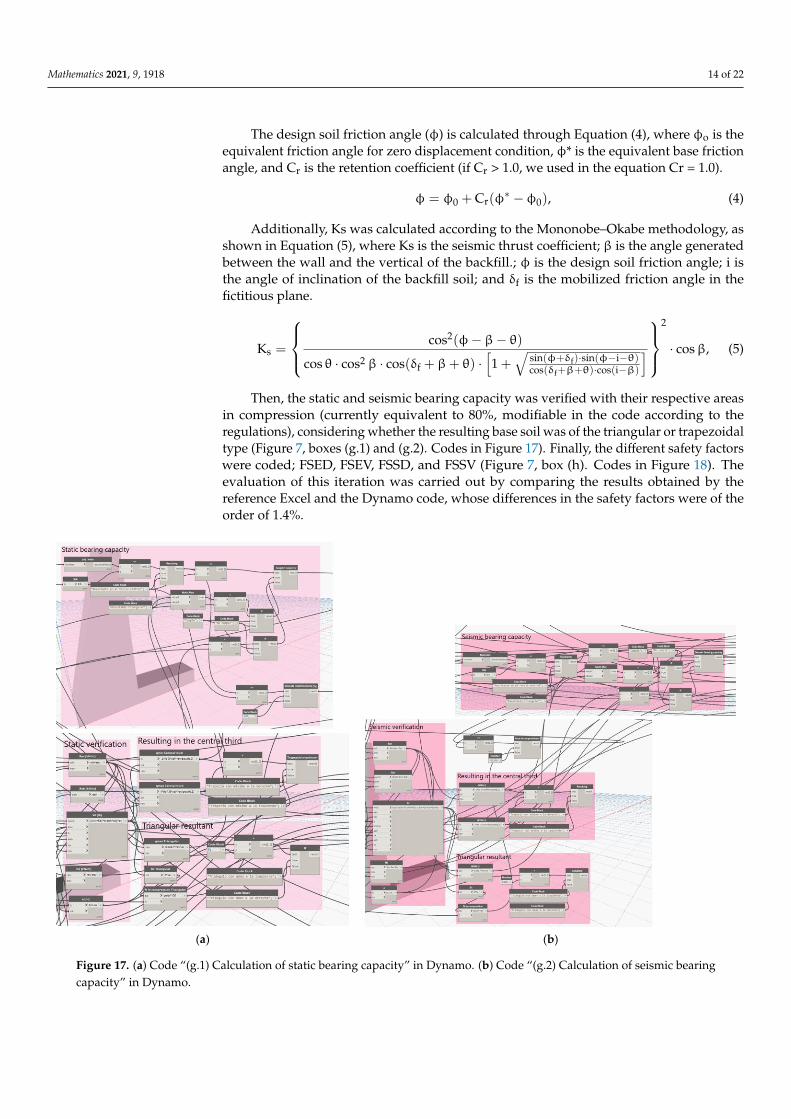
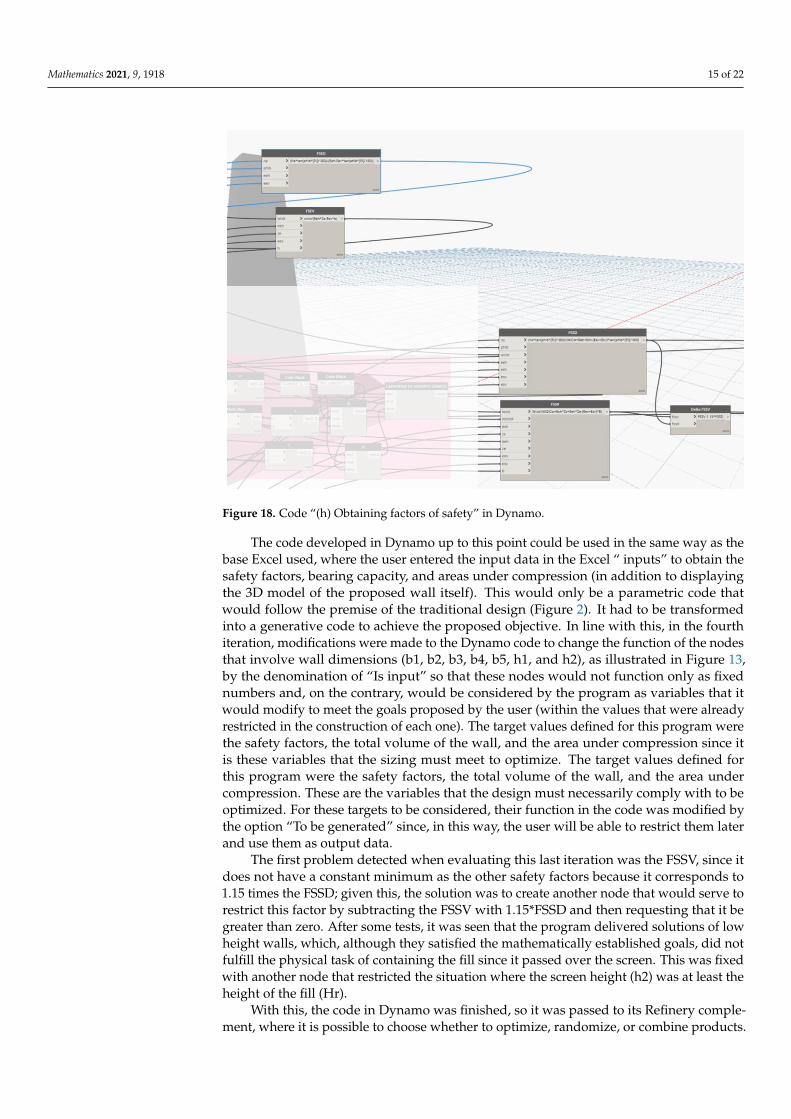
Then, the static and seismic bearing capacity was verified with their respective areasin compression (currently equivalent to 80%, modifiable in the code according to theregulations), considering whether the resulting base soil was of the triangular or trapezoidaltype (Figure 7, boxes (g.1) and (g.2). Codes in Figure 17). Finally, the different safety factorswere coded; FSED, FSEV, FSSD, and FSSV (Figure 7, box (h). Codes in Figure 18). Theevaluation of this iteration was carried out by comparing the results obtained by thereference Excel and the Dynamo code, whose differences in the safety factors were of theorder of 1.4%.
Mathematics 2021, 9, x FOR PEER REVIEW 15 of 23
The design soil friction angle (ϕ) is calculated through Equation (4), where ϕo is the
equivalent friction angle for zero displacement condition, ϕ* is the equivalent base friction
angle, and Cr is the retention coefficient (if Cr > 1.0, we used in the equation Cr = 1.0).
ϕ = ϕ0 + Cr(ϕ∗ − ϕ0), (4)
Additionally, Ks was calculated according to the Mononobe–Okabe methodology, as
shown in Equation (5), where Ks is the seismic thrust coefficient; β is the angle generated
between the wall and the vertical of the backfill.; ϕ is the design soil friction angle; i is the
angle of inclination of the backfill soil; and δf is the mobilized friction angle in the fictitious
plane.
Ks =
{
cos2(ϕ − β − θ)
cosθ ⋅ cos2β ⋅ cos (δf + β + θ) ⋅ [1 + √sin(ϕ + δf) ⋅ sin(ϕ − i − θ)cos(δf + β + θ) ⋅ cos (i − β)
]
}
2
⋅ cos β, (5)
Then, the static and seismic bearing capacity was verified with their respective areas
in compression (currently equivalent to 80%, modifiable in the code according to the reg-
ulations), considering whether the resulting base soil was of the triangular or trapezoidal
type (Figure 7, boxes (g.1) and (g.2). Codes in Figure 17). Finally, the different safety fac-
tors were coded; FSED, FSEV, FSSD, and FSSV (Figure 7, box (h). Codes in Figure 18). The
evaluation of this iteration was carried out by comparing the results obtained by the ref-
erence Excel and the Dynamo code, whose differences in the safety factors were of the
order of 1.4%.
(a) (b)
Figure 17. (a) Code “(g.1) Calculation of static bearing capacity” in Dynamo. (b) Code “(g.2) Calculation of seismic bearing
capacity” in Dynamo. Figure 17. (a) Code “(g.1) Calculation of static bearing capacity” in Dynamo. (b) Code “(g.2) Calculation of seismic bearingcapacity” in Dynamo.
Mathematics 2021, 9, 1918 15 of 22Mathematics 2021, 9, x FOR PEER REVIEW 16 of 23
Figure 18. Code “(h) Obtaining factors of safety” in Dynamo.
The code developed in Dynamo up to this point could be used in the same way as
the base Excel used, where the user entered the input data in the Excel “ inputs” to obtain
the safety factors, bearing capacity, and areas under compression (in addition to display-
ing the 3D model of the proposed wall itself). This would only be a parametric code that
would follow the premise of the traditional design (Figure 2). It had to be transformed
into a generative code to achieve the proposed objective. In line with this, in the fourth
iteration, modifications were made to the Dynamo code to change the function of the
nodes that involve wall dimensions (b1, b2, b3, b4, b5, h1, and h2), as illustrated in Figure
13, by the denomination of “Is input” so that these nodes would not function only as fixed
numbers and, on the contrary, would be considered by the program as variables that it
would modify to meet the goals proposed by the user (within the values that were already
restricted in the construction of each one). The target values defined for this program were
the safety factors, the total volume of the wall, and the area under compression since it is
these variables that the sizing must meet to optimize. The target values defined for this
program were the safety factors, the total volume of the wall, and the area under com-
pression. These are the variables that the design must necessarily comply with to be opti-
mized. For these targets to be considered, their function in the code was modified by the
option “To be generated” since, in this way, the user will be able to restrict them later and
use them as output data.
The first problem detected when evaluating this last iteration was the FSSV, since it
does not have a constant minimum as the other safety factors because it corresponds to
1.15 times the FSSD; given this, the solution was to create another node that would serve
to restrict this factor by subtracting the FSSV with 1.15*FSSD and then requesting that it
be greater than zero. After some tests, it was seen that the program delivered solutions of
low height walls, which, although they satisfied the mathematically established goals, did
not fulfill the physical task of containing the fill since it passed over the screen. This was
fixed with another node that restricted the situation where the screen height (h2) was at
least the height of the fill (Hr).
With this, the code in Dynamo was finished, so it was passed to its Refinery comple-
ment, where it is possible to choose whether to optimize, randomize, or combine products.
Figure 18. Code “(h) Obtaining factors of safety” in Dynamo.
The code developed in Dynamo up to this point could be used in the same way as thebase Excel used, where the user entered the input data in the Excel “ inputs” to obtain thesafety factors, bearing capacity, and areas under compression (in addition to displayingthe 3D model of the proposed wall itself). This would only be a parametric code thatwould follow the premise of the traditional design (Figure 2). It had to be transformedinto a generative code to achieve the proposed objective. In line with this, in the fourthiteration, modifications were made to the Dynamo code to change the function of the nodesthat involve wall dimensions (b1, b2, b3, b4, b5, h1, and h2), as illustrated in Figure 13,by the denomination of “Is input” so that these nodes would not function only as fixednumbers and, on the contrary, would be considered by the program as variables that itwould modify to meet the goals proposed by the user (within the values that were alreadyrestricted in the construction of each one). The target values defined for this program werethe safety factors, the total volume of the wall, and the area under compression since itis these variables that the sizing must meet to optimize. The target values defined forthis program were the safety factors, the total volume of the wall, and the area undercompression. These are the variables that the design must necessarily comply with to beoptimized. For these targets to be considered, their function in the code was modified bythe option “To be generated” since, in this way, the user will be able to restrict them laterand use them as output data.
The first problem detected when evaluating this last iteration was the FSSV, since itdoes not have a constant minimum as the other safety factors because it corresponds to1.15 times the FSSD; given this, the solution was to create another node that would serve torestrict this factor by subtracting the FSSV with 1.15*FSSD and then requesting that it begreater than zero. After some tests, it was seen that the program delivered solutions of lowheight walls, which, although they satisfied the mathematically established goals, did notfulfill the physical task of containing the fill since it passed over the screen. This was fixedwith another node that restricted the situation where the screen height (h2) was at least theheight of the fill (Hr).
With this, the code in Dynamo was finished, so it was passed to its Refinery comple-ment, where it is possible to choose whether to optimize, randomize, or combine products.
Mathematics 2021, 9, 1918 16 of 22
For this study, the optimize tool was more useful since it allows us to minimize and maxi-mize variables. Refinery uses a multi-objective optimization approach where the optimalsolution is refined over series of generations for the defined population size. Then, it isasked which input data should be varied, and to this it is proposed to leave all the optionsalready marked by default, which correspond to the dimensions of the wall that weredefined as “Is input” (b1, b2, b3, b4, b5, h1, and h2). There may be a situation where thevalue of some of these variables is already known in advance (due to a site constraint), sothey should be deselected in this step, and their dimension should be set in the Dynamocode. The program then asks what output data should be used as targets to be reached,giving as options everything defined as “Generated.” At this point, it is recommended tominimize both the total volume and the four safety factors, as shown in Table 3. However,as in the previous step, another variable may need to be maximized or minimized.
Table 3. Input data to be restricted.
Variable Select Minimize Maximize
Total volume 3 3 -FSED 3 3 -FSEV 3 3 -
Area under compression - - -FSSD 3 3 -
Delta FSSV 3 3 -Height restriction - - -
Finally, the program asks for the output data to be restricted, having to be filled in asindicated in Table 4. Additionally, the program by default asks how many “Populationsize,” “Generations,” and “Seed” it should work with. The first one by default comes in20 but can be increased, always in multiples of four, and implies that in each iteration of“generation,” which will be the number of alternatives that the program will consider, thesecond one is predetermined as ten and is the number of iterations that will be performed.The second is predetermined as ten and is the number of iterations that will be performed,and it can also be increased (depending on the capacity of the computer on which theprogram is run) in order to refine the results further. Finally, “Seed” refers to a numberor vector from which pseudo-random values that will generate the options that will beevaluated in each iteration will be output; this number can be increased so that the deliveredsolutions vary more from each other. This information is relevant since, in internal tests,when modifying certain parameters, the program did not achieve satisfactory results, sothat, to solve this problem, the default values (especially the number of generations) had tobe increased so that the program could find solutions that complied with the restrictionsproposed in each case.
Table 4. Output data to be restricted.
Variable Select Minimize Observations
Total volume - - -FSED 3 1.5 According to Highway Manual, vol. 3 [8]FSEV 3 1.5 According to Highway Manual, vol. 3 [8]
Area under compression 3 80 According to Highway Manual, vol. 3 [8]FSSD 3 1.1 According to Highway Manual, vol. 3 [8]
Delta FSSV 3 0 FSSV − 1.15* FSSD > 0
Height restriction 3 0 The height of the screen must be greaterthan the fill height
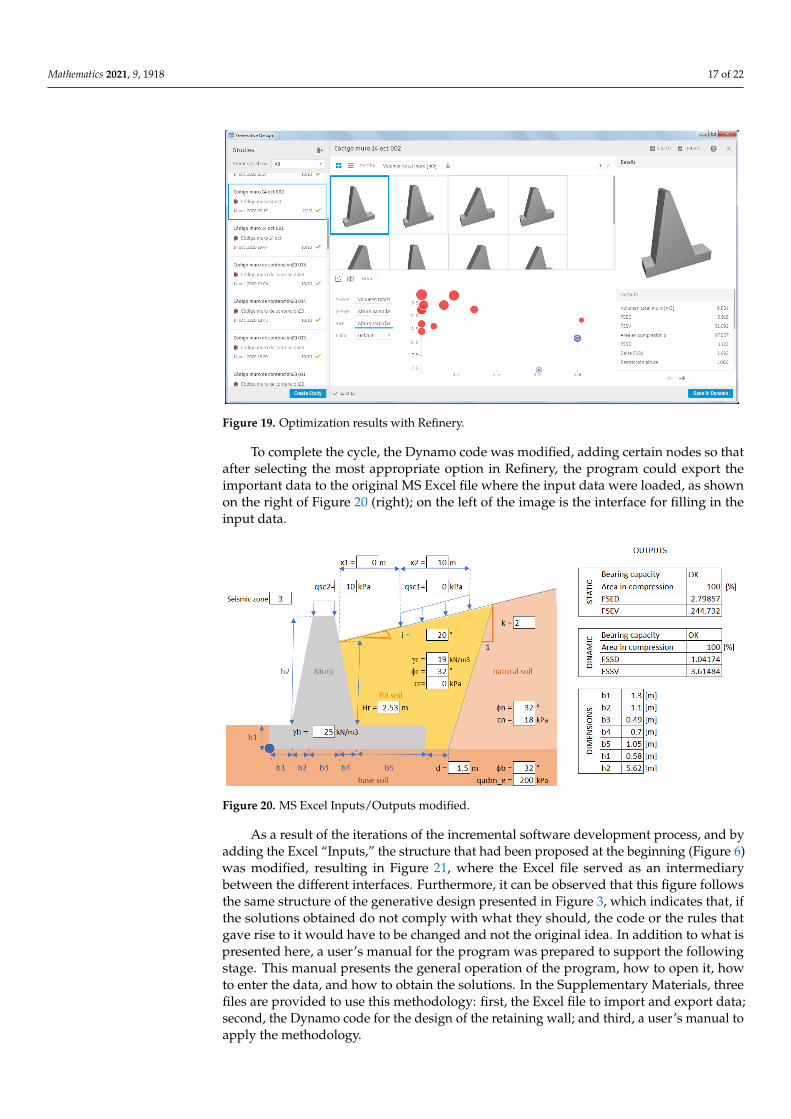
Then, some input data values were proposed for one of the case studies tested by theresearch team, resulting in 12 retaining wall designs (Figure 19).
Mathematics 2021, 9, 1918 17 of 22
Mathematics 2021, 9, x FOR PEER REVIEW 18 of 23
Then, some input data values were proposed for one of the case studies tested by the
research team, resulting in 12 retaining wall designs (Figure 19).
Figure 19. Optimization results with Refinery.
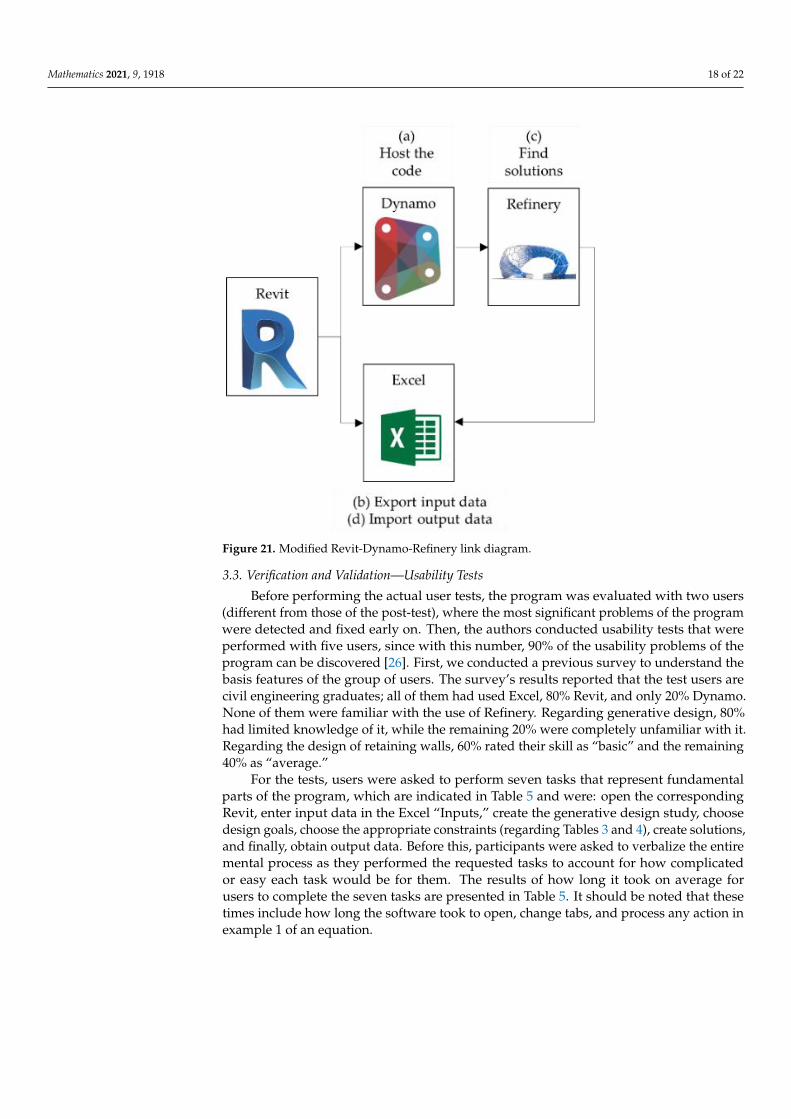
To complete the cycle, the Dynamo code was modified, adding certain nodes so that
after selecting the most appropriate option in Refinery, the program could export the im-
portant data to the original MS Excel file where the input data were loaded, as shown on
the right of Figure 20 (right); on the left of the image is the interface for filling in the input
data.
Figure 20. MS Excel Inputs/Outputs modified.
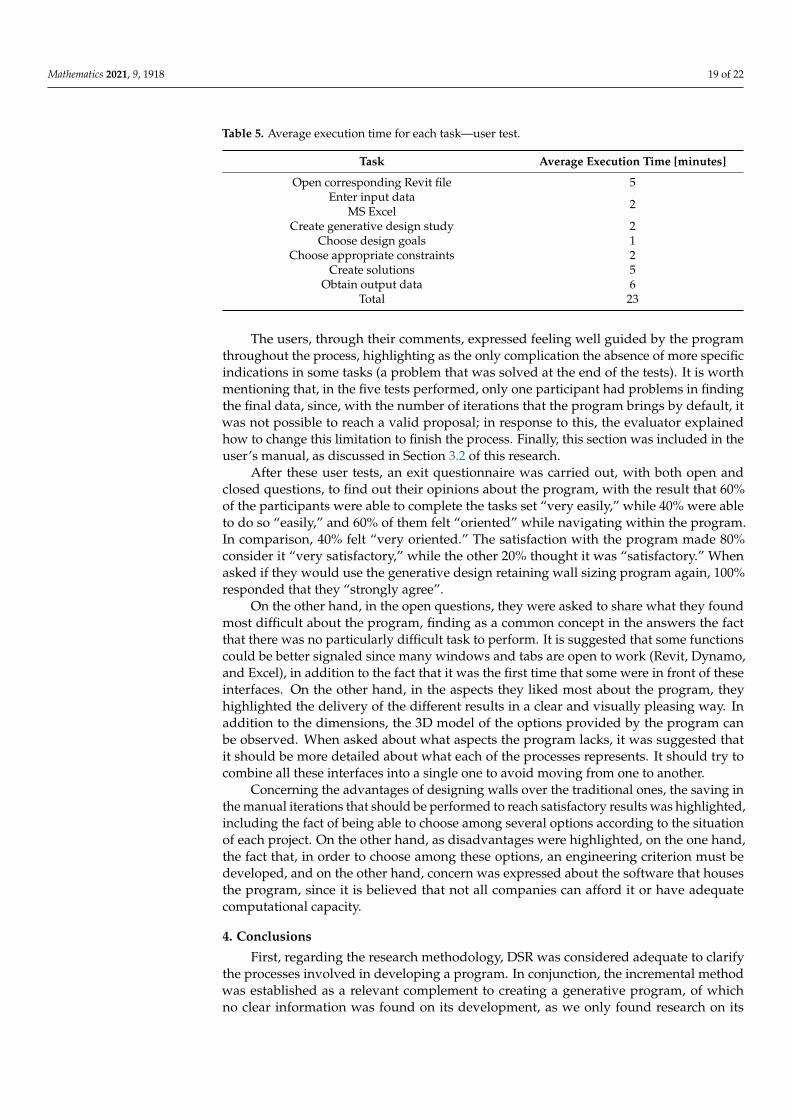
As a result of the iterations of the incremental software development process, and by
adding the Excel “Inputs,” the structure that had been proposed at the beginning (Figure
6) was modified, resulting in Figure 21, where the Excel file served as an intermediary
between the different interfaces. Furthermore, it can be observed that this figure follows
the same structure of the generative design presented in Figure 3, which indicates that, if
the solutions obtained do not comply with what they should, the code or the rules that
gave rise to it would have to be changed and not the original idea. In addition to what is
presented here, a user’s manual for the program was prepared to support the following
stage. This manual presents the general operation of the program, how to open it, how to
enter the data, and how to obtain the solutions. In the Supplementary Materials, three files
Figure 19. Optimization results with Refinery.
To complete the cycle, the Dynamo code was modified, adding certain nodes so thatafter selecting the most appropriate option in Refinery, the program could export theimportant data to the original MS Excel file where the input data were loaded, as shownon the right of Figure 20 (right); on the left of the image is the interface for filling in theinput data.
Mathematics 2021, 9, x FOR PEER REVIEW 18 of 23
Then, some input data values were proposed for one of the case studies tested by the
research team, resulting in 12 retaining wall designs (Figure 19).
Figure 19. Optimization results with Refinery.
To complete the cycle, the Dynamo code was modified, adding certain nodes so that
after selecting the most appropriate option in Refinery, the program could export the im-
portant data to the original MS Excel file where the input data were loaded, as shown on
the right of Figure 20 (right); on the left of the image is the interface for filling in the input
data.
Figure 20. MS Excel Inputs/Outputs modified.
As a result of the iterations of the incremental software development process, and by
adding the Excel “Inputs,” the structure that had been proposed at the beginning (Figure
6) was modified, resulting in Figure 21, where the Excel file served as an intermediary
between the different interfaces. Furthermore, it can be observed that this figure follows
the same structure of the generative design presented in Figure 3, which indicates that, if
the solutions obtained do not comply with what they should, the code or the rules that
gave rise to it would have to be changed and not the original idea. In addition to what is
presented here, a user’s manual for the program was prepared to support the following
stage. This manual presents the general operation of the program, how to open it, how to
enter the data, and how to obtain the solutions. In the Supplementary Materials, three files
Figure 20. MS Excel Inputs/Outputs modified.
As a result of the iterations of the incremental software development process, and byadding the Excel “Inputs,” the structure that had been proposed at the beginning (Figure 6)was modified, resulting in Figure 21, where the Excel file served as an intermediarybetween the different interfaces. Furthermore, it can be observed that this figure followsthe same structure of the generative design presented in Figure 3, which indicates that, ifthe solutions obtained do not comply with what they should, the code or the rules thatgave rise to it would have to be changed and not the original idea. In addition to what ispresented here, a user’s manual for the program was prepared to support the followingstage. This manual presents the general operation of the program, how to open it, howto enter the data, and how to obtain the solutions. In the Supplementary Materials, threefiles are provided to use this methodology: first, the Excel file to import and export data;second, the Dynamo code for the design of the retaining wall; and third, a user’s manual toapply the methodology.
Mathematics 2021, 9, 1918 18 of 22
Mathematics 2021, 9, x FOR PEER REVIEW 19 of 23
are provided to use this methodology: first, the Excel file to import and export data; sec-
ond, the Dynamo code for the design of the retaining wall; and third, a user’s manual to
apply the methodology.
Figure 21. Modified Revit–Dynamo–Refinery link diagram.
3.3. Verification and Validation—Usability Tests
Before performing the actual user tests, the program was evaluated with two users
(different from those of the post-test), where the most significant problems of the program
were detected and fixed early on. Then, the authors conducted usability tests that were
performed with five users, since with this number, 90% of the usability problems of the
program can be discovered [26]. First, we conducted a previous survey to understand the
basis features of the group of users. The survey’s results reported that the test users are
civil engineering graduates; all of them had used Excel, 80% Revit, and only 20% Dynamo.
None of them were familiar with the use of Refinery. Regarding generative design, 80%
had limited knowledge of it, while the remaining 20% were completely unfamiliar with
it. Regarding the design of retaining walls, 60% rated their skill as “basic” and the remain-
ing 40% as “average.”
For the tests, users were asked to perform seven tasks that represent fundamental
parts of the program, which are indicated in Table 5 and were: open the corresponding
Revit, enter input data in the Excel “Inputs,” create the generative design study, choose
design goals, choose the appropriate constraints (regarding Tables 3 and 4), create solu-
tions, and finally, obtain output data. Before this, participants were asked to verbalize the
entire mental process as they performed the requested tasks to account for how compli-
cated or easy each task would be for them. The results of how long it took on average for
users to complete the seven tasks are presented in Table 5. It should be noted that these
times include how long the software took to open, change tabs, and process any action in
example 1 of an equation.
Figure 21. Modified Revit-Dynamo-Refinery link diagram.
3.3. Verification and Validation—Usability Tests
Before performing the actual user tests, the program was evaluated with two users(different from those of the post-test), where the most significant problems of the programwere detected and fixed early on. Then, the authors conducted usability tests that wereperformed with five users, since with this number, 90% of the usability problems of theprogram can be discovered [26]. First, we conducted a previous survey to understand thebasis features of the group of users. The survey’s results reported that the test users arecivil engineering graduates; all of them had used Excel, 80% Revit, and only 20% Dynamo.None of them were familiar with the use of Refinery. Regarding generative design, 80%had limited knowledge of it, while the remaining 20% were completely unfamiliar with it.Regarding the design of retaining walls, 60% rated their skill as “basic” and the remaining40% as “average.”
For the tests, users were asked to perform seven tasks that represent fundamentalparts of the program, which are indicated in Table 5 and were: open the correspondingRevit, enter input data in the Excel “Inputs,” create the generative design study, choosedesign goals, choose the appropriate constraints (regarding Tables 3 and 4), create solutions,and finally, obtain output data. Before this, participants were asked to verbalize the entiremental process as they performed the requested tasks to account for how complicatedor easy each task would be for them. The results of how long it took on average forusers to complete the seven tasks are presented in Table 5. It should be noted that thesetimes include how long the software took to open, change tabs, and process any action inexample 1 of an equation.
Mathematics 2021, 9, 1918 19 of 22
Table 5. Average execution time for each task—user test.
Task Average Execution Time [minutes]
Open corresponding Revit file 5Enter input data
MS Excel 2
Create generative design study 2Choose design goals 1
Choose appropriate constraints 2Create solutions 5
Obtain output data 6Total 23
The users, through their comments, expressed feeling well guided by the programthroughout the process, highlighting as the only complication the absence of more specificindications in some tasks (a problem that was solved at the end of the tests). It is worthmentioning that, in the five tests performed, only one participant had problems in findingthe final data, since, with the number of iterations that the program brings by default, itwas not possible to reach a valid proposal; in response to this, the evaluator explainedhow to change this limitation to finish the process. Finally, this section was included in theuser’s manual, as discussed in Section 3.2 of this research.
After these user tests, an exit questionnaire was carried out, with both open andclosed questions, to find out their opinions about the program, with the result that 60%of the participants were able to complete the tasks set “very easily,” while 40% were ableto do so “easily,” and 60% of them felt “oriented” while navigating within the program.In comparison, 40% felt “very oriented.” The satisfaction with the program made 80%consider it “very satisfactory,” while the other 20% thought it was “satisfactory.” Whenasked if they would use the generative design retaining wall sizing program again, 100%responded that they “strongly agree”.
On the other hand, in the open questions, they were asked to share what they foundmost difficult about the program, finding as a common concept in the answers the factthat there was no particularly difficult task to perform. It is suggested that some functionscould be better signaled since many windows and tabs are open to work (Revit, Dynamo,and Excel), in addition to the fact that it was the first time that some were in front of theseinterfaces. On the other hand, in the aspects they liked most about the program, theyhighlighted the delivery of the different results in a clear and visually pleasing way. Inaddition to the dimensions, the 3D model of the options provided by the program canbe observed. When asked about what aspects the program lacks, it was suggested thatit should be more detailed about what each of the processes represents. It should try tocombine all these interfaces into a single one to avoid moving from one to another.
Concerning the advantages of designing walls over the traditional ones, the saving inthe manual iterations that should be performed to reach satisfactory results was highlighted,including the fact of being able to choose among several options according to the situationof each project. On the other hand, as disadvantages were highlighted, on the one hand,the fact that, in order to choose among these options, an engineering criterion must bedeveloped, and on the other hand, concern was expressed about the software that housesthe program, since it is believed that not all companies can afford it or have adequatecomputational capacity.
4. Conclusions
First, regarding the research methodology, DSR was considered adequate to clarifythe processes involved in developing a program. In conjunction, the incremental methodwas established as a relevant complement to creating a generative program, of whichno clear information was found on its development, as we only found research on its
Mathematics 2021, 9, 1918 20 of 22
direct application. Therefore, this research serves as a basis for others to develop theirapplications with generative design, regardless of the area in which they work.
Through this research, it was possible to show how generative design emerges asan alternative to the traditional design of retaining walls, since it showed a concrete useof generative design in civil engineering, with advantages such as saving design time,the multiplicity of alternative solutions, and also the option of choosing the shape of thewall that needs the least amount of material possible to be built and meet the restrictionsproposed by the user, which will cause a decrease in the cost of the structure and CO2emissions by the generation of the same. Additionally, the authors can conclude that itis possible to apply generative design for the design of structural elements in the AECindustry; however, this requires a high compatibility between analysis and modelingsoftware, which can be solved using visual programming tools that include softwarealigned with the BIM methodology. In addition, with this methodology, it is possible toevaluate different options delivered through complex optimization methods, which shouldbe complemented with multi-criteria decision-making analysis.
Responding to the research questions presented, it can be said that the developedsoftware complies with the requirements of the current Chilean regulations (highwaymanual, volume 3) [8]. This design is performed in a fast and user-friendly way, consideringthe fundamental parameters of each project, and obtaining, as a result, the completedimensioning of the wall and the necessary verifications to guarantee its stability—in thiscase, safety factors, support capacity, and areas in compression (both static and seismic).This program is adaptable to the requirements of each country or a specific project since thegeneral structure of the wall design is already established in the code; therefore, to modify,eliminate, or add any variable, it is not necessary to redo the whole program, but only thatspecific part.
The above aspects were validated in user tests. The participants of these tests pos-itively highlighted the fact that the program is easy to use even for people who do notknow or know very little about generative design and Revit, Dynamo, and Refinery soft-ware. Likewise, for the users, this way of dimensioning retaining walls does present animprovement over the traditional one, mainly because of the savings in the manual itera-tions necessary to arrive at an adequate solution, given that, on average, the process wascompleted in 23 min, as well as in the variety of these proposals. These last characteristicsare the main advantages of the generative design found in the literature and are confirmedin the initial evaluation. Even though this research was based on the dimensioning ofretaining walls, it favors the understanding of this new design process in general. On theother hand, one of the negative aspects mentioned by the users is the cumbersome use ofseveral windows in the use of the program. This could cease to be a complication since,during this study, the Revit software (version 2021) included a generative design section inits interface without the need to jump to Dynamo and Refinery.
The program created will be useful for civil engineers and construction companies withlittle experience in designing walls to optimize the dimensioning process and quickly findan adequate solution. It is worth mentioning that, in order to use the program developedin this research, it is necessary to have the license of the Excel and Revit programs (eitherstudent or professional) and download the Dynamo and Refinery add-ins (which can beobtained for free if you already have the Revit license); in addition, you must have the filesthat are attached in the supplementary material: Dynamo code, Excel “Inputs”, and theuser’s manual.
To further validate the developed program, it should be tested with more experiencedretaining wall design professionals to see whether it improves their professional practice.This was not conducted because, in this case, given their advanced knowledge, it would beappropriate to teach these users to modify the code for each of their projects (and not onlyexplore it) and thus demonstrate the adaptability of the program to people with differentlevels of expertise in retaining wall design.
Mathematics 2021, 9, 1918 21 of 22
As future lines of research, it is recommended to include steel reinforcements in thepresented model, which in a seismic country such as Chile are indispensable. This aspectis easily programmable in the code, functioning as a new variable to be considered inthe analysis. In addition, this design process should be explored and analyzed to see itspossibilities, limitations, and possible connections with the BIM methodology. Likewise,it is recommended to use generative design in other civil engineering applications thatdepend on traditional iterative design, such as steel connections, whose characteristicsare suitable for coding, or other aspects, such as the optimal positioning of buildingsin previously realized topologies. In addition, from the point of view of usability, it isrecommended to perform an exhaustive analysis based on heuristics, both with those ofNielsen and some of our own created specifically for generative design, since, at the timeof this study, no heuristics were found in the literature.
Supplementary Materials: The following are available online at https://www.mdpi.com/article/10.3390/math9161918/s1, Excel inputs-and outputs—retaining wall; Dynamo code—retaining wall;and User manual—retaining wall.
Author Contributions: This paper represents the results of teamwork. G.D. and R.F.H. designedthe research methodology. G.D. carried out the literature review, methods, and experiments. Allthe authors worked on the results, discussions, and conclusions of the manuscript. Finally, R.F.H.,F.M.-L.R. and E.A. reviewed and edited the manuscript. All authors have read and agreed to thepublished version of the manuscript.
Funding: This research was funded by CONICYT grant number CONICYT-PCHA/InternationalDoctorate/2019-72200306 for funding the graduate research of Muñoz–La Rivera. The APC wasfunded by Pontificia Universidad Católica de Valparaíso.
Institutional Review Board Statement: Not applicable.
Informed Consent Statement: Not applicable.
Data Availability Statement: Not applicable.
Acknowledgments: The authors wish to thank all organizations participating in this study as wellas the experts for the insight provided. The authors wish to thank the TIMS space (Technology,Innovation, Management, and Innovation) of the School of Civil Engineering of the PontificiaUniversidad Católica de Valparaíso (Chile) where the research was carried out.
Conflicts of Interest: The authors declare no conflict of interest.
References1. Brooks, H.; Nielsen, J. Basics of Retaining Wall Design, 10th ed.; HBA Publication: Newport Beach, CA, USA, 2013.2. Prada, F.; Ramos, A.; Solaque, D.; Caicedo, B. Confiabilidad aplicada al diseño geotécnico de un muro de contención. Obras Proy.
2011, 9, 49–58. [CrossRef]3. Khan, F.; Zamiran, S.; Osouli, A. Comparison of Seismic Response of Gravity and Cantilever Walls Backfilled with Dirty Coarse-
Grained Material. In Proceedings of the Geo-Congress 2019, Reston, VA, USA, 24–27 March 2019; American Society of CivilEngineers: Reston, VA, USA, 2019; pp. 57–65.
4. Lucero Pardo, F.H.; Pachacama Caiza, E.A.; Rodriguez Montero, W.A. Analisis y Diseño de Muros de Contención; UniversidadCentral del Ecuador: Quito, Ecuador, 2012.
5. Fenton, G.A.; Griffiths, D.V.; Williams, M.B. Reliability of traditional retaining wall design. Géotechnique 2005, 55, 55–62. [CrossRef]6. Madabhushi, S.P.G.; Zeng, X. Seismic response of flexible cantilever retaining walls with dry backfill. Geomech. Geoengin. 2006, 1,
275–289. [CrossRef]7. Gandomi, A.H.; Kashani, A.R.; Roke, D.A.; Mousavi, M. Optimization of retaining wall design using recent swarm intelligence
techniques. Eng. Struct. 2015, 103, 72–84. [CrossRef]8. MOP Volumen N◦3. Instrucciones y Criterior de Diseño. In Manual de Carreteras; Ministerio de Obras Públicas: Santiago, Chile,
2014; Volume 3, p. 1285.9. Hooley, I.W.; Al-Deen, S. Design of cantilever retaining walls for minimum tilting tendency. Aust. J. Struct. Eng. 2020, 21, 1–9.
[CrossRef]10. Velasco Pérez, R. Estudio de la Aplicación del Diseño Generativo al Diseño Conceptual Arquitectónico; Universitat Politecnica de
Valencia: Valencia, Spain, 2015.

Mathematics 2021, 9, 1918 22 of 22
11. Kalemci, E.N.; Ikizler, S.B.; Dede, T.; Angın, Z. Design of reinforced concrete cantilever retaining wall using Grey wolf optimizationalgorithm. Structures 2020, 23, 245–253. [CrossRef]
12. Díaz, G.; Herrera, R.F.; Muñoz-La Rivera, F.C.; Atencio, E. Applications of generative design in structural engineering. Rev. Ing.Construcción 2021, 36, 29–47. [CrossRef]
13. McKnight, M. Generative Design: What it is? How is it being used? Why it’s a game changer. KnE Eng. 2017, 2, 176. [CrossRef]14. Khan, S.; Awan, M.J. A generative design technique for exploring shape variations. Adv. Eng. Inform. 2018, 38, 712–724. [CrossRef]15. Tafraout, S.; Bourahla, N.; Bourahla, Y.; Mebarki, A. Automatic structural design of RC wall-slab buildings using a genetic
algorithm with application in BIM environment. Autom. Constr. 2019, 106, 102901. [CrossRef]16. Van Telgen, M. Exploring Structural Design Options Using Generative Design. Available online: https://dynamobim.org/
exploring-structural-design-options-using-generative-design/ (accessed on 9 August 2021).17. Abdallah, H.; Ezzedine, F.; Haddad, A.; Salami, G.; Sanboskani, H.; Dabaghi, M.; Hamzeh, F. Employing Generative Design for
Sustainable Construction; Budapest University of Technology and Economics: Budapest, Hungary, 2019; pp. 692–698. [CrossRef]18. García Alvarado, R.; Lyon Gottlieb, A. Diseño paramétrico en Arquitectura; método, técnicas y aplicaciones. Arquisur 2013, 31,
20–31. [CrossRef]19. Johan, R.; Chernyavsky, M.; Fabbri, A.; Gardner, N.; Haeusler, M.H.; Zavoleas, Y. Building Intelliengence through Generative
design: Structural Analysis and Optimisation Informed by Material Performance. In Proceedings of the 24th InternationalConferences of the Association for Computer-Aided Architectural Design Research in Asia (CAADRIA), Wellington, NewZealand, 15–18 April 2019; Volume 1, pp. 371–380.
20. Turney, D. Concrete Forms Get Stronger, Lighter, and More Sustainable with Generative Design. Available online: https://redshift.autodesk.com/sustainable-concrete/ (accessed on 9 August 2021).
21. Hevner, A.R. A three cycle view of design science research. Scand. J. Inf. Syst. 2007, 19, 87–92. Available online: http://aisel.aisnet.org/sjis/vol19/iss2/4 (accessed on 9 August 2021).
22. Hevner, A.R.; Chatterjee, S. Design science research frameworks. In Design Sicence Research in Information Systems; Springer:Boston, MA, USA, 2010; pp. 23–31.
23. Guevara Anzules, M. Estudio Comparativo del Análisi de Muros de Contención Tanto Como, muro en Voladizo vs. Muro de Contrafuertes,de un muro de altura = 7.5 m, Tanto en su Análisis Estructural Como en su Análisi técnico-Económico; Universidad de Guayaquil:Guayaquil, Ecuador, 2009.
24. Trivedi, P.; Sharma, A. A comparative study between iterative waterfall and incremental software development life cycle modelfor optimizing the resources using computer simulation. In Proceedings of the 2013 2nd International Conference on InformationManagement in the Knowledge Economy, Chandigarh, India, 19–20 December 2013; Institute of Electrical and ElectronicsEnginers (IEEE): Chandigarh, India, 2013; pp. 188–194.
25. Das, B.M.; Sivakugan, N. Fundamentals of Geothecnical Engineering, 5th ed.; Cengage Learning: Boston, MA, USA, 2016.26. Nielsen, J.; Landauer, T.K. A mathematical model of the finding of usability problems. In Proceedings of the ACM INTERCHI’93
Conference, Amsterdam, The Netherlands, 24–29 April 1993; IOS Press: Amsterdam, The Netherlands, 1993; pp. 206–213.