generalization seems to be appropriate; less than one in ten women
TRANSCRIPT
80
Chapter 4
Total Overall Economic Importance of
Saltwater Recreational Fishin
Introduction
The purpose of this chapter is to draw together the information developedin Chapters 2 and 3. This chapter will not only combine the resident andtourist sectors; but will compare and contrast the two sectors which make upsaltwater recreational fishing in Florida. We shall also extend the analysisof the valuation of the fishery resource itself.
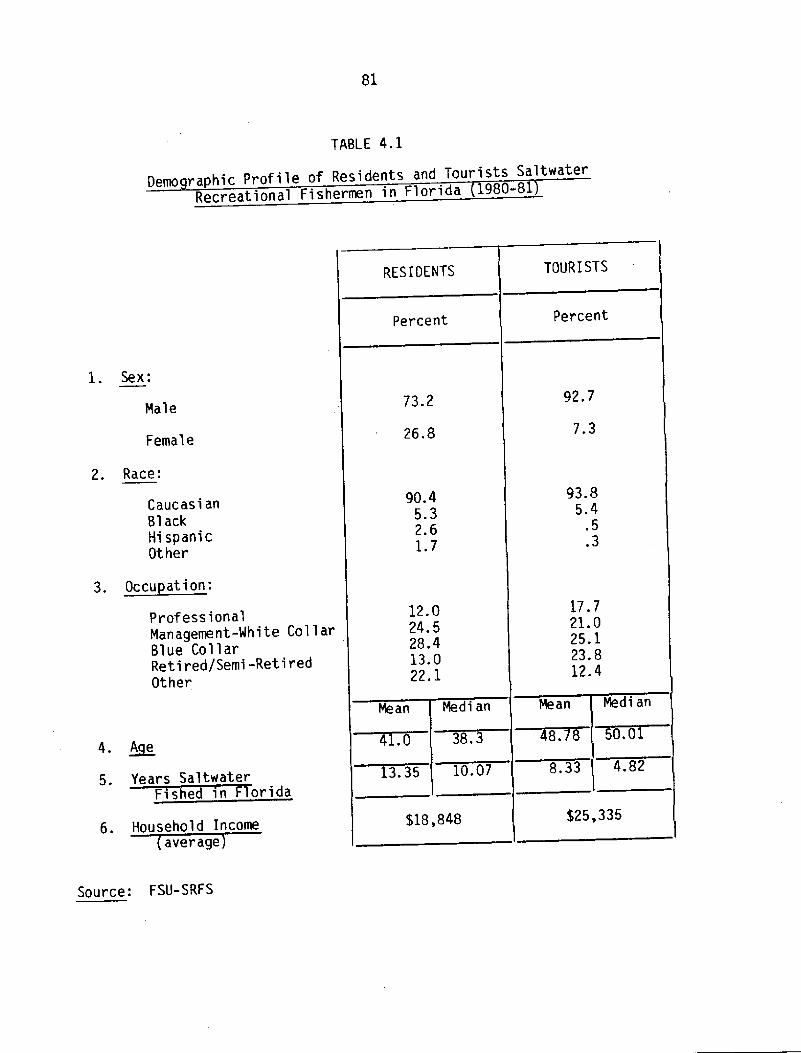
Table 4. 1 presents the demographic characteristics of tourists andresidents. As might be expected, females are a much larger fraction of theresident saltwater anglers than of the tourists. More than a quarter of theresident anglers are women. This is fairly substantial since saltwaterangling is usually perceived as a "man's sport". For the tourists thisgeneralization seems to be appropriate; less than one in ten women touristsparticipate. With respect to race, there is strong simi larity betweenresidents and tourists. The single difference between the two groups is thehigher participation of hispanics among residents. This is what might beexpected given the higher percentage of hispanics in Florida compared to theU.S. population. With respect to occupation, tourist anglers show a higherpercentage of professionals as compared to residents. Of considerableinterest, nearly one quarter of the tourist anglers are retired. This issignificant in Florida which has a large retirement communi ty. Touristanglers are on average nearly 8 years older than their resident counterparts.As might be expected, residents have been fishing in Florida about 5 yearslonger than the tourist anglers. Finally, the averaqe household income issignificantly higher among the tourist anglers $25,335 as compared to $18,848for residents!. Three factors may explain the difference. First, there is ah igher percentage of professionals among touri sts. Second, many of thetourists are from northern states where wages tend to be higher than in
Florida. Third, the higher percentage of males in the tourist sample may also
81
TABLE 4.1
Demo raphic Profile of Residents and Tourists SaltwaterRecreational Fishermen in Florida 1980-81
1. Sex:
Male
Female
2. Race:
CaucasianBlack
HispanicOther
3. Occupation:
Prof ess ionalManagement-White CollarBlue CollarRetired/Semi -RetiredOther
4. ~Ae
6.di id
ehol d Income6.
Source: FSU-SRFS
82
contribute to the income differential, since there would be a lowerprobability of interviewing a tourist whose household was headed by a woman.
Number of An lers and Recreational Days
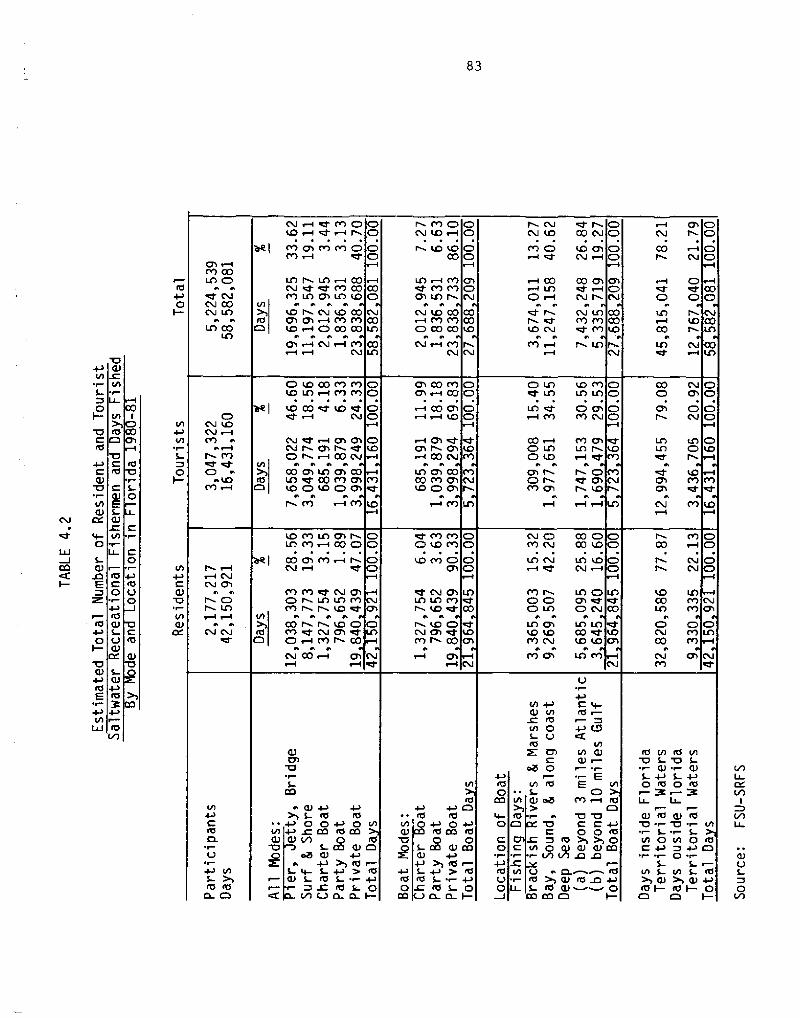
Resident and tourist saltwater anglers numbered an estimated 5,224,539 inFlorida over the 1980-81 period �2 months! of this study. Table 4.2 showsthese comparisons. Tourist anglers comprised 58 percent of the total anglers.But in terms of fishing days, the story was quite different. Touristsaccounted for 16,431,160 fishing days, or only 28 percent of total fishingdays which numbered 58,582,081. 19 Even though tourist anglers outnumber edresident anglers, the latter spend almost four times as many days per yearfishing than the former. Therefore, in terms of fishing pressure as measuredby fishing days, residents are the dominant force.
Let us now consider mode of fishing as shown in Table 4.2. "Privateboat" and "pier, jetty, and bridge" were the two most important modes offishing measured in terms of fishing days for both tourist and residentanglers in Florida. However, there are significant differences betweenresidents and tourists anglers with respect to mode of fishing. For example,over 47 percent of resident fishing days are spent via the private boat, modecompared to about 24 percent for tourist anglers. Over 65 percent of touristangler days were spent fishing from structures i.e., pier, jetty and bridges!and shore compared to 48 percent for residents. As expected, tourist anglersspent, more of their time on charter and party boats than residents. But weagain see the domi nance of private boat use among residents who used the boatmode over 90 percent! and tourists also about 70 percent!.
19The reader should recognize that the estimated number of total fishing daysin this report will necessarily be at vari ance with that reported on "useroccasions" by the Florida Department of Natural Resources. In 1980, DNR 1980! reported 23,938,000 user occasions for saltwater recreational fishing,when residents and tourists are combined. The DNR "user occasion" isparticipation by one person in one type of activity one time Conceptually,on the same day a recreationalist may participate in more than one activity.Therefore, that day may be counted more than one time in saltwater fishing notto mention other recreational activities. Thus, the saltwater recreationalday in this study is not comparable to a "user occasion". One might expectDNR user occasions to be more numerous than the days reported in this study i.e., one day can be counted more than one time in recreational fishing!.Since the researchers could not obtai n the methodology for blowing up DNR'ssample, we can go no further in this analysis.
83
0 0 W P! 0~ ~
CO
CXI NLD ChN W
0 O 0 00 0
N lDP! 0 N CO0
PI COLCI O
el
N CON ID
aLA CO
~ COP5 CO
LD CO
CQ CO~ I
W P!
Ih M Pl~ I5 P! P!
~ e ~ INLD CGM P! P!0 CO CO
~ I
~ CO~ IDO e-I
~ e e
lD Ne ~
ID M LDN +sf'Pl LA Ol
MCh~LD ~ 0
Ch W N
0 00 eltCl
CO
eCP
CO Ch
~ IN LDPl P!d
0
0 0
0 0
Ch CO PICh~ CO
w CO Ch
O Lfl~ II' LA
~ 92LA M
ID PlID LCI
O Ch0 0 0 O 0 0 0 N 0
0N 92D
W P5d d
~ e 92D
'r
0I�
+ Ch CCh h Chw CO N~ eIA Ch COCO PI ChLD O Ch
W P!
CO ~D IDO LO~ ee
D hP! Ch
ED LD M~ e
I 0d Chh LD
P!
0 0 00
N P! P!DLD P!
~ ~IDP! O
Ch
N 00 0e
0 00 0 0C>
Pl0 0
0 L50
0 0W NN Ch
~ e eN O~ LO
~ e ~N N
LD LD PIh ID cl~ e
ID ON Ch <Pl r CO
COIO
0
CO 0 P!~ e
CO~~P! < N0&PI
ee ee eeN COW
N ChLD PILD el5LD O
CO
0 00 LCI
e eeID Ch
~ 0Pl Ch
LA O
D N~ 92LD IC!CO NLD LOLD P5
II5 IIIS-
T e ISI
0 Ille � R
gp rl50 I~ r N 0C Vr r
5-LrI S~ Clrl5 I�
II5 SrrS-IP
S- V0 rl5
II/'0 r LII~ r N Q rI5
V A0 ~ r
S r�V! S II5~ QJ VeI- 0
I�
V ArljO V
CO II50
U COrl5 r�~ e-5- 0D I�
CO
rr5 S-QCCI Cl
~ e I55
~ ~ V OV!ID0
oB
e
CC
CL
eV Irrl
CL A
0rII5O0
0ISI
0cn
C A
CC rl5IS!
ISIv!CD S-Cc' -IS!
0 rS-Q! e�
ISS
OZ~ rl5rt$ C!
5-0 0I � ID
CIJ S-CUII5
~ r
4J
N W ~ P! CI'LD ~ ct
~ 92 ~P> Ch Pl Pl O
~ I5
0 LD CO P! P! 0ID LA W P! P! 0
~ ~ ~ ' ~ ~ ~LO CO m LD W 0
N CI
N ~ Ch ~ M0 W M CO N~ e el ee eeCO Ch IC! Ch COLD eII' CO PI ChSD O LD O Ch
~ I
SD P5 IA Ch WID P! M CO Cr
~ ~ ~ ~COChP5~ r
rl5 II5O V OCO rI5 CO
0S-CO SAID
~ ll5 rS- VtO S
0MCL CLI�
I/I V C II-ISI III
rl5III 0 V COS-
LIIIrl Q
C CD~e@ 0 e r
r ~ e-l/I rl5 E VlS- 0
DQ rl5
II5 ++00 C5 ID ID ID
rl5W QPII5 ISI ~~ 0
COCOA I�
84
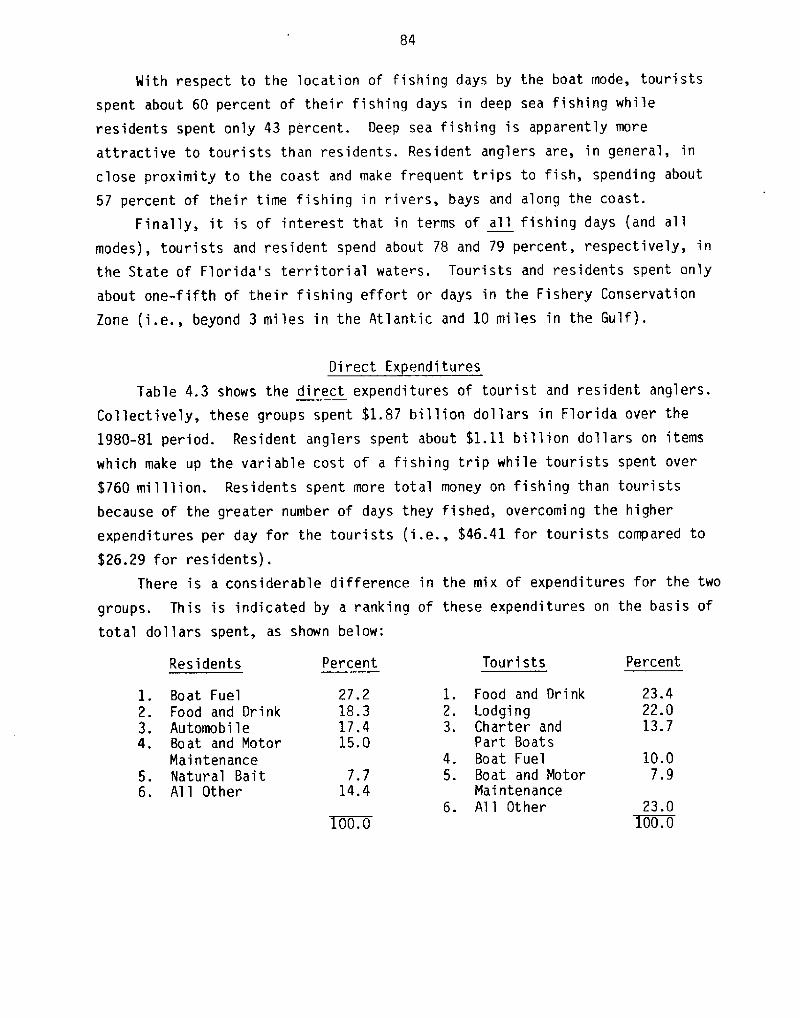
With respect to the location of fishing days by the boat mode, tourists
spent about 60 percent of their fishing days in deep sea fishing while
residents spent only 43 percent. Deep sea fishing is apparently more
attractive to tourists than residents. Resident anglers are, in general, in
close proximity to the coast and make frequent trips to fish, spending about
57 percent of their time fishing in rivers, bays and along the coast.
Finally, it is of interest that in terms of' all fishing days and allmodes!, tourists and resident spend about 78 and 79 percent, respectively, in
the State of Florida's territorial waters. Tourists and residents spent only
about one-fifth of their fishing effort or days in the Fishery Conservation
Zone i.e., beyond 3 miles in the Atlantic and 10 miles in the Gulf!.
Tourists PercentPercentResidents
1. Food and Drink2. I odging3. Charter and
Part Boats4. Boat Fuel5. Boat and Motor
Maintenance
6. All Other
23.4
22.013.7
27.218.317.415.0
1.2.
3 ~4.
Boat FuelFood and DrinkAu tomo b i 1 eBo at and MotorMaintenanceNatural Bait
All Other
10.07.97.7
14.45.6.
23.0
F00. 0F00. 0
Direct Expenditures
Table 4.3 shows the direct expenditures of tourist and resident anglers.
Collectively, these groups spent $1.87 billion dollars in Florida over the
1980-81 period. Resident anglers spent about $1. 11 billion dollars on items
which make up the variable cost of a fishing trip while tourists spent over
$760 mi 1 1 lion. Residents spent more total money on fi shi ng than touri sts
because of the greater number of days they fished, overcoming the higher
expenditures per day for the tourists i.e., $46.41 for tourists compared to
$26.29 for residents!.
There is a considerable difference in the mix of expenditures for the two
groups. This is indicated by a ranking of these expenditures on the basis oftotal dollars spent, as shown below:
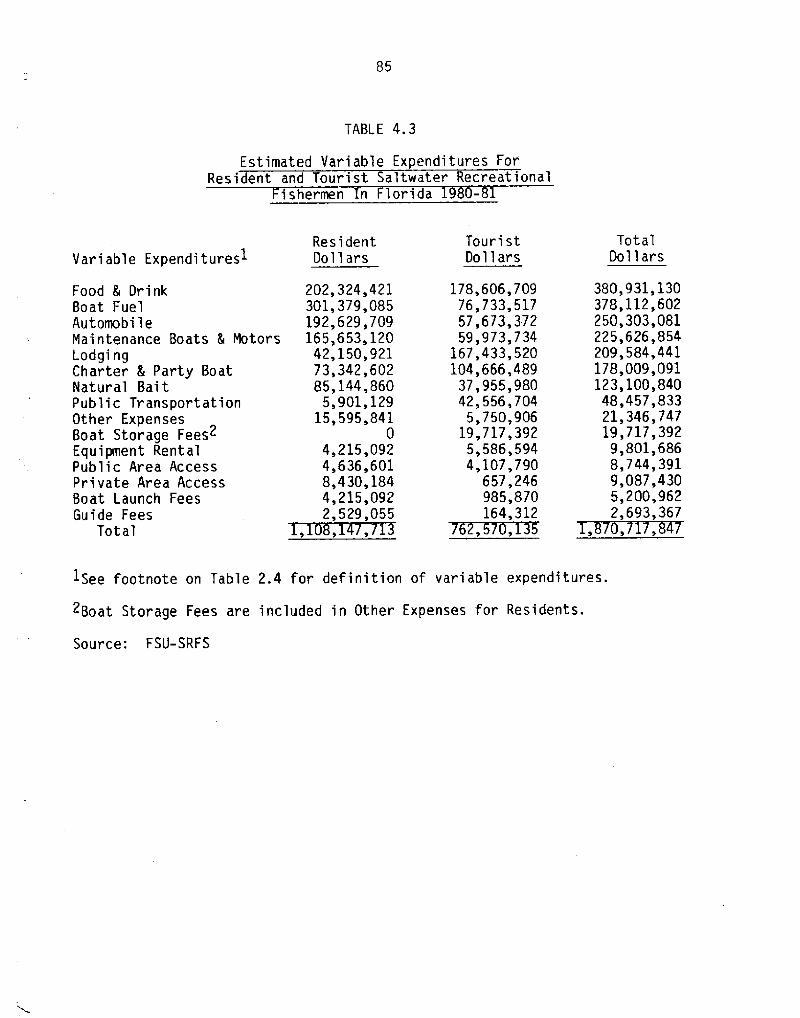
TABLE 4.3
Estimated Vari able Expenditures ForResident and Tourist Saltwater Recreational
ishermen n lorida
TotalDo l l ars
Touri stDollars
Resident
DollarsVariable Expenditures1
1See footnote on Table 2.4 for definition of variable expenditures.
2Boat Storage Fees are included in Other Expenses for Residents.
Source: FSU-SRFS
Food & DrinkBoat FuelAutomobi l eMaintenance Boats & MotorsLodgingCharter & Party BoatNatural BaitPublic TransportationOther ExpensesBoat Storage Fees2Equipment RentalPublic Area AccessPrivate Area AccessBoat Launch FeesGuide Fees
Total
202,324,421301,379,085192,629,709165,653,120
42,150,92173,342,60285,144,860
5,901,12915,595,841
0
4,215,0924,636,6018,430,1844,215,0922,529,055
178,606,70976,733,51757,673,37259,973,734
167,433,520104,666,489
37,955,98042,556,704
5,750,90619,717,3925,586,5944,107,790
657,246985,870164,312
EF37KI35
380,931,130378,112,602250,303,081225,626,854209,584,441178,009,091123,100,84048,457,83321,346,74719,717,3929,801,6868,744,3919,087,4305,200,9622,693,367
86
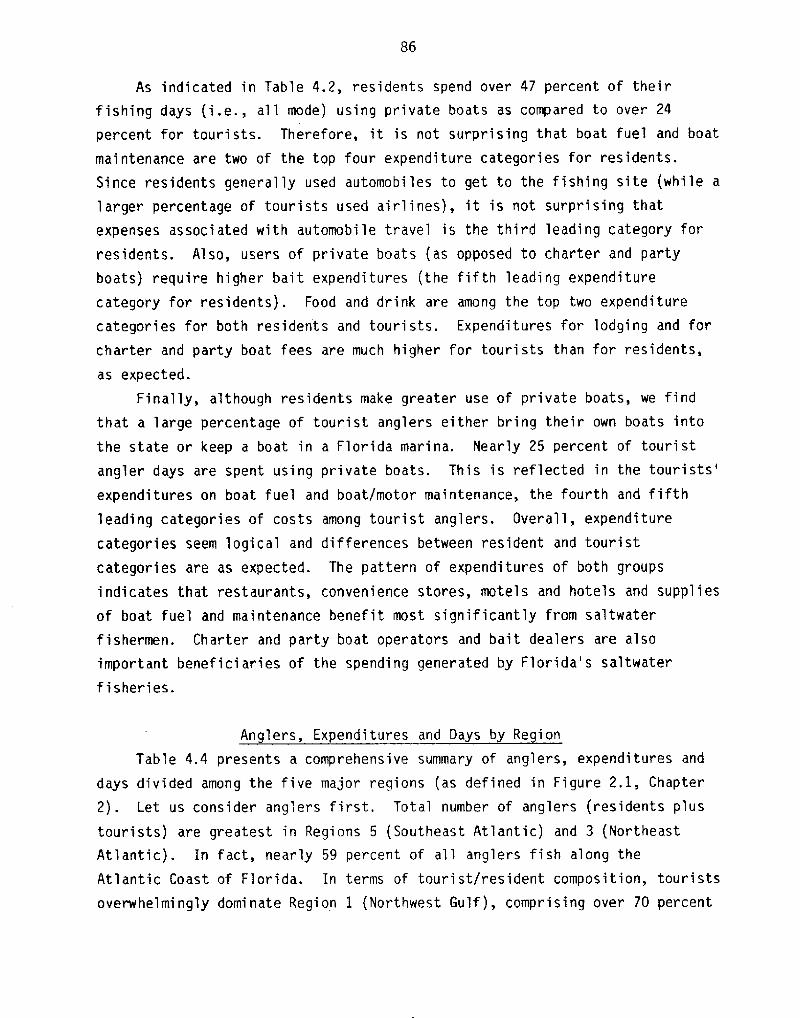
As indicated in Table 4.2, residents spend over 47 percent of their
fishing days i.e., all mode! using private boats as compared to over 24
percent for tourists. Therefore, it is not surprising that boat fuel and boat
maintenance are two of the top four expenditure categories for residents.
Since residents generally used automobiles to get to the fishing site while a
larger percentage of tourists used airlines!, it is not surprising that
expenses associated with automobile travel is the thi rd leading category for
residents' Also, users of private boats as opposed to charter and party
boats! require higher bait expenditures the fifth leading expenditure
category for residents!. Food and drink are among the top two expenditure
categories for both residents and tourists. Expenditures f' or lodging and for
charter and party boat fees are much higher for tourists than for residents,
as expected.
Finally, although residents make greater use of private boats, we find
that a large percentage of tourist anglers either bring their own boats into
the state or keep a boat in a Florida marina. Nearly 25 percent of tourist
angler days are spent using private boats. This is reflected in the tourists'
expenditures on boat fuel and boat/motor maintenance, the fourth and fifth
leading categories of costs among tourist anglers. Overall, expenditure
categories seem logical and differences between resident and tourist
categories are as expected. The pattern of expenditures of both groups
indicates that restaurants, convenience stores, motels and hotels and supplies
of boat fuel and maintenance benefit most significantly from saltwater
fi shermen. Charter and party boat operators and bai t dealers are also
important beneficiaries of the spending generated by Florida's saltwater
fisheries.
Anglers, Expenditures and Days by Re ion
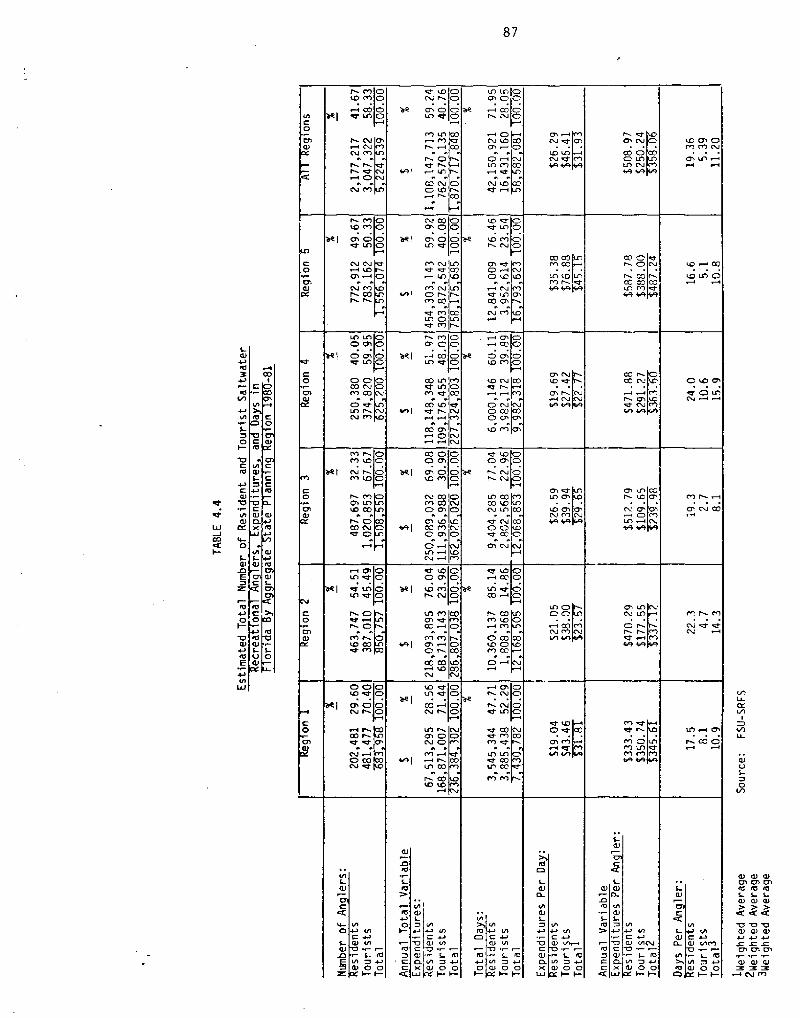
Table 4.4 presents a comprehensive summary of anglers, expenditures and
days d~vided among the five major regions as defined in Figure 2.I, Chapter
2!. Let us consider anglers first. Total number of anglers residents plus
tourists! are greatest in Regions 5 Southeast Atlantic! and 3 Northeast
Atlantic!. In fact, nearly 59 percent of all anglers fish along the
Atlantic Coast of Florida. In terms of tourist/resident composition, tourists
overwhelmingly dominate Region I Northwest Gulf!, comprising over 70 percent
87
0 OJQJ CQ 00 LCJLrf N0 wLCI rr/
N ICJ
lO WC/l 0'Cf' L/l
CQ Cw O0 0'QJCX
O LQ
Cf' L/fCQ
D ChC/I 0 0
ffel ~ CQ 0vt
0IOJQJ
QI N
Cr rCQ LCJ
CQ C/IIQ C
0I
/If LQ CQ 0O Ol
N hJvf LQ 0 Cl
QllCl CQ~ 0CQ NQP O
N cr'w D
~ Cf92
QC LCJL/f rt
0LA CfC,' C'
N~ CQN /If 0 w
OOlCI WCfI D N N+ LA
C 0 OfmD
QJ
0
0
l/I I1. JJS0 0
Vf CIfL Cl
V0 0
VlI
0f-
d vlQJL/J CL
CQ 4-O f-IJQE
O QJQfE
la/
I/I CQJ rf- CC rff
O C QJ QJ0. Vx
rrf
0 IffQJ
QJ
N NNN /If
rr D
N N
r cQ
0 C'QQ Cvfvf CQO NNm
N Cf~ O
LQ CQIQ fvf
cQ ~d QC~ 'N rrCl CQN d'
Ql
Ifff-lff!
IJ ICf 0N P Dcd 0 cLlf CP 0
~ 0
CQ ND LCJ
N CQ Dcd 0 Ocrl o 0Irf Qr O
N ILK'
/Q NO N/Q CCcj
N CQ 0Pl CQ N0 Ol 0
CQ /Q,NC' CfI O
LAW 920
~ Q LQO0 c/Io
r ND
C/I ~CQ ~rIf /IfC/I0 rCQ CQNLCJ IQ DLrf vC CtCQNN O
C/I DN 0
L/f CQI~ CQJCJ 92Cf
Vlvr
CQJ vllrf
Lrf L/J D0 0
w CQ 0Nl C
ICf N !CQ
~ LQ Ow CQ 0Lh N OCQ w 0
~ CQrIf LQ
0 CQLJQ OCQ CQ
N CQIQ- /IJ
Llf L/fM CQLCJ CQ
vfvf5 rff0 0I � t-
92/IVlrr
0 0
QJ
IQ
92 IQ!
C QJ VIN0 I I�
LQ C/I 0
0 LO CffIQ' 0 u.
ftr ~ C/I
QJ QJ Qr092 Cfl CrlJCf Qf lQf- S- f-Qf QJ QJ
ClQJ Ql QJ
IQJ QJ QJ
N rvf
of the total. In only one region, do residents outnumber tourists. This is
Region 2 West Gulf!.With respect to total annual expenditures residents and tourists!, over
three quarters of a billion dollars are spent in Region 5 SoutheastAtlantic!. This is the leading region by far with respect to both tourist andresident expenditures. Put differently, over 40 percent of all saltwaterangler expenditures in the state are concentrated in the Southeast AtlanticRegion. Region 3 Northeast Atlantic! is the second leading region in termsof total expenditures with over one-third of a billion dollars spent in the 12month period 1980-81. Residents spent more than tourists in all regionsexcept Region 1 Northwest Gulf! where only 28.56 percent of the expenditureswere derived from residents. As discussed in Chapter 3 on the regional
multiplier, we would expect that the economy of Region 1 would show arelatively greater impact from tourist expenditures.
With respect to total days, Region 5 Southeast Atlantic! again was theleading area with 16,793,623 days fished or 28.7 percent of all saltwaterfishing days. Residents contributed over 76 percent of the total days in theSoutheast Atlantic. Tourist days predomi nated in only one regi on, Region 1 Northwest Gulf!. This is consistent with other findings regarding theNorthwest Gulf Region. These statistics indicate that Florida is nothomogeneous in terms of patterns of fishing. Regionalization althoughlimited by sample sizes! reveals considerable variations.
Tourist expenditures per day were uniformly higher than residentexpenditures per day among all regions. For the state as a whole,expenditures per day for both tourists and residents were $31.93.Expenditures per day are about twice as high for tourists as compared toresidents in Region 1 Northwest Gulf !; Region 2 West Gulf!; and Region 5 Southeast Atlantic!.
Despite uniformly lower expenditures per day by residents, annualexpenditures per ~an ier tourist and resident showed a dit'tercet pattern due tothe greater number of total fishing days per year for residents. For theentire state, expenditures per angler resident were more than double that oftourists $508.97 vs. $250.24!. Except in Region 1, resident expenditures perangler were significantly higher than those of tourists. The difference inRegion 1 is explained by the fact that Northwest Gulf tourists spent a highnumber of days per year at a high expenditure per day as compared to other
89
regions. Also, the residents of Region 1 recorded a relatively low number ofdays per angler as compared to other regions. In Region 1 the ratio of
resident to tourist days per angler is about 2 to 1 while in Region 3
Northeast Atlantic! this ratio is over 7 to 1. Despite differences in this
ratio among regions, residents universally recorded much higher numbers of
annual fishing days per angler as compared to tourists.
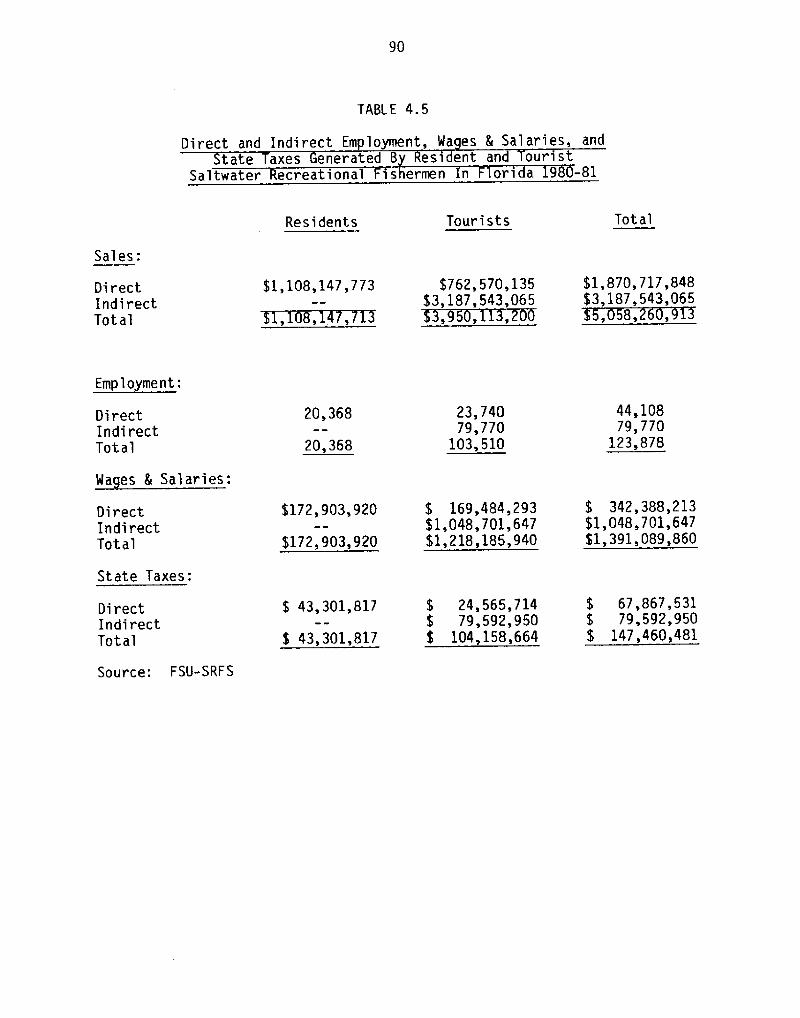
Direct and Indirect Employment, Wa es and State Taxes
Table 4.5 provides a summary of the estimated employment, wages and taxes
generated by the expenditures of tourists and residents on saltwater
recreational fishing. Direct employment is generated by tourist and resident
expenditures at the retail level. Although residents spend more dollars on
saltwater recreational fisheries than tourists �5 percent more!, we estimate
that tourists generate somewhat more employment ~ Tourist expenditures
generate 23,740 jobs as compared to 20,368 jobs for resident expenditures for
a total of 44,108 direct jobs. Tourist expenditures are focused on labor
intensive activities such as lodging and party and charter boat operations.
Resident anglers spend a large part �5 percent! of their dollars on boat fuel
and auto related costs mostly gasoline!. The sale of fuel or gasoline
generates fewer jobs in Florida since much of the money goes to out-of-state
refineries. As discussed in Chapter 3, tourist dollars have a multiplier
impact on the Florida economy since this is part of the economic base or theexport sector!. A great deal of indirect employment is generated by the
tourist sector. We estimate that these indirect dollars create 79,770 jobs.
We cautioned in Chapter 3 that this estimate is subject to some variability
depending on the regional multiplier and how typical this tourist sector is in
terms of its impact on all the Florida economy when compared to other export
industries. We estimate that by ~combinin residents and tourists 123.878 jobsare created by the existence of Florida's saltwater recreational fishery
resources.
The wages generated by tourist anglers are almost $173 million dollars
while more than $169 mi llion dollars are generated by resident anglers, for a
total of $343 million dollars in direct wages. When indirect wages are
considered, almost $1 billion i n wages must be added. Overall, $1. 391 bi 1 lion
in ~wa es are ~ener ated ~b tourist and resident ~an iers
90
TABLE 4.5
Direct and Indirect Employment, Wa es & Salaries, andtate axes enerated By esident an ourist
Saltwater ecreational Fishermen n Flori a 98 -81
TotalTouristsResidents
Sales:
$1,870,717,848$3,187,543,065
$1,108,].47,773
8,
Employment:
342 388 213$1,048,701,647$1,391,089,860
State Taxes:
$ 67,867,531$ 79,592,950$ 147,460,481
Source: FSU-SRFS
Direct
IndirectTot a' I
Direct
Indirect
Total
DirectIndirectTotal
DirectIndirect
Total
20,368
20,368
$172,903,920
$172,903,920
$ 43,301,817
$ 43,301,817
$762 570 135$3,187,543,065
23,74079,770
103,510
$ 169,484,293$1, 048, 701, 647$1, 218,185,940
$ 24,565,714$ 79,592,950
104,158,664
44,10879,770
123,878
91
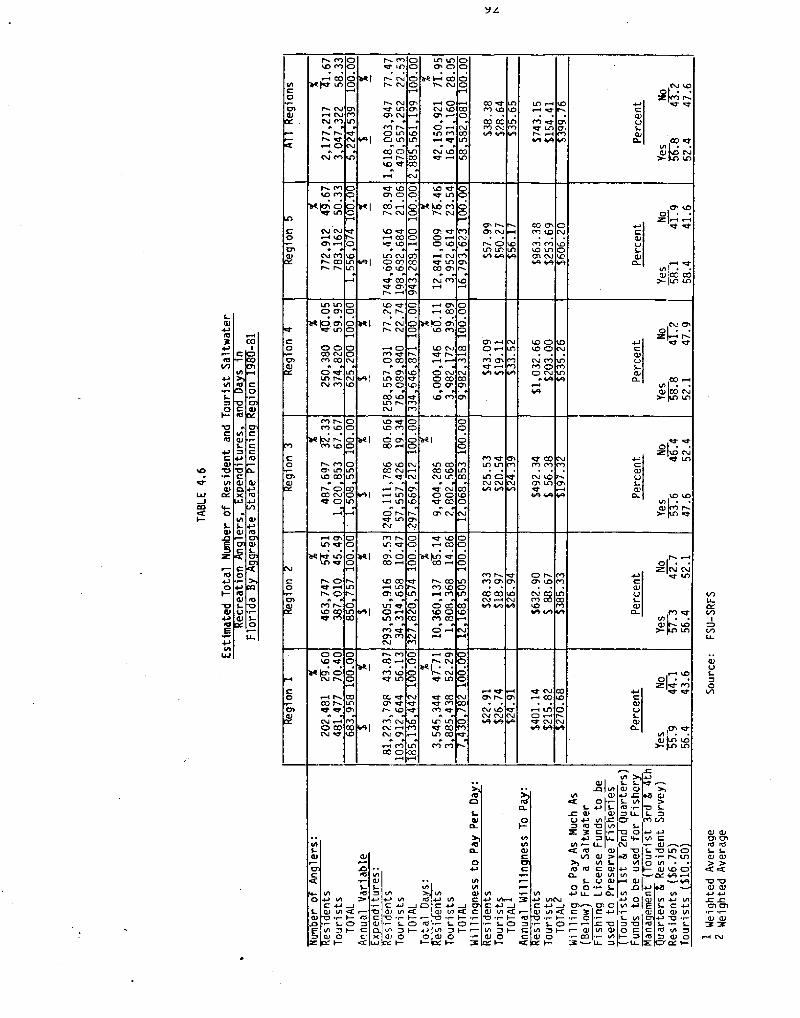
User Value b Re ions
Table 4.6 presents a summary of the willingness to pay or user valuequestion which was described in Chapters 2 and 3. As shown in Table 4.6 combining angler days per year and average willingness to pay per day!touri sts and residents combined would be willing to pay more than $2.088billion annually for the right to use the saltwater fisheries in Florida.User value varies considerably by region. For residents, user value washighest in Region 5 Southeast Atlantic! and lowest in Region 1 NorthwestGulf!. For tourists, user value was highest in Region 4 Southwest Gulf! andlowest in Region 2 Northeast Atlantic!. Remember, user value is an annualflow of value from the fishery resources. The saltwater fishery resource isan important natural resource asset to the State of Florida, and this assetvalue is an addition to the fishery's effects in stimulating expenditures.What is the asset value of the state's recreational saltwater fisheries? And
what can be done with knowledge of the value of this asset7
The value of .an asset is defined as follows:
�! ~+n o ~+n ' ' ' ~+nwhere,
value of the assetreturns to the assetdiscount ratetime
number of periods0, 1....I<
n =
tk =
t =
If the returns, R, flow for a large number of periods k ~ !, thenequation �! can be simplied where the returns are constant into the future R1=R2=...Rk!.
Al l of these expenditures on saltwater recreational fishing create statetaxes. Considering only sales, ~bevera e, ~asoline and corporate profit taxes which vary directly with retail sales!, we estimate that tourist and resident~an lers ~enerated over $147 mi1 lion in state taxes over the 12-month surveyperiod.
d LA
r
D Q O DClQ CJVl
C 0
N M
w ONm
0'
N
CO ~h N
d LAILO M4 ND CICj
d d
~ ~
N N920Ol ~
r cO
cr'. dO ~D L0
Nd LACO ChN Pl
NM COd LOLA NO COLO LOd CO
DM PlLO LACrl NVh %FAN
I0 dCV rr
Cl CPO
l IBIQ
Inj
CjO ClO CIQ
IJP OI0 OOOCO N
m cOO dLA rNm
CP
AO ND COO OICO Pl
N mM O
* VrrVll0I
Irj c0
CPO O
LD dI0 MO CrD Ilj CPCP
C 0 LA l/l d CO
LO COr DCO Nd C
LrlCO 920N LA~ 'd NQ Qd CO
N COCh LA
Vl QP$- J-JQP hj
CPCl
M W
Clr QCO w OIO0I-
pl rm chr Dd w
OPl PCO COd Pl
LO COCj'. ICILA dILA M
~ COM LO+MO COI0 OM COp w
O N CO
CO ~
d LA
Cj QPLJl-0
d LAO CI O CICO
Cl0 d COd Pl
LC' LAd COLA COM M
CO rd d
O CON d
N LON NCrI d
CD QPIQ IljI ICD QP
CI C$Ql ID+JCh ChI
P I/Ie wQP VlD I/IQP 0
Ql0 VlQPLLP CL
CO lr-0 l-QJJDE
ih CQP r'L C
CIQI0QP QP
IQ
C0IIC$QJl-LPQr $-
0
M COD
P PIOICP M QQODd LA O
MrMLOI OINr Om C0 D
H Crr QLA d OQ LA OLAd O
ODDIJ$d O+DON~O
QP
l-ICII/I !VI CC~ r l D$ I � C
0 CI�
r NCh Nm riCI LAO LACO QH rI0 d
w QD CO
Lrl COLA CPCO LCPLA h
CO LOCO CV
~ 92AO ~d LA
CCI dOI d
M N
CO p
VIe Jv&DIh JC
I0 D2 I�0 0I � I�
W DN LOCh ~Q wIA M
CV LOd w
IhlhVl
cr
I- O ~0I
r DLoLA LA IA
OI r I NQ wMOLM4/I J/I
P
I/I I
CD Vl CCD r I � hrI- OIh
QP 0 C
IhChNCW~QP Vl +1,
I~ l-OVlQP 0
QP
cC 0lCDIQ CI
K 3 CVl~ LlICI
I/I QPVlIO lrj C0 Ql
00 0J-I IJcr92 crlC 3 C0 '
Ql IhCO~ IJ-
I--
CL CO d
C QPI-QP0 CO M
LA
IDCP
i ID Qp rd
ZIN Nd IA
Qr0-
Lfl
z/«'cr dC
93
The U. S. Water Resources Council currently reconeends under itsPrinciples and Standards for valuing water resources such as fisheries adiscount rate of 7.625 percent. Using equation �! and the estimated uservalue or R for both residents and tourists we have the following:
'll = $2. 088561199 billion � $27. 391 bi 1 l i on�! . 6 5
The analysis indicated that fishery resources used for saltwaterrecreational fishing in Florida have an asset value of $27.391 billion. Howis such a number useful7 In a potential trade-off situation, for example,where wetlands might be destroyed which support fisheries, one could point tothe role of wetlands in supporting the value of the recreational fisheries.This amount would then be added to the wetland contribution to commercialfisheries. Now we would have an estimate of the value of both extramarketeconomic activity and market activity. Other applications of asset value usessuggest themselves naturally from this example.
A statistic that is widely used is the user value per day. Once this isknown, we can estimate user value when the number of days varies. Table 4.6gives the per day user values. For residents, user value per day is amazinglyuniform for Regions 1 Northwest Gulf!; 2 West Gulf! and 3 NortheastAtlantic!. This uniformity of $22.91 to $28 ~ 33 per day is found in "Northern"Florida for residents. The user value per day is considerably higher inRegions 4 Southwest Gulf! and 5 Southeast Atlantic!. The latter region hada daily user value of $57.99. Generally, user values per day were lower ineach region for the average tourist angler, except Region 1 Northwest Gulf!.On the state level, user day values were $38.38 and $28.64 for residents andtourists respectively. Table 4.6 also shows annual user value per angler.
Finally, we asked respondents their willingness to pay for a saltwaterfishing license. Generally, residents were more willing to pay for such alicense than tourists see Chapter 3 for details on phrasing questions onlicensing!.
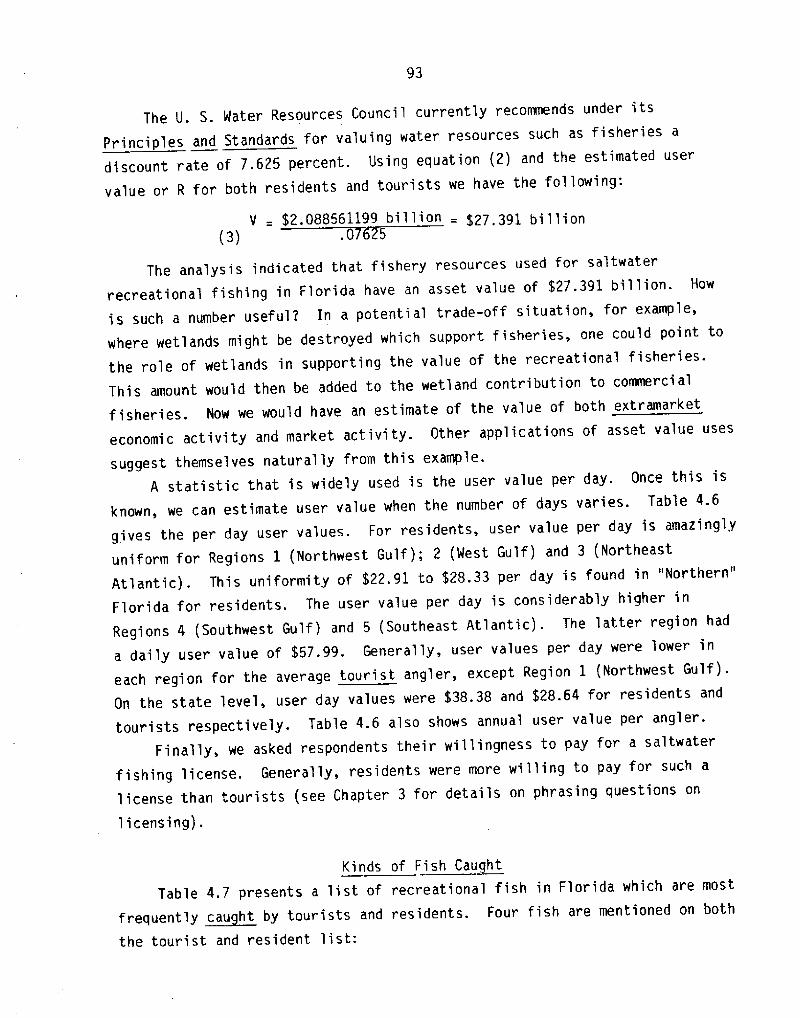
Kinds of Fish Cau ht
Table 4.7 presents a list of recreational fish in Florida which are mostfrequently ~cau ht by tourists and residents. Four tish are mentioned on boththe tourist and resident list:
TABLE 4.7
A Comparison of the Top 6 Species Cau ht by Residentand Tourist ecreational altwater n lers in
ori a F an NM
NMFSFSU-SRFS
Resident Tourists
Rank2 SpeciesRankl Rank3 Species
3.3.
4.4.
SpotKingf ish Whiting!Grouper
5.
Grunt6.
> Rank based on the number of people reporting the species as one of the Top 3species they usually caught.
2 Rank based on total number of people reporting.
3 Rank based on total number of fish caught. Includes residents and touristcatch.
Source: FSU - SRFS �982! and NMFS �980!
Species
Snappers
Seatrout
Grouper
King Mackerel
Oolphinf ish
Catfish
Catfish
Seatrout
Snapper
Bl uef ish
Catfish
Seatrout
Croaker
Pinf ish
1. Sn ap per
2. Se atrout
3. Grouper
4. Catf i sh
Residents list king mackerel and dolphinfish among their top six whiletourists list bluefish and kingfish whiting!. Me checked this list with datapublished by the National Marine Fisheries Service for 1979. The NMFS usednumber of fish caught as an indicator rather than number of people reporting.Only two species - catfish and seatrout - were in agreement with our twolists. The NMFS list includes croaker and pinfish which are usually notsought for their "good eating". Of course, many fish may be caught whilefishing e.g., catfish!, but not really desired ~
Disposition of Fish
Table 4.8 shows the comparative disposition of the six leading fish amongresidents and tourists. For residents, over 90 percent of the top five fishare eaten. The lone exception is catfish. Tourists are less likely to eatthe fish they catch. They are more likely to give the fish away or releasethem alive. For residents, 94 percent of snapper, seatrout and ~rouper areeaten, only 3.1 percenKare given away, and a little over one percent arereleased alive. For tourists, 84 percent of the same three species are eatenwhile over 11 percent are released alive. As might be expected, many touristsdo not take their fish home and they may lack the necessary facilities for
preparing fish for eating.
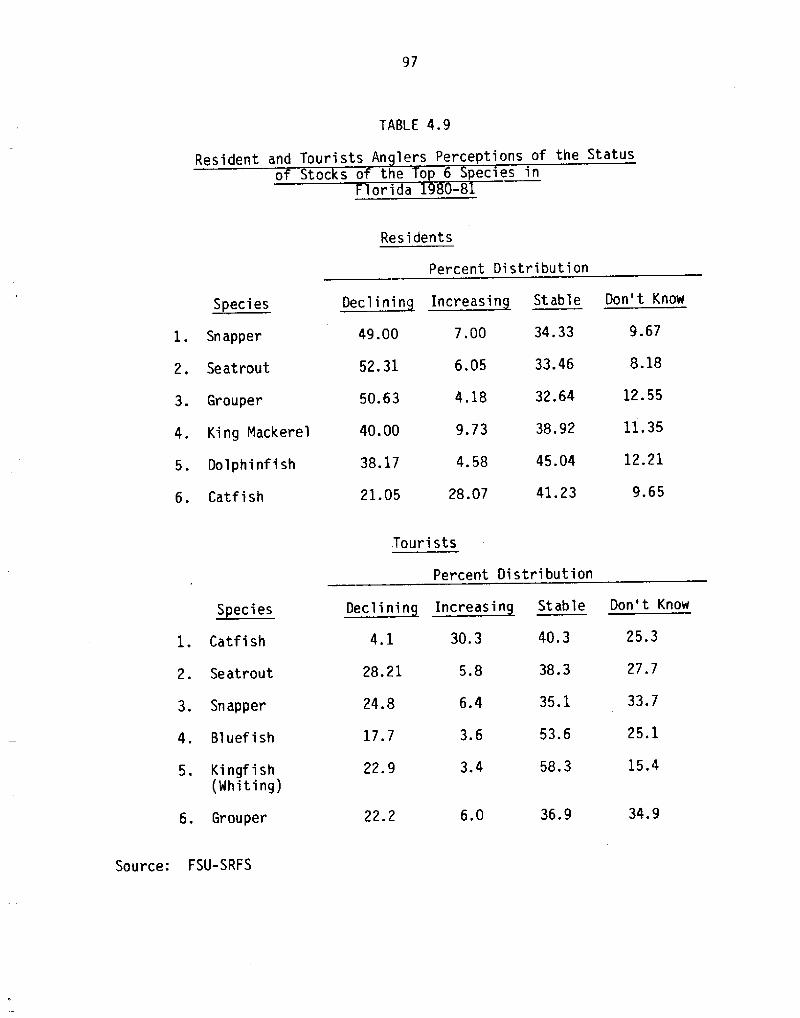
Perce tion of the Status of the Fishery Stocks
The f inal compari son between residents and tauri sts involves theperception of the fishery stocks. Let us consider the four species on bothlists, as shown in Table 4.9. Forty-nine percent of the residents felt thatsnapper stocks were declining while only 24.8 percent of the tourists hadthis perception. This is quite surprising given the fact that the averagetourist has been fishing for over eight years in Florida. About 50 percent ofthe residents felt seatrout and grouper were declining stocks, while onlyabout a quarter of the tourists held this opinion. Generally, tourists wereless pessimi stic about the Florida fishery stocks than residents.
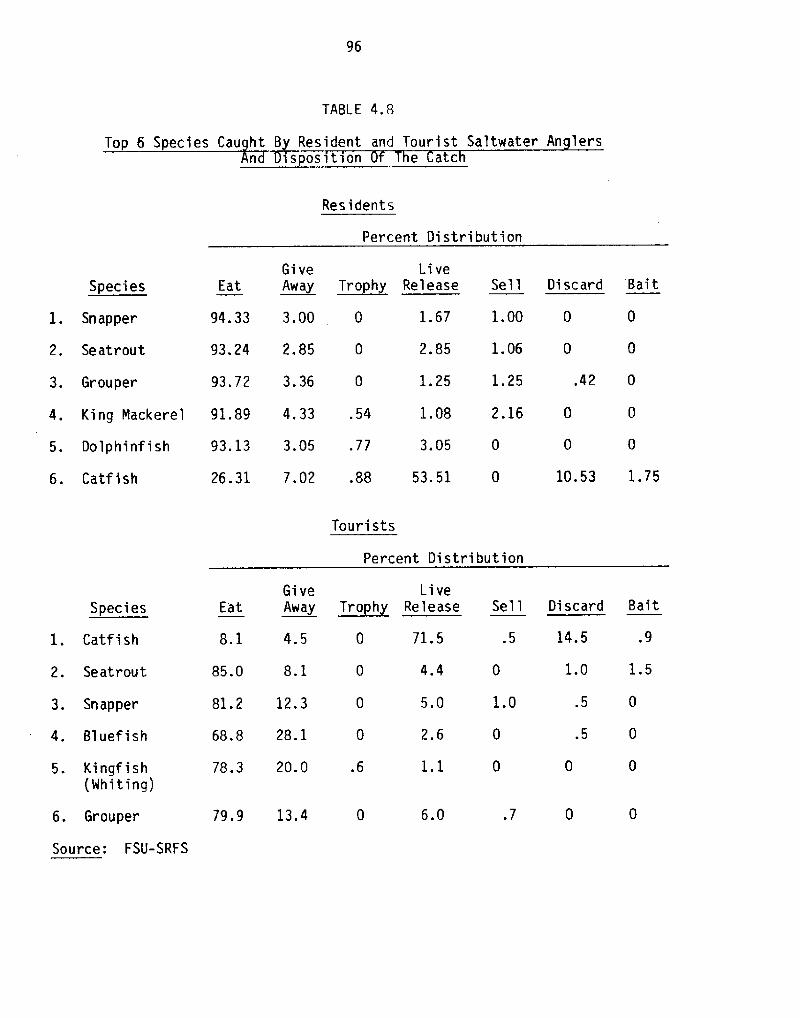
TABLE 4.8
ident and Tourist Saltwater An lers>t~on e atc
Residents
Percent Distribution
GiveEat Away
Li ve
Trophy Release Sell Di scard Bai tSpecies
1.67 1.00
1. 062. 85
1.25 1.25
1.08 2.16 0 04. King Mackerel 91.89 4.33 .54
3.05 0
53. 51 0
0 093.13 3.05 .775. Do 1phinf i sh
6. Catf ish 10. 53 1. 7526.31 7.02 .88
Tourists
Percent Distribution
Give LiveEat Away Trophy Release Sell Discard Bait
8.1 4.5 0 71.5 .5 14.5 .9
85.0 8.1 0 4.4 0 1.0 1.5
.5 01.00 5 ~ 081.2 12.3
68.8 28.1 0 2.6 0 .5 0
78.3 20.0 .6 1.15. Kingf i sh Mhiting!
.779.9 13.4 6.06. Grouper
Source: FSU-SRFS
1. Snapper
2. Seatrout
3. Grouper
Species
1. Catfish
2. Seatrout
3. Snapper
4. Bluef i sh
94. 33 3. 00
93. 24 2. 85
93.72 3.36
0 0
0 0
~ 42 0
97
TABLE 4.9
Resident and Tourists An lers Perceptions of the Statusof toc s of the Top pecies in
lori a -8
Residents
Percent Distribution
~Decl inin Stable Don't KnowSpecies
1. Sn apper
2. Seatrout
3. Grouper
4. King Mackerel
5. Do 1 phinf i sh
6. Catfish
34. 33
33. 46
32. 64
9 ' 677.0049.00
8.1852 ' 31 6. 05
12.55
11.35
12.21
4.18
38. 929. 73
45. 044 ' 58
41.23 9.6528.07
Tourists
Percent Distribution
~Decl inin Stable Don't KnowSpecies
25. 340.330.34.1
28.21 38.3 27.75 ' 8
35.16.424.8 33. 7
25.117.7 53.63.6
3.422. 9 15. 458. 3
22. 2 36.96.0 34.9
Source: FSU-SRFS
1. Catf i sh
2. Se atrout
3. Snapper
4. Bl uef i sh
5. Kingf i sh Whiting!
6. Grouper
50. 63
40.00
38.17
21. 05
98
Chapter 5
Policy Implications of the Study
Introduction
It is the primary purpose of this study to establish a data base onrecreational fishing in the state of Florida to aid in fishery management. Webelieve that Chapters 1-4 do provide a good summary of the social and economicdimensions of the impact of saltwater anglers on the state. Nodes of fishinghave been identified and quantified with respect to use i.e., fishing days!.This may be helpful to the state in planning new facilities or the privatemarket in expanding exi sti ng facilities. Also, we have identified andquantified user value which can be useful in evaluating the economicsignificance of extra or nonmarket goods. It is not the purpose in thischapter to promulgate policy, but to point out areas of critical state concernregarding recreational saltwater fishing. The most important concern is theresource itself.
The Status of the Fishery Resource
There is much controversy surrounding the condition of various fisherystocks in Florida. Nany of the fishery stocks are located both in stateterritorial waters and the Fishery Conservation Zone FCZ!. Therefore, twojurisdictions are involved. The data indicate that the management role interms of a fishing day of the State of Florida is preeminent for therecreational fishing sector.
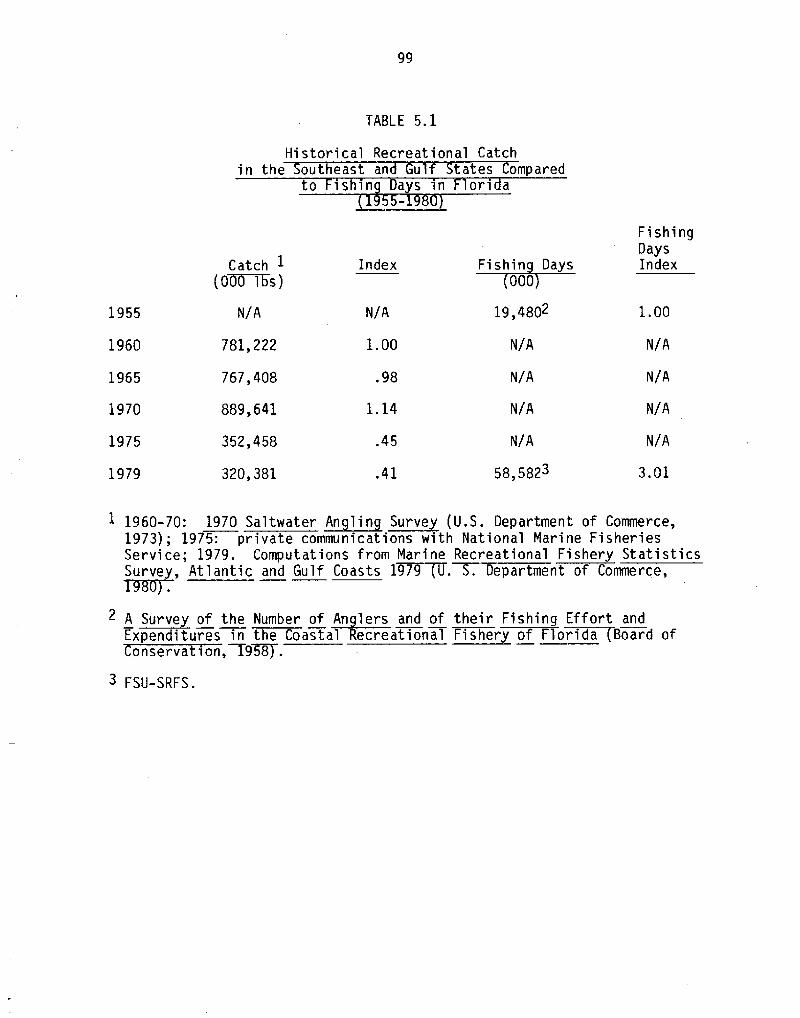
Before looking at individual stocks, let us first consider some aggregatestatistics. Table 5. 1 presents some fragmentary data on recreational catch inthe Southeast North Carolina to Texas! from various surveys. The reliabilityof these data is open to some question, especially the early years.~0 Directcatch data were available by state for only 1979, as wi 11 be discussed below.
~0In a paper by North �976!, there is much controversy surrounding thetemporal data published in the 1970 Saltwater An lin Survey �973!.Researchers will tend to use these ata especially since t e National NarineFisheries Services compares the trend in number of anglers, number of fishcaught and weight of fish caught by regi on for 1960, I965 and 1970 in apublished table. Ho qualification to this table i.e., Table I, p. 9 SMAS,1973! is given. We shall still use these data to look at broad trends inspite of government officials that have repudi ated their own work.
99
TABLE 5.1
Historical Recreational Catchin the outheast and Gulf tates ompared
FishingDaysIndexCatch 1
�mj lbs!Index
19,4802 1.00N/AN/A1955
N/A N/A1.001960 781,222
767,408
889,641
352,458
320,381
N/A N/A.981965
N/AN/A1.141970
N/A N/A1975
58,5823 3.011979
1 1960-70: 1970 Saltwater ~An lin Survey U.S. llepartment of Commerce,1973!; 1975: private communications with National Marine FisheriesService; 1979. Computations from Marine Recreational Fishery Statistics
G f «199K~«CT98|I! .
7 A Survey of the Number of ~An lars and of their Fishing Effort andExpenditures in the Coastal Recreational Fishery of Florida guard of
,W9~8.
3 FSU-SRFS.
100
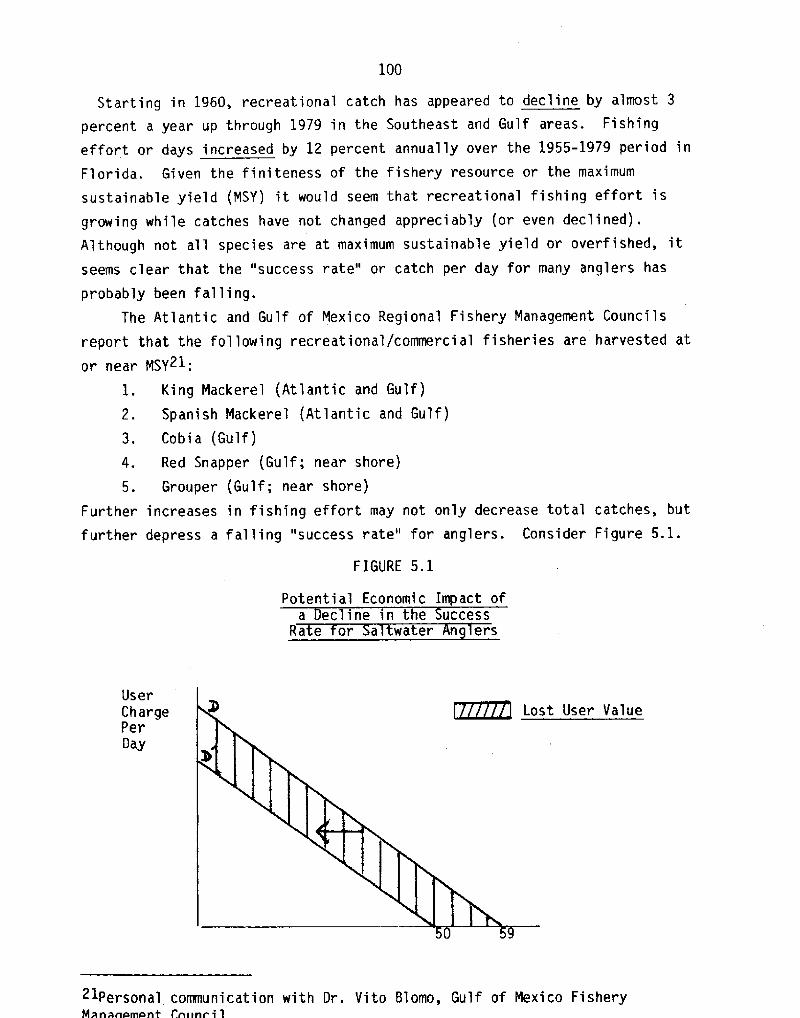
FIGURE 5.1
Potential Economic Impact ofa ec ine in the uccess
Rate or a water n ers
User
ChargePer
Day
t User Value
21Personal communication with Dr. Vito Blomo, Gulf of Mexico FisheryMansnemont Cn<>nr il
Starting in 1960, recreational catch has appeared to decline by almost 3percent a year up through 1979 in the Southeast and Gulf areas. Fishingeffort or days increased by 12 percent annually over the 1955-1979 period in
Florida. Given the finiteness of the fishery resource or the maximum
sustainable yield MSY! it would seem that recreational fishing effort is
growi ng while catches have not changed appreciably or even declined!.Although not all species are at maximum sustainable yield or overfished, itseems clear that the "success rate" or catch per day for many anglers has
probably been falling.
The Atlantic and Gulf of Mexico Regional Fishery Management Councils
report that the following recreational/commercial fisheries are harvested at
or near MSY21:
1 ~ King Mackerel Atlantic and Gulf!
2. Spanish Mackerel Atlantic and Gulf!
3 ~ Cobia Gulf!
4. Red Snapper Gulf; near shore!
5. Grouper Gulf; near shore!
Further increases in fishing effort may not only decrease total catches, but
further depress a falling "success rate" for anglers. Consider Figure 5. 1.
101
Assume that the current success rate declines by 20 percent. Before the
decline, 59 million recreational days were spent by tourists and residents. 22Assume further that tourists and residents cut back their recreational fishing
days due to the poor fishing in the same proportion. Using the user value per
day from Table 4.6, we have the following loss:
Lost User Value = 9 million days x $35.65 = $321 million.
There would be further losses to the economy in terms of annual variable
expenditures. A loss of nine million fishing days would decrease resident
and tourist expenditures on industries involved in serving saltwater
recreational fishermen. The following possible losses would be involved:
Resident Expenditure Decline = 9 million days x $26. 29 per day
= $237 mi 1 1 i on
Tourist Expenditure Decline = 9 million days x $46.41 per day
= $418 million
A decline in these sectors might have differential effects on the Florida
economy. Residents may transfer their $237 roillion dollars to other
recreation in Florida. The net impact would be a short run dislocation of
capital and labor that service fishermen. In the long run, the net impact
might be minimal. However, residents may leave the state for saltwater
fishing elsewhere. In this case, the negative economic impact would be severe
since lost income i.e ~ , expenditures! from the state would result in lost
jobs. The loss of $418 mi llion in tourist expenditures could be even more
catastrophic if they were completely withdrawn from the state. That is, a
negative multiplier impact would be present. A decline in tourist dollars
$418 million x the multiplier of 5.18! means a $2.16 billion decline in state
income. Needless to say, many jobs would be lost in the state.
This discussion has been largely theoretical in that we assumed that a
drop in the "success rate" would deter residents and tourists from
22In reality, an interaction may take place. That is, the surge in fishingpressure will reduce catch per unit of effort or "success". If this is adeterrent to fishermen, a reduction in fishing effort will take place. In thelong run, catch per unit of effort would then rise. Whether losses would betemporary or permanent would depend on future perceptions.
102
participating in saltwater recreational fishing by 9 mi llion days. If this
were a known fact, then the values e.g., expenditures per day! generated in
this study could be used to estimate the economic impact. Unfortunately,
little is known about the relationship between the success rate and the
recreational demand curve. Even though catching fish is usually not listed as
the number one reason for engaging in the recreational experience, it is
obvious that the expected probability of' catching a fish cannot fall
indefinitely without, at some point, impacting the angler's decision to fish.
Steven �966! has investigated the empirical importance of angler success per
unit of effort as a quality determinant of recreational values i.e., user
value! . He found the fol lowing:
1. A ten percent increase in salmon angling success would induce along run increase in angling effort of approximately ten percent;
2. Bottom fish sea perch, etc.! angling effort seems to be consid-erably less responsive to changes in success.
1980-81 Percent Change1990
mi 1 1 i ons!
28.984
mi 1 lions!
16.431 + 76Tour~st Fishin Days
+ 60Resident Fishin Days
Total Days
42. 150
58.581
67.469
+ 6596.453
In Chapter 4, we indicated that many tourists and anglers perceive the
fishery stocks to be declining. For example, 49 percent of the resident
saltwater fishermen felt that the snapper stocks were on the decline, and over
50 percent felt seatrout and grouper were declining. The tourist were less
aware of a decline than residents. For tourists, success rates may be
relatively high in Florida compared to elsewhere; therefore, they may respond
more positively or optimistically. For the most part, residents have been
fishing the resource for a greater number of years and visit it more
frequently each year. For these reasons, one might want to weight resident
opinions more heavily.
What does the future hold with respect to increased fishing effort? We
made some rough projections assuming two things: �! the participation rates
for tourists and residents do not change and �! the days fished per year
remain constant for residents and tourists. The following projections follow
from growth in population residents! and in tourists visiting Florida based
o n 1970-80 grow th r ates!:

103
Over the 1970-BO period, the number of tourists grew by 4.36 percent per year
according to the Florida Division of Tourism. We used this rate to project
the number of tourists and corresponding angler days to 1990. For the
residents, we used population projections to the year 1990 furnished by the
Bureau of Business and Economic Research University of Florida!. As one can
see, a sizeable increase in fishing effort is expected, amounting overall to a
65 percent increase over the next 10 years. It is quite obvious that for
desired fish species, catch rates or success rates will probably fall. The
inflexibility of the supply of traditional sport fish will be a major factor
in the future of the saltwater recreational fishing sector. For this reason
there may be greater emphasis on under-utilized species to take up the slack.
This is certainly a critical policy area.
The following policy options are presently under debate:
1. Fish hatcheries to expand the fishery stock where economically
f easibl e
2. Bag limits per angler where economically feasible
3. Licensing of all saltwater fishermen, both residents and tourists
A discussion of the implications of the above measures in great detail is
beyond the scope of this report. One factor is fundamental. Any regulations
or measures should be subject to a benefit-cost analysis to see if the action
is economically beneficial. This is in keeping with the Florida Economic
Impact Disclosure Act. Finally, we hope that this study wil 1 serve as a
valuable input in addressing the policy issues discussed above.
Conflicts with Commercial Fisheries
One of the fundamental problems in managing Florida's fishery resources
is a long term conflict between recreational and commercial fishermen over the
use of various species. Recreational fishermen feel that commercial fishermen
are a threat to the resource, especially where technologically advanced gear
i s introduced. In Chapter 2, we found that resident saltwater anglers who
perceived some fishery resource to be declining felt that one of the main
reasons was "too many commercial fishermen". Saltwater tourist anglers
Chapter 3! gave the same reason as number one. With the large number of
recreational fishermen documented in this study, we would not be surprised to
find that commercial fishermen feel threaten by recreational fishermen.
104
During 1980-81, there were nearly five and quarter million recreationalfishermen in Florida of which 40 percent are residents. In 1975, there were
only 11,139 individuals employed in the harvesting of commercial fish i nF',orida.
The fundamental problem of the fisheries is the common property nature of
the resource. This is why overfishing occurs and also why the commercial-
recreational fi shery conflict exi sts. There is no market mechani sm to
allocate fishery resources among alternative demanders or users. Neither
sports nor commercial fishermen are at fault. If a private i ndi vi dual owned,
the red snapper resource, for example, he would rent it to commercial and
recreational fishermen based upon their relative demand. The proportions used
by each group would be chosen to maximize the resource's highest economic use.
Re do not want to imply that the highest economic use of the fishery resources
in Florida is always recreational. This decision requires careful study on a
species-by-species basis and most probably would require locational analysis.
Obviously, our data would be very helpful in dealing with this policy issue.
The Regional Fishery Management Councils have allocated the various fi shery
resources to recreational and commercial uses. The allocation criteri a are
usually based on historical shares or the political power of the groups in
question. This may be at great vari ance with basing allocation on the
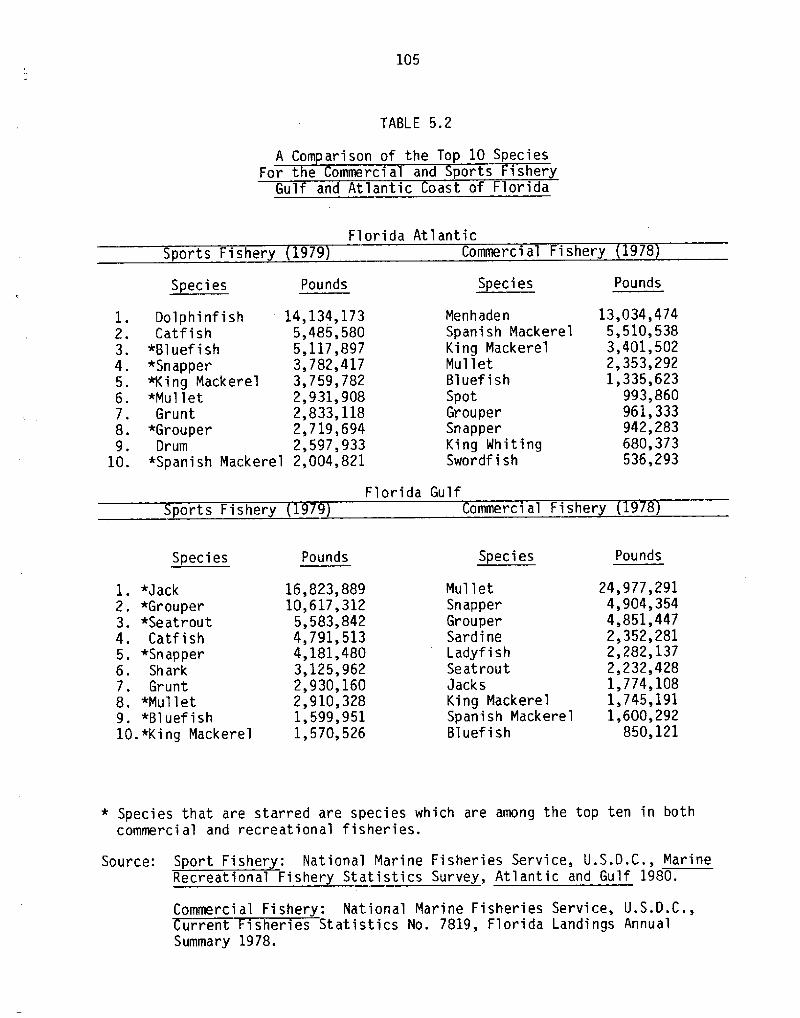
"highest economic use". Some data from Florida may be enlightening. Table
5.2 shows the top ten species measured by weight for both commercial and
recreational users in the most recent years for which we could obtai n reliable
data. 23
For the sports fishery, data were used from the NMFS �980!. No direct
information is given on the weight of the catch by species for the Atlantic
and Gulf sides of Florida. However, the number of fish caught and released is
published by the NMFS for these areas by species. For each species, we
calculated the average weight per fish by dividing the published weight by the
number of fish caught for the South Atlantic and Gulf regions. Then, the
average weight per fish was multiplied by the number of fish for each species
reported for Florida i.e., Atlantic and Gulf treated separately!. This gave
us a rough estimate of the weight of the sport catch. The researcher has no
23We are comparing the estimated 1979 recreational catch with the published1978 commercial catch. 1979 commercial catch statistics were not available atthe time of this writing, but this should not change the analysis much.
10S
TABLE 5.2
A Comparison of the Top 10 SpeciesFor the ommerci al and ports ishery
ulf and Atlantic oast of Florida
Florida AtlanticCommercial Fishery 978Sports Fisher 979
SpeciesSpecies PoundsPounds
1. Dol phinf i sh 14,134,1732. Catf i sh 5,485,5803. *Bl uef i sh 5,117,8974. *Snapper 3, 782,4175. Wing Mackerel 3,759,7826. *Mullet 2,931,9087. Grunt 2,833,1188. *Grouper 2,719,6949. Drum 2,597,933
10. *Spanish Mackerel 2,004,821
Fl ori da Gul fommerci al Fishery 978ports Fishery 979
PoundsSpeciesSpecies Pounds
* Species that are starred are species which are among the top ten in bothcommercial and recreational fisheries.
Sour ce: Sport Fishery: National Marine Fisheries Service, U.S.D.C., MarineRecreational Fishery Statistics Survey, Atlantic and Gulf 1980.
Commercial Fishery: National Marine Fisheries Service, U.S.D.C.,urrent isheries Statistics No. 7819, Florida Landings Annual
Summary 1978.
1. *Jack2. *Grouper3. *Seatrout4. CatfishS. *Snapper6. Shark7. Grunt8. *Mullet9. *Bluefish10.*King Mackerel
16,823,88910,617,3].2
5,583,8424,791,5134,181,4803,125,9622,930,1602,910,3281,599,9511,570,526
MenhadenSpanish MackerelKing MackerelMullet
Bl uef i shSpotGrouperSnapperKing WhitingSwordf i sh
Mul 1 et
SnapperGrouperSardineLadyfishSeatroutJacksKing MackerelSpanish MackerelBl uef i sh
13,034,4745,510,5383,401,5022,353,2921,335,623
993,86096].,333942,283680,373536,293
24,977,2914,904,3544,851,4472,352,2812,282,1372,232,4281,774,1081,745,1911,600,292
850,121
106
1979�00~s lbs.!
1970�00~sl bs. !
South Atlantic4,0332,098
34,94214,623
ngSpanish MackerelGulf of Mexico
5,9312,257
27,4597,808
King MackerelSpanish Mackerel
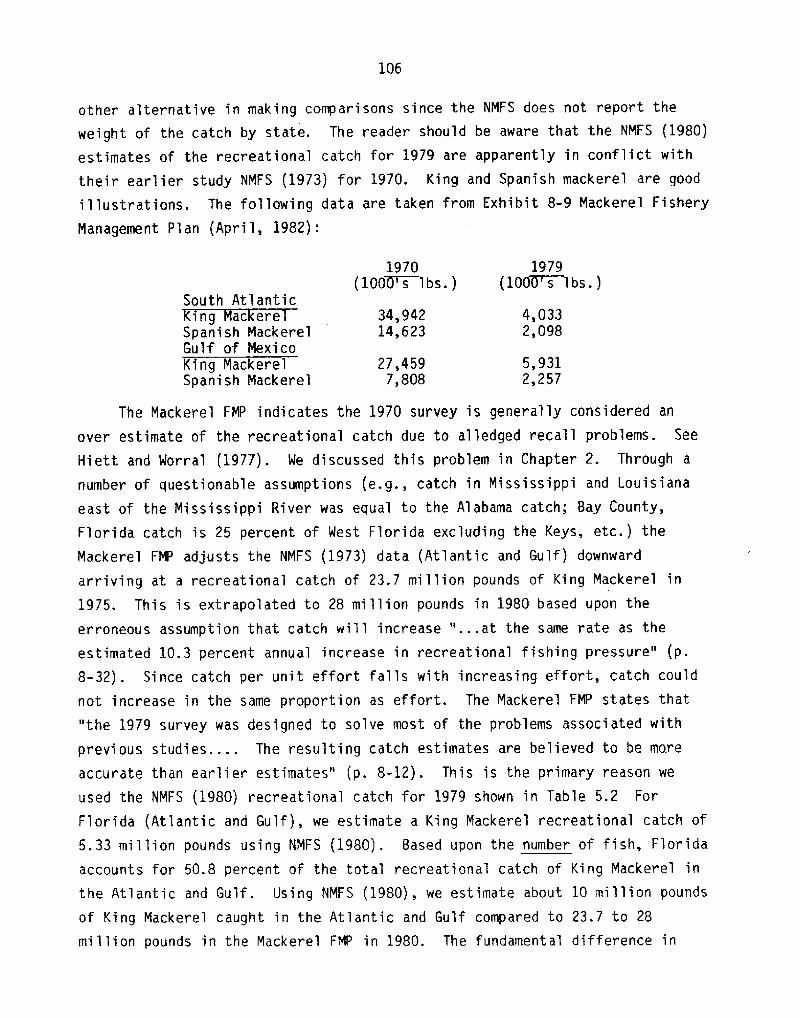
The Mackerel FMP indicates the 1970 survey is generally consider ed an
over estimate of the recreational catch due to alledged recall problems. See
Hiett and hlorral �977!. Me discussed this problem in Chapter 2. Through a
number of questionable assumptions e.g., catch in Mississippi and Louisiana
east of the Mississippi River was equal to the Alabama catch; Bay County,
Florida catch is 25 percent of Mest Florida excluding the Keys, etc.! the
Mackerel FMP adjusts the NMFS �973! data Atlantic and Gulf'! downward
arriving at a recreational catch of 23.7 million pounds of King Mackerel in
1975. This is extrapolated to 28 million pounds in 1980 based upon the
erroneous assumption that catch will increase "...at the same rate as the
estimated 10.3 percent annual increase in recreational fishing pressure" p.8-32!. Since catch per unit effort falls with increasing effort, catch could
not increase in the same proportion as effort. The Mackerel FMP states that
"the 1979 survey was designed to solve most of the problems associ ated with
previ ous studi es.... The resulting catch estimates are believed to be more
accurate than earlier estimates" p. 8-12!. This is the primary reason we
used the NMFS 1980! recreational catch for 1979 shown in Table 5.2 For
Florida Atlantic and Gulf'!, we estimate a King Mackerel recreational catch of
5.33 mi llion pounds using NMFS �980!. Based upon the number of fish, Florida
accounts for 50.8 percent of the total recreational catch of King Mackerel in
the Atlantic and Gulf . Using NMFS 1980!, we estimate about 10 million pounds
of King Mackerel caught in the Atlantic and Gulf compared to 23.7 to 28
mi llion pounds in the Mackerel FMP in 1980. The fundamentaI difference in
other alternative in making comparisons since the NMFS does not report the
weight of the catch by state. The reader should be aware that the NMFS �980!estimates of the recreational catch for 1979 are apparently in conflict with
their earlier study NMFS �973! for 1970. King and Spanish mackerel are good
illustrations. The following data are taken from Exhibit 8-9 Mackerel Fishery
Management Plan April, 1982!:
107
these estimates is the great decline in catch of King Mackerel shown by the
two surveys despite efforts to scale down the 1970 recreational catch.
In the case of Spanish Mackerel, the same problems exist. The Mackerel
FN' April, l982! reports a catch of 8.4-15.1 or an average of 12 mi Ilionpounds for the Atlantic and Gulf in 1981. The same procedures of reducing theNMFS �973! published catch were employed even though the assumptions usedwere very arbitrary i.e., see above!. For Florida Atlantic and Gulf!, weestimated a catch of 3.068 million pounds using NMFS l980! which measured interms of the number of fish was 64.2 percent of the South Atlantic and Gulf
regions. For Spanish Mackerel, the total catch for both regions would be 4.78million pounds. Although the recreational catch for King and Spanish Mackerelused in this report differs from the Mackerel FMP, we would defend our choice
which is based upon the most recent data and improved survey design i.e., norecal] controversy!. Finally, we have no reason to believe that the
controversy surrounding King and Spanish mackerels applies in any way to otherrecreational catch published in NMFS �980!.
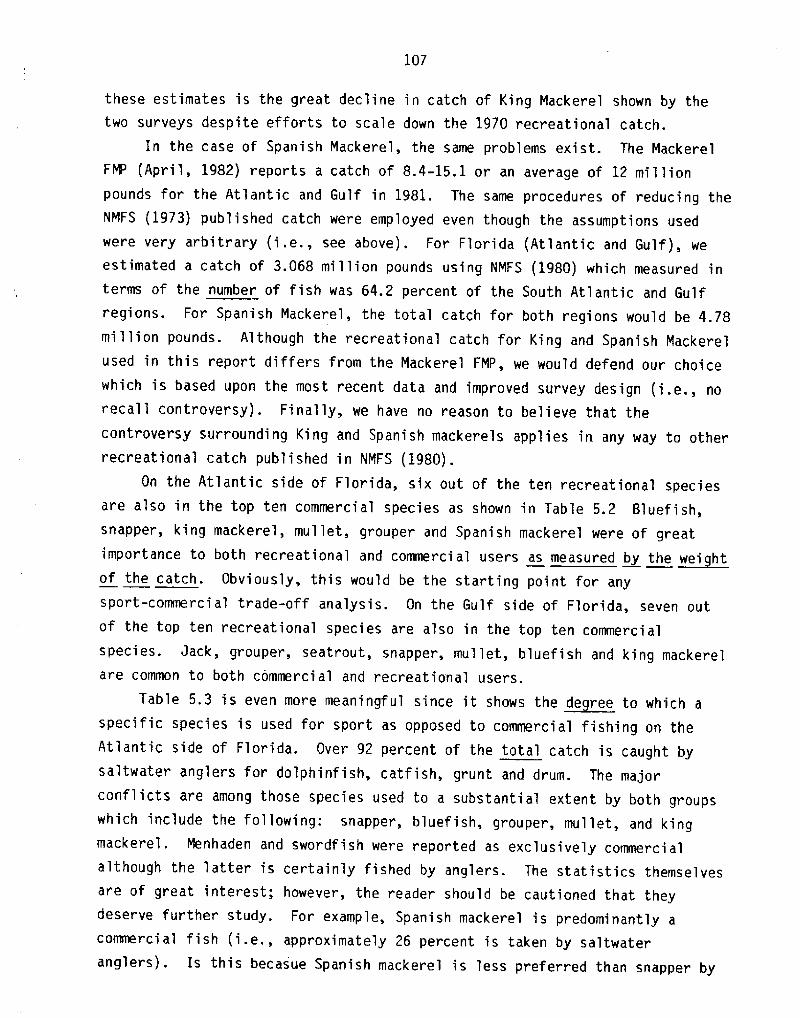
On the Atlantic side of Florida, six out of the ten recreational speciesare also in the top ten commercial species as shown in Table 5.2 Bluefish,snapper, king mackere1, mullet, grouper and Spanish mackerel were of greatimportance to both recreational and comme ciai users as measured by the ~wei htof the catch. Obviously, this would be the starting point for anysport-commercial trade-off analysis. On the Gulf side of Florida, seven out
of the top ten recreational species are also in the top ten commercialspecies. Jack, grouper, seatrout, snapper, mullet, bluefish and king mackerelare common to both commercial and recreational users.
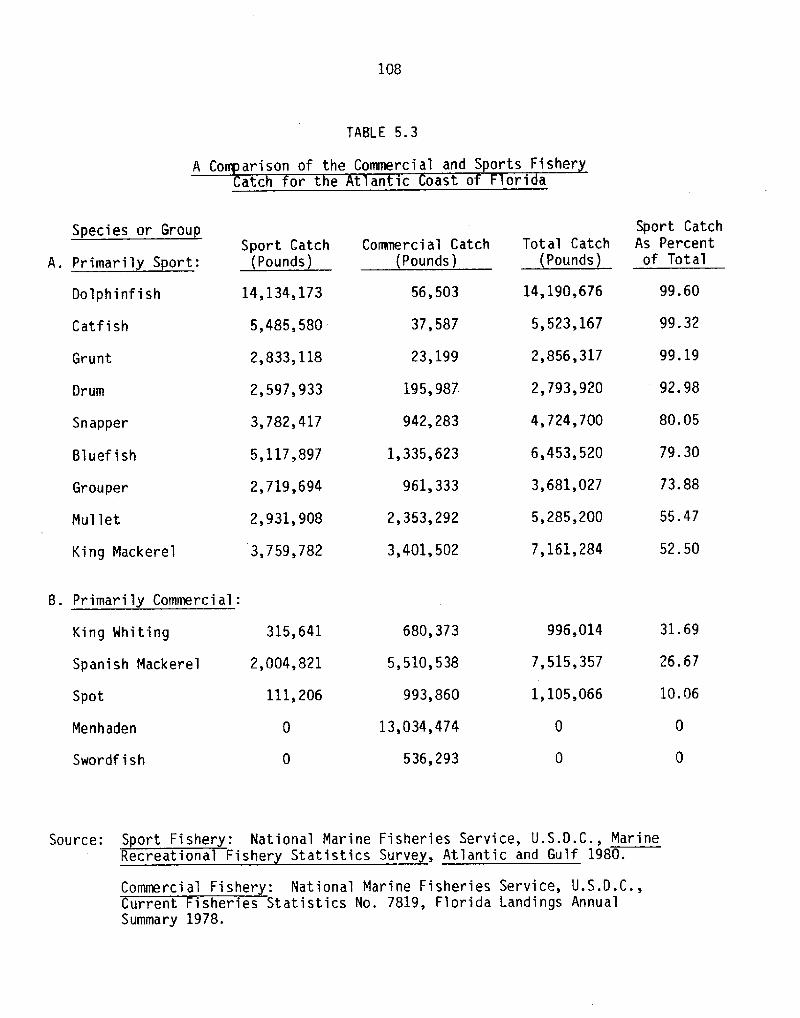
Table 5.3 is even more meaningful since it shows the degree to which aspecific species is used for sport as opposed to commercial fishing on theAtlantic side of Florida. Over 92 percent of the total catch is caught bysaltwater anglers for dolphinfish, catfish, grunt and drum. The majorconflicts are among those species used to a substantial extent by both groupswhich include the following: snapper, bluefish, grouper, mullet, and kingmackerel. Menhaden and swordfish were reported as exclusively commercialalthough the fatter is certainly fished by anglers. The statistics themselvesare of great interest; however, the reader should be cautioned that theydeserve further study. For example, Spanish mackerel is predominantly acommercial fish i.e., approximately 26 percent is taken by saltwateranglers!. Is this becasue Spanish mackerel is less preferred than snapper by
108
TABLE 5.3
A Comparison of the Commercial and Sports Fisheratc or the t antic oast o ori a
Sport CatchAs Percent
of Total
Species or GroupSport Catch
Pounds!Total Catch
Pounds!Commercial Catch
Pounds!
Do l p hinf i s h
Catfish
Grunt
B. Primarily Commercial:
King Whiting
Spanish Mackerel
31.69996,014
7,515,357
1,105,066
315,641
2,004,821
111,206
26.67
10.06Spot
Menhaden
Swordfish
Source: Sport Fishery: National Marine Fisheries Service, U.S.D.C., MarineRecreational Fishery Statistics Survey, Atlantic and Gulf 1980.
Commercial Fishery: National Marine Fisheries Service, U.S.D.C.,Statistics No. 7819, Florida Landings Annual
Summary 1978.
Snapper
Bluef i sh
Grouper
Mullet
King Mackerel
14,134,173
5,485,580
2,833,118
2,597,933
3,782,417
5,117,897
2,719,694
2,931,908
3,759,782
56,503
37,587
23,199
195,987
942,283
1,335,623
961,333
2,353,292
3,401,502
680,373
5,510,538
993,860
13,034,474
536,293
14,190,676
5,523,].67
2,856,317
2,793,920
4,724,700
6,453,520
3,68].,027
5,285,200
7,16].,284
99.60
99.32
99.19
92.98
80.05
79.30
73.88
55.47
52.50
109
anglers, or is it due to heavy fishing effort by commercial fishermen that
lowers success rates for sport fisherman?
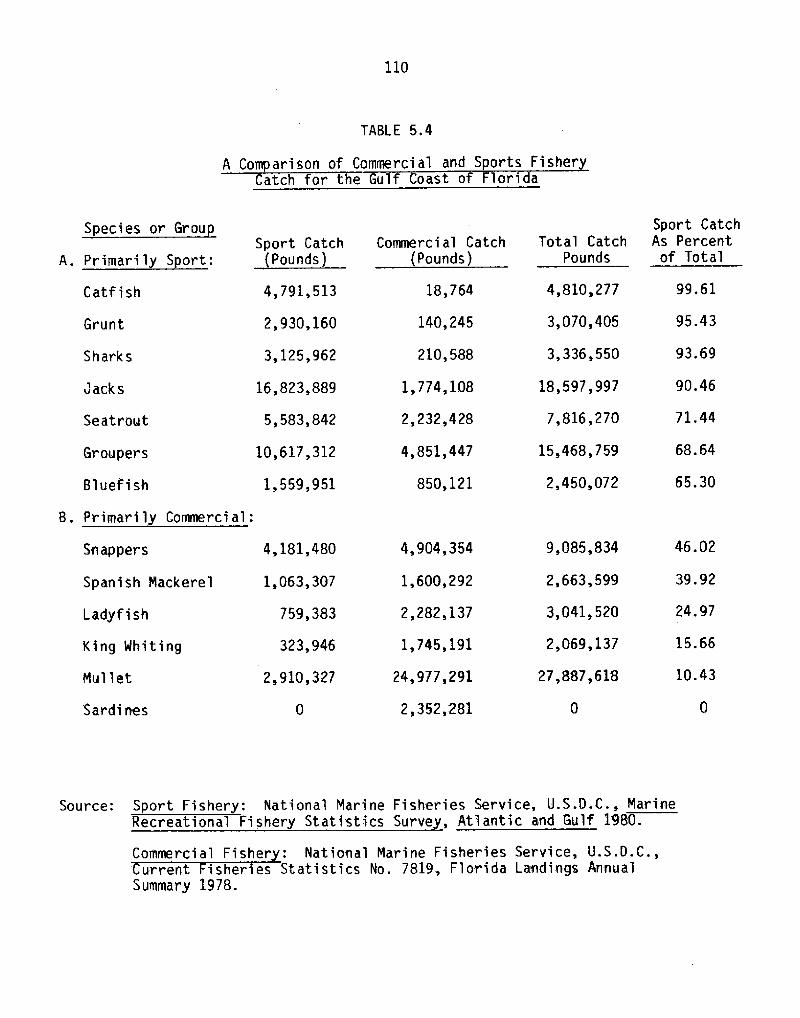
Table 5.4 shows the results on the Gulfside of Florida. Catfish, grunt,
shark, jack and seatrout are predominately sport fish. However, grouper and
bluefish are more equally shared by commercial and sports fishermen. Even
King and Spanish mackerel plus snapper have a significant sport fish component
on the Gulf side of Florida. These tables Tables 5.2, 5.3 and 5.4! show the
inevitable conflict for fixed or finite resources. Many of these species are
fished at maximum sustainable yield; therefore, a rise in fishing effort which
will certainly be dictated as the demand for fish for both food and recreation
increases will make this an issue of critical state concern.
The Supply of Fishin Modes
The private market usually works fairly weIl in providing certain types
of fishing modes such as charter, party and private boats. Almost 53 percent
of all saltwater fishing effort is expended via pier/jetty bridge and surf and
shore. The private market does not automatically insure a supply of these
modes based upon demand. Beaches which are currently common property
resources could be converted to private ownership if residential development
continues, reducing surf and shore fishing. Piers, jetties and bridges are in
most cases not built expressly for fishermen. These facilities wi 11 usualIy
not be supplied by the private market. The deterioration or even elimination
of a jetty or bridge may involve an adverse economic impact on the saltwater
recreational fishing industry. One third of all fishing effort takes place on
piers, jetties and bridges. This is another area of critical state concern.
The Florida Department of Natural Resources is aware of these supply problems,
but wi 11 have to work with other agencies to be effective. Further discussion
of' these problems is provided in Outdoor Recreation in Florida �980!.
Environmental Dama e
The destruction of wetlands and general estuarine areas has had a
detrimental impact on fishery productivity. See Lynne et. al. �981!. The
user values generated in this paper can be used to evaluate U. S. Army Corps
of Engineers projects in Florida especially if saltwater recreational
activities are reduced. The Florida Department of Environmental Regulations
110
TABLE 5.4
A Comparison of Commercial and Sports Fisheratch for the ulf oast of lori a
Sport CatchAs Percent
of Total
Species or GroupTotal Catch
PoundsSport Catch Commercial Catch
Pounds!A.
99.61
95.43
93.69
90.46
71.44
68.64
65.30
B. Primarily Commercial:
10. 43
Source: Sport Fishery: National Marine Fisheries Service, U.S.D.C., MarineRecreational Fishery Statistics Survey, Atlantic and Gulf 1980.
National Marine Fisheries Service, U.S.D.C.,Statistics No. 7819, Florida Landings Annual
Summary 1978.
Catfish
Grunt
Sharks
Jacks
Seatrout
Groupers
Hluef i sh
Snappers
Spanish Mackerel
Ladyfish
King Mhiting
Mullet
Sar dines
4,791,513
2,930,160
3,125,962
16,823,889
5,583,842
10,617,312
1,559,951
4,181,480
1,063,307
759,383
323,946
2,910,327
18,764
140,245
210,588
1,774,108
2,232,428
4,851,447
850,121
4,904,354
1,600,292
2,282,137
1,745,191
24,977,291
2,352,281
4,810,277
3,070,405
3,336,550
18,597,997
7,816,270
15,468,759
2,450,072
9,085,834
2,663,599
3,041,520
2,069,137
27,887,618
46.02
39.92
24.97
15.66
111
and the Department of Natural Resources will have direct valuation of
Florida's sport fishery resources. This will be of substantial help since
projects involving water resources require adherence to the U. S. Principles
and Standards.
Coordination With Other Projects
Two other major pieces of research are directly related to our work here.
The U. S. Fish and Wildlife Service USFWLS! is making state estimates of the
number of saltwater anglers for both residents and nonresidents. Their
estimates are considerably below ones reported in this study. They estimate
only 2.6 mi llion anglers as compared to our 5.2 mi llion. However, we are in
agreement in terms of days fished per resident and nonresident. Their
preliminary report indicates 19 days per resident and five days per
nonresident as compared with 19.36 and 5.39 for residents and tourists,
respectively, in our study!. At this writing, the authors do not know why
their estimates of the number of anglers differ from ours. In fairness, their
report is so preliminary that we must await final results before determining
sources of differences.
The second study was completed by the National Marine Fisheries Service
i n 1980. This study showed 2. 3 mi 1 lion resident anglers of all ages i n
Florida compared to our estimated 2. 1 million resident anglers 18 years of age
or older. These estimates are in fairly good agreement. But the NMFS shows
only 1.65 million nonresident anglers in 1979 while our estimate is about
three million. We do not know why such a great difference should exist. In
fact, the NMFS reported nonresident saltwater anglers in Florida to be 2.8
million in 1974, and the number should surely be higher today. See NMFS
�975! �977!. In the 1979 study, the NMFS survey shows only 6.11 fishingdays i.e., trips! per resident, where their "trip" is equivalent to a day.
For nonresidents, the NMFS survey shows only 2.85 fishing "trips" or days. We
are at a loss to explain these low figures which greatly disagree with our
study and other independent studies. For example, in 1975 the USFWS reported
a usage rate of about 26 days per resident angler. In 1955, Ellis, Rosen and
Moffett �958! estimated resident anglers fished 11 ' 4 days per year. We have
been working closely with both NMFS and USFWS and hope to resolve some of
these apparent data differences.
112
A Footnote on Commerical Fisheries
Bell �979! has estimated the relative economic impact of recreational
versus commercial fisheries. He estimated that in 1975 the Florida commercial
fishing industry i.e., Florida landings only! generated about $60 million of
retail sales within the State. Sales i. e., not at retail, but at wholesale!
to other states of Florida caught fish were estimated at approximately $100
million. Thus, Hell concluded that Florida's commercial harvest of fish and
shellfish may have generated $160 mil]ion in final sales in 1975. It is
erroneously assumed that the analysis of commercial and recreational fisheries
by Bell is compari ng "apples and oranges". The charge is made that "The
multiplier is used on sport values at retail, while on commercial at wholesale
dockside!".24 The estimated value of $160 million in 1975 for Florida'scommercial fisheries is only the first round i. e., primary impact! sales at
r etail within the state and naturally at wholesales/processing outside the
state. In Bell {1979!, the regional multiplier is applied to wages to obtain
indirect employment created. The multiplier is applied to export wages at all
stages of production that are applicable for commercial fishing i. e.,production, processing, wholesaling!. There are no export "retail wages" for
commercial fishing since the product is sold to other states by processors or
wholesalers in Florida. This is the source of some of the confusion. Using
data from the USFWS �977! and other sources, Bell estimated that saltwater
recreational fishermen i. e., residents and tourists! spent $851 million in
Florida at retail in 1975 {exclusive of multiplier effects!. Thus, Bell
concluded that recreational saltwater fishermen spend 5.3 times the amount
generated by commercial fishermen for their catch i. e., $851 million divided
by $160 million!. Cato and Prochaska �980! have taken issue with this
conclusion by indicating that other estimates of the impact of commercial
fishing differ from that computed by Hell. Norris �977! indicates Florida
landings of fish and shellfish valued at $73.7 million in 1975 generated a
primary i. e., without a multiplier! economic impact of $184.1 million
excluding the value added by retailing within the State See Table 5 in Cato
and Prochaska, 1980!. Thus, the Bell and Norris primary impacts differ
somewhat. Cato and Prochaska argue that Bell gives no consideration to the
24A reviewer of this manuscript.
113
economic impact of the processing of fish purchased outside the state. Theyargue that fish imports into the state are induced by the existence of thedomestic or state harvesting sector; therefore, both sectors i.e., domesticplus imports! should be counted. One might argue that the import and domesticsectors are not complementary but substitutes. If the domestic sector
declined, increased imports would be expected subject to locational factors.That is, processors are dependent upon both domestic and imported shrimp, forexample. It is not clear whether the absence of domestically caught fishwould drive the processor out of business or he would merely step up his
orders for imported fish. Experience throughout the country indicates thatnumerous processors handle only imported fish. We feel that the point raisedby Cato and Prochaska needs further research.
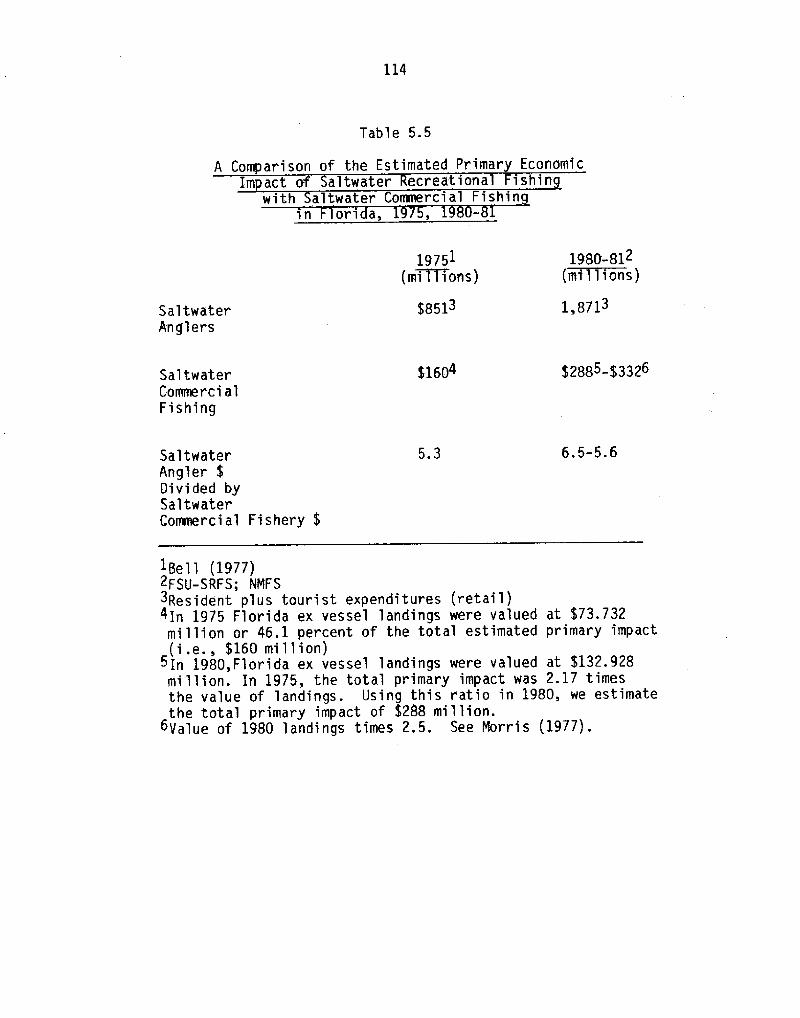
Table 5.5 shows a 1980-81 �2 months! update of the earlier study made by
Bell �979!. Unadjusted for inflation, saltwater anglers increased their
expenditure in Florida from $851 million in 1975 to $1,871 million in 1980-81.This was a substantial increase; however, the reader should be aware that the
methodologies were quite different in the two studies.
In 1975, Bell estimated that the total primary impact of the Florida
commercial fishing harvesting sector was 2.17 times the ex vessel value of
1andlings. Morris discussed above! indicated a 2.5 ratio of the primaryimpact to the ex vessel value of landings. In 1980, Florida landings were
valued at approximately $133 million. Using 2.17 ratio of primary impact ofthe value of landings, we estimate $288 million in primary impact for 1980.The Morris rates yeilds $332 million in primary impact. Therefore, we
estimate that for 1980-1 saltwater recreational fishing generated from 5.6 to
6.5 times the primary sales of commercially harvested fishery products in theState of Florida. This, of course, is subject to the qualifications discussed
above i.e., imported fish should be included!.In summary, the saltwater sport fisheries of Florida are among its most
valuable and unique resources. The asset value of these fisheries exceeds $27billion. Approximately $5 billion were directly or indirectly generated by
saltwater anglers i.e., tourist plus residents!. This in turn produced
almost $1.4 bill~on annually in wages within the State of Florida, creating
about 124,000 jobs. Tourist and resident saltwater anglers generate almost
$150 million in state taxes for Florida.
114
Table 5.5
A Comparison of the Estimated Primary EconomicImpact of altwater ecreational 1shin
'th lt t C l F h'
1980-812 ~lit'I 11OIIS!
19751 miiiTons!
$8513 1,8713SaltwaterAnglers
$1604 2885-$3326SaltwaterCommercialFishing
5 ~ 3SaltwaterAngler $Divided bySaltwaterCommercial Fishery $
6 ~ 5-5 ~ 6
18ell �977!2FSU-SRFS; NMFS3Resident plus tourist expenditures retail!4In 1975 Florida ex vessel landings were valued at $73.732million or 46. 1 percent of the total estimated primary impact i.e., $160 million!
5In 1980,Florida ex vessel landings were valued at $132.928million ~ In 1975, the total primary impact was 2 ~ 17 timesthe value of landings. Using this ratio in 1980, we estimatethe total primary impact of $288 million ~
6Value of 1980 landings times 2.5. See Morris �977!.
115
The most critical public policy question relating to these fisheries
involves the present and future decline of fishery stocks. Measures must soon
be adopted which will allocate these limited stocks among competing uses.
Habitat destruction and water pollution will have to be controlled in the
framework of the economic values that are at stake i.e., a benefit-cost
framework!. The data and analysis presented here should provide a beginningpoint for some of the needed policy decisions.
116
Bell, Frederick W., Recreational Versus Commercial Fishin in Florida: An
!!niversit~y, a11aaaassee, ~Farida!
Bishop, Richard and Herberlein, Thomas, "Measuring Values of ExtramarketGoods: Are Indirect Measures Biased?" Presented at annual meetings ofthe American Agricultural Economics Associ ation, Pullman, Washington,July 29 - August 1, 1979.
Brown, William, Singh A. K. and Castle E., 1964, An Economic Evaluation of theOregon Salmon and Steelhead Sport Fishery. Oregon AgriculturalExperiment Station. Technical Bulletin. 78, Oregon State University.,Cova11is.
Brown, William, Singh A. K. and Richards, Jack A. 1972. Influence of ImprovedEstimating Technique on Predicted Net Economic Values for Salmon andSteelhead. Typed manuscript. Department of Agricultural Economics,Oregon State University.
Cato, James C. and Prochaska, Fred J. "Economic Impact Estimates For Florida'sComttlrci al Fisheries: 1978", Food and Resource Economics Department,Institute of Food and Agricultural Sciences, University of Gainesvi lie,Florida. Staff Paper 155, May 1980.
Centaur Management Consultants, Inc., Economic Activity Associated With Marine. r:Korea
Clawson M. and Knetch J., Economics of Outdoor Recreation The Johns HopkinsPress, 1966!.
Crutchfield and Douglas MacFarlane, Economic Valuation of the 1965-1966
6~8.
Ellis, Robert W., Rosen, A1bert and Moffett Alan W., A Survey of the Numberof An lers and of Their Fishin Effort and Expenditures in the Coastal!iecreationa~isaie~ry o or> a,~tate o ori a, nard of~onservation,
ries, No . Y4~May 958! .
Florida Department of Revenue personal communications!.
Florida Department of Commerce personal coeaunication!.
Florida Department of Natural Resources, Division of Parks and Recreation personal communications!.
Florida Department of Natural Resources, Division of Recreation and Parks,Outdoor Recreation in Florida 1980.
117
Florida Division of Tourism, Marketing Research, 1973-1981 Florida TouristStudies.
Florida Tax Handbook 1981. Finance, Taxation & Claims Committee, FloridaSenate.
Hammack, Judd 1969. Toward and Economic Evaluation of a FugitiveRecreational Resource: Waterfowl. PhD. dissertation., Department ofEconomics, University of Washington, Seattle.
Hammack, Judd and Brown, Garner. Waterfowl and Wetlands: Towardseio-economic Analysis. 8altimore: The Johns iiopkin P~ress, 974.
Hiett, R. and Worrall J., "Marine Recreational Fishermen's Ability to estimateCatch and to Recall Catch and Effort Over Time", unpublished manuscript.Human Sciences Research Inc., Mclean, Virginia July 6, 1977.
Horvath, Joseph C., "Economic Survey of Southeastern Wildlife and Wildlife-Oriented Recreation". Paper read at 39th North American Wildlife andNatural Resources Conference, Wildlife Management Institut~, April 1974.
Krutilla, John V. and Cicchetti. 1972. Evaluating benefits of environmentalresources with special application to the Hell's Canyon. Natura'1Resources Journal 12 �!: 1-29.
Lynne, Gary, et. al., "Economic Valuation of Marsh Areas for MarineProduction Processes," Journal of Environmental and EconomicM t June 1981! .
Mathews, S. B. and Gardner Brown. 1970. Economic Evaluation of the 1967Sport Salmon Fisheries of Washington. Technical Report No 2, WashingtonDepartment of Fisheries, Olympia.
Morris, Robert Allen, Primary Economic Impact of Florida' s Commercial FishingAct~vity. Masters Thesis. Food and Resource Economics Department,University of Florida, Gainesvi lie, Florida 1977.
National Marine Fisheries Service, U.S.D.C., 1970 Saltwater Angling Survey.
National Marine Fisheries Service, U.S.D.Cre Marine Recreational Fisherys «s . « I «Tfmnmnnmn. IIIK .
National Marine Fisheries Service, U.S.D.Cr e Sport Fishery Economics Workshop under contract no. N208-0350-72, 1973!
National Marine Fisheries Service, U.S.D.C., Estimated Expenditures byMarine Recreational Fishermen by State of Resident and ExpenditureCategory, Southeastern Region, unpublished data �975!.
National Marine Fisheries Service, U.S.D.C., Current Fisheries StatisticsNo. 7819, Florida Landings Annual Summary 1978.
118
North, Ronald M., "Economic Values For Marine Recreational Fisheries", MarineRecreational Fisheries/ IGFA, NCMC, SFI 1976. pp. 37-52.
Pearse, Peter. 1968. A new approach to the Evaluation of Non-PricedRecreational Resources. Land Economics. Feb: 87-99.
Scott, A. "The Valuation of Game Resources: Some Theoretical Aspects,"Canadian Fisheries Reports, No. 4, May 1965 '
d~Gai nesvi 1 1 e.
Stevens, J. B., "Angler Success as a juality Determinant of Sport FisheryRecreational Values," Transaction of the American Fisheries Society,Vol�. 94:1965.
Sudman E. and Bradburn N. M., "Effects of Time and Memory Factors on Responsein Surveys," Journal of the American Statistical Association, Dec. 1973,Vo 1 . 68, No. 344.
Talhelm, Daniel R., A General Theory of Supply and Demand for OutdoorRecreation in Recreation Systems. micniga~ntate Univers~ity, 978.v
The Gulf of Mexico and Atlantic Fishery Management Councils, Mackerel FisheryManagement Plan; Final Environmental Impact Statement; Regulatory Impact
c
%9~
Tiebout, Charles M,, The Community Economic Base Study. New York, Committeefor Economic Development 1962.
U. S. Census Bureau
U.S. Fish and Wildlife Service, 1975 National Survey of Hunting, Fishing andWildlife-Associated Recreation. 1976
S. Uepartment of Transportation, Cost of ~0wnin and ~0peratin Automobilesand Vans 1979.
U. S. Treasury Department, Internal Revenue Service, Corporate Income TaxReturns, Statistics of Income Dec. 1981!.
United States Travel Data Center, The Impact of Travel on State Economics1979.
U. S. Water Resources Counci 1, "18 CFR Parts 713 and 716" Federal RequestsVol. 45, No. 190, September 29, 1980.
Copies available from:
Saa Grant IVtarine Advisory Program .GO22 INoCarty HallUniversity of F loridaGainesville, FL 3261'l
The State University System of Florida Sea Grant College is supported by autard of the Office of Sea Grant ¹tional Oceastk andAtmospheric Administration, US. Department of Commerce, grant number NASOAA-D-00038, under proviekea of the NatonalSea Grant College and Programs Act of l 966. This information is puMished by the Marine Advisory Program ruhich functions as acomponent of the Florida Cooperative Extension Service, John T. Woeste, dean, in conducttngCooperattve Extension rvorih inAgriculture, Home Economics, and Marine Sciences, State of Florida, U.S. Department of Agriculture�US, Department of Com-merce, and Boards of County Commissioners, cooperating Printed and distributed in furtherance o f the Acts of Congress of May 8and Ane g4, 1914. The Florida Sea Grant College is an Equal Employment Opportunity-A ffirmative Action employer authorisedto provide research, educational information and other services only to individuals and institutions that function reithout rsfbsrd torace, color, sex, or national origin.
This public document was promulgated at a cost of $lllol.97 Q'r $ Per coPYprovide information on the economic impact and valuation of saltwater recrea-tional Fisheries in Florida to interested audiences. The cost does not includepostage and handling.