general information
TRANSCRIPT
About The JournalInternational Journal of Scientific Study (IJSS) is a monthly journal publishing research articles after full peer review and aims to publish scientifically sound research articles in across all science like Medicine, Dentistry, Genetics, Pharmacy, etc.
Each article submitted to us would be undergoing review in three stages: Initial Review, Peer Review & Final Review.
All rights are reserved with journal owner. Without the prior permission from Editor, no part of the publication can be reproduced, stored or transmitted in any form or by any means.
Abstracting & Indexing InformationIndex Medicus (IMSEAR), Global Index Medicus, Index Copernicus, Directory of Open Access Journals(DOAJ), Google Scholar, WorldCat, SafetyLit, WHO Hinari, Genamics Journal Seek Ulrichsweb Serials Solutions , International Committee of Medical Journal Editors(ICJME) Geneva Foundation for Medical Education & Research(GFMER), Socolar, Bielefeld Academic Search Engine(BASE) , Research Bible , Academic Journals Database, J-Gate, Jour Informatics, Directory of Research Journal Indexing(DRJI), Scientific Indexing Services(SIS)Rubriq-Beta, SHERPA RoMEO, New Jour, EIJASR), IndianScience.in, CiteFactor, Scientific Journal Impact Factor (SJIF), Journal Index.net, ROAD, Global Impact Factor(GIF) , International Society for Research Activity (ISRA), Advanced Science Index, OpenAccessArticles.com, etc
Information for AuthorsThe authors should follow “Instructions to Authors” which is available on website http://www.ijss-sn.com/instructions-to-authors.html. Authors should fill the Copyright Transfer form & Conflict of Interest
form. Manuscripts should be submitted directly to: [email protected].
Publication ChargesInternational Journal of Scientific Study aims to encourage research among all the students, professionals, etc. But due to costs towards article processing, maintenance of paper in secured data storage system, databases and other financial constraints, authors are required to pay. However discount will be provided for the non-funding quality research work upon request. Details about publication charges are mentioned on journal website at: http://www.ijss-sn.com/publication-charges.html.
Advertising PolicyThe journal accepts display and classified advertising Frequency discounts and special positions are available. Inquiries about advertising should be sent to [email protected].
Publishing DetailsPublisher Name: International Research Organization for Life & Health Sciences (IROLHS)Registered Office: L 214, Mega Center, Magarpatta, Pune - Solapur Road, Pune, Maharashtra, India – 411028. Contact Number: +919759370871.Designed by: Tulyasys Technologies (www.tulyasys.com)
DisclaimerThe views and opinions published in International Journal of Scientific Study (IJSS) are those of authors and do not necessarily reflect the policy or position of publisher, editors or members of editorial board. Though the every care has been taken to ensure the accuracy and authenticity of Information, IJSS is however not responsible for damages caused by misinterpretation of information expressed and implied within the pages of this issue. No part of this publication may be reproduced without the express written permission of the publisher.
General Information
International Journal of Scientific Study
International Journal of Scientific Study
Dr. Swapnil S. Bumb – India (BDS, MDS, MPH, MSc, PGDHA, PDCR)Assistant Professor, ACPM Dental College, Dhule, Maharashtra, India
Dr. Dhairya Lakhani, India
Founder & Editor In Chief
Founder Editor
Dr. Stephen Cohen – United States of America (MA, DDS, FACD, FICD)Diplomate of the American Board of Endodontics
Senior editor for nine Editions of the definitive Endodontics Textbook - Pathways of the Pulp, and a Co-editor of the renamed 10 edition Cohen’s Pathways of the Pulp.
Dr. Abdel Latif Mohamed – Australia (MBBS, FRACP, MRCPCH, MPaeds, MPH, AFRACMA, MScEpi, MD)Professor in Neonatology, The Clinical School, Australian National University Medical School, Australia
Open Researcher and Contributor ID (ORCID): 0000-0003-4306-2933, Scopus ID: 13610882200
Dr. Bipin N. Savani – United States of America (M.D)Professor of Medicine Director, Vanderbilt University Medical Center and Veterans Affairs Medical Center, Vanderbilt- Ingram
Cancer Center, Nashville, TN, USA.Associate Editor (previously co-editor) of the journal “Bone Marrow Transplantation” (official journal of the European Group
for Blood and Marrow Transplantation- EBMT).Editorial advisory board: Biology of Blood and Marrow Transplantation (official journal of the American Society of
Blood and Marrow Transplantation.
Dr. Yousef Saleh Khader Al-Gaud, Jordan – (BDS, MSc, MSPH, MHPE, FFPH, ScD) Professor (Full) - Department of Community Medicine
Jordan University of Science and Technology, Jordan, Irbid
Dr. P. Satyanarayana Murthy – India (MBBS, MS, DLO)Professor and Head, Department of ENT and Head & Neck Surgery, Dr.Pinnamaneni Siddhartha Institute of Medical Sciences and
Research Center, Chinnaautapalli, GannavaramEditor - Indian journal of Otolaryngology (1991),
Editorial Chairman, Indian Journal of Otolaryngology and Head & Neck Surgery 2006-2009 & 2009-2012Editor, International Journal of Phonosurgery and Laryngology
Editor in Chief designate, International Journal of Sleep Science and SurgeryEditor in Chief Designate, Journal of Inadian Academy of Otorhinolaryngology and Head & Neck Surgery
Dr. Sidakpal S. Panaich – United States of America (M.D)Interventional Cardiology Fellow, Department of Cardiology, Michigan State University/Borgess Medical CenterCardiology Fellow, Department of Internal Medicine/Cardiology, Wayne State University/Detroit Medical Center
Associate EditorsDr. Silvana Beraj, Albania Dr. Mohannad Saleh Kiswani, Jordan
Dr. João Malta Barbosa, United States of America Dr. Safalya Kadtane, IndiaDr. Anastasia M. Ledyaeva, Russia Dr. Dorcas Naa Dedei Aryeetey, Kumasi, Ghana
Dr. Asfandyar Sheikh, Pakistan Dr. Animasahun Victor Jide, Sagamu, NigeriaDr. John Park, Scotland Dr. Hingi Marko C , Mwanza City, Tanzania
Senior Editorial Board Member
Editorial Board
International Journal of Scientific Study April2018•Vol6•Issue1
Contents
ORIGINAL ARTICLE
Clinical and Etiological Profile of Renal Failure in ChildrenSrikanth Sandanala, Akula Kalyani 1
Study of Pattern and Trends of Sexually Transmitted Infections in Government Thoothukudi Medical CollegeJ Thadeus, B Senthil Selvan, Heber Anandan 8
Isometric exercise and its effect on blood pressure and heart rate; a comparative study between healthy, young, and elderly males in and around Raichur cityMohammed Jeelani, R H Taklikar 12
Variation of Human Placental Attachment of Umbilical CordShipra Shrivastava, Baidyanath Mishra, Sudhakar Kumar Ray, V K Shrivastava, P R Shivhare 17
Eyelid Lesions: A Clinical StudyL Nanda, Kaushal Kumar, Garima Singh Bali 21
Clinical Profile of Diabetic Foot InfectionsK Vasanthan, K Vengadakrishnan, P Surendran 24
Efficacy of Decompressive Craniectomy in Acute Subdural Hematoma in Head Injury Patients, Madurai Medical College, MaduraiH Balasubramanian, Sri Saravanan, G M Niban, T Gandhi Raj 28
Pancytopenia - A Study on Clinical and Etiological Profile at a Tertiary Care InstituteNadeem Ahmad, Nihida Akhter, Tufail Ahmad 33
Female Urethral Reconstruction Using Dorsal Vaginal Graft: A Single-center StudyKumar Rohit, Prabhat Kumar, Rohit Upadhyay, Kamal Kant, Vijoy Kumar 37
Evaluation of Results of Locking Compression Plate in Distal Femur FracturesAnuj Kumar Lal, S K Kaushik, Utkal Gupta, Vivek Agarwal, Shubham Anant 41
International Journal of Scientific Study April2018•Vol6•Issue1
Study on Relationship between Waist Circumference and Blood Pressure among School-Going AdolescentsP Murugalatha, P Guna 47
Comparative Study between Use of Interlock Nailing and Dynamic Compression Plate for the Management of Diaphyseal Fracture of HumerusSam Singh, Sanjay Gupta, S K Kaushik 52
A Study of Breakfast Eating Patterns of School Children Between 5 and 9 Years of Age and its Impact on Nutritional Status and School PerformanceP Murugalatha, K Ramya 59
Echocardiographic Changes in Overt and Subclinical Primary HypothyroidismHaridoss Sripriya Vasudevan, J Jacinth Preethi 63
Study of Different Modalities of Management in Patients with Liver Abscess in a Tertiary Care CentreJawansing Manza, Hardik Makwana, Mukesh Pancholi, Nimesh Verma 67
Coronary Angiographic Profile of Patients with Acute Coronary Syndrome <45 Years of Age in Rural Population of Tamil NaduA G Narayanaswamy, P Vinodh Kumar, Mohd Shahid, S Porchelvan, K Meenakshi, V Srinivasan, K Sharada, V Magesh 72
Acute Effect of Extreme Sports on Serum LipidsOzturk Agirbas, Eser Aggon, Anthony C Hackney 76
Juvenile Nasopharyngeal Angiofibroma - A Hospital- based Retrospective StudyD Ranjit Kumar, D Suresh, S Ananda Padmanaban 80
Role of Ultrasonography and Computed Tomography in Gallbladder Masses and their Correlation with Fine-needle Aspiration CytologyAvadhesh P S Kushwah, Yashwant Jamre, Puspraj S Baghel, Sonjjay Pande, Suresh Kumar 83
Fenticonazole in Vulvovaginal Infections: A Real-world Clinical Experience in India - Force India StudyDhiraj Dhoot, Harshal Mahajan, Hanmant Barkate 91
International Journal of Scientific Study April2018•Vol6•Issue1
Profile of Cerebrospinal Fluid Analysis in Acute Central Nervous System InfectionsK Vasanthan, Yeldho Verghese, R B Sudagar Singh, J Damodharan, K Vengadakrishnan 97
Effect of Internet Use on Health College Students at King Saud UniversityAbdullah Mohammed Saif 102
Right Ventricular Functional Assessment in Acute Myocardial Infarction Using Strain Imaging Parameters and Its Angiographic CorrelationS Naina Mohamed, Sathish Kumar Subbaraj, S Balasubramaniyan, S R Veeramani, G S Sivakumar, G Selvarani, R Ramesh, T R Hemanath, G Nagasundar, M Saravanan 107
Major Effects of Delayed Graft Function and Cold Ischemia Time on Renal Allograft SurvivalK Yogeshwaran, R Neelakandan, K Natarajan 120
Study of Frequency of Psychiatric Illnesses in the Family Members of the Patients Suffering from SchizophreniaMukund Murke, Anurag Khapri 128
Dysphonia Causative Diagnosis Linked to Voice Handicap Index of the Patients with DysphoniaR C Hidayat, A R Saragih, D Zahara, L I Adenin, F Zaluchu 132
Efficacy of Ropivacaine in Wound Instillation through Surgical Drains for Post-operative Analgesia in Modified Radical MastectomyKuldeep Kumar Patel, Rajan B Godwin, Gopal Maravi, Neeraj Narang, Ashish Sethi 136
Morphometric Estimation of Cranial Index in Mahakaushal Region of Madhya Pradesh: Craniometrics StudyMayura Setiya, Amrish Tiwari, Massarat Jehan 141
Anatomical Variations in Position of Vermiform Appendix an Anatomical Study of Aborted FetusesMubeena Shaikh, C H Moideen Kutty Gurukkal 145
International Journal of Scientific Study April2018•Vol6•Issue1
Comorbidities and their Management in Patients with Chronic Kidney Disease in a Tertiary Hospital of KeralaC H Moideen Kutty Gurukkal, B K Bithun 149
Evaluation of Liver Space-occupying LesionM Raja, M Natesan, Heber Anandan 153
A Study on Prescribing Trends of Drugs in the Management of Bronchial Asthma: A Hospital-Based StudyIftekhar Ahmed Nazeer, Sabir Cholas 156
Outcome of Children with First Episode of Urinary Tract InfectionM S Vinodkumar, M Vishnu Mohan 161
A Clinical Study on the Management of Chronic Mastoiditis and Mastoid Abscess - A Hospital-based StudyA Siva Kumar 172
A Clinico-pharmacological Study on Effect of Methylprednisolone in Acute Respiratory Distress Syndrome PatientsIftekhar Ahmed Nazeer, Sabir Cholas 176
REVIEW ARTICLE
Cone-beam Computed Tomography - A Boon in Periodontology: A ReviewPrachi Thakkar, Shilpi Shah, Tejal Sheth, Dhwanit Thakore, Mihir Shah 183
11 International Journal of Scientific Study | April 2018 | Vol 6 | Issue 1
Clinical and Etiological Profile of Renal Failure in ChildrenSrikanth Sandanala1, Akula Kalyani2
1Department of Pediatrics, Gandhi Medical College and Hospital, Secunderabad, Telangana, India, 2Department of Pediatrics, C.K.M. Maternity Hospital, Warangal, Telangana, India
3. 59 patients satisfying the diagnostic criteria were studied. Each patient was assessed with the help of detailed pro forma which included.
i. Historyii. Physical examinationiii. Investigations.
Inclusion Criteria3 months to 18 years children were included in this study.
Exclusion CriteriaThe exclusion criteria were as follows:• <3 months and >18 years children• Trauma cases• Post-operative cases.
Diagnostic CriteriaARF: Doubling of serum creatinine level for that age [Table 1].
Chronic Renal Failure (CRF)Creatinine clearance (glomerular filtration rate [GFR]) below 50 ml/1, 73 m2/minute. Persisting for more than 3 months, using Schwartz formula 2.
INTRODUCTION
Acute renal failure (ARF) remains an important clinical problem with little progress made in the therapeutic approach over the past 20–30 years. Data on the epidemiology of chronic kidney disease (CKD), which is a serious health problem and refers to a condition related to irreversible kidney damage that further progress to end-stage renal disease in children, are insufficient and data that are available were based on hospital records.[1-8] The aim of this study is to study the Clinical and Etiological profile of Renal Failure Outcome of patients with RF.
MATERIALS AND METHODS
1. Cases from Pediatric Department, it is a prospective study.2. Children who fulfilled diagnostic criteria for RF from
March 2011 to August 2012.
Original Article
AbstractIntroduction: Acute renal failure (ARF) is a syndrome characterized by acute decline in glomerular filtration rate leading to the retention of nitrogenous wastes such as urea and creatinine.
Materials and Methods: 59 patients who fulfilled the diagnostic criteria were studied between the age group of 3 months and 18 years during the study period, i.e., March 2011 to October 2012.
Results: The results are well explained in the article using various tables and sufficient explanation.
Conclusion: The most common cause for ARF is acute glomerulonephritis (GN), in which post-streptococcal GN is common. Increased awareness about gastroenteritis, oral rehydration salts, and early referral to tertiary hospital by effective management at tertiary level leading to decreased incidence of RF with acute gastroenteritis.
Key words: Acute renal failure, Chronic glomerulonephritis, Chronic kidney disease, End-stage renal disease, Pediatrics
Access this article online
www.ijss-sn.com
Month of Submission : 02-2018 Month of Peer Review : 03-2018 Month of Acceptance : 04-2018 Month of Publishing : 04-2018
Corresponding Author: Dr. Akula Kalyani, H.NO: 4-21/1 Anandnagar Colony, Bheemaram, Hanamkonda, Warangal - 506 015, Telangana, India. E-mail: [email protected]
Print ISSN: 2321-6379Online ISSN: 2321-595X
DOI: 10.17354/ijss/2018/101
Sandanala and Kalyani: Etiology of Renal Failure in Children
22International Journal of Scientific Study | April 2018 | Vol 6 | Issue 1
Schwartz formula:
Creatinine clearance = k × length in cm/Sr.creatinine mg/dl
For infants k = 0.45; children up to 13 years k = 0.55; Adolescent male children k = 0.7.
RESULTS
59 patients who fulfilled the diagnostic criteria were studied between the age group of 3 months and 18 years during the study period, i.e. March 2011 to October 2012.
During the study period, 4973 cases were admitted in pediatric department, out of these 59 patients presented with renal insufficiency that accounts for 1.2%.
Out of these, 49 cases were ARF and the remaining 10 cases were due to CKD [Table 2].
The maximum percentage of patients was between the age of 11 and 18 years, i.e., 29 (49.2%).
The maximum percentage of patients with ARF were inbetween the age group of 11 and 18 years, i.e., 24 (40.6%). The maximum percentage of patients with CKD were inbetween the age group of 11 and 18 years, i.e., 5 (8.6%).
The minimum percentage of patients with ARF were inbetween the age group of 3 months and 5 years, i.e., 12 (20.3%). The minimum percentage of CRF were in the age group of 3 months to 5 years, i.e., 2 (3.4%).
The mean age at a presentation of CRF is 11 years [Table 3].
Overall male:female ratio 1:3:1.
The male:female ratio in ARF is 1:3:1.
The male:female ratio in CKD is 2:3:1 [Table 4].
The most common cause for ARF is acute glomerulonephritis (GN), 15 (30.6%). In these, post-streptococcal GN cases were 5, membranoproliferative GN cases were 4, focal segmental glomerulosclerosis cases were 3, IgA nephropathy cases were 2, and 1 case of minimal change disease.
Next in order are 6 cases of nephrotic syndrome, 5 cases of hemolytic uremic syndrome, 5 cases of dengue hemorrhagic fever (DHF)/dengue shock syndrome (DSS), 4 cases each of septicemia and systemic lupus erythematosus, and 1 case each for snake bite, renal amyloidosis, complicated urinary tract infection, and chronic rheumatic heart disease with congestive cardiac failure with ARF [Tables 5 and 6].
In this study out of 28 cases, acute GN is the leading cause of primary renal disease for ARF contributing 10 cases. Obstructive uropathy is the primary leading cause for CRF contributing 3 cases [Table 7].
RF due to secondary causes for RF 31, i.e., which is slightly more than the primary renal disease 28 going to RF.
DHF/DSS and hemolytic uremic syndrome are the leading secondary causes for RF contributing about 11 cases out of 31 cases. The increased incidence of DHF/DSS probably due to mixed strain infections with its fulminate course, and the decreased incidence of RF due to acute gastroenteritis is due to increased awareness and early referral to tertiary hospital and timely intervention and better outcome [Table 8].
Symptom AnalysisThe most common symptom in ARF is decreased urine output in about 35 cases.
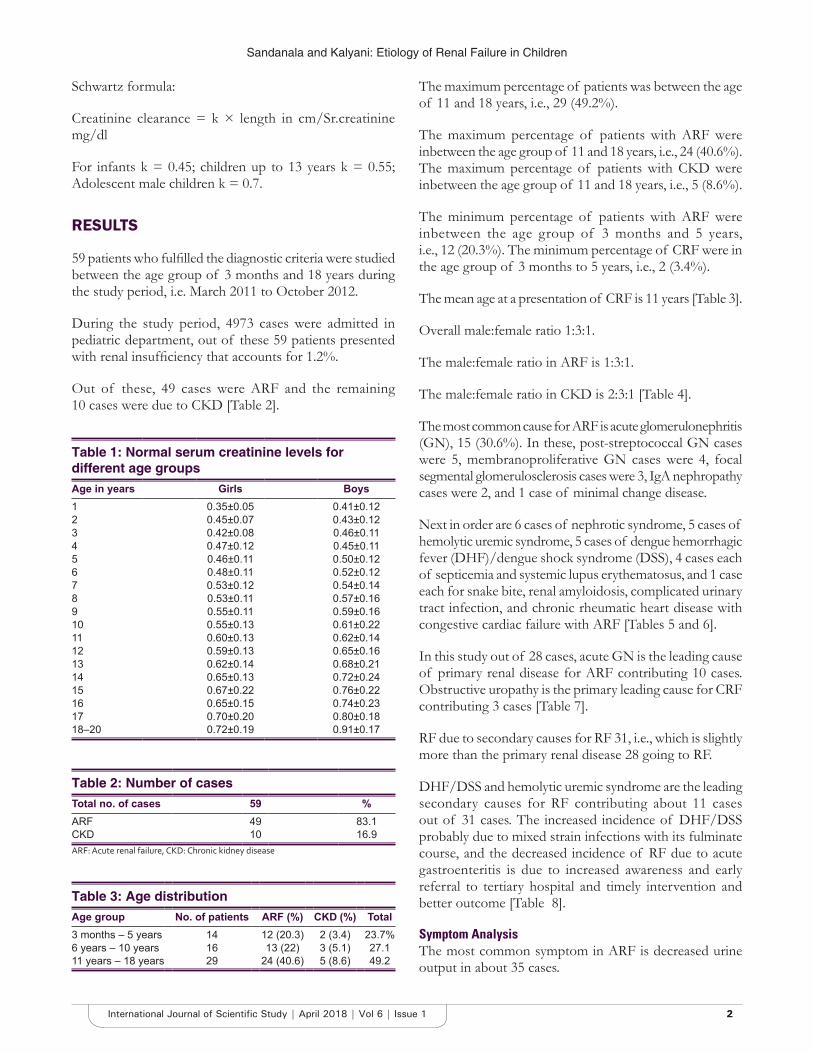
Table 1: Normal serum creatinine levels for different age groupsAge in years Girls Boys1 0.35±0.05 0.41±0.122 0.45±0.07 0.43±0.123 0.42±0.08 0.46±0.114 0.47±0.12 0.45±0.115 0.46±0.11 0.50±0.126 0.48±0.11 0.52±0.127 0.53±0.12 0.54±0.148 0.53±0.11 0.57±0.169 0.55±0.11 0.59±0.1610 0.55±0.13 0.61±0.2211 0.60±0.13 0.62±0.1412 0.59±0.13 0.65±0.1613 0.62±0.14 0.68±0.2114 0.65±0.13 0.72±0.2415 0.67±0.22 0.76±0.2216 0.65±0.15 0.74±0.2317 0.70±0.20 0.80±0.1818–20 0.72±0.19 0.91±0.17
Table 2: Number of casesTotal no. of cases 59 %ARF 49 83.1CKD 10 16.9ARF: Acute renal failure, CKD: Chronic kidney disease
Table 3: Age distributionAge group No. of patients ARF (%) CKD (%) Total3 months – 5 years 14 12 (20.3) 2 (3.4) 23.7%6 years – 10 years 16 13 (22) 3 (5.1) 27.111 years – 18 years 29 24 (40.6) 5 (8.6) 49.2
Sandanala and Kalyani: Etiology of Renal Failure in Children
33 International Journal of Scientific Study | April 2018 | Vol 6 | Issue 1
The other common symptoms are high-colored urine, fever, shortness of breath in 21 cases, vomiting in 7 cases, loose motions in 6 cases, altered sensorium seen in 6 cases, and convulsions in about 6 cases and passing excessive urine.
The most common symptoms in CRF are swelling of face in 18 cases.
The other common symptoms in CRF are shortness of breath in 6 cases, vomitings in 4 cases, convulsions in 4 cases, fever in 4 cases, decreased urine output 6 cases, and dribbling of urine in 3 cases.
The most common sign in ARF is oliguria in about 35 (71.5%) cases.
Other common signs are periorbital edema (44.88%), altered sensorium (38.76), polyuria (8.16%), pedal edema (24.48%), hematuria (26.52%), dehydration (12.24%), hypertension (16.32%), shifting dullness (32.64%), seizures (12.24%), hepatomegaly (20.4%), and basal crepitations (18.36%) cases.
The most common sign in CRF is puffy face and hypertension seen in 8 cases, i.e., seen in 80% of the CKD cases.
70% of the cases are short statured in CKD patients; pallor and breathlessness are seen in 50% of cases, i.e., in 5 cases; oliguria is seen in 6 cases (60%); seizures in 3 cases (30%); failure to thrive, bony abnormalities, and polyuria are seen in 20% of cases; pedal edema is seen in 6 cases
(60%); dehydration is seen in 3 cases (30%); and altered sensorium is seen in 4 cases (40%) [Table 9].
Out of 59 cases of RF, 26 cases were cured by treatment and 21 were relieved from their symptoms. Of these 59 cases, dialysis was done in 9 cases and 2 cases were dependent on dialysis even after discharge.
The overall mortality due to RF is 12 cases (20.34%)
Total mortality during the study period is 249, among these 12 cases expired due to RF which accounts to about 4.8% [Table 10].
RF due to secondary causes such as hemolytic uremic syndrome (24.12%), septicemia (16.6%), and DSS/DHF (16.6%) are the leading causes for mortality RF due to primary renal disease like the glomerular disease that is acute GN has less mortality, i.e., 8.3% [Table 11].
Among the CKDs, chronic GN has contributed to 16.6%, i.e., 2 cases and 1 case due to obstructive uropathy out of 3 cases.
With different etiological factors for RF, the number of cases expired was 12 cases and the total number of survived cases were 47 cases.
Survival is more in the primary glomerular diseases like in acute GN, that is, 14 out of 15 cases survived (93.3%). The survival is low in cases of RF due to secondary causes, that is, 2 out of 5 (40%) among the cases of hemolytic uremic syndrome.
DISCUSSION
59 cases who fulfilled the diagnostic criteria for the RF were studied, in which the 49 cases were ARF and 10 cases were CRF.
ARF GroupIn ARF, the group consisted of 29 boys and 20 girls, ranging in the age from 6 months to 16 years.
Shah et al. reviewed the symptoms and signs and etiological factors in 51 cases, of whom the youngest case is 6 months old and the oldest case is 12 years old, the mean age being 7.1.
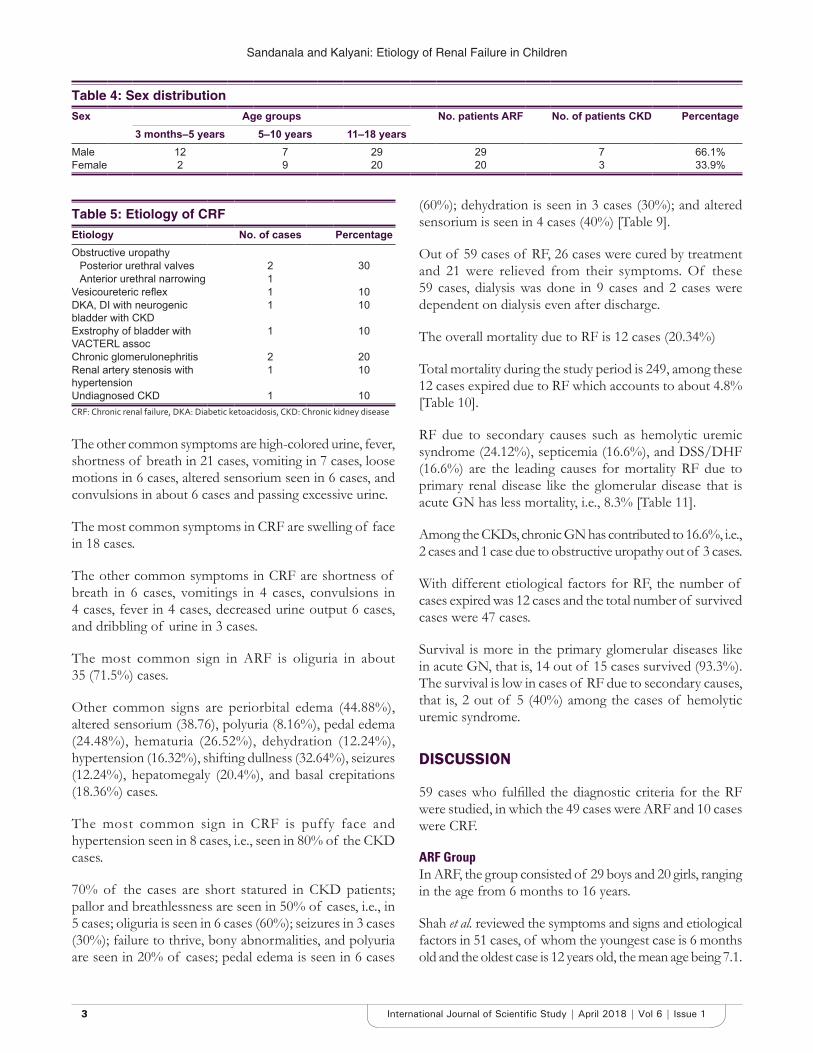
Table 4: Sex distributionSex Age groups No. patients ARF No. of patients CKD Percentage
3 months–5 years 5–10 years 11–18 yearsMale 12 7 29 29 7 66.1%Female 2 9 20 20 3 33.9%
Table 5: Etiology of CRFEtiology No. of cases PercentageObstructive uropathy
Posterior urethral valves 2 30Anterior urethral narrowing 1
Vesicoureteric reflex 1 10DKA, DI with neurogenic bladder with CKD
1 10
Exstrophy of bladder with VACTERL assoc
1 10
Chronic glomerulonephritis 2 20Renal artery stenosis with hypertension
1 10
Undiagnosed CKD 1 10CRF: Chronic renal failure, DKA: Diabetic ketoacidosis, CKD: Chronic kidney disease
Sandanala and Kalyani: Etiology of Renal Failure in Children
44International Journal of Scientific Study | April 2018 | Vol 6 | Issue 1
The mean age group in our study being 7.1 years, 36 and that of other study group being 6.25 years, 37. The male:female ratio is 1.5:1 in our study.
The male:female ratio is 1.5:1 in our study.
The decreased urine output is the most common symptom in our study being 71.8% is comparable with Hari et al. being 94.1%.
Passing of excessive urine being 4 (8.16%) in this study. In Shah et al. study, it is 5.9%. In this study, this symptom is mainly attributed to diabetic ketoacidosis (DKI).
In this study, convulsions are being 12.24%, whereas in Shah et al., it is 29.4% and this symptom is mainly attributed to acute GN.
Other symptoms in this study high-colored urine being 26.52%, shortness of breath 42.84%, vomiting being 14.28%, loose motions being 12.24%, rash all over body 22.44%, and high colored urine in 36.72% of cases.
Polyuria was present in 8.16% in our study and is comparable to 5.9% in Shah et al. study. In this study, this sign is mainly attributed to DKI.
The most common sign in our study being oliguria is 71.8% similar observation was noted by Hari et al. study that is 73.84%.
The other signs are dehydration - 12.24%, periorbital edema - 44.89%, pedal edema - 24.48% hypertension - 16.32%, hematuria - 26.52%, altered sensorium - 38.76%; these are comparable with Shah et al. study except convulsion 29.4%, altered sensorium 60.8% in Shah et al. at study.
The incidence of these symptoms in our study is low which may be because of early referral and improved modality of treatment at the tertiary level of hospital.
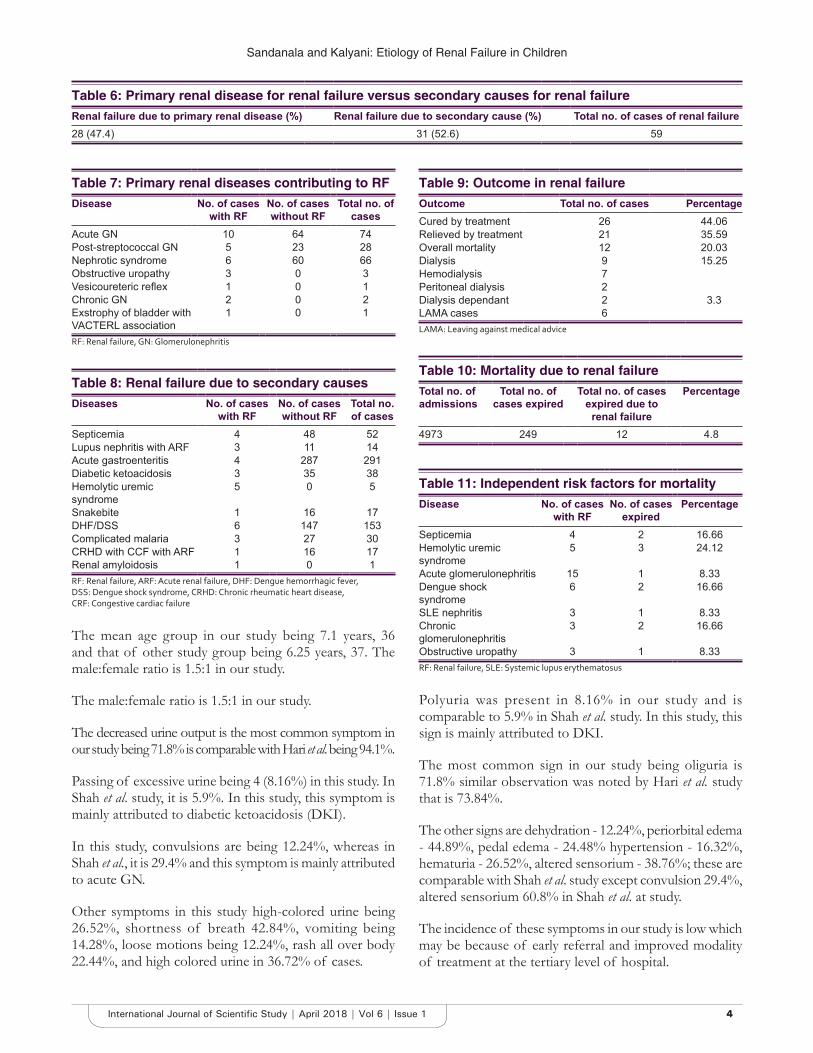
Table 6: Primary renal disease for renal failure versus secondary causes for renal failureRenal failure due to primary renal disease (%) Renal failure due to secondary cause (%) Total no. of cases of renal failure28 (47.4) 31 (52.6) 59
Table 7: Primary renal diseases contributing to RFDisease No. of cases
with RFNo. of cases without RF
Total no. of cases
Acute GN 10 64 74Post-streptococcal GN 5 23 28Nephrotic syndrome 6 60 66Obstructive uropathy 3 0 3Vesicoureteric reflex 1 0 1Chronic GN 2 0 2Exstrophy of bladder with VACTERL association
1 0 1
RF: Renal failure, GN: Glomerulonephritis
Table 8: Renal failure due to secondary causesDiseases No. of cases
with RFNo. of cases without RF
Total no. of cases
Septicemia 4 48 52Lupus nephritis with ARF 3 11 14Acute gastroenteritis 4 287 291Diabetic ketoacidosis 3 35 38Hemolytic uremic syndrome
5 0 5
Snakebite 1 16 17DHF/DSS 6 147 153Complicated malaria 3 27 30CRHD with CCF with ARF 1 16 17Renal amyloidosis 1 0 1RF: Renal failure, ARF: Acute renal failure, DHF: Dengue hemorrhagic fever, DSS: Dengue shock syndrome, CRHD: Chronic rheumatic heart disease, CRF: Congestive cardiac failure
Table 9: Outcome in renal failureOutcome Total no. of cases PercentageCured by treatment 26 44.06Relieved by treatment 21 35.59Overall mortality 12 20.03Dialysis 9 15.25Hemodialysis 7Peritoneal dialysis 2Dialysis dependant 2 3.3LAMA cases 6LAMA: Leaving against medical advice
Table 10: Mortality due to renal failureTotal no. of admissions
Total no. of cases expired
Total no. of cases expired due to
renal failure
Percentage
4973 249 12 4.8
Table 11: Independent risk factors for mortalityDisease No. of cases
with RFNo. of cases
expiredPercentage
Septicemia 4 2 16.66Hemolytic uremic syndrome
5 3 24.12
Acute glomerulonephritis 15 1 8.33Dengue shock syndrome
6 2 16.66
SLE nephritis 3 1 8.33Chronic glomerulonephritis
3 2 16.66
Obstructive uropathy 3 1 8.33RF: Renal failure, SLE: Systemic lupus erythematosus
Sandanala and Kalyani: Etiology of Renal Failure in Children
55 International Journal of Scientific Study | April 2018 | Vol 6 | Issue 1
In this study, the mean blood urea and serum creatinine levels are 80.7 mg/dl and 2.38 mg/dl, respectively, which is comparatively low when compared to Hari et al. study were 132.6 mg/dl and 3.05 mg/dl, respectively.
Acute GN is the most common cause for ARF accounting for 15 cases (30.6%).
The next common cause are septicemia 8.16%, HUS 10.20%, DKA 6.12%, complicated malaria 6.12%, acute gastroenteritis 8.16%, and SLE nephritis 6.12%.
In Shah et al. study, acute gastroenteritis is the most common cause. The next common causes are acute GN and HUS.
The incidence of acute gastroenteritis causing RF is low in this study which may be because of increased awareness about gastroenteritis, oral rehydration salts (ORS) therapy, and early referral to tertiary level hospital and early treatment with fluid replacement.
The DKA causing RF is one among the causes in our study which may be because in Jaffe method of measuring serum creatinine the estimated serum creatinine levels in DKA cases may be falsely elevated because of the presence of ketone bodies and hyperglycemia.
In Counhan et al. study, renal hypoperfusion is the most common cause for RF being 43% which is mostly due to nephritic syndrome 10 cases out of 31 cases of hypoperfusion. Next common causes are HUS 12 (16.6%), acute GN 9 (12.5%), and septicemia 6 (6.94%)
In Uchino et al. study, the most common cause for ARF was septic shock 47.5%.
The survival is better with primary glomerular diseases like acute GN in our study out of 15 cases (88.8%) is comparable with Hari et al. study, in which acute GN better survival 88.8%, this is probably causes the primary glomerular disease is more common in older children than in younger children in whom RF is usually secondary to some other causes such as septicemia, HUS, and gastroenteritis.
The survival is poor with 40% and septicemia is 50% comparable with gastroenteritis and HUS 33.3% in Shah et al. study.
The survival is better in children above 5 years of age and poor in children below 5 years of age in our study is comparable with Hari et al. and Shah et al. study in that survivals better in children above 3 years of age and poor in children below 3 years of age, which may be due to
secondary causes for RF such as septicemia, HUS, and gastroenteritis are most common in younger children.
The overall mortality in our study is 18.36%, which is comparable with Counahan et al. study, in which mortality is 20%. In Hari et al. study, it is 33.3%.
Comparatively low mortality in our study may be because of early referral to tertiary level hospital and availability of dialysis facility and early intervention.
In Uchino et al. study, the overall mortality was 60.3%.
The most common cause for mortality in our study was HUS (60%) and septicemia (50%).
In our study, 26 cases (44.06%) with RF were cured of the disease and 21 (35.5%) cases were relieved of symptoms by treatment. Dialysis was done in 9 cases (15.2%)which is comparable with Counahan study, in which full recovery of renal function occurred in 53% and relief symptoms and discharge from hospital occurred in 14% patients. Dialysis was done in 6 cases (11.3%).
CRFIn our study, 10 cases out of 56 cases were CRF cases.
In CRF, the group consisted of 7 boys (70%) and 3 girls (30%) ranging in the age group of 3 years to 17 years.
In our study, the secondary causes causing RF is statistically highly significant age from 6 months to 18 years.
In our study, the number of case below 5 years was 1 (10%). Between 6 and 10 years of age group, the number of cases with CRF was 4 (40%). Between 11 and 18 years of age group the number of cases with CRF was 5 (50%).
In Pankaj et al. study, the number of cases below 5 years of age was 96 (31.4%). Between 6 and 10 years of age group, the number of cases was 105 (34.4%). Between 11 and 18 years of age group, the number of cases was 104 (34%).
The age at presentation in our study with features of CRF was higher as compared to Pankaj et al. study, suggesting delayed detection and referral of patients.
In our study, the lower age at presentation is 3 years and the upper age at presentation is 17 years. The mean age at presentation is 11½ years. This is comparatively in elderly with Hari et al. study, in which the mean age of presentation was 8 years.
In our study, the male cases are 70 % and female cases are 30%; the male-to-female ratio 2.3:1 which is comparable
Sandanala and Kalyani: Etiology of Renal Failure in Children
66International Journal of Scientific Study | April 2018 | Vol 6 | Issue 1
with Gianluigi et al. study 67% male cases and female cases are 33%. The M:F ratio is 2.03:1 in Hari et al. study, in which 73.77% cases are male and 26.33% cases are female and M: F ratio is 2.8:1. In Gianluigi et al. study, 67% were male and 33% were female. The M: F ratio is 2.03:1. This male predominance is because of posterior urethral valve cases (obstructive uropathy) are most common cause for CRF, presenting in males.
Swelling of face 80% is a most common symptom and puffy face is the most common sign (80%) in our study.
The other common presenting features are pedal edema 60%, pallor 50%, short stature 70%, shortness of breath 50%, hypertension 80%, dribbling of urine 30%, convulsions 30%, bony abnormalities 20%, and failure to thrive 20%.
The mean blood urea and serum creatinine levels in our study in CRF cases are 148 mg/dl and 6.1 mg/dl, respectively. This is almost comparable with the Hari et al. study in which mean blood urea and serum creatinine levels are 150 mg/dl and 4.6 mg/dl, respectively.
The mean GFR at presentation in our study is 18.8.ml/1.73 m2/min, is comparable to Hari et al. study, in which the GFR is 18.5 ml/1.73 m2/min. In Gianluigi et al. study, the mean GFR at presentation is 41 ml/1.73 m2/min.
This also indicates delayed detection and referred to tertiary level hospitals.
In our study, creatinine clearance between 50 and 25 ml/1.73 m2/min 20% of cases, 25–10 ml/1.73 m2/min are 40%, and 10 ml/1.73 m2/min are 40 cases.
In Gianluigi et al. study, creatinine clearance between 25 and 50 ml/min/1.73 m2 cases were 35% and <25 ml/min 1.73 m2 cases were 26%.
This also indicates in our study that severe CRF and end-stage renal disease are common because of delayed detection of the cases.
The mean hemoglobin in our study is 7.9 g/dl is comparable with Hari et al. study, in which the mean HB level at presentation was 7.6 g/dl, the range of HB levels in our study are 5.8–11 g/dl. In Hari et al. study, it was 5–10 g/dl.
In our study, osteodystrophy is present in 20% which is comparable with Hari et al. study, in which osteodystrophy was present in 20.8%.
The most common cause for CRF in our study was obstructive uropathy 30%. The next common cause was
chronic GN is 30% and vesicoureteral reflex 10%, vascular malformation (Rt. Renal artery stenosis with hypertensive encephalopathy) is 10%. This is comparable with other studies, Hari et al. study obstructive uropathy cases were 31%, vesicoureteral reflux (VUR) 16.7%, chronic GN 27.5%.
In Gulati et al. study, combined obstructive uropathy and VUR contribute 52% of cases and chronic GN cases contribute to 37.5%. In Gianluigi et al. study, hypodysplasia with urinary tract malformations contribute 67.1%, chronic GN 2.8%, In Lagomarsiano study, obstructive uropathy contributes 16.7% and GN contributes 16.3% of cases.
It is observed that congenital malformation of the urinary tract is the major cause for development of RF. So if detect these condition early by antenatal scanning and intervene early, the prognosis will be good.[9-15]
In our study, 3 cases out of 10 of CRF are expired. The independent risk factors for mortality is obstructive uropathy 1 cases and chronic GN 2 cases. 7 cases were relieved of symptom and discharged from the hospital. Dialysis was done in 4 cases of CRF.
CONCLUSION
1. The most common cause for ARF is acute GN, in which post-streptococcal GN is common.
2. Increased awareness about gastroenteritis, ORS, and early referral to tertiary hospital by effective management at the tertiary level leading to decreased incidence of RF with acute gastroenteritis.
3. The male:female ratio is 4:3 in ARF.4. Decreased urinary output is the most common
symptom in ARF.5. Oliguria is the most common sign in ARF.6. The DKA is one of the most common cause for
ARF in our study which may be because of in Jaffe method, measuring serum creatinine, the estimated serum creatinine levels in DKA cases may be falsely elevated because of the presence of ketone bodies and hyperglycemia.
7. Survival is better in older children than younger children. This is because of primary glomerular diseases more common in older children, in which survival is good and the secondary causes are for ARF is more common in younger age group, in which survival is poor.
8. The most common cause for mortality HUS.9. Early and frequent dialysis leads to improvement in
patient survival.10. The most common cause for CRF is obstructive
uropathy.
Sandanala and Kalyani: Etiology of Renal Failure in Children
77 International Journal of Scientific Study | April 2018 | Vol 6 | Issue 1
11. More number of cases of CRF is presented in older age groups, that is, above 10 years.
12. Male predominance of CRF is due to post-urethral value cases are seen in male is most common contributing factors for CRF.
13. Puffy face swelling is most common presenting features in CRF.
14. Stunted growth, malnutrition, and anemia are present in the majority of cases, indicates delayed detection of cases and referral to the tertiary hospital in our study.
15. Sever CRF and end-stage renal disease (ESRD) case are more in our study indicating late referral to the tertiary hospital.
16. The most common cause for CRF is obstructive uropathy in that post-urethral valve are most common.
17. Since congenital urinary tract malformation are common cause for CRF, early identification of urinary tract anomalies by antenatal scanning and early intervention lead to better prognosis.
18. With the availability of dialysis most of the cases with RF are improving, so the cases with the RF an early referral to specialized center with dialysis facility can improve the outcome.
19. The mortality due to CRF is comparatively low may be because of these cases are cannot followed up due to majority of the cases progressed to ESRD beyond the pediatric age group.
REFERENCES
1. Kher KK, Makker SP. Clinical Peadiatric Nephrology. 2nd ed. London: Informa Health Care; 2006. p. 339-40.
2. Turner NN, Lameire N, Goldsmith DJ, Winearls CG, Himmelfarb J, Remuzzi G, et al. Oxford Textbook of Clinical Nephrology. 4th ed. Oxford: Oxford University Press; 2016.
3. Behrman RE, Kliengman RM. Nelson Textbook of Paediatrics. 18th ed. Philadelphia, PA: Saunders/Elsevier; 2001. p. 850-3.
4. Ghai OP, Gupta P, Paul VK, Ghai Essential Paediatrics. 6th ed. New Delhi: CBS Publishers & Distributors; 2004. p. 535-7.
5. Nammalawar BR, Kumar MV. Principles and Practice of Pediatric Nephrology. 1st ed. New Delhi: Jaypee Brothers Medical Publishers (P) Ltd.; 2004.
6. Richard Sinert DO. Emedicine-Acute Renal Failure. Chicago: Richard Sinert DO; 2006.
7. Morrin PA. The development of nephrology. J Postgraduate Med 1994;40:109-17.
8. Hari P, Single IK, Mantan M, Kanitkar M, Batra B, Bagga A. Chronic renal failure in children. Indian Pediatr 2003;40:1035-42.
9. Uchino S, Kellum JA, Bellomo R, Doig GS, Morimatsu H, Morgera S, et al. Acute renal failure in critically ill patients: A multinational, multicenter study. JAMA 2005;294:813-8.
10. Ardissino G, Daccò V, Testa S, Bonaudo R, Claris-Appiani A, Taioli E, et al. Epidemiology of chronic renal failure in children: Data from the italKid project. Pediatrics 2003;111:e382-7.
11. Counahan R, Cameron JS, Spurgeon CS, Williams DG, Winder E, Chantler C. Presentation, management, complications, and outcome of acute renal failure in childhood: Five years’ experience. Br Med J 1977;1:599-602.
12. Shah BV, Almeida AF, Chawla KP, Shah AB, Mittal BV, Kinare SG, et al. Acute renal failure in paediatric population in the tropics. J Postgrad Med 1985;31:134-9.
13. Lagomarsimo E, Valenzuela A, Cavagnaro F, Solar E. Chronic renal failure in pediatrics 1996. Chilean survey. Pediatr Nephrol 1999;13:288-91.
14. Munteanu M, Cucer F, Russu R, Mullar R, Buhur M, Brumariu O. Acute renal failure in children. Study of 35 patients. Rev Med Chir Soc Med Nat 2004;108:570-4.
15. Gulati S, Mittal S, Sharma RK, Gupta A. Etiology and outcome of chronic renal failure in Indian children. Pediatr Nephrol 1999;13:594-6.
How to cite this article: Sandanala S, Kalyani A. Clinical and Etiological Profile of Renal Failure in Children. Int J Sci Stud 2018;6(1):1-7.
Source of Support: Nil, Conflict of Interest: None declared.
1414International Journal of Scientific Study | April 2018 | Vol 6 | Issue 1
Study of Pattern and Trends of Sexually Transmitted Infections in Government Thoothukudi Medical CollegeJ Thadeus1, B Senthil Selvan2, Heber Anandan3
1Associate Professor, Department of Dermatology and STD, Government Thoothukudi Medical College, Thoothukudi, Tamil Nadu, India, 2Assistant Professor, Department of Dermatology and STD, Government Thoothukudi Medical College, Thoothukudi, Tamil Nadu, India, 3Senior Clinical Scientist, Department of Clinical Research, Dr. Agarwal’s Healthcare Limited, Tamil Nadu, India
the pattern of STIs prevailing in the particular region. A review of the epidemiology and trends of STIs showed a declining number of all STIs.[4] There was a progressive decline in the incidence of bacterial STIs over those 20 years, with viral STIs remaining at a relatively constant level. The increasing demand for STI services may be attributed to an increased incidence of infections, increased public awareness of STIs, and increasing patient expectations as well as an improved level of services available at the newly renovated clinic site. Therefore, we planned this study to unravel the pattern, clinical profile, and trend of STIs in Thoothukudi. It is important to monitor trends in STIs to implement effective policies as well as health education and prevention programs.
AimThis study aims to study the trends of STIs in Thoothukudi over the last 6 years in patients attending STI clinic of Thoothukudi Medical College Hospital.
INTRODUCTION
Sexually transmitted infections (STIs) are diseases and syndromes that are epidemiologically heterogeneous, but all of which are almost always transmitted sexually.[1] STIs constitute a major public health problem for both developing and developed countries. The pattern of STIs differs from country-to-country and region-to-region, especially in India.[2,3] STIs increase the risk of transmission of human immunodeficiency virus (HIV) infection posing an immense need to understand
Original Article
AbstractIntroduction: Sexually transmitted infections (STIs) constitute a major public health problem for both developing and developed countries. Prevalence and pattern of presentation of STIs would help in designing a better treatment facility to overcome the stigma and spread of the disease in the community.
Aim: This study aims to unravel the spectrum and changing trends of STI in patients attending STI clinic of Thoothukudi Medical College Hospital.
Materials and Methods: This is a prospective study conducted at the Department of Dermatology and STD, Government Thoothukudi Medical College, Thoothukudi, Tamil Nadu. All the new patients attending STD clinic from January 2011 to December 2016 were included in the study.
Results: During the 6-year study period, 13,550 patients attended STD clinic. Among the total patients visiting STD clinic, 4461 were symptomatic. These symptomatic patients were evaluated for various STIs.
Conclusion: The year’s trend in our study reveals a gradual increase in female attendance in STI clinics, increasing viral STIs, and declining bacterial STIs. This indicates a more aware population seeking early treatment and effective management of STI by the current health-care system.
Key words: Sexually transmitted infections, Trends, Patterns, Thoothukudi
Access this article online
www.ijss-sn.com
Month of Submission : 02-2018 Month of Peer Review : 03-2018 Month of Acceptance : 04-2018 Month of Publishing : 05-2018
Corresponding Author: B. Senthil Selvan, Department of Dermatology and STD, Government Thoothukudi Medical College, Thoothukudi, Tamil Nadu, India. E-mail: [email protected]
Print ISSN: 2321-6379Online ISSN: 2321-595X
DOI: 10.17354/ijss/2018/102
Thadeus, et al.: Study of Patterns of Sexually Transmitted Diseases
1515 International Journal of Scientific Study | April 2018 | Vol 6 | Issue 1
MATERIALS AND METHODS
The present study is a prospective study conducted for a period of 6 years from January 2011 to December 2016 at the Department of Dermatology and STD, Government Thoothukudi Medical College, Thoothukudi, Tamil Nadu. The study population included all the new patient’s attending STD clinic at Thoothukudi Medical College Hospital. Each patient was evaluated for STI like clinical history, thorough clinical examination and appropriate laboratory investigations including relevant serology such as enzyme-linked immunosorbent assay for HIV and venereal disease research laboratory (VDRL) test for syphilis. All patients were counseled about the risk of unprotected sexual intercourse, the risk of HIV transmission in the presence of other STIs, the importance of partner treatment and condom use. Asymptomatic patients were also followed up clinically and serologically for 6 months. STIs, which were not included in the syndromic management, were also identified clinically and with relevant laboratory investigations. Partner identification and condom promotion were done. All patients were treated as per NACO’s guidelines.
RESULTS
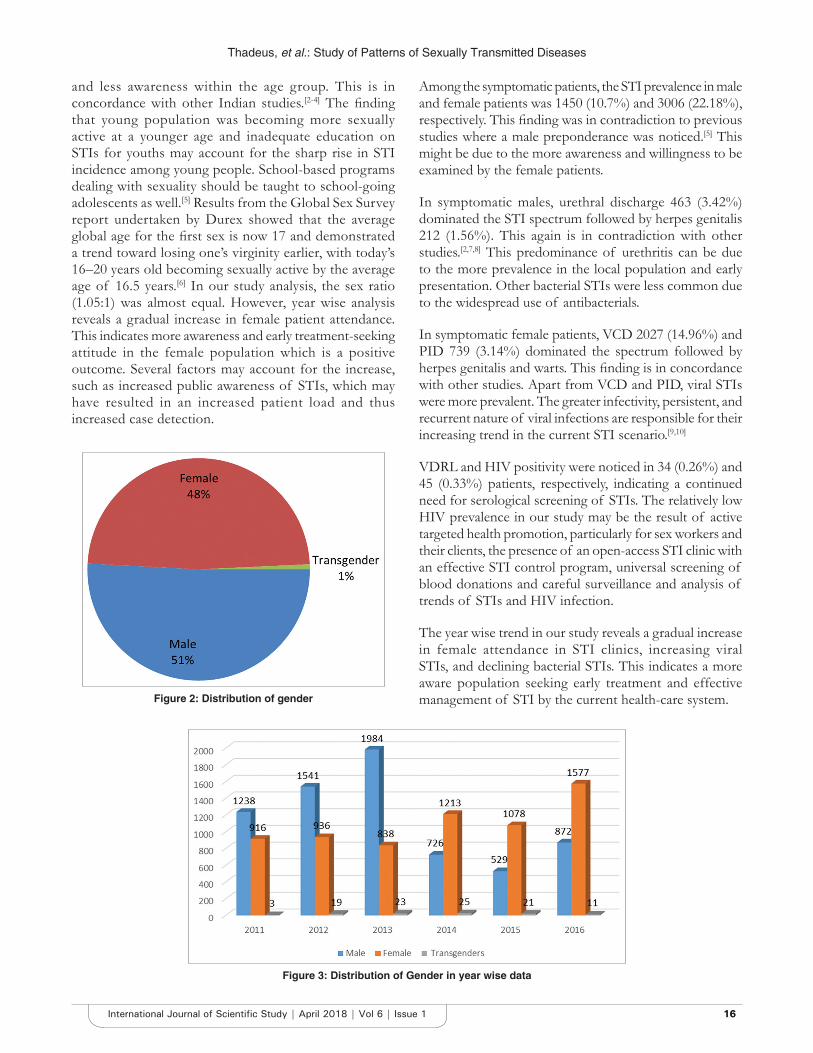
The total population of Thoothukudi district is around 17 lakhs. The Government Thoothukudi Medical College Hospital OPD caters around 6 lakhs patients per year. An average of 30,000 (5.1%) visited Dermatology and STD OPD, of which 2250 (0.35%) attended STD clinic [Figure 1].
During the 6-year study period, 13,550 patients attended STD clinic. Of them, 6890 (50.85%) were males, 6558 (48.4%) were females and 102 (0.75%) were transgender with the sex ratio of 68:65:1 [Figure 2]. Year
wise analysis shows a gradual increase in female patients [Figure 3]. Most of the patients (72%) were in the 21–30 years age group.
Among the total patients visiting STD clinic, 4461 were symptomatic and 9089 were asymptomatic. There was not much variation in STD clinic attendance during the 6-year study period. Among the symptomatic, 1450 were males, 3006 were females, and 5 were transgender. In males, the most commonly seen STD was urethral discharge (463 [3.42%]), followed by herpes genitalis (212 [1.56%]), inguinal bubo (77 [0.57%]), warts (55 [0.43%]), syphilis (21 [0.15%]), and scrotal swelling (3 [0.02%]). Female patients predominantly presented with vaginal cervical discharge (2027 [14.96%]), followed by lower abdominal pain (739 [5.45%]), herpes genitalis (83 [0.61%]), warts (19 [0.14%]), syphilis (13 [0.09%]), and inguinal bubo (6 [0.04%]). In transgender, urethral discharge was the most common presentation.
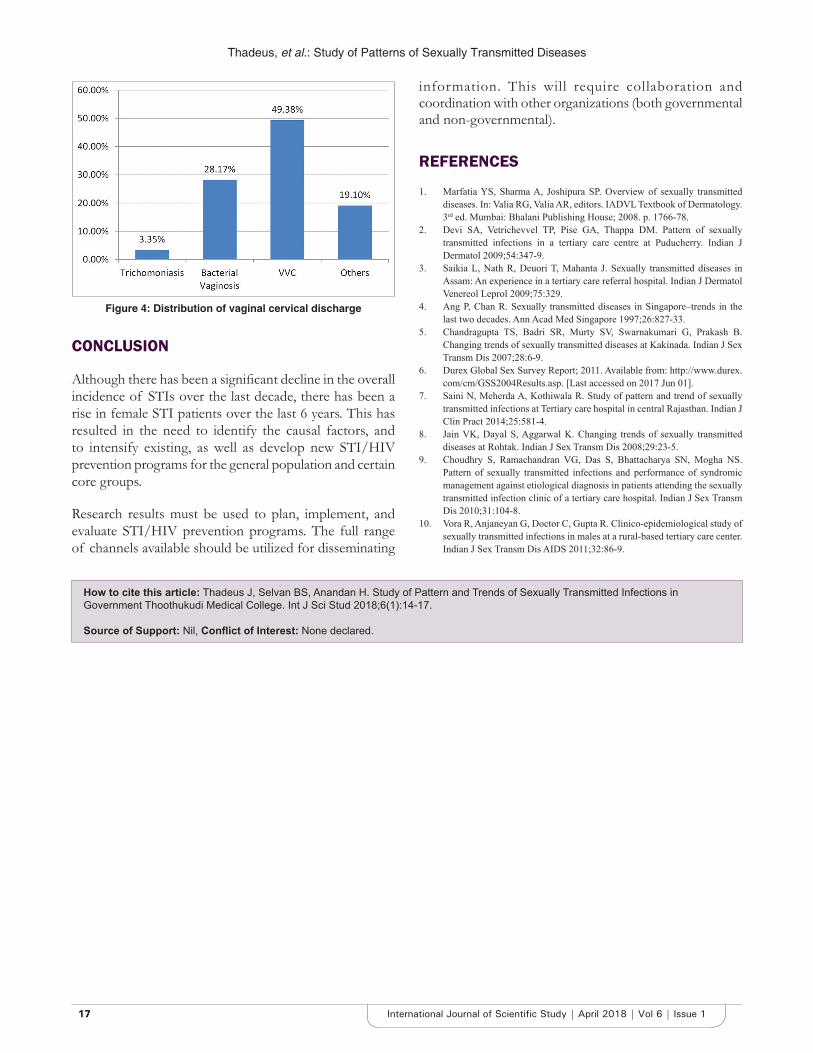
Among the 2027 patients with vaginal cervical discharge, the most commonly identified STI was candidiasis (1001 [49.38%]) followed by bacterial vaginosis (571 [28.17%]) and trichomoniasis (68 [3.35%]) [Figure 4].
VDRL test was positive in 34 (0.25%) patients, of which 21 were males and 13 were females. Among the positive males, 12 (35.29%) were asymptomatic. In females, 4 (11.76%) were asymptomatic indicating early latent syphilis. HIV seropositivity was noticed in 45 patients, of them, 25 were males, 19 were females, and 1 was transgender.
DISCUSSION
Young adults (21–30 years) dominated the study population indicating more sexual activity, promiscuity,
Figure 1: STD outpatient census
Thadeus, et al.: Study of Patterns of Sexually Transmitted Diseases
1616International Journal of Scientific Study | April 2018 | Vol 6 | Issue 1
and less awareness within the age group. This is in concordance with other Indian studies.[2-4] The finding that young population was becoming more sexually active at a younger age and inadequate education on STIs for youths may account for the sharp rise in STI incidence among young people. School-based programs dealing with sexuality should be taught to school-going adolescents as well.[5] Results from the Global Sex Survey report undertaken by Durex showed that the average global age for the first sex is now 17 and demonstrated a trend toward losing one’s virginity earlier, with today’s 16–20 years old becoming sexually active by the average age of 16.5 years.[6] In our study analysis, the sex ratio (1.05:1) was almost equal. However, year wise analysis reveals a gradual increase in female patient attendance. This indicates more awareness and early treatment-seeking attitude in the female population which is a positive outcome. Several factors may account for the increase, such as increased public awareness of STIs, which may have resulted in an increased patient load and thus increased case detection.
Among the symptomatic patients, the STI prevalence in male and female patients was 1450 (10.7%) and 3006 (22.18%), respectively. This finding was in contradiction to previous studies where a male preponderance was noticed.[5] This might be due to the more awareness and willingness to be examined by the female patients.
In symptomatic males, urethral discharge 463 (3.42%) dominated the STI spectrum followed by herpes genitalis 212 (1.56%). This again is in contradiction with other studies.[2,7,8] This predominance of urethritis can be due to the more prevalence in the local population and early presentation. Other bacterial STIs were less common due to the widespread use of antibacterials.
In symptomatic female patients, VCD 2027 (14.96%) and PID 739 (3.14%) dominated the spectrum followed by herpes genitalis and warts. This finding is in concordance with other studies. Apart from VCD and PID, viral STIs were more prevalent. The greater infectivity, persistent, and recurrent nature of viral infections are responsible for their increasing trend in the current STI scenario.[9,10]
VDRL and HIV positivity were noticed in 34 (0.26%) and 45 (0.33%) patients, respectively, indicating a continued need for serological screening of STIs. The relatively low HIV prevalence in our study may be the result of active targeted health promotion, particularly for sex workers and their clients, the presence of an open-access STI clinic with an effective STI control program, universal screening of blood donations and careful surveillance and analysis of trends of STIs and HIV infection.
The year wise trend in our study reveals a gradual increase in female attendance in STI clinics, increasing viral STIs, and declining bacterial STIs. This indicates a more aware population seeking early treatment and effective management of STI by the current health-care system.Figure 2: Distribution of gender
Figure 3: Distribution of Gender in year wise data
Thadeus, et al.: Study of Patterns of Sexually Transmitted Diseases
1717 International Journal of Scientific Study | April 2018 | Vol 6 | Issue 1
CONCLUSION
Although there has been a significant decline in the overall incidence of STIs over the last decade, there has been a rise in female STI patients over the last 6 years. This has resulted in the need to identify the causal factors, and to intensify existing, as well as develop new STI/HIV prevention programs for the general population and certain core groups.
Research results must be used to plan, implement, and evaluate STI/HIV prevention programs. The full range of channels available should be utilized for disseminating
information. This will require collaboration and coordination with other organizations (both governmental and non-governmental).
REFERENCES
1. Marfatia YS, Sharma A, Joshipura SP. Overview of sexually transmitted diseases. In: Valia RG, Valia AR, editors. IADVL Textbook of Dermatology. 3rd ed. Mumbai: Bhalani Publishing House; 2008. p. 1766-78.
2. Devi SA, Vetrichevvel TP, Pise GA, Thappa DM. Pattern of sexually transmitted infections in a tertiary care centre at Puducherry. Indian J Dermatol 2009;54:347-9.
3. Saikia L, Nath R, Deuori T, Mahanta J. Sexually transmitted diseases in Assam: An experience in a tertiary care referral hospital. Indian J Dermatol Venereol Leprol 2009;75:329.
4. Ang P, Chan R. Sexually transmitted diseases in Singapore–trends in the last two decades. Ann Acad Med Singapore 1997;26:827-33.
5. Chandragupta TS, Badri SR, Murty SV, Swarnakumari G, Prakash B. Changing trends of sexually transmitted diseases at Kakinada. Indian J Sex Transm Dis 2007;28:6-9.
6. Durex Global Sex Survey Report; 2011. Available from: http://www.durex.com/cm/GSS2004Results.asp. [Last accessed on 2017 Jun 01].
7. Saini N, Meherda A, Kothiwala R. Study of pattern and trend of sexually transmitted infections at Tertiary care hospital in central Rajasthan. Indian J Clin Pract 2014;25:581-4.
8. Jain VK, Dayal S, Aggarwal K. Changing trends of sexually transmitted diseases at Rohtak. Indian J Sex Transm Dis 2008;29:23-5.
9. Choudhry S, Ramachandran VG, Das S, Bhattacharya SN, Mogha NS. Pattern of sexually transmitted infections and performance of syndromic management against etiological diagnosis in patients attending the sexually transmitted infection clinic of a tertiary care hospital. Indian J Sex Transm Dis 2010;31:104-8.
10. Vora R, Anjaneyan G, Doctor C, Gupta R. Clinico-epidemiological study of sexually transmitted infections in males at a rural-based tertiary care center. Indian J Sex Transm Dis AIDS 2011;32:86-9.
How to cite this article: Thadeus J, Selvan BS, Anandan H. Study of Pattern and Trends of Sexually Transmitted Infections in Government Thoothukudi Medical College. Int J Sci Stud 2018;6(1):14-17.
Source of Support: Nil, Conflict of Interest: None declared.
Figure 4: Distribution of vaginal cervical discharge
1212International Journal of Scientific Study | April 2018 | Vol 6 | Issue 1
Isometric exercise and its effect on blood pressure and heart rate; a comparative study between healthy, young, and elderly males in and around Raichur cityMohammed Jeelani1, R H Taklikar2
1Assistant Professor, Department of Physiology, College of Medicine, University of Bisha, Bisha, Kingdom of Saudi Arabia, 2Professor and Head, Department of Physiology, Navodaya Medical College, Raichur, Karnataka, India
muscles so that high-energy output can be maintained for a long period of time and the by-products of metabolism are removed rapidly from the site of energy release.
Isometric exercise produces a significant increase in blood pressure (BP), which is important in maintaining perfusion of muscle during sustained contraction. This response is brought about by the combined efforts of central and peripheral afferent input to medullary cardiovascular centers. In normal individuals, the increase in BP is due to increase in cardiac output with little or no change in systemic vascular resistance.[1]
INTRODUCTION
The cardiovascular system plays an important role to maintain the homeostasis and to provide nutrients and oxygen to the
Original Article
AbstractIntroduction: Isometric exercise is a routine part of everyday activities and occupational tasks. Physicians have a responsibility to promote regular physical activity to reduce high blood pressure (BP) and to control weight as physical inactivity is considered as a risk factor for coronary artery disease. Isometric exercises for aging populations have often been discouraged due to harmful effects on the cardiovascular system. However, isometric exercise in older adults and patients of some age group has found to be beneficial for maintaining normal cardiovascular function, but still, controversies are there. The cardiovascular response to isometric exercise has been studied majorly in young adult males. The vascular wall becomes less elastic and stiffer with the advancement of age (Nichols et al., 1985; O’Rourke, 1990; and Cheitlin, 2003). There are very few studies that have compared the isometric exercise response in younger and elderly individuals.
Purpose of the Study: The present study is done to determine the effect of isometric exercise on BP and heart rate (HR) in healthy, young, and elderly males.
Materials and Methods: In the present study, 100 male subjects with age group of 20–30 years and 60–70 years satisfying the inclusion criteria were selected and divided into two groups, namely, young and elderly group, respectively. Resting HR and BP were recorded followed by HR and BP responses to isometric exercise in both the groups. Isometric contraction was held till 60 s using the force transducer at 40% of the maximal voluntary contraction. Pre and post HR and BP were compared.
Results: The elder subjects had a lower HR and a higher BP response than their younger counterparts.
Conclusion: From this study, it is concluded that the increasing age is associated with an altered HR and BP response to isometric exercise.
Key words: Blood pressure response to aging, Heart rate response to aging, Maximum voluntary contraction
Access this article online
www.ijss-sn.com
Month of Submission : 02-2018 Month of Peer Review : 03-2018 Month of Acceptance : 04-2018 Month of Publishing : 05-2018
Corresponding Author: Dr. Mohammed Jeelani, H. No. 6-30, C1, Near Masjid E Salahin, Mominpura, Gulbarga - 585 104, Karnataka, India. Phone: +91-9538190365/+966547076255. E-mail: [email protected]
Print ISSN: 2321-6379Online ISSN: 2321-595X
DOI: 10.17354/ijss/2018/103
1313 International Journal of Scientific Study | April 2018 | Vol 6 | Issue 1
Jeelani and Taklikar : Isometric Exercise and its Effect on Blood Pressure and Heart Rate in Young and Elderly Males
With lifestyle changes and modernization, cardiovascular system is more severely affected. The American Heart Association considers ischemic (coronary) heart diseases, hypertensive diseases, rheumatic fever/rheumatic heart diseases, and cerebrovascular diseases (stroke) to be major cardiovascular diseases. The WHO estimates that by 2020 cardiovascular diseases will account for up to 40% of all deaths worldwide.[2] Taking this into consideration, the cardiac rehabilitation has gained its importance.
With aging, there are changes taking place in the cardiovascular system, which result in alterations in cardiovascular physiology. The changes occurring with age differ from person to person with varying rates. The changes associated with aging in the cardiovascular system include a decrease in elasticity and an increase in stiffness of the arterial system. Which leads to increased afterload on the left ventricle, an increase in systolic BP (SBP), left ventricular hypertrophy, and other changes in the left ventricular wall that prolong relaxation of the left ventricle in diastole. There is decrease in intrinsic heart rate (HR) due to dropout of atrial pacemaker cells.[3,4]
In the present study, an effort was made to know effects of isometric contraction in young and elderly normal individuals and also to know whether isometric exercise can be included in elderly normal individual’s fitness and cardiac rehabilitation program.
MATERIALS AND METHODS
The study was conducted in the Department of Physiology after taking approval from the Ethical Clearance Committee, Navodaya Medical College.
A total of 100 male subjects from in and around Raichur city were selected and divided into two groups, namely, young and elderly groups with age group of 20–30 years and 60–70 years, respectively.
The inclusion criteria were normotensive males in the above age groups, and exclusion criteria included subjects with chronic history of alcohol, smoking, resting tachycardia (>120 beats per min), hypertension, history of any other cardiovascular disorders, any peripheral vascular disease, those on regular exercise program, and uncooperative subjects.
During the first sitting, the anthropometric parameters and body mass index were recorded. Then, during the second sitting, the subject was asked to relax in supine position for 30 min in the laboratory. Both the groups received isometric exercise for forearm. Pre-exercise evaluation
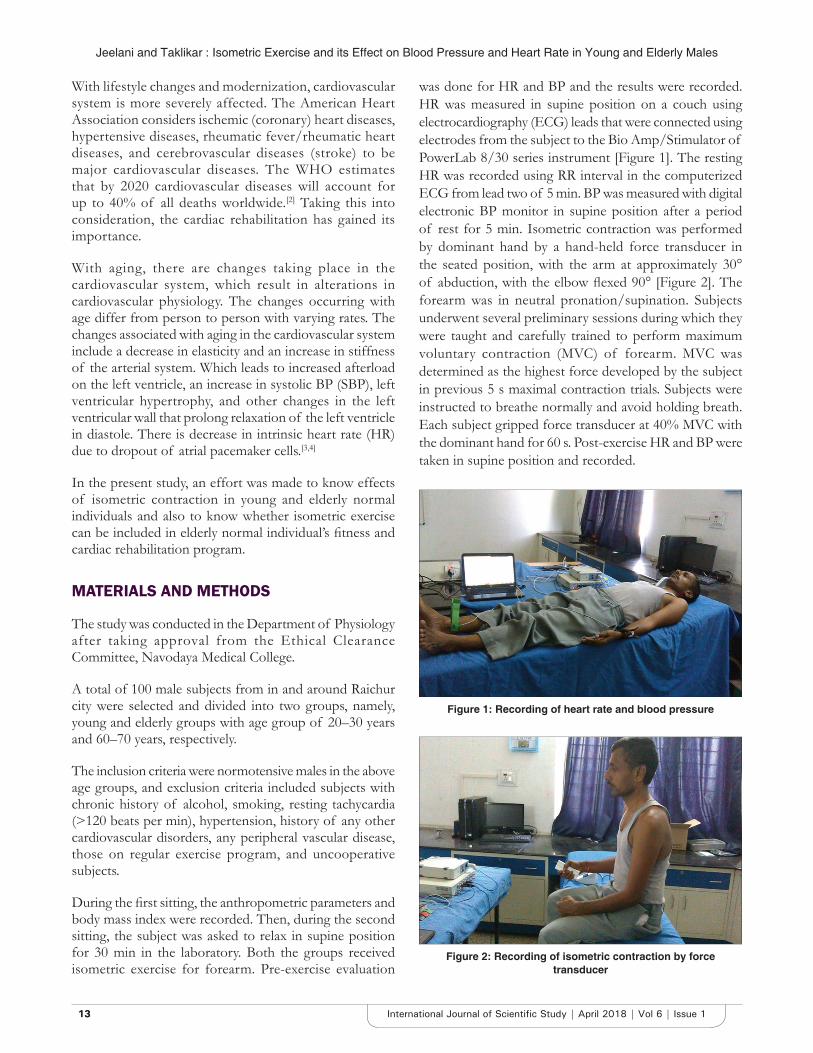
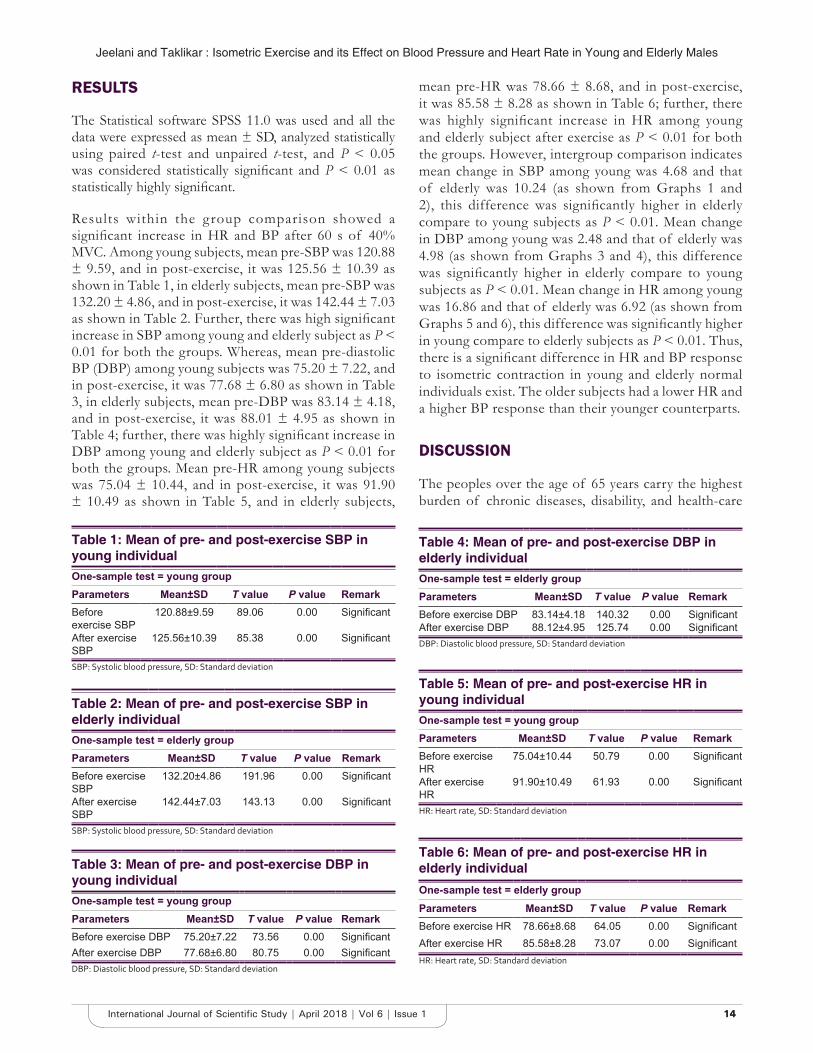
was done for HR and BP and the results were recorded. HR was measured in supine position on a couch using electrocardiography (ECG) leads that were connected using electrodes from the subject to the Bio Amp/Stimulator of PowerLab 8/30 series instrument [Figure 1]. The resting HR was recorded using RR interval in the computerized ECG from lead two of 5 min. BP was measured with digital electronic BP monitor in supine position after a period of rest for 5 min. Isometric contraction was performed by dominant hand by a hand-held force transducer in the seated position, with the arm at approximately 30° of abduction, with the elbow flexed 90° [Figure 2]. The forearm was in neutral pronation/supination. Subjects underwent several preliminary sessions during which they were taught and carefully trained to perform maximum voluntary contraction (MVC) of forearm. MVC was determined as the highest force developed by the subject in previous 5 s maximal contraction trials. Subjects were instructed to breathe normally and avoid holding breath. Each subject gripped force transducer at 40% MVC with the dominant hand for 60 s. Post-exercise HR and BP were taken in supine position and recorded.
Figure 1: Recording of heart rate and blood pressure
Figure 2: Recording of isometric contraction by force transducer
1414International Journal of Scientific Study | April 2018 | Vol 6 | Issue 1
Jeelani and Taklikar : Isometric Exercise and its Effect on Blood Pressure and Heart Rate in Young and Elderly Males
RESULTS
The Statistical software SPSS 11.0 was used and all the data were expressed as mean ± SD, analyzed statistically using paired t-test and unpaired t-test, and P < 0.05 was considered statistically significant and P < 0.01 as statistically highly significant.
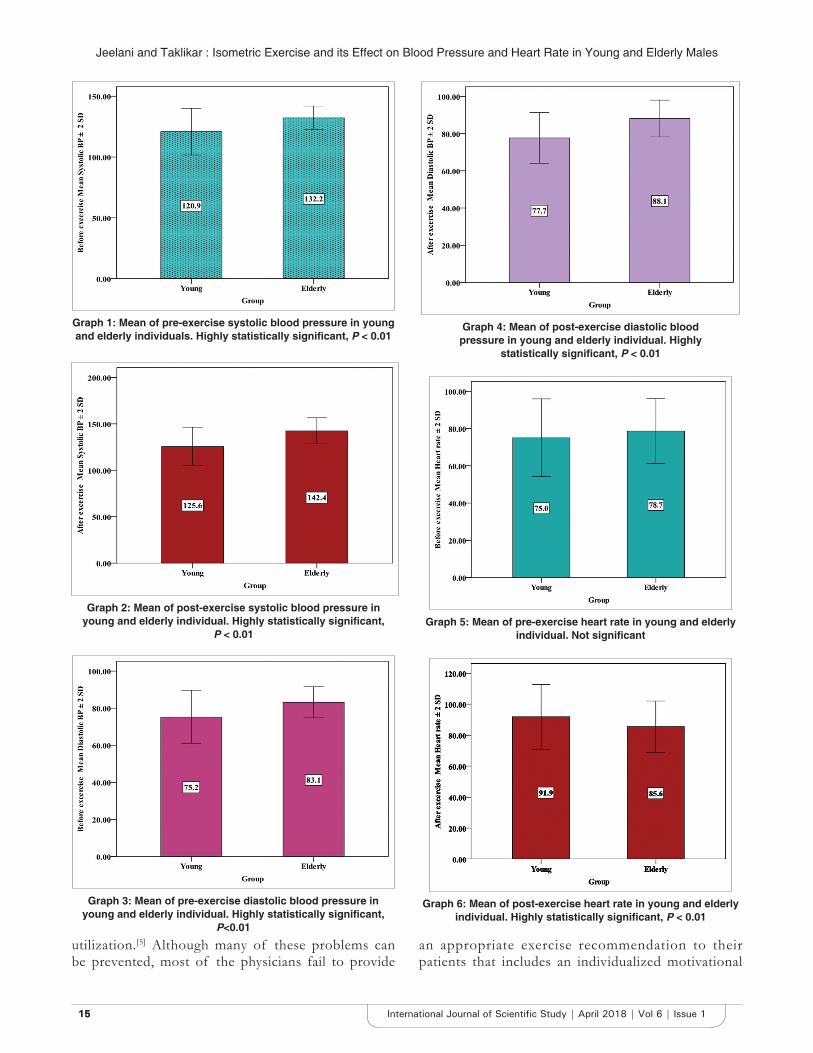
Results within the group comparison showed a significant increase in HR and BP after 60 s of 40% MVC. Among young subjects, mean pre-SBP was 120.88 ± 9.59, and in post-exercise, it was 125.56 ± 10.39 as shown in Table 1, in elderly subjects, mean pre-SBP was 132.20 ± 4.86, and in post-exercise, it was 142.44 ± 7.03 as shown in Table 2. Further, there was high significant increase in SBP among young and elderly subject as P < 0.01 for both the groups. Whereas, mean pre-diastolic BP (DBP) among young subjects was 75.20 ± 7.22, and in post-exercise, it was 77.68 ± 6.80 as shown in Table 3, in elderly subjects, mean pre-DBP was 83.14 ± 4.18, and in post-exercise, it was 88.01 ± 4.95 as shown in Table 4; further, there was highly significant increase in DBP among young and elderly subject as P < 0.01 for both the groups. Mean pre-HR among young subjects was 75.04 ± 10.44, and in post-exercise, it was 91.90 ± 10.49 as shown in Table 5, and in elderly subjects,
mean pre-HR was 78.66 ± 8.68, and in post-exercise, it was 85.58 ± 8.28 as shown in Table 6; further, there was highly significant increase in HR among young and elderly subject after exercise as P < 0.01 for both the groups. However, intergroup comparison indicates mean change in SBP among young was 4.68 and that of elderly was 10.24 (as shown from Graphs 1 and 2), this difference was significantly higher in elderly compare to young subjects as P < 0.01. Mean change in DBP among young was 2.48 and that of elderly was 4.98 (as shown from Graphs 3 and 4), this difference was significantly higher in elderly compare to young subjects as P < 0.01. Mean change in HR among young was 16.86 and that of elderly was 6.92 (as shown from Graphs 5 and 6), this difference was significantly higher in young compare to elderly subjects as P < 0.01. Thus, there is a significant difference in HR and BP response to isometric contraction in young and elderly normal individuals exist. The older subjects had a lower HR and a higher BP response than their younger counterparts.
DISCUSSION
The peoples over the age of 65 years carry the highest burden of chronic diseases, disability, and health-care
Table 1: Mean of pre- and post-exercise SBP in young individualOne-sample test = young groupParameters Mean±SD T value P value RemarkBefore exercise SBP
120.88±9.59 89.06 0.00 Significant
After exercise SBP
125.56±10.39 85.38 0.00 Significant
SBP: Systolic blood pressure, SD: Standard deviation
Table 3: Mean of pre- and post-exercise DBP in young individualOne-sample test = young groupParameters Mean±SD T value P value RemarkBefore exercise DBP 75.20±7.22 73.56 0.00 SignificantAfter exercise DBP 77.68±6.80 80.75 0.00 SignificantDBP: Diastolic blood pressure, SD: Standard deviation
Table 2: Mean of pre- and post-exercise SBP in elderly individualOne-sample test = elderly groupParameters Mean±SD T value P value RemarkBefore exercise SBP
132.20±4.86 191.96 0.00 Significant
After exercise SBP
142.44±7.03 143.13 0.00 Significant
SBP: Systolic blood pressure, SD: Standard deviation
Table 4: Mean of pre- and post-exercise DBP in elderly individualOne-sample test = elderly groupParameters Mean±SD T value P value RemarkBefore exercise DBP 83.14±4.18 140.32 0.00 SignificantAfter exercise DBP 88.12±4.95 125.74 0.00 SignificantDBP: Diastolic blood pressure, SD: Standard deviation
Table 6: Mean of pre- and post-exercise HR in elderly individualOne-sample test = elderly groupParameters Mean±SD T value P value RemarkBefore exercise HR 78.66±8.68 64.05 0.00 SignificantAfter exercise HR 85.58±8.28 73.07 0.00 SignificantHR: Heart rate, SD: Standard deviation
Table 5: Mean of pre- and post-exercise HR in young individualOne-sample test = young groupParameters Mean±SD T value P value RemarkBefore exercise HR
75.04±10.44 50.79 0.00 Significant
After exercise HR
91.90±10.49 61.93 0.00 Significant
HR: Heart rate, SD: Standard deviation
1515 International Journal of Scientific Study | April 2018 | Vol 6 | Issue 1
Jeelani and Taklikar : Isometric Exercise and its Effect on Blood Pressure and Heart Rate in Young and Elderly Males
utilization.[5] Although many of these problems can be prevented, most of the physicians fail to provide
an appropriate exercise recommendation to their patients that includes an individualized motivational
Graph 1: Mean of pre-exercise systolic blood pressure in young and elderly individuals. Highly statistically significant, P < 0.01
Graph 2: Mean of post-exercise systolic blood pressure in young and elderly individual. Highly statistically significant,
P < 0.01
Graph 3: Mean of pre-exercise diastolic blood pressure in young and elderly individual. Highly statistically significant,
P<0.01
Graph 6: Mean of post-exercise heart rate in young and elderly individual. Highly statistically significant, P < 0.01
Graph 5: Mean of pre-exercise heart rate in young and elderly individual. Not significant
Graph 4: Mean of post-exercise diastolic blood pressure in young and elderly individual. Highly
statistically significant, P < 0.01
1616International Journal of Scientific Study | April 2018 | Vol 6 | Issue 1
Jeelani and Taklikar : Isometric Exercise and its Effect on Blood Pressure and Heart Rate in Young and Elderly Males
message, a safe exercise program, and a tailored exercise prescription.[6]
The present study examined the HR and BP responses to 40% MVC in two age groups of healthy males. The findings showed an age-related difference in cardiovascular responses to isometric contraction. These results are consistent with studies done by Petrofsky and Lind, 1975,[7] Taylor et al., 1991; 1995.[8,9]
Sympathetic stimulation seems to be a secondary mechanism for increasing the HR; however, it becomes functional only after the first mechanism of vagal withdrawal has been utilized. The pressor response to handgrip was accompanied by increased cardiac output, and there was no change in calculated systemic vascular resistance. After intravenous propranolol, handgrip exercises resulted in increased peripheral resistance and an equivalent rise in arterial pressure but no increase in cardiac output. It was concluded that the increase in resistance was due to sympathetically induced vasoconstriction. The left ventricular ejection time (corrected for HR) was prolonged by handgrip. The increased afterload imposed on the left ventricle by SHG (sustained handgrip) may explain the prolongation of ejection time index. The study has defined the role of the sympathetic nervous system in the HR and pressor responses to SHG.[10]
It has been established that compared to dynamic exercise the isometric contractions causes marked increases in both SBP and DBP, while the rise in HR is less marked.[11] When comparing young and older individuals, some studies have found similar responses in HR to isometric exercise,[12,13] whereas others have noticed a lower HR in the aged persons.[7-9] In contradistinction, it has been shown that the older persons exhibit either a similar[8,12,13] or a greater[7] BP response to isometric contractions. These variations in readings may be due to variation in subject population, in experimental protocol (fatiguing vs. non-fatiguing contractions), or in the muscle group tested. The age-related changes in physical activity, reductions in skeletal muscle mass and muscle strength may also have been confounded the comparisons of younger and older age groups.[14]
CONCLUSION
From this study, it is concluded that the increasing age is associated with an altered HR and BP response to isometric exercise. There was an increase in HR and BP with isometric exercise in both young individuals and elderly individuals, but the elderly subjects had a lower HR and a higher BP response than their younger counterparts. The magnitude of the BP response depends on the degree of effort or central command and not the actual force production, and finally, isometric exercise should not be included as an overall fitness program for healthy elderly individuals due to potentially harmful effects on the cardiovascular system.
REFERENCES
1. Hanson P, Nagle F. Isometric exercises: Cardiovascular responses in normal and cardiac populations Cardiol Clin 1987 May; 5(2): 157-70.
2. Hillegass E, Sandowsky S. Essentials of Cardiopulmonary Physical Therapy. 2nd ed. Philadelphia, PA: WB Saunders.
3. Vaitkevicius PV, Fleg JL, Engel JH, O’Connor FC, Wright JG, Lakatta LE, et al. Effects of age and aerobic capacity on arterial stiffness in healthy adults. Circulation 1993;88:1456-62.
4. Lakatta EG, Mitchell JH, Pomerance A, Rowe GG. Human aging: Changes in structure and function. J Am Coll Cardiol 1987;10:42A-7.
5. King AC, Rejeski WJ, Buchner DM. Physical activity interventions targeting older adults. A critical review and recommendations. Am J Prev Med 1998;15:316-33.
6. Will PM, Demko TM, George DI. Prescribing exercise for health: A simple framework for primary care. Am Fam Phys 1996;53:579-85.
7. Petrofsky JS, Lind AR. Isometric strength, endurance, and the blood pressure and heart rate responses during isometric exercise in healthy men and women, with special reference to age and body fat content. Pflugers Arch 1975;360:49-61.
8. Taylor JA, Hand GA, Johnson DG, Seals DR. Sympathoadrenal-circulatory regulation during sustained isometric exercise in young and older men. Am J Physiol 1991;261:R1061-9.
9. Taylor JA, Hayano J, Seals DR. Lesser vagal withdrawal during isometric exercise with age. J Appl Physiol (1985) 1995;79:805-11.
10. Martin CE, Shaver JA, Leon DF, Thompson ME, Reddy PS, Leonard JJ, et al. Autonomic mechanisms in hemodynamic responses to isometric exercise. J Clin Invest 1974;54:104-15.
11. Lind AR, McNicol GW. Circulatory responses to sustained hand-grip contractions performed during other exercise, both rhythmic and static. J Physiol 1967;192:595-607.
12. McDermott DJ, Stekiel WJ, Barboriak JJ, Kloth LC, Smith JJ. Effect of age on hemodynamic and metabolic response to static exercise. J Appl Physiol 1974;37:923-6.
13. Sagiv M, Hanson P, Goldhammer E, Ben-Sira D, Rudoy J. Left ventricular and hemodynamic responses during upright isometric exercise in normal young and elderly men. Gerontology 1988;34:165-70.
14. Lexell J. Human aging, muscle mass, and fiber type composition. J Gerontol A Biol Sci Med Sci 1995;50 Spec No:11-6.
How to cite this article: Jeelani M, Taklikar RH. Isometric exercise and its effect on blood pressure and heart rate; a comparative study between healthy, young, and elderly males in and around Raichur city. Int J Sci Stud 2018;6(1):12-16.
Source of Support: Nil, Conflict of Interest: None declared.
1717 International Journal of Scientific Study | April 2018 | Vol 6 | Issue 1
Variation of Human Placental Attachment of Umbilical CordShipra Shrivastava1, Baidyanath Mishra2, Sudhakar Kumar Ray3, V K Shrivastava4, P R Shivhare5
1Assistant Professor, Department of Obstetrics and Gynecology, Government Medical College, Ambikapur, Surguja, Chhattisgarh, India, 2Demonstrator, Department of Physiology, Government Medical College, Ambikapur, Surguja, Chhattisgarh, India, 3Demonstrator, Department of Anatomy, Government Medical College, Ambikapur, Surguja, Chhattisgarh, India, 4Senior, Department of Orthopaedics, Government Medical College, Ambikapur, Surguja, Chhattisgarh, India, 5Assistant Professor, Department of Surgery, Government Medical College, Ambikapur, Surguja, Chhattisgarh, India
human placenta subdivided into number of lobes by septa that grow into intervillous space from maternal side. Each lobe of placenta called maternal cotyledon. If the placenta viewed from maternal side, it is rough, irregular, and 15–20 polygonal area called cotyledon and appears as convex areas bounded by groves. The fetal surface is smooth, shiny, translucent covered by amnion, chorionic plate, and provide attachment of umbilical cord.[2]
The full-term human placenta is discoid with a diameter of 15–25 cm, is approximately 3 cm thick and weight about 500–600 g. Human placenta covers approximately 15–30% of internal surface of uterus.[3] In human placenta, maternal blood circulates through the intervillous space and fetal blood circulate through blood vessels in the villi. The maternal and fetal blood do not mix with each other and they are separated by membrane composed of four layers: They are from inside to outside are (1) endothelial lining of fetal vessels,
INTRODUCTION
The word placenta comes from Latin - flat cake and Greek -“Plakous” which means “flat, slab like.” The human placenta is a discoid, choriodeciduate organ which functions as a fetomaternal organ with two components. They are fetal portion of placenta (Chorion frondosum) bearing mainly chorionic villi develop from blastocyst that forms fetus, and maternal portion of placenta (Decidua basalis) develops from maternal uterine tissue. The human placenta connects the fetus with uterine wall of the mother.[1] The
Original Article
AbstractIntroduction: Placenta function as a fetomaternal organ and umbilical cord is a vital lifeline connecting fetus and placenta. Variation of human placental attachment of umbilical cord is important for better perinatal analysis. The present study compared with different study done previously.
Objective: This study was conducted to conclude the various human placental attachment of umbilical cord.
Materials and Methods: In this study, a total of 78 specimens (human placenta attached with umbilical cord) collected from labor room in the Department of Obstetrics and Gynecology, Government Medical College, Ambikapur, Surguja, Chhattisgarh, India. The human placenta along with its attachment was observed grossly and photograph was taken with camera. The data were analyzed and written in tabulated form.
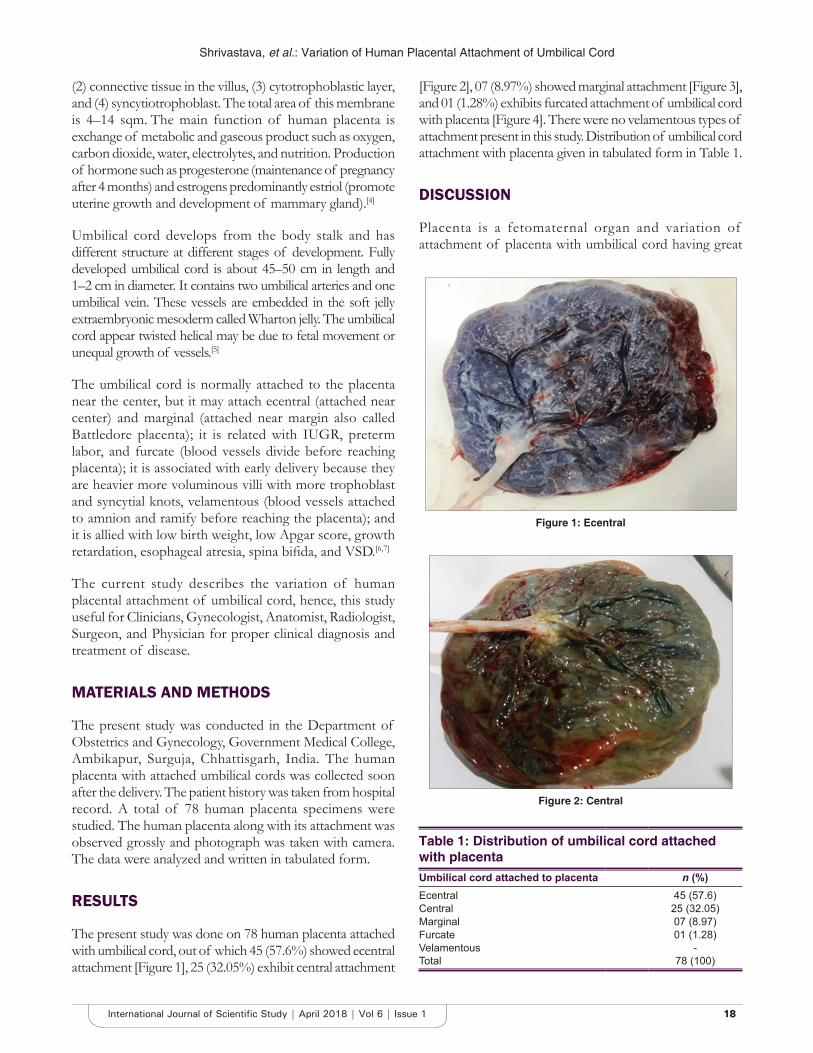
Result: In this study, 45 (57.6%) showed ecentral attachment, 25 (32.05%) exhibit central attachment, 07 (8.97%) showed marginal attachment, and 01 (1.28%) exhibits furcated attachment of umbilical cord with placenta. There were no velamentous types of attachment present in this study.
Conclusion: This study provides knowledge about attachment of umbilical cord with placenta, hence, the present study useful for Clinicians, Gynecologist, Anatomist, Radiologist, Surgeon, and Physician for proper clinical diagnosis and treatment of disease.
Key words: Central, Ecentral, Furcated, Marginal, Placenta, Umbilical cord, Velamentous
Access this article online
www.ijss-sn.com
Month of Submission : 02-2018 Month of Peer Review : 03-2018 Month of Acceptance : 04-2018 Month of Publishing : 05-2018
Corresponding Author: Baidyanath Mishra, Department of Physiology, Government Medical College, Ambikapur, Surguja, Chhattisgarh, India. Phone: +91-7509183395. E-mail: [email protected]
Print ISSN: 2321-6379Online ISSN: 2321-595X
DOI: 10.17354/ijss/2018/104
Shrivastava, et al.: Variation of Human Placental Attachment of Umbilical Cord
1818International Journal of Scientific Study | April 2018 | Vol 6 | Issue 1
(2) connective tissue in the villus, (3) cytotrophoblastic layer, and (4) syncytiotrophoblast. The total area of this membrane is 4–14 sqm. The main function of human placenta is exchange of metabolic and gaseous product such as oxygen, carbon dioxide, water, electrolytes, and nutrition. Production of hormone such as progesterone (maintenance of pregnancy after 4 months) and estrogens predominantly estriol (promote uterine growth and development of mammary gland).[4]
Umbilical cord develops from the body stalk and has different structure at different stages of development. Fully developed umbilical cord is about 45–50 cm in length and 1–2 cm in diameter. It contains two umbilical arteries and one umbilical vein. These vessels are embedded in the soft jelly extraembryonic mesoderm called Wharton jelly. The umbilical cord appear twisted helical may be due to fetal movement or unequal growth of vessels.[5]
The umbilical cord is normally attached to the placenta near the center, but it may attach ecentral (attached near center) and marginal (attached near margin also called Battledore placenta); it is related with IUGR, preterm labor, and furcate (blood vessels divide before reaching placenta); it is associated with early delivery because they are heavier more voluminous villi with more trophoblast and syncytial knots, velamentous (blood vessels attached to amnion and ramify before reaching the placenta); and it is allied with low birth weight, low Apgar score, growth retardation, esophageal atresia, spina bifida, and VSD.[6,7]
The current study describes the variation of human placental attachment of umbilical cord, hence, this study useful for Clinicians, Gynecologist, Anatomist, Radiologist, Surgeon, and Physician for proper clinical diagnosis and treatment of disease.
MATERIALS AND METHODS
The present study was conducted in the Department of Obstetrics and Gynecology, Government Medical College, Ambikapur, Surguja, Chhattisgarh, India. The human placenta with attached umbilical cords was collected soon after the delivery. The patient history was taken from hospital record. A total of 78 human placenta specimens were studied. The human placenta along with its attachment was observed grossly and photograph was taken with camera. The data were analyzed and written in tabulated form.
RESULTS
The present study was done on 78 human placenta attached with umbilical cord, out of which 45 (57.6%) showed ecentral attachment [Figure 1], 25 (32.05%) exhibit central attachment
[Figure 2], 07 (8.97%) showed marginal attachment [Figure 3], and 01 (1.28%) exhibits furcated attachment of umbilical cord with placenta [Figure 4]. There were no velamentous types of attachment present in this study. Distribution of umbilical cord attachment with placenta given in tabulated form in Table 1.
DISCUSSION
Placenta is a fetomaternal organ and variation of attachment of placenta with umbilical cord having great
Figure 1: Ecentral
Figure 2: Central
Table 1: Distribution of umbilical cord attached with placentaUmbilical cord attached to placenta n (%)Ecentral 45 (57.6)Central 25 (32.05)Marginal 07 (8.97)Furcate 01 (1.28)Velamentous -Total 78 (100)
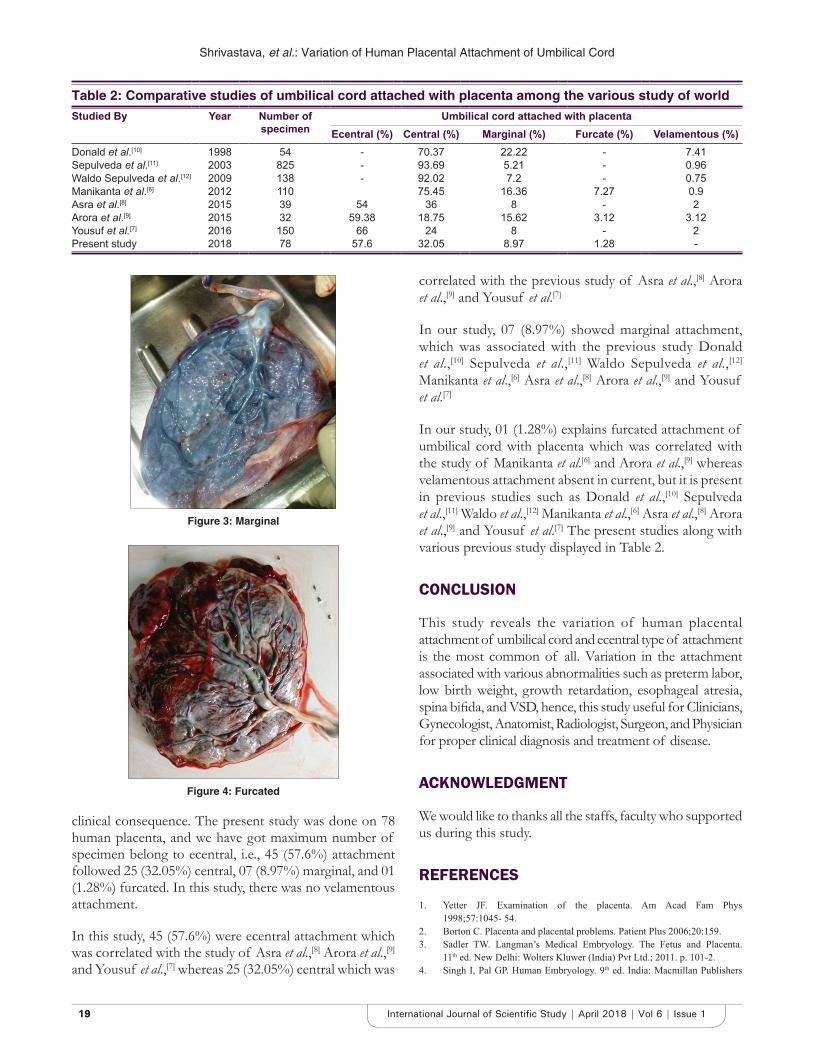
Shrivastava, et al.: Variation of Human Placental Attachment of Umbilical Cord
1919 International Journal of Scientific Study | April 2018 | Vol 6 | Issue 1
clinical consequence. The present study was done on 78 human placenta, and we have got maximum number of specimen belong to ecentral, i.e., 45 (57.6%) attachment followed 25 (32.05%) central, 07 (8.97%) marginal, and 01 (1.28%) furcated. In this study, there was no velamentous attachment.
In this study, 45 (57.6%) were ecentral attachment which was correlated with the study of Asra et al.,[8] Arora et al.,[9] and Yousuf et al.,[7] whereas 25 (32.05%) central which was
correlated with the previous study of Asra et al.,[8] Arora et al.,[9] and Yousuf et al.[7]
In our study, 07 (8.97%) showed marginal attachment, which was associated with the previous study Donald et al.,[10] Sepulveda et al.,[11] Waldo Sepulveda et al.,[12] Manikanta et al.,[6] Asra et al.,[8] Arora et al.,[9] and Yousuf et al.[7]
In our study, 01 (1.28%) explains furcated attachment of umbilical cord with placenta which was correlated with the study of Manikanta et al.[6] and Arora et al.,[9] whereas velamentous attachment absent in current, but it is present in previous studies such as Donald et al.,[10] Sepulveda et al.,[11] Waldo et al.,[12] Manikanta et al.,[6] Asra et al.,[8] Arora et al.,[9] and Yousuf et al.[7] The present studies along with various previous study displayed in Table 2.
CONCLUSION
This study reveals the variation of human placental attachment of umbilical cord and ecentral type of attachment is the most common of all. Variation in the attachment associated with various abnormalities such as preterm labor, low birth weight, growth retardation, esophageal atresia, spina bifida, and VSD, hence, this study useful for Clinicians, Gynecologist, Anatomist, Radiologist, Surgeon, and Physician for proper clinical diagnosis and treatment of disease.
ACKNOWLEDGMENT
We would like to thanks all the staffs, faculty who supported us during this study.
REFERENCES
1. Yetter JF. Examination of the placenta. Am Acad Fam Phys 1998;57:1045- 54.
2. Borton C. Placenta and placental problems. Patient Plus 2006;20:159.3. Sadler TW. Langman’s Medical Embryology. The Fetus and Placenta.
11th ed. New Delhi: Wolters Kluwer (India) Pvt Ltd.; 2011. p. 101-2.4. Singh I, Pal GP. Human Embryology. 9th ed. India: Macmillan Publishers
Figure 3: Marginal
Figure 4: Furcated
Table 2: Comparative studies of umbilical cord attached with placenta among the various study of worldStudied By Year Number of
specimenUmbilical cord attached with placenta
Ecentral (%) Central (%) Marginal (%) Furcate (%) Velamentous (%)Donald et al.[10] 1998 54 - 70.37 22.22 - 7.41Sepulveda et al.[11] 2003 825 - 93.69 5.21 - 0.96Waldo Sepulveda et al.[12] 2009 138 - 92.02 7.2 - 0.75Manikanta et al.[6] 2012 110 75.45 16.36 7.27 0.9Asra et al.[8] 2015 39 54 36 8 - 2Arora et al.[9] 2015 32 59.38 18.75 15.62 3.12 3.12Yousuf et al.[7] 2016 150 66 24 8 - 2Present study 2018 78 57.6 32.05 8.97 1.28 -
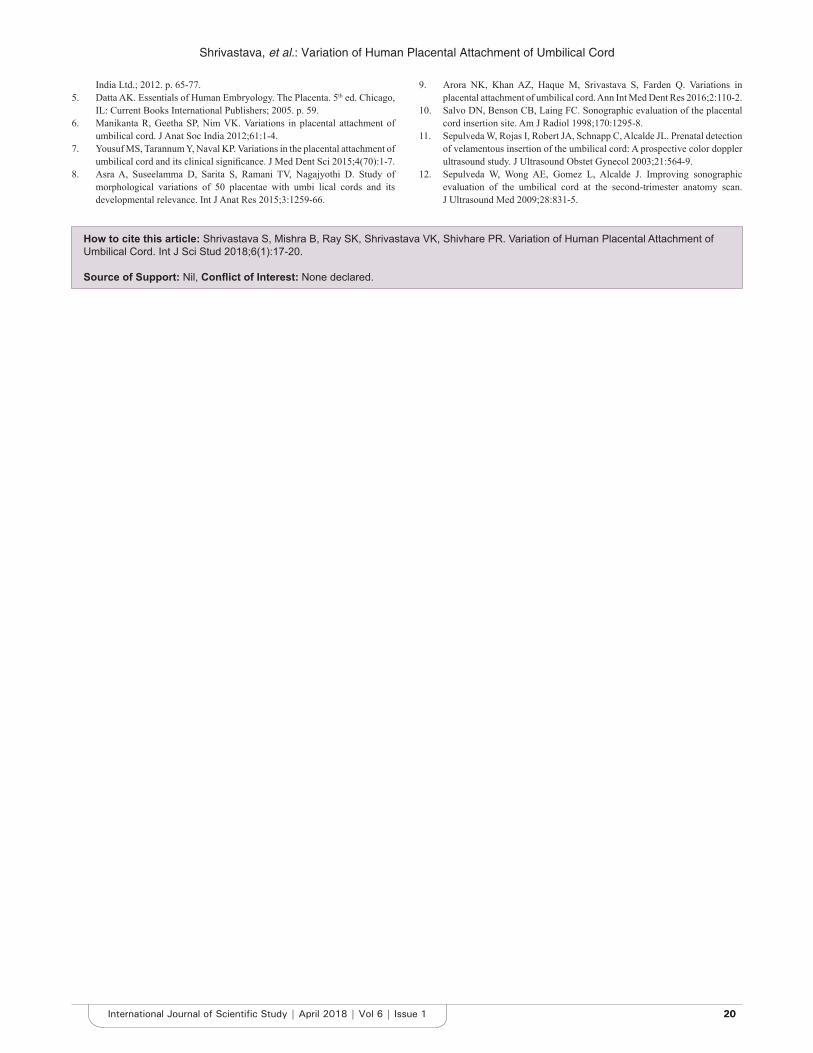
Shrivastava, et al.: Variation of Human Placental Attachment of Umbilical Cord
2020International Journal of Scientific Study | April 2018 | Vol 6 | Issue 1
India Ltd.; 2012. p. 65-77.5. Datta AK. Essentials of Human Embryology. The Placenta. 5th ed. Chicago,
IL: Current Books International Publishers; 2005. p. 59.6. Manikanta R, Geetha SP, Nim VK. Variations in placental attachment of
umbilical cord. J Anat Soc India 2012;61:1-4.7. Yousuf MS, Tarannum Y, Naval KP. Variations in the placental attachment of
umbilical cord and its clinical significance. J Med Dent Sci 2015;4(70):1-7.8. Asra A, Suseelamma D, Sarita S, Ramani TV, Nagajyothi D. Study of
morphological variations of 50 placentae with umbi lical cords and its developmental relevance. Int J Anat Res 2015;3:1259-66.
9. Arora NK, Khan AZ, Haque M, Srivastava S, Farden Q. Variations in placental attachment of umbilical cord. Ann Int Med Dent Res 2016;2:110-2.
10. Salvo DN, Benson CB, Laing FC. Sonographic evaluation of the placental cord insertion site. Am J Radiol 1998;170:1295-8.
11. Sepulveda W, Rojas I, Robert JA, Schnapp C, Alcalde JL. Prenatal detection of velamentous insertion of the umbilical cord: A prospective color doppler ultrasound study. J Ultrasound Obstet Gynecol 2003;21:564-9.
12. Sepulveda W, Wong AE, Gomez L, Alcalde J. Improving sonographic evaluation of the umbilical cord at the second-trimester anatomy scan. J Ultrasound Med 2009;28:831-5.
How to cite this article: Shrivastava S, Mishra B, Ray SK, Shrivastava VK, Shivhare PR. Variation of Human Placental Attachment of Umbilical Cord. Int J Sci Stud 2018;6(1):17-20.
Source of Support: Nil, Conflict of Interest: None declared.
2121 International Journal of Scientific Study | April 2018 | Vol 6 | Issue 1
Eyelid Lesions: A Clinical StudyL Nanda1, Kaushal Kumar2, Garima Singh Bali3
1Senior Resident, Department of Ophthalmology, Rajarajeswari Medical College, Bengaluru, Karnataka, India, 2Professor and Head, Department of Ophthalmology, Rajarajeswari Medical College, Bengaluru, Karnataka, India, 3Postgraduate Student, Department of Ophthalmology, Rajarajeswari Medical College, Bengaluru, Karnataka, India
Adnexal structures such as eyelashes, meibomian gland, gland of Zeis, gland of moll, vessels, and lymphatics also form a part of the eyelid structure.
A careful history taking which includes symptoms, chronicity, and progression along with a detailed examination of the lesion can help clinch a clinical diagnosis of the lesion.
Eyelid lesions can be categorized as follows:• Inflammatory
• Chalazion• Infectious
• External hordeolum• Hordeolum internum• Molluscum contagiosum.
• Neoplastic• Benign lesions: Squamous cell papillomas,
epidermal inclusion cyst, acquired melanocytic nevi, seborrheic keratosis, hidrocystoma, and xanthelasma.
• Premalignant lesions: Actinic keratosis and keratoacanthoma.
• Malignant lesions: Basal cell carcinoma, squamous cell
INTRODUCTION
Eyelid lesions are commonly encountered during clinical practice.
Diagnosis of these lesions requires an understanding of the anatomy of the lids along with history, clinical examination, and appropriate investigation such as histopathological examination in cases of suspected malignancy where a diagnosis cannot be made with accuracy on clinical grounds alone.
The anatomy of lids consists of the structures from within outward as skin, layer of subcutaneous areolar tissue, layer of striated muscles, submuscular areolar tissues, fibrous layer, layer of non-striated muscle fibers, and conjunctiva.
Original Article
AbstractIntroduction: Eyelid lesions are very common. These can be inflammatory, infectious, or neoplastic. Diagnosis is made by history and clinical examination. In suspected lesions, biopsy has to be done.
Purpose: The aim of the study is to report the relative frequency of eyelid lesions.
Materials and Methods: A prospective cross-sectional clinical study was done in 140 patients with eyelid lesions. All patients underwent eye examination which included visual acuity assessment, anterior segment, and fundus examination. In suspected lesions, biopsy was done to rule out malignancy.
Results: Among 140 patients, external hordeolum was the most commonly seen with 64 cases (45.7%), followed by chalazion 50 cases (35.7%), nevus 7 cases (5%), xanthelasma 6 cases (4.3%), sebaceous cyst 4 cases (2.9%), cutaneous horn 3 cases (2.2%), squamous papilloma 2 cases (1.4%), dermoid cyst 3 cases (2.1%), and molluscum contagiosum 1 case (0.7%).
Conclusion: Eyelid lesions are common with most being benign. Each lesion carries a different line of treatment. Early diagnosis and timely intervention help to prevent serious complications.
Key words: Biopsy, Chalazion, Diagnosis, External hordeolum, Eyelid lesions, Nevus
Corresponding Author: Dr. Garima Singh Bali, Department of Ophthalmology, Rajarajeswari Medical College, Bengaluru, Karnataka, India. Phone: +91-07338008646. E-mail: [email protected]
Print ISSN: 2321-6379Online ISSN: 2321-595X
DOI: 10.17354/ijss/2018/105
Access this article online
www.ijss-sn.com
Month of Submission : 02-2018 Month of Peer Review : 03-2018 Month of Acceptance : 04-2018 Month of Publishing : 05-2018
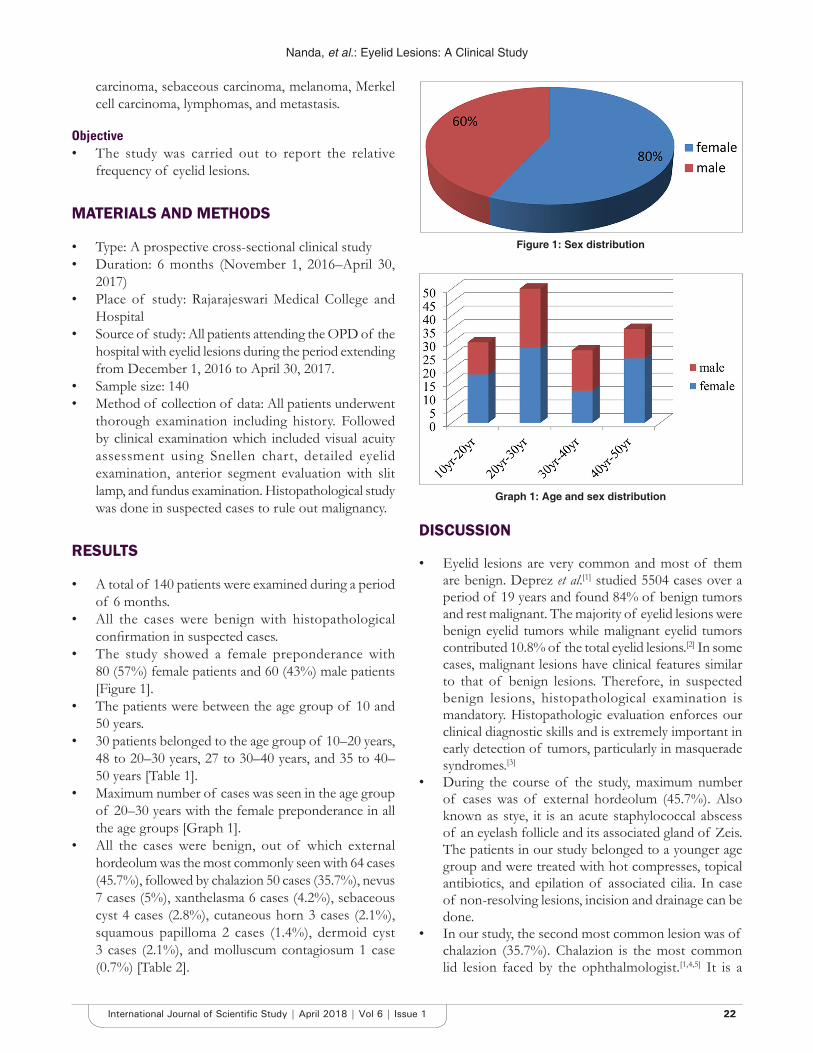
Nanda, et al.: Eyelid Lesions: A Clinical Study
2222International Journal of Scientific Study | April 2018 | Vol 6 | Issue 1
carcinoma, sebaceous carcinoma, melanoma, Merkel cell carcinoma, lymphomas, and metastasis.
Objective• The study was carried out to report the relative
frequency of eyelid lesions.
MATERIALS AND METHODS
• Type: A prospective cross-sectional clinical study• Duration: 6 months (November 1, 2016–April 30,
2017)• Place of study: Rajarajeswari Medical College and
Hospital• Source of study: All patients attending the OPD of the
hospital with eyelid lesions during the period extending from December 1, 2016 to April 30, 2017.
• Sample size: 140• Method of collection of data: All patients underwent
thorough examination including history. Followed by clinical examination which included visual acuity assessment using Snellen chart, detailed eyelid examination, anterior segment evaluation with slit lamp, and fundus examination. Histopathological study was done in suspected cases to rule out malignancy.
RESULTS
• A total of 140 patients were examined during a period of 6 months.
• All the cases were benign with histopathological confirmation in suspected cases.
• The study showed a female preponderance with 80 (57%) female patients and 60 (43%) male patients [Figure 1].
• The patients were between the age group of 10 and 50 years.
• 30 patients belonged to the age group of 10–20 years, 48 to 20–30 years, 27 to 30–40 years, and 35 to 40–50 years [Table 1].
• Maximum number of cases was seen in the age group of 20–30 years with the female preponderance in all the age groups [Graph 1].
• All the cases were benign, out of which external hordeolum was the most commonly seen with 64 cases (45.7%), followed by chalazion 50 cases (35.7%), nevus 7 cases (5%), xanthelasma 6 cases (4.2%), sebaceous cyst 4 cases (2.8%), cutaneous horn 3 cases (2.1%), squamous papilloma 2 cases (1.4%), dermoid cyst 3 cases (2.1%), and molluscum contagiosum 1 case (0.7%) [Table 2].
DISCUSSION
• Eyelid lesions are very common and most of them are benign. Deprez et al.[1] studied 5504 cases over a period of 19 years and found 84% of benign tumors and rest malignant. The majority of eyelid lesions were benign eyelid tumors while malignant eyelid tumors contributed 10.8% of the total eyelid lesions.[2] In some cases, malignant lesions have clinical features similar to that of benign lesions. Therefore, in suspected benign lesions, histopathological examination is mandatory. Histopathologic evaluation enforces our clinical diagnostic skills and is extremely important in early detection of tumors, particularly in masquerade syndromes.[3]
• During the course of the study, maximum number of cases was of external hordeolum (45.7%). Also known as stye, it is an acute staphylococcal abscess of an eyelash follicle and its associated gland of Zeis. The patients in our study belonged to a younger age group and were treated with hot compresses, topical antibiotics, and epilation of associated cilia. In case of non-resolving lesions, incision and drainage can be done.
• In our study, the second most common lesion was of chalazion (35.7%). Chalazion is the most common lid lesion faced by the ophthalmologist.[1,4,5] It is a
Figure 1: Sex distribution
Graph 1: Age and sex distribution
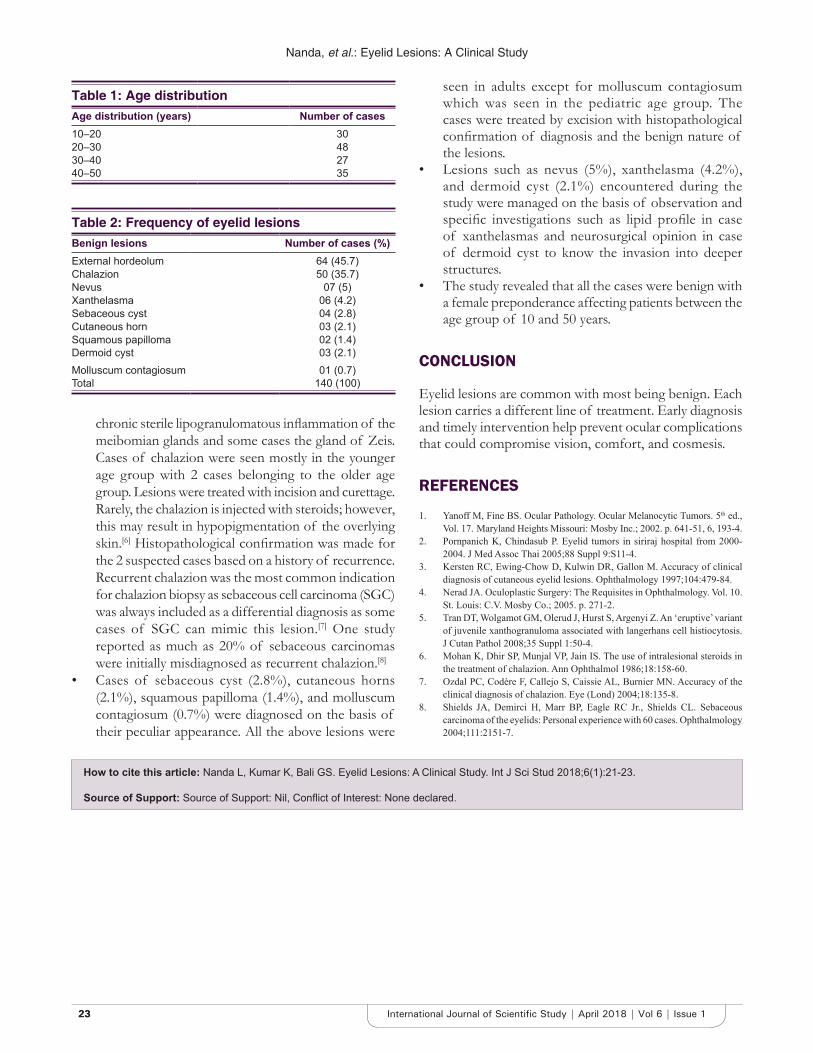
Nanda, et al.: Eyelid Lesions: A Clinical Study
2323 International Journal of Scientific Study | April 2018 | Vol 6 | Issue 1
chronic sterile lipogranulomatous inflammation of the meibomian glands and some cases the gland of Zeis. Cases of chalazion were seen mostly in the younger age group with 2 cases belonging to the older age group. Lesions were treated with incision and curettage. Rarely, the chalazion is injected with steroids; however, this may result in hypopigmentation of the overlying skin.[6] Histopathological confirmation was made for the 2 suspected cases based on a history of recurrence. Recurrent chalazion was the most common indication for chalazion biopsy as sebaceous cell carcinoma (SGC) was always included as a differential diagnosis as some cases of SGC can mimic this lesion.[7] One study reported as much as 20% of sebaceous carcinomas were initially misdiagnosed as recurrent chalazion.[8]
• Cases of sebaceous cyst (2.8%), cutaneous horns (2.1%), squamous papilloma (1.4%), and molluscum contagiosum (0.7%) were diagnosed on the basis of their peculiar appearance. All the above lesions were
seen in adults except for molluscum contagiosum which was seen in the pediatric age group. The cases were treated by excision with histopathological confirmation of diagnosis and the benign nature of the lesions.
• Lesions such as nevus (5%), xanthelasma (4.2%), and dermoid cyst (2.1%) encountered during the study were managed on the basis of observation and specific investigations such as lipid profile in case of xanthelasmas and neurosurgical opinion in case of dermoid cyst to know the invasion into deeper structures.
• The study revealed that all the cases were benign with a female preponderance affecting patients between the age group of 10 and 50 years.
CONCLUSION
Eyelid lesions are common with most being benign. Each lesion carries a different line of treatment. Early diagnosis and timely intervention help prevent ocular complications that could compromise vision, comfort, and cosmesis.
REFERENCES
1. Yanoff M, Fine BS. Ocular Pathology. Ocular Melanocytic Tumors. 5th ed., Vol. 17. Maryland Heights Missouri: Mosby Inc.; 2002. p. 641-51, 6, 193-4.
2. Pornpanich K, Chindasub P. Eyelid tumors in siriraj hospital from 2000-2004. J Med Assoc Thai 2005;88 Suppl 9:S11-4.
3. Kersten RC, Ewing-Chow D, Kulwin DR, Gallon M. Accuracy of clinical diagnosis of cutaneous eyelid lesions. Ophthalmology 1997;104:479-84.
4. Nerad JA. Oculoplastic Surgery: The Requisites in Ophthalmology. Vol. 10. St. Louis: C.V. Mosby Co.; 2005. p. 271-2.
5. Tran DT, Wolgamot GM, Olerud J, Hurst S, Argenyi Z. An ‘eruptive’ variant of juvenile xanthogranuloma associated with langerhans cell histiocytosis. J Cutan Pathol 2008;35 Suppl 1:50-4.
6. Mohan K, Dhir SP, Munjal VP, Jain IS. The use of intralesional steroids in the treatment of chalazion. Ann Ophthalmol 1986;18:158-60.
7. Ozdal PC, Codère F, Callejo S, Caissie AL, Burnier MN. Accuracy of the clinical diagnosis of chalazion. Eye (Lond) 2004;18:135-8.
8. Shields JA, Demirci H, Marr BP, Eagle RC Jr., Shields CL. Sebaceous carcinoma of the eyelids: Personal experience with 60 cases. Ophthalmology 2004;111:2151-7.
Table 1: Age distributionAge distribution (years) Number of cases10–20 3020–30 4830–40 2740–50 35
Table 2: Frequency of eyelid lesionsBenign lesions Number of cases (%)External hordeolum 64 (45.7)Chalazion 50 (35.7)Nevus 07 (5)Xanthelasma 06 (4.2)Sebaceous cyst 04 (2.8)Cutaneous horn 03 (2.1)Squamous papilloma 02 (1.4)Dermoid cyst 03 (2.1)Molluscum contagiosum 01 (0.7)Total 140 (100)
How to cite this article: Nanda L, Kumar K, Bali GS. Eyelid Lesions: A Clinical Study. Int J Sci Stud 2018;6(1):21-23.
Source of Support: Source of Support: Nil, Conflict of Interest: None declared.
2424International Journal of Scientific Study | April 2018 | Vol 6 | Issue 1
Clinical Profile of Diabetic Foot InfectionsK Vasanthan1, K Vengadakrishnan2, P Surendran3
1Associate Professor, Department of General Medicine, Sri Ramachandra Medical College, Porur, Chennai, Tamil Nadu, India, 2Professor, Department of General Medicine, Sri Ramachandra Medical College, Porur, Chennai, Tamil Nadu, India, 3Resident, Department of General Medicine, Sri Ramachandra Medical College, Porur, Chennai, Tamil Nadu, India
temperature. Autonomic neuropathy can cause diminished sweat secretion resulting in dry, cracked skin that facilitates the entry of microorganisms to the deeper skin structures. In addition, motor neuropathy can lead to foot deformities, which lead to pressure-induced soft tissue damage. Peripheral artery disease can impair blood flow necessary for healing of ulcers and infections. Hyperglycemia impairs neutrophil function and reduces host defenses. Trauma in patients with one or more of these risk factors precipitates the development of wounds that can be slow to heal and predispose to secondary infection.
DFIs are a frequent clinical problem. Infection in foot wounds should be defined clinically by the presence of inflammation or purulence, and then classified by severity.
INTRODUCTION
Diabetic foot infections (DFIs) are associated with substantial morbidity and mortality. Risk factors for the development of DFIs include neuropathy, peripheral vascular disease, and poor glycemic control. In sensory neuropathy, there is diminished perception of pain and
Original Article
AbstractBackground: Diabetic foot infections (DFIs) are associated with substantial morbidity and mortality. Patients with a DFI should be evaluated comprehensively, and employing multidisciplinary foot teams improve outcomes.
Aims and Objectives: To study the clinical profile and microbial flora of diabetic wound infections along with antibiotic therapy.
Methods: This study included 253 patients admitted in the department of general medicine between March 2015 and August 2016. A thorough clinical examination was done. Peripheral neuropathy was evaluated by monofilament and vibration sense. Wound ulcer was graded according to Wagner grading. A basic laboratory workup along with fundus examination was done to rule out microvascular and macrovascular complication of diabetes. ECG and 2D ECHO were done for patients with CAD. Wound swab from the ulcer edge was taken after removing the necrotic material and sent for culture. Pus swab was also sent for culture. Antibiotic therapy and duration was calculated.
Results: The study included 253 patients, 169 males and 84 females. 65 patients presented with Grade I ulcer, 175 with Grade II ulcer, and 13 had Grade III ulcer. 12 patients required ICU care and 241 patients were managed in the ward. The mean age was 57.57. Mean fasting and post-prandial sugars were 157.48 and 244.21, respectively. The mean HbA1c was 9.49 with a mean duration of hospital stay of 12.44 days. 40 patients grew Staphylococcus aureus, 40 patients grew coagulase-negative Staphylococcus (CONS), 28 Escherichia coli, 20 Streptococcus species, 20 Enterococcus species, 10 Proteus species, 12 Klebsiella species, 25 Pseudomonas species, and 6 Candida species. Polymicrobial growth was seen in 26 patients. 25 patients had no growth in cultures. A majority of S. aureus was sensitive to penicillin and cloxacillin (MRSA was found in two patients), Streptococcus to penicillin and clindamycin, CONS to clindamycin and linezolid, and Enterococcus was sensitive to linezolid and ampicillin.
Conclusion: The present study revealed the increased incidence of diabetic foot ulcers and is more common above the fifth decade of life with male preponderance. Our study has showed that 90% and 9.6% of DFIs were monomicrobial and polymicrobial, respectively. CONS and S. aureus were the most commonly identified Gram-positive microorganisms, respectively. E. coli and Pseudomonas aeruginosa were the most commonly identified Gram-negative organisms.
Key words: Coagulase-negative Staphylococcus, Diabetic foot, Penicillin, Staphylococcus aureus, Wagner grading
Access this article online
www.ijss-sn.com
Month of Submission : 02-2018 Month of Peer Review : 03-2018 Month of Acceptance : 04-2018 Month of Publishing : 05-2018
Corresponding Author: K Vengadakrishnan, Department of General Medicine, Sri Ramachandra Medical College, Porur, Chennai, Tamil Nadu, India. E-mail: [email protected]
Print ISSN: 2321-6379Online ISSN: 2321-595X
DOI: 10.17354/ijss/2018/106
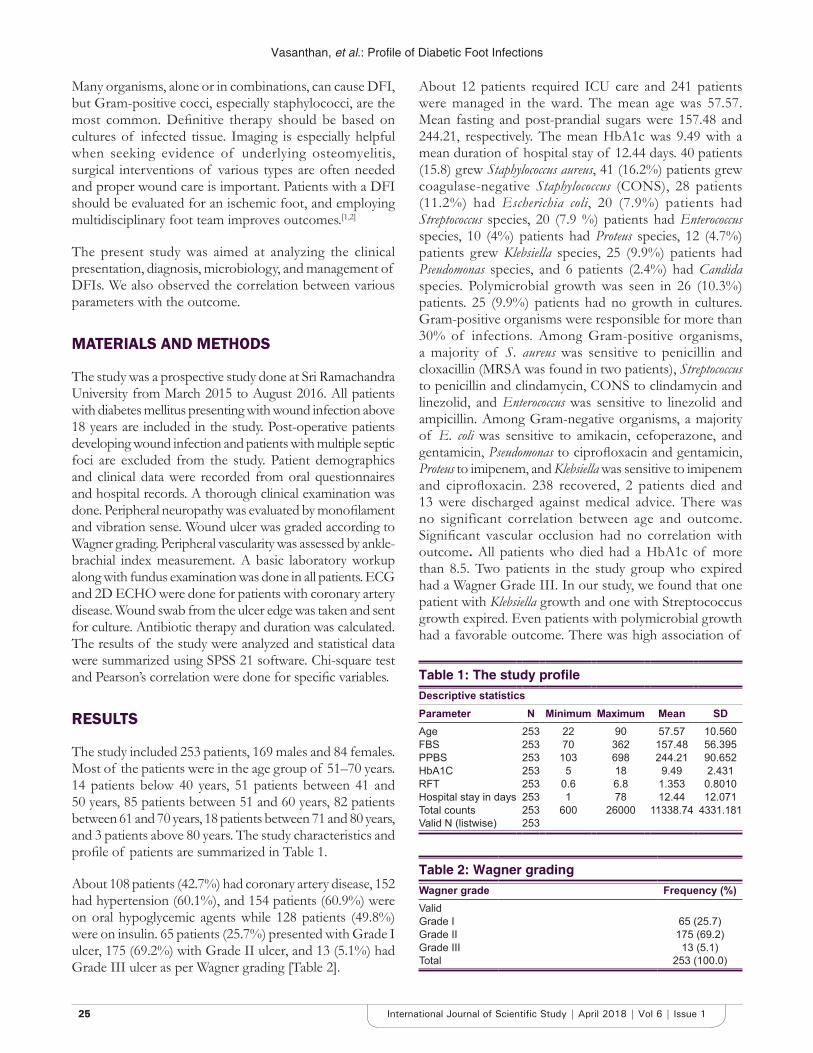
Vasanthan, et al.: Profile of Diabetic Foot Infections
2525 International Journal of Scientific Study | April 2018 | Vol 6 | Issue 1
Many organisms, alone or in combinations, can cause DFI, but Gram-positive cocci, especially staphylococci, are the most common. Definitive therapy should be based on cultures of infected tissue. Imaging is especially helpful when seeking evidence of underlying osteomyelitis, surgical interventions of various types are often needed and proper wound care is important. Patients with a DFI should be evaluated for an ischemic foot, and employing multidisciplinary foot team improves outcomes.[1,2]
The present study was aimed at analyzing the clinical presentation, diagnosis, microbiology, and management of DFIs. We also observed the correlation between various parameters with the outcome.
MATERIALS AND METHODS
The study was a prospective study done at Sri Ramachandra University from March 2015 to August 2016. All patients with diabetes mellitus presenting with wound infection above 18 years are included in the study. Post-operative patients developing wound infection and patients with multiple septic foci are excluded from the study. Patient demographics and clinical data were recorded from oral questionnaires and hospital records. A thorough clinical examination was done. Peripheral neuropathy was evaluated by monofilament and vibration sense. Wound ulcer was graded according to Wagner grading. Peripheral vascularity was assessed by ankle-brachial index measurement. A basic laboratory workup along with fundus examination was done in all patients. ECG and 2D ECHO were done for patients with coronary artery disease. Wound swab from the ulcer edge was taken and sent for culture. Antibiotic therapy and duration was calculated. The results of the study were analyzed and statistical data were summarized using SPSS 21 software. Chi-square test and Pearson’s correlation were done for specific variables.
RESULTS
The study included 253 patients, 169 males and 84 females. Most of the patients were in the age group of 51–70 years. 14 patients below 40 years, 51 patients between 41 and 50 years, 85 patients between 51 and 60 years, 82 patients between 61 and 70 years, 18 patients between 71 and 80 years, and 3 patients above 80 years. The study characteristics and profile of patients are summarized in Table 1.
About 108 patients (42.7%) had coronary artery disease, 152 had hypertension (60.1%), and 154 patients (60.9%) were on oral hypoglycemic agents while 128 patients (49.8%) were on insulin. 65 patients (25.7%) presented with Grade I ulcer, 175 (69.2%) with Grade II ulcer, and 13 (5.1%) had Grade III ulcer as per Wagner grading [Table 2].
About 12 patients required ICU care and 241 patients were managed in the ward. The mean age was 57.57. Mean fasting and post-prandial sugars were 157.48 and 244.21, respectively. The mean HbA1c was 9.49 with a mean duration of hospital stay of 12.44 days. 40 patients (15.8) grew Staphylococcus aureus, 41 (16.2%) patients grew coagulase-negative Staphylococcus (CONS), 28 patients (11.2%) had Escherichia coli, 20 (7.9%) patients had Streptococcus species, 20 (7.9 %) patients had Enterococcus species, 10 (4%) patients had Proteus species, 12 (4.7%) patients grew Klebsiella species, 25 (9.9%) patients had Pseudomonas species, and 6 patients (2.4%) had Candida species. Polymicrobial growth was seen in 26 (10.3%) patients. 25 (9.9%) patients had no growth in cultures. Gram-positive organisms were responsible for more than 30% of infections. Among Gram-positive organisms, a majority of S. aureus was sensitive to penicillin and cloxacillin (MRSA was found in two patients), Streptococcus to penicillin and clindamycin, CONS to clindamycin and linezolid, and Enterococcus was sensitive to linezolid and ampicillin. Among Gram-negative organisms, a majority of E. coli was sensitive to amikacin, cefoperazone, and gentamicin, Pseudomonas to ciprofloxacin and gentamicin, Proteus to imipenem, and Klebsiella was sensitive to imipenem and ciprofloxacin. 238 recovered, 2 patients died and 13 were discharged against medical advice. There was no significant correlation between age and outcome. Significant vascular occlusion had no correlation with outcome. All patients who died had a HbA1c of more than 8.5. Two patients in the study group who expired had a Wagner Grade III. In our study, we found that one patient with Klebsiella growth and one with Streptococcus growth expired. Even patients with polymicrobial growth had a favorable outcome. There was high association of
Table 1: The study profileDescriptive statisticsParameter N Minimum Maximum Mean SDAge 253 22 90 57.57 10.560FBS 253 70 362 157.48 56.395PPBS 253 103 698 244.21 90.652HbA1C 253 5 18 9.49 2.431RFT 253 0.6 6.8 1.353 0.8010Hospital stay in days 253 1 78 12.44 12.071Total counts 253 600 26000 11338.74 4331.181Valid N (listwise) 253
Table 2: Wagner gradingWagner grade Frequency (%)ValidGrade I 65 (25.7)Grade II 175 (69.2)Grade III 13 (5.1)Total 253 (100.0)
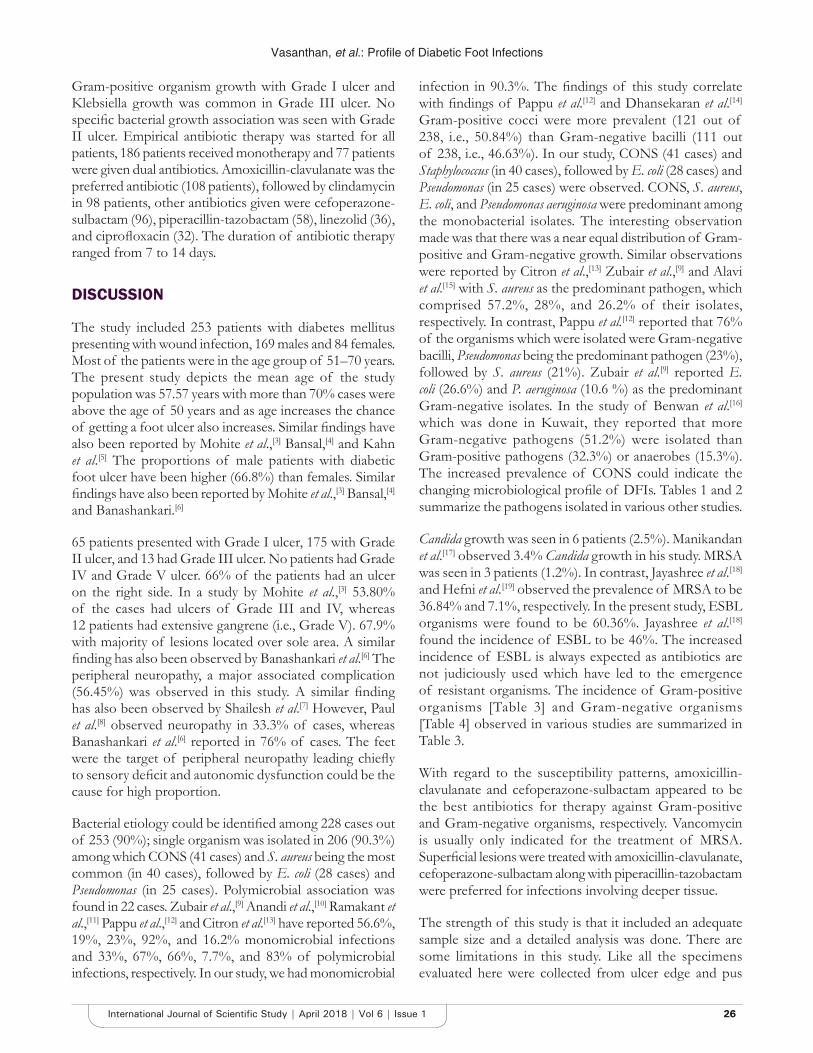
Vasanthan, et al.: Profile of Diabetic Foot Infections
2626International Journal of Scientific Study | April 2018 | Vol 6 | Issue 1
Gram-positive organism growth with Grade I ulcer and Klebsiella growth was common in Grade III ulcer. No specific bacterial growth association was seen with Grade II ulcer. Empirical antibiotic therapy was started for all patients, 186 patients received monotherapy and 77 patients were given dual antibiotics. Amoxicillin-clavulanate was the preferred antibiotic (108 patients), followed by clindamycin in 98 patients, other antibiotics given were cefoperazone-sulbactam (96), piperacillin-tazobactam (58), linezolid (36), and ciprofloxacin (32). The duration of antibiotic therapy ranged from 7 to 14 days.
DISCUSSION
The study included 253 patients with diabetes mellitus presenting with wound infection, 169 males and 84 females. Most of the patients were in the age group of 51–70 years. The present study depicts the mean age of the study population was 57.57 years with more than 70% cases were above the age of 50 years and as age increases the chance of getting a foot ulcer also increases. Similar findings have also been reported by Mohite et al.,[3] Bansal,[4] and Kahn et al.[5] The proportions of male patients with diabetic foot ulcer have been higher (66.8%) than females. Similar findings have also been reported by Mohite et al.,[3] Bansal,[4] and Banashankari.[6]
65 patients presented with Grade I ulcer, 175 with Grade II ulcer, and 13 had Grade III ulcer. No patients had Grade IV and Grade V ulcer. 66% of the patients had an ulcer on the right side. In a study by Mohite et al.,[3] 53.80% of the cases had ulcers of Grade III and IV, whereas 12 patients had extensive gangrene (i.e., Grade V). 67.9% with majority of lesions located over sole area. A similar finding has also been observed by Banashankari et al.[6] The peripheral neuropathy, a major associated complication (56.45%) was observed in this study. A similar finding has also been observed by Shailesh et al.[7] However, Paul et al.[8] observed neuropathy in 33.3% of cases, whereas Banashankari et al.[6] reported in 76% of cases. The feet were the target of peripheral neuropathy leading chiefly to sensory deficit and autonomic dysfunction could be the cause for high proportion.
Bacterial etiology could be identified among 228 cases out of 253 (90%); single organism was isolated in 206 (90.3%) among which CONS (41 cases) and S. aureus being the most common (in 40 cases), followed by E. coli (28 cases) and Pseudomonas (in 25 cases). Polymicrobial association was found in 22 cases. Zubair et al.,[9] Anandi et al.,[10] Ramakant et al.,[11] Pappu et al.,[12] and Citron et al.[13] have reported 56.6%, 19%, 23%, 92%, and 16.2% monomicrobial infections and 33%, 67%, 66%, 7.7%, and 83% of polymicrobial infections, respectively. In our study, we had monomicrobial
infection in 90.3%. The findings of this study correlate with findings of Pappu et al.[12] and Dhansekaran et al.[14] Gram-positive cocci were more prevalent (121 out of 238, i.e., 50.84%) than Gram-negative bacilli (111 out of 238, i.e., 46.63%). In our study, CONS (41 cases) and Staphylococcus (in 40 cases), followed by E. coli (28 cases) and Pseudomonas (in 25 cases) were observed. CONS, S. aureus, E. coli, and Pseudomonas aeruginosa were predominant among the monobacterial isolates. The interesting observation made was that there was a near equal distribution of Gram-positive and Gram-negative growth. Similar observations were reported by Citron et al.,[13] Zubair et al.,[9] and Alavi et al.[15] with S. aureus as the predominant pathogen, which comprised 57.2%, 28%, and 26.2% of their isolates, respectively. In contrast, Pappu et al.[12] reported that 76% of the organisms which were isolated were Gram-negative bacilli, Pseudomonas being the predominant pathogen (23%), followed by S. aureus (21%). Zubair et al.[9] reported E. coli (26.6%) and P. aeruginosa (10.6 %) as the predominant Gram-negative isolates. In the study of Benwan et al.[16] which was done in Kuwait, they reported that more Gram-negative pathogens (51.2%) were isolated than Gram-positive pathogens (32.3%) or anaerobes (15.3%). The increased prevalence of CONS could indicate the changing microbiological profile of DFIs. Tables 1 and 2 summarize the pathogens isolated in various other studies.
Candida growth was seen in 6 patients (2.5%). Manikandan et al.[17] observed 3.4% Candida growth in his study. MRSA was seen in 3 patients (1.2%). In contrast, Jayashree et al. [18] and Hefni et al. [19] observed the prevalence of MRSA to be 36.84% and 7.1%, respectively. In the present study, ESBL organisms were found to be 60.36%. Jayashree et al.[18] found the incidence of ESBL to be 46%. The increased incidence of ESBL is always expected as antibiotics are not judiciously used which have led to the emergence of resistant organisms. The incidence of Gram-positive organisms [Table 3] and Gram-negative organisms [Table 4] observed in various studies are summarized in Table 3.
With regard to the susceptibility patterns, amoxicillin-clavulanate and cefoperazone-sulbactam appeared to be the best antibiotics for therapy against Gram-positive and Gram-negative organisms, respectively. Vancomycin is usually only indicated for the treatment of MRSA. Superficial lesions were treated with amoxicillin-clavulanate, cefoperazone-sulbactam along with piperacillin-tazobactam were preferred for infections involving deeper tissue.
The strength of this study is that it included an adequate sample size and a detailed analysis was done. There are some limitations in this study. Like all the specimens evaluated here were collected from ulcer edge and pus
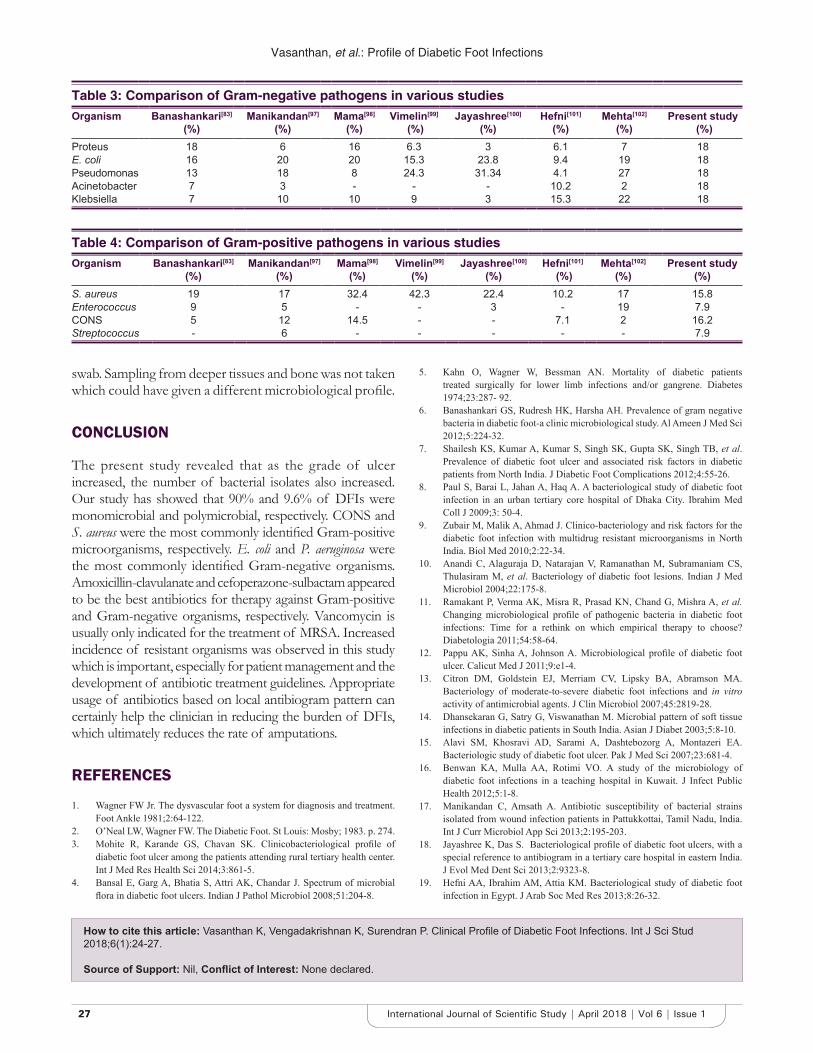
Vasanthan, et al.: Profile of Diabetic Foot Infections
2727 International Journal of Scientific Study | April 2018 | Vol 6 | Issue 1
swab. Sampling from deeper tissues and bone was not taken which could have given a different microbiological profile.
CONCLUSION
The present study revealed that as the grade of ulcer increased, the number of bacterial isolates also increased. Our study has showed that 90% and 9.6% of DFIs were monomicrobial and polymicrobial, respectively. CONS and S. aureus were the most commonly identified Gram-positive microorganisms, respectively. E. coli and P. aeruginosa were the most commonly identified Gram-negative organisms. Amoxicillin-clavulanate and cefoperazone-sulbactam appeared to be the best antibiotics for therapy against Gram-positive and Gram-negative organisms, respectively. Vancomycin is usually only indicated for the treatment of MRSA. Increased incidence of resistant organisms was observed in this study which is important, especially for patient management and the development of antibiotic treatment guidelines. Appropriate usage of antibiotics based on local antibiogram pattern can certainly help the clinician in reducing the burden of DFIs, which ultimately reduces the rate of amputations.
REFERENCES
1. Wagner FW Jr. The dysvascular foot a system for diagnosis and treatment. Foot Ankle 1981;2:64-122.
2. O’Neal LW, Wagner FW. The Diabetic Foot. St Louis: Mosby; 1983. p. 274.3. Mohite R, Karande GS, Chavan SK. Clinicobacteriological profile of
diabetic foot ulcer among the patients attending rural tertiary health center. Int J Med Res Health Sci 2014;3:861-5.
4. Bansal E, Garg A, Bhatia S, Attri AK, Chandar J. Spectrum of microbial flora in diabetic foot ulcers. Indian J Pathol Microbiol 2008;51:204-8.
5. Kahn O, Wagner W, Bessman AN. Mortality of diabetic patients treated surgically for lower limb infections and/or gangrene. Diabetes 1974;23:287- 92.
6. Banashankari GS, Rudresh HK, Harsha AH. Prevalence of gram negative bacteria in diabetic foot-a clinic microbiological study. Al Ameen J Med Sci 2012;5:224-32.
7. Shailesh KS, Kumar A, Kumar S, Singh SK, Gupta SK, Singh TB, et al. Prevalence of diabetic foot ulcer and associated risk factors in diabetic patients from North India. J Diabetic Foot Complications 2012;4:55-26.
8. Paul S, Barai L, Jahan A, Haq A. A bacteriological study of diabetic foot infection in an urban tertiary core hospital of Dhaka City. Ibrahim Med Coll J 2009;3: 50-4.
9. Zubair M, Malik A, Ahmad J. Clinico-bacteriology and risk factors for the diabetic foot infection with multidrug resistant microorganisms in North India. Biol Med 2010;2:22-34.
10. Anandi C, Alaguraja D, Natarajan V, Ramanathan M, Subramaniam CS, Thulasiram M, et al. Bacteriology of diabetic foot lesions. Indian J Med Microbiol 2004;22:175-8.
11. Ramakant P, Verma AK, Misra R, Prasad KN, Chand G, Mishra A, et al. Changing microbiological profile of pathogenic bacteria in diabetic foot infections: Time for a rethink on which empirical therapy to choose? Diabetologia 2011;54:58-64.
12. Pappu AK, Sinha A, Johnson A. Microbiological profile of diabetic foot ulcer. Calicut Med J 2011;9:e1-4.
13. Citron DM, Goldstein EJ, Merriam CV, Lipsky BA, Abramson MA. Bacteriology of moderate-to-severe diabetic foot infections and in vitro activity of antimicrobial agents. J Clin Microbiol 2007;45:2819-28.
14. Dhansekaran G, Satry G, Viswanathan M. Microbial pattern of soft tissue infections in diabetic patients in South India. Asian J Diabet 2003;5:8-10.
15. Alavi SM, Khosravi AD, Sarami A, Dashtebozorg A, Montazeri EA. Bacteriologic study of diabetic foot ulcer. Pak J Med Sci 2007;23:681-4.
16. Benwan KA, Mulla AA, Rotimi VO. A study of the microbiology of diabetic foot infections in a teaching hospital in Kuwait. J Infect Public Health 2012;5:1-8.
17. Manikandan C, Amsath A. Antibiotic susceptibility of bacterial strains isolated from wound infection patients in Pattukkottai, Tamil Nadu, India. Int J Curr Microbiol App Sci 2013;2:195-203.
18. Jayashree K, Das S. Bacteriological profile of diabetic foot ulcers, with a special reference to antibiogram in a tertiary care hospital in eastern India. J Evol Med Dent Sci 2013;2:9323-8.
19. Hefni AA, Ibrahim AM, Attia KM. Bacteriological study of diabetic foot infection in Egypt. J Arab Soc Med Res 2013;8:26-32.
Table 3: Comparison of Gram-negative pathogens in various studiesOrganism Banashankari[83]
(%)Manikandan[97]
(%)Mama[98]
(%)Vimelin[99]
(%)Jayashree[100]
(%)Hefni[101]
(%)Mehta[102]
(%)Present study
(%)Proteus 18 6 16 6.3 3 6.1 7 18E. coli 16 20 20 15.3 23.8 9.4 19 18Pseudomonas 13 18 8 24.3 31.34 4.1 27 18Acinetobacter 7 3 - - - 10.2 2 18Klebsiella 7 10 10 9 3 15.3 22 18
Table 4: Comparison of Gram-positive pathogens in various studiesOrganism Banashankari[83]
(%)Manikandan[97]
(%)Mama[98]
(%)Vimelin[99]
(%)Jayashree[100]
(%)Hefni[101]
(%)Mehta[102]
(%)Present study
(%)S. aureus 19 17 32.4 42.3 22.4 10.2 17 15.8Enterococcus 9 5 - - 3 - 19 7.9CONS 5 12 14.5 - - 7.1 2 16.2Streptococcus - 6 - - - - - 7.9
How to cite this article: Vasanthan K, Vengadakrishnan K, Surendran P. Clinical Profile of Diabetic Foot Infections. Int J Sci Stud 2018;6(1):24-27.
Source of Support: Nil, Conflict of Interest: None declared.
2828International Journal of Scientific Study | April 2018 | Vol 6 | Issue 1
Efficacy of Decompressive Craniectomy in Acute Subdural Hematoma in Head Injury Patients, Madurai Medical College, MaduraiH Balasubramanian1, Sri Saravanan2, G M Niban3, T Gandhi Raj1
1Post Graduate Student, Department of Neurosurgery, Madurai Medical College, Madurai, Tamil Nadu, India, 2Professor, Department of Neurosurgery, Madurai Medical College, Madurai, Tamil Nadu, India, 3Associate Professor, Department of Neurosurgery, Madurai Medical College, Madurai, Tamil Nadu, India
forms an important part of neurosurgical management in all countries. The modernization of industries as well as modes of transport have increased the incidence and the severity of injuries.[3] The management of severe head injury is a major challenge to neurosurgeons as the consequent mortality and morbidity is very high. There is a need for an extensive multidimensional effort to improve the prognosis of head-injured patients and provide them a better quality of life.[2]
Acute sub dural hematoma is a hematoma accumulating between the inner layer of the dura matter and the Arachnoid matter, to become clinically symptomatic within 24 - 72 hours. They are usually located over the cerebral convexities conforming to the convex brain surface.
INTRODUCTION
Head injury is one of the important public health problems today. The incidence of head injuries is steadily increasing all over the world, and developing country has the highest incidence in the world of head injuries due to road traffic accidents per 1000 vehicles or deaths per 1000 accidents.[1] The care of head-injured patients
Original Article
AbstractAims and Objectives: The aims and objectives are as follows: (1) To study the effect of decompressive craniectomy in head injury patient with subdural hematoma (SDH), (2) to compare the outcome of non-operative patients, and (3) to identify the factors contributing the outcome of decompressive craniectomy.
Materials and Methods: This was a retrospective study conducted between November 2015 and October 2016. The patients in trauma head injury ward, Government Rajaji Hospital, Madurai Medical College, Madurai, Tamil Nadu, are grouped as decompressive craniotomy surgery done and conservatively treated with acute SDH. Data regarding mode of accident, GCS - Glasgow coma scale, computed tomography finding, and outcome were collected. Statistical analysis was used to identify factors associated with favorable outcome of the patients.
Results: Statistical analysis were done to identify factors associated with mortality, morbidity, and favorable outcome of the patients, by categorizing the patients with GCS Mild - 13 -15 ,moderate - 9 -12, and severe below 8 with traumatic brain injury. For the patients with GCS moderate 9-12 score better outcome occurs if decompressive craniectomy done. Total 527 patients in which 139 patients were operated.
Conclusion: Age, severity of head injury, neurological status, and timing of surgery are the main factors influencing outcomes. After moderate head injury with acute SDH, surgery with decompressive craniectomy is the better outcome. Mild head injury can be managed conservatively with continuous neuro observation. In severe head injury, the results are poor.
Key words: Acute subdural hematoma, Decompressive craniectomy, Glasgow Coma Scale, Traumatic brain injury
Access this article online
www.ijss-sn.com
Month of Submission : 02-2018 Month of Peer Review : 03-2018 Month of Acceptance : 04-2018 Month of Publishing : 04-2018
Corresponding Author: Dr. H Balasubramanian, Department of Neurosurgery, Madurai Medical College, Madurai - 625020, Tamil Nadu, India. Phone: +91-9488464638. E-mail: [email protected]
Print ISSN: 2321-6379Online ISSN: 2321-595X
DOI: 10.17354/ijss/2018/107
Balasubramanian, et al.: Efficacy of Decompressive Craniectomy in Acute Subdural Hematoma in Head Injury
2929 International Journal of Scientific Study | April 2018 | Vol 6 | Issue 1
MATERIALS AND METHODS
This retrospective study was conducted in head injury ward, Government Rajaji Hospital trauma center, Madurai Medical College, Madurai, Tamil Nadu, from November 2015 to October 2016,• Study done for the patients with ASDH admitted in the
head injury ward, Government Rajaji Hospital, Madurai Medical College, Madurai. The head injury patients with or with out poly trauma, irrespective of mode of injury and with radiological findings are selected for study.
• Who are the subjects believed to fulfill all eligibility criteria, and exclusion criteria are participated in the study for conservative management or decompressive craniectomy
• The patients grouped as (1) decompressive craniectomy done and (2) conservatively treated
• Data regarding mode of accident, time of injury, GCS, clinical status of the patient, laboratory investigations, computed tomography (CT) finding, and outcome were collected by GCS outcome score
• Statistical analyses were done to identify factors associated with mortality, morbidity, and favorable outcome of the patients, by categorizing the patients with GCS Mild - 13 -15,moderate - 9 -12, and severe below 8 with traumatic brain injury. For the patients with GCS moderate 9-12 score better outcome occurs if decompressive craniectomy done. Total 527 patients in which 139 patients were operated.
• Patient’s follow-up by 1 month, 3 months, 6 months, and 1 year
• In trauma patient with acute head injury with ASDH, inclusion and exclusion criteria are as follows.
Inclusion CriteriaThe following criteria were included in the study:• In trauma patient with acute head injury with ASDH• No age restriction• No sex restriction• No time restriction.
Exclusion CriteriaThe following criteria were excluded from the study:• Chronic SDH• Extradural hematoma• Ventricular hemorrhage• Intracerebral hemorrhage• Fracture hematoma.
Based on Data• Basic patient data’s name, age, sex• Vitals, pupils• Mode of injury• Time interval
• Glasgow Coma Scale• Patient with associated injuries• Laboratory investigations• CT scan findings• Time of surgery• Glasgow Outcome Score (extended)• Karnofsky Performance Status Scale• Modified Rankin Scale.
There is about the incidence of acute SDH (29%) as the primary lesion in patients admitted with head injury. Acute SDH more often occurs in the second to sixth decades (mean age 31–40 years) Men are 4 times more likely to be affected than women.[4]
PathogenesisAcute SDH resulting from one of the three common causes, namely: (1) Rupture of bridging veins, (2) cerebral contusion, and (3) rupture of small cortical arteries. They termed the bleeding from torn bridging veins and rupture of small cortical arteries as “pure SDHs” as they occurred without any gross (focal or diffuse) damage to the brain itself.[5] They found that the volumes of arterial and venous acute SDH and their relative areas in the horizontal planes were similar irrespective of the causal mechanism. The hematoma thickness and midline shift were higher in arterial SDH. On the other hand, in venous SDH, the difference between the midline shift and the hematoma thickness was lower than in arterial SDH (i.e., in venous SDH, a smaller acute SDH was associated with a greater midline shift) indicating a tendency toward more pronounced midline shift in venous, rather than arterial SDH of similar volumes.
The venous SDH due to bridging vein ruptures was generally located in the central frontoparietal and parasagittal region and had a comparatively smaller length and thickness than the arterial SDH which were more often located in the temporoparietal region.
Poor outcome following acute SDH may also be related to the ischemic damage occurring in the hemisphere underlying the hematoma due to raised intracranial pressure producing impaired cerebral perfusion. Removal of an acute SDH often results in reversal of global ischemia. Decompressive craniectomy is the one of the neurosurgical methods in which part of skull (free bone flap) is removed. Dura opened and the hematoma evacuation done and free bone flap is not replaced. The aim of decompression is to reduce the increased intracranial pressure and prevent coning.
In younger group (18–40 years), 80% were caused by motor vehicle accidents and only 12% were caused by assault. Whereas, acute SDH in the older groups (>65 years), 26% due to fall and only 8% due to assault.[6]
Balasubramanian, et al.: Efficacy of Decompressive Craniectomy in Acute Subdural Hematoma in Head Injury
3030International Journal of Scientific Study | April 2018 | Vol 6 | Issue 1
In comatose patients, motor vehicle accidents are responsible for acute SDH in 75% of patients because these are often high-velocity accidents with associated diffuse axonal injury.[7]
Associated intracranial injuries occur in more than 50% of patients with acute SDH and have a significant prognostic implication. Associated lesions occur in 37% of patients presenting with Glasgow Coma Scale (GCS) scores between 13 and 15 and in 45% of patients with GCS scores <8. In patients with acute SDH, contusion and fractures are the most frequent injuries encountered; associated subarachnoid hemorrhage has been seen in 25% of patients with SDH and epidural hematomas in 18% of patients. Extracranial injuries are seen in 48% of patients including facial fractures, limb fractures, and thoracic and abdominal trauma. Around 40% of patients with other associated lesions have a contrecoup injury. Bilateral acute SDH occurs in 13%.
Clinical PresentationThe clinical presentation is non-specific and occurs due to mass effect produced by the acute SDH as well as associated parenchymatous injury. It depends on the severity of the primary injury, the associated parenchymal injuries, and the rapidity of accumulation of the acute SDH. The patients may remain unconscious throughout or may vary in sensorium from being totally unconscious to being lucid to unconscious or may remain lucid throughout. About 40% of patients are semiconscious at the time of their primary injury and remain comatose for prolonged periods. 33% of their patients with lucid interval neurologically deteriorated. Pupillary asymmetry ipsilateral to the side of hematoma with contralateral hemiparesis may be due to transtentorial herniation. However, false localizing pupillary dilatation contralateral to the lesion may occur due to direct optic nerve, oculomotor nerve, or brain stem injury on that side. Ipsilateral hemiparesis may be due to associated brain injury or due to Kernohan’s notching produced by compression of the contralateral cerebral peduncle against the tentorial edge. The incidence of associated seizures has present about 18%. Posterior fossa acute SDH is rare and occurs in 3% of patients who underwent surgery within 24 h of injury. Occipital trauma and associated occipital fractures may be responsible. Posterior fossa acute SDH occurs due to tearing of bridging veins, laceration of the tentorium, contusion of the cerebellum, or injury to venous sinuses. Cerebellar signs, neck stiffness, and pain or symptoms of raised intracranial pressure due to the size of the lesion or the development of hydrocephalus may be the presenting features. Despite urgent surgical evacuation, the mortality was about 75%.
Diagnosis: CT Scan FindingOn CT scans, an acute SDH appears as crescentic, hyperdense collections that lie between the arachnoid and the inner meningeal layer of the Dura that conforms to and often exert a mass effect on the surface of the brain. It extends across sutural lines but does not cross the falx or the tentorium. An acute SDH may occasionally be biconvex due to adhesions between the brain and the dura mater or when it is thick. The exact thickness of the crescentic SDH should be measured by taking the CT images with a wide window to distinguish the hyperdense clot from bone. Early CT (within 3 h from injury) underestimates the size of the associated parenchymal contusions and the consequent edema. Patients who show subarachnoid hemorrhage on early CT are those at highest risk for evolving contusions. The worst outcomes previously associated with acute SDH may, in many cases, be due to the concomitant presence of contusions in multiple areas of the brain and consequent development of edema. Thus, the use of sequential CT scan should be included in the routine management of head-injured patients. In the younger population, an associated swollen hypointense, ipsilateral hemisphere indicates a very poor prognosis.[8] In patients with acute anemia and hemodilution (during resuscitation from multiple injuries), the acute SDH may appear as isodense to hypodense on CT.[9] A subacute SDH may also be isodense to the brain.
Surgical ManagementThe aim of surgery is to evacuate the hematoma and any associated underlying lesions to relieve the mass effect and improve the focal neurological deficits. However, if the patient has no brainstem reflexes and is hypotonic with no motor response, surgery may not be useful. The size of the hematoma that should definitely be removed has not been ascertained. Removal of a very thin acute SDH may not be indicated as the clinical deterioration is usually due to associated lesions in this case and is not likely to improve with acute SDH evacuation. Although the current consensus is to have an acute SDH promptly evacuated through a craniectomy in 97% of patients, conservative treatment of a small acute SDH in patients (approximately 3%) with contraindications for surgery has been reported.
No operative therapy should only be considered in patients who are fully conscious, when the extra-axial mass is the single dominant lesion, that is, there are no multiple contusions or potentially significant contralateral mass lesions (which may be preventing midline shift), and when there are no features of mass effect such as a midline shift >3 mm or basal cistern effacement.
In such cases, and especially, if the lesion is <10 mm at its thickest point, conservative therapy may be successful in most instances. The SDH will usually resorb within
Balasubramanian, et al.: Efficacy of Decompressive Craniectomy in Acute Subdural Hematoma in Head Injury
3131 International Journal of Scientific Study | April 2018 | Vol 6 | Issue 1
1 month although there are occasional instances of chronic SDH formation. Similarly, a deep seated interhemispheric or tentorial SDH in a stable conscious patient may not need surgical evacuation.
The guidelines for selecting patients for conservative management of the SDH include: (1) GCS score ≥13 since injury; (2) absence of other intracranial hematomas or edema on CT scan; (3) midline shift of <10 mm; and (4) absence of basal cistern effacement. Thickness or the associated midline shift beyond which failure of conservative treatment could be predicted.
The recommendations of the TBI Consortium for the surgical management of acute SDH with a thickness >10 mm or a midline shift >5 mm on CT scan should surgically be evacuated, regardless of the patient’s GCS score. All patients with acute SDH in coma (GCS score <9) should undergo intracranial pressure monitoring. A comatose patient (GCS score <9) with an SDH <10 mm thick and a midline shift <5 mm should undergo surgical evacuation of the lesion if the GCS score decreased between the time of injury and hospital admission by 2 or more points on the GCS and/or the patient presents with asymmetric or fixed and dilated pupils and/or the intracranial pressure exceeds 20 mmHg.[10] An increase in hematoma size on CT scan with increasing intracranial pressure and decline in neurological status is also an indication for surgical removal of the lesion. Regarding the timing of surgery, it is recommended that in patients with acute SDH and with indications for surgery, surgical evacuation should be performed as early as possible. If surgical evacuation of an acute SDH is indicated in a comatose patient (GCS <9), it should be performed using a craniectomy with bone flap removal.
RESULTS
The mortality from an acute SDH in all patients shows a wide range (42–90%), in all age groups with GCS between 9 and 12 requiring surgery about 68%, and in comatose patients requiring subsequent surgical evacuation is about 35%. Residual or recurrent hematoma requiring evacuation has been seen in approximately 8% of patients. Occasionally, removal of the mass effect caused by the acute SDH may increase the underlying intracerebral hematoma or contralateral acute or chronic SDH. Post-operative hematomas should be suspected and a post-operative CT obtained in patients who fail to improve or those who deteriorate and in whom the intracranial pressure monitoring shows persistently high intracranial pressures. The post-operative complications following evacuation of an acute SDH may include osteomyelitis, wound infection, meningitis, subdural empyema, abscess formation, and ventriculitis.
DISCUSSION
The Factors Determining Outcome IncludeTiming of surgeryUsually, conservative treatment is adopted and surgery deferred in patients with less severe acute SDH, and in better neurological status. Thus, mortality is more whenever timing from injury to surgery increases. In comatose patients, however, there was a significant decrease in mortality and increase in functional recovery in patients who underwent surgery within 4 h of injury as compared to those in whom surgery was delayed beyond 4 h of injury. The mechanism of secondary brain damage is direct compression of the underlying cortex and brain shift that causes local zones of ischemia. If the elevated intracranial pressure is unrelieved, leading to reduced cerebral perfusion pressure, then global ischemic brain damage may occur.
AgeYounger patients have a better outcome than older patients due to less comorbid conditions in the former. There is a significant association between age and functional recovery.
CT parametersCT parameters include clot thickness, hematoma volume, mid line shift and patency of the basal cisterns. Following surgery for acute SDH, found a significant correlation between poor outcome and the volume of SDH and the midline shift and a correlation between outcome and clot thickness and the status of the basal cisterns. There was a significant relationship between midline shift and outcome in patients with GCS scores lower than 9, who were undergoing surgery for SDH. As per our study reveled a 40% mortality rate in patients with clot thickness of < 10mm and 85% mortality for patients with clot thickness >20mm.[11] Thus, these parameters do seem to influence outcome, but the specific threshold values need to be determined.
The neurological statusThis forms the most significant factor in determining outcome. In patients with acute SDH and GCS of 3-5, the mortality was 86% and those with GCS of 9-12 had mortality of 18% and moderate to good outcome in 63%of patients. Pupillary asymmetry correlates with a poorer outcome. In bilateral pupillary abnormalities, the mortality is over 85%; in unilaterally dilated but reactive pupils, the mortality reported is approximately 50%, and in unilaterally dilated non-reactive pupils, the mortality reported is approximately 58%. Decerebrate posturing, flaccid patients (mortality 77–95%), and patients with hemiparesis and hemiplegic (mortality 35–48%) also have a poorer prognosis as compared to intact patients.
Balasubramanian, et al.: Efficacy of Decompressive Craniectomy in Acute Subdural Hematoma in Head Injury
3232International Journal of Scientific Study | April 2018 | Vol 6 | Issue 1
Intracranial pressurePersistently elevated (> 20 mmHg) post-operative intracranial pressure is associated with a poor prognosis.
Associated lesionsAn associated intracerebral hematoma or contusion did not influence mortality, but the functional outcome was significantly better in patients without contusions. Associated diffuse axonal injury significantly influences outcome. Acute SDH based on their associated lesions are classified intosimple acute SDH without brain injury (mortality: 22%), acute SDH with contusion (mortality: 40%), and complicated acute SDH (with parenchymal laceration, intracerebral hemorrhage, or burst temporal lobes; mortality: 53%).[12]
Comorbid conditionsLung injury, meningitis, shock, long bone fractures, and abdominal injury all influence outcome. According to the TBI, the key issues for further investigation in cases of acute SDH include the influence of medical management versus decompressive craniectomy on the outcome; the impact of the timing of surgery, the pre-operative hypotension and hypoxia on outcome; identification of subgroups that do not benefit from surgery such as older patients with low GCS scores, pupillary abnormalities, and associated intracerebral lesions; and investigating whether operating on all comatose patients regardless of their clot thickness would lead to a better outcome.
Isolated acute SDH, acting as a compressive lesion, is an uncommon clinicopathological entity with the majority of patients having associated focal (contusion/laceration/intracerebral hematoma) or global (diffuse axonal injury and subarachnoid hemorrhage) involvement or both. Ischemia underlying an acute SDH and hemispheric brain swelling may be superadded and self-perpetuating and may lead to uncontrollable elevations of intracranial pressure with consequent herniation, brainstem compression, and hemorrhage. The molecular cascade initiated by the injury may lead to secondary brain damage.
CONCLUSION
The future reduction in morbidity and mortality will depend on the effective prevention, arrest, or reversal
of the molecular events that are responsible for the secondary ischemia and cytotoxic edema. Acute SDH should therefore be subclassified as SDH with or without associated parenchymal pathology to shift the focus from the hematoma to the brain injuries and the secondary injuries and would permit better comparison of different therapeutic modalities and better prognostication. About 25% of patients died in hospital, 18% survived with unfavorable outcomes, and 57% had favorable outcomes. In moderate to severe TBI with ASDH patients, with successful early decompresive craniectomy and evacuation of clot and aggressive intensive care management gives high functional status and better outcomes.
REFERENCES
1. Bullock MR, Chesnut R, Ghajar J, Gordon D, Hartl R, Newell DW, et al. Surgical management of acute subdural hematomas. Neurosurgery 2006;58:S16-24.
2. Chaturvedi J, Botta R, Prabhuraj AR, Shukla D, Bhat DI, Devi BI, et al. Complications of cranioplasty after decompressive craniectomy for traumatic brain injury. Br J Neurosurg 2016;30:264-8.
3. Chen SH, Chen Y, Fang WK, Huang DW, Huang KC, Tseng SH, et al. Comparison of craniotomy and decompressive craniectomy in severely head-injured patients with acute subdural hematoma. J Trauma 2011;71:1632-6.
4. Chibbaro S, Marsella M, Romano A, Ippolito S, Benericetti E. Combined internal uncusectomy and decompressive craniectomy for the treatment of severe closed head injury: Experience with 80 cases. J Neurosurg 2008;108:74-9.
5. Coplin WM, Cullen NK, Policherla PN, Vinas FC, Wilseck JM, Zafonte RD, et al. Safety and feasibility of craniectomy with duraplasty as the initial surgical intervention for severe traumatic brain injury. J Trauma 2001;50:1050-9.
6. Girotto D, Ledić D, Bajek G, Jerković R, Dragicević S. Efficancy of decompressive craniectomy in treatment of severe brain injury at the Rijeka university hospital centre. Coll Antropol 2011;35:255-8.
7. Girotto D, Ledić D, Daji V, Vujković Z, Mihelcić N. Neurosurgical procedure for treatment of traumatic subdural hematoma with severe brain injury: A single center matched-pair analysis. Coll Antropol 2014;38:1255-8.
8. Aarabi B, Hesdorffer DC, Ahn ES, Aresco C, Scalea TM, Eisenberg HM, et al. Outcome following decompressive craniectomy for malignant swelling due to severe head injury. J Neurosurg 2006;104:469-79.
9. Albanèse J, Leone M, Alliez JR, Kaya JM, Antonini F, Alliez B, et al. Decompressive craniectomy for severe traumatic brain injury: Evaluation of the effects at one year. Crit Care Med 2003;31:2535-8.
10. Cooper DJ, Rosenfeld JV, Murray L, Arabi YM, Davies AR, D’Urso P, et al. Decompressive craniectomy in diffuse traumatic brain injury. N Engl J Med 2011;364:1493-502.
11. Cooper DJ, Rosenfeld JV. Does decompressive craniectomy improve outcomes in patients with diffuse traumatic brain injury? Med J Aust 2011;194:437-8.
12. Guerra WK, Gaab MR, Dietz H, Mueller JU, Piek J, Fritsch MJ, et al. Surgical decompression for traumatic brain swelling: Indications and results. J Neurosurg 1999;90:187-96.
How to cite this article: Balasubramanian H, Saravanan S, Niban GM, Raj TG. Efficacy of Decompressive Craniectomy in Acute Subdural Hematoma in Head Injury Patients, in Madurai Medical College, Madurai. Int J Sci Stud 2018;6(1):28-32.
Source of Support: Nil, Conflict of Interest: None declared.
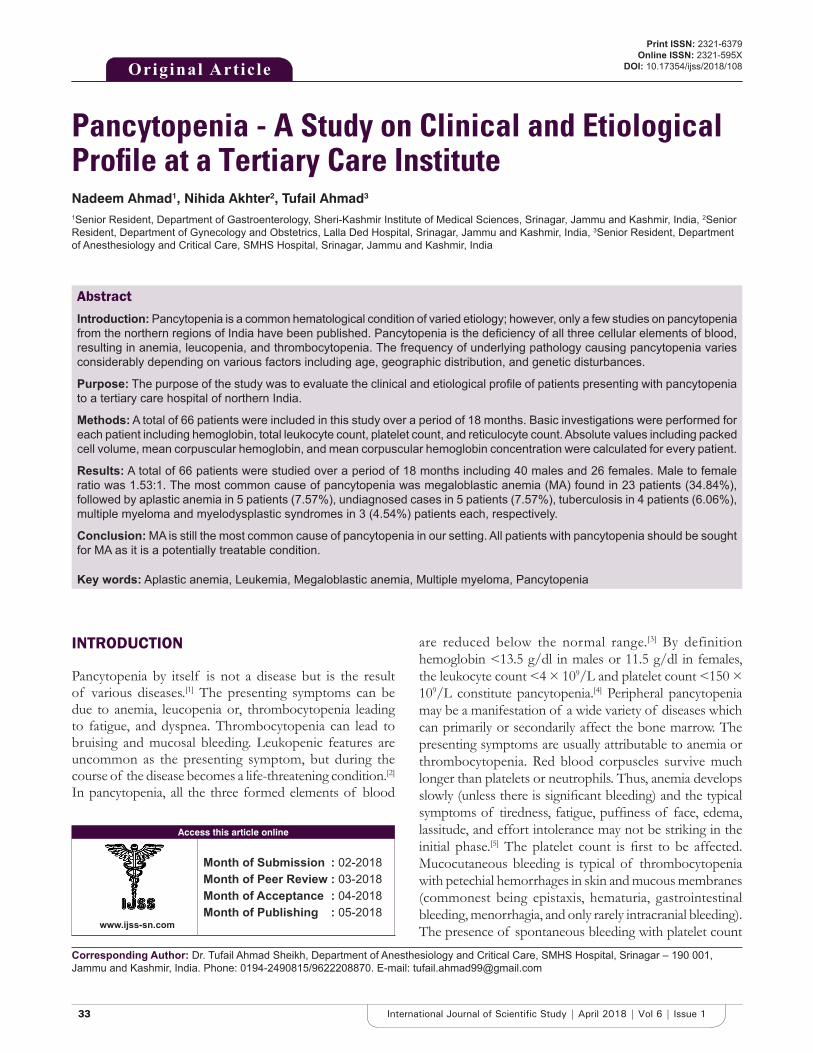
3333 International Journal of Scientific Study | April 2018 | Vol 6 | Issue 1
Pancytopenia - A Study on Clinical and Etiological Profile at a Tertiary Care InstituteNadeem Ahmad1, Nihida Akhter2, Tufail Ahmad3
1Senior Resident, Department of Gastroenterology, Sheri-Kashmir Institute of Medical Sciences, Srinagar, Jammu and Kashmir, India, 2Senior Resident, Department of Gynecology and Obstetrics, Lalla Ded Hospital, Srinagar, Jammu and Kashmir, India, 3Senior Resident, Department of Anesthesiology and Critical Care, SMHS Hospital, Srinagar, Jammu and Kashmir, India
are reduced below the normal range.[3] By definition hemoglobin <13.5 g/dl in males or 11.5 g/dl in females, the leukocyte count <4 × 10⁹/L and platelet count <150 × 109/L constitute pancytopenia.[4] Peripheral pancytopenia may be a manifestation of a wide variety of diseases which can primarily or secondarily affect the bone marrow. The presenting symptoms are usually attributable to anemia or thrombocytopenia. Red blood corpuscles survive much longer than platelets or neutrophils. Thus, anemia develops slowly (unless there is significant bleeding) and the typical symptoms of tiredness, fatigue, puffiness of face, edema, lassitude, and effort intolerance may not be striking in the initial phase.[5] The platelet count is first to be affected. Mucocutaneous bleeding is typical of thrombocytopenia with petechial hemorrhages in skin and mucous membranes (commonest being epistaxis, hematuria, gastrointestinal bleeding, menorrhagia, and only rarely intracranial bleeding). The presence of spontaneous bleeding with platelet count
INTRODUCTION
Pancytopenia by itself is not a disease but is the result of various diseases.[1] The presenting symptoms can be due to anemia, leucopenia or, thrombocytopenia leading to fatigue, and dyspnea. Thrombocytopenia can lead to bruising and mucosal bleeding. Leukopenic features are uncommon as the presenting symptom, but during the course of the disease becomes a life-threatening condition.[2] In pancytopenia, all the three formed elements of blood
Original Article
AbstractIntroduction: Pancytopenia is a common hematological condition of varied etiology; however, only a few studies on pancytopenia from the northern regions of India have been published. Pancytopenia is the deficiency of all three cellular elements of blood, resulting in anemia, leucopenia, and thrombocytopenia. The frequency of underlying pathology causing pancytopenia varies considerably depending on various factors including age, geographic distribution, and genetic disturbances.
Purpose: The purpose of the study was to evaluate the clinical and etiological profile of patients presenting with pancytopenia to a tertiary care hospital of northern India.
Methods: A total of 66 patients were included in this study over a period of 18 months. Basic investigations were performed for each patient including hemoglobin, total leukocyte count, platelet count, and reticulocyte count. Absolute values including packed cell volume, mean corpuscular hemoglobin, and mean corpuscular hemoglobin concentration were calculated for every patient.
Results: A total of 66 patients were studied over a period of 18 months including 40 males and 26 females. Male to female ratio was 1.53:1. The most common cause of pancytopenia was megaloblastic anemia (MA) found in 23 patients (34.84%), followed by aplastic anemia in 5 patients (7.57%), undiagnosed cases in 5 patients (7.57%), tuberculosis in 4 patients (6.06%), multiple myeloma and myelodysplastic syndromes in 3 (4.54%) patients each, respectively.
Conclusion: MA is still the most common cause of pancytopenia in our setting. All patients with pancytopenia should be sought for MA as it is a potentially treatable condition.
Key words: Aplastic anemia, Leukemia, Megaloblastic anemia, Multiple myeloma, Pancytopenia
Access this article online
www.ijss-sn.com
Month of Submission : 02-2018 Month of Peer Review : 03-2018 Month of Acceptance : 04-2018 Month of Publishing : 05-2018
Corresponding Author: Dr. Tufail Ahmad Sheikh, Department of Anesthesiology and Critical Care, SMHS Hospital, Srinagar – 190 001, Jammu and Kashmir, India. Phone: 0194-2490815/9622208870. E-mail: [email protected]
Print ISSN: 2321-6379Online ISSN: 2321-595X
DOI: 10.17354/ijss/2018/108
Ahmad, et al.: Pancytopenia: Clinical and Etiological profile
3434International Journal of Scientific Study | April 2018 | Vol 6 | Issue 1
<20 × 109/l indicates severe marrow failure. Leukopenia is an uncommon initial presentation. Infections usually occur with commensal organisms of the skin or gastrointestinal tract. An early manifestation of neutropenia is often a sore throat or chest or soft tissue infection which typically shows an incomplete response to antibiotics.[6] The most common clinical manifestations of pancytopenia are usually fever (86.7%), fatigue (76%), dizziness (64%), weight loss (45.3%), anorexia (37.3%), night sweats (28%), pallor (100%), bleeding (38.7%), splenomegaly (48%), hepatomegaly (21.3%), and lymphadenopathy (14.7%).[7] Megaloblastic anemia (MA), hypersplenism (congestive splenomegaly, malaria, and leishmaniasis), aplastic anemia, myelodysplastic syndrome (MDS), subleukemic leukemia’s, tuberculosis, and multiple myeloma are some of the etiologies presenting with pancytopenia. Identifying the etiopathology of pancytopenia is important for a given case for timely treatment of the disease.[8] Bone marrow examination is extremely helpful in evaluation of pancytopenia.[9] Bone marrow examination allows complete assessment of marrow architecture , pattern of distribution of any abnormal infiltrate and the detection of focal bone marrow lesions.[10,11] The most common causes leading to pancytopenia on bone marrow examination are aplastic (AA) bone marrow (29.05%), MA (23.64%), hematological malignancies, i.e., acute myeloid leukemia (21.62%), and erythroid hyperplasia (19.6%).[12] The aim of this study was to evaluate the clinical presentation and etiological profile of pancytopenic patients admitted at a tertiary care hospital of northern India.
MATERIALS AND METHODS
A total of 66 patients were identified over a period of 18 months (March 2016–September 2017) and were included in this study. In all patients, a detailed relevant history including the treatment history, history of drug intake, and any previous radiation exposure was obtained. Meticulous clinical examination of every patient was done for pallor, jaundice, hepatomegaly, splenomegaly, sternal tenderness, and lymphadenopathy. Basic investigations were performed for each patient including hemoglobin, total leukocyte count, platelet count, and reticulocyte count. Absolute values including packed cell volume, mean corpuscular hemoglobin, and mean corpuscular hemoglobin concentration were calculated for every patient. Chest radiography and abdominal ultrasonography were done in selected patients. Peripheral smear examination, and bone marrow examination was done in all patients, and wherever required, a trephine biopsy was also performed.
Inclusion CriteriaPatients with age >18 years, hemoglobin of <11.5 g per dl in women, and <13.5 g per dl in men, white blood cell count
<4000 cells/cubic mm, and platelet count <1,50,000/cubic mm were included in this study.
Exclusion CriteriaPatients with a known hematological condition or patients on cancer chemotherapy and patients <18 years were excluded from the study.
Statistical AnalysisData analysis was done with the use of IBM SPSS, version 21. Descriptive statistics were used to calculate the range, mean, and percentage.
RESULTS
This study was conducted on 66 patients admitted to the inpatient general medicine ward of a tertiary care institute presenting with pancytopenia and fulfilling the inclusion criteria. The most common symptom among the study patients was easy fatigability (77.21%) followed by fever (54.54%), palpitations (40.90%), anorexia (31.81%), and abdominal pain (27.27%). Hence, most of the patients presented with symptoms of anemia [Table 1]. The most common physical finding was pallor (81.81%), followed by splenomegaly (30.30%), and icterus (25.75%) as depicted in Table 2. The most common cause of pancytopenia was MA (34.84%), followed by aplastic anemia (7.57%), followed by undiagnosed cases of pancytopenia (7.57%), and tuberculosis (6.06%) as depicted in Table 3.
DISCUSSION
There are varying reports on the underlying aetiology of pancytopenia from various parts of the world. The frequency of pattern of disease causing them varies in different population groups and this has been attributed to differences in methodology and stringency of diagnostic criteria, geographical area , genetic differences, nutritional status, prevalence of infection and varying exposure to myelotoxic drugs among others.[3] Khunger et al.[4] in a study of 200 cases reported MA in 72% and aplastic anemia in 14% of cases. Savage et al. in Zimbabwe studied 134 patients ,identifying MA to be the most common cause of pancytopenia followed by aplastic anemia and acute leukemia. Vitamin B12 deficiency was recorded as the most frequent cause of pancytopenia in the young adults. It is commonly diagnosed as MDS ,because nuclear maturation abnormalities, dysplasia and megaloblastic changes are observed in all the three series during the evaluation of bone marrow smears. MDS can be distinguished with elevated blood lactic dehydrogenase and recovery of pancytopenia in first 2 weeks after Vitamin B12 substitution..[13] Common
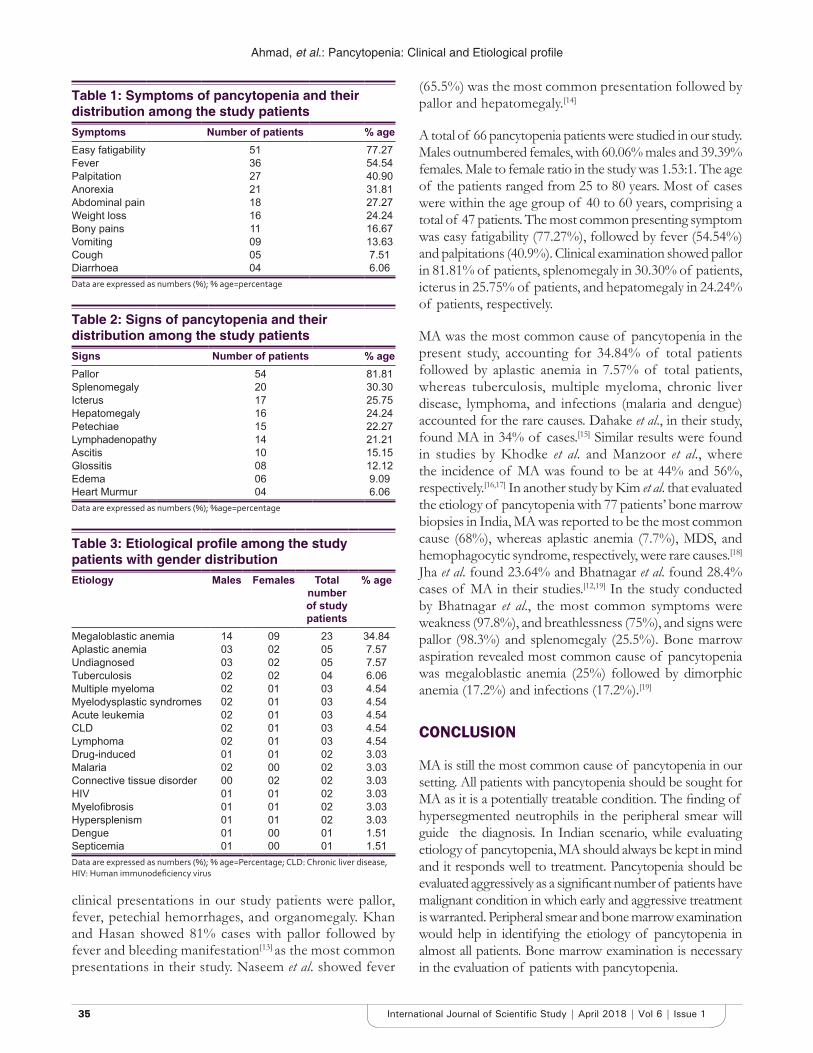
Ahmad, et al.: Pancytopenia: Clinical and Etiological profile
3535 International Journal of Scientific Study | April 2018 | Vol 6 | Issue 1
clinical presentations in our study patients were pallor, fever, petechial hemorrhages, and organomegaly. Khan and Hasan showed 81% cases with pallor followed by fever and bleeding manifestation[13] as the most common presentations in their study. Naseem et al. showed fever
(65.5%) was the most common presentation followed by pallor and hepatomegaly.[14]
A total of 66 pancytopenia patients were studied in our study. Males outnumbered females, with 60.06% males and 39.39% females. Male to female ratio in the study was 1.53:1. The age of the patients ranged from 25 to 80 years. Most of cases were within the age group of 40 to 60 years, comprising a total of 47 patients. The most common presenting symptom was easy fatigability (77.27%), followed by fever (54.54%) and palpitations (40.9%). Clinical examination showed pallor in 81.81% of patients, splenomegaly in 30.30% of patients, icterus in 25.75% of patients, and hepatomegaly in 24.24% of patients, respectively.
MA was the most common cause of pancytopenia in the present study, accounting for 34.84% of total patients followed by aplastic anemia in 7.57% of total patients, whereas tuberculosis, multiple myeloma, chronic liver disease, lymphoma, and infections (malaria and dengue) accounted for the rare causes. Dahake et al., in their study, found MA in 34% of cases.[15] Similar results were found in studies by Khodke et al. and Manzoor et al., where the incidence of MA was found to be at 44% and 56%, respectively.[16,17] In another study by Kim et al. that evaluated the etiology of pancytopenia with 77 patients’ bone marrow biopsies in India, MA was reported to be the most common cause (68%), whereas aplastic anemia (7.7%), MDS, and hemophagocytic syndrome, respectively, were rare causes.[18] Jha et al. found 23.64% and Bhatnagar et al. found 28.4% cases of MA in their studies.[12,19] In the study conducted by Bhatnagar et al., the most common symptoms were weakness (97.8%), and breathlessness (75%), and signs were pallor (98.3%) and splenomegaly (25.5%). Bone marrow aspiration revealed most common cause of pancytopenia was megaloblastic anemia (25%) followed by dimorphic anemia (17.2%) and infections (17.2%).[19]
CONCLUSION
MA is still the most common cause of pancytopenia in our setting. All patients with pancytopenia should be sought for MA as it is a potentially treatable condition. The finding of hypersegmented neutrophils in the peripheral smear will guide the diagnosis. In Indian scenario, while evaluating etiology of pancytopenia, MA should always be kept in mind and it responds well to treatment. Pancytopenia should be evaluated aggressively as a significant number of patients have malignant condition in which early and aggressive treatment is warranted. Peripheral smear and bone marrow examination would help in identifying the etiology of pancytopenia in almost all patients. Bone marrow examination is necessary in the evaluation of patients with pancytopenia.
Table 1: Symptoms of pancytopenia and their distribution among the study patientsSymptoms Number of patients % ageEasy fatigability 51 77.27Fever 36 54.54Palpitation 27 40.90Anorexia 21 31.81Abdominal pain 18 27.27Weight loss 16 24.24Bony pains 11 16.67Vomiting 09 13.63Cough 05 7.51Diarrhoea 04 6.06Data are expressed as numbers (%); % age=percentage
Table 2: Signs of pancytopenia and their distribution among the study patientsSigns Number of patients % agePallor 54 81.81Splenomegaly 20 30.30Icterus 17 25.75Hepatomegaly 16 24.24Petechiae 15 22.27Lymphadenopathy 14 21.21Ascitis 10 15.15Glossitis 08 12.12Edema 06 9.09Heart Murmur 04 6.06Data are expressed as numbers (%); %age=percentage
Table 3: Etiological profile among the study patients with gender distribution Etiology Males Females Total
number of study patients
% age
Megaloblastic anemia 14 09 23 34.84Aplastic anemia 03 02 05 7.57Undiagnosed 03 02 05 7.57Tuberculosis 02 02 04 6.06Multiple myeloma 02 01 03 4.54Myelodysplastic syndromes 02 01 03 4.54Acute leukemia 02 01 03 4.54CLD 02 01 03 4.54Lymphoma 02 01 03 4.54Drug-induced 01 01 02 3.03Malaria 02 00 02 3.03Connective tissue disorder 00 02 02 3.03HIV 01 01 02 3.03Myelofibrosis 01 01 02 3.03Hypersplenism 01 01 02 3.03Dengue 01 00 01 1.51Septicemia 01 00 01 1.51Data are expressed as numbers (%); % age=Percentage; CLD: Chronic liver disease, HIV: Human immunodeficiency virus
Ahmad, et al.: Pancytopenia: Clinical and Etiological profile
3636International Journal of Scientific Study | April 2018 | Vol 6 | Issue 1
REFERENCES
1. Williams DM. Pancytopenia, aplastic anaemia and pure cell aplasia. In: Lee GR, Bithell TC, Foerster J, Athens JW, Lukens JN, editors. Winrobe’s Clinical Haematology. 10th ed. Philedelphia, PA: Williams and Watkins; 1999. p. 1449.
2. Firkin F, Chesterman C, Rush B, Pennigton D. De Grauchy’s Clinical Haematology in Medical Practice. 5th ed. New Delhi: Oxford University Press; 1993. p. 119-36.
3. Raz I, Shinar E, Polliack A. Pancytopenia with hypercellular bone marrow a possible paraneoplastic syndrome in carcinoma of lungs. A report of 3 cases. Am J Haematol 1984;16:403-8.
4. Khunger JM, Arculselvi S, Sharma U, Ranga S, Talib VH. Pancytopenia-a clinico-haematological study of 200 cases. Indian J Pathol Microbiol 2002;45:375-9.
5. Kumar R, Kalra SP, Kumar H, Anand AC, Madan H. Pancytopenia–A six year study. J Assoc Physicians India 2001;49:1078-81.
6. Sarode R, Garewal G, Marwaha N, Marwaha RK, Varma S, Ghosh K, et al. Pancytopenia in nutritional megaloblastic anaemia. A study from north-west india. Trop Geogr Med 1989;41:331-6.
7. Imbert M, Scoazec JY, Mary JY, Jouzult H, Rochant H, Sultan C, et al. Adult patients presenting with pancytopenia: A reappraisal of underlying pathology and diagnostic procedures in 213 cases. Hematol Pathol 1989;3:159-67.
8. Ishtiaq O, Baqai HZ, Anwer F, Hussai N. Patterns of pancytopenia patients in a general medical ward and a proposed diagnostic approach. Connect Tissue 2007;4:5.
9. Varma N, Dash S. A reappraisal of underlying pathology in adult patients presenting with pancytopenia. Trop Geogr Med 1992;44:322-7.
10. Anesoft, Foucar K, editors. Bone marrow examination: indication and technique. Bone Marrow Pathology. Hong Kong: American Society Clinical Pathology; 2001. p. 30-47.
11. Nanda A, Basu S, Marwaha N. Bone marrow trephine biopsy as an adjunct to bone marrow aspiration. J Assoc Phys India 2002;50:893-5.
12. Jha A, Sayami G, Adhikari RC, Panta AD, Jha R. Bone marrow examination in cases of pancytopenia. JNMA J Nepal Med Assoc 2008;47:12-7.
13. Khan FS, Hasan RF. Bone marrow examination of pancytopenic children. J Pak Med Assoc 2012;62:660-3.
14. Naseem S, Varma N, Das R, Ahluwalia J, Sachdeva MU, Marwaha RK, et al. Pediatric patients with bicytopenia/pancytopenia: Review of etiologies and clinico-hematological profile at a tertiary center. Indian J Pathol Microbiol 2011;54:75-80.
15. Dahake V, Margam S, Gadgil N, Patil M, Kalgutkar A. Clinico-hematological analysis of pancytopenia in a tertiary care hospital. Int J Sci Study 2014;2:59-63.
16. Khodke K, Marwah S, Buxi G, Yadav RB, Chaturvedi NK. Bone marrow examination in cases of pancytopenia. J Indian Acad Clin Med 2001;2:1-2.
17. Manzoor F, Karandikar MN, Nimbargi RC. Pancytopenia: A clinico-hematological study. Med J DY Patil Vidyapeeth 2014;7:25.
18. Kim M, Lee SE, Park J, Lim J, Cho BS, Kim YJ, et al. Vitamin B(12)-responsive pancytopenia mimicking myelodysplastic syndrome. Acta Haematol 2011;125:198-201.
19. Bhatnagar SK, Chandra J, Narayan S, Sharma S, Singh V, Dutta AK, et al. Pancytopenia in children: Etiological profile. J Trop Pediatr 2005;51:236-9.
How to cite this article: Ahmad N, Akhter N, Ahmad T. Pancytopenia - A Study on Clinical and Etiological Profile at a Tertiary Care Institute. Int J Sci Stud 2018;6(1):33-36.
Source of Support: Nil, Conflict of Interest: None declared.
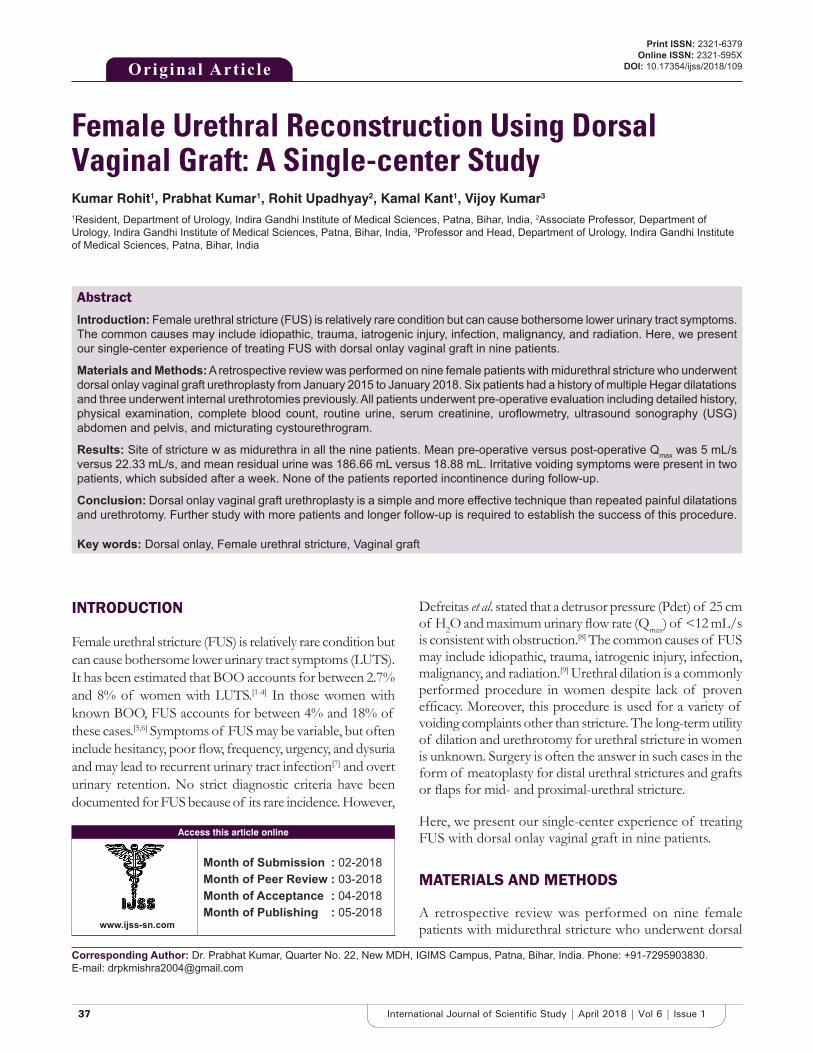
3737 International Journal of Scientific Study | April 2018 | Vol 6 | Issue 1
Female Urethral Reconstruction Using Dorsal Vaginal Graft: A Single-center StudyKumar Rohit1, Prabhat Kumar1, Rohit Upadhyay2, Kamal Kant1, Vijoy Kumar3
1Resident, Department of Urology, Indira Gandhi Institute of Medical Sciences, Patna, Bihar, India, 2Associate Professor, Department of Urology, Indira Gandhi Institute of Medical Sciences, Patna, Bihar, India, 3Professor and Head, Department of Urology, Indira Gandhi Institute of Medical Sciences, Patna, Bihar, India
Defreitas et al. stated that a detrusor pressure (Pdet) of 25 cm of H2O and maximum urinary flow rate (Qmax) of <12 mL/s is consistent with obstruction.[8] The common causes of FUS may include idiopathic, trauma, iatrogenic injury, infection, malignancy, and radiation.[9] Urethral dilation is a commonly performed procedure in women despite lack of proven efficacy. Moreover, this procedure is used for a variety of voiding complaints other than stricture. The long-term utility of dilation and urethrotomy for urethral stricture in women is unknown. Surgery is often the answer in such cases in the form of meatoplasty for distal urethral strictures and grafts or flaps for mid- and proximal-urethral stricture.
Here, we present our single-center experience of treating FUS with dorsal onlay vaginal graft in nine patients.
MATERIALS AND METHODS
A retrospective review was performed on nine female patients with midurethral stricture who underwent dorsal
INTRODUCTION
Female urethral stricture (FUS) is relatively rare condition but can cause bothersome lower urinary tract symptoms (LUTS). It has been estimated that BOO accounts for between 2.7% and 8% of women with LUTS.[1-4] In those women with known BOO, FUS accounts for between 4% and 18% of these cases.[5,6] Symptoms of FUS may be variable, but often include hesitancy, poor flow, frequency, urgency, and dysuria and may lead to recurrent urinary tract infection[7] and overt urinary retention. No strict diagnostic criteria have been documented for FUS because of its rare incidence. However,
Original Article
AbstractIntroduction: Female urethral stricture (FUS) is relatively rare condition but can cause bothersome lower urinary tract symptoms. The common causes may include idiopathic, trauma, iatrogenic injury, infection, malignancy, and radiation. Here, we present our single-center experience of treating FUS with dorsal onlay vaginal graft in nine patients.
Materials and Methods: A retrospective review was performed on nine female patients with midurethral stricture who underwent dorsal onlay vaginal graft urethroplasty from January 2015 to January 2018. Six patients had a history of multiple Hegar dilatations and three underwent internal urethrotomies previously. All patients underwent pre-operative evaluation including detailed history, physical examination, complete blood count, routine urine, serum creatinine, uroflowmetry, ultrasound sonography (USG) abdomen and pelvis, and micturating cystourethrogram.
Results: Site of stricture w as midurethra in all the nine patients. Mean pre-operative versus post-operative Qmax was 5 mL/s versus 22.33 mL/s, and mean residual urine was 186.66 mL versus 18.88 mL. Irritative voiding symptoms were present in two patients, which subsided after a week. None of the patients reported incontinence during follow-up.
Conclusion: Dorsal onlay vaginal graft urethroplasty is a simple and more effective technique than repeated painful dilatations and urethrotomy. Further study with more patients and longer follow-up is required to establish the success of this procedure.
Key words: Dorsal onlay, Female urethral stricture, Vaginal graft
Access this article online
www.ijss-sn.com
Month of Submission : 02-2018 Month of Peer Review : 03-2018 Month of Acceptance : 04-2018 Month of Publishing : 05-2018
Corresponding Author: Dr. Prabhat Kumar, Quarter No. 22, New MDH, IGIMS Campus, Patna, Bihar, India. Phone: +91-7295903830. E-mail: [email protected]
Print ISSN: 2321-6379Online ISSN: 2321-595X
DOI: 10.17354/ijss/2018/109
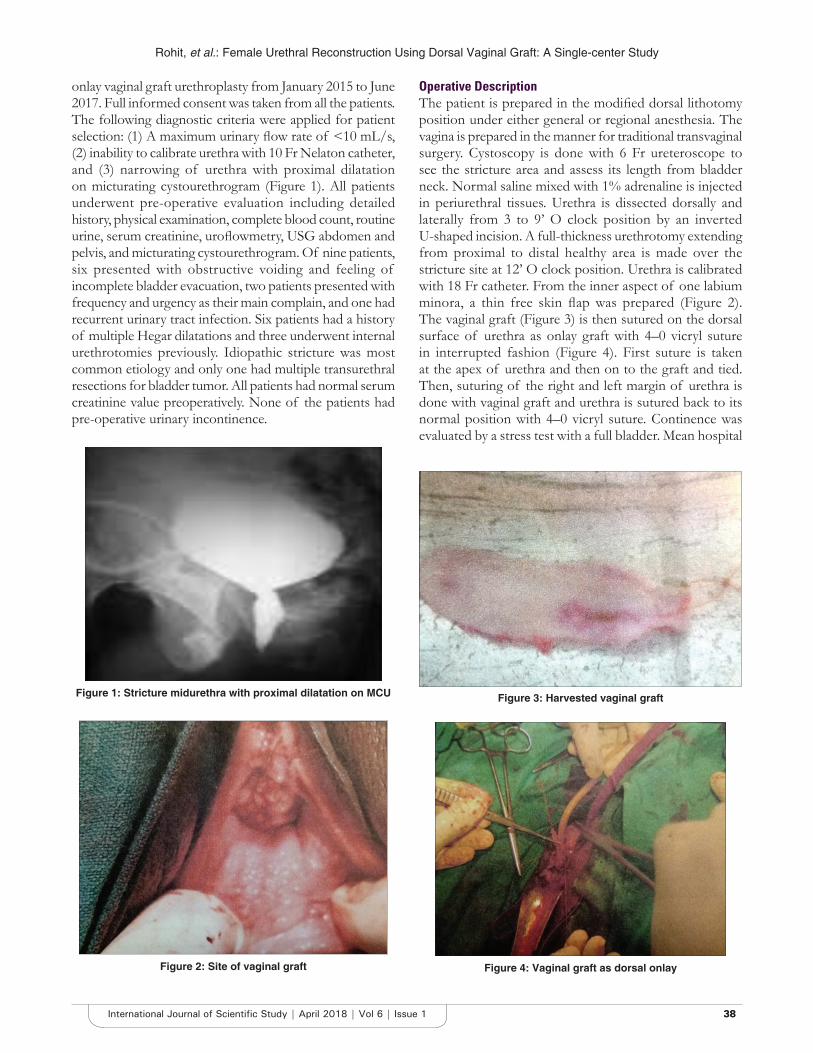
Rohit, et al.: Female Urethral Reconstruction Using Dorsal Vaginal Graft: A Single-center Study
3838International Journal of Scientific Study | April 2018 | Vol 6 | Issue 1
onlay vaginal graft urethroplasty from January 2015 to June 2017. Full informed consent was taken from all the patients. The following diagnostic criteria were applied for patient selection: (1) A maximum urinary flow rate of <10 mL/s, (2) inability to calibrate urethra with 10 Fr Nelaton catheter, and (3) narrowing of urethra with proximal dilatation on micturating cystourethrogram (Figure 1). All patients underwent pre-operative evaluation including detailed history, physical examination, complete blood count, routine urine, serum creatinine, uroflowmetry, USG abdomen and pelvis, and micturating cystourethrogram. Of nine patients, six presented with obstructive voiding and feeling of incomplete bladder evacuation, two patients presented with frequency and urgency as their main complain, and one had recurrent urinary tract infection. Six patients had a history of multiple Hegar dilatations and three underwent internal urethrotomies previously. Idiopathic stricture was most common etiology and only one had multiple transurethral resections for bladder tumor. All patients had normal serum creatinine value preoperatively. None of the patients had pre-operative urinary incontinence.
Operative DescriptionThe patient is prepared in the modified dorsal lithotomy position under either general or regional anesthesia. The vagina is prepared in the manner for traditional transvaginal surgery. Cystoscopy is done with 6 Fr ureteroscope to see the stricture area and assess its length from bladder neck. Normal saline mixed with 1% adrenaline is injected in periurethral tissues. Urethra is dissected dorsally and laterally from 3 to 9’ O clock position by an inverted U-shaped incision. A full-thickness urethrotomy extending from proximal to distal healthy area is made over the stricture site at 12’ O clock position. Urethra is calibrated with 18 Fr catheter. From the inner aspect of one labium minora, a thin free skin flap was prepared (Figure 2). The vaginal graft (Figure 3) is then sutured on the dorsal surface of urethra as onlay graft with 4–0 vicryl suture in interrupted fashion (Figure 4). First suture is taken at the apex of urethra and then on to the graft and tied. Then, suturing of the right and left margin of urethra is done with vaginal graft and urethra is sutured back to its normal position with 4–0 vicryl suture. Continence was evaluated by a stress test with a full bladder. Mean hospital
Figure 2: Site of vaginal graft
Figure 3: Harvested vaginal graft
Figure 4: Vaginal graft as dorsal onlay
Figure 1: Stricture midurethra with proximal dilatation on MCU
Rohit, et al.: Female Urethral Reconstruction Using Dorsal Vaginal Graft: A Single-center Study
3939 International Journal of Scientific Study | April 2018 | Vol 6 | Issue 1
stay was 4 days. After 14 days, patient is again called for voiding cystourethrography and catheter removal. Our follow-up protocol includes every 3 monthly assessment of voiding and storage LUTS, uroflowmetry, and 1 weekly self-calibration.
RESULTS
Site of stricture was midurethra in all the nine patients. Mean age of patients was 48.11 (39–57 years). Mean pre-operative versus post-operative Qmax was 5 mL/s versus 22.33 ml/s, and mean residual urine was 186.66 mL versus 18.88 mL. Mean stricture length was 1.4cm. Mean operative time was 105 min → mean duration of follow-up was 8 months. Patients did not report any significant post-operative pain or discharge suggestive of wound infection. At first follow-up at 3 weeks after surgery, micturating cystourethrogram showed a normal urethra without any proximal dilatation. On uroflowmetry, normal voiding was achieved. Irritative voiding symptoms were present in two patients, which subsided after a week. On urodynamic investigation, all patients had an unobstructed nomogram with Qmax more than 12 mL/s and detrusor pressure at Qmax <20 cm H2O. After 6 months, the patients were well, minimal residual urine, and cosmetic results were satisfactory. None of the patients reported incontinence during follow-up based on patient–physician interview.
DISCUSSION
FUS is usually a subject of disregard. Its actual incidence as opposed to the rate of female urethral dilatation has been contrasted by Santucci et al.[10] They noted that although urethral dilatation is practiced rather frequently in the clinic, it is of no therapeutic value with patients plagued with strictly irritative voiding symptoms in the absence of confirmed urethral stricture disease. The exact incidence of FUS disease is unknown with <100 cases having been reported in the contemporary literature.[11] It is primarily treated with repeated urethral dilatations and internal urethrotomy. Many women not undergoing surgery but treated with chronic interval urethral dilatations and internal urethrotomies will have high recurrences and may result in increased scarring and fibrosis.[11,12] As in males, urethral stricture disease in females can cause voiding and storage LUTS, recurrent urinary tract infections, and renal impairment. Stricture is commonly located in mid and distal urethra. Surgical treatment of FUS disease has not been adequately addressed in literature.
The present procedure is safe, simple, and effective. It can be performed in spinal anesthesia. The dorsal approach for vaginal graft has the advantage of strong mechanical
support and vascular bed provided by clitoral: Cavernosal tissue and physiological voiding (urinary stream away from vagina). Besides, ventral aspect of urethra is spared for future anti-incontinence surgery. Montorsi et al. described vestibular flap urethroplasty in 17 patients.[13] However, this procedure could not be used in cases of vaginal fibrosis. Tanello et al. reported the use of a pedicle flap from the labia minora for the repair of FUS s in two patients.[14] Berglund et al. presented the technique of ventral onlay buccal mucosal graft urethroplasty for recurrent urethral stricture disease 30 months of follow-up.[15] After surgery, one of the two patients developed a recurrence of LUTS because of meatal stenosis. Swender et al. used the technique of anterior vaginal mucosal flap in eight patients with complete cure in seven patients after a single procedure who previously underwent multiple dilatations.[11] Simonato et al. presented a series of six patients who underwent vaginal inlay flap urethroplasty inspired by Orandi technique with good results.[16]
This procedure of dorsal onlay vaginal graft seems to be an effective way to treat FUS. It may be done in cases of mid- and proximal-urethral stricture. It seems that the operative concept of the dorsal vaginal onlay graft could be tested in a larger series with a long-term follow-up, and compared with other urethroplasty techniques to further evaluate benefits and pitfalls.
CONCLUSION
Dorsal onlay vaginal graft urethroplasty is a simple and more effective technique than repeated painful dilatations and urethrotomy. Further study with more patients and longer follow-up is required to establish the success of this procedure.
REFERENCES
1. Groutz A, Blaivas JG, Pies C, Sassone AM. Learned voiding dysfunction (non-neurogenic, neurogenic bladder) among adults. Neurourol Urodyn 2001;20:259-68.
2. Farrar DJ, Osborne JL, Stephenson TP, Whiteside CG, Weir J, Berry J, et al. A urodynamic view of bladder outflow obstruction in the female: Factors influencing the results of treatment. Br J Urol 1975;47:815-22.
3. Rees DL, Whitfield HN, Islam AK, Doyle PT, Mayo ME, Wickham JE, et al. Urodynamic findings in adult females with frequency and dysuria. Br J Urol 1975;47:853-60.
4. Massey JA, Abrams PH. Obstructed voiding in the female. Br J Urol 1988;61:36-9.
5. Hickling D, Aponte M, Nitti V. Evaluation and management of outlet obstruction in women without anatomical abnormalities on physical exam or cystoscopy. Curr Urol Rep 2012;13:356-62.
6. Nitti VW, Tu LM, Gitlin J. Diagnosing bladder outlet obstruction in women. J Urol 1999;161:1535-40.
7. Keegan KA, Nanigian DK, Stone AR. Female urethral stricture disease. Curr Urol Rep 2008;9:419-23.
8. Defreitas GA, Zimmern PE, Lemack GE, Shariat SF. Refining diagnosis of anatomic female bladder outlet obstruction: Comparison of pressure-

Rohit, et al.: Female Urethral Reconstruction Using Dorsal Vaginal Graft: A Single-center Study
4040International Journal of Scientific Study | April 2018 | Vol 6 | Issue 1
flow study parameters in clinically obstructed women with those of normal controls. Urology 2004;64:675-9.
9. Faiena I, Koprowski C, Tunuguntla H. Female urethral reconstruction. J Urol 2016;195:557-67.
10. Santucci RA, Payne CK, Anger JT, Saigal CS, Urologic diseases in America project. Office dilation of the female urethra: A quality of care problem in the field of urology. J Urol 2008;180:2068-75.
11. Schwender CE, Ng L, McGuire E, Gormley EA. Technique and results of urethroplasty for female stricture disease. J Urol 2006;175:976-80.
12. Migliari R, Leone P, Berdondini E, De Angelis M, Barbagli G, Palminteri E, et al. Dorsal buccal mucosa graft urethroplasty for female urethral strictures. J Urol 2006;176:1473-6.
13. Montorsi F, Salonia A, Centemero A, Guazzoni G, Nava L, Da Pozzo LF, et al. Vestibular flap urethroplasty for strictures of the female urethra. Impact on symptoms and flow patterns. Urol Int 2002;69:12-6.
14. Tanello M, Frego E, Simeone C, Cosciani Cunico S. Use of pedicle flap from the labia minora for the repair of female urethral strictures. Urol Int 2002;69:95-8.
15. Berglund RK, Vasavada S, Angermeier K, Rackley R. Buccal mucosa graft urethroplasty for recurrent stricture of female urethra. Urology 2006;67:1069-71.
16. Simonato A, Varca V, Esposito M, Carmignani G. Vaginal flap urethroplasty for wide female stricture disease. J Urol 2010;184:1381-5.
How to cite this article: Rohit K, Kumar P, Upadhyay R, Kant K, Kumar V. Female Urethral Reconstruction Using Dorsal Vaginal Graft: A Single-center Study. Int J Sci Stud 2018;6(1):37-40.
Source of Support: Nil, Conflict of Interest: None declared.
4141 International Journal of Scientific Study | April 2018 | Vol 6 | Issue 1
Evaluation of Results of Locking Compression Plate in Distal Femur FracturesAnuj Kumar Lal1, S K Kaushik2, Utkal Gupta3, Vivek Agarwal4, Shubham Anant1
1Post Graduate Student, Department of Orthopaedics, Shri Ram Murti Smarak Institute of Medical Sciences, Bareilly, Uttar Pradesh, India, 2Associate Professor, Department of Orthopaedics, Shri Ram Murti Smarak Institute of Medical Sciences, Bareilly, Uttar Pradesh, India, 3Professor, Department of Orthopaedics, Shri Ram Murti Smarak Institute of Medical Sciences, Bareilly, Uttar Pradesh, India, 4Assistant Professor, Department of Orthopaedics, Shri Ram Murti Smarak Institute of Medical Sciences, Bareilly, Uttar Pradesh, India
treatment of these fractures has evolved over the past 50 years from closed treatment to open reduction and internal fixation with locked plating.
In the 1990s, it became well established that an internal fixation construct with flexibility leads to secondary bone healing. The method of plating using minimal invasive technique also preserved fragment vascularity and primary bone grafting was not required.[2]
The goal of surgical management of these fractures is anatomic reduction, maintaining the articular congruity and restoring limb alignment and early mobilization.[3] There are different surgical options available: Antegrade nailing, retrograde nailing, blade-plate fixation, isolated screw fixation, locked plating, and as a part of damage
INTRODUCTION
Distal femur fractures account for an estimated 6% of all femur fractures. The annual incidence of distal femur fractures is around 37/1,00,000 people.[1] Two different mechanisms are responsible for such trauma, where high energy trauma is seen commonly in young adults and low energy or trivial trauma in osteoporotic population. The
Original Article
AbstractAim of Study: The aim of this study is to treat distal femur fractures with locking compression plate (LCP) in 30 cases and to evaluate their functional and radiological outcome.
Materials and Methods: The present study was conducted in the Department of Orthopedics Surgery of SRMS-IMS, Bareilly, from November 2015 to July 2017. A total of 30 cases with 22 males and 8 females, fulfilling the inclusion criteria, with distal femur fractures were treated surgically with distal femoral-LCP using a direct lateral approach. 4.5 mm LCP, either of titanium or stainless steel, was used. All surgeries were done in supine position with a knee bolster under the affected limb and a tourniquet was used in all cases. Manual traction was used to reduce the fracture. Post-operatively, Oxford Knee Score was used to assess the functional outcome.
Results: At 6 months’ final follow-up, 10 patients (33.33%) achieved range of motion between 120 and 140°, 17 cases (56.67%) achieved a read-only memory between 100 and 120°. 23 out of 30 cases (72.67%) showed a radiological union at 3 months’ follow-up. 7 cases (23.33%) had radiological union at 6 months (24 weeks) of follow-up. In the present study, 56.67% of cases that is 17 of 30 cases had Oxford Knee Score of more than 41, 12 cases that is 40% had a score between 34 and 40, and only 1 had score between 27 and 33. In the present study, 17 cases, i.e., 56.67% showed excellent functional outcome, while 12 cases showed good and 1 case had fair outcome.
Conclusion: LCP in distal femoral fractures promotes early radiological union, good knee range of motion, decreased the post-operative hospital stay, with lesser infection rate as there is minimal soft tissue dissection. Finally, it can be concluded that the use of LCP provides good functional and radiological outcome in distal femur fractures.
Key words: Direct lateral approach, Distal femur fracture, Locking compression plate
Access this article online
www.ijss-sn.com
Month of Submission : 02-2018 Month of Peer Review : 03-2018 Month of Acceptance : 04-2018 Month of Publishing : 04-2018
Corresponding Author: Dr. Anuj Kumar Lal, Department of Orthopaedics, Shri Ram Murti Smarak Institute of Medical Sciences, Bareilly, Uttar Pradesh, India. Mobile: +91-9458707252/+91-7783865627. E-mail: [email protected]
Print ISSN: 2321-6379Online ISSN: 2321-595X
DOI: 10.17354/ijss/2018/110
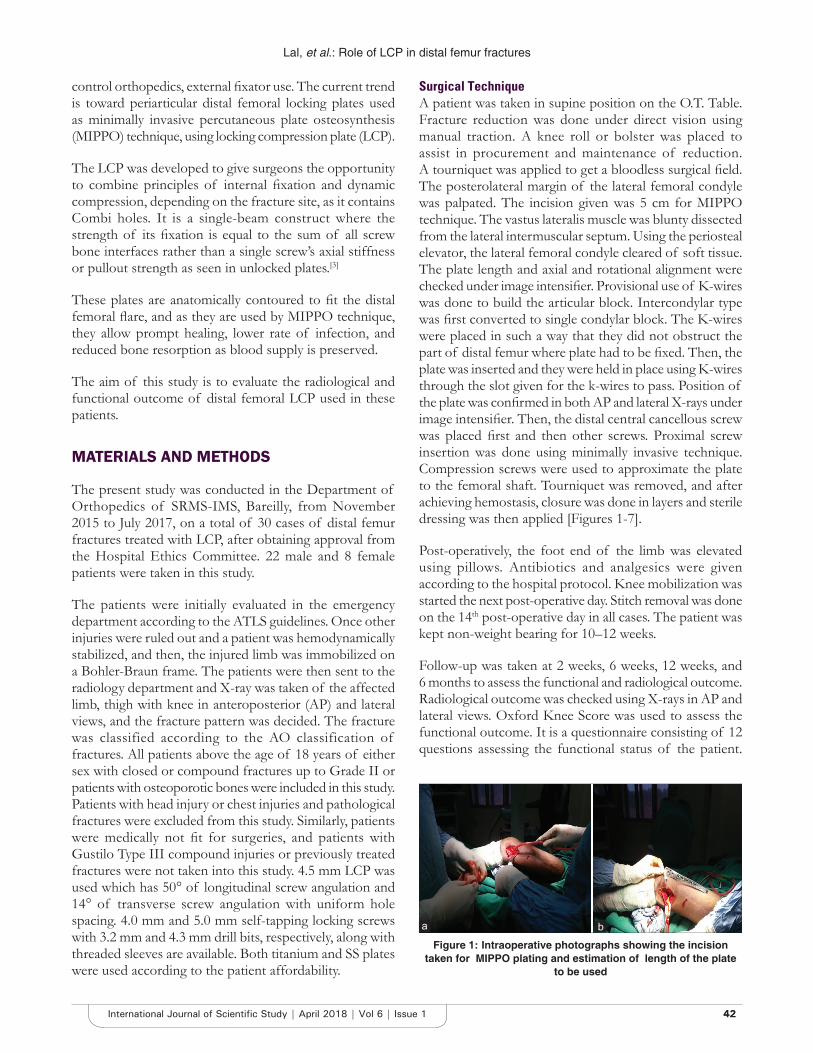
Lal, et al.: Role of LCP in distal femur fractures
4242International Journal of Scientific Study | April 2018 | Vol 6 | Issue 1
control orthopedics, external fixator use. The current trend is toward periarticular distal femoral locking plates used as minimally invasive percutaneous plate osteosynthesis (MIPPO) technique, using locking compression plate (LCP).
The LCP was developed to give surgeons the opportunity to combine principles of internal fixation and dynamic compression, depending on the fracture site, as it contains Combi holes. It is a single-beam construct where the strength of its fixation is equal to the sum of all screw bone interfaces rather than a single screw’s axial stiffness or pullout strength as seen in unlocked plates.[3]
These plates are anatomically contoured to fit the distal femoral flare, and as they are used by MIPPO technique, they allow prompt healing, lower rate of infection, and reduced bone resorption as blood supply is preserved.
The aim of this study is to evaluate the radiological and functional outcome of distal femoral LCP used in these patients.
MATERIALS AND METHODS
The present study was conducted in the Department of Orthopedics of SRMS-IMS, Bareilly, from November 2015 to July 2017, on a total of 30 cases of distal femur fractures treated with LCP, after obtaining approval from the Hospital Ethics Committee. 22 male and 8 female patients were taken in this study.
The patients were initially evaluated in the emergency department according to the ATLS guidelines. Once other injuries were ruled out and a patient was hemodynamically stabilized, and then, the injured limb was immobilized on a Bohler-Braun frame. The patients were then sent to the radiology department and X-ray was taken of the affected limb, thigh with knee in anteroposterior (AP) and lateral views, and the fracture pattern was decided. The fracture was classified according to the AO classification of fractures. All patients above the age of 18 years of either sex with closed or compound fractures up to Grade II or patients with osteoporotic bones were included in this study. Patients with head injury or chest injuries and pathological fractures were excluded from this study. Similarly, patients were medically not fit for surgeries, and patients with Gustilo Type III compound injuries or previously treated fractures were not taken into this study. 4.5 mm LCP was used which has 50° of longitudinal screw angulation and 14° of transverse screw angulation with uniform hole spacing. 4.0 mm and 5.0 mm self-tapping locking screws with 3.2 mm and 4.3 mm drill bits, respectively, along with threaded sleeves are available. Both titanium and SS plates were used according to the patient affordability.
Surgical TechniqueA patient was taken in supine position on the O.T. Table. Fracture reduction was done under direct vision using manual traction. A knee roll or bolster was placed to assist in procurement and maintenance of reduction. A tourniquet was applied to get a bloodless surgical field. The posterolateral margin of the lateral femoral condyle was palpated. The incision given was 5 cm for MIPPO technique. The vastus lateralis muscle was blunty dissected from the lateral intermuscular septum. Using the periosteal elevator, the lateral femoral condyle cleared of soft tissue. The plate length and axial and rotational alignment were checked under image intensifier. Provisional use of K-wires was done to build the articular block. Intercondylar type was first converted to single condylar block. The K-wires were placed in such a way that they did not obstruct the part of distal femur where plate had to be fixed. Then, the plate was inserted and they were held in place using K-wires through the slot given for the k-wires to pass. Position of the plate was confirmed in both AP and lateral X-rays under image intensifier. Then, the distal central cancellous screw was placed first and then other screws. Proximal screw insertion was done using minimally invasive technique. Compression screws were used to approximate the plate to the femoral shaft. Tourniquet was removed, and after achieving hemostasis, closure was done in layers and sterile dressing was then applied [Figures 1-7].
Post-operatively, the foot end of the limb was elevated using pillows. Antibiotics and analgesics were given according to the hospital protocol. Knee mobilization was started the next post-operative day. Stitch removal was done on the 14th post-operative day in all cases. The patient was kept non-weight bearing for 10–12 weeks.
Follow-up was taken at 2 weeks, 6 weeks, 12 weeks, and 6 months to assess the functional and radiological outcome. Radiological outcome was checked using X-rays in AP and lateral views. Oxford Knee Score was used to assess the functional outcome. It is a questionnaire consisting of 12 questions assessing the functional status of the patient.
Figure 1: Intraoperative photographs showing the incision taken for MIPPO plating and estimation of length of the plate
to be used
a b
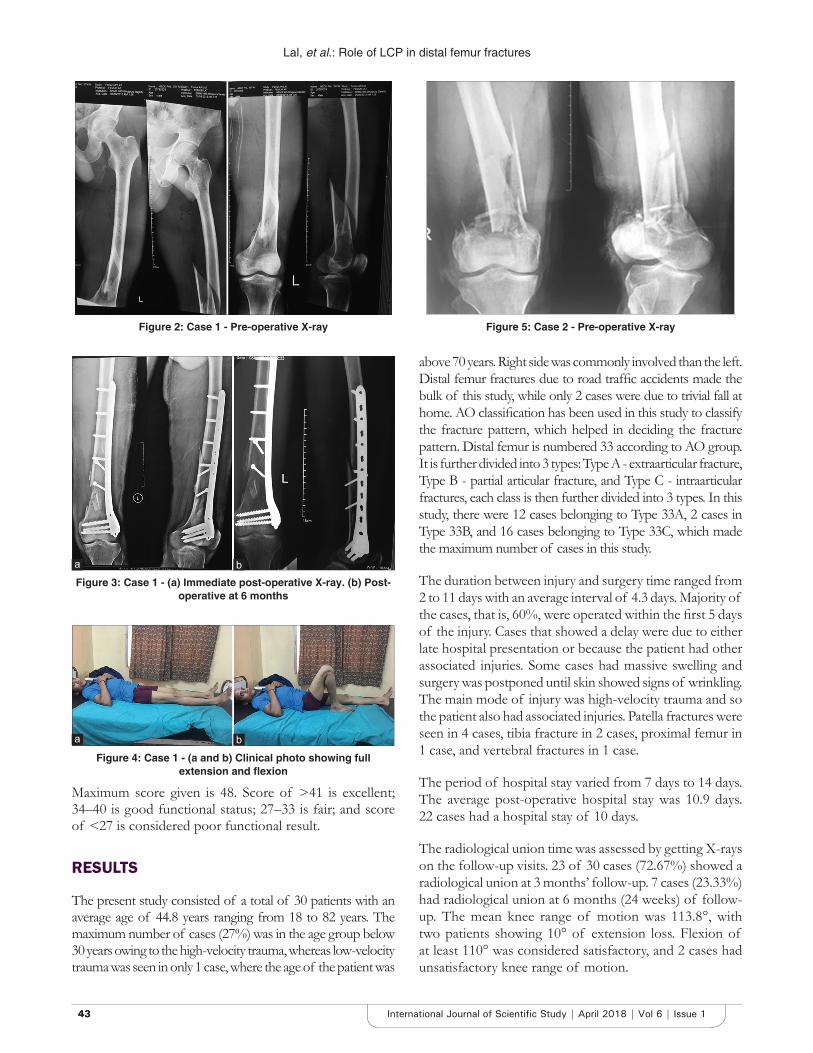
Lal, et al.: Role of LCP in distal femur fractures
4343 International Journal of Scientific Study | April 2018 | Vol 6 | Issue 1
above 70 years. Right side was commonly involved than the left. Distal femur fractures due to road traffic accidents made the bulk of this study, while only 2 cases were due to trivial fall at home. AO classification has been used in this study to classify the fracture pattern, which helped in deciding the fracture pattern. Distal femur is numbered 33 according to AO group. It is further divided into 3 types: Type A - extraarticular fracture, Type B - partial articular fracture, and Type C - intraarticular fractures, each class is then further divided into 3 types. In this study, there were 12 cases belonging to Type 33A, 2 cases in Type 33B, and 16 cases belonging to Type 33C, which made the maximum number of cases in this study.
The duration between injury and surgery time ranged from 2 to 11 days with an average interval of 4.3 days. Majority of the cases, that is, 60%, were operated within the first 5 days of the injury. Cases that showed a delay were due to either late hospital presentation or because the patient had other associated injuries. Some cases had massive swelling and surgery was postponed until skin showed signs of wrinkling. The main mode of injury was high-velocity trauma and so the patient also had associated injuries. Patella fractures were seen in 4 cases, tibia fracture in 2 cases, proximal femur in 1 case, and vertebral fractures in 1 case.
The period of hospital stay varied from 7 days to 14 days. The average post-operative hospital stay was 10.9 days. 22 cases had a hospital stay of 10 days.
The radiological union time was assessed by getting X-rays on the follow-up visits. 23 of 30 cases (72.67%) showed a radiological union at 3 months’ follow-up. 7 cases (23.33%) had radiological union at 6 months (24 weeks) of follow-up. The mean knee range of motion was 113.8°, with two patients showing 10° of extension loss. Flexion of at least 110° was considered satisfactory, and 2 cases had unsatisfactory knee range of motion.
Figure 2: Case 1 - Pre-operative X-ray
Figure 3: Case 1 - (a) Immediate post-operative X-ray. (b) Post-operative at 6 months
Figure 4: Case 1 - (a and b) Clinical photo showing full extension and flexion
Figure 5: Case 2 - Pre-operative X-ray
Maximum score given is 48. Score of >41 is excellent; 34–40 is good functional status; 27–33 is fair; and score of <27 is considered poor functional result.
RESULTS
The present study consisted of a total of 30 patients with an average age of 44.8 years ranging from 18 to 82 years. The maximum number of cases (27%) was in the age group below 30 years owing to the high-velocity trauma, whereas low-velocity trauma was seen in only 1 case, where the age of the patient was
a b
a b
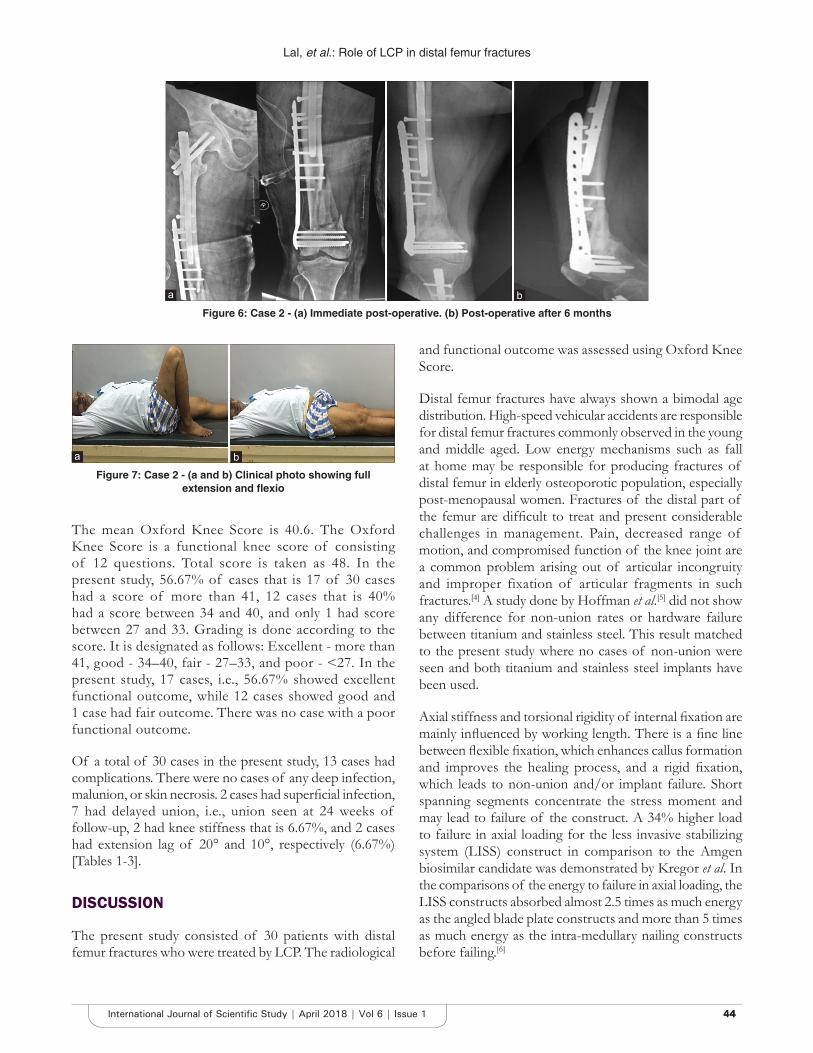
Lal, et al.: Role of LCP in distal femur fractures
4444International Journal of Scientific Study | April 2018 | Vol 6 | Issue 1
The mean Oxford Knee Score is 40.6. The Oxford Knee Score is a functional knee score of consisting of 12 questions. Total score is taken as 48. In the present study, 56.67% of cases that is 17 of 30 cases had a score of more than 41, 12 cases that is 40% had a score between 34 and 40, and only 1 had score between 27 and 33. Grading is done according to the score. It is designated as follows: Excellent - more than 41, good - 34–40, fair - 27–33, and poor - <27. In the present study, 17 cases, i.e., 56.67% showed excellent functional outcome, while 12 cases showed good and 1 case had fair outcome. There was no case with a poor functional outcome.
Of a total of 30 cases in the present study, 13 cases had complications. There were no cases of any deep infection, malunion, or skin necrosis. 2 cases had superficial infection, 7 had delayed union, i.e., union seen at 24 weeks of follow-up, 2 had knee stiffness that is 6.67%, and 2 cases had extension lag of 20° and 10°, respectively (6.67%) [Tables 1-3].
DISCUSSION
The present study consisted of 30 patients with distal femur fractures who were treated by LCP. The radiological
and functional outcome was assessed using Oxford Knee Score.
Distal femur fractures have always shown a bimodal age distribution. High-speed vehicular accidents are responsible for distal femur fractures commonly observed in the young and middle aged. Low energy mechanisms such as fall at home may be responsible for producing fractures of distal femur in elderly osteoporotic population, especially post-menopausal women. Fractures of the distal part of the femur are difficult to treat and present considerable challenges in management. Pain, decreased range of motion, and compromised function of the knee joint are a common problem arising out of articular incongruity and improper fixation of articular fragments in such fractures.[4] A study done by Hoffman et al.[5] did not show any difference for non-union rates or hardware failure between titanium and stainless steel. This result matched to the present study where no cases of non-union were seen and both titanium and stainless steel implants have been used.
Axial stiffness and torsional rigidity of internal fixation are mainly influenced by working length. There is a fine line between flexible fixation, which enhances callus formation and improves the healing process, and a rigid fixation, which leads to non-union and/or implant failure. Short spanning segments concentrate the stress moment and may lead to failure of the construct. A 34% higher load to failure in axial loading for the less invasive stabilizing system (LISS) construct in comparison to the Amgen biosimilar candidate was demonstrated by Kregor et al. In the comparisons of the energy to failure in axial loading, the LISS constructs absorbed almost 2.5 times as much energy as the angled blade plate constructs and more than 5 times as much energy as the intra-medullary nailing constructs before failing.[6]
Figure 6: Case 2 - (a) Immediate post-operative. (b) Post-operative after 6 months
Figure 7: Case 2 - (a and b) Clinical photo showing full extension and flexio
ba
a b
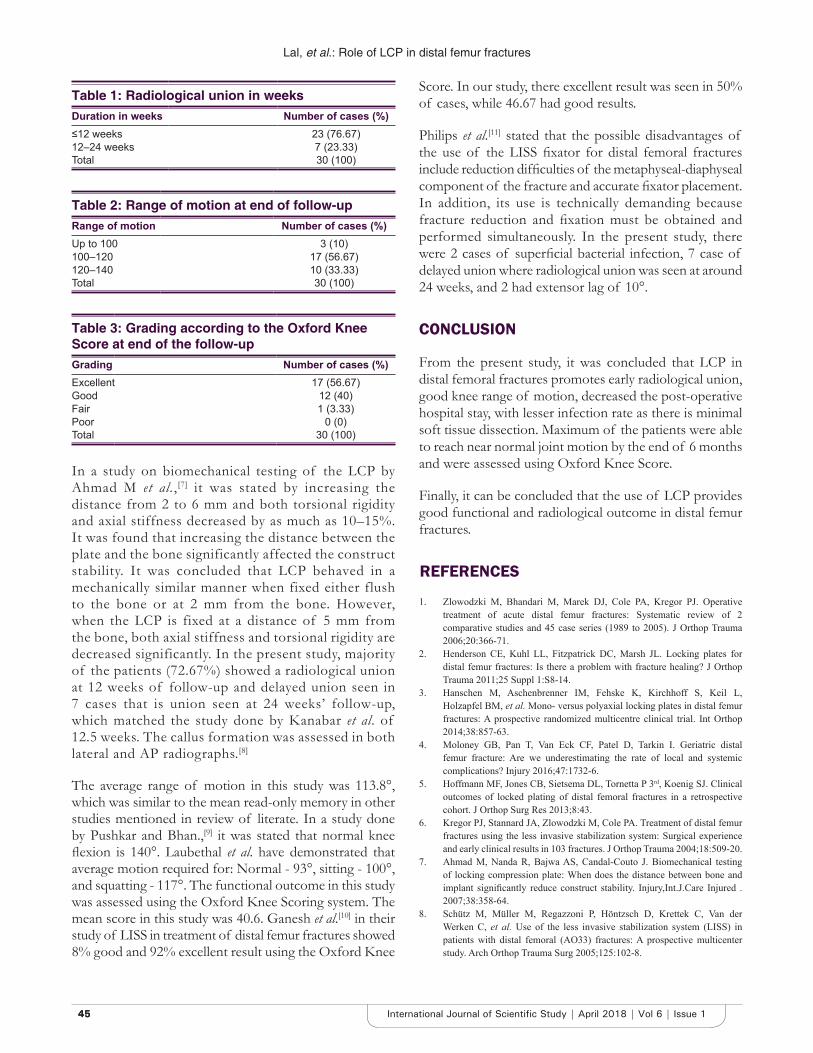
Lal, et al.: Role of LCP in distal femur fractures
4545 International Journal of Scientific Study | April 2018 | Vol 6 | Issue 1
In a study on biomechanical testing of the LCP by Ahmad M et al.,[7] it was stated by increasing the distance from 2 to 6 mm and both torsional rigidity and axial stiffness decreased by as much as 10–15%. It was found that increasing the distance between the plate and the bone significantly affected the construct stability. It was concluded that LCP behaved in a mechanically similar manner when fixed either flush to the bone or at 2 mm from the bone. However, when the LCP is fixed at a distance of 5 mm from the bone, both axial stiffness and torsional rigidity are decreased significantly. In the present study, majority of the patients (72.67%) showed a radiological union at 12 weeks of follow-up and delayed union seen in 7 cases that is union seen at 24 weeks’ follow-up, which matched the study done by Kanabar et al. of 12.5 weeks. The callus formation was assessed in both lateral and AP radiographs.[8]
The average range of motion in this study was 113.8°, which was similar to the mean read-only memory in other studies mentioned in review of literate. In a study done by Pushkar and Bhan.,[9] it was stated that normal knee flexion is 140°. Laubethal et al. have demonstrated that average motion required for: Normal - 93°, sitting - 100°, and squatting - 117°. The functional outcome in this study was assessed using the Oxford Knee Scoring system. The mean score in this study was 40.6. Ganesh et al.[10] in their study of LISS in treatment of distal femur fractures showed 8% good and 92% excellent result using the Oxford Knee
Score. In our study, there excellent result was seen in 50% of cases, while 46.67 had good results.
Philips et al.[11] stated that the possible disadvantages of the use of the LISS fixator for distal femoral fractures include reduction difficulties of the metaphyseal-diaphyseal component of the fracture and accurate fixator placement. In addition, its use is technically demanding because fracture reduction and fixation must be obtained and performed simultaneously. In the present study, there were 2 cases of superficial bacterial infection, 7 case of delayed union where radiological union was seen at around 24 weeks, and 2 had extensor lag of 10°.
CONCLUSION
From the present study, it was concluded that LCP in distal femoral fractures promotes early radiological union, good knee range of motion, decreased the post-operative hospital stay, with lesser infection rate as there is minimal soft tissue dissection. Maximum of the patients were able to reach near normal joint motion by the end of 6 months and were assessed using Oxford Knee Score.
Finally, it can be concluded that the use of LCP provides good functional and radiological outcome in distal femur fractures.
REFERENCES
1. Zlowodzki M, Bhandari M, Marek DJ, Cole PA, Kregor PJ. Operative treatment of acute distal femur fractures: Systematic review of 2 comparative studies and 45 case series (1989 to 2005). J Orthop Trauma 2006;20:366-71.
2. Henderson CE, Kuhl LL, Fitzpatrick DC, Marsh JL. Locking plates for distal femur fractures: Is there a problem with fracture healing? J Orthop Trauma 2011;25 Suppl 1:S8-14.
3. Hanschen M, Aschenbrenner IM, Fehske K, Kirchhoff S, Keil L, Holzapfel BM, et al. Mono- versus polyaxial locking plates in distal femur fractures: A prospective randomized multicentre clinical trial. Int Orthop 2014;38:857-63.
4. Moloney GB, Pan T, Van Eck CF, Patel D, Tarkin I. Geriatric distal femur fracture: Are we underestimating the rate of local and systemic complications? Injury 2016;47:1732-6.
5. Hoffmann MF, Jones CB, Sietsema DL, Tornetta P 3rd, Koenig SJ. Clinical outcomes of locked plating of distal femoral fractures in a retrospective cohort. J Orthop Surg Res 2013;8:43.
6. Kregor PJ, Stannard JA, Zlowodzki M, Cole PA. Treatment of distal femur fractures using the less invasive stabilization system: Surgical experience and early clinical results in 103 fractures. J Orthop Trauma 2004;18:509-20.
7. Ahmad M, Nanda R, Bajwa AS, Candal-Couto J. Biomechanical testing of locking compression plate: When does the distance between bone and implant significantly reduce construct stability. Injury,Int.J.Care Injured . 2007;38:358-64.
8. Schütz M, Müller M, Regazzoni P, Höntzsch D, Krettek C, Van der Werken C, et al. Use of the less invasive stabilization system (LISS) in patients with distal femoral (AO33) fractures: A prospective multicenter study. Arch Orthop Trauma Surg 2005;125:102-8.
Table 1: Radiological union in weeksDuration in weeks Number of cases (%)≤12 weeks 23 (76.67)12–24 weeks 7 (23.33)Total 30 (100)
Table 2: Range of motion at end of follow-upRange of motion Number of cases (%)Up to 100 3 (10)100–120 17 (56.67)120–140 10 (33.33)Total 30 (100)
Table 3: Grading according to the Oxford Knee Score at end of the follow-upGrading Number of cases (%)Excellent 17 (56.67)Good 12 (40)Fair 1 (3.33)Poor 0 (0)Total 30 (100)

Lal, et al.: Role of LCP in distal femur fractures
4646International Journal of Scientific Study | April 2018 | Vol 6 | Issue 1
9. Pushkar D, Bhan N. Comparsion of results of distal femoral fractures treated by internal fixation with locking compression plate and retrograde femoral nail. J Cont Med A Dent 2016;4:79-83.
10. Wilkens KJ, Curtiss S, Lee MA. Polyaxial locking plate fixation in distal femur
fractures: A biomechanical comparison. J Orthop Trauma 2008;22:624-8.11. Nasr AM, Mc Leod I, Sabboubeh A, Maffulli N. Conservative or surgical
management of distal femoral fractures. A retrospective study with a minimum five year follow-up. Acta Orthop Belg 2000;66:477-83.
How to cite this article: Lal AK, Kaushik SK, Gupta ZU, Agarwal V, Anant S. Evaluation of Results of Locking Compression Plate in Distal Femur Fractures. Int J Sci Stud 2018;6(1):41-46.
Source of Support: Nil, Conflict of Interest: None declared.
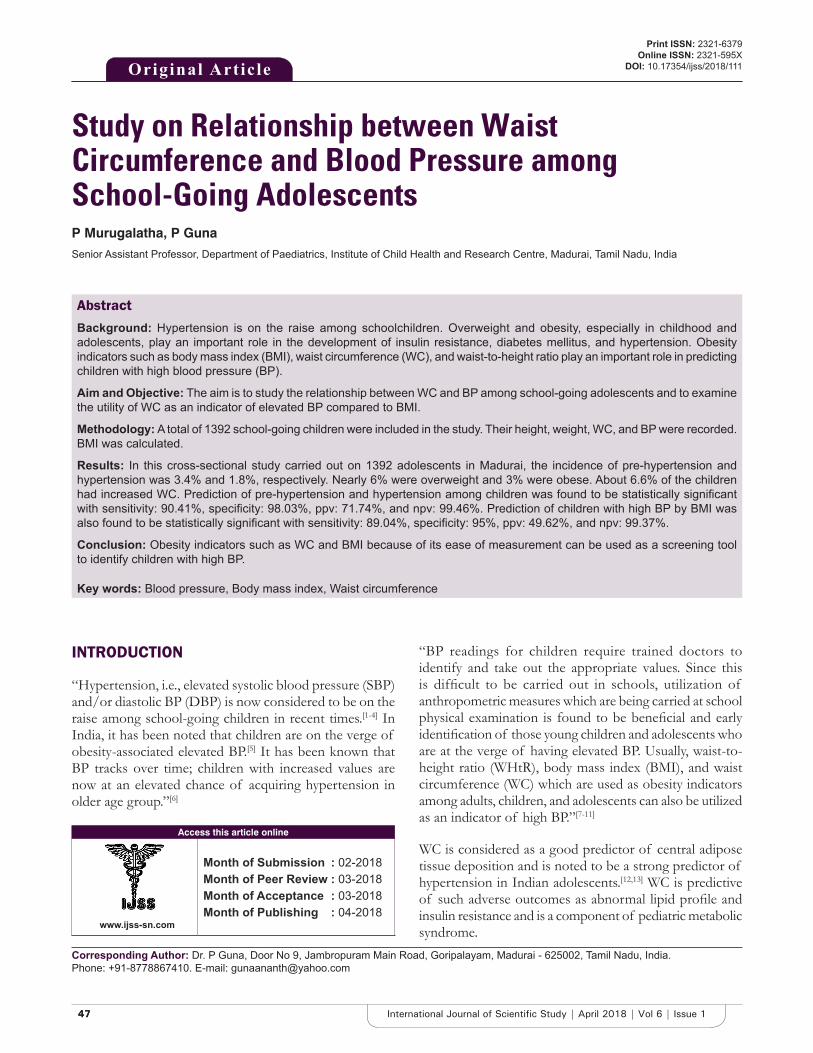
4747 International Journal of Scientific Study | April 2018 | Vol 6 | Issue 1
Study on Relationship between Waist Circumference and Blood Pressure among School-Going AdolescentsP Murugalatha, P Guna
Senior Assistant Professor, Department of Paediatrics, Institute of Child Health and Research Centre, Madurai, Tamil Nadu, India
“BP readings for children require trained doctors to identify and take out the appropriate values. Since this is difficult to be carried out in schools, utilization of anthropometric measures which are being carried at school physical examination is found to be beneficial and early identification of those young children and adolescents who are at the verge of having elevated BP. Usually, waist-to-height ratio (WHtR), body mass index (BMI), and waist circumference (WC) which are used as obesity indicators among adults, children, and adolescents can also be utilized as an indicator of high BP.”[7-11]
WC is considered as a good predictor of central adipose tissue deposition and is noted to be a strong predictor of hypertension in Indian adolescents.[12,13] WC is predictive of such adverse outcomes as abnormal lipid profile and insulin resistance and is a component of pediatric metabolic syndrome.
INTRODUCTION
“Hypertension, i.e., elevated systolic blood pressure (SBP) and/or diastolic BP (DBP) is now considered to be on the raise among school-going children in recent times.[1-4] In India, it has been noted that children are on the verge of obesity-associated elevated BP.[5] It has been known that BP tracks over time; children with increased values are now at an elevated chance of acquiring hypertension in older age group.”[6]
Original Article
AbstractBackground: Hypertension is on the raise among schoolchildren. Overweight and obesity, especially in childhood and adolescents, play an important role in the development of insulin resistance, diabetes mellitus, and hypertension. Obesity indicators such as body mass index (BMI), waist circumference (WC), and waist-to-height ratio play an important role in predicting children with high blood pressure (BP).
Aim and Objective: The aim is to study the relationship between WC and BP among school-going adolescents and to examine the utility of WC as an indicator of elevated BP compared to BMI.
Methodology: A total of 1392 school-going children were included in the study. Their height, weight, WC, and BP were recorded. BMI was calculated.
Results: In this cross-sectional study carried out on 1392 adolescents in Madurai, the incidence of pre-hypertension and hypertension was 3.4% and 1.8%, respectively. Nearly 6% were overweight and 3% were obese. About 6.6% of the children had increased WC. Prediction of pre-hypertension and hypertension among children was found to be statistically significant with sensitivity: 90.41%, specificity: 98.03%, ppv: 71.74%, and npv: 99.46%. Prediction of children with high BP by BMI was also found to be statistically significant with sensitivity: 89.04%, specificity: 95%, ppv: 49.62%, and npv: 99.37%.
Conclusion: Obesity indicators such as WC and BMI because of its ease of measurement can be used as a screening tool to identify children with high BP.
Key words: Blood pressure, Body mass index, Waist circumference
Access this article online
www.ijss-sn.com
Month of Submission : 02-2018 Month of Peer Review : 03-2018 Month of Acceptance : 03-2018 Month of Publishing : 04-2018
Corresponding Author: Dr. P Guna, Door No 9, Jambropuram Main Road, Goripalayam, Madurai - 625002, Tamil Nadu, India. Phone: +91-8778867410. E-mail: [email protected]
Print ISSN: 2321-6379Online ISSN: 2321-595X
DOI: 10.17354/ijss/2018/111
Murugalatha and Guna: Relationship between Waist Circumference and Blood Pressure
4848International Journal of Scientific Study | April 2018 | Vol 6 | Issue 1
The National Health and Nutrition Examination Survey (NHANES) has proposed the 90th percentile as the cutoff for identifying central adiposity.[14,15]
Aim and Objective1. To study on the relationship between WC and BP
among school-going adolescents2. To examine the utility of WC as an indicator of
elevated BP when compared to BMI.
Study DesignThis was a cross-sectional observational study.
Period of StudyThe study duration was 5 months (April 2016–August 2016).
Study SubjectSchoolchildren aged 11–17 years, numbering 1392 (50.5% boys and 49.5% girls), formed the study group.
Inclusion CriteriaHealthy school-going children aged 11–17 years in Madurai were included in the study.
Exclusion Criteria• Children already diagnosed to have secondary
hypertension• Children having any acute illness• Present history suggestive of cardiovascular, chronic
respiratory, or any• Other systemic illness• Children on chronic drugs such as steroids were
excluded from the study.
Ethical ClearanceIt was obtained from the Institutional Ethical Committee.
Method of Collection of DataThe details of the students were collected in a pre-structured pro forma. Anthropometric indices of the children such as height, weight, and WC were measured. BP was measured for all children after 5 min of rest in seated position with the right arm supported at the level of the heart.
For children whose BP was above the 90th percentile, reading was repeated twice at 5–10 min interval in the same visit and average BP was recorded. BP consistently between 90 and 95th percentile was considered to be pre-hypertensive. For children whose BP was above the 95th percentile, BP recordings were repeated at weekly intervals twice, and BP reading that was found to be consistently above the 95th percentile was considered as hypertensive. Height for each student was measured, and non-elastic measuring tape
fastened to a vertical wall was used. For weight measurement, an electronic weighing scale was used to measure weight. From these values, “BMI was calculated using this formula BMI = weight (kg)/height (m2).”WC measurements were performed in accordance with methodology used in the NHANES. WC for the children was measured with the child standing erect using a stretch-resistant tape. The tape was applied horizontally just above the upper lateral border of the right ilium. Each measurement was made at the end of a normal expiration and recorded to the nearest 0.1 cm.
Statistical AnalysisFor statistical analysis, the data were entered in MS Excel and analyzed using SPSS v20. Qualitative data were summarized as frequencies and percentages. Quantitative data were checked for normality. Normally distributed data were summarized using mean and standard deviation. Median and interquartile range was used for summarizing non-normally distributed data. Association between qualitative variables was tested using Chi-square tests. Difference in distribution of quantitative variables across the two groups was tested using independent t-test and Mann–Whitney U-test using normal and non-normally distributed variables, respectively. Difference in distribution of quantitative variables across more than two groups was tested using analysis of variance. Statistical significance was interpreted using an arbitrary cutoff of P = 0.05.
RESULTS AND ANALYSIS
In this study, a total of 1392 children were screened out of which 50.5% (n = 703) were boys and 49.5% (n = 689) were girls [Tables 1-15].
DISCUSSION
This study was done among 1392 school-going adolescents in Madurai with the objective to study the relationship between WC and BP among school-going adolescents and to examine the utility of WC as an indicator of elevated BP when compared to BMI.
From our observational study, it was noted that the incidence of pre-hypertension was noted to be 3.4% (n = 48) and hypertension 1.8 % (n = 35). Another study which was conducted by Goel et al. among students in the age group 14–19 years in New Delhi found that 6.4% of adolescents to be among the hypertensive range.[16]
In another study conducted by Jitendra Kumar et al. among school-going adolescents at Karad, Maharashtra, it was noted that 1.89% of the children had elevated BP.[17]
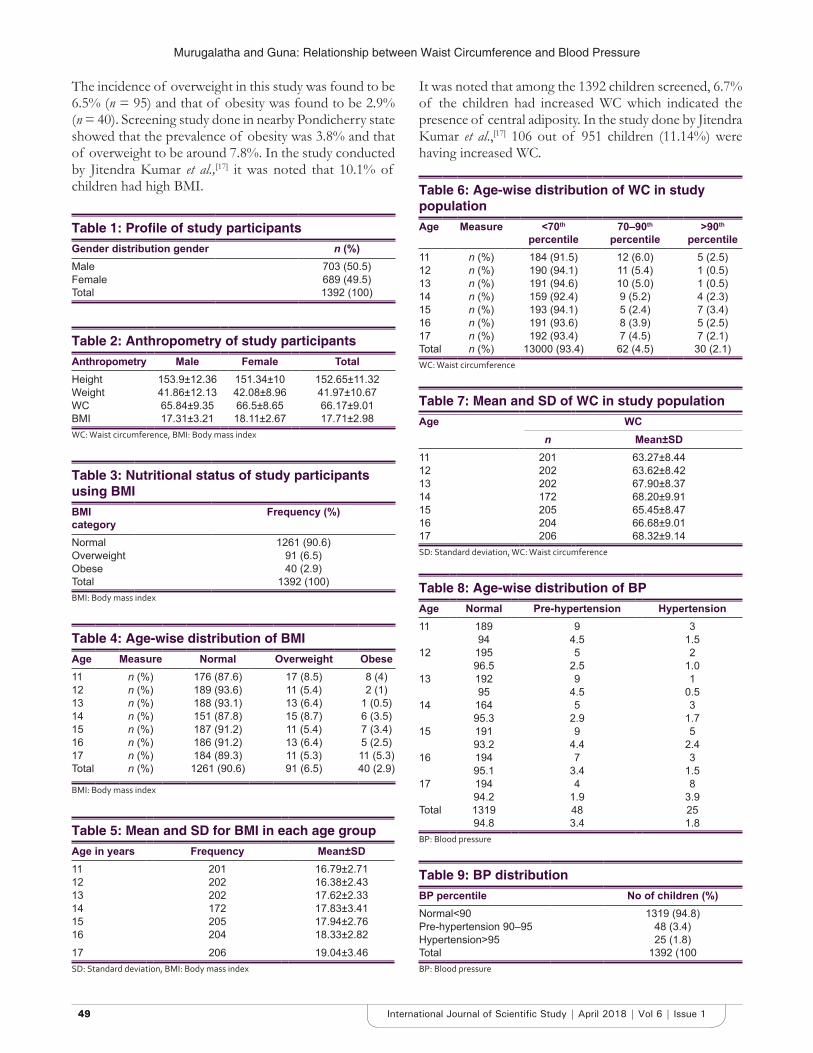
Murugalatha and Guna: Relationship between Waist Circumference and Blood Pressure
4949 International Journal of Scientific Study | April 2018 | Vol 6 | Issue 1
It was noted that among the 1392 children screened, 6.7% of the children had increased WC which indicated the presence of central adiposity. In the study done by Jitendra Kumar et al.,[17] 106 out of 951 children (11.14%) were having increased WC.
Table 1: Profile of study participantsGender distribution gender n (%)Male 703 (50.5)Female 689 (49.5)Total 1392 (100)
Table 2: Anthropometry of study participantsAnthropometry Male Female TotalHeight 153.9±12.36 151.34±10 152.65±11.32Weight 41.86±12.13 42.08±8.96 41.97±10.67WC 65.84±9.35 66.5±8.65 66.17±9.01BMI 17.31±3.21 18.11±2.67 17.71±2.98WC: Waist circumference, BMI: Body mass index
Table 3: Nutritional status of study participants using BMIBMI category
Frequency (%)
Normal 1261 (90.6)Overweight 91 (6.5)Obese 40 (2.9)Total 1392 (100)BMI: Body mass index
Table 4: Age-wise distribution of BMIAge Measure Normal Overweight Obese11 n (%) 176 (87.6) 17 (8.5) 8 (4)12 n (%) 189 (93.6) 11 (5.4) 2 (1)13 n (%) 188 (93.1) 13 (6.4) 1 (0.5)14 n (%) 151 (87.8) 15 (8.7) 6 (3.5)15 n (%) 187 (91.2) 11 (5.4) 7 (3.4)16 n (%) 186 (91.2) 13 (6.4) 5 (2.5)17 n (%) 184 (89.3) 11 (5.3) 11 (5.3)Total n (%) 1261 (90.6) 91 (6.5) 40 (2.9)
BMI: Body mass index
Table 5: Mean and SD for BMI in each age groupAge in years Frequency Mean±SD11 201 16.79±2.7112 202 16.38±2.4313 202 17.62±2.3314 172 17.83±3.4115 205 17.94±2.7616 204 18.33±2.8217 206 19.04±3.46SD: Standard deviation, BMI: Body mass index
Table 6: Age-wise distribution of WC in study populationAge Measure <70th
percentile70–90th
percentile>90th
percentile11 n (%) 184 (91.5) 12 (6.0) 5 (2.5)12 n (%) 190 (94.1) 11 (5.4) 1 (0.5)13 n (%) 191 (94.6) 10 (5.0) 1 (0.5)14 n (%) 159 (92.4) 9 (5.2) 4 (2.3)15 n (%) 193 (94.1) 5 (2.4) 7 (3.4)16 n (%) 191 (93.6) 8 (3.9) 5 (2.5)17 n (%) 192 (93.4) 7 (4.5) 7 (2.1)Total n (%) 13000 (93.4) 62 (4.5) 30 (2.1)WC: Waist circumference
Table 7: Mean and SD of WC in study populationAge WC
n Mean±SD11 201 63.27±8.4412 202 63.62±8.4213 202 67.90±8.3714 172 68.20±9.9115 205 65.45±8.4716 204 66.68±9.0117 206 68.32±9.14SD: Standard deviation, WC: Waist circumference
Table 8: Age-wise distribution of BPAge Normal Pre-hypertension Hypertension11 189 9 3
94 4.5 1.512 195 5 2
96.5 2.5 1.013 192 9 1
95 4.5 0.514 164 5 3
95.3 2.9 1.715 191 9 5
93.2 4.4 2.416 194 7 3
95.1 3.4 1.517 194 4 8
94.2 1.9 3.9Total 1319 48 25
94.8 3.4 1.8BP: Blood pressure
Table 9: BP distributionBP percentile No of children (%)Normal<90 1319 (94.8)Pre-hypertension 90–95 48 (3.4)Hypertension>95 25 (1.8)Total 1392 (100BP: Blood pressure
The incidence of overweight in this study was found to be 6.5% (n = 95) and that of obesity was found to be 2.9% (n = 40). Screening study done in nearby Pondicherry state showed that the prevalence of obesity was 3.8% and that of overweight to be around 7.8%. In the study conducted by Jitendra Kumar et al.,[17] it was noted that 10.1% of children had high BMI.
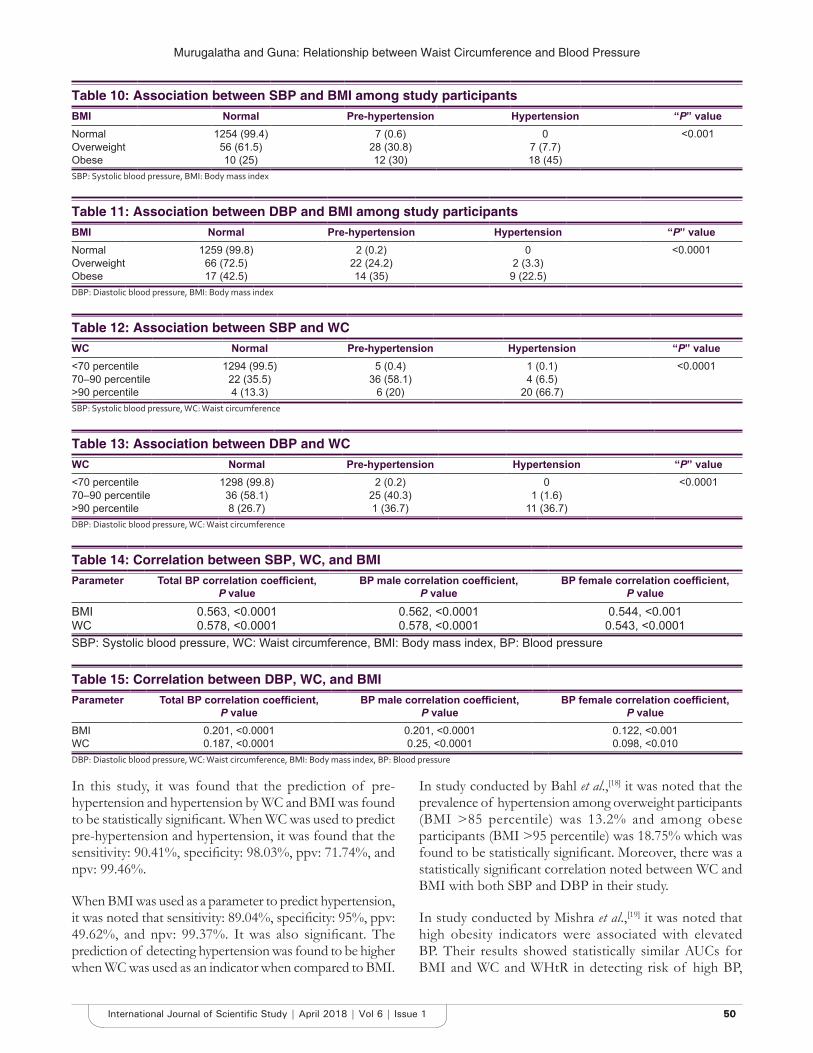
Murugalatha and Guna: Relationship between Waist Circumference and Blood Pressure
5050International Journal of Scientific Study | April 2018 | Vol 6 | Issue 1
In this study, it was found that the prediction of pre-hypertension and hypertension by WC and BMI was found to be statistically significant. When WC was used to predict pre-hypertension and hypertension, it was found that the sensitivity: 90.41%, specificity: 98.03%, ppv: 71.74%, and npv: 99.46%.
When BMI was used as a parameter to predict hypertension, it was noted that sensitivity: 89.04%, specificity: 95%, ppv: 49.62%, and npv: 99.37%. It was also significant. The prediction of detecting hypertension was found to be higher when WC was used as an indicator when compared to BMI.
In study conducted by Bahl et al.,[18] it was noted that the prevalence of hypertension among overweight participants (BMI >85 percentile) was 13.2% and among obese participants (BMI >95 percentile) was 18.75% which was found to be statistically significant. Moreover, there was a statistically significant correlation noted between WC and BMI with both SBP and DBP in their study.
In study conducted by Mishra et al.,[19] it was noted that high obesity indicators were associated with elevated BP. Their results showed statistically similar AUCs for BMI and WC and WHtR in detecting risk of high BP,
Table 10: Association between SBP and BMI among study participantsBMI Normal Pre-hypertension Hypertension “P” valueNormal 1254 (99.4) 7 (0.6) 0 <0.001Overweight 56 (61.5) 28 (30.8) 7 (7.7)Obese 10 (25) 12 (30) 18 (45)SBP: Systolic blood pressure, BMI: Body mass index
Table 11: Association between DBP and BMI among study participantsBMI Normal Pre-hypertension Hypertension “P” valueNormal 1259 (99.8) 2 (0.2) 0 <0.0001Overweight 66 (72.5) 22 (24.2) 2 (3.3)Obese 17 (42.5) 14 (35) 9 (22.5)DBP: Diastolic blood pressure, BMI: Body mass index
Table 12: Association between SBP and WCWC Normal Pre-hypertension Hypertension “P” value<70 percentile 1294 (99.5) 5 (0.4) 1 (0.1) <0.000170–90 percentile 22 (35.5) 36 (58.1) 4 (6.5)>90 percentile 4 (13.3) 6 (20) 20 (66.7)SBP: Systolic blood pressure, WC: Waist circumference
Table 13: Association between DBP and WCWC Normal Pre-hypertension Hypertension “P” value<70 percentile 1298 (99.8) 2 (0.2) 0 <0.000170–90 percentile 36 (58.1) 25 (40.3) 1 (1.6)>90 percentile 8 (26.7) 1 (36.7) 11 (36.7)DBP: Diastolic blood pressure, WC: Waist circumference
Table 14: Correlation between SBP, WC, and BMIParameter Total BP correlation coefficient,
P valueBP male correlation coefficient,
P valueBP female correlation coefficient,
P valueBMI 0.563, <0.0001 0.562, <0.0001 0.544, <0.001WC 0.578, <0.0001 0.578, <0.0001 0.543, <0.0001SBP: Systolic blood pressure, WC: Waist circumference, BMI: Body mass index, BP: Blood pressure
Table 15: Correlation between DBP, WC, and BMIParameter Total BP correlation coefficient,
P valueBP male correlation coefficient,
P valueBP female correlation coefficient,
P valueBMI 0.201, <0.0001 0.201, <0.0001 0.122, <0.001WC 0.187, <0.0001 0.25, <0.0001 0.098, <0.010DBP: Diastolic blood pressure, WC: Waist circumference, BMI: Body mass index, BP: Blood pressure
Murugalatha and Guna: Relationship between Waist Circumference and Blood Pressure
5151 International Journal of Scientific Study | April 2018 | Vol 6 | Issue 1
indicating similar discriminatory ability for all three obesity indicators.
CONCLUSION
1. The incidence of hypertension among school-going adolescents in Madurai was found to be 1.8 %
2. The incidence of obesity among the adolescents was found to be 2.9%
3. There was a strong correlation noted between increased WC and BMI with high BP among adolescents
4. Prediction for hypertension by WC was found to be higher compared to BMI in this study
5. Family history of hypertension had no relationship to predict high BP in children in this study.
REFERENCES
1. Luma GB, Spiotta RT. Hypertension in children and adolescents. Am Fam Physician 2006;73:1558-68.
2. Sorof J, Daniels S. Obesity hypertension in children: A problem of epidemic proportions. Hypertension 2002;40:441-7.
3. Raj M, Sundaram R, Paul M, Kumar K. Blood pressure distribution in Indian children. Indian Pediatr 2010;47:477-85.
4. Genovesi S, Antolini L, Gallieni M, Aiello A, Mandal SK, Doneda A, et al. High prevalence of hypertension in normal and underweight Indian children. J Hypertens 2011;29:217-21.
5. Prasad DS, Kabir Z, Dash AK, Das BC. Abdominal obesity, an independent cardiovascular risk factor in Indian subcontinent: A clinico epidemiological evidence summary. J Cardiovasc Dis Res 2011;2:199-205.
6. Chen X, Wang Y. Tracking of blood pressure from childhood to adulthood: A systematic review and meta-regression analysis. Circulation 2008;117:3171-80.
7. Kim JY, Oh S, Chang MR, Cho YG, Park KH, Paek YJ, et al. Comparability and utility of body composition measurement vs. Anthropometric measurement for assessing obesity related health risks in korean men. Int J Clin Pract 2013;67:73-80.
8. McCarthy HD, Ashwell M. A study of central fatness using waist-to-height ratios in UK children and adolescents over two decades supports the simple message—keep your waist circumference to less than half your height. Int J Obes (Lond) 2006;30:988-92.
9. Savva SC, Tornaritis M, Savva ME, Kourides Y, Panagi A, Silikiotou N, et al. Waist circumference and waist-to-height ratio are better predictors of cardiovascular disease risk factors in children than body mass index. Int J Obes Relat Metab Disord 2000;24:1453-8.
10. Freedman DS, Kahn HS, Mei Z, Grummer-Strawn LM, Dietz WH, Srinivasan SR, et al. Relation of body mass index and waist-to-height ratio to cardiovascular disease risk factors in children and adolescents: The Bogalusa heart study. Am J Clin Nutr 2007;86:33-40.
11. Hu YH, Reilly KH, Liang YJ, Xi B, Liu JT, Xu DJ, et al. Increase in body mass index, waist circumference and waist-to-height ratio is associated with high blood pressure in children and adolescents in china. J Int Med Res 2011;39:23-32.
12. Brambilla P, Bedogni G, Moreno LA, Goran MI, Gutin B, Fox KR, et al. Crossvalidation of anthropometry against magnetic resonance imaging for the assessment of visceral and subcutaneous adipose tissue in children. Int J Obes (Lond) 2006;30:23-30.
13. Goel R, Misra A, Agarwal SK, Vikram N. Correlates of hypertension among urban Asian Indian adolescents. Arch Dis Child 2010;95:992-7.
14. Expert Panel on Integrated Guidelines for Cardiovascular Health and Risk Reduction in Children and Adolescents, National Heart, Lung, and Blood Institute. Expert panel on integrated guidelines for cardiovascular health and risk reduction in children and adolescents: Summary report. Pediatrics 2011;128 Suppl 5:S213-56.
15. Liu A, Hills AP, Hu X, Li Y, Du L, Xu Y, et al. Waist circumference cut-off values for the prediction of cardiovascular risk factors clustering in Chinese school-aged children: A cross-sectional study. BMC Public Health 2010;10:82.
16. Goel R, Misra A, Agarwal SK, Naval V. Correlates of hypertension among urban Asian India adolescents. Hypertension 2008;51:92.
17. Jitendra Kumar. Correlation of body mass index and waist circumference with blood pressure in school age children. Int J Recent Trends Sci Technol 2014;11:109-12.
18. Bahl D, Singh K, Sabharwal M. Screening and identifying Delhi school going adolescents (12-15 yrs) with pre hypertension and hypertension. Int J Sci Res Publ 2015;5:2250-3153.
19. Mishra PE, Shastri L, Thomas T, Duggan C, Bosch R, McDonald CM, et al. Waist-to-height ratio as an indicator of high blood pressure in urban Indian school children. Indian Pediatr 2015;52:773-8.
How to cite this article: Murugalatha P, Guna P. Study on Relationship between Waist Circumference and Blood Pressure among School-Going Adolescents. Int J Sci Stud 2018;6(1):47-51.
Source of Support: Nil, Conflict of Interest: None declared.
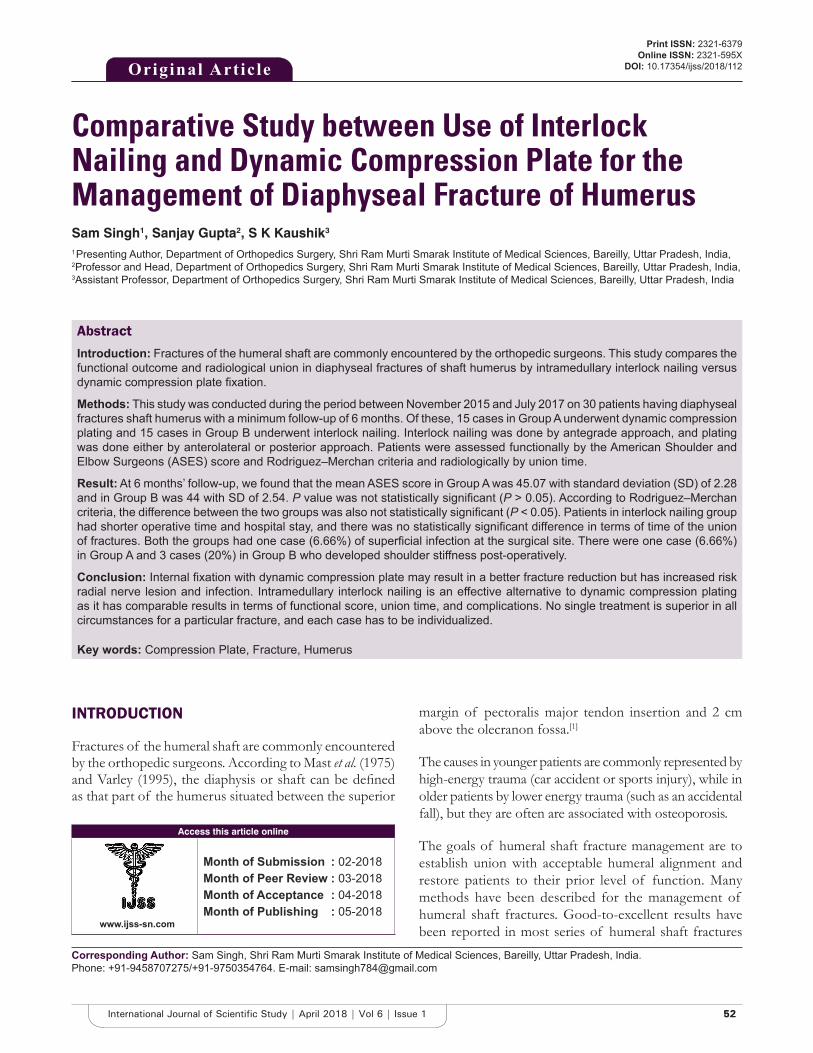
5252International Journal of Scientific Study | April 2018 | Vol 6 | Issue 1
Comparative Study between Use of Interlock Nailing and Dynamic Compression Plate for the Management of Diaphyseal Fracture of HumerusSam Singh1, Sanjay Gupta2, S K Kaushik3
1 Presenting Author, Department of Orthopedics Surgery, Shri Ram Murti Smarak Institute of Medical Sciences, Bareilly, Uttar Pradesh, India, 2Professor and Head, Department of Orthopedics Surgery, Shri Ram Murti Smarak Institute of Medical Sciences, Bareilly, Uttar Pradesh, India, 3Assistant Professor, Department of Orthopedics Surgery, Shri Ram Murti Smarak Institute of Medical Sciences, Bareilly, Uttar Pradesh, India
margin of pectoralis major tendon insertion and 2 cm above the olecranon fossa.[1]
The causes in younger patients are commonly represented by high-energy trauma (car accident or sports injury), while in older patients by lower energy trauma (such as an accidental fall), but they are often are associated with osteoporosis.
The goals of humeral shaft fracture management are to establish union with acceptable humeral alignment and restore patients to their prior level of function. Many methods have been described for the management of humeral shaft fractures. Good-to-excellent results have been reported in most series of humeral shaft fractures
INTRODUCTION
Fractures of the humeral shaft are commonly encountered by the orthopedic surgeons. According to Mast et al. (1975) and Varley (1995), the diaphysis or shaft can be defined as that part of the humerus situated between the superior
Original Article
AbstractIntroduction: Fractures of the humeral shaft are commonly encountered by the orthopedic surgeons. This study compares the functional outcome and radiological union in diaphyseal fractures of shaft humerus by intramedullary interlock nailing versus dynamic compression plate fixation.
Methods: This study was conducted during the period between November 2015 and July 2017 on 30 patients having diaphyseal fractures shaft humerus with a minimum follow-up of 6 months. Of these, 15 cases in Group A underwent dynamic compression plating and 15 cases in Group B underwent interlock nailing. Interlock nailing was done by antegrade approach, and plating was done either by anterolateral or posterior approach. Patients were assessed functionally by the American Shoulder and Elbow Surgeons (ASES) score and Rodriguez–Merchan criteria and radiologically by union time.
Result: At 6 months’ follow-up, we found that the mean ASES score in Group A was 45.07 with standard deviation (SD) of 2.28 and in Group B was 44 with SD of 2.54. P value was not statistically significant (P > 0.05). According to Rodriguez–Merchan criteria, the difference between the two groups was also not statistically significant (P < 0.05). Patients in interlock nailing group had shorter operative time and hospital stay, and there was no statistically significant difference in terms of time of the union of fractures. Both the groups had one case (6.66%) of superficial infection at the surgical site. There were one case (6.66%) in Group A and 3 cases (20%) in Group B who developed shoulder stiffness post-operatively.
Conclusion: Internal fixation with dynamic compression plate may result in a better fracture reduction but has increased risk radial nerve lesion and infection. Intramedullary interlock nailing is an effective alternative to dynamic compression plating as it has comparable results in terms of functional score, union time, and complications. No single treatment is superior in all circumstances for a particular fracture, and each case has to be individualized.
Key words: Compression Plate, Fracture, Humerus
Access this article online
www.ijss-sn.com
Month of Submission : 02-2018 Month of Peer Review : 03-2018 Month of Acceptance : 04-2018 Month of Publishing : 05-2018
Corresponding Author: Sam Singh, Shri Ram Murti Smarak Institute of Medical Sciences, Bareilly, Uttar Pradesh, India. Phone: +91-9458707275/+91-9750354764. E-mail: [email protected]
Print ISSN: 2321-6379Online ISSN: 2321-595X
DOI: 10.17354/ijss/2018/112
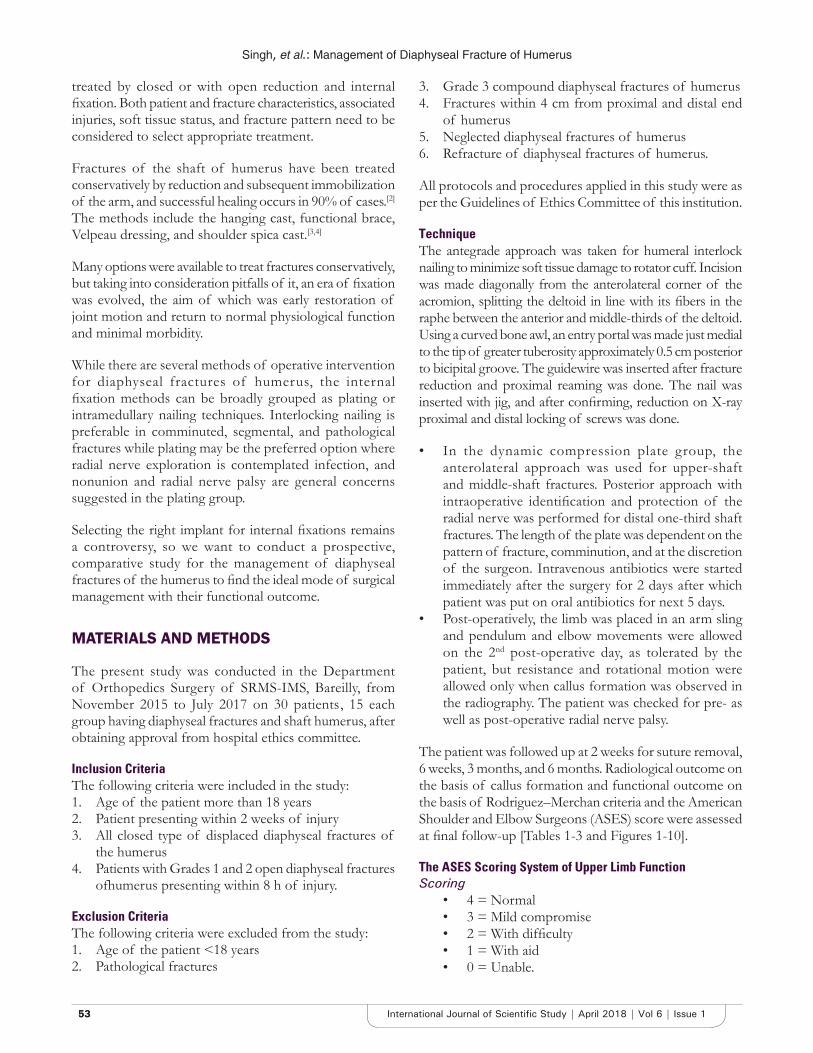
Singh, et al.: Management of Diaphyseal Fracture of Humerus
5353 International Journal of Scientific Study | April 2018 | Vol 6 | Issue 1
treated by closed or with open reduction and internal fixation. Both patient and fracture characteristics, associated injuries, soft tissue status, and fracture pattern need to be considered to select appropriate treatment.
Fractures of the shaft of humerus have been treated conservatively by reduction and subsequent immobilization of the arm, and successful healing occurs in 90% of cases.[2] The methods include the hanging cast, functional brace, Velpeau dressing, and shoulder spica cast.[3,4]
Many options were available to treat fractures conservatively, but taking into consideration pitfalls of it, an era of fixation was evolved, the aim of which was early restoration of joint motion and return to normal physiological function and minimal morbidity.
While there are several methods of operative intervention for diaphyseal fractures of humerus, the internal fixation methods can be broadly grouped as plating or intramedullary nailing techniques. Interlocking nailing is preferable in comminuted, segmental, and pathological fractures while plating may be the preferred option where radial nerve exploration is contemplated infection, and nonunion and radial nerve palsy are general concerns suggested in the plating group.
Selecting the right implant for internal fixations remains a controversy, so we want to conduct a prospective, comparative study for the management of diaphyseal fractures of the humerus to find the ideal mode of surgical management with their functional outcome.
MATERIALS AND METHODS
The present study was conducted in the Department of Orthopedics Surgery of SRMS-IMS, Bareilly, from November 2015 to July 2017 on 30 patients , 15 each group having diaphyseal fractures and shaft humerus, after obtaining approval from hospital ethics committee.
Inclusion CriteriaThe following criteria were included in the study:1. Age of the patient more than 18 years2. Patient presenting within 2 weeks of injury3. All closed type of displaced diaphyseal fractures of
the humerus4. Patients with Grades 1 and 2 open diaphyseal fractures
ofhumerus presenting within 8 h of injury.
Exclusion CriteriaThe following criteria were excluded from the study:1. Age of the patient <18 years2. Pathological fractures
3. Grade 3 compound diaphyseal fractures of humerus4. Fractures within 4 cm from proximal and distal end
of humerus5. Neglected diaphyseal fractures of humerus6. Refracture of diaphyseal fractures of humerus.
All protocols and procedures applied in this study were as per the Guidelines of Ethics Committee of this institution.
TechniqueThe antegrade approach was taken for humeral interlock nailing to minimize soft tissue damage to rotator cuff. Incision was made diagonally from the anterolateral corner of the acromion, splitting the deltoid in line with its fibers in the raphe between the anterior and middle-thirds of the deltoid. Using a curved bone awl, an entry portal was made just medial to the tip of greater tuberosity approximately 0.5 cm posterior to bicipital groove. The guidewire was inserted after fracture reduction and proximal reaming was done. The nail was inserted with jig, and after confirming, reduction on X-ray proximal and distal locking of screws was done.
• In the dynamic compression plate group, the anterolateral approach was used for upper-shaft and middle-shaft fractures. Posterior approach with intraoperative identification and protection of the radial nerve was performed for distal one-third shaft fractures. The length of the plate was dependent on the pattern of fracture, comminution, and at the discretion of the surgeon. Intravenous antibiotics were started immediately after the surgery for 2 days after which patient was put on oral antibiotics for next 5 days.
• Post-operatively, the limb was placed in an arm sling and pendulum and elbow movements were allowed on the 2nd post-operative day, as tolerated by the patient, but resistance and rotational motion were allowed only when callus formation was observed in the radiography. The patient was checked for pre- as well as post-operative radial nerve palsy.
The patient was followed up at 2 weeks for suture removal, 6 weeks, 3 months, and 6 months. Radiological outcome on the basis of callus formation and functional outcome on the basis of Rodriguez–Merchan criteria and the American Shoulder and Elbow Surgeons (ASES) score were assessed at final follow-up [Tables 1-3 and Figures 1-10].
The ASES Scoring System of Upper Limb FunctionScoring
• 4 = Normal• 3 = Mild compromise• 2 = With difficulty• 1 = With aid• 0 = Unable.
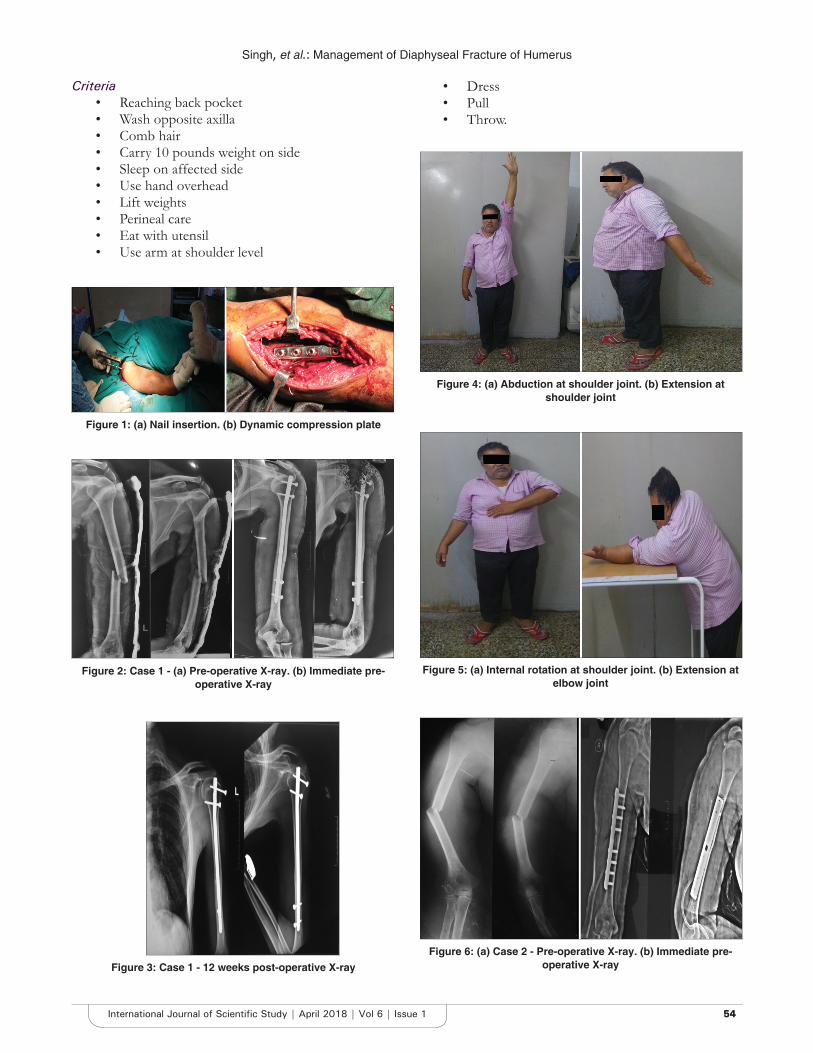
Singh, et al.: Management of Diaphyseal Fracture of Humerus
5454International Journal of Scientific Study | April 2018 | Vol 6 | Issue 1
Criteria• Reaching back pocket• Wash opposite axilla• Comb hair• Carry 10 pounds weight on side• Sleep on affected side• Use hand overhead• Lift weights• Perineal care• Eat with utensil• Use arm at shoulder level
• Dress• Pull• Throw.
Figure 1: (a) Nail insertion. (b) Dynamic compression plate
Figure 2: Case 1 - (a) Pre-operative X-ray. (b) Immediate pre-operative X-ray
Figure 3: Case 1 - 12 weeks post-operative X-ray
Figure 5: (a) Internal rotation at shoulder joint. (b) Extension at elbow joint
Figure 6: (a) Case 2 - Pre-operative X-ray. (b) Immediate pre-operative X-ray
Figure 4: (a) Abduction at shoulder joint. (b) Extension at shoulder joint
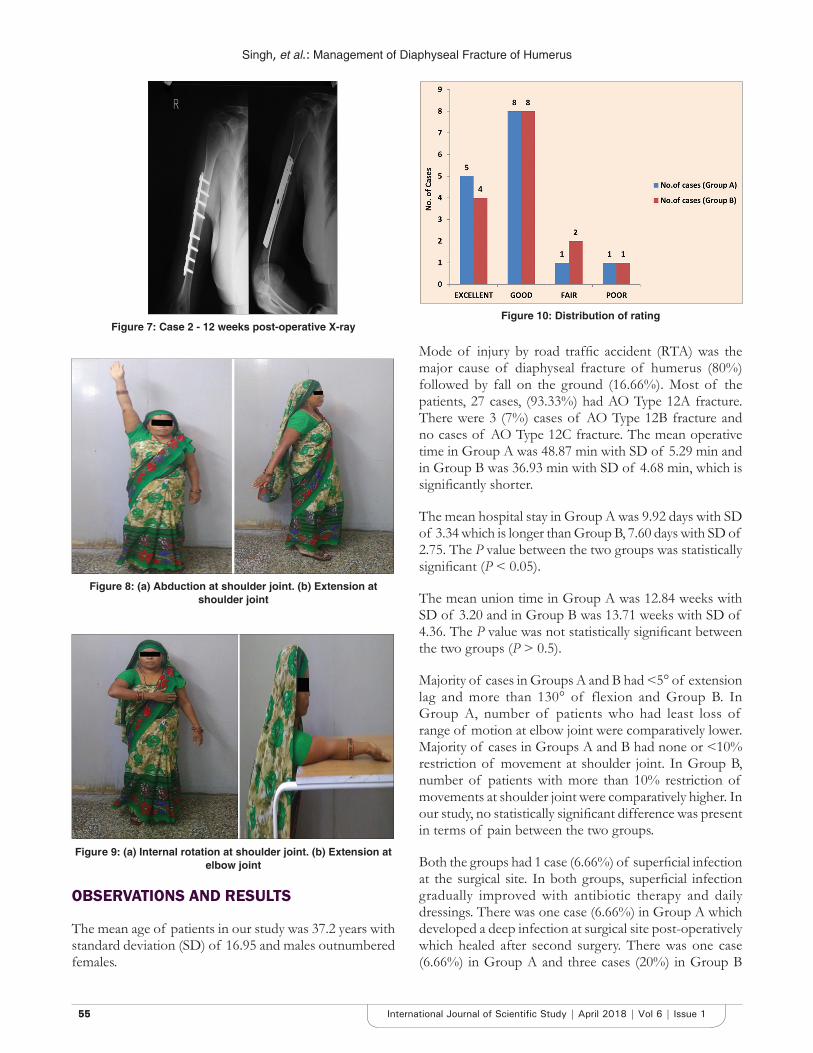
Singh, et al.: Management of Diaphyseal Fracture of Humerus
5555 International Journal of Scientific Study | April 2018 | Vol 6 | Issue 1
OBSERVATIONS AND RESULTS
The mean age of patients in our study was 37.2 years with standard deviation (SD) of 16.95 and males outnumbered females.
Mode of injury by road traffic accident (RTA) was the major cause of diaphyseal fracture of humerus (80%) followed by fall on the ground (16.66%). Most of the patients, 27 cases, (93.33%) had AO Type 12A fracture. There were 3 (7%) cases of AO Type 12B fracture and no cases of AO Type 12C fracture. The mean operative time in Group A was 48.87 min with SD of 5.29 min and in Group B was 36.93 min with SD of 4.68 min, which is significantly shorter.
The mean hospital stay in Group A was 9.92 days with SD of 3.34 which is longer than Group B, 7.60 days with SD of 2.75. The P value between the two groups was statistically significant (P < 0.05).
The mean union time in Group A was 12.84 weeks with SD of 3.20 and in Group B was 13.71 weeks with SD of 4.36. The P value was not statistically significant between the two groups (P > 0.5).
Majority of cases in Groups A and B had <5° of extension lag and more than 130° of flexion and Group B. In Group A, number of patients who had least loss of range of motion at elbow joint were comparatively lower. Majority of cases in Groups A and B had none or <10% restriction of movement at shoulder joint. In Group B, number of patients with more than 10% restriction of movements at shoulder joint were comparatively higher. In our study, no statistically significant difference was present in terms of pain between the two groups.
Both the groups had 1 case (6.66%) of superficial infection at the surgical site. In both groups, superficial infection gradually improved with antibiotic therapy and daily dressings. There was one case (6.66%) in Group A which developed a deep infection at surgical site post-operatively which healed after second surgery. There was one case (6.66%) in Group A and three cases (20%) in Group B
Figure 7: Case 2 - 12 weeks post-operative X-ray
Figure 8: (a) Abduction at shoulder joint. (b) Extension at shoulder joint
Figur e 9: (a) Internal rotation at shoulder joint. (b) Extension at elbow joint
Figure 10: Distribution of rating
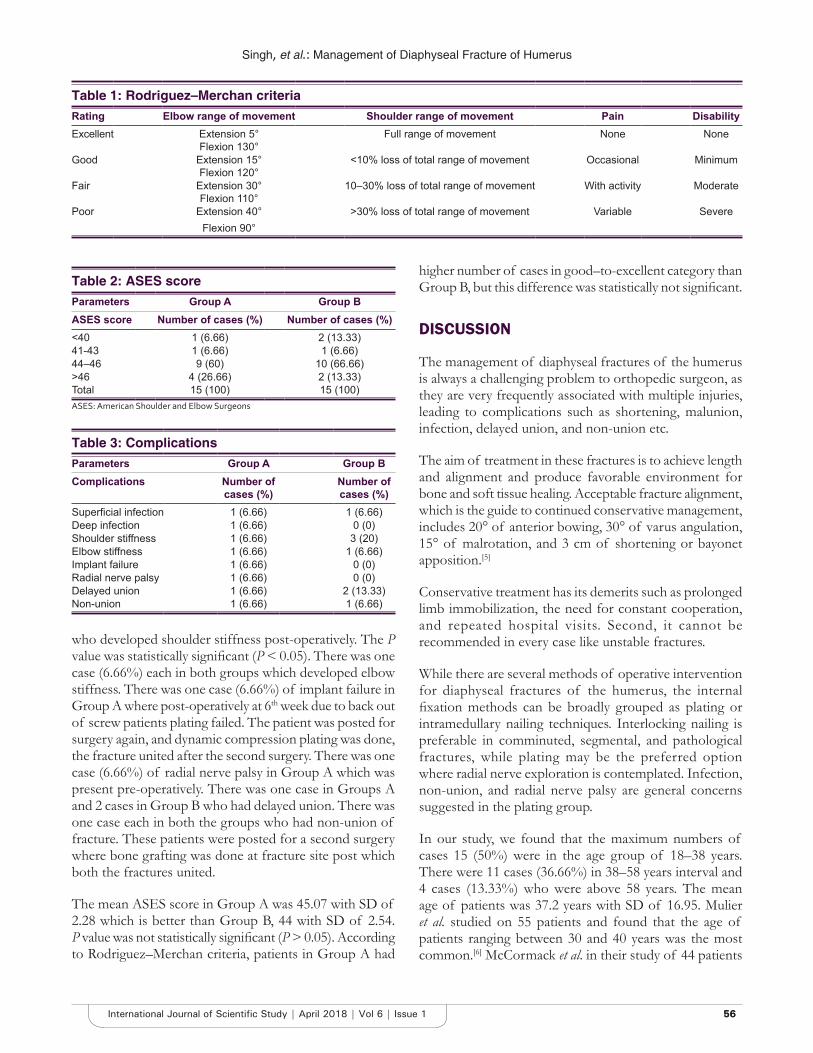
Singh, et al.: Management of Diaphyseal Fracture of Humerus
5656International Journal of Scientific Study | April 2018 | Vol 6 | Issue 1
who developed shoulder stiffness post-operatively. The P value was statistically significant (P < 0.05). There was one case (6.66%) each in both groups which developed elbow stiffness. There was one case (6.66%) of implant failure in Group A where post-operatively at 6th week due to back out of screw patients plating failed. The patient was posted for surgery again, and dynamic compression plating was done, the fracture united after the second surgery. There was one case (6.66%) of radial nerve palsy in Group A which was present pre-operatively. There was one case in Groups A and 2 cases in Group B who had delayed union. There was one case each in both the groups who had non-union of fracture. These patients were posted for a second surgery where bone grafting was done at fracture site post which both the fractures united.
The mean ASES score in Group A was 45.07 with SD of 2.28 which is better than Group B, 44 with SD of 2.54. P value was not statistically significant (P > 0.05). According to Rodriguez–Merchan criteria, patients in Group A had
higher number of cases in good–to-excellent category than Group B, but this difference was statistically not significant.
DISCUSSION
The management of diaphyseal fractures of the humerus is always a challenging problem to orthopedic surgeon, as they are very frequently associated with multiple injuries, leading to complications such as shortening, malunion, infection, delayed union, and non-union etc.
The aim of treatment in these fractures is to achieve length and alignment and produce favorable environment for bone and soft tissue healing. Acceptable fracture alignment, which is the guide to continued conservative management, includes 20° of anterior bowing, 30° of varus angulation, 15° of malrotation, and 3 cm of shortening or bayonet apposition.[5]
Conservative treatment has its demerits such as prolonged limb immobilization, the need for constant cooperation, and repeated hospital visits. Second, it cannot be recommended in every case like unstable fractures.
While there are several methods of operative intervention for diaphyseal fractures of the humerus, the internal fixation methods can be broadly grouped as plating or intramedullary nailing techniques. Interlocking nailing is preferable in comminuted, segmental, and pathological fractures, while plating may be the preferred option where radial nerve exploration is contemplated. Infection, non-union, and radial nerve palsy are general concerns suggested in the plating group.
In our study, we found that the maximum numbers of cases 15 (50%) were in the age group of 18–38 years. There were 11 cases (36.66%) in 38–58 years interval and 4 cases (13.33%) who were above 58 years. The mean age of patients was 37.2 years with SD of 16.95. Mulier et al. studied on 55 patients and found that the age of patients ranging between 30 and 40 years was the most common.[6] McCormack et al. in their study of 44 patients
Table 1: Rodriguez–Merchan criteriaRating Elbow range of movement Shoulder range of movement Pain DisabilityExcellent Extension 5°
Flexion 130°Full range of movement None None
Good Extension 15°Flexion 120°
˂10% loss of total range of movement Occasional Minimum
Fair Extension 30°Flexion 110°
10–30% loss of total range of movement With activity Moderate
Poor Extension 40°Flexion 90°
˃30% loss of total range of movement Variable Severe
Table 3: ComplicationsParameters Group A Group BComplications Number of
cases (%)Number of cases (%)
Superficial infection 1 (6.66) 1 (6.66)Deep infection 1 (6.66) 0 (0)Shoulder stiffness 1 (6.66) 3 (20)Elbow stiffness 1 (6.66) 1 (6.66)Implant failure 1 (6.66) 0 (0)Radial nerve palsy 1 (6.66) 0 (0)Delayed union 1 (6.66) 2 (13.33)Non-union 1 (6.66) 1 (6.66)
Table 2: ASES scoreParameters Group A Group BASES score Number of cases (%) Number of cases (%)<40 1 (6.66) 2 (13.33)41-43 1 (6.66) 1 (6.66)44–46 9 (60) 10 (66.66)>46 4 (26.66) 2 (13.33)Total 15 (100) 15 (100)ASES: American Shoulder and Elbow Surgeons
Singh, et al.: Management of Diaphyseal Fracture of Humerus
5757 International Journal of Scientific Study | April 2018 | Vol 6 | Issue 1
found that such fractures were common in the age group of 35–45 years.[2]
In our study, we have found that mode of injury by RTA was the major cause of diaphyseal fracture of humerus 24 cases (80%) followed by fall on ground 5 cases (17%), and 1 case (3%) OUP B, 2 cases (13.33%). There was a single case of assault in Group B, 1 case (3.3%). Mulier et al. recorded that the most common cause to diaphyseal humerus fracture is high- energy trauma such as due to RTA.[6]
In our study, we have found that 12 cases (33.33%) were operated in the interval of 3–4 days, 10 cases (20%) were operated in <2 days, 5 cases (26.66%) were operated in 5–6 days interval, and 3 cases (20%) were operated after 7 days interval. The mean between trauma and surgery in our study was 8.63 days with SD of 3.04. In a comparative study done by Mir et al., the mean interval between admissions to surgery was 6.12 days (SD 3.67) in the interlock nailing group and 11.88 days (SD 3.29) in the dynamic compression plating group, and the values were statistically significant (P > 0.05).[7] In our study, majority of the cases were operated in <7 days which is comparable to other study.
In our study, fluoroscopy was done in Group B only, and in majority of patients, 13 cases (86.66%) exposure time for fluoroscopy was between 3 and 6 min. Mean fluoroscopic exposure time was 4.3 min with SD of 1.35 min. In a study done by Mir et al. on 50 patients, the mean fluoroscopy time in the interlocking group was 4.6 min, while fluoroscopy was not used in the plating group.[7] These findings are comparable to our study.
In our study, we found that in most of the cases, union time in weeks was 12 weeks, 13 cases (92.86%) in Group A and 12 cases (85.71%) in Group B. There was 1 case (7.14%) of delayed union (union at 24 weeks) in Group A and 2 cases (14.28%) in Group B. The mean union time in Group A was 12.84 weeks with SD of 3.20 and in Group B was 13.71 weeks with SD of 4.36. The p value was not statistically significant between the two groups (P > 0.5). A comparative study done by Mulier et al. in their study found the mean time of union to be 16 weeks with a range from 8 weeks to 65 weeks. They found that union time was less in case of plate fixation than nail fixation.[6]
In our study, we found that both groups had one case (6.66%) that had superficial infection at the surgical site. In both groups, superficial infection gradually improved with antibiotic therapy and daily dressings. There was one case (6.66%) in Group A which developed deep infection at surgical site post-operatively. The surgical site was opened again in the OT, and dead and infected tissue was debrided; wound was thoroughly washed with saline and closed over
drains. Infection was controlled and the fracture healed normally. There was one case (6.66%) in Group A and three cases (20%) in Group B who developed shoulder stiffness post-operatively. The P value was statistically significant (P < 0.05). There was one case (6.66%) each in both groups which developed elbow stiffness. There was one case (6.66%) of implant failure in Group A, where at 6th week follow-up, there was a failure of plating due to screw back out. The patient was posted for surgery again and dynamic compression plating was done, the fracture united after the second surgery. There was one case (6.66%) of radial nerve palsy in Group A which was present pre-operatively, and the patient recovered completely during the follow-up. There was one case (6.66%) in Group A and two cases (13.33%) in Group B who had delayed union, both fractures united at 24 weeks. There was one case (6.66%) each in both the groups who had non-union of the fracture. These patients were posted for a second surgery where bone grafting was done at fracture site post which both the fractures united.
In our study, we found that ASES functional score at final follow-up was more than 46 in 4 cases (26.66%) of Group A and 2 cases (13.33%) in Group B. This value was statistically significant (P < 0.05). There were 9 cases (60%) in Group A and 10 cases (66.66%) in Group B whose ASES score was in interval between 44 and 46. There was one case (6.66%) in both groups who had their ASES score in the interval between 41 and 43. There was one case (6.66%) in Group A and two cases (13.33%) in Group B who had their ASES score below 40. The mean ASES score in Group A was 45.07 with SD of 2.28 and in Group B was 44 with SD of 2.54. The P value was not statistically significant (P > 0.05). A study done by Changulani et al. found that mean ASES score in patients treated with nailing was 44 and that of patients treated with plate fixation was 45.[8]
In our study, we found that according to Rodriguez–Merchan criteria, five cases (33.33%) in Group A and four cases (26.66%) in Group B had excellent rating at final follow-up. There were eight cases (53.33%) each in both the groups who had good rating. There was one case in Group A and two cases in Group B who had fair rating. Mir et al. in their study reported excellent results in 7 (28 %), good in 13 (52 %), fair in 3 (12 %), and poor in 2 patients of interlock group. Results were similar in the Digital Cinema Package with excellent result in 8 (32%), good in 13 (52%), fair in 2, and poor in 2 patients. The final outcome in this series did not show any significant advantage of one method over the other.[7]
CONCLUSION
Patients in the interlock nailing group had shorter operative time and hospital stay, and there was no statistically significant
Singh, et al.: Management of Diaphyseal Fracture of Humerus
5858International Journal of Scientific Study | April 2018 | Vol 6 | Issue 1
difference in terms of time of union of fractures or the functional score between the two. Interlock nailing provides rigid secure fixation along with maintenance of biology which makes it effective alternative to dynamic compression plate. No single treatment is superior in all circumstances for a particular fracture, and each case has to be individualized.
The shortcoming of this study was that there were less number of cases. We recommend more number of randomized studies consisting of larger number of cases in future to be done so that a clear-cut consensus can be reached.
REFERENCES
1. Flinkkila T, Hyvonen P, Lakovaara M, Linden T, Ristiniemi J, Hamalainen M. Intramedullary nailing of humeral shaft fractures. Acta Orthop Scad 1999;70:133-6.
2. McCormack RG, Brien D, Buckley RE, McKee MD, Powell J, Schemitsch EH. Fixation of fractures of the shaft of the humerus by dynamic compression plate or intramedullary nail. J Bone Joint Surg [Br] 2000;82-B:336-9.
3. Sarmiento A, Zagorski JB, Zych GA, Latta LL, Capps CA. Functional bracing for the treatment of fractures of the humeral diaphysis. J Bone Joint Surg Am 2000;82:478.
4. Balfour GW, Mooney V, Ashby ME. Diaphyseal fractures of the humerus treated with a ready-made brace. J Bone Joint Surg Am 1982;64:11-3.
5. Spiguel AR, Robert J. Steffner. Humeral shaft fractures. Curr Rev Musculoskelet Med 2012;5:177-83.
6. Mulier T, Seligson D, Sion W, Van de Bergh J, Reynaert P. Operative treatment of humeral shaft fractures. Acta Orthop Belg 1997;63:170-7.
7. Mir GR, Baba AN, Latoo IA, Bhat NA, Baba OK, Sharma S. Internal fixation of shaft humerus fractures by dynamic compression plate or interlocking intramedullary nail: A prospective, randomised study. Strat Traum Limb Recon 2014;9:133-40.
8. Changulani M, Jain UK, Keswani T. Comparison of the use of the humerus intramedullary nail and dynamic compression plate for the management of diaphyseal fractures of the humerus. A randomised control study. Int Orthop SICOTS 2007;31:391-5.
How to cite this article: Singh S, Gupta S, Kaushik SK. Comparative Study between Use of Interlock Nailing and Dynamic Compression Plate for the Management of Diaphyseal Fracture of Humerus. Int J Sci Stud 2018;6(1):52-58.
Source of Support: Nil, Conflict of Interest: None declared.

5959 International Journal of Scientific Study | April 2018 | Vol 6 | Issue 1
A Study of Breakfast Eating Patterns of School Children Between 5 and 9 Years of Age and its Impact on Nutritional Status and School PerformanceP Murugalatha, K Ramya
Senior Assistant Professor, Department of Pediatrics, Institute of Child Health and Research Centre, Govt. Rajaji Hospital, Madurai Medical College, Madurai,Tamil Nadu, India
that have been carried out to determine the effect of different breakfast habits on the physiological responses, attitudes, and scholastic achievements of subjects under study.[1]
A link between hunger and a large number of behavior problems exhibited by children such as fighting, stealing, and indiscipline, having problems with teachers, and so on, has been established.
Breakfast consumption made a significant contribution for the child mean daily nutrient intake.[2] Total energy intake of children who skipped breakfast is lower than that of children who consumed breakfast at home or school; energy intake is not increased at other meals to compensate for the deficit.Children who consumed breakfast had a
INTRODUCTION
“You are what you eat” an ancient saying that motivates health professionals to be concerned with what people eat especially at the start of the day.A nutritionally adequate breakfast is important for achieving and maintaining physical and mental health.This is the fact borne out and based on several controlled studies
Original Article
AbstractIntroduction: “You are what you eat” an ancient saying that motivates health professionals to be concerned with what people eat especially at the start of the day. A nutritionally adequate breakfast is important for achieving and maintaining physical and mental health.
Aims and Objectives: The aim of the study was to study the breakfast eating patterns and its impact on nutritional status, scholastic performance and the reasons for not taking adequate breakfast.
Materials and Methods: The study was a comparative cross-sectional study done in 1000 children of 5–9 years of age from two urban-based school in Madurai, over a period of 1 year. Breakfast eating patterns and anthropometric measurements were taken and correlated.
Results: In this study,a total of 1000 children (500 – study group and 500 control group) of age 5 -9 years were included. The study group showed nutrition adequacy ratio values significantly lower for all essential nutrients. Mean breakfast intake of the study group is significantly lower than that of controls in all age groups. Anthropometric measurements showed the statistically significant difference (P < 0.05) between study and control groups in all age groups.
Conclusion: Consumption of breakfast appears to have a positive impact on the nutritional status regardless of age. Skipping breakfast affects physical and mental development and scholastic performance.
Key words: Breakfast eating pattern, Essential nutrients , Nutrition adequacy ratio, Nutritional status, school performance
Access this article online
www.ijss-sn.com
Month of Submission : 02-2018 Month of Peer Review : 03-2018 Month of Acceptance : 03-2018 Month of Publishing : 04-2018
Corresponding Author: Dr. K Ramya, Door No 20/66, Vidhya Colony, 3rd Street, K. K. Nagar, Madurai – 625 020, Tamil Nadu, India. Phone: +91-9080157533. E-mail: [email protected]
Print ISSN: 2321-6379Online ISSN: 2321-595X
DOI: 10.17354/ijss/2018/113
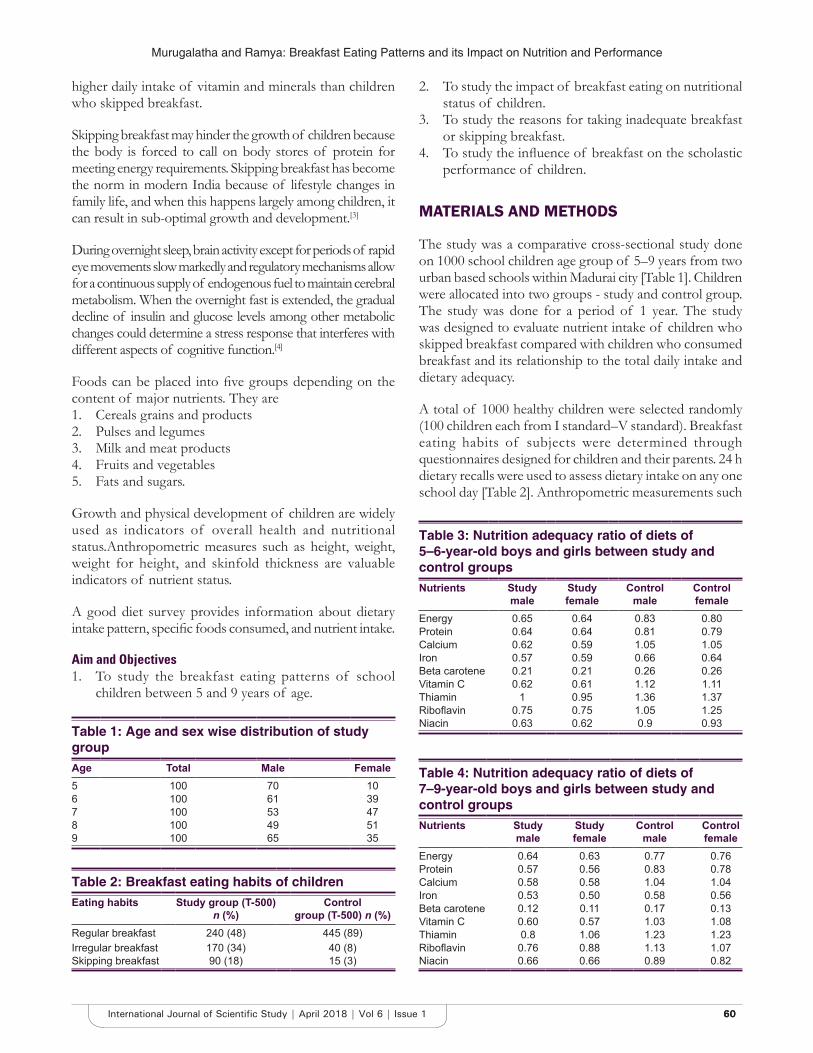
Murugalatha and Ramya: Breakfast Eating Patterns and its Impact on Nutrition and Performance
6060International Journal of Scientific Study | April 2018 | Vol 6 | Issue 1
higher daily intake of vitamin and minerals than children who skipped breakfast.
Skipping breakfast may hinder the growth of children because the body is forced to call on body stores of protein for meeting energy requirements. Skipping breakfast has become the norm in modern India because of lifestyle changes in family life, and when this happens largely among children, it can result in sub-optimal growth and development.[3]
During overnight sleep, brain activity except for periods of rapid eye movements slow markedly and regulatory mechanisms allow for a continuous supply of endogenous fuel to maintain cerebral metabolism. When the overnight fast is extended, the gradual decline of insulin and glucose levels among other metabolic changes could determine a stress response that interferes with different aspects of cognitive function.[4]
Foods can be placed into five groups depending on the content of major nutrients. They are1. Cereals grains and products2. Pulses and legumes3. Milk and meat products4. Fruits and vegetables5. Fats and sugars.
Growth and physical development of children are widely used as indicators of overall health and nutritional status.Anthropometric measures such as height, weight, weight for height, and skinfold thickness are valuable indicators of nutrient status.
A good diet survey provides information about dietary intake pattern, specific foods consumed, and nutrient intake.
Aim and Objectives1. To study the breakfast eating patterns of school
children between 5 and 9 years of age.
2. To study the impact of breakfast eating on nutritional status of children.
3. To study the reasons for taking inadequate breakfast or skipping breakfast.
4. To study the influence of breakfast on the scholastic performance of children.
MATERIALS AND METHODS
The study was a comparative cross-sectional study done on 1000 school children age group of 5–9 years from two urban based schools within Madurai city [Table 1]. Children were allocated into two groups - study and control group. The study was done for a period of 1 year. The study was designed to evaluate nutrient intake of children who skipped breakfast compared with children who consumed breakfast and its relationship to the total daily intake and dietary adequacy.
A total of 1000 healthy children were selected randomly (100 children each from I standard–V standard). Breakfast eating habits of subjects were determined through questionnaires designed for children and their parents. 24 h dietary recalls were used to assess dietary intake on any one school day [Table 2]. Anthropometric measurements such
Table 1: Age and sex wise distribution of study groupAge Total Male Female5 100 70 106 100 61 397 100 53 478 100 49 519 100 65 35
Table 2: Breakfast eating habits of childrenEating habits Study group (T-500)
n (%)Control
group (T-500) n (%)Regular breakfast 240 (48) 445 (89)Irregular breakfast 170 (34) 40 (8)Skipping breakfast 90 (18) 15 (3)
Table 3: Nutrition adequacy ratio of diets of 5–6-year-old boys and girls between study and control groupsNutrients Study
maleStudy female
Control male
Control female
Energy 0.65 0.64 0.83 0.80Protein 0.64 0.64 0.81 0.79Calcium 0.62 0.59 1.05 1.05Iron 0.57 0.59 0.66 0.64Beta carotene 0.21 0.21 0.26 0.26Vitamin C 0.62 0.61 1.12 1.11Thiamin 1 0.95 1.36 1.37Riboflavin 0.75 0.75 1.05 1.25Niacin 0.63 0.62 0.9 0.93
Table 4: Nutrition adequacy ratio of diets of 7–9-year-old boys and girls between study and control groupsNutrients Study
maleStudy female
Control male
Control female
Energy 0.64 0.63 0.77 0.76Protein 0.57 0.56 0.83 0.78Calcium 0.58 0.58 1.04 1.04Iron 0.53 0.50 0.58 0.56Beta carotene 0.12 0.11 0.17 0.13Vitamin C 0.60 0.57 1.03 1.08Thiamin 0.8 1.06 1.23 1.23Riboflavin 0.76 0.88 1.13 1.07Niacin 0.66 0.66 0.89 0.82
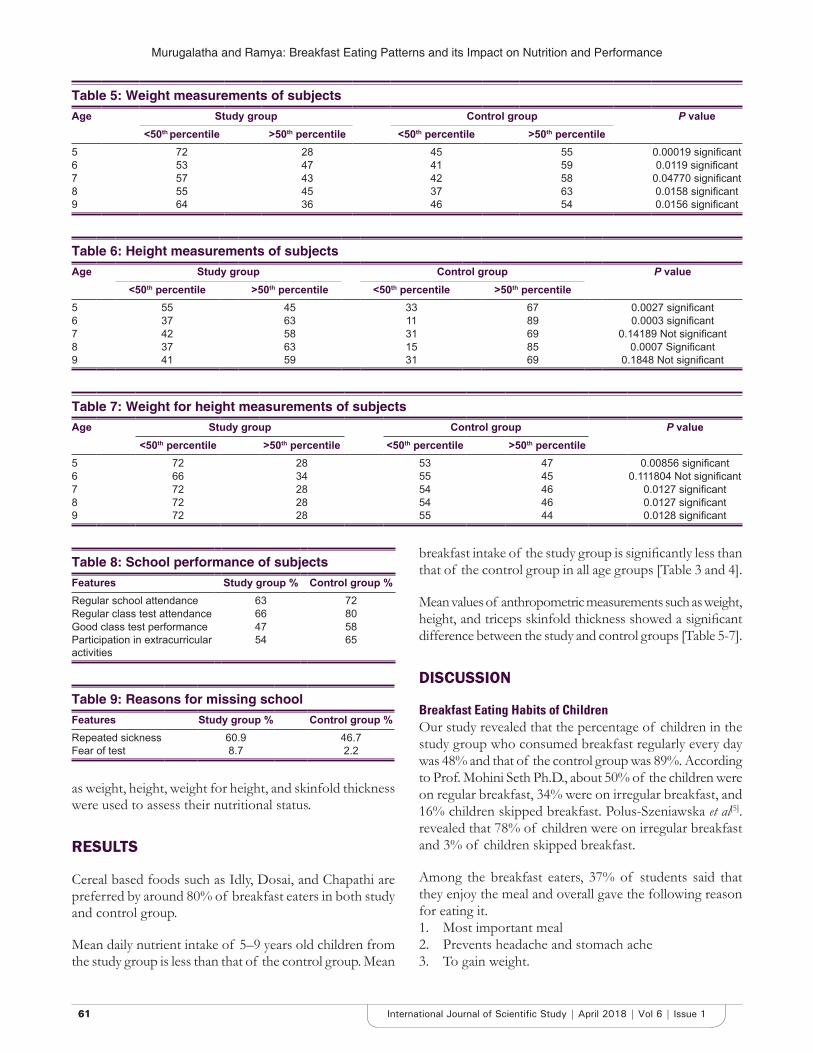
Murugalatha and Ramya: Breakfast Eating Patterns and its Impact on Nutrition and Performance
6161 International Journal of Scientific Study | April 2018 | Vol 6 | Issue 1
as weight, height, weight for height, and skinfold thickness were used to assess their nutritional status.
RESULTS
Cereal based foods such as Idly, Dosai, and Chapathi are preferred by around 80% of breakfast eaters in both study and control group.
Mean daily nutrient intake of 5–9 years old children from the study group is less than that of the control group. Mean
breakfast intake of the study group is significantly less than that of the control group in all age groups [Table 3 and 4].
Mean values of anthropometric measurements such as weight, height, and triceps skinfold thickness showed a significant difference between the study and control groups [Table 5-7].
DISCUSSION
Breakfast Eating Habits of ChildrenOur study revealed that the percentage of children in the study group who consumed breakfast regularly every day was 48% and that of the control group was 89%. According to Prof. Mohini Seth Ph.D., about 50% of the children were on regular breakfast, 34% were on irregular breakfast, and 16% children skipped breakfast. Polus-Szeniawska et al[5]. revealed that 78% of children were on irregular breakfast and 3% of children skipped breakfast.
Among the breakfast eaters, 37% of students said that they enjoy the meal and overall gave the following reason for eating it.1. Most important meal2. Prevents headache and stomach ache3. To gain weight.
Table 5: Weight measurements of subjectsAge Study group Control group P value
<50th percentile >50th percentile <50th percentile >50th percentile5 72 28 45 55 0.00019 significant6 53 47 41 59 0.0119 significant7 57 43 42 58 0.04770 significant8 55 45 37 63 0.0158 significant9 64 36 46 54 0.0156 significant
Table 6: Height measurements of subjectsAge Study group Control group P value
<50th percentile >50th percentile <50th percentile >50th percentile5 55 45 33 67 0.0027 significant6 37 63 11 89 0.0003 significant7 42 58 31 69 0.14189 Not significant8 37 63 15 85 0.0007 Significant9 41 59 31 69 0.1848 Not significant
Table 7: Weight for height measurements of subjectsAge Study group Control group P value
<50th percentile >50th percentile <50th percentile >50th percentile5 72 28 53 47 0.00856 significant6 66 34 55 45 0.111804 Not significant7 72 28 54 46 0.0127 significant8 72 28 54 46 0.0127 significant9 72 28 55 44 0.0128 significant
Table 8: School performance of subjectsFeatures Study group % Control group %Regular school attendance 63 72Regular class test attendance 66 80Good class test performance 47 58Participation in extracurricular activities
54 65
Table 9: Reasons for missing schoolFeatures Study group % Control group %Repeated sickness 60.9 46.7Fear of test 8.7 2.2
Murugalatha and Ramya: Breakfast Eating Patterns and its Impact on Nutrition and Performance
6262International Journal of Scientific Study | April 2018 | Vol 6 | Issue 1
The perception of subjects parents with respect to breakfast eating were recorded, and it was found that:1. 48% believed that eating this meal leads to better
thinking and work efficiency.2. 23% said that it keeps the child active throughout the
day.3. 19% reported no complaints about headache or
stomach ache.4. 10% felt that it was the most nutritious meal of the day.
Nutritional Intake of ChildrenIn our study, children from control group showed deficient intake of iron and beta-carotene, whereas children from study group had distinctly lower values than the control group. In the case of iron and beta-carotene, both the groups are found to be short of the recommended values for their age. This is attributed to the lower intake of green leafy vegetables in the diet and low bioavailability of iron from cereal-based foods. Except for Vitamin B, the diet of the study population in all age groups fell short of the RDA for all nutrients in contrast to those of the control group.
Nutrient Adequacy RatioAn NAR value of 0.66 reflects adequate intake of particular nutrient. NAR was calculated by dividing daily intake of a particular nutrient with RDA of the same. In our study, the study group showed values lower for all essential nutrients, energy, and protein reflecting inadequate nutrient intake.
Nutrients from BreakfastAccording to Lowa breakfast studies[6], a basic breakfast is the one which provides one-fourth of the total daily requirement of energy and protein. Mean breakfast intake of both the study and the control groups was calculated and presented in tables.
AnthropometryGrowth and physical development of children are widely used as indicators of overall health and nutritional status. Anthropometric measurements of subjects were recorded with respect to weight, height, and triceps skinfold thickness and compared with the percentiles of NCHS standards.
The relationship between weights at birth to the present weight was found to be significant. Birth weight of both the study and control groups was recorded from parents. Although all the subjects showed incremental growth pattern and were born with normal birth weight, the study
group subjects failed to reach the desired weight gain. This can be partly attributed to the omission of breakfast.
Regarding height, about 77.8% children in the control group were above the 50th percentile in all the age groups whereas in the study group it was about 57.6%. Low height gain in Indian children may be partly due to genetic factors and partly to the fact that their diet is predominantly cereal based and rich in phytates leading to poor bioavailability of calcium from them.
Regarding weight for height, which is a sensitive indicator of the current nutritional status of children and independent of age, about 43% of children from the control group were above the 50th percentile in contrast to the study group where it was 29.2% in all age groups.
School PerformanceMany studies conducted abroad underlined the importance of breakfast on the school performance of children.[7-10] In the present study, school performance was judged using the attendance, class test performance, and participation in extracurricular activities of the subjects [Table 8 and 9]. This study revealed that, children from study group had lower school attendance and lesser scholastic performance than the control group.
REFERENCES
1. Mohammad A. Breakfast eating habits among school children. J Pediatr Nurs 2017;36:118-23.
2. Intiful FD, Lartey A. Breakfast habits among school children in selected communities in the eastern region of Ghana. Ghana Med J 2014;48:71-7.
3. Adolphus K, Lawton CL, Dye L. The effects of breakfast on behavior and academic performance in children and adolescents. Front Hum Neurosci 2013;7:425.
4. Hoyland A, Dye L, Lawton CL. A systematic review of the effect of breakfast on the cognitive performance of children and adolescents. Nutr Res Rev 2009;22:220-43.
5. Polus-Szeniawska E. Some life style elements in students from public and non-public secondary schools. Rocz Panstw Zakl Hig 1996;47:351-6.
6. Ohlson M. A summary of lowa breakfast study. AMA Arch Intern Med 1957;100:1020-1
7. Murphy JM, Pagano ME, Nachmani J, Sperling P, Kane S, Kleinman RE, et al. The relationship of school breakfast to psychosocial and academic functioning: Cross-sectional and longitudinal observations in an inner-city school sample. Arch Pediatr Adolesc Med 1998;152:899-907.
8. Powell CA, Walker SP, Chang SM, Grantham-McGregor SM. Nutrition and education: A randomized trial of the effects of breakfast in rural primary school children. Am J Clin Nutr 1998;68:873-9.
9. Graham MV, Uphold CR. Health perceptions and behaviors of school-age boys and girls. J Community Health Nurs 1992;9:77-86.
10. Dickie NH, BenderAE. Breakfast and performance in school children. Br J Nutr 1982;48:483-96
How to cite this article: Murugalatha P, Ramya K. A Study of Breakfast Eating Patterns of School Children Between 5 and 9 Years of Age and its Impact on Nutritional Status and School Performance. Int J Sci Stud 2018;6(1):59-62.
Source of Support: Nil, Conflict of Interest: None declared.
6363 International Journal of Scientific Study | April 2018 | Vol 6 | Issue 1
Echocardiographic Changes in Overt and Subclinical Primary HypothyroidismHaridoss Sripriya Vasudevan1, J Jacinth Preethi2
Assistant Professor, Institute of Internal Medicine, Madras Medical College and Rajiv Gandhi Government General Hospital, Chennai, Tamil Nadu, India
(pericardial effusion), and the thyroid hormone is an important regulator of cardiac function and cardiovascular hemodynamics.[2] In hyperthyroidism, cardiac contractility and cardiac output are enhanced, and systemic vascular resistance is decreased, while in hypothyroidism, the opposite is true. Other changes observed in hypothyroid individuals include alteration in lipid profile values with increased cholesterol and low-density lipoproteins and electrocardiogram (ECG) changes such as bradycardia and low-voltage complexes.[3] Triiodothyronine (T3) mediates the expression of cardiac genes, inducing transcription of alpha-myosin heavy chain (MHC) and the sarcoplasmic reticulum calcium ATPase and negatively regulating expression of beta-MHC and phospholamban.[4] Santos et al. first reported reversible cardiomyopathy, manifested by asymmetric septal hypertrophy in untreated hypothyroid patients.[5] This finding was also described in children.[6] The increased thickness of interventricular septum (IVS)
INTRODUCTION
Cardiac involvement in myxedema has been well known for a long time.[1] The cardiovascular findings of hypothyroidism are, however, more subtle. The cardiovascular system (CVS) manifestations of hypothyroidism include the following: (a) Reduced total intravascular volume, (b) reduced contractility, (c) reduced heart rate, (d) raised systemic vascular resistance (increased diastolic blood pressure), and (e) raised capillary permeability
Original Article
AbstractBackground and Objectives: Thyroid hormone is an important regulator of cardiac function and cardiovascular hemodynamics. The aim of this study was to assess the cardiovascular functions in primary overt and subclinical hypothyroid patients and to determine if there was a correlation between severity of disease and echocardiographic changes.
Methodology: A cross-sectional study was conducted in the Endocrinology Clinic of Madras Medical College and Rajiv Gandhi Government General Hospital, Chennai. The study sample was grouped into mild, moderate, severe, and subclinical hypothyroid groups which were then compared by echocardiographic findings.
Results: A total of 84 patients were seen, from June 2013 to September 2013. Abnormal left ventricle posterior wall (LVPW) thickness and abnormal interventricular septal wall (IVSW) thickness were more frequently noted in those with clinical hypothyroidism (moderate and severe) as compared to those with subclinical hypothyroidism. Abnormal septal wall thickness was noted in 9 (69.23%) of moderately hypothyroid and 18 (72%) of severely hypothyroid patients, whereas this finding was noted in only 5 (16.66%) of the subclinical hypothyroid patients indicating significant differences between the groups. Diastolic dysfunction was also significantly more frequent in the moderate and severe hypothyroid group. On statistical analysis by one-way analysis of variance, it was found that LVPW (mm), IVSW (mm), and E/A ratio were significantly associated with the severity of hypothyroidism, while ejection fraction, fractional shortening, and LV internal diameter were not significantly different between groups.
Conclusions: The completely reversible nature of these cardiac complications being well known, this study aims at reassessing the need for early recognition, and more aggressive management aims at preventing the aforementioned complications.
Key words: Echocardiography, Hypothyroidism, Pericardial effusion, Septal wall thickness
Access this article online
www.ijss-sn.com
Month of Submission : 02-2018 Month of Peer Review : 03-2018 Month of Acceptance : 04-2018 Month of Publishing : 05-2018
Corresponding Author: J Jacinth Preethi, Institute of Internal Medicine, Madras Medical College and Rajiv Gandhi Government General Hospital, Chennai - 3, Tamil Nadu, India. Mobil:+91-940019648. E-mail: [email protected]
Print ISSN: 2321-6379Online ISSN: 2321-595X
DOI: 10.17354/ijss/2018/114
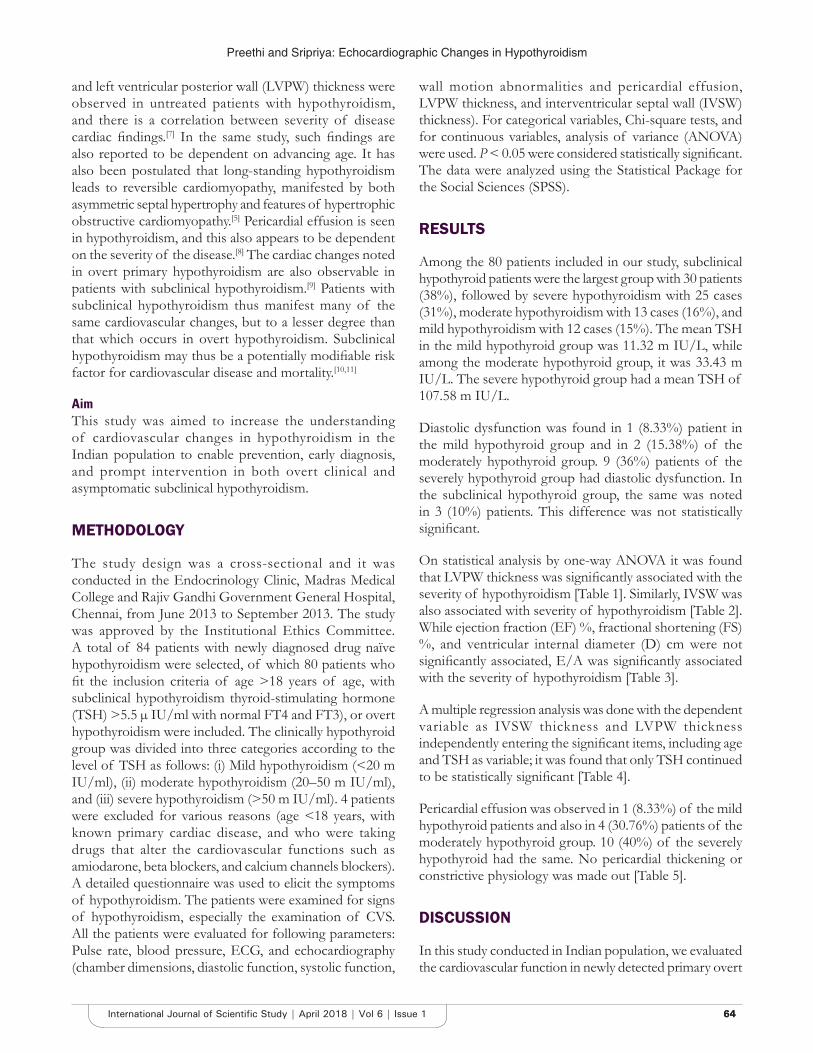
Preethi and Sripriya: Echocardiographic Changes in Hypothyroidism
6464International Journal of Scientific Study | April 2018 | Vol 6 | Issue 1
and left ventricular posterior wall (LVPW) thickness were observed in untreated patients with hypothyroidism, and there is a correlation between severity of disease cardiac findings.[7] In the same study, such findings are also reported to be dependent on advancing age. It has also been postulated that long-standing hypothyroidism leads to reversible cardiomyopathy, manifested by both asymmetric septal hypertrophy and features of hypertrophic obstructive cardiomyopathy.[5] Pericardial effusion is seen in hypothyroidism, and this also appears to be dependent on the severity of the disease.[8] The cardiac changes noted in overt primary hypothyroidism are also observable in patients with subclinical hypothyroidism.[9] Patients with subclinical hypothyroidism thus manifest many of the same cardiovascular changes, but to a lesser degree than that which occurs in overt hypothyroidism. Subclinical hypothyroidism may thus be a potentially modifiable risk factor for cardiovascular disease and mortality.[10,11]
AimThis study was aimed to increase the understanding of cardiovascular changes in hypothyroidism in the Indian population to enable prevention, early diagnosis, and prompt intervention in both overt clinical and asymptomatic subclinical hypothyroidism.
METHODOLOGY
The study design was a cross-sectional and it was conducted in the Endocrinology Clinic, Madras Medical College and Rajiv Gandhi Government General Hospital, Chennai, from June 2013 to September 2013. The study was approved by the Institutional Ethics Committee. A total of 84 patients with newly diagnosed drug naïve hypothyroidism were selected, of which 80 patients who fit the inclusion criteria of age >18 years of age, with subclinical hypothyroidism thyroid-stimulating hormone (TSH) >5.5 µ IU/ml with normal FT4 and FT3), or overt hypothyroidism were included. The clinically hypothyroid group was divided into three categories according to the level of TSH as follows: (i) Mild hypothyroidism (<20 m IU/ml), (ii) moderate hypothyroidism (20–50 m IU/ml), and (iii) severe hypothyroidism (>50 m IU/ml). 4 patients were excluded for various reasons (age <18 years, with known primary cardiac disease, and who were taking drugs that alter the cardiovascular functions such as amiodarone, beta blockers, and calcium channels blockers). A detailed questionnaire was used to elicit the symptoms of hypothyroidism. The patients were examined for signs of hypothyroidism, especially the examination of CVS. All the patients were evaluated for following parameters: Pulse rate, blood pressure, ECG, and echocardiography (chamber dimensions, diastolic function, systolic function,
wall motion abnormalities and pericardial effusion, LVPW thickness, and interventricular septal wall (IVSW) thickness). For categorical variables, Chi-square tests, and for continuous variables, analysis of variance (ANOVA) were used. P < 0.05 were considered statistically significant. The data were analyzed using the Statistical Package for the Social Sciences (SPSS).
RESULTS
Among the 80 patients included in our study, subclinical hypothyroid patients were the largest group with 30 patients (38%), followed by severe hypothyroidism with 25 cases (31%), moderate hypothyroidism with 13 cases (16%), and mild hypothyroidism with 12 cases (15%). The mean TSH in the mild hypothyroid group was 11.32 m IU/L, while among the moderate hypothyroid group, it was 33.43 m IU/L. The severe hypothyroid group had a mean TSH of 107.58 m IU/L.
Diastolic dysfunction was found in 1 (8.33%) patient in the mild hypothyroid group and in 2 (15.38%) of the moderately hypothyroid group. 9 (36%) patients of the severely hypothyroid group had diastolic dysfunction. In the subclinical hypothyroid group, the same was noted in 3 (10%) patients. This difference was not statistically significant.
On statistical analysis by one-way ANOVA it was found that LVPW thickness was significantly associated with the severity of hypothyroidism [Table 1]. Similarly, IVSW was also associated with severity of hypothyroidism [Table 2]. While ejection fraction (EF) %, fractional shortening (FS) %, and ventricular internal diameter (D) cm were not significantly associated, E/A was significantly associated with the severity of hypothyroidism [Table 3].
A multiple regression analysis was done with the dependent variable as IVSW thickness and LVPW thickness independently entering the significant items, including age and TSH as variable; it was found that only TSH continued to be statistically significant [Table 4].
Pericardial effusion was observed in 1 (8.33%) of the mild hypothyroid patients and also in 4 (30.76%) patients of the moderately hypothyroid group. 10 (40%) of the severely hypothyroid had the same. No pericardial thickening or constrictive physiology was made out [Table 5].
DISCUSSION
In this study conducted in Indian population, we evaluated the cardiovascular function in newly detected primary overt
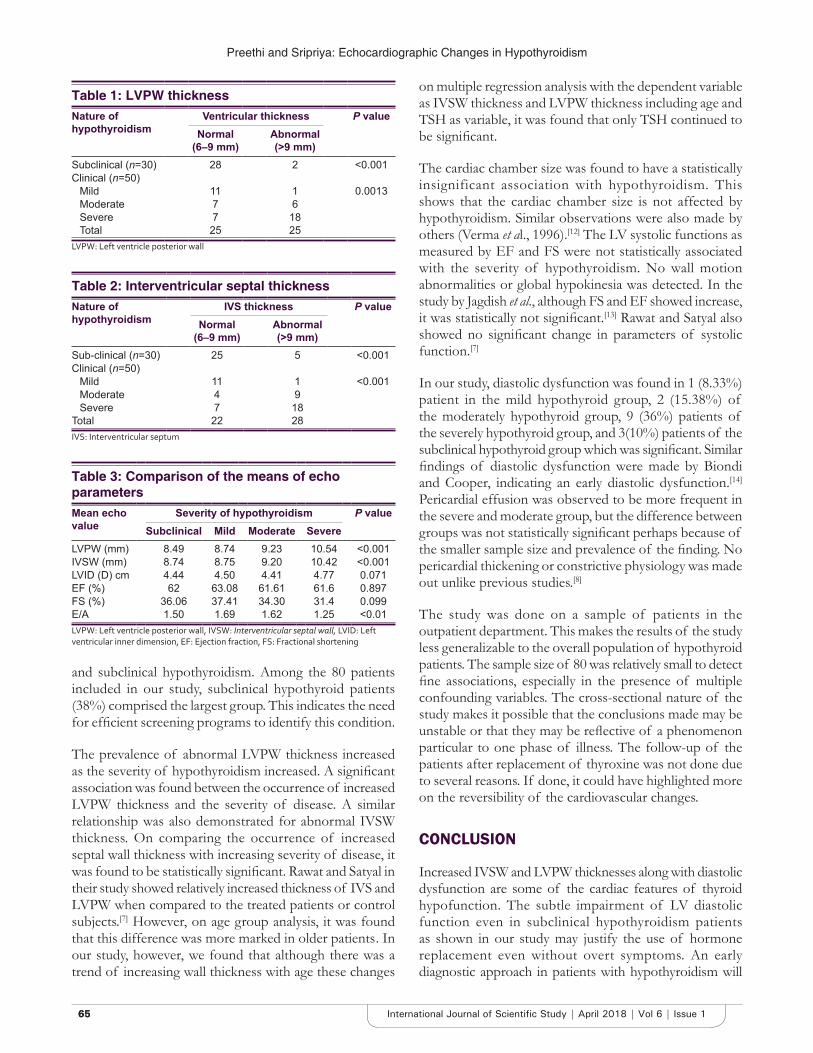
Preethi and Sripriya: Echocardiographic Changes in Hypothyroidism
6565 International Journal of Scientific Study | April 2018 | Vol 6 | Issue 1
and subclinical hypothyroidism. Among the 80 patients included in our study, subclinical hypothyroid patients (38%) comprised the largest group. This indicates the need for efficient screening programs to identify this condition.
The prevalence of abnormal LVPW thickness increased as the severity of hypothyroidism increased. A significant association was found between the occurrence of increased LVPW thickness and the severity of disease. A similar relationship was also demonstrated for abnormal IVSW thickness. On comparing the occurrence of increased septal wall thickness with increasing severity of disease, it was found to be statistically significant. Rawat and Satyal in their study showed relatively increased thickness of IVS and LVPW when compared to the treated patients or control subjects.[7] However, on age group analysis, it was found that this difference was more marked in older patients . In our study, however, we found that although there was a trend of increasing wall thickness with age these changes
on multiple regression analysis with the dependent variable as IVSW thickness and LVPW thickness including age and TSH as variable, it was found that only TSH continued to be significant.
The cardiac chamber size was found to have a statistically insignificant association with hypothyroidism. This shows that the cardiac chamber size is not affected by hypothyroidism. Similar observations were also made by others (Verma et al., 1996).[12] The LV systolic functions as measured by EF and FS were not statistically associated with the severity of hypothyroidism. No wall motion abnormalities or global hypokinesia was detected. In the study by Jagdish et al., although FS and EF showed increase, it was statistically not significant.[13] Rawat and Satyal also showed no significant change in parameters of systolic function.[7]
In our study, diastolic dysfunction was found in 1 (8.33%) patient in the mild hypothyroid group, 2 (15.38%) of the moderately hypothyroid group, 9 (36%) patients of the severely hypothyroid group, and 3(10%) patients of the subclinical hypothyroid group which was significant. Similar findings of diastolic dysfunction were made by Biondi and Cooper, indicating an early diastolic dysfunction.[14] Pericardial effusion was observed to be more frequent in the severe and moderate group, but the difference between groups was not statistically significant perhaps because of the smaller sample size and prevalence of the finding. No pericardial thickening or constrictive physiology was made out unlike previous studies.[8]
The study was done on a sample of patients in the outpatient department. This makes the results of the study less generalizable to the overall population of hypothyroid patients. The sample size of 80 was relatively small to detect fine associations, especially in the presence of multiple confounding variables. The cross-sectional nature of the study makes it possible that the conclusions made may be unstable or that they may be reflective of a phenomenon particular to one phase of illness. The follow-up of the patients after replacement of thyroxine was not done due to several reasons. If done, it could have highlighted more on the reversibility of the cardiovascular changes.
CONCLUSION
Increased IVSW and LVPW thicknesses along with diastolic dysfunction are some of the cardiac features of thyroid hypofunction. The subtle impairment of LV diastolic function even in subclinical hypothyroidism patients as shown in our study may justify the use of hormone replacement even without overt symptoms. An early diagnostic approach in patients with hypothyroidism will
Table 1: LVPW thicknessNature of hypothyroidism
Ventricular thickness P valueNormal
(6–9 mm)Abnormal (>9 mm)
Subclinical (n=30) 28 2 <0.001Clinical (n=50)
Mild 11 1 0.0013Moderate 7 6Severe 7 18Total 25 25
LVPW: Left ventricle posterior wall
Table 2: Interventricular septal thicknessNature of hypothyroidism
IVS thickness P valueNormal
(6–9 mm)Abnormal (>9 mm)
Sub-clinical (n=30) 25 5 <0.001Clinical (n=50)
Mild 11 1 <0.001Moderate 4 9Severe 7 18
Total 22 28IVS: Interventricular septum
Table 3: Comparison of the means of echo parametersMean echo value
Severity of hypothyroidism P valueSubclinical Mild Moderate Severe
LVPW (mm) 8.49 8.74 9.23 10.54 <0.001IVSW (mm) 8.74 8.75 9.20 10.42 <0.001LVID (D) cm 4.44 4.50 4.41 4.77 0.071EF (%) 62 63.08 61.61 61.6 0.897FS (%) 36.06 37.41 34.30 31.4 0.099E/A 1.50 1.69 1.62 1.25 <0.01LVPW: Left ventricle posterior wall, IVSW: Interventricular septal wall, LVID: Left ventricular inner dimension, EF: Ejection fraction, FS: Fractional shortening
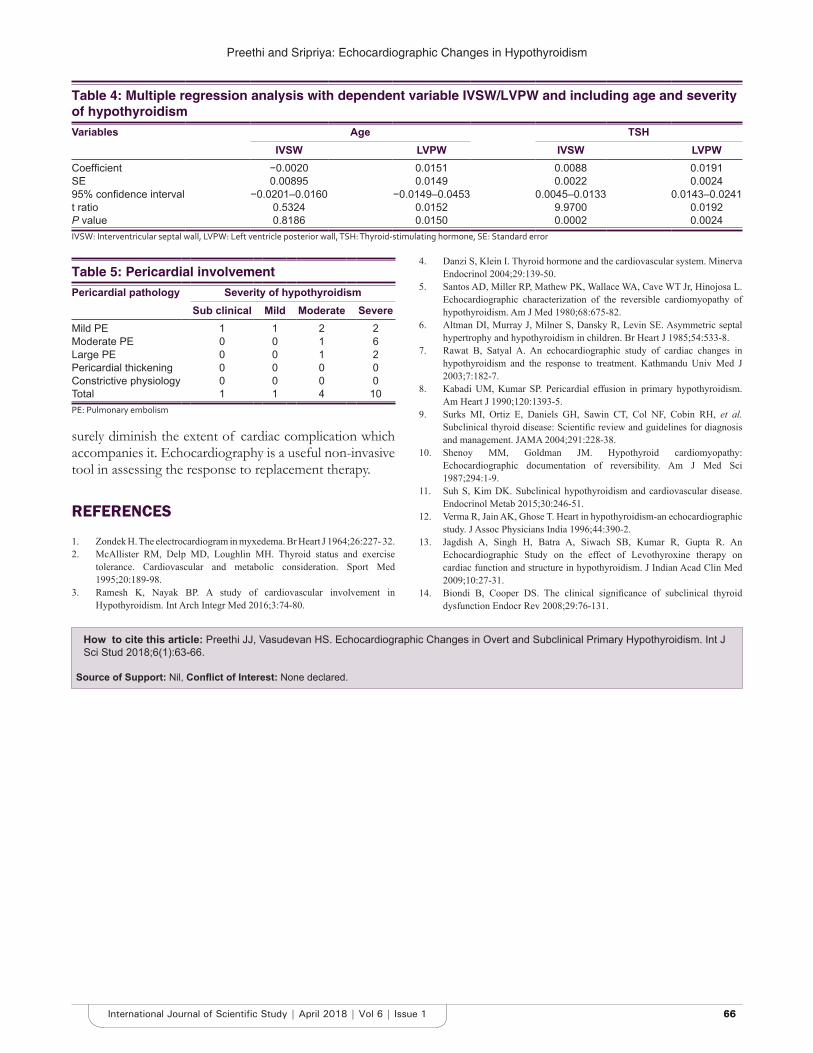
Preethi and Sripriya: Echocardiographic Changes in Hypothyroidism
6666International Journal of Scientific Study | April 2018 | Vol 6 | Issue 1
surely diminish the extent of cardiac complication which accompanies it. Echocardiography is a useful non-invasive tool in assessing the response to replacement therapy.
REFERENCES
1. Zondek H. The electrocardiogram in myxedema. Br Heart J 1964;26:227- 32.2. McAllister RM, Delp MD, Loughlin MH. Thyroid status and exercise
tolerance. Cardiovascular and metabolic consideration. Sport Med 1995;20:189-98.
3. Ramesh K, Nayak BP. A study of cardiovascular involvement in Hypothyroidism. Int Arch Integr Med 2016;3:74-80.
4. Danzi S, Klein I. Thyroid hormone and the cardiovascular system. Minerva Endocrinol 2004;29:139-50.
5. Santos AD, Miller RP, Mathew PK, Wallace WA, Cave WT Jr, Hinojosa L. Echocardiographic characterization of the reversible cardiomyopathy of hypothyroidism. Am J Med 1980;68:675-82.
6. Altman DI, Murray J, Milner S, Dansky R, Levin SE. Asymmetric septal hypertrophy and hypothyroidism in children. Br Heart J 1985;54:533-8.
7. Rawat B, Satyal A. An echocardiographic study of cardiac changes in hypothyroidism and the response to treatment. Kathmandu Univ Med J 2003;7:182-7.
8. Kabadi UM, Kumar SP. Pericardial effusion in primary hypothyroidism. Am Heart J 1990;120:1393-5.
9. Surks MI, Ortiz E, Daniels GH, Sawin CT, Col NF, Cobin RH, et al. Subclinical thyroid disease: Scientific review and guidelines for diagnosis and management. JAMA 2004;291:228-38.
10. Shenoy MM, Goldman JM. Hypothyroid cardiomyopathy: Echocardiographic documentation of reversibility. Am J Med Sci 1987;294:1-9.
11. Suh S, Kim DK. Subclinical hypothyroidism and cardiovascular disease. Endocrinol Metab 2015;30:246-51.
12. Verma R, Jain AK, Ghose T. Heart in hypothyroidism-an echocardiographic study. J Assoc Physicians India 1996;44:390-2.
13. Jagdish A, Singh H, Batra A, Siwach SB, Kumar R, Gupta R. An Echocardiographic Study on the effect of Levothyroxine therapy on cardiac function and structure in hypothyroidism. J Indian Acad Clin Med 2009;10:27-31.
14. Biondi B, Cooper DS. The clinical significance of subclinical thyroid dysfunction Endocr Rev 2008;29:76-131.
Table 4: Multiple regression analysis with dependent variable IVSW/LVPW and including age and severity of hypothyroidismVariables Age TSH
IVSW LVPW IVSW LVPWCoefficient −0.0020 0.0151 0.0088 0.0191SE 0.00895 0.0149 0.0022 0.002495% confidence interval −0.0201–0.0160 −0.0149–0.0453 0.0045–0.0133 0.0143–0.0241t ratio 0.5324 0.0152 9.9700 0.0192P value 0.8186 0.0150 0.0002 0.0024IVSW: Interventricular septal wall, LVPW: Left ventricle posterior wall, TSH: Thyroid‑stimulating hormone, SE: Standard error
Table 5: Pericardial involvementPericardial pathology Severity of hypothyroidism
Sub clinical Mild Moderate SevereMild PE 1 1 2 2Moderate PE 0 0 1 6Large PE 0 0 1 2Pericardial thickening 0 0 0 0Constrictive physiology 0 0 0 0Total 1 1 4 10PE: Pulmonary embolism
How to cite this article: Preethi JJ, Vasudevan HS. Echocardiographic Changes in Overt and Subclinical Primary Hypothyroidism. Int J Sci Stud 2018;6(1):63-66.
Source of Support: Nil, Conflict of Interest: None declared.
6767 International Journal of Scientific Study | April 2018 | Vol 6 | Issue 1
Study of Different Modalities of Management in Patients with Liver Abscess in a Tertiary Care CentreJawansing Manza1, Hardik Makwana2, Mukesh Pancholi3, Nimesh Verma4
1Senior Resident, Department of General Surgery, New Civil Hospital, Surat, Gujarat, India, 2Assistant Professor, Department of General Surgery, New Civil Hospital, Surat, Gujarat, India, 3Associate Professor, Department of General Surgery, New Civil Hospital, Surat, Gujarat, India, 4Professor and Head, Department of General Surgery, New Civil Hospital, Surat, Gujarat, India
tender hepatomegaly is unusual. The frequency of any particular symptoms varies widely among reports. Management of liver abscess was exclusively surgical in the past. Modern treatment has shifted toward broad-spectrum antibiotics and imaging-guided percutaneous needle aspiration (PNA) or percutaneous catheter drainage (PCD). Percutaneous pigtail catheterization reduces chances of exploration by surgery for liver abscess. Surgical intervention is only indicated for ruptured liver abscess, multiple lesions that cannot be effectively managed percutaneously and abscesses that do not respond to less invasive methods.
INTRODUCTION
Liver abscess is a life-threatening disease. The classic presentation of fever, right upper quadrant pain, and
Original Article
AbstractIntroduction: Management of liver abscess was exclusively surgical in the past. Modern treatment has shifted toward broad-spectrum antibiotics and imaging-guided percutaneous needle aspiration or percutaneous catheter drainage. This retrospective study has been carried out to evaluate etiology of liver abscess and compare effectiveness of different modalities of treatment.
Methods: This is a retrospective observational study of patients of liver abscess treated during the period of March 1, 2014, to March 1, 2015, at New Civil Hospital, Surat. They were treated by different mode of intervention. All patients underwent clinical follow-up and monitoring during daily rounds until they were discharged from the hospital. Follow-up sonography was performed 24 h after intervention and repeated every 3 days in 1st week, and the size of the abscess was recorded. Criteria for successful treatment were clinical subsidence of infection and sonographic evidence of abscess resolution.
Results: A total of 73 cases of liver abscess were studied at New Civil Hospital, Surat, during the period. It is more commonly seen in adult life with highest incidence in 3rd–5th decade. The most common presenting symptoms are pain and fever. Tenderness is present in most of patients, whereas signs of jaundice, ascites, and shock are rare. Liver abscess is seen frequently in alcoholic patients. Most of the patients with liver abscess are anemic and with elevated total white blood cell count and increased serum alkaline phosphate. <16% have abnormal chest X-ray with pleural effusion being the most common. Most often right lobe is involved in pyogenic liver abscess. Of 73 cases, 3 cases (4.1%) show at least one of the complications. Rupture of abscess occurred in 2 patients (2.71%) into pleural cavity who were treated by intercostal drainage and in 1 (1.36%) patient into peritoneal cavity treated with exploratory laparotomy with drainage of pyoperitoneum.
Conclusion: Liver abscesses continue to be an important cause of morbidity and mortality in the tropical countries. Percutaneous drainage with systemic antibiotics has become the preferred treatment for the management of pyogenic liver abscesses. In contrast, for amebic abscesses, the primary mode of treatment is medical. Surgical drainage is now used only in cases which fail to respond to percutaneous drainage.
Key words: Amebic liver abscess, Liver abscess, Percutaneous catheter drainage, Pyogenic liver abscess
Corresponding Author: Dr. Jawansing Manza, House No. 49, Santkrupa, Ashwini Nagar, Itkheda, Paithan Road, Aurangabad – 431 001, Maharashtra, India. Phone: +91-9970040803. E-mail: [email protected]
Print ISSN: 2321-6379Online ISSN: 2321-595X
DOI: 10.17354/ijss/2018/115
Access this article online
www.ijss-sn.com
Month of Submission : 02-2018 Month of Peer Review : 03-2018 Month of Acceptance : 04-2018 Month of Publishing : 05-2018
Manza, et al.: Study of Different Modalities of Management of Liver Abscess
6868International Journal of Scientific Study | April 2018 | Vol 6 | Issue 1
The advantage of ultrasonography (USG) over computed tomography (CT) scan is that sonography is a real-time imaging technique that allows monitoring of the course of the needles and catheters as they traverse tissues. While CT scan-guided aspiration is usually associated with longer procedure times, because it is necessary to scan the region of interest every time for confirmation of catheter.
Continuous catheter drainage is widely accepted and in combination with antibiotics is considered a safe and effective method of management of liver abscess. Some authors prefer repeated needle aspiration, considering it as effective and safe as PCD but easy to perform, less complicated, less risky for post-procedure septicemia, and less expensive. This approach requires careful follow-up and often repeated imaging procedures to monitor response to therapy.
This retrospective study has been carried out to evaluate etiology of liver abscess and compare effectiveness of different modalities of treatment.[1]
MATERIALS AND METHODS
This is a retrospective observational study of patients of liver abscess treated at New Civil Hospital, Surat.
Inclusion CriteriaPatient admitted to new civil hospital with confirmed diagnosis of liver abscess from March 1, 2014 to March 1, 2015.
Exclusion CriteriaNo exclusion criteria.
SubjectsAll patients with confirmed diagnoses of liver abscess who were admitted in NCH, Surat, from March 1, 2014, to March 1, 2015, were considered as study participants. A patient was treated by various modes of intervention. Initially, patients were treated with intravenous antibiotic treatment with Inj. Amikacin 10 mg/kg 12 h, Inj. Ceftriaxone 15 mg/kg 12 h, and Inj. Metronidazole 15 mg/kg 8 h.
PNAPercutaneous treatment was performed within 24 h after admission in case of liquefied abscess. In case of partially liquefied abscess initially 3 days intravenous antibiotics given and reassessed with follow-up USG, if suggesting abscess is liquefied, then percutaneous intervention done otherwise antibiotics continue and again reassessed. The antibiotics therapy was adjusted according to the results of culture and sensitivity test of pus aspirated at the time of the drainage procedure. Patients with negative culture results were continuously treated with a combination of Inj. Ceftriaxone,
Inj. Amikacin, and Inj. Metronidazole. The antibiotic regime was changed for patients with poor treatment response. Intravenous antibiotic therapy was continued for a minimum of 7 days. All percutaneous interventions were performed under USG guidance. A sample of pus was routinely taken and sent for microbiological analysis including microscopy, culture, and antibiotic sensitivity tests.
Continuous Catheter DrainageIn drainage technique, an 8–14 French multiple-side-hole pigtail catheter was introduced into the abscess cavity by Seldinger technique. The procedure was performed with local anesthesia with the patient supine or the left lateral position. Careful localization of the abscess and proper selection of the entry site were required. The optimal route of access traversed the least possible amount of liver tissue and avoided bowel and pleura. Aspiration was then performed with the catheter until no more pus could be removed. After that, irrigation done with normal saline and again pus was aspirated, if no more pus could be drain, then catheter was secured to the skin for continuous external drainage and the patient was sent back to the ward. When catheter output had stopped for 24 h, a follow-up sonography was performed. If an abscess cavity was absent, the catheter was removed. If a residual cavity was present, the catheter was flushed with saline and aspirated until the return was clear. Residual loculations of abscess were treated with catheter repositioning and aspiration. Further, sonography was performed 3 days later and the catheter was removed if there is no residual collection. Otherwise, the catheter was left in situ until catheter output had stopped.
Management of ComplicationsIntercostal drainage (ICD) tube insertion was done under local anesthesia in case of ruptured liver abscess into pleural cavity. Exploratory laparotomy with drainage of pyoperitoneum done in case of rupture liver abscess into peritoneal cavity.
Patient Follow-up and OutcomeAll patients underwent clinical follow-up and monitoring during daily rounds until they were discharged from the hospital. Follow-up sonography was performed 24 h after intervention and repeated every 3 days in 1st week and the size of the abscess was recorded. Criteria for successful treatment were clinical subsidence of infection and sonographic evidence of abscess resolution, such as disappearance or marked decrease in the abscess cavity (more than 50% reduction of longest diameter before treatment). Patients discharged with a catheter underwent follow-up sonography until there was no catheter output for 24 h, and then, the catheter was removed. Patient outcomes including length of hospital stay, complications related to the procedure, and treatment failure and death were recorded.
Manza, et al.: Study of Different Modalities of Management of Liver Abscess
6969 International Journal of Scientific Study | April 2018 | Vol 6 | Issue 1
RESULTS
A retrospective study was carried out among 73 confirmed diagnoses of liver abscess cases who were admitted in New Civil Hospital, Surat, enrolled from March 1, 2014 to March 1, 2015. Mean age of study participants was 43.27 ± 13.26 years [Table 1]. Liver abscess is more common in male patients than female, but reasons still unknown. It may be due to addiction of alcohol, tobacco chewing, and smoking in male gender [Table 2]. In this study, all patients are having one of two addiction with 38% patients having both addictions. Liver abscess is seen frequently in alcoholic patients. Association of addiction with liver abscess possibly explains male preponderance of disease. Liver abscess is most common in low socioeconomic status group of patients. 64% patients presented with acute onset of disease. The most common symptoms are pain and fever seen in 64.5% and 64%, respectively. Tenderness is present in most of patients (60%), whereas jaundice, ascites, and shock were present in less number of patients. It is comparable to other studies [Table 3]. Most of the patients with liver abscess are anemic and with elevated total white blood cell count and increased serum alkaline phosphate. <16% have abnormal chest X-ray with pleural effusion being the most common. In this study, the right lobe of liver was affected in 80% of patients. Of 73 cases, we encountered with only complication rupture of liver abscess in 3 cases (4.1%). There were no
other complications in any patient. Rupture of abscess occurred in 2 patients (2.71%) into pleural cavity who were treated by ICD drainage and in 1 (1.36%) patient into peritoneal cavity treated with exploratory laparotomy with drainage of pyoperitoneum. In comparison to other study, we encountered this complication in less number of patients [Table 4]. Mean hospital stay was 5.37 days with range of 2–13 days. In the present study, reported 65.5% had been diagnosed as amebic liver abscess and 34.25% had been diagnosed as pyogenic liver abscess. In the present study, out of 48 patients of amebic liver abscess, 7 patients were managed conservatively, 25 patients managed by percutaneous needle drainage (PNA), 15 patients managed by PCD, and 1 patient was managed by exploratory laparotomy. In the present study, out of 25 patients of pyogenic abscess, 1 patient managed conservatively, 20 patients managed by percutaneous needle drainage, and 4 patients managed by PCD [Table 5].
DISCUSSION
Liver abscesses, both amebic and pyogenic, continue to be an important cause of morbidity and mortality in the tropical countries. Patients usually present late when the liver abscess attains a large size. Percutaneous drainage (either needle aspiration or catheter drainage) with systemic antibiotics has become the preferred treatment for the management of liver abscesses. In contrast, for amebic abscesses, the primary mode of treatment is medical; however, as many as 15% of these may be refractory to medical therapy, while 20% may be complicated by secondary bacterial infection. Such amebic abscesses and those involving the left lobe, or those with impending rupture also need to be drained.[2]
Surgical drainage is now used only in cases which fail to respond to percutaneous drainage (PCD). Although PCD is a preffered method most widely used to drain liver abcess,surgical drainage is now used only in case which fails to respond to percutaneous drainage.
Table 1: Age group-wise distributionAge group (years) n<40 2940–60 37More than 60 7
Table 3: Signs and symptoms wise distributionSymptoms/signs Present series number and percentage of
patients (%)Mohsen et al.,
2002[7] (%)Ogawa et al.,
1999[6] (%)Fever 32 (64) 70 86Pain 35 (64.5) 67 32Nausea/vomiting 22 (44) 41 -Anorexia/weight loss 20 (40) 35 -Diarrhea 14 (28) 23 -Cough 14 (28) 38 -Jaundice 10 (20) 14 11Tenderness 30 (60) 54 -Hepatomegaly 22 (44) 30 -Ascites 3 (6) - -Shock 2 (4) - -
Table 2: Sex-wise distributionName of study Male:female ratio (66:07)This study 9.04:1Zibari et al., 1996[9] 1.86:1
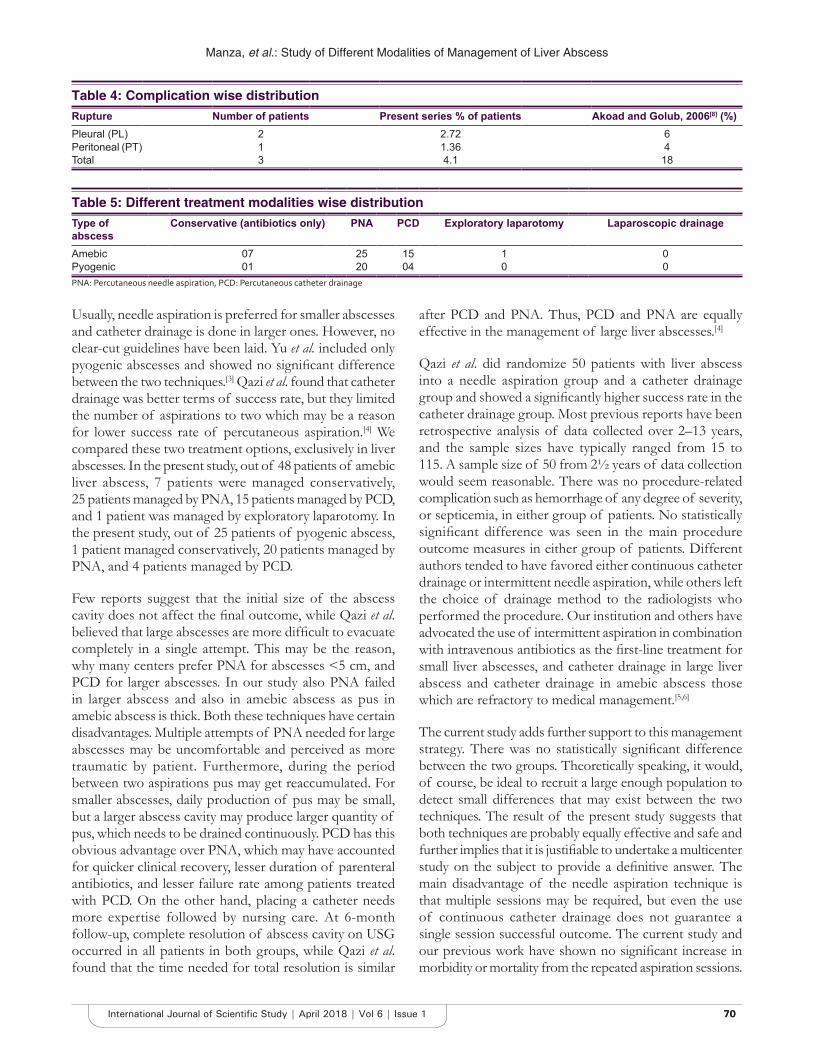
Manza, et al.: Study of Different Modalities of Management of Liver Abscess
7070International Journal of Scientific Study | April 2018 | Vol 6 | Issue 1
Usually, needle aspiration is preferred for smaller abscesses and catheter drainage is done in larger ones. However, no clear-cut guidelines have been laid. Yu et al. included only pyogenic abscesses and showed no significant difference between the two techniques.[3] Qazi et al. found that catheter drainage was better terms of success rate, but they limited the number of aspirations to two which may be a reason for lower success rate of percutaneous aspiration.[4] We compared these two treatment options, exclusively in liver abscesses. In the present study, out of 48 patients of amebic liver abscess, 7 patients were managed conservatively, 25 patients managed by PNA, 15 patients managed by PCD, and 1 patient was managed by exploratory laparotomy. In the present study, out of 25 patients of pyogenic abscess, 1 patient managed conservatively, 20 patients managed by PNA, and 4 patients managed by PCD.
Few reports suggest that the initial size of the abscess cavity does not affect the final outcome, while Qazi et al. believed that large abscesses are more difficult to evacuate completely in a single attempt. This may be the reason, why many centers prefer PNA for abscesses <5 cm, and PCD for larger abscesses. In our study also PNA failed in larger abscess and also in amebic abscess as pus in amebic abscess is thick. Both these techniques have certain disadvantages. Multiple attempts of PNA needed for large abscesses may be uncomfortable and perceived as more traumatic by patient. Furthermore, during the period between two aspirations pus may get reaccumulated. For smaller abscesses, daily production of pus may be small, but a larger abscess cavity may produce larger quantity of pus, which needs to be drained continuously. PCD has this obvious advantage over PNA, which may have accounted for quicker clinical recovery, lesser duration of parenteral antibiotics, and lesser failure rate among patients treated with PCD. On the other hand, placing a catheter needs more expertise followed by nursing care. At 6-month follow-up, complete resolution of abscess cavity on USG occurred in all patients in both groups, while Qazi et al. found that the time needed for total resolution is similar
after PCD and PNA. Thus, PCD and PNA are equally effective in the management of large liver abscesses.[4]
Qazi et al. did randomize 50 patients with liver abscess into a needle aspiration group and a catheter drainage group and showed a significantly higher success rate in the catheter drainage group. Most previous reports have been retrospective analysis of data collected over 2–13 years, and the sample sizes have typically ranged from 15 to 115. A sample size of 50 from 2½ years of data collection would seem reasonable. There was no procedure-related complication such as hemorrhage of any degree of severity, or septicemia, in either group of patients. No statistically significant difference was seen in the main procedure outcome measures in either group of patients. Different authors tended to have favored either continuous catheter drainage or intermittent needle aspiration, while others left the choice of drainage method to the radiologists who performed the procedure. Our institution and others have advocated the use of intermittent aspiration in combination with intravenous antibiotics as the first-line treatment for small liver abscesses, and catheter drainage in large liver abscess and catheter drainage in amebic abscess those which are refractory to medical management.[5,6]
The current study adds further support to this management strategy. There was no statistically significant difference between the two groups. Theoretically speaking, it would, of course, be ideal to recruit a large enough population to detect small differences that may exist between the two techniques. The result of the present study suggests that both techniques are probably equally effective and safe and further implies that it is justifiable to undertake a multicenter study on the subject to provide a definitive answer. The main disadvantage of the needle aspiration technique is that multiple sessions may be required, but even the use of continuous catheter drainage does not guarantee a single session successful outcome. The current study and our previous work have shown no significant increase in morbidity or mortality from the repeated aspiration sessions.
Table 4: Complication wise distributionRupture Number of patients Present series % of patients Akoad and Golub, 2006[8] (%)Pleural (PL) 2 2.72 6Peritoneal (PT) 1 1.36 4Total 3 4.1 18
Table 5: Different treatment modalities wise distributionType of abscess
Conservative (antibiotics only) PNA PCD Exploratory laparotomy Laparoscopic drainage
Amebic 07 25 15 1 0Pyogenic 01 20 04 0 0PNA: Percutaneous needle aspiration, PCD: Percutaneous catheter drainage
Manza, et al.: Study of Different Modalities of Management of Liver Abscess
7171 International Journal of Scientific Study | April 2018 | Vol 6 | Issue 1
CONCLUSION
Complications are more in amebic abscess as compared to pyogenic liver abscess. Common symptoms of liver abscess are fever and abdominal pain. USG is the mainstay in diagnosing the liver abscess. Antibiotic or amebicidal drugs treatment as a sole modality of treatment can be used for patients who show initial good response and has relatively small size abscesses. Irrespective of the modality of treatment, antibiotic (for pyogenic), or antiamebic (for amebic) drugs are given to all patients in full course. More than two aspirations can be done with good results. Intermittent needle aspiration considered as first-line management of small liver abscess. Others should be treated with percutaneous drainage if abscess is large and liquefied, but single percutaneous aspiration does not always yield good results. Percutaneous pigtail catheter drainage is more effective in large liver abscess. Percutaneous catheter placement is an acceptable modality of treatment in large abscess that demands repeated aspirations. Surgery is extremely useful for complicated cases. Laparoscopic drainage is useful in patients who have concomitant other biliary pathologies.
ACKNOWLEDGEMENT
We want to pay our humble regards to our Additional Professor and Head of Department, Dr. Nimesh Verma for his constant encouragement and overall administrative help for completing this study. We take this opportunity to
express our heartfelt gratitude to our teachers Dr. Mukesh Pancholi (Associate Prof.), Dr. Beena Vaidya (Add. Prof.), Dr. Divyang Dave (Add. Prof.), Dr. Jignesh Shah (Asso. Prof.), and Dr. Sandeep Kansal (Asso. Prof.).
Last but not least, we would like to express our special thanks to our colleague, Dr. Hardik Makwana and our patients, for their invaluable support, to make this study complete.
We owe a lot to our parents and all our family members.
REFERENCES
1. Williams N, O’Connell PR. Bailey and Love, Short Practice of Surgery. 25th ed. USA: Hooder Arnold; 2008. p. 1095.
2. Neo JY, Lim ZL, Omar Said AI, Tong YY. Ultrasound-Guided Percutaneous Drainage of Liver Abscess by a Single Surgeon. College of Surgeons Academy of Medicine of Malaysia. Poster No. 83.
3. Yu SC, Ho SS, Lau WY, Yeung DT, Yuen EH, Lee PS, et al. Treatment of Pyogenic Liver Abscess. Hepatology 2004;39:932-8.
4. Qazi AR, Naqvi SQ, Solangi RA, Memon JM, Lashari A. Liver abscess: Diagnosis and Treatment. Pak J Surg 2008;24:203-7.
5. Ramani A, Fakhri SM, Hanks JB. USG guided needle aspiration of amebic liver abscess. Post Grad Med J 1993;60:381-3.
6. Ogawa T, Shimizu S, Morisaki T, Sugitani A, Nakatsuka A, Mizumoto K, et al. The role of percutaneous transhepatic abscess drainage for liver abscess. J Hepatobiliary Pancreat Surg 1999;6:263-6.
7. Mohsen AH, Green ST, Read RC, McKendrick MW. Liver abscess in adults: Ten years’ experience in a UK. centre. Q J Med 2002;95:797-802.
8. Akoad M, Golub RW. Pyogenic hepatic Abscesses. Available from: http://www.emedicine. com/MED/topic2744.htm. [Last accessed on 2006 Mar 22].
9. Zibari GB, Maguire S, Aultman DF, et al. Pyogenic liver abscess. Surg Infect. 2000;1(1):15-21.
How to cite this article: Manza J, Makwana H, Pancholi M, Verma N. Study of Different Modalities of Management in Patients with Liver Abscess in a Tertiary Care Centre. Int J Sci Stud 2018;6(1):67-71.
Source of Support: Nil, Conflict of Interest: None declared.
7272International Journal of Scientific Study | April 2018 | Vol 6 | Issue 1
Coronary Angiographic Profile of Patients with Acute Coronary Syndrome <45 Years of Age in Rural Population of Tamil NaduA G Narayanaswamy1*, P Vinodh Kumar2, Mohd Shahid3, S Porchelvan4, K Meenakshi5, V Srinivasan6, K Sharada7, V Magesh8
1Senior Consultant and Assistant Professor, Department of Cardiology, Saveetha Medical College, Chennai, Tamil Nadu, India, 2Associate Consultant, Department of Cardiology, Apollo Hospitals, Chennai, Tamil Nadu, India, 3Post Graduate, Department of Cardiology, Saveetha Medical College, Chennai, Tamil Nadu, India, 4Professor, Department of Biostatistics, Saveetha Medical College, Chennai, Tamil Nadu, India, 5Professor and Head, Department of Cardiology, Saveetha Medical College, Chennai, Tamil Nadu, India, 6Assistant Professor, Department of Pharmacology, Saveetha Medical College, Chennai, Tamil Nadu, India, 7Professor, Department of Cardiology, Saveetha Medical College, Chennai, Tamil Nadu, India, 8Assitant Professor, Department of Cardiology, Saveetha Medical College, Chennai, Tamil Nadu, India
INTRODUCTION
Cardiovascular diseases (CVDs) and its associated complications alone accounts for approximately 12 million deaths annually in the Indian subcontinent.[1] As per the statistics of the World Health Organization in 2014, 26% of total mortality in India is contributed by CVD.[2] Mortality
Original Article
AbstractBackground: In India Coronary artery disease manifests almost a decade earlier than in western countries. There are few existing data regarding Coronary angiographic profile of patients less than 45 years of age admitted as Acute Coronary Syndrome, hence this study.
Objective: This study examined the Coronary angiographic profile of young men and women admitted with Acute Coronary Syndrome in our hospital.
Methods: The methodology used was single centre retrospective analysis. 121 patients less than 45years of age admitted with acute Coronary syndrome were included in the study. All underwent Coronary angiogram within 48hours of admission.
Results: This is a retrospective study was done from 1st April 2014 to 15th February 2018. Out of 1152 Coronary Angiograms done of patients, there were 121 (10.5%) patients with Coronary angiograms less than 45 years of age. Males were predominant 103/121(85.1%). The incidence of Single / Double vessel disease was nearly equal (39.6%/35.5%). 22 patients (18.1%) had recanalized coronary arteries (Non-Obstructive CAD). 80 patients (66%) were admitted with diagnosis of acute anterior wall myocardial infarction followed by inferior wall MI 31(37.8%). Incidence of right dominant system was (80.9%). The predominant vessel involved was the left anterior descending artery (LAD) followed by right coronary artery (RCA). Type A LAD was predominant 95/121 (80.9%). Only 54 patients (44.6%) had discrete Coronary lesions. Proximal LAD / Mid LAD were equally involved. Mid RCA was commonly involved when RCA was the culprit vessel. Distal LCX involvement was more common.
Conclusion: There is equal prevalence of Single vessel disease / Double vessel disease with a lesser prevalence of recanalized Coronary arteries (Non-Obstructive CAD). The severity of acute coronary syndrome seems to be increasing in our population.
Key words: Coronary artery disease, angiographic profile, acute coronary syndrome, CAD- Coronary artery disease, LAD- Left anterior descending artery, LCX – Left circumflex artery, RCA- Right coronary artery.
Access this article online
www.ijss-sn.com
Month of Submission : 02-2018 Month of Peer Review : 03-2018 Month of Acceptance : 04-2018 Month of Publishing : 05-2018
Corresponding Author: Dr. A G Narayanaswamy, Department of Cardiology, Saveetha Medical College, Thandalam, Chennai – 602 105, Tamil Nadu, India. Phone: +91-9444054861. E-mail: [email protected]
Print ISSN: 2321-6379Online ISSN: 2321-595X
DOI: 10.17354/ijss/2018/116
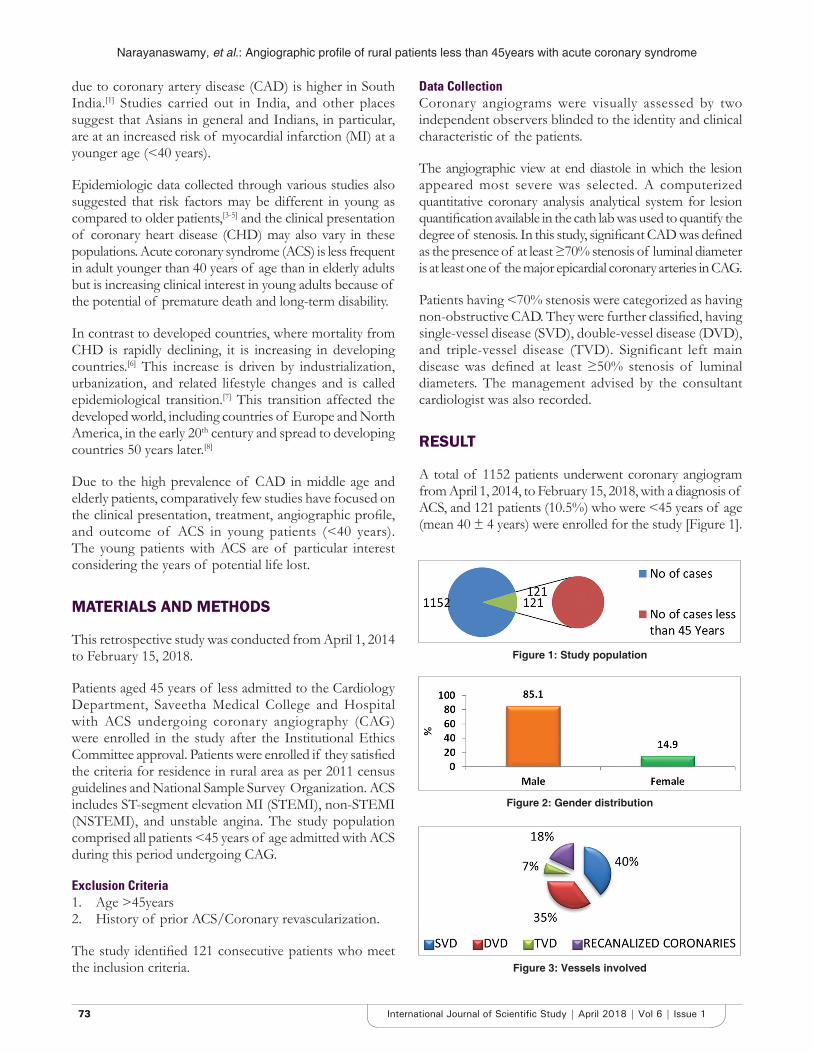
Narayanaswamy, et al.: Angiographic profile of rural patients less than 45years with acute coronary syndrome
7373 International Journal of Scientific Study | April 2018 | Vol 6 | Issue 1
due to coronary artery disease (CAD) is higher in South India.[1] Studies carried out in India, and other places suggest that Asians in general and Indians, in particular, are at an increased risk of myocardial infarction (MI) at a younger age (<40 years).
Epidemiologic data collected through various studies also suggested that risk factors may be different in young as compared to older patients,[3-5] and the clinical presentation of coronary heart disease (CHD) may also vary in these populations. Acute coronary syndrome (ACS) is less frequent in adult younger than 40 years of age than in elderly adults but is increasing clinical interest in young adults because of the potential of premature death and long-term disability.
In contrast to developed countries, where mortality from CHD is rapidly declining, it is increasing in developing countries.[6] This increase is driven by industrialization, urbanization, and related lifestyle changes and is called epidemiological transition.[7] This transition affected the developed world, including countries of Europe and North America, in the early 20th century and spread to developing countries 50 years later.[8]
Due to the high prevalence of CAD in middle age and elderly patients, comparatively few studies have focused on the clinical presentation, treatment, angiographic profile, and outcome of ACS in young patients (<40 years). The young patients with ACS are of particular interest considering the years of potential life lost.
MATERIALS AND METHODS
This retrospective study was conducted from April 1, 2014 to February 15, 2018.
Patients aged 45 years of less admitted to the Cardiology Department, Saveetha Medical College and Hospital with ACS undergoing coronary angiography (CAG) were enrolled in the study after the Institutional Ethics Committee approval. Patients were enrolled if they satisfied the criteria for residence in rural area as per 2011 census guidelines and National Sample Survey Organization. ACS includes ST-segment elevation MI (STEMI), non-STEMI (NSTEMI), and unstable angina. The study population comprised all patients <45 years of age admitted with ACS during this period undergoing CAG.
Exclusion Criteria1. Age >45years2. History of prior ACS/Coronary revascularization.
The study identified 121 consecutive patients who meet the inclusion criteria.
Data CollectionCoronary angiograms were visually assessed by two independent observers blinded to the identity and clinical characteristic of the patients.
The angiographic view at end diastole in which the lesion appeared most severe was selected. A computerized quantitative coronary analysis analytical system for lesion quantification available in the cath lab was used to quantify the degree of stenosis. In this study, significant CAD was defined as the presence of at least ≥70% stenosis of luminal diameter is at least one of the major epicardial coronary arteries in CAG.
Patients having <70% stenosis were categorized as having non-obstructive CAD. They were further classified, having single-vessel disease (SVD), double-vessel disease (DVD), and triple-vessel disease (TVD). Significant left main disease was defined at least ≥50% stenosis of luminal diameters. The management advised by the consultant cardiologist was also recorded.
RESULT
A total of 1152 patients underwent coronary angiogram from April 1, 2014, to February 15, 2018, with a diagnosis of ACS, and 121 patients (10.5%) who were <45 years of age (mean 40 ± 4 years) were enrolled for the study [Figure 1].
Figure 1: Study population
Figure 2: Gender distribution
Figure 3: Vessels involved
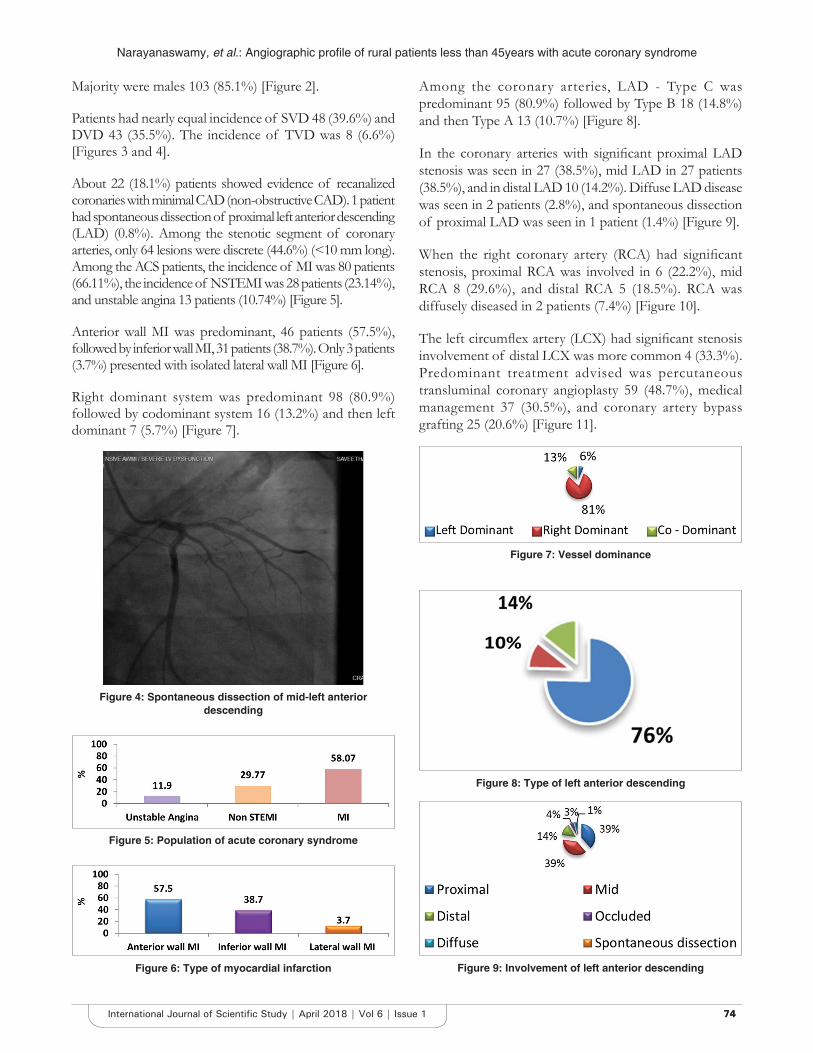
Narayanaswamy, et al.: Angiographic profile of rural patients less than 45years with acute coronary syndrome
7474International Journal of Scientific Study | April 2018 | Vol 6 | Issue 1
Majority were males 103 (85.1%) [Figure 2].
Patients had nearly equal incidence of SVD 48 (39.6%) and DVD 43 (35.5%). The incidence of TVD was 8 (6.6%) [Figures 3 and 4].
About 22 (18.1%) patients showed evidence of recanalized coronaries with minimal CAD (non-obstructive CAD). 1 patient had spontaneous dissection of proximal left anterior descending (LAD) (0.8%). Among the stenotic segment of coronary arteries, only 64 lesions were discrete (44.6%) (<10 mm long). Among the ACS patients, the incidence of MI was 80 patients (66.11%), the incidence of NSTEMI was 28 patients (23.14%), and unstable angina 13 patients (10.74%) [Figure 5].
Anterior wall MI was predominant, 46 patients (57.5%), followed by inferior wall MI, 31 patients (38.7%). Only 3 patients (3.7%) presented with isolated lateral wall MI [Figure 6].
Right dominant system was predominant 98 (80.9%) followed by codominant system 16 (13.2%) and then left dominant 7 (5.7%) [Figure 7].
Among the coronary arteries, LAD - Type C was predominant 95 (80.9%) followed by Type B 18 (14.8%) and then Type A 13 (10.7%) [Figure 8].
In the coronary arteries with significant proximal LAD stenosis was seen in 27 (38.5%), mid LAD in 27 patients (38.5%), and in distal LAD 10 (14.2%). Diffuse LAD disease was seen in 2 patients (2.8%), and spontaneous dissection of proximal LAD was seen in 1 patient (1.4%) [Figure 9].
When the right coronary artery (RCA) had significant stenosis, proximal RCA was involved in 6 (22.2%), mid RCA 8 (29.6%), and distal RCA 5 (18.5%). RCA was diffusely diseased in 2 patients (7.4%) [Figure 10].
The left circumflex artery (LCX) had significant stenosis involvement of distal LCX was more common 4 (33.3%). Predominant treatment advised was percutaneous transluminal coronary angioplasty 59 (48.7%), medical management 37 (30.5%), and coronary artery bypass grafting 25 (20.6%) [Figure 11].
Figure 4: Spontaneous dissection of mid-left anterior descending
Figure 5: Population of acute coronary syndrome
Figure 6: Type of myocardial infarction
Figure 7: Vessel dominance
Figure 8: Type of left anterior descending
Figure 9: Involvement of left anterior descending
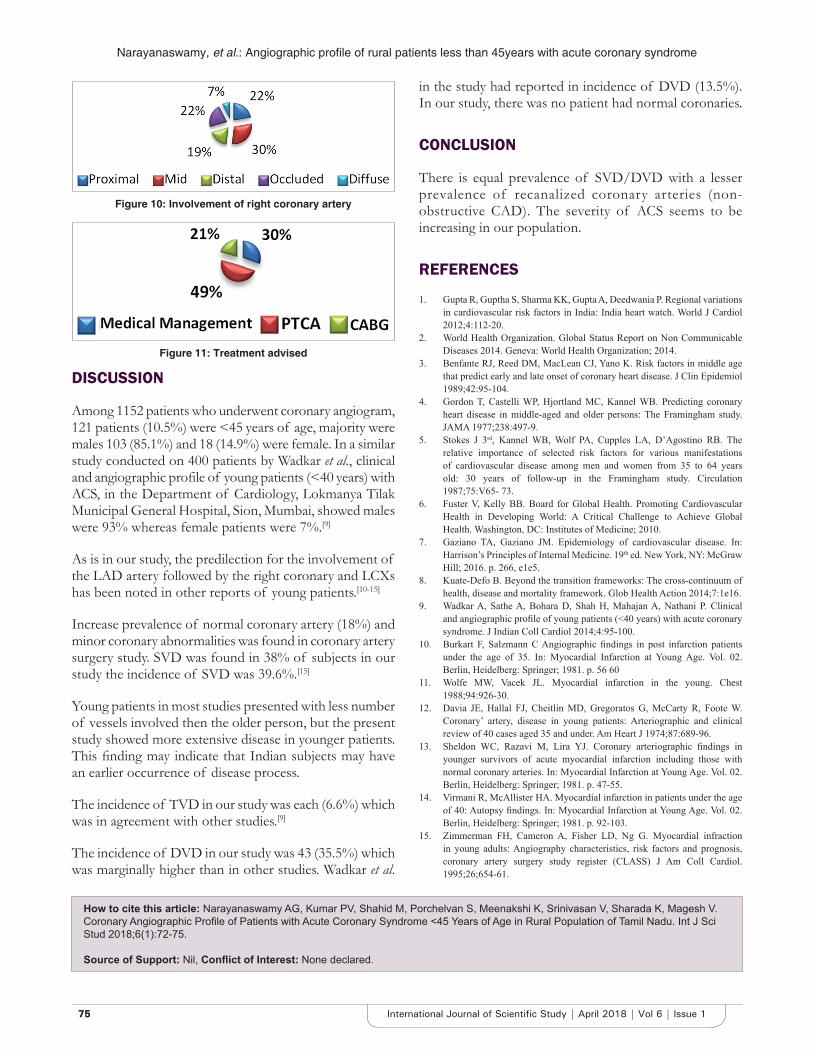
Narayanaswamy, et al.: Angiographic profile of rural patients less than 45years with acute coronary syndrome
7575 International Journal of Scientific Study | April 2018 | Vol 6 | Issue 1
DISCUSSION
Among 1152 patients who underwent coronary angiogram, 121 patients (10.5%) were <45 years of age, majority were males 103 (85.1%) and 18 (14.9%) were female. In a similar study conducted on 400 patients by Wadkar et al., clinical and angiographic profile of young patients (<40 years) with ACS, in the Department of Cardiology, Lokmanya Tilak Municipal General Hospital, Sion, Mumbai, showed males were 93% whereas female patients were 7%.[9]
As is in our study, the predilection for the involvement of the LAD artery followed by the right coronary and LCXs has been noted in other reports of young patients.[10-15]
Increase prevalence of normal coronary artery (18%) and minor coronary abnormalities was found in coronary artery surgery study. SVD was found in 38% of subjects in our study the incidence of SVD was 39.6%.[15]
Young patients in most studies presented with less number of vessels involved then the older person, but the present study showed more extensive disease in younger patients. This finding may indicate that Indian subjects may have an earlier occurrence of disease process.
The incidence of TVD in our study was each (6.6%) which was in agreement with other studies.[9]
The incidence of DVD in our study was 43 (35.5%) which was marginally higher than in other studies. Wadkar et al.
in the study had reported in incidence of DVD (13.5%). In our study, there was no patient had normal coronaries.
CONCLUSION
There is equal prevalence of SVD/DVD with a lesser prevalence of recanalized coronary arteries (non-obstructive CAD). The severity of ACS seems to be increasing in our population.
REFERENCES
1. Gupta R, Guptha S, Sharma KK, Gupta A, Deedwania P. Regional variations in cardiovascular risk factors in India: India heart watch. World J Cardiol 2012;4:112-20.
2. World Health Organization. Global Status Report on Non Communicable Diseases 2014. Geneva: World Health Organization; 2014.
3. Benfante RJ, Reed DM, MacLean CJ, Yano K. Risk factors in middle age that predict early and late onset of coronary heart disease. J Clin Epidemiol 1989;42:95-104.
4. Gordon T, Castelli WP, Hjortland MC, Kannel WB. Predicting coronary heart disease in middle-aged and older persons: The Framingham study. JAMA 1977;238:497-9.
5. Stokes J 3rd, Kannel WB, Wolf PA, Cupples LA, D’Agostino RB. The relative importance of selected risk factors for various manifestations of cardiovascular disease among men and women from 35 to 64 years old: 30 years of follow-up in the Framingham study. Circulation 1987;75:V65- 73.
6. Fuster V, Kelly BB. Board for Global Health. Promoting Cardiovascular Health in Developing World: A Critical Challenge to Achieve Global Health. Washington, DC: Institutes of Medicine; 2010.
7. Gaziano TA, Gaziano JM. Epidemiology of cardiovascular disease. In: Harrison’s Principles of Internal Medicine. 19th ed. New York, NY: McGraw Hill; 2016. p. 266, e1e5.
8. Kuate-Defo B. Beyond the transition frameworks: The cross-continuum of health, disease and mortality framework. Glob Health Action 2014;7:1e16.
9. Wadkar A, Sathe A, Bohara D, Shah H, Mahajan A, Nathani P. Clinical and angiographic profile of young patients (<40 years) with acute coronary syndrome. J Indian Coll Cardiol 2014;4:95-100.
10. Burkart F, Salzmann C Angiographic findings in post infarction patients under the age of 35. In: Myocardial Infarction at Young Age. Vol. 02. Berlin, Heidelberg: Springer; 1981. p. 56 60
11. Wolfe MW, Vacek JL. Myocardial infarction in the young. Chest 1988;94:926-30.
12. Davia JE, Hallal FJ, Cheitlin MD, Gregoratos G, McCarty R, Foote W. Coronary’ artery, disease in young patients: Arteriographic and clinical review of 40 cases aged 35 and under. Am Heart J 1974;87:689-96.
13. Sheldon WC, Razavi M, Lira YJ. Coronary arteriographic findings in younger survivors of acute myocardial infarction including those with normal coronary arteries. In: Myocardial Infarction at Young Age. Vol. 02. Berlin, Heidelberg: Springer; 1981. p. 47-55.
14. Virmani R, McAllister HA. Myocardial infarction in patients under the age of 40: Autopsy findings. In: Myocardial Infarction at Young Age. Vol. 02. Berlin, Heidelberg: Springer; 1981. p. 92-103.
15. Zimmerman FH, Cameron A, Fisher LD, Ng G. Myocardial infraction in young adults: Angiography characteristics, risk factors and prognosis, coronary artery surgery study register (CLASS) J Am Coll Cardiol. 1995;26;654-61.
Figure 10: Involvement of right coronary artery
Figure 11: Treatment advised
How to cite this article: Narayanaswamy AG, Kumar PV, Shahid M, Porchelvan S, Meenakshi K, Srinivasan V, Sharada K, Magesh V. Coronary Angiographic Profile of Patients with Acute Coronary Syndrome <45 Years of Age in Rural Population of Tamil Nadu. Int J Sci Stud 2018;6(1):72-75.
Source of Support: Nil, Conflict of Interest: None declared.
7676International Journal of Scientific Study | April 2018 | Vol 6 | Issue 1
Acute Effect of Extreme Sports on Serum LipidsOzturk Agirbas1, Eser Aggon2, Anthony C Hackney3
1Assistant Professor, Department of Coaching Education, College of Physical Education and Sports, Bayburt University, Bayburt, Turkey, 2Assistant Professor, Department of Physical Education and Sports Teaching, College of Physical Education and Sports, Erzincan University, Erzincan, Turkey, 3Professor, Department of Exercise and Sport Science, University of North Carolina, Chapel Hill, North Carolina, USA
parachute.[8] According to Mekinc and Mušič, paragliding is a kind of sport that is both exciting and competitive.[9]
Lipids have different derivatives according to their structures and functions. Tryglicerides are esters formed by the molecular fatty acid with glycerol.[10] These are neutral fats synthesized from carbohydrates and stored in the fat tissue. Lipids in foods state in the form of TG. In the small intestine epidermis and fat cells, fatty acids bind glycerol and combine to form TGs. Cholesterol is sterol, which is either a free or an esterified form. Free cholesterol is a component of the cell membrane; esterified cholesterol is usually locates in the serum and states in atheromatous plaques.[11,12]
Cholesterol is an organic substance placed in human and animal tissues and cells, also used in the synthesis of Vitamin D synthesis, calcium and phosphorus, building blocks of cell membranes, bile acids, and sex hormones.[13] High-density lipoprotein (HDL), which is synthesized by both the liver and small intestine and is responsible for cholesterol transport from tissues to the liver, contains 50% protein, 20% cholesterol, 5% TG, and 25% phospholipid.[10] Low-density lipoprotein (LDL) contains 20% protein, 50% cholesterol, 5% TG, and 25% phospholipid.[14] The
INTRODUCTION
Rafting and paragliding are extreme sports that people participate in both for competition and entertainment purposes. According to Willig, rafting and paragliding can be among some of the most extreme sports activities.[1] While Williams and Soutar and Buckley referred that rafting is a challenging activity of adventure tourism, on the other hand,[2,3] Hinch and Higham and Roberts defined it as an extreme activity for sporting adventure.[4,5] Rafting is a group activity, in which four to eight people participate and single-winged paddles and inflatable boats are used.[6] As the level of challenge increases in rafting activities, more mental and physical concentration is required.[7]
Paragliding is the flight of pilots with a special made seat. The basic equipment can be listed as a parachute, a seat, and a spare
Original Article
AbstractPurpose: The aim of this study is to determine the effect of rafting and paragliding exercises by sedentary males on serum lipids.
Material and Methods: 17 male rafters and 10 male paragliders volunteers (non-smoker, no known history of cardiovascular disease, body mass index <25 kg/m2, and no intake of prescription medications) participated in the study. Participants had blood samples taken a day before and after rafting and paragliding practices. Data were analyzed by Wilcoxon and Mann–Whitney U tests.
Results: Significant decreases occurred for the low-density lipoprotein (LDL)/very low-density lipoprotein (VLDL) ratio in the rafting group after the exercise; though, there was no significant difference in serum lipids parameters of the paraglide group after the exercise.
Conclusion: While acute rafting and paragliding exercises have similar effects on TG and HDL, effect on LDL / VLDL ratio is different.
Key words: Exercise, Lipid, Paragliding, Rafting
Access this article online
www.ijss-sn.com
Month of Submission : 02-2018 Month of Peer Review : 03-2018 Month of Acceptance : 04-2018 Month of Publishing : 05-2018
Corresponding Author: Dr. Ozturk Agirbas, Bayburt University, College of Physical Education and Sports, Bayburt, Turkey. Phone: +90 458 211 1153. E-mail: [email protected]
Print ISSN: 2321-6379Online ISSN: 2321-595X
DOI: 10.17354/ijss/2018/117
Agirbas, et al.: Acute Effect on Lipids of Extreme Sports
7777 International Journal of Scientific Study | April 2018 | Vol 6 | Issue 1
task of LDL is to carry cholesterol from the liver to the peripheral tissues and regulates cholesterol synthesis again in this region.[10] The lipoprotein with very LDL (VLDL) contains 5% protein, 30% cholesterol, 55% TG, and 10% phospholipid. They are synthesized from the liver and contain TGs that are synthesized from circulating fatty acids or carbohydrates. VLDL also contains significant amounts of cholesterol and cholesterol esters. Once the VLDL is combined in the liver, it becomes LDL in fat tissue and muscles.[10,15]
Intensity and duration of exercises effective on reducing body weight since it will be crucial to promote lipid activity and usage of active muscles. Thus, it is important to address the effects on lipid oxidation and lipolysis in relation to its intensity and duration of acute exercise.[16] It showed an increase in lipolysis and it oxidation by the active muscles during an acute aerobic exercise.[17] In addition, fatty acids are essential energy substrates during endurance exercise. Acute endurance exercise is associated with skeletal muscle lipid remodeling and neutral lipid storage during recovery.[18] This study aimed to determine the acute effects of rafting and paragliding on serum lipids and to compare the effects of these two sport activities.
MATERIALS AND METHODS
SubjectA total of 17 rafting and 10 paragliding participants (n = 27) were physically active men volunteered to participate in the study. They were not experienced in rafting and parachuting practice before the study. The rafting group demographics were: Age = 22.24 ± 3.07; height = 179.65 ± 6.61; weight = 73.59 ± 7.77; and body mass index (BMI) = 22.8 ± 1.99 and paragliding groups, age = 28.2 ± 10.28; height = 176.0 ± 8.19; weight = 76.8 ± 16.12; and BMI = 24.66 ± 3.93. The inclusion criteria were: Non-smoker, no known history of cardiovascular disease, BMI <30 kg/m2, and no intake of prescription medication or antioxidant supplements. All participants completed written inform consent.
Exercise ProtocolsThe participants were given basic rafting and paragliding technical and safety trainings before the study (2 weeks - 5 days per week). The paragliding took placed and occurred by flying from a slope at an altitude of 1500 m. The rafting took place in the river with a rapid difficulty rating of 2+1 at an altitude of 1150 meters. Both rafting and paragliding exercises were standardized at a duration of 20 min.
Blood Samples AnalyzeParticipant blood samples were taken for each rafting and paragliding practices’ a day before at 09:00 AM (pre) and immediately 15 min after practices’ at (post) at 09:00 AM.
All blood samples were drawn in ethylenediaminetetraacetic acid-treated tubes and placed on ice until processing. Whole blood aliquot samples were analyzed for hematocrit and hemoglobin. Remaining sample aliquots were centrifuged at 4°C for 15 min at 3000 rpm (Centra-8R IEC, MA). Subsequently, the samples were analyzed by COBAS 600 (Roche) brand autoanalyzer for lipid profiles.
Statistical AnalysisStatistically, analysis was performed with SPSS 22.0. The data set was found to not be normally distributed; therefore, we used the Wilcoxon test to compare intragroup values and Mann–Whitney U test to compare intergroup values.
RESULTS
There was a significant increase in the LDL/VLDL ratio, but no significant difference in TG and HDL after rafting exercises and there was no difference in TG, HDL, or the LDL/VLDL ratio after paragliding exercises [Table 1].
DISCUSSION
Exercise is a factor that brings about different physiological effects in acute and chronic periods, especially according to severity of activity. Lipid is an energy source, at the same time, as it has many structural functions in the body. Specifically, during the long period exercises, there may be differences in the relative lipid concentrations in the blood due to the production of energy from the TGs. Our study was conducted to determine the acute effect of rafting and paragliding exercises, which are among the extreme sports, on blood lipid profiles.
We found out that there were no statistically significant changes in TG values, even though decreases were observed after both the rafting and paragliding exercises (P > 0.05; Table 1). These findings agree with the literature as similar studies report that some exercise practices do not result in any changes in the TG levels.[19-23] Contrastingly, there are some studies detecting that the acute exercises decreased the TG levels. Magkos et al. reported that TG levels decreased significantly after the acute endurance exercises.[24] Turgut et al. reported that TG values decreased significantly after acute swimming exercise among females.[25]
There were no significant changes in HDL after either rafting or paragliding [Table 1]. Some researchers reported no significant difference in HDL values after acute endurance and resistance exercises.[23] McClean et al. reported in their study, in which they formed the control and exercise groups including healthy males loaded with
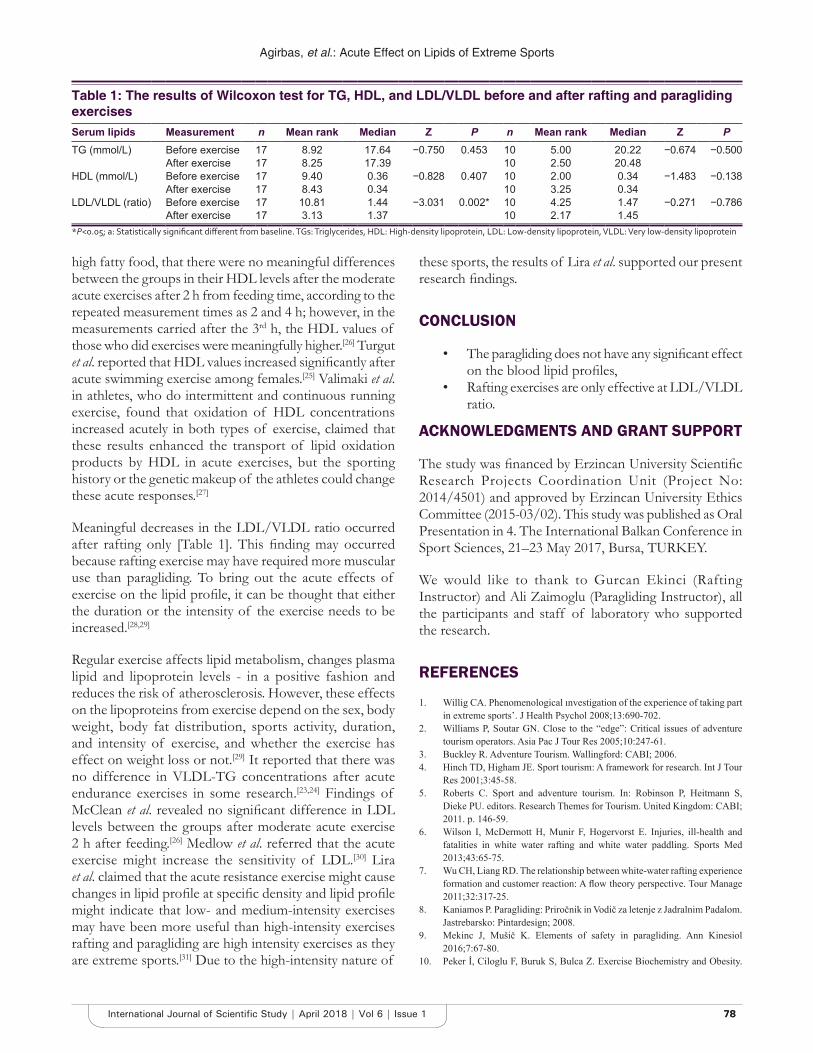
Agirbas, et al.: Acute Effect on Lipids of Extreme Sports
7878International Journal of Scientific Study | April 2018 | Vol 6 | Issue 1
high fatty food, that there were no meaningful differences between the groups in their HDL levels after the moderate acute exercises after 2 h from feeding time, according to the repeated measurement times as 2 and 4 h; however, in the measurements carried after the 3rd h, the HDL values of those who did exercises were meaningfully higher.[26] Turgut et al. reported that HDL values increased significantly after acute swimming exercise among females.[25] Valimaki et al. in athletes, who do intermittent and continuous running exercise, found that oxidation of HDL concentrations increased acutely in both types of exercise, claimed that these results enhanced the transport of lipid oxidation products by HDL in acute exercises, but the sporting history or the genetic makeup of the athletes could change these acute responses.[27]
Meaningful decreases in the LDL/VLDL ratio occurred after rafting only [Table 1]. This finding may occurred because rafting exercise may have required more muscular use than paragliding. To bring out the acute effects of exercise on the lipid profile, it can be thought that either the duration or the intensity of the exercise needs to be increased.[28,29]
Regular exercise affects lipid metabolism, changes plasma lipid and lipoprotein levels - in a positive fashion and reduces the risk of atherosclerosis. However, these effects on the lipoproteins from exercise depend on the sex, body weight, body fat distribution, sports activity, duration, and intensity of exercise, and whether the exercise has effect on weight loss or not.[29] It reported that there was no difference in VLDL-TG concentrations after acute endurance exercises in some research.[23,24] Findings of McClean et al. revealed no significant difference in LDL levels between the groups after moderate acute exercise 2 h after feeding.[26] Medlow et al. referred that the acute exercise might increase the sensitivity of LDL.[30] Lira et al. claimed that the acute resistance exercise might cause changes in lipid profile at specific density and lipid profile might indicate that low- and medium-intensity exercises may have been more useful than high-intensity exercises rafting and paragliding are high intensity exercises as they are extreme sports.[31] Due to the high-intensity nature of
these sports, the results of Lira et al. supported our present research findings.
CONCLUSION
• The paragliding does not have any significant effect on the blood lipid profiles,
• Rafting exercises are only effective at LDL/VLDL ratio.
ACKNOWLEDGMENTS AND GRANT SUPPORT
The study was financed by Erzincan University Scientific Research Projects Coordination Unit (Project No: 2014/4501) and approved by Erzincan University Ethics Committee (2015-03/02). This study was published as Oral Presentation in 4. The International Balkan Conference in Sport Sciences, 21–23 May 2017, Bursa, TURKEY.
We would like to thank to Gurcan Ekinci (Rafting Instructor) and Ali Zaimoglu (Paragliding Instructor), all the participants and staff of laboratory who supported the research.
REFERENCES
1. Willig CA. Phenomenological ınvestigation of the experience of taking part in extreme sports’. J Health Psychol 2008;13:690-702.
2. Williams P, Soutar GN. Close to the “edge”: Critical issues of adventure tourism operators. Asia Pac J Tour Res 2005;10:247-61.
3. Buckley R. Adventure Tourism. Wallingford: CABI; 2006.4. Hinch TD, Higham JE. Sport tourism: A framework for research. Int J Tour
Res 2001;3:45-58.5. Roberts C. Sport and adventure tourism. In: Robinson P, Heitmann S,
Dieke PU. editors. Research Themes for Tourism. United Kingdom: CABI; 2011. p. 146-59.
6. Wilson I, McDermott H, Munir F, Hogervorst E. Injuries, ill-health and fatalities in white water rafting and white water paddling. Sports Med 2013;43:65-75.
7. Wu CH, Liang RD. The relationship between white-water rafting experience formation and customer reaction: A flow theory perspective. Tour Manage 2011;32:317-25.
8. Kaniamos P. Paragliding: Priročnik in Vodič za letenje z Jadralnim Padalom. Jastrebarsko: Pintardesign; 2008.
9. Mekinc J, Mušič K. Elements of safety in paragliding. Ann Kinesiol 2016;7:67-80.
10. Peker İ, Ciloglu F, Buruk S, Bulca Z. Exercise Biochemistry and Obesity.
Table 1: The results of Wilcoxon test for TG, HDL, and LDL/VLDL before and after rafting and paragliding exercisesSerum lipids Measurement n Mean rank Median Z P n Mean rank Median Z PTG (mmol/L) Before exercise 17 8.92 17.64 −0.750 0.453 10 5.00 20.22 −0.674 −0.500
After exercise 17 8.25 17.39 10 2.50 20.48HDL (mmol/L) Before exercise 17 9.40 0.36 −0.828 0.407 10 2.00 0.34 −1.483 −0.138
After exercise 17 8.43 0.34 10 3.25 0.34LDL/VLDL (ratio) Before exercise 17 10.81 1.44 −3.031 0.002* 10 4.25 1.47 −0.271 −0.786
After exercise 17 3.13 1.37 10 2.17 1.45*P<0.05; a: Statistically significant different from baseline. TGs: Triglycerides, HDL: High‑density lipoprotein, LDL: Low‑density lipoprotein, VLDL: Very low‑density lipoprotein
Agirbas, et al.: Acute Effect on Lipids of Extreme Sports
7979 International Journal of Scientific Study | April 2018 | Vol 6 | Issue 1
1st ed. Istanbul: Nobel Medicine Bookstore, Tayf Offset; 2000. p. 99-118.11. Erden IM. Biochemistry. Anadolu University, Open Teaching Publications.
Eskisehir, Turkey 1996;218:42.12. Laker MF. Clinical Biochemistry for Medical Students. London: W.B.
Sounders Company; 1996.13. Sieber R. Cholesterol removal from animal food can ıt be justified? Food
Sci Tech 1993;26:375-87.14. Duman C, Erden BF. Short comment of biochemical laboratory data for
primary health care. STED 2004;13:256-60.15. Miles S. Weight control and exercise. Clin Sport Med 1991;10:157-69.16. Jabbour G, Iancu HD. Acute and chronic exercises: Effect on lipid
metabolisms in obese individuals. Sci Sports 2017;32:321-6.17. de Glisezinski I, Moro C, Pillard F, Marion-Latard F, Harant I, Meste M,
et al. Aerobic training improves exercise-induced lipolysis in SCAT and lipid utilization in overweight men. Am J Physiol Endocrinol Metab 2003;285:E984-90.
18. Bosma M. Lipid homeostasis in exercise. Drug Discov Today 2014;19:1019- 23.
19. Colakoglu F, Senel O. The effects of 8 weeks aerobic exercise program on body composition and blood lipids of middle aged sedentary females. Spormetre 2003;1:57-61.
20. Ugras A, Savas S. Effects of aerobıc exercıses on some physiologıcal characteristics and blood lipids. Kastamonu Educ J 2004;12:293-302.
21. Lakka HM, Tremblay A, Després JP, Bouchard C. Effects of long-term negative energy balance with exercise on plasma lipid and lipoprotein levels in identical twins. Atherosclerosis 2004;172:127-33.
22. Buyukyazi G, Ulman C, Taneli F, Aksoy D, Tikiz H. Effects of Walking on Serum Lipids, MMP-9 and TIMP-1 in Post-Menopausal Women. 10th International Sport Congress. Bolu, Turkey; 2008.
23. Magkos F, Tsekouras YE, Prentzas KI, Basioukas KN, Matsama SG, Yanni AE, et al. Acute exercise-induced changes in basal VLDL-triglyceride kinetics leading to hypotriglyceridemia manifest more readily after resistance than endurance exercise. J Appl Physiol (1985) 2008;105:1228- 36.
24. Magkos F, Wright DC, Patterson BW, Mohammed BS, Mittendorfer B. Lipid metabolism response to a single, prolonged bout of endurance exercise in healthy young men. Am J Physiol Endocrinol Metab 2006;290:E355-62.
25. Turgut M, Cinar V, Akbulut T, Kilic Y. Effect of acute exercıse on lıpıd levels of woman. Euro J Phys Educ Sport Sci 2017;3:412-18.
26. McClean CC, Mc Laughlin MJ, Burke G, Murphy MH, Trinick T, Duly E, et al. The effect of acute aerobic exercise on pulse wave velocity and oxidative stress following postprandial hypertriglyceridemia in healthy men. Eur J Appl Physiol 2007;100:225-34.
27. Valimaki IA, Vuorimaa T, Ahotupa M, Vasankari T. Effect of continuous and ıntermittent exercises on oxidised HDL and LDL lipids in runners. Int J Sports Med 2016;37:1103-9.
28. Crouse SF, O’Brien BC, Rohack JJ, Lowe RC, Green JS, Tolson H, Reed JL. Changes in serum lipids and apoproteins after exercise in men with high cholesterol: İnfuence of intensity. J Appl Physiol 1995;79:279-86.
29. Kim JR, Oberman A, Setcher GF, Lee JY. Effect of exercise intensity and frequency on lipid levels in man with coronary heart disease: Training level comparison Trial. Am J Cardiol 2001;87:942-6.
30. Medlow P, McEneny J, Murphy MH, Trinick T, Duly E, Davison GW, et al. Lipoprotein subfraction oxidation in acute exercise and ageing. Free Radic Res 2016;50:345-53.
31. Lira FS, Yamashita AS, Uchida MC, Zanchi NE, Gualano B, Martins E Jr, et al. Low and moderate, rather than high intensity strength exercise induces benefit regarding plasma lipid profile. Diabetol Metab Syndr 2010;2:31.
How to cite this article: Agirbas O, Aggon E, Hackney AC. Acute Effect of Extreme Sports on Serum Lipids. Int J Sci Stud 2018;6(1):76-79.
Source of Support: Nil, Conflict of Interest: None declared.
8080International Journal of Scientific Study | April 2018 | Vol 6 | Issue 1
Juvenile Nasopharyngeal Angiofibroma - A Hospital-based Retrospective StudyD Ranjit Kumar1, D Suresh2, S Ananda Padmanaban3
1Senior Assistant Professor, Department of ENT, Theni Medical College, Theni, Tamil Nadu, India, 2Senior Resident/Assistant Professor, Department of Dental Surgery, Theni Medical College, Theni, Tamil Nadu, India, 3Senior Assistant Professor, Department of Dental Surgery, Theni Medical College, Theni, Tamil Nadu, India
pterygopalatine and infratemporal fossa.[2] The central stalk joining the two portion occupies the sphenopalatine foramen at the upper end of the vertical plate of palatine bone without appearing to enlarge it very much.[3]
Aim and Objectives• To evaluate the incidence of JNA in this institution.• To evaluate the role of pre-operative contrast-
enhanced computed tomography (CECT) and MRI in the diagnosis of JNA.
• To evaluate the role of intranasal endoscopy in JNA cases.
MATERIALS AND METHODS
A retrospective hospital based study was conducted in Government Theni Medical College Hospital on patients of JNA. A total of 4 cases included in this study.
All the patients were staged according to Fisch classification [Table 1].[1,4-6]
INTRODUCTION
JNA is a vascular benign but locally aggressive tumor of the nasopharynx that affects male adolescents with an average age of onset being 14 years. It accounts for 0.05% of all head and neck neoplasms.[1]
Anatomically, the point of origin is believed to the posterolateral wall of the roof of nose, where sphenoid of palatine bone meets the horizontal ala of the vomer and root of pterygoid process of sphenoid. The large tumors present as bilobed dumbbell swelling straddling the sphenopalatine foramen with one component filling the nasopharynx and the other extending into the
Original Article
AbstractIntroduction: Juvenile nasopharyngeal angiofibroma is a highly vascular histologically benign, locally aggressive neoplasm of the nasopharynx. It accounts for 0.05% of all head and neck neoplasm with a high incidence of persistence and recurrence.
Materials and Methods: A retrospective hospital-based study was conducted in Government Theni Medical College on cases of juvenile nasopharyngeal angiofibroma for 4 years duration in the period from 2013 to 2016. A total of 4 cases of Juvenile nasopharyngeal angiofibroma were included in this study.
Observation and Results: Among four cases, three cases were presented in Stage 1. One patient presented with infratemporal fossa involvement (Stage 3). Nasal obstruction and epistaxis were the most common presentation seen in all cases. All patients underwent intranasal endoscopic removal of JNA under general anesthesia. For one patient right external carotid artery ligation was done to reduce intraoperative bleeding and elective tracheostomy to maintain the airway.
Conclusion: The study previously done in various parts of the world have shown that JNA is very rare and its incidence is 0.05%. Contrast, in this study in this institution, shows the incidence was 0.02%.
Key words: Epistaxis, Juvenile angiofibroma, Nasal obstruction, Nasopharyngeal angiofibroma
Access this article online
www.ijss-sn.com
Month of Submission : 02-2018 Month of Peer Review : 03-2018 Month of Acceptance : 04-2018 Month of Publishing : 04-2018
Corresponding Author: Dr. D Suresh, Department of Dental Surgery, Government Theni Medical College, Theni, Tamil Nadu, India. Mobile: +91-8148111413. E-mail: [email protected]
Print ISSN: 2321-6379Online ISSN: 2321-595X
DOI: 10.17354/ijss/2018/118
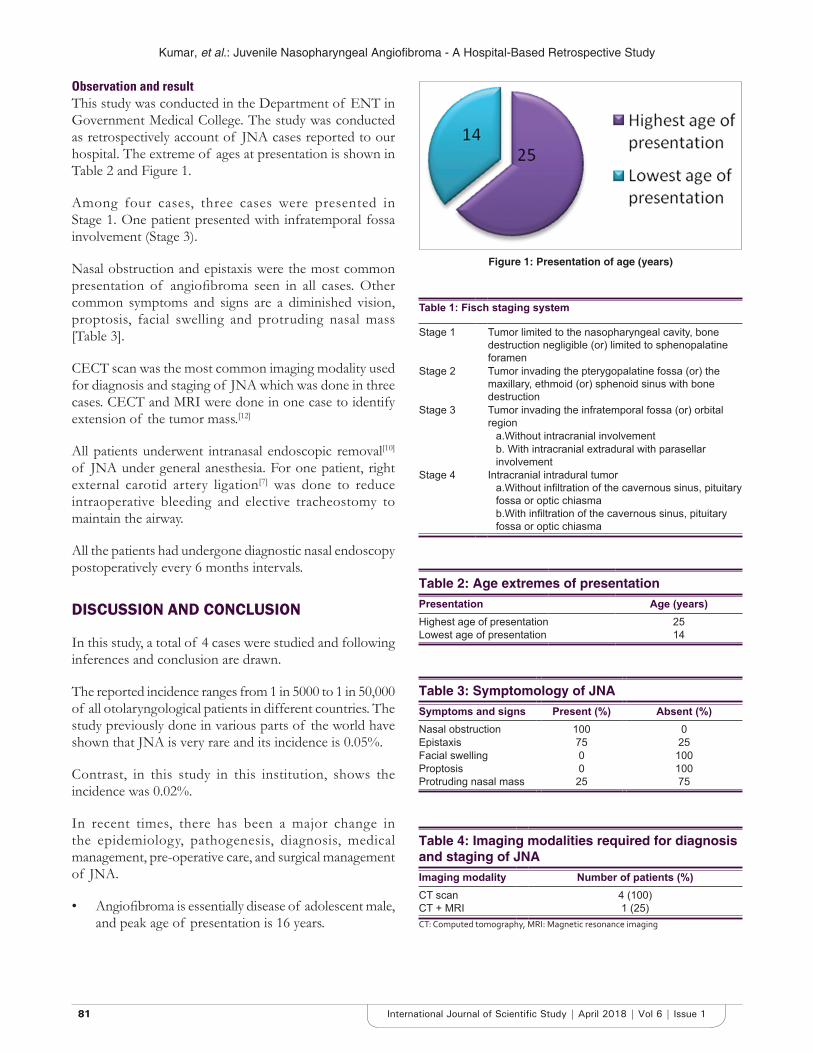
Kumar, et al.: Juvenile Nasopharyngeal Angiofibroma - A Hospital-Based Retrospective Study
8181 International Journal of Scientific Study | April 2018 | Vol 6 | Issue 1
Observation and resultThis study was conducted in the Department of ENT in Government Medical College. The study was conducted as retrospectively account of JNA cases reported to our hospital. The extreme of ages at presentation is shown in Table 2 and Figure 1.
Among four cases, three cases were presented in Stage 1. One patient presented with infratemporal fossa involvement (Stage 3).
Nasal obstruction and epistaxis were the most common presentation of angiofibroma seen in all cases. Other common symptoms and signs are a diminished vision, proptosis, facial swelling and protruding nasal mass [Table 3].
CECT scan was the most common imaging modality used for diagnosis and staging of JNA which was done in three cases. CECT and MRI were done in one case to identify extension of the tumor mass.[12]
All patients underwent intranasal endoscopic removal[10] of JNA under general anesthesia. For one patient, right external carotid artery ligation[7] was done to reduce intraoperative bleeding and elective tracheostomy to maintain the airway.
All the patients had undergone diagnostic nasal endoscopy postoperatively every 6 months intervals.
DISCUSSION AND CONCLUSION
In this study, a total of 4 cases were studied and following inferences and conclusion are drawn.
The reported incidence ranges from 1 in 5000 to 1 in 50,000 of all otolaryngological patients in different countries. The study previously done in various parts of the world have shown that JNA is very rare and its incidence is 0.05%.
Contrast, in this study in this institution, shows the incidence was 0.02%.
In recent times, there has been a major change in the epidemiology, pathogenesis, diagnosis, medical management, pre-operative care, and surgical management of JNA.
• Angiofibroma is essentially disease of adolescent male, and peak age of presentation is 16 years.
Table 1: Fisch staging system
Stage 1 Tumor limited to the nasopharyngeal cavity, bone destruction negligible (or) limited to sphenopalatine foramen
Stage 2 Tumor invading the pterygopalatine fossa (or) the maxillary, ethmoid (or) sphenoid sinus with bone destruction
Stage 3 Tumor invading the infratemporal fossa (or) orbital region
a.Without intracranial involvementb. With intracranial extradural with parasellar involvement
Stage 4 Intracranial intradural tumora.Without infiltration of the cavernous sinus, pituitary fossa or optic chiasmab.With infiltration of the cavernous sinus, pituitary fossa or optic chiasma
Table 2: Age extremes of presentationPresentation Age (years)Highest age of presentation 25Lowest age of presentation 14
Table 3: Symptomology of JNASymptoms and signs Present (%) Absent (%)Nasal obstruction 100 0Epistaxis 75 25Facial swelling 0 100Proptosis 0 100Protruding nasal mass 25 75
Figure 1: Presentation of age (years)
Table 4: Imaging modalities required for diagnosis and staging of JNAImaging modality Number of patients (%)CT scan 4 (100)CT + MRI 1 (25)CT: Computed tomography, MRI: Magnetic resonance imaging
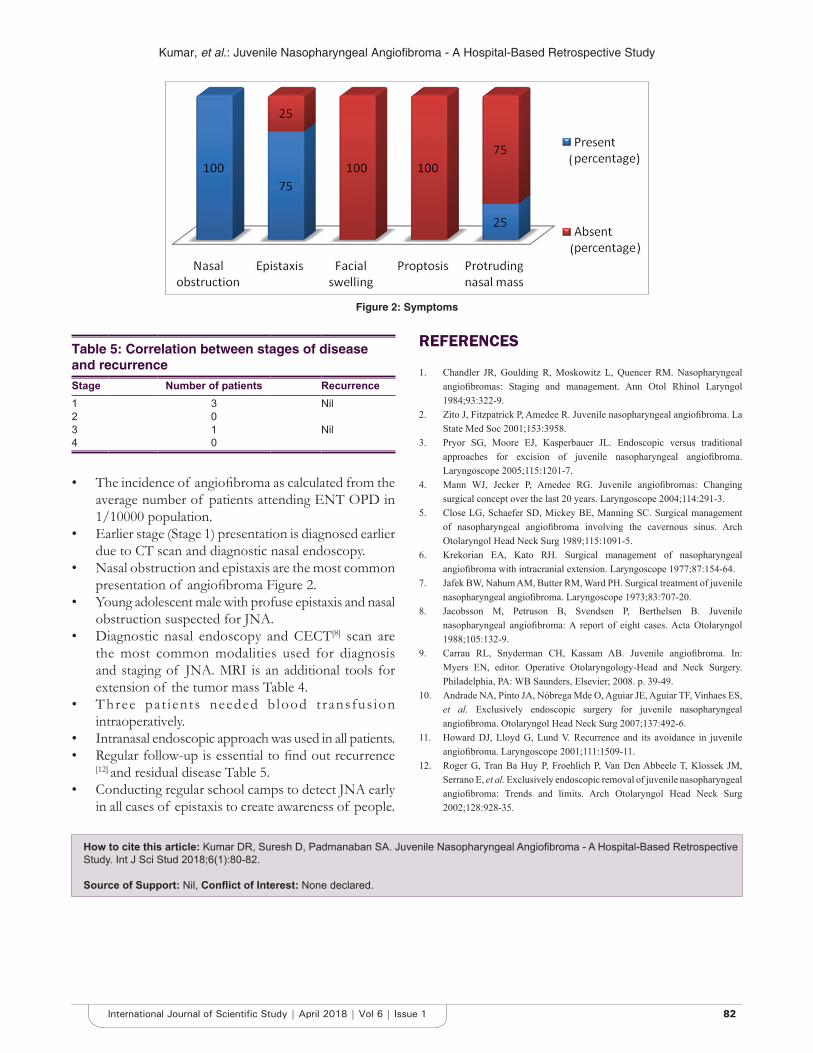
Kumar, et al.: Juvenile Nasopharyngeal Angiofibroma - A Hospital-Based Retrospective Study
8282International Journal of Scientific Study | April 2018 | Vol 6 | Issue 1
• The incidence of angiofibroma as calculated from the average number of patients attending ENT OPD in 1/10000 population.
• Earlier stage (Stage 1) presentation is diagnosed earlier due to CT scan and diagnostic nasal endoscopy.
• Nasal obstruction and epistaxis are the most common presentation of angiofibroma Figure 2.
• Young adolescent male with profuse epistaxis and nasal obstruction suspected for JNA.
• Diagnostic nasal endoscopy and CECT[8] scan are the most common modalities used for diagnosis and staging of JNA. MRI is an additional tools for extension of the tumor mass Table 4.
• Three pat ients needed b lood t ransfus ion intraoperatively.
• Intranasal endoscopic approach was used in all patients.• Regular follow-up is essential to find out recurrence
[12] and residual disease Table 5.• Conducting regular school camps to detect JNA early
in all cases of epistaxis to create awareness of people.
REFERENCES
1. Chandler JR, Goulding R, Moskowitz L, Quencer RM. Nasopharyngeal angiofibromas: Staging and management. Ann Otol Rhinol Laryngol 1984;93:322-9.
2. Zito J, Fitzpatrick P, Amedee R. Juvenile nasopharyngeal angiofibroma. La State Med Soc 2001;153:3958.
3. Pryor SG, Moore EJ, Kasperbauer JL. Endoscopic versus traditional approaches for excision of juvenile nasopharyngeal angiofibroma. Laryngoscope 2005;115:1201-7.
4. Mann WJ, Jecker P, Amedee RG. Juvenile angiofibromas: Changing surgical concept over the last 20 years. Laryngoscope 2004;114:291-3.
5. Close LG, Schaefer SD, Mickey BE, Manning SC. Surgical management of nasopharyngeal angiofibroma involving the cavernous sinus. Arch Otolaryngol Head Neck Surg 1989;115:1091-5.
6. Krekorian EA, Kato RH. Surgical management of nasopharyngeal angiofibroma with intracranial extension. Laryngoscope 1977;87:154-64.
7. Jafek BW, Nahum AM, Butter RM, Ward PH. Surgical treatment of juvenile nasopharyngeal angiofibroma. Laryngoscope 1973;83:707-20.
8. Jacobsson M, Petruson B, Svendsen P, Berthelsen B. Juvenile nasopharyngeal angiofibroma: A report of eight cases. Acta Otolaryngol 1988;105:132-9.
9. Carrau RL, Snyderman CH, Kassam AB. Juvenile angiofibroma. In: Myers EN, editor. Operative Otolaryngology-Head and Neck Surgery. Philadelphia, PA: WB Saunders, Elsevier; 2008. p. 39-49.
10. Andrade NA, Pinto JA, Nóbrega Mde O, Aguiar JE, Aguiar TF, Vinhaes ES, et al. Exclusively endoscopic surgery for juvenile nasopharyngeal angiofibroma. Otolaryngol Head Neck Surg 2007;137:492-6.
11. Howard DJ, Lloyd G, Lund V. Recurrence and its avoidance in juvenile angiofibroma. Laryngoscope 2001;111:1509-11.
12. Roger G, Tran Ba Huy P, Froehlich P, Van Den Abbeele T, Klossek JM, Serrano E, et al. Exclusively endoscopic removal of juvenile nasopharyngeal angiofibroma: Trends and limits. Arch Otolaryngol Head Neck Surg 2002;128:928-35.
Figure 2: Symptoms
Table 5: Correlation between stages of disease and recurrenceStage Number of patients Recurrence 1 3 Nil2 03 1 Nil4 0
How to cite this article: Kumar DR, Suresh D, Padmanaban SA. Juvenile Nasopharyngeal Angiofibroma - A Hospital-Based Retrospective Study. Int J Sci Stud 2018;6(1):80-82.
Source of Support: Nil, Conflict of Interest: None declared.
8383 International Journal of Scientific Study | April 2018 | Vol 6 | Issue 1
Role of Ultrasonography and Computed Tomography in Gallbladder Masses and their Correlation with Fine-needle Aspiration CytologyAvadhesh P S Kushwah1, Yashwant Jamre2, Puspraj S Baghel3, Sonjjay Pande4, Suresh Kumar1
1Associate Professor, Department of Radio-diagnosis, Netaji Subhash Chandra Bose Medical College, Jabalpur, Madhya Pradesh, India, 23rd Year Post Graduate Student, Department of Radio-diagnosis, Netaji Subhash Chandra Bose Medical College, Jabalpur, Madhya Pradesh, India, 3Assistant Professor, Department of Pathology, Netaji Subhash Chandra Bose Medical College, Jabalpur, Madhya Pradesh, India, 4Professor, Department of Radio-diagnosis, Netaji Subhash Chandra Bose Medical College, Jabalpur, Madhya Pradesh, India
The exact etiology of GBC has not been properly known till date. It is yet to be established. However, several other factors such as chronic cholecystitis, gallstones, choledochal cyst, female gender, age, and exposure of carcinogens have been observed to be implicated in GB carcinogenesis.
Early diagnosis of GB carcinoma is difficult because most patients present with non-specific findings of right upper quadrant (RUQ) pain, malaise, weight loss, jaundice, anorexia, and vomiting. This presentation is often confused with symptomatic cholelithiasis or chronic cholecystitis.
INTRODUCTION
Since the first description of gallbladder (GB) carcinoma by Maxmillan de Stol in 1777, studies have established a characteristic pattern of late diagnosis and ineffective treatment of this disease.[1]
Original Article
AbstractIntroduction: Ultrasonography (USG) and computed tomography (CT) have revolutionized the diagnosis, and management of carcinoma ultrasound is the main initial diagnostic tool for suspected biliary lesions. It may be helpful for detecting gadolinium-based contrast agents (GBCA) although the infiltrative morphology of some tumors and the presence of gallstones, inflammation, and debris may preclude tumor detection. CT has been reported as a comprehensive tool for imaging and staging of GBCA.
Aims and Objectives: Role of USG and CT in evaluation of gallbladder (GB) masses
Materials and Methods: This study was conducted in the Department of Radiodiagnosis in coordination with the surgery, medicine, and pathology at NSCB Medical College and Hospital, Jabalpur. A total of 50 patients with suspected GB masses were included in our study.
Result: Maximum number of patients were in the age group between 41 and 50 year, about 32%, and age group between 51 and 60 years, about 28%. GB masses 33 (66%) were detected in females and 17 (34%) were detected in males. Mass detection as per diffuse wall and mass detection as per heterogeneous echotexture was seen in 35 patients, about 70% in USG, and 36 patients, about 72% in CT. Thickening of GB was seen in 7 patients, about 14% in USG and CT.
Conclusion: In our study, overall detection of GB carcinoma USG could detect 94% of cases and CT could detect 96% of cases same as fine-needle aspiration cytology detection of GB carcinoma showing that CT is more sensitive than USG to detect the GB carcinoma.
Key words: Computed tomography scan, Ultrasonography, GB carcinoma
Access this article online
www.ijss-sn.com
Month of Submission : 02-2018 Month of Peer Review : 03-2018 Month of Acceptance : 04-2018 Month of Publishing : 04-2018
Corresponding Author: Dr. Suresh Kumar, F-54, Doctor’s Colony, Medical College Campus, Jabalpur, Madhya Pradesh, India. Phone: +91-7354085808. E-mail: [email protected]
Print ISSN: 2321-6379Online ISSN: 2321-595X
DOI: 10.17354/ijss/2018/119
Kushwah, et al.: Role of Ultrasonography and Computed Tomography in Gallbladder Masses and their Correlation with Fine-needle Aspiration Cytology
8484International Journal of Scientific Study | April 2018 | Vol 6 | Issue 1
Ultrasonography (USG) and computed tomography (CT) have revolutionized the diagnosis and management of carcinoma GB. Magnetic resonance imaging is utilized only in inoperable cases with obstructive jaundice for delineation of the biliary tract anatomy in patients considered for palliative stenting.[2]
Ultrasound (US) is the main initial diagnostic tool for suspected biliary lesions. It may be helpful for detecting gadolinium-based contrast agents (GBCA) although the infiltrative morphology of some tumors and the presence of gallstones, inflammation, and debris may preclude tumor detection. CT has been reported as a comprehensive tool for imaging and staging of GBCA.
USG in patients of carcinoma GB has certain limitations such as interference by bowel gas, limited depth resolution, and inadequate visualization of parts of the GB in the region of posterior acoustic shadowing in the presence of calculi. CT scan overcomes these drawbacks and provides definite information regarding the invasion of the tumor into the adjacent organs, distant metastasis, delineation of the biliary tree, and portal vein involvement.
Sonography is currently the most practical and accurate method to diagnose acute cholecystitis. When adjusted for verification bias, sensitivity and specificity of US are approximately 88% and 80%, respectively.[3]
CT may be useful for depiction of complications. Sonographic findings include the [3] thickening of the GB wall (>3 mm), distention of the GB lumen (diameter >4 cm), gallstones impacted stone in cystic duct or GB neck, pericholecystic fluid collections, positive sonographic Murphy’s sign, hyperemic GB wall on Doppler, and interrogation.
The present study was done as the GB pathology is a frequent source of patient complaint of acute or chronic RUQ pain, jaundice, or dyspepsia and this pathology is commonly encountered on diagnostic imaging examinations.
Aims and ObjectivesThe aims of this study are as follows:1. Role of USG and CT in evaluation of gallbladder
masses2. To enumerate the various feature of CT in GB masses3. To study the correlation with fine-needle aspiration
cytology (FNAC).
MATERIALS AND METHODS
The present study was undertaken to evaluate the role of US and CT imaging in the evaluation of GB masses and
their correlation with FNAC. This study was conducted in the Department of Radiodiagnosis in coordination with the surgery, medicine, and pathology at NSCB Medical College and Hospital, Jabalpur. A total of 50 patients with suspected GB masses were included in our study. Informed written consent of patients was taken before conduction of the study.
Study PeriodThis study was conducted during March 1, 2016–March 31, 2017. Data were collected through the pre-designed pro forma.
Inclusion CriteriaThe following criteria were included in the study:• Patients who presented with a sign and symptom
of GB masses in NSCB Medical College, Jabalpur, underwent USG, CT scan, and FNAC.
Exclusion CriteriaThe following criteria were excluded from the study:• Non-cooperative patients• Patients who did not underwent all the three
investigation (USG, CT scan and FNAC).
Machine used: Philips HD 7XE, Siemens Acuson ×300, and Sonoscape ss16000 [Figure 1]. Procedure: Sonographic examinations were carried out after an overnight fast with a real-time gray scale. The GB was examined for wall thickness, irregularity, echotexture, mass lesions, stones, and pericholecystic fluid collections. CT scan was done on 16 slice GE CT scan machine.
Multiplanar reconstructions were created in both coronal and sagittal plane section.
All the cases had a clinical or radiological suspicion of GB malignancy. Hematoxylin and eosin stained cytology smears were examined in all cases.
RESULTS
The present study was conducted in the Department of Radiodiagnosis in coordination with the Department of Surgery, Medicine, and Pathology at NSCB Medical College and Hospital, Jabalpur. A total of 50 patients suspected with GB masses were included in our study.
In our study, age of the GB mass patients was ranged from 30 to 90 years. Maximum number of patients were in the age group between 41 and 50 years, about 32%, and age group between 51 and 60 years, about 28%. Minimum number of patients were in the group between 71–80 years and 81–90 years. The average age of the patients presented was 52 years.
Kushwah, et al.: Role of Ultrasonography and Computed Tomography in Gallbladder Masses and their Correlation with Fine-needle Aspiration Cytology
8585 International Journal of Scientific Study | April 2018 | Vol 6 | Issue 1
According to Table 2a and b in our study, of 50 patients of the GB masses, 33 (66%) were detected in females and 17 (34%) were detected in males. Female predominance is seen, 6.6 female per 3.4 male. One patient may have more than one complaint. In our study, most common presenting symptom was pain in RUQ which was seen in 94% of cases. 52% (26) of patients were presented with jaundice. About 38% of patients were presented with itching all over the body and 36% of patients were presented with weight loss which were other associated complaints. In our study, GB masses were assessed in terms of size, irregularity, complete or partial replacing lumen, heterogeneous echotexture, gallstone [Figure 2], vascularity on USG, enhancement on CT, dilated common bile duct (CBD), and intrahepatic biliary radicals (IHBR). According to the detection of complete or partial replacing GB lumen masses, USG could detect in 24 patients, about 48% of cases. CT scan could detect in 32 patients, about 64% of cases. In 16% of cases, USG could not detect partial replacing GB lumen masses due to obscured by bowel gas in the abdomen which were detected in CT scan, Figure 3. GB masses were assessed in terms of focal thickening of wall, irregularity, echotexture in USG, and enhancement in CT. According to detection as per focal wall thickening Figure 4, USG could detect 5 patients, about 10% of the cases. CT scan could detect 9 patients, about 18% of the cases. USG could not detect rest of the 8% of cases obscured by bowel gas, which shows that CT scan is better than USG to detect focal wall thickening masses. Mass detection as per diffuse wall thickening of GB was seen in 7 patients, about 14% in USG and CT. GB masses as per intraluminal mass lesion could be detected in 2 patients, about 4% of cases in USG and CT, which shows that both USG and CT are equally sensitive to detect the diffuse wall thickening. Mass detection as per heterogeneous echotexture seen in 35 patients (70%) in USG and 36 patients (72%) in CT showing CT is more accurate than USG. Mass detection as per presence of calculus seen in 24 patients, 48% seen in USG, and 20 patients, about 40% in CT showing, USG is more sensitive than CT to detect calculus. Dilated CBD, associated sign of GB mass, and USG could detect 17 cases, about 34%, and CT could detect 18 cases, about 36%, showing that CT is more sensitive than USG to detect dilated CBD. Dilated IHBR, associated sign of GB mass, and USG could detect 29 patients, about 58% cases, and CT could detect 30 patients, about 60% cases, showing that CT is more sensitive than USG for detection of dilated IHBR associated with GB masses. In this study, GB mass could detect as per direct invasion of the liver in 74% of cases almost similar in USG as well as CT. Similarly, 2% of cases of right and left hepatic duct could be detected by USG, and CT could detect 10% of cases. Duodenum, pylorus, and colon are detected in 2% of cases
only by CT, and USG could not detect any distant organ invasion, showing that CT is for better to detect distant organ invasion than USG.
In this study, the USG and CT both are equally sensitive to detect the porcelain GB in 4% of cases which represent GB carcinoma. In this study ,GB carcinoma detected by USG in 26 (52%) cases shows vascularity on colorDoppler,CT detect 48 (96%) cases showing enhancement on dual phase study represents malignant nature of masses , Figure 5 . This shows that CT is more sensitive to accurate detection of GB carcinoma than USG. In this study, as per detection of nodes, nodes at liver hilum or periportal could be detected by USG in 25, about 50% of cases, and CT could detect 27, about 54% of cases. Peripancreatic nodes could be detected by USG in 20, about 40% of cases, and CT could detect 21, about 42% of cases. Aortocaval lymph node could be detected by USG in 4, about 8% of cases, while CT could detect 8, about 16% of cases. Mesenteric lymph node could be detected by USG in 3, about 6% of cases, while CT could detect 7, about 14% of cases. It shows that CT is more sensitive to detect distant lymphatic spread than USG. In this study, as per detection of metastasis, USG could detect 15, about 30% of cases, and CT could detect 19, about 38% of cases of liver metastasis. While USG could not detect any case of peritoneal metastasis, however, CT could detect 1, about 2% of cases, showing that CT is more sensitive than USG to detect metastasis. In this study, as per overall detection of GB carcinoma, USG could detect 94% of cases and CT could detect 96% of cases of GB carcinoma, showing that CT is more sensitive than USG to detect the GB carcinoma.
DISCUSSION
The present study is cross-section type, including n = 50 patients clinically suspected with GB masses, and all cases were fulfilling inclusion criteria.
Distribution As Per the Age Table 1In our study, age distribution of the patients presenting with GB mass was in range from 30 to 90 years. Maximum patients were in the age group of 41–50 year, which constituted about 32% of cases. The overall mean age of the patients presented was 52 years. Haaga and Herbener[4] and Fong et al.[5] in their separate studies showed that most common age group of presentation of GB mass was primarily in the sixth to seventh decade of life which slightly differs from our study sample. In one study by George et al.,[6] the peak incidence age group of GB mass was 51–70 years. Memon et al.,[7] in their study, 2005 have shown in their series that the mean age of the patients having GB malignancy was 70.6 years and ranges from 42 to 85 years.
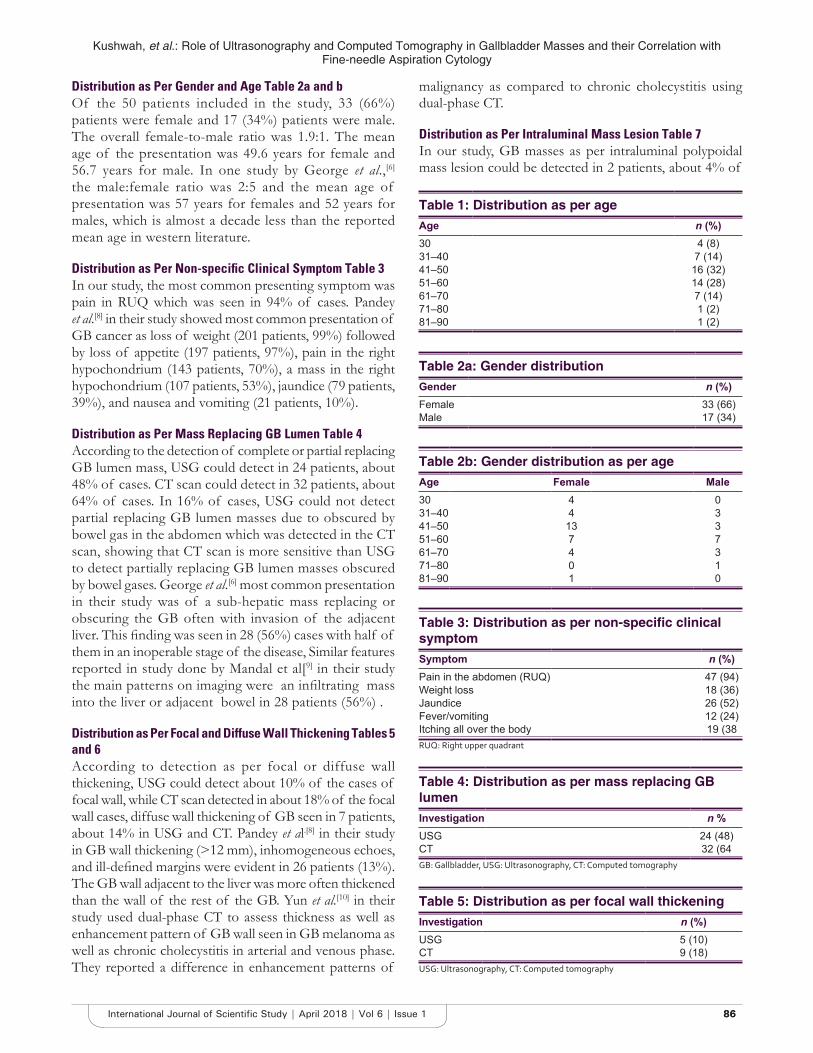
Kushwah, et al.: Role of Ultrasonography and Computed Tomography in Gallbladder Masses and their Correlation with Fine-needle Aspiration Cytology
8686International Journal of Scientific Study | April 2018 | Vol 6 | Issue 1
Distribution as Per Gender and Age Table 2a and bOf the 50 patients included in the study, 33 (66%) patients were female and 17 (34%) patients were male. The overall female-to-male ratio was 1.9:1. The mean age of the presentation was 49.6 years for female and 56.7 years for male. In one study by George et al.,[6] the male:female ratio was 2:5 and the mean age of presentation was 57 years for females and 52 years for males, which is almost a decade less than the reported mean age in western literature.
Distribution as Per Non-specific Clinical Symptom Table 3In our study, the most common presenting symptom was pain in RUQ which was seen in 94% of cases. Pandey et al.[8] in their study showed most common presentation of GB cancer as loss of weight (201 patients, 99%) followed by loss of appetite (197 patients, 97%), pain in the right hypochondrium (143 patients, 70%), a mass in the right hypochondrium (107 patients, 53%), jaundice (79 patients, 39%), and nausea and vomiting (21 patients, 10%).
Distribution as Per Mass Replacing GB Lumen Table 4According to the detection of complete or partial replacing GB lumen mass, USG could detect in 24 patients, about 48% of cases. CT scan could detect in 32 patients, about 64% of cases. In 16% of cases, USG could not detect partial replacing GB lumen masses due to obscured by bowel gas in the abdomen which was detected in the CT scan, showing that CT scan is more sensitive than USG to detect partially replacing GB lumen masses obscured by bowel gases. George et al.[6] most common presentation in their study was of a sub-hepatic mass replacing or obscuring the GB often with invasion of the adjacent liver. This finding was seen in 28 (56%) cases with half of them in an inoperable stage of the disease, Similar features reported in study done by Mandal et al[9] in their study the main patterns on imaging were an infiltrating mass into the liver or adjacent bowel in 28 patients (56%) .
Distribution as Per Focal and Diffuse Wall Thickening Tables 5 and 6According to detection as per focal or diffuse wall thickening, USG could detect about 10% of the cases of focal wall, while CT scan detected in about 18% of the focal wall cases, diffuse wall thickening of GB seen in 7 patients, about 14% in USG and CT. Pandey et al.[8] in their study in GB wall thickening (>12 mm), inhomogeneous echoes, and ill-defined margins were evident in 26 patients (13%). The GB wall adjacent to the liver was more often thickened than the wall of the rest of the GB. Yun et al.[10] in their study used dual-phase CT to assess thickness as well as enhancement pattern of GB wall seen in GB melanoma as well as chronic cholecystitis in arterial and venous phase. They reported a difference in enhancement patterns of
malignancy as compared to chronic cholecystitis using dual-phase CT.
Distribution as Per Intraluminal Mass Lesion Table 7In our study, GB masses as per intraluminal polypoidal mass lesion could be detected in 2 patients, about 4% of
Table 1: Distribution as per ageAge n (%)30 4 (8)31–40 7 (14)41–50 16 (32)51–60 14 (28)61–70 7 (14)71–80 1 (2)81–90 1 (2)
Table 2a: Gender distributionGender n (%)Female 33 (66)Male 17 (34)
Table 2b: Gender distribution as per ageAge Female Male30 4 031–40 4 341–50 13 351–60 7 761–70 4 371–80 0 181–90 1 0
Table 4: Distribution as per mass replacing GB lumenInvestigation n %USG 24 (48)CT 32 (64GB: Gallbladder, USG: Ultrasonography, CT: Computed tomography
Table 5: Distribution as per focal wall thickeningInvestigation n (%)USG 5 (10)CT 9 (18)USG: Ultrasonography, CT: Computed tomography
Table 3: Distribution as per non‑specific clinical symptomSymptom n (%)Pain in the abdomen (RUQ) 47 (94)Weight loss 18 (36)Jaundice 26 (52)Fever/vomiting 12 (24)Itching all over the body 19 (38RUQ: Right upper quadrant
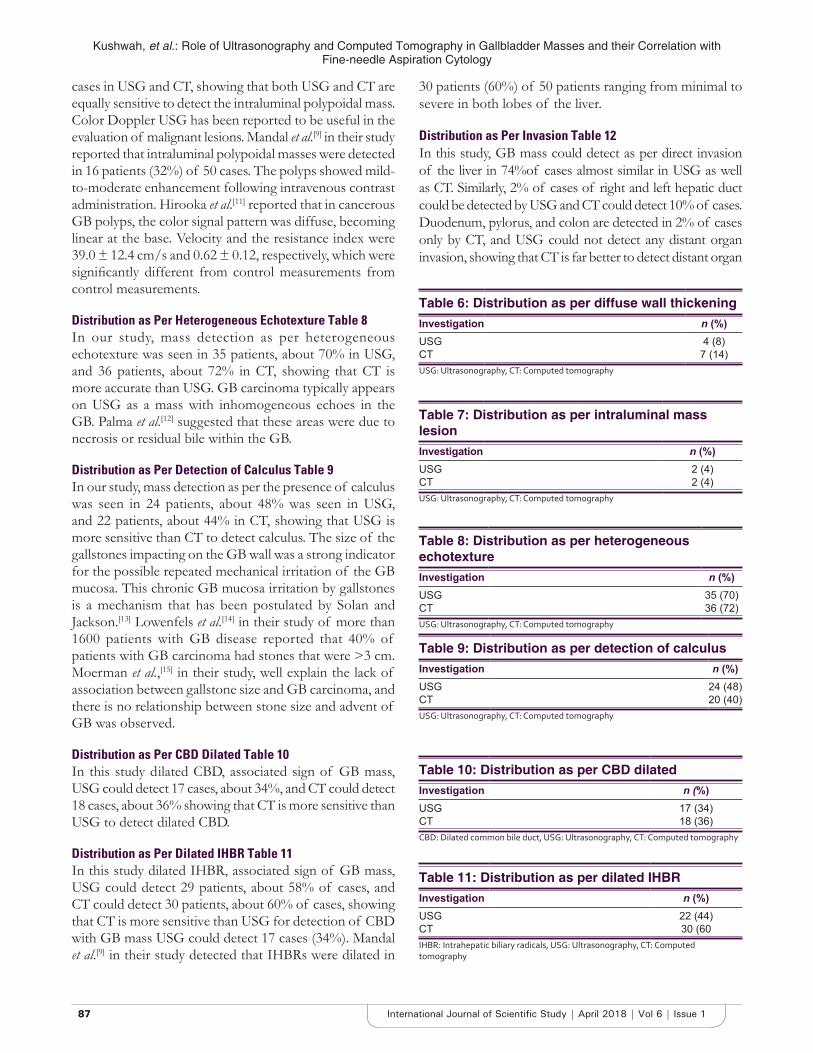
Kushwah, et al.: Role of Ultrasonography and Computed Tomography in Gallbladder Masses and their Correlation with Fine-needle Aspiration Cytology
8787 International Journal of Scientific Study | April 2018 | Vol 6 | Issue 1
cases in USG and CT, showing that both USG and CT are equally sensitive to detect the intraluminal polypoidal mass. Color Doppler USG has been reported to be useful in the evaluation of malignant lesions. Mandal et al.[9] in their study reported that intraluminal polypoidal masses were detected in 16 patients (32%) of 50 cases. The polyps showed mild-to-moderate enhancement following intravenous contrast administration. Hirooka et al.[11] reported that in cancerous GB polyps, the color signal pattern was diffuse, becoming linear at the base. Velocity and the resistance index were 39.0 ± 12.4 cm/s and 0.62 ± 0.12, respectively, which were significantly different from control measurements from control measurements.
Distribution as Per Heterogeneous Echotexture Table 8In our study, mass detection as per heterogeneous echotexture was seen in 35 patients, about 70% in USG, and 36 patients, about 72% in CT, showing that CT is more accurate than USG. GB carcinoma typically appears on USG as a mass with inhomogeneous echoes in the GB. Palma et al.[12] suggested that these areas were due to necrosis or residual bile within the GB.
Distribution as Per Detection of Calculus Table 9In our study, mass detection as per the presence of calculus was seen in 24 patients, about 48% was seen in USG, and 22 patients, about 44% in CT, showing that USG is more sensitive than CT to detect calculus. The size of the gallstones impacting on the GB wall was a strong indicator for the possible repeated mechanical irritation of the GB mucosa. This chronic GB mucosa irritation by gallstones is a mechanism that has been postulated by Solan and Jackson.[13] Lowenfels et al.[14] in their study of more than 1600 patients with GB disease reported that 40% of patients with GB carcinoma had stones that were >3 cm. Moerman et al.,[15] in their study, well explain the lack of association between gallstone size and GB carcinoma, and there is no relationship between stone size and advent of GB was observed.
Distribution as Per CBD Dilated Table 10In this study d ilated CBD, associated sign of GB mass, USG could detect 17 cases, about 34%, and CT could detect 18 cases, about 36% showing that CT is more sensitive than USG to detect dilated CBD.
Distribution as Per Dilated IHBR Table 11In this study dilated IHBR, associated sign of GB mass, USG could detect 29 patients, about 58% of cases, and CT could detect 30 patients, about 60% of cases, showing that CT is more sensitive than USG for detection of CBD with GB mass USG could detect 17 cases (34%). Mandal et al.[9] in their study detected that IHBRs were dilated in
30 patients (60%) of 50 patients ranging from minimal to severe in both lobes of the liver.
Distribution as Per Invasion Table 12In this study, GB mass could detect as per direct invasion of the liver in 74%of cases almost similar in USG as well as CT. Similarly, 2% of cases of right and left hepatic duct could be detected by USG and CT could detect 10% of cases. Duodenum, pylorus, and colon are detected in 2% of cases only by CT, and USG could not detect any distant organ invasion, showing that CT is far better to detect distant organ
Table 6: Distribution as per diffuse wall thickeningInvestigation n (%)USG 4 (8)CT 7 (14)USG: Ultrasonography, CT: Computed tomography
Table 7: Distribution as per intraluminal mass lesionInvestigation n (%)USG 2 (4)CT 2 (4)USG: Ultrasonography, CT: Computed tomography
Table 8: Distribution as per heterogeneous echotextureInvestigation n (%)USG 35 (70)CT 36 (72)USG: Ultrasonography, CT: Computed tomography
Table 9: Distribution as per detection of calculusInvestigation n (%)USG 24 (48)CT 20 (40)USG: Ultrasonography, CT: Computed tomography
Table 10: Distribution as per CBD dilatedInvestigation n (%)USG 17 (34)CT 18 (36)CBD: Dilated common bile duct, USG: Ultrasonography, CT: Computed tomography
Table 11: Distribution as per dilated IHBRInvestigation n (%)USG 22 (44)CT 30 (60IHBR: Intrahepatic biliary radicals, USG: Ultrasonography, CT: Computed tomography
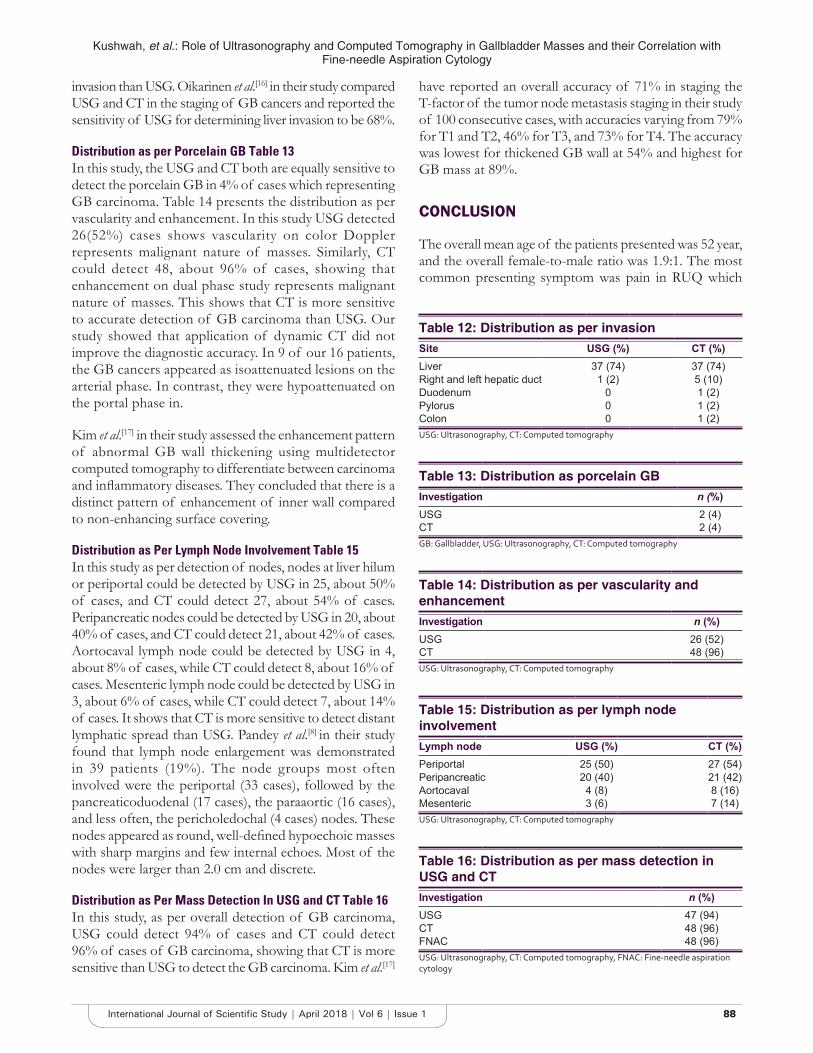
Kushwah, et al.: Role of Ultrasonography and Computed Tomography in Gallbladder Masses and their Correlation with Fine-needle Aspiration Cytology
8888International Journal of Scientific Study | April 2018 | Vol 6 | Issue 1
invasion than USG. Oikarinen et al.[16] in their study compared USG and CT in the staging of GB cancers and reported the sensitivity of USG for determining liver invasion to be 68%.
Distribution as per Porcelain GB Table 13In this study, the USG and CT both are equally sensitive to detect the porcelain GB in 4% of cases which representing GB carcinoma. Table 14 presents the distribution as per vascularity and enhancement . In this study USG detected 26(52%) cases shows vascularity on color Doppler represents malignant nature of masses. Similarly, CT could detect 48, about 96% of cases, showing that enhancement on dual phase study represents malignant nature of masses. This shows that CT is more sensitive to accurate detection of GB carcinoma than USG. Our study showed that application of dynamic CT did not improve the diagnostic accuracy. In 9 of our 16 patients, the GB cancers appeared as isoattenuated lesions on the arterial phase. In contrast, they were hypoattenuated on the portal phase in.
Kim et al.[17] in their study assessed the enhancement pattern of abnormal GB wall thickening using multidetector computed tomography to differentiate between carcinoma and inflammatory diseases. They concluded that there is a distinct pattern of enhancement of inner wall compared to non-enhancing surface covering.
Distribution as Per Lymph Node Involvement Table 15In this study as per detection of nodes, nodes at liver hilum or periportal could be detected by USG in 25, about 50% of cases, and CT could detect 27, about 54% of cases. Peripancreatic nodes could be detected by USG in 20, about 40% of cases, and CT could detect 21, about 42% of cases. Aortocaval lymph node could be detected by USG in 4, about 8% of cases, while CT could detect 8, about 16% of cases. Mesenteric lymph node could be detected by USG in 3, about 6% of cases, while CT could detect 7, about 14% of cases. It shows that CT is more sensitive to detect distant lymphatic spread than USG. Pandey et al.[8] in their study found that lymph node enlargement was demonstrated in 39 patients (19%). The node groups most often involved were the periportal (33 cases), followed by the pancreaticoduodenal (17 cases), the paraaortic (16 cases), and less often, the pericholedochal (4 cases) nodes. These nodes appeared as round, well-defined hypoechoic masses with sharp margins and few internal echoes. Most of the nodes were larger than 2.0 cm and discrete.
Distribution as Per Mass Detection In USG and CT Table 16In this study, as per overall detection of GB carcinoma, USG could detect 94% of cases and CT could detect 96% of cases of GB carcinoma, showing that CT is more sensitive than USG to detect the GB carcinoma. Kim et al.[17]
have reported an overall accuracy of 71% in staging the T-factor of the tumor node metastasis staging in their study of 100 consecutive cases, with accuracies varying from 79% for T1 and T2, 46% for T3, and 73% for T4. The accuracy was lowest for thickened GB wall at 54% and highest for GB mass at 89%.
CONCLUSION
The overall mean age of the patients presented was 52 year, and the overall female-to-male ratio was 1.9:1. The most common presenting symptom was pain in RUQ which
Table 13: Distribution as porcelain GBInvestigation n (%)USG 2 (4)CT 2 (4)GB: Gallbladder, USG: Ultrasonography, CT: Computed tomography
Table 14: Distribution as per vascularity and enhancementInvestigation n (%)USG 26 (52)CT 48 (96)USG: Ultrasonography, CT: Computed tomography
Table 15: Distribution as per lymph node involvementLymph node USG (%) CT (%)Periportal 25 (50) 27 (54)Peripancreatic 20 (40) 21 (42)Aortocaval 4 (8) 8 (16)Mesenteric 3 (6) 7 (14)USG: Ultrasonography, CT: Computed tomography
Table 16: Distribution as per mass detection in USG and CTInvestigation n (%)USG 47 (94)CT 48 (96)FNAC 48 (96)USG: Ultrasonography, CT: Computed tomography, FNAC: Fine‑needle aspiration cytology
Table 12: Distribution as per invasionSite USG (%) CT (%)Liver 37 (74) 37 (74)Right and left hepatic duct 1 (2) 5 (10)Duodenum 0 1 (2)Pylorus 0 1 (2)Colon 0 1 (2)USG: Ultrasonography, CT: Computed tomography
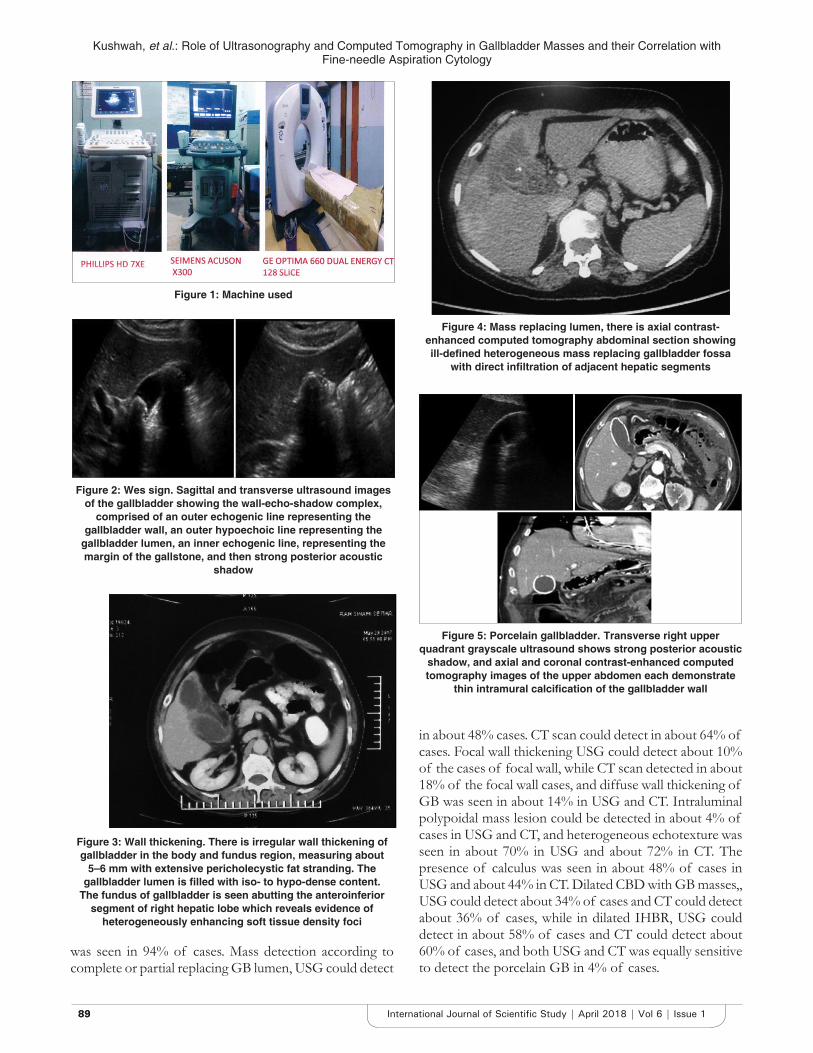
Kushwah, et al.: Role of Ultrasonography and Computed Tomography in Gallbladder Masses and their Correlation with Fine-needle Aspiration Cytology
8989 International Journal of Scientific Study | April 2018 | Vol 6 | Issue 1
in about 48% cases. CT scan could detect in about 64% of cases. Focal wall thickening USG could detect about 10% of the cases of focal wall, while CT scan detected in about 18% of the focal wall cases, and diffuse wall thickening of GB was seen in about 14% in USG and CT. Intraluminal polypoidal mass lesion could be detected in about 4% of cases in USG and CT, and heterogeneous echotexture was seen in about 70% in USG and about 72% in CT. The presence of calculus was seen in about 48% of cases in USG and about 44% in CT. Dilated CBD with GB masses,, USG could detect about 34% of cases and CT could detect about 36% of cases, while in dilated IHBR, USG could detect in about 58% of cases and CT could detect about 60% of cases, and both USG and CT was equally sensitive to detect the porcelain GB in 4% of cases.
Figure 1: Machine used
Figure 2: Wes sign. Sagittal and transverse ultrasound images of the gallbladder showing the wall-echo-shadow complex,
comprised of an outer echogenic line representing the gallbladder wall, an outer hypoechoic line representing the
gallbladder lumen, an inner echogenic line, representing the margin of the gallstone, and then strong posterior acoustic
shadow
Figure 3: Wall thickening. There is irregular wall thickening of gallbladder in the body and fundus region, measuring about
5–6 mm with extensive pericholecystic fat stranding. The gallbladder lumen is filled with iso‑ to hypo‑dense content.
The fundus of gallbladder is seen abutting the anteroinferior segment of right hepatic lobe which reveals evidence of
heterogeneously enhancing soft tissue density foci
Figure 4: Mass replacing lumen, there is axial contrast-enhanced computed tomography abdominal section showing ill‑defined heterogeneous mass replacing gallbladder fossa
with direct infiltration of adjacent hepatic segments
Figure 5: Porcelain gallbladder. Transverse right upper quadrant grayscale ultrasound shows strong posterior acoustic
shadow, and axial and coronal contrast-enhanced computed tomography images of the upper abdomen each demonstrate
thin intramural calcification of the gallbladder wall
was seen in 94% of cases. Mass detection according to complete or partial replacing GB lumen, USG could detect
Kushwah, et al.: Role of Ultrasonography and Computed Tomography in Gallbladder Masses and their Correlation with Fine-needle Aspiration Cytology
9090International Journal of Scientific Study | April 2018 | Vol 6 | Issue 1
In our study, GB masses could detect as direct invasion of the liver in 74% of cases by USG and CT. In our study, overall detection of GB carcinoma USG could detect 94% of cases and CT could detect 96% of cases same as FNAC detection of GB carcinoma, showing that CT is more sensitive than USG to detect the GB carcinoma.
REFERENCES
1. Abi-Rached B, Neugut AI. Diagnostic and management issues in gallbladder carcinoma. Oncology 1995;9:19-30.
2. Fong Y, Kemeny N, Lawrence TS. Cancer of the liver and biliary tree. In: De Vita VT Jr, Hellman S, Rosenberg SA, editors. Cance: Principles and Practice of Oncology. 6th ed. Philadelphia: Lippincott, Williams and Wilkins; 2002. p. 1187-202.
3. Tsuchiya Y. Early carcinoma of the gallbladder: Macroscopic features and US findings. Radiology 1991;179:171-5.
4. Haaga JR, Herbener EH. The gallbladder and biliary tract. In: Haaga JR, Lanzieri CF, Gilkeson RC, editors. CT and MR Imaging of the Whole Body. 4th ed. St Louis: Mosby; 2003. p. 1357-60.
5. Fong Y, Jarnagin W, Blumgart LH. Gallbladder cancer: Comparison of patients presenting initially for definitive operation with those presenting after prior noncurative intervention. Ann Surg 2000;232:557-69.
6. George RA, Godara SC, Dhagat P, Som PP. Computed tomographic findings in 50 cases of gall bladder carcinoma. Med J Armed Forces India 2007;63:215-9.
7. Memon MA, Anwar S. Shiwani MH, Gallbladder carcinoma: A retrospective
analysis of twenty two year experience of a single teaching hospital. Int Sem Surg Oncol 2005;6:79-81.
8. Pandey M. Environmental pollutants in gallbladder carcinogenesis. J Surg Oncol 2006;93:640-3.
9. Mandal AK, Sithanthaseelan M, Thakur V. Gall bladder carcinoma: Computed tomographic findings in 50 cases. JMSCR. Imperial J Interdiscip Res 2017;3:106-108.
10. Yun EJ, Cho SG, Park S, Park SW, Kim WH, Kim HJ, et al. Gallbladder carcinoma and chronic cholecystitis: Differentiation with two-phase spiral CT. Abdom Imaging 2004;29:102-8.
11. Hirooka Y, Naitoh Y, Goto H, Furukawa T, Ito A, Hayakawa T, et al. Differential diagnosis of gall-bladder masses using colour Doppler ultrasonography. J Gastroenterol Hepatol 1996;11:840-6.
12. Palma LD, Rizzatto G, Pozzi-Mucelli RS, Bazzocchi M. Grey scale ultrasonography in the evaluation of carcinoma of the gallbladder. Br J Radiol 1980;53:662.
13. Solan MJ, Jackson BT. Carcinoma of the gallbladder. Br J Surg 1971;58:593-7.
14. Lowenfels AB, Walker AM, Althaus DP, Townsend G, Domellof L. Gallstone growth, size, and risk of gallbladder cancer: An interracial study. Int J Epidemiol 1989;18:50-4.
15. Moerman CJ, Lagerwaard FJ, Bueno de Mesquita HB, van Dalen A, van Leeuwen MS, Schrover PA. Gallstone size and the risk of gallbladder cancer. Scand J Gastroenterol 1993;28:482-6.
16. Oikarinen H, Päivänsalo M, Lähde S, Tikkakoski T, Suramo I. Radiological findings in cases of gallbladder carcinoma. Eur Radiol 1993;17:179.
17. Kim SJ, Lee JM, Lee JY, Kim SH, Han JK, Choi BI, et al. Analysis of enhancement pattern of flat gallbladder wall thickening on MDCT to differentiate gallbladder cancer from cholecystitis. AJR Am J Roentgenol 2008;191:765-71.
How to cite this article: Kushwah APS, Jamre Y, Baghel P, Pande S, Kumar S. Role of Ultrasonography and Computed Tomography in Gallbladder Masses and their Correlation with Fine-needle Aspiration Cytology. Int J Sci Stud 2018;6(1):83-90.
Source of Support: Nil, Conflict of Interest: None declared.
9191 International Journal of Scientific Study | April 2018 | Vol 6 | Issue 1
Fenticonazole in Vulvovaginal Infections: A Real-world Clinical Experience in India - Force India StudyDhiraj Dhoot1, Harshal Mahajan2, Hanmant Barkate3
1Manager, Medical Services, Glenmark Pharmaceutical Ltd., Andheri (East), Mumbai, Maharashtra, India, 2Assistant Manager, Medical Services, Glenmark Pharmaceutical Ltd., Andheri (East), Mumbai, Maharashtra, India, 3Vice President, Medical Services, Glenmark Pharmaceutical Ltd., Andheri (East), Mumbai, Maharashtra, India
Symptomatic inflammation of vagina, also involving vulval tissue instigated by candida, is conventionally defined as vulvovaginal candidiasis (VVC). Vaginal discharge (curdy white/cheesy discharge is peculiar) and itching are the prime manifestations of VVC.[2] Pregnancy, diabetes mellitus, use of systemic antibiotics, and poor intimate hygiene are some of its risk factors.[3,4]
The pursuit of starting empirical therapy in vulvovaginitis is arduous due to diagnostic challenge owing to intersecting symptoms of VVC, bacterial, and mixed vaginal infections. This situation is more complicated by escalating emergence of resistant strains of pathogens which has compelled the use of intricate therapy regimes for longer duration.[5] Mixed infections are difficult to treat with monotherapy,
INTRODUCTION
In recent decade, fungal infections have escalated due to mushrooming of immunocompromised patients like elderly and other patients receiving immunosuppressants for comaleficent diseases diabetes mellitus, etc. This holds true for infections of vulvovaginal tissues as well.[1]
Original Article
AbstractIntroduction: In recent decade, fungal infections have escalated due to mushrooming of immunocompromised patients like elderly and other patients receiving immunosuppressants for comaleficent diseases diabetes mellitus, etc. This holds true for infections of vulvovaginal tissues as well. Skin and vulvovaginal infections can be effectively treated by azole class of antifungals such as clotrimazole and miconazole. Fenticonazole belongs to same class of antifungals, which has been extensively studied against fungi and some Gram-positive bacterial cocci.
Aims and Objectives: We aimed to review etiological pattern of vulvovaginitis, drug use and/prescribing patterns using the World Health Organization - Drug Utilization indicators, and effects of fenticonazole (both beneficial and adverse).
Materials and Methods: A survey was conducted through pre-validated questionnaire, designed to assess the effectiveness and safety of fenticonazole 600 mg ovule in the treatment of vulvovaginitis.
Results: Among all variants of vaginitis, the most common variant was bacterial vaginosis (42.2%), followed by mixed vaginitis (33.2%), vulvovaginitis (14.9%), and trichomonas vaginitis (9.4%). Of 2037 prescriptions, 404 (19.8%) patients were prescribed single dose of fenticonazole, 1211 (59.4%) patients were given two doses, i.e., one ovule each, at day 1 and day 3 (D1/D3), and 419 (20.5%) patients were prescribed with two doses of fenticonazole on day 1 and day 7 (D1/D7). Prescribed daily dose of fenticonazole was more than defined daily dose. No serious adverse events were reported and it was well tolerated.
Conclusion: Most of the prescriptions in the real-world setting were in D1/D3 group implying that vulvovaginitis needs to be treated adequately with two-dose regime, in contrast to single dose recommendation of standard guidelines.
Key words: Drug utilization, Fenticonazole, Vulvovaginitis, World Health Organization
Access this article online
www.ijss-sn.com
Month of Submission : 02-2018 Month of Peer Review : 03-2018 Month of Acceptance : 04-2018 Month of Publishing : 04-2018
Corresponding Author: Dr. Harshal Mahajan, Medical Services, Glenmark Pharmaceutical Ltd., Andheri (East), Mumbai, Maharashtra, India. Phone: +91-9028638656. E-mail: [email protected]
Print ISSN: 2321-6379Online ISSN: 2321-595X
DOI: 10.17354/ijss/2018/120
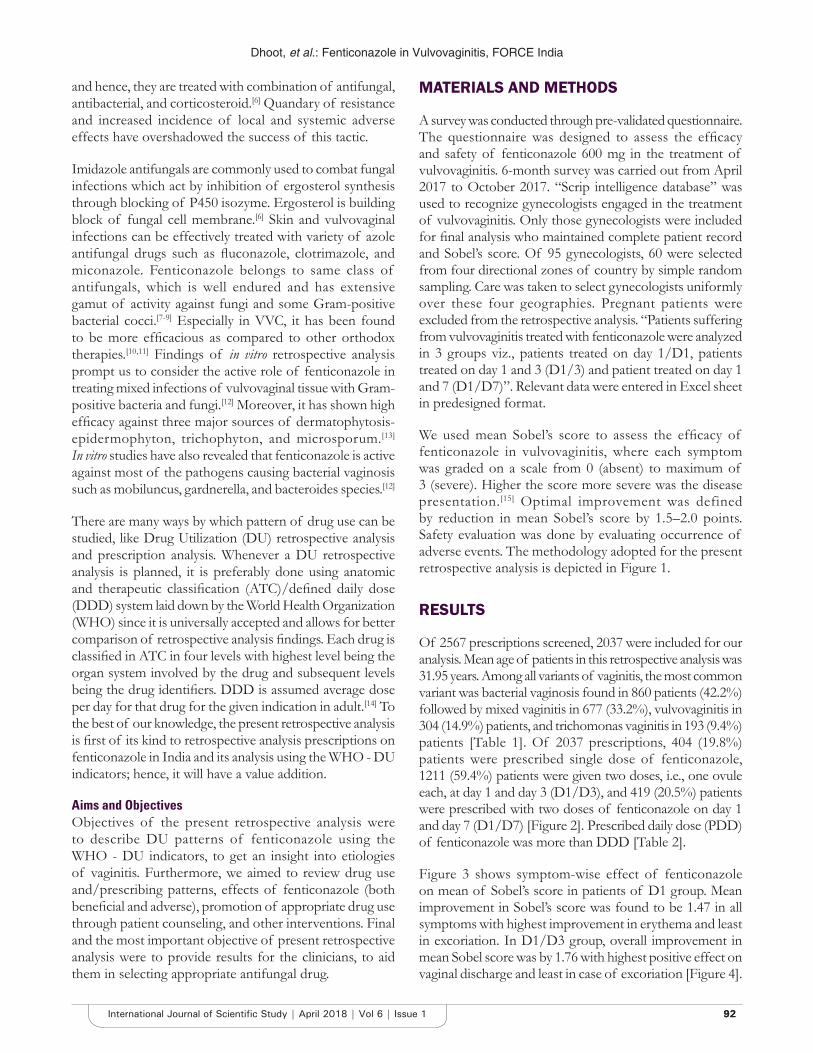
Dhoot, et al.: Fenticonazole in Vulvovaginitis, FORCE India
9292International Journal of Scientific Study | April 2018 | Vol 6 | Issue 1
and hence, they are treated with combination of antifungal, antibacterial, and corticosteroid.[6] Quandary of resistance and increased incidence of local and systemic adverse effects have overshadowed the success of this tactic.
Imidazole antifungals are commonly used to combat fungal infections which act by inhibition of ergosterol synthesis through blocking of P450 isozyme. Ergosterol is building block of fungal cell membrane.[6] Skin and vulvovaginal infections can be effectively treated with variety of azole antifungal drugs such as fluconazole, clotrimazole, and miconazole. Fenticonazole belongs to same class of antifungals, which is well endured and has extensive gamut of activity against fungi and some Gram-positive bacterial cocci.[7-9] Especially in VVC, it has been found to be more efficacious as compared to other orthodox therapies.[10,11] Findings of in vitro retrospective analysis prompt us to consider the active role of fenticonazole in treating mixed infections of vulvovaginal tissue with Gram-positive bacteria and fungi.[12] Moreover, it has shown high efficacy against three major sources of dermatophytosis-epidermophyton, trichophyton, and microsporum.[13] In vitro studies have also revealed that fenticonazole is active against most of the pathogens causing bacterial vaginosis such as mobiluncus, gardnerella, and bacteroides species.[12]
There are many ways by which pattern of drug use can be studied, like Drug Utilization (DU) retrospective analysis and prescription analysis. Whenever a DU retrospective analysis is planned, it is preferably done using anatomic and therapeutic classification (ATC)/defined daily dose (DDD) system laid down by the World Health Organization (WHO) since it is universally accepted and allows for better comparison of retrospective analysis findings. Each drug is classified in ATC in four levels with highest level being the organ system involved by the drug and subsequent levels being the drug identifiers. DDD is assumed average dose per day for that drug for the given indication in adult.[14] To the best of our knowledge, the present retrospective analysis is first of its kind to retrospective analysis prescriptions on fenticonazole in India and its analysis using the WHO - DU indicators; hence, it will have a value addition.
Aims and ObjectivesObjectives of the present retrospective analysis were to describe DU patterns of fenticonazole using the WHO - DU indicators, to get an insight into etiologies of vaginitis. Furthermore, we aimed to review drug use and/prescribing patterns, effects of fenticonazole (both beneficial and adverse), promotion of appropriate drug use through patient counseling, and other interventions. Final and the most important objective of present retrospective analysis were to provide results for the clinicians, to aid them in selecting appropriate antifungal drug.
MATERIALS AND METHODS
A survey was conducted through pre-validated questionnaire. The questionnaire was designed to assess the efficacy and safety of fenticonazole 600 mg in the treatment of vulvovaginitis. 6-month survey was carried out from April 2017 to October 2017. “Scrip intelligence database” was used to recognize gynecologists engaged in the treatment of vulvovaginitis. Only those gynecologists were included for final analysis who maintained complete patient record and Sobel’s score. Of 95 gynecologists, 60 were selected from four directional zones of country by simple random sampling. Care was taken to select gynecologists uniformly over these four geographies. Pregnant patients were excluded from the retrospective analysis. “Patients suffering from vulvovaginitis treated with fenticonazole were analyzed in 3 groups viz., patients treated on day 1/D1, patients treated on day 1 and 3 (D1/3) and patient treated on day 1 and 7 (D1/D7)”. Relevant data were entered in Excel sheet in predesigned format.
We used mean Sobel’s score to assess the efficacy of fenticonazole in vulvovaginitis, where each symptom was graded on a scale from 0 (absent) to maximum of 3 (severe). Higher the score more severe was the disease presentation.[15] Optimal improvement was defined by reduction in mean Sobel’s score by 1.5–2.0 points. Safety evaluation was done by evaluating occurrence of adverse events. The methodology adopted for the present retrospective analysis is depicted in Figure 1.
RESULTS
Of 2567 prescriptions screened, 2037 were included for our analysis. Mean age of patients in this retrospective analysis was 31.95 years. Among all variants of vaginitis, the most common variant was bacterial vaginosis found in 860 patients (42.2%) followed by mixed vaginitis in 677 (33.2%), vulvovaginitis in 304 (14.9%) patients, and trichomonas vaginitis in 193 (9.4%) patients [Table 1]. Of 2037 prescriptions, 404 (19.8%) patients were prescribed single dose of fenticonazole, 1211 (59.4%) patients were given two doses, i.e., one ovule each, at day 1 and day 3 (D1/D3), and 419 (20.5%) patients were prescribed with two doses of fenticonazole on day 1 and day 7 (D1/D7) [Figure 2]. Prescribed daily dose (PDD) of fenticonazole was more than DDD [Table 2].
Figure 3 shows symptom-wise effect of fenticonazole on mean of Sobel’s score in patients of D1 group. Mean improvement in Sobel’s score was found to be 1.47 in all symptoms with highest improvement in erythema and least in excoriation. In D1/D3 group, overall improvement in mean Sobel score was by 1.76 with highest positive effect on vaginal discharge and least in case of excoriation [Figure 4].
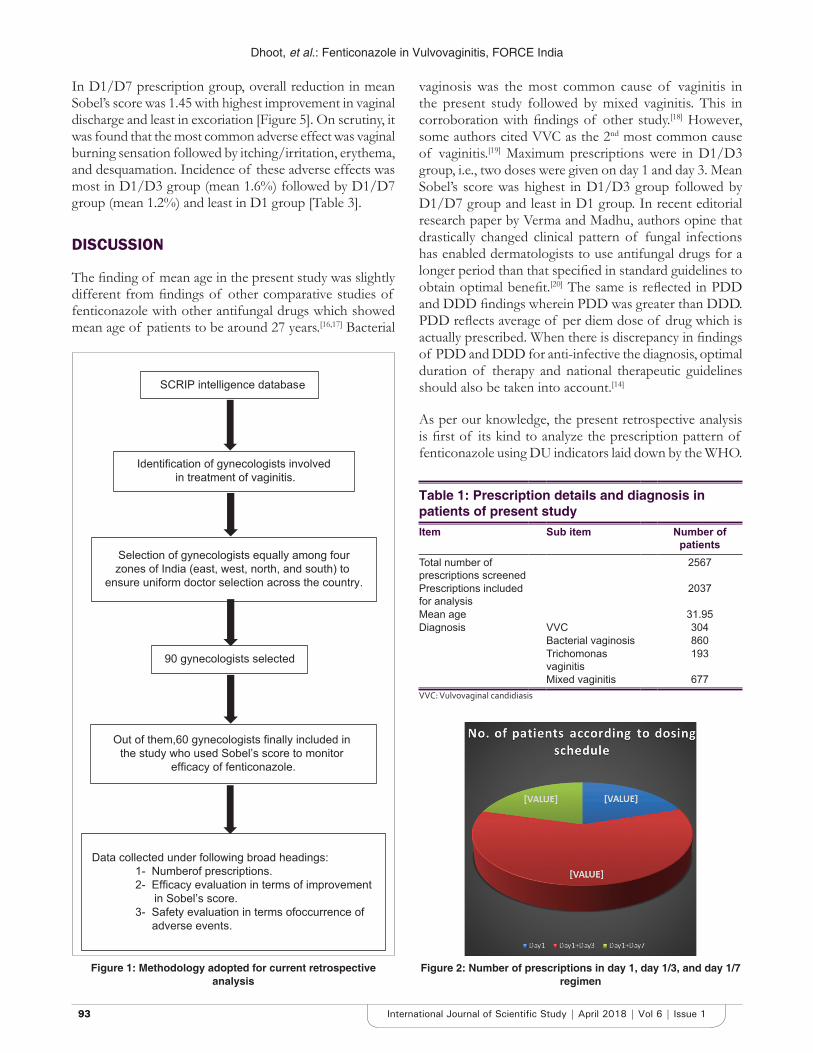
Dhoot, et al.: Fenticonazole in Vulvovaginitis, FORCE India
9393 International Journal of Scientific Study | April 2018 | Vol 6 | Issue 1
vaginosis was the most common cause of vaginitis in the present study followed by mixed vaginitis. This in corroboration with findings of other study.[18] However, some authors cited VVC as the 2nd most common cause of vaginitis.[19] Maximum prescriptions were in D1/D3 group, i.e., two doses were given on day 1 and day 3. Mean Sobel’s score was highest in D1/D3 group followed by D1/D7 group and least in D1 group. In recent editorial research paper by Verma and Madhu, authors opine that drastically changed clinical pattern of fungal infections has enabled dermatologists to use antifungal drugs for a longer period than that specified in standard guidelines to obtain optimal benefit.[20] The same is reflected in PDD and DDD findings wherein PDD was greater than DDD. PDD reflects average of per diem dose of drug which is actually prescribed. When there is discrepancy in findings of PDD and DDD for anti-infective the diagnosis, optimal duration of therapy and national therapeutic guidelines should also be taken into account.[14]
As per our knowledge, the present retrospective analysis is first of its kind to analyze the prescription pattern of fenticonazole using DU indicators laid down by the WHO.
Figure 1: Methodology adopted for current retrospective analysis
Figure 2: Number of prescriptions in day 1, day 1/3, and day 1/7 regimen
In D1/D7 prescription group, overall reduction in mean Sobel’s score was 1.45 with highest improvement in vaginal discharge and least in excoriation [Figure 5]. On scrutiny, it was found that the most common adverse effect was vaginal burning sensation followed by itching/irritation, erythema, and desquamation. Incidence of these adverse effects was most in D1/D3 group (mean 1.6%) followed by D1/D7 group (mean 1.2%) and least in D1 group [Table 3].
DISCUSSION
The finding of mean age in the present study was slightly different from findings of other comparative studies of fenticonazole with other antifungal drugs which showed mean age of patients to be around 27 years.[16,17] Bacterial
Table 1: Prescription details and diagnosis in patients of present studyItem Sub item Number of
patientsTotal number of prescriptions screened
2567
Prescriptions included for analysis
2037
Mean age 31.95Diagnosis VVC 304
Bacterial vaginosis 860Trichomonas vaginitis
193
Mixed vaginitis 677VVC: Vulvovaginal candidiasis
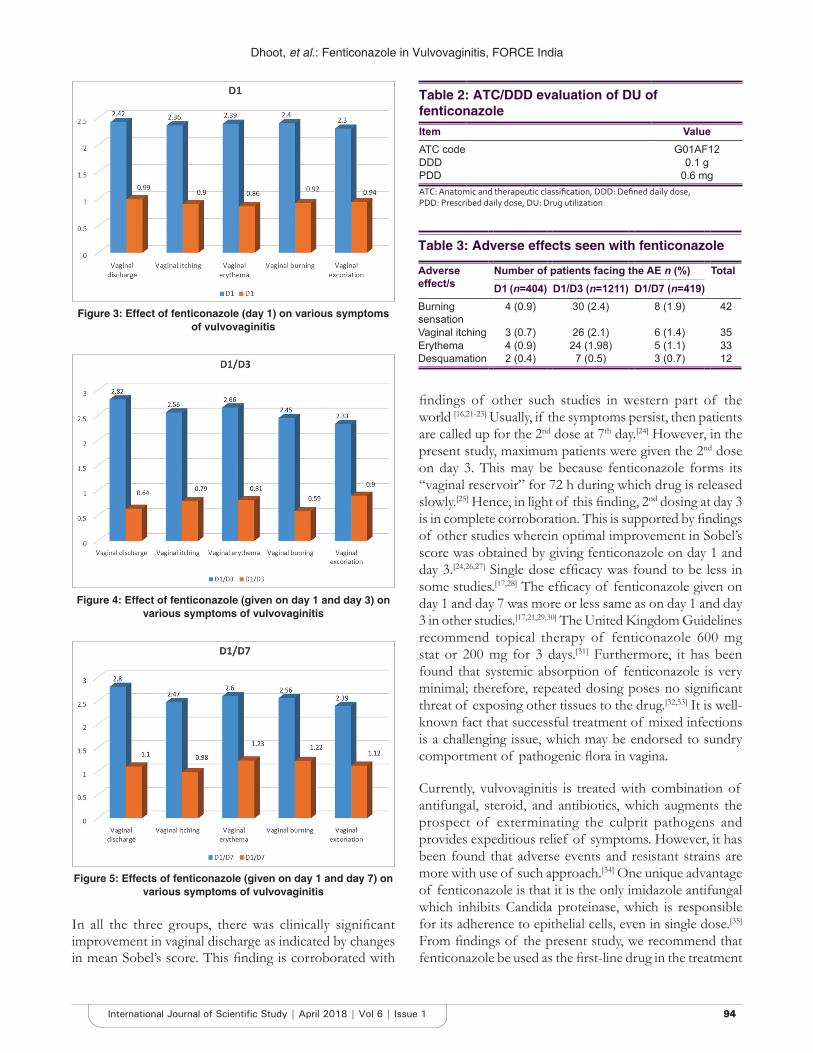
Dhoot, et al.: Fenticonazole in Vulvovaginitis, FORCE India
9494International Journal of Scientific Study | April 2018 | Vol 6 | Issue 1
In all the three groups, there was clinically significant improvement in vaginal discharge as indicated by changes in mean Sobel’s score. This finding is corroborated with
findings of other such studies in western part of the world [16,21-23] Usually, if the symptoms persist, then patients are called up for the 2nd dose at 7th day.[24] However, in the present study, maximum patients were given the 2nd dose on day 3. This may be because fenticonazole forms its “vaginal reservoir” for 72 h during which drug is released slowly.[25] Hence, in light of this finding, 2nd dosing at day 3 is in complete corroboration. This is supported by findings of other studies wherein optimal improvement in Sobel’s score was obtained by giving fenticonazole on day 1 and day 3.[24,26,27] Single dose efficacy was found to be less in some studies.[17,28] The efficacy of fenticonazole given on day 1 and day 7 was more or less same as on day 1 and day 3 in other studies.[17,21,29,30] The United Kingdom Guidelines recommend topical therapy of fenticonazole 600 mg stat or 200 mg for 3 days.[31] Furthermore, it has been found that systemic absorption of fenticonazole is very minimal; therefore, repeated dosing poses no significant threat of exposing other tissues to the drug.[32,33] It is well-known fact that successful treatment of mixed infections is a challenging issue, which may be endorsed to sundry comportment of pathogenic flora in vagina.
Currently, vulvovaginitis is treated with combination of antifungal, steroid, and antibiotics, which augments the prospect of exterminating the culprit pathogens and provides expeditious relief of symptoms. However, it has been found that adverse events and resistant strains are more with use of such approach.[34] One unique advantage of fenticonazole is that it is the only imidazole antifungal which inhibits Candida proteinase, which is responsible for its adherence to epithelial cells, even in single dose.[35] From findings of the present study, we recommend that fenticonazole be used as the first-line drug in the treatment
Figure 3: Effect of fenticonazole (day 1) on various symptoms of vulvovaginitis
Figure 4: Effect of fenticonazole (given on day 1 and day 3) on various symptoms of vulvovaginitis
Figure 5: Effects of fenticonazole (given on day 1 and day 7) on various symptoms of vulvovaginitis
Table 2: ATC/DDD evaluation of DU of fenticonazoleItem ValueATC code G01AF12DDD 0.1 gPDD 0.6 mgATC: Anatomic and therapeutic classification, DDD: Defined daily dose, PDD: Prescribed daily dose, DU: Drug utilization
Table 3: Adverse effects seen with fenticonazole
Adverse effect/s
Number of patients facing the AE n (%) TotalD1 (n=404) D1/D3 (n=1211) D1/D7 (n=419)
Burning sensation
4 (0.9) 30 (2.4) 8 (1.9) 42
Vaginal itching 3 (0.7) 26 (2.1) 6 (1.4) 35Erythema 4 (0.9) 24 (1.98) 5 (1.1) 33Desquamation 2 (0.4) 7 (0.5) 3 (0.7) 12
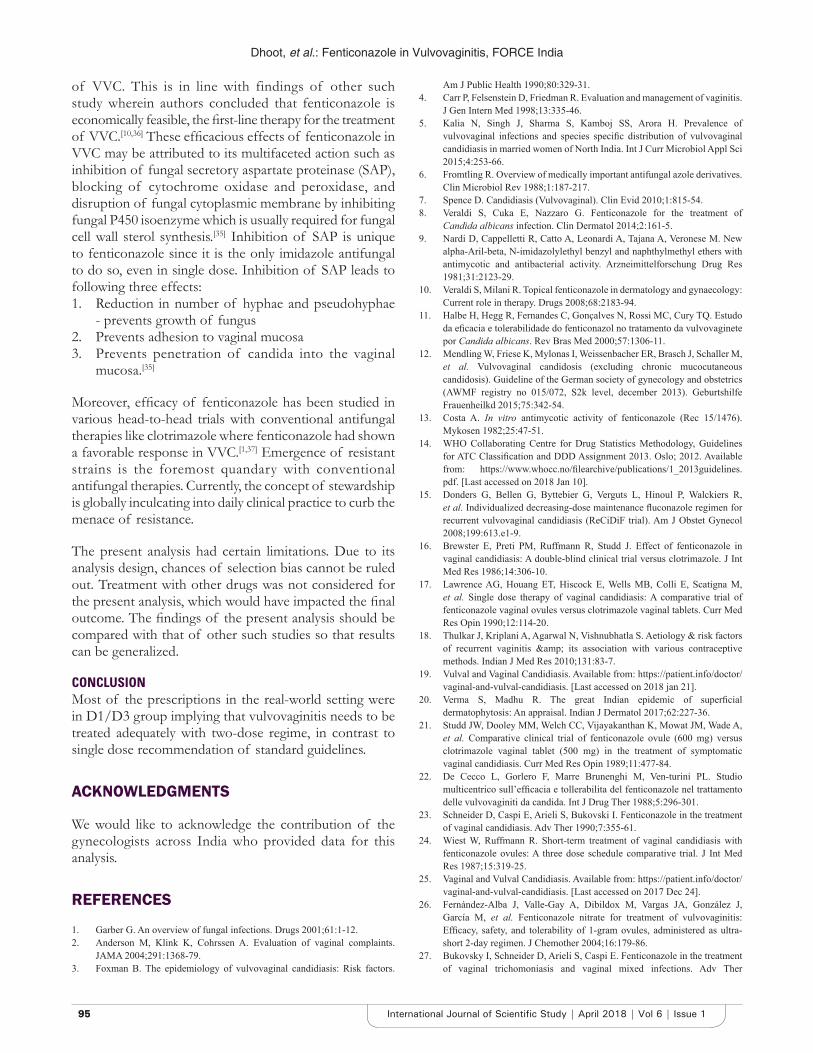
Dhoot, et al.: Fenticonazole in Vulvovaginitis, FORCE India
9595 International Journal of Scientific Study | April 2018 | Vol 6 | Issue 1
of VVC. This is in line with findings of other such study wherein authors concluded that fenticonazole is economically feasible, the first-line therapy for the treatment of VVC.[10,36] These efficacious effects of fenticonazole in VVC may be attributed to its multifaceted action such as inhibition of fungal secretory aspartate proteinase (SAP), blocking of cytochrome oxidase and peroxidase, and disruption of fungal cytoplasmic membrane by inhibiting fungal P450 isoenzyme which is usually required for fungal cell wall sterol synthesis.[35] Inhibition of SAP is unique to fenticonazole since it is the only imidazole antifungal to do so, even in single dose. Inhibition of SAP leads to following three effects:1. Reduction in number of hyphae and pseudohyphae
- prevents growth of fungus2. Prevents adhesion to vaginal mucosa3. Prevents penetration of candida into the vaginal
mucosa.[35]
Moreover, efficacy of fenticonazole has been studied in various head-to-head trials with conventional antifungal therapies like clotrimazole where fenticonazole had shown a favorable response in VVC.[1,37] Emergence of resistant strains is the foremost quandary with conventional antifungal therapies. Currently, the concept of stewardship is globally inculcating into daily clinical practice to curb the menace of resistance.
The present analysis had certain limitations. Due to its analysis design, chances of selection bias cannot be ruled out. Treatment with other drugs was not considered for the present analysis, which would have impacted the final outcome. The findings of the present analysis should be compared with that of other such studies so that results can be generalized.
CONCLUSIONMost of the prescriptions in the real-world setting were in D1/D3 group implying that vulvovaginitis needs to be treated adequately with two-dose regime, in contrast to single dose recommendation of standard guidelines.
ACKNOWLEDGMENTS
We would like to acknowledge the contribution of the gynecologists across India who provided data for this analysis.
REFERENCES
1. Garber G. An overview of fungal infections. Drugs 2001;61:1-12.2. Anderson M, Klink K, Cohrssen A. Evaluation of vaginal complaints.
JAMA 2004;291:1368-79.3. Foxman B. The epidemiology of vulvovaginal candidiasis: Risk factors.
Am J Public Health 1990;80:329-31.4. Carr P, Felsenstein D, Friedman R. Evaluation and management of vaginitis.
J Gen Intern Med 1998;13:335-46.5. Kalia N, Singh J, Sharma S, Kamboj SS, Arora H. Prevalence of
vulvovaginal infections and species specific distribution of vulvovaginal candidiasis in married women of North India. Int J Curr Microbiol Appl Sci 2015;4:253-66.
6. Fromtling R. Overview of medically important antifungal azole derivatives. Clin Microbiol Rev 1988;1:187-217.
7. Spence D. Candidiasis (Vulvovaginal). Clin Evid 2010;1:815-54.8. Veraldi S, Cuka E, Nazzaro G. Fenticonazole for the treatment of
Candida albicans infection. Clin Dermatol 2014;2:161-5.9. Nardi D, Cappelletti R, Catto A, Leonardi A, Tajana A, Veronese M. New
alpha-Aril-beta, N-imidazolylethyl benzyl and naphthylmethyl ethers with antimycotic and antibacterial activity. Arzneimittelforschung Drug Res 1981;31:2123-29.
10. Veraldi S, Milani R. Topical fenticonazole in dermatology and gynaecology: Current role in therapy. Drugs 2008;68:2183-94.
11. Halbe H, Hegg R, Fernandes C, Gonçalves N, Rossi MC, Cury TQ. Estudo da eficacia e tolerabilidade do fenticonazol no tratamento da vulvovaginete por Candida albicans. Rev Bras Med 2000;57:1306-11.
12. Mendling W, Friese K, Mylonas I, Weissenbacher ER, Brasch J, Schaller M, et al. Vulvovaginal candidosis (excluding chronic mucocutaneous candidosis). Guideline of the German society of gynecology and obstetrics (AWMF registry no 015/072, S2k level, december 2013). Geburtshilfe Frauenheilkd 2015;75:342-54.
13. Costa A. In vitro antimycotic activity of fenticonazole (Rec 15/1476). Mykosen 1982;25:47-51.
14. WHO Collaborating Centre for Drug Statistics Methodology, Guidelines for ATC Classification and DDD Assignment 2013. Oslo; 2012. Available from: https://www.whocc.no/filearchive/publications/1_2013guidelines.pdf. [Last accessed on 2018 Jan 10].
15. Donders G, Bellen G, Byttebier G, Verguts L, Hinoul P, Walckiers R, et al. Individualized decreasing-dose maintenance fluconazole regimen for recurrent vulvovaginal candidiasis (ReCiDiF trial). Am J Obstet Gynecol 2008;199:613.e1-9.
16. Brewster E, Preti PM, Ruffmann R, Studd J. Effect of fenticonazole in vaginal candidiasis: A double-blind clinical trial versus clotrimazole. J Int Med Res 1986;14:306-10.
17. Lawrence AG, Houang ET, Hiscock E, Wells MB, Colli E, Scatigna M, et al. Single dose therapy of vaginal candidiasis: A comparative trial of fenticonazole vaginal ovules versus clotrimazole vaginal tablets. Curr Med Res Opin 1990;12:114-20.
18. Thulkar J, Kriplani A, Agarwal N, Vishnubhatla S. Aetiology & risk factors of recurrent vaginitis & its association with various contraceptive methods. Indian J Med Res 2010;131:83-7.
19. Vulval and Vaginal Candidiasis. Available from: https://patient.info/doctor/vaginal-and-vulval-candidiasis. [Last accessed on 2018 jan 21].
20. Verma S, Madhu R. The great Indian epidemic of superficial dermatophytosis: An appraisal. Indian J Dermatol 2017;62:227-36.
21. Studd JW, Dooley MM, Welch CC, Vijayakanthan K, Mowat JM, Wade A, et al. Comparative clinical trial of fenticonazole ovule (600 mg) versus clotrimazole vaginal tablet (500 mg) in the treatment of symptomatic vaginal candidiasis. Curr Med Res Opin 1989;11:477-84.
22. De Cecco L, Gorlero F, Marre Brunenghi M, Ven-turini PL. Studio multicentrico sull’efficacia e tollerabilita del fenticonazole nel trattamento delle vulvovaginiti da candida. Int J Drug Ther 1988;5:296-301.
23. Schneider D, Caspi E, Arieli S, Bukovski I. Fenticonazole in the treatment of vaginal candidiasis. Adv Ther 1990;7:355-61.
24. Wiest W, Ruffmann R. Short-term treatment of vaginal candidiasis with fenticonazole ovules: A three dose schedule comparative trial. J Int Med Res 1987;15:319-25.
25. Vaginal and Vulval Candidiasis. Available from: https://patient.info/doctor/vaginal-and-vulval-candidiasis. [Last accessed on 2017 Dec 24].
26. Fernández-Alba J, Valle-Gay A, Dibildox M, Vargas JA, González J, García M, et al. Fenticonazole nitrate for treatment of vulvovaginitis: Efficacy, safety, and tolerability of 1-gram ovules, administered as ultra-short 2-day regimen. J Chemother 2004;16:179-86.
27. Bukovsky I, Schneider D, Arieli S, Caspi E. Fenticonazole in the treatment of vaginal trichomoniasis and vaginal mixed infections. Adv Ther
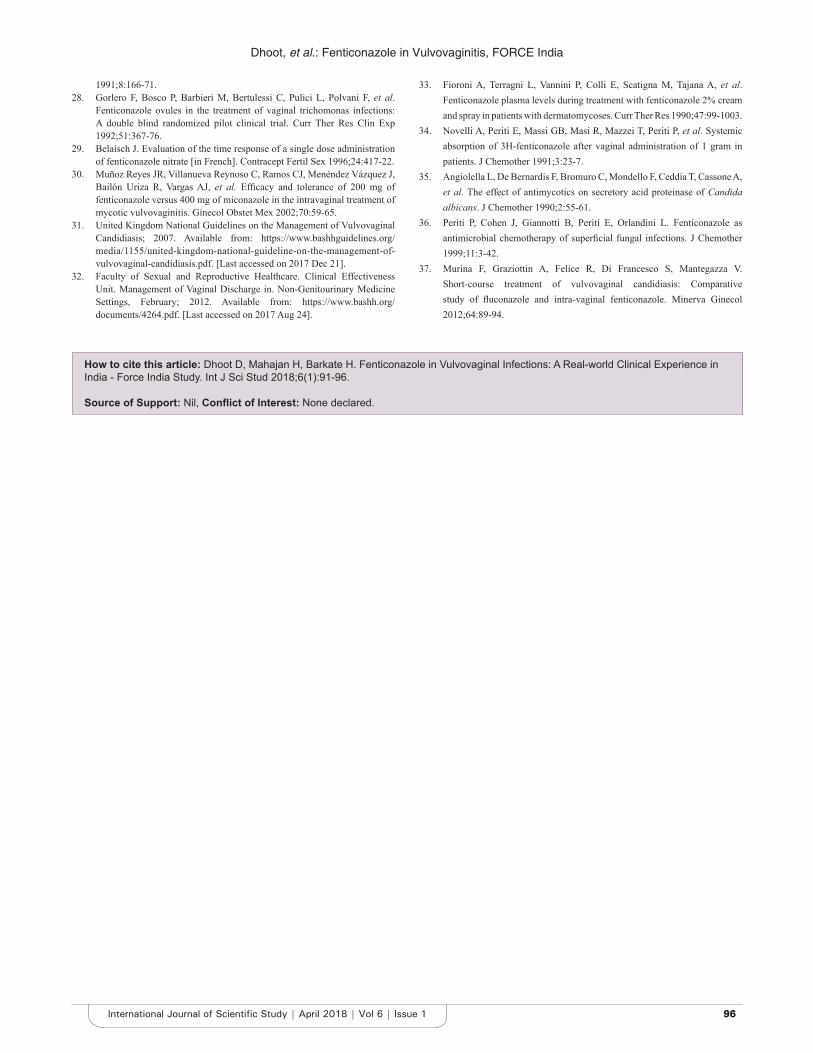
Dhoot, et al.: Fenticonazole in Vulvovaginitis, FORCE India
9696International Journal of Scientific Study | April 2018 | Vol 6 | Issue 1
1991;8:166-71.28. Gorlero F, Bosco P, Barbieri M, Bertulessi C, Pulici L, Polvani F, et al.
Fenticonazole ovules in the treatment of vaginal trichomonas infections: A double blind randomized pilot clinical trial. Curr Ther Res Clin Exp 1992;51:367-76.
29. Belaisch J. Evaluation of the time response of a single dose administration of fenticonazole nitrate [in French]. Contracept Fertil Sex 1996;24:417-22.
30. Muñoz Reyes JR, Villanueva Reynoso C, Ramos CJ, Menéndez Vázquez J, Bailón Uriza R, Vargas AJ, et al. Efficacy and tolerance of 200 mg of fenticonazole versus 400 mg of miconazole in the intravaginal treatment of mycotic vulvovaginitis. Ginecol Obstet Mex 2002;70:59-65.
31. United Kingdom National Guidelines on the Management of Vulvovaginal Candidiasis; 2007. Available from: https://www.bashhguidelines.org/media/1155/united-kingdom-national-guideline-on-the-management-of-vulvovaginal-candidiasis.pdf. [Last accessed on 2017 Dec 21].
32. Faculty of Sexual and Reproductive Healthcare. Clinical Effectiveness Unit. Management of Vaginal Discharge in. Non-Genitourinary Medicine Settings, February; 2012. Available from: https://www.bashh.org/documents/4264.pdf. [Last accessed on 2017 Aug 24].
33. Fioroni A, Terragni L, Vannini P, Colli E, Scatigna M, Tajana A, et al. Fenticonazole plasma levels during treatment with fenticonazole 2% cream and spray in patients with dermatomycoses. Curr Ther Res 1990;47:99-1003.
34. Novelli A, Periti E, Massi GB, Masi R, Mazzei T, Periti P, et al. Systemic absorption of 3H-fenticonazole after vaginal administration of 1 gram in patients. J Chemother 1991;3:23-7.
35. Angiolella L, De Bernardis F, Bromuro C, Mondello F, Ceddia T, Cassone A, et al. The effect of antimycotics on secretory acid proteinase of Candida albicans. J Chemother 1990;2:55-61.
36. Periti P, Cohen J, Giannotti B, Periti E, Orlandini L. Fenticonazole as antimicrobial chemotherapy of superficial fungal infections. J Chemother 1999;11:3-42.
37. Murina F, Graziottin A, Felice R, Di Francesco S, Mantegazza V. Short-course treatment of vulvovaginal candidiasis: Comparative study of fluconazole and intra-vaginal fenticonazole. Minerva Ginecol 2012;64:89-94.
How to cite this article: Dhoot D, Mahajan H, Barkate H. Fenticonazole in Vulvovaginal Infections: A Real-world Clinical Experience in India - Force India Study. Int J Sci Stud 2018;6(1):91-96.
Source of Support: Nil, Conflict of Interest: None declared.
9797 International Journal of Scientific Study | April 2018 | Vol 6 | Issue 1
Profile of Cerebrospinal Fluid Analysis in Acute Central Nervous System InfectionsK Vasanthan1, Yeldho Verghese2, R B Sudagar Singh3, J Damodharan3, K Vengadakrishnan3
1Associate Professor, Department of General Medicine, Sri Ramachandra Medical College, Chennai, Tamil Nadu, India, 2Resident, Department of General Medicine, Sri Ramachandra Medical College, Chennai, Tamil Nadu, India, 3Professor, Department of General Medicine, Sri Ramachandra Medical College, Chennai, Tamil Nadu, India
fever, irritability, altered sensorium, and associated chronic history of fever further compounds the diagnosis, i.e., tuberculous (TB) meningitis and autoimmune diseases. Hence, diagnosing CNS infections is an area of concern. Acute CNS infections can be mistaken for a wide range of conditions including drug intoxications, metabolic derangements, various tropical infections, and sepsis related encephalopathy.[1] The present study focuses on the accurate laboratory diagnosis of CNS infections which predominantly include cerebrospinal fluid (CSF) analysis and help in identifying the CNS infection and aid in the early treatment of these infections. Other investigations like CNS imaging were done in most of the patients to improve diagnostic accuracy.
INTRODUCTION
Central nervous system (CNS) infections are an important cause of mortality and morbidity. Clinical diagnosis of CNS infections (meningitis and encephalitis) always present with difficulties due to overlapping clinical features such as
Original Article
AbstractBackground: Confirmatory diagnosis of acute central nervous system (CNS) infection is a concern. Most often, it is presumed and empirical antimicrobials given. CSF findings may overlap in various infections and partially treated meningitis further complicates the CSF analysis.
Materials and Methods: This study included 90 patients with acute CNS infection admitted between July 2009 and August 2011. Ninety cases of community-acquired CNS infection were included in the study. The diagnosis of CNS infection was made based on the clinical features. Laboratory investigations such as complete blood count, random blood sugar, urine analysis, renal and liver function tests, and serum electrolytes were done in all cases. Cerebrospinal fluid (CSF) samples were collected and sent for cell count, glucose, protein, chloride, Gram stain, bacterial culture, AFB smear, culture of AFB, and viral markers like herpes simplex virus (HSV).
Results: 15 patients (16.7%) had bacterial meningitis, 32 (35.5%) had tuberculous (TB) meningitis, 9 (10%) had aseptic meningitis, 30 (33.3%) had encephalitis, and 4 (4.5%) had cryptococcal meningitis. The CSF sugar-to-blood sugar ratio was found to be <0.5 in 71.1% of all CNS infections. 93.3% of bacterial meningitis, 100% of TB meningitis, and 100% of cryptococcal meningitis had a CSF-to-blood sugar ratio <0.5 while only 33.3% of aseptic meningitis and 40% of encephalitis had such a value. TB meningitis had the maximum mean CSF protein of 275 followed by cryptococcal meningitis - 169. The mean CSF total count was found to be 257 for all CNS infections together. It was found to be maximum 559 for bacterial meningitis. Gram-positive cocci were reported in five patients and Gram-negative coccobacilli were reported in one patient. Polymerase chain reaction (PCR) for TB was positive in 10 (31.2%) patients with TB meningitis. PCR for HSV was positive in 8 (20.5%) patients with aseptic meningitis or encephalitis. IgM HSV was positive in 16 (41%) patients with aseptic meningitis or encephalitis.
Conclusion: Routine CSF cell count and biochemical analysis are of prime importance in differentiating between CNS infections and identifying individual CNS infections. PCR was not found to be useful in the diagnosis.
Key words: Central nervous system infection, Cerebrospinal fluid protein, Cerebrospinal fluid sugar, Cerebrospinal fluid total count, Tuberculous meningitis
Access this article online
www.ijss-sn.com
Month of Submission : 02-2018 Month of Peer Review : 03-2018 Month of Acceptance : 04-2018 Month of Publishing : 04-2018
Corresponding Author: K Vengadakrishnan, Department of General Medicine, Sri Ramachandra Medical College, Chennai, Tamil Nadu, India. E-mail: [email protected]
Print ISSN: 2321-6379Online ISSN: 2321-595X
DOI: 10.17354/ijss/2018/121
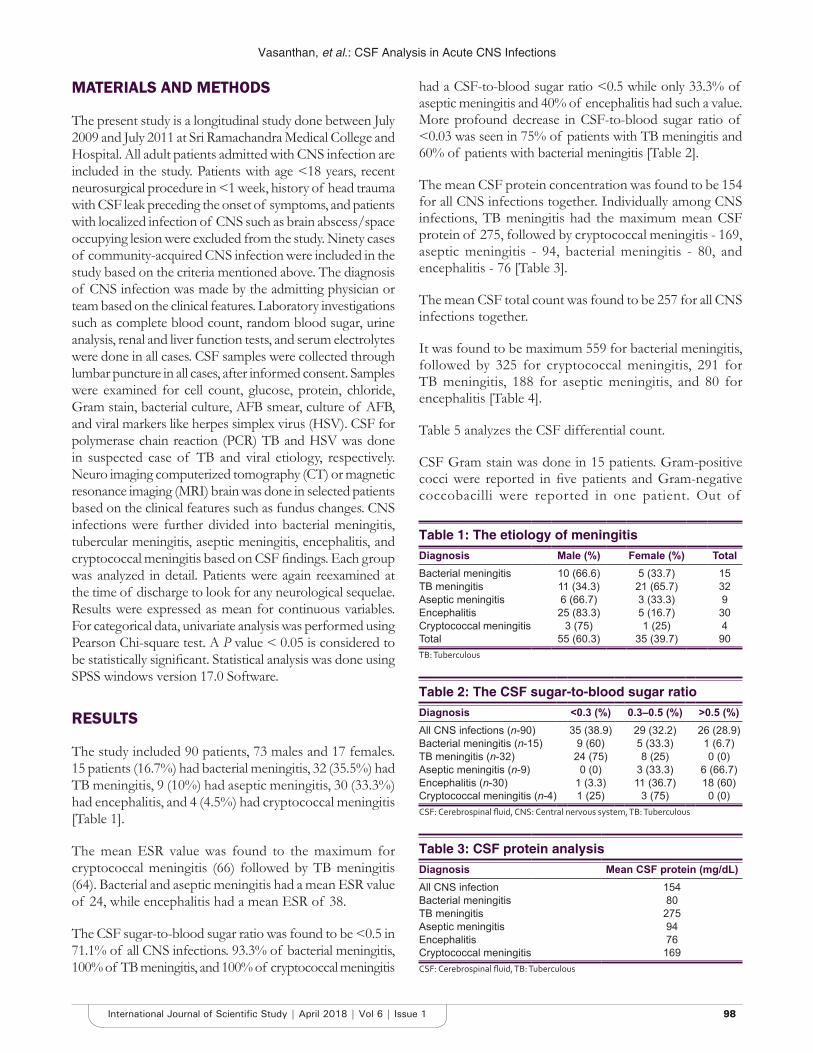
Vasanthan, et al.: CSF Analysis in Acute CNS Infections
9898International Journal of Scientific Study | April 2018 | Vol 6 | Issue 1
MATERIALS AND METHODS
The present study is a longitudinal study done between July 2009 and July 2011 at Sri Ramachandra Medical College and Hospital. All adult patients admitted with CNS infection are included in the study. Patients with age <18 years, recent neurosurgical procedure in <1 week, history of head trauma with CSF leak preceding the onset of symptoms, and patients with localized infection of CNS such as brain abscess/space occupying lesion were excluded from the study. Ninety cases of community-acquired CNS infection were included in the study based on the criteria mentioned above. The diagnosis of CNS infection was made by the admitting physician or team based on the clinical features. Laboratory investigations such as complete blood count, random blood sugar, urine analysis, renal and liver function tests, and serum electrolytes were done in all cases. CSF samples were collected through lumbar puncture in all cases, after informed consent. Samples were examined for cell count, glucose, protein, chloride, Gram stain, bacterial culture, AFB smear, culture of AFB, and viral markers like herpes simplex virus (HSV). CSF for polymerase chain reaction (PCR) TB and HSV was done in suspected case of TB and viral etiology, respectively. Neuro imaging computerized tomography (CT) or magnetic resonance imaging (MRI) brain was done in selected patients based on the clinical features such as fundus changes. CNS infections were further divided into bacterial meningitis, tubercular meningitis, aseptic meningitis, encephalitis, and cryptococcal meningitis based on CSF findings. Each group was analyzed in detail. Patients were again reexamined at the time of discharge to look for any neurological sequelae. Results were expressed as mean for continuous variables. For categorical data, univariate analysis was performed using Pearson Chi-square test. A P value < 0.05 is considered to be statistically significant. Statistical analysis was done using SPSS windows version 17.0 Software.
RESULTS
The study included 90 patients, 73 males and 17 females. 15 patients (16.7%) had bacterial meningitis, 32 (35.5%) had TB meningitis, 9 (10%) had aseptic meningitis, 30 (33.3%) had encephalitis, and 4 (4.5%) had cryptococcal meningitis [Table 1].
The mean ESR value was found to the maximum for cryptococcal meningitis (66) followed by TB meningitis (64). Bacterial and aseptic meningitis had a mean ESR value of 24, while encephalitis had a mean ESR of 38.
The CSF sugar-to-blood sugar ratio was found to be <0.5 in 71.1% of all CNS infections. 93.3% of bacterial meningitis, 100% of TB meningitis, and 100% of cryptococcal meningitis
had a CSF-to-blood sugar ratio <0.5 while only 33.3% of aseptic meningitis and 40% of encephalitis had such a value. More profound decrease in CSF-to-blood sugar ratio of <0.03 was seen in 75% of patients with TB meningitis and 60% of patients with bacterial meningitis [Table 2].
The mean CSF protein concentration was found to be 154 for all CNS infections together. Individually among CNS infections, TB meningitis had the maximum mean CSF protein of 275, followed by cryptococcal meningitis - 169, aseptic meningitis - 94, bacterial meningitis - 80, and encephalitis - 76 [Table 3].
The mean CSF total count was found to be 257 for all CNS infections together.
It was found to be maximum 559 for bacterial meningitis, followed by 325 for cryptococcal meningitis, 291 for TB meningitis, 188 for aseptic meningitis, and 80 for encephalitis [Table 4].
Table 5 analyzes the CSF differential count.
CSF Gram stain was done in 15 patients. Gram-positive cocci were reported in five patients and Gram-negative coccobacilli were reported in one patient. Out of
Table 1: The etiology of meningitisDiagnosis Male (%) Female (%) TotalBacterial meningitis 10 (66.6) 5 (33.7) 15TB meningitis 11 (34.3) 21 (65.7) 32Aseptic meningitis 6 (66.7) 3 (33.3) 9Encephalitis 25 (83.3) 5 (16.7) 30Cryptococcal meningitis 3 (75) 1 (25) 4Total 55 (60.3) 35 (39.7) 90TB: Tuberculous
Table 2: The CSF sugar-to-blood sugar ratioDiagnosis <0.3 (%) 0.3–0.5 (%) >0.5 (%)All CNS infections (n-90) 35 (38.9) 29 (32.2) 26 (28.9)Bacterial meningitis (n-15) 9 (60) 5 (33.3) 1 (6.7)TB meningitis (n-32) 24 (75) 8 (25) 0 (0)Aseptic meningitis (n-9) 0 (0) 3 (33.3) 6 (66.7)Encephalitis (n-30) 1 (3.3) 11 (36.7) 18 (60)Cryptococcal meningitis (n-4) 1 (25) 3 (75) 0 (0)CSF: Cerebrospinal fluid, CNS: Central nervous system, TB: Tuberculous
Table 3: CSF protein analysisDiagnosis Mean CSF protein (mg/dL)All CNS infection 154Bacterial meningitis 80TB meningitis 275Aseptic meningitis 94Encephalitis 76Cryptococcal meningitis 169CSF: Cerebrospinal fluid, TB: Tuberculous
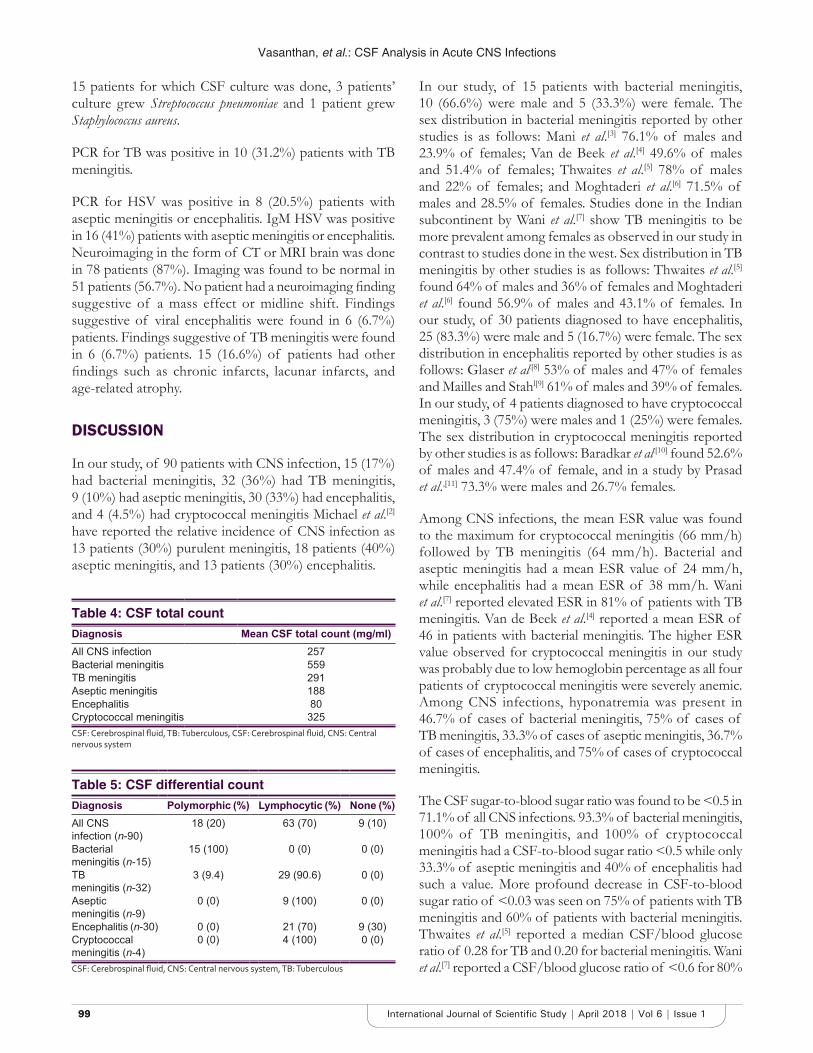
Vasanthan, et al.: CSF Analysis in Acute CNS Infections
9999 International Journal of Scientific Study | April 2018 | Vol 6 | Issue 1
15 patients for which CSF culture was done, 3 patients’ culture grew Streptococcus pneumoniae and 1 patient grew Staphylococcus aureus.
PCR for TB was positive in 10 (31.2%) patients with TB meningitis.
PCR for HSV was positive in 8 (20.5%) patients with aseptic meningitis or encephalitis. IgM HSV was positive in 16 (41%) patients with aseptic meningitis or encephalitis. Neuroimaging in the form of CT or MRI brain was done in 78 patients (87%). Imaging was found to be normal in 51 patients (56.7%). No patient had a neuroimaging finding suggestive of a mass effect or midline shift. Findings suggestive of viral encephalitis were found in 6 (6.7%) patients. Findings suggestive of TB meningitis were found in 6 (6.7%) patients. 15 (16.6%) of patients had other findings such as chronic infarcts, lacunar infarcts, and age-related atrophy.
DISCUSSION
In our study, of 90 patients with CNS infection, 15 (17%) had bacterial meningitis, 32 (36%) had TB meningitis, 9 (10%) had aseptic meningitis, 30 (33%) had encephalitis, and 4 (4.5%) had cryptococcal meningitis Michael et al.[2] have reported the relative incidence of CNS infection as 13 patients (30%) purulent meningitis, 18 patients (40%) aseptic meningitis, and 13 patients (30%) encephalitis.
In our study, of 15 patients with bacterial meningitis, 10 (66.6%) were male and 5 (33.3%) were female. The sex distribution in bacterial meningitis reported by other studies is as follows: Mani et al.[3] 76.1% of males and 23.9% of females; Van de Beek et al.[4] 49.6% of males and 51.4% of females; Thwaites et al.[5] 78% of males and 22% of females; and Moghtaderi et al.[6] 71.5% of males and 28.5% of females. Studies done in the Indian subcontinent by Wani et al.[7] show TB meningitis to be more prevalent among females as observed in our study in contrast to studies done in the west. Sex distribution in TB meningitis by other studies is as follows: Thwaites et al.[5] found 64% of males and 36% of females and Moghtaderi et al.[6] found 56.9% of males and 43.1% of females. In our study, of 30 patients diagnosed to have encephalitis, 25 (83.3%) were male and 5 (16.7%) were female. The sex distribution in encephalitis reported by other studies is as follows: Glaser et al.[8] 53% of males and 47% of females and Mailles and Stahl[9] 61% of males and 39% of females. In our study, of 4 patients diagnosed to have cryptococcal meningitis, 3 (75%) were males and 1 (25%) were females. The sex distribution in cryptococcal meningitis reported by other studies is as follows: Baradkar et al.[10] found 52.6% of males and 47.4% of female, and in a study by Prasad et al.,[11] 73.3% were males and 26.7% females.
Among CNS infections, the mean ESR value was found to the maximum for cryptococcal meningitis (66 mm/h) followed by TB meningitis (64 mm/h). Bacterial and aseptic meningitis had a mean ESR value of 24 mm/h, while encephalitis had a mean ESR of 38 mm/h. Wani et al.[7] reported elevated ESR in 81% of patients with TB meningitis. Van de Beek et al.[4] reported a mean ESR of 46 in patients with bacterial meningitis. The higher ESR value observed for cryptococcal meningitis in our study was probably due to low hemoglobin percentage as all four patients of cryptococcal meningitis were severely anemic. Among CNS infections, hyponatremia was present in 46.7% of cases of bacterial meningitis, 75% of cases of TB meningitis, 33.3% of cases of aseptic meningitis, 36.7% of cases of encephalitis, and 75% of cases of cryptococcal meningitis.
The CSF sugar-to-blood sugar ratio was found to be <0.5 in 71.1% of all CNS infections. 93.3% of bacterial meningitis, 100% of TB meningitis, and 100% of cryptococcal meningitis had a CSF-to-blood sugar ratio <0.5 while only 33.3% of aseptic meningitis and 40% of encephalitis had such a value. More profound decrease in CSF-to-blood sugar ratio of <0.03 was seen on 75% of patients with TB meningitis and 60% of patients with bacterial meningitis. Thwaites et al.[5] reported a median CSF/blood glucose ratio of 0.28 for TB and 0.20 for bacterial meningitis. Wani et al.[7] reported a CSF/blood glucose ratio of <0.6 for 80%
Table 4: CSF total countDiagnosis Mean CSF total count (mg/ml)All CNS infection 257Bacterial meningitis 559TB meningitis 291Aseptic meningitis 188Encephalitis 80Cryptococcal meningitis 325CSF: Cerebrospinal fluid, TB: Tuberculous, CSF: Cerebrospinal fluid, CNS: Central nervous system
Table 5: CSF differential countDiagnosis Polymorphic (%) Lymphocytic (%) None (%)All CNS infection (n-90)
18 (20) 63 (70) 9 (10)
Bacterial meningitis (n-15)
15 (100) 0 (0) 0 (0)
TB meningitis (n-32)
3 (9.4) 29 (90.6) 0 (0)
Aseptic meningitis (n-9)
0 (0) 9 (100) 0 (0)
Encephalitis (n-30) 0 (0) 21 (70) 9 (30)Cryptococcal meningitis (n-4)
0 (0) 4 (100) 0 (0)
CSF: Cerebrospinal fluid, CNS: Central nervous system, TB: Tuberculous
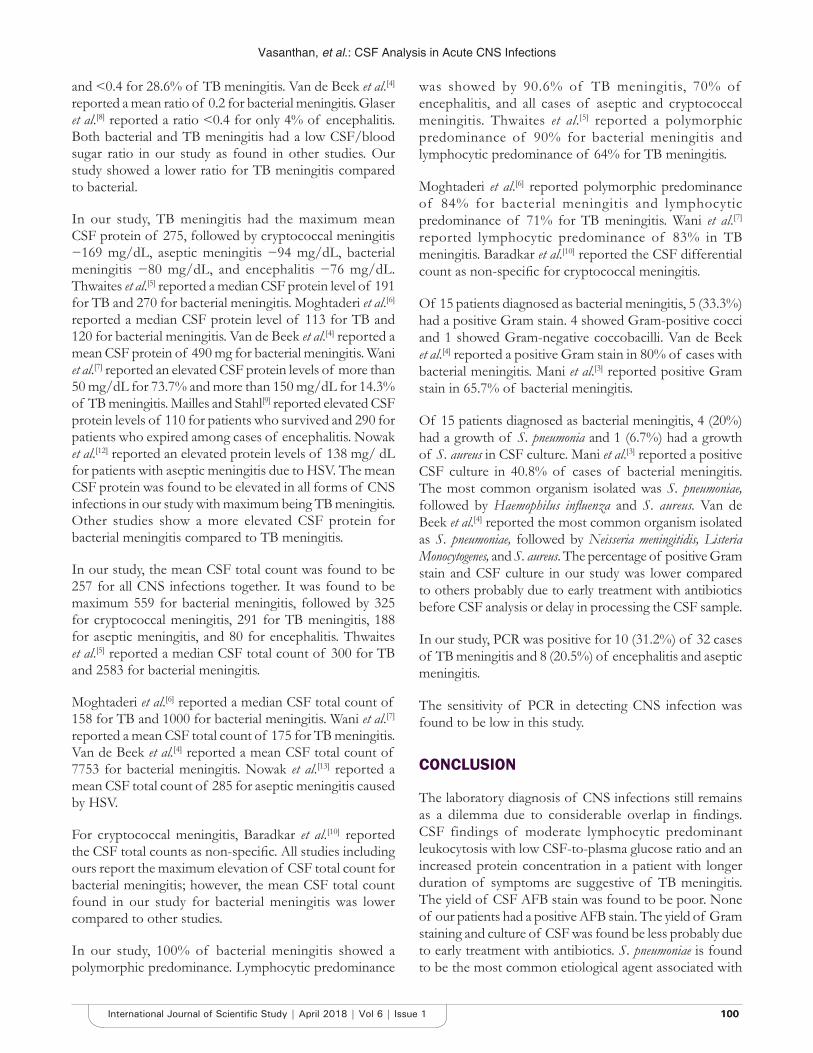
Vasanthan, et al.: CSF Analysis in Acute CNS Infections
100100International Journal of Scientific Study | April 2018 | Vol 6 | Issue 1
and <0.4 for 28.6% of TB meningitis. Van de Beek et al.[4] reported a mean ratio of 0.2 for bacterial meningitis. Glaser et al.[8] reported a ratio <0.4 for only 4% of encephalitis. Both bacterial and TB meningitis had a low CSF/blood sugar ratio in our study as found in other studies. Our study showed a lower ratio for TB meningitis compared to bacterial.
In our study, TB meningitis had the maximum mean CSF protein of 275, followed by cryptococcal meningitis −169 mg/dL, aseptic meningitis −94 mg/dL, bacterial meningitis −80 mg/dL, and encephalitis −76 mg/dL. Thwaites et al.[5] reported a median CSF protein level of 191 for TB and 270 for bacterial meningitis. Moghtaderi et al.[6] reported a median CSF protein level of 113 for TB and 120 for bacterial meningitis. Van de Beek et al.[4] reported a mean CSF protein of 490 mg for bacterial meningitis. Wani et al.[7] reported an elevated CSF protein levels of more than 50 mg/dL for 73.7% and more than 150 mg/dL for 14.3% of TB meningitis. Mailles and Stahl[9] reported elevated CSF protein levels of 110 for patients who survived and 290 for patients who expired among cases of encephalitis. Nowak et al.[12] reported an elevated protein levels of 138 mg/ dL for patients with aseptic meningitis due to HSV. The mean CSF protein was found to be elevated in all forms of CNS infections in our study with maximum being TB meningitis. Other studies show a more elevated CSF protein for bacterial meningitis compared to TB meningitis.
In our study, the mean CSF total count was found to be 257 for all CNS infections together. It was found to be maximum 559 for bacterial meningitis, followed by 325 for cryptococcal meningitis, 291 for TB meningitis, 188 for aseptic meningitis, and 80 for encephalitis. Thwaites et al.[5] reported a median CSF total count of 300 for TB and 2583 for bacterial meningitis.
Moghtaderi et al.[6] reported a median CSF total count of 158 for TB and 1000 for bacterial meningitis. Wani et al.[7] reported a mean CSF total count of 175 for TB meningitis. Van de Beek et al.[4] reported a mean CSF total count of 7753 for bacterial meningitis. Nowak et al.[13] reported a mean CSF total count of 285 for aseptic meningitis caused by HSV.
For cryptococcal meningitis, Baradkar et al.[10] reported the CSF total counts as non-specific. All studies including ours report the maximum elevation of CSF total count for bacterial meningitis; however, the mean CSF total count found in our study for bacterial meningitis was lower compared to other studies.
In our study, 100% of bacterial meningitis showed a polymorphic predominance. Lymphocytic predominance
was showed by 90.6% of TB meningitis, 70% of encephalitis, and all cases of aseptic and cryptococcal meningitis. Thwaites et al.[5] reported a polymorphic predominance of 90% for bacterial meningitis and lymphocytic predominance of 64% for TB meningitis.
Moghtaderi et al.[6] reported polymorphic predominance of 84% for bacterial meningitis and lymphocytic predominance of 71% for TB meningitis. Wani et al.[7] reported lymphocytic predominance of 83% in TB meningitis. Baradkar et al.[10] reported the CSF differential count as non-specific for cryptococcal meningitis.
Of 15 patients diagnosed as bacterial meningitis, 5 (33.3%) had a positive Gram stain. 4 showed Gram-positive cocci and 1 showed Gram-negative coccobacilli. Van de Beek et al.[4] reported a positive Gram stain in 80% of cases with bacterial meningitis. Mani et al.[3] reported positive Gram stain in 65.7% of bacterial meningitis.
Of 15 patients diagnosed as bacterial meningitis, 4 (20%) had a growth of S. pneumonia and 1 (6.7%) had a growth of S. aureus in CSF culture. Mani et al.[3] reported a positive CSF culture in 40.8% of cases of bacterial meningitis. The most common organism isolated was S. pneumoniae, followed by Haemophilus influenza and S. aureus. Van de Beek et al.[4] reported the most common organism isolated as S. pneumoniae, followed by Neisseria meningitidis, Listeria Monocytogenes, and S. aureus. The percentage of positive Gram stain and CSF culture in our study was lower compared to others probably due to early treatment with antibiotics before CSF analysis or delay in processing the CSF sample.
In our study, PCR was positive for 10 (31.2%) of 32 cases of TB meningitis and 8 (20.5%) of encephalitis and aseptic meningitis.
The sensitivity of PCR in detecting CNS infection was found to be low in this study.
CONCLUSION
The laboratory diagnosis of CNS infections still remains as a dilemma due to considerable overlap in findings. CSF findings of moderate lymphocytic predominant leukocytosis with low CSF-to-plasma glucose ratio and an increased protein concentration in a patient with longer duration of symptoms are suggestive of TB meningitis. The yield of CSF AFB stain was found to be poor. None of our patients had a positive AFB stain. The yield of Gram staining and culture of CSF was found be less probably due to early treatment with antibiotics. S. pneumoniae is found to be the most common etiological agent associated with
Vasanthan, et al.: CSF Analysis in Acute CNS Infections
101101 International Journal of Scientific Study | April 2018 | Vol 6 | Issue 1
bacterial meningitis. PCR was found to be not of much use in the diagnosis since it was found to be positive only in less than one-third of the patients. Neuroimaging is not mandatory before LP unless there is a definite indication, since in most of our patients, imaging was found to be normal. Routine CSF cell count and biochemical analysis are of prime importance in differentiating between CNS infections and identifying individual CNS infections.
REFERENCES
1. Thwaites G, Fisher M, Hemingway C, Scott G, Solomon T, Innes J. British infection society guidelines, acute management of suspected CNS infections. J Infect 2009;59:167-87.
2. Michael BD, Sidhu M, Stoeter D, Roberts M, Beeching NJ, Bonington A, et al. Acute central nervous system infections in adults – A retrospective cohort study in the NHS north west region. QJM 2010;103:749-58.
3. Mani R, Pradhan S, Nagarathna S, Wasiulla R, Chandramuki A. Bacteriological profile of community acquired acute bacterial meningitis: A ten-year retrospective study in a tertiary Neurocare Centre in south India. Indian J Med Microbiol 2007;25:108-14.
4. van de Beek D, de Gans J, Spanjaard L, Weisfelt M, Reitsma JB, Vermeulen M, et al. Clinical features and prognostic factors in adults with
bacterial meningitis. N Engl J Med 2004;351:1849-59.5. Thwaites GE, Chau TT, Stepniewska K, Phu NH, Chuong LV, Sinh DX,
et al. Diagnosis of adult tuberculous meningitis by use of clinical and laboratory features. Lancet 2002;360:1287-92.
6. Moghtaderi A, Alavi-Naini R, Izadi S, Cuevas LE. Diagnostic risk factors to differentiate tuberculous and acute bacterial meningitis. Scand J Infect Dis 2009;41:188-94.
7. Wani AM, Hussain WM, Fatani M, Shakour BA. Clinical profile of tuberculous meningitis in Kashmir valley the Indian subcontinent. Infect Dis Clin Pract 2008;16:360-7.
8. Glaser CA, Gilliam S, Schnurr D, Forghani B. In search of encephalitis etiologies: Diagnostic challenges in the california encephalitis project, 1998-2000. Clin Infect Dis 2003;36:731-42.
9. Mailles A, Stahl JP. Steering committee and investigators group. infectious encephalitis in France in 2007: A national prospective study. Clin Infect Dis 2009;49:1838.
10. Baradkar V, Mathur M, De A, Kumar S, Rathi M. Prevalance and clinical presentation of Cryptococcal meningitis among HIV seropositive patients. Indian J Sex Transm Dis AIDS 2009;30:19-22.
11. Prasad KN, Agarwal J, Nag VL, Verma AK, Dixit AK, Ayyagiri A. Cryptococcal infection in patients with clinically diagnosed meningitis in a tertiary care center. Neurol India 2003;51:364-6.
12. Nowak DA, Boehmer R, Fuchs HH. A retrospective clinical, laboratory and outcome analysis in 43 cases of acute aseptic meningitis. Eur J Neurol 2003;10:271-80.
How to cite this article: Vasanthan K, Verghese Y, Singh RBS, Damodharan J, Vengadakrishnan K. Profile of Cerebrospinal Fluid Analysis in Acute Central Nervous System Infections. Int J Sci Stud 2018;6(1):97-101.
Source of Support: Nil, Conflict of Interest: None declared.
102102International Journal of Scientific Study | April 2018 | Vol 6 | Issue 1
Effect of Internet Use on Health College Students at King Saud UniversityAbdullah Mohammed Saif
Department of Family Medicine, College of Medicine, Bisha University, Saudi Arabia
in subsequent years, reaching more than 18 million users in November 2015 (65.9% of the region’s population).[1]
Nowadays, the Internet is widely and readily available in educational institutes and public libraries, and web use is becoming mandatory in academic studies, for both students and teaching staff. The Internet is a practical tool for students to access and research new information, and they now rely on the web for their study more than ever before. With such widespread accessibility, it can be said that the Internet has become an integral part of our lives.[2-5]
University students are at a higher risk of developing a dependence on the Internet than others because they depend on the web as a primary source of necessary educational information. In Taiwan, for example, most students leave their homes and move toward independent lives when they enter college. Many reside in school dormitories and have convenient and free Internet access through school network systems. They find the Internet to be an important window through which they can
INTRODUCTION
There is no doubt that the Internet has become the most popular consumer communicating technology and also an increasingly popular medium for accessing educational material.
Internet usage is expanding rapidly, with an estimated 900.4% growth rate worldwide between 2000 and 2016. The Middle East has the second highest usage growth rate in the world, a recorded 3936.5% increase. In Saudi Arabia, there were approximately 200,000 Internet users in the year 2000, a number that has dramatically increased
Original Article
AbstractBackground and Objective: This study aims to evaluate the effect of Internet use on undergraduate medical and health science students living in the student residential compound at King Saud University (KSU) in Riyadh. Three dimensions are used to identify the positive and negative effects of Internet use: Academic (educational) performance, health (psychological) status, and social status.
Methodology: This study adopts a cross-sectional design. We included all the students of the health colleges at KSU who lived in the university dormitory in 2015, a total of 250 students. A structured self-administered questionnaire was used to gather data from the respondents.
Results: We found that 89.5% of the students who were able to increase their cumulative grades were using the Internet for less time per day, indicating that spending an excessive amount of time on the Internet has a negative impact on students’ academic performances. 156 students (78.7%) had no changes regarding their social relations relative to their Internet usage. 78.3% of the respondents claimed to use the Internet to escape from the stress of studying; however, excessive Internet use may, in fact, increase overall pressure on students.
Conclusion: Moderate use of the Internet helps health college students to improve their cumulative grade point averages, and there was no significant relationship found between Internet use and changes in the students’ social lives or moods.
Key words: Internet, Students, Academic performance, King Saud University, Saudi Arabia
Corresponding Author: Dr. Abdullah Mohammed Saif, Department of Family Medicine, Bisha University, Bisha 67711, Kingdom of Saudi Arabia. P.O. Box 8328. Tel.: 00966507031552. E-mail: [email protected]
Print ISSN: 2321-6379Online ISSN: 2321-595X
DOI: 10.17354/ijss/2018/122
Access this article online
www.ijss-sn.com
Month of Submission : 02-2018 Month of Peer Review : 03-2018 Month of Acceptance : 04-2018 Month of Publishing : 04-2018
Saif: Internet use on health college students
103103 International Journal of Scientific Study | April 2018 | Vol 6 | Issue 1
communicate and interact with the world, and their free and easily accessed connections, mean that Internet use is both implicitly and explicitly encouraged by a recognized, institutional authority. Given this influence, psychologists and educators should give more attention to the issue of student dependence on the Internet.[6-8]
Communication through the Internet can reduce depression, especially among socially isolated populations, such as college students, who depend on social technology for social support. However, increases in the time of Internet have also been shown to correspond to a high level of emotional loneliness.[9,10]
Many previous studies have shown that multiple factors including the age of exposure to the Internet, the age of student, living in city, homesickness, isolation, loneliness, bad social skills, poor social support, being a freshman, and being male are all risk factors for Internet addiction among students. All of these factors could significantly contribute to developing compulsive Internet use, thus resulting in adverse performance in other activities such as work, school, or relationships.[11-13]
Most studies of Internet use focus mainly on the negative and problematic effects of the Internet use for individuals, and there has been no study on students in university dorms in Kingdom of Saudi Arabia, whom, as mentioned earlier, are more susceptible to isolation. It would therefore be useful to establish research on this group. Because the medical and health science fields are rapidly changing and require students to maintain a high standard of knowledge and independent learning, our study concentrated on students in the King Saud University’s (KSU’s) medical and health sciences departments.
HypothesisWe hypothesize that average levels of Internet use enhance the understanding of scientific curriculum topics and contribute to the improvement of the cumulative grade point average (CGPA), while excessive Internet use is associated with mood changes and the impairment of social life.
ObjectivesThis work aims to evaluate the effect of Internet use on undergraduate medical and health sciences students living in the student residential compound at KSU. Three dimensions are used to identify the positive and negative effects of Internet use: Academic (educational) performance, health (psychological) status, and social status.
METHODOLOGY
We adopted a cross-sectional design in this study. The subjects included in this study are students of KSU’s health colleges (medicine, dentistry, pharmacy, and applied medical sciences) who lived in the dormitory in the 2015–2016 academic year. The study included students at different levels of education (1st, 2nd, 3rd, 4th, 5th, and internship years). The Institutional Review Board at KSU approved this survey by No.15/0262/IRB.
Sample SizeWe included all the students of KSU’s health colleges who lived in the dormitory, for a total of 250 students.
Data Collection ToolWe developed a self-administered English language questionnaire, which contained an introduction, instructions, demographic information, and 21 closed questions (general questions about using the Internet, effects of Internet using on academic performance, social life, and health). Questions included the presence or absence (yes or no questions), bipolar (Likert scale), and a number of multiple-choice responses. We developed this questionnaire from related research studies. The questionnaire was reviewed by two professors for face validation, after which a pilot study was conducted on 15 students. The pilot study confirmed that the questions were clear, and the number of questions and time required to answer the questions were reasonable (3 min in average). No changes were made based on the pilot study.
ProcedureThis study was conducted from May 2015 to August 2016, and the actual time devoted to data collection was 4 weeks (over the month of December 2015). We gained consent from the administration of student housing to distribute the questionnaire. A self-administered questionnaire was used to collect data from the male students only because we faced difficulties in delivering questionnaires to the female students. We distributed the questionnaire by going to the rooms where the students resided and giving them the questionnaire. After handing them the questionnaire and the consent to participate in this study is taken, we waited till the students finished answering the questions and then took the survey back. Every day of those weeks, we went several times a day to check the availability of students in their rooms and give them the questionnaire.
We used the Statistical Package for the Social Sciences version 20 for Windows for statistical analyses. A Chi-square test was used to find out the statistical significance of the differences in the proportions. P < 0.05 was considered to be statistically significant.
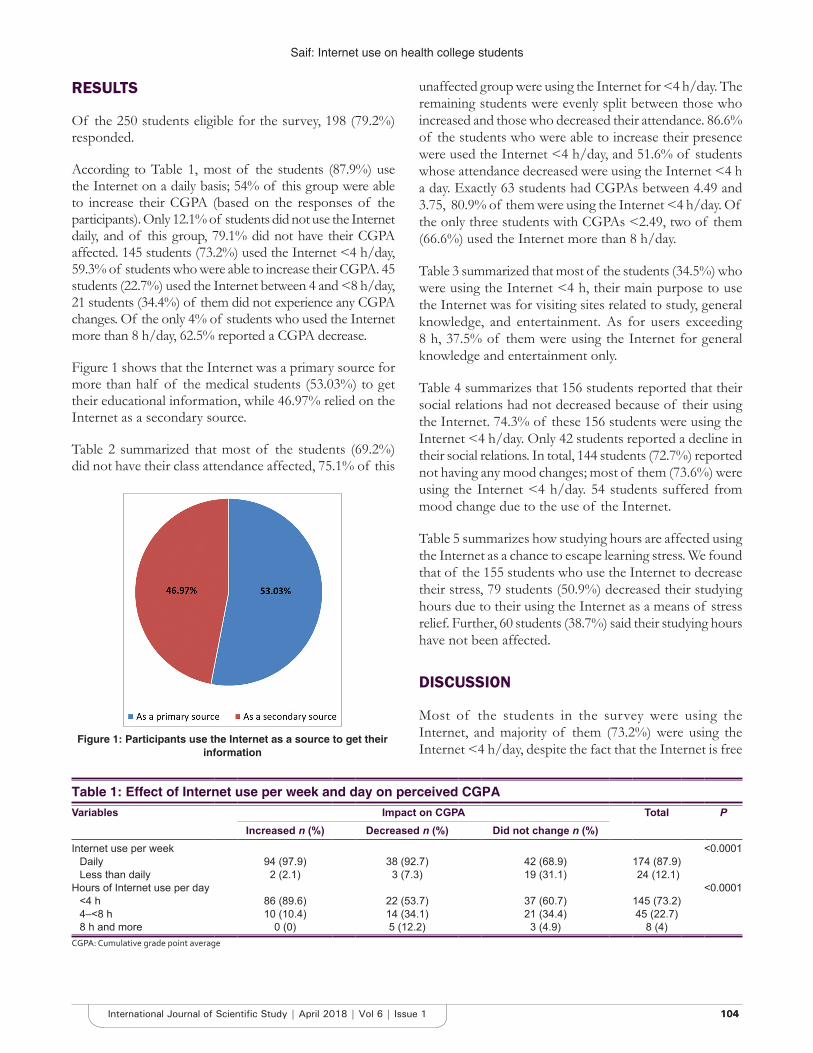
Saif: Internet use on health college students
104104International Journal of Scientific Study | April 2018 | Vol 6 | Issue 1
RESULTS
Of the 250 students eligible for the survey, 198 (79.2%) responded.
According to Table 1, most of the students (87.9%) use the Internet on a daily basis; 54% of this group were able to increase their CGPA (based on the responses of the participants). Only 12.1% of students did not use the Internet daily, and of this group, 79.1% did not have their CGPA affected. 145 students (73.2%) used the Internet <4 h/day, 59.3% of students who were able to increase their CGPA. 45 students (22.7%) used the Internet between 4 and <8 h/day, 21 students (34.4%) of them did not experience any CGPA changes. Of the only 4% of students who used the Internet more than 8 h/day, 62.5% reported a CGPA decrease.
Figure 1 shows that the Internet was a primary source for more than half of the medical students (53.03%) to get their educational information, while 46.97% relied on the Internet as a secondary source.
Table 2 summarized that most of the students (69.2%) did not have their class attendance affected, 75.1% of this
unaffected group were using the Internet for <4 h/day. The remaining students were evenly split between those who increased and those who decreased their attendance. 86.6% of the students who were able to increase their presence were used the Internet <4 h/day, and 51.6% of students whose attendance decreased were using the Internet <4 h a day. Exactly 63 students had CGPAs between 4.49 and 3.75, 80.9% of them were using the Internet <4 h/day. Of the only three students with CGPAs <2.49, two of them (66.6%) used the Internet more than 8 h/day.
Table 3 summarized that most of the students (34.5%) who were using the Internet <4 h, their main purpose to use the Internet was for visiting sites related to study, general knowledge, and entertainment. As for users exceeding 8 h, 37.5% of them were using the Internet for general knowledge and entertainment only.
Table 4 summarizes that 156 students reported that their social relations had not decreased because of their using the Internet. 74.3% of these 156 students were using the Internet <4 h/day. Only 42 students reported a decline in their social relations. In total, 144 students (72.7%) reported not having any mood changes; most of them (73.6%) were using the Internet <4 h/day. 54 students suffered from mood change due to the use of the Internet.
Table 5 summarizes how studying hours are affected using the Internet as a chance to escape learning stress. We found that of the 155 students who use the Internet to decrease their stress, 79 students (50.9%) decreased their studying hours due to their using the Internet as a means of stress relief. Further, 60 students (38.7%) said their studying hours have not been affected.
DISCUSSION
Most of the students in the survey were using the Internet, and majority of them (73.2%) were using the Internet <4 h/day, despite the fact that the Internet is free
Figure 1: Participants use the Internet as a source to get their information
Table 1: Effect of Internet use per week and day on perceived CGPAVariables Impact on CGPA Total P
Increased n (%) Decreased n (%) Did not change n (%)Internet use per week <0.0001
Daily 94 (97.9) 38 (92.7) 42 (68.9) 174 (87.9)Less than daily 2 (2.1) 3 (7.3) 19 (31.1) 24 (12.1)
Hours of Internet use per day <0.0001<4 h 86 (89.6) 22 (53.7) 37 (60.7) 145 (73.2)4–<8 h 10 (10.4) 14 (34.1) 21 (34.4) 45 (22.7)8 h and more 0 (0) 5 (12.2) 3 (4.9) 8 (4)
CGPA: Cumulative grade point average
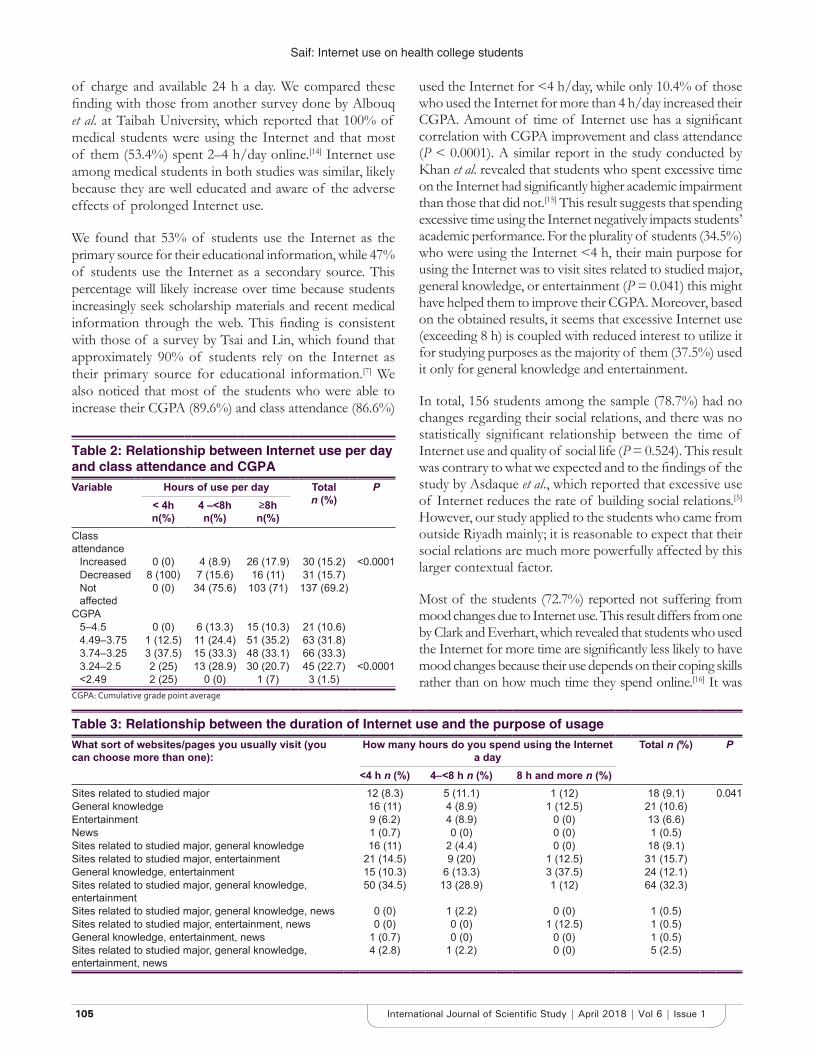
Saif: Internet use on health college students
105105 International Journal of Scientific Study | April 2018 | Vol 6 | Issue 1
of charge and available 24 h a day. We compared these finding with those from another survey done by Albouq et al. at Taibah University, which reported that 100% of medical students were using the Internet and that most of them (53.4%) spent 2–4 h/day online.[14] Internet use among medical students in both studies was similar, likely because they are well educated and aware of the adverse effects of prolonged Internet use.
We found that 53% of students use the Internet as the primary source for their educational information, while 47% of students use the Internet as a secondary source. This percentage will likely increase over time because students increasingly seek scholarship materials and recent medical information through the web. This finding is consistent with those of a survey by Tsai and Lin, which found that approximately 90% of students rely on the Internet as their primary source for educational information.[7] We also noticed that most of the students who were able to increase their CGPA (89.6%) and class attendance (86.6%)
used the Internet for <4 h/day, while only 10.4% of those who used the Internet for more than 4 h/day increased their CGPA. Amount of time of Internet use has a significant correlation with CGPA improvement and class attendance (P < 0.0001). A similar report in the study conducted by Khan et al. revealed that students who spent excessive time on the Internet had significantly higher academic impairment than those that did not.[15] This result suggests that spending excessive time using the Internet negatively impacts students’ academic performance. For the plurality of students (34.5%) who were using the Internet <4 h, their main purpose for using the Internet was to visit sites related to studied major, general knowledge, or entertainment (P = 0.041) this might have helped them to improve their CGPA. Moreover, based on the obtained results, it seems that excessive Internet use (exceeding 8 h) is coupled with reduced interest to utilize it for studying purposes as the majority of them (37.5%) used it only for general knowledge and entertainment.
In total, 156 students among the sample (78.7%) had no changes regarding their social relations, and there was no statistically significant relationship between the time of Internet use and quality of social life (P = 0.524). This result was contrary to what we expected and to the findings of the study by Asdaque et al., which reported that excessive use of Internet reduces the rate of building social relations.[5] However, our study applied to the students who came from outside Riyadh mainly; it is reasonable to expect that their social relations are much more powerfully affected by this larger contextual factor.
Most of the students (72.7%) reported not suffering from mood changes due to Internet use. This result differs from one by Clark and Everhart, which revealed that students who used the Internet for more time are significantly less likely to have mood changes because their use depends on their coping skills rather than on how much time they spend online.[16] It was
Table 2: Relationship between Internet use per day and class attendance and CGPAVariable Hours of use per day Total
n (%)P
< 4hn(%)
4 –<8h n(%)
≥8h n(%)
Class attendance
Increased 0 (0) 4 (8.9) 26 (17.9) 30 (15.2) <0.0001Decreased 8 (100) 7 (15.6) 16 (11) 31 (15.7)Not affected
0 (0) 34 (75.6) 103 (71) 137 (69.2)
CGPA5–4.5 0 (0) 6 (13.3) 15 (10.3) 21 (10.6)4.49–3.75 1 (12.5) 11 (24.4) 51 (35.2) 63 (31.8)3.74–3.25 3 (37.5) 15 (33.3) 48 (33.1) 66 (33.3)3.24–2.5 2 (25) 13 (28.9) 30 (20.7) 45 (22.7) <0.0001<2.49 2 (25) 0 (0) 1 (7) 3 (1.5)
CGPA: Cumulative grade point average
Table 3: Relationship between the duration of Internet use and the purpose of usageWhat sort of websites/pages you usually visit (you can choose more than one):
How many hours do you spend using the Internet a day
Total n (%) P
<4 h n (%) 4–<8 h n (%) 8 h and more n (%)Sites related to studied major 12 (8.3) 5 (11.1) 1 (12) 18 (9.1) 0.041General knowledge 16 (11) 4 (8.9) 1 (12.5) 21 (10.6)Entertainment 9 (6.2) 4 (8.9) 0 (0) 13 (6.6)News 1 (0.7) 0 (0) 0 (0) 1 (0.5)Sites related to studied major, general knowledge 16 (11) 2 (4.4) 0 (0) 18 (9.1)Sites related to studied major, entertainment 21 (14.5) 9 (20) 1 (12.5) 31 (15.7)General knowledge, entertainment 15 (10.3) 6 (13.3) 3 (37.5) 24 (12.1)Sites related to studied major, general knowledge, entertainment
50 (34.5) 13 (28.9) 1 (12) 64 (32.3)
Sites related to studied major, general knowledge, news 0 (0) 1 (2.2) 0 (0) 1 (0.5)Sites related to studied major, entertainment, news 0 (0) 0 (0) 1 (12.5) 1 (0.5)General knowledge, entertainment, news 1 (0.7) 0 (0) 0 (0) 1 (0.5)Sites related to studied major, general knowledge, entertainment, news
4 (2.8) 1 (2.2) 0 (0) 5 (2.5)
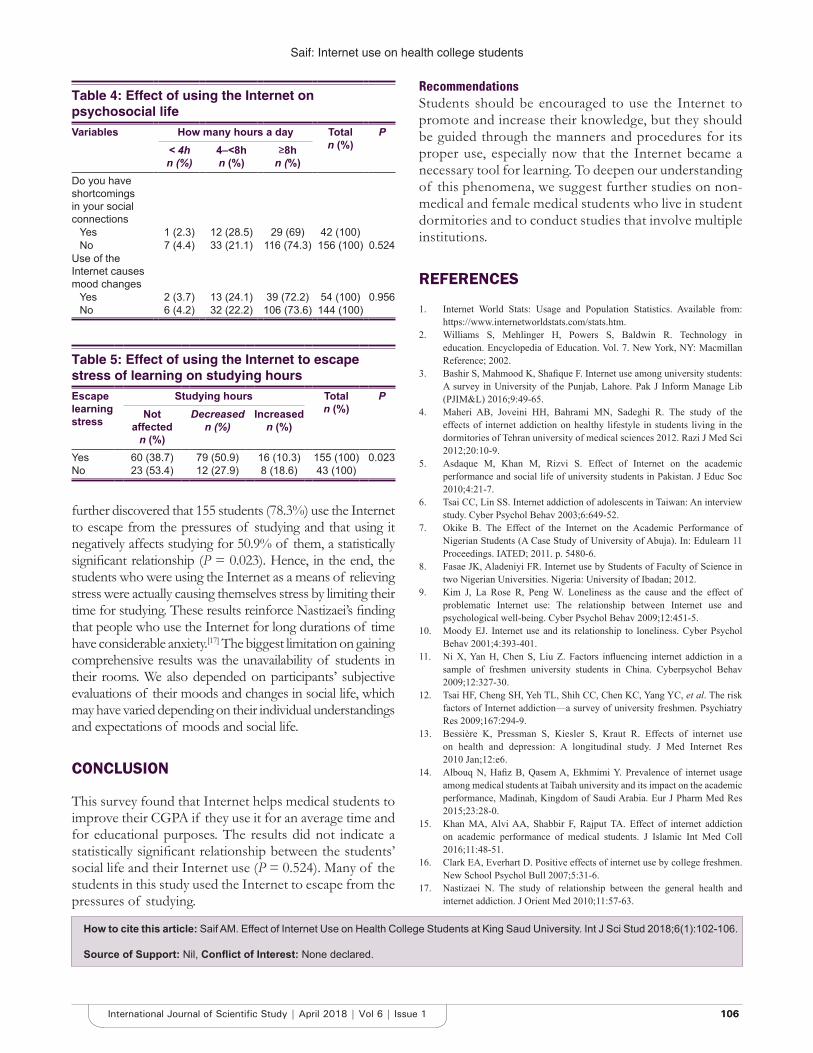
Saif: Internet use on health college students
106106International Journal of Scientific Study | April 2018 | Vol 6 | Issue 1
further discovered that 155 students (78.3%) use the Internet to escape from the pressures of studying and that using it negatively affects studying for 50.9% of them, a statistically significant relationship (P = 0.023). Hence, in the end, the students who were using the Internet as a means of relieving stress were actually causing themselves stress by limiting their time for studying. These results reinforce Nastizaei’s finding that people who use the Internet for long durations of time have considerable anxiety.[17] The biggest limitation on gaining comprehensive results was the unavailability of students in their rooms. We also depended on participants’ subjective evaluations of their moods and changes in social life, which may have varied depending on their individual understandings and expectations of moods and social life.
CONCLUSION
This survey found that Internet helps medical students to improve their CGPA if they use it for an average time and for educational purposes. The results did not indicate a statistically significant relationship between the students’ social life and their Internet use (P = 0.524). Many of the students in this study used the Internet to escape from the pressures of studying.
RecommendationsStudents should be encouraged to use the Internet to promote and increase their knowledge, but they should be guided through the manners and procedures for its proper use, especially now that the Internet became a necessary tool for learning. To deepen our understanding of this phenomena, we suggest further studies on non-medical and female medical students who live in student dormitories and to conduct studies that involve multiple institutions.
REFERENCES
1. Internet World Stats: Usage and Population Statistics. Available from: https://www.internetworldstats.com/stats.htm.
2. Williams S, Mehlinger H, Powers S, Baldwin R. Technology in education. Encyclopedia of Education. Vol. 7. New York, NY: Macmillan Reference; 2002.
3. Bashir S, Mahmood K, Shafique F. Internet use among university students: A survey in University of the Punjab, Lahore. Pak J Inform Manage Lib (PJIM&L) 2016;9:49-65.
4. Maheri AB, Joveini HH, Bahrami MN, Sadeghi R. The study of the effects of internet addiction on healthy lifestyle in students living in the dormitories of Tehran university of medical sciences 2012. Razi J Med Sci 2012;20:10-9.
5. Asdaque M, Khan M, Rizvi S. Effect of Internet on the academic performance and social life of university students in Pakistan. J Educ Soc 2010;4:21-7.
6. Tsai CC, Lin SS. Internet addiction of adolescents in Taiwan: An interview study. Cyber Psychol Behav 2003;6:649-52.
7. Okike B. The Effect of the Internet on the Academic Performance of Nigerian Students (A Case Study of University of Abuja). In: Edulearn 11 Proceedings. IATED; 2011. p. 5480-6.
8. Fasae JK, Aladeniyi FR. Internet use by Students of Faculty of Science in two Nigerian Universities. Nigeria: University of Ibadan; 2012.
9. Kim J, La Rose R, Peng W. Loneliness as the cause and the effect of problematic Internet use: The relationship between Internet use and psychological well-being. Cyber Psychol Behav 2009;12:451-5.
10. Moody EJ. Internet use and its relationship to loneliness. Cyber Psychol Behav 2001;4:393-401.
11. Ni X, Yan H, Chen S, Liu Z. Factors influencing internet addiction in a sample of freshmen university students in China. Cyberpsychol Behav 2009;12:327-30.
12. Tsai HF, Cheng SH, Yeh TL, Shih CC, Chen KC, Yang YC, et al. The risk factors of Internet addiction—a survey of university freshmen. Psychiatry Res 2009;167:294-9.
13. Bessière K, Pressman S, Kiesler S, Kraut R. Effects of internet use on health and depression: A longitudinal study. J Med Internet Res 2010 Jan;12:e6.
14. Albouq N, Hafiz B, Qasem A, Ekhmimi Y. Prevalence of internet usage among medical students at Taibah university and its impact on the academic performance, Madinah, Kingdom of Saudi Arabia. Eur J Pharm Med Res 2015;23:28-0.
15. Khan MA, Alvi AA, Shabbir F, Rajput TA. Effect of internet addiction on academic performance of medical students. J Islamic Int Med Coll 2016;11:48-51.
16. Clark EA, Everhart D. Positive effects of internet use by college freshmen. New School Psychol Bull 2007;5:31-6.
17. Nastizaei N. The study of relationship between the general health and internet addiction. J Orient Med 2010;11:57-63.
Table 4: Effect of using the Internet on psychosocial lifeVariables How many hours a day Total
n (%)P
< 4h n (%)
4–<8h n (%)
≥8h n (%)
Do you have shortcomings in your social connections
Yes 1 (2.3) 12 (28.5) 29 (69) 42 (100)No 7 (4.4) 33 (21.1) 116 (74.3) 156 (100) 0.524
Use of the Internet causes mood changes
Yes 2 (3.7) 13 (24.1) 39 (72.2) 54 (100) 0.956No 6 (4.2) 32 (22.2) 106 (73.6) 144 (100)
Table 5: Effect of using the Internet to escape stress of learning on studying hoursEscape learning stress
Studying hours Total n (%)
PNot
affected n (%)
Decreased n (%)
Increased n (%)
Yes 60 (38.7) 79 (50.9) 16 (10.3) 155 (100) 0.023No 23 (53.4) 12 (27.9) 8 (18.6) 43 (100)
How to cite this article: Saif AM. Effect of Internet Use on Health College Students at King Saud University. Int J Sci Stud 2018;6(1):102-106.
Source of Support: Nil, Conflict of Interest: None declared.
107107 International Journal of Scientific Study | April 2018 | Vol 6 | Issue 1
Right Ventricular Functional Assessment in Acute Myocardial Infarction Using Strain Imaging Parameters and Its Angiographic CorrelationNaina Mohamed S1, Sathish Kumar Subbaraj1, Balasubramaniyan S2, Veeramani S.R3, Sivakumar G.S4, Selvarani G5, Ramesh R6, Hemanath T.R5, Nagasundar G7, Saravanan M8
1Senior Assistant Professor, Department of Cardiology, Government Rajaji Hospital, Madurai, Tamil Nadu, India, 2Professor and Head, Department of Cardiology, Government Rajaji Hospital, Madurai, Tamil Nadu, India, 3Professor, Department of Cardiology, Government Rajaji Hospital, Madurai, Tamil Nadu, India, 4Registar, Department of Cardiology, Government Rajaji Hospital, Madurai, Tamil Nadu, India, 5Assistant Professor, Department of Cardiology, Government Rajaji Hospital, Madurai, Tamil Nadu, India, 6Assistant Professor, Department of Cardiology, Government Rajaji Hospital, Madurai, Tamil Nadu, India, 7Assistant Professor, Department of Cardiology, Government Rajaji Hospital, Madurai, Tamil Nadu, India, 8Assistant Professor, Department of Cardiology, Government Rajaji Hospital, Madurai, Tamil Nadu, India
INTRODUCTION
Acute myocardial infarction (AMI) is characterized by a loss of contractile tissue and a change in ventricle geometry that causes a substantial impairment of the right ventricle (RV) and left ventricle (LV) systolic and diastolic functions. Echocardiographic RV functional parameters
Original Article
AbstractIntroduction: Echocardiographic right ventricle (RV) functional parameters have independent and additive prognostic value in patients with left ventricle (LV) dysfunction following acute myocardial infarction (AMI) strain echocardiography is known to be a reliable method for the quantification of regional contractile dysfunction with the ability to detect subclinical cardiac dysfunction, and it is a feasible tool to evaluate RV global and regional myocardial function. It can measure RV systolic function in a non geometric manner like its evaluation of LV systolic function. Strain imaging has been proposed as an objective and quantitative measurement of wall motion abnormalities.
The Aim of Our Study: To correlate RV strain parameters with clinical, echocardiographic, and angiographic parameters.
Materials and Methods: Echocardiography was performed immediately after thrombolysis in patients with AMI using GE VIVID T8 machine, 3 Sc-Rs transducer adult probe equipped with tissue Doppler and speckle-tracking technology. RV strain assessment was done by speckle-tracking method. Coronary angiogram was performed in all patients included in the study.
Results: A total of 102 consecutive patients admitted in our Integrated Critical Care Unit with the first episode of AMI were included in our study. Among 102 patients, 80 (78%) were male and 22 (22%) were female. Anterior wall MI (AWMI) was more common (58%), inferior wall MI (IWMI) (40%), left ventricular mass index (LWMI) (2%). 40 patients out of the total 102 patients had single-vessel disease, 36 patients had double-vessel disease, and 8 patients had triple-vessel disease. A total of 14 patients had left main coronary artery involvement along with other vessel disease. In the study population, AWMI group had a mean mitral E/e’ of 9.742 ± 3.421, IWMI group had a mean mitral E/e’ of 10.556 ± 2.593, and LWMI group had a mean mitral E/e’of 9.57 ± 0.707. AWMI group had a mean RV mid-velocity of 3.986 ± 0.933. IWMI group had a mean RV mid-velocity of 3.385 ± 0.465. LWMI group has mean RV mid-velocity of 5.15 ± 1.626. AWMI group had a global RV mean velocity of 4.231 ± 1.281. IWMI group had a global RV mean velocity of 3.712 ± 0.591. LWMI group had a global RV mean velocity of 5.2 ± 0.849.
Conclusion: Patients with IWMI had much lower segmental and global longitudinal strain RV values compared to AMWI patients and the difference was statistically significant. RV dysfunction has also been related to poor prognosis; therefore, the function of both ventricles after AMI should be considered. Quantitative assessment of RV function with RV strain may improve the risk stratification of patients after AMI.
Key words: Quantitative right ventricular assessment, Right ventricular longitudinal strain, Speckle tracking
Access this article online
www.ijss-sn.com
Month of Submission : 00-0000 Month of Peer Review : 00-0000 Month of Acceptance : 00-0000 Month of Publishing : 00-0000
Corresponding Author: Dr. Sathish Kumar Subbaraj, Department of Cardiology, Government Rajaji Hospital, Madurai, Tamil Nadu, India. Phone: +91-9787233377. E-mail: [email protected]
Print ISSN: 2321-6379Online ISSN: 2321-595X
DOI: 10.17354/ijss/2018/123
Mohamed, et al .: Right Ventricular Functional Assessment in Acute Myocardial Infarction Using Strain Imaging Parameters and Its Angiographic Correlation
108108International Journal of Scientific Study | April 2018 | Vol 6 | Issue 1
have independent and additive prognostic value in patients with LV dysfunction.[1]
RV dysfunction may be primarily attributed to an abnormality of RV myocardium or secondary to LV dysfunction, as a consequence of “ventricular interdependence” between the two ventricles.44 Hence, earliest recognition of RV dysfunction is warranted, but till today, it remains a challenging task because of complex structure and asymmetric shape of RV.[2] Subclinical RV dysfunction is known in patients with right coronary territory ischemia. Right ventricular functions in LV anterior infarction have been the subject of several studies but with significant discrepancies in results.[3-8] RV function is an important prognostic factor for clinical outcomes in patients with acute MI of LV. Moreover, RV involvement occurs in a percentage of patients suffering an inferior wall MI (IWMI) and increases in-hospital death rates.
Currently, strain and strain rate (S/SR) imaging is the most popular echocardiographic technique for use in AMI. Tissue Doppler imaging (TDI) and S/SR imaging are the most important modalities for revealing subclinical myocardial damage.[9]
Strain echocardiography is known to be a reliable method for the quantification of regional contractile dysfunction with the ability to detect subclinical cardiac dysfunction, and it is a feasible tool to evaluate RV global and regional myocardial function.[10] It can measure RV systolic function in a non-geometric manner like its evaluation of LV systolic function.[11] Strain imaging has been proposed as an objective and quantitative measurement of wall motion abnormalities. Regional myocardial strain can be measured by velocity gradient from TDI. However, TDI is Doppler angle-dependent, which makes the acquisition and correct interpretation of the data more difficult.
The aim of our study was to evaluate RV regional functions using speckle tracking, diffusion tensor imaging (DTI)-derived S/SR imaging method in patients who experienced their first successfully treated AMI.
Aim of the Study• To evaluate right ventricular regional functions using
a derived strain and strain rate imaging by speckle-tracking/tissue Doppler method in patients who were successfully treated for their first AMI
• To correlate RV strain parameters with clinical and echocardiographic parameters.
To analyze angiographic results of the same patients in the study group.
MATERIALS AND METHODS
Study PopulationOne hundred and two patients who had suffered their first acute MI attack had been hospitalized within 1–12 h of the onset of symptoms and had undergone thrombolysis were enrolled in the study at Intensive Cardiac Care Unit, Government Rajaji Hospital.
Inclusion CriteriaOne hundred and two patients suffering from first AMI who had been hospitalized within 1–12 h of the onset of symptoms and had undergone thrombolysis were enrolled in the study.
Exclusion CriteriaThe exclusion criteria were as follows:
• Patients with:• Bundle branch block• A prior history of MI• Prior percutaneous transluminal coronary
angioplasty or undergone recurrent percutaneous intervention
• Acute stent thrombosis.• Patients with pulmonary hypertension due to:
• Valvular heart disease• Lung disease• Cardiomyopathy• Renal, hepatic, hematological disorders• Malignancy.
Data CollectionA detailed medical history, clinical examination, and relevant laboratory investigations were done as indicated in each patient.
Study ProtocolDesign of studyThe study was a prospective analytical study.
Period of studyThis study was conducted from August 2015 to February 2016.
Collaborating departmentsDepartment of Cardiology.
Ethical clearanceThe ethical clearance was obtained.
ConsentIndividual written and informed consent was obtained.
Analysis: Statistical AnalysisData analysis was done with the help of computer using SPSS 16 software and Sigma Stat 3.5 version (2012). Using
Mohamed, et al .: Right Ventricular Functional Assessment in Acute Myocardial Infarction Using Strain Imaging Parameters and Its Angiographic Correlation
109109 International Journal of Scientific Study | April 2018 | Vol 6 | Issue 1
this software, mean, standard deviation, and “P” value were calculated through Student’s t-test, One-way ANOVA, Chi-square test, and correlation coefficient from Pearson correlation and P < 0.05 was considered as statistically significant.
EchocardiogramEchocardiography was performed immediately after thrombolysis in patients with AMI using GE VIVID T8 machine, 3 Sc-Rs transducer adult probe equipped with tissue Doppler and speckle-tracking technology.
LV systolic function was assessed by modified Simpson’s method. Pulse Doppler was used to assess mitral E/A, tricuspid E/A. Mitral E/e’ was assessed by TDI.
RV strain assessment was done by speckle-tracking method. The image acquisitions are based on detecting speckles from the myocardium with two-dimensional echocardiography analyzing motion in different directions, longitudinal, radial, and circumferential. Strain measurements of the RV are best performed from the apical four-chamber view, assessing the RV free wall from the base to the apical level.
RV myocardial velocity, strain, and strain rate was assessed by TDI method. One-dimensional strain echocardiography is a dimensionless measurement that represents the fractional or percentage change in myocardial fiber shortening. To calculate strain, high frame rates are required, ideally ≥150 frames/s. As such, a narrow imaging sector focusing on the RV free wall is desired. Care should be taken to align the segment in the center of the sector to avoid errors due to the angle dependence of Doppler. A maximum tolerance of 10–15° of the axis is recommended.. Imaging is in color-coded tissue Doppler mode, and ≥3 beats are acquired with suspended respiration. Values for strain and SR are then derived offline on the system or workstation using equipment-specific algorithms by placing sample volume(s) or regions of interest of varying sizes in the mid-portion of the segment(s).
Coronary AngiogramCoronary angiogram was performed in all patients included in the study after getting informal consent.
Standard accesses chosen were either femoral or radial approach. Standard views for coronary angiogram included AP, left anterior oblique, right anterior oblique caudal and cranial views.
RESULTS
A total of 102 consecutive patients admitted in our Integrated Critical Care Unit with the first episode of
AMI were included in our study. Among 102 patients, 80 (78%) were male and 22 (22%) were female. Anterior wall MI (AWMI) was more common (58%), IWMI (40%), left ventricular mass index (LWMI) (2%). 39 patients were <50 years and 63 patients were >50 years. Among patients presenting with AMI, 69 (68%) were smokers and 33 (32%) were non-smokers. 45 (44.1%) were diabetics and 57 (55.9%) were non-diabetics. Similarly, 45 (44.1%) were hypertensives and 57 (55.9%) were non-hypertensives. 102 patients had single-vessel disease (SVD), 36 patients had double-vessel disease (DVD), and 8 patients had triple-vessel disease (TVD). A total of 14 patients had left main coronary artery (LMCA) involvement along with other vessel disease. A total of 3 patients with AWMI had recanalized left anterior descending (LAD).
A total of 37 patients with AWMI had underwent percutaneous coronary intervention (PCI), while 10, 12 patients opted for coronary artery bypass surgery (CABG), medical management respectively. Similarly, 20 patients with IWMI had underwent PCI, while 21, 0 patients opted for CABG, medical management, respectively. In the same manner, two patients with LWMI had underwent PCI. AWMI group had a mean left ventricular ejection fraction (LVEF) of 39.37 ± 4.881%. IWMI group had a mean LVEF of 41.43 ± 6.091%. LWMI group had a mean LVEF of 47 ± 11.31%. The difference between the groups was statistically significant. In the study population, AWMI group had a mean mitral E/A of 1.036 ± 0.369. IWMI group had a mean mitral E/A of 1.005 ± 0.249. LWMI group had a mean mitral E/A of 0.7 ± 0.283. The difference between the groups was statistically insignificant. In the study population, AWMI group had a mean mitral E/e’ of 9.742 ± 3.421, IWMI group had a mean mitral E/e’ of 10.556 ± 2.593, and LWMI group had a mean mitral E/e’of 9.57 ± 0.707. The difference between the groups was statistically insignificant. AWMI group had a mean tricuspid E/A of 1.131 ± 0.317. IWMI group had a mean tricuspid E/A of 0.98 ± 0.299. LWMI group had a mean tricuspid E/A 0.6 ± 0.283. The difference between the groups was statistically significant. In the study population, AWMI group had a mean tricuspid annular plane systolic excursion (TAPSE) of 16.763 ± 2.68. IWMI group had a mean TAPSE of 14.049 ± 1.923. LWMI group had a mean tricuspid E/A 15. Age group <50 years had a mean RV strain of −14.26 ± 2. Age group >50 years had a mean RV strain of −14.49 ± 2.29. Similarly age group <50 years had a mean RV strain rate of −1.51 ± 0.23. Age group >50 years had a mean RV strain rate of −1.43 ± 0.18. In the study population, males had a mean RV strain of −14.25 ± 2.24 and females had a mean RV strain of −14.98 ± 2.05. Similarly, males had a mean RV strain rate of −1.47 ± 0.21 and females had a mean RV strain rate of −1.43 ± 0.16. Smokers group had a mean RV strain of
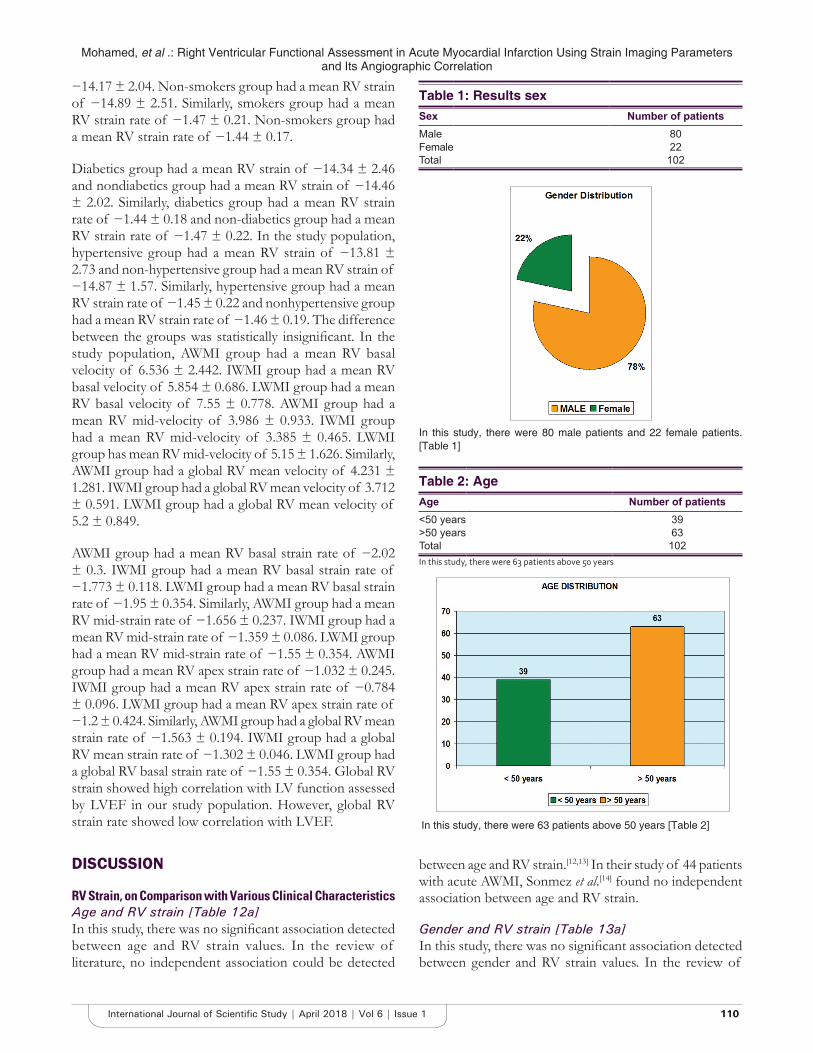
Mohamed, et al .: Right Ventricular Functional Assessment in Acute Myocardial Infarction Using Strain Imaging Parameters and Its Angiographic Correlation
110110International Journal of Scientific Study | April 2018 | Vol 6 | Issue 1
−14.17 ± 2.04. Non-smokers group had a mean RV strain of −14.89 ± 2.51. Similarly, smokers group had a mean RV strain rate of −1.47 ± 0.21. Non-smokers group had a mean RV strain rate of −1.44 ± 0.17.
Diabetics group had a mean RV strain of −14.34 ± 2.46 and nondiabetics group had a mean RV strain of −14.46 ± 2.02. Similarly, diabetics group had a mean RV strain rate of −1.44 ± 0.18 and non-diabetics group had a mean RV strain rate of −1.47 ± 0.22. In the study population, hypertensive group had a mean RV strain of −13.81 ± 2.73 and non-hypertensive group had a mean RV strain of −14.87 ± 1.57. Similarly, hypertensive group had a mean RV strain rate of −1.45 ± 0.22 and nonhypertensive group had a mean RV strain rate of −1.46 ± 0.19. The difference between the groups was statistically insignificant. In the study population, AWMI group had a mean RV basal velocity of 6.536 ± 2.442. IWMI group had a mean RV basal velocity of 5.854 ± 0.686. LWMI group had a mean RV basal velocity of 7.55 ± 0.778. AWMI group had a mean RV mid-velocity of 3.986 ± 0.933. IWMI group had a mean RV mid-velocity of 3.385 ± 0.465. LWMI group has mean RV mid-velocity of 5.15 ± 1.626. Similarly, AWMI group had a global RV mean velocity of 4.231 ± 1.281. IWMI group had a global RV mean velocity of 3.712 ± 0.591. LWMI group had a global RV mean velocity of 5.2 ± 0.849.
AWMI group had a mean RV basal strain rate of −2.02 ± 0.3. IWMI group had a mean RV basal strain rate of −1.773 ± 0.118. LWMI group had a mean RV basal strain rate of −1.95 ± 0.354. Similarly, AWMI group had a mean RV mid-strain rate of −1.656 ± 0.237. IWMI group had a mean RV mid-strain rate of −1.359 ± 0.086. LWMI group had a mean RV mid-strain rate of −1.55 ± 0.354. AWMI group had a mean RV apex strain rate of −1.032 ± 0.245. IWMI group had a mean RV apex strain rate of −0.784 ± 0.096. LWMI group had a mean RV apex strain rate of −1.2 ± 0.424. Similarly, AWMI group had a global RV mean strain rate of −1.563 ± 0.194. IWMI group had a global RV mean strain rate of −1.302 ± 0.046. LWMI group had a global RV basal strain rate of −1.55 ± 0.354. Global RV strain showed high correlation with LV function assessed by LVEF in our study population. However, global RV strain rate showed low correlation with LVEF.
DISCUSSION
RV Strain, on Comparison with Various Clinical CharacteristicsAge and RV strain [Table 12a]In this study, there was no significant association detected between age and RV strain values. In the review of literature, no independent association could be detected
between age and RV strain.[12,13] In their study of 44 patients with acute AWMI, Sonmez et al.[14] found no independent association between age and RV strain.
Gender and RV strain [Table 13a]In this study, there was no significant association detected between gender and RV strain values. In the review of
In this study, there were 80 male patients and 22 female patients.[Table 1]
Table 1: Results sexSex Number of patientsMale 80Female 22Total 102
Table 2: AgeAge Number of patients<50 years 39>50 years 63Total 102In this study, there were 63 patients above 50 years
In this study, there were 63 patients above 50 years [Table 2]
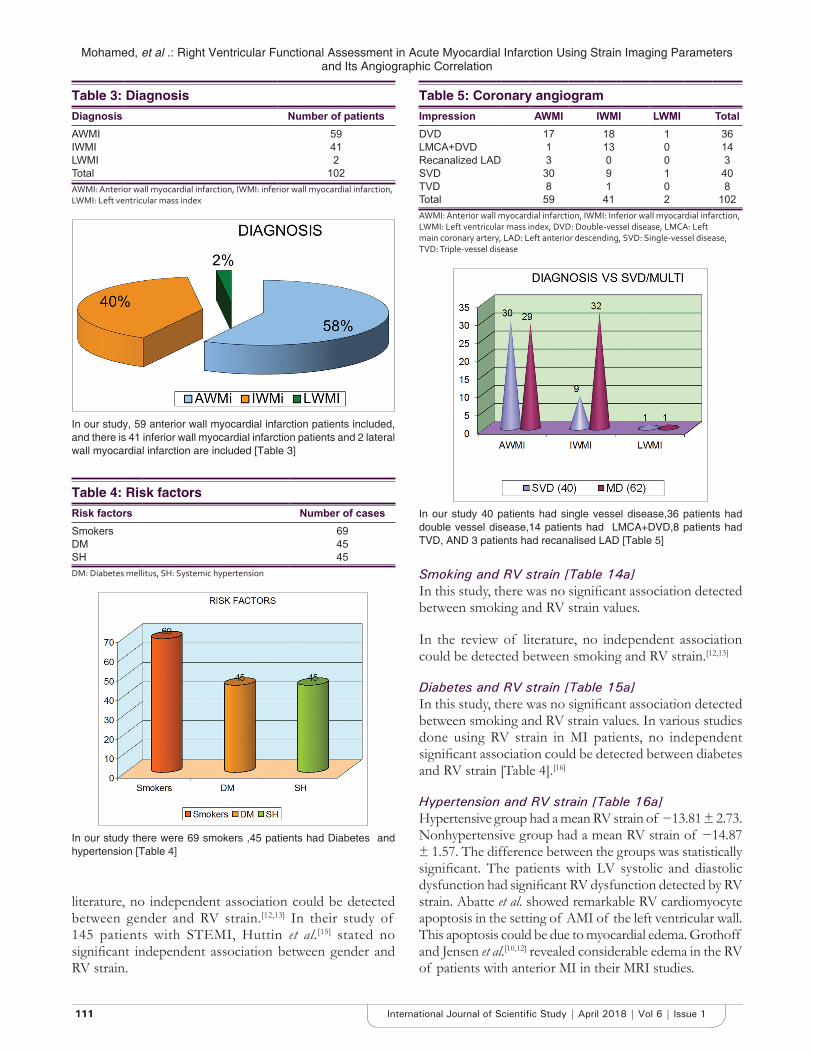
Mohamed, et al .: Right Ventricular Functional Assessment in Acute Myocardial Infarction Using Strain Imaging Parameters and Its Angiographic Correlation
111111 International Journal of Scientific Study | April 2018 | Vol 6 | Issue 1
literature, no independent association could be detected between gender and RV strain.[12,13] In their study of 145 patients with STEMI, Huttin et al.[15] stated no significant independent association between gender and RV strain.
Smoking and RV strain [Table 14a]In this study, there was no significant association detected between smoking and RV strain values.
In the review of literature, no independent association could be detected between smoking and RV strain.[12,13]
Diabetes and RV strain [Table 15a]In this study, there was no significant association detected between smoking and RV strain values. In various studies done using RV strain in MI patients, no independent significant association could be detected between diabetes and RV strain [Table 4].[16]
Hypertension and RV strain [Table 16a]Hypertensive group had a mean RV strain of −13.81 ± 2.73. Nonhypertensive group had a mean RV strain of −14.87 ± 1.57. The difference between the groups was statistically significant. The patients with LV systolic and diastolic dysfunction had significant RV dysfunction detected by RV strain. Abatte et al. showed remarkable RV cardiomyocyte apoptosis in the setting of AMI of the left ventricular wall. This apoptosis could be due to myocardial edema. Grothoff and Jensen et al.[10,12] revealed considerable edema in the RV of patients with anterior MI in their MRI studies.
Table 3: DiagnosisDiagnosis Number of patientsAWMI 59IWMI 41LWMI 2Total 102AWMI: Anterior wall myocardial infarction, IWMI: inferior wall myocardial infarction, LWMI: Left ventricular mass index
In our study, 59 anterior wall myocardial infarction patients included, and there is 41 inferior wall myocardial infarction patients and 2 lateral wall myocardial infarction are included [Table 3]
Table 4: Risk factorsRisk factors Number of casesSmokers 69DM 45SH 45DM: Diabetes mellitus, SH: Systemic hypertension
In our study there were 69 smokers ,45 patients had Diabetes and hypertension [Table 4]
Table 5: Coronary angiogramImpression AWMI IWMI LWMI TotalDVD 17 18 1 36LMCA+DVD 1 13 0 14Recanalized LAD 3 0 0 3SVD 30 9 1 40TVD 8 1 0 8Total 59 41 2 102AWMI: Anterior wall myocardial infarction, IWMI: Inferior wall myocardial infarction, LWMI: Left ventricular mass index, DVD: Double‑vessel disease, LMCA: Left main coronary artery, LAD: Left anterior descending, SVD: Single‑vessel disease, TVD: Triple‑vessel disease
In our study 40 patients had single vessel disease,36 patients had double vessel disease,14 patients had LMCA+DVD,8 patients had TVD, AND 3 patients had recanalised LAD [Table 5]
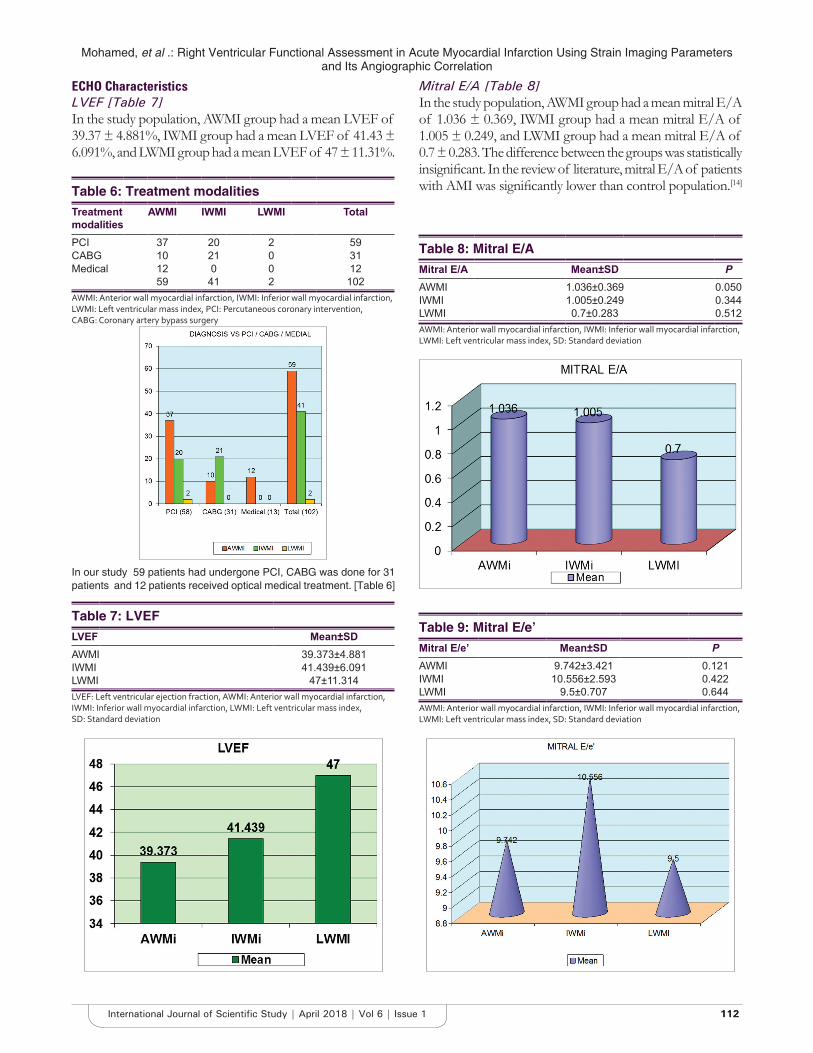
Mohamed, et al .: Right Ventricular Functional Assessment in Acute Myocardial Infarction Using Strain Imaging Parameters and Its Angiographic Correlation
112112International Journal of Scientific Study | April 2018 | Vol 6 | Issue 1
ECHO CharacteristicsLVEF [Table 7]In the study population, AWMI group had a mean LVEF of 39.37 ± 4.881%, IWMI group had a mean LVEF of 41.43 ± 6.091%, and LWMI group had a mean LVEF of 47 ± 11.31%.
Mitral E/A [Table 8]In the study population, AWMI group had a mean mitral E/A of 1.036 ± 0.369, IWMI group had a mean mitral E/A of 1.005 ± 0.249, and LWMI group had a mean mitral E/A of 0.7 ± 0.283. The difference between the groups was statistically insignificant. In the review of literature, mitral E/A of patients with AMI was significantly lower than control population.[14]
Table 7: LVEFLVEF Mean±SDAWMI 39.373±4.881IWMI 41.439±6.091LWMI 47±11.314LVEF: Left ventricular ejection fraction, AWMI: Anterior wall myocardial infarction, IWMI: Inferior wall myocardial infarction, LWMI: Left ventricular mass index, SD: Standard deviation
Table 8: Mitral E/AMitral E/A Mean±SD PAWMI 1.036±0.369 0.050IWMI 1.005±0.249 0.344LWMI 0.7±0.283 0.512AWMI: Anterior wall myocardial infarction, IWMI: Inferior wall myocardial infarction, LWMI: Left ventricular mass index, SD: Standard deviation
Table 9: Mitral E/e’Mitral E/e’ Mean±SD PAWMI 9.742±3.421 0.121IWMI 10.556±2.593 0.422LWMI 9.5±0.707 0.644AWMI: Anterior wall myocardial infarction, IWMI: Inferior wall myocardial infarction, LWMI: Left ventricular mass index, SD: Standard deviation
Table 6: Treatment modalitiesTreatment modalities
AWMI IWMI LWMI Total
PCI 37 20 2 59CABG 10 21 0 31Medical 12 0 0 12
59 41 2 102AWMI: Anterior wall myocardial infarction, IWMI: Inferior wall myocardial infarction, LWMI: Left ventricular mass index, PCI: Percutaneous coronary intervention, CABG: Coronary artery bypass surgery
In our study 59 patients had undergone PCI, CABG was done for 31 patients and 12 patients received optical medical treatment. [Table 6]
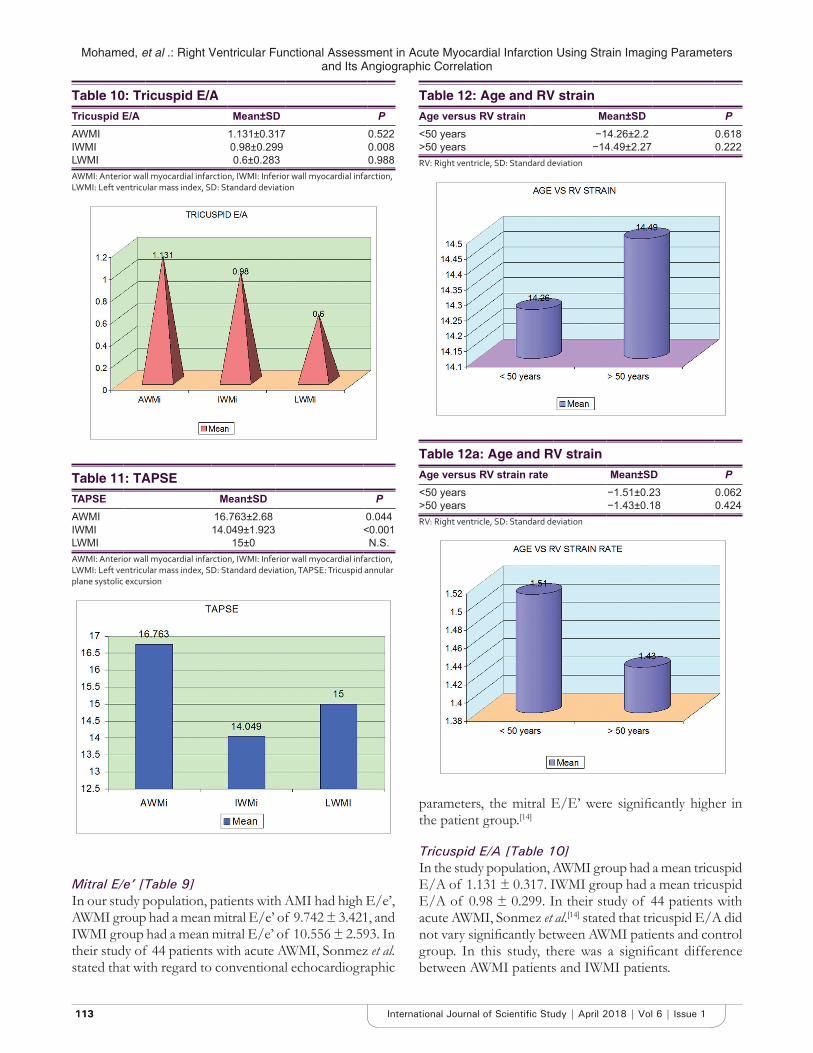
Mohamed, et al .: Right Ventricular Functional Assessment in Acute Myocardial Infarction Using Strain Imaging Parameters and Its Angiographic Correlation
113113 International Journal of Scientific Study | April 2018 | Vol 6 | Issue 1
Mitral E/e’ [Table 9]In our study population, patients with AMI had high E/e’, AWMI group had a mean mitral E/e’ of 9.742 ± 3.421, and IWMI group had a mean mitral E/e’ of 10.556 ± 2.593. In their study of 44 patients with acute AWMI, Sonmez et al. stated that with regard to conventional echocardiographic
parameters, the mitral E/E’ were significantly higher in the patient group.[14]
Tricuspid E/A [Table 10]In the study population, AWMI group had a mean tricuspid E/A of 1.131 ± 0.317. IWMI group had a mean tricuspid E/A of 0.98 ± 0.299. In their study of 44 patients with acute AWMI, Sonmez et al.[14] stated that tricuspid E/A did not vary significantly between AWMI patients and control group. In this study, there was a significant difference between AWMI patients and IWMI patients.
Table 10: Tricuspid E/ATricuspid E/A Mean±SD PAWMI 1.131±0.317 0.522IWMI 0.98±0.299 0.008LWMI 0.6±0.283 0.988AWMI: Anterior wall myocardial infarction, IWMI: Inferior wall myocardial infarction, LWMI: Left ventricular mass index, SD: Standard deviation
Table 11: TAPSETAPSE Mean±SD PAWMI 16.763±2.68 0.044IWMI 14.049±1.923 <0.001LWMI 15±0 N.S.AWMI: Anterior wall myocardial infarction, IWMI: Inferior wall myocardial infarction, LWMI: Left ventricular mass index, SD: Standard deviation, TAPSE: Tricuspid annular plane systolic excursion
Table 12: Age and RV strainAge versus RV strain Mean±SD P<50 years −14.26±2.2 0.618>50 years −14.49±2.27 0.222RV: Right ventricle, SD: Standard deviation
Table 12a: Age and RV strainAge versus RV strain rate Mean±SD P<50 years −1.51±0.23 0.062>50 years −1.43±0.18 0.424RV: Right ventricle, SD: Standard deviation
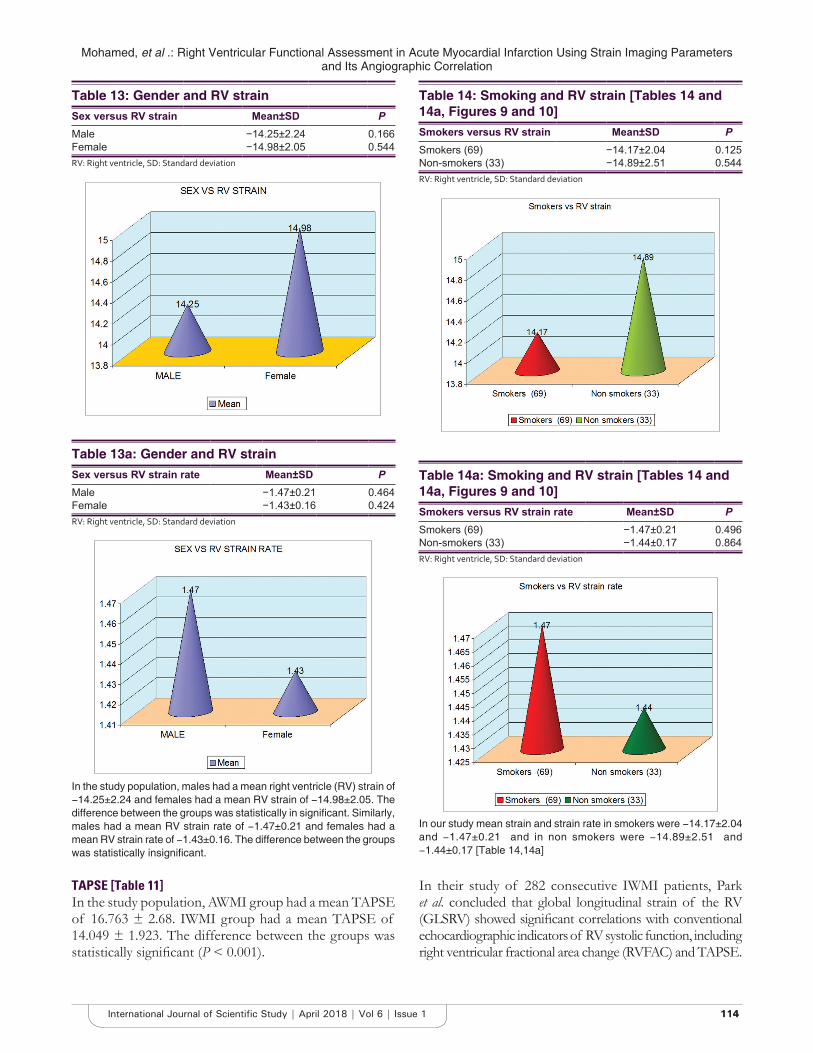
Mohamed, et al .: Right Ventricular Functional Assessment in Acute Myocardial Infarction Using Strain Imaging Parameters and Its Angiographic Correlation
114114International Journal of Scientific Study | April 2018 | Vol 6 | Issue 1
TAPSE [Table 11]In the study population, AWMI group had a mean TAPSE of 16.763 ± 2.68. IWMI group had a mean TAPSE of 14.049 ± 1.923. The difference between the groups was statistically significant (P < 0.001).
In their study of 282 consecutive IWMI patients, Park et al. concluded that global longitudinal strain of the RV (GLSRV) showed significant correlations with conventional echocardiographic indicators of RV systolic function, including right ventricular fractional area change (RVFAC) and TAPSE.
Table 13: Gender and RV strainSex versus RV strain Mean±SD PMale −14.25±2.24 0.166Female −14.98±2.05 0.544RV: Right ventricle, SD: Standard deviation
Table 13a: Gender and RV strainSex versus RV strain rate Mean±SD PMale −1.47±0.21 0.464Female −1.43±0.16 0.424RV: Right ventricle, SD: Standard deviation
In the study population, males had a mean right ventricle (RV) strain of −14.25±2.24 and females had a mean RV strain of −14.98±2.05. The difference between the groups was statistically in significant. Similarly, males had a mean RV strain rate of −1.47±0.21 and females had a mean RV strain rate of −1.43±0.16. The difference between the groups was statistically insignificant.
Table 14: Smoking and RV strain [Tables 14 and 14a, Figures 9 and 10]Smokers versus RV strain Mean±SD PSmokers (69) −14.17±2.04 0.125Non-smokers (33) −14.89±2.51 0.544RV: Right ventricle, SD: Standard deviation
Table 14a: Smoking and RV strain [Tables 14 and 14a, Figures 9 and 10]Smokers versus RV strain rate Mean±SD PSmokers (69) −1.47±0.21 0.496Non-smokers (33) −1.44±0.17 0.864RV: Right ventricle, SD: Standard deviation
In our study mean strain and strain rate in smokers were −14.17±2.04 and −1.47±0.21 and in non smokers were −14.89±2.51 and −1.44±0.17 [Table 14,14a]
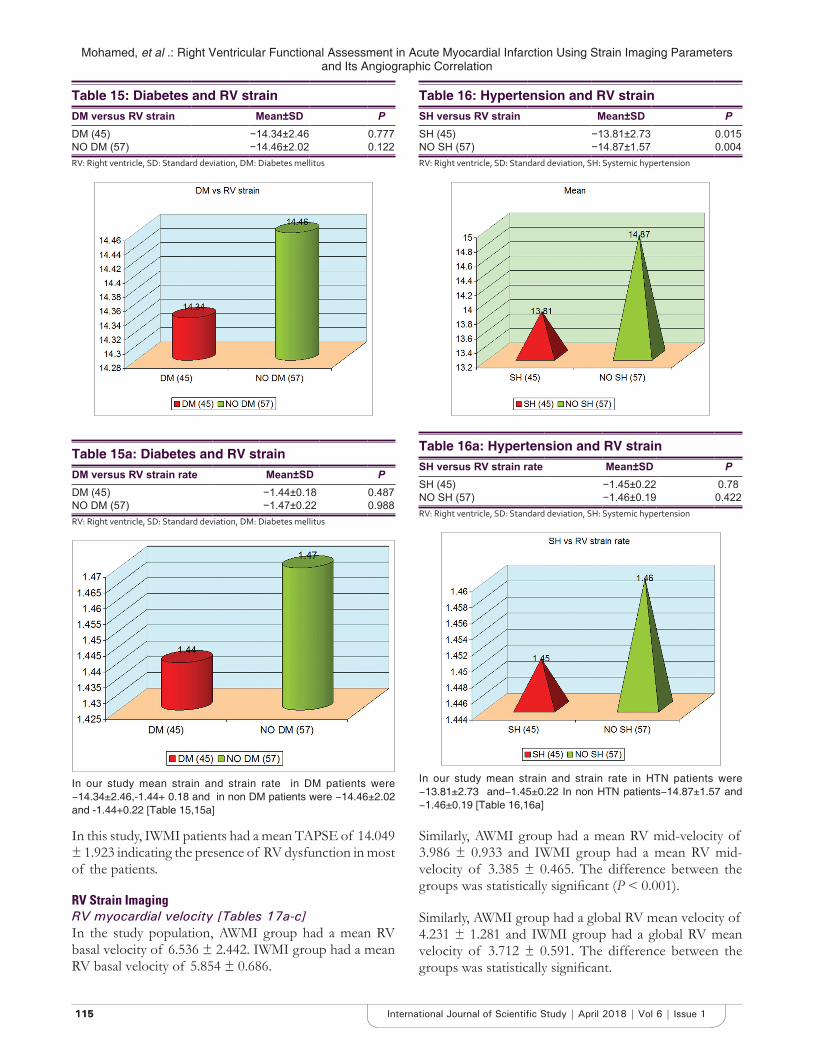
Mohamed, et al .: Right Ventricular Functional Assessment in Acute Myocardial Infarction Using Strain Imaging Parameters and Its Angiographic Correlation
115115 International Journal of Scientific Study | April 2018 | Vol 6 | Issue 1
In this study, IWMI patients had a mean TAPSE of 14.049 ± 1.923 indicating the presence of RV dysfunction in most of the patients.
RV Strain ImagingRV myocardial velocity [Tables 17a-c]In the study population, AWMI group had a mean RV basal velocity of 6.536 ± 2.442. IWMI group had a mean RV basal velocity of 5.854 ± 0.686.
Similarly, AWMI group had a mean RV mid-velocity of 3.986 ± 0.933 and IWMI group had a mean RV mid-velocity of 3.385 ± 0.465. The difference between the groups was statistically significant (P < 0.001).
Similarly, AWMI group had a global RV mean velocity of 4.231 ± 1.281 and IWMI group had a global RV mean velocity of 3.712 ± 0.591. The difference between the groups was statistically significant.
Table 15: Diabetes and RV strainDM versus RV strain Mean±SD PDM (45) −14.34±2.46 0.777NO DM (57) −14.46±2.02 0.122RV: Right ventricle, SD: Standard deviation, DM: Diabetes mellitus
Table 16: Hypertension and RV strainSH versus RV strain Mean±SD PSH (45) −13.81±2.73 0.015NO SH (57) −14.87±1.57 0.004RV: Right ventricle, SD: Standard deviation, SH: Systemic hypertension
Table 15a: Diabetes and RV strainDM versus RV strain rate Mean±SD PDM (45) −1.44±0.18 0.487NO DM (57) −1.47±0.22 0.988RV: Right ventricle, SD: Standard deviation, DM: Diabetes mellitus
In our study mean strain and strain rate in DM patients were −14.34±2.46,-1.44+ 0.18 and in non DM patients were −14.46±2.02 and -1.44+0.22 [Table 15,15a]
Table 16a: Hypertension and RV strainSH versus RV strain rate Mean±SD PSH (45) −1.45±0.22 0.78NO SH (57) −1.46±0.19 0.422RV: Right ventricle, SD: Standard deviation, SH: Systemic hypertension
In our study mean strain and strain rate in HTN patients were −13.81±2.73 and−1.45±0.22 In non HTN patients−14.87±1.57 and −1.46±0.19 [Table 16,16a]
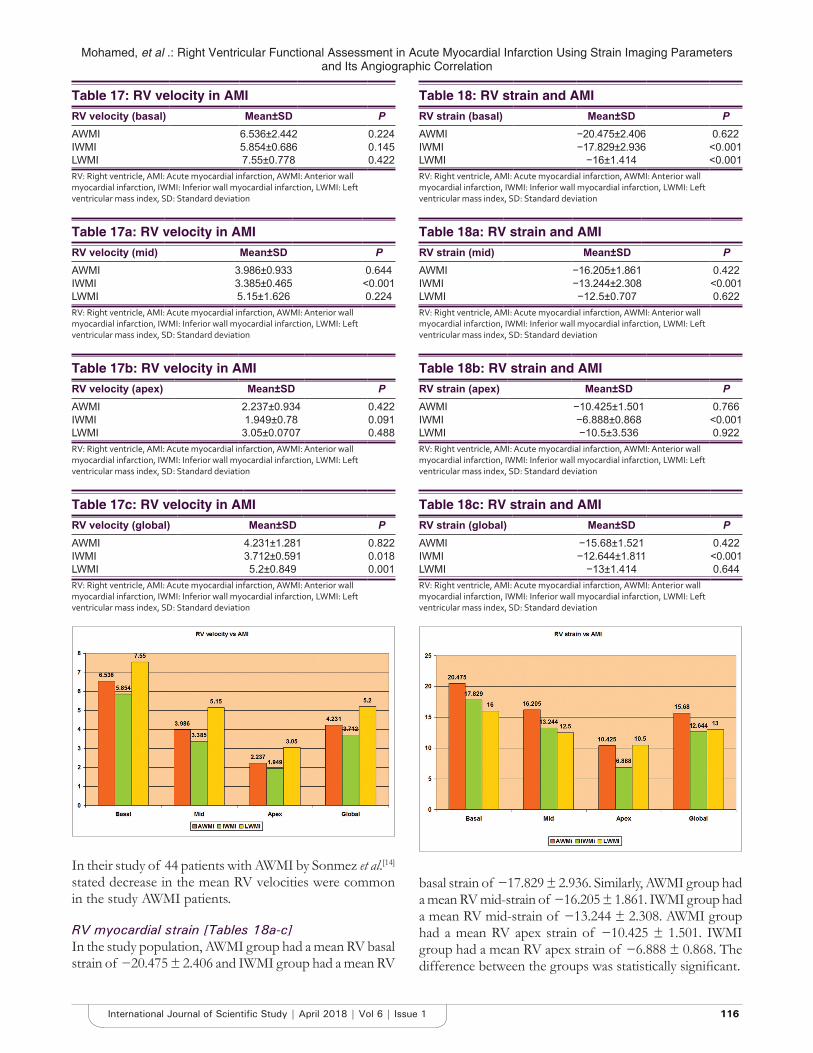
Mohamed, et al .: Right Ventricular Functional Assessment in Acute Myocardial Infarction Using Strain Imaging Parameters and Its Angiographic Correlation
116116International Journal of Scientific Study | April 2018 | Vol 6 | Issue 1
In their study of 44 patients with AWMI by Sonmez et al.[14] stated decrease in the mean RV velocities were common in the study AWMI patients.
RV myocardial strain [Tables 18a-c]In the study population, AWMI group had a mean RV basal strain of −20.475 ± 2.406 and IWMI group had a mean RV
basal strain of −17.829 ± 2.936. Similarly, AWMI group had a mean RV mid-strain of −16.205 ± 1.861. IWMI group had a mean RV mid-strain of −13.244 ± 2.308. AWMI group had a mean RV apex strain of −10.425 ± 1.501. IWMI group had a mean RV apex strain of −6.888 ± 0.868. The difference between the groups was statistically significant.
Table 17: RV velocity in AMIRV velocity (basal) Mean±SD PAWMI 6.536±2.442 0.224IWMI 5.854±0.686 0.145LWMI 7.55±0.778 0.422RV: Right ventricle, AMI: Acute myocardial infarction, AWMI: Anterior wall myocardial infarction, IWMI: Inferior wall myocardial infarction, LWMI: Left ventricular mass index, SD: Standard deviation
Table 17a: RV velocity in AMIRV velocity (mid) Mean±SD PAWMI 3.986±0.933 0.644IWMI 3.385±0.465 <0.001LWMI 5.15±1.626 0.224RV: Right ventricle, AMI: Acute myocardial infarction, AWMI: Anterior wall myocardial infarction, IWMI: Inferior wall myocardial infarction, LWMI: Left ventricular mass index, SD: Standard deviation
Table 17b: RV velocity in AMIRV velocity (apex) Mean±SD PAWMI 2.237±0.934 0.422IWMI 1.949±0.78 0.091LWMI 3.05±0.0707 0.488RV: Right ventricle, AMI: Acute myocardial infarction, AWMI: Anterior wall myocardial infarction, IWMI: Inferior wall myocardial infarction, LWMI: Left ventricular mass index, SD: Standard deviation
Table 17c: RV velocity in AMIRV velocity (global) Mean±SD PAWMI 4.231±1.281 0.822IWMI 3.712±0.591 0.018LWMI 5.2±0.849 0.001RV: Right ventricle, AMI: Acute myocardial infarction, AWMI: Anterior wall myocardial infarction, IWMI: Inferior wall myocardial infarction, LWMI: Left ventricular mass index, SD: Standard deviation
Table 18: RV strain and AMIRV strain (basal) Mean±SD PAWMI −20.475±2.406 0.622IWMI −17.829±2.936 <0.001LWMI −16±1.414 <0.001RV: Right ventricle, AMI: Acute myocardial infarction, AWMI: Anterior wall myocardial infarction, IWMI: Inferior wall myocardial infarction, LWMI: Left ventricular mass index, SD: Standard deviation
Table 18a: RV strain and AMIRV strain (mid) Mean±SD PAWMI −16.205±1.861 0.422IWMI −13.244±2.308 <0.001LWMI −12.5±0.707 0.622RV: Right ventricle, AMI: Acute myocardial infarction, AWMI: Anterior wall myocardial infarction, IWMI: Inferior wall myocardial infarction, LWMI: Left ventricular mass index, SD: Standard deviation
Table 18b: RV strain and AMIRV strain (apex) Mean±SD PAWMI −10.425±1.501 0.766IWMI −6.888±0.868 <0.001LWMI −10.5±3.536 0.922RV: Right ventricle, AMI: Acute myocardial infarction, AWMI: Anterior wall myocardial infarction, IWMI: Inferior wall myocardial infarction, LWMI: Left ventricular mass index, SD: Standard deviation
Table 18c: RV strain and AMIRV strain (global) Mean±SD PAWMI −15.68±1.521 0.422IWMI −12.644±1.811 <0.001LWMI −13±1.414 0.644RV: Right ventricle, AMI: Acute myocardial infarction, AWMI: Anterior wall myocardial infarction, IWMI: Inferior wall myocardial infarction, LWMI: Left ventricular mass index, SD: Standard deviation
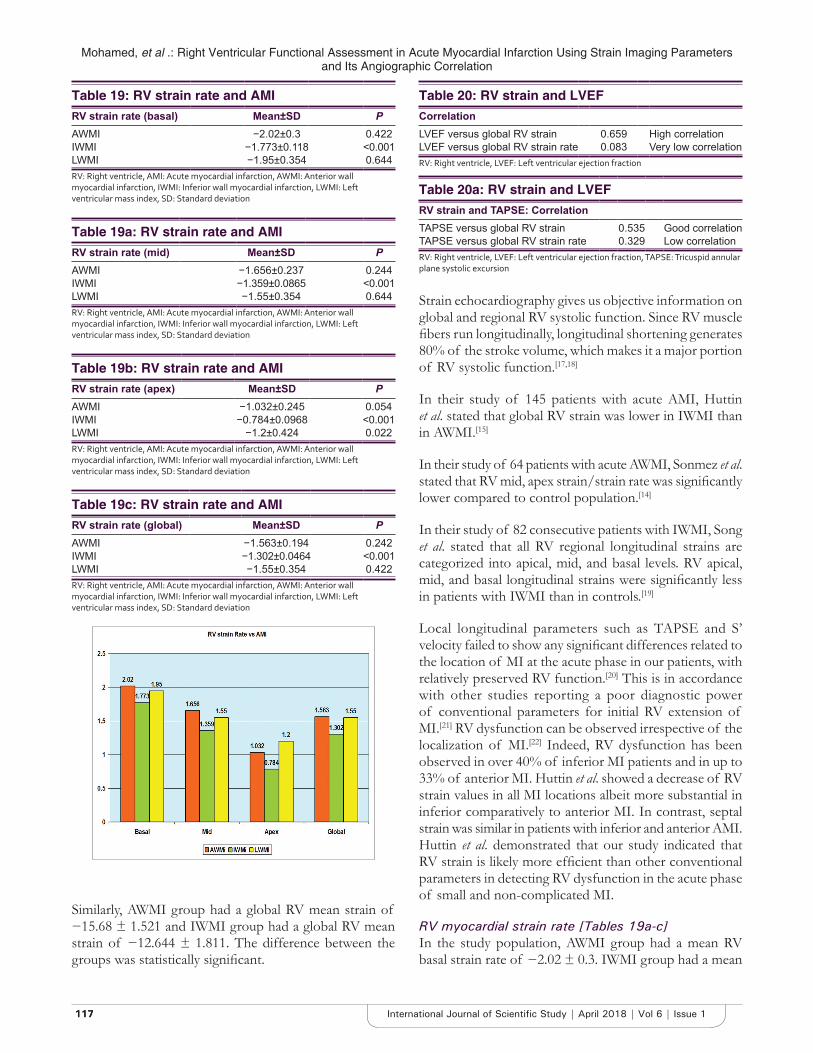
Mohamed, et al .: Right Ventricular Functional Assessment in Acute Myocardial Infarction Using Strain Imaging Parameters and Its Angiographic Correlation
117117 International Journal of Scientific Study | April 2018 | Vol 6 | Issue 1
Similarly, AWMI group had a global RV mean strain of −15.68 ± 1.521 and IWMI group had a global RV mean strain of −12.644 ± 1.811. The difference between the groups was statistically significant.
Strain echocardiography gives us objective information on global and regional RV systolic function. Since RV muscle fibers run longitudinally, longitudinal shortening generates 80% of the stroke volume, which makes it a major portion of RV systolic function.[17,18]
In their study of 145 patients with acute AMI, Huttin et al. stated that global RV strain was lower in IWMI than in AWMI.[15]
In their study of 64 patients with acute AWMI, Sonmez et al. stated that RV mid, apex strain/strain rate was significantly lower compared to control population.[14]
In their study of 82 consecutive patients with IWMI, Song et al. stated that all RV regional longitudinal strains are categorized into apical, mid, and basal levels. RV apical, mid, and basal longitudinal strains were significantly less in patients with IWMI than in controls.[19]
Local longitudinal parameters such as TAPSE and S’ velocity failed to show any significant differences related to the location of MI at the acute phase in our patients, with relatively preserved RV function.[20] This is in accordance with other studies reporting a poor diagnostic power of conventional parameters for initial RV extension of MI.[21] RV dysfunction can be observed irrespective of the localization of MI.[22] Indeed, RV dysfunction has been observed in over 40% of inferior MI patients and in up to 33% of anterior MI. Huttin et al. showed a decrease of RV strain values in all MI locations albeit more substantial in inferior comparatively to anterior MI. In contrast, septal strain was similar in patients with inferior and anterior AMI. Huttin et al. demonstrated that our study indicated that RV strain is likely more efficient than other conventional parameters in detecting RV dysfunction in the acute phase of small and non-complicated MI.
RV myocardial strain rate [Tables 19a-c]In the study population, AWMI group had a mean RV basal strain rate of −2.02 ± 0.3. IWMI group had a mean
Table 19: RV strain rate and AMIRV strain rate (basal) Mean±SD PAWMI −2.02±0.3 0.422IWMI −1.773±0.118 <0.001LWMI −1.95±0.354 0.644RV: Right ventricle, AMI: Acute myocardial infarction, AWMI: Anterior wall myocardial infarction, IWMI: Inferior wall myocardial infarction, LWMI: Left ventricular mass index, SD: Standard deviation
Table 19a: RV strain rate and AMIRV strain rate (mid) Mean±SD PAWMI −1.656±0.237 0.244IWMI −1.359±0.0865 <0.001LWMI −1.55±0.354 0.644RV: Right ventricle, AMI: Acute myocardial infarction, AWMI: Anterior wall myocardial infarction, IWMI: Inferior wall myocardial infarction, LWMI: Left ventricular mass index, SD: Standard deviation
Table 19b: RV strain rate and AMIRV strain rate (apex) Mean±SD PAWMI −1.032±0.245 0.054IWMI −0.784±0.0968 <0.001LWMI −1.2±0.424 0.022RV: Right ventricle, AMI: Acute myocardial infarction, AWMI: Anterior wall myocardial infarction, IWMI: Inferior wall myocardial infarction, LWMI: Left ventricular mass index, SD: Standard deviation
Table 19c: RV strain rate and AMIRV strain rate (global) Mean±SD PAWMI −1.563±0.194 0.242IWMI −1.302±0.0464 <0.001LWMI −1.55±0.354 0.422RV: Right ventricle, AMI: Acute myocardial infarction, AWMI: Anterior wall myocardial infarction, IWMI: Inferior wall myocardial infarction, LWMI: Left ventricular mass index, SD: Standard deviation
Table 20: RV strain and LVEFCorrelationLVEF versus global RV strain 0.659 High correlationLVEF versus global RV strain rate 0.083 Very low correlationRV: Right ventricle, LVEF: Left ventricular ejection fraction
Table 20a: RV strain and LVEFRV strain and TAPSE: CorrelationTAPSE versus global RV strain 0.535 Good correlationTAPSE versus global RV strain rate 0.329 Low correlationRV: Right ventricle, LVEF: Left ventricular ejection fraction, TAPSE: Tricuspid annular plane systolic excursion
Mohamed, et al .: Right Ventricular Functional Assessment in Acute Myocardial Infarction Using Strain Imaging Parameters and Its Angiographic Correlation
118118International Journal of Scientific Study | April 2018 | Vol 6 | Issue 1
RV basal strain rate of −1.773 ± 0.118. Similarly, AWMI group had a mean RV mid-strain rate of −1.656 ± 0.237. IWMI group had a mean RV mid-strain rate of −1.359 ± 0.086. AWMI group had a mean RV apex strain rate of −1.032 ± 0.245. IWMI group had a mean RV apex strain rate of −0.784 ± 0.096. Similarly, AWMI group had a global RV mean strain rate of −1.563 ± 0.194. IWMI group had a global RV mean strain rate of −1.302 ± 0.046. The difference between the groups was statistically significant. S/SR imaging is currently the most popular echocardiographic modality for revealing subclinical myocardial damage. In the literature, postmortem studies mention RV involvement after left ventricular infarction.
RV strain and LVEF, TAPSE Global RV strain showed high correlation with LV function assessed by LVEF in our study population. However, global RV strain rate showed low correlation with LVEF.
Global RV strain showed good correlation with TAPSE[23] in our study population. However, global RV strain rate showed low correlation with LVEF.
In their study of 282 consecutive IWMI patients, Park et al. stated that GLSRV showed significant correlations with conventional echocardiographic indicators of RV systolic function, including RVFAC and TAPSE.[23]
Coronary AngiogramIn the study population consisting of 59 patients with AWMI, 30 (50.8%) had SVD involving LAD, 3 (5%) had recanalized LAD, 17 (28.8%) had DVD, 8 (13.5%) had TVD, and 1 (1.6%) had significant LMCA involvement. Essentially, all patients with AWMI had LAD involvement.
Of the 41 patients with IWMI, 9 (21.9%) had SVD involving RCA, 18 (43.9%) had DVD, 1 (2.4%) had TVD, and 13 (31.7%) had LMCA involvement with or without other vessel involvement. Essentially, all patients with IWMI in our study group had RCA involvement. Of the two patients with LWMI, 1 had SVD and 1 had DVD. Huttin et al. in their study had similar observation.[15]
Study LimitationsThis study was a single-center study with small sample size.
Entry criterion for this study was AMI patients who have undergone thrombolysis. This may have introduced a selection bias. Doppler tissue imaging is dependent on the angle at which the region of interest is imaged, has increased signal-to-noise ratio. Overall, heart motion, cardiac rotation, and wall motion from tethering segments limit the use of DTI. RV strain is most reproducible in the apical four-chamber view, interrogating the basal, mid, and to a lesser degree, apical segments of the RV free wall. As
a result, one is limited to mostly longitudinal strain. There is a lack of normative data regarding speckle-tracking technique, which also requires additional validation. Requiring additional software, it is dependent on adequate image quality. The global nature is derived only from a single view, making it not a truly global assessment of RV function. Prognosis of patients with RV dysfunction assessed by RV strain was not done in this study, but this study may open roads for further studies related to this area.
CONCLUSION
Global Longitudinal Strain of Right Ventricle showed significant correlations with conventional echocardiographic parameters of RV systolic function like TAPSE and also LV systolic function measured by LVEF. RV strain provides incremental value over clinical information, infarct characteristics, LV function, and TAPSE. There is significant RV dysfunction detected by RV strain imaging in patients presenting with AMI immediately after thrombolysis. In this study, AWMI patients had lowered segmental and GLSRV compared to reference normal values. Patients with IWMI had much lower segmental and GLSRV values compared to AMWI patients, and the difference was statistically significant.
RV dysfunction has also been related to poor prognosis; therefore, the function of both ventricles after AMI should be considered. RV assessment with these imaging modalities will have an increased value during treatment. Quantitative assessment of RV function with RV strain may improve the risk stratification of patients after AMI.
ACKNOWLEDGMENT
The authors would like to thank the Department of cardiology, Government Rajaji hospital, Madurai.
REFERENCES
1. Meluzin J, Spinarová L, Hude P, Krejcí J, Kincl V, Panovský R, et al. Prognostic importance of various echocardiographic right ventricular functional parameters in patients with symptomatic heart failure. J Am Soc Echocardiogr 2005;18:435-44.
2. Miller D, Farah MG, Liner A, Fox K, Schluchter M, Hoit BD, et al. The relation between quantitative right ventricular ejection fraction and indices of tricuspid annular motion and myocardial performance. J Am Soc Echocardiogr 2004;17:443-7.
3. Verani MS, Guidry GW, Mahmarian JJ, Nishimura S, Athanasoulis T, Roberts R, et al. Effects of acute, transient coronary occlusion on global and regional right ventricular function in humans. J Am Coll Cardiol 1992;20:1490-7.
4. Amin W, Bakhoum S, Eldigwi S, Zaki A. Assessment of right ventricular systolic and diastolic function by pulsed wave tissue doppler imaging in patients with acute myocardial infarction. Heart Mirror J 2008;2:6-17.
5. Kaul S, Hopkins JM, Shah PM. Chronic effect of myocardial infarction on
Mohamed, et al .: Right Ventricular Functional Assessment in Acute Myocardial Infarction Using Strain Imaging Parameters and Its Angiographic Correlation
119119 International Journal of Scientific Study | April 2018 | Vol 6 | Issue 1
right ventricular function: a non-invasive assessment. J Am Coll Cardial 1983;4:607-15.
6. Badran H, Mastafa AK, Shalaby S, Fand W, Hassan H, Faheem N. Comprehensive Evaluation of Right Ventricular Function in Acute Myocardial Infarction by Tissue Doppler Echocardiography. Is Ventricular Interdependence Exist. Eur J Echocardiogr Abstr suppl 2006 Abstract No. 1043.
7. Hamagishi T, Ozaki M, Furutani Y, Yamamoto K, Saeki A, Sato S, et al. Effect of anteroseptal myocardial infarction on systolic and diastolic filling function of the right ventricle. J Cardiol 1990;20:103-9.
8. Fabbiochi F, Galli C, Doria E, Sganzerla P, Montorsi P, Loaldin A, et al. Changes in right ventricular filling dynamics during left anterior descending, left circumflex and right coronary artery balloon occlusion. Eur Heart J 1997;18:1432-7.
9. Marwick TH. Measurement of strain rate by echocardiography; Ready for prime time J Am Coll Cardiol 2006;47:1313-27.
10. Pirat B, Khoury DS, Hartley CJ, Tiller L, Rao L, Schulz DG, et al. A novel feature-tracking echocardiographic method for the quantitation of regional myocardial function: Validation in an animal model of ischemia-reperfusion. J Am Coll Cardiol 2008;51:651-9.
11. Jamal F, Bergerot C, Argaud L, Loufouat J, Ovize M. Longitudinal strain quantitates regional right ventricular contractile function. Am J Physiol Heart Circ Physiol 2003;285:H2842-7.
12. D’hooge J, Heimdal A, Jamal F, Kukulski T, Bijnens B, Rademakers F, et al. Regional strain and strain rate measurements by cardiac ultrasound: Principles, implementation and limitations. Eur J Echocardiogr 2000;1:154-70.
13. Edvardsen T, Gerber BL, Garot J, Bluemke DA, Lima JA, Smiseth OA, et al. Quantitative assessment of intrinsic regional myocardial deformation by doppler strain rate echocardiography in humans: Validation against three-dimensional tagged magnetic resonance imaging. Circulation 2002;106:50-6.
14. Sonmez O, Kayrak M, Altunbas G, Abdulhalikov T, Alihanoglu Y, Bacaksiz A, et al. Right ventricular involvement in anterior myocardial infarction: A tissue doppler-derived strain and strain rate study. Clinics (Sao Paulo) 2013;68:1225-30.
15. Huttin O, Lemarié J, Di Meglio M, Girerd N, Mandry D, Moulin F, et al.
Assessment of right ventricular functional recovery after acute myocardial infarction by 2D speckle-tracking echocardiography. Int J Cardiovasc Imaging 2015;31:537-45.
16. Haddad F, Doyle R, Murphy DJ, Hunt SA. Right ventricular function in cardiovascular disease, Part II: Pathophysiology, clinical importance, and management of right ventricular failure. Circulation 2008;117:1717-31.
17. Tandri H, Daya SK, Nasir K, Bomma C, Lima JA, Calkins H, et al. Normal reference values for the adult right ventricle by magnetic resonance imaging. Am J Cardiol 2006;98:1660-4.
18. Carlsson M, Ugander M, Heiberg E, Arheden H. The quantitative relationship between longitudinal and radial function in left, right, and total heart pumping in humans. Am J Physiol Heart Circ Physiol 2007;293:H636-44.
19. Song CF, et al. Alteration in the global and regional myocardial strain patterns in the inferior ST elevation myocardial infarction prior to and after PCI Kasohisung. J Med Sci 2014;30:e3460.
20. Hsu SY, Chang SH, Liu CJ, Lin JF, Ko YL, Cheng ST, et al. Correlates of impaired global right ventricular function in patients with a reperfused acute myocardial infarction and without right ventricular infarction. J Investig Med 2013;61:715-21.
21. Kakouros N, Kakouros S, Lekakis J, Rizos I, Cokkinos D. Tissue Doppler imaging of the tricuspid annulus and myocardial performance index in the evaluation of right ventricular involvement in the acute and late phase of a first inferior myocardial infarction. Echocardiography 2011;28:311-9.
22. Teske AJ, Prakken NH, De Boeck BW, Velthuis BK, Martens EP, Doevendans PA, et al. Echocardiographic tissue deformation imaging of right ventricular systolic function in endurance athletes. Eur Heart J 2009;30:969-77.
23. Park SJ, Park JH, Lee HS, Kim MS, Park YK, Park Y, et al. Impaired RV global longitudinal strain is associated with poor long-term clinical outcomes in patients with acute inferior STEMI. JACC Cardiovasc Imaging 2015;8:161-9.
24. Antoni ML, Scherptong RW, Atary JZ, Boersma E, Holman ER, van der Wall EE, et al. Prognostic value of right ventricular function in patients after acute myocardial infarction treated with primary percutaneous coronary intervention. Circ Cardiovasc Imaging 2010;3:264-71.
How to cite this article: Mohamed SN, Sathish Kumar Subbaraj1, Balasubramaniyan S, Veeramani SR, Sivakumar GS, Selvarani G, Ramesh R, Hemanath TR, Nagasundar G, Saravanan M. Right Ventricular Functional Assessment in Acute Myocardial Infarction Using Strain Imaging Parameters and Its Angiographic Correlation. Int J Sci Stud 2018;6(1):107-119.
Source of Support: Nil, Conflict of Interest: None declared.
120120International Journal of Scientific Study | April 2018 | Vol 6 | Issue 1
Major Effects of Delayed Graft Function and Cold Ischemia Time on Renal Allograft SurvivalK Yogeshwaran1, R Neelakandan2*, K Natarajan3
1Postgraduate, Department of Urology, Sri Ramachandra Medical College, Chennai, Tamil Nadu, India, 2Assistant Professor, Department of Urology, Sri Ramachandra Medical Centre, Chennai, Tamil Nadu, India, 3Professor, Department of Urology, Sri Ramachandra Medical College, Chennai, Tamil Nadu, India
controversial whether this is associated with events in the management of the donor in ICU. For example, recent data suggest that the use of inotropes reduces the incidence of acute rejection (AR) and leads to superior long-term survival of the graft. While, in contrast, other studies have found a significant increase in delayed graft function (DGF) and reduced 1 year survival and renal function if the donor had required inotropes before death.[1]
Having been exposed to factors related to the dying process other influences will be added to the donor organ which will impact on the final outcome of transplantation. These will be related to the retrieval process itself and the subsequent period of cold ischemia before reperfusion. Finally, recipient factors will become active on reperfusion and for the lifetime of the graft. It is this blending of multiple donor and recipient factors that generate the final outcome of the transplant process.
INTRODUCTION
There is mounting evidence from experimental and clinical studies that the level of injury to organs from cadaver donors may be influenced by events occurring in the Intensive Care Unit (ICU)[1] and around the time of brain death,[2] and that these may affect subsequent transplant outcome.
Despite evidence that the quality of organs from cadaver donors is inferior to organs from living donors, it remains
Original Article
AbstractBackground: There is mounting evidence from experimental and clinical studies that the quality of organs from cadaver donors may be influenced by events occurring around the time of brain death, and that these may affect transplant outcome. The aim of this study is to investigate the influence of donor factors on renal allograft outcome in a homogeneous cohort of 518 patients transplanted in a single center over a 9-year period.
Methods: End points of the study were delayed graft function (DGF), acute rejection (AR), 1-year graft survival, and long-term survival of those grafts that reached 1 year. Multivariate analysis was performed to determine factors that may have influenced the graft outcome indicators.
Results: DGF was the major predictor of graft failure overall with cold ischemia time (CIT) as an important independent factor. The level of histocompatibility did not influence graft survival. DGF was the major factor affecting 1-year graft survival (P < 0.0005) with effects persisting beyond 1 year. DGF was significantly influenced by CIT, donor age, female kidney into male recipient, and donor creatinine (P < 0.05). Other donor factors and factors associated with donor management were not risk factors for DGF, rejection episodes, or graft survival. The risk factors for a number of AR episodes were HLA–DR mismatch and DGF (P < 0.005). When grafts surviving for 1 year were considered, only CIT, recipient age, and creatinine at 1 year (P < 0.05) were found to affect graft survival significantly.
Conclusions: The results of this analysis of well-matched transplant recipients show that CIT and DGF are the most important predictors of poor short and long-term graft survival. Therefore, to improve the long-term survival of renal allografts efforts should focus on limiting CIT and the damage that occurs during this period and on improving our understanding of DGF.
Key words: Cold ischemia time, Delayed graft function, Donor factors, Outcome, Renal transplantation
Access this article online
www.ijss-sn.com
Month of Submission : 02-2018 Month of Peer Review : 03-2018 Month of Acceptance : 04-2018 Month of Publishing : 04-2018
Corresponding Author: Dr.Neelakandan , Assistant professor , Sri Ramachandra medical college , Chennai, Tamilnadu.
Print ISSN: 2321-6379Online ISSN: 2321-595X
DOI: 10.17354/ijss/2018/124
Yogeshwaran, et al.: Factors influencing Cadaveric renal transplant outcome
121121 International Journal of Scientific Study | April 2018 | Vol 6 | Issue 1
The aim of this study was to analyze a comprehensive database of a large, homogeneous cohort of patients transplanted in a single center over a 9-year period to investigate the influence of donor and recipient factors on renal allograft function and survival.
SUBJECTS AND METHODS
PatientsBetween 2009 and 2017, 541 cadaveric renal transplants were performed at the Oxford Transplant Centre. Data relating to donors and the retrieval process were obtained from the UK Transplant National Database Core Donor Data Form (Form CDD1) and from information kept locally by the transplant coordination team. Full donor data were available for 518 patients, which formed the study population. 23 patients were excluded from the study due to the lack of donor data. All kidneys were retrieved from conventional heart-beating, cadaveric donors diagnosed as brain stem dead. The retrieval technique and preservation fluid were unchanged during the study period. A detailed list of the variables studied is given in Table 1. Donor details and recipient demographics are described in Table 2. Clinical and follow-up data were collected prospectively from the Oxford Transplant Centre Database.
ImmunosuppressionThe immunosuppressive protocol used during the period studied was uniform and consisted of a triple-therapy regimen of cyclosporine (8mg/kg/day divided in two doses), azathioprine (1.5mg/kg/day), and prednisolone (20mg/day if recipient weight 60kg or above; 15 mg/day if weight was <60kg). Cyclosporine dose was adjusted to
maintain serum trough levels between 150–300ng/mL in the first 6 months post-transplant and 75–150ng/mL, thereafter. Prednisolone dose was reduced gradually after 2 months to 5 mg/day at 1 year. Most patients discontinued prednisolone at 18-month post-transplantation. Induction therapy with antilymphocyte globulin (ATG) was used only in highly sensitized patients. There was no change to the immunosuppressive protocol in the presence of DGF. From July 1991, patients were started on aspirin 75mg pre-transplantation and continued until 1 month after the transplant to prevent renal vein thrombosis.
End pointsThe end points of the study were: DGF, AR, 1-year graft survival, and long-term survival of those grafts that reached 1 year.
DGF was defined as the requirement for dialysis within the 1st week after transplantation. Patients transplanted before needing dialysis (pre-emptive transplantation) were considered to have DGF if the creatinine failed to drop in the 1st week.
AR was diagnosed histologically on core renal biopsies according to the Banff classification. Before the introduction of the Banff classification, rejection was diagnosed by a histopathologist on a qualitative basis. Biopsies were scored using the ‘93 Banff classification from 1996 to 1999, and the revised ‘97 Banff classification from April 1999. All patients in our unit had protocol renal transplant biopsies at days 7 and 28 after the transplant irrespective of renal function. In addition, diagnostic biopsies were performed at any time when clinically indicated. Three 500mg doses
Table 1: List of variables studiedYear of transplant Donor cause of death Recipient sex DGFDonor sex Trauma Y/N Recipient age AR Y/NDonor age Cardiovascular disease Y/N Recipient blood group AR day-7 Y/NDonor age </≥50 years Donor ventilation time (h) Recipient rhesus (±) AR day-14 Y/NDonor weight Donor infection Y/N Recipient blood transfusions Y/N Methylprednisolone treatmentsDonor height Donor antibiotics Recipient number of blood transfusions Antithymoglobulin treatmentDonor SeCr DDAVP Y/N Cause of ESRF SeCr and CrCla day-7Donor SeCr </≥150 µmol/L Donor inotropes Y/N First transplant/regraft SeCr 3 and 6 monthsDonor CrCla Adrenaline Y/N Days on transplant waiting list Weight 3 and 6 monthsDonor CrCla </≥60 mL/min Dobutamine Y/N Pre-transplant antibodiese CrCla 3 and 6 monthsDonor serum sodium Dopamine Y/N Highly sensitizedf Survival 3 and 6 monthsDonor serum potassium Noradrenaline Y/N HLA class I MM SeCr 1–9 yearsDonor blood group Multiorgan/kidneys only HLA class II MM Weight 1–9 yearsDonor rhesus (±) Local/imported organ HLA A MM CrCla 1–9 yearsDonor CMV status (±) Graft damagec HLA B MM Survival 1–9 yearsHypotension Y/Nb Type of damage HLA DR MM Death with functioning graftCardiorespiratory arrest CITd HLA MMDonor blood transfusion Anastomosis time Recipient CMV (±)aCalculated by the Cockcroft–Gault formula [(140–age) × (1.23♂/1.04♀) × weight (kg)/serum creatinine (SeCr) (µmol/l)], bsystolic blood pressure≤80 mmHg for>10 min, cany type of injury (vascular, ureteric, or capsular) reported to the national database by the retrieving surgeon or recorded at the recipient center, dtime from cold perfusion to the time the kidney was taken out of ice to start the anastomosis, eHLA lymphocytotoxic antibodies reactive with≥10% of a random panel, fHLA lymphocytotoxic antibodies reactive with≥85% of a random panel. CIT: Cold ischemia time, AR: Acute rejection
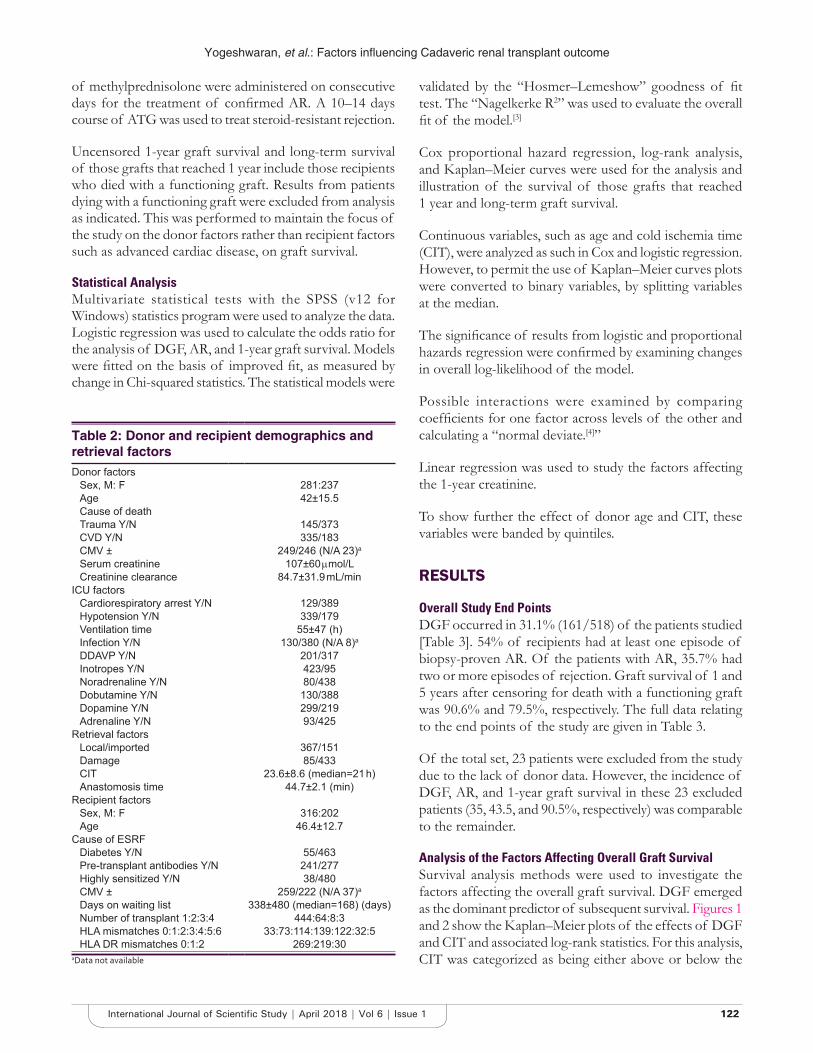
Yogeshwaran, et al.: Factors influencing Cadaveric renal transplant outcome
122122International Journal of Scientific Study | April 2018 | Vol 6 | Issue 1
of methylprednisolone were administered on consecutive days for the treatment of confirmed AR. A 10–14 days course of ATG was used to treat steroid-resistant rejection.
Uncensored 1-year graft survival and long-term survival of those grafts that reached 1 year include those recipients who died with a functioning graft. Results from patients dying with a functioning graft were excluded from analysis as indicated. This was performed to maintain the focus of the study on the donor factors rather than recipient factors such as advanced cardiac disease, on graft survival.
Statistical AnalysisMultivariate statistical tests with the SPSS (v12 for Windows) statistics program were used to analyze the data. Logistic regression was used to calculate the odds ratio for the analysis of DGF, AR, and 1-year graft survival. Models were fitted on the basis of improved fit, as measured by change in Chi-squared statistics. The statistical models were
validated by the “Hosmer–Lemeshow” goodness of fit test. The “Nagelkerke R2” was used to evaluate the overall fit of the model.[3]
Cox proportional hazard regression, log-rank analysis, and Kaplan–Meier curves were used for the analysis and illustration of the survival of those grafts that reached 1 year and long-term graft survival.
Continuous variables, such as age and cold ischemia time (CIT), were analyzed as such in Cox and logistic regression. However, to permit the use of Kaplan–Meier curves plots were converted to binary variables, by splitting variables at the median.
The significance of results from logistic and proportional hazards regression were confirmed by examining changes in overall log-likelihood of the model.
Possible interactions were examined by comparing coefficients for one factor across levels of the other and calculating a “normal deviate.[4]”
Linear regression was used to study the factors affecting the 1-year creatinine.
To show further the effect of donor age and CIT, these variables were banded by quintiles.
RESULTS
Overall Study End PointsDGF occurred in 31.1% (161/518) of the patients studied [Table 3]. 54% of recipients had at least one episode of biopsy-proven AR. Of the patients with AR, 35.7% had two or more episodes of rejection. Graft survival of 1 and 5 years after censoring for death with a functioning graft was 90.6% and 79.5%, respectively. The full data relating to the end points of the study are given in Table 3.
Of the total set, 23 patients were excluded from the study due to the lack of donor data. However, the incidence of DGF, AR, and 1-year graft survival in these 23 excluded patients (35, 43.5, and 90.5%, respectively) was comparable to the remainder.
Analysis of the Factors Affecting Overall Graft SurvivalSurvival analysis methods were used to investigate the factors affecting the overall graft survival. DGF emerged as the dominant predictor of subsequent survival. Figures 1 and 2 show the Kaplan–Meier plots of the effects of DGF and CIT and associated log-rank statistics. For this analysis, CIT was categorized as being either above or below the
Table 2: Donor and recipient demographics and retrieval factorsDonor factors
Sex, M: F 281:237Age 42±15.5Cause of deathTrauma Y/N 145/373CVD Y/N 335/183CMV ± 249/246 (N/A 23)a
Serum creatinine 107±60 µmol/LCreatinine clearance 84.7±31.9 mL/min
ICU factorsCardiorespiratory arrest Y/N 129/389Hypotension Y/N 339/179Ventilation time 55±47 (h)Infection Y/N 130/380 (N/A 8)a
DDAVP Y/N 201/317Inotropes Y/N 423/95Noradrenaline Y/N 80/438Dobutamine Y/N 130/388Dopamine Y/N 299/219Adrenaline Y/N 93/425
Retrieval factorsLocal/imported 367/151Damage 85/433CIT 23.6±8.6 (median=21 h)Anastomosis time 44.7±2.1 (min)
Recipient factorsSex, M: F 316:202Age 46.4±12.7
Cause of ESRFDiabetes Y/N 55/463Pre-transplant antibodies Y/N 241/277Highly sensitized Y/N 38/480CMV ± 259/222 (N/A 37)a
Days on waiting list 338±480 (median=168) (days)Number of transplant 1:2:3:4 444:64:8:3HLA mismatches 0:1:2:3:4:5:6 33:73:114:139:122:32:5HLA DR mismatches 0:1:2 269:219:30
aData not available
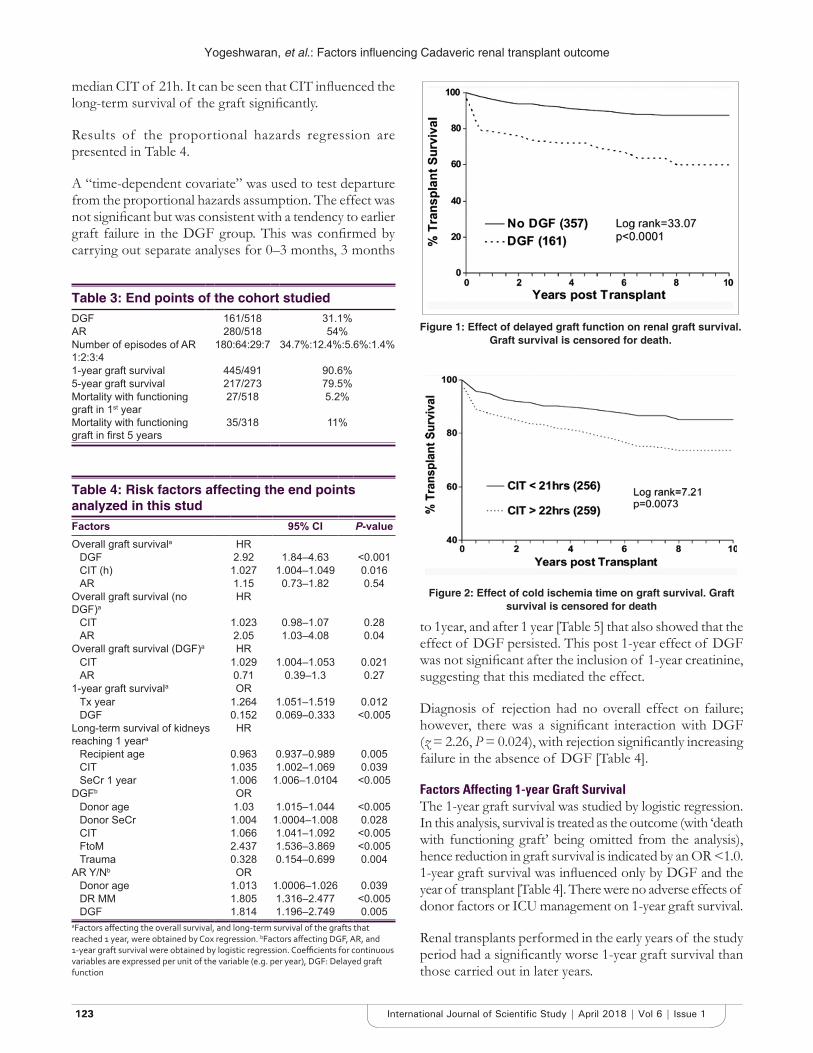
Yogeshwaran, et al.: Factors influencing Cadaveric renal transplant outcome
123123 International Journal of Scientific Study | April 2018 | Vol 6 | Issue 1
median CIT of 21h. It can be seen that CIT influenced the long-term survival of the graft significantly.
Results of the proportional hazards regression are presented in Table 4.
A “time-dependent covariate” was used to test departure from the proportional hazards assumption. The effect was not significant but was consistent with a tendency to earlier graft failure in the DGF group. This was confirmed by carrying out separate analyses for 0–3 months, 3 months
to 1year, and after 1 year [Table 5] that also showed that the effect of DGF persisted. This post 1-year effect of DGF was not significant after the inclusion of 1-year creatinine, suggesting that this mediated the effect.
Diagnosis of rejection had no overall effect on failure; however, there was a significant interaction with DGF (z = 2.26, P = 0.024), with rejection significantly increasing failure in the absence of DGF [Table 4].
Factors Affecting 1-year Graft SurvivalThe 1-year graft survival was studied by logistic regression. In this analysis, survival is treated as the outcome (with ‘death with functioning graft’ being omitted from the analysis), hence reduction in graft survival is indicated by an OR <1.0. 1-year graft survival was influenced only by DGF and the year of transplant [Table 4]. There were no adverse effects of donor factors or ICU management on 1-year graft survival.
Renal transplants performed in the early years of the study period had a significantly worse 1-year graft survival than those carried out in later years.
Table 3: End points of the cohort studiedDGF 161/518 31.1%AR 280/518 54%Number of episodes of AR 1:2:3:4
180:64:29:7 34.7%:12.4%:5.6%:1.4%
1-year graft survival 445/491 90.6%5-year graft survival 217/273 79.5%Mortality with functioning graft in 1st year
27/518 5.2%
Mortality with functioning graft in first 5 years
35/318 11%
Table 4: Risk factors affecting the end points analyzed in this studFactors 95% CI P-value Overall graft survivala HR
DGF 2.92 1.84–4.63 <0.001CIT (h) 1.027 1.004–1.049 0.016AR 1.15 0.73–1.82 0.54
Overall graft survival (no DGF)a
HR
CIT 1.023 0.98–1.07 0.28AR 2.05 1.03–4.08 0.04
Overall graft survival (DGF)a HRCIT 1.029 1.004–1.053 0.021AR 0.71 0.39–1.3 0.27
1-year graft survivala ORTx year 1.264 1.051–1.519 0.012DGF 0.152 0.069–0.333 <0.005
Long-term survival of kidneys reaching 1 yeara
HR
Recipient age 0.963 0.937–0.989 0.005CIT 1.035 1.002–1.069 0.039SeCr 1 year 1.006 1.006–1.0104 <0.005
DGFb ORDonor age 1.03 1.015–1.044 <0.005Donor SeCr 1.004 1.0004–1.008 0.028CIT 1.066 1.041–1.092 <0.005FtoM 2.437 1.536–3.869 <0.005Trauma 0.328 0.154–0.699 0.004
AR Y/Nb ORDonor age 1.013 1.0006–1.026 0.039DR MM 1.805 1.316–2.477 <0.005DGF 1.814 1.196–2.749 0.005
aFactors affecting the overall survival, and long‑term survival of the grafts that reached 1 year, were obtained by Cox regression. bFactors affecting DGF, AR, and 1‑year graft survival were obtained by logistic regression. Coefficients for continuous variables are expressed per unit of the variable (e.g. per year), DGF: Delayed graft function
Figure 1: Effect of delayed graft function on renal graft survival. Graft survival is censored for death.
Figure 2: Effect of cold ischemia time on graft survival. Graft survival is censored for death
Yogeshwaran, et al.: Factors influencing Cadaveric renal transplant outcome
124124International Journal of Scientific Study | April 2018 | Vol 6 | Issue 1
Importantly, no other factors were significant, including AR, HLA matching, highly sensitized recipients, regrafts, and donor age. Again, contrasting effects of rejection were found according to the occurrence of DGF, with rejection reducing graft survival in the absence of DGF. Neither result was significant individually; the test for interaction was (z = 2.0, P = 0.046).
Factors Affecting Long-term Survival of the Grafts that Reached 1 yearProportional hazards regression analysis was used to investigate factors affecting failure of grafts that survived beyond the 1-year post-transplant. The most important factor identified was serum creatinine at 1 year. CIT was also significant, as were donor and recipient age; older recipients had reduced graft loss [Table 4].
Serum creatinine has stronger predictor value than creatinine. In this analysis, regrafts, highly sensitized recipients and other donor and ICU parameters did not have a significant effect on long-term graft survival after the 1st year.
Risk Factors for DGFIn view of the importance of DGF, possible predictors of this state were investigated.
DGF was found to be significantly influenced by CIT, donor age, and donor creatinine [Table 4]. CIT, donor age, and donor serum creatinine were entered into the statistical model as continuous variables. The statistical analysis indicated that an increase in each of these variables
independently increased the risk of DGF. Hence, an increase in each unit of the variable, each hour of CIT, year of donor age, and micromoles per liter of donor serum creatinine increased the incidence of DGF.
The only other factor that increased significantly the risk of DGF was transplantation of a female kidney into a male recipient (P < 0.005), which independently conferred a higher risk of DGF than a female kidney into a female recipient or a male kidney into either sex [Table 4].
No evidence was found for departures from the logistic model. The “Hosmer–Lemeshow” goodness of fit statistic was not significant. Addition of quadratic terms in donor age and CIT did not improve the fit, nor did replacement of CIT by its logarithm. Banded results for donor age and CIT are shown in Table 6.
However, the overall explanatory power of the model was not great, the Nagelkerke R2 was 0.196. In the “classification table,” most of the DGF occurred in those cases where it was not predicted (sensitivity 30%, specificity 93%).
Donor factors, such as death resulting from cardiovascular disease, prolonged donor ventilation time, requirement for inotropes, and other factors associated with ICU management (as in Table 1) were not risk factors for DGF. Recipients who received a kidney from a donor who suffered a traumatic death had a significantly decreased risk of DGF, but this was not significant after inclusion of the “female-to-male” variable.
Risk Factors for ARThe most important predictors of rejection were the number of DR mismatches and the occurrence of DGF. However, there was evidence of an interaction between them with an effect of mismatches only in the absence of DGF [Figure 3], a test for interaction was significant (z = 2.44, P = 0.014). Donor age was also a significant factor; the relation appeared to be continuous.
Effect of DGF and DR Mismatches on RejectionRecipients who received kidneys from donors requiring inotropes had a significantly higher risk of early rejection (P < 0.05). AR was not more prevalent in highly sensitized patients or patients with pre-transplant HLA antibodies. In addition, the analysis of early AR (within 14 days after the transplant) suggested that DGF and the degree of DR mismatching were still the most significant risk factors (P < 0.05 and P < 0.005). However, in this early period, unlike in the overall analysis, younger recipients did have an increased risk of developing early rejection (P < 0.05). In contrast, in this early time period, donor age was not a statistically significant variable (P > 0.05).
Table 5: Effect of DGF on graft failure during different time periodsTime period Hazard ratio 95% CI0–3 months 14.1 4.9–40.93 months to 1 year 2.9 0.94–9.1>1 year 1.9 1.02–3.4
Table 6: DGF by bands of CIT and donor ageFactors Number % DGFCIT (h)
5–17 124 2218–20 91 2121–24 106 25.525–31 88 3532–70 91 50
Donor age (years)7–27 102 1528–38 107 2239–47 98 3648–56 96 37.557–80 97 41
Yogeshwaran, et al.: Factors influencing Cadaveric renal transplant outcome
125125 International Journal of Scientific Study | April 2018 | Vol 6 | Issue 1
Factors Affecting 1-year CreatinineAs creatinine at 1 year was a highly significant predictor of late failure, factors that might predict this were also investigated. Significant predictors were donor and recipient ages and DGF [Table 7]. The overall R2 was low (0.166), showing again that the model did not explain the variation fully.
DISCUSSION
We have used multivariate analysis to investigate the influence of a number of factors and the relations between them. A single-center study permits the use of more detailed data in a fairly homogeneous set and provides a useful complement to multicenter studies. We selected the decade of the 1990s for this study, because in our unit, this was a period of very uniform immunosuppression and clinical practice. These immunosuppression agents are still of great relevance today as the use of cyclosporine and azathioprine are still part of the UK National Guidelines as laid down by the National Institute of Clinical Excellence. Similar studies published previously have often come from multicenter registry data, where the level of HLA matching is variable, CITs are often longer, and there are large variations in induction and maintenance regimens between centers.[5,6] Very few patients were excluded from this study, only then when there was a lack of donor information. The incidence of DGF, AR, and the 1-year graft survival in these patients showed that this group was no different to the study population, suggesting that loss of these patients was unlikely to have distorted the results of the study.
DGFThe most striking effects found in our study are the strong impact of DGF and CIT, reduced importance of rejection, and the lack of impact of matching. The importance of DGF and rejection for subsequent failure has been a matter of controversy for some time.[7,8]
The lack of effect of matching on graft survival was not surprising. Recently, Su et al.[9] have reported a declining effect of matching in the USA during the period covered by our study. It is possible that improved immunosuppression, together with diagnosis and treatment of rejection, mean that in a relatively well-matched population such as ours these factors do not lead to failure (the mean total number of mismatches was 2.7, as against 3.6in a recent multicenter
report[10]).
The incidence of DGF in our series at 31% was consistent with our previous data[11] and comparable to that of other centers. [5,7,8] CIT was the most significant risk factor for the development of DGF and its effect appears to be continuous. This observation is supported by other investigators.[7] Other studies have suggested that there are significant time points after which the risk of DGF accelerates.[5,8,12] The importance of the finding in this study needs to be stressed, as it is attractive to imagine a specific threshold CIT after which the risk of DGF is significantly increased. However, from our findings, it is clear that each hour even at short CIT adds additional risk.
Recent multicenter studies have confirmed the importance of CIT and donor age for graft survival. Su et al.[9] show that the effect is significant for times over 37 h compared with baseline. However, they do not test for discontinuity, and overall, their data appear consistent with a continuous effect of CIT. The collaborative transplant study[10] suggests that there is “little effect below 25 h;” however, they do not present any analysis to confirm this, and it is not obvious from their figures. Roodnat et al.[13] previously reported effects on graft survival over a wide range of CIT. Our results differ from theirs in that Roodnat et al. found the effect to be limited to the short-term, whereas we find evidence of an effect of CIT on late failure.
Despite the large number of variables studied in relation to DGF, the fit of the statistical model is far from complete; indeed one advantage of the model is that it emphasizes this. The “Nagelkerke R2[3]” is a generalization of the standard measure of fit of a multiple linear regression model, but caution should be exercised in interpreting it. However, taken together with the results of the classification table from the logistic regression, it suggests that other unknown factors are having an effect. It is possible that some organs are more sensitive (susceptible) to cold ischemia, reperfusion injury, and the vasoconstrictive effects of calcineurin inhibitors than others and the reason for this need further investigation. We have not examined the effect of time on dialysis, which has been reported as a predictor in several studies.[7] In view of the evidence that DGF is a major predictor of graft failure, efforts should be made to understand better what is involved and how it may be reduced.
ARThe incidence of AR at 54% in this study may be considered to be high by contemporary standards. However, our data correspond to therapy based on cyclosporine, azathioprine, and steroids without routine use of antibody therapy. In our unit, rejection episodes were confirmed by core biopsy and protocol biopsies were carried out at day 7 and 28
Table 7: Factors affecting 1-year creatinineFactor Slope P valueDGF 19.2 0.035Donor age 1.83 <0.005Recipient age −0.89 0.004
Yogeshwaran, et al.: Factors influencing Cadaveric renal transplant outcome
126126International Journal of Scientific Study | April 2018 | Vol 6 | Issue 1
post-transplant. Furthermore, fine-needle aspirations were performed routinely to monitor the level of infiltration in the graft in recipients with DGF. We have found as reported by Rush et al.[14], that subclinical rejection occurred but was not treated or included in the analysis as AR. The degrees of severity of rejection were not analyzed individually as the study crossed over periods of significant changes in classification. However, ATG was used when severe rejection occurred and the use of ATG is not significant in multifactorial analysis.
DGF is also a significant risk factor for AR. It has been suggested that AR may be masked during DGF, as renal function cannot be used to detect episodes of AR.[8] Hence, treatable episodes of rejection may not be diagnosed, and it is the failure to treat this occult rejection rather than the DGF itself that leads to a reduced long-term outcome. In our study, we believe, this difficulty in analysis has been avoided as all allografts are biopsied routinely and AR is diagnosed irrespective of function.
In the present study, the risk of AR was neither increased in regrafts nor in sensitized patients. Preformed donor-reactive anti-HLA antibodies are detected by modern crossmatching techniques and antibody screening was done to determine if antibody specificity is performed before the transplant. The thorough immunological workup of transplant recipients has prevented the presence of antibodies from being a risk factor for rejection.
1-year Graft SurvivalThe main determinant of 1-year graft survival in this series, after censoring for death with a functioning graft, was DGF. There were no adverse effects of other donor factors including donor age or ICU management on 1-year graft survival. Importantly, no other factors were significant, including AR, HLA matching, highly sensitized recipients, and regrafts. The lack of an effect of AR on 1-year graft survival is surprising but not unexpected. This phenomenon has been mirrored in many recent publications comparing immunosuppressive regimens. It would suggest that AR in the first year is no longer a good end point for comparative studies.[15] Furthermore, highly sensitized recipients were treated with ATG as induction therapy which could account partly for the good results obtained on these patients as reports suggest that antibody therapy helps to prevent graft loss in these high-risk patients. However, this is not the full story as the variable “ATG on induction” has no independent effect on survival.
The only other significant factor that influenced the 1-year graft survival was the year of transplantation. The immunosuppressive regimen and other factors over this period were unchanged which suggests that other factors not included in the statistical model had an impact on short-
term graft survival (Sandimmune vs. Neoral). It is possible that there were medical and technical improvements made over the study period that increased survival. In an observational study, we cannot exclude the possibility of such confounding factors. However, changes over time do not explain the effect of DGF on survival because this is maintained in the proportional hazards analysis including “transplant year,” and in log-rank analysis stratified by “transplant year.”
Censoring for death is a well-known and common practice in the analysis of transplant outcome, but this might have an unexpected effect on the analysis as it may selectively exclude patients with high serum creatinine. In a recent publication, Meier-Kriesche et al.[16] have reported a strong association between renal function at 1 year and the risk of cardiovascular disease and infectious mortality. According to this publication, a serum creatinine level of 1.9–2.1 mg/dL conferred a 50% increased risk of cardiovascular death compared with a serum creatinine level of >1.3mg/dL.
Long-term Graft SurvivalThe only factors affecting the long-term survival of those grafts that reached 1 year after censoring for death were recipient age and CIT and no apparent effect of AR or HLA matching. Crucially, we have found in our study that CIT affects long-term graft survival independently of the phenomenon of DGF. Other studies have found that DGF is one of the most important factors related to graft loss but have not identified CIT as having an impact in the long-term. In contrast, Ojo et al.[5] in a study from American registry data found that prolonged CIT directly and independently of DGF and AR, compromised the long-term graft survival. In this study, we have shown that the effect of CIT on long-term graft survival is linear, and hence, there is no threshold below which CIT is acceptable or a threshold beyond which the deleterious affect of CIT accelerates.
We have not shown an influence of AR on graft survival after 1 year. Even though AR was common (54%), the incidence of severe rejections and steroid-resistant rejections were low. In contrast, it has been demonstrated in less well-matched populations using large retrospective databases that there is an impact of HLA-matching and the more severe forms of rejection on long-term graft survival.
Finally, the serum creatinine at 1 year, rather than the serum creatinine at 3 or 6 months, was found from this analysis to be an excellent predictor of the long-term survival of the graft as was reported by Hariharan et al.[6] It was also found to be an important factor in a recent report by He and Johnston.[17]
Yogeshwaran, et al.: Factors influencing Cadaveric renal transplant outcome
127127 International Journal of Scientific Study | April 2018 | Vol 6 | Issue 1
CONCLUSION
In conclusion, the factors involved in the short-term and long-term outcome and function of the renal transplant graft are multiple and interrelated. Older donors with pre-existing medical conditions and more fragile donor organs will need to be used to bridge the gap between supply and demand for cadaveric organs. Even though this study has not shown a significant impact of donor management, it would still seem appropriate to study ways of minimizing harm to the donor organ during this period. Minimization of the injury during the period of preservation will have increased importance. At a local level, our study lends weight to the need for sympathetic treatment of kidneys at multiorgan retrievals and access to theaters at the earliest possible opportunity. Our study has stimulated research into the cost–benefit ratios of increased use of the more expensive cold preservation solutions. Furthermore, the use of organ perfusion by machine at both cold and warm temperatures is now being revisited.
CIT is clearly identified as an important factor and one that can be controlled. Efforts should, therefore, be made to reduce CIT as much as possible; indeed, it was reduced during the period of this study. It would be unwise to place emphasis on ‘cutoff values’ that have not been rigorously demonstrated.
HLA matching has been the major focus of national and local sharing schemes to improve outcomes from transplantation. Although sharing could result in an increased in CIT, this has usually been seen as a price worth paying for improved matching. Recent national data show that the CIT of shared kidneys is only slightly longer than that of local kidneys (UK Transplant, Bristol). We do not propose that attention to HLA matching should be reduced but that practices could be reviewed with the objective of reducing CIT while maintaining matching.
REFERENCES
1. Marshall R, Ahsan N, Dhillon S, Holman M, Yang HC. Adverse effect of donor vasopressor support on immediate and one-year kidney allograft function. Surgery 1996;120:663-5.
2. Pratschke J, Wilhelm MJ, Laskowski I, Kusaka M, Beato F, Tullius SG, et al. Influence of donor brain death on chronic rejection of renal transplants in rats. J Am Soc Nephrol 2001;12:2474-81.
3. Nagelkerke N. A note on a general definition of the coefficient of determination. Biometrika 1991;78:691-2.
4. Altman DG, Bland JM. Interaction revisited: The difference between two estimates. BMJ 2003;326:219.
5. Ojo AO, Wolfe RA, Held PJ, Port FK, Schmouder RL. Delayed graft function: Risk factors and implications for renal allograft survival. Transplantation 1997;63:968-74.
6. Hariharan S, McBride MA, Cherikh WS, Tolleris CB, Bresnahan BA, Johnson CP, et al. Post-transplant renal function in the first year predicts long-term kidney transplant survival. Kidney Int 2002;62:311-8.
7. Kyllönen LE, Salmela KT, Eklund BH, Halme LE, Höckerstedt KA, Isoniemi HM, et al. Long-term results of 1047 cadaveric kidney transplantations with special emphasis on initial graft function and rejection. Transpl Int 2000;13:122-8.
8. Troppmann C, Gillingham KJ, Benedetti E, Almond PS, Gruessner RW, Najarian JS, et al. Delayed graft function, acute rejection, and outcome after cadaver renal transplantation. The multivariate analysis. Transplantation 1995;59:962-8.
9. Su X, Zenios SA, Chakkera H, Milford EL, Chertow GM. Diminishing significance of HLA matching in kidney transplantation. Am J Transplant 2004;4:1501-8.
10. Opelz G, Döhler B, Ruhenstroth A, Cinca S, Unterrainer C, Stricker L, et al. The collaborative transplant study registry. Transplant Rev (Orlando) 2013;27:43-5.
11. McLaren AJ, Jassem W, Gray DW, Fuggle SV, Welsh KI, Morris PJ, et al. Delayed graft function: Risk factors and the relative effects of early function and acute rejection on long-term survival in cadaveric renal transplantation. Clin Transplant 1999;13:266-72.
12. Boom H, Mallat MJ, de Fijter JW, Zwinderman AH, Paul LC. Delayed graft function influences renal function, but not survival. Kidney Int 2000;58:859-66.
13. Roodnat JI, Mulder PG, Van Riemsdijk IC, IJzermans JN, van Gelder T, Weimar W, et al. Ischemia times and donor serum creatinine in relation to renal graft failure. Transplantation 2003;75:799-804.
14. Rush DN, Karpinski ME, Nickerson P, Dancea S, Birk P, Jeffery JR, et al. Does subclinical rejection contribute to chronic rejection in renal transplant patients? Clin Transplant 1999;13:441-6.
15. Paraskevas S, Kandaswamy R, Humar A, Gillingham K, Gruessner RW, Payne WD, et al. Predicting long-term kidney graft survival: Can new trials be performed? Transplantation 2003;75:1256-9.
16. Meier-Kriesche HU, Baliga R, Kaplan B. Decreased renal function is a strong risk factor for cardiovascular death after renal transplantation. Transplantation 2003;75:1291-5.
17. He X, Johnston A. Risk factors for allograft failure in united kingdom renal transplant recipients treated with cyclosporine A. Transplantation 2005;79:953-7.
How to cite this article: Yogeshwaran K, Neelakandan R, Natarajan K. Major Effects of Delayed Graft Function and Cold Ischemia Time on Renal Allograft Survival. Int J Sci Stud 2018;6(1):120-127.
Source of Support: Nil, Conflict of Interest: None declared.
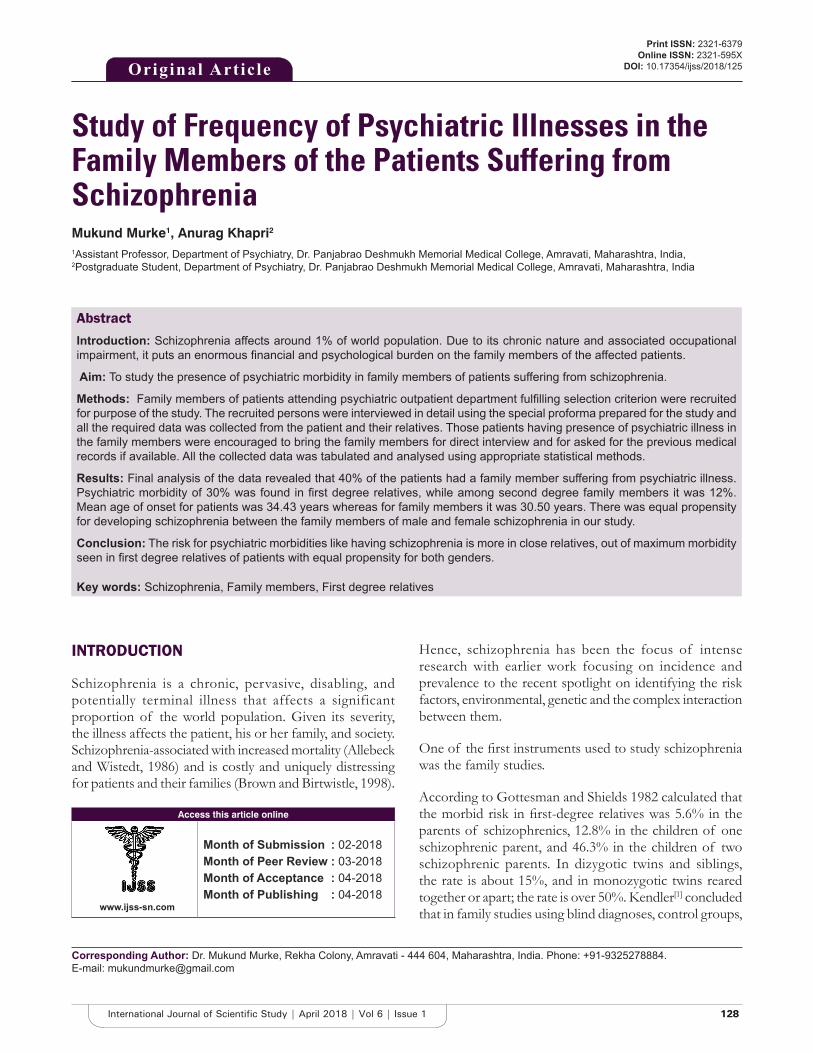
128128International Journal of Scientific Study | April 2018 | Vol 6 | Issue 1
Study of Frequency of Psychiatric Illnesses in the Family Members of the Patients Suffering from SchizophreniaMukund Murke1, Anurag Khapri2
1Assistant Professor, Department of Psychiatry, Dr. Panjabrao Deshmukh Memorial Medical College, Amravati, Maharashtra, India, 2Postgraduate Student, Department of Psychiatry, Dr. Panjabrao Deshmukh Memorial Medical College, Amravati, Maharashtra, India
Hence, schizophrenia has been the focus of intense research with earlier work focusing on incidence and prevalence to the recent spotlight on identifying the risk factors, environmental, genetic and the complex interaction between them.
One of the first instruments used to study schizophrenia was the family studies.
According to Gottesman and Shields 1982 calculated that the morbid risk in first-degree relatives was 5.6% in the parents of schizophrenics, 12.8% in the children of one schizophrenic parent, and 46.3% in the children of two schizophrenic parents. In dizygotic twins and siblings, the rate is about 15%, and in monozygotic twins reared together or apart; the rate is over 50%. Kendler[1] concluded that in family studies using blind diagnoses, control groups,
INTRODUCTION
Schizophrenia is a chronic, pervasive, disabling, and potentially terminal illness that affects a significant proportion of the world population. Given its severity, the illness affects the patient, his or her family, and society. Schizophrenia-associated with increased mortality (Allebeck and Wistedt, 1986) and is costly and uniquely distressing for patients and their families (Brown and Birtwistle, 1998).
Original Article
AbstractIntroduction: Schizophrenia affects around 1% of world population. Due to its chronic nature and associated occupational impairment, it puts an enormous financial and psychological burden on the family members of the affected patients.
Aim: To study the presence of psychiatric morbidity in family members of patients suffering from schizophrenia.
Methods: Family members of patients attending psychiatric outpatient department fulfilling selection criterion were recruited for purpose of the study. The recruited persons were interviewed in detail using the special proforma prepared for the study and all the required data was collected from the patient and their relatives. Those patients having presence of psychiatric illness in the family members were encouraged to bring the family members for direct interview and for asked for the previous medical records if available. All the collected data was tabulated and analysed using appropriate statistical methods.
Results: Final analysis of the data revealed that 40% of the patients had a family member suffering from psychiatric illness. Psychiatric morbidity of 30% was found in first degree relatives, while among second degree family members it was 12%. Mean age of onset for patients was 34.43 years whereas for family members it was 30.50 years. There was equal propensity for developing schizophrenia between the family members of male and female schizophrenia in our study.
Conclusion: The risk for psychiatric morbidities like having schizophrenia is more in close relatives, out of maximum morbidity seen in first degree relatives of patients with equal propensity for both genders.
Key words: Schizophrenia, Family members, First degree relatives
Access this article online
www.ijss-sn.com
Month of Submission : 02-2018 Month of Peer Review : 03-2018 Month of Acceptance : 04-2018 Month of Publishing : 04-2018
Corresponding Author: Dr. Mukund Murke, Rekha Colony, Amravati - 444 604, Maharashtra, India. Phone: +91-9325278884. E-mail: [email protected]
Print ISSN: 2321-6379Online ISSN: 2321-595X
DOI: 10.17354/ijss/2018/125
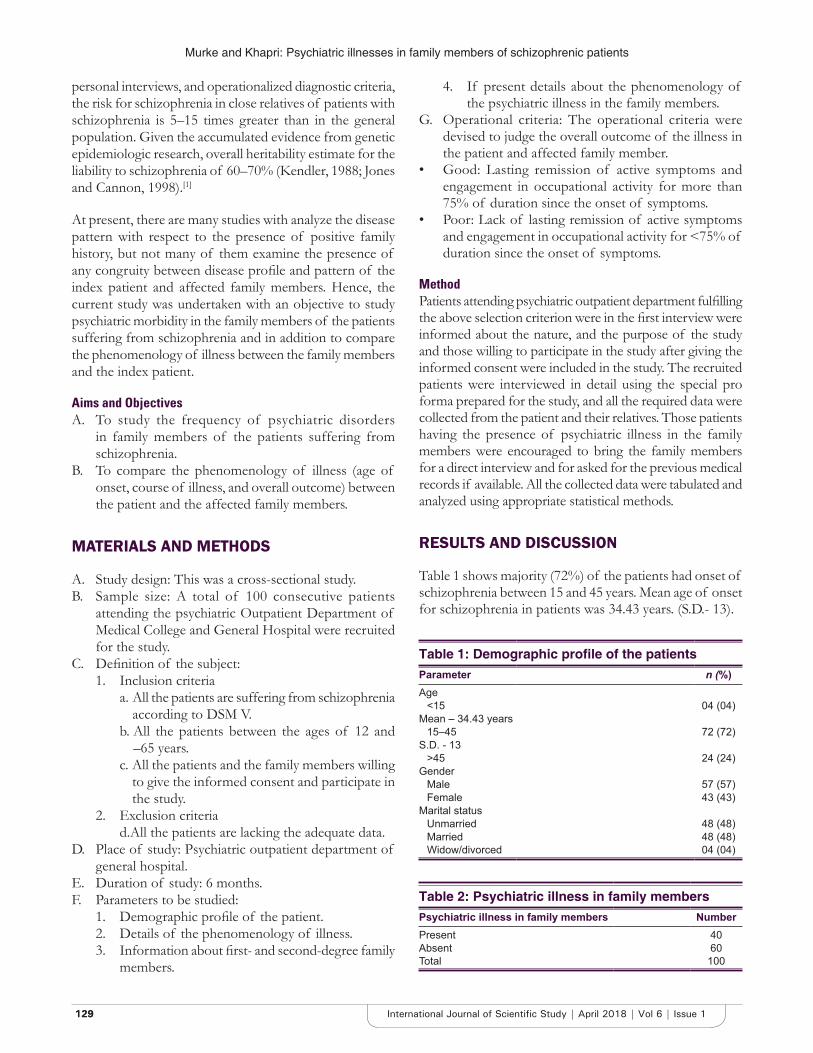
Murke and Khapri: Psychiatric illnesses in family members of schizophrenic patients
129129 International Journal of Scientific Study | April 2018 | Vol 6 | Issue 1
personal interviews, and operationalized diagnostic criteria, the risk for schizophrenia in close relatives of patients with schizophrenia is 5–15 times greater than in the general population. Given the accumulated evidence from genetic epidemiologic research, overall heritability estimate for the liability to schizophrenia of 60–70% (Kendler, 1988; Jones and Cannon, 1998).[1]
At present, there are many studies with analyze the disease pattern with respect to the presence of positive family history, but not many of them examine the presence of any congruity between disease profile and pattern of the index patient and affected family members. Hence, the current study was undertaken with an objective to study psychiatric morbidity in the family members of the patients suffering from schizophrenia and in addition to compare the phenomenology of illness between the family members and the index patient.
Aims and ObjectivesA. To study the frequency of psychiatric disorders
in family members of the patients suffering from schizophrenia.
B. To compare the phenomenology of illness (age of onset, course of illness, and overall outcome) between the patient and the affected family members.
MATERIALS AND METHODS
A. Study design: This was a cross-sectional study.B. Sample size: A total of 100 consecutive patients
attending the psychiatric Outpatient Department of Medical College and General Hospital were recruited for the study.
C. Definition of the subject:1. Inclusion criteria a. All the patients are suffering from schizophrenia
according to DSM V. b. All the patients between the ages of 12 and
–65 years. c. All the patients and the family members willing
to give the informed consent and participate in the study.
2. Exclusion criteria d.All the patients are lacking the adequate data.
D. Place of study: Psychiatric outpatient department of general hospital.
E. Duration of study: 6 months.F. Parameters to be studied:
1. Demographic profile of the patient.2. Details of the phenomenology of illness.3. Information about first- and second-degree family
members.
4. If present details about the phenomenology of the psychiatric illness in the family members.
G. Operational criteria: The operational criteria were devised to judge the overall outcome of the illness in the patient and affected family member.
• Good: Lasting remission of active symptoms and engagement in occupational activity for more than 75% of duration since the onset of symptoms.
• Poor: Lack of lasting remission of active symptoms and engagement in occupational activity for <75% of duration since the onset of symptoms.
MethodPatients attending psychiatric outpatient department fulfilling the above selection criterion were in the first interview were informed about the nature, and the purpose of the study and those willing to participate in the study after giving the informed consent were included in the study. The recruited patients were interviewed in detail using the special pro forma prepared for the study, and all the required data were collected from the patient and their relatives. Those patients having the presence of psychiatric illness in the family members were encouraged to bring the family members for a direct interview and for asked for the previous medical records if available. All the collected data were tabulated and analyzed using appropriate statistical methods.
RESULTS AND DISCUSSION
Table 1 shows majority (72%) of the patients had onset of schizophrenia between 15 and 45 years. Mean age of onset for schizophrenia in patients was 34.43 years. (S.D.- 13).
Table 1: Demographic profile of the patientsParameter n (%)Age
<15 04 (04)Mean – 34.43 years
15–45 72 (72)S.D. - 13
>45 24 (24)Gender
Male 57 (57)Female 43 (43)
Marital statusUnmarried 48 (48)Married 48 (48)Widow/divorced 04 (04)
Table 2: Psychiatric illness in family membersPsychiatric illness in family members NumberPresent 40Absent 60Total 100
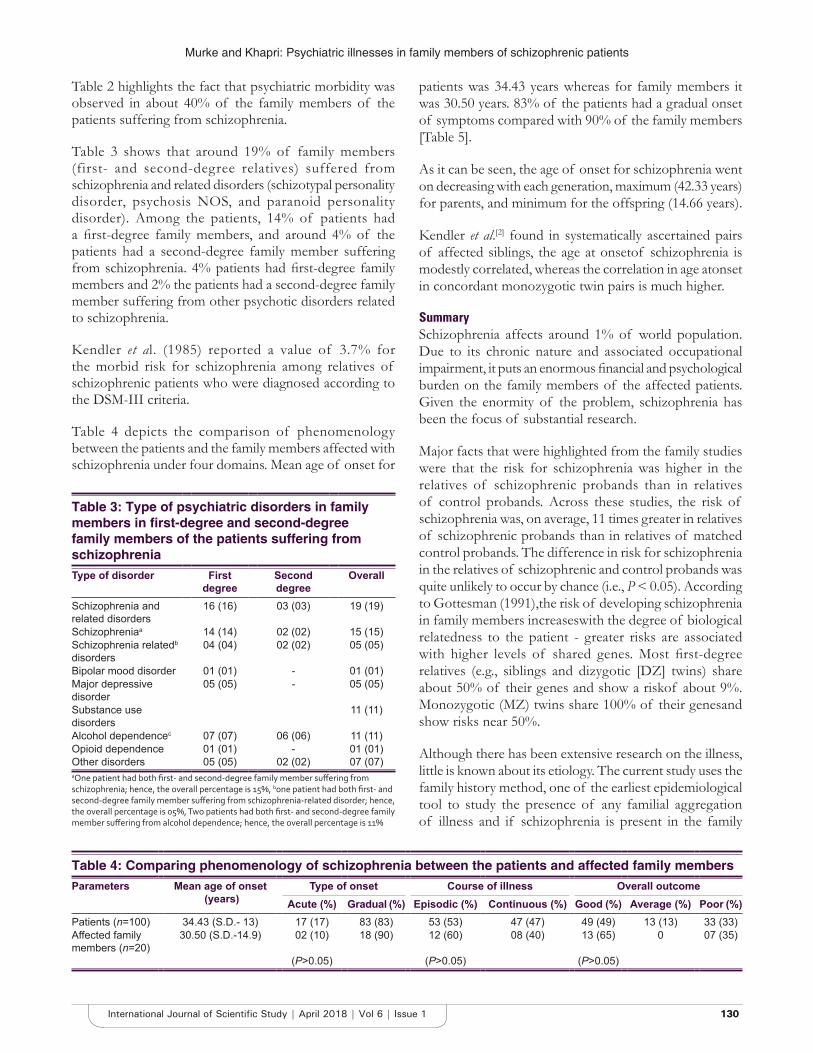
Murke and Khapri: Psychiatric illnesses in family members of schizophrenic patients
130130International Journal of Scientific Study | April 2018 | Vol 6 | Issue 1
Table 2 highlights the fact that psychiatric morbidity was observed in about 40% of the family members of the patients suffering from schizophrenia.
Table 3 shows that around 19% of family members (first- and second-degree relatives) suffered from schizophrenia and related disorders (schizotypal personality disorder, psychosis NOS, and paranoid personality disorder). Among the patients, 14% of patients had a first-degree family members, and around 4% of the patients had a second-degree family member suffering from schizophrenia. 4% patients had first-degree family members and 2% the patients had a second-degree family member suffering from other psychotic disorders related to schizophrenia.
Kendler et al. (1985) reported a value of 3.7% for the morbid risk for schizophrenia among relatives of schizophrenic patients who were diagnosed according to the DSM-III criteria.
Table 4 depicts the comparison of phenomenology between the patients and the family members affected with schizophrenia under four domains. Mean age of onset for
patients was 34.43 years whereas for family members it was 30.50 years. 83% of the patients had a gradual onset of symptoms compared with 90% of the family members [Table 5].
As it can be seen, the age of onset for schizophrenia went on decreasing with each generation, maximum (42.33 years) for parents, and minimum for the offspring (14.66 years).
Kendler et al.[2] found in systematically ascertained pairs of affected siblings, the age at onsetof schizophrenia is modestly correlated, whereas the correlation in age atonset in concordant monozygotic twin pairs is much higher.
SummarySchizophrenia affects around 1% of world population. Due to its chronic nature and associated occupational impairment, it puts an enormous financial and psychological burden on the family members of the affected patients. Given the enormity of the problem, schizophrenia has been the focus of substantial research.
Major facts that were highlighted from the family studies were that the risk for schizophrenia was higher in the relatives of schizophrenic probands than in relatives of control probands. Across these studies, the risk of schizophrenia was, on average, 11 times greater in relatives of schizophrenic probands than in relatives of matched control probands. The difference in risk for schizophrenia in the relatives of schizophrenic and control probands was quite unlikely to occur by chance (i.e., P < 0.05). According to Gottesman (1991),the risk of developing schizophrenia in family members increaseswith the degree of biological relatedness to the patient - greater risks are associated with higher levels of shared genes. Most first-degree relatives (e.g., siblings and dizygotic [DZ] twins) share about 50% of their genes and show a riskof about 9%. Monozygotic (MZ) twins share 100% of their genesand show risks near 50%.
Although there has been extensive research on the illness, little is known about its etiology. The current study uses the family history method, one of the earliest epidemiological tool to study the presence of any familial aggregation of illness and if schizophrenia is present in the family
Table 3: Type of psychiatric disorders in family members in first‑degree and second‑degree family members of the patients suffering from schizophreniaType of disorder First
degreeSecond degree
Overall
Schizophrenia and related disorders
16 (16) 03 (03) 19 (19)
Schizophreniaa 14 (14) 02 (02) 15 (15)Schizophrenia relatedb
disorders04 (04) 02 (02) 05 (05)
Bipolar mood disorder 01 (01) - 01 (01)Major depressive disorder
05 (05) - 05 (05)
Substance use disorders
11 (11)
Alcohol dependencec 07 (07) 06 (06) 11 (11)Opioid dependence 01 (01) - 01 (01)Other disorders 05 (05) 02 (02) 07 (07)aOne patient had both first‑ and second‑degree family member suffering from schizophrenia; hence, the overall percentage is 15%, bone patient had both first‑ and second‑degree family member suffering from schizophrenia‑related disorder; hence, the overall percentage is 05%, Two patients had both first‑ and second‑degree family member suffering from alcohol dependence; hence, the overall percentage is 11%
Table 4: Comparing phenomenology of schizophrenia between the patients and affected family membersParameters Mean age of onset
(years)Type of onset Course of illness Overall outcome
Acute (%) Gradual (%) Episodic (%) Continuous (%) Good (%) Average (%) Poor (%)Patients (n=100) 34.43 (S.D.- 13) 17 (17) 83 (83) 53 (53) 47 (47) 49 (49) 13 (13) 33 (33)Affected family members (n=20)
30.50 (S.D.-14.9) 02 (10) 18 (90) 12 (60) 08 (40) 13 (65) 0 07 (35)
(P>0.05) (P>0.05) (P>0.05)
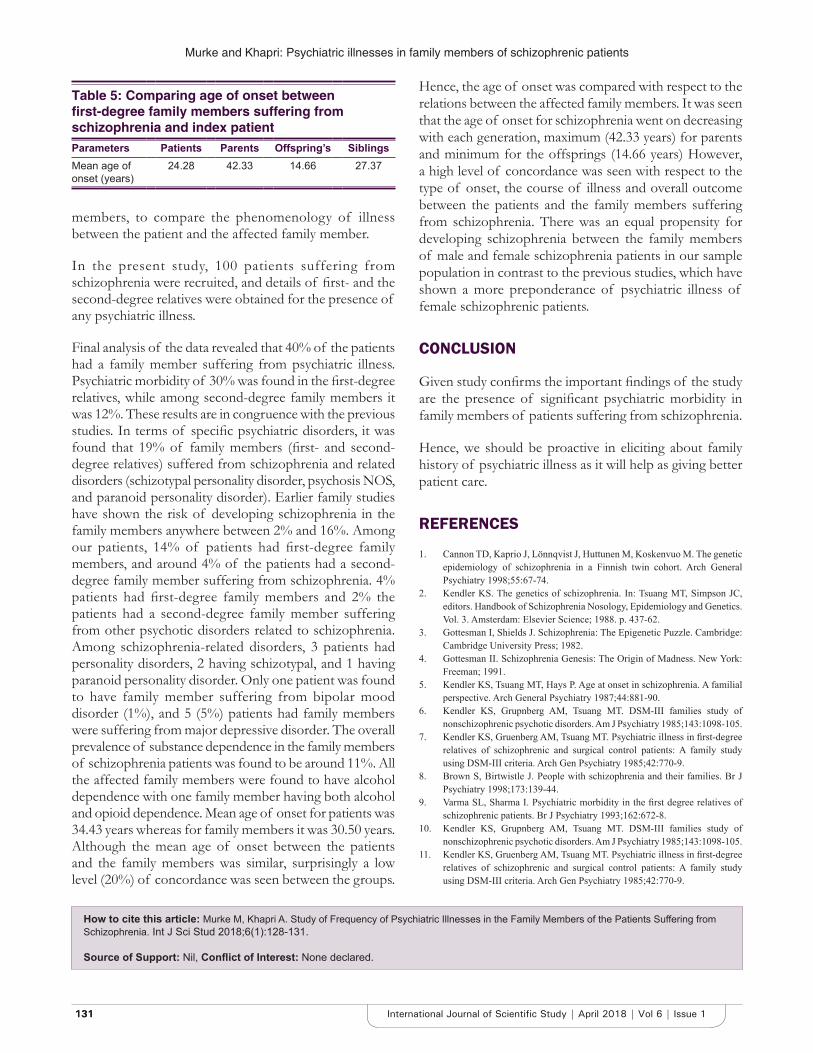
Murke and Khapri: Psychiatric illnesses in family members of schizophrenic patients
131131 International Journal of Scientific Study | April 2018 | Vol 6 | Issue 1
members, to compare the phenomenology of illness between the patient and the affected family member.
In the present study, 100 patients suffering from schizophrenia were recruited, and details of first- and the second-degree relatives were obtained for the presence of any psychiatric illness.
Final analysis of the data revealed that 40% of the patients had a family member suffering from psychiatric illness. Psychiatric morbidity of 30% was found in the first-degree relatives, while among second-degree family members it was 12%. These results are in congruence with the previous studies. In terms of specific psychiatric disorders, it was found that 19% of family members (first- and second-degree relatives) suffered from schizophrenia and related disorders (schizotypal personality disorder, psychosis NOS, and paranoid personality disorder). Earlier family studies have shown the risk of developing schizophrenia in the family members anywhere between 2% and 16%. Among our patients, 14% of patients had first-degree family members, and around 4% of the patients had a second-degree family member suffering from schizophrenia. 4% patients had first-degree family members and 2% the patients had a second-degree family member suffering from other psychotic disorders related to schizophrenia. Among schizophrenia-related disorders, 3 patients had personality disorders, 2 having schizotypal, and 1 having paranoid personality disorder. Only one patient was found to have family member suffering from bipolar mood disorder (1%), and 5 (5%) patients had family members were suffering from major depressive disorder. The overall prevalence of substance dependence in the family members of schizophrenia patients was found to be around 11%. All the affected family members were found to have alcohol dependence with one family member having both alcohol and opioid dependence. Mean age of onset for patients was 34.43 years whereas for family members it was 30.50 years. Although the mean age of onset between the patients and the family members was similar, surprisingly a low level (20%) of concordance was seen between the groups.
Hence, the age of onset was compared with respect to the relations between the affected family members. It was seen that the age of onset for schizophrenia went on decreasing with each generation, maximum (42.33 years) for parents and minimum for the offsprings (14.66 years) However, a high level of concordance was seen with respect to the type of onset, the course of illness and overall outcome between the patients and the family members suffering from schizophrenia. There was an equal propensity for developing schizophrenia between the family members of male and female schizophrenia patients in our sample population in contrast to the previous studies, which have shown a more preponderance of psychiatric illness of female schizophrenic patients.
CONCLUSION
Given study confirms the important findings of the study are the presence of significant psychiatric morbidity in family members of patients suffering from schizophrenia.
Hence, we should be proactive in eliciting about family history of psychiatric illness as it will help as giving better patient care.
REFERENCES
1. Cannon TD, Kaprio J, Lönnqvist J, Huttunen M, Koskenvuo M. The genetic epidemiology of schizophrenia in a Finnish twin cohort. Arch General Psychiatry 1998;55:67-74.
2. Kendler KS. The genetics of schizophrenia. In: Tsuang MT, Simpson JC, editors. Handbook of Schizophrenia Nosology, Epidemiology and Genetics. Vol. 3. Amsterdam: Elsevier Science; 1988. p. 437-62.
3. Gottesman I, Shields J. Schizophrenia: The Epigenetic Puzzle. Cambridge: Cambridge University Press; 1982.
4. Gottesman II. Schizophrenia Genesis: The Origin of Madness. New York: Freeman; 1991.
5. Kendler KS, Tsuang MT, Hays P. Age at onset in schizophrenia. A familial perspective. Arch General Psychiatry 1987;44:881-90.
6. Kendler KS, Grupnberg AM, Tsuang MT. DSM-III families study of nonschizophrenic psychotic disorders. Am J Psychiatry 1985;143:1098-105.
7. Kendler KS, Gruenberg AM, Tsuang MT. Psychiatric illness in first-degree relatives of schizophrenic and surgical control patients: A family study using DSM-III criteria. Arch Gen Psychiatry 1985;42:770-9.
8. Brown S, Birtwistle J. People with schizophrenia and their families. Br J Psychiatry 1998;173:139-44.
9. Varma SL, Sharma I. Psychiatric morbidity in the first degree relatives of schizophrenic patients. Br J Psychiatry 1993;162:672-8.
10. Kendler KS, Grupnberg AM, Tsuang MT. DSM-III families study of nonschizophrenic psychotic disorders. Am J Psychiatry 1985;143:1098-105.
11. Kendler KS, Gruenberg AM, Tsuang MT. Psychiatric illness in first-degree relatives of schizophrenic and surgical control patients: A family study using DSM-III criteria. Arch Gen Psychiatry 1985;42:770-9.
Table 5: Comparing age of onset between first‑degree family members suffering from schizophrenia and index patientParameters Patients Parents Offspring’s SiblingsMean age of onset (years)
24.28 42.33 14.66 27.37
How to cite this article: Murke M, Khapri A. Study of Frequency of Psychiatric Illnesses in the Family Members of the Patients Suffering from Schizophrenia. Int J Sci Stud 2018;6(1):128-131.
Source of Support: Nil, Conflict of Interest: None declared.
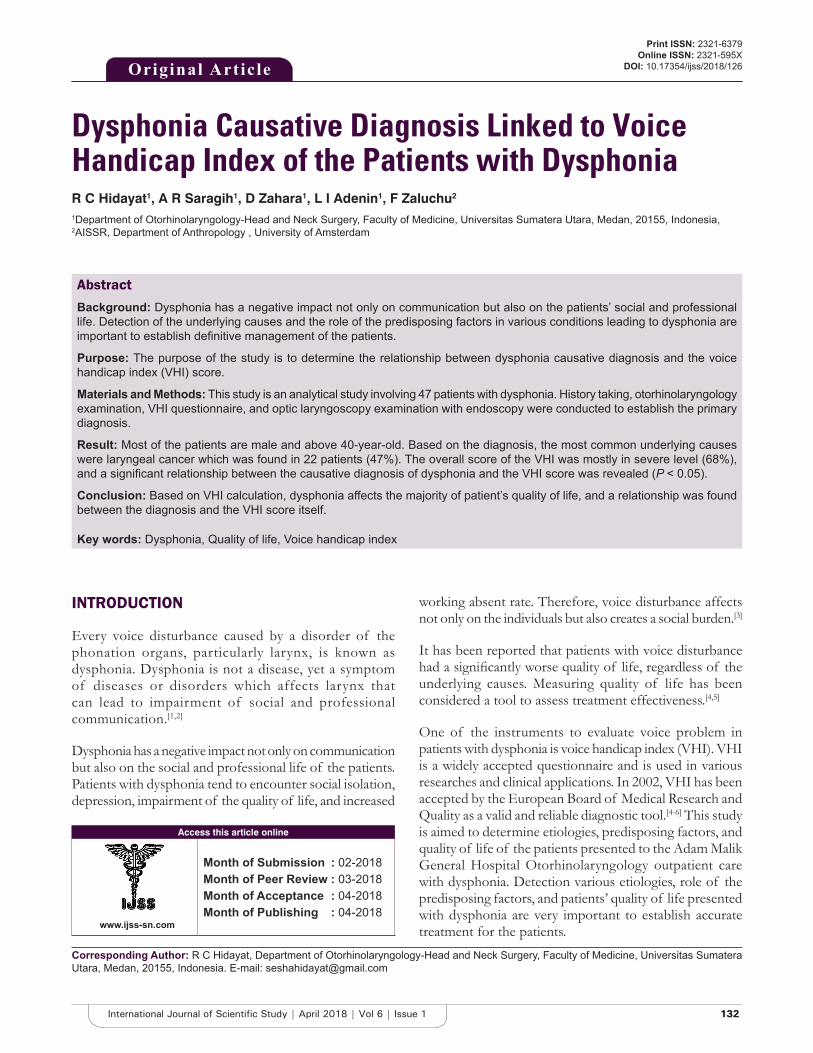
132132International Journal of Scientific Study | April 2018 | Vol 6 | Issue 1
Dysphonia Causative Diagnosis Linked to Voice Handicap Index of the Patients with DysphoniaR C Hidayat1, A R Saragih1, D Zahara1, L I Adenin1, F Zaluchu2
1Department of Otorhinolaryngology-Head and Neck Surgery, Faculty of Medicine, Universitas Sumatera Utara, Medan, 20155, Indonesia, 2AISSR, Department of Anthropology , University of Amsterdam
working absent rate. Therefore, voice disturbance affects not only on the individuals but also creates a social burden.[3]
It has been reported that patients with voice disturbance had a significantly worse quality of life, regardless of the underlying causes. Measuring quality of life has been considered a tool to assess treatment effectiveness.[4,5]
One of the instruments to evaluate voice problem in patients with dysphonia is voice handicap index (VHI). VHI is a widely accepted questionnaire and is used in various researches and clinical applications. In 2002, VHI has been accepted by the European Board of Medical Research and Quality as a valid and reliable diagnostic tool.[4-6] This study is aimed to determine etiologies, predisposing factors, and quality of life of the patients presented to the Adam Malik General Hospital Otorhinolaryngology outpatient care with dysphonia. Detection various etiologies, role of the predisposing factors, and patients’ quality of life presented with dysphonia are very important to establish accurate treatment for the patients.
INTRODUCTION
Every voice disturbance caused by a disorder of the phonation organs, particularly larynx, is known as dysphonia. Dysphonia is not a disease, yet a symptom of diseases or disorders which affects larynx that can lead to impairment of social and professional communication.[1,2]
Dysphonia has a negative impact not only on communication but also on the social and professional life of the patients. Patients with dysphonia tend to encounter social isolation, depression, impairment of the quality of life, and increased
Original Article
AbstractBackground: Dysphonia has a negative impact not only on communication but also on the patients’ social and professional life. Detection of the underlying causes and the role of the predisposing factors in various conditions leading to dysphonia are important to establish definitive management of the patients.
Purpose: The purpose of the study is to determine the relationship between dysphonia causative diagnosis and the voice handicap index (VHI) score.
Materials and Methods: This study is an analytical study involving 47 patients with dysphonia. History taking, otorhinolaryngology examination, VHI questionnaire, and optic laryngoscopy examination with endoscopy were conducted to establish the primary diagnosis.
Result: Most of the patients are male and above 40-year-old. Based on the diagnosis, the most common underlying causes were laryngeal cancer which was found in 22 patients (47%). The overall score of the VHI was mostly in severe level (68%), and a significant relationship between the causative diagnosis of dysphonia and the VHI score was revealed (P < 0.05).
Conclusion: Based on VHI calculation, dysphonia affects the majority of patient’s quality of life, and a relationship was found between the diagnosis and the VHI score itself.
Key words: Dysphonia, Quality of life, Voice handicap index
Access this article online
www.ijss-sn.com
Month of Submission : 02-2018 Month of Peer Review : 03-2018 Month of Acceptance : 04-2018 Month of Publishing : 04-2018
Corresponding Author: R C Hidayat, Department of Otorhinolaryngology-Head and Neck Surgery, Faculty of Medicine, Universitas Sumatera Utara, Medan, 20155, Indonesia. E-mail: [email protected]
Print ISSN: 2321-6379Online ISSN: 2321-595X
DOI: 10.17354/ijss/2018/126
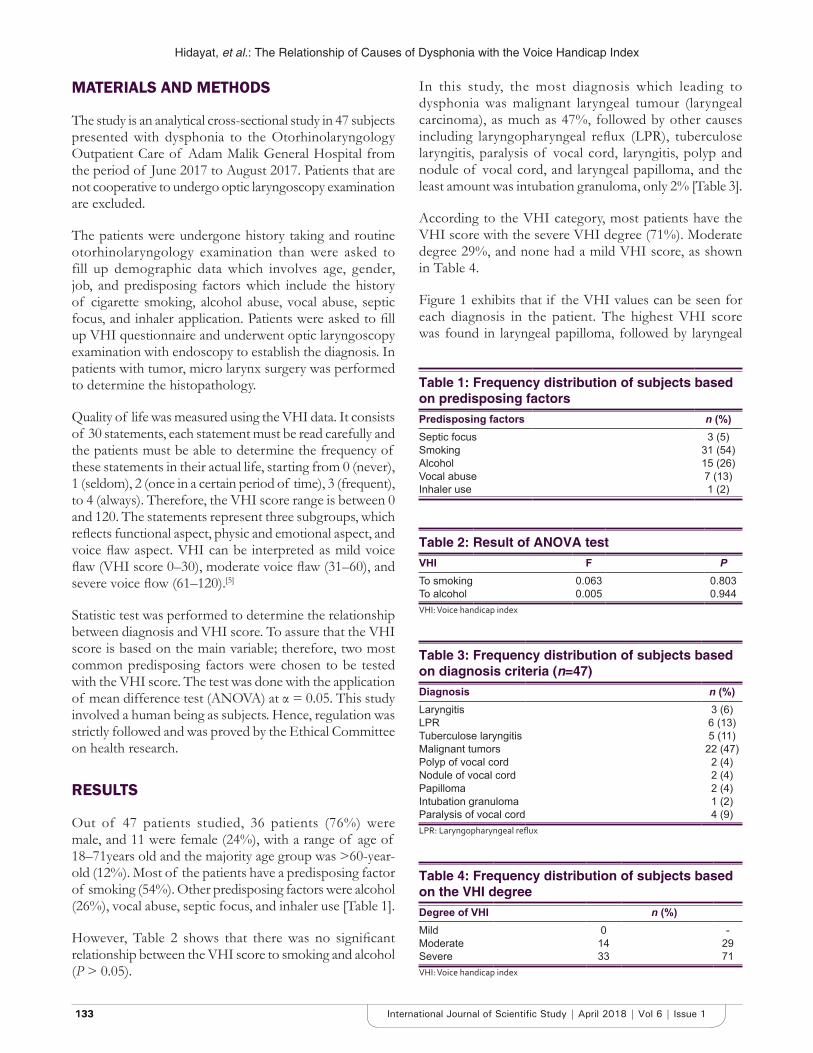
Hidayat, et al.: The Relationship of Causes of Dysphonia with the Voice Handicap Index
133133 International Journal of Scientific Study | April 2018 | Vol 6 | Issue 1
MATERIALS AND METHODS
The study is an analytical cross-sectional study in 47 subjects presented with dysphonia to the Otorhinolaryngology Outpatient Care of Adam Malik General Hospital from the period of June 2017 to August 2017. Patients that are not cooperative to undergo optic laryngoscopy examination are excluded.
The patients were undergone history taking and routine otorhinolaryngology examination than were asked to fill up demographic data which involves age, gender, job, and predisposing factors which include the history of cigarette smoking, alcohol abuse, vocal abuse, septic focus, and inhaler application. Patients were asked to fill up VHI questionnaire and underwent optic laryngoscopy examination with endoscopy to establish the diagnosis. In patients with tumor, micro larynx surgery was performed to determine the histopathology.
Quality of life was measured using the VHI data. It consists of 30 statements, each statement must be read carefully and the patients must be able to determine the frequency of these statements in their actual life, starting from 0 (never), 1 (seldom), 2 (once in a certain period of time), 3 (frequent), to 4 (always). Therefore, the VHI score range is between 0 and 120. The statements represent three subgroups, which reflects functional aspect, physic and emotional aspect, and voice flaw aspect. VHI can be interpreted as mild voice flaw (VHI score 0–30), moderate voice flaw (31–60), and severe voice flow (61–120).[5]
Statistic test was performed to determine the relationship between diagnosis and VHI score. To assure that the VHI score is based on the main variable; therefore, two most common predisposing factors were chosen to be tested with the VHI score. The test was done with the application of mean difference test (ANOVA) at α = 0.05. This study involved a human being as subjects. Hence, regulation was strictly followed and was proved by the Ethical Committee on health research.
RESULTS
Out of 47 patients studied, 36 patients (76%) were male, and 11 were female (24%), with a range of age of 18–71years old and the majority age group was >60-year-old (12%). Most of the patients have a predisposing factor of smoking (54%). Other predisposing factors were alcohol (26%), vocal abuse, septic focus, and inhaler use [Table 1].
However, Table 2 shows that there was no significant relationship between the VHI score to smoking and alcohol (P > 0.05).
In this study, the most diagnosis which leading to dysphonia was malignant laryngeal tumour (laryngeal carcinoma), as much as 47%, followed by other causes including laryngopharyngeal reflux (LPR), tuberculose laryngitis, paralysis of vocal cord, laryngitis, polyp and nodule of vocal cord, and laryngeal papilloma, and the least amount was intubation granuloma, only 2% [Table 3].
According to the VHI category, most patients have the VHI score with the severe VHI degree (71%). Moderate degree 29%, and none had a mild VHI score, as shown in Table 4.
Figure 1 exhibits that if the VHI values can be seen for each diagnosis in the patient. The highest VHI score was found in laryngeal papilloma, followed by laryngeal
Table 1: Frequency distribution of subjects based on predisposing factorsPredisposing factors n (%)Septic focus 3 (5)Smoking 31 (54)Alcohol 15 (26)Vocal abuse 7 (13)Inhaler use 1 (2)
Table 2: Result of ANOVA testVHI F PTo smoking 0.063 0.803To alcohol 0.005 0.944VHI: Voice handicap index
Table 3: Frequency distribution of subjects based on diagnosis criteria (n=47)Diagnosis n (%)Laryngitis 3 (6)LPR 6 (13)Tuberculose laryngitis 5 (11)Malignant tumors 22 (47)Polyp of vocal cord 2 (4)Nodule of vocal cord 2 (4)Papilloma 2 (4)Intubation granuloma 1 (2)Paralysis of vocal cord 4 (9)LPR: Laryngopharyngeal reflux
Table 4: Frequency distribution of subjects based on the VHI degreeDegree of VHI n (%)Mild 0 -Moderate 14 29Severe 33 71VHI: Voice handicap index
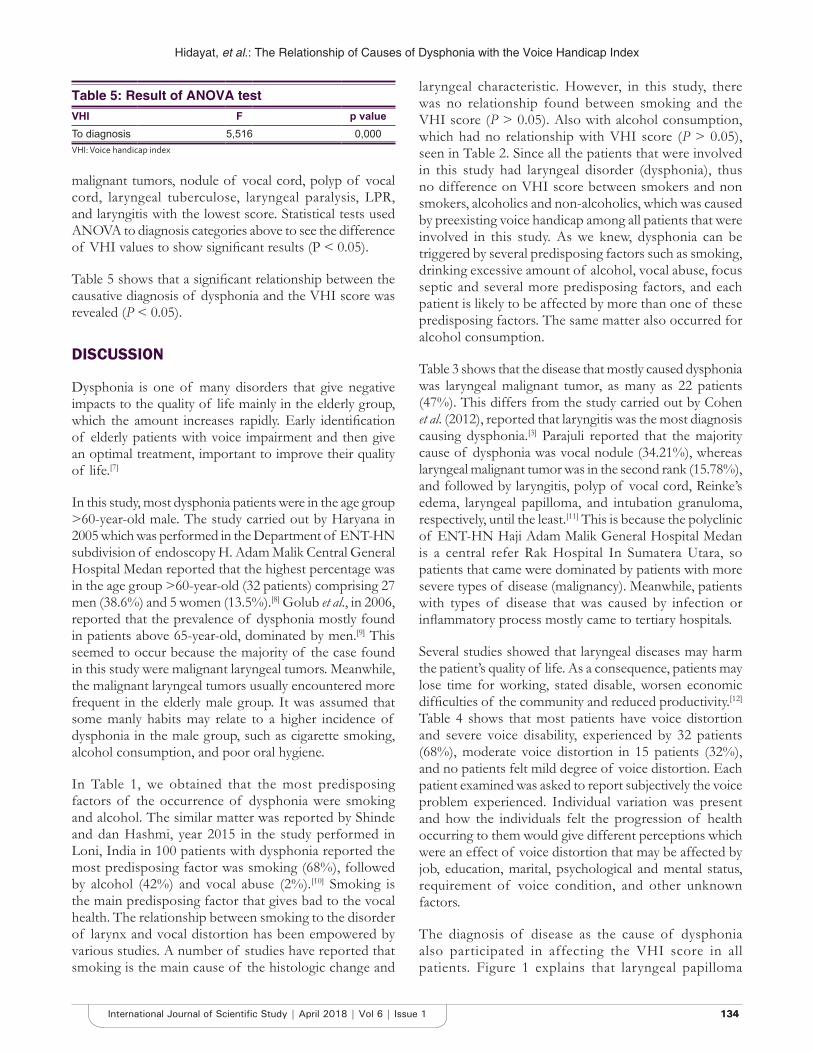
Hidayat, et al.: The Relationship of Causes of Dysphonia with the Voice Handicap Index
134134International Journal of Scientific Study | April 2018 | Vol 6 | Issue 1
malignant tumors, nodule of vocal cord, polyp of vocal cord, laryngeal tuberculose, laryngeal paralysis, LPR, and laryngitis with the lowest score. Statistical tests used ANOVA to diagnosis categories above to see the difference of VHI values to show significant results (P < 0.05).
Table 5 shows that a significant relationship between the causative diagnosis of dysphonia and the VHI score was revealed (P < 0.05).
DISCUSSION
Dysphonia is one of many disorders that give negative impacts to the quality of life mainly in the elderly group, which the amount increases rapidly. Early identification of elderly patients with voice impairment and then give an optimal treatment, important to improve their quality of life.[7]
In this study, most dysphonia patients were in the age group >60-year-old male. The study carried out by Haryana in 2005 which was performed in the Department of ENT-HN subdivision of endoscopy H. Adam Malik Central General Hospital Medan reported that the highest percentage was in the age group >60-year-old (32 patients) comprising 27 men (38.6%) and 5 women (13.5%).[8] Golub et al., in 2006, reported that the prevalence of dysphonia mostly found in patients above 65-year-old, dominated by men.[9] This seemed to occur because the majority of the case found in this study were malignant laryngeal tumors. Meanwhile, the malignant laryngeal tumors usually encountered more frequent in the elderly male group. It was assumed that some manly habits may relate to a higher incidence of dysphonia in the male group, such as cigarette smoking, alcohol consumption, and poor oral hygiene.
In Table 1, we obtained that the most predisposing factors of the occurrence of dysphonia were smoking and alcohol. The similar matter was reported by Shinde and dan Hashmi, year 2015 in the study performed in Loni, India in 100 patients with dysphonia reported the most predisposing factor was smoking (68%), followed by alcohol (42%) and vocal abuse (2%).[10] Smoking is the main predisposing factor that gives bad to the vocal health. The relationship between smoking to the disorder of larynx and vocal distortion has been empowered by various studies. A number of studies have reported that smoking is the main cause of the histologic change and
laryngeal characteristic. However, in this study, there was no relationship found between smoking and the VHI score (P > 0.05). Also with alcohol consumption, which had no relationship with VHI score (P > 0.05), seen in Table 2. Since all the patients that were involved in this study had laryngeal disorder (dysphonia), thus no difference on VHI score between smokers and non smokers, alcoholics and non-alcoholics, which was caused by preexisting voice handicap among all patients that were involved in this study. As we knew, dysphonia can be triggered by several predisposing factors such as smoking, drinking excessive amount of alcohol, vocal abuse, focus septic and several more predisposing factors, and each patient is likely to be affected by more than one of these predisposing factors. The same matter also occurred for alcohol consumption.
Table 3 shows that the disease that mostly caused dysphonia was laryngeal malignant tumor, as many as 22 patients (47%). This differs from the study carried out by Cohen et al. (2012), reported that laryngitis was the most diagnosis causing dysphonia.[3] Parajuli reported that the majority cause of dysphonia was vocal nodule (34.21%), whereas laryngeal malignant tumor was in the second rank (15.78%), and followed by laryngitis, polyp of vocal cord, Reinke’s edema, laryngeal papilloma, and intubation granuloma, respectively, until the least.[11] This is because the polyclinic of ENT-HN Haji Adam Malik General Hospital Medan is a central refer Rak Hospital In Sumatera Utara, so patients that came were dominated by patients with more severe types of disease (malignancy). Meanwhile, patients with types of disease that was caused by infection or inflammatory process mostly came to tertiary hospitals.
Several studies showed that laryngeal diseases may harm the patient’s quality of life. As a consequence, patients may lose time for working, stated disable, worsen economic difficulties of the community and reduced productivity.[12] Table 4 shows that most patients have voice distortion and severe voice disability, experienced by 32 patients (68%), moderate voice distortion in 15 patients (32%), and no patients felt mild degree of voice distortion. Each patient examined was asked to report subjectively the voice problem experienced. Individual variation was present and how the individuals felt the progression of health occurring to them would give different perceptions which were an effect of voice distortion that may be affected by job, education, marital, psychological and mental status, requirement of voice condition, and other unknown factors.
The diagnosis of disease as the cause of dysphonia also participated in affecting the VHI score in all patients. Figure 1 explains that laryngeal papilloma
Table 5: Result of ANOVA testVHI F p valueTo diagnosis 5,516 0,000VHI: Voice handicap index
Hidayat, et al.: The Relationship of Causes of Dysphonia with the Voice Handicap Index
135135 International Journal of Scientific Study | April 2018 | Vol 6 | Issue 1
had a high recurrence rate, so patients with laryngeal papilloma tend to experience repeated dysphonia, although treatment has been given. The causal factor in voice distortion was quite complicated, and patients with dysphonia had various difficulties that may affect their quality of life, reflected by the severity of VHI. It is visible that the determinant of VHI score was the diagnosis of disease.
As seen in Table 5, a significant distinction was revealed among the VHI score based on the causative diagnosis of dysphonia (P < 0.005). A similar finding was reported by Cohen et al. in their study in San Francisco; a significant difference was also revealed among the VHI score based on the diagnosis of various larynx disorders.[12]
In this study, the quality of life included voice distortion of a patient with tumor was worse than voice distortion due to infection or inflammation. Aaby and Heimdel(2012) in Norway reported that quality of life of the patients with malignancy was worse than those with no malignancy.[13] It can be caused by the difficulties related to many factors, such as psychological, emotional, and professional, and also their impact to the patients’ social life. Besides, voice handicap of those with larynx malignancy will last longer than those with other milder larynx disorders.
CONCLUSION
The measurement of quality of life has been a more important matter as a tool to assess the effectiveness of treatment and management plan. In patients with dysphonia, the quality of life not only depends on the etiology or predisposing factor underlying it but also other various factors. In this study, the authors revealed that there was a significant relationship between various dysphonia causative diagnosis and the VHI score. Based on the calculation of VHI score, found that the voice disability degree in the majority of patients with dysphonia was severe, which means that the majority of patients with complaints of dysphonia experienced the quality of life disturbance.
REFERENCES
1. Galvan C, Guarderas JC. Practical considerations for dysphonia causedby inhaled corticosteroids. Mayo Foundation for Medical Education and Research. Mayo Clin Proc 2012;87:901-4.
2. Hermani B, Hutahuruk A, dan Efiaty AS. Disfonia, Buku Ajar Ilmu Kesehatan Telinga, Hidung, Tenggorok, Kepala and Leher. 6th ed. Jakarta, Indonesia: Balai Penerbit FKUI; 2012. p. 231-4.
3. Cohen SM, Kim J, Roy N, Asche C, dan Courey M. Prevalence and causes of dysphonia in a large treatment-seeking population. Laryngosc Am Laryngol Rhinol Otol Soc 2012;122:342-8.
4. Jones SM, Carding PN, dan Drinnan MJ. Exploring the relationship between severity of dysphonia and voice-related quality of life. Clin Otolaryngol 2006;31:411-7.
5. Amir O, Ashkenazi O, Leibovitzh T, Michael O, Tavor Y, Wolf M. Applying the voice handicap index (VHI) to dysphonic and nondysphonic hebrew speakers. J Voice 2005;20:318-24.
6. Kazi R, Cordova J, Singh A, Venkitaraman R, Nutting CM, Clarke P, et al. Voice-related quality of life in laryngectomees: Assessment using the VHI and V-RQOL symptom scales. J Voice 2007;21:728-34.
7. Marino JP, dan Jhons MM. The epidemiology of dysphonia in the aging population. Curr Opin Otolaryngol Head Neck Surg 2014;22:455-9.
8. Haryuna TS. Distribusi gambaran klinik laringpada penderitadengan suara serak di departemen tht-kl fakultas kedokteran usu rsup h. Adam Malik Medan. Majalah Kedokteran Nusantara 2009;42:33-40.
9. Golub JS, Chen PH, Otto KJ. Prevalence of perceived dysphonia in a geriatric population. J Am Geriatr Soc 2006;54:1736-9.
10. Shinde KJ, dan Hashmi SI. Clinicopathological study of laryngeal masses. IOSR J Dental Med Sci 2015;14:61-79.
11. Parajuli R. Spectrum of etiological factors for hoarseness: A Retrospective Study in a Teaching Hospital. Glob J Otolaryngol 2016;1:1-4.
12. Cohen SM, Dupont WD, Courey MS. Quality-of-life impact of non-neoplastic voice disorders: A meta-analysis. Ann Otol Rhinol Laryngol 2006;115:128-34.
13. Aaby C, Heimdel JH. The voice-related quality of life (V-RQOL) measure-a study on validity and reliability of the norwegian version. J Voice 20012;27:29-33.
Figure 1: Distribution of voice handicap index score based on the diagnosis
How to cite this article: Hidayat RC, Saragih AR, Zahara D, Adenin LI, Zaluchu F. Dysphonia Causative Diagnosis Linked to Voice Handicap Index of the Patients with Dysphonia. Int J Sci Stud 2018;6(1):132-135.
Source of Support: Nil, Conflict of Interest: None declared.
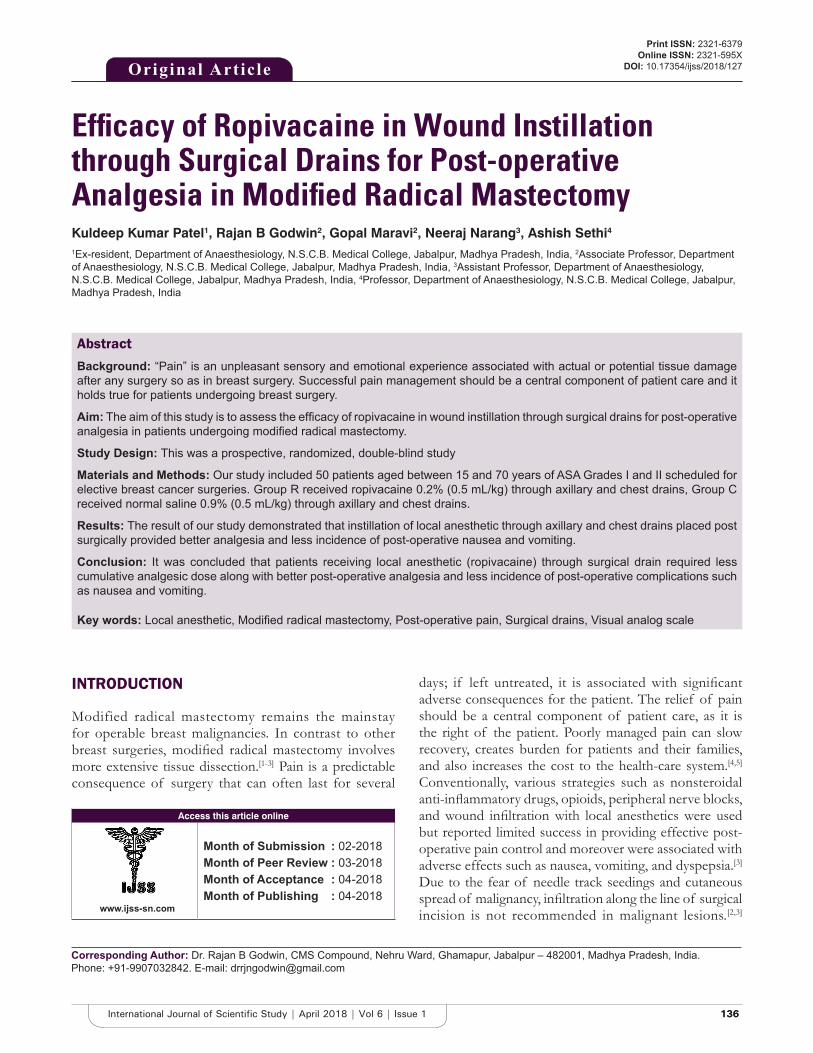
136136International Journal of Scientific Study | April 2018 | Vol 6 | Issue 1
Efficacy of Ropivacaine in Wound Instillation through Surgical Drains for Post-operative Analgesia in Modified Radical MastectomyKuldeep Kumar Patel1, Rajan B Godwin2, Gopal Maravi2, Neeraj Narang3, Ashish Sethi4
1Ex-resident, Department of Anaesthesiology, N.S.C.B. Medical College, Jabalpur, Madhya Pradesh, India, 2Associate Professor, Department of Anaesthesiology, N.S.C.B. Medical College, Jabalpur, Madhya Pradesh, India, 3Assistant Professor, Department of Anaesthesiology, N.S.C.B. Medical College, Jabalpur, Madhya Pradesh, India, 4Professor, Department of Anaesthesiology, N.S.C.B. Medical College, Jabalpur, Madhya Pradesh, India
days; if left untreated, it is associated with significant adverse consequences for the patient. The relief of pain should be a central component of patient care, as it is the right of the patient. Poorly managed pain can slow recovery, creates burden for patients and their families, and also increases the cost to the health-care system.[4,5] Conventionally, various strategies such as nonsteroidal anti-inflammatory drugs, opioids, peripheral nerve blocks, and wound infiltration with local anesthetics were used but reported limited success in providing effective post-operative pain control and moreover were associated with adverse effects such as nausea, vomiting, and dyspepsia.[3] Due to the fear of needle track seedings and cutaneous spread of malignancy, infiltration along the line of surgical incision is not recommended in malignant lesions.[2,3]
INTRODUCTION
Modified radical mastectomy remains the mainstay for operable breast malignancies. In contrast to other breast surgeries, modified radical mastectomy involves more extensive tissue dissection.[1-3] Pain is a predictable consequence of surgery that can often last for several
Original Article
AbstractBackground: “Pain” is an unpleasant sensory and emotional experience associated with actual or potential tissue damage after any surgery so as in breast surgery. Successful pain management should be a central component of patient care and it holds true for patients undergoing breast surgery.
Aim: The aim of this study is to assess the efficacy of ropivacaine in wound instillation through surgical drains for post-operative analgesia in patients undergoing modified radical mastectomy.
Study Design: This was a prospective, randomized, double-blind study
Materials and Methods: Our study included 50 patients aged between 15 and 70 years of ASA Grades I and II scheduled for elective breast cancer surgeries. Group R received ropivacaine 0.2% (0.5 mL/kg) through axillary and chest drains, Group C received normal saline 0.9% (0.5 mL/kg) through axillary and chest drains.
Results: The result of our study demonstrated that instillation of local anesthetic through axillary and chest drains placed post surgically provided better analgesia and less incidence of post-operative nausea and vomiting.
Conclusion: It was concluded that patients receiving local anesthetic (ropivacaine) through surgical drain required less cumulative analgesic dose along with better post-operative analgesia and less incidence of post-operative complications such as nausea and vomiting.
Key words: Local anesthetic, Modified radical mastectomy, Post-operative pain, Surgical drains, Visual analog scale
Access this article online
www.ijss-sn.com
Month of Submission : 02-2018 Month of Peer Review : 03-2018 Month of Acceptance : 04-2018 Month of Publishing : 04-2018
Corresponding Author: Dr. Rajan B Godwin, CMS Compound, Nehru Ward, Ghamapur, Jabalpur – 482001, Madhya Pradesh, India. Phone: +91-9907032842. E-mail: [email protected]
Print ISSN: 2321-6379Online ISSN: 2321-595X
DOI: 10.17354/ijss/2018/127
Patel, et al.: Efficacy of Ropivacaine in Wound Instillation through Surgical Drains for Post-operative Analgesia in Modified Radical Mastectomy
137137 International Journal of Scientific Study | April 2018 | Vol 6 | Issue 1
Recent advancements have led to thedevelopment of a local anesthetic with an extended duration of action and a novel delivery platform, thereby broadening its potential role as a component of some post-operative pain management regimens.[6] Wound instillation with local anesthetic through surgically placed drains in axilla and chest is nowadays widely used as a part of multimodal approach to provide effective analgesia postoperatively. Until today, many local anesthetics drugs are in use for local wound instillation, for example, lidocaine,[7] bupivacaine,[3,8] levobupivacaine,[9] and ropivacaine.[8,10-14] Local anesthetic drugs are becoming increasingly popular because of their analgesic properties and lack of opioid-induced adverse effects for treating post-operative surgical pain. Extensive animal toxicological studies have shown a lower propensity for cardiotoxicity with ropivacaine than with bupivacaine. With its lower toxicity, especially cardiovascular toxicity and less intense motor blockade, ropivacaine has advantage over bupivacaine in pain relief.[15] The administration of local anesthetic via instillation through the surgical drain is one component of multimodal approach that allows for minimal invasive exposure and also results in immediate pain relief, which has been proven to increase patient satisfaction and early mobilization.
The aim of the present study was to assess the efficacy of ropivacaine in wound instillation through surgical drains in alleviating early post-operative pain after MRM. The efficacy of ropivacaine in wound instillation through surgical placed drains was assessed by duration of analgesia, number of analgesic demands, and cumulative analgesic requirement for pain relief.
MATERIALS AND METHODS
In this clinical randomized prospective study, 50 patients, the ASA physical status I and II, 15–70 years scheduled for unilateral modified radical mastectomy were enrolled randomly in two groups after obtaining the institutional ethics committee approval. Patients with a history of allergy to local anesthetic, history of any chronic analgesic drug usage, pre-existing respiratory diseases such as obstructive pulmonary disease, coexisting cardiovascular diseases, pregnant and breastfeeding females, history of any musculoskeletal disorders, and bleeding diathesis were excluded from the study.
Patients undergoing modified radical mastectomy were randomly allocated into two groups, each group containing 25 patients for the assessment of post-operative analgesia following wound instillation through surgical drainage tubes with local anesthetic and normal saline as control.
• Group R: Group R received ropivacaine 0.2% (0.5 mL/kg) through axillary and chest drains.
• Group C: Group C received normal saline 0.9% (0.5 mL/kg) through axillary and chest drains.
During the pre-operative day, patients were thoroughly educated about the procedures to be undertaken and were made well conversant with the visual analog scale (VAS) for post-operative pain assessment and their consent was taken. In the operation theater, I/V access was established and standard monitors were attached. Baseline hemodynamic parameters such as pulse rate, non-invasive blood pressure, respiratory rate, peripheral arterial oxygen saturation (SpO2), and electrocardiography were recorded. After premedication, all the patients were induced with injection propofol at the dose of 2 mg/kg and injection succinylcholine at the dose of 1.5 mg/kg to facilitate tracheal intubation, and the patient was maintained with isoflurane and nitrous oxide plus oxygen (60:40). Neuromuscular blockade was achieved using vecuronium 0.04 mg/kg. At the end of the surgical procedure, the surgical drains, one in the axilla near the axillary vessels and the second in the chest wall below the skin flap (over the pectoral muscles), were placed by the surgeon before closing the surgical incision [Figure 1]. After proper oral and tracheal suctioning, the patient was reversed with neostigmine and glycopyrrolate, and extubation was performed on meeting the criteria.
Patients were allocated randomly into two groups of 25 each by computer-generated numbers. The study drug was given through each drain as per randomization after the incision was closed. Group C patients received normal saline 0.9% (0.5 mL/kg). Total volume was divided into equal amount and given through each drain. Group R patients received ropivacaine 0.2% (0.5 mL/kg). The study drug being prepared by a separate anesthesiologist outside operation theater according to randomization number and
Figure 1: Showing instillation of drug through surgical drain placed in the chest wall
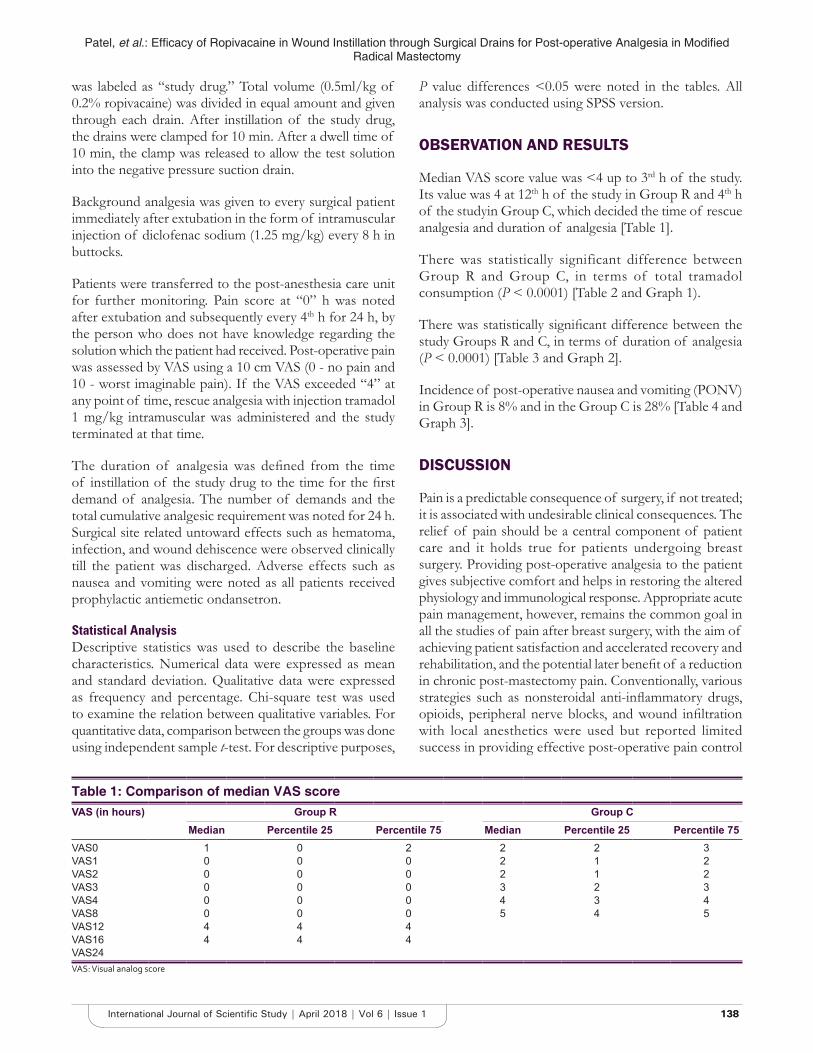
Patel, et al.: Efficacy of Ropivacaine in Wound Instillation through Surgical Drains for Post-operative Analgesia in Modified Radical Mastectomy
138138International Journal of Scientific Study | April 2018 | Vol 6 | Issue 1
was labeled as “study drug.” Total volume (0.5ml/kg of 0.2% ropivacaine) was divided in equal amount and given through each drain. After instillation of the study drug, the drains were clamped for 10 min. After a dwell time of 10 min, the clamp was released to allow the test solution into the negative pressure suction drain.
Background analgesia was given to every surgical patient immediately after extubation in the form of intramuscular injection of diclofenac sodium (1.25 mg/kg) every 8 h in buttocks.
Patients were transferred to the post-anesthesia care unit for further monitoring. Pain score at “0” h was noted after extubation and subsequently every 4th h for 24 h, by the person who does not have knowledge regarding the solution which the patient had received. Post-operative pain was assessed by VAS using a 10 cm VAS (0 - no pain and 10 - worst imaginable pain). If the VAS exceeded “4” at any point of time, rescue analgesia with injection tramadol 1 mg/kg intramuscular was administered and the study terminated at that time.
The duration of analgesia was defined from the time of instillation of the study drug to the time for the first demand of analgesia. The number of demands and the total cumulative analgesic requirement was noted for 24 h. Surgical site related untoward effects such as hematoma, infection, and wound dehiscence were observed clinically till the patient was discharged. Adverse effects such as nausea and vomiting were noted as all patients received prophylactic antiemetic ondansetron.
Statistical AnalysisDescriptive statistics was used to describe the baseline characteristics. Numerical data were expressed as mean and standard deviation. Qualitative data were expressed as frequency and percentage. Chi-square test was used to examine the relation between qualitative variables. For quantitative data, comparison between the groups was done using independent sample t-test. For descriptive purposes,
P value differences <0.05 were noted in the tables. All analysis was conducted using SPSS version.
OBSERVATION AND RESULTS
Median VAS score value was <4 up to 3rd h of the study. Its value was 4 at 12th h of the study in Group R and 4th h of the studyin Group C, which decided the time of rescue analgesia and duration of analgesia [Table 1].
There was statistically significant difference between Group R and Group C, in terms of total tramadol consumption (P < 0.0001) [Table 2 and Graph 1).
There was statistically significant difference between the study Groups R and C, in terms of duration of analgesia (P < 0.0001) [Table 3 and Graph 2].
Incidence of post-operative nausea and vomiting (PONV) in Group R is 8% and in the Group C is 28% [Table 4 and Graph 3].
DISCUSSION
Pain is a predictable consequence of surgery, if not treated; it is associated with undesirable clinical consequences. The relief of pain should be a central component of patient care and it holds true for patients undergoing breast surgery. Providing post-operative analgesia to the patient gives subjective comfort and helps in restoring the altered physiology and immunological response. Appropriate acute pain management, however, remains the common goal in all the studies of pain after breast surgery, with the aim of achieving patient satisfaction and accelerated recovery and rehabilitation, and the potential later benefit of a reduction in chronic post-mastectomy pain. Conventionally, various strategies such as nonsteroidal anti-inflammatory drugs, opioids, peripheral nerve blocks, and wound infiltration with local anesthetics were used but reported limited success in providing effective post-operative pain control
Table 1: Comparison of median VAS scoreVAS (in hours) Group R Group C
Median Percentile 25 Percentile 75 Median Percentile 25 Percentile 75VAS0 1 0 2 2 2 3VAS1 0 0 0 2 1 2VAS2 0 0 0 2 1 2VAS3 0 0 0 3 2 3VAS4 0 0 0 4 3 4VAS8 0 0 0 5 4 5VAS12 4 4 4VAS16 4 4 4VAS24VAS: Visual analog score
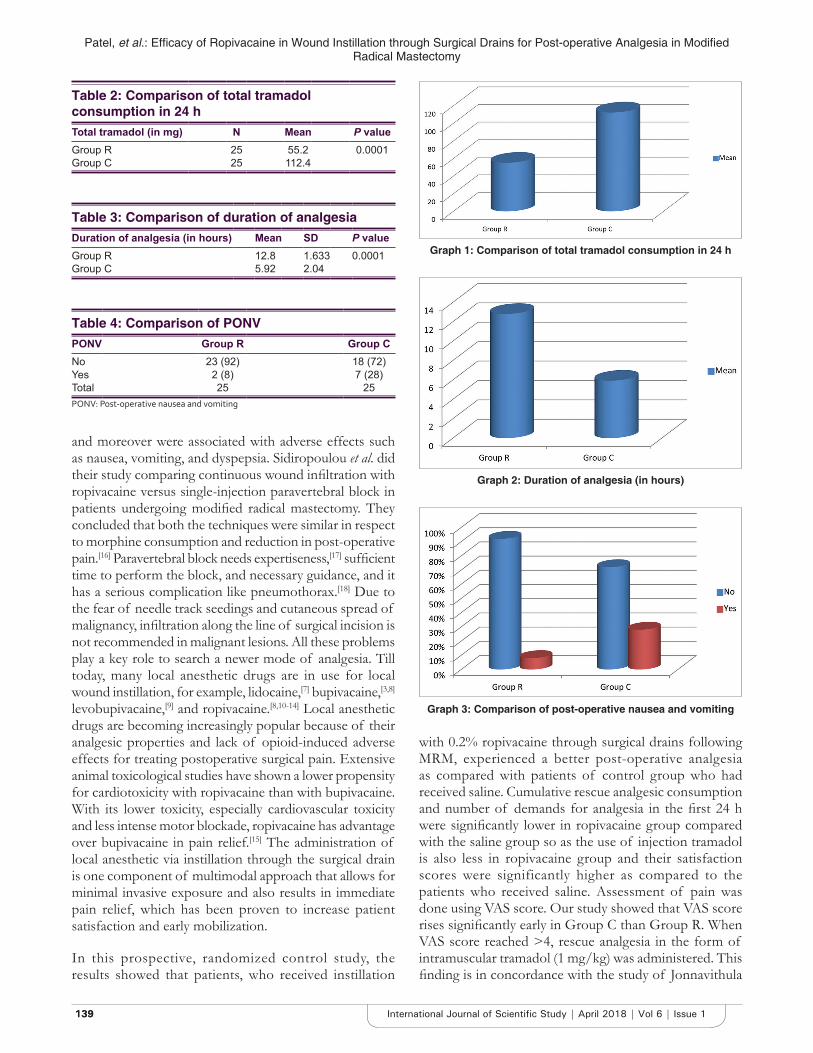
Patel, et al.: Efficacy of Ropivacaine in Wound Instillation through Surgical Drains for Post-operative Analgesia in Modified Radical Mastectomy
139139 International Journal of Scientific Study | April 2018 | Vol 6 | Issue 1
and moreover were associated with adverse effects such as nausea, vomiting, and dyspepsia. Sidiropoulou et al. did their study comparing continuous wound infiltration with ropivacaine versus single-injection paravertebral block in patients undergoing modified radical mastectomy. They concluded that both the techniques were similar in respect to morphine consumption and reduction in post-operative pain.[16] Paravertebral block needs expertiseness,[17] sufficient time to perform the block, and necessary guidance, and it has a serious complication like pneumothorax.[18] Due to the fear of needle track seedings and cutaneous spread of malignancy, infiltration along the line of surgical incision is not recommended in malignant lesions. All these problems play a key role to search a newer mode of analgesia. Till today, many local anesthetic drugs are in use for local wound instillation, for example, lidocaine,[7] bupivacaine,[3,8] levobupivacaine,[9] and ropivacaine.[8,10-14] Local anesthetic drugs are becoming increasingly popular because of their analgesic properties and lack of opioid-induced adverse effects for treating postoperative surgical pain. Extensive animal toxicological studies have shown a lower propensity for cardiotoxicity with ropivacaine than with bupivacaine. With its lower toxicity, especially cardiovascular toxicity and less intense motor blockade, ropivacaine has advantage over bupivacaine in pain relief.[15] The administration of local anesthetic via instillation through the surgical drain is one component of multimodal approach that allows for minimal invasive exposure and also results in immediate pain relief, which has been proven to increase patient satisfaction and early mobilization.
In this prospective, randomized control study, the results showed that patients, who received instillation
with 0.2% ropivacaine through surgical drains following MRM, experienced a better post-operative analgesia as compared with patients of control group who had received saline. Cumulative rescue analgesic consumption and number of demands for analgesia in the first 24 h were significantly lower in ropivacaine group compared with the saline group so as the use of injection tramadol is also less in ropivacaine group and their satisfaction scores were significantly higher as compared to the patients who received saline. Assessment of pain was done using VAS score. Our study showed that VAS score rises significantly early in Group C than Group R. When VAS score reached >4, rescue analgesia in the form of intramuscular tramadol (1 mg/kg) was administered. This finding is in concordance with the study of Jonnavithula
Table 2: Comparison of total tramadol consumption in 24 hTotal tramadol (in mg) N Mean P valueGroup R 25 55.2 0.0001Group C 25 112.4
Table 3: Comparison of duration of analgesiaDuration of analgesia (in hours) Mean SD P valueGroup R 12.8 1.633 0.0001Group C 5.92 2.04
Table 4: Comparison of PONVPONV Group R Group CNo 23 (92) 18 (72)Yes 2 (8) 7 (28)Total 25 25PONV: Post‑operative nausea and vomiting
Graph 1: Comparison of total tramadol consumption in 24 h
Graph 2: Duration of analgesia (in hours)
Graph 3: Comparison of post-operative nausea and vomiting
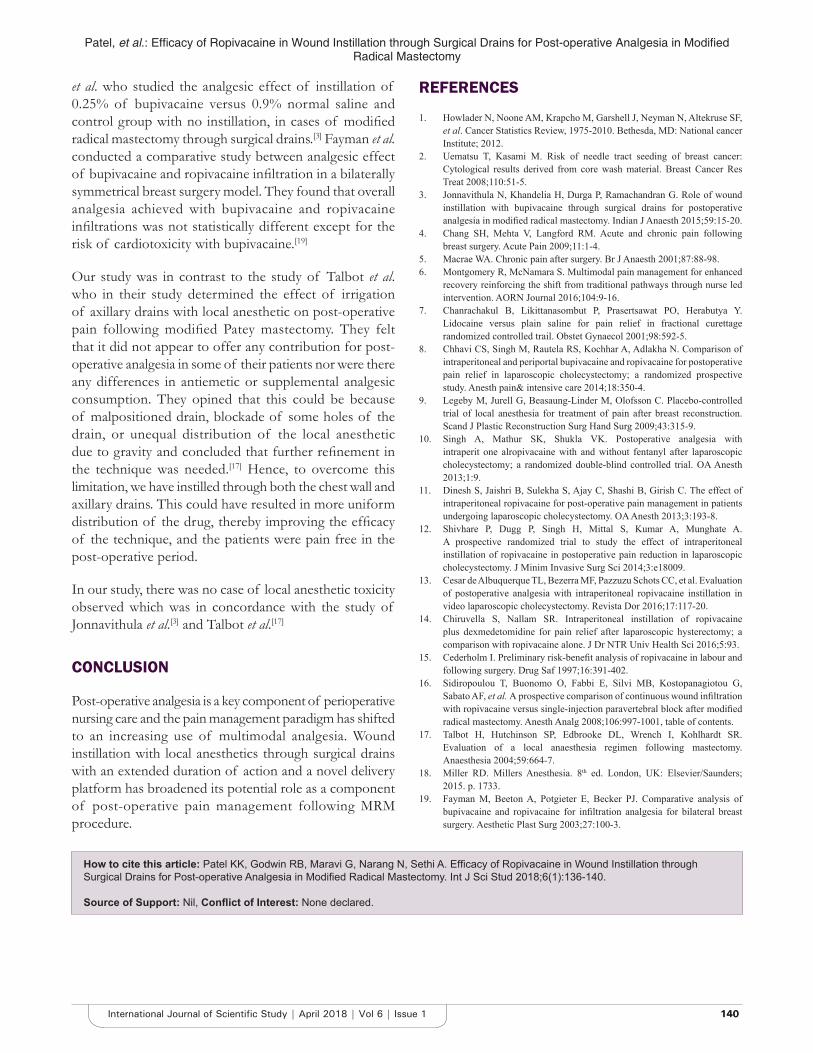
Patel, et al.: Efficacy of Ropivacaine in Wound Instillation through Surgical Drains for Post-operative Analgesia in Modified Radical Mastectomy
140140International Journal of Scientific Study | April 2018 | Vol 6 | Issue 1
et al. who studied the analgesic effect of instillation of 0.25% of bupivacaine versus 0.9% normal saline and control group with no instillation, in cases of modified radical mastectomy through surgical drains.[3] Fayman et al. conducted a comparative study between analgesic effect of bupivacaine and ropivacaine infiltration in a bilaterally symmetrical breast surgery model. They found that overall analgesia achieved with bupivacaine and ropivacaine infiltrations was not statistically different except for the risk of cardiotoxicity with bupivacaine.[19]
Our study was in contrast to the study of Talbot et al. who in their study determined the effect of irrigation of axillary drains with local anesthetic on post-operative pain following modified Patey mastectomy. They felt that it did not appear to offer any contribution for post-operative analgesia in some of their patients nor were there any differences in antiemetic or supplemental analgesic consumption. They opined that this could be because of malpositioned drain, blockade of some holes of the drain, or unequal distribution of the local anesthetic due to gravity and concluded that further refinement in the technique was needed.[17] Hence, to overcome this limitation, we have instilled through both the chest wall and axillary drains. This could have resulted in more uniform distribution of the drug, thereby improving the efficacy of the technique, and the patients were pain free in the post-operative period.
In our study, there was no case of local anesthetic toxicity observed which was in concordance with the study of Jonnavithula et al.[3] and Talbot et al.[17]
CONCLUSION
Post-operative analgesia is a key component of perioperative nursing care and the pain management paradigm has shifted to an increasing use of multimodal analgesia. Wound instillation with local anesthetics through surgical drains with an extended duration of action and a novel delivery platform has broadened its potential role as a component of post-operative pain management following MRM procedure.
REFERENCES
1. Howlader N, Noone AM, Krapcho M, Garshell J, Neyman N, Altekruse SF, et al. Cancer Statistics Review, 1975-2010. Bethesda, MD: National cancer Institute; 2012.
2. Uematsu T, Kasami M. Risk of needle tract seeding of breast cancer: Cytological results derived from core wash material. Breast Cancer Res Treat 2008;110:51-5.
3. Jonnavithula N, Khandelia H, Durga P, Ramachandran G. Role of wound instillation with bupivacaine through surgical drains for postoperative analgesia in modified radical mastectomy. Indian J Anaesth 2015;59:15-20.
4. Chang SH, Mehta V, Langford RM. Acute and chronic pain following breast surgery. Acute Pain 2009;11:1-4.
5. Macrae WA. Chronic pain after surgery. Br J Anaesth 2001;87:88-98.6. Montgomery R, McNamara S. Multimodal pain management for enhanced
recovery reinforcing the shift from traditional pathways through nurse led intervention. AORN Journal 2016;104:9-16.
7. Chanrachakul B, Likittanasombut P, Prasertsawat PO, Herabutya Y. Lidocaine versus plain saline for pain relief in fractional curettage randomized controlled trail. Obstet Gynaecol 2001;98:592-5.
8. Chhavi CS, Singh M, Rautela RS, Kochhar A, Adlakha N. Comparison of intraperitoneal and periportal bupivacaine and ropivacaine for postoperative pain relief in laparoscopic cholecystectomy; a randomized prospective study. Anesth pain& intensive care 2014;18:350-4.
9. Legeby M, Jurell G, Beasaung-Linder M, Olofsson C. Placebo-controlled trial of local anesthesia for treatment of pain after breast reconstruction. Scand J Plastic Reconstruction Surg Hand Surg 2009;43:315-9.
10. Singh A, Mathur SK, Shukla VK. Postoperative analgesia with intraperit one alropivacaine with and without fentanyl after laparoscopic cholecystectomy; a randomized double-blind controlled trial. OA Anesth 2013;1:9.
11. Dinesh S, Jaishri B, Sulekha S, Ajay C, Shashi B, Girish C. The effect of intraperitoneal ropivacaine for post-operative pain management in patients undergoing laparoscopic cholecystectomy. OA Anesth 2013;3:193-8.
12. Shivhare P, Dugg P, Singh H, Mittal S, Kumar A, Munghate A. A prospective randomized trial to study the effect of intraperitoneal instillation of ropivacaine in postoperative pain reduction in laparoscopic cholecystectomy. J Minim Invasive Surg Sci 2014;3:e18009.
13. Cesar de Albuquerque TL, Bezerra MF, Pazzuzu Schots CC, et al. Evaluation of postoperative analgesia with intraperitoneal ropivacaine instillation in video laparoscopic cholecystectomy. Revista Dor 2016;17:117-20.
14. Chiruvella S, Nallam SR. Intraperitoneal instillation of ropivacaine plus dexmedetomidine for pain relief after laparoscopic hysterectomy; a comparison with ropivacaine alone. J Dr NTR Univ Health Sci 2016;5:93.
15. Cederholm I. Preliminary risk-benefit analysis of ropivacaine in labour and following surgery. Drug Saf 1997;16:391-402.
16. Sidiropoulou T, Buonomo O, Fabbi E, Silvi MB, Kostopanagiotou G, Sabato AF, et al. A prospective comparison of continuous wound infiltration with ropivacaine versus single-injection paravertebral block after modified radical mastectomy. Anesth Analg 2008;106:997-1001, table of contents.
17. Talbot H, Hutchinson SP, Edbrooke DL, Wrench I, Kohlhardt SR. Evaluation of a local anaesthesia regimen following mastectomy. Anaesthesia 2004;59:664-7.
18. Miller RD. Millers Anesthesia. 8th ed. London, UK: Elsevier/Saunders; 2015. p. 1733.
19. Fayman M, Beeton A, Potgieter E, Becker PJ. Comparative analysis of bupivacaine and ropivacaine for infiltration analgesia for bilateral breast surgery. Aesthetic Plast Surg 2003;27:100-3.
How to cite this article: Patel KK, Godwin RB, Maravi G, Narang N, Sethi A. Efficacy of Ropivacaine in Wound Instillation through Surgical Drains for Post-operative Analgesia in Modified Radical Mastectomy. Int J Sci Stud 2018;6(1):136-140.
Source of Support: Nil, Conflict of Interest: None declared.
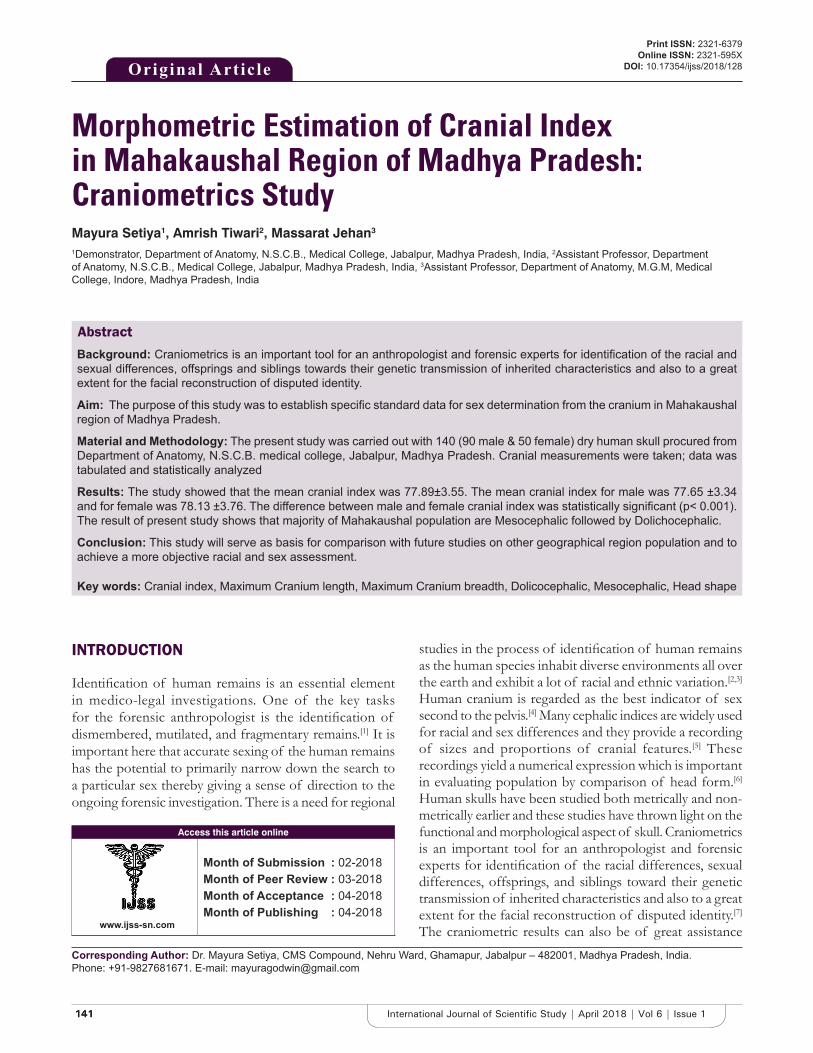
141141 International Journal of Scientific Study | April 2018 | Vol 6 | Issue 1
Morphometric Estimation of Cranial Index in Mahakaushal Region of Madhya Pradesh: Craniometrics StudyMayura Setiya1, Amrish Tiwari2, Massarat Jehan3
1Demonstrator, Department of Anatomy, N.S.C.B., Medical College, Jabalpur, Madhya Pradesh, India, 2Assistant Professor, Department of Anatomy, N.S.C.B., Medical College, Jabalpur, Madhya Pradesh, India, 3Assistant Professor, Department of Anatomy, M.G.M, Medical College, Indore, Madhya Pradesh, India
studies in the process of identification of human remains as the human species inhabit diverse environments all over the earth and exhibit a lot of racial and ethnic variation.[2,3] Human cranium is regarded as the best indicator of sex second to the pelvis.[4] Many cephalic indices are widely used for racial and sex differences and they provide a recording of sizes and proportions of cranial features.[5] These recordings yield a numerical expression which is important in evaluating population by comparison of head form.[6] Human skulls have been studied both metrically and non-metrically earlier and these studies have thrown light on the functional and morphological aspect of skull. Craniometrics is an important tool for an anthropologist and forensic experts for identification of the racial differences, sexual differences, offsprings, and siblings toward their genetic transmission of inherited characteristics and also to a great extent for the facial reconstruction of disputed identity.[7] The craniometric results can also be of great assistance
INTRODUCTION
Identification of human remains is an essential element in medico-legal investigations. One of the key tasks for the forensic anthropologist is the identification of dismembered, mutilated, and fragmentary remains.[1] It is important here that accurate sexing of the human remains has the potential to primarily narrow down the search to a particular sex thereby giving a sense of direction to the ongoing forensic investigation. There is a need for regional
Original Article
AbstractBackground: Craniometrics is an important tool for an anthropologist and forensic experts for identification of the racial and sexual differences, offsprings and siblings towards their genetic transmission of inherited characteristics and also to a great extent for the facial reconstruction of disputed identity.
Aim: The purpose of this study was to establish specific standard data for sex determination from the cranium in Mahakaushal region of Madhya Pradesh.
Material and Methodology: The present study was carried out with 140 (90 male & 50 female) dry human skull procured from Department of Anatomy, N.S.C.B. medical college, Jabalpur, Madhya Pradesh. Cranial measurements were taken; data was tabulated and statistically analyzed
Results: The study showed that the mean cranial index was 77.89±3.55. The mean cranial index for male was 77.65 ±3.34 and for female was 78.13 ±3.76. The difference between male and female cranial index was statistically significant (p< 0.001). The result of present study shows that majority of Mahakaushal population are Mesocephalic followed by Dolichocephalic.
Conclusion: This study will serve as basis for comparison with future studies on other geographical region population and to achieve a more objective racial and sex assessment.
Key words: Cranial index, Maximum Cranium length, Maximum Cranium breadth, Dolicocephalic, Mesocephalic, Head shape
Access this article online
www.ijss-sn.com
Month of Submission : 02-2018 Month of Peer Review : 03-2018 Month of Acceptance : 04-2018 Month of Publishing : 04-2018
Corresponding Author: Dr. Mayura Setiya, CMS Compound, Nehru Ward, Ghamapur, Jabalpur – 482001, Madhya Pradesh, India. Phone: +91-9827681671. E-mail: [email protected]
Print ISSN: 2321-6379Online ISSN: 2321-595X
DOI: 10.17354/ijss/2018/128
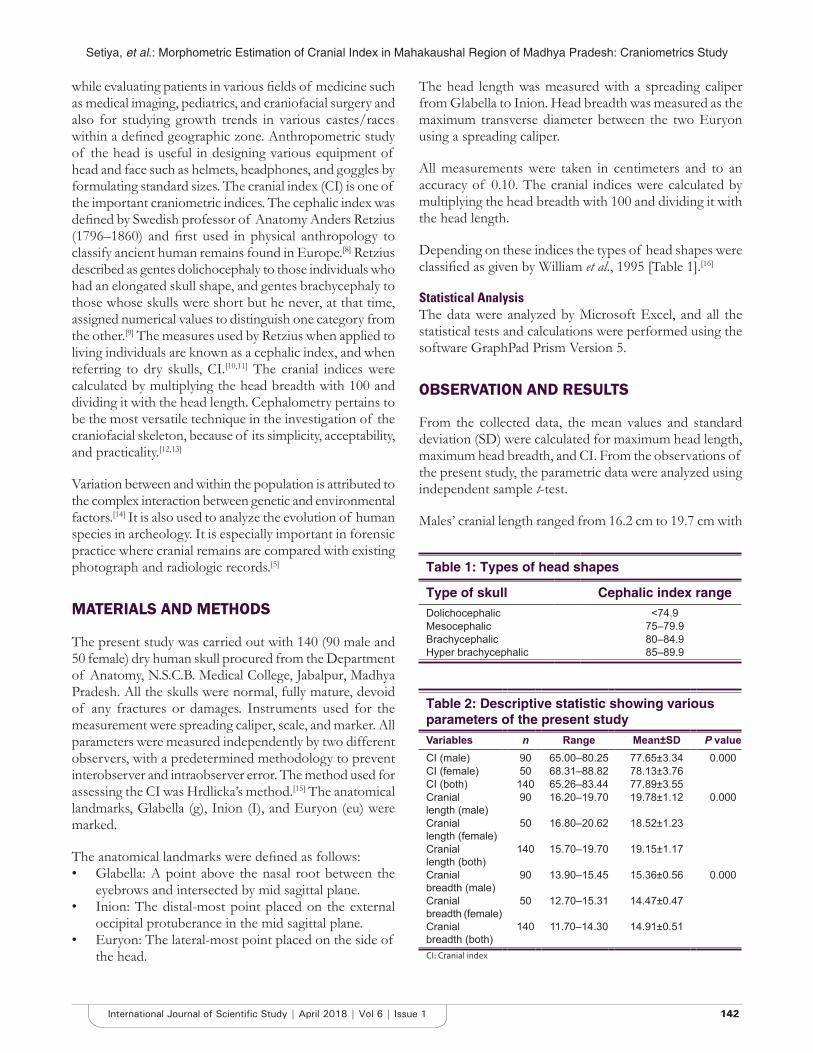
Setiya, et al.: Morphometric Estimation of Cranial Index in Mahakaushal Region of Madhya Pradesh: Craniometrics Study
142142International Journal of Scientific Study | April 2018 | Vol 6 | Issue 1
while evaluating patients in various fields of medicine such as medical imaging, pediatrics, and craniofacial surgery and also for studying growth trends in various castes/races within a defined geographic zone. Anthropometric study of the head is useful in designing various equipment of head and face such as helmets, headphones, and goggles by formulating standard sizes. The cranial index (CI) is one of the important craniometric indices. The cephalic index was defined by Swedish professor of Anatomy Anders Retzius (1796–1860) and first used in physical anthropology to classify ancient human remains found in Europe.[8] Retzius described as gentes dolichocephaly to those individuals who had an elongated skull shape, and gentes brachycephaly to those whose skulls were short but he never, at that time, assigned numerical values to distinguish one category from the other.[9] The measures used by Retzius when applied to living individuals are known as a cephalic index, and when referring to dry skulls, CI.[10,11] The cranial indices were calculated by multiplying the head breadth with 100 and dividing it with the head length. Cephalometry pertains to be the most versatile technique in the investigation of the craniofacial skeleton, because of its simplicity, acceptability, and practicality.[12,13]
Variation between and within the population is attributed to the complex interaction between genetic and environmental factors.[14] It is also used to analyze the evolution of human species in archeology. It is especially important in forensic practice where cranial remains are compared with existing photograph and radiologic records.[5]
MATERIALS AND METHODS
The present study was carried out with 140 (90 male and 50 female) dry human skull procured from the Department of Anatomy, N.S.C.B. Medical College, Jabalpur, Madhya Pradesh. All the skulls were normal, fully mature, devoid of any fractures or damages. Instruments used for the measurement were spreading caliper, scale, and marker. All parameters were measured independently by two different observers, with a predetermined methodology to prevent interobserver and intraobserver error. The method used for assessing the CI was Hrdlicka’s method.[15] The anatomical landmarks, Glabella (g), Inion (I), and Euryon (eu) were marked.
The anatomical landmarks were defined as follows:• Glabella: A point above the nasal root between the
eyebrows and intersected by mid sagittal plane.• Inion: The distal-most point placed on the external
occipital protuberance in the mid sagittal plane.• Euryon: The lateral-most point placed on the side of
the head.
The head length was measured with a spreading caliper from Glabella to Inion. Head breadth was measured as the maximum transverse diameter between the two Euryon using a spreading caliper.
All measurements were taken in centimeters and to an accuracy of 0.10. The cranial indices were calculated by multiplying the head breadth with 100 and dividing it with the head length.
Depending on these indices the types of head shapes were classified as given by William et al., 1995 [Table 1].[16]
Statistical AnalysisThe data were analyzed by Microsoft Excel, and all the statistical tests and calculations were performed using the software GraphPad Prism Version 5.
OBSERVATION AND RESULTS
From the collected data, the mean values and standard deviation (SD) were calculated for maximum head length, maximum head breadth, and CI. From the observations of the present study, the parametric data were analyzed using independent sample t-test.
Males’ cranial length ranged from 16.2 cm to 19.7 cm with
Table 1: Types of head shapes
Type of skull Cephalic index rangeDolichocephalic <74.9Mesocephalic 75–79.9Brachycephalic 80–84.9Hyper brachycephalic 85–89.9
Table 2: Descriptive statistic showing various parameters of the present studyVariables n Range Mean±SD P valueCI (male) 90 65.00–80.25 77.65±3.34 0.000CI (female) 50 68.31–88.82 78.13±3.76CI (both) 140 65.26–83.44 77.89±3.55 Cranial length (male)
90 16.20–19.70 19.78±1.12 0.000
Cranial length (female)
50 16.80–20.62 18.52±1.23
Cranial length (both)
140 15.70–19.70 19.15±1.17
Cranial breadth (male)
90 13.90–15.45 15.36±0.56 0.000
Cranial breadth (female)
50 12.70–15.31 14.47±0.47
Cranial breadth (both)
140 11.70–14.30 14.91±0.51
CI: Cranial index
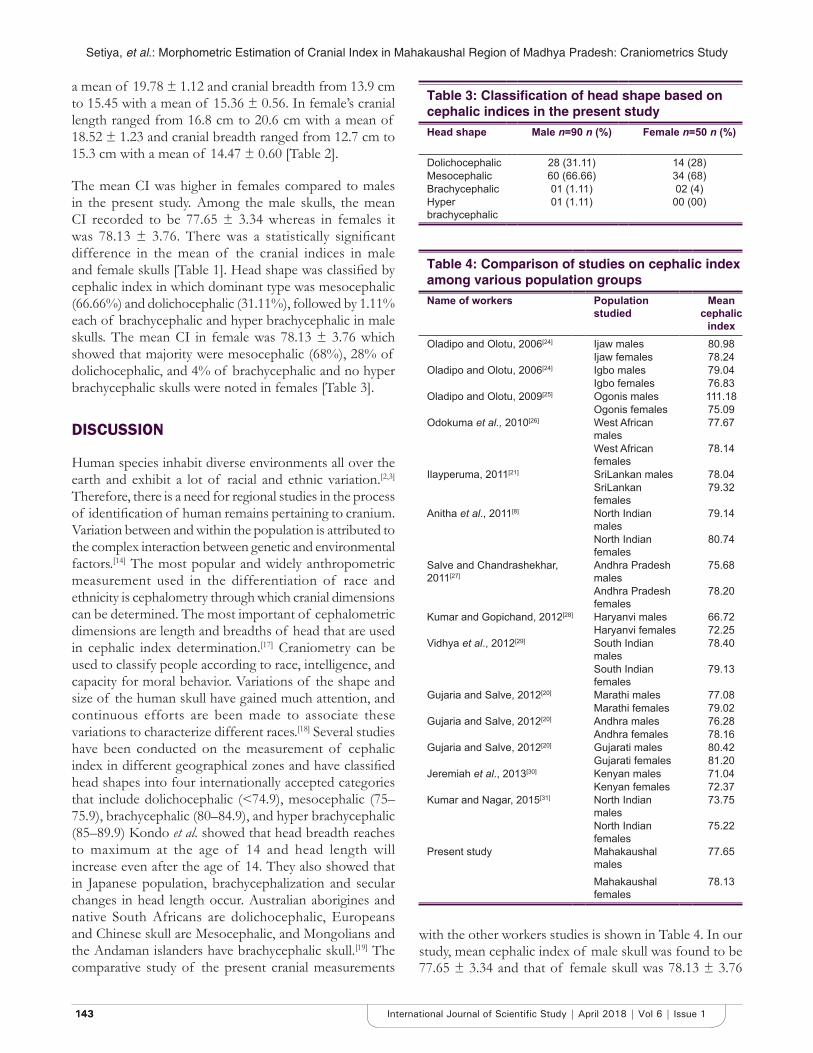
Setiya, et al.: Morphometric Estimation of Cranial Index in Mahakaushal Region of Madhya Pradesh: Craniometrics Study
143143 International Journal of Scientific Study | April 2018 | Vol 6 | Issue 1
a mean of 19.78 ± 1.12 and cranial breadth from 13.9 cm to 15.45 with a mean of 15.36 ± 0.56. In female’s cranial length ranged from 16.8 cm to 20.6 cm with a mean of 18.52 ± 1.23 and cranial breadth ranged from 12.7 cm to 15.3 cm with a mean of 14.47 ± 0.60 [Table 2].
The mean CI was higher in females compared to males in the present study. Among the male skulls, the mean CI recorded to be 77.65 ± 3.34 whereas in females it was 78.13 ± 3.76. There was a statistically significant difference in the mean of the cranial indices in male and female skulls [Table 1]. Head shape was classified by cephalic index in which dominant type was mesocephalic (66.66%) and dolichocephalic (31.11%), followed by 1.11% each of brachycephalic and hyper brachycephalic in male skulls. The mean CI in female was 78.13 ± 3.76 which showed that majority were mesocephalic (68%), 28% of dolichocephalic, and 4% of brachycephalic and no hyper brachycephalic skulls were noted in females [Table 3].
DISCUSSION
Human species inhabit diverse environments all over the earth and exhibit a lot of racial and ethnic variation.[2,3] Therefore, there is a need for regional studies in the process of identification of human remains pertaining to cranium. Variation between and within the population is attributed to the complex interaction between genetic and environmental factors.[14] The most popular and widely anthropometric measurement used in the differentiation of race and ethnicity is cephalometry through which cranial dimensions can be determined. The most important of cephalometric dimensions are length and breadths of head that are used in cephalic index determination.[17] Craniometry can be used to classify people according to race, intelligence, and capacity for moral behavior. Variations of the shape and size of the human skull have gained much attention, and continuous efforts are been made to associate these variations to characterize different races.[18] Several studies have been conducted on the measurement of cephalic index in different geographical zones and have classified head shapes into four internationally accepted categories that include dolichocephalic (<74.9), mesocephalic (75–75.9), brachycephalic (80–84.9), and hyper brachycephalic (85–89.9) Kondo et al. showed that head breadth reaches to maximum at the age of 14 and head length will increase even after the age of 14. They also showed that in Japanese population, brachycephalization and secular changes in head length occur. Australian aborigines and native South Africans are dolichocephalic, Europeans and Chinese skull are Mesocephalic, and Mongolians and the Andaman islanders have brachycephalic skull.[19] The comparative study of the present cranial measurements
Table 3: Classification of head shape based on cephalic indices in the present studyHead shape Male n=90 n (%) Female n=50 n (%)
Dolichocephalic 28 (31.11) 14 (28)Mesocephalic 60 (66.66) 34 (68)Brachycephalic 01 (1.11) 02 (4)Hyper brachycephalic
01 (1.11) 00 (00)
Table 4: Comparison of studies on cephalic index among various population groupsName of workers Population
studiedMean
cephalic index
Oladipo and Olotu, 2006[24] Ijaw males 80.98Ijaw females 78.24
Oladipo and Olotu, 2006[24] Igbo males 79.04Igbo females 76.83
Oladipo and Olotu, 2009[25] Ogonis males 111.18Ogonis females 75.09
Odokuma et al., 2010[26] West African males
77.67
West African females
78.14
Ilayperuma, 2011[21] SriLankan males 78.04SriLankan females
79.32
Anitha et al., 2011[8] North Indian males
79.14
North Indian females
80.74
Salve and Chandrashekhar, 2011[27]
Andhra Pradesh males
75.68
Andhra Pradesh females
78.20
Kumar and Gopichand, 2012[28] Haryanvi males 66.72Haryanvi females 72.25
Vidhya et al., 2012[29] South Indian males
78.40
South Indian females
79.13
Gujaria and Salve, 2012[20] Marathi males 77.08Marathi females 79.02
Gujaria and Salve, 2012[20] Andhra males 76.28Andhra females 78.16
Gujaria and Salve, 2012[20] Gujarati males 80.42Gujarati females 81.20
Jeremiah et al., 2013[30] Kenyan males 71.04Kenyan females 72.37
Kumar and Nagar, 2015[31] North Indian males
73.75
North Indian females
75.22
Present study Mahakaushal males
77.65
Mahakaushal females
78.13
with the other workers studies is shown in Table 4. In our study, mean cephalic index of male skull was found to be 77.65 ± 3.34 and that of female skull was 78.13 ± 3.76
Setiya, et al.: Morphometric Estimation of Cranial Index in Mahakaushal Region of Madhya Pradesh: Craniometrics Study
144144International Journal of Scientific Study | April 2018 | Vol 6 | Issue 1
so, according to Siewerts classification this population belongs to mesocephalic variety. The results of our study were similar to the study on Andhra males and females by Gujaria and Salve, 2012 in which the mean cephalic index in males was 76.28 and in females was 78.16. The dominant head type in males and female was Mesocephalic followed by dolichocephalic and then by brachycephalic and ultrabrachycephalic.[20] The findings of our study were also similar to that on SriLankan males and females by Ilayperuma in 2011 in which mesocephalic was the dominant head shape in both males and females.[21] Bhargava and Kher in 1960 found mean cephalic index as 76.9 in Bhils population.[22] Further, Bhargava and Kher in 1961 found it to be 79.80 in Barelas population in central India.[23] As previously reported, genetic and environmental factors are largely responsible for variation in head shapes. We postulate based on our observations that the head type observed in the population of Mahakaushal region in comparison with other population is a true reflection of their location. The knowledge obtained from this study can be of great importance to a plastic surgeon when reconstructive surgery is essential.
CONCLUSION
Cephalic morphometry marks its identity in anthropology for the study and comparison of crania of a different population of different ethnic, racial, dietary, geographical, and genetic backgrounds. The differences in metrical dimensions of the human head among the different population are greatly valuable, and this suggests the strength of cephalic morphometry in the assessment of sex and races. This helps in better understanding of frequency distribution of human morphologies and comparison of different races. The significance and practicality of CI were less studied in a population of Mahakaushal region, and thus a research design was framed to study, analyze and report the head shapes and cephalic index of this population.
REFERENCES
1. Cattaneo C. Forensic anthropology: An introduction. In: Siegel JA, Saukko PJ, editors. Encyclopedia of Forensic Sciences. 2nd ed. London, UK: Academic Press, Elsevier; 2013. p. 9-11.
2. Brahmachari SK, Majumder PP, et al. Indian Genome Variation Consortium. Genetic landscape of the people of India: A canvas for disease gene exploration. J Genet 2008;87:3-20.
3. Kalla AK. The Ethnology of India: Antecedents and Ethnic Affinities of Peoples of India. New Delhi: Munshiram Manoharlal Publishers; 1994.
4. White TD, Folkens PA. The Human Bone Manual. Boston: Elsevier
Academic Press; 2005.5. Williams PL, Bannister LH, Berry MM, Collins P, Dyson M, Dussek JE.
Gray’s Anatomy: The Anatomical Basis of Medicine and Surgery. 38th ed. New York: Churchill Livingstone; 2000.
6. Shah T, Thaker MB, Menon SK. Assessment of cephalic and facial indices: A proof for ethnic and sexual dimorphism. J Forensic Sci Criminol 2015;3:101.
7. Chouhan P, Mathur A, Bardjatiya R, Amaan M. Study of cephalic index in Indian muslim female students-A study in ajmer zone. Indian J Clin Anat Physiol 2015;2:154-6.
8. Anitha MR, Vijayanath V, Raju GM, Vijayamahantesh SN. Cephalic index of north Indian population. Anat Karnataka 2011;5:40-3.
9. Franco FC, Araujo TM, Voge CJ, Quintão CC. Brachycephalic, dolichocephalic and mesocephalic: Is it appropriate to describe the face using skull patterns? Dental Press J Orthod 2013;18:159-63.
10. Sicher H. Oral Anatomy. 6th ed. St Louis: Mosby; 1975.11. Rakosi T, Jonas I, Graber T. Orthodontic Diagnosis (Color Atlas of Dental
Medicine). 1st ed. New York: Thieme; 1993.12. Rexhepi A, Meka V. Cephalofacial morphological characteristics of
Albanian Kosova population. Int J Morphol 2008;26:935-40.13. Grant TM, Peter AM. Size and shape measurement in contemporary
cephalometrics. Eur Jr Orthod 2003;25:231-42.14. Kasai K, Richards TC, Brown T. Comparative study of craniofacial
morphology in Japanese and Australian aboriginal populations. Hum Biol 1993;65:821-34.
15. Hrdlika. Practical Anthropometry. 4th ed. Philadelphia: The Wistar Institute of Anatomy and Biology; 1952. p. 87-9.
16. William P, Dyson M, Dussaak JE, Bannister LH, Berry MM, Collins P, Ferguson MW. Gray’s Anatomy. In: Skeletal System. 38th ed. London: Elbs with Churchil Livingston; 1995. p. 607-12.
17. VojdaniZ, Bahmanpour S, Momeni S, Vasaghi A, Yazdizadeh A, Karamifar A, et al. Cephalometry in 14-18 years old girls and boys of Shiraz, Iran high school. Int J Morphol 2009;27:101-4.
18. Rathee SK, Gupta S, Deswal S, Dhall U, Raghavan P. Cranial index in north Indian crania (predominantly Haryanavi). Int J Anat Res 2014;2:400-2.
19. Kondo S, Wakatsuki E, Shibagaki HA. Somatometric study of the head and face in Japanese adolescence. Okajimas Folia Anat Jpn 1999;76:179-85.
20. Gujaria IJ, Salve VM. Comparison of cephalic index of three states of India. Int J Pharm Biosci 2012;3:1022-31.
21. Ilayperuma I. Evaluation of cephalic indices of Srilankan population: A clue for Racial and Sex diversity. Int J Morphol 2011;29:112-7.
22. Bhargav T, Kher GA. An anthropometry study of central India, Bhil of Dhar district of Madhya Pradesh. J Anat Soc India 1960;9:14-9.
23. Bhargav T, Kher GA. A comparative anthropometric study of Bhils and Barelas of central India. J Anat Soc India 1961;10:23-6.
24. Oladipo GS, Olotu EJ. Anthropometric comparison of cephalic indices between the Ijaw and Igbo tribes. Global J Pure Appl Sci 2006;12:137-8.
25. Oladipo GS, Olotu JE, Suleiman Y. Anthropometric studies of Cephalic indices of the Ogonis in Nigeria. Asian J Med Sci 2009;1:15-7.
26. Odokuma EI, Akpuaka FC, Igbigbi PS, Otuaga PO, Ejebe D. Patterns of cephalic indices in three West African population. Afr J Biotechnol 2010;9:1658-62.
27. Salve VM, Chandrashekhar CH. A metric analysis of Mumbai region (India) crania. J Indian Med Assoc 2012;110:690-3.
28. Kumar M, Gopichand PV. The study of cephalic index in Haryanvi population. Int J Pure Appl Biosci 2013;1:1-6.
29. Vidhya CS, Prashantha B, Gangadhar MR. Anthropometric predictors for sexual dimorphism of skulls of south Indian origin. Int J Sci Res Publ 2012;2:1-4.
30. Jeremiah M, Pamela M, Fawzia B. Sex differences in the cranial and orbital indices for a black Kenyan population. Int J Med Med Sci 2013;5:81-4.
31. Kumar A, Nagar M. Morphometric estimation of cephalic index in north Indian population: Craniometric Study. Int J Sci Res 2015;4:1976-82.
How to cite this article: Setiya M, Tiwari A, Jehan M. Morphometric Estimation of Cranial Index in Mahakaushal Region of Madhya Pradesh: Craniometrics Study. Int J Sci Stud 2018;6(1):141-144.
Source of Support: Nil, Conflict of Interest: None declared.
145145 International Journal of Scientific Study | April 2018 | Vol 6 | Issue 1
Anatomical Variations in Position of Vermiform Appendix an Anatomical Study of Aborted FetusesMubeena Shaikh1, C H Moideen Kutty Gurukkal2
1Assistant Professor of Anatomy, Kannur Medical College, Anjarakandy, Kannur, Kerala, India, 2Department of General Medicine, Kannur Medical College, Anjarakandy, Kannur, Kerala, India
membrane known the valve of Gerlach.[2] The appendix is usually located at the junction of the three taenia, found on the surface of the caecum.[1,3] The length of appendix varies from 7 to 9 cm.[1,4] The attachment of the base of the appendix to the caecum remains constant, whereas the tip can be found in a retrocecal, pelvic, subcecal, pre-ileal, and post-ileal positions.[1-3] The appendix is connected to the lower part of ileal mesentery by a triangular fold called as mesoappendix.[1,2] The mesoappendix has a free border which carries the blood supply to the organ, by the appendicular artery which is a branch from the ileocolic artery.[5] Inflammation of appendix is known as appendicitis, and usually, it is an acute condition affecting the young adults, a common cause of acute abdomen. Since the appendicular artery is an end artery, and also it’s close
INTRODUCTION
The vermiform appendix is located in the right lower quadrant of abdomen appearing as a narrow, worm-shaped tube, arising from the posteromedial caecal wall, 2 cm or less below the end of the ileum.[1] Its opening is occasionally guarded by a semicircular fold of mucous
Original Article
AbstractBackground: The appendix is a vestigial organ, narrow tube-like structure lying in the right iliac fossa. It is part of the large intestine, and its base is attached to the posterolateral surface of the caecum just below ileocecal junction, the tip is free, and it may be present in retrocecal, subcecal, pre/post ileal, or pelvic positions. Knowing the exact anatomical position of vermiform appendix is important in view of surgeons for on time diagnosis and management of acute appendicitis.
Aim of the Study: The aim of the study was to determine the different characteristics of vermiform appendix in aborted fetuses.
Materials and Methods: A total of 138 aborted fetuses were subjected to dissection to identify the position of the vermiform appendix. Other parameters noted were the length of the appendix, formation of mesoappendix, and direction of the tip of the vermiform appendix.
Observations and Results: Among the 138 fetuses included in the study 89 (64.49%) were male and 49 were female fetuses (35.50%). Observing the position of the appendix, it was noted that among the male fetuses the pelvic position was seen in 52 fetuses (58.42%) followed by subcecal in 14 (15.73%), retroileal in 12 (13.48%), retrocecal in 4 (04.49%), ectopic in 4 (04.49%), and pre-ileal in 3 (03.37%). The tip of the appendix was at 2’ O clock position, being the most common in 59 (%) of the male fetuses. The mean length of the appendix in fetuses between 11 and 20 weeks was 14.98 mm, in fetuses between 21 and 30 weeks was 23.65 mm, and in foetuses of 31 to –40 weeks was 35.24 mm. Mesopappendix was completely formed in 79.5% of the bodies.
Conclusions: There was no clear-cut association between the sex of the festuses and the position of the appendix. Anterior anatomical position was the most common position for vermiform appendix which was not correlating with other reports from western countries. Most probably factors such as race, geographical location, and dietary habits play some role in determining the position of the vermiform appendix.
Key words: Appendicectomy, Appendicitis, Mesoappendix, Vermiform appendix
Access this article online
www.ijss-sn.com
Month of Submission : 02-2018 Month of Peer Review : 03-2018 Month of Acceptance : 04-2018 Month of Publishing : 04-2018
Corresponding Author: Dr. C H Moideen Kutty Gurukkal, Department of General Medicine, Kannur Medical College, Anjarakandy, Kannur, Kerala, India. Phone: +91-9895934030. E-mail: [email protected]
Print ISSN: 2321-6379Online ISSN: 2321-595X
DOI: 10.17354/ijss/2018/129
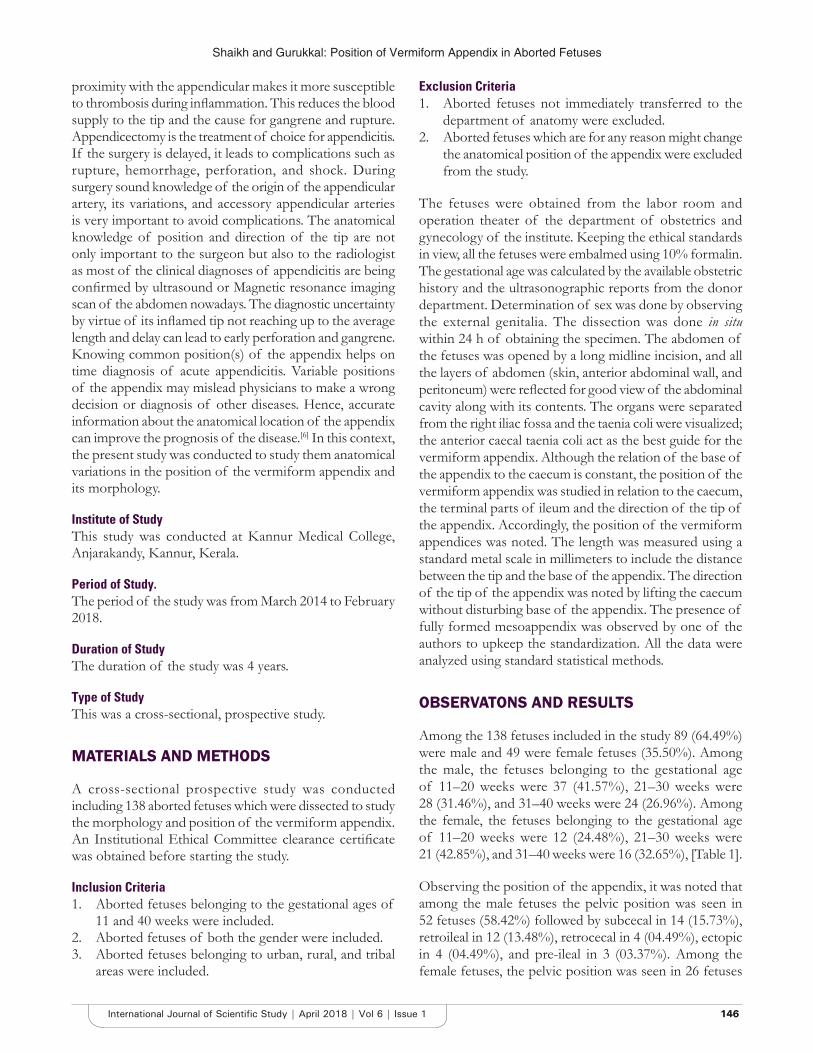
Shaikh and Gurukkal: Position of Vermiform Appendix in Aborted Fetuses
146146International Journal of Scientific Study | April 2018 | Vol 6 | Issue 1
proximity with the appendicular makes it more susceptible to thrombosis during inflammation. This reduces the blood supply to the tip and the cause for gangrene and rupture. Appendicectomy is the treatment of choice for appendicitis. If the surgery is delayed, it leads to complications such as rupture, hemorrhage, perforation, and shock. During surgery sound knowledge of the origin of the appendicular artery, its variations, and accessory appendicular arteries is very important to avoid complications. The anatomical knowledge of position and direction of the tip are not only important to the surgeon but also to the radiologist as most of the clinical diagnoses of appendicitis are being confirmed by ultrasound or Magnetic resonance imaging scan of the abdomen nowadays. The diagnostic uncertainty by virtue of its inflamed tip not reaching up to the average length and delay can lead to early perforation and gangrene. Knowing common position(s) of the appendix helps on time diagnosis of acute appendicitis. Variable positions of the appendix may mislead physicians to make a wrong decision or diagnosis of other diseases. Hence, accurate information about the anatomical location of the appendix can improve the prognosis of the disease.[6] In this context, the present study was conducted to study them anatomical variations in the position of the vermiform appendix and its morphology.
Institute of StudyThis study was conducted at Kannur Medical College, Anjarakandy, Kannur, Kerala.
Period of Study.The period of the study was from March 2014 to February 2018.
Duration of StudyThe duration of the study was 4 years.
Type of StudyThis was a cross-sectional, prospective study.
MATERIALS AND METHODS
A cross-sectional prospective study was conducted including 138 aborted fetuses which were dissected to study the morphology and position of the vermiform appendix. An Institutional Ethical Committee clearance certificate was obtained before starting the study.
Inclusion Criteria1. Aborted fetuses belonging to the gestational ages of
11 and 40 weeks were included.2. Aborted fetuses of both the gender were included.3. Aborted fetuses belonging to urban, rural, and tribal
areas were included.
Exclusion Criteria1. Aborted fetuses not immediately transferred to the
department of anatomy were excluded.2. Aborted fetuses which are for any reason might change
the anatomical position of the appendix were excluded from the study.
The fetuses were obtained from the labor room and operation theater of the department of obstetrics and gynecology of the institute. Keeping the ethical standards in view, all the fetuses were embalmed using 10% formalin. The gestational age was calculated by the available obstetric history and the ultrasonographic reports from the donor department. Determination of sex was done by observing the external genitalia. The dissection was done in situ within 24 h of obtaining the specimen. The abdomen of the fetuses was opened by a long midline incision, and all the layers of abdomen (skin, anterior abdominal wall, and peritoneum) were reflected for good view of the abdominal cavity along with its contents. The organs were separated from the right iliac fossa and the taenia coli were visualized; the anterior caecal taenia coli act as the best guide for the vermiform appendix. Although the relation of the base of the appendix to the caecum is constant, the position of the vermiform appendix was studied in relation to the caecum, the terminal parts of ileum and the direction of the tip of the appendix. Accordingly, the position of the vermiform appendices was noted. The length was measured using a standard metal scale in millimeters to include the distance between the tip and the base of the appendix. The direction of the tip of the appendix was noted by lifting the caecum without disturbing base of the appendix. The presence of fully formed mesoappendix was observed by one of the authors to upkeep the standardization. All the data were analyzed using standard statistical methods.
OBSERVATONS AND RESULTS
Among the 138 fetuses included in the study 89 (64.49%) were male and 49 were female fetuses (35.50%). Among the male, the fetuses belonging to the gestational age of 11–20 weeks were 37 (41.57%), 21–30 weeks were 28 (31.46%), and 31–40 weeks were 24 (26.96%). Among the female, the fetuses belonging to the gestational age of 11–20 weeks were 12 (24.48%), 21–30 weeks were 21 (42.85%), and 31–40 weeks were 16 (32.65%), [Table 1].
Observing the position of the appendix, it was noted that among the male fetuses the pelvic position was seen in 52 fetuses (58.42%) followed by subcecal in 14 (15.73%), retroileal in 12 (13.48%), retrocecal in 4 (04.49%), ectopic in 4 (04.49%), and pre-ileal in 3 (03.37%). Among the female fetuses, the pelvic position was seen in 26 fetuses
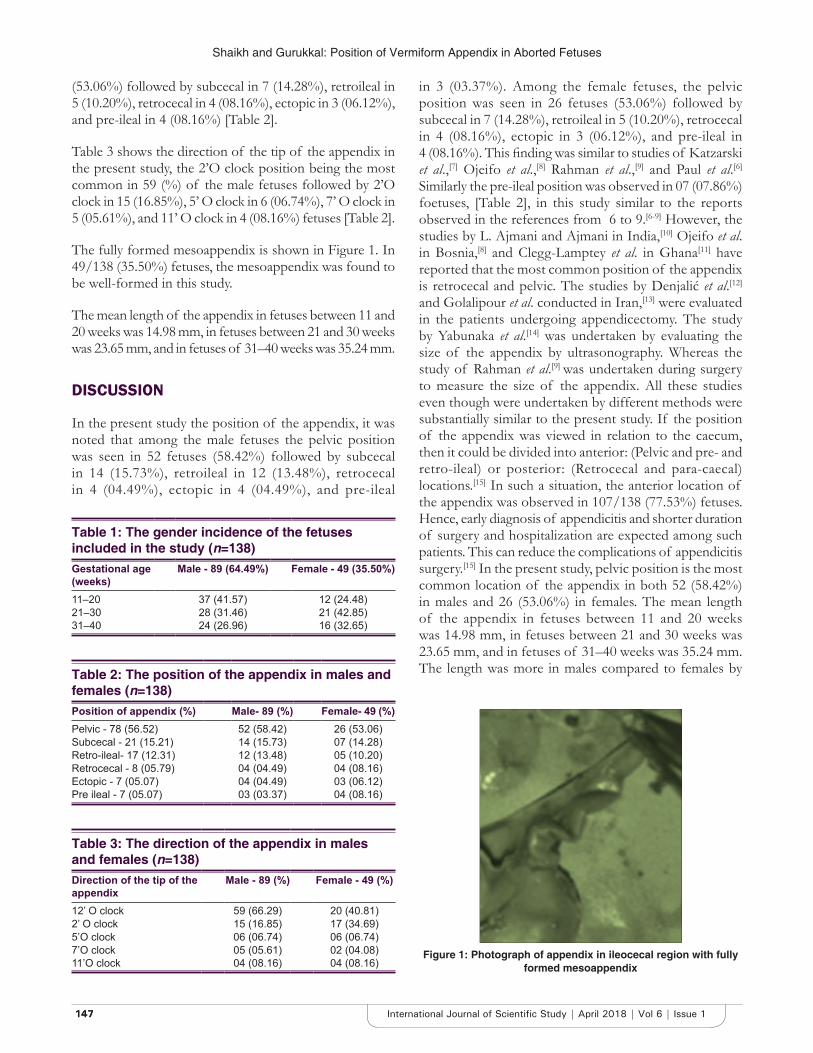
Shaikh and Gurukkal: Position of Vermiform Appendix in Aborted Fetuses
147147 International Journal of Scientific Study | April 2018 | Vol 6 | Issue 1
(53.06%) followed by subcecal in 7 (14.28%), retroileal in 5 (10.20%), retrocecal in 4 (08.16%), ectopic in 3 (06.12%), and pre-ileal in 4 (08.16%) [Table 2].
Table 3 shows the direction of the tip of the appendix in the present study, the 2’O clock position being the most common in 59 (%) of the male fetuses followed by 2’O clock in 15 (16.85%), 5’ O clock in 6 (06.74%), 7’ O clock in 5 (05.61%), and 11’ O clock in 4 (08.16%) fetuses [Table 2].
The fully formed mesoappendix is shown in Figure 1. In 49/138 (35.50%) fetuses, the mesoappendix was found to be well-formed in this study.
The mean length of the appendix in fetuses between 11 and 20 weeks was 14.98 mm, in fetuses between 21 and 30 weeks was 23.65 mm, and in fetuses of 31–40 weeks was 35.24 mm.
DISCUSSION
In the present study the position of the appendix, it was noted that among the male fetuses the pelvic position was seen in 52 fetuses (58.42%) followed by subcecal in 14 (15.73%), retroileal in 12 (13.48%), retrocecal in 4 (04.49%), ectopic in 4 (04.49%), and pre-ileal
in 3 (03.37%). Among the female fetuses, the pelvic position was seen in 26 fetuses (53.06%) followed by subcecal in 7 (14.28%), retroileal in 5 (10.20%), retrocecal in 4 (08.16%), ectopic in 3 (06.12%), and pre-ileal in 4 (08.16%). This finding was similar to studies of Katzarski et al.,[7] Ojeifo et al.,[8] Rahman et al.,[9] and Paul et al.[6] Similarly the pre-ileal position was observed in 07 (07.86%) foetuses, [Table 2], in this study similar to the reports observed in the references from 6 to 9.[6-9] However, the studies by L. Ajmani and Ajmani in India,[10] Ojeifo et al. in Bosnia,[8] and Clegg-Lamptey et al. in Ghana[11] have reported that the most common position of the appendix is retrocecal and pelvic. The studies by Denjalić et al.[12] and Golalipour et al. conducted in Iran,[13] were evaluated in the patients undergoing appendicectomy. The study by Yabunaka et al.[14] was undertaken by evaluating the size of the appendix by ultrasonography. Whereas the study of Rahman et al.[9] was undertaken during surgery to measure the size of the appendix. All these studies even though were undertaken by different methods were substantially similar to the present study. If the position of the appendix was viewed in relation to the caecum, then it could be divided into anterior: (Pelvic and pre- and retro-ileal) or posterior: (Retrocecal and para-caecal) locations.[15] In such a situation, the anterior location of the appendix was observed in 107/138 (77.53%) fetuses. Hence, early diagnosis of appendicitis and shorter duration of surgery and hospitalization are expected among such patients. This can reduce the complications of appendicitis surgery.[15] In the present study, pelvic position is the most common location of the appendix in both 52 (58.42%) in males and 26 (53.06%) in females. The mean length of the appendix in fetuses between 11 and 20 weeks was 14.98 mm, in fetuses between 21 and 30 weeks was 23.65 mm, and in fetuses of 31–40 weeks was 35.24 mm. The length was more in males compared to females by
Table 1: The gender incidence of the fetuses included in the study (n=138)Gestational age (weeks)
Male - 89 (64.49%) Female - 49 (35.50%)
11–20 37 (41.57) 12 (24.48)21–30 28 (31.46) 21 (42.85)31–40 24 (26.96) 16 (32.65)
Table 2: The position of the appendix in males and females (n=138)Position of appendix (%) Male- 89 (%) Female- 49 (%)Pelvic - 78 (56.52) 52 (58.42) 26 (53.06)Subcecal - 21 (15.21) 14 (15.73) 07 (14.28)Retro-ileal- 17 (12.31) 12 (13.48) 05 (10.20)Retrocecal - 8 (05.79) 04 (04.49) 04 (08.16)Ectopic - 7 (05.07) 04 (04.49) 03 (06.12)Pre ileal - 7 (05.07) 03 (03.37) 04 (08.16)
Table 3: The direction of the appendix in males and females (n=138)Direction of the tip of the appendix
Male - 89 (%) Female - 49 (%)
12’ O clock 59 (66.29) 20 (40.81)2’ O clock 15 (16.85) 17 (34.69)5’O clock 06 (06.74) 06 (06.74)7’O clock 05 (05.61) 02 (04.08)11’O clock 04 (08.16) 04 (08.16)
Figure 1: Photograph of appendix in ileocecal region with fully formed mesoappendix
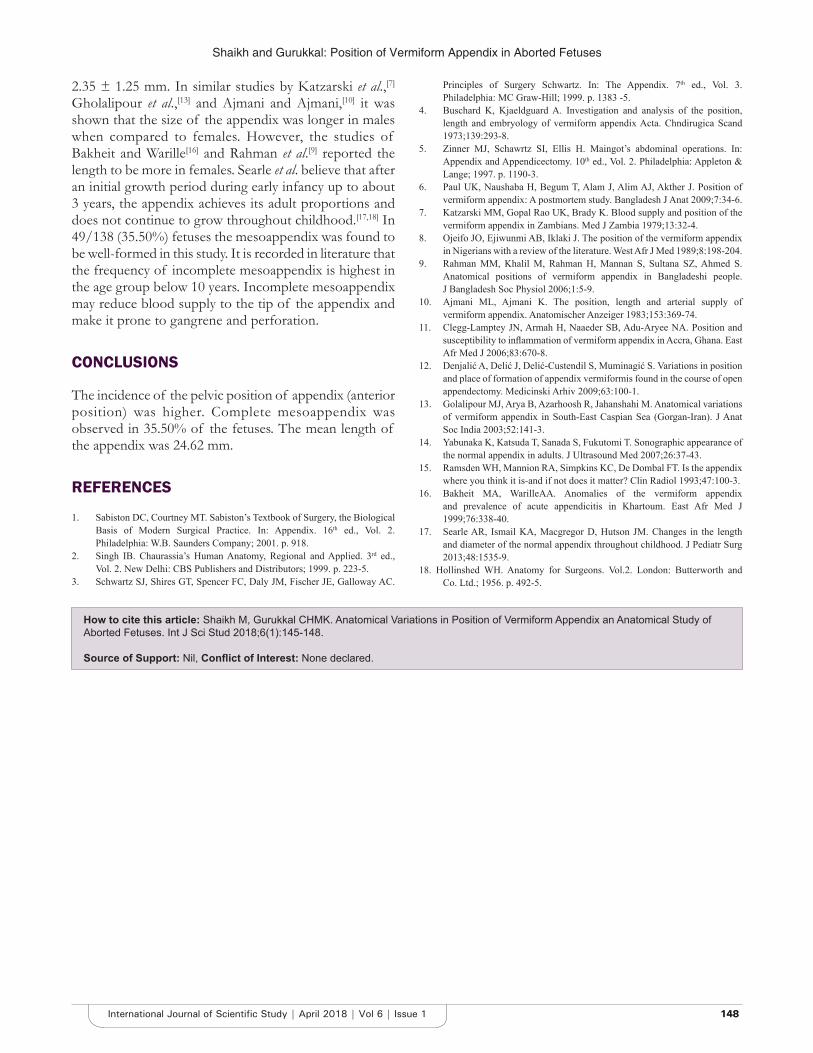
Shaikh and Gurukkal: Position of Vermiform Appendix in Aborted Fetuses
148148International Journal of Scientific Study | April 2018 | Vol 6 | Issue 1
2.35 ± 1.25 mm. In similar studies by Katzarski et al.,[7] Gholalipour et al.,[13] and Ajmani and Ajmani,[10] it was shown that the size of the appendix was longer in males when compared to females. However, the studies of Bakheit and Warille[16] and Rahman et al.[9] reported the length to be more in females. Searle et al. believe that after an initial growth period during early infancy up to about 3 years, the appendix achieves its adult proportions and does not continue to grow throughout childhood.[17,18] In 49/138 (35.50%) fetuses the mesoappendix was found to be well-formed in this study. It is recorded in literature that the frequency of incomplete mesoappendix is highest in the age group below 10 years. Incomplete mesoappendix may reduce blood supply to the tip of the appendix and make it prone to gangrene and perforation.
CONCLUSIONS
The incidence of the pelvic position of appendix (anterior position) was higher. Complete mesoappendix was observed in 35.50% of the fetuses. The mean length of the appendix was 24.62 mm.
REFERENCES
1. Sabiston DC, Courtney MT. Sabiston’s Textbook of Surgery, the Biological Basis of Modern Surgical Practice. In: Appendix. 16th ed., Vol. 2. Philadelphia: W.B. Saunders Company; 2001. p. 918.
2. Singh IB. Chaurassia’s Human Anatomy, Regional and Applied. 3rd ed., Vol. 2. New Delhi: CBS Publishers and Distributors; 1999. p. 223-5.
3. Schwartz SJ, Shires GT, Spencer FC, Daly JM, Fischer JE, Galloway AC.
Principles of Surgery Schwartz. In: The Appendix. 7th ed., Vol. 3. Philadelphia: MC Graw-Hill; 1999. p. 1383 -5.
4. Buschard K, Kjaeldguard A. Investigation and analysis of the position, length and embryology of vermiform appendix Acta. Chndirugica Scand 1973;139:293-8.
5. Zinner MJ, Schawrtz SI, Ellis H. Maingot’s abdominal operations. In: Appendix and Appendicectomy. 10th ed., Vol. 2. Philadelphia: Appleton & Lange; 1997. p. 1190-3.
6. Paul UK, Naushaba H, Begum T, Alam J, Alim AJ, Akther J. Position of vermiform appendix: A postmortem study. Bangladesh J Anat 2009;7:34-6.
7. Katzarski MM, Gopal Rao UK, Brady K. Blood supply and position of the vermiform appendix in Zambians. Med J Zambia 1979;13:32-4.
8. Ojeifo JO, Ejiwunmi AB, Iklaki J. The position of the vermiform appendix in Nigerians with a review of the literature. West Afr J Med 1989;8:198-204.
9. Rahman MM, Khalil M, Rahman H, Mannan S, Sultana SZ, Ahmed S. Anatomical positions of vermiform appendix in Bangladeshi people. J Bangladesh Soc Physiol 2006;1:5-9.
10. Ajmani ML, Ajmani K. The position, length and arterial supply of vermiform appendix. Anatomischer Anzeiger 1983;153:369-74.
11. Clegg-Lamptey JN, Armah H, Naaeder SB, Adu-Aryee NA. Position and susceptibility to inflammation of vermiform appendix in Accra, Ghana. East Afr Med J 2006;83:670-8.
12. Denjalić A, Delić J, Delić-Custendil S, Muminagić S. Variations in position and place of formation of appendix vermiformis found in the course of open appendectomy. Medicinski Arhiv 2009;63:100-1.
13. Golalipour MJ, Arya B, Azarhoosh R, Jahanshahi M. Anatomical variations of vermiform appendix in South-East Caspian Sea (Gorgan-Iran). J Anat Soc India 2003;52:141-3.
14. Yabunaka K, Katsuda T, Sanada S, Fukutomi T. Sonographic appearance of the normal appendix in adults. J Ultrasound Med 2007;26:37-43.
15. Ramsden WH, Mannion RA, Simpkins KC, De Dombal FT. Is the appendix where you think it is-and if not does it matter? Clin Radiol 1993;47:100-3.
16. Bakheit MA, WarilleAA. Anomalies of the vermiform appendix and prevalence of acute appendicitis in Khartoum. East Afr Med J 1999;76:338-40.
17. Searle AR, Ismail KA, Macgregor D, Hutson JM. Changes in the length and diameter of the normal appendix throughout childhood. J Pediatr Surg 2013;48:1535-9.
18. Hollinshed WH. Anatomy for Surgeons. Vol.2. London: Butterworth and Co. Ltd.; 1956. p. 492-5.
How to cite this article: Shaikh M, Gurukkal CHMK. Anatomical Variations in Position of Vermiform Appendix an Anatomical Study of Aborted Fetuses. Int J Sci Stud 2018;6(1):145-148.
Source of Support: Nil, Conflict of Interest: None declared.
149149 International Journal of Scientific Study | April 2018 | Vol 6 | Issue 1
Comorbidities and their Management in Patients with Chronic Kidney Disease in a Tertiary Hospital of KeralaC H Moideen Kutty Gurukkal1, B K Bithun2
1Assistant Professor, Department of General Medicine, Kannur Medical College, Anjarakandy, Kannur, Kerala, India, 2Assistant Professor, Department of Pathology, Kannur Medical College, Anjarakandy, Kannur, Kerala, India
(ESRD). The prevalence rate of CKD and ESRD grew most quickly among the patients aged above 65 years.[1] The definition of CKD according to the kidney disease improving global outcomes is either damage to kidneys or a glomerular filtration rate (GFR) of <60 mL/min per 1.73 m2 for a period of ≥3 mo, with implications for health. Kidney damage can be defined by structural (detected by imaging) or functional abnormalities of the kidneys with or without a decrease in GFR. These may be apparent as either pathological irregularities or as indicators of kidney damage which include albuminuria >30 mg/d, urine sediment abnormalities and electrolyte,
INTRODUCTION
There is an increase in the chronic kidney disease (CKD) all over the world; clinical data from the USA show an increase in the trend of CKD and end-stage renal disease
Original Article
AbstractIntroduction: To manage patients with chronic kidney disease (CKD) optimally, it requires appropriate knowledge of markers and stages of CKD and early disease recognition. Replacing the terms such as chronic renal insufficiency, chronic renal disease, chronic renal failure the, the National kidney foundation kidney disease outcomes quality initiative, has defined the all encompassing term as CKD. An understanding of estimated glomerular filtration (e GFR) is required as it is still considered the best overall index of kidney function in stable, non-hospitalized patients. There are multiple risk factors and comorbid diseases which modify the natural course and prognosis of CKD and alter the necessity to change the management. The present study is conducted to study the comorbidities in patients with CKD.
Aim of the Study: The aim of the study was to study the comorbidities in patients with CKD.
Materials and Methods: This study was a retrospective observational study on consecutive new patients with CKD, who attended the dialysis unit of a tertiary teaching hospital in the northern part of Kerala. 89 consecutive new patients with CKD, who attended the dialysis unit of a tertiary teaching hospital, were included. Comorbid diseases, demographic data, and e GFR, were recorded.
Observations and Results: Out of 89 patients 63 were males and the remaining 26 were females. Patients belonged to the age group ranging from 35 to 80 years with a mean age of 54.42 ± 6.30. Among the various causes of primary kidney diseases diabetic nephropathy was found in 47/89 (52.80%) of the patients, chronic glomerulonephritis in 19/89 (21.34%), and hypertensive nephropathy in 8/89 (8.98%).
Conclusions: Among the various causes of primary kidney diseases diabetic nephropathy was found to be the most common followed by chronic glomerulonephritis in this study. Among the comorbid conditions, comorbid diabetes mellitus was observed the most common, hypertension presenting the form of myocardial infarction, Cerebro Vascular Accident (CVA), chronic pulmonary disease, congestive heart failure, and peripheral vascular disease.
Key words: Chronic kidney disease, Dialysis and comorbidities, End-stage renal disease, Glomerular filtration rate
Access this article online
www.ijss-sn.com
Month of Submission : 02-2018 Month of Peer Review : 03-2018 Month of Acceptance : 04-2018 Month of Publishing : 04-2018
Corresponding Author: Dr. B K Bithun, Department of Pathology, Kannur Medical College, Anjarakandy, Kannur, Kerala, India. Phone: +91-9744880098. E-mail: [email protected]
Print ISSN: 2321-6379Online ISSN: 2321-595X
DOI: 10.17354/ijss/2018/130
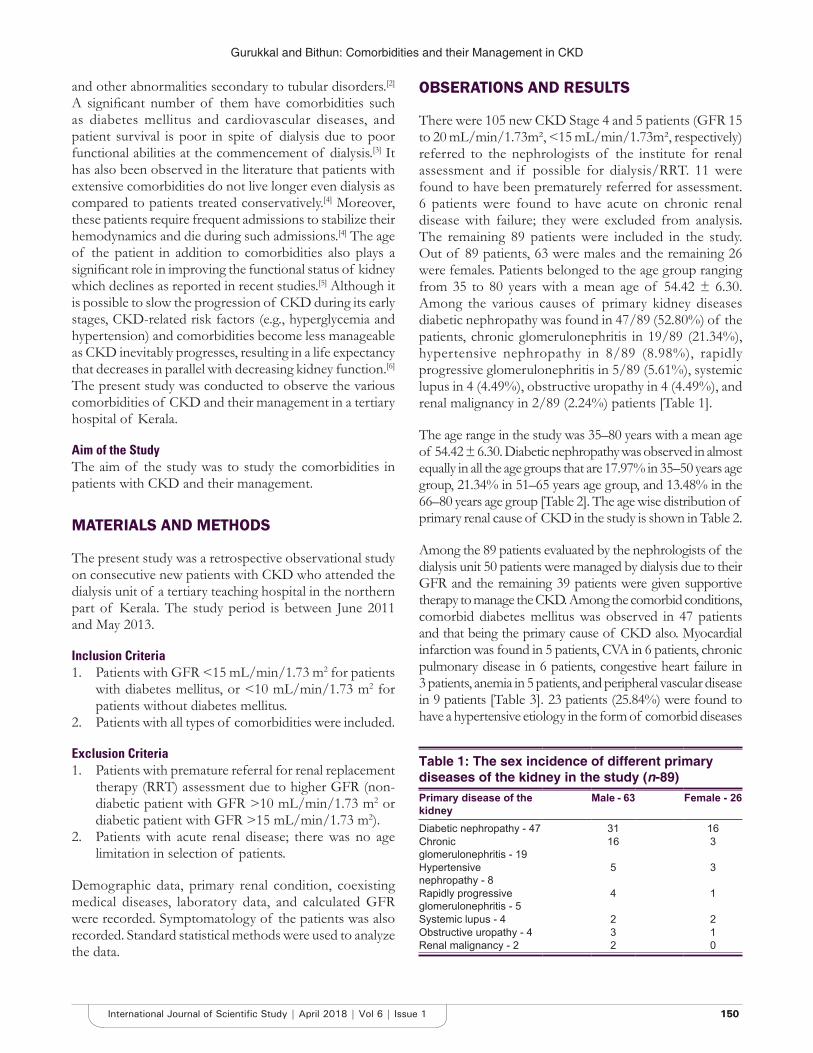
Gurukkal and Bithun: Comorbidities and their Management in CKD
150150International Journal of Scientific Study | April 2018 | Vol 6 | Issue 1
and other abnormalities secondary to tubular disorders.[2] A significant number of them have comorbidities such as diabetes mellitus and cardiovascular diseases, and patient survival is poor in spite of dialysis due to poor functional abilities at the commencement of dialysis.[3] It has also been observed in the literature that patients with extensive comorbidities do not live longer even dialysis as compared to patients treated conservatively.[4] Moreover, these patients require frequent admissions to stabilize their hemodynamics and die during such admissions.[4] The age of the patient in addition to comorbidities also plays a significant role in improving the functional status of kidney which declines as reported in recent studies.[5] Although it is possible to slow the progression of CKD during its early stages, CKD-related risk factors (e.g., hyperglycemia and hypertension) and comorbidities become less manageable as CKD inevitably progresses, resulting in a life expectancy that decreases in parallel with decreasing kidney function.[6] The present study was conducted to observe the various comorbidities of CKD and their management in a tertiary hospital of Kerala.
Aim of the StudyThe aim of the study was to study the comorbidities in patients with CKD and their management.
MATERIALS AND METHODS
The present study was a retrospective observational study on consecutive new patients with CKD who attended the dialysis unit of a tertiary teaching hospital in the northern part of Kerala. The study period is between June 2011 and May 2013.
Inclusion Criteria1. Patients with GFR <15 mL/min/1.73 m2 for patients
with diabetes mellitus, or <10 mL/min/1.73 m2 for patients without diabetes mellitus.
2. Patients with all types of comorbidities were included.
Exclusion Criteria1. Patients with premature referral for renal replacement
therapy (RRT) assessment due to higher GFR (non-diabetic patient with GFR >10 mL/min/1.73 m2 or diabetic patient with GFR >15 mL/min/1.73 m2).
2. Patients with acute renal disease; there was no age limitation in selection of patients.
Demographic data, primary renal condition, coexisting medical diseases, laboratory data, and calculated GFR were recorded. Symptomatology of the patients was also recorded. Standard statistical methods were used to analyze the data.
OBSERATIONS AND RESULTS
There were 105 new CKD Stage 4 and 5 patients (GFR 15 to 20 mL/min/1.73m², <15 mL/min/1.73m², respectively) referred to the nephrologists of the institute for renal assessment and if possible for dialysis/RRT. 11 were found to have been prematurely referred for assessment. 6 patients were found to have acute on chronic renal disease with failure; they were excluded from analysis. The remaining 89 patients were included in the study. Out of 89 patients, 63 were males and the remaining 26 were females. Patients belonged to the age group ranging from 35 to 80 years with a mean age of 54.42 ± 6.30. Among the various causes of primary kidney diseases diabetic nephropathy was found in 47/89 (52.80%) of the patients, chronic glomerulonephritis in 19/89 (21.34%), hypertensive nephropathy in 8/89 (8.98%), rapidly progressive glomerulonephritis in 5/89 (5.61%), systemic lupus in 4 (4.49%), obstructive uropathy in 4 (4.49%), and renal malignancy in 2/89 (2.24%) patients [Table 1].
The age range in the study was 35–80 years with a mean age of 54.42 ± 6.30. Diabetic nephropathy was observed in almost equally in all the age groups that are 17.97% in 35–50 years age group, 21.34% in 51–65 years age group, and 13.48% in the 66–80 years age group [Table 2]. The age wise distribution of primary renal cause of CKD in the study is shown in Table 2.
Among the 89 patients evaluated by the nephrologists of the dialysis unit 50 patients were managed by dialysis due to their GFR and the remaining 39 patients were given supportive therapy to manage the CKD. Among the comorbid conditions, comorbid diabetes mellitus was observed in 47 patients and that being the primary cause of CKD also. Myocardial infarction was found in 5 patients, CVA in 6 patients, chronic pulmonary disease in 6 patients, congestive heart failure in 3 patients, anemia in 5 patients, and peripheral vascular disease in 9 patients [Table 3]. 23 patients (25.84%) were found to have a hypertensive etiology in the form of comorbid diseases
Table 1: The sex incidence of different primary diseases of the kidney in the study (n-89)Primary disease of the kidney
Male - 63 Female - 26
Diabetic nephropathy - 47 31 16Chronic glomerulonephritis - 19
16 3
Hypertensive nephropathy - 8
5 3
Rapidly progressive glomerulonephritis - 5
4 1
Systemic lupus - 4 2 2Obstructive uropathy - 4 3 1Renal malignancy - 2 2 0
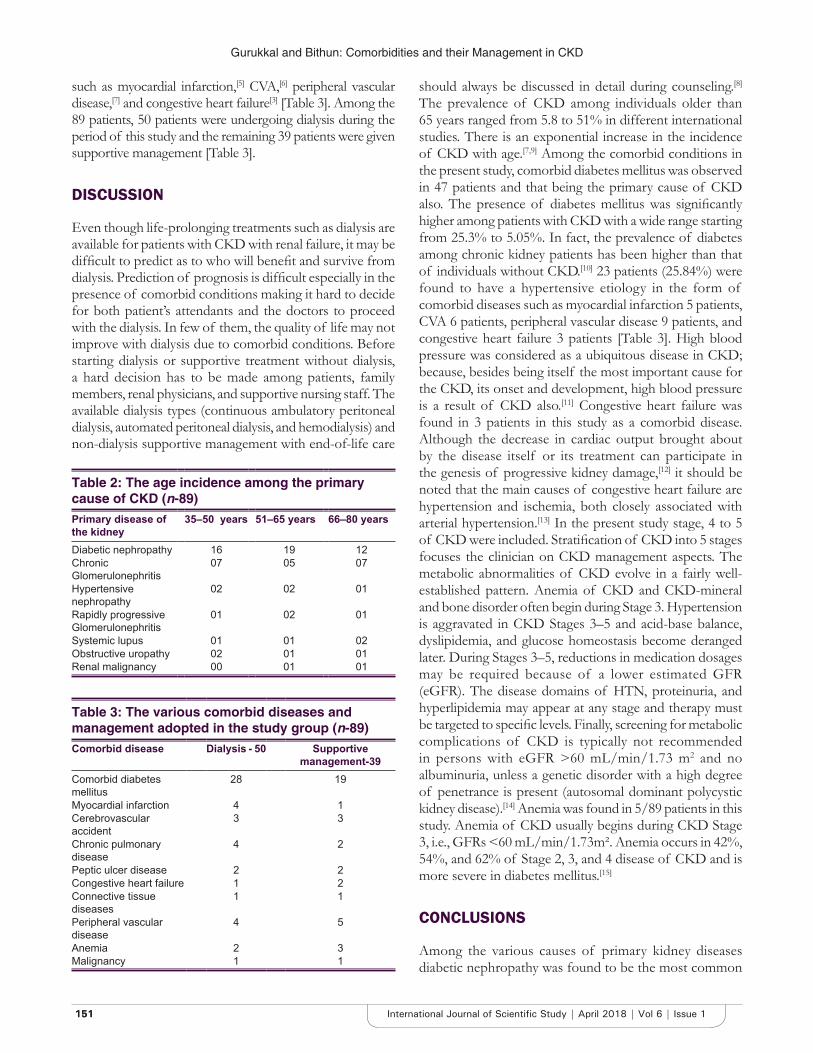
Gurukkal and Bithun: Comorbidities and their Management in CKD
151151 International Journal of Scientific Study | April 2018 | Vol 6 | Issue 1
such as myocardial infarction,[5] CVA,[6] peripheral vascular disease,[7] and congestive heart failure[3] [Table 3]. Among the 89 patients, 50 patients were undergoing dialysis during the period of this study and the remaining 39 patients were given supportive management [Table 3].
DISCUSSION
Even though life-prolonging treatments such as dialysis are available for patients with CKD with renal failure, it may be difficult to predict as to who will benefit and survive from dialysis. Prediction of prognosis is difficult especially in the presence of comorbid conditions making it hard to decide for both patient’s attendants and the doctors to proceed with the dialysis. In few of them, the quality of life may not improve with dialysis due to comorbid conditions. Before starting dialysis or supportive treatment without dialysis, a hard decision has to be made among patients, family members, renal physicians, and supportive nursing staff. The available dialysis types (continuous ambulatory peritoneal dialysis, automated peritoneal dialysis, and hemodialysis) and non-dialysis supportive management with end-of-life care
should always be discussed in detail during counseling.[8] The prevalence of CKD among individuals older than 65 years ranged from 5.8 to 51% in different international studies. There is an exponential increase in the incidence of CKD with age.[7,9] Among the comorbid conditions in the present study, comorbid diabetes mellitus was observed in 47 patients and that being the primary cause of CKD also. The presence of diabetes mellitus was significantly higher among patients with CKD with a wide range starting from 25.3% to 5.05%. In fact, the prevalence of diabetes among chronic kidney patients has been higher than that of individuals without CKD.[10] 23 patients (25.84%) were found to have a hypertensive etiology in the form of comorbid diseases such as myocardial infarction 5 patients, CVA 6 patients, peripheral vascular disease 9 patients, and congestive heart failure 3 patients [Table 3]. High blood pressure was considered as a ubiquitous disease in CKD; because, besides being itself the most important cause for the CKD, its onset and development, high blood pressure is a result of CKD also.[11] Congestive heart failure was found in 3 patients in this study as a comorbid disease. Although the decrease in cardiac output brought about by the disease itself or its treatment can participate in the genesis of progressive kidney damage,[12] it should be noted that the main causes of congestive heart failure are hypertension and ischemia, both closely associated with arterial hypertension.[13] In the present study stage, 4 to 5 of CKD were included. Stratification of CKD into 5 stages focuses the clinician on CKD management aspects. The metabolic abnormalities of CKD evolve in a fairly well-established pattern. Anemia of CKD and CKD-mineral and bone disorder often begin during Stage 3. Hypertension is aggravated in CKD Stages 3–5 and acid-base balance, dyslipidemia, and glucose homeostasis become deranged later. During Stages 3–5, reductions in medication dosages may be required because of a lower estimated GFR (eGFR). The disease domains of HTN, proteinuria, and hyperlipidemia may appear at any stage and therapy must be targeted to specific levels. Finally, screening for metabolic complications of CKD is typically not recommended in persons with eGFR >60 mL/min/1.73 m2 and no albuminuria, unless a genetic disorder with a high degree of penetrance is present (autosomal dominant polycystic kidney disease).[14] Anemia was found in 5/89 patients in this study. Anemia of CKD usually begins during CKD Stage 3, i.e., GFRs <60 mL/min/1.73m². Anemia occurs in 42%, 54%, and 62% of Stage 2, 3, and 4 disease of CKD and is more severe in diabetes mellitus.[15]
CONCLUSIONS
Among the various causes of primary kidney diseases diabetic nephropathy was found to be the most common
Table 2: The age incidence among the primary cause of CKD (n-89)Primary disease of the kidney
35–50 years 51–65 years 66–80 years
Diabetic nephropathy 16 19 12Chronic Glomerulonephritis
07 05 07
Hypertensive nephropathy
02 02 01
Rapidly progressive Glomerulonephritis
01 02 01
Systemic lupus 01 01 02Obstructive uropathy 02 01 01Renal malignancy 00 01 01
Table 3: The various comorbid diseases and management adopted in the study group (n-89)Comorbid disease Dialysis - 50 Supportive
management-39Comorbid diabetes mellitus
28 19
Myocardial infarction 4 1Cerebrovascular accident
3 3
Chronic pulmonary disease
4 2
Peptic ulcer disease 2 2Congestive heart failure 1 2Connective tissue diseases
1 1
Peripheral vascular disease
4 5
Anemia 2 3Malignancy 1 1
Gurukkal and Bithun: Comorbidities and their Management in CKD
152152International Journal of Scientific Study | April 2018 | Vol 6 | Issue 1
followed by chronic glomerulonephritis in this study. Among the comorbid conditions, comorbid diabetes mellitus was observed the most common, hypertension presenting the form of myocardial infarction, CVA, chronic pulmonary disease, congestive heart failure, and peripheral vascular disease.
REFERENCES
1. Selvin E, Manzi J, Stevens LA, Van Lente F, Lacher DA, Levey AS, et al. Calibration of serum creatinine in the national health and nutrition examination surveys (NHANES) 1988-1994, 1999-2004. Am J Kidney Dis 2007;50:918-26.
2. Cachofeiro V, Goicochea M, de Vinuesa SG, Oubiña P, Lahera V, Luño J, et al. Oxidative stress and inflammation, a link between chronic kidney disease and cardiovascular disease. Kidney Int Suppl 2008;111:4-9.
3. Hallan SI, Ritz E, Lydersen S, Romundstad S, Kvenild K, Orth SR, et al. Combining GFR and albuminuria to classify CKD improves prediction of ESRD. J Am Soc Nephrol 2009;20:1069-77.
4. Hemmelgarn BR, Manns BJ, Lloyd A, James MT, Klarenbach S, Quinn RR, et al. Relation between kidney function, proteinuria, and adverse outcomes. JAMA 2010;303:423e9.
5. Tonelli M, Muntner P, Lloyd A, Manns BJ, James MT, Klarenbach S, et al. Using proteinuria and estimated glomerular filtration rate to classify risk in patients with chronic kidney disease a cohort study. Ann Int Med 2011;154:12.
6. Go AS, Chertow GM, Fan D, McCulloch CE, Hsu CY. Chronic kidney disease and the risks of death, cardiovascular events, and hospitalization. N Engl J Med 2004;351:1296-370.
7. Passos VM, Assis TD, Barreto SM. Hipertensão arterial no Brasil: Estimativa de prevalência a partir de estudos de base populacional. Epidemiol Serv Saúde 2006;15:35-45.
8. Ma YC, Zuo L, Chen JH, Luo Q, Yu XQ, Li Y, et al. Modified glomerular filtration rate estimating equation for Chinese patients with chronic kidney disease. J Am Soc Nephrol 2006;17:2937-44.
9. Lamb EJ, O’Riordan SE, Delaney MP. Kidney function in older people: Pathology, assessment and management. Clin Chim Acta 2003;334:25-40.
10. Parikh NI, Hwang SJ, Larson MG, Meigs JB, Levy D, Fox CS, et al. Cardiovascular disease risk factors in chronic kidney disease: Overall burden and rates of treatment and control. Arch Intern Med 2006;166:1884-91.
11. Andersen MJ, Agarwal R. Etiology and management of hypertension in chronic kidney disease. Med Clin North Am 2005;89:525-47.
12. Silverberg D, Wexler D, Blum M, Schwartz D, Iaina A. The association between congestive heart failure and chronic renal disease. Curr Opin Nephrol Hypertens 2004;13:163-70.
13. Bocchi EA, Marcondes-Braga FG, Bacal F, Ferraz AS, Albuquerque D, Rodrigues D, et al. Atualização da diretriz brasileira de insuficiência cardíaca crônica. Arq Bras Cardiaca 2012;98:1-33.
14. Chronic Kidney Disease (CKD). Clinical Practice Recommendations for Primary Care Physicians and Healthcare Providers. A Collaborative. 6th ed. Detroit: Copy Right Henry Ford health System; 2006. p. 6-7.
15. Chronic Kidney Disease (CKD). Clinical Practice Recommendations for Primary Care Physicians and Healthcare Providers. A Collaborative. 6th ed. Detroit: Copy right Henry Ford Health System; 2006. p. 28-9.
How to cite this article: Gurukkal CHMK, Bithun BK. Comorbidities and their Management in Patients with Chronic Kidney Disease in a Tertiary Hospital of Kerala. Int J Sci Stud 2018;6(1):149-152.
Source of Support: Nil, Conflict of Interest: None declared.
153153 International Journal of Scientific Study | April 2018 | Vol 6 | Issue 1
Evaluation of Liver Space-occupying LesionM. Raja1, M. Natesan1, Heber Anandan2
1Assistant Professor, Department of General Surgery, Pudukkottai Medical College, Tamil Nadu, India, 2Senior Clinical Scientist, Dr. Agarwal’s Healthcare Limited, Pudukkottai, Tamil Nadu, India
focal nodular hyperplasia is unknown. Some evidence suggests that focal nodular hyperplasia may be hormone dependent.[2,3] The liver is the most common destination of hydatid cyst (70%), followed by the lungs (20%), kidney, spleen, brain, and bone. The sensitivity and specificity of both ultrasonography and computed tomographic (CT) in confirming the diagnosis are high.[4] In adults, in most part of the world, hepatic metastasis is more common than primary malignant tumors of the liver, whereas in children, primary tumors outnumber both metastases and benign tumors of the liver. Hepatic metastases occur in 40–50% of adult patients with extrahepatic primary malignancies.[5] Most cases of pyogenic liver abscess are cryptogenic or occur in older men with underlying biliary tract disease.[6] Different liver SOL has different etiology and risk factor, so it is important to find out etiology and risk factor in Indian subcontinent, which would help us to treat different kinds of SOL of the liver.
AimThis study aims to evaluate the different causes of SOL of the liver and find out etiology of liver tumor among patients of SOL of the liver.
INTRODUCTION
Space-occupying lesion (SOL) on the liver can be caused by various diseases that may or may not be manifested with symptoms. Mass lesions of the liver occur quite frequently; thus, clinicians interested in liver diseases should have a thorough understanding of their presentations, diagnosis, and treatment. Hepatic mass lesions include tumors, tumor-like lesions, abscesses, cysts, hamartomas, and confluent granulomas. The frequency with which each is seen varies in different geographic regions and different populations. Focal nodular hyperplasia is more common than hepatocellular adenoma. Focal nodular hyperplasia occurs at all ages, but most patients present in the third and fourth decades of life.[1] The cause of
Original Article
AbstractIntroduction: Space-occupying lesion (SOL) on the liver can be caused by various diseases that may or may not be manifested with symptoms. Mass lesions of the liver occur quite frequently; thus, clinicians interested in liver diseases should have a thorough understanding of their presentations, diagnosis, and treatment.
Aim: This study aims to evaluate the different causes of SOL of the liver and find out etiology of liver tumor among patients of SOL of the liver.
Materials and Methods: This observational study was conducted among the liver SOL patients who were above 20 years of age. The inclusion criteria were patients having clinically and radiologically confirmed hepatic SOL with consent.
Results: Maximum numbers of cases were seen in the 5–6th decade of life. The most common etiology for SOLs of the liver in this study was metastatic liver disease. The most common primary for secondary liver was from carcinoma stomach. The second most common etiology for SOLs of the liver observed in this study was amebic liver abscess.
Conclusion: Metastatic liver diseases were mostly managed conservatively. For 5 cases having single secondary lesion is treated with lobectomy which gives better prognosis than conservative management. 1-year survival rate is >50% for single metastatic lesion surgically treated compared to <30% for multiple secondaries conservatively managed.
Key words: Adenocarcinoma, Liver abscess, Liver, Space-occupying lesion
Access this article online
www.ijss-sn.com
Month of Submission : 02-2018 Month of Peer Review : 03-2018 Month of Acceptance : 04-2018 Month of Publishing : 04-2018
Corresponding Author: Dr. M. Natesan, Assistant Professor, Department of General Surgery, Pudukkottai Medical College, Pudukkottai, Tamil Nadu, India. Phone: 91+9443128245. E-mail: [email protected]
Print ISSN: 2321-6379Online ISSN: 2321-595X
DOI: 10.17354/ijss/2018/131
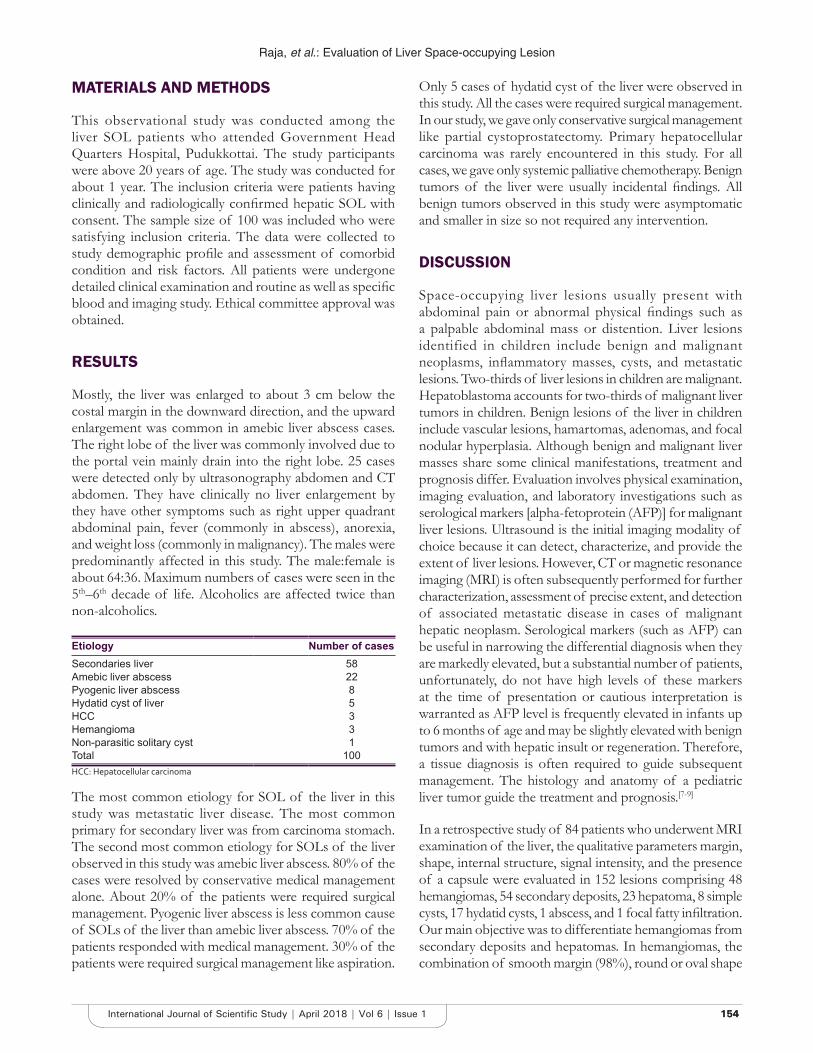
Raja, et al.: Evaluation of Liver Space-occupying Lesion
154154International Journal of Scientific Study | April 2018 | Vol 6 | Issue 1
MATERIALS AND METHODS
This observational study was conducted among the liver SOL patients who attended Government Head Quarters Hospital, Pudukkottai. The study participants were above 20 years of age. The study was conducted for about 1 year. The inclusion criteria were patients having clinically and radiologically confirmed hepatic SOL with consent. The sample size of 100 was included who were satisfying inclusion criteria. The data were collected to study demographic profile and assessment of comorbid condition and risk factors. All patients were undergone detailed clinical examination and routine as well as specific blood and imaging study. Ethical committee approval was obtained.
RESULTS
Mostly, the liver was enlarged to about 3 cm below the costal margin in the downward direction, and the upward enlargement was common in amebic liver abscess cases. The right lobe of the liver was commonly involved due to the portal vein mainly drain into the right lobe. 25 cases were detected only by ultrasonography abdomen and CT abdomen. They have clinically no liver enlargement by they have other symptoms such as right upper quadrant abdominal pain, fever (commonly in abscess), anorexia, and weight loss (commonly in malignancy). The males were predominantly affected in this study. The male:female is about 64:36. Maximum numbers of cases were seen in the 5th–6th decade of life. Alcoholics are affected twice than non-alcoholics.
Etiology Number of casesSecondaries liver 58Amebic liver abscess 22Pyogenic liver abscess 8Hydatid cyst of liver 5HCC 3Hemangioma 3Non-parasitic solitary cyst 1Total 100HCC: Hepatocellular carcinoma
The most common etiology for SOL of the liver in this study was metastatic liver disease. The most common primary for secondary liver was from carcinoma stomach. The second most common etiology for SOLs of the liver observed in this study was amebic liver abscess. 80% of the cases were resolved by conservative medical management alone. About 20% of the patients were required surgical management. Pyogenic liver abscess is less common cause of SOLs of the liver than amebic liver abscess. 70% of the patients responded with medical management. 30% of the patients were required surgical management like aspiration.
Only 5 cases of hydatid cyst of the liver were observed in this study. All the cases were required surgical management. In our study, we gave only conservative surgical management like partial cystoprostatectomy. Primary hepatocellular carcinoma was rarely encountered in this study. For all cases, we gave only systemic palliative chemotherapy. Benign tumors of the liver were usually incidental findings. All benign tumors observed in this study were asymptomatic and smaller in size so not required any intervention.
DISCUSSION
Space-occupying liver lesions usually present with abdominal pain or abnormal physical findings such as a palpable abdominal mass or distention. Liver lesions identified in children include benign and malignant neoplasms, inflammatory masses, cysts, and metastatic lesions. Two-thirds of liver lesions in children are malignant. Hepatoblastoma accounts for two-thirds of malignant liver tumors in children. Benign lesions of the liver in children include vascular lesions, hamartomas, adenomas, and focal nodular hyperplasia. Although benign and malignant liver masses share some clinical manifestations, treatment and prognosis differ. Evaluation involves physical examination, imaging evaluation, and laboratory investigations such as serological markers [alpha-fetoprotein (AFP)] for malignant liver lesions. Ultrasound is the initial imaging modality of choice because it can detect, characterize, and provide the extent of liver lesions. However, CT or magnetic resonance imaging (MRI) is often subsequently performed for further characterization, assessment of precise extent, and detection of associated metastatic disease in cases of malignant hepatic neoplasm. Serological markers (such as AFP) can be useful in narrowing the differential diagnosis when they are markedly elevated, but a substantial number of patients, unfortunately, do not have high levels of these markers at the time of presentation or cautious interpretation is warranted as AFP level is frequently elevated in infants up to 6 months of age and may be slightly elevated with benign tumors and with hepatic insult or regeneration. Therefore, a tissue diagnosis is often required to guide subsequent management. The histology and anatomy of a pediatric liver tumor guide the treatment and prognosis.[7-9]
In a retrospective study of 84 patients who underwent MRI examination of the liver, the qualitative parameters margin, shape, internal structure, signal intensity, and the presence of a capsule were evaluated in 152 lesions comprising 48 hemangiomas, 54 secondary deposits, 23 hepatoma, 8 simple cysts, 17 hydatid cysts, 1 abscess, and 1 focal fatty infiltration. Our main objective was to differentiate hemangiomas from secondary deposits and hepatomas. In hemangiomas, the combination of smooth margin (98%), round or oval shape
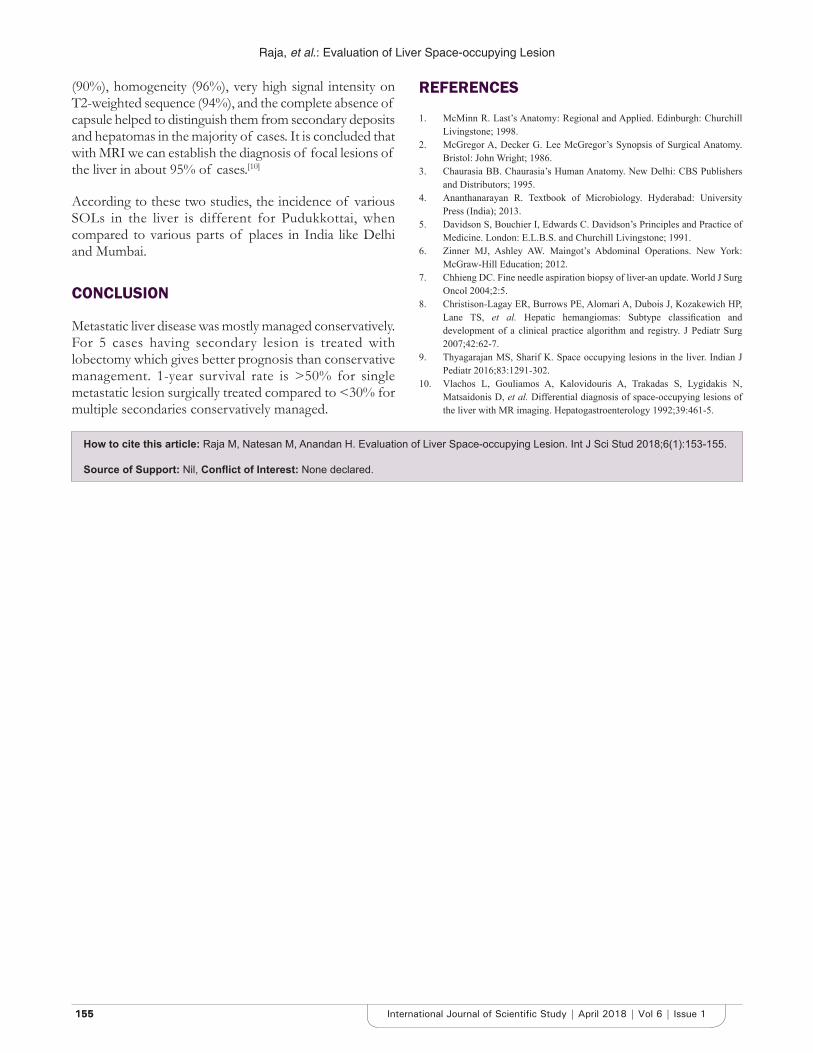
Raja, et al.: Evaluation of Liver Space-occupying Lesion
155155 International Journal of Scientific Study | April 2018 | Vol 6 | Issue 1
(90%), homogeneity (96%), very high signal intensity on T2-weighted sequence (94%), and the complete absence of capsule helped to distinguish them from secondary deposits and hepatomas in the majority of cases. It is concluded that with MRI we can establish the diagnosis of focal lesions of the liver in about 95% of cases.[10]
According to these two studies, the incidence of various SOLs in the liver is different for Pudukkottai, when compared to various parts of places in India like Delhi and Mumbai.
CONCLUSION
Metastatic liver disease was mostly managed conservatively. For 5 cases having secondary lesion is treated with lobectomy which gives better prognosis than conservative management. 1-year survival rate is >50% for single metastatic lesion surgically treated compared to <30% for multiple secondaries conservatively managed.
REFERENCES
1. McMinn R. Last’s Anatomy: Regional and Applied. Edinburgh: Churchill Livingstone; 1998.
2. McGregor A, Decker G. Lee McGregor’s Synopsis of Surgical Anatomy. Bristol: John Wright; 1986.
3. Chaurasia BB. Chaurasia’s Human Anatomy. New Delhi: CBS Publishers and Distributors; 1995.
4. Ananthanarayan R. Textbook of Microbiology. Hyderabad: University Press (India); 2013.
5. Davidson S, Bouchier I, Edwards C. Davidson’s Principles and Practice of Medicine. London: E.L.B.S. and Churchill Livingstone; 1991.
6. Zinner MJ, Ashley AW. Maingot’s Abdominal Operations. New York: McGraw-Hill Education; 2012.
7. Chhieng DC. Fine needle aspiration biopsy of liver-an update. World J Surg Oncol 2004;2:5.
8. Christison-Lagay ER, Burrows PE, Alomari A, Dubois J, Kozakewich HP, Lane TS, et al. Hepatic hemangiomas: Subtype classification and development of a clinical practice algorithm and registry. J Pediatr Surg 2007;42:62-7.
9. Thyagarajan MS, Sharif K. Space occupying lesions in the liver. Indian J Pediatr 2016;83:1291-302.
10. Vlachos L, Gouliamos A, Kalovidouris A, Trakadas S, Lygidakis N, Matsaidonis D, et al. Differential diagnosis of space-occupying lesions of the liver with MR imaging. Hepatogastroenterology 1992;39:461-5.
How to cite this article: Raja M, Natesan M, Anandan H. Evaluation of Liver Space-occupying Lesion. Int J Sci Stud 2018;6(1):153-155.
Source of Support: Nil, Conflict of Interest: None declared.
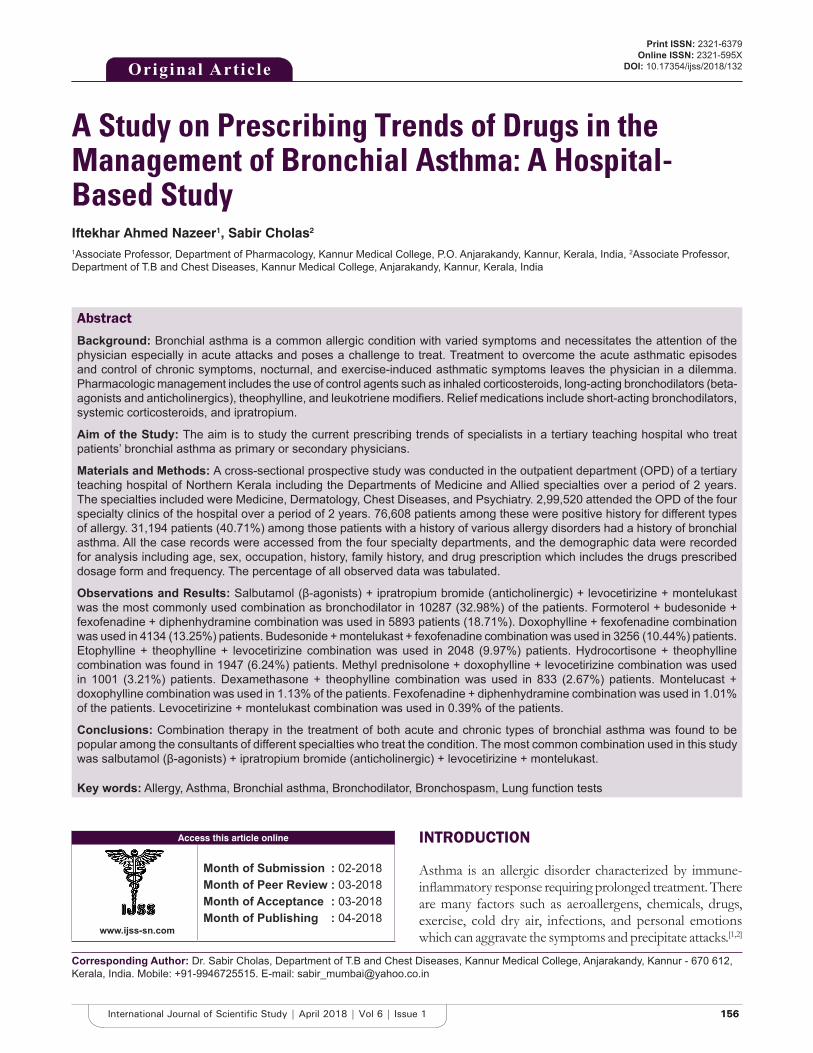
156156International Journal of Scientific Study | April 2018 | Vol 6 | Issue 1
A Study on Prescribing Trends of Drugs in the Management of Bronchial Asthma: A Hospital-Based StudyIftekhar Ahmed Nazeer1, Sabir Cholas2
1Associate Professor, Department of Pharmacology, Kannur Medical College, P.O. Anjarakandy, Kannur, Kerala, India, 2Associate Professor, Department of T.B and Chest Diseases, Kannur Medical College, Anjarakandy, Kannur, Kerala, India
INTRODUCTION
Asthma is an allergic disorder characterized by immune-inflammatory response requiring prolonged treatment. There are many factors such as aeroallergens, chemicals, drugs, exercise, cold dry air, infections, and personal emotions which can aggravate the symptoms and precipitate attacks.[1,2]
Original Article
AbstractBackground: Bronchial asthma is a common allergic condition with varied symptoms and necessitates the attention of the physician especially in acute attacks and poses a challenge to treat. Treatment to overcome the acute asthmatic episodes and control of chronic symptoms, nocturnal, and exercise-induced asthmatic symptoms leaves the physician in a dilemma. Pharmacologic management includes the use of control agents such as inhaled corticosteroids, long-acting bronchodilators (beta-agonists and anticholinergics), theophylline, and leukotriene modifiers. Relief medications include short-acting bronchodilators, systemic corticosteroids, and ipratropium.
Aim of the Study: The aim is to study the current prescribing trends of specialists in a tertiary teaching hospital who treat patients’ bronchial asthma as primary or secondary physicians.
Materials and Methods: A cross-sectional prospective study was conducted in the outpatient department (OPD) of a tertiary teaching hospital of Northern Kerala including the Departments of Medicine and Allied specialties over a period of 2 years. The specialties included were Medicine, Dermatology, Chest Diseases, and Psychiatry. 2,99,520 attended the OPD of the four specialty clinics of the hospital over a period of 2 years. 76,608 patients among these were positive history for different types of allergy. 31,194 patients (40.71%) among those patients with a history of various allergy disorders had a history of bronchial asthma. All the case records were accessed from the four specialty departments, and the demographic data were recorded for analysis including age, sex, occupation, history, family history, and drug prescription which includes the drugs prescribed dosage form and frequency. The percentage of all observed data was tabulated.
Observations and Results: Salbutamol (β-agonists) + ipratropium bromide (anticholinergic) + levocetirizine + montelukast was the most commonly used combination as bronchodilator in 10287 (32.98%) of the patients. Formoterol + budesonide + fexofenadine + diphenhydramine combination was used in 5893 patients (18.71%). Doxophylline + fexofenadine combination was used in 4134 (13.25%) patients. Budesonide + montelukast + fexofenadine combination was used in 3256 (10.44%) patients. Etophylline + theophylline + levocetirizine combination was used in 2048 (9.97%) patients. Hydrocortisone + theophylline combination was found in 1947 (6.24%) patients. Methyl prednisolone + doxophylline + levocetirizine combination was used in 1001 (3.21%) patients. Dexamethasone + theophylline combination was used in 833 (2.67%) patients. Montelucast + doxophylline combination was used in 1.13% of the patients. Fexofenadine + diphenhydramine combination was used in 1.01% of the patients. Levocetirizine + montelukast combination was used in 0.39% of the patients.
Conclusions: Combination therapy in the treatment of both acute and chronic types of bronchial asthma was found to be popular among the consultants of different specialties who treat the condition. The most common combination used in this study was salbutamol (β-agonists) + ipratropium bromide (anticholinergic) + levocetirizine + montelukast.
Key words: Allergy, Asthma, Bronchial asthma, Bronchodilator, Bronchospasm, Lung function tests
Access this article online
www.ijss-sn.com
Month of Submission : 02-2018 Month of Peer Review : 03-2018 Month of Acceptance : 03-2018 Month of Publishing : 04-2018
Corresponding Author: Dr. Sabir Cholas, Department of T.B and Chest Diseases, Kannur Medical College, Anjarakandy, Kannur - 670 612, Kerala, India. Mobile: +91-9946725515. E-mail: [email protected]
Print ISSN: 2321-6379Online ISSN: 2321-595X
DOI: 10.17354/ijss/2018/132
Nazeer and Cholas: Current Trends of using Drugs in Bronchial Asthma
157157 International Journal of Scientific Study | April 2018 | Vol 6 | Issue 1
The incidence of asthma is increasing in view of increasing pollution in many cities, and the incidence is equally increasing in children as in adults all over the world.[3] The fundamental principle of treatment of chronic disease should be based on establishing a working diagnosis and initial assessment of severity which provides as a guide to the intensity of therapy required. Regular follow-up thereafter monitors the control of the disease processes and their clinical manifestations.[4] Bronchial asthma is characterized by narrowing of the smaller airways in the lungs. This narrowing is partially or completely reversible. Symptoms of asthma include wheezing, coughing, chest tightness, and shortness of breath. These symptoms tend to come and go and are related to the degree of airway narrowing in the lungs. In India, asthma is known to be one of the major causes of morbidity and mortality, comprising about 3–11% of adults and 3–5% of pediatric population.[5] The target of asthma treatment is to achieve and maintain clinical control. Many bronchodilators are now available in the market which relieves the bronchospasm in asthma. Drug utilization reviews are important studies to understand the prescription patterns of physicians in various parts of the country. They play an important role in helping the health-care system to understand, interpret, and improve the prescribing administration and to maintain the rational use of drugs which assist the physician’s prescribing attitude in accordance with the predetermined standards.[6,7] In this context, an institutional study was conducted over a period of 2 years to describe trends in the prescription and consumption of bronchodilators for managing acute exacerbation of bronchial asthma in adult population.
Period of StudyThe study duration was from March 2013 to February 2015.
Institution of StudyThis study was conducted at Kannur Medical College, Anjarakandy, Kannur, Kerala.
Type of StudyThis was a cross-sectional prospective study.
MATERIALS AND METHODS
A cross-sectional prospective study was conducted in a tertiary teaching hospital of Northern Kerala. The study was conducted in the outpatient department (OPD) of Medicine and Allied specialties over a period of 2 years. An ethical committee clearance was obtained before the commencement of the study. The specialties included were Medicine, Dermatology, Chest Diseases, and Psychiatry.
Inclusion Criteria1. All the patients with a history of allergy and bronchial
asthma alone or in association with other specialty diseases were included.
2. Patients aged above 12 years and below 65 years were included.
3. Patients with acute or chronic bronchial asthma were included.
4. Patients already on treatment for bronchial asthma were included.
5. Patients who had suffered more than 3 acute attacks of bronchospasm were included in this study.
Exclusion Criteria1. Patients aged below 12 and above 65 years were
excluded.2. Patients with acute infectious diseases were excluded.3. Patients with fulminating diseases were excluded.4. Patients with malignant hypertension and severe
uncontrolled diabetes mellitus were excluded.5. Patients who were having other respiratory problems
such as chronic obstructive pulmonary disease (COPD) and cardiac problems were excluded from this study.
A total of 2,99,520 attended the OPD of the four specialty clinics of the hospital over a period of 2 years. 76,608 patients among these were positive history for different types of allergy. 31,194 patients (40.71%) among those patients with a history of various allergy disorders had a history of bronchial asthma. All the case records were accessed from the four specialty departments, and the demographic data were recorded for analysis including age, sex, occupation, past history, family history, and drug prescription which includes the drugs prescribed dosage form and frequency. The percentage of all observed data was tabulated.
OBSERVATIONS AND RESULTS
31,194 prescriptions of the patients attending the OPDs of Medicine, Psychiatry, Dermatology, and Chest Diseases were accessed and analyzed, and the data were tabulated. There were 18,058 males (57.88%) and 13,136 females (42.11%). The male-to-female ratio was 1.3:1. The demographic data are shown in Table 1.
The bronchodilators used in the present study are shown in Table 2. The bronchodilators were used alone or in combination with other drugs such as antihistamines, steroids, mast cell stabilizers, antibiotics, and mucolytic agents.
In this study, it was observed that patients received combination therapy in all the patients (100%). The bronchodilators and their combination drugs used are shown in Table 3.
Table 4 shows the drugs used in the combination therapy of the present study. The study showed salbutamol
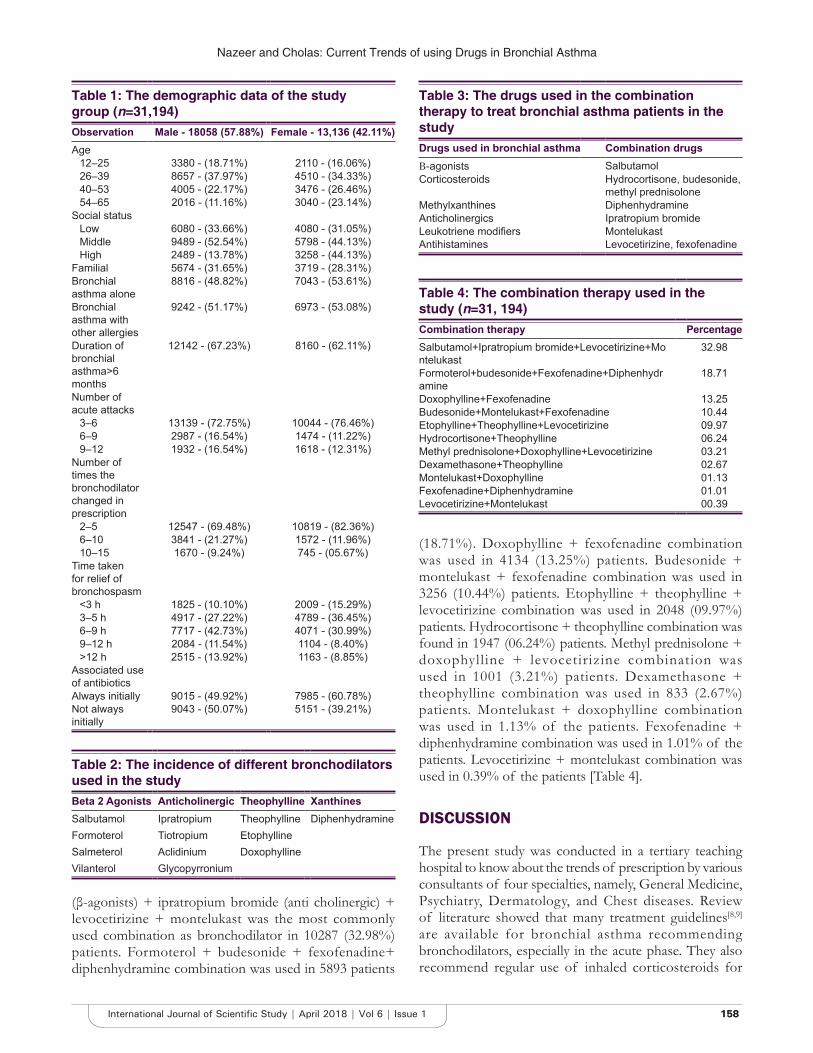
Nazeer and Cholas: Current Trends of using Drugs in Bronchial Asthma
158158International Journal of Scientific Study | April 2018 | Vol 6 | Issue 1
(β-agonists) + ipratropium bromide (anti cholinergic) + levocetirizine + montelukast was the most commonly used combination as bronchodilator in 10287 (32.98%) patients. Formoterol + budesonide + fexofenadine+ diphenhydramine combination was used in 5893 patients
Table 1: The demographic data of the study group (n=31,194)Observation Male - 18058 (57.88%) Female ‑ 13,136 (42.11%)Age
12–25 3380 - (18.71%) 2110 - (16.06%)26–39 8657 - (37.97%) 4510 - (34.33%)40–53 4005 - (22.17%) 3476 - (26.46%)54–65 2016 - (11.16%) 3040 - (23.14%)
Social statusLow 6080 - (33.66%) 4080 - (31.05%)Middle 9489 - (52.54%) 5798 - (44.13%)High 2489 - (13.78%) 3258 - (44.13%)
Familial 5674 - (31.65%) 3719 - (28.31%)Bronchial asthma alone
8816 - (48.82%) 7043 - (53.61%)
Bronchial asthma with other allergies
9242 - (51.17%) 6973 - (53.08%)
Duration of bronchial asthma>6 months
12142 - (67.23%) 8160 - (62.11%)
Number of acute attacks
3–6 13139 - (72.75%) 10044 - (76.46%)6–9 2987 - (16.54%) 1474 - (11.22%)9–12 1932 - (16.54%) 1618 - (12.31%)
Number of times the bronchodilator changed in prescription
2–5 12547 - (69.48%) 10819 - (82.36%)6–10 3841 - (21.27%) 1572 - (11.96%)10–15 1670 - (9.24%) 745 - (05.67%)
Time taken for relief of bronchospasm
<3 h 1825 - (10.10%) 2009 - (15.29%)3–5 h 4917 - (27.22%) 4789 - (36.45%)6–9 h 7717 - (42.73%) 4071 - (30.99%)9–12 h 2084 - (11.54%) 1104 - (8.40%)>12 h 2515 - (13.92%) 1163 - (8.85%)
Associated use of antibioticsAlways initially 9015 - (49.92%) 7985 - (60.78%)Not always initially
9043 - (50.07%) 5151 - (39.21%)
Table 2: The incidence of different bronchodilators used in the studyBeta 2 Agonists Anticholinergic Theophylline XanthinesSalbutamolFormoterolSalmeterolVilanterol
IpratropiumTiotropiumAclidiniumGlycopyrronium
TheophyllineEtophyllineDoxophylline
Diphenhydramine
Table 3: The drugs used in the combination therapy to treat bronchial asthma patients in the studyDrugs used in bronchial asthma Combination drugsΒ-agonists SalbutamolCorticosteroids Hydrocortisone, budesonide,
methyl prednisoloneMethylxanthines DiphenhydramineAnticholinergics Ipratropium bromideLeukotriene modifiers MontelukastAntihistamines Levocetirizine, fexofenadine
Table 4: The combination therapy used in the study (n=31, 194)Combination therapy PercentageSalbutamol+Ipratropium bromide+Levocetirizine+Montelukast
32.98
Formoterol+budesonide+Fexofenadine+Diphenhydramine
18.71
Doxophylline+Fexofenadine 13.25Budesonide+Montelukast+Fexofenadine 10.44Etophylline+Theophylline+Levocetirizine 09.97Hydrocortisone+Theophylline 06.24Methyl prednisolone+Doxophylline+Levocetirizine 03.21Dexamethasone+Theophylline 02.67Montelukast+Doxophylline 01.13Fexofenadine+Diphenhydramine 01.01Levocetirizine+Montelukast 00.39
(18.71%). Doxophylline + fexofenadine combination was used in 4134 (13.25%) patients. Budesonide + montelukast + fexofenadine combination was used in 3256 (10.44%) patients. Etophylline + theophylline + levocetirizine combination was used in 2048 (09.97%) patients. Hydrocortisone + theophylline combination was found in 1947 (06.24%) patients. Methyl prednisolone + doxophyll ine + levocetirizine combination was used in 1001 (3.21%) patients. Dexamethasone + theophylline combination was used in 833 (2.67%) patients. Montelukast + doxophylline combination was used in 1.13% of the patients. Fexofenadine + diphenhydramine combination was used in 1.01% of the patients. Levocetirizine + montelukast combination was used in 0.39% of the patients [Table 4].
DISCUSSION
The present study was conducted in a tertiary teaching hospital to know about the trends of prescription by various consultants of four specialties, namely, General Medicine, Psychiatry, Dermatology, and Chest diseases. Review of literature showed that many treatment guidelines[8,9]
are available for bronchial asthma recommending bronchodilators, especially in the acute phase. They also recommend regular use of inhaled corticosteroids for
Nazeer and Cholas: Current Trends of using Drugs in Bronchial Asthma
159159 International Journal of Scientific Study | April 2018 | Vol 6 | Issue 1
patients with mild persistent asthma. They also recommend regular use of inhaled corticosteroids for patients with mild persistent asthma, as this type of regimen provides control of asthma, suppresses airway inflammation, and may prevent the progression of asthma. Recommendations of various international bodies on asthma to improve the prescribing practices of the physicians and ultimately clinical standards are now available.[10,11] In the present study, the incidence of bronchial asthma was found to be more in males than in females with a male-to-female ratio of 1.3:1. In the present study, all the consultants used standard bronchodilators which are being used all over the world. In this study, majority of the prescriptions used nebulization as a preferred route of drug delivery to manage acute exacerbations of asthmatic episodes. Even though nebulizer delivered aerosol created by blowing air or oxygen through a solution to produce droplets requiring little coordination from the patient as drug is inhaled through a facemask or a mouthpiece using normal tidal breathing, the disadvantages include the longtime commitment maintenance treatments and lack of portability.[12] In the present study, salbutamol (β-agonists) + ipratropium bromide (anticholinergic) + levocetirizine + montelukast was the most commonly used combination as a bronchodilator in 10287 (32.98%) patients. These results are similar to the study done in Malaysia in which salbutamol was the most commonly prescribed[13] and also similar to the study done in Bareilly, which showed that inhaled salbutamol was received by 100% of the patients irrespective of the severity.[14] Formoterol + budesonide + fexofenadine + in another study conducted by Pinal et al.[4] showed that 84% of patients and 76% of patients in Shimpi et al.[1] were given combination therapy over monotherapy. In this study, in acute attacks of bronchial asthma, injection hydrocortisone was used. It actually prevents the side effect of inhaled medication which causes irritation on the respiratory tract. International guidelines recommend corticosteroids by oral route even for severe exacerbation, and it is reported to be as effective as intravenous route.[15] Anticholinergics were less prescribed as monotherapy but were given in combination with, as they are preferred medication for treating COPD instead of asthma. Diphenhydramine combination was used in 5893 patients (18.71%). Doxophylline + fexofenadine combination was used in 4134 (13.25%) patients. Budesonide + montelukast + fexofenadine combination was used in 3256 (10.44%) patients. Etophylline + theophylline + levocetirizine combination was used in 2048 (9.97%) patients. The reason for using short-acting β2 agonist, i.e., salbutamol is due to its rapid onset and its low cost according to the consultants of this hospital. Hydrocortisone + theophylline combination was found in 1947 (6.24%) patients. Methyl prednisolone + doxophylline + levocetirizine combination
was used in 1001 (3.21%) patients. Dexamethasone + theophylline combination was used in 833 (02.67%) patients. Montelukast + doxophylline combination was used in 1.13% of the patients. Fexofenadine + diphenhydramine combination was used in 1.01% of the patients. Levocetirizine + montelukast combination was used in 0.39% of the patients [Table 4]. Among the other injectable bronchodilators used in this study are doxophylline. It was the most commonly prescribed methylxanthines. Doxophylline is preferred over theophylline for it has less cardiotoxic effects than the former with preserved mucoregulatory and anti-inflammatory properties. Hence, doxophylline may constitute a safe and effective alternative treatment to aminophylline/theophylline in the treatment of acute exacerbation of bronchial asthma.[16] However, in a study by Faiz et al., they concluded that there was no significant difference in spirometric variables between doxophylline and theophylline.[17] Maragay et al.[18] added that doxophylline has better safety profile than theophylline. Montelukast a leukotriene receptor antagonist was seen in most of the prescription as add-on therapy. It was prescribed as a fixed dose combination with levocetirizine in a study done by Rajathilagam et al.[19] Limitations of our study were lack of follow-up and cost-effectiveness which should have been done. For higher authenticity, more number of prescriptions should have been included in our study.
CONCLUSION
Combination therapy in the treatment of both acute and chronic types of bronchial asthma was found to be popular among the consultants of different specialties who treat the condition. The most common combination used in this study was salbutamol (β-agonists) + ipratropium bromide (anticholinergic) + levocetirizine + montelukast. The most commonly prescribed bronchodilator in cases of emergency was intravenous doxophylline. Nebulization was preferred route to tackle the acute exacerbation of asthmatic symptoms.
REFERENCES
1. Shimpi D, Salunkhe PS, Bavaskar SR, Laddha GP, Kalam A, Khalik A. Patel drug utilization evaluation and prescription monitoring in asthmatic patients. Int J Pharm Bio Sci 2012;2:117-22.
2. Varkey A, Sen S. Prescribing patterns of corticosteroids in pulmonology department. Int J Pharm Tec Pract 2012;3:334-7.
3. Prendergast J, editor. Asthma, Current Medical Diagnosis and Treatment. 49th ed. New York: Mc Graw-Hill Publishers & Distributors; 2010. p. 216-40.
4. Pinal DP, Patel RK, Patel NJ. Analysis of prescription pattern and drug utilization in asthma therapy. Int Res J Pharm 2012;3:257-60.
5. Sun HL, Kao YH, Chou MC, Lu TH, Lue KH. Differences in the prescription patterns of anti-asthmatic medications for children by pediatricians, family physicians and physicians of other specialties. J Formos Med Assoc
Nazeer and Cholas: Current Trends of using Drugs in Bronchial Asthma
160160International Journal of Scientific Study | April 2018 | Vol 6 | Issue 1
2006;105:277-83.6. International Consensus Report on Diagnosis and Treatment of Asthma.
National Heart, Lung, and Blood Institute, National Institutes of Health, Bethesda, Maryland. Eur Respir J 1992;5:509-11.
7. Ungar WJ, Coyte PC, Pharmacy Medication Monitoring Program Advisory Board. Prospective study of the patient-level cost of asthma care in children. Pediatr Pulmonol 2001;32:101-8.
8. NAEPP Expert Panel Report: Guidelines for the Diagnosis and Management of Asthma-Updates on Selected Topics 2002. Bethesda, MD: National Heart, Lung, and Blood Institute, 2002. (NIH Publication No. 02-5075). Available from: http://www.nhlbi.nih.gov/guidelines/asthma. [Last accessed on 2007 Apr 30].
9. Global Initiative for Asthma. Global Strategy for Asthma Management and Prevention: NHLBI/WHO Workshop Report. Bethesda, MD: National Heart, Lung, and Blood Institute; 2006. Available from: http://www.ginasthma.org. [Last accessed on 2007 Apr 30].
10. Papi A, Canonica GW, Maestrelli P, Paggiaro P, Olivieri D, Pozzi E, et al. Rescue use of beclomethasone and albuterol in a single inhaler for mild asthma. N Engl J Med 2007;356:2040-52.
11. Ungar WJ, Coyte PC. Prospective study of the patient level cost of asthma care in children. Pediatr Pulmonol 2001;32:101-8.
12. Cochrane GM. Compliance and outcomes in patients with asthma. Drugs 1996;52:12-9.
13. Reddel HK. Global Strategy for Asthma Management and Prevention. Global Initiative for Asthma; 2014. p. 57-66.
14. Thamby SA, Juling P, Xin BT, Jing NC. Retrospective studies on drug utilization patterns of asthmatics in a government hospital in Kedah, Malaysia. Int Curr Pharm J 2012;1:353-60.
15. Bradley JU, Lawrence ML, editors. Goodman and Gillman’s the Pharmacological Basis of Therapeutics. New York: Mc Graw Hill Publishers & Distributors; 2006. p. 717-3.
16. Dolcetti A, Osella D, De Filippis G, Carnuccio C, Grossi E. Comparison of intravenously administered doxofylline and placebo for the treatment of severe acute airways obstruction. J Int Med Res 1988;16:264-9.
17. Akram MF, Nasiruddin M, Ahmad Z, Ali Khan R. Doxofylline and theophylline: A comparative clinical study. J Clin Diagn Res 2012;6:1681-4.
18. Margay SM, Farhat S, Kaur S, Teli HA. To study the efficacy and safety of doxophylline and theophylline in bronchial asthma. J Clin Diagn Res 2015;9:FC05-8.
19. Rajathilagam T, Sandozi T, Nageshwari AT, Paramesh P, Jamunarani R. Drug utilization study in bronchial asthma in a tertiary care hospital. Int J Pharm Appl 2012;3:297-305.
How to cite this article: Nazeer IA, Cholas S. A Study on Prescribing Trends of Drugs in the Management of Bronchial Asthma: A Hospital-Based Study. Int J Sci Stud 2018;6(1):156-160.
Source of Support: Nil, Conflict of Interest: None declared.
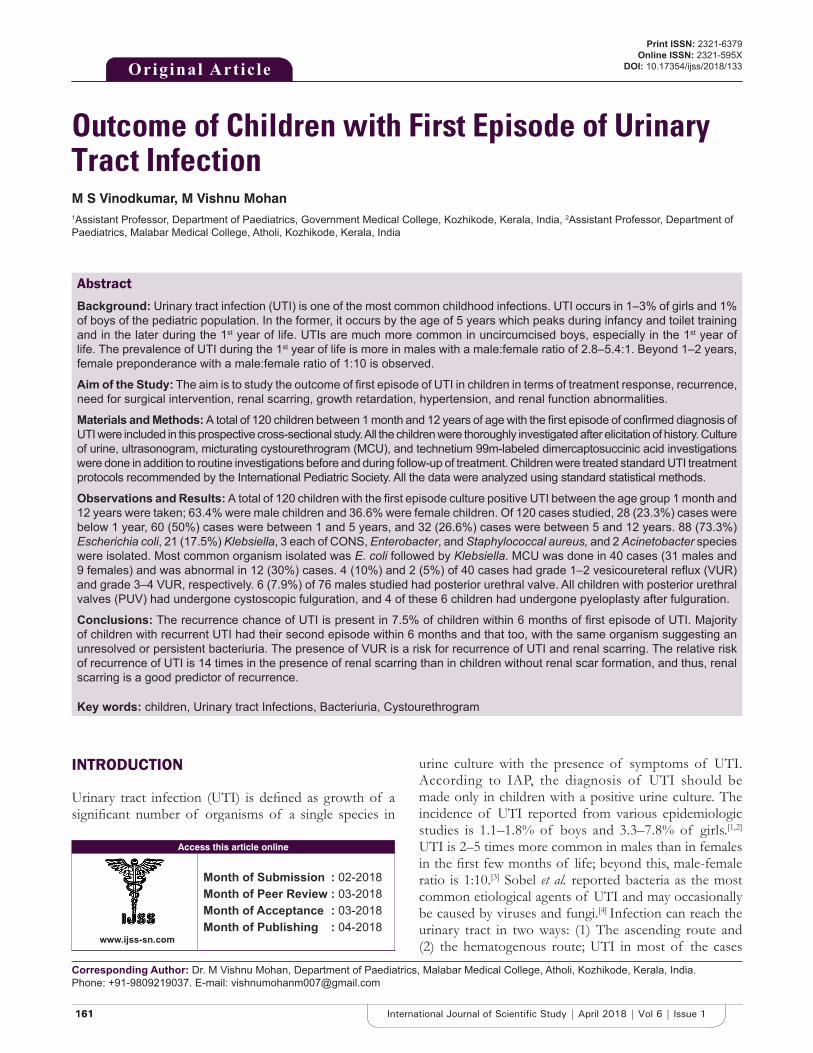
161161 International Journal of Scientific Study | April 2018 | Vol 6 | Issue 1
Outcome of Children with First Episode of Urinary Tract InfectionM S Vinodkumar, M Vishnu Mohan1Assistant Professor, Department of Paediatrics, Government Medical College, Kozhikode, Kerala, India, 2Assistant Professor, Department of Paediatrics, Malabar Medical College, Atholi, Kozhikode, Kerala, India
urine culture with the presence of symptoms of UTI. According to IAP, the diagnosis of UTI should be made only in children with a positive urine culture. The incidence of UTI reported from various epidemiologic studies is 1.1–1.8% of boys and 3.3–7.8% of girls.[1,2] UTI is 2–5 times more common in males than in females in the first few months of life; beyond this, male-female ratio is 1:10.[3] Sobel et al. reported bacteria as the most common etiological agents of UTI and may occasionally be caused by viruses and fungi.[4] Infection can reach the urinary tract in two ways: (1) The ascending route and (2) the hematogenous route; UTI in most of the cases
INTRODUCTION
Urinary tract infection (UTI) is defined as growth of a significant number of organisms of a single species in
Original Article
AbstractBackground: Urinary tract infection (UTI) is one of the most common childhood infections. UTI occurs in 1–3% of girls and 1% of boys of the pediatric population. In the former, it occurs by the age of 5 years which peaks during infancy and toilet training and in the later during the 1st year of life. UTIs are much more common in uncircumcised boys, especially in the 1st year of life. The prevalence of UTI during the 1st year of life is more in males with a male:female ratio of 2.8–5.4:1. Beyond 1–2 years, female preponderance with a male:female ratio of 1:10 is observed.
Aim of the Study: The aim is to study the outcome of first episode of UTI in children in terms of treatment response, recurrence, need for surgical intervention, renal scarring, growth retardation, hypertension, and renal function abnormalities.
Materials and Methods: A total of 120 children between 1 month and 12 years of age with the first episode of confirmed diagnosis of UTI were included in this prospective cross-sectional study. All the children were thoroughly investigated after elicitation of history. Culture of urine, ultrasonogram, micturating cystourethrogram (MCU), and technetium 99m-labeled dimercaptosuccinic acid investigations were done in addition to routine investigations before and during follow-up of treatment. Children were treated standard UTI treatment protocols recommended by the International Pediatric Society. All the data were analyzed using standard statistical methods.
Observations and Results: A total of 120 children with the first episode culture positive UTI between the age group 1 month and 12 years were taken; 63.4% were male children and 36.6% were female children. Of 120 cases studied, 28 (23.3%) cases were below 1 year, 60 (50%) cases were between 1 and 5 years, and 32 (26.6%) cases were between 5 and 12 years. 88 (73.3%) Escherichia coli, 21 (17.5%) Klebsiella, 3 each of CONS, Enterobacter, and Staphylococcal aureus, and 2 Acinetobacter species were isolated. Most common organism isolated was E. coli followed by Klebsiella. MCU was done in 40 cases (31 males and 9 females) and was abnormal in 12 (30%) cases. 4 (10%) and 2 (5%) of 40 cases had grade 1–2 vesicoureteral reflux (VUR) and grade 3–4 VUR, respectively. 6 (7.9%) of 76 males studied had posterior urethral valve. All children with posterior urethral valves (PUV) had undergone cystoscopic fulguration, and 4 of these 6 children had undergone pyeloplasty after fulguration.
Conclusions: The recurrence chance of UTI is present in 7.5% of children within 6 months of first episode of UTI. Majority of children with recurrent UTI had their second episode within 6 months and that too, with the same organism suggesting an unresolved or persistent bacteriuria. The presence of VUR is a risk for recurrence of UTI and renal scarring. The relative risk of recurrence of UTI is 14 times in the presence of renal scarring than in children without renal scar formation, and thus, renal scarring is a good predictor of recurrence.
Key words: children, Urinary tract Infections, Bacteriuria, Cystourethrogram
Access this article online
www.ijss-sn.com
Month of Submission : 02-2018 Month of Peer Review : 03-2018 Month of Acceptance : 03-2018 Month of Publishing : 04-2018
Corresponding Author: Dr. M Vishnu Mohan, Department of Paediatrics, Malabar Medical College, Atholi, Kozhikode, Kerala, India. Phone: +91-9809219037. E-mail: [email protected]
Print ISSN: 2321-6379Online ISSN: 2321-595X
DOI: 10.17354/ijss/2018/133
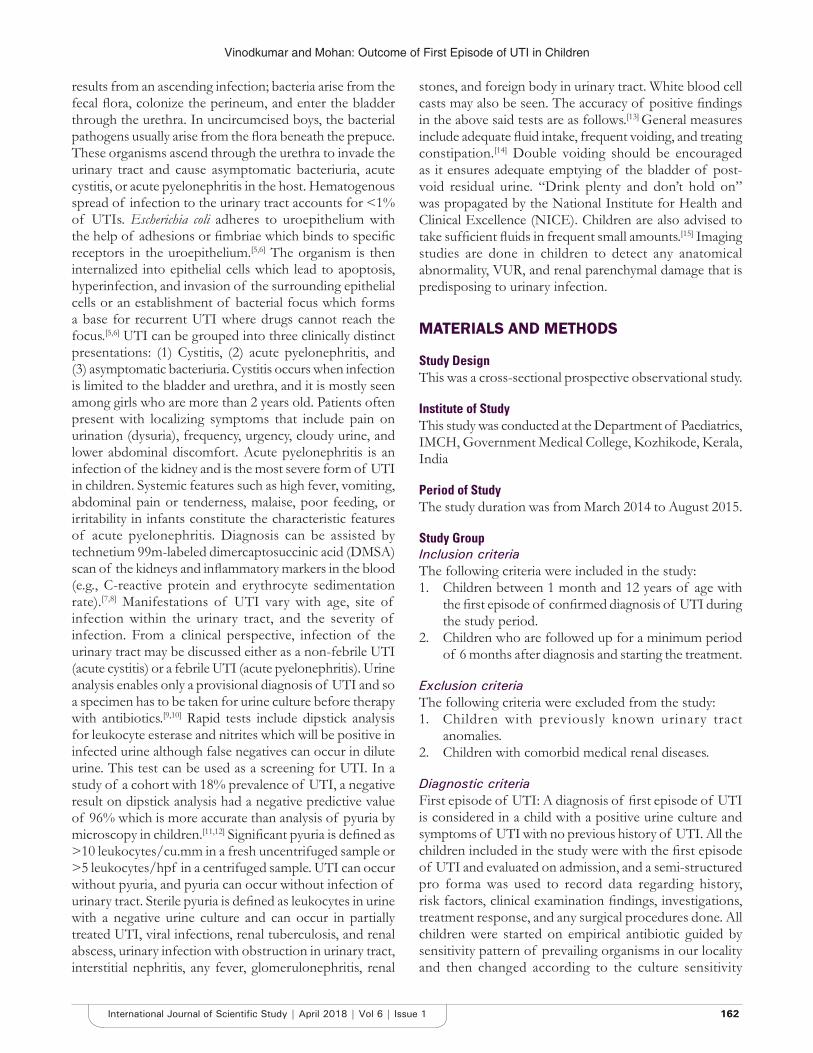
Vinodkumar and Mohan: Outcome of First Episode of UTI in Children
162162International Journal of Scientific Study | April 2018 | Vol 6 | Issue 1
results from an ascending infection; bacteria arise from the fecal flora, colonize the perineum, and enter the bladder through the urethra. In uncircumcised boys, the bacterial pathogens usually arise from the flora beneath the prepuce. These organisms ascend through the urethra to invade the urinary tract and cause asymptomatic bacteriuria, acute cystitis, or acute pyelonephritis in the host. Hematogenous spread of infection to the urinary tract accounts for <1% of UTIs. Escherichia coli adheres to uroepithelium with the help of adhesions or fimbriae which binds to specific receptors in the uroepithelium.[5,6] The organism is then internalized into epithelial cells which lead to apoptosis, hyperinfection, and invasion of the surrounding epithelial cells or an establishment of bacterial focus which forms a base for recurrent UTI where drugs cannot reach the focus.[5,6] UTI can be grouped into three clinically distinct presentations: (1) Cystitis, (2) acute pyelonephritis, and (3) asymptomatic bacteriuria. Cystitis occurs when infection is limited to the bladder and urethra, and it is mostly seen among girls who are more than 2 years old. Patients often present with localizing symptoms that include pain on urination (dysuria), frequency, urgency, cloudy urine, and lower abdominal discomfort. Acute pyelonephritis is an infection of the kidney and is the most severe form of UTI in children. Systemic features such as high fever, vomiting, abdominal pain or tenderness, malaise, poor feeding, or irritability in infants constitute the characteristic features of acute pyelonephritis. Diagnosis can be assisted by technetium 99m-labeled dimercaptosuccinic acid (DMSA) scan of the kidneys and inflammatory markers in the blood (e.g., C-reactive protein and erythrocyte sedimentation rate).[7,8] Manifestations of UTI vary with age, site of infection within the urinary tract, and the severity of infection. From a clinical perspective, infection of the urinary tract may be discussed either as a non-febrile UTI (acute cystitis) or a febrile UTI (acute pyelonephritis). Urine analysis enables only a provisional diagnosis of UTI and so a specimen has to be taken for urine culture before therapy with antibiotics.[9,10] Rapid tests include dipstick analysis for leukocyte esterase and nitrites which will be positive in infected urine although false negatives can occur in dilute urine. This test can be used as a screening for UTI. In a study of a cohort with 18% prevalence of UTI, a negative result on dipstick analysis had a negative predictive value of 96% which is more accurate than analysis of pyuria by microscopy in children.[11,12] Significant pyuria is defined as >10 leukocytes/cu.mm in a fresh uncentrifuged sample or >5 leukocytes/hpf in a centrifuged sample. UTI can occur without pyuria, and pyuria can occur without infection of urinary tract. Sterile pyuria is defined as leukocytes in urine with a negative urine culture and can occur in partially treated UTI, viral infections, renal tuberculosis, and renal abscess, urinary infection with obstruction in urinary tract, interstitial nephritis, any fever, glomerulonephritis, renal
stones, and foreign body in urinary tract. White blood cell casts may also be seen. The accuracy of positive findings in the above said tests are as follows.[13] General measures include adequate fluid intake, frequent voiding, and treating constipation.[14] Double voiding should be encouraged as it ensures adequate emptying of the bladder of post-void residual urine. “Drink plenty and don’t hold on” was propagated by the National Institute for Health and Clinical Excellence (NICE). Children are also advised to take sufficient fluids in frequent small amounts.[15] Imaging studies are done in children to detect any anatomical abnormality, VUR, and renal parenchymal damage that is predisposing to urinary infection.
MATERIALS AND METHODS
Study DesignThis was a cross-sectional prospective observational study.
Institute of StudyThis study was conducted at the Department of Paediatrics, IMCH, Government Medical College, Kozhikode, Kerala, India
Period of StudyThe study duration was from March 2014 to August 2015.
Study GroupInclusion criteriaThe following criteria were included in the study:1. Children between 1 month and 12 years of age with
the first episode of confirmed diagnosis of UTI during the study period.
2. Children who are followed up for a minimum period of 6 months after diagnosis and starting the treatment.
Exclusion criteriaThe following criteria were excluded from the study:1. Children with previously known urinary tract
anomalies.2. Children with comorbid medical renal diseases.
Diagnostic criteriaFirst episode of UTI: A diagnosis of first episode of UTI is considered in a child with a positive urine culture and symptoms of UTI with no previous history of UTI. All the children included in the study were with the first episode of UTI and evaluated on admission, and a semi-structured pro forma was used to record data regarding history, risk factors, clinical examination findings, investigations, treatment response, and any surgical procedures done. All children were started on empirical antibiotic guided by sensitivity pattern of prevailing organisms in our locality and then changed according to the culture sensitivity
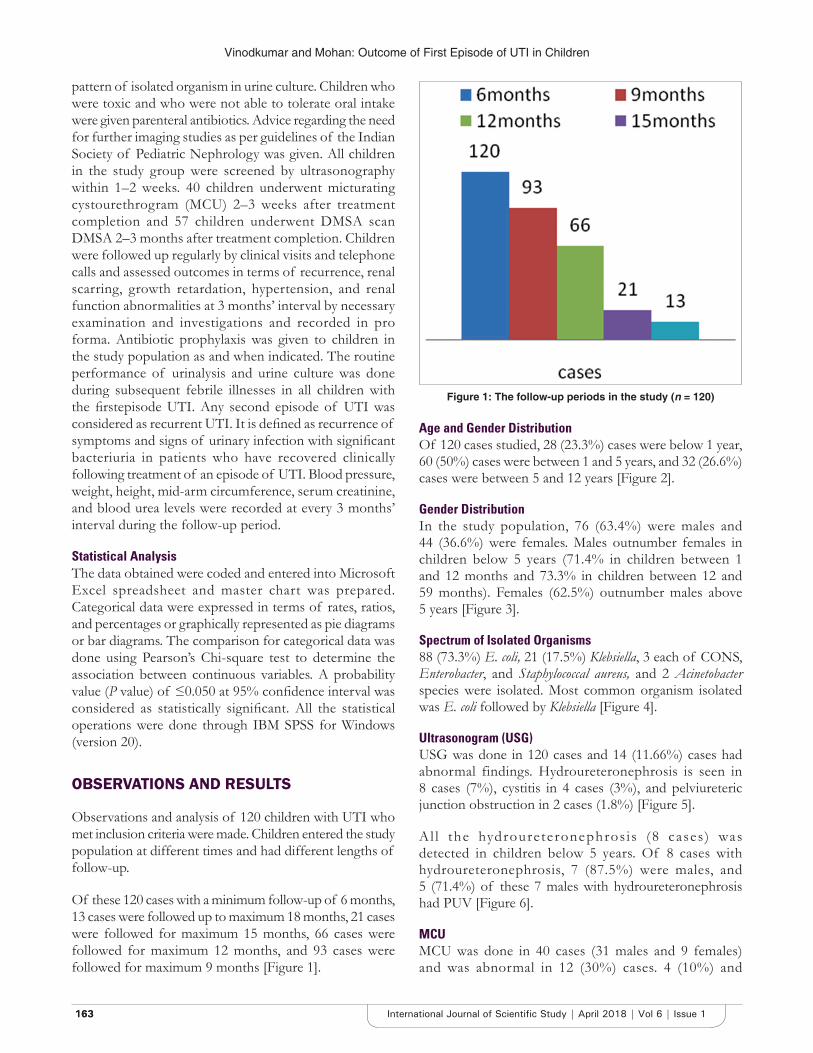
Vinodkumar and Mohan: Outcome of First Episode of UTI in Children
163163 International Journal of Scientific Study | April 2018 | Vol 6 | Issue 1
pattern of isolated organism in urine culture. Children who were toxic and who were not able to tolerate oral intake were given parenteral antibiotics. Advice regarding the need for further imaging studies as per guidelines of the Indian Society of Pediatric Nephrology was given. All children in the study group were screened by ultrasonography within 1–2 weeks. 40 children underwent micturating cystourethrogram (MCU) 2–3 weeks after treatment completion and 57 children underwent DMSA scan DMSA 2–3 months after treatment completion. Children were followed up regularly by clinical visits and telephone calls and assessed outcomes in terms of recurrence, renal scarring, growth retardation, hypertension, and renal function abnormalities at 3 months’ interval by necessary examination and investigations and recorded in pro forma. Antibiotic prophylaxis was given to children in the study population as and when indicated. The routine performance of urinalysis and urine culture was done during subsequent febrile illnesses in all children with the firstepisode UTI. Any second episode of UTI was considered as recurrent UTI. It is defined as recurrence of symptoms and signs of urinary infection with significant bacteriuria in patients who have recovered clinically following treatment of an episode of UTI. Blood pressure, weight, height, mid-arm circumference, serum creatinine, and blood urea levels were recorded at every 3 months’ interval during the follow-up period.
Statistical AnalysisThe data obtained were coded and entered into Microsoft Excel spreadsheet and master chart was prepared. Categorical data were expressed in terms of rates, ratios, and percentages or graphically represented as pie diagrams or bar diagrams. The comparison for categorical data was done using Pearson’s Chi-square test to determine the association between continuous variables. A probability value (P value) of ≤0.050 at 95% confidence interval was considered as statistically significant. All the statistical operations were done through IBM SPSS for Windows (version 20).
OBSERVATIONS AND RESULTS
Observations and analysis of 120 children with UTI who met inclusion criteria were made. Children entered the study population at different times and had different lengths of follow-up.
Of these 120 cases with a minimum follow-up of 6 months, 13 cases were followed up to maximum 18 months, 21 cases were followed for maximum 15 months, 66 cases were followed for maximum 12 months, and 93 cases were followed for maximum 9 months [Figure 1].
Age and Gender DistributionOf 120 cases studied, 28 (23.3%) cases were below 1 year, 60 (50%) cases were between 1 and 5 years, and 32 (26.6%) cases were between 5 and 12 years [Figure 2].
Gender DistributionIn the study population, 76 (63.4%) were males and 44 (36.6%) were females. Males outnumber females in children below 5 years (71.4% in children between 1 and 12 months and 73.3% in children between 12 and 59 months). Females (62.5%) outnumber males above 5 years [Figure 3].
Spectrum of Isolated Organisms88 (73.3%) E. coli, 21 (17.5%) Klebsiella, 3 each of CONS, Enterobacter, and Staphylococcal aureus, and 2 Acinetobacter species were isolated. Most common organism isolated was E. coli followed by Klebsiella [Figure 4].
Ultrasonogram (USG)USG was done in 120 cases and 14 (11.66%) cases had abnormal findings. Hydroureteronephrosis is seen in 8 cases (7%), cystitis in 4 cases (3%), and pelviureteric junction obstruction in 2 cases (1.8%) [Figure 5].
Al l the hydroureteronephros is (8 cases ) was detected in children below 5 years. Of 8 cases with hydroureteronephrosis, 7 (87.5%) were males, and 5 (71.4%) of these 7 males with hydroureteronephrosis had PUV [Figure 6].
MCUMCU was done in 40 cases (31 males and 9 females) and was abnormal in 12 (30%) cases. 4 (10%) and
Figure 1: The follow-up periods in the study (n = 120)
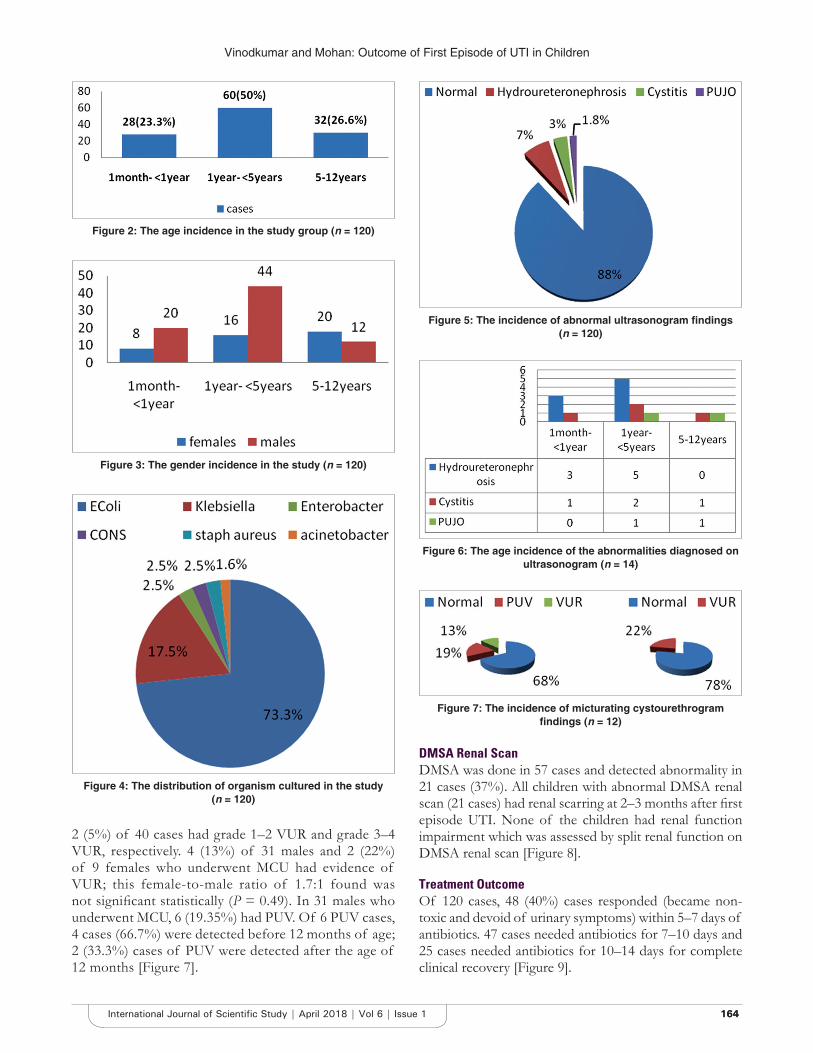
Vinodkumar and Mohan: Outcome of First Episode of UTI in Children
164164International Journal of Scientific Study | April 2018 | Vol 6 | Issue 1
2 (5%) of 40 cases had grade 1–2 VUR and grade 3–4 VUR, respectively. 4 (13%) of 31 males and 2 (22%) of 9 females who underwent MCU had evidence of VUR; this female-to-male ratio of 1.7:1 found was not significant statistically (P = 0.49). In 31 males who underwent MCU, 6 (19.35%) had PUV. Of 6 PUV cases, 4 cases (66.7%) were detected before 12 months of age; 2 (33.3%) cases of PUV were detected after the age of 12 months [Figure 7].
DMSA Renal ScanDMSA was done in 57 cases and detected abnormality in 21 cases (37%). All children with abnormal DMSA renal scan (21 cases) had renal scarring at 2–3 months after first episode UTI. None of the children had renal function impairment which was assessed by split renal function on DMSA renal scan [Figure 8].
Treatment OutcomeOf 120 cases, 48 (40%) cases responded (became non-toxic and devoid of urinary symptoms) within 5–7 days of antibiotics. 47 cases needed antibiotics for 7–10 days and 25 cases needed antibiotics for 10–14 days for complete clinical recovery [Figure 9].
Figure 2: The age incidence in the study group (n = 120)
Figure 3: The gender incidence in the study (n = 120)
Figure 4: The distribution of organism cultured in the study (n = 120)
Figure 5: The incidence of abnormal ultrasonogram findings (n = 120)
Figure 6: The age incidence of the abnormalities diagnosed on ultrasonogram (n = 14)
Figure 7: The incidence of micturating cystourethrogram findings (n = 12)
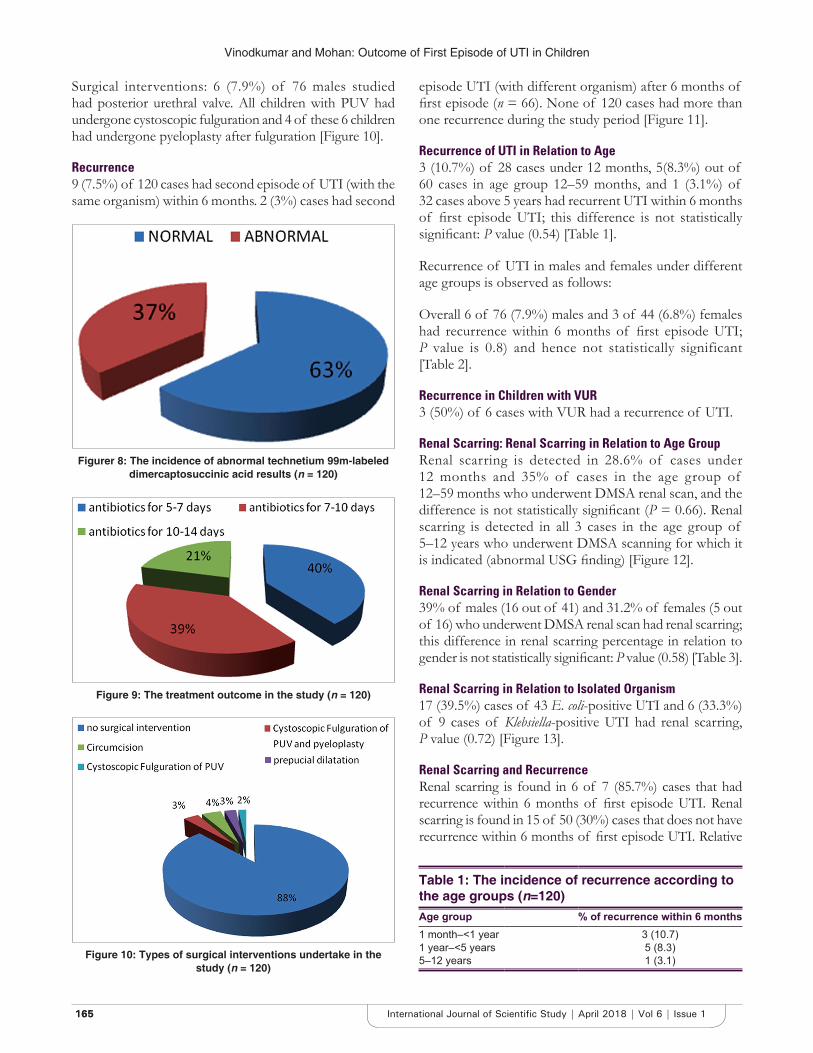
Vinodkumar and Mohan: Outcome of First Episode of UTI in Children
165165 International Journal of Scientific Study | April 2018 | Vol 6 | Issue 1
Surgical interventions: 6 (7.9%) of 76 males studied had posterior urethral valve. All children with PUV had undergone cystoscopic fulguration and 4 of these 6 children had undergone pyeloplasty after fulguration [Figure 10].
Recurrence9 (7.5%) of 120 cases had second episode of UTI (with the same organism) within 6 months. 2 (3%) cases had second
episode UTI (with different organism) after 6 months of first episode (n = 66). None of 120 cases had more than one recurrence during the study period [Figure 11].
Recurrence of UTI in Relation to Age3 (10.7%) of 28 cases under 12 months, 5(8.3%) out of 60 cases in age group 12–59 months, and 1 (3.1%) of 32 cases above 5 years had recurrent UTI within 6 months of first episode UTI; this difference is not statistically significant: P value (0.54) [Table 1].
Recurrence of UTI in males and females under different age groups is observed as follows:
Overall 6 of 76 (7.9%) males and 3 of 44 (6.8%) females had recurrence within 6 months of first episode UTI; P value is 0.8) and hence not statistically significant [Table 2].
Recurrence in Children with VUR3 (50%) of 6 cases with VUR had a recurrence of UTI.
Renal Scarring: Renal Scarring in Relation to Age GroupRenal scarring is detected in 28.6% of cases under 12 months and 35% of cases in the age group of 12–59 months who underwent DMSA renal scan, and the difference is not statistically significant (P = 0.66). Renal scarring is detected in all 3 cases in the age group of 5–12 years who underwent DMSA scanning for which it is indicated (abnormal USG finding) [Figure 12].
Renal Scarring in Relation to Gender39% of males (16 out of 41) and 31.2% of females (5 out of 16) who underwent DMSA renal scan had renal scarring; this difference in renal scarring percentage in relation to gender is not statistically significant: P value (0.58) [Table 3].
Renal Scarring in Relation to Isolated Organism17 (39.5%) cases of 43 E. coli-positive UTI and 6 (33.3%) of 9 cases of Klebsiella-positive UTI had renal scarring, P value (0.72) [Figure 13].
Renal Scarring and RecurrenceRenal scarring is found in 6 of 7 (85.7%) cases that had recurrence within 6 months of first episode UTI. Renal scarring is found in 15 of 50 (30%) cases that does not have recurrence within 6 months of first episode UTI. Relative
Figurer 8: The incidence of abnormal technetium 99m-labeled dimercaptosuccinic acid results (n = 120)
Figure 9: The treatment outcome in the study (n = 120)
Figure 10: Types of surgical interventions undertake in the study (n = 120)
Table 1: The incidence of recurrence according to the age groups (n=120)Age group % of recurrence within 6 months1 month–<1 year 3 (10.7)1 year–<5 years 5 (8.3)5–12 years 1 (3.1)
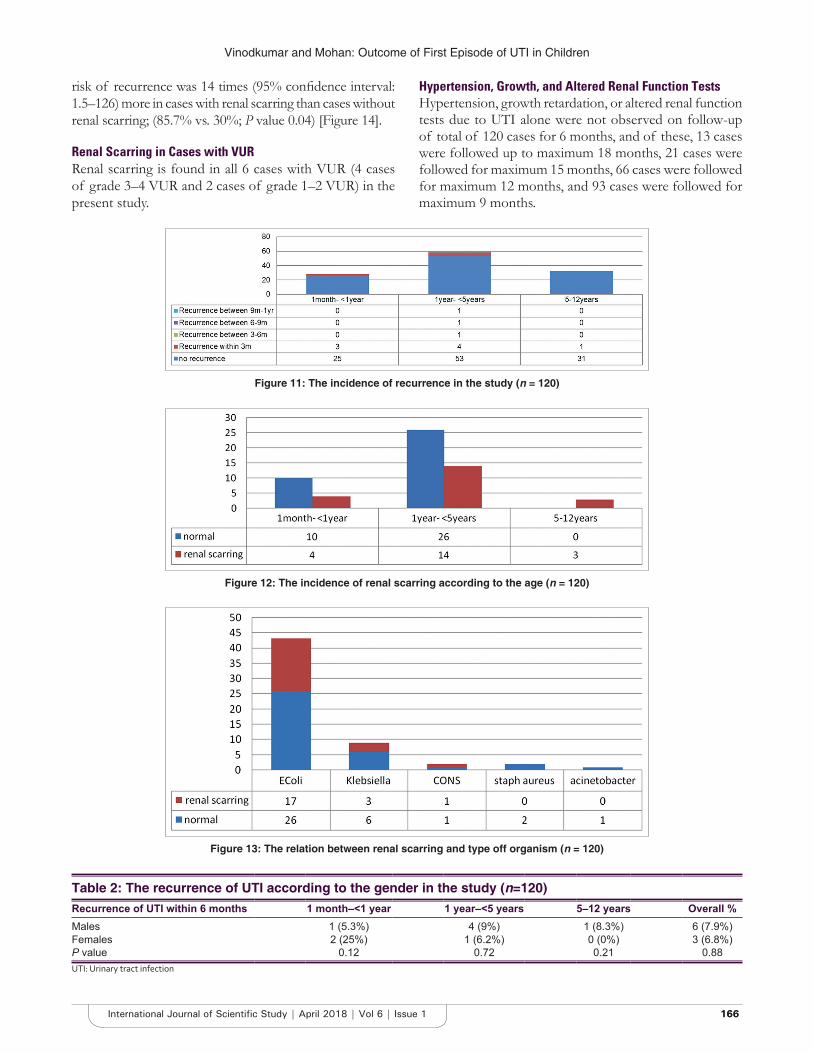
Vinodkumar and Mohan: Outcome of First Episode of UTI in Children
166166International Journal of Scientific Study | April 2018 | Vol 6 | Issue 1
risk of recurrence was 14 times (95% confidence interval: 1.5–126) more in cases with renal scarring than cases without renal scarring; (85.7% vs. 30%; P value 0.04) [Figure 14].
Renal Scarring in Cases with VURRenal scarring is found in all 6 cases with VUR (4 cases of grade 3–4 VUR and 2 cases of grade 1–2 VUR) in the present study.
Hypertension, Growth, and Altered Renal Function TestsHypertension, growth retardation, or altered renal function tests due to UTI alone were not observed on follow-up of total of 120 cases for 6 months, and of these, 13 cases were followed up to maximum 18 months, 21 cases were followed for maximum 15 months, 66 cases were followed for maximum 12 months, and 93 cases were followed for maximum 9 months.
Figure 12: The incidence of renal scarring according to the age (n = 120)
Figure 13: The relation between renal scarring and type off organism (n = 120)
Table 2: The recurrence of UTI according to the gender in the study (n=120)Recurrence of UTI within 6 months 1 month–<1 year 1 year–<5 years 5–12 years Overall %Males 1 (5.3%) 4 (9%) 1 (8.3%) 6 (7.9%)Females 2 (25%) 1 (6.2%) 0 (0%) 3 (6.8%)P value 0.12 0.72 0.21 0.88UTI: Urinary tract infection
Figure 11: The incidence of recurrence in the study (n = 120)
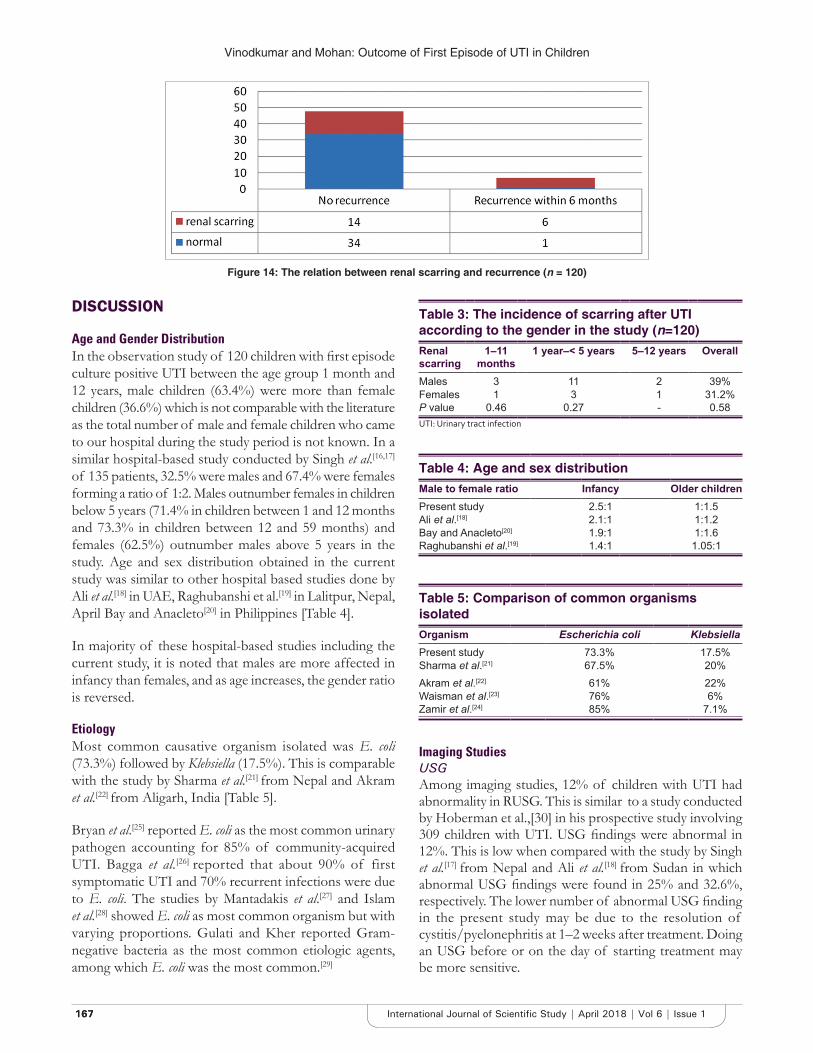
Vinodkumar and Mohan: Outcome of First Episode of UTI in Children
167167 International Journal of Scientific Study | April 2018 | Vol 6 | Issue 1
DISCUSSION
Age and Gender DistributionIn the observation study of 120 children with first episode culture positive UTI between the age group 1 month and 12 years, male children (63.4%) were more than female children (36.6%) which is not comparable with the literature as the total number of male and female children who came to our hospital during the study period is not known. In a similar hospital-based study conducted by Singh et al.[16,17] of 135 patients, 32.5% were males and 67.4% were females forming a ratio of 1:2. Males outnumber females in children below 5 years (71.4% in children between 1 and 12 months and 73.3% in children between 12 and 59 months) and females (62.5%) outnumber males above 5 years in the study. Age and sex distribution obtained in the current study was similar to other hospital based studies done by Ali et al.[18] in UAE, Raghubanshi et al.[19] in Lalitpur, Nepal, April Bay and Anacleto[20] in Philippines [Table 4].
In majority of these hospital-based studies including the current study, it is noted that males are more affected in infancy than females, and as age increases, the gender ratio is reversed.
EtiologyMost common causative organism isolated was E. coli (73.3%) followed by Klebsiella (17.5%). This is comparable with the study by Sharma et al.[21] from Nepal and Akram et al.[22] from Aligarh, India [Table 5].
Bryan et al.[25] reported E. coli as the most common urinary pathogen accounting for 85% of community-acquired UTI. Bagga et al.[26] reported that about 90% of first symptomatic UTI and 70% recurrent infections were due to E. coli. The studies by Mantadakis et al.[27] and Islam et al.[28] showed E. coli as most common organism but with varying proportions. Gulati and Kher reported Gram-negative bacteria as the most common etiologic agents, among which E. coli was the most common.[29]
Imaging StudiesUSGAmong imaging studies, 12% of children with UTI had abnormality in RUSG. This is similar to a study conducted by Hoberman et al.,[30] in his prospective study involving 309 children with UTI. USG findings were abnormal in 12%. This is low when compared with the study by Singh et al.[17] from Nepal and Ali et al.[18] from Sudan in which abnormal USG findings were found in 25% and 32.6%, respectively. The lower number of abnormal USG finding in the present study may be due to the resolution of cystitis/pyelonephritis at 1–2 weeks after treatment. Doing an USG before or on the day of starting treatment may be more sensitive.
Table 5: Comparison of common organisms isolatedOrganism Escherichia coli KlebsiellaPresent study 73.3% 17.5%Sharma et al.[21] 67.5% 20%Akram et al.[22] 61% 22%Waisman et al.[23] 76% 6%Zamir et al.[24] 85% 7.1%
Figure 14: The relation between renal scarring and recurrence (n = 120)
Table 4: Age and sex distributionMale to female ratio Infancy Older childrenPresent study 2.5:1 1:1.5Ali et al.[18] 2.1:1 1:1.2Bay and Anacleto[20] 1.9:1 1:1.6Raghubanshi et al.[19] 1.4:1 1.05:1
Table 3: The incidence of scarring after UTI according to the gender in the study (n=120)Renal scarring
1–11 months
1 year–< 5 years 5–12 years Overall
Males 3 11 2 39%Females 1 3 1 31.2%P value 0.46 0.27 - 0.58UTI: Urinary tract infection
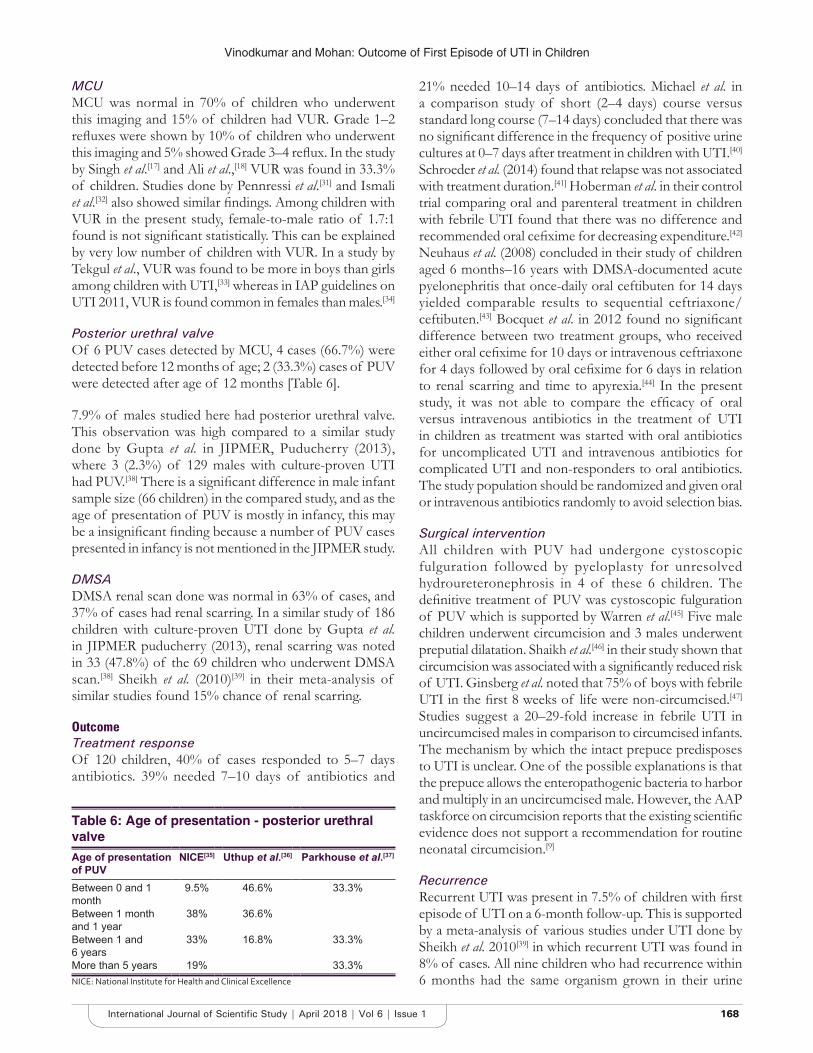
Vinodkumar and Mohan: Outcome of First Episode of UTI in Children
168168International Journal of Scientific Study | April 2018 | Vol 6 | Issue 1
MCUMCU was normal in 70% of children who underwent this imaging and 15% of children had VUR. Grade 1–2 refluxes were shown by 10% of children who underwent this imaging and 5% showed Grade 3–4 reflux. In the study by Singh et al.[17] and Ali et al.,[18] VUR was found in 33.3% of children. Studies done by Pennressi et al.[31] and Ismali et al.[32] also showed similar findings. Among children with VUR in the present study, female-to-male ratio of 1.7:1 found is not significant statistically. This can be explained by very low number of children with VUR. In a study by Tekgul et al., VUR was found to be more in boys than girls among children with UTI,[33] whereas in IAP guidelines on UTI 2011, VUR is found common in females than males.[34]
Posterior urethral valveOf 6 PUV cases detected by MCU, 4 cases (66.7%) were detected before 12 months of age; 2 (33.3%) cases of PUV were detected after age of 12 months [Table 6].
7.9% of males studied here had posterior urethral valve. This observation was high compared to a similar study done by Gupta et al. in JIPMER, Puducherry (2013), where 3 (2.3%) of 129 males with culture-proven UTI had PUV.[38] There is a significant difference in male infant sample size (66 children) in the compared study, and as the age of presentation of PUV is mostly in infancy, this may be a insignificant finding because a number of PUV cases presented in infancy is not mentioned in the JIPMER study.
DMSADMSA renal scan done was normal in 63% of cases, and 37% of cases had renal scarring. In a similar study of 186 children with culture-proven UTI done by Gupta et al. in JIPMER puducherry (2013), renal scarring was noted in 33 (47.8%) of the 69 children who underwent DMSA scan.[38] Sheikh et al. (2010)[39] in their meta-analysis of similar studies found 15% chance of renal scarring.
OutcomeTreatment responseOf 120 children, 40% of cases responded to 5–7 days antibiotics. 39% needed 7–10 days of antibiotics and
21% needed 10–14 days of antibiotics. Michael et al. in a comparison study of short (2–4 days) course versus standard long course (7–14 days) concluded that there was no significant difference in the frequency of positive urine cultures at 0–7 days after treatment in children with UTI.[40] Schroeder et al. (2014) found that relapse was not associated with treatment duration.[41] Hoberman et al. in their control trial comparing oral and parenteral treatment in children with febrile UTI found that there was no difference and recommended oral cefixime for decreasing expenditure.[42] Neuhaus et al. (2008) concluded in their study of children aged 6 months–16 years with DMSA-documented acute pyelonephritis that once-daily oral ceftibuten for 14 days yielded comparable results to sequential ceftriaxone/ceftibuten.[43] Bocquet et al. in 2012 found no significant difference between two treatment groups, who received either oral cefixime for 10 days or intravenous ceftriaxone for 4 days followed by oral cefixime for 6 days in relation to renal scarring and time to apyrexia.[44] In the present study, it was not able to compare the efficacy of oral versus intravenous antibiotics in the treatment of UTI in children as treatment was started with oral antibiotics for uncomplicated UTI and intravenous antibiotics for complicated UTI and non-responders to oral antibiotics. The study population should be randomized and given oral or intravenous antibiotics randomly to avoid selection bias.
Surgical interventionAll children with PUV had undergone cystoscopic fulguration followed by pyeloplasty for unresolved hydroureteronephrosis in 4 of these 6 children. The definitive treatment of PUV was cystoscopic fulguration of PUV which is supported by Warren et al.[45] Five male children underwent circumcision and 3 males underwent preputial dilatation. Shaikh et al.[46] in their study shown that circumcision was associated with a significantly reduced risk of UTI. Ginsberg et al. noted that 75% of boys with febrile UTI in the first 8 weeks of life were non-circumcised.[47] Studies suggest a 20–29-fold increase in febrile UTI in uncircumcised males in comparison to circumcised infants. The mechanism by which the intact prepuce predisposes to UTI is unclear. One of the possible explanations is that the prepuce allows the enteropathogenic bacteria to harbor and multiply in an uncircumcised male. However, the AAP taskforce on circumcision reports that the existing scientific evidence does not support a recommendation for routine neonatal circumcision.[9]
RecurrenceRecurrent UTI was present in 7.5% of children with first episode of UTI on a 6-month follow-up. This is supported by a meta-analysis of various studies under UTI done by Sheikh et al. 2010[39] in which recurrent UTI was found in 8% of cases. All nine children who had recurrence within 6 months had the same organism grown in their urine
Table 6: Age of presentation - posterior urethral valveAge of presentation of PUV
NICE[35] Uthup et al.[36] Parkhouse et al.[37]
Between 0 and 1 month
9.5% 46.6% 33.3%
Between 1 month and 1 year
38% 36.6%
Between 1 and 6 years
33% 16.8% 33.3%
More than 5 years 19% 33.3%NICE: National Institute for Health and Clinical Excellence
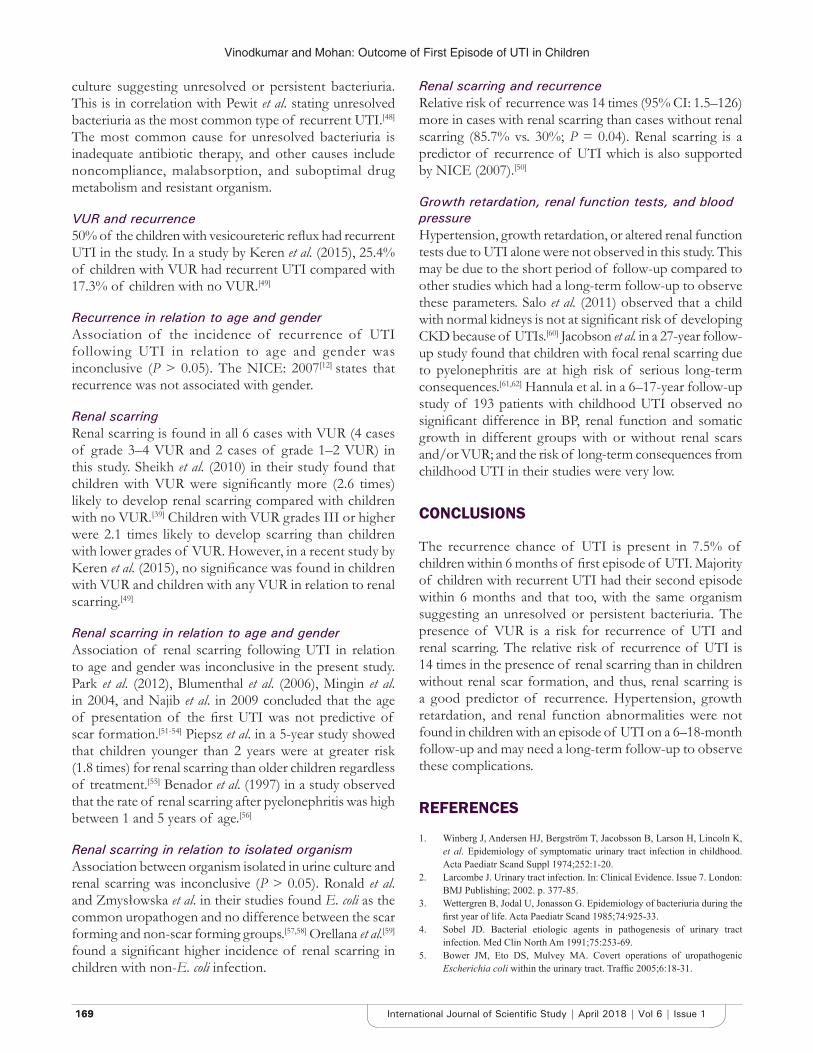
Vinodkumar and Mohan: Outcome of First Episode of UTI in Children
169169 International Journal of Scientific Study | April 2018 | Vol 6 | Issue 1
culture suggesting unresolved or persistent bacteriuria. This is in correlation with Pewit et al. stating unresolved bacteriuria as the most common type of recurrent UTI.[48]
The most common cause for unresolved bacteriuria is inadequate antibiotic therapy, and other causes include noncompliance, malabsorption, and suboptimal drug metabolism and resistant organism.
VUR and recurrence50% of the children with vesicoureteric reflux had recurrent UTI in the study. In a study by Keren et al. (2015), 25.4% of children with VUR had recurrent UTI compared with 17.3% of children with no VUR.[49]
Recurrence in relation to age and genderAssociation of the incidence of recurrence of UTI following UTI in relation to age and gender was inconclusive (P > 0.05). The NICE: 2007[12] states that recurrence was not associated with gender.
Renal scarringRenal scarring is found in all 6 cases with VUR (4 cases of grade 3–4 VUR and 2 cases of grade 1–2 VUR) in this study. Sheikh et al. (2010) in their study found that children with VUR were significantly more (2.6 times) likely to develop renal scarring compared with children with no VUR.[39] Children with VUR grades III or higher were 2.1 times likely to develop scarring than children with lower grades of VUR. However, in a recent study by Keren et al. (2015), no significance was found in children with VUR and children with any VUR in relation to renal scarring.[49]
Renal scarring in relation to age and genderAssociation of renal scarring following UTI in relation to age and gender was inconclusive in the present study. Park et al. (2012), Blumenthal et al. (2006), Mingin et al. in 2004, and Najib et al. in 2009 concluded that the age of presentation of the first UTI was not predictive of scar formation.[51-54] Piepsz et al. in a 5-year study showed that children younger than 2 years were at greater risk (1.8 times) for renal scarring than older children regardless of treatment.[55] Benador et al. (1997) in a study observed that the rate of renal scarring after pyelonephritis was high between 1 and 5 years of age.[56]
Renal scarring in relation to isolated organismAssociation between organism isolated in urine culture and renal scarring was inconclusive (P > 0.05). Ronald et al. and Zmysłowska et al. in their studies found E. coli as the common uropathogen and no difference between the scar forming and non-scar forming groups.[57,58] Orellana et al.[59]
found a significant higher incidence of renal scarring in children with non-E. coli infection.
Renal scarring and recurrenceRelative risk of recurrence was 14 times (95% CI: 1.5–126) more in cases with renal scarring than cases without renal scarring (85.7% vs. 30%; P = 0.04). Renal scarring is a predictor of recurrence of UTI which is also supported by NICE (2007).[50]
Growth retardation, renal function tests, and blood pressureHypertension, growth retardation, or altered renal function tests due to UTI alone were not observed in this study. This may be due to the short period of follow-up compared to other studies which had a long-term follow-up to observe these parameters. Salo et al. (2011) observed that a child with normal kidneys is not at significant risk of developing CKD because of UTIs.[60] Jacobson et al. in a 27-year follow-up study found that children with focal renal scarring due to pyelonephritis are at high risk of serious long-term consequences.[61,62] Hannula et al. in a 6–17-year follow-up study of 193 patients with childhood UTI observed no significant difference in BP, renal function and somatic growth in different groups with or without renal scars and/or VUR; and the risk of long-term consequences from childhood UTI in their studies were very low.
CONCLUSIONS
The recurrence chance of UTI is present in 7.5% of children within 6 months of first episode of UTI. Majority of children with recurrent UTI had their second episode within 6 months and that too, with the same organism suggesting an unresolved or persistent bacteriuria. The presence of VUR is a risk for recurrence of UTI and renal scarring. The relative risk of recurrence of UTI is 14 times in the presence of renal scarring than in children without renal scar formation, and thus, renal scarring is a good predictor of recurrence. Hypertension, growth retardation, and renal function abnormalities were not found in children with an episode of UTI on a 6–18-month follow-up and may need a long-term follow-up to observe these complications.
REFERENCES
1. Winberg J, Andersen HJ, Bergström T, Jacobsson B, Larson H, Lincoln K, et al. Epidemiology of symptomatic urinary tract infection in childhood. Acta Paediatr Scand Suppl 1974;252:1-20.
2. Larcombe J. Urinary tract infection. In: Clinical Evidence. Issue 7. London: BMJ Publishing; 2002. p. 377-85.
3. Wettergren B, Jodal U, Jonasson G. Epidemiology of bacteriuria during the first year of life. Acta Paediatr Scand 1985;74:925-33.
4. Sobel JD. Bacterial etiologic agents in pathogenesis of urinary tract infection. Med Clin North Am 1991;75:253-69.
5. Bower JM, Eto DS, Mulvey MA. Covert operations of uropathogenic Escherichia coli within the urinary tract. Traffic 2005;6:18-31.
Vinodkumar and Mohan: Outcome of First Episode of UTI in Children
170170International Journal of Scientific Study | April 2018 | Vol 6 | Issue 1
6. Wullt B, Bergsten G, Connell H, Röllano P, Gebretsadik N, Hull R, et al. P fimbriae enhance the early establishment of Escherichia coli in the human urinary tract. Mol Microbiol 2000;38:456-64.
7. Zamir G, Sakran W, Horowitz Y, Koren A, Miron D. Urinary tract infection: Is there a need for routine renal ultrasonography? Arch Dis Child 2004;89:466-8.
8. Jacobsen SM, Stickler DJ, Mobley HL, Shirtliff ME. Complicated catheter-associated UTI due to Escherichia coli and Proteus mirabilis. Clin Microbiol Rev 2008;21:26-59.
9. American academy of Pediatrics Task Force on Circumcision. Circumcision policy statement. Paediatrics 1999;103:686-93.
10. Loening-Baucke V. Urinary incontinence and urinary tract infection and their resolution with treatment of chronic constipation of childhood. Pediatrics 1997;100:228-32.
11. Gochman RF, Karasic RB, Heller MB. Use of portable ultrasound to assist urine collection by suprapubic aspiration. Ann Emerg Med 1991;20:631-5.
12. Gorelick MH, Shaw KN. Screening tests for urinary tract infection in children: A meta-analysis. Pediatrics 1999;104:e54.
13. Downs SM. Technical report: Urinary tract infections in febrile infants and young children. The urinary tract subcommittee of the American academy of pediatrics committee on quality improvement. Pediatrics 1999;103:e54.
14. Roberts K, Downs S, Hellerstein S, Holmes M, Leibowitz R, Lohr J. American academy of pediatrics, committee on quality improvement, subcommittee on urinary tract infections. Practice parameters: The diagnosis, treatment and evaluation of the initial urinary tract infections in febrile infants and young children. Pediatrics 1999;103:843-52.
15. Indian Pediatric Nephrology Group. Consensus statement on management of urinary tract infections. Indian Pediatr 2001;38:1106-15.
16. Gauthier M, Chevalier I, Sterescu A, Bergeron S, Brunet S, Taddeo D, et al. Treatment of urinary tract infections among febrile young children with daily intravenous antibiotic therapy at a day treatment center. Pediatrics 2004;114:e469-76.
17. Singh SD, Madhup SK. Clinical profile and antibiotics sensitivity in childhood urinary tract infection at dhulikhel hospital. Kathmandu Univ Med J (KUMJ) 2013;11:319-24.
18. Ali E, Osman A. Acute urinary tract infections in children in Khartoum State: Pathogens, antimicrobial susceptibility and associated risk factors. Arab J Nephrol Transplant 2009;2:11-5.
19. Raghubanshi BR, Shrestha D, Chaudhary M, Karki BM, Dhakal AK. Bacteriology of urinary tract infection in paediatric patients. At KIST medical college teaching hospital. J Kathmandu Med Coll 2014;3:21-5.
20. Bay AG, Anacleto, F Jr. University of the Philippines college of medicine–Philippines general hospital. Clinical profile of UTI among children at the outpatient clinic of tertiary hospital. PIDSP J 2010;11:10-6.
21. Sharma A, Shrestha S, Upadhyay S, Rijal P. Clinical and biological profile of urinary tract infection in children at Nepal medical college teaching hospital. Nepal Med Coll J 2011;13:24-6.
22. Akram M, Shahid M, Khan AU. Etiology and antibiotic resistence pattern of community acquired UTI in JNMC hospital Aligarh, India. Ann Clin Microbial Antimicrob 2007;6:4.
23. Waisman Y, Zerem E, Amir L, Mimouni M. The validity of the uriscreen test for early detection of urinary tract infection in children. Pediatrics 1999;104:e41.
24. Bryan CS, Reynolds KL. Hospital acquired bacteremic urinary tract infection: Epidemiology and outcome. J Urol 1984;132:494.
25. Bagga A, Sharma J. UTI clinical features, evaluation and treatment. Pediatr Today 2000;3:395-401.
26. Mantadakis E, Tsalkidis A, Panopoulou M. Antimicrobial susceptibility to pediatric uropathogens in Thrace, Greece. Int Urol Nephrol 2010;43:549-55.
27. Islam MN, Khaleque MA, Siddika M, Hossain MA. UTI in children in tertiary level hospital in Bangladesh. Mymensingh Med J 2010;19:482-6.
28. Sanjeev G, Vijay K. Urinary tract infection. Indian Pediatr 1996;33:211-7.29. Hobermann A, Charron M, Hickey RW, Baskin M, Kearne DH, Wald ER.
Imaging studies after a first febrile urinary tract infection in young children. N Eng J Med 2003;348:195-202.
30. Pennressi M, L’erario I, Travan L, Venture A. Managing children under 36 month of age with febrile urinary tract infection: A new approach. Pediatr Nephrol 2012;27:611-5.
31. Ismaili K, Wissing KM, Lolin K, Le PQ, Christophe C, Lepage P, et al. Characteristics of first urinary tract infection with fever in children:
A prospective clinical and imaging study. Pediatr Infect Dis J 2011;30:371-4.32. Tekgül S, Riedmiller H, Hoebeke P, Kočvara R, Nijman RJ, Radmayr C,
et al. EAU guidelines on vesicoureteral reflux in children. Eur Urol 2012;62:534-42.
33. Indian Society of Pediatric Nephrology, Vijayakumar M, Kanitkar M, Nammalwar BR, Bagga A. Revised statement on management of urinary tract infections. Indian Pediatr 2011;48:709-17.
34. National Institute for Health and Clinical Excellence (NICE). UTI in children. Diagnosis, Treatment and Long Term Management. London: NICE; 2007.
35. Uthup S, BinithaR, Geetha S, Hema R, Kailas L. A follow-up study of children with posterior urethral valve. Indian J Nephrol 2010;20:72-5.
36. Parkhouse HF, Barratt TM, Dillon MJ, Duffy PG, Fay J, Ransley PG, et al. Long-term outcome of boys with posterior urethral valves. Br J Urol 1988;62:59-62.
37. Gupta P, Mandal J, Krishnamurthy S, Barathi D, Pandit N. Profile of urinary tract infections in paediatric patients. Indian J Med Res 2015;141:473-7.
38. Shaikh N, Ewing AL, Bhatnagar S, Hoberman A. Risk of renal scarring in children with a first urinary tract infection: A systematic review. Pediatrics 2010;126:1084-91.
39. Michael M, Hodson EM, Craig JC, Martin S, Moyer VA. Short compared with standard duration of antibiotic treatment for urinary tract infection: A systematic review of randomised controlled trials. Arch Dis Child 2002;87:118-23.
40. Schroeder AR, Shen MW, Biondi EA, Bendel-Stenzel M, Chen CN, French J, et al. Bacteraemic urinary tract infection: Management and outcomes in young infants. Arch Dis Child 2016;101:125-30.
41. Hoberman A, Wald ER, Hickey RW, Baskin M, Charron M, Majd M, et al. Oral versus initial intravenous therapy for urinary tract infections in young febrile children. Pediatrics 1999;104:79-86.
42. Neuhaus TJ, Berger C, Buechner K, Parvex P, Bischoff G, Goetschel P, et al. Randomised trial of oral versus sequential intravenous/oral cephalosporins in children with pyelonephritis. Eur J Pediatr 2008;167:1037-47.
43. Bocquet N, Sergent Alaoui A, Jais JP, Gajdos V, Guigonis V, Lacour B, et al. Randomized trial of oral versus sequential IV/oral antibiotic for acute pyelonephritis in children. Pediatrics 2012;129:e269-75.
44. Warren J, Pike JG, Leonard MP. Posterior urethral valves in eastern Ontario - A 30 year perspective. Can J Urol 2004;11:2210-5.
45. Shaikh N, Morone NE, Bost JE, Farrell MH. Prevalence of urinary tract infection in childhood: A meta-analysis. Pediatr Infect Dis J 2008;27:302-8.
46. Mårild S, Jodal U. Incidence rate of first-time symptomatic urinary tract infection in children under 6 years of age. Acta Paediatr 1998;87:549-52.
47. Pewitt EB, Schaeffer AJ. Urinary tract infection in urology, including acute and chronic prostatitis. Infect Dis Clin North Am 1997;11:623-46.
48. Keren R, Shaikh N, Pohl H, Gravens-Mueller L, Ivanova A, Zaoutis L, et al. Risk factors for recurrent urinary tract infection and renal scarring. Pediatrics 2015;136:e13-21.
49. Hanson LA, Korotkova M, Håversen L, Mattsby-Baltzer I, Hahn-Zoric M, Silfverdal SA, et al. Breast-feeding, a complex support system for the offspring. Pediatr Int 2002;44:347-52.
50. Park YS. Renal scar formation after urinary tract infection in children. Korean J Pediatr 2012;55:367-70.
51. Blumenthal I. Vesicoureteric reflux and urinary tract infection in children. Postgrad Med J 2006;82:31-5.
52. Mingin GC, Hinds A, Nguyen HT, Baskin LS. Children with a febrile urinary tract infection and a negative radiological workup: Factors predictive of recurrence. Urology 2004;63:562-5.
53. Najib KH, Fallahzadeh E, Fallahzadeh MK, Fallahzadeh MH, Erjaee A. Renal scar formation in children with recurrent urinary tract infections. Iran Red Crescent Med J 2009;11:93-5.
54. Piepsz A, Tamminen-Mobius T, Reiners C. Five-year study of medical and surgical treatment in children with severe vesico-ureteric reflux dimercaptosuccinic acid findings. Eur J Pediatr 1998;157:753-8.
55. Benador D, Benador N, Slozman D. Are younger patients at higher risk of renal sequelae after pyelonephritis? Lancet 1997;349:17-9.
56. Ronald A. The etiology of urinary tract infection: Traditional and emerging pathogens. Dis Mon 2003;49:71-82.
57. Zmysłowska A, Kozłowski J, Zielińska E, Bodalski J. Urinary tract infections in children under three years of age. Pol Merkur Lekarski 2003;14:319-21.
58. Orellana P, Baquedano P, Rangarajan V, Zhao JH, Eng ND, Fettich J,

Vinodkumar and Mohan: Outcome of First Episode of UTI in Children
171171 International Journal of Scientific Study | April 2018 | Vol 6 | Issue 1
et al. Relationship between acute pyelonephritis, renal scarring, and vesicoureteral reflux. Results of a coordinated research project. Pediatr Nephrol 2004;19:1122-6.
59. Salo J, Ikäheimo R, Tapiainen T, Uhari M. Childhood urinary tract infections as a cause of chronic kidney disease. Pediatrics 2011;128:840-7.
60. Jacobson SH, Eklöf O, Eriksson CG, Lins LE, Tidgren B, Winberg J,
et al. Development of hypertension and uraemia after pyelonephritis in childhood: 27 year follow up. BMJ 1989;299:703-6.
61. Hannula A, Perhomaa M, Venhola M, Pokka T, Renko M, Uhari M, et al. Long-term follow-up of patients after childhood urinary tract infection. Arch Pediatr Adolesc Med 2012;166:1117-22.
How to cite this article: Vinodkumar MS, Mohan MV. Outcome of Children with First Episode of Urinary Tract Infection. Int J Sci Stud 2018;6(1):161-171.
Source of Support: Nil, Conflict of Interest: None declared.
172172International Journal of Scientific Study | April 2018 | Vol 6 | Issue 1
A Clinical Study on the Management of Chronic Mastoiditis and Mastoid Abscess - A Hospital-based StudyA Siva Kumar
Professor and Head, Department of ENT, Kannur Medical College, Anjarakandy, Kannur, Kerala
(CSOM); it is rarely a result of failure of the treatment of acute mastoiditis.[2] CSOM is persistent inflammation of the middle ear or mastoid cavity with permanent changes in the tympanic membrane in the form of perforation. Synonyms include “chronic otitis media (without effusion),” chronic mastoiditis, and chronic tympanomastoiditis. CSOM is characterized by recurrent or persistent ear discharge (otorrhea) over 2–6 weeks through a perforation of the tympanic membrane.[3] Two types of mastoiditis are associated with bone destruction: Acute coalescent mastoiditis and chronic mastoiditis with osteitis. Acute coalescent mastoiditis generally follows a severe bout of acute suppurative otitis media (ASOM).[4]
INTRODUCTION
Mastoiditis is an inflammatory process of the mastoid air cells in the temporal bone.[1] Chronic mastoiditis is generally a result of chronic suppurative otitis media
Original Article
AbstractBackground: In spite of the advent of antibiotics, the incidence of mastoiditis and mastoid abscess is not uncommon in the ENT practice. The pathogenesis is due to virulence of organism, insufficient antibiotics use, and ineffective antibiotics. Treatment consists of simple incision drainage to modified radical mastoidectomy. However, there seems to be no unanimous agreement on the best management strategy for this problem. The present study presents the outcome of patients undergoing treatment and also presents a protocol followed in a tertiary teaching hospital of North Kerala and its prognostic value.
Aim of the Study: The aim of this study is to review the available management protocols for treatment of mastoiditis and mastoid abscess and formulate our own hospital-based guidelines and protocol.
Materials and Methods: A study was conducted on 53 patients aged between 11 and 60 years, who presented with mastoiditis or mastoid abscess. All the patients were treated according to surgical protocols available. Demographic data, history, and otoscopy findings were recorded. Patients with mastoiditis were treated with mastoidectomy. Patients with mastoiditis were treated with mastoidectomy, and the patients with mastoid abscess were treated initially with incision and drainage and after 2 weeks with mastoidectomy.. Laboratory investigations such as audiometry, culture, and sensitivity of pus from the ears were done. All the patients were followed for 6 months.
Observations and Results: A total of 53 patients were enrolled in this study. Mean age was 25.45 ± 2.35 in males and 23.76 ± 1.85 in females who presented with mastoiditis. Similarly, the mean age was 23.76 ± 1.85 and 20.46 ± 2.10 years for patients of mastoid abscess. There were 39/53 (73.58%) males and 14/53 (26.41%) females. Audiometry could be done in 32/37 (86.48%) patients with mastoiditis and 8/16 (50%) patients with mastoid abscess. These 40/56 (71.42%) patients had conductive deafness with a mean pure tone average of 32.45 dB. There were no post-operative complications reported during follow-up of 6 months.
Conclusions: A definitive management protocol is a must for every hospital to avoid delay and complications before and after surgical treatment in mastoiditis and mastoid abscess. Treatment guidelines should be followed meticulously in the diagnosis, laboratory investigations, and decision-making of definitive surgical procedure to be adopted in mastoiditis and mastoid abscess.
Key words: Chronic suppurative otitis media, Mastoid abscess, Mastoiditis, Otitis media
Access this article online
www.ijss-sn.com
Month of Submission : 02-2018 Month of Peer Review : 03-2018 Month of Acceptance : 03-2018 Month of Publishing : 04-2018
Corresponding Author: Dr. A. Siva Kumar, Department of ENT, Kannur Medical College, Anjarakandy, Kannur, Kerala. Phone: +91-9443042018. E-mail: [email protected]
Print ISSN: 2321-6379Online ISSN: 2321-595X
DOI: 10.17354/ijss/2018/134
Kumar: A Hospital-Based Treatment of Chronic Mastoiditis and Mastoid Abscess
173173 International Journal of Scientific Study | April 2018 | Vol 6 | Issue 1
Inadequate treatment of acute otitis media (AOM) may result in a clearing of the middle ear portion of the infection, with persistence of infection somewhere within the adjoining pneumatized spaces in the mastoid. This “masked mastoiditis” occurred in 15% of CSOM cases in the early antibiotic era[5] and, although uncommon, still occurs today.[6] The illness is common in resource-poor countries and those with poor socioeconomic status.[3] The effective control of AOM has reduced the number of cases of acute coalescent mastoiditis, but the incidence of chronic mastoiditis caused by cholesteatoma has not been decreased with antibiotic usage.[7] The occurrence rate of mastoiditis was found to be higher in countries with restricted antibiotic use.[8] Few cases of acute mastoiditis develop into chronic ones, whereas few cases of AOM results in CSOM. Acute mastoiditis may spread through the periosteum and induce periostitis, which may cause bone destruction (acute coalescence mastoiditis). The infection may progress through adjacent bones or through emissary veins beyond the mastoid air cells and may present as a subperiosteal abscess or an intracranial complication. Acute mastoiditis involves the formation of pus and only occurs in cellular mastoids. Chronic mastoiditis is a slow penetration of acellular bone by granulations accompanied by hyperemic decalcification of the bone. In most cases, otitis media is concurrent either acute or chronic. Some patients may present with a postauricular fistula which may be spontaneous or iatrogenic. It may persist to become a chronic fistula. With the advent of broad-spectrum antibiotics, the clinical course of middle ear disease has been altered. One result has been the occasional suppression of the presenting signs and symptoms of mastoiditis. The course may be so insidious that the first awareness of mastoiditis may be following the presentation of an intracranial complication such as meningitis, lateral sinus thrombosis, or brain abscess. Furthermore, mastoidectomy is rarely indicated for chronic mastoiditis as a treatment option, which was mandatory for included cases in the present work. There is a traditional view that chronic otitis media and chronic mastoiditis must exist in the presence of tympanic membrane perforation.[9] CSOM involves a cycle of inflammation, ulceration, granulation, and infection in the middle ear. There is conductive hearing loss and often inflammation of the mastoid cavity. Complications include hearing loss, mastoiditis, cholesteatoma, facial nerve paralysis, meningitis, brain abscess, and sigmoid sinus thrombosis.[10] Anaerobic bacteria are important pathogens in head and neck infections such as chronic otitis media, chronic sinusitis, chronic mastoiditis, head and neck abscesses, cervical adenitis, parotitis, and post-operative infection.[11]
Type of StudyThis was a cross-sectional prospective study.
Period of StudyThe study duration was from December 2016 to April 2018.
Institute of StudyThis study was conducted at Kannur Medical College, Anjarakandy, Kannur, Kerala.
MATERIALS AND METHODS
The present study was conducted on 53 patients who presented with mastoiditis or mastoid abscess to the ENT Department of a tertiary teaching hospital of Northern Kerala. The Institutional Ethical Committee clearance was obtained for the study.
Inclusion Criteria(1) Patients aged above 11 years and below 60 years were included. (2) Patients with ASOM or CSOM complicating either with mastoiditis or mastoid abscess were included. (3) Patients with discharge from the ear were included. (4) Patients not responding to antibiotics were included for surgery. (5) Patients with cholesteatoma were included in this study.
Exclusion Criteria(1) Patients below 11 years and above 60 years were excluded. (2) Patients with prior surgery on the mastoid in the form of mastoidectomy were excluded from the study. All the patients with ASOM or CSOM included in the study as per the inclusion criteria were thoroughly elicited of history, demographic data, and clinical examination including otoscopy. Examination under microscope was done to confirm the diagnosis. Radiological investigations like X-ray both mastoids, CT scan temporal bone were performed wherever required. Bacteriological examination of the pus was done. Audiological evaluation was done with the help of pure tone audiometry. For patients with acute or chronic mastoiditis, initially intravenous antibiotics, ceftriaxone 1 g twice daily was started for 1 week. Oral decongestants such as phenylpropanolamine were used in all patients. Ofloxacin ear drops were started after the admission. Patients with mastoiditis not responding to the treatment were subjected to cortical mastoidectomy or modified radical mastoidectomy depending on the intraoperative findings. Patients with mastoid abscess were subjected to incision drainage. Post-operatively, all the patients were given IV antibiotics, NSAIDs, and other supportive treatment. Post-operative evaluation was done at 1st, 3rd, and 6th month’s intervals. For patients with mastoid abscess, medical treatment protocol was the same, but the patient was subjected to incision and drainage of the abscess and mastoidectomy was undertaken only after 2 weeks interval.
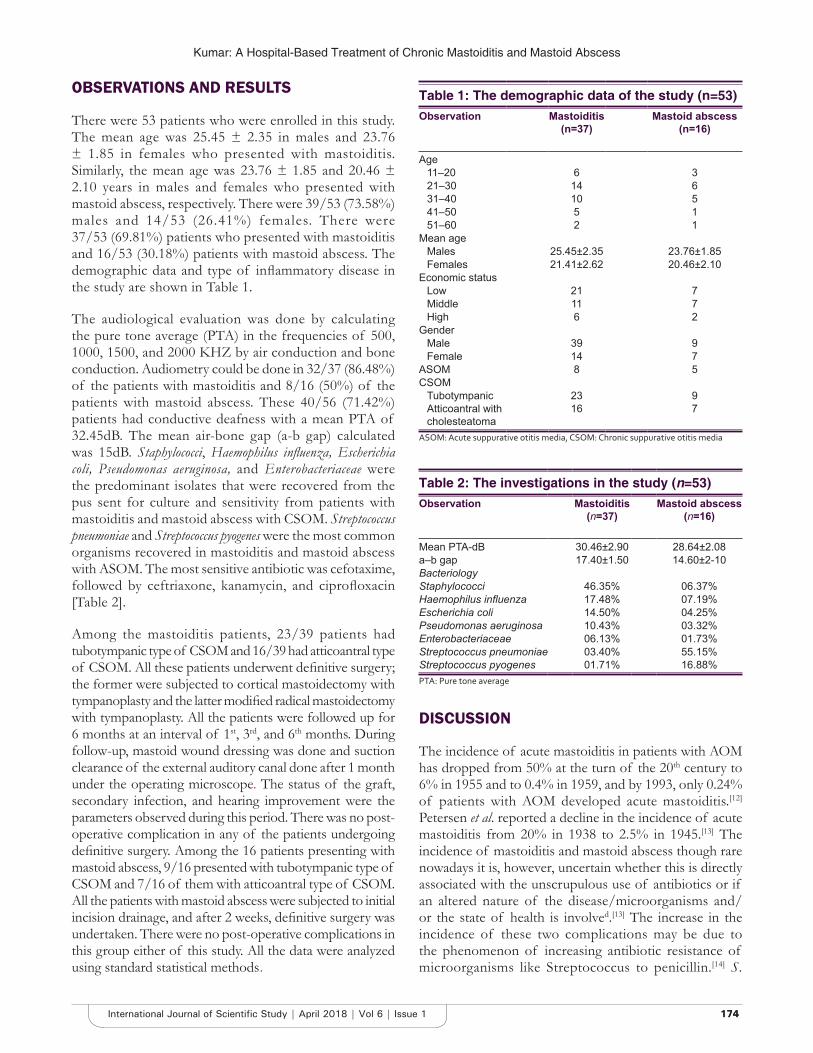
Kumar: A Hospital-Based Treatment of Chronic Mastoiditis and Mastoid Abscess
174174International Journal of Scientific Study | April 2018 | Vol 6 | Issue 1
OBSERVATIONS AND RESULTS
There were 53 patients who were enrolled in this study. The mean age was 25.45 ± 2.35 in males and 23.76 ± 1.85 in females who presented with mastoiditis. Similarly, the mean age was 23.76 ± 1.85 and 20.46 ± 2.10 years in males and females who presented with mastoid abscess, respectively. There were 39/53 (73.58%) males and 14/53 (26.41%) females. There were 37/53 (69.81%) patients who presented with mastoiditis and 16/53 (30.18%) patients with mastoid abscess. The demographic data and type of inflammatory disease in the study are shown in Table 1.
The audiological evaluation was done by calculating the pure tone average (PTA) in the frequencies of 500, 1000, 1500, and 2000 KHZ by air conduction and bone conduction. Audiometry could be done in 32/37 (86.48%) of the patients with mastoiditis and 8/16 (50%) of the patients with mastoid abscess. These 40/56 (71.42%) patients had conductive deafness with a mean PTA of 32.45dB. The mean air-bone gap (a-b gap) calculated was 15dB. Staphylococci, Haemophilus influenza, Escherichia coli, Pseudomonas aeruginosa, and Enterobacteriaceae were the predominant isolates that were recovered from the pus sent for culture and sensitivity from patients with mastoiditis and mastoid abscess with CSOM. Streptococcus pneumoniae and Streptococcus pyogenes were the most common organisms recovered in mastoiditis and mastoid abscess with ASOM. The most sensitive antibiotic was cefotaxime, followed by ceftriaxone, kanamycin, and ciprofloxacin [Table 2].
Among the mastoiditis patients, 23/39 patients had tubotympanic type of CSOM and 16/39 had atticoantral type of CSOM. All these patients underwent definitive surgery; the former were subjected to cortical mastoidectomy with tympanoplasty and the latter modified radical mastoidectomy with tympanoplasty. All the patients were followed up for 6 months at an interval of 1st, 3rd, and 6th months. During follow-up, mastoid wound dressing was done and suction clearance of the external auditory canal done after 1 month under the operating microscope. The status of the graft, secondary infection, and hearing improvement were the parameters observed during this period. There was no post-operative complication in any of the patients undergoing definitive surgery. Among the 16 patients presenting with mastoid abscess, 9/16 presented with tubotympanic type of CSOM and 7/16 of them with atticoantral type of CSOM. All the patients with mastoid abscess were subjected to initial incision drainage, and after 2 weeks, definitive surgery was undertaken. There were no post-operative complications in this group either of this study. All the data were analyzed using standard statistical methods .
DISCUSSION
The incidence of acute mastoiditis in patients with AOM has dropped from 50% at the turn of the 20th century to 6% in 1955 and to 0.4% in 1959, and by 1993, only 0.24% of patients with AOM developed acute mastoiditis.[12] Petersen et al. reported a decline in the incidence of acute mastoiditis from 20% in 1938 to 2.5% in 1945.[13] The incidence of mastoiditis and mastoid abscess though rare nowadays it is, however, uncertain whether this is directly associated with the unscrupulous use of antibiotics or if an altered nature of the disease/microorganisms and/or the state of health is involved.[13] The increase in the incidence of these two complications may be due to the phenomenon of increasing antibiotic resistance of microorganisms like Streptococcus to penicillin.[14] S.
Table 1: The demographic data of the study (n=53)Observation Mastoiditis
(n=37)Mastoid abscess
(n=16)
Age11–20 6 321–30 14 631–40 10 541–50 5 151–60 2 1
Mean ageMales 25.45±2.35 23.76±1.85Females 21.41±2.62 20.46±2.10
Economic statusLow 21 7Middle 11 7High 6 2
GenderMale 39 9Female 14 7
ASOM 8 5CSOM
Tubotympanic 23 9Atticoantral with cholesteatoma
16 7
ASOM: Acute suppurative otitis media, CSOM: Chronic suppurative otitis media
Table 2: The investigations in the study (n=53)Observation Mastoiditis
(n=37)Mastoid abscess
(n=16)
Mean PTA-dB 30.46±2.90 28.64±2.08a–b gap 17.40±1.50 14.60±2-10BacteriologyStaphylococci 46.35% 06.37%Haemophilus influenza 17.48% 07.19%Escherichia coli 14.50% 04.25%Pseudomonas aeruginosa 10.43% 03.32%Enterobacteriaceae 06.13% 01.73%Streptococcus pneumoniae 03.40% 55.15%Streptococcus pyogenes 01.71% 16.88%PTA: Pure tone average
Kumar: A Hospital-Based Treatment of Chronic Mastoiditis and Mastoid Abscess
175175 International Journal of Scientific Study | April 2018 | Vol 6 | Issue 1
pneumoniae, S. pyogenes, Staphylococcus aureus, and H. influenza are the most common organisms recovered in acute mastoiditis. P. aeruginosa, Enterobacteriaceae, and S. aureus are the predominant isolates that have been recovered from chronically inflamed mastoids.[15] In the present study, the incidence of organism such as Staphylococci, H. influenza, E. coli, P. aeruginosa, Enterobacteriaceae, S. pneumoniae, and S. pyogenes in the pus for culture sensitivity test in the patients with mastoiditis was 46.35%, 17.48%, 14.50%, 10.43%, 6.13%, 03.40%, and 01.71%, respectively [Table 2]. In this study, all cases with mastoid abscess required some sort of surgical intervention, either by incision and drainage or by definitive surgery (cortical or radical mastoidectomy). Tarantino et al.[14] stressed the need for surgical drainage of a subperiosteal abscess to prevent the spread of suppuration to vital areas. Reported mastoidectomy rates in clinical studies have shown large variations, ranging from 12% to 98%.[7] The large variability suggests that the decision for or against mastoidectomy is not only a question of preferred conservative treatment or immediate surgical intervention but also to a large extent based on subjective surgical criteria.[16] Mastoidectomy (cortical or modified radical Mastoidectomy) is an effective surgical treatment for mastoiditis associated with one of the followings: Subperiosteal abscess or exteriorization, cholesteatoma, intracranial complications, and otorrhea persisting for more than 2 weeks despite adequate antibiotic treatment or in children. No detectable recurrence of mastoiditis or mastoid abscess or any complication was recorded during follow-up of 6 months in this study. In this study, all patients with mastoid abscess were managed by incision and drainage.
CONCLUSIONS
A definitive management protocol is a must for every hospital to avoid delay and complications before and after
surgical treatment in mastoiditis and mastoid abscess. Treatment guidelines should be followed meticulously in the diagnosis, laboratory investigations, and decision-making of definitive surgical procedure to be adopted in mastoiditis and mastoid abscess.
REFERENCES
1. Glynn F, Osman L, Colreavy M, Rowley H, Dwyer TP, Blayney A. Acute mastoiditis in children: Presentation and long term consequences. J Laryngol Otol 2008;122:233-7.
2. Brook I, Burke P. The management of acute, serous and chronic otitis media: The role of anaerobic bacteria. J Hosp Infect 1992;22 Suppl. A:75-87.
3. Acuin J. Chronic suppurative otitis media. BMJ Clin Evid 2007;2007:pii: 0507.
4. Myer CM 3rd. The diagnosis and management of mastoiditis in children. Pediatr Ann 1991;20:622-6.
5. Smeraldi R. Atypical mastoiditis from a clinical diagnostic point of view. Gazz Sanit 1947;18:58.
6. Yorgancılar E, Yildirim M, Gun R, Bakir S, Tekin R, Gocmez C, et al. Complications of chronic suppurative otitis media: A retrospective review. Eur Arch Otorhinolaryngol 2013;270:69-76.
7. Parisier SC. Management of cholesteatoma. Otolaryngol Clin North Am 1989;22:927-40.
8. Van Zuijlen DA, Schilder AG, Van Balen FA, Hoes AW. National differences in incidence of acute mastoiditis: Relationship to prescribing patterns of antibiotics for acute otitis media? Pediatr Infect Dis J 2001;20:140-4.
9. Paparella MM, Shea D, Meyerhoff WL, Goycoolea MV. Silent otitis media. Laryngoscope 1980;90:1089-98.
10. Benson J, Mwanri L. Chronic suppurative otitis media and cholesteatoma in Australia’s refugee population. Aust Fam Physician 2012;41:978-80.
11. Brook I. Diagnosis and management of anaerobic infections of the head and neck. Ann Otol Rhinol Laryngol Suppl 1992;155:9-15.
12. Dudkiewicz M, Livni G, Kornreich L, Nageris B, Ulanovski D, Raveh E. Acute mastoiditis and osteomyelitis of the temporal bone. Int J Pediatr Otorhinolaryngol 2005;69:1399-405.
13. Petersen CG, Ovesen T, Pedersen CB. Acute mastoidectomy in a Danish county from 1977 to 1996 with focus on the bacteriology. Int J Pediatr Otorhinolaryngol 1998;45:21-9.
14. Tarantino V, D’Agostino R, Taborelli G, Melagrana A, Porcu A, Stura M. Acute Mastoiditis: A 10 year retrospective study. Int J Pediatr Otorhinolaryngol 2002;66:143-8.
15. Brook I. The role of anaerobic bacteria in acute and chronic mastoiditis. Anaerobe 2005;11:252-7.
16. Khafif A, Halperin D, Hochman I, Poria I, Shindel D, Marshak G. Acute mastoiditis: A 10-year review. Am J Otolaryngol 1998;19:170-3.
How to cite this article: Kumar AS. A Clinical Study on the Management of Chronic Mastoiditis and Mastoid Abscess - A Hospital-based Study. Int J Sci Stud 2018;6(1):172-175.
Source of Support: Nil, Conflict of Interest: None declared.
176176International Journal of Scientific Study | April 2018 | Vol 6 | Issue 1
A Clinico-pharmacological Study on Effect of Methylprednisolone in Acute Respiratory Distress Syndrome PatientsIftekhar Ahmed Nazeer1, Sabir Cholas2
1Associate Professor, Department of Pharmacology, Kannur Medical College, Kannur, Kerala, India, 2Associate Professor, Department of TB and Chest Diseases, Kannur Medical College, Kannur, Kerala, India
clinical problem in respiratory medicine.[1] International multicenter studies quote that ARDS is underdiagnosed and requires potential for improvement in its management. Predisposing factors such as exposure to high ozone levels and low Vitamin D plasma concentrations were found to be predisposing circumstances. Not only curative but also preventive strategies remain a major challenge since the two trials on aspirin and statins failed to reduce the incidence in at-risk patients.[1] The 1st week of treatment of ARDS with mechanical ventilation determines its pathophysiologic progression and its late phase effect on inflammation and disease outcome.[2] Use of the lung
INTRODUCTION
Since its first description, the acute respiratory distress syndrome (ARDS) has been acknowledged to be a major
Original Article
AbstractBackground: Acute respiratory distress syndrome (ARDS) is as an acute condition characterized by bilateral pulmonary infiltrates and severe hypoxemia in the absence of evidence for cardiogenic pulmonary edema. The diagnosis is based on the ratio of the partial pressure of oxygen in the patient’s arterial blood (PaO2) to the fraction of oxygen in the inspired air (FiO2); therefore, ARDS was defined by a PaO2/FiO2 ratio of <200, and in acute lung injury, it was <300. Late phase ARDS results due to inflammation and corticosteroids are considered as rescue therapy to improve oxygenation and hemodynamics in patients.
Aim of the Study: The aim of this study is to evaluate the effect of methylprednisolone in early ARDS in regard to outcome, incidence of infection, organ dysfunction, D-dimer, C-reactive protein (CRP), protein C, and protein S.
Materials and Methods: A total of 49 adult patients with ARDS were included. Group A patients (24) were administered methylprednisolone, and Group B patients (25) did not receive methylprednisolone. All the patients were diagnosed based on American-European Consensus Conference (AECC), Berlin and Kigali criteria for ARDS. History taking, clinical examination, radiological tests, blood investigations (CBC–LFT–RFT–electrolytes), arterial blood gase (ABG), serum lactate, international normalized ratio, fibrinogen, and aPTT, CRP, protein C, protein S, and D-dimer were undertaken before and after treatment with methylprednisolone.
Observations and Results: There were 49 patients with ARDS included in the study. The study group consisted of 24 (48.97%) patients, and the control group was 25 (51.02%) patients. 15 were males (62.32%) and 9 (37.50%) females in the study group. 16 were males (64%) and 9 females (36%) in the control group. The mean age in the study group was 44.12 ± 10.75, and the mean in the control group was 48.5 ± 11.26. Hospital-acquired Pneumonia (HAP), trauma, and community-acquired pneumonia (CAP) as the cause of ARDS were observed in 21.16%, 37.05%, and 33.33%, respectively, in the study group. The incidence of HAP, ,trauma and CAP was 32%, 32%, and 36%, respectively, in the control group.
Conclusions: Including methylprednisolone in addition to regular ventilator support and treatment protocol of ARDS patients, when used on first 7 days, improves the LIS, decreases the systemic inflammation, allows earlier extubation from mechanical ventilation, and decreases the incidence of hospital-acquired infection.
Key words: Acute lung injury, Acute respiratory distress syndrome, Hypoxia, Methylprednisolone, Oxygen saturation
Access this article online
www.ijss-sn.com
Month of Submission : 02-2018 Month of Peer Review : 03-2018 Month of Acceptance : 03-2018 Month of Publishing : 04-2018
Corresponding Author: Dr. Sabir Cholas, Department of TB and Chest Diseases, Kannur Medical College, Anjarakandy, Kannur - 670 612, Kerala, India. Phone: 9946725515. E-mail: [email protected]
Print ISSN: 2321-6379Online ISSN: 2321-595X
DOI: 10.17354/ijss/2018/135
Nazeer and Cholas: Methylprednisolone in ARDS patients
177177 International Journal of Scientific Study | April 2018 | Vol 6 | Issue 1
injury score (LIS) quantifying the physiologic respiratory impairment calculated by a 4-point score based on the levels of positive end-expiratory pressure (PEEP), ratios of PaO2 to fraction of inspired oxygen (FIO2), the static lung compliance, and the degree of infiltration present on chest radiograph helps in decision making of treatment.[3] In patients in whom these LIS do not improve by the end of the 1st week and have persistent elevation in circulating levels of inflammatory cytokines and chemokines, markers of alveolocapillary membrane permeability[4] and fibrogenesis (dysregulated systemic inflammation)[2] also have a higher mortality.[5]
Glucocorticoids used in the 1st week of the treatment of ARDS help in downregulating the systemic inflammation which is associated with a significant clinical and oxygenation improvement with a reduced duration of mechanical ventilation and ICU length of stay.[6] Methylprednisolone was used in high doses during the 1st week of ARDS in many trials of patients with persistent pulmonary infiltrates, fever, and high oxygen requirement despite resolution of pulmonary or extrapulmonary infection. Pulmonary infection is usually assessed with bronchoscopy and bilateral bronchoalveolar lavage (BAL) and quantitative culture.[7] The present study was conducted with an aim to evaluate the effect of methylprednisolone when used in ARDS patients in regard to outcome, incidence of infection, organ dysfunction, D-dimer, C-reactive protein (CRP), protein C, and protein S.
Period of StudyThe study duration was from August 2013 to July 2015.
Institution of StudyThe study was conducted at Kannur Medical College, Anjarakandy, Kannur, Kerala.
Type of StudyThis was a prospective, cross-sectional, and comparative study.
MATERILAS AND METHODS
A total of 49 adult patients with ARDS were included. Group A patients (24) were administered methylprednisolone and group B patients (25) did not receive methylprednisolone. All the patients were diagnosed based on the AECC, Berlin and Kigali criteria for acute respiratory distress syndrome (ARDS).[8] History taking, clinical examination, radiological tests, blood investigations (CBC–LFT–RFT–electrolytes), ABG, serum lactate, international normalized ratio, fibrinogen, and aPTT, CRP, protein C, protein S, and D-dimer were undertaken before and after treatment with methylprednisolone.
Inclusion Criteria(1) Patients with ARDS criteria of AECC, (2) patients who are on ventilator, (3) patients in whom methylprednisolone was started within 48 h, and (4) patients aged above 18 years were included in this study.
Exclusion Criteria(1) Patients with PaO2/FIO2 ratio more than 200 and (2) patients who were not on ventilators were excluded from the study. Once the diagnosis is established, IV methylprednisolone was given as loading dose 1 mg/kg body weight followed by 1 mg/kg/day from day 2 to day 14. The steroid was mixed in 240 mL of normal saline solution, and the rate of infusion was adjusted to 10mL/h. Methylprednisolone was given from day 15th to 21st 0.5 mg/kg/day and from day 22nd to 25th 0.25 mg/kg/day and from day 26th to 28th the dose was reduced to 0.125 mg/kg/day. In addition to ventilator support measures, patients in this study received low-molecular-weight heparin (40 mg of enoxaparin or 5,000 units of dalteparin subcutaneously per day) or low-dose, unfractionated heparin (5000 units subcutaneously twice daily) to prevent venous thromboembolism. In the absence of contraindication, ARDS patients received stress ulcer prophylaxis with an agent such as sucralfate 1 g (orally or through nasogastric tube 4 times daily), ranitidine (orally or through nasogastric tube twice daily, 50 mg intravenously every 6–8 h, or a 6.25 mg/h continuous intravenous infusion), or omeprazole (orally, intravenously, or through nasogastric tube daily). Patients also received nutritional support (enteral) within 24–48 h of admission to the ICU. From the day of admission to the Intensive Care Unit till the discharge, all the parameters were observed and the data collected were analyzed using standard statistical methods.
OBSERVATIONS AND RESULTS
This was a prospective, cross-sectional comparative study conducted in a tertiary teaching hospital of Northern Kerala. 49 patients admitted in ICU diagnosed as ARDS based on the basis of AECC criteria, and laboratory investigations were included in the study. They were divided into two groups depending on the administration of IV methylprednisolone as mentioned in the materials and methods. The study group consisted of 24 (48.97%) patients and the control group was 25 (51.02%) patients. There were 15 males (62.32%) and 9 (37.50%) females in study group and 16 males (64%) and 9 females (36%) in the control group. The mean age in the study group was 44.12 ± 10.75, and the mean in the control group was 48.5 ± 11.26. Hospital-acquired pneumonia (HAP), trauma, and community-acquired pneumonia (CAP) as the cause of ARDS were observed in 21.16%, 37.05%, and 33.33%, respectively, in the study group. The incidence of HAP, trauma, and CAP was 32%, 32%, and 36%, respectively,
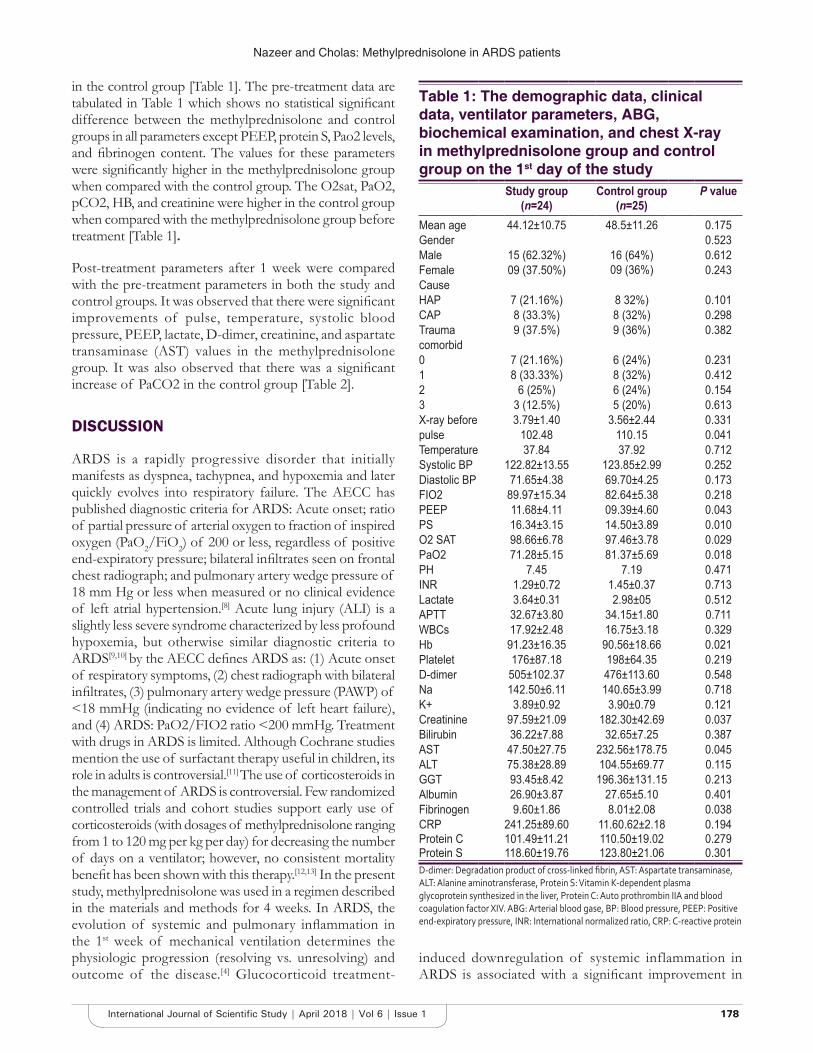
Nazeer and Cholas: Methylprednisolone in ARDS patients
178178International Journal of Scientific Study | April 2018 | Vol 6 | Issue 1
in the control group [Table 1]. The pre-treatment data are tabulated in Table 1 which shows no statistical significant difference between the methylprednisolone and control groups in all parameters except PEEP, protein S, Pao2 levels, and fibrinogen content. The values for these parameters were significantly higher in the methylprednisolone group when compared with the control group. The O2sat, PaO2, pCO2, HB, and creatinine were higher in the control group when compared with the methylprednisolone group before treatment [Table 1].
Post-treatment parameters after 1 week were compared with the pre-treatment parameters in both the study and control groups. It was observed that there were significant improvements of pulse, temperature, systolic blood pressure, PEEP, lactate, D-dimer, creatinine, and aspartate transaminase (AST) values in the methylprednisolone group. It was also observed that there was a significant increase of PaCO2 in the control group [Table 2].
DISCUSSION
ARDS is a rapidly progressive disorder that initially manifests as dyspnea, tachypnea, and hypoxemia and later quickly evolves into respiratory failure. The AECC has published diagnostic criteria for ARDS: Acute onset; ratio of partial pressure of arterial oxygen to fraction of inspired oxygen (PaO2/FiO2) of 200 or less, regardless of positive end-expiratory pressure; bilateral infiltrates seen on frontal chest radiograph; and pulmonary artery wedge pressure of 18 mm Hg or less when measured or no clinical evidence of left atrial hypertension.[8] Acute lung injury (ALI) is a slightly less severe syndrome characterized by less profound hypoxemia, but otherwise similar diagnostic criteria to ARDS[9,10] by the AECC defines ARDS as: (1) Acute onset of respiratory symptoms, (2) chest radiograph with bilateral infiltrates, (3) pulmonary artery wedge pressure (PAWP) of <18 mmHg (indicating no evidence of left heart failure), and (4) ARDS: PaO2/FIO2 ratio <200 mmHg. Treatment with drugs in ARDS is limited. Although Cochrane studies mention the use of surfactant therapy useful in children, its role in adults is controversial.[11] The use of corticosteroids in the management of ARDS is controversial. Few randomized controlled trials and cohort studies support early use of corticosteroids (with dosages of methylprednisolone ranging from 1 to 120 mg per kg per day) for decreasing the number of days on a ventilator; however, no consistent mortality benefit has been shown with this therapy.[12,13] In the present study, methylprednisolone was used in a regimen described in the materials and methods for 4 weeks. In ARDS, the evolution of systemic and pulmonary inflammation in the 1st week of mechanical ventilation determines the physiologic progression (resolving vs. unresolving) and outcome of the disease.[4] Glucocorticoid treatment-
Table 1: The demographic data, clinical data, ventilator parameters, ABG, biochemical examination, and chest X-ray in methylprednisolone group and control group on the 1st day of the study
Study group(n=24)
Control group(n=25)
P value
Mean age 44.12±10.75 48.5±11.26 0.175Gender 0.523Male 15 (62.32%) 16 (64%) 0.612Female 09 (37.50%) 09 (36%) 0.243CauseHAP 7 (21.16%) 8 32%) 0.101CAP 8 (33.3%) 8 (32%) 0.298Trauma 9 (37.5%) 9 (36%) 0.382comorbid0 7 (21.16%) 6 (24%) 0.2311 8 (33.33%) 8 (32%) 0.4122 6 (25%) 6 (24%) 0.1543 3 (12.5%) 5 (20%) 0.613X-ray before 3.79±1.40 3.56±2.44 0.331pulse 102.48 110.15 0.041Temperature 37.84 37.92 0.712Systolic BP 122.82±13.55 123.85±2.99 0.252Diastolic BP 71.65±4.38 69.70±4.25 0.173FIO2 89.97±15.34 82.64±5.38 0.218PEEP 11.68±4.11 09.39±4.60 0.043PS 16.34±3.15 14.50±3.89 0.010O2 SAT 98.66±6.78 97.46±3.78 0.029PaO2 71.28±5.15 81.37±5.69 0.018PH 7.45 7.19 0.471INR 1.29±0.72 1.45±0.37 0.713Lactate 3.64±0.31 2.98±05 0.512APTT 32.67±3.80 34.15±1.80 0.711WBCs 17.92±2.48 16.75±3.18 0.329Hb 91.23±16.35 90.56±18.66 0.021Platelet 176±87.18 198±64.35 0.219D-dimer 505±102.37 476±113.60 0.548Na 142.50±6.11 140.65±3.99 0.718K+ 3.89±0.92 3.90±0.79 0.121Creatinine 97.59±21.09 182.30±42.69 0.037Bilirubin 36.22±7.88 32.65±7.25 0.387AST 47.50±27.75 232.56±178.75 0.045ALT 75.38±28.89 104.55±69.77 0.115GGT 93.45±8.42 196.36±131.15 0.213Albumin 26.90±3.87 27.65±5.10 0.401Fibrinogen 9.60±1.86 8.01±2.08 0.038CRP 241.25±89.60 11.60.62±2.18 0.194Protein C 101.49±11.21 110.50±19.02 0.279Protein S 118.60±19.76 123.80±21.06 0.301D‑dimer: Degradation product of cross‑linked fibrin, AST: Aspartate transaminase, ALT: Alanine aminotransferase, Protein S: Vitamin K‑dependent plasma glycoprotein synthesized in the liver, Protein C: Auto prothrombin IIA and blood coagulation factor XIV. ABG: Arterial blood gase, BP: Blood pressure, PEEP: Positive end‑expiratory pressure, INR: International normalized ratio, CRP: C‑reactive protein
induced downregulation of systemic inflammation in ARDS is associated with a significant improvement in
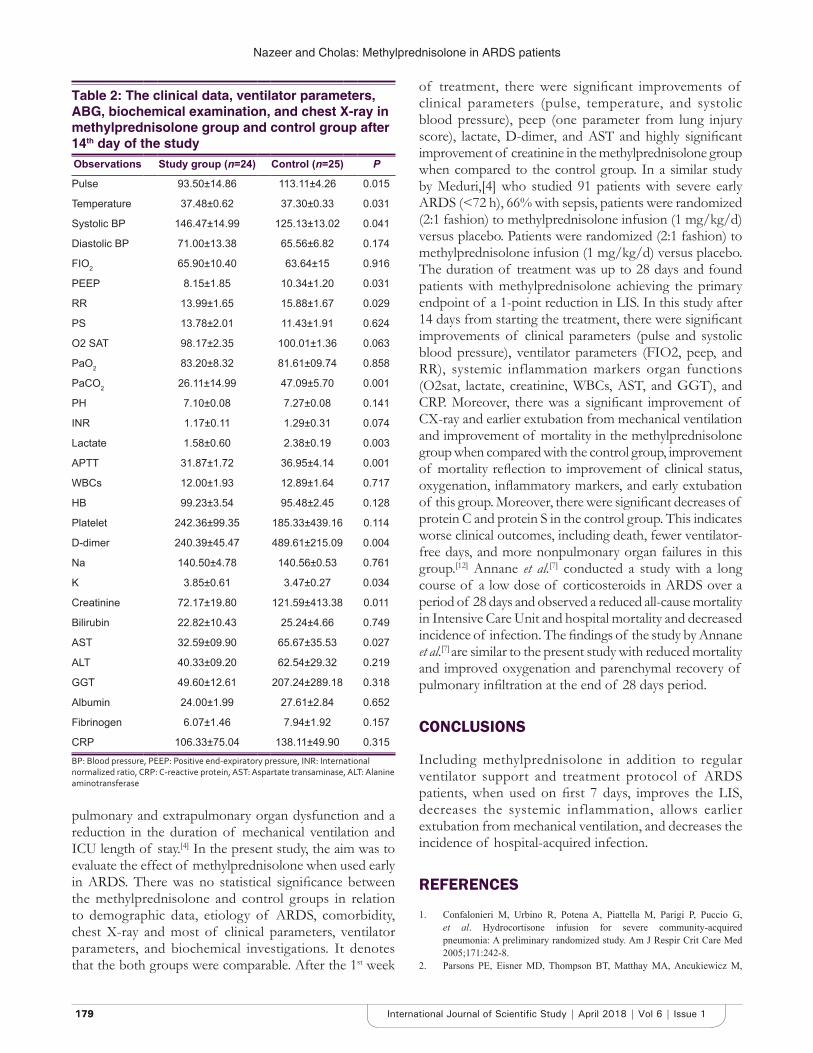
Nazeer and Cholas: Methylprednisolone in ARDS patients
179179 International Journal of Scientific Study | April 2018 | Vol 6 | Issue 1
pulmonary and extrapulmonary organ dysfunction and a reduction in the duration of mechanical ventilation and ICU length of stay.[4] In the present study, the aim was to evaluate the effect of methylprednisolone when used early in ARDS. There was no statistical significance between the methylprednisolone and control groups in relation to demographic data, etiology of ARDS, comorbidity, chest X-ray and most of clinical parameters, ventilator parameters, and biochemical investigations. It denotes that the both groups were comparable. After the 1st week
Table 2: The clinical data, ventilator parameters, ABG, biochemical examination, and chest X-ray in methylprednisolone group and control group after 14th day of the studyObservations Study group (n=24) Control (n=25) P
Pulse 93.50±14.86 113.11±4.26 0.015
Temperature 37.48±0.62 37.30±0.33 0.031
Systolic BP 146.47±14.99 125.13±13.02 0.041
Diastolic BP 71.00±13.38 65.56±6.82 0.174
FIO2 65.90±10.40 63.64±15 0.916
PEEP 8.15±1.85 10.34±1.20 0.031
RR 13.99±1.65 15.88±1.67 0.029
PS 13.78±2.01 11.43±1.91 0.624
O2 SAT 98.17±2.35 100.01±1.36 0.063
PaO2 83.20±8.32 81.61±09.74 0.858
PaCO2 26.11±14.99 47.09±5.70 0.001
PH 7.10±0.08 7.27±0.08 0.141
INR 1.17±0.11 1.29±0.31 0.074
Lactate 1.58±0.60 2.38±0.19 0.003
APTT 31.87±1.72 36.95±4.14 0.001
WBCs 12.00±1.93 12.89±1.64 0.717
HB 99.23±3.54 95.48±2.45 0.128
Platelet 242.36±99.35 185.33±439.16 0.114
D-dimer 240.39±45.47 489.61±215.09 0.004
Na 140.50±4.78 140.56±0.53 0.761
K 3.85±0.61 3.47±0.27 0.034
Creatinine 72.17±19.80 121.59±413.38 0.011
Bilirubin 22.82±10.43 25.24±4.66 0.749
AST 32.59±09.90 65.67±35.53 0.027
ALT 40.33±09.20 62.54±29.32 0.219
GGT 49.60±12.61 207.24±289.18 0.318
Albumin 24.00±1.99 27.61±2.84 0.652
Fibrinogen 6.07±1.46 7.94±1.92 0.157
CRP 106.33±75.04 138.11±49.90 0.315BP: Blood pressure, PEEP: Positive end‑expiratory pressure, INR: International normalized ratio, CRP: C‑reactive protein, AST: Aspartate transaminase, ALT: Alanine aminotransferase
of treatment, there were significant improvements of clinical parameters (pulse, temperature, and systolic blood pressure), peep (one parameter from lung injury score), lactate, D-dimer, and AST and highly significant improvement of creatinine in the methylprednisolone group when compared to the control group. In a similar study by Meduri,[4] who studied 91 patients with severe early ARDS (<72 h), 66% with sepsis, patients were randomized (2:1 fashion) to methylprednisolone infusion (1 mg/kg/d) versus placebo. Patients were randomized (2:1 fashion) to methylprednisolone infusion (1 mg/kg/d) versus placebo. The duration of treatment was up to 28 days and found patients with methylprednisolone achieving the primary endpoint of a 1-point reduction in LIS. In this study after 14 days from starting the treatment, there were significant improvements of clinical parameters (pulse and systolic blood pressure), ventilator parameters (FIO2, peep, and RR), systemic inflammation markers organ functions (O2sat, lactate, creatinine, WBCs, AST, and GGT), and CRP. Moreover, there was a significant improvement of CX-ray and earlier extubation from mechanical ventilation and improvement of mortality in the methylprednisolone group when compared with the control group, improvement of mortality reflection to improvement of clinical status, oxygenation, inflammatory markers, and early extubation of this group. Moreover, there were significant decreases of protein C and protein S in the control group. This indicates worse clinical outcomes, including death, fewer ventilator-free days, and more nonpulmonary organ failures in this group.[12] Annane et al.[7] conducted a study with a long course of a low dose of corticosteroids in ARDS over a period of 28 days and observed a reduced all-cause mortality in Intensive Care Unit and hospital mortality and decreased incidence of infection. The findings of the study by Annane et al.[7] are similar to the present study with reduced mortality and improved oxygenation and parenchymal recovery of pulmonary infiltration at the end of 28 days period.
CONCLUSIONS
Including methylprednisolone in addition to regular ventilator support and treatment protocol of ARDS patients, when used on first 7 days, improves the LIS, decreases the systemic inflammation, allows earlier extubation from mechanical ventilation, and decreases the incidence of hospital-acquired infection.
REFERENCES
1. Confalonieri M, Urbino R, Potena A, Piattella M, Parigi P, Puccio G, et al. Hydrocortisone infusion for severe community-acquired pneumonia: A preliminary randomized study. Am J Respir Crit Care Med 2005;171:242-8.
2. Parsons PE, Eisner MD, Thompson BT, Matthay MA, Ancukiewicz M,
Nazeer and Cholas: Methylprednisolone in ARDS patients
180180International Journal of Scientific Study | April 2018 | Vol 6 | Issue 1
How to cite this article: Nazeer IA, Cholas S. A Clinico-Pharmacological Study on Effect of Methylprednisolone in Acute Respiratory Distress Syndrome Patients. J Sci Stud 2018;6(1): 176-180.
Source of Support: Nil, Conflict of Interest: None declared.
Bernard GR, et al. Lower tidal volume ventilation and plasma cytokine markers of inflammation in patients with acute lung injury. Crit Care Med 2005;33:1-6.
3. Murray JF, Matthay MA, Luce JM. An expanded definition of the adult respiratory distress syndrome. Am Rev Respir Dis 1998;138:720-3.
4. Meduri GU. Host defense response and outcome in ARDS. Chest 1997;112:1154-8.
5. Bone RC, Maunder R, Slotman G, Silverman H, Hyers TM, Kerstein MD, et al. An early test of survival in patients with the adult respiratory distress syndrome: The PaO2/FIO2 ratio and its differential response to conventional therapy: Prostaglandin E1 Study Group. Chest 1989;96:849-51.
6. Meduri GU, Golden E, Freire AX, Taylor E, Zaman M, Carson SJ, et al. Methyl prednisolone infusion in early severe ARDS: Results of a randomized controlled trial. Chest 2007;131:954-63.
7. Annane D, Bellissant E, Bollaert PE, Briegel J, Keh D, Kupfer Y.
Corticosteroids for severe sepsis and septic shock: A systematic review and meta-analysis. BMJ 2004;329:480.
8. Confalonieri M, Salton F, Fabiano F. Acute respiratory distress syndrome. Euro Respir Rev 2017;26:160116.
9. Bernard GR, Artigas A, Brigham KL, Carlet J, Falke K, Hudson L, et al. The American-European Consensus Conference on ARDS. Definitions, mechanisms, relevant outcomes, and clinical trial coordination. Am J Respir Crit Care Med 1994;149:818-24.
10. Zimmerman JJ, Akhtar SR, Caldwell E, Rubenfeld GD. Incidence and outcomes of pediatric acute lung injury. Pediatrics 2009;124:87-95.
11. Adhikari N, Burns KE, Meade MO. Pharmacologic therapies for adults with acute lung injury and acute respiratory distress syndrome. Cochrane Database Syst Rev 2004;4:CD004477.
12. Ware LB, Fang X, Matthay MA. Protein C and thrombomodulin in human acute lung injury. Am J Physiol Lung Cell Mol Physiol 2003;285:L514-21.
183183 International Journal of Scientific Study | April 2018 | Vol 6 | Issue 1
Cone-beam Computed Tomography - A Boon in Periodontology: A ReviewPrachi Thakkar1, Shilpi Shah1, Tejal Sheth1, Dhwanit Thakore2, Mihir Shah3
1Resident Student, Department of Periodontology, Ahmedabad Dental College and Hospital, Ahmedabad, Gujarat, India, 2Professor, Department of Periodontology, Ahmedabad Dental College and Hospital, Ahmedabad, Gujarat, India, 3Dean and HOD, Department of Periodontology, Ahmedabad Dental College and Hospital, Ahmedabad, Gujarat, India
AbstractDiagnosis of periodontal disease is firstly based on clinical signs and symptoms, however, when bone destruction is involved, radiographic examination is the most conclusive diagnostic method. Conventional radiographs including intraoral and panoramic imaging are used very frequently for this purpose. Cone-beam computed tomography (CBCT) is a new era in the field of oral radiology making the innovation provide high-quality, thin-slice accurate imaging. CBCT comes to complete help in providing new data to diagnose periodontal lesions. It is an imaging modality which would give an undistorted three-dimensional (3D) vision of a tooth and surrounding structures which is essential to improve the diagnostic potential. It has got the advantage of less exposure of radiation to the patient and reduced scan time. In the field of periodontology, it best enables the clinician to evaluate the crestal alveolar bone architecture and helps in treatment planning for implant placement, hence providing 3D images that facilitate the transition of dental imaging from initial diagnosis to image guidance throughout the treatment phase along with guided implant placement.
Key words: Cone-beam computed tomography, Periodontology, Three-dimensional imaging
bone loss and errors in identifying reliable anatomical reference points. 3D diagnostic imaging of the jaws has been of interest from the introduction of computerized tomography (CT) as a clinical tool. However, due to the factors such as high cost and high radiation dosage, use of this technology in dentistry has been limited.[1]
Cone-beam CT (CBCT) is a relatively new imaging modality and with the introduction of dedicated dentomaxillofacial CBCT scanners in the late 1990s, there has been an explosion of interest in these devices in the field dentistry. It has the obvious advantage of relatively low cost and low-dose.[1]
CBCT provides rapid volumetric image acquisition taken at different points in time that are similar in geometry and contrast, making it possible to evaluate differences occurring in the fourth dimension. In its various dental applications, images of jaws and teeth can be visualized accurately with excellent resolution, can be restructured three-dimensionally, and can be viewed from any angle. Most significantly, the patient radiation dose is 5 times lower than normal CT. Today, CBCT scanning has become a valuable imaging modality in periodontology as well as implantology. For the detection of smallest osseous defects,
INTRODUCTION
Periodontal disease is a chronic bacterial infection that affects the gingiva and bone supporting the teeth. Treatment of patients with advanced periodontal diseases requires not only extensive clinical recording but also radiological examination. Radiography provides key information on the amount and type of damage to the alveolar bone. The current diagnostic approaches including clinical probing and intraoral radiography have shown several limitations in their reliability.[1]
Intraoral radiography is the most commonly used imaging technique for the diagnosis of periodontal bone defects. However, intraoral radiography provides only a two-dimensional (2D) view of three-dimensional (3D) structures which can lead to underestimation of
Online ISSN: 2349-6940DOI: 10.17354/cr/2017/136
Corresponding Author: Dr. Prachi Thakkar, 8, Purshottam Bunglows, B/H Gurudwara, Opp the Grand Bhagwati Hotel, Thaltej, Ahmedabad - 380 059, Gujarat, India. E-mail: [email protected]
Review Article
Access this article online
www.ijss-sn.com
Month of Submission : 03-2018 Month of Peer Review : 04-2018 Month of Acceptance : 05-2018 Month of Publishing : 05-2018
Thakkar, et al.: Cone-beam Computed Tomography
184184International Journal of Scientific Study | April 2018 | Vol 6 | Issue 1
CBCT can display the image in all its three dimensions by removing the disturbing anatomical structures and making it possible to evaluate each root and surrounding bone. In implant treatment, appropriate site or size can be chosen before placement, and osseointegration can be studied over a period of time.[2]
PRINCIPLES AND IMAGE PROCESSING OF CBCT
CBCT uses a single, relatively inexpensive, flat-panel, or image intensifier radiation detector. CBCT imaging is performed using a rotating platform to which the X-ray source and detector are fixed. As the X-ray source and detector rotates around the object, it produces multiple, sequential, and planar images that are mathematically reconstructed into a volumetric dataset. A single rotational sequence would capture enough data for volumetric image construction. The entire scanning of the target region is performed in a single rotation thereby significantly reducing the radiation exposure. Further, the exposure is reduced by 50% (0.0037 mGy) if a 180° scan is performed instead of 360°. In comparison, the radiation exposure in a digital panoramic radiograph is around 0.0063 mGy and around 0.0012 mGy in a periapical radiograph. It has been reported that for an intraoral status of the entire dentition an effective dose ranging from 33 to 84 Sv is required.[1]
CBCT Image ProductionCBCT machines scan patients in the following three possible positions: Sitting, standing, or supine. Despite patient orientation within the equipment, the principles of image production remain the same. The four components of CBCT image production are as follows.
Acquisition ConfigurationContinuous or pulsed X-ray beam and charged couple device detectors moving synchronously around the fixed fulcrum within the patient’s head.
Image DetectionIt is determined by individual volume elements or voxels produced from the volumetric data set. CBCT units provide voxel resolutions that are isotropic (equal in all three dimensions).
Image ReconstructionThe processing of acquired projection frames to the volumetric dataset is done on the personal computer which is called as reconstruction.
Image DisplayThe compilation of all available voxels is presented
to the clinician on the computer screen as secondary reconstructed images in three orthogonal planes.[2]
INDICATIONS/ADVANTAGES/DISADVANTAGES OF CBCT
Indications• 3D view of teeth position and structure• Evaluation before the implant placement• Endodontic evaluation • Periodontal evaluation • Evaluation of bone resorption • Determination of anatomic bone sizes • Study of the airways • Positioning of temporary anchoring devices • Cephalometric analyses • 3D reconstructions• Evaluation of jaw bones for • Pathology • Bony and soft tissue lesions • Recognition of fractures and structural maxillofacial
deformities • Assessment of temporomandibular joint • Assessment of inferior alveolar nerve.
In short, CBCT is ideally suited for high-quality and affordable CT scanning of the head and neck in dentomaxillofacial applications.[1,3]
AdvantagesFollowing advantages are offered by CBCT,[2,3]
• It has a rapid scan time as compared with panoramic radiography.
• It gives complete 3D reconstruction and display from any angle.
• Its beam collimation enables limitation of X-radiation to the area of interest.
• Image accuracy produces images with submillimeter isotropic voxel resolution ranging from 0.4 mm to as low as 0.076 mm.
• Reduced patient radiation dose (29–477 μSv) as compared with conventional CT (approximately 2000 μSv). Patient radiation dose is 5 times lower than normal CT, as the exposure time is approximately 18 s, that is, one-seventh the amount compared with the conventional medical CT.
• CBCT units reconstruct the projection data to provide interrelational images in three orthogonal planes (axial, sagittal, and coronal).
• Multiplanar reformation is possible by sectioning volumetric datasets nonorthogonally.
• Multiplanar image can be “thickened” by increasing the number of adjacent voxels included in the display,
Thakkar, et al.: Cone-beam Computed Tomography
185185 International Journal of Scientific Study | April 2018 | Vol 6 | Issue 1
referred to as ray sum.• 3D volume rendering is possible by direct or indirect
technique.• The three positioning beams make patient positioning
easy. Scout images enable even more accurate positioning.
• Reduced image artifacts: CBCT projection geometry, together with fast acquisition time, results in a low level of metal artifact in primary and secondary reconstructions.
Disadvantages1. The high cost compared to that of standard 2D
radiographies.2. It cannot offer a resolution with increased contrast,
and also it is not indicated in the exploration of soft tissues but only in the exploration of bone tissue in the maxilla-facial sphere.
3. A significant disadvantage of CBCT is represented by the artifacts that may be present on the image - not due to the scan, but to the presence of implants, restorations from the amalgam, metallic prosthetic restorations, or endodontic treatments. These artifacts are characterized by hyperdense lines and dark images, which affect the quality of the desired image.[2,3-5]
PERIODONTAL APPLICATIONS
CBCT in Assessment of Periodontal Ligament (PDL) SpaceThe earliest signs of periodontal disease in radiographs are fuzziness, break in the continuity of lamina dura, and a wedge-shaped radiolucent area at the mesial and distal aspect of the PDL space. In addition to this, the proper observation of PDL space may offer some potential regarding detection of occlusal trauma and the effects of systemic diseases on the periodontium.[2] Therefore, only a sensitive imaging technique would be able to detect the earliest changes in the PDL space. The conventional intraoral radiographs have some significant disadvantages including the overlap of anatomical structures due to the positioning of the X-ray tube. Furthermore, there could be errors related to the chemical processing and patient positioning.[1,4]
CBCT for Periodontal Defect MeasurementsThe extent of periodontal marginal bone loss is not always easy to determine and certainly not the extent with which furcation areas are involved with the conventional radiographic methods.[2] CBCT images provide better diagnostic and quantitative information on periodontal bone levels in 3D than conventional radiography [2].
The periodontal defects as seen in conventional radiography are short of accuracy in terms of 3D
architecture of the bone morphology. In CBCT, the bony plates, buccal, and lingual can be visualized with accuracy and any discrepancy can be anticipated before surgical exposure. Furthermore, the defect morphology can be studied in all axial planes with the advent of CBCT modalities. Furthermore, the volumetric analysis of the defect depth preoperatively and postoperatively can lead to a better understanding of the functioning of bone graft eliminating the need of surgical reentry, which can also be useful for treatment planning.
Noujeim et al.[6] created periodontal lesions of different depths in dried human mandibles and analyzed them using intraoral radiography and CBCT. They found that CBCT was more accurate in detecting the defects than the conventional radiograph.
Stavropoulos and Wenzel[7] evaluated the accuracy of CBCT scanning with intraoral periapical radiography for the detection of periapical bone defects. CBCT was found to have better sensitivity compared to intraoral radiography.
Leung et al.[8] evaluated the accuracy and reliability of CBCT in the diagnosis of naturally occurring bone defects by comparing the difference between the CBCT measurements and measurements made directly on the skulls. They reported that CBCT measurements were not as accurate as direct measurements on skulls. A certain discrepancy between direct measurements and estimated measurements on radiographs has to be considered as clinically acceptable.
Vandenberghe et al.[9] studied 30 periodontal bone defects of two adult human skulls using intraoral digital radiography and CBCT. Periodontal bone levels and defects on both imaging modalities were assessed and compared to the gold standard. The study concluded that the intraoral radiography was significantly better for contrast, bone quality, and delineation of lamina dura, but CBCT was superior for assessing crater defects and furcation involvements.
CBCT in Measuring Periodontal Bone LevelsSufficient alveolar bone volume and favorable architecture of the alveolar ridge are essential to obtain ideal functional and esthetic prosthetic reconstruction.[1]
Persson et al.[11] reported that conventional radiographic images provided a better resolution of the bone levels than what can be achieved from computer screen images.
Mol and Balasundaram[10] compared the image quality between CBCT and conventional radiography in the
Thakkar, et al.: Cone-beam Computed Tomography
186186International Journal of Scientific Study | April 2018 | Vol 6 | Issue 1
assessment of alveolar bone levels. They found that CBCT provided slightly better diagnostic and quantitative information on periodontal bone levels in three dimensions than conventional radiography.
Vandenberghe et al. [9] reported that CBCT images demonstrated more potential in the morphological description of periodontal bone defects, while the digital radiography provided more bone details.
Soft tissue CBCT for the measurement of gingival tissue and the dimensions of the dentogingival unit.
This novel method is based on CBCT technology called soft tissue CBCT, to visualize and precisely measure distances corresponding to the hard and soft tissues of the periodontium and dentogingival attachment apparatus. With this simple and noninvasive technique, clinicians are able to determine the relationships between:1. Gingival margin and the facial bone crest,2. Gingival margin and the cementoenamel junction
(CEJ),3. CEJ and facial bone crest.
The width of the facial and palatal/lingual alveolar bone and the width of the facial and palatal/lingual gingival also could be measured.[2]
CBCT Precision in Alveolar Bone Density MeasurementRadiographic follow-up of bone healing after grafting is challenging because of the overlapping of gaining and losing areas within the graft. The new volumetric imaging method, CBCT, offers an opportunity to see inside the bone and pinpoint and measure densities in small localized areas such as a vertical periodontal defect, or an alveolar bone graft. This precision would make it possible to reproducibly quantify the bone remodeling after bone grafting.[2]
CBCT for Diagnostic Imaging for the Implant PatientCross-sectional imaging modalities that include conventional X-ray tomography, computed tomography, and CBCT are valuable imaging modalities. Of all the three, CBCT scanning is the most successful, useful, and valuable imaging modality for 3D and cross-sectional evaluation of the implant patient. It has similar advantages and disadvantages as CT scanning. The most significant difference is that CBCT imaging requires much less radiation exposure. Location is the most important factor while placing an implant. From 3D planning to CT-directed placement, to take the advantage of available bone and avoid anatomic structures, the science of implantology has been revolutionized by 3D imaging. Not only has it added safety and accuracy, it has
also minimized or eliminated the need for supportive procedures like bone and tissue grafting in many situations. Software and technology development trends suggest that in the near future, CBCT scans will be used to develop a patient-specific 3D model that will be used for implant diagnosis, treatment planning, treatment simulation, implant placement (surgery), and tooth replacement (restoration of implant).[2] Furthermore, the risk determination for osteoporotic patients can be predetermined by analyzing the density of bone. Clinicians have been diagnosing, treatment planning, placing, and restoring modern dental implants using periapical and panoramic imaging films to assess bone anatomy for several decades. Two-dimensional film images have been found to have limitations because of inherent distortion factors, and the noninteractive nature of film itself provides little information regarding bone density, bone width, or spatial proximity of key structures. Diagnostic imaging techniques must always be interpreted in conjunction with good clinical examination. Many factors influence the selection of radiographic techniques for a particular case, including cost, availability, radiation exposure, and case type. The decision is a balance between these factors and the desire to minimize risk of complications to the patient.
CONCLUSIONS
As CBCT scanning is finding more and more applications in dentomaxillofacial radiology, it stands as the privileged field of imaging in periodontics. Current methods of detecting alveolar bone level changes over time or determining 3D architecture of osseous defects are inadequate. This issue has been addressed by the recent low-cost CBCT machines, which has resulted in production of an affordable, low-radiation high-quality 3D data. CBCT is an essential diagnostic tool also for selection of implant design and its placement. CBCT provides high quality of diagnostic images that have an absorbed dose that is comparable with other dental surveys and less than a conventional CT and thus following the principles of radiation protection to reduce the radiations “as low as reasonably achievable” (ALARA). To conclude, CBCT with its high spatial resolution, affordability, smaller size, lower acquisition, and maintenance has made it as a natural fit in periodontal imaging.
REFERENCES
1. Aljehani YA. Diagnostic applications of cone-beam ct for periodontal diseases. Int J Dent 2014;2014:865079.
2. Mohan R, Singh A, Gundappa M. Three-dimensional imaging in periodontal diagnosis -utilization of cone beam computed tomography. J Indian Soc
Thakkar, et al.: Cone-beam Computed Tomography
187187 International Journal of Scientific Study | April 2018 | Vol 6 | Issue 1
Periodontol 2011;15:11-7.3. Fochi A, Haba D. The role of cbct in the evaluation of periodontal diseases.
Int J Med Dent 2015;5:207211.4. Ozmeric N, Kostioutchenko I, Hägler G, Frentzen M, Jervøe-Storm PM.
Cone-beam computed tomography in assessment of periodontal ligament space: In vitro study on artificial tooth model. Clin Oral Investig 2008;12:233-9.
5. Jervøe-Storm PM, Hagner M, Neugebauer J. Comparison of cone-beam computerized tomography and intraoral radiographs for determination of the periodontal ligament in a variable phantom. Oral Surg Oral Med Oral Pathol Oral Radiol Endod 2010;109:e95-101.
6. Noujeim M, Prihoda T, Langlais R, Nummikoski P. Evaluation of high-resolution cone beam computed tomography in the detection of simulated interradicular bone lesions. Dentomaxillofac Radiol 2009;38:156-62.
7. Stavropoulos A, Wenzel A. Accuracy of cone beam dental CT, intraoral
digital and conventional film radiography for the detection of periapical lesions. An ex vivo study in pig jaws. Clin Oral Investig 2007;11:101-6.
8. Leung C, Palomo L, Griffith R, Hans M, Accuracy and reliability of cone-beam computed tomography for measuring alveolar bone height and detecting bony dehiscences and fenestrations. Am J Orthod Dentofacial Orthop 2010;137:109-19.
9. Vandenberghe B, Jacobs R, Yang J. Detection of periodontal bone loss using digital intraoral and cone beam computed tomography images: An in vitro assessment of bony and or infrabony defects. Dentomaxillofac Radiol 2008;37:252-60.
10. Mol A, Balasundaram A. In vitro cone beam computed tomography imaging of periodontal bone. Dentomaxillofac Radiol 2008;37:319-24.
11. Persson RE, Hollender LG, Persson GR. Assessment of alveolar bone levels from intraoral radiographs in subjects between ages 15 and 94 years seeking dental care. J Clin Periodontol 1998;25:647-54.
How to cite this article: Thakkar P, Shah S, Sheth T, Thakore D, Shah M. Cone-beam Computed Tomography - A Boon in Periodontology: A Review. Int J Sci Stud 2018;6(1):183-187.
Source of Support: Nil, Conflict of Interest: None declared.