gamma ray-density logging - onepetro
TRANSCRIPT
SOCIETY OF PETROLEUM ENGINEERS OF AIME Fidelity Union Bldg. Dallas, Tex.
PAPER NUMBER 1253-G
THIS IS A PREPRINT --- SUBJECT TO CORRECTION
Gamma Ray-Density Logging
By
Albin J. Zak and Joe Ed Smith, Junior Members AIME Core Laboratories Inc., Dallas, Tex.
ABSTRACT
This paper presents a review of current methods of interpreting and applying gamma raydensity logs in evaluating fundamental reservoir data. The basic theories and physical principles underlying the techniques of density logging with gamma rays are discussed along with some of the problems associated with the instrumentation of such a tool. An effort has been made to evaluate the instrument calibration techniques, and discussion and figures are presented which describe the effect of borehole conditions, pressure, temperature, etc. The relationship of natural density, grain density, and interstitial fluid density to porosity is presented. Field data illustrate how density logs can be correlated with porosity and grain density data. With the aid of adequate core analysis data, a reasonably accurate estimate of formation porosity can be obtained from density log interpretation. The paper also offers a discussion of the limitations of the density log as a porosity tool. The current applications of the density log to geologic work are cited, and the prospective uses and future developments are briefly explored.
SUMMARY
The principle of gamma ray absorption as a function of density was adapted to the logging of petroleum formations through the utilization of a phenomenon known as "back-scattering". This technique uses a tool which contains both a gamma ray source and detector. The detector measures the intensity of the gamma rays emitted from the source that have been back-scattered to the detector by the formation. After proper instrument calibration, the log response can be used to compute the natural density of the formation. Since there is a definite relationship between natural density and porosity, it is possible to predict formation porosity from density logs. It is necessary to correlate carefully density log data with core analysis data before the direct correlation of density log response with porosity can be made.
In the practical logging tool, a beam of gamma rays is emitted into the formation. A small fraction of these photons find their way back to the detector. Normally, the detector used is a Geiger-Muller counter or scintillation counter. Studies of other detecting devices, such as cloud chambers and ionization chambers, have shown them to be unsuitable for this purpose. The most common gamma ~ay source for this tool is radioactive cobalt (CobO ). The source is Shielded from the detector with lead such that the majority of the gamma rays counted by the detector are those back-scattered from the formation.
Initial calibration of the instrument is made in special testholes in which the density of the calibrating material is carefully controlled. These experiments are made in various hole sizes in each of several different mud densities. From this, an adequate prediction has been established as to the effect of borehole diameter and borehole fluid density on the log response. To date, there are no valid correction factors proposed for the effects due to poor borehole geometry. The rules and limitations of logging speed, time-constant, bed thickness, etc., that apply to conventional radioactivity logs also apply to density logging. The effects of temperature and pressure are those effects that are imposed on the response of the gamma ray counter, and the effects on the densities of the interstitial fluids.
The basic interpretation of the density log is fairly simple; the possible applications are numerous. The most prominent denSity log applications are: (1) lithological eorrelations, (2)
i determination of density grad:"ents for gravity , meter surveys, (3) determination of borehole fluid
denSity for gradient surveys, (4) location of casing shoe and cement top, (5) location of casing leaks, (6) aid in the interpretation and evaluation of other logs, and (7) method of estimating formation porosity. Application 7 is probably the most important and most widely used.
Maximum use of the density log nas not been fully realized. Although there are some severe limitations in its use, there are many cases where
References and illust!13,tion~~t,~~?f p_~_~~_. ___ -,- ______________________________________________ ---'
Dow
nloaded from http://onepetro.org/SPEPBO
GR
/proceedings-pdf/59PBOR
/All-59PBOR
/SPE-1253-G/2087146/spe-1253-g.pdf by guest on 01 June 2022
2 GAMMA RAY-DENSITY LOGGING 1253-G
the density log is an effective tool, and serves as a valuable aid in f'ormation evaluation.
INTRODUCTION
Gamma ray-density logging has progressed far since its original experimental stage. Numerous major oil companies and several service companies have made significant contributions to its advancement. Although the tool was originally conceived as an al~iliary exploration device, continued research and development has created new and improved equipment and techniques. This paper is an analysis of the theories, modern techniques and interpretation procedures applicable to formation evaluation.
Often, the reservoir geologist, petroleum engineer, and log analyst are not familiar with the basic theory and physical principles that underlie a particular logging tool. This results in the interpreter being unable, or limited in his ability, to evaluate logs. An attempt is made herein to "bridge the gap" between theory and application.
The purpose of this paper is to inform the user of the basis of gamma ray-density logging; to describe the equipment used; present the accepted principles of interpretation; illustrate the uses and applications; and cite the known advantages and limitations.
THEORY AND PHYSICAL PRINCIPLES
Basic Nuclear Concepts
In order to fully understand the nuclear processes that occur when a gamma ray-density log is run, it will be necessary to briefly review some basic radiochemical theory and physical concepts. The discussion here will not begin with the most elementary principles; for introductory material on the subject of atomic PhYSicS3 the reader may refer to the works of Bttter,l Fermi,25 Friedlander and Kennedy,2b Lapp and Andrews,31 and Semat.36 From the beginning, the inquirer must realize that gamma ray-density logging is different from conventional gamma rayneutron logging. The gamma ray-density log is often referred to as the gamma-gamma log, which means that the source emits gamma rays and the detector counts gamma rays. This paper will present only that material which is related and necessary to the understanding of gamma raydensity logging.
The definitions of nuclear terms presented by Faul,24 will be sufficient for this paper; the atomic number Z, or nuclear charge as it is sometimes called, is the integral number of protons in the nucleus of an atom. The mass number A, or atomic mass, is the total number of nucleons in the nucleus of an atom; a nucleon can be either a proton or neutron. The reader will
recall that atoms with nuclei of the same Z but different A are forms of the same element and are called isotopes.
Beta rays (~) are believed to be physically equivalent to electrons if the beta radiation has a negative charge. If the beta rays have a positive charge, they are equivalent to positivecharged electrons and are called positrons. When talking about positrons, the term negatron is usually used instead of electron; negatrons and electrons are exactly the same. Beta radiations, positrons, and negatrons all have the same relative charge, either plus or minus one, and they all have the same relative mass of one. (As shown in Table 1, a proton (p+) has a relative charge of plus one, and a relative mass of approximately 1,836; a neutron (n) has a relative charge of zero, and a relative mass of approximately 1,840.) Unless otherwise stated, the charge of beta radiation is always assumed to be negative and equivalent to an electron. Hence, when a nucleus decays by beta emission, Z will increase by one unit and A will remain constant. It should be pointed out that the exact value of mass will decrease very slightly; this is a necessary conclusion in order to explain the release of energy.
Alpha particles (0<) are equivalent to accelerated helium atoms that have been stripped of their electrons. Thus, the alpha particle will have a nuclear charge of plus two and an atomic mass of four. Therefore, if a nucleus decays by alpha emiSSion, Z will decrease by two and A will decrease by four. Note that in either beta or alpha decay, isotopes of the mother element are not formed; the residual that is formed is always a different element. However, the
I
series disintegration of an element tr~ough both alpha and beta decay will often produce isotopes of the original element.
In atomic physics, it is conventional to express energy in terms of elec~ron-volts. An electron-volt is equal to 1.6 x 10⁻¹² ergs; it is further defined as the kinetic energy required by an electron to move through a potential difference of one volt. Since the electron-volt is a rather
I small unit, thousands of elect:ron-volts (Kev) , and millions of electron-volts (Mev) have been adopted as standard units. Occasionally, units of electron-volts (ev), and billions of electronvolts (Bev) are used. Alpha particles will normally exhibit energies in the range of several Mev; beta particles have no normal energy range -some are as low as one ev, whereas some are as high as ten Mev. Gamma rays have energies in the order of one Mev for naturally occurring decay. It is interesting to note that cosmic rays have energies in the order of several Bev, and are capable of penetrating ten to fifteen feet of lead.
Nuclear reactions can be expressed in a
Dow
nloaded from http://onepetro.org/SPEPBO
GR
/proceedings-pdf/59PBOR
/All-59PBOR
/SPE-1253-G/2087146/spe-1253-g.pdf by guest on 01 June 2022
1253-G ALBIN J. ZAK AND JOE ED SMITH 3
manner similar to chemical reactions. The statement must involve at least four terms: target, (projectile, product) residual. The projectile and product particles are commonly abbreviated. A classic example would be that of a lithium7 atom* being bombarded with an energetic proton. Since the proton has a positive charge, it will experience an electrostatic repulsion as it approaches the nucleus of the lithium atom; but if the proton is accelerated to a sufficiently high energy level, it will penetrate inside the nuclear radius where the strong, short-range attractive forces are at work. At this point, the proton will disappear into the nucleus of the Li7 atom, forming an excited nucleus. This nucleus will then split into the product particle (0<) and the residual nucleus (He~). Fau124 estimates that the time necessary for this process is in the order of 10-12 seconds. This reaction is written: Li 7 + p+_o<-tHe'f or more commonly, L', 7(p +,0<) He'+. If the projectile and product particles are the same, the process is known as scattering. The scattered particle (product) will always have less energy than the projectile particle because some of the energy will be transferred to the residual nucleus as kinetic recoil energy. This scattering process should be carefully noted it is the cardinal principle upon which the gamma ray-density log is based. The process will be discussed in detail after introductory material on gamma radiation has been presented.
One other definition must be stated before going into the discussion of the nuclear disintegration processes. It is possible to express the probability of a projectile particle interacting with a target nucleus in terms of nuclear cross sections. The cross section is said to be large when the probability of a reaction is very higb, and conversely, the cross section is said to be low when the probability of a reaction is remote. Nuclear cross sections vary over a wide range; they are dependent on the type of particles energy of particles, type of target, and type of process. The common unit of nuclear cross section is the barn (10-24 cm2 ). This concept of cross sections will be used later to help explain gamma ray attenuation.
It took many years to define the nuclear disintegration processes in terms of mathematical expressions. The first significant conclusion was that the amount of radioactivity of a pure substance decreases with time according to some parabolic or hyperbolic function. It was later observed that radioactive decay is statistical in nature, that it could not be predicted when any given atom would disintegrate, and that some statistical hypothesis would have to be developed to explain the process. 28 ,31 Although it was a long time before the contemporary, exponential law of
* Superscripts above names of elements are Atomic Masses and not reference numbers in the Bibliography.
nuclear disintegration was fully accepted by the scientific world, its mathematical development is very simple: It is observed that the1loss in radioactive nuclei (-dN) that occurs during an interval (Jt) is directly proportional to the total number of nuclei (N) that is present after the time (dt ). Thus,
. . . . (1)
where ~ is a proportionality constant. By separation of variables,
j dN \\\ .... (2) N =-1j dt:
Integrating Eq. 2 leads to:
Using algebra, Eg. 3 will simplify to: N = ce-~t where C = some constant of integration. The constant C can be evaluated by setting t = 0, such that N = C; therefore, C must be equal to No, where No is the number of radioactive nuclei present at t = O. Hence, the classic exponential law of nuclear disintegration is normally written:
N . . . . (4)
where'\. is a constant universally called the disintegration constant. The time required for No to decrease to Noh is called the half-life (T) or decay period. By Eq.,
I/,'\ ... I _~T . . . . (5) T\NoJ = l'-loe
Using algebra, Eg. 5 clears to:
\T = LOSe Z. .... (6)
Eg. 6 then becomes:
. (6a)
where T is the half-life of the substance. Since N and No are very difficult numbers to measure, the exponential law is often expressed in terms of:
where R is the disintegration rate or nuclear activity of the material. (Halliday28 presents adequate explanation of this paramet~r.) It will suffice here to say that R- dN or something -(ff proportional to it. The decay period (1l) is normally found by plotting Log R vs t. From Eq. 7 it can be seen that ~ is the slope of the straight line through these data, thereby allowing the
Dow
nloaded from http://onepetro.org/SPEPBO
GR
/proceedings-pdf/59PBOR
/All-59PBOR
/SPE-1253-G/2087146/spe-1253-g.pdf by guest on 01 June 2022
4 GAMMA RAY-DENSITY LOGGING 1253-G
calculation ofT with Eq. 6a. This technique is important with respect to the calibration of the density log. Before an instrument is put into service, it is necessary first to calibrate the instrument response with the radioactive source, usually Cobalt (A = 60). Then as the tool is put into actual use, it is necessary to know the strength of the radioactive source at all times in order to utilize the calibration curves. Since the strength of the C060 is constantly decreasing by radioactive decay, it is necessary to apply the exponential law to predict the source strength at any time.
An enlightening subject in the study of nuclear radiation is the radioactivity decay series. There are numerous series; only the heavy end elements of the nuclear chart have been thoroughly explored in this respect. Most of the other radioactive elements are too short-lived to be followed in a decay series. There are four recognized heavy disintegration series~ Thorium, Neptunium, Uranium-Radium, and Actinium. The heavy end elements are best known because of their rather long-lived radioactive members. The Thorium series is illustrated on Fig. 1. Reactions that move from left to right occur through alpha emission, whereas reactions that move up or down occur through some type of beta decay. Note that isotopes are formed only through the combined efforts of both alpha and beta radiation. An excellent example of this would be Uranium-240 decaying to Uranium-236 in three steps~
"2.40 7...'l-C>
(a) U --. Np + f-(b) N;4\) ~ 9u2'?\ r(c) PUL'f() ~ U U\, ~ 0<...
Before discussing gamma emission, it can be pointed out here that nuclei do not change in A or Z due to gamma radiation; however, there is a loss of nuclear energy.
An interesting aspect of the nuclear disintegration process is that a great many nuclei decay by two or more types of radiation. An example from Fig. 1 will illustrate this phenomenon: Ac224 will decay by alpha emission to Fr220
in X per cent of the disintegrations and by positron decay to Ra22)~ in Y per cent of the disintegrations. X and Yare experimentally determined; X + y: 100 per cent. By differen-
tiation of Eq. 7, rt.(l£) = - (~~t R-' ,and
\ tv) :: - (~:)y R- \ . Also, '\ 6t- ... '<) = \l)() ~ \l\')
. • . . (8)
where ~(x), ,\(y) 'and Y\h+y ) are the diSintegration constants for 0<. decay, f3 decay, and the combined decay. From the given data:
~~ IDO \Cxt,()
If the period (T) is known, then,\(x), '\.(y) and \(x+y) can be calculated. Halliday28 has given adequate treatments to this matter. He states that the type of detector is unimportant; it can be counting alpha particles, positrons, or both -a plot of Log R vs t will always give the same period rO.693 J. The period ~ is that
h(x+y) J \(y) period which would occur if the alpha decay did not occur simultaneously with the positron decay.
The reader is referred to the literature for detailed discussions of the exact nature of alpha and beta emission. No attempt will be made to present such information in this paper since ~ and (3 have very little direct bearing on gamma ray-density logging. Gamma emission is the important process here and will be treated in such a manner as to give sufficient explanation of the behavior of the gamma ray-density log.
Gamma rays are highly penetrating radiations that originate in radioactive materials; they are unaffected by electric or magnetic fields. Gamma radiation is actually a part of the classic electromagnetic spectrum -- their wavelength is in the order of 0.1 Angstrom Uni.t or less, an extremely high frequency. Cosmic rays have somewhat shorter wavelengths and X-rays have slightly longer wavelengths. The differences between gamma rays and cosmic rays are not fully understood at this time. The only known difference is that cosmic rays have a higher frequency and shorter wavelength which consequently explains their higher energy level and greater penetrating power. The only difference between X-rays and gamma rays is that X-rays originate within the radioactive atom, outside the nucleus; whereas gamma rays always originate from within the nucleus. Gamma rays and X-rays are otherwise identical. Although seldom the case, it is possible to have gamma rays existing at energy levels less than the normal X-rays energy level. The nomenclature of gamma rays and X-rays is purely a matter of their atomic origin. These definitions are greatly simplified, but are adequate for the purpose of this paper. Semat's discussion of gamma rays and X-rays offers an academic treatment of the subject matter. Since there is no difference in the type of interactions that gamma rays and X-rays (of the same energy level) have with matter, this paper will use the generic term "photon" to mean either or both.
Interaction of Photons with Matter
According to Fan022 , there are four kinds of interaction between photons and atomic particles: (1) basic interaction with atomic electrons, (2) basic interaction with particles within the nucleus, (3) interaction with electric
Dow
nloaded from http://onepetro.org/SPEPBO
GR
/proceedings-pdf/59PBOR
/All-59PBOR
/SPE-1253-G/2087146/spe-1253-g.pdf by guest on 01 June 2022
1253-G ALBIN J. ZAK AND JOE ED SMITH 5
field surrounding charged particles, and (4) in- I 1.022 Mev before pair-production can occur since teraction with meson field surrounding the nu- I this amount of energy is needed to supply the rest cleus. It is further observed that each of these I energy. For large values of E., Ee- is four kinds of interaction may produce three dif- I ferent effects: photon absorption, elastic i essentially equal to E_ e+· For the values of scattering of photon, and inelastic scattering of ! photon. Referring to the basic definition of I, Eyemmitted by Co "0 , Er -Z>'Y\c2.may be shared scattering, the process is called elastic if the projectile acts upon the target as a whole, whereas the process is termed inelastic if the projectile acts upon and produces some effect on a constituent part of the target. There are twelve possible interaction processes between photons and matter. Some of these have never been observed and exist only as physical hypotheses. It is believed that only four of these twelve processes have any influence on the gamma ray-density log: photoelectric absorption, pairproduction, Compton scattering, and Rayleigh scattering. In all of these processes, the incident photon is either absorbed or scattered away by the atom or some part thereof.
In the photoelectric process, a photon experiences a collision with an atomic electron and immediately disappears. The electron which absorbs the photon is ejected from its orbit and retains its own energy plus the photon energy minus the binding energy of the electron. This process does not occur for free electrons, and it is reasoned that the effect is more prevalent for the tightly bound electrons in the K-shell. Nuclear physicists normally treat the photoelectric effect as an interaction with the entire atom and not with the ejected electron. Although this treatment is not exactly correct, it simplified the theoretical analysis of the process. Because of the higher energy level of the photon, the ejected electron generally flies off in the direction of the incident photon. The process is most likely to occur for gamma ray energies less than 0.5 Mev and for material with large values of Z.
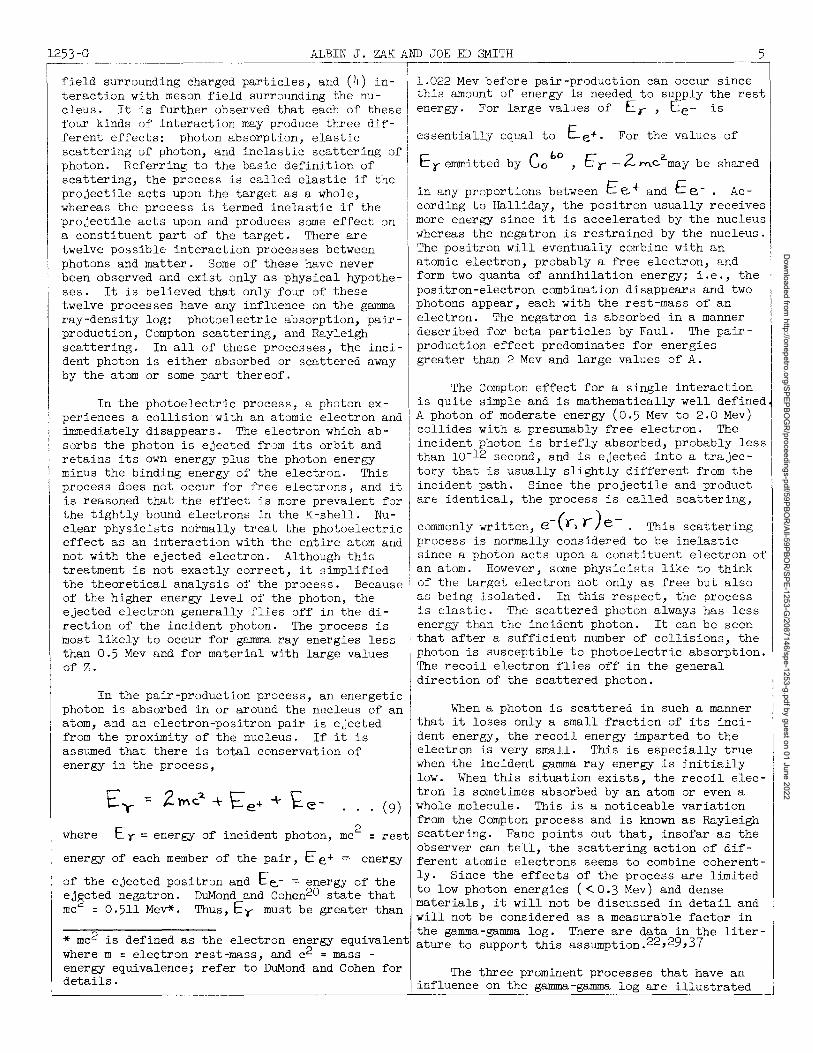
In the pair-production process, an energetic photon is absorbed in or around the nucleus of an atom, and an electron-positron pair is ejected from the proximity of the nucleus. If it is assumed that there is total conservation of energy in the process,
where Er = energy of incident photon, mc2 = rest
energy of each member of the pair, E e+ = energy
of the ejected positron and Ee,- ==- energy of the ej~cted negatron. DuMond and Cohen20 state that mc = 0.511 Mev*. Thus, Ey must be greater than
* mc2 is defined as the electron energy equivalent where m = electron rest-mass, and c2 = mass -energy equivalence; refer to DuMond and Cohen for details.
in any proportions between E e 1- and E e -. According to Halliday, the positron usually receives more energy since it is accelerated by the nucleus whereas the negatron is restrained by the nucleus. The positron will eventually combine with an atomic electron, probably a free electron, and form two quanta of annihilation energy; i.e., the positron-electron combination disappears and two photons appear, each with the rest-mass of an electron. The negatron is absorbed in a manner described for beta particles by Faul. The pairproduction effect predominates for energies greater than 2 Mev and large values of A.
The Compton effect for a single interaction is quite simple and is mathematically well defined A photon of moderate energy (0.5 Mev to 2.0 Mev) collides with a presumably free electron. The incident photon is briefly absorbed, probably less than 10-12 second, and is ejected into a trajectory that is usually slightly different from the incident path. Since the projectile and product are identical, the process is called scattering,
commonly written, e-(') r ) e -. This scattering process is normally considered to be inelastic since a photon acts upon a constituent electron of an atom. However, some physicists like to think of the target electron not only as free but also as being isolated. In this respect, the process is elastic. The scattered photon always has less energy than the incident photon. It can be seen that after a sufficient number of collisions, the photon is susceptible to photoelectric absorption. The recoil electron flies off in the general direction of the scattered photon.
When a photon is scattered in such a manner that it loses only a small fraction of its incident energy, the recoil energy imparted to the electron is very small. This is especially true when the incident gamma ray energy is initially low. When this situation exists, the recoil electron is sometimes absorbed by an atom or even a whole molecule. This is a noticeable variation from the Compton process and is known as Rayleigh scattering. Fano points out that, insofar as the observer can tell, the scattering action of different atomic electrons seems to combine coherently. Since the effects of the process are limited to low photon energies (<.0.3 Mev) and dense materials, it will not be discussed in detail and will not be considered as a measurable factor in the gamma-gamma log. There are data in the literature to support this assumption. 22 ,29,37
The three prominent processes that have an influence on the gamma-gamma log are illustrated
Dow
nloaded from http://onepetro.org/SPEPBO
GR
/proceedings-pdf/59PBOR
/All-59PBOR
/SPE-1253-G/2087146/spe-1253-g.pdf by guest on 01 June 2022
6 GAMMA RAY-DENSITY LOGGING 1253-G
0:-;~g~~ -;: :h~- p:otoelec::~c effect, the
I
photon expells an atomic electron from the Kshell. In the pair-production process, the gamma quantum vanishes, and an electron-positron pair is produced. The photon is scattered by an electron in the Compton process; the photon loses some of its energy, and the electron is recoiled from the atomic radius. Also, note that there is a case where the photon passes through the atom without having any kind of interaction. In fact, there is always the finite possibility that a photon will travel through an infinite thickness of matter without experiencing a collision with any atomic particle. Through the use of !!good geometry!!, it is possible to construct a model that will allow academic treatment of the gamma ray attenuation problem. The term !!good geometry!! was coined by the early experimenters in this field, and is used to describe the ideal conditions that are necessary to measure the combined effects of Compton scattering, pair-production, and photoelectric effect of photons penetrating various absorber materials. Fig. 3, which will be used to develop the gamma ray attenuation concept, does not illustrate the !!good geometry!! concept. However, Halliday28 and Cowan* present experiments utilizing good geometry.
In Fig. 3, Po is the number of photons that enter the absorber and P is the number of photons that pass through the absorber without having an interaction. Af is the area of the absorber face, and x is the absorber thickness, such that the product of x and Af is the bulk volume of the absorber. Each dot within the absorber medium indicates a photoelectric, pair-production or Compton process. In the first two processes, the photon is absorbed; in the latter process, the photon is not absorbed but disappears as far as the detector is concerned. The reader should be advised that Fig. 3 is a simplified schematic diagram of the experimental model, and that the !!good geometry!! previously mentioned is necessary in actually making these experiments. It is further necessary that the incident photons be monoenergetic and collimated into narrow beams.
The value of P will depend on the values of Po and x. If an additional absorber thickness (dx) is added, P will decrease by (-dP). If stil another absorber thickness (dx) is added, (P-dP) will decrease by (-dP). Thus, there is a definitE mathematical pattern observed:
P C( Pc.lX -~~ C{ ~ d)(.
.I
- c\~' ex: (?- ~\» dx' /
.(lOa
. (lOb)
.(lOc)
It is hence reasoned, that if P photons pass through an absorber thickness x, the number of
* See Physics Review, Vol. 74, (1948), page 1841.
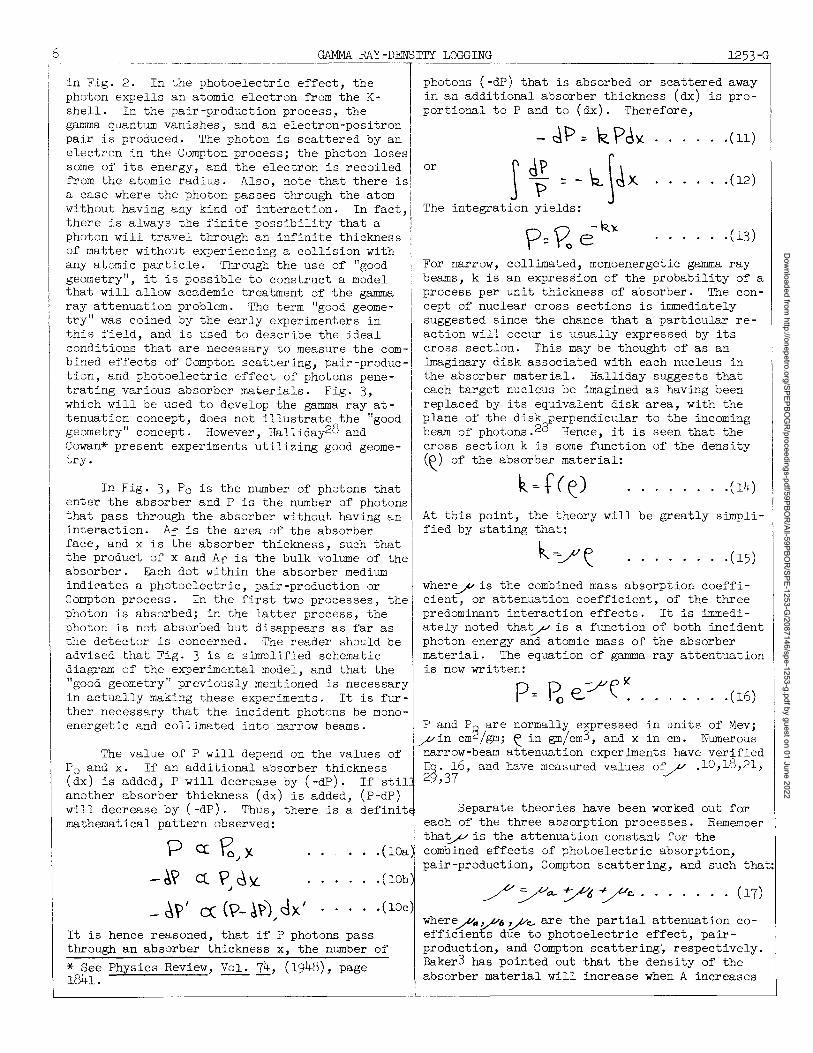
photons (-dP) that is absorbed or scattered away in an additional absorber thickness (dx) is proportional to P and to (dx). Therefore,
- dP: k Pdx .. (n)
or I <I; - - \,. ~ clx integration yields:
....•. (12)
The
p:: ?o e- k ): . • • . . .( 13)
For narrow, collimated, monoenergetic gamma ray beams, k is an expression of the probability of a process per unit thickness of absorber. The concept of nuclear cross sections is immediately suggested since the chance that a particular reaction will occur is usually expressed by its cross section. This may be thought of as an imaginary disk associated with each nucleus in the absorber material. Halliday suggests that each target nucleus be imagined as having been replaced by its equivalent disk area, with the plane of the disk perpendicular to the incoming beam of photons. 28 Hence, it is seen that the cross section k is some function of the density (~) of the absorber material:
. .....• (14)
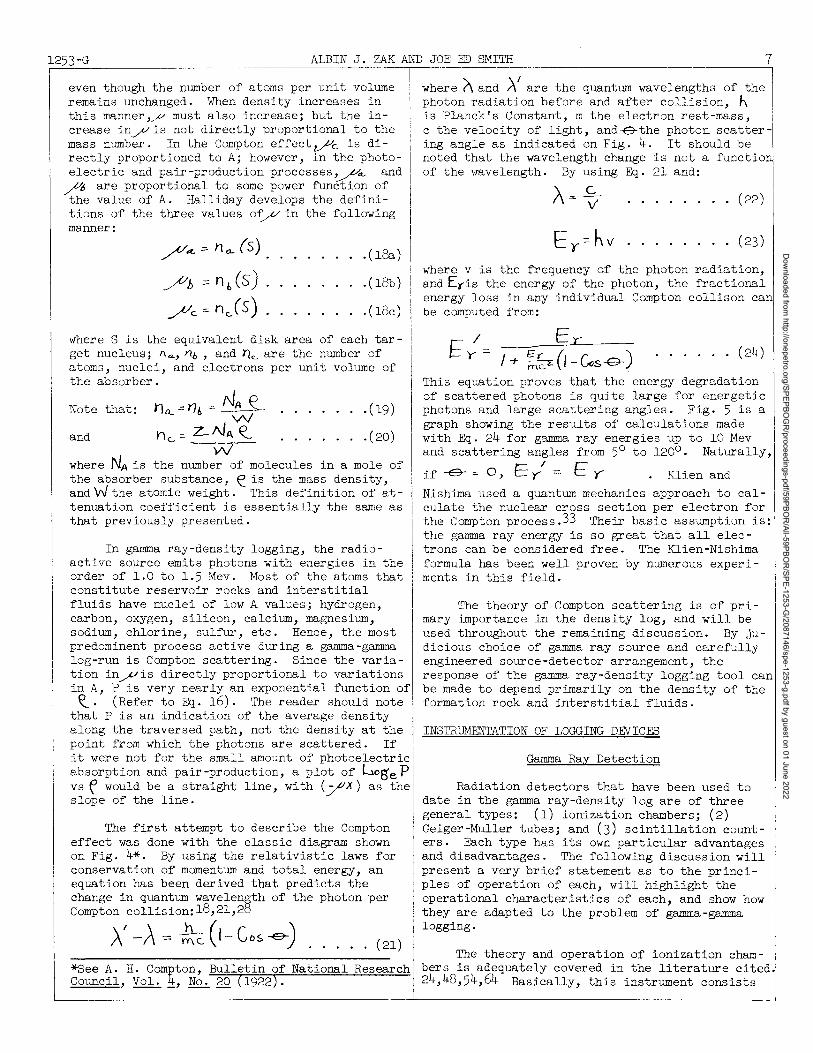
At this point, the theory will be greatly simplified by stating that:
• . • . . . . . (15)
where~ is the combined mass absorption coefficient, or attenuation coefficient, of the three predominant interaction effects. ately noted tha~ is a function photon energy and atomic mass of material. The equation of gamma is now writter":
P'" D -:-pel( 1-0 e .
It is immediof both incident the absorber ray attentuation
. . (16)
P and P~ are normally expressed in units of Mev; / in cm /gmj e in gm/cm3, and x in cm. Numerous
narrow-beam attenuation experiments have verified Eq. 16, and have measured values of~ .10,18,21, 29,37
Separate theories have been worked out for each of the three absorption processes. Remember tha~ is the attenuation constant for the combined effects of photoelectric absorption, pair-production, Compton scattering, and such that:
where/ .. ,"p6 vVc.- are the partial attenuation coefficien£s due to photoelectric effect, pairproduction, and Compton scattering~ respectively. Baker3 has pointed out that the density of the absorber material will increase when A increases
Dow
nloaded from http://onepetro.org/SPEPBO
GR
/proceedings-pdf/59PBOR
/All-59PBOR
/SPE-1253-G/2087146/spe-1253-g.pdf by guest on 01 June 2022
l253-G ALBIN J. ZAK AND JOE ED SMITH 7
even though the number of atoms per uni t vOl~eTw~e-: (\ and-A' a~: the quantum wavelengths of the remains unchanged. When density increases in I photon radiation before and after collision, ~ this manner,~ must also increase; but the in- is Planck's Constant, m the electron rest-mass, crease in~is not directly proportional to the c the velocity of light, and~the photon scatter-mass number. In the Compton effect~c is di- ing angle as indicated on Fig. 4. It should be rectly proportioned to A; however, in the photo- noted that the wavelength change is not a functio electric and pair-production processes~~ and of the wavelength. By using Eq. 21 and: ~ are proportional to some power function of \ C the value of A. Halliday develops the defini- 1\= ~ ...... (22) tions of the three values o~ in the following II
manner:
/h =: n" (s) /c =0 n,JS)
I
· (100) I · (18b)
· (18c)
where S is the equivalent disk area of each target nucleus; l\a., Ylb , and >lc.. are the number of atoms, nuclei, and electrons per unit volume of the absorber.
Note that: hQ.'::: r}b .:: NA ~ V\/
nc.. =c Z-NA ~ and
· (19)
.(20) vV
where NA is the number of molecules in a mole of the absorber substance, ~ is the mass density, and W the atomic weight. This definition of attenuation coefficient is essentially the same as that previously presented.
In gamma ray-density logging, the radioactive source emits photons with energies in the order of 1.0 to 1.5 Mev. Most of the atoms that constitute reservoir rocks and interstitial fluids have nuclei of low A values; hydrogen, carbon, oxygen, silicon, calcium, magnesium, sodium, chlorine, sulfur, etc. Hence, the most predominent process active during a gamma-gamma log-run is Compton scattering. Since the variation in~is directly proportional to variations in A, P is very nearly an exponential function of ~. (Refer to Eq. 16). The reader should note
that P is an indication of the average density along the traversed path, not the density at the point from which the photons are scattered. If it were not for the small amount of photoelectric absorption and pair-production, a plot of Loge P vs f would be a straight line, with (~x) as the slope of the line.
The first attempt to describe the Compton effect was done with the classic diagram shown on Fig. 4*. By using the relativistic laws for conservation of momentum and total energy, an equation has been derived that predicts the change in quantum wavelength of the photon per Compton collision: 18,2l,2b
. . . (23)
where v is the frequency of the photon radiation, and E~is the energy of the photon, the fractional energy loss in any individual Compton collison can be computed from:
I I Ex: ~ y::::' I E(" (r ) + meZ: 1- vcs-G-
.... (24)
This equation proves that the energy degradation of scattered photons is quite large for energetic photons and large scattering angles. Fig. 5 is a graph showing the results of calculations made with Eq. 24 for gamma ray energies up to 10 Mev and scattering angles from 50 to 1200 . Naturally,
if -e- -= 0) E / = E Y Klien and
Nishima used a quantum mechanics approach to calculate the nuclear cross section per electron for the Compton process. 33 Their basic assumption is: the gamma ray energy is so great that all electrons can be considered free. The Klien-Nishima formula has been well proven by numerous experiments in this field.
'I'he theory of Compton scattering is of primary importance in the density log, and will be used throughout the remaining discussion. By judicious choice of gamma ray source and carefully engineered source-detector arrangement, the response of the gamma ray-density logging tool can be made to depend primarily on the density of the formation rock and interstitial fluids.
INSTRUMENTATION OF LOGGING DEVICES
Gamma Ray Detection
Radiation detectors that have been used to date in the gamma ray-density log are of three general types: (1) ionization chambers; (2) Geiger-Muller tubes; and (3) scintillation counters. Each type has its own particular advantages and disadvantages. The following discussion will present a very brief statement as to the principles of operation of each, will highlight the operational characteristics of each, and show how they are adapted to the problem of gamma-gamma logging. A'_A=~(I-Cos~) ..... (2l)
The theory and operation of ionization cham*See A. H. Compton, Bulletin of National Research bers is adequately covered in the literature cited. Council, Vol. ~, No. 20 (1922). 24,48,54,64 Basically, this instrument consists
Dow
nloaded from http://onepetro.org/SPEPBO
GR
/proceedings-pdf/59PBOR
/All-59PBOR
/SPE-1253-G/2087146/spe-1253-g.pdf by guest on 01 June 2022
8 GAMMA RAY-DENSITY LOGGING 1253-G 1------- ~--~-----"-='------'1
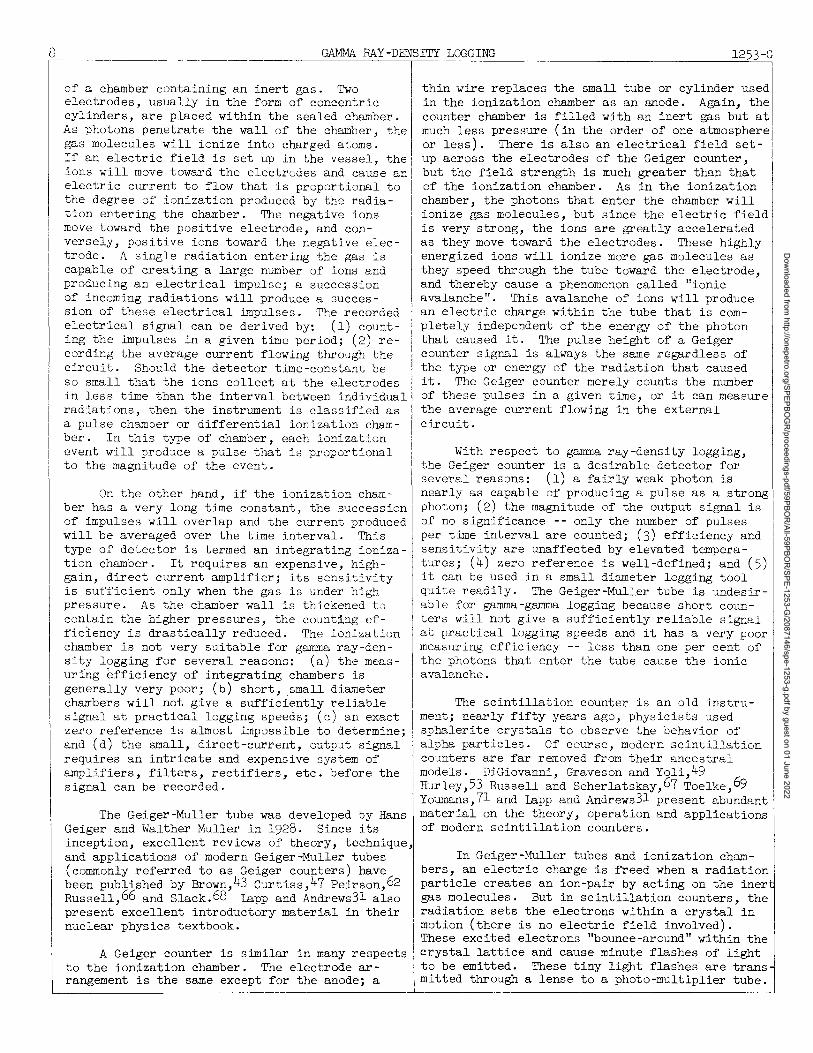
of a chamber containing an inert gas. Two I thin wire replaces the small tube or cylinder used electrodes, usually in the form of concentric in the ionization chamber as an anode. Again, the cylinders, are placed within the sealed chamber. counter chamber is filled with an inert gas but at As photons penetrate the wall of the chamber, the much less pressure (in the order of one atmosphere gas molecules will ionize into charged atoms. or less). There is also an electrical field set-If an electric field is set up in the vessel, the! up across the electrodes of the Geiger counter, ions will move toward the electrodes and cause an but the field strength is much greater than that electric current to flow that is proportional to of the ionization chamber. As in the ionization the degree of ionization produced by the radia- chamber, the photons that enter the chamber will tion entering the chamber. The negative ions ionize gas molecules, but since the electric field move toward the positive electrode, and con- is very strong, the ions are greatly accelerated versely, positive ions toward the negative elec- as they move toward the electrodes. These highly trode. A single radiation entering the gas is energized ions will ionize more gas molecules as capable of creating a large number of ions and they speed through the tube toward the electrode, producing an electrical impulse; a succession and thereby cause a phenomenon called "ionic of incoming radiations will produce a succes - avalanche". This avalanche of ions will produce sion of these electrical impulses. The recorded an electric charge within the tube that is comelectrical signal can be derived by: (1) count- pletely independent of the energy of the photon ing the impulses in a given time period; (2) re- that caused it. The pulse height of a Geiger cording the average current flowing through the counter signal is always the same regardless of circuit. Should the detector time-constant be the type or energy of the radiation that caused so small that the ions collect at the electrodes it. The Geiger counter merely counts the number in less time than the interval between individual of these pulses in a given time, or it can measure radiations, then the instrument is classified as the average current flowing in the external a pulse chamber or differential ionization cham- circuit. ber. In this type of chamber, each ionization event will produce a pulse that is proportional to the magnitude of the event.
On the other hand, if the ionization chawber has a very long time constant, the succession of impulses will overlap and the current produced will be averaged over the time interval. This type of detector is termed an integrating ionization chamber. It requires an expensive, highgain, direct current amplifier; its sensitivity is sufficient only when the gas is under high pressure. As the chamber wall is thickened to contain the higher pressures, the counting efficiency is drastically reduced. The ionization chamber is not very suitable for gamma ray-density logging for several reasons: (a) the measuring efficiency of integrating chambers is generally very poor; (b) short, small diameter chambers will not give a sufficiently reliable signal at practical logging speeds; (c) an exact zero reference is almost impossible to determine; and (d) the small, direct-current, output signal requires an intricate and expensive system of amplifiers, filters, rectifiers, etc. before the signal can be recorded.
The Geiger-Muller tube was developed by Hans Geiger and Walther Muller in 1928. Since its inception, excellent reviews of theory, technique, and applications of modern Geiger-Muller tubes (commonly referred to as Geiger counters) have been published by Brown,43 Curtiss,47 Peirson,62 Russell,66 and Slack.68 Lapp and Andrews31 also present excellent introductory material in their nuclear physics textbook.
A Geiger counter is similar in many respects to the ionization chamber. The electrode arrangement is the same except for the anode; a
With respect to gamma ray-density logging, the Geiger counter is a desirable detector for several reasons: (1) a fairly weak photon is nearly as capable of producing a pulse as a strong photon; (2) the magnitude of the output signal is of no significance -- only the number of pulses per time interval are counted; (3) efficiency and sensitivity are unaffected by elevated temperatures; (4) zero reference is well-defined; and (5) it can be used in a small diameter logging tool quite readily. The Geiger-Muller tube is undesirable for gamma-gamma logging because short counters will not give a sufficiently reliable signal at practical logging speeds and it has a very poor measuring efficiency -- less than one per cent of the photons that enter the tube cause the ionic avalanche.
The scintillation counter is an old instrument; nearly fifty years ago, physicists used sphalerite crystals to observe the behavior of alpha particles. Of course, modern scintillation counters are far removed from their ancestral models. DiGiovanni, Graveson and Yoli,49 Hurley,53 Russell and Scherlatskay,67 Toelke,69 Youmans,71 and Lapp and Andrews31 present abundant material on the theory, operation and applications of modern scintillation counters.
In Geiger-Muller tubes and ionization chambers, an electric charge is freed when a radiation particle creates an ion-pair by acting on the iner gas molecules. But in scintillation counters, the radiation sets the electrons within a crystal in motion (there is no electric field involved). These excited electrons "bounce-around" within the crystal lattice and cause minute flashes of light to be emitted. These tiny light flashes are trans mitted through a lense to a photo-multiplier tube.
Dow
nloaded from http://onepetro.org/SPEPBO
GR
/proceedings-pdf/59PBOR
/All-59PBOR
/SPE-1253-G/2087146/spe-1253-g.pdf by guest on 01 June 2022
1253-G ALBIN J. ZAK AND JOE ED SMITH 9
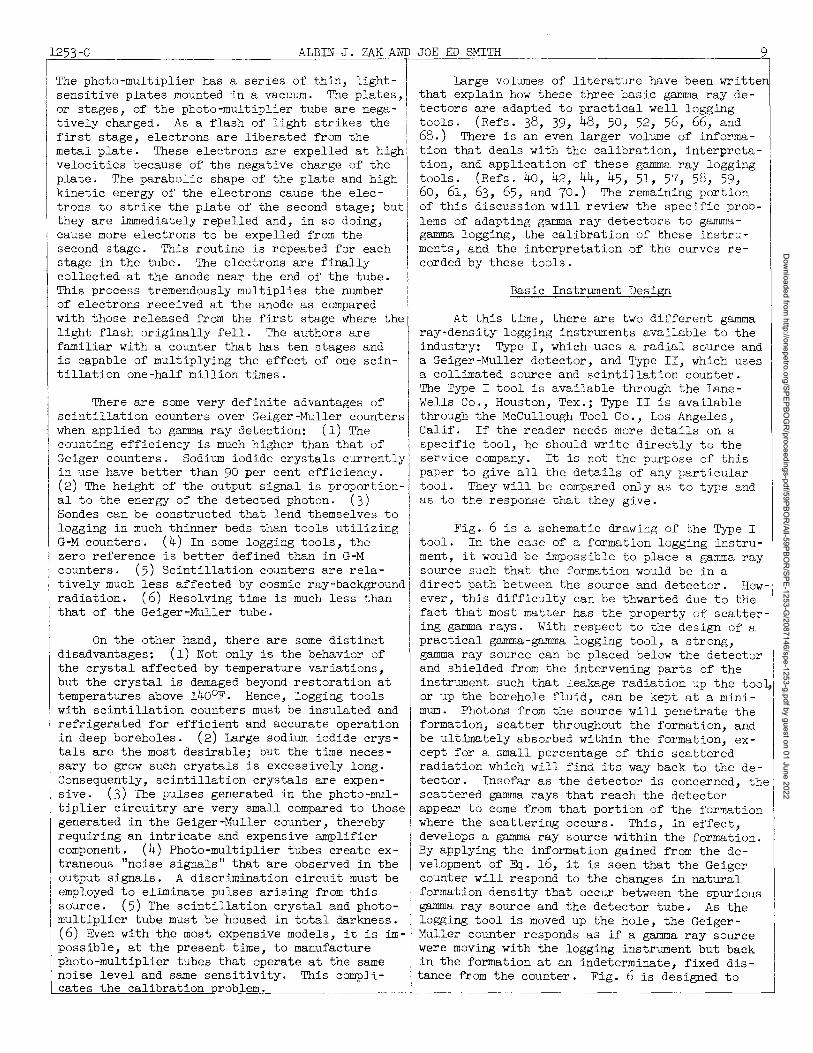
The photo-multiplier has a series of thin,~ight- 'I Large volumes of literature have been writte sensitive plates mounted in a vacuum. The plates, I that explain how these three basic gamma ray deor stages, of the photo-multiplier tube are nega- i tectors are adapted to practical well logging tively charged. As a flash of light strikes the ' tools. (Refs. 38, 39, 48, 50, 52, 56, 66, and first stage, electrons are liberated from the 68.) There is an even larger volume of informa-metal plate. These electrons are expelled at high tion that deals with the calibration, interpreta-velocities because of the negative charge of the tion, and application of these gamma ray logging plate. The parabolic shape of the plate and high tools. (Refs. 40, 42, 44, 45, 51, 57, 58, 59, kinetic energy of the electrons cause the elec- 60, 61, 63, 65, and 70.) The remaining portion trons to strike the plate of the second stage; but of this discussion will review the specific prob-they are immediately repelled and, in so doing, lems of adapting gamma ray detectors to gamma-cause more electrons to be expelled from the gamma logging, the calibration of these instru-second stage. This routine is repeated for each ments, and the interpretation of the curves re-stage in the tube. The electrons are finally corded by these tools. collected at the anode near the end of the tube. This process tremendously multiplies the number of electrons received at the anode as compared i with those released from the first stage where the light flash originally fell. The authors are familiar with a counter that has ten stages and is capable of multiplying the effect of one scintillation one-half million times.
There are some very definite advantages of scintillation counters over Geiger-Muller counters when applied to gamma ray detection: (1) The counting efficiency is much higher than that of Geiger counters. Sodium iodide crystals currently in use have better than 90 per cent efficiency. (2) The height of the output signal is proportional to the energy of the detected photon. (3) Sondes can be constructed that lend themselves to logging in much thinner beds than tools utilizing G-M counters. (4) In some logging tools, the zero reference is better defined than in G-M counters. (5) Scintillation counters are relatively much less affected by cosmic ray-background radiation. (6) Resolving time is much less than that of the Geiger-Muller tube.
On the other hand, there are some distinct disadvantages: (1) Not only is the behavior of the crystal affected by temperature variations, but the crystal is damaged beyond restoration at temperatures above 1400 F. Hence, logging tools with scintillation counters must be insulated and refrigerated for efficient and accurate operation in deep boreholes. (2) Large sodium iodide crystals are the most desirable; but the time necessary to grow such crystals is excessively long. Consequently, scintillation crystals are expensive. (3) The pulses generated in the photo-multiplier circuitry are very small compared to those generated in the Geiger-Muller counter, thereby requiring an intricate and expensive amplifier component. (4) Photo-multiplier tubes create extraneous "noise signals" that are observed in the output signals. A discrimination circuit must be employed to eliminate pulses ariSing from this source. (5) The scintillation crystal and photomultiplier tube must be housed in total darkness. (6) Even with the most expensive models, it is impOSSible, at the present time, to manufacture photo-multiplier tubes that operate at the same noise level and same sensitivity. This complicates the calibration roblem.
Basic Instrument Design
At this time, there are two different gamma ray-density logging instruments available to the industry: Type I, which uses a radial source and a Geiger-Muller detector, and Type II, which uses a collimated source and scintillation counter. The Type I tool is available through the LaneWells Co., Houston, Tex.; Type II is available through the McCullough Tool Co., Los Angeles, Calif. If the reader needs more details on a specific tool, he should write directly to the service company. It is not the purpose of this paper to give all the details of any particular tool. They will be compared only as to type and as to the response that they give.
Fig. 6 is a schematic drawing of the Type I tool. In the case of a formation logging instrument, it would be impossible to place a gamma ray source such that the formation would be in a direct path between the source and detector. However, this difficulty can be thwarted due to the fact that most matter has the property of scattering gamma rays. With respect to the design of a practical gamma-gamma logging tool, a strong, gamma ray source can be placed below the detector and shielded from the intervening parts of the instrument such that leakage radiation up the too~ or up the borehole fluid, can be kept at a minimum. Photons from the source will penetrate the formation, scatter throughout the formation, and be ultimately absorbed within the formation, except for a small percentage of this scattered radiation which will find its way back to the detector. Insofar as the detector is concerned, the scattered gamma rays that reach the detector appear to come from that portion of the formation where the scattering occurs. ThiS, in effect, develops a gamma ray source within the formation. By applying the information gained from the development of Eq. 16, it is seen that the Geiger counter will respond to the changes in natural formation denSity that occur between the spurious gamma ray source and the detector tube. As the logging tool is moved up the hole, the GeigerMuller counter responds as if a gamma ray source were moving with the logging instrument but back in the formation at an indeterminate, fixed distance from the counter. Fig. 6 is designed to
Dow
nloaded from http://onepetro.org/SPEPBO
GR
/proceedings-pdf/59PBOR
/All-59PBOR
/SPE-1253-G/2087146/spe-1253-g.pdf by guest on 01 June 2022
10 GAMMA RAY_::Q~~ __ L_OG_G_IN_G __ ~~~~~~~~~~~~~--=12=.,5,,-,,3'---=,G I
illustrate most of these concepts. The source i material in the Type I tool is radioactive cobalt;! the photons emitted from C060 are polyenergetic, II
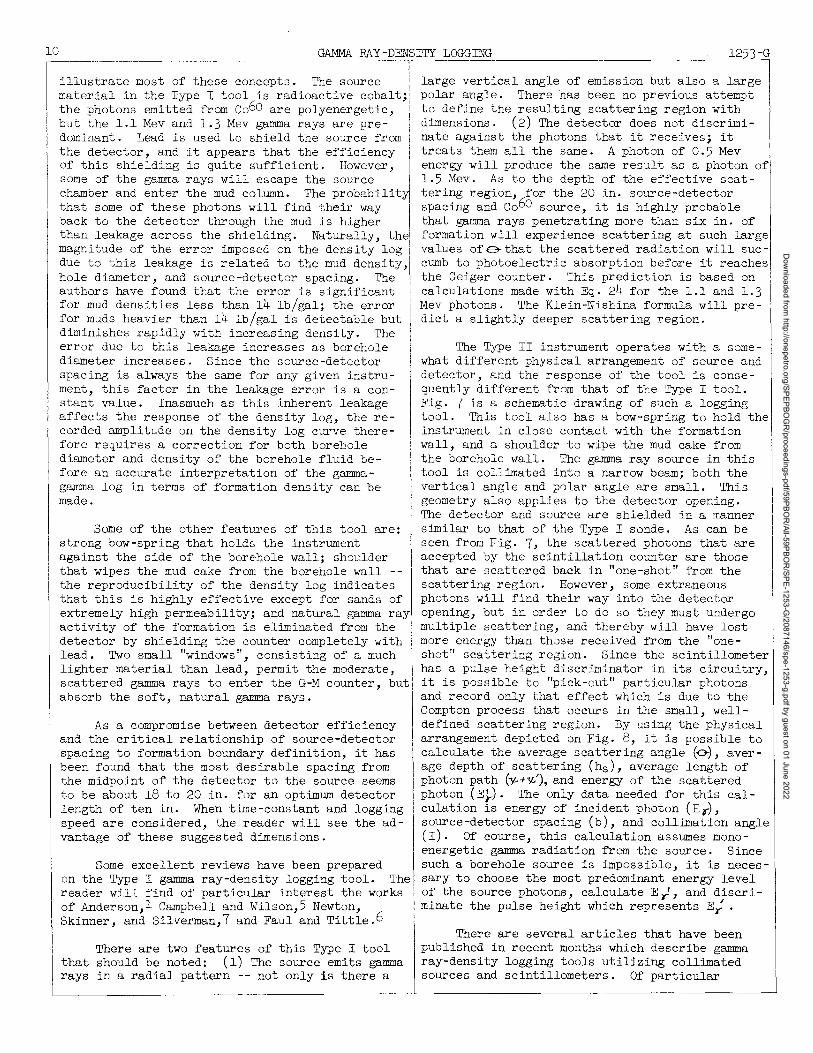
but the 1.1 Mev and 1.3 Mev gamma rays are pre- i dominant. Lead is used to shield the source from I the detector, and it appears that the efficiency I of this shielding is quite sufficient. However, some of the gamma rays will escape the source I chamber and enter the mud column. The probabilit~ that some of these photons will find their way I back to the detector through the mud is higher than leakage across the shielding. Naturally, thel magnitude of the error imposed on the density log i due to this leakage is related to the mud density,' hole diameter, and source-detector spacing. The authors have found that the error is significant for mud densities less than 14 lb/gal; the error for muds heavier than 14 lb/gal is detectable but diminishes rapidly with increasing density. The error due to this leakage increases as borehole diameter increases. Since the source-detector spacing is always the same for any given instrument, this factor in the leakage error is a constant value. Inasmuch as this inherent leakage affects the response of the density log, the recorded amplitude on the density log curve therefore requires a correction for both borehole diameter and density of the borehole fluid before an accurate interpretation of the gammagamma log in terms of formation density can be made.
Some of the other features of this tool are: strong bow-spring that holds the instrument against the side of the borehole wall; shoulder that wipes the mud cake from the borehole wall -the reproducibility of the density log indicates that this is highly effective except for sands of extremely high permeability; and natural gamma ray activity of the formation is eliminated from the I detector by shielding the counter completely with I lead. Two small "windows", consisting of a much 'I'
lighter material than lead, permit the moderate, scattered gamma rays to enter the G-M counter, but absorb the soft, natural gamma rays.
As a compromise between detector efficiency and the critical relationship of source-detector spacing to formation boundary definition, it has been found that the most desirable spacing from the midpoint of the detector to the source seems to be about 18 to 20 in. for an optimum detector length of ten in. When time-constant and logging speed are considered, the reader will see the advantage of these suggested dimensions.
Some excellent reviews have been prepared on the Type I gamma ray-density logging tool. The reader will find of particular interest the works of Anderson,l Campbell and Wilson,5 Newton, Skinner, and Silverman,7 and Faul and Tittle. 6
There are two features of this Type I tool that should be noted: (1) The source emits gamma rays in a radial pattern -- not only is there a
large vertical angle of emission but also a large polar angle. There has been no previous attempt to define the resulting scattering region with dimensions. (2) The detector does not discriminate against the photons that it receives; it treats them all the same. A photon of 0.5 Mev energy will produce the same result as a photon of 1.5 Mev. As to the depth of the effective scattering region, for the 20 in. source-detector spacing and C060 source, it is highly probable that gamma rays penetrating more than six in. of formation will experience scattering at such large values of -e- that the scattered radiation will suc-cumb to photoelectric absorption before it reaches the Geiger counter. This prediction is based on calculations made with Eq. 24 for the 1.1 and 1.3 Mev photons. The Klein-Nishina formula will predict a slightly deeper scattering region.
The Type II instrument operates with a somewhat different physical arrangement of source and detector, and the response of the tool is consequently different from that of the Type I tool. Fig. 7 is a schematic drawing of such a logging tool. This tool also has a bow-spring to hold the instrument in close contact with the formation wall, and a shoulder to wipe the mud cake from the borehole wall. The gamma ray source in this tool is collimated into a narrow beam; both the vertical angle and polar angle are small. This geometry also applies to the detector opening. The detector and source are shielded in a manner similar to that of the Type I sonde. As can be seen from Fig. 7, the scattered photons that are accepted by the scintillation counter are those that are scattered back in "one-shot" from the scattering region. However, some extraneous photons will find their way into the detector opening, but in order to do so they must undergo multiple scattering, and thereby will have lost more energy than those received from the "oneshot" scattering region. Since the scintillometer has a pulse height discriminator in its circuitry, it is possible to "pick-out" particular photons and record only that effect which is due to the Compton process that occurs in the small, welldefined scattering region. By using the physical arrangement depicted on Fig. 8, it is possible to calculate the average scattering angle (t8, average depth of scattering (hs ), average length of photon path (-y.+;t,'), and energy of the scattered photon (EY)' The only data needed for this calculation is energy of incident photon (E (") , source-detector spacing (b), and collimation angle (I). Of course, this calculation assumes monoenergetic gamma radiation from the source. Since such a borehole source is impossible, it is necessary to choose the most predominant energy level of the source photons, calculate Ey', and discriminate the pulse height which represents E; .
There are several articles that have been published in recent months which describe gamma ray-density logging tools utilizing collimated sources and scintillometers. Of particular
Dow
nloaded from http://onepetro.org/SPEPBO
GR
/proceedings-pdf/59PBOR
/All-59PBOR
/SPE-1253-G/2087146/spe-1253-g.pdf by guest on 01 June 2022
ALBIN J. ZAK AND JOE ED c:=SM~IT""H,=--________________ -=l=-,l
I 12 -G
interest is the works of Baker,3,11 Caldwell, 4, 16 I Sippel and Hodges,9 and Caldwell and Sippel. 17 I
I
The scintillation counter and its associated! electronic components are very intricate and delil cate. The behavior of the crystal is extremely i
sensitive to temperature changes above 800 F, and I the necessity of insulating and refrigerating i the counter cannot be over emphasized. It is i
I
felt that a large majority of the early sondes I were insufficiently protected against the temper-atures encountered in wellbores. Photo-multi- I plier tubes are difficult to calibrate with respect to a common reference due to the dissimi- i larity of tubes even of the same make and model. I Pulse height discrimination is a relatively new I technique as applied in gamma-gamma logging, al- I though it is a standard procedure in X-ray I analysis. I
To the present time, the Type I sonde has been more widely used in the Mid-Continent and I Gulf Coast areas. Consequently, calibration I curves and interpretation aids on this tool are readily available. The Type I tool has a limited-detail caliper that ,is run simultaneously with the gamma-gamma curve, thus eliminating the chance of miscorrelation of "wash-outs" on the density log.
Calibration of Instrument
The attenuation of gamma rays using good geometry and monoenergetic, narrow, collimated, gamma ray beams is predicted by Eq. 16. The Compton process is well-defined with Eqs. 21 and 24, but only for a monoenergetic photon experiencing a single scattering in one plane. The complete process of gaJJllDa ray scattering and absorption is so complex that it is mathematically prohibitive to attempt computing the response of this instrument in a borehole. Consequently, the preliminary calibrations were made in special test holes of several diameters. Rocks and special concrete mixtures of known density were used as the scattering media. When the density logging tools were used in the field with boreholes that had been cored, values of density derived from core analysis were correlated with density measured with the gamma-gamma log. This combination of data has been used to construct the basic calibration charts necessary for density log interpretation. In the case of the Type I tool, these charts (See Fig. 10) give density log deflections as a function of natural rock density (e~) for any instrument response factor (IRF) at various values of borehole diameter (D) and borehole fluid density (~~). Campbell and Wilson5 have presented an excellent review of the calibration of this tool, source strength and sensitivity adjustments, and mud weight and hole size corrections.
The calibration curve for the Type II density log instrument is much less complex than
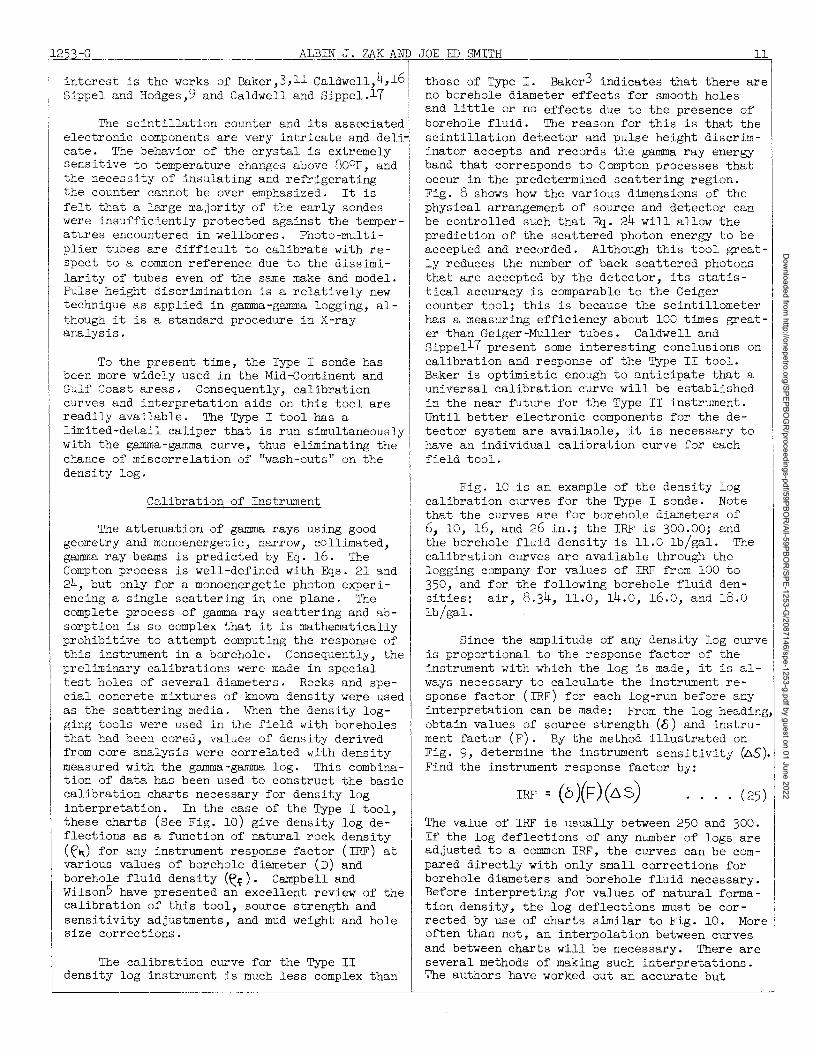
those of Type I. Baker3 indicates that there are no borehole diameter effects for smooth holes and little or no effects due to the presence of borehole fluid. The reason for this is that the scintillation detector and pulse height discriminator accepts and records the gamma ray energy band that corresponds to Compton processes that occur in the predetermined scattering region. Fig. 8 shows how the various dimensions of the physical arrangement of source and detector can be controlled such that Eg. 24 will allow the prediction of the scattered photon energy to be accepted and recorded. Although this tool greatly reduces the number of back scattered photons that are accepted by the detector, its statistical accuracy is comparable to the Geiger counter tool; this is because the scintillometer has a measuring efficiency about 100 times greater than Geiger-Muller tubes. Caldwell and Sippel17 present some interesting conclusions on calibration and response of the Type II tool. Baker is optimistic enough to anticipate that a universal calibration curve will be established in the near future for the Type II instrument. Until better electronic components for the detector system are available, it is necessary to have an individual calibration curve for each field tool.
Fig. 10 is an example of the density log calibration curves for the Type I sonde. Note that the curves are for borehole diameters of 6, 10, 16, and 26 in.; the IRF is 300.00; and the borehole fluid density is 11.0 lb/gal. The calibration curves are available through the logging company for values of IRF from 100 to 350, and for the following borehole fluid densities: air, 8.34, 11.0, 14.0, 16.0, and 18.0 lb/gal.
Since the amplitude of any density log curve is proportional to the response factor of the instrument with which the log is made, it is always necessary to calculate the instrument response factor (IRF) for each log-run before any interpretation can be made: From the log heading, obtain values of source strength (6) and instrument factor (F). By the method illustrated on Fig. 9, determine the instrument sensitivity (bS). Find the instrument response factor by:
•. (25)
The value of IRF is usually between 250 and 300. If the log deflections of any number of logs are adjusted to a COJJllDon IRF, the curves can be compared directly with only small corrections for borehole diameters and borehole fluid necessary. Before interpreting for values of natural formation density, the log deflections must be corrected by use of charts similar to Fig. 10. More often than not, an interpolation between curves and between charts will be necessary. There are several methods of making such interpretations. The authors have worked out an accurate but
Dow
nloaded from http://onepetro.org/SPEPBO
GR
/proceedings-pdf/59PBOR
/All-59PBOR
/SPE-1253-G/2087146/spe-1253-g.pdf by guest on 01 June 2022
12 GAMMA RAY -DENBITY LOGc--=-:cG-=ING'-'-'-_______________ l_25'--'3'---------,G
com:~~-ca-ted-tr~-p-l-e-l-· n-t-~r-p-o-l-a-t-ion-p-r-o-c-e-d-ur-~.--F-o-r- I methods of statistical correlations, curve fit- I ting and curve interpolation, see Ref. 75, 76, i 77,78,85,88,89. The entire interpretation isl , programed on an electronic digital computer I
(IBM 650) thus minimizing the manual efforts.
A brief note on statistical error, sensitivity, time-constant, and logging speed is in order A very comprehensive analysis of these parameters is presented in literature published by LaneWells Co.56 Any geologist or engineer confronted with the analysis of radioactivity logs should have a thorough understanding of these factors. Assuming that the reader is familiar with this subject matter, this paper will recognize a few of the important points that apply specifically to gamma ray-density logging:
(A) Make certain that the log quality is sufficient. Experience is the best formula here, but the "quality index number" makes a good rule of thumb for the inexperienced. This number is the ratio of the distance between maximum and minimum deflections of the logged section to the distance between maximum and minimum peaks on the statistical recording. This index number should be greater than five for safe interpretation. Experience in local areas may indicate that a much higher quality index should be expected for reliable interpretation.
(B) The density logging instruments automatically correct for lag. It is important that the logging reference point on the sonde is under stood in this respect.
(c) Normally, density logs are run at speed from 20 ft/min to 50 ft/min. Logging speed is an important parameter with regard to density log interpretation, and logging speed and time-constant should be selected such that good log quality is assured.
(D) Repeat runs should be made over the sections of interest along zero and statistical checks. Instrument sensitivity should be determined both before and after the log is run.
INTERPRETATION AND APPLICATIONS
Geologic Applications
It is anticipated that the density log will have great utility to the geophysicist, petroleum geologist and engineer. DenSity measurements will expedite the solution of a great number of geophysical problems that are common in exploration work. Values of natural density are important in the interpretation of gravity meter surveys. Newton, Skinner, and Silverman7 were among the first to use a density logging tool for this purpose. Geologists were later able to make use of the concept. It has been used in several
localities as a correlation log. When a formation is known to be homogenous and non-porous, or only slightly porous, the density log makes an excellent log from which to construct cross sections and follow the general lithology of an area.
Estimation of Porosity from Formation Density
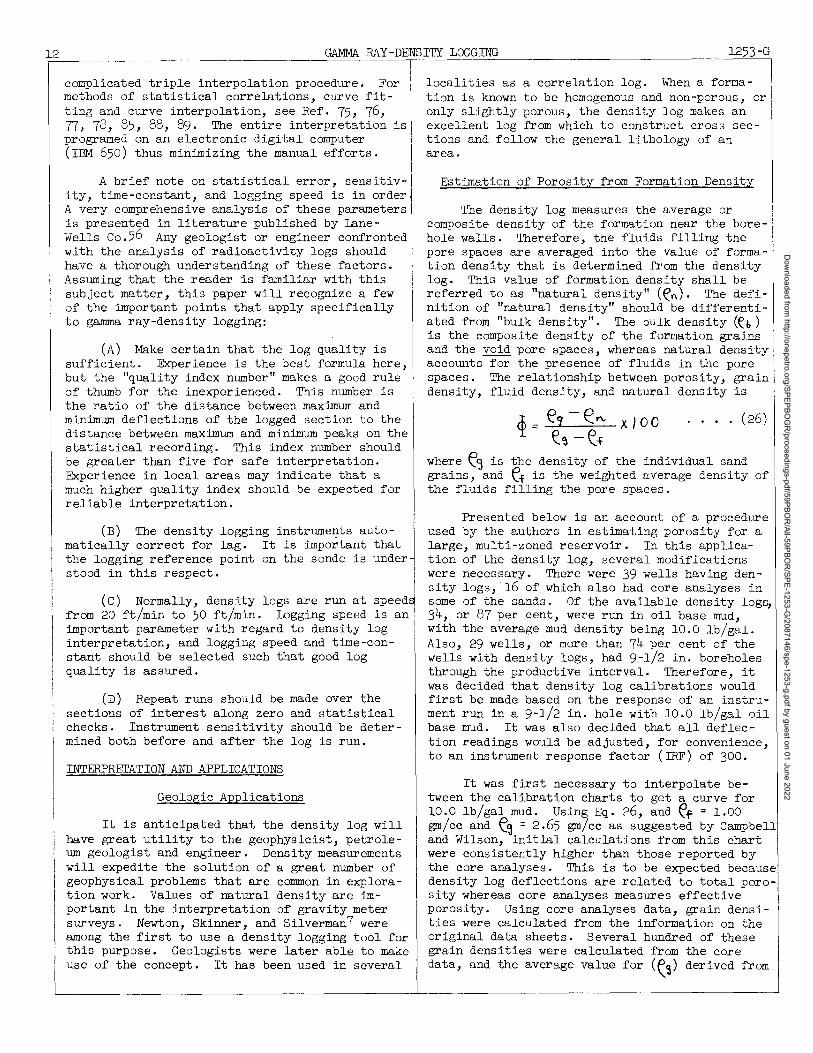
The density log measures the average or composite density of the formation near the borehole walls. Therefore, the fluids filling the pore spaces are averaged into the value of formation density that is determined from the density log. This value of formation density shall be referred to as "natural denSity" (~n)' The definition of "natural density" should be differentiated from "bulk density". The bulk density (~" ) is the composite density of the formation grains and the void pore spaces, whereas natural denSity accounts for the presence of fluids in the pore spaces. The relationship between porOSity, grain density, fluid density, and natural denSity is
~::: eC] -€n. X 100 ~~ - e-f
..•. (26)
where e~ is the density of the individual sand grains, and ef is the weighted average density of the fluids filling the pore spaces.
Presented below is an account of a procedure used by the authors in estimating porosity for a large, multi-zoned reservoir. In this application of the density log, several modifications were necessary. There were 39 wells having density logs, 16 of which also had core analyses in some of the sands. Of the available density log~ 34, or 87 per cent, were run in oil base mud, with the average mud density being 10.0 lb/gal. Also, 29 wells, or more than 74 per cent of the wells with density logs, had 9-1/2 in. boreholes through the productive interval. Therefore, it was decided that density log calibrations would first be made based on the response of an instrument run in a 9-1/2 in. hole with 10.0 lb/gal oil base mud. It was also decided that all deflection readings would be adjusted, for convenience, to an instrument response factor (IRF) of 300.
It was first necessary to interpolate between the calibration charts to get a curve for 10.0 lb/gal mud. Using Eq. 26, and er = 1.00 gm/cc and e~ = 2.65 gm/cc as suggested by Campbell and Wilson, initial calculations from this chart were consistently higher than those reported by the core analyses. This is to be expected because denSity log deflections are related to total porosity whereas core analyses measures effective porOSity. Using core analyses data, grain densities were calculated from the information on the original data sheets. Several hundred of these grain densities were calculated from the core data, and the average value for (e~) derived from
Dow
nloaded from http://onepetro.org/SPEPBO
GR
/proceedings-pdf/59PBOR
/All-59PBOR
/SPE-1253-G/2087146/spe-1253-g.pdf by guest on 01 June 2022
ALBIN J. UK AND JOE ED SMITH __________________ -=1""'3 - I -1253-G
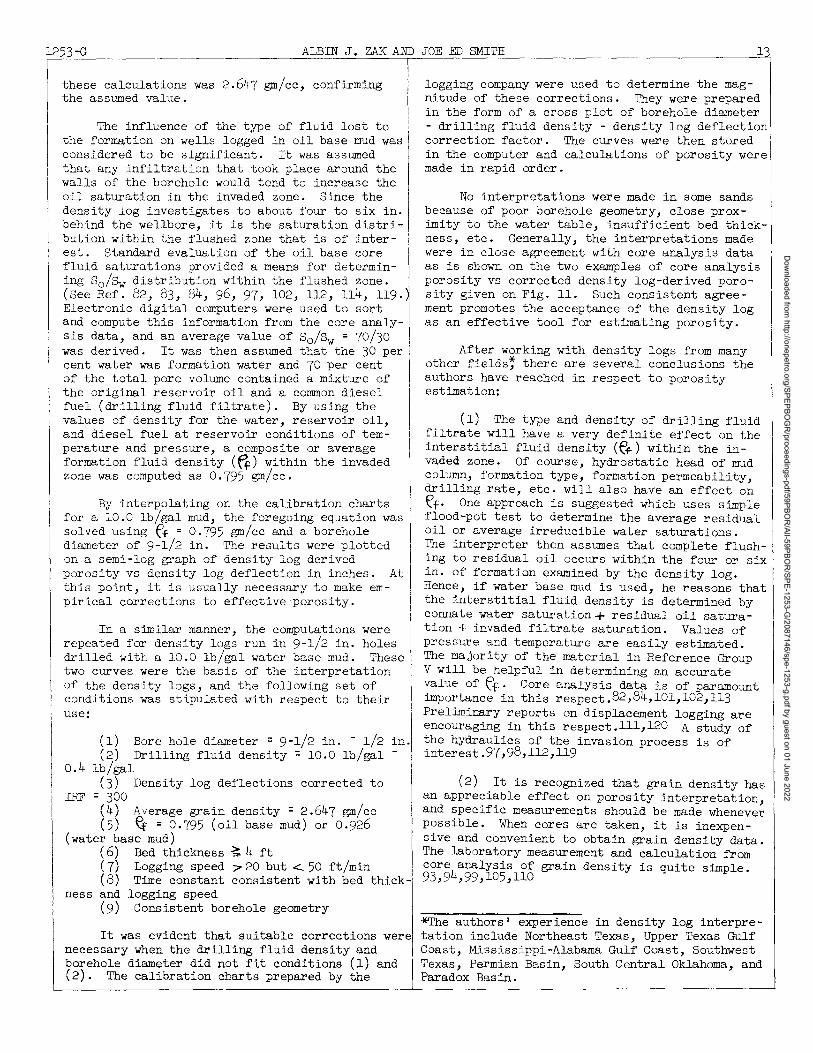
these calculations was 2.647 gm/cc, confirming I the assumed value.
The influence of the type of fluid lost to the formation on wells logged in oil base mud was considered to be significant. It was assumed
I
that any infiltration that took place around the walls of the borehole would tend to increase the oil saturation in the invaded zone. Since the density log investigates to about four to six in. behind the wellbore, it is the saturation distribution within the flushed zone that is of interest. Standard evaluation of the oil base core I fluid saturations provided a means for determin- I ing So/Sw distribution within the flushed zone. (See Ref. 82, 83, 84, 96, 97, 102, 112, 114, 119.~ Electronic digital computers were used to sort and compute this information from the core analysis data, and an average value of So/Sw = 70/30 was derived. It was then assumed that the 30 per cent water was formation water and 70 per cent of the total pore volume contained a mixture of the original reservoir oil and a common diesel fuel (drilling fluid filtrate). By using the values of density for the water, reservoir oil, and diesel fuel at reservoir conditions of temperature and pressure, a composite or average formation fluid density (ff) within the invaded zone was computed as 0.795 gm/cc.
By interpolating on the calibration charts for a 10.0 Ib/gal mud, the foregoing equation was solved using e~ = 0.795 gm/cc and a borehole diameter of 9-1/2 in. The results were plotted on a semi-log graph of density log derived porosity vs density log deflection in inches. At this point, it is usually necessary to make empirical corrections to effective porosity.
In a similar manner, the computations were repeated for density logs run in 9-1/2 in. holes drilled with a 10.0 Ib/gal water base mud. These two curves were the basis of the interpretation of the density logs, and the following set of conditions was stipulated with respect to their use:
(1) Bore hole diameter = 9-1/2 in. - 1/2 in. (2) Drilling fluid density = 10.0 Ib/gal -
0.4 Ib/gal (3) Density log deflections corrected to
IRF = 300 (4) Average grain density = 2.647 gm/cc (5) Ef = 0.795 (oil base mud) or 0.926
(water base mud) (6) Bed thickness ~4 ft (7) Logging speed? 20 but.::... 50 n/min (8) Time constant consistent with bed thick
ness and logging speed (9) Consistent borehole geometry
It was evident that suitable corrections were necessary when the drilling fluid density and borehole diameter did not fit conditions (1) and (2). The calibration charts prepared by the
logging company were used to determine the magnitude of these corrections. They were prepared in the form of a cross plot of borehole diameter - drilling fluid density - density log deflection correction factor. The curves were then stored in the computer and calculations of porOSity were made in rapid order.
No interpretations were made in some sands because of poor borehole geometry, close proximity to the water table, insufficient bed thickness, etc. Generally, the interpretations made were in close agreement with core analysis data as is shown on the two examples of core analysis porosity vs corrected density log-derived porosity given on Fig. 11. Such consistent agreement promotes the acceptance of the density log as an effective tool for estimating porosity.
After working with density logs from many other fields; there are several conclusions the authors have reached in respect to porosity estimation:
(1) The type and denSity of drilling fluid filtrate will have a very definite effect on the interstitial fluid density (e~) within the invaded zone. Of course, hydrostatic head of mud column, formation type, formation permeability, drilling rate, etc. will also have an effect on ef· One approach is suggested which uses simple flood-pot test to determine the average residual oil or average irreducible water saturations. The interpreter then assumes that complete flushing to residual oil occurs within the four or six in. of formation examined by the density log. Hence, if water base mud is used, he reasons that the interstitial fluid denSity is determined by connate water saturation+ residual oil saturation + invaded filtrate saturation. Values of pressure and temperature are easily estimated. The majority of the material in Reference Group V will be helpful in determining an accurate value of ~f' Core analYsis data is of paramount importance in this respect.82,84,101,102~113 Preliminary reports on displacement logging are encouraging in this respect. lll,120 A study of the hydraulics of the invasion process is of interest.97,98,112,119
(2) It is recognized that grain density has an appreciable effect on porosity interpretation and specific measurements should be made wheneve; possible. When cores are taken, it is inexpensive and convenient to obtain grain denSity data. The laboratory measurement and calculation from core analYSis of grain denSity is quite simple. 93,94,99, 105,110
*The authors' experience in density log interpretation include Northeast Texas, Upper Texas Gulf Coast, Mississippi-Alabama Gulf Coast, Southwest Texas, Permian Basin, South Central Oklahoma, and Paradox Basin.
Dow
nloaded from http://onepetro.org/SPEPBO
GR
/proceedings-pdf/59PBOR
/All-59PBOR
/SPE-1253-G/2087146/spe-1253-g.pdf by guest on 01 June 2022
14 GAMMA RAY-DENS:rrY LOGGING 1253-G
I~--~~
(3) Borehole geometry is important. Through experience the log analyst must learn to recognize the effects of poor borehole geometry.
(4) Porosity values developed from core analysis data should be used in the development of field calibration curves. The analysis should include porosity, permeability, fluid saturations, grain density, and rock descriptions. Adequate core data must be available to construct the field calibration curves and to check the validity of this correlation as the field develops.
An interesting evaluation of the density log as a porosity tool is presented by Northcote. 8 It is unfortunate that similar such investigations have not been published on other area of activity. The work of Andersonl highlights effects of variations in grain density and interstitial fluid density on density log-derived porosity.
other Applications of Density Logging
Gamma ray-density logging instruments are finding other useful applications. Caldwell and Sippel17 give an account of a borehole fluid density tool and a cement-top locator. The former device has application in locating casing leaks or making gradient surveys. Sippel and Hodges9 have presented a tool that is used to log LPG storage wells for the location of fluid interfaces. McLendon59 cites a density logging device used to locate gas sands. Campbell and Wilson5 suggest that the tool may be useful in sulfur prospecting. The future applications of the density log are prospectively unlimited; the tool can be run in any borehole in any type of fluid. Its usefulness will be limited only by the wellbore conditions which prevent the precise measurements of density.
REFERENCES
General information concerning the interpretation and application of density logs is listed under Group I; more specific information on the theory, physical principles, instrumentation, and logging techniques are listed in Groups II and III. Research workers and log analysts will find literature of interest in all five groups.
The five reference groups are defined as follows:
detection and counting of gamma rays.
Group IV: Correlation of phenomenological laws with mathematical expressions; elementary and advanced theory of statistical correlations; and methods of curve fitting and curve interpolation.
Group V: Petrophysics of petroleum reservoir materials; evaluation of interstitial fluid properties and interstitial fluid hydraulics with respect to the quantities measured by the density log.
GROUP I
1.
2.
3·
4.
5·
6.
7·
8.
9·
Anderson, R. H.: "Applications of the Densilog", (Paper originally presented at the Oklahoma Geological Society Annual Meeting, Oklahoma City, Spring, 1958). "New Logging Technique Measures Density and Porosity", World Oil (Dec., 1954) m, 7. Baker, P.E.: "Density Logging with Gamma Rays", Trans •.• AIME (1957) 210, 289-294. Caldwell, Richard L.: "Using Nuclear Methods in Oil Well Logging", Nucleonics (Dec., 1958) 16, 12, 58-65. Campbell, John L. P., and Wilson, John C.: "Density Logging in the Gulf Coast Area", Jour. Pet. Tech., (July, 1958) 10, 7, 21-25. Faul, Henry, and Tittle, C. W.: "Logging of Drill Holes by the Neutron-Gamma Method and Gamma Ray Scattering", Geophysics, (1951) 16, 261-276. Newton, G. R., Skinner, J. E., and Silverman, Daniel: "Subsurface Formation Density Logging", Geophysics, (1954) 12, 3, 636 -abstract. (Paper originally presented at 24th Annual Meeting of Society of Exploration Geophysicists, St. Louis, Mo., April 12-15, 1954 ) • Northcote, K. E.: "A Preliminary Investigation of the Density Log As A Porosity Log", Canadian Oil and Gas Industries, (April, 1958 97-106. Sippel, R. F., and Hodges, D.: "Simplified Gamma Ray Technique Used in LPG Storage Well Logging", Pet. Engr. (1958) 3Q, 4, B-u8.
GROUP II
10. Aronson, R., and Goldstein, H.: "Status of Calculations of Gamma Ray Penetration", NDA Report No. 15C-l, (1952), Nuclear Development Associates, White Plains, N. Y.
Group I: Direct reference to interpreta- 11. Baker, P. E.: ''Neutron Capture Gamma Ray Spectra of Earth Formations", Jour. Pet. Tech. (March, 1957) 2, 3·
tion and application of density logs; brief discussions of physical principles.
Group II: Theoretical aspects of the den-sity log; academic treatment of the physical laws governing the behavior of gamma rays.
Group III: Detailed survey of instrumen-
12.
tation and logging techniques involving the 13.
Belcher, D. J., Herner, R. C., Cuykendall, T. R., and Sack, H. S.: "Use of Radioactive Material to Measure Soil Moisture and Density", AS'lM Tech. Paper No. 134 (1953) American SOCiety of Testing Engineers, Philadelphia, Pa., 10-22. Bitter, Francis M.: Nuclear Physics (1950)
Dow
nloaded from http://onepetro.org/SPEPBO
GR
/proceedings-pdf/59PBOR
/All-59PBOR
/SPE-1253-G/2087146/spe-1253-g.pdf by guest on 01 June 2022
1253-G
14.
15·
16.
17·
18.
19·
20.
2l.
22.
23·
24.
25·
26.
27·
28.
29·
30.
3l.
32.
Addison-Wesley and Co., cambri~::::~. ZAK ANDI3:~E :lm~::. T.: "Graphs of the Compton fuer~: Blatt, S. M., and Weisskopf, V. F.: Theo-, Angle Relationships and the Klein-Nishina retical Nuclear Physics, (1952) John Wiley Formula from 10 Kev to 500 Mev", National and Sons, New York, N. Y. I Bureau of Standards Circular No. 542 (1953) Caldwell, Richard L.: "Gamma Radiation from U. S. Dept. of Commerce, Washington, D. C. Inelastic Scattering of 14-Mev Neutrons in 34. Occhialini, G. P. S., and Powell, C. F.: the Common Earth Elements", Bull., Am. Phy- I "Nuclear Disintegration Produced by Slow sics Society, Series II (Feb. 24, 1956)}, I Charged Particles of Small Mass", Nature No.2, 90. (1947) 122, 186-190. Caldwell, Richard L.: "Nuclear Physics in 35. Pocock, B. W.: "An Analysis of Certain Petroleum Exploration Research", World Pet. Mathematical Assumptions Underlying the De-(1956) ~, No.4, 59. sign and Operation of Gamma Ray Surface Caldwell, Richard L., and Sippel, Robert F.: DenSity Gages", Michigan State Highway De-I~ew Developments in Radioactive Well Log- partment Report No. 261 (July 17, 1956). ging Research", Bull., AAPG (Jan., 1958) 42, 36. Semat, Henry: Introduction to Atomic Phys-No.1, 159-171. ics, (1946) Rinehart and Co., New York, N. Y. Compton, A. H., and Allison, S. K.: X-Rays 37. White, G. R.: "X-Ray Attenuation Coeffici-in Theory and Experiment, (1935) D. Van Nos- ents from 10 Kev to 100 Mev", National Bureau trand and Co., New York, N. Y. of Standards Report No. 1003 (1952) U. S. Dienes, C. J.: "Radiations Effects in Dept. of Commerce, Washington, D. C. Solids", Annual Review of Nuclear Science (1953) g, 187-220. DuMond, J. W. M., and Cohen, E. R.: "LeastSquares Adjustment of the Atomic Constants", Reviews in Modern Physics (1953) £2, 691-708. Evans, R. D., and Evans, O. R.: "Studies of Self-Absorption in Gamma Ray Sources", Review of Modern Physics (1948) 20, 305-326. Fano, Ugo: "Gamma Ray Attenuation", Nucleonics (1953) 11, No.8, 8-12 and No.9, 56-61. --Fano, Ugo: "Principles of Radiological Physics", National Bureau of Standards Report No. 1002 (1951) U. S. Department of Commerce, Washington, D. C. Faul, Henry, et al: Nuclear Geology, (1954) John Wiley and Sons, New York, N. Y. Fermi, Enrico: Nuclear Physics, (1950) University of Chicago Press, Chicago, Ill. Friedlander, G., and Kennedy, J. W.: Introduction to Radiochemistry, (1949) John Wiley and Sons, New York, N. Y. Glasstone, S. H.: Sourcebook on Atomic Energy, (1950) D. Van Nostrand and Co., New York, N. Y. Halliday, David: Introduction to Nuclear PhYSics, 2nd Edition, (1955) John Wiley and Sons. Hirshfelder, J. 0., Magee, J. L., and Hull, M. H.: "The Penetration of Gamma Radiation Through Thick Layers", Physics Review (1948) 1.3., 852-862. Lane, D. A., Torchinsky, B. B., and Spinks, J. W. T.: "Determining Soil Moisture and Density by Nuclear Radiations", AS'lM Tech. Paper No. 134 (1953) 23-34. Lapp, R. E., and Andrews, H. L.: Nuclear Radiation Physics, (1954) Prentice-Hall, New York, N. Y. Lind, D. A., Brown, J. R., and DuMond, J. W. M.: "A Precision Determination of the Energy of the 1.1 and 1.3 Mev Gamma Radiations from c060 by Direct Crystal Diffraction", Physics Review (1949) 12, 591.
GROUP III
38.
39·
40.
4l.
42.
44.
46.
48.
Armstrong, F. E.: "A Small Diameter Transistor Operated Probe for Gamma Ray Logging", (Presented at Symposium on Applications of Radioactivity in Petroleum Exploration and Production, No~ 6-8, 1957, Houston, Tex.). Atkins, E. R.: "Fundamental Theory and Instrumentation of Radioactivity Logging", AIME Tech. Paper No. 586-G. (Paper presented at Formation Evaluation Symposium, Houston, Tex., Oct. 27-28, 1955.). Blanchard, A., and Dewan, J. T.: "The Calibration of Gamma Ray Logs", Pet. Engr. (Aug., 1953) B76-B80. Bousquet, A. G.: "Counting Rate Meters vs Scalers", Nucleonics (1949) ~, No.2, 67-76. Brannon, H. R., and Osaba, J. S.: "Spectral Gamma Ray Logging", Jour. Pet. Tech. (Feb. 1956) 30. Brown, S. C.: "Theory and Operation of Geiger-Muller Counters", Nucleonics (1948) g, No.6, 10-22; (1949) }, No.2, 50-64 and No.4, 46-6l. Bush, Robert E., and Mardock, E. S.: "The Quantitative Application of Radioactivity Logs", Trans. AIME (1951) 192, 191-198. Bush, Robert E., and Mardock, E. S.: "Some Preliminary Investigations of Quantitative Interpretations of Radioactivity Logs", Trans. AIME (1950) 189, 19-34. Cooke-Yarborough, E. H., and Pulsford, E. W.: "A Counting-Rate Meter of High Accuracy", Proc., Institute of Electrical Engineers, London, fugland (1951) 2§, Part II, 191-195. Curt is s, L. F.: "The Geiger -Muller Counter", USNBS Circ. No. 490 (1950) U. S. National Bureau of Standards, Washington, D. C., 1-25. Curtiss, L. F.: "Measurements of Radioactivity", USNBS Circ. No. 476 (1949) u. S. National Bureau of Standards, Washington, D. C., 1-84. DiGiovanni, H. J., Graveson, R. T., and Yoli, A. H.: "Scintillation Unit for Drill Hole
Dow
nloaded from http://onepetro.org/SPEPBO
GR
/proceedings-pdf/59PBOR
/All-59PBOR
/SPE-1253-G/2087146/spe-1253-g.pdf by guest on 01 June 2022
16
1:. I 51.
52.
53·
54.
55·
56.
57·
58.
59·
60.
61.
62.
64.
66.
68.
GAMMA RAY-DENSITY LOGGING 1253-G ---------- --r--Logging", Nucleonics (1953) ll, No.4, 34-39.1 69· Fearon, R. E.: "Gamma Ray Well Logging", I
Nucleonics (1949) ~, No.4, 67-75. I
Fearon, R. E., and Mardock, E. S.: "The I 70. Quantitative Interpretation of Radioactivity I
Logs", Oil and Gas Jour. (March 24, 1952) I 188-194. I 71. Guelke, R. J., Heydenrych, C. R., and Ander-
Toelke, L. W.: !!Scintillation Spectrometer Well Logging", AIME Tech. Paper No. 495-G (Presented in Denver, Colo., May, 1955.). Vomocil, J. A.: "In Situ Measurement of Soil Bulk Density", Agricultural Engr. (1954) l2., No·9· Youmans, Arthur, and Monaghan, Ralph: "Stability Requirements for Scintillation Counters Used in Radioactivity Logging", Trans. AIME (1957) 210, 231.
son, F.: !Measurement of Radioactivity and I Temperature in Narrcw Boreholes and the II
Development 'Jf Instruments for this Purpose!!, Jour. of Scientific Instruments and Physics GROUP IV in Industry (1949) 26, 150-153. Hur ley, P. M.: !!Direct Radiometr ic Measurement by Gamma-Ray Scintillation Spectrometer!!, Bull. GSA (1956) fil, 395, 405.
72.
Korff, S. A.: Electron and Nuclear Counters, 73. (1946) D. Van Nostrand Co., New York, N. Y. Lane-Wells Co.: !!Basic Principles of Radioactivity!!, Radioactivity Well Logging, LaneWells Publication No. LR-91-C (1956).
74.
Lane-Wells Co.: "Instrumentation and Log-ging Procedures!!, Radioactivity Well Logging, 75. Lane-Wells Publication No. LR-92-C (1956). Lane-Wells Co.: !!Other Radioactivity Curves and Their Uses!!, Radioactivity Well Logging, Lane-Wells Publication No. LR-95-C (1956). Loevinger, R., and Berman, M.: "Efficiency Criteria in Radioactivity Counting", Nucleonics (1951) 2, No.1, 26-39. McLendon, Dan H.: !!Radioactivity Logs for Gas Location!!, World Oil (Feb., 1959) 148, No.2, 79-84. Mercier, V. J., and Redford, W. H.: "New Calibration and Conversion Techniques for Radioactivity Logs!!, Jour. Pet. Tech. (Sept., 1957) IX, No·9, 11-15. Muench, N. L., and Osaba, J. S.: "Identification of Earth Materials by Induced Gamma Ray Spectrol Analysis", Tr~ AIME (1947) 210, 89. Peirson, D. H.: !!The Background Counting Rate in a Geiger-Muller Counter", Proc. International Physics Society, London, England (1951) B-64, 427-428. Pirson, Sylvain J.: "Radioactivity Well Logging", Oil Reservoir En ineerin , Second Edition (1958 McGraw-Hill Book Co., New York, N. Y., 212-232. Rossi, B. B., and Staub, H. H.: Ionization Chambers and Counters, (1949) McGraw-Hill Book Co., New York, N. Y. Russell, William L.: !!The Total Gamma Ray Activity of Sedimentary Rocks as Indicated by Geiger Counter Determinations", Geophysics (1944) 2, 180-216. Russell, William L.: !!Well Logging by Radioactivity!!, Bull. AAPG (Sept., 1941) £2., No. 9, 1775-1788.
76.
77·
78.
79·
80.
81.
82.
84.
Russell, William L., and Scherlatskoy, S. A.: 85. "The Use of Sensitive Gamma Ray Detectors in Prospecting", Economic Geol. (1951) 46, 427-446. Slack, H. A.: !~ield Measurement of the Radioact i vi ty of Rocks", Trans. AGU (1952)
897-901.
86.
Aitken, A. C.: Statistical Mathematics, 7th Edition, (1952) Oliver and Boyd Publishing Co., London, England. Churchill, Ruel V.: Modern Operational Mathematics in Engineering, First Edition, (1944) McGraw-Hill Book Co., New York, N. Y. Cowden, Dudley J.: Applied General Statistics, (1940) Prentice-Hall, Inc., New York, N. Y. Crout, P. D.: cal Problems", (1940) 12., 34. Deming, W. E.: Squares", Bull. (1938) 136-141.
"Integral Equations and PhysiJour. of Math. and Physics
"Some Notes on Least U. S. Dept. of Agriculture
Ezekiel, Mordecai: !!A First Approximation to the Sampling Reliability of Multiple Correlation Curves Obtained from Successive Graphic Approximations", Math. Statistics Annual (Sept., 1930) 1. Ezekiel, Mordecai: "A Method of Handling Curvilinear Correlation For Any Number of Variables", Bull. Am. Statistics Assn. (Dec. 1924) XIX, 431-453. Ezekiel, Mordecai: Methods of Correlation Analysis, (1941) John Wiley and Sons, Inc., New York, N. Y. Fisher, R. A.: !!Statistical Methods for Research Workers", Seventh Edition (1938) Oliver and Boyd Publishing Co., London, England. Hoel, Paul G.: Introduction to Mathematical Statistics, (1954) John Wiley and Sons, Inc., New York, N. Y. Kelton, Frank C., et al: "A Statistical Correlation of Total Water As Measured by Core Analyses With Actual Connate Water", (Unpublished data in confidential files of Core Laboratories, Inc., Dallas, Tex.). Law, Jan: "A Statistical Approach to the Interstitial Heterogeneity of Sand Reservoirs", Trans. AIME (1944) ill. Law, Jan, and Cerini, William F.: "A Statistical Approach to Core-AnalYSis Interpretation", Drill. and Prod. Prac., API (1946) 373-385· Rachford, H. H., and Schultz, W. P.: "Some Useful Tables for Approximating Smooth Curves by Fifth and Lower Degree Polynominals", Trans. AIME (1955) 204, 289-290. Snedecor, George W.: Statistical Methods, (1956) Iowa State College Press, Ames, Iowa.
Dow
nloaded from http://onepetro.org/SPEPBO
GR
/proceedings-pdf/59PBOR
/All-59PBOR
/SPE-1253-G/2087146/spe-1253-g.pdf by guest on 01 June 2022
1253-G ALBIN J. ZAK AND JOE ED SMITH 17
88.
Sokolinkoff, Ivan S., and Sokolinkoff, Elizabeth S.: Higher Mathematics for Engineers and Physicists, (1941) McGraw-Hill Book Co., New York, N. Y. Tolley, H. R., and Ezekiel, M.: "A Method of Handling Multiple Correlation Problems", Bull. Am. Statistics Assn. (Dec., 1923) XVIII, 994-1003. Worthing, A. G., and Geffuer, J.: Treatment of Experimental Data, (1943) John Wiley and Sons, Inc., New York, N. Y.
105·
106.
107·
GROUP V 108.
90.
91.
92.
93·
94.
95·
96.
97·
98.
99·
100.
101.
102.
Archie, G. E.: "Classification of Carbonate Reservoir Rocks and Petrophysical Considera-tions", Bull. AAPG (Feb., 1952) .3Q, No.2, 278-298. Archie, G. E.: "Introduction to Petrophysics of Reservoir Rocks", Bull. AAPG (May, 1950) ~, No.5· Arps, J. J.: "The Effect of Temperature on the Density and Electrical Resistivity of
109·
110.
Sodium Chloride Solutions", Jour. Pet. Tech. Ill. (Oct., 1953) 2, No. 10. Athy, L. F.: "Density, Porosity and Compac-tion of Sedimentary Rocks", Bull. AAPG (1930) 112. 14, 1-24. Brooks, C. S.: "An Evaluation of the Proce-dures Used in the Determination of the Grain 113. Densities of Petroleum Reservoir Minerals", Trans. AJME (1957) 210, 235 -243. Campbell, W. M., and Martin, J. L.: "Displacement Logging", Trans. AJME (1955) 204, 233-239·
114.
Clark, A. P.: "A Method for Determining Re- I
sidual Connate and Drilling Water Saturations 115. for Cable -Tool Cores", Drill. and Prod. Prac., API (1947) 175-185. deWitte, L.: "Resistivity and Saturation Distribution in Infiltrated Zones of Porous Formations", Oil and Gas Jour. (July 27, 1950) ~, No. 12, 246. Doll, H. G.: "The Invasion Process in High Permeability Sands", Pet. Engr. (Jan., 1955). Griffiths, J. C.: "Grain Size Distribution and Reservoir Rocks Characteristics", Bull. AAPG (Feb., 1952) 3Q, No.2. Hanson, G. H., Kuist, B. B., and Brown, G. G.: "Liquid Densities of Volatile Hydro-carbon Mixtures", Ind. Engr. Chern. (1944) 3Q, 1161. Horner, William L.: "Contamination of Cores by Drilling Fluid Can Be Estimated by Dis-solving Simple Chemicals in Mud", Oil Weekly (1935) ]§, No·3, 29· Horner, William L., and Lewis, James A.: "Differentiation of Water in Oil Field Cores", Prod. Monthly (Aug., 1943) 1, No.8, 45.
116.
I 117·
118.
119·
120.
103. Horner, William L., and LeWis, James A.: "Interstitial Water Saturation in the Pore Space of Reservoirs", Oil Weekly (1936) 86, No.6, 36.
104. Howard, W. V., and David, M. W.: "Development of Porosity in Limestones", Bull. AAPG
(1936) 20, 1389-1412. Imbt, William C., and Ellison, Sam P.: "Porosity in Limestone and Dolomite Petroleum Reservoirs", Drill. and Prod. Prac., API (1946) 364-372. Jones, Park J.: Petroleum Production - Mechanics of Production of Oil, Condensate, and Natural Gas, Vol. I, (1946) Reinhold Publishing Corp., New York, N. Y., 30-50. Katz, Donald L.: "Prediction of the Shrinkage of Crude Oils", Dr ill. and Prod. Prac., API (1942) 137. Kay, W. B.: "Density of Hydrocarbon Gases and Vapors", Ind. Engr. Chern. (1936) 28, 1014. LeRoy, L. W., et al: Subsurface Geologic Methods, Second Edition, (1951) A. B. Hirschfield Press, Denver, COlo., 329-341. Nafe, J. E., and Drake, C. L.: ''Variation with Depth in Shallow and Deep Water Marine Sediments of Porosity, Density, and Velocity of Compressional and Shear Waves", Geophysics (July, 1957) 22, No.3. Pritchett, W. C.: "Displacement Logging -A New Concept in Resistivity Logging", Pet. ~. (Feb., 1959) XXXI, No.2, B56-B70. Prokop, C. L.: "Radial Filtration of Drilling Mud", Jour. Pet. Tech. (Jan., 1952) ~ No. 1. Pyle, H. C., and Jones, P. H.: "Qu8,ntitative Determination of Connate Water Content of Oil Sands", Drill. and Prod. Prac., API (1936) 171-180. Schilthuis, Ralph J.: "Connate Water in Oil and Gas Sands", Trans. AJME (1938) 127, 199-214. Standing, M. B.: "A Pressure-Volume-Temperature Correlation For Mixtures of California Oils and Gases", Drill. and Prod. Prac., API (1947) 275-287. Standing, M. B.: "Oil Field Hydrocarbon Systems", (1952) Reinhold Publishing Corp., New York, N. Y. Standing, M. B., and Katz, Donald L.: "Density of Natural Gases", Trans. AIME (1942) 146, 140. Standing, M. E., and Katz, Donald L.: "Density of Crude Oils Saturated with Natural Gas", Trans. AJME (1942) 146, 159. Stuart, R. W.: "Use of Oil-Base Mud at Elk Hills Naval Petroleum Reserve", Drill. and Prod. Prac. (1946) American Petroleum Institute, 69-75.
I
Winn, R. H.: "A Report on Displacement Logging", Jour. Pet. Tech. (Feb., 1958) K, 2.
Dow
nloaded from http://onepetro.org/SPEPBO
GR
/proceedings-pdf/59PBOR
/All-59PBOR
/SPE-1253-G/2087146/spe-1253-g.pdf by guest on 01 June 2022
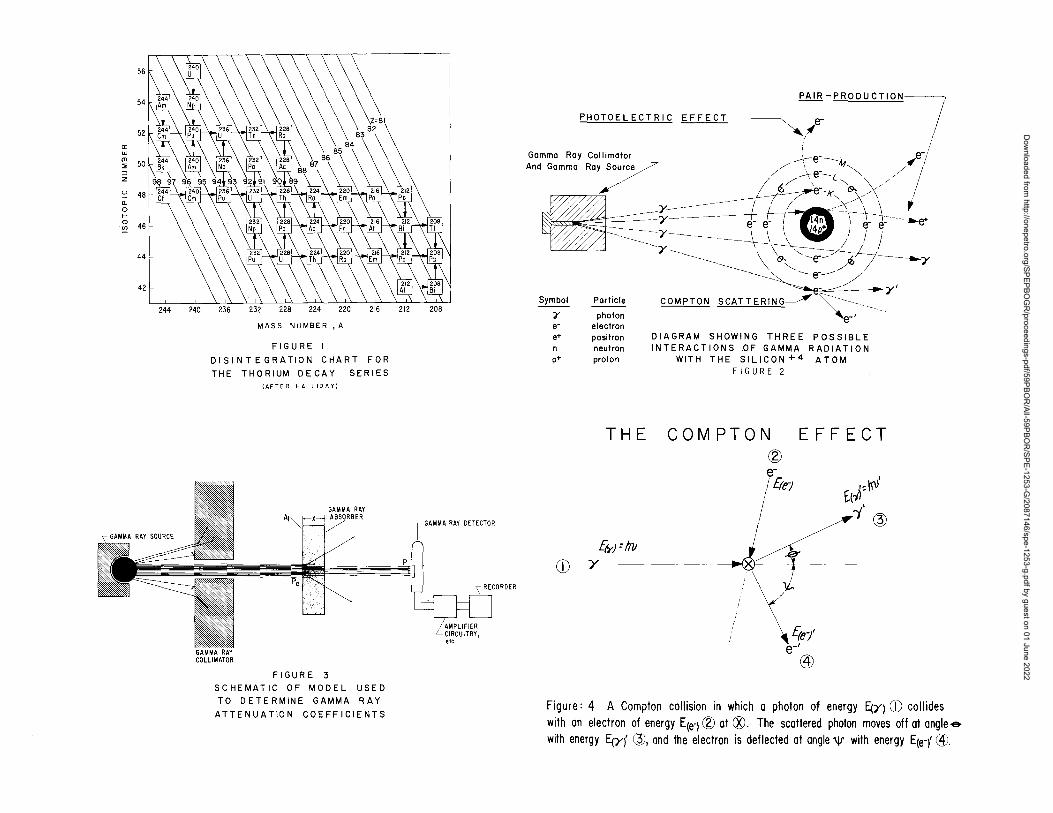
56
54
52
a: UJ (D
50 ::;; ::> z
':: Q.
0 >--0 ~
MASS NUMBER, A
FIGURE I
DISINTEGRATION CHART FOR
THE THORIUM DECAY SERIES
GAMMA RAY COLLIMATOR
(AFTER HALLIDAY)
FIGURE 3
SCHEMATIC OF MODEL USED
TO DETERMINE GAMMA RAY
ATTENUATION COEFFICIENTS
GAMMA RAY DETECTOR
p
PAIR -PRODUCTION~
PH OT 0 E L E C T RIC .!::E.!:FJ:F:..!E=-,CUT.---~ /
Gamma Ray Collimator ~e------ e-~'/'- 1
And Gamma Ray sourcy / \ _ 4t~ /~ / ~/--\\e~L..'" ,,//
'21./ --I(" 61->.;/\
~Y ( ! I ~Ir!{~-+ \ ~<:~~~f--t\ ( V ) 1(-
ee+ n p+
Particle
photon electron positron neutron proton
THE
\~Y ---e-.----- /
-----= ~y' COMPTON SCATTERING~ 'C---_----. __ ~ __
e-'
DIAGRAM SHOWING THREE POSSIBLE INTERACTIONS .OF GAMMA RADIATION
WITH THE SILICON+4 ATOM FIGURE 2
COMPTON ® e
Erel
EFFECT
£(1l~ hll'
I ~"l@ ",r In! ~J--
CD y-------.(x\:) ~i- ..
e-' @
Figure: 4 A Compton collision in which a photon of energy EtYl CD collides with an electron of energy E(e-l ® at ®. The scattered photon moves off at angle e
with energy Efyf @, and the electron is deflected at angle 'IV with energy E(e-)' ®.
Dow
nloaded from http://onepetro.org/SPEPBO
GR
/proceedings-pdf/59PBOR
/All-59PBOR
/SPE-1253-G/2087146/spe-1253-g.pdf by guest on 01 June 2022
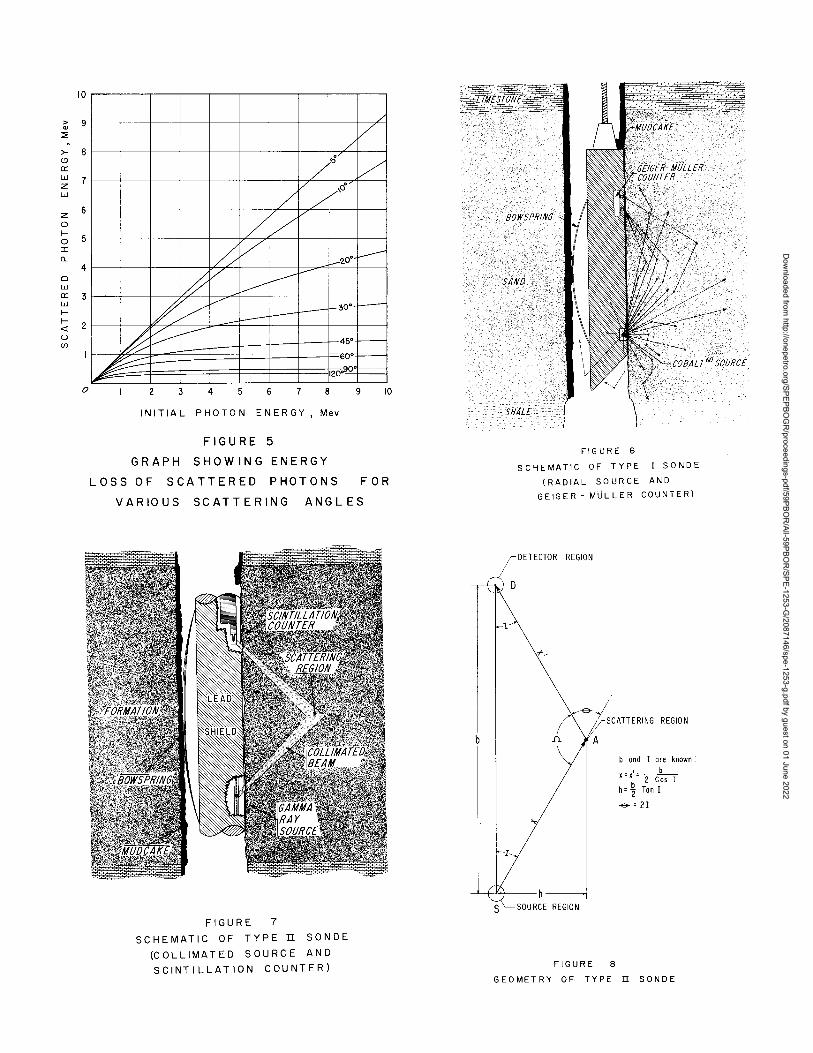
10
> 9 '" ::i<
>- 8 t9 0::: W 7 z w
z 6
0 I-
5 0 I 0-
4 0 W 0::: 3 w l-I- 2 « u U)
o
/ ~
/ !/ ],/,0"
/ /'
/ VV ~ / 1--'2.0•
# /' ---I---""'
/
1/ /' V _30· I--- f-.---
I~ V ----- 45·
~ ~ 60·
::--12~0
~
2 3 4 5 6 7 8
INITIAL PHOTON ENERGY, Mev
FIGURE 5
GRAPH SHOWING ENERGY
LOSS OF SCATTERED PHOTONS
/
V
V
L.----
--= -
9 10
FOR
VARIOUS SCATTERING ANGLES
FIGURE 7
SCHEMATIC OF TYPE n SONDE
(COLLIMATED SOURCE AND
SCINTILLATION COUNTER)
b
1
I
,-
FIG URE 6
SCHEMATIC OF TYPE I SONDE
(RADIAL SOURCE AND
GEIGER - MULLER COUNTER)
DETECTOR REGION
REGIO N
b and I are known· , b
'"'b" 2ToST h"Z TonI
-e- " 21
.! h-----I S L SOURCE REGION
FIGURE 8
GEOMETRY OF TYPE IT SONDE
Dow
nloaded from http://onepetro.org/SPEPBO
GR
/proceedings-pdf/59PBOR
/All-59PBOR
/SPE-1253-G/2087146/spe-1253-g.pdf by guest on 01 June 2022
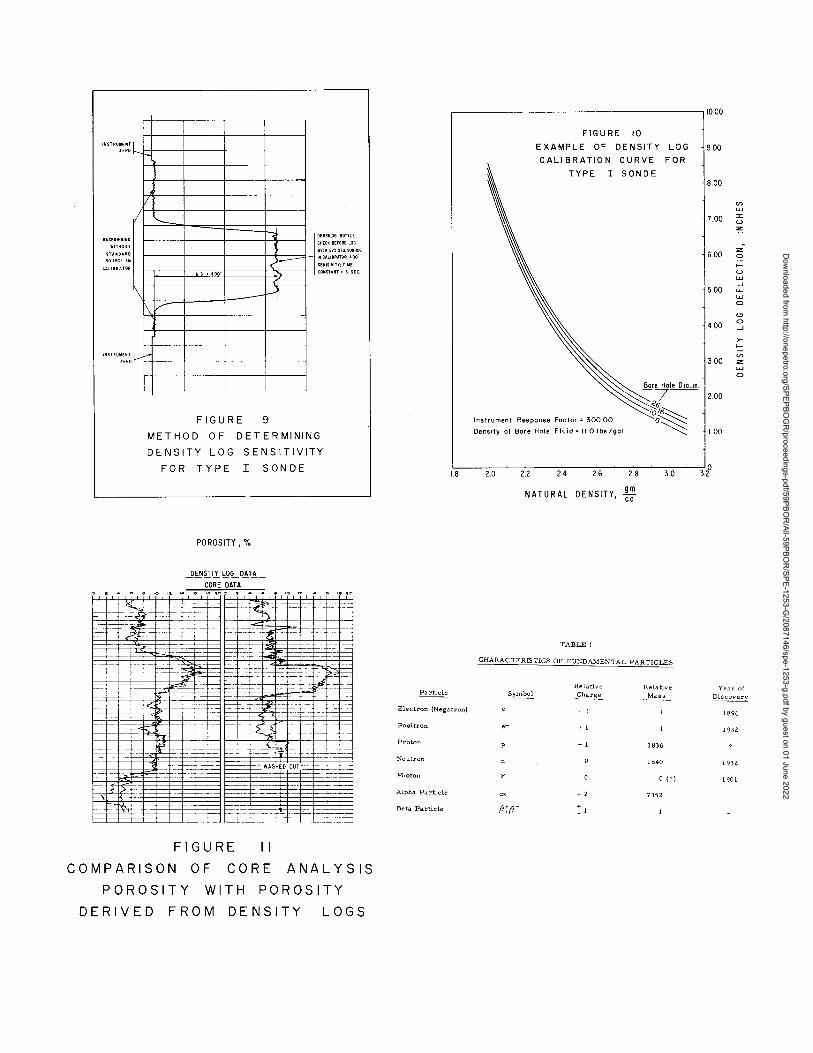
L
/
STANDARD
CALIBRATOR
'\
of--
'-
AS '4.00"
I\V
FIGURE
(~
- -
9
, WITH 215 STo. SOURC£
NCALIBRATOR,400"
SEM1SIVITY,TIWE
COMSUNT' 5 SEC
METHOD OF DETERMINING
DENSITY LOG SENSITIVITY
FOR TYPE I SONDE
POROSITY, %
--P f!!~ T.!.I,Q'L I)!T.!_ CORE DATA
o 2 ... ~ e ,0 ,2 14 '6 'EI 20 0 2
FIGURE II
COMPARISON OF CORE ANALYSIS
PO RO SIT Y WITH POROSITY
DERIVED FROM DENSITY LOGS
1.8
Particle
Electron (Negatron)
Positron
Proton
Neutron
Photon
Alpha Particle
Beta Particle
FIGURE 10
EXAMPLE OF DENSITY LOG
CALIBRATION CURVE FOR
TYPE I SONDE
Instrument Response Factor = 300.00
Density of Bore Hole Fluid = II Olbs/gcl
2.0 2.2 24 2.6 2.8 3.0
NATURAL DENSITY, ~ cc
TABLE I
CHARACTERISTICS OF FUNDAMENTAL PARTICLES
Relative Synlbol Charge
I
e+ + I
+ I
y
+ 2
(J: (J-
Relahve Mass
1836
1840
o PI
7352
10.00
9.00
8.00
V)
w
7.00 ::r: <..> :z
6.00 :z 0
I-<..> w -'
5.00 u... w 0
'" 4 00 0 -'
>-l-
V)
300 :z w 0
2.00
1.00
0 3.2
Year of Discovery
1896
1932
1932
1901
Dow
nloaded from http://onepetro.org/SPEPBO
GR
/proceedings-pdf/59PBOR
/All-59PBOR
/SPE-1253-G/2087146/spe-1253-g.pdf by guest on 01 June 2022