gabaergic circuits mediate the reinforcement-related signals of striatal cholinergic interneurons
TRANSCRIPT

Novel GABAergic circuits mediate the reinforcement-relatedsignals of striatal cholinergic interneurons
Daniel F. English1, Osvaldo Ibanez-Sandoval1, Eran Stark1, Fatuel Tecuapetla1,†, GyorgyBuzsaki1, Karl Deisseroth2, James M. Tepper1, and Tibor Koos1
1Center for Molecular and Behavioral Neuroscience, Rutgers University, Newark, NJ 071022Department of Bioengineering, Stanford University, Stanford, CA 94305
AbstractNeostriatal cholinergic interneurons are believed to play an important role in reinforcementmediated learning and response selection by signaling the occurrence and motivational value ofbehaviorally relevant stimuli through precisely timed multiphasic population responses. Animportant problem is to understand how these signals regulate the functioning of the neostriatum.Here we describe the synaptic organization of a novel circuit that involves direct nicotinicexcitation of GABAergic interneurons and enables cholinergic interneurons to exert rapidinhibitory control of the activity of projection neurons. We also demonstrate that the dominanteffect of an optogenetically reproduced pause-excitation population response of cholinergicinterneurons is powerful and rapid inhibition of the firing of projection neurons that is coincidentwith synchronous cholinergic activation. These results reveal a previously unknown circuitmechanism that transmits reinforcement-related information of ChAT interneurons in the mouseneostriatal network.
The neostriatum plays a critical role in the reinforcement mediated acquisition and selectionof adaptive behavioral responses1,2. These functions require neuronal representation ofinformation about the occurrence and motivational value of external stimuli that areprovided by 2 major neuromodulatory systems, midbrain dopaminergic neurons, and localcholinergic (ChAT) interneurons. These 2 neuron populations exhibit coincident firing ratechanges in response to the presentation of unpredicted or the omission of predicted primaryreinforcement, as well as to cues predictive of these stimuli and together encode the value,magnitude and expectation probability of these events2-8. In particular, ChAT interneuronsexhibit multiphasic population responses which consist of a brief (200-300 ms) cessation offiring, termed the pause response and, depending on the nature of the stimulus and itsbehavioral context, an immediately following and sometimes a preceding period of briefsemi-synchronous excitation3,4,6-9. An important question is to elucidate how these
Correspondence should be addressed to Tibor Koos, Ph.D., Center for Molecular and Behavioral Neuroscience, Rutgers University,197 University Avenue Newark, NJ 07102, Tel: 973.353.1080 × 3634, Fax: 973.353.1588 [email protected] Address: Neurobiology of Action, Instituto Gulbenkian de Ciencia, Rua da Quinta Grande, 6, 2780-156 Oeiras, Portugal
Author Contributions. D.E. carried out all in vivo recording experiments and data analysis and performed the majority of the in vitroexperiments, contributed to virus production, virus injections and confocal imaging (with the exception of Fig. 1a, obtained by Dr. J.Berlin). O.I. and F.T. performed the initial in vitro analysis of NPY-NGF neurons and O.I. first identified nicotinic synapses in theseinterneurons. E.S. contributed to the design of in vivo recording and optical stimulation methods and data analysis, molecular biologyand virus production. G.B. contributed to optrode design and the design and analysis of in vivo recording experiments. K.D. designedand provided constructs for optogenetic expression vectors, designed and produced the AAV5-DIO-eNpHR3.0-YFP and the AAV5-DIO-ChR2-mCherry virus vectors and contributed to optogenetic methods. J.M.T. contributed to the development of in vitro and invivo recording methods. T.K. performed in vitro recordings, recombinant DNA procedures and lentivirus production. The study wasdesigned by T.K., J.M.T and D.E. and the manuscript was written by T.K. with significant contribution from D.E. and J.M.T.reflecting input from all authors.
NIH Public AccessAuthor ManuscriptNat Neurosci. Author manuscript; available in PMC 2012 July 01.
Published in final edited form as:Nat Neurosci. ; 15(1): 123–130. doi:10.1038/nn.2984.
NIH
-PA Author Manuscript
NIH
-PA Author Manuscript
NIH
-PA Author Manuscript
population responses regulate the functioning of the neostriatal network. Due to themultiphasic nature of these responses and the absence of spatial segregation of ChATinterneurons classical methods have not been adequate to address this issue. Here we usedoptogenetic excitatory and inhibitory tools to reproduce synchronous excitation and pause-excitation firing patterns of ChAT interneurons and demonstrate that ChAT interneuronsactivate parallel GABAergic circuits that mediate powerful inhibition of striatal projectionneurons in vitro as well as in vivo.
ResultsCholinergic interneurons activate GABAergic inhibition in SPNs
All experiments were conducted with the approval of the Rutgers University InstitutionalAnimal Care and Use Committee. The effects of synchronous activation of ChATinterneurons were examined using Channelrhodopsin-2 (ChR2-YFP) expressed in ChATinterneurons with viral mediated transfer of a Cre-lox controlled transgene. ChR2 expressionspecificity was verified with immunocytochemistry demonstrating ChAT expression in∼98.7% (81/82) of ChR2-YFP+ neurons (Fig. 1a). Postsynaptic responses to activation ofcholinergic interneurons (Fig. 1b) were investigated in vitro in brains slices prepared fromadult (PD 60-390) mice using standard methods10. In all SPNs examined, (n=94),synchronous activation of ChAT interneurons elicited a polysynaptic GABAA receptormediated inhibitory postsynaptic potential/current (IPSP/IPSC, Fig. 1c, d) involvingnicotinic receptors, because the response was blocked by selective antagonists of GABAAand Type-2 nicotinic receptors (bicuculline, 10 μM, n=10, and dihydro-β-erythroidine,DHβE, 100 nM-10 μM, n=10, respectively, Fig. 1d), but not by antagonists of AMPA-typeglutamatergic receptors (CNQX, 10 μM, n=10, Supplementary Fig. 1) or muscarinicreceptors (atropine, 10 μM, n=3, not shown). The IPSC was characterized by a relativelylong onset-latency and short rise-time (11±1.7 ms and 5.0±0.6 ms, respectively, n=11), andexhibited a peak conductance of 2.8±0.9 nS. In current clamp, optical stimulation elicitedlarge amplitude IPSPs in SPNs (n=20) that efficiently blocked action potential generationand decreased the momentary firing rate of projection neurons in a rate dependent manner(Fig. 1c, Supplementary Fig. 2). We also investigated the contribution of single ChATinterneurons to the inhibition of SPNs using paired recordings. In ∼50% of pairs, (n=21),single spikes in ChAT interneurons elicited bicuculline (10 μM, n=4) and DHβE (10 μM,n=3) sensitive small IPSCs in SPNs (<20 pA, CsCl internal solution, E[Cl]∼=-10 mV,Supplementary Fig. 3).
The GABAergic inhibition in SPNs involves multiple biophysically distinct mechanismsThe optically elicited IPSCs in SPNs were multiphasic consisting of 3 kinetically distinctphases characterized by τdecay values of 5.2±1.8 ms, 96±11.7 ms and 906±106 ms (n=6).Henceforth, we will refer to the first 2 components as fast and slow IPSCs (fIPSC, andsIPSC, Fig. 1e). Due to its small amplitude (∼20 pA) the mechanism underlying the slowestcomponent was not investigated further. In about 1/3 of the SPNs the transition betweenthese response components was not monotonic but the sIPSC was introduced by a clearinflection (Fig. 1e) suggesting that the compound response represents the superposition of 2distinct GABAergic responses, a typical fast IPSC and a slowly rising and slowly decayingGABAergic response, that was less apparent when the onset of the sIPSC was obscured bylarger or slower fIPSC components (Fig. 1e, inset). To test more directly the involvement of2 distinct mechanisms we examined the trial-to-trial correlation of the amplitudes of thefIPSC and sIPSC components (Fig. 1f). Close examination of individual responses andlinear regression analysis demonstrated that the amplitude of the fIPSC and the sIPSC variedindependently (Fig. 1f). This excluded the possibility that the sIPSC represented a distinctkinetic phase of activation of the same receptors that mediate the fIPSC or that the 2
English et al. Page 2
Nat Neurosci. Author manuscript; available in PMC 2012 July 01.
NIH
-PA Author Manuscript
NIH
-PA Author Manuscript
NIH
-PA Author Manuscript
responses were secondary to the release of GABA from the same axon terminals reachingfunctionally distinct receptor populations.
We also noted that the sIPSC appeared similar to a form of slow GABAA receptor mediatedinhibition (GABAA-slow) first described in the hippocampus and the neocortex11-13. To testthe possibility that the sIPSC involved a similar mechanism we took advantage of thecharacteristic sensitive dependence of the τdecay of this response on inhibition of GABAtransport14-16, a characteristic not exhibited by conventional GABAergic synapses16,17.Application of NO711 (10 μM) a selective inhibitor of GAT-1 dramatically increased theτdecay of the sIPSC from 57.5±2.5 ms to 185.2±17.5 ms (322%, n=4, Wilcoxon test, p=0.02,Fig. 1g). In contrast, the time course of the fIPSC was not affected (Fig. 1g, Control:10.5±1.7 ms, NO711: 9.3±4.9 ms; n=3, p=0.6, Wilcoxon test). Together these resultsdemonstrated that the fIPSC and the sIPSC originate from separate and biophysicallydistinct mechanism including a component that resembles GABAA-slow.
NPY-NGF neurons give rise to the sIPSC component of inhibition in SPNsWe have recently demonstrated the existence of a class of neuropeptide Y (NPY) expressinginterneurons in the neostriatum, the NPY-neurogliaform (NPY-NGF interneurons) that aremorphologically and electrophysiologically distinct from the previously known NPYexpressing, plateau depolarization-low threshold spike (NPY-PLTS) neurons18. Importantly,unlike NPY-PLTS neurons that very rarely contact SPNs,19 NPY-NGF interneurons elicit anIPSC in most nearby SPNs (∼84%) that is kinetically very similar to GABAA-slow18. Thecomparative properties of NPY-NGF and NPY-PLTS interneurons are illustrated inSupplementary Fig. 4 and 5. Interestingly, in addition to eliciting a slow GABAergic IPSCthese interneurons exhibit striking electrophysiological and morphological similarity to NPYexpressing neurogliaform neurons in the neocortex15 and hippocampus14 that are theprimary source of GABAA-slow in these brain areas20.
We thus hypothesized that NPY-NGF interneurons may be responsible for the sIPSCcomponent in SPNs. To examine this possibility we first obtained triple and pairedrecordings to test if NPY-NGF interneurons received nicotinic synaptic excitation fromChAT interneurons and whether the same NPY-NGF interneurons elicited IPSCs similar tothe sIPSC component in SPNs using NPY-EGFP transgenic reporter mice (Fig. 2a). In 8 of14 instances of simultaneously recorded ChAT and NPY-NGF interneurons (n=8 of ChAT,NPY-NGF, SPN triples and n=6 pairs) a postsynaptic response could be elicited in the NPY-NGF neurons by single action potentials in the ChAT interneuron (57% connectivity, Fig.2b). While in most cases the ChAT interneurons were activated in voltage clamp actionpotentials triggered in current clamp elicited similar postsynaptic responses (SupplementaryFig. 6). The response had an average amplitude of 0.96±0.7 mV, (range: 0.28-2.27 mV), risetime of 14.7±5.3 ms, (range: 9.0-24.7 ms), decay time constant of 75.6±40.2 ms, (range:27.8-147 ms), onset latency of 3.6±1.6 ms and exhibited no transmission failures (Fig. 2b).The response was a Type-2 receptor mediated nicotinic postsynaptic excitatory potential(nEPSP) because it was blocked by DHβE (200 nM, n=3; 1 μM, n=2; Fig. 2b) but not byglutamatergic AMPA or GABAA receptor antagonists (CNQX, 10 μM, n=3; bicuculline, 10μM, n=4; not shown). Stimulation of ChAT interneurons also triggered recurrent IPSCs(Fig. 2c). Train stimulation (n=2; 3.33 Hz, 3 spikes) revealed significant but incompletedepression of the nEPSP (60-75%, n=2, Fig. 2d) that contrasted the complete use-dependentsuppression of recurrent GABAergic inhibition in simultaneously recorded ChATinterneurons (Fig. 2d). Among the 8 NPY-NGF interneurons shown to receive nicotinicinnervation from a ChAT interneuron 4 out of 5 tested interneurons elicited IPSCs in SPNs(Fig. 2e). The IPSC elicited by NPY-NGF interneurons in SPNs (n=11, 4 from triplerecordings and 7 in additional pairs) was similar to GABAA-slow and exhibited an averageamplitude of 155.7±160.7 pA, (range: 17.6-534 pA), rise time of 9.5±4.9 ms, (range:
English et al. Page 3
Nat Neurosci. Author manuscript; available in PMC 2012 July 01.
NIH
-PA Author Manuscript
NIH
-PA Author Manuscript
NIH
-PA Author Manuscript
3.6-17.8 ms), τdecay of 65.8±14.98 ms, (range: 37-93 ms; CsCl internal solution, Fig. 2e, f,Supplementary Fig. 5). The probability of connectivity to SPNs was very high 11/14 (78 %).The τdecay of the IPSC (68.7±12.1 ms, range: 56-93 ms) did not differ significantly from theτdecay of the sIPSC in SPNs elicited with optogenetic stimulation of ChAT interneurons(96±28.7 ms, Wilcoxon test, p>0.05, n=6). Importantly, the IPSCs elicited by NPY-NGFinterneurons never included fast IPSC components or exhibited biphasic decay (Fig. 2e, f,Supplementary Fig. 5).
To further test the contribution of NPY-NGF interneurons to the sIPSC we next tested theeffect of GAT-1 inhibition. NO711 increased the τdecay of the IPSC in a dose dependentmanner from 61.3±9.2 ms to 205.6±28 ms at 10 μM (336%, n=3, Fig. 2f) and from 92±28.3ms to 1310±975 ms at 50 μM (not shown, n=2, p=0.02, Wilcoxon test, n=5 total). Theeffects of NO711 on the optogenetic sIPSC and the IPSC elicited by NPY-NGF neuronswere essentially identical at the same drug concentration (322% vs. 336%, Fig. 2f).
In addition, we observed that in 3/14 pairs (21 %), NPY-NGF interneurons elicited aGABAergic IPSC in ChAT interneurons (Fig. 2e). This response was blocked by bicuculline(n=2, Fig. 2e) and exhibited small amplitudes (9.4±8 pA; range: 2.8-18.5 pA, E[Cl-]∼=-10mV). Importantly, NPY-NGF neurons could not mediate recurrent inhibition of ChATinterneurons because this IPSC and the recurrent IPSCs exhibited very different τdecayvalues (77±37 ms, n=3 vs. 19.2±12.7 ms, n=8, respectively; p=0.014, Wilcoxon test; Fig. 2c,e) and because activation of single ChAT interneurons never elicited action potentials ornEPSPs approaching spike threshold in NPY-NGF neurons although recurrent inhibitionwas frequently triggered (Fig. 2c, Supplementary Fig. 7). Finally, electrotonic coupling wasalso observed in 1 of 2 pairs of NPY-NGF interneurons (Supplementary Fig. 5).
These observations demonstrate the existence of a highly interconnected circuitry betweenChAT and NPY-NGF interneurons and SPNs in which NPY-NGF neurons receive densecholinergic excitatory input from ChAT interneurons and provide widespread innervation ofSPNs using slow GABAergic inhibition.
We next tested if synchronous activation of ChAT interneurons elicited action potentials inNPY-NGF interneurons using slices from double transgenic ChAT-Cre/NPY-EGFP micethat allowed selective optogenetic stimulation of ChAT interneurons using targeted ChR2expression and visualized recording from NPY-NGF neurons (Fig. 3a, b). Optogeneticstimulation of the ChAT interneuron population elicited large amplitude depolarizingpostsynaptic potentials in all NPY-NGF neurons tested, and in 2 of 7 neurons triggered 1-3action potentials with interspike intervals < 10 ms. (Fig. 3c-e). Simultaneous recordingsfrom nearby SPNs (n=3) demonstrated that the postsynaptic responses in the NPY-NGFneurons were accompanied by compound optogenetic IPSCs in the SPNs and that the sameNPY-NGF neurons themselves elicited slow GABAA receptor mediated responses in theprojection neurons (Fig. 3c). Reversal potential measurements revealed that theoptogenetically elicited postsynaptic response in NPY-NGF interneurons consisted of anearly excitatory and a delayed inhibitory component (Fig. 3d). The IPSC component, whichitself was secondary to nicotinic receptor activation (not shown), exhibited 4-12 mVamplitudes (Vm∼-45 mV, E[Cl]∼-69 mV) and was GABAA receptor mediated (bicuculline,10 μM, n=5, Fig. 3d, e). This inhibitory response may play an important role in limiting thenicotinic activation of NPY-NGF neurons because in 1 cell that did not fire action potentialsin control medium firing was elicited after GABAA receptor block (Fig. 3e). Thepharmacologically isolated excitatory response (n=5) was a nEPSP because it was reducedin amplitude by >95% by DHβE both at 200 nM (n=2) and at 1 μM (n=3, Fig. 3c, e). ThenEPSP exhibited amplitudes of 8.8-34.2 mV (average: 16.8 mV±10.3 mV), rise time of
English et al. Page 4
Nat Neurosci. Author manuscript; available in PMC 2012 July 01.
NIH
-PA Author Manuscript
NIH
-PA Author Manuscript
NIH
-PA Author Manuscript

16.8±2.2 ms (range: 16.5-21.5 ms), and τdecay of 60.0±8.9 ms, (range: 51-71 ms, Fig. 3e).No contribution from glutamatergic AMPA receptors was detected (Fig. 3e).
FS interneurons and NPY-PLTS interneurons are not involved in the GABAergic responseselicited by ChAT interneurons
Other neostriatal interneuron types were tested to see if they could mediate the fIPSC and/orcontribute to the sIPSC component of the compound optogenetic IPSC in SPNs. SPNsthemselves could be excluded because they lack nicotinic receptors21 and were not activatedin optogenetic experiments (Fig. 1c). Fast spiking interneurons (FSI) are another majorsource of inhibition of SPNs22 (Fig. 4a) and represent an important candidate because theyexpress nicotinic receptors23 and receive cholinergic innervation24. Cholinergic stimulationfailed to elicit significant depolarization (>3 mV) or action potential firing in the recordedFSIs (n=8) despite the presence of IPSCs including large fIPSC components in nearby SPNsdemonstrating that FSIs were not involved in the feed-forward inhibition of SPNs (Fig. 4b).The absence of excitation was not a slice preparation artifact because nEPSCs were readilyelicited in all NPY-NGF neurons (Figs. 2 and 3).
A possible contribution by the sparse input to SPNs from NPY-PLTS neurons19 wasexcluded using the same double transgenic optogenetic strategy employed wheninvestigating the role of NPY-NGF interneurons (Supplementary Fig. 8). These resultshowever did not rule out small depolarizing effects on FS and NPY-PLTS interneurons orthat presynaptic facilitation of GABA release from these interneurons contributed to theinhibition of SPNs.
Finally, biophysical differences and stimulus intensity dependent dissociation of the feed-forward inhibition of SPNs and recurrent inhibition in ChAT interneurons25 strongly suggestthat these responses were not mediated by the same interneurons (Supplementary Fig. 7).
The pause-excitation population activity of ChAT interneurons regulates the activity ofSPNs in vitro and in vivo
In behaving primates the most common reinforcement-related population activity of putativeChAT interneurons is a pause-excitation sequence3,4,7-9. Quantitative properties of thepostsynaptic effects of this population response may not be evaluated adequately usingChR2 mediated synchronous activation alone because this approach does not reproduce thepause-associated reduction in cholinergic tone that may have significant effects via receptordeactivation23,26 or recovery from desensitization 27 and because of the possibility ofeliciting non-physiologically enhanced neurotransmitter release and abnormally highextracellular acetylcholine transients due to prolonged presynaptic depolarization and Ca++
influx. To overcome these problems we used optogenetic inhibition to elicit a pauseexcitation response by taking advantage of the fact that ChAT interneurons respond to briefhyperpolarization with semi-synchronous rebound firing28. ChAT interneurons expressingan enhanced variant of Natronomonas Pharaonis Halorhodopsin29 (eNpHR3.0) exhibitednormal intrinsic properties in vitro and responded to optical stimuli (green light, 200-300ms) with hyperpolarizing responses and rebound action potentials (Fig. 5a, b). Cell attachedand extracellular recordings showed that the majority of ChAT interneurons werespontaneously active and generated variable latency rebound firing following opticalinhibition (Fig. 5b-e) that successfully approximated the pause-excitation population patternof putative ChAT interneurons recorded in vivo3,4,8,30 (Fig. 5c). The optically inducedpopulation activity of cholinergic interneurons elicited large amplitude GABAergic IPSPs inSPNs (Fig. 5c-e) that were secondary to the activation of Type-2 nicotinic receptors asshown by DHβE block (200 nM, n=5, Fig. 5e). The onset of the response followed the endof the light pulse with a short latency (∼50 ms), and was apparently initiated by the first
English et al. Page 5
Nat Neurosci. Author manuscript; available in PMC 2012 July 01.
NIH
-PA Author Manuscript
NIH
-PA Author Manuscript
NIH
-PA Author Manuscript
cholinergic rebound spikes (Fig. 5c, d). The IPSP effectively blocked action potentialgeneration in SPNs (Fig. 5c-e). A minority of the SPNs (n=5) exhibited an additional moredelayed period of inhibition that was similarly blocked by DHβE (200 nM, n=2) andcoincided with longer latency rebound activity of some ChAT interneurons (Fig. 5a, e).Current recordings revealed that the elicited synaptic response in SPNs resembled thecompound response described above (Fig. 5d). These latter experiments were conductedusing eNpHR1.0-mCherry (Methods) which is not expressed in axons and thereforecircumvents any potential effects of direct axon terminal hyperpolarization29,31.
Finally, we sought to confirm that the pause-excitation activity pattern of ChATinterneurons also exerts inhibitory control on projection neurons in vivo. We obtained singleand multi-unit recordings in the dorsal striatum of freely moving mice expressing eNpHR3.0in ChAT interneurons with chronically implanted optrodes containing 4 movable tetrodesand a fixed, laser-coupled optic fiber. The optical stimulus was a 200 ms (n=9) or a 1000 ms(n=3) laser pulse (10-30 mW, 594 nm) delivered at fixed 20 s or 30 s intervals. None of themice exhibited observable behavioral responses to the delivery of light pulses. Units wereseparated and classified as described in the Methods (Fig. 6a). The identity of ChATinterneurons was directly confirmed based on zero time lag optical inhibition.
Six isolated ChAT units were identified in four animals. These neurons exhibited irregulartonic activity that was similar to the firing pattern of putative ChAT interneurons describedin primates as well as to optogenetically identified ChAT interneurons in the nucleusaccumbens32 (Fig. 6b). 200 ms optical inhibition elicited a pause excitation sequencecharacterized by nearly complete silencing during illumination followed by rebound firing(Fig. 6c). The rebound population activity lasted approximately 150 ms and exhibited amaximal firing rate of 370% of baseline that occurred about 45 ms after the offset of thestimulus and recovered exponentially with a time constant of 64 ms (Fig. 6c). The overallresponse and the characteristics of rebound excitation closely recapitulated the keyproperties of putative ChAT interneuron population responses recorded in a variety ofbehavioral paradigms3,4,8,30.
The same optical stimuli elicited statistically significant inhibition of firing in putative SPNsincluding 7 isolated and 5 multiunit recordings of these neurons (Fig. 6d). The inhibitionexhibited a rapid onset (112.5±90.8 ms delay from the end of the light to pulse to the first 50ms PSTH bin below 2SD from the mean). Mean maximal inhibition was 84.7±15.3 %(defined as the mean firing rate reduction during the 2 most strongly inhibited consecutivebins) representing a significant change (p=0.0019, see Methods) for each putative SPN.(Note that the smaller magnitude of the maximal inhibition of the SPN population activity(74%, Fig. 6d) is due to averaging of multiple responses with different response latencies).The firing rate remained below a level of mean-2SD for 200±85.3 ms and recovered bi-exponentially from its minimal value with time constants of 190 ms (64% of peak) and 0.4 s(36% of peak, n=12). To confirm that the coincidence of the onset of the inhibition and theend of the light pulse reflected a causal relationship we also tested the effect of 1000 ms(n=3) light pulses. The inhibitory responses elicited by these stimuli were similarly timed tothe end of the stimuli (Fig. 6d). Importantly, there was no indication of firing rate changes inthe same units during either 200 or 1000 ms optical inhibition of ChAT interneurons (Fig.6d).
Finally, inhibition resembling the responses of putative SPNs was also observed in 2 unitsthat exhibited firing rates and waveforms different from putative SPNs (Fig. 6a) suggestingthat some GABAergic interneurons may be regulated similarly to SPNs (Supplementary Fig.9).
English et al. Page 6
Nat Neurosci. Author manuscript; available in PMC 2012 July 01.
NIH
-PA Author Manuscript
NIH
-PA Author Manuscript
NIH
-PA Author Manuscript
DiscussionThis study demonstrates the existence of multiple GABAergic circuits that are activated byChAT interneurons and examines their role in the regulation of the activity of SPNs. Thedetailed organization of these circuits remains incompletely understood. We show that NPY-NGF interneurons are directly activated by nicotinic synaptic input and elicit slowGABAeric inhibition in SPNs. The electrophysiological and circuitry properties of NPY-NGF interneurons appear well suited for transmitting cholinergic population responses.Specifically, the slow time course of the nEPSP is expected to facilitate integration ofsynaptic inputs during semi-synchronous activation of ChAT interneurons while the highcurrent threshold and the feed-forward inhibition of NPY-NGF interneurons may preventtheir spurious activation by randomly coincident presynaptic inputs. Further, the utilizationof GABAA-slow, which, based on experiments using low affinity antagonists15, subtypespecific modulators12,14,15,33, diffusional interference15 and blockade of GABAtransport14-16 appears to involve volume transmission and possibly the activation ofextrasynaptic receptors33,34 enables high fidelity, widespread inhibition of large neuronpopulations by single presynaptic elements. These characteristics, together with theextremely high probability of connectivity and electrotonic coupling of NPY-NGF neuronssupport uniform inhibition of SPNs despite the relatively small population size of theseinterneurons18.
Biophysical and pharmacological evidence also demonstrated the cholinergic activation of asecond, separate GABAergic input to SPNs responsible for the fIPSC. The possibility thatthe fIPSC is generated by direct synaptic contacts of NPY-NGF neurons onto SPNs whilethe sIPSC originates through volume transmission of GABA released from a larger set ofterminals of the same interneurons is inconsistent with the observation that in a largenumber of paired recordings of NPY-NGF interneurons and SPNs (n=40, 11 this study and29 in our earlier report18) no fast IPSC components have been observed. Presynapticnicotinic facilitation or GABA release could mediate the fIPSC35-37, possibly involvingterminals of FS interneurons that express nicotinic receptors, but a presynaptic mechanism isinconsistent with the absence of an asynchronous barrage of mini-IPSCs during thecompound response35,36. However, presynaptic facilitation of GABA release from synapsesresponsible for the sIPSC cannot be excluded and this mechanism could account for theIPSCs elicited in SPNs by single ChAT interneurons. Thus, the simplest hypothesisregarding the origin of the fIPSC is that it is elicited by action potential firing in a type ofGABAergic interneuron that is distinct from NPY-NGF, NPY-PLTS and FS neurons. Themost likely candidates are calretinin38 (CR) and tyrosine hydroxylase (TH) expressinginterneurons39. Similarly, the recurrent inhibition of ChAT interneurons is also likely tooriginate from a subset of CR or TH interneurons that appear to be distinct from thosemediating the fIPSC. ChAT interneurons form a complex network with their GABAergicpostsynaptic partners that includes 2 different inhibitory feedback mechanisms, electricalcoupling between NPY-NGF neurons and inhibition among some of the GABAergicinterneurons themselves. This network may be important for shaping and processing thetransient population responses of ChAT interneurons and may contribute to the generationand behaviorally contingent frequency transitions of gamma range oscillations in theneostriatum40.
We also investigated the effect of a physiologically realistic pause-excitation activity patternof ChAT interneurons on the spontaneous firing of putative SPNs in freely moving mice.SPNs exhibited a rapidly developing, powerful inhibitory response that coincided with thesynchronous firing of ChAT interneurons confirming our in vitro results. Interestingly, brief(<1 s) silencing of ChAT interneurons did not elicit an observable effect suggesting theabsence of tonic muscarinic modulation of SPNs or their synaptic inputs23,26 or sustained
English et al. Page 7
Nat Neurosci. Author manuscript; available in PMC 2012 July 01.
NIH
-PA Author Manuscript
NIH
-PA Author Manuscript
NIH
-PA Author Manuscript
nicotinic receptor driven GABAergic inhibition. Therefore the pause response of ChATinterneurons may not affect striatal function primarily through the regulation of the firing ofSPNs but by involving other mechanisms, including reversal of the permissive nicotinicfacilitation of dopamine release41,42. A potential involvement of more complex muscariniceffects26 cannot be ruled out based on our experiments. In addition, the in vivo and in vitroresponses of SPNs to manipulation of ChAT interneuron activity appear to differ in thedorsal striatum from those in the nucleus accumbens32 suggesting significant differences inthe circuit organization of the 2 brain areas.
From a behavioral perspective, feed-forward inhibition of SPNs by ChAT interneurons maycontribute to the interruption and reorientation of ongoing behavior when salient stimuli areencountered. Synchronous activation of ChAT interneurons by intralaminar thalamic inputsthat carry information about alerting stimuli43 is expected to trigger feed-forward inhibitionof SPNs and interrupt the ongoing activity of cortico-basal ganglia loops. Furthermore, feed-forward inhibition may aid adaptive reorientation of behavior by promoting preferentialactivation of specific SPNs and cortico-basal ganglia circuits that are responsive to thethalamo-striatal excitatory inputs activated by the alerting stimuli. The targeting of SPNs bythe same excitatory thalamic input responsible for synchronous cholinergic activation mayalso explain why inhibition of the firing of SPNs is less consistently observed duringnaturally occurring than optogenetically elicited synchronous activity of ChAT interneuronsin behaving animals44. Importantly, since ChAT interneurons respond primarily to stimuliwith conditioned reinforcement value the feed-forward inhibitory circuit can selectively gatethe impact of external stimuli on ongoing behavior depending on the behavioral significanceof these stimuli.
Finally, the inhibitory circuits described here may causally link the partial loss of ChATinterneurons45 and the motor symptoms of Tourette syndrome as previouslyhypothesized 46.
Methods1. Transgenic mice
Cholinergic interneurons were targeted in homozygotic ChAT-IRES-Cre transgenic mice(B6;129S6-Chat<tme1(cre)Lowl>/J, Jackson Laboratory). The role of NPY interneurons wasexamined in double transgenic mice generated by cross breeding the ChAT-IRES-Cre strainwith a B6.FVB-Tg(NPY-hrGFP)1Lowl/J strain of mice (Jackson Laboratory). GFP targetedpaired recording from ChAT interneurons and SPNs was performed using B6.Cg-Tg(RP23-268L19-EGFP)2Mik/J mice (Jackson Laboratory).
2. Production of AAV-2, AAV-5 and integration deficient lentivirus vectorsAdeno-associated virus serotype 2 (AAV-2) was used for the expression of ChR2-YFP andserotype 5 (AAV-5) virus for eNpHR3.0-YFP and ChR2-mCherry. The AAV-2 vector wasproduced at Vector Biolabs (Philadelphia, PA) using transfer vector DNA designed andconstructed by K.D. The AAV-5 vectors were produced by the vector core of the Universityof North Carolina for K.D. The transfer vector plasmids and the transgene constructs weredesigned by K.D. (http://www.stanford.edu/group/dlab/optogenetics/sequence_info.html).
Lentivirus mediated, Cre/lox controlled expression of eNpHR1.0-mCherry was carried outwith integration deficient lentiviral (IDL) particles to prevent chromosomal rearrangementsthat may occur across multiple proviral loxP or lox2227 recombination sites whenintegrating virus is employed. IDL particles were produced in 293FT cells (Invitrogen)grown to 95-100% confluence in DMEM (+10% FBS and 1% L-glutamine) usingTransIT-293 (Mirus) transfection agent as described previously47. Briefly, confluent 293FT
English et al. Page 8
Nat Neurosci. Author manuscript; available in PMC 2012 July 01.
NIH
-PA Author Manuscript
NIH
-PA Author Manuscript
NIH
-PA Author Manuscript
cells in each of 6, 175 cm2 flasks (Falcon) were co-transfected with 22 μg of the lentiviraltransfer vector DNA (pLenti:EF1:DOI:eNpHR1.0-mCherry:WPRE) and the secondgeneration packaging plasmids pCMV-dR8.74-D64V (15 μg), and pMD2.G 5 μg;(Addgene, 12259) supplemented with a plasmid carrying a suppressor of a dsRNA inhibitor(pAdvantage, Promega, 2 μg). The pCMV-dR8.74-D64V plasmid encodes the lentiviralintegrase carrying a D64V point mutation that completely blocks proviral integration48 andwas a gift from Dr. Rafael Yanez-Munoz. 24 hours after transfection the medium waschanged to a viral production medium (Ultraculture, Lonza, + 1% pen-strep, 1% Na-Pyruvate, and 5 mM Na-Butyrate) and 48 hours post-transfection the virus-containingsupernatant was collected and concentrated with ultracentrifugation. The titer of theconcentrated IDL was not directly determined, but comparison with lentivirus stocks ofknown titer injected in mouse brains indicated that it approached 109 IU/ml.
The eNpHR1.0-mCherry transgene was produced by adding the ER export and membranelocalization signals described by Gradinaru et al.,31 in 2 rounds of extension PCR using ahigh fidelity DNA polymerase (Accuprime Pfx, Invitrogen) to the coding sequence ofNpHR-mCherry produced by K.D.(http://www.stanford.edu/group/dlab/optogenetics/sequence_info.html). The primersequences for the first and second PCR rounds were, respectively: 5′,-GTCGTCTCTCTGTTCTCTCTGCTTCAGGACACAGAGACCCTGCCTCCCGTGACCGAGAGT-3′ and 5′-TTACACCTCGTTCTCGTAGCAGAACTTGTACAGCTCGTCCATGC-3′, and 5′-GGCCTGCGCTAGCGCCACCATGAGGGGTACGCCCCTGCTCCTCGTCGTCTCTCTGTTCTCTCTGCTTCAG-3′, and 5-′CggacccatatgGGCGCGCCTTACACCTCGTTCTCGT-3′. The PCR product wassubcloned in an inverted orientation between the loxP/lox2722 flanking recombination sitesreplacing the ChR2-YFP coding sequence in an AAV:EF1:DOI:ChR2-YFP:WPRE plasmidproduced and provided by K.D., from which subsequently the entire expression cassette(EF1:DOI:eNpHR1.0-mCherry:WPRE) was cloned into a 3rd-generation (Tat-independent)self-inactivating lentiviral expression vector. Detailed map is available from T.K. on request.
3. Intracerebral virus injectionAll in vivo and in vitro surgical procedures were performed in accordance with the NationalInstitutes of Health Guide to the Care and Use of Laboratory Animals and with the approvalof the Rutgers University Institutional Animal Care and Use Committee. The virus injectionsurgeries were performed in a custom built surgical setup inside a isolation cabinet underBiosafety Level-2 (BL-2) confinement. Mice were anesthetized with isoflurane and the skullwas exposed under antiseptic conditions using local anesthesia with bupivacaine. A smallburr hole was drilled at coordinates 0.5 -1.0 mm anterior to Bregma, 1.5-2.2 mm lateral.0.5-1.5 μl of concentrated virus stock solution was injected using a Nanoject-2 pressureinjection apparatus using glass pipettes over 10-40 minutes at a depth of 2.4-2.7 mm fromthe surface of the brain. Animals were housed in a BL-2 safety cabinet for at least 6 days.Experiments were conducted 7-30 days following injection.
4. ImmunocytochemistryFixation was performed after establishing anesthesia with ketamine (400 mg/kg, i.p.) withtranscardial perfusion using 10 ml of ice cold oxygenated Ringer solution followed by75-100 ml of 4% paraformaldehyde and 15% saturated picric acid in 0.15 M phosphatebuffer. Brains were kept in the same fixative overnight. 60 μm sections were cut on aVibratome. The immunocytochemical labeling of ChAT included pre-incubation in 10%methanol and 3% hydrogen peroxide in phosphate buffered saline (PBS), blocking ofnonspecific binding with 10% normal donkey serum, 3% bovine serum albumin in a 0.5%
English et al. Page 9
Nat Neurosci. Author manuscript; available in PMC 2012 July 01.
NIH
-PA Author Manuscript
NIH
-PA Author Manuscript
NIH
-PA Author Manuscript
Triton X-100 solution in PBS, followed by incubation in the blocking solution containing1:200 goat anti-ChAT primary antibody (cat. # AB144P; Millipore Corp.) for 48 hours atroom temperature. After wash, sections were incubated in 1:100 donkey anti-goat IgGconjugated with Alexa-594 in PBS at room temperature overnight. Sections were mountedin Vectashield medium.
5. In vitro optical stimulationChR2-YFP was activated using a 750 mW blue LED (www.Cree.com) with light projectedonto the slice through the condenser of the microscope with the bottom DIC polarizerremoved. The intensity and duration of the illumination were controlled through a D/Aconverter output of a ITC-18 digitizer and a Mightex SLA LED driver. eNpHR3.0-YFP andeNpHR1.0-mCehrry were activated with alternating pulses of 200-300 ms green (514±20nm) and blue (470±20 nm) light delivered through the epifluorescence illumination pathwayusing Chroma Technologies filter cubes under temporal control with a Uniblitz shutter(Vincent Associates, Rochester NY, USA). Blue light was delivered to facilitate recoveryfrom photodesensitization. Optical stimuli were delivered at 30-60 s intervals to allowrecovery to baseline.
6. In vivo optical stimulation125 μm multi mode optic fibers (Part #AFS105/125Y; Thor Labs, Newton NJ, USA) werechronically implanted as part of the optrode described in #8. To minimize tissue damage andincrease the lateral distribution of light, optical fibers were etched by immersing ∼200 μmof the tip of the fiber in hydrofluoric acid (Sigma-Aldrich) overlaid with mineral oil and thenslowly lifting the fiber tip into the protective oil layer (over ∼ 30-60 min) resulting in asmooth, gradual taper and a tip diameter of <50 μm. Implanted fibers were coupled to a 594nm DPSS laser (LaserGlow Technologies, Toronto Canada) via modified LC connectors(Part # 86024-5500; Thor Labs, Newton NJ, USA) and ceramic attachments encasing theexternal end of the fiber. Light intensity at the fiber tip was measured before implantation as10-30 mW. Illumination duration was controlled via a TTL-gated shutter with a transitiontime of less than 0.5 ms (Uniblitz LS2; Vincent Associates, Rochester NY, USA).Stimulation timing was controlled via Spike2 software running a CED micro MKII Digitizer(Software and hardware from Cambridge Electronic Design, Cambridge, England).
7. In vitro slice preparation and recordingTransgenic mice were 60-390 days old when sacrificed. Brain slices were prepared andvisualized whole cell recordings performed as described in detail in ref:10 Voltage clamprecordings were performed with a CsCl based medium in some cases including QX-314(5-15 mM). Action potentials were elicited in ChAT interneurons usually in voltage clampwith 3-5 ms, 70-100 mV pulses. These recordings used KCl based internal solution withE[Cl-]∼-10 mV to facilitate detection of recurrent IPSCs. Most neurons were intracellularlylabeled with Alexa-594 or Alexa-488 (25-75 μM).
8. Chronic in vivo extracellular recordingOptrodes were composed of four independently movable tetrodes mounted in a 5-cannulaarray surrounding a central optic fiber with lateral distances between the 5 elements set at200 μm. Tetrode wires were gold-plated to impedances of <400 kOhm measured at 1 kHz,no more than 1 hour before implantation. Coordinates targeting dorsal striatum were,anterior, +0.5-1.0 mm, lateral, 1.6-2.0 mm and ventral, -2.4-2.7 mm (relative to Bregma).Animals were implanted with optrodes > 7 days post virus injection.
English et al. Page 10
Nat Neurosci. Author manuscript; available in PMC 2012 July 01.
NIH
-PA Author Manuscript
NIH
-PA Author Manuscript
NIH
-PA Author Manuscript

Wires were advanced slowly until units were encountered. The recorded extracellularpotential was pre-amplified 20× using a headstage pre-amplifier (Plexon, Dallas Texas,USA) and further amplified 100× and band-pass filtered (0.1-10,000 Hz) using an analogamplifier (Grass Technologies, West Warwick Rhode Island, USA), digitized at 25 kHz(micro MKII Digitizer, Cambridge Electronic Design, Cambridge, England) and recordedfor off-line analysis using Spike2 software (Cambridge Electronic Design, Cambridge,England).
9. Analysis of in vitro dataAnalysis was performed in Axograph2.0 (J. Clements) or routines written in IgorPro(WaveMetrics, Oswego, CA). Rise times were defined as the time difference between thedata points at which the amplitude of the response was 10 and 90 % of peak, respectively.For the analysis of the correlation of fIPSC and sIPSC amplitudes individual responseamplitudes were defined as the mean within a 1 ms (fIPSC) or 15-35 ms (sIPSC) window(Fig. 1f). The wide window averaging was carried out to eliminate the contribution of theuncorrelated stochastic channel noise associated with the sIPSC. An exponential functionwas then fitted to the fIPSC and sIPSC amplitudes of subsequent compound responsesexpressed as functions of recording time, which revealed that both amplitudes decayed overrepeated stimulations. The exponentially fitted trend of amplitude decay was then subtractedfrom the individual amplitudes and the de-trended amplitudes were expressed relative to therespective average fIPSCs and sIPSCs amplitudes, thus defining ΔfIPSC and ΔsIPSC (Fig.1f). This procedure does remove a source of correlated variance of unknown origin but theuncorrelated nature of the residual variance excludes in itself the possibility of sharedreceptor mechanisms or neurotransmitter pools underlying the 2 response components.
10. Analysis of in vivo dataSpike2 software was used for spike detection and sorting. Signals were band-pass filtered(300-6,000 Hz, digital 2-pole Butterworth filter) and an appropriate spike trigger thresholdwas set by the experimenter (approximately 3-5 times the SD of the noise). Wavemarksdefined as 0.5 ms pre and 1.0 ms post peak threshold crossing were extracted from eachchannel when at least one channel was triggered. After detection, the mean of the peakamplitudes (negative going) on the four channels was measured and this data was combinedwith the relative ratios of the peaks on the four channels yielding 5 variables from which 3principal components were extracted using a PCA routing of Spike2. The events were thenprojected in thus defined 3D space and were automatically over-clustered using the K-meanstatistics (10-20 clusters are initially cut for data actually having less than 5 units). Clustersmanually classified as noise on the basis of waveform shapes and inter-stimulus interval(ISI) histograms were discarded. The remaining potential units were then recombined andreclassified the same way a second time, with the effect of reducing the bias introduced inthe first iteration by the noise and improving the extraction of principal components mostdiscriminative among extracellular spikes. The identified clusters were then subjected toPCA analysis based on multidimensional data defined by all amplitudes values in the spikewaveforms. K-means were again used to automatically over-cluster the data, and theclustering information from waveforms and relative amplitude ratios was reconciledmanually. Auto and cross-correlation histograms were constructed and units were classifiedas putative single units if there was a clear refractory period (>3 ms) and if in the ISIhistogram 10% or less of the spikes in the first 50 ms occurred in the first 5 ms49. Unitclusters that had classifiable waveforms similar to single units but did not meet these criteriawere classified as multiple unit recordings.
Differences in waveform shape and firing pattern as well as optical responses were used toclassify cell types. In accordance with previous reports58,63,64, putative SPN single units had
English et al. Page 11
Nat Neurosci. Author manuscript; available in PMC 2012 July 01.
NIH
-PA Author Manuscript
NIH
-PA Author Manuscript
NIH
-PA Author Manuscript
firing rates <2 Hz (mean=0.74 Hz, SD=0.62) and band pass filtered (300-6,000 Hz)waveform valley widths >0.35 ms (mean=0.51 ms, SD=0.09)50. ChAT units were identifiedbased on zero latency optical inhibition. Surprisingly, the waveforms of ChAT and SPNunits were similar, the most reliable difference being an initial positive phase present only inChAT units (Fig. 6). Spikes of ChAT units fired tonically whereas SPNs tended to firesingle spikes or bursts interspersed with long (>1s) periods of silence. Units classified as“other neurons” had firing rates similar to ChAT interneurons but had significantly shorterwaveforms than all other unit classes and their firing rate was not directly modulated byillumination.
To examine the relationship between optical stimulation and changes in the firing rate ofSPNs, PSTHs were constructed using 50 ms binning and the mean and the SD of the spikenumber per bin were calculated for the 10-20 s preceding the stimulus (20-40 bins). Astatistically significant change in firing rate change was defined as 2 consecutive binsoutside mean±2SD defining a significance level of p=0.0019.
11. Statistical methodsDue to the small number of observations in most cases the nonparametric Wilcoxon rank-sum test was used to compare means of populations. These calculations and linearregression analysis were performed in IgorPro or StatView. Population measurements arereported as mean ± An exponential function standard deviation unless otherwise indicated.The statistical significance of firing rate changes in vivo were determined as describedabove (#10).
Supplementary MaterialRefer to Web version on PubMed Central for supplementary material.
AcknowledgmentsWe thank Dr. J. Berlin for confocal microscopy, Dr. L. Zaborszky for providing ChAT-EGFP mice, Dr. R. Yanez-Munoz for providing integration deficient pCMV-dR8.74-D64V plasmid DNA and for advice regarding virusproduction, Dr. N. Altan-Bonnet, Dr. W. Friedman and Dr. Haesun Kim for generously providing access to anultracentrifuge facility and other equipment in their laboratories, C.T. Unal and Dr. A. Kreitzer for valuablediscussion, Dr. A. Berenyi, Dr. S. Fujisawa, and Dr. M. Vandecasteele, for advise regarding in vivo recordingmethods, H. Xenias for help with confocal imaging, F. Shah for help with immunocytochemical procedures andother technical assistance and I. Tadros for virus injections. The research was supported by NS072950 and a BuschBiomedical Research Grant of Rutgers University to T.K., and NS034865 to J.M.T. and Rutgers University funds.
References1. Graybiel AM. Neurobiol Learn Mem. 1998; 70:119–36. [PubMed: 9753592]
2. Schultz W. J Neurophysiol. 1998; 80:1–27. [PubMed: 9658025]
3. Morris G, Arkadir D, Nevet A, Vaadia E, Bergman H. Neuron. 2004; 43:133–43. [PubMed:15233923]
4. Joshua M, Adler A, Mitelman R, Vaadia E, Bergman H. J Neurosci. 2008; 28:11673–84. [PubMed:18987203]
5. Hyland BI, Reynolds JN, Hay J, Perk CG, Miller R. Neuroscience. 2002; 114:475–92. [PubMed:12204216]
6. Kimura M, Rajkowski J, Evarts E. Proc Natl Acad Sci U S A. 1984; 81:4998–5001. [PubMed:6589643]
7. Apicella P. Trends Neurosci. 2007; 30:299–306. [PubMed: 17420057]
8. Aosaki T, et al. J Neurosci. 1994; 14:3969–84. [PubMed: 8207500]
9. Aosaki T, Kimura M, Graybiel AM. J Neurophysiol. 1995; 73:1234–52. [PubMed: 7608768]
English et al. Page 12
Nat Neurosci. Author manuscript; available in PMC 2012 July 01.
NIH
-PA Author Manuscript
NIH
-PA Author Manuscript
NIH
-PA Author Manuscript
10. Tecuapetla F, Koos T, Tepper JM, Kabbani N, Yeckel MF. J Neurosci. 2009; 29:8977–90.[PubMed: 19605635]
11. Pearce RA. Neuron. 1993; 10:189–200. [PubMed: 8382497]
12. Banks MI, Li TB, Pearce RA. J Neurosci. 1998; 18:1305–17. [PubMed: 9454840]
13. Tamas G, Lorincz A, Simon A, Szabadics J. Science. 2003; 299:1902–5. [PubMed: 12649485]
14. Karayannis T, et al. J Neurosci. 2010; 30:9898–909. [PubMed: 20660272]
15. Szabadics J, Tamas G, Soltesz I. Proc Natl Acad Sci U S A. 2007; 104:14831–6. [PubMed:17785408]
16. Banks MI, White JA, Pearce RA. Neuron. 2000; 25:449–57. [PubMed: 10719898]
17. Overstreet LS, Jones MV, Westbrook GL. J Neurosci. 2000; 20:7914–21. [PubMed: 11050111]
18. Ibanez-Sandoval O, Tecuapetla F, Unal B, Shah F, Koos T, Tepper JM. Journal of Neuroscience.2011
19. Gittis AH, Nelson AB, Thwin MT, Palop JJ, Kreitzer AC. J Neurosci. 2010; 30:2223–34.[PubMed: 20147549]
20. Capogna M, Pearce RA. Trends Neurosci. 2011; 34:101–12. [PubMed: 21145601]
21. Hill JA Jr, Zoli M, Bourgeois JP, Changeux JP. J Neurosci. 1993; 13:1551–68. [PubMed:8463835]
22. Koos T, Tepper JM. Nat Neurosci. 1999; 2:467–72. [PubMed: 10321252]
23. Koos T, Tepper JM. J Neurosci. 2002; 22:529–35. [PubMed: 11784799]
24. Chang HT, Kita H. Brain Res. 1992; 574:307–11. [PubMed: 1638402]
25. Sullivan MA, Chen H, Morikawa H. J Neurosci. 2008; 28:8682–90. [PubMed: 18753369]
26. Ding JB, Guzman JN, Peterson JD, Goldberg JA, Surmeier DJ. Neuron. 2010; 67:294–307.[PubMed: 20670836]
27. Giniatullin R, Nistri A, Yakel JL. Trends Neurosci. 2005; 28:371–8. [PubMed: 15979501]
28. Wilson CJ. Neuron. 2005; 45:575–85. [PubMed: 15721243]
29. Gradinaru V, et al. Cell. 2010; 141:154–65. [PubMed: 20303157]
30. Apicella P, Ravel S, Sardo P, Legallet E. J Neurophysiol. 1998; 80:3341–4. [PubMed: 9862929]
31. Gradinaru V, Thompson KR, Deisseroth K. Brain Cell Biol. 2008; 36:129–39. [PubMed:18677566]
32. Witten IB, et al. Science. 2010; 330:1677–81. [PubMed: 21164015]
33. Olah S, et al. Nature. 2009; 461:1278–81. [PubMed: 19865171]
34. Banks MI, Pearce RA. J Neurosci. 2000; 20:937–48. [PubMed: 10648698]
35. Wonnacott S. Trends Neurosci. 1997; 20:92–8. [PubMed: 9023878]
36. McGehee DS, Heath MJ, Gelber S, Devay P, Role LW. Science. 1995; 269:1692–6. [PubMed:7569895]
37. De Rover M, Lodder JC, Schoffelmeer AN, Brussaard AB. Synapse. 2005; 55:17–25. [PubMed:15499607]
38. Kubota Y, Mikawa S, Kawaguchi Y. Neuroreport. 1993; 5:205–8. [PubMed: 7507722]
39. Ibanez-Sandoval O, et al. J Neurosci. 2010; 30:6999–7016. [PubMed: 20484642]
40. Berke JD. Eur J Neurosci. 2009; 30:848–59. [PubMed: 19659455]
41. Zhou FM, Liang Y, Dani JA. Nat Neurosci. 2001; 4:1224–9. [PubMed: 11713470]
42. Rice ME, Cragg SJ. Nat Neurosci. 2004; 7:583–4. [PubMed: 15146188]
43. Matsumoto N, Minamimoto T, Graybiel AM, Kimura M. J Neurophysiol. 2001; 85:960–76.[PubMed: 11160526]
44. Hikosaka O, Sakamoto M, Usui S. J Neurophysiol. 1989; 61:814–32. [PubMed: 2723722]
45. Kataoka Y, et al. J Comp Neurol. 2010; 518:277–91. [PubMed: 19941350]
46. Leckman JF, Vaccarino FM, Kalanithi PS, Rothenberger A. J Child Psychol Psychiatry. 2006;47:537–50. [PubMed: 16712630]
47. Han X, et al. Neuron. 2009; 62:191–8. [PubMed: 19409264]
48. Yanez-Munoz RJ, et al. Nat Med. 2006; 12:348–53. [PubMed: 16491086]
English et al. Page 13
Nat Neurosci. Author manuscript; available in PMC 2012 July 01.
NIH
-PA Author Manuscript
NIH
-PA Author Manuscript
NIH
-PA Author Manuscript

49. Jog MS, et al. J Neurosci Methods. 2002; 117:141–52. [PubMed: 12100979]
50. Berke JD. J Neurosci. 2008; 28:10075–80. [PubMed: 18829965]
English et al. Page 14
Nat Neurosci. Author manuscript; available in PMC 2012 July 01.
NIH
-PA Author Manuscript
NIH
-PA Author Manuscript
NIH
-PA Author Manuscript
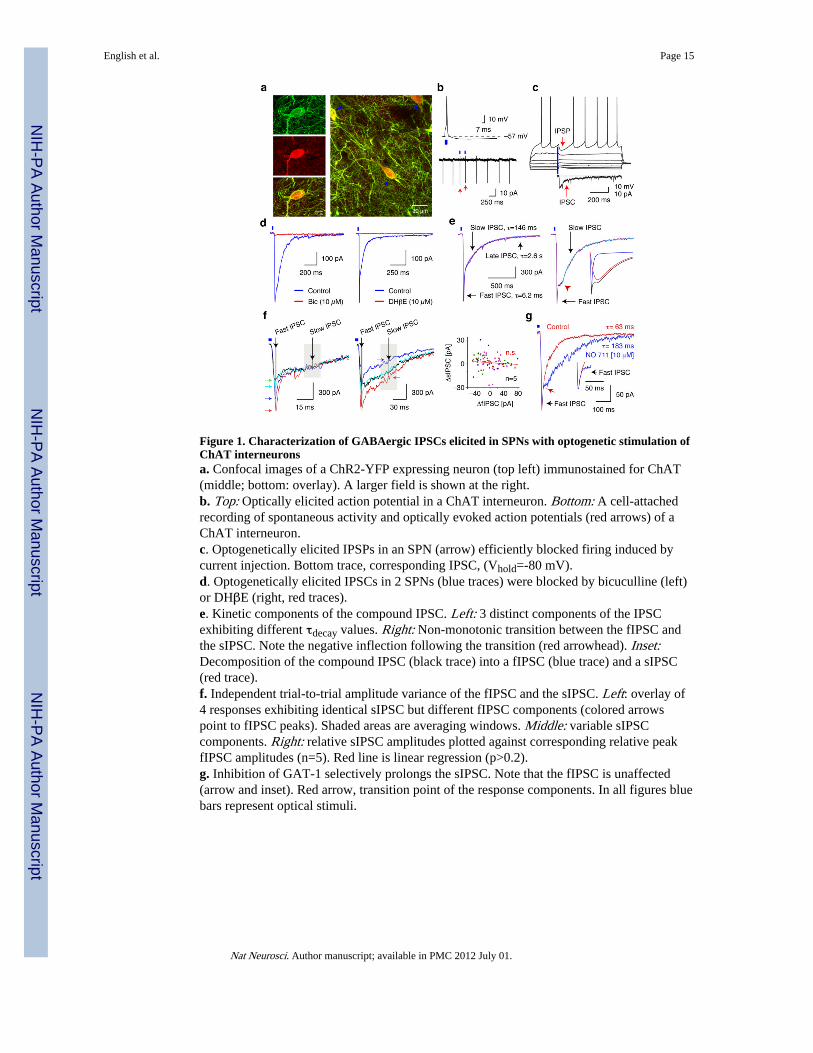
Figure 1. Characterization of GABAergic IPSCs elicited in SPNs with optogenetic stimulation ofChAT interneuronsa. Confocal images of a ChR2-YFP expressing neuron (top left) immunostained for ChAT(middle; bottom: overlay). A larger field is shown at the right.b. Top: Optically elicited action potential in a ChAT interneuron. Bottom: A cell-attachedrecording of spontaneous activity and optically evoked action potentials (red arrows) of aChAT interneuron.c. Optogenetically elicited IPSPs in an SPN (arrow) efficiently blocked firing induced bycurrent injection. Bottom trace, corresponding IPSC, (Vhold=-80 mV).d. Optogenetically elicited IPSCs in 2 SPNs (blue traces) were blocked by bicuculline (left)or DHβE (right, red traces).e. Kinetic components of the compound IPSC. Left: 3 distinct components of the IPSCexhibiting different τdecay values. Right: Non-monotonic transition between the fIPSC andthe sIPSC. Note the negative inflection following the transition (red arrowhead). Inset:Decomposition of the compound IPSC (black trace) into a fIPSC (blue trace) and a sIPSC(red trace).f. Independent trial-to-trial amplitude variance of the fIPSC and the sIPSC. Left: overlay of4 responses exhibiting identical sIPSC but different fIPSC components (colored arrowspoint to fIPSC peaks). Shaded areas are averaging windows. Middle: variable sIPSCcomponents. Right: relative sIPSC amplitudes plotted against corresponding relative peakfIPSC amplitudes (n=5). Red line is linear regression (p>0.2).g. Inhibition of GAT-1 selectively prolongs the sIPSC. Note that the fIPSC is unaffected(arrow and inset). Red arrow, transition point of the response components. In all figures bluebars represent optical stimuli.
English et al. Page 15
Nat Neurosci. Author manuscript; available in PMC 2012 July 01.
NIH
-PA Author Manuscript
NIH
-PA Author Manuscript
NIH
-PA Author Manuscript
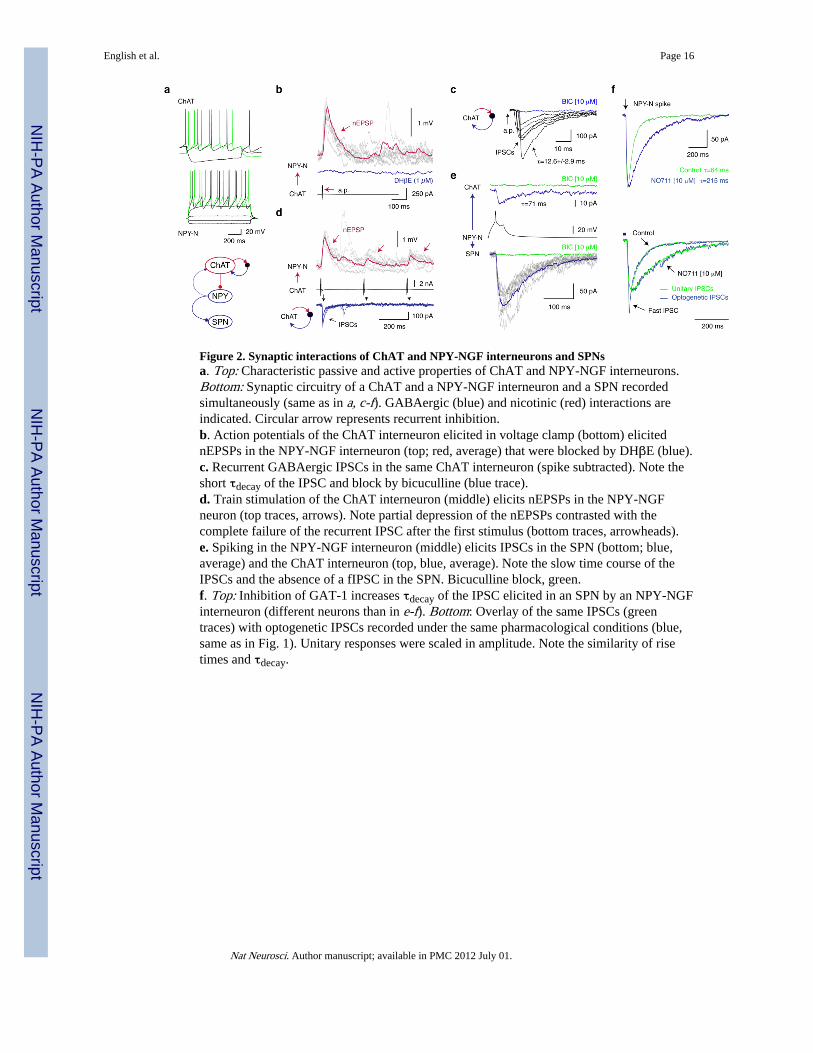
Figure 2. Synaptic interactions of ChAT and NPY-NGF interneurons and SPNsa. Top: Characteristic passive and active properties of ChAT and NPY-NGF interneurons.Bottom: Synaptic circuitry of a ChAT and a NPY-NGF interneuron and a SPN recordedsimultaneously (same as in a, c-f). GABAergic (blue) and nicotinic (red) interactions areindicated. Circular arrow represents recurrent inhibition.b. Action potentials of the ChAT interneuron elicited in voltage clamp (bottom) elicitednEPSPs in the NPY-NGF interneuron (top; red, average) that were blocked by DHβE (blue).c. Recurrent GABAergic IPSCs in the same ChAT interneuron (spike subtracted). Note theshort τdecay of the IPSC and block by bicuculline (blue trace).d. Train stimulation of the ChAT interneuron (middle) elicits nEPSPs in the NPY-NGFneuron (top traces, arrows). Note partial depression of the nEPSPs contrasted with thecomplete failure of the recurrent IPSC after the first stimulus (bottom traces, arrowheads).e. Spiking in the NPY-NGF interneuron (middle) elicits IPSCs in the SPN (bottom; blue,average) and the ChAT interneuron (top, blue, average). Note the slow time course of theIPSCs and the absence of a fIPSC in the SPN. Bicuculline block, green.f. Top: Inhibition of GAT-1 increases τdecay of the IPSC elicited in an SPN by an NPY-NGFinterneuron (different neurons than in e-f). Bottom: Overlay of the same IPSCs (greentraces) with optogenetic IPSCs recorded under the same pharmacological conditions (blue,same as in Fig. 1). Unitary responses were scaled in amplitude. Note the similarity of risetimes and τdecay.
English et al. Page 16
Nat Neurosci. Author manuscript; available in PMC 2012 July 01.
NIH
-PA Author Manuscript
NIH
-PA Author Manuscript
NIH
-PA Author Manuscript
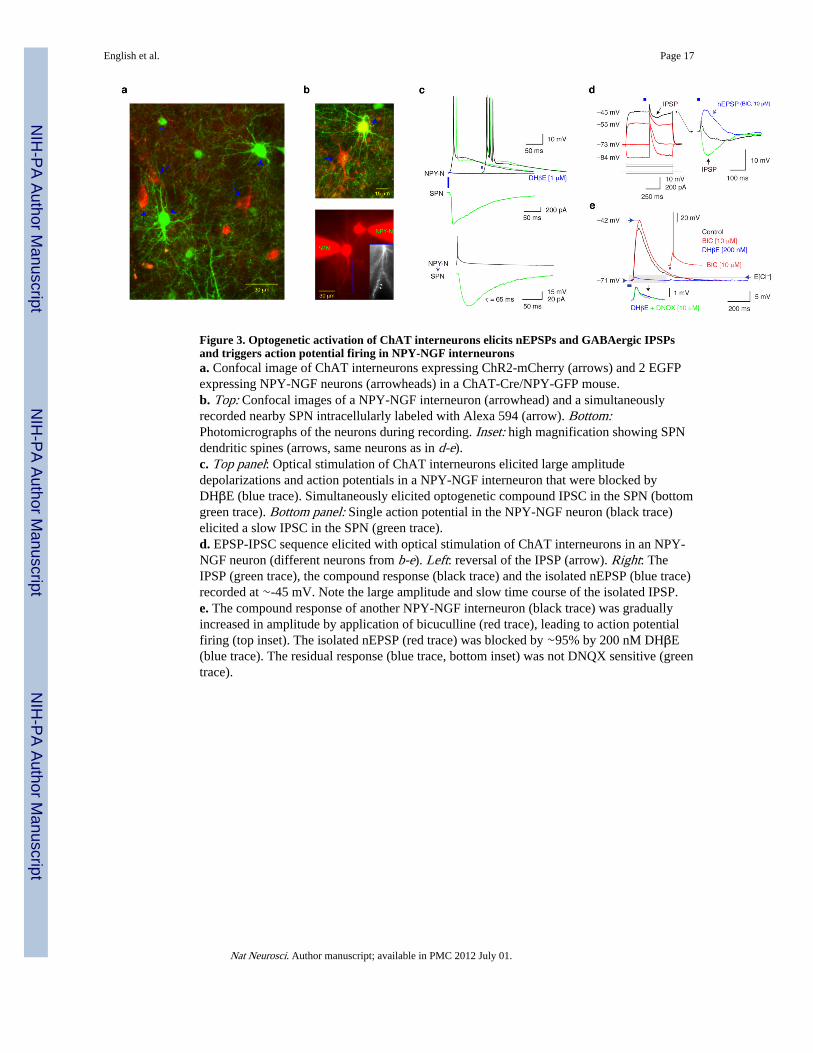
Figure 3. Optogenetic activation of ChAT interneurons elicits nEPSPs and GABAergic IPSPsand triggers action potential firing in NPY-NGF interneuronsa. Confocal image of ChAT interneurons expressing ChR2-mCherry (arrows) and 2 EGFPexpressing NPY-NGF neurons (arrowheads) in a ChAT-Cre/NPY-GFP mouse.b. Top: Confocal images of a NPY-NGF interneuron (arrowhead) and a simultaneouslyrecorded nearby SPN intracellularly labeled with Alexa 594 (arrow). Bottom:Photomicrographs of the neurons during recording. Inset: high magnification showing SPNdendritic spines (arrows, same neurons as in d-e).c. Top panel: Optical stimulation of ChAT interneurons elicited large amplitudedepolarizations and action potentials in a NPY-NGF interneuron that were blocked byDHβE (blue trace). Simultaneously elicited optogenetic compound IPSC in the SPN (bottomgreen trace). Bottom panel: Single action potential in the NPY-NGF neuron (black trace)elicited a slow IPSC in the SPN (green trace).d. EPSP-IPSC sequence elicited with optical stimulation of ChAT interneurons in an NPY-NGF neuron (different neurons from b-e). Left: reversal of the IPSP (arrow). Right: TheIPSP (green trace), the compound response (black trace) and the isolated nEPSP (blue trace)recorded at ∼-45 mV. Note the large amplitude and slow time course of the isolated IPSP.e. The compound response of another NPY-NGF interneuron (black trace) was graduallyincreased in amplitude by application of bicuculline (red trace), leading to action potentialfiring (top inset). The isolated nEPSP (red trace) was blocked by ∼95% by 200 nM DHβE(blue trace). The residual response (blue trace, bottom inset) was not DNQX sensitive (greentrace).
English et al. Page 17
Nat Neurosci. Author manuscript; available in PMC 2012 July 01.
NIH
-PA Author Manuscript
NIH
-PA Author Manuscript
NIH
-PA Author Manuscript
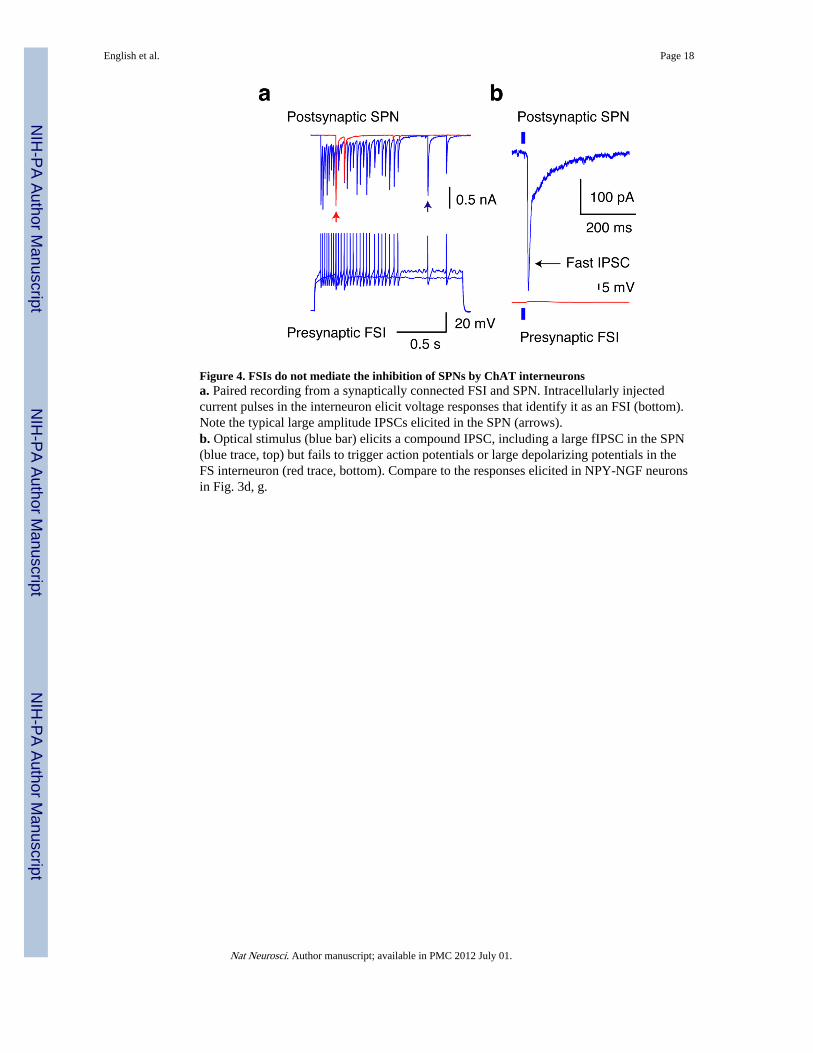
Figure 4. FSIs do not mediate the inhibition of SPNs by ChAT interneuronsa. Paired recording from a synaptically connected FSI and SPN. Intracellularly injectedcurrent pulses in the interneuron elicit voltage responses that identify it as an FSI (bottom).Note the typical large amplitude IPSCs elicited in the SPN (arrows).b. Optical stimulus (blue bar) elicits a compound IPSC, including a large fIPSC in the SPN(blue trace, top) but fails to trigger action potentials or large depolarizing potentials in theFS interneuron (red trace, bottom). Compare to the responses elicited in NPY-NGF neuronsin Fig. 3d, g.
English et al. Page 18
Nat Neurosci. Author manuscript; available in PMC 2012 July 01.
NIH
-PA Author Manuscript
NIH
-PA Author Manuscript
NIH
-PA Author Manuscript
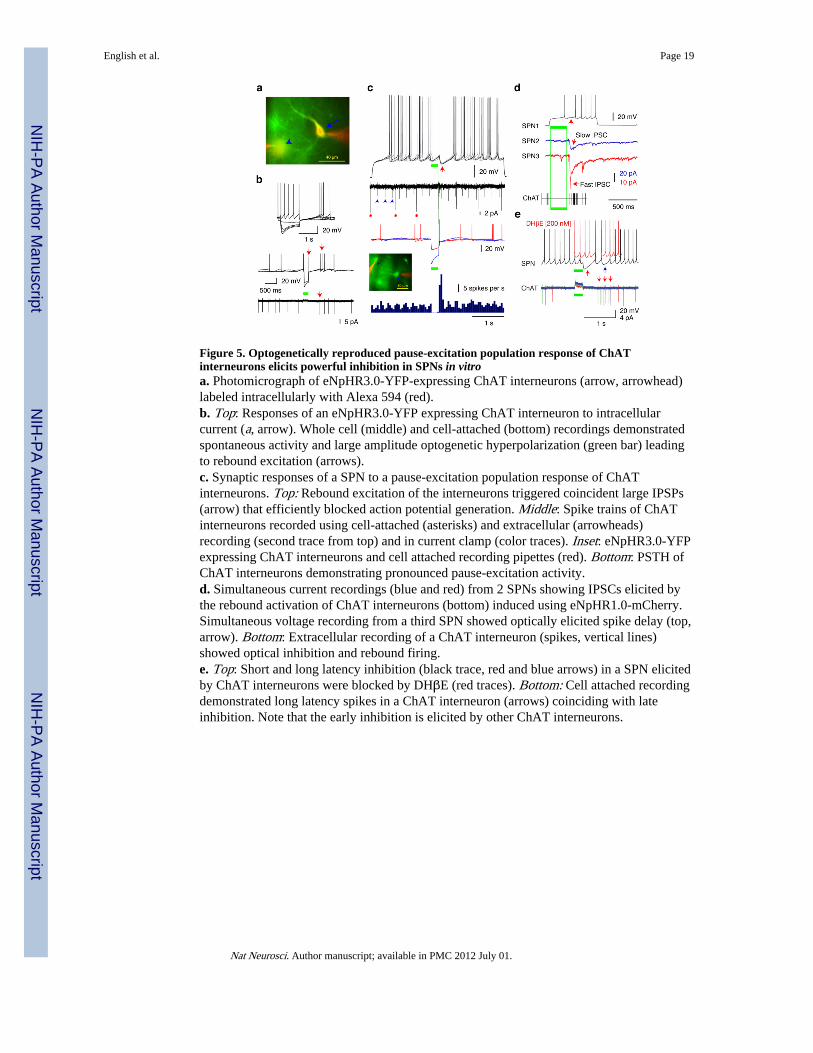
Figure 5. Optogenetically reproduced pause-excitation population response of ChATinterneurons elicits powerful inhibition in SPNs in vitroa. Photomicrograph of eNpHR3.0-YFP-expressing ChAT interneurons (arrow, arrowhead)labeled intracellularly with Alexa 594 (red).b. Top: Responses of an eNpHR3.0-YFP expressing ChAT interneuron to intracellularcurrent (a, arrow). Whole cell (middle) and cell-attached (bottom) recordings demonstratedspontaneous activity and large amplitude optogenetic hyperpolarization (green bar) leadingto rebound excitation (arrows).c. Synaptic responses of a SPN to a pause-excitation population response of ChATinterneurons. Top: Rebound excitation of the interneurons triggered coincident large IPSPs(arrow) that efficiently blocked action potential generation. Middle: Spike trains of ChATinterneurons recorded using cell-attached (asterisks) and extracellular (arrowheads)recording (second trace from top) and in current clamp (color traces). Inset: eNpHR3.0-YFPexpressing ChAT interneurons and cell attached recording pipettes (red). Bottom: PSTH ofChAT interneurons demonstrating pronounced pause-excitation activity.d. Simultaneous current recordings (blue and red) from 2 SPNs showing IPSCs elicited bythe rebound activation of ChAT interneurons (bottom) induced using eNpHR1.0-mCherry.Simultaneous voltage recording from a third SPN showed optically elicited spike delay (top,arrow). Bottom: Extracellular recording of a ChAT interneuron (spikes, vertical lines)showed optical inhibition and rebound firing.e. Top: Short and long latency inhibition (black trace, red and blue arrows) in a SPN elicitedby ChAT interneurons were blocked by DHβE (red traces). Bottom: Cell attached recordingdemonstrated long latency spikes in a ChAT interneuron (arrows) coinciding with lateinhibition. Note that the early inhibition is elicited by other ChAT interneurons.
English et al. Page 19
Nat Neurosci. Author manuscript; available in PMC 2012 July 01.
NIH
-PA Author Manuscript
NIH
-PA Author Manuscript
NIH
-PA Author Manuscript
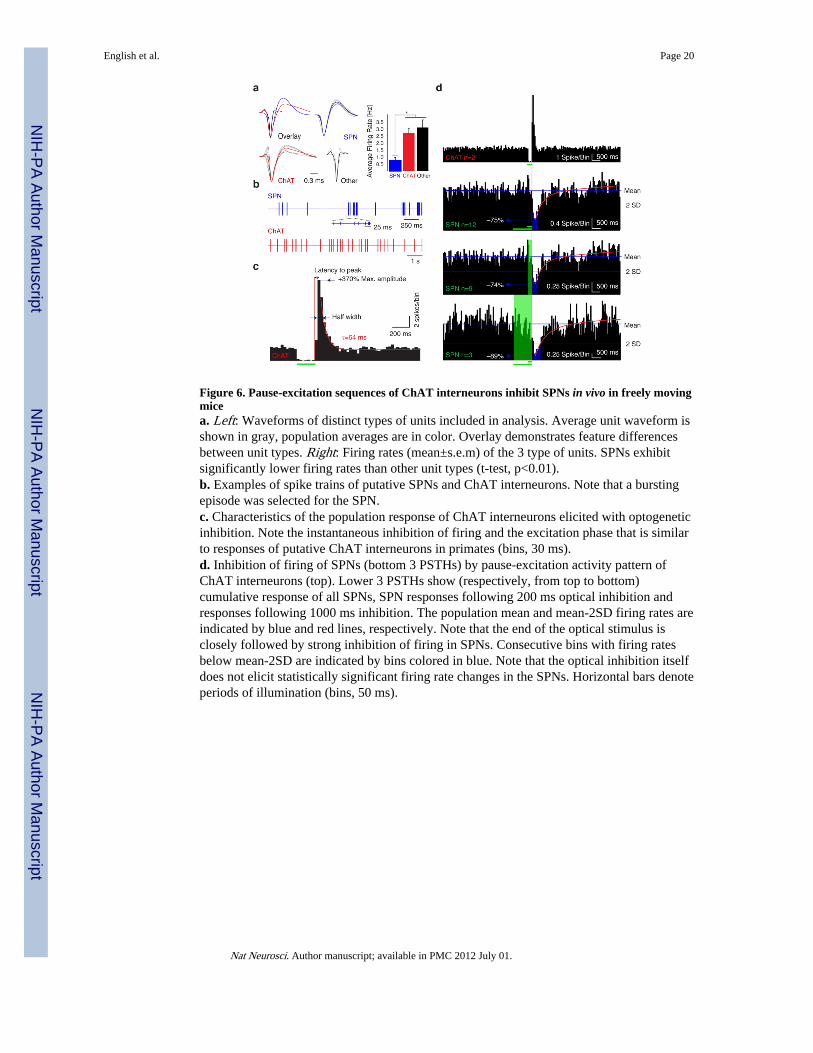
Figure 6. Pause-excitation sequences of ChAT interneurons inhibit SPNs in vivo in freely movingmicea. Left: Waveforms of distinct types of units included in analysis. Average unit waveform isshown in gray, population averages are in color. Overlay demonstrates feature differencesbetween unit types. Right: Firing rates (mean±s.e.m) of the 3 type of units. SPNs exhibitsignificantly lower firing rates than other unit types (t-test, p<0.01).b. Examples of spike trains of putative SPNs and ChAT interneurons. Note that a burstingepisode was selected for the SPN.c. Characteristics of the population response of ChAT interneurons elicited with optogeneticinhibition. Note the instantaneous inhibition of firing and the excitation phase that is similarto responses of putative ChAT interneurons in primates (bins, 30 ms).d. Inhibition of firing of SPNs (bottom 3 PSTHs) by pause-excitation activity pattern ofChAT interneurons (top). Lower 3 PSTHs show (respectively, from top to bottom)cumulative response of all SPNs, SPN responses following 200 ms optical inhibition andresponses following 1000 ms inhibition. The population mean and mean-2SD firing rates areindicated by blue and red lines, respectively. Note that the end of the optical stimulus isclosely followed by strong inhibition of firing in SPNs. Consecutive bins with firing ratesbelow mean-2SD are indicated by bins colored in blue. Note that the optical inhibition itselfdoes not elicit statistically significant firing rate changes in the SPNs. Horizontal bars denoteperiods of illumination (bins, 50 ms).
English et al. Page 20
Nat Neurosci. Author manuscript; available in PMC 2012 July 01.
NIH
-PA Author Manuscript
NIH
-PA Author Manuscript
NIH
-PA Author Manuscript