fy 2022-23 city manager's proposed budget - townnews
TRANSCRIPT

FY 2022-23City Manager’s Proposed BudgetA u g u s t 6 , 2 0 2 2
FY2022-2023
August 6, 2022 ID22-251

2
Presentation Objective
• Present an overview of budget structure and budget process
• Budget Assumptions
• Tax Rate and Revenue Assumptions
• General Fund
• Internal Service and Special Revenue Funds
• Utility Budgets
• Capital Budget
• Next steps
August 6, 2022 ID22-251

Budget CalendarC I P B u d get C a le n d a r
Date Action Date Action
December 10 CIP Budget Kick-off February 22-25 Operating Budget Kick-off
January 21 Call for CIP Projects Due to Finance March 1-7 Budget Prep Workshops Available
February CIP Review Meetings –Departments & Finance
March 25Operating Budgets Due (see checklist on pg. 12)
March 15 CIP Revisions Due to Finance March 28 – April 8 Finance Review and Analysis
March 16-31Finance meeting with CMO &
Executive Staff to prioritize projects.April 11 - 22
Operating Budget Review Meetings –Departments & Finance
AprilBudget staff draft CIP budget
documentApril 26 Final Revisions due to Finance
May Draft CIP budget document and preliminary supplemental list presented to CMO and Executive Staff
June – July Finance provides PUB & City Council periodic Budget Updates
August 6 Budget Workshop with City Council – departments present supplementals & are available to answer questions
September 27 City Council adopts CIP and Operating budget for FY 2022-23, tax rate, utility rates and other fee schedules3
O p e r a t i n g B u d g e t C a l e n d a r
August 6, 2022 ID22-251

August 6, 2022 ID22-251
FY 2022-23 Key Focus Areas

Key Focus Areas Summary
August 6, 2022 ID22-251
KFA 1: Employee retention through
competitive pay and benefits
KFA 2: Comprehensive
Capital Improvement
Plan
KFA 3: Seek alternative Economic
Development funding
KFA 4: Enhance quality of life service levels
KFA 5: Enhance public safety
resources
KFA 6: Enhance resources
dedicated to sustainability
5

6
Financial Assumptions & Forecast
August 6, 2022 ID22-251

Tax Rate Definitions
Tax Rate 1. M&O Rate – Maintenance and Operations Rate
General Fund operations
2. I&S Rate – Interest and Sinking Rate, also referred to as debt rate
General Government debt service
• No-New-Revenue - calculated rate that would provide the City with about the same amount of revenue it received in the year before on properties taxed in both years. If property values rise, the NNR tax rate goes down and vice versa.
• Voter Approval Rate - calculated maximum rate allowed by law without voter approval.
August 6, 2022 ID22-251 7

Economic and Growth Factors
August 6, 2022 ID22-251
9.1% Inflation Rate (June 2022)
22% City of Denton Forecasted
Population Growth 2022-2030
-
1.00
2.00
3.00
4.00
5.00
6.00
7.00
8.00
9.00
10.00
Jan
uar
y
Feb
ruar
y
Mar
ch
Apr
il
May
Jun
e
July
Aug
ust
Sep
tem
ber
Oct
ob
er
No
vem
ber
Dec
emb
er
Per
cen
tage
Month
2019
2020
2021
2022
020,00040,00060,00080,000
100,000120,000140,000160,000180,000200,000
2022
2023
2024
2025
2026
2027
2028
2029
2030
PO
PU
LATI
ON
YEAR
8

Compensation & Benefits Assumptions
Compensation Benefits
Health Insurance
• Assumes no change to City contributions
• No increase to employee contribution rates
Retirement
• TMRS rate increase from 17.65% to 18.15%
• Fire pension remains at 18.5%
• Salary Adjustments
• 3% COLA + 2% Merit (one-time) in FY 2022-23
• 3% in FY 2024 - 2027
• Compensation Study
• Expected completion mid-year FY 2022-23
• Adjustments programmed in for salary
adjustments as a result of study
August 6, 2022 ID22-251 9

Assumptions for General Fund • Assessed Values
• FY 2022/23 – 19% increase from previous year
• FY 2023/24 and future – Assumes reduced M&O tax rate to correspond with AV Increases
• 99% Collection Rate
• Total proposed tax rate of $0.555682 (decrease of 1.0 cent)
• Sales Tax
• FY 2022-23 – 5% above the revised estimate for FY 2021-22
• FY 2022-23 and beyond – 3% increase
• Return on Investment (ROI)
• Maintains 6% ROI for Electric Fund
• Franchise Fees
• Transfer of $15.1 million to Streets Improvement Fund (increase of $623,672)
August 6, 2022 ID22-251 10

11
Sales Tax History
August 6, 2020 ID 20-1154
-10%
-5%
0%
5%
10%
15%
20%
-
10,000,000
20,000,000
30,000,000
40,000,000
50,000,000
60,000,000
Annual Sales Tax Total Annual Sales Tax Growth

Tax Year 2017 2018 2019 2020 2021 2022
Final Value ($Billions) $ 10.3 $11.3 $ 12.6 $ 13.6 $14.4 $17.1
Value Change ($Millions) $1,214.6 $984.8 $1,303.6 $961.1 $820.9 $2,694.3
Percent Change 13.6% 9.7% 10.4% 5.8% 7.9% 19%
• Total Certified Appraised Value is $17.1 billion (excluding TIRZ)
19% increase compared to 2021 value of $14.4 billion
$2.7 billion increase in value
$562 million in new value
$2.1 billion from change in existing properties
• Excluding frozen values ($2,111,900,001), Certified appraisal is $15 billion
• Average homestead value increased from $275,361 to $307,283
August 6, 2022 ID22-251
Appraised Values
12

13
Assessed Value History
August 6, 2022 ID22-251
3%
5%4%
12%
9% 8%
14%
10%
12%
4%
11%
19%
$0
$2,000,000,000
$4,000,000,000
$6,000,000,000
$8,000,000,000
$10,000,000,000
$12,000,000,000
$14,000,000,000
$16,000,000,000
$18,000,000,000
$20,000,000,000
$22,000,000,000
0%
2%
4%
6%
8%
10%
12%
14%
16%
18%
20%
2011 2012 2013 2014 2015 2016 2017 2018 2019 2020 2021 2022
Ass
ess
ed
Val
ue
Tax Year

*Includes TIRZ and Frozen Value
Values as of Certified Total or Certified Estimate ~ July 25th Each Year
Fiscal Year Certified Value* Total ARB Value
Total Assessed Value
Properties In Review
2022-23 $15,526,387,812 $1,834,872,127 $17,361,259,939 11%
2021-22 $13,828,457,000 $811,257,679 $14,639,714,679 6%
2020-21 $8,563,757,277 $5,930,330,015 $14,494,087,292 41%
2019-20 $12,545,128,503 $244,259,543 $12,789,388,046 2%
2018-19 $10,936,139,629 $491,429,271 $11,427,568,900 4%
August 6, 2022 ID22-251
Assessed Value and Tax Rate Assumptions
• The City received Certified Estimates instead of Certified Totals from the Denton County Appraisal District (DCAD).
• If the Appraisal District has not approved appraisal records, the Chief Appraiser shall provide a certified estimate.
• Assessed values increased 19% from FY 2021-22, however, 11% of properties are still in review.
• The high percentage of protest creates uncertainty in total assessed values and revenues.
14

Assessed Values*
75% 80% 85%
Scenario Proposed Budget Scenario
Certified Value $15,526,387,812 $15,526,387,812 $15,526,387,812
Protest Value $1,379,154,095 $1,467,897,702 $1,559,641,308
Total AV $16,905,541,907 $16,994,285,514 $17,086,029,120
Proposed Tax Rate $0.55568 $0.55568 $0.55568
Total Levy Difference from Proposed Budget
($320,804) $0 $320,804
*Includes TIRZ August 6, 2022 ID22-25115
Assessed Value Assumptions• Since July 25, 2021, the City’s certified value has increased 19% or $2.7 billion.• The proposed budget is based on 80% of the $1.8 billion under review returning
to the total certified value. • The proposed budget anticipates a collection rate of 99%.• In FY 2020-21, protest values were upheld at 75%.

Tax RateProposed Tax Rate
Maintenance & Operation $0.351432 / $100
Debt Service $0.204250 / $100
Total Proposed Tax Rate $0.555682 / $100
Required Tax Rate for FY23 Baseline Budget (including FY22 Mid-Year Amendments)
Maintenance & Operation $0.325332 / $100
Debt Service $0.204250 / $100
Total Required Tax Rate $0.529582 / $100*
*Fund Balance below target in future fiscal years
No-New-Revenue Rate $0.511429 / $100
Voter Approval Rate $0.603743 / $100
August 6, 2022 ID22-251 16

17
Tax Rate Discussion
August 6, 2022 ID22-251 * Fund Balance below target in future years
No New Revenue (NNR)
Tax Rate
FY 23 Baseline+ FY 22 Budget
AmendmentTier 1 Tier 2
Proposed Tax Rate (Tier 3)
Tax Rate $0.511429 $0.529582 $0.540682 $0.545682 $0.55568
General Fund Revenue
$175,508,624 $178,149,063 $179,763,611 $180,490,884 $181,945,431
General Fund Expenses*
$178,139,972 $178,139,972 $178,139,972 $178,139,972 $178,139,972
FY 2023 Supplementals
$0 $0 $1,563,554 $2,534,596 $3,387,274
Net ($2,631,348)* $9,091* $60,085* $(183,684)* $418,185

18
Tax Rate Discussion
• The proposed budget includes a tax rate equal to $0.555682. Of this amount, $0.351432 is provided to operation and maintenance expense and $0.204250 for debt.
• The maintenance and operations rate increased by $0.001, and the debt service rate will decrease by $0.011, as a result of the increase in assessed values.
• The average residential property owner will see a $12.50/month or $150/year increase in their City property taxes.
Proposed Rate
Fiscal Year Operations Rate Debt Rate Total Rate Average Taxable Value Average Tax Bill
2023 $0.35143 $0.20425 $0.55568 $307,283 $1,708
2022 $0.35030 $0.21538 $0.56568 $275,361 $1,558
2021 $0.38036 $0.21009 $0.59045 $259,097 $1,530
2020 $0.38536 $0.20509 $0.59045 $248,909 $1,470
2019 $0.40543 $0.21505 $0.62048 $233,165 $1,447
2018 $0.43031 $0.20755 $0.63786 $214,376 $1,366
2017 $0.46674 $0.21660 $0.68334 $197,379 $1,349

19
General Fund Forecast
August 6, 2022 ID22-251
FY 2020-21 Actual
FY 2021-22 Budget
FY 2021-22 Forecast
FY 2022-23 Proposed
FY 2023-2024 Projected
FY 2024-25 Projected
FY 2025-2026 Projected
FY 2026-2027 Projected
Beginning Fund Balance $ 33,782,211 $ 39,013,842 $ 38,499,990 $ 40,400,516 $ 40,818,701 $ 41,115,336 $ 41,449,465 $ 42,129,358
Property Tax 49,495,424 49,727,138 49,306,801 56,993,689 59,094,738 61,340,984 63,745,228 66,321,625
Sales Tax 45,404,857 46,246,938 51,992,420 54,592,041 56,229,802 57,916,696 59,654,197 61,443,823
Other Revenues 52,893,554 54,351,492 52,247,753 56,385,993 56,904,357 57,765,387 57,948,782 59,308,858
Data Center Revenue 13,973,708 13,973,708 13,973,708 13,973,708 13,973,708
Total Revenues $ 147,793,835 $ 150,325,568 $ 153,546,974 $ 181,945,431 $ 186,202,605 $ 190,996,775 $ 195,321,914 $ 201,048,014
Personnel Services $ 97,632,313 $ 103,465,424 $ 101,678,916 $ 109,898,555 $ 112,749,676 $ 115,851,115 $ 118,105,714 $ 121,805,970
Maintenance & Operations 25,146,904 26,462,949 24,917,555 30,824,105 32,097,947 32,940,645 33,828,505 34,713,911
Transfers 20,296,840 20,065,369 22,232,984 22,247,843 22,675,751 23,356,023 24,056,704 24,778,405
One-Time Data Center Expenses 13,973,708 13,973,708 13,973,708 13,973,708 13,973,708
Approved Mid-Year Budget Amendments - - 1,302,603 1,195,761 1,231,633 1,268,582 1,306,640 1,345,839
One-Time Supplemental Packages - - 1,514,390 302,560 - - - -
Recurring Supplemental Packages - - - 3,084,714 3,177,255 3,272,573 3,370,750 3,471,873
Total Expenditures $ 143,076,056 $ 149,993,742 $ 151,646,448 $ 181,527,246 $ 185,905,971 $ 190,662,646 $ 194,642,021 $ 200,089,705
Ending Fund Balance $ 38,499,990 $ 39,345,668 $ 40,400,516 $ 40,818,701 $ 41,115,336 $ 41,449,465 $ 42,129,358 $ 43,087,667
Change in Fund Balance $ 4,717,779 $ 331,826 $ 1,900,526 $ 418,185 $ 296,635 $ 334,129 $ 679,893 $ 958,309
Fund Balance as % of Total Expenditures 26.91% 26.23% 26.64% 24.36% 23.91% 23.46% 23.32% 23.15%

20
FY 2022 – One Time Expenses
Department Program Title Key Focus Area Total Cost
Fire Squad 9 Light Rescue Apparatus Support Healthy and Safe Communities $300,000
Fire Equipment and Training Support Healthy and Safe Communities $214,011
Planning Southridge Historic Survey Strengthen Community and Quality of Life $100,000
Planning Vision Zero Phase 2 Support Healthy and Safe Communities $250,000
Finance/Planning Development Services Fee Study Pursue Organizational Excellence $30,000
Planning Wayfinding Sign Update Enhance Infrastructure and Mobility $40,000
Building Inspections Building Plan Scanning Pursue Organizational Excellence $185,000
Parks New Property Artwork Strengthen Community and Quality of Life $106,246
Libraries North Branch Library Drive-thru Replacement Strengthen Community and Quality of Life $9,133
Public Affairs Branding Study Pursue Organizational Excellence $80,000
City Manager Crisis Communications Support Healthy and Safe Communities $20,000
Economic Development Business Survey Strengthen Community and Quality of Life $30,000
Traffic Driver Feedback Signs Enhance Infrastructure and Mobility $50,000
Community Services Community Service Programs Foster Economic Opportunity and Affordability $100,000
Total $1,514,390
August 6, 2022 ID22-251

Residential Annual Tax and Utility Bill Impact
Tax Bill Impact
August 6, 2022 ID22-251 21
Tax Impact
Fiscal Year 2021 2022 2023 - Proposed Comments
Tax Rate $0.59045 $0.56568 $0.55568
Average Taxable Value $259,097 $275,361 $307,283*
Average Tax Bill $1,530 $1,558 $1,708 $150 Annual Increase
Utility Impact
Water $559 $531 $531 No Rate Change
Wastewater $378 $378 $378 No Rate Change
Electric $1,334 $1,334 $1,334 No Rate Change
Solid Waste $246 $246 $246 No Rate Change
Average Utility Bill $2,517 $2,489 $2,489
Total Average Bill $4,047 $4,047 $4,197 $150.00 Annual Increase
*Average Home Value

Public SafetyS u p p o r t H e a l t h y a n d S a fe C o m m u n i t i e s
August 6, 2022 ID22-251

Police Staffing Projection
• Matrix Consulting completed staffing assessment of Police Department in 2019.
• The study recommended staffing levels of 220 sworn positions by 2025 and 236 sworn positions by 2030.
• FY 2022-23 Proposed Budget includes 5 sworn Police Officers.
August 6, 2022 ID22-251 23
160
170
180
190
200
210
220
230
FY 2019 FY 2020 FY 2021 FY 2022 FY 2023 FY 2024 FY 2025
SWORN POSITIONS
Sworn Positions Goal

24
Position Summary
• 55 positions added to Police Department since FY 2019
Home Business UnitFY 18-19 Actuals
FY 19-20 Actuals
FY 20-21 Actuals
FY 21-22 Estimate
FY 22-23 Proposed
Administration 32 32 45 29 29Records 12 12 10 0 0Support 0 0 0 64.23 71.23North Patrol 99 103 101 56 56South Patrol 12 14 13 53 53Criminal Invest. 39 39 47.5 59 60Neighborhood Srvc. 45.73 48.73 44.23 0 0Public Safety Com. 30 33.5 41.5 40.5 42.5Mental Health 0 0 5 13 13Total 269.73 282.23 307.23 314.73 324.73

Police Metrics
25
2021 Calls for Service
Dispatched 77,973
Officer-Initiated 31,566
Total 109,539
2022 YTD (1/1 to 6/15)Calls for Service
Dispatched 39,718
Officer-Initiated 19,316
Total 59,034
From May 16, 2021 (launch) to May 31, 2022:
• 1,168 cases assigned to CIRT pairs• 2,511 follow-ups conducted• 282 Emergency Detention Orders (EDOs) completed• 523 active calls for service in which a clinician was present/on scene• 2,116 calls for service overall involving mental health or suicidal
individuals
CIRT by the Numbers
2015 2016 2017 2018 2019 2020 20212022ytd
Calls 103,05 103,39 105,11 100,34 108,62 101,36 109,53 59,034
-
20,000
40,000
60,000
80,000
100,000
120,000
Total Calls for Service
August 6, 2022 ID22-251

2021 Incoming Phone Calls
9-1-1 92,587
Non-emergency 192,432
Total 285,019
26
Public Safety Communications
2022 YTD (1/1 to 7/31)Incoming Phone Calls
9-1-1 63,534
Non-emergency 129,374
Total 192,908
Increase from 2018 to 2021 of 66.84%
Total Incoming Phone Calls by Year
2018 180,350
2019 216,189
2020 244,413
2021 285,019
2022 (1/1-7/31) 192,908
2018 2019 2020 2021 2022 ytd
Calls 99,769 113,615 126,411 166,461 132,646
-
20,000
40,000
60,000
80,000
100,000
120,000
140,000
160,000
180,000
Total Calls for Service Entered (All Agencies)
August 6, 2022 ID22-251

27
Fire Staffing Projection
August 6, 2022 ID22-251

28
Performance MetricsFY 20-21
Call for Service
FY 21-22 (YTD)
Call For Service
Fire 535 477
EMS 12,092 10,207
Rescue 91 74
Hazmat 325 347
Service Calls 5,312 4,469
Total 19,995 16,484
Average Response Time 4:26 4:19
Fire Metrics
August 6, 2022 ID22-251

Community ServicesS t r e n g t h e n C o m m u n i t y a n d Q u a l i t y o f L i fe
August 6, 2022 ID22-251

C O M M U N I T Y I M P R O V E M E N T S E R V I C E S
30
METRICS
Increase in verbal
compliance (more than
50% in the first 7 days)
Proactive cases
dropped in 2020 due
to COVID policy. 32%
drop in all cases.
C O M M U N I T Y D E V E L O P M E N T
TOP 3 VIOLATION1.Trash & Debris2.Vegetation3.Parking
GRANT PROGRAMS MANAGED FY20/21
O N G O I N G C O U N C I L P R I O R I T Y P RO J E C T S
▪ 909 N. Loop 288 Project
▪ Denton Affordable Housing Strategy and Toolkit
▪ Strengthening the Housing Crisis Response System
and Homelessness Initiatives
F Y 2 0 / 2 1 F U N D S E X P E N D E D : $5,391,408
333 1. AFFORDABLE HOUSING
5,2062. MAKING HOMELESSNESS RARE,
BRIEF, AND NONRECURRING
5,972 3. PUBLIC SERVICES
8,719 4. PUBLIC FACILITIES, IMPROVEMENTS,
AND INFRASTRUCTURE
F Y 2 0 / 2 1 P E R S O N S S E R V E D
August 6, 2022 ID22-251

Community ServicesFUNDING CHART FY2020-21 FY2021-22 FY2022-23
Grant (CDBG) $157,769 $154,654 $138,859
Grant (General Fund) $342,231 $326,250 $362,250
Grants (ARPA SLFRF) $0 $1,445,000 $1,500,000
Child Victims of Abuse/Neglect Children’s Advocacy Center (PD) $180,405 $141,950 $189,975
Utility Assistance – Interfaith (DME) $133,000 $125,000 $125,000
DISD Mentor Program (General Fund) $20,000 $20,000 $20,000
Homelessness Initiatives (General Fund) $703,450 $703,450 $703,450
Homelessness Initiatives – Loop 288 (ARPA SLFRF) $0 $5,000,000 $1,295,000
Homelessness Initiatives – Hotel Voucher Program (ARPA SLFRF) $0 $550,000 $2,500,000
City Housing Assistance Projects HAP, HIP, MRP, DFG (CDBG, HOME, GF) $1,878,592 $1,270,442 $550,427
Nonprofit Housing (i.e.. DAHC, Fairoaks, Habitat, Cumberland, etc.) $300,783 $100,000 $453,527
City Improvements/Infrastructure Projects (CDBG) $638,610 $292,000 $208,800
Public Facility Improvements (CDBG) $429,367 $402,327 $165,635
CARES Act–CDBG-CV & ESG-CV only $2,910,440 $685,440 $0
Admin & Operations (CDBG,HOME) $329,711 $336,551 $237,525
Admin & Operations (General Fund) $1,997,358 $2,166,761 $1,863,496
TOTAL $10,021,716 $13,719,825 $10,313,944
Homelessness Initiatives – Loop 288 Building (Bond) $2,000,000 $6,000,000 $0
August 6, 2022 ID22-251 31

Parks & RecreationS t r e n g t h e n C o m m u n i t y a n d Q u a l i t y o f L i fe
August 6, 2022 ID22-251

33
Parks & RecreationStrengthen Community and Quality of Life
The Parks and Recreation Department strives to unite and grow lives by preserving parks and encouraging play,which is supported through strategic planning, capital improvement enhancements, and the provision of avariety of passive and active recreational opportunities, programs, and special events.
46%
47%
48%
49%
50%
51%
52%
0
100
200
300
400
FY 2021 FY 2022 Est FY 2023
Trail Expansion Tree Plantings
0
50
100
150
200
250
300
$0
$2
$4
$6
$8
$10
$12
FY 2021 FY 2022 Est FY 2023
Acquired Land (Acres) Land Value ($M)
August 6, 2022 ID22-251

34
Parks & Recreation Metrics
August 6, 2022 ID22-251
Performance Metric FY 2020-21 Actual FY 2021-22 Goal FY 2021-22 Estimate FY 2022-23 Goal
Facility Utilization (counters)
338,344 400,000 550,000 600,000
Volunteer Impact (Hour/$)
14,928/$406,042 15,000/$428,100 16,000/$456,640 17,000/$485,180
Social Media Impression 463,085 700,000 800,000 1,000,000
Customer Satisfaction (Good or Better rating)
88% 90% 89% 90%
Meeting & Event Outreach ( # Of
Contacts)3,460 4,500 4,500 8,000
Sports Tourism Projected Economic
Impact$539,560 $700,000 $1,500,000 $1,600,000
Sports Tourism Projected
Spectators/Visitors13,915 25,000 50,000 60,000

LibrariesS t r e n g t h e n C o m m u n i t y a n d Q u a l i t y o f L i fe
August 6, 2022 ID22-251
36
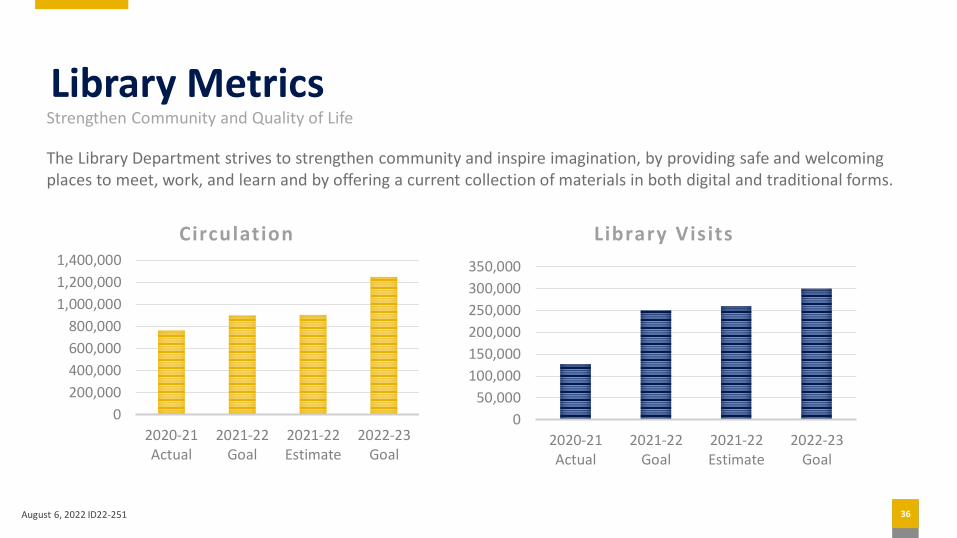
Library MetricsStrengthen Community and Quality of Life
The Library Department strives to strengthen community and inspire imagination, by providing safe and welcoming places to meet, work, and learn and by offering a current collection of materials in both digital and traditional forms.
August 6, 2022 ID22-251
0
200,000
400,000
600,000
800,000
1,000,000
1,200,000
1,400,000
2020-21Actual
2021-22Goal
2021-22Estimate
2022-23Goal
Circulation
0
50,000
100,000
150,000
200,000
250,000
300,000
350,000
2020-21Actual
2021-22Goal
2021-22Estimate
2022-23Goal
Library Visits

37
Library Metrics
August 6, 2022 ID22-251
1,280
1,300
1,320
1,340
1,360
1,380
1,400
1,420
1,440
1,460
2020-21Actual
2021-22 Goal 2021-22Estimate
2022-23 Goal
Classes & Events
0
1,000
2,000
3,000
4,000
5,000
6,000
7,000
2020-21Actual
2021-22 Goal 2021-22Estimate
2022-23 Goal
New Library Accounts

DevelopmentE n h a n c e I n f r a s t r u c t u r e a n d M o b i l i t y
August 6, 2022 ID22-251

39
Planning Metrics
• Planning is seeing an increasing demand for development projects. Planning estimates a 24% increase from previous year in number of development projects.
• Increases in revenues associated with development, offset the expenses related to proposed staff increases.
0
100
200
300
2019 2020 2021 2022 EST
Pre-Application and Pre-Construction Meetings Held
0
200
400
600
800
2019 2020 2021 2022 EST
Development Project Activity
8,182 7,543 8,37110,135
$-
$500
$1,000
$1,500
$2,000
$2,500
02,0004,0006,0008,000
10,00012,000
2019 2020 2021 2022EST
Mill
ion
sPermits Issued/Construction Value
Permits Issued Construction Value
August 6, 2022 ID22-251

40
Building Inspections
• Building Inspection Division is responsible for the safety and review of applications for health permits.
• During past five years, department has seen 42% increase for reviews per employee. Increasing revenues associated with inspections, offset the expenses related to proposed staff increases.
August 6, 2022 ID22-251
12,033
18,37521,126 20,937 21,063
25,389
34,776
0
5000
10000
15000
20000
25000
30000
35000
40000
2016 2017 2018 2019 2020 2021 2022EST
Residential Inspection Counts
5,518 4,748
8,880
18,838
25,702
18,152
648 424 520 1,202
5,682
1,514
0
10000
20000
30000
2019 2020 2021 2022 2023 2024
Total Apartment InspectionsBased on Issued Permits
Total Inspections Recorded Inspections

41
Supplemental Requests
41August 6, 2022 ID22-251

42
Supplemental Requests Summary
Total supplemental requests funded in Proposed Budget
• $3,387,274
Council initiated supplemental requests funded in Proposed Budget
• $257,922
Internal Service Fund supplemental requests funded in Proposed Budget
• $1,767,882
August 6, 2022 ID22-251

Supplemental Package Summary General Fund
• Supplemental packages have been grouped into tiers ranging from 1-5.
• $302,560 one-time Cost, $4,841,959 recurring cost
• Tiers 1-3 included in Proposed Budget
Tier 1Tier 2
Tier 3
Tier 4
Tier 5
Increase Above Proposed Rate
One-Time Cost Recurring Cost Tier Total Total Cost
Tier 1 $.00 $241,560 $1,321,994 $1,563,554 $1,563,554
Tier 2 $.00 $0 $971,042 $971,042 $2,534,596
Tier 3 $.00 $61,000 $791,678 $852,678 $3,387,274
Tier 4 $.01 $0 $1,198,789 $1,198,789 $4,586,063
Tier 5 $.02 $0 $558,456 $558,456 $5,144,519
August 6, 2022 ID22-251 43

Supplemental Funding Requests –Tier #1 - Funded
Tier Department Program Title FTEsOn-Going
CostOne-Time
CostsTotal Cost
1 Council Initiative Paid Parental Leave $257,922 $257,922
1 Community Services Community Development Manager* 1 $132,041 $132,041
1 Police Police Officers 5 $634,843 $241,560 $876,403
1 Police Jailers (Civilian) 2 $180,309 $180,309
1 Human Resources Business Partner 1 $116,879 $116,879
Total 9 $1,321,994 $241,560 $1,563,554
* Existing positionAugust 6, 2022 ID22-251 44

Supplemental Funding Requests –Tier #2 - Funded
Tier Department Program Title FTEsOn-Going
CostOne-Time
CostsTotal Cost
2 Human Resources HR Generalist 1 $102,997 $102,997
2 Fire Fire Fighters (Drivers) 2 $299,110 $299,110
2 Fire Fire Inspector 1 $116,000 $116,000
2 Police Digital Forensic Investigator 1 $98,885 $98,885
2 Legal Intern 0.13 $29,320 $29,320
2 Community Services Landlord Rental Maintenance Grant $100,000 $100,000
2 Community Services Affordable Housing Incentive Package $75,000 $75,000
2 Libraries Librarian 1 $74,865 $74,865
2 Libraries Adult Services Librarian 1 $74,865 $74,865
Total 7.13 $971,042 $971,042
*Excludes associated revenue offsetAugust 6, 2022 ID22-251 45

Supplemental Funding Requests –Tier #3 - Funded
Tier Department Program Title FTEsOn-Going
CostOne-Time
CostsTotal Cost
3 Planning Planning Technician* 1 $84,565 $6,000 $90,565
3 Planning Principal Planner* 1 $94,045 $6,000 $100,045
3 Planning Administrative Assistant* 1 $59,392 $2,500 $61,892
3 Building Inspections Building Safety Positions* 2 $188,090 $40,500 $228,590
3 Building Inspections Permit Technician Position* 1 $70,008 $6,000 $76,008
3 Police Public Safety Dispatch 2 $207,017 $207,017
3 Parks Tennis Positions (expanded hours) $8,561 $8,561
3 Parks Aquatics Technician* 1 $80,000 $80,000
Total 9 $791,678 $61,000 $852,678
*Excludes associated revenue offsetAugust 6, 2022 ID22-251 46

Tier Department Program Title FTEsOn-Going
CostOne-Time
CostsTotal Cost
4 City Manager Additional COLA Increase (1%) $1,036,789 $1,036,789
4 City Manager Sponsorship (Cash) $12,000 $12,000
4 City Manager Co-Sponsorship (In-Kind) $150,000 $150,000
Total $1,198,789 $1,198,789
Supplemental Funding Requests –Tier #4 - Unfunded
August 6, 2022 ID22-251 47

Tier Department Program Title FTEsOn-Going
CostOne-Time
CostsTotal Cost
5 Libraries Part-Time Positions 1.5 $107,917 $107,917
5 Police Administrative Support Position 1 $183,238 $183,238
5 Parks Park Maintenance Position 1 $81,489 $81,489
5 Parks Parks Outdoor Supervisor 1 $95,524 $95,424
5 Parks GIS Analyst 1 $90,388 $90,388
Total 5.5 $558,556 $558,456
Supplemental Funding Requests –Tier #5 - Unfunded
*Excludes associated revenue offsetAugust 6, 2022 ID22-251 48

49
Supplemental Packages - Internal Service Funds
Department Program Title FTEsOn-Going
CostOne-Time
CostsTotal Cost
Procurement Buyer Position 1 $92,291 $92,291
Fleet Fleet Technicians 3 $128,233 $128,233
Technology Services IT Program Manager 1 $165,406 $165,406
Technology Services GIS Architect 1 $136,641 $136,641
Technology Services Public Safety IT Supervisor 1 $130,346 $130,346
Technology Services IT Security Analyst 1 $143,303 $143,303
Technology Services Managed Security Service Provider $276,000 $276,000
Engineering Project Manager 1 $78,656 $78,656
Engineering Public Works Inspector II 1 $82,062 $82,062
Engineering Public Works Inspector I 1 $74,192 $74,192
Customer Service Biller I & Biller II 2 $130,324 $130,324
Customer Service Key Account Specialist 1 $135,209 $135,209
Streets Field Service Supervisor 1 $89,775 $2,200 $91,975
Airport Field Service Positions 1.5 $103,244 $103,244
Total 16.5 $1,765,682 $2,200 $1,767,882
August 6, 2022 ID22-251

50
Position Summary
FundFY 2021-22
BudgetFY 2021-22
EstimateFY 2022-23Proposed
Increase
General Fund 903.40 917.66 957.79 40.13
Utilities 514.00 521.00 545.00 24.00
Internal Service, Special Revenue 335.37 337.54 355.22 17.68
Total 1,752.77 1,776.20 1,858.01 81.81
25Public Safety Positions
17.68Internal Service Fund
24Utility Positions
81.81New Positions
August 6, 2022 ID22-251

American Rescue Plan Act FundingS u p p o r t H e a l t h y a n d S a fe C o m m u n i t i e s
August 6, 2022 ID22-251

American Rescue Plan Act FundingAmerican Rescue Plan Act of 2021 (ARP) – enacted March 11, 2021
• $1.9 trillion pandemic relief bill
• Authorized $350 Billion in state and local government fiscal assistance
Respond to COVID and
Public Health
Replace Revenue lost due to COVID
Premium Pay for Workers
Invest in Water & Wastewater Infrastructure
August 6, 2022 ID22-251 52

53
ARP Act Funding Summary
• City of Denton Local Fiscal Assistance: $23.29 million in two “tranches”• 50% delivered June 2021
• 50% delivered June 2022
• Final Rule received January 2022
ID#21-1054, July 27, 2021
August 6, 2022 ID22-251

54
Year 1 Update
Proposed Projects ARP CategoryOne-time or Reoccurring
CostsAllocation
End of Year Estimate
Day Center & Overnight Shelter (Loop 288 Building) Support Public Health Resources One-time $5,000,000 $5,000,000
Vaccine Clinic Support Support Public Health Resources One-time $550,000 $2,000
Temporary Alternative Shelter Support Public Health Resources One-time $550,000 $895,000
Behavioral Healthcare Services (grant program) Support Public Health Resources One-time $895,000 $895,000
Emergency Management Program Manager* Support Public Health Resources Reoccurring $95,000 $95,000
Public Communication Software (Code Red replacement) Support Public Health Resources Reoccurring $75,000 $0
Street Outreach Expansion (FTE’s)* Support Public Health Resources Reoccurring $250,000 $250,000
Street Outreach Expansion (Vehicle) Support Public Health Resources One-time $50,000 $50,000
Non-Profit Capacity Support (grant program) Address Negative Economic Impacts One-time $550,000 $1,103,000
Lease & Rent Relief for Small Businesses (grant program) Address Negative Economic Impacts One-time $2,330,000 $2,000,000
Arts/Music/Cultural Business Grant Program Address Negative Economic Impacts One-time $550,000 $550,000
City Facilities - COVID updates Address Negative Economic Impacts One-time $750,000 $600,000
Total $11,645,000 $11,645,000
*50% funded from General Fund
Proposed projects include program administration expensesAugust 6, 2022 ID22-251

55
Year 2 Proposed Projects
Proposed Projects ARP CategoryOne-time or
Reoccurring CostsAllocation
Temporary Alternative Shelter Support Public Health Resources One-time $2,500,000
Emergency Management Program Manager* Support Public Health Resources Reoccurring $100,000
Street Outreach Program* Support Public Health Resources Reoccurring $250,000
Day Center & Overnight Shelter Support Public Health Resources One-time $1,295,000
Public Safety Equipment Support Public Health Resources One-time $3,000,000
Parks & Recreation projects Address Negative Economic Impacts One-time $3,000,000
Non-Profit Capacity Support (grant program) Address Negative Economic Impacts One-time $1,500,000
Total $11,645,000
*50% funded from General Fund
Proposed projects include program administration expensesAugust 6, 2022 ID22-251

56
Data Center Revenue
August 6, 2022 ID22-251

Data Center Revenue
• FY23 estimate $13.9 million to General Fund through ROI & FF• Avoid reliance on single business for recurring General Fund expenses
• Phase 1 (22 MWH) operational
• Phase 2 (80 MWH) estimated operational by end of September 2022
• Phase 3 (198 MWH) estimated operational by end of January 2023
• Proposed FY23 Allocation• Catalyst Fund - $5 million
• Sustainability Framework Fund - $4 million
• One-time General Fund Capital - $2.9 million
• Streets capital - $2 million
August 6, 2022 ID22-251 57

58
Special Revenue Funds
August 6, 2022 ID22-251

Special Revenue Funds
• Account for the receipt of specific revenue sources that are restricted for a specific purpose.
• Total of 22 Special Revenue Funds, major funds include:• Downtown TIRZ Fund
• Westpark TIRZ Fund
• Tourist and Convention Fund
• Recreation Fund
• Catalyst Fund
• Sustainability Framework Fund
• Street Improvement Fund
59

Downtown TIRZ Budget
August 6, 2022 ID22-25160
FY 2021-22
Budget
FY 2021-22
Estimate
FY 2022-23
Proposed
Beginning Fund Balance 1,979,248$ 1,979,248$ 2,650,206$
Revenues 832,314$ 742,465$ 857,191$
Expenses 225,303$ 71,507$ 200,000$
Ending Fund Balance 2,586,259$ 2,650,206$ 3,307,397$
FY 2023 Revenues• Base value of $79,356,854 and a 2022 certified estimate of $251,073,576• Estimated revenue for FY 2022-23 of $857,191
➢ Based on a proposed tax rate of $0.555682
➢ Incremental value used decreased from 95% to 90%
➢ Revenue based on incremental value of $154,545,050
FY 2023 Expenses• Downtown Reimbursement Grant Program: $200,000

61
TIRZ #1 (Downtown) Appraised Values
2010 Base value $79,356,854
August 6, 2022 ID22-251
Tax Year 2014 2015 2016 2017 2018 2019 2020 2021 2022
Final Value
($Millions)$114.90 $118.40 $136.00 $142.10 $167.00 $210.53 $232.75 $232.90 $251.07
Value
Change
($Millions)
$18.60 $3.60 $17.60 $6.00 $24.90 $43.53 $22.22 $0.15 $18.17
TIRZ Revenue $258,053 $330,030 $458,739 $496,856 $516,619 $750,706 $759,695 $832,314 $857,191
3.10% 14.80% 0.06% 7.80%
$2.10 $1.08 $1.50 $2.40
10.55%
$2.67 New Value
(Millions)
Percent
Change4.40% 17.52% 26.07%
$2.70 $4.80 $0.30 $6.10
19.30%

62
Westpark TIRZFY 2021-22
Budget
FY 2021-22
Estimate
FY 2022-23
Proposed
Beginning Fund Balance 866,924$ 866,924$ 1,388,622$
Revenues 724,954$ 724,954$ 860,620$
Expenses 203,256$ 203,256$ 207,063$
Ending Fund Balance 1,388,622$ 1,388,622$ 2,042,179$
FY 2023 RevenuesBase value of $119,458 and a 2022 certified estimate of $273,309,389
Estimated revenue for FY 2022-23 of $860,620
➢ Based on a proposed tax rate of $0.555682
➢ 40% Incremental value used
➢ Revenue based on incremental value of $109,275,972
FY 2023 ExpensesProposed budget includes incentive payment to WinCo Foods: $207,063
August 6, 2022 ID22-251
63
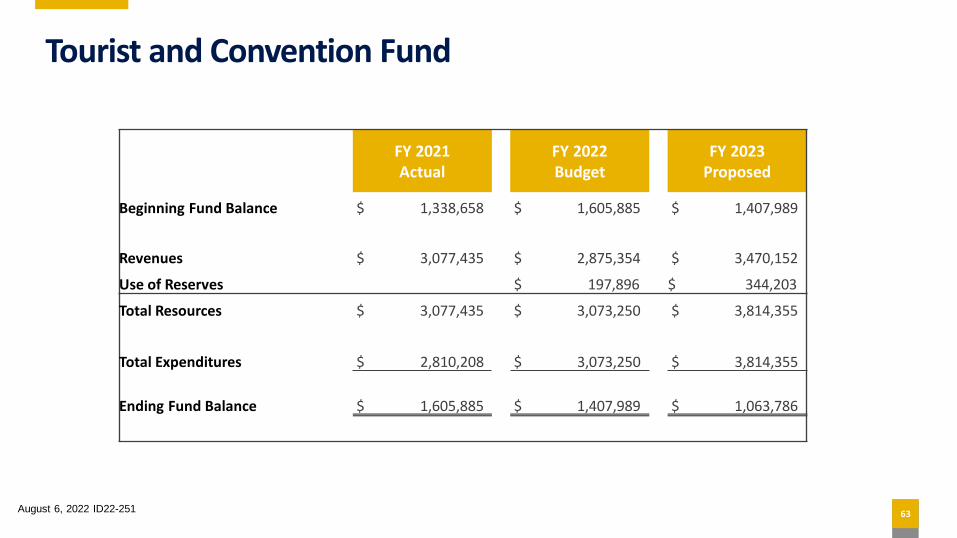
Tourist and Convention Fund
FY 2021 Actual
FY 2022 Budget
FY 2023 Proposed
Beginning Fund Balance $ 1,338,658 $ 1,605,885 $ 1,407,989
Revenues $ 3,077,435 $ 2,875,354 $ 3,470,152
Use of Reserves $ 197,896 $ 344,203
Total Resources $ 3,077,435 $ 3,073,250 $ 3,814,355
Total Expenditures $ 2,810,208 $ 3,073,250 $ 3,814,355
Ending Fund Balance $ 1,605,885 $ 1,407,989 $ 1,063,786
August 6, 2022 ID22-251
64
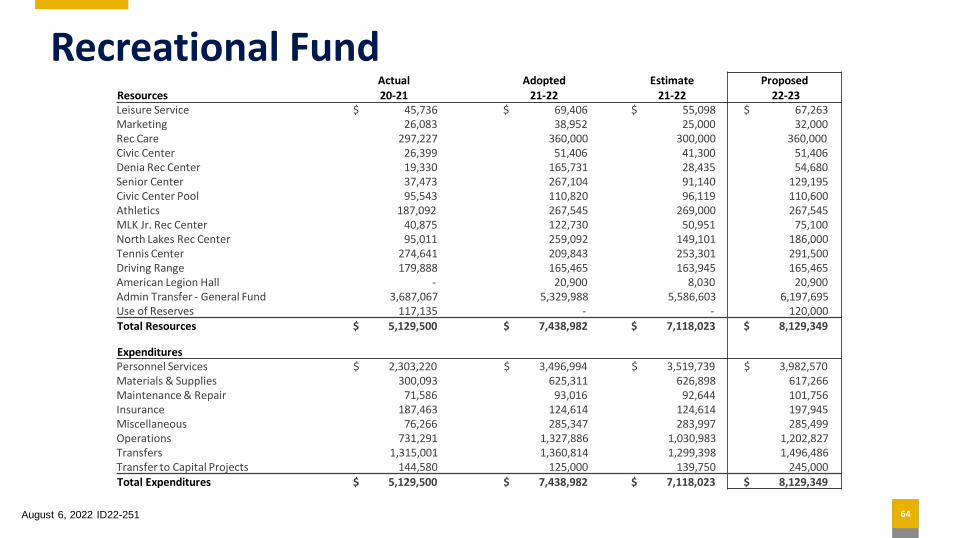
Recreational Fund
August 6, 2022 ID22-251
Actual Adopted Estimate ProposedResources 20-21 21-22 21-22 22-23Leisure Service $ 45,736 $ 69,406 $ 55,098 $ 67,263 Marketing 26,083 38,952 25,000 32,000 Rec Care 297,227 360,000 300,000 360,000 Civic Center 26,399 51,406 41,300 51,406 Denia Rec Center 19,330 165,731 28,435 54,680 Senior Center 37,473 267,104 91,140 129,195 Civic Center Pool 95,543 110,820 96,119 110,600 Athletics 187,092 267,545 269,000 267,545 MLK Jr. Rec Center 40,875 122,730 50,951 75,100 North Lakes Rec Center 95,011 259,092 149,101 186,000 Tennis Center 274,641 209,843 253,301 291,500 Driving Range 179,888 165,465 163,945 165,465 American Legion Hall - 20,900 8,030 20,900 Admin Transfer - General Fund 3,687,067 5,329,988 5,586,603 6,197,695 Use of Reserves 117,135 - - 120,000 Total Resources $ 5,129,500 $ 7,438,982 $ 7,118,023 $ 8,129,349
ExpendituresPersonnel Services $ 2,303,220 $ 3,496,994 $ 3,519,739 $ 3,982,570 Materials & Supplies 300,093 625,311 626,898 617,266 Maintenance & Repair 71,586 93,016 92,644 101,756 Insurance 187,463 124,614 124,614 197,945 Miscellaneous 76,266 285,347 283,997 285,499 Operations 731,291 1,327,886 1,030,983 1,202,827 Transfers 1,315,001 1,360,814 1,299,398 1,496,486 Transfer to Capital Projects 144,580 125,000 139,750 245,000 Total Expenditures $ 5,129,500 $ 7,438,982 $ 7,118,023 $ 8,129,349

65
Catalyst Fund• Formerly the Economic Development Investment Fund, pending formal Council approval.
August 6, 2022 ID22-251
Actual Adopted Estimate Proposed
Resources 2020-21 2021-22 2021-22 2022-23
Mixed Beverage Tax $ 154,666 $ 150,000 $ 150,000 $ 150,000
Transfers In - - - 7,000,000
Total Revenues 154,666 150,000 150,000 7,150,000
Use of Reserves - 358,000 36,600 143,325
Total Resources $ 154,666 $ 508,000 $ 186,600 $ 7,293,325
Expenditures
Operations $ 2,500 $ 508,000 $ 186,600 $ 7,293,325
Total Expenditures $ 2,500 $ 508,000 $ 186,600 $ 7,293,325

66
Sustainability Framework Fund• Established by Ordinance 21-1689 in FY 2021-22.
August 6, 2022 ID22-251
Actual Adopted Estimate Proposed
2020-21 2021-22 2021-22 2022-23
Total Resources $ - $ 500,000 $ 500,000 $ 4,000,000
Total Expenditures $ - $ 500,000 $ 500,000 $ 4,000,000

67
Street Improvement Fund
August 6, 2022 ID22-251

Other Special Revenue Funds
• Tree Mitigation Fund - $452,056
• Roadway Impact Fee Fund - $12,500,000
• Police Confiscation Fund - $85,000
• Parks Gas Well Fund - $50,000
• McKenna Trust Fund - $5,000
• Public Education Government Fund - $540,000
• Parkland Dedication Fund - $2,400,000
• Parkland Development Fund - $1,500,000
• Donation Funds - $288,005
August 6, 2022 ID22-251 68

69
Internal Service Funds
August 6, 2022 ID22-251

Internal Service Funds
• Accounts for the financing of goods and services provided by one department to another department within the same governmental organization.
• Budget is based on reimbursement of actual costs.
• Each budget is allocated based on type of services performed by fund.
• Eight Internal Service Funds
70August 6, 2022 ID22-251

71
Internal Service Fund Expenditures
FY 2021 Actual
FY 2022 Budget
FY 2022 Estimate
FY 2023 Proposed
Impact to General Fund
Facilities $5,013,093 $5,410,461 $5,181,021 $6,318,097 $571,119
Fleet Management* $11,319,537 $12,341,342 $14,611,034 $16,184,911 $351,586
Materials Management $15,518,385 $16,359,798 $14,043,712 $16,627,414 $230,753
Engineering $7,215,667 $9,991,664 $9,047,477 $10,390,995 $10,062
Customer Service $5,860,937 $7,379,504 $6,922,663 $7,890,013 $0
Technology Services $17,748,709 $18,540,466 $17,206,949 $20,170,578 $366,483
Risk** $6,099,115 $9,178,534 $9,178,534 $7,181,798 $435,919
Health $28,070,426 $30,075,555 $30,059,927 $30,786,653 $74,253
*Pending budget amendment, ** Includes approved budget amendmentAugust 6, 2022 ID22-251

Enterprise Funds
August 6, 2022 ID22-251

Airport Fund
August 6, 2022 ID22-251
Airport FundActual Adopted Estimated Proposed Projected Projected Projected Projected2021 2022 2022 2023 2023 2025 2026 2027
Beginning Fund Balance $ 3,570,365 $ 2,899,720 $ 2,899,720 2,380,921 $ 1,728,168 $ 963,540 $ 174,517 $ -
Resources
Hangar Leases 142,057 656,492 144,000 144,000 144,000 144,000 144,000 144,000
Land Leases 679,339 144,000 688,000 699,719 785,711 809,282 833,560 858,567
Fuel Flowage Fees 217,979 212,160 235,000 235,000 239,700 244,494 249,384 254,372
FBO Hangar/Tiedown Commissions 119,352 118,560 140,000 140,000 158,836 165,190 171,797 178,669
Miscellaneous Revenues 163,752 - 3,554 2,000 - - - -
Transfers in - - - - - - 633,929 838,210
Gas Well Royalties 422,043 231,830 331,830 315,239 299,477 284,503 270,278 256,764
Gas Well Interest Income 29,696 40,800 10,000 9,500 9,025 8,574 8,145 7,738
Total Revenues $ 1,774,218 $ 1,403,842 $ 1,552,384 $ 1,545,458 $ 1,636,749 $ 1,656,042 $ 2,311,094 $ 2,538,320
Use of Reserves 53,433 616,251 518,799 652,754 764,628 789,023 174,517 -
Total Resources $ 1,827,651 $ 2,020,093 $ 2,071,183 $ 2,198,211 $ 2,401,376 $ 2,445,065 $ 2,485,611 $ 2,538,320
Expenditures
Personnel Services 350,296 431,902 418,857 560,395 577,207 594,523 612,359 630,730
Materials & Supplies 8,243 34,890 38,850 46,890 47,928 48,886 49,864 50,861
Maintenance & Repair 20,083 76,400 113,400 68,400 69,768 71,163 72,587 74,038
Insurance 41,237 27,411 27,411 40,628 41,847 43,102 44,395 45,727
Operations 142,494 212,135 235,310 235,267 242,325 249,595 257,083 264,795
Cost of Service - General Fund 246,229 250,365 250,365 249,972 257,471 265,195 273,151 281,346
Cost of Service - Other 206,146 212,331 212,331 209,901 216,198 222,684 229,364 236,245
Debt Service 762,923 724,659 724,659 736,758 898,633 899,916 896,808 904,578
Gas Well Other 50,000 50,000 50,000 50,000 50,000 50,000 50,000 50,000
Total Expenditures $ 1,827,651 $ 2,020,093 $ 2,071,183 $ 2,198,211 $ 2,401,376 $ 2,445,065 $ 2,485,611 $ 2,538,320
Net Income $ - $ - $ - $ - $ - $ - $ - $ -
Ending Fund Balance $ 3,516,932 $ 2,283,469 $ 2,380,921 $ 1,728,168 $ 963,540 $ 174,517 $ - $ -

74
Water Five Year Forecast
August 6, 2022 ID22-251
Actual Adopted Estimate Proposed Forecast Forecast Forecast Forecast
2021 2022 2022 2023 2024 2025 2026 2027
Beginning Fund Balance 24,725,215$ 23,582,745$ 23,582,745$ 24,705,221$ 24,893,205$ 25,179,586$ 23,498,934$ 23,056,725$
Resources
Minimum Charge 9,556,389$ 9,628,059$ 9,983,673$ 10,167,214$ 10,490,981$ 10,869,685$ 11,207,701$ 11,552,256$
Volumetric Charge 27,919,350 31,790,782 31,010,317 33,666,688 34,965,361 36,269,966 37,439,457 38,631,740
Water Miscellaneous Revenues 3,099,288 4,225,666 3,848,951 5,508,578 5,652,637 5,800,648 5,952,724 6,108,978
Cost Participation - - - 6,200,000 - - - -
Impact Fees 6,605,000 6,605,000 6,605,000 6,605,000 6,605,000 6,605,000 6,605,000 6,605,000
Total Revenues 47,180,027$ 52,249,507$ 51,447,940$ 62,147,481$ 57,713,979$ 59,545,299$ 61,204,881$ 62,897,974$
Use of Reserves - - - 812,016 - 1,680,652 442,210 1,083,558
Total Resources 47,180,027$ 52,249,507$ 51,447,940$ 62,959,497$ 57,713,979$ 61,225,951$ 61,647,090$ 63,981,532$
Expenditures
Personnel 7,701,977$ 8,798,948$ 8,038,296$ 9,927,339$ 10,125,886$ 10,328,403$ 10,534,972$ 10,745,671$
Operating Expenditures 6,600,589 8,686,072 8,465,146 10,461,451 9,810,463 10,006,672 10,206,806 10,410,942
Cost of Service Transfers 5,239,853 5,709,734 5,765,557 8,046,304 6,422,230 6,550,675 6,681,688 6,815,322
Franchise Fee 1,846,319 2,070,942 2,070,942 2,191,695 2,272,817 2,356,983 2,432,358 2,509,200
Return on Investment Fee 1,292,424 1,449,659 1,449,659 1,534,187 1,590,972 1,649,888 1,702,650 1,756,440
Revenue Funded Capital 9,729,970 10,200,759 10,200,759 17,058,703 11,937,351 13,346,437 10,554,609 9,887,522
Impact Fee Project Revenue Funding 2,725,000 3,500,000 3,500,000 3,500,000 3,000,000 2,725,000 2,725,000 3,500,000
Debt Service 10,901,425 10,835,105 10,835,105 10,239,818 12,267,879 14,261,893 16,809,008 18,356,436
Total Expenditures 46,037,557$ 51,251,219$ 50,325,464$ 62,959,497$ 57,427,598$ 61,225,951$ 61,647,090$ 63,981,532$
Net Income 1,142,470$ 998,288$ 1,122,476$ -$ 286,381$ -$ -$ -$
Ending Fund Balance 23,582,745$ 24,581,033$ 24,705,221$ 24,893,205$ 25,179,586$ 23,498,934$ 23,056,725$ 21,973,167$
Rate Increase -2% 0% 0% 0% 0% 0% 0% 0%
Target Reserves
Wrking Cptl/ Op Reserve Target - 33% 15,135,635$ 16,849,716$ 16,545,358$ 18,660,656$ 18,880,306$ 20,129,080$ 20,267,537$ 21,035,024$
Wrking Cptl/ Op Reserve Target - 50% 22,703,453$ 25,274,574$ 24,818,037$ 27,990,985$ 28,320,459$ 30,193,620$ 30,401,305$ 31,552,536$
Impact Fee Reserve 14,789,942$ 15,085,741$ 15,085,741$ 15,387,455$ 15,695,204$ 16,009,109$ 16,329,291$ 16,655,877$
Development Plan Lines 1,000,000$ 1,000,000$ 1,000,000$ -$ 1,000,000$ 1,000,000$ 1,000,000$ 1,000,000$
Water Fund

75
Wastewater Five Year Forecast
August 6, 2022 ID22-251
Actual Adopted Estimate Proposed Forecast Forecast Forecast Forecast
2021 2022 2022 2023 2024 2025 2026 2027
Beginning Fund Balance 15,305,922$ 15,455,340$ 15,455,340$ 24,812,688$ 15,624,183$ 17,260,121$ 16,665,653$ 15,195,242$
Resources
Minimum Charge 5,640,749$ 6,202,831$ 5,568,625$ 6,377,474$ 6,729,674$ 6,923,865$ 7,126,367$ 7,333,426$
Volumetric Charge 18,057,425 19,856,790 19,564,166 22,782,960 24,787,282 26,471,664 28,136,261 29,041,951
Sewer Miscellaneous Revenue 2,317,483 2,679,695 2,442,738 2,843,929 2,889,828 2,936,645 2,749,398 2,798,105
Cost Participation - - 9,000,000 13,648,000 - - - -
Impact Fees 4,270,000 4,270,000 4,270,000 4,270,000 4,270,000 4,270,000 4,270,000 4,270,000
Drainage 5,168,014 5,638,696 6,030,856 6,287,091 6,863,052 7,066,780 7,276,620 7,492,755
Total Revenues 35,453,671$ 38,648,012$ 46,876,386$ 56,209,454$ 45,539,835$ 47,668,953$ 49,558,646$ 50,936,238$
Use of Reserves - - - 10,188,506 - 594,468 1,470,411 3,232,081
Total Resources 35,453,671$ 38,648,012$ 46,876,386$ 66,397,960$ 45,539,835$ 48,263,421$ 51,029,057$ 54,168,319$
Expenditures
Personnel 8,050,103$ 8,881,839$ 8,557,682$ 8,699,786$ 8,896,230$ 9,097,276$ 9,303,036$ 9,513,626$
Operating Expenditures 6,487,057 7,437,125 7,197,176 8,225,155 8,039,231 8,200,016 8,364,016 8,531,297
Cost of Service Transfers 5,378,410 5,907,049 5,770,292 8,473,931 7,630,773 7,790,974 7,954,605 8,121,744
Franchise Fee 1,240,655 1,302,981 1,256,640 1,458,022 1,575,848 1,669,776 1,763,131 1,818,769
Return on Investment Fee 868,458 912,087 879,648 1,020,615 1,103,093 1,168,844 1,234,192 1,273,138
Revenue Funded Capital 6,259,700 5,390,309 5,782,469 29,641,759 6,508,226 6,172,470 6,090,679 6,947,713
Impact Fee Project Revenue Funding 500,000 250,000 250,000 250,000 250,000 250,000 250,000 250,000
Debt Service 6,519,870 7,825,131 7,825,131 8,628,692 9,900,496 13,914,066 16,069,397 17,712,032
Total Expenditures 35,304,253$ 37,906,521$ 37,519,037$ 66,397,960$ 43,903,897$ 48,263,421$ 51,029,057$ 54,168,319$
Net Income 149,418$ 741,491$ 9,357,348$ -$ 1,635,938$ -$ -$ -$
Rate Increase 0% 0% 0% 0% 3% 3% 3% 0%
Ending Fund Balance 15,455,340$ 16,196,831$ 24,812,688$ 15,624,183$ 17,260,121$ 16,665,653$ 15,195,242$ 11,963,161$
Target Reserves
Wrking Cptl/ Op Reserve Target - 28% 9,672,398$ 10,385,348$ 10,279,188$ 11,986,290$ 12,028,465$ 13,222,855$ 13,980,564$ 14,840,635$
Wrking Cptl/ Op Reserve Target - 39% 13,541,357$ 14,539,488$ 14,390,864$ 16,780,807$ 16,839,851$ 18,511,997$ 19,572,789$ 20,776,889$
Development Plan Lines 1,000,000$ 1,000,000$ 1,000,000$ -$ 1,000,000$ 1,000,000$ 1,000,000$ 1,000,000$
Wastewater & Drainage Fund
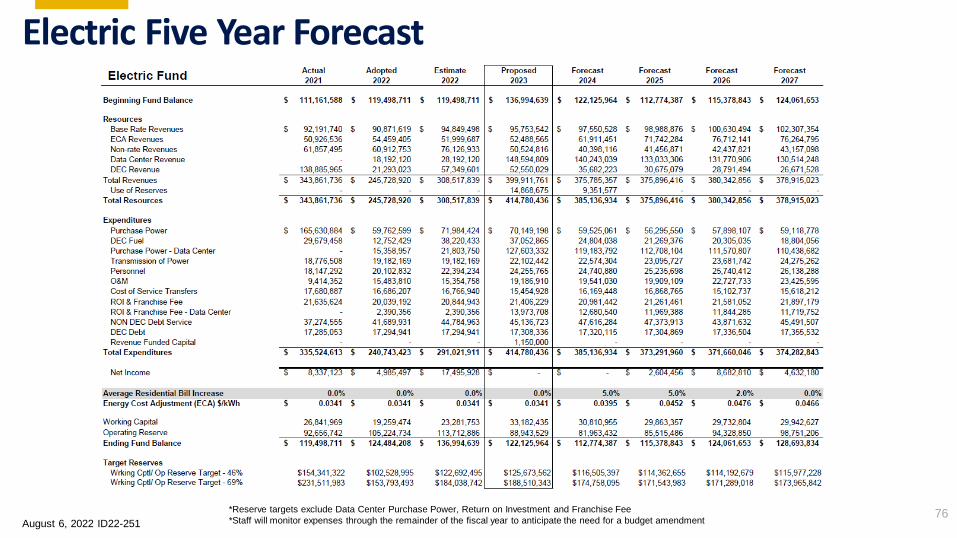
76*Reserve targets exclude Data Center Purchase Power, Return on Investment and Franchise Fee
*Staff will monitor expenses through the remainder of the fiscal year to anticipate the need for a budget amendment
Electric Five Year Forecast
August 6, 2022 ID22-251

77
Solid Waste Five Year Forecast
August 6, 2022 ID22-251

Since FY 2018, the City’s continued emphasis on financial transparency and cost containment has resulted in no rate increases for City of
Denton Utilities.
78
Rate Change History
Utility FY 2016 FY 2017 FY 2018 FY 2019 FY 2020 FY 2021 FY 2022 FY 2023
Electric 4.50% 4.50% -1.20% -3.50% 0 0 0 0
Water 6.30% 4.30% 0 0 0 -2.00% 0 0
Wastewater 2.70% 1.80% 0 -5.00% 0 0 0 0
Solid Waste 2.40% 4.00% 0 -12.00% -12.00% -5.00% 0 0
Rate Increases/(Decreases)
August 6, 2022 ID22-251

Proposed Capital BudgetFY
2022-2023

FY 2022-23 Capital Budget Development Process
Date Action
December CIP Budget Kickoff
January Finance meetings with departments to review CIP process.
February Finance reviewed the project submissions.
March/April Interdepartmental meetings to review projects across departments.
Budget staff prepared draft CIP budget document
May/June Draft CIP budget document presented to CMO and Executive Staff containing all
projects, recommended funding sources, and project status.
June/July PUB / Council Workshops
August Council Workshop
September City Council adopts Annual Program of Services, First Year of CIP, tax rate, approves utility rates
80August 6, 2022 ID22-251

FY 2022-23 Preliminary Capital Budget Book
Structure
• Introductory Information (Pages 2 – 14)
• Summary Pages (Pages 15 – 19)
• 2022-23 Preliminary Capital Budget Summary
• General Government
• Utility / Enterprise
• 2019 Bond Program Timeline
• Future Bond Election Projects
• Department Pages (Pages 20 – 160)
• A summary of project expenditures and revenue sources by category.
• A breakdown of projects with each project’s 5-year budget forecast.
• Individual project details.
81August 6, 2022 ID22-251

5-Year CIP Expenditure & FundingGeneral Government Summary - CIP Book (Page 16)
2022-23 2023-24 2024-25 2025-26 2026-27 TOTAL
2019 Bond Election (Proposition 1) - Streets $ 34,355 $ 35,600 $ 18,900 $ - $ - $ 88,855
General Government - Fleet 1,300 650 - - - 1,950
General Government - Fleet (Vehicle Additions) 1,660 2,500 - - - 4,160 General Government - Fleet (Vehicle Replacements) 3,802 4,956 4,396 5,564 3,342 22,060
General Government - Finance 2,000 4,500 4,500 - - 11,000 General Government - Facilities 19,023 5,149 5,390 5,878 20,270 55,710 General Government - Parks 1,550 1,114 1,207 1,756 817 6,444 General Government – Streets & Traffic 19,268 10,023 10,498 10,948 11,448 62,185 General Government - Drainage 1,500 - - - - 1,500 General Government - Technology Services 1,585 6,763 3,219 3,943 2,234 17,745
Total Proposed Capital Projects $ 86,043 $ 71,255 $ 48,110 $ 28,089 $ 38,111 $ 271,609
Revenue Funded $ 6,762 $ 6,325 $ 6,909 $ 7,431 $ 7,176 $ 34,603 Impact Fees 12,500 3,675 3,850 4,000 4,200 28,225 General Obligation Bonds 34,355 35,600 18,900 0 0 88,855 Certificates of Obligation 32,426 25,655 18,451 16,658 26,735 119,926
Total Proposed New Funding $ 86,043 $ 71,255 $ 48,110 $ 28,089 $ 38,111 $ 271,609
Total Current Appropriated 214,125
General Government Total $ 300,16882August 6, 2022 ID22-251

5-Year CIP Expenditure & FundingUtility/Enterprise Fund Summary - CIP Book (Page 17)
2022-23 2023-24 2024-25 2025-26 2026-27 TOTALElectric $ 79,723 $ 46,384 $ 33,895 $ 41,500 $ 23,861 $ 225,363 Water 54,031 47,230 57,300 37,851 26,953 223,365 Wastewater 70,576 72,070 40,684 32,040 23,609 238,978 Solid Waste 23,235 8,810 6,450 9,732 4,500 52,727 Airport 2,220 - - - - 2,220
Total Proposed Capital Projects $ 229,784 $ 174,495 $ 138,329 $ 121,123 $ 78,922 $ 742,653
Certificates of Obligation $ 164,817 $ 143,496 $ 103,265 $ 88,232 $ 50,533 $ 550,343 Revenue Funded Capital 21,038 18,909 20,707 16,582 17,388 94,624 Cost Participation 33,248 2,650 5,600 6,650 1,220 49,368 Impact Fee Funding 3,750 3,250 3,250 3,250 3,250 16,750 Vehicle Replacement Fund 6,932 6,189 5,507 6,409 6,531 31,568
Total Proposed New Funding $ 229,784 $ 174,495 $ 138,329 $ 121,123 $ 78,922 $ 742,653
Total Current Appropriated $ 208,803
Utility / Enterprise Total $ 438,587
83August 6, 2022 ID22-251

Summary
August 6, 2022 ID22-251

85
FY 2022-23 Proposed
Budget by Fund -
$1,864,080,121
10%
5%
31%
8%
40%
6%
General Fund Debt Service Fund
Utilities Internal Service Funds
Capital Improvement Program Other Funds
August 6, 2022 ID22-251

Residential Annual Tax and Utility Bill Impact
Tax Bill Impact
August 6, 2022 ID22-251 86
Tax Impact
Fiscal Year 2021 2022 2023 - Proposed Comments
Tax Rate $0.59045 $0.56568 $0.55568
Average Taxable Value $259,097 $275,361 $307,283*
Average Tax Bill $1,530 $1,558 $1,708 $150 Annual Increase
Utility Impact
Water $559 $531 $531 No Rate Change
Wastewater $378 $378 $378 No Rate Change
Electric $1,334 $1,334 $1,334 No Rate Change
Solid Waste $246 $246 $246 No Rate Change
Average Utility Bill $2,517 $2,489 $2,489
Total Average Bill $4,047 $4,047 $4,197 $150.00 Annual Increase
*Average Home Value

Community Engagement Opportunities
➢City Council Meetings (August)
➢City of Denton Budget Webpage (Citizen feedback form)
➢Budget Simulation Tool (Balancing Act)
➢Public Tax Rate and Budget Hearing (September 20, 2022)
August 6, 2022 ID22-25187

Next Steps
• August – Follow up on outstanding items from Budget Workshop
• September 20, 2022 – Budget and Tax Rate Public Hearings
• September 27, 2022 – City Council Adopts Budget, Tax Rate, Rates and Capital Improvement Plan
August 6, 2022 ID22-25188

89
Questions?