fundamental aspects of nickel electrowinning
TRANSCRIPT
FUNDAMENTAL ASPECTS OF NICKEL ELECTROWINNING
FROM CHLORIDE ELECTROLYTES
by
JINXING JI
B.Eng., Shanghai University of Technology, 1982
M.Eng., Shanghai University of Technology, 1985
A THESIS SUBMITTED IN PARTIAL FULFILLMENT OF
THE REQUIREMENTS FOR THE DEGREE OF
DOCTOR OF PHILOSOPHY
in
THE FACULTY OF GRADUATE STUDIES
The Department of Metals and Materials Engineering
We accept this thesis as conforming
to the required standard
THE UNIVERSITY OF BRITISH COLUMBIA
February 1994
©JinxingJi, 1994
In presenting this thesis in partial fulfillment of the requirements for an advanced
degree at the University of British Columbia, I agree that the Library shall make it
freely available for reference and study. Ifurther agree that permission for extensive
copying of this thesis for scholarly purposes may be granted by the head of my
department or by his or her representatives. It is understood that copying or
publication of this thesis for financial gain shall not be allowed without my written
permission.
(Signature):
_____________________________
Department of Metals and Materials Engineering
The University of British Columbia
Vancouver, B.C., Canada
Date: February 14, 1994
Abstract ii
Abstract
Nickel electrowinning from chloride electrolytes is an innovative and efficient processdeveloped and commercialized mainly by Falconbridge Ltd. Several fundamental aspects relatedto this process have been addressed in this thesis, including the thermodynamic study of nickelelectrolytes, the measurement and modelling of the cathode surface pH during nickel electrowinningand the kinetic study of nickel reduction and hydrogen evolution. The major apparatus andequipment used include a surface pH measuring device, an EG&G rotating disc electrode, aSOLARTRON 1286 Electrochemical Interface and a RADIOMETER titrator system. All of theexperiments were carried out via computer control.
The thermodynamic study includes the activity coefficient of the hydrogen ion and the speciation of nickel electrolytes to obtain a better understanding of the properties of nickel electrolytes.The activity coefficient of the hydrogen ion (y11+) was measured using a combination glass pHelectrode. It was found that was greater than 1 in concentrated NiCl2 solutions and increasedsignificantly with increasing NiCl2concentration. The addition of NaC1 increases ‘y11÷ , whereas theaddition of Na2SO4decreases it. Theoretically, several useful equations were derived based onMeissner’ sand Stokes-Robinson’s theories to calculate the single-ion activity coefficients including
These equations are the two-parameter (q and h) functions, capable of predicting with reasonable accuracy single-ion activity coefficients in any concentrated pure electrolytes and in mixed
electrolytes of the type 1:1 + 1:1, 2:1 + 1:1 and 2:1 + 1:1 + 1:1. The accuracy of the calculationsmay be further improved when the Meissner parameter q is adjusted properly and the effect of ionic
strength on the hydration parameter h is taken into account. A series of speciation diagrams fornickel species was plotted with and the effect of the ionic strength on the equilibrium constantsbeing taken into account. It was discovered that the predominant nickel species in the acidic regionare Ni2 and NiCl in concentrated pure NiC12solutions and Ni2,NiCl and NiSO4in concentratedsulfate-containing NiCl2 solutions. The traditionally accepted electroactive species NiOH is
negligible until the NiCl2concentration is lowered to the order of 106 M. When the pH increases,the formation of insoluble Ni(OH)$) should be expected if the NiCl2 concentration is higher than106 M. The pH where Ni(OH)S) starts to form decreases with increasing NiCl2concentration and
temperature.
A limited number of electrowinning tests were carried out under conditions similar to those
employed in the industrial process in order to obtain information concerning the current efficiencyof nickel deposition. It was found that higher nickel concentration, higher pH and the addition ofNaCl,H3B03and NH4C1improved the current efficiency ofnickel deposition. However, the addition
Abstract iii
of sulfate decreased the current efficiency of nickel. In 0.937 M NiC12at 60°C, the pH may go aslow as 1.5 for a current efficiency above 96 %. Nickel deposition was also found to be a steady-stateprocess since the amount of acid added to the electrolyte at a constant pH increased linearly withtime.
To acquire data on the cathode pH behaviour during nickel deposition, the cathode surface pHwas measured using a flat-bottom combination glass pH electrode and a fine mesh gold gauze ascathode. Nickel was deposited on the front side of the gold gauze and the pH electrode was positionedin the back and in direct contact with the nickel-plated gold gauze. The cathode surface pH wasalways found to be higher than the pH in the bulk electrolyte, and if the current density was sufficiently large, it would eventually reach a level causing precipitation of insoluble Ni(OH)S) on thecathode surface. Lower bulk pH, higher nickel concentration, higher temperature and the additionofH3B03and NH4C1 effectively depress the rise of the cathode surface pH. Additions of NaCl andNa2SO4also depress the rise of the cathode surface pH but to a much smaller degree. Also, agitationof the electrolyte decreases the cathode surface pH. In order to predict the cathode surface pH,mathematical modelling in the case of 0.937 M NiCl2 and 2 M NiCl2was carried out. The modelwas in reasonably good agreement with the experimental data.
Nickel deposition and hydrogen evolution were studied using a rotating disc electrode. Thehydrogen evolution was found to be affected strongly by the RPM. The rate of nickel deposition
was first order with respect to the activity of nickel ion and zero order with respect to the activitiesof chloride and hydrogen ions. The rate of hydrogen evolution was found to be first order withrespect to the activity of hydrogen ion and to be zero order with respect to the activities of nickeland chloride ions. These findings indicate that nickel deposition and hydrogen evolution proceed
independently. The Tafel slopes obtained from the partial polarization curves were 94 mV/decadefor nickel deposition and 112 mV/decade for hydrogen evolution.
Hydrogen evolution was also studied using a rotating nickel-coated Pt disc electrode in 2.5 M
NaCl solution in the absence of nickel ions. The rate of hydrogen evolution was first order with
respect to the activity of hydrogen ion and zero order with respect to the activity of chloride ion.
According to the relationship between the limiting current density and the square root of rotational
speed, hydrogen evolution was mass transfer controlled under the limiting conditions and thebuffering actions of H3B03 and NH4C1 were negligible. The magnitude of the limiting current
density at a given pH or a given acidity in the presence of sulfate can be well explained consideringthe activity coefficient of the hydrogen ion.
Further studies of nickel electrowinning should be directed towards hydrogen evolution on thenickel substrate in nickel-containing electrolytes, focusing on the hydrogen bubble’s nucleation,
Abstract iv
growth, coalescence and detachment. The use of addition agents affecting hydrogen evolution byway of adsorption, change in interfaciai tension or destruction of atomic hydrogen is worthinvestigating. The identity of intermediate species during nickel reduction is not clear. Theidentification of these species would be quite rewarding in clarifying the mechanism of nickelreduction. The nucleation of nickel and crystal growth in the initial stages of deposition on varioussubstrates including titanium, stainless steel, copper and nickel are other important aspects of nickelelectrowinning which should be investigated.
Table of Contents v
Table of Contents
Abstract
Table of Contents v
List of Tables ix
List of Figures xii
Acknowledgements xix
Nomenclature xx
Introduction 1
Chapter 1 Literature Review on Nickel Electrodeposition 7
1.1 Nickel matte chlorine leaching process 7
1.2 Plant practice of nickel electrowinning 10
1.3 Nickel electrodeposition in chloride and chloride-sulfate electrolytes 15
1.4 Kinetics and mechanism of nickel electrodeposition 20
1.5 Hydrogen evolution during nickel electrodeposition and on a nickel substratein acidic media 26
Chapter 2 Thermodynamics of Nickel Chloride Solutions 34
2.1 Activity coefficients in multicomponent nickel chloride solutions 34
2.1.1 Measurement of activity coefficient of hydrogen ion 35
2.1.2 Calculation of mean activity coefficients and water activity 47
2.1.3 Calculation of single-ion activity coefficients 55
2.1.3.1 Single-ion activity coefficients in aqueous solutions ofpure electrolytes 56
2.1.3.2 Single-ion activity coefficients in aqueous solution of mixed NiCI2-HC1-
NaCZ 61
2.2 The pH for the formation of insoluble nickel hydroxide 67
2.3 Distribution of nickel species in aqueous solutions as a function of pH 72
Table of Contents vi
Chapter 3 Electrodeposition of Nickel in Various Electrolytes 84
3.1 Experimental apparatus and set-up for nickel electrodeposition 84
3.2 Electrodeposition of nickel at 25°C 85
3.3 Electrodeposition of nickel at 60°C 87
3.4 Electrodeposition of nickel in 2 M NiC12+ 6 M HC1 95
3.5 Measurement of current efficiency of nickel from the acid volume 98
Chapter 4 Surface pH Measurement during Nickel Electrodeposition 103
4.1 Experimental apparatus and set-up for surface pH measurement 104
4.2 Characterization of gold gauze 106
4.2.1 Electrochemical properties of gold in chloride solution 106
4.2.2 Investigation of new 500-mesh gold gauze 107
4.2.3 Investigation of nickel-coated 500-mesh gold gauze 111
4.3 Effect of nickel concentration on the surface pH in pure NiCl2 solutions at25°C 116
4.4 Effect of sulfate on the surface pH in NiCl2-Na2SO4solutions at 25°C 118
4.5 Effect of sodium chloride on the surface pH in NiCl2-NaCl solution at 25°C .. 119
4.6 Effect of boric acid on the surface pH in NiCl2-H3B03solution at 25°C 120
4.7 Effect of ammonium chloride on the surface pH in NiCl2-NH4C1solution at25°C 126
4.8 Effect of temperature on the surface pH in pure nickel chloride solution 127
4.9 Effect of ultrasound on the surface pH 132
4.10 Surface pH measurements at 60°C 133
Chapter 5 Modelling of Surface pH during Nickel Electrodeposition 135
5.1 Modelling of surface pH for the solution NiCl2-HC1-H20 136
5.2 Modelling of surface pH in 0.937 M NiC12 at bulk pH 2.5 and 25°C 142
5.3 Modelling of surface pH in 2 M NiCl2 at bulk pH 2.5 and 25°C 149
Table of Contents vii
Chapter 6 Rotating Disc Electrode Study of Nickel Electrodeposition 152
6.1 Fundamentals of the rotating disc electrode technique 152
6.2 Experimental apparatus, procedures and conditions for the RDE tests 156
6.3 Reaction orders of the rates of nickel reduction and hydrogen evolution withrespect to the concentrations of electrolyte components 160
6.4 Effect of RPM on the hydrogen evolution and electrode potential duringnickel electrodeposition 164
6.5 Polarization curves of nickel reduction and hydrogen evolution 167
6.6 Nickel electrowinning at high current density 177
6.7 Hydrogen evolution on the nickel cathode in electrolytes without NiC12 178
6.8 Probable mechanisms for nickel electroreduction and hydrogen evolution 187
Chapter 7 Conclusions 193
Chapter 8 Recommendations for Further Work 195
Bibliography 196
Appendix 1 Correction for Liquid Junction Potential in the pH Determination 206
Appendix 2 Single-ion Activity Coefficients in Pure Electrolytes 211
Appendix 3 Single-ion Activity Coefficients in Mixed Chloride Electrolytes 214
Appendix 4 Computer Programs for the RADIOMETER Titrator 221
(1) pH titration 221
(2) REDOX titration 224
(3) pH-stat tests 226
Appendix 5 Computer programs for the SOLARTRON 1286 Electrochemical Interface 228
(1) Recovery of lost experimental data from the SOLARTRON’s data file 229
(2) Galvanostatic experiments 229
(3) Potentiostatic experiments 231
(4) Linear potential sweep experiments 232
Table of Contents viii
(5) Cyclic voltammetry experiments 233
(6) Galvanostatic anodic dissolution 235
(7) Potentiostatic anodic dissolution 236
Appendix 6 Computer program for the SOLARTRON 1286 ElectrochemicalInterface together with the RADIOMETER titrator 239
Biographical Data 242
List of Tables ix
List of Tables -
Table 1 Reactions taking place during nickel electrowinning 10
Table 2 Operating conditions for direct nickel matte electrowinning 12
Table 3 Operating conditions for electrowinning from nickel sulfate electrolyte 13
Table 4 Operating conditions for electrowinning from nickel chloride electrolyte 14
Table 5 Temperature coefficients of the overpotentials of nickel cathodic deposition andanodic dissolution in 1 M NiC12 and 1 M NiSO4at pH 1.5 25
Table 6 Properties of pH responsive electrodes 37
Table 7 Activity coefficients of hydrogen ion in aqueous solutions of pure and sulfate-containing nickel chloride in the pH range 1-4 at 25,40 and 60°C 38
Table 8 Equilibrium quotients for the reaction SO +H = HSO at 25°C based on
equation (90) 45
Table 9 Activity coefficients of hydrogen ion in aqueous solutions of sulfate-containingnickel chloride in the pH range 1-4 at 25°C 45
Table 10 Characteristic parameter q for pure electrolytes at 25°C 49
Table 11 Mean activity coefficient of NiCl2 and activity of water in aqueous solutions ofnickel chloride at 25°C 51
Table 12 Mean activity coefficient of NiSO4and activity of water in aqueous solutions ofnickel sulfate at 25°C 52
Table 13 Mean activity coefficient of HC1 in aqueous solutions of hydrochloric acid at 25°C 53
Table 14 Mean activity coefficient of HC1 in mixed aqueous solutions ofNiC12-HC1 at 25°C 54
Table 15 Activity of water in mixed aqueous solutions of NiCl2-HC1 at 25°C 54
Table 16 Parameters for Stokes-Robinson’s hydration theory equation 56
Table 17 Activity coefficients of hydrogen and chloride ions in aqueous solutions ofHC1-NaC1 at 25°C 65
Table 18 Comparison between calculated and experimental activity coefficients of hydrogen ion in aqueous solution ofNiCl2-NaCl-HC1 at 25, 40 and 60°C 65
Table 19 Comparison of activity coefficient of hydrogen ion in electrolytes of sodiumchloride and calcium chloride at 25°C 66
List of Tables x
Table 20 Dissociation quotient of water at 25°C 69
Table 21 Equilibrium quotients of nickel hydrolysis at 25°C 69
Table 22 The pH’s for the formation of Ni(OH)S) in different solutions 71
Table 23 Equilibrium quotients in solutions of pure nickel chloride at 25°C 75
Table 24 Equilibrium quotients in solutions of mixed nickel chloride and sulfate at 25°C 75
Table 25 Current efficiencies of nickel deposition in NiC12-H3B03and NiCl2-NH4C1 atpH 2.5 and 25°C (two hours for each run) 87
Table 26 Current efficiencies of nickel deposition in various solutions at 60°C and pH 1.1 88
Table 27 Current efficiencies of nickel deposition in various solutions at 60°C and pH 1.5 89
Table 28 Current efficiencies of nickel deposition in various solutions at 60°C and pH 2 89
Table 29 Current efficiencies of nickel deposition in various solutions at 60°C and pH 2.5 89
Table 30 Current efficiency of nickel deposition in 2 M NiCl2+ 6 M HC1 at 25 and 60°C 96
Table 31 Current efficiency of nickel deposition in 2 M NiC12+ 6 M HC1 at 95°C 96
Table 32 Calculated activity coefficients, activities and electrode potential shifts in 2 MNiC12+ 6 M HC1 at 25, 60 and 95°C 97
Table 33 Errors in current efficiency due to ±0.01 pH shift in 200 mL 0.937 M NiCl2 at300 A/m2 (0.09 A) for 2 hours 102
Table 34 Errors in current efficiency due to ±0.01 pH shift in 200 mL 0.572 M NiCl2 +
0.365 M NiSO4 at 300 A/m2 (0.09 A) for 2 hours 102
Table 35 Dimensions of gold gauzes 105
Table 36 The coefficients of the 8 x 8 multilinear equations for the surface pH modellingof the aqueous solution ofNiC12-HC1-H20 141
Table 37 Density and viscosity of aqueous solutions of NiC12+ HC1 at 25°C 144
Table 38 Diffusion coefficients in 0.937 M NiCl2 at 25°C 145
Table 39 Equilibrium quotients in 0.937 M NiC12at 25°C 146
Table 40 Diffusion coefficients in 2 M NiCl2 at 25°C 150
Table 41 Equilibrium quotients in 2 M NiC12 at 25°C 150
Table 42 Tafel slopes determined from the partial polarization curves 176
List of Tables xi
Table 43 Calculated Tafel slope and reaction order for the rate of nickel reduction when theeffect of the coverage of the cathode with the adsorbed nickel species is taken intoaccount 188
Table 44 Calculated Tafel slope and reaction order for the rate of the reduction of nickelions for different mechanisms 189
Table 45 Tafel slope and reaction order for the rate of hydrogen evolution with respect tothe concentration of hydrogen ion 192
Table 46 Liquid junction potentials and the corresponding pH shifts in nickel chloridesolutions at 25°C 209
Table 47 Liquid junction potentials and the corresponding pH shifts in mixed sulfatecontaining nickel chloride solutions at 25°C 210
List of Figures Xii
List of Figures
Figure 1 The electrolyte conductivity and viscosity of 2 M (NiC12+ NiSO4)at 60°C 4
Figure 2 Flowsheet of the Falconbridge nickel matte chlorine leaching process 8
Figure 3 The electrolyte conductivity and viscosity of NiC12 solutions at various temperatures 16
Figure 4 The partial current density vs. potential for the deposition and dissolution ofnickel on a platinum RDE at 1,000 rpm (1 M NiC12-2 M NaCl - 0.01 M HC1 at21°C) 21
Figure 5 The overpotentials of nickel cathodic deposition and anodic dissolution in 1 MNiC12 and 1 M NiSO4 at 100 Aim2and pH 1.5 25
Figure 6 Concentration of hydrogen ion as a function of its activity in nickel chloridesolutions 40
Figure 7 Concentrations of hydrogen plus bisulfate ions as a function of hydrogen ionactivity in sulfate-containing nickel chloride solutions at 25°C 42
Figure 8 Sub-section distribution curve of nickel species in 3.92 M NiC12 at 25°C 42
Figure 9 Concentration of hydrogen ion as a function of its activity in sulfate-containingnickel chloride solutions at 25°C 46
Figure 10 The activity of water in aqueous solutions of nickel chloride as a function of ionicstrength (I =3mNC12) 53
Figure 11 Calculated activity of nickel ion as a function of its concentration at different 59temperatures
Figure 12 Concentration of hydrogen ion as a function of its activity in aqueous solutionsof sodium chloride and calcium chloride at 25°C (HC1 added continuously) 66
Figure 13 Dependence of the pH of nickel hydroxide formation on the nickel concentrationand temperature in nickel chloride solutions 68
Figure 14 Distribution curves of nickel species in nickel chloride solutions at 25°C 76
Figure 15 Distribution curves of nickel species in sulfate-containing nickel chloridesolutions at 25°C 80
Figure 16 pH titration curve of dilute solution of nickel chloride (13.6 g/L NiC12•6H20,150 mL sample, 25°C and 2 mL/min. speed) 82
List of Figures xiii
Figure 17 Schematic drawing of the apparatus for nickel electrodeposition tests 84
Figure 18 SEM photomicrograph of the cross-section of nickel deposit obtained from0.937 M NiC12 at 750 Aim2,bulk pH 2.5 and 60°C 90
Figure 19 The potential of nickel electrode as a function of time in 0.937 M NiC12 at750 A/m2,bulk pH 2.5 and 60°C 91
Figure 20 Sub-section potential and nature ofnickel cathode as a function of time in 0.937 MNiCI2at 750 A/m2,bulk pH 2.5 and 60°C 91
Figure 21 The potential of nickel electrode as a function of time in 0.937 M NiC12 at1,000 Aim2,bulk pH 2 and 60°C 92
Figure 22 SEM photomicrograph of the cross-section of nickel deposit obtained from0.937 M NiCl2 at 1,000 A/m2,bulk pH 2 and 60°C 93
Figure 23 SEM photomicrograph of the morphology in the black zone of nickel depositobtained from 0.937 M NiC12 at 1,000 AIm2,bulk pH 2 and 60°C 93
Figure 24 The acid volume added to the electrolyte as a function of time during nickelelectrodeposition from 0.937 M NiCl2(55 g/L Ni2)and 0.572 M NiC12- 0.365 MNiSO4 (55 gIL Ni2 and 35 g/L SO) at 300 AIm2, different pH’s and temperatures 100
Figure 25 Schematic drawing of the apparatus for surface pH measurement and associatedequipment 104
Figure 26 SEM photomicrograph of 500-mesh gold gauze (dull side) (20 kV, 500X) 108
Figure 27 SEM photomicrograph of 500-mesh gold gauze (shiny side) (20kV, 500X) 108
Figure 28 SEM photomicrograph of 500-mesh gold gauze (dull side) (20 kV, 2,000 X) 109
Figure 29 SEM photomicrograph of 500-mesh gold gauze (shiny side) (20kV, 2,000 X) 109
Figure 30 SEM photomicrograph of 500-mesh gold gauze (cross-section) (20 kV, 4,000 X) 110
Figure 31 Schematic drawing of the 500-mesh gold gauze 111
Figure 32 EDX diagrams of 500-mesh gold gauze coated with nickel layer of differentthicknesses (0.05-1 jim) and after anodic dissolution (20 kV, 7,000 X) 112
Figure 33 SEM photomicrograph of 500-mesh gold gauze coated with -0.05 jim (nominal)thick nickel film (20 kV, 2,000 X) (morphology) 114
Figure 34 SEM photomicrograph of 500-mesh gold gauze coated with --0.5 jim (nominal)thick nickel film (20 kV, 2,000 X) (morphology) 114
Figure 35 SEM photomicrograph of 500-mesh gold gauze coated with —1 pm (nominal)thick nickel film (20 kV, 2,000 X) (morphology) 115
List of Figures xiv
Figure 36 SEM photomicrograph of 500-mesh gold gauze coated with -1 Im (nominal)thick nickel film (20 kV, 2,000 X) (cross-section) 115
Figure 37 Surface pH as a function of time at 50 A/m2 (500-mesh gold gauze, 0.937 MNiCl2,bulk pH 2.5, 25°C) 116
Figure 38 pH titration curves for different NiCl2 concentrations at 25°C (150 mL sampleand 0.5 mLJmin speed) 117
Figure 39 The surface pH as a function of current density for different NiCI2concentrationsat 25°C (500-mesh gold gauze and bulk pH 2.5) 117
Figure 40 The surface pH as a function ofcurrent density for different sulfate concentrationsat 25°C (500-mesh gold gauze and bulk pH 2.5) 118
Figure 41 pH titration curves for different sulfate concentrations at 25 and 60°C (0.937 MNiC12,0.937 M NiC12+ 0.365 M Na2SO4,0.572 M NiCl2 + 0.365 M NiSO4and0.572 M NiCl2 + 0.365 M NiSO4 + 0.365 M Na2SO4, 150 mL sample and0.5 mLlmin speed) 118
Figure 42 pH titration curve for 0.937 M NiC12 - 2 M NaCl at 25°C (150 mL sample and0.5 mLfmin speed) 120
Figure 43 The surface pH as a function of current density in 0.937 M NiCl2 -2 M NaCl at25°C (500-mesh gold gauze and bulk pH 2.5) 120
Figure 44 Distribution curves of boric acid species in aqueous solutions containing 5 and40 g/LH3B03at 25°C 122
Figure 45 Distribution curves of boric acid species at 25°C (consideringH3B03and B(OH)
only) 123
Figure 46 pH titration curve for free boric acid at 25°C (0.485 M H3B03,30 mL sample,and 0.5 mL/min speed) 123
Figure 47 Volume difference of 5 M NaOH between 2nd and 1st peaks as a function ofboric acid concentration at 25°C (30 mL sample) 123
Figure 48 pH titration curve for the boric acid in 2 M NaC1 - 0.485 MH3B03at 25°C (30 mLsample, and 0.5 mLJmin speed) 124
Figure 49 Volume difference of 5 M NaOH between 2nd and 1st peaks as a function ofboric acid concentration in solutions containing 2 M NaC1 (30 mL sample) 124
Figure 50 pH titration curve for 0.937 M NiCl2 - 0.485 MH3B03at 25°C (150 mL sampleand 0.5 mL/min speed) 125
Figure 51 The surface pH as a function ofcurrent density in 0.937 M NiCl2- 0.485 MH3B03at 25°C (500-mesh gold gauze and bulk pH 2.5) 125
List of Figures XV
Figure 52 pH titration curve for the free ammonium chloride solution at 25°C (1.31 MNfT4C1, 30 mL sample, and 0.5 mlJmin speed) 126
Figure 53 pH titration curve for 0.937 M NiC12 - 1.31 M NH4C1 at 25°C (150 mL sampleand 0.5 mlJmin speed) 126
Figure 54 The surface pH as a function of current density in 0.937 M NiC12- 1.31 M NH4C1at 25°C (500-mesh gold gauze and bulk pH 2.5) 127
Figure 55 pH titration curves for 0.937 M NiC12at different temperatures (150 mL sampleand 0.5 mL/min speed) 127
Figure 56 The surface pH as a function of current density in 0.937 M NiC12 at differenttemperatures (500-mesh gold gauze and bulk pH 2.5) 127
Figure 57 The potential of nickel electrode vs. time in deaerated 0.937 M NiCl2 at bulkpH 2.5 and 60°C (50 Nm2,with N2 bubbling and under agitation except wheremarked) 129
Figure 58 The potential of nickel electrode vs. time in non-deaerated 0.937 M NiCl2at bulkpH 2.5 and 60°C (50 Nm2,under agitation except where marked) 129
Figure 59 The potential of nickel electrode vs. time in 0.937 M NiCl2 at bulk pH 2.5 and60°C (50 Nm2,under agitation except where marked, with prior air bubbling for10 minutes) 129
Figure 60 The potential of nickel electrode vs. time in the non-deaerated 0.937 M NiCl2atbulk pH 2 and 25°C (50 A/m2,without prior deaeration, under agitation exceptwhere marked) 129
Figure 61 The potential of nickel electrode vs. time in deaerated 0.937 M NiC12 at bulkpH 2 and 25°C (50 Nm2, with 10 minutes prior N2 bubbling, under agitationexcept where marked) 130
Figure 62 The potential of nickel electrode vs. time in 0.937 M NiCl2at bulk pH 2 and 25°C(50 Nm2,with 10 minutes air bubbling, under agitation except where marked) 130
Figure 63 The effect of ultrasound on the surface pH in 0.937 M NiCl2at bulk pH 2.5,25°Cand c.d. 80 and 180 Nm2 132
Figure 64 The surface pH as a function ofcurrent density at 60°C without agitation in variouselectrolytes (500-mesh gold gauze) 133
Figure 65 pH titration curves for highly concentrated solutions at 60°C (3.92 M NiC12and3.555 M NiCl2+ 0.365 M NiSO4, 150 mL sample and 0.5 mLfmin speed) 133
Figure 66 The potential of nickel electrode vs. time in deaerated 3.92 M NiCl2at bulk pH 2and 60°C (50 Nm2,with 10 minutes prior N2bubbling and under agitation exceptwhere marked) 134
List of Figures xvi
Figure 67 Interactions between species in the solution NiCl2-HC1-H20 136
Figure 68 Definition of X-coordinate for the surface pH modelling 136
Figure 69 The viscosity and density of aqueous NiC12-HC1 solution at 25°C (dashed linescontain no HC1, solid lines contain 0.1 M HCI, density times a factor of i03 kglm3,absolute viscosity times i0 kg/msec, kinematic viscosity times 106m2/sec) ... 143
Figure 70 Modelled surface pH in 0.937 M NiC12at bulk pH 2.5 and 25°C 148
Figure 71 Sub-section distribution curve of nickel species in 0.937 M NiC12 at 25°C 149
Figure 72 Modelled surface pH in 2 M NiCl2 at bulk pH 2.5 and 25°C 151
Figure 73 Schematic drawing of the rotating disc electrode 152
Figure 74 Dimensions of the surface of the rotating disc electrode 156
Figure 75 Schematic drawing of the apparatus for the rotating disc electrode study 156
Figure 76 The effect of ohmic drop on the polarization curve (0.937 M NiC12,pH 2, 25°C,1,000 rpm, 5 mV/sec and bare Pt) 158
Figure 77 The current density vs. time for potentiostatic operation (0.3 M NiCl2 + 2.7 MCaCl2,0.005 M HC1 <pH 0.90>, 25°C, 2,000 rpm, Ni-coated Pt) 159
Figure 78 The current density vs. time for linear potentiostatic anodic dissolution (0.937 MNiC12+ 0.485 MH3B03,pH 2, 25°C and 2,000 rpm) 160
Figure 79 The current densities of nickel reduction and hydrogen evolution as a functionof nickel concentration (NiC12 + CaC12 = 3 M, pH 1.1, 25°C, 2,000 rpm andNi-coated Pt disc) 161
Figure 80 The current densities of nickel reduction and hydrogen evolution as a functionofHC1 concentration (0.3 M NiC12+ 2.7 M CaC12,25°C, 2,000 rpm and Ni-coatedPt disc) 161
Figure 81 The current densities of nickel reduction and hydrogen evolution as a functionof chloride concentration [0.5 M Ni(C104)2+ 3 M (NaC1 + NaC1O4)+ 0.005 MHC1, 25°C, 2,000 rpm and Ni-coated Pt disc] 162
Figure 82 The effect of rotational speed on the current efficiency in various electrolytesand at different pH’s (25°C, -0.850 volt vs. SCE and Ni-coated Pt disc) 165
Figure 83 The effect of rotational speed on the electrode potential in electrolytes of purenickel chloride (started with Pt substrate at 25°C) 166
Figure 84 Polarization curve at a sweep rate of 2 mV/sec (0.3 M NiC12 + 2.7 M CaCl2,0.005 M HC1 <pH —0.9 >, 25°C, 2,000 rpm and Ni-coated Pt disc) 168
List of Figures xvii
Figure 85 Polarization curves of combined nickel reduction and hydrogen evolution indifferent electrolytes (2,000 rpm, pH 2, 25°C, 2 mV/sec, Ni-coated Pt disc) 168
Figure 86 Polarization curves of combined nickel reduction and hydrogen evolution in0.937 M NiC12at different pH’s (2,000 rpm, 25°C, 2 mV/sec, Ni-coated Pt disc) 172
Figure 87 Current efficiency of nickel over the potential range covering the wholepolarization curve (0.937 M NiC12,pH 2, 25°C, 2,000 rpm, Ni-coated Pt disc) 173
Figure 88 Partial polarization curves ofnickel reduction and hydrogen evolution in 0.937 MNiC12 at pH 2, 25°C and 2,000 rpm (Ni-coated Pt disc) 174
Figure 89 Tafel plots of the partial polarization for nickel reduction and hydrogen evolutionin 0.937 M NiCl2 at pH 2, 25°C and 2,000 rpm (Ni-coated Pt disc) 176
Figure 90 Polarization curves for hydrogen evolution on Ni-coated Pt electrode in 2.5 MNaCl, 2.5 M NaCl + 0.365 M Na2SO4 and 2.5 M NaC1 + 0.485 M H3B03 atdifferent RPM’s (25°C, 2 mV/sec. —2 pm Ni-coated Pt disc) 179
Figure 91 Limiting current density for hydrogen evolution as a function of the square rootofRPM in electrolyte containing no nickel ions at different pH’s (25°C and —2 pmNi-coated Pt disc) 181
Figure 92 Reaction order for the rate of hydrogen evolution with respect to hydrogen ionconcentration in the electrolytes containing no nickel ions (25°C, 2,000 rpm and—2 pm Ni-coated Pt disc) 182
Figure 93 The limiting current density for hydrogen evolution in different electrolytes vs.the concentration ofhydrogenion (25°C, 2,000rpm and —2 pm Ni-coated Pt disc) 183
Figure 94 The slope of (L vs. ,IRPM) as a function of hydrogen ion activity in differentelectrolytes (25°C and —2 pm Ni-coated Pt disc) 183
Figure 95 The current density of hydrogen evolution as a function of chloride concentrationin 3 M (NaC1 + NaC1O4)+ 0.01 M HC1 (25°C, 2,000 rpm and —2 p.m Ni-coatedPt disc) 184
Figure 96 Tafel plot of hydrogen evolution in 2.5 M NaCl at pH 2, 25°C and 2,000 rpm(2 mV/sec and —2 p.m Ni-coated Pt disc) 184
Figure 97 Polarization curves of hydrogen evolution in electrolytes without nickel ions atdifferent pH’s (25°C, 2,000 rpm, 2 mV/sec and 2 pm Ni-coated Pt disc) 185
Figure 98 Polarization curves of the hydrogen evolution in electrolytes without nickel ionsat different acid concentrations (25°C, 2,000 rpm, 2 mV/sec and —2 pm Ni-coatedPt disc) 186
Figure 99 The possible routes for hydrogen evolution 190
Figure 100 Separated view of a combination glass pH electrode 206
List of Figures xviii
Figure 101 The equivalent conductivities of electrolytes (KC1, NaC1, NiCl2,Na2SO4andNiSO4)at25°C 206
Figure 102 In-situ screen output during pH titration 222
Figure 103 dpHJdV vs. volume for pH titration 222
Figure 104 pH vs. volume for pH titration 223
Figure 105 dpHJdV vs. pH for pH titration 223
Figure 106 In-situ screen output during REDOX titration 224
Figure 107 dPOTENTIALIdV vs. volume for REDOX titration 225
Figure 108 POTENTIAL vs. volume for REDOX titration 225
Figure 109 dPOTENTIAL/dV vs. POTENTIAL for REDOX titration 226
Figure 110 In-situ screen output for pH-stat test 226
Figure 111 Volume vs. time for pH-stat test 227
Figure 112 In-situ screen output for reading data from SOLARTRON’s data file 229
Figure 113 Potential vs. time for galvanostatic experiment 230
Figure 114 Potential vs. time for galvanostatic experiment 230
Figure 115 In-situ screen output for potentiostatic experiment 231
Figure 116 Current density vs. time for potentiostatic experiment 232
Figure 117 In-situ screen output for linear potential sweep 232
Figure 118 Current density vs. potential for linear potential sweep 233
Figure 119 In-situ screen output for cyclic voltammetry 234
Figure 120 Current density vs. potential for cyclic voltammetry 235
Figure 121 In-situ screen output for galvanostatic anodic dissolution 235
Figure 122 Potential vs. time for galvanostatic anodic dissolution 236
Figure 123 In-situ screen output for potentiostatic anodic dissolution 237
Figure 124 Current density vs. time for potentiostatic anodic dissolution 237
Figure 125 In-situ screen output for galvanostatic electrolysis with pH measurement 240
Figure 126 Surface pH vs. time for galvanostatic electrolysis with pH measurement 240
Figure 127 Potential vs. time for galvanostatic electrolysis with pH measurement 241
Acknowledgements xix
Acknowledgements
I would like to express my sincere gratitude to Dr. W. Charles Cooper for his thoughtfulsupervision and numerous constructive discussions in the progress of this thesis work, for hisconscientious reviewing and editing of this thesis, and for his fatherly care of my life since I worked
for him. I would like also to express my appreciation to Dr. David B. Dreisinger and
Dr. Ernest Peters for their acceptance of myself to study in this department, for all the conveniences
and instruments provided for my experiments, and for their consistent interest in and enlightening
advice to my thesis work.
Many thanks are due to my fellow graduate students and research engineers in the hydrome
tallurgy laboratory for their great assistance in various ways in the years ofworking together. Special
thanks are extended to Ms. Mary Mager for her technical help in using the scanning electron
microscope and to the technicians in the machine shop and the secretaries in the department for
their support.
The generous financial support of this research provided by Falconbridge Limited is greatly
appreciated. In addition, I wish to thank the personnel in the Metallurgy Technology Centre at
Falconbridge Limited for their many valuable comments during project review meetings.
Nomenclature
Nomenclature
ROMAN SYMBOLS AND ABBREVIATIONS
a activity of an ion (cation or anion) or compound
a,.. activity of water
an ion-size-related parameter, (A)
A constant of Debye-Huckel equation for the activity coefficient, which isequal to 0.509 (molefkg)”2for water at 25°C in equation (93); predominantspecies
abs absorbed
AC alternating current
A.C.S. American Chemical Society
ads adsorbed
aq aquated; aqueous medium; solvated; hydrated
b the bulk of electrolyte
B coefficient of ion-size term of Debye-Huckel equation for the activitycoefficient, which is equal to 0.329 x 10¹⁰m1(molefkg)’ for water at 25°Cin equation (93); B = 0.75 - 0.065q in Meissner’s equation (99)
C C = 1 + 0.055 q exp(-0.02313)in Meissner’s equation (100); molarity, i.e.,moles of solute per litre of solution, (molefL)
Cb molar concentration in the bulk of electrolyte, (moleIL)
C molar concentration at the electrode surface, (molelL)
Calcd. calculated
c.d. or C.D. current density, (Aim2)
CE current efficiency, (%)
d electrode gap, (m); wire diameter of gold gauze, (jim)
D diffusion coefficient, (m2/sec)
D÷ cation diffusion coefficient, (m2/sec)
Nomenclature xxi
D anion diffusion coefficient, (m2/sec)
Dsait diffusion coefficient of a salt, (m2lsec)
DC direct current
DH Debye-HUckel
Diff. difference
DSA dimensionally stable anode, often made of the titanium substrate with a noblemetal oxide coating, such as Ti-Ru02for chlorine evolution
e charge of an electron
E electrode potential, (volt)
corrosion or mixed potential, (volt)
standard electrode potential, (volt)
EDX energy dispersive X-ray
EMF electromotive force
eq equilibrium
EW electrowinning
Exptl. experimental
f rational (or mole-fraction scale) activity coefficient
f± mean-ion rational activity coefficient
F Faraday constant, (96,500 C/equiv.)
FRP fiberglass reinforced polyester
g gaseous phase; standard acceleration, (9.81 mlsec2)
AG Gibbs free energy, (kJ/mole)
AG° standard Gibbs free energy, (U/mole)
h hydration parameter; electrode height, (m)
[Itj molar concentration of the hydrogen ion, (mole/L)
H2Q hydroquinone (HOC6H4OH)
i current density, (A/rn2); species i
4orr. corrosion current density, (Aim2)
Nomenclature xxii
td diffusion current density, (Aim2)
1L limiting current density, (A/rn2) -
i0 exchange current density, (A/rn2)
I current, (A); ionic strength, I = 0.5m1z
IHP inner Helmholtz plane
j speciesj
J flux of matter, (kmo1Im2sec)
k Boltzmann’s constant, (1.3807 x 10²³ J/°K); rate constant of a reaction;Sievert’s law constant
rate constant of a backward reaction
kf rate constant of a forward reaction
K thermodynamic equilibrium constant
K, solubility product of an insoluble compound
K,,, ionization constant of water
L electrode length, (m)
m molality, i.e., moles of solute per kilogram of water, (molelkg•H20)
M molecular weight, (g/mole); unit for molar concentration, (moleIL); metal
n the number of electrons transferred; the number of total species in thesolution
N mole fraction of the solvent
[Nj2] molar concentration of the nickel ion, (molefL)
OHP outer Helmholtz plane
Ox oxidant
P pressure, (atm)
PGM platinum group metals
pH negative logarithm to base 10 of the activity of hydrogen ion, pH = — log(a+)
ppm parts per million
Nomenclature xxiii
PRC periodic reverse current
PTFE polytetrafluoroethylene
PVC polyvinyl chloride
Q equilibrium quotient; the number of coulombs, (C); benzoquinone(0C6H40)
Q solubility quotient of an insoluble compound
ionization quotient of water, Q = [H9.[OH1
r the radial coordinate in the poiar coordinate system
r radius of an ion, (m)
R molar gas constant, 8.3 14 J/mole•°K; regression coefficient (IRI 1)
R, ohmic resistance, (2)
RDE rotating disc electrode
r.d.s. rate-determining step
Re Reynolds number, Re w• r2 I V
Red reductant
rpm, or RPM revolution per minute, RPM =60 cx I (2it)
RRDE rotating ring-disc electrode
s space between wires of gold gauze, (urn); electrode surface; solid
Sc Schmidt number, Sc = v I D
SCE saturated calomel electrode
SEM scanning electron microscopy
SHE standard hydrogen electrode
S.S. stainless steel
t transference number (t 1); electrolysis time, (mm.); temperature, (°C);
T absolute temperature, (°K)
TBP tributyl phosphate, [CH3(CH2)30]3P(O)
TIOA triisooctylamine, [CH3(CH2)7]3N
V volume, (mL); flow velocity of the solution, (mlsec)

Nomenclature xxiv
w water
x - distance from the electrode surface, (m); unknown molar concentration ofa species, (molelL)
X mole fraction of the solute; ligand; anion
y molar activity coefficient
mean-ion molar activity coefficient
z charge on an ionic species; the vertical distance from the disc surface (m)
z charge on a cation
z charge on an anion
GREEK SYMBOLS
cathodic charge transfer coefficient (x 1)
anodic charge transfer coefficient (f3 1); stability constant
ö thickness of the diffusion layer, (m)
&ff effective thickness of the diffusion layer of a binary electrolyte
thickness of hydrodynamic boundary layer, ö0 = 3.6’J
TI overpotential, (volt)
molal activity coefficient
mean-ion molal activity coefficient
logf* —O.5107q11(l+ cfij in Meissner’s equation (101)
logf’+ = logy+I I z z_ I in Meissner’s equation (97)
K conductivity, (mho/m)
equivalent conductivity, (mho•m2/equiv.)
Ii mobility, (m2/sec•volt); viscosity, (kglm.sec)
v kinematic viscosity of electrolyte, v = iJp, (m2/sec)
the number of moles of cation per mole of solute
the number of moles of anion per mole of solute
Nomenclature xxv
V12 V12=V++V_
angular velocity of the disc, (radian/sec)
azimuthal coordinate of the poiar coordination system
osmotic coefficient, for aqueous solution, 0 —1000 lna/(l8v1m1);electrical potential of the solution, (volt)
Wi electrical potential at the outer Helmholtz plane with respect to the bulksolution, (volt)
p density, (kg/rn3)
0 coverage of electrode surface with adsorbed species, (0 1)
Introduction 1
Introduction
Nickel is used primarily in the production of metal alloys. The production of stainless steelaccounts for 64 % of total nickel consumption, and nickel-based and copper-based alloys accountfor another 12 %[1]• Other important applications include a base deposit for chrome plating, powdersfor coinage and catalysts, and oxides for anodes in rechargeable batteries. According to the 1988statistics, 175,000 tons of nickel were produced electrolytically, amounting to 31 % of the totalnickel production in the non-Communist wor1d21.The major electrolytic nickel producers are INCOLtd. in Canada, Falconbridge Ltd. in Norway, Sumitomo Metal Mining Co. in Japan, Outokumpuin Finland, Jinchuan Non-Ferrous Metals Corp. in China, Rustenburg Base Metals Refmers in SouthAfrica, and Société Le Nickel in France.
Three electrolyte systems are in use today in the nickel industry. Direct nickel matte elec
trowinning in mixed chloride-sulfate electrolyte, whose overall cell reaction is Ni3S2 = 3Ni+ 2S, is
in operation at INCO’s Thompson, Manitoba nickel refmery, Sumitomo’s Niihama nickel refinery
and Jinchuan’ s nickel refinery. Nickel sulfate electrowinning, whose overall cell reaction is 2NiSO4
+ 2H20= 2Ni + 2H2S04+ 02, is practiced at Outokumpu’s nickel refinery and by Rustenburg Base
Metals Refiners. Nickel chloride electrowinning, the most innovative and efficient electrolytic
process, whose overall cell reaction is NiCl2 = Ni + Cl2, is employed by Falconbridge’s Nikkelverk
A/S. Sumitomo Metal Mining Co. and Société Le Nickel.
The copper content of the nickel matte affects the process of choice. Nickel mattes with a
lower copper content (< 7 %) are usually suitable for direct matte electrowinning, pressure ammonialeaching orC12-FeCl3leaching. Nickel mattes with a high copper content (>25 %) are often pro
cessed by atmospheric orH2S04pressure leaching, orCl2-CuCl2leaching31.Except for direct matte
electrowinning, the nickel matte is first subjected to leaching. Following the leaching or matte
electrowinning, the electrolyte must be purified of impurities including copper (Cu2),cobalt (Co),
lead (Pb2), arsenic (AsO), iron (Fe2), manganese (Mn2)before being pumped to the cathode
compartments in the electrowinning tankhouse. The steps involved in each process, that is, leaching,
purification, hydrogen reduction and electrowinning of nickel were recently well reviewed
respectively by Conard21,Kerfoot and Weir131,Burkin41 and Hofirek and Kerfoot51.
The desired electrowon nickel should be a dense coherent deposit with a smooth surface to
minimize occlusion of electrolyte. This goal is not difficult to achieve even in the absence of any
addition agents due to the high overpotential of nickel itself. As a result of its low exchange current
density, nickel reduction is normally under activation control and the resulting cathode deposit
consists offine grains. An undesirable feature ofnickel electrowinning is the inevitable simultaneous
Introduction 2
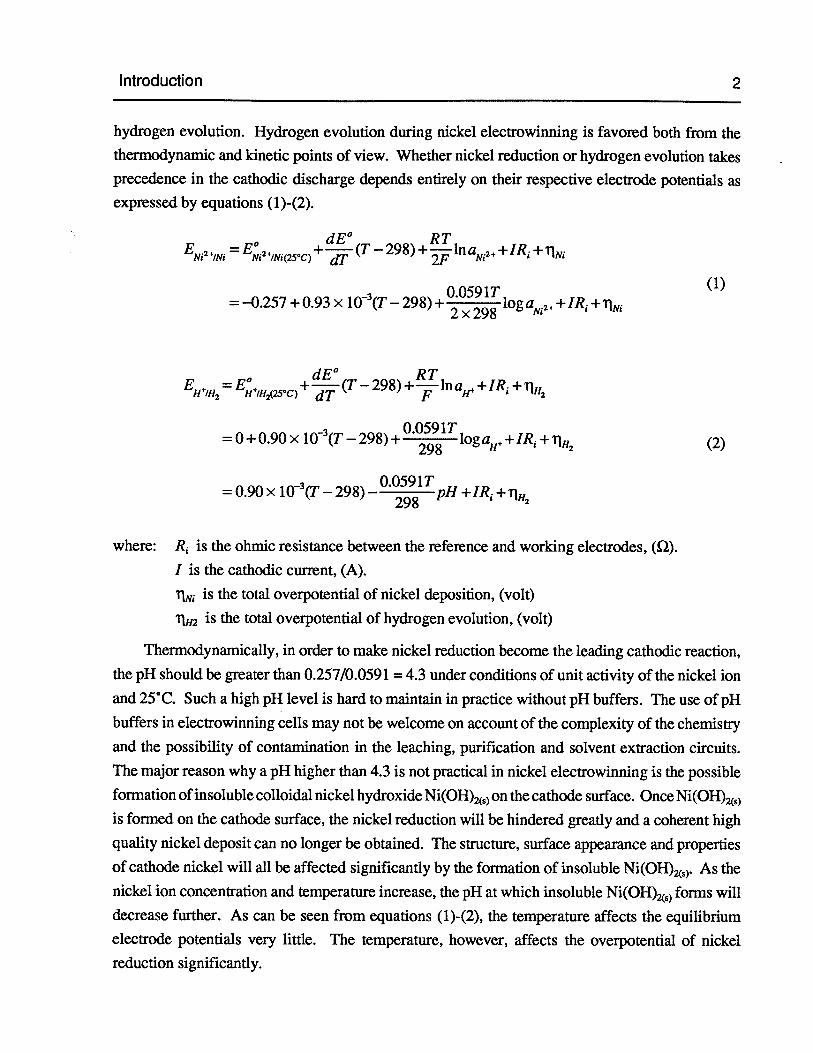
hydrogen evolution. Hydrogen evolution during nickel electrowinning is favored both from thethermodynamic and kinetic points of view. Whether nickel reduction or hydrogen evolution takesprecedence in the cathodic discharge depends entirely on their respective electrode potentials asexpressed by equations (1)-(2).
= +-(T —298) + in + JR1 +1lNi
00591T (1)= —0.257 + 0.93 x 10⁴(T —298)
+ 2 x 298log aN.2+ + JR1 + flNj
= E+,H,c) +4jjj- (T — 298) +-in aH+ + JR1 +r
= 0+0.90 x 1W3(T — 298)+298
loga++JR1flH2 (2)
= 0.90 x l(T3(T — 298) O.OS91TH+JR1ThI2
where: R is the ohmic resistance between the reference and working electrodes, (2).
I is the cathodic current, (A).
1lNi is the total overpotential of nickel deposition, (volt)
TIH2 is the total overpotential of hydrogen evolution, (volt)
Thermodynamically, in order to make nickel reduction become the leading cathodic reaction,
the pH should be greater than 0.257/0.059 1 = 4.3 under conditions of unit activity of the nickel ion
and 25°C. Such a high pH level is hard to maintain in practice without pH buffers. The use of pH
buffers in electrowinning cells may not be welcome on account of the complexity of the chemistry
and the possibility of contamination in the leaching, purification and solvent extraction circuits.
The major reason why a pH higher than 4.3 is not practical in nickel electrowinning is the possible
formation ofinsoluble colloidal nickel hydroxide Ni(OH)) on the cathode surface. Once Ni(OH)S)is formed on the cathode surface, the nickel reduction will be hindered greatly and a coherent high
quality nickel deposit can no longer be obtained. The structure, surface appearance and properties
of cathode nickel will all be affected significantly by the formation of insoluble Ni(OH)S). As the
nickel ion concentration and temperature increase, the pH at which insoluble Ni(OH)S) forms will
decrease further. As can be seen from equations (l)-(2), the temperature affects the equilibrium
electrode potentials very little. The temperature, however, affects the overpotential of nickel
reduction significantly.
Introduction 3
Kinetically, nickel reduction is not favored either in view of the high overpotential of nickeland the low overpotential of hydrogen evolution on the nickel substrate. In spite of the fact thathydrogen evolution can be alleviated to a less significant extent by optimizing the operating conditions, the hydrogen evolution is unlikely to be surmountable completely during nickel electrowinning. The factors influencing both nickel reduction and hydrogen evolution are the pH andtemperature of the electrolyte, nickel ion concentration, current density, agitation, electrolytecomposition, addition agents and the nature of the cathode surface. Lower electrolyte pH in nickelelectrowinning is not feasible. At low pH, copious hydrogen gas will evolve on the cathode,consuming energy unnecessarily and hence raising the operating costs. The other disadvantage ofthe abundant hydrogen evolution is the absorption of hydrogen into the cathode nickel which causesharmful stress in the nickel. The only advantage of hydrogen evolution is the enhancement of themass transport near the cathode.
Theoretically, only in sulfate electrowinning will the pH of the electrolyte decrease as theelectrowinning proceeds due to the anodic generation of acid. This is why a diaphragm cell isalways used in nickel sulfate electrowinning to control the catholyte pH. Another reason for usinga diaphragm in nickel sulfate electrowinning is to avoid contamination from the scaling of thedeposit from the lead anodes. In nickel matte and nickel chloride electrowinning, however, diaphragm cells are used for the purpose of collecting anode slimes and chlorine gas, respectively.Nickel matte chlorine leaching and nickel electrowinning in chloride electrolytes which were mainlydeveloped and commercialized by Falconbridge in Norway represent the future direction of nickelhydrometallurgy. In chloride solutions, it is likely that the nickel ion forms a nickel chloro complex(NiCl). Contrary to most of the complex species where complexation causes a substantial negativeshift in the equilibrium potential and cathodic overpotential, the formation ofa nickel chioro complexactually promotes the reduction of nickel ions. One argument as regards the function of chlorideions is that the promotion of nickel reduction comes from the interfacial phenomenon representedin particular by “chloride ion bridge” theory rather than from the bulk solution chemistry6.Thisargument might be true since it has been found in this thesis work that the reaction orders of therates of nickel reduction and hydrogen evolution with respect to the chloride activity are both equalto zero when the chloride concentration is above 0.4 M.
The advantages of using chloride electrolytes compared with sulfate electrolytes can besummarized as higher electrical conductivity and lower viscosity (Figure 1) of the electrolyte, lowercathodic nickel and anodic chlorine overpotentials, higher solubiity of NiC12 than NiSO4,higheractivity coefficient of nickel ion and easier nickel-cobalt (Ni-Co) separation by solvent extractionin the preceding purification stage. These properties result in a higher current efficiency of nickelreduction, lower cell voltage and thus a lower energy consumption. The lower JR drop across the
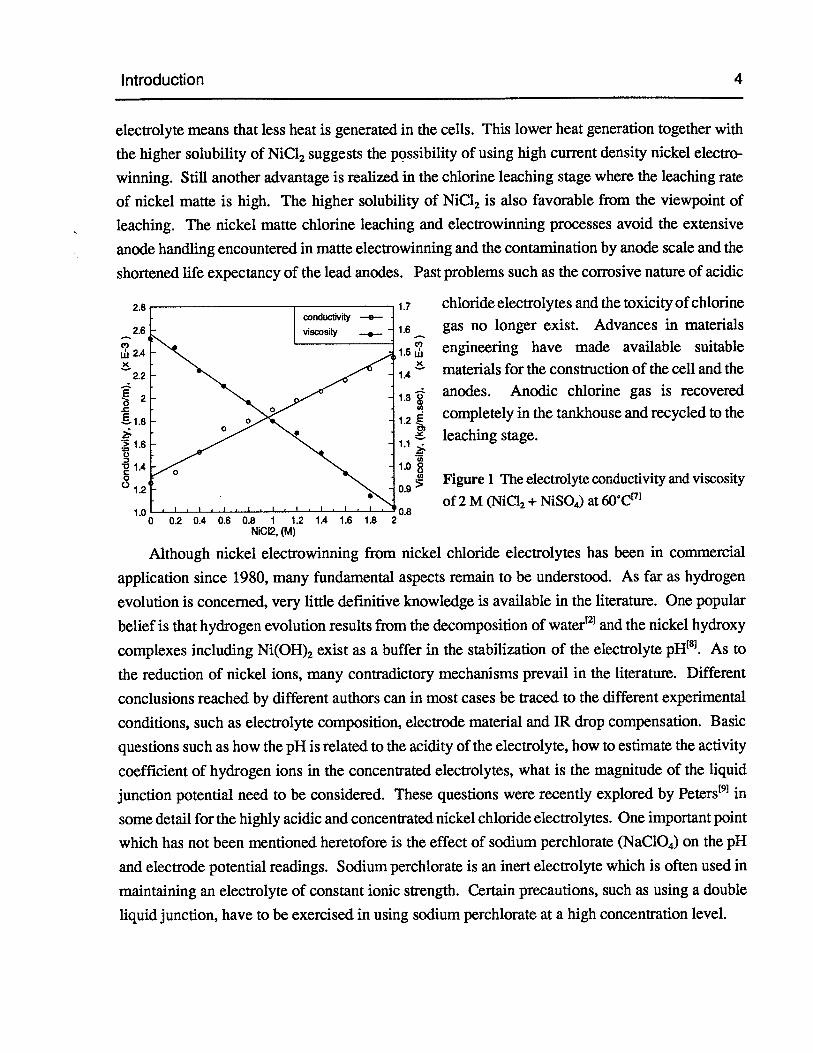
Introduction 4
electrolyte means that less heat is generated in the cells. This lower heat generation together with
the higher solubiity of NiC12 suggests the possibility of using high current density nickel electro
winning. Still another advantage is realized in the chlorine leaching stage where the leaching rate
of nickel matte is high. The higher solubility of NiC12 is also favorable from the viewpoint of
leaching. The nickel matte chlorine leaching and electrowinning processes avoid the extensive
anode handling encountered in matte electrowinning and the contamination by anode scale and the
shortened life expectancy of the lead anodes. Past problems such as the corrosive nature of acidic
1.7 chloride electrolytes and the toxicity of chlorine
gas no longer exist. Advances in materials
engineering have made available suitable
materials for the construction of the cell and the
anodes. Anodic chlorine gas is recovered
completely in the tankhouse and recycled to the
leaching stage.
Figure 1 The electrolyte conductivity and viscosity
0.8of 2 M (NiCl2+ NiSO4)at 60C1
0 0.2 0.4 0.6 0.8 1 1.2 1.4 1.6 1.8NI2, (M)
Although nickel electrowinning from nickel chloride electrolytes has been in commercial
application since 1980, many fundamental aspects remain to be understood. As far as hydrogen
evolution is concerned, very little definitive knowledge is available in the literature. One popular
belief is that hydrogen evolution results from the decomposition of water21 and the nickel hydroxy
complexes including Ni(OH)2exist as a buffer in the stabilization of the electrolyte pH81. As to
the reduction of nickel ions, many contradictory mechanisms prevail in the literature. Different
conclusions reached by different authors can in most cases be traced to the different experimental
conditions, such as electrolyte composition, electrode material and JR drop compensation. Basic
questions such as how the pH is related to the acidity of the electrolyte, how to estimate the activity
coefficient of hydrogen ions in the concentrated electrolytes, what is the magnitude of the liquid
junction potential need to be considered. These questions were recently explored by Peters19 in
some detail for the highly acidic and concentrated nickel chloride electrolytes. One important point
which has not been mentioned heretofore is the effect of sodium perchiorate (NaC1O4)on the pH
and electrode potential readings. Sodium perchlorate is an inert electrolyte which is often used in
maintaining an electrolyte of constant ionic strength. Certain precautions, such as using a double
liquid junction, have to be exercised in using sodium perchlorate at a high concentration level.
2.8
2.6C’)jj 2.4
2.2
E
1.6
1.40
°1.2
1.0
1.6C’)
1.5th‘C
1.4
1.3
0’
1.1
1.0 80.9
Introduction 5
The use of high current density electrowinning of nickel in chloride electrolytes is an attractivealternative. Before going far in this direction, amore reliable understanding ofthe physical chemistryand electrochemistry of the process is needed. The operating conditions for achieving both anacceptable current efficiency and a high quality of cathode nickel need to be determined. Thepresent thesis addresses a number of the above-mentioned problems and focuses on the fundamentalaspects of nickel electrowinning in chloride electrolytes. Thermodynamically, a series of distribution curves of nickel species is plotted using the available equilibrium constants (quotients) withthe effects of the activity coefficients and ionic strength being taken into account. The activitycoefficients of hydrogen ions, nickel ions and chloride ions have been studied theoretically. Theactivity coefficient of hydrogen ion has been measured experimentally using a combination glasspH electrode, even though such measurements are not perfectly rigid from the viewpoint of thermodynamics. The error in such measurements has been addressed with respect to the liquid junctionpotential.
The applied experiments embrace simple nickel electrodeposition under various conditions,the measurement of cathodic surface pH during nickel electrodeposition and the study of electrodekinetics using a rotating disc electrode. As to the electrodeposition tests, pure nickel instead of adimensionally stable anode (DSA) has been used as the anode in order to simplify the cell construction and test procedures. These experiments are selective and not extensive, considering thesuccessful industrial operating conditions and the work done by other investigators’°121. Themeasurement of cathode surface pH has been carried out using a self-designed apparatus mainly at25CC for electrolytes of major importance. An effort has been made to understand the change inthe cathode surface pH and to model it mathematically for the electrolytes with a simpler composition. In the study of electrode kinetics in the presence of concentration polarization, the rotatingdisc electrode is the electrode of choice, as a uniform and known diffusion layer near the workingelectrode surface can be established with satisfactory precision. The reaction orders of the rates ofnickel reduction and hydrogen evolution have been determined with respect to the three mostimportant electrolyte components, i.e., nickel ion activity, chloride ion activity and pH. In addition,a series of polarization curves has been constructed using the technique of linear potential sweepand attempts have been made to separate the combined polarization curves into partial polarizationcurves for some important electrolytes. Although not exactly the same as in nickel electrowinning,hydrogen evolution has been studied using a nickel-coated platinum substrate in sodium chloridesolution without nickel chloride.
The results of the above-mentioned studies should permit the establishment of some guidelinesfor choosing electrolyte compositions and operating conditions for nickel electrowinning fromchloride solutions. They should also assist in understanding the various phenomena involved in

Introduction 6
the physical chemistry of nickel chloride electrolytes and in the electrochemistry of cathode nickelreduction and hydrogen evolution. Finally they should provide directions for further studies andfor the improvement of current industrial operations.
Nickel matte chlorine leaching process 7
Chapter 1 Literature Review on Nickel Electrodeposition
1.1 Nickel matte chlorine leaching processThe nickel matte chlorine leaching process was developed and commercialized primariiy by
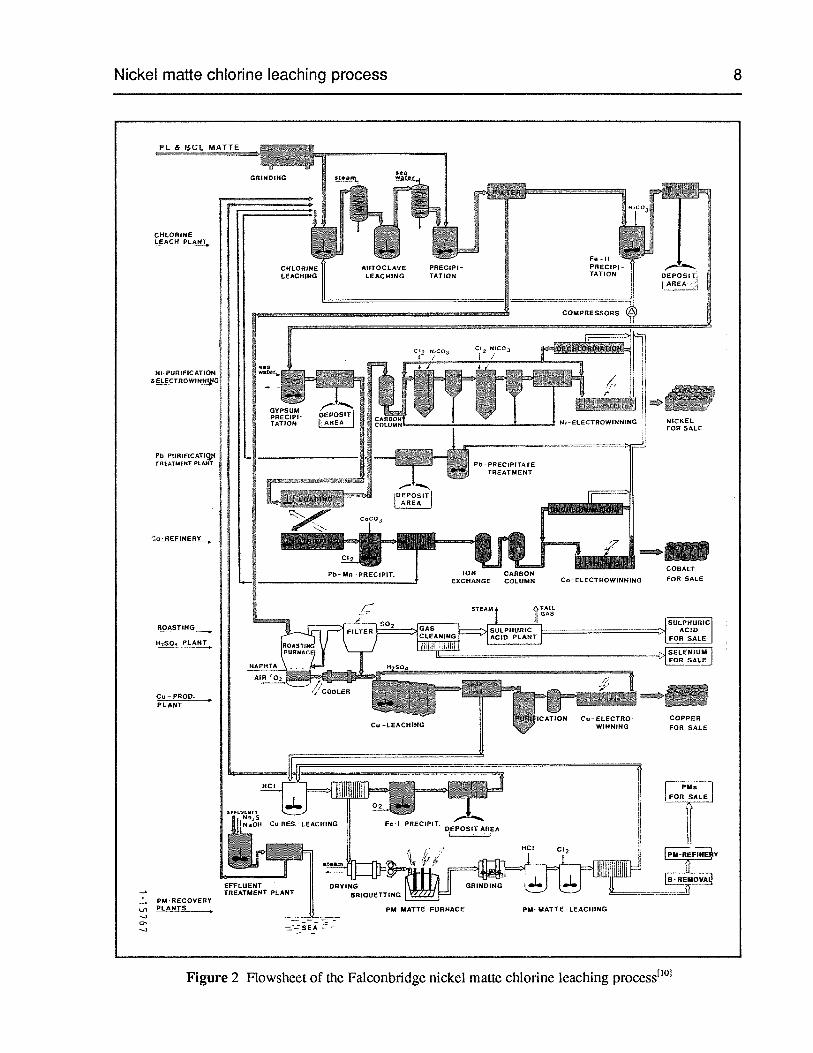
Falconbridge Ltd. in Norway10’‘. It was studied on a laboratory scale between 1966 and 1969,and was tested further on a pilot-scale between 1970 and 1972. Industrial scale chlorine leachingwas started in 1975 and by 1981 the changeover to the new chlorine process including the purificationstage was completed. However, improvements continued to be effected until 1987.
The nickel-copper matte, comprised mainly of Ni3S2,Cu2S and a Ni-Cu alloy with a ratio of7Ni: 3Cu contained 40-45 % Ni, 25-30 % Cu, 20-22 % S, 2-3 % Fe and 1.0-1.5 % Co. The leachingproceeded in two stages. In the first stage of leaching, the matte was leached in CuCI2in the presenceof Cl2 gas. The selective dissolution of nickel was made possible by controlling the redox potentialof the slurry at a predetermined value through an appropriate ratio of matte to chlorine. It was foundadvantageous to keep the liquid:solid ratio low enough in order to have a highly concentrated NiCl2solution and to make cuprous ions soluble in the leach slurry. The temperature was controlled ataround 110°C, the boiling point of the slurry at atmospheric pressure to take advantage of theagitation effect of boiling. The boiling temperature was also beneficial for concentrating the slurry,as each tonne of chlorine afided would produce one tonne of steam. The leaching was quite fastand the heat generated was adequate to maintain the slurry at the boil. The chlorine reacted almostcompletely during the leach. The sulfur contained in the matte was transformed mainly to elementalsulfur with less than 1 % oxidized to sulfate. The principal chemical reactions taking place duringthe leaching were:
2Cu(I) + Cl2 = 2Cu(II) + 2C1 (3)
Ni3S2 + 2Cu(II) = 2NiS + Ni(II) + 2Cu(I) (4)
NiS + 2Cu(II) Ni(II) + S + 2Cu(I) (5)
Cu2S+S=2CuS (6)
The solution resulting from the first stage leaching contained about 200 g/L Ni2 and 50-70 g/LCu2. The second stage leaching was aimed to precipitate Cu2 as CuS by adding fresh matte. Theredox potential was also controlled. The major chemical reactions were:
Ni3S2 + S + 2Cu(I) = 2NiS + Ni(II) + Cu2S (7)
Ni + S + 2Cu(I) = Ni(II) + Cu2S (8)
Cu2S+S=2CuS (9)
Nickel matte chlorine leaching process 8
CHLORINELEACH PLANT
Pb-PURIFICATIQ_NrALArMENt PLANT
NICKELFOR SALE
REFINERY
ROASTING
H5O PLANT
COBALT
FOR SALE
- PROD.PLANT
COPPERFOR SALE
- PM-RECOVERY,, PLANTS—30’
PM- MATTE -FURNACE PU- MATTE-LEACHING
Figure 2 Flowsheet of the Falconbridge nickel matte chlorine leaching process1101
Nickel matte chlorine leaching process 9
S + 2Cu(I) = Cu(II) + CuS (10)
To reduce the input of matte, the process was modified later on. Instead of adding more fresh matte,the slurry from the first stage of chlorine leaching was processed in an autoclave at 140-145°C. Atsuch a high temperature, the following two reactions would occur:
NiS + 2Cu(I) = Ni(II) + Cu2S (11)
Cu2S+S=2CuS (12)
The solution from the second-stage leach contained around 230 g/L Ni2 and 0.2 g/L Cu2. Theleach residue was filtered and washed. The filter cake, containing 15 % Ni and 50 % Cu, was thenroasted in a fluidized bed furnace to transform the sulfides to oxides. The calcine was subsequentlyleached selectively in the spent copper electrolyte (H2S04+ CuSO4)with a 90 % copper recoveryand resulting in a solution containing 95 g/LH2S04and 50 g/L Cu24.
The residue from the calcine leaching stage, containing 55 % Ni, 18 % Cu and all the PGMmetals, was subjected to dilute HC1 (20-30 g/L) leaching at 95°C. Most of the nickel and coppercould be leached Out and the dissolution of the PGM metals could be minimized by adding a smallamount of matte during leaching. The filtrate, after the removal of its iron via precipitation, waspumped to the first-stage chlorine leach. The resulting residue contained primarily PGM metals.
The purification process consisted of three stages, (1) precipitation of Fe and As, (2) solventextraction of Co and other minor elements, and (3) precipitation ofPb and the remaining impurities.In the first-stage of purification, the very concentrated pregnant solution from the chlorine leachstage was neutralized using NICO3under oxidizing conditions ofCl2gas to precipitate Fe as Fe(OH)3and As as arsenate. In the second-stage of purification, triisooctylarnine (TIOA) (15 vol. % in anaromatic solvent) was used as the extractant for cobalt removal, reducing the Co concentration from5 g/L to 1 mg/L. The resulting raffmate contained 230 g/L Ni24, <0.001 g/L Co2,0.15 g/L Pb24,0.15 g/L 4fl24 4 g/L HC1 and 0.01 g/L organic. The organic was then removed by passing thesolution through an activated carbon column.
To remove lead (Pb24) and manganese (hi2) the solution was diluted to about 85 g/L Ni24using the anolyte from the tankhouse. The Pb24 and Mn24 were removed as precipitates formed byusing NiCO3under the atmosphere ofCl2gas. After this stage ofpurification, the solution containedonly < 0.02 mg/L Pb24 and < 0.05 mg/L Mn2. The other trace impurities, Co, Fe, Cu and As, werealso further removed. The purified NiC12solution was then pumped to the electrowinning tankhouse.
Nickel matte chlorine leaching was also investigated separately by Société Le Nickel (SLN)at Le Havre-Sandouville in France112. SLN switched to the chlorine leaching of nickel matte followed by electrowinning from the chloride solution in 1980 after a tragic fire. The nickel matte,
Plant practice of nickel electrowinning 10
imported from SLN’s facility in Doniambo, New Caledonia, containing 75 % Ni and small amountsof S, Fe, Co and virtually no Cu, was leached in a ferric chloride solution in the presence of chlorinegas. The ferric chloride came from the iron removal stage. The resulting pregnant solution afterleaching contained NiC12 (200 g/L Ni2), CoC12 (5 g/L Co2), FeC!3 (10 g/L Fe) and elementalsulfur. After filtering the slurry to remove the residues, the solution went to the purification stagewhere ferric ions were separated by solvent extraction using iributyl phosphate (TBP) as theextractant. The FeCI3 recovered from scrubbing the ferric loaded organic phase with fresh waterwas recycled in part to the chlorine leach stage, and the rest was sold after being concentrated byevaporation. The removal of cobalt from the nickel chloride solution was achieved using TIOA
solvent extraction. The cobalt-free nickel chloride solution was subsequently subjected to selective
electrolysis to remove the small amount of lead and then passed through an activated carbon colunm
to remove any remaining impurities including trace organics. Finally, the purified nickel chloridesolution was pumped to the electrowinning tankhouse.
1.2 Plant practice of nickel electrowinning
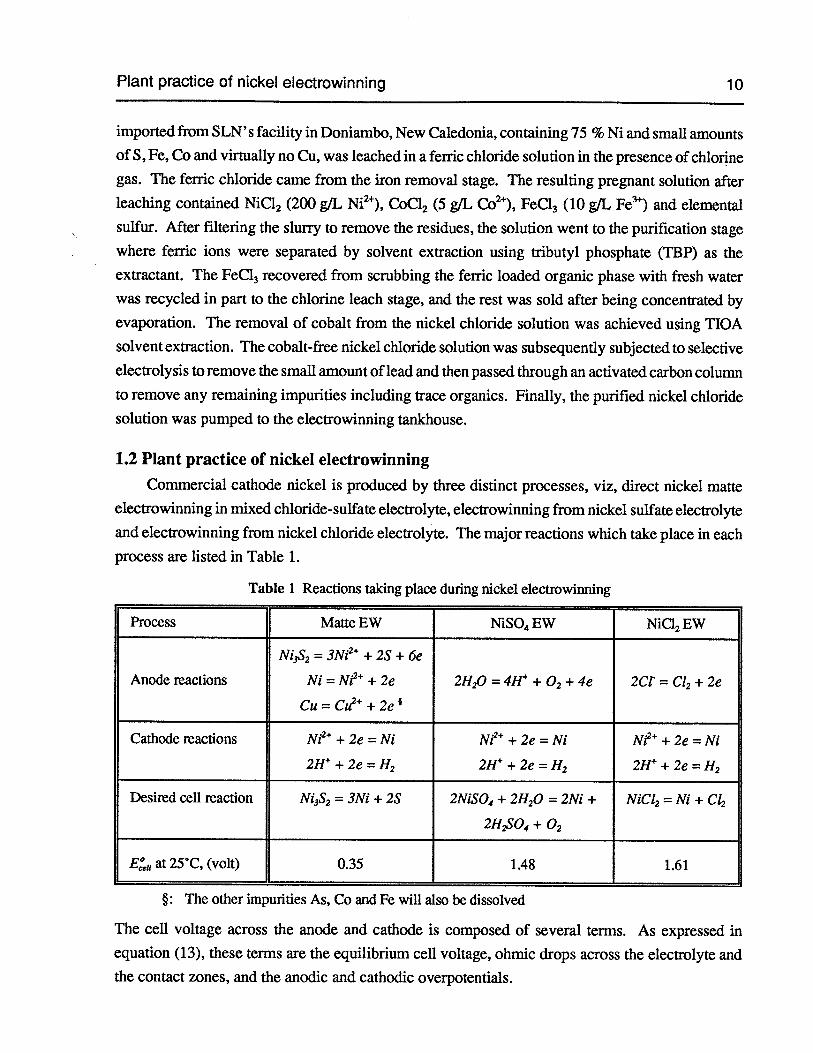
Commercial cathode nickel is produced by three distinct processes, viz, direct nickel matteelectrowinning in mixed chloride-sulfate electrolyte, electrowinning from nickel sulfate electrolyteand electrowinning from nickel chloride electrolyte. The major reactions which take place in eachprocess are listed in Table 1.
Table 1 Reactions taking place during nickel electrowinning
Process Matte EW NiSO4EW NiC12EW
Ni3S2 = 3Ni2 + 2S + 6e
Anode reactions Ni = Ni2 + 2e 2H/) = 4Lt + °2 + 4e 2Ct = Cl2 + 2e
Cu = Cu2 + 2e
Cathode reactions N? + 2e = Ni Ni2 + 2e = Ni Ni2 + 2e = Ni
2H+2e—H2 2H+2e=H2 2H4+2e=H2
Desired cell reaction Ni3S2 = 3Ni + 2S 2N1SO4+ 2H20 = 2N1 + N1CI2 = Ni + Cl2
2H2S04+ °2
E:eu at25°C, (volt) 0.35 1.48 1.61
: The other impurities As, Co and Fe will also be dissolved
The cell voltage across the anode and cathode is composed of several terms. As expressed in
equation (13), these terms are the equilibrium cell voltage, ohmic drops across the electrolyte andthe contact zones, and the anodic and cathodic overpotentials.
Plant practice of nickel electrowinning 11
,dE RT
Ece=Ece+ (T—298)+—ln ,..... (13)dl nF )reactart
As to the direct nickel matte electrowinning, the matte contains mostly Ni3S2and a significantamountofNi-Cu alloy. The impurity content especially copper in the matte should be low. However,2-3 % copper content was found to be beneficial as the resulting anode slime was porous and thusthe voltage drop across this slime was decreased. The electrolyte is basically a mixed chloride-sulfatein the presence of boric acid. Among the three processes listed in Table 1, the (absolute) equilibriumcell voltage is the smallest for direct matte electrowinning. However, there is large voltage dropacross the anode slime, and this voltage drop increases as the anode slime becomes thicker. Duringmatte electrowinning, a small percentage of the anodic current is wasted in dissolving someimpurities and in oxidizing sulfur and water to sulfate and oxygen gas. Thus more nickel is depositedon the cathode than is dissolved at the anode. As a result, it is necessary to replenish the electrolytecontinuously. This is done by leaching a portion of ground anode residue in an air-agitated reactor.The Ni3S2in the anode residue remains practically unleached21:
2N1 + 2H2S04+02= 2NiSO4+ 2H20 (14)
The major disadvantages with direct nickel matte electrowinning are the high-grade nickel matterequired, extensive handling ofmatte anodes and residual anodes, high residual anode, large voltagedrop across the voluminous sulfur anode slime, and extensive purification of impurities. Directnickel matte elecirowinning is currently in operation at INCO’s Thompson Nickel Refinery inManitoba, Canada16 , at Sumitomo’s Niihama Nickel Refinery in Japan17’91 and at the RefineryofJinchuan Non-Ferrous Metals Corp. in China°1.Their operating conditions are listed in Table 2.
Nickel electrowinning from pure nickel sulfate electrolyte is being practised at Outokumpu’s
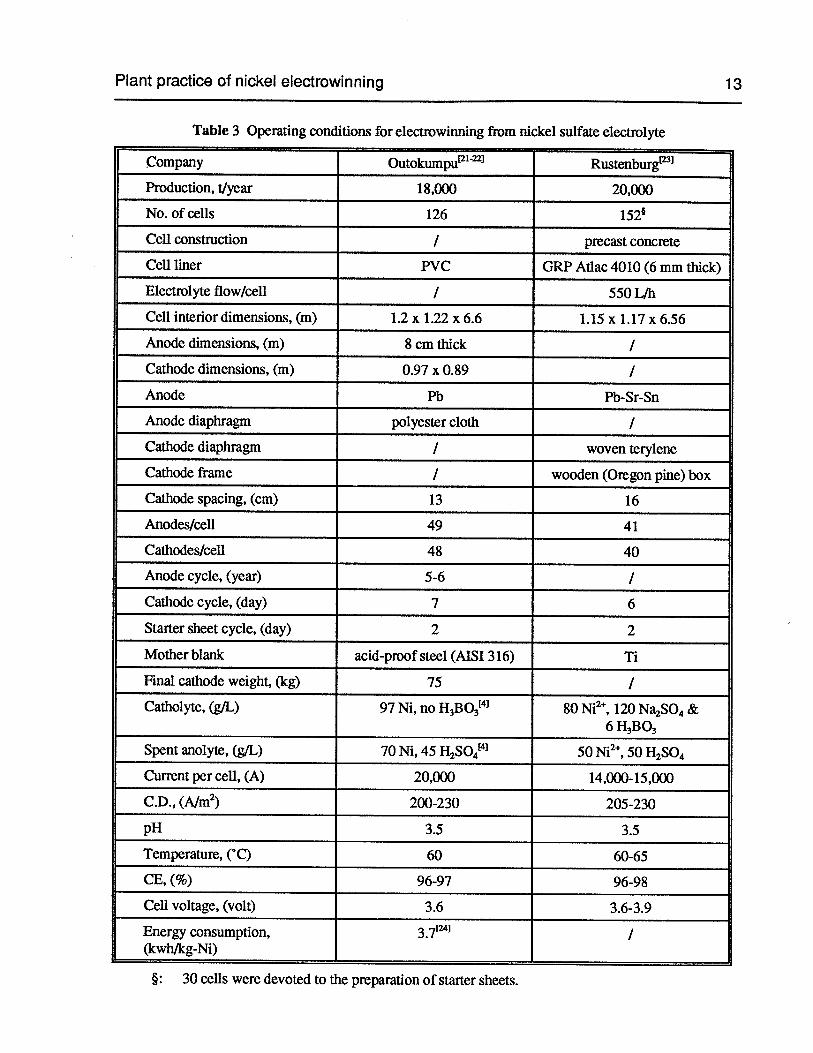
nickel refinery in Finland1211 and at Rustenburg Base Metals Refiners Ltd. in South Africa1.Their operating conditions are listed in Table 3. In nickel sulfate electrowinning, since an equivalent
amount of sulfuric acid is generated in the anode compartment, the anode compartment must beseparated from the cathode compartment. This is usually done by using a cloth diaphragm andcirculating electrolyte from the cathode compartments into the anode compartments. The acid richspent anolyte is recycled to the leach stage. The advantages of the sulfate electrolyte are theinsignificant corrosion and the inexpensive lead or lead alloy which serves as the anode.
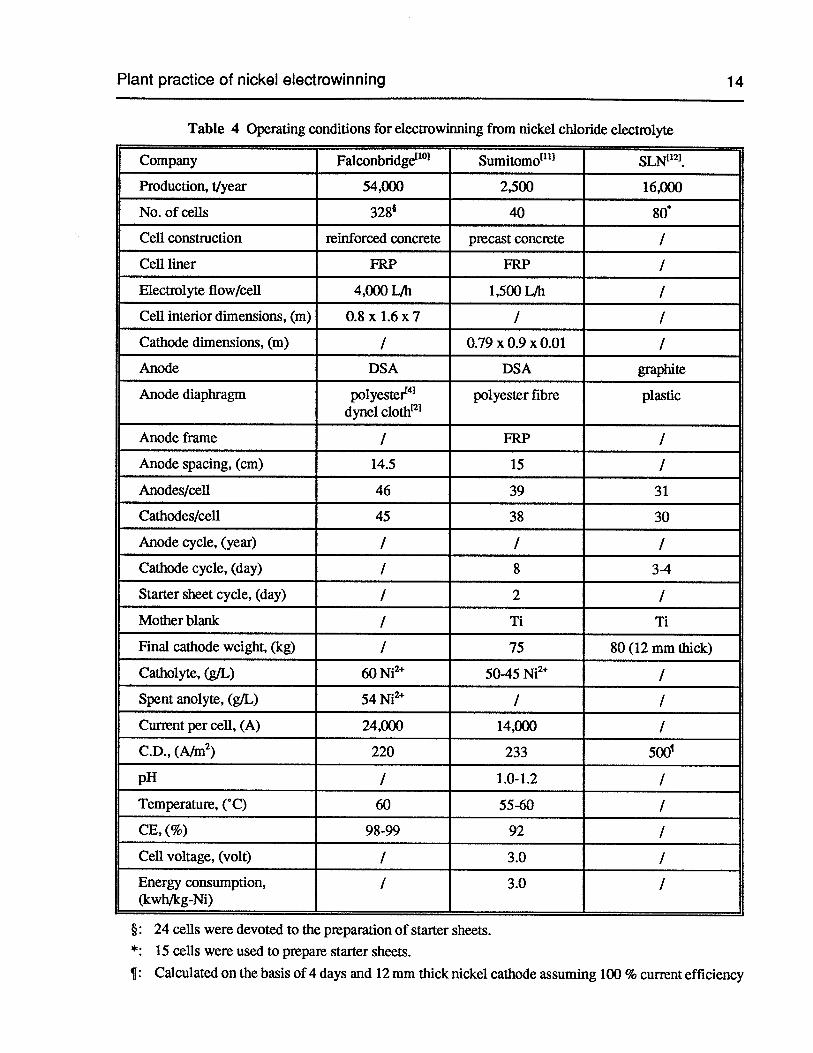
The most efficient nickel electrowinning is carried out in chloride electrolyte. The processwas developed and commercialized mainly by Falconbridge Ltd. in Norway. Falconbridge Nikkelverk A/S in Kristiansand-S in Norway101,Sumitomo Metal Mining (SMM) in Japan1’1andSociété Le Nickel (SLN) at Le Havre-Sandouville inFrance112 are using this process. Theiroperating
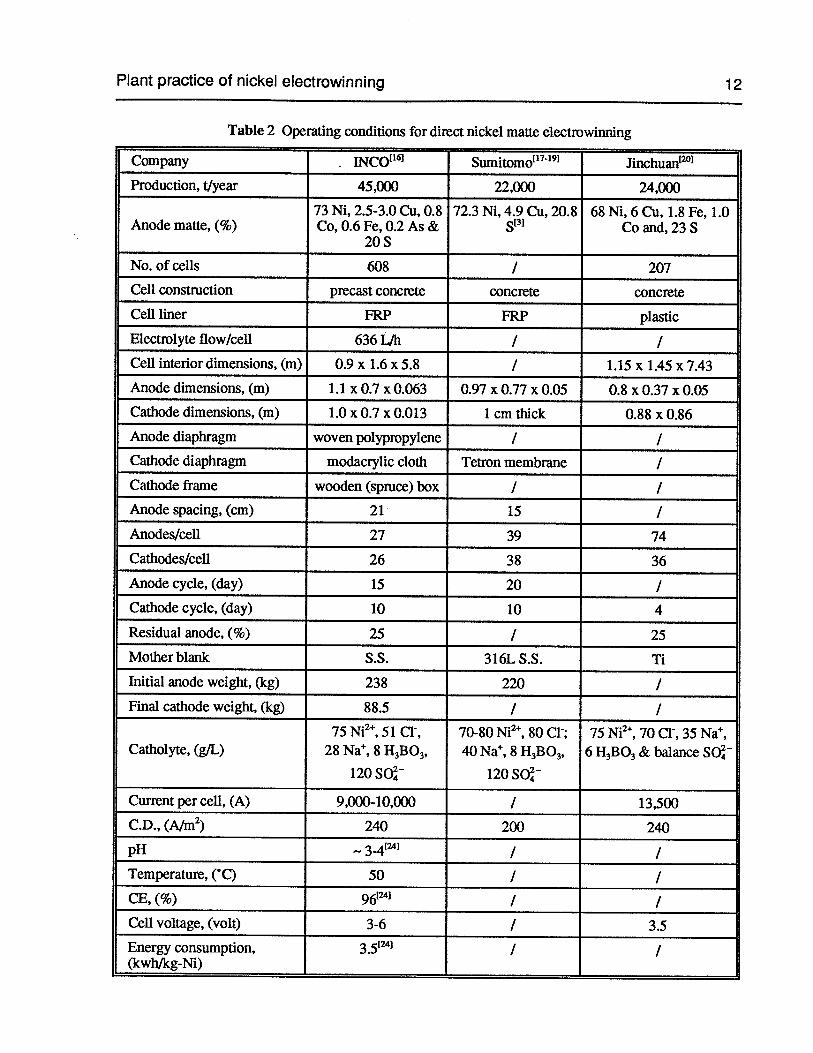
Plant practice of nickel electrowin fling 12
Table 2 Operating conditions for direct nickel matte electrowinning
Company INCO’61 Sumitomo’7’9 Jinchuan°
Production, tlyear 45,000 22,000 24,000
73 Ni, 2.5-3.0 Cu, 0.8 72.3 Ni, 4.9 Cu, 20.8 68 Ni, 6 Cu, 1.8 Fe, 1.0Anode matte, (%) Co, 0.6 Fe, 0.2 As & [31 Co and, 23 S
20 S
No. of cells 608 / 207
Cell construction precast concrete concrete concrete
Cell liner FRP FRP plastic
Electrolyte flow/cell 636 LJh / /Cell interior dimensions, (m) 0.9 x 1.6 x 5.8 / 1.15 x 1.45 x 7.43
Anode dimensions, (m) 1.1 x 0.7 x 0.063 0.97 x 0.77 x 0.05 0.8 x 0.37 x 0.05Cathode dimensions, (m) 1.0 x 0.7 x 0.013 1 cm thick 0.88 x 0.86
Anode diaphragm woven polypropylene / ICathode diaphragm modacrylic cloth Tetron membrane /
Cathode frame wooden (spruce) box / /Anode spacing, (cm) 21 15 /
Anodes/cell 27 39 74
Cathodes/cell 26 38 36
Anode cycle, (day) 15 20 /
Cathode cycle, (day) 10 10 4
Residual anode, (%) 25 / 25
Mother blank S.S. 316L S.S. Ti
Initial anode weight, (kg) 238 220 /
Final cathode weight, (kg) 88.5 / /
75 Ni2, 51 C1, 70-80 Ni2, 80 Cl; 75 Ni2, 70 Cl, 35 Nat,Catholyte, (g/L) 28 Na, 8 H3B03, 40 Na, 8 H3B03, 6 H3B03& balance SO
120 SO 120 SO
Current per cell, (A) 9,000-10,000 / 13,500
C.D., (A/rn2) 240 200 240
pH -.3-4 / /Temperature, (‘C) 50 / /CE, (%) 96 / /Cell voltage, (volt) 3-6 / 3.5Energy consumption, 351 / /(kwh/kg-Ni)
Plant practice of nickel electrowinning 13
Table 3 Operating conditions for electrowinning from nickel sulfate electrolyte
Company Outokumpu’21 Rustenburg
Production, 1/year 18,000 20,000
No. of cells 126 152
Cell construction I precast concrete
Cell liner PVC GRP Atlac 4010(6 mm thick)
Electrolyte flow/cell / 5501db
Cell interior dimensions, (m) 1.2 x 1.22 x 6.6 1.15 x 1.17 x 6.56
Anode dimensions, (m) 8 cm thick I
Cathode dimensions, (m) 0.97 x 0.89 /
Anode Pb Pb-Sr-Sn
Anode diaphragm polyester cloth /
Cathode diaphragm / woven terylene
Cathode frame / wooden (Oregon pine) box
Cathode spacing, (cm) 13 16
Anodes/cell 49 41
Cathodes/cell 48 40
Anode cycle, (year) 5-6 /
Cathode cycle, (day) 7 6
Starter sheet cycle, (day) 2 2
Mother blank acid-proof steel (AISI 316) Ti
Final cathode weight, (kg) 75 /
Catholyte, (gIL) 97 Ni, noH3BO341 80 Ni2, 120 Na2SO4&6H3B03
Spent anolyte, (gIL) 70 Ni, 45H2SO441 50 Ni2,50H2S04
Current per cell, (A) 20,000 14,000-15,000
C.D., (A/rn2) 200-230 205-230
pH 3.5 3.5
Temperature, (°C) 60 60-65
CE, (%) 96-97 96-98
Cell voltage, (volt) 3.6 3.6-3.9
Energy consumption, 3•71/
(kwh/kg-Ni)
§: 30 cells were devoted to the preparation of starter sheets.
Plant practice of nickel electrowinning 14
Table 4 Operating conditions for electrowinning from nickel chloride electrolyte
Company Falconbridge’°’ Sumitomo1111 SLN1121.
Production, i/year 54,000 2,500 16,000
No. of cells 3281 40 80’
Cell construction reinforced concrete precast concrete /
Cell liner FRP FRP /
Electrolyte flow/cell 4,000 LJh 1,500 LJh /
Cell interior dimensions, (m) 0.8 x 1.6 x 7 / /
Cathode dimensions, (m) / 0.79 x 0.9 x 0.01 IAnode DSA DSA graphite
Anode diaphragm polyester41 polyester fibre plasticdynel cloth12
Anode frame / FRP /
Anode spacing, (cm) 14.5 15 /
Anodes/cell 46 39 31
Cathodes/cell 45 38 30
Anode cycle, (year) / I /
Cathode cycle, (day) / 8 3-4
Starter sheet cycle, (day) / 2 I
Mother blank / Ti Ti
Final cathode weight, (kg) / 75 80(12 mm thick)
Catholyte, (gIL) 60 Ni2 50-45 Ni2 I
Spent anolyte, (gIL) 54 Ni2 / I
Current per cell, (A) 24,000 14,000 I
C.D.,(A/m2) 220 233 500’
pH / 1.0-1.2 /
Temperature, (‘C) 60 55-60 /
CE, (%) 98-99 92 /
Cell voltage, (volt) / 3.0 I
Energy consumption, / 3.0 /(kwh/kg-Ni)
§: 24 cells were devoted to the preparation of starter sheets.*: 15 cells were used to prepare starter sheets.
¶: Calculated on the basis of 4 days and 12mm thick nickel cathode assuming 100 % current efficiency
Nickel electrodeposition in chloride and chloride-sulfate electrolytes 15
conditions are listed in Table 4. The dimensionally stable anode (DSA) used in nickel chlorideelectrowinning is chemically inert, stable in dimensions and has a long life expectancy. The useof DSA avoids the extensive anode and scrap handling encountered in direct matte electrowinning
and also prevents the contamination of the anode scale experienced in nickel sulfate electrowinning.
The chlorine gas evolved on the anode is collected completely and recycled to the leach stage. The
cathode nickel, after being washed, is heated at 700°C to reduce the hydrogen content to less than5 ppm12’. The purity of the cathode nickel can reach as high as 99.97 % Ni’.
1.3 Nickel electrodeposition in chloride and chloride-sulfate electrolytes
As early as 1977, Falconbridge conducted extensive experiments on nickel electrowinning
from pure nickel chloride electrolytes on a pilot scale1. The two cells used were actually of
industhalsize,viz,0.8 x 1.6 x 7 m3. Thecathodehadthedimensions 1.14 x 0.63m2andthegraphite
anode had the dimensions 1.3 x 0.62 x 0.06 m3. The distance between the two anodes was 18.9 cm.
The number of cathodes was 31 in one cell and 26 in the other cell. The maximum conductivity of
electrolyte was found at a nickel concentration of around 130 g/L Ni2 at temperatures 40, 60 and80°C. The test conditions were 130 g/L Ni2, 60-65°C, pH —l and 200-250 A/m2with a currentefficiency of 97-98 %. Sodium chloride and boric acid were not added to the electrolyte as no
beneficial effects were found with their additions. At pH 1, the cathode deposit obtained had a very
good quality from the viewpoint of purity and surface appearance. The results obtained at pH 1
were even better than at pH 2 in that the occasional pitting on the cathode surface could be avoided.
The current density was found to have the potential to be raised further, as good quality nickel
cathode could still be attained at current density up to 400-500 A/m2. The restricting factor in the
use ofa high current density was found to be the overheating at the cathode contacts. The impurities
Pb, Fe, Cu, Co. Mn, As and Zn were also studied. Lead was found to deposit completely with
nickel, accounting for 3 ppm in the cathode when the electrolyte contained 0.4 mg/L Pb2. The lead
content of the cathode was almost the same as in the electrolyte 0.4 x iO /130 x 106 3 ppm. As
for iron, its content in the cathode was somehow higher than that in the electrolyte, 87 ppm versus
5 mg/L, as 5 x iO / 130 x 106 38 ppm. Although it was not found that iron had any adverse
effect on the cathode nickel, the cathode surface pitting observed at pH2 might be associated with
the iron in the electrolyte. The presence of copper had a deleterious effect on the cathode nickel.Due to its higher electrode potential, copper would probably be deposited at the limiting rate andcause harmful dendrite formation on the cathode. When the electrolyte contained less than 1 mg/LCu2, dendrites did not form. However, the cathode nickel contained 27 ppm Cu. The tolerableconcentrations of other impurities were 1-4 mg/L Co2,<2 mgfL Mn2and <2 mg/L Zn2.
Gong et al1 recently investigated the electrowinning of nickel from nickel chloride electrolytes. The cathode was a pure nickel sheet, the anode was a platinum foil or Mn02-coated titanium
Nickel electrodeposition in chloride and chloride-sulfate electrolytes 16
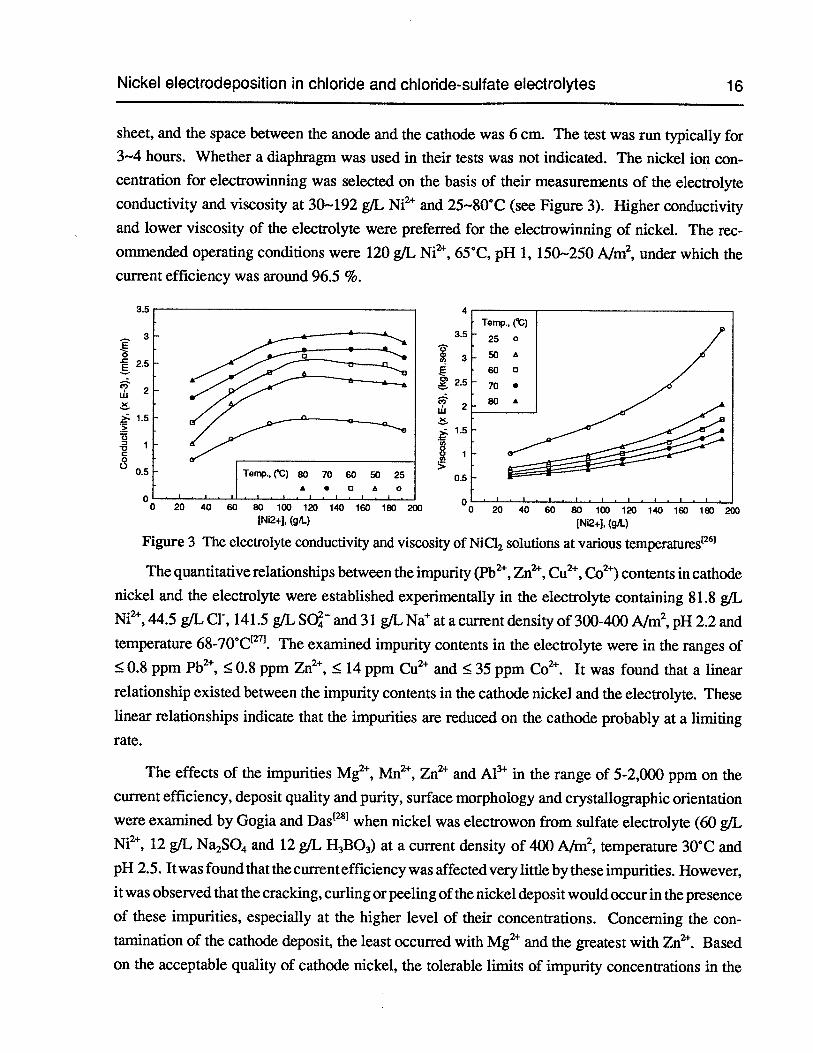
sheet, and the space between the anode and the cathode was 6 cm. The test was run typically for3—4 hours. Whether a diaphragm was used in their tests was not indicated. The nickel ion concentration for electrowinning was selected on the basis of their measurements of the electrolyteconductivity and viscosity at 30—192 g/L Ni2 and 25—80°C (see Figure 3). Higher conductivityand lower viscosity of the electrolyte were preferred for the electrowinning of nickel. The recommended operating conditions were 120 g/L Ni2, 65°C, pH 1, 150—250 A/rn2, under which thecurrent efficiency was around 96.5 %.
3.5 4
—. 3 3.5Eo 53
w 2
1.5
C.) —0C 18
0.50.5
0 0I I I I I
0 20406080100120140160180200 0 20406080100120140160160200[N12+J, (gil.) LNI2+1, (gil.)
Figure 3 The electrolyte conductivity and viscosity of NiC12 solutions at various temperatures
The quantitative relationships between the impurity (Pb2,Zn2,2+ (2+) contents in cathodenickel and the electrolyte were established experimentally in the electrolyte containing 81.8 g/LNi2,44.5 g/L Ct, 141.5 g/L SO and 31 gIL Na at a current density of 300-400 A/rn2,pH 2.2 andtemperature 68-70°C. The examined impurity contents in the electrolyte were in the ranges of
0.8 ppm Pb2, 0.8 ppm Zn2, 14 ppm Cu2 and 35 ppm Co2. It was found that a linearrelationship existed between the impurity contents in the cathode nickel and the electrolyte. Theselinear relationships indicate that the impurities are reduced on the cathode probably at a limitingrate.
The effects of the impurities Mg2,Mn2,Zn2 and Al in the range of 5-2,000 ppm on thecurrent efficiency, deposit quality and purity, surface morphology and crystallographic orientationwere examined by Gogia and Das when nickel was electrowon from sulfate electrolyte (60 gILNi2, 12 g/L Na2SO4and 12 g/L H3B03)at a current density of 400 Nm2, temperature 30°C andpH 2.5. It was found that the current efficiency was affectedvery little by these impurities. However,it was observed that the cracking, curling or peeling of the nickel deposit would occur in the presenceof these impurities, especially at the higher level of their concentrations. Concerning the contamination of the cathode deposit, the least occurred with Mg2 and the greatest with Zn2. Basedon the acceptable quality of cathode nickel, the tolerable limits of impurity concentrations in the
Temp., (t)
25 0
50 A
60 0
70 •
80*
Temp., (°C) 80 70 60 50 25A • C A 0
Nickel electrodeposition in chloride and chloride-sulfate electrolytes 17
electrolyte were 500 ppm Mg2, 250 ppm Mn2, 100 ppm Zn2and 5 ppm Al. The reasonsbehind the effects of these impurities were not stated clearly by Gogia and Das. It is believed thatthe effects of these impurities may not be purely electrochemical in nature, as their equilibrium
potentials are all well below that of nickel. As regards zinc, it may be deposited with nickel at apotential much more positive than the Zn2/Zn equilibrium potential, due to the so-called under-
potential deposition phenomenon’291.Underpotential deposition is mainly due to the formation of
a solid solution of Zn-Ni. Therefore, the activity of zinc in the metallic (cathode) phase is greatly
reduced and the electrode potential ofZn27Zn is shifted in the positive direction.
The purpose of nickel electrodeposition is to obtain a coherent and compact cathode depositin most cases. However, nickel powder can also be produced via electrodeposition. Ostanina et
a1t301 studied the production of nickel powder from a mixed nickel chloride-sulfate electrolyte
containing 47.8-57.4 g/L NiSO4•7H20,200 g/L NaCl and 50 g/L NRC1 at pH 4.5-4.8 at a tem
perature of 50°C. In order to maintain a large portion of fine particles, the (nominal) current density
was increased linearly during electrolysis to account for the increase in the actual cathode area. The
current density was increased linearly at a rate of 600-10,000 A/m2hfrom the initial limiting c.d.up to 2,200-10,000 A/m2. When the current density reached the predetermined maximum, thepowder on the cathode was shaken off. Then the electrolysis was continued again in the same cycle.
This technique gave not only a uniform nickel powder but also a lower energy consumption. On
the basis of the experimental results, mathematical models of the mean size of the powder and the
current efficiency were developed as functions of the rate of current density increase, the maximum
c.d. and the time interval of powder removal.
A new technique was developed by Teschke and Galembeck311to produce large nickel particlesfrom an electrolyte containing 300 g/LNiSO4•6H2O,45 g/L NiC12•6H20and 30 g/LH3B03at 30°Con a PTFE-covered nickel cathode. The typical pinhole diameters on the PTFE film were around
5 im. The electrons could transfer only through the paths of pinholes, cracks and protrusions inthe PTFE layer. Due to a very small fraction of active cathode area, an apparent current density of100 AJm2 resulted in a very negative cathode potential of -2 volts vs. SCE. The nickel particleshad the following characteristics: (1) The particles had little direct contact with the substrate metal.
A slight disturbance of the electrolyte would make them fall off. (2) The particles were approximately hemispherical in shape. (3) The bases of the particles were parallel to the PTFE layer. The
problem with Teschke and Galembeck’s method lies in the fact that it is quite difficult to controlthe real active cathode area.
Philip and Nicol32conducted a limited number of tests on nickel electrodeposition from purenickel chloride solutions. The highest current efficiency they obtained was 94.3 % under theconditions of 1 M NiC12,0.1 M HC1, 53°C and 225 A/rn2in an electrolysis of 6-hours duration. The
Nickel electrodeposition in chloride and chloride-sulfate electrolytes 18
authors believed that chloride ions play a catalytic role in the nickel cathodic reduction, reducingthe overpotential of nickel deposition and thus resulting in little or no simultaneous hydrogenevolution. The process, without the need of a pH buffer, was also relatively insensitive to the pHfluctuations in the feed solution and less demanding in the requirements for diaphragm materials.
The impurities, Fe2, Zn2 and 2+ were also investigated in the electrolyte of 1 M NiCl2, 2 M
NaCl and 0.01 M HC1. It was found that for ferrous ion, its effect was negligible when its concentration was between i03 and 10.2 M. However, when its concentration reached i0’ M, it was
reduced as well with nickel, accounting for 13 % of iron in the cathode deposit at 250 A/m2 and
20 % at 1,200 A/rn2,compared with 60 % and 52 % at 250 and 1,200 A/rn2respectively in the sulfate
electrolyte. While for zinc, 25 % Zn was found in the cathode nickel deposit at 600 A/rn2when the
electrolyte contained 10.1 M Zn2,compared with 42 % in the sulfate electrolyte.
It was pointed out by Finkelstein et a133 that a high cathode current efficiency and a satisfactory
nickel deposit should be obtained from chloride media. For the optimization ofthe current efficiencyand improvement in the nature of the deposits, the following conditions should be met: higher
concentrations of nickel and chloride ions, higher temperature and 0.01 M acid. They found thatvigorous agitation was advantageous since it reduced the problems associated with the mass transfer.
Fujimori etal1 stated that one disadvantage of the all chloride electrolyte was the high internal
stress of the nickel deposit. The presence of sulfate in the electrolyte would decrease the magnitude
of this stress. The causes of the internal stress were not indicated. The high stress would increase
the tendency for short circuits, leading to an inefficient operation. The deposit stress was found torise with increasing chloride concentration. Therefore, although high chloride concentration lowers
the cell voltage due to the increase in the electrolyte conductivity, a compromised chloride concentration must be chosen. They found that the deposit stress became less severe as the temperature
and pH rose. The development of the stress inside the deposit may be attributed to the interaction
of atomic hydrogen with the nickel cathode and the adsorption followed by dissolution of hydrogeninto the body of the cathode. This is in keeping with Fujimori et al’s” observation that the stresscould be increased by lowering the temperature and pH. The specific adsorption of chloride ions
on the cathode surface and the occlusion of electrolyte might also be responsible for the internal
stress inside the cathode deposit.
The electrowinning of nickel from nickel chloride electrolytes was also investigated in athree-compartment diaphragm cell1. The cathode reaction was the reduction of nickel ions,
whereas the anodic reaction was the decomposition of water with oxygen evolution. The purpose
ofelectrolysis was to produce hydrochloric acid in the centre compartment. The cathode diaphragm,made from woven terelyne, was used to control the pH of the catholyte (NiC12). Without a cathodediaphragm, the pH of the catholyte would become low enough so as to result in a deteriorating
Nickel electrodeposition in chloride and chloride-sulfate electrolytes 19
current efficiency for nickel deposition. The anode diaphragm, made from a porous ceramicmembrane, was more critical and was employed to prevent chlorine evolution on the anode. Theleakage of chloride ions into the anode compartment was found to be around 0.4 % according tothe amount of acid generated. The anolyte was a 34 % H2S04solution. The catholyte contained50-74 gIL Ni2 (as NiCl2)at 55°C, pH 2,200 A/m2 and 2.9 volts. The current efficiency of nickelwas over 97 % even when the nickel ion was stripped down to 55 g/L. The overflow electrolytefrom the centre compartment contained around 30 g/L HQ and 1.5 g/LH2S04.This process seemsto be successful technically; however, it may not be economically viable. The demanding propertiesof the anode and cathode diaphragms and the difficulty in controlling the appropriate flow rates ofthe feeds (NiCl2 andH20) are likely to discourage would-be users.
An interesting work was carried out by Sabot et al3 on nickel electrorefining in 5 M Cad2electrolyte at 98°C. Calcium chloride was believed to provide the best electrolyte system for nickelelectrorefming considering its electrochemical properties and price. The conductivity of theelectrolyte increased with temperature. However, interestingly the conductivity of the electrolytedid not increase continuously with CaC12concentration. The maximum conductivity was found ata CaC12concentration around 2.5-3 M. The reason for choosing 5 M CaCl2,which was not optimumas regards the conductivity of the electrolyte, was based mainly on the electrochemical reversibilityof the nickel electrode Ni2fNi. The purification of 5 M CaC12 could be achieved by anionic ionexchange or by TBP solvent extraction. Ferronickel, which contained 94.4 % Ni and the rest Fe,
Co and Cu, was tested and a cathode product with 99.7 % Ni was obtained after electrorefming in
5 M CaC12+ 0.5 M NiCl2. The current efficiency, pH of the electrolyte and the effect of pH on thecurrent efficiency are not disclosed.
One important method which has been used widely in nickel electroplating to improve theplating quality is to use periodic reverse current (PRC)1. Although the current efficiency inelectroplating is not as serious a concern as in electrowinning, the benefits achieved sometimesoutweigh the cost due to the loss ofcurrent efficiency. The example given by Teschke and Soaresis the electroplating of nickel in an electrolyte containing 300 g/L NiSO46H2O,45 g/LNiCl26H2O,30 g/LH3B03at 80°C. The PRC parameters studied were the ratios of current amplitudes and pulsewidths in each cycle of deposition and dissolution. Using the PRC technique, not only can thecurrent density be raised, but also the growth morphology can actually be controlled by changingthe periods and amplitudes of each cycle.
Boric acid is widely used in nickel electrowinning and electrorefming. The purpose of usingboric acid, besides improving the cathode quality, is to control and stabilize the electrolyte pH nearthe cathode surface. However, the interpretation of the function of boric acid is quite controversial,mainly between two opinions whether it is a buffer or a surface catalyst. In a dilute solution of
Kinetics and mechanism of nickel electrodeposition 20
boric acid, the buffering point pH is around In the presence of nickel ions, does the bufferingpoint pH remain the same? Using the pH titration technique, Tilak and co-workers38investigated
the behavior of boric acid in an electrolyte ofNiSO4-Na2SO4-NaC1at 55°C. Two series of titrationswere carried out, one on the effect ofboric acid concentration (0.1-0.5 M) in 0.97 M NiSO4- 0.33 M
Na2SO4- 1.33 M NaCI and the other on the effect of nickel sulfate (0.1-0.5 M) in 0.3 MH3B03-
0.33 MNa2SO4- 1.33 M NaC1. They found that the buffering capacity of the electrolyte increased
both with increasing concentrations of boric acid and NiSO4. To account for this fact, a weak
complex of nickel with boric acid was assumed to exist. Their thermodynamic calculations and
mass balance were based on the following four reactions (15)-(18):
K1 (15)H3B03= H+H2BO
K2 (16)Ni2+2H2BO = Ni(H2B03)2
K4 (17)Ni2+SO = NISO4
K5 (18)Ni2+H2O = NiOH+H
The equilibrium constant for the reaction (19) was calculated to be log K = -12.2 — -11.1.
K (19)Ni2+2H3BO3= Ni(H2BO3)2+2H
Although the complex of nickel with boric acid is likely to exist, the accuracy of the authors’
calculations is questionable. Besides the question of the reliability of the equilibrium constants
used in the calculations, Tilak et al did not consider the nickel chloro complex and the formation
of bisulfate. As for bisulfate, however, such an omission may create only a marginal difference as
the initial pH’s for their pH titrations were around 3.5. Hoar&391 believed that the nickel-boric acid
complex could be reduced much more favorably.
1.4 Kinetics and mechanism of nickel electrodeposition
Most of the mechanisms proposed so far are related to nickel electrodeposition from the Watts
bath (NiSO4-NiC12-H3B03)which was developed for nickel refining and especially for nickel
electroplating. The addition of chloride is to promote the dissolution of the nickel anode. It is
normally believed that the nickel ion is reduced in two consecutive one-electron charge transfer
steps. Two linear regions are observed on the Tafel plot (Figure 4). Considerable controversy
exists regarding the mechanism and the rate-determining step in the electroreduction of nickel ion.
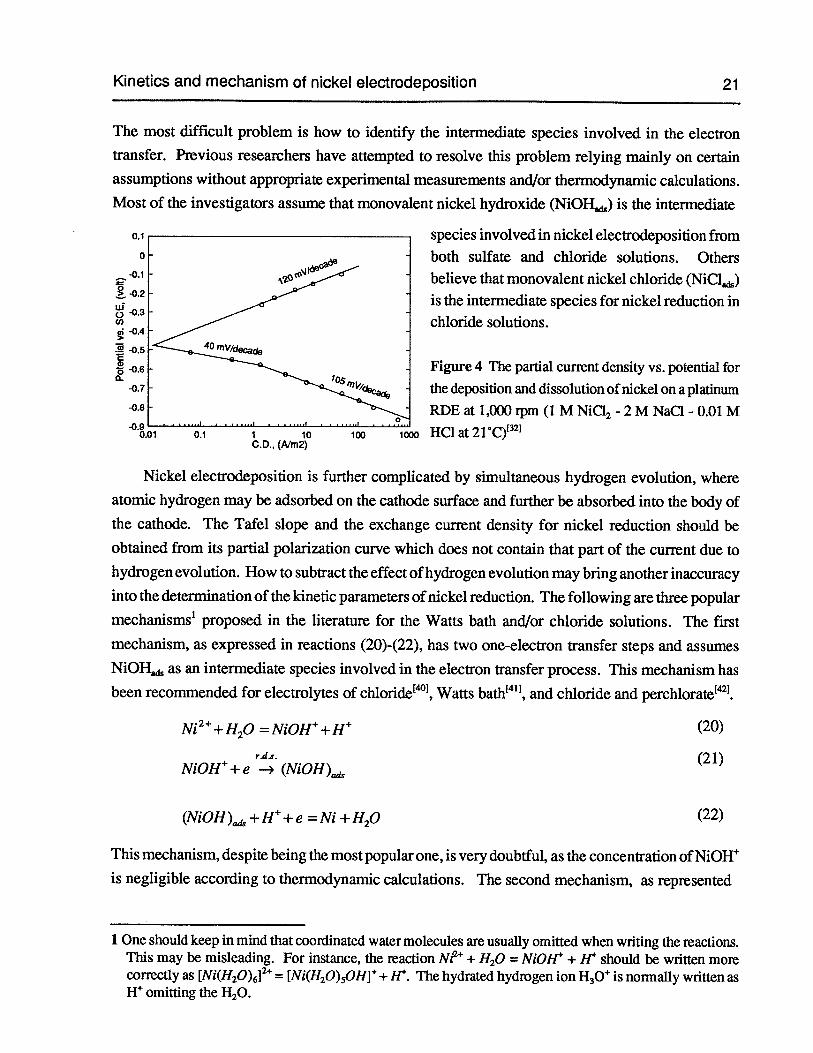
Kinetics and mechanism of nickel electrodeposition 21
The most difficult problem is how to identify the intermediate species involved in the electrontransfer. Previous researchers have attempted to resolve this problem relying mainly on certainassumptions without appropriate experimental measurements and/or thermodynamic calculations.Most of the investigators assume that monovalent nickel hydroxide (NiOH.) is the intermediate
0.1 species involved in nickel electrodeposition from0 both sulfate and chloride solutions. Others
-0.1 believe that monovalent nickel chloride (NiC1)- ° is the intermediate species for nickel reduction ino -0.3
chloride solutions.-OA
: 0.5
-0.6 Figure 4 The partial current density vs. potential for-0.7 the deposition and dissolution ofnickel on a platinum-0.8 RDE at 1,000 rpm (1 M NiCI2 -2 M NaC1 - 0.01 M-0.9 woo HCI at 2lC)321
Nickel electrodeposition is further complicated by simultaneous hydrogen evolution, where
atomic hydrogen may be adsorbed on the cathode surface and further be absorbed into the body of
the cathode. The Tafel slope and the exchange current density for nickel reduction should beobtained from its partial polarization curve which does not contain that part of the current due tohydrogen evolution. How to subtract the effect ofhydrogen evolution may bring another inaccuracyinto the determination of the kinetic parameters ofnickel reduction. The following are three popular
mechanisms’ proposed in the literature for the Watts bath and/or chloride solutions. The first
mechanism, as expressed in reactions (20)-(22), has two one-electron transfer steps and assumes
NiOH as an intermediate species involved in the electron transfer process. This mechanism has
been recommended for electrolytes of chloride°1,Watts bath411,and chloride and perchlorate42.
Ni2+H2O—NiOH+H (20)
r4.. (21)NiOH+e -* (NiOH)
(NiOH)+H+e =Ni+H20 (22)
This mechanism, despite being the most popular one, is very doubtful, as the concentration ofNiOHis negligible according to thermodynamic calculations. The second mechanism, as represented
1 One should keep in mind that coordinated water molecules are usually omitted when writing the reactions.This may be misleading. For instance, the reaction N? + 1120 = Ni0H + H should be written morecorrectly as [Ni(H20)6]2 [Ni(H20)5OH]+ J[4.• The hydrated hydrogen ionH3O is nomially written as1i omitting the H20.
0.1 1 10 100C.D., (A/m2)
Kinetics and mechanism of nickel electrodeposition 22
in reactions (23)-(25), also has two one-electron transfer steps; however, it assumes NiCl as anintermediate species associated with the electron transfer during nickel ion reduction. Thismechanism has been proposed for chloride electrolytes(3Z3343j and the Watts bath. The rate-
determining step may shift with the magnitude of the overpotential.
Ni2+C1 =NiCl (23)
r4.. (24)NiCl+e —* (NiCl)
at highzT
r4s. (25)(NiCl) + e -, Ni + cr
at Iowufl
The third mechanism, as described in reactions (26)-(27), seems to be the simplest one, involving
neither the nickel hydroxy complex nor the nickel chloro complex. This mechanism is the most
likely one when considered together with the results of the present investigation.
r4. (26.2+Ni + e —* Nz
Ni+e=Ni (27)
The third mechanism was proposed by Ovari and Rotinyant451 based on their studies on the cathodic
reduction of nickel ions in pure nickel chloride electrolyte at 55°C, and by Ragauskas and Leuk
sminas1 in view of their test results obtained in the electrolyte 3 M KC1 + 0.1—0.6 M NiC12 at
25°C. The kinetic equation for the third mechanism can be expressed ast451:
.2 (ctFE”I (28)1Ni = 2Fk [Ni ] exp—
RT 3where x is approximately equal to 0.5. Equation (28) was also found to be true by Vilche and
Arvia471 for expressing the kinetic rate of nickel reduction in the electrolyte of 1 M NiC12+ HC1 +
NaC1 at temperatures 25-75°C. The chloride ion was found not to be involved in the electrode
reactions. The slight increase in the electrode reaction rate resulting from the addition of NaC1 was
attributed entirely to the enhanced activity of the nickel ion. Ovari and Rotinyant451 defended their
mechanism expressed in reactions (26)-(27) using theirother supportive results on the measurements
of the exchange current density, corrosion potential and corrosion current.
=k0[Ni]’ (29)
= k (30)corr. corr.I- -I
RT 0.0591 (31)= Const. +
(1+ aNI +1112)F1’HConst.
— 2at 25°C
Kinetics and mechanism of nickel electrodeposition 23
Vilche and Arviat471 derived similar equations for the corrosion potential and current at 25°C.
RT (kC,R2[Hi 0.059 0.059= (1+ aM + 0.5)F lfllL k4,N, J 2
loIj — 2
pH (32)
( F F(l+aNJF 1 (33)=k11[Hj exp—E01,.)= kN exPIL RT
Ecori.]
The electrochemical impedance technique was found to be useful in identifying the existence
of intermediate species involved in nickel reduction451.It seems certain from these studies that
the monovalent nickel aciion is involved; however, it is still very difficult to distinguish between
Ni, NiOH and NiCl.
Wruck°1,using the rotating disc electrode technique, studied the effect of electrolyte com
position, temperature and rotational speed on the current efficiency of nickel electroreduction under
the conditions of 0.16-0.5 M NiCl2plus 2 M NaCl at pH 1.2-2.4, temperature 25,40 and 60°C, and
RPM 600, 1,600 and 3,000. Some of his findings are consistent with the results of the present
research. For instance, Wruck found that the current efficiency of nickel increased with pH, tem
perature and overpotential but decreased with increasing mass transfer rate. He also observed that
the sharp drop in current density would occur when the potential became sufficiently negative. This
phenomenon was called cathodic passivation. It was believed that the cathodic passivation was
caused by the formation of insoluble nickel hydroxide on the cathode surface due to the hydrogen
evolution reaching a limiting condition. Wruck’s contributions to understanding nickel deposition
are outstanding. However, his modelling and related calculations are subject to question. Based
on the reactions (34)-(36):
fast (34)Ni2+H20 = NiOH + H
rds (35)NiOH+e -* (NiOH)
fast (36)(NiOH)+H+e = Ni+H20
Wruck derived, without providing any details, the following equation (37) for the rate of nickel ion
reduction:
Ni =i1[NiOH [H4]{exP[(2 —a)F
T1NI] — exP(_c-nNi)}(37)
For the rate of hydrogen evolution, he derived the equation (38):
Kinetics and mechanism of nickel electrodeposition 24
.0 1 r(1—a)F 1 ( czF ‘ii (38)1112 =t112[’fl
RT 1lH2j— exPL%_nH2)1
The concentrations of nickel and hydrogen ions in equations (37) and (38) are those at the electrode
surface. The problem in deriving equations (37) and (38) is that Wruck confused the overpotential
with the electrode potential. Furthermore, he studied neither of the effects of acid and chloride
concentrations, and in his calculations, only Ni2 and NiOW were considered for the nickel species.
Consequently, the validity of equations (37) and (38) is suspect. Platinum was used as the anode;
however, how the contamination by chlorine gas was eliminated is not indicated. Whether the
ohmic drop between the working and reference electrodes was compensated or not is not mentioned
either. Anotherquestion concerns the omission ofthe nickel chioro complex NiCP in the equilibrium
calculations.
A work somewhat similar to one of Wruck’s studies was carried out by Hurlen521. Using a
stationary nickel wire as cathode, he studied the kinetics ofnickel reduction at 25CC in the electrolyte
0.03—4 m NiC12 + 0—7 m CaC12. He found that the Tafel slope was equal to 21 mV/decade at the
lower overpotential and 118 mV/decade at the higher overpotential. Based on his thermodynamic
and kinetics studies, he believed that the reduction of nickel ion proceeds by a two-step mechanism
with Ni(I) as the intermediate species. The first electron transfer step, Ni(ll) —* Ni(I), involves two
parallel reactions and is independent of kink sites on the cathode surface:
Ni(H2O)+e =Ni(H20) (39)
NiC1(H20) + e = NiC1(2o) (40)
Reaction (39) was dominant at low and moderate chloride activity and high water activity, while
reaction (40) predominated at high chloride activity and low water activity. The second electron
transfer step, Ni(I) — Ni, occurred directly on the kink sites. Chloride ion was found not to be
involved in this second electron transfer. However, Hurlen could not confirm the existence of Ni(I)
using the rotating ring-disc electrode technique. Nevertheless, he argued that Ni(I) species was
soluble in the electrolyte and its life was too short or its concentration was too low to be detected
on the ring. The problem with Hurlen’s studies is mainly the lack of the investigation of the effect
of the mass transfer rate on the nickel reduction. In addition, his belief that Ni(I) is soluble may be
incorrect.
The rest potential of nickel in a solution containing 2 M NaC1 or 2 M NaC1O4was found to be
not equal to either the potential of HfH2orNi2/Ni; however, it was dependent on the pH and the
anion in the electrolyte42.It was also discovered that at low pH the initial portion of the cathodic
Tafel plot was related mainly to the hydrogen evolution, whereas at higher pH and higher currentdensity the hydrogen evolution and nickel reduction occurred simultaneously. However, the method
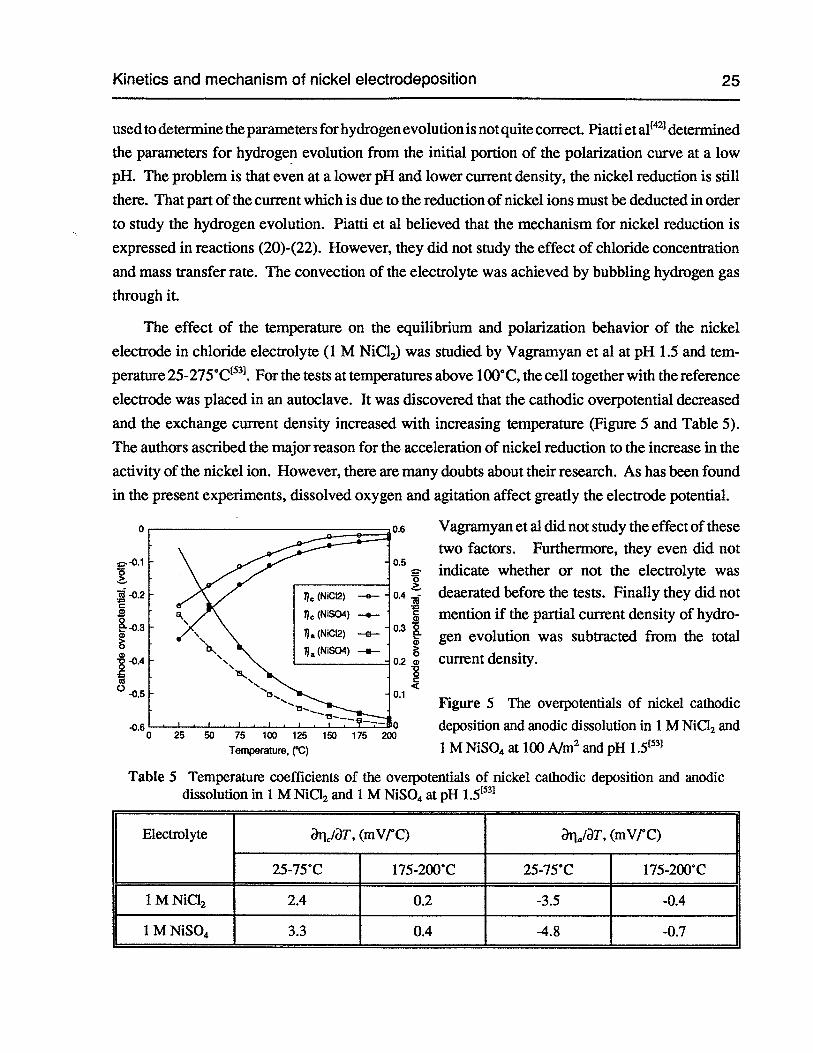
Kinetics and mechanism of nickel electrodeposition 25
used to determine the parameters for hydrogen evolution is notquite correct. Piatti eta1t42 determined
the parameters for hydrogen evolution from the initial portion of the polarization curve at a low
pH. The problem is that even at a lower pH and lower current density, the nickel reduction is still
there. That part of the current which is due to the reduction of nickel ions must be deducted in order
to study the hydrogen evolution. Piatti et al believed that the mechanism for nickel reduction is
expressed in reactions (20)-(22). However, they did not study the effect of chloride concentration
and mass transfer rate. The convection of the electrolyte was achieved by bubbling hydrogen gas
through it.
The effect of the temperature on the equilibrium and polarization behavior of the nickel
electrode in chloride electrolyte (1 M NiC12)was studied by Vagramyan et al at pH 1.5 and tem
perature 25275°Ct531. For the tests at temperatures above 100°C, the cell together with the reference
electrode was placed in an autoclave. It was discovered that the cathodic overpotential decreased
and the exchange current density increased with increasing temperature (Figure 5 and Table 5).
The authors ascribed the major reason for the acceleration of nickel reduction to the increase in the
activity of the nickel ion. However, there are many doubts about their research. As has been found
in the present experiments, dissolved oxygen and agitation affect greatly the electrode potential.
Vagramyan et al did not study the effect of thesetwo factors. Furthermore, they even did notindicate whether or not the electrolyte was
deaerated before the tests. Finally they did notmention if the partial current density of hydro
gen evolution was subtracted from the totalcurrent density.
Figure 5 The overpotentials of nickel cathodic
deposition and anodic dissolution in 1 M NiCI2 and
1 M NiSO4 at 100 A/rn2 and pH
Table 5 Temperature coefficients of the overpotentials of nickel cathodic deposition and anodicdissolution in 1 M NiC12 and 1 M NiSO4at pH 1 •153]
Electrolyte JrlIJT, (mV/°C) aria/aT, (mV/°C)
25-75°C 175-200°C 25-75°C 175-200°C
1 M NiC12 2.4 0.2 -3.5 -0.4
1 M NiSO4 3.3 0.4 -4.8 -0.7
. -0.1
Ca)
-0.3
- -0.4
0.0.5
aa,
0.2 a,
C
0 25 50 75 100 125 150 175 200
Temperature, (‘C)
Hydrogen evolution during nickel electrodeposition and on a nickel substrate 26in acidic media
1.5 Hydrogen evolution during nickel electrodeposition and on a nickel substrate in
acidic media
Nickel electrowinning is always accompanied by simultaneous hydrogen evolution under
normal operating conditions due to nickel being electrochemically negative to hydrogen, high nickel
overpotential and low hydrogen overpotential. The hydrogen evolution in nickel electrowinning
wastes electricity and the adsorbed hydrogen is responsible for some defects in the cathode nickel
deposit. The absorption of atomic hydrogen and adsorption of nickel hydroxide and basic salts
might increase the undesirable high internal stress and hardness, and reduce the ductility of the
nickel cathode deposit. In the case of high current density electrowinning, the prevention or at least
a lessening of hydrogen evolution is necessary; otherwise, the surface pH will increase markedly,leading to the precipitation of insoluble nickel hydroxide. This precipitate will in time depress
greatly the reduction of nickel ion and make impossible the achievement of a coherent cathode
nickel deposit. Boric acid is commonly used in the Watts bath to stabilize the electrolyte pH.
Yeager and co-workers55believed that the simultaneous hydrogen evolution during nickel
electrowinning might well be compared with the hydrogen evolution on the nickel substrate in the
acidic media without nickel ions, as they found that hydrogen evolution and nickel reduction didnot have any evident interactions. In Yeager and co-workers’ tests, the cathode was positioned
horizontally and the electrolyte was injected parallel to the electrode surface at a velocity of 45
cm/sec. The electrolyte was saturated with hydrogen gas. The rate of reduction of nickel ion was
found to be independent of pH, while the rate of hydrogen evolution was independent of nickel ion
concentration. From the experimental data, the Tafel slopes were calculated to be 123 mV/decadefor hydrogen evolution and 103 mV/decade for nickel reduction in 0.5 M NiC12at pH 2,25°C and
in the current density range of 10-1,000 A/m2. However, the reaction order with respect to chloride
ion concentration was not determined. Furthermore, the ionic strength was not held constant intheir tests.
On the basis of their experimental studies on hydrogen evolution on a nickel cathode in
0.005-1 MH2S04and 0.01-0.5 M HC1, Tamm et al derived equation (41) to describe the over-potential of hydrogen evolution:
, 1—a 1—aRT RT . (41)—i = E + — —i- ln[H] + ln i
where Wi is the potential at the outer Helmholtz plane. It has to be pointed out that equation (41)
does not consider the concentration polarization. When the concentration is taken into account,equation (41) becomes:
Hydrogen evolution during nickel electrodeposition and on a nickel substrate 27in acidic media
1—a 1—aRT I ( i RT (42)—=E + i— -ln1[H1bl—iJ1+lnz
Equation (41) was successful in explaining the experimental results for the Tafel slope and the effect
of acid concentration. It was also successful in elucidating the (around 60 mV) lower overpotential
in HC1 solution than inH2S04solution on account of the specific adsorption of chloride ions on thenickel cathode surface leading to a decreased
One of the problems associated with hydrogen evolution during nickel electrowinning is theformation of pits on the cathode. To eliminate these pits, the adsorbed hydrogen bubbles must beremoved either via chemical oxidation or mechanical agitation. Chemical oxidation was found tobe effective using hydrogen peroxide. The stability of hydrogen peroxide in a nickel electrolyte
was studied by Chen et a11. Their electrolyte contained 65 gIL Ni2,30 g/L Na, 40 g/L C1, 6 g/L
H3B03at 60°C. The mechanism for hydrogen bubble destruction was supposed to be due to thereaction H202 + 2H, = 21120. However, the true mechanism is not well understood. Chen et alformulated an equation from their experimental results to represent the decomposition rate of
peroxide as:
[H20,J = [H202J exp(—5.5 x 10³t) (43)
where [11202] is the initial peroxide concentration and r is the time in seconds. The decomposition
reaction was 2H202= 2H20+ °2• It can be calculated from equation (43) that almost no peroxide
will be left in the electrolyte after one hour. On the other hand, considering the standard electrode
potential E° = 1.776 volt vs. SHE (at 25°C) for the cathodic reduction of peroxide, 11202 + 2H +
2e =21120, it is understood that peroxide should be reduced preferentially to water on the cathode
rather than nickel reduction and hydrogen evolution. Therefore, the behaviorofH2O2in suppressing
H2 pits on the cathode remains a mystery. In practice, it may be necessary to add peroxide con
tinuously to the electrolyte during nickel electrowinning.
Considering the higher decomposition rate and higher consumption of hydrogen peroxide
(100 mLlkg-Ni) in depressing hydrogen bubbles, sodium hypochlorite (NaC1O) was tried and wasfound to be more effective than hydrogen peroxide58.Thermodynamically, hypochiorite may still
be reduced on the cathode, as the standard potential is 0.81 volt vs. SHE at 25°C for the reaction
Cl() + H20 + 2e = Ci + 20H. One alternative to avoid hydrogen pits on the cathode nickel is toadd some surfactants which can increase the surface tension between nickel and the hydrogen
bubbles. However, such an addition may cause some undesirable side effects.
Ovari and Rotinyan451 investigated hydrogen evolution during nickel deposition from purenickel chloride electrolyte under the conditions of 55°C, 0.25-2 M NiC12and pH 0.75-2.5. They
Hydrogen evolution during nickel electrodeposition and on a nickel substrate 28in acidic media
discovered that the rate of hydrogen evolution obeyed a simple kinetic expression:
ZN2 = Fk[H’] exp(_)
where a is approximately equal to 0.5. Ovari and Rotinyan also measured the surface pH on the
cathode using a micro glass pH electrode. They found that the surface pH was always higher than
the bulk pH if the bulk pH was above 1.5. They claimed that the surface pH increased initially withincreasing current density; however, it did not increase further when the current density reached a
certain level. This experimental finding could be an artifact. The range of current density studied
was quite limited, only up to 150 A/m2. It is believed that the surface pH would increase continuously
with the current density. The major reason for this conclusion is that the change in current density
was not large enough.
The simultaneous nickel reduction and hydrogen evolution was modelled by Diard and LeGorrec59 in chloride media (0.5 M NiC12+ 1 M KC1) at pH 2. A rotating disc electrode was usedfor their experimental tests. After realizing the difficulties in identifying the intermediate species
involved in electron transfer during nickel ion reduction, Diard and Le Gorrec came up with the
idea of proposing a theoretical mechanism first and comparing the theoretical response with the
experimental results. Their modelling was based on the mechanism that the nickel ion waschemically reduced by molecular hydrogen produced electrochemically at the cathode.
H+s+e=H (45)
H + H + e = (46)
H2() = H2(g) (47)
H2() + Ni2 = Ni + 2H (48)
where s represents the cathode substrate. However, their mechanism is difficult to accept, as it is
unlikely that the reduction ofnickel ions is caused by hydrogen gas at ambient pressure. Furthermore,
their mathematical modelling is too complicated to be understood.
Using the rotating disc electrode technique, Dorsch° studied the simultaneous nickel depo
sition and hydrogen evolution on a gold substrate in a nickel sulfate electrolyte (1 M NiSO4+ 20 g/L
H3B03). It was observed that nickel was not deposited and only hydrogen gas evolved until a
minimum current density was exceeded. In addition, it was found that at higher total current density
the partial current density of hydrogen evolution remained constant and was equal to its limiting
current density. It was concluded that the minimum current density was equal to the limiting
reduction rate of W ions at pH below 3. At a pH above 3, the minimum current density was limited
Hydrogen evolution during nickel electrodeposition and on a nickel substrate 29in acidic media
by the diffusion of hydroxyl ions or complex ions such as NiOW. However, such conclusions axenot reasonable. The question is how to explain under the limiting condition of hydrogen reductionwhy insoluble nickel hydroxide Ni(OH)S) does not form and why the nickel deposition can stillproceed smoothly.
Interestingly, a membrane cell was used by Ragauskas and Leuksminas in their study of
simultaneous hydrogen evolution during nickel electrodeposition from chloride electrolytes611.On
one side of a palladium membrane (16.2 p.m thick), cathodic reactions (nickel reduction plus
hydrogen evolution) took place in the electrolyte 3 M KC1 + NiC12. On the other side of themembrane, the permeated atomic hydrogen was completely oxidized anodically in 0.1 M NaOH at
a potential of 0.700 volt vs. SHE. The collection efficiency of the atomic hydrogen permeation is
unbelievably high, amounting to 97 % ofthe hydrogen evolved on the cathodic side of the membrane.
The permeation time through the Pd membrane plus 1 pm thick nickel layer was only 2 seconds.
Based on the current determined from the anodic oxidation of permeated atomic hydrogen, the
partial current densities for nickel reduction and hydrogen evolution could be separated. There was
a peak on the nickel partial polarization curve. The hydrogen evolution after the peak was believed
to be due not to direct decomposition of water but to the reduction of water by univalent nickel
ions. The presence of univalent nickel ions was claimed to be confirmed by the rotating ring-disk
electrode studies.
The hydrogen evolution and hydrogen content in the cathode nickel can be affected by
superimposing a sinusoidal alternating current (AC) on a direct current (DC) electrolysis process2.
The studied conditions were: AC frequency 20-5,000 Hz, electrolyte containing 210 g/L
NiSO47H2O, 25 g/L H3B03 and 9 gfL NaC1, temperature 24°C, pH 4.2, DC current density
100 AIm2,and the amplitude ratio between AC and DC 1:1, 5:1 and 10:1. The hydrogen content
in the cathode nickel was determined by vacuum extraction while heating the samples to 500°C and
the hydrogen gas was determined volumetrically. Higher hydrogen evolution and lower hydrogen
content in the cathode nickel were found when using combined AC and DC electrolysis rather thanDC alone. Also it was found that the minimum hydrogen content in the cathode nickel occurred atan AC frequency of 50 Hz. The effects resulting from superimposing a sinusoidal AC were due
not to the anodic dissolution of nickel, but to the decrease in the thickness of the diffusion layer.
The reduction of nickel ion proceeded with little concentration polarization. However, the
simultaneous hydrogen evolution took place near the limiting rate. Therefore, the decrease in the
thickness of the diffusion layer led to a substantial increase in the mass transfer rate towards the
cathode. The lower hydrogen content in the cathode nickel may also be due to hydrogen ionization
on the nickel cathode. However, one problem with such a technique is that the current efficiency
Hydrogen evolution during nickel electrodeposition and on a nickel substrate 30in acidic media
of nickel will be sacrificed to a certain degree.
Current reversal and straight DC electrolysis have been investigated in the case of nickel. Itwas found that the technique did not generate any differences in the appearance of cathode nickelif soluble organic additives were absent631. However, in the presence of soluble organics, such aspitting additive caprylic acidCH3(CH2)6COOH, hydrogen pitting on the cathode was found to bemore serious than when using DC alone. The tests were conducted in an electrolyte containing
105 g/L Ni2, 85 g/L Cl-, 120 g/L SO and a small amount (< i0 M) of caprylic acid at pH 2.5,
65°C and 350 A/rn2. When using the current reversal electrolysis, the addition of sodium chlorate
(NaC1O3)or tetramethylammoniurn sulfate [(CH3)4N12S04did not prevent the pit formation on thecathode. The reasons for the formation of hydrogen pits under current reversal are not given.
Temperature was found to have a significant effect on hydrogen evolution and the hydrogen
content of the cathode nickel in an electrolyte containing 0.43 M NiSO4•6H20and 0.5 MH3B03atc.d. 50 A/rn2and pH 1.5. The temperature increase from 20 to 50°C brought down the hydrogen
content from —21 ppm to —7 ppm. A further increase in temperature affected the hydrogen contentvery little. However, the current efficiency of nickel increased continuously with increasing
temperature, —42 % at 20°C, —50 % at 50°C and —93 % at 100°C, respectively. It was believed thatatomic hydrogen in cathode nickel existed in the form of nonstoichiometric nickel hydride NiH.
(n = 0.1-0.9). This nickel hydride was not stable even at ambient temperature. The subsequent
decomposition of this nickel hydride caused dislocations in the structure of the nickel cathode.
The adsorbed atomic hydrogen can be absorbed into the nickel cathode. The solubility ofatomic hydrogen in nickel is quite low, in the order of 10.6 mole/cm3. However, nickel is ahydride-forming metal and the absorption of atomic hydrogen into nickel is an exothermic pro
cess651. The solubility of atomic hydrogen in most metals obeys Sievert’s law, that is:
[H]0=k-fl (49)
where P112 is the partial pressure of hydrogen gas, and k is the Sievert’s law constant. Actually,
Sievert’s law was derived from the following equilibrium,
H)=2M—H=2M—H (50)
The two commonly used addition agents in nickel electroplating, the leveller 2-butyne 1 ,4-diol
(CH2OH-CC-CH2OH)and the brightener sodium benzene sulfonate (CJ{5-SO3Na)were found toaffect the hydrogen evolution as well during nickel deposition in a Watts electrolyte at 50°C. Itwas found that 2-butyne 1 ,4-diol increased the hydrogen evolution while sodium benzene sulfonatedepressed the hydrogen evolution.
Hydrogen evolution during nickel electrodeposition and on a nickel substrate 31in acidic media
Another issue related to the hydrogen evolution during nickel electrodeposition is the cathodesurface pH which is usually higher than the bulk pH. The higher surface pH may cause numerous
undesirable consequences. The formation of ferrous hydroxide was found to be responsible for the
abnormal electrodeposition of an iron-nickel alloy67. The theoretical prediction of surface pH was
attempted by Dahms and &oll[67] although their model was over simplified. In order to make the
prediction, the partial current density for hydrogen evolution must be known in advance. The
problem with Dahms and Croll’s modelling is that they did not take into account the electrical
migration of ions, such as, bisulfate, soluble nickel and ferrous hydroxides and the ion pair NiSO4.
The activity coefficient of the hydrogen ion and a proper correction for the equilibrium constants
due to the ionic strength were not considered either.
In a generalized case of divalent metal electrodeposition in an electrolyte without any pH
buffers and ligands, the distribution of ionic species in the diffusion layer and the surface pH were
analyzed theoretically by Harris. The increase in surface pH was believed due to the reduction
of hydrogen ions. The electrolyte adjacent to the cathode surface would become basic as soon as
the reduction of hydrogen ions reached its limiting condition:
1112 > FDH+[H]b /6 (51)
The formation of soluble metal hydroxy complexes would suppress the rise of the surface pH. The
drawbacks of Harris analysis lies in the fact that the selection of parameters such as diffusion
coefficients and equilibrium constants is arbitrary and the specific details of the calculations are
not given in his paper. Of course, equation (51) must be modified if there are any pH buffers in
the electrolyte.
One of the methods of measuring the surface pH involves the use of a micro pH-sensing
electrode. Pt/H2and antimony micro electrodes have been used to measure the cathode surface pH
during the electrolysis of acidic sodium chloride solution. The change in the surface pH was
found to be quite significant under the conditions of 25°C and 0.5-100 A/m2even though the tip of
pH-sensing electrode was positioned 150 iim away from the cathode surface. The electrolyte wasnot agitated mechanically in the tests. However, the 112 bubbles evolving on the cathode affected
the flow of electrolyte nearby.
Controversial results prevail in the literature concerning the surface pH during nickel elec
trodeposition. One paper published by Berezina et al°1 deals with the surface pH measurement
during nickel electrodeposition in 0.89 M NiSO4without and withH3BO3(0.5 M) at 20°C. It was
found there was a maximum in the surface pH at a bulk pH of around 3 on the curve of surface pHversus the bulk pH. It is difficult to understand why the surface pH decreased as the bulk pH
Hydrogen evolution during nickel electrodeposition and on a nickel substrate 32in acidic media
increased. Besides, the authors’ surface pH values are too high, reaching above 9 at 20 AIm2and20°C. Such an ermneously high surface pH value may be ascribed to the method used for the
measurements. They determined the surface pH based on the electrode potential of the cathode
immediately after the current was switched off. In the presence of boric acid, they found that the
maximum in the surface pH disappeared mysteriously. However, according to the results of the
present investigation, the surface pH is again too high in the presence of boric acid, being above
8.5 at2O A/rn2,bulk pH —2.6 and 20° C. The problem is that the authors did not consider the formation
of insoluble nickel hydroxide Ni(OH)2at these high surface pH’s. In their subsequent studies in
chloride electrolyte under the conditions of 0.3-1 M NiCl2 and bulk pH 0.5-5, the effect of the
surface pH on the mechanism of nickel reduction was determined at 23°C’:
.2 2 ( aFE” (52)When the surface pH < 6.5, 1N1 = 2Fk[Ni ] . exp—
RT
[Ni2] ( aFE (53)When the surface pH > 6.5, ‘N = 2Fk . expl —____
[0H] RT
Kuhn and Chan12 reviewed the reliability of surface pH measurements during nickel
electrodeposition using different techniques. Each technique, as they pointed out, had certain
drawbacks, associated with the effect of gas bubbles and the current flow. The convenient technique
was to use a pH-sensing electrode, such as black Pt/H2,Pt-quinhydrone, Sb203/Sb and glass pH
electrodes, among which the glass pH electrode was the most widely used. The use of the glass
pH electrode with a flat bottom was not mentioned in their review. They proposed new techniques
such as using an optically-transparent electrode together with a UV-visible indicator which are not
easily feasible.
An innovative technique for measuring the surface pH is to use a flat-bottom glass pH electrode
together with a very fine gold gauze cathode87375. In a study carried out in an unstirred dilute
(<0.2 M NiCl2)nickel chloride electrolyte Deligianni and Romanldw41used as the cathode a 2,000
mesh gold gauze, having an aperture diameter of 7 .tm and a thickness of 5 Im. Their results appear
to be reasonable qualitatively. They found that a higher nickel concentration and the presence of
boric acid resulted in a lower surface pH. Using a rotating pH electrode, they discovered that the
surface pH decreased continuously with increasing RPM31. Nevertheless, there are certain dis
crepancies in their study. Their tests were based on a potentiostatic step or liner potential sweep.
It is not clear whether or not the ohmic drop between the working and reference electrodes was
compensated. Furthermore, their curves of the surface pH vs. potential and of the current vs.potential are not well defined. The problems might arise from the nature of the cathode substrate.
It may be unlikely that they precoated the gold gauze with nickel and deaerated the electrolyte
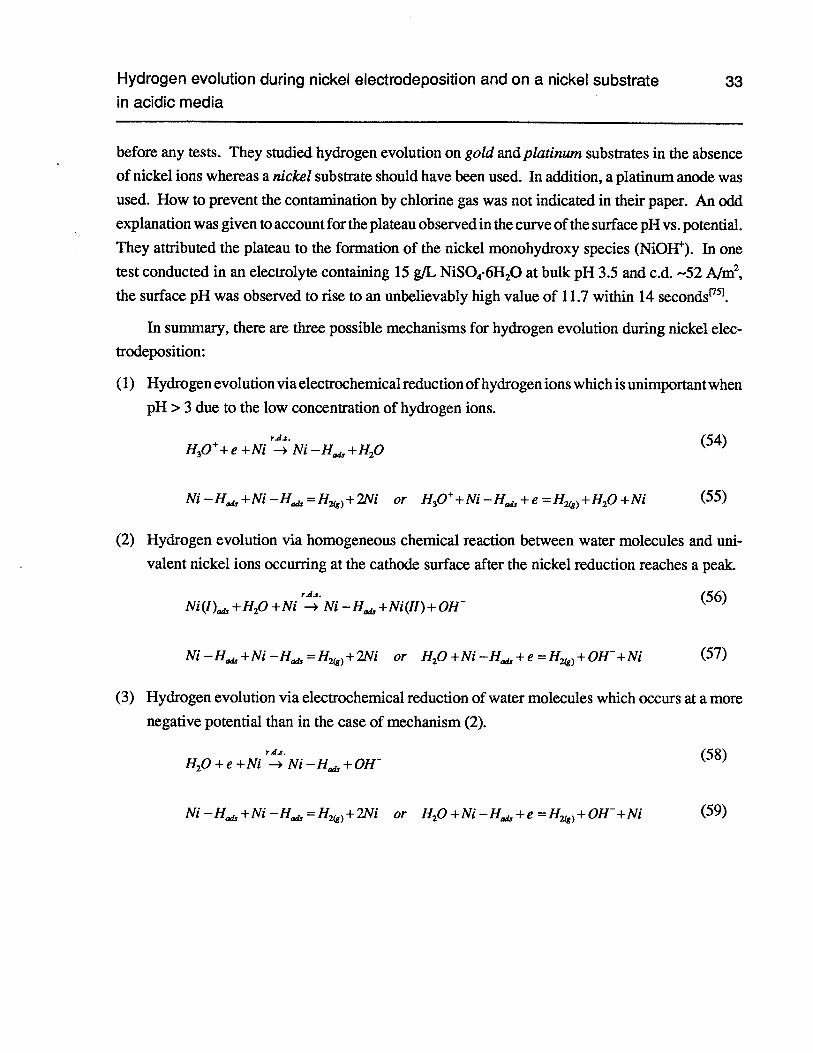
Hydrogen evolution during nickel electrodeposition and on a nickel substrate 33in acidic media
before any tests. They studied hydrogen evolution on gold and platinum substrates in the absenceof nickel ions whereas a nickel substrate should have been used. In addition, a platinum anode was
used. How to prevent the contamination by chlorine gas was not indicated in their paper. An odd
explanation was given to account for the plateau observed in the curve of the surface pH vs. potential.
They attributed the plateau to the formation of the nickel monohydroxy species (NiOW). In one
test conducted in an electrolyte containing 15 gIL NiSO4•6H20at bulk pH 3.5 and c.d. —52 A/m2,
the surface pH was observed to rise to an unbelievably high value of 11.7 within 14 seconds.
In summary, there are three possible mechanisms for hydrogen evolution during nickel elec
trodeposition:
(1) Hydrogen evolution via electrochemical reduction ofhydrogen ions which is unimportant when
pH >3 due to the low concentration of hydrogen ions.
r43. (54)1130k + e + Ni -* Ni -H +H20
Ni—H+Ni—H=H)+2Ni orH30+Ni—H+e=H)+H20+Ni (55)
(2) Hydrogen evolution via homogeneous chemical reaction between water molecules and uni
valent nickel ions occurring at the cathode surface after the nickel reduction reaches a peak.
(56)Ni(!) +1120 +Ni — Ni —H +Ni(Il)+ 0H
Ni-H+Ni-tç,,--H)+mi orH20+Ni-H+e=H)+OW+Ni (57)
(3) Hydrogen evolution via electrochemical reduction of water molecules which occurs at a more
negative potential than in the case of mechanism (2).
(58)H20 + e + Ni -* Ni -H, + OW
Ni -H41,+Ni -H =H)+mi or H20 +Ni -H+e =H)+0Fr+Ni (59)

Activity coefficients in multicomponent nickel chloride solutions 34
Chapter 2 Thermodynamics of Nickel Chloride Solutions
2.1 Activity coefficients in multicomponent nickel chloride solutionsThe significance of the activity coefficients of the hydrogen and nickel ions has been well
described by Peters91 for highly acidic and concentrated nickel chloride solutions. The importanceof activity coefficients has also been increasingly realized in the present experimental work on thepH titrations and surface pH measurements. As the activity coefficient of the hydrogen ion isrequired to interpret more accurately the experimental results for pH titrations and surface pHbehavior, and in the speciation study of nickel species and mathematical modelling of the surfacepH, an effort was made to deal properly with this subject. In addition, the pH for the formation ofinsoluble nickel hydroxide was estimated to provide an upper limit for the surface pH. The distribution ofnickel species with pH is also important in understanding the solution behavior ofnickel
chloride and in the selection of nickel species for the surface pH modelling.
The single-ion activities in the electrolyte NiC12-HC1-NaCl can be expressed by the following
equations (60)-(6 1):
= “3’Ni2+ mN.2+ aH+ = YII+ mJ,+ (60)
a+= mN+ acr = cr •mcr (61)
where y is the single-ion activity coefficient and mis the molal concentration. As the activity andthe activity coefficient are usually considered as dimensionless parameters, sthctly speaking, the
activity should be expressed as:
m (62)a =y—=n
where m3jd is the molal concentration at the standard state, which is equal to unit molality and isusually omitted in writing. The activity of nickel chloride can be represented as:
aMI = •(a)2= a = (m• (63)
Therefore, the cube of the mean activity coefficient of nickel chloride is equal to the product ofnickel ion activity coefficient times the square of the activity coefficient of the chloride ion.
()3= (YNI2i’
()2 (64)
The important points to be remembered are that the single-ion activity coefficient of neither thenickel ion nor the chloride ion is equal to the mean activity coefficient of NiCl2,and the activity ofNiCl2 is not equal to the sum of Ni2 activity plus Cl activity.
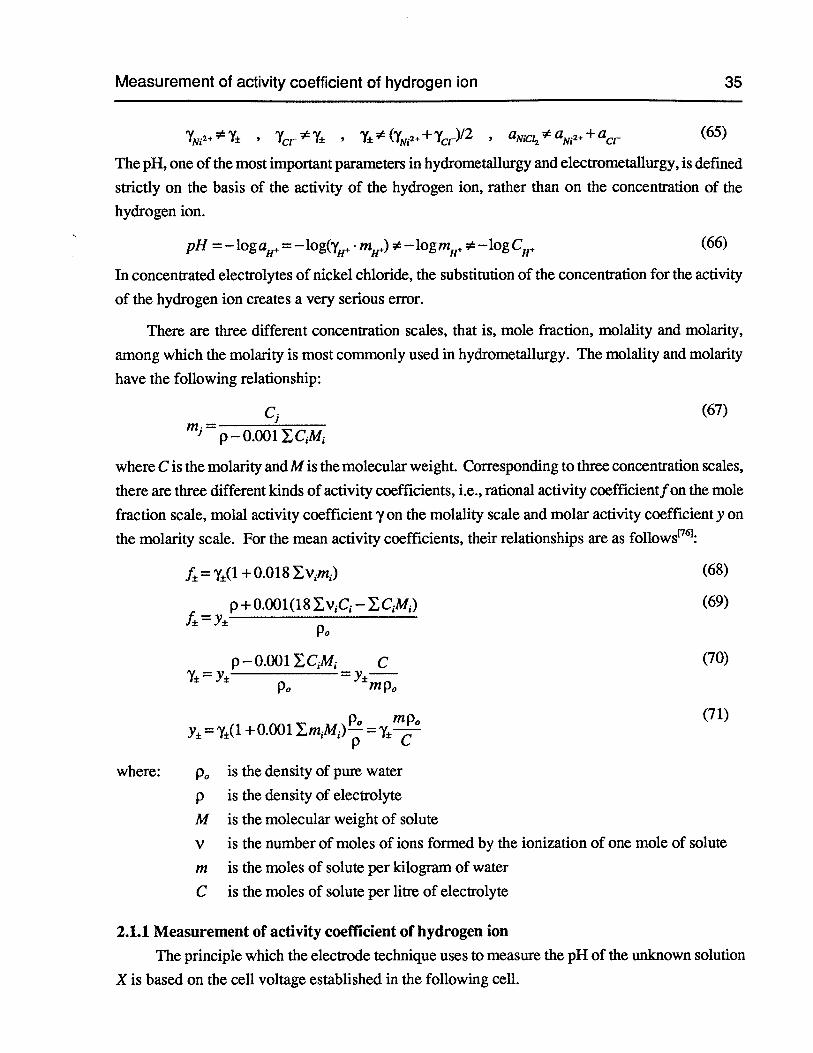
Measurement of activity coefficient of hydrogen ion 35
7Ni (÷+ y)/2 + acr (65)
The pH, one of the most important parameters in hydrometallurgy and electrometallurgy, is defined
strictly on the basis of the activity of the hydrogen ion, rather than on the concentration of the
hydrogen ion.
pH = —loga÷ = —log(y+. mH+) —logm+ —logç+ (66)
In concentrated electrolytes of nickel chloride, the substitution of the concentration for the activity
of the hydrogen ion creates a very serious error.
There are three different concentration scales, that is, mole fraction, molality and molarity,
among which the molarity is most commonly used in hydrometallurgy. The molality and molarity
have the following relationship:
— ci (67)
- p-0.0Ol £C1M1
where C is the molarity and Mis the molecular weight. Corresponding to three concentration scales,
there are three different kinds of activity coefficients, i.e., rational activity coefficientfon the mole
fraction scale, molal activity coefficient y on the molality scale and molar activity coefficient y on
the molarity scale. For the mean activity coefficients, their relationships are as follows61:
f=y(l +0.0l8Xv1m1) (68)
p + 0.001(18v1C1— YCIM1) (69)f±=Y±
p0
p—0.00lECM1 C (70)=y±—p° mp0
p0 mp0 (71)= y(1 + 0.001 EmM4)—=
where: p0 is the density of pure water
p is the density of electrolyte
M is the molecular weight of solute
v is the number of moles of ions formed by the ionization of one mole of solute
m is the moles of solute per kilogram of water
C is the moles of solute per litre of electrolyte
2.1.1 Measurement of activity coefficient of hydrogen ion
The principle which the electrode technique uses to measure the pH of the unknown solution
X is based on the cell voltage established in the following cell.
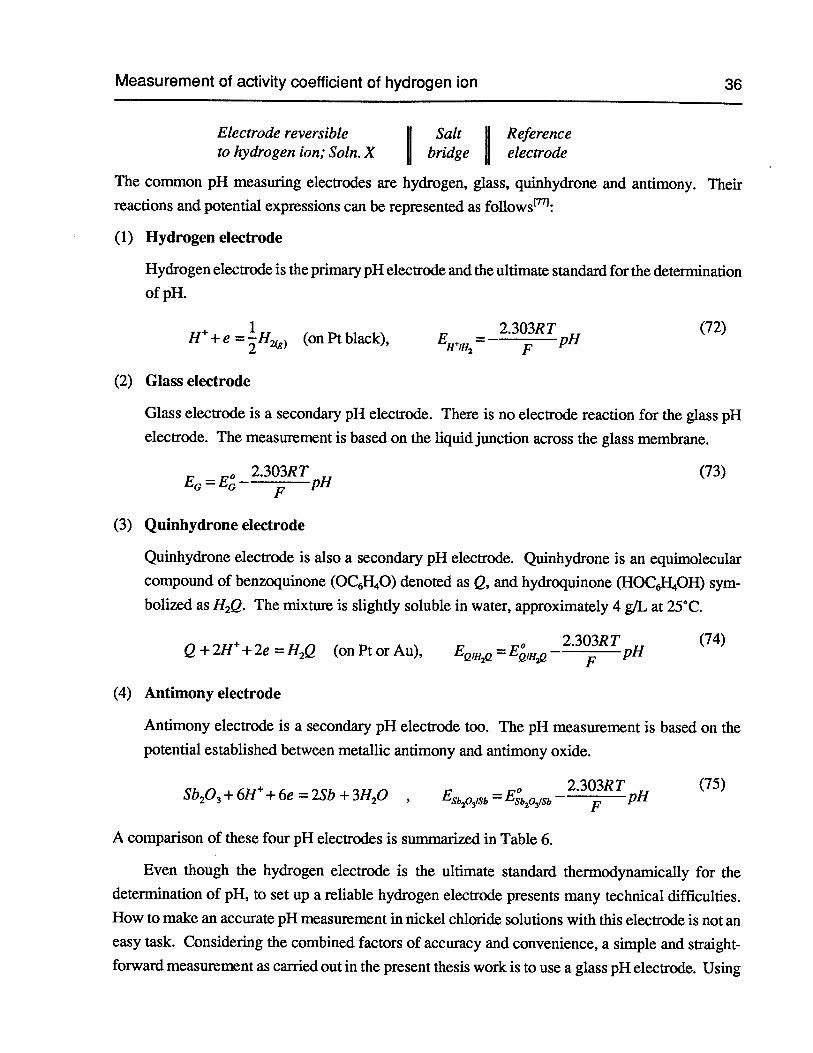
Measurement of activity coefficient of hydrogen ion 36
Electrode reversible Salt Referenceto hydrogen ion, Soln. X bridge electrode
The common pH measuring electrodes are hydrogen, glass, quinhydrone and antimony. Theirreactions and potential expressions can be represented as follows:
(1) Hydrogen electrode
Hydrogen electrode is the primary pH electrode and the ultimate standard for the determination
of pH.
+ 1 2.303RT (72)H + e =H) (on Pt black), EH+/H =
— FpH
(2) Glass electrode
Glass electrode is a secondary pH electrode. There is no electrode reaction for the glass pHelectrode. The measurement is based on the liquid junction across the glass membrane.
2.303RT (73)EG=EG—
FpH
(3) Quinhydrone electrode
Quinhydrone electrode is also a secondary pH electrode. Quinhydrone is an equimolecular
compound of benzoquinone (0CJ140)denoted as Q, and hydroquinone (HOC6H,40H) symbolized as H2Q. The mixture is slightly soluble in water, approximately 4 g/L at 25°C.
Q + 2H + 2e = H2Q (on Pt or Au), EQ,11Q = E,112Q— 2.303R TpH (74)
(4) Antimony electrode
Antimony electrode is a secondary pH electrode too. The pH measurement is based on thepotential established between metallic antimony and antimony oxide.
Sb203+ 6H + 6e = 2Sb + 3H20 , Esb203,sb = E:bO,Sb— 2.303R TPH (75)
A comparison of these four pH electrodes is summarized in Table 6.
Even though the hydrogen electrode is the ultimate standard thermodynamically for thedetermination of pH, to set up a reliable hydrogen electrode presents many technical difficulties.How to make an accurate pH measurement in nickel chloride solutions with this electrode is not aneasy task. Considering the combined factors of accuracy and convenience, a simple and straightforward measurement as carried out in the present thesis work is to use a glass pH electrode. Using
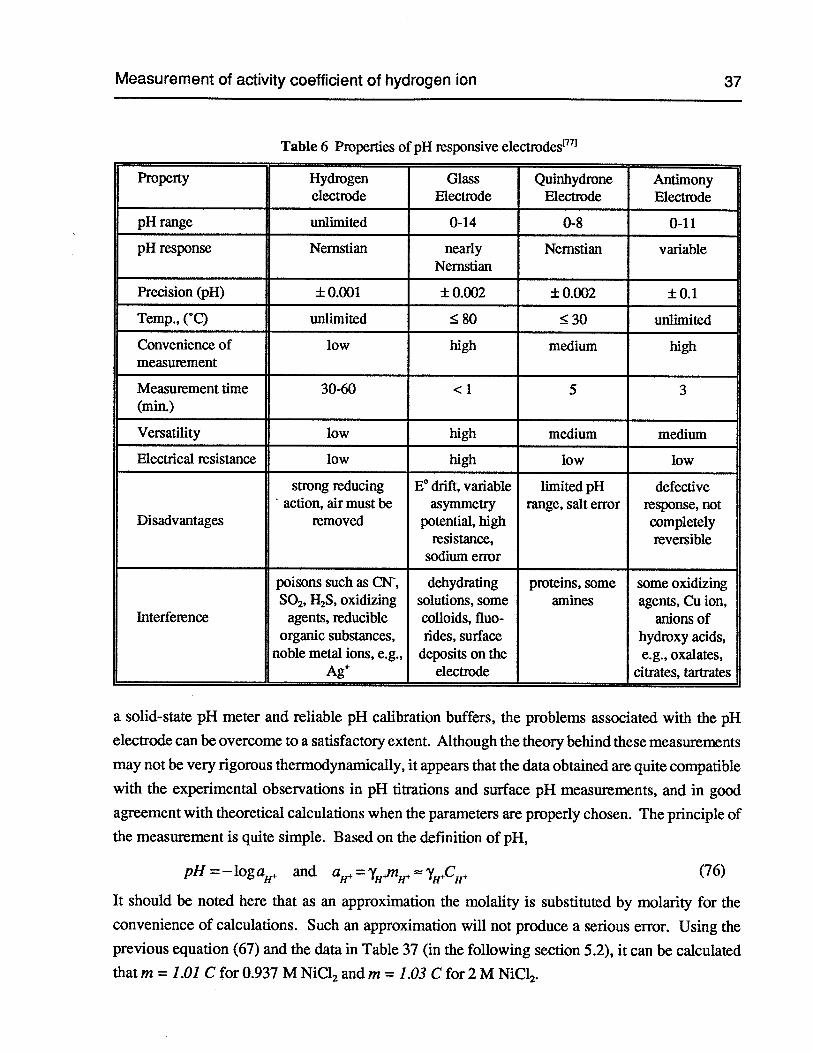
Measurement of activity coefficient of hydrogen ion 37
Table 6 Properties of pH responsive electrodes7
Property Hydrogen Glass Quinhydrone Antimonyelectrode Electrode Electrode Electrode
pH range unlimited 0-14 0-8 0-11
pH response Nemstian nearly Nemstian variableNernstian
Precision (pH) ± 0.001 ± 0.002 ± 0.002 ± 0.1
Temp., (C) unlimited 80 30 unlimited
Convenience of low high medium highmeasurement
Measurement time 30-60 < 1 5 3(mm.)
Versatility low high medium medium
Electrical resistance low high low low
strong reducing E° drift, variable limited pH defectiveaction, air must be asymmetry range, salt error response, not
Disadvantages removed potential, high completelyresistance, reversible
sodium error
poisons such as CN, dehydrating proteins, some some oxidizingSO2,H2S, oxidizing solutions, some amines agents, Cu ion,
Interference agents, reducible colloids, fluo- anions oforganic substances, rides, surface hydroxy acids,
noble metal ions, e.g., deposits on the e.g., oxalates,Ag electrode citrates, tartrates
a solid-state pH meter and reliable pH calibration buffers, the problems associated with the pH
electrode can be overcome to a satisfactory extent. Although the theory behind these measurements
may not be very rigorous thermodynamically, it appears that the data obtained are quite compatible
with the experimental observations in pH titrations and surface pH measurements, and in good
agreement with theoretical calculations when the parameters are properly chosen. The principle ofthe measurement is quite simple. Based on the definition of pH,
pH = —log a+ and = YJf*h1fl+ YH÷CH+ (76)
It should be noted here that as an approximation the molality is substituted by molarity for theconvenience of calculations. Such an approximation will not produce a serious error. Using theprevious equation (67) and the data in Table 37 (in the following section 5.2), it can be calculated
thatm = 1.01 Cfor0.937 MNiCl2andm = 1.03 Cfor2MNiCl2.
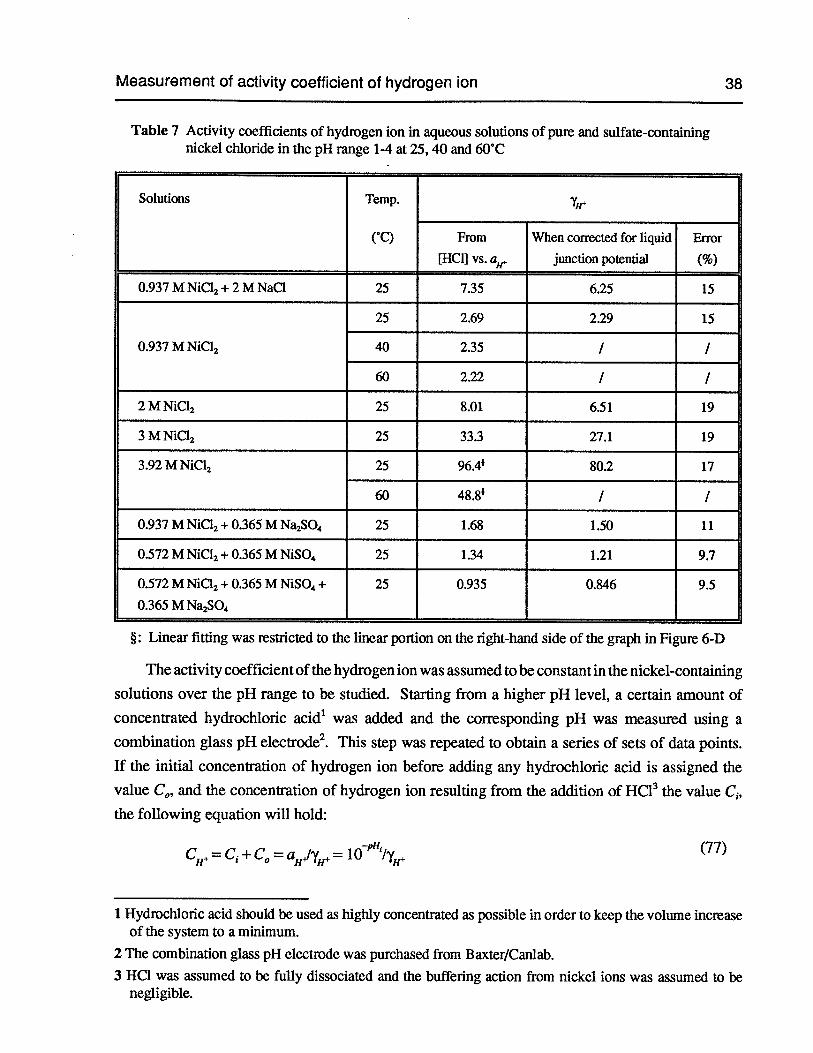
Measurement of activity coefficient of hydrogen ion 38
Table 7 Activity coefficients of hydrogen ion in aqueous solutions of pure and sulfate—containingnickel chloride in the pH range 1-4 at 25,40 and 60°C
Solutions Temp.
(C) From When corrected for liquid Error
[HC1] vs. junction potential (%)
0.937 M NiCI2+2 M NaC1 25 7.35 6.25 15
25 2.69 229 15
0.937 M N1C12 40 2.35 I /
60 2.22 / /
2MNiC12 25 8.01 6.51 19
3MNiC1, 25 33.3 27.1 19
3.92 M NiC12 25 96.4k 802 17
60 48.8k
0.937 M NiC12+ 0.365 M Na2SO4 25 1.68 1.50 11
0.572MNiCl+0.365MNiSO4 25 1.34 121 9.7
0.572 M NiC1, + 0.365 M NiSO4+ 25 0.935 0.846 9.50.365 MNa2SO4
§: Linear fitting was restricted to the linear portion on the right-hand side of the graph in Figure 6-D
The activity coefficient of the hydrogen ion was assumed to be constant in the nickel-containing
solutions over the pH range to be studied. Starting from a higher pH level, a certain amount of
concentrated hydrochloric acid’ was added and the corresponding pH was measured using a
combination glass pH electrode2. This step was repeated to obtain a series of sets of data points.
If the initial concentration of hydrogen ion before adding any hydrochloric acid is assigned the
value C0, and the concentration of hydrogen ion resulting from the addition of HC13 the value C1,the following equation will hold:
CH+ = C1 + C0 =a114! = 1O”/y,+ (77)
1 Hydrochloric acid should be used as highly concentrated as possible in order to keep the volume increaseof the system to a minimum.
2 The combination glass pH electrode was purchased from Baxter/Canlab.
3 HC1 was assumed to be fully dissociated and the buffering action from nickel ions was assumed to benegligible.
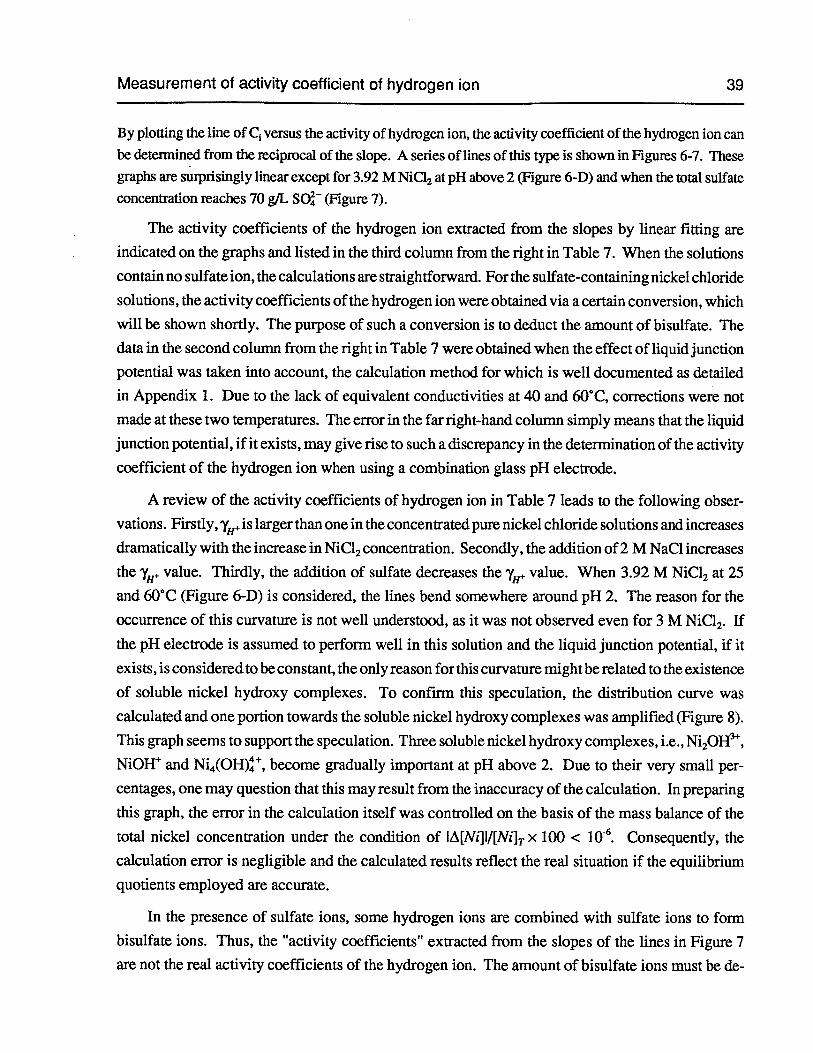
Measurement of activity coefficient of hydrogen ion 39
By plotting the line of C, versus the activity of hydrogen ion, the activity coefficient of the hydrogen ion canbe determined from the reciprocal of the slope. A series of lines of this type is shown in Figures 6-7. Thesegraphs are surprisingly linear except for 3.92 M NiCI2at pH above 2 (Figure 6-D) and when the total sulfateconcentration reaches 70 g/L SO (Figure 7).
The activity coefficients of the hydrogen ion extracted from the slopes by linear fitting are
indicated on the graphs and listed in the third column from the right in Table 7. When the solutions
contain no sulfate ion, the calculations are straightforward. For the sulfate-containing nickel chloride
solutions, the activity coefficients ofthe hydrogen ion were obtained via a certain conversion, which
will be shown shortly. The purpose of such a conversion is to deduct the amount of bisulfate. The
data in the second column from the right in Table 7 were obtained when the effect of liquid junction
potential was taken into account, the calculation method for which is well documented as detailed
in Appendix 1. Due to the lack of equivalent conductivities at 40 and 60°C, corrections were not
made at these two temperatures. The error in the far right-hand column simply means that the liquid
junction potential, if it exists, may give rise to such a discrepancy in the determination of the activity
coefficient of the hydrogen ion when using a combination glass pH electrode.
A review of the activity coefficients of hydrogen ion in Table 7 leads to the following obser
vations. Firstly,‘H
is larger than one in the concentrated pure nickel chloride solutions and increases
dramatically with the increase in NiCl2concentration. Secondly, the addition of2 M NaC1 increases
the value. Thirdly, the addition of sulfate decreases the value. When 3.92 M NiC12 at 25
and 60°C (Figure 6-D) is considered, the lines bend somewhere around pH 2. The reason for the
occurrence of this curvature is not well understood, as it was not observed even for 3 M NiCl2. If
the pH electrode is assumed to perform well in this solution and the liquid junction potential, if it
exists, is considered to be constant, the only reason for this curvature might be related to the existence
of soluble nickel hydroxy complexes. To confirm this speculation, the distribution curve was
calculated and one portion towards the soluble nickel hydroxy complexes was amplified (Figure 8).
This graph seems to support the speculation. Three soluble nickel hydroxy complexes, i.e.,Ni2OH,
NiOW andNi4(OH), become gradually important at pH above 2. Due to their very small per
centages, one may question that this may result from the inaccuracy of the calculation. In preparing
this graph, the error in the calculation itself was controlled on the basis of the mass balance of the
total nickel concentration under the condition of Iz[Nz]I/[Ni]T x 100 < 106. Consequently, the
calculation error is negligible and the calculated results reflect the real situation if the equilibrium
quotients employed are accurate.
In the presence of sulfate ions, some hydrogen ions are combined with sulfate ions to form
bisulfate ions. Thus, the “activity coefficients” extracted from the slopes of the lines in Figure 7
are not the real activity coefficients of the hydrogen ion. The amount of bisulfate ions must be de
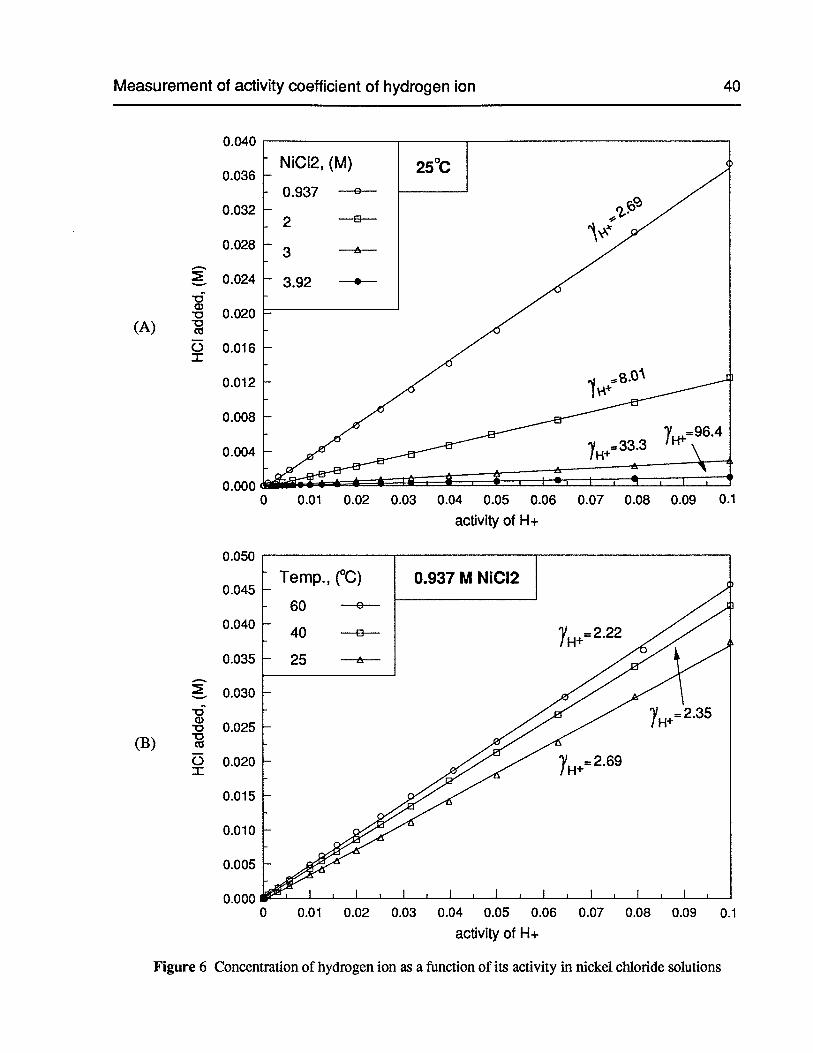
Measurement of activity coefficient of hydrogen ion 40
0.040
0.036
0.032
0.028
0.0240
0.020(A
5 0.016I
0.012
0.008
0.004
0.000
0.050
0.045
0.040
0.035
0.0300
0.025(B)
0.020
0.015
0.010
0.005
0.0000 0.01 0.02 0.03 0.04 0.05 0.06 0.07 0.08 0.09 0.1
activity of H+
Figure 6 Concentration of hydrogen ion as a function of its activity in nickel chloride solutions
0 0.01 0.02 0.03 0.04 0.05 0.06 0.07 0.08 0.09 0.1
activity of H+
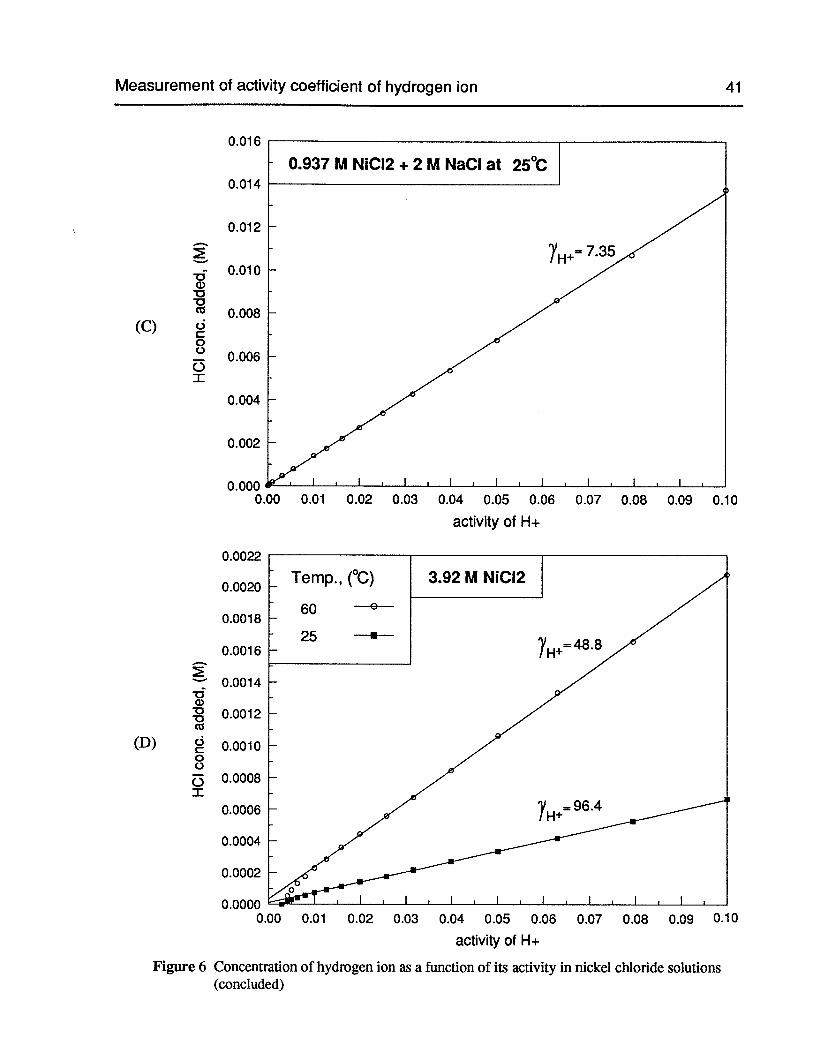
Measurement of activity coefficient of hydrogen ion 41
0.0022
0.0020
0.0018
0.0016
0.0014
G)g 0.0012
(D) o.ooio00
5 0.0008I
0.0006
0.0004
0.0002
0.00000.00 0.01 0.02 0.03 0.04 0.05 0.06 0.07 0.08 0.09 0.10
activity of H+
Figure 6 Concentration of hydrogen ion as a function of its activity in nickel chloride solutions(concluded)
0w
-D0
0
00
0
(C)
0.016
0.937 M N1CI2 + 2 M NaCI at 25°C0.014
0.012 -
0.010 -
0.008 -
0.006 -
0.004 -
0.002 -
0.000 I I I I
0.00 0.01 0.02 0.03 0.04 0.05 0.06 0.07 0.08 0.09 0.10
activity of H+
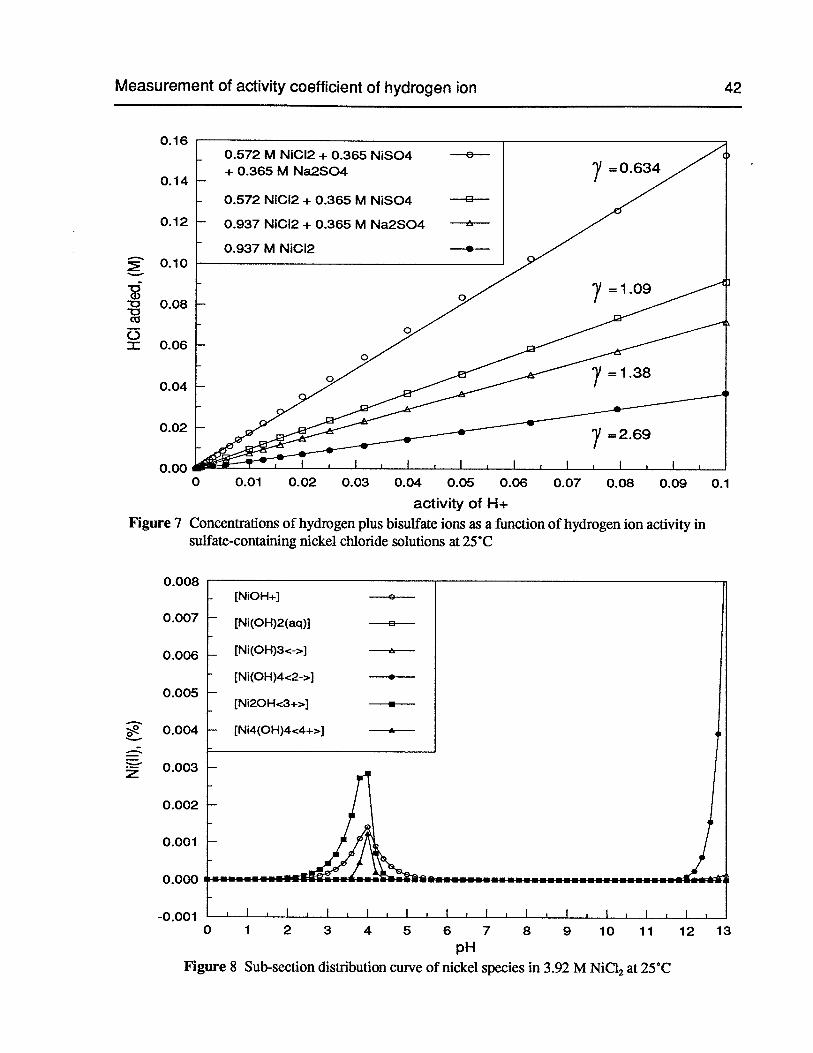
Measurement of activity coefficient of hydrogen ion 42
0.16
0.14
0.12
0.10
0.08
()= 0.06
0.04
0.02
0.000 0.01 0.02 0.03 0.04 0.05 0.06 0.07 0.08 0.09 0.1
activity of H+Figure 7 Concentrations of hydmgen plus bisulfate ions as a function of hydrogen ion activity in
sulfate-containing nickel chloride solutions at 25C
0.008
0.007
0.006
0.005
0.004
0.003
0.002
0.001
0.000
-0.0010 1 2 3 4 5 6 7 8 9 10 11
pH
Figure 8 Sub-section distribution curve of nickel species in 3.92 M NiC12at 25CC
[NiOH+]
[Ni(OH)2(aq)]
[Ni(OH)3<-,.]
[Ni(OH)4<2->.J
[NI2OH<3i-,.]
[N14(OH)4<4+>]
p
p
A
12 13
Measurement of activity coefficient of hydrogen ion 43
aH+ = 10” = + [HSO41)
H+SO = HSO
Q2Ni2+SO4= NISO4
Q3Ni2+cr =NiCl
[SO1 + [HSO41+ [NiSO4]= [SO4]T
[Cr] + [NiCfl = [Cl]T + [Clifrd nct = [Clip + 10”/y = [Cl] +
[Ni2+ [NiCfl + [NiSO4]= [NuT
From equation (79) and equilibrium (80) the following relation (86) can be derived:
ducted for the accurate calculations. The accuracy of the calculated activity coefficients of thehydrogen ion, of course, depends on the reliability of the equilibrium quotients used in the calculations. It is obvious from Figure 7 that the following linear relationship holds:
aJ,+ 10”=y[HCl] (78)
wherey is the reciprocal ofthe slope. As the concentration ofadded HC1 is equal to the concentrations
of hydrogen plus bisulfate ions, equation (78) is equivalent to the following equation (79):
(79)
In the calculations, only seven species are considered, that is, H, SO, HSO, NiSO4,Ni2,NiCl
and C1. Therefore, it is necessary to find seven equations and to solve for the concentration of the
seven species. Besides equation (79), there are three chemical equilibria and three mass balance
equations (80)-(85):
Qi (80)
(81)
(82)
(83)
(84)
(85)
At a given pH, i.e., a is known, the above equation is a function only of the concentration of the
hydrogen ion. From equation (83) and equilibria (80)-(81), equation (87) can be obtained:
Measurement of activity coefficient of hydrogen ion 44
Since [SO] is a function of [114], [Ni24] will also be a function of [if4] as [SO4]T is known. It
follows from equation (84) and equilibñum (82) that:
[Cl]T+a,Jy (88)[Cu
= +Q3[Ni24]
Combining equations (85) and (88), equation (89) can be obtained:
[CuT +[Ni24](11 +Q3[Ni24]
+Q2[SO]]_[Ni]T=0(89)
As [Ni] and [CuT are known, y can be obtained from the slope of the lines in Figure 7, and [Ni2J
and [SO] are both a function only of [114], [114] can be solved definitely based on equation (89)using a simple bisection calculation method.
The required equilibrium quotients Q1,Q2 and Q3 at 25°C can be found from the literature81,
that is, log Q1 = 0.95 (2 M NaC1O4),log Q2 = 0.57(1 M NaCIO4)and log Q = -0.17 (2 M NaC1O4).
Alternatively, there is an equation for Q1 at 25°C19:
[HSO] 2.O36q1 (90)logQ1
= [H] [SO1= 1.99—
0.4’Ji
where I is the real ionic strength of solution. For the solutionNiCl2-NiSO4-Na2SO4,the real ionic
strength is equal to:
1 (91)I
=C1z= (4[Ni24]+ [NiCfl + [114] + [Na4] + [Cu + 4[S04j+ [HSO])
while the formal ionic strength can be expressed as:
I = +4CNjSO + (92)
Thus calculated ionic strengths and equilibrium quotient Q1 for three sulfate-containing nickel
chloride solutions are listed in Table 8. Using four sets ofQ1 values for each solution, i.e., calculated
at formal ionic strength and at real ionic strength (Table 8), log Q1 = 0.95 (2 M NaC1O4),and log Q1= 1.99 (at I = 0), the activity coefficient of the hydrogen ion was calculated to see which values of
Q1 would generate reasonable data. The calculated concentration of the hydrogen ion is plotted
against its activity in Figure 9.
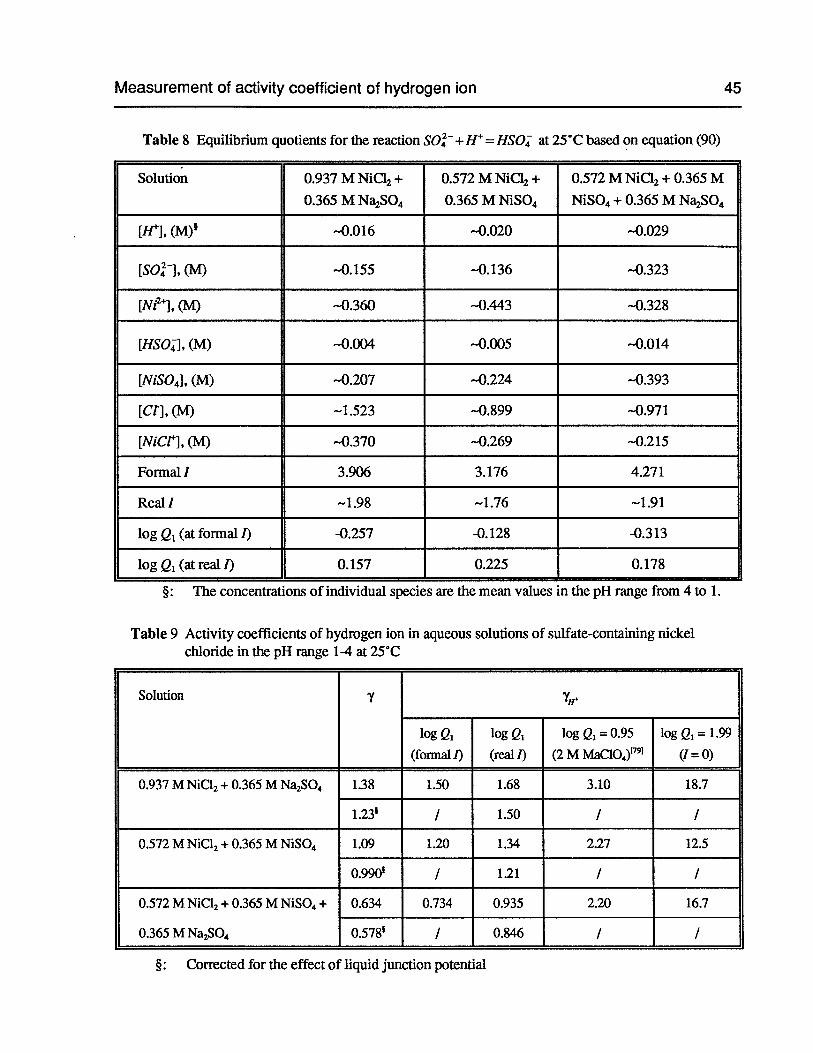
Measurement of activity coefficient of hydrogen ion 45
Table 8 Equilibrium quotients for the reaction SO+H=HSO at 25°C based on equation (90)
Solution 0.937 M NiCI2+ 0.572 M NiC12+ 0.572 M NiC12+ 0.365 M
0.365 M NaSO4 0.365 M NiSO4 NiSO4+ 0.365 M Na2SO4
[H], (M) —0.016 —0.020 —0.029
[SOt], (M) —0.155 —0.136 —0.323
[Ni], (M) —0.360 —0.443 —0.328
[HSO], (M) —0.004 —0.005 —0.014
[NiSO4], (M) —0.207 —0.224 —0.393
[Ct], (M) —1.523 —0.899 —0.971
[NiCfl, (M) —0.370 —0.269 —0.215
Formal! 3.906 3.176 4.271
RealI —1.98 —1.76 —1.91
logQ1(atformall) -0.257 -0.128 -0.313
logQ1(atreall) 0.157 0.225 0.178
§: The concentrations of individual species are the mean values in the pH range from 4 to 1.
Table 9 Activity coefficients of hydrogen ion in aqueous solutions of sulfate-containing nickelchloride in the pH range 1-4 at 25°C
Solution y 1,1+
log Q1 log Q1 log Q1 = 0.95 log Q1 = 1.99
(fonnal 1) (real 1) (2 M MaC1O4)9’ (1=0)
0.937 M NiC12+ 0.365 M Na2SO4 1.38 1.50 1.68 3.10 18.7
1.23k / 1.50 I /
0.572 M NiCl2+ 0.365 M NiSO4 1.09 1.20 1.34 2.27 12.5
0.990* / 1.21 / /
0.572 M NiC12+ 0.365 M N1SO4+ 0.634 0.734 0.935 2.20 16.7
0.365 M Na2SO4 0.578 I 0.846 / /
§: Corrected for the effect of liquid junction potential
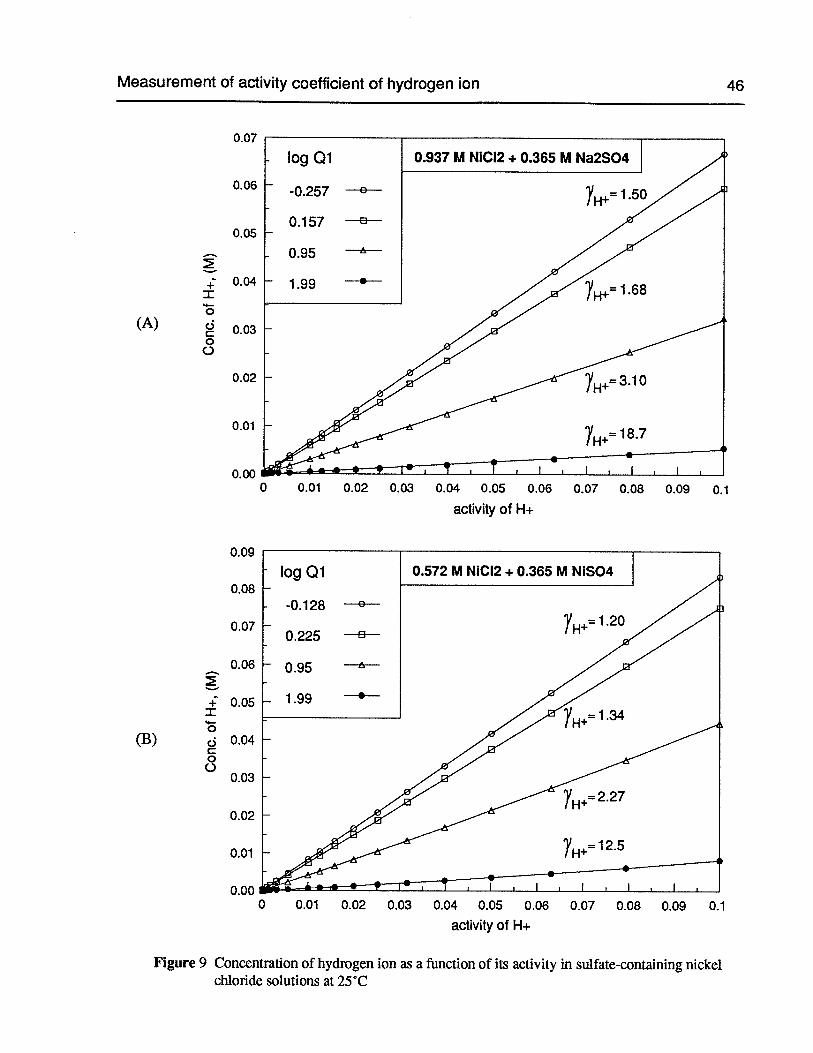
Measurement of activity coefficient of hydrogen ion
0.06
0.05
.0.04
x0
C)C00
0.02
0.01
0.00
o.o
0.08
0.07
0.06
. 0.05
0
d 0.04
(0.03
0.02
0.01
0.00
0.07
46
(A)
(B)
0 0.01 0.02 0.03 0.04 0.05 0.06 0.07 0.08 0.09 0.1
activity of H÷
0 0.01 0.02 0.03 0.04 0.05 0.06 0.07 0.08 0.09 0.1
activity of H+
Figure 9 Concentration of hydrogen ion as a function of its activity in sulfate-containing nickelchloride solutions at 25CC
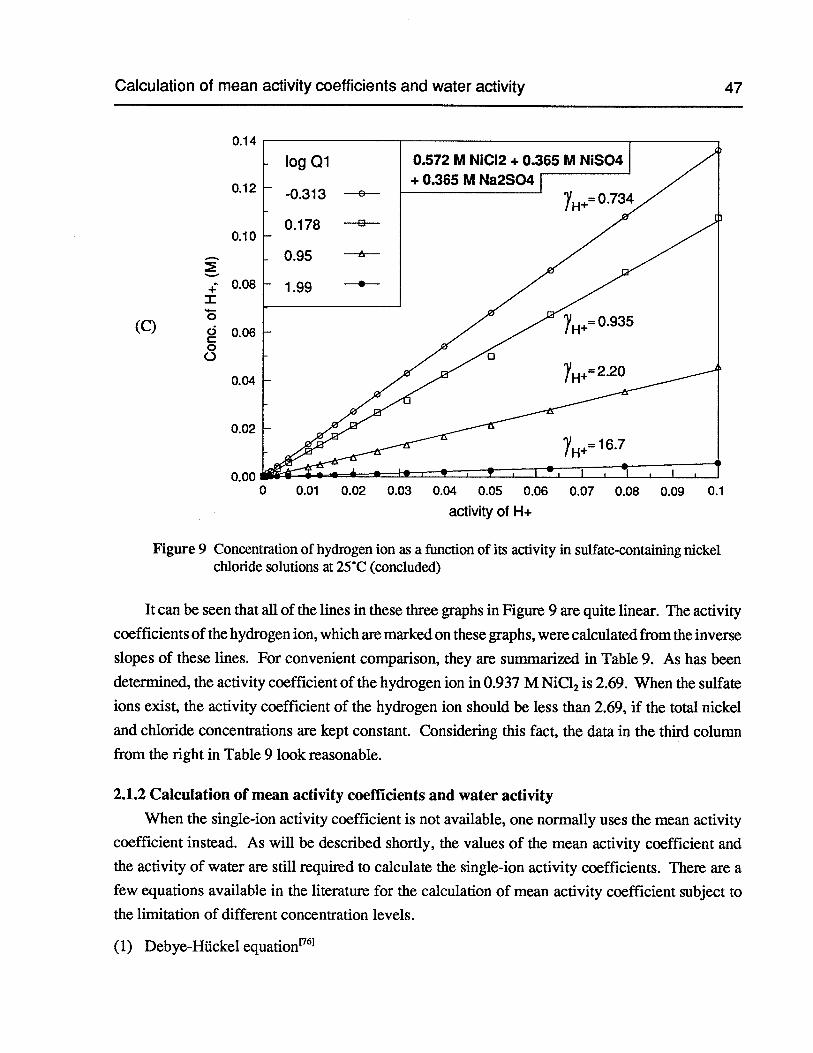
Calculation of mean activity coefficients and water activity 47
0.14
0.12
0.10
0.08
(C) ::0.02
0.00
Figure 9 Concentration of hydrogen ion as a function of its activity in sulfate-containing nickelchloride solutions at 25CC (concluded)
It can be seen that all of the lines in these three graphs in Figure 9 are quite linear. The activity
coefficients of the hydrogen ion, which are marked on these graphs, were calculated from the inverse
slopes of these lines. For convenient comparison, they are summarized in Table 9. As has been
determined, the activity coefficient of the hydrogen ion in 0.937 M NiCl2is 2.69. When the sulfate
ions exist, the activity coefficient of the hydrogen ion should be less than 2.69, if the total nickel
and chloride concentrations are kept constant. Considering this fact, the data in the third column
from the right in Table 9 look reasonable.
2.1.2 Calculation of mean activity coefficients and water activity
When the single-ion activity coefficient is not available, one normally uses the mean activity
coefficient instead. As will be described shortly, the values of the mean activity coefficient and
the activity of water are still required to calculate the single-ion activity coefficients. There are a
few equations available in the literature for the calculation of mean activity coefficient subject to
the limitation of different concentration levels.
0 0.01 0.02 0.03 0.04 0.05 0.06 0.07 0.08 0.09 0.1
activity of H+
(1) Debye-Huckel equation61
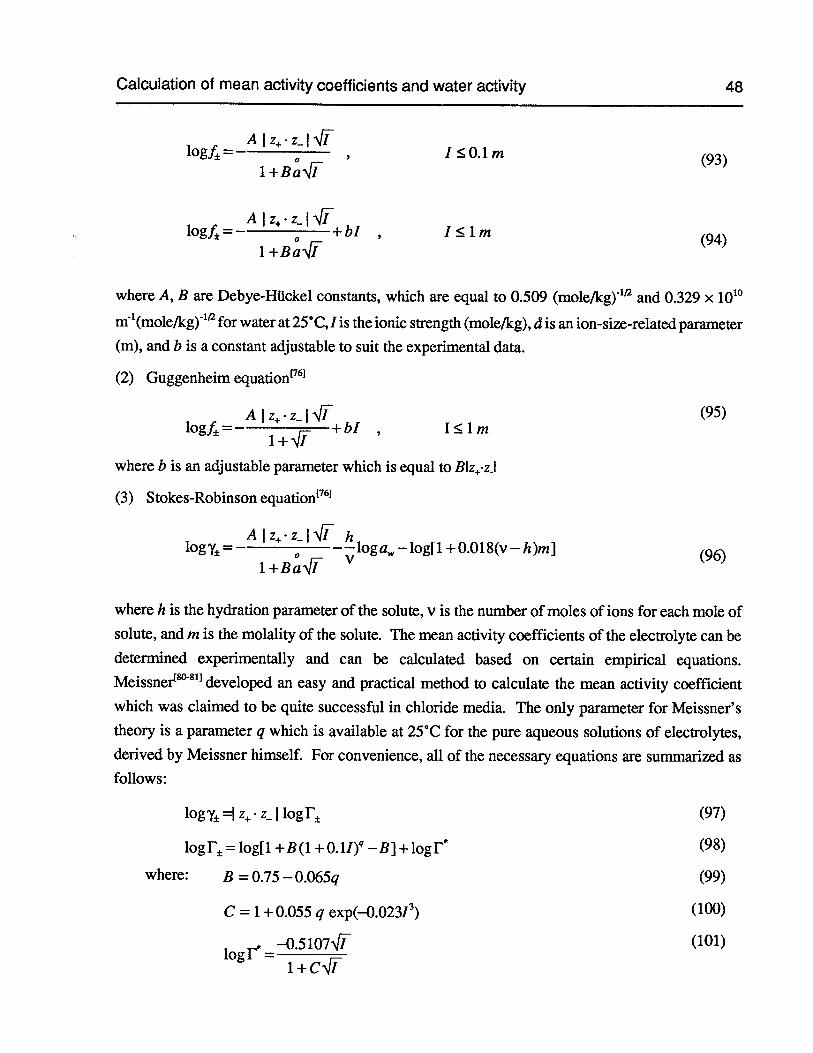
Calculation of mean activity coefficients and water activity 48
AIz+•zj’jTlogf =
— 0I 0.1 m (93)
1+Ba’Ji
AIz+•z41ilogf =
—
+ bI , I 1 m (94)1+Ba,IT
where A, B are Debye-HUckel constants, which are equal to 0.509 (mole/kg)’2and 0.329 x 10¹⁰
m4(mole/kg)1for water at 25°C, 1 is the ionic strength (mole/kg), d is an ion-size-related parameter(m), and b is a constant adjustable to suit the experimental data.
(2) Guggenheim equation6
AIz+.z_l’Ji (95)logf=— +bI , Ilmi+.qi
where b is an adjustable parameter which is equal to Blzzi
(3) Stokes-Robinson equation’61
AIz+z_Ii hlogy =
—
——loga,, —log[1 +0.018(v —h)m] (96)1+Baqi
V
where h is the hydration parameter of the solute, v is the number of moles of ions for each mole ofsolute, and m is the molality of the solute. The mean activity coefficients of the electrolyte can bedetermined experimentally and can be calculated based on certain empirical equations.Meissner08’developed an easy and practical method to calculate the mean activity coefficientwhich was claimed to be quite successful in chloride media. The only parameter for Meissner’stheory is a parameter q which is available at 25°C for the pure aqueous solutions of electrolytes,derived by Meissner himself. For convenience, all of the necessary equations are summarized asfollows:
logy=Iz.z_flogT’ (97)
logf= log[1 +B(1 +0•1J) _B]+logr* (98)
where: B = 0.75 — 0.065q (99)
C = 1+0.055 q exp(—0.02313) (100)
* —0.5107qi (101)logf =
i+cqi
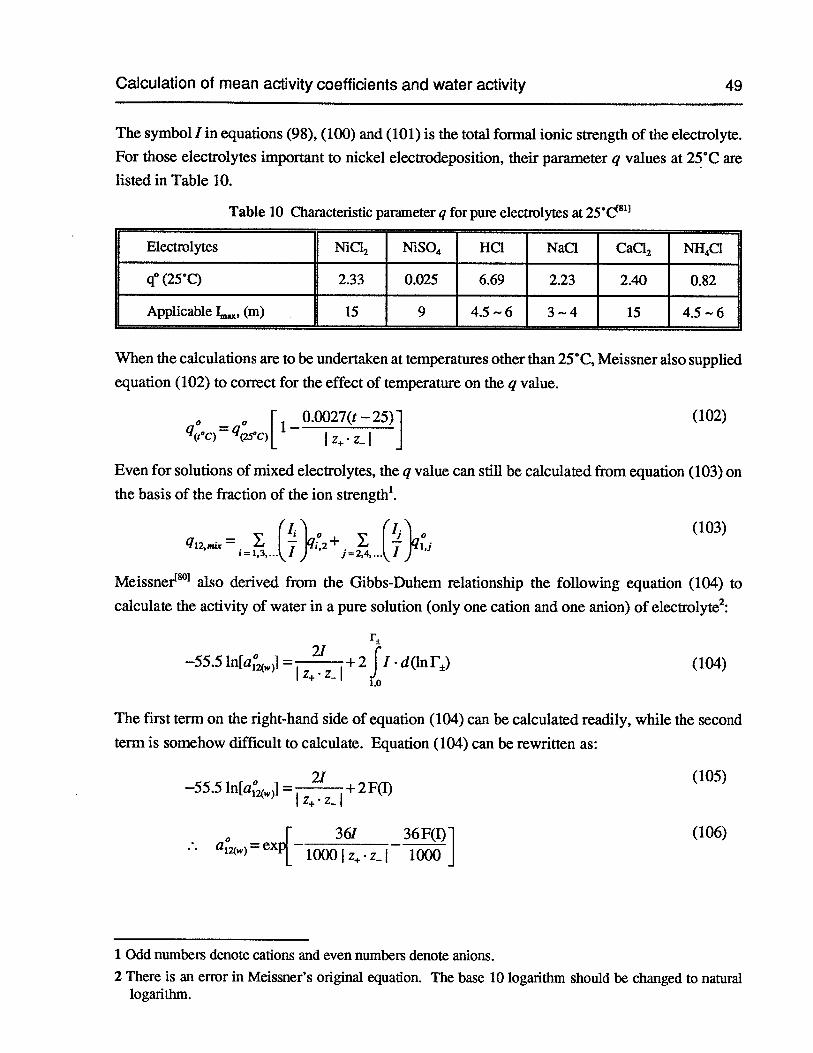
Calculation of mean activity coefficients and water activity 49
The symbol I in equations (98), (100) and (101) is the total formal ionic strength of the electrolyte.
For those electrolytes important to nickel electrodeposition, their parameter q values at 25°C are
listed in Table 10.
Table 10 Characteristic parameter q for pure electrolytes at 25°d81’
Electrolytes NiC12 NiSO4 HQ NaC1 CaCl2 NH4C1
q° (25°C) 2.33 0.025 6.69 2.23 2.40 0.82
Applicable L, (m) 15 9 4.5 —6 3 —4 15 4.5 —6
When the calculations are to be undertaken at temperatures other than 25°C, Meissner also supplied
equation (102) to correct for the effect of temperature on the q value.
— F1 — 0.0027(t —25)] (102)1Q”C) — “(25°C)[ I z+• z_ I ]
Even for solutions of mixed electrolytes, the q value can still be calculated from equation (103) on
the basis of the fraction of the ion strength’.
(jf’i (103)— I IIOL IIqiz— I — I1i,2m I — rllj
i=1,3,...iI) j=2,4...I)
Meissner°1 also derived from the Gibbs-Duhem relationship the following equation (104) to
calculate the activity of water in a pure solution (only one cation and one anion) of electrolyte2:
—55.5 ln[a= +2J1.d(lnr±) (104)I z+.z_I
1.0
The first term on the right-hand side of equation (104) can be calculated readily, while the second
term is somehow difficult to calculate. Equation (104) can be rewritten as:
______
(105)—55.5 ln[a,J = +2F(I)
I z+. z_
— F 361 36F(I)] (106)at2(W)_ex11lJ00IZZI 1000 j
1 Odd numbers denote calions and even numbers denote anions.2 There is an error in Meissner’s original equation. The base 10 logarithm should be changed to natural
logarithm.
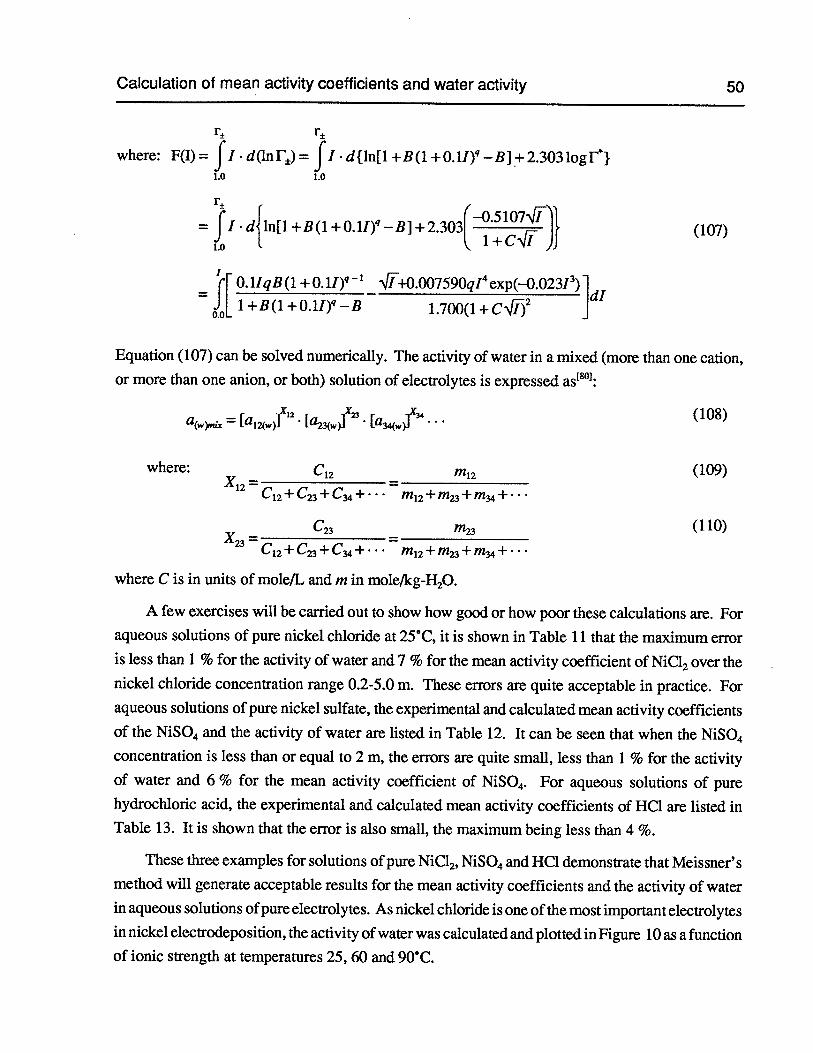
Calculation of mean activity coefficients and water activity 50
where: F=
d(lnr)= d{ln[l +B(1
= d{ln[1 +B(1 +o1I) _B]+2.303()} (107)
—
‘([0. lIqB (1+0. — ‘Ji+0.007590qI exp(—0.02313)dl[ 1±B(10.1J)_B 1.700(1+CJij2
Equation (107) can be solved numerically. The activity of water in a mixed (more than one cation,or more than one anion, or both) solution of electrolytes is expressed as°1:
— r i12 r r (108)— Lal2(W La23(W)J [a34(W)
where: C12
_________________
(109)x12= =C12+C+C+•
c
_____________
(110)x= =2 C12+C+C+. m12+rn+m+••
where C is in units of mole/L and m in molelkg-H20.
A few exercises will be carried out to show how good or how poor these calculations are. Foraqueous solutions of pure nickel chloride at 25°C, it is shown in Table 11 that the maximum erroris less than 1 % for the activity of water and 7 % for the mean activity coefficient of NiCl2over thenickel chloride concentration range 0.2-5.0 m. These errors are quite acceptable in practice. Foraqueous solutions of pure nickel sulfate, the experimental and calculated mean activity coefficientsof the NiSO4 and the activity of water are listed in Table 12. It can be seen that when the NiSO4concentration is less than or equal to 2 m, the errors are quite small, less than 1 % for the activityof water and 6 % for the mean activity coefficient of NiSO4. For aqueous solutions of purehydrochloric acid, the experimental and calculated mean activity coefficients of HC1 are listed inTable 13. It is shown that the error is also small, the maximum being less than 4 %.
These three examples for solutions of pure NiC12,NiSO4and HC1 demonstrate that Meissner’smethod will generate acceptable results for the mean activity coefficients and the activity of waterin aqueous solutions ofpure electrolytes. As nickel chloride is one of the most important electrolytesin nickel electrodeposition, the activity ofwater was calculated and plotted in Figure 10 as a functionof ionic strength at temperatures 25, 60 and 90°C.
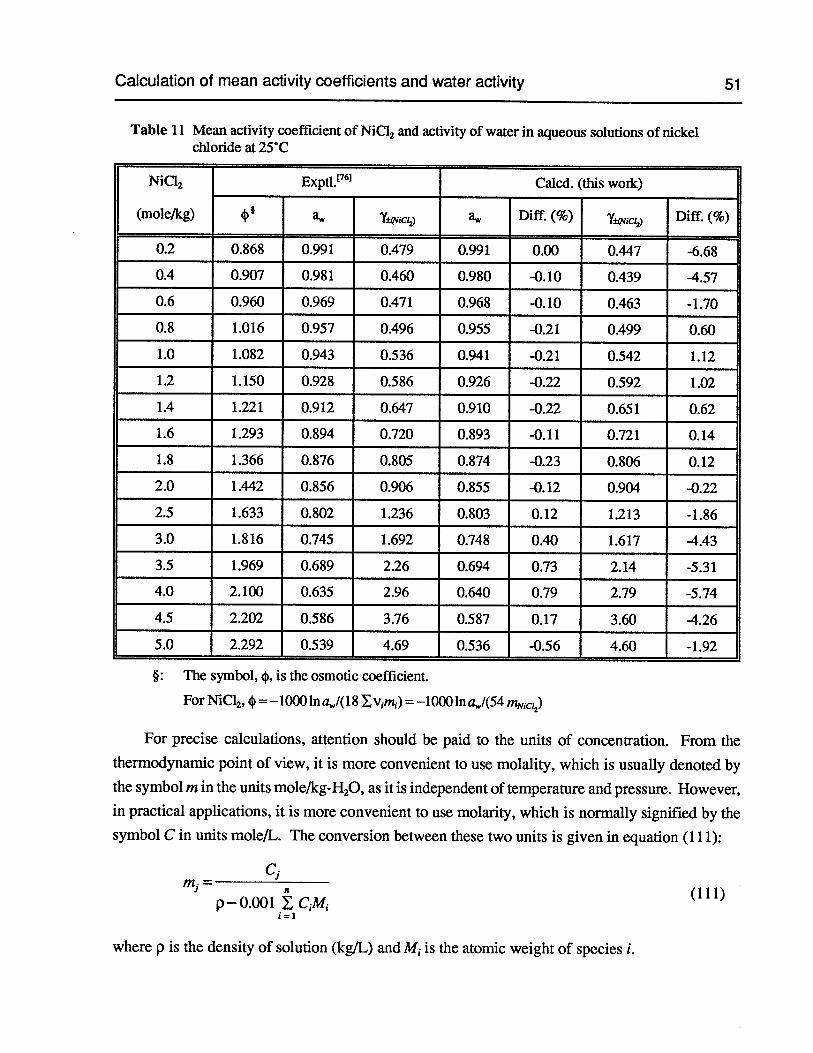
Calculation of mean activity coefficients and water activity 51
Table 11 Mean activity coefficient of NiC12 and activity of water in aqueous solutions of nickelchloride at 25C
NiCl2 Exptl.1761 Calcd. (this work)
(mole/kg) a Y±YicL2) a Diff. (%) Y±QiCl2) Diff. (%)
0.2 0.868 0.991 0.479 0.991 0.00 0.447 -6.68
0.4 0.907 0.981 0.460 0.980 -0.10 0.439 -4.57
0.6 0.960 0.969 0.471 0.968 -0.10 0.463 -1.70
0.8 1.016 0.957 0.496 0.955 -0.21 0.499 0.60
1.0 1.082 0.943 0.536 0.941 -0.21 0.542 1.12
1.2 1.150 0.928 0.586 0.926 -0.22 0.592 1.02
1.4 1.221 0.912 0.647 0.910 -0.22 0.651 0.62
1.6 1.293 0.894 0.720 0.893 -0.11 0.721 0.14
1.8 1.366 0.876 0.805 0.874 -0.23 0.806 0.12
2.0 1.442 0.856 0.906 0.855 -0.12 0.904 -0.22
2.5 1.633 0.802 1.236 0.803 0.12 1.213 -1.86
3.0 1.816 0.745 1.692 0.748 0.40 1.617 -4.43
3.5 1.969 0.689 2.26 0.694 0.73 2.14 -5.31
4.0 2.100 0.635 2.96 0.640 0.79 2.79 -5.74
4.5 2.202 0.586 3.76 0.587 0.17 3.60 -4.26
5.0 2.292 0.539 4.69 0.536 -0.56 4.60 -1.92
§: The symbol, 4), is the osmotic coefficient.
For NiC12,4) = —1000 1na/(18v1m1)= —1000 Ina/(54 mMc,)
For precise calculations, attention should be paid to the units of concentration. From thethermodynamic point of view, it is more convenient to use molality, which is usually denoted bythe symbol m in the units mole/kg-H20,as it is independent of temperature and pressure. However,in practical applications, it is more convenient to use molarity, which is normally signified by thesymbol C in units mole/L. The conversion between these two units is given in equation (111):
Ci
(111)p-0.OOl C1M1
1=1
where p is the density of solution (kg/L) and M. is the atomic weight of species i.
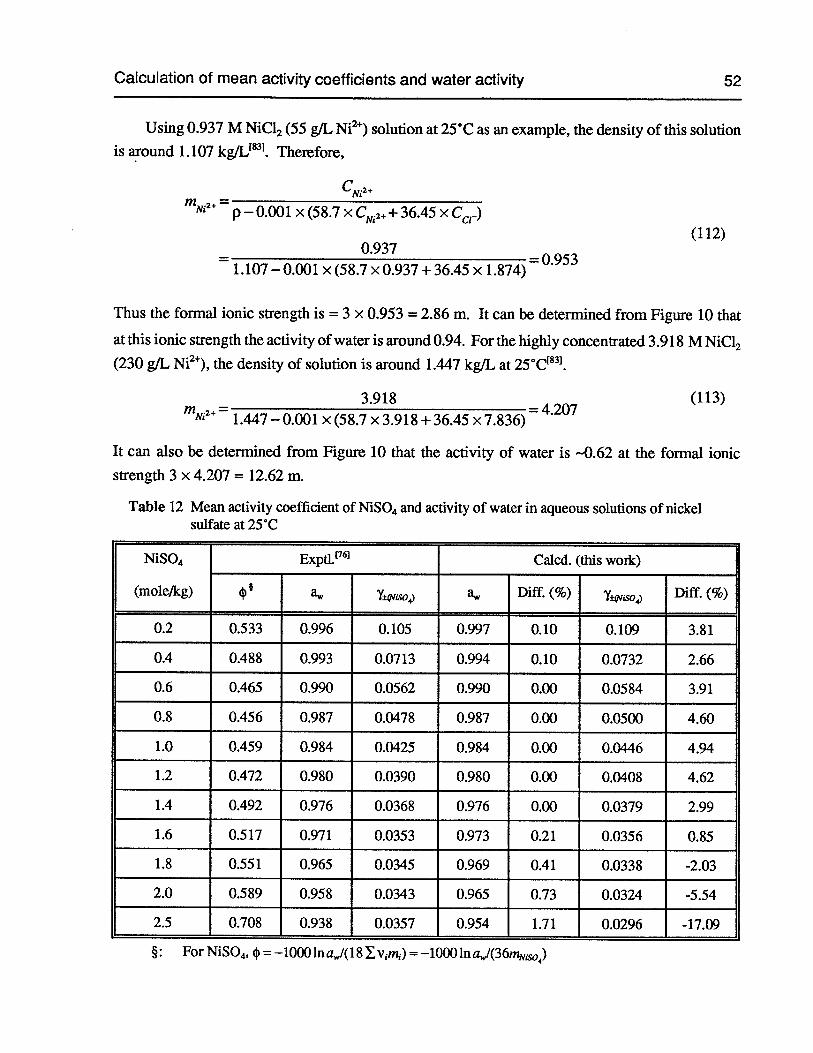
Calculation of mean activity coefficients and water activity 52
Using 0.937 M NiC12 (55 g/L Ni2)solution at 25CC as an example, the density of this solutionis around 1.107 kgf1i83. Therefore,
= p — 0.001 x (58.7 x CN+ + 36.45 x
(112)0.937
0953— 1.107—0.001 x(58.7 xO.937+36.45 x 1.874)
Thus the formal ionic strength is = 3 x 0.953 = 2.86 m. It can be determined from Figure 10 that
at this ionic strength the activity ofwater is around 0.94. For the highly concentrated 3.918 M NiC12
(230 g/L Ni2), the density of solution is around 1.447 kgfL at 25C831.
3.918 (113)
= 1.447 — 0.001 x (58.7 x 3.9 18 + 36.45 x 7.836)= 4.207
It can also be determined from Figure 10 that the activity of water is --0.62 at the formal ionic
strength 3 x 4.207 = 12.62 m.
Table 12 Mean activity coefficient of NiSO4and activity of water in aqueous solutions of nickelsulfate at 25C
NiSO4 Exptl.t761 Calcd. (this work)
(mole/kg) a a Diff. (%) Duff. (%)
0.2 0.533 0.996 0.105 0.997 0.10 0.109 3.81
0.4 0.488 0.993 0.0713 0.994 0.10 0.0732 2.66
0.6 0.465 0.990 0.0562 0.990 0.00 0.0584 3.91
0.8 0.456 0.987 0.0478 0.987 0.00 0.0500 4.60
1.0 0.459 0.984 0.0425 0.984 0.00 0.0446 4.94
1.2 0.472 0.980 0.0390 0.980 0.00 0.0408 4.62
1.4 0.492 0.976 0.0368 0.976 0.00 0.0379 2.99
1.6 0.517 0.971 0.0353 0.973 0.21 0.0356 0.85
1.8 0.551 0.965 0.0345 0.969 0.41 0.0338 -2.03
2.0 0.589 0.958 0.0343 0.965 0.73 0.0324 -5.54
2.5 0.708 0.938 0.0357 0.954 1.71 0.0296 -17.09
§: For NiSO4,.p —1000 1na/(1 8 Ev1m) = —1000 1na/(36m,4)
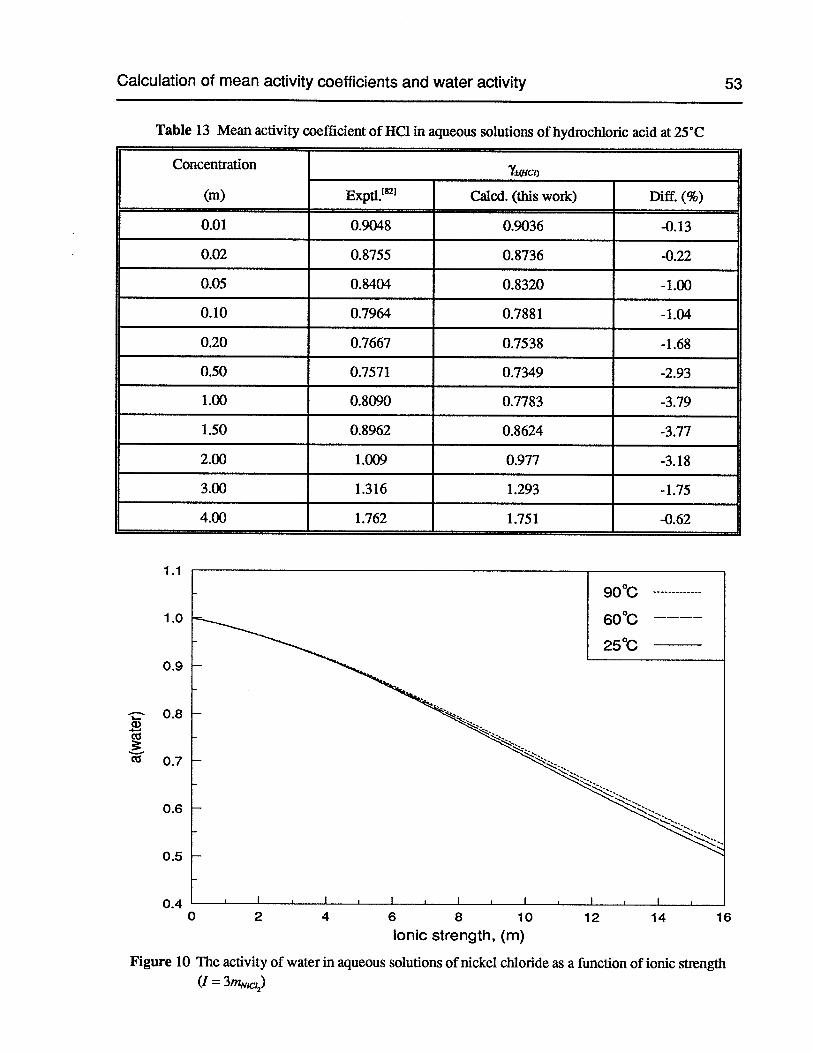
Calculation of mean activity coefficients and water activity 53
Table 13 Mean activity coefficient of HC1 in aqueous solutions of hydrochionc acid at 25C
Concentration
(m) ExpU. Calcd. (this work) Duff. (%)
0.01 0.9048 0.9036 -0.13
0.02 0.8755 0.8736 -0.22
0.05 0.8404 0.8320 -1.00
0.10 0.7964 0.7881 -1.04
0.20 0.7667 0.7538 -1.68
0.50 0.757 1 0.7349 -2.93
1.00 0.8090 0.7783 -3.79
1.50 0.8962 0.8624 -3.77
2.00 1.009 0.977 -3.18
3.00 1.316 1.293 -1.75
4.00 1.762 1.751 -0.62
a)
as
1.1
1.0
0.9
0.8
0.7
0.6
0.5
0.40 2 4 6 8 10 12 14 16
Ionic strength, (m)
Figure 10 The activity of water in aqueous solutions of nickel chloride as a function of ionic strength(I =3mNC,2)
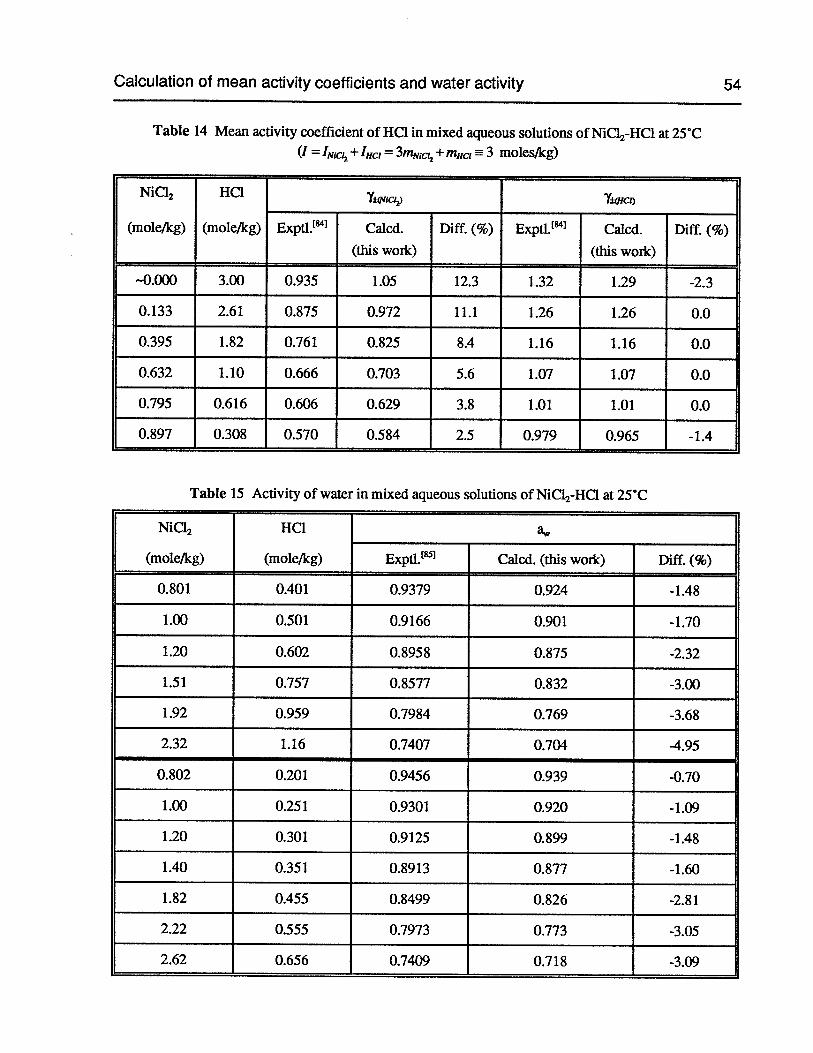
Calculation of mean activity coefficients and water activity 54
Table 14 Mean activity coefficient of HC1 in mixed aqueous solutions ofNiC12-HC1 at 25C(I = ‘NiC + ‘HCl = 3mNjc + m,JC, 3 moles/kg)
NiC12 HQ‘Y±qlcr)
(mole/kg) (mole/kg) Expt1. Calcd. Diff. (%) Exptl. Calcd. Duff. (%)(this work) (this work)
—0.000 3.00 0.935 1.05 12.3 1.32 1.29 -2.3
0.133 2.61 0.875 0.972 11.1 1.26 1.26 0.0
0.395 1.82 0.761 0.825 8.4 1.16 1.16 0.0
0.632 1.10 0.666 0.703 5.6 1.07 1.07 0.0
0.795 0.616 0.606 0.629 3.8 1.01 1.01 0.0
0.897 0.308 0.570 0.584 2.5 0.979 0.965 -1.4
Table 15 Activity of water in mixed aqueous solutions ofNiC12-HC1 at 25C
NiC12 HQ
(mole/kg) (mole/kg) ExptL Calcd. (this work) Duff. (%)
0.801 0.401 0.9379 0.924 -1.48
1.00 0.501 0.9166 0.901 -1.70
1.20 0.602 0.8958 0.875 -2.32
1.51 0.757 0.8577 0.832 -3.00
1.92 0.959 0.7984 0.769 -3.68
2.32 1.16 0.7407 0.704 -4.95
0.802 0.20 1 0.9456 0.939 -0.70
1.00 0.251 0.9301 0.920 -1.09
1.20 0.301 0.9125 0.899 -1.48
1.40 0.351 0.8913 0.877 -1.60
1.82 0.455 0.8499 0.826 -2.81
2.22 0.555 0.7973 0.773 -3.05
2.62 0.656 0.7409 0.7 18 -3.09
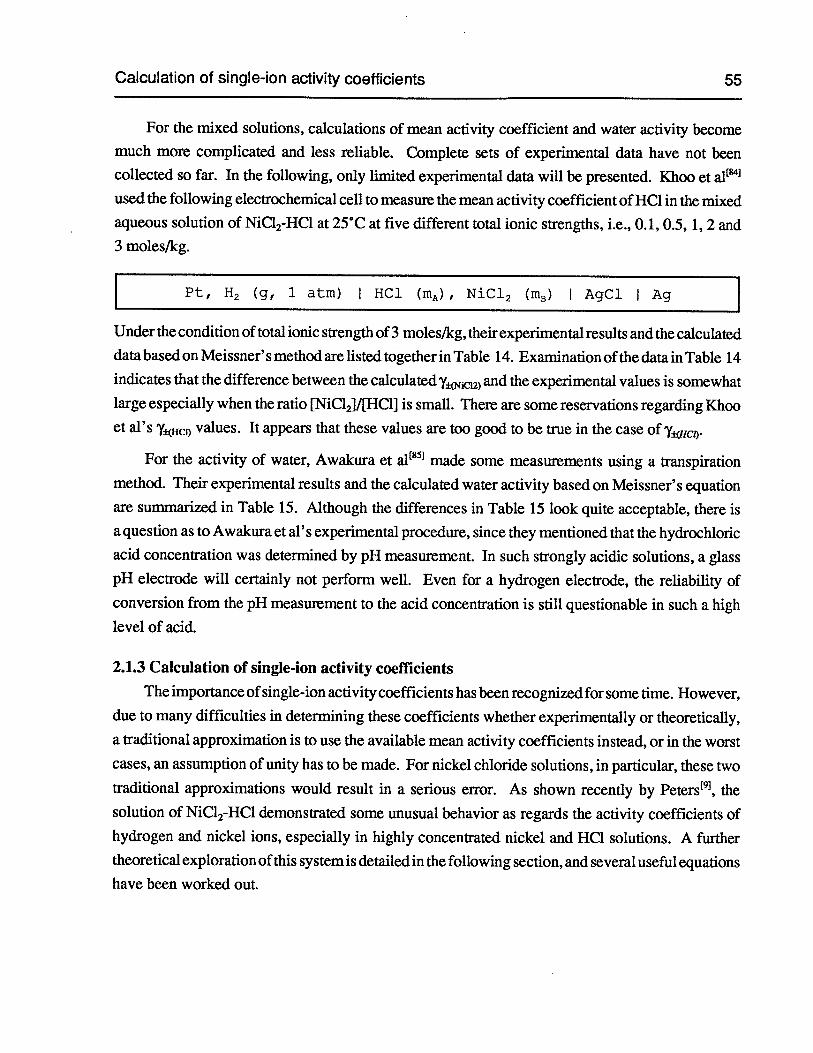
Calculation of single-ion activity coefficients 55
For the mixed solutions, calculations of mean activity coefficient and water activity become
much more complicated and less reliable. Complete sets of experimental data have not beencollected so far. In the following, only limited experimental data will be presented. Khoo et alused the following electrochemical cell to measure the mean activity coefficient ofHC1 in the mixedaqueous solution of NiC12-HC1 at 25CC at five different total ionic strengths, i.e., 0.1,0.5, 1,2 and3 moles/kg.
Pt, H2 (g, 1 atm) I HC1 (mA), NIC12 (mB) I AgC1 I Ag
Under the condition oftotal ionic strength of3 moles/kg, their experimental results and the calculateddata based on Meissner’ s method are listed together in Table 14. Examination of the data in Table 14indicates that the difference between the calculated y>and the experimental values is somewhatlarge especially when the ratio [NiC12J/[HC1J is small. There are some reservations regarding Khooet al’s Ycl) values. It appears that these values are too good to be true in the case of Y±HC1).
For the activity of water, Awakura et al made some measurements using a transpirationmethod. Their experimental results and the calculated water activity based on Meissner’s equationare summarized in Table 15. Although the differences in Table 15 look quite acceptable, there isa question as to Awakura et al’s experimental procedure, since they mentioned that the hydrochloricacid concentration was determined by pH measurement. In such strongly acidic solutions, a glasspH electrode will certainly not perform well. Even for a hydrogen electrode, the reliability ofconversion from the pH measurement to the acid concentration is still questionable in such a high
level of acid.
2.1.3 Calculation of single-ion activity coefficients
The importance ofsingle-ion activity coefficients has been recognized for some time. However,
due to many difficulties in determining these coefficients whether experimentally or theoretically,a traditional approximation is to use the available mean activity coefficients instead, or in the worst
cases, an assumption of unity has to be made. For nickel chloride solutions, in particular, these twotraditional approximations would result in a serious error. As shown recently by Peters91, thesolution of NiCl2-HC1 demonstrated some unusual behavior as regards the activity coefficients ofhydrogen and nickel ions, especially in highly concentrated nickel and HC1 solutions. A furthertheoretical exploration of this system is detailed in the following section, and several useful equationshave been worked out.
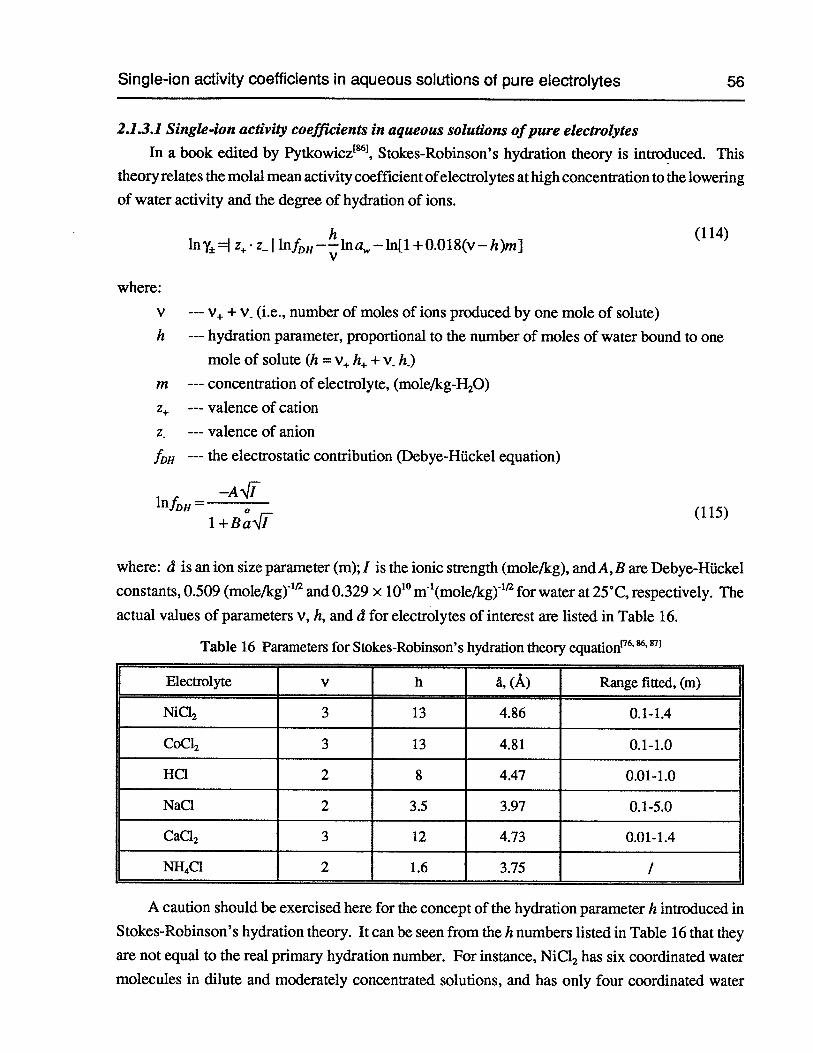
Single-ion activity coefficients in aqueous solutions of pure electrolytes 56
2.1.3.1 Single-ion activity coefficients in aqueous solutions ofpure electrolytes
In a book edited by Pytkowicz, Stokes-Robinson’s hydration theory is introduced. This
theory relates the molal mean activity coefficientofelectrolytes at high concentration to the lowering
of water activity and the degree of hydration of ions.
h (114)ln’±=iz÷.z_IlnfDH;lnaW1n[1+0.018(vh)m]
where:
v --- v + v. (i.e., number of moles of ions produced by one mole of solute)
h --- hydration parameter, proportional to the number of moles of water bound to one
mole of solute (Ii = v.. h + v.. hj
m --- concentration of electrolyte, (mole/kg-H20)
valence of cation
z. --- valence of anion
JDH --- the electrostatic contribution (Debye-Huckel equation)
—AJT1fDH
1+Ba41
where: €1 is an ion size parameter (m); I is the ionic strength (mole/kg), and A, B are Debye-Huckel
constants, 0.509 (mole/kg)”2and 0.329 x 10¹⁰m4(mole/kg)”2for water at 25°C, respectively. The
actual values of parameters v, h, and d for electrolytes of interest are listed in Table 16.
Table 16 Parameters for Stokes-Robinson’s hydration theory equation6‘
Electrolytev h a, (A) Range fitted, (m)
NiCI2 3 13 4.86 0.1-1.4
Cod2 3 13 4.81 0.1-1.0
HC1 2 8 4.47 0.01-1.0
NaC1 2 3.5 3.97 0.1-5.0
CaCI2 3 12 4.73 0.01-1.4
NH4C1 2 1.6 3.75 /
A caution should be exercised here for the concept of the hydration parameter h introduced in
Stokes-Robinson’s hydration theory. It can be seen from the h numbers listed in Table 16 that they
are not equal to the real primary hydration number. For instance, NiCl2has six coordinated water
molecules in dilute and moderately concentrated solutions, and has only four coordinated water
Single-ion activity coefficients in aqueous solutions of pure electrolytes 57
molecules when highly concentrated HC1 is added. However, h is directly proportional to thehydration number of the solute. The values of the parameter h in Table 16 were derived from curvefitting based on the experimental data. There is a reasonable speculation that the values of thehydration parameter h should decrease as the electrolyte becomes more concentrated.
For a general formula of an electrolyte with complete dissociation:
MX =v÷M+v_X (116)
where M denotes a cation and X represents an anion. The symbol V12 is defined as equal to v + V..
On the basis of the Gibbs-Duhem relationship and Stokes-Robinson’s hydration theory, a general
equation has been developed to calculate the single-ion activity coefficients in aqueous solutions
of pure electrolyte.
z. V12 z_ VZh 1na ln[1 +0.018(v12—vh)m]ln=1ny—
12
—Iz_I (117)
The detailed derivation of equation (117) is documented in Appendix 2. Three assumptions were
used in developing equation (117).
(1) Anion (such as chloride ion) is assumed not to be hydrated.
(2) Water bound to one or both ionic species is no longer part of the bulk solvent.
(3) The Debye-HUckel theory gives correct values for the activity coefficients of hydrated
ions on the mole-fraction scale.
The specific equations for individual electrolytes can be derived from the general equation (117).
For the pure electrolytes of 1:1 univalent chlorides, such as HC1, NaCl, KC1 or NH4C1 etc. z = 1,
Izi = 1, v = 1, V. = 1, and V12 = v÷ + V. = 2. When these numbers are placed into equation (117), it
follows that:
><.h . lna+
111n[1 +0.018(2—1 xh)m]=lny±—lna
h (118)log = logy—1oga
h (119)logy_ = 2 x logy—logy = logy+loga
In terms of the osmotic coefficient, 4, for 1:1 pure electrolyte:
Single-ion activity coefficients in aqueous solutions of pure electrolytes 58
—100Olna —1000lna —2.303 x l000xloga,4, (120)
182v1rn1 18v12m — 36m
... loga=—O.01563m (121)
Replacing equation (121)into equations (118) and (119), it follows that:
hlogy÷ = logy — loga = logy + 0.00782hm
(122)
hlogy_ = logy+loga = logy—0.00782hm
(123)
Equations (122) and (123) are exactly the same as those developed by Bates et al. Bates et a1
showed that these two equations were quite successful for solutions ofHC1, LiC1, NaCl, KC1, RbC1,
CsC1 and NH4C1. For example, 2 m HC1 has y = 1.009, y÷ = 1.42 1, ‘ = 0.7 17 while 3 m HC1 has
= 1.316, ‘y+ = 2.357, ‘y = 0.735. The parameter h in equations (122) and (123) is the hydration
parameter of the cation or electrolyte, as the anion is assumed not to be hydrated. According to
Robinson and Bates881,when the hydration of the anion is taken into account, equations (122) and
(123) can be simply rewritten as equations (124) and (125):
(h—h_) (124)logy = log ‘‘±
— 2log a,4, = 1ogy + 0.00782(h — h_)m
(h÷—h_) (125)logy_ = logy+
2loga = logy—0.00782(h—h_)mØ
For the pure electrolytes of 2:1 divalent chlorides, such as NiCl2,CoCl2,MnCl2,MgC12 and
CaC12. z =2, Izj = 1, v. = 1, v =2, and v12 v÷ + v. = 3. Again, when these numbers are put into
the general equation (117), the following equation is obtained:
ln12+=1ny±—3<2.h.lna+211ln[1+0.018(3—1xh)m](126)
h=2xlny±—-lna+ln[1 +0.018(3—h)m]
h (127)logy24.= 2 x logy—--loga,4,+ log[1 + 0.018(3 — h)m]
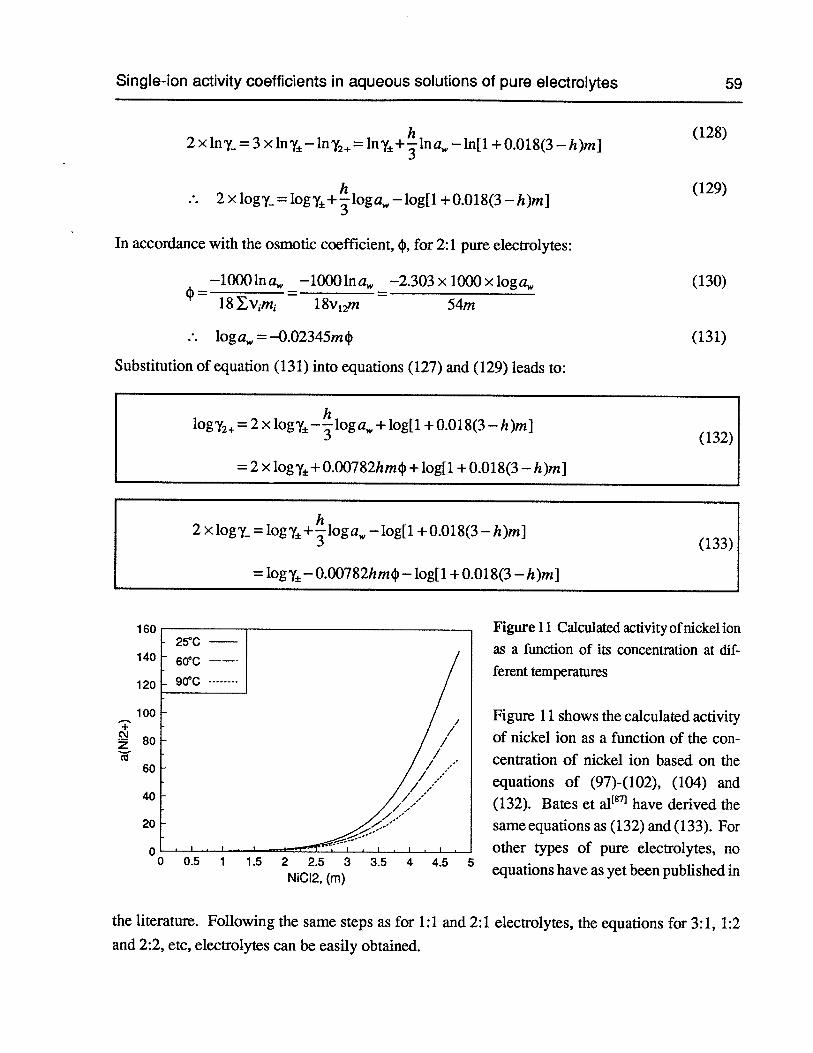
Single-ion activity coefficients in aqueous solutions of pure electrolytes 59
2x1ny_=3x1ny±—iny2+=lny±+lna--1n[1+0.018(3—h)m]
2 x logy_= 1ogy+-loga —log[1 + 0.018(3 —h)m]
In accordance with the osmotic coefficient, , for 2:1 pure electrolytes:
— —1000 in a,4, — —1000 in a,4, — —2.303 x 1000 x log a,4,18v1m1 — 18v12m — 54m
.. log a,4, = —O.02345m
Substitution of equation (131) into equations (127) and (129) leads to:
(128)
(129)
(130)
(131)
logy2= 2 x log’y—loga + log[1 + 0.018(3 —h)m](132)
= 2 x logy+ 0.00782hm + log[1 + 0.018(3 — h)mj
2 x logy_ = logy+-loga —log[1 + 0.018(3 — h)m](133)
= logy— 0.00782hm — log[1 + 0.018(3 — h)m]
Figure 11 Calculated activity ofnickel ion
as a function of its concentration at different temperatures
Figure 11 shows the calculated activityof nickel ion as a function of the concentration of nickel ion based on theequations of (97)-(102), (104) and(132). Bates et a1 have derived thesame equations as (132) and (133). Forother types of pure electrolytes, noequations have as yet been published in
the literature.
and 2:2, etc, electrolytes can be easily obtained.
Following the same steps as for 1:1 and 2:1 electrolytes, the equations for 3:1, 1:2
+c’Jz
160
140
120
100
80
60
40
20
00 0.5 1 1.5 2 2.5 3 3.5 4 4.5 5
N1CI2, (m)
Single-ion activity coefficients in aqueous solutions of pure electrolytes 60
(1) 3:1 electrolytes, such as Aid3
logy3=3 x 1ogy—1oga + 2 x log[1 + 0.018(4 — h)m](134)
=3x1ogy+0.00782hm+2x1og[1+0.018(4—h)m]
3x1og=1ogy+1oga—2x1og[1+O.O18(4—h)m](135)
= 1ogy— O.00782hm —2 x log[1 + 0.018(4— h)m]
—1000 ma)4,— —1000 1na — —2.303 x 1000 x 1oga (136)
18v1m1 — 18v12m — 72m
(2) 1:2 electrolytes, such as Na2SO4
2 x logy÷ = 1ogy—h 1oga — log[1 + 0.018(3 —2h)mJ(137)
= 1ogy— 4 x 0.00782hm — log[1 + 0.018(3 — 2h)mJ
logy2_= 2 x 1ogy+h 1oga +log[1 + 0.018(3 — 2h)mJ(138)
= 2 x 1ogy+ 4 x 0.00782hm4 + log[1 + 0.018(3 — 2h)m]
—10001na —10001na —2.303 x 1000x1oga (139)
18vm1 — 18v12m — 54m
(3) 2.2 electrolytes, such as NiSO4
h (140)logy2÷ = 1ogy—1oga = 1ogy+0.00782hm
h (141)1ogy_ = 1ogy+1oga = 1ogy—0.00782hm
—10O01na —100OIna —2.303 x 1000x1oga (142)
18v1m1 — 18v12m — 36m
Single-ion activity coefficients in aqueous solution of mixed N1CI2-HCI-NaCI 61
2.1.3.2 Single-ion activity coefficients in aqueous solution ofmixedNiC12-HC1-NaC1By definition, the mixed solutions contain more than one cation, or more than one anion, or
both. Here to be considered is a mixed chloride solution of NiCl2+ HC1 + NaCl with a common
chloride anion. The following symbols have been assigned:
mHc, --- molality of HC1 hHc, --- hydration parameter of HC1
molality of NiC12 hN --- hydration parameter of NiC12
molality of NaCI hNj --- hydration parameter of NaC1
m =mHC,+mNQ+mN1 (143)
XHCI =m111/m , = mN/m and XN, = mN,/m (144)
h = XHcI +XN. hNIc +XN,. (145)
(XHC1 +2XN + XN,) log1cr =X11,logHc,) +XNlog Y±(NicL + XN, log’y±(NCl)
XHCI — +XN—+XN, —L! loga,4, — XHCI log{1 + 0.018(2— hHCl)mHC,J
2 3 2 (146)
—2XNC log[1 + 0.018(3— hN)mNj — XN, log[1 + 0.018(2
— hNl)mN,1
+log{1 + 0.018[(2— hHCl)mHC, + (3— hN)mN + (2—
Based on the same Gibbs-Duhem relationship and Stokes-Robinson’s hydration theory and applying
the same assumptions as in developing equation (117) for pure electrolytes, the equation (146) has
been developed to calculate the activity coefficient of the chloride ion. The details for developing
equation (146) are documented in Appendix 3. In terms of the osmotic coefficient, 4),
(XHC, + NiCL2+ XNI) log7cr = XHC, log Y±(HCI) + XNlogYiN + XN, log Y±(Nacl)
_0.00782c1{X11c1 +X—— +XNZ’ J +3mN +2mNI)
(147)
—XHC, log[1 + 0.018(2— hHCl)mHCI] —2Xlog[l + 0.0 18(3
— hNIC,2)mNC]
—XN, log[1 + 0.018(2— hN,)mN,]
+ log[ 1+0.01 8[(2— hHC,)mHCZ + (3— hN)mN + (2— hNl)mN,] }
—1000lna —2.303 x 1000 xloga,4, (148)where: 4)= =18 2v1m1 l8(2mHcl +3mNjcL2+2mNo.c,)
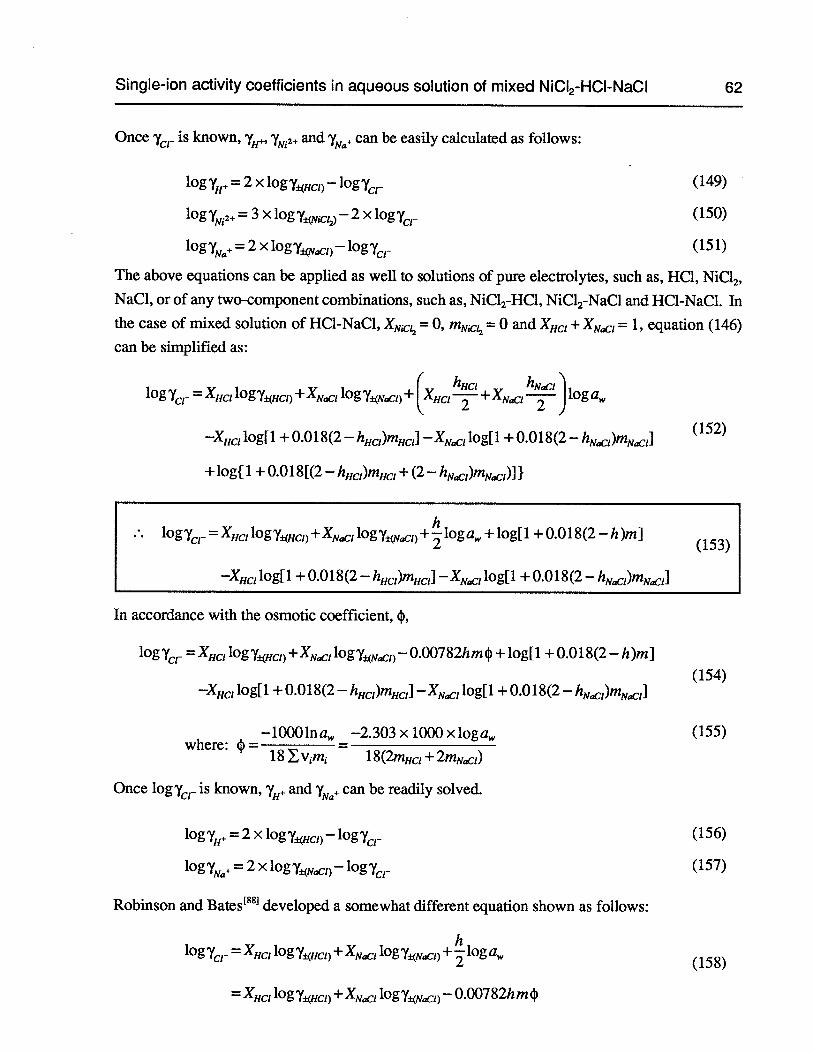
Single-ion activity coefficients in aqueous solution of mixed NiCI2-HCI-NaCl 62
hHc,log’y =X111 log YHc,) +XN, logyq,) + —i— +X,, J loga
X11c, log[1 + 0.0 18(2— hHC,)mffci] —X, log{1 + 0.018(2
— hN,c,)mN,1
+ log[ 1+0.01 8[(2— hHC,)mHC, + (2— hNI)mN,)] }
Once Ycr is known, YN2+ and can be easily calculated as follows:
1og+ = 2 x log’±(llcl)— logy (149)
logy.2+=3 x logy— 2 xlogy (150)
logy+ = 2 xlogyN,)_logy (151)
The above equations can be applied as well to solutions of pure electrolytes, such as, HC1, NiCl2,NaCl, or of any two-component combinations, such as, NiC12-HC1, NiC12-NaC1 and HC1-NaCl. In
the case of mixed solution of HC1-NaCl, XN =0, mNQ =0 and XJJJ + XNQJ1 = 1, equation (146)
can be simplified as:
(152)
In accordance with the osmotic coefficient, ,
logy = XHC, log Y±(Hc,) +XN, logyj(NQ) — 0.00782hm + log[1 + 0.018(2 — h )m]
—XHc, log[1 + 0.0 18(2— hHC,)mHC,l —XNl log[1 + 0.0 18(2
—
—1000 ina —2.303 x 1000 x iogawhere:
= 18 Yv1m1 = 18(2mHc, +2mN1)
Once logcr is known,1H
and can be readily solved.
log‘y11÷ =2 x log’y±(c1) — log
logy+ = 2 x logy±(N1)—logy
Robinson and Bates881 developed a somewhat different equation shown as follows:
logcr = XHCI log Y±(Hci) +XN, logY±(N,) + loga,4,
(154)
(155)
(156)
(157)
(158)
= XHC, logy(Hc,) +XN, logy<J) — 0.00782hm
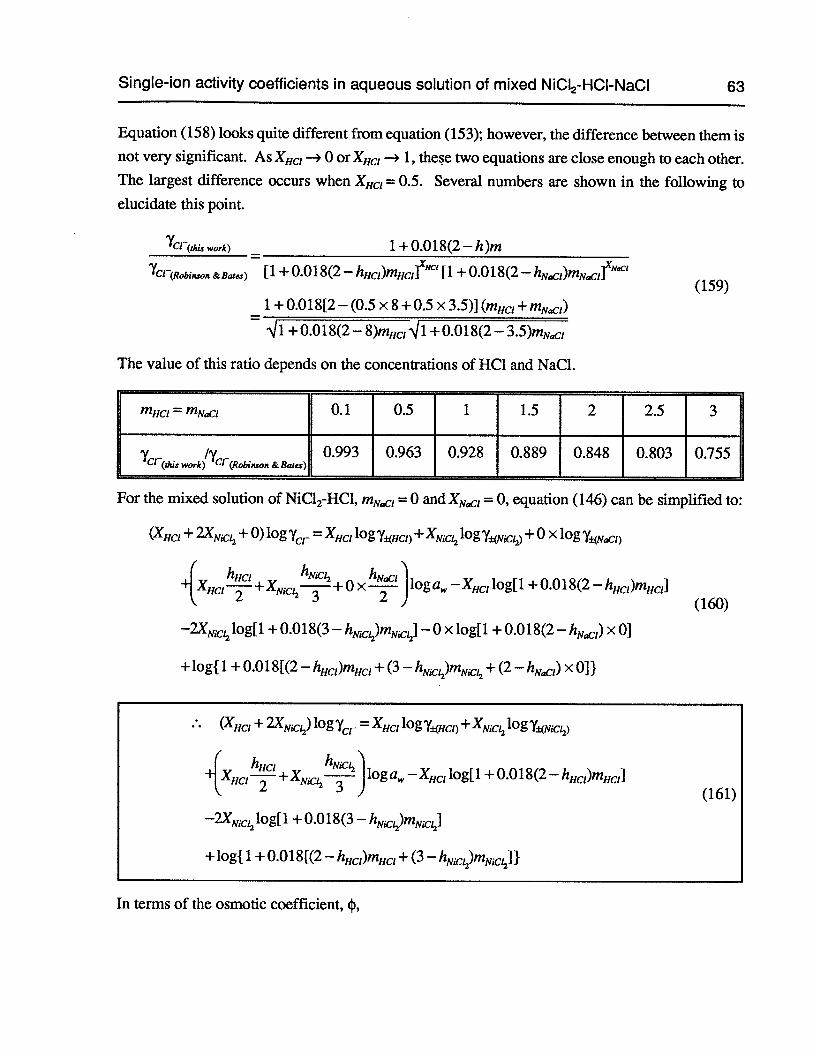
Single-ion activity coefficients in aqueous solution of mixed NiCI2-HCI-NaCl 63
Equation (158) looks quite different from equation (153); however, the difference between them isnot very significant. As XHC, —*0 or XHc, -4 1, these two equations are close enough to each other.The largest difference occurs when XHc, = 0.5. Several numbers are shown in the following toelucidate this point.
1C1(thLç work) = 1 +0.018(2—h)m
‘7CF(Robj,ison &Bales) [1+0.018(2 — hHc,)mHc,}X [1+0.018(2 — hN,)mN,]’(159)
— 1+ 0.018[2 —(0.5 x 8 + 0.5 x 3.5)] (mild + mN.,Q)
— 1 +0.018(2—8)m11,g1+O.Ol8(2—3.S)mN,
The value of this ratio depends on the concentrations of HC1 and NaC1.
mHc,=mN1 0.1 0.5 1 1.5 2 2.5 3
Ycr( work) ‘C1 (Robüison0.993 0.963 0.928 0.889 0.848 0.803 0.755
For the mixed solution of NiCl2-HC1, mN, =0 and XNd, =0, equation (146) can be simplified to:
(X11,+ + 0) log1cr =X11,log Y±(ilc,) +XN1og,+ 0 x log Y±(NQ1)
+( hHd, hN, ‘
XHdj——+XN----+ 0 x__Jloaw —X,log[l + 0.018(2— hHC,)mHC,]
(160)
—2XNjc, log[1 + 0.018(3— hN)mN] —0 x log[1 + 0.018(2 — hN,) X 0]
+log{1 + 0.018[(2— hild,)mild, + (3— hN)mN + (2— hN,) x 0]}
(X11,+ Nid12)log7cr = XHcj logyflC,) +XN
+( h11,XHd,—--+xNICI2__,J1oaw —X, log[1 + 0.018(2
—h11c,)m11,](161)
2XNjC log[1 + 0.018(3— hN)mN]
+log{ 1+ 0.018[(2— hHCI)mHC, + (3—
In terms of the osmotic coefficient, ,
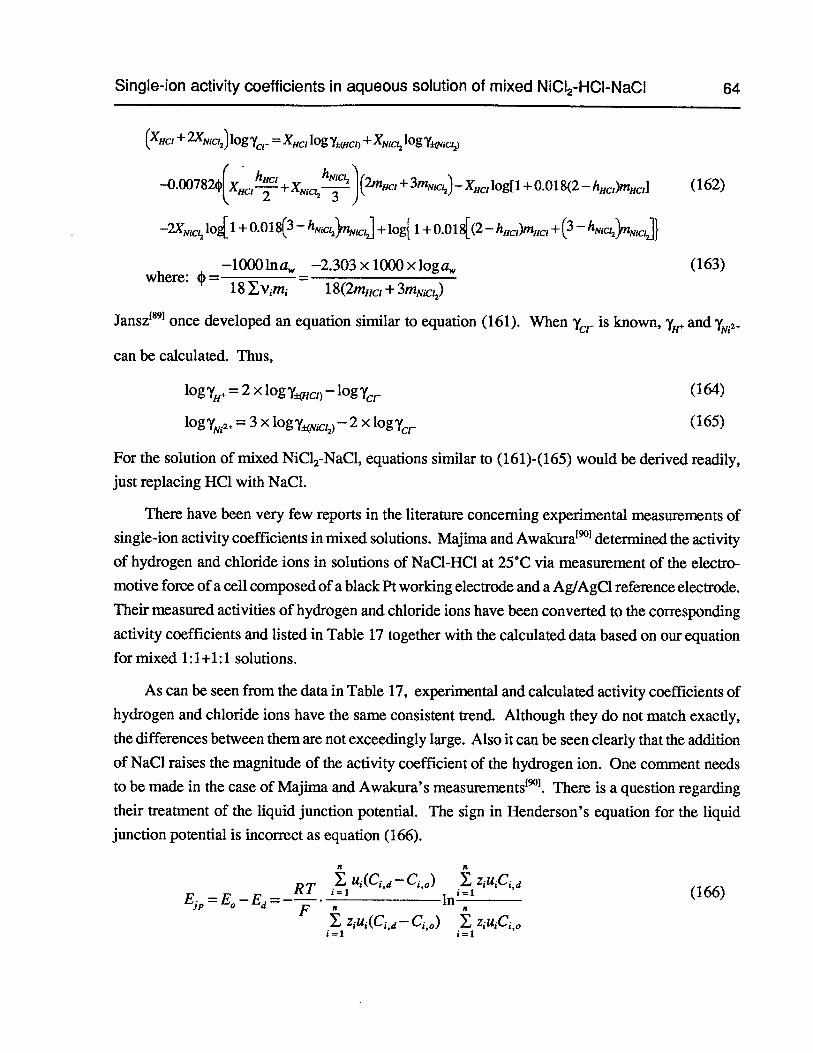
Single-ion activity coefficients in aqueous solution of mixed NiCl2-HCI-NaCI 64
(XHCI + 2KNIcL,) logy = XHC, log’y0+ XNc logYjQiC)
_O.00782(xHC! + XNIC,_f! J (2m,c, + 3mNiclj — X, Iog[1 + 0.018(2— hHC,)mHC,} (162)
NiC1, iog[ 1+0.018(3— hNicljrnNc,j + Iog{ 1+0.01 8[(2 — hHC,)?nHC, + (3_ hNic1l)nM,]}
—10O0lna —2.3O3xl000xloga,4, (163)where: = =
18 Evgmj 18(2mnc, +3mNic,2)
Jansz891 once developed an equation similar to equation (161). When cr is known, y11+ and
can be calculated. Thus,
log. =2 x log Y±(HCI) — log (164)
logy.2+=3 xlogy— 2 x logy (165)
For the solution of mixed NiCl2-NaC1, equations similar to (161)-(165) would be derived readily,
just replacing HC1 with NaC1.
There have been very few reports in the literature concerning experimental measurements of
single-ion activity coefficients in mixed solutions. Majima and Awakura°1determined the activityof hydrogen and chloride ions in solutions of NaC1-HCI at 25°C via measurement of the electro
motive force of a cell composed of a black Pt working electrode and a Ag/AgC1 reference electrode.Their measured activities of hydrogen and chloride ions have been converted to the corresponding
activity coefficients and listed in Table 17 together with the calculated data based on our equation
for mixed 1:1+1:1 solutions.
As can be seen from the data in Table 17, experimental and calculated activity coefficients of
hydrogen and chloride ions have the same consistent trend. Although they do not match exactly,
the differences between them are not exceedingly large. Also it can be seen clearly that the addition
of NaCI raises the magnitude of the activity coefficient of the hydrogen ion. One comment needsto be made in the case of Majima and Awakura’s measurements°1.There is a question regarding
their treatment of the liquid junction potential. The sign in Henderson’s equation for the liquid
junction potential is incorrect as equation (166).
± uI(CI,d—C,O) ZU1C
E —E E —
‘1‘ (166)
jp o dF n
zuI(CId—C10) z1u1C10i=1 1=1
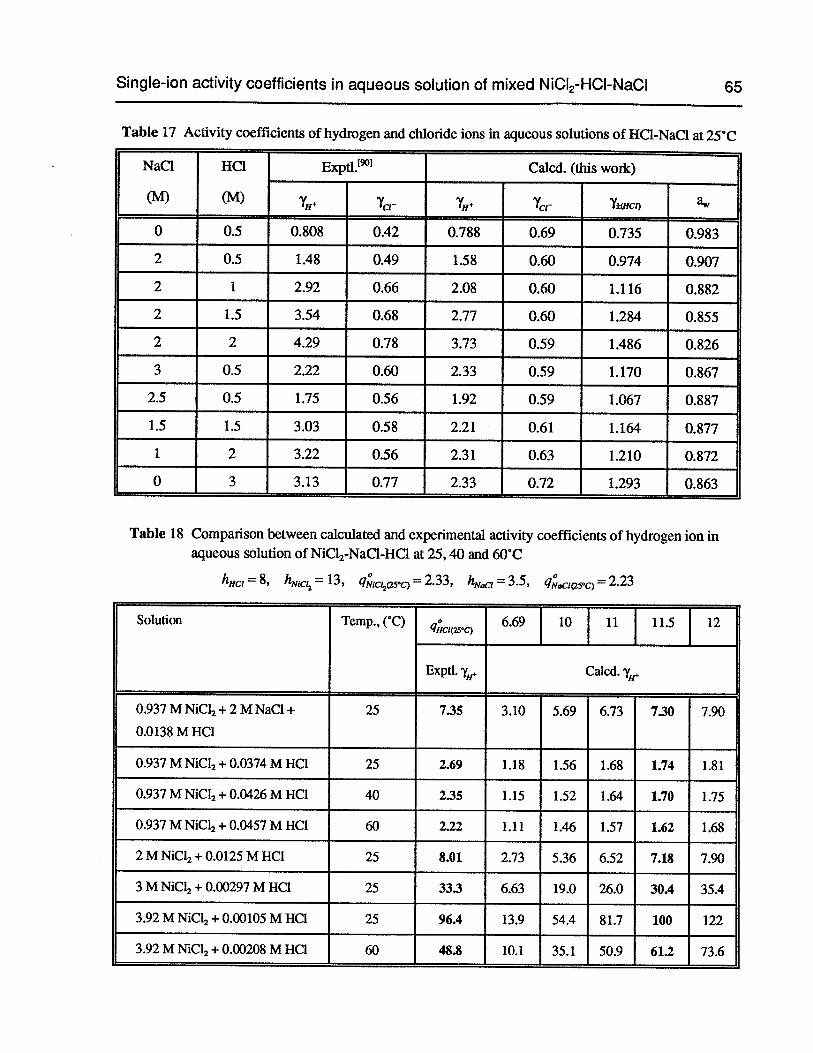
Single-ion activity coefficients in aqueous solution of mixed N1CI2-HCI-NaCI 65
Table 17 Activity coefficients of hydrogen and chloride ions in aqueous solutions of HC1-NaCI at 25CC
NaC1 HC1 ExptL°1 Calcd. (this work)
(M) (M) Y±tpcz)
0 0.5 0.808 0.42 0.788 0.69 0.735 0.983
2 0.5 1.48 0.49 1.58 0.60 0.974 0.907
2 1 2.92 0.66 2.08 0.60 1.116 0.882
2 1.5 3.54 0.68 2.77 0.60 1.284 0.855
2 2 4.29 0.78 3.73 0.59 1.486 0.826
3 0.5 2.22 0.60 2.33 0.59 1.170 0.867
2.5 0.5 1.75 0.56 1.92 0.59 1.067 0.887
1.5 1.5 3.03 0.58 2.21 0.61 1.164 0.877
1 2 3.22 0.56 2.31 0.63 1.210 0.872
0 3 3.13 0.77 2.33 0.72 1.293 0.863
Table 18 Comparison between calculated and experimental activity coefficients of hydrogen ion inaqueous solution ofNiC12-NaC1-HC1 at 25,40 and 60C
hHc, =8, hMc = 13, = 2.33, hN, 3.5, 2.23
Solution Temp.,(C) 6.69 10 11 11.5 12qHc,(2sc)
Exptl. y+ Calcd.
0.937 M NiC12+2 M NaC1 + 25 7.35 3.10 5.69 6.73 7.30 7.90
0.O138MHC1
0.937 M NiCI2+ 0.0374 M HC1 25 2.69 1.18 1.56 1.68 1.74 1.81
0.937 M NiC12+ 0.0426 M HC1 40 2.35 1.15 1.52 1.64 1.70 1.75
0.937 M NiC12+ 0.0457 M HC1 60 2.22 1.11 1.46 1.57 1.62 1.68
2 M NiC12+ 0.0125 M HC1 25 8.01 2.73 5.36 6.52 7.18 7.90
3 M NiCI2+ 0.00297 M HCI 25 33.3 6.63 19.0 26.0 30.4 35.4
3.92MNiC12+0.OO1O5MHC1 25 96.4 13.9 54.4 81.7 100 122
3.92 M NiC12+ 0.00208 M HC1 60 48.8 10.1 35.1 50.9 61.2 73.6
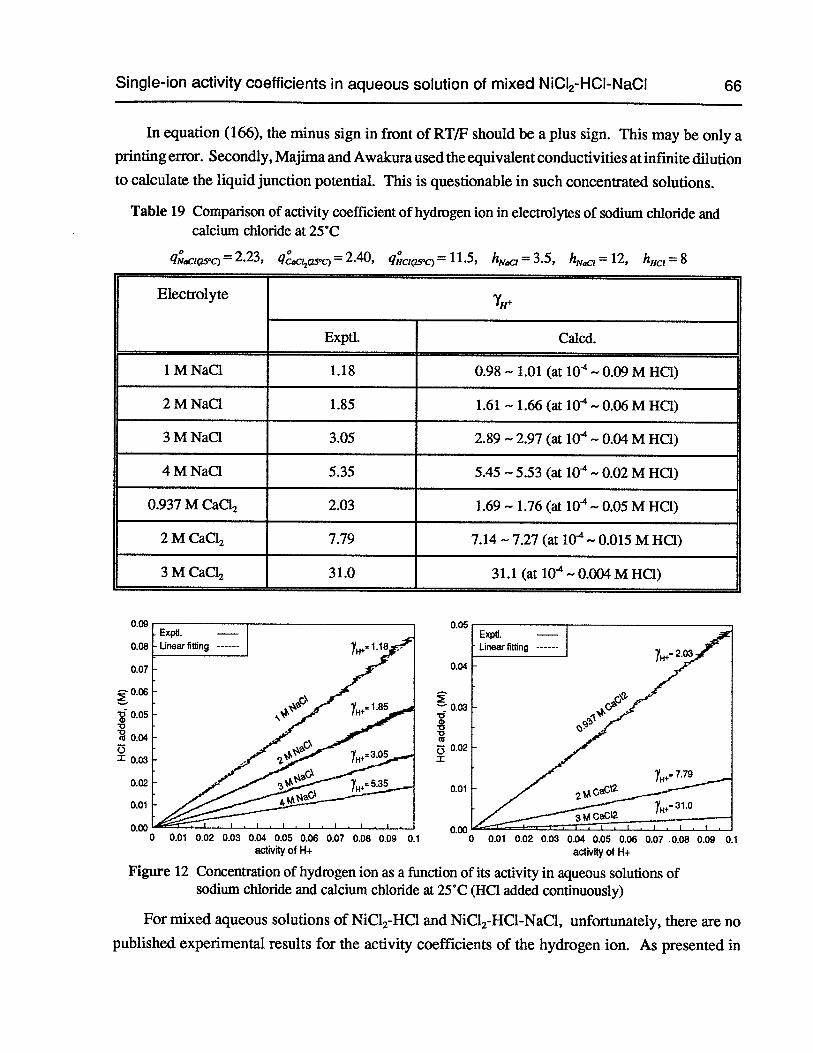
Single-ion activity coefficients in aqueous solution of mixed NiCI2-HCI-NaCI 66
In equation (166), the minus sign in front of RTIF should be a plus sign. This may be only aprinting error. Secondly, Majima and Awakura used the equivalent conductivities at infmite dilutionto calculate the liquid junction potential. This is questionable in such concentrated solutions.
Table 19 Comparison of activity coefficient of hydrogen ion in electrolytes of sodium chloride andcalcium chloride at 25°C
= 2.23, qcacL2soc) = 2.40, qczc,.c) = 11.5, hN, = 3.5, h,qj = 12, hHcz = 8
Electrolyte
Exptl. Calcd.
1 MNaC1 1.18 0.98 1.01 (at l0— 0.O9MHC1)
2 M NaCl 1.85 1.61 — 1.66 (at 10 — 0.06 M HG)
3 M NaCl 3.05 2.89 — 2.97 (at l0 — 0.04 M HG)
4 M NaC1 5.35 5.45 — 5.53 (at l0 — 0.02 M HG)
0.937 M CaCl2 2.03 1.69 — 1.76 (at l0 — 0.05 M HG)
2 M CaC12 7.79 7.14 — 7.27 (at iO 0.0 15 M HG)
3MCaC12 31.0 31.1 (atlO4—0.OO4MHCI)
0.09
0.08
0.07
.0.05
.0.040z
0.02
0.01
0.000 0.01 0.02 0.03 0.04 0.05 0.06 0.07 0.08 0.09 0.1 0 0.01 0.02 0.03 0.04 0.05 0.06 0.07 0.08 0.09 0.1
activity of H+ activity of H+
Figure 12 Concentration of hydrogen ion as a function of its activity in aqueous solutions ofsodium chloride and calcium chloride at 25°C (HG added continuously)
For mixed aqueous solutions of NiC12-HC1 and NiC12-HC1-NaCl, unfortunately, there are no
published experimental results for the activity coefficients of the hydrogen ion. As presented in
0a00
0
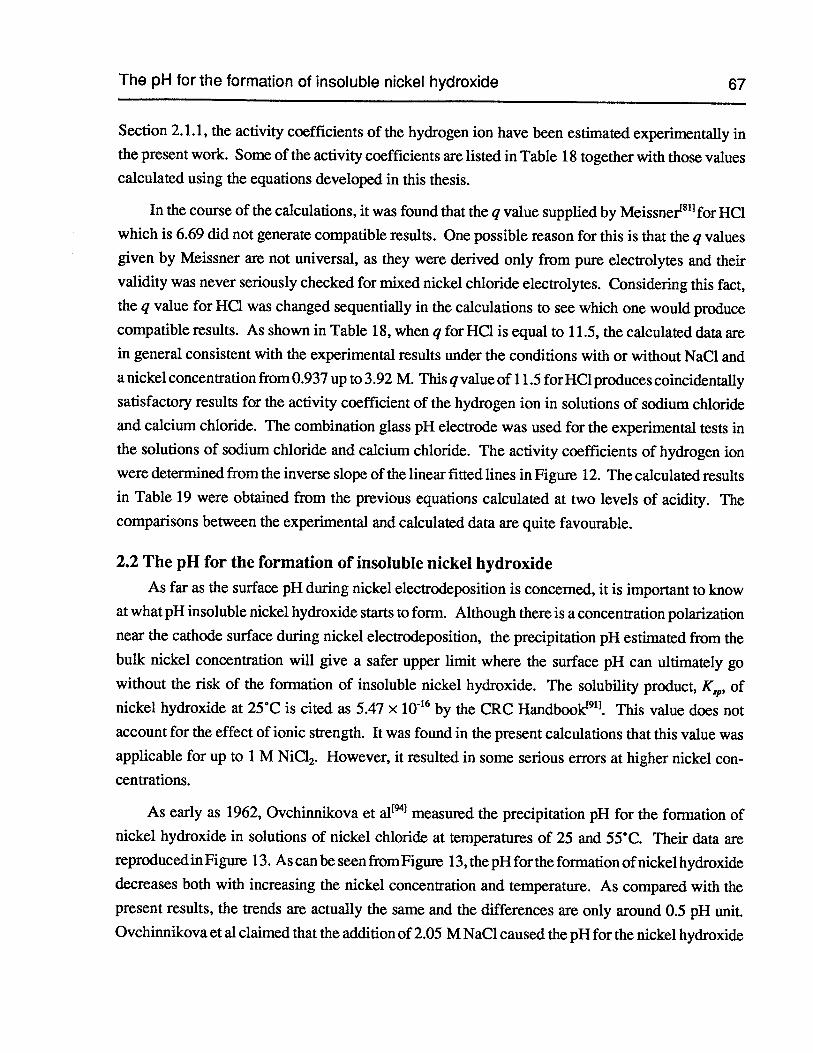
The pH for the formation of insoluble nickel hydroxide 67
Section 2.1.1, the activity coefficients of the hydrogen ion have been estimated experimentally inthe present work. Some of the activity coefficients are listed in Table 18 together with those valuescalculated using the equations developed in this thesis.
In the course of the calculations, it was found that the q value supplied by Meissnert811for HC1which is 6.69 did not generate compatible results. One possible reason for this is that the q valuesgiven by Meissner are not universal, as they were derived only from pure electrolytes and theirvalidity was never seriously checked for mixed nickel chloride electrolytes. Considering this fact,the q value for HCI was changed sequentially in the calculations to see which one would producecompatible results. As shown in Table 18, when q forHCl is equal to 11.5, the calculated data arein general consistent with the experimental results under the conditions with or without NaCl anda nickel concentration from 0.937 up to 3.92 M. This q value of 11.5 for HC1 produces coincidentallysatisfactoiy results for the activity coefficient of the hydrogen ion in solutions of sodium chlorideand calcium chloride. The combination glass pH electrode was used for the experimental tests inthe solutions of sodium chloride and calcium chloride. The activity coefficients of hydrogen ionwere determined from the inverse slope of the linear fitted lines in Figure 12. The calculated resultsin Table 19 were obtained from the previous equations calculated at two levels of acidity. Thecomparisons between the experimental and calculated data are quite favourable.
2.2 The pH for the formation of insoluble nickel hydroxide
As far as the surface pH during nickel electrodeposition is concerned, it is important to knowat what pH insoluble nickel hydroxide starts to form. Although there is a concentration polarizationnear the cathode surface during nickel electrodeposition, the precipitation pH estimated from thebulk nickel concentration will give a safer upper limit where the surface pH can ultimately gowithout the risk of the formation of insoluble nickel hydroxide. The solubility product, K,,,, ofnickel hydroxide at 25C is cited as 5.47 x 10b6 by the CRC Handbookt911. This value does notaccount for the effect of ionic strength. It was found in the present calculations that this value wasapplicable for up to 1 M NiC12. However, it resulted in some serious errors at higher nickel concentrations.
As early as 1962, Ovchinnikova et a1 measured the precipitation pH for the formation ofnickel hydroxide in solutions of nickel chloride at temperatures of 25 and 5YC. Their data arereproduced in Figure 13. As can be seen fromFigure 13, the pH for the formation ofnickel hydroxidedecreases both with increasing the nickel concentration and temperature. As compared with thepresent results, the trends are actually the same and the differences are only around 0.5 pH unit.Ovchinnikova et al claimed that the addition of 2.05 M NaCl caused the pH for the nickel hydroxide
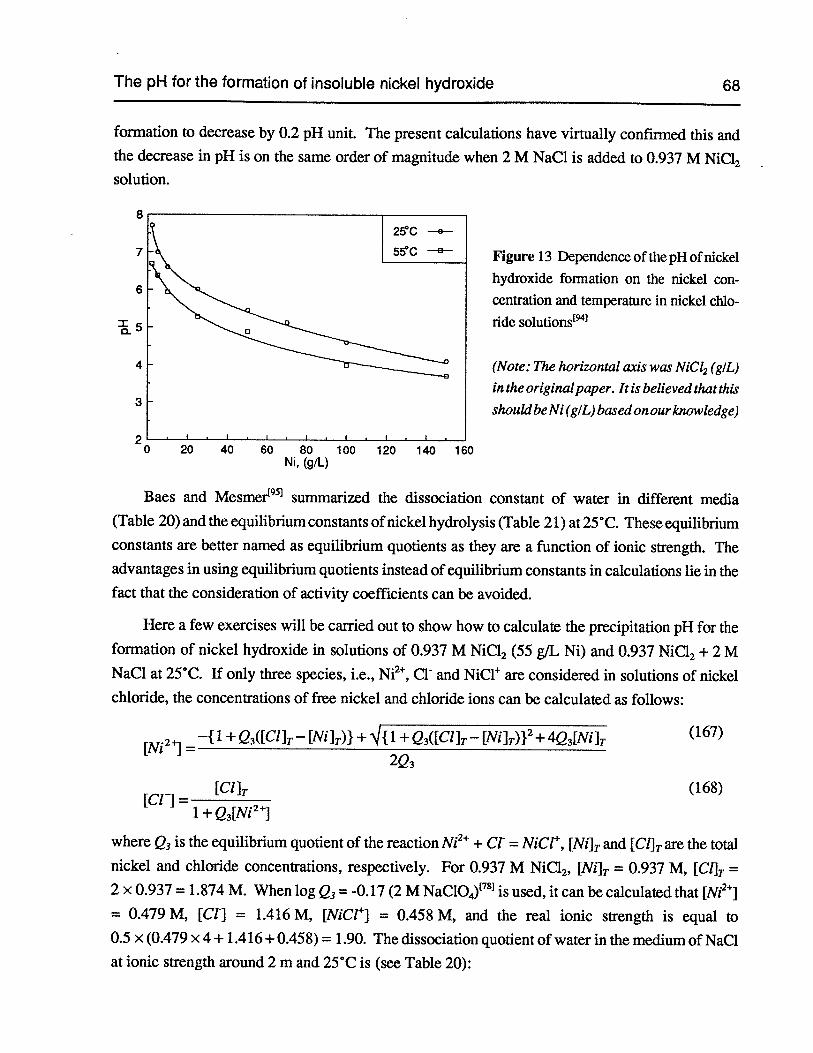
The pH for the formation of insoluble nickel hydroxide 68
Figure 13 Dependence of the pH ofnickelhydmxide formation on the nickel concentration and temperature in nickel chloride solutions1
(Note: The horizontal axis was NiCI2 (gIL)in the originalpaper. It is believed that this
shouldbeNi (gIL) based on our knowledge)
formation to decrease by 0.2 pH unit. The present calculations have virtually confirmed this andthe decrease in pH is on the same order of magnitude when 2 M NaC1 is added to 0.937 M NiC12solution.
0
20 20 40 60 80 100 120 140 160
Ni, (g/L)
Baes and Mesmert9S] summarized the dissociation constant of water in different media(Table 20) and the equilibrium constants of nickel hydrolysis (Table 21) at 25°C. These equilibriumconstants are better named as equilibrium quotients as they are a function of ionic strength. Theadvantages in using equilibrium quotients instead of equilibrium constants in calculations lie in thefact that the consideration of activity coefficients can be avoided.
Here a few exercises will be carried out to show how to calculate the precipitation pH for theformation of nickel hydroxide in solutions of 0.937 M NiC12 (55 g/L Ni) and 0.937 NiC12 + 2 MNaC1 at 25°C. If only three species, i.e., Ni2,Ct and NiCl are considered in solutions of nickelchloride, the concentrations of free nickel and chloride ions can be calculated as follows:
(167)[Ni2]=
2Q3
[Cl]T (168)[Cu =
1+Q3[Ni2]
where Q3 is the equilibrium quotient of the reaction Ni2 + Ci = NiCl, [Ni]T and [ClJ are the totalnickel and chloride concentrations, respectively. For 0.937 M NiCl2, [Ni] = 0.937 M, [Cl]T =
2 x 0.937 = 1.874 M. When log Q3 = -0.17(2 M NaClO4)8is used, it can be calculated that [Ni2J
= 0.479 M, [Cl] = 1.4 16 M, [NiCfl = 0.458 M, and the real ionic strength is equal to0.5 x (0.479 x 4+ 1.416+0.458) = 1.90. The dissociation quotient of water in the medium of NaCIat ionic strength around 2 m and 25°C is (see Table 20):
—{ 1 +Q3([Cl] — [Ni]T)} + { 1 + Q3([Cl]. — [Ni]T)}2+4Q3[NIIT
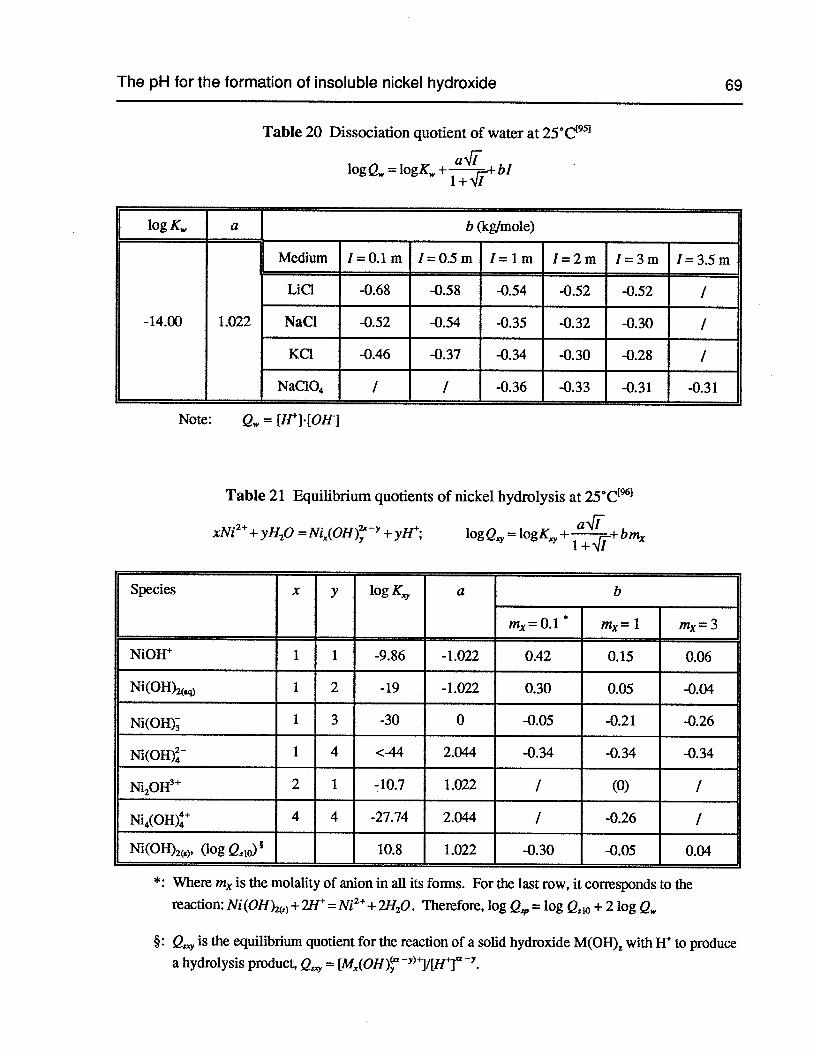
The pH for the formation of insoluble nickel hydroxide 69
Table 20 Dissociation quotient of water at 25°C195
aJi1ogQ=1ogK+ r_+bJ
1+ -qI
log K a b (kg/mole)
Medium 1=O.lm l=O.Sm I=lm I=2m I—3m I=3.5m
Lid -0.68 -0.58 -0.54 -0.52 -0.52 /
-14.00 1.022 NaCI -0.52 -0.54 -0.35 -0.32 -0.30 I
KC1 -0.46 -0.37 -0.34 -0.30 -0.28 /
NaC104 I I -0.36 -0.33 -0.31 -0.31
Note: Q = [HJ.[OH]
Table 21 Equilibrium quotients of nickel hydrolysis at 25°C
xNi2+yH2O =Ni(OH) +yH; 1ogQ = 1ogK +
Species x y logK a b
mx0.1* m=1 m=3
NiOW 1 1 -9.86 -1.022 0.42 0.15 0.06
Ni(OH>2 1 2 -19 -1.022 0.30 0.05 -0.04
Ni(OH) 1 3 -30 0 -0.05 -0.21 -0.26
Ni(OH) 1 4 <-44 2.044 -0.34 -0.34 -0.34
Ni2OH3 2 1 -10.7 1.022 I (0) /
Ni4(OH) 4 4 -27.74 2.044 I -0.26 I
Ni(OH)2(8), (log = = 10.8 1.022 -0.30 -0.05 0.04
*: Where mx is the molality of anion in all its forms. For the last row, it corresponds to thereaction: Ni(OH).,,)+2fI=Ni2+2fI2O.Therefore, log Q,,, = log Q,10 +2 log Q
§: Q is the equilibrium quotient for the reaction of a solid hydroxide M(OH)1with H to producea hydrolysis product, Q = [M(OH)j/[H4].
The pH for the formation of insoluble nickel hydroxide 70
logQ =—14.00+1.02
‘—O32J=1400+ 1.022XJL_0321.90(169)
—14.02
For the reaction Ni(OH)2()+ 2H = Ni2 + 2H20, the equilibrium quotient is equal to (see Table 21):
1 022qy 1 022JT (170)1ogQ310=10.8+ —O.OOx[Cl]= 10.8+
In terms of dissociation of nickel hydroxide, Ni(OH)2(,)= Ni + 20FF, the solubility product, Q,,can be expressed as:
log Q,, = logQ10 +2 x log Q
= 10.8+ 1.0221i
2 x 1—14.00 + 1.022JT 0321’1 = —17.2+ 3.066Ji
0.641 (171)i+’Ji i+’ii ) i+’1i
= —17.2+ 3.066 x
0.64 x 1.90 = —16.64i+-qi
By definition, Q, = [Ni2].[0H]2.Accordingly, the precipitation pH for the formation of nickelhydroxide can be calculated as:
1
_______________
1 (172)pH = — log = — log = 5.4
2 (Q)2(H)2[Ni2] 2 (10_14.02)2 x 2.692 x 0.479
If = 5.47 x 10 is usedt911,the pH would be equal to:
1 5.47x10⁶ (173)pH=—log =6.1
2 (10_14.02)2 x 2.692 x 0.479
These two pH values have a difference of 0.7 pH unit. Estimated from the pH titration curve, theactual pH is between these two values, yet closer to the latter. For the solution of 0.937 M NiCl2+2 M NaC1, [Ni]T = 0.937 M, [CuT =2 x 0.937 +2=3.874 M. Using the same Q3 value, it can becalculated that [Ni2] = 0.294 M, [Ct] = 3.23 1 M, [NiCfl = 0.643 M and [Na] = 2 M. The realionic strength is equal to 0.5 x (0.294 x 4 + 3.23 1 +0.643 + 2) = 3.53. The dissociation quotientof water and solubility product are represented as:
1 022’Ji 1 022 x (174)logQ,4,= —14.00 + —0.3! = —14.00 + —0.3 x 3.53 —14.39
+qi1 0224i (175)
logQ310 = 10.8+ +O.O4[Cl]T1+i1
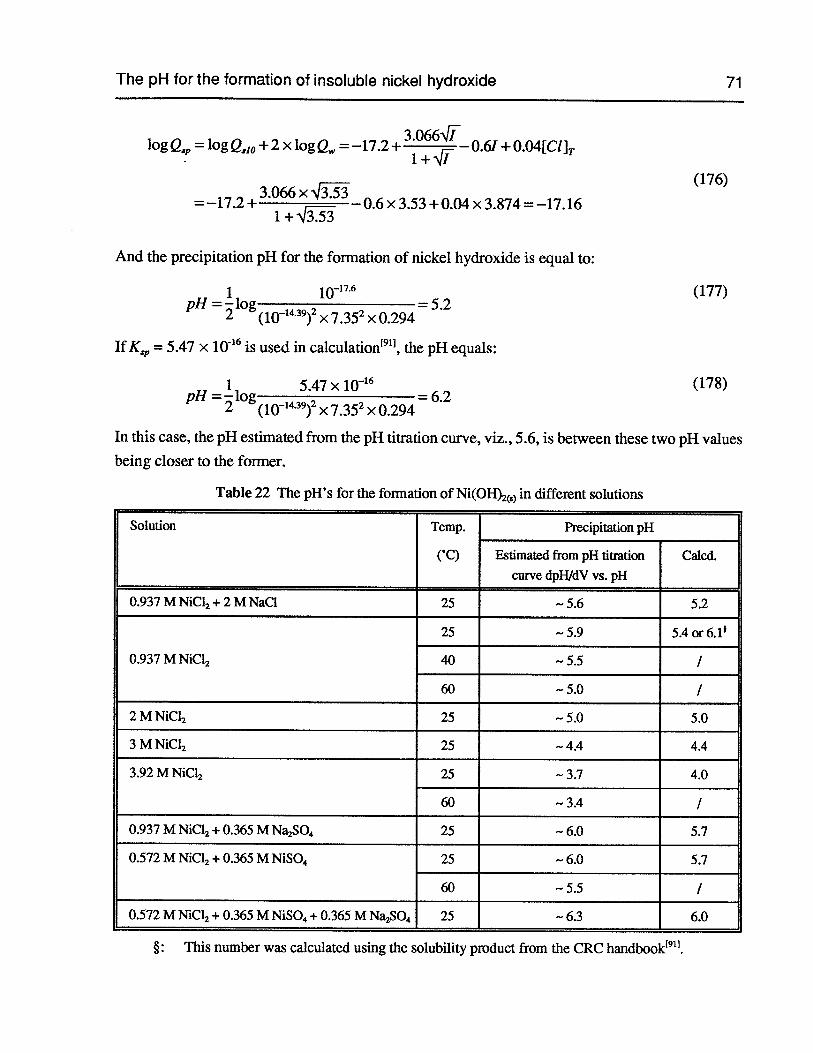
The pH for the formation of insoluble nickel hydroxide 71
log Q,1, = logQ,10 + 2 x log Q = —17.2+ 3.0’_
0.61 +O.04[Cl]T
(176)
= —17.2+ 3.0 x
0.6 x 3.53 + 0.04 x 3.874 = —17.16
And the precipitation pH for the formation of nickel hydroxide is equal to:
1 1O_176 (177)pH=—log =5.2
2 (10_14.39)2 x 7352 x 0.294
IfK31, = 5.47 x 10 is used in calculationt911,the pH equals:
1 5.47 x 10_16 (178)pH=—log =6.2
2 (10_14.39)2 x 7352 x 0.294
In this case, the pH estimated from the pH titration curve, viz., 5.6, is between these two pH values
being closer to the former.
Table 22 The p11’s for the formation of Ni(OH)S) in different solutions
Solution Temp. Precipitation pH
(‘C) Estimated from pH titntion Calcd.curve dpH/dV vs. pH
0.937 M NiC12+2 M NaC1 25 — 5.6 5.2
25 —5.9 5.4or6.1’
0.937 M NiC12 40 — 5.5 /
60 —5.0 /
2 M NiC12 25 — 5.0 5.0
3 M NiCZ2 25 — 4.4 4.4
3.92 M NiCI2 25 — 3.7 4.0
60 —3.4 I
0.937 M NiC12+ 0.365 M Na2SO4 25 — 6.0 5.7
0.572 M NiCI2+ 0.365 M NiSO4 25 — 6.0 5.7
60 —5.5 /
0.572 M NiC12+ 0.365 M NiSO4+ 0.365 M Na2SO4 25 — 6.3 6.0
§: This number was calculated using the solubility product from the CRC handbookt911.
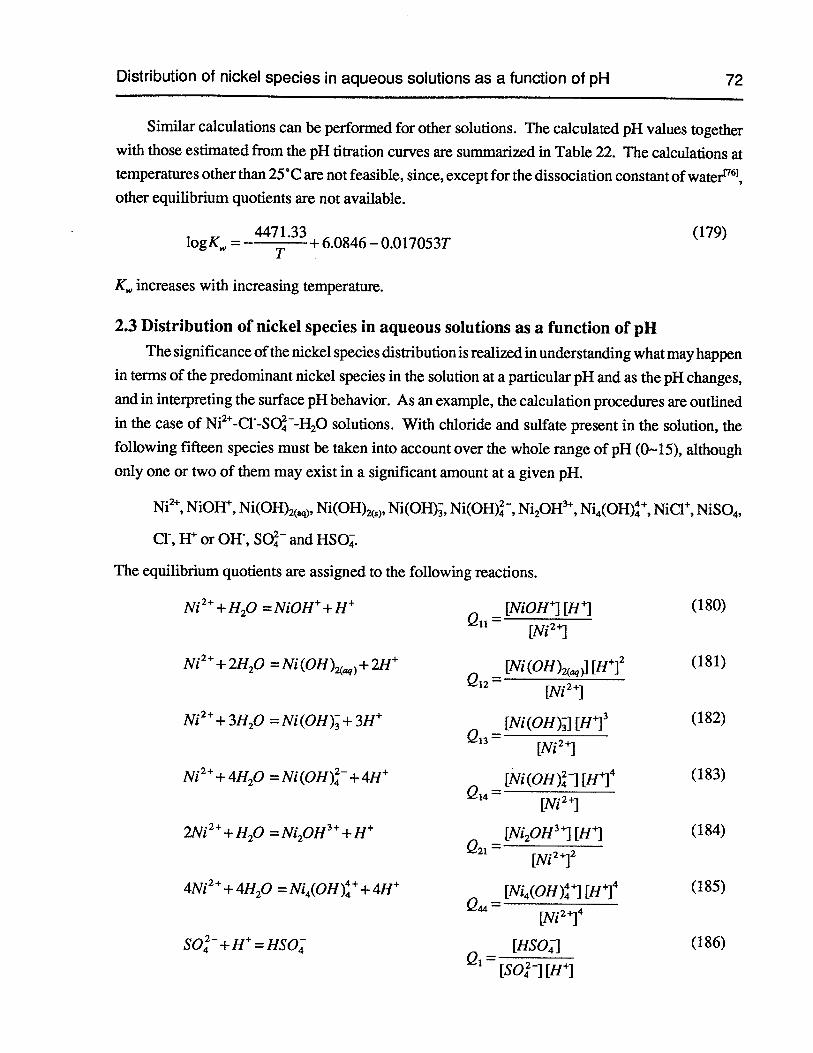
Distribution of nickel species in aqueous so’utions as a function of pH 72
Similar calculations can be performed for other solutions. The calculated pH values togetherwith those estimated from the pH titration curves are summarized in Table 22. The calculations attemperatures other than 25CC are not feasible, since, except for the dissociation constant ofwater61,other equilibrium quotients are not available.
4471 33 (179)logK=—
T+6.0846—O.017053T
K increases with increasing temperature.
2.3 Distribution of nickel species in aqueous solutions as a function of pHThe significance of the nickel species distribution is realized in understanding what may happen
in terms of the predominant nickel species in the solution at a particular pH and as the pH changes,and in interpreting the surface pH behavior. As an example, the calculation procedures are outlinedin the case ofNi2-Cl-SO-H2Osolutions. With chloride and sulfate present in the solution, thefollowing fifteen species must be taken into account over the whole range of pH (0—15), althoughonly one or two of them may exist in a significant amount at a given pH.
Ni2,NiOH, Ni(OH)2),Ni(OH)5),Ni(OH), Ni(OH),Ni2OH,Ni4(OH), NiCl, Ni504,
C1, H or OW, SO and HSO.
The equilibrium quotients are assigned to the following reactions.
Ni2+H20 = NiOH + H [NiOH] [H] (180)
[Ni2]
Ni2+ 2H20 = Ni (OH)) + 2H — [Ni (OH))j [H]2 (181)
[Ni2]
Ni2+ 3H20 = Ni (OH)-i- 3H [Ni (OH)J [H]3 (182)
[NiJ
Ni2+4H2O=Ni(OH)+4H — [Ni(OH)] [HJ4 (183)
[Ni9
21Vi2+H20 =Ni2OH3+ + H — [N120H3] [H] (184)
— [NiJ2
4Ni2+ + 4H20 = Ni4(OH) + + 4H — [Ni4(OH)] [H]4 (185)
[Ni2J4
SO4+ H = HSO [HSO] (186)
— [SO421 WI
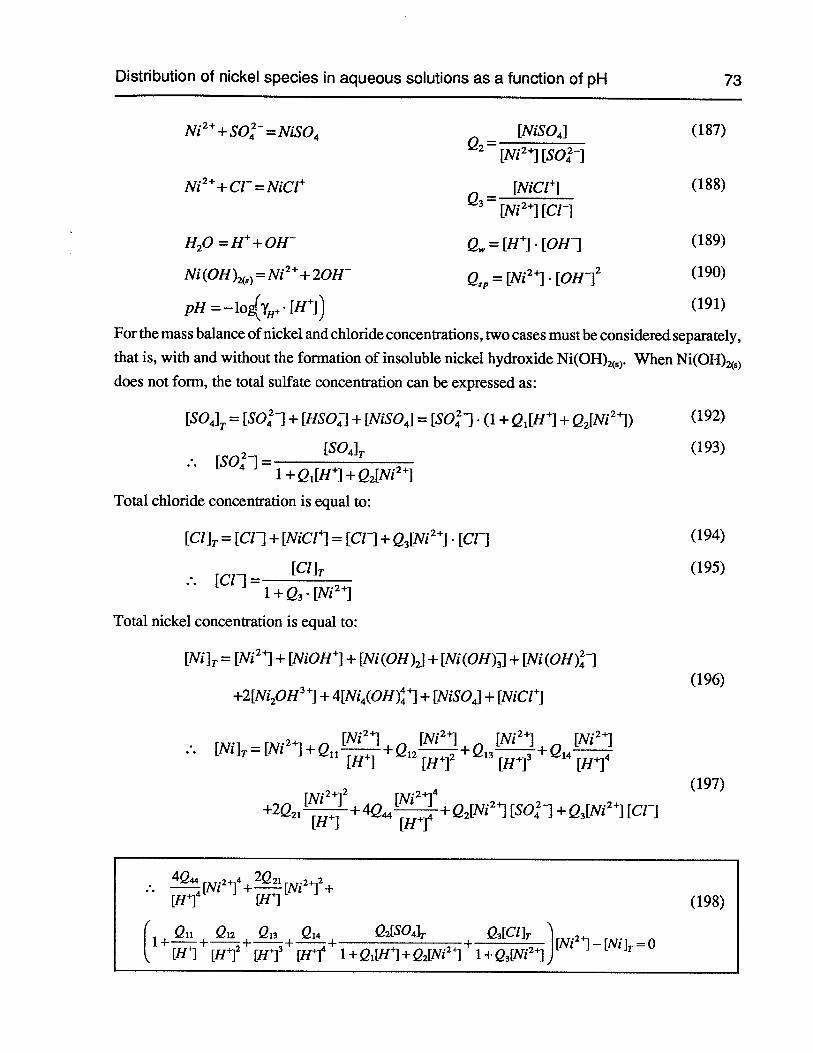
Distribution of nickel species in aqueous solutions as a function of pH 73
Ni2+SO=NiSQ4 — [NiSO] (187)2 [Ni2][SOt]
Ni2+Cr=NiCl — [NiC1I (188)
— [Ni2][Cu
H20 =H+OH’ Q = [H’]. [OH1 (189)
Ni (OH),) = Ni 2++ 20H Q = [Ni2’]. [0H12 (190)
pH = log(y+ [11+]) (191)
For the mass balance ofnickel and chloride concentrations, two cases must be considered separately,that is, with and without the formation of insoluble nickel hydroxide Ni(OH),). When Ni(OH)5)
does not form, the total sulfate concentration can be expressed as:
[S04]T = [S01 + [HSO41+ [NiSO4]= [S01• (1+Q1[H4]+Q2[Ni2) (192)
[SO4]T (193)[SO]=
1 +Q1[H] +Q2[Nz2]
Total chloride concentration is equal to:
[CuT = [Cr] +[NiCfl = [Cr] +Q3[Ni29.[Cr] (194)
[Cl]T (195)[Cr]=
1+Q3.[Ni2]
Total nickel concentration is equal to:
[Ni] = [Ni2]+ [NiOH] + [Ni (011)2] + [Ni(0H)] + [Ni(OH)4j(196)
+2[Ni2OH3]+4{Ni4(OH)] + [NiSO4]+ [NiCfl
[Ni]T=[Ni21]
(197).2+2 •2+
+2Q21 + 4Q +Q2[Ni24][S04j+Q3[Ni24][Cr]
4Q .2 2Q21 .2 2—[Ni j +—[Nz J +[Hi4
[Jf4](198)
( Q11 Q12 Q1 Q14 Q2[S04],. Q3[C1JT ‘I + [Ni ‘]—[Ni]=O[Hi [H}2 [Hi3 [H]4 1 +Q1[Hi +Q2[Ni2j I +Q3[Ni21)
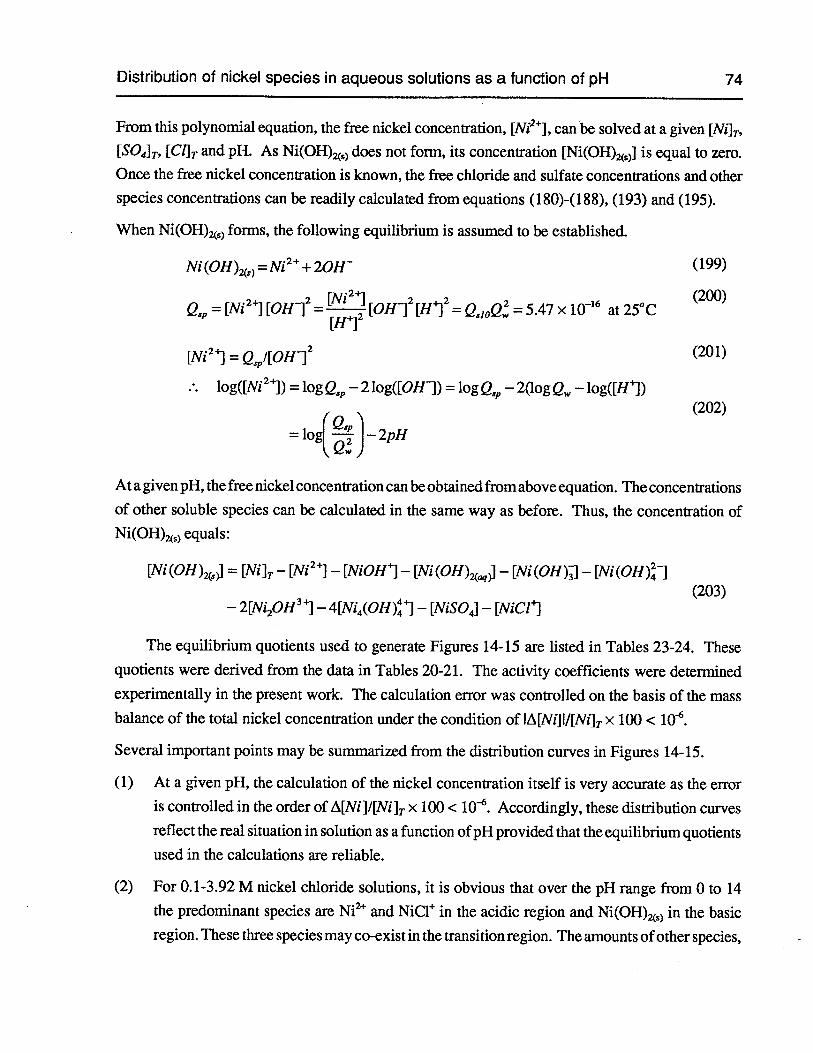
Distribution of nickel species in aqueous solutions as a function of pH 74
From this polynomial equation, the free nickel concentration, [Ni24], can be solved at a given [NuT,
[SO4]T, [CuT and pH. As Ni(OH)ZS) does not form, its concentration [Ni(OH)S)] is equal to zero.Once the free nickel concentration is known, the free chloride and sulfate concentrations and otherspecies concentrations can be readily calculated from equations (180)-(188), (193) and (195).
When Ni(OH)S) forms, the following equilibrium is assumed to be established.
Ni(OH))=Ni2+2OW (199)
[N24] (200)= [Ni24] [0H12
= [H4]2[0H12[H4]2= QZJOQW2= 5.47 x 10 at 25°C
[Ni24] = QI[OH12 (201)
.. log([Nij) = logQ2— 2log([OH1) = logQ2— 2(logQ,4,— log([H4])(202)
= lo(]_2PH
At a given pH, the free nickel concentration can be obtained from above equation. The concentrationsof other soluble species can be calculated in the same way as before. Thus, the concentration ofNi(OH),) equals:
[Ni(OH)j = [NuT —Ni24]— INiOH41— Ni(OH)) — Ni(OH)j — INi(OH)1(203)
— 2[Ni2OH34]—4[Ni4(OH)4] — [NiSOJ — [NiCfl
The equilibrium quotients used to generate Figures 14-15 are listed in Tables 23-24. Thesequotients were derived from the data in Tables 20-21. The activity coefficients were determinedexperimentally in the present work. The calculation error was controlled on the basis of the massbalance of the total nickel concentration under the condition of lA[Nu]I/[Ni]T x 100 < 10.
Several important points may be summarized from the distribution curves in Figures 14-15.
(1) At a given pH, the calculation of the nickel concentration itself is very accurate as the erroris controlled in the order of t[Ni]/[NiJT x 100 < 10. Accordingly, these distribution curvesreflect the real situation in solution as a function ofpH provided that the equilibrium quotients
used in the calculations are reliable.
(2) For 0.1-3.92 M nickel chloride solutions, it is obvious that over the pH range from 0 to 14
the predominant species are Ni2 and NiCl in the acidic region and Ni(OH)S) in the basicregion. These three species may co-exist in the transition region. The amounts ofother species,
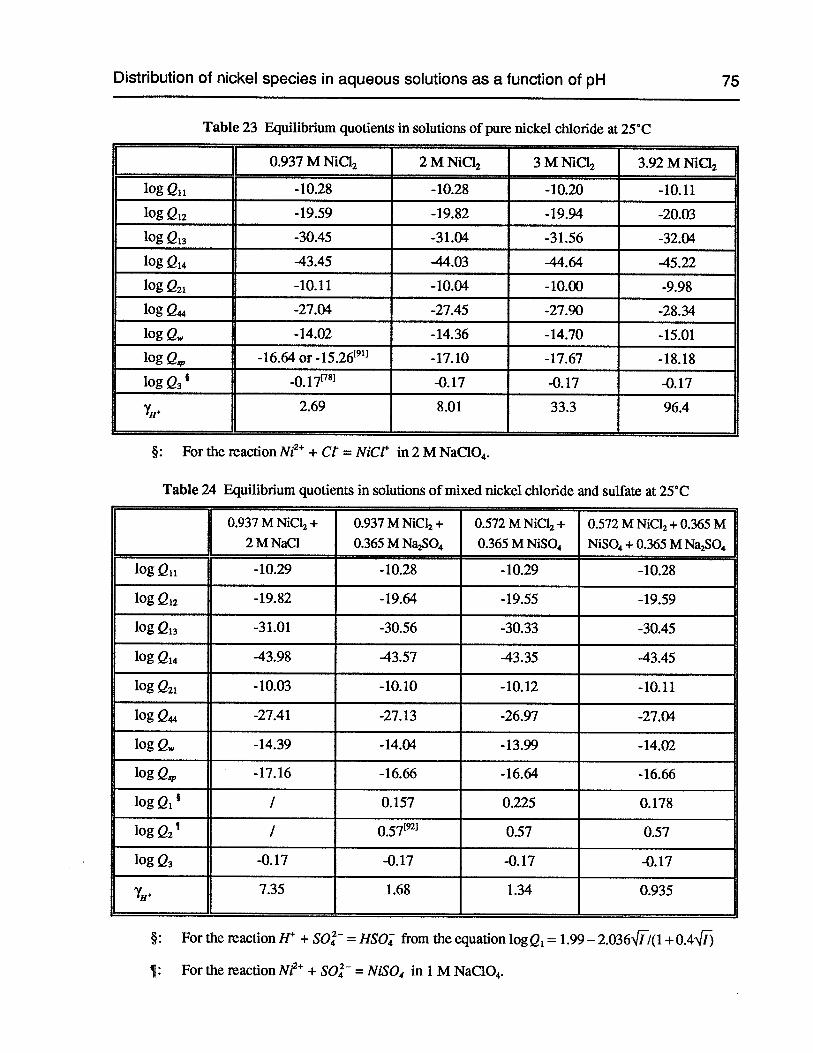
Distribution of nickel species in aqueous solutions as a function of pH 75
Table 23 Equilibrium quotients in solutions of pure nickel chloride at 25°C
0.937 M NiCl2 2 M NIC12 3 M NiC12 3.92 M NiC12
log Q11 -10.28 -10.28 -10.20 -10.11
log Q12 -19.59 -19.82 -19.94 -20.03
log Q13 -30.45 -31.04 -31.56 -32.04
log Q14 -43.45 -44.03 -44.64 -45.22
log Q21 -10.11 -10.04 -10.00 -9.98
log Q -27.04 -27.45 -27.90 -28.34
logQ -14.02 -14.36 -14.70 -15.01
logQ, -16.64or-15.2691 -17.10 -17.67 -18.18
logQ3’ -0.17 -0.17 -0.17
y 2.69 8.01 33.3 96.4H
§: For the reaction Ni2 + Ct = NiC1 in 2 M NaC1O4.
Table 24 Equilibrium quotients in solutions of mixed nickel chloride and sulfate at 25°C
0.937 M NiC12+ 0.937 M NiC12+ 0.572 M NiC12+ 0.572 M NiC12+ 0.365 M2 M NaCI 0.365 M Na2SO4 0.365 M NiSO4 N1SO4+ 0.365 M Na2SO4
log Q11 -10.29 -10.28 -10.29 -10.28
log Q12 -19.82 -19.64 -19.55 -19.59
log Q13 -31.01 -30.56 -30.33 -30.45
log Q14 -43.98 -43.57 -43.35 -43.45
log Q21 -10.03 -10.10 -10.12 -10.11
log Q -27.41 -27.13 -26.97 -27.04
logQ -14.39 -14.04 -13.99 -14.02
logQ, -17.16 -16.66 -16.64 -16.66
log Q1 I 0.157 0.225 0.178
log Q2’ I 0.57 0.57 0.57
logQ3 -0.17 -0.17 -0.17 -0.17
7.35 1.68 1.34 0.935
§: For the reaction H + SO = HSO from the equation logQ1= 1.99— 2.036Ji’(1 + 0.4Iij
¶: For the reaction Ni2 + SO = NLSO4 in 1 M NaClO4.
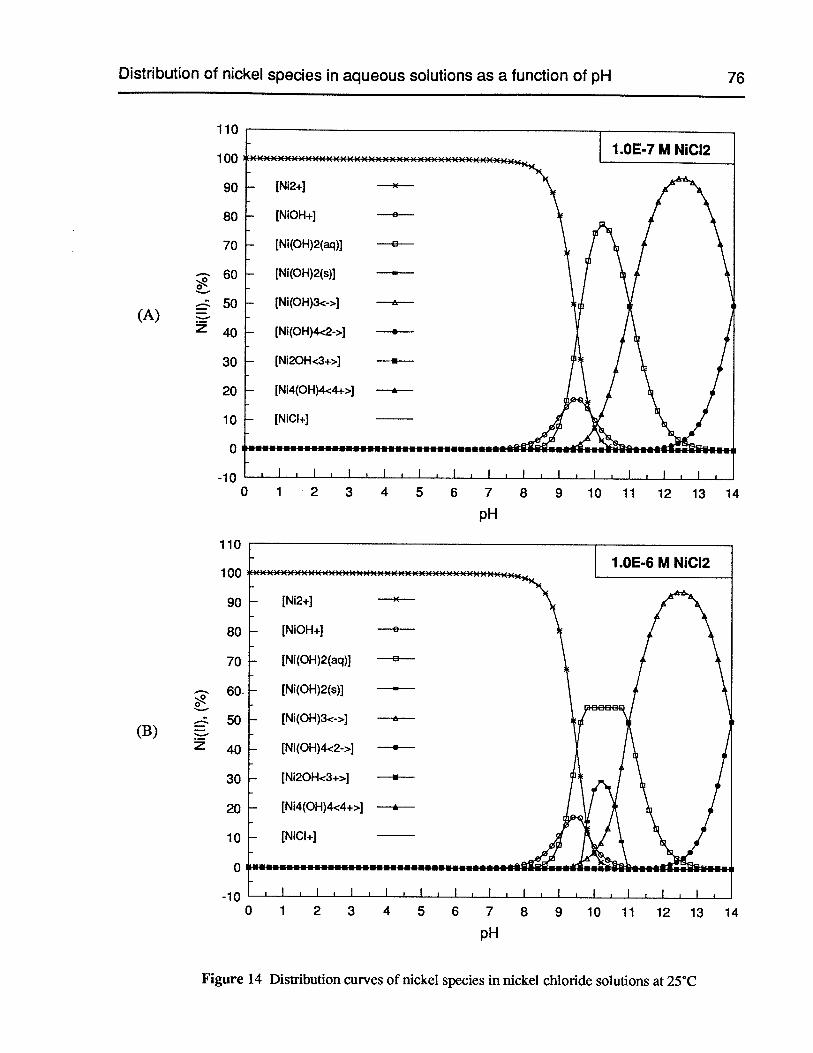
Distribution of nickel species in aqueous solutions as a function of pH 76
110
100
90
80
70
60
—50(A)
z40
30
20
10
0
-10o 1 2 3 4 5 6 7 8 9 10 11 12 13 14
pH
110
100
90
80
70
- 60.
— 50(B)
Z 40
30
20
10
0
-100 1 2 3 4 5 6 7 8 9 10 11 12 13 14
pH
Figure 14 Distribution curves of nickel species in nickel chloride solutions at 25C
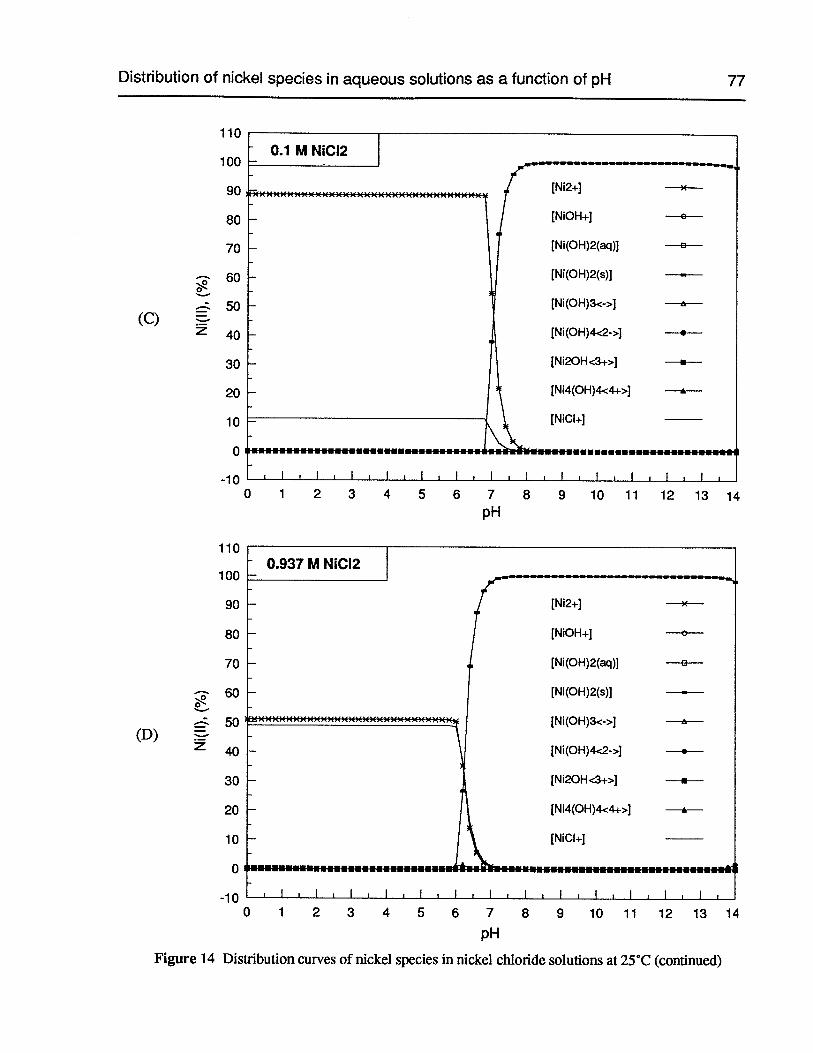
Distribution of nickel species in aqueous solutions as a function of pH 77
110
100
90
80
70
- 60
50(C)
40
30
20
10
0
-10
110
100
90
80
70
-60
50(D)
40
30
20
10
0
-10
[Ni2+]
[N1OH+J
[Ni(OH)2(aq)]
[Ni(OH)2(s)]
[N(OH)3<->]
[N(OH)4<2->]
[N12OH<3+>)
[N14(OH)4<4÷>]
[NiCk-]
0 1 2 3 4 5 6 7 8 9 1011 121314
[N 120H <3+>]
[N14(OH)4.c4-i->]
[NICI+]
0 1 2 3 4 5 6 7 8 9 10 11 12 13 14
pH
p
pH
p
[Ni2-*-]
[NiOH+]
[Ni(OH)2(aq)]
[Ni(OH)2(s)]
[Ni(OH)3.<->]
[Ni(OH)4<2->]
p
p
Figure 14 Distribution curves of nickel species in nickel chloride solutions at 25°C (continued)
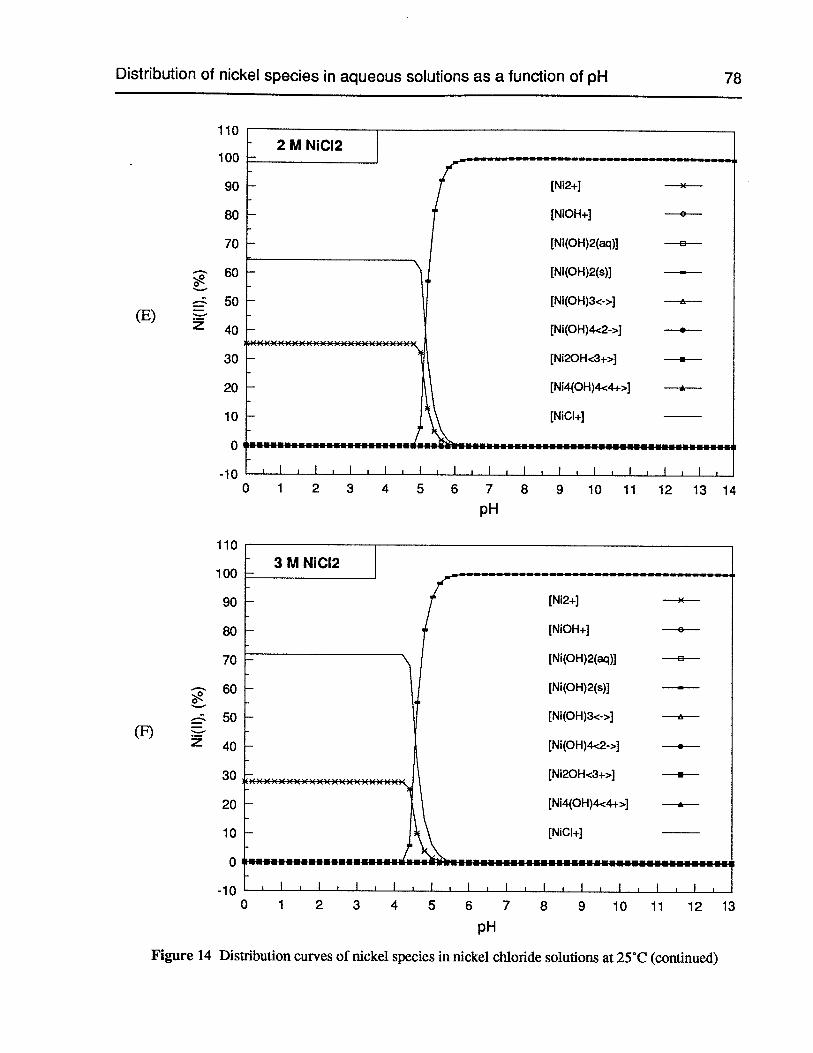
Distribution of nickel species in aqueous solutions as a function of pH 78
110
100
90
80
70
60
50(E)
40
30
20
10
0
-10
[N12+]
[N1OH+]
[Ni(OH)2(aq)]
[Ni(OH)2(s)J
[Ni(OH)3<->]
[Ni(OH)4<2->]
[N12OH<3÷>J
[Ni4(OH)4<4+>]
[NiCk-]
0 1 2 3 4 5 6 7 8 9 1011121314
110
100
90
80
70
- 60
50(F)
40
30
20
10
0
-10
pH
[Ni2+]
[N1OH+]
[Ni(OH)2(aq)]
[Ni(OH)2(s)]
[Ni(OH)3<->]
[Ni(OH)4<2->]
[NI2OH<3-t->]
[N14(OH)4<4+>]
[NiCk-]
8 9 10 11 12 13
p
p
A
A
pH
p
A
0 1 2 3 4 5 6 7
Figure 14 Distribution curves of nickel species in nickel chloride solutions at 25CC (continued)
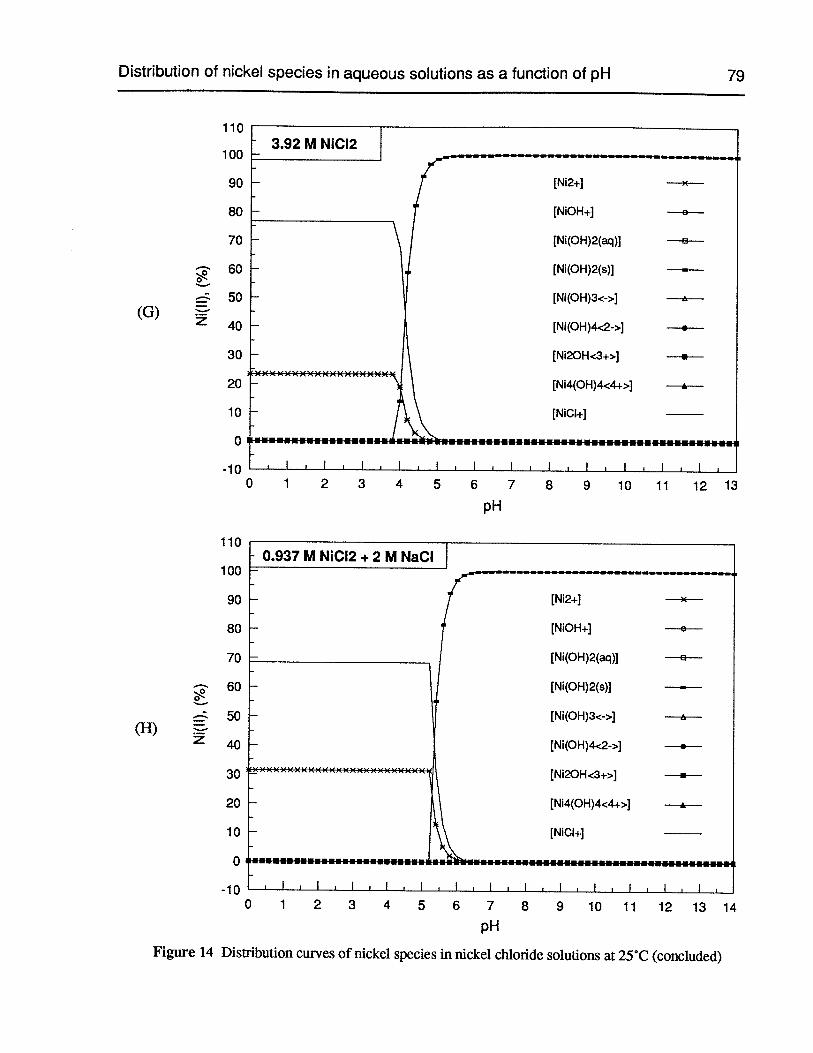
Distribution of nickel species in aqueous solutions as a function of pH 79
p
p
[Ni2+]
[N1OH+]
[Ni(OH)2(aq)J
[Ni(OH)2(s)J
[Ni(OH)3<->]
[Ni(OH)4<2->j
[NI2OH.c3+>]
[N14(OH)4<4-f>]
[NiCk-]
110
100
90
80
70
60
50(0)
40
30
20
10
0
-10
110
100
90
80
70
- 60
50(H)
40
30
20
10
A
0 1 2 3 4 5 6 7 8 9 10 11 1213
pH
• 0.937 M NiCI2 +2 M NaCI
XX )( XXX XX XX ) )O XX XX )( XX XX XX )( *i
[Ni2+]
[N1OH+]
[Ni(OH)2(aq)]
[Ni(OH)2(s)]
[Ni(OH)3.<->]
[Ni(OH)4<2->]
[Ni2OH<3+>J
[Ni4(OH)4<4±>]
[N1CI+]
p
p
A
A
0
—10 I I I I I I I I I I I0 1 2 3 4 5 6 7 8 9 1011 121314
pH
Figure 14 Distribution curves of nickel species in nickel chloride solutions at 25CC (concluded)
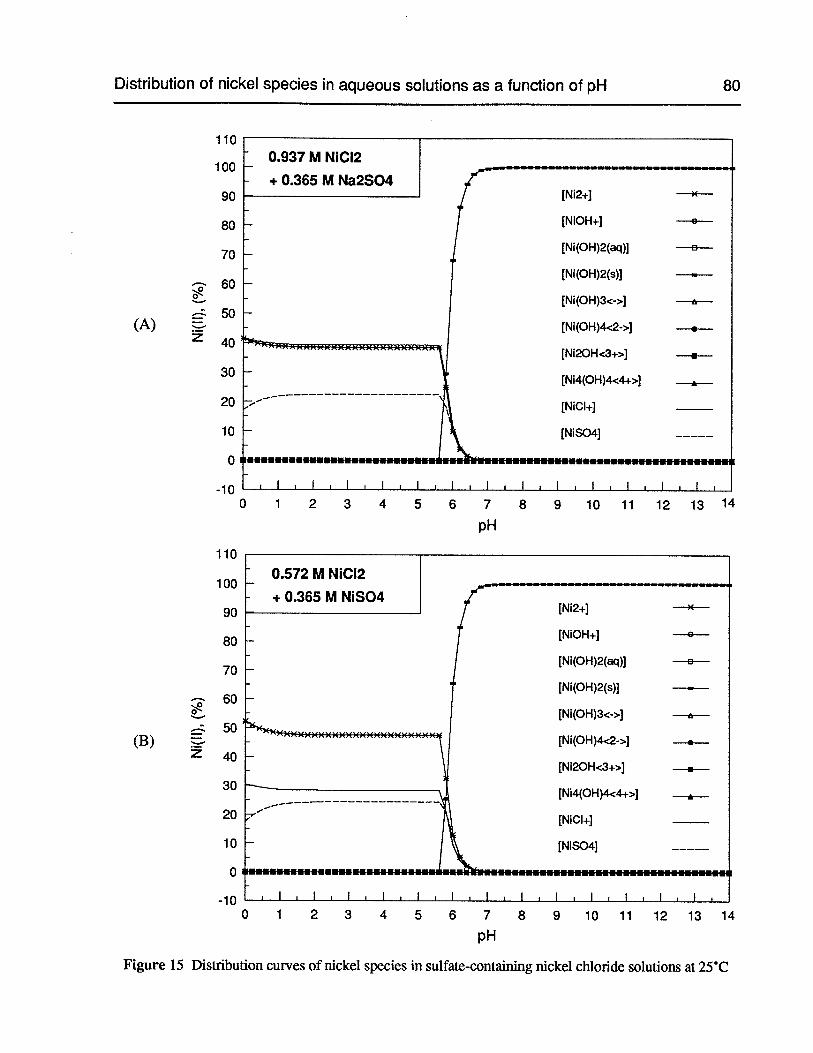
Distribution of nickel species in aqueous solutions as a function of pH 80
110
100
90
80
70
60
50(A)
40
30
20
10
0
-10
110
100
90
80
70
-60
-50(B)
Z 40
30
20
10
0
-10
[N12-t-]
[N1OH+]
[Ni(OH)2(aq)]
[Ni(OH)2(s)]
[Ni(OH)3<->]
[Ni(OH)4<2->]
[NI2OHc3+>]
[N14(OH)4<4-i->]
[NiCk-]
[NISO4]
0 1 2 3 4 5 6 7 8 9 1011 121314
[Ni2+]
[NIOH÷J
[Ni(OH)2(aq)]
[Ni(OH)2(s)]
[Ni(OH)3<->]
[Ni(OH)4<2->]
[N12OH<3÷>]
[N14(OH)4<4+>]
[NiCk-]
[NISO4]
0 1 2 3 4 5 6 7 8 9 10 11 12 13 14
pH
0.937 M NiCI2
+ 0.365 M Na2SO4
p
p
A
pH
0.572 M NICI2
+ 0.365 M NiSO4
p
p
Figure 15 Distribution curves of nickel species in sulfate-containing nickel chloride solutions at 25°C
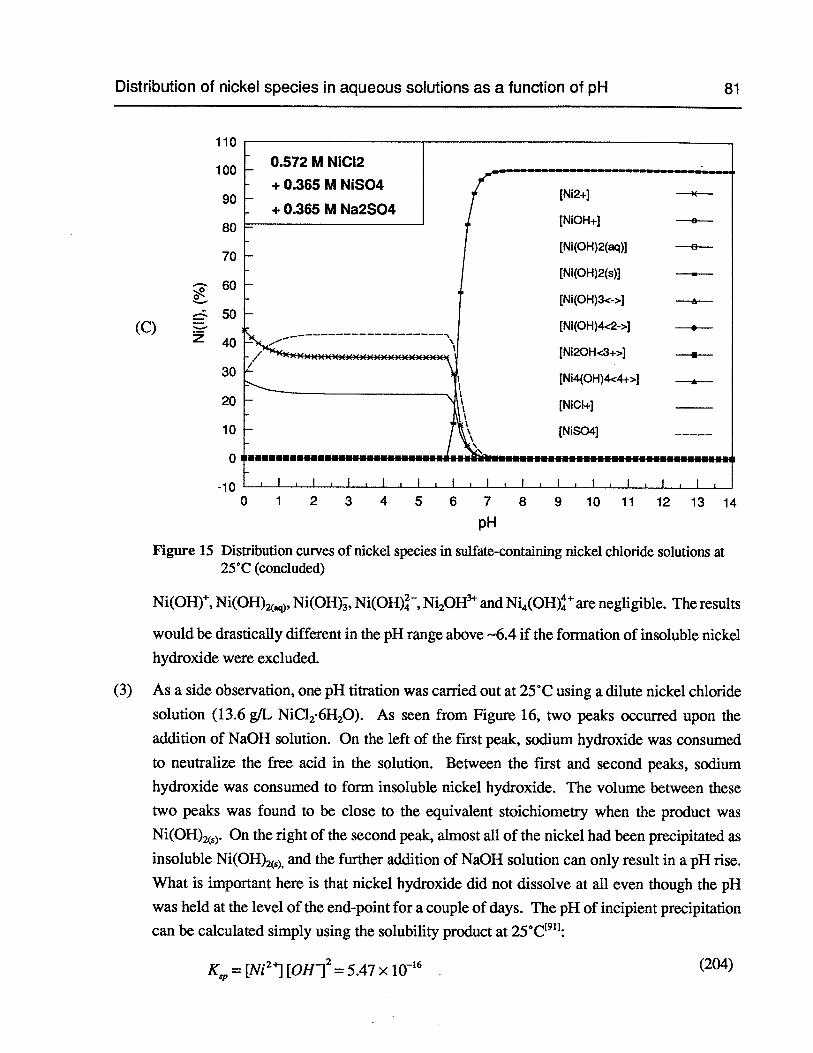
Distribution of nickel species in aqueous solutions as a function of pH 81
pH
Figure 15 Distribution curves of nickel species in sulfate-containing nickel chloride solutions at25CC (concluded)
Ni(OH), Ni(OH)), Ni(OH), Ni(OH),Ni2OH andNi4(OH) are negligible. The results
would be drastically different in the pH range above -P6.4 if the formation of insoluble nickel
hydroxide were excluded.
(3) As a side observation, one pH titration was carried out at 25CC using a dilute nickel chloride
solution (13.6 g/L NiC12•6H20). As seen from Figure 16, two peaks occurred upon the
addition of NaOH solution. On the left of the first peak, sodium hydroxide was consumed
to neutralize the free acid in the solution. Between the first and second peaks, sodium
hydroxide was consumed to form insoluble nickel hydroxide. The volume between these
two peaks was found to be close to the equivalent stoichiometry when the product was
Ni(OH)S). On the right of the second peak, almost all of the nickel had been precipitated as
insoluble Ni(OH)S) and the further addition of NaOH solution can only result in a pH rise.
What is important here is that nickel hydroxide did not dissolve at all even though the pH
was held at the level of the end-point for a couple of days. The pH of incipient precipitation
can be calculated simply using the solubility product at 250C[9u:
0.572 M NiCl2
+ 0.365 M NiSO4
+ 0.365 M Na2SO4
(C)
110
100
90
80
70
60
50
40
30
20
10
0
-10
p
[Ni2+J
[NIOH÷]
[Ni(OH)2(aq)]
[Ni(OH)2(s)]
[Ni(OH)3<->]
[Ni(OH)4<2->]
[NI2OH<3+>j
[N14(OH)4.c4-i->]
[NICI+J
[NiSO4]
0 1 2 3 4 5 6 7 8 9 10 11 12 13 14
=[Ni21[0H12=5.47 x lO_16 (204)
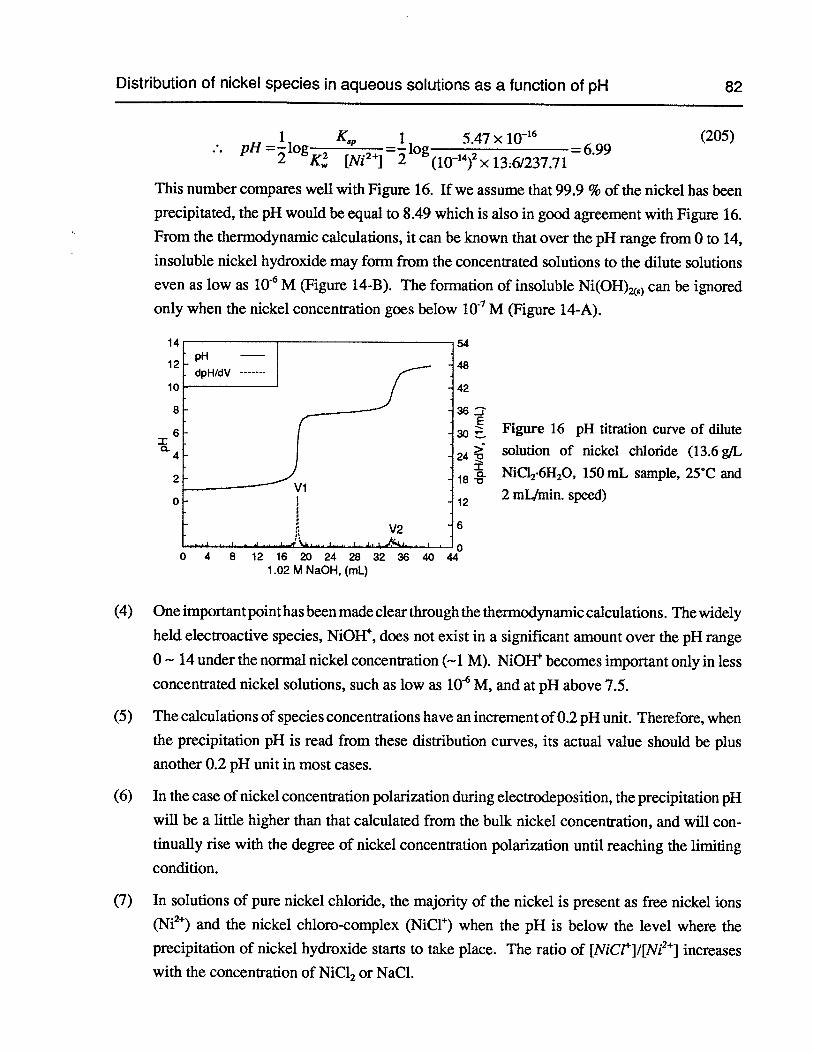
Distribution of nickel species in aqueous solutions as a function of pH 82
1 K,=!log 5.47 x 10_16
= 6.99.. pH =log2[Ni2] 2 (10’)2x13;6/237.71
(205)
This number compares well with Figure 16. If we assume that 99.9 % of the nickel has beenprecipitated, the pH would be equal to 8.49 which is also in good agreement with Figure 16.From the thermodynamic calculations, it can be known that over the pH range from 0 to 14,insoluble nickel hydroxide may form from the concentrated solutions to the dilute solutions
even as low as l0 M (Figure 14-B). The formation of insoluble Ni(OH)) can be ignoredonly when the nickel concentration goes below M (Figure 14-A).
-JE
>-D
018 -o
12
Figure 16 pH titration curve of dilutesolution of nickel chloride (13.6 g/LNiC12•6H20, 150 mL sample, 25CC and
2 mL/min. speed)
(4) One important pointhas been made clear through the thermodynamic calculations. The widely
held electroactive species, NiOW, does not exist in a significant amount over the pH range
0— 14 under the normal nickel concentration (—1 M). NiOH becomes important only in less
concentrated nickel solutions, such as low as 10 M, and at pH above 7.5.
(5) The calculations of species concentrations have an increment of0.2 pH unit. Therefore, when
the precipitation pH is read from these distribution curves, its actual value should be plusanother 0.2 pH unit in most cases.
(6) In the case of nickel concentration polarization during electrodeposition, the precipitation pH
will be a little higher than that calculated from the bulk nickel concentration, and will con
tinually rise with the degree of nickel concentration polarization until reaching the limiting
condition.
(7) In solutions of pure nickel chloride, the majority of the nickel is present as free nickel ions(Ni2j and the nickel chloro-complex (NiCl) when the pH is below the level where theprecipitation of nickel hydroxide starts to take place. The ratio of [NiClj/[Ni2’]increases
with the concentration of NiCl2or NaC1.
10
8
62:O4
2
0
0 4 8 12 16 20 24 28 32 36 40 441.02 M NaOH, (mL)
Distribution of nickel species in aqueous solutions as a function of pH 83
(8) In 0.937 M NiC12 solution, Ni4(OH) may exist when the pH is between 5.2—6.6 with a
maximum percentage of —1.5 % at pH 6. This will explain the later surface pH modellingwhere it was found that the incorporation of this species would lower the surface pH when itwent above —5.
(9) When sulfate is present in the solution, the percentage ofthe ion-pair NiSO4is quite significantand it must be taken into account in any considerations related to the surface pH. Its concentration rises with the total sulfate concentration.
(10) Whether in solutions of pure nickel chloride or mixed nickel chloride and sulfate, the pHdifference between where nickel ions start to precipitate as Ni(OH)S) and where almost nosoluble nickel ions are left in solution is not more than 1.5 units.
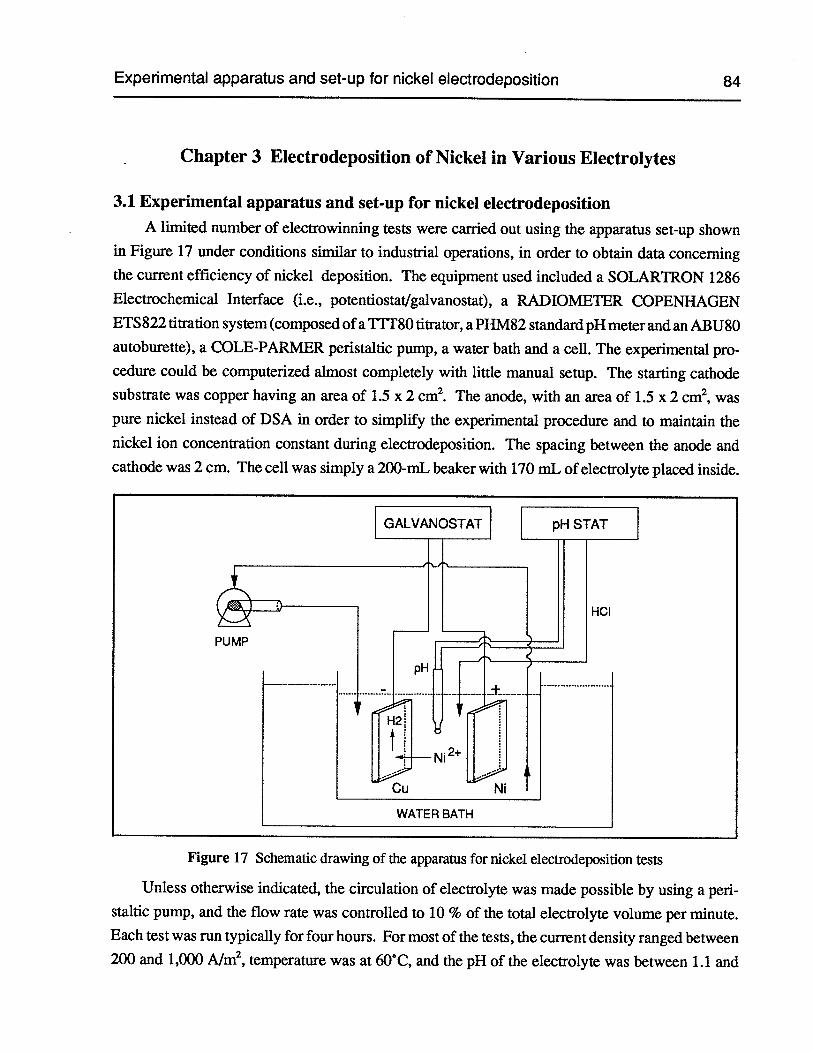
Experimental apparatus and set-up for nickel electrodeposition 84
Chapter 3 Electrodeposition of Nickel in Various Electrolytes
3.1 Experimental apparatus and set-up for nickel electrodepositionA limited number of electrowinning tests were carried out using the apparatus set-up shown
in Figure 17 under conditions similar to industrial operations, in order to obtain data concerningthe current efficiency of nickel deposition. The equipment used included a SOLARTRON 1286Electrochemical Interface (i.e., potentiostat/galvanostat), a RADIOMETER COPENHAGENETS 822 titration system (composed ofa TTT8O titrator, a PHM82 standard pH meter and an ABU8Oautoburette), a COLE-PARMER peristaltic pump, a water bath and a cell. The experimental procedure could be computerized almost completely with little manual setup. The starting cathodesubstrate was copper having an area of 1.5 x 2 cm2. The anode, with an area of 1.5 x 2 cm2, waspure nickel instead of DSA in order to simplify the experimental procedure and to maintain thenickel ion concentration constant during electrodeposition. The spacing between the anode andcathode was 2 cm. The cell was simply a 200-mL beaker with 170 mL of electrolyte placed inside.
Unless otherwise indicated, the circulation of electrolyte was made possible by using a peristaltic pump, and the flow rate was controlled to 10 % of the total electrolyte volume per minute.Each test was run typically for four hours. For most of the tests, the current density ranged between200 and 1,000 A/m2,temperature was at 60°C, and the pH of the electrolyte was between 1.1 and
Figure 17 Schematic drawing of the apparatus for nickel electrodeposition tests
Electrodeposition of nickel at 25°C 85
2.5. The pH of the electrolyte during electrolysis was held constant by adding 2.5 M HC1 solutioncontinuously through the RADIOMETER titrator system. The tested electrolytes were NiC12,NiCl2-NjSO4,NiC12-Na2504,NiC12-NiSO4-Na2SO4,NiC12-H3B03,NiC12-NiSO4-H3B03,NiC12-NH4C1 and NiCl2-HC1. The electrolytes were prepared using A.C.S. reagent grade chemicals anddeionized water. The concentration of nickel ion changed from 0.937 to 3.92 M. The study of theelectrolyte composition may not seem to be very systematical; however, the results certainly revealmuch useful information.
The current efficiency of nickel was determined according to the weight gain of the cathodeafter electrodeposition. Since the current passing through the cell and the electrolysis time couldbe controlled precisely, and the electrodeposition was run for a long period of time, the values ofthe nickel current efficiency are reliable and quite accurate as regards the measurement itself. Thecurrent efficiency of hydrogen evolution can be calculated simply by subtracting the nickel currentefficiency from 100. The current efficiency ofnickel can also be calculated according to the volumeof acid added to the electrolyte during electrodeposition. For this type of test, the electrolyte mustbe stirred to ensure a uniform electrolyte pH in the cell and to achieve a satisfactory agreementbetween the two methods of measuring the current efficiency, i.e., on the basis of weight gain andacid volume.
3.2 Electrodeposition of nickel at 25°C
A limited number of electrodeposition tests were carried out at 25°C with the main purpose ofconfirming the later measurements of surface pH. The electrolytes were agitated mechanicallyrather than circulated. The agitation rate was controlled so as to be same as in the surface pHmeasurements. Tests were conducted under the following conditions:
(1) 0.937 M NiC12 (55 g/L Ni2), pH 1.1, 2.0, 2.5 and 3.0
(2) 0.572 M NiCl2+ 0.365 M NiSO4 (55 g/L Ni2 and 35 g/L SO), pH 2.5 and 3.0
(3) 0.937 M NiCl2+2 M NaCl at pH 2.5
(4) 0.937 M NiCl2 + 0.485 MH3B03at pH 2.5
(5) 0.937 M NiCI2+ 1.31 M NH.4C1 at pH 2.5
For all of the electrolytes, the results of the electrodeposition tests were in general in goodagreement with the surface pH measurements. Using 0.937 M NiCl2 (55 g/L Ni2) at pH 2.5 as anexample, electrodepositions were quite successful when the current density was below 200 A/m2.However, at 250 A/rn2, the deposit was poorer with a black and greenish surface. At 300 A/m2,there was a very large hydrogen evolution, no metallic nickel was deposited at all, and the whole
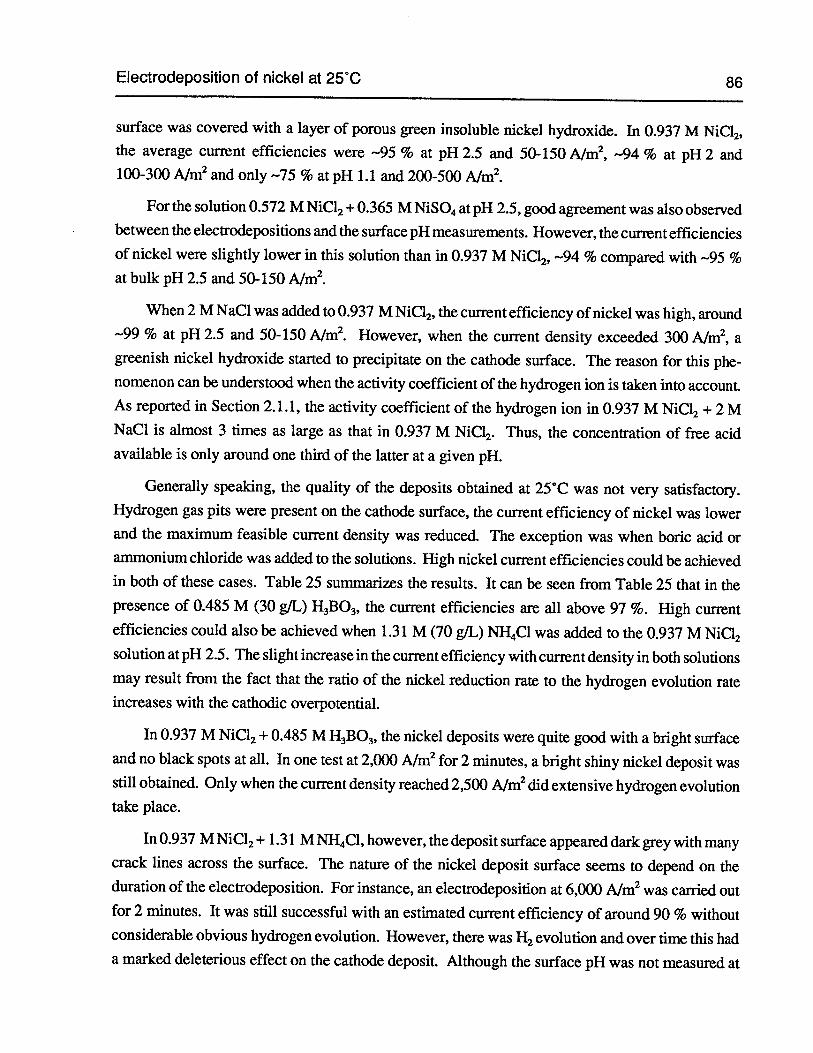
Electrodeposition of nickel at 25°C 86
surface was covered with a layer of porous green insoluble nickel hydroxide. In 0.937 M NiC12,the average current efficiencies were —95 % at pH 2.5 and 50-150 A/m2, —94 % at pH 2 and100-300 Aim2 and only —75 % at pH 1.1 and 200-500 A/rn2.
For the solution 0.572 M NiC12+ 0.365 M NiSO4at pH 2.5, good agreement was also observedbetween the electrodepositions and the surface pH measurements. However, the current efficienciesof nickel were slightly lower in this solution than in 0.937 M NiCl2,—94 % compared with —95 %at bulk pH 2.5 and 50-150 A/m2.
When 2 M NaC1 was added to 0.937 M NiC12,the current efficiency of nickel was high, around—99 % at pH 2.5 and 50-150 A/rn2. However, when the current density exceeded 300 A/m2, agreenish nickel hydroxide started to precipitate on the cathode surface. The reason for this phenomenon can be understood when the activity coefficient of the hydrogen ion is taken into account.As reported in Section 2.1.1, the activity coefficient of the hydrogen ion in 0.937 M NiCl2 + 2 MNaC1 is almost 3 times as large as that in 0.937 M NiC12. Thus, the concentration of free acidavailable is only around one third of the latter at a given pH.
Generally speaking, the quality of the deposits obtained at 25°C was not very satisfactory.Hydrogen gas pits were present on the cathode surface, the current efficiency of nickel was lowerand the maximum feasible current density was reduced. The exception was when boric acid orammonium chloride was added to the solutions. High nickel current efficiencies could be achievedin both of these cases. Table 25 summarizes the results. It can be seen from Table 25 that in thepresence of 0.485 M (30 g/L) H3B03,the current efficiencies are all above 97 %. High currentefficiencies could also be achieved when 1.31 M (70 g/L) NH4C1 was added to the 0.937 M NiC12solution at pH 2.5. The slight increase in the current efficiency with current density in both solutionsmay result from the fact that the ratio of the nickel reduction rate to the hydrogen evolution rateincreases with the cathodic overpotential.
In 0.937 M NiC12+ 0.485 MH3B03,the nickel deposits were quite good with a bright surfaceand no black spots at all. In one test at 2,000 Aim2for 2 minutes, a bright shiny nickel deposit wasstill obtained. Only when the current density reached 2,500 Aim2did extensive hydrogen evolutiontake place.
In 0.937 M NiCl2+ 1.31 MNH4C1, however, the deposit surface appeared dark grey with manycrack lines across the surface. The nature of the nickel deposit surface seems to depend on theduration of the electrodeposition. For instance, an electrodeposition at 6,000 Aim2was carried outfor 2 minutes. It was still successful with an estimated current efficiency of around 90 % withoutconsiderable obvious hydrogen evolution. However, there was H2 evolution and over time this hada marked deleterious effect on the cathode deposit. Although the surface pH was not measured at
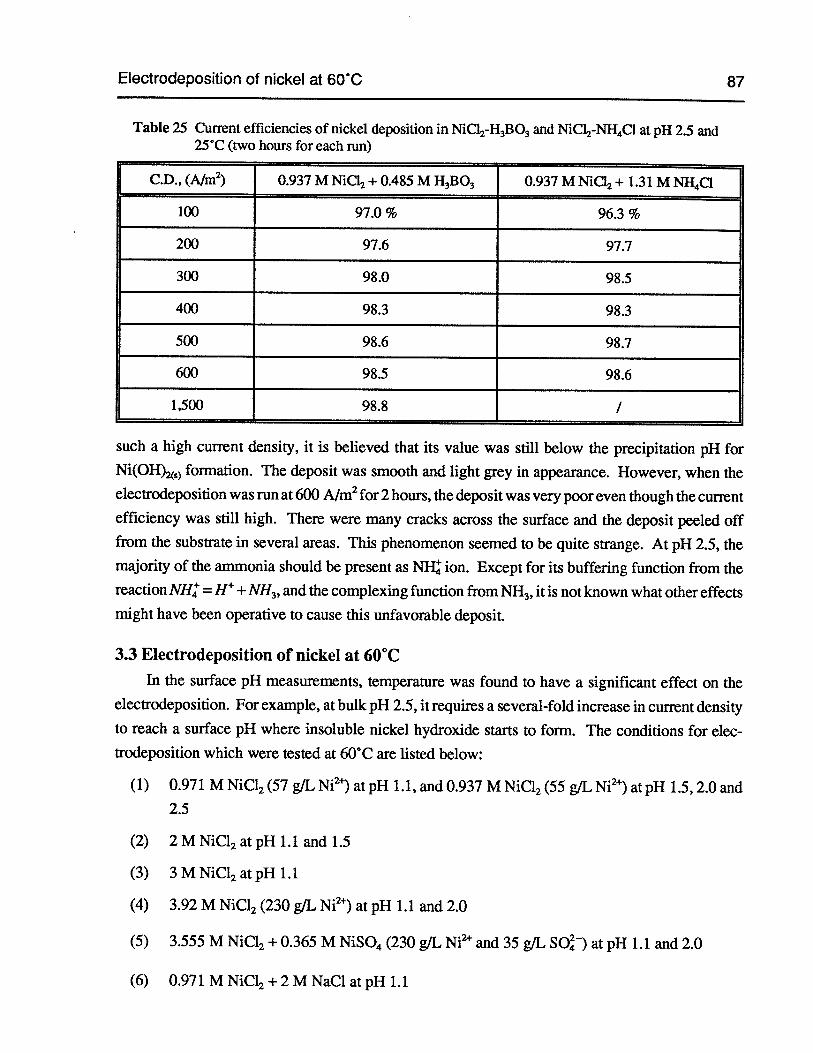
Electrodeposition of nickel at 60°C 87
Table 25 Current efficiencies of nickel deposition in NiC12-H3B03and NiC12-NH4CIat pH 2.5 and25°C (two hours for each run)
C.D., (A/rn2) 0.937 M NiCI2+ 0.485 M H3B03 0.937 M NiQ2+ 1.31 M NH4C1
100 97.0 % 96.3 %
200 97.6 97.7
300 98.0 98.5
400 98.3 98.3
500 98.6 98.7
600 98.5 98.6
1,500 98.8 /
such a high current density, it is believed that its value was still below the precipitation pH forNi(OH)) formation. The deposit was smooth and light grey in appearance. However, when theelectrodeposition was run at 600 A/rn2for 2 hours, the deposit was very poor even though the currentefficiency was still high. There were many cracks across the surface and the deposit peeled offfrom the substrate in several areas. This phenomenon seemed to be quite strange. At pH 2.5, themajority of the ammonia should be present as NH ion. Except for its buffering function from thereaction NH = H + NH3,and the complexing function from NH3,it is not known what other effectsmight have been operative to cause this unfavorable deposit.
3.3 Electrodeposition of nickel at 60°CIn the surface pH measurements, temperature was found to have a significant effect on the
electrodeposition. For example, at bulk pH 2.5, it requires a several-fold increase in current densityto reach a surface pH where insoluble nickel hydroxide starts to form. The conditions for electrodeposition which were tested at 60°C are listed below:
(1) 0.971 M NiC12 (57 g/L Ni2)at pH 1.1, and 0.937 M NiCl2(55 g/L Ni2)at pH 1.5, 2.0 and2.5
(2) 2 M NiCl2 at pH 1.1 and 1.5
(3) 3 M NiC12 at pH 1.1
(4) 3.92 M NiCl2 (230 g/L Ni2) at pH 1.1 and 2.0
(5) 3.555 M NiC12 + 0.365 M NiSO4 (230 g/L Ni and 35 g/L SO) at pH 1.1 and 2.0
(6) 0.971 M NiC12+ 2 M NaCl at pH 1.1
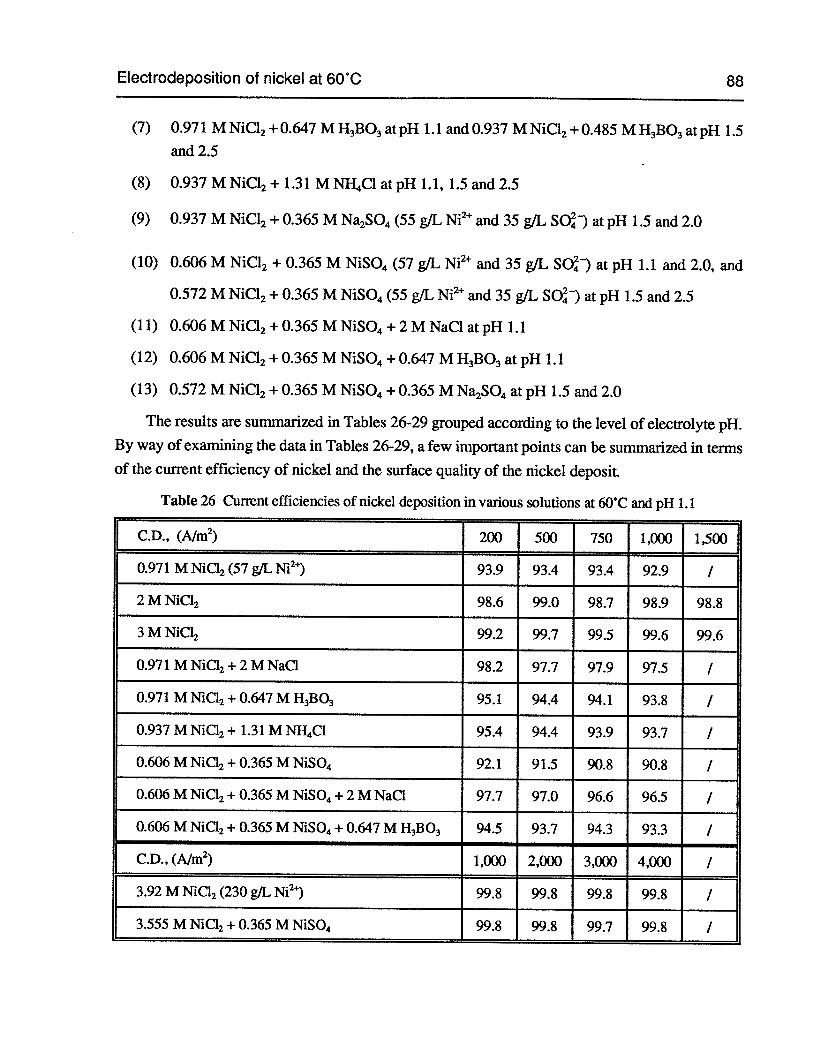
Electrodeposition of nickel at 6OC 88
(7) 0.971 M NiC12+ 0.647 MH3B03at pH 1.1 and 0.937 M NiC12+ 0.485 MH3B03at pH 1.5and 2.5
(8) 0.937 M NiC12+ 1.31 M NH.4C1 at pH 1.1, 1.5 and 2.5
(9) 0.937 M NiC12+ 0.365 M Na2SO4(55 gIL Ni2 and 35 g/L SO) at pH 1.5 and 2.0
(10) 0.606 M NiC12 + 0.365 M NiSO4 (57 g/L Ni2 and 35 g/L SO) at pH 1.1 and 2.0, and
0.572 M NiC12+ 0.365 M NiSO4 (55 g/L Ni2 and 35 g/L SO) at pH 1.5 and 2.5
(11) 0.606 M NiC12+ 0.365 M NiSO4 + 2 M NaC1 at pH 1.1
(12) 0.606 M NiC12+ 0.365 M NiSO4+0.647 MH3B03at pH 1.1
(13) 0.572 M NiC12+ 0.365 M NiSO4 + 0.365 M Na2SO4at pH 1.5 and 2.0
The results are summarized in Tables 26-29 grouped according to the level of electrolyte pH.By way of examining the data in Tables 26-29, a few important points can be summarized in termsof the current efficiency of nickel and the surface quality of the nickel deposit.
Table 26 Current efficiencies of nickel deposition in various solutions at 60C and pH 1.1
f C.D., (A/rn2) 200 500 750 1,000 1,500
0.971 M NiC12(57 g/L Ni2) 93.9 93.4 93.4 92.9 I
2 M NiCI2 98.6 99.0 98.7 98.9 98.8
3 M NiCl2 99.2 99.7 99.5 99.6 99.6
0.971 M NiCl2 + 2 M NaC1 98.2 97.7 97.9 97.5 I
0.971 M NiC12+ 0.647 M H3B03 95.1 94.4 94.1 93.8 I
0.937 M NiCI2+ 1.31 M NH4C1 95.4 94.4 93.9 93.7 I
0.606 M NiC12 + 0.365 M NiSO4 92.1 91.5 90.8 90.8 /
0.606 M NiCI2+ 0.365 M NiSO4+ 2 M NaCI 97.7 97.0 96.6 96.5 /
0.606 M NiCI2+ 0.365 M NiSO4+ 0.647 M H3B03 94.5 93.7 94.3 93.3 /
C.D., (A/rn2) 1,000 2,000 3,000 4,000 I
3.92 M NiC12 (230 g/L N12) 99.8 99.8 99.8 99.8 /
3.555 M NiC12+ 0.365 M NiSO4 99.8 99.8 99.7 99.8 /
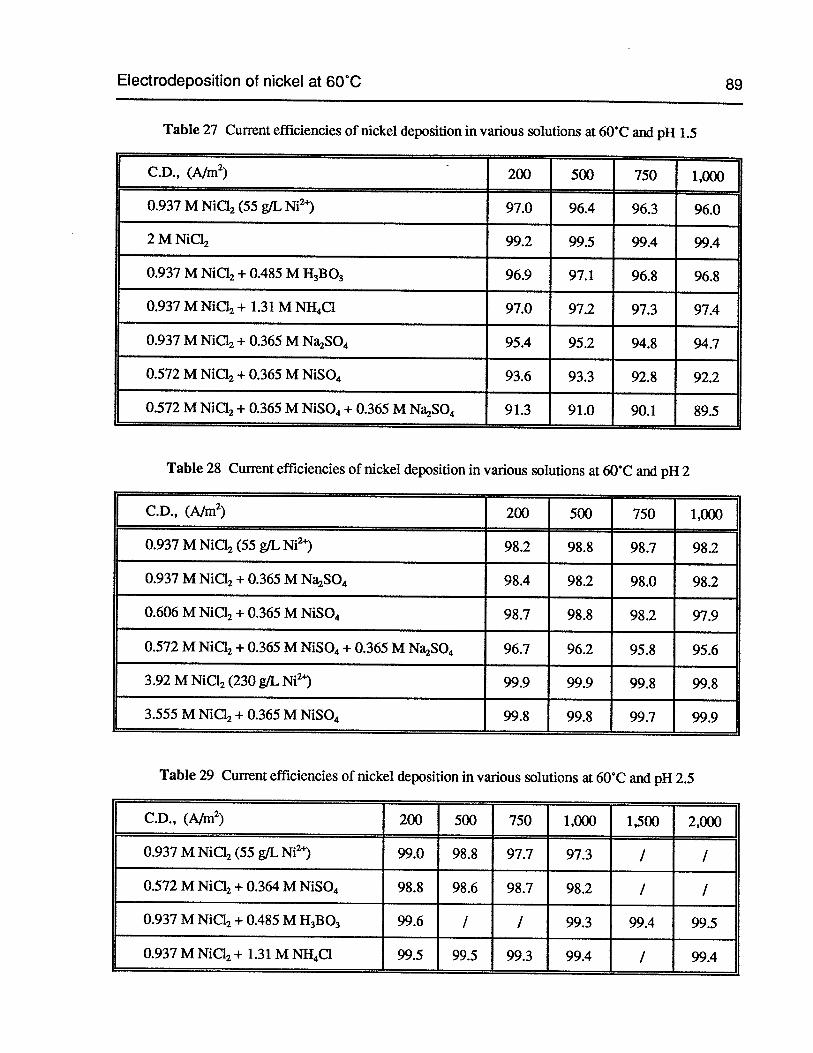
Electrodeposition of nickel at 60°C 89
Table 27 Current efficiencies of nickel deposition in various solutions at 60°C and pH 1.5
C.D., (A/rn2) 200 500 750 1,000
0.937 M NiCl2 (55 g/L Ni24) 97.0 96.4 96.3 96.0
2 M NiC12 99.2 99.5 99.4 99.4
0.937 M NiC12+ 0.485 M H3B03 96.9 97.1 96.8 96.8
0.937 M NiCI2+ 1.31 M NH4C1 97.0 97.2 97.3 97.4
0.937 M NiC12+ 0.365 M Na2SO4 95.4 95.2 94.8 94.7
0.572 M NiQ2+ 0.365 M NiSO4 93.6 93.3 92.8 92.2
0.572 M NiC12+ 0.365 M NiSO4+ 0.365 M Na2SO4 91.3 91.0 90.1 89.5
Table 28 Current efficiencies of nickel deposition in various solutions at 60°C and pH 2
C.D.,(A/rn2) 200 500 750 1,000
0.937 M NiQ2 (55 WE Ni2) 98.2 98.8 98.7 98.2
0.937 M NiCI2+ 0.365 M Na2SO4 98.4 98.2 98.0 98.2
0.606 M NiCI2+ 0.365 M N1SO4 98.7 98.8 98.2 97.9
0.572 M NiCI2+ 0.365 M NiSO4÷ 0.365 M Na2SO4 96.7 96.2 95.8 95.6
3.92 M NiCI2 (230 WE Ni24) 99.9 99.9 99.8 99.8
3.555 M N1CI2+ 0.365 M NISO4 99.8 99.8 99.7 99.9
Table 29 Current efficiencies of nickel deposition in various solutions at 60°C and pH 2.5
C.D., (A/rn2) 200 500 750 1,000 1,500 2,000
0.937 M NiC12 (55 WE Ni2) 99.0 98.8 97.7 97.3 I /
0.572 M NiCI2+ 0.364 M NISO4 98.8 98.6 98.7 98.2 I /
0.937 M NiCI2+ 0.485 MH3B03 99.6 I I 99.3 99.4 99.5
0.937 M NiC.12 + 1.31 M NH4C1 99.5 99.5 99.3 99.4 / 99.4
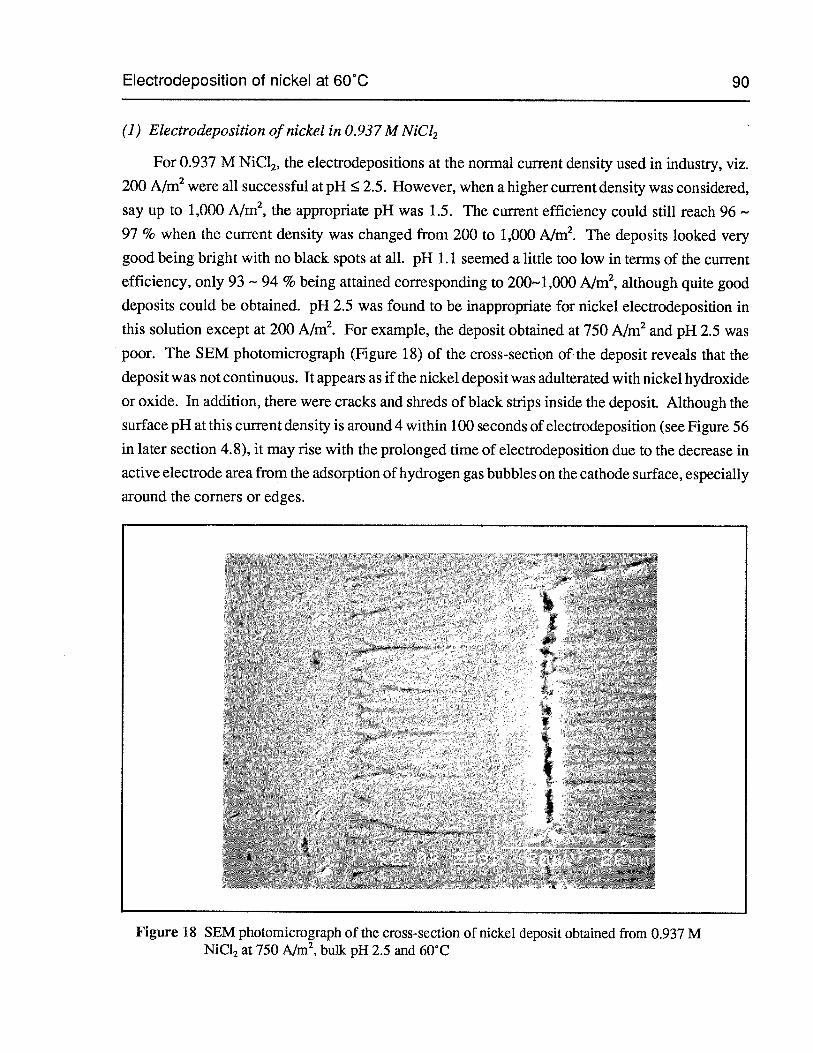
Electrodeposition of nickel at 60°C
(1) Electrodeposition of nickel in O.937M NiC12
90
For 0.937 M NiC12,the electrodepositions at the normal current density used in industry, viz.
200 A/rn2were all successful at pH 2.5. However, when a higher current density was considered,
say up to 1,000 A/rn2, the appropriate pH was 1.5. The current efficiency could still reach 96 —
97 % when the current density was changed from 200 to 1,000 A/m2. The deposits looked very
good being bright with no black spots at all. pH 1.1 seemed a little too low in terms of the current
efficiency, only 93 — 94 % being attained corresponding to 200—1,000 A/rn2,although quite gooddeposits could be obtained. pH 2.5 was found to be inappropriate for nickel electrodeposition inthis solution except at 200 A/rn2. For example, the deposit obtained at 750 A/rn2 and pH 2.5 was
poor. The SEM photomicrograph (Figure 18) of the cross-section of the deposit reveals that the
deposit was not continuous. It appears as if the nickel deposit was adulterated with nickel hydroxide
or oxide. In addition, there were cracks and shreds of black strips inside the deposit. Although the
surface pH at this current density is around 4 within 100 seconds of electrodeposition (see Figure 56in later section 4.8), it may rise with the prolonged tirne of electrodeposition due to the decrease inactive electrode area frorn the adsorption of hydrogen gas bubbles on the cathode surface, especially
around the corners or edges.
Figure 18 SEM photomicrograph of the cross-section of nickel deposit obtained from 0.937 MNiC12 at 750 A/rn2,bulk pH 2.5 and 60°C
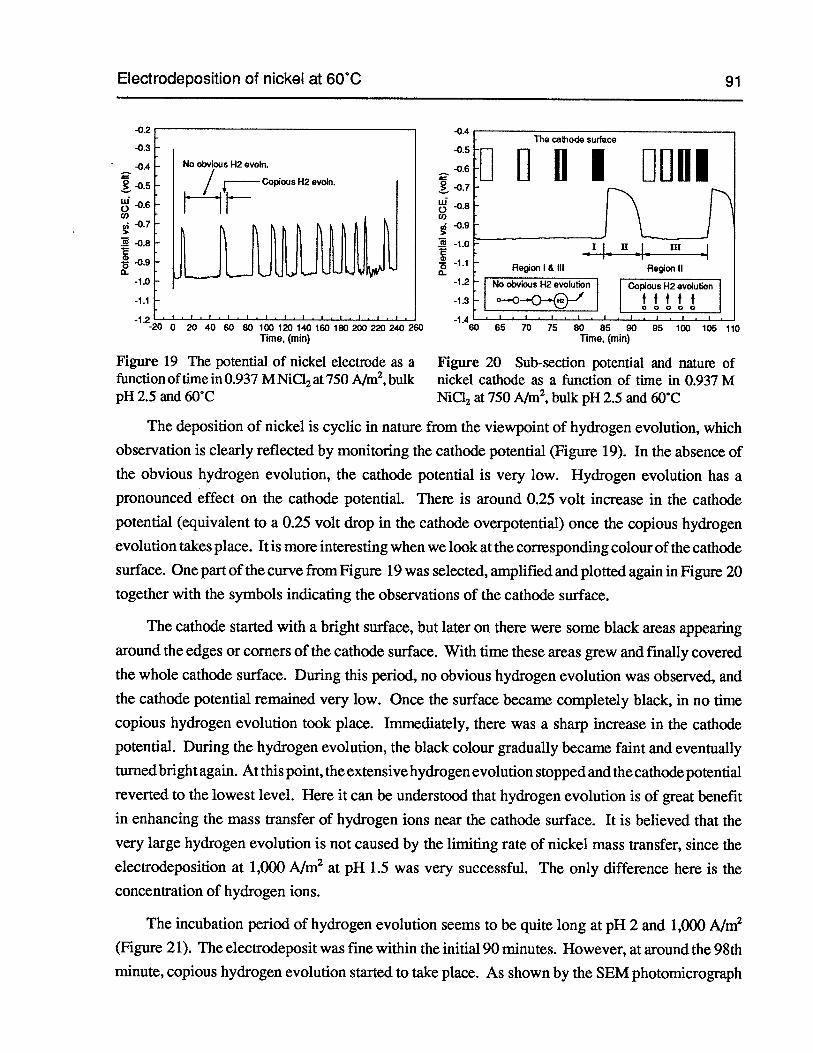
Electrodeposition of nickel at 60C 91
The deposition of nickel is cyclic in nature from the viewpoint of hydrogen evolution, which
observation is clearly reflected by monitoring the cathode potential (Figure 19). In the absence of
the obvious hydrogen evolution, the cathode potential is very low. Hydrogen evolution has apronounced effect on the cathode potential. There is around 0.25 volt increase in the cathode
potential (equivalent to a 0.25 volt drop in the cathode overpotential) once the copious hydrogen
evolution takes place. It is more interesting when we look at the corresponding colour of the cathodesurface. One part of the curve from Figure 19 was selected, amplified and plotted again in Figure 20together with the symbols indicating the observations of the cathode surface.
The cathode started with a bright surface, but later on there were some black areas appearing
around the edges or corners of the cathode surface. With time these areas grew and finally covered
the whole cathode surface. During this period, no obvious hydrogen evolution was observed, and
the cathode potential remained very low. Once the surface became completely black, in no time
copious hydrogen evolution took place. Immediately, there was a sharp increase in the cathode
potential. During the hydrogen evolution, the black colour gradually became faint and eventually
turned bright again. At this point, the extensivehydrogen evolution stopped and the cathode potential
reverted to the lowest level. Here it can be understood that hydrogen evolution is of great benefit
in enhancing the mass transfer of hydrogen ions near the cathode surface. It is believed that thevery large hydrogen evolution is not caused by the limiting rate of nickel mass transfer, since theelectrodeposition at 1,000 Aim2 at pH 1.5 was very successful. The only difference here is theconcentration of hydrogen ions.
The incubation period of hydrogen evolution seems to be quite long at pH 2 and 1,000 A/rn2
(Figure 21). The electrodeposit was fine within the initial 90 minutes. However, at around the 98thminute, copious hydrogen evolution started to take place. As shown by the SEM photomicrograph
No obvious H2 evoln.
/ opious H2
-0.2 -
-0.3
-0.4
-0.5
0.60
-0,7
.f -0.8
E
-12 -‘‘-
-2001.1.1.1.1.1.1.1.1.1.1.1
-04The cathode surface::u no i unoi
Region I & III Region II-1.2 No obv,ous H2 evolutio1 Copious H2 evolution
-1.3 I
__________________________________
00000
—1.4 — I I I I
60 65 70 75 80 85 90 95 100 105 110Time, (mm)
Figure 20 Sub-section potential and nature ofnickel cathode as a function of time in 0.937 MNiCI2at 750 A/rn2,bulk pH 2.5 and 60C
20 40 60 80 100 120 140 160 180 200 220 240 260Time, (mm)
Figure 19 The potential of nickel electrode as afunction of time in 0.937 M NiC12at 750 A/rn2,bulkpH 2.5 and 6(YC
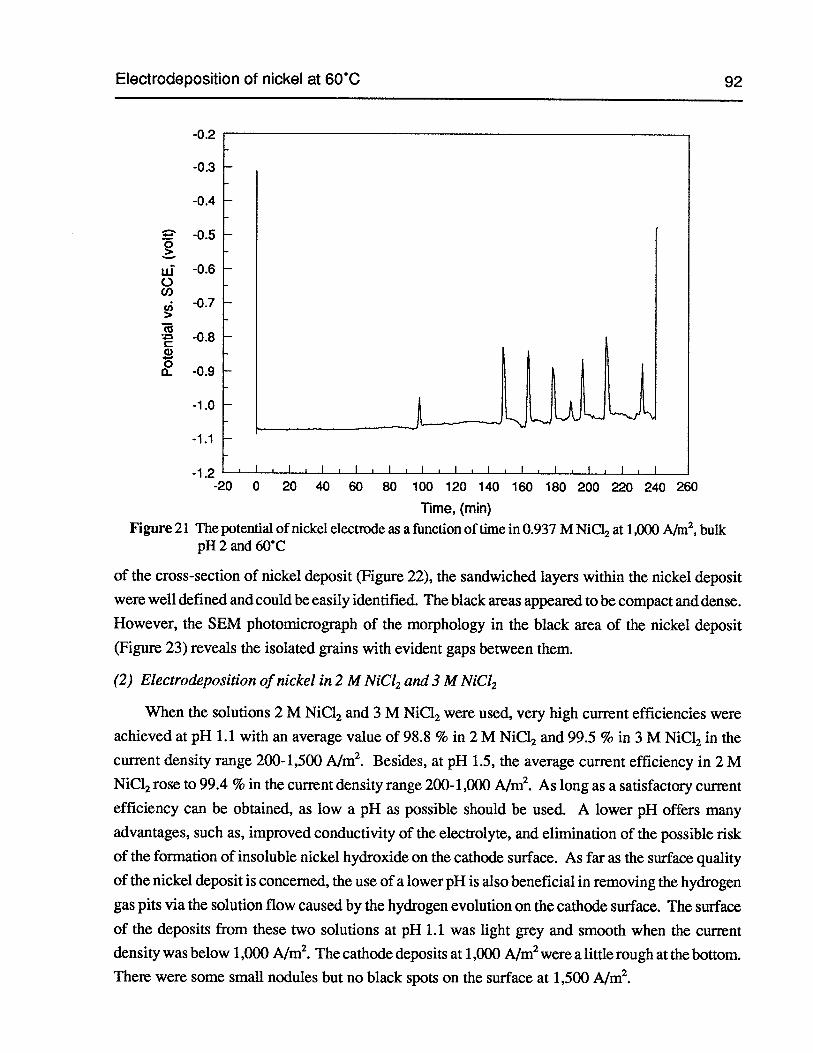
Electrodeposition of nickel at 60’C 92
-0.2
-0.3
-0.4
2 -0.5
ui -0.6C)C,)
ui -0.7
-20 0 20 40 60 80 100 120 140 160 180 200 220 240 260
lime, (mm)
Figure 21 The potential of nickel electrode as a function of time in 0.937 M NiCl2at 1,000 A/rn2,bulkpH2and6OC
of the cross-section of nickel deposit (Figure 22), the sandwiched layers within the nickel deposit
were well defined and could be easily identified. The black areas appeared to be compact and dense.
However, the SEM photomicrograph of the morphology in the black area of the nickel deposit
(Figure 23) reveals the isolated grains with evident gaps between them.
(2) Electrodeposition of nickel in 2 M NiC12 and 3 M NiC12
When the solutions 2 M NiCl2 and 3 M NiC12were used, very high current efficiencies were
achieved at pH 1.1 with an average value of 98.8 % in 2 M NiC12 and 99.5 % in 3 M NiC12 in the
current density range 200-1,500 A/rn2. Besides, at pH 1.5, the average current efficiency in 2 M
NiC12rose to 99.4 % in the current density range 200-1,000 A/rn2. As long as a satisfactory current
efficiency can be obtained, as low a pH as possible should be used. A lower pH offers many
advantages, such as, improved conductivity of the electrolyte, and elimination of the possible riskof the formation of insoluble nickel hydroxide on the cathode surface. As far as the surface quality
of the nickel deposit is concerned, the use of a lower pH is also beneficial in removing the hydrogen
gas pits via the solution flow caused by the hydrogen evolution on the cathode surface. The surface
of the deposits from these two solutions at pH 1.1 was light grey and smooth when the current
density was below 1,000 A/m2.The cathode deposits at 1,000 A/m2were a little rough at the bottom.There were some small nodules but no black spots on the surface at 1,500 A/m2.
I I I • I I • I I
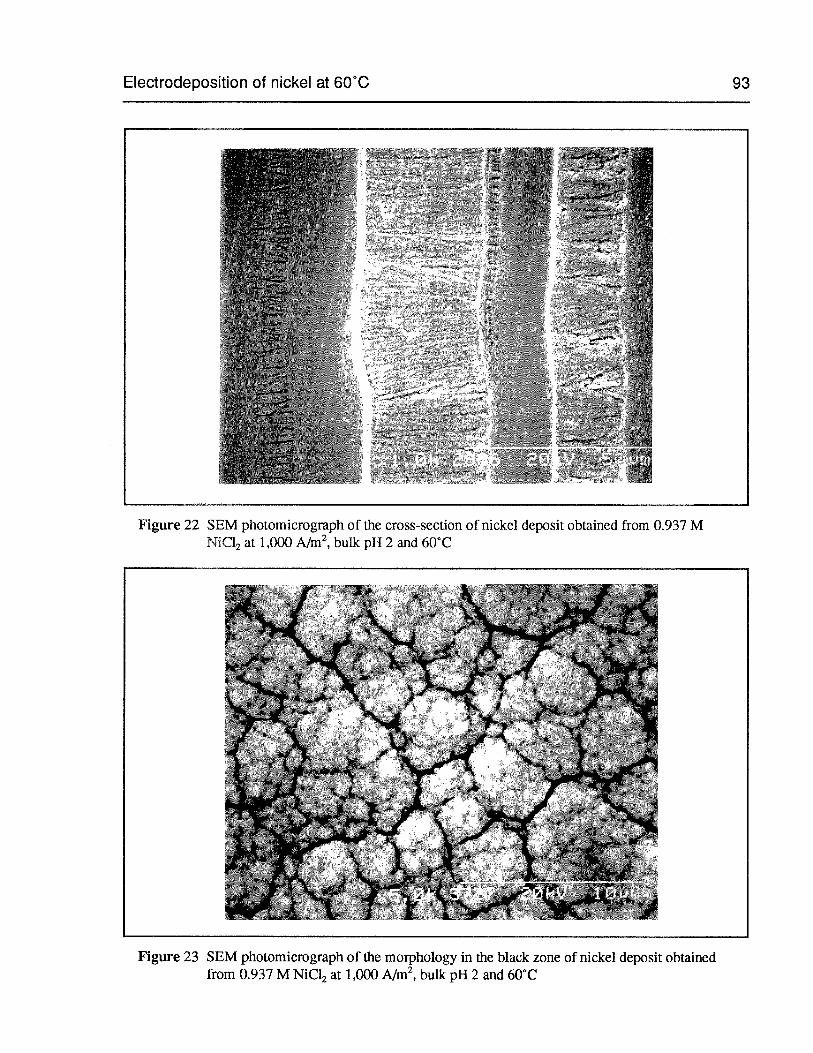
Electrodeposition of nickel at 60°C
Figure 22 SEM photomicrograph of the cross-section of nickel deposit obtained from 0.937 MNiC12 at 1,000 A/rn2,bulk pH 2 and 60°C
93
31
Figure 23 SEM photomicrograph of the morphology in the black zone of nickel deposit obtainedfrom 0.937 M NiC12 at 1,000 A/rn2,bulk pH 2 and 60°C
Electrodeposition of nickel at 60C 94
(3) Electrodeposition of nickel in 3.92 M NiC12 and 3.555 M NiC12 + 0365 M NiSO4
In the highly concentrated solutions 3.92 M NiC12and 3.555 M NiC12+ 0.365 M N1SO4,almost100 % current efficiencies of nickel were realized at pH 1.1 even when the current density rangedbetween 1,000 and 4,000 A/rn2. A very smooth electrodeposit was achieved at a current densityup to 1,000 A/rn2. There were some small nodules on the cathode surface at 2,000 A/m2. At 3,000and 4,000 A/rn2,when the electrodeposition was carried out in 3.92 M NiC12, the surface of the
deposits was very rough, yet the deposits were still compact and adhered well to the substrate.However, in 3.555 M NiC12 + 0.365 M NiSO4,the deposits were poorly adherent and peeled offfrom the substrate at 3,000 and 4,000 A/rn2. It should be pointed out that the flow rate used in thecell was quite slow, as the circulation rate was controlled at only 10 % of the cell volume per minutein a 200-mL cell. As the flow rate in the cell increases, the surface quality of deposit wouldunquestionably be improved. The operating pH in these two solutions has the potential of beingfurther lowered in practice.
(4) Electrodeposition of nickel in the presence ofsulfate
As regards the addition of sulfate, three compositions were tested, viz., 0.937 M NiC12 +
0.365 MNa2SO4,0.572 M NiCl2+ 0.365 M NiSO4and 0.572 M NiC12+ 0.365 M NiSO4+ 0.365 MNa2SO4.The effect of sulfate ions is clearly reflected in the current efficiencies at pH 1.5 as shownin Table 27. The current efficiency decreased with the increase in the sulfate concentration or withthe decrease in the chloride concentration. However, at pH 2, there was little difference in thecurrent efficiency whether the solutions contained 35 g/L SO or not. When the sulfate concentration reached 70 g/L SO, there was around 2 % drop in the current efficiency. The surfacequality of the deposits was similar to that in the solutions of pure nickel chloride. One thing hasbeen ascertained from the experiments, that is, the maximum operating current density can be raisedto a higher level when sulfate is present. The appropriate pH seems to be around 2 in the solutionsof mixed nickel chloride and sulfate whose composition is 55 g/L Ni2 and 35 g/L SO with acurrent efficiency in the order of 98 % (Table 28).
(5) Electrodeposition of nickel in the presence of2 M NaC1
When 2 M NaC1 was added to 0.971 M NiC12or 0.606 M NiCl2+ 0.365 M NiSO4,substantialincreases in current efficiency were observed at pH 1.1 with an average of 97.8 %1 and 97.0 %2,
respectively, at current densities 200-1,000 A/rn2. The function of NaC1 is dual facilitating thecharge transfer of the nickel ion and raising the activity coefficient of the hydrogen ion. The surfacequality of the nickel deposits in both solutions was good with a smooth yet slightly grey dark surface.
1 Average increase in current efficiency was 4.4 % compared with that for 0.971 M NiCI2.2 Average increase in current efficiency was 5.7 % compared with that for 0.606 M NiC12+ 0.365 M NiSO4.
Electrodeposition of nickel in 2 M NICI2 + 6 M HCI 95
(6) Electrodeposition of nickel in the presence ofboric acid
The addition of boric acid was effective too, especially in improving the surface quality of thenickel cathode. As far as the current efficiency is concerned, it increases to some degree (Tables 27and 29). Furthermore, with the addition of boric acid, the operating current density could be raisedto a much higher level, which fact is quite important when the pH must be controlled to be around2.5 and the electrodeposition must be carried out at room temperature. As discussed previously,the addition of boric acid was very effective even at 25°C. The quality of the nickel deposit at 60°Cwas found again to be related to the time of electrodeposition, as the surface of the nickel depositbecame rougher with time. One electrodeposition was carried out at 6,000 A/rn2 and pH 2.5 foronly 2 minutes. There was no great evolution of hydrogen and the deposit was fine and dark onlyaround the edges.
(7) Electrodeposition of nickel in the presence ofammonium chloride
When ammonium chloride was present in the nickel chloride solutions, the current efficiencyof nickel could also be increased. The most important feature of the addition of ammonium chlorideis that it enables the use of a high current density even at pH 2.5. In one test run at 6,000 A/rn2 foronly 2 minutes, the deposit still looked fine, with the dark areas appearing only around the edgeswithout a large hydrogen evolution during electrodeposition. Of course, the surface quality of thedeposit depends on the duration of the electrodeposition. In the present tests, the deposits obtainedbelow 750 A/rn2 for 4 hours were found to be satisfactory. However, at 1,000 Aim2, there weremany tiny cracks across the surface both at pH 1.1 and 1.5. One concern with the addition ofNH4C1is the colour of the nickel deposits. The deposits always looked dark grey, not bright at all.
3.4 Electrodeposition of nickel in 2 M NiC12 + 6 M HC1Some preliminary work on the electrodeposition of nickel in 2 M NiCl2+6 M HC1 was carried
out at temperatures 25, 60 and 95°C. The incentive for this test came from the fact that the nickelactivity can be raised dramatically by using an electrolyte which is highly concentrated in hydrochloric acid. Copper was used as the cathode substrate and metallic nickel as the anode. A 200-mLbeaker was used for the electrolytic cell and the solution was circulated at a rate of —10 % of thecell solution volume per minute. Each electrodeposition ran for two hours. The results are summarized in Tables 30-3 1.
The current efficiencies of nickel and the anode were determined by weight gain and loss,respectively. The current efficiency of hydrogen evolution was calculated by the subtraction from100 of the nickel current efficiency. The results listed in Tables 30-3 1 show current efficiencieswhich are far from optimum. Under all temperatures and current densities, there was always acopious hydrogen evolution on the cathode. At 25°C, the corrosion of copper and nickel was not
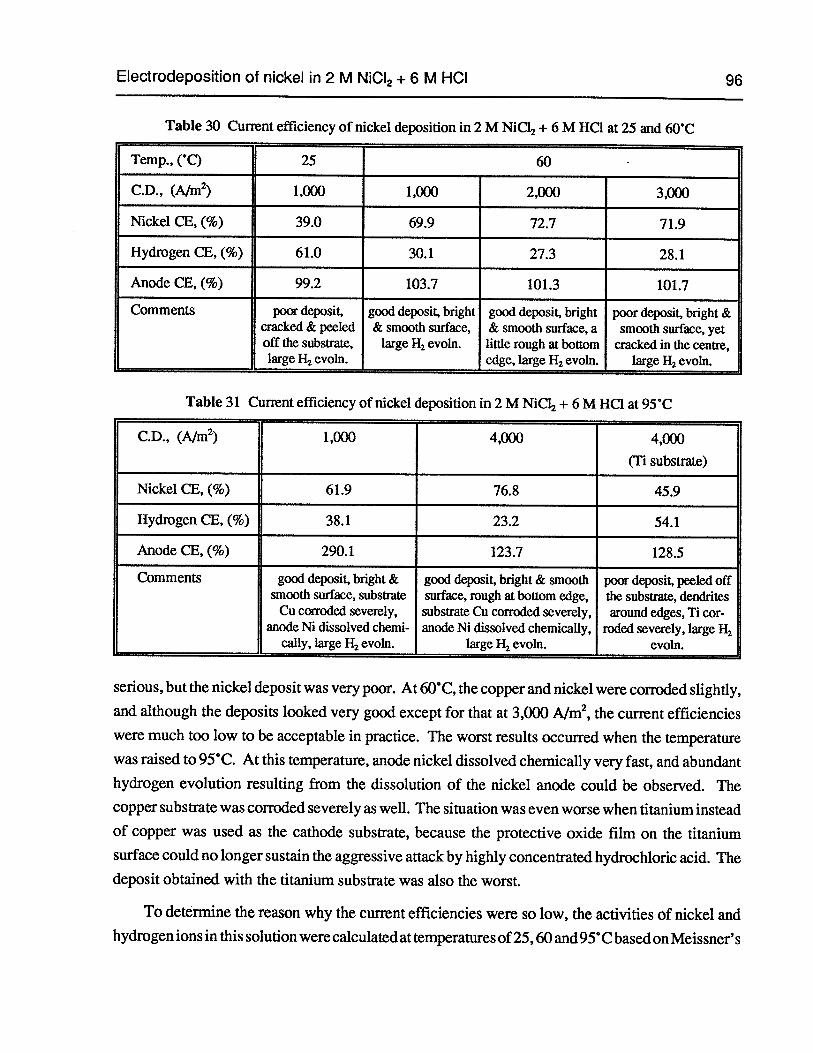
Electrodeposition of nickel in 2 M NiCI2 + 6 M HCI 96
Table 30 Current efficiency of nickel deposition in 2 M NiCI2+6 M HQ at 25 and 60’C
Temp., (°C) 25 60 -
C.D., (A/rn2) 1,000 1,000 2,000 3,000
Nickel CE, (%) 39.0 69.9 72.7 71.9
Hydrogen CE, (%) 61.0 30.1 27.3 28.1
Anode CE, (%) 99.2 103.7 101.3 101.7
Comments poor deposit, good deposit, bright good deposit, bright poor deposit, bright &cracked & peeled & smooth surface, & smooth surface, a smooth surface, yetoff the substrate, large H2 evoin. little rough at bottom cracked in the centre,large H2 evoin. edge, large H2 evoin. large H2 evoin.
Table 31 Current efficiency of nickel deposition in 2 M NiCI2+ 6 M HQ at 95°C
C.D., (Aim2) 1,000 4,000 4,000
(Ti substrate)
Nickel CE, (%) 61.9 76.8 45.9
Hydrogen CE, (%) 38.1 23.2 54.1
Anode CE, (%) 290.1 123.7 128.5
Comments good deposit, bright & good deposit, bright & smooth poor deposit, peeled offsmooth surface, substrate surface, rough at bottom edge, the substrate, dendrites
Cu corroded severely, substrate Cu corroded severely, around edges, Ti coranode Ni dissolved chemi- anode Ni dissolved chemically, roded severely, large H2
cally, large H2 evoin. large H2 evoin. evoln.
serious, but the nickel deposit was very poor. At 60°C, the copper and nickel were corroded slightly,and although the deposits looked very good except for that at 3,000 A/rn2, the current efficiencies
were much too low to be acceptable in practice. The worst results occurred when the temperaturewas raised to 95°C. At this temperature, anode nickel dissolved chernicafly very fast, and abundanthydrogen evolution resulting from the dissolution of the nickel anode could be observed. Thecopper substrate was corroded severely as well. The situation was even worse when titanium insteadof copper was used as the cathode substrate, because the protective oxide film on the titaniumsurface could no longer sustain the aggressive attack by highly concentrated hydrochloric acid. Thedeposit obtained with the titanium substrate was also the worst.
To determine the reason why the current efficiencies were so low, the activities of nickel andhydrogen ions in this solution were calculated at temperatures of25, 60 and 95°C based on Meissner’ s
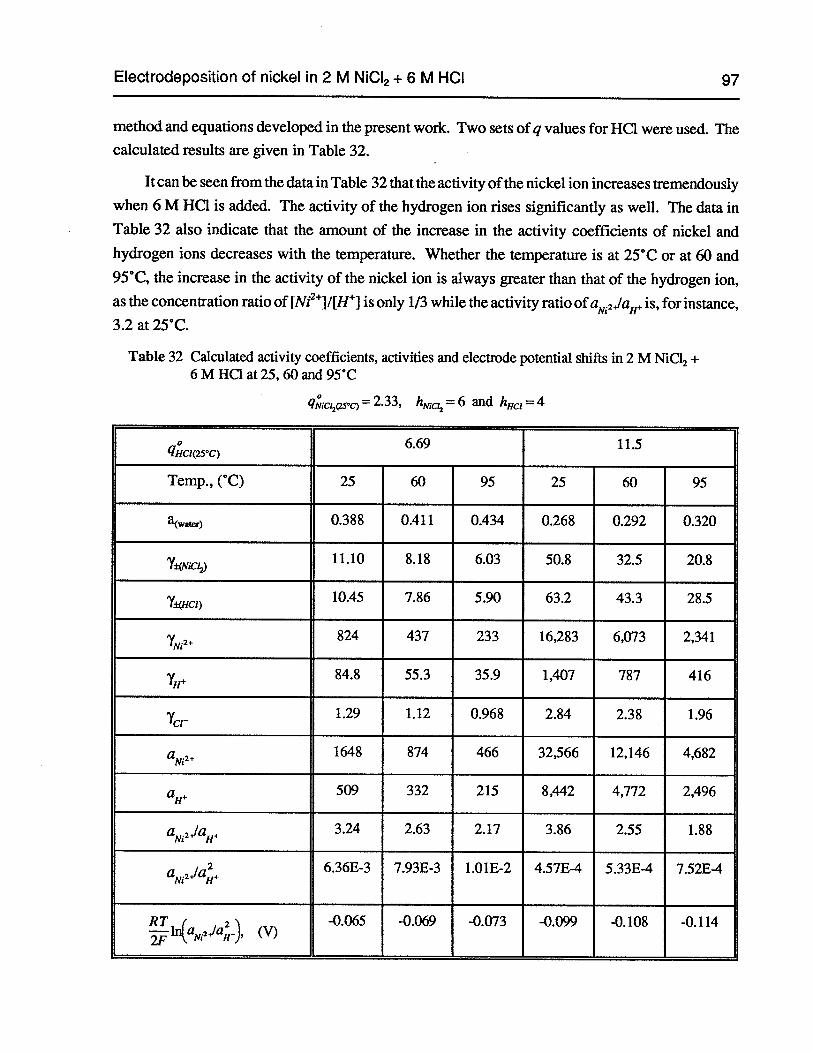
Electrodeposition of nickel in 2 M N1CI2 + 6 M HCI 97
method and equations developed in the present work. Two sets of q values for HC1 were used. Thecalculated results are given in Table 32.
It can be seen from the data in Table 32 that the activity ofthe nickel ion increases tremendouslywhen 6 M HC1 is added. The activity of the hydrogen ion rises significantly as well. The data inTable 32 also indicate that the amount of the increase in the activity coefficients of nickel and
hydrogen ions decreases with the temperature. Whether the temperature is at 25°C or at 60 and
95°C, the increase in the activity of the nickel ion is always greater than that of the hydrogen ion,
as the concentration ratio of[Ni2]/[HJ is only 1/3 while the activity ratio of aN2JaH+ is, for instance,
3.2 at 25°C.
Table 32 Calculated activity coefficients, activities and electrode potential shifts in 2 M NiCI2 +6 M HQ at 25,60 and 95°C
= 2.33, hNI =6 and hHc, = 4
o 6.69 11.5qHc,(2s’c)
Temp., (°C) 25 60 95 25 60 95
a(waeT) 0.388 0.411 0.434 0.268 0.292 0.320
Y±(NiCL,,11.10 8.18 6.03 50.8 32.5 20.8
Y±(HCI)10.45 7.86 5.90 63.2 43.3 28.5
YNi2+824 437 233 16,283 6,073 2,341
‘1H84.8 55.3 35.9 1,407 787 416
1cr1.29 1.12 0.968 2.84 2.38 1.96
a 1648 874 466 32,566 12,146 4,682Ni2
509 332 215 8,442 4,772 2,496aJ÷
a ,/a11 3.24 2.63 2.17 3.86 2.55 1.88N:
a .2÷/a, 6.36E-3 7.93E3 1.01E2 4.57E4 5.33E4 7.52E4Ni
RT2JlnI\aNI24/aH+), (V)
-0.065 -0.069 -0.073 -0.099 -0.108 -0.114
Measurement of current efficiency of nickel from the acid volume 98
The cathodic reduction of nickel ions and hydrogen evolution are two competing reactions,and which one takes priority depends on its electrode potential. At 25°C, the difference in standardpotentials between the nickel and hydrogen electrodes is -0.257 volt. At 60 and 95°C, the differencein the standard potentials may not be the same as at 25°C, but it will not be far off. This potentialdifference means that if we want to have nickel ions take precedence in the electron discharge, thenegative difference in the standard potentials must be compensated by a positive shift in the termof activity quotient RT/(2F) xln(aNI2Ja,+) and/or overpotential flH2—TINI. Unfortunately, the calculations ofRT/(2F) xln(aNI2.Ja+) do not give the desired result. In the last row of Table 32, thisterm brings not a positive but a negative shift.
Although the overpotentials of nickel reduction and hydrogen evolution have not been considered here, the calculations seem to be compatible with the lower current efficiencies observedin the experiments. The experimental results and the calculations of the activities of nickel andhydrogen ions demonstrate that considering the nickel activity alone is insufficient, and the activityof the hydrogen ion must be taken into account as well when the operating conditions for electrolysisare selected.
3.5 Measurement of current efficiency of nickel from the acid volumeThe above-mentioned current efficiencies of nickel electrodeposition were all measured by
the weight difference of the cathode before and after electrodeposition. These current efficienciesare accurate and reliable. However, they reflect the average current efficiency of nickel over a longperiod of time. They do not indicate any information about the current efficiency at different timesduring elecirodeposition. In this regard it should be noted that actually there are two current efficiencies on the basis of time. The most commonly used current efficiency should strictly be calledthe overall current efficiency, which deals with a period of time (0 —* t). The more important currentefficiency, although seldom used, is called the instantaneous current efficiency, which deals witha very short period of time (dt). The measurement of instantaneous current efficiency is not alwayseasy. During nickel electrodeposition, there are no more cathodic reactions other than the reductionof nickel and hydrogen evolution, i.e., the total current I is equal to ‘Ni + ‘fl2• When the pH ofelectrolyte is controlled strictly at a constant value during electrodeposition, the current efficiencyof nickel can be determined from the amount of acid added.
For a galvanostatic (constant current) electrolysis, the instantaneous current efficiencies ofhydrogen evolution and nickel deposition can be expressed respectively as:
“2 dVHC, 1o3 too (206)InstantaneousCE11(%)=jj-x
dtX---XC,X9650OX---j--
Measurement of current efficiency of nickel from the acid volume 99
Instantaneous CEN1(%) 100—Instantaneous CEH2(%)(207)
dVHC, io 100=100—
dtX--XCHC,X96500X—7—
The symbols in these two equations are:
VHC, --- volume of HC1 solution, (mL)
CHCI --- concentration of HC1, (M)
I --- total current applied, (A)
‘Ni --- current consumed for nickel deposition, (A)
I --- current consumed for hydrogen evolution, (A)
t --- electrolysis time, (minute)
dVHc/dt --- acid volume change per unit time, (mL/min)
Thus, it is shown clearly in equations (206)-(207) that the instantaneous efficiency of nickel isdirectly proportional to the slope of the line ofV, vs. time. The overall current efficiency is definedin equation (208).
Overall CE(%) =4- x 100 =f Instantaneous CE(%) di’ (208)
where = 601 t (coulomb). Therefore, the overall current efficiencies of nickel and hydrogenevolution can be calculated respectively from the following two equations.
Overall CE11(%)= 1 dV11,
x x CHC, x 96500 x!o
(209)
= VHCI x i0 XCHC, x96500x&_
Overall CEN(%)lj(100 dVHCI
x-x CHC, x96500 xJdt
(210)
= 100—VHC,xlWxCffC,x96500x-
If the nickel electrodeposition is a steady-state process, the slope dV11,’dt is constant and theinstantaneous and overall current efficiencies will be equal to each other.
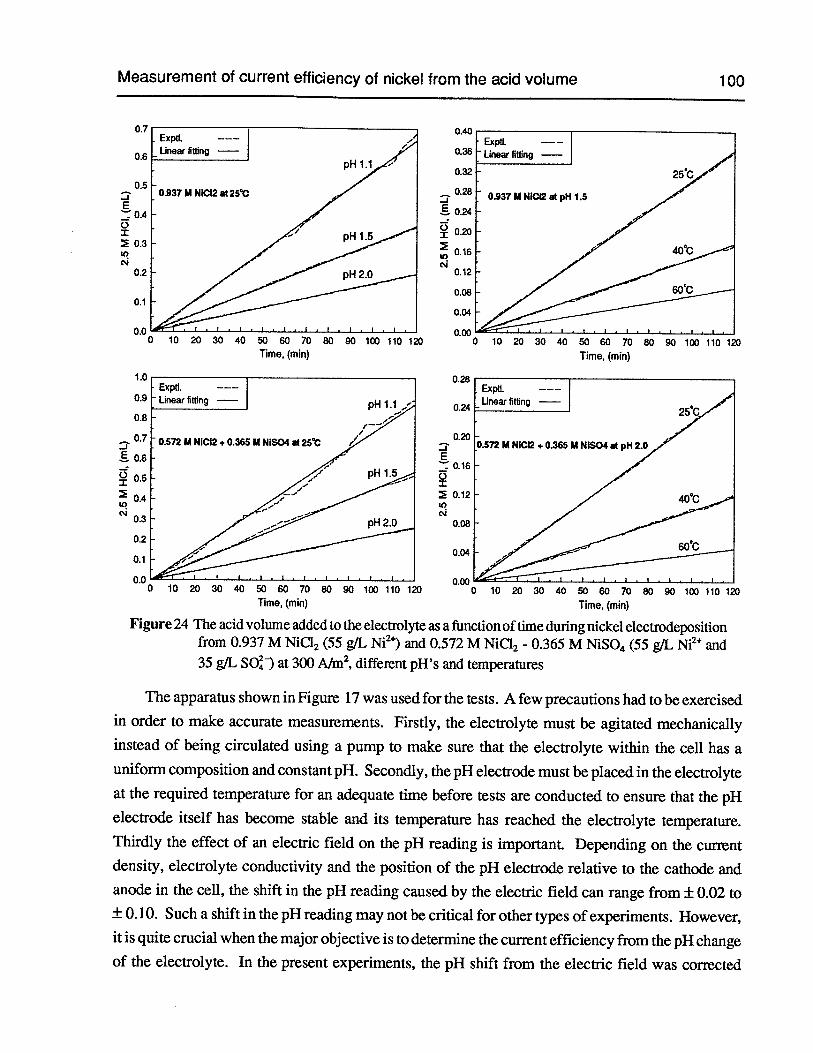
Measurement of current efficiency of nickel from the acid volume
0.7
0.6
0.5-JE
0.4C)
0.3I’)C%4
0.2
0.1
0.0
1.0
0.9
0.8
0.7-J
0.6
0.5
0.4U)c,i
0.3
0.2
0.1
0.0 0.000102030405060708090100110120 0 102030405060708090100110120
Time, (mm) Time, (mm)
Figure 24 The acid volume added to the electrolyte as a functionof time during nickel electrodepositionfrom 0.937 M NiCI2 (55 g/L Ni2) and 0.572 M NiCI2 - 0.365 M NiSO4 (55 g/L Ni2 and35 g/L SO) at 300 A/rn2,different pH’s and temperatures
100
-JE
0I
U,c’J
0 10 20 30 40 50 6070 80 90100110120Time, (mm) Time, (mm)
0.28
0.24
0.20-JE
0.16C)I
U)
0.08
0.12
0.04
The apparatus shown in Figure 17 was used for the tests. A few precautions had to be exercisedin order to make accurate measurements. Firstly, the electrolyte must be agitated mechanicallyinstead of being circulated using a pump to make sure that the electrolyte within the cell has auniform composition and constant pH. Secondly, the pH electrode must be placed in the electrolyteat the required temperature for an adequate time before tests are conducted to ensure that the pHelectrode itself has become stable and its temperature has reached the electrolyte temperature.Thirdly the effect of an electric field on the pH reading is important. Depending on the currentdensity, electrolyte conductivity and the position of the pH electrode relative to the cathode andanode in the cell, the shift in the pH reading caused by the electric field can range from ± 0.02 to± 0.10. Such a shift in the pH reading may not be critical for other types of experiments. However,it is quite crucial when the major objective is to determine the current efficiency from the pH changeof the electrolyte. In the present experiments, the pH shift from the electric field was corrected
Measurement of current efficiency of nickel from the acid volume 101
prior to conducting any tests. The experimental results are presented in Figure 24. The tests at60°C were not very successful. Therefore, the lines for 60°C in Figure 24 were simply calculatedfrom the weight gain of the cathode after electrodeposition.
All of the data shown in Figure 24 indicate that the acid volume added to the electrolyteincreases linearly with time as the electrodeposition proceeds. The poorer linearity at the lower pHespecially in the electrolyte NiC12-NiSO4results from the limited resolution of the pH meter (±0.01).The linear relationship between the acid volume added and the electrolysis time shows that thenickel electrodeposition is quite stable in both these electrolytes. In other words, the hydrogenevolution remains relatively constant during nickel electrodeposition, and thus the instantaneouscurrent efficiency is equal to the overall current efficiency.
The possible errors resulting from the ±0.01 variation of the pH meter are analyzed as follows.By definition pH is equal to:
1 (211)pH =—log(a+)—log(yff+. CH+) ..
CH+=_lWmYH+
If the activity coefficient of the hydrogen ion is assumed not to change during electrodeposition,the change in the hydrogen ion concentration can be obtained as:
(C+)H 2 —ApH . —ApH
= 10 i.e., (CH+) — (CH+) = (CH+)l (10 — 1) (212)k
1 (213)ACH÷=1O”•(lO”_ 1)
For 200 mL of electrolyte and using 2.5 M HC1 solution to adjust the pH, the change in the acidvolume is equal to:
tC +x200 200 (214)All I r H —
______
1-pH j1—ApH —
,,iJ
Lj..)
The corresponding change in the current efficiency for a period of two hours can be expressed as:
iXV+(mL) x i0 x 2.5 x 96500 (215)ACE11(%)=
72001xlOO
The calculated errors are summarized in Tables 33-34. It can be seen from Tables 33-34 thatthe errors in current efficiency due to a ±0.01 pH shift are acceptable in practice. However, theerrors increase at the lower pH’s and at a lower activity coefficient of hydrogen ion. As shown inTable 34, the error reaches ±5 % at pH 1.1 and 25°C in the electrolyte NiCl2-NiSO4.
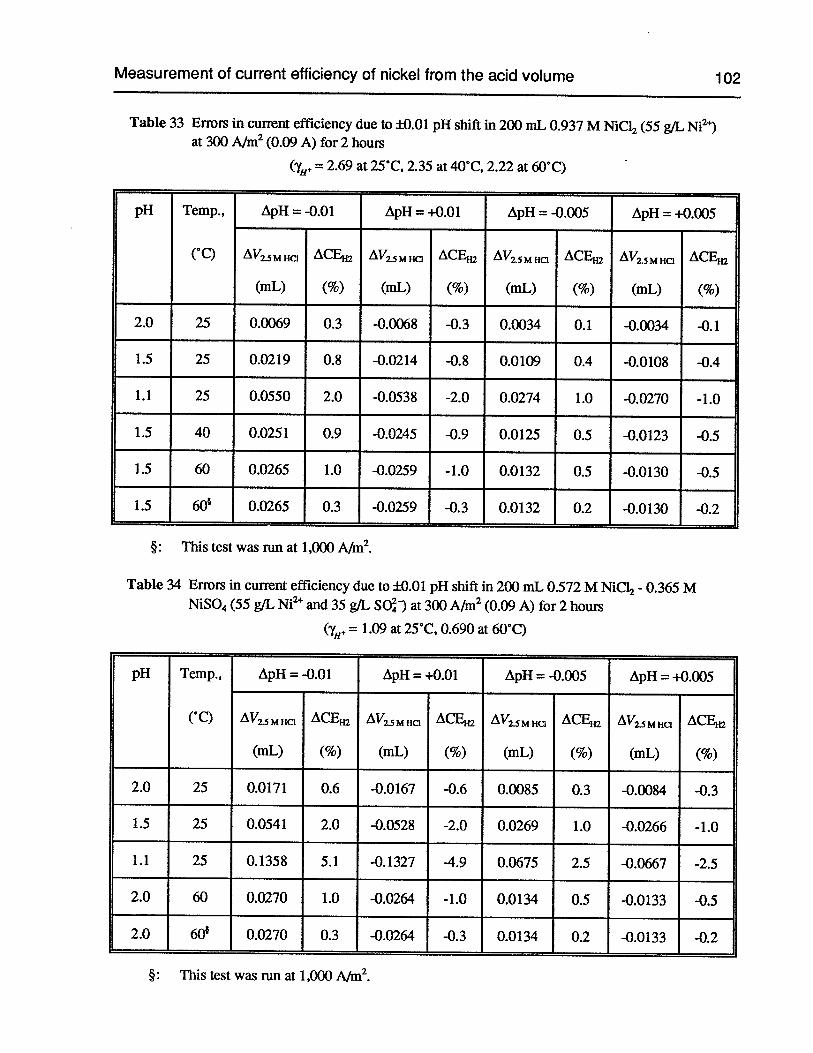
Measurement of current efficiency of nickel from the acid volume 102
Table 33 Errors in current efficiency due to ±0.01 pH shift in 200 mL 0.937 M N1C12 (55 g/L N12)at 300 A/rn2 (0.09 A) for 2 hours
(y,,+ = 2.69 at 25°C, 2.35 at 40°C, 2.22 at 60°C)
pH Temp., ApH = -0.01 ApH = +0.01 ApH = -0.005 ApH = ÷0.005
(‘C) AV1SMHC ACE IXVMHa ACE AVMfl ACE AVISMHQ H2
(mL) (%) (mL) (%) (rnL) (%) (mL) (%)
2.0 25 0.0069 0.3 -0.0068 -0.3 0.0034 0.1 -0.0034 -0.1
1.5 25 0.0219 0.8 -0.0214 -0.8 0.0109 0.4 -0.0108 -0.4
1.1 25 0.0550 2.0 -0.0538 -2.0 0.0274 1.0 -0.0270 -1.0
1.5 40 0.025 1 0.9 -0.0245 -0.9 0.0125 0.5 -0.0123 -0.5
1.5 60 0.0265 1.0 -0.0259 -1.0 0.0132 0.5 -0.0130 -0.5
1.5 60* 0.0265 0.3 -0.0259 -0.3 0.0132 0.2 -0.0130 -0.2
§: This test was run at 1,000 Ahi2.
Table 34 Errors in current efficiency due to ±0.01 pH shift in 200 mL 0.572 M N1C12 - 0.365 MNiSO4(55 g/L Ni2 and 35 g/L SO) at 300 Mn2 (0.09 A) for 2 hours
(y+ = 1.09 at 25°C, 0.690 at 60°C)
pH Temp., ApH = -0.01 ApH = +0.01 ApH = -0.005 ApH = +0.005
(‘C) AVMHØ ACE AVz.5MH ACE AV2.SMHCI ACE AV15MHCI H2
(rnL) (%) (mL) (%) (mL) (%) (mL) (%)
2.0 25 0.0171 0.6 -0.0167 -0.6 0.0085 0.3 -0.0084 -0.3
1.5 25 0.0541 2.0 -0.0528 -2.0 0.0269 1.0 -0.0266 -1.0
1.1 25 0.1358 5.1 -0.1327 -4.9 0.0675 2.5 -0.0667 -2.5
2.0 60 0.0270 1.0 -0.0264 -1.0 0.0134 0.5 -0.0133 -0.5
2.0 60* 0.0270 0.3 -0.0264 -0.3 0.0134 0.2 -0.0133 -0.2
§: This test was run at 1,000 A/rn2.
Chapter 4 Surface pH Measurement during Nickel Electrodeposition 103
Chapter 4 Surface pH Measurement during Nickel Electrodeposition
The electrodeposition ofnickel often does not proceed at 100 % current efficiency. The balanceof the current is consumed normally in hydrogen evolution. Due to this hydrogen evolution, thehydrogen ion is depleted near the cathode surface. Therefore, the pH near the cathode surface isalways higher than that in the bulk electrolyte. What affects the electrode process is really thecathode surface pH rather than the pH in the bulk electrolyte. For hydrogen evolution, the reactantsare hydrogen ions in acidic media and water in basic media
2H30 + 2e = H2 + 2H20 in acidic media (216)
2H20 + 2e = 112 + 20ff in basic media (217)
The effect of potential at the outer Helmholtz plane on the cathode surface pH may not beneglected if the ionic strength is very low. Dissolved oxygen, if present, will affect the cathodesurface pH too.
°2()+ 4H + 4e = 21120 (218)
There are three basic factors which can depress the increase of the cathode surface pH. Thefirst one is the mass transfer rate of hydrogen ions towards the cathode surface. In this regard, thelower bulk pH and the thinner thickness of the diffusion layer brought about by vigorous agitationwill prevent to a large extent the cathode surface pH from rising. The second factor is the protondonating pH buffers, such as boric acidH3B03,or the bisulfate ion, HSO. The third factor is thehydroxylconsuming pH buffers, such as NiOH,Ni4(OH). As the cathode surface pH increases,the following equilibrium reactions will shift to the right to generate more protons:
HS0 — S0+H (219)
Ni2+H20—Ni0H+H (220)
4Ni2+ 41120 —*Ni4(0H)+ 4H (221)
Ni2+2H3B03— Ni(H2803)2+2H (222)
When the supply of hydrogen ions is unable to meet their depletion rate, the cathode surface pHwill rise and eventually lead to the formation of insoluble nickel hydroxide on the cathode surface.
Ni2+21120 — Ni (0H)) + 2H (223)
The formation of insoluble nickel hydroxide must be avoided during nickel electrowinning.
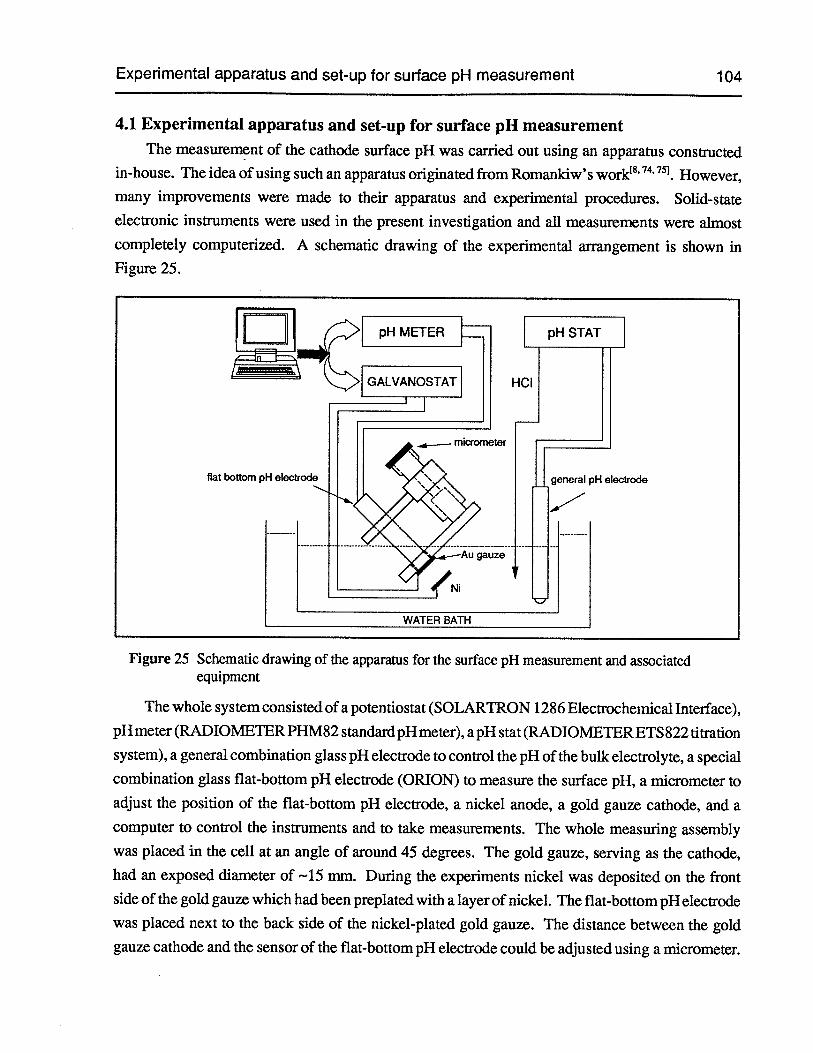
Experimental apparatus and set-up for surface pH measurement 104
4.1 Experimental apparatus and set-up for surface pH measurementThe measurement of the cathode surface pH was carried out using an apparatus constructed
in-house. The idea of using such an apparatus originated from Romankiw’s work18’ However,many improvements were made to their apparatus and experimental procedures. Solid-stateelectronic instruments were used in the present investigation and all measurements were almostcompletely computerized. A schematic drawing of the experimental arrangement is shown inFigure 25.
Figure 25 Schematic drawing of the apparatus for the surface pH measurement and associatedequipment
The whole system consisted of a potentiostat (SOLARTRON 1286 Electrochemical Interface),pH meter (RADIOMETER PHM82 standard pH meter), a pH stat (RADIOMETERETS 822 titrationsystem), a general combination glass pH electrode to control the pH of the bulk electrolyte, a specialcombination glass flat-bottom pH electrode (ORION) to measure the surface pH, a micrometer toadjust the position of the flat-bottom pH electrode, a nickel anode, a gold gauze cathode, and acomputer to control the instruments and to take measurements. The whole measuring assemblywas placed in the cell at an angle of around 45 degrees. The gold gauze, serving as the cathode,had an exposed diameter of —15 mm. During the experiments nickel was deposited on the frontside of the gold gauze which had been preplated with a layer of nickel. The flat-bottom pH electrodewas placed next to the back side of the nickel-plated gold gauze. The distance between the goldgauze cathode and the sensor of the flat-bottom pH electrode could be adjusted using a micrometer.
flat bottom p1-1 electrode
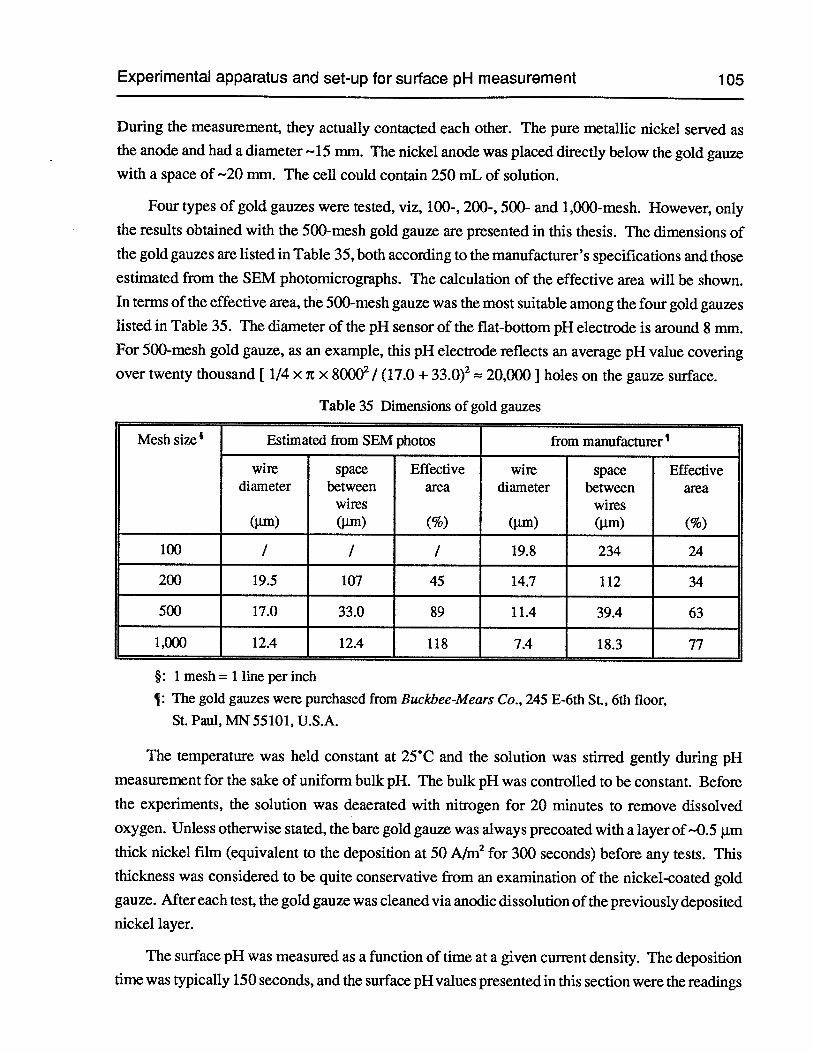
Experimental apparatus and set-up for surface pH measurement 105
During the measurement, they actually contacted each other. The pure metallic nickel served asthe anode and had a diameter —15 mm. The nickel anode was placed directly below the gold gauzewith a space of -20 mm. The cell could contain 250 mL of solution.
Four types of gold gauzes were tested, viz, 100-, 200-, 500- and 1,000-mesh. However, onlythe results obtained with the 500-mesh gold gauze are presented in this thesis. The dimensions ofthe gold gauzes are listed in Table 35, both according to the manufacturer’s specifications and thoseestimated from the SEM photomicrographs. The calculation of the effective area will be shown.In terms of the effective area, the 500-mesh gauze was the most suitable among the four gold gauzeslisted in Table 35. The diameter of the pH sensor of the flat-bottom pH electrode is around 8 mm.For 500-mesh gold gauze, as an example, this pH electrode reflects an average pH value coveringover twenty thousand [1/4 x it x 80002 / (17.0 + 33.0)2 20,000] holes on the gauze surface.
Table 35 Dimensions of gold gauzes
Mesh size Estimated from SEM photos from manufacturer1
wire space Effective wire space Effectivediameter between area diameter between area
wires wires(jim) (jim) (%) (jim) (jim) (%)
100 / / / 19.8 234 24
200 19.5 107 45 14.7 112 34
500 17.0 33.0 89 11.4 39.4 63
1,000 12.4 12.4 118 7.4 18.3 77
§: 1 mesh = 1 line per inch
¶: The gold gauzes were purchased from Buckbee-Mears Co., 245 E-6th St., 6th floor,St. Paul, MN 55101, U.S.A.
The temperature was held constant at 25°C and the solution was stirred gently during pH
measurement for the sake of uniform bulk pH. The bulk pH was controlled to be constant. Beforethe experiments, the solution was deaerated with nitrogen for 20 minutes to remove dissolvedoxygen. Unless otherwise stated, the bare gold gauze was always precoated with a layer of —0.5 jimthick nickel film (equivalent to the deposition at 50 AIm2 for 300 seconds) before any tests. Thisthickness was considered to be quite conservative from an examination of the nickel-coated goldgauze. After each test, the gold gauze was cleaned via anodic dissolution of the previously depositednickel layer.
The surface pH was measured as a function of time at a given current density. The depositiontime was typically 150 seconds, and the surface pH values presented in this section were the readings
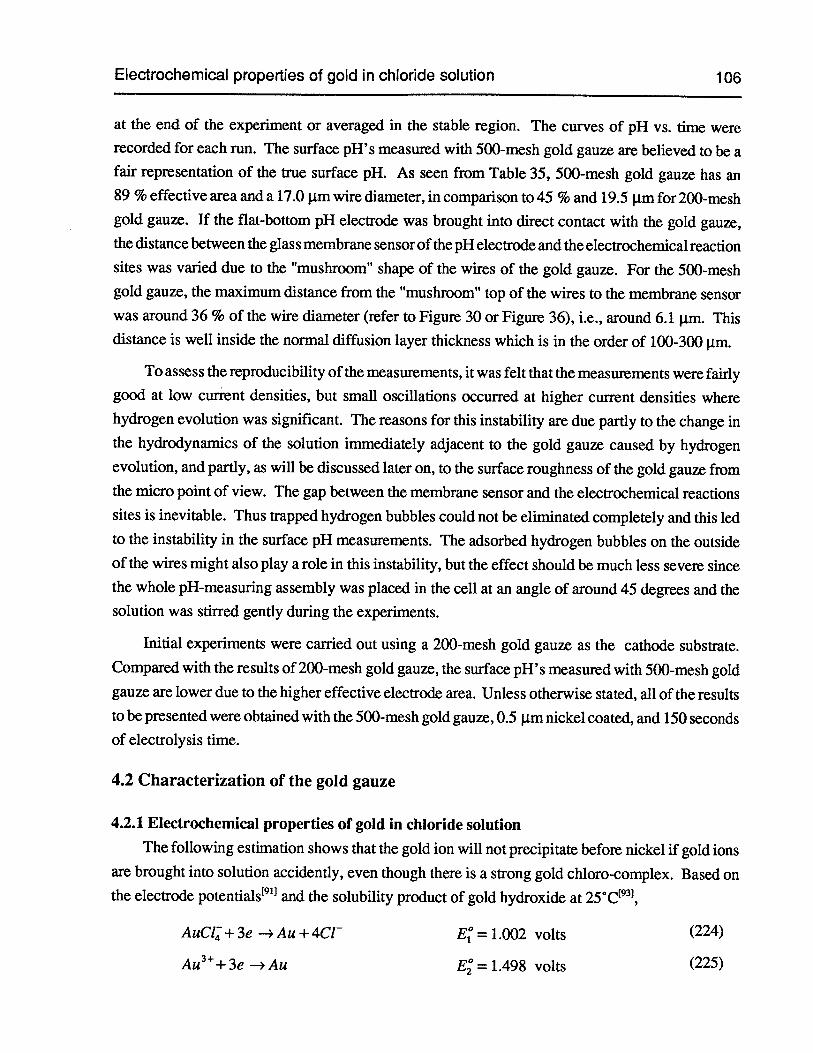
Electrochemical properties of gold in chloride solution 106
at the end of the experiment or averaged in the stable region. The curves of pH vs. time wererecorded for each run. The surface pH’s measured with 500-mesh gold gauze are believed to be afair representation of the true surface pH. As seen from Table 35, 500-mesh gold gauze has an89 % effective area and a 17.0 urn wire diameter, in comparison to 45 % and 19.5 im for 200-meshgold gauze. If the flat-bottom pH electrode was brought into direct contact with the gold gauze,the distance between the glass membrane sensor of the pH electrode and the electrochemical reactionsites was varied due to the “mushroom” shape of the wires of the gold gauze. For the 500-meshgold gauze, the maximum distance from the “mushroom” top of the wires to the membrane sensorwas around 36 % of the wire diameter (refer to Figure 30 or Figure 36), i.e., around 6.1 jim. Thisdistance is well inside the normal diffusion layer thickness which is in the order of 100-300 p.m.
To assess the reproducibility of the measurements, it was felt that the measurements were fairlygood at low current densities, but small oscillations occurred at higher current densities wherehydrogen evolution was significant. The reasons for this instability are due partly to the change inthe hydrodynamics of the solution immediately adjacent to the gold gauze caused by hydrogenevolution, and partly, as will be discussed later on, to the surface roughness of the gold gauze fromthe micro point of view. The gap between the membrane sensor and the electrochemical reactionssites is inevitable. Thus trapped hydrogen bubbles could not be eliminated completely and this ledto the instability in the surface pH measurements. The adsorbed hydrogen bubbles on the outsideof the wires might also play a role in this instability, but the effect should be much less severe sincethe whole pH-measuring assembly was placed in the cell at an angle of around 45 degrees and thesolution was stirred gently during the experiments.
Initial experiments were carried out using a 200-mesh gold gauze as the cathode substrate.Compared with the results of 200-mesh gold gauze, the surface pH’s measured with 500-mesh goldgauze are lower due to the higher effective electrode area. Unless otherwise stated, all of the resultsto be presented were obtained with the 500-mesh gold gauze, 0.5 p.m nickel coated, and 150 secondsof electrolysis time.
4.2 Characterization of the gold gauze
4.2.1 Electrochemical properties of gold in chloride solution
The following estimation shows that the gold ion will not precipitate before nickel if gold ionsare brought into solution accidently, even though there is a strong gold chioro-complex. Based onthe electrode potentials’911 and the solubility product of gold hydroxide at 25°C,
AuCl + 3e — Au + 4C1 E1° = 1.002 volts (224)
Au3+3e — Au = 1.498 volts (225)
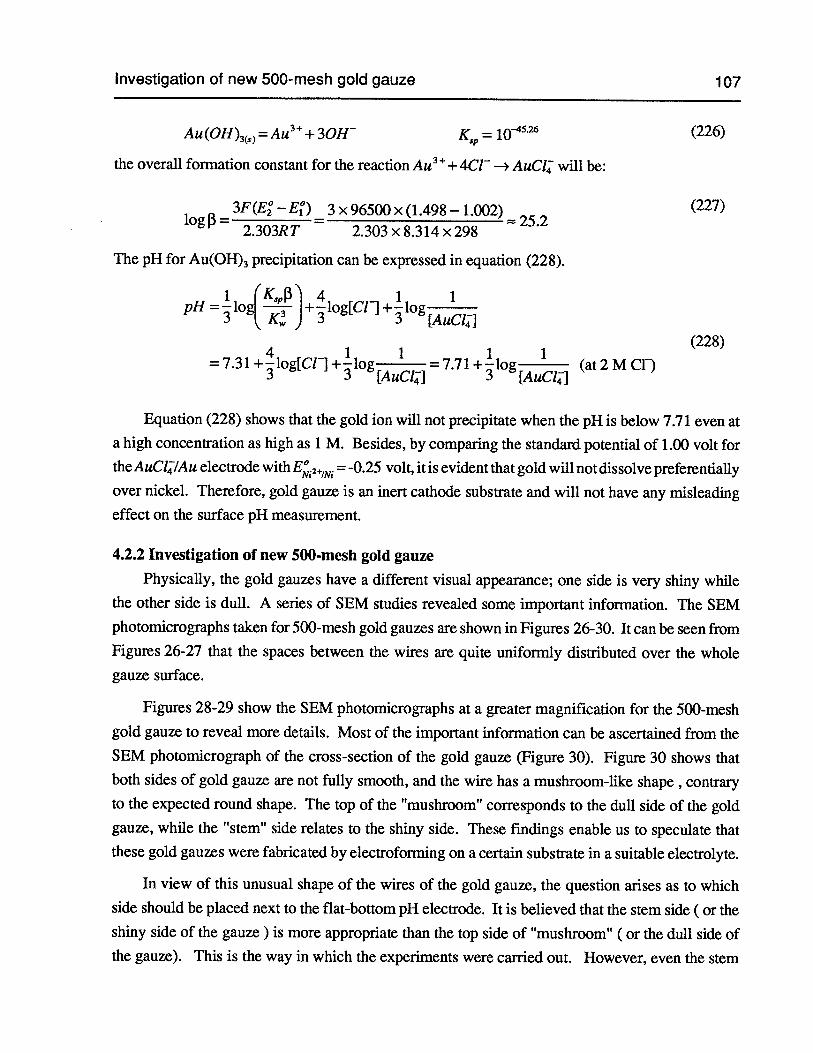
Investigation of new 500-mesh gold gauze 107
Au(OH))=Au3+3OW K5 = i0 (226)
the overall formation constant for the reaction Au3+ + 4C1 —* AuCl will be:
— 3F(E2°—E10) 3 x96500x(1.498— 1.002)252
(227)
2.303RT — 2.303x8.314x298
The pH for Au(OH)3precipitation can be expressed in equation (228).
1 (K2 4 1 1pH =—lod —f-- I+—log[Cl1 +—log
3 1K) 3 3 [AuC1J(228)
4 1 1 1 1 -
= 7.31 +—log[Cl1 +—log = 7.71 +—log (at 2 M Cl)3 3 [AuClE] 3 [AuC1J
Equation (228) shows that the gold ion will not precipitate when the pH is below 7.71 even ata high concentration as high as 1 M. Besides, by comparing the standard potential of 1.00 volt forthe AuCl/Au electrode withE12+,NI = -0.25 volt, it is evident that gold will not dissolve preferentiallyover nickel. Therefore, gold gauze is an inert cathode substrate and will not have any misleadingeffect on the surface pH measurement.
4.2.2 Investigation of new 500-mesh gold gauze
Physically, the gold gauzes have a different visual appearance; one side is very shiny whilethe other side is dull. A series of SEM studies revealed some important information. The SEM
photomicrographs taken for 500-mesh gold gauzes are shown in Figures 26-30. It can be seen fromFigures 26-27 that the spaces between the wires are quite uniformly distributed over the wholegauze surface.
Figures 28-29 show the SEM photomicrographs at a greater magnification for the 500-meshgold gauze to reveal more details. Most of the important information can be ascertained from theSEM photomicrograph of the cross-section of the gold gauze (Figure 30). Figure 30 shows thatboth sides of gold gauze are not fully smooth, and the wire has a mushroom-like shape , contraryto the expected round shape. The top of the “mushroom” corresponds to the dull side of the goldgauze, while the “stem” side relates to the shiny side. These findings enable us to speculate thatthese gold gauzes were fabricated by electroforming on a certain substrate in a suitable electrolyte.
In view of this unusual shape of the wires of the gold gauze, the question arises as to which
side should be placed next to the flat-bottom pH electrode. It is believed that the stem side ( or theshiny side of the gauze ) is more appropriate than the top side of “mushroom” (or the dull side ofthe gauze). This is the way in which the experiments were carried out. However, even the stem
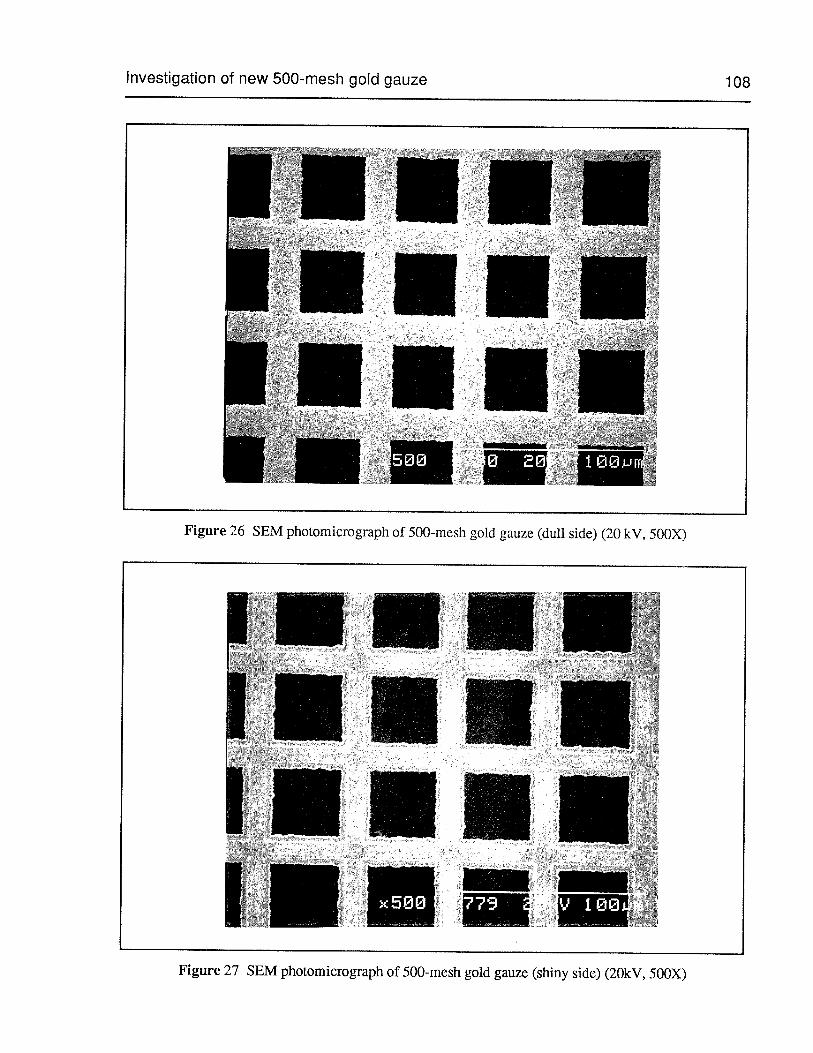
Investigation of new 500-mesh gold gauze 108
1oØJJrrl
Figure 26 SEM photomicrograph of 500-mesh gold gauze (dull side) (20 kV, 500X)
[1 I
_____ _____
4V
Figure 27 SEM photomicrograph of 500-mesh gold gauze (shiny side) (20kv, 500X)
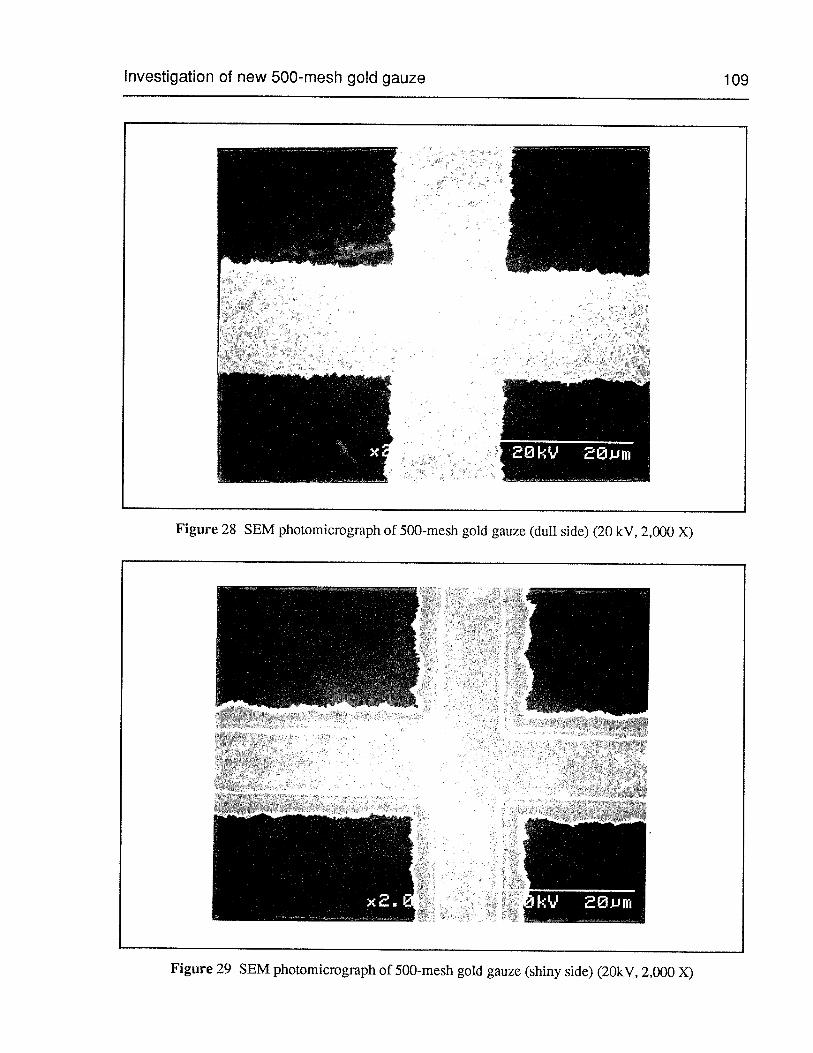
Investigation of new 500-mesh gold gauze
Figure 28 SEM photomicrograph of 500-mesh gold gauze (dull side) (20 kV, 2,000 X)
109
E -—
I
I
IkV jm
Figure 29 SEM photomicrograph of 500-mesh gold gauze (shiny side) (20kv, 2,000 X)
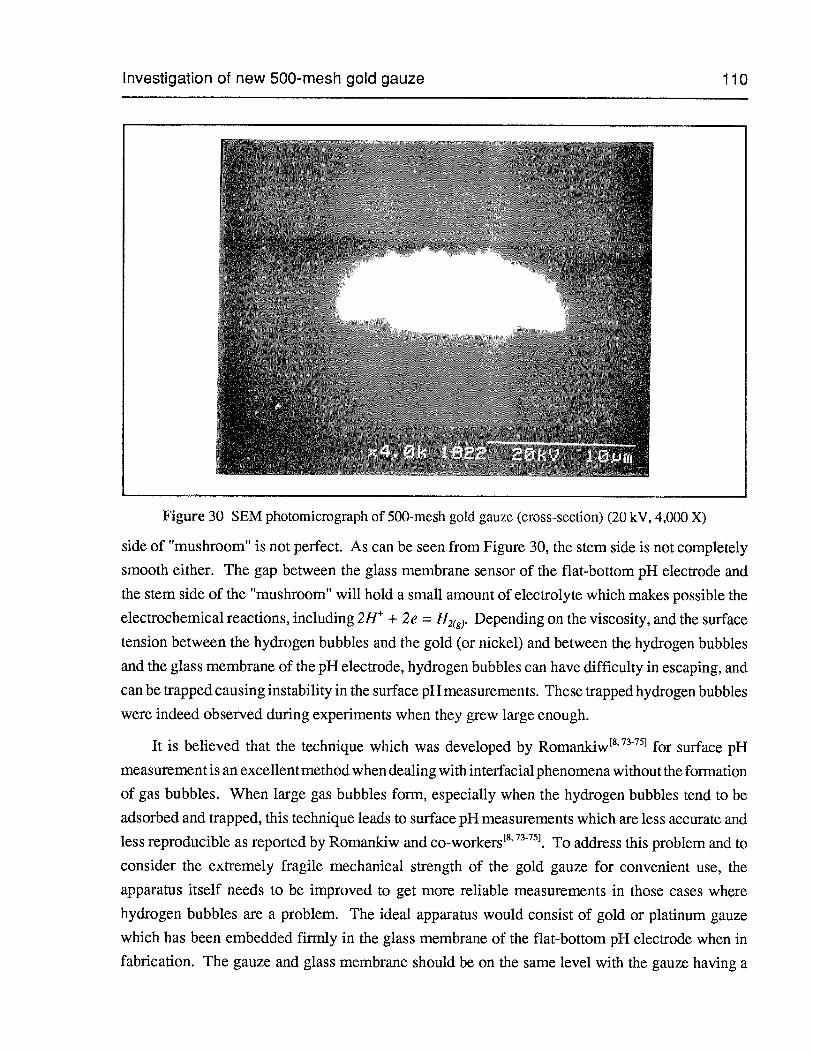
Investigation of new 500-mesh gold gauze 110
side of “mushroom” is not perfect. As can be seen from Figure 30, the stem side is not completely
smooth either. The gap between the glass membrane sensor of the flat-bottom pH electrode and
the stem side of the “mushroom” will hold a small amount of electrolyte which makes possible the
electrochemical reactions, including 2H + 2e = H2(g,. Depending on the viscosity, and the surface
tension between the hydrogen bubbles and the gold (or nickel) and between the hydrogen bubbles
and the glass membrane of the pH electrode, hydrogen bubbles can have difficulty in escaping, and
can be trapped causing instability in the surface pH measurements. These trapped hydrogen bubbles
were indeed observed during experiments when they grew large enough.
It is believed that the technique which was developed by Romankiw8’73751 for surface pH
measurement is an excellent method when dealing with interfacial phenomena without the formation
of gas bubbles. When large gas bubbles form, especially when the hydrogen bubbles tend to be
adsorbed and trapped, this technique leads to surface pH measurements which are less accurate and
less reproducible as reported by Romankiw and co-workers8’73751.To address this problem and to
consider the extremely fragile mechanical strength of the gold gauze for convenient use, the
apparatus itself needs to be improved to get more reliable measurements in those cases where
hydrogen bubbles are a problem. The ideal apparatus would consist of gold or platinum gauze
which has been embedded firnily in the glass membrane of the flat-bottom pH electrode when infabrication. The gauze and glass membrane should be on the same level with the gauze having a
Figure 30 SEM photomicrograph of 500-mesh gold gauze (cross-section) (20 kV, 4,000 X)
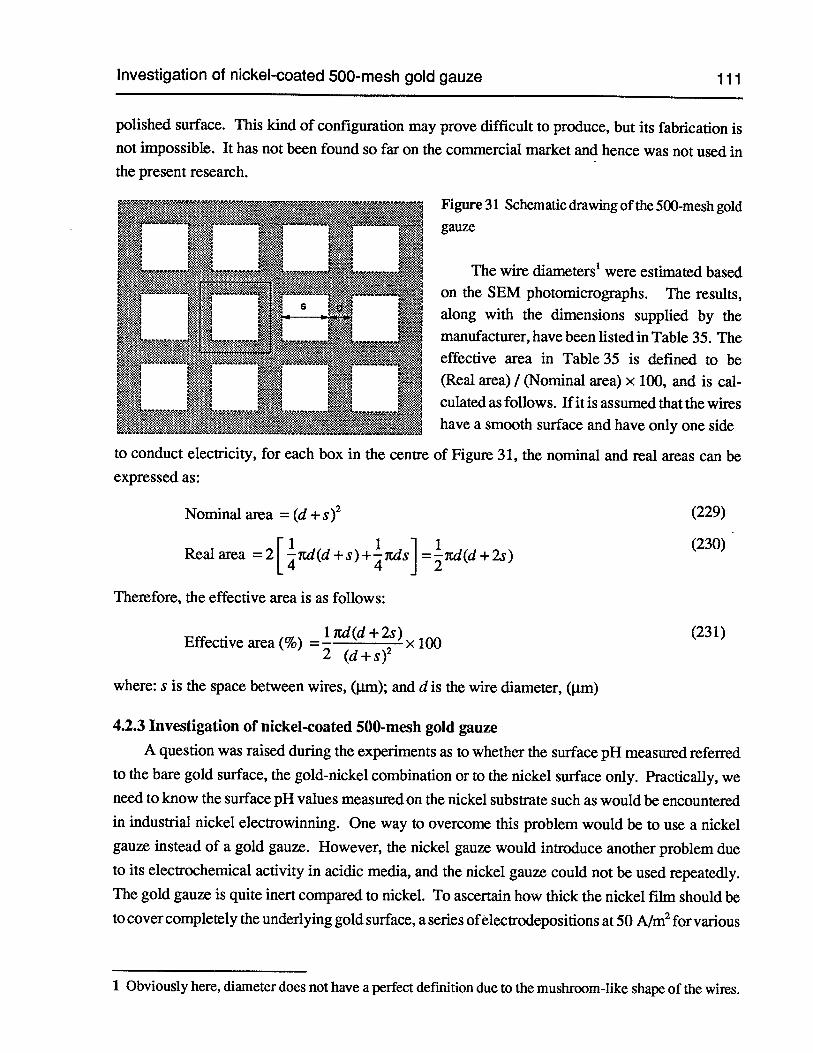
Investigation of nickel-coated 500-mesh gold gauze 111
polished surface. This kind of configuration may prove difficult to produce, but its fabrication isnot impossible. It has not been found so far on the commercial market and hence was not used inthe present research.
Figure 31 Schematic drawing of the 500-mesh goldgauze
The wire diameters1were estimated basedon the SEM photomicrographs. The results,along with the dimensions supplied by themanufacturer, have been listed in Table 35. Theeffective area in Table 35 is defined to be(Real area) / (Nominal area) x 100, and is calculated as follows. If it is assumed that the wireshave a smooth surface and have only one side
to conduct electricity, for each box in the centre of Figure 31, the nominal and real areas can be
Nominal area = (d + s )2 (229)
ri 1 1 1 (230)Real area =2L7td(d+s)+1tdsj=1td(d+2s)
Therefore, the effective area is as follows:
1itd(d+2s) (231)Effective area (%) = — x 100
2 (d+s)2
where: s is the space between wires, (urn); and d is the wire diameter, (jim)
4.2.3 Investigation of nickel-coated 500-mesh gold gauze
A question was raised during the experiments as to whether the surface pH measured referredto the bare gold surface, the gold-nickel combination or to the nickel surface only. Practically, weneed to know the surface pH values measured on the nickel substrate such as would be encounteredin industhal nickel electrowinning. One way to overcome this problem would be to use a nickelgauze instead of a gold gauze. However, the nickel gauze would introduce another problem dueto its electrochemical activity in acidic media, and the nickel gauze could not be used repeatedly.The gold gauze is quite inert compared to nickel. To ascertain how thick the nickel film should beto cover completely the underlying gold surface, a series ofelectrodepositions at 50 A/rn2for various
expressed as:
1 Obviously here, diameter does not have a perfect defmition due to the mushroom-like shape of the wires.
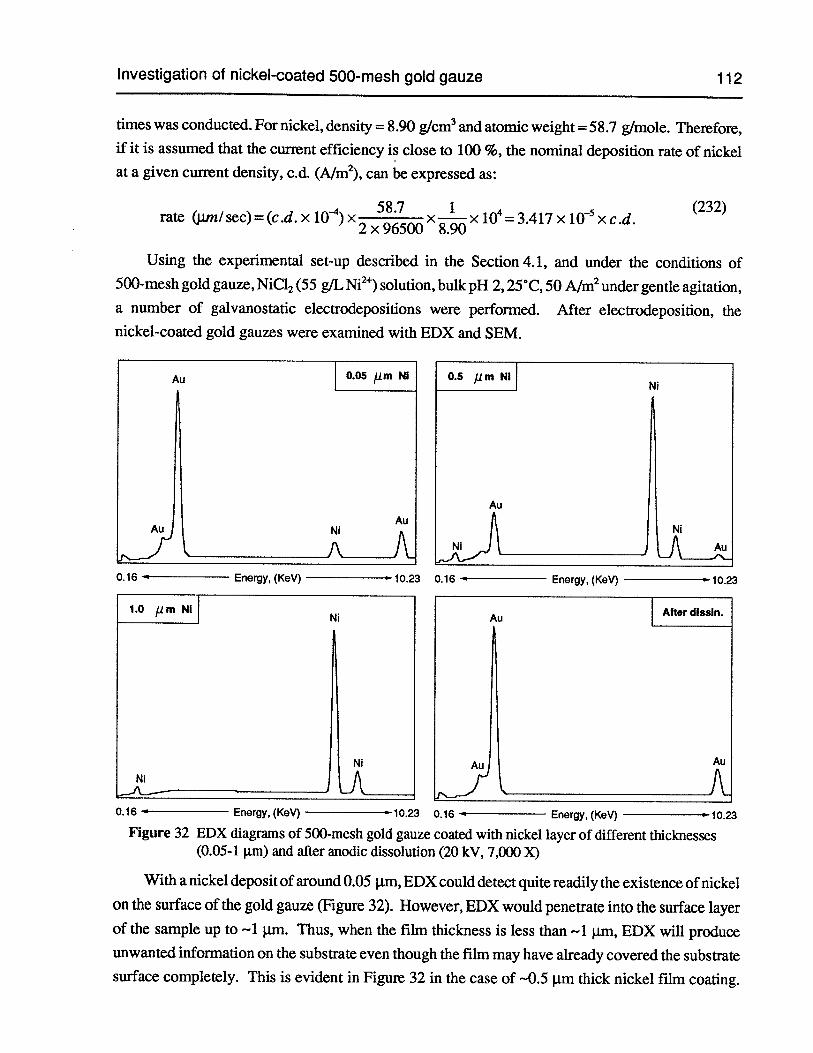
Investigation of nickel-coated 500-mesh gold gauze 112
times was conducted. For nickel, density = 8.90 g/cm3and atomic weight = 58.7 gfmole. Therefore,if it is assumed that the current efficiency is close to 100 %, the nominal deposition rate of nickelat a given current density, c.d. (A/rn2), can be expressed as:
58.7 1rate (pin/ sec)= (c.d. x l0) X2
x965OO8.9Ox = 3.417 x i0 x c.d.
(232)
Using the experimental set-up described in the Section 4.1, and under the conditions of500-mesh gold gauze, NiC12(55 g/LNi2)solution, bulk pH 2, 25C, 50 A/rn2under gentle agitation,a number of galvanostatic electrodepositions were performed. After electrodeposition, thenickel-coated gold gauzes were examined with EDX and SEM.
Au
0.16 Energy, (Key) 10.23 0.16 Energy, (KeV) 10.23
Figure 32 EDX diagrams of 500-mesh gold gauze coated with nickel layer of different thicknesses(0.05-1 jim) and after anodic dissolution (20 kV, 7,000 X)
With a nickel deposit of around 0.05 j.trn, EDX could detect quite readily the existence ofnickelon the surface of the gold gauze (Figure 32). However, EDX would penetrate into the surface layerof the sample up to —1 p.m. Thus, when the film thickness is less than —1 jim, EDX will produceunwanted information on the substrate even though the film may have already covered the substratesurface completely. This is evident in Figure 32 in the case of —0.5 p.m thick nickel film coating.
0.16 Energy, (Key) 10.23 0.16 Energy, (Key) .- 10.23
1.0 p m NiNi Au After dissin.
Ni iL
Investigation of nickel-coated 500-mesh gold gauze 113
As will be seen later from the SEM photomicrographs and the curve of pH vs. time, the surface ofthe gold gauze was quite probably completely covered with a nickel film in this case. As shownin Figure 32, EDX can verify without any doubt that --1 jim thick nickel film is sufficient to covertotally the entire surface of the 500-mesh gold gauze since no gold peaks appear. The nickel-coatedgold gauze, after nickel was dissolved anodically, was also examined with EDX (Figure 32). Thissurface exhibited no nickel peaks. Hence one can be sure that using the potential sweep anodicdissolution method, the deposited nickel film can be completely dissolved anodically by controllingthe final potential up to 0.05 volt vs. SCE.
Due to the ineffectiveness of EDX when the sample thickness is less than 1 jIm, thenickel-coated gold gauzes were subjected to SEM examination. The SEM photomicrographs weretaken from the surface of the gold gauze and also from the cross-section of the wires. ComparingFigures 33-35 with Figure 28, it can be seen that a —0.05 jim thick coating does not change thesurface morphology of the original gold gauze very much. However, a —0.5 jim thick coatingchanges the surface morphology significantly. For a —1 jim thick coating (Figures 35-36), SEMphotomicrographs of both the surface and cross-section of the wires demonstrate that the substratesurface has been covered completely with the nickel film. More details can be seen from Figure 36where the nickel film was uniformly deposited along the contours of the substrate surface. If thethickness is decreased by 50 %, that is, to 0.5 jim, it is not hard to see that the surface would stillbe covered completely with the nickel film. Unfortunately, successful SEM work was not achievedon the sample of—0.5 jim thick nickel-coated gold gauze, let alone to the samples having a coatingless than --0.5 p.m.
The failure to achieve acceptable SEM data in the case of the thin film coated samples can beattributed mainly to the polishing procedure used in the preparation of the SEM samples. Thisprocedure blurred the boundary between the nickel and the surface of the gold gauze. One featureabout the coating of nickel film is that the nickel was quite uniformly deposited over the entiresurface of the gold gauze even at --5 p.m thickness. This is not difficult to understand from theviewpoint of the high activation overpotential of nickel.
The change in the nature of the cathode substrate will affect the magnitude of the surface pH.When passing a current through the electrodes, the cathode substrate (gold gauze) will possessexcessive negative charges which will attract hydrogen ions from the electrolyte. The pH changedue to this phenomenon is, however, impossible to detect using the gold gauze, since this changeoccurs in the electrical double layer. In the case of copper electrodeposition, the surface pH wasfound experimentally to be nearly equal to the bulk pH when the current density was below thecopper limiting current density’8775.Therefore, the pH change detected can be indicative only ofthe change in the hydrogen ion activity within the diffusion layer and its rise can only result from
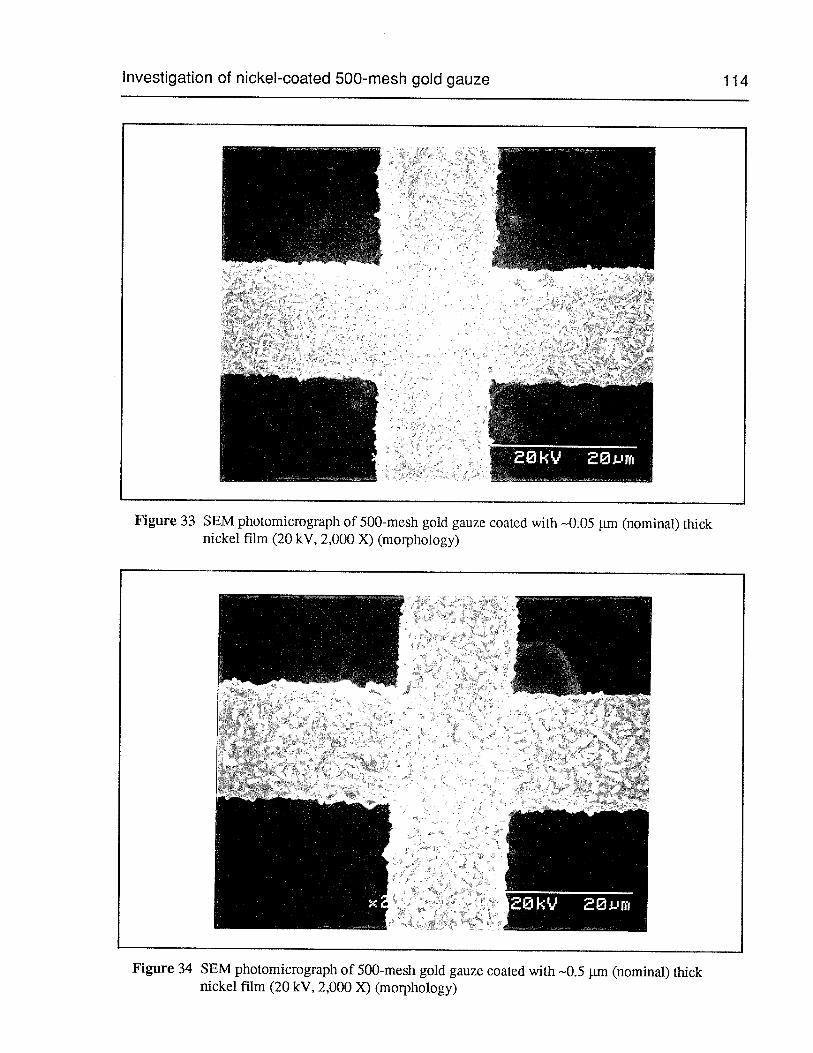
Investigation of nickel-coated 500-mesh gold gauze
Figure 33 SEM photomicrograph of 500-mesh gold gauze coated with —0.05 p.m (nominal) thicknickel film (20 kV, 2,000 X) (morphology)
Figure 34 SEM photomicrograph of 500-mesh gold gauze coated with —0.5 jim (nominal) thicknickel film (20 kV, 2,000 X) (morphology)
114
I
I
J
kV EOjim
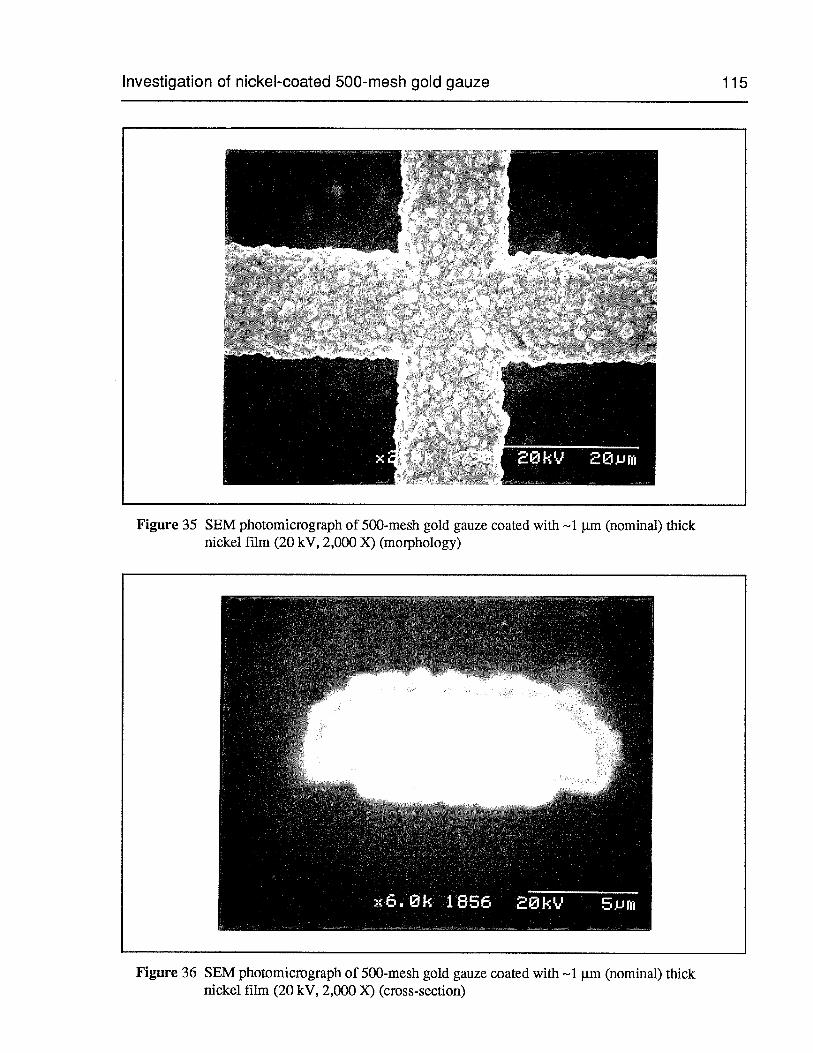
Investigation of nickel-coated 500-mesh gold gauze 115
Figure 35 SEM photomicrograph of 500-mesh gold gauze coated with —1 urn (nominal) thicknickel film (20 kV, 2,000 X) (morphology)
Figure 36 SEM photornicrograph of 500-mesh gold gauze coated with --l jtm (nominal) thicknickel film (20 kV, 2,000 X) (cross-section)
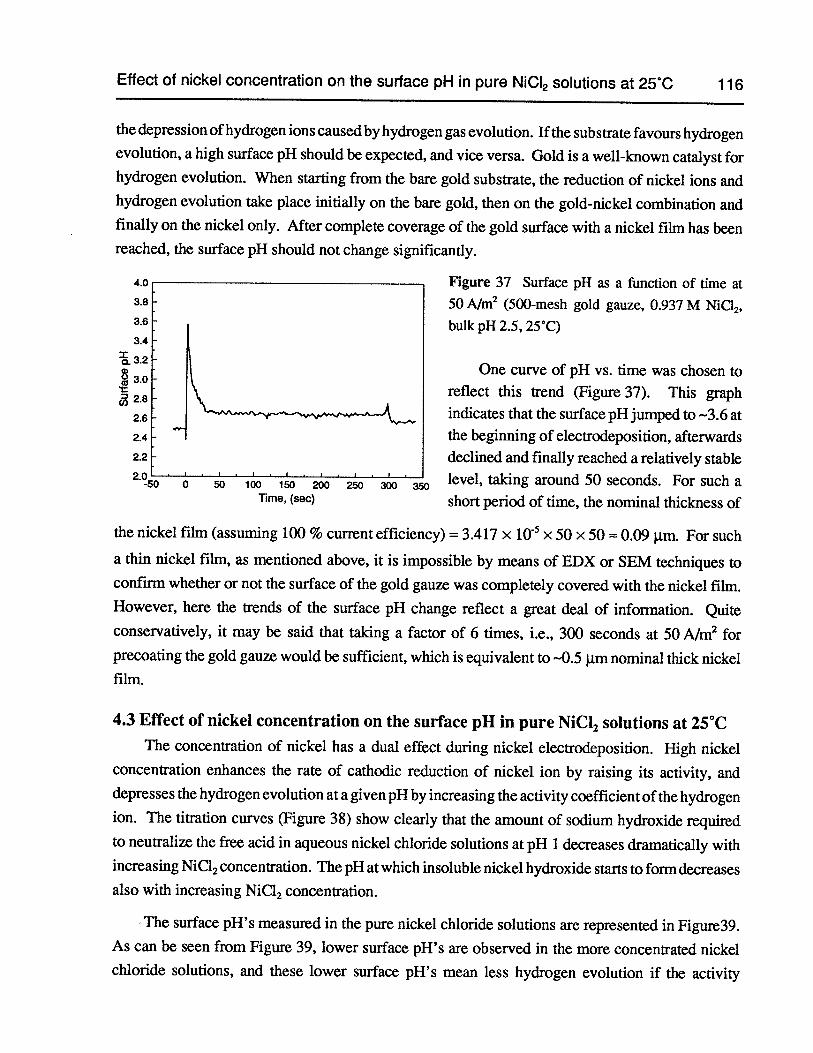
Effect of nickel concentration on the surface pH in pure NiCI2 solutions at 25C 116
the depression ofhydrogen ions caused by hydrogen gas evolution. If the substrate favours hydrogenevolution, a high surface pH should be expected, and vice versa. Gold is a well-known catalyst forhydrogen evolution. When starting from the bare gold substrate, the reduction of nickel ions andhydrogen evolution take place initially on the bare gold, then on the gold-nickel combination andfinally on the nickel only. After complete coverage of the gold surface with a nickel film has beenreached, the surface pH should not change significantly.
4.0 Figure 37 Surface pH as a function of time at3.8 50 A/rn2 (500-mesh gold gauze, 0.937 M NiCI2,3.6 bulk pH 2.5, 25CC)3.4
3.2One curve of pH vs. time was chosen to
reflect this trend (Figure 37). This graph
2.6 indicates that the surface pH jumped to —3.6 at2.4 the beginning of electrodeposition, afterwards2.2 declined and finally reached a relatively stable2.O I
I I • I• level,takingaround50seconds. Forsucha
short period of time, the nominal thickness of
the nickel film (assuming 100 % current efficiency) = 3.417 x x 50 x 50 0.09 l.Lm. For such
a thin nickel film, as mentioned above, it is impossible by means of EDX or SEM techniques toconfirm whether or not the surface of the gold gauze was completely covered with the nickel film.However, here the trends of the surface pH change reflect a great deal of information. Quiteconservatively, it may be said that taking a factor of 6 times, i.e., 300 seconds at 50 A/m2 forprecoating the gold gauze would be sufficient, which is equivalent to —0.5 im nominal thick nickelfilm.
4.3 Effect of nickel concentration on the surface pH in pure NiC12 solutions at 25°CThe concentration of nickel has a dual effect during nickel elecirocleposition. High nickel
concentration enhances the rate of cathodic reduction of nickel ion by raising its activity, anddepresses the hydrogen evolution at a given pH by increasing the activity coefficient of the hydrogenion. The titration curves (Figure 38) show clearly that the amount of sodium hydroxide requiredto neutralize the free acid in aqueous nickel chloride solutions at pH 1 decreases dramatically withincreasing NiCl2concentration. The pH at which insoluble nickel hydroxide starts to form decreasesalso with increasing NiCl2 concentration.
The surface pH’s measured in the pure nickel chloride solutions are represented in Figure39.As can be seen from Figure 39, lower surface pH’s are observed in the more concentrated nickelchloride solutions, and these lower surface pH’s mean less hydrogen evolution if the activity
0 50 100 150 200 250 300Time, (sec)
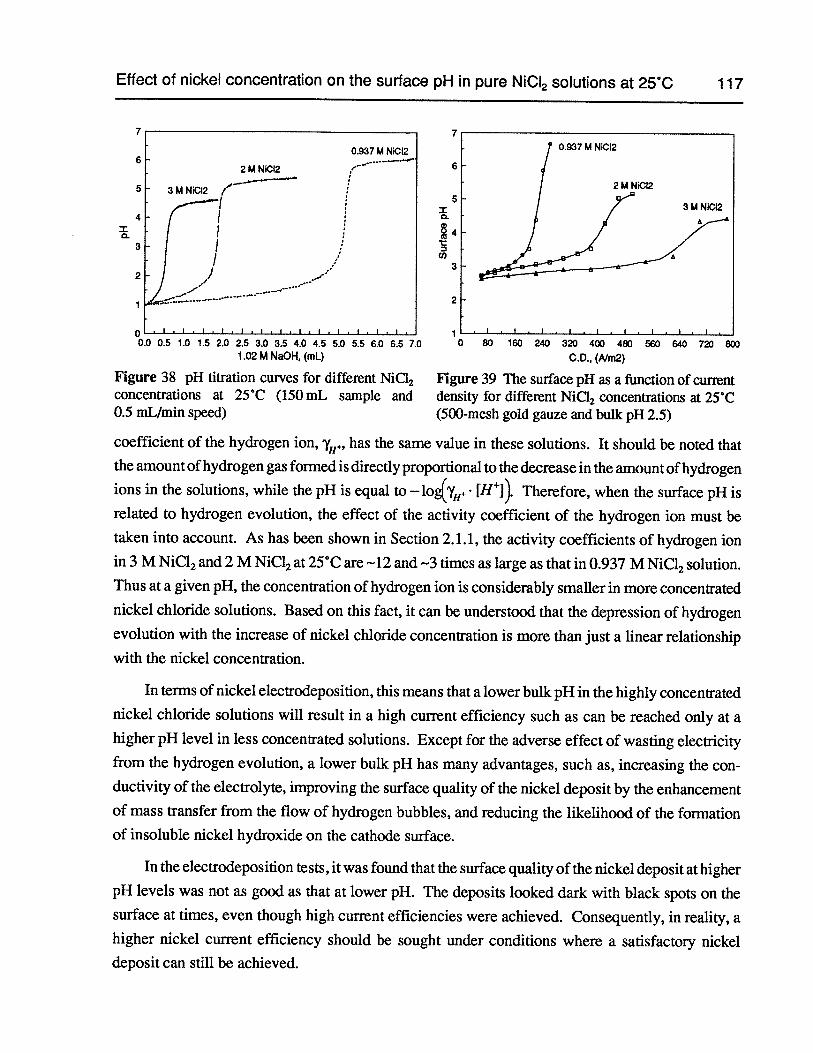
Effect of nickel concentration on the surface pH in pure NICI2 solutions at 25°C 117
80 160 240 320 400 480 560 640 720 800
C.D., (Nm2)
Figure 39 The surface pH as a function of currentdensity for different N1C12 concentrations at 25°C(500-mesh gold gauze and bulk pH 2.5)
coefficient of the hydrogen ion, ‘y11+, has the same value in these solutions. It should be noted thatthe amount ofhydrogen gas formed is directly proportional to the decrease in the amount ofhydrogenions in the solutions, while the pH is equal to —log(y11+ [H]). Therefore, when the surface pH isrelated to hydrogen evolution, the effect of the activity coefficient of the hydrogen ion must betaken into account. As has been shown in Section 2.1.1, the activity coefficients of hydrogen ionin 3 M NiC12and 2 M NiCI2at 25°C are —12 and -3 times as large as that in 0.937 M NiCI2solution.Thus at a given pH, the concentration of hydrogen ion is considerably smaller in more concentratednickel chloride solutions. Based on this fact, it can be understood that the depression of hydrogenevolution with the increase of nickel chloride concentration is more than just a linear relationshipwith the nickel concentration.
In terms of nickel electrodeposition, this means that a lower bulk pH in the highly concentratednickel chloride solutions will result in a high current efficiency such as can be reached only at ahigher pH level in less concentrated solutions. Except for the adverse effect of wasting electricityfrom the hydrogen evolution, a lower bulk pH has many advantages, such as, increasing the conductivity of the electrolyte, improving the surface quality of the nickel deposit by the enhancementof mass transfer from the flow of hydrogen bubbles, and reducing the likelihood of the formationof insoluble nickel hydroxide on the cathode surface.
In the electrodeposition tests, it was found that the surface quality of the nickel deposit at higherpH levels was not as good as that at lower pH. The deposits looked dark with black spots on thesurface at times, even though high current efficiencies were achieved. Consequently, in reality, ahigher nickel current efficiency should be sought under conditions where a satisfactory nickeldeposit can still be achieved.
7
6
0.937 U Ni02
2 U NICI2
5I 3M NC12
2
0.5 1.0 1.5 2.0 2.5 3.0 3.5 4.0 4.5 5.0 5.5 6.0 6.5 7.01.02 M NaOH, (mL)
Figure 38 pH titration curves for different NiCI2concentrations at 25°C (150 mL sample and0.5 mL/min speed)
0I . I . I . I . I . I .
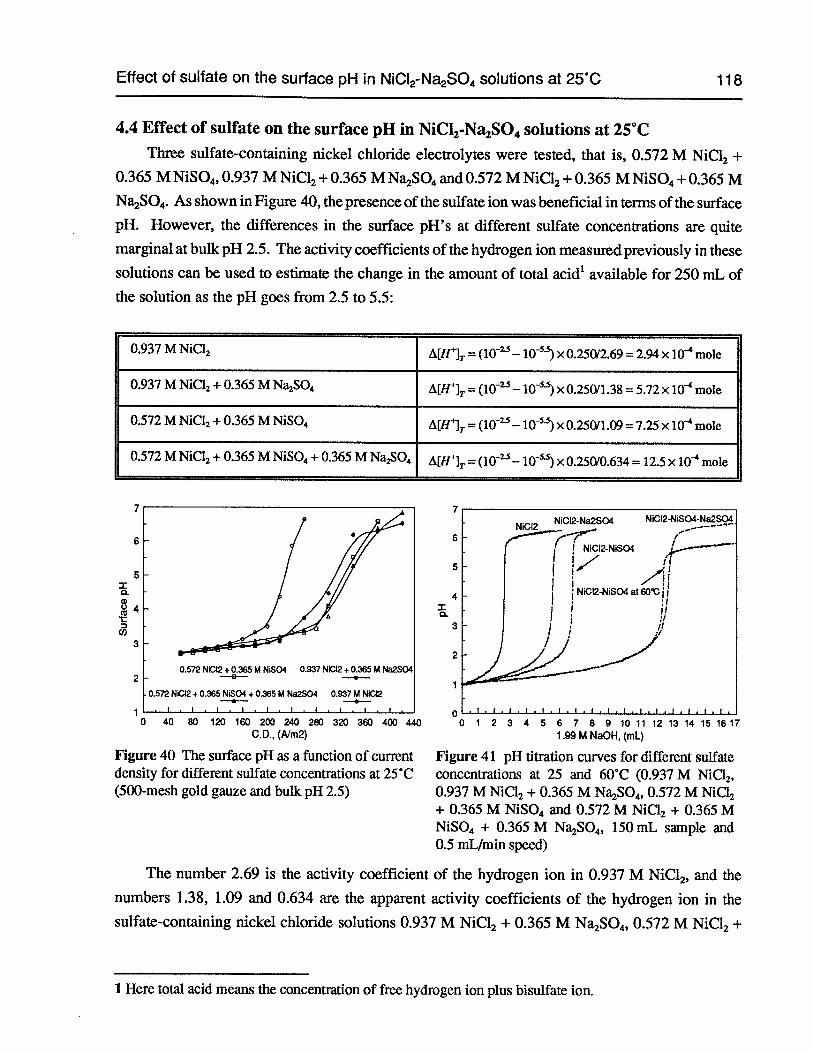
Effect of sulfate on the surface pH in NiCl2-Na2SO4solutions at 25°C 118
4.4 Effect of sulfate on the surface pH in NiC12-Na2SO4solutions at 25°C
Three sulfate-containing nickel chloride electrolytes were tested, that is, 0.572 M NiCI2 +
0.365 M NiSO4,0.937 M NiC12+ 0.365 MNa2SO4and 0.572 M NiC12+ 0.365 M NiSO4+ 0.365 MNa2SO4.As shown in Figure 40, the presence of the sulfate ion was beneficial in terms of the surfacepH. However, the differences in the surface pH’s at different sulfate concentrations are quitemarginal at bulk pH 2.5. The activity coefficients of the hydrogen ion measured previously in these
solutions can be used to estimate the change in the amount of total acid1 available for 250 mL ofthe solution as the pH goes from 2.5 to 5.5:
0.937 M NiC12 A[H]T = (10’s — i0) x 0.250/2.69 = 2.94 x 10 mole
0.937 M NiC12+ 0.365 M NaSO4 = (10 — 10-) x 0.250/1.38 = 5.72 x 10 mole
0.572 M NiCI2+ 0.365 M NiSO4 = (10 — 10) x 0.250/1.09 = 7.25 x 10 mole
0.572 M NiC12+ 0.365 M NiSO4+ 0.365 M Na2SO4 L[HlT = (10 — i0) x 0.250/0.634 = 12.5 x mole
2
10 40 80 120 160 200 240 280 320 360 400 440C.D., (A1m2)
Figure 40 The surface pH as a function of currentdensity for different sulfate concentrations at 25°C(500-mesh gold gauze and bulk pH 2.5)
00 1 2 3 4 5 6 7 8 9 10 11 12 13 14 15 16 17
1.99 M NaOH, (mL)
Figure 41 pH titration curves for different sulfateconcentrations at 25 and 60°C (0.937 M NiCI2,0.937 M NiCI2 + 0.365 M Na2SO4,0.572 M NiCI2+ 0.365 M NiSO4 and 0.572 M NiCI2 + 0.365 MNiSO4 + 0.365 M Na2SO4, 150 mL sample and0.5 mLlmin speed)
6
5I0
(4
(I)3
7
6
5
4
0.
3
NiCI2N1CI2-Na2SO4 NiCI2-NiSO4-Na2SO4
J?I NICI2-NISO4
J,zjf
N1CI2-NiSO4at6O’Cji:II,
I,/ I,
0.572 NKI2 + 0.365 U NISO4 0.937 Ni2 + 0.365 U Na2SO4
0.572 NI2 + 0.365 NISO4 + 0.365 U Na2SO4 0.937 U NC--
.1.1. 1.1 • 1.1,1 1.1.
2
The number 2.69 is the activity coefficient of the hydrogen ion in 0.937 M NiCl2, and the
numbers 1.38, 1.09 and 0.634 are the apparent activity coefficients of the hydrogen ion in thesulfate-containing nickel chloride solutions 0.937 M NiC12 + 0.365 M Na2SO4,0.572 M NiC12 +
1 Here total acid means the concentration of free hydrogen ion plus bisulfate ion.
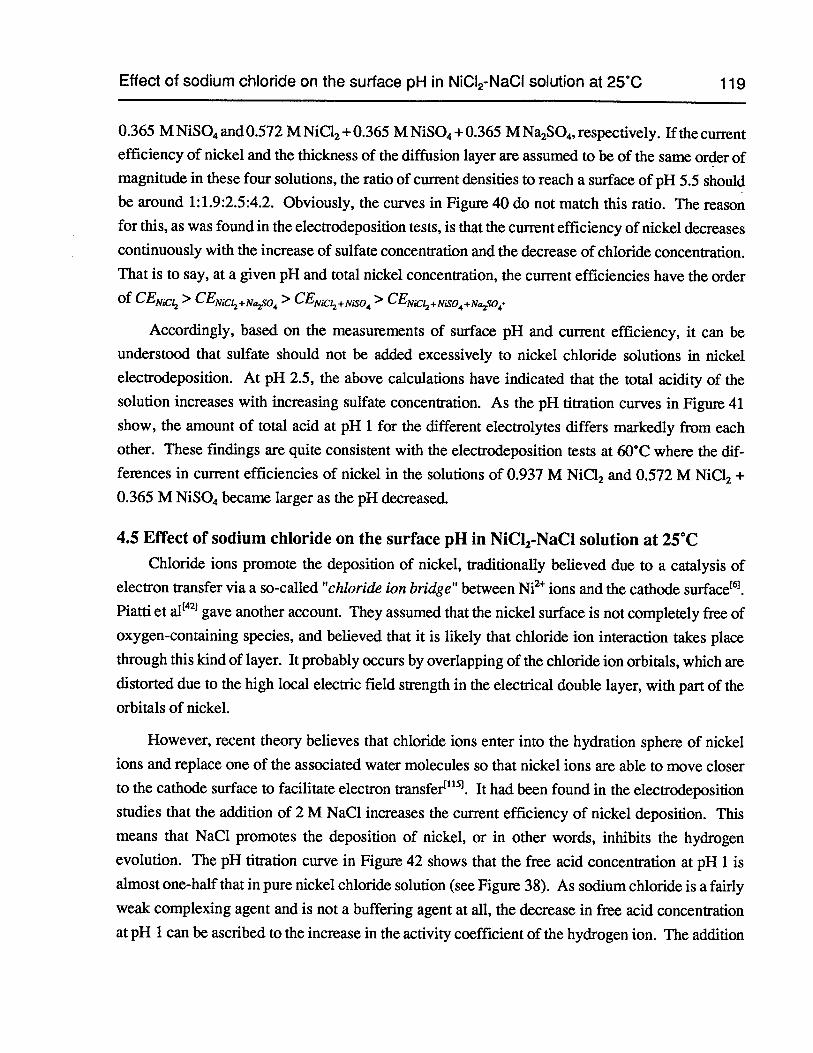
Effect of sodium chloride on the surface pH in NiCI2-NaCI solution at 25°C 119
0.365 MNiSO4and 0.572 MNiC12+0.365 MNiSO4+ 0.365 MNa2SO4,respectively. If the currentefficiency of nickel and the thickness of the diffusion layer are assumed to be of the same order ofmagnitude in these four solutions, the ratio of current densities to reach a surface of pH 5.5 shouldbe around 1:1.9:2.5:4.2. Obviously, the curves in Figure 40 do not match this ratio. The reasonfor this, as was found in the electrodeposition tests, is that the current efficiency of nickel decreasescontinuously with the increase of sulfate concentration and the decrease of chloride concentration.That is to say, at a given pH and total nickel concentration, the current efficiencies have the orderof CENiCIZ> CENiC12+NSO4>CENiC12+NiS04>CEN+NO4+NSO4.
Accordingly, based on the measurements of surface pH and current efficiency, it can beunderstood that sulfate should not be added excessively to nickel chloride solutions in nickelelectrodeposition. At pH 2.5, the above calculations have indicated that the total acidity of thesolution increases with increasing sulfate concentration. As the pH titration curves in Figure 41show, the amount of total acid at pH 1 for the different electrolytes differs markedly from eachother. These findings are quite consistent with the electrodeposition tests at 60°C where the differences in current efficiencies of nickel in the solutions of 0.937 M NiCI2 and 0.572 M NiC12 +
0.365 M N1SO4became larger as the pH decreased.
4.5 Effect of sodium chloride on the surface pH in NiC12-NaC1 solution at 25°CChloride ions promote the deposition of nickel, traditionally believed due to a catalysis of
electron transfer via a so-called “chloride ion bridge” between Ni2 ions and the cathode surface61.Piatti et a1421 gave another account. They assumed that the nickel surface is not completely free of
oxygen-containing species, and believed that it is likely that chloride ion interaction takes place
through this kind of layer. It probably occurs by overlapping of the chloride ion orbitals, which aredistorted due to the high local electric field strength in the electrical double layer, with part of theorbitals of nickel.
However, recent theory believes that chloride ions enter into the hydration sphere of nickelions and replace one of the associated water molecules so that nickel ions are able to move closerto the cathode surface to facilitate electron transfer”51. It had been found in the electrodepositionstudies that the addition of 2 M NaCl increases the current efficiency of nickel deposition. Thismeans that NaCl promotes the deposition of nickel, or in other words, inhibits the hydrogenevolution. The pH titration curve in Figure 42 shows that the free acid concentration at pH 1 isalmost one-half that in pure nickel chloride solution (see Figure 38). As sodium chloride is a fairlyweak complexing agent and is not a buffering agent at all, the decrease in free acid concentrationat pH 1 can be ascribed to the increase in the activity coefficient of the hydrogen ion. The addition
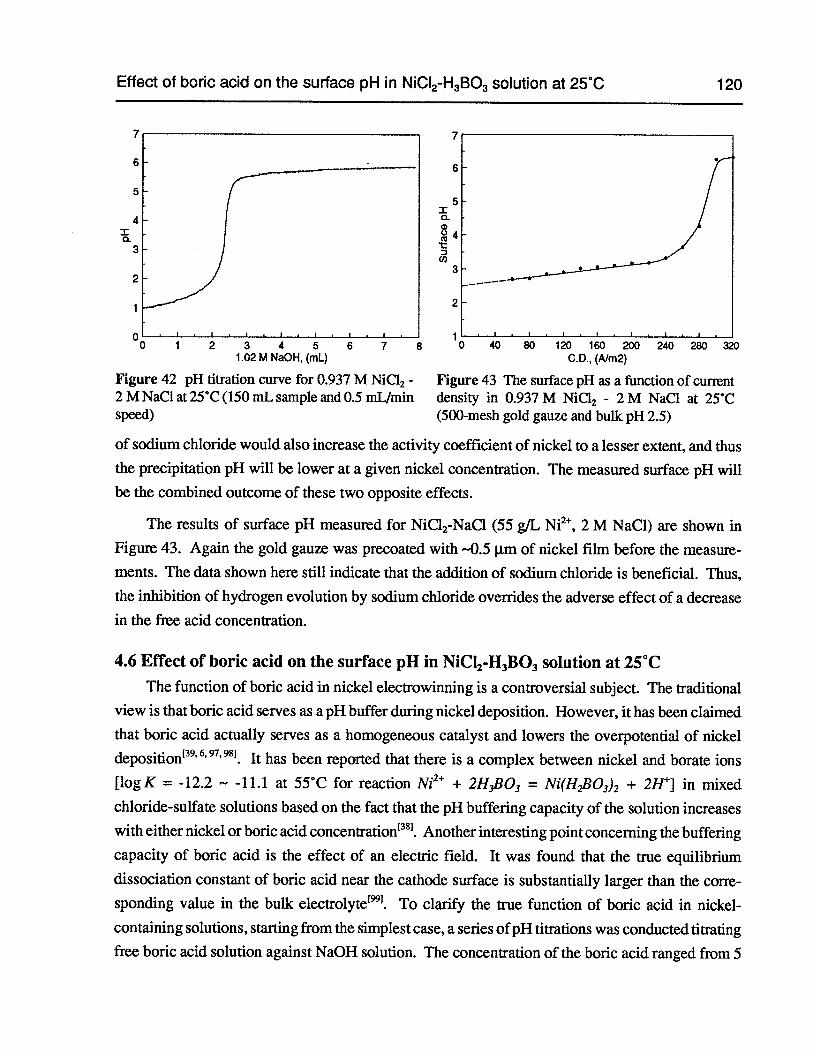
Effect of boric acid on the surface pH in NiCI2-H3B03solution at 25°C 120
I0.
of sodium chloride would also increase the activity coefficient of nickel to a lesser extent, and thusthe precipitation pH will be lower at a given nickel concentration. The measured surface pH willbe the combined outcome of these two opposite effects.
The results of surface pH measured for NiC12-NaC1 (55 g/L Ni2, 2 M NaC1) are shown inFigure 43. Again the gold gauze was precoated with —0.5 p.m of nickel film before the measurements. The data shown here still indicate that the addition of sodium chloride is beneficial. Thus,
the inhibition of hydrogen evolution by sodium chloride overrides the adverse effect of a decrease
in the free acid concentration.
4.6 Effect of boric acid on the surface pH in NiCI2-H3B03solution at 25°C
The function of boric acid in nickel electrowinning is a controversial subject. The traditionalview is that boric acid serves as a pH buffer during nickel deposition. However, it has been claimed
that boric acid actually serves as a homogeneous catalyst and lowers the overpotential of nickel
deposition’39’6’97’98] It has been reported that there is a complex between nickel and borate ions
[log K = -12.2 — -11.1 at 55°C for reaction Ni2 + 2H3B03 = Ni(H2B03)2+ 2H9 in mixed
chloride-sulfate solutions based on the fact that the pH buffering capacity of the solution increaseswith either nickel or boric acid concentrafion138.Another interesting point concerning the buffering
capacity of boric acid is the effect of an electric field. It was found that the true equilibrium
dissociation constant of boric acid near the cathode surface is substantially larger than the corre
sponding value in the bulk electrolyte. To clarify the true function of boric acid in nickel-containing solutions, starting from the simplest case, a series ofpH titrations was conducted titratingfree boric acid solution against NaOH solution. The concentration of the boric acid ranged from 5
3 4 120 160 2001.02 M NaOH, (mL) C.D., (A/m2)
Figure 42 pH titration curve for 0.937 M NiC12 - Figure 43 The surface pH as a function of current2 M NaC1 at 25°C (150 mL sample and 0.5 mL/min density in 0.937 M NiCl2 - 2 M NaC1 at 25°Cspeed) (500-mesh gold gauze and bulk pH 2.5)
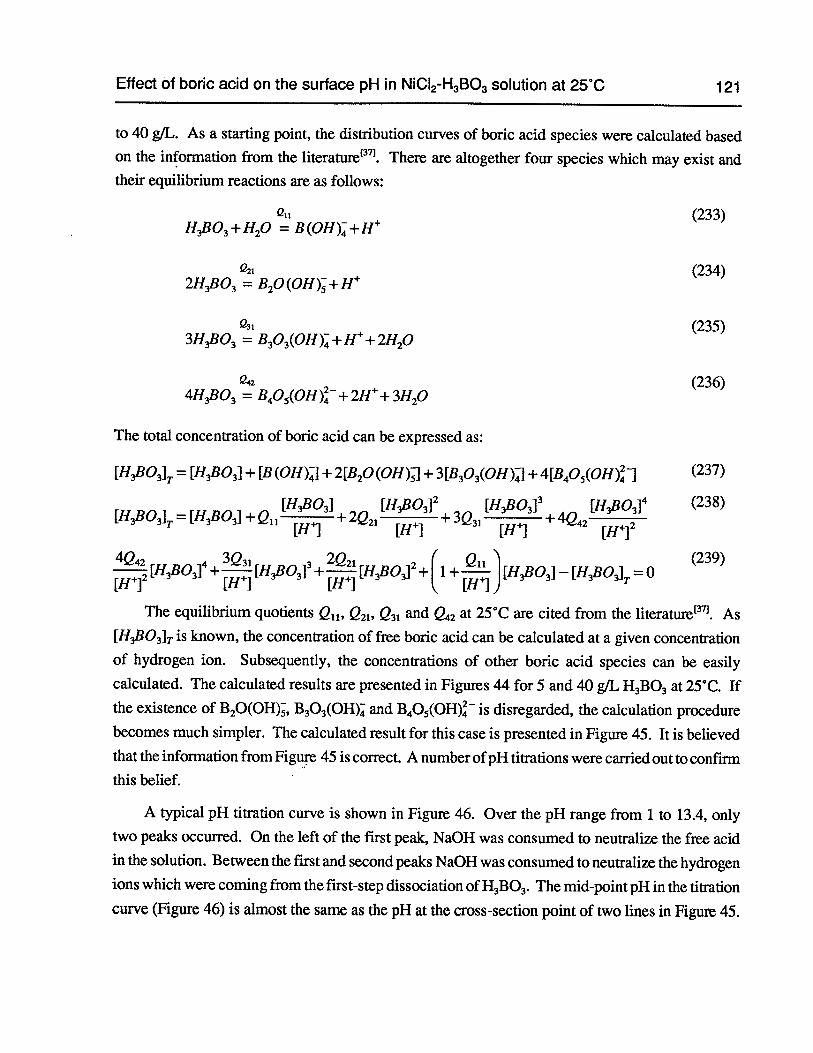
Effect of boric acid on the surface pH in NiCI2-H3B03solution at 25°C 121
to 40 g/L. As a starting point, the distribution curves of boric acid species were calculated basedon the information from the literature37. There are altogether four species which may exist andtheir equilibrium reactions are as follows:
(233)H3B03+H20= B(OH)-t-H
(234)2H3B03 =B2O(OH)+H
(235)3H3B03 B3O3(OH)+H+2H2O
(236)4H3B03=B4O5(OH)+2H+3H2O
The total concentration of boric acid can be expressed as:
[H3BO3]T= [H3B03]+ [B (OH)J + 2[B20(OH)] +3[B3O3(OH)] +4[B4O5(OH)1 (237)
[113803] [H3B03]2 [H3B03]3 [H3803] (238)[H3BO3IT= [H3B03]+ 11
[H]+ 2Q21
[H]+ 3Q31
[11k]+ 4Q42
[H]2
4Q42 3Q31 2Q21 ( Q11 (239)
[H]2[H3B03]4+ —-[H3BO] +—-[H3B03]2+ 1+)[H3B03]— [H3B03]
T=
The equilibrium quotients Q11,Q2,Q31 and Q42 at 25°C are cited from the literature37. As
[H3BO3]is known, the concentration of free boric acid can be calculated at a given concentrationof hydrogen ion. Subsequently, the concentrations of other boric acid species can be easilycalculated. The calculated results are presented in Figures 44 for 5 and 40 g/LH3B03at 25°C. ifthe existence ofB2O(OH),B3O3(OH) andB4O5(OH) is disregarded, the calculation procedurebecomes much simpler. The calculated result for this case is presented in Figure 45. It is believedthat the information from Figure 45 is correct A number ofpH titrations were carried out to confirmthis belief.
A typical pH titration curve is shown in Figure 46. Over the pH range from 1 to 13.4, onlytwo peaks occurred. On the left of the first peak, NaOH was consumed to neutralize the free acidin the solution. Between the first and second peaks NaOH was consumed to neutralize the hydrogenions which were coming from the first-step dissociation ofH3B03.The mid-point pH in the titrationcurve (Figure 46) is almost the same as the pH at the cross-section point of two lines in Figure 45.
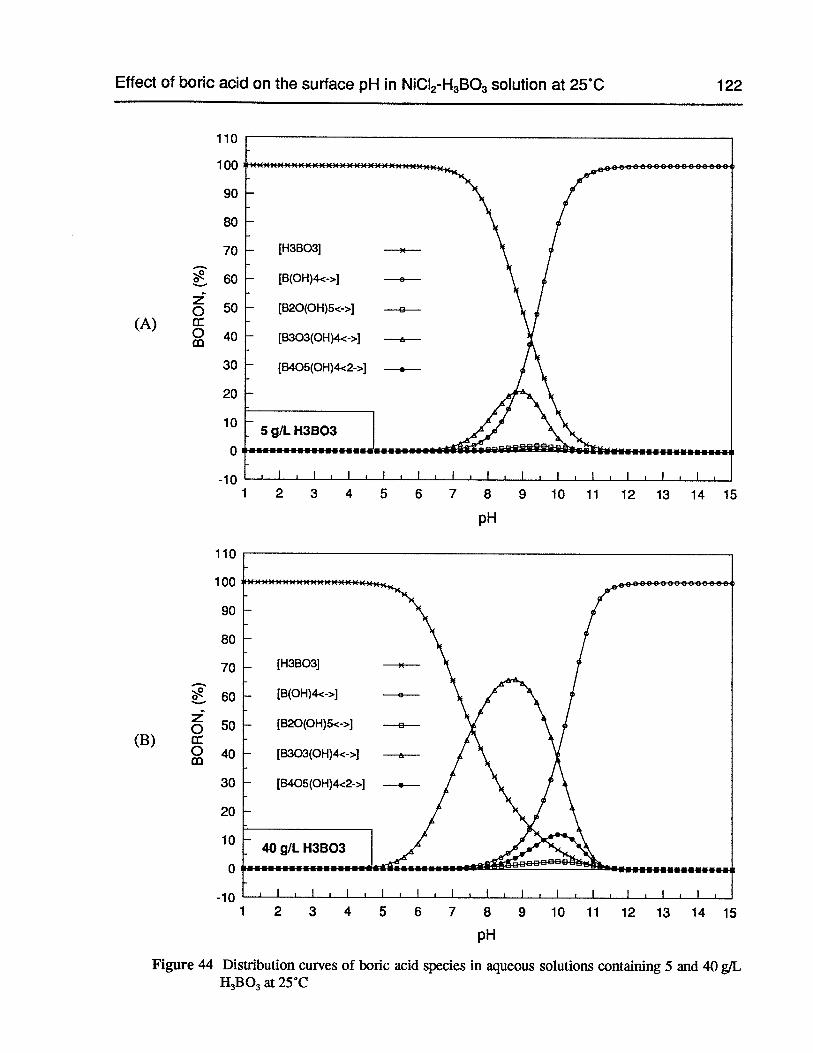
Effect of boric acid on the surface pH in N1CI2-H3B03solution at 25°C
110
100
90
80
70
.60
zQ 50
(A’040
30
20
10
0
-10
110
100
90
80
70
60
z50
(B)40
30
20
10
0
-10
pH
122
Figure 44 Distribution curves of boric acid species in aqueous solutions containing 5 and 40 gILH3B03at 25°C
1 2 3 4 5 6 7 8 9 10 11 12 13 14 15
pH
1 2 3 4 5 6 7 8 9 101112131415
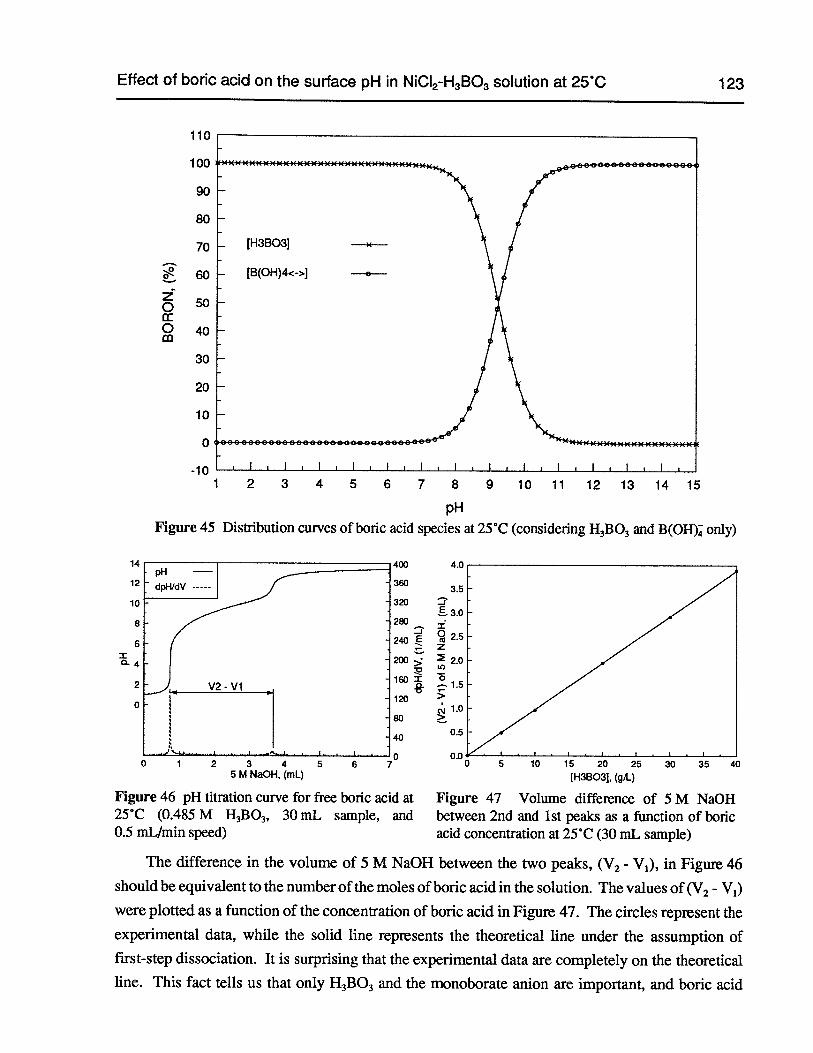
z00
-j
2.5z
2.0U)
01.5
>1.0
>
0.5
““0 5 10 15 20 25 30 35 40
[H38031, (gi)
Figure 47 Volume difference of 5 M NaOHbetween 2nd and 1st peaks as a function of boricacid concentration at 25°C (30 mL sample)
Effect of boric acid on the surface pH in NiCI2-H3B03solution at 25°C 123
110
100
90
80
70
60
50
40
30
20
10
0
-101 2 3 4 5 6 7 8 9 10 11 12 13 14 15
pHFigure 45 Distribution curves of boric acid species at 25°C (considering H3B03and B(OH) only)
14
12
10
B
6
04
2
0
3.5
-JE
> z,.3 4
5 M NaOH, (mL)
Figure 46 pH titration curve for free boric acid at25°C (0.485 M H3B03, 30 mL sample, and0.5 mL/min speed)
The difference in the volume of 5 M NaOH between the two peaks, (V2 - V1), in Figure 46should be equivalent to the number of the moles of boric acid in the solution. The values of (V2 - V1)
were plotted as a function of the concentration of boric acid in Figure 47. The circles represent theexperimental data, while the solid line represents the theoretical line under the assumption offirst-step dissociation. It is surprising that the experimental data are completely on the theoreticalline. This fact tells us that only H3B03 and the monoborate anion are important, and boric acid
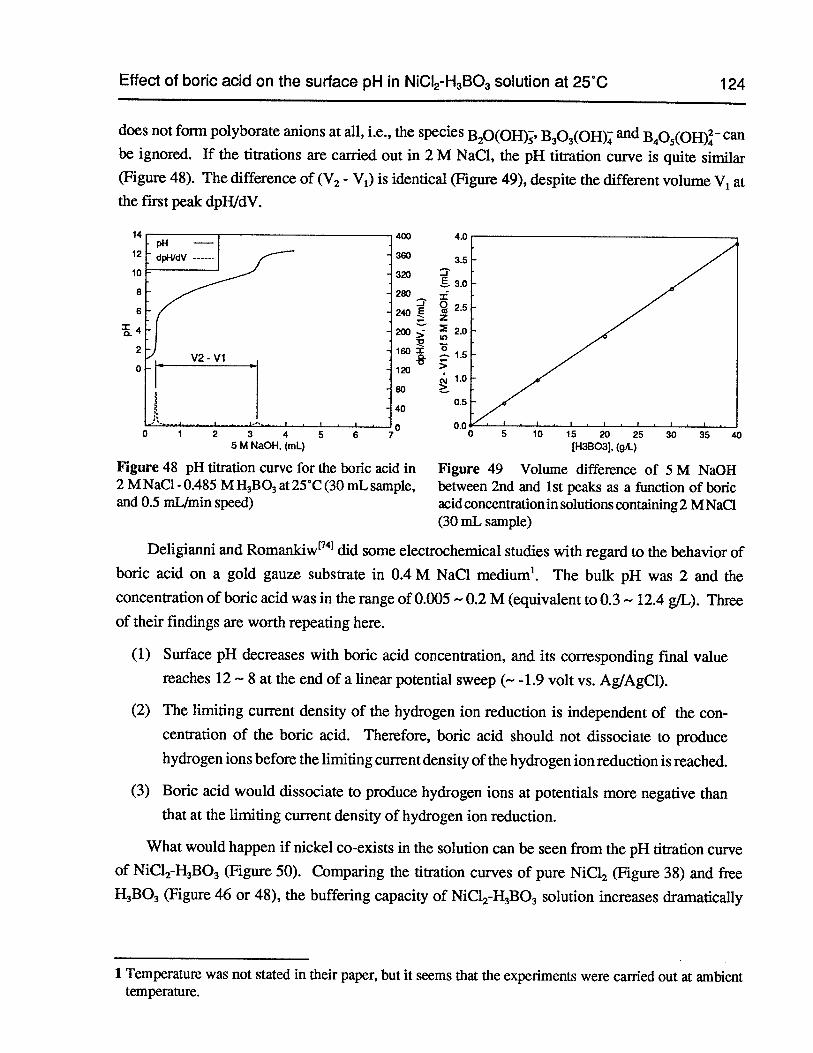
Effect of boric acid on the surface pH in N1CI2-H3B03solution at 25°C 124
does not form polyborate anions at all, i.e., the speciesB2o(oH);B3O3(OH) andB4O5(oH)canbe ignored. If the titrations are carried out in 2 M NaC1, the pH titration curve is quite similar(Figure 48). The difference of (V2 - V,) is identical (Figure 49), despite the different volume V1 atthe first peak dpH/dV.
4.0
0.00 5 10 15 20 25 30 35 40
[H3B03J, (giL)
Figure 49 Volume difference of 5 M NaOHbetween 2nd and 1st peaks as a function of boricacid concentration in solutions containing 2 M NaC1(30 mL sample)
Deligianni and Romankiw174 did some electrochemical studies with regard to the behavior ofboric acid on a gold gauze substrate in 0.4 M NaCl medium’. The bulk pH was 2 and theconcentration of boric acid was in the range of 0.005 —0.2 M (equivalent to 0.3 — 12.4 g/L). l’hreeof their findings are worth repeating here.
(1) Surface pH decreases with boric acid concentration, and its corresponding final valuereaches 12 — 8 at the end of a linear potential sweep (— -1.9 volt vs. Ag/AgC1).
(2) The limiting current density of the hydrogen ion reduction is independent of the concentration of the boric acid. Therefore, boric acid should not dissociate to producehydrogen ions before the limiting current density of the hydrogen ion reduction is reached.
(3) Boric acid would dissociate to produce hydrogen ions at potentials more negative thanthat at the limiting current density of hydrogen ion reduction.
What would happen if nickel co-exists in the solution can be seen from the pH titration curveof NiC12-H3B03(Figure 50). Comparing the titration curves of pure NiC12 (Figure 38) and freeH,B03 (Figure 46 or 48), the buffering capacity of NiC12-H,B03solution increases dramatically
1 Temperature was not stated in their paper, but it seems that the experiments were carried out at ambienttemperature.
-JE
>
14
12
10
8
6
=0
2
0
3 45 M NaOH, (mL)
Figure 48 pH titration curve for the boric acid in2 M NaCI - 0.485 M H,BO, at 25°C (30 mL sample,and 0.5 mL/min speed)
3.5-j
&3.0
2.5z
2.0U,
>1.0
>
0.5
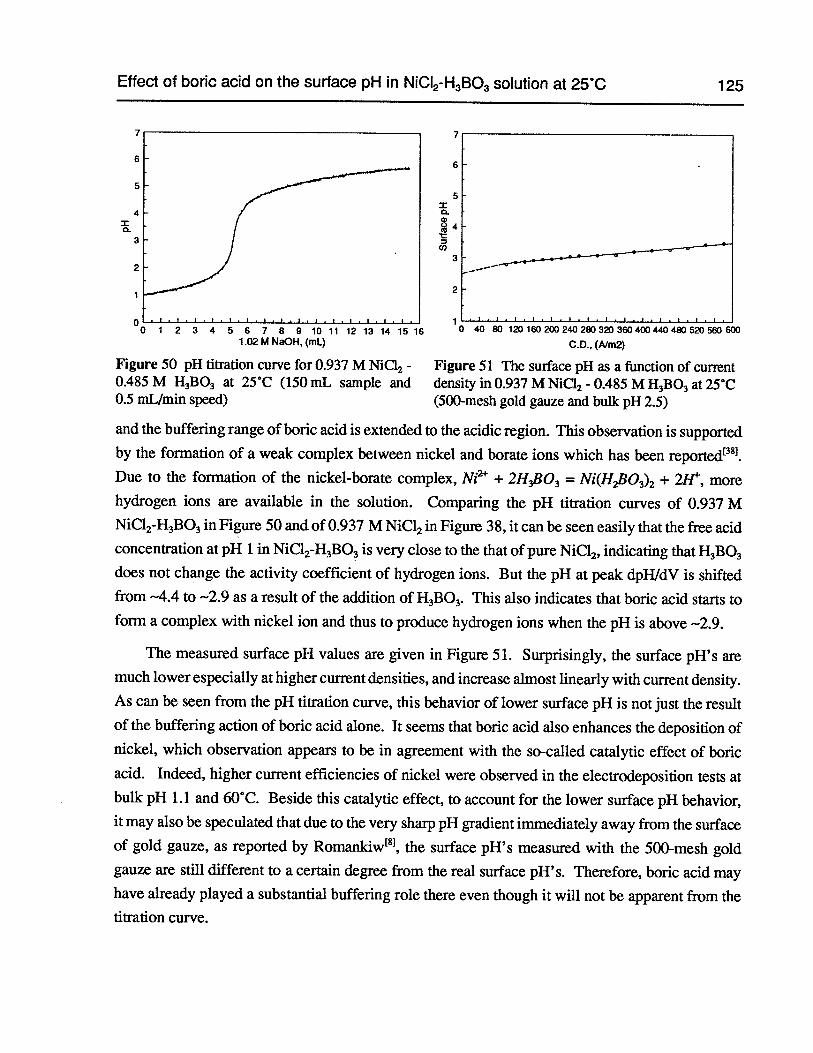
Effect of boric acid on the surface pH in NICI2-H3B03solution at 2WC 125
7
6
5
4=
3
2
Oo 1 2 3 4 5 6 7 8 9 10 11 12 13 14 15 16 0 40 4004404805205606001.O2MNaOH,(mL) C.D.,(A1m2)
Figure 50 pH titration curve for 0.937 M NiCI2 - Figure 51 The surface pH as a function of current
0.485 M H3B03 at 25°C (150 mL sample and density in 0.937 M NiC12 - 0.485 MH3B03at 25C0.5 mLlmin speed) (500-mesh gold gauze and bulk pH 2.5)
and the buffering range of boric acid is extended to the acidic region. This observation is supportedby the formation of a weak complex between nickel and borate ions which has been reported381.Due to the formation of the nickel-borate complex, Ni2 + 2H3B03= Ni(H,fl03)2+ 2H, morehydrogen ions axe available in the solution. Comparing the pH tiiration curves of 0.937 MNiC12-H3B03in Figure 50 and of 0.937 M NiCl2in Figure 38, it can be seen easily that the free acidconcentration at pH 1 in NiC12-H3B03is very close to the that of pure NiC12,indicating thatH3B03does not change the activity coefficient of hydrogen ions. But the pH at peak dpHIdV is shiftedfrom —4.4 to —2.9 as a result of the addition ofH3B03. This also indicates that boric acid starts toform a complex with nickel ion and thus to produce hydrogen ions when the pH is above —2.9.
The measured surface pH values are given in Figure 51. Surprisingly, the surface pH’s aremuch lower especially at higher current densities, and increase almost linearly with current density.As can be seen from the pH titration curve, this behavior of lower surface pH is not just the resultof the buffering action of boric acid alone. It seems that boric acid also enhances the deposition ofnickel, which observation appears to be in agreement with the so-called catalytic effect of boricacid. Indeed, higher current efficiencies of nickel were observed in the electrodeposition tests atbulk pH 1.1 and 60°C. Beside this catalytic effect, to account for the lower surface pH behavior,it may also be speculated that due to the very sharp pH gradient immediately away from the surfaceof gold gauze, as reported by Romankiw, the surface pH’s measured with the 500-mesh goldgauze axe still different to a certain degree from the real surface pH’s. Therefore, boric acid mayhave already played a substantial buffering role there even though it will not be apparent from thetitration curve.
6
S
2
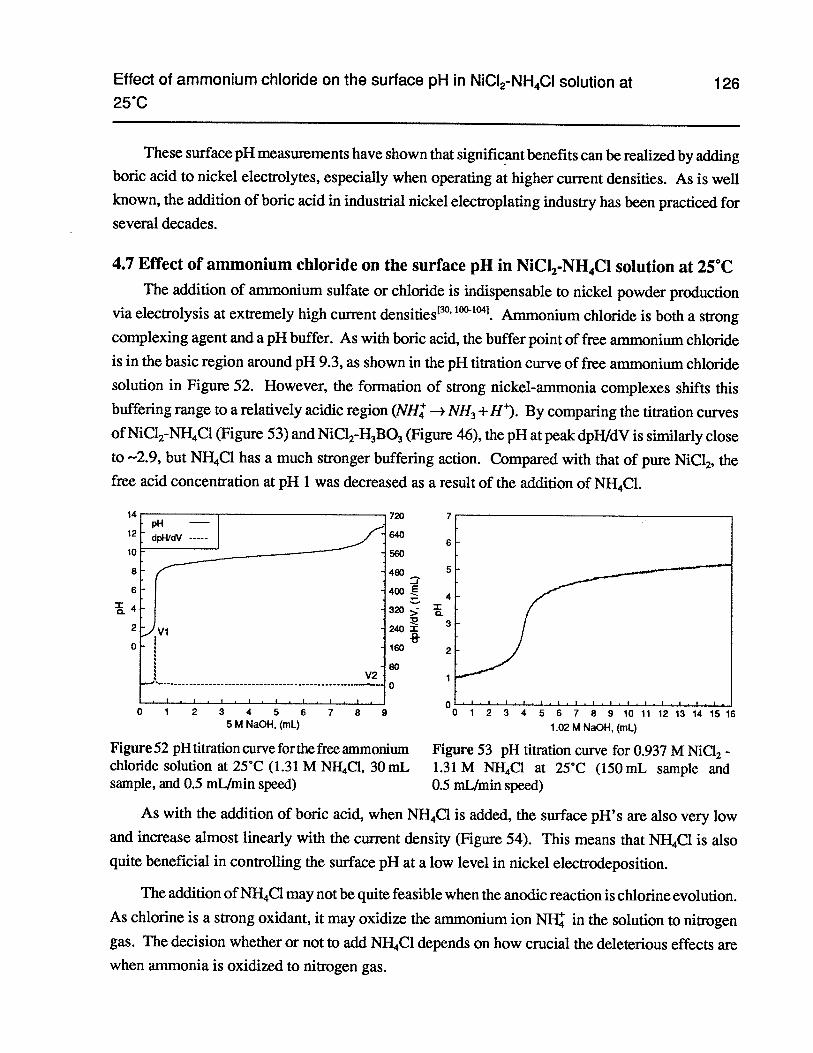
Effect of ammonium chloride on the surface pH in NiCI2-NH4CIsolution at25CC
126
These surface pH measurements have shown that significant benefits can be realized by addingboric acid to nickel electrolytes, especially when operating at higher current densities. As is wellknown, the addition of boric acid in industrial nickel electroplating industry has been practiced forseveral decades.
4.7 Effect of ammonium chloride on the surface pH in NiC12-NH4C1solution at 25°CThe addition of ammonium sulfate or chloride is indispensable to nickel powder production
via electrolysis at extremely high current densities° 100.104) Ammonium chloride is both a strongcomplexing agent and a pH buffer. As with boric acid, the buffer point of free ammonium chlorideis in the basic region around pH 9.3, as shown in the pH titration curve of free ammonium chloridesolution in Figure 52. However, the formation of strong nickel-ammonia complexes shifts thisbuffering range to a relatively acidic region (NH: — NH3+H). By comparing the titration curvesofNiC12-NH4C1(Figure 53) andNiC12-H3B03(Figure 46), the pH at peak dpHJdV is similarly closeto —2.9, but NH4C1 has a much stronger buffering action. Compared with that of pure NiCl2, thefree acid concentration at pH 1 was decreased as a result of the addition of NH4C1.
0
As with the addition of boric acid, when NH4C1 is added, the surface pH’s are also very lowand increase almost linearly with the current density (Figure 54). This means that NHC1 is alsoquite beneficial in controlling the surface pH at a low level in nickel electrodeposition.
The addition ofNH4C1may not be quite feasible when the anodic reaction is chlorine evolution.As chlorine is a strong oxidant, it may oxidize the ammonium ion NH in the solution to nitrogengas. The decision whether or not to add NU4C1 depends on how crucial the deleterious effects arewhen ammonia is oxidized to nitrogen gas.
I .1
0 1 2 3 4 5 6 7 8 95 M NaOH, (mL)
Figure 52 pH titration curve for the free ammoniumchloride solution at 25°C (1.31 M NH4C1, 30 mLsample, and 0.5 mL/min speed)
00 1 2 3 4 5 6 7 8 9 10 11 12 13 14 1516
102 M NaOH, (ml.)
Figure 53 pH titration curve for 0.937 M NiC12 -
1.31 M NH4C1 at 25°C (150 mL sample and0.5 mLlmin speed)
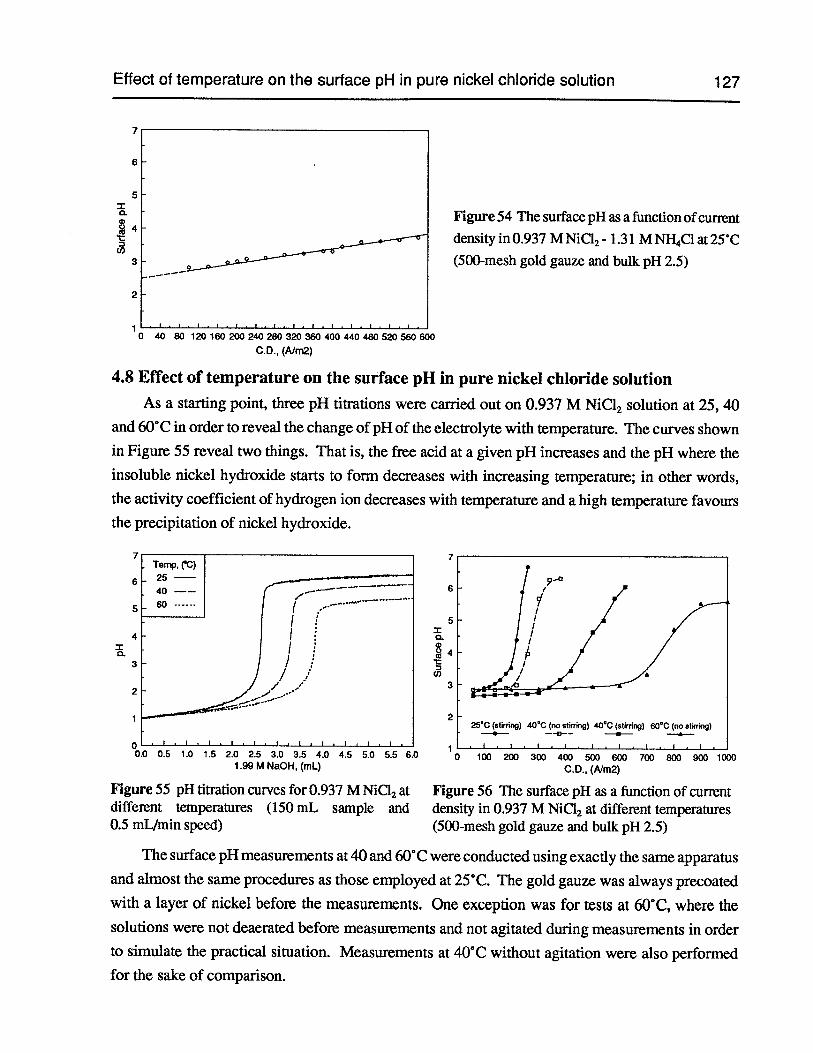
Effect of temperature on the surface pH in pure nickel chloride solution
2
•1I .1.1 I .1 I I 1.1.
0 40 80 120 160 200 240 280 320 360 400 440 480 520 560 600
C.D., (A/m2)
4.8 Effect of temperature on the surface pH in pure nickel chloride solution
As a starting point, three pH titrations were carried out on 0.937 M NiC12 solution at 25, 40and 60°C in order to reveal the change of pH of the electrolyte with temperature. The curves shownin Figure 55 reveal two things. That is, the free acid at a given pH increases and the pH where theinsoluble nickel hydroxide starts to form decreases with increasing temperature; in other words,the activity coefficient of hydrogen ion decreases with temperature and a high temperature favoursthe precipitation of nickel hydroxide.
1100 200 300 400 500 600 700 800 900 1000
0.0., (A1m2)
Figure 56 The surface pH as a function of currentdensity in 0.937 M NiC12 at different temperatures(500-mesh gold gauze and bulk pH 2.5)
The surface pH measurements at 40 and 60°C were conducted using exactly the same apparatusand almost the same procedures as those employed at 25°C. The gold gauze was always precoatedwith a layer of nickel before the measurements. One exception was for tests at 60°C, where thesolutions were not deaerated before measurements and not agitated during measurements in orderto simulate the practical situation. Measurements at 40°C without agitation were also performedfor the sake of comparison.
7
6
5
127
Figure 54 The surfacepH asafunction of currentdensity in 0.937 M NiCl2- 1.31 M NH4C1 at 25°C(500-mesh gold gauze and bulk pH 2.5)
6
5
7
6
5
4
03
2
00.0 0.5 1.0 1.5 2.0 2.5 3.0 3.5 4.0 4.5 5.0 5.5 6.0
1.99 M NaOH, (mL)
Figure 55 pH titration curves for 0.937 M NiCl2 atdifferent temperatures (150 mL sample and0.5 mL/min speed)
3
225C (string) 40CC (no stwring) 40CC (stirring) 60CC (no stirring)
—.- --€-- —.-- —a-
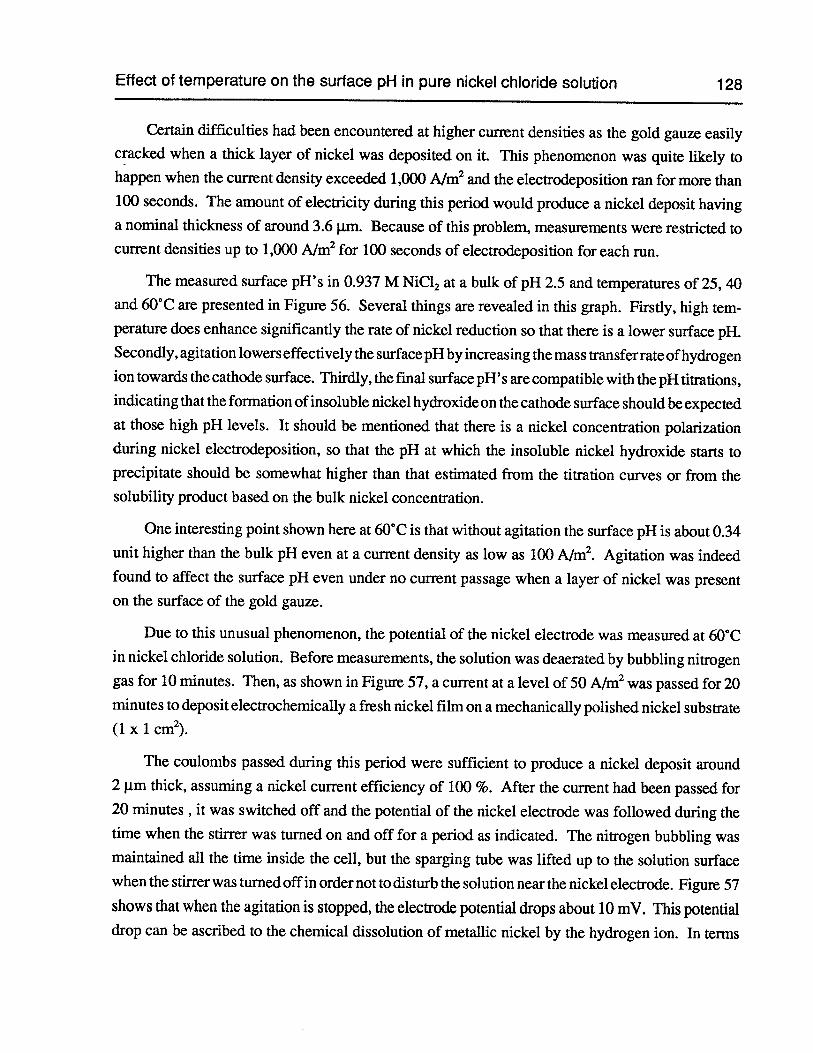
Effect of temperature on the surface pH in pure nickel chloride solution 128
Certain difficulties had been encountered at higher current densities as the gold gauze easilycracked when a thick layer of nickel was deposited on it. This phenomenon was quite likely tohappen when the current density exceeded 1,000 A/m2and the elecirodeposition ran for more than100 seconds. The amount of electricity during this period would produce a nickel deposit havinga nominal thickness of around 3.6 p.m. Because of this problem, measurements were restricted tocurrent densities up to 1,000 A/m2for 100 seconds of electrodeposition for each run.
The measured surface pH’s in 0.937 M NiC12 at a bulk of pH 2.5 and temperatures of 25, 40and 60°C are presented in Figure 56. Several things are revealed in this graph. Firstly, high temperature does enhance significantly the rate of nickel reduction so that there is a lower surface pH.Secondly, agitation lowers effectively the surface pH by increasing the mass transferrate ofhydrogenion towards the cathode surface. Thirdly, the final surface pH’s are compatible with the pH titrations,indicating that the formation ofinsoluble nickel hydroxide on the cathode surface should be expectedat those high pH levels. It should be mentioned that there is a nickel concentration polarizationduring nickel elecirodeposition, so that the pH at which the insoluble nickel hydroxide starts toprecipitate should be somewhat higher than that estimated from the titration curves or from thesolubility product based on the bulk nickel concentration.
One interesting point shown here at 60°C is that without agitation the surface pH is about 0.34unit higher than the bulk pH even at a current density as low as 100 AIm2. Agitation was indeedfound to affect the surface pH even under no current passage when a layer of nickel was presenton the surface of the gold gauze.
Due to this unusual phenomenon, the potential of the nickel electrode was measured at 60°Cin nickel chloride solution. Before measurements, the solution was deaerated by bubbling nitrogengas for 10 minutes. Then, as shown in Figure 57, a current at a level of 50 A/rn2was passed for 20minutes to deposit electrochemically a fresh nickel film on a mechanically polished nickel substrate(1 x 1 cm2).
The coulombs passed during this period were sufficient to produce a nickel deposit around2 p.m thick, assuming a nickel current efficiency of 100 %. After the current had been passed for20 minutes , it was switched off and the potential of the nickel electrode was followed during thetime when the stirrer was turned on and off for a period as indicated. The nitrogen bubbling wasmaintained all the time inside the cell, but the sparging tube was lifted up to the solution surfacewhen the stirrer was turned off in order not to disturb the solution near the nickel electrode. Figure 57shows that when the agitation is stopped, the electrode potential drops about 10 mY. This potentialdrop can be ascribed to the chemical dissolution of metallic nickel by the hydrogen ion. In terms
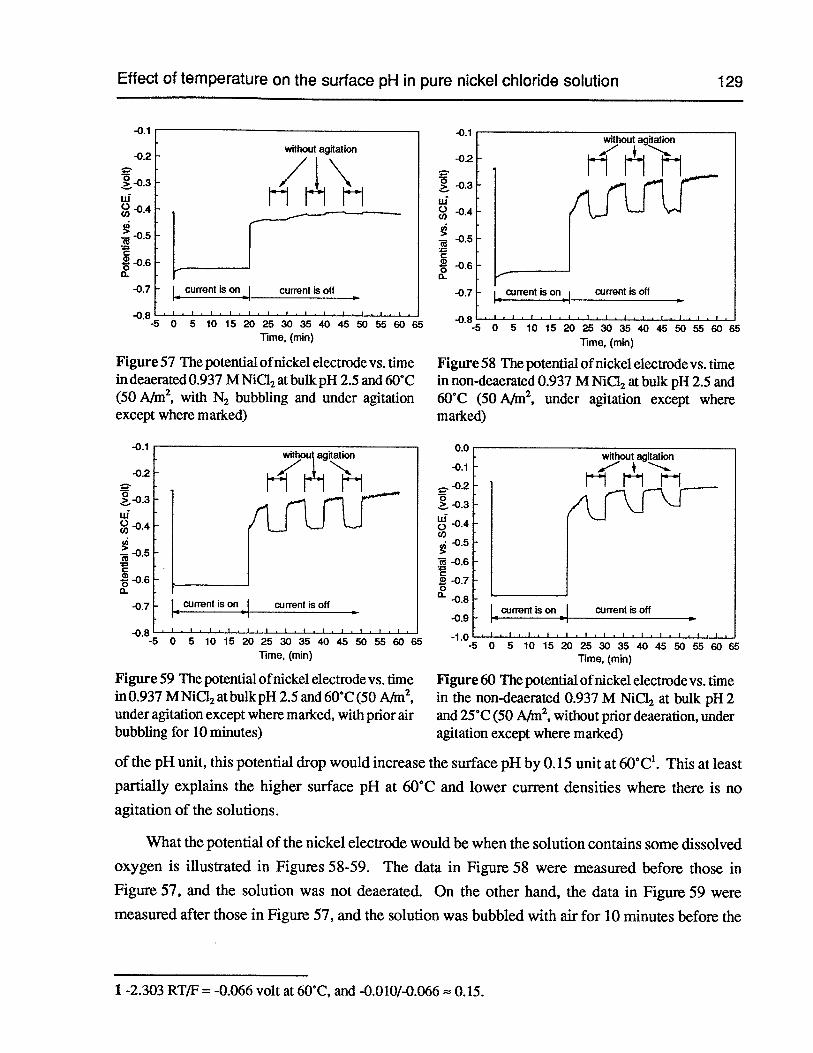
Effect of temperature on the surface pH in pure nickel chloride solution
-0.1
-0.2
Ui()C’)
-0.5
-0.6C
-0.70
-0.8I currentison current is oft
-0.9
—1.0 ii, .5,5.5.5,5.1.1,5,
-5 0 5 101520253035404550556065Time, (mm)
Figure 60 The potential ofnickel electrode vs. timein the non-deaerated 0.937 M NiCl2 at bulk pH 2and 25°C (50 Ari2,without prior deaeration, underagitation except where marked)
of the pH unit, this potential drop would increase the surface pH by 0.15 unit at 6(YC1. This at leastpartially explains the higher surface pH at 60°C and lower current densities where there is noagitation of the solutions.
What the potential of the nickel electrode would be when the solution contains some dissolvedoxygen is illustrated in Figures 58-59. The data in Figure 58 were measured before those inFigure 57, and the solution was not deaerated. On the other hand, the data in Figure 59 were
measured after those in Figure 57, and the solution was bubbled with air for 10 minutes before the
129
without agitation-0.1
-0.2
0> -0.3
Ui-0.4
-0.5
n
1_current is on
-0.1
without agitation
-0.5
-0.60
-0.7 current is on current is off
-0.8 -. I I I I I I I
-5 0 5 10 15 20 25 30 35 40 45 50 55 60 65Time, (mm)
Figure 57 The potential ofnickel electrode vs. timein deaerated 0.937 MNiCl2atbulkpH 2.5 and (iO°C(50 A/rn2, with N2 bubbling and under agitationexcept where marked)
-0.1
-0.2
0> -0.3
Ui
-0.4
0.5
current is oft
0 5 10 15 20 25 30 35 40 45 50 55 60 65
Time, (mm)
Figure 58 The potential of nickel electrode vs. timein non-deaerated 0.937 M NiCI2at bulk pH 2.5 and60°C (50 A/rn2, under agitation except wheremarked)
0.0without agitation
current is ona—
current •is oft
-5 0 5 101520253035404550556065Time, (mm)
Figure 59 The potential ofnickel electrode vs. timein 0.937 M NiC12at bulk pH 2.5 and 60°C (50 Aj2,under agitation except where marked, with prior airbubbling for 10 minutes)
1 -2.303 RT/F = -0.066 volt at 60°C, and -0.010/-0.066 0.15.
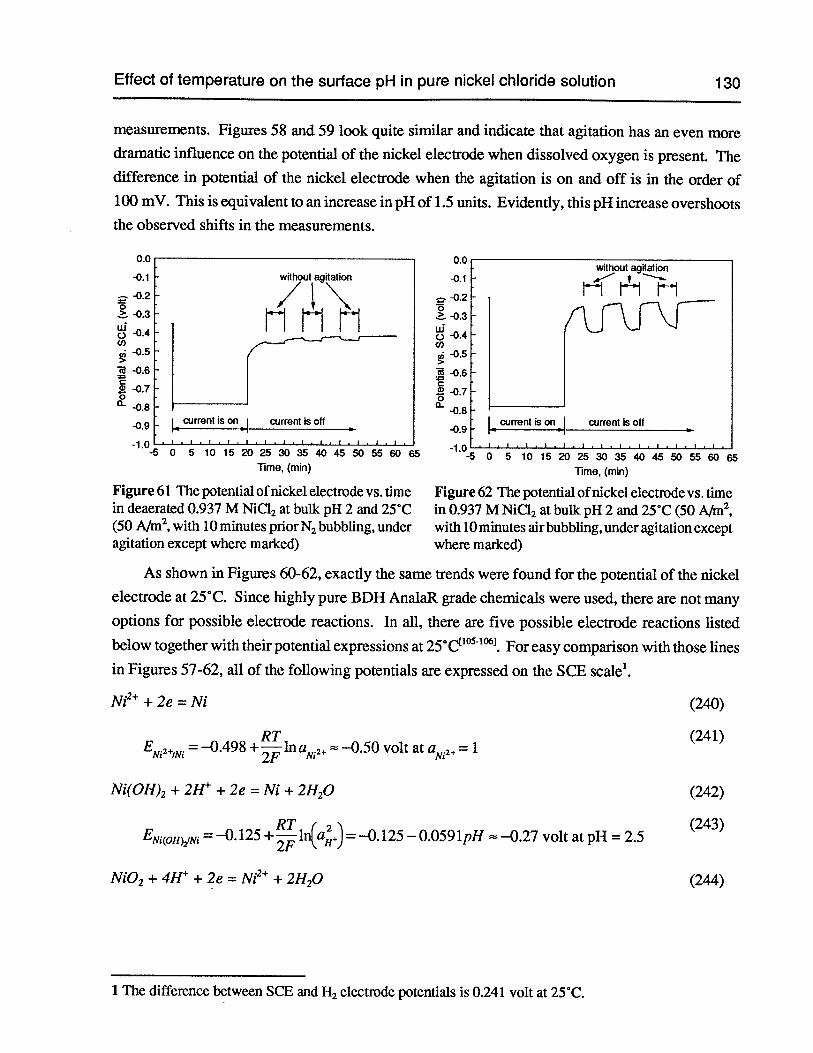
Effect of temperature on the surface pH in pure nickel chloride solution 130
measurements. Figures 58 and 59 look quite similar and indicate that agitation has an even moredramatic influence on the potential of the nickel electrode when dissolved oxygen is present. Thedifference in potential of the nickel electrode when the agitation is on and off is in the order of100 mV. This is equivalent to an increase in pH of 1.5 units. Evidently, this pH increase overshootsthe observed shifts in the measurements.
As shown in Figures 60-62, exactly the same trends were found for the potential of the nickel
electrode at 25°C. Since highly pure BDH AnalaR grade chemicals were used, there are not many
options for possible electrode reactions. In all, there are five possible electrode reactions listed
below together with their potential expressions at 25°C’°’°61.For easy comparison with those lines
in Figures 57-62, all of the following potentials are expressed on the SCE scale’.
Ni2 + 2e = Ni (240)
RT (241)EN.2.,,N. = —0.498 + in —0.50 volt at aNI2+ 1
without agitation
-jI.-j
0.0
-0.1 without agitation
/\ririri-0.5
-0.6
-0.7- -0.8
i current ison current is off-0.9
—10-5 0 5 101520253035404550556065
Time, (mm)
Figure 61 The potential ofnickel electrode vs. timein deaerated 0.937 M NiCI2 at bulk pH 2 and 25°C(50 Mn2,with 10 minutes priorN2bubbling, underagitation except where marked)
-0.1
-0.20. -0.3wo -0.4C,)
-0.5>
-0.6C
-0.70
-0.8
-0.9
1.c50 5 lo 15 20 25 30 35 40 45 50 55 60
Time, (mm)
Figure 62 The potential ofnickel electrode vs. timein 0.937 M NiC12 at bulk pH 2 and 25°C (50 A/m2,with 10 minutes air bubbling, under agitation exceptwhere marked)
current is on current is oil4
• I. I.? • 1,1 1.1.1,
Ni(OH)2 + 2I-f + 2e = Ni + 2H20 (242)
RT 2 (243)EN1(oH,N1 =—0.125+j1n(aH+) =—0.125--0.0591pH —0.27 volt atpH = 2.5
Ni02 + 4H + 2e = Ni2 + 2H20 (244)
1 The difference between SCE and H2 electrode potentials is 0.241 volt at 25°C.
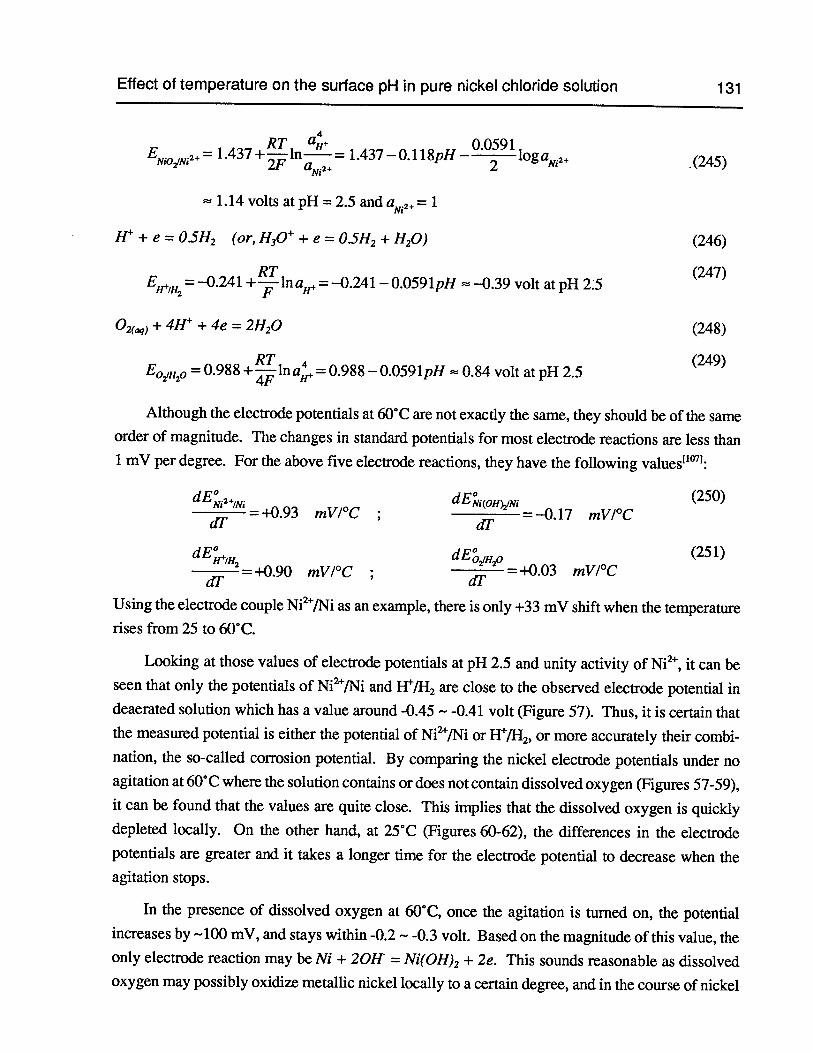
Effect of temperature on the surface pH in pure nickel chloride solution 131
RT 0.0591EN,N.2+ = 1.437 +ln— = 1.437—0.1 l8pH
— 2lOga.2+ (245)
1.14 volts at pH = 2.5 and = 1
+ e = O.5H2 (or, H30 + e = 05H2 + 1120) (246)
RT (247)EH+,H=_O.24l+FlnaIl+ —0.241 —O.O59lp11 =—O.39 volt atpH 2:5
°2(aq) + 4H + 4e =21120 (248)
RT (249)E021110 = 0.988 +lna, = 0.988 — 0.0591pH 0.84 volt at pH 2.5
Although the electrode potentials at 60°C are not exactly the same, they should be of the sameorder of magnitude. The changes in standard potentials for most electrode reactions are less than1 mV per degree. For the above five electrode reactions, they have the following valuest1°7:
dE+,N. dE°N(QH,N1 (250)
a, = +0.93 mV/ C ; a, =-0.17 mV/ C
dE+,H dEHo (251)
a,2
+0.90 mV/°C ; a, = +0.03 mV/°C
Using the electrode coupleNi2fNi as an example, there is only +33 mV shift when the temperaturerises from 25 to 60°C.
Looking at those values of electrode potentials at pH 2.5 and unity activity of Ni2, it can beseen that only the potentials ofNi2/Ni and W/H2 are close to the observed electrode potential indeaerated solution which has a value around -0.45 — -0.41 volt (Figure 57). Thus, it is certain thatthe measured potential is either the potential ofNi2fNi or H/H2,or more accurately their combination, the so-called corrosion potential. By comparing the nickel electrode potentials under noagitation at 60°C where the solution contains or does not contain dissolved oxygen (Figures 57-59),it can be found that the values are quite close. This implies that the dissolved oxygen is quicklydepleted locally. On the other hand, at 25°C (Figures 60-62), the differences in the electrodepotentials are greater and it takes a longer time for the electrode potential to decrease when theagitation stops.
In the presence of dissolved oxygen at 60°C, once the agitation is turned on, the potentialincreases by —100 mV, and stays within -0.2 — -0.3 volt. Based on the magnitude of this value, theonly electrode reaction may be Ni + 20H = Ni(0H)2+ 2e. This sounds reasonable as dissolvedoxygen may possibly oxidize metallic nickel locally to a certain degree, and in the course of nickel
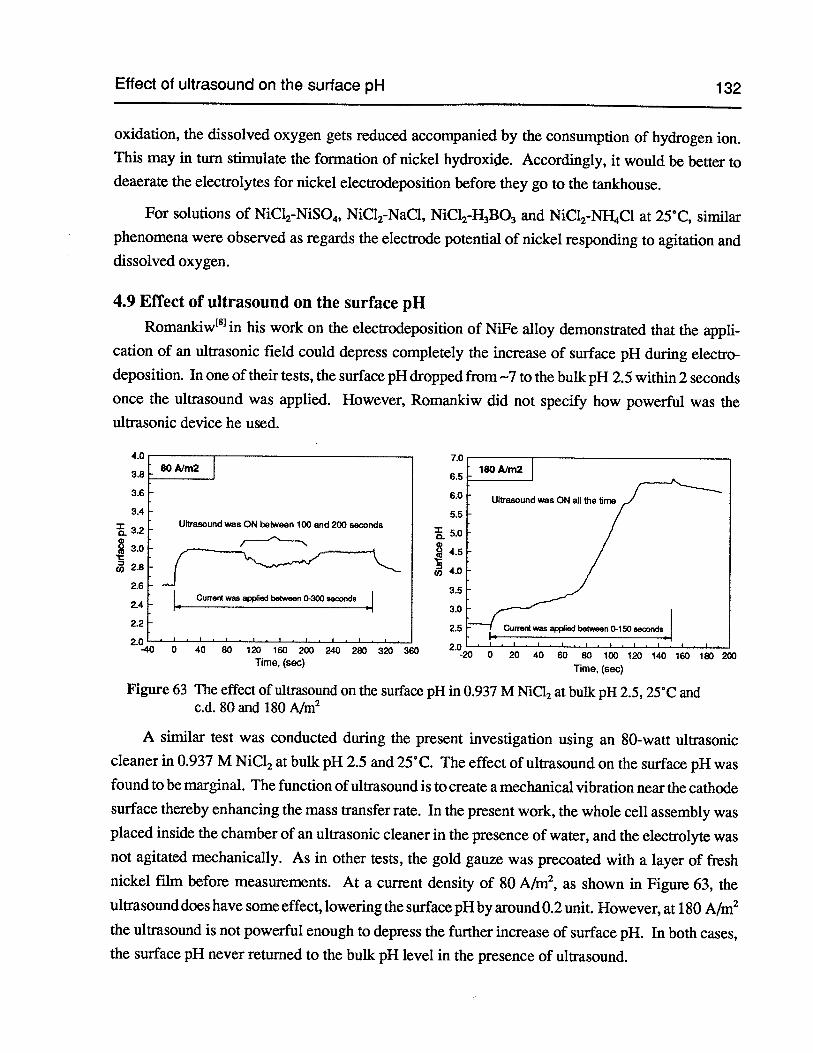
Effect of ultrasound on the surface pH 132
oxidation, the dissolved oxygen gets reduced accompanied by the consumption of hydrogen ion.This may in turn stimulate the formation of nickel hydroxide. Accordingly, it would be better todeaerate the electrolytes for nickel electrodeposition before they go to the tankhouse.
For solutions of NiC12-NiSO4,NiC12-NaC1, NiCl2-H3B03and NiC12-NH4C1 at 25°C, similarphenomena were observed as regards the electrode potential of nickel responding to agitation anddissolved oxygen.
4.9 Effect of ultrasound on the surface pHRomankiw81in his work on the electrocleposition of NiFe alloy demonstrated that the appli
cation of an ultrasonic field could depress completely the increase of surface pH during electrodeposition. In one of their tests, the surface pH dropped from —7 to the bulk pH 2.5 within 2 secondsonce the ultrasound was applied. However, Romankiw did not specify how powerful was theultrasonic device he used.
7.080A/m2 IBOA/m2
E 6.0 Ulasound ON I theme
32UltrasoundwasONbetweenl0oand200seconds
3
‘E24
p1 between 0- .1 30
2.2 2.5 Gun ent was applied between 0-150 seconds
2.0I I I I I
I I I I I I-40 0 40 80 120 160 200 240 280 320 2.020 0 20 40 60 80 100 120 140 160 180 200Time, (sec)
Time, (sec)
Figure 63 The effect of ultrasound on the surface pH in 0.937 M NiCl2at bulk pH 2.5, 25°C andc.d. 80 and 180 A/rn2
A similar test was conducted during the present investigation using an 80-watt ultrasoniccleaner in 0.937 M NiCl2at bulk pH 2.5 and 25°C. The effect of ultrasound on the surface pH wasfound to be marginal. The function ofultrasound is to create a mechanical vibration near the cathodesurface thereby enhancing the mass transfer rate. In the present work, the whole cell assembly wasplaced inside the chamber of an ultrasonic cleaner in the presence of water, and the electrolyte wasnot agitated mechanically. As in other tests, the gold gauze was precoated with a layer of freshnickel film before measurements. At a current density of 80 AIm2, as shown in Figure 63, theultrasound does have some effect, lowering the surface pH by around 0.2 unit. However, at 180 A/rn2the ultrasound is not powerful enough to depress the further increase of surface pH. In both cases,the surface pH never returned to the bulk pH level in the presence of ultrasound.
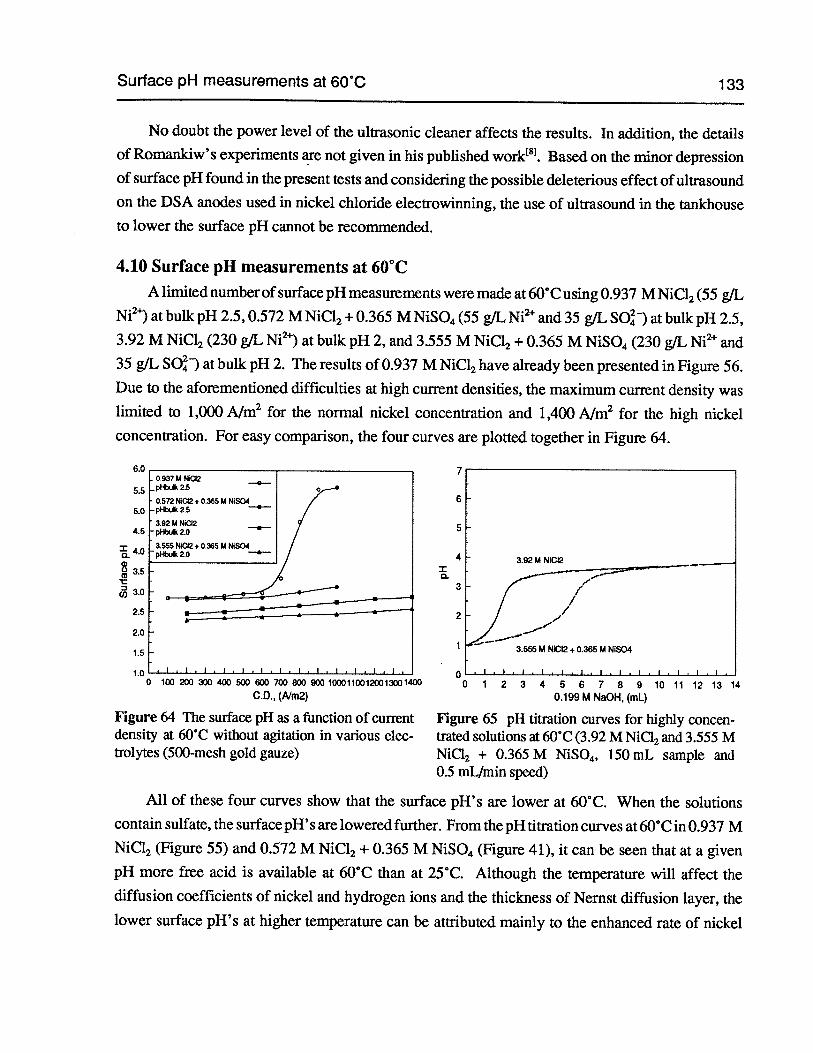
Surface pH measurements at 60°C 133
No doubt the power level of the ultrasonic cleaner affects the results. In addition, the detailsof Romankiw’s experiments are not given in his published work8. Based on the minor depressionof surface pH found in the present tests and considering the possible deleterious effect of ultrasoundon the DSA anodes used in nickel chloride electrowinning, the use of ultrasound in the tankhouseto lower the surface pH cannot be recommended.
4.10 Surface pH measurements at 60°CA limited numberof surface pH measurements were made at 60°C using 0.937 M NiC12(55 g/L
Ni2)at bulk pH 2.5,0.572 M NiC12+ 0.365 M NiSO4(55 g/L Ni2and 35 g/L SO) at bulk pH 2.5,3.92 M NiCl2 (230 g/L Ni2) at bulk pH 2, and 3.555 M NiC12+ 0.365 M NiSO4 (230 g/L Ni2 and35 g/L SO) at bulk pH 2. The results of 0.937 M NiCl2have already been presented in Figure 56.Due to the aforementioned difficulties at high current densities, the maximum current density waslimited to 1,000 A/rn2 for the normal nickel concentration and 1,400 A/rn2 for the high nickelconcentration. For easy comparison, the four curves are plotted together in Figure 64.
5.5
5.0
4.5
I0 100 200 300 400 500 600 700 800 900 10001100120013001400
C.D., (A/m2)
Figure 64 The surface pH as a function of currentdensity at 60°C without agitation in various electrolytes (500-mesh gold gauze)
All of these four curves show that the surface pH’s are lower at 60°C. When the solutionscontain sulfate, the surface pH’s are lowered further. From the pH titration curves at 60°C in 0.937 MNiCl2 (Figure 55) and 0.572 M NiCl2 + 0.365 M NiSO4 (Figure 41), it can be seen that at a givenpH more free acid is available at 60°C than at 25°C. Although the temperature will affect thediffusion coefficients of nickel and hydrogen ions and the thickness of Nernst diffusion layer, thelower surface pH’s at higher temperature can be attributed mainly to the enhanced rate of nickel
0.937M 2pHbuk 2.5
0.572 NC2 + 0.365 A NSO4pN*2.5
3.92 IA NiC12p*2.0
3.555 N4C12 + 0.365 U NiSO4pithulc2.0
0
012345678 910111213140.199 M NaOH, (mL)
Figure 65 pH titration curves for highly concentrated solutions at 60°C (3.92 M NiCl2and 3.555 MNiCl2 + 0.365 M NiSO4, 150 mL sample and0.5 mL/min speed)
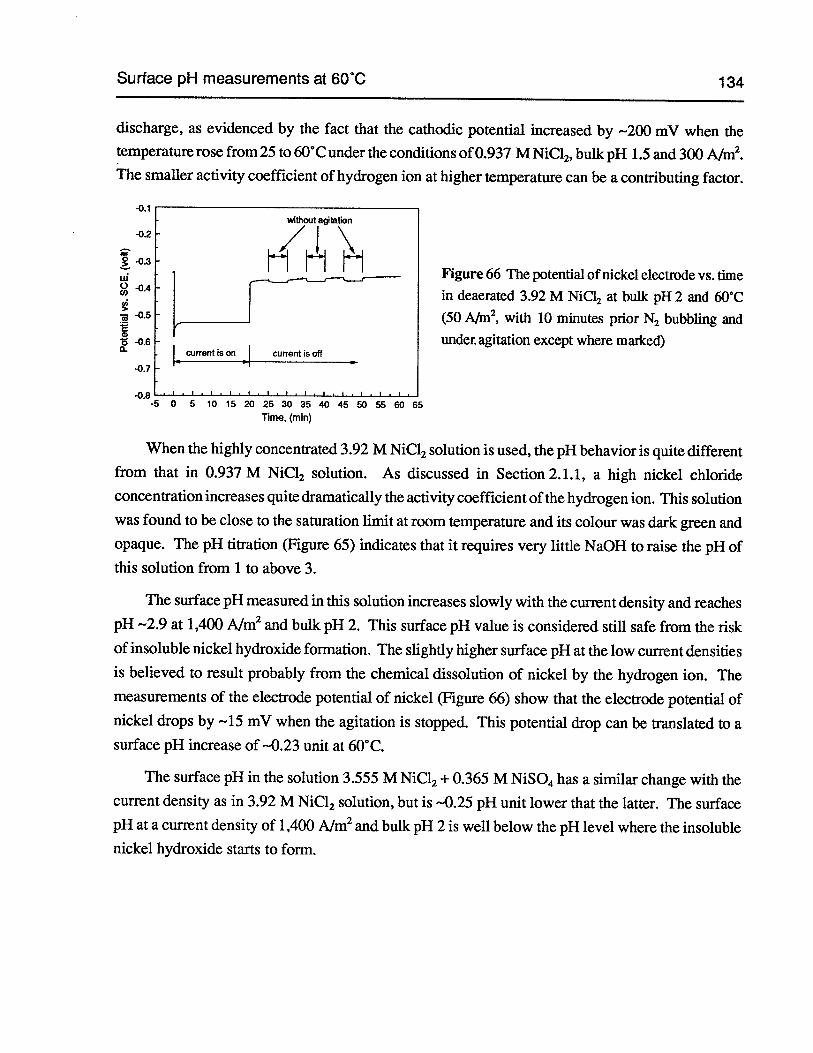
Surface pH measurements at 60C 134
discharge, as evidenced by the fact that the cathodic potential increased by —200 mV when thetemperature rose from 25 to 6(YC under the conditions of0.937 MNiC12,bulk pH 1.5 and 300 A/m2.The smaller activity coefficient of hydrogen ion at higher temperature can be a contributing factor.
-0.1without agtior
-0.2 /\Figure 66 The potential ofmckel electrode vs. tune
-0.4 in deaerated 3.92 M NiC12 at bulk pH 2 and 60°C- -0.5 (50 A/rn2, with 10 minutes prior N2 bubbling and
-0.6 under. agitation except where maiked)1-4 current is on I current is off
-0.7
-0.8.1.1. • 1,1,1.1. 1.1,1 •
-50 5101520253035404550556065Time, (mm)
When the highly concentrated 3.92 M NiC12solution is used, the pH behavior is quite differentfrom that in 0.937 M NiC12 solution. As discussed in Section 2.1.1, a high nickel chlorideconcentration increases quite dramatically the activity coefficient of the hydrogen ion. This solutionwas found to be close to the saturation limit at room temperature and its colour was dark green andopaque. The pH titration (Figure 65) indicates that it requires very little NaOH to raise the pH ofthis solution from 1 to above 3.
The surface pH measured in this solution increases slowly with the current density and reachespH —2.9 at 1,400 A/rn2 and bulk pH 2. This surface pH value is considered still safe from the riskof insoluble nickel hydroxide formation. The slightly higher surface pH at the low current densitiesis believed to result probably from the chemical dissolution of nickel by the hydrogen ion. Themeasurements of the electrode potential of nickel (Figure 66) show that the electrode potential ofnickel drops by —15 mV when the agitation is stopped. This potential drop can be translated to asurface pH increase of —0.23 unit at 60°C.
The surface pH in the solution 3.555 M NiC12+ 0.365 M NiSO4has a similar change with thecurrent density as in 3.92 M NiC12 solution, but is —0.25 pH unit lower that the latter. The surfacepH at a current density of 1,400 A/m2and bulk pH 2 is well below the pH level where the insolublenickel hydroxide starts to form.
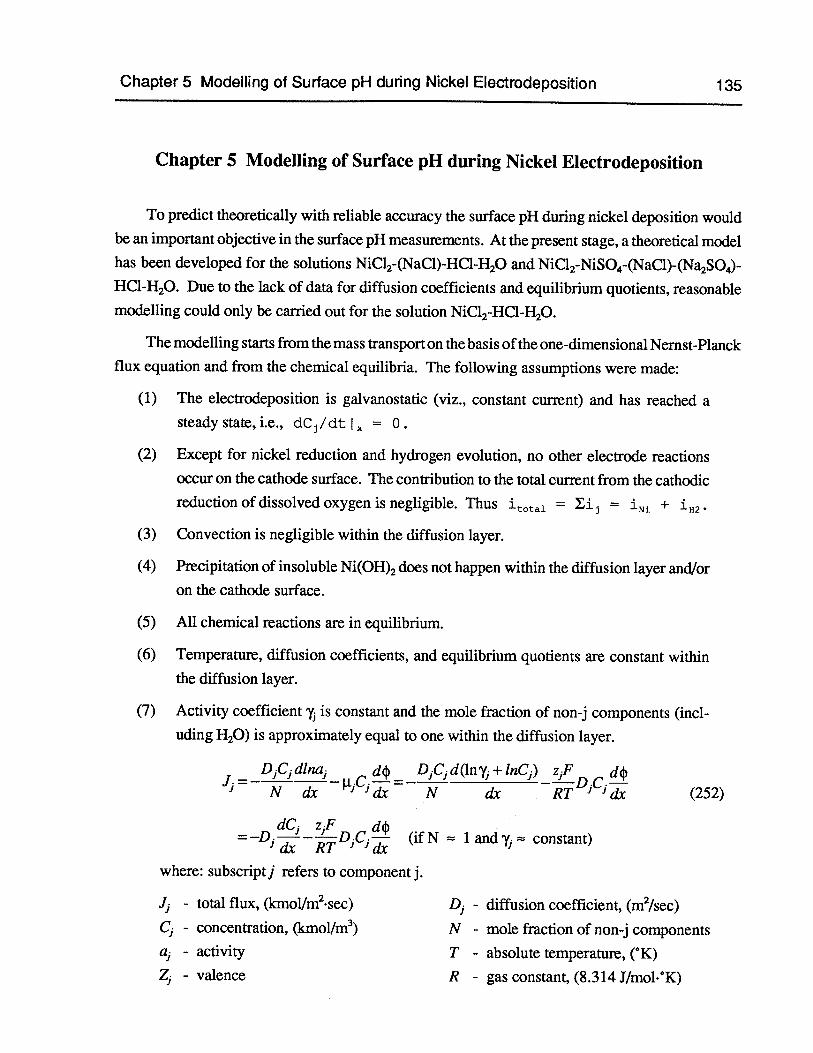
Chapter 5 Modelling of Surface pH during Nickel Electrodeposition 135
Chapter 5 Modelling of Surface pH during Nickel Electrodeposition
To predict theoretically with reliable accuracy the surface pH during nickel deposition wouldbe an important objective in the surface pH measurements. At the present stage, a theoretical modelhas been developed for the solutionsNiC12-(NaC1)-HC1-H20andNiC12-NiSO4-(NaC1)-(Na2SO4)-HC1-H20. Due to the lack of data for diffusion coefficients and equilibrium quotients, reasonablemodelling could only be carried out for the solution NiCl2-HC1-H20.
The modeffing starts from the mass transport on the basis of the one-dimensional Nemst-Planckflux equation and from the chemical equilibria. The following assumptions were made:
(1) The electrodeposition is galvanostatic (viz., constant current) and has reached asteadystate,i.e., dC1/dtI 0.
(2) Except for nickel reduction and hydrogen evolution, no other electrode reactionsoccur on the cathode surface. The contribution to the total current from the cathodicreduction of dissolved oxygen is negligible. Thus ‘total = +
(3) Convection is negligible within the diffusion layer.
(4) Precipitation of insoluble Ni(OH)2does not happen within the diffusion layer and/oron the cathode surface.
(5) All chemical reactions are in equilibrium.
(6) Temperature, diffusion coefficients, and equilibrium quotients are constant withinthe diffusion layer.
(7) Activity coefficient y, is constant and the mole fraction of non-i components (including H20) is approximately equal to one within the diffusion layer.
— D,C1dlna dØ — DC1d(ln’, + lnC) zFD
dØ- N dx dx N dx RT -‘ dx (252)
dC zF dØ(if N 1 and constant)
where: subscriptj refers to componentj.
.1,, - total flux, (kmol/m2•see) - diffusion coefficient, (m2/sec)C1 - concentration, (kmol/m3) N - mole fraction of non-j components
- activity T - absolute temperature, (°K)
4 - valence R - gas constant, (8.3 14 J/mol°K)
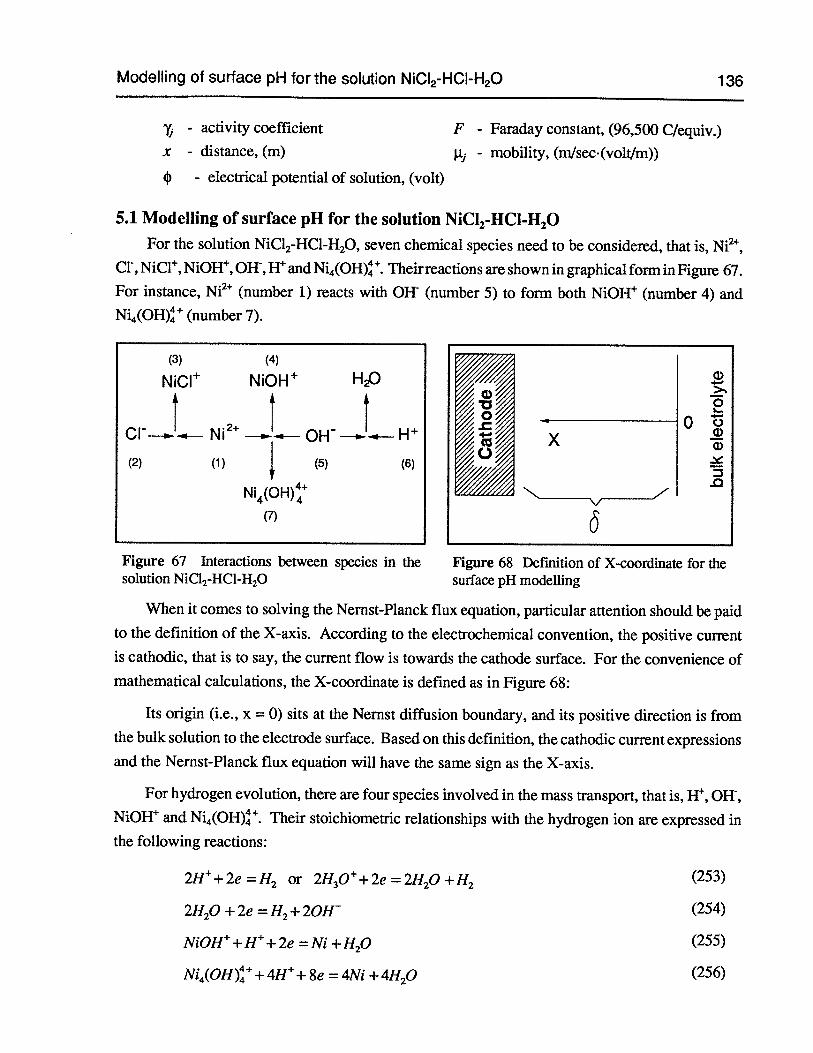
Modelling of surface pH for the solution N1CI2-HCI-H20 136
- activity coefficient F - Faraday constant, (96,500 C/equiv.)x - distance, (m) - mobility, (m/sec.(volt/m))
- electrical potential of solution, (volt)
5.1 Modelling of surface pH for the solution NiC12-HC1-H20
For the solution NiC12-HC1-H20,seven chemical species need to be considered, that is, Ni2,C1, NiC1, NiOH, 0H, H andNi4(OH). Their reactions are shown in graphical form in Figure 67.For instance, Ni2 (number 1) reacts with OW (number 5) to form both NiOH (number 4) andNi4(OH) (number 7).
When it comes to solving the Nernst-Planck flux equation, particular attention should be paidto the definition of the X-axis. According to the electrochemical convention, the positive currentis cathodic, that is to say, the current flow is towards the cathode surface. For the convenience ofmathematical calculations, the X-coordinate is defined as in Figure 68:
Its origin (i.e., x =0) sits at the Nernst diffusion boundary, and its positive direction is fromthe bulk solution to the electrode surface. Based on this definition, the cathodic current expressionsand the Nernst-Planck flux equation will have the same sign as the X-axis.
For hydrogen evolution, there are four species involved in the mass transport, that is, H, OH-,NiOH andNi4(OH). Their stoichiometric relationships with the hydrogen ion are expressed inthe following reactions:
2H+2e=H2 or 2H30+2e=2H20+H2 (253)
2H20+ 2e = H2+20W (254)
Ni0H+H+2e —Ni+H20 (255)
(3) (4)
NiCl NiOH H20
CrJ_ Ni2 OW W
(2) (1) (5) (6)
Ni4(OH)(7)
a)4->1
0
Ot‘I a)A
D.0
7Figure 67 Interactions between species in thesolutionNiCI2-HC1-H20
Figure 68 Defmition of X-coordinate for thesurface pH modelling
Ni4(0H)+4H+8e =4Ni +4H20 (256)
Modelling of surface pH for the solution NiCI2-HCI-H20 137
Therefore, the total flux of the hydrogen ion according to reactions (253)-(256) is equal to:
= (--f4)+ (—J5)+J6 + (—4J7) (kinol/m2•sec)(257)
1H2(NiOHh)
+ +1H2(H)
+1N0j 1H2 (kA/m2)
- F F F F F
For the cathodic reduction of nickel ion, there are also four species involved in the mass transport,i.e., Ni2,NiCi, NiOH andNi4(OH). Their stoichiometric relationships with the nickel ion areshown as follows:
Ni2+ 2e = Ni or [Ni (H20)612+ + 2e = Ni + 6H20 (258)
NiCl + 2e = Ni + C1 (259)
NiOH + H + 2e = Ni + 1120 (260)
Ni4(OH)+4H+8e =4Ni +41120 (261)
Accordingly, the total flux of the nickel based on the reactions (258)-(261) can be presented as:
= J1 +J3 +J4 + 4J7 (kmol/m2.sec)(262)
— ZNi(Ni24)+
lNi(N1CI1)+1Ni(NjOHj
+M(M4(ohlf4j— SNi (kA/m2)
2F 2F 2F 2F - 2F
For the chloride ion, there are two species involved in the mass transport, viz., Cl and NiCl. Asthe chloride ion is neither reduced nor oxidized, its net flux should be equal to zero.
cr230 (263)
The specific flux equations for the above individual species are as follows based on the Nernst-Planckequation:
dC1 2F dØ (264)1 ‘dx RT ‘dx
dC2 (—1)F d (265)
2dx RT 22dx
dC3 F d (266)
x RT dx
dC4 F dØ (267)
dx RT 4dx
Modelling of surface pH for the solution NiCI2-HCI-H20 138
J — DdC5 (1)F13
cd (268)
5dx RT dx
dC6 F d (269)6 6 RT 6 6&
dC 4F d4 (270)
‘cLx RT7dx
Substituting equations (264)-(270) into the above flux equations (257), (262) and (263) forhydrogen,nickel and chloride ions, and after some appropriate rearrangements, the following three equations(271)-(273) can be obtained.
dC4 D dC5 D6dC6 41)-, dC., I D5 D6 16D_c F d = (271)+D++[c4D_c573c6+
D4 7j D4F
dC1 D3dC3 D4dC4 4137 dC-, ( 133 D4 161)7 F d?p = — Ni (272)--+---+--+ —-+12C1+1)C3+1)C4
+ D1C7Jgp;
2D1F
dC2 D3dC3 1 D3 F d=0
(273)
In view of chemical equilibria, there are altogether four reactions (274)-(277):
K3 (274)Ni cr = NiCl
K4 (275)Ni2+OH = NiOH
K7 (276)4Ni+4OW =Ni4(OH)
K (277)H20 =H+OIf
— aN.C,+ —
________________
— y3c3 — ‘y C3 (278)K3
— aNi2dJcr — (YN2+CN2+) —j1C1y2C2 YY2C1C2
C3 (279)c1c=K3=Q3 i.e., C3=Q3C1C2
After differentiating equation (279) and making some rearrangements, it follows that:
Modelling of surface pH for the solution NiCI2-HCI-H20 139
dC1 dC2 dC3 (280) I[
Q3C2-+Q3C1-----=0
aNU,H+ y4c4 ‘y4 C4 (281)K4 = = = = —
aNIZ+aOW (YNI2+CNI2+) (YOHCOH) y1C1y5C5 yjyC1C5
C4 ‘Y1Y5 (282)..
=K4—=Q4 i.e., C4=Q4C1C55 Y4
Differentiating equation (282) and making some rearrangements results in:
I dC1 dC4 dC5 (283) II
Q4C5---+Q4C1--=0
aN. (OH)4+ tNi4OF1)’Ni4(OH) C7K7=
= = (284)aNI2+aOH_ (YNI2+CN2+)4(YOH_Cow)4
()4(Ys)4 (C1)4(C5)4
C7
(C1)4(C5)4= K7
)4
= i.e., C7 =Q7(C1)4(C5)4(285)
17
Differentiating equation (285) again and rearranging, we obtain:
dC5 dC74Q7(C1)3(C5)+4Q7(C1)4(C5)3--— =0
K = aH÷aOH = (YH÷C) (YOHCOW) =y5y6C5C6 (287)
K (288)... C5C6=—=Q
1516
Differentiation of equation (288) and rearrangement gives:
dC5 dC6 (289)C6--+C5--=0
Except for the electhcal double layer, electrical neutrality applies everywhere in the solution.
— Ccr + CN,+ + CN.OH+ — C011.+ CH+ +4CN (OH)
(290)
(291)
i.e., 2C1—C2+C3+C4—C5+C6+4C7=0 (292)
Modelling of surface pH for the solution NiCI2-HCI-H20 140
Differentiation of equation (292) results in:
I dC1 dC2 dC3 dC4 dC5 dC6 dC7 (293)
I 2--—-+--+--+--+4--=0
Equations (271), (272), (273), (280), (283), (286), (289) and (293) consist ofa set of 8 x 8 multilinear
equations.
dC1 dC2 dC3 dC4 dC5 dC6 dC7 d4 (294)a11--+a12--+a13--+a14--+a15--+a16--+a17--+a18 = b1
dC1 dC2 dC3 dC4 dC5 dC6 dC7 d (295)a--+a+a--+a--+a--+--+a--+a b2
dC1 dC2 dC3 dC4 dC5 dC6 dC-, d4 (296)a71-+ a.73—+a74--+a75--+a76--+a77--+a78 = b7
dC1 dC2 dC3 dC4 dC5 dC6 dC7 d (297)b8
The coefficients a and b. are summarized in Table 36. The boundary conditions at x =0, i.e., atthe Nernst boundary layer, are as follows:
c:——io”(298)
111+
— Q,., (299)
5c;
(300)
[Ni]T = C° + C3° + c: + 4C. = C° +Q3C°C° +Q4C°C’ +4Q7(C°)4(C°)4(301)
= 4Q7(C)4(C)4+ C(1 +Q4C50)+Q3C([Ni]T + C1° — C5° + C60)
4Q7(C1°)4(C5°)4+Q3(C1°)2 +
{ + Q4C5°+Q3([Ni]T — C5° +C60)}C1°— [NuT 0 (302)
From the polynomial equation (302), C1° can be solved by iteration. Knowing the value of C, it
follows that values for C20,C3°, C° and C7° can be obtained.
C=[Ni]T+C—C50+C6° (303)
C3° =Q3C°C2° (304)
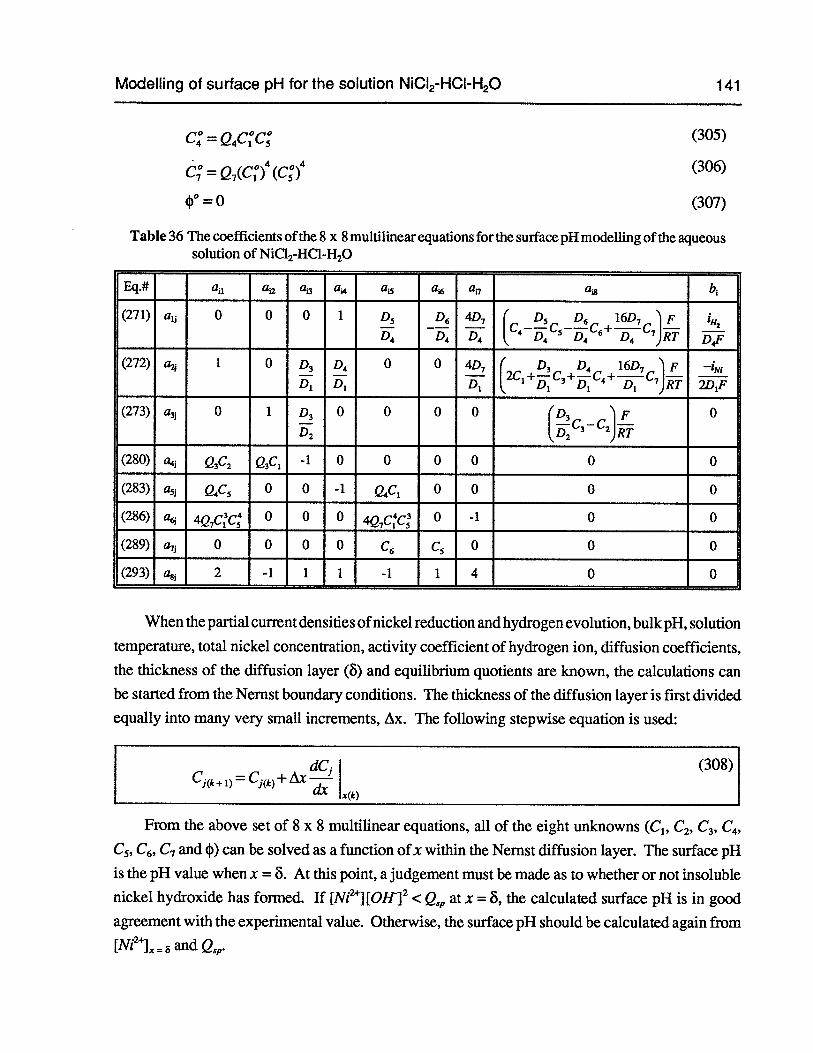
Modelling of surface pH for the solution N1CI2-HCI-H20 141
C: = Q r°r°4’1 ‘5
=Q7(C)4(C)4
=0
(305)
(306)
(307)
Table 36 The coefficients ofthe 8 x 8 multilinear equations for the surface pH modeffing ofthe aqueoussolution ofNiCI2-HCI-H20
Eq.# a11 a a a a a a a
(271) a1 0 0 0 1 D D Ic —c +Zc ‘f ‘2
1)4 D4 1)4 I) 6 1)4 7)RT D
(272) a 1 0 1)3 1)4 0 0 41)7 ( D3 134 16D7 ‘\ F —i,,.i; - -;
(273) a 0 1 D 0 0 0 0 (D3 F 0j C3C2J
(280) a Q3C2 Q3C1 -1 0 0 0 0 0 0
(283) a Q4C5 0 0 -1 Q4C1 0 0 0 0
(286) a 7cc 0 0 0 0 -l 0 0
(289) a7j 0 0 0 0 C6 C5 0 0 0
(293) a 2 -1 1 1 -1 1 4 0 0
When the partial current densities ofnickel reduction and hydrogen evolution, bulk pH, solution
temperature, total nickel concentration, activity coefficient of hydrogen ion, diffusion coefficients,
the thickness of the diffusion layer (3) and equilibrium quotients are known, the calculations can
be started from the Nemst boundary conditions. The thickness of the diffusion layer is first divided
equally into many very small increments, Ax. The following stepwise equation is used:
From the above set of 8 x 8 multilinear equations, all of the eight unknowns (C1,C2, C3,C4,C5,C6,C7 and ) can be solved as a function ofx within the Nernst diffusion layer. The surface pH
is the pH value when x = & At this point, a judgement must be made as to whether or not insoluble
nickel hydroxide has fonned. If [Ni2][OHi2< at x =6, the calculated surface pH is in good
agreement with the experimental value. Otherwise, the surface pH should be calculated again from
[Ni2i= 8 and Q,,.
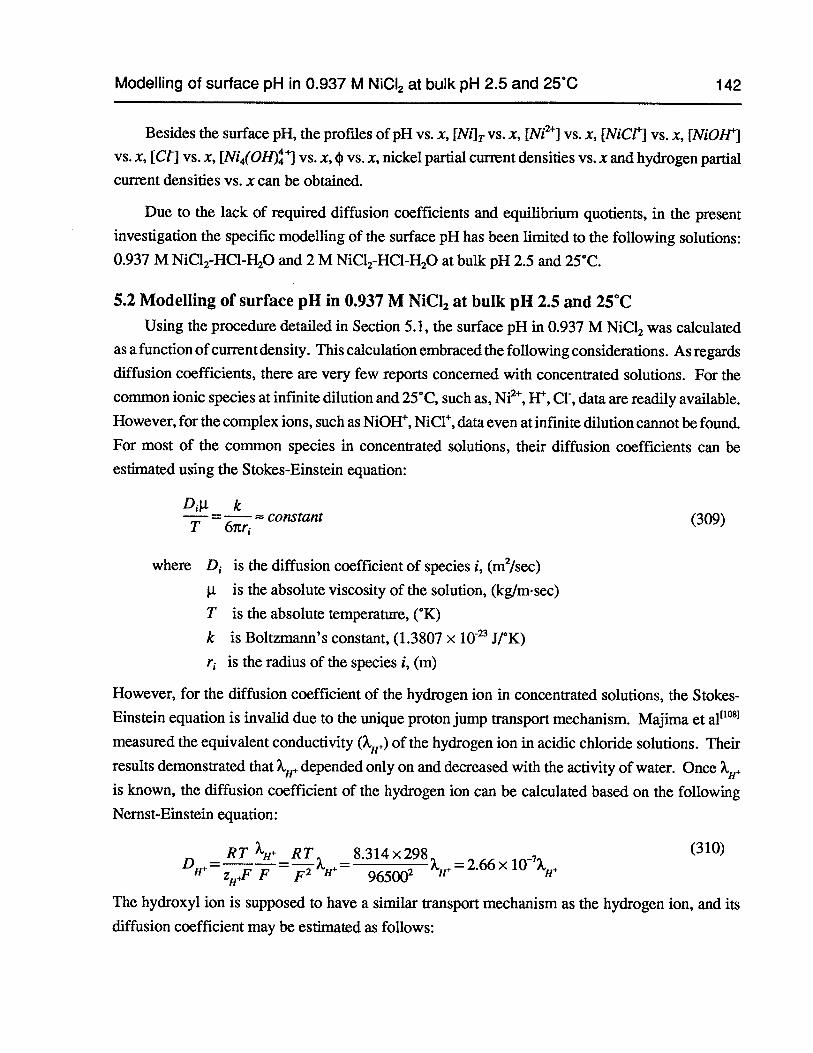
Modelling of surface pH in 0.937 M NiCI2 at bulk pH 2.5 and 25°C 142
Besides the surface pH, the profiles of pH vs. x, [NuT vs. x, [Ni2]vs. x, [NiCr] vs. x, [NiOtEJvs. x, [Ct] vs. x, [Ni4(OH)] vs. x, p vs. x, nickel partial current densities vs. x and hydrogen partialcurrent densities vs. x can be obtained.
Due to the lack of required diffusion coefficients and equilibrium quotients, in the presentinvestigation the specific modelling of the surface pH has been limited to the following solutions:0.937 M NiC12-HC1-H20and 2 M NiC12-HC1-H20at bulk pH 2.5 and 25°C.
5.2 Modelling of surface pH in 0.937 M NiCl2 at bulk pH 2.5 and 25°CUsing the procedure detailed in Section 5.1, the surface pH in 0.937 M NiC12was calculated
as a function ofcurrent density. This calculation embraced the following considerations. As regardsdiffusion coefficients, there are very few reports concerned with concentrated solutions. For thecommon ionic species at infmite dilution and 25°C, such as, Ni2,H, Ct, data are readily available.
However, for the complex ions, such as NiOW, NiCl, data even at infmite dilution cannot be found.For most of the common species in concentrated solutions, their diffusion coefficients can beestimated using the Stokes-Einstein equation:
D1p k= constant (3()9)
where D is the diffusion coefficient of species i, (m2/sec)
jt is the absolute viscosity of the solution, (kg/m.sec)
T is the absolute temperature, (°K)
k is Boltzmann’s constant, (1.3807 x 10 J/°K)
r1 is the radius of the species i, (m)
However, for the diffusion coefficient of the hydrogen ion in concentrated solutions, the Stokes-
Einstein equation is invalid due to the unique proton jump transport mechanism. Majima et a111081
measured the equivalent conductivity ()+) of the hydrogen ion in acidic chloride solutions. Their
results demonstrated that + depended only on and decreased with the activity of water. Onceis known, the diffusion coefficient of the hydrogen ion can be calculated based on the followingNernst-Einstein equation:
RT RT 8.314x298 (310)
=•;;-i;-;E- = --I1+ = 965002
2+ = 2.66 x 10
The hydroxyl ion is supposed to have a similar transport mechanism as the hydrogen ion, and itsdiffusion coefficient may be estimated as follows:
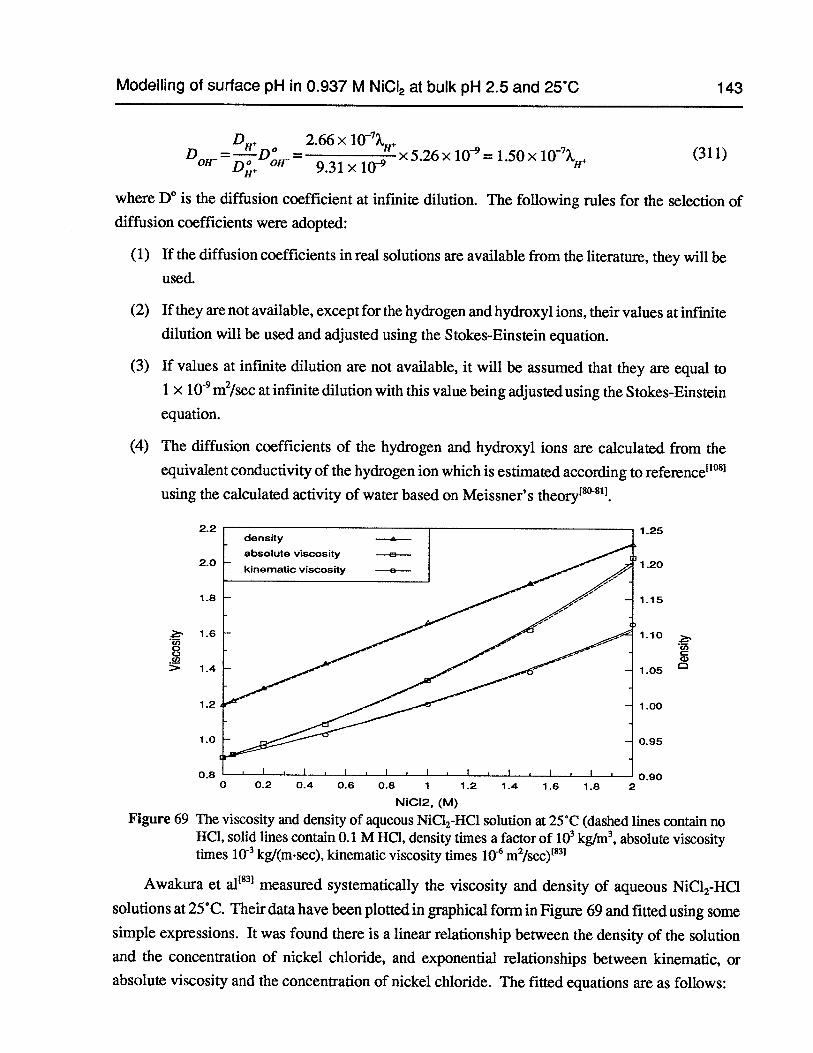
U)
ci)
Modelling of surface pH in 0.937 M NiCI2 at bulk pH 2.5 and 25’C 143
DH+ 2.66x1O7D =—D°= x5.26x1O=1.50x1O÷ (311)oir OH 9.31xlO H
where D° is the diffusion coefficient at infinite dilution. The following rules for the selection ofdiffusion coefficients were adopted:
(1) If the diffusion coefficients in real solutions are available from the literature, they will beused.
(2) If they are not available, except for the hydrogen and hydroxyl ions, their values at infmitedilution will be used and adjusted using the Stokes-Einstein equation.
(3) If values at infinite dilution are not available, it will be assumed that they are equal to1 x i(Ym2/sec at infmite dilution with this value being adjusted using the Stokes-Einsteinequation.
(4) The diffusion coefficients of the hydrogen and hydroxyl ions are calculated from theequivalent conductivity of the hydrogen ion which is estimated according to reference10
using the calculated activity of water based on Meissner’s theory°811.
2.2 1.25
2.0 1.20
1.8
. 1.6U)
8U)> 1.4
1.2
1.0
0.8
1.15
1.10
1.05
1.00
0 0.2 0.4 0.6 0.8 1 1.2 1.4 1.6 1.8 2
0.95
N1CI2, (M)
Figure 69 The viscosity and density of aqueous NiCI2-HC1 solution at 25CC (dashed lines contain noHO, solid lines contain 0.1 M HO, density times a factor of kg/rn3,absolute viscositytimes i0 kg/(m•sec), kinematic viscosity times 1Om2/sec)83
0.90
Awakura et a1831 measured systematically the viscosity and density of aqueous NiCI2-HC1solutions at 25CC. Their data have been plotted in graphical form in Figure 69 and fitted using somesimple expressions. It was found there is a linear relationship between the density of the solutionand the concentration of nickel chloride, and exponential relationships between kinematic, orabsolute viscosity and the concentration of nickel chloride. The fitted equations are as follows:
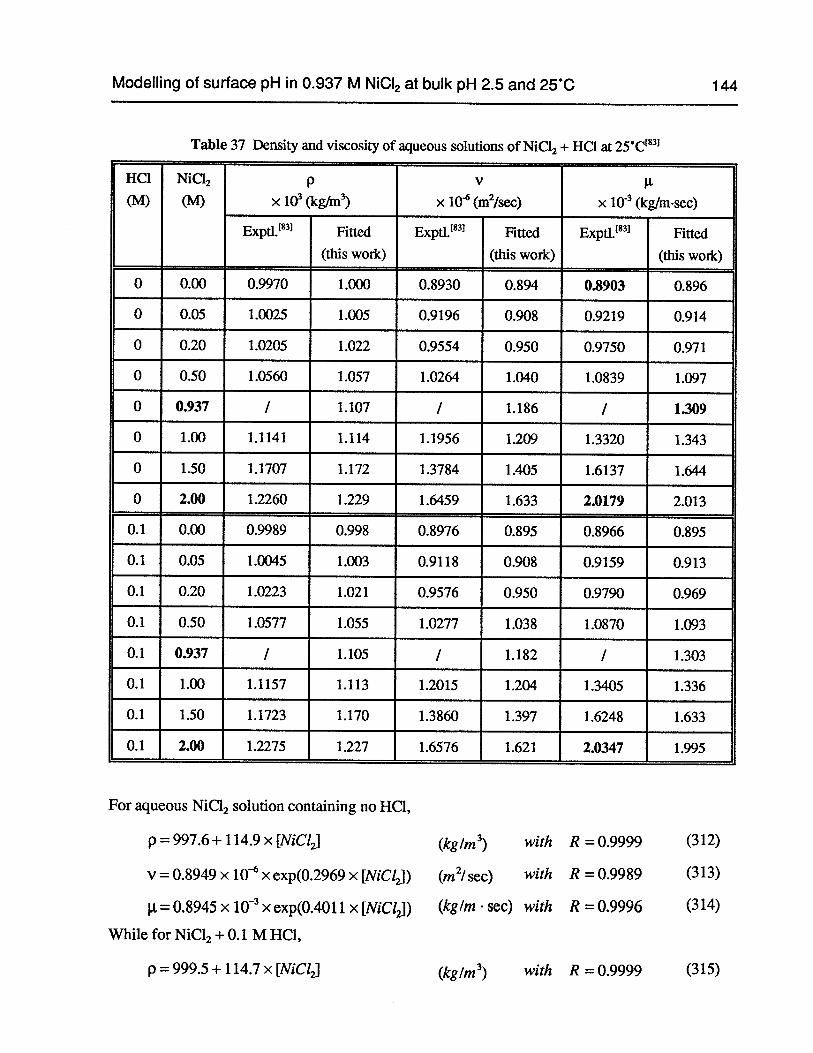
Modelling of surface pH in 0.937 M NiCI2 at bulk pH 2.5 and 25C 144
Table 37 Density and viscosity of aqueous solutions of NiC12+ HO at 25°Ct83
HO NiC12 p v(M) (M) x io (kg,n3) x 10(m2/sec) x io (kgfm•sec)
ExptlJ831 Fitted Exptl.831 Fitted Exptl.83 Fitted(this work) (this work) (this work)
0 0.00 0.9970 1.000 0.8930 0.894 0.8903 0.896
0 0.05 1.0025 1.005 0.9196 0.908 0.9219 0.914
0 0.20 1.0205 1.022 0.9554 0.950 0.9750 0.971
0 0.50 1.0560 1.057 1.0264 1.040 1.0839 1.097
0 0.937 I 1.107 / 1.186 / 1.309
0 1.00 1.1141 1.114 1.1956 1.209 1.3320 1.343
0 1.50 1.1707 1.172 1.3784 1.405 1.6137 1.644
0 2.00 1.2260 1.229 1.6459 1.633 2.0179 2.013
0.1 0.00 0.9989 0.998 0.8976 0.895 0.8966 0.895
0.1 0.05 1.0045 1.003 0.9118 0.908 0.9159 0.913
0.1 0.20 1.0223 1.02 1 0.9576 0.950 0.9790 0.969
0.1 0.50 1.0577 1.055 1.0277 1.038 1.0870 1.093
0.1 0.937 / 1.105 I 1.182 / 1.303
0.1 1.00 1.1157 1.113 1.2015 1.204 1.3405 1.336
0.1 1.50 1.1723 1.170 1.3860 1.397 1.6248 1.633
0.1 2.00 1.2275 1.227 1.6576 1.621 2.0347 1.995
For aqueous NiC12 solution containing no HC1,
p = 997.6+114.9 X [NiC12J (kg/rn3) with R = 0.9999 (312)
V = 0.8949 x 10 x exp(0.2969 x [NiC12J) (m2/sec) with R = 0.9989 (313)
= 0.8945 x i0 x exp(0.401 1 x [NIC12I) (kg/rn . see) with R = 0.9996 (314)
While for NiC12 + 0.1 M HC1,
p = 999.5+114.7 x [NiClJ (kg/rn3) with R 0.9999 (315)
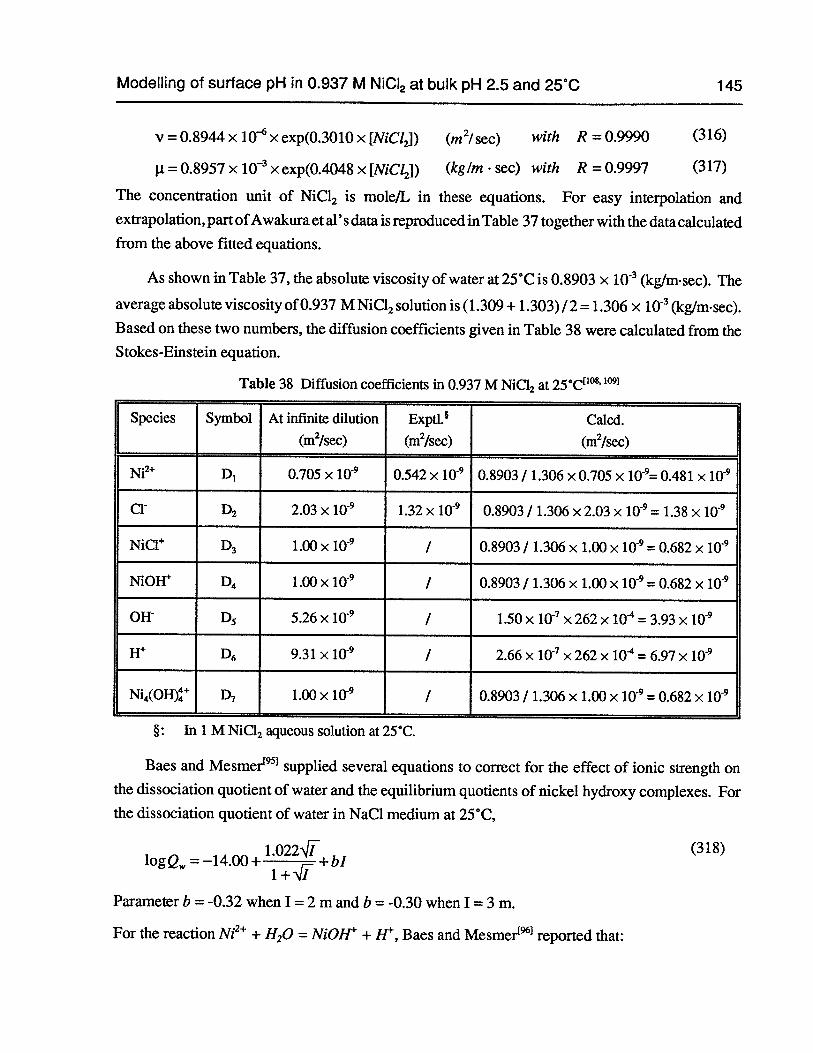
Modelling of surface pH in 0.937 M NiCI2 at bulk pH 2.5 and 25°C 145
v=0.8944x 10xexp(0.3010x[NiCl2]) (rn2/sec) with R =0.9990 (316)
= 0.8957 x i0 x exp(0.4048 x [NiC1,J) (kg/rn sec) with R = 0.9997 (317)
The concentration unit of NiC12 is mole/L in these equations. For easy interpolation andextrapolation, part ofAwakura et al’s data is reproduced in Table 37 together with the data calculatedfrom the above fitted equations.
As shown in Table 37, the absolute viscosity of water at 25°C is 0.8903 x i0 (kg/m.sec). The
average absolute viscosity of 0.937 M NiCl2solution is (1.309 +1.303) / 2=1.306 x 10 (kg/rn. sec).Based on these two numbers, the diffusion coefficients given in Table 38 were calculated from theStokes-Einstein equation.
Table 38 Diffusion coefficients in 0.937 M NiC12 at 25°C108”°91
Species Symbol At infinite dilution ExptL Calcd.(m2/sec) (m2/sec) (m2/sec)
Ni2 D1 0.705 x 0.542 x 0.8903 / 1.306 x 0.705 x io= 0.481 x iO
cr D2 2.03 x i0 1.32 x i0 0.8903 / 1.306 x 2.03 x io 1.38 x
NiCl D3 1.00 x io / 0.8903 / 1.306 x 1.00 x iO = 0.682 x i0
NiOH 1)4 1.00 x / 0.8903/ 1.306 x 1.00 x = 0.682 x i0
OW D5 5.26 x io / 1.50 x iO x 262 x iO = 3.93 x 10
H 1)6 9.31 x iO / 2.66 x i0 x262 x i0= 6.97x io
Ni4(OH) D7 1.00 x i09 / 0.8903 / 1.306 x 1.00 x = 0.682 x l0
§: In 1 M NiCI2 aqueous solution at 25°C.
Baes and Mesmer951 supplied several equations to correct for the effect of ionic strength onthe dissociation quotient of water and the equilibrium quotients of nickel hydroxy complexes. Forthe dissociation quotient of water in NaC1 medium at 25°C,
1.022JT (318)1ogQ=—14.00+
1+ ‘41
Parameter b = -0.32 when 1=2 m and b = -0.30 when 1=3 m.
For the reaction Ni2 + H20 = NiOH + H, Baes and Mesrner reported that:
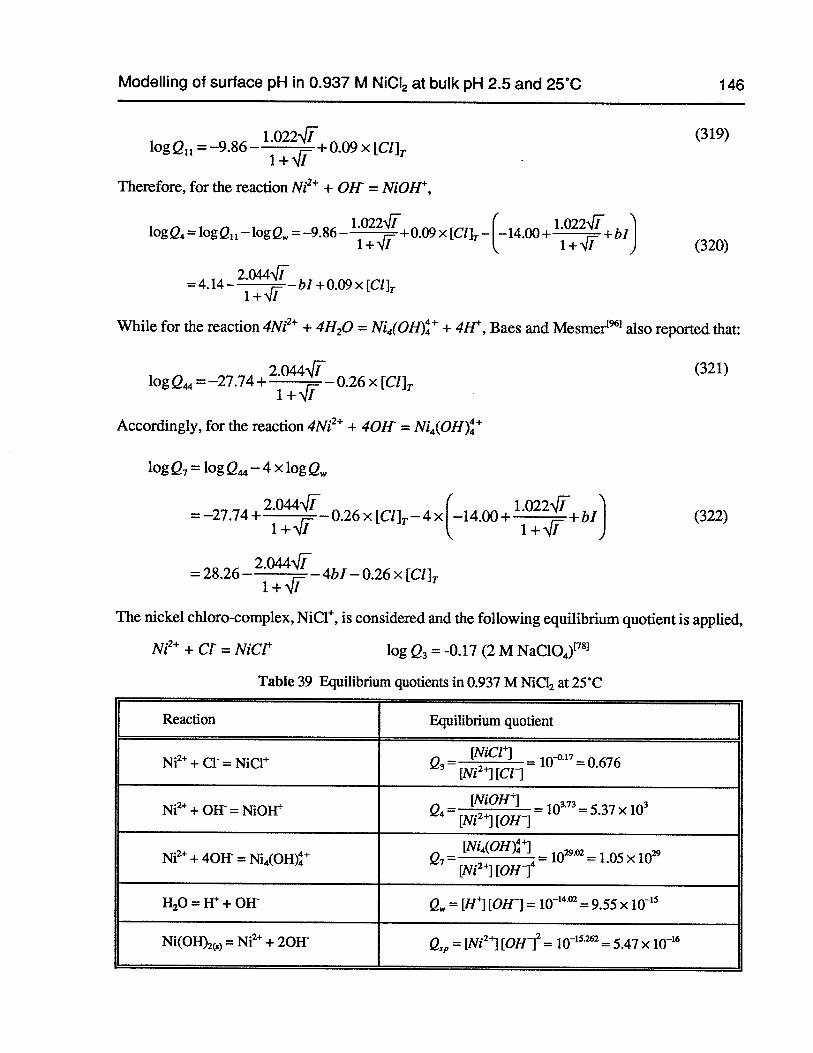
Modelling of surface pH in 0.937 M N1CI2 at bulk pH 2.5 and 25C 146
1022-/i (319)logQ11=—9.86—
_
+O.O9x[Cl].l+-’iI
Therefore, for the reaction Ni2 + 0H = NiOH,
log Q4 = logQ11 — logQ = —9.86— 0.09 x [Cl]T — [_14.00+ °+
bI](320)
= 4.14—2.044JT
bI + 0.09 x [CuT1 +‘Ji
While for the reaction 4Ni2 + 4H20=Ni4(OI-I) + 4H, Baes and Mesmer1also reported that:
2044-41 (321)1ogQ=—27.74+ —O.26x[Cl]T
i+-Ji
Accordingly, for the reaction 4Ni2 + 40Ff =Ni4(OH)
log Q7 = logQ —4 x log Q
= —27.74+ 2.044q1
0.26 x [CuT —4 x 114.00+1.022-41 bI (322)i+4i i+’Ji )
= 28.26—2.0444i
4b1 —0.26 x [Cl]
The nickel chioro-complex, NiCl, is considered and the following equilibrium quotient is applied,
Ni2 + Ci = NiC1 log Q3 = -0.17 (2 M NaClO4)81
Table 39 Equilibrium quotients in 0.937 M NiCl2 at 25C
Reaction Equilibrium quotient
[NiCfl= = 0.676Ni2 + C1 = NiCl
= [Ni24] [Cr]
[NiOHI10 = 5.37 x i0Ni2 + 0H = NiOW
= [Nij [OH1
[Ni4(OH)]Ni2+ 40W =Ni4(0H)
= [Ni24][QJf]4 =10 = 1.05 x 10
H20 = W + OH Q = w4] [OH1 = 1014.02 = 9.55 x
Ni(OH),) = Ni2 + 20W = lNi24] [0H12= 10_15262 5.47 x 10
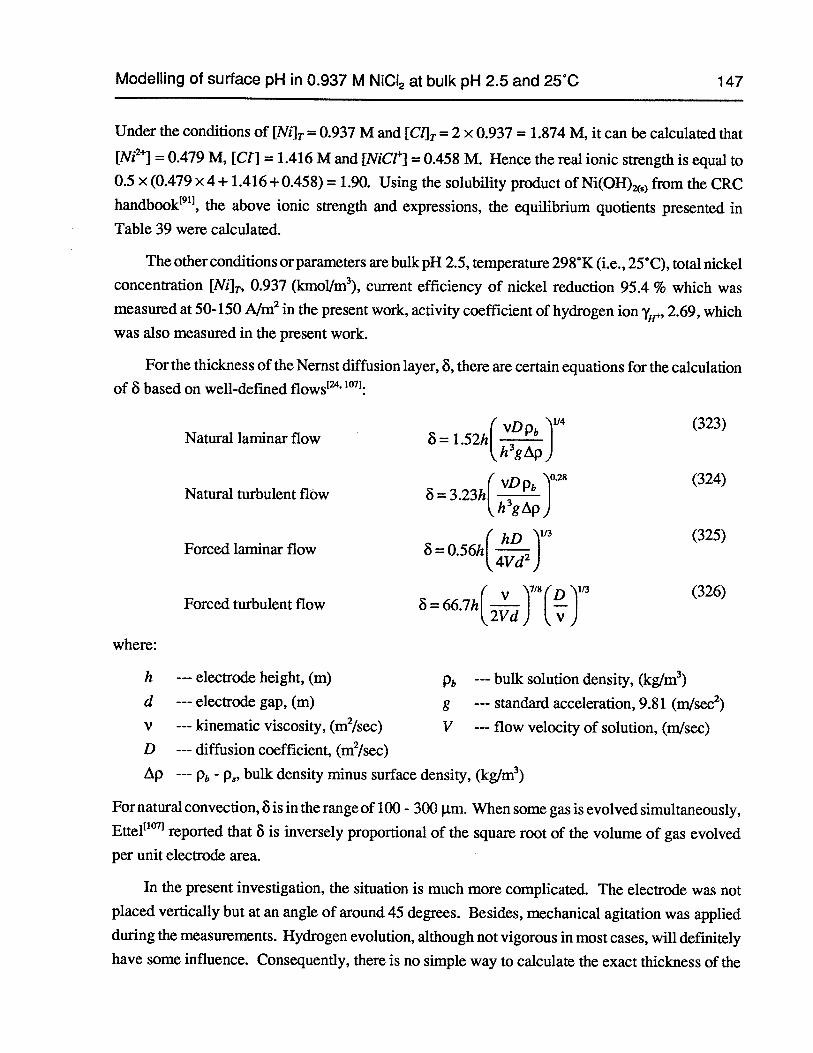
Modelling of surface pH in 0.937 M N1CI2 at bulk pH 2.5 and 25°C 147
Under the conditions of [NiJ = 0.937 M and [Cl] =2 x 0.937 = 1.874 M, it can be calculated that
[Ni2’] = 0.479 M, [CI] = 1.416 M and [NiC1] = 0.458 M. Hence the real ionic strength is equal to0.5 x (0.479 x 4 + 1.4 16 + 0.458) = 1.90. Using the solubiity product of Ni(OH)2(S)from the CRChandbookt911,the above ionic strength and expressions, the equilibrium quotients presented inTable 39 were calculated.
The other conditions or parameters are bulk pH 2.5, temperature 298°K (i.e., 25°C), total nickelconcentration [Ni]T, 0.937 (kmol/m3), current efficiency of nickel reduction 95.4 % which wasmeasured at 50-150 A/rn2 in the present work, activity coefficient of hydrogen ion y11+, 2.69, whichwas also measured in the present work.
For the thickness of the Nemst diffusion layer, ö, there are certain equations for the calculationof 3 based on well-defined flows 1071:
(vD PbN1I4 (323)
Natural laminar flow 6 = 1.52h1h3gAp
(vD Pb ‘10.28 (324)Natural turbulent flow 6= 3.23hi
i., h3g Ap
( hD ‘1/3 (325)Forced laminar flow 6
=O.S6h4vd2J
1 v 7181D W3 (326)Forced turbulent flow 6= 66.7h1 — I I —
2Vd) V
where:
h --- electrode height, (m) Pb --- bulk solution density, (kg/rn3)d --- electrode gap, (m) g standard acceleration, 9.81 (rn/sec2)v --- kinematic viscosity, (m2/sec) V --- flow velocity of solution, (rn/see)D --- diffusion coefficient, (m2/sec)
Pb - P. bulk density minus surface density, (kg/rn3)
For natural convection, 6 is in the range of 100 - 300 Lm. When some gas is evolved simultaneously,Ettel’°’71 reported that 6 is inversely proportional of the square root of the volume of gas evolvedper unit electrode area.
In the present investigation, the situation is much more complicated. The electrode was notplaced vertically but at an angle of around 45 degrees. Besides, mechanical agitation was appliedduring the measurements. Hydrogen evolution, although not vigorous in most cases, will definitelyhave some influence. Consequently, there is no simple way to calculate the exact thickness of the
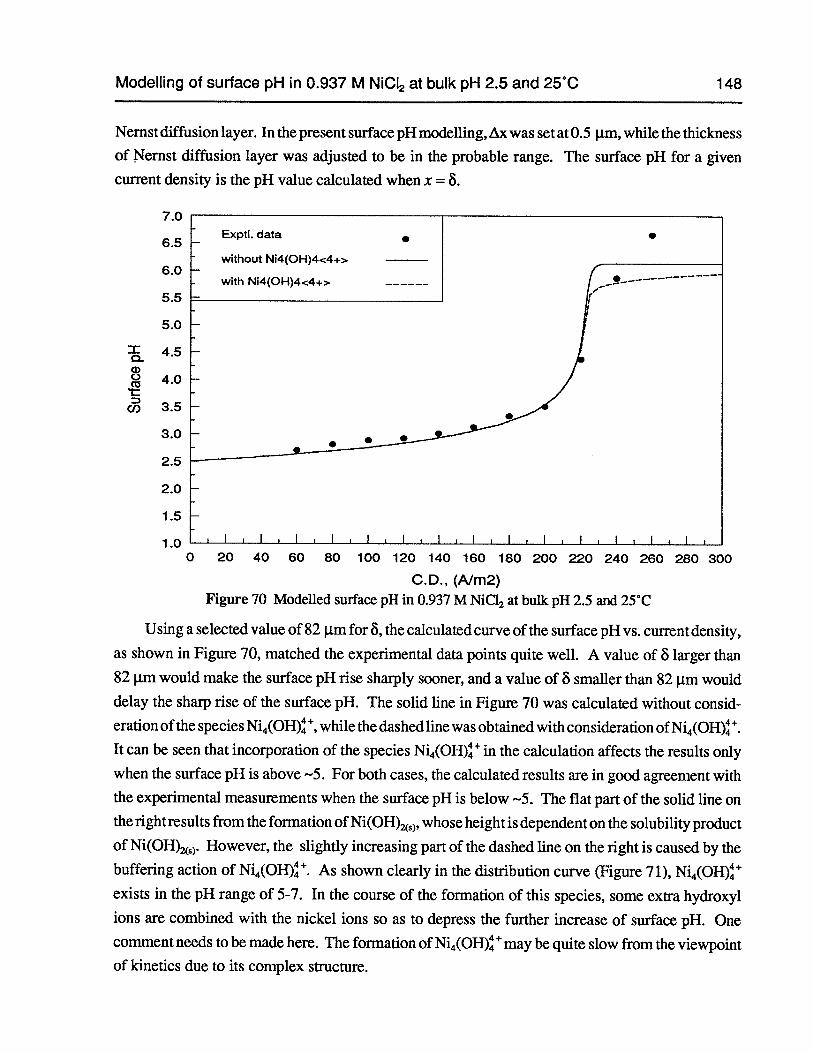
Modelling of surface pH in 0.937 M NICI2 at bulk pH 2.5 and 25°C 148
Nernst diffusion layer. In the present surface pH modelling, Ax was set at 0.5 pm, while the thickness
of Nernst diffusion layer was adjusted to be in the probable range. The surface pH for a given
current density is the pH value calculated when x =6.
7.0
6.5
6.0
2.5
2.0
1.5
1.00 20 40 60 80 100 120 140 160 180 200 220 240 260 280 300
C.D., (A1m2)Figure 70 Modelled surface pH in 0.937 M NiC12 at bulk pH 2.5 and 25°C
Using a selected value of 82 pm for 6, the calculated curve of the surface pH vs. current density,
as shown in Figure 70, matched the experimental data points quite well. A value of 6 larger than82 p.m would make the surface pH rise sharply sooner, and a value of 8 smaller than 82 p.m woulddelay the sharp rise of the surface pH. The solid line in Figure 70 was calculated without consideration ofthe speciesNi4(OH)4,while the dashed line was obtained with consideration ofNi4(OH)4.It can be seen that incorporation of the speciesNi4(OH) in the calculation affects the results onlywhen the surface pH is above -‘5. For both cases, the calculated results are in good agreement withthe experimental measurements when the surface pH is below —5. The flat part of the solid line onthe rightresults from the formation ofNi(OH)5),whose height is dependent on the solubility productof Ni(OH)>. However, the slightly increasing part of the dashed line on the right is caused by thebuffering action ofNi4(OH). As shown clearly in the disthbution curve (Figure 71), Ni4(OH)4exists in the pH range of 5-7. In the course of the formation of this species, some extra hydroxylions are combined with the nickel ions so as to depress the further increase of surface pH. Onecomment needs to be made here. The formation ofNi4(OH)may be quite slow from the viewpointof kinetics due to its complex structure.
5.5
5.0
4.5
4.0
3.5
3.0
0a)0
C/)
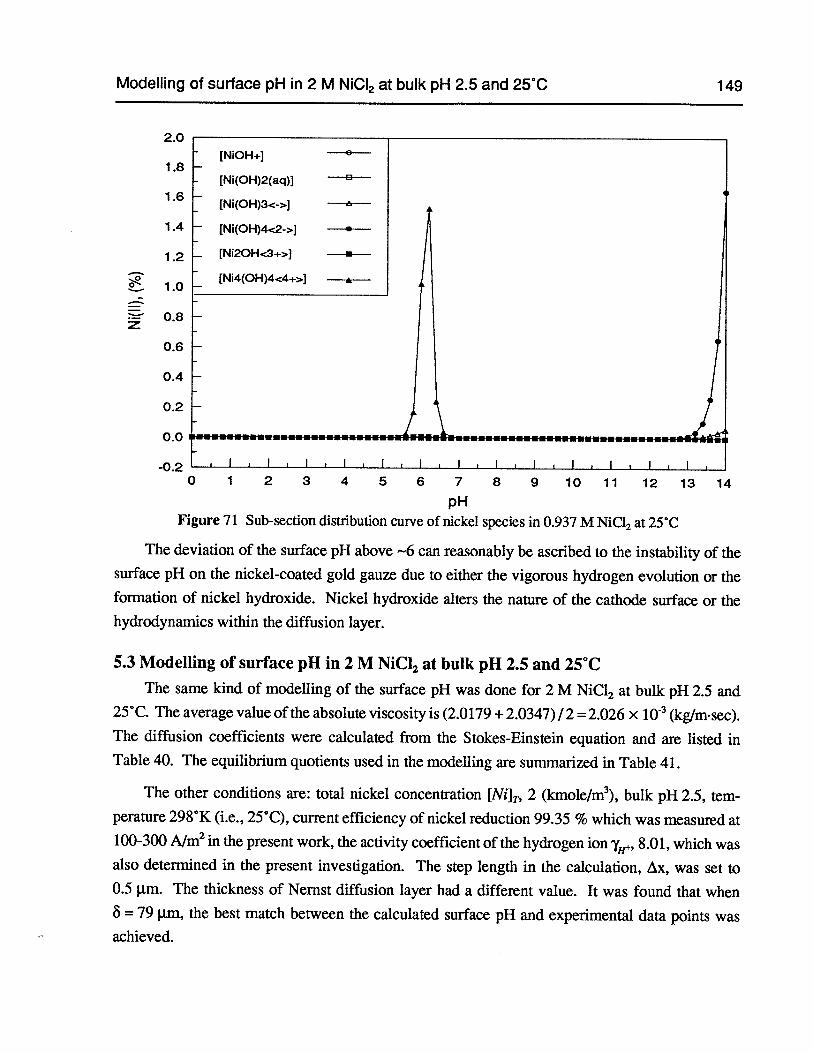
pHFigure 71 Sub-section distribution curve of nickel species in 0.937 M NiCI2 at 25°C
The deviation of the surface pH above —6 can reasonably be ascribed to the instability of thesurface pH on the nickel-coated gold gauze due to either the vigorous hydrogen evolution or theformation of nickel hydroxide. Nickel hydroxide alters the nature of the cathode surface or thehydrodynamics within the diffusion layer.
5.3 Modelling of surface pH in 2 M NiCl2 at bulk pH 2.5 and 25°CThe same kind of modelling of the surface pH was done for 2 M NiCl2 at bulk pH 2.5 and
25°C. The average value of the absolute viscosity is (2.0179 + 2.0347)/2=2.026 x iO (kg/m•sec).The diffusion coefficients were calculated from the Stokes-Einstein equation and are listed inTable 40. The equilibrium quotients used in the modelling are summarized in Table 41.
The other conditions are: total nickel concentration [NuT, 2 (kmole/m3),bulk pH 2.5, temperature 298°K (i.e., 25°C), current efficiency of nickel reduction 99.35 % which was measured at100-300 A/m2in the present work, the activity coefficient of the hydrogen ion
1H’8.01, which was
also determined in the present investigation. The step length in the calculation, Ax, was set to0.5 I.Lm. The thickness of Nernst diffusion layer hail a different value. It was found that when6=79 p.m. the best match between the calculated surface pH and experimental data points wasachieved.
Modelling of surface pH in 2 M NiCI2 at bulk pH 2.5 and 25°C 149
p
p
[NIOH-i-]
[Ni(OH)2(aq)]
[Ni(OH)3..c-,.]
[Ni(OH)4.c2-.]
[NI2OH.c3+>.]
[N14(OH)4<4÷>J
z
2.0
1.8
1.6
1.4
1.2
1.0
0.8
0.6
0.4
0.2
0.0
-0.20 1 2 3 4 5 6 7 8 9 10 11 12 13 14
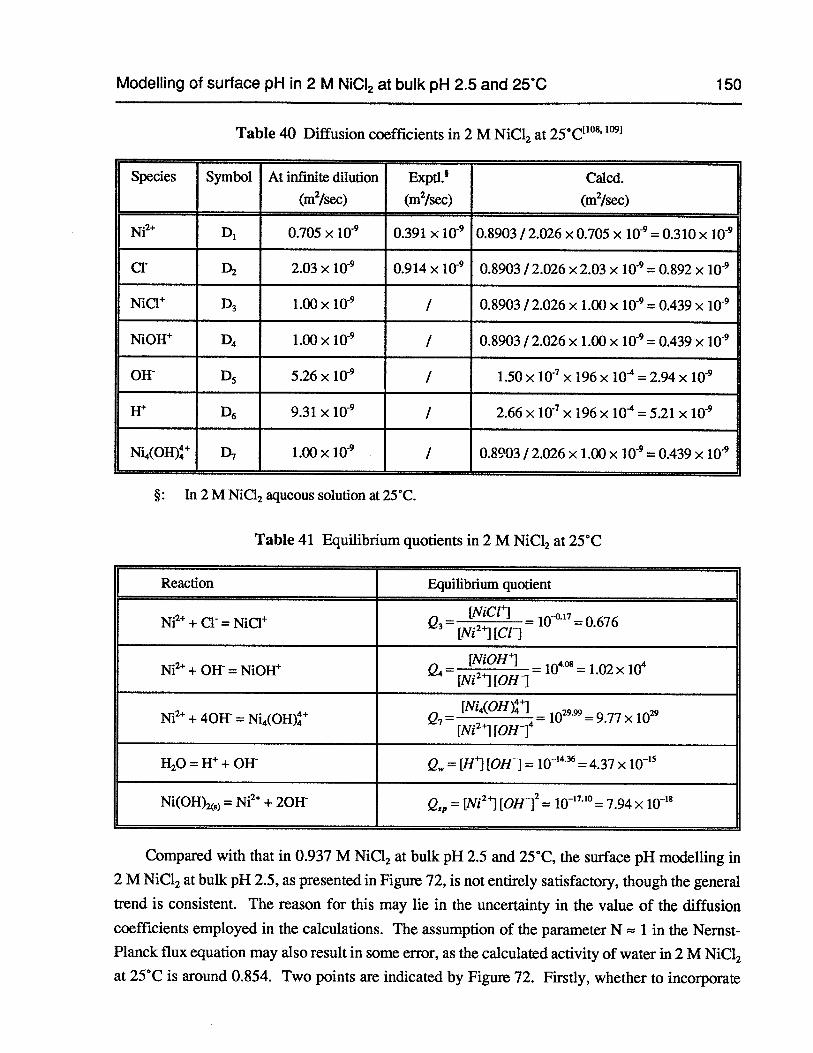
Modelling of surface pH in 2 M N1CI2 at bulk pH 2.5 and 25°C 150
Table 40 Diffusion coefficients in 2 M NiC12at 25°C10 109]
Species Symbol At infinite dilution ExptL Calcd.(m2/sec) (m2/sec) (m2/sec)
Ni2 D1 0.705 x l0 0.39 1 x 10 0.8903 / 2.026 x 0.705 x 10 = 0.3 10 x i0
cr D2 2.03 x io 0.914 x iü 0.8903 / 2.026 x 2.03 x = 0.892 x
NiC1 D3 1.00 x i0 / 0.8903 / 2.026 x 1.00 x i0 0.439 x 10
NiOH 1)4 1.00 x i0 / 0.8903 / 2.026 x 1.00 x io = 0.439 x io
OH- D5 5.26 x I 1.50 x i04 x 196 x 10 = 2.94 x i0
H D6 9.31 x i0 I 2.66 x io x 196 x 10 = 5.21 x i0
Ni4(OH) D7 1.00 x i09 I 0.8903 I 2.026 x 1.00 x i0 = 0.439 x i0
§: In 2 M NiC12 aqueous solution at 25°C.
Table 41 Equilibrium quotients in 2 M NiC12 at 25°C
Reaction Equilibrium quotient
Ni2 + Cl = NiC1[Nj[Cfl
= i-°•’ = 0.676
Ni2 + OH = NiOW = 4]= = 1.02 x l0
[Ni4(OH)4]Ni2 + 40W =Ni4(OH)
= [Ni24][0H14= 1029 = 9.77 x 10
H20 = H + OH- = [114] [OH1 = i0’ = 4.37 x
Ni(OH)2()= Ni2 + 20W = [Ni2’] [01112 = x 10_is
Compared with that in 0.937 M NiC12 at bulk pH 2.5 and 25°C, the surface pH modelling in2 M NiC12at bulk pH 2.5, as presented in Figure 72, is not entirely satisfactory, though the general
trend is consistent. The reason for this may lie in the uncertainty in the value of the diffusion
coefficients employed in the calculations. The assumption of the parameter N 1 in the NernstPlanck flux equation may also result in some error, as the calculated activity of water in 2 M NiC12
at 25°C is around 0.854. Two points are indicated by Figure 72. Firstly, whether to incorporate
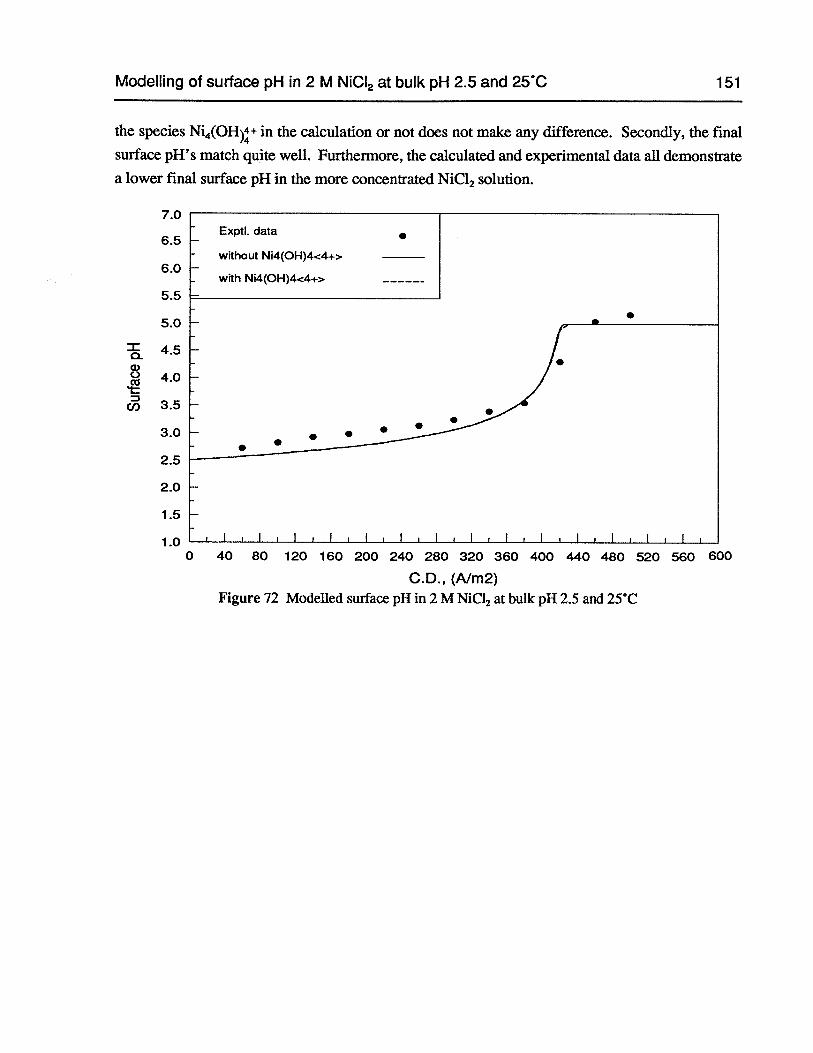
1.00 40 80 120 160 200 240 280 320 360 400 440 480 520 560 600
C.D., (A1m2)Figure 72 Modelled surface pH in 2 M NiC12 at bulk pH 2.5 and 25°C
Modelling of surface pH in 2 M NICI2 at bulk pH 2.5 and 25°C 151
the speciesNi4(OH)+ in the calculation or not does not make any difference. Secondly, the final
surface pH’s match quite well. Furthermore, the calculated and experimental data all demonstrate
a lower final surface pH in the more concentrated NiCl2 solution.
7.0
6.5
6.0
5.5
5.0
4.5
5
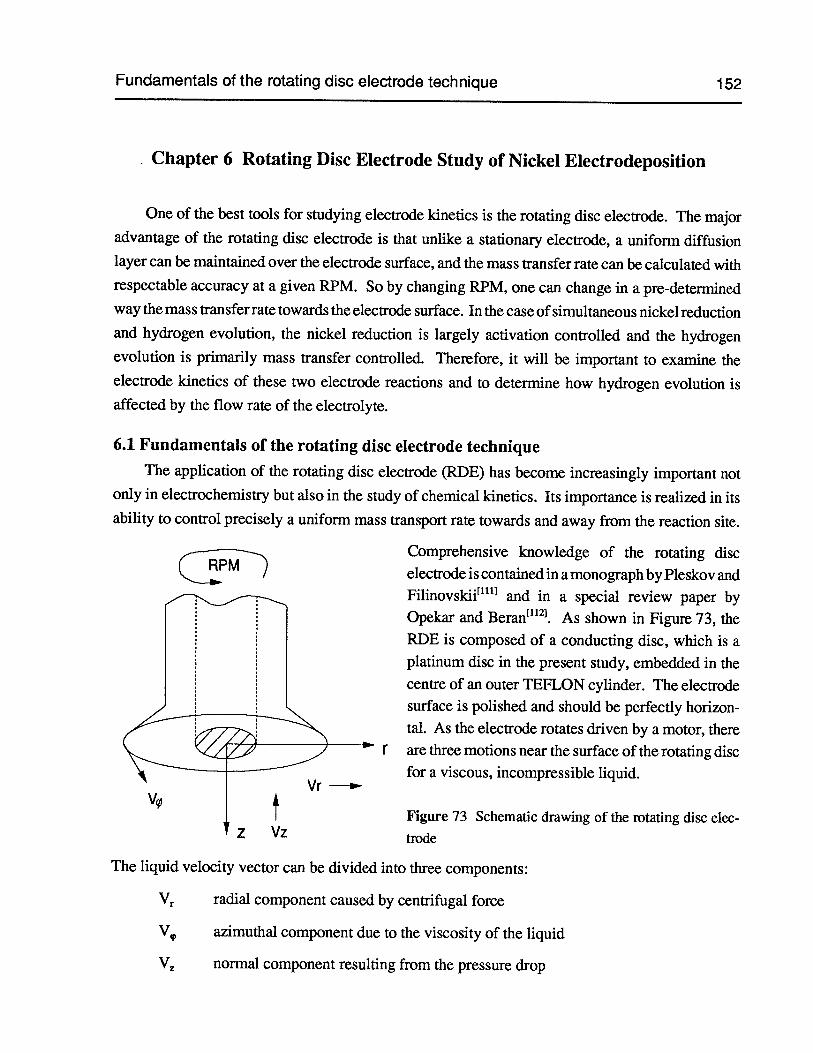
Fundamentals of the rotating disc electrode technique 152
• Chapter 6 Rotating Disc Electrode Study of Nickel Electrodeposition
One of the best tools for studying electrode kinetics is the rotating disc electrode. The majoradvantage of the rotating disc electrode is that unlike a stationary electrode, a uniform diffusionlayer can be maintained over the electrode surface, and the mass transfer rate can be calculated withrespectable accuracy at a given RPM. So by changing RPM, one can change in a pre-determinedway the mass transfer rate towards the electrode surface. In the case ofsimultaneous nickel reductionand hydrogen evolution, the nickel reduction is largely activation controlled and the hydrogenevolution is primarily mass transfer controlled. Therefore, it will be important to examine theelectrode kinetics of these two electrode reactions and to determine how hydrogen evolution isaffected by the flow rate of the electrolyte.
6.1 Fundamentals of the rotating disc electrode techniqueThe application of the rotating disc electrode (RDE) has become increasingly important not
only in electrochemistry but also in the study of chemical kinetics. Its importance is realized in itsability to control precisely a uniform mass transport rate towards and away from the reaction site.
Comprehensive knowledge of the rotating discelectrode is contained in a monograph by Pleskov andFilinovskii” and in a special review paper byOpekar and Beran”121. As shown in Figure 73, theRDE is composed of a conducting disc, which is aplatinum disc in the present study, embedded in thecentre of an outer TEFLON cylinder. The electrodesurface is polished and should be perfectly horizontal. As the electrode rotates driven by a motor, there
r are three motions near the surface of the rotating discfor a viscous, incompressible liquid.
Figure 73 Schematic drawing of the rotating disc electrode
The liquid velocity vector can be divided into three components:
V radial component caused by centrifugal force
azimuthal component due to the viscosity of the liquid
c)
v,Vr
Z Vz
normal component resulting from the pressure drop
Fundamentals of the rotating disc electrode technique 153
These three components of motion are a function of the rotational speed, liquid viscosity, the radialdistance and the vertical distance from the disc surface. They can be expressed mathematically asfollows1111:
V. = r (.O• F() V,= r o• G() v = -jZj .H() (327)
(328)where: =IS\J z
0) is the angular velocity of the disc (0 = 2i RPMI6O), V is the kinematic viscosity, r is the radial
distance and z is the vertical distance from the disc surface. F(), G() and H() are dimensionlessfunctions. There are two special situations worth mentioning here’1:
(1) At the disc surface
z=0,=0,F()=0,G()=1andH()=0. Therefore,Vr=0,V,=r0),Vz=0
(2) z 3.6’I10/(2it• 2000/60) = 249 (I.un) at 2,000 rpm and 25°C
Vr 0, Vpp 0, Vz 0.89’1.
Even at z = F() = 0.036 — 0, G() = 0.050 — 0 and H() 0.802. The thickness of the
diffusion layer depends on the magnitude of Schmidt number (Sc = v / D)’”11.
When 100 < Sc <250 ,= 1.61))(1+O.298OSc”4O.1451Sc)
(329)
When 250 <Sc < = 1.61 J (1 +O.3539Sc36)(330)
6—161 (Y 161D1R 1/6 -1When Sc —>00 — ) ) —
. V Ct)(331)
Equation (331) is the well-known Levich equation31.For aqueous solutions, the Levich equationis sufficiently accurate as Sc = v ID l0 I iO = i0. For instance, the kinematic viscosity anddiffusion coefficient of the nickel ion are 1.209 x 10⁶ m2/sec1 and 0.542 x 10 m2/sec’°respectively in 1 M NiCl2 at 25CC. Therefore, Sc = 1.209 x 10 / 0.542 x i0 = 2231. The errorresulting from using the Levich equation is only:
1 — (1+0.2980 x 223 l’ + 0.145 1 x 2231) (332)Error (%)
1X 100 = 2.4
The thickness of the diffusion layer in 1 M NiC12 at 2,000 rpm and 25CC and the limiting currentdensity are approximately equal respectively to:
Fundamentals of the rotating disc electrode technique 154
= 1.61(0.542 x (1.209 < io (333I =9.4(pn)
l.2O9xlOJ l2ir•2000/60)
nFDN.2+CN.2+ 2 x 96500 x 0.542 x 10 x 1 x 10= 11,000 (A/rn2)
(334)
= 9.4x10
If no other background electrolytes are present, the NiC12 solution should be treated as a binaryelectrolyte. For a binary electrolyte, the limiting current density should be calculated according toequation
(335)[111]
= z+FD+(l +-_=11z+zFDC (335)
Iz_I)ax iz_iJ eff.
where the effective thickness of the diffusion layer can be expressed as follows:
1/2 \1/3f 1/2i i v (336)=1.61_)
2.RPM/60J
I z. ) (337)Dsaii =
zD + z_
D = 0.542 x i(Ym2/sec and D = 1.32 x i(Ym2/sec in 1 M NiC12 at 25C’°91. Thus from equation
(337), D can be calculated as:
0.542x 10x 1.32x 10(2+ 1)=0.893 x 10(rn2/sec)
(338)=
2x0.542xl0+ 1 x1.32x10
It follows from equation (336) and (335) that:
0.893 x 10 (i .209 x 10 1h12= 11.1 (Wn)
(339)= 1.61
1.209 x lOJ 2000/60)
2 x 96500 x 0.542 x 10 x 1 X 10= 28,300 (A/rn2)
(340)lL1+J
11.1x10
Obviously, the limiting current densities calculated from equations (334) and (340) can hardly beexceeded in the normal experimental tests.
All of the above-mentioned equations for the RDE are applicable only for the laminar flow.The mode of liquid flow is characterized by a dimensionless number, called the Reynolds number,Re 0r2/v, where Co is the angular velocity of the disc (rad/sec), r is the radius of rotating disc (m),and V is the kinematic viscosity of the liquid (m2/sec). The conversion from the laminar flow toturbulent flow is a gradual process. First, the disc edge is affected by turbulence and then graduallythis effect spreads towards the centre of the disc as the rotational speed of the disc is increased. The
Fundamentals of the rotating disc electrode technique 155
critical Reynolds number for the conversion from laminar flow to turbulent flow is around
1.8 — 3.1 x io (h12j For the r =6 mm in the present study, the applicable maximum RPM will be
in the range of:
RPM <(1.8—3.1) x i0.- = (1.8—3.1) x i0560 X 10
48,000—82,000(341)
2tr2 2 x 3.1415 x (6 x 10_3)2
The above calculated rotational speed is extraordinarily fast. In practice, it is rarely exceeded in
the experimental tests. If the disc vibrates vertically or radially, or if the disc surface is not perfectly
smooth, turbulence may occur at a much lower Reynolds number than that calculated above. Another
situation which must be avoided is when the diameter of the disc is comparable to, .5, =
the thickness of hydrodynamic boundary layer which is equal to 0.249 mm at 2,000 rpm. At a
sufficiently low rotational speed, the natural convection becomes significant. According to the
Reynolds number, this situation will occur when Re < 10 [h12]•
60v 60 x io (342)RPM>10—=10 =3
2itr2 2 x 3.1415 x (6 x 10_3)2
The ratio of the diameter of the outer insulator to the diameter of the disc must be large enough to
eliminate the edge effects.
Using the RDE, one of the most distinguishable features is that the thickness of the diffusion
layer is known. All of general kinetic equations are applicable for the RDE. For instance, in the
case of the mixed concentration and activation control (larger overpotential lii> 100 mV), the
current density can be expressed as1141:
( 1’ (343)i =nFkCS=nFkCbj 1.
\
• i i i 1 1 (344)
I pzFkCbiLnFkCbnFDCb/
Since the thickness of the diffusion layer, , is inversely proportional to the square root of rotational
speed, the concentration polarization can be decreased at a higher rotational speed. If there is a
preceding homogeneous chemical reaction, the currentdensity is composed ofthree components114:
k (345)A Ox+ne —Red
inFkCb
In the case of RDE, the thickness of diffusion layer is uniform over the disc surface and can
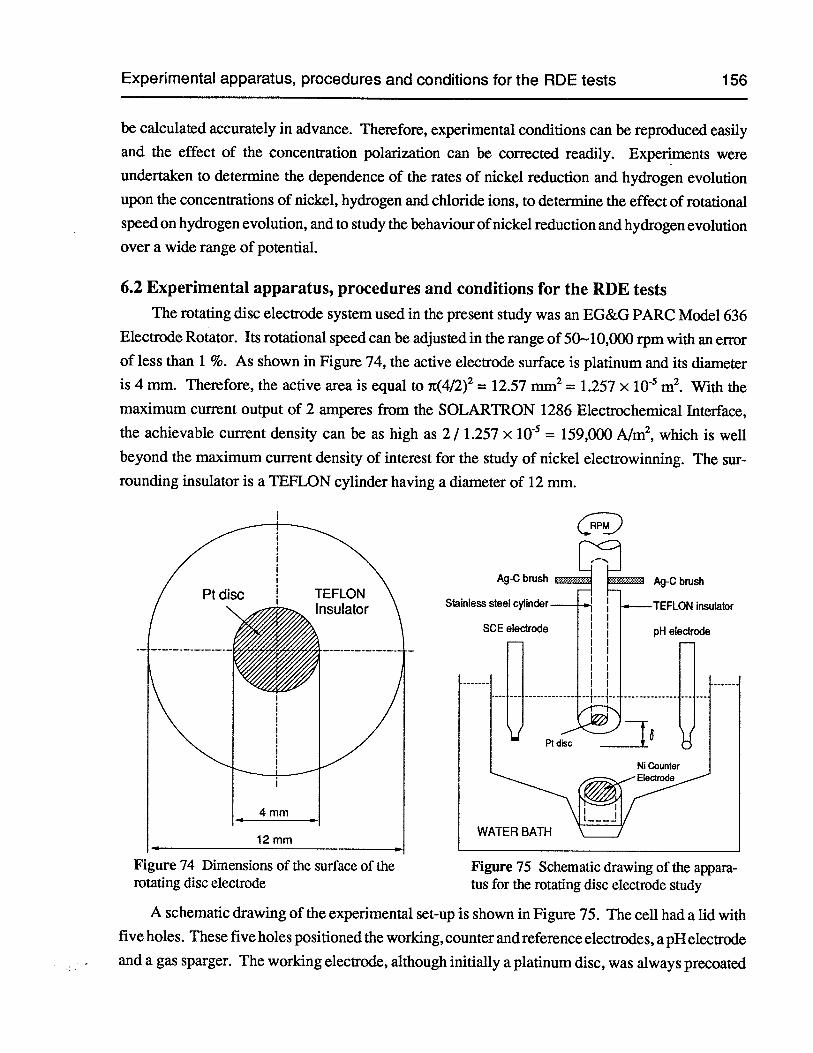
Experimental apparatus, procedures and conditions for the RDE tests 156
be calculated accurately in advance. Therefore, experimental conditions can be reproduced easilyand the effect of the concentration polarization can be corrected readily. Experiments wereundertaken to determine the dependence of the rates of nickel reduction and hydrogen evolutionupon the concentrations of nickel, hydrogen and chloride ions, to determine the effect of rotationalspeed on hydrogen evolution, and to study the behaviour ofnickel reduction and hydrogen evolutionover a wide range of potential.
6.2 Experimental apparatus, procedures and conditions for the RDE testsThe rotating disc electrode system used in the present study was an EG&G PARC Model 636
Electrode Rotator. Its rotational speed can be adjusted in the range of 50—10,000 rpm with an errorof less than 1 %. As shown in Figure 74, the active electrode surface is platinum and its diameteris 4 mm. Therefore, the active area is equal to 7t(4/2)2 = 12.57 = 1.257 x i0 m2. With themaximum current output of 2 amperes from the SOLARTRON 1286 Electrochemical Interface,the achievable current density can be as high as 2/1.257 x i05 = 159,000 A/m2, which is wellbeyond the maximum current density of interest for the study of nickel electrowinning. The surrounding insulator is a TEFLON cylinder having a diameter of 12 mm.
Figure 74 Dimensions of the surface of the Figure 75 Schematic drawing of the appararotating disc electrode tus for the rotating disc electrode study
A schematic drawing of the experimental set-up is shown in Figure 75. The cell had a lid withfive holes. These five holes positioned the working, counter and reference electrodes, a pH electrodeand a gas sparger. The working electrode, although initially a platinum disc, was always precoated
Experimental apparatus, procedures and conditions for the RDE tests 157
with a nickel film (around 1 jim) before any tests. The immersion depth of the RDE into the
electrolyte was about 10 mm. The counter electrode, directly below the RDE, was a pure metallicnickel disc with a diameter of 10 mm. The pH and calomel reference electrodes were placed oneither side of the RDE. The electrical contact of the RDE to the potentiostat was made possible bytwo silver-carbon brushes in the upper part of the RDE as shown in Figure 75. The cell and electrodeswere all from EG&G PARC. For all of the tests, only 100 mL of electrolyte was poured into thecell. The pH ofthe electrolyte was maintained constant through a pH electrode and a RADIOMETER
titrator.
One caution that has to be exercised with the rotating disc electrode is occasioned by the ohmicresistance between the working RDE and the SCE reference electrode, and between the Ag-C brushand the rotating cylinder. For most applications, it is suggested that a Luggin capillary be used andplaced as close as possible to the working electrode surface in order to minimize the IR drop. For
the rotating disc electrode, this method will not work well, since any objects close to the rotating
disc surface will affect the hydrodynamics nearby and thus alter the mass transport equationsapplicable to the RDE. Furthermore, the ohmic resistance in the Ag-C brush zone will always bethere.
The potentiostat used in the present study was the SOLARTRON 1286 Electrochemical
Interface which has two optional facilities for the ohmic drop compensation in the mode of
potentiostatic operation. One is called the feedback technique and the other is called the samplingtechnique. When using the feedback technique, one has to know exactly the parasitic ohmic
resistance between the working and reference electrodes, whose measurement can be done using
an oscilloscope or the AC impedance method. There is no current interruption during this compensation. One disadvantage with the feedback technique is that one can have less than 100 %compensation only. Once one feeds back a resistance which is equal to or greater than the parasitic
ohmic resistance between the working and reference electrodes, the electronic circuits inside theSOLARTRON will become unstable. In the sampling technique, one does not need to know theparasitic ohmic resistance between the working and reference electrodes. Actually, the SOLARTRON reads the electrode potential immediately after the current interruption (Interruption time ison the orderof27 jisec). One caution that has to be exercised is that one needs to do some preliminarytest work to make sure that such a short current interruption will not affect or affect very little theelectrode process which is being studied.
An example is given in Figure 76 to elucidate the magnitude of the effect of the IR drop onthe polarization curve,. It can be easily seen from this graph that the difference in current densityat a given potential or the difference in potential at a given current density increases significantly
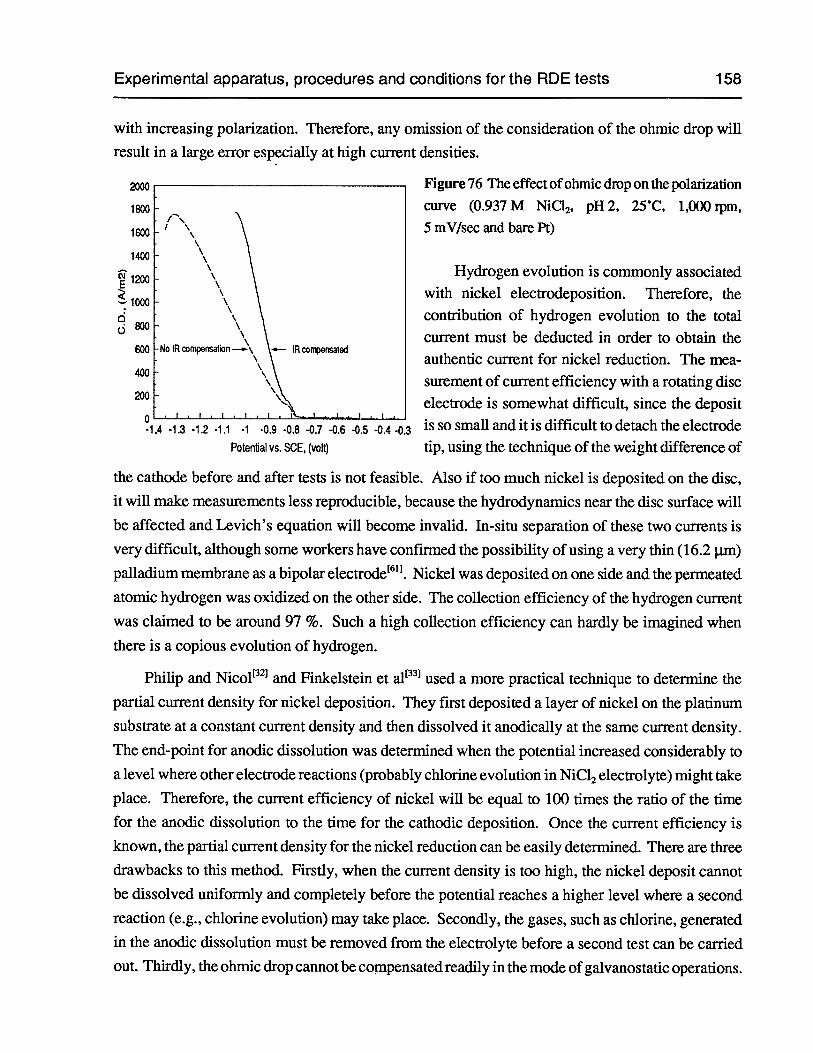
Experimental apparatus, procedures and conditions for the RDE tests 158
with increasing polarization. Therefore, any omission of the consideration of the ohmic drop will
result in a large error especially at high current densities.
Figure 76 The effect of ohmic dmp on the polarizationcurve (0.937 M NiCl2, pH 2, 25C, 1,000 1pm,5 mV/sec and bare Pt)
Hydrogen evolution is commonly associatedwith nickel electrodeposition. Therefore, thecontribution of hydrogen evolution to the totalcurrent must be deducted in order to obtain theauthentic current for nickel reduction. The measurement of current efficiency with a rotating discelectrode is somewhat difficult, since the depositis so small and it is difficult to detach the electrodetip, using the technique of the weight difference of
the cathode before and after tests is not feasible. Also if too much nickel is deposited on the disc,
it will make measurements less reproducible, because the hydrodynamics near the disc surface will
be affected and Levich’s equation will become invalid. In-situ separation of these two currents is
very difficult, although some workers have confirmed the possibility of using a very thin (16.2 I.I.m)palladium membrane as a bipolar electrode161.Nickel was deposited on one side and the permeated
atomic hydrogen was oxidized on the other side. The collection efficiency of the hydrogen current
was claimed to be around 97 %. Such a high collection efficiency can hardly be imagined when
there is a copious evolution of hydrogen.
Philip and Nicol132 and Finkelstein et al331 used a more practical technique to determine the
partial current density for nickel deposition. They first deposited a layer of nickel on the platinum
substrate at a constant current density and then dissolved it anodically at the same current density.
The end-point for anodic dissolution was determined when the potential increased considerably to
a level where other electrode reactions (probably chlorine evolution in NiCl2electrolyte) might take
place. Therefore, the current efficiency of nickel will be equal to 100 times the ratio of the time
for the anodic dissolution to the time for the cathodic deposition. Once the current efficiency is
known, the partial current density for the nickel reduction can be easily determined. There are three
drawbacks to this method. Firstly, when the current density is too high, the nickel deposit cannot
be dissolved uniformly and completely before the potential reaches a higher level where a second
reaction (e.g., chlorine evolution) may take place. Secondly, the gases, such as chlorine, generatedin the anodic dissolution must be removed from the electrolyte before a second test can be carried
out. Thirdly, the ohmic drop cannot be compensated readily in the mode of galvanostatic operations.
2000
1800
1800
1400
1200
1000
800
600
400
200
0-1.4 1.3 -12 -1.1 -1 -0.9 -0.8 -0.7 -0.6 -0.5 0.4 -0.3
Potential vs. SCE, (volt)
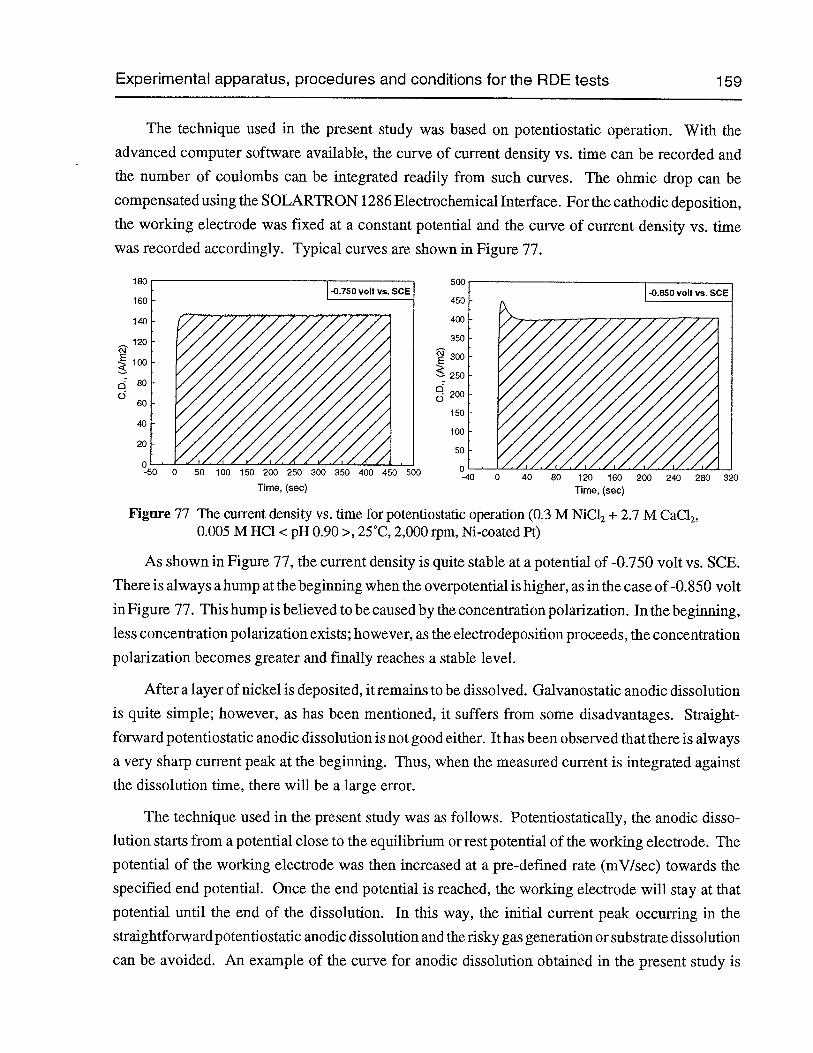
Experimental apparatus, procedures and conditions for the RDE tests 159
The technique used in the present study was based on potentiostatic operation. With theadvanced computer software available, the curve of current density vs. time can be recorded andthe number of coulombs can be integrated readily from such curves. The ohmic drop can becompensated using the SOLARTRON 1286 Electrochemical Interface. For the cathodic deposition,the working electrode was fixed at a constant potential and the curve of current density vs. timewas recorded accordingly. Typical curves are shown in Figure 77.
50 100 150 200 250 300 350 400 450 50080 120 160 200 240 280 320
Time, (sec) (sec)
Figure 77 The current density vs. time for potentiostatic operation (0.3 M N1C12 + 2.7 M CaC12,0.005 M HC1 <pH 0.90>, 25°C, 2,000 rpm, Ni-coated Pt)
As shown in Figure 77, the current density is quite stable at a potential of -0.750 volt vs. SCE.
There is always a hump at the beginning when the overpotential is higher, as in the case of -0.850 volt
in Figure 77. This hump is believed to be caused by the concentration polarization. In the beginning,
less concentration polarization exists; however, as the electrodeposition proceeds, the concentration
polarization becomes greater and finally reaches a stable level.
After a layer of nickel is deposited, it remains to be dissolved. Galvanostatic anodic dissolution
is quite simple; however, as has been mentioned, it suffers from some disadvantages. Straight
forward potentiostatic anodic dissolution is not good either. It has been observed that there is always
a very sharp current peak at the beginning. Thus, when the measured current is integrated against
the dissolution time, there will be a large error.
The technique used in the present study was as follows. Potentiostatically, the anodic disso
lution starts from a potential close to the equilibrium or rest potential of the working electrode. The
potential of the working electrode was then increased at a pre-defined rate (mV/sec) towards the
specified end potential. Once the end potential is reached, the working electrode will stay at that
potential until the end of the dissolution. In this way, the initial current peak occurring in the
straightforward potentiostatic anodic dissolution and the risky gas generation or substrate dissolution
can be avoided. An example of the curve for anodic dissolution obtained in the present study is
120
100
d800
60
40
20
0
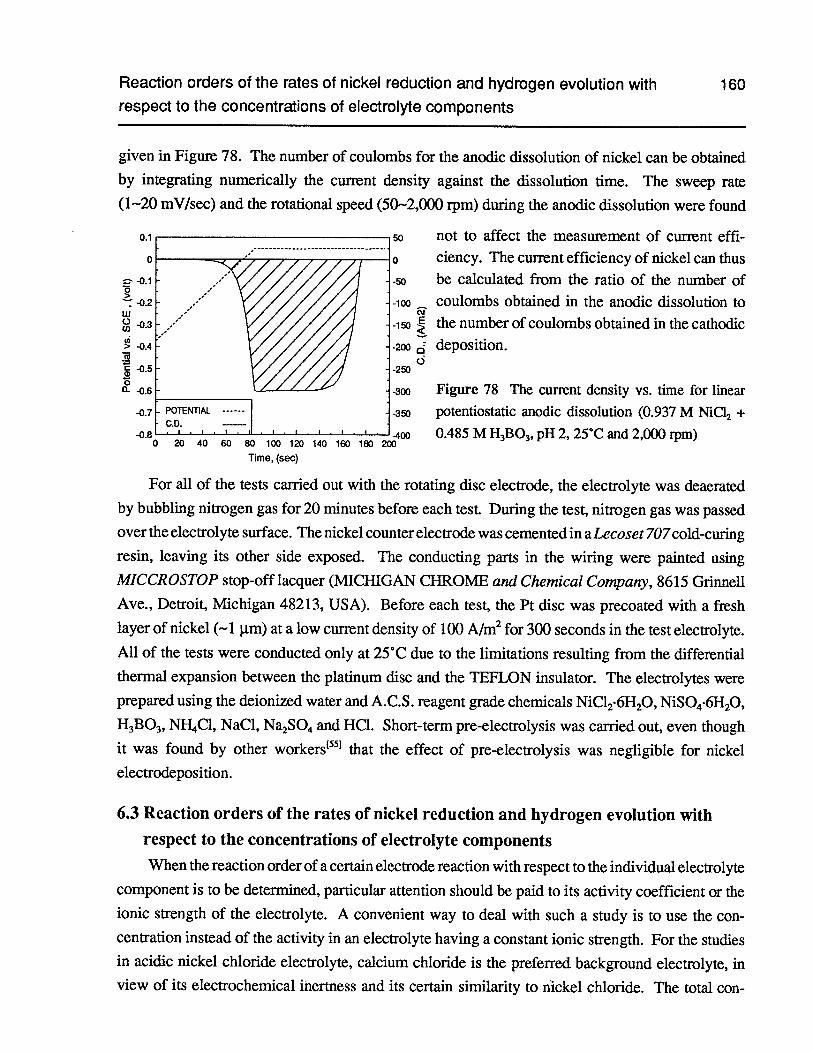
Reaction orders of the rates of nickel reduction and hydrogen evolution with 160respect to the concentrations of electrolyte components
given in Figure 78. The number of coulombs for the anodic dissolution of nickel can be obtained
by integrating numerically the current density against the dissolution time. The sweep rate(1--20 mV/sec) and the rotational speed (50—2,000 rpm) during the anodic dissolution were found
not to affect the measurement of current efficiency. The current efficiency of nickel can thusbe calculated from the ratio of the number ofcoulombs obtained in the anodic dissolution tothe number of coulombs obtained in the cathodicdeposition.
Figure 78 The current density vs. time for linearpotentiostatic anodic dissolution (0.937 M NiCI2 +
0.485 MH3B03,pH 2, 25°C and 2,000 ipm)
For all of the tests carried out with the rotating disc electrode, the electrolyte was deaerated
by bubbling nitrogen gas for 20 minutes before each test. During the test, nitrogen gas was passedover the electrolyte surface. The nickel counter electrode was cemented in aLecoset7O7cold-curing
resin, leaving its other side exposed. The conducting parts in the wiring were painted using
MICCROSTOP stop-off lacquer (MICHIGAN CHROME and Chemical Company, 8615 GrinnellAve., Detroit, Michigan 48213, USA). Before each test, the Pt disc was precoated with a fresh
layer of nickel (—1 tm) at a low current density of 100 A/m2for 300 seconds in the test electrolyte.
All of the tests were conducted only at 25°C due to the limitations resulting from the differentialthermal expansion between the platinum disc and the TEFLON insulator. The electrolytes were
prepared using the deionized water and A.C.S. reagent grade chemicals NiC12•6H20,NiSO46H2O,H3B03,NH4C1, NaCl, Na2SO4and HC1. Short-term pre-electrolysis was carried out, even though
it was found by other workers55 that the effect of pre-electrolysis was negligible for nickelelectrodeposition.
6.3 Reaction orders of the rates of nickel reduction and hydrogen evolution with
respect to the concentrations of electrolyte components
When the reaction order of a certain electrode reaction with respect to the individual electrolytecomponent is to be determined, particular attention should be paid to its activity coefficient or theionic strength of the electrolyte. A convenient way to deal with such a study is to use the concentration instead of the activity in an electrolyte having a constant ionic strength. For the studiesin acidic nickel chloride electrolyte, calcium chloride is the preferred background electrolyte, inview of its electrochemical inertness and its certain similarity to nickel chloride. The total con-
0.1
0
-0.10>
-02w
-0.3
-0.4
-0.50- -0.6
-0.7
-0.8
C0
0 20 40 60 80 100 120 140 160 180 200
Time, (sec)
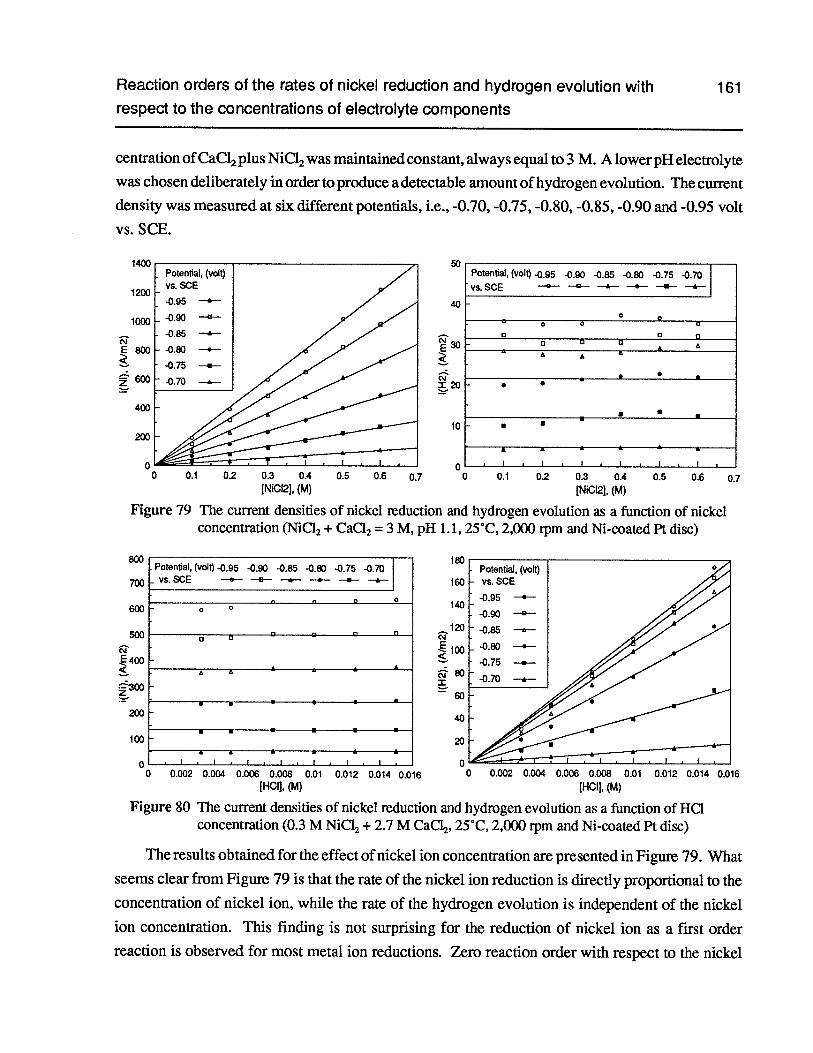
Reaction orders of the rates of nickel reduction and hydrogen evolution with
respect to the concentrations of electrolyte components
161
centration ofCaC12plus NiC12was maintained constant, always equal to 3 M. A lower pH electrolytewas chosen deliberately in order to produce a detectable amount of hydrogen evolution. The current
density was measured at six different potentials, i.e., -0.70, -0.75, -0.80, -0.85, -0.90 and -0.95 volt
vs. SCE.
50Potential, (volt) -0.95 -0.90 -0.85 -080 -0.75 -0.70vs. SCE — —— —• I • —A-—
00 o oo 0 p
•A A
AA A
p P
• . -
— S • p
• p
* p A A A
I I I I • I
0 0.1 0.2 0.3 0.4 0.5 0.6 0.7 0 0.1 0.2 0.3 0.4 0.5 0.6[NiCI2J, (M) [N1CI2I, (M)
Figure 79 The current densities of nickel reduction and hydrogen evolution as a function of nickelconcentration (NiC12+ CaCI2= 3M, pH 1.1, 25CC, 2,000 rpm and Ni-coated Pt disc)
Potential, (volt) -0.95 -0.90 -0.85 -0.80 -0.75 .0.70vs. SCE —.—- —e— —*-- —.-— —.-- —*-—
,, 0
0
pp a
A A AA
pa a
p. =
p p A A A A
I I I I •
c’JE
z
40
c’JE30
c’J120
10
00.7
800
700
600
500
400
‘300
200
100
180
160
140
120
______________________
100
80I
__________________
60
40
20
0 - 00 0.002 0.004 0.006 0.008 0.01 0.012 0.014 0.016 0 0.002 0004 0.006 0.008 0.01 0.012 0.014 0.016
[HCI], (M) [HCl], (M)
Figure 80 The current densities of nickel reduction and hydrogen evolution as a function of HQconcentration (0.3 M N1C12 + 2.7 M CaCl2,250C, 2,000 rpm and Ni-coated Pt disc)
The results obtained for the effect ofnickel ion concentration are presented in Figure 79. Whatseems clear from Figure 79 is that the rate of the nickel ion reduction is directly proportional to theconcentration of nickel ion, while the rate of the hydrogen evolution is independent of the nickelion concentration. This finding is not surprising for the reduction of nickel ion as a first orderreaction is observed for most metal ion reductions. Zero reaction order with respect to the nickel
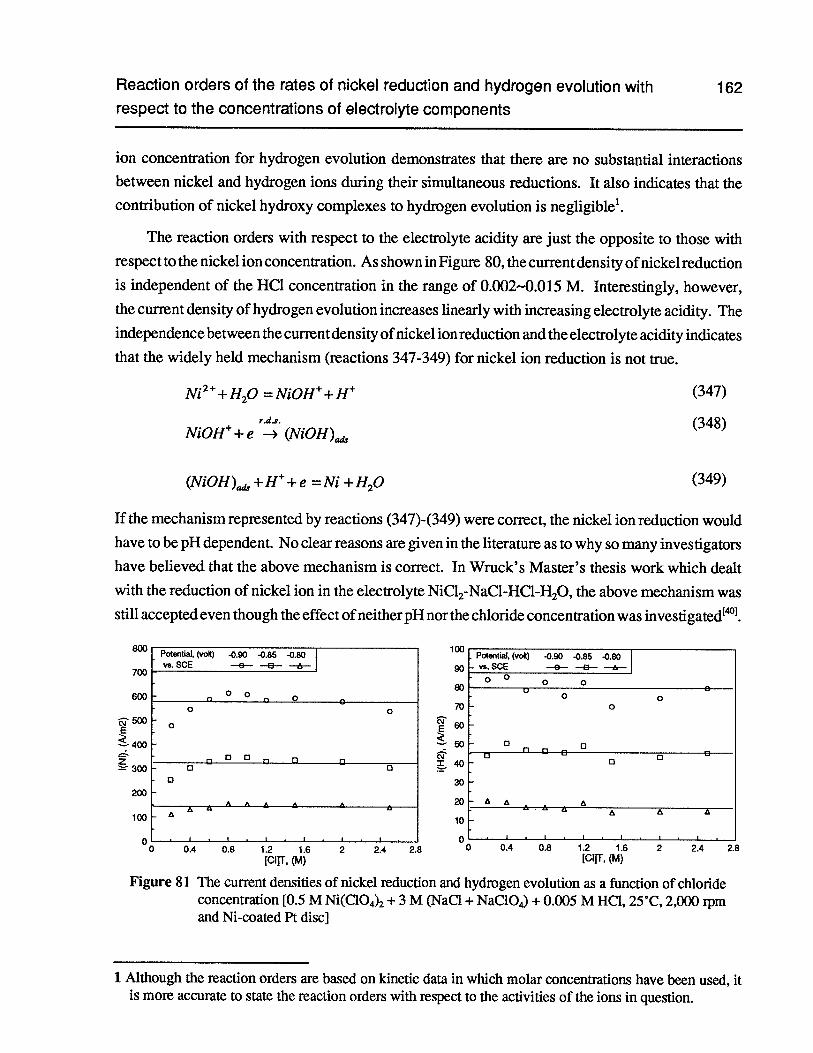
Reaction orders of the rates of nickel reduction and hydrogen evolution with 162respect to the concentrations of electrolyte components
ion concentration for hydrogen evolution demonstrates that there are no substantial interactions
between nickel and hydrogen ions during their simultaneous reductions. It also indicates that the
contribution of nickel hydroxy complexes to hydrogen evolution is negligible1.
The reaction orders with respect to the electrolyte acidity are just the opposite to those with
respect to the nickel ion concentration. As shown in Figure 80, the current density ofnickel reduction
is independent of the HCI concentration in the range of 0.002—0.015 M. Interestingly, however,
the current density of hydrogen evolution increases linearly with increasing electrolyte acidity. The
independence between the currentdensity ofnickel ion reduction and the electrolyte acidity indicates
that the widely held mechanism (reactions 347-349) for nickel ion reduction is not true.
Ni2+H2O=NiOH+H (347)
r4.s. (348)NiOH + e -, (NiOH)
(NiOH)+H+e =Ni+H20 (349)
If the mechanism represented by reactions (347)-(349) were correct, the nickel ion reduction would
have to be pH dependent. No clear reasons are given in the literature as to why so many investigators
have believed that the above mechanism is correct. In Wruck’s Master’s thesis work which dealt
with the reduction of nickel ion in the electrolyteNiC12-NaC1-HC1-H20,the above mechanism was
still accepted even though the effect of neither pH nor the chloride concentration was investigated1401.
800 100
700 90
_____________________________
80600
_____________________________________________
70
—400
___________________________
-
Z X40300
30200
_____________________________
20
_____________________________
100 10
0 00 0.4 0.8 12 1.6 2 2.4 2.8 0 0.4 0.8 1.2 1.6 2 2.4 2.8
lclrr, (M) [C]T, (M)
Figure 81 The current densities of nickel reduction and hydrogen evolution as a function of chlorideconcentration [0.5 M Ni(C104)2+3 M (NaC1 + NaClO4)+0.005 M HC1, 25C, 2,000 rpmand Ni-coated Pt disc]
1 Although the reaction orders are based on kinetic data in which molar concentrations have been used, itis more accurate to state the reaction orders with respect to the activities of the ions in question.
Potential. (volt) -0.90 -0.85 -0.80vs. SCE —0-— —a—
—
00C, r, 0
0 0
0
0000 00 0
0
A A A A A
AA
Potential, (volt) -0.90 -0.85 -0.80vs. SCE —e— —a-- —&—
00 0 0U
0 00
0fl 0
0p0 0
A AA A
A A A
I I I I I I
Reaction orders of the rates of nickel reduction and hydrogen evolution with 163respect to the concentrations of electrolyte components
The effect of chloride concentration on the current densities of nickel reduction and hydrogenevolution was also studied in the present work. As shown in Figure 81, there are some fluctuationsin the results; however, considering the overall trend, the current densities of nickel reduction andhydrogen evolution appear to be relatively constant over the total chloride concentration rangingfrom 0.2 to 2.5 M.
As the ionic strength of the electrolyte was controlled by using sodium perchlorate, sodiumchloride was the major source of the chloride ion. The source of nickel ion was the compoundnickel perchlorate Ni(Cl04)2.The zero reaction order with respect to the chloride ion concentrationfor the reduction of nickel ion appears to be conditional. In their studies on the effect of chlorideion concentration on nickel reduction under the conditions of 1 M Ni(C104)2+ 2 M (NaC1 + NaC1O4),54CC and 0.01-1 M [CuT, Philip and Nicol and Finkeistein et aI331 found that the slope dlog(iM)/dlog([Cl]T) was equal to 0.87 at -0.625 volt vs. SCE, indicating almost a first order reaction.There are no reasons to suspect their results. In fact, somewhat similar results were obtained in thepresent investigation in the lower range of chloride ion concentration. For example, the currentdensity of nickel reduction at 0.2 M [CuT was 476 A/m2 at -0.90 volt vs. SCE, compared with546 A/rn2 at 0.4 M [CuT. However, the sloped log iN/d log[Cl]T is only 0.19, or d logi1/dlog[ClJis only 0.18 at -0.9 volt vs. SCE in the range of [C1IT = 0.2 —0.6 M. Furthermore, the tests at below0.2 M [CuT were difficult, as the nickel deposit did not adhere well to the platinum substrate.
Florence’51considered that the enhanced rate of nickel ion reduction is due to the introductionof chloride ions into the primary solvation sphere of the nickel ions, so that the lability of theremaining primary water molecules is drastically increased. Considering the fact that the currentdensity of nickel reduction does not increase continuously with increasing the chloride concentration, the effect of chloride ion may come from the interfacial interaction rather than from thechange in the bulk electrolyte properties. It is well known that chloride ion is a strong adsorbent.The adsorption of chloride ions on the cathode surface may decrease significantly the potential j1iat the outer Helmhokz plane where nickel ions accept electrons from the cathode. When theconcentration polarization and Ni are taken into account, the Butler-Volmer equation can be writtenas follows if -i 100/n mV:
( i ( zF’qf r F(E-V1)i =zFkCbI l—-- lexpi — Iexvl —________
1j) RT ) [ RT (350)
( i “i r (z—an)Fijf1l ( WZFE=zFkCb 1_i: ex
— RTexp
- RTFor the reduction of nickel ion, equation (350) can be transformed into:
Effect of RPM on hydrogen evolution and electrode potential during nickel 164electrodeposition
.2r 1NI 1 T (2—0.5x1)F’qi1l iFE” (351)
lNI2Fk[M1][1_.—_jexP[_ jexPt_- J1Ni(L) RT RT
It can be seen from equation (351) that any negative shift in q11 will increase the current density of
nickel reduction. If the cathode surface is attacked chemically due to the presence of chloride ion,
the rate constant kin equation (351) will change as well. However, there is no quantitative equation
to describe such a chemical change.
Unlike the reduction of nickel ions, the rate of hydrogen evolution is hardly affected by the
presence of chloride ions. The slight fluctuations visible in Figure 81 are likely caused by the
fluctuation of the electrode potential due to sodium perchlorate. It was observed experimentally
that the presence of NaC1O4 affected the ceramic junction of the calomel electrode. The corre
sponding potential change could sometimes be as high as 20 - 30 mV. The reason for such a
phenomenon can be attributed probably to the precipitation of KC1O4within the ceramic junction
as a result of its very low solubility. For the same reason, the combination glass pH electrode was
affected by NaC1O4. In this case, the pH reading would drop up to 0.5 unit if the pH electrode was
left in the electrolyte for more than 1 hour. On account of this unusual situation, a double liquid
junction was used to avoid the direct contact of the calomel electrode with the NaC1O4solution. In
addition the acidity of the electrolyte was controlled rather than the pH.
Theoretically, the negative shift in will affect the rate of hydrogen evolution. A similar
expression can be obtained from equation (350):
iH_Fk[H][1]P[RT](I?1J
(352)
It is clear from equation (352) that the effect of is less significant for hydrogen evolution. Another
consideration has to be made which concerns the size of the hydrogen ion. Although the hydrogen
ion exists in a hydrated form in aqueous solution, the degree of hydration is much less than that of
the Ni2 ion. Therefore, the hydrogen ion accepts electrons from the cathode at a distance closer
to the cathode surface than does the nickel ion. Accordingly, ji1 for the hydrogen ion is not same
as that for the nickel ion. Nevertheless, the effect of Ni1 is negligible for hydrogen evolution on the
basis of the experimental results.
6.4 Effect of RPM on hydrogen evolution and electrode potential during nickel elec
trodeposition
One of the most interesting features of hydrogen evolution during nickel electrodeposition is
the effect of agitation. The results obtained with the rotating disc electrode are shown in Figures 82
under the conditions of 25°C and -0.850 volt vs. SCE on the Ni-coated Pt disc. It is obvious here
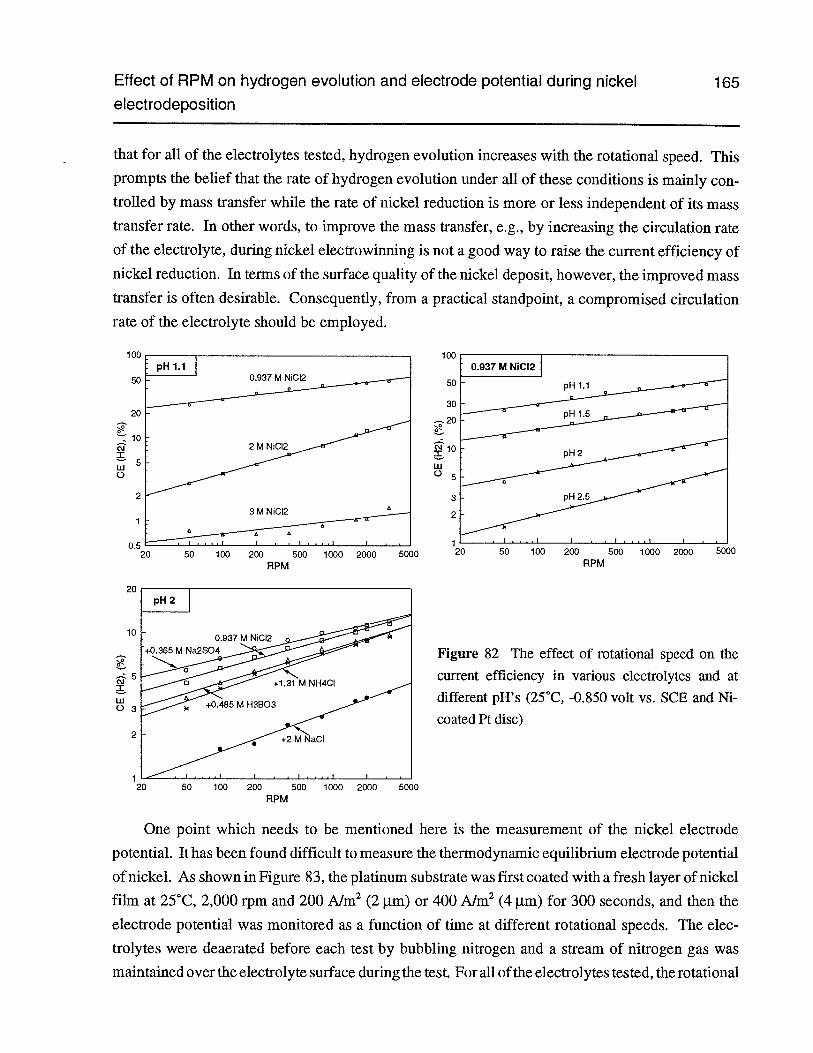
Effect of RPM on hydrogen evolution and electrode potential during nickel 165e lect rodepos it ion
that for all of the electrolytes tested, hydrogen evolution increases with the rotational speed. Thisprompts the belief that the rate of hydrogen evolution under all of these conditions is mainly controlled by mass transfer while the rate of nickel reduction is more or less independent of its masstransfer rate. In other words, to improve the mass transfer, e.g., by increasing the circulation rateof the electrolyte, during nickel electrowinning is not a good way to raise the current efficiency ofnickel reduction. In terms of the surface quality of the nickel deposit, however, the improved masstransfer is often desirable. Consequently, from a practical standpoint, a compromised circulationrate of the electrolyte should be employed.
100
50 50
3020
—rio(‘ilo
2:w
o 05
2 3
2
0.550 100 200 500 1000 2000 5000
120 50 100 200 500 1000 2000 5000
RPM RPM
20
10
Figure 82 The effect of rotational speed on the
s current efficiency in various electrolytes and atdifferent PH’S (25CC, -0.850 volt vs. SCE and Ni-coated Pt disc)
2
120
One point which needs to be mentioned here is the measurement of the nickel electrode
potential. Ithas been found difficult to measure the thermodynamic equilibrium electrode potential
ofnickel. As shown in Figure 83, the platinum substrate was first coated with a fresh layer ofnickel
film at 25°C, 2,000 rpm and 200 Aim2 (2 urn) or 400 Aim2 (4 urn) for 300 seconds, and then the
electrode potential was monitored as a function of time at different rotational speeds. The elec
trolytes were deaerated before each test by bubbling nitrogen and a stream of nitrogen gas was
maintained over the electrolyte surface during the test. For all of the electrolytes tested, the rotational
pH 1.17MNiCI2
CI2
MNiCI2°
0.937 M NICI2
pH 1.1
RPM
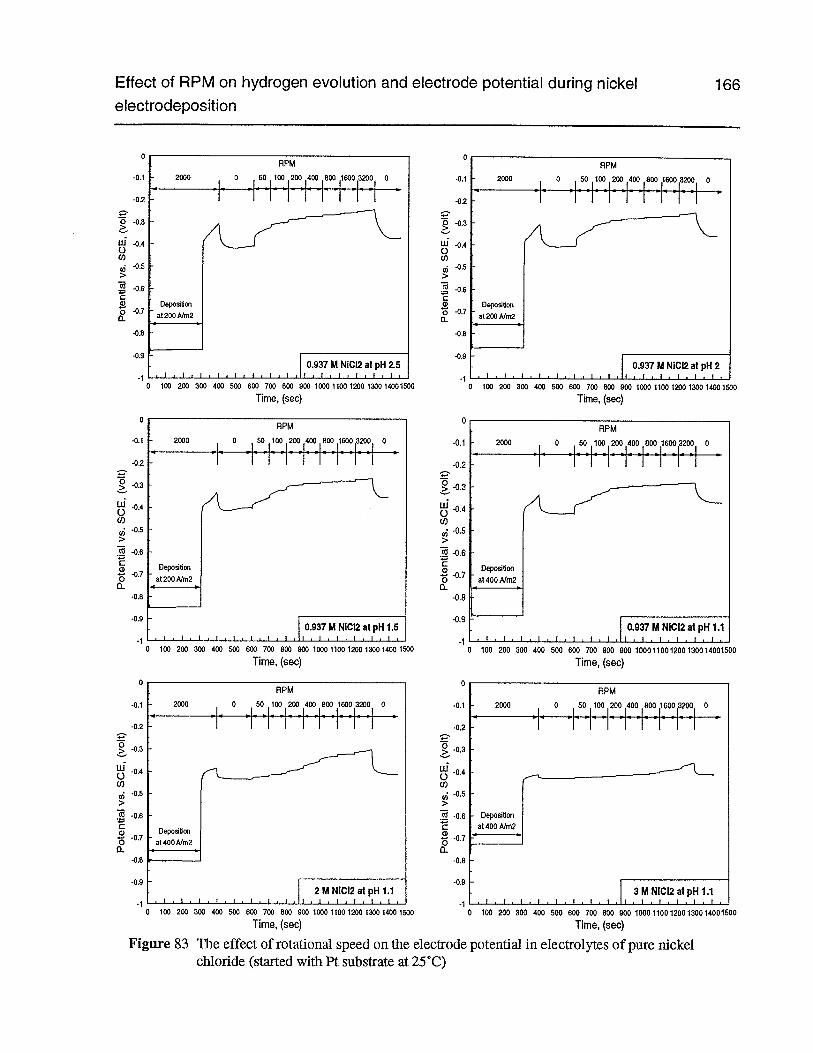
Effect of RPM on hydrogen evolution and electrode potential during nickel 166electrodeposition
RPM
2000 0 501100120040085011600132001 0
RPM
2000 50 110012001400 1800 i1600i3200i 0-- i- .i
Deposi&
at 200 A/m2
0.937 N1CI2 at pH 2.5
—r
floposi6on
a1200 A1m2
0.937MN1CI2atpH 2
0 100 200 300 400 500 650 700 800 900 1000 1100 1200 1300 14001500
Time, (see)
-0.1
-0.2
-0.3
-0.4
Ci)-Os
>
.13 -0.6C
-0.70
-0.8
-0.9
0
-0.1
-0.2
0> -0.3
Cl)-0.5
>
(0 -0.6
-0.9
0 100 200 300 400 500 600 750 800 900 1000 1100 1200 1300 1400 1500
Time, (see)
-0.1
-0.2
-0.3
-0.4
CI)-OS
>
.13 -0.6C
-0.713.
-0.8
-0.9
0
-0-I
-02
-0.3
-04
C))-0.5
>(0 -0.6
-0.9
0
-0-I
-02
-0.3
-O4
(I)-0.5
>
(0 -0.6
-0.9
RPM
2000 0 50 100 200 400 80) 1600 3200 0
Deposition
at 200 Afm2
I • I I I0.937 M N1CI2 atpH 1.5
RPM
2000 0 50 100 200 400 800 1600 3200 0
Deposition
at400Afm2
I • I I • I • I
0.937MN1C12 at pH 1.1
0 100 200 300 400 500 600 700 800 900 1600 1100 120013001400 l
Time, (see)00 O 100 200 300 400 500 600 700 800 900 1000 11001200 1300 14001500
Time, (sec)
0 100 200 300 400 550 600 750 860 900 1000 1100 1200 1300 1400 1500 0 100 200 300 400 500 600 700 800 900 18001100120013001400
Time, (see) Time, (see)
Figure 83 The effect of rotational speed on the electrode potential in electrolytes of pure nickelchloride (started with Pt substrate at 25 °C)
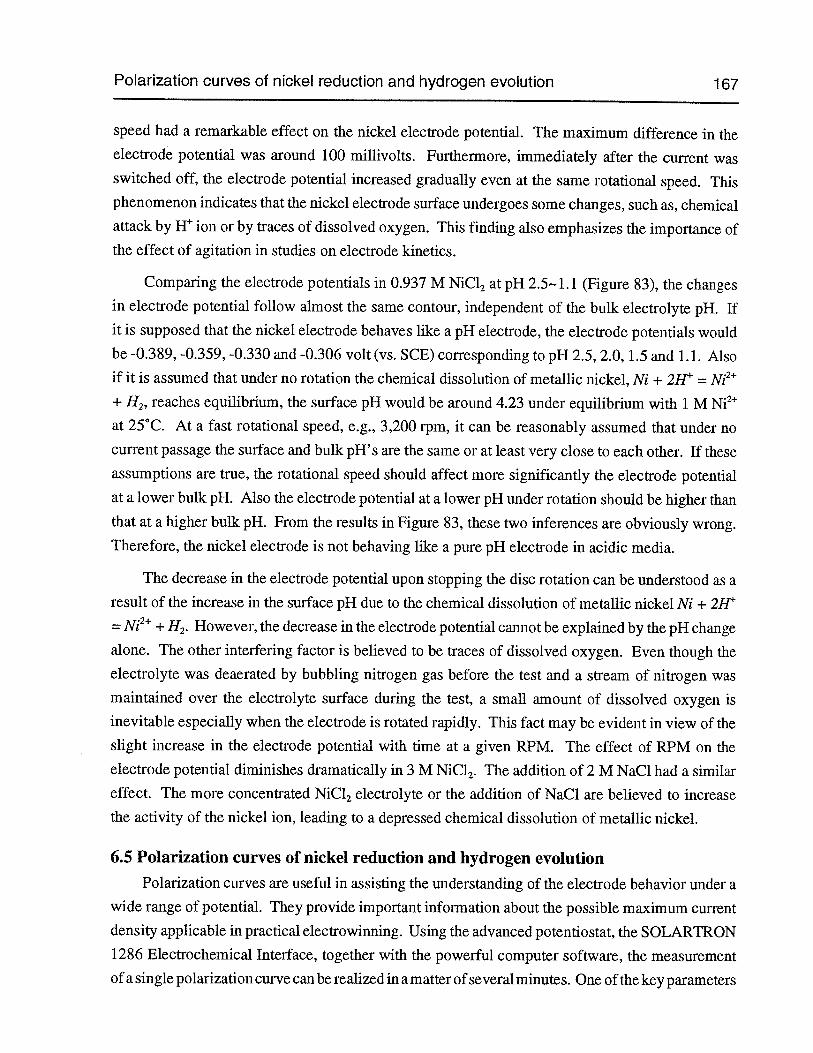
Polarization curves of nickel reduction and hydrogen evolution 167
speed had a remarkable effect on the nickel electrode potential. The maximum difference in theelectrode potential was around 100 millivolts. Furthermore, immediately after the current wasswitched off, the electrode potential increased gradually even at the same rotational speed. Thisphenomenon indicates that the nickel electrode surface undergoes some changes, such as, chemicalattack by H ion or by traces of dissolved oxygen. This finding also emphasizes the importance ofthe effect of agitation in studies on electrode kinetics.
Comparing the electrode potentials in 0.937 M NiC12 at pH 2.5’- 1.1 (Figure 83), the changesin electrode potential follow almost the same contour, independent of the bulk electrolyte pH. Ifit is supposed that the nickel electrode behaves like a pH electrode, the electrode potentials wouldbe -0.389, -0.359, -0.330 and -0.306 volt (vs. SCE) corresponding to pH 2.5, 2.0, 1.5 and 1.1. Alsoif it is assumed that under no rotation the chemical dissolution of metallic nickel, Ni + 2W = Ni2+ H2, reaches equilibrium, the surface pH would be around 4.23 under equilibrium with 1 M Ni2at 25CC. At a fast rotational speed, e.g., 3,200 rpm, it can be reasonably assumed that under nocurrent passage the surface and bulk pH’s are the same or at least very close to each other. If theseassumptions are true, the rotational speed should affect more significantly the electrode potentialat a lower bulk pH. Also the electrode potential at a lower pH under rotation should be higher thanthat at a higher bulk pH. From the results in Figure 83, these two inferences are obviously wrong.Therefore, the nickel electrode is not behaving like a pure pH electrode in acidic media.
The decrease in the electrode potential upon stopping the disc rotation can be understood as aresult of the increase in the surface pH due to the chemical dissolution of metallic nickel Ni + 2W
= Ni2 + H2. However, the decrease in the electrode potential cannot be explained by the pH changealone. The other interfering factor is believed to be traces of dissolved oxygen. Even though theelectrolyte was deaerated by bubbling nitrogen gas before the test and a stream of nitrogen wasmaintained over the electrolyte surface during the test, a small amount of dissolved oxygen isinevitable especially when the electrode is rotated rapidly. This fact may be evident in view of theslight increase in the electrode potential with time at a given RPM. The effect of RPM on theelectrode potential diminishes dramatically in 3 M NiCl2. The addition of 2 M NaCl had a similar
effect. The more concentrated NiCl2 electrolyte or the addition of NaCl are believed to increase
the activity of the nickel ion, leading to a depressed chemical dissolution of metallic nickel.
6.5 Polarization curves of nickel reduction and hydrogen evolution
Polarization curves are useful in assisting the understanding of the electrode behavior under awide range of potential. They provide important information about the possible maximum current
density applicable in practical electrowinning. Using the advanced potentiostat, the SOLARTRON1286 Electrochemical Interface, together with the powerful computer software, the measurement
of a single polarization curve can be realized in a matter ofseveral minutes. One ofthe key parameters
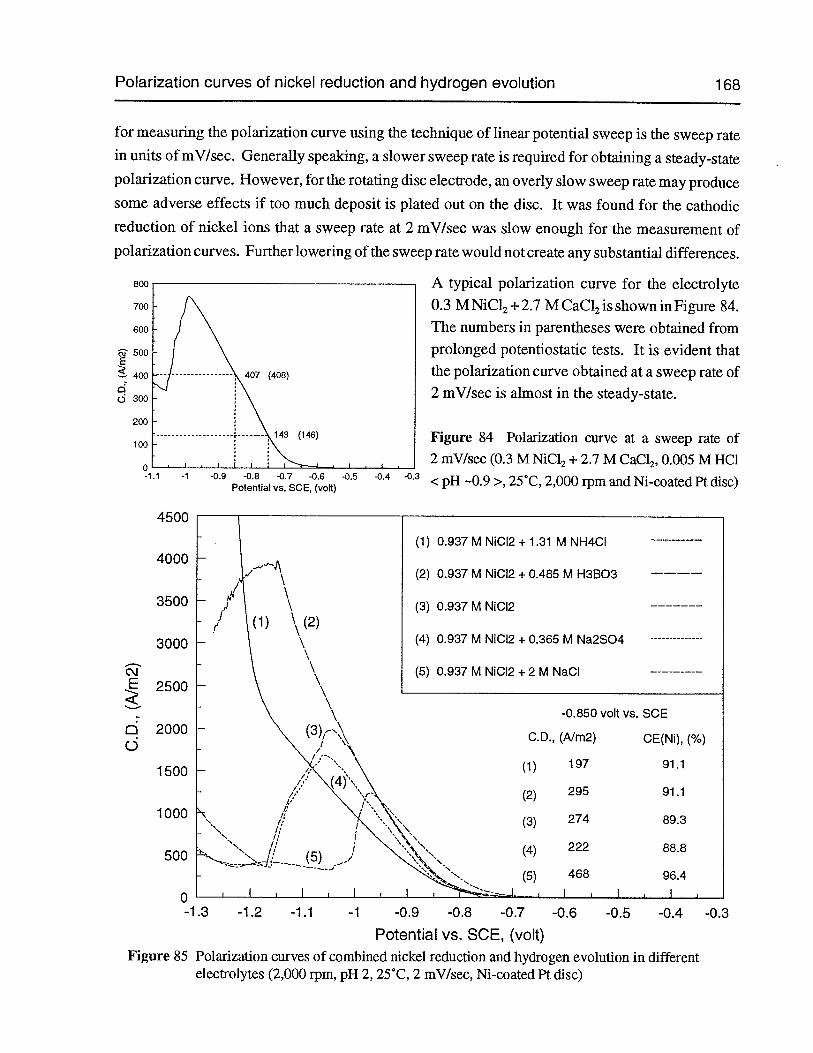
Polarization curves of nickel reduction and hydrogen evolution 168
for measuring the polarization curve using the technique of linear potential sweep is the sweep ratein units of mV/sec. Generally speaking, a slower sweep rate is required for obtaining a steady-statepolarization curve. However, for the rotating disc electrode, an overly slow sweep rate may producesome adverse effects if too much deposit is plated out on the disc. It was found for the cathodicreduction of nickel ions that a sweep rate at 2 mV/sec was slow enough for the measurement ofpolarization curves. Further lowering of the sweep rate would not create any substantial differences.
0
A typical polarization curve for the electrolyte0.3 M NiCl2+ 2.7 M CaCl2is shown in Figure 84.The numbers in parentheses were obtained fromprolonged potentiostatic tests. It is evident thatthe polarization curve obtained at a sweep rate of2 mV/sec is almost in the steady-state.
Figure 84 Polarization curve at a sweep rate of2 mV/sec (0.3 M NiC12+ 2.7 M CaC12,0.005 M HC1<pH -0.9 >, 25°C, 2,000 rpm and Ni-coated Pt disc)
-1.3 -1.2 -1.1 -1 -0.9 -0.8 -0.7 -0.6 -0.5 -0.4
Potential vs. SCE, (volt)Figure 85 Polarization curves of combined nickel reduction and hydrogen evolution in different
electrolytes (2,000 rpm, pH 2, 25°C, 2 mV/sec, Ni-coated Pt disc)
51 500E
-0.9 -0.8 -0.7 -0.6 -0.5 -0.4 -0.3Potential vs. SCE, (volt)
(1) 0.937 M N1CI2 + 1.31 M NH4CI
(2) 0.937 M N1CI2 + 0.485 M H3B03
(3) 0.937 M NiCI2
4500
4000
3500
3000
2500
2000
1500
1000
500
C’]E
bd
(4) 0.937 M NiCI2 + 0.365 M Na2SO4
(5) 0.937 M NICI2 +2 M NaCI
-0.850 volt vs. SCE
C.D., (A1m2)
(1)
CE(Ni), (%)
197 91.1
295(2)
(3)
91.1
274
(4)
89.3
222
(5)
88.8
468 96.4
-0.3
Polarization curves of nickel reduction and hydrogen evolution 169
For the convenience of comparisons, five polarization curves in five different electrolytes areplotted together in Figure 85. The current densities in Figure 85 are the combined values of nickelreduction and hydrogen evolution. The current densities and current efficiencies of nickel measuredat -0.850 volt vs. SCE are presented at the lower right inside Figure 85. By comparing these fivecurrent efficiencies of nickel, the same kind of information is revealed here as found previously inthe tests of nickel electrodeposition at 60°C. That is to say, the current efficiency at the same pHis highest in the electrolyte of NiC12-NaCl, and the lowest in NiC12-Na2SO4.Also, both of theadditions of NH4C1 and H3B03 increase the current efficiency of nickel. In terms of the current
density, the highest value was achieved in the electrolyte NiC12-NaC1 when the electrode potentialwas not more negative than -0.96 volt vs. SCE. The addition of boric acid increased the total current
density very little compared with the pure nickel chloride electrolyte if the electrode potential wasabove -1.02 volts vs. SCE. However, the addition of Na2SO4and especially NH4C1 decreased thetotal current density. The increase or decrease in the total current density can be attributed mainly
to the increase or decrease in the activity of the nickel ion in the electrolyte resulting from theaddition of the individual components.
One unique feature of the polarization curves in all of the electrolytes tested except for theaddition of NH4C1 is that the polarization curves have a peak at a potential somewhere between
-0.97 and -1.15 volts vs. SCE. The reasons for the occurrence of these peaks are not quite clear.
However, it is considered that the formation of insoluble nickel hydroxide or oxide on the electrode
surface is very probably responsible. This speculation seems reasonable in that the height of the
peak is related to the electrolyte composition explainable through the nickel ion activity, the
buffering capacity of electrolyte and the rate of hydrogen evolution. For instance, in the electrolyte
0.937 M NiCl2 + 2 M NaCl, the activity of the nickel ion was raised and the acid concentration at
the same pH was reduced. These two reasons may account for the lower peak height in spite of a
higher current efficiency of nickel. On the other hand, for the electrolyte 0.937 M NiC12+ 0.485 M
H3B03,the peak height was raised considerably as a result of the enhanced buffering capacity of
the electrolyte in the presence of boric acid. Even though it seems somewhat controversial to say
boric acid is a pH buffer during nickel electrodeposition, it is believed that boric acid does have
some catalytic function at a lower surface pH in view of the higher current efficiency of nickel, and
that it does behave like a pH buffer at a higher surface pH on account of the lower surface pH
observed at higher current densities and the pH titration results (compare Figure 50 with Figure 38).
Compared with the pure nickel chloride electrolyte, the almost double height of the peak in the
presence of 0.485 MH3B03in Figure 85 cannot be explained only from the —2 % increase in the
current efficiency of nickel.
Polarization curves of nickel reduction and hydrogen evolution 170
When ainmonium chloride was added to the nickel chloride electrolyte, the change in the shapeofpolarization curve was substantial, indicating the disappearance of the peak. The couple NH/NH3has a middle-point buffer pH of around 9.25 at 25°C. Accordingly, one would not expect anysubstantial buffering action under acidic conditions (pH < 7). As with boric acid, this middle-pointbuffer pH may be shifted to the acidic region in the presence of nickel ions due to the formation ofstrong nickel ainmine complexes:
Ni2+xNH —> xH+Ni(NH3)2 (353)
Bjerrum1”61had studied the nickel ammine complexes in 2 M NH4NO3and 1 M NH4C1 at 30°C. Itwas found that the number of NH3 bound to Ni2 ion increased continuously with increasing NH3concentration, starting from Ni(NH3)2up to Ni(NH3). The following calculations indicate thepH above which nickel monoammine complex Ni(NH3)2’should start to form.
AG’
Ni2+NH3 = Ni(NH3)2 log f3 = 2.82 (1 M NH4C1O4at 25°C)’171
The standard formation free energies for aqueous species Nit), NH3(aq) and Maq> at 25°C are
-46.4 kJ/mole1061,-26.6 kJ/mole’181 and -79.4 kJ/mole’181,respectively. Thus, the formation free
energy of Ni(NH3)2is equal to:
IXG.(NH)2+ = AG1°+ AGJ.2++ AG?H = —2.303RT log f + + AGH (354)
= —2.303 x 8.314 x 298 x 2.82/1000 + (—46.4) + (—26.6)
=—89.1 LI
If Ni(NH3)2is assumed to be the first nickel ammine complex formed, the standard free energy
change of reaction (355) should be equal to:
(355)Ni2+NH —> H+Ni(NH3)2
AG2° = AG.(NH)2+ — — AGJ,,+ = —89.1 — (—46.4) — (—79.4) = 36.7 LI (356)
I A/’° 4 3 (357)I I 36.7x10 i -7K = expi — I = expi —_________ = 3.70 x 10RT ) 8.314x298)
If a is designated as the initial concentration of Ni2 ion, and b as the initial concentration of NH,
and x as the concentration of Ni(NH3)2formed, it follows that:
[Ni(NH3)2][H1 (358)K2
= [Ni2}• [NHJ = (a — x) (b — x) ab
Polarization curves of nickel reduction and hydrogen evolution 171
Using the molarity to approximate the molality, the concentration x of the nickel monoainminecomplex Ni(NH3)2in the solution 0.937 M NiC12 - 1.31 M NH4C1 can be calculated as follows:
x fK2ab = ‘13.70 x i0 x 0.937 x 1.31 6.74 x l0 (359)
.. pH —logx —log(6.74 x lOj = 3.2 (360)
Thus, it is clear that the formation of the nickel monoammine complex Ni(NH3)2should be expectedat a pH above 3.2.
By comparing the titration curves in the presence (Figure 53) and absence (Figure 38) ofammonium chloride, the existence of a buffering function is evident. The formation of the strongnickel ammine complexes actually prevented effectively the occurrence of the peak which had beenobserved for other electrolytes (Figure 85).
The observations on the electrode surface during the linear potential sweep may be instructive.Before the occurrence of the peak, the electrode surface was observed to be bright without a significant amount of gas evolution. Just at the top of the peak, the electrode surface turned graduallyblack starting around the edges and corners. As the black area spread over the whole electrodesurface, the gas evolution became more and more massive. At the point where the current densityreached a minimum and started to rise again, it was believed that water began to decompose on thecathode. If the electrodeposition was run potentiostatically at a potential between the peak and the
valley, the cathode deposit was black. However, when the electrodeposition was carried outpotentiostatically at a potential beyond the valley, a green deposit on the cathode was obtained.The sharp drop in the current density after the peak is probably due to the precipitation of insoluble
nickel hydroxide or oxide on the cathode surface. The poorly conductive Ni(OH)<S), or NiO on the
cathode surface would increase greatly the ohmic drop and possibly the activation energy for thereduction of nickel ions as well. The green deposit is obviously Ni(OH)). What is the black
deposit? According to the experience of personnel at Falconbridge Ltd, the most probable com
position of this black deposit is nickel oxide119], which is equivalent to dehydrated nickel hydroxide.
Ragauskas and Leuksminas1461 believed that the black deposit encountered in their studies was
not a basic nickel compound but highly dispersed nickel powder. The nickel powder was considered
to be formed from the disproportionation of monovalent nickel ions, 2Ni = Ni2 + Ni. The black
deposit was also believed to be a mixture of nickel powder and nickel hydroxide201.Such a con
clusion is suspect, and cannot explain why the current density drops sharply as the dispersed pul
verulent nickel has a larger real active surface area and should be more active electrochemically
compared to dense compact nickel.
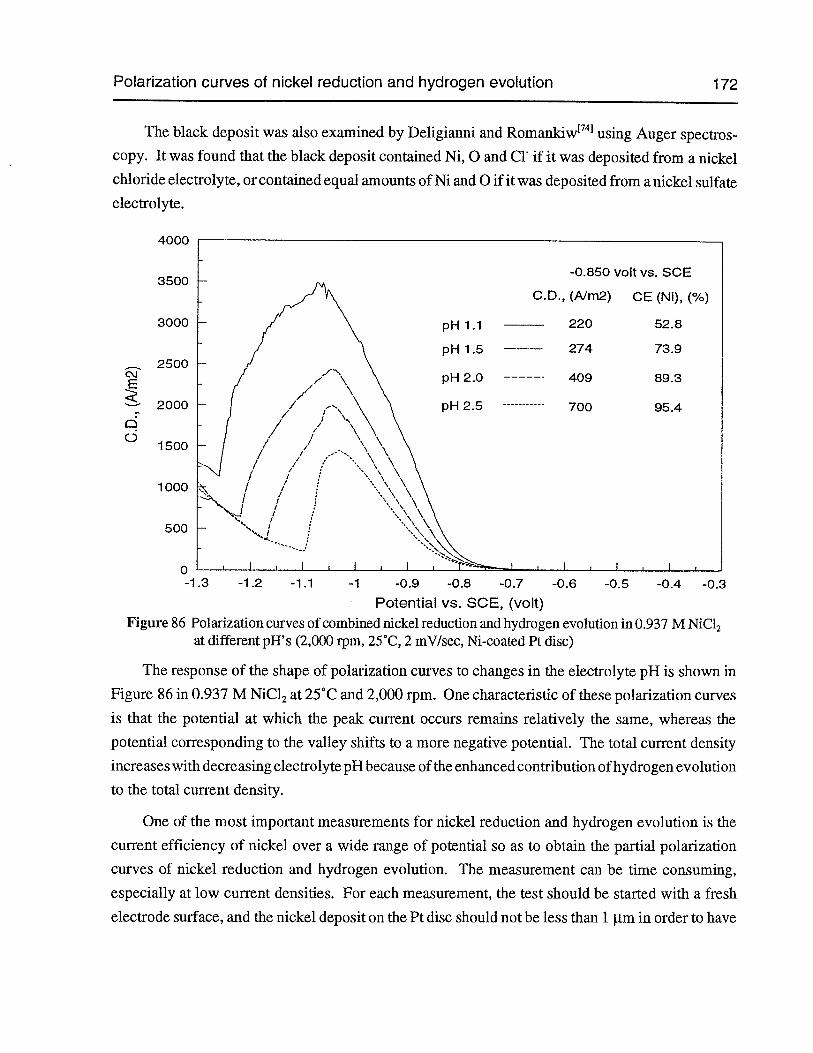
Polarization curves of nickel reduction and hydrogen evolution 172
The black deposit was also examined by Deligianni and Romankiw1741 using Auger spectroscopy. It was found that the black deposit contained Ni, 0 and C1 if it was deposited from a nickelchloride electrolyte, or contained equal amounts of Ni and 0 if it was deposited from a nickel sulfateelectrolyte.
4000
3500
0-1.3 -1.2 -1.1 -1 -0.9 -0.8 -0.7 -0.6 -0.5 -0.4 -0.3
Potential vs. SCE, (volt)Figure 86 Polarization curves of combined nickel reduction and hydrogen evolution in 0.937 M NiCI2
at different pH’s (2,000 rpm, 25°C, 2 mVlsec, Ni-coated Pt disc)
The response of the shape of polarization curves to changes in the electrolyte pH is shown in
Figure 86 in 0.937 M NiCl2at 25°C and 2,000 rpm. One characteristic of these polarization curves
is that the potential at which the peak current occurs remains relatively the same, whereas the
potential corresponding to the valley shifts to a more negative potential. The total current density
increases with decreasing electrolyte pH because of the enhanced contribution of hydrogen evolution
to the total current density.
One of the most important measurements for nickel reduction and hydrogen evolution is the
current efficiency of nickel over a wide range of potential so as to obtain the partial polarization
curves of nickel reduction and hydrogen evolution. The measurement can be time consuming,
especially at low current densities. For each measurement, the test should be started with a fresh
electrode surface, and the nickel deposit on the Pt disc should not be less than 1 pm in order to have
cJ2
ciC-)
3000
2500
2000
1500
1000
500
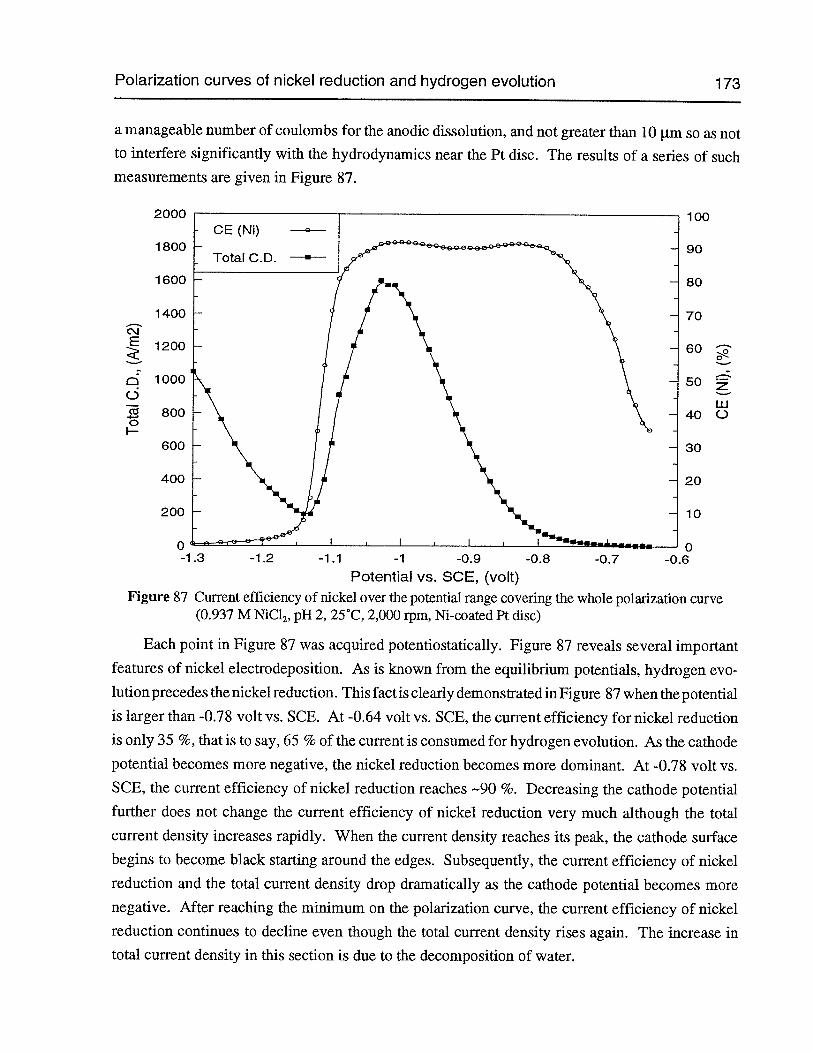
Polarization curves of nickel reduction and hydrogen evolution 173
a manageable number of coulombs for the anodic dissolution, and not greater than 10 im so as notto interfere significantly with the hydrodynamics near the Pt disc. The results of a series of suchmeasurements are given in Figure 87.
-1.2 -1.1 -1 -0.9 -0.8 -0.7
Potential vs. SCE, (volt)Figure 87 Current efficiency of nickel over the potential range covering the whole polarization curve
(0.937 M NiCI2,pH 2, 25CC, 2,000 rpm, Ni-coated Pt disc)
Each point in Figure 87 was acquired potentiostatically. Figure 87 reveals several important
features of nickel electrodeposition. As is known from the equilibrium potentials, hydrogen evolution precedes the nickel reduction. This fact is clearly demonstrated in Figure 87 when the potentialis larger than -0.78 volt vs. SCE. At -0.64 volt vs. SCE, the current efficiency for nickel reductionis only 35 %, that is to say, 65 % of the current is consumed for hydrogen evolution. As the cathodepotential becomes more negative, the nickel reduction becomes more dominant. At -0.78 volt vs.SCE, the current efficiency of nickel reduction reaches —90 %. Decreasing the cathode potential
further does not change the current efficiency of nickel reduction very much although the total
current density increases rapidly. When the current density reaches its peak, the cathode surface
begins to become black starting around the edges. Subsequently, the current efficiency of nickel
reduction and the total current density drop dramatically as the cathode potential becomes morenegative. After reaching the minimum on the polarization curve, the current efficiency of nickel
reduction continues to decline even though the total current density rises again. The increase intotal current density in this section is due to the decomposition of water.
2
0
-a0
I—
2000
1800
1600
1400
1200
1000
800
600
400
200
0-1.3
100
90
80
70
60
50
Lii40 0
30
20
10
0-0.6
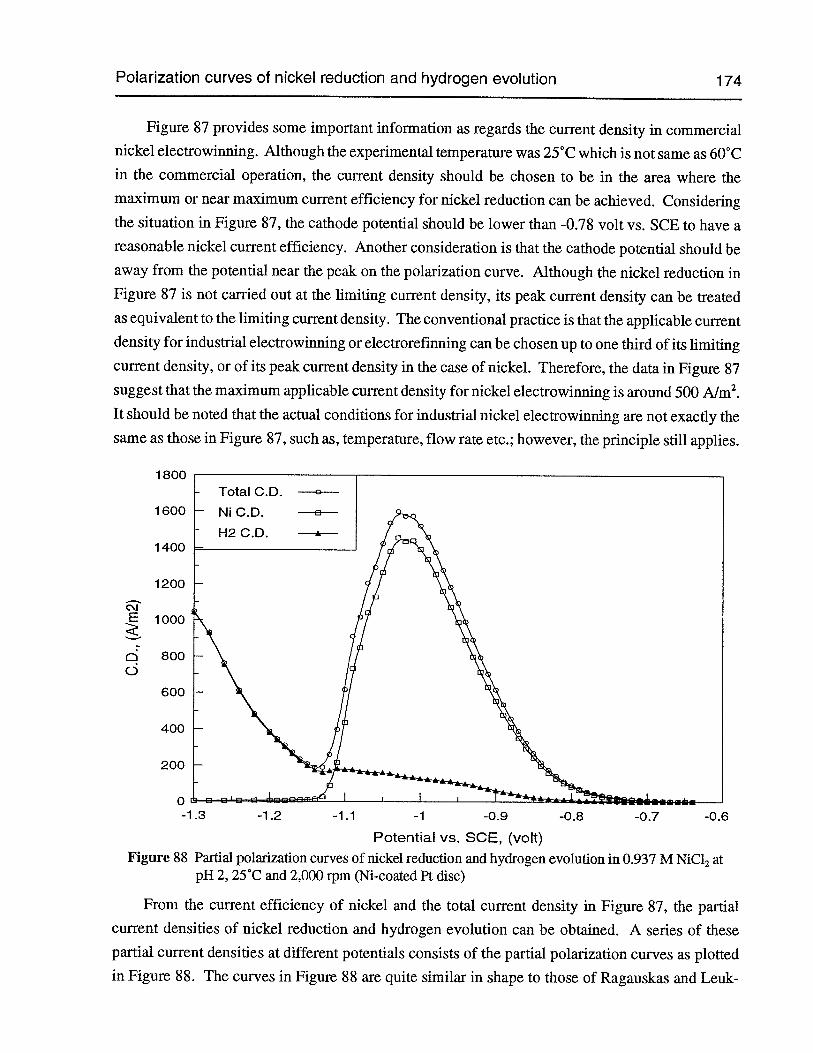
Polarization curves of nickel reduction and hydrogen evolution 174
Figure 87 provides some important information as regards the current density in commercialnickel electrowinning. Although the experimental temperature was 25°C which is not same as 60°Cin the commercial operation, the current density should be chosen to be in the area where themaximum or near maximum current efficiency for nickel reduction can be achieved. Consideringthe situation in Figure 87, the cathode potential should be lower than -0.78 volt vs. SCE to have areasonable nickel current efficiency. Another consideration is that the cathode potential should beaway from the potential near the peak on the polarization curve. Although the nickel reduction inFigure 87 is not carried out at the limiting current density, its peak current density can be treatedas equivalent to the limiting current density. The conventional practice is that the applicable currentdensity for industrial electrowinning or electrorefmning can be chosen up to one third of its limitingcurrent density, or of its peak current density in the case of nickel. Therefore, the data in Figure 87suggest that the maximum applicable current density for nickel electrowinning is around 500 A/m2.It should be noted that the actual conditions for industrial nickel electrowinning are not exactly thesame as those in Figure 87, such as, temperature, flow rate etc.; however, the principle still applies.
1800
1600
1400
1200
200
0-1.3 -1.2 -1.1 —1 -0.9 -0.8 -0.7 -0.6
Potential vs. SCE, (volt)Figure 88 Partial polarization curves of nickel reduction and hydrogen evolution in 0.937 M NiC12 at
pH 2, 25°C and 2,000 rpm (Ni-coated Pt disc)
From the current efficiency of nickel and the total current density in Figure 87, the partialcurrent densities of nickel reduction and hydrogen evolution can be obtained. A series of thesepartial current densities at different potentials Consists of the partial polarization curves as plottedin Figure 88. The curves in Figure 88 are quite similar in shape to those of Ragauskas and Leuk
C\J2
ci6
1000
800
600
400
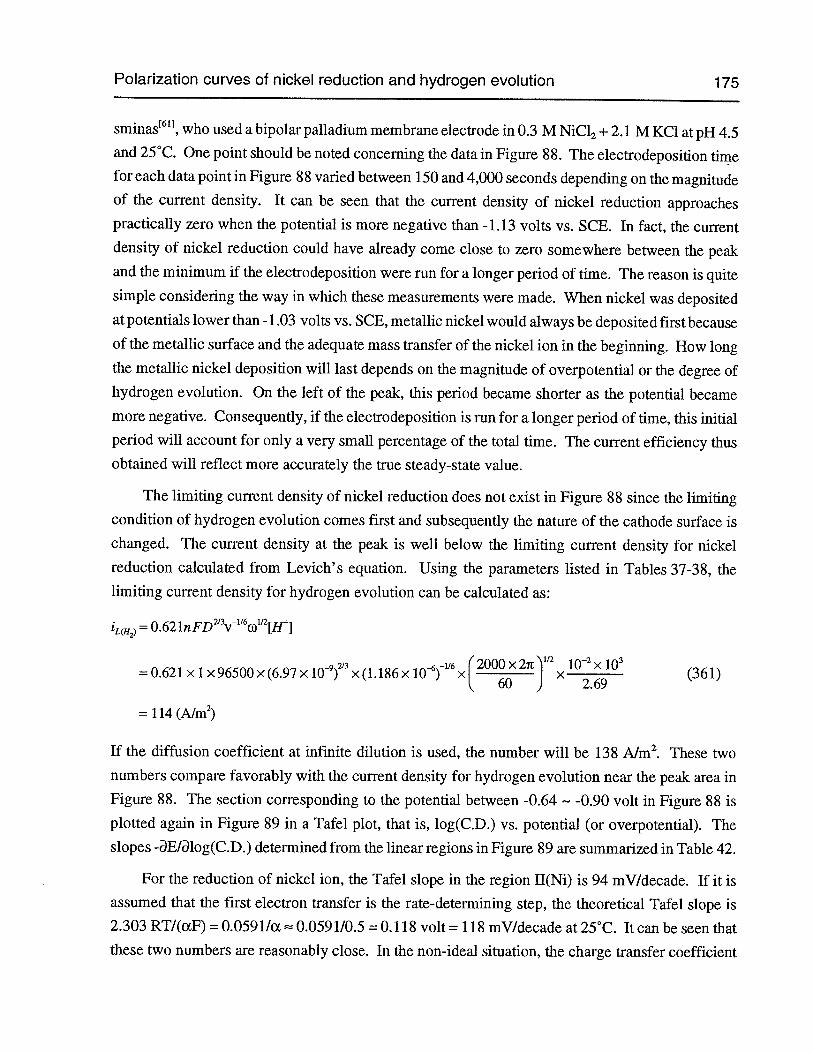
Polarization curves of nickel reduction and hydrogen evolution 175
sminas611,who used a bipolar palladium membrane electrode in 0.3 M NiC12+ 2.1 M KC1 at pH 4.5and 25°C. One point should be noted concerning the data in Figure 88. The electrodeposition timefor each data point in Figure 88 varied between 150 and 4,000 seconds depending on the magnitudeof the current density. It can be seen that the current density of nickel reduction approachespractically zero when the potential is more negative than -1.13 volts vs. SCE. In fact, the currentdensity of nickel reduction could have already come close to zero somewhere between the peakand the minimum if the electrodeposition were run for a longer period of time. The reason is quitesimple considering the way in which these measurements were made. When nickel was depositedat potentials lower than -1.03 volts vs. SCE, metallic nickel would always be deposited first becauseof the metallic surface and the adequate mass transfer of the nickel ion in the beginning. How longthe metallic nickel deposition will last depends on the magnitude of overpotential or the degree ofhydrogen evolution. On the left of the peak, this period became shorter as the potential becamemore negative. Consequently, if the electrodeposition is run for a longer period of time, this initialperiod will account for only a very small percentage of the total time. The current efficiency thusobtained will reflect more accurately the true steady-state value.
The limiting current density of nickel reduction does not exist in Figure 88 since the limitingcondition of hydrogen evolution comes first and subsequently the nature of the cathode surface ischanged. The current density at the peak is well below the limiting current density for nickelreduction calculated from Levich’s equation. Using the parameters listed in Tables 37-3 8, thelimiting current density for hydrogen evolution can be calculated as:
1L(H2)= 0.62lnFD3v’’6co’[Hi
= 0.621 xl x 96500 x (6.97 x l09)213 x (1.186 x lOhI6 2000x 2ic )112 lOx 10(361)
= 114 (AIm2)
If the diffusion coefficient at infinite dilution is used, the number will be 138 Aim2. These two
numbers compare favorably with the current density for hydrogen evolution near the peak area inFigure 88. The section corresponding to the potential between -0.64 -0.90 volt in Figure 88 is
plotted again in Figure 89 in a Tafel plot, that is, log(C.D.) vs. potential (or overpotential). Theslopes -aEThlog(C.D.) determined from the linear regions in Figure 89 are summarized in Table 42.
For the reduction of nickel ion, the Tafel slope in the region II(Ni) is 94 mV/decade. If it isassumed that the first electron transfer is the rate-determining step, the theoretical Tafel slope is2.303 RT/(xF) = 0.059 1/x 0.0591/0.5 = 0.118 volt = 118 mV/decade at 25°C. It can be seen thatthese two numbers are reasonably close. In the non-ideal situation, the charge transfer coefficient
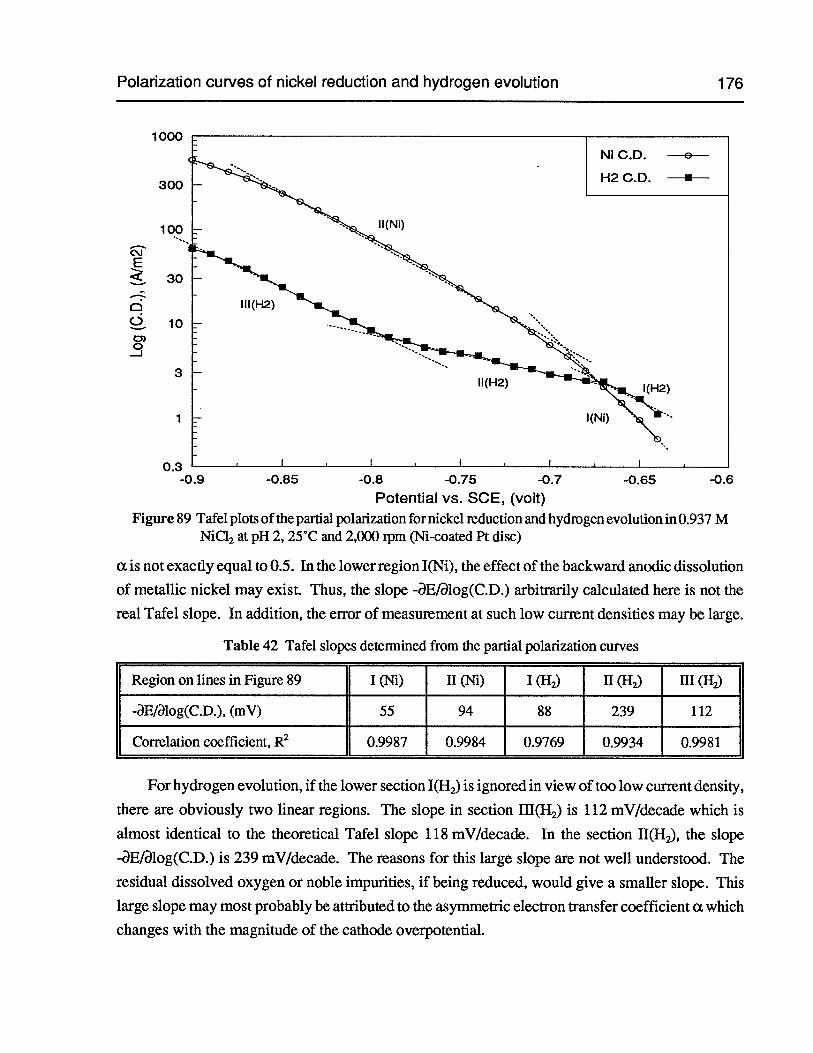
Polarization curves of nickel reduction and hydrogen evolution
c..JE
6
1000
176
-0.85 -0.8 -0.75 -0.7 -0.65 -0.6
Potential vs. SCE, (volt)Figure 89 Tafel plots of the partial polarization for nickel reduction and hydrogen evolution in 0.937 M
NiC12 at pH 2, 25°C and 2,000 rpm (Ni-coated Pt disc)
a is not exactly equal to 0.5. In the lower region I(Ni), the effect of the backward anodic dissolution
of metallic nickel may exist Thus, the slope -aE/alog(C.D.) arbitrarily calculated here is not the
real Tafel slope. In addition, the error of measurement at such low current densities may be large.
Table 42 Tafel slopes detennined from the partial polarization curves
Region on lines in Figure 89 I (Ni) II (Ni) I (112) 11(112) 111(112)
-aE/alog(C.D.), (mV) 55 94 88 239 112
Correlation coefficient, R2 0.9987 0.9984 0.9769 0.9934 0.9981
For hydrogen evolution, if the lower section I(H2) is ignored in view of too low current density,
there are obviously two linear regions. The slope in section 111(H2)is 112 mV/decade which is
almost identical to the theoretical Tafel slope 118 mV/decade. In the section 11(112), the slope
-aE/alog(C.D.) is 239 mV/decade. The reasons for this large slope are not well understood. The
residual dissolved oxygen or noble impurities, if being reduced, would give a smaller slope. This
large slope may most probably be attributed to the asymmetric electron transfer coefficient a which
changes with the magnitude of the cathode overpotential.
300
100
0.3-0.9
Nickel electrowinning at high current density 177
6.6 Nickel electrowinning at high current density
Regarding high current density nickel electrowinning, changes in the electrolyte compositioncan impose some restrictions on the electrowinning process itself or on other related processes. Theaddition of ammonium chloride appears to be the best candidate on the basis of the polarizationcurves. However, during research aimed at producing nickel granules in nickel chloride electrolytescarried out by Falconbridge Ltd., it was found that the ammonium ions were oxidized by the anodicchlorine gas. Although the addition of ammonium chloride is not compatible when the anodicreaction is chlorine evolution, it could be useful in other processes where the anodic reaction issimply the dissolution of metallic nickel, as in nickel electrorefining or in the production of nickelpowder.
The addition of boric acid is also worth considering in high current density nickel electrowinning. As shown in Figure 85, the achievable maximum current density is extraordinarily higheven at 25°C. The restriction of using boric acid is not in the electrowinning itself, but in theassociated purification circuit, especially in solvent extraction. Nevertheless, boric acid has beenwidely used in nickel electroplating, direct nickel matte electrowinning, nickel sulfate electrowinning, and nickel electrorefining. The benefits from the use of boric acid are realized mainly ina higher nickel current efficiency, stabilized bulk electrolyte pH, and especially in improved cathodesurface quality.
The concept of high current density nickel electrowinning has not been well defmed. What
constitutes high current density electrowinning? The current density for commercial nickel
electrowinning is between 200 and 240 AIm2. Can it be called high current density electrowinningif the operation is run at 400 A/m2or even at 300 A/m2?It is believed to be so, since the productivityof the plant would be increased by —100 % or —50 %. Even a 50 % increase in productivity is afonnidable increase. Since it has not been specified clearly in industry what is high current densitynickel electrowinning, some investigators may have gone to the extreme, believing that the current
density must be above 1,000 AIm2. High current density for nickel electrowinning has been defined
by Ettel11211 as 400-800 A/m2.
If a moderate concept of high current density electrowinning is considered, say double the
present commercial current density, it can be seen from Figure 85 that the addition of sodium
chloride is quite beneficial. The benefits are realized in high nickel current efficiency, lower cathodeoverpotential and possibly lower anode overpotential, and improved conductivity of the electrolyte.The addition of sodium chloride is unlikely to have adverse effects on other processes associatedwith nickel electrowinning.
Hydrogen evolution on the nickel cathode in electrolytes without NiCl2 178
The addition ofsulfate may not be beneficial in terms of the total current density and the currentefficiency of nickel. However, the presence of sulfate does not have a deleterious effect on thesequantities. It was found from the surface pH measurements that the addition of an appropriateamount of sulfate assists in maintaining a lower surface pH.
6.7 Hydrogen evolution on the nickel cathode in electrolytes without N1CI2Hydrogen evolution was found to be heavily dependent on the rotational speed of the disc (i.e.,
mass transfer rate) in the preceding sections. In order to get a clearer understanding of hydrogen
evolution, systematic measurements of the polarization curves of hydrogen evolution were madeon the nickel-coated platinum rotating disc electrode at different rotational speeds and pH’s. Each
test required a fresh coating of nickel film, whose thickness was controlled to around 2 pm. The
coating conditions were the same for all tests, that is, 0.937 M NiC12,pH 1.8, 25°C, 100 A/mZ, 600seconds and 2,000 rpm. After the coating, the disc electrode was washed thoroughly using deionized
water and immediately transferred to the test electrolyte. After each measurement, the nickel film
was stripped anodically in another electrolyte similar to the coating electrolyte. Before each
measurement, the electrolyte was always deaerated by bubbling nitrogen gas and a stream ofnitrogen
gas flow was maintained during the measurement. The potential sweep rate was controlled at
2 mV/sec.
Some of the polarization curves of hydrogen evolution are summarized in Figure 90 in the
range of RPM from 100 to 3,600. It can seen that all of these curves are well-defined and smooth,
even though there is abundant hydrogen evolution. The potential where the current density of H
reduction reaches its limiting value and where water starts to decompose shifts to a more negative
value as the rotational speed increases or as the pH decreases. This phenomenon is typical for
processes controlled by the mass transfer rate. The polarization curves in the electrolyte containing
Na2504have a similar shape. The presence of sulfate does not change the current density con
siderably at lower overpotential. However, at high overpotential and in the limiting regions, the
current density of hydrogen evolution increases dramatically. Since the viscosity of the electrolyte
can only increase when the electrolyte becomes more concentrated, the major reason for the
increased hydrogen current density is the lower activity coefficient of the hydrogen ion in the
presence of sulfate.
When H3B03 is added, there are changes in three aspects. Firstly, the current density at a
potential before the limiting plateau is smaller than that in 2.5 M NaCl alone. Secondly, the potential
for the decomposition of water shifts to a more positive value, meaning that the presence ofH3B03
activates the decomposition of water. Thirdly, the limiting current density plateau is somehow not
perfect, rising gradually as the potential becomes more negative. The third phenomenon is believed
to be related to the dissociation of boric acid, as more protons are generated from the boric acid at
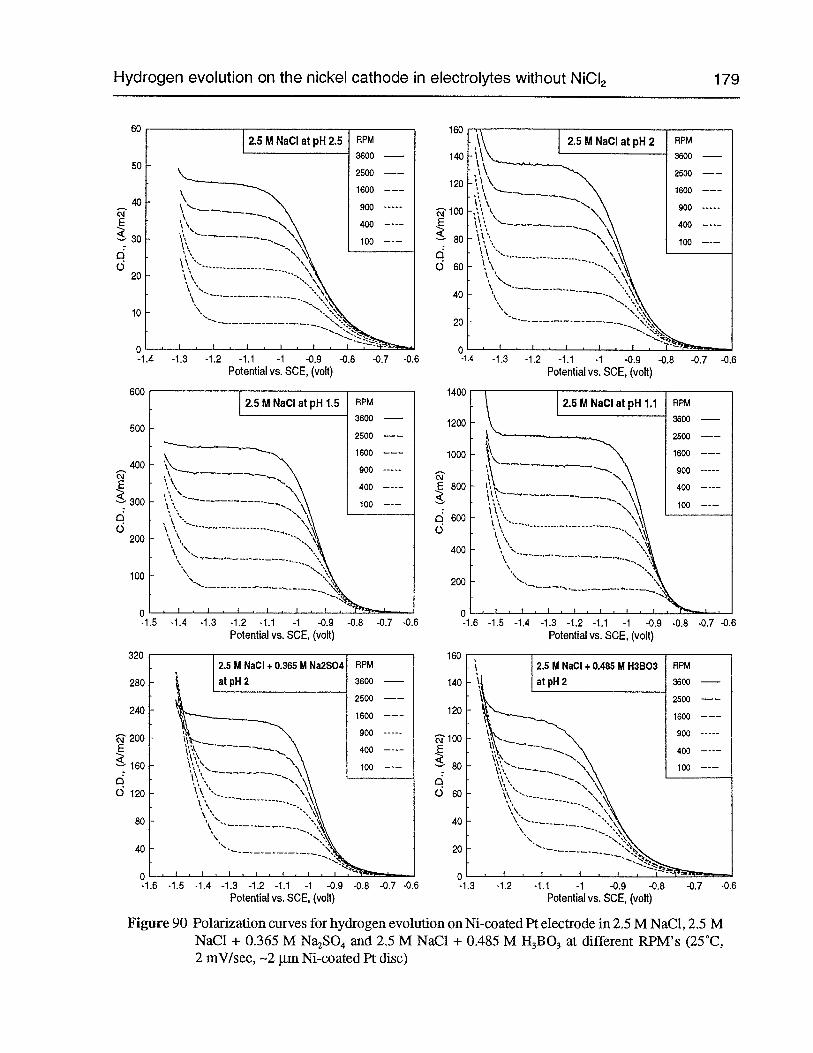
Hydrogen evolution on the nickel cathode in electrolytes without NiCI2 179
60
50
40
10
c’JE
dC
0-1.4 -1.3 -1.2 -1.1 -1 -0.9 -0.8 -0.7 -0.6
Potential vs. SCE, (volt)
C”E
C
-1.5 -1.4 -1.3 -1.2 -1.1 -1 -0.9 -0.8 -0.7 -0.6Potential vs. SCE, (volt)
2.5 M NaCI + 0.365 M Na2SO4atpH2
0-1.6 -1.5 -1.4 -1.3 -1.2 -1.1 -1 -0.9 -0.8 -0.7 -0.6
Potential vs. SCE, (volt)
160
140
320
280
240
200E
160
C) 120
80
40
RPM
3600
2500 ——
1600
900
400
100
120
100E
80
C) 60
40
20
0-1.31.6 -1.5 -1.4 -1.3 -1.2 -1.1 -1 -0.9 -0.8 -0.7 -0.6 -1.2 -1.1 -1 -0.9 -0.8 -0.7 -0.6
Potential vs. SCE, (volt) Potential vs. SCE, (volt)
Figure 90 Polarization curves for hydrogen evolution on Ni-coated Pt electrode in 2.5 M NaC1, 2.5 MNaCI + 0.365 M Na2SO4 and 2.5 M NaC1 + 0.485 M 113B03 at different RPM’s (25CC,2 mV/sec, —2 p.m Ni-coated Pt disc)
Hydrogen evolution on the nickel cathode in electrolytes without N1CI2 180
a higher pH. Comparing the results in 4.5 M NaC1 and 2.5 M NaC1, the current density at a given
potential and the limiting current density are both decreased, due mainly to the fact that the activity
coefficient of the hydrogen ion and the viscosity of the electrolyte are increased. However, the
polarization curves in electrolytes containing NH4C1 are very unusual and less reproducible.
According to Levich’ s equation, the limiting current density for hydrogen evolution can be described
as follows:
= 0.62lnFD3v6wu2Cb= 0.62lnFD3vh!6(’ x 2lrJCb
(362)
RPM 112a + (363)1L(H2)
= 0.62 lFDvh!6(60
x 27t) —-
Using 2.5 M NaC1 at pH 2 and 2,500 rpm as an example, the diffusion coefficient of the hydrogen
ion is 5.73 x l0 m2/sec in 2.27 M NaC1 at 25°C’221, the kinematic viscosity of 2.5 M NaC1 is
1.18 x 10.6 m2/sec at 20°C”°’, and the activity coefficient of hydrogen ion can be calculated to be
around 2.21 using the method discussed in Section 2.1.3 (also refer to Figure 12). Thus, it follows
from equation (363) that:
tL(H) = 0.621 x 96500 x (5.73 x i0’ (1.18 x l0hl6 x27tJlOxlO
137 (AIm2)(364)
This number, in spite of not being exactly the same, is close to the limiting current density found
in Figure 90.
For the electrolytes containing 2.5 M NaC1, 4.5 M NaCl, 2.5 M NaC1 + 0.365 M Na2SO4,
2.5 M NaCl + 0.485 MH3B03and 2.5 M NaC1 + 1.31 M NH4C1, the limiting current densities for
hydrogen evolution determined from the polarization curves are plotted in Figure 91 as a function
of the square root of RPM at pH 2.5, 2, 1.5 and 1.1. Except for the ill-defined behavior of the
electrolyte containing NH4C1, the linear relationships between the limiting current density and
-sJRPM were surprisingly good in all of the electrolytes studied. The change in the slopes of these
lines reflects the combined consequence of the change in the diffusion coefficient, viscosity and
the total acid concentration. If there are some pH buffers present in the electrolyte, the dissociable
protons should be added to the acid concentration. Another common concern is the viscosity of
electrolyte. The viscosity of the electrolyte will in most cases increase as it becomes more con
centrated. In the present study, the viscosity of the electrolytes with the addition ofNa2SO4,NaC1,
H3B03or NEI4C1should be higher than that in 2.5 M NaC1. The diffusion coefficient of the hydrogen
ion will accordingly decrease. As a result, the limiting current density decreases.
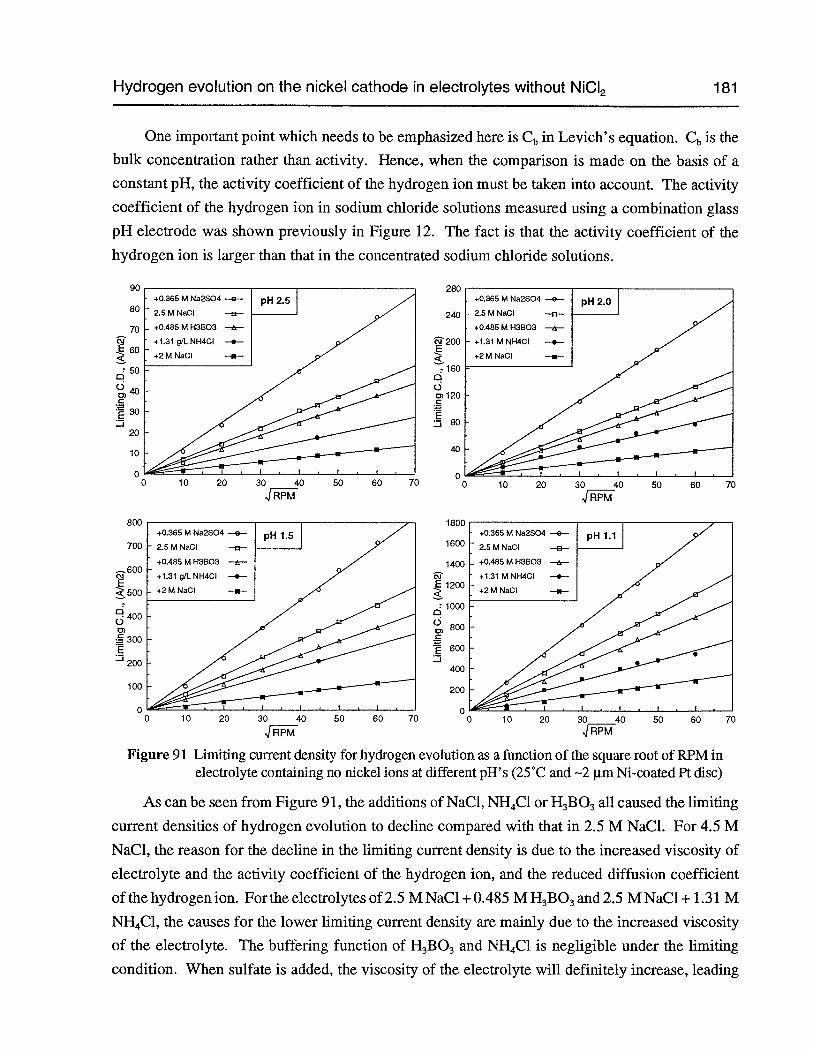
Hydrogen evolution on the nickel cathode in electrolytes without NICI2 181
One important point which needs to be emphasized here is Cb in Levich’s equation. Cb is thebulk concentration rather than activity. Hence, when the comparison is made on the basis of aconstant pH, the activity coefficient of the hydrogen ion must be taken into account. The activitycoefficient of the hydrogen ion in sodium chloride solutions measured using a combination glasspH electrode was shown previously in Figure 12. The fact is that the activity coefficient of the
hydrogen ion is larger than that in the concentrated sodium chloride solutions.
1800
1800
1400
1200
ci 1000
,800
600-J
400
200
030 40 30 40 50 60 70
1RPM
Figure 91 Limiting current density for hydrogen evolution as a function of the square root of RPM inelectrolyte containing no nickel ions at different PH’S (25°C and —2 pm Ni-coated Pt disc)
As can be seen from Figure 91, the additions of NaCl, NH4C1 orH3B03all caused the limiting
current densities of hydrogen evolution to decline compared with that in 2.5 M NaC1. For 4.5 M
NaC1, the reason for the decline in the limiting current density is due to the increased viscosity of
electrolyte and the activity coefficient of the hydrogen ion, and the reduced diffusion coefficient
of the hydrogen ion. For the electrolytes of 2.5 M NaC1 + 0.485 MH3B03and 2.5 M NaC1 + 1.31 M
NH4C1, the causes for the lower limiting current density are mainly due to the increased viscosity
of the electrolyte. The buffering function of H3B03 and NH4CI is negligible under the limiting
condition. When sulfate is added, the viscosity of the electrolyte will definitely increase, leading
800
700
_600
500
400
300E
200
0 10 20
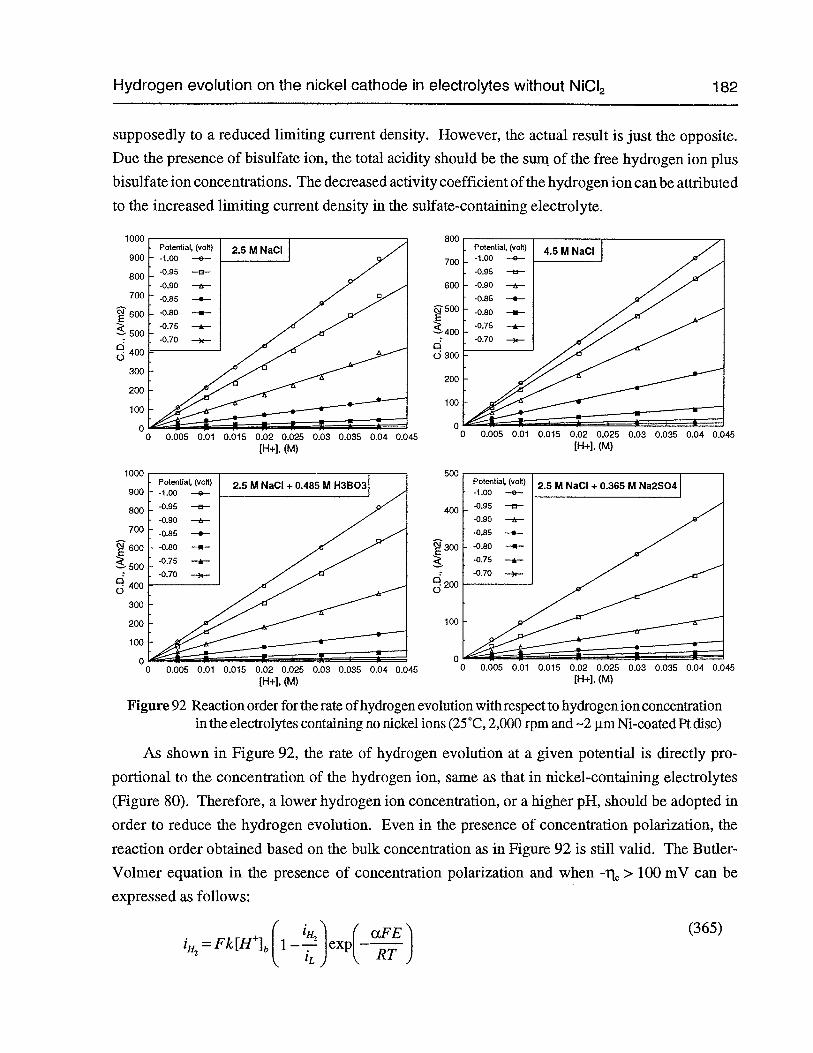
Hydrogen evolution on the nickel cathode in electrolytes without NICI2 182
supposedly to a reduced limiting current density. However, the actual result is just the opposite.
Due the presence of bisulfate ion, the total acidity should be the sum of the free hydrogen ion plus
bisuifate ion concentrations. The decreased activity coefficient of the hydrogen ion can be attributed
to the increased limiting current density in the sulfate-containing electrolyte.
uvu
900
______________ _______________
800
700
800
400
300
200
100
0
1000
900
_________________________________
800
700
600
500
400
300
200
100
0
800
5MNaCI
700
Potential, (volt) Potential, (volt) 4.5 M NaCI-1.00 —G— -l 00 —0-—
-0.90 —h-— 600 -0.90 ——
-0.85 —.— -0.85 —.—
-0.80 —.— 500 080 —*—
-0.75 —i-- -0.75 —*--400
£-0.70
(300
200
100
00 0.005 0.01 0.015 0.02 0.025 0.03 0.035 0.04 0.045 0 0.005 0.010.015 0.02 0.025 0.03 0.035 0.04 0.045
[H+1, (M) [H÷], (M)
Potential, (volt) 2.5 M NaCI + 0.485 M H3BO3-1.00 —0-—
-0.95 —s—
• -0.90 —h—
• -0.85 —.—
• -0.80 —a—
-0.75 —*—
0.70
0 0.005 0.01 0.015 0.02 0.025 0.03 0.035 0.04 0.045(H+], (M)
0 0.005 0.01 0.015 0.02 0.025 0.03 0.035 0.04 0.045[H+], (M)
Figure 92 Reaction order for the rate ofhydrogen evolution with respect to hydrogen ion concentrationin the electrolytes containing no nickel ions (25°C, 2,000 rpm and -‘2 jim Ni-coated Pt disc)
As shown in Figure 92, the rate of hydrogen evolution at a given potential is directly pro
portional to the concentration of the hydrogen ion, same as that in nickel-containing electrolytes
(Figure 80). Therefore, a lower hydrogen ion concentration, or a higher pH, should be adopted in
order to reduce the hydrogen evolution. Even in the presence of concentration polarization, the
reaction order obtained based on the bulk concentration as in Figure 92 is still valid. The Butler
Volmer equation in the presence of concentration polarization and when -it> 100 mV can be
expressed as follows:
II2 = Fk[H]8[l_42]exp(_’)
(365)
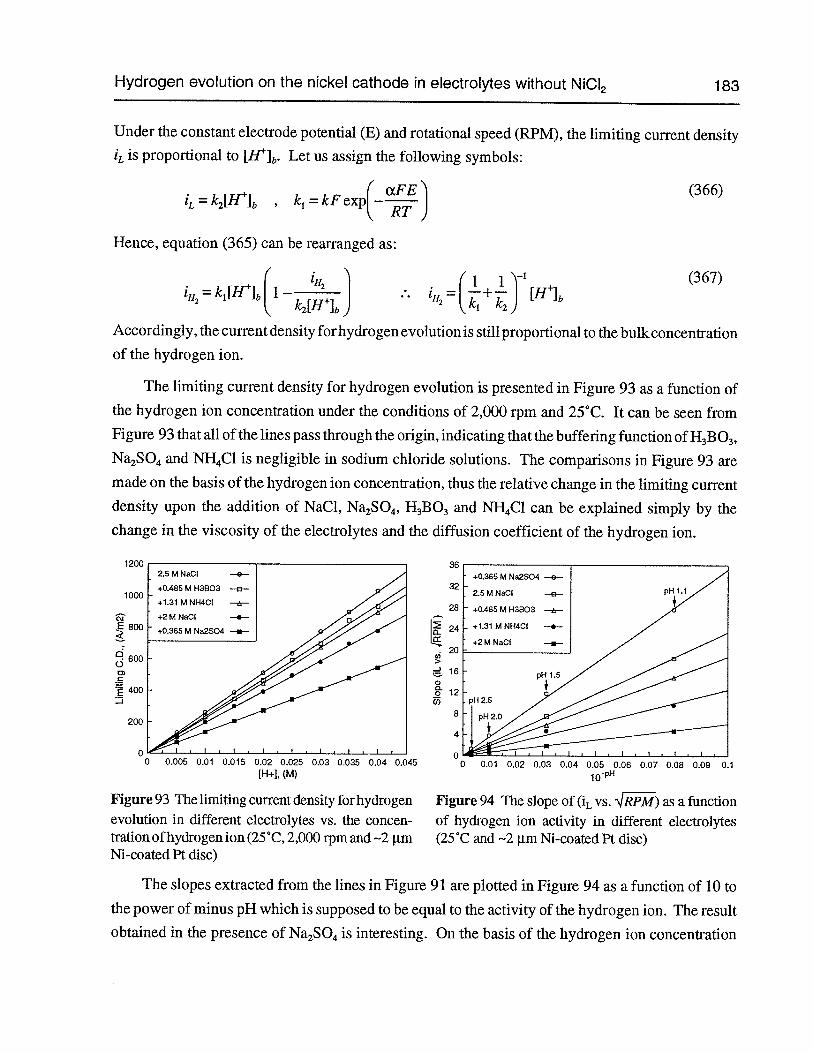
Hydrogen evolution on the nickel cathode in electrolytes without NiCI2 183
Under the constant electrode potential (E) and rotational speed (RPM), the limiting current density
1L is proportional to [H9b. Let us assign the following symbols:
( ciFE” (366)=k2[H]b , k1 = kF exp—
RT
Hence, equation (365) can be rearranged as:
( -‘ (367)iH2_kl[H1b[l_+J ... IH=+J [HJb
Accordingly, the current density forhydrogen evolution is still proportional to the bulkconcentrationof the hydrogen ion.
The limiting current density for hydrogen evolution is presented in Figure 93 as a function ofthe hydrogen ion concentration under the conditions of 2,000 rpm and 25°C. It can be seen fromFigure 93 that all of the lines pass through the origin, indicating that the buffering function ofH3B03,Na2SO4and NH4C1 is negligible in sodium chloride solutions. The comparisons in Figure 93 aremade on the basis of the hydrogen ion concentration, thus the relative change in the limiting currentdensity upon the addition of NaCl, Na2SO4,H3B03 and NH4C1 can be explained simply by thechange in the viscosity of the electrolytes and the diffusion coefficient of the hydrogen ion.
1200 36
321000
28
800
o U)•600—J 163)
12Ci)
8200
4
0 00 0.005 0.01 0.015 0.02 0.025 0.03 0.035 0.04 0.045 0 0.01 0.02 0.03 0.04 0.05 0.06 0.07 0.08 0.09 0.1
[H+],(M)
Figure 93 The limiting current density for hydrogen Figure 94 The slope of (L vs. ‘JRPM) as a functionevolution in different electrolytes vs. the concen- of hydrogen ion activity in different electrolytestration ofhydrogen ion (25°C, 2,000 rpm and —2 .Lm (25°C and —2 Lm Ni-coated Pt disc)Ni-coated Pt disc)
The slopes extracted from the lines in Figure 91 are plotted in Figure 94 as a function of 10 tothe power of minus pH which is supposed to be equal to the activity of the hydrogen ion. The resultobtained in the presence of Na2SO4is interesting. On the basis of the hydrogen ion concentration
+0.365 M Na2SO4 —0-—
2.5 M NaCI —o-
+0.465 M 83803 —a—
+1.31 M NH4CI —.-—
+2MNaCI -—
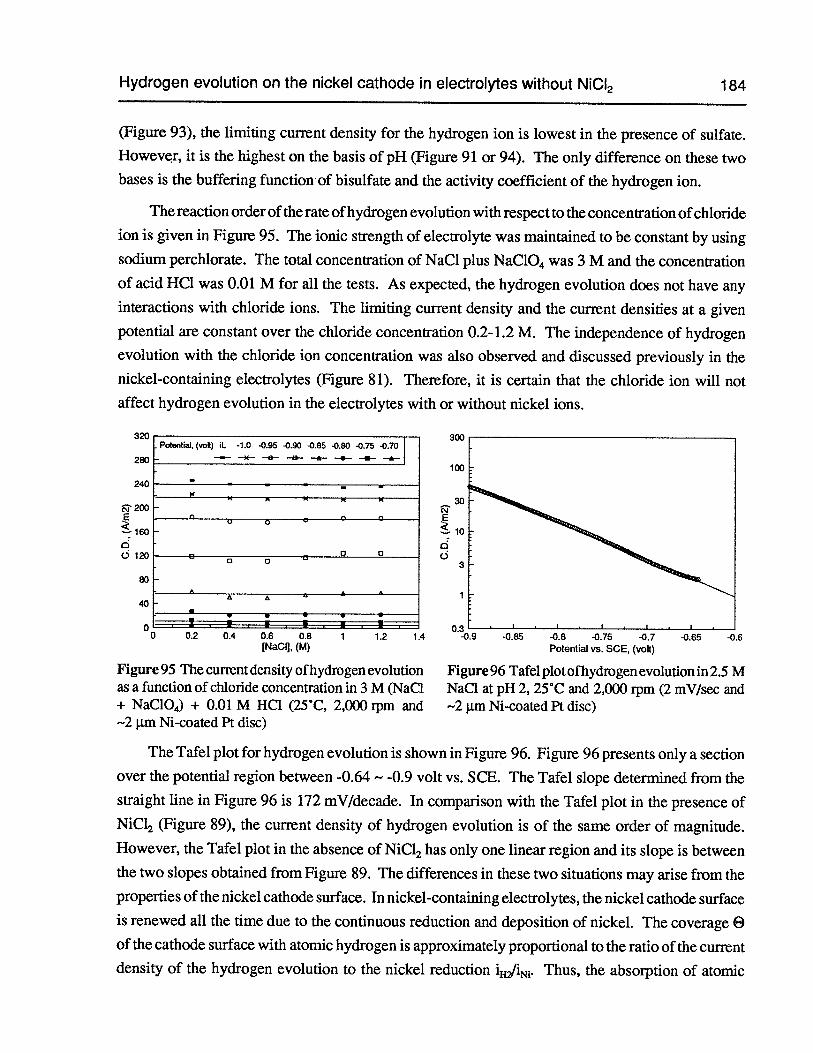
Hydrogen evolution on the nickel cathode in electrolytes without N1CI2 184
(Figure 93), the limiting current density for the hydrogen ion is lowest in the presence of sulfate.However, it is the highest on the basis of pH (Figure 91 or 94). The only difference on these twobases is the buffering functionof bisulfate and the activity coefficient of the hydrogen ion.
Thereaction order ofthe rate ofhydrogen evolution with respect to the concentration ofchlorideion is given in Figure 95. The ionic strength of electrolyte was maintained to be constant by usingsodium perchlorate. The total concentration of NaC1 plus NaC1O4was 3 M and the concentrationof acid HC1 was 0.01 M for all the tests. As expected, the hydrogen evolution does not have anyinteractions with chloride ions. The limiting current density and the current densities at a givenpotential are constant over the chloride concentration 0.2-1.2 M. The independence of hydrogenevolution with the chloride ion concentration was also observed and discussed previously in thenickel-containing electrolytes (Figure 81). Therefore, it is certain that the chloride ion will notaffect hydrogen evolution in the electrolytes with or without nickel ions.
320
280
240
200
160
C) 120
80
40
n
Potential. (vo’) IL -1.0 -0.95 -0.90 -0.85 -0.80 -0.75 -0.70— -- -a- -a- -- -a- --
n n fl0 0
0 ° °0 0
AA A
p— • p — p
- • i.I. .1.0 0.2 0.4 0.6 0.8 1 12 1.4
INaC, (M)
Figure 95 The current density ofhydrogen evolutionas a function of chloride concentration in 3 M (NaCl+ NaC1O4) + 0.01 M HQ (25C, 2,000 rpm and—2 jim Ni-coated Pt disc)
The Tafel plot for hydrogen evolution is shown in Figure 96. Figure 96 presents only a section
over the potential region between -0.64 — -0.9 volt vs. SCE. The Tafel slope determined from thestraight line in Figure 96 is 172 mV/decade. In comparison with the Tafel plot in the presence ofNiCI2 (Figure 89), the current density of hydrogen evolution is of the same order of magnitude.
However, the Tafel plot in the absence of NiCl2has only one linear region and its slope is betweenthe two slopes obtained from Figure 89. The differences in these two situations may arise from theproperties of the nickel cathode surface. In nickel-containing electrolytes, the nickel cathode surfaceis renewed all the time due to the continuous reduction and deposition of nickel. The coverage 8of the cathode surface with atomic hydrogen is approximately proportional to the ratio of the currentdensity of the hydrogen evolution to the nickel reduction Thus, the absorption of atomic
C)
-0.8 -0.75 -0.7Potential vs. SCE, (volt)
Figure 96 Tafel plotofhydrogen evolution in 2.5 MNaC1 at pH 2, 25°C and 2,000 rpm (2 mV/sec and-2 jim Ni-coated Pt disc)
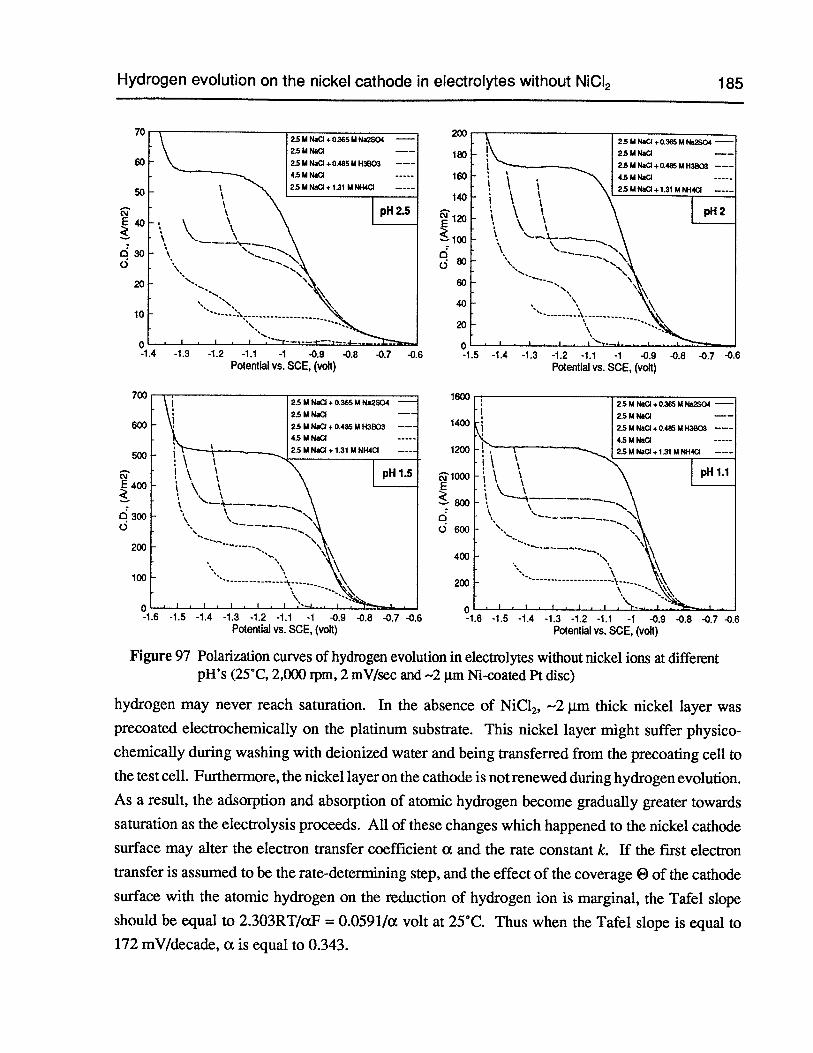
Hydrogen evolution on the nickel cathode in electrolytes without NiCI2 185
70
60
50
;40
d30(.5
20
10
0-1.4 -1.3 -1.2 -1.1 -1 -0.9 -0.8 -0.7 -0.6
Potential vs. SCE, (volt)
1400
1200
1000,400 E
‘80003000 d600
400
200
0-1.6 -1.5 -1.4 -1.3 -1.2 -1.1 -1 -0.9 -0.8 -0.7 -0.6
Potential vs. SCE, (volt)
Figure 97 Polarization curves of hydrogen evolution in electrolytes without nickel ions at differentpH’s (25°C, 2,000 rpm, 2 mV/sec and —2 jim Ni-coated Pt disc)
hydrogen may never reach saturation. In the absence of NiC12, —2 p.m thick nickel layer wasprecoated electrochemically on the platinum substrate. This nickel layer might suffer physicochemically during washing with deionized water and being transferred from the precoating cell tothe test cell. Furthermore, the nickel layer on the cathode is not renewed during hydrogen evolution.As a result, the adsorption and absorption of atomic hydrogen become gradually greater towardssaturation as the electrolysis proceeds. All of these changes which happened to the nickel cathodesurface may alter the electron transfer coefficient a and the rate constant k. If the first electrontransfer is assumed to be the rate-determining step, and the effect of the coverage 0 of the cathodesurface with the atomic hydrogen on the reduction of hydrogen ion is marginal, the Tafel slopeshould be equal to 2.303RT/czF = 0.0591/a volt at 25°C. Thus when the Tafel slope is equal to172 mV/decade, a is equal to 0.343.
160025UNaL1+O.365UNa2SO4 —
a5UNac —
2.5UNa+OA85MH3D3 ——
4.5UN
2.5MNaCl+1.31MNH4c
0-1.6 -1.5 -1.4 -1.3 -1.2 -1.1 -1 -0.9 -0.8 -0.7 -0.6
Potential vs. SCE, (volt)
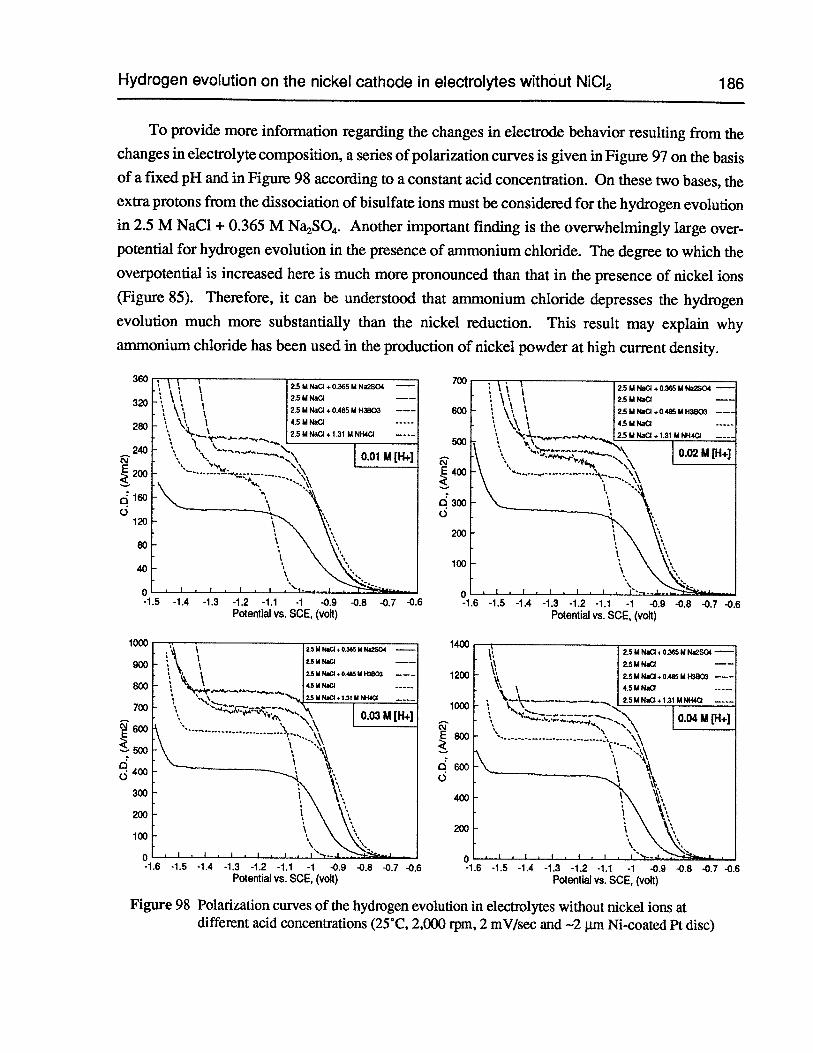
Hydrogen evolution on the nickel cathode in electrolytes without NiCI2 186
To provide more information regarding the changes in electrode behavior resulting from thechanges in electrolyte composition, a series of polarization curves is given in Figure 97 on the basisof a fixed pH and in Figure 98 according to a constant acid concentration. On these two bases, theextra protons from the dissociation of bisulfate ions must be considered for the hydrogen evolutionin 2.5 M NaC1 + 0.365 M Na2SO4. Another important finding is the overwhelmingly large over-potential for hydrogen evolution in the presence of ammonium chloride. The degree to which theoverpotential is increased here is much more pronounced than that in the presence of nickel ions(Figure 85). Therefore, it can be understood that ammonium chloride depresses the hydrogenevolution much more substantially than the nickel reduction. This result may explain whyammonium chloride has been used in the production of nickel powder at high current density.
320
280
240
200
c160()
120
80
40
0-1.5 -1.4 -1.3 -1.2 -1.1 -1 -0.9 -0.8 -0.7 -0.6
Potenlial vs. SCE, (volt)
1200
1000
c.’J2
600a
400
200
0-1.6 -1.5 -1.4 -1.3 -1.2 -1.1 -1 -0.9 -0.8 -0.7
Potential vs. SCE, (volt)
Figure 98 Polarization curves of the hydrogen evolution in electrolytes without nickel ions atdifferent acid concentrations (25C, 2,000 rpm, 2 mV/sec and —2 jim Ni-coated Pt disc)
800
1400
-1.6 -1.5 -1.4 -1.3 -1.2 -1.1 -1 -0.9 -0.8 -0.7 -0.6Potential vs. SCE, (volt)
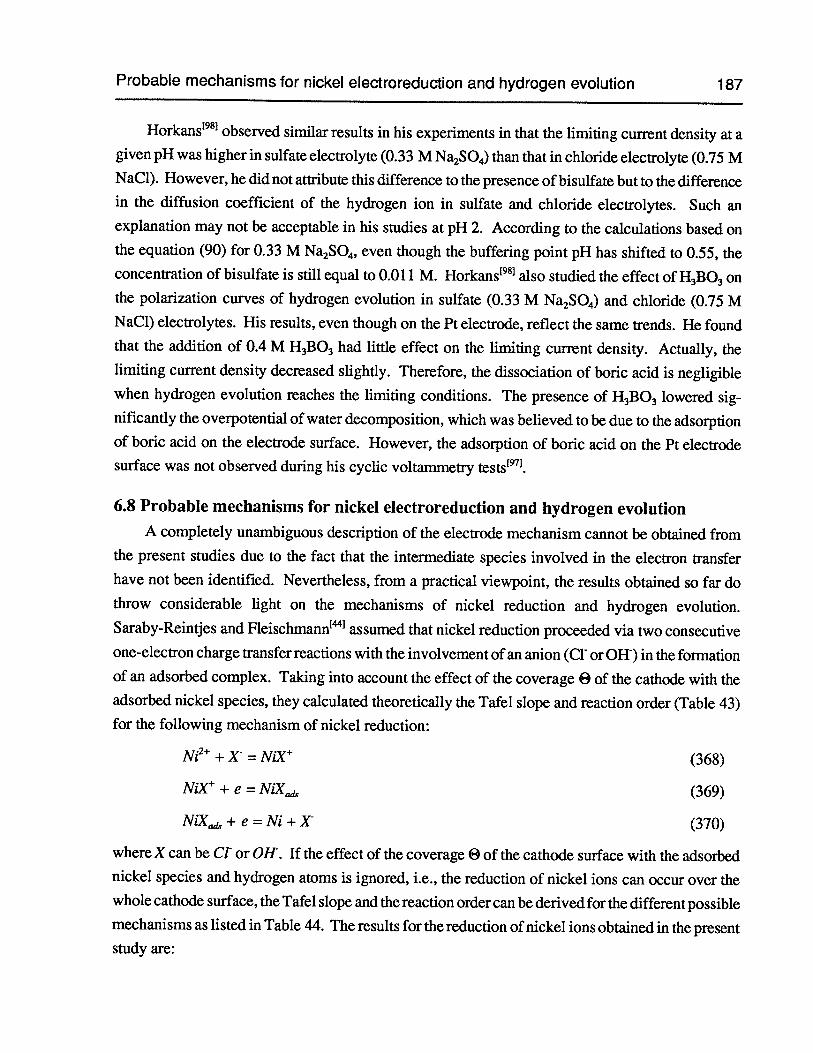
Probable mechanisms for nickel electroreduction and hydrogen evolution 187
Horkans1981 observed similar results in his experiments in that the limiting current density at agiven pH was higher in sulfate electrolyte (0.33 MNa2SO4)than that in chloride electrolyte (0.75 MNaC1). However, he did not attribute this difference to the presence of bisulfate but to the differencein the diffusion coefficient of the hydrogen ion in sulfate and chloride electrolytes. Such anexplanation may not be acceptable in his studies at pH 2. According to the calculations based onthe equation (90) for 0.33 M Na2SO4,even though the buffering point pH has shifted to 0.55, theconcentration of bisulfate is still equal to 0.011 M. Horkans98also studied the effect ofH3B03onthe polarization curves of hydrogen evolution in sulfate (0.33 M Na2SO4)and chloride (0.75 MNaCl) electrolytes. His results, even though on the Pt electrode, reflect the same trends. He foundthat the addition of 0.4 M H3B03had little effect on the limiting current density. Actually, thelimiting current density decreased slightly. Therefore, the dissociation of boric acid is negligiblewhen hydrogen evolution reaches the limiting conditions. The presence ofH3B03lowered significantly the overpotential of water decomposition, which was believed to be due to the adsorptionof boric acid on the electrode surface. However, the adsorption of boric acid on the Pt electrodesurface was not observed during his cyclic voltammetry tests1.
6.8 Probable mechanisms for nickel electroreduction and hydrogen evolutionA completely unambiguous description of the electrode mechanism cannot be obtained from
the present studies due to the fact that the intermediate species involved in the electron transferhave not been identified. Nevertheless, from a practical viewpoint, the results obtained so far dothrow considerable light on the mechanisms of nickel reduction and hydrogen evolution.Saraby-Reintjes and Fleischmann assumed that nickel reduction proceeded via two consecutiveone-electron charge transfer reactions with the involvement of an anion (Cl or OH) in the formationof an adsorbed complex. Taking into account the effect of the coverage 0 of the cathode with theadsorbed nickel species, they calculated theoretically the Tafel slope and reaction order (Table 43)for the following mechanism of nickel reduction:
Ni2 + K = NiX (368)
NiX + e = N1K (369)
NiX, + e = Ni + K (370)
where X can be Ci or 0H. If the effect of the coverage 0 of the cathode surface with the adsorbednickel species and hydrogen atoms is ignored, i.e., the reduction of nickel ions can occur over thewhole cathode surface, the Tafel slope and the reaction order can be derived for the different possiblemechanisms as listed in Table 44. The results for the reduction of nickel ions obtained in the presentstudy are:
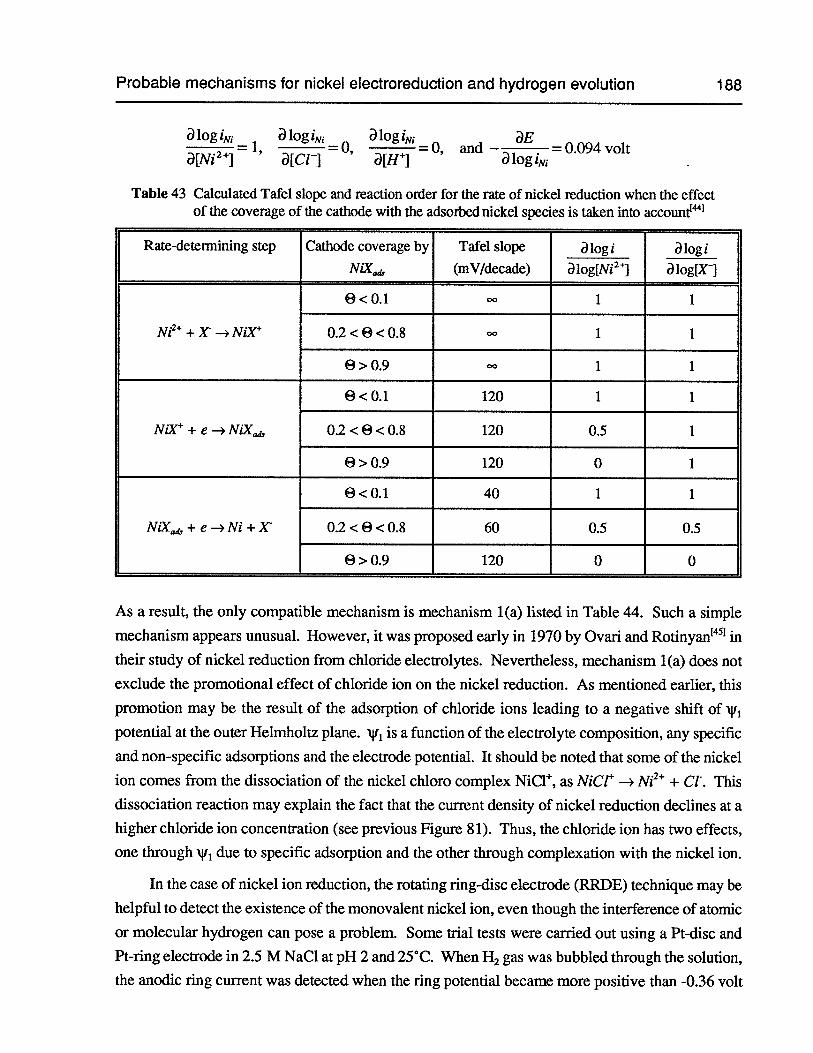
Probable mechanisms for nickel electroreduction and hydrogen evolution 188
alogi, a logiN, alog1Ni aE1, = 0, = 0, and — = 0.094 volt
a[Ni2] a[Cl-] a[Fr] alogi1
Table 43 Calculated Tafel slope and reaction order for the rate of nickel reduction when the effectof the coverage of the cathode with the adsorbed nickel species is taken into account”1
Rate-determining step Cathode coverage by Tafel slope alogi alogiNiX, (mV/decade) a log[Ni2] a log[X1
0<0.1 1 1
Ni+K—*NiX 0.2<0<0.8 1 1
0>0.9 00 1 1
0<0.1 120 1 1
NiK + e —* NiX, 0.2<6< 0.8 120 0.5 1
0>0.9 120 0 1
0<0.1 40 1 1
NiX, + e — Ni + K 0.2<6 < 0.8 60 0.5 0.5
0>0.9 120 0 0
As a result, the only compatible mechanism is mechanism 1(a) listed in Table 44. Such a simple
mechanism appears unusual. However, it was proposed early in 1970 by Ovari and Rotinyan4in
their study of nickel reduction from chloride electrolytes. Nevertheless, mechanism 1(a) does not
exclude the promotional effect of chloride ion on the nickel reduction. As mentioned earlier, this
promotion may be the result of the adsoiption of chloride ions leading to a negative shift of
potential at the outer Helmholtz plane. ji is a function of the electrolyte composition, any specific
and non-specific adsorptions and the electrode potential. It should be noted that some of the nickel
ion comes from the dissociation of the nickel chloro complex NiCl, as NICt’ —> Ni + Ci. This
dissociation reaction may explain the fact that the current density of nickel reduction declines at a
higher chloride ion concentration (see previous Figure 81). Thus, the chloride ion has two effects,
one through N’i due to specific adsorption and the other through complexation with the nickel ion.
In the case of nickel ion reduction, the rotating ring-disc electrode (RRDE) technique may be
helpful to detect the existence of the monovalent nickel ion, even though the interference of atomic
or molecular hydrogen can pose a problem. Some trial tests were carried out using a Pt-disc and
Pt-ring electrode in 2.5 M NaC1 at pH 2 and 25CC. When H2 gas was bubbled through the solution,
the anodic ring current was detected when the ring potential became more positive than -0.36 volt
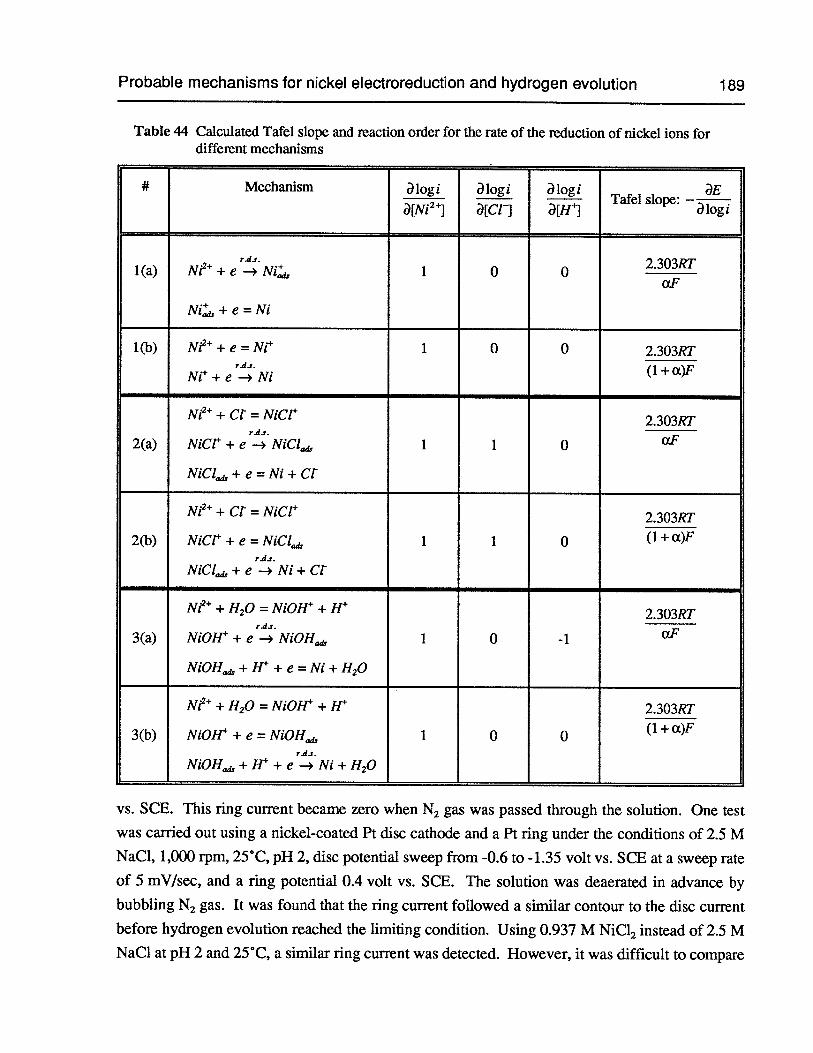
Probable mechanisms for nickel electroreduction and hydrogen evolution 189
Table 44 Calculated Tafel slope and reaction order for the rate of the reduction of nickel ions fordifferent mechanisms
# Mechanism alogi alogi alogiTafel slope:
—____
a[Ni2] [C11 a[H] alogi
r4.r. 2.303RT1(a) N? + e —* Ni 1 0 0F
Ni, + e = Ni
1(b) N? + e = Ni 1 0 0 2.303RTr4.x.
Ni+e-*Ni (l+cx)F
Ni2 + Ct = NiCr 2.303RTr4.z.
2(a) N1C1 + e —* NiC1, 1 1 0
NiCl + e = Ni + Ct
Ni2 + Ct NiCr 2.303RT
2(b) NiC1 + e = NiCl4, 1 1 0 (1 + (X)F
r4.s.
NiC1+e —*Ni+Ct
N? + H20 = NiOH + H 2.303RTr4s.
3(a) NiOH + e -* NiOH 1 0 -l aF
NiOH+H+e=Ni+H2O
Ni+H2O=NiOW+H 2.303RT
3(b) NiOH + e = NiOH, i o o (1 + a)F
Y4j.
NiOH+H+e—Ni+H2O
vs. SCE. This ring current became zero when N2 gas was passed through the solution. One test
was carried out using a nickel-coated Pt disc cathode and a Pt ring under the conditions of 2.5 M
NaC1, 1,000 rpm, 25°C, pH 2, disc potential sweep from -0.6 to -1.35 volt vs. SCE at a sweep rate
of 5 mV/see, and a ring potential 0.4 volt vs. SCE. The solution was deaerated in advance bybubbling N2 gas. It was found that the ring current followed a similar contour to the disc current
before hydrogen evolution reached the limiting condition. Using 0.937 M NiC12 instead of 2.5 MNaCI at pH 2 and 25°C, a similar ring current was detected. However, it was difficult to compare
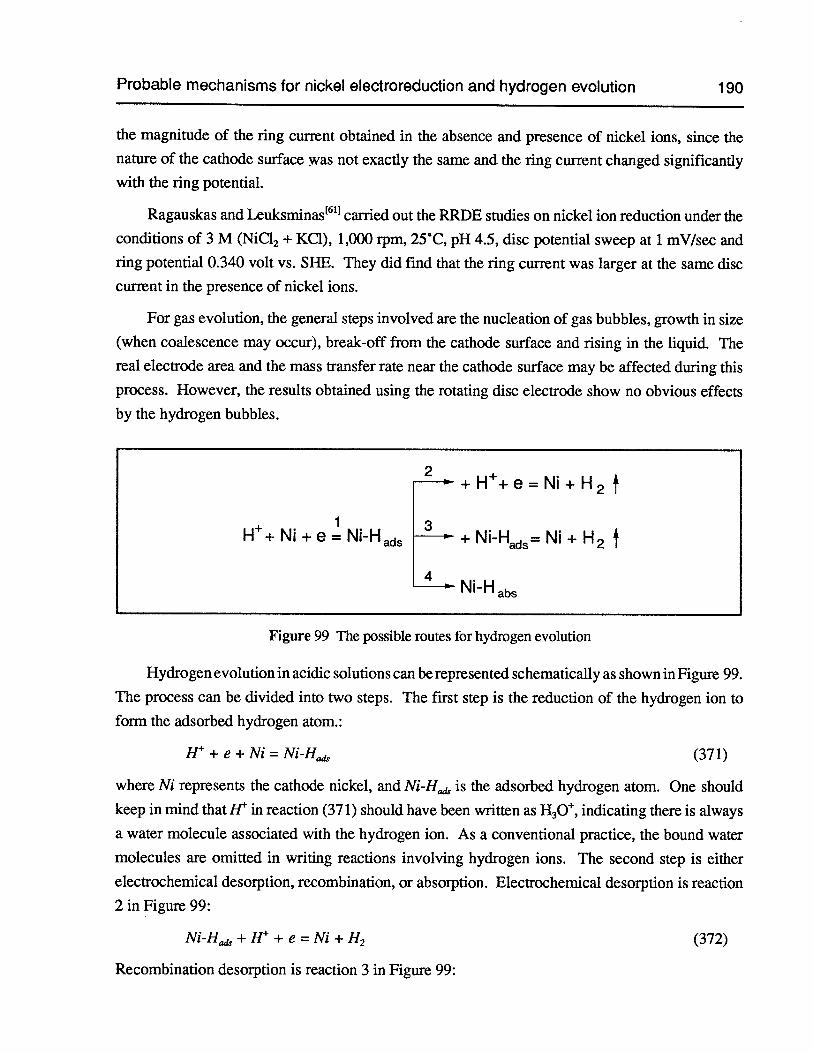
Probable mechanisms for nickel electroreduction and hydrogen evolution 190
the magnitude of the ring current obtained in the absence and presence of nickel ions, since thenature of the cathode surface was not exactly the same and the ring current changed significantlywith the ring potential.
Ragauskas and Leuksminas61carried out the RRDE studies on nickel ion reduction under theconditions of 3 M (NiCl2 + KC1), 1,000 rpm, 25°C, pH 4.5, disc potential sweep at 1 mV/sec andring potential 0.340 volt vs. SHE. They did find that the ring current was larger at the same disc
current in the presence of nickel ions.
For gas evolution, the general steps involved are the nucleation of gas bubbles, growth in size
(when coalescence may occur), break-off from the cathode surface and rising in the liquid. Thereal electrode area and the mass transfer rate near the cathode surface may be affected during this
process. However, the results obtained using the rotating disc electrode show no obvious effects
by the hydrogen bubbles.
2+H÷e=Ni÷H2
H+ Ni + e 1 NH ads + NHads= Ni + H2
4NiH
Figure 99 The possible routes for hydrogen evolution
Hydrogen evolution in acidic solutions can be represented schematically as shown in Figure 99.
The process can be divided into two steps. The first step is the reduction of the hydrogen ion to
form the adsorbed hydrogen atom.:
H + e + Ni = Ni-Ha, (371)
where Ni represents the cathode nickel, and Ni-H is the adsorbed hydrogen atom. One should
keep in mind that H in reaction (371) should have been written as H3O, indicating there is always
a water molecule associated with the hydrogen ion. As a conventional practice, the bound water
molecules are omitted in writing reactions involving hydrogen ions. The second step is either
electrochemical desorption, recombination, or absorption. Electrochemical desorption is reaction
2 in Figure 99:
Ni-H+H+e=Ni+H2 (372)
Recombination desorption is reaction 3 in Figure 99:
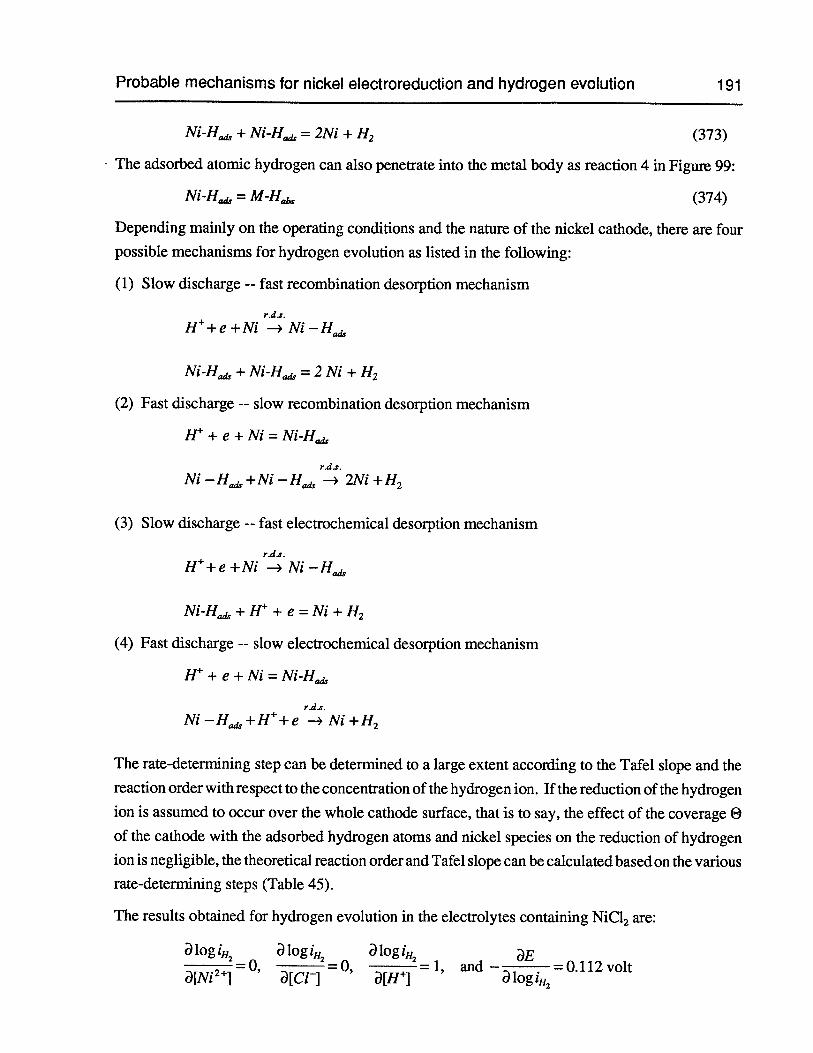
Probable mechanisms for nickel electroreduction and hydrogen evolution 191
Ni-H + Ni-H = 2Ni + H2 (373)
The adsorbed atomic hydrogen can also penetrate into the metal body as reaction 4 in Figure 99:
Ni-H = M-H (374)
Depending mainly on the operating conditions and the nature of the nickel cathode, there are fourpossible mechanisms for hydrogen evolution as listed in the following:
(1) Slow discharge -- fast recombination desorption mechanism
r.d.s.H+e+Ni —*Ni—H
Ni-H + Ni-H = 2 Ni + H2
(2) Fast discharge -- slow recombination desorption mechanism
H + e + Ni = Ni-H
r4.s.
Ni -H + Ni H —* 2Ni + H2
(3) Slow discharge -- fast electrochemical desorption mechanism
r4.s.
H+e+Ni —*Ni—H
Ni-H+H4’+ e =Ni+H2
(4) Fast discharge -- slow electrochemical desorption mechanism
H + e + Ni = Ni-H
rds.Ni—H+H+e —>Ni+H2
The rate-determining step can be determined to a large extent according to the Tafel slope and the
reaction order with respect to the concentration of the hydrogen ion. If the reduction of the hydrogen
ion is assumed to occur over the whole cathode surface, that is to say, the effect of the coverage €)
of the cathode with the adsorbed hydrogen atoms and nickel species on the reduction of hydrogenion is negligible, the theoretical reaction order and Tafel slope can be calculated based on the variousrate-determining steps (Table 45).
The results obtained for hydrogen evolution in the electrolytes containing NiCl2 are:
a log 1H2 a log1H2 a logi112 aE= 0, = 0, = 1, and — = 0.112 volt
a[Ni2J a[Cl-] [H9 alogiH2
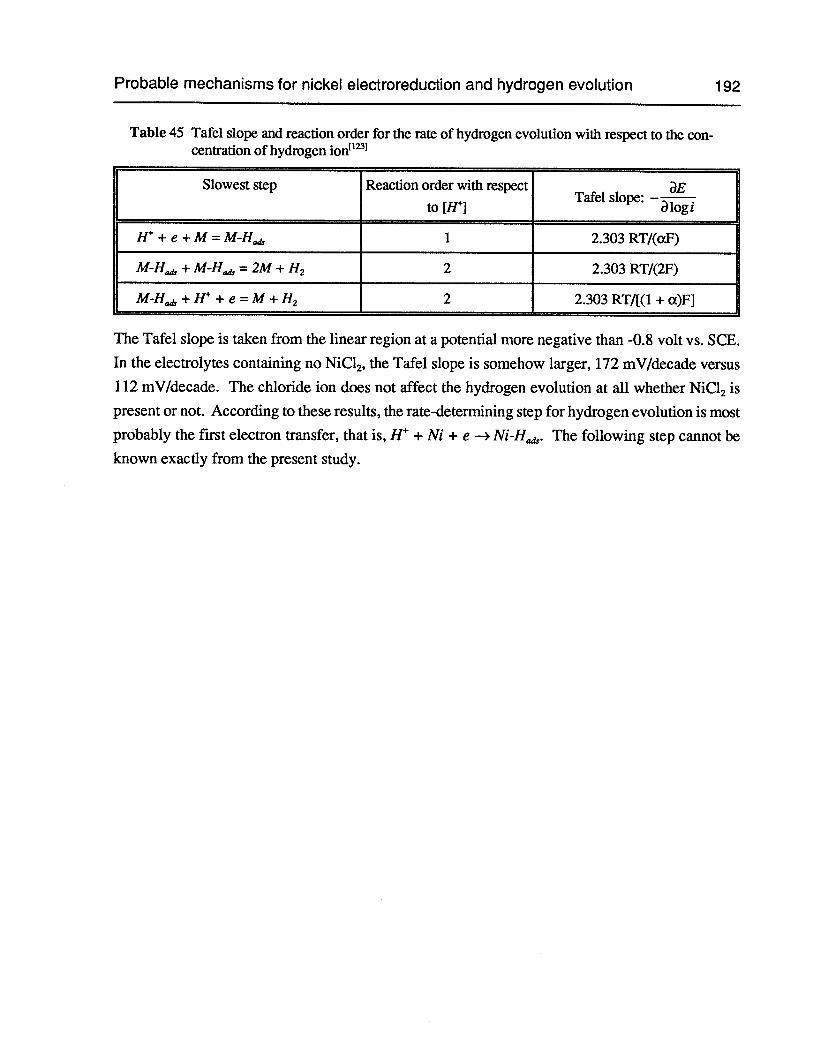
Probable mechanisms for nickel electroreduction and hydrogen evolution 192
Table 45 Tafel slope and reaction order for the rate of hydrogen evolution with respect to the concentration of hydrogen ion”
Slowest step Reaction order with respectTafel slope: —_____
to[If] alogi
H + e + M = M-H 1 2.303 RT/((xF)
M-H + M-H = 2M + ‘2 2 2.303 RT/(2F)
M-H+H+e=M+H2 2 2.303RT/[(1+a)F]
The Tafel slope is taken from the linear region at a potential more negative than -0.8 volt vs. SCE.
In the electrolytes containing no NiCl2,the Tafel slope is somehow larger, 172 mV/decade versus
112 mV/decade. The chloride ion does not affect the hydrogen evolution at all whether NiCl2 is
present or not. According to these results, the rate-determining step for hydrogen evolution is most
probably the first electron transfer, that is, H + Ni + e —* Ni-H. The following step cannot be
known exactly from the present study.
Chapter 7 Conclusions 193
Chapter 7 Conclusions
The following are the principal conclusions resulting from the study of the fundamental and appliedaspects of nickel electrowinning from chloride electrolytes:
(1) The thermodynamics of nickel chloride electrolytes were examined with reference to theactivity coefficients in simple and multicomponent solutions and nickel speciation in suchsolutions.
In concentrated NiC12solutions, the activity coefficient of the hydrogen ion is always greaterthan one and increases steadily with increasing NiC12 or NaC1 concentration; however, itdecreases continuously with increasing sulfate concentration.
In the acidic region, the predominant nickel species are Ni2 and NiCl in concentrated pureNiC12solutions andNi2,NiCl and NiSO4in the concentrated mixed sulfate-containing NiC12solutions. The concentration of the traditionally believed electroactive species NiOW isnegligible. All other species such as Ni(OH)), Ni(OH), Ni(OH),Ni2OH andNi4(OH)are negligible too over the pH range 0 to 14.
The pH for the precipitation of insoluble Ni(OH)S) decreases with increasing nickel ionconcentration and temperature. The effect of ionic strength on the solubility product anddissociation constant should be taken into account in such calculations.
(2) To better understand the electrochemistry at the cathode-electrolyte interface, the cathode
surface pH was measured using a flat-bottom combination glass pH electrode and a 500-mesh
gold gauze cathode which had been preplated with nickel.
The cathode surface pH is strongly dependent on the bulk pH, electrolyte composition,
temperature, current density and agitation. Lower bulk pH, higher NiC12concentration, higher
temperature, application of agitation and the additions of NaC1, H3B03and NH4C1 result in
a lower surface pH.
Addition of a small amount of sulfate to the electrolyte is beneficial in lowering the surface
pH. However, excessive addition of sulfate is inappropriate, as the surface pH will not befurther lowered and the current efficiency of nickel decreases severely.
The cathode surface pH during nickel electrowinning was modelled theoretically and a generalconsistency with the experimental measurements was found for 0.937 M NiC12and 2 M NiCI2at bulk pH 2.5.
Chapter 7 Conclusions 194
(3) In small-scale electrowinning experiments it was found that higher nickel concentration, andthe additions of NaC1, H3B03 and NH4C1 lead to a higher current efficiency of nickel.However, the current efficiency of nickel decreases with increasing sulfate concentration. In0.937 M NiC12at 6(YC, the suitable bulk pH is around 1.5. At this pH, a satisfactoty nickeldeposit can be achieved at a current density up to 1,000 A/m2 with a current efficiencyaveraging 96.4 % and without any risk of the formation of insoluble Ni(OH)) on the cathodesurface.
(4) The cathode kinetics during nickel electrowinning were studied using the rotating discelectrode.
It was found that the rate of nickel deposition is first order with respect to the activity of nickelion and zero order with respect to the activity of chloride and hydrogen ions.
The rate of hydrogen evolution was observed to be first order with respect to the activity ofhydrogen ion and zero order with respect to the activity of chloride and nickel ions.
Polarization curves obtained in electrolytes of NiC12, NiC12-NaC1, NiC12-Na2SO4andNiC12-H3B03all had a characteristic peak. The height of the peak depends on the concentrationof hydrogen ions. Under these limiting conditions of hydrogen evolution the cathode surfacepH is raised resulting in the formation of a black deposit, most probably nickel oxide.
(5) Concerning nickel electrowinning at moderately high current densities (up to 500 A/rn2), allof the electrolytes studied appear to be suitable for producing a good quality nickel cathodewith an acceptable current efficiency. When the current density is above 1,000 A/rn2, theaddition ofH3B03or NH.4C1, or the use of a more concentrated NiC12electrolyte is indicated.
Chapter 8 Recommendations for Further Work 195
Chapter 8 Recommendations for Further Work -
Due to the time limit in this thesis work, many important areas have not been explored. It isbelieved that these areas are worth investigating in the future from the viewpoint of the basicunderstanding and the practical application of nickel electrowinning.
One ofthe most important areas for study is the nucleation, growth, coalescence and detachmentof hydrogen gas bubbles on the nickel substrate during nickel electrowinning. One excellenttechnique is the optical method which has been used successfully by Bozhkov and co-workersin their studies on hydrogen evolution during zinc electrowinning. They found that the hydrogenbubbles on the cathode changed not only in size but in shape as well. Any substances which canalter the surface tension will affect the contact angle and the bubble shape.
Another important area of investigation which can be both theoretical and speculative, is anAC impedance study. AC impedance during nickel electrodeposition has been studied to a certainextent, mainly by Wiart “ ‘. This technique is claimed to be very useful in identifying qualitatively the adsorbed species which often form during the electroreduction of polyvalent metal ionssuch as divalent nickel.
The third area is not electrochemical in nature but concerns solution purification. The presentstudy has shown the feasibility of high current density electrowinning in an electrolyte having ahigh nickel chloride concentration. The solution from the leaching of nickel matte by chlorine isvery concentrated, containing around 230 g/L Ni2. The reason for diluting this concentratedsolution is to facilitate its subsequent purification. An impurity ofmajor concern is lead. Therefore,it is necessary to develop a purification process which can remove lead from concentrated nickelchloride solutions.
Finally, consideration should be given to the study of the nucleation of nickel and crystalgrowth in the initial stages of deposition on various substrates including titanium, stainless steel,copper and nickel under conditions similar to industrial operations.
Bibliography 196
Bibliography
[1] Desjardins, P.R., “Nickel Smelting and Refining”, CIM Bulletin, Feb. 1993, 95-99.
[2] Conard, B.R., “Copper, Nickel and Cobalt Electrometallurgy”, A Short Course onFundamentals and Practice ofAqueous Electrometallurgy, The Hydrometallurgy Sectionof The Metallurgical Society of CIM, Montréal, Québec, Canada, October 20-2 1, 1990.
[3] Kerfoot, D.G.E. and Weir, D.R., “The Hydro- and Electrometallurgy of Nickel andCobalt”, Extractive Metallurgy ofNickel & Cobalt”, ed. by G.P. Tyroler and C.A. Landolt,117th TMS Annual Meeting, The Metallurgical Society/AIME, 1988, 24 1-267.
[41 Burkin, A.R., “Hydrometallurgy of Nickel Sulfides”, Extractive Metallurgy ofNickel, ed.by A.R. Burkin, John Wiley & Sons, Chichester, U.K., 1987, 98-146.
[5] Hofirek, Z. and Kerfoot, D.G.E., “The Chemistry of the Nickel-Copper Matte Leach andIts Application to Process Control and Optimization”, Hydrometallurgy, Theory andPractice, Part A, ed. by W.C. Cooper and D.B. Dreisinger, Proc. of the Ernest PetersInternational Symposium, Elsevier, New York, 1992, 357-38 1.
[61 Hoare, J.P., “On the Role of Boric Acid in the Watts Bath”, Proceedings ofthe Symposiumon ELECTRODEPOSITION TECHNOLOGY, THEORY AND PRACTICE, ed. by L.T.Romankiw and D.R. Turner, 1987, The Electrochemical Society, 269-284.
[7] Gran, T.V. and Kheifets, V.L., “Electrolytic Refinement of Nickel Using a ChlorideElectrolyte”, Electrometallurgy of Chloride Solutions, ed. by V.V. Stender, ConsultantsBureau, New York., 1965, 91-97.
[8] Romankiw, L.T., “pH Changes at the Cathode during Electrolysis of Ni, Fe, Cu andTheir Alloys and a Simple Technique for Measuring pH changes at Electrodes”, Proceedings of the Symposium on ELECTRODEPOSITION TECHNOLOGY, THEORY ANDPRACTICE, ed. by L.T. Romankiw and D.R. Turner, The Electrochemical Society, 1987,301-325.
[9] Peters, E., “Activity Coefficients in Hydrometallurgical Calculations”, Introduction toEs-pH Diagrams (Short Course Notes), ed. by E. Peters and D. Dreisinger, Dept. of Metalsand Materials Engineering, The Univ. of British Columbia, Vancouver, B.C., Canada, 1990.
[10] Stensholt, E.O., Zachariasen, H., Lund, J.H. and Thornhill, P.G., “Recent Improvementsin the Falconbridge Nickel Refinery”, Extractive Metallurgy ofNickel & Cobalt, ed. byG.P. Tyroler and C.A. Landolt, 117th TMS Annual Meeting, The Metallurgical Society,1988, 403-412.
[11] Fujimori, M., Ono, N., Tamura, N. and Kohga, T., “Electrowinning from AqueousChlorides in SMM’s Nickel and Cobalt Refining Process”, Chloride Electrometallurgy[Proc. Conf.], ed. by P.D. Parker, The Metallurgical Society/AIME, 1982, 155-166.
Bibliography 197
[12) Anonymous, “New Nickel Refining is Back on Stream at Le Havre-Sondouville”, Eng.and Mm. J., Feb. 1980, 35-36.
[13) Stensholt, E.O., Zachariasen, H. and Lund, J.H., “The Falconbridge Chlorine LeachProcess”, Nickel Metallurgy. Vo1J. Extraction and Refining ofNickel [Proc. Conf.], ed. byE. Ozberk and S.W. Marcuson, 25th Annual Conference of Metallurgists, CIM, 1986,442-467.
[14) Stensholt, E.O., Zachariasen, H. and Lund, J.H., “Falconbridge Chlorine Leach Process”,Trans. Inst. Mm. Metall. C, March 1986, 95, C10-C16.
[15] Stensholt, E.O., Zachariasen, H. and Lund, J.H., “The Falconbridge Chlorine LeachProcess”, Extractive Metallurgy’ 85 [Proc. Conf.], London, U.K., 1985, 377-397.
[16) Goble, M.L. and Chapman, J.A., “Electrolytic Nickel Production in the ThompsonRefinery”, Nickel Metallurgy, vol.1. Extraction and Refining of Nickel [Proc. Conf.], ed.by E. Ozberk and S.W. Marcuson, 25th Annual Conference of Metallurgists, CIM, 1986,464-480.
[17] Inanii, T., Ishikawa, Y., Tsuchida, N. and Hirao, M., “Effect of Slime on the AnodePotential in Nickel Matte Electrorefining”, Extractive Metallurgy ofNickel & Cobalt, ed.by G.P. Tyroler and C.A. Landolt, 117th TMS Annual Meeting, The Metallurgical Society,1988, 429-445.
[18] Ueda, M., “Environmental Problems and Sumitomo’s Nickel Refining Technology”,Proceedings ofthe International Conference on Mining and Metallurgy ofComplex NickelOres, ed. by Chongyue Fu, Huanhua He and Chuanfu Zhang, International AcademicPublishers, Beijing, China, Sept. 1993, 12-21.
[19] Inami, T., Tsuchida, N., Tomoda, K. and Shigemura, H., “Studies on Anodic Dissolutionof Nickel Sulfides in the Nickel Matte Electrolysis”, Nickel Metallurgy, vol.1. Extractionand Refining ofNickel [Proc. Conf.], ed. by E. Ozberk and S.W. Marcuson, 25th AnnualConference of Metallurgists, CIM, 1986, 482-511.
[20] Yang, Y. and Meng, X., “Operating Practice and Technical Developments in NickelRefining and Cobalt Recovery at Jinchuan Non-ferrous Metal Company”, ElectrometallurgicaiPlant Practice, 20th Annual Hydrometallurgical Meeting of CIM, ed. by P.L.Claessens and G.B. Harris, Pergarnon Press, Toronto, 1990, 253-268.
[21] Koskinen, P., Virtanen, M. and Eerola, H., “Integrated Nickel Production in OutokumpuOy”, Extractive Metallurgy ofNickel & Cobalt, ed. by G.P. Tyroler and C.A. Landok, 117thTMS Annual Meeting, The Metallurgical Society, 1988, 355-371.
[22] Saarinen, H. and Seilo, M., “Production of the Cathode Nickel in the Outokumpu Process”, Refining Processes in Metallurgy [Proc. Conf.], 1MM Institution of Mining andMetallurgy, 1983, 267-283.
Bibliography 198
[23] Hofirek, Z. andHakon, P., “Production ofHigh Quality Electrowon Nickel at RustenburgBase Metals Refiners (Pty.) Ltd”, Electrometallurgical Plant Practice, 20th AnnualHydrometallurgical Meeting ofCIM, ed. by P.L. Claessens and G.B. Harris, Pergamon Press,Toronto, 1990,233-251.
[24] Ettel, V.A. and Tilak, B.V., “Electrolytic Refining and Winning of Metals”, Comprehensive Treatise of Electrochemistry, vol.2 (Electrochemical Processing), ed. byI. O’M. Bockris, B.E. Conway, E. Yeager and R.E. White, Plenum Press, New York, 1981,327-3 80.
[25] Hougen, L.R., Parkinson, R., Saetre, 3. and Van Weert, G., “Operating Experiences witha Pilot Plant for the Electrowinning of Nickel from All-Chloride Electrolyte”, CIMBulletin, June 1977, 136-143.
[26] Gong, Q., Liao, H., Yang, T., Hu, J. and Fang, Z., “Electrodeposition of Nickel fromAll-Chloride Electrolyte”, Trans. Nonferrous Met. Soc. China, 1992,2(3), 46-52.
[27] Alekseeva, R.K. and Zenkevich, V.V., “Permissible Impurity Content of Nickel Electrolytes When Operating at High Current Densities”, Tsvetn. Met., 1977, (9), 23-25.
[28] Gogia, S .K. and Das, S.C., “The Effect ofMg2,Mn2,Zn2and Al3on the Nickel Depositduring Electrowinning from Sulfate Bath”, Metall. Trans. B, 1988, 19B(6), 823-830.
[29] Ettel, V.A., “Fundamentals, Practice and Control in Electrodeposition - An Overview”,Application ofPolarization Measurements in the Control ofMetal Deposition, ed. by I.H.Warren, Elsevier Science Publishers, 1984, 1-14.
[30] Ostanina, T.N., Murashova, I.B. and Pomosov, A.V., “Production of Electrolytic NickelPowders under Conditions of a Linearly Increasing Current”, Soy. Powder Metall. Met.Ceram., 1988, 27(7), 523-526.
[31] Teschke, 0. and Galembeck, F., “Large Nickel Particle Powder Formed by Electrode-position on a Metal Surface Partially Covered by Polytetrafluoroethylene Layer”, J.Electrochem. Soc., 1984, 131(8), 185 1-1853.
[32] Philip, H.I. and Nicol, M.J., “The Kinetics and Mechanism of the Deposition of Nickelfrom Chloride Solutions”, Chloride Hydrometallurgy [Proc. Conf.], Benelux Metallurgie,Brussels, 1977, 250-269.
[33] Finkeistein, N.P., Philip, H.I., Nicol, M.J. and Balaes, A.M.E., “The Mechanism of theElectrodeposition and Dissolution of Nickel from Chloride Media”, NIM ReportNo .1 796, National Institute for Metallurgy, 1 Yale Rd., Milner Park, Johannesburg, SouthAfrica, April 21, 1976, pp.31.
[34] Pittie, W.H. and Overbeek, G., “The Electrowinning of Base Metals from ChlorideSolutions with Insoluble Anodes”, Chloride Hydrometallurgy [Proc. Conf.], BeneluxMetallurgie, Brussels, 1977, 283-293.
Bibliography 199
[35] Sabot, J.L., Musanda, K., Bauer, D. and Rosset, R., “Electrorefining in Calcium Chloride(5M) at 98°C: Applications to Purification of Nickel and Lead’, Chloride Hydrometallurgy, [Proc. Conf.], Benelux Metallurgie, Brussels, 1977, 270-282.
[36] Teschke, 0. and Menez Soares, D., “Electrodeposition of Nickel by an AsymmetricPeriodically Reversed Step Current”, J. Electrochem. Soc., 1983, 130(2), 306-310.
[37] Baes, Jr., C. F. and Mesmer, R. E., The Hydrolysis of Cations, John Wiley & Sons, NewYork, 1976, 104-111.
[38] Tilak, B.V., Gendron, A.S. and Mosoiu, M.A., “Borate Buffer Equilibrium in NickelElectrorefining Electrolytes”, J. Appi. Electrochem., 1977, 7(6), 495-500.
[39] Hoare, J.P., “Boric Acid as Catalyst in Nickel Plating Solutions”, J. Electrochem. Soc.,1987, 134(12), 3102-3103.
[40] Wruck, W.J., “Electrodeposition of Nickel from Chloride Solutions”, M.S. Thesis, University of Wisconsin, Madison, WI, 1978.
[41] Epelboin, I. and Wiart, R., “Mechanism of the Electrocrystallization ofNickel and Cobaltin Acidic Solution”, J. Electrochem. Soc., 1971, 118(10), 1577-1582.
[42] Piatti, R.C.V., Arvia, A.J. and Poclesta, J.J., “The Electrochemical Kinetics Behavior ofNickel in Acid Solutions Containing Chloride (Ci) and Perchlorate (C1O) Ions”,Electrochim. Acta, 1969, 14, 541-560.
[43] Chevalet, J. and Zutic, V., “The Effect of Chloride Ions on the Electrochemical Behaviorof Nickel at Mercury Electrodes”, J. Electroanal. Chem. Interfacial Electrochem., 1973,44, 411-423.
[441 Saraby-Reintjes, A. and Fleischmann, M., “Kinetics of Electrodeposition of Nickel fromWatts Bath”, Electrochim. Acta, 1984, 29(4), 557-566.
[45] Ovari, E. and Rotinyan, A.I., “Electrode Processes of a Nickel Electrode in NickelChloride Solutions”, Soy. Electrochem., 1970, 6(4), 5 16-520.
[46] Ragauskas, R. and Leuksminas, V., “Possible Reason for the Peak Appearing in Polarization Curves for Nickel Ion Discharge in Chloride Solutions”, Soy. Electrochem., 1988,24(6), 675-682.
[47] Vilche, J.R. and Arvia, A.J., “Kinetics and Mechanism of the Nickel Electrode - I. AcidSolutions Containing a High Concentration of Chloride and Nickel Ions”, Corros. Sci.,1975, 15, 419-43 1.
[48] Chassaing, E., Joussellin, M. and Wiart, R., “The Kinetics of Nickel Electrodeposition:Inhibition by Adsorbed Hydrogen and Anions”, .1. Electroanal. Chem. InterfacialElectrochem., 1983, 157(1), 75-88.
Bibliography 200
[49] Epelboin, I., Joussellin, M. and Wiart, R., Impedance Measurements for Nickel Deposition in Sulfate and Chloride Electrolytes”, J. Electroanal. Chem. Inteifacial Electrochem., 1981, 119, 61-71.
[50] Epelboin, I., Joussellin, M. and Wiart, R., “Impedance of Nickel Deposition in Sulfateand Chloride Electrolytes”, J. Electroanal. Chem. Interfacial Electrochem., 1979, 101,281-284.
[51] Joussellin, M. and Wiart, R., “Anion Dependence of Ni Electrodeposition in AcidicElectrolytes”, Proc. ofthe Symp. on Electrocrystalllzation, ed. by R. Weil and R.G. Barradas,The Electrochemical Society, 1981, vol.81-6, 111-123.
[52] Hurlen, T., Kinetics and Thermodynamics of Ni/Ni(ll) Reactions in ConcentratedSolutions of Nickel and Calcium Chlorides”, Electrochim. Acta, 1975, 20, 499-505.
[53] Vagramyan, A.T., Zhamagortsyan, M.A., Uvarov, L.A. and Yavich, A.A., “Effect ofTemperature on the Electrochemical Behavior of Nickel in Chloride Solutions”, Soy.Electrochem., 1970, 6(6), 733-738.
[54] Kozlov, V.M., “Importance of Hydrogen Evolution in the Development of StructuralImperfections during Nickel Electrocrystallization”, Soy. Electrochem., 1982, 18(10),1203-1207.
[55] Yeager, 3., Cels, J.P., Yeager, E. and Hovorka, F., “The Electrochemistry of Nickel: I.Codeposition of Nickel and Hydrogen from Simple Aqueous Solutions”, J. Electrochem.Soc., 1959, 106(4), 328-336.
[56] Tamm, L.V., Tamm, Yu.K. and Past, V.E., “Effect of Acid Concentration on HydrogenOvervoltage at Nickel”, Soy. Electrochem., 1974, 10(1), 75-77.
[57] Chen, B., Shu, Y. and Xie, S., “Study on the Inhibition of Gas Holes in Nickel CathodebyH202”,J. Central-South Inst. Mi Metall., 1989,20(3), 3 17-323.
[58] Fossi, P., Gandon, L., Bozec, C. and Demarthe, J.M., “Refining of High-Nickel Concentrates”, CIM Bulletin, July 1977, 188-197.
[59) Diard, J.P. and Le Gorrec, B., “Identifications of the Parameters of the SimultaneousCathodic Reduction of H and Ni2Ions in a Chloride Medium of pH 2.1. PotentiostaticIdentification”, Surf. Technol., 1981, 13, 127-144.
[60] Dorsch, R.K., “Simultaneous Electrodeposition of Nickel and Hydrogen on RotatingDisk Electrode”, J. Electroanal. Chem. Interfacial Electrochem., 1969, 21, 495-508.
[61] Ragauskas, R. and Leuksminas, V., “Hydrogen Evolution during Nickel Discharge inChloride Solutions”, Soy. Electrochem., 1987, 23(3), 295-301.
[62] Polukarov, Yu.M., Grinina, V.V. and Antonyan, S.B., “Nickel Electrodeposition underthe Combined Effect of AC and DC”, Soy. Electrochem., 1980, 16(3), 361-363.
Bibliography 201
[63] Semenova, A.I., Orlova, E.A. and Andrushchenko, V.N., “Effects of Current Reversal onPit Formation during the Electrodeposition ofNickel”, Soy. Non-FerrousMet. Res., 1981,9(6), 510-512.
[64] Nakahara, S. and Felder, E.C., “Defect Structure in Nickel Electrodeposits”, J. Electrochem. Soc., 1982, 129, 45-49.
[65] Subramanyan, P.K., “Electrochemical Aspects of Hydrogen in Metals”, ComprehensiveTreatise of Electrochemistry, Vol.4, Electrochemical Materials Science, ed. byJ. O’M. Bockris, B.E. Conway, E. Yeager and R.E. White, Plenum Press, New York, 1980,411-459.
[66] Amblard, 3., Epelboin, I., Froment, M. and Maurin, G., “Inhibition and Nickel Electrocrystallization”, .1. Appi. Electrochem., 1979, 9, 233-242.
[67] Dahms H. and Croll, I.M., “The Anomalous Codeposition of fron-Nickel Alloys”, J.Electrochem. Soc., 1965, 112(8), 77 1-775.
[68] Harris, L.B., “Change in pH near the Cathode during the Electrodeposition ofa BivalentMetal. Analysis”, J. Electrochem. Soc., 1973, 120(8), 1034-1040.
[69] Chan, C.Y., Khoo, K.H., Lim. T.K. and Khoo, A.T., “Determination of pH Changes inthe Near-Electrode Solution Layer at a Nickel Cathode during Electrolysis of NaC1Solutions”, Surf. Technol., 1982, 15(4), 383-394.
[70] Berezina, S.I., Gorbachuk, G.A. and Kurenkova, A.N., “The Role of Cathodic HydrogenEvolution in the Formation of Nickel Platings”, Soy. Electrochem., 1971,7(4), 447-452.
[71] Berezina, S.I., Gorbachuk, G.A. and Sageeva, R.M., “Influence of the pH of the Spacenear the Cathode on the Mechanism of the Electrochemical Reduction of Aqua-Complexes of Nickel from Chloride Electrolytes”, Soy. Electrochem., 1971, 7(7),1019-1022.
[72] Kuhn, A.T. and Chan, C.Y., “pH Changes at near-Electrode Surfaces”, J. Appi. Electrochem., 1983, 13, 189-207.
[73) Deligianni, H. and Romankiw, L.T., “In Situ Surface pH Measurement During Electrolysis Using a Rotating pH Electrode”, IBM J. Res. Develop., 1993,37(2), 85-95.
[74] Deligianni, H. and Romankiw, L.T., “Effect of near-Surface pH on Electrodeposition ofNickel”, Proceedings of the Symposium on MAGNETIC MATERIALS PROCESSES ANDDEVICES, ed. by L.T. Romankiw and D.A.R. Herman, Jr., The Electrochemical Society,1990, 407-422.
[75] Romanlciw, L.T., “pH Measurement Technique on Cathodes during Electrolysis”,Presented at SUR/FIN 1990, July 9-11(1990).
[76] Robinson, R.A. and Stokes, R.H., Electrolyte Solutions, 2nd edition, Academic Press Inc.,New York, 1965.
Bibliography 202
[77] Bates, R.G., Determination ofpH, Theory and Practice, John Wiley & Sons, New York,1973, 279-306.
[781 Silén, L.G. and Martell, A.E., Stability Constants of Metal-Ion Complexes, SupplementNo.1, Special Publication No.25, The Chemical Society, London, 1971, p.173.
[79] Sillén, L.G. and Martell, A.E., Stability Constants of Metal-Ion Complexes, SupplementNo.1, Special Publication No.25, The Chemical Society, London, 1971, p.135.
[80] Meissner, H.P., “Prediction of Activity Coefficients of Strong Electrolytes in AqueousSystems”, Thermodynamics of Aqueous Systems with Industrial Applications, ed. byS.A. Newman, American Chemical Society, 1980, 495-511.
[81] Kusik, C.L. and Meissner, H.P., “Electrolyte Activity Coefficients in Inorganic Processing”, AJChE Symposium Series, 1978,74(173), 14-20.
[82] Dobos, D., Electrochemical Data, A Handbookfor Electrochemistry in Industry and Universities, Elsevier Sci. Pub. Co., New York, 1975, p.205.
[83] Awakura, Y., Aoki, M., Tsuchiya, A. and Majima, H., “Determination of the DiffusionCoefficients of NiCI2,ZnCI2,and CdCI2in Aqueous Solution”, Metall. Trans. B., 1989,20B, 555-565.
[84] Khoo, K.H., Lim, T.K. and Chan, C.Y., “Activity Coefficients for HCI-NiCl2-H20at298.15°K and Effects of Higher-Order Electrostatic Terms”, Journal of SolutionChemistry, 1978, 7(4), 291-301.
[85] Awakura, Y., Kawasaki, Y., Uno, A., Sato, K. and Majima, H., “Activity of Water andHCI in Aqueous Solution Systems of HCl-MCl including CuCI2,NiCI2 and FeCI3”,Hydrometallurgy, 1987, 19, 137-157.
[861 Pytkowicz, R.M., Activity Coefficients in Electrolyte Solutions, Vol.1, CRC Press, Inc.,Florida, 1979, 104-109.
[87] Bates, R.G., Staples, B.R. and Robinson, R.A., “Ionic Hydration and Single-ion Activitiesin Unassociated Chlorides at High Ionic Strengths”, Analytical Chemistry, 1970, 42(8),867-87 1.
[88] Robinson, R.A. and Bates, R.G., “Ionic Hydration and Single-ion Activities in Mixturesof Electrolytes with a Common Unhydrated Anion”, Analytical Chemistry, 1973,45(9),1666- 167 1.
[89] Jansz, J.J.C.,”Estimation of Ionic Activities in Chloride Systems at Ambient and Elevated Temperature”, Hydrometallurgy, 1983, 11, 13-3 1.
[90] Majima, H. and Awakura, Y., “Measurement of the Activity of Electrolytes and theApplication of Activity to Hydrometallurgical Studies”, Metall. Trans. B., 1981, 12B,141-147.
Bibliography 203
[91] Weast, R.C., CRC Handbook of Chemistry and Physics, 70th edition, CRC Press, Florida,1989-1990, B208.
[92] Silén, L.G. and Martell, A.E., Stability Consta,us of Metal-Ion Complexes, SupplementNo.1, Special Publication No.25, The Chemical Society, London, 1971, p.142.
[93] Silén, L.G. and Martell, A.E., Stability Constants ofMetal-Ion Complexes, Special Publication No.17, The Chemical Society, London, 1964, p.61.
[94] Ovchinnikova, T.M., Taran, L.A. and Rotinyan, A.L., “Changes in Acidity near theCathode during the Electrolysis of Nickel Chloride Solutions”, Russian Journal ofPhysical Chemistry, 1962,36(9), 103 1-1033.
[95] Baes, Jr., C. F. and Mesmer, R. E., The Hydrolysis of Cations, John Wiley & Sons, NewYork, 1976, 84-87.
[96] Baes, Jr., C. F. and Mesmer, R. E., The Hydrolysis of Cations, John Wiley & Sons, NewYork, 1976, 241-247.
[97] Hoare, J.P., “On the Role of Boric Acid in the Watts Bath”, .1. Electrochem. Soc., 1986,133(12), 2491-2494.
[98] Horkans, J., “On the Role of Buffers and Anions in NiFe Electrodeposition”, J. Electrochem. Soc., 126(12), 1979, 1861-1867.
[99] Mairanovskii, S.G. and Churilina. A.P., “Influence of Electrode Field on the DissociationConstant of Boric Acid in the Layer Adjacent to the Electrode”, Elektrokhimiya, 1970,12(6), 1857-1860.
[100] Khalil, R.M., “Electrodeposition of Catalytically Active Nickel Powders from Electrolytes of Various Anionic Compositions”, J. App!. Electrochem., 1988, 18(2), 292-297.
[101] Venkateswaran, K.V. and Vasu, K.I., “Various Methods of Electrolytic Production ofMetal Powders and the Future Trends in This Field”, PMAI News!., 1987, 13(4), 12-17.
[102] Calusaru, A., “Chapter XVIII, Nickel”, Electrodeposition of Metal Powders, ElsevierScientific Publishing Co., New York, 1979, 376-386.
[103] Ibi, N., “Application of Mass Transfer Theory: The Formation of Powdered MetalDeposits”, Advances in Electrochemistry and Electrochemical Engineering, vol.2, ed. byC.W. Tobias, Interscience Publishers, New York, 1962, 49- 143.
[104] Mantell, C.L., “Electrodeposition of Powders for Powder Metallurgy”, J. Electrochem.Soc., 1959, 106(1), 70-74.
[105] Weast, R.C., CRC Handbook of Chemistry and Physics, 70th edition, CRC Press, Florida,1989-1990, D151-D158.
[106] Bard, A.J., Parsons, R. and Jordan, 3., Standard Potentials in Aqueous Solutions, MarcelDekker, Inc., New York, 1985, 321-337.
Bibliography 204
[107] Ettel, V., “Chapter III, Fundamentals B -- Fundamentals of Electrochemistry”,Hydrometallurgy: Theory and Practice Course Notes, Dept. of Metals and MaterialsEngineering, The Univ. of British Columbia, Vancouver, B.C., Canada, 1990.
[108] Majima, H., Peters, E., Awakura, Y., Park, S.K. and Aoki, M., “Electrical Conductivity ofAcid Chloride Solutions”, Metal!. Trans. B., 1988, 19B, 53-58.
[109] Mills, R. and Lobo, V.M.M., Self-Diffusion in Electrolyte Solutions, a critical examinationofdata compiledfrom the literature, Elsevier, New York, 1989, 133-134.
[1101 Weast, R.C., CRC Handbook of Chemistry and Physics, 70th edition, CRC Press, Florida,1989-1990, D256.
[1111 Pleskov, Yu. V. and Filinovskii, V. Yu., The Rotating Disc Electrode, translated byH.S. Wroblowa, ed. by H.S. Wroblowa and B.E. Conway, Consultants Bureau, New York,1976.
[112] Opekar, F. and Beran, P., “Rotating Disk Electrodes”, .1. Electroanal. Chem., 1976, 69,1-105.
[113] Levich, V.G., Physicochemical Hydrodynamics, Prentice-Hall, Englewood Cliffs, NewJersey, 1962.
[114] Zhou, W., Electrochemical Measurements, Shanghai Sci. & Technology Publisher,Shanghai, China, 1985, 153-182.
[115] Florence, T.M., “Polarography of Nickel in Concentrated Chloride Media”, Aust. J.Chem., 1966, 19, 1343-1355.
[116] Bjerrum, J., “Vifi. The Consecutive Complexity Constants of the Hexammine Cobaltousand the Hexammine Nickel Ions and the Absorption Spectra of the Nickel AmmineIons”, Metal Ammine Formation in Aqueous Solution, P. Haase and Son, Copenhagen,Denmark, 1957, 180-198.
[117] Hogfeldt, E., Stability Constants of Metal-Ion Complexes, Part A: Inorganic Ligands,Pergamon Press, Toronto, 1982, p.1 10.
[118] Bard, A.J., Parsons, R. and Jordan, J., Standard Potentials in Aqueous Solutions, MarcelDekker, Inc., New York, 1985, p.137.
[119] Xue, T., Personal Communiction, Falconbridge Ltd., Falconbridge, Ontario, March 2, 1993.
[120] Savel’ev, S.S., “Acidity of the Layer next to the Cathode during Galvanic NickelPlating”, Soy. Electrochem., 1974, 10(6), 845-847.
[121] Ettel, V.A., “Energy Requirements in Electrolytic Winning and Refining of Metals”,CIM Bulletin, July 1977, 179-186.
[122] Mills, R. and Lobo, V.M.M., Self-Diffusion in Electrolyte Solutions, a critical examinationofdata compiledfrom the literature, Elsevier, New York, 1989, p.208.
Bibliography 205
[123] Cha, Quanxing, Introduction to Kinetics of Electrode Processes, 2nd edition, SciencePublisher, Beijing, China, 1987, 333-349.
[124] Bozhkov, C., Ivanov, I and Rashkov, S., “The Relationship between the Growth Rate ofHydrogen Bubbles and the Duration of the ‘Induction Period’ in the Electrowinningof Zinc from Sulfate Electrolytes”, J. Appi. Electrochem., 1990,20,447-453.
[125] Bressan, 3. and Wiart, R., “Diffusion Controlled Inhibition of Electrodeposition:Impedance Measurements”, J. Appl. Electrochem., 1979, 9(5), 615-62 1.
[126] Oloman, C., Course Notes ofCHML477 - Electrochemical Engineering, Dept. of ChemicalEngineering, The Univ. of British Columbia, Vancouver, B.C., Canada, 1978, 34-35.
[1271 Bates, R.G., Determination ofpH, Theory and Practice, John Wiley & Sons, New York,1973, p.59.
[128] Weast, R.C., CRC Handbook of Chemistry and Physics, 70th edition, CRC Press, Florida,1989-1990, D 169-D 170.
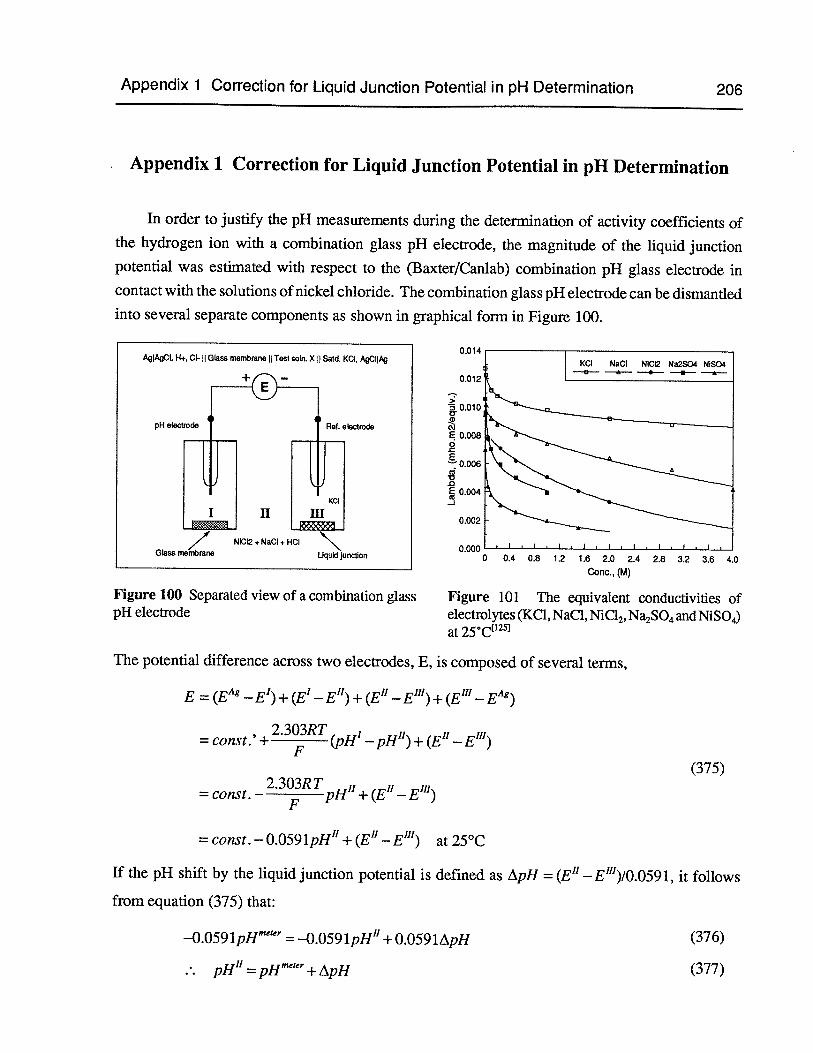
Appendix 1 Correction for Liquid Junction Potential in pH Determination 206
Appendix 1 Correction for Liquid Junction Potential in pH Determination
In order to justify the pH measurements during the determination of activity coefficients ofthe hydrogen ion with a combination glass pH electrode, the magnitude of the liquid junctionpotential was estimated with respect to the (Baxter/Canlab) combination pH glass electrode incontact with the solutions of nickel chloride. The combination glass pH electrode can be dismantledinto several separate components as shown in graphical form in Figure 100.
Figure 100 Separated view of a combination glasspH electrode
0.002
0.0000 0.4 0.8 1.2 1.6 2.0 2.4 2.8 3.2 3.6 4.0
Conc., (M)
Figure 101 The equivalent conductivities ofelectrolytes (KCI, NaCl, N1C12,Na2SO4and NiSO4)at 25C
The potential difference across two electrodes, E, is composed of several terms,
E = (E4— E’) + (E’ — E”) + (E” — E”) + (E” —E4)
2.303RTConSt.+
F(pH’—pH”)+(E”—E”)
= cot.2.3O3RTHH(EJIEJII)
= const. — 0.0591pH” + (E” — E”) at 25°C
(375)
If the pH shift by the liquid junction potential is defined as ApH = (E” — E”)/0.0591, it follows
from equation (375) that:
—0.O591pH’” = —0.0591pH” + 0.O591ApH (376)
A9IAgCI, H+, C ((Glass membrane (I Test sohi. Xjj SaId. KCI, AgClI
pH electrode
Glass
0.014
0.012
>0.010
0•
C’,0.008
0
!o.006
.00.004
KCI NaCI N1CI2 Na2SO4 N1SO4-- - -- -.- -*-
pH” =pH + ApH (377)
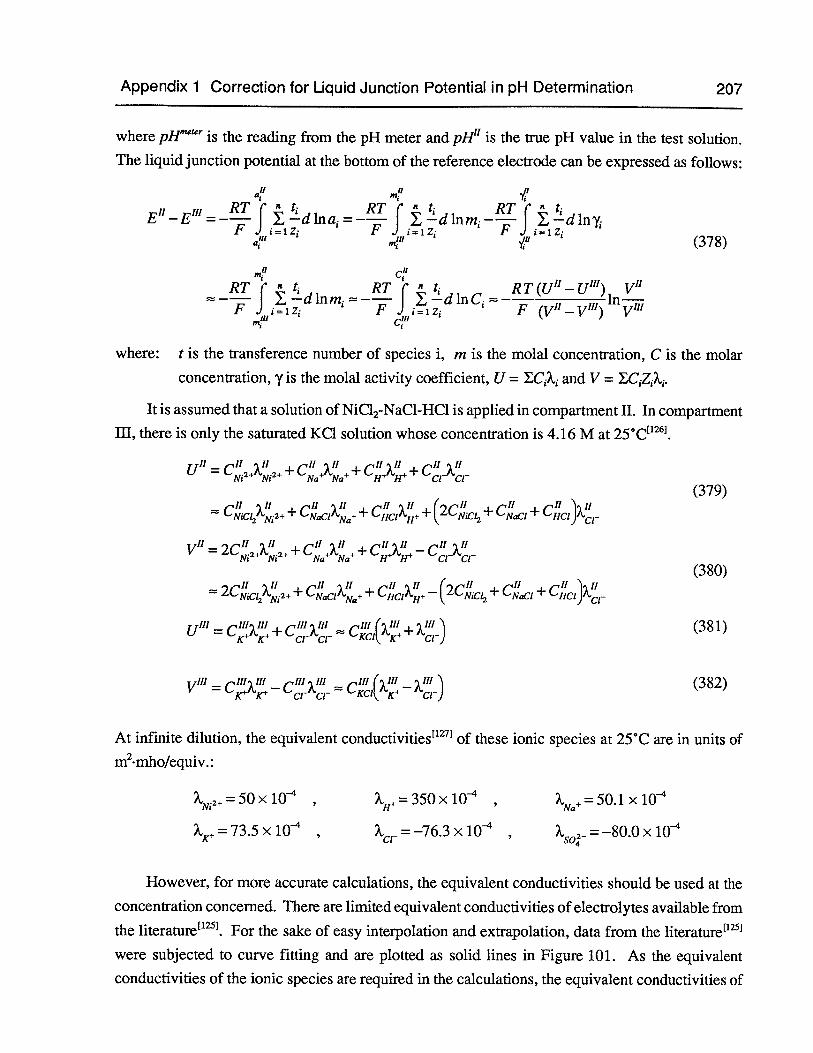
Appendix 1 Correction for liquid Junction Potential in pH Determination 207
where pHmis the reading from the pH meter and pH” is the true pH value in the test solution.The liquid junction potential at the bottom of the reference electrode can be expressed as follows:
II 11 IIa;ri
E”—E” =_f Y--dlna1=—9 J° .-dlnm1_j°dln
(378)
mt1 C1’
RT (‘‘ RT (°
“ RT(U”—U”) V”— _--j_d mm1 —--j.YZ1-dlnC1
F (V’1 — V”)lnj
where: t is the transference number of species i, m is the molal concentration, C is the molar
concentration, ‘ is the molal activity coefficient, U = Y.C?, and V = YC1Z.
It is assumed that a solution ofNiC12-NaCl-HCI is applied in compartment II. In compartmentifi, there is only the saturated KC1 solution whose concentration is 4.16 M at 25°C1.
U” = C+’.2++ C:+2’+ +C1’,’)+ + C)r(379)
C12++C1&”+ + C +(2c1+ C + C’ci)r
V’1 =2C2).2++ C)++ C)+ — C)r(380)
2CcQ.2+ + CC,?+ + C,r’c,2’+ (2Cczz + C1+
u” = c;;+c— c,(+k”)(381)
v”1 — c”&,” — c”i” c”(xiii — hh1 (382)
— K K ci cr KCI K Cr)
At infmite dilution, the equivalent conductivities1of these ionic species at 25°C are in units of
m2.mho/equiv.:
N12÷5°)<1O ‘ H÷350><10
= 73.5 x 10, cr = —76.3 x so = —80.0 x 10
However, for more accurate calculations, the equivalent conductivities should be used at the
concentration concerned. There are limited equivalent conductivities of electrolytes available from
the literature’1.For the sake of easy interpolation and extrapolation, data from the literature’1
were subjected to curve fitting and are plotted as solid lines in Figure 101. As the equivalent
conductivities of the ionic species are required in the calculations, the equivalent conductivities of
Appendix 1 Correction for Liquid Junction Potential in pH Determination 208
electrolytes need somehow to be separated into ionic equivalent conductivities. In the presentcalculations, the ratios such as N.2+/N1C12are assumed to be constant despite the change in themagnitude of the equivalent conductivity of the electrolyte. 0.937 M NiC12+ 3.74 x 10 M HC1 isused as an example to show how to separate the equivalent conductivity of the electrolyte. Becausethe amount of HC1 is so little, its contribution to the total conductivity of the electrolyte can beignored. From Figure 101, the equivalent conductivity of 0.937 M NiCI2 solution at 25°C is51.7 x 10m2mho/equiv. Accordingly, the ionic equivalent conductivities are calculated as:
Ni2+= 50+76
3X 51.7 x 10 = 20.5 x 10 Qn2•mho/equiv.)(383)
cr 50±763x 51.7 x 10 = —31.2 x 10 Qn2•mho/equiv.)
(m2mho/equiv.)
For other concentrations, the same kind of calculations can be made. The calculated liquid junctionpotentials and their corresponding pH shifts are summarized in Table 46 for the nickel-containingchloride solutions. The results for the mixed chloride and sulfate solutions are listed in Table 47.
The data in Tables 46-47 indicate that when the equivalent conductivities at defined concentrations are used, the pH shifts resulting from the liquid junction potential are not more than 0.1unit. These pH shifts are included in the calculations of the activity coefficients of the hydrogenion and values so obtained are listed in Table 7.
When the values of the activity coefficients of the hydrogen ions without and with the correctionof liquid junction potentials are compared with each other, the errors are around 17 % in purechloride solutions and —10 % in mixed chloride and sulfate solutions. For practical applications,these errors should be acceptable. Since the ApH values are not large, the pH values in this workwere not corrected for liquid junction potentials.
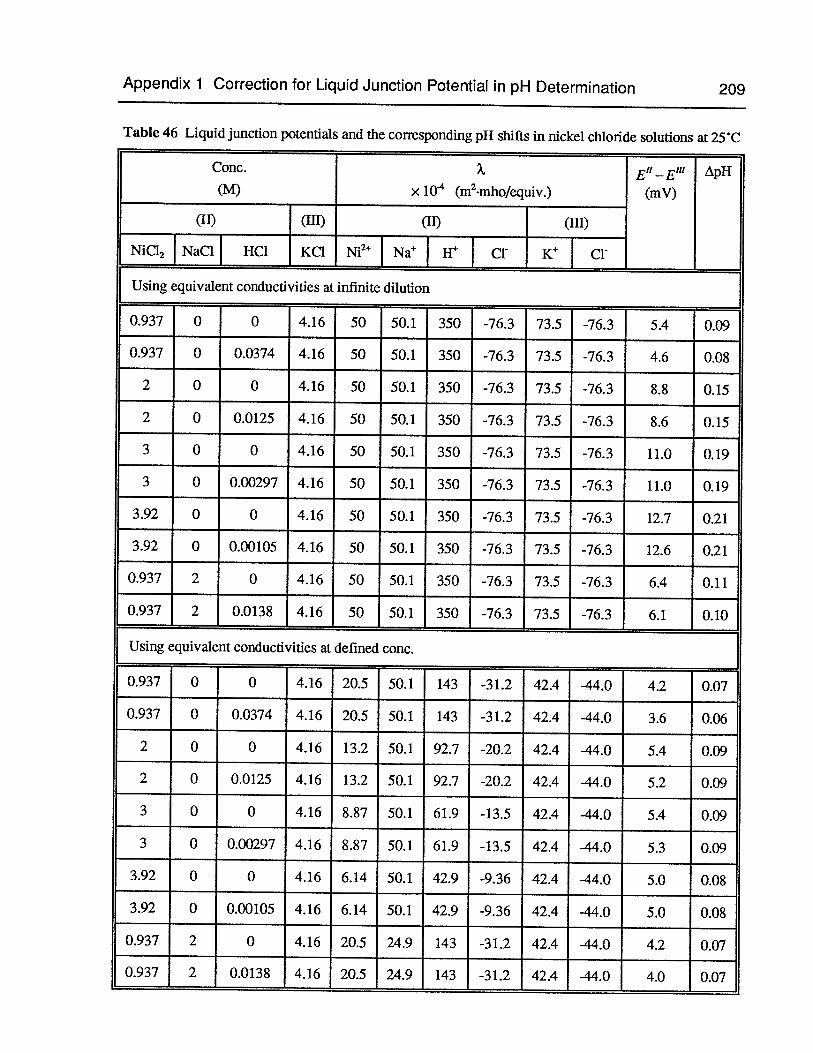
Appendix 1 Correction for Liquid Junction Potential in pH Determination 209
Table 46 Liquid junction potentials and the corresponding pH shifts in nickel chloride solutions at 25°C
Conc. E” —E” ApH(M) x l0 (m2.mho/equiv.) (my)
(II) (III) (II) (III)
NiC12 NaC1 HQ KC1 Ni2 ( Na H cr K Cr
Using equivalent conductivities at infinite dilution
0.937 0 0 4.16 50 50.1 350 -76.3 73.5 -76.3 5.4 0.09
0.937 0 0.0374 4.16 50 50.1 350 -76.3 73.5 -76.3 4.6 0.08
2 0 0 4.16 50 50.1 350 -76.3 73.5 -76.3 8.8 0.15
2 0 0.0125 4.16 50 50.1 350 -76.3 73.5 -76.3 8.6 0.15
3 0 0 4.16 50 50.1 350 -76.3 73.5 -76.3 11.0 0.19
3 0 0.00297 4.16 50 50.1 350 -76.3 73.5 -76.3 11.0 0.19
3.92 0 0 4.16 50 50.1 350 -76.3 73.5 -76.3 12.7 0.21
3.92 0 0.00105 4.16 50 50.1 350 -76.3 73.5 -76.3 12.6 0.21
0.937 2 0 4.16 50 50.1 350 -76.3 73.5 -76.3 6.4 0.11
0.937 2 0.0138 4.16 50 50.1 350 -76.3 73.5 -76.3 6.1 0.10
Using equivalent conductivities at defined conc.
0.937 0 0 4.16 20.5 50.1 143 -31.2 42.4 -44.0 4.2 0.07
0.937 0 0.0374 4.16 20.5 50.1 143 -31.2 42.4 -44.0 3.6 0.06
2 0 0 4.16 13.2 50.1 92.7 -20.2 42.4 -44.0 5.4 0.09
2 0 0.0125 4.16 13.2 50.1 92.7 -20.2 42.4 -44.0 5.2 0.09
3 0 0 4.16 8.87 50.1 61.9 -13.5 42.4 -44.0 5.4 0.09
3 0 0.00297 4.16 8.87 50.1 61.9 -13.5 42.4 -44.0 5.3 0.09
3.92 0 0 4.16 6.14 50.1 42.9 -9.36 42.4 -44.0 5.0 0.08
3.92 0 0.00105 4.16 6.14 50.1 42.9 -9.36 42.4 -44.0 5.0 0.08
0.937 2 0 4.16 20.5 24.9 143 -31.2 42.4 -44.0 4.2 0.07
0.937 2 0.0138 4.16 20.5 24.9 143 -31.2 42.4 -44.0 4.0 0.07
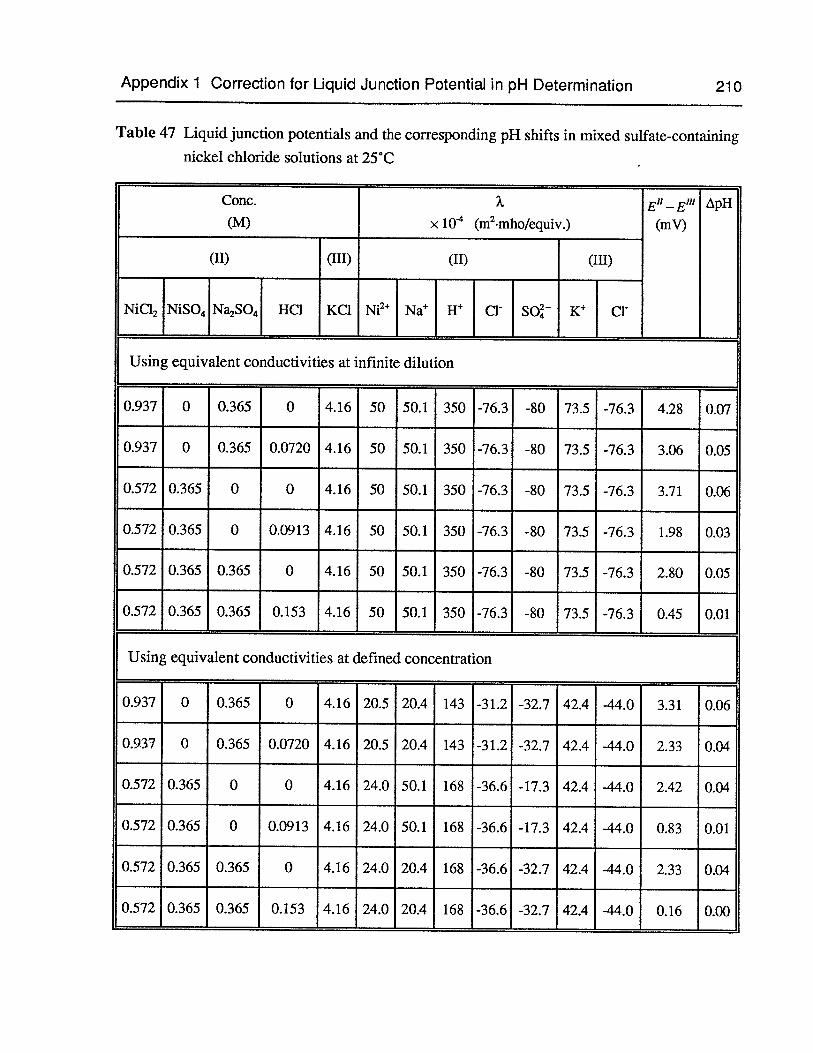
Appendix 1 Correction for Liquid Junction Potential in pH Determination 210
Table 47 Liquid junction potentials and the corresponding pH shifts in mixed sulfate-containingnickel chloride solutions at 25°C
Conc. E”—E” zpH(M) x 10 (m2.mho/equiv.) (my)
(II) (III) (II) (III)
NiCI2 NiSO4 Na2SO4 HC1 KC1 Ni2 Na H C1 SO K Cr
Using equivalent conductivities at infinite dilution
0.937 0 0.365 0 4.16 50 50.1 350 -76.3 -80 73.5 -76.3 4.28 0.07
0.937 0 0.365 0.0720 4.16 50 50.1 350 -76.3 -80 73.5 -76.3 3.06 0.05
0.572 0.365 0 0 4.16 50 50.1 350 -76.3 -80 73.5 -76.3 3.71 0.06
0.572 0.365 0 0.0913 4.16 50 50.1 350 -76.3 -80 73.5 -76.3 1.98 0.03
0.572 0.365 0.365 0 4.16 50 50.1 350 -76.3 -80 73.5 -76.3 2.80 0.05
0.572 0.365 0.365 0.153 4.16 50 50.1 350 -76.3 -80 73.5 -76.3 0.45 0.01
Using equivalent conductivities at defined concentration
0.937 0 0.365 0 4.16 20.5 20.4 143 -31.2 -32.7 42.4 -44.0 3.31 0.06
0.937 0 0.365 0.0720 4.16 20.5 20.4 143 -31.2 -32.7 42.4 -44.0 2.33 0.04
0.572 0.365 0 0 4.16 24.0 50.1 168 -36.6 -17.3 42.4 -44.0 2.42 0.04
0.572 0.365 0 0.0913 4.16 24.0 50.1 168 -36.6 -17.3 42.4 -44.0 0.83 0.01
0.572 0.365 0.365 0 4.16 24.0 20.4 168 -36.6 -32.7 42.4 -44.0 2.33 0.04
0.572 0.365 0.365 0.153 4.16 24.0 20.4 168 -36.6 -32.7 42.4 -44.0 0.16 0.00
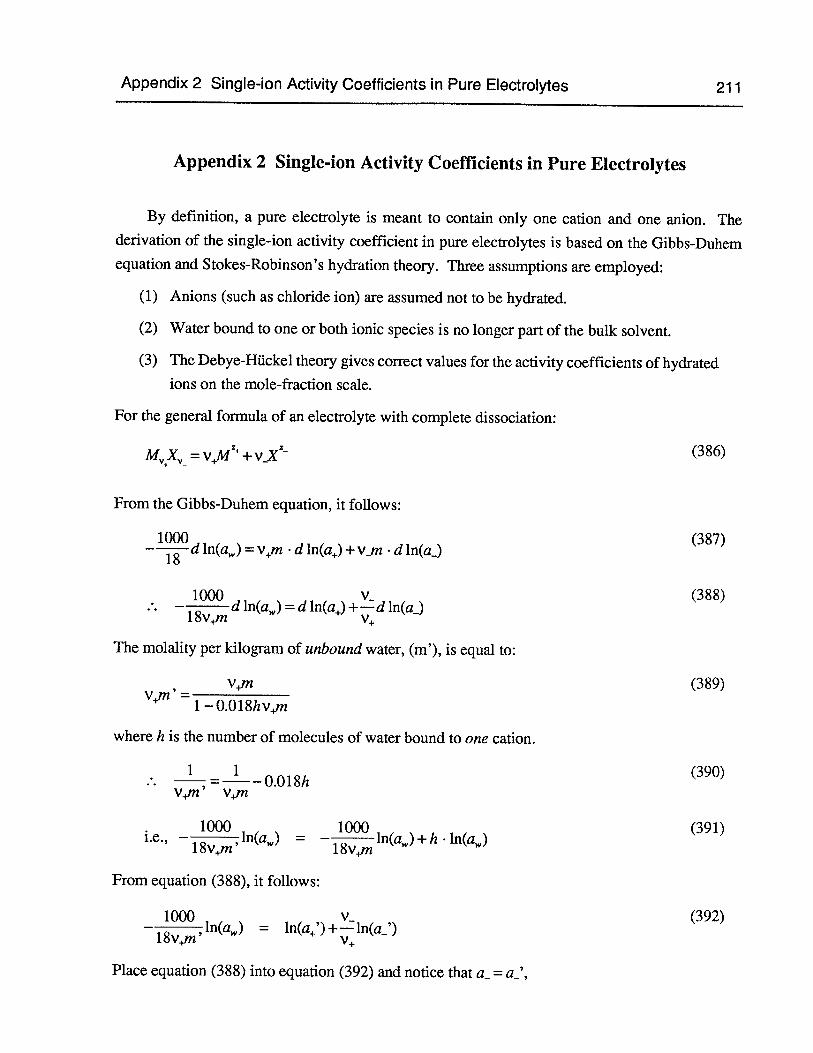
Appendix 2 Single-ion Activity Coefficients in Pure Electrolytes 211
Appendix 2 Single-ion Activity Coefficients in Pure Electrolytes
By definition, a pure electrolyte is meant to contain only one cation and one anion. Thederivation of the single-ion activity coefficient in pure electrolytes is based on the Gibbs-Duhemequation and Stokes-Robinson’s hydration theory. Three assumptions are employed:
(1) Anions (such as chloride ion) are assumed not to be hydrated.
(2) Water bound to one or both ionic species is no longer part of the bulk solvenL
(3) The Debye-Huckel theory gives correct values for the activity coefficients of hydratedions on the mole-fraction scale.
For the general formula of an electrolyte with complete dissociation:
MX = vM’+v_X (386)
From the Gibbs-Duhem equation, it follows:
1000 (387)— 18
dln(a)—v+m dln(a)+vjn dln(a_)
1000 v.. (388)— 18vm
d ln(a) = d ln(a) +—d ln(a)
The molality per kilogram of unbound water, (m’), is equal to:
v÷m (389)Vm
=1—O.O18hv
where h is the number of molecules of water bound to one cation.
1 1 (390)———-—0.018/i
v+Jn’ v4)n
• 1000 1000 (391)i.e.,— 18 ,ln(a) =
l8 ln(aw)+h •ln(a)
From equation (388), it follows:
iooo v (392)l8v+n,h14) =
Place equation (388) into equation (392) and notice that a_ =
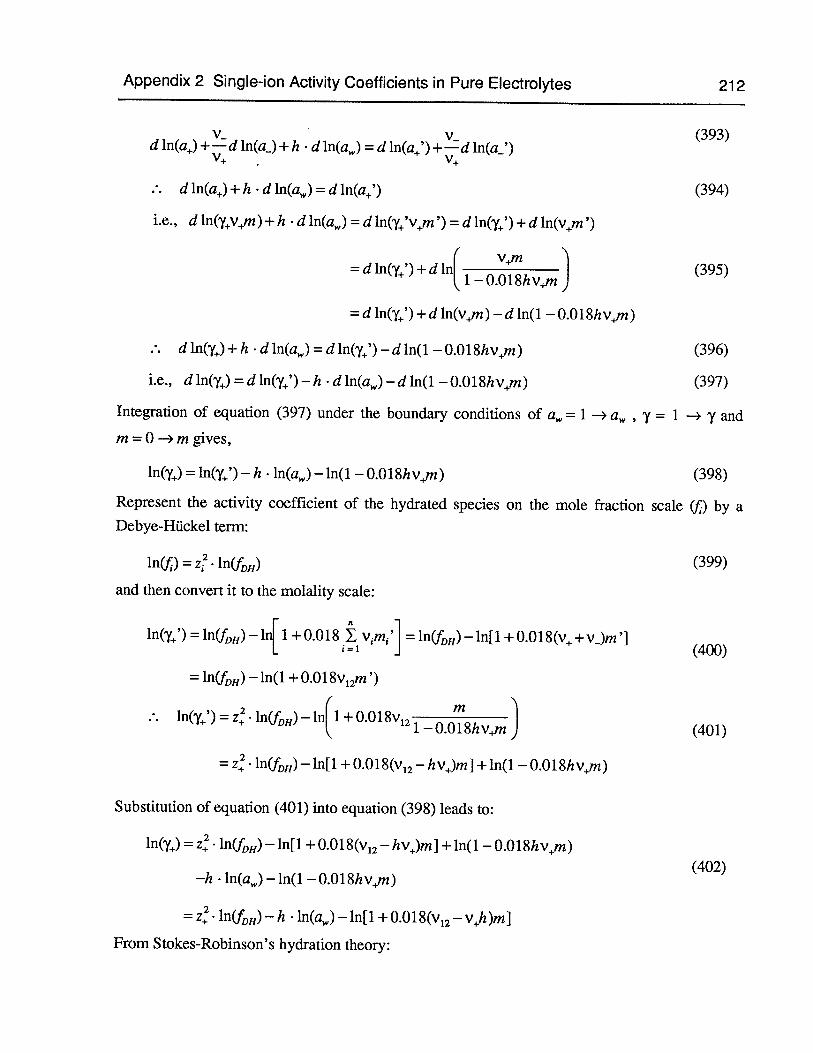
Appendix 2 Single-ion Activity Coefficients in Pure Electrolytes 212
v v.. (393)d1n(a)+—d1n(a_)+ h dln(a) = dln(a÷’)+—dln(a_’)
d1n(a)+h •d1n(a)=d1n(a+’) (394)
i.e., d1n(yvm)+h dln(a,4,) dln(7’v÷m’) = dln(y’)+dln(vm’)
d ln(y÷’) + d ln[i— 0.O18hv,n
(395)
=dln(y÷’)+dln(v÷m)—dln(l —0.Ol8hv÷m)
d ln(y÷)+ h d 1n(a) d ln(y÷’) — d ln(1 — 0.018hvm) (396)
i.e., d1n(y)=dln(y’)—h d1n(a)—dn(1 —0.018hvm) (397)
Integration of equation (397) under the boundary conditions of a,4, = 1 —> a , y = 1 —* ‘y and
m =0 —* m gives,
1n(y) = ln(y’) — h 1n(a) — ln(1 — 0.Ol8hv÷m) (398)
Represent the activity coefficient of the hydrated species on the mole fraction scale (j) by aDebye-HUckel term:
ln(X) = z• lfl(t,H) (399)
and then convert it to the molality scale:
ln(y’) = 1n1f,11)— ln[ 1+0.018 vim1’] = lnj11)— ln[1 + 0.018(v +vjm ‘1i=1 (400)
= ln(/H) — ln(1 + 0.018v12m’)
1n(y’) = z• ln(11)— 1n1 + 0.018v121— 0.018hvn] (401)
= Z ‘(fH) —ln[1 + 0.018(v12—hv)m] + ln(1 — 0.018hvm)
Substitution of equation (401) into equation (398) leads to:
1n(y) = . 1n(I,11)— ln[1 + 0.018(v12— hvjm] + ln(1 — 0.018hvm)(402)
—h ln(a)—ln(1 —0.018hvm)
= z• ln(f,)— h 1n(a)—1n[1 + 0.018(v12—v÷h)m]
From Stokes-Robinson’s hydration theory:
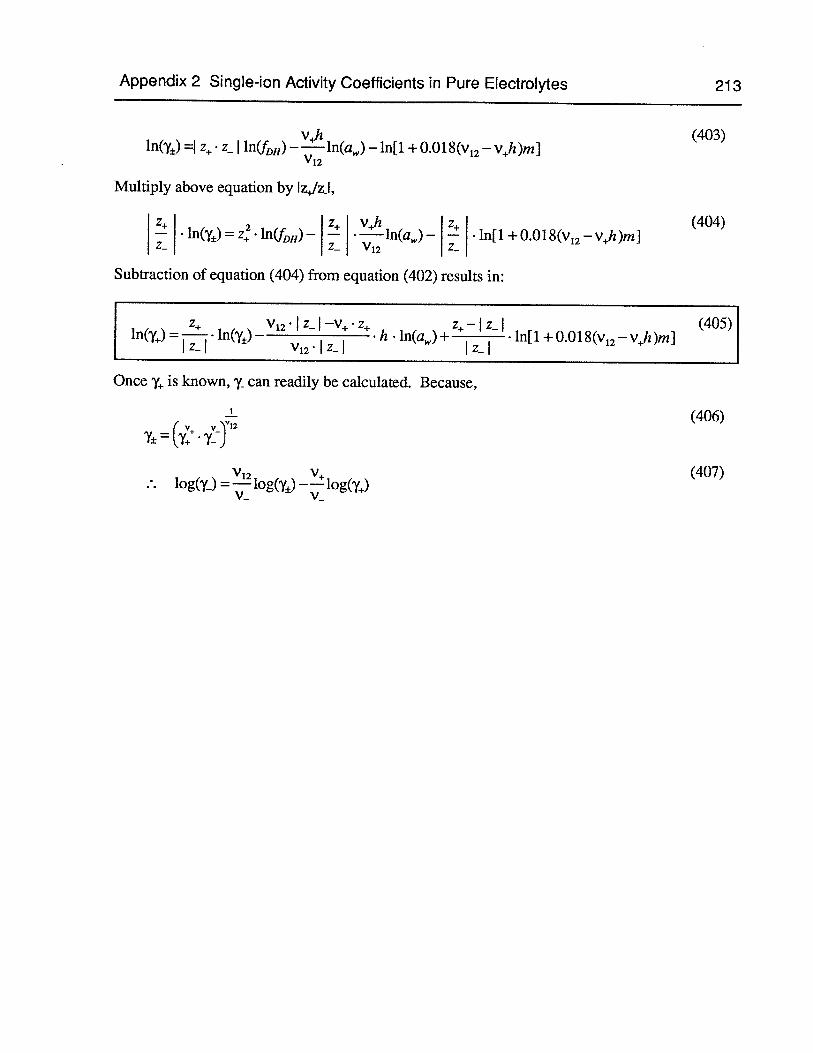
Appendix 2 Single-ion Activity Coefficients in Pure Electrolytes 213
vjz (403)ln(y) =1 z• z ln(tjH)——ln(aW)—ln[l +0.018(v12—vh)m]
V’2
Multiply above equation by lz4Jzi,
z z vh z (404)— •ln(y)=z.lnQ)—
— — •ln[l+0.018(v,2—v÷h)m]z_ z_ V12
Subtraction of equation (404) from equation (402) results in:
I Z V12 Z Vh ln(a)
z— I z- (405)
I lnCY+)=’j—j•ln(Yi— + •1n[l+0.0l8(v,2—vh)m]
Once ‘y is known, ‘y. can readily be calculated. Because,
(406)(v v’\’12
=
(407).. log(yj = — log(y) — — log(y)
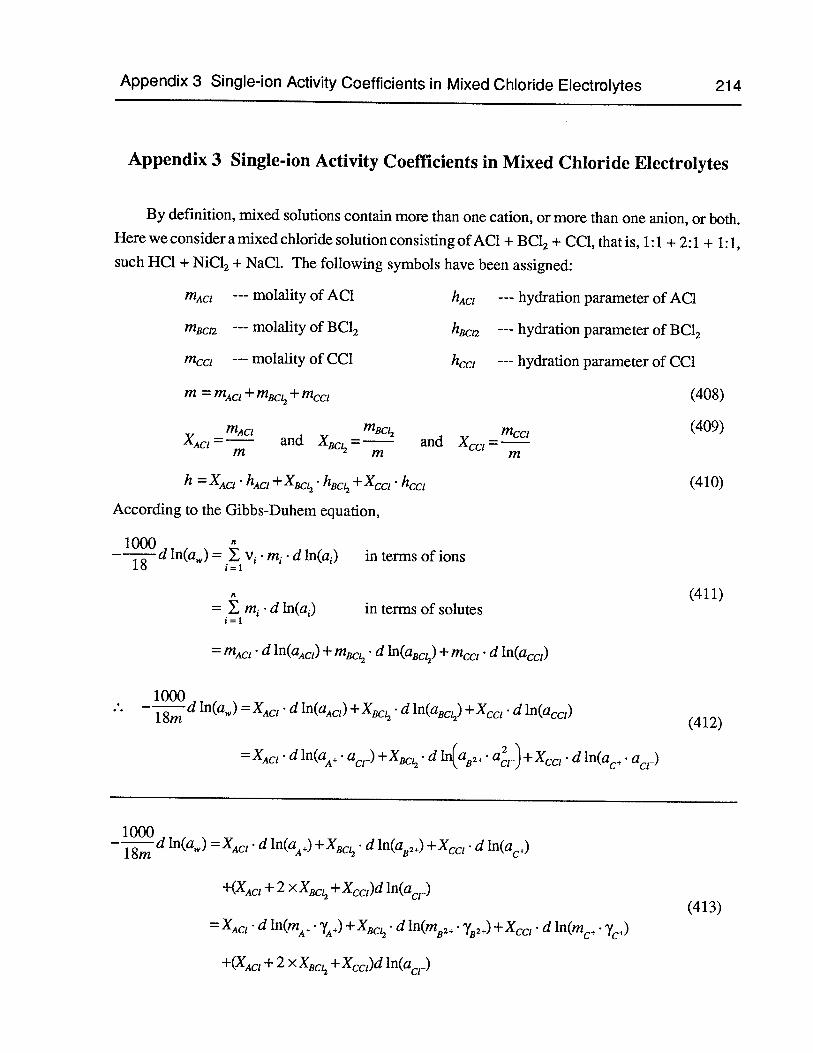
Appendix 3 Single-ion Activity Coefficients in Mixed Chloride Electrolytes 214
Appendix 3 Single-ion Activity Coefficients in Mixed Chloride Electrolytes
By definition, mixed solutions contain more than one cation, or more than one anion, or both.Here we consider a mixed chloride solution consisting of AC1 + BC12 + CC1, that is, 1:1 + 2:1 + 1:1,such HC1 + NiC12 + NaC1. The following symbols have been assigned:
mAci --- molality of AC1 hAd --- hydration parameter of AC1
mBc --- molality of BC12 hBc --- hydration parameter of BC12
mcci --- molality of CC1 h1 --- hydration parameter of CC1
m mJc +m+ (408)
mAc, mBc,2 mcci (409)XAC, — and XBc = — and =
h XACI hAd,+Xp, hBc,2+Xcdz (410)
According to the Gibbs-Duhem equation,
1000 -
— d 1n(a) = m d ln(a1) in terms of ions18 1=1
‘I (411)= m d ln(a) in terms of solutes
1=1
= mAci d ln(aAd,) + mBc,2•d ln(aBc,) + mcci . d ln(acc,)
— ln(a) XAc, . d ln(aAc,) +XBc d ln(aBc) +Xcci d ln(acc,)(412)
XAdI . d ln(aA+.a1)+XBc, d h(aBl+. a) +Xcc, d ln(ac+
— d ln(a) XACI d ln(aA+) +XBc d lfl(aB2+) +Xcci . d ln(ac+)
+(XAc, +2 X XBC + Xcc,)d ln(ac,.)(413)
XAc, . d ln(mA+. YA+) d lfl(mB2+ ‘YB2+)+Xcc, d ln(mc+-
+(XAc, +2 xX8,2+ Xcc,)d ln(aci.)
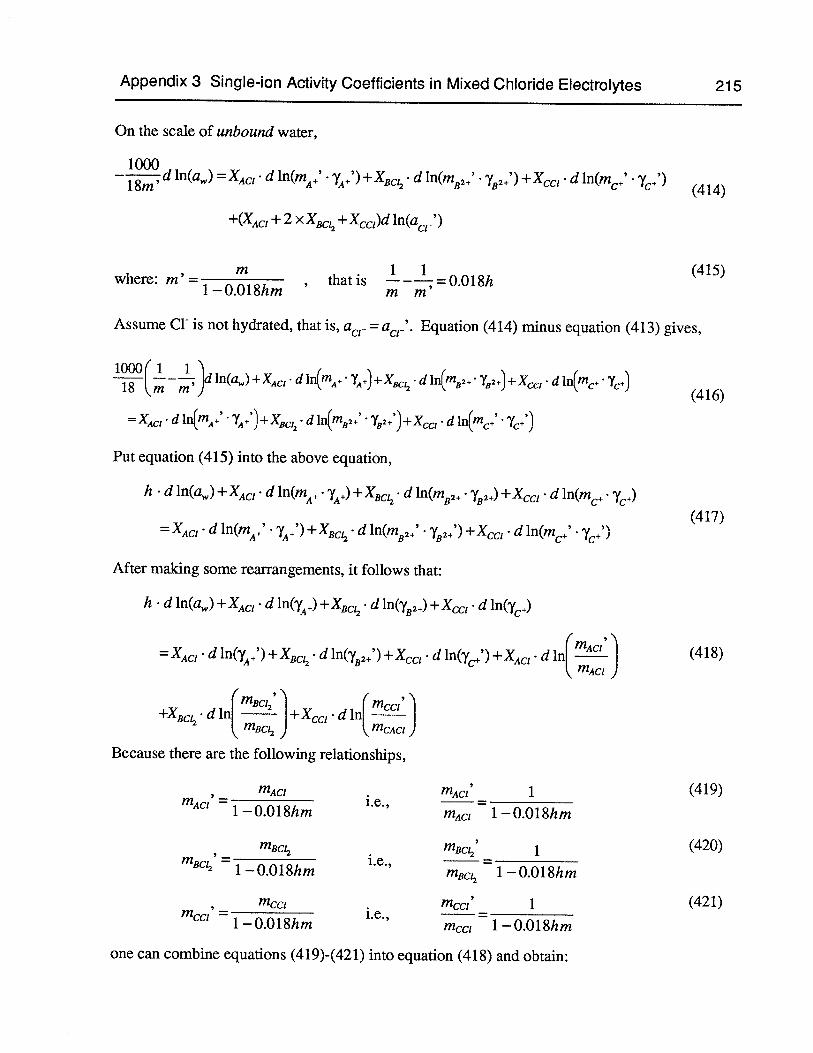
Appendix 3 Single-ion Activity Coefficients in Mixed Chloride Electrolytes 215
On the scale of unbound water,
—
ln(a) =XAC,’ d ln(mA+’ ‘A +XBc d ln(mB2÷’ ‘B +X d 1n(m+’‘‘ (414)
+(XAC, + 2 X XBC,2+X1)dln(acr’)
m . 1 1 (415)where: m’ , that is ——----=O.018h1—O.Ol8hm m m
Assume Cl is not hydrated, that is, acr = acr’. Equation (414) minus equation (413) gives,
l8(mm1+XAc1 dlnQnA+ +)÷XBC.d1n(m82..y2+)+XCC, dlnQn+Y+)(416)
=XAcI• dln(mA+’ YA+)+XBCl• dln(mB2.’ YB2+)+XcC, dlnQflc÷’
Put equation (415) into the above equation,
h dln(aW)+XAC, d ln(mA÷. YA+)+X dln(mB2+ ‘‘B2÷)+X1 d1n(m.
(417)• d ln(mA+’ ‘‘A +XBc,. d ln(mB2+’ +Xa1 d ln(m+’
After making some rearrangements, it follows that:
h . d 1n(a) +XAC, d ln(YA+) +XBc• d ‘fl(YB2+) +Xa, • d ln(y+)
=XAC, • d 1n(+’) +X8d 1n(2÷’) • d ln(y+’) +XAC, d1[m ] (418)
mAc,
(mBc’‘ (mcci’
+XBc,• d ln( Hcc1 d lnjm,2) ‘LmcAc,
Because there are the following relationships,
mAc, • mAc, 1 (419)mAci
1—O.Ol8hmi.e.,
mAC,l—O.Ol8hm
mBcI2 . m8c12 1 (420)mBc
= 1 —0.Ol8hmi.e.,
mBc,2 = 1 —0.Ol8hm
mcci mcci’ 1 (421)mcci
= 1 —0.Ol8hmi.e.,
mcci = 1 —0.Ol8hm
one can combine equations (419)-(421) into equation (418) and obtain:
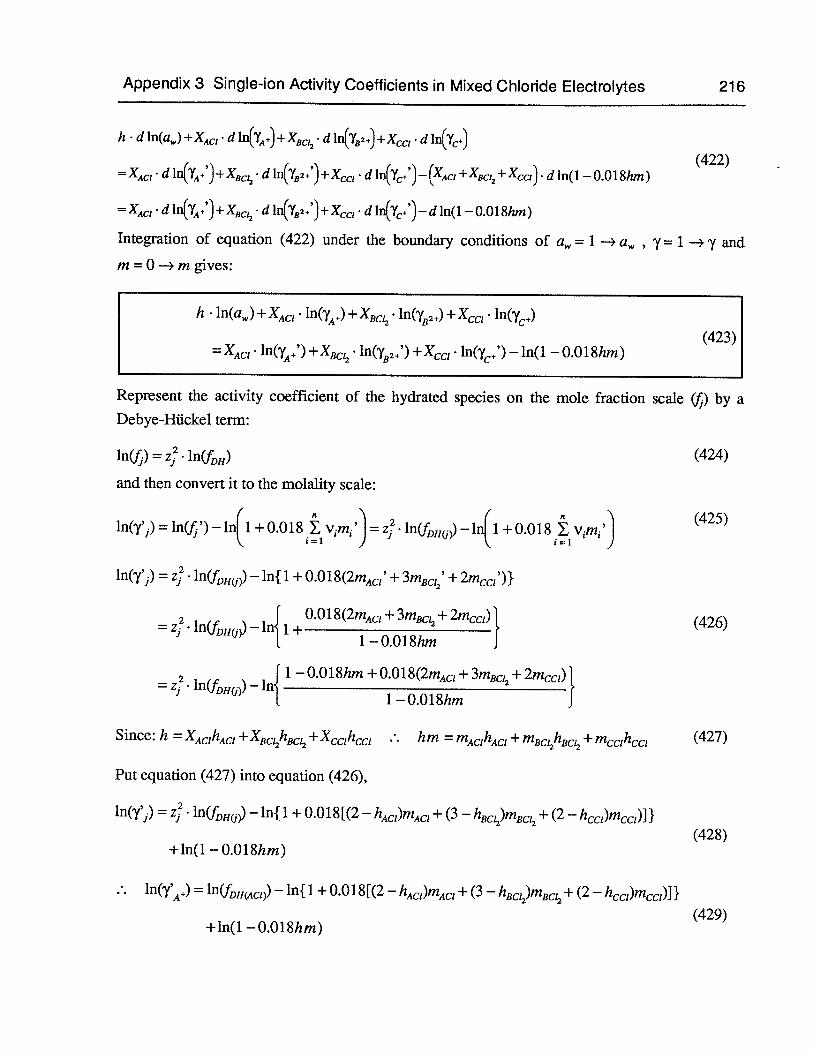
Appendix 3 Single-ion Activity Coefficients in Mixed Chloride Electrolytes 216
h d ln(aW)+XAC, dln(YA+)+XRC,2.dln(YBI+)+XCC, d1n(’Y+)
(422)= XACI d lfl(YA+ ) +XBc d 1n(Yi+’) +Xca d in(c÷’) — (XAC, + XBC,2+ Xcc1). d ln(1 — 0.01 8hm)
d ln(YA+’)+XBC, d ln(YB2+’)+XCC, d ln(Y+’)—d ln(1 — 0.Ol8hm)
Integration of equation (422) under the boundary conditions of a = 1 — a , y = 1 — ‘ and
m =0 —* m gives:
h . ln(a) +XAC, + XBCja. ln(y2+)+X1 . lr1O’÷)
(423)=XAC, ln(YA+’) +XBc• ln(yB2+’) +Xa1 ln(y+’) —ln(1 — 0.Ol8hm)
Represent the activity coefficient of the hydrated species on the mole fraction scale (j5) by aDebye-Huckel term:
ln(f) = z• ln(f11) (424)
and then convert it to the molality scale:
(425)ln(y’) =ln(J’)_ln(1 +0.018vim’J= zI. lnOJH(i))—ln(1 +0.018vimi’J
ln(y’) = ln(fHO)) — ln{ 1 + 0.018(2mACI’ +3mBC,2 + 2m1‘)}
= z. ln(J . — in’1 1+O.Ol8(2mAc, +3mBc + 2mccj) (426)
0 1—0.Ol8hm J
2 fi —0.Oi8hm+O.Ol8(2mAc,+3mBc,+2mcc1)=z.
1—0.Ol8hm
Since: h = XACIhACI + XBchBc + .. hm = mACIliAC, + mBChBC + (427)
Put equation (427) into equation (426),
ln(7’) z• ‘(f,Hw) — ln{ 1 + 0.018[(2 — hAC,)mAC, + (3 — hBC,)mBC, + (2— hcct)mc,)l }(428)
+ln(1 —0.Oi8hm)
1friii) — ln{ 1 + 0.018 [(2 — hAC,)mAC, + (3 — hBC)mBC + (2 hcc,)mcc,)1 }(429)
+in(1 —0.Oi8hm)
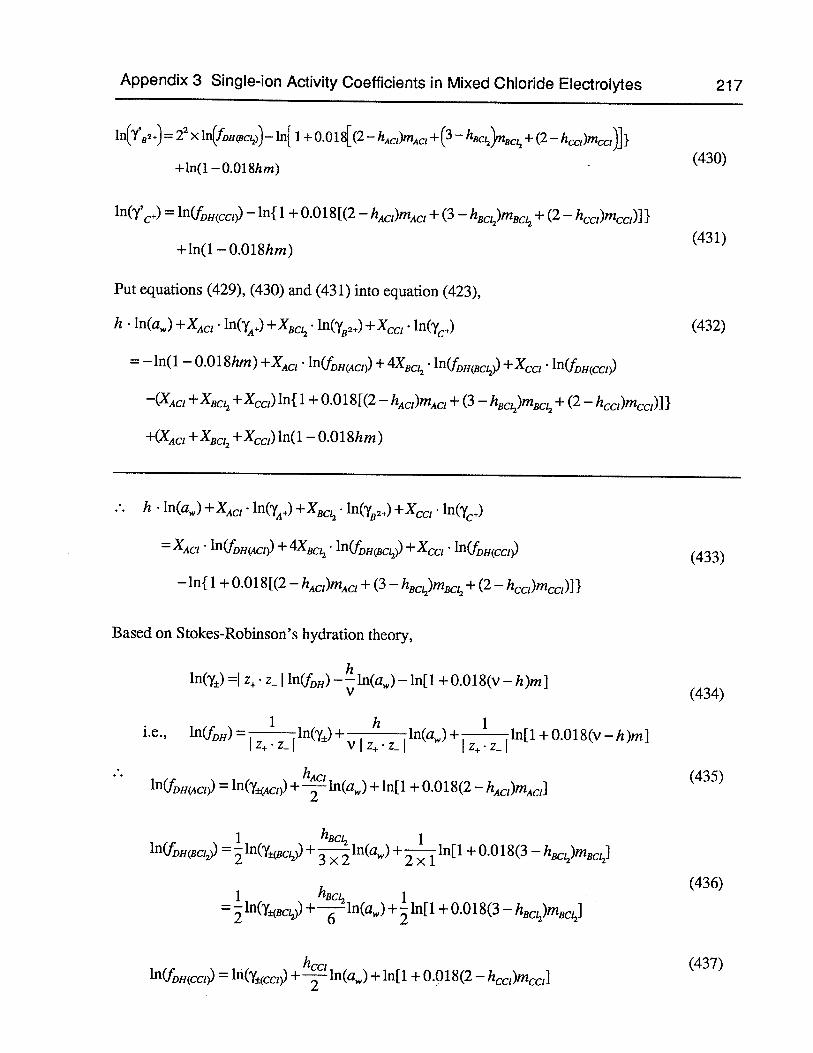
Appendix 3 Single-ion Activity Coefficients in Mixed Chloride Electrolytes 217
1n(Y’82+) =22 x ln(fDiicscl2))— in{ 1 + 0.01 8[(2 — hAC,)mAC, + (3_ hBcj?zBC,2+ (2— hccz)mccs)] }(430)
+ln(1—0.Ol8hm)
ln(y’+) = OHCco) — 1n 1 + O.018[(2— hAC,)mAC, + (3 hBC,)mBC,2+ (2 hcct)mcc,)1}
(431)+ln(1 —0.Ol8hm)
Put equations (429), (430) and (431) into equation (423),
h 1n(a) +XACI lnerg) +X8•‘flO’B2+) +X, ln(y+) (432)
=— ln( 1 — 0.01 8hm) + XACI ln(fDHACl)) +4XBc• ‘‘(fDH(BCt2))+X1 1”(tH(CCI))
—(XAC, +X3+ Xx,) ln{ 1 + 0.01 8[(2— hAC,)mAC, + (3— hBc)mBC,2+ (2 hcc1)mcc,)1 }
+(XAC, +XBc,+Xcc,)1n(l —0.Ol8hm)
.. h 1n(a) +XAC1 ln(YA+) +XBc• ln(yB2+) +X.1
= XAC,• ln(f,H(AC,)) +4XBc,2•‘(fDH(BCi2))+Xyj ‘‘(fDH(CCl)) (433)
— ln{ 1 + 0.018 [(2— hACJ)mAC, + (3 — hBC)mBC + (2— hcc,)mc,)] }
Based on Stokes-Robinson’s hydration theory,
1n(y) =1 z• 1nO) —1n(a) — ln[1 + 0.018(v — h)m](434)
i.e., ln(L11)= •
11n(a)+ 11n[1 +0.018(V—h)ml
hAd (435)ln(fDH(AC1)) = ‘(±(Ac,)) +-j--1n(a) +ln[1 + 0.018(2
— hACI)mAC,1
1 hBc 1‘(fDll(Bc) = 1n(y)
+ x2mn
2 < ihnl[1 + 0.018(3— hBC)mBC,]
(436)1 hBd,2 1
= 1nCy±8)4-——1n(a) +1n[1 + 0.018(3 — hBC)mBC]
(437)ln(.IDH(CCI)) = 1n(y±(cd,) + -i-- 1n(a) + ln[ 1 + 0.018(2—
Appendix 3 Single-ion Activity Coefficients in Mixed Chloride Electrolytes 218
Put equations (435), (436) and (437) into equation (433),
h 1n(a) +XAC, +X1,.lfl(YB2+) +X1 ln(y+)
= XAC, ln(yc,)) +2XBC. 1fl(Y±8,)+ 1fl(YcCz))
XACIT+XBC 3+XcciJln(aw) +XAc, ln[1 + 0.018(2
— hAC1)mACIJ
(438)+[ hAd 2hBc ‘1
+2XBC. ln[1+O.Ol8(3—hBC)mBC,]+XCC, ln[1 +O.Ol8(2—h,)m1]
—ln{ 1 + 0.018[(2— hAC,)mAC, + (3 —h8c)m8c,2+ (2 hcc,)mcc,)]}
.. Xc, in(.) + XBc, lfl(YB2+) +xx1 infyc+) = XAC, 1n(yc,)) +2XBC?21fl(’Y±BCI2))+ Xcj hnl(Y±(ccl))
hAd 2h8— [h
— XAclj —X8 —1n(a) + XAc,• ln[1 + 0.018(2
— hAC,)mACI]
(439)+2X8c,,. ln[1 + 0.018(3 _hBcL2)nBdl2]+X, ln[1 +O.Ol8(2—hcc,)mcc,1
— ln{ 1 + 0.01 8[(2 — hACl)mAC, + (3_h8,2}n8,2+ (2 hcci)mccz)] }
XACZ 1n(.) +X1 .:;2J+x . in(+) = XAC, . 1n(yC,)) + 2XBCZ2.lrl(’Y±(8C12))+ Xc
—( hAd BC1 hXAC, hACl + XBdi h8, + Xcahca XAC1T_X8c,2_Xca]h(ç) (0)
In[1 + 0.018(2 — hAd,)mAd,] + 2X8,• ln{ 1 + 0.018(3 — haci)mJ
+Xca . ln[1 + 0.018(2 — hca)mcal — ln{ 1 + 0.01 8{(2 — hAd,)mAd, + (3 + (2— hca)mca)]}
XAC,.
+XBc ln(y) +X 1n(y+)
= XACI .1O’±(AcI)) +2XBCL, ln(h,±(Bc) +X(1 . ln()
(441)h11n(a) +XAc, ln[1 + 0.018(2
— hAC,)mAC,]XAci_j—+XBc---+Xccl_j—j
+2XBCI, ln[1 + 0.018(3— hBC)mBC] +X.1 . ln[1 + 0.018(2—hcc1)mcc,l
— ln{ 1 + 0.01 8[(2— hAC,)mAC, + (3 — hBC)mBC,2+ (2— }
Appendix 3 Single-ion Activity Coefficients in Mixed Chloride Electrolytes 219
Since there are the following relationships,
ln(YA+) =2 ln(ycj))—
.. X,c, ln(YA+) =2XACI ln(ycj)) —XAC,1’cr(442)
ln(1B2+) = 3 ln(y8).. Xc ln(yB2+) =3XBCI2‘(Y±(BCz,)) —
XBC121fl(y1) (443)
‘(4)=2 ln(ycc,>) — ln(y).. X, in(+) = 2X ln(Y±(ccl)) — lnCy,) (444)
Add the above three equations,
XAC, h’A÷) +XBcln(yB2+) +X0ln(y+)
(445)= AC1 ‘(Y±<ACI +3XBc ln(yc)) + ln(y,>) — (XAC, +2XBC +X,) ln(ycr)
Put equation (445) into equation (441),
(XACJ +2XBC +Xcc1)ln(yJ) = XAC, ln(yC,)) +X8ç‘(Y±(Bc) + Xa, 1CY±(cc,))
hAd h8ln(a) —XAc, ln[1 + 0.018(2
— hAC,)mAC,]XAcj—---+XBc-—---+XccI-—-—J
(446)2XBc,. ln[1 + 0.018(3 —hBC,2)mBC} —X ln[1 +O.Ol8(2—h,)m1]
+ ln{ 1 + 0.018 [(2— hACL)mAC, + (3 — hBC,2)mBC + (2— }
Convert it to logarithms on the base 10,
(XAC, + BCL2+ Xc,) logO’1)
XAC, log(yC,)) + XBc log(Bc)) + log(c,))
XAC, +XBc+X, log(a)— XAC, log[ 1+0.018(2— hAC,)mAC,j
+( hAd hBc4
—2X2•log[1 + 0.018(3— hBC)mBC] Xa1 log[1 + 0.018(2
— hcc1)mcc,]
+ log{ 1 + 0.018 [(2— hACl)mAC, + (3— hBC)mBC + (2— h,)m1]}
—1000 1n(a) —2.303 x 1000 log(a)In terms of the osmotic coefficient: 0 == 18(2 +3mBc, +2mcc,)18 vm,
i=1
Appendix 3 Single-ion Activity Coefficients in Mixed Chloride Electro’ytes 220
(XAc1+2XBC + Xcc,) log(y,) = XAC, log(’±(c1 + XBc log(y±(Bc) + iog(±>)
_0.007821{XACJ L +XBc— EEf. (2mAC, +3mBC + 2m1)(448)
—XACI• log[1 +O.Ol8(2—hAC,)mAC,]—2XBCI: log[1 + 0.018(3 —hBC,2)mBC,21
log[1 + 0.0 18(2—
+ log{ 1 + 0.01 8[(2— hACI)mACI + (3
— hBC)mBC,2+ (2— hcc,)mcczl }
When is known,‘+
and can be calculated as follows:
log(y÷) =2log(’yfAc1))— log(y1) (449)
log(y2+) 3 log(y8,)—2 logCy,) (450)
log(y+) = 2 Iog(c,)) — log(y1) (451)
pH titration 221
Appendix 4 Computer Programs for the RADIOMETER Titrator
Three programs were developed during the thesis research for the RADIOMETERCOPENHAGEN ETS822 titration system (composed ofTfl80 titrator, PHM82 standard pH meterand ABU8O autoburette). These three programs are all written in ASYST language (version 3.1)and are to be operated in a menu-driven style. The users are not required to have any knowledgeof ASYST language in order to run these programs. The data can be displayed in-situ numericallyor graphically and can be saved into a LOTUS 123 file (recommended), or into an ASYST file ona floppy disk. The hardware requirements are as follows:
(1) RADIOMETER COPENHAGEN ETS822 titration system (composed of ‘TTI’80 titrator,PHM82 standard pH meter and ABU8O autoburette)
(2) One IBM or compatible computer with a 12 MHZ or faster execution speed
(3) One ASYST compatible data acquisition board with two -10 +10 volts A/D channels
(4) ASYST (version 3.1) software plus the appropriate programs described in this appendix
(5) One pH electrode for pH titrations and pH-stat work, or one Pt electrode for REDOXtitrations. If pH and Pt electrodes are not of the combination type, a reference electrode isrequired.
This appendix describes only briefly the principles of each program. The detailed operatinginstructions are available upon request to the writer.
(1) pH titrationThe pH titration is defined as the neutralization of an acidic solution using a base titrant, or
vice versa, and the recording of the pH and titrant volume at the same time. The end-point volumeis determined automatically on the basis of the peak dpHldV or manually on the basis of the end-pointpH.
During the pH titration, the program records and prints out on the screen in each second thedata number, time, pH and volume, and immediately calculates the slope of dpH/dV. The pH anddpHIdV are also displayed in graphical form on the screen. The data dpHJdV shown on the graphhave been attenuated by a user-defined factor. The fastest sampling rate achievable for a 12 MHzcomputer is one set of readings per second. This sampling rate is acceptable for most of the pHtitrations. During the pH titration, one will get a screen output similar to Figure 102. For most ofthe acid-base titrations, the pH titration can be regarded as completed after a peak dpH/dV occurs.The pH corresponding to the peak dpHIdV is in the range of the theoretical buffer point. After the
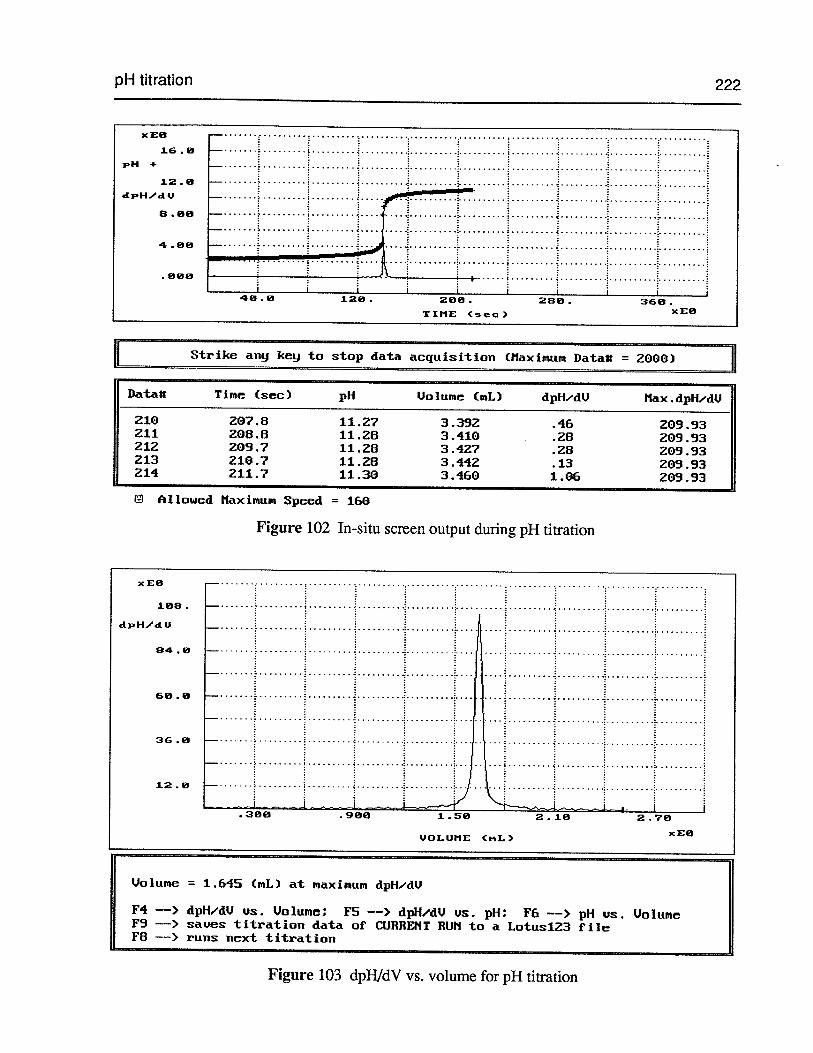
pH titration 222
II Strike anrJ kej to stop data acquisition (Maximum Datau = 2000)
Datalt Time (sec) pH Volume (mL) dpHdU t1ax.dpHdU
210 207.8 11.27 3.392 .46 209.93211 208.8 11.28 3.410 .28 209.93212 209.7 11.28 3.427 .28 209.93213 210.7 11.28 3.442 .13 Z09.93214 211.7 11.30 3.460 1.06 209.93
G Allowed Maximum Speed = 160
Figure 102 In-situ screen output during pH titration
xEO—
168. —dpH/ctU —
84.6 —
60.8 —.
36.6 —
12.0 —
.360 .966 1.56 2.16 2.76
x E6UOLUtIE (tiL)
Volume = 1.645 (nL) at maximum dpH/dV
F4 —> dpH#dU us. Volume; F5 ——> dpH/dU us. pH; F6 ——> pH us. VolumeF9 ——> saues titration data of CURRENT RUN to a LotuslZ3 fileFO —> runs next titration
Figure 103 dpH/dV vs. volume for pH titration
x
16 .8
pH +
12.0
dpHddIJ
8 • 60
4 • 08
060
46.0 126. 206.
TItlE (sec)
366.x E8
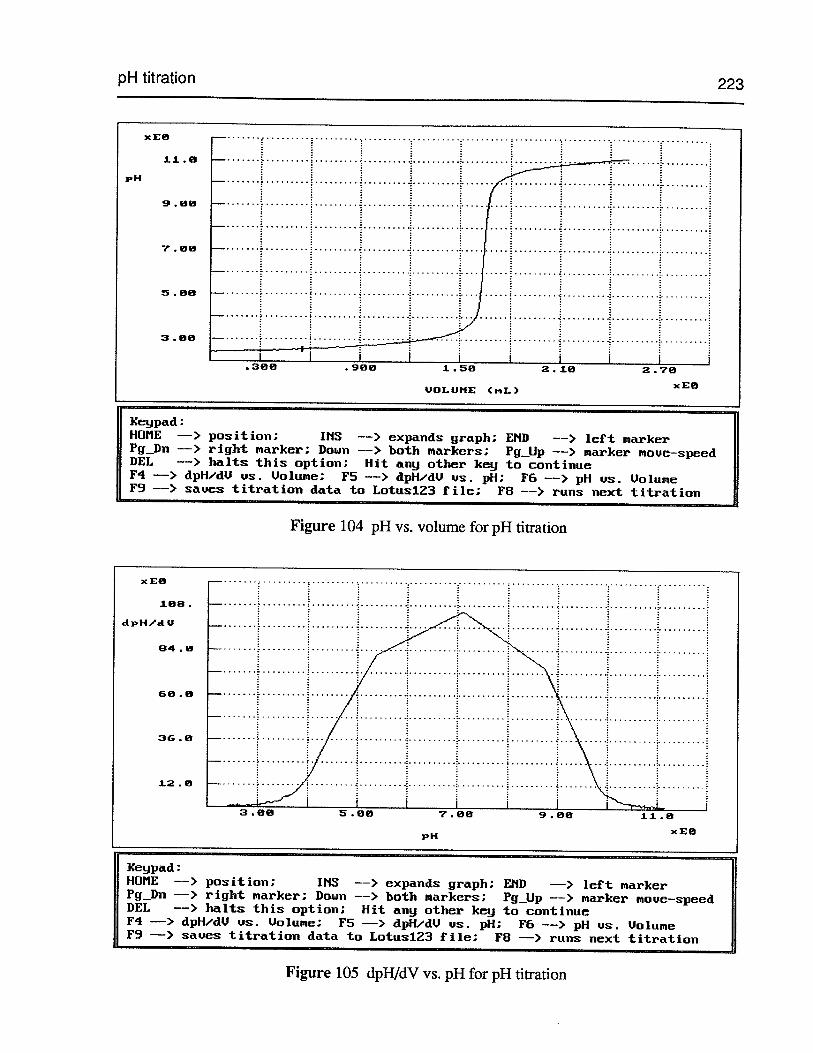
pH titration
pH
x Em
is .m
9 • 80
7 • 88
5.88
3.88
.1. .58
VOLUME (tiL)
223
Xeypad:HOME ——> position; INS ——> expands graph; END —--> left markerPg_Dn ——> right marker; Down —> both markers; Pg_Up ——> marker move—speedDEL —--> halts this option; Hit any other key to continueF4 —> dpH/dV vs. Volume; F5 —> dpHdU us. pH; P6 —> pH us. VolumeP9 ——> saves titration data to LotuslZ3 file; PB ——> runs next titration
xEO
188.
dpHJd U
84 • 8
68 • 8
Figure 104 pH vs. volume for pH titration
Neypad:HOME ——> position; INS ——> expands graph; END ——> left markerPg_Dn ——> right marker; Down ——> both markers; Pg_Up ——> marker move—speedDEL ——> halts this option; Hit any other key to continueF4 —-> dpHdV us. Volume; P5 —> dpH/dU us. pH; P6 —> pH us. VolumeP9 —> saves titration data to LotuslZ3 file; YB —--> runs next titration
Figure 105 dpH/dV vs. pH for pH titration
x E0
36 .0
12.0
3.00 5.80 7.60 9.00 11.6
pHxEO
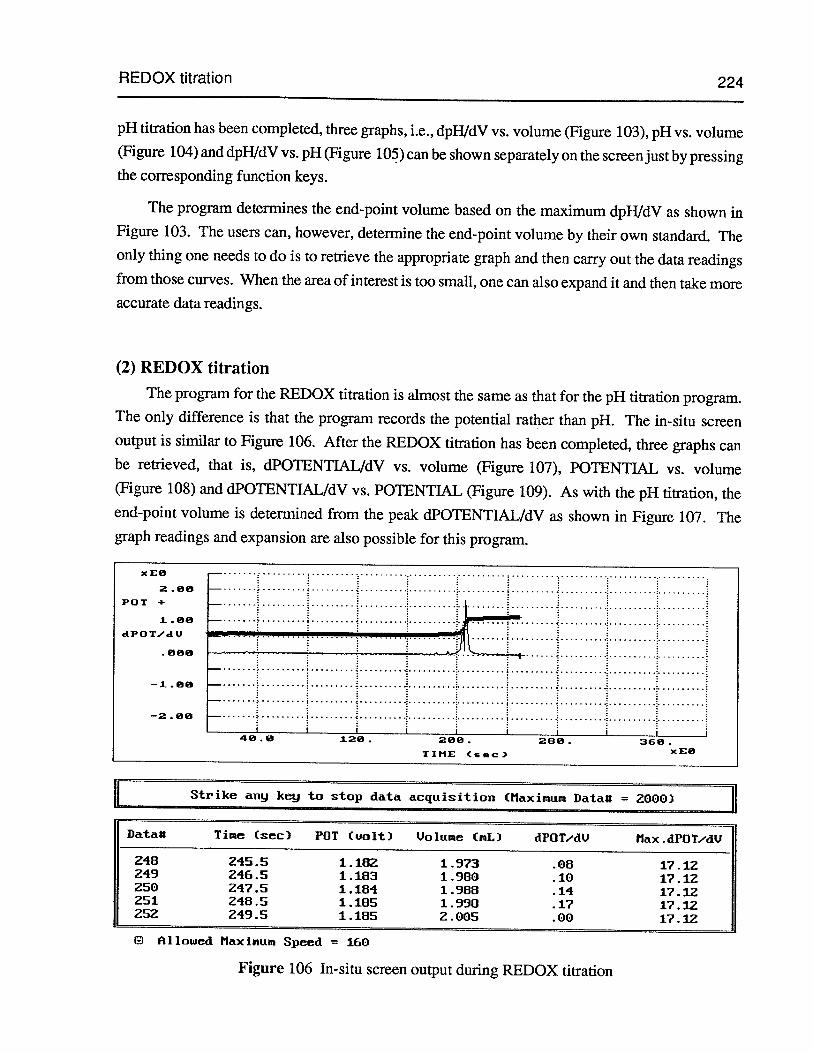
REDOX titration 224
pH titration has been completed, three graphs, i.e., dpH/dV vs. volume (Figure 103), pH vs. volume(Figure 104) and dpH/dV vs. pH (Figure 105) can be shown separately on the screen just by pressingthe corresponding function keys.
The program determines the end-point volume based on the maximum dpH/dV as shown inFigure 103. The users can, however, determine the end-point volume by their own standard. Theonly thing one needs to do is to retrieve the appropriate graph and then carry out the data readingsfrom those curves. When the area of interest is too small, one can also expand it and then take moreaccurate data readings.
(2) REDOX titration
The program for the REDOX titration is almost the same as that for the pH titration program.The only difference is that the program records the potential rather than pH. The in-situ screenoutput is similar to Figure 106. After the REDOX titration has been completed, three graphs canbe retrieved, that is, CIPOTENTIAL/dV vs. volume (Figure 107), POTENTIAL vs. volume(Figure 108) and dPOTENTIALIdV vs. POTENTIAL (Figure 109). As with the pH titration, theend-point volume is determined from the peak CIPOTENTIAL/dV as shown in Figure 107. Thegraph readings and expansion are also possible for this program.
II Strike anj ke!J to stop data acquisition (Maximum DataU 2000)
Datalt Time (sec) POT (unit) Volume (mL) dPOT,dU Max .dPOT/dU
248 245.5 1.182 1.973 .08 17.12249 246.5 1.183 1.980 .10 17.12250 247.5 1.184 1.988 .14 17.12251 248.5 1.185 1.998 .17 17.1Z252 249.5 1.185 2.005 .00 17.12
0 Allowed Maximum Speed 160
xE$
2 .$$
POT +
dPOTdU
—i .en
-2 .
4$ •
—
-I-
126. 268.
TIME (s.c)
280. 368.x E8
Figure 106 In-situ screen output during REDOX titration
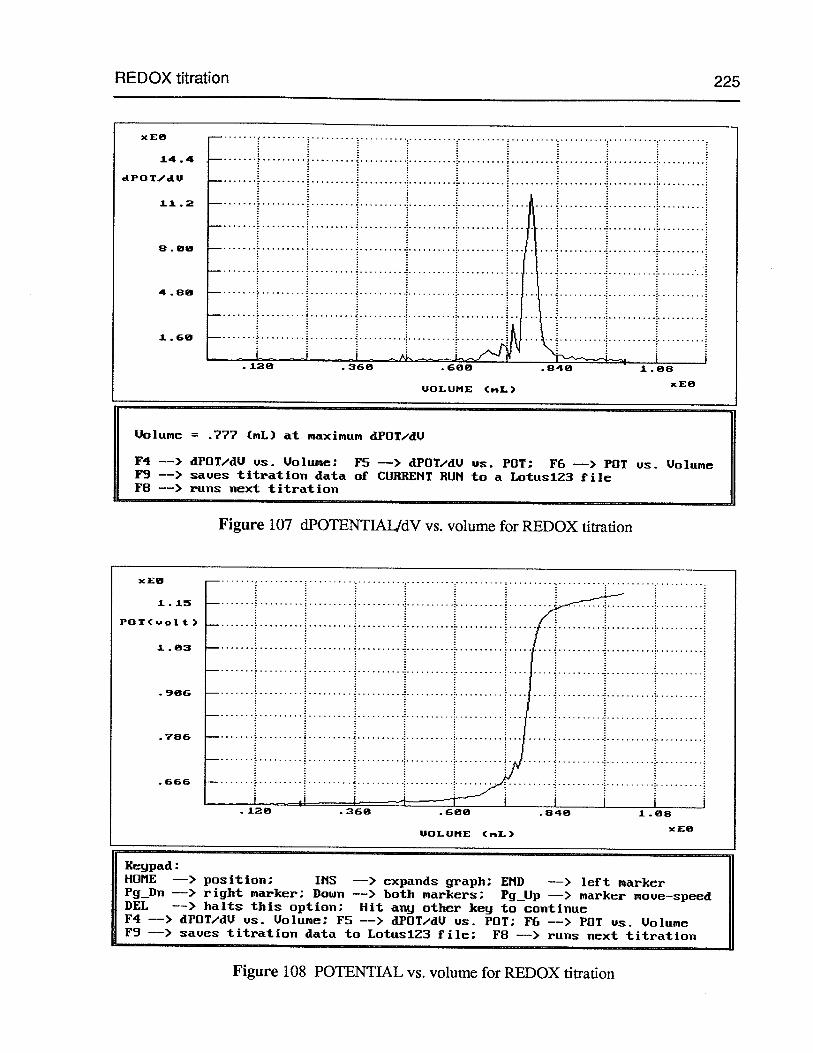
REDOX titration
Figure 107 dPOTENTIALJdV vs. volume for REDOX titration
Figure 108 POTENTIAL vs. volume for REDOX titration
225
x Em
.1.4.4
dPOTJdU
11.2
8.60
4.86
S • 60
126 360 600 • 840
VOLUME (ML)
1 • 08
xEO
Volume = .777 (mL) at maximum dPOT,dV
P4 ——> dPOT/dV us. Volume; P5 ——> dPOT/dV us. POT; F6 ——> POT us. VolumeP9 —> saues titration data of CURRENT RUN to a LotuslZ3 filePB ——> runs next titration
x Em
1 .
POT(el t.)
5 .03
966
.786
.666
)eypad:HOME —> position; Ills —--> expands graph; END ——> left markerPg_Dn ——> right marker; Down ——> both markers; Pg_Up ——> marker noue—speedDEL ——> halts this option; Hit anj other ke!,J to continueF4 ——> dPOT/dV us. Volume; F5 ——> dPOT,dV us. POT: P6 ——> POT us. VolumeP9 —> saues titration data to LotuslZ3 file; F8 —> runs next titration
.660
VOLUME (tiL)
1 .08
xEO
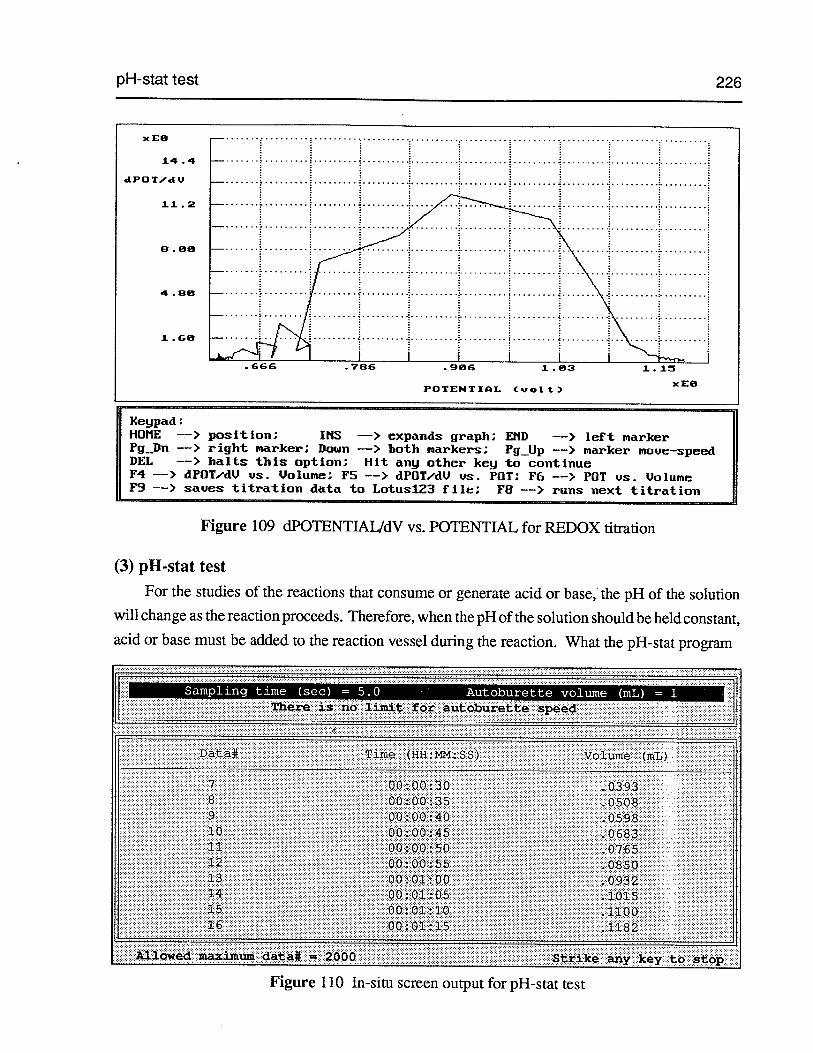
pH-stat test 226
.
.
.666 .786 .96 1.3 1.15
xEPOTENTIAL (volt)
Keypad:HOME ——> position; INS —> expands graph; END ——> left narkerPg_Dn ——> right narker; Down ——> both narkers; Pg_Up —> narker noue—speedDEL ——> halts this option; Hit any other key to continueF4 ——> dPOT/dV us. Uolume; F5 ——> dPOT/dU us. POT; F6 ——> POT us. UolumeF ——> saves titration data to LotuslZ3 file; F8 ——> runs next titration
Figure 109 dPOTENTIALJdV vs. POTENTIAL for REDOX titration
(3) pH-stat test
For the studies of the reactions that consume or generate acid or base, the pH of the solutionwill change as the reaction proceeds. Therefore, when the pH of the solution should be held constant,acid or base must be added to the reaction vessel during the reaction. What the pH-stat program
Sampling time (sec) = 5.0 Autoburette volume (mL) = 1There is no limit for autoiurette speed
Data# Time (HH:MM:SS) Volume (niL)
7 00:00:30 .03938 00:00:35 .05089 00:00:40 .059810 00:00:45 .068311 00:00:50 .076512 00:00:55 .085013 00:01:00 .093214 00:01:05 .101515 00:01:10 .110016 00:01:15 .1182
Allowed maximum data* = 2000 Strike any key to stop
Figure 110 In-situ screen output for pH-stat test
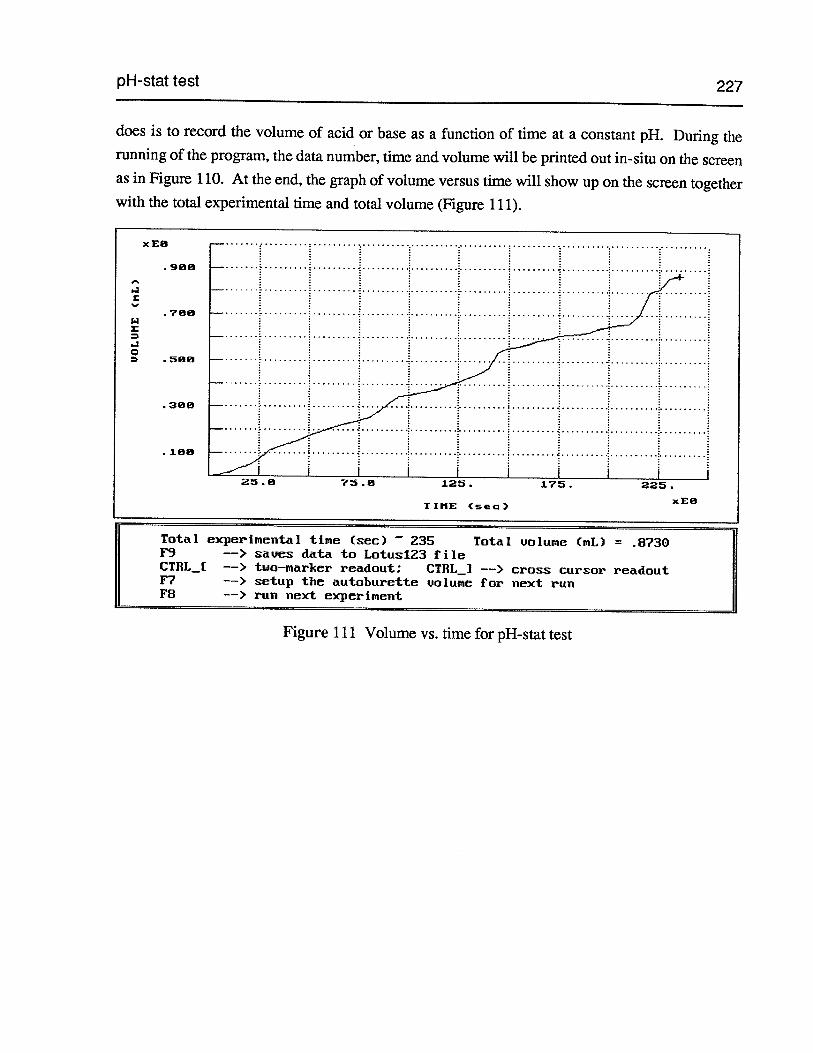
pH-stat test 227
does is to record the volume of acid or base as a function of time at a constant pH. During therunning of the program, the data number, time and volume will be printed out in-situ on the screenas in Figure 110. At the end, the graph of volume versus time will show up on the screen togetherwith the total experimental time and total volume (Figure 111).
xEa—
.9ø —.
.
7 —
ED —
O—
— :
.1ø — .
25. 75. 125. 175. 225.
xTIME (sec)
Total experimental time (sec) 235 Total uolume (mL) .8730F9 ——> saues data to LotuslZ3 fileCTBL_[ ——> tuo—marker readout; CTRL_] ——> cross cursor readoutF? ——> setup the autoburette uolume for next runF8 ——> run next experiment
Figure 111 Volume vs. time for pH-stat test
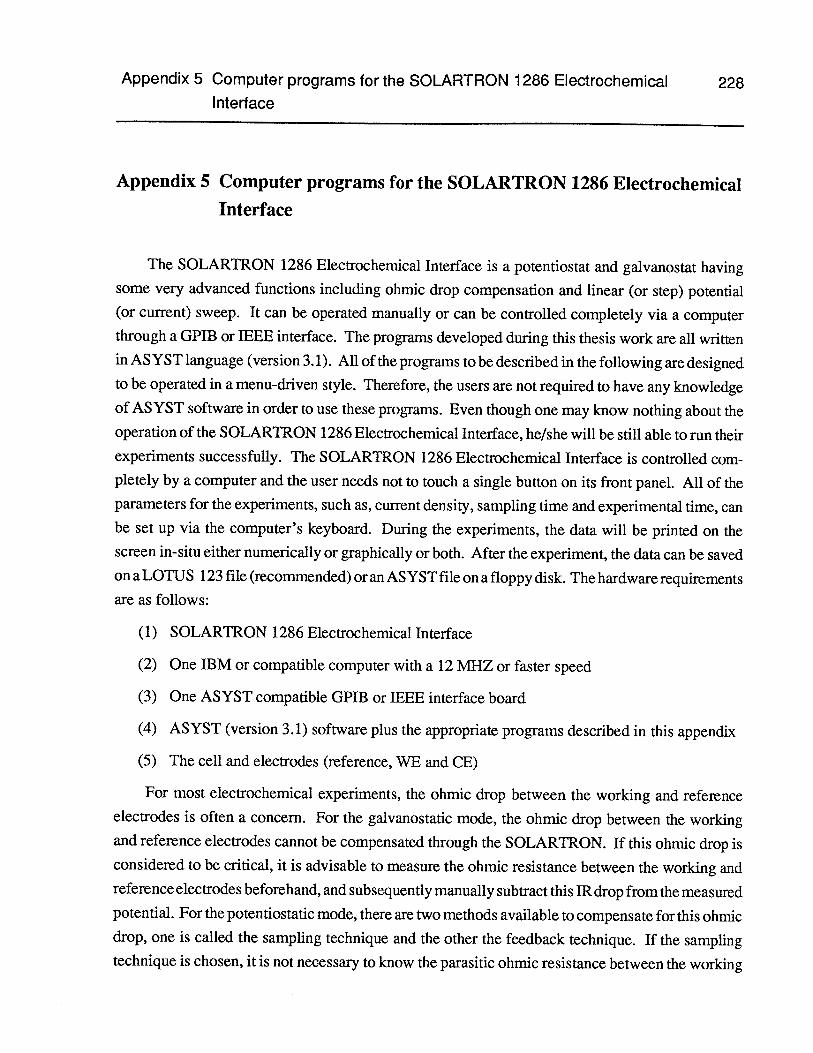
Appendix 5 Computer programs for the SOLARTRON 1286 Electrochemical 228I nterface
Appendix 5 Computer programs for the SOLARTRON 1286 ElectrochemicalInterface
The SOLARTRON 1286 Electrochemical Interface is a potentiostat and galvanostat havingsome very advanced functions including ohmic drop compensation and linear (or step) potential(or current) sweep. It can be operated manually or can be controlled completely via a computerthrough a GPIB or IEEE interface. The programs developed during this thesis work are all writtenin ASYST language (version 3.1). All of the programs to be described in the following are designedto be operated in a menu-driven style. Therefore, the users are not required to have any knowledgeof ASYST software in order to use these programs. Even though one may know nothing about theoperation of the SOLARTRON 1286 Electrochemical Interface, he/she will be still able to run theirexperiments successfully. The SOLARTRON 1286 Electrochemical Interface is controlled completely by a computer and the user needs not to touch a single button on its front panel. All of theparameters for the experiments, such as, current density, sampling time and experimental time, canbe set up via the computer’s keyboard. During the experiments, the data will be printed on thescreen in-situ either numerically or graphically or both. After the experiment, the data can be savedon a LOTUS 123 file (recommended) or an ASYST file on a floppy disk. The hardware requirementsare as follows:
(1) SOLARTRON 1286 Electrochemical Interface
(2) One IBM or compatible computer with a 12 MHZ or faster speed
(3) One ASYST compatible GPIB or IEEE interface board
(4) ASYST (version 3.1) software plus the appropriate programs described in this appendix
(5) The cell and electrodes (reference, WE and CE)
For most electrochemical experiments, the ohmic drop between the working and referenceelectrodes is often a concern. For the galvanostatic mode, the ohmic drop between the workingand reference electrodes cannot be compensated through the SOLARTRON. If this ohmic drop isconsidered to be critical, it is advisable to measure the ohmic resistance between the working andreference electrodes beforehand, and subsequently manually subtract this JR drop from the measuredpotential. For the potentiostatic mode, there are two methods available to compensate for this ohmicdrop, one is called the sampling technique and the other the feedback technique. If the samplingtechnique is chosen, it is not necessary to know the parasitic ohmic resistance between the working
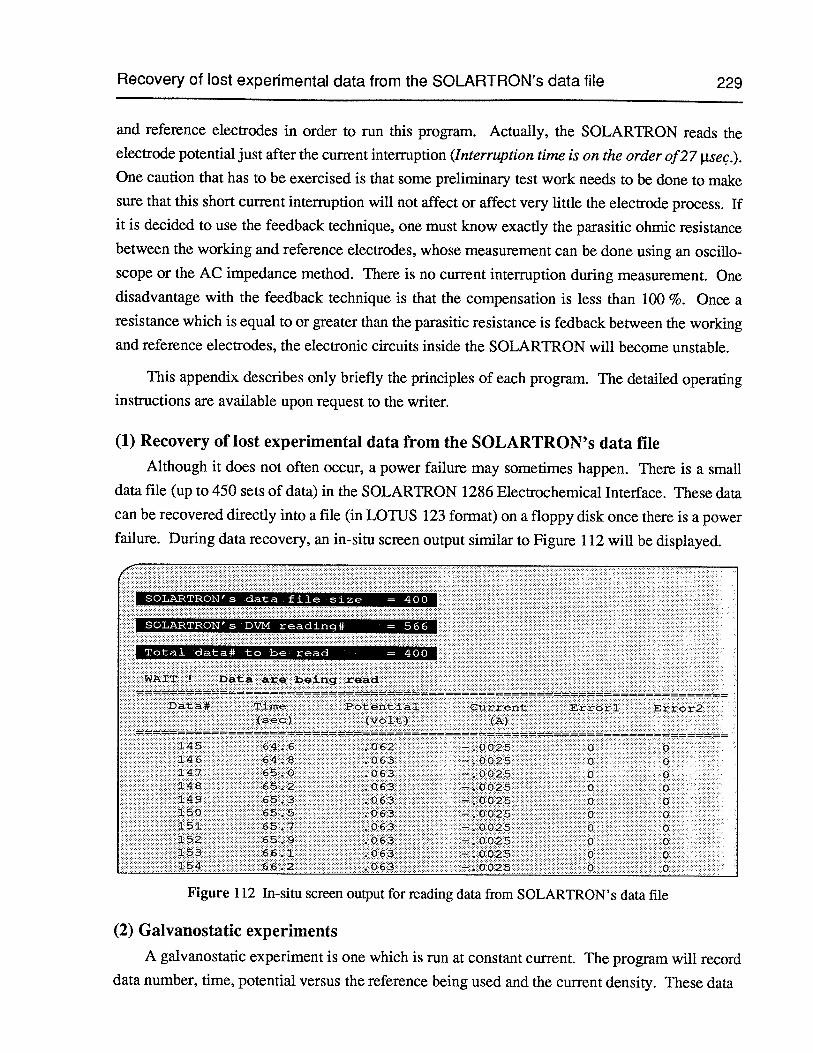
Recovery of lost experimental data from the SOLARTRON’s data file 229
and reference electrodes in order to run this program. Actually, the SOLARTRON reads theelectrode potential just after the current interruption (Interruption time is on the order of27 Ilsec.).One caution that has to be exercised is that some preliminary test work needs to be done to makesure that this short current interruption will not affect or affect very little the electrode process. Ifit is decided to use the feedback technique, one must know exactly the parasitic ohmic resistancebetween the working and reference electrodes, whose measurement can be done using an oscilloscope or the AC impedance method. There is no current interruption during measurement. Onedisadvantage with the feedback technique is that the compensation is less than 100 %. Once aresistance which is equal to or greater than the parasitic resistance is fedback between the workingand reference electrodes, the electronic circuits inside the SOLARTRON will become unstable.
This appendix describes only briefly the principles of each program. The detailed operatinginstructions are available upon request to the writer.
(1) Recovery of lost experimental data from the SOLARTRON’s data file
Although it does not often occur, a power failure may sometimes happen. There is a smalldata file (up to 450 sets of data) in the SOLARTRON 1286 Electrochemical Interface. These datacan be recovered directly into a file (in LOTUS 123 format) on a floppy disk once there is a powerfailure. During data recovery, an in-situ screen output similar to Figure 112 will be displayed.
(2) Galvanostatic experiments
A galvanostatic experiment is one which is run at constant current. The program will recorddata number, time, potential versus the reference being used and the current density. These data
SOLARTRON’s data file size = 400
SOLARTRON’s DVM reading# 566
Total data4t to be read = 400
Figure 112 In-situ screen output for reading data from SOLARTRON’s data file
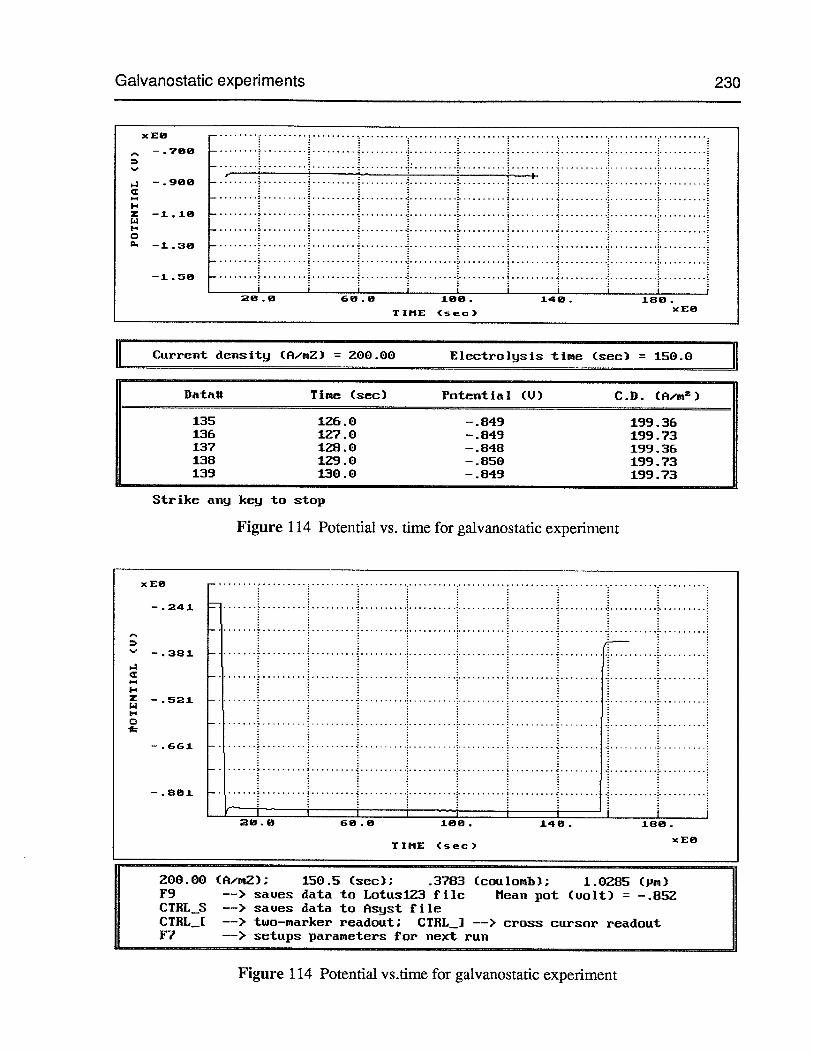
Galvanostatic experiments 230
II Current densitV (A/mZ) = 200.00 E1ectro1sis time (sec) = 150.0
Datafl Time (sec) Potential (U) C.D. (A.,mZ)
135 126.0 —.849 199.36136 127.0 —.849 199.73137 128.0 —.848 199.36138 129.0 —.850 199.73139 130.0 —.849 199.73
Strike an,j kej to stop
Figure 114 Potential vs. time for galvanostatic experiment
xEO
—.241
-%
•- —. 381
-
,.
-
‘-4
.5a1
— . 661 -
-.881 -• zzz20.8 60.0 100. 146. 186.
xEOTIME (sec)
200.00 (flm2); 150.5 (sec); .3783 (coulomb); 1.0285 (pm)F9 —> saues data to LotuslZ3 file Mean pot (uolt) = —.852CTBL_S ——> saues data to Asjst fileCTBL_[ ——> two—marker readout; CTRL_) —> cross cursor readoutF? ——> setups parameters for next run
Figure 114 Potential vs.time for galvanostatic experiment
xEO
-
. 700 .
3
6 ‘—a—- .988
C—
Z —1.18 6 .
C—1.30
-1.50
20.0 60.0 186. 140. 180.
TIME C) xEO
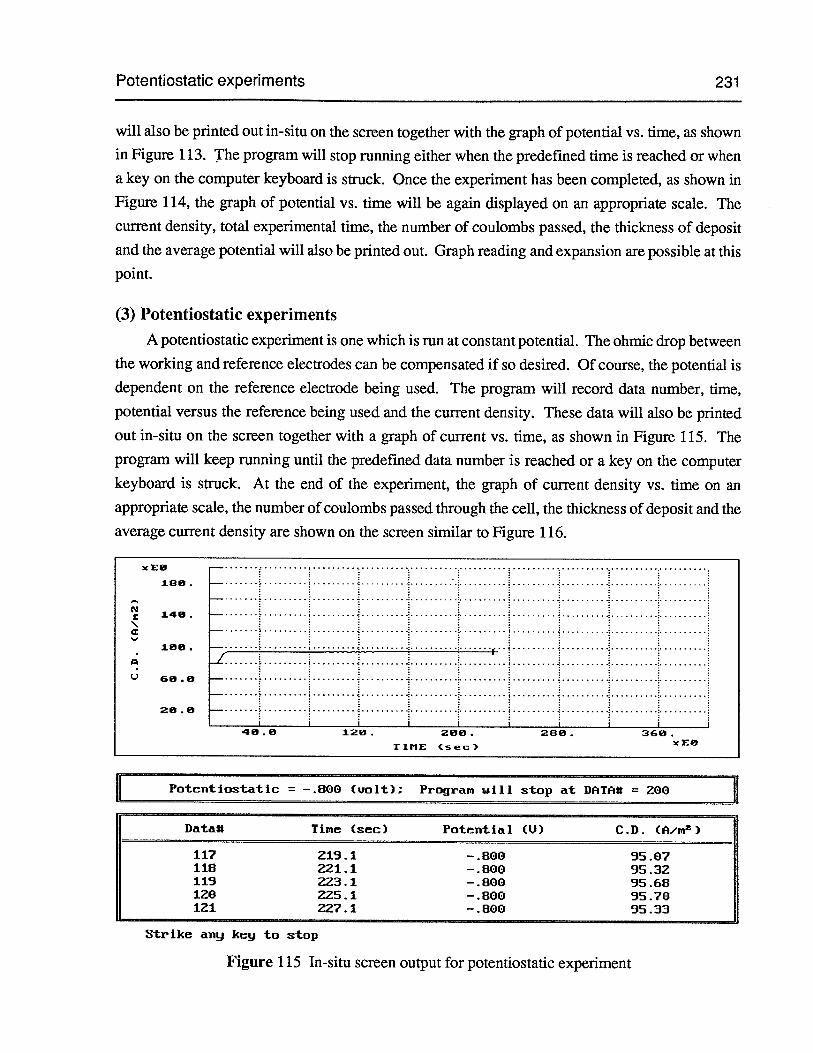
Potentiostatic experiments 231
will also be printed out in-situ on the screen together with the graph of potential vs. time, as shown
in Figure 113. The program will stop running either when the predefined time is reached or when
a key on the computer keyboard is struck. Once the experiment has been completed, as shown in
Figure 114, the graph of potential vs. time will be again displayed on an appropriate scale. Thecurrent density, total experimental time, the number of coulombs passed, the thickness of depositand the average potential will also be printed out. Graph reading and expansion are possible at thispoint.
(3) Potentiostatic experiments
A potentiostatic experiment is one which is run at constant potential. The ohmic drop between
the working and reference electrodes can be compensated if so desired. Of course, the potential is
dependent on the reference electrode being used. The program will record data number, time,
potential versus the reference being used and the current density. These data will also be printed
out in-situ on the screen together with a graph of current vs. time, as shown in Figure 115. The
program will keep running until the predefined data number is reached or a key on the computer
keyboard is struck. At the end of the experiment, the graph of current density vs. time on anappropriate scale, the number of coulombs passed through the cell, the thickness of deposit and the
average current density are shown on the screen similar to Figure 116.
II Potentiostatic = —.800 (uolt); Program will stop at DAThU = 200
Datah Time (sec) Potential (U) C.D. (A,mZ)
117 219.1 —.800 95.07110 221.1 —.800 95.32119 223.1 —.800 95.68120 225.1 —.800 95.70121 227.1 —.800 95.33
Strike an,j kej to stop
xEø
L8.
i4.N
C
U
18g.
lEE
12e. 2.
TIME (sec)
28e. 36g.x E
Figure 115 In-situ screen output for potentiostatic experiment
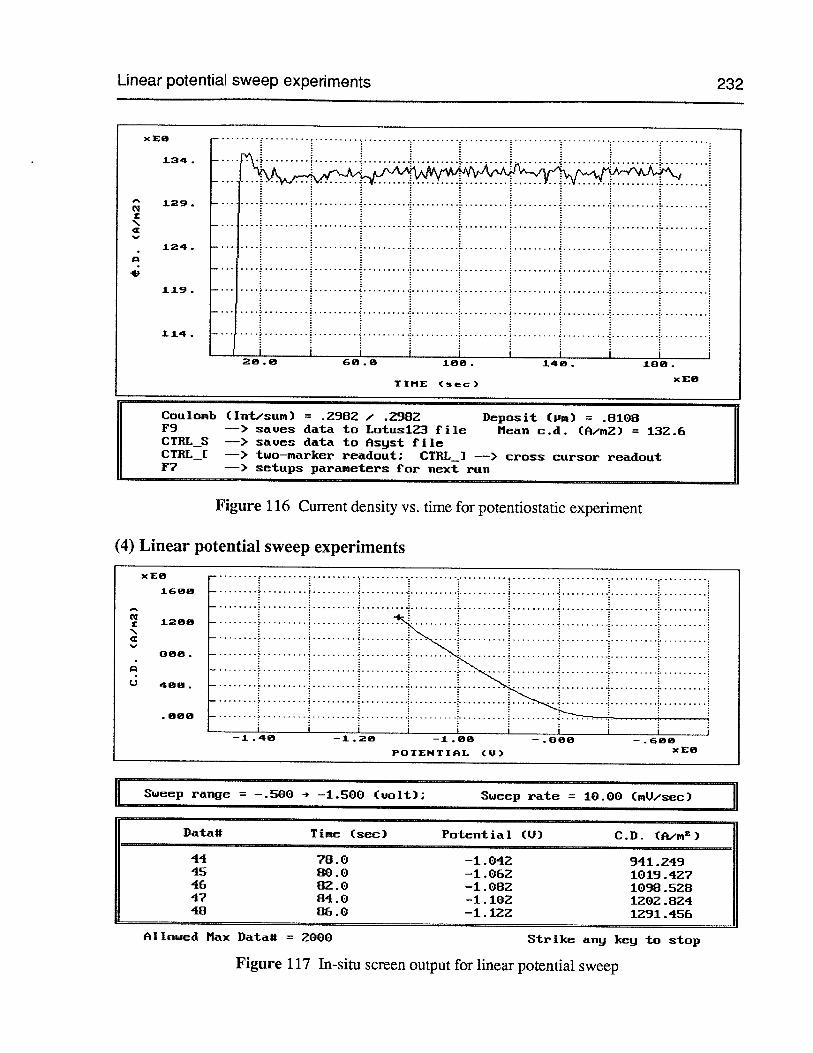
Linear potential sweep experiments 232
xE8 -
1.34 -
129. - i
124. -
119. -
114. -
L i28.8 68.8 146. 188.
Coulomb (mt/sum) = .2982 / .2982 Deposit (I’m) = .0108F9 ——> saves data to LotuslZ3 file Mean c.d. (A.i2) = 132.6CTBL_S ——> saves data to Asyst fileCTRL_[ ——> two—marker readout; CTRL_] ——> cross cursor readoutF? ——> setups parameters for next run
Figure 116 Current density vs. time for potentiostatic experiment
(4) Linear potential sweep experiments
xE8 -1668 -
E—1.48 —1.28 —1.88 —.806 —.688
POTENTIAL (U) xEO
..
Datafl Time (sec) Potential (0) C.D. (A/rn2)
44 78.0 —1.042 941.24945 80.0 —1.062 1019.42?46 82.0 —1.082 1098.5284? 84.0 —1.102 1202.82448 06.0 —1.122 1291.456
Allowed Ilax Datafl = 2000 Strike any key to stop
Figure 117 In-situ screen output for linear potential sweep
Sweep rate = 10.00 (mU/sec)
TIME (sec)x E8
Sweep range = —.500 -‘ —1.500 (volt);
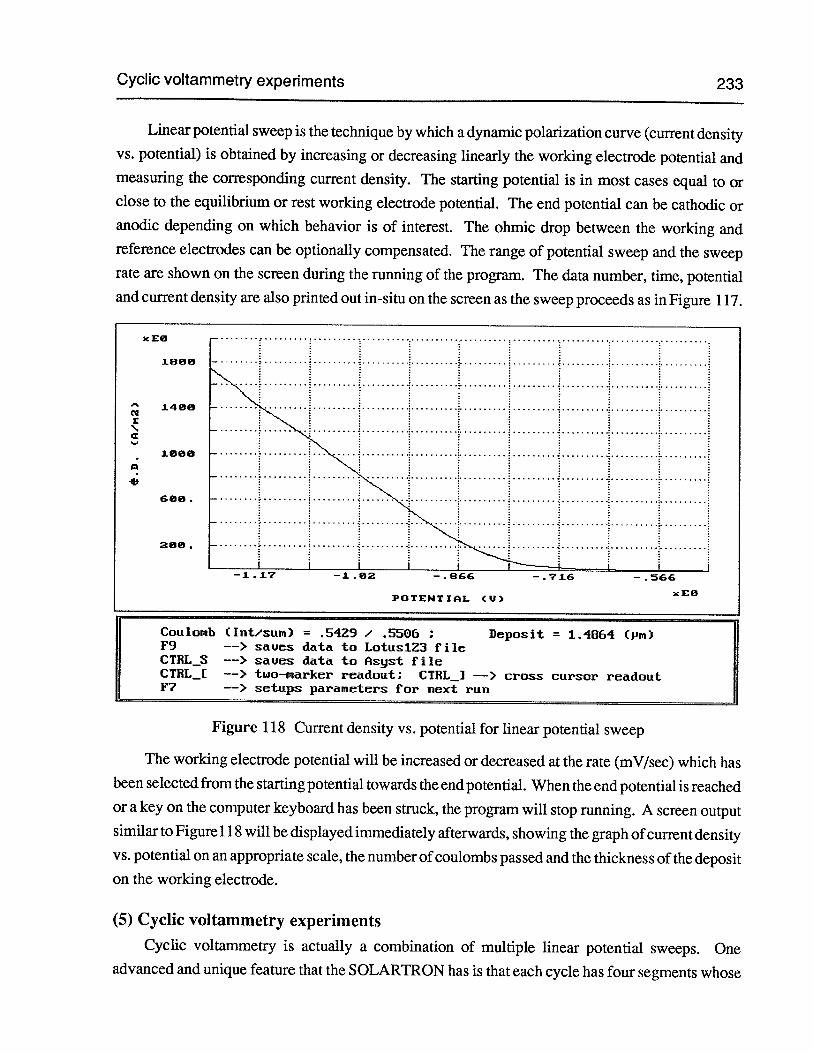
Cyclic voltammetry experiments 233
Linear potential sweep is the technique by which a dynamic polarization curve (current densityvs. potential) is obtained by increasing or decreasing linearly the working electrode potential andmeasuring the corresponding current density. The starting potential is in most cases equal to orclose to the equilibrium or rest working electrode potential. The end potential can be cathodic oranodic depending on which behavior is of interest. The ohmic drop between the working andreference electrodes can be optionally compensated. The range of potential sweep and the sweeprate are shown on the screen during the running of the program. The data number, time, potentialand current density are also printed out in-situ on the screen as the sweep proceeds as in Figure 117.
x E
i8
14ø
4-
—1.17 —1.82 —.866 —.716 —.566
E8POTENTIAL CU)
Coulomb (hit/sum) = .5429 / .5506 ; Deposit = 1.4664 (JJ)
F9 ——> saves data to LotuslZ3 fileCTRL_S ——> saves data to Asyst fileCTBL_[ —> two—marker readout; CTRL_] ——> cross cursor readoutF? ——> setups parameters for next run
Figure 118 Current density vs. potential for linear potential sweep
The working electrode potential will be increased or decreased at the rate (mVlsec) which hasbeen selected from the starting potential towards the end potential. When the end potential is reachedor a key on the computer keyboard has been struck, the program will stop running. A screen outputsimilar to Figure 118 will be displayed immediately afterwards, showing the graph ofcurrent densityvs. potential on an appropriate scale, the number ofcoulombs passed and the thickness of the depositon the working electrode.
(5) Cyclic voltammetry experiments
Cyclic voltammetry is actually a combination of multiple linear potential sweeps. Oneadvanced and unique feature that the SOLARTRON has is that each cycle has four segments whose
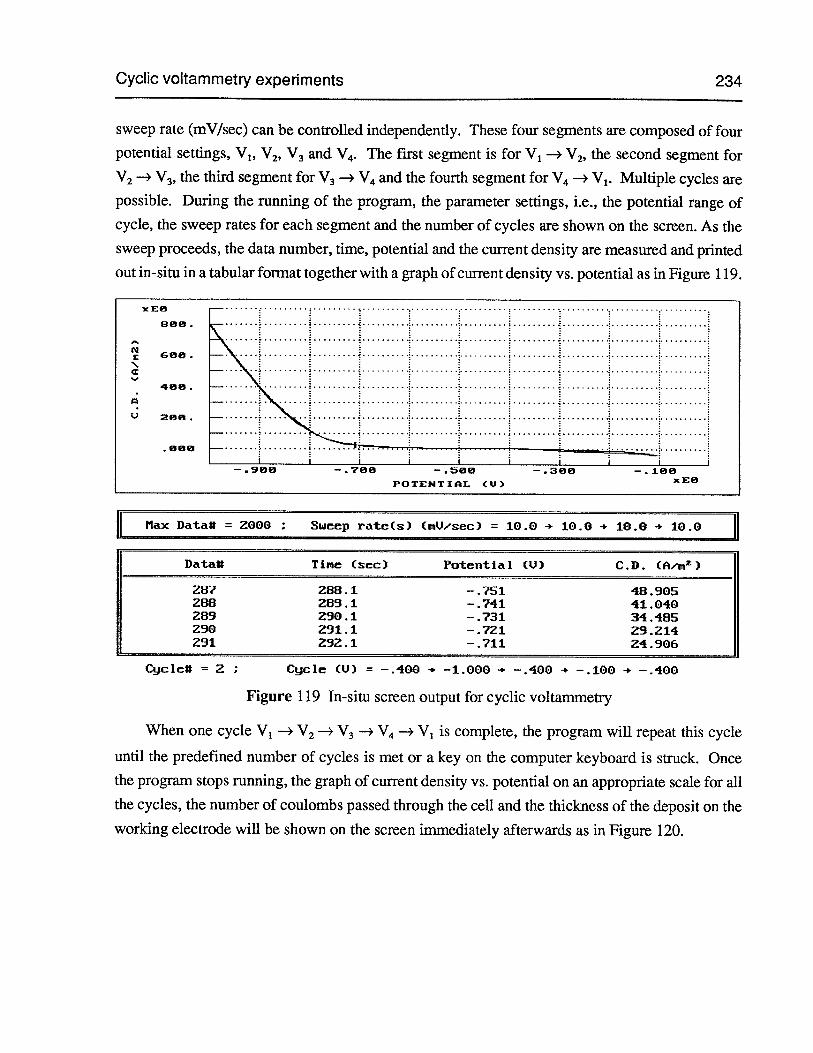
Cyclic voltammetry experiments 234
sweep rate (mV/sec) can be controlled independently. These four segments are composed of fourpotential settings, V1, V2. V3 and V4. The first segment is for V1 —* V2. the second segment forV2 — V3. the third segment for V3 — V4 and the fourth segment for V4 — V1. Multiple cycles arepossible. During the running of the program, the parameter settings, i.e., the potential range ofcycle, the sweep rates for each segment and the number of cycles are shown on the screen. As thesweep proceeds, the data number, time, potential and the current density are measured and printed
out in-situ in a tabular format together with a graph of current density vs. potential as in Figure 119.
.
.
::.zizzz4. — .
2. — .
— —
____ _________________ ____ ____ ____
L
________
— . 9B — . 76 — . — . 3 —.
POTENTIAL (U) xE
Max Datafl = 2000 Sweep rate(s) (mU/sec) = 10.0 -‘ 10.0 10.0 10.0
Datafl Tine (sec) Potential (11) C.D. (flZ)
28? 288.1 —.751 48.905288 289.1 —.741 41.040289 290.1 —.731 34.485290 291.1 —.721 29.214291 292.1 —.711 Z4.906
C!Jclet 2 ; Cycle (U) = —.400 • —1.000 —.400 —.100 —.400
Figure 119 In-situ screen output for cyclic voltammetry
When one cycle V1 —* V2 — V3 — V4 — V1 is complete, the program will repeat this cycle
until the predefined number of cycles is met or a key on the computer keyboard is struck. Oncethe program stops running, the graph of current density vs. potential on an appropriate scale for allthe cycles, the number of coulombs passed through the cell and the thickness of the deposit on the
working electrode will be shown on the screen immediately afterwards as in Figure 120.
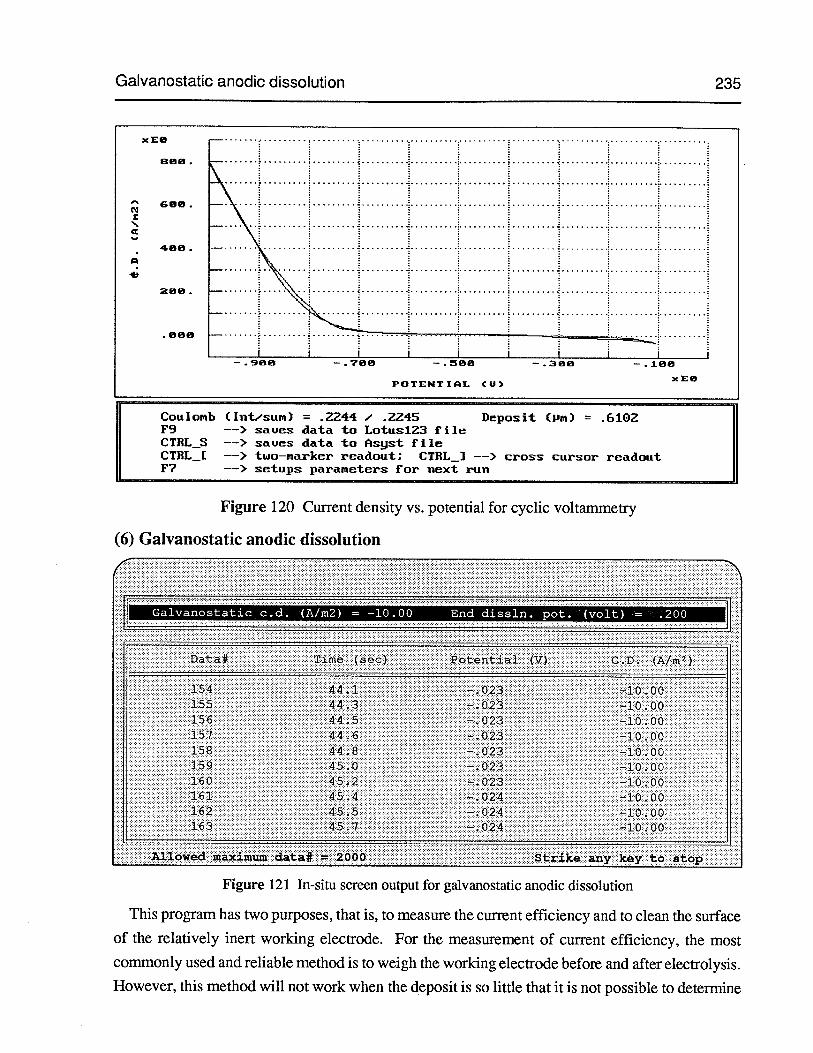
Galvanostatic anodic dissolution 235
—.
-S — .C
— . .A
zee. — ,.
— —
—- — . 7 — . 5 — . 3e — . iee
xEePOTENTIAL CU)
Coulomb (Intsum) = .2244 / .2Z45 Deposit (pm) .6102F9 ——> saues data to LotuslZ3 fileCTRL_S ——> saucs data to Asyst fileCTBL_[ ——> two—marker readout; CTEL_..] —> cross cursor readoutF? ——> setups parameters for next run
Figure 120 Current density vs. potential for cyclic vohammetry
(6) Galvanostatic anodic dissolution
Galvanostaticc.d. (A/rn2) = —10.00 End dissln. pot. (volt) = .200 iiData# Time (sec) Potential {V) C.D. (A/m2)
154 44.1 —.023 —10.00155 44.3 —.023 —10.00156 44.5 —.023 —10.00157 44.6 —.023 —10.00158 44.8 —.023 —10.00159 45.0 —.023 —10.00160 45.2 —.023 —10.00161 45.4 —.024 —10.00162 45.5 —.024 —10.00163 45.7 —.024 —10.00
Allowed maximum data# = 2000 Strike any key to stop
Figure 121 In-situ screen output for galvanostatic anodic dissolution
This program has two purposes, that is, to measure the current efficiency and to clean the surfaceof the relatively inert working electrode. For the measurement of current efficiency, the mostcommonly used and reliable method is to weigh the working electrode before and after electrolysis.However, this method will not work when the deposit is so little that it is not possible to determine
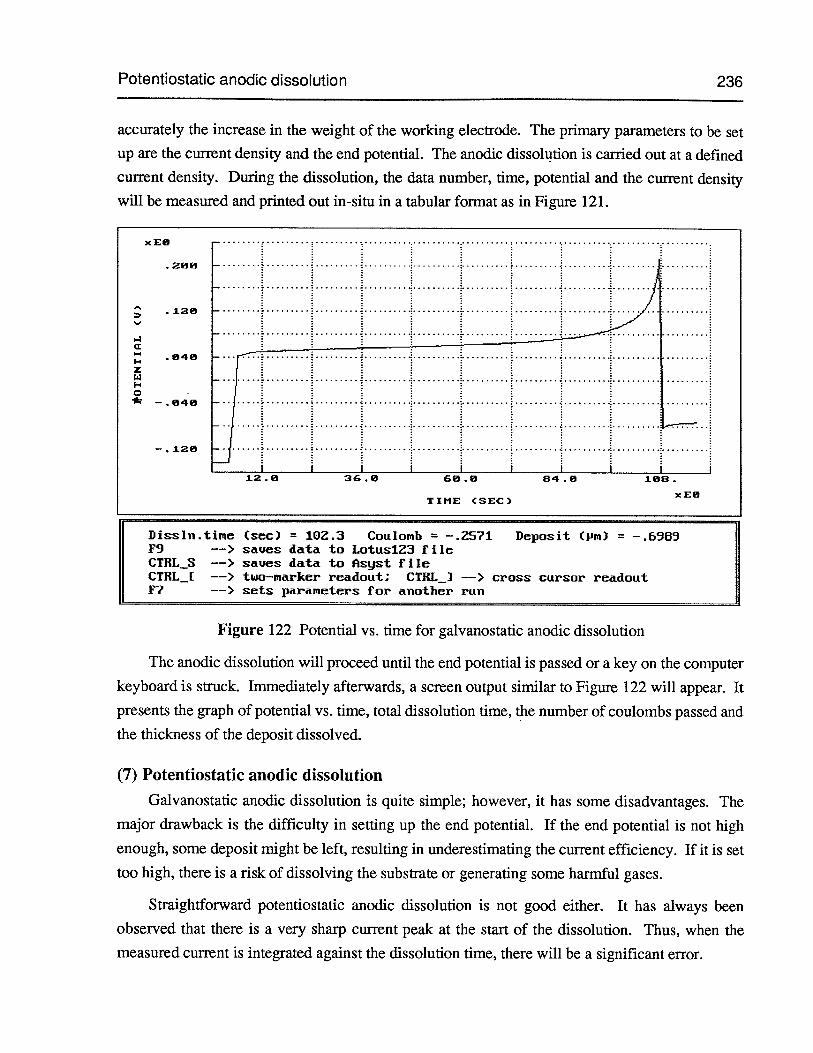
Potentiostatic anodic dissolution 236
accurately the increase in the weight of the working electrode. The primary parameters to be setup are the current density and the end potential. The anodic dissolution is carried out at a definedcurrent density. During the dissolution, the data number, time, potential and the current densitywill be measured and printed out in-situ in a tabular format as in Figure 121.
xE
.2B
.12 .
z1-4C*
—.I2 . .
___ ___
j
___ ___ ___
[
___ ___ ___
j
___ ___
L2.ø 36. se.e 84.e see.
x ETIME (SEC)
Dissln.tine (sec) = 102.3 Coulomb = —.2571 Deposit (I’m) = —.6909F9 ——> saves data to LotuslZ3 fileCTRL_3 ——> saves data to Asyst fileCTRL_[ ——> two—marker readout; CTBL_] ——> cross cursor readoutF? ——> sets parameters for another run
Figure 122 Potential vs. time for galvanostatic anodic dissolution
The anodic dissolution will proceed until the end potential is passed or a key on the computer
keyboard is struck. Immediately afterwards, a screen output similar to Figure 122 will appear. It
presents the graph of potential vs. time, total dissolution time, the number of coulombs passed and
the thickness of the deposit dissolved.
(7) Potentiostatic anodic dissolution
Galvanostatic anodic dissolution is quite simple; however, it has some disadvantages. The
major drawback is the difficulty in setting up the end potential. If the end potential is not high
enough, some deposit might be left, resulting in underestimating the current efficiency. If it is set
too high, there is a risk of dissolving the substrate or generating some harmful gases.
Straightforward potentiostatic anodic dissolution is not good either. It has always been
observed that there is a very sharp current peak at the start of the dissolution. Thus, when the
measured current is integrated against the dissolution time, there will be a significant error.
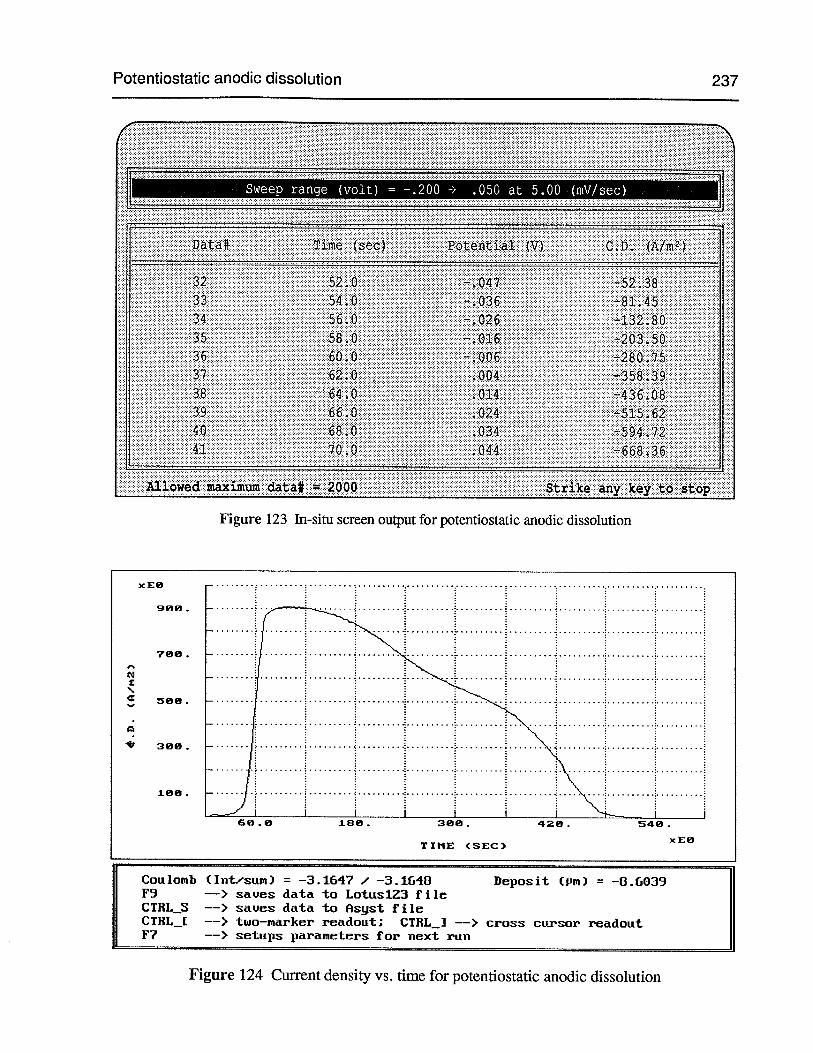
Potentiostatic anodic dissolution
I’
N
‘S
C
237
—5238—81 45—132 80—203 50—280 75—358 39—436O8.-51562.:—594 72
cimum..._
Figure 123 In-situ screen output for potentiostatic anodic dissolution
Sweep range (volt) = —.200 -> .050 at 5.00 (mV/sec)
::::.::CD .).::.:::
x Eø
9.
7.
56g.
3e.
i.
::
x ETIME (SEC)
Coulonb (mt/sum) = —3.164? / —3.1648 Deposit (pm) = —8.6039F9 —> saves data to LotuslZ3 fileCTRL_S ——> saves data to Asyst fileCTRL_L ——> two—marker readout; CTBL_] ——> cross cursor readoutF? ——> setups parameters for next run
Figure 124 Current density vs. time for potentiostatic anodic dissolution
66. 18g. 3e6. 42g. 54g.
Potentiostatic anodic dissolution 238
In the program described in this appendix the anodic dissolution will start from a potentialwhich is close to the equilibrium or rest potential of the working electrode. The potential of theworking electrode will then be increased at the rate (mV/sec) towards the end potential which hasbeen specified by the investigator. Once the end potential is reached, the working electrode willstay at that potential until the end of the dissolution. In this way, one can avoid the initial currentpeak occurring in straight potentiostatic anodic dissolution and the risk of substrate dissolution orthe generation of gases as can happen in galvanostatic anodic dissolution. During the execution ofthe program, a screen output similar to Figure 123 will be obtained.
The program will continue running until a key on the computer keyboard is struck. Immediatelyafter the program has ended, the graph of current density vs. time will show up, and the number ofcoulombs passed and the thickness of deposit dissolved will be printed out as in Figure 124.
Appendix 6 Computer program for the SOLARTRON 1286 Electrochemical 239Interface together with the RADIOMETER titrator
Appendix 6 Computer program for the SOLARTRON 1286 ElectrochemicalInterface together with the RADIOMETER titrator
When the working electrode is polarized either galvanostatically or potentiostatically, the pHon the surface of the working electrode will change if the electrode reactions consume or generateacid. One example is nickel electrowinning, where hydrogen gas evolution takes place simultaneously with nickel electrodeposition, leading to a higher pH on the nickel cathode surface. Theprogram to be described in this appendix is also written in ASYST language (version 3.1). Theprogram is in a menu-driven style. Therefore, the users are not required to have any knowledge ofASYST software in order to use these programs. The hardware requirements are as follows:
(1) SOLARTRON 1286 Electrochemical Interface
(2) RADIOMETER COPENHAGEN ETS822 titration system (composed of flT8O titrator,PHM82 standard pH meter and ABU8O autoburette)
(3) One IBM or compatible computer with a 12 MHZ or faster speed
(4) One ASYST compatible GPIB or IEEE board
(5) One ASYST compatible data acquisition board with two -10 +10 volts A/D channels
(6) ASYST (version 3.1) software plus the appropriate program described in this appendix
(7) The cell and electrodes (pH, reference, WE and CE) for the experiments
This appendix describes only briefly the principles of the program. The detailed operatinginstructions are available upon request to the writer.
Three programs were developed for this category, including galvanostatic electrolysis with pHmeasurement, galvanostatic anodic dissolution with pH measurement and potentiostatic anodicdissolution with pH measurement. However, only the first program will be described.
The purpose of this program is to run a constant current electrolysis with simultaneous pHmeasurements. The whole process is divided into seven stages, begin-rest, begin-initial, 1st-stage,2nd-stage, 3rd-stage, end-initial and end-rest. The electrolysis time and sampling rate can becontrolled in each stage. During the execution of the program, the data number, time, surface pH,potential and current will be measured and printed out in-situ as in Figure 125. The program willcontinue running until the predefined electrolysis time is reached or a key on the computer keyboard
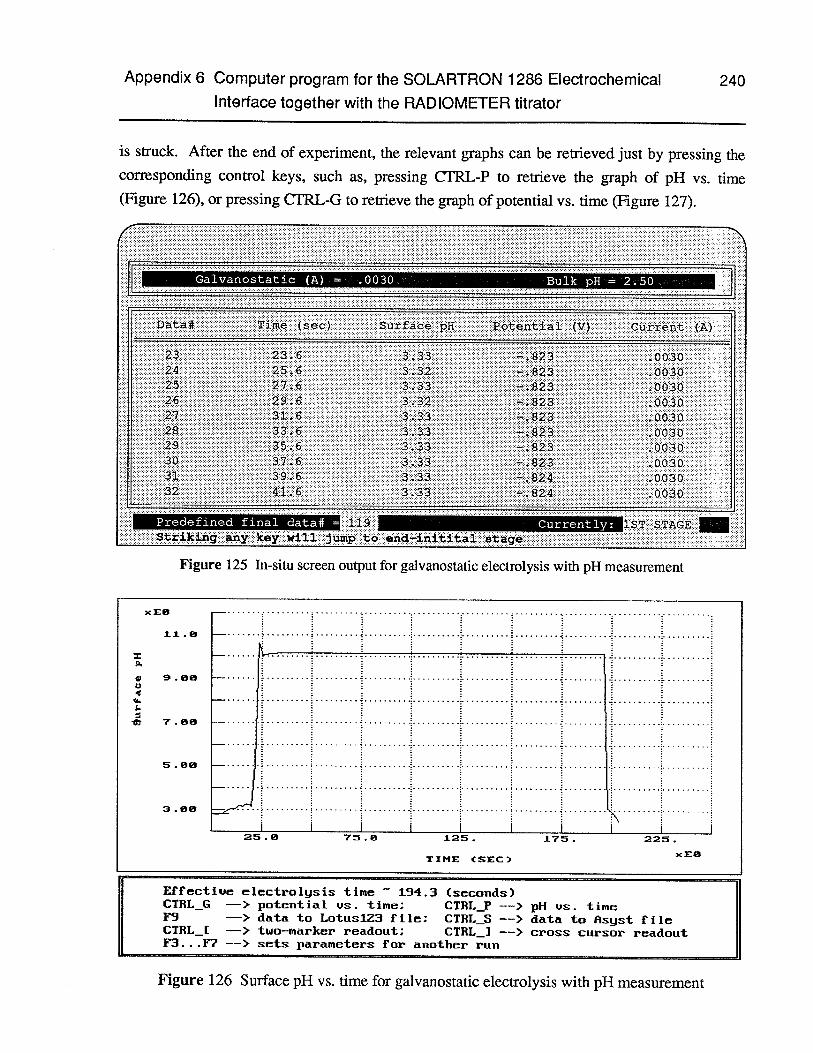
I.-.
C-,
‘-4,
CD‘t
C)
CDCD
Cs,
0CD
b-’
.— CD
0 CD
CD
CD
C-
CDCD
o CD
CD.c
CDCD
C-,
CDCD
‘
-t
0iz
’CD
‘-i’
‘,.
CDCD
> V CD D a 0)
C)
—o
CD aV
(D(D
—-‘
Ov
CD
-‘
(D
O
—O
D-‘
——
CDCD
;33(I
)>
0
-40
rnz
—‘a
D CD 0 C)
CD a C) 1\)
surf
ace
)H‘C M
U. .r4
r’()
-I
ICl
“2r’
)&
—-1
,‘1ilIc
::
:C
Ci
_
C).
..
.
CD:
: :
0:
:.
:
CD....
—t
1:
:
_
C.
..
..
..
a:
CD:
aa
IIl
a:
::
iIl
-
-0
VV
V:
a:
::
C’,
a
(C4
:a
::
:a
—C
..
..
..
CD‘.
CD.
..
..
..
Ca
:.
aa
.a
:
1 I I
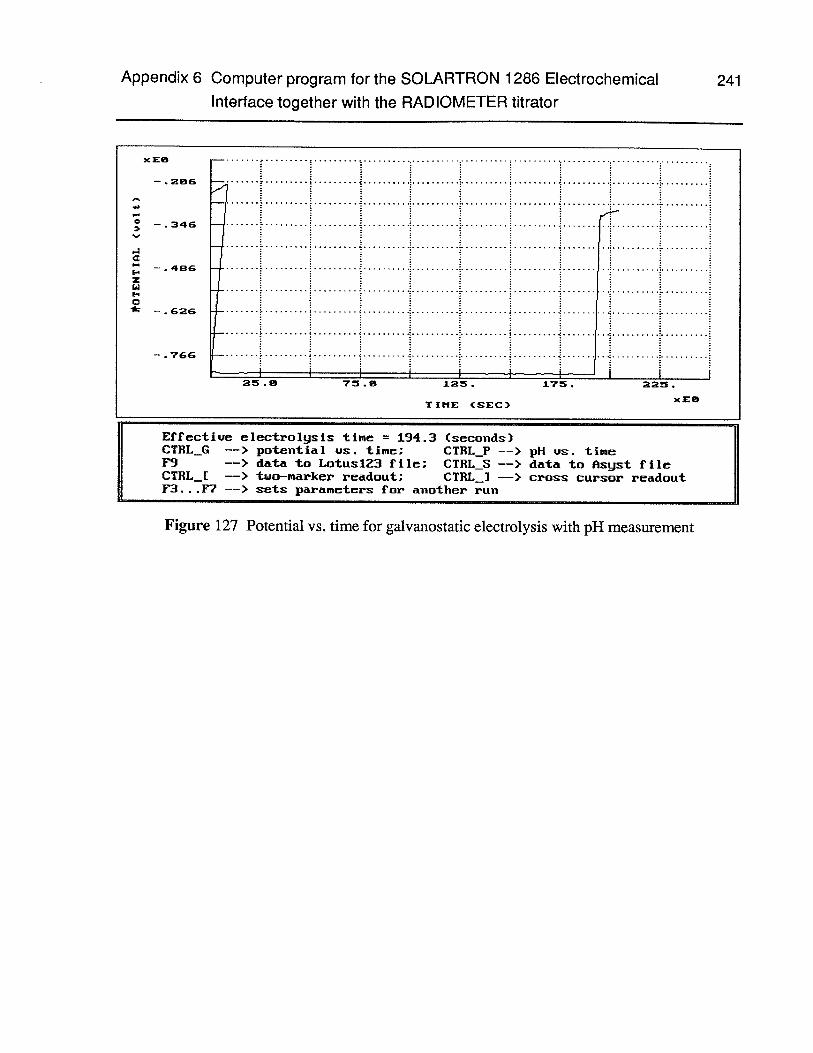
Appendix 6 Computer program for the SOLARTRON 1286 Electrochemical 241Interface together with the RADIOMETER titrator
175. 225.
xE
Effectiue electrol!,Jsis time 194.3 (seconds)CTEL_G ——> potential us. tine: CTRL_P ——> pH us. timeF9 ——> data to Lotusl23 file; CTRL_3 ——> data to Asyst fileCTRL_[ —> two—marker readout; CTBL_] ——> cross cursor readoutF3... .F7 ——> sets parameters £or another run
Figure 127 Potential vs. time for galvanostatic electrolysis with pH measurement
0
IzwC*
- . 26
- .346
-. 486
-. 626
-. 766
TIME (SEC)
25.m 75. 125.