fos immunoreactivity in the rat forebrain induced by electrical stimulation of the dorsolateral...
TRANSCRIPT

Journal of Chemical Neuroanatomy 38 (2009) 83–96
Fos immunoreactivity in the rat forebrain induced by electrical stimulationof the dorsolateral periaqueductal gray matter
Lee Wei Lim a,b,d,e,*, Yasin Temel a,b,d,e, Veerle Visser-Vandewalle b,d,Arjan Blokland c,e, Harry Steinbusch a,e
a Department of Neuroscience, Maastricht University, Maastricht, The Netherlandsb Department of Neurosurgery, Maastricht University Medical Center, Maastricht, The Netherlandsc Department of Neurocognition, Faculty of Psychology, Maastricht University, Maastricht, The Netherlandsd Maastricht Institute of Neuromodulative Development (MIND), The Netherlandse European Graduate School of Neuroscience (EURON), The Netherlands
A R T I C L E I N F O
Article history:
Received 17 July 2008
Received in revised form 29 June 2009
Accepted 29 June 2009
Available online 7 July 2009
Keywords:
Periaqueductal gray
Escape behaviour
Panic-like behaviour
Fear-like behaviour
c-Fos immunoreactivity
Neuroanatomy
Forebrain
A B S T R A C T
Electrical stimulation of the dorsolateral periaqueductal gray (dlPAG) matter induces panic- or fear-like
responses with intense emotional distress and severe anxiety. In this study, we evoked panic-like
behaviour by dlPAG stimulation and evaluated the effect on neuronal activation in different brain
regions. The number of c-Fos immunoreactive (c-Fos-ir) cells was measured semi-quantitatively
through series of stained rat brain sections. Our results demonstrate strong neural activation in the
medial prefrontal cortex, orbital cortex, anterior olfactory nuclei, secondary motor cortex, and the
somatosensory cortex. Moderate increases in the number of c-Fos-ir cells were detected in various
regions, including the hypothalamus, amygdala, and striatum. Additionally, there was mild expression of
c-Fos-ir cells in the hippocampus, thalamus, and habenula regions. In conclusion, we have shown that
deep brain stimulation of the dlPAG produced a distinctive pattern of neuronal activation across
forebrain regions as compared to the sham and control animals.
� 2009 Elsevier B.V. All rights reserved.
Contents lists available at ScienceDirect
Journal of Chemical Neuroanatomy
journal homepage: www.e lsev ier .com/ locate / jchemneu
1. Introduction
Electrical stimulation of the dorsolateral periaqueductal gray(dlPAG) evokes a typical reaction which is generally described asescape or defensive behaviour (Bandler and Shipley, 1994; De Ocaet al., 1998). This behaviour consists of a spontaneous flightreaction characterized by wild running, galloping, and jumpingaccompanied by hypertension, tachycardia, tachypnoea, freezing,and fear (Bittencourt et al., 2005; Hogg et al., 2006; Lim et al.,2008a). It is now widely accepted that this escape behaviour hassimilarities with a panic attack in humans (Deakin and Graeff,1991; Nashold et al., 1969; Schenberg et al., 1998). In clinicalpractice, panic attack occurs spontaneously and produces intenseemotional distress with significant changes in autonomic andneurological functions including palpitation, chest strains, sweat-ing, dyspnoe, feeling of choking, trembling, nausea, dizziness,paresthesia, chills or hot flushes, depersonalization or derealiza-
* Corresponding author at: Department of Neuroscience and Neurosurgery,
Maastricht University, Universiteitssingel 50 (Box 38), 6229 ER, Maastricht, The
Netherlands.
E-mail address: [email protected] (L.W. Lim).
0891-0618/$ – see front matter � 2009 Elsevier B.V. All rights reserved.
doi:10.1016/j.jchemneu.2009.06.011
tion, and fear of dying or losing control (American-Psychiatric-Association, 1994; Cassano and Savino, 1993). Importantly, panicattack can be induced both in humans and rodents by electricalstimulation of the dorsal parts of the PAG (Hogg et al., 2006;Hunsperger, 1956; Nashold et al., 1969).
Despite several studies, the pathophysiology of fear and panicrelated to the PAG is relatively unknown probably due to a complexinterplay between anatomical circuits, neurotransmitters, andneuropeptides (Borelli et al., 2005; de Bortoli et al., 2006; Limet al., 2008a,b). This type of fear-like behaviour is complex andrequires higher cortical connections to process the acquireddefensive information of external threats. The PAG, however, isinvolved in the coordination of defensive behaviour (Maren andQuirk, 2004; Mobbs et al., 2007). Recent preclinical studies havedemonstrated that electrical stimulation of the dlPAG withstimulation parameters which causes an escape reaction, led to asignificant increase in the number of c-Fos immunoreactive (c-Fos-ir) cells in specific brain regions (Borelli et al., 2005; Lim et al., 2008a).This neural activation highlights the existence of a brain networkcontrolling defensive behaviour (Coimbra et al., 2006; McNaughtonand Corr, 2004; Vianna and Brandao, 2003). More specifically,electrical or chemical stimulation of the dlPAG induced significant c-Fos expression in the ventromedial hypothalamus, dorsal premam-

L.W. Lim et al. / Journal of Chemical Neuroanatomy 38 (2009) 83–9684
millary nucleus, local coeruleus, amygdala and prefrontal cortex(Borelli et al., 2005; Vianna et al., 2003). Nevertheless, a systematicanalysis of the effects of dlPAG stimulation on c-Fos expression of thebrain is lacking. Such information would show which specific (partsof) regions are directly or indirectly involved in defensive behaviour.In this experiment, we systematically analyzed the neuronalactivation in different regions resulting from deep brain stimulationof the dlPAG. The number of c-Fos immunoreactive (c-Fos-ir) cellswas measured qualitatively through consecutive series of immu-nohistochemically stained rat brain sections.
2. Material and methods
2.1. Subjects
Subjects were male albino Wistar rats (N = 16, 12 weeks old, bred and housed at
the Central Animal Facility of Maastricht University, Maastricht, the Netherlands).
Rats had an average body weight of 300–350 g at the time of surgery. They were
housed individually in standard cages on sawdust bedding in an air-conditioned
room (about 20 8C) under a 12/12-h reversed light/dark cycle. Food, standard
laboratory chow (Hopefarms, Woerden, the Netherlands) and water were available
ad libitum. All experimental procedures were approved by the Animal Experiments
and Ethics Committee of Maastricht University, the Netherlands.
2.2. Surgical procedure
A detailed description of the surgical procedure and the electrodes has been
provided previously (Lim et al., 2008a; Temel et al., 2007). In brief, the rats were
anesthetized throughout the entire surgical procedure using a combination of
ketamine (90 mg/kg s.c.) and xylazine (10 mg/kg s.c.). Rats were placed in a
stereotactic apparatus (Stoelting, Wood Dale, USA; model 51653). After making
burr holes in the skull, rats received implantation of the electrodes at the level of the
dlPAG (coordinates from Bregma: AP,�7.6; ML, 0.7; and V,�4.8; approached with a
coronal angle of 108). A construction of one gold-plated needle-like electrodes with
an inner wire of a platinum–iridium combination (Technomed, Beek, The
Netherlands), with a tip diameter of 50 mm and a shaft diameter of 250 mm,
was employed in this experiment. The electrode was fixed in position using dental
cement (Heraeus Kulzer, Hanau, Germany). After the operation, rats were injected
with Temgesic (0.1 mg/kg s.c.) and received two-week recovery and animal
handling periods. Control rats received no surgery.
2.3. Deep brain stimulation
All animals had a preliminary stimulation session to determine the escape
threshold. The stimulation amplitudes were gradually increased until escape
Fig. 1. Representative low-power photomicrographs of a 30 mm-thick coronal section f
electrode to stimulate the dlPAG (Fig. A, scale bar = 0.5 mm) are shown. Fig. B, Schema
Watson atlas, respectively. The symbol (~) indicates the electrode localization in the d
gray.
behaviour was observed. At each step, stimulation duration was 15 s followed by
stimulation off period of 45 s. The stimulation frequency was set at 50 Hz, and pulse
width at 0.1 ms based on previous experiments that variation in pulse width did not
influence the behavioural performance (Desbonnet et al., 2004). A World Precision
Instruments digital stimulator (DS8000, WPI, Berlin, Germany) and a stimulus
isolator (DLS100, WPI, Berlin, Germany) were used to deliver the stimuli. Real time
verification of the parameters applied during stimulation was obtained using a
digital oscilloscope (Agilent 54622D oscilloscope, Agilent Technologies, Amstelv-
een, the Netherlands). After confirming the current amplitudes necessary to evoke
escape behaviour, all rats had a two-week stimulation off period before the final
stimulation session was performed at the lowest threshold of escape reaction.
2.4. Behavioural evaluation
Rats were placed in an open-field (OF) arena (square: 100 cm � 100 cm, and
height: 40 cm), clear Plexiglas box with an open top and a dark floor (Lim et al.,
2008c). The apparatus was located in a dimly red lit condition (15–20 lx) based
on the recommendation guide for the light intensity in animal rooms (UFAW,
1999; Van Zutphen et al., 2006). All testing was conducted in the same room and
the apparatus was cleaned after each experimental procedure with ethanol. Rats
were connected to an external stimulator through externalized leads. The
stimulation started approximately 1 min after the rat was placed in the OF arena.
We observed three different types of behaviour during the experimental
procedure, consisting of ‘no effect’, ‘freezing’ behaviour characterized by
piloerection, micturition/defaecation, and immobility, and ‘escape behaviour’
characterized by rigorous and aimlessly running. Behavioural changes during
this procedure were observed by two researchers. Freezing behaviour was
consistently characterized by immobility (without body movement) accom-
panied by two distinctive symptoms of increased alertness (head scanning) and
piloerection. After cessation of stimulation, freezing disappeared and animals
began to move again. Animals with escape thresholds above 100 mA were
discarded from analysis. All the testing conditions and experimental paradigms
were ensured to be similar in all animals in order to avoid differences in
activation due to factors other than the stimulation.
2.5. Experimental groups
These procedures resulted in three experimental groups, rats with dlPAG
stimulation (n = 7), sham (n = 2), and control rats (n = 5). Initially, there were 11 rats
for dlPAG stimulation, however, two rats from the dlPAG showed malfunction of the
electrode (no escape reaction, while histological evaluation showed placement of
the electrode in the dlPAG) and these rats were considered as sham-operated
animals, retrospectively. Meanwhile, the electrode tips of another two rats showed
misplacement and they were discarded from analysis. The treatment and handling
of the 5 no-surgery controls were similar to the sham and stimulated animals
during the entire procedure of behavioural testing.
rom the brain of a rat subjected to stereotactic implantation of concentric bipolar
tic representation of the electrode sites in the dlPAG according to the Paxinos and
lPAG. Abbreviation: Aq = aquaduct of Sylvius, dlPAG = dorsolateral periaqueductal

Table 1Overview of the effects of electrical stimulation of the dlPAG as compared to the
sham and control animals on c-Fos-ir cells expression in brain regions of medial
prefrontal cortex, orbital cortex, agranular insular cortex, somatosensory cortex,
olfactory areas, and other areas (bregma coordinates from 3.70 mm till 0.20 mm).
Semi-quantitative scores of positive c-Fos-ir cells: no expression (0), basal
expression of c-Fos-ir (1), weak (2), mild (3), moderate (4), and strong (5).
Brain Regions Experimental Groups p-Value
Sham (n = 2) Control (n = 5) dlPAG DBS (n = 7)
Medial Prefrontal Cortex
Cg1 1 1 5 p < 0.05
Cg2 1 1 5 p < 0.05
PrL 1 1 5 p < 0.05
IL 1 1 5 p < 0.05
DP 1 1 5 p < 0.05
Orbital Cortex
MO 1 1 5 p < 0.05
VO 1 1 5 p < 0.05
LO 1 1 5 p < 0.05
Agranular Insula Cortex
AI 1 1 3 p < 0.05
AID 1 1 3 p < 0.05
AIV 1 1 3 p < 0.05
AIP 1 1 3 p < 0.05
Somatosensory Cortex
S1J 1 1 5 p < 0.05
S1FL 1 1 5 p < 0.05
S1JO 1 1 5 p < 0.05
S1DZ 1 1 5 p < 0.05
S1ULp 1 1 5 p < 0.05
Olfactory Areas
AOM 1 1 5 p < 0.05
AOV 1 1 5 p < 0.05
AOP 1 1 5 p < 0.05
Tu 1 1 4 p < 0.05
TuDC 1 1 4 p < 0.05
L.W. Lim et al. / Journal of Chemical Neuroanatomy 38 (2009) 83–96 85
2.6. Histological processing
Two hours after the final electrical stimulation procedure, rats were placed under
generalized anesthesia with Nembutal (75 mg/kg) and perfused transcardially with
Tyrode (0.1 M) and fixative containing paraformaldehyde, picric acid and
glutaraldehyde in phosphate buffer (pH 7.6). The rat brains have been post-fixed
for 2 h. Hereafter, the brains were cryoprotected by overnight sucrose treatment.
Brain tissue was then quickly frozen with CO2 and stored at �80 8C. Subsequently,
the brains were cut serially (10 series) on a cryostat (MICROM, Germany) into
30 mm frontal sections and again stored at �80 8C. One section out of ten was used
for c-Fos immunohistochemistry which was carried out by using an anti-c-Fos
rabbit polyclonal antibody (Santa Cruz Biotechnology Inc., Santa Cruz, CA) (diluted
1:20,000 in 0.1% Bovine Serum Albumin (BSA) and Tris Buffered Solution (TBS)-
Triton (TBS-T) solution). After overnight incubation at room temperature, sections
were rinsed with TBS-T, then TBS, and then TBS-T again. They were then incubated
with the secondary antibody (diluted 1:400, biotinylated donkey anti-rabbit;
Jackson Immunoresearch Laboratories Inc., Westgrove, USA) for 90 min. Subse-
quently, the sections were incubated with an avidin–biotin–peroxidase complex
(diluted 1:800 in Elite ABC-kit, Vectastatin; Burlingame, USA) for 2 h. In between
steps, sections were washed with TBS and TBS-T. To visualize the immune complex
of Horseradish Peroxide (HRP) reaction product, sections were incubated with 3,30-
diaminobenzidine tetrahydrochloride (DAB)/Nickel Chloride (NiCl2) solution (5 ml
DAB solution, 5 ml Tris/HCl, 50 ml NiCl2, and 3.35 ml hydrogen peroxide). This
reaction was stopped after 10 min by rinsing thoroughly all the sections with TBS.
All sections were then mounted on gelatin-coated glasses. After dehydrating, all
sections were cover-slipped with Pertex (HistolabProducts ab, Goteborg, Sweden).
Additionally, another sequence of sections per animal was stained with standard
hematoxylin–eosin (Merck, Darmstadt, Germany) to examine the localization of the
electrode tips.
2.7. Qualitative evaluation of c-Fos immunoreactive cells
Photographs of the areas of interest were taken at 4� magnification using an
Olympus DP70 camera connected to an Olympus AX70 bright-field microscope
(analySIS: Imaging System, Munster, Germany). The semi-quantitative assessment
was similar to a previously reported method, with minor modifications (Nguyen
et al., 2006). The nomenclature and selected boundaries for evaluation of the areas
of interest were established using the rat brain atlas of Paxinos and Watson (Paxinos
and Watson, 1998) and based on the following coordinates according to bregma
(mm, anteroposterior levels): 3.70, 3.20, 2.70, 2.20, 1.70, 1.20, 0.70, 0.48, 0.20,
�1.80, �1.88, �2.12, �2.80, �3.14, �3.30, �3.80, �4.16, and �4.30. Sections after
bregma levels�4.52 mm were not taken into evaluation because they were stained
with standard hematoxylin–eosin (Merck, Darmstadt, Germany) for evaluation of
electrode tip localization. The number of positive c-Fos-ir cells was graded by two
researchers independently with the following scores: no expression (0), basal
expression of c-Fos-ir (1), weak (2) mild (3), moderate (4), and strong (5), a method
used previously (Nguyen et al., 2006). The same light intensity and threshold
conditions were employed for all sections.
2.8. Statistical analysis
Behavioural data are presented as mean � S.E.M. using one-sample T-test. The
data of the c-Fos-ir cells were analysed using the 5-point scale by the non-parametric
test for K related independent samples (Kruskal Wallis). All statistical analyses were
performed with SPSS 16.0 version for Windows. p-Values lower than 0.05 were
Fig. 2. This figure shows the current amplitudes (mA) necessary to induce escape
reaction. Data represent means � S.E.M. of dlPAG group.
considered significant. The inter-rater reliability was approximately 90% for the c-Fos
ratings.
3. Results
3.1. Histological evaluation of the electrode localization
In two rats, electrode tips were not located in the dlPAG and inthese rats the escape threshold was >100 mA. These rats werediscarded from analysis. Two rats showed no escape reaction,
TuPO 1 1 4 p < 0.05
TuPI 1 1 4 p < 0.05
Other Areas
M1 1 1 1 p = n.s.
M2 1 1 5 p < 0.05
GI 1 1 4 p < 0.05
DI 1 1 5 p < 0.05
Cl 1 1 5 p < 0.05
Pir 1 1 5 p < 0.05
DEn 1 1 4 p < 0.05
Acb 1 1 4 p < 0.05
CPu 1 1 4 p < 0.05
SHi 1 1 4 p < 0.05
LSI 1 1 4 p < 0.05
Ld 1 1 4 p < 0.05
MS 1 1 4 p < 0.05
VDB 1 1 4 p < 0.05
VTT 1 1 2 p < 0.05
DTT 1 1 2 p < 0.05
HDB 1 1 4 p < 0.05
fmi 0 0 0 p = n.s.
aca 0 0 0 p = n.s.
aci 0 0 0 p = n.s.
mfba 2 2 2 p < 0.05

L.W. Lim et al. / Journal of Chemical Neuroanatomy 38 (2009) 83–9686
while the electrodes were located in the dlPAG due to electrodemalfunction. The data of these subjects were used as sham surgery.The localizations of the electrode tips in the dlPAG are illustrated inFig. 1. Based on the histological staining with hematoxylin andeosin, no gross neuronal damage was observed except for theelectrode trajectory.
3.2. Behavioural effects on stimulation
Stimulation with 78.57 � 4.04 mA induced ‘freezing behaviour’and 85.71 � 5.05 mA ‘escape behaviour’ (Fig. 2). The latter currentintensity was applied to study neuronal activation.
3.3. Distribution of c-Fos immunoreactive cells
High numbers of c-Fos-ir cells were observed in the medialprefrontal cortex, orbital cortex, anterior olfactory nuclei, second-
Table 2Overview of the effects of electrical stimulation of the dlPAG as compared to the
sham and control animals on c-Fos-ir cells expression in brain regions of cortical
areas, amygdala, basal ganglia, and hippocampus (bregma coordinates from
�1.80 mm till �4.30 mm). Semi-quantitative scores of positive c-Fos-ir cells: no
expression (0), basal expression of c-Fos-ir (1), weak (2), mild (3), moderate (4), and
strong (5).
Brain Regions Experimental Groups p-Value
Sham
(n = 2)
Control
(n = 5)
dlPAG DBS
(n = 7)
Cortical Areas
RSGb 1 1 3 p < 0.05
RSA 1 1 3 p < 0.05
M2 1 1 3 p < 0.05
M1 1 1 3 p < 0.05
PtA 1 1 3 p < 0.05
S1Tr 1 1 5 p < 0.05
S1HL 1 1 5 p < 0.05
S1FL 1 1 5 p < 0.05
S1DZ 1 1 5 p < 0.05
S1BF 1 1 5 p < 0.05
S1 1 1 5 p < 0.05
S2 1 1 5 p < 0.05
GI 1 1 3 p < 0.05
DI 1 1 3 p < 0.05
Ect 1 1 3 p < 0.05
PRh 1 1 3 p < 0.05
AuD 1 1 3 p < 0.05
Au1 1 1 3 p < 0.05
AuV 1 1 3 p < 0.05
TeA 1 1 3 p < 0.05
LEnt 1 1 3 p < 0.05
AIP 1 1 5 p < 0.05
Pir 1 1 4 p < 0.05
Amygdala
CeA 1 1 3 p < 0.05
BLA 1 1 3 p < 0.05
BMA 1 1 4 p < 0.05
MeA 1 1 4 p < 0.05
ACo 1 1 4 p < 0.05
LA 1 1 4 p < 0.05
PLCo 1 1 4 p < 0.05
Basal Ganglia
CPu 1 1 4 p < 0.05
LGP 1 1 1 p = n.s.
MGP 1 1 1 p = n.s.
STN 1 1 3 p < 0.05
ic 1 1 1 p < 0.05
Hippocampus
DG 1 1 3 p < 0.05
CA1 1 1 3 p < 0.05
CA3 1 1 1 p = n.s.
Hilus 1 1 1 p = n.s.
ary motor cortex, and the somatosensory cortex in rats with dlPAGstimulation as compared to sham and control rats. In addition,moderate numbers of c-Fos-ir cells were detected in variousregions, including the hypothalamus, amygdala, striatum, andfrontal cortex. Furthermore, there was mild expression of c-Fos-ircells in the hippocampus, thalamus, and habenula regions.Tables 1–3 provide more detailed information concerning thepattern of c-Fos-ir cells in different areas of the brain resultingfrom dlPAG stimulation.
3.4. Cortical regions
Electrical stimulation of the dlPAG increased the number of c-Fos-ir cells in the frontal cortical areas such as the cingulate gyrus(Cg1 and Cg2), prelimbic (PrL), infralimbic (IL), and motor cortex 2(M2), but not in the motor cortex 1 (M1) as compared to sham andcontrol animals (Fig. 3A–F). Other cortical regions, for instance thepiriform cortex (Pir), dorsal and ventral parts of agranular insularcortex (AID and AIV), claustrum (Cl), ventral and lateral part oforbital cortex (VO and LO) (Fig. 4A–F), retrosplenial agranular(RSA), retrospenial agranular a and b cortex (RSGa and RSGb),primary somatosensory cortex (S1), and secondary somatosensorycortex (S2) (Fig. 5A–F), showed a strong increase in the number ofc-Fos-ir cells in comparison to sham and control animals.Interestingly, we noted that dlPAG stimulation induced c-Fos
Table 3Overview of the effects of electrical stimulation of the dlPAG as compared to the
sham and control animals on c-Fos-ir cells expression in brain regions of habenula,
thalamus, and hypothalamus (bregma coordinates from �1.80 mm till �4.30 mm).
Semi-quantitative scores of positive c-Fos-ir cells: no expression (0), basal
expression of c-Fos-ir (1), weak (2), mild (3), moderate (4), and strong (5).
Brain Regions Experimental Groups p-Value
Sham
(n = 2)
Control
(n = 5)
dlPAG DBS
(n = 7)
Habenula
MHb 1 1 1 p = n.s.
LHbM 1 1 4 p < 0.05
LHBL 1 1 1 p = n.s.
Thalamus
Rt 1 1 2 p < 0.05
VA 1 1 1 p = n.s.
VM 1 1 1 p = n.s.
VL 1 1 1 p = n.s.
VPL 1 1 1 p = n.s.
VPM 1 1 1 p = n.s.
CM 1 1 3 p < 0.05
IMD 1 1 1 p = n.s.
AV th 1 1 1 p = n.s.
MD 1 1 1 p = n.s.
AD 1 1 1 p = n.s.
PT 1 1 1 p = n.s.
PC 1 1 1 p = n.s.
LDDM 1 1 4 p < 0.05
LDDL 1 1 1 p = n.s.
LPMR 1 1 1 p = n.s.
LPLR 1 1 1 p = n.s.
DLG 1 1 1 p = n.s.
PVA 1 1 4 p < 0.05
PV 2 2 4 p < 0.05
PVP 1 1 4 p < 0.05
Rh 1 1 1 p = n.s.
Re 1 1 1 p = n.s.
Hypothalamus
LH 1 1 4 p < 0.05
AHC 1 1 4 p < 0.05
AHP 1 1 4 p < 0.05
VMH 1 1 4 p < 0.05
DMD 1 1 4 p < 0.05
Pe 1 1 4 p < 0.05
Pa 1 1 4 p < 0.05

Fig. 3. Representative photomicrographs of a 30 mm-thick coronal section from brain regions of the frontal cortical areas at the bregma level of 2.20 mm. Figs. A, C, and E show
the c-Fos-ir cells in animals with the dlPAG DBS as compared to the control animals (Figs. B, D, and F). The small dark dots represent c-Fos-ir cells at 4�magnification power.
The inset in A shows a representative high-power photomicrograph of a c-Fos-ir cell. Abbreviations: Cg1 (cingulate gyrus 1), M1 (motor cortex 1), M2 (motor cortex 2), PrL
(prelimbic cortex), IL (infralimbic cortex), Cl (claustrum), VO (ventral orbital cortex), Acb (nucleus accumbens), aca (anterior commissure, anterior part), TuPO (olfactory
tubercle plexiform), and TuDC (olfactory tubercle densocellular layer).
L.W. Lim et al. / Journal of Chemical Neuroanatomy 38 (2009) 83–96 87

Fig. 4. Representative photomicrographs of a 30 mm-thick coronal section from brain regions of the frontal cortical areas at the bregma level of 2.20 mm. Figs. A, C, and E show
the c-Fos-ir cells in animals with the dlPAG DBS as compared to the control animals (Figs. B, D, and F). The small dark dots represent c-Fos-ir cells at 4�magnification power.
Abbreviations: M1 (motor cortex 1), fmi (forceps minor of the corpus callosum), Cl (claustrum), VO (ventral orbital cortex), LO (lateral orbital cortex), AIV (agranular insular
cortex, ventral part), AID (agranular insular cortex, dorsal part), aca (anterior commissure, anterior part), and Pir (piriform cortex).
L.W. Lim et al. / Journal of Chemical Neuroanatomy 38 (2009) 83–9688
expression in the 5th and 6th cortical layers of the granular insularcortex (GI), dysgranular insular cortex (DI), and the posterior partof agranular insular cortex (AIP), but not in the 1st–4th corticallayers (Fig. 6A–D).
3.5. Thalamus, hypothalamus, and habenula
Moderate numbers of c-Fos-ir cells were observed in thedorsomedial part of laterodorsal thalamic nucleus (LDDM),
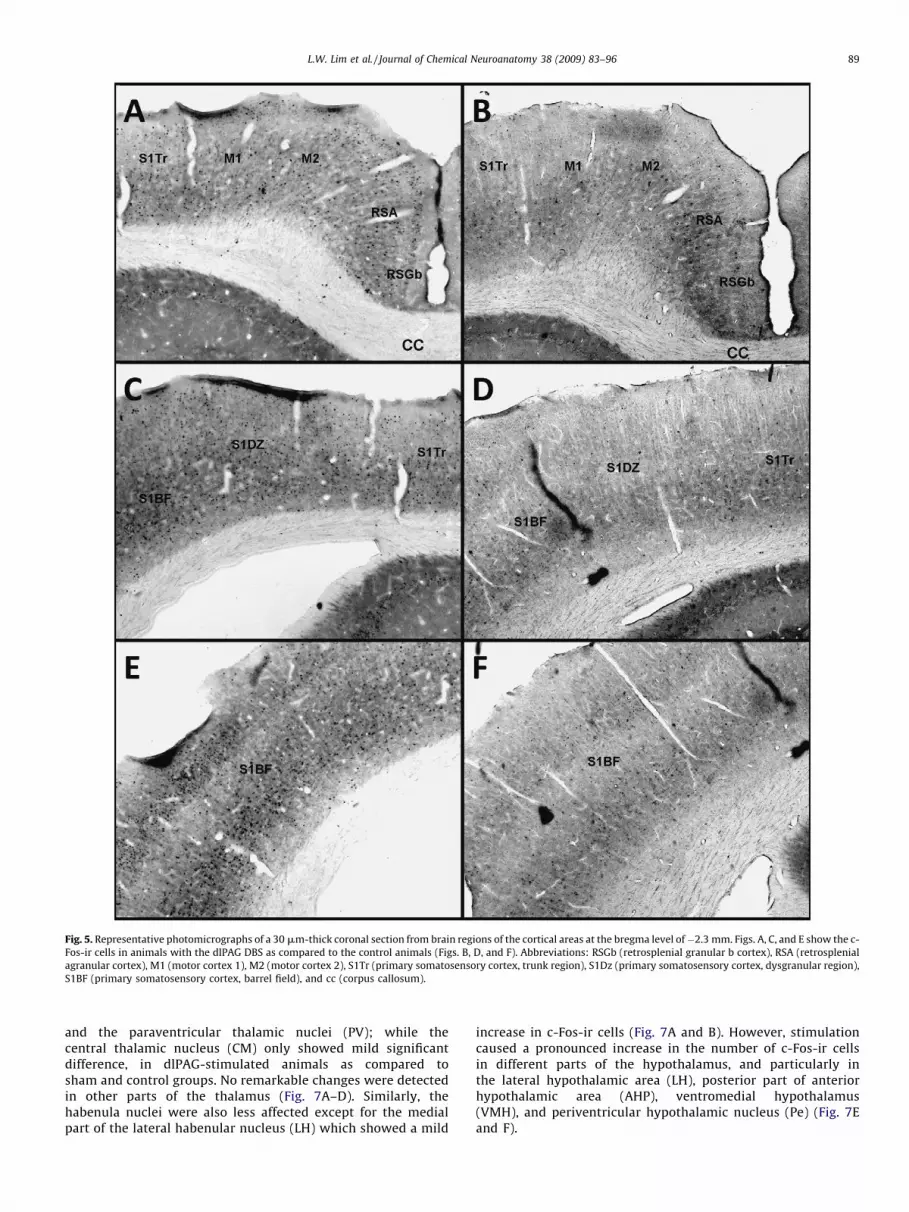
Fig. 5. Representative photomicrographs of a 30 mm-thick coronal section from brain regions of the cortical areas at the bregma level of�2.3 mm. Figs. A, C, and E show the c-
Fos-ir cells in animals with the dlPAG DBS as compared to the control animals (Figs. B, D, and F). Abbreviations: RSGb (retrosplenial granular b cortex), RSA (retrosplenial
agranular cortex), M1 (motor cortex 1), M2 (motor cortex 2), S1Tr (primary somatosensory cortex, trunk region), S1Dz (primary somatosensory cortex, dysgranular region),
S1BF (primary somatosensory cortex, barrel field), and cc (corpus callosum).
L.W. Lim et al. / Journal of Chemical Neuroanatomy 38 (2009) 83–96 89
and the paraventricular thalamic nuclei (PV); while thecentral thalamic nucleus (CM) only showed mild significantdifference, in dlPAG-stimulated animals as compared tosham and control groups. No remarkable changes were detectedin other parts of the thalamus (Fig. 7A–D). Similarly, thehabenula nuclei were also less affected except for the medialpart of the lateral habenular nucleus (LH) which showed a mild
increase in c-Fos-ir cells (Fig. 7A and B). However, stimulationcaused a pronounced increase in the number of c-Fos-ir cellsin different parts of the hypothalamus, and particularly inthe lateral hypothalamic area (LH), posterior part of anteriorhypothalamic area (AHP), ventromedial hypothalamus(VMH), and periventricular hypothalamic nucleus (Pe) (Fig. 7Eand F).

Fig. 6. Representative photomicrographs of a 30 mm-thick coronal section from brain regions of the cortical areas at the bregma level of�2.3 mm. Figs. A, C, and E show the c-
Fos-ir cells in animals with the dlPAG DBS as compared to the control animals (Figs. B, D, and F). Abbreviations: S2 (secondary somatosensory cortex), GI (granular insular
cortex), DI (dysgranular insular cortex), AIP (agranular insular cortex, posterior part), CPu (caudate-putamen), Pir (piriform cortex), BLA (basolateral amygdaloid nucleus,
anterior part).
L.W. Lim et al. / Journal of Chemical Neuroanatomy 38 (2009) 83–9690
3.6. Basal ganglia
As shown in Fig. 8C and D, dlPAG DBS did not cause clear c-Fosexpression in the global pallidus, but in the CPu moderate numberc-Fos-ir cells were found in rats with stimulation as compared tothe sham and control groups.
3.7. Other brain areas
Moderate numbers of c-Fos-ir cells were observed in the medial(MeA), basomedial (BMA), and anterior cortical (ACo) amygdaloidnuclei; while the basolateral (BLA) and central (CeA) nuclei of theamygdala showed a mild increase in the number of c-Fos-ir cells in

Fig. 7. Representative photomicrographs of a 30 mm-thick coronal section from brain regions of the epithalamic nuclei and thalamic nuclei (Figs. A, B, C and D), and
hypothalamic nuclei (Figs. E and F) at the bregma level of�3.14 mm. Figs. A, C, and E show the c-Fos-ir cells in animals with the dlPAG DBS as compared to the control animals
(Figs. B, D, and F). Abbreviations: LDDM (laterodorsal thalamic nucleus, dorsomedial part), sm (stria medullaris of the thalamus), LHbL (lateral habenular nucleus, lateral part),
LHbM (lateral habenular nucleus, medial part), MHb (medial habenular nucleus), MD (mediodorsal thalamic nucleus), VL (ventrolateral thalamic nucleus), PV
(paraventricular thalamic nucleus), IMD (intermediadorsal thalamic nucleus), CM (central medial thalamic nucleus), D3V (dorsal 3rd ventricle), ic (interna capsule), Rt
(reticular thalamic nucleus), VPL (ventral posterolateral thalamic nucleus), VPM (ventral posteromedial thalamic nucleus), Po (posterior thalamic nuclear group), LH (lateral
hypothalamic area), TC (tuber cinereum area), AHP (anterior hypothalamic area, posterior part), VMH (ventromedial hypothalamic nucleus), Pe (periventricular
hypothalamic nucleus), Arc (arcuate hypothalamic nucleus), and 3V (3rd ventricle).
L.W. Lim et al. / Journal of Chemical Neuroanatomy 38 (2009) 83–96 91

Fig. 8. Representative photomicrographs of a 30 mm-thick coronal section from brain regions of the hippocampus areas (Figs. A and B), basal ganglia structures (Figs. C and D),
and amygdaloid nuclei (Figs. E and F) at the bregma level of �3.14 mm. Figs. A, C, and E show the c-Fos-ir cells in animals with the dlPAG DBS as compared to the control
animals (Figs. B, D, and F). Abbreviations: CA1, CA3 (CA1, CA3 fields of hippocampus), Hilus (CA4 field of hippocampus), DG (dentate gyrus), CPu (caudate-putamen), cc
(corpus callosum), LGP (lateral globus pallidus), MGP (medial globus pallidus), ic (interna capsule), Rt (reticular thalamic nucleus), VPL (ventral posterolateral thalamic
nucleus), BLA (basolateral amygdaloid nucleus, anterior part), CeA (central amygdaloid nucleus), MeA (medial amygdaloid nucleus), BMA (basomedial amygdaloid nucleus),
and ACo (anterior cortical amygdaloid nucleus).
L.W. Lim et al. / Journal of Chemical Neuroanatomy 38 (2009) 83–9692
dlPAG-stimulated animals in comparison to the sham andcontrol groups (Fig. 8E and F). As shown in Fig. 8A and B,mild c-Fos expression was detected in the hippocampal regionsCA1 and dentate gyrus (DG), but not in the hilus and the CA3region.
3.8. Effect of sham surgery
The pattern of c-Fos expression in the two animals withelectrode malfunction was similar to the c-Fos expression of thecontrol subjects (see Fig. 9).

Fig. 9. Representative photomicrographs of a 30 mm-thick coronal section from brain regions of the frontal cortical areas at the bregma level of 2.20 mm; and the
hippocampus and basal ganglia structures at the bregma level of �3.14 mm. Figs. A, C, and E show the c-Fos-ir cells in sham animals of dlPAG electrode implantation as
compared to the control animals (Figs. B, D, and F). The small dark dots represent c-Fos-ir cells at 4�magnification power. Abbreviations: Cg1 (cingulate gyrus 1), M1 (motor
cortex 1), M2 (motor cortex 2), PrL (prelimbic cortex), CA1, CA3 (CA1, CA3 fields of hippocampus), Hilus (CA4 field of hippocampus), DG (dentate gyrus), CPu (caudate-
putamen), LGP (lateral globus pallidus), MGP (medial globus pallidus), ic (interna capsule), Rt (reticular thalamic nucleus), and VPL (ventral posterolateral thalamic nucleus).
L.W. Lim et al. / Journal of Chemical Neuroanatomy 38 (2009) 83–96 93

Table 4Abbreviations.
Abbreviations
Medial Prefrontal Cortex
Cg1—cingulate gyrus 1
Cg2—cingulate gyrus 2
PrL—prelimbic cortex
IL—infralimbic cortex
DP—dorsal peduncular cortex
Orbital Cortex
MO—medial orbital cortex
VO—ventral orbital cortex
LO—lateral orbital cortex
Agranular Insula Cortex
AI—agranular insular cortex
AID—agranular insular cortex, dorsal part
AIV—agranular insular cortex, ventral part
AIP—agranular insular cortex, posterior part
Somatosensory Cortex
S1—primary somatosensory cortex
S2—secondary somatosensory cortex
S1J—primary somatosensory cortex, jaw region
S1JO—primary somatosensory cortex, jaw and oral region
S1Tr—primary somatosensory cortex, trunk region
S1HL—primary somatosensory cortex, hindlimb region
S1FL—primary somatosensory cortex, forelimb region
S1DZ—primary somatosensory cortex, dysgranular region
S1BF—primary somatosensory cortex, barrel field
L.W. Lim et al. / Journal of Chemical Neuroanatomy 38 (2009) 83–9694
4. Discussion
In the present study, we evaluated the pattern of activation indifferent brain regions induced by deep brain stimulation of thedlPAG. Stimulation activated specific parts of the hypothalamus,amygdala, prefrontal cortex, and some related cortical areas. Inaddition, specific changes in c-Fos expression were observed inparts of the thalamus and basal ganglia. The stimulation effectsseem to be specific to stimulation and not related to implantation(sham-effect), since no clear difference in c-Fos expression wasobserved between control and sham subjects.
4.1. Frontal cortex
In line with our results, a series of retrograde studies havedemonstrated that projections to the PAG arise predominantlyfrom the medial prefrontal cortex and some from the orbital/anterior insular prefrontal cortex regions (Floyd et al., 2000; Reepand Winans, 1982). These projections target specific columns ofthe PAG. The medial prefrontal cortex projects densely to thedlPAG, whereas the ventrolateral PAG received a robust input fromthe orbital and anterior insular areas and weaker input from themedial and dorsomedial prefrontal areas (Floyd et al., 2000, 2001;Jasmin et al., 2004). Besides, the dorsomedial prefrontal cortex wasfound to project to the lateral PAG column which indicates thatdifferent types of defensive behaviour are controlled by differentPAG columns (Gabbott, 2003; Gabbott et al., 2003; Jasmin et al.,2004; Yasui et al., 1991).
There were some novel findings in the current study. Forinstance, we have found c-Fos-ir cells mainly in the 5th and 6thcortical layers of the granular insular cortex, dysgranular insularcortex, and the posterior part of the agranular insular cortex, butnot the 1st–4th cortical layers. This is actually in line with theobservation that cortical projecting neurons to subcortical areasare located in the deep layers 5 and 6 of the cortex (DeFelipe andFarinas, 1992). The insular cortex is considered as the viscer-osensory region processing afferent cardiovascular, cardiopul-monary, gastrointestinal, odour, gustatory, and other relatedsensory and pain information (Jasmin et al., 2004; Ruggieroet al., 1987; Saper, 1982). This information is subsequently relayedto a variety of lower autonomic regions (ventral striatum-nucleusaccumbens, basolateral amygdala, mediodorsal thalamus, lateralhypothalamus, parabrachial nucleus, dlPAG, ventral tegmentalarea, dorsal raphe, and medullary regions) and higher regionsincluding the orbital and medial prefrontal cortices (Gabbott et al.,2003; Jasmin et al., 2004).
In view of these results, the connection of the frontal cortexwith the PAG seems to be particularly important in the integrationof cognitive-affective information during the escape- or panic-likebehaviour. The prelimbic and infralimbic cortices have a significantrole in the expression of fear and cognitive functions (Corcoran andQuirk, 2007; Lim et al., 2008a; Radley et al., 2006), and in learningand coping with threatening stimuli or environments (Rich andShapiro, 2007). Furthermore, the cingulate gyrus and insular cortexare connected with the hypothalamus and amygdala which appearto be involved in autonomic functions such as regulating the bloodpressure and heart rate during defensive behaviour (Allman et al.,2001; Jasmin et al., 2004).
4.2. Hypothalamus
The medial hypothalamic area, including the anterior hypotha-lamus, dorsomedial part of the ventromedial hypothalamus(VMHdm), and dorsal premammillary nucleus (PMd), whichtogether form a defensive system (Canteras, 2002; Canteraset al., 2001), shows a strong activation to conditioned fear in
rodents (e.g. cat odour, as well as a live cat) (Canteras et al., 1997;Dielenberg et al., 2001a,b; Dielenberg and McGregor, 2001). Thebed nucleus of the stria terminalis, ventral part of the lateralseptum, and PAG are also activated during cat odour exposure.Keay and Bandler (2001) showed that the axons of the medialprefrontal cortex target the ventromedial hypothalamic nucleusand anterior hypothalamic area and terminate in the dlPAG(Canteras, 2002; Keay and Bandler, 2001; Vianna and Brandao,2003). On the other hand, the orbital and anterior insularprefrontal cortices selectively target the lateral hypothalamusand project only to the ventrolateral PAG. Furthermore, thedorsomedial prefrontal cortex and anterior cingulate cortex (area24) project first to the dorsal hypothalamic areas and then sendcollaterals that terminate in the lateral PAG.
4.3. Amygdala
The function of the amygdala is probably to synthesize thevarious inputs from the environment and then inform the PAGabout the degree of the threat (LeDoux, 1994; LeDoux et al., 1988;McNaughton and Corr, 2004). Retrograde tracer experiments havedemonstrated that the central nucleus and ventrolateral part of thebasal nucleus of the amygdala project to the PAG (Gabbott et al.,2003, 2005; Gray and Magnuson, 1992). Different parts of themidbrain are involved in mediating conditioned fear, such as thefear-potentiated startle and freezing, both of which are dependentof the amygdala. A study by Zhao and Davis has shown that fear-potentiated startle in the rats is mediated by neurons in the deeplayers of the superior colliculus/deep mesencephalic nucleus of therostral midbrain through the glutamate non-NMDA receptorswhereas the dorsal or lateral PAG were responsible for freezing(Zhao and Davis, 2004). Previous studies also suggested thatunconditioned fear (cat odour) activated downstream pheromone-related structures, including the posteroventral part of the medialamygdala (Dielenberg and McGregor, 2001; McGregor et al., 2004).Moreover, lesioning the medial amygdala reduced freezing orimmobility in rats exposed to cat odour (Blanchard et al., 2005; Liet al., 2004) (Table 4).

Table 4 (Continued )
Abbreviations
Cortical Areas
RSGb—retrosplenial granular b cortex
RSA—retrosplenial agranular cortex
M2—motor cortex 2
M1—motor cortex 1
PtA—parietal association cortex
GI—granular insular cortex
DI—dysgranular insular cortex
Ect—ectorhinal cortex
PRh—perirhinal cortex
AuD—secondary auditory cortex, dorsal area
Au1—primary auditory cortex
AuV—secondary auditory cortex, ventral area
TeA—temporal association cortex
LEnt—lateral entorhinal cortex
Pir—piriform cortex
Other Areas
Acb—nucleus accumbens
Cl—claustrum
DEn—dorsal endopiriform nucleus
SHi—septonippocampal nucleus
LSI—lateral septal nucleus, intermedial parts
Ld—lambdoid septal zone
MS—medial septal nucleus
VDB—nucleus of the vertical limb of the diagonal band
HDB—nucleus of the horizontal limb of the diagonal band
VTT—ventral tenia tecta
DTT—dorsal tenia tecta
fmi—forceps minor of the corpus callosum
aca—anterior commissure, anterior part
aci—anterior commissure, intrabulbar part
mfba—medial forebrain bundle, ‘a’ component
cc—corpus callosum
sm—stria medullaris of the thalamus
D3V—dorsal 3rd ventricle
3V—3rd ventricle
TC—tuber cinereum area
Olfactory Areas
AOM—anterior olfactory nucleus, medial part
AOV—anterior olfactory nucleus, ventral part
AOP—anterior olfactory nucleus, posterior part
Tu—olfactory tubercle
TuDC—olfactory tubercle densocellular layer
TuPO—olfactory tubercle polymorph layer
TuPI—olfactory tubercle plexiform layer
Amygdala
CeA—central amygdaloid nucleus
BLA—basolateral amygdaloid nucleus
BMA—basomedial amygdaloid nucleus
MeA—medial amygdaloid nucleus
ACo—anterior cortical amygdaloid nucleus
LA—lateral amygdaloid nucleus
PLCo—posterolateral cortical amygdaloidnucleus
Basal Ganglia
CPu—caudate-putamen
LGP—lateral globus pallidus
MGP—medial globus pallidus
STN—subthalamic nucleus
ic—interna capsule
Hippocampus
DG—dentate gyrus
CA1—CA1 field of hippocampus
CA3—CA3 field of hippocampus
Hilus—CA4 field of hippocampus
Habenula
MHb—medial habenular nucleus
LHbM—lateral habenular nucleus, medial part
LHBL—lateral habenular nucleus, lateral part
Thalamus
Rt—reticular thalamic nucleus
VA—ventral anterior thalamic nucleus
VM—ventromedial anterior thalamic nucleus
Table 4 (Continued )
Abbreviations
VL—ventrolateral thalamic nucleus
VPL—ventral posterolateral thalamic nucleus
VPM—ventral posteromedial thalamic nucleus
CM—central medial thalamic nucleus
IMD—intermediadorsal thalamic nucleus
AV th—anterior ventral thalamic nucleus
MD—mediodorsal thalamic nucleus
AD—anterior dorsal thalamic nucleus
PT—paratenial thalamic nucleus
PC—paracentral thalamic nucleus
LDDM—laterodorsal thalamic nucleus, dorsomedial part
LDDL—laterodorsal thalamic nucleus, dorsolateral part
LPMR—lateral posterior thalamic nucleus, mediorostral part
LPLR—lateral posterior thalamic nucleus, laterorostral part
DLG—dorsal lateral geniculate nucleus
Po—posterior thalamic nuclear group
PV—paraventricular thalamic nucleus
PVA—paraventricular thalamic nucleus, anterior part
PVP—paraventricular thalamic nucleus, posterior part
Rh—rhomboid thalamic nucleus
Re—reunions thalamic nucleus
Hypothalamus
LH—lateral hypothalamic area
AHC—anterior hypothalamic area, central part
AHP—anterior hypothalamic area, posterior part
VMH—ventromedial hypothalamic nucleus
DMD—dorsomedial hypothalamic nucleus, dorsal part
Pe—periventricular hypothalamic nucleus
Pa—peraventricular hypothalamic nucleus
Arc—arcuate hypothalamic nucleus
L.W. Lim et al. / Journal of Chemical Neuroanatomy 38 (2009) 83–96 95
5. Conclusion
Electrical stimulation of the dlPAG produced panic-like reactionbehaviourally, followed by a typical pattern of neuronal activationin the rodent brain. Systematic analysis of this has revealed thatthe pattern of activation corresponds to some extent with theconcept of the defense system related to rage, panic and fear(McNaughton and Corr, 2004) but also involves other regions suchas the frontal cortex, anterior olfactory nuclei, somatosensorycortex, hippocampus, thalamus and habenular regions.
Acknowledgements
This research was supported by a grant from the FP6 MarieCurie Fellowship (MEST-CT-2005-020589) and by a grant from theNetherlands Organization for Scientific Research (NWO-Veni, No.016.096.032).
References
Allman, J.M., Hakeem, A., Erwin, J.M., Nimchinsky, E., Hof, P., 2001. The anteriorcingulate cortex. The evolution of an interface between emotion and cognition.Ann. N.Y. Acad. Sci. 935, 107–117.
American-Psychiatric-Association, 1994. Diagnostic and Statistical Manual of Men-tal Disorders, 4th ed. American Psychiatric Association, Washington, DC.
Bandler, R., Shipley, M.T., 1994. Columnar organization in the midbrain periaque-ductal gray: modules for emotional expression? Trends Neurosci. 17, 379–389.
Bittencourt, A.S., Nakamura-Palacios, E.M., Mauad, H., Tufik, S., Schenberg, L.C.,2005. Organization of electrically and chemically evoked defensive behaviorswithin the deeper collicular layers as compared to the periaqueductal graymatter of the rat. Neuroscience 133, 873–892.
Blanchard, D.C., Canteras, N.S., Markham, C.M., Pentkowski, N.S., Blanchard, R.J.,2005. Lesions of structures showing FOS expression to cat presentation: effectson responsivity to a cat, cat odor, and nonpredator threat. Neurosci. Biobehav.Rev. 29, 1243–1253.
Borelli, K.G., Ferreira-Netto, C., Coimbra, N.C., Brandao, M.L., 2005. Fos-like immu-noreactivity in the brain associated with freezing or escape induced by inhibi-tion of either glutamic acid decarboxylase or GABAA receptors in the dorsalperiaqueductal gray. Brain Res. 1051, 100–111.

L.W. Lim et al. / Journal of Chemical Neuroanatomy 38 (2009) 83–9696
Canteras, N.S., 2002. The medial hypothalamic defensive system: hodologicalorganization and functional implications. Pharmacol. Biochem. Behav. 71,481–491.
Canteras, N.S., Chiavegatto, S., Valle, L.E., Swanson, L.W., 1997. Severe reduction ofrat defensive behavior to a predator by discrete hypothalamic chemical lesions.Brain Res. Bull. 44, 297–305.
Canteras, N.S., Ribeiro-Barbosa, E.R., Comoli, E., 2001. Tracing from the dorsalpremammillary nucleus prosencephalic systems involved in the organizationof innate fear responses. Neurosci. Biobehav. Rev. 25, 661–668.
Cassano, G.B., Savino, M., 1993. Symptomatology of panic disorder: an attempt todefine the panic-agoraphobic spectrum phenomenology. In: Montgomery, S.A.(Ed.), The Psychopharmacology of Panic. Oxford University Press, New York, pp.38–57.
Coimbra, N.C., De Oliveira, R., Freitas, R.L., Ribeiro, S.J., Borelli, K.G., Pacagnella, R.C.,Moreira, J.E., da Silva, L.A., Melo, L.L., Lunardi, L.O., Brandao, M.L., 2006. Neu-roanatomical approaches of the tectum-reticular pathways and immunohisto-chemical evidence for serotonin-positive perikarya on neuronal substrates ofthe superior colliculus and periaqueductal gray matter involved in the elabora-tion of the defensive behavior and fear-induced analgesia. Exp. Neurol. 197, 93–112.
Corcoran, K.A., Quirk, G.J., 2007. Activity in prelimbic cortex is necessary for theexpression of learned, but not innate, fears. J. Neurosci. 27, 840–844.
de Bortoli, V.C., Nogueira, R.L., Zangrossi Jr., H., 2006. Effects of fluoxetine andbuspirone on the panicolytic-like response induced by the activation of 5-HT1Aand 5-HT2A receptors in the rat dorsal periaqueductal gray. Psychopharmacol-ogy (Berl.) 183, 422–428.
De Oca, B.M., DeCola, J.P., Maren, S., Fanselow, M.S., 1998. Distinct regions of theperiaqueductal gray are involved in the acquisition and expression of defensiveresponses. J. Neurosci. 18, 3426–3432.
Deakin, J.F.W., Graeff, F.G., 1991. 5-HT and mechanisms of defence. J. Psychophar-macol. 305–315.
DeFelipe, J., Farinas, I., 1992. The pyramidal neuron of the cerebral cortex: mor-phological and chemical characteristics of the synaptic inputs. Prog. Neurobiol.39, 563–607.
Desbonnet, L., Temel, Y., Visser-Vandewalle, V., Blokland, A., Hornikx, V., Steinbusch,H.W., 2004. Premature responding following bilateral stimulation of the ratsubthalamic nucleus is amplitude and frequency dependent. Brain Res. 1008,198–204.
Dielenberg, R.A., Carrive, P., McGregor, I.S., 2001a. The cardiovascular and beha-vioral response to cat odor in rats: unconditioned and conditioned effects. BrainRes. 897, 228–237.
Dielenberg, R.A., Hunt, G.E., McGregor, I.S., 2001b. When a rat smells a cat’’: thedistribution of Fos immunoreactivity in rat brain following exposure to apredatory odor. Neuroscience 104, 1085–1097.
Dielenberg, R.A., McGregor, I.S., 2001. Defensive behavior in rats towards predatoryodors: a review. Neurosci. Biobehav. Rev. 25, 597–609.
Floyd, N.S., Price, J.L., Ferry, A.T., Keay, K.A., Bandler, R., 2000. Orbitomedial pre-frontal cortical projections to distinct longitudinal columns of the periaque-ductal gray in the rat. J. Comp. Neurol. 422, 556–578.
Floyd, N.S., Price, J.L., Ferry, A.T., Keay, K.A., Bandler, R., 2001. Orbitomedial pre-frontal cortical projections to hypothalamus in the rat. J. Comp. Neurol. 432,307–328.
Gabbott, P.L., 2003. Radial organisation of neurons and dendrites in human corticalareas 25,32, and 32’. Brain Res. 992, 298–304.
Gabbott, P.L., Warner, T.A., Jays, P.R., Bacon, S.J., 2003. Areal and synaptic inter-connectivity of prelimbic (area 32), infralimbic (area 25) and insular cortices inthe rat. Brain Res. 993, 59–71.
Gabbott, P.L., Warner, T.A., Jays, P.R., Salway, P., Busby, S.J., 2005. Prefrontal cortex inthe rat: projections to subcortical autonomic, motor, and limbic centers. J.Comp. Neurol. 492, 145–177.
Gray, T.S., Magnuson, D.J., 1992. Peptide immunoreactive neurons in the amygdalaand the bed nucleus of the stria terminalis project to the midbrain central grayin the rat. Peptides 13, 451–460.
Hogg, S., Michan, L., Jessa, M., 2006. Prediction of anti-panic properties of escita-lopram in the dorsal periaqueductal grey model of panic anxiety. Neurophar-macology 51, 141–145.
Hunsperger, R.W., 1956. Affective reaction from electric stimulation of brain stem incats. Helv. Physiol. Pharmacol. Acta 14, 70–92.
Jasmin, L., Burkey, A.R., Granato, A., Ohara, P.T., 2004. Rostral agranular insularcortex and pain areas of the central nervous system: a tract-tracing study in therat. J. Comp. Neurol. 468, 425–440.
Keay, K.A., Bandler, R., 2001. Parallel circuits mediating distinct emotional copingreactions to different types of stress. Neurosci. Biobehav. Rev. 25, 669–678.
LeDoux, J.E., 1994. The amygdala: contributions to fear and stress. Semin. Neurosci.6, 231–237.
LeDoux, J.E., Iwata, J., Cicchetti, P., Reis, D.J., 1988. Different projections of the centralamygdaloid nucleus mediate autonomic and behavioral correlates of condi-tioned fear. J. Neurosci. 8, 2517–2529.
Li, C.I., Maglinao, T.L., Takahashi, L.K., 2004. Medial amygdala modulation ofpredator odor-induced unconditioned fear in the rat. Behav. Neurosci. 118,324–332.
Lim, L.W., Blokland, A., Visser-Vandewalle, V., Vlamings, R., Sesia, T., Steinbusch, H.,Schruers, K., Griez, E., Temel, Y., 2008a. High-frequency stimulation of thedorsolateral periaqueductal gray and ventromedial hypothalamus fails to inhi-bit panic-like behaviour. Behav. Brain Res. 193, 197–203.
Lim, L.W., Temel, Y., Sesia, T., Vlamings, R., Visser-Vandewalle, V., Steinbusch, H.W.,Blokland, A., 2008b. Buspirone induced acute and chronic changes of neuralactivation in the periaqueductal gray of rats. Neuroscience 155, 164–173.
Lim, L.W., Temel, Y., Visser-Vandewalle, V., Steinbusch, H., Schruers, K., Hameleers,R., Esquivel, G., Griez, E., Blokland, A., 2008c. Effect of buspirone on thebehavioral regulation of rats in low versus high anxiety conditions. Arzneimit-telforschung 58, 269–276.
Maren, S., Quirk, G.J., 2004. Neuronal signalling of fear memory. Nat. Rev. Neurosci.5, 844–852.
McGregor, I.S., Hargreaves, G.A., Apfelbach, R., Hunt, G.E., 2004. Neural correlates ofcat odor-induced anxiety in rats: region-specific effects of the benzodiazepinemidazolam. J. Neurosci. 24, 4134–4144.
McNaughton, N., Corr, P.J., 2004. A two-dimensional neuropsychology of defense:fear/anxiety and defensive distance. Neurosci. Biobehav. Rev. 28, 285–305.
Mobbs, D., Petrovic, P., Marchant, J.L., Hassabis, D., Weiskopf, N., Seymour, B., Dolan,R.J., Frith, C.D., 2007. When fear is near: threat imminence elicits prefrontal-periaqueductal gray shifts in humans. Science 317, 1079–1083.
Nashold Jr., B.S., Wilson, W.P., Slaughter, D.G., 1969. Sensations evoked by stimula-tion in the midbrain of man. J. Neurosurg. 30, 14–24.
Nguyen, H.P., Kobbe, P., Rahne, H., Worpel, T., Jager, B., Stephan, M., Pabst, R.,Holzmann, C., Riess, O., Korr, H., Kantor, O., Petrasch-Parwez, E., Wetzel, R.,Osmand, A., von Horsten, S., 2006. Behavioral abnormalities precede neuro-pathological markers in rats transgenic for Huntington’s disease. Hum. Mol.Genet. 15, 3177–3194.
Paxinos, G., Watson, C., 1998. The Rat Brain in Stereotaxic Coordinates. AcademicPress, New York.
Radley, J.J., Arias, C.M., Sawchenko, P.E., 2006. Regional differentiation of the medialprefrontal cortex in regulating adaptive responses to acute emotional stress. J.Neurosci. 26, 12967–12976.
Reep, R.L., Winans, S.S., 1982. Efferent connections of dorsal and ventral agranularinsular cortex in the hamster, Mesocricetus auratus. Neuroscience 7, 2609–2635.
Rich, E.L., Shapiro, M.L., 2007. Prelimbic/infralimbic inactivation impairs memoryfor multiple task switches, but not flexible selection of familiar tasks. J.Neurosci. 27, 4747–4755.
Ruggiero, D.A., Mraovitch, S., Granata, A.R., Anwar, M., Reis, D.J., 1987. A role ofinsular cortex in cardiovascular function. J. Comp. Neurol. 257, 189–207.
Saper, C.B., 1982. Convergence of autonomic and limbic connections in the insularcortex of the rat. J. Comp. Neurol. 210, 163–173.
Schenberg, L.C., Vargas, L.C., Medeiros, R.L., Marques, T.A., Silva, S.R., Fraipont, P.T.S.,1998. Evaluation of the rat defense reaction as a model of panic attack inman: pharmacological and neuroendocrine evidence. Int. J. Psychophys. 127–128.
Temel, Y., Boothman, L.J., Blokland, A., Magill, P.J., Steinbusch, H.W., Visser-Vande-walle, V., Sharp, T., 2007. Inhibition of 5-HT neuron activity and induction ofdepressive-like behavior by high-frequency stimulation of the subthalamicnucleus. Proc. Natl. Acad. Sci. U.S.A. 104, 17087–17092.
UFAW, 1999. Handbook on the Care and Management of Laboratory Animals, 7thed. London Blackwell Science Ltd..
Van Zutphen, L.F.M., Baumans, V., Beynen, A.C., 2006. Principles of LaboratoryAnimal Science (Revised Edition). Elsevier, pp. 21–32.
Vianna, D.M., Borelli, K.G., Ferreira-Netto, C., Macedo, C.E., Brandao, M.L., 2003. Fos-like immunoreactive neurons following electrical stimulation of the dorsalperiaqueductal gray at freezing and escape thresholds. Brain Res. Bull. 62,179–189.
Vianna, D.M., Brandao, M.L., 2003. Anatomical connections of the periaqueductalgray: specific neural substrates for different kinds of fear. Braz. J. Med. Biol. Res.36, 557–566.
Yasui, Y., Itoh, K., Kaneko, T., Shigemoto, R., Mizuno, N., 1991. Topographicalprojections from the cerebral cortex to the nucleus of the solitary tract inthe cat. Exp. Brain Res. 85, 75–84.
Zhao, Z., Davis, M., 2004. Fear-potentiated startle in rats is mediated by neurons inthe deep layers of the superior colliculus/deep mesencephalic nucleus of therostral midbrain through the glutamate non-NMDA receptors. J. Neurosci. 24,10326–10334.