formation, evolution, and stability of coastal cliffs–status and
TRANSCRIPT
U.S. Department of the InteriorU.S. Geological Survey
Formation, Evolution, and Stability ofCoastal Cliffs–Status and Trends
Professional Paper 1693
Formation, Evolution, and Stability ofCoastal Cliffs–Status and Trends
Monty A. Hampton and Gary B. Griggs, Editors
Cliffs are a common feature along U.S. coastlines. Understanding thegeology of coastal cliffs is essential to addressing the impact of landwardcliff retreat in developed areas.
Professional Paper 1693
U.S. Department of the InteriorU.S. Geological Survey
U.S. Department of the InteriorGale A. Norton, Secretary
U.S. Geological SurveyCharles G. Groat, Director
Any use of trade, product, or firm names in this publicationis for descriptive purposes only and does not imply endorsement by the U.S. Government.
United States Government Printing Office: 2004
For additional copies please contact:
USGS Information ServicesBox 25286Denver, CO 80225
This report and any updates to it are available athttp://pubs.usgs.gov/pp/pp1693/
Additional USGS publications can be found athttp://geology.usgs.gov/products.html
For more information about the USGS and its products:
Telephone: 1–888–ASK–USGS (1-888-275-8747)World Wide Web: http://www.usgs.gov/
Text edited by Peter H. Stauffer and James W. Hendley II Layout and design by Stephen L. Scott Manuscript approved for publication, March 18, 2004
FRONT COVERPhotograph taken just before the 1997-98 El Niño storms, showing the northward view along the approximately 30-m tall sea cliff at North Explanade beach in Pacifica, California. The soft cliff shows signs of erosion, and a rip-rap sea wall is being constructed at the cliff base to protect houses along the cliff edge. The sea wall was not completed before the storms, and the cliff retreated more than 10 m (see later photograph on page 1). Most of the houses along the cliff were condemned and razed after the storm season.
Cataloging-in-Publication data are on file with the Library of Congress
Preface
The Ocean Studies Board of the National Research Council recently reviewed the U.S. Geological Survey’s Coastal and Marine Geology (USGS-CMG) program (National Research Council, 1999). One of the Board’s primary recommendations was that CMG prepare compre-hensive assessments of the nation’s coastal and marine regions, drawing on expertise not only from within the USGS, but also from outside agencies and academic institutions. In response to that recommendation, this report assesses the status and trends of coastal cliffs along the shore-lines of the conterminous United States and the Great Lakes. By “status” is meant the present distribution and character of coastal cliffs, as well as their current relevance to social issues such as coastal development. By “trends” is meant the changes in status caused by both geological forces and human activities. Coastal cliffs are steep escarpments at the coastline. They commonly form during times of rising sea level, such as the present, as the shoreline advances landward and erodes the elevated landmass. Coastal cliffs are a common landform, particularly on the west, northeast, and Great Lakes coasts of the United States, as well as within large estuaries. The land adjacent to coastal cliffs has been heavily developed along much of the coast, particularly in urban areas where the natural instability and progressive retreat of the cliffs pose a threat to life and property. Coastal land is permanently lost when coastal cliffs collapse and retreat landward, which is an important national issue in coastal planning, management, and engineering. The content of this report was derived from the personal expertise of the authors and from the extensive scientific literature concerned with coastal cliffs. As a report to the Nation, it is intended for a broad audience. Both topical and regional aspects are presented. It is important to recognize that the emphasis of this report is on the geology of coastal cliffs; engineering, land-use, and regulatory issues are addressed only where there is a clear link to the geologic nature of coastal cliffs. The editors appreciate the thorough and careful review of the entire manuscript by Alan Trenhaile and Laura Moore. Their editing, comments, and questions greatly improved the con-tent and clarity of the final report.
Reference
National Research Council, 1999, Science for decisionmaking; Coastal and Marine Geology at the U.S. Geological Survey: Washington, D.C., National Academy Press, 113 p.
iii
Contents
Preface--------------------------------------------------------------------------------------------------- iii By Monty A. Hampton and Gary B. Griggs
Contributors to this Professional Paper--------------------------------------------------------------- vii
Introduction---------------------------------------------------------------------------------------------- 1 By Monty A. Hampton, Gary B. Griggs, Tuncer B. Edil, Donald E. Guy, Joseph T. Kelley, Paul D. Komar, David M. Mickelson, and Hugh M. Shipman
Topical IssuesProcesses That Govern the Formation and Evolution of Coastal Cliffs--------------------------- 7 By Monty A. Hampton, Gary B. Griggs, Tuncer B. Edil, Donald E. Guy, Joseph T. Kelley, Paul D. Komar, David M. Mickelson, and Hugh M. Shipman
The Measurement and Interpretation of Coastal Cliff and Bluff Retreat------------------------- 39 By Cheryl J. Hapke
Regional IssuesCalifornia’s Coastal Cliffs and Bluffs------------------------------------------------------------------- 53 By Gary B. Griggs and Kiki B. Patsch
Oregon’s Coastal Cliffs: Processes and Erosion Impacts------------------------------------------- 65 By Paul D. Komar
Coastal Bluffs and Sea Cliffs On Puget Sound, Washington--------------------------------------- 81 By Hugh M. Shipman
Coastal Bluffs of New England------------------------------------------------------------------------- 95 By Joseph T. Kelley
Erosion of Coastal Bluffs In the Great Lakes--------------------------------------------------------- 107 By David M. Mickelson, Tuncer B. Edil, and Donald E. Guy
v
vii
Contributors to this Professional PaperEdil, Tuncer B. Geological Engineering Program University of Wisconsin Madison, WI 53706
Griggs, Gary B. Institute of Marine Sciences Department of Earth Sciences University of California Santa Cruz, CA 95064
Guy, Donald E. Ohio Department of Natural Resources Division of Geological Survey Sandusky, OH 44870
Hampton, Monty A. U.S. Geological Survey Menlo Park, CA 94025
Hapke, Cheryl J. U.S. Geological Survey Pacific Science Center Santa Cruz, California 95064
Kelley, Joseph T. Department of Global Sciences University of Maine Orono, ME 04469
Komar, Paul D. College of Oceanic and Atmospheric Sciences Oregon State University Corvallis, OR 97331
Mickelson, David M. Geological Engineering Program University of Wisconsin Madison, WI 53706
Patsch, Kiki B. Institute of Marine Sciences Department of Earth Sciences University of California Santa Cruz, CA 95064
Shipman, Hugh M. Washington State Department of Ecology Bellevue, WA 98008
1
The term “coastal cliff ” refers to a steeply sloping surface where elevated land meets the shoreline. Coastal cliffs are a geomorphic feature of first-order significance, occurring along about 80 percent of the world’s shorelines (Emery and Kuhn, 1982). Like virtually all landforms, modern coastal cliffs are a “work in progress,” continually acted upon by a broad as-sortment of offshore (marine or lacustrine) and terrestrial processes that cause them to change form and location through time. An important consequence is that coastal cliffs “retreat” (that is, move landward), and the adjacent coastal land is per-manently removed as they do so. Retreat can be slow and per-sistent, but on many occasions it is rapid and episodic.
Coastal cliff is a general term that refers to steep slopes along the shorelines of both the oceans (where they are com-monly called “sea cliffs”) and lakes (where they are com-monly called “lake bluffs”). The term “bluff ” also can refer to escarpments eroded into unlithified material, such as glacial till, along the shore of either an ocean or a lake. Often, the terms “cliff ” and “bluff ” are used interchangeably.
Coastal cliffs typically originate by marine or lacustrine erosional processes, particularly as the shoreline transgresses landward with a rise of water level. However, some initiate as scarps of large landslides or faults (see, for example, Moore and others, 1989; Kershaw and Guo, 2001) or by glacial ero-sion (Shipman, this volume). Although their ultimate origin is special, these types of features are here included as coastal cliffs, because in many respects they evolve similarly to other coastal cliffs. Unless otherwise mentioned, however, the fol-lowing discussions are implicitly about coastal cliffs that originate by marine or lacustrine erosional processes.
The definition of coastal cliffs given above establishes no bounds on the constituent materials, height, or inclination of the eroded surface. In practice, the bounds are established by utility. Erosional processes can carve a cliff face into any geologic material with adequate relief—slowly into hard rocks such as unweathered granite, rapidly into soft sedimen-tary rocks such as a sandstone, and even more rapidly into unlithified material such as glacial till (Sunamura, 1983). A practical lower bound of bluff or cliff height is a few meters, below which there are few hazard concerns, but above which the serious engineering and land-use issues associated with coastal-cliff retreat become important. Some coastal cliffs are more than 100 m high. Typical inclination of surfaces that are recognized as true coastal cliffs ranges from about 40° to 90°, but it can be as low as 20° in soft sediment such as clay. In some places, overhanging rock faces can exist.
The terrain landward of a coastal cliff can be steep, rug-ged, and mountainous at one extreme, as along the Big Sur
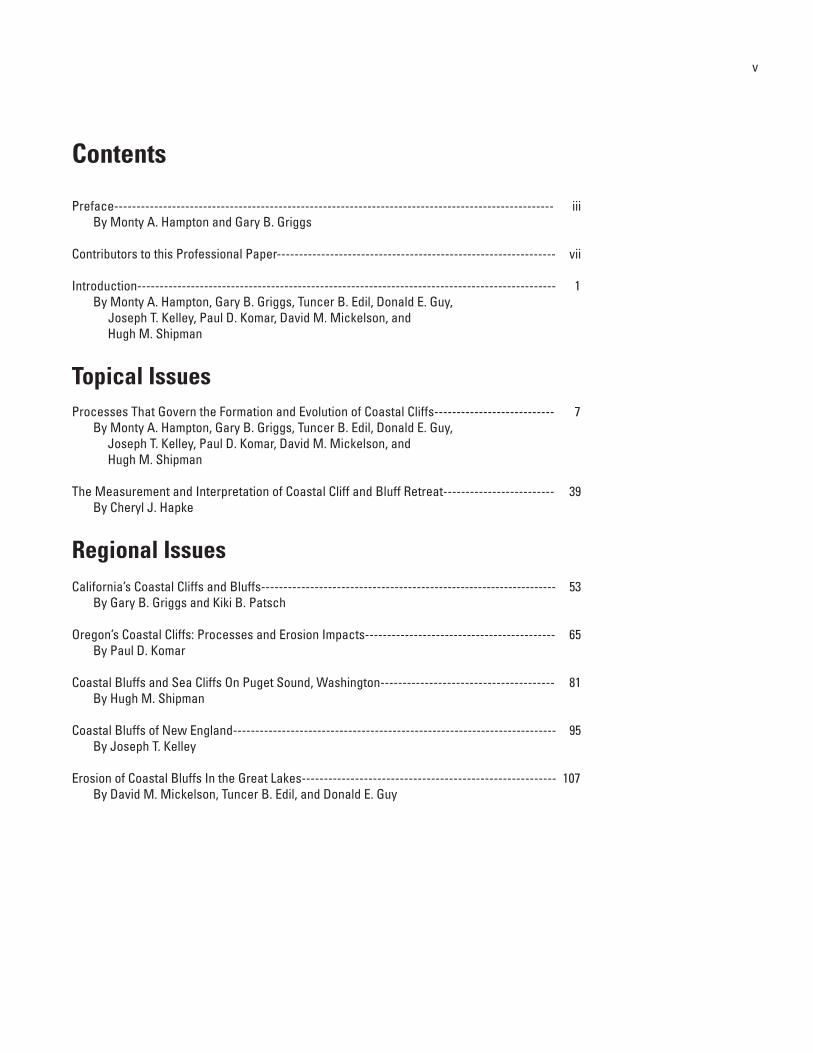
coast of central California, or relatively flat as is common along much of the urban coasts of California, New England, and along the Great Lakes. Problems related to coastal-cliff retreat exist within both types of terrain. The flat terraces and gently sloping plains in urbanized coastal areas in particular have attracted development, because the flat surfaces provide nearly ready-made building sites, and the elevated position can provide magnificent coastal vistas (fig. 1). Cliff retreat
Figure 1. This coastal cliff in Daly City, California, is about 150 m high. As evidenced by the large landslide near the center of the photograph, the cliff is unstable, posing a threat to the nearby densely developed area. The San Andreas Fault is a short distance offshore.
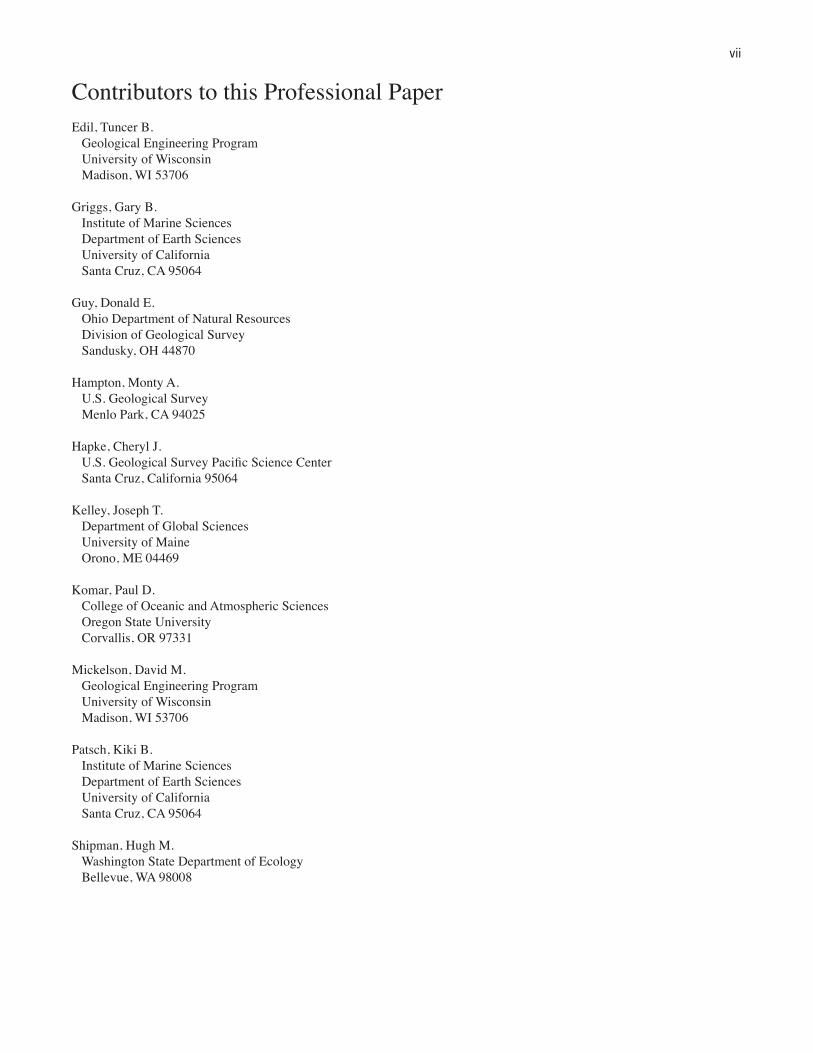
Figure 2. Rapid retreat of this sea cliff in Pacifica, California, caused damage to these houses, which later were declared unsafe and demolished. Compare with the cover photo of the same area, taken about 2-1/2 months previously, before the arrival of the 1997-98 El Niño storms.
U.S. Geological Survey Professional Paper 1693
Introduction
By Monty A. Hampton, Gary B. Griggs, Tuncer B. Edil, Donald E. Guy, Joseph T. Kelley, Paul D. Komar, David M. Mickelson, and Hugh M. Shipman
2 Formation, Evolution, and Stability of Coastal Cliffs—Status and Trends
has caused damage to structures in many of these places (fig. 2). A common problem along mountain-backed coastal cliffs, which typically are sparsely developed, is damage to or loss of coastal roadways as the coastal cliff retreats (fig. 3).
There are many social as well as scientific issues that emerge from the present understanding of coastal cliffs in the United States, and coastal-cliff retreat is an important national issue. Houses, commercial buildings, roads, and other infra-structure located along a coastal cliff, either on the elevated crest or at the base, have been damaged or destroyed when cliffs collapsed. The loss of typically high-value coastal prop-erty has an economic impact because it reduces local property-tax revenues and effects Federal disaster relief and insurance programs. For local governments, the loss of public roads and sewer and water lines on coastal cliffs has a burdensome eco-nomic impact. Coastal-cliff retreat also can have an impact in relatively unpopulated areas. For instance, cliff retreat in coast-al parks causes financial loss to the tourist industry through loss of access, as well as loss of camping and picnicking sites, and in some places, loss of historically significant sites. Ar-resting the retreat of a coastal cliff is costly, and many attempts have failed (fig. 4). Furthermore, some coastal-cliff stabiliza-tion projects have contributed to beach erosion by cutting off an important source of sand and gravel that nourishes the downdrift beaches. Various studies have documented the extent of the U.S. coastlines that are undergoing erosion (USACE, 1971; Habel and Armstrong, 1978; Griggs and Savoy, 1985; Pope and others, 1999; Komar, 1997; Terich, 1987; Kelley and
others, 1989; Carter and others, 1987; McCormick and others, 1984); a reported 86 percent of the shoreline of California, for example (Griggs, 1999). Because of the desirability of living directly on the coast, which in many regions means living on a cliff above an eroding coastline, there are significant short- and long-term risks associated with the population migration to, and more intense development of, those areas. Coastal erosion has become an increasingly publicized regional and national issue that is going to affect the Nation for many de-cades. Globally, more than a billion people live near the coast (Nicholls and Small, 2002; Small and others, 2000), and many of those reside only a few meters above sea level or behind an encroaching hazard, the edge of the coastal cliff.
Present engineering and regulatory attempts to mitigate the problems associated with coastal-cliff retreat are clearly inadequate, because land, buildings, infrastructure, and lives continue to be lost. There is lively controversy regarding the best approach to a resolution of these problems. “Hard” engineering solutions, such as constructing revetments or seawalls; “soft” solutions, such as replenishing or nourishing protective beaches; “regulatory” solutions, such as establishing effective setback distances; and “passive” solutions that advocate relinquishing threatened land to the advancing sea, all have their vocal con-stituencies as well as firm opposition. The vast majority of the public, however, does not appreciate the problem of coastal-cliff erosion as well as it does the issue of beach erosion.
Beaches and coastal cliffs are intimately linked. The re-lease of sand and gravel during coastal-cliff erosion is a signifi-cant coastal management issue, because the sediment becomes part of the littoral system and contributes to the sediment bud-get of the beaches (see, for example, studies by Osborne and others, 1989; Everts, 1991; Best and Griggs 1991; Galster and Schwartz, 1990; Diener, 2000; Mickelson and others, 2002; Runyan and Griggs, 2002; Runyan and Griggs, 2003). Halting coastal-cliff erosion by installing seawalls to protect coastal property might reduce the supply of sand, which thereby reduc-
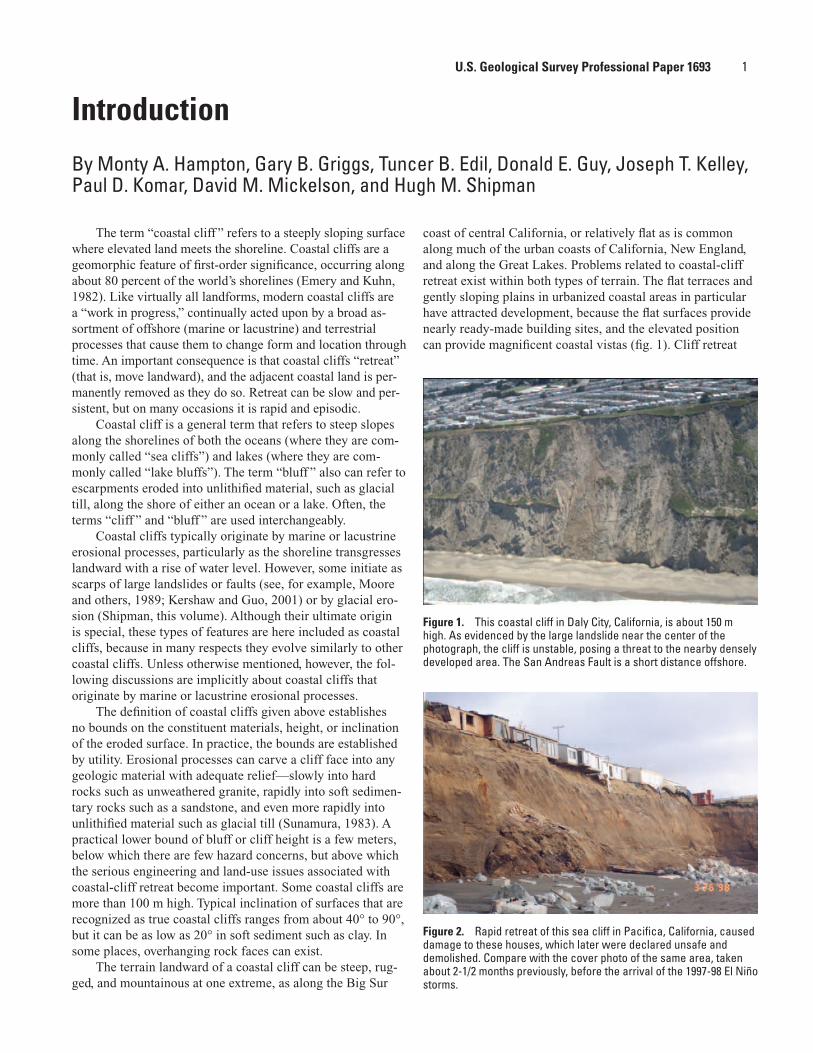
Figure 3. Movement of this large landslide on the Big Sur coast of central California is related to erosion of the coastal cliff at its base, plus other factors such as ground water. Occasional movement of large slides such as this one results in frequent damage to and associated closure of California state Highway 1, which generally follows the coast, as shown here.
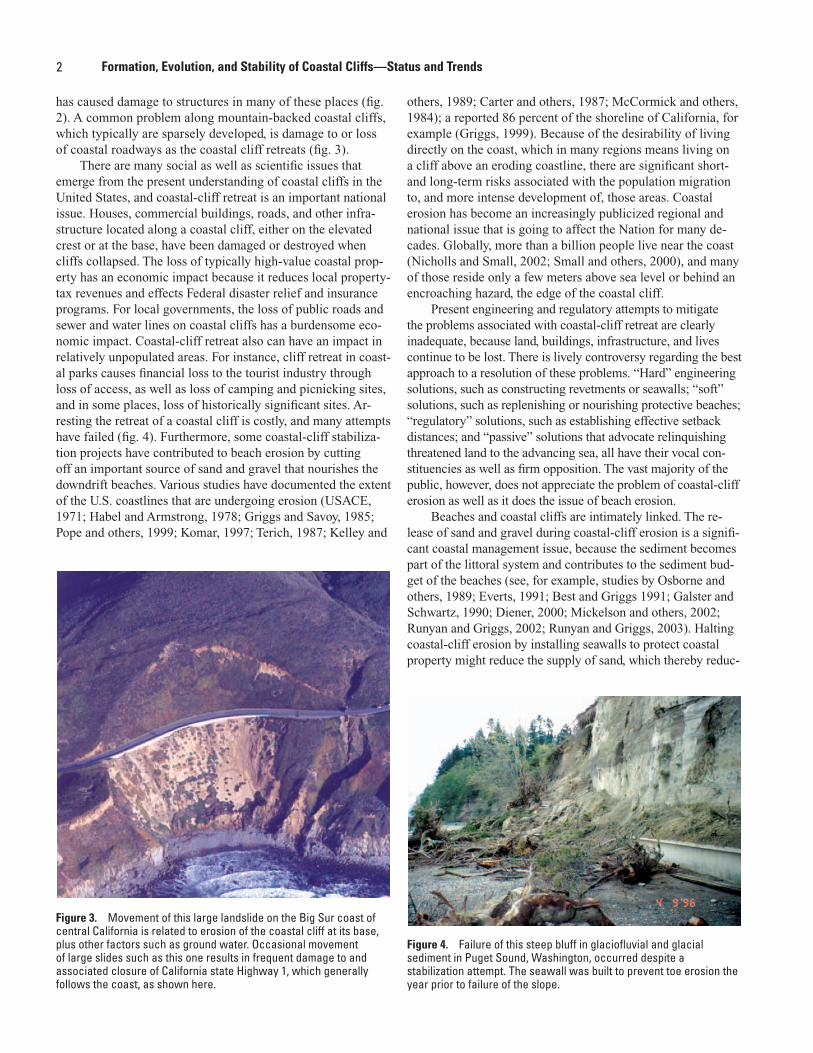
Figure 4. Failure of this steep bluff in glaciofluvial and glacial sediment in Puget Sound, Washington, occurred despite a stabilization attempt. The seawall was built to prevent toe erosion the year prior to failure of the slope.
3
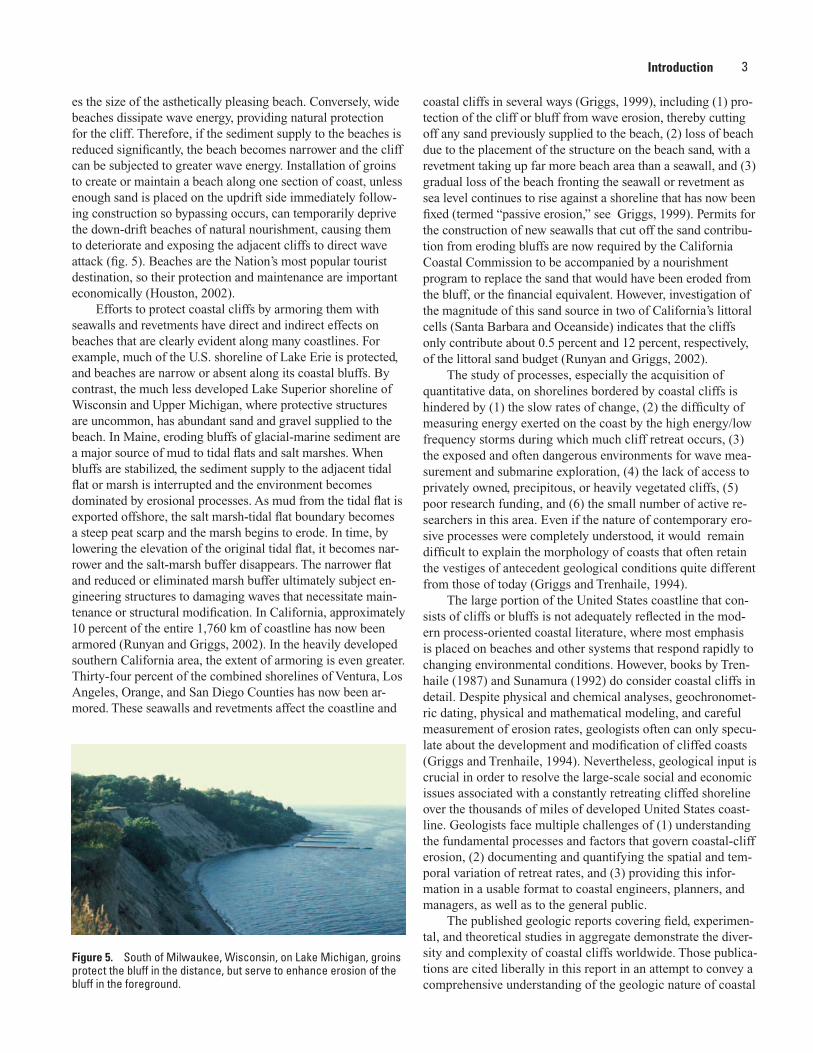
es the size of the asthetically pleasing beach. Conversely, wide beaches dissipate wave energy, providing natural protection for the cliff. Therefore, if the sediment supply to the beaches is reduced significantly, the beach becomes narrower and the cliff can be subjected to greater wave energy. Installation of groins to create or maintain a beach along one section of coast, unless enough sand is placed on the updrift side immediately follow-ing construction so bypassing occurs, can temporarily deprive the down-drift beaches of natural nourishment, causing them to deteriorate and exposing the adjacent cliffs to direct wave attack (fig. 5). Beaches are the Nation’s most popular tourist destination, so their protection and maintenance are important economically (Houston, 2002).
Efforts to protect coastal cliffs by armoring them with seawalls and revetments have direct and indirect effects on beaches that are clearly evident along many coastlines. For example, much of the U.S. shoreline of Lake Erie is protected, and beaches are narrow or absent along its coastal bluffs. By contrast, the much less developed Lake Superior shoreline of Wisconsin and Upper Michigan, where protective structures are uncommon, has abundant sand and gravel supplied to the beach. In Maine, eroding bluffs of glacial-marine sediment are a major source of mud to tidal flats and salt marshes. When bluffs are stabilized, the sediment supply to the adjacent tidal flat or marsh is interrupted and the environment becomes dominated by erosional processes. As mud from the tidal flat is exported offshore, the salt marsh-tidal flat boundary becomes a steep peat scarp and the marsh begins to erode. In time, by lowering the elevation of the original tidal flat, it becomes nar-rower and the salt-marsh buffer disappears. The narrower flat and reduced or eliminated marsh buffer ultimately subject en-gineering structures to damaging waves that necessitate main-tenance or structural modification. In California, approximately 10 percent of the entire 1,760 km of coastline has now been armored (Runyan and Griggs, 2002). In the heavily developed southern California area, the extent of armoring is even greater. Thirty-four percent of the combined shorelines of Ventura, Los Angeles, Orange, and San Diego Counties has now been ar-mored. These seawalls and revetments affect the coastline and
coastal cliffs in several ways (Griggs, 1999), including (1) pro-tection of the cliff or bluff from wave erosion, thereby cutting off any sand previously supplied to the beach, (2) loss of beach due to the placement of the structure on the beach sand, with a revetment taking up far more beach area than a seawall, and (3) gradual loss of the beach fronting the seawall or revetment as sea level continues to rise against a shoreline that has now been fixed (termed “passive erosion,” see Griggs, 1999). Permits for the construction of new seawalls that cut off the sand contribu-tion from eroding bluffs are now required by the California Coastal Commission to be accompanied by a nourishment program to replace the sand that would have been eroded from the bluff, or the financial equivalent. However, investigation of the magnitude of this sand source in two of California’s littoral cells (Santa Barbara and Oceanside) indicates that the cliffs only contribute about 0.5 percent and 12 percent, respectively, of the littoral sand budget (Runyan and Griggs, 2002).
The study of processes, especially the acquisition of quantitative data, on shorelines bordered by coastal cliffs is hindered by (1) the slow rates of change, (2) the difficulty of measuring energy exerted on the coast by the high energy/low frequency storms during which much cliff retreat occurs, (3) the exposed and often dangerous environments for wave mea-surement and submarine exploration, (4) the lack of access to privately owned, precipitous, or heavily vegetated cliffs, (5) poor research funding, and (6) the small number of active re-searchers in this area. Even if the nature of contemporary ero-sive processes were completely understood, it would remain difficult to explain the morphology of coasts that often retain the vestiges of antecedent geological conditions quite different from those of today (Griggs and Trenhaile, 1994).
The large portion of the United States coastline that con-sists of cliffs or bluffs is not adequately reflected in the mod-ern process-oriented coastal literature, where most emphasis is placed on beaches and other systems that respond rapidly to changing environmental conditions. However, books by Tren-haile (1987) and Sunamura (1992) do consider coastal cliffs in detail. Despite physical and chemical analyses, geochronomet-ric dating, physical and mathematical modeling, and careful measurement of erosion rates, geologists often can only specu-late about the development and modification of cliffed coasts (Griggs and Trenhaile, 1994). Nevertheless, geological input is crucial in order to resolve the large-scale social and economic issues associated with a constantly retreating cliffed shoreline over the thousands of miles of developed United States coast-line. Geologists face multiple challenges of (1) understanding the fundamental processes and factors that govern coastal-cliff erosion, (2) documenting and quantifying the spatial and tem-poral variation of retreat rates, and (3) providing this infor-mation in a usable format to coastal engineers, planners, and managers, as well as to the general public.
The published geologic reports covering field, experimen-tal, and theoretical studies in aggregate demonstrate the diver-sity and complexity of coastal cliffs worldwide. Those publica-tions are cited liberally in this report in an attempt to convey a comprehensive understanding of the geologic nature of coastal
Figure 5. South of Milwaukee, Wisconsin, on Lake Michigan, groins protect the bluff in the distance, but serve to enhance erosion of the bluff in the foreground.
Introduction
4 Formation, Evolution, and Stability of Coastal Cliffs—Status and Trends
cliffs, even though the focus of the report is the cliffs along the shores of the United States, including the Great Lakes. Gener-alizations about coastal cliffs are difficult, and forecasting the timing and rate of retreat is particularly problematic. This re-port synthesizes the current knowledge of the status and trends of U.S. coastal cliffs.
References CitedBest, T.C., and Griggs, G.B., 1991, A sediment budget for the
Santa Cruz littoral cell, California, in Osborne, R.H., ed., From shoreline to abyss; contributions in marine geology in honor of Francis Parker Shepard: Society of Economic Paleontologists and Mineralogists Special Publication no. 46, p. 35-50.
Carter, C.H., Neal, W.J., Haras, W.S., and Pilkey, O.H., 1987, Living with the Lake Erie shore: Durham, North Carolina, Duke University Press, 255 p.
Diener, B.G., 2000, Sand contribution from bluff recession between Point Conception and Santa Barbara, California: Shore and Beach, v. 68, no. 2, p. 7-14.
Emery, K.O., and Kuhn, G.G., 1982, Sea cliffs; their processes, profiles, and classification: Geological Society of America Bulletin, v. 93, p. 644-654.
Everts, C.H., 1991, Seacliff retreat and coarse sediment yields in southern California; in Coastal Sediments ’91: Spe-cialty Conference on Quantitative Approaches to Coastal Sediment Processes, Seattle, Washington, 25-27 June 1991, Proceedings, p. 1586-1598.
Galster, R.W., and Schwartz, M. L., 1990, Ediz Hook—a case history of coastal erosion and rehabilitation, in Schwartz, M.L., and Bird, E.C.F., eds., Artificial beaches: Journal of Coastal Research Special Issue, v. 6, p. 103-113.
Griggs, G.B., 1999, The protection of California’s coast; past, pres-ent and future: Shore and Beach, v. 67, no. 1, p. 18-28.
Griggs, G.B., and Savoy, L., 1985, Living with the California coast: Durham, North Carolina, Duke University Press, 393 p.
Griggs, G.B., and Trenhaile, A.S., 1994, Coastal cliffs and plat-forms, in Carter, R.W.G., and Woodroffe, C.D., eds., Coast-al evolution; late Quaternary shoreline morphodynamics: Cambridge, Cambridge University Press, p. 425-450.
Habel, J.S., and Armstrong, G.A., 1978, Assessment and atlas of shoreline erosion along the California coast: State of California, Dept. of Navigation and Ocean Development, 277p.
Houston, J.R., 2002, The economic value of beaches—a 2002 update: Shore and Beach, v. 70, no.1, p. 9-12.
Kelley, J. T., Kelley, A.R., and Pilkey, O.H., Sr., 1989, Living with the Maine coast: Durham, North Carolina, Duke University Press, 174 p.
Kershaw, S., and Guo, L., 2001, Marine notches in coastal cliffs; indicators of relative sea-level change, Perachora Peninsula, central Greece: Marine Geology, v. 179, p. 213-228.
Komar, P.D., 1997, Erosion of a massive artificial “landslide”
on the California coast: Shore and Beach, v. 65, no. 4, p. 8-14.
McCormick, L.R., Pilkey, O.H., Jr., Neal, W.J., and Pilkey, O.H., Sr., 1984, Living with Long Island’s south shore: Durham, North Carolina, Duke University Press, 157 p.
Mickelson, D. M., Brown, E. A., Edil, T. B., Meadows, G. A., Guy, D. E., Liebenthal, D. L., and Fuller, J. A., 2002, Comparison of sediment budgets of bluff/beach/nearshore environments near Two Rivers, Wisconsin, on Lake Michigan, and at Painesville, Ohio, on Lake Erie: Geological Society of America Abstracts with Programs, v. 34, no. 2, p. A-12.
Moore, J.G., Clague, D.A., Holcomb, R.T., Lipman, P.W., Normark, W.R., and Torresan, M.E., 1989, Prodigious submarine landslides on the Hawaiian Ridge: Journal of Geophysical Research, v. 94, no. B12, p. 17,465-484.
Nicholls, R.J., and Small, C., 2002, Improved estimates of coastal population and exposure to hazards released: Eos, Transactions, American Geophysical Union, v. 83, no. 28, p. 301,305.
Osborne, R.H., Fogarty, T.M., and Kuhn, G.G., 1989, A quanti-tative comparison of coarse-grained sediment yield from contributing cliffs and associated rivers; southern Orange and San Diego Counties, California: Geological Society of America, Cordilleran Section, Abstracts with Programs, v. 21, no. 5, p. 126.
Pope, J., Stewart, C.J., Dolan, R., Peatross, J., and Thompson, C.L., 1999, The Great Lakes shoreline type, erosion, and accretion [Unpublished map]: Vicksburg, Missis-sippi, U.S. Army Corps of Engineers, 1 sheet with text, 1:2,000,000.
Runyan, K.B., and Griggs, G.B., 2002, Contributions from coastal cliff erosion to the littoral budget, in Coyne, M., and Ster-rett, K., eds., California Beach Restoration Study: Sacra-mento, California, Department of Boating and Waterways & State Coastal Conservancy, p. 8.1-8.51.
Runyan, K.B., and Griggs, G.B., 2003, The effects of armoring sea cliffs on the natural sand supply to the beaches of California: Journal of Coastal Research, v. 19, no. 2, p. 336-347.
Small, C., Gornitz, V., and Cohen, J.E., 2000, Coastal hazards and the distribution of human population: Environmental Geoscience, v. 7, p. 3-12.
Sunamura, T., 1983, Processes of seacliff and platform erosion, in Komar, P.D., ed., CRC handbook of coastal processes and erosion: Boca Raton, Florida, CRC Press, p. 233-265.
Sunamura, T., 1992, Geomorphology of rock coasts: New York, John Wiley and Sons, 302 p.
Terich, T. A., 1987, Living with the shore of Puget Sound and the Georgia Strait: Durham, North Carolina, Duke University Press, 165 p.
Trenhaile, A.S., 1987, The geomorphology of rock coasts: Ox-ford, Oxford University Press, 384 p.
USACE (United States Army Corps of Engineers), 1971, Na-tional Shoreline Study—California Regional Inventory: San Francisco, California, Corps of Engineers, District Office, 105 p.

5 U.S. Geological Survey Professional Paper 1693
TOPICAL ISSUES

6 Formation, Evolution, and Stability of Coastal Cliffs—Status and Trends
7
Setting and General FeaturesFor many people, their image of the coastline is a rocky
sea cliff being pounded by waves. This spectacular scenery, which characterizes so many of the world’s coasts, is primar-ily a result of the abrupt meeting of storm waves and elevated land. Although most of Earth’s coastal cliffs are nearly vertical and composed of bedrock, there is a wide range of cliff types, depending on material, morphology, and relief. They range from the low, several-meter-high bluffs cut into glacial till on Long Island, New York, to the 500-m-high, nearly vertical cliffs cut into lava flows on the north shore of Molokai in the Hawaiian Islands (fig. 1). Material variations within or among coastal cliffs often are reflected in morphologic variations (figs. 2-4).
On global and regional scales, coastal morphology often correlates closely with tectonic setting (Inman and Nordstrom, 1971). Major geomorphic contrasts exist between the subdued coastlines typical of the passive continental margins of the east and gulf coasts of the United States and the rugged coastlines that dominate active or collisional plate boundaries along the west coast.
Many exposed coastlines along the passive continental margins of the United States consist of a low-relief coastal plain bordered offshore by a wide continental shelf. There are no rocky cliffs and few bluffs along these generally stable and low-elevation coastlines. Instead, they are characterized by
Processes that Govern the Formation and Evolution of Coastal CliffsBy Monty A. Hampton, Gary B. Griggs, Tuncer B. Edil, Donald E. Guy, Joseph T. Kelley, Paul D. Komar, David M. Mickelson, and Hugh M. Shipman
Figure 1. Steep cliff in basalt, more than 300 m high, on the northern coast of Molokai, Hawaii.
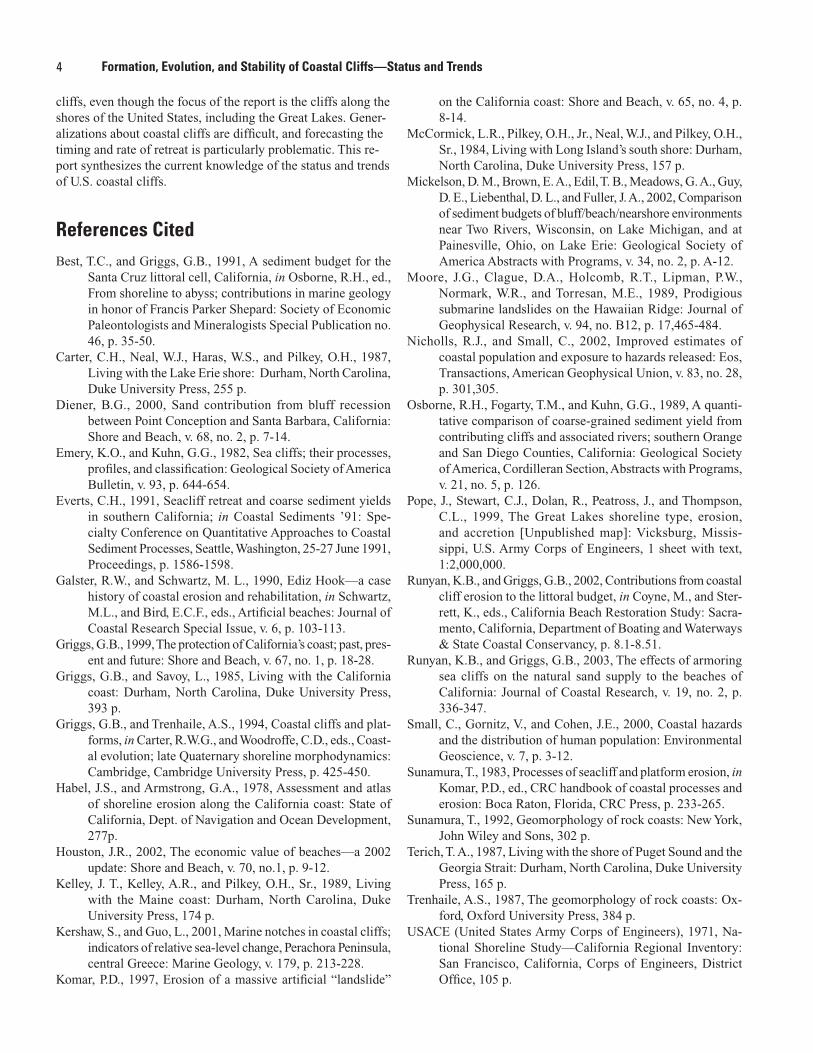
Figure 2. This vertical coastal cliff of basalt in the San Juan Islands of northern Puget Sound, Washington, has a narrow erosional ramp at the base, but no beach. Because of the strength of the rock and low wave energy, the erosion rate is negligible, with the exception of rare block falls.
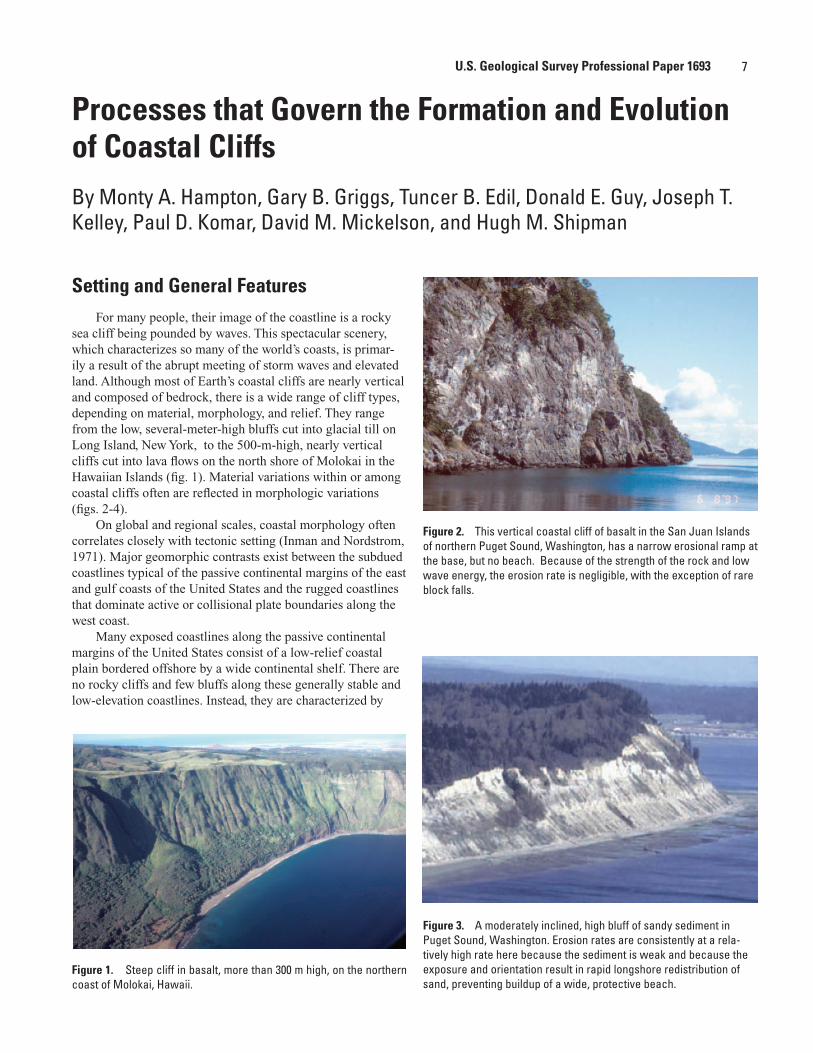
Figure 3. A moderately inclined, high bluff of sandy sediment in Puget Sound, Washington. Erosion rates are consistently at a rela-tively high rate here because the sediment is weak and because the exposure and orientation result in rapid longshore redistribution of sand, preventing buildup of a wide, protective beach.
U.S. Geological Survey Professional Paper 1693
8 Formation, Evolution, and Stability of Coastal Cliffs—Status and Trends
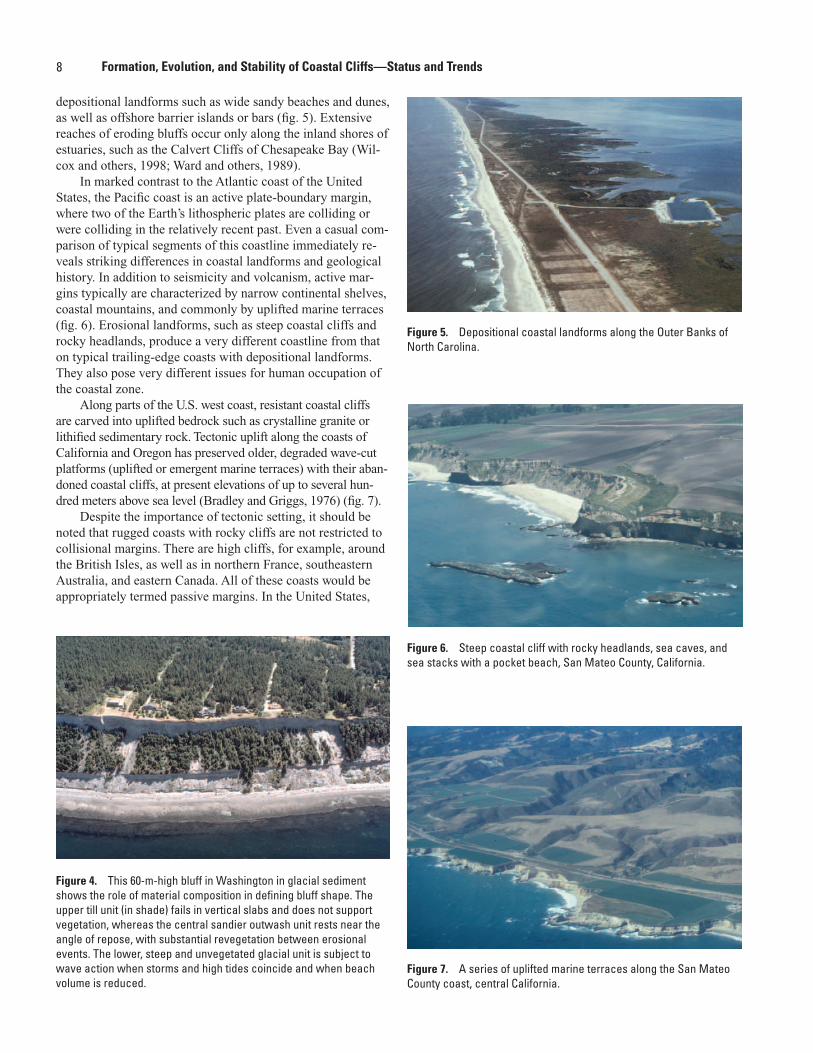
depositional landforms such as wide sandy beaches and dunes, as well as offshore barrier islands or bars (fig. 5). Extensive reaches of eroding bluffs occur only along the inland shores of estuaries, such as the Calvert Cliffs of Chesapeake Bay (Wil-cox and others, 1998; Ward and others, 1989).
In marked contrast to the Atlantic coast of the United States, the Pacific coast is an active plate-boundary margin, where two of the Earth’s lithospheric plates are colliding or were colliding in the relatively recent past. Even a casual com-parison of typical segments of this coastline immediately re-veals striking differences in coastal landforms and geological history. In addition to seismicity and volcanism, active mar-gins typically are characterized by narrow continental shelves, coastal mountains, and commonly by uplifted marine terraces (fig. 6). Erosional landforms, such as steep coastal cliffs and rocky headlands, produce a very different coastline from that on typical trailing-edge coasts with depositional landforms. They also pose very different issues for human occupation of the coastal zone.
Along parts of the U.S. west coast, resistant coastal cliffs are carved into uplifted bedrock such as crystalline granite or lithified sedimentary rock. Tectonic uplift along the coasts of California and Oregon has preserved older, degraded wave-cut platforms (uplifted or emergent marine terraces) with their aban-doned coastal cliffs, at present elevations of up to several hun-dred meters above sea level (Bradley and Griggs, 1976) (fig. 7).
Despite the importance of tectonic setting, it should be noted that rugged coasts with rocky cliffs are not restricted to collisional margins. There are high cliffs, for example, around the British Isles, as well as in northern France, southeastern Australia, and eastern Canada. All of these coasts would be appropriately termed passive margins. In the United States,
Figure 4. This 60-m-high bluff in Washington in glacial sediment shows the role of material composition in defining bluff shape. The upper till unit (in shade) fails in vertical slabs and does not support vegetation, whereas the central sandier outwash unit rests near the angle of repose, with substantial revegetation between erosional events. The lower, steep and unvegetated glacial unit is subject to wave action when storms and high tides coincide and when beach volume is reduced.
Figure 5. Depositional coastal landforms along the Outer Banks of North Carolina.
Figure 6. Steep coastal cliff with rocky headlands, sea caves, and sea stacks with a pocket beach, San Mateo County, California.
Figure 7. A series of uplifted marine terraces along the San Mateo County coast, central California.
9
formerly glaciated coasts in New England, although on a pas-sive margin, possess sea cliffs carved into abundant elevated exposures of hard, erosion-resistant igneous and metamorphic rocks that are punctuated with outcrops of softer till, outwash, and muddy glacial-marine sediment (Kelley and others, 1989; Kelley and Dickson, 2000).
Close examination of nearly any section of a cliffed coast reveals features related to alongshore variations in lithology, stratigraphy, and structure that have influenced erosion. Cliffs in more resistant rocks generally stand seaward as head-lands, or persist offshore as sea stacks or islands, whereas the weaker or softer materials occupy a more landward position. Embayed coastal cliffs can occur at locations of structural weakness such as faults and joints, as well as intrinsically weak rock types such as typical mudstones and glacial till. These geologic differences produce a wide variety of coastal landforms and configurations under the same environmental conditions. Rocks such as massive granite commonly erode in a relatively uniform fashion because of their homogeneity in composition and strength. In contrast, layered sedimentary rocks display heterogeneity between layers that respond dif-ferently to weathering and erosional processes. Differential erosion of alternating sandstone and shale beds, for example, produces an irregular cliff or shoreline with the typically more resistant sandstone forming ledges or protrusions between the softer and weaker shale beds. Much of the coastline of Oregon is rugged because it is dominated by bold volcanic headlands with intervening embayments eroded into weaker sedimentary rocks.
To summarize, the primary requirement for the exis-tence of coastal cliffs is elevated land, irrespective of material type. Consequently, cliffs are most typical along the coasts of tectonically active margins, but they also exist along vast stretches of inactive margins where previous tectonic or sedi-mentary (for example, glacial) activity has raised the land sur-face. Spatial differences in geological material and structure, augmented by differences in geologic processes (discussed below), cause differences in steepness of cliffs and ruggedness of the coastline.
Formation and Evolution of Coastal Cliffs
The majority of cliffs along today’s coastlines are rela-tively young geologic features, having formed after the most recent ice age—the Wisconsinan stage of the Pleistocene epoch—or during earlier Pleistocene transgressions (see, for example, Minard, 1971). About 21,000 years ago, the climate was considerably cooler and the Earth was in the waning stages of a period of extensive glaciation (Peltier, 1999). About 44 million km3 of sea water was locked up on the continents as ice sheets and glaciers that covered large areas of the Earth. Removal of this water from the oceans caused a worldwide drop in sea level of about 120 m. Consequently, the shoreline along the coast of California at that time was 10 to 25 km west
of the present one, and that of New York was more than 100 km farther to the east.
The ice sheets and glaciers melted as the climate warmed after the Wisconsinan stage; meltwater flowed into the ocean and sea level rose globally. This worldwide process, related to the total amount of water in the oceans, is termed eustatic sea-level change. Sea level rose at an average rate of nearly 1 cm/yr between 21,000 and about 5,000 years ago (Fairbanks, 1989). From that time until the present, the rate has slowed, although sea level has continued to rise at about 2 mm/yr for the past century (Cabanes and others, 2001). Waves breaking along the transgressing shoreline eroded elevated land in front of them, forming a gently inclined platform just below sea level, with an abrupt step—a sea cliff—at its leading edge. A similar process occurred as the Great Lakes basins filled with water during glacial melting.
These global events were imposed on a variety of regional geologic frameworks and processes, resulting in a substantial diversity of cliffed coastlines. For example, when sea level was low during the ice age, tectonic forces uplifted large regions of the U.S. west coast, exposing resistant bedrock to cliff-forming processes during the subsequent sea-level rise. In contrast, gla-ciers and aggrading streams deposited sediment along many parts of the shorelines of New York, Massachusetts, Puget Sound, and the Great Lakes. Coastal cliffs carved into glacial till or alluvium typically consist of relatively weak gravelly, sandy, and muddy sediment that is particularly susceptible to erosion. As the ice retreated across the Maine coast about 14,000 years ago, the ocean flooded the coastal lowlands, mantling them with glacial-marine mud (Dorion and others, 2001). Later, the land rebounded upward, and relative sea level fell locally to a lowstand about 60 m below present. Relative sea level has risen since then, with consequent erosion of sea cliffs, as a result of land stability and eustatically rising ocean waters (Barnhardt and others, 1997).
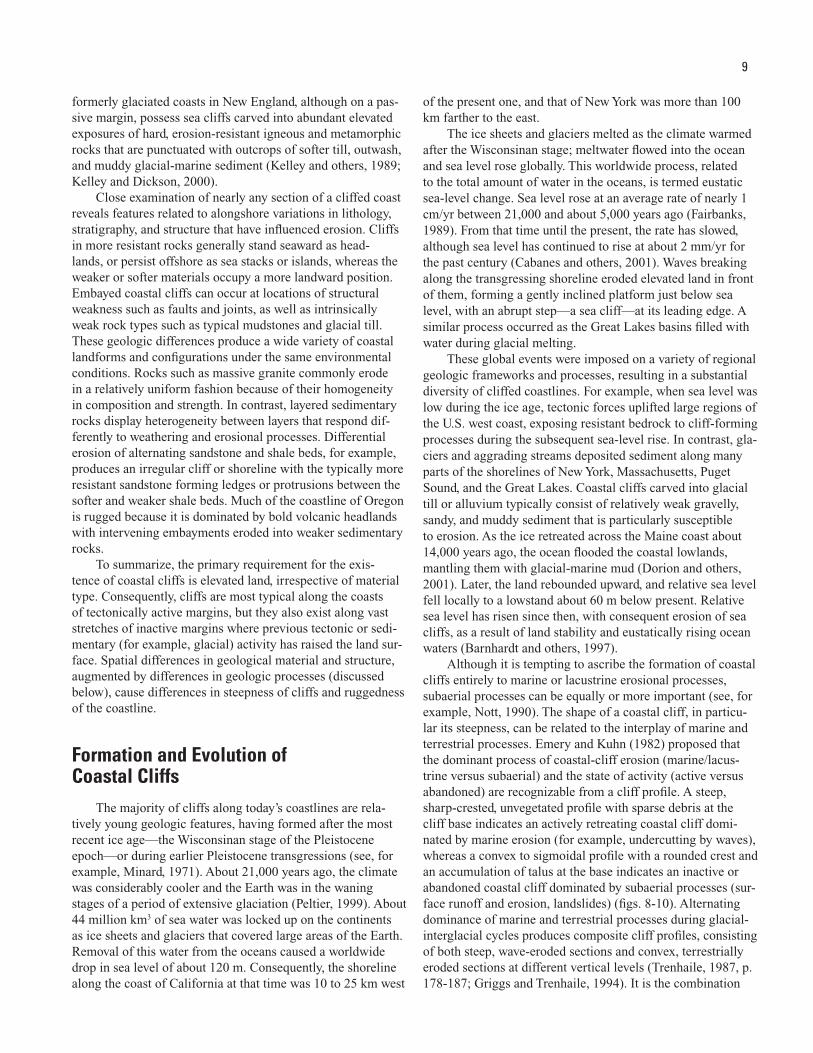
Although it is tempting to ascribe the formation of coastal cliffs entirely to marine or lacustrine erosional processes, subaerial processes can be equally or more important (see, for example, Nott, 1990). The shape of a coastal cliff, in particu-lar its steepness, can be related to the interplay of marine and terrestrial processes. Emery and Kuhn (1982) proposed that the dominant process of coastal-cliff erosion (marine/lacus-trine versus subaerial) and the state of activity (active versus abandoned) are recognizable from a cliff profile. A steep, sharp-crested, unvegetated profile with sparse debris at the cliff base indicates an actively retreating coastal cliff domi-nated by marine erosion (for example, undercutting by waves), whereas a convex to sigmoidal profile with a rounded crest and an accumulation of talus at the base indicates an inactive or abandoned coastal cliff dominated by subaerial processes (sur-face runoff and erosion, landslides) (figs. 8-10). Alternating dominance of marine and terrestrial processes during glacial-interglacial cycles produces composite cliff profiles, consisting of both steep, wave-eroded sections and convex, terrestrially eroded sections at different vertical levels (Trenhaile, 1987, p. 178-187; Griggs and Trenhaile, 1994). It is the combination
�
10 Formation, Evolution, and Stability of Coastal Cliffs—Status and Trends
of subaerial and marine processes, as well as the nature of the constituent materials, that create distinctive coastal cliffs and bluffs, and whether or not the cliff assumes a vertical free face depends upon the relative importance of these two different factors (Pethick, 1984).
Erosion of coastal cliffs can be envisioned as a 4-step sequence: (1) detachment of grains, slabs, or blocks from the cliff face, (2) transport down the inclined surface of the coastal cliff, (3) deposition at the base of the coastal cliff, and (4) removal of debris by marine or lacustrine processes (Lee, 1997). This concept can be extended to define a cyclical, episodic model of coastal-cliff evolution (see, for example, Hutchinson, 1973; Quigley and others, 1977; Everts, 1991; van Rijn, 1998). Waves erode the base of a coastal cliff, under-cutting and oversteepening it. This destabilizes the overlying
Figure 8. Undercut cliff (A) and adjacent cliff failure caused by undercutting (B) at Capitola, California. Note that the cliff-face morphology is determined by near-vertical jointing.
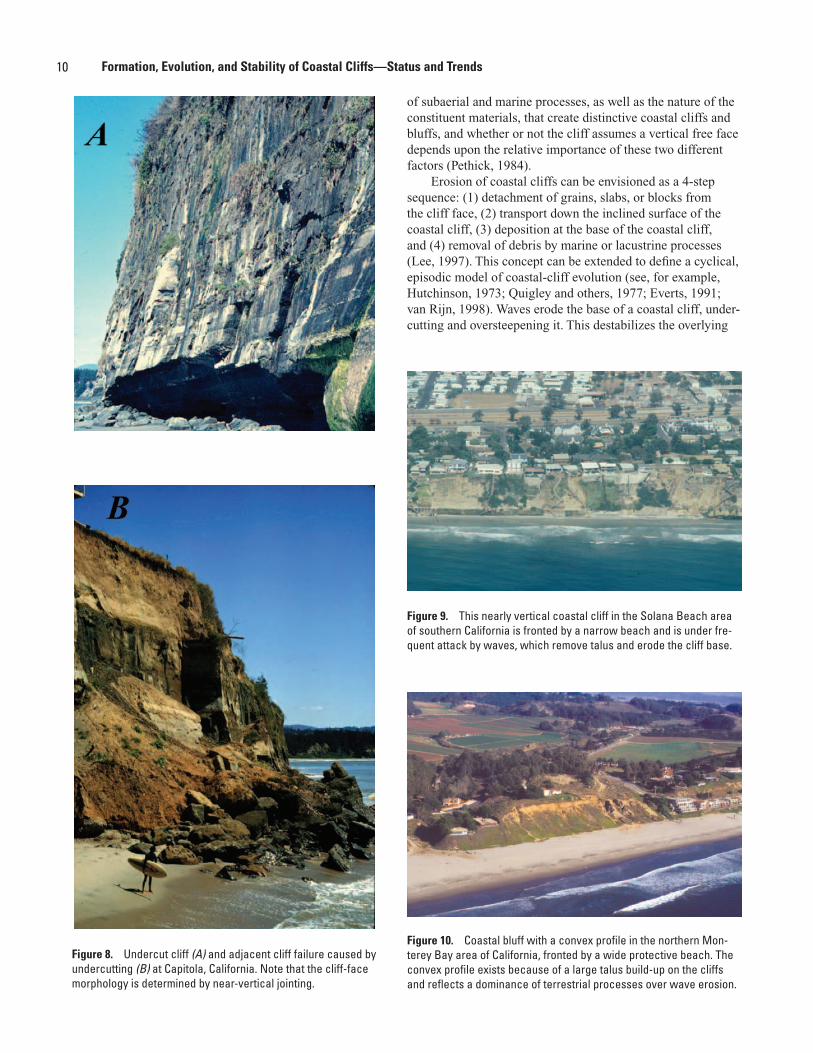
Figure 9. This nearly vertical coastal cliff in the Solana Beach area of southern California is fronted by a narrow beach and is under fre-quent attack by waves, which remove talus and erode the cliff base.
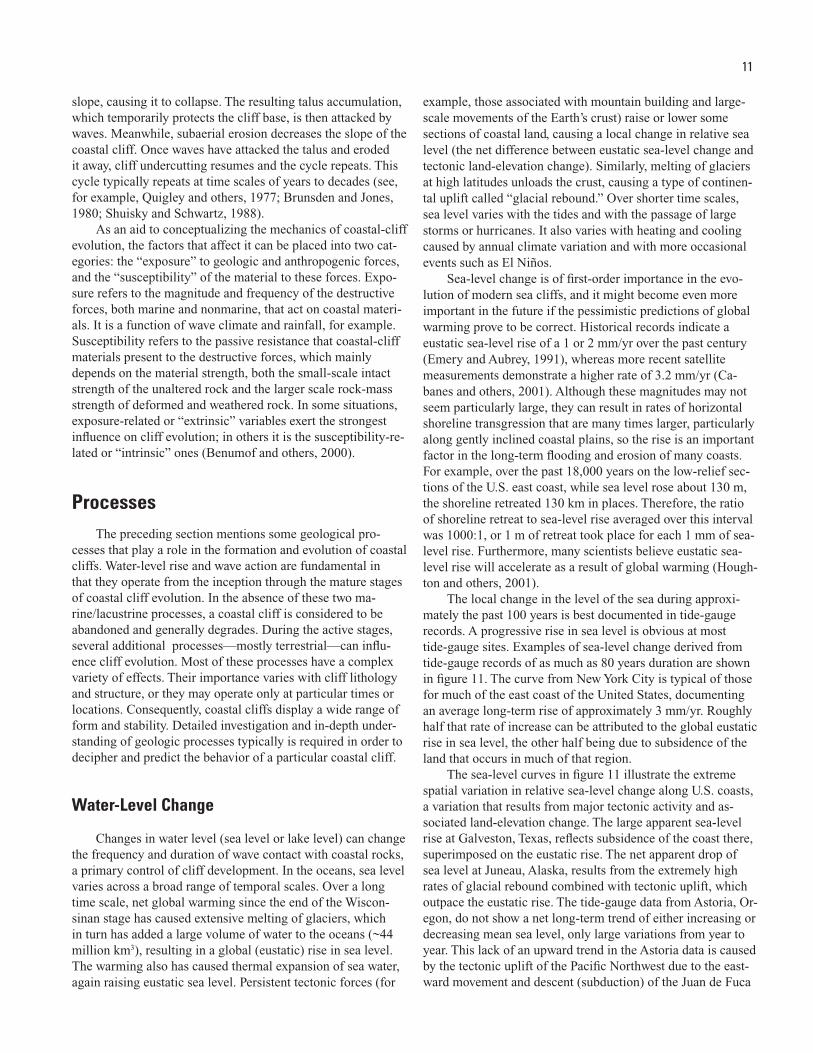
Figure 10. Coastal bluff with a convex profile in the northern Mon-terey Bay area of California, fronted by a wide protective beach. The convex profile exists because of a large talus build-up on the cliffs and reflects a dominance of terrestrial processes over wave erosion.
11
slope, causing it to collapse. The resulting talus accumulation, which temporarily protects the cliff base, is then attacked by waves. Meanwhile, subaerial erosion decreases the slope of the coastal cliff. Once waves have attacked the talus and eroded it away, cliff undercutting resumes and the cycle repeats. This cycle typically repeats at time scales of years to decades (see, for example, Quigley and others, 1977; Brunsden and Jones, 1980; Shuisky and Schwartz, 1988).
As an aid to conceptualizing the mechanics of coastal-cliff evolution, the factors that affect it can be placed into two cat-egories: the “exposure” to geologic and anthropogenic forces, and the “susceptibility” of the material to these forces. Expo-sure refers to the magnitude and frequency of the destructive forces, both marine and nonmarine, that act on coastal materi-als. It is a function of wave climate and rainfall, for example. Susceptibility refers to the passive resistance that coastal-cliff materials present to the destructive forces, which mainly depends on the material strength, both the small-scale intact strength of the unaltered rock and the larger scale rock-mass strength of deformed and weathered rock. In some situations, exposure-related or “extrinsic” variables exert the strongest influence on cliff evolution; in others it is the susceptibility-re-lated or “intrinsic” ones (Benumof and others, 2000).
ProcessesThe preceding section mentions some geological pro-
cesses that play a role in the formation and evolution of coastal cliffs. Water-level rise and wave action are fundamental in that they operate from the inception through the mature stages of coastal cliff evolution. In the absence of these two ma-rine/lacustrine processes, a coastal cliff is considered to be abandoned and generally degrades. During the active stages, several additional processes—mostly terrestrial—can influ-ence cliff evolution. Most of these processes have a complex variety of effects. Their importance varies with cliff lithology and structure, or they may operate only at particular times or locations. Consequently, coastal cliffs display a wide range of form and stability. Detailed investigation and in-depth under-standing of geologic processes typically is required in order to decipher and predict the behavior of a particular coastal cliff.
Water-Level Change
Changes in water level (sea level or lake level) can change the frequency and duration of wave contact with coastal rocks, a primary control of cliff development. In the oceans, sea level varies across a broad range of temporal scales. Over a long time scale, net global warming since the end of the Wiscon-sinan stage has caused extensive melting of glaciers, which in turn has added a large volume of water to the oceans (~44 million km3), resulting in a global (eustatic) rise in sea level. The warming also has caused thermal expansion of sea water, again raising eustatic sea level. Persistent tectonic forces (for
example, those associated with mountain building and large-scale movements of the Earth’s crust) raise or lower some sections of coastal land, causing a local change in relative sea level (the net difference between eustatic sea-level change and tectonic land-elevation change). Similarly, melting of glaciers at high latitudes unloads the crust, causing a type of continen-tal uplift called “glacial rebound.” Over shorter time scales, sea level varies with the tides and with the passage of large storms or hurricanes. It also varies with heating and cooling caused by annual climate variation and with more occasional events such as El Niños.
Sea-level change is of first-order importance in the evo-lution of modern sea cliffs, and it might become even more important in the future if the pessimistic predictions of global warming prove to be correct. Historical records indicate a eustatic sea-level rise of a 1 or 2 mm/yr over the past century (Emery and Aubrey, 1991), whereas more recent satellite measurements demonstrate a higher rate of 3.2 mm/yr (Ca-banes and others, 2001). Although these magnitudes may not seem particularly large, they can result in rates of horizontal shoreline transgression that are many times larger, particularly along gently inclined coastal plains, so the rise is an important factor in the long-term flooding and erosion of many coasts. For example, over the past 18,000 years on the low-relief sec-tions of the U.S. east coast, while sea level rose about 130 m, the shoreline retreated 130 km in places. Therefore, the ratio of shoreline retreat to sea-level rise averaged over this interval was 1000:1, or 1 m of retreat took place for each 1 mm of sea-level rise. Furthermore, many scientists believe eustatic sea-level rise will accelerate as a result of global warming (Hough-ton and others, 2001).
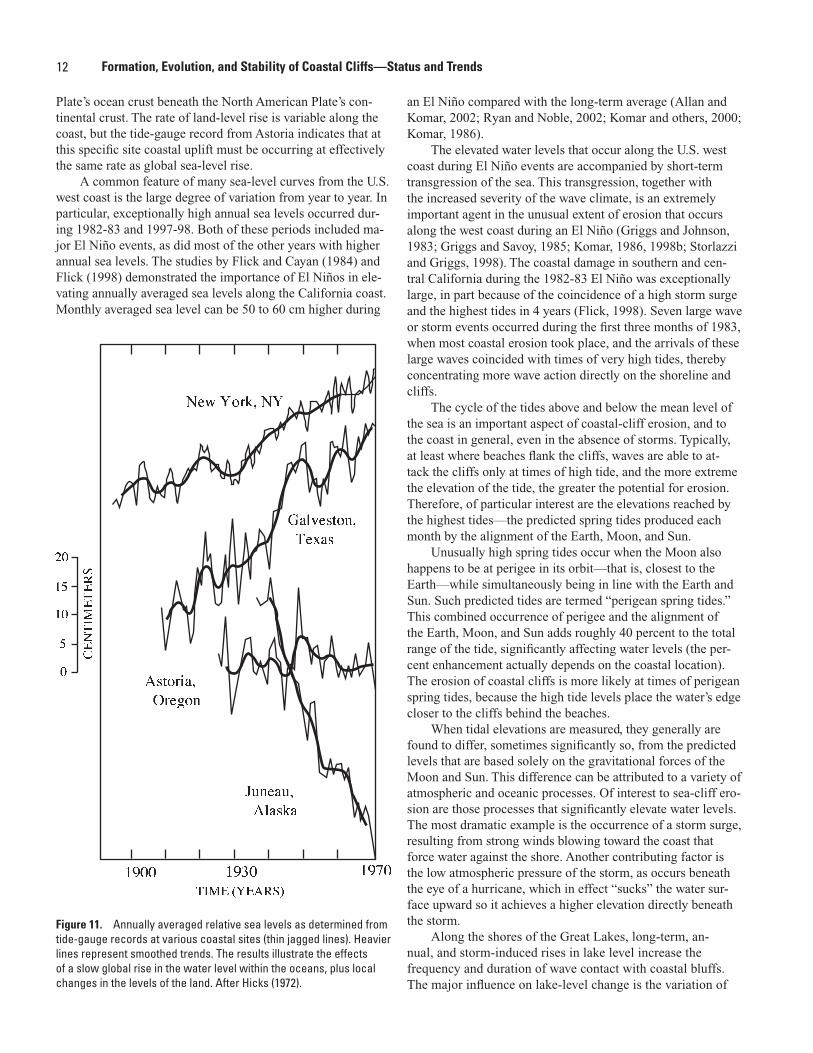
The local change in the level of the sea during approxi-mately the past 100 years is best documented in tide-gauge records. A progressive rise in sea level is obvious at most tide-gauge sites. Examples of sea-level change derived from tide-gauge records of as much as 80 years duration are shown in figure 11. The curve from New York City is typical of those for much of the east coast of the United States, documenting an average long-term rise of approximately 3 mm/yr. Roughly half that rate of increase can be attributed to the global eustatic rise in sea level, the other half being due to subsidence of the land that occurs in much of that region.
The sea-level curves in figure 11 illustrate the extreme spatial variation in relative sea-level change along U.S. coasts, a variation that results from major tectonic activity and as-sociated land-elevation change. The large apparent sea-level rise at Galveston, Texas, reflects subsidence of the coast there, superimposed on the eustatic rise. The net apparent drop of sea level at Juneau, Alaska, results from the extremely high rates of glacial rebound combined with tectonic uplift, which outpace the eustatic rise. The tide-gauge data from Astoria, Or-egon, do not show a net long-term trend of either increasing or decreasing mean sea level, only large variations from year to year. This lack of an upward trend in the Astoria data is caused by the tectonic uplift of the Pacific Northwest due to the east-ward movement and descent (subduction) of the Juan de Fuca
�
12 Formation, Evolution, and Stability of Coastal Cliffs—Status and Trends
Plate’s ocean crust beneath the North American Plate’s con-tinental crust. The rate of land-level rise is variable along the coast, but the tide-gauge record from Astoria indicates that at this specific site coastal uplift must be occurring at effectively the same rate as global sea-level rise.
A common feature of many sea-level curves from the U.S. west coast is the large degree of variation from year to year. In particular, exceptionally high annual sea levels occurred dur-ing 1982-83 and 1997-98. Both of these periods included ma-jor El Niño events, as did most of the other years with higher annual sea levels. The studies by Flick and Cayan (1984) and Flick (1998) demonstrated the importance of El Niños in ele-vating annually averaged sea levels along the California coast. Monthly averaged sea level can be 50 to 60 cm higher during
an El Niño compared with the long-term average (Allan and Komar, 2002; Ryan and Noble, 2002; Komar and others, 2000; Komar, 1986).
The elevated water levels that occur along the U.S. west coast during El Niño events are accompanied by short-term transgression of the sea. This transgression, together with the increased severity of the wave climate, is an extremely important agent in the unusual extent of erosion that occurs along the west coast during an El Niño (Griggs and Johnson, 1983; Griggs and Savoy, 1985; Komar, 1986, 1998b; Storlazzi and Griggs, 1998). The coastal damage in southern and cen-tral California during the 1982-83 El Niño was exceptionally large, in part because of the coincidence of a high storm surge and the highest tides in 4 years (Flick, 1998). Seven large wave or storm events occurred during the first three months of 1983, when most coastal erosion took place, and the arrivals of these large waves coincided with times of very high tides, thereby concentrating more wave action directly on the shoreline and cliffs.
The cycle of the tides above and below the mean level of the sea is an important aspect of coastal-cliff erosion, and to the coast in general, even in the absence of storms. Typically, at least where beaches flank the cliffs, waves are able to at-tack the cliffs only at times of high tide, and the more extreme the elevation of the tide, the greater the potential for erosion. Therefore, of particular interest are the elevations reached by the highest tides—the predicted spring tides produced each month by the alignment of the Earth, Moon, and Sun.
Unusually high spring tides occur when the Moon also happens to be at perigee in its orbit—that is, closest to the Earth—while simultaneously being in line with the Earth and Sun. Such predicted tides are termed “perigean spring tides.” This combined occurrence of perigee and the alignment of the Earth, Moon, and Sun adds roughly 40 percent to the total range of the tide, significantly affecting water levels (the per-cent enhancement actually depends on the coastal location). The erosion of coastal cliffs is more likely at times of perigean spring tides, because the high tide levels place the water’s edge closer to the cliffs behind the beaches.
When tidal elevations are measured, they generally are found to differ, sometimes significantly so, from the predicted levels that are based solely on the gravitational forces of the Moon and Sun. This difference can be attributed to a variety of atmospheric and oceanic processes. Of interest to sea-cliff ero-sion are those processes that significantly elevate water levels. The most dramatic example is the occurrence of a storm surge, resulting from strong winds blowing toward the coast that force water against the shore. Another contributing factor is the low atmospheric pressure of the storm, as occurs beneath the eye of a hurricane, which in effect “sucks” the water sur-face upward so it achieves a higher elevation directly beneath the storm.
Along the shores of the Great Lakes, long-term, an-nual, and storm-induced rises in lake level increase the frequency and duration of wave contact with coastal bluffs. The major influence on lake-level change is the variation of
Figure 11. Annually averaged relative sea levels as determined from tide-gauge records at various coastal sites (thin jagged lines). Heavier lines represent smoothed trends. The results illustrate the effects of a slow global rise in the water level within the oceans, plus local changes in the levels of the land. After Hicks (1972).
13
regional precipitation that produces 7- to 25-year cycles of water-level change of a meter or two, which significantly af-fects lake-bluff erosion (Quigley and others, 1977; Quigley and Di Nardo, 1980; Quigley and Zeman, 1980; Lawrence, 1994; Cox and others, 2000; Brown, 2000; Brown and oth-ers, 2001). Changes in lake outflow, and in the amount of evaporation, also cause measurable variations in lake level. Moreover, lake level undergoes annual cycles of tens of cen-timeters because of seasonal temperature differences, and it experiences daily variations caused by tides and storm surge. Being small bodies of water, the Great Lakes have tides that amount to only a few centimeters in amplitude. However, seiching (oscillatory waves moving back and forth across a confined body of water) is important, governed by the natural period of oscillation of the lake—the period is on the order of one day or somewhat less, and amplitudes can involve tens of centimeters, so the effect is much like tides. Storm surge also can be significant on the Great Lakes, because of their shal-low water depths. For example, a water-level change due to a storm surge measured at Toledo, Ohio, on Lake Erie was on the order of 1.5 m (Dewberry and Davis, 1995). A pattern of seiching also was associated with that storm.
Bluff-base erosion and subsequent recession of the bluff crest typically occur more rapidly during rising or high stages of lake level, and the cyclic nature of lake-level variation cor-relates with a cyclicity in the volume of sediment removed from the bluffs (Lawrence, 1994; Quigley and Di Nardo, 1980; Cox and others, 2000). However, the erosion and recession typically are preceded by downcutting of the nearshore lake floor during periods of low lake level (Nairn, 1997). Downcut-ting of nearshore cohesive deposits results in a lowering of the nearshore profile. If there is insufficient sand to build up the nearshore profile during rising or high lake levels, a typical case for many areas of the Great Lakes, then larger waves will be able to reach closer to shore before breaking, thereby con-tributing to more rapid erosion.
For Lake Erie and Lake Michigan, there may be a thresh-old lake level above which erosion proceeds more quickly. A study of wave erosion at the bluff toe at five sites on Lake Erie found that wave erosion increased whenever the combina-tion of lake level and storm surge produced a storm lake level exceeding 1.3 m above chart datum (Carter and Guy, 1988). Similar anecdotal observations have been made for the Illinois lakeshore of Lake Michigan.
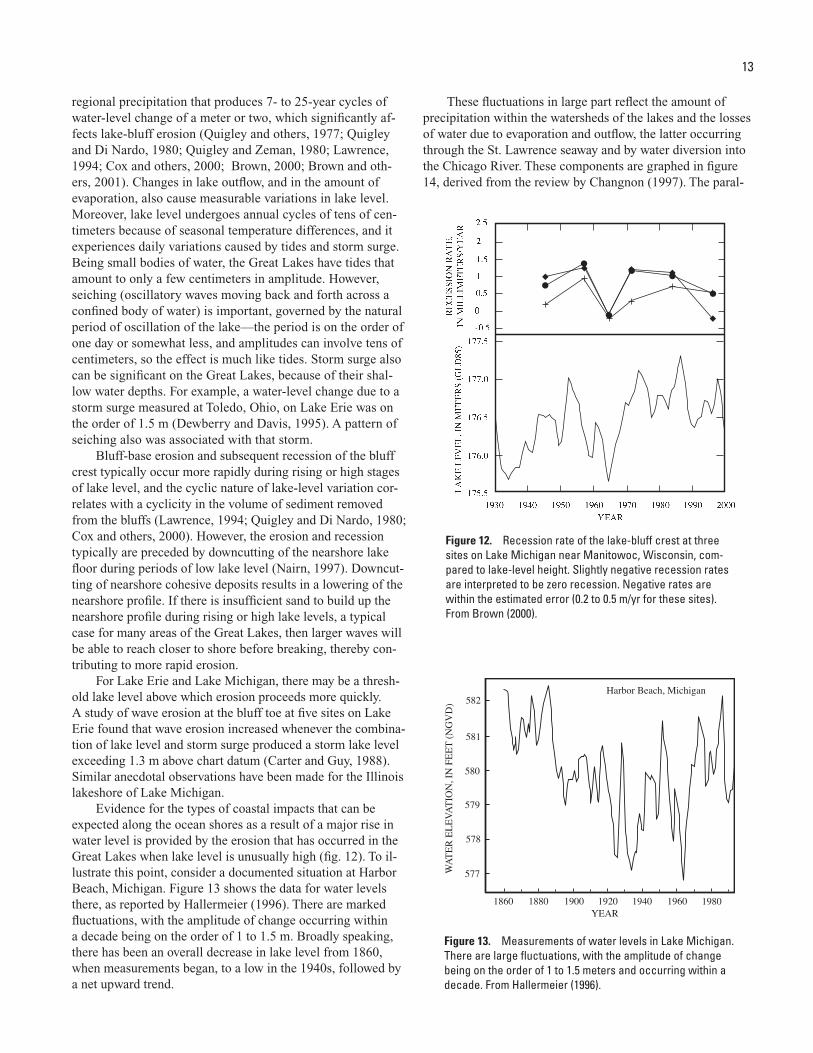
Evidence for the types of coastal impacts that can be expected along the ocean shores as a result of a major rise in water level is provided by the erosion that has occurred in the Great Lakes when lake level is unusually high (fig. 12). To il-lustrate this point, consider a documented situation at Harbor Beach, Michigan. Figure 13 shows the data for water levels there, as reported by Hallermeier (1996). There are marked fluctuations, with the amplitude of change occurring within a decade being on the order of 1 to 1.5 m. Broadly speaking, there has been an overall decrease in lake level from 1860, when measurements began, to a low in the 1940s, followed by a net upward trend.
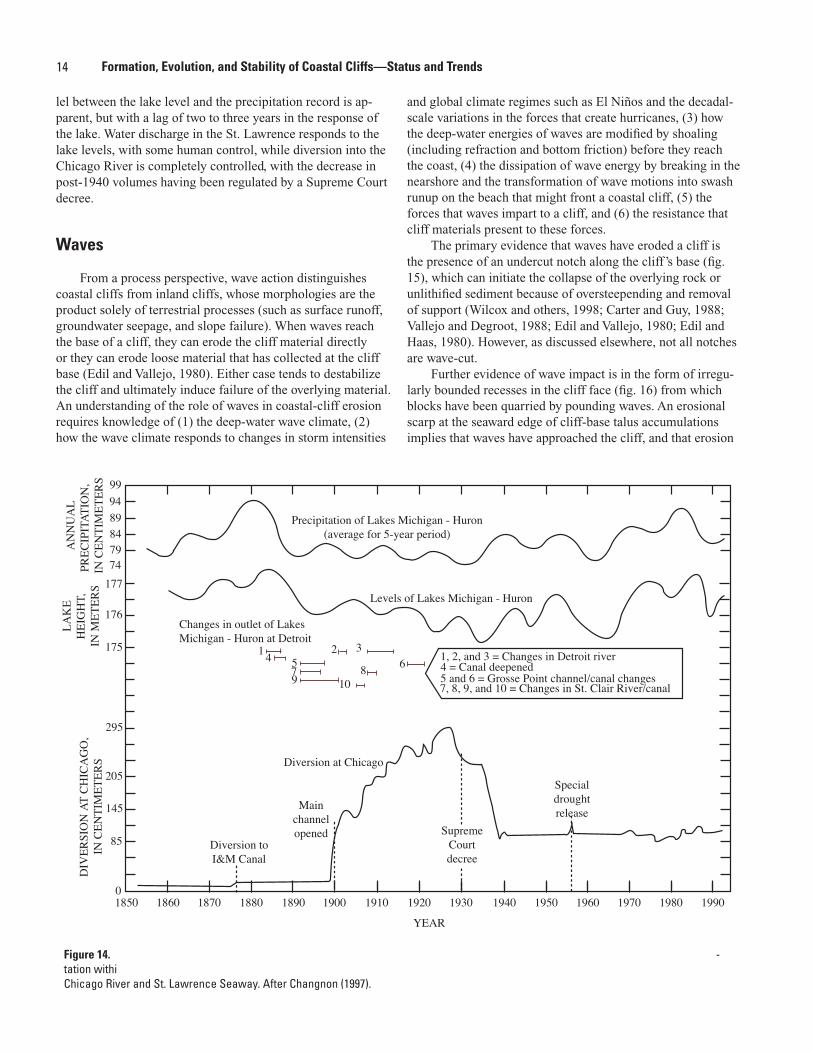
These fluctuations in large part reflect the amount of precipitation within the watersheds of the lakes and the losses of water due to evaporation and outflow, the latter occurring through the St. Lawrence seaway and by water diversion into the Chicago River. These components are graphed in figure 14, derived from the review by Changnon (1997). The paral-
Figure 12. Recession rate of the lake-bluff crest at three sites on Lake Michigan near Manitowoc, Wisconsin, com-pared to lake-level height. Slightly negative recession rates are interpreted to be zero recession. Negative rates are within the estimated error (0.2 to 0.5 m/yr for these sites). From Brown (2000).
Figure 13. Measurements of water levels in Lake Michigan. There are large fluctuations, with the amplitude of change being on the order of 1 to 1.5 meters and occurring within a decade. From Hallermeier (1996).
Harbor Beach, Michigan
WAT
ER E
LEVA
TIO
N, I
N F
EET
(NG
VD
) 582
581
580
579
578
577
1860 1880 1900 1920 1940 1960YEAR
1980
�
14 Formation, Evolution, and Stability of Coastal Cliffs—Status and Trends
lel between the lake level and the precipitation record is ap-parent, but with a lag of two to three years in the response of the lake. Water discharge in the St. Lawrence responds to the lake levels, with some human control, while diversion into the Chicago River is completely controlled, with the decrease in post-1940 volumes having been regulated by a Supreme Court decree.
Waves
From a process perspective, wave action distinguishes coastal cliffs from inland cliffs, whose morphologies are the product solely of terrestrial processes (such as surface runoff, groundwater seepage, and slope failure). When waves reach the base of a cliff, they can erode the cliff material directly or they can erode loose material that has collected at the cliff base (Edil and Vallejo, 1980). Either case tends to destabilize the cliff and ultimately induce failure of the overlying material. An understanding of the role of waves in coastal-cliff erosion requires knowledge of (1) the deep-water wave climate, (2) how the wave climate responds to changes in storm intensities
and global climate regimes such as El Niños and the decadal-scale variations in the forces that create hurricanes, (3) how the deep-water energies of waves are modified by shoaling (including refraction and bottom friction) before they reach the coast, (4) the dissipation of wave energy by breaking in the nearshore and the transformation of wave motions into swash runup on the beach that might front a coastal cliff, (5) the forces that waves impart to a cliff, and (6) the resistance that cliff materials present to these forces.
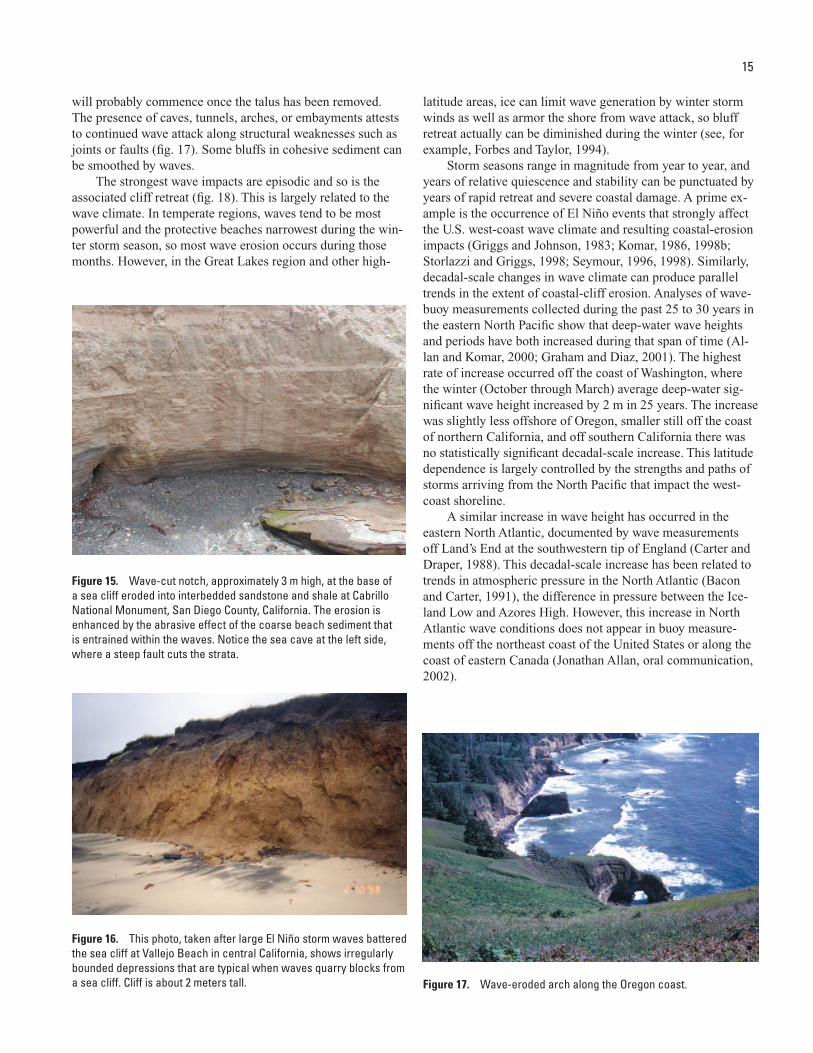
The primary evidence that waves have eroded a cliff is the presence of an undercut notch along the cliff ’s base (fig. 15), which can initiate the collapse of the overlying rock or unlithified sediment because of oversteepending and removal of support (Wilcox and others, 1998; Carter and Guy, 1988; Vallejo and Degroot, 1988; Edil and Vallejo, 1980; Edil and Haas, 1980). However, as discussed elsewhere, not all notches are wave-cut.
Further evidence of wave impact is in the form of irregu-larly bounded recesses in the cliff face (fig. 16) from which blocks have been quarried by pounding waves. An erosional scarp at the seaward edge of cliff-base talus accumulations implies that waves have approached the cliff, and that erosion
999489847974
AN
NU
AL
PREC
IPIT
ATIO
N,
IN C
ENTI
MET
ERS
1850 1860 1870 1880 1890 1900 1910 1920 1930 1940 1950 1960 1970 1980 1990
Precipitation of Lakes Michigan - Huron(average for 5-year period)
Levels of Lakes Michigan - Huron
LAK
EH
EIG
HT,
IN M
ETER
S 177
176
175
DIV
ERSI
ON
AT
CH
ICA
GO
,IN
CEN
TIM
ETER
S
295
205
145
85
0
Changes in outlet of LakesMichigan - Huron at Detroit
1 4 579
2 3
810
6 1, 2, and 3 = Changes in Detroit river4 = Canal deepened5 and 6 = Grosse Point channel/canal changes7, 8, 9, and 10 = Changes in St. Clair River/canal
Diversion toI&M Canal
Mainchannelopened
Diversion at Chicago
SupremeCourtdecree
Specialdroughtrelease
YEAR
Figure 14. � -tation withi�Chicago River and St. Lawrence Seaway. After Changnon (1997).
15
will probably commence once the talus has been removed. The presence of caves, tunnels, arches, or embayments attests to continued wave attack along structural weaknesses such as joints or faults (fig. 17). Some bluffs in cohesive sediment can be smoothed by waves.
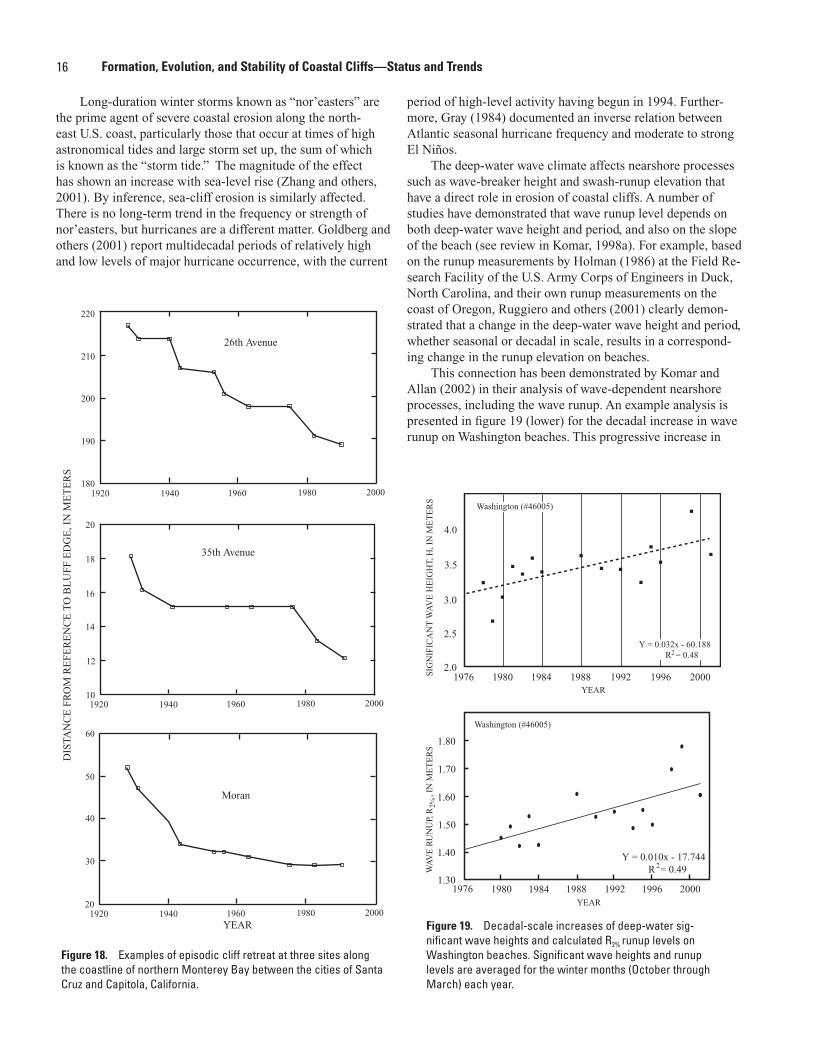
The strongest wave impacts are episodic and so is the associated cliff retreat (fig. 18). This is largely related to the wave climate. In temperate regions, waves tend to be most powerful and the protective beaches narrowest during the win-ter storm season, so most wave erosion occurs during those months. However, in the Great Lakes region and other high-
Figure 15. Wave-cut notch, approximately 3 m high, at the base of a sea cliff eroded into interbedded sandstone and shale at Cabrillo National Monument, San Diego County, California. The erosion is enhanced by the abrasive effect of the coarse beach sediment that is entrained within the waves. Notice the sea cave at the left side, where a steep fault cuts the strata.
Figure 16. This photo, taken after large El Niño storm waves battered the sea cliff at Vallejo Beach in central California, shows irregularly bounded depressions that are typical when waves quarry blocks from a sea cliff. Cliff is about 2 meters tall. Figure 17. Wave-eroded arch along the Oregon coast.
latitude areas, ice can limit wave generation by winter storm winds as well as armor the shore from wave attack, so bluff retreat actually can be diminished during the winter (see, for example, Forbes and Taylor, 1994).
Storm seasons range in magnitude from year to year, and years of relative quiescence and stability can be punctuated by years of rapid retreat and severe coastal damage. A prime ex-ample is the occurrence of El Niño events that strongly affect the U.S. west-coast wave climate and resulting coastal-erosion impacts (Griggs and Johnson, 1983; Komar, 1986, 1998b; Storlazzi and Griggs, 1998; Seymour, 1996, 1998). Similarly, decadal-scale changes in wave climate can produce parallel trends in the extent of coastal-cliff erosion. Analyses of wave-buoy measurements collected during the past 25 to 30 years in the eastern North Pacific show that deep-water wave heights and periods have both increased during that span of time (Al-lan and Komar, 2000; Graham and Diaz, 2001). The highest rate of increase occurred off the coast of Washington, where the winter (October through March) average deep-water sig-nificant wave height increased by 2 m in 25 years. The increase was slightly less offshore of Oregon, smaller still off the coast of northern California, and off southern California there was no statistically significant decadal-scale increase. This latitude dependence is largely controlled by the strengths and paths of storms arriving from the North Pacific that impact the west-coast shoreline.
A similar increase in wave height has occurred in the eastern North Atlantic, documented by wave measurements off Land’s End at the southwestern tip of England (Carter and Draper, 1988). This decadal-scale increase has been related to trends in atmospheric pressure in the North Atlantic (Bacon and Carter, 1991), the difference in pressure between the Ice-land Low and Azores High. However, this increase in North Atlantic wave conditions does not appear in buoy measure-ments off the northeast coast of the United States or along the coast of eastern Canada (Jonathan Allan, oral communication, 2002).
�
16 Formation, Evolution, and Stability of Coastal Cliffs—Status and Trends
Long-duration winter storms known as “nor’easters” are the prime agent of severe coastal erosion along the north-east U.S. coast, particularly those that occur at times of high astronomical tides and large storm set up, the sum of which is known as the “storm tide.” The magnitude of the effect has shown an increase with sea-level rise (Zhang and others, 2001). By inference, sea-cliff erosion is similarly affected. There is no long-term trend in the frequency or strength of nor’easters, but hurricanes are a different matter. Goldberg and others (2001) report multidecadal periods of relatively high and low levels of major hurricane occurrence, with the current
period of high-level activity having begun in 1994. Further-more, Gray (1984) documented an inverse relation between Atlantic seasonal hurricane frequency and moderate to strong El Niños.
The deep-water wave climate affects nearshore processes such as wave-breaker height and swash-runup elevation that have a direct role in erosion of coastal cliffs. A number of studies have demonstrated that wave runup level depends on both deep-water wave height and period, and also on the slope of the beach (see review in Komar, 1998a). For example, based on the runup measurements by Holman (1986) at the Field Re-search Facility of the U.S. Army Corps of Engineers in Duck, North Carolina, and their own runup measurements on the coast of Oregon, Ruggiero and others (2001) clearly demon-strated that a change in the deep-water wave height and period, whether seasonal or decadal in scale, results in a correspond-ing change in the runup elevation on beaches.
This connection has been demonstrated by Komar and Allan (2002) in their analysis of wave-dependent nearshore processes, including the wave runup. An example analysis is presented in figure 19 (lower) for the decadal increase in wave runup on Washington beaches. This progressive increase in
Figure 18. Examples of episodic cliff retreat at three sites along the coastline of northern Monterey Bay between the cities of Santa Cruz and Capitola, California.
Figure 19. Decadal-scale increases of deep-water sig-nificant wave heights and calculated R2% runup levels on Washington beaches. Significant wave heights and runup levels are averaged for the winter months (October through March) each year.
220
210
200
190
180
26th Avenue
1920 1940 1960 1980 2000
1920 1940 1960 1980 2000
1920 1940 1960 1980 2000YEAR
20
18
16
14
12
10
35th Avenue
60
50
40
30
20
Moran
DIS
TAN
CE
FR
OM
RE
FER
EN
CE
TO
BL
UFF
ED
GE
, IN
ME
TE
RS
Washington (#46005)
Washington (#46005)
Y = 0.032x - 60.188 R = 0.482
SIG
NIF
ICA
NT
WA
VE
HE
IGH
T, H
, IN
ME
TE
RS
1976 1980 1984 1988 1992 1996 2000YEAR
1976 1980 1984 1988 1992 1996 2000YEAR
4.0
3.5
3.0
2.5
2.0
Y = 0.010x - 17.744 R = 0.492
WA
VE
RU
NU
P, R
,
IN
ME
TE
RS
2%
1.70
1.80
1.60
1.50
1.40
1.30
17
the average runup has resulted in a horizontal “transgression” of the mean shoreline by about 8 m during the past 25 years, greater than the transgression from the relative rise in sea level along the Washington coast during that period. The shift in the deep-water wave climate and associated nearshore pro-cesses is of obvious significance to the Washington coast, re-sulting in increased erosion of coastal cliffs and dune-backed shores. In similar analyses for the coast of California, it was found that El Niño events account for the most extreme runup elevations, decadal-scale trends not being a factor (Komar and Allan, 2002).
The nearshore wave climate in relation to the deep-water wave conditions can be affected by wave shoaling, including wave refraction and the loss of energy due to bottom friction exerted on the waves. The effects of wave refraction in con-trolling the extent of sea-cliff erosion are illustrated by the long-term cliff retreat that has undermined the city of Dun-wich on the North Sea coast of England (Robinson, 1980). In the 13th century, Dunwich was one of England’s major cities and the location of a commercially important harbor. Over the centuries, erosion of the glacial-till bluffs has pro-gressively undermined the city to such an extent that today it is only a small village of a few houses. Shoals are common in the North Sea, formed by strong tidal currents, and one shoal—Sizewell Bank—is present directly offshore from Dunwich. Robinson (1980) demonstrated that wave refraction over Sizewell Bank was for several centuries important to the erosion of Dunwich, because the shoal acted like a lens to fo-cus the energy of the waves on its shoreline. This focusing of wave energy intensified the storm-related nearshore processes on the Dunwich shore, including the size of breaking waves, the swash-runup elevation, and the storm surge that elevated tides. Robinson also demonstrated that the erosion has dimin-ished during the last fifty years, concluding that this reduction has resulted from the slow northward migration of Sizewell Bank, shifting the focus of wave energy by refraction away from Dunwich.
The amount of wave-induced erosion is a function of the energy expended against the cliff by the waves, through the compressional force of impact and the tractive force of uprush (Trenhaile, 1987; Sunamura, 1992). Waves impart the most energy in the form of shock pressure if they collide directly with the cliff just as they break. Compressed air within cavi-ties in the cliff can expand explosively as the wave recedes, hydraulically quarrying blocks from the cliff face (fig. 16). However, waves more commonly reach a cliff as swash on a fronting beach, having already broken offshore. Erosion then occurs mainly by the tractive force of the wave as it washes up the cliff face, particularly if coarse, abrasive sediment has been entrained from the beach (Robinson, 1977; Kamphuis, 1987; Nairn, 1997). Elsewhere, in the absence of a beach or exposed platform, some cliffs are in constant contact with the water. In this case the water level oscillates up and down the cliff face, and a notch can be slowly eroded just above the mean water level. Of course, many cliffs experience different types of contact with waves as conditions change.
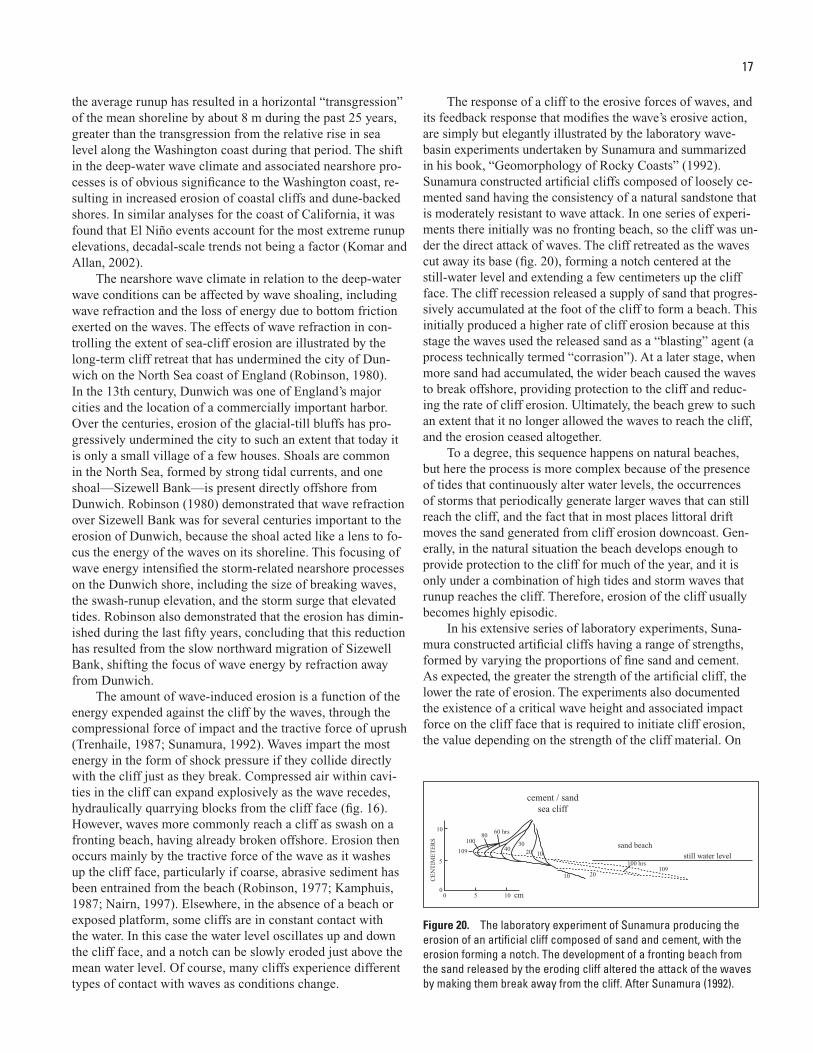
The response of a cliff to the erosive forces of waves, and its feedback response that modifies the wave’s erosive action, are simply but elegantly illustrated by the laboratory wave-basin experiments undertaken by Sunamura and summarized in his book, “Geomorphology of Rocky Coasts” (1992). Sunamura constructed artificial cliffs composed of loosely ce-mented sand having the consistency of a natural sandstone that is moderately resistant to wave attack. In one series of experi-ments there initially was no fronting beach, so the cliff was un-der the direct attack of waves. The cliff retreated as the waves cut away its base (fig. 20), forming a notch centered at the still-water level and extending a few centimeters up the cliff face. The cliff recession released a supply of sand that progres-sively accumulated at the foot of the cliff to form a beach. This initially produced a higher rate of cliff erosion because at this stage the waves used the released sand as a “blasting” agent (a process technically termed “corrasion”). At a later stage, when more sand had accumulated, the wider beach caused the waves to break offshore, providing protection to the cliff and reduc-ing the rate of cliff erosion. Ultimately, the beach grew to such an extent that it no longer allowed the waves to reach the cliff, and the erosion ceased altogether.
To a degree, this sequence happens on natural beaches, but here the process is more complex because of the presence of tides that continuously alter water levels, the occurrences of storms that periodically generate larger waves that can still reach the cliff, and the fact that in most places littoral drift moves the sand generated from cliff erosion downcoast. Gen-erally, in the natural situation the beach develops enough to provide protection to the cliff for much of the year, and it is only under a combination of high tides and storm waves that runup reaches the cliff. Therefore, erosion of the cliff usually becomes highly episodic.
In his extensive series of laboratory experiments, Suna-mura constructed artificial cliffs having a range of strengths, formed by varying the proportions of fine sand and cement. As expected, the greater the strength of the artificial cliff, the lower the rate of erosion. The experiments also documented the existence of a critical wave height and associated impact force on the cliff face that is required to initiate cliff erosion, the value depending on the strength of the cliff material. On
Figure 20. The laboratory experiment of Sunamura producing the erosion of an artificial cliff composed of sand and cement, with the erosion forming a notch. The development of a fronting beach from the sand released by the eroding cliff altered the attack of the waves by making them break away from the cliff. After Sunamura (1992).
cement / sandsea cliff
00
5
5
10
10 cm
109
10080
60 hrs
4030
20 10
10 20
100 hrs109
sand beachstill water level
CE
NT
IME
TE
RS
�
18 Formation, Evolution, and Stability of Coastal Cliffs—Status and Trends
the basis of his experimental results, Sunamura (1992) devel-oped a mathematical model that relates the rate of cliff retreat to the forces of wave impact compared with the resistance strength of the rock. By assuming that the force of erosion is proportional to the height of the assailing waves, and using the compressive strength of the rock as a measure of its resistance, Sunamura derived an equation for the rate of cliff retreat as a function of these parameters:
Retreat rate = k(C + ln qgH/Sc),
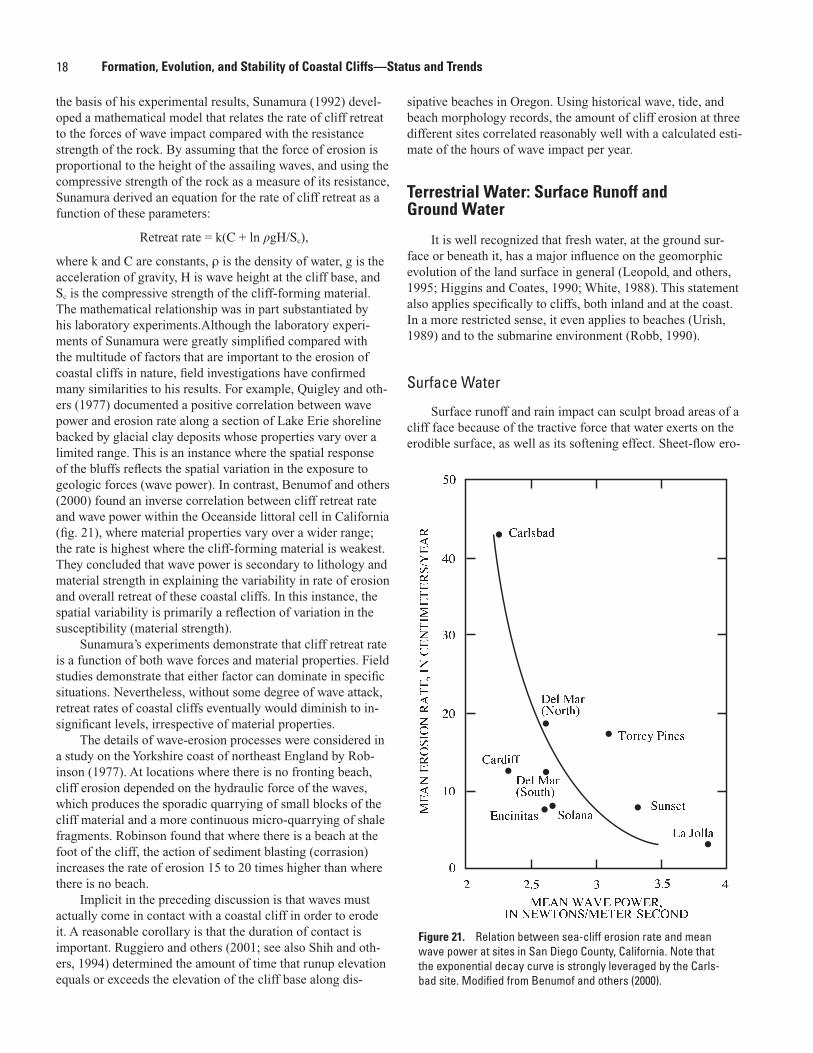
where k and C are constants, ρ is the density of water, g is the acceleration of gravity, H is wave height at the cliff base, and Sc is the compressive strength of the cliff-forming material. The mathematical relationship was in part substantiated by his laboratory experiments.Although the laboratory experi-ments of Sunamura were greatly simplified compared with the multitude of factors that are important to the erosion of coastal cliffs in nature, field investigations have confirmed many similarities to his results. For example, Quigley and oth-ers (1977) documented a positive correlation between wave power and erosion rate along a section of Lake Erie shoreline backed by glacial clay deposits whose properties vary over a limited range. This is an instance where the spatial response of the bluffs reflects the spatial variation in the exposure to geologic forces (wave power). In contrast, Benumof and others (2000) found an inverse correlation between cliff retreat rate and wave power within the Oceanside littoral cell in California (fig. 21), where material properties vary over a wider range; the rate is highest where the cliff-forming material is weakest. They concluded that wave power is secondary to lithology and material strength in explaining the variability in rate of erosion and overall retreat of these coastal cliffs. In this instance, the spatial variability is primarily a reflection of variation in the susceptibility (material strength).
Sunamura’s experiments demonstrate that cliff retreat rate is a function of both wave forces and material properties. Field studies demonstrate that either factor can dominate in specific situations. Nevertheless, without some degree of wave attack, retreat rates of coastal cliffs eventually would diminish to in-significant levels, irrespective of material properties.
The details of wave-erosion processes were considered in a study on the Yorkshire coast of northeast England by Rob-inson (1977). At locations where there is no fronting beach, cliff erosion depended on the hydraulic force of the waves, which produces the sporadic quarrying of small blocks of the cliff material and a more continuous micro-quarrying of shale fragments. Robinson found that where there is a beach at the foot of the cliff, the action of sediment blasting (corrasion) increases the rate of erosion 15 to 20 times higher than where there is no beach.
Implicit in the preceding discussion is that waves must actually come in contact with a coastal cliff in order to erode it. A reasonable corollary is that the duration of contact is important. Ruggiero and others (2001; see also Shih and oth-ers, 1994) determined the amount of time that runup elevation equals or exceeds the elevation of the cliff base along dis-
sipative beaches in Oregon. Using historical wave, tide, and beach morphology records, the amount of cliff erosion at three different sites correlated reasonably well with a calculated esti-mate of the hours of wave impact per year.
Terrestrial Water: Surface Runoff and Ground Water
It is well recognized that fresh water, at the ground sur-face or beneath it, has a major influence on the geomorphic evolution of the land surface in general (Leopold, and others, 1995; Higgins and Coates, 1990; White, 1988). This statement also applies specifically to cliffs, both inland and at the coast. In a more restricted sense, it even applies to beaches (Urish, 1989) and to the submarine environment (Robb, 1990).
Surface Water
Surface runoff and rain impact can sculpt broad areas of a cliff face because of the tractive force that water exerts on the erodible surface, as well as its softening effect. Sheet-flow ero-
Figure 21. Relation between sea-cliff erosion rate and mean wave power at sites in San Diego County, California. Note that the exponential decay curve is strongly leveraged by the Carls-bad site. Modified from Benumof and others (2000).
19
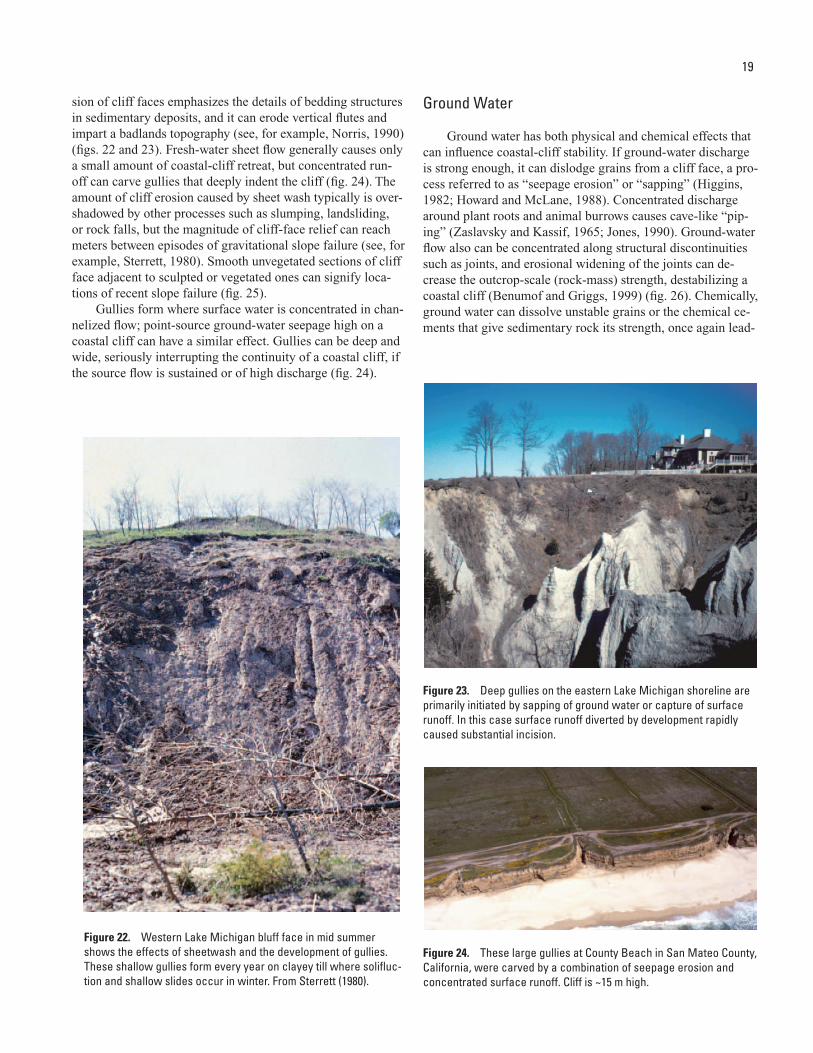
sion of cliff faces emphasizes the details of bedding structures in sedimentary deposits, and it can erode vertical flutes and impart a badlands topography (see, for example, Norris, 1990) (figs. 22 and 23). Fresh-water sheet flow generally causes only a small amount of coastal-cliff retreat, but concentrated run-off can carve gullies that deeply indent the cliff (fig. 24). The amount of cliff erosion caused by sheet wash typically is over-shadowed by other processes such as slumping, landsliding, or rock falls, but the magnitude of cliff-face relief can reach meters between episodes of gravitational slope failure (see, for example, Sterrett, 1980). Smooth unvegetated sections of cliff face adjacent to sculpted or vegetated ones can signify loca-tions of recent slope failure (fig. 25).
Gullies form where surface water is concentrated in chan-nelized flow; point-source ground-water seepage high on a coastal cliff can have a similar effect. Gullies can be deep and wide, seriously interrupting the continuity of a coastal cliff, if the source flow is sustained or of high discharge (fig. 24).
Ground Water
Ground water has both physical and chemical effects that can influence coastal-cliff stability. If ground-water discharge is strong enough, it can dislodge grains from a cliff face, a pro-cess referred to as “seepage erosion” or “sapping” (Higgins, 1982; Howard and McLane, 1988). Concentrated discharge around plant roots and animal burrows causes cave-like “pip-ing” (Zaslavsky and Kassif, 1965; Jones, 1990). Ground-water flow also can be concentrated along structural discontinuities such as joints, and erosional widening of the joints can de-crease the outcrop-scale (rock-mass) strength, destabilizing a coastal cliff (Benumof and Griggs, 1999) (fig. 26). Chemically, ground water can dissolve unstable grains or the chemical ce-ments that give sedimentary rock its strength, once again lead-
Figure 22. Western Lake Michigan bluff face in mid summer shows the effects of sheetwash and the development of gullies. These shallow gullies form every year on clayey till where solifluc-tion and shallow slides occur in winter. From Sterrett (1980).
Figure 23. Deep gullies on the eastern Lake Michigan shoreline are primarily initiated by sapping of ground water or capture of surface runoff. In this case surface runoff diverted by development rapidly caused substantial incision.
Figure 24. These large gullies at County Beach in San Mateo County, California, were carved by a combination of seepage erosion and concentrated surface runoff. Cliff is ~15 m high.
�
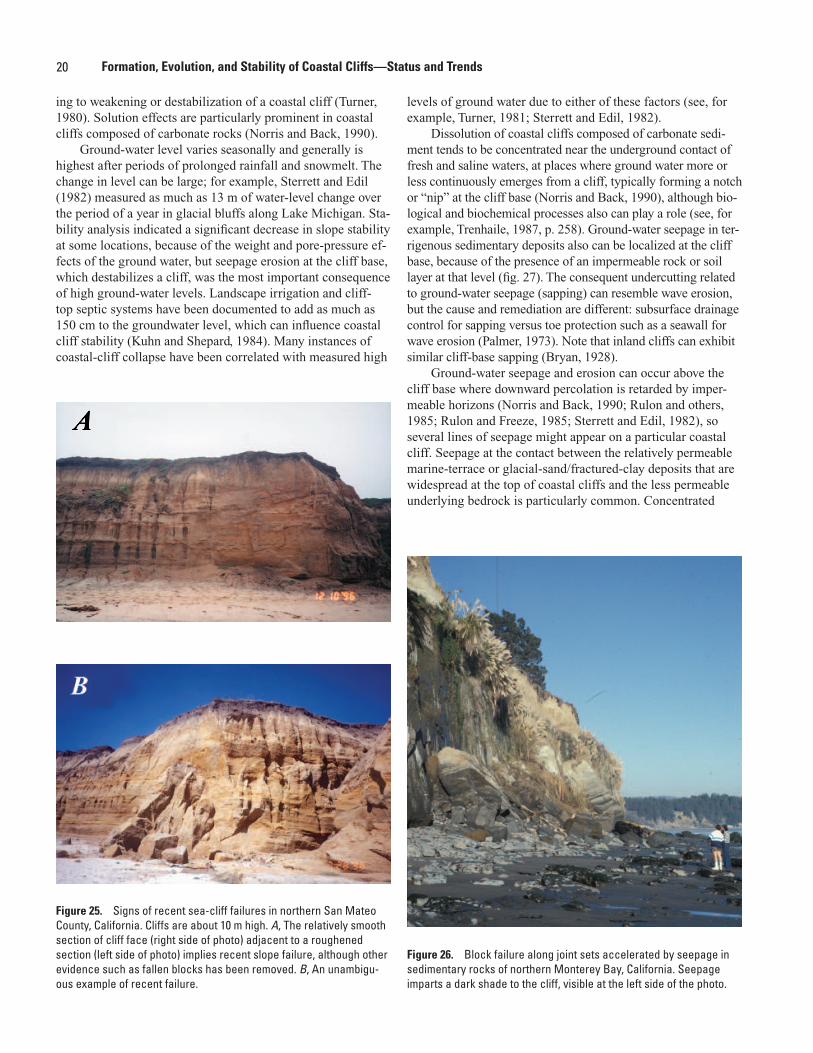
20 Formation, Evolution, and Stability of Coastal Cliffs—Status and Trends
ing to weakening or destabilization of a coastal cliff (Turner, 1980). Solution effects are particularly prominent in coastal cliffs composed of carbonate rocks (Norris and Back, 1990).
Ground-water level varies seasonally and generally is highest after periods of prolonged rainfall and snowmelt. The change in level can be large; for example, Sterrett and Edil (1982) measured as much as 13 m of water-level change over the period of a year in glacial bluffs along Lake Michigan. Sta-bility analysis indicated a significant decrease in slope stability at some locations, because of the weight and pore-pressure ef-fects of the ground water, but seepage erosion at the cliff base, which destabilizes a cliff, was the most important consequence of high ground-water levels. Landscape irrigation and cliff-top septic systems have been documented to add as much as 150 cm to the groundwater level, which can influence coastal cliff stability (Kuhn and Shepard, 1984). Many instances of coastal-cliff collapse have been correlated with measured high
levels of ground water due to either of these factors (see, for example, Turner, 1981; Sterrett and Edil, 1982).
Dissolution of coastal cliffs composed of carbonate sedi-ment tends to be concentrated near the underground contact of fresh and saline waters, at places where ground water more or less continuously emerges from a cliff, typically forming a notch or “nip” at the cliff base (Norris and Back, 1990), although bio-logical and biochemical processes also can play a role (see, for example, Trenhaile, 1987, p. 258). Ground-water seepage in ter-rigenous sedimentary deposits also can be localized at the cliff base, because of the presence of an impermeable rock or soil layer at that level (fig. 27). The consequent undercutting related to ground-water seepage (sapping) can resemble wave erosion, but the cause and remediation are different: subsurface drainage control for sapping versus toe protection such as a seawall for wave erosion (Palmer, 1973). Note that inland cliffs can exhibit similar cliff-base sapping (Bryan, 1928).
Ground-water seepage and erosion can occur above the cliff base where downward percolation is retarded by imper-meable horizons (Norris and Back, 1990; Rulon and others, 1985; Rulon and Freeze, 1985; Sterrett and Edil, 1982), so several lines of seepage might appear on a particular coastal cliff. Seepage at the contact between the relatively permeable marine-terrace or glacial-sand/fractured-clay deposits that are widespread at the top of coastal cliffs and the less permeable underlying bedrock is particularly common. Concentrated
Figure 25. Signs of recent sea-cliff failures in northern San Mateo County, California. Cliffs are about 10 m high. A, The relatively smooth section of cliff face (right side of photo) adjacent to a roughened section (left side of photo) implies recent slope failure, although other evidence such as fallen blocks has been removed. B, An unambigu-ous example of recent failure.
Figure 26. Block failure along joint sets accelerated by seepage in sedimentary rocks of northern Monterey Bay, California. Seepage imparts a dark shade to the cliff, visible at the left side of the photo.
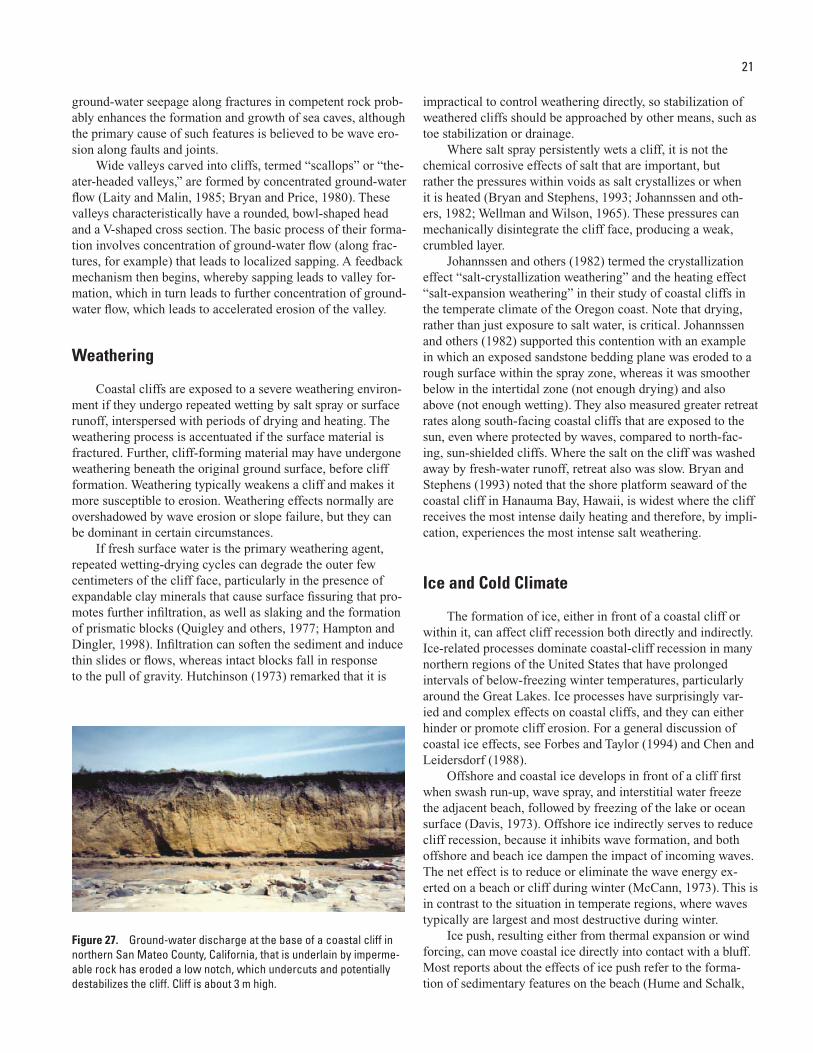
21
ground-water seepage along fractures in competent rock prob-ably enhances the formation and growth of sea caves, although the primary cause of such features is believed to be wave ero-sion along faults and joints.
Wide valleys carved into cliffs, termed “scallops” or “the-ater-headed valleys,” are formed by concentrated ground-water flow (Laity and Malin, 1985; Bryan and Price, 1980). These valleys characteristically have a rounded, bowl-shaped head and a V-shaped cross section. The basic process of their forma-tion involves concentration of ground-water flow (along frac-tures, for example) that leads to localized sapping. A feedback mechanism then begins, whereby sapping leads to valley for-mation, which in turn leads to further concentration of ground-water flow, which leads to accelerated erosion of the valley.
Weathering
Coastal cliffs are exposed to a severe weathering environ-ment if they undergo repeated wetting by salt spray or surface runoff, interspersed with periods of drying and heating. The weathering process is accentuated if the surface material is fractured. Further, cliff-forming material may have undergone weathering beneath the original ground surface, before cliff formation. Weathering typically weakens a cliff and makes it more susceptible to erosion. Weathering effects normally are overshadowed by wave erosion or slope failure, but they can be dominant in certain circumstances.
If fresh surface water is the primary weathering agent, repeated wetting-drying cycles can degrade the outer few centimeters of the cliff face, particularly in the presence of expandable clay minerals that cause surface fissuring that pro-motes further infiltration, as well as slaking and the formation of prismatic blocks (Quigley and others, 1977; Hampton and Dingler, 1998). Infiltration can soften the sediment and induce thin slides or flows, whereas intact blocks fall in response to the pull of gravity. Hutchinson (1973) remarked that it is
impractical to control weathering directly, so stabilization of weathered cliffs should be approached by other means, such as toe stabilization or drainage.
Where salt spray persistently wets a cliff, it is not the chemical corrosive effects of salt that are important, but rather the pressures within voids as salt crystallizes or when it is heated (Bryan and Stephens, 1993; Johannssen and oth-ers, 1982; Wellman and Wilson, 1965). These pressures can mechanically disintegrate the cliff face, producing a weak, crumbled layer.
Johannssen and others (1982) termed the crystallization effect “salt-crystallization weathering” and the heating effect “salt-expansion weathering” in their study of coastal cliffs in the temperate climate of the Oregon coast. Note that drying, rather than just exposure to salt water, is critical. Johannssen and others (1982) supported this contention with an example in which an exposed sandstone bedding plane was eroded to a rough surface within the spray zone, whereas it was smoother below in the intertidal zone (not enough drying) and also above (not enough wetting). They also measured greater retreat rates along south-facing coastal cliffs that are exposed to the sun, even where protected by waves, compared to north-fac-ing, sun-shielded cliffs. Where the salt on the cliff was washed away by fresh-water runoff, retreat also was slow. Bryan and Stephens (1993) noted that the shore platform seaward of the coastal cliff in Hanauma Bay, Hawaii, is widest where the cliff receives the most intense daily heating and therefore, by impli-cation, experiences the most intense salt weathering.
Ice and Cold Climate
The formation of ice, either in front of a coastal cliff or within it, can affect cliff recession both directly and indirectly. Ice-related processes dominate coastal-cliff recession in many northern regions of the United States that have prolonged intervals of below-freezing winter temperatures, particularly around the Great Lakes. Ice processes have surprisingly var-ied and complex effects on coastal cliffs, and they can either hinder or promote cliff erosion. For a general discussion of coastal ice effects, see Forbes and Taylor (1994) and Chen and Leidersdorf (1988).
Offshore and coastal ice develops in front of a cliff first when swash run-up, wave spray, and interstitial water freeze the adjacent beach, followed by freezing of the lake or ocean surface (Davis, 1973). Offshore ice indirectly serves to reduce cliff recession, because it inhibits wave formation, and both offshore and beach ice dampen the impact of incoming waves. The net effect is to reduce or eliminate the wave energy ex-erted on a beach or cliff during winter (McCann, 1973). This is in contrast to the situation in temperate regions, where waves typically are largest and most destructive during winter.
Ice push, resulting either from thermal expansion or wind forcing, can move coastal ice directly into contact with a bluff. Most reports about the effects of ice push refer to the forma-tion of sedimentary features on the beach (Hume and Schalk,
Figure 27. Ground-water discharge at the base of a coastal cliff in northern San Mateo County, California, that is underlain by imperme-able rock has eroded a low notch, which undercuts and potentially destabilizes the cliff. Cliff is about 3 m high.
�
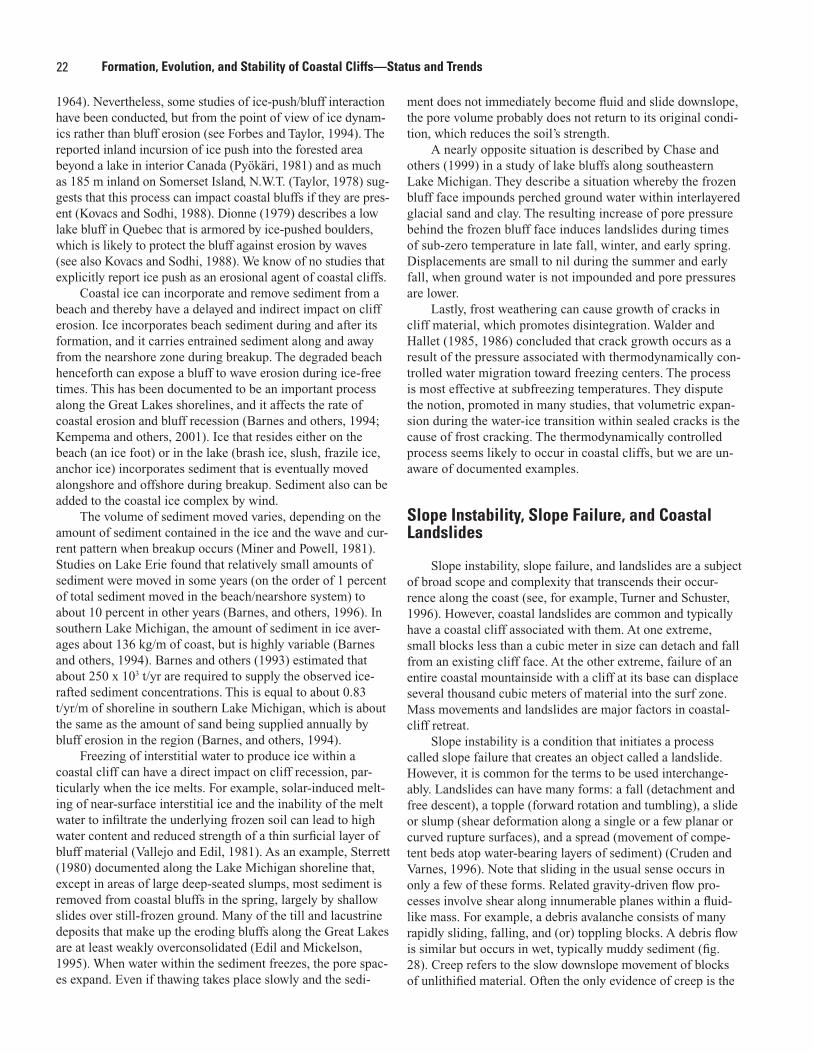
22 Formation, Evolution, and Stability of Coastal Cliffs—Status and Trends
1964). Nevertheless, some studies of ice-push/bluff interaction have been conducted, but from the point of view of ice dynam-ics rather than bluff erosion (see Forbes and Taylor, 1994). The reported inland incursion of ice push into the forested area beyond a lake in interior Canada (Pyökäri, 1981) and as much as 185 m inland on Somerset Island, N.W.T. (Taylor, 1978) sug-gests that this process can impact coastal bluffs if they are pres-ent (Kovacs and Sodhi, 1988). Dionne (1979) describes a low lake bluff in Quebec that is armored by ice-pushed boulders, which is likely to protect the bluff against erosion by waves (see also Kovacs and Sodhi, 1988). We know of no studies that explicitly report ice push as an erosional agent of coastal cliffs.
Coastal ice can incorporate and remove sediment from a beach and thereby have a delayed and indirect impact on cliff erosion. Ice incorporates beach sediment during and after its formation, and it carries entrained sediment along and away from the nearshore zone during breakup. The degraded beach henceforth can expose a bluff to wave erosion during ice-free times. This has been documented to be an important process along the Great Lakes shorelines, and it affects the rate of coastal erosion and bluff recession (Barnes and others, 1994; Kempema and others, 2001). Ice that resides either on the beach (an ice foot) or in the lake (brash ice, slush, frazile ice, anchor ice) incorporates sediment that is eventually moved alongshore and offshore during breakup. Sediment also can be added to the coastal ice complex by wind.
The volume of sediment moved varies, depending on the amount of sediment contained in the ice and the wave and cur-rent pattern when breakup occurs (Miner and Powell, 1981). Studies on Lake Erie found that relatively small amounts of sediment were moved in some years (on the order of 1 percent of total sediment moved in the beach/nearshore system) to about 10 percent in other years (Barnes, and others, 1996). In southern Lake Michigan, the amount of sediment in ice aver-ages about 136 kg/m of coast, but is highly variable (Barnes and others, 1994). Barnes and others (1993) estimated that about 250 x 103 t/yr are required to supply the observed ice-rafted sediment concentrations. This is equal to about 0.83 t/yr/m of shoreline in southern Lake Michigan, which is about the same as the amount of sand being supplied annually by bluff erosion in the region (Barnes, and others, 1994).
Freezing of interstitial water to produce ice within a coastal cliff can have a direct impact on cliff recession, par-ticularly when the ice melts. For example, solar-induced melt-ing of near-surface interstitial ice and the inability of the melt water to infiltrate the underlying frozen soil can lead to high water content and reduced strength of a thin surficial layer of bluff material (Vallejo and Edil, 1981). As an example, Sterrett (1980) documented along the Lake Michigan shoreline that, except in areas of large deep-seated slumps, most sediment is removed from coastal bluffs in the spring, largely by shallow slides over still-frozen ground. Many of the till and lacustrine deposits that make up the eroding bluffs along the Great Lakes are at least weakly overconsolidated (Edil and Mickelson, 1995). When water within the sediment freezes, the pore spac-es expand. Even if thawing takes place slowly and the sedi-
ment does not immediately become fluid and slide downslope, the pore volume probably does not return to its original condi-tion, which reduces the soil’s strength.
A nearly opposite situation is described by Chase and others (1999) in a study of lake bluffs along southeastern Lake Michigan. They describe a situation whereby the frozen bluff face impounds perched ground water within interlayered glacial sand and clay. The resulting increase of pore pressure behind the frozen bluff face induces landslides during times of sub-zero temperature in late fall, winter, and early spring. Displacements are small to nil during the summer and early fall, when ground water is not impounded and pore pressures are lower.
Lastly, frost weathering can cause growth of cracks in cliff material, which promotes disintegration. Walder and Hallet (1985, 1986) concluded that crack growth occurs as a result of the pressure associated with thermodynamically con-trolled water migration toward freezing centers. The process is most effective at subfreezing temperatures. They dispute the notion, promoted in many studies, that volumetric expan-sion during the water-ice transition within sealed cracks is the cause of frost cracking. The thermodynamically controlled process seems likely to occur in coastal cliffs, but we are un-aware of documented examples.
Slope Instability, Slope Failure, and Coastal Landslides
Slope instability, slope failure, and landslides are a subject of broad scope and complexity that transcends their occur-rence along the coast (see, for example, Turner and Schuster, 1996). However, coastal landslides are common and typically have a coastal cliff associated with them. At one extreme, small blocks less than a cubic meter in size can detach and fall from an existing cliff face. At the other extreme, failure of an entire coastal mountainside with a cliff at its base can displace several thousand cubic meters of material into the surf zone. Mass movements and landslides are major factors in coastal-cliff retreat.
Slope instability is a condition that initiates a process called slope failure that creates an object called a landslide. However, it is common for the terms to be used interchange-ably. Landslides can have many forms: a fall (detachment and free descent), a topple (forward rotation and tumbling), a slide or slump (shear deformation along a single or a few planar or curved rupture surfaces), and a spread (movement of compe-tent beds atop water-bearing layers of sediment) (Cruden and Varnes, 1996). Note that sliding in the usual sense occurs in only a few of these forms. Related gravity-driven flow pro-cesses involve shear along innumerable planes within a fluid-like mass. For example, a debris avalanche consists of many rapidly sliding, falling, and (or) toppling blocks. A debris flow is similar but occurs in wet, typically muddy sediment (fig. 28). Creep refers to the slow downslope movement of blocks of unlithified material. Often the only evidence of creep is the
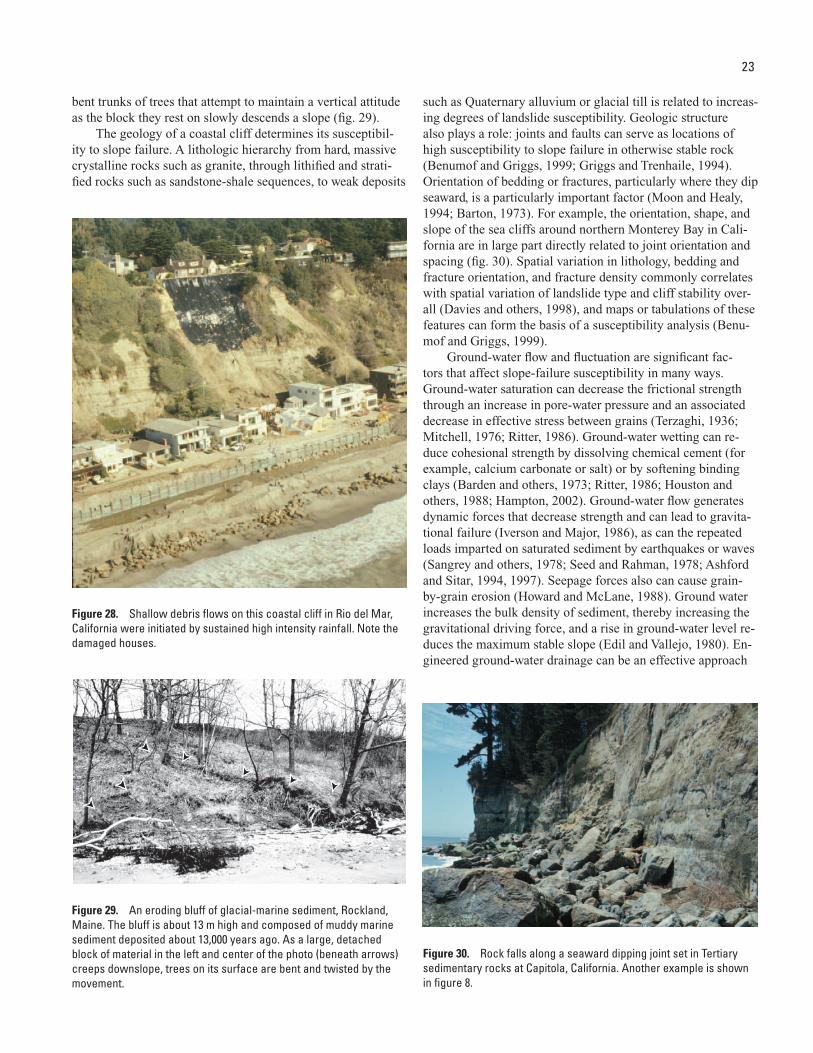
23
bent trunks of trees that attempt to maintain a vertical attitude as the block they rest on slowly descends a slope (fig. 29).
The geology of a coastal cliff determines its susceptibil-ity to slope failure. A lithologic hierarchy from hard, massive crystalline rocks such as granite, through lithified and strati-fied rocks such as sandstone-shale sequences, to weak deposits
such as Quaternary alluvium or glacial till is related to increas-ing degrees of landslide susceptibility. Geologic structure also plays a role: joints and faults can serve as locations of high susceptibility to slope failure in otherwise stable rock (Benumof and Griggs, 1999; Griggs and Trenhaile, 1994). Orientation of bedding or fractures, particularly where they dip seaward, is a particularly important factor (Moon and Healy, 1994; Barton, 1973). For example, the orientation, shape, and slope of the sea cliffs around northern Monterey Bay in Cali-fornia are in large part directly related to joint orientation and spacing (fig. 30). Spatial variation in lithology, bedding and fracture orientation, and fracture density commonly correlates with spatial variation of landslide type and cliff stability over-all (Davies and others, 1998), and maps or tabulations of these features can form the basis of a susceptibility analysis (Benu-mof and Griggs, 1999).
Ground-water flow and fluctuation are significant fac-tors that affect slope-failure susceptibility in many ways. Ground-water saturation can decrease the frictional strength through an increase in pore-water pressure and an associated decrease in effective stress between grains (Terzaghi, 1936; Mitchell, 1976; Ritter, 1986). Ground-water wetting can re-duce cohesional strength by dissolving chemical cement (for example, calcium carbonate or salt) or by softening binding clays (Barden and others, 1973; Ritter, 1986; Houston and others, 1988; Hampton, 2002). Ground-water flow generates dynamic forces that decrease strength and can lead to gravita-tional failure (Iverson and Major, 1986), as can the repeated loads imparted on saturated sediment by earthquakes or waves (Sangrey and others, 1978; Seed and Rahman, 1978; Ashford and Sitar, 1994, 1997). Seepage forces also can cause grain-by-grain erosion (Howard and McLane, 1988). Ground water increases the bulk density of sediment, thereby increasing the gravitational driving force, and a rise in ground-water level re-duces the maximum stable slope (Edil and Vallejo, 1980). En-gineered ground-water drainage can be an effective approach
Figure 28. Shallow debris flows on this coastal cliff in Rio del Mar, California were initiated by sustained high intensity rainfall. Note the damaged houses.
Figure 29. An eroding bluff of glacial-marine sediment, Rockland, Maine. The bluff is about 13 m high and composed of muddy marine sediment deposited about 13,000 years ago. As a large, detached block of material in the left and center of the photo (beneath arrows) creeps downslope, trees on its surface are bent and twisted by the movement.
Figure 30. Rock falls along a seaward dipping joint set in Tertiary sedimentary rocks at Capitola, California. Another example is shown in figure 8.
�
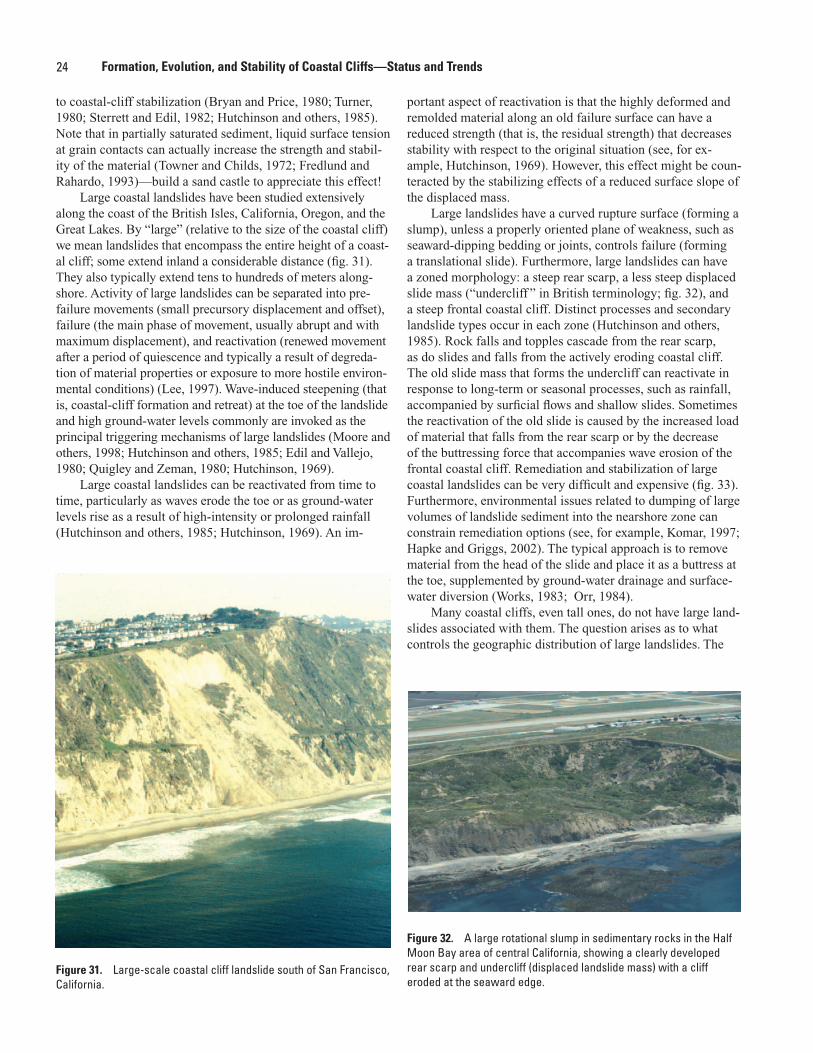
24 Formation, Evolution, and Stability of Coastal Cliffs—Status and Trends
to coastal-cliff stabilization (Bryan and Price, 1980; Turner, 1980; Sterrett and Edil, 1982; Hutchinson and others, 1985). Note that in partially saturated sediment, liquid surface tension at grain contacts can actually increase the strength and stabil-ity of the material (Towner and Childs, 1972; Fredlund and Rahardo, 1993)—build a sand castle to appreciate this effect!
Large coastal landslides have been studied extensively along the coast of the British Isles, California, Oregon, and the Great Lakes. By “large” (relative to the size of the coastal cliff) we mean landslides that encompass the entire height of a coast-al cliff; some extend inland a considerable distance (fig. 31). They also typically extend tens to hundreds of meters along-shore. Activity of large landslides can be separated into pre-failure movements (small precursory displacement and offset), failure (the main phase of movement, usually abrupt and with maximum displacement), and reactivation (renewed movement after a period of quiescence and typically a result of degreda-tion of material properties or exposure to more hostile environ-mental conditions) (Lee, 1997). Wave-induced steepening (that is, coastal-cliff formation and retreat) at the toe of the landslide and high ground-water levels commonly are invoked as the principal triggering mechanisms of large landslides (Moore and others, 1998; Hutchinson and others, 1985; Edil and Vallejo, 1980; Quigley and Zeman, 1980; Hutchinson, 1969).
Large coastal landslides can be reactivated from time to time, particularly as waves erode the toe or as ground-water levels rise as a result of high-intensity or prolonged rainfall (Hutchinson and others, 1985; Hutchinson, 1969). An im-
portant aspect of reactivation is that the highly deformed and remolded material along an old failure surface can have a reduced strength (that is, the residual strength) that decreases stability with respect to the original situation (see, for ex-ample, Hutchinson, 1969). However, this effect might be coun-teracted by the stabilizing effects of a reduced surface slope of the displaced mass.
Large landslides have a curved rupture surface (forming a slump), unless a properly oriented plane of weakness, such as seaward-dipping bedding or joints, controls failure (forming a translational slide). Furthermore, large landslides can have a zoned morphology: a steep rear scarp, a less steep displaced slide mass (“undercliff ” in British terminology; fig. 32), and a steep frontal coastal cliff. Distinct processes and secondary landslide types occur in each zone (Hutchinson and others, 1985). Rock falls and topples cascade from the rear scarp, as do slides and falls from the actively eroding coastal cliff. The old slide mass that forms the undercliff can reactivate in response to long-term or seasonal processes, such as rainfall, accompanied by surficial flows and shallow slides. Sometimes the reactivation of the old slide is caused by the increased load of material that falls from the rear scarp or by the decrease of the buttressing force that accompanies wave erosion of the frontal coastal cliff. Remediation and stabilization of large coastal landslides can be very difficult and expensive (fig. 33). Furthermore, environmental issues related to dumping of large volumes of landslide sediment into the nearshore zone can constrain remediation options (see, for example, Komar, 1997; Hapke and Griggs, 2002). The typical approach is to remove material from the head of the slide and place it as a buttress at the toe, supplemented by ground-water drainage and surface-water diversion (Works, 1983; Orr, 1984).
Many coastal cliffs, even tall ones, do not have large land-slides associated with them. The question arises as to what controls the geographic distribution of large landslides. The
Figure 31. Large-scale coastal cliff landslide south of San Francisco, California.
Figure 32. A large rotational slump in sedimentary rocks in the Half Moon Bay area of central California, showing a clearly developed rear scarp and undercliff (displaced landslide mass) with a cliff eroded at the seaward edge.
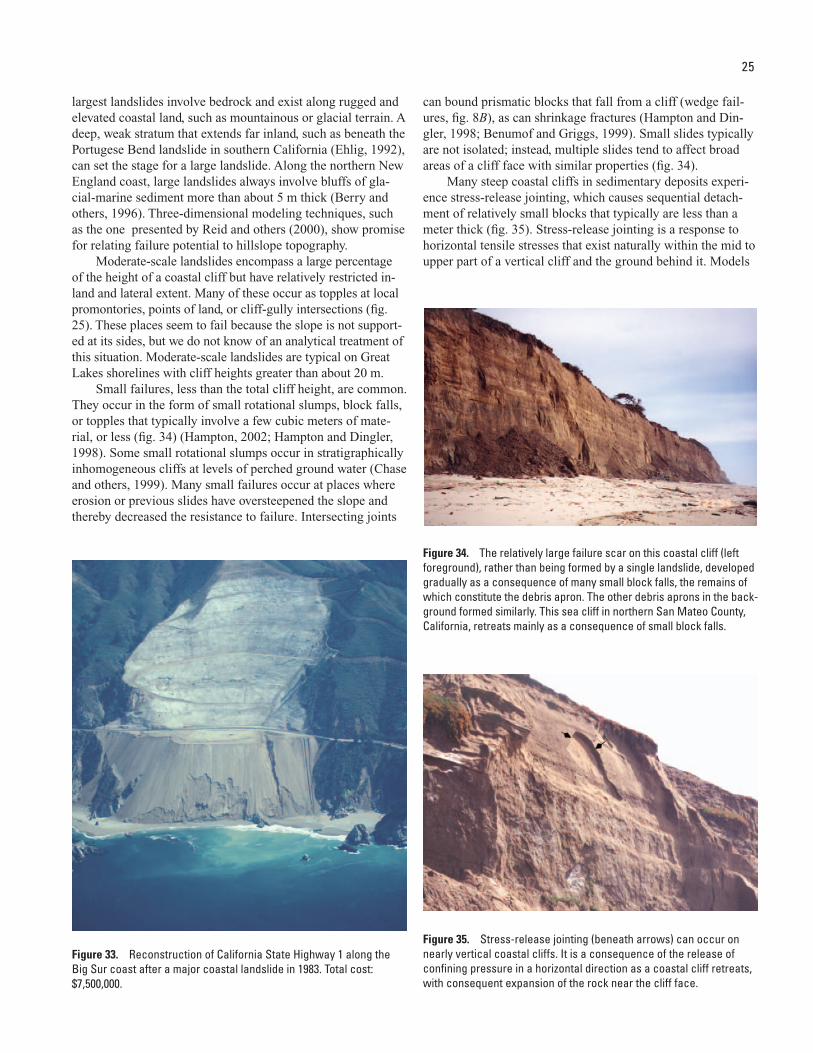
25
largest landslides involve bedrock and exist along rugged and elevated coastal land, such as mountainous or glacial terrain. A deep, weak stratum that extends far inland, such as beneath the Portugese Bend landslide in southern California (Ehlig, 1992), can set the stage for a large landslide. Along the northern New England coast, large landslides always involve bluffs of gla-cial-marine sediment more than about 5 m thick (Berry and others, 1996). Three-dimensional modeling techniques, such as the one presented by Reid and others (2000), show promise for relating failure potential to hillslope topography.
Moderate-scale landslides encompass a large percentage of the height of a coastal cliff but have relatively restricted in-land and lateral extent. Many of these occur as topples at local promontories, points of land, or cliff-gully intersections (fig. 25). These places seem to fail because the slope is not support-ed at its sides, but we do not know of an analytical treatment of this situation. Moderate-scale landslides are typical on Great Lakes shorelines with cliff heights greater than about 20 m.
Small failures, less than the total cliff height, are common. They occur in the form of small rotational slumps, block falls, or topples that typically involve a few cubic meters of mate-rial, or less (fig. 34) (Hampton, 2002; Hampton and Dingler, 1998). Some small rotational slumps occur in stratigraphically inhomogeneous cliffs at levels of perched ground water (Chase and others, 1999). Many small failures occur at places where erosion or previous slides have oversteepened the slope and thereby decreased the resistance to failure. Intersecting joints
can bound prismatic blocks that fall from a cliff (wedge fail-ures, fig. 8B), as can shrinkage fractures (Hampton and Din-gler, 1998; Benumof and Griggs, 1999). Small slides typically are not isolated; instead, multiple slides tend to affect broad areas of a cliff face with similar properties (fig. 34).
Many steep coastal cliffs in sedimentary deposits experi-ence stress-release jointing, which causes sequential detach-ment of relatively small blocks that typically are less than a meter thick (fig. 35). Stress-release jointing is a response to horizontal tensile stresses that exist naturally within the mid to upper part of a vertical cliff and the ground behind it. Models
Figure 33. Reconstruction of California State Highway 1 along the Big Sur coast after a major coastal landslide in 1983. Total cost: $7,500,000.
Figure 34. The relatively large failure scar on this coastal cliff (left foreground), rather than being formed by a single landslide, developed gradually as a consequence of many small block falls, the remains of which constitute the debris apron. The other debris aprons in the back-ground formed similarly. This sea cliff in northern San Mateo County, California, retreats mainly as a consequence of small block falls.
Figure 35. Stress-release jointing (beneath arrows) can occur on nearly vertical coastal cliffs. It is a consequence of the release of confining pressure in a horizontal direction as a coastal cliff retreats, with consequent expansion of the rock near the cliff face.
�
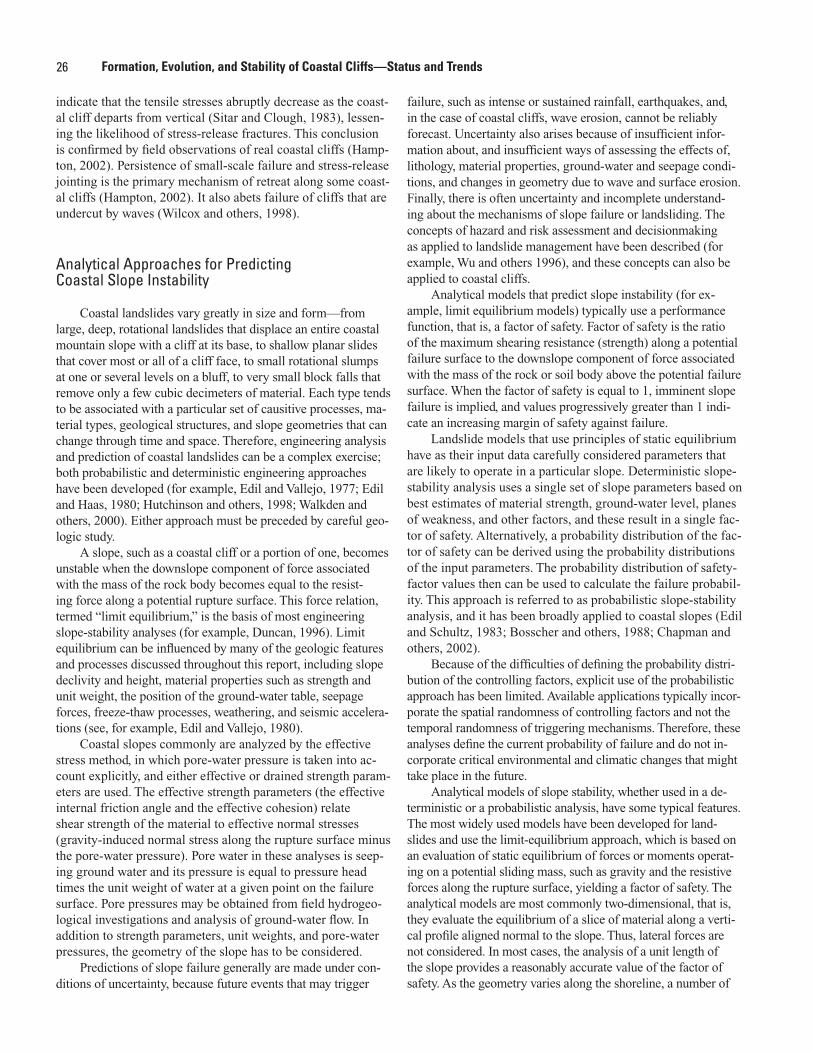
26 Formation, Evolution, and Stability of Coastal Cliffs—Status and Trends
indicate that the tensile stresses abruptly decrease as the coast-al cliff departs from vertical (Sitar and Clough, 1983), lessen-ing the likelihood of stress-release fractures. This conclusion is confirmed by field observations of real coastal cliffs (Hamp-ton, 2002). Persistence of small-scale failure and stress-release jointing is the primary mechanism of retreat along some coast-al cliffs (Hampton, 2002). It also abets failure of cliffs that are undercut by waves (Wilcox and others, 1998).
Analytical Approaches for Predicting Coastal Slope Instability
Coastal landslides vary greatly in size and form—from large, deep, rotational landslides that displace an entire coastal mountain slope with a cliff at its base, to shallow planar slides that cover most or all of a cliff face, to small rotational slumps at one or several levels on a bluff, to very small block falls that remove only a few cubic decimeters of material. Each type tends to be associated with a particular set of causitive processes, ma-terial types, geological structures, and slope geometries that can change through time and space. Therefore, engineering analysis and prediction of coastal landslides can be a complex exercise; both probabilistic and deterministic engineering approaches have been developed (for example, Edil and Vallejo, 1977; Edil and Haas, 1980; Hutchinson and others, 1998; Walkden and others, 2000). Either approach must be preceded by careful geo-logic study.
A slope, such as a coastal cliff or a portion of one, becomes unstable when the downslope component of force associated with the mass of the rock body becomes equal to the resist-ing force along a potential rupture surface. This force relation, termed “limit equilibrium,” is the basis of most engineering slope-stability analyses (for example, Duncan, 1996). Limit equilibrium can be influenced by many of the geologic features and processes discussed throughout this report, including slope declivity and height, material properties such as strength and unit weight, the position of the ground-water table, seepage forces, freeze-thaw processes, weathering, and seismic accelera-tions (see, for example, Edil and Vallejo, 1980).
Coastal slopes commonly are analyzed by the effective stress method, in which pore-water pressure is taken into ac-count explicitly, and either effective or drained strength param-eters are used. The effective strength parameters (the effective internal friction angle and the effective cohesion) relate shear strength of the material to effective normal stresses (gravity-induced normal stress along the rupture surface minus the pore-water pressure). Pore water in these analyses is seep-ing ground water and its pressure is equal to pressure head times the unit weight of water at a given point on the failure surface. Pore pressures may be obtained from field hydrogeo-logical investigations and analysis of ground-water flow. In addition to strength parameters, unit weights, and pore-water pressures, the geometry of the slope has to be considered.
Predictions of slope failure generally are made under con-ditions of uncertainty, because future events that may trigger
failure, such as intense or sustained rainfall, earthquakes, and, in the case of coastal cliffs, wave erosion, cannot be reliably forecast. Uncertainty also arises because of insufficient infor-mation about, and insufficient ways of assessing the effects of, lithology, material properties, ground-water and seepage condi-tions, and changes in geometry due to wave and surface erosion. Finally, there is often uncertainty and incomplete understand-ing about the mechanisms of slope failure or landsliding. The concepts of hazard and risk assessment and decisionmaking as applied to landslide management have been described (for example, Wu and others 1996), and these concepts can also be applied to coastal cliffs.
Analytical models that predict slope instability (for ex-ample, limit equilibrium models) typically use a performance function, that is, a factor of safety. Factor of safety is the ratio of the maximum shearing resistance (strength) along a potential failure surface to the downslope component of force associated with the mass of the rock or soil body above the potential failure surface. When the factor of safety is equal to 1, imminent slope failure is implied, and values progressively greater than 1 indi-cate an increasing margin of safety against failure.
Landslide models that use principles of static equilibrium have as their input data carefully considered parameters that are likely to operate in a particular slope. Deterministic slope-stability analysis uses a single set of slope parameters based on best estimates of material strength, ground-water level, planes of weakness, and other factors, and these result in a single fac-tor of safety. Alternatively, a probability distribution of the fac-tor of safety can be derived using the probability distributions of the input parameters. The probability distribution of safety-factor values then can be used to calculate the failure probabil-ity. This approach is referred to as probabilistic slope-stability analysis, and it has been broadly applied to coastal slopes (Edil and Schultz, 1983; Bosscher and others, 1988; Chapman and others, 2002).
Because of the difficulties of defining the probability distri-bution of the controlling factors, explicit use of the probabilistic approach has been limited. Available applications typically incor-porate the spatial randomness of controlling factors and not the temporal randomness of triggering mechanisms. Therefore, these analyses define the current probability of failure and do not in-corporate critical environmental and climatic changes that might take place in the future.
Analytical models of slope stability, whether used in a de-terministic or a probabilistic analysis, have some typical features. The most widely used models have been developed for land-slides and use the limit-equilibrium approach, which is based on an evaluation of static equilibrium of forces or moments operat-ing on a potential sliding mass, such as gravity and the resistive forces along the rupture surface, yielding a factor of safety. The analytical models are most commonly two-dimensional, that is, they evaluate the equilibrium of a slice of material along a verti-cal profile aligned normal to the slope. Thus, lateral forces are not considered. In most cases, the analysis of a unit length of the slope provides a reasonably accurate value of the factor of safety. As the geometry varies along the shoreline, a number of
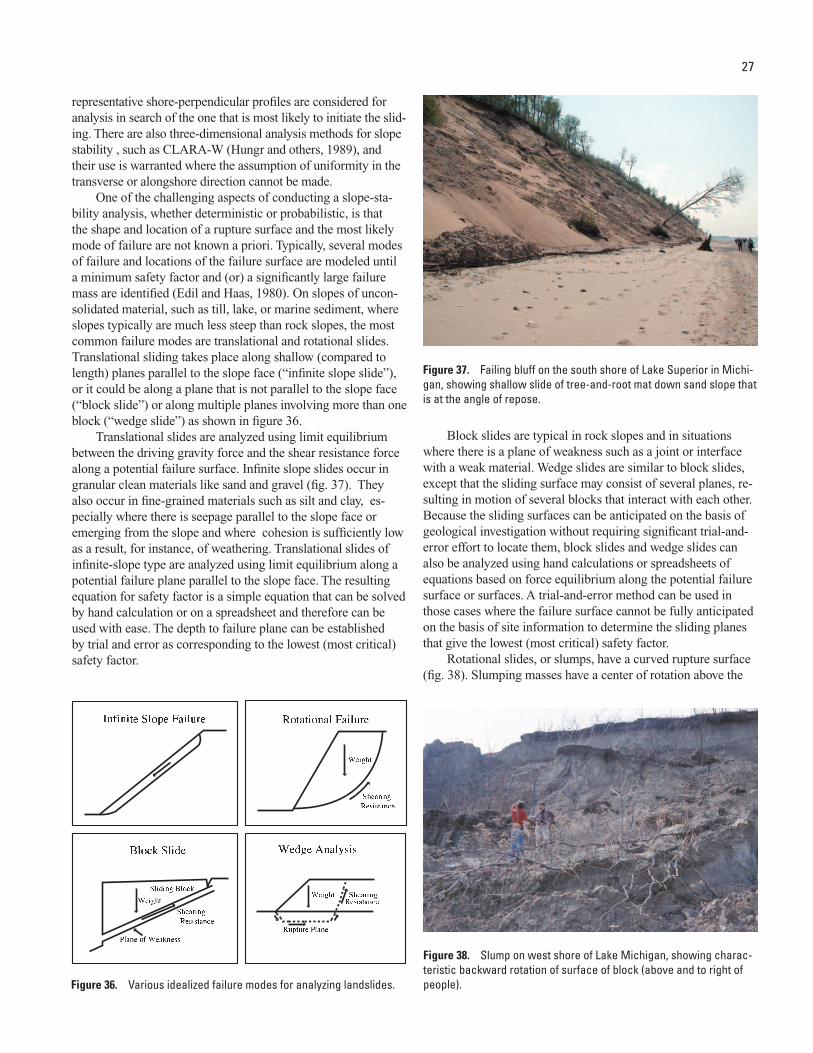
27
representative shore-perpendicular profiles are considered for analysis in search of the one that is most likely to initiate the slid-ing. There are also three-dimensional analysis methods for slope stability , such as CLARA-W (Hungr and others, 1989), and their use is warranted where the assumption of uniformity in the transverse or alongshore direction cannot be made.
One of the challenging aspects of conducting a slope-sta-bility analysis, whether deterministic or probabilistic, is that the shape and location of a rupture surface and the most likely mode of failure are not known a priori. Typically, several modes of failure and locations of the failure surface are modeled until a minimum safety factor and (or) a significantly large failure mass are identified (Edil and Haas, 1980). On slopes of uncon-solidated material, such as till, lake, or marine sediment, where slopes typically are much less steep than rock slopes, the most common failure modes are translational and rotational slides. Translational sliding takes place along shallow (compared to length) planes parallel to the slope face (“infinite slope slide”), or it could be along a plane that is not parallel to the slope face (“block slide”) or along multiple planes involving more than one block (“wedge slide”) as shown in figure 36.
Translational slides are analyzed using limit equilibrium between the driving gravity force and the shear resistance force along a potential failure surface. Infinite slope slides occur in granular clean materials like sand and gravel (fig. 37). They also occur in fine-grained materials such as silt and clay, es-pecially where there is seepage parallel to the slope face or emerging from the slope and where cohesion is sufficiently low as a result, for instance, of weathering. Translational slides of infinite-slope type are analyzed using limit equilibrium along a potential failure plane parallel to the slope face. The resulting equation for safety factor is a simple equation that can be solved by hand calculation or on a spreadsheet and therefore can be used with ease. The depth to failure plane can be established by trial and error as corresponding to the lowest (most critical) safety factor.
Figure 36. Various idealized failure modes for analyzing landslides.
Figure 37. Failing bluff on the south shore of Lake Superior in Michi-gan, showing shallow slide of tree-and-root mat down sand slope that is at the angle of repose.
Block slides are typical in rock slopes and in situations where there is a plane of weakness such as a joint or interface with a weak material. Wedge slides are similar to block slides, except that the sliding surface may consist of several planes, re-sulting in motion of several blocks that interact with each other. Because the sliding surfaces can be anticipated on the basis of geological investigation without requiring significant trial-and-error effort to locate them, block slides and wedge slides can also be analyzed using hand calculations or spreadsheets of equations based on force equilibrium along the potential failure surface or surfaces. A trial-and-error method can be used in those cases where the failure surface cannot be fully anticipated on the basis of site information to determine the sliding planes that give the lowest (most critical) safety factor.
Rotational slides, or slumps, have a curved rupture surface (fig. 38). Slumping masses have a center of rotation above the
Figure 38. Slump on west shore of Lake Michigan, showing charac-teristic backward rotation of surface of block (above and to right of people).
�
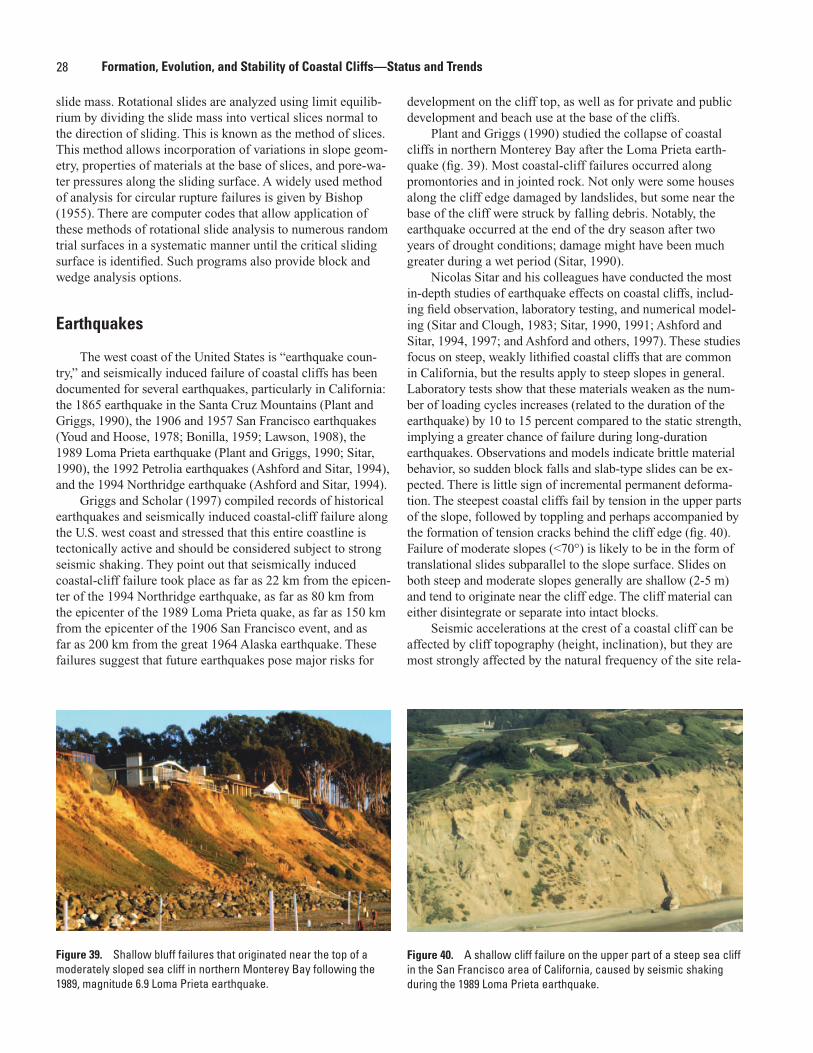
28 Formation, Evolution, and Stability of Coastal Cliffs—Status and Trends
slide mass. Rotational slides are analyzed using limit equilib-rium by dividing the slide mass into vertical slices normal to the direction of sliding. This is known as the method of slices. This method allows incorporation of variations in slope geom-etry, properties of materials at the base of slices, and pore-wa-ter pressures along the sliding surface. A widely used method of analysis for circular rupture failures is given by Bishop (1955). There are computer codes that allow application of these methods of rotational slide analysis to numerous random trial surfaces in a systematic manner until the critical sliding surface is identified. Such programs also provide block and wedge analysis options.
Earthquakes
The west coast of the United States is “earthquake coun-try,” and seismically induced failure of coastal cliffs has been documented for several earthquakes, particularly in California: the 1865 earthquake in the Santa Cruz Mountains (Plant and Griggs, 1990), the 1906 and 1957 San Francisco earthquakes (Youd and Hoose, 1978; Bonilla, 1959; Lawson, 1908), the 1989 Loma Prieta earthquake (Plant and Griggs, 1990; Sitar, 1990), the 1992 Petrolia earthquakes (Ashford and Sitar, 1994), and the 1994 Northridge earthquake (Ashford and Sitar, 1994).
Griggs and Scholar (1997) compiled records of historical earthquakes and seismically induced coastal-cliff failure along the U.S. west coast and stressed that this entire coastline is tectonically active and should be considered subject to strong seismic shaking. They point out that seismically induced coastal-cliff failure took place as far as 22 km from the epicen-ter of the 1994 Northridge earthquake, as far as 80 km from the epicenter of the 1989 Loma Prieta quake, as far as 150 km from the epicenter of the 1906 San Francisco event, and as far as 200 km from the great 1964 Alaska earthquake. These failures suggest that future earthquakes pose major risks for
development on the cliff top, as well as for private and public development and beach use at the base of the cliffs.
Plant and Griggs (1990) studied the collapse of coastal cliffs in northern Monterey Bay after the Loma Prieta earth-quake (fig. 39). Most coastal-cliff failures occurred along promontories and in jointed rock. Not only were some houses along the cliff edge damaged by landslides, but some near the base of the cliff were struck by falling debris. Notably, the earthquake occurred at the end of the dry season after two years of drought conditions; damage might have been much greater during a wet period (Sitar, 1990).
Nicolas Sitar and his colleagues have conducted the most in-depth studies of earthquake effects on coastal cliffs, includ-ing field observation, laboratory testing, and numerical model-ing (Sitar and Clough, 1983; Sitar, 1990, 1991; Ashford and Sitar, 1994, 1997; and Ashford and others, 1997). These studies focus on steep, weakly lithified coastal cliffs that are common in California, but the results apply to steep slopes in general. Laboratory tests show that these materials weaken as the num-ber of loading cycles increases (related to the duration of the earthquake) by 10 to 15 percent compared to the static strength, implying a greater chance of failure during long-duration earthquakes. Observations and models indicate brittle material behavior, so sudden block falls and slab-type slides can be ex-pected. There is little sign of incremental permanent deforma-tion. The steepest coastal cliffs fail by tension in the upper parts of the slope, followed by toppling and perhaps accompanied by the formation of tension cracks behind the cliff edge (fig. 40). Failure of moderate slopes (<70°) is likely to be in the form of translational slides subparallel to the slope surface. Slides on both steep and moderate slopes generally are shallow (2-5 m) and tend to originate near the cliff edge. The cliff material can either disintegrate or separate into intact blocks.
Seismic accelerations at the crest of a coastal cliff can be affected by cliff topography (height, inclination), but they are most strongly affected by the natural frequency of the site rela-
Figure 39. Shallow bluff failures that originated near the top of a moderately sloped sea cliff in northern Monterey Bay following the 1989, magnitude 6.9 Loma Prieta earthquake.
Figure 40. A shallow cliff failure on the upper part of a steep sea cliff in the San Francisco area of California, caused by seismic shaking during the 1989 Loma Prieta earthquake.
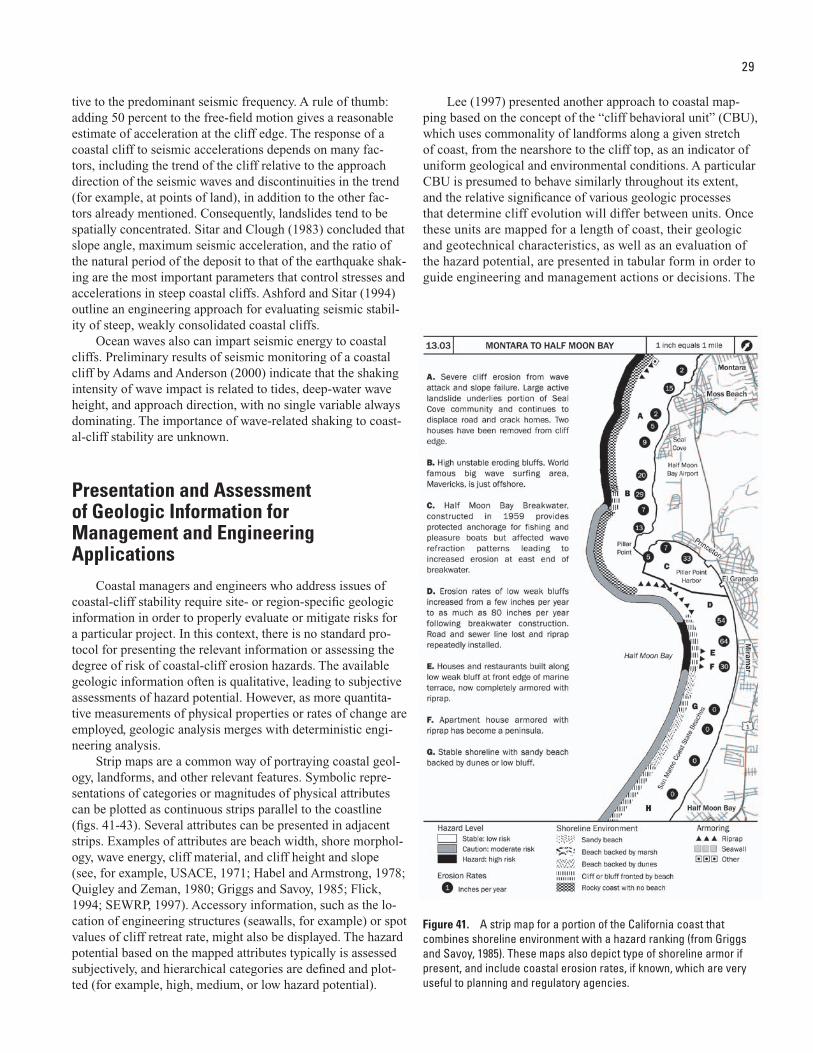
29
tive to the predominant seismic frequency. A rule of thumb: adding 50 percent to the free-field motion gives a reasonable estimate of acceleration at the cliff edge. The response of a coastal cliff to seismic accelerations depends on many fac-tors, including the trend of the cliff relative to the approach direction of the seismic waves and discontinuities in the trend (for example, at points of land), in addition to the other fac-tors already mentioned. Consequently, landslides tend to be spatially concentrated. Sitar and Clough (1983) concluded that slope angle, maximum seismic acceleration, and the ratio of the natural period of the deposit to that of the earthquake shak-ing are the most important parameters that control stresses and accelerations in steep coastal cliffs. Ashford and Sitar (1994) outline an engineering approach for evaluating seismic stabil-ity of steep, weakly consolidated coastal cliffs.
Ocean waves also can impart seismic energy to coastal cliffs. Preliminary results of seismic monitoring of a coastal cliff by Adams and Anderson (2000) indicate that the shaking intensity of wave impact is related to tides, deep-water wave height, and approach direction, with no single variable always dominating. The importance of wave-related shaking to coast-al-cliff stability are unknown.
Presentation and Assessment of Geologic Information for Management and Engineering Applications
Coastal managers and engineers who address issues of coastal-cliff stability require site- or region-specific geologic information in order to properly evaluate or mitigate risks for a particular project. In this context, there is no standard pro-tocol for presenting the relevant information or assessing the degree of risk of coastal-cliff erosion hazards. The available geologic information often is qualitative, leading to subjective assessments of hazard potential. However, as more quantita-tive measurements of physical properties or rates of change are employed, geologic analysis merges with deterministic engi-neering analysis.
Strip maps are a common way of portraying coastal geol-ogy, landforms, and other relevant features. Symbolic repre-sentations of categories or magnitudes of physical attributes can be plotted as continuous strips parallel to the coastline (figs. 41-43). Several attributes can be presented in adjacent strips. Examples of attributes are beach width, shore morphol-ogy, wave energy, cliff material, and cliff height and slope (see, for example, USACE, 1971; Habel and Armstrong, 1978; Quigley and Zeman, 1980; Griggs and Savoy, 1985; Flick, 1994; SEWRP, 1997). Accessory information, such as the lo-cation of engineering structures (seawalls, for example) or spot values of cliff retreat rate, might also be displayed. The hazard potential based on the mapped attributes typically is assessed subjectively, and hierarchical categories are defined and plot-ted (for example, high, medium, or low hazard potential).
Lee (1997) presented another approach to coastal map-ping based on the concept of the “cliff behavioral unit” (CBU), which uses commonality of landforms along a given stretch of coast, from the nearshore to the cliff top, as an indicator of uniform geological and environmental conditions. A particular CBU is presumed to behave similarly throughout its extent, and the relative significance of various geologic processes that determine cliff evolution will differ between units. Once these units are mapped for a length of coast, their geologic and geotechnical characteristics, as well as an evaluation of the hazard potential, are presented in tabular form in order to guide engineering and management actions or decisions. The
Figure 41. A strip map for a portion of the California coast that combines shoreline environment with a hazard ranking (from Griggs and Savoy, 1985). These maps also depict type of shoreline armor if present, and include coastal erosion rates, if known, which are very useful to planning and regulatory agencies.
�
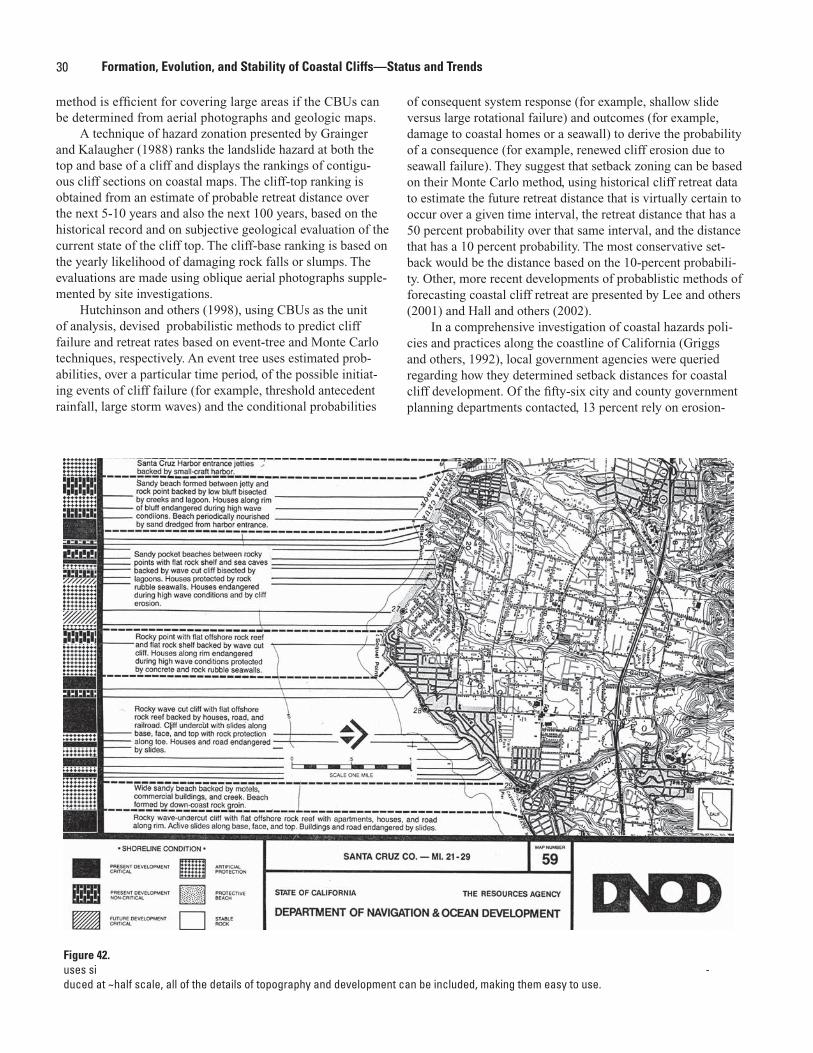
30 Formation, Evolution, and Stability of Coastal Cliffs—Status and Trends
method is efficient for covering large areas if the CBUs can be determined from aerial photographs and geologic maps.
A technique of hazard zonation presented by Grainger and Kalaugher (1988) ranks the landslide hazard at both the top and base of a cliff and displays the rankings of contigu-ous cliff sections on coastal maps. The cliff-top ranking is obtained from an estimate of probable retreat distance over the next 5-10 years and also the next 100 years, based on the historical record and on subjective geological evaluation of the current state of the cliff top. The cliff-base ranking is based on the yearly likelihood of damaging rock falls or slumps. The evaluations are made using oblique aerial photographs supple-mented by site investigations.
Hutchinson and others (1998), using CBUs as the unit of analysis, devised probabilistic methods to predict cliff failure and retreat rates based on event-tree and Monte Carlo techniques, respectively. An event tree uses estimated prob-abilities, over a particular time period, of the possible initiat-ing events of cliff failure (for example, threshold antecedent rainfall, large storm waves) and the conditional probabilities
of consequent system response (for example, shallow slide versus large rotational failure) and outcomes (for example, damage to coastal homes or a seawall) to derive the probability of a consequence (for example, renewed cliff erosion due to seawall failure). They suggest that setback zoning can be based on their Monte Carlo method, using historical cliff retreat data to estimate the future retreat distance that is virtually certain to occur over a given time interval, the retreat distance that has a 50 percent probability over that same interval, and the distance that has a 10 percent probability. The most conservative set-back would be the distance based on the 10-percent probabili-ty. Other, more recent developments of probablistic methods of forecasting coastal cliff retreat are presented by Lee and others (2001) and Hall and others (2002).
In a comprehensive investigation of coastal hazards poli-cies and practices along the coastline of California (Griggs and others, 1992), local government agencies were queried regarding how they determined setback distances for coastal cliff development. Of the fifty-six city and county government planning departments contacted, 13 percent rely on erosion-
Figure 42. �uses si� -duced at ~half scale, all of the details of topography and development can be included, making them easy to use.
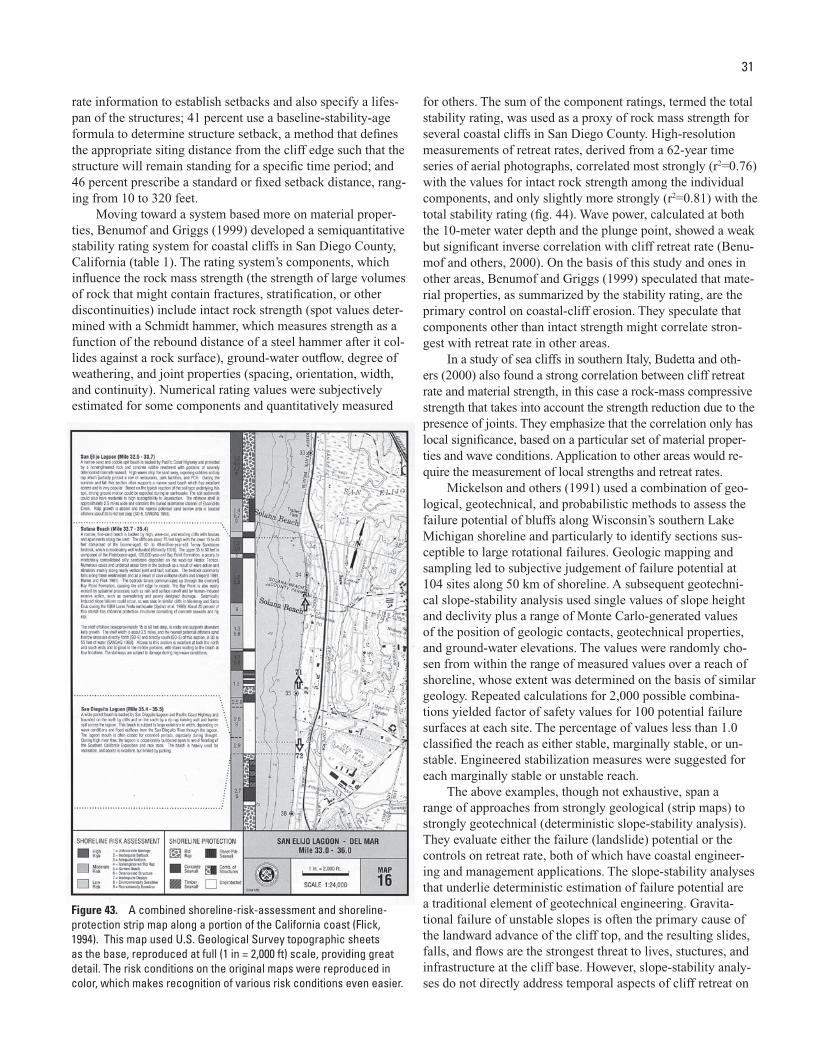
31
rate information to establish setbacks and also specify a lifes-pan of the structures; 41 percent use a baseline-stability-age formula to determine structure setback, a method that defines the appropriate siting distance from the cliff edge such that the structure will remain standing for a specific time period; and 46 percent prescribe a standard or fixed setback distance, rang-ing from 10 to 320 feet.
Moving toward a system based more on material proper-ties, Benumof and Griggs (1999) developed a semiquantitative stability rating system for coastal cliffs in San Diego County, California (table 1). The rating system’s components, which influence the rock mass strength (the strength of large volumes of rock that might contain fractures, stratification, or other discontinuities) include intact rock strength (spot values deter-mined with a Schmidt hammer, which measures strength as a function of the rebound distance of a steel hammer after it col-lides against a rock surface), ground-water outflow, degree of weathering, and joint properties (spacing, orientation, width, and continuity). Numerical rating values were subjectively estimated for some components and quantitatively measured
for others. The sum of the component ratings, termed the total stability rating, was used as a proxy of rock mass strength for several coastal cliffs in San Diego County. High-resolution measurements of retreat rates, derived from a 62-year time series of aerial photographs, correlated most strongly (r2=0.76) with the values for intact rock strength among the individual components, and only slightly more strongly (r2=0.81) with the total stability rating (fig. 44). Wave power, calculated at both the 10-meter water depth and the plunge point, showed a weak but significant inverse correlation with cliff retreat rate (Benu-mof and others, 2000). On the basis of this study and ones in other areas, Benumof and Griggs (1999) speculated that mate-rial properties, as summarized by the stability rating, are the primary control on coastal-cliff erosion. They speculate that components other than intact strength might correlate stron-gest with retreat rate in other areas.
In a study of sea cliffs in southern Italy, Budetta and oth-ers (2000) also found a strong correlation between cliff retreat rate and material strength, in this case a rock-mass compressive strength that takes into account the strength reduction due to the presence of joints. They emphasize that the correlation only has local significance, based on a particular set of material proper-ties and wave conditions. Application to other areas would re-quire the measurement of local strengths and retreat rates.
Mickelson and others (1991) used a combination of geo-logical, geotechnical, and probabilistic methods to assess the failure potential of bluffs along Wisconsin’s southern Lake Michigan shoreline and particularly to identify sections sus-ceptible to large rotational failures. Geologic mapping and sampling led to subjective judgement of failure potential at 104 sites along 50 km of shoreline. A subsequent geotechni-cal slope-stability analysis used single values of slope height and declivity plus a range of Monte Carlo-generated values of the position of geologic contacts, geotechnical properties, and ground-water elevations. The values were randomly cho-sen from within the range of measured values over a reach of shoreline, whose extent was determined on the basis of similar geology. Repeated calculations for 2,000 possible combina-tions yielded factor of safety values for 100 potential failure surfaces at each site. The percentage of values less than 1.0 classified the reach as either stable, marginally stable, or un-stable. Engineered stabilization measures were suggested for each marginally stable or unstable reach.
The above examples, though not exhaustive, span a range of approaches from strongly geological (strip maps) to strongly geotechnical (deterministic slope-stability analysis). They evaluate either the failure (landslide) potential or the controls on retreat rate, both of which have coastal engineer-ing and management applications. The slope-stability analyses that underlie deterministic estimation of failure potential are a traditional element of geotechnical engineering. Gravita-tional failure of unstable slopes is often the primary cause of the landward advance of the cliff top, and the resulting slides, falls, and flows are the strongest threat to lives, stuctures, and infrastructure at the cliff base. However, slope-stability analy-ses do not directly address temporal aspects of cliff retreat on
Figure 43. A combined shoreline-risk-assessment and shoreline-protection strip map along a portion of the California coast (Flick, 1994). This map used U.S. Geological Survey topographic sheets as the base, reproduced at full (1 in = 2,000 ft) scale, providing great detail. The risk conditions on the original maps were reproduced in color, which makes recognition of various risk conditions even easier.
�
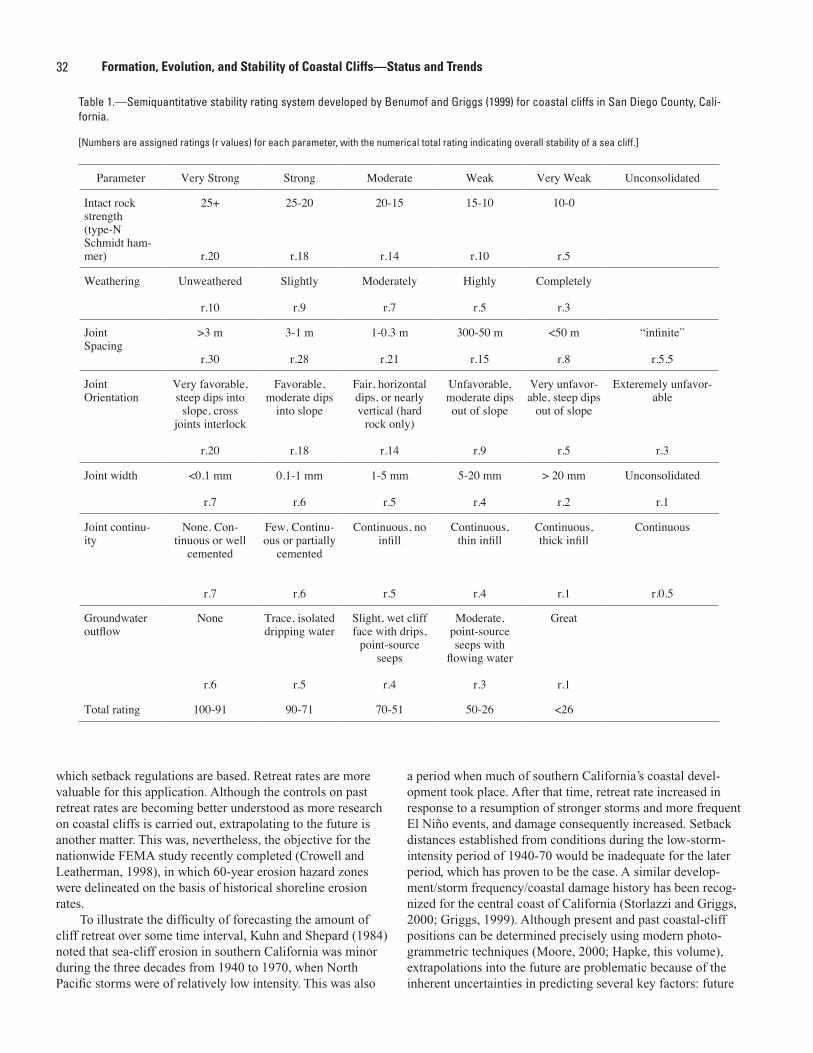
32 Formation, Evolution, and Stability of Coastal Cliffs—Status and Trends
which setback regulations are based. Retreat rates are more valuable for this application. Although the controls on past retreat rates are becoming better understood as more research on coastal cliffs is carried out, extrapolating to the future is another matter. This was, nevertheless, the objective for the nationwide FEMA study recently completed (Crowell and Leatherman, 1998), in which 60-year erosion hazard zones were delineated on the basis of historical shoreline erosion rates.
To illustrate the difficulty of forecasting the amount of cliff retreat over some time interval, Kuhn and Shepard (1984) noted that sea-cliff erosion in southern California was minor during the three decades from 1940 to 1970, when North Pacific storms were of relatively low intensity. This was also
a period when much of southern California’s coastal devel-opment took place. After that time, retreat rate increased in response to a resumption of stronger storms and more frequent El Niño events, and damage consequently increased. Setback distances established from conditions during the low-storm-intensity period of 1940-70 would be inadequate for the later period, which has proven to be the case. A similar develop-ment/storm frequency/coastal damage history has been recog-nized for the central coast of California (Storlazzi and Griggs, 2000; Griggs, 1999). Although present and past coastal-cliff positions can be determined precisely using modern photo-grammetric techniques (Moore, 2000; Hapke, this volume), extrapolations into the future are problematic because of the inherent uncertainties in predicting several key factors: future
Parameter Very Strong Strong Moderate Weak Very Weak Unconsolidated
Intact rockstrength(type-N Schmidt ham-mer)
25+
r.20
25-20
r.18
20-15
r.14
15-10
r.10
10-0
r.5
Weathering Unweathered
r.10
Slightly
r.9
Moderately
r.7
Highly
r.5
Completely
r.3
JointSpacing
>3 m
r.30
3-1 m
r.28
1-0.3 m
r.21
300-50 m
r.15
<50 m
r.8
“infinite”
r.5.5
JointOrientation
Very favorable, steep dips into
slope, cross joints interlock
r.20
Favorable, moderate dips
into slope
r.18
Fair, horizontal dips, or nearly vertical (hard
rock only)
r.14
Unfavorable, moderate dips out of slope
r.9
Very unfavor-able, steep dips
out of slope
r.5
Exteremely unfavor-able
r.3
Joint width <0.1 mm
r.7
0.1-1 mm
r.6
1-5 mm
r.5
5-20 mm
r.4
> 20 mm
r.2
Unconsolidated
r.1
Joint continu-ity
None. Con-tinuous or well
cemented
r.7
Few. Continu-ous or partially
cemented
r.6
Continuous, no infill
r.5
Continuous, thin infill
r.4
Continuous, thick infill
r.1
Continuous
r.0.5
Groundwater outflow
None
r.6
Trace, isolated dripping water
r.5
Slight, wet cliff face with drips,
point-source seeps
r.4
Moderate, point-source seeps with
flowing water
r.3
Great
r.1
Total rating 100-91 90-71 70-51 50-26 <26
Table 1.—Semiquantitative stability rating system developed by Benumof and Griggs (1999) for coastal cliffs in San Diego County, Cali-fornia.
[Numbers are assigned ratings (r values) for each parameter, with the numerical total rating indicating overall stability of a sea cliff.]
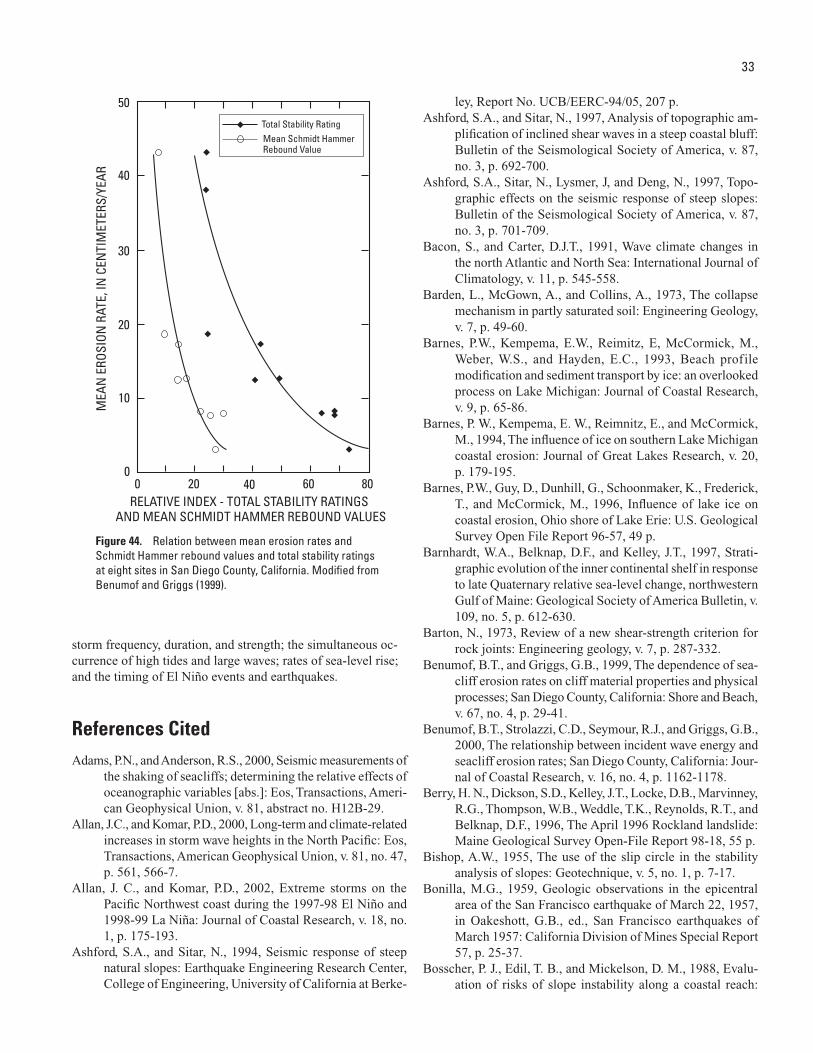
33
storm frequency, duration, and strength; the simultaneous oc-currence of high tides and large waves; rates of sea-level rise; and the timing of El Niño events and earthquakes.
References CitedAdams, P.N., and Anderson, R.S., 2000, Seismic measurements of
the shaking of seacliffs; determining the relative effects of oceanographic variables [abs.]: Eos, Transactions, Ameri-can Geophysical Union, v. 81, abstract no. H12B-29.
Allan, J.C., and Komar, P.D., 2000, Long-term and climate-related increases in storm wave heights in the North Pacific: Eos, Transactions, American Geophysical Union, v. 81, no. 47, p. 561, 566-7.
Allan, J. C., and Komar, P.D., 2002, Extreme storms on the Pacific Northwest coast during the 1997-98 El Niño and 1998-99 La Niña: Journal of Coastal Research, v. 18, no. 1, p. 175-193.
Ashford, S.A., and Sitar, N., 1994, Seismic response of steep natural slopes: Earthquake Engineering Research Center, College of Engineering, University of California at Berke-
ley, Report No. UCB/EERC-94/05, 207 p.Ashford, S.A., and Sitar, N., 1997, Analysis of topographic am-
plification of inclined shear waves in a steep coastal bluff: Bulletin of the Seismological Society of America, v. 87, no. 3, p. 692-700.
Ashford, S.A., Sitar, N., Lysmer, J, and Deng, N., 1997, Topo-graphic effects on the seismic response of steep slopes: Bulletin of the Seismological Society of America, v. 87, no. 3, p. 701-709.
Bacon, S., and Carter, D.J.T., 1991, Wave climate changes in the north Atlantic and North Sea: International Journal of Climatology, v. 11, p. 545-558.
Barden, L., McGown, A., and Collins, A., 1973, The collapse mechanism in partly saturated soil: Engineering Geology, v. 7, p. 49-60.
Barnes, P.W., Kempema, E.W., Reimitz, E, McCormick, M., Weber, W.S., and Hayden, E.C., 1993, Beach profile modification and sediment transport by ice: an overlooked process on Lake Michigan: Journal of Coastal Research, v. 9, p. 65-86.
Barnes, P. W., Kempema, E. W., Reimnitz, E., and McCormick, M., 1994, The influence of ice on southern Lake Michigan coastal erosion: Journal of Great Lakes Research, v. 20, p. 179-195.
Barnes, P.W., Guy, D., Dunhill, G., Schoonmaker, K., Frederick, T., and McCormick, M., 1996, Influence of lake ice on coastal erosion, Ohio shore of Lake Erie: U.S. Geological Survey Open File Report 96-57, 49 p.
Barnhardt, W.A., Belknap, D.F., and Kelley, J.T., 1997, Strati-graphic evolution of the inner continental shelf in response to late Quaternary relative sea-level change, northwestern Gulf of Maine: Geological Society of America Bulletin, v. 109, no. 5, p. 612-630.
Barton, N., 1973, Review of a new shear-strength criterion for rock joints: Engineering geology, v. 7, p. 287-332.
Benumof, B.T., and Griggs, G.B., 1999, The dependence of sea-cliff erosion rates on cliff material properties and physical processes; San Diego County, California: Shore and Beach, v. 67, no. 4, p. 29-41.
Benumof, B.T., Strolazzi, C.D., Seymour, R.J., and Griggs, G.B., 2000, The relationship between incident wave energy and seacliff erosion rates; San Diego County, California: Jour-nal of Coastal Research, v. 16, no. 4, p. 1162-1178.
Berry, H. N., Dickson, S.D., Kelley, J.T., Locke, D.B., Marvinney, R.G., Thompson, W.B., Weddle, T.K., Reynolds, R.T., and Belknap, D.F., 1996, The April 1996 Rockland landslide: Maine Geological Survey Open-File Report 98-18, 55 p.
Bishop, A.W., 1955, The use of the slip circle in the stability analysis of slopes: Geotechnique, v. 5, no. 1, p. 7-17.
Bonilla, M.G., 1959, Geologic observations in the epicentral area of the San Francisco earthquake of March 22, 1957, in Oakeshott, G.B., ed., San Francisco earthquakes of March 1957: California Division of Mines Special Report 57, p. 25-37.
Bosscher, P. J., Edil, T. B., and Mickelson, D. M., 1988, Evalu-ation of risks of slope instability along a coastal reach:
Figure 44. Relation between mean erosion rates and Schmidt Hammer rebound values and total stability ratings at eight sites in San Diego County, California. Modified from Benumof and Griggs (1999).
Total Stability RatingMean Schmidt HammerRebound Value
RELATIVE INDEX - TOTAL STABILITY RATINGSAND MEAN SCHMIDT HAMMER REBOUND VALUES
10
0 20 40 60 80
20
30
40
50
0
MEA
N E
ROSI
ON
RAT
E, IN
CEN
TIM
ETER
S/YE
AR
�
34 Formation, Evolution, and Stability of Coastal Cliffs—Status and Trends
International Symposium on Landslides, 5th, Lausanne, Switzerland, Proceedings, v. 2, p. 1119-1125.
Bradley, W. C., and Griggs, G.B., 1976, Form, genesis and defor-mation of coastal California wave-cut platforms: Geologi-cal Society of America Bulletin, v. 87, p. 433-449.
Brown, E.A., 2000, Influence of water level, wave climate, and weather on coastal recession along a Great Lakes shoreline: Madison, Wisconsin, M.S. Thesis, University of Wisconsin, 176 pp.
Brown, E.A., Mickelson, D.M., Wu, Chin, Edil, T.B., 2001, Influence of lake level on recession of high and low shore bluffs on Wisconsin’s Lake Michigan Shoreline [abs.]: Geological Society of America Abstracts with Programs, v. 33, no. 4, p. A-12.
Brunsden, D., and Jones, D.K.C., 1980, Relative time scales and formative events in coastal landslide systems: Zeitschrift für Geomorphologie, Supplementband 34, p. 1-19.
Bryan, K., 1928, Niches and other cavities in sandstone at Chaco Canyon, N.M: Zeitschrift für Geomorphologie, v. 3, no. 3, p. 125-140.
Bryan, R.B., and Price, A.G., 1980, Recession of the Scarborough Bluffs, Ontario, Canada: Zeitschrift für Geomorphologie, Supplementband 34, p. 48-62.
Bryan, W.B., and Stephens, R.S., 1993, Coastal bench formation at Hanauma Bay, Oahu, Hawaii: Geological Society of America Bulletin, v. 105, p. 377-386.
Budetta, P., Galietta, G., and Santo, A., 2000, A methodology for the study of the relation between coastal cliff erosion and the mechanical strength of soils and rock masses: Engineering Geology, v. 56, p. 243-256.
Cabanes, C., Cazenave, A., and Le Provost, C., 2001, Sea-level rise during the past 40 years determined from satellite and in situ observations: Science, v. 294, p. 840-842.
Carter, C.H., and Guy, D.E., Jr., 1988, Coastal erosion; processes, timing and magnitudes at the bluff toe: Marine Geology, v. 84, no. 1-2, p. 1-17.
Carter, D.J.T., and Draper, L., 1988, Has the north-east Atlantic become rougher?: Nature, v. 332, p. 494.
Changnon, S.A., 1997, Climate change and the water levels of the Great Lakes: Shore and Beach, v. 65, no. 2, p. 4-6.
Chapman, J.A., Edil, T.B., and Mickelson, D.M., 2002, Interpreta-tion of probabilistic slope analyses for shoreline bluffs, in Ewing, Lesley, and Wallendorf, Louise, eds., Solutions to coastal disasters ‘02: American Society of Civil Engineers, p. 640-651.
Chase, R.B, Kehew, A.E., and Montgomery, W.W., 1999, The destabilizing influences of perched ground water in shore-line bluffs composed of heterogeneous glacial materials [abs.]: Geological Society of America Annual Meeting Abstracts, p. A-225.
Chen, A.T., and Leidersdorf, C.B., eds., 1988, Arctic coastal processes and slope protection design: New York, American Society of Civil Engineers, 247 p.
Cox, J.C., Jones, C.P., Riebau, M., and Vargas, A.M., 2000, De-veloping shoreline recession rates for the bluffed Wisconsin coast: Shore and Beach, v. 68, no. 3, p. 3-10.
Crowell, M., and Leatherman, S.P., eds., 1998, Coastal erosion and management: Journal of Coastal Research, Special Issue 28, 196 p.
Crudden, D.M., and Varnes, D.J., 1996, Landslide types and processes, in Turner, A.K., and Schuster, R.L., eds., Land-slides; investigation and mitigation: Washington, D.C., National Academy Press, Transportation Research Board, National Research Council Special Report 247, p. 36-75.
Davies, P., Williams, A.T., and Bombee, P., 1998, Numerical analysis of coastal cliff failure aling the Pembrokeshire coast national park, Wales, UK: Earth Surface Processes and Landforms, v. 23, p. 1123-1134.
Davis, R.A., Jr., 1973, Coastal ice formation and its effect on beach sedimentation: Shore and Beach, v. 41, no. 1, p. 3-10.
Dewberry and Davis, 1995, Basic analyses of wave action and erosion with extreme floods on Great Lakes shores: Report for the Federal Emergency Management Agency, prepared by Dewberry and Davis, Fairfax, Virginia, 51 p.
Dionne, J.-C., 1979, Ice action in the lacustrine environment; a review with particular reference to subarctic Quebec, Canada: Earth Science Reviews, v. 15, p. 185-212.
Dorion, C.C., Balco, G.A., Kaplan, M.R., Kreutz, K.J., Wright, J.D., and Borns, H.W., 2001, Stratigraphy, paleoceanog-raphy, chronology and environment during deglciation of eastern Maine, in Weddle, T.K., and Retelle, M.J., eds., Deglacial history and relative sea-level changes, northern New England and adjacent Canada: Geological Society of America Special Paper 351, p. 215-242.
Duncan, J.M., 1996, Soil slope stability analysis, in Turner, A.K., and Schuster, R.L., eds., Landslides; investigation and mitigation: Washington, D.C., National Academy Press, Transportation Research Board, National Research Council Special Report 247, p. 337-371.
Edil, T.B., and Haas, B.J., 1980, Proposed criteria for interpret-ing stability of lakeshore bluffs: Engineering Geology, v. 16, p. 97-110.
Edil, T.B., and Mickelson, D.M., 1995, Overconsolidated tills in eastern Wisconsin: National Research Council, Transporta-tion Research Board Record N. 1479, p. 99-106.
Edil, T. B., and Schultz, M. N., 1983, Landslide hazard potential determination along a shoreline segment: Engineering Geology, v. 19, p. 159-177.
Edil, T.B., and Vallejo, L.E., 1977, Shoreline erosion and land-slides in the Great Lakes: International Conference on Soil Mechanics and Foundation Engineering, 9th, v. 2, p. 51-57.
Edil, T.B., and Vallejo, L.E., 1980, Mechanics of coastal land-slides and the influence of slope parameters, in Koh, S. L., ed., Mechanics of landslides and slope stability: Engineer-ing Geology, v. 16, p. 83-96.
Ehlig, P.E., 1992, Evolution, mechanics and mitigation of the Portuguese Bend landslide Palos Verdes Peninsula, Cali-fornia, in Pipkin, B.W., and Proctor, R.J., eds., Engineer-ing geology practice in southern California: Association of Engineeering Geologists, Southern California Section,
35
Special Publication No. 4, p. 531-553.Emery, K.O., and Aubrey, D.G., 1991, Sea levels, land levels, and
tide gauges: New York, Springer-Verlag, 237 p.Emery, K.O., and Kuhn, G.G., 1982, Sea cliffs; their processes,
profiles, and classification: Geological Society of America Bulletin, v. 93, p. 644-654.
Everts, C.H., 1991, Seacliff retreat and coarse sediment yields in southern California; in Coastal Sediments ’91, Spe-cialty Conference on Quantitative Approaches to Coastal Sediment Processes, Seattle, Washington, 25-27 June 1991, Proceedings, p. 1586-1598.
Fairbanks, R.G., 1989, A 17,000 year old glacial eustatic sea level record; influence of glacial melting rates in the Younger Dryas event and deep ocean circulation: Nature, v. 342, p. 637-641.
Flick, R.E. 1994, Shoreline erosion assessment and atlas of the San Diego region, v. 2: Sacramento, California, California Department of Boating and Waterways and San Diego As-sociation of Governments, unpaginated.
Flick, R.E., 1998, Comparison of tides, storm surges, and mean sea level during the El Niño Winters of 1982-83 and 1997-98: Shore and Beach, v. 66, no. 3, p. 7-17.
Flick, R.E., and Cayan, D.R., 1984, Extreme sea levels on the coast of California: American Society of Civil Engineers, Coastal Engineering Conference, 19th, Proceedings, p. 886-898.
Forbes, D.L., and Taylor, R.B., 1994, Ice in the shore zone and the geomorphology of cold coasts: Progress in Physical Geography, v. 18, no. 1, p. 59-89.
Fredlund, D.G., and Rahardo, H., 1993, An overview of unsatu-rated soil behavior, in Houston, S.L., and Wray, W.K., eds., Unsaturated Soils: American Society of Civil Engineers Geotechnical Publication No. 39, p. 1-31.
Goldberg, S.B., Landsea, C.W., Mestas-Nuñez, A.M., and Gray, W.M., 2001, The recent increase in Atlantic hurricane activ-ity; causes and implications: Science, v. 293, p. 474-479.
Grainger, P., and Kalaugher, P.G., 1988, Hazard zonation of coast-al landslides, in Bonnard, C., ed., Landslides: Rotterdam, A.A. Balkema, International Symposium on Landslides, 5th, Proceedings, v. 1, p. 1169-1174.
Graham, N.E., and Diaz, H.F., 2001, Evidence for intensification of north Pacific winter cyclones since 1948: Bulletin of the American Meteorological Society, v. 82, p. 1869-1893.
Gray, W.M, 1984, Atlantic seasonal hurricane frequency; Part I, El Niño and 30 mb Quasi-Biennial Oscillation influences: Monthly Weather Review, v. 112, p. 1649-1668.
Griggs, G.B., 1999, California’s coastline; El Niño, erosion and protection, in Ewing, L.C., and Sherman, D.J., eds., California’s Coastal Natural Hazards: University of South-ern California Sea Grant Program, CSBPA Conference, p. 36-55.
Griggs, G.B., and Johnson, R.E. 1983, The impact of the 1983 storms on the coastline of northern Monterey Bay: Cali-fornia Geology, v. 36, p. 163-174.
Griggs, G.B., and Savoy, L., 1985, Living with the California coast: Durham, North Carolina, Duke University Press,
393 p.Griggs, G.B., and Scholar, D., 1997, Coastal erosion caused by
earthquake-induced slope failure: Shore and Beach, v. 65, no. 4, p. 2-7.
Griggs, G.B., and Trenhaile, A.S., 1994, Coastal cliffs and platforms, in Carter, R.W.G., and Woodroffe, C.D., eds., Coastal evolution; Late Quaternary shoreline morpho-dynamics: Cambridge, Cambridge University Press, p. 425-450.
Griggs, G.B., Pepper, J.E., and Jordan, M.E., 1992, California’s coastal hazards; a critical assessment of existing land-use policies and practices: Berkeley, California, University of California, California Policy Seminar Research Report, 224 p.
Habel, J.S., and Armstrong, G.A., 1978. Assessment and atlas of shoreline erosion along the California coast: State of California, Dept. of Navigation and Ocean Development, 277 p.
Hall, J.W., Meaddowcroft, I.C., Lee, E.M., and van Gelder, P.H.A.J.M., 2002, Stochastic simulation of episodic soft coastal cliff recession: Coastal Engineering, v. 46, p. 159-174.
Hallermier, R.J., 1996, Two treatments of shore erosion in extreme floods on U.S. Great Lakes, in Edge, B.L., ed., Coastal En-gineeering 1996: International Conference, 25th, Orlando, Florida, Proceedings, p. 2705-2717.
Hampton, M.A., 2002, Gravitational failure of sea cliffs in weakly lithified sediment: Environmental and Engineering Geosci-ence, v. 8, no. 3, p. 175-191.
Hampton, M.A., and Dingler, J.R., 1998, Short-term evolution of three coastal cliffs in San Mateo County, California: Shore and Beach, v. 66, no. 4, p. 24-30.
Hapke, C.J., and Griggs, G.B., 2002, Long-term volumetric sediment contribution from landslides; Big Sur coastline, California, in Ewing, L., and Wallendorf, L., eds., Solu-tions to Coastal Disasters ‘02 Conference: San Diego, Proceedings, p. 652-663.
Hicks, S.D., 1972, On the classification and trends of long period sea level series: Shore and Beach, v. 40, no. 1, p. 20-23.
Higgins, C.G., 1982, Drainage systems developed by sapping on Earth and Mars: Geology, v. 10, p. 147-152.
Higgins, C.G., and Coates, D.R., eds., 1990, Groundwater geomorphology: Geological Society of America Special Paper 252, 368 p.
Holman, R.A., 1986, Extreme value statistics for wave run-up on a natural beach: Coastal Engineering, v. 9, p. 527-544.
Houghton, J.T., Ding, Y., Griggs, D.J., Noguer, M., van der Linden, P.J., Dai, X., Maskel, K., and Johnson, C.A., eds., 2001, Climate change 2001; the scientific basis: Cam-bridge, England, Cambridge University press, 881 p.
Houston, S. L., Houston, W. N., and Spadola, D. J., 1988, Pre-diction of field collapse of soils due to wetting: American Society of Civil Engineers Journal of Geotechnical Engi-neering, v. 114, p. 40-58.
Howard, A.D., and McLane, C.F., III, 1988, Erosion of cohesion-less sediment by groundwater seepage: Water Resources
�
36 Formation, Evolution, and Stability of Coastal Cliffs—Status and Trends
Research, v. 24, p. 1659-1674.Hume, J.D., and Schalk, M., 1964, The effects of ice-push on
arctic beaches: American Journal of Science, v. 262, p. 267-273.
Hungr, O., Salgado, F.M., and Byrne, P.M., 1989, Evaluation of a three dimensional method of slope stability analysis: Ca-nanadian Geotechnical Journal, v. 26, no. 4, p. 679-686.
Hutchinson, J.N., 1969, A reconsideration of the coastal land-slides at Folkstone Warren, Kent: Géotechnique, v. 19, no. 1, p. 6-38.
Hutchinson, J.N., 1973, The response of London clay cliffs to differing rates of toe erosion, in Guzzetta, G., ed., Natural slope instability and conservation: Cosenza, Italy, Instituto per la Protezione Geological Applicata Idrogeologia, p. 221-239.
Hutchinson, J.N., Chandler, M.P., and Bromhead, E.N., 1985, A review of current research on the coastal landslides form-ing the undercliff of the Isle of Wight, with some practical implications: Conference on Problems Associated with the Coastline, Isle of Wight, Proccedings, p. 1-16.
Hutchinson, J., Lee, E.M., and Meadowcroft, I.C., 1998, Reces-sion of soft cliffs; prediction and control: MAFF Confer-ence of River and Coastal Engineers, 33rd, Keele, England, Proceedings, p. 3.1.1-3.1.16.
Inman, D.L, and Nordstrom, C.E., 1971. The tectonic and mor-phologic classification of coasts: Journal of Geology, v 79: p. 1-21.
Iverson, R.M., and Major, J.J., 1986, Groundwater seepage vectors and the potential for hillslope failure and debris flow mobilization: Water Resources Research, v. 22, p. 1543-1548.
Johannessen, C.L, Feiereisen, J.J., and Wells, A.N., 1982, Weath-ering of ocean cliffs by salt expansion in a mid-latitude coastal environment: Shore and Beach, v. 51, p. 26-34.
Jones, J.J.A., 1990, Piping effects in humid lands, in Higgins, C.G., and Coates, D.R., eds., Groundwater Geomorphol-ogy; the role of subsurface water in earth-surface processes and landforms: Geological Society of America Special Paper 252, p. 111-138.
Kamphuis, J.W., 1987, Recession rate of glacial till bluffs: Journal of Waterway, Port, Coastal and Ocean Engineering, v. 113, no. 1, p. 60-73.
Kelley, J.T., and Dickson, S.M., 2000, Low-cost bluff stability mapping in coastal Maine; providing geological hazard information without alarming the public: Environmental Geosciences, v. 7, p. 46-56.
Kelley, J.T., Kelley, A.R., and Pilkey, O.H., Sr., 1989, Living with the Maine Coast: Durham, North Carolina, Duke University Press, 174 p.
Kempema, E.W., Riemnitz, E., and Barnes, P.W., 2001, An-chor-ice formation and ice rafting in southwestern Lake Michigan: Journal of Sedimentary Research, v. 71, no. 3, p. 346-354.
Komar, P.D. 1986, The 1982-83 El Niño and erosion on the coast of Oregon: Shore and Beach, v. 54, p. 3-12.
Komar, P.D., 1997, Erosion of a massive artificial “landslide”
on the California coast: Shore and Beach, v. 65, no. 4, p. 8-14.
Komar, P.D., 1998a, Wave erosion of a massive artificial land-slide: Earth Surface Processes and Landforms, v. 23, p. 415-428.
Komar, P.D., 1998b, The 1997-98 El Niño and erosion on the Oregon coast: Shore and Beach, v. 66, no. 3, p. 33-41.
Komar, P.D., and Allan J.C., 2002, Nearshore-process climates related to changing deep-water wave conditions: Shore and Beach, v. 70, no. 3, p. 31-40.
Komar, P., Allan, J., Diaz-Mendez, G.M., Marra, J.J., and Rug-giero, P., 2000, El Niño and La Niña — erosion processes and impacts: American Society of Civil Engineers, Inter-national Conference on Coastal Engineering, 27th, Proceed-ings, p. 2414-2427.
Kovacs, A., and Sodhi, D.S., 1988, Onshore ice pile-up and ride-up; observations and theoretical assessment, in Chen, A.T., and Leidersdorf, C.B., eds., Arctic coastal processes and slope protection design: New York, American Society of Civil Engineers, p. 108-142.
Kuhn, G.G., and Shepard, F.P., 1984, Sea cliffs, beaches, and coastal valleys of San Diego County: Berkeley, California, University of California Press, 193 p.
Laity, J.E., and Malin, M.C., 1985, Sapping processes and the development of theater-headed valley networks on the Colorado Plateau: Geological Society of America Bulletin, v. 96, p. 203-217.
Lawrence, P.L., 1994, Natural hazards of shoreline bluff erosion; a case study of Horizon View, Lake Huron: Geomorphol-ogy, v. 10, p. 65-81.
Lawson, A.C., 1908, California earthquake of April 18, 1906; Report to the State Earthquake Investigation Committee: Washington, D.C., Carnegie Institute of Washington, Pub-lication No 87, v. 1.
Lee, E.M., 1997, Investigation and management of soft rock cliffs: MAFF Conference of River and Coastal En-gineers, 32nd, Keele, England, 1997, Proceedings, p. B1.1-B1.12.
Lee, E.M, Hall, J.W., and Meadowcroft, I.C., 2001, Coastal cliff recession; the use of probabilistic prediction methods: Geomorphology, v. 40, p. 253-269.
Leopold, L.B., Miller, J.P., and Wolman, M.G., 1995, Fluvial Processes in Geomorphology: Mineola, New York, Dover Publications, Inc., 322 p.
McCann, S.B., 1973, Beach processes in an arctic environment, in Coates, D.R., ed., Coastal Geomorphology: Binghampton, New York, State University of New York, p. 141-155.
Mickelson, D.M., Edil, T.B., and Bosscher, P.J., 1991, Landslide hazard assessment for shoreline erosion management, in Bell, D.H., ed., Landslides: Rotterdam, A.A. Balkema, p. 1009-1014.
Minard, C.R., Jr., 1971, Quaternary beaches and coasts between the Russian River and Drakes Bay, California: Hydraulic Engineering laboratory, University of California at Berke-ley, Technical Report HEL 2-35, 205 p.
Miner, J.J., and Powell, R.D., 1981, An evaluation of ice-rafted
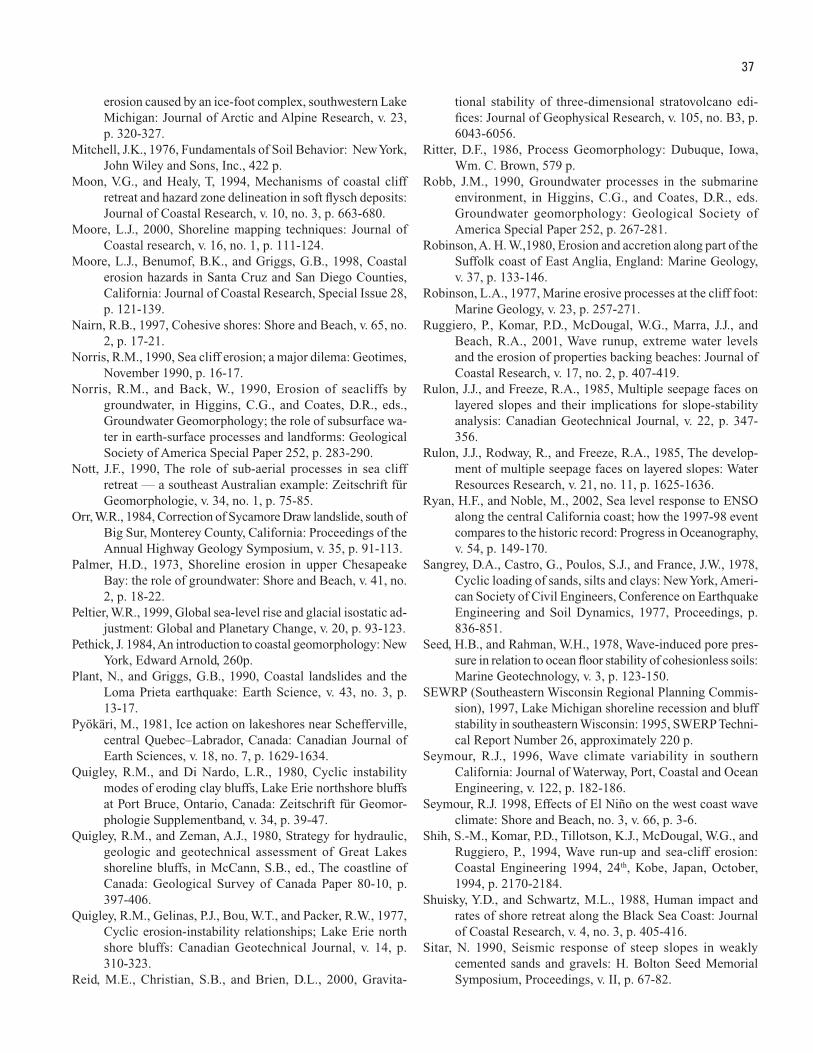
37
erosion caused by an ice-foot complex, southwestern Lake Michigan: Journal of Arctic and Alpine Research, v. 23, p. 320-327.
Mitchell, J.K., 1976, Fundamentals of Soil Behavior: New York, John Wiley and Sons, Inc., 422 p.
Moon, V.G., and Healy, T, 1994, Mechanisms of coastal cliff retreat and hazard zone delineation in soft flysch deposits: Journal of Coastal Research, v. 10, no. 3, p. 663-680.
Moore, L.J., 2000, Shoreline mapping techniques: Journal of Coastal research, v. 16, no. 1, p. 111-124.
Moore, L.J., Benumof, B.K., and Griggs, G.B., 1998, Coastal erosion hazards in Santa Cruz and San Diego Counties, California: Journal of Coastal Research, Special Issue 28, p. 121-139.
Nairn, R.B., 1997, Cohesive shores: Shore and Beach, v. 65, no. 2, p. 17-21.
Norris, R.M., 1990, Sea cliff erosion; a major dilema: Geotimes, November 1990, p. 16-17.
Norris, R.M., and Back, W., 1990, Erosion of seacliffs by groundwater, in Higgins, C.G., and Coates, D.R., eds., Groundwater Geomorphology; the role of subsurface wa-ter in earth-surface processes and landforms: Geological Society of America Special Paper 252, p. 283-290.
Nott, J.F., 1990, The role of sub-aerial processes in sea cliff retreat — a southeast Australian example: Zeitschrift für Geomorphologie, v. 34, no. 1, p. 75-85.
Orr, W.R., 1984, Correction of Sycamore Draw landslide, south of Big Sur, Monterey County, California: Proceedings of the Annual Highway Geology Symposium, v. 35, p. 91-113.
Palmer, H.D., 1973, Shoreline erosion in upper Chesapeake Bay: the role of groundwater: Shore and Beach, v. 41, no. 2, p. 18-22.
Peltier, W.R., 1999, Global sea-level rise and glacial isostatic ad-justment: Global and Planetary Change, v. 20, p. 93-123.
Pethick, J. 1984, An introduction to coastal geomorphology: New York, Edward Arnold, 260p.
Plant, N., and Griggs, G.B., 1990, Coastal landslides and the Loma Prieta earthquake: Earth Science, v. 43, no. 3, p. 13-17.
Pyökäri, M., 1981, Ice action on lakeshores near Schefferville, central Quebec–Labrador, Canada: Canadian Journal of Earth Sciences, v. 18, no. 7, p. 1629-1634.
Quigley, R.M., and Di Nardo, L.R., 1980, Cyclic instability modes of eroding clay bluffs, Lake Erie northshore bluffs at Port Bruce, Ontario, Canada: Zeitschrift für Geomor-phologie Supplementband, v. 34, p. 39-47.
Quigley, R.M., and Zeman, A.J., 1980, Strategy for hydraulic, geologic and geotechnical assessment of Great Lakes shoreline bluffs, in McCann, S.B., ed., The coastline of Canada: Geological Survey of Canada Paper 80-10, p. 397-406.
Quigley, R.M., Gelinas, P.J., Bou, W.T., and Packer, R.W., 1977, Cyclic erosion-instability relationships; Lake Erie north shore bluffs: Canadian Geotechnical Journal, v. 14, p. 310-323.
Reid, M.E., Christian, S.B., and Brien, D.L., 2000, Gravita-
tional stability of three-dimensional stratovolcano edi-fices: Journal of Geophysical Research, v. 105, no. B3, p. 6043-6056.
Ritter, D.F., 1986, Process Geomorphology: Dubuque, Iowa, Wm. C. Brown, 579 p.
Robb, J.M., 1990, Groundwater processes in the submarine environment, in Higgins, C.G., and Coates, D.R., eds. Groundwater geomorphology: Geological Society of America Special Paper 252, p. 267-281.
Robinson, A. H. W.,1980, Erosion and accretion along part of the Suffolk coast of East Anglia, England: Marine Geology, v. 37, p. 133-146.
Robinson, L.A., 1977, Marine erosive processes at the cliff foot: Marine Geology, v. 23, p. 257-271.
Ruggiero, P., Komar, P.D., McDougal, W.G., Marra, J.J., and Beach, R.A., 2001, Wave runup, extreme water levels and the erosion of properties backing beaches: Journal of Coastal Research, v. 17, no. 2, p. 407-419.
Rulon, J.J., and Freeze, R.A., 1985, Multiple seepage faces on layered slopes and their implications for slope-stability analysis: Canadian Geotechnical Journal, v. 22, p. 347-356.
Rulon, J.J., Rodway, R., and Freeze, R.A., 1985, The develop-ment of multiple seepage faces on layered slopes: Water Resources Research, v. 21, no. 11, p. 1625-1636.
Ryan, H.F., and Noble, M., 2002, Sea level response to ENSO along the central California coast; how the 1997-98 event compares to the historic record: Progress in Oceanography, v. 54, p. 149-170.
Sangrey, D.A., Castro, G., Poulos, S.J., and France, J.W., 1978, Cyclic loading of sands, silts and clays: New York, Ameri-can Society of Civil Engineers, Conference on Earthquake Engineering and Soil Dynamics, 1977, Proceedings, p. 836-851.
Seed, H.B., and Rahman, W.H., 1978, Wave-induced pore pres-sure in relation to ocean floor stability of cohesionless soils: Marine Geotechnology, v. 3, p. 123-150.
SEWRP (Southeastern Wisconsin Regional Planning Commis-sion), 1997, Lake Michigan shoreline recession and bluff stability in southeastern Wisconsin: 1995, SWERP Techni-cal Report Number 26, approximately 220 p.
Seymour, R.J., 1996, Wave climate variability in southern California: Journal of Waterway, Port, Coastal and Ocean Engineering, v. 122, p. 182-186.
Seymour, R.J. 1998, Effects of El Niño on the west coast wave climate: Shore and Beach, no. 3, v. 66, p. 3-6.
Shih, S.-M., Komar, P.D., Tillotson, K.J., McDougal, W.G., and Ruggiero, P., 1994, Wave run-up and sea-cliff erosion: Coastal Engineering 1994, 24th, Kobe, Japan, October, 1994, p. 2170-2184.
Shuisky, Y.D., and Schwartz, M.L., 1988, Human impact and rates of shore retreat along the Black Sea Coast: Journal of Coastal Research, v. 4, no. 3, p. 405-416.
Sitar, N. 1990, Seismic response of steep slopes in weakly cemented sands and gravels: H. Bolton Seed Memorial Symposium, Proceedings, v. II, p. 67-82.
�
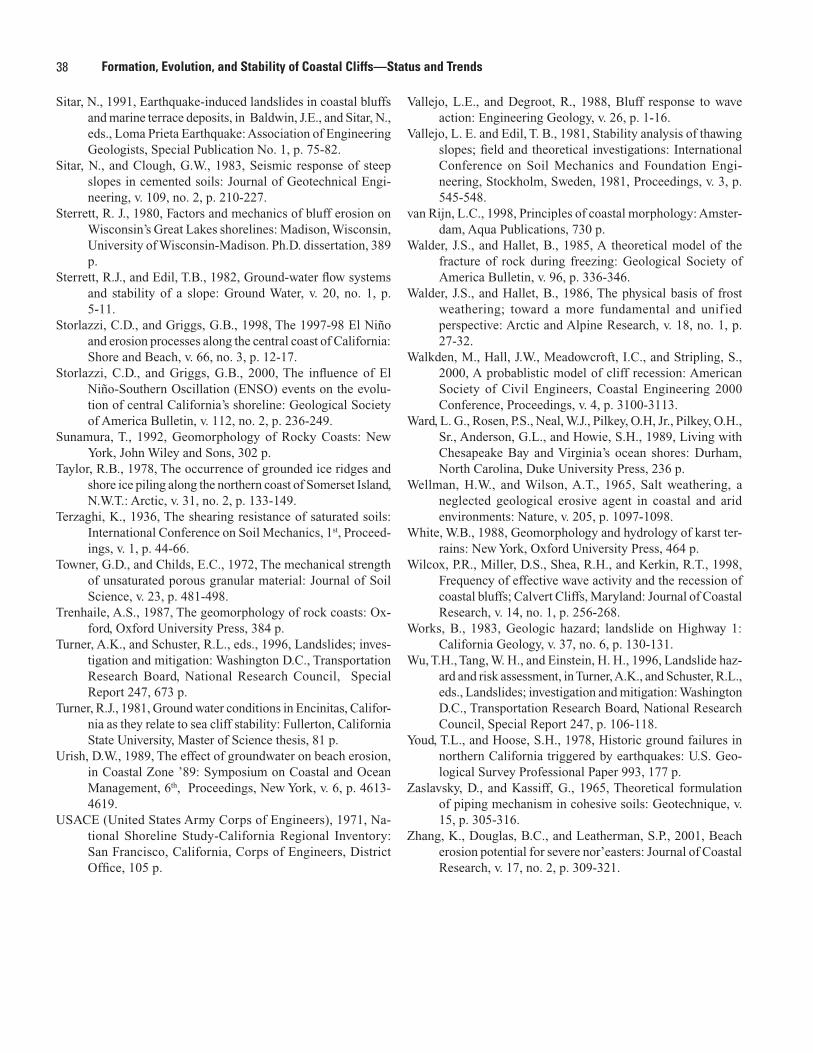
38 Formation, Evolution, and Stability of Coastal Cliffs—Status and Trends
Sitar, N., 1991, Earthquake-induced landslides in coastal bluffs and marine terrace deposits, in Baldwin, J.E., and Sitar, N., eds., Loma Prieta Earthquake: Association of Engineering Geologists, Special Publication No. 1, p. 75-82.
Sitar, N., and Clough, G.W., 1983, Seismic response of steep slopes in cemented soils: Journal of Geotechnical Engi-neering, v. 109, no. 2, p. 210-227.
Sterrett, R. J., 1980, Factors and mechanics of bluff erosion on Wisconsin’s Great Lakes shorelines: Madison, Wisconsin, University of Wisconsin-Madison. Ph.D. dissertation, 389 p.
Sterrett, R.J., and Edil, T.B., 1982, Ground-water flow systems and stability of a slope: Ground Water, v. 20, no. 1, p. 5-11.
Storlazzi, C.D., and Griggs, G.B., 1998, The 1997-98 El Niño and erosion processes along the central coast of California: Shore and Beach, v. 66, no. 3, p. 12-17.
Storlazzi, C.D., and Griggs, G.B., 2000, The influence of El Niño-Southern Oscillation (ENSO) events on the evolu-tion of central California’s shoreline: Geological Society of America Bulletin, v. 112, no. 2, p. 236-249.
Sunamura, T., 1992, Geomorphology of Rocky Coasts: New York, John Wiley and Sons, 302 p.
Taylor, R.B., 1978, The occurrence of grounded ice ridges and shore ice piling along the northern coast of Somerset Island, N.W.T.: Arctic, v. 31, no. 2, p. 133-149.
Terzaghi, K., 1936, The shearing resistance of saturated soils: International Conference on Soil Mechanics, 1st, Proceed-ings, v. 1, p. 44-66.
Towner, G.D., and Childs, E.C., 1972, The mechanical strength of unsaturated porous granular material: Journal of Soil Science, v. 23, p. 481-498.
Trenhaile, A.S., 1987, The geomorphology of rock coasts: Ox-ford, Oxford University Press, 384 p.
Turner, A.K., and Schuster, R.L., eds., 1996, Landslides; inves-tigation and mitigation: Washington D.C., Transportation Research Board, National Research Council, Special Report 247, 673 p.
Turner, R.J., 1981, Ground water conditions in Encinitas, Califor-nia as they relate to sea cliff stability: Fullerton, California State University, Master of Science thesis, 81 p.
Urish, D.W., 1989, The effect of groundwater on beach erosion, in Coastal Zone ’89: Symposium on Coastal and Ocean Management, 6th, Proceedings, New York, v. 6, p. 4613-4619.
USACE (United States Army Corps of Engineers), 1971, Na-tional Shoreline Study-California Regional Inventory: San Francisco, California, Corps of Engineers, District Office, 105 p.
Vallejo, L.E., and Degroot, R., 1988, Bluff response to wave action: Engineering Geology, v. 26, p. 1-16.
Vallejo, L. E. and Edil, T. B., 1981, Stability analysis of thawing slopes; field and theoretical investigations: International Conference on Soil Mechanics and Foundation Engi-neering, Stockholm, Sweden, 1981, Proceedings, v. 3, p. 545-548.
van Rijn, L.C., 1998, Principles of coastal morphology: Amster-dam, Aqua Publications, 730 p.
Walder, J.S., and Hallet, B., 1985, A theoretical model of the fracture of rock during freezing: Geological Society of America Bulletin, v. 96, p. 336-346.
Walder, J.S., and Hallet, B., 1986, The physical basis of frost weathering; toward a more fundamental and unified perspective: Arctic and Alpine Research, v. 18, no. 1, p. 27-32.
Walkden, M., Hall, J.W., Meadowcroft, I.C., and Stripling, S., 2000, A probablistic model of cliff recession: American Society of Civil Engineers, Coastal Engineering 2000 Conference, Proceedings, v. 4, p. 3100-3113.
Ward, L. G., Rosen, P.S., Neal, W.J., Pilkey, O.H, Jr., Pilkey, O.H., Sr., Anderson, G.L., and Howie, S.H., 1989, Living with Chesapeake Bay and Virginia’s ocean shores: Durham, North Carolina, Duke University Press, 236 p.
Wellman, H.W., and Wilson, A.T., 1965, Salt weathering, a neglected geological erosive agent in coastal and arid environments: Nature, v. 205, p. 1097-1098.
White, W.B., 1988, Geomorphology and hydrology of karst ter-rains: New York, Oxford University Press, 464 p.
Wilcox, P.R., Miller, D.S., Shea, R.H., and Kerkin, R.T., 1998, Frequency of effective wave activity and the recession of coastal bluffs; Calvert Cliffs, Maryland: Journal of Coastal Research, v. 14, no. 1, p. 256-268.
Works, B., 1983, Geologic hazard; landslide on Highway 1: California Geology, v. 37, no. 6, p. 130-131.
Wu, T.H., Tang, W. H., and Einstein, H. H., 1996, Landslide haz-ard and risk assessment, in Turner, A.K., and Schuster, R.L., eds., Landslides; investigation and mitigation: Washington D.C., Transportation Research Board, National Research Council, Special Report 247, p. 106-118.
Youd, T.L., and Hoose, S.H., 1978, Historic ground failures in northern California triggered by earthquakes: U.S. Geo-logical Survey Professional Paper 993, 177 p.
Zaslavsky, D., and Kassiff, G., 1965, Theoretical formulation of piping mechanism in cohesive soils: Geotechnique, v. 15, p. 305-316.
Zhang, K., Douglas, B.C., and Leatherman, S.P., 2001, Beach erosion potential for severe nor’easters: Journal of Coastal Research, v. 17, no. 2, p. 309-321.
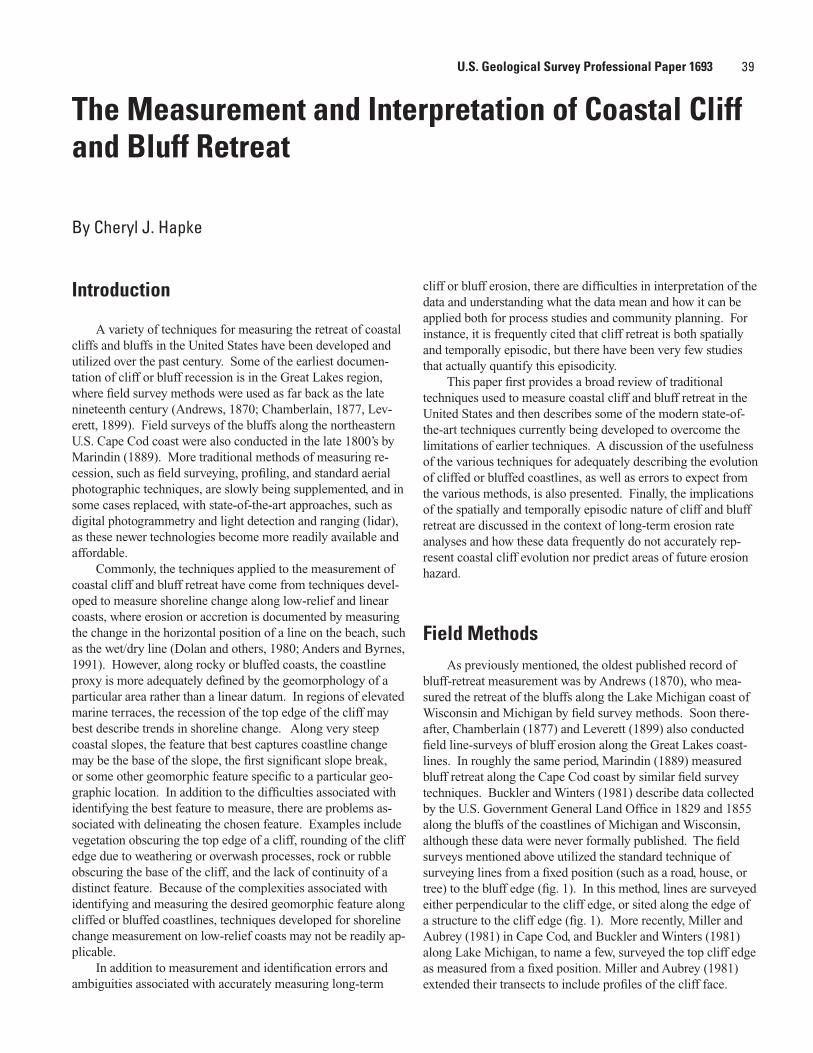
39
Introduction
A variety of techniques for measuring the retreat of coastal cliffs and bluffs in the United States have been developed and utilized over the past century. Some of the earliest documen-tation of cliff or bluff recession is in the Great Lakes region, where field survey methods were used as far back as the late nineteenth century (Andrews, 1870; Chamberlain, 1877, Lev-erett, 1899). Field surveys of the bluffs along the northeastern U.S. Cape Cod coast were also conducted in the late 1800’s by Marindin (1889). More traditional methods of measuring re-cession, such as field surveying, profiling, and standard aerial photographic techniques, are slowly being supplemented, and in some cases replaced, with state-of-the-art approaches, such as digital photogrammetry and light detection and ranging (lidar), as these newer technologies become more readily available and affordable.
Commonly, the techniques applied to the measurement of coastal cliff and bluff retreat have come from techniques devel-oped to measure shoreline change along low-relief and linear coasts, where erosion or accretion is documented by measuring the change in the horizontal position of a line on the beach, such as the wet/dry line (Dolan and others, 1980; Anders and Byrnes, 1991). However, along rocky or bluffed coasts, the coastline proxy is more adequately defined by the geomorphology of a particular area rather than a linear datum. In regions of elevated marine terraces, the recession of the top edge of the cliff may best describe trends in shoreline change. Along very steep coastal slopes, the feature that best captures coastline change may be the base of the slope, the first significant slope break, or some other geomorphic feature specific to a particular geo-graphic location. In addition to the difficulties associated with identifying the best feature to measure, there are problems as-sociated with delineating the chosen feature. Examples include vegetation obscuring the top edge of a cliff, rounding of the cliff edge due to weathering or overwash processes, rock or rubble obscuring the base of the cliff, and the lack of continuity of a distinct feature. Because of the complexities associated with identifying and measuring the desired geomorphic feature along cliffed or bluffed coastlines, techniques developed for shoreline change measurement on low-relief coasts may not be readily ap-plicable.
In addition to measurement and identification errors and ambiguities associated with accurately measuring long-term
cliff or bluff erosion, there are difficulties in interpretation of the data and understanding what the data mean and how it can be applied both for process studies and community planning. For instance, it is frequently cited that cliff retreat is both spatially and temporally episodic, but there have been very few studies that actually quantify this episodicity.
This paper first provides a broad review of traditional techniques used to measure coastal cliff and bluff retreat in the United States and then describes some of the modern state-of-the-art techniques currently being developed to overcome the limitations of earlier techniques. A discussion of the usefulness of the various techniques for adequately describing the evolution of cliffed or bluffed coastlines, as well as errors to expect from the various methods, is also presented. Finally, the implications of the spatially and temporally episodic nature of cliff and bluff retreat are discussed in the context of long-term erosion rate analyses and how these data frequently do not accurately rep-resent coastal cliff evolution nor predict areas of future erosion hazard.
Field MethodsAs previously mentioned, the oldest published record of
bluff-retreat measurement was by Andrews (1870), who mea-sured the retreat of the bluffs along the Lake Michigan coast of Wisconsin and Michigan by field survey methods. Soon there-after, Chamberlain (1877) and Leverett (1899) also conducted field line-surveys of bluff erosion along the Great Lakes coast-lines. In roughly the same period, Marindin (1889) measured bluff retreat along the Cape Cod coast by similar field survey techniques. Buckler and Winters (1981) describe data collected by the U.S. Government General Land Office in 1829 and 1855 along the bluffs of the coastlines of Michigan and Wisconsin, although these data were never formally published. The field surveys mentioned above utilized the standard technique of surveying lines from a fixed position (such as a road, house, or tree) to the bluff edge (fig. 1). In this method, lines are surveyed either perpendicular to the cliff edge, or sited along the edge of a structure to the cliff edge (fig. 1). More recently, Miller and Aubrey (1981) in Cape Cod, and Buckler and Winters (1981) along Lake Michigan, to name a few, surveyed the top cliff edge as measured from a fixed position. Miller and Aubrey (1981) extended their transects to include profiles of the cliff face.
The Measurement and Interpretation of Coastal Cliff and Bluff Retreat
By Cheryl J. Hapke
U.S. Geological Survey Professional Paper 1693
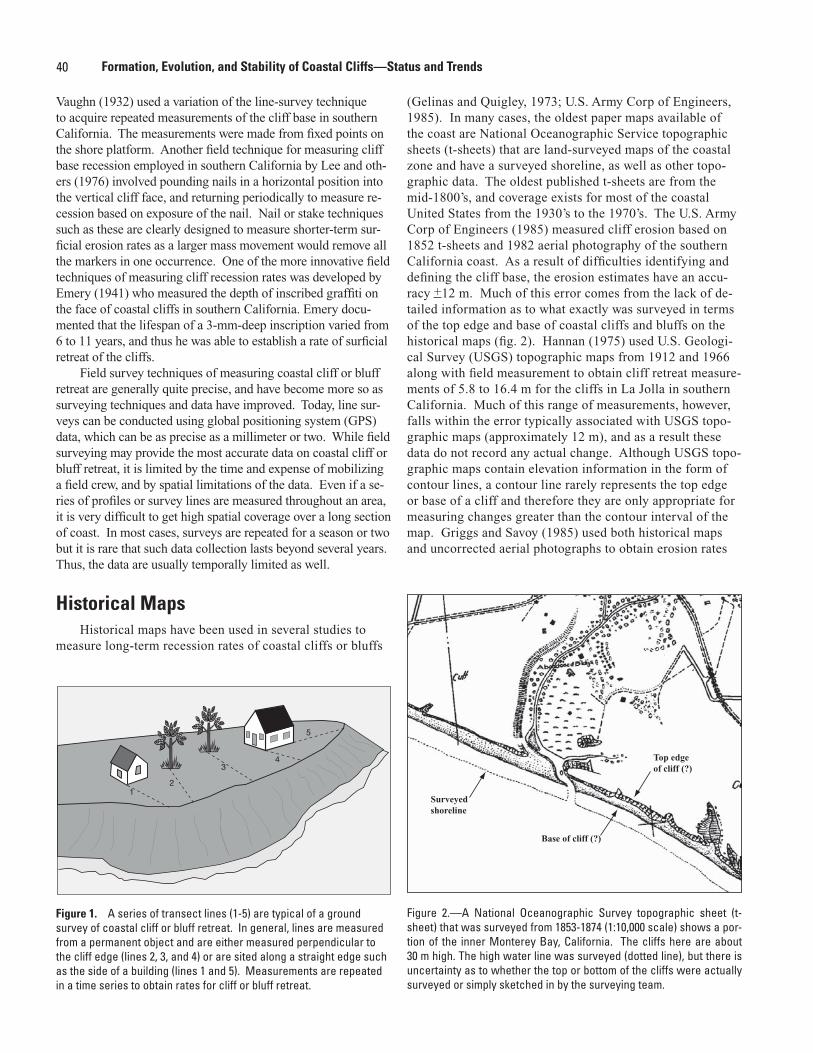
40 Formation, Evolution, and Stability of Coastal Cliffs—Status and Trends
Vaughn (1932) used a variation of the line-survey technique to acquire repeated measurements of the cliff base in southern California. The measurements were made from fixed points on the shore platform. Another field technique for measuring cliff base recession employed in southern California by Lee and oth-ers (1976) involved pounding nails in a horizontal position into the vertical cliff face, and returning periodically to measure re-cession based on exposure of the nail. Nail or stake techniques such as these are clearly designed to measure shorter-term sur-ficial erosion rates as a larger mass movement would remove all the markers in one occurrence. One of the more innovative field techniques of measuring cliff recession rates was developed by Emery (1941) who measured the depth of inscribed graffiti on the face of coastal cliffs in southern California. Emery docu-mented that the lifespan of a 3-mm-deep inscription varied from 6 to 11 years, and thus he was able to establish a rate of surficial retreat of the cliffs.
Field survey techniques of measuring coastal cliff or bluff retreat are generally quite precise, and have become more so as surveying techniques and data have improved. Today, line sur-veys can be conducted using global positioning system (GPS) data, which can be as precise as a millimeter or two. While field surveying may provide the most accurate data on coastal cliff or bluff retreat, it is limited by the time and expense of mobilizing a field crew, and by spatial limitations of the data. Even if a se-ries of profiles or survey lines are measured throughout an area, it is very difficult to get high spatial coverage over a long section of coast. In most cases, surveys are repeated for a season or two but it is rare that such data collection lasts beyond several years. Thus, the data are usually temporally limited as well.
Historical MapsHistorical maps have been used in several studies to
measure long-term recession rates of coastal cliffs or bluffs
(Gelinas and Quigley, 1973; U.S. Army Corp of Engineers, 1985). In many cases, the oldest paper maps available of the coast are National Oceanographic Service topographic sheets (t-sheets) that are land-surveyed maps of the coastal zone and have a surveyed shoreline, as well as other topo-graphic data. The oldest published t-sheets are from the mid-1800’s, and coverage exists for most of the coastal United States from the 1930’s to the 1970’s. The U.S. Army Corp of Engineers (1985) measured cliff erosion based on 1852 t-sheets and 1982 aerial photography of the southern California coast. As a result of difficulties identifying and defining the cliff base, the erosion estimates have an accu-racy +12 m. Much of this error comes from the lack of de-tailed information as to what exactly was surveyed in terms of the top edge and base of coastal cliffs and bluffs on the historical maps (fig. 2). Hannan (1975) used U.S. Geologi-cal Survey (USGS) topographic maps from 1912 and 1966 along with field measurement to obtain cliff retreat measure-ments of 5.8 to 16.4 m for the cliffs in La Jolla in southern California. Much of this range of measurements, however, falls within the error typically associated with USGS topo-graphic maps (approximately 12 m), and as a result these data do not record any actual change. Although USGS topo-graphic maps contain elevation information in the form of contour lines, a contour line rarely represents the top edge or base of a cliff and therefore they are only appropriate for measuring changes greater than the contour interval of the map. Griggs and Savoy (1985) used both historical maps and uncorrected aerial photographs to obtain erosion rates
12
34
5
Figure 1. A series of transect lines (1-5) are typical of a ground survey of coastal cliff or bluff retreat. In general, lines are measured from a permanent object and are either measured perpendicular to the cliff edge (lines 2, 3, and 4) or are sited along a straight edge such as the side of a building (lines 1 and 5). Measurements are repeated in a time series to obtain rates for cliff or bluff retreat.
Surveyed shoreline
Base of cliff (?)
Top edgeof cliff (?)
Figure 2.—A National Oceanographic Survey topographic sheet (t-sheet) that was surveyed from 1853-1874 (1:10,000 scale) shows a por-tion of the inner Monterey Bay, California. The cliffs here are about 30 m high. The high water line was surveyed (dotted line), but there is uncertainty as to whether the top or bottom of the cliffs were actually surveyed or simply sketched in by the surveying team.
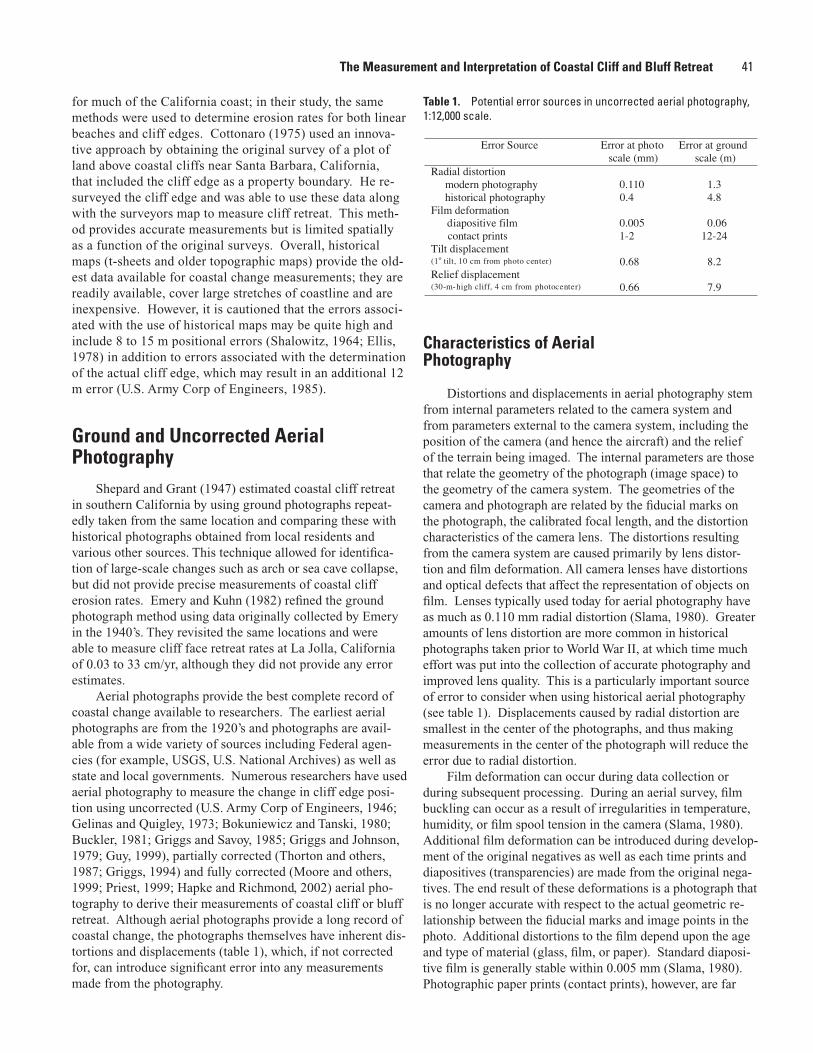
41
for much of the California coast; in their study, the same methods were used to determine erosion rates for both linear beaches and cliff edges. Cottonaro (1975) used an innova-tive approach by obtaining the original survey of a plot of land above coastal cliffs near Santa Barbara, California, that included the cliff edge as a property boundary. He re-surveyed the cliff edge and was able to use these data along with the surveyors map to measure cliff retreat. This meth-od provides accurate measurements but is limited spatially as a function of the original surveys. Overall, historical maps (t-sheets and older topographic maps) provide the old-est data available for coastal change measurements; they are readily available, cover large stretches of coastline and are inexpensive. However, it is cautioned that the errors associ-ated with the use of historical maps may be quite high and include 8 to 15 m positional errors (Shalowitz, 1964; Ellis, 1978) in addition to errors associated with the determination of the actual cliff edge, which may result in an additional 12 m error (U.S. Army Corp of Engineers, 1985).
Ground and Uncorrected Aerial Photography
Shepard and Grant (1947) estimated coastal cliff retreat in southern California by using ground photographs repeat-edly taken from the same location and comparing these with historical photographs obtained from local residents and various other sources. This technique allowed for identifica-tion of large-scale changes such as arch or sea cave collapse, but did not provide precise measurements of coastal cliff erosion rates. Emery and Kuhn (1982) refined the ground photograph method using data originally collected by Emery in the 1940’s. They revisited the same locations and were able to measure cliff face retreat rates at La Jolla, California of 0.03 to 33 cm/yr, although they did not provide any error estimates.
Aerial photographs provide the best complete record of coastal change available to researchers. The earliest aerial photographs are from the 1920’s and photographs are avail-able from a wide variety of sources including Federal agen-cies (for example, USGS, U.S. National Archives) as well as state and local governments. Numerous researchers have used aerial photography to measure the change in cliff edge posi-tion using uncorrected (U.S. Army Corp of Engineers, 1946; Gelinas and Quigley, 1973; Bokuniewicz and Tanski, 1980; Buckler, 1981; Griggs and Savoy, 1985; Griggs and Johnson, 1979; Guy, 1999), partially corrected (Thorton and others, 1987; Griggs, 1994) and fully corrected (Moore and others, 1999; Priest, 1999; Hapke and Richmond, 2002) aerial pho-tography to derive their measurements of coastal cliff or bluff retreat. Although aerial photographs provide a long record of coastal change, the photographs themselves have inherent dis-tortions and displacements (table 1), which, if not corrected for, can introduce significant error into any measurements made from the photography.
Characteristics of Aerial Photography
Distortions and displacements in aerial photography stem from internal parameters related to the camera system and from parameters external to the camera system, including the position of the camera (and hence the aircraft) and the relief of the terrain being imaged. The internal parameters are those that relate the geometry of the photograph (image space) to the geometry of the camera system. The geometries of the camera and photograph are related by the fiducial marks on the photograph, the calibrated focal length, and the distortion characteristics of the camera lens. The distortions resulting from the camera system are caused primarily by lens distor-tion and film deformation. All camera lenses have distortions and optical defects that affect the representation of objects on film. Lenses typically used today for aerial photography have as much as 0.110 mm radial distortion (Slama, 1980). Greater amounts of lens distortion are more common in historical photographs taken prior to World War II, at which time much effort was put into the collection of accurate photography and improved lens quality. This is a particularly important source of error to consider when using historical aerial photography (see table 1). Displacements caused by radial distortion are smallest in the center of the photographs, and thus making measurements in the center of the photograph will reduce the error due to radial distortion.
Film deformation can occur during data collection or during subsequent processing. During an aerial survey, film buckling can occur as a result of irregularities in temperature, humidity, or film spool tension in the camera (Slama, 1980). Additional film deformation can be introduced during develop-ment of the original negatives as well as each time prints and diapositives (transparencies) are made from the original nega-tives. The end result of these deformations is a photograph that is no longer accurate with respect to the actual geometric re-lationship between the fiducial marks and image points in the photo. Additional distortions to the film depend upon the age and type of material (glass, film, or paper). Standard diaposi-tive film is generally stable within 0.005 mm (Slama, 1980). Photographic paper prints (contact prints), however, are far
Table 1. Potential error sources in uncorrected aerial photography, 1:12,000 scale.
The Measurement and Interpretation of Coastal Cliff and Bluff Retreat
Error Source Error at photoscale (mm)
Error at groundscale (m)
Radial distortion modern photography historical photography
0.1100.4
1.34.8
Film deformation diapositive film contact prints
0.0051-2
0.0612-24
Tilt displacement(1o tilt, 10 cm from photo center) 0.68 8.2Relief displacement(30-m-high cliff, 4 cm from photocenter) 0.66 7.9

42 Formation, Evolution, and Stability of Coastal Cliffs—Status and Trends
less stable and can change in size from 1 to 3 percent dur-ing processing alone (Slama, 1980; Wolf and Dewitt, 2000). Thieler and Danforth (1994) found 1-2 mm of shrinkage or expansion in contact prints due to age and paper quality. For aerial photographs at a scale of 1:12,000, this can result in er-rors of 12 to 24 m (table 1).
The parameters external to the camera system that can cause points on film to be displaced from their true position are primarily related to tilt displacement and relief displace-ment. Atmospheric displacement can also occur, although it is only of concern in high-altitude aerial photography which is not commonly used for measuring coastal cliff erosion.
Tilt displacement occurs as a result of changes in the atti-tude of the aerial camera during the collection of photography. The aircraft carrying the camera can easily deviate from being exactly level; the result is a difference in scale across the pho-tograph (see Leatherman, 1983; Moore, 2000). Some degree of tilt is always present in an aerial photograph, and can pro-duce significant errors (10 to 20 m), even with a tilt as small as 1 to 2o (table 1) (Anders and Byrnes, 1991).
Relief displacement is caused by changes in ground eleva-tion or objects (such as buildings) within a photo such that ob-jects that are closer to the camera are larger (at a larger scale) than those farther away. The result is a shift in the position of an object relative to the elevation of the object above a datum (for example, mean sea level). Relief distortion is a function of the height of an object, the distance of the object from the center of the photograph, and the flying height (and thus scale) of the photography (Slama, 1980; Wolf and Dewitt, 2000). For example, the relief displacement of the edge of a 30-m-high cliff located 4 cm (in image space) from the center of a photo-graph on a 1:12,000 scale photograph is 7.9 m (table 1). Al-though relief displacement may be negligible along low relief coasts, it can be a significant source of error when measuring change along coastal cliffs and bluffs, and must be accounted for either by elimination with photogrammmetric processing or incorporation in an error analysis.
Rectified Aerial PhotographyThe science of modern photogrammetry has been used
for years to remove the inherent distortions and displacements in aerial photographs in order to make accurate measurements from the corrected photographs. The first airplane flight to collect aerial photographs for mapping was in 1913 (Wolf and Dewitt, 2000). The use of photogrammetry to produce ac-curate maps escalated during World War II, and advancements in instrumentation and technologies have continued at a rapid pace ever since.
Although full orthorectification processing of aerial pho-tography is required to remove all distortions and displace-ments from aerial photography, the time and cost of such pro-cessing can overwhelm a project. Numerous researchers have instead developed methods to partially rectify photography in coastal cliff and bluff erosion studies, which lessens the er-
rors associated with the photography but does not completely remove them.
Leatherman (1983) developed a single-frame resection technique called “metric mapping” that removes radial distor-tion and tilt displacement from aerial photography but does not account for relief displacement. Although metric mapping was applied primarily to low-relief coasts, extensive mapping of coastal bluffs in Massachusetts was conducted using this method (Leatherman, 1983). Griggs and Johnson (1979), Thorton and others (1987), and Griggs (1994) used compara-tors to assess coastal cliff retreat in central California. Thorton and others (1987) employed a stereocomparator to minimize tilt and relief displacement on aerial photographs of the cliffs in Monterey Bay. This method incorporates surveyed ground control points and stereo visualization to accurately adjust for scale differences within a single photograph in the area of interest on the photograph. The result is accurate but requires a large number of ground control points per stereo pair, thus requiring a substantial amount of field work. Griggs and Johnson (1979) and Griggs (1994) utilized a monocompara-tor to measure a time series of coastal cliff retreat in Santa Cruz. A monocomparator allows a user to measure the dis-tance between two points on maps or photographs of different scales. This technique requires some field data from which the maps or photographs are scaled, but it does not adjust the photographs for any relief or tilt displacement, nor does it ac-commodate for film or radial distortions. This technique can be precise, although not highly accurate, for measuring coastal cliff retreat. It can, however, quickly provide information on relative change. Comparators are no longer widely used for photo-interpretation applications.
Digital Stereo Photogrammetry, Lidar, Digital Terrain Models, and GIS
Over the past several decades digital photogrammetry, lidar and geographical information systems (GIS) techniques have found widespread application among coastal researchers. Digital photogrammetry is currently the most accurate method of determining coastal cliff and bluff retreat from aerial photo-graphs, but it is also relatively expensive and time consuming. Lidar is increasingly being used to document coastal change (Sallenger and others, 1999), but has not yet been widely ap-plied to coastal cliff and bluff erosion studies. Sallenger and others (2002) measured coastal cliff retreat from profiles ex-tracted from lidar data, and correlated the cliff retreat to beach elevation. Like digital photogrammetry, lidar is capable of pro-viding accurate topographic information and has an advantage in that data are easily collected over large portions of the coast, but it is still quite expensive. Both digital photogrammetry and lidar provide data that can be used to produce 3-dimen-sional digital terrain models (DTMs) of the coast. These mod-els can then be incorporated into GIS to perform any number of spatial and temporal analyses.
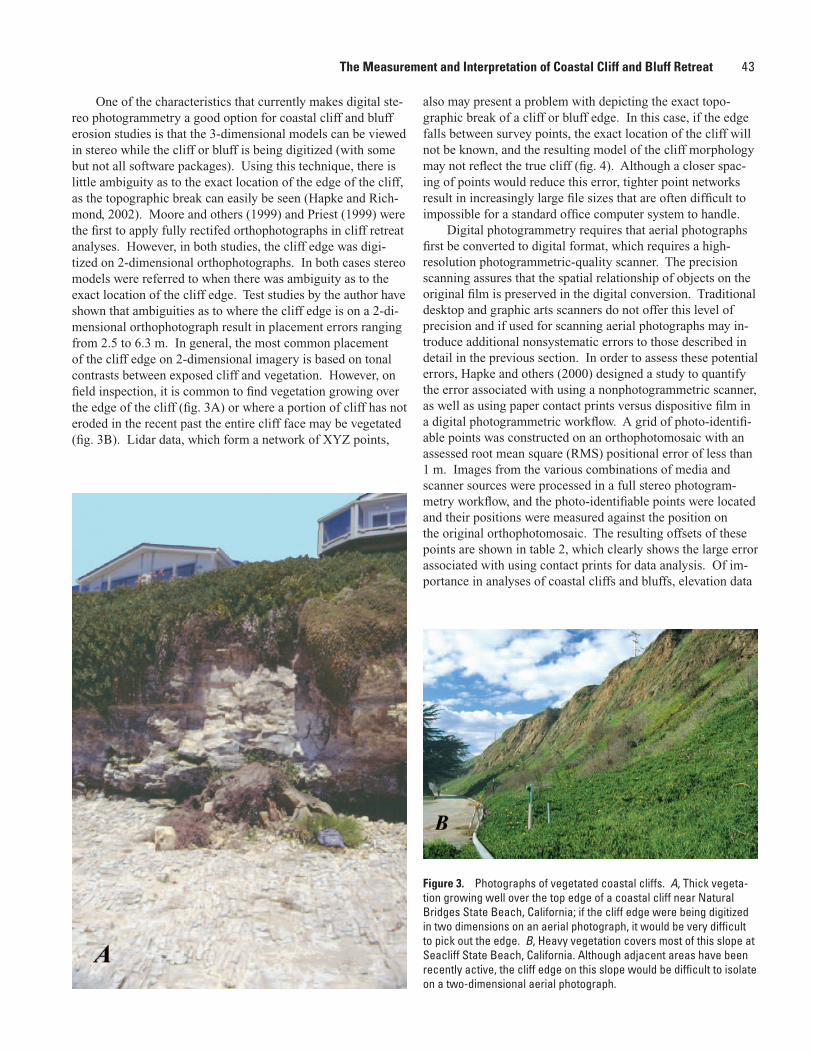
43
One of the characteristics that currently makes digital ste-reo photogrammetry a good option for coastal cliff and bluff erosion studies is that the 3-dimensional models can be viewed in stereo while the cliff or bluff is being digitized (with some but not all software packages). Using this technique, there is little ambiguity as to the exact location of the edge of the cliff, as the topographic break can easily be seen (Hapke and Rich-mond, 2002). Moore and others (1999) and Priest (1999) were the first to apply fully rectifed orthophotographs in cliff retreat analyses. However, in both studies, the cliff edge was digi-tized on 2-dimensional orthophotographs. In both cases stereo models were referred to when there was ambiguity as to the exact location of the cliff edge. Test studies by the author have shown that ambiguities as to where the cliff edge is on a 2-di-mensional orthophotograph result in placement errors ranging from 2.5 to 6.3 m. In general, the most common placement of the cliff edge on 2-dimensional imagery is based on tonal contrasts between exposed cliff and vegetation. However, on field inspection, it is common to find vegetation growing over the edge of the cliff (fig. 3A) or where a portion of cliff has not eroded in the recent past the entire cliff face may be vegetated (fig. 3B). Lidar data, which form a network of XYZ points,
also may present a problem with depicting the exact topo-graphic break of a cliff or bluff edge. In this case, if the edge falls between survey points, the exact location of the cliff will not be known, and the resulting model of the cliff morphology may not reflect the true cliff (fig. 4). Although a closer spac-ing of points would reduce this error, tighter point networks result in increasingly large file sizes that are often difficult to impossible for a standard office computer system to handle.
Digital photogrammetry requires that aerial photographs first be converted to digital format, which requires a high-resolution photogrammetric-quality scanner. The precision scanning assures that the spatial relationship of objects on the original film is preserved in the digital conversion. Traditional desktop and graphic arts scanners do not offer this level of precision and if used for scanning aerial photographs may in-troduce additional nonsystematic errors to those described in detail in the previous section. In order to assess these potential errors, Hapke and others (2000) designed a study to quantify the error associated with using a nonphotogrammetric scanner, as well as using paper contact prints versus dispositive film in a digital photogrammetric workflow. A grid of photo-identifi-able points was constructed on an orthophotomosaic with an assessed root mean square (RMS) positional error of less than 1 m. Images from the various combinations of media and scanner sources were processed in a full stereo photogram-metry workflow, and the photo-identifiable points were located and their positions were measured against the position on the original orthophotomosaic. The resulting offsets of these points are shown in table 2, which clearly shows the large error associated with using contact prints for data analysis. Of im-portance in analyses of coastal cliffs and bluffs, elevation data
Figure 3. Photographs of vegetated coastal cliffs. A, Thick vegeta-tion growing well over the top edge of a coastal cliff near Natural Bridges State Beach, California; if the cliff edge were being digitized in two dimensions on an aerial photograph, it would be very difficult to pick out the edge. B, Heavy vegetation covers most of this slope at Seacliff State Beach, California. Although adjacent areas have been recently active, the cliff edge on this slope would be difficult to isolate on a two-dimensional aerial photograph.
The Measurement and Interpretation of Coastal Cliff and Bluff Retreat
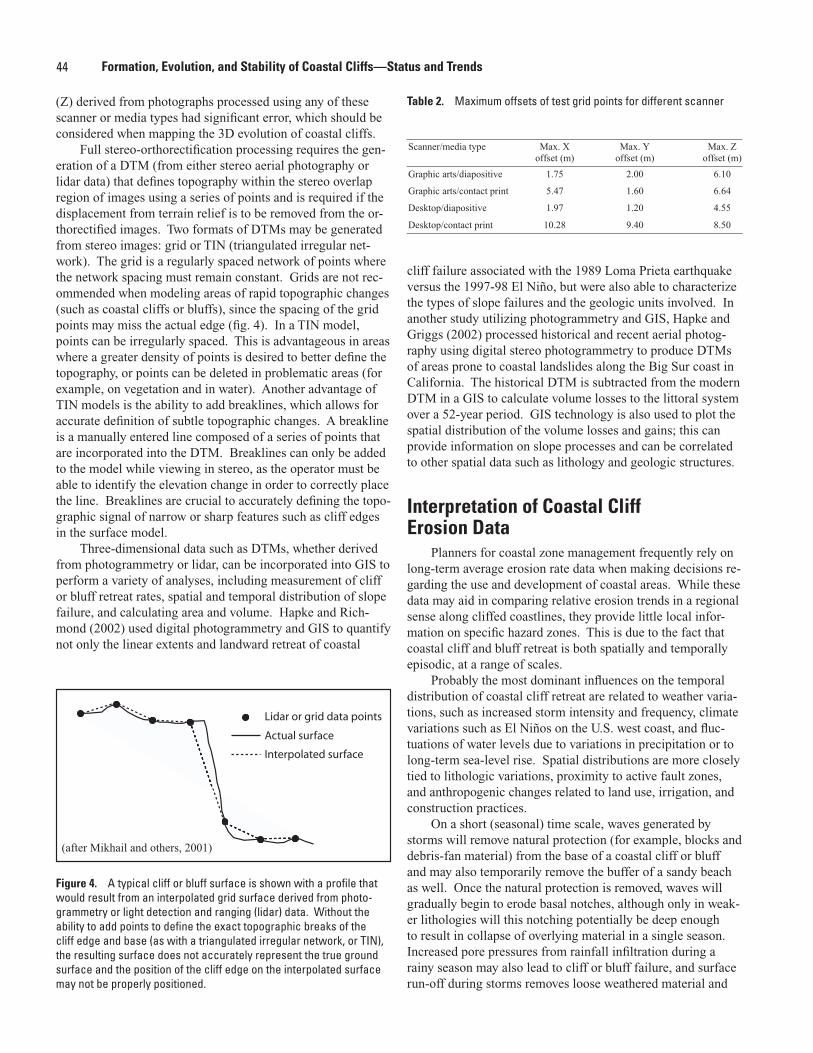
44 Formation, Evolution, and Stability of Coastal Cliffs—Status and Trends
(Z) derived from photographs processed using any of these scanner or media types had significant error, which should be considered when mapping the 3D evolution of coastal cliffs.
Full stereo-orthorectification processing requires the gen-eration of a DTM (from either stereo aerial photography or lidar data) that defines topography within the stereo overlap region of images using a series of points and is required if the displacement from terrain relief is to be removed from the or-thorectified images. Two formats of DTMs may be generated from stereo images: grid or TIN (triangulated irregular net-work). The grid is a regularly spaced network of points where the network spacing must remain constant. Grids are not rec-ommended when modeling areas of rapid topographic changes (such as coastal cliffs or bluffs), since the spacing of the grid points may miss the actual edge (fig. 4). In a TIN model, points can be irregularly spaced. This is advantageous in areas where a greater density of points is desired to better define the topography, or points can be deleted in problematic areas (for example, on vegetation and in water). Another advantage of TIN models is the ability to add breaklines, which allows for accurate definition of subtle topographic changes. A breakline is a manually entered line composed of a series of points that are incorporated into the DTM. Breaklines can only be added to the model while viewing in stereo, as the operator must be able to identify the elevation change in order to correctly place the line. Breaklines are crucial to accurately defining the topo-graphic signal of narrow or sharp features such as cliff edges in the surface model.
Three-dimensional data such as DTMs, whether derived from photogrammetry or lidar, can be incorporated into GIS to perform a variety of analyses, including measurement of cliff or bluff retreat rates, spatial and temporal distribution of slope failure, and calculating area and volume. Hapke and Rich-mond (2002) used digital photogrammetry and GIS to quantify not only the linear extents and landward retreat of coastal
cliff failure associated with the 1989 Loma Prieta earthquake versus the 1997-98 El Niño, but were also able to characterize the types of slope failures and the geologic units involved. In another study utilizing photogrammetry and GIS, Hapke and Griggs (2002) processed historical and recent aerial photog-raphy using digital stereo photogrammetry to produce DTMs of areas prone to coastal landslides along the Big Sur coast in California. The historical DTM is subtracted from the modern DTM in a GIS to calculate volume losses to the littoral system over a 52-year period. GIS technology is also used to plot the spatial distribution of the volume losses and gains; this can provide information on slope processes and can be correlated to other spatial data such as lithology and geologic structures.
Interpretation of Coastal Cliff Erosion Data
Planners for coastal zone management frequently rely on long-term average erosion rate data when making decisions re-garding the use and development of coastal areas. While these data may aid in comparing relative erosion trends in a regional sense along cliffed coastlines, they provide little local infor-mation on specific hazard zones. This is due to the fact that coastal cliff and bluff retreat is both spatially and temporally episodic, at a range of scales.
Probably the most dominant influences on the temporal distribution of coastal cliff retreat are related to weather varia-tions, such as increased storm intensity and frequency, climate variations such as El Niños on the U.S. west coast, and fluc-tuations of water levels due to variations in precipitation or to long-term sea-level rise. Spatial distributions are more closely tied to lithologic variations, proximity to active fault zones, and anthropogenic changes related to land use, irrigation, and construction practices.
On a short (seasonal) time scale, waves generated by storms will remove natural protection (for example, blocks and debris-fan material) from the base of a coastal cliff or bluff and may also temporarily remove the buffer of a sandy beach as well. Once the natural protection is removed, waves will gradually begin to erode basal notches, although only in weak-er lithologies will this notching potentially be deep enough to result in collapse of overlying material in a single season. Increased pore pressures from rainfall infiltration during a rainy season may also lead to cliff or bluff failure, and surface run-off during storms removes loose weathered material and
Table 2. Maximum offsets of test grid points for different scanner
Scanner/media type Max. Xoffset (m)
Max. Yoffset (m)
Max. Zoffset (m)
Graphic arts/diapositive 1.75 2.00 6.10
Graphic arts/contact print 5.47 1.60 6.64
Desktop/diapositive 1.97 1.20 4.55
Desktop/contact print 10.28 9.40 8.50
Figure 4. A typical cliff or bluff surface is shown with a profile that would result from an interpolated grid surface derived from photo-grammetry or light detection and ranging (lidar) data. Without the ability to add points to define the exact topographic breaks of the cliff edge and base (as with a triangulated irregular network, or TIN), the resulting surface does not accurately represent the true ground surface and the position of the cliff edge on the interpolated surface may not be properly positioned.
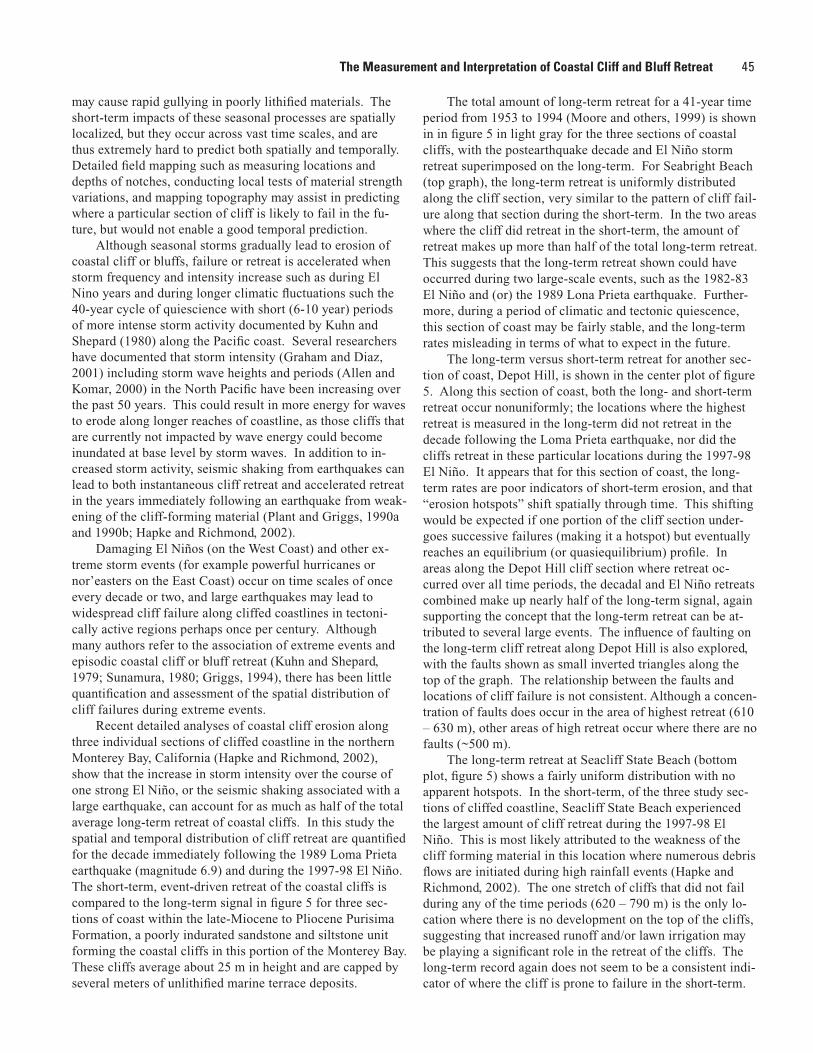
45
may cause rapid gullying in poorly lithified materials. The short-term impacts of these seasonal processes are spatially localized, but they occur across vast time scales, and are thus extremely hard to predict both spatially and temporally. Detailed field mapping such as measuring locations and depths of notches, conducting local tests of material strength variations, and mapping topography may assist in predicting where a particular section of cliff is likely to fail in the fu-ture, but would not enable a good temporal prediction.
Although seasonal storms gradually lead to erosion of coastal cliff or bluffs, failure or retreat is accelerated when storm frequency and intensity increase such as during El Nino years and during longer climatic fluctuations such the 40-year cycle of quiescience with short (6-10 year) periods of more intense storm activity documented by Kuhn and Shepard (1980) along the Pacific coast. Several researchers have documented that storm intensity (Graham and Diaz, 2001) including storm wave heights and periods (Allen and Komar, 2000) in the North Pacific have been increasing over the past 50 years. This could result in more energy for waves to erode along longer reaches of coastline, as those cliffs that are currently not impacted by wave energy could become inundated at base level by storm waves. In addition to in-creased storm activity, seismic shaking from earthquakes can lead to both instantaneous cliff retreat and accelerated retreat in the years immediately following an earthquake from weak-ening of the cliff-forming material (Plant and Griggs, 1990a and 1990b; Hapke and Richmond, 2002).
Damaging El Niños (on the West Coast) and other ex-treme storm events (for example powerful hurricanes or nor’easters on the East Coast) occur on time scales of once every decade or two, and large earthquakes may lead to widespread cliff failure along cliffed coastlines in tectoni-cally active regions perhaps once per century. Although many authors refer to the association of extreme events and episodic coastal cliff or bluff retreat (Kuhn and Shepard, 1979; Sunamura, 1980; Griggs, 1994), there has been little quantification and assessment of the spatial distribution of cliff failures during extreme events.
Recent detailed analyses of coastal cliff erosion along three individual sections of cliffed coastline in the northern Monterey Bay, California (Hapke and Richmond, 2002), show that the increase in storm intensity over the course of one strong El Niño, or the seismic shaking associated with a large earthquake, can account for as much as half of the total average long-term retreat of coastal cliffs. In this study the spatial and temporal distribution of cliff retreat are quantified for the decade immediately following the 1989 Loma Prieta earthquake (magnitude 6.9) and during the 1997-98 El Niño. The short-term, event-driven retreat of the coastal cliffs is compared to the long-term signal in figure 5 for three sec-tions of coast within the late-Miocene to Pliocene Purisima Formation, a poorly indurated sandstone and siltstone unit forming the coastal cliffs in this portion of the Monterey Bay. These cliffs average about 25 m in height and are capped by several meters of unlithified marine terrace deposits.
The total amount of long-term retreat for a 41-year time period from 1953 to 1994 (Moore and others, 1999) is shown in in figure 5 in light gray for the three sections of coastal cliffs, with the postearthquake decade and El Niño storm retreat superimposed on the long-term. For Seabright Beach (top graph), the long-term retreat is uniformly distributed along the cliff section, very similar to the pattern of cliff fail-ure along that section during the short-term. In the two areas where the cliff did retreat in the short-term, the amount of retreat makes up more than half of the total long-term retreat. This suggests that the long-term retreat shown could have occurred during two large-scale events, such as the 1982-83 El Niño and (or) the 1989 Lona Prieta earthquake. Further-more, during a period of climatic and tectonic quiescence, this section of coast may be fairly stable, and the long-term rates misleading in terms of what to expect in the future.
The long-term versus short-term retreat for another sec-tion of coast, Depot Hill, is shown in the center plot of figure 5. Along this section of coast, both the long- and short-term retreat occur nonuniformly; the locations where the highest retreat is measured in the long-term did not retreat in the decade following the Loma Prieta earthquake, nor did the cliffs retreat in these particular locations during the 1997-98 El Niño. It appears that for this section of coast, the long-term rates are poor indicators of short-term erosion, and that “erosion hotspots” shift spatially through time. This shifting would be expected if one portion of the cliff section under-goes successive failures (making it a hotspot) but eventually reaches an equilibrium (or quasiequilibrium) profile. In areas along the Depot Hill cliff section where retreat oc-curred over all time periods, the decadal and El Niño retreats combined make up nearly half of the long-term signal, again supporting the concept that the long-term retreat can be at-tributed to several large events. The influence of faulting on the long-term cliff retreat along Depot Hill is also explored, with the faults shown as small inverted triangles along the top of the graph. The relationship between the faults and locations of cliff failure is not consistent. Although a concen-tration of faults does occur in the area of highest retreat (610 – 630 m), other areas of high retreat occur where there are no faults (~500 m).
The long-term retreat at Seacliff State Beach (bottom plot, figure 5) shows a fairly uniform distribution with no apparent hotspots. In the short-term, of the three study sec-tions of cliffed coastline, Seacliff State Beach experienced the largest amount of cliff retreat during the 1997-98 El Niño. This is most likely attributed to the weakness of the cliff forming material in this location where numerous debris flows are initiated during high rainfall events (Hapke and Richmond, 2002). The one stretch of cliffs that did not fail during any of the time periods (620 – 790 m) is the only lo-cation where there is no development on the top of the cliffs, suggesting that increased runoff and/or lawn irrigation may be playing a significant role in the retreat of the cliffs. The long-term record again does not seem to be a consistent indi-cator of where the cliff is prone to failure in the short-term.
The Measurement and Interpretation of Coastal Cliff and Bluff Retreat
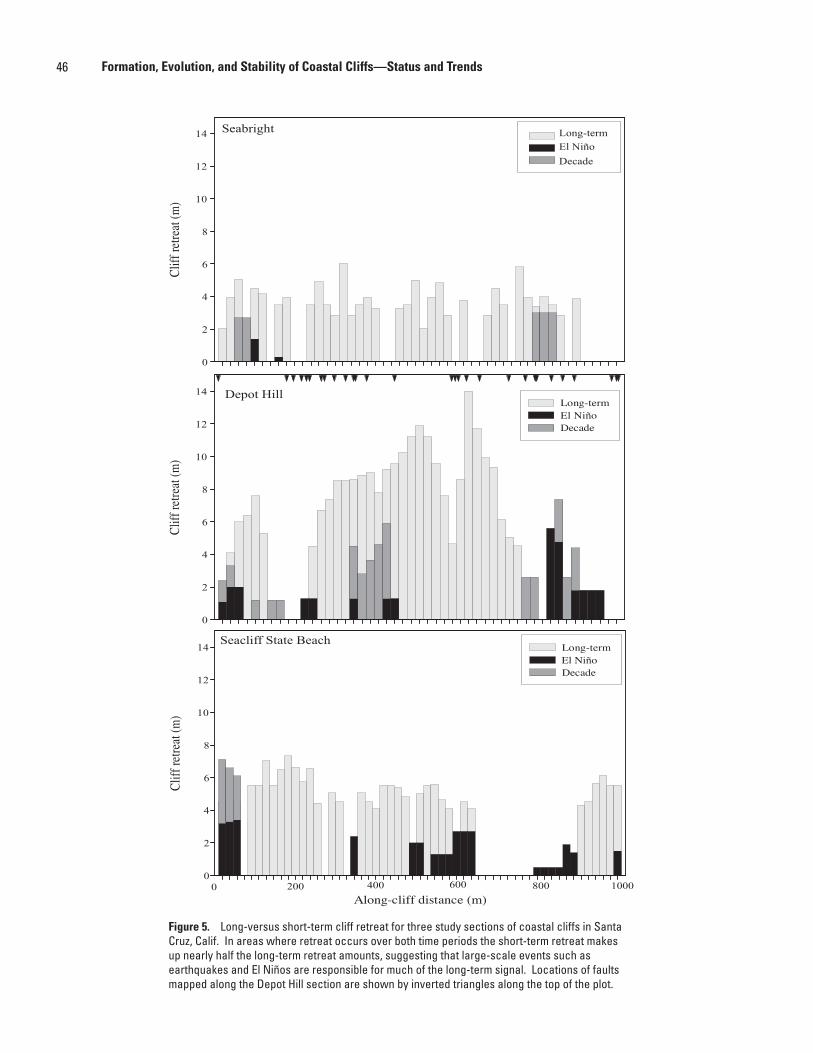
46 Formation, Evolution, and Stability of Coastal Cliffs—Status and Trends
Cliffretreat(m)
0
2
4
6
8
10
12
14
Decade
El NiñoLong-termSeabright
Along-cliff distance (m)
Cliffretreat(m)
0
2
4
6
8
10
12
14
0 200 400 600 800 1000
Seacliff State BeachLong-termEl NiñoDecade
Cliff
retrea
t(m)
0
2
4
6
8
10
12
14Long-termEl NiñoDecade
Depot Hill
Figure 5. Long-versus short-term cliff retreat for three study sections of coastal cliffs in Santa Cruz, Calif. In areas where retreat occurs over both time periods the short-term retreat makes up nearly half the long-term retreat amounts, suggesting that large-scale events such as earthquakes and El Niños are responsible for much of the long-term signal. Locations of faults mapped along the Depot Hill section are shown by inverted triangles along the top of the plot.
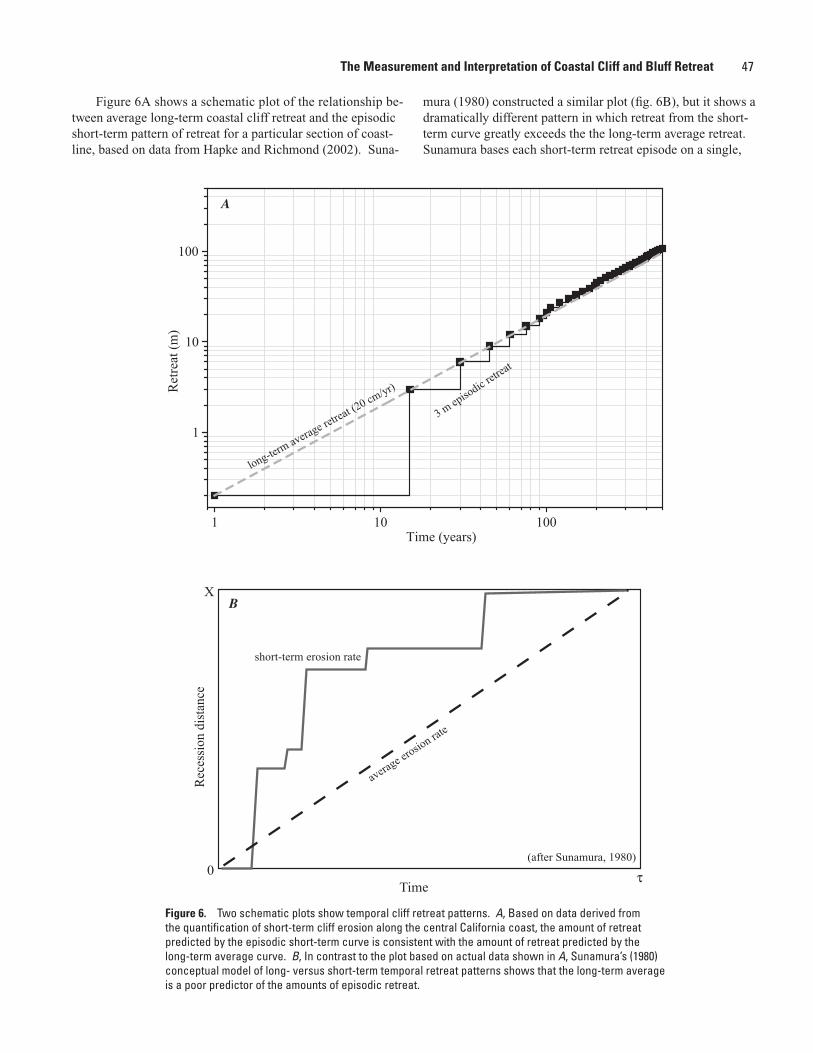
47
Figure 6A shows a schematic plot of the relationship be-tween average long-term coastal cliff retreat and the episodic short-term pattern of retreat for a particular section of coast-line, based on data from Hapke and Richmond (2002). Suna-
mura (1980) constructed a similar plot (fig. 6B), but it shows a dramatically different pattern in which retreat from the short-term curve greatly exceeds the the long-term average retreat. Sunamura bases each short-term retreat episode on a single,
Figure 6. Two schematic plots show temporal cliff retreat patterns. A, Based on data derived from the quantification of short-term cliff erosion along the central California coast, the amount of retreat predicted by the episodic short-term curve is consistent with the amount of retreat predicted by the long-term average curve. B, In contrast to the plot based on actual data shown in A, Sunamura’s (1980) conceptual model of long- versus short-term temporal retreat patterns shows that the long-term average is a poor predictor of the amounts of episodic retreat.
1 10 100
A
1
10
100
long-term average retreat (20 cm/yr)
3 m ep
isodic r
etreat
Time (years)
Ret
reat
(m
)
Rec
essi
on d
ista
nce
0Time
τ
X
average e
rosion ra
te
short-term erosion rate
(after Sunamura, 1980)
B
The Measurement and Interpretation of Coastal Cliff and Bluff Retreat
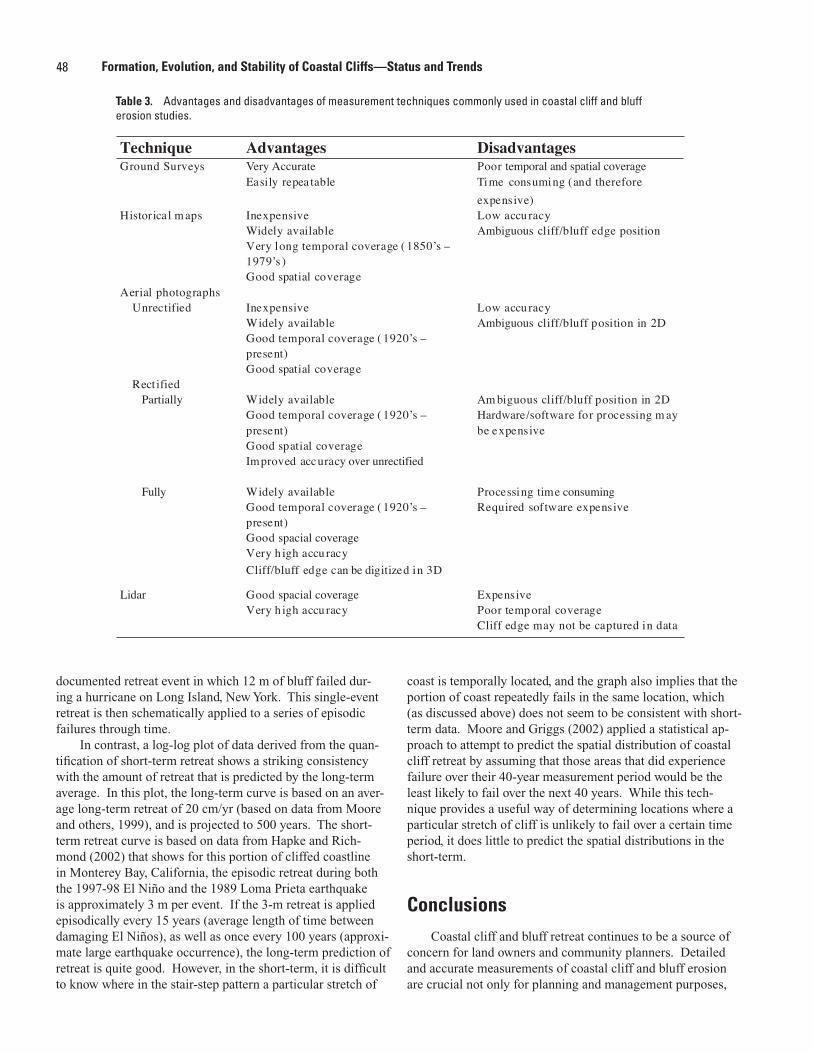
48 Formation, Evolution, and Stability of Coastal Cliffs—Status and Trends
documented retreat event in which 12 m of bluff failed dur-ing a hurricane on Long Island, New York. This single-event retreat is then schematically applied to a series of episodic failures through time.
In contrast, a log-log plot of data derived from the quan-tification of short-term retreat shows a striking consistency with the amount of retreat that is predicted by the long-term average. In this plot, the long-term curve is based on an aver-age long-term retreat of 20 cm/yr (based on data from Moore and others, 1999), and is projected to 500 years. The short-term retreat curve is based on data from Hapke and Rich-mond (2002) that shows for this portion of cliffed coastline in Monterey Bay, California, the episodic retreat during both the 1997-98 El Niño and the 1989 Loma Prieta earthquake is approximately 3 m per event. If the 3-m retreat is applied episodically every 15 years (average length of time between damaging El Niños), as well as once every 100 years (approxi-mate large earthquake occurrence), the long-term prediction of retreat is quite good. However, in the short-term, it is difficult to know where in the stair-step pattern a particular stretch of
coast is temporally located, and the graph also implies that the portion of coast repeatedly fails in the same location, which (as discussed above) does not seem to be consistent with short-term data. Moore and Griggs (2002) applied a statistical ap-proach to attempt to predict the spatial distribution of coastal cliff retreat by assuming that those areas that did experience failure over their 40-year measurement period would be the least likely to fail over the next 40 years. While this tech-nique provides a useful way of determining locations where a particular stretch of cliff is unlikely to fail over a certain time period, it does little to predict the spatial distributions in the short-term.
ConclusionsCoastal cliff and bluff retreat continues to be a source of
concern for land owners and community planners. Detailed and accurate measurements of coastal cliff and bluff erosion are crucial not only for planning and management purposes,
Technique Advantages DisadvantagesGround Surveys Very Accurate
Easily repea tablePoor temporal and spatial coverageTime consuming (and thereforeexpensive)
Historical maps InexpensiveWidely availableVery long temporal coverage ( 1850ʼs –1979ʼs )Good spatial coverage
Low accuracyAmbiguous cliff/bluff edge position
Aerial photographsUnrectified
Rect ified Partially
Fully
InexpensiveWidely availableGood temporal coverage ( 1920ʼs –present)Good spatial coverage
Widely availableGood temporal coverage ( 1920ʼs –present)Good spatial coverageImproved accuracy over unrectified
Widely availableGood temporal coverage ( 1920ʼs –present)Good spacial coverage Very h igh accuracyCliff/bluff edge can be digitized in 3D
Low accuracyAmbiguous cliff/bluff position in 2D
Am biguous cliff/bluff position in 2DHardware/software for processing m aybe expensive
Processing time consumingRequired software expensive
Lidar Good spacial coverageVery h igh accuracy
ExpensivePoor temp oral coverageCliff edge may not be captured in data
Table 3. Advantages and disadvantages of measurement techniques commonly used in coastal cliff and bluff erosion studies.
49
but also to understand the processes of slope failure and the factors that drive failure in any given area. A variety of tech-niques have been developed to calculate cliff and bluff retreat rates, including repeated ground surveys, determining the cliff edge position on historical maps and comparing this with re-cent aerial photography, and state-of-the-art techniques using digital photogrammetry, lidar, and GIS. Each technique has advantages and disadvantages over others (table 3). Research-ers need to assess what spatial coverage and accuracy are required for a particular project and choose a technique that is appropriate. A full error analysis is essential with any quanti-fication of coastal cliff or bluff retreat, and at present this has been largely ignored in the published literature. A substantial amount of the published data on coastal cliff and bluff retreat present values that are more accurate than the error for a par-ticular method. Standard methods of calculating and present-ing error should be developed and utilized by the coastal cliff and bluff research community.
Regardless of the method used to calculate coastal cliff or bluff retreat rates, the interpretation of cliff retreat data poses an additional challenge for researchers and planners. Typically, long-term average erosion rates are derived for a particular stretch of coastline and the erosion pattern is used to determine erosion hotspots and (or) hazard zones. However, quantification of short-term cliff retreat amounts and their spa-tial distribution suggest that areas identified as hotspots in the long-term record are not always good predictors of future re-treat because the zones of rapid erosion shift spatially depend-ing on the current equilibrium state of the particular section of cliff.
Cliff retreat amounts determined by averaging over the long-term appear to be consistent with total retreat that oc-curs episodically during extreme events. Therefore, long-term average erosion rates are valid for determination of how much the cliff will retreat and this is very useful for planning and management purposes. However, the long-term average retreat patterns do not provide information on precisely where and when any given section of cliff will fail in the short-term, and thus short-term hazard prediction using currently implemented techniques is difficult.
References
Allen, J.C., and Komar, P.D., 2000, Long-term and climate-related increases in storm wave heigths in the North Pacific: Eos, Transactions, American Geophysical Union, v. 81, no. 47, p. 561, 566-567.
Anders, F.J., and Byrnes, M.R., 1991, Accuracy of shoreline change rates as determined from maps and aerial photo-graphs: Shore and Beach, v. 59, no. 1, p. 17-26.
Andrews, E., 1870, The North American Lakes as considered as chronometers of post-glacial time: Chicago Academy of Science Transactions, v. 2, p. 1-23.
Bokuniewicz, H., and Tanski, J., 1980, Managed localized erosion of coastal bluffs, in Coastal Zone ’80: v. 3, p.
1883-1899.Buckler, W.R., 1981, Rates and implications of bluff recession
along the Lake Michigan shorezone of Michigan and Wisconsin: Department of Geography, Michigan State University, Ph.D. dissertation.
Buckler, W.R., and Winters, H.A., 1983, Lake Michigan bluff recession: Dept. of Geography, Michigan State Univer-sity, Annals of the Association of American Geographers, v. 73, no. 1, p. 89-110.
Chamberlin, T.C., 1877, Geology of eastern Wisconsin, in Geol-ogy of Wisconsin, survey of 1873-1877: Wisconsin Geo-logical and Natural History Survey, Madison, Wisconsin, p. 93-405.
Cottonaro, W.F., 1975, Sea cliff erosion, Isla Vista, California: California Geology, v. 28, no. 6, p. 140-143.
Dolan, R., Hayden, B., May, P., and May, S., 1980, The reliability of shoreline change measurements from aerial photo-graphs: Shore and Beach, v. 48, no. 4, p. 22-29.
Ellis, M.Y., ed., 1978, Coastal Mapping Handbook: Washington, D.C., U.S. Dept. of Commerce, U.S. Dept. of Interior, 197 p.
Emery, K.O., 1941, Rate of surface retreat of sea cliffs based on dated inscriptions: Science, v. 93, p. 617-618.
Emery, K.O., and Kuhn, G.G., 1982, Sea cliffs—their processes, profiles and classifications: Geological Society of Ameri-can Bulletin, v. 93, p. 644-654.
Gelinas, P.J., and Quigley, R.M., 1973, The influence of geology on erosion rates along the north shore of Lake Erie: Inter-national Association of Great Lakes Research, Proceedings of the Sixteenth Conference, p. 421-430.
Graham, N.E., and Diaz, H.F., 2001, Evidence for intensification of North Pacific winter cyclones since 1948: Bulletin of the American Meteorological Society, v. 82, p. 1869-1893.
Griggs, G.B., 1994, California’s coastal hazards: Journal of Coastal Research, Special Issue 12, p. 1-15.
Griggs, G.B., and Johnson, R.E., 1979, Coastline erosion, Santa Cruz County: California Geology, v. 32, no. 4, p. 67-76.
Griggs, G., and Savoy, L., 1985, Living with the California coast: Durham, North Carolina, Duke University Press, 393 p.
Guy, D.E., Jr., 1999, Erosion hazard area mapping, Lake County, Ohio: Journal of Coastal Research Special Issue 28— Coastal Erosion Mapping and Management, p. 185-196.
Hannan, D.L, 1975, Sea-cliff stability, west of the Marine Biology Building, Scripps Institution of Oceanography, La Jolla, San Diego: Benton Engineering, Project No. 75-9-18F6, 5 p.
Hapke, C.J., and Griggs, G.B., 2002, Long-term volumetric sediment contribution from landslides—Big Sur coastline, California, in Ewing, L., and Wallendorf, L., eds., Solu-tions to Coastal Disasters: San Diego, California, 2002, Conference Proceedings, p. 652-663.
Hapke, C.J., and Richmond, B.M., 2002, The impact of climatic and seismic events on the short-term evolution of seacliffs based on 3-D mapping—Northern Monterey Bay, Califor-nia: Marine Geology, v. 187, no. 3-4, p. 259-278.
Hapke, C., Willis, C., and D’Iorio, M, 2000, Going digital—error
The Measurement and Interpretation of Coastal Cliff and Bluff Retreat
50 Formation, Evolution, and Stability of Coastal Cliffs—Status and Trends
evaluation of media and scanner types for aerial photo-graphic analyses in coastal change studies, in American Shore and Beach Preservation Association Annual Meet-ing, Ka’anapali, Maui, Conference Proceedings.
Kuhn, G.G., and Shepard, F.P., 1979, Accelerated beach-cliff erosion related to unusual storms in southern California: California Geology, v. 32, no. 3, p. 58-59.
Kuhn, G.G., and Shepard, F.P., 1980, Beach processes and sea cliff erosion in San Diego County, California: in CRC Handbook of Coastal Processes and Erosion, p. 267-284.
Leatherman, S.P., 1983, Shoreline mapping—a comparison of techniques: Shore and Beach, v. 51, p. 28-33.
Lee, L., Pinckney, C., and Bemis, Charles, 1976, Sea cliff base erosion: ASCE National Water Resources and Ocean Engineering, San Diego, California, 1976, Conference Proceedings, p. 1-14.
Leverett, F., 1899, The Illinois glacial lobe: U.S. Geological Survey Monograph No. 38, 817 p.
Marindin, H.L., 1889, Encroachment of the sea upon the coast of Cape Cod: U.S. Coast and Geodetic Survey, Annual Report 13, p. 409-457.
Mikhail, E.M., Bethel, J.S., and McGlone, J.C., 2001, Introduc-tion to modern photogrammetry: New York, John Wiley and Sons, 479 p.
Miller, M.C., and Aubrey, D.G., 1981, Beach changes on east-ern Cape Cod, Massachusetts, from Newcomb Hollow to Nauset Inlet, 1970-74: Raleigh, North Carolina, Science Application, Inc.
Moore, L. J., 2000, Shoreline mapping techniques: Journal of Coastal Research, v. 16, p. 111-124.
Moore, L.J., and Griggs, G.B., 2002, Long-term cliff retreat and erosion hotspots along the central shores of the Monterey Bay National Marine Sanctuary: Journal of Coastal Re-search, v. 181, no. 1-3, p. 265-283.
Moore, L.J., Benumof, B.T., and Griggs, G.B., 1999, Coastal ero-sion hazards in Santa Cruz and San Diego counties, Califor-nia: Journal of Coastal Research, Special Issue 28—Coastal Erosion Mapping and Management, p. 121-139.
Plant, N., and Griggs, G.B., 1990a, Coastal landslides caused by the October 17, 1989 earthquake: California Geology, v. 43, no. 4, p. 75-84.
Plant, N., and Griggs, G.B., 1990b, Coastal landslides and the Loma Prieta earthquake: Earth Science, v. 43, no. 3, p. 13-17.
Priest, G.R., 1999, Coastal shoreline change study northern
and central Lincoln County, Oregon: Journal of Coastal Research, Special Issue 28—Coastal Erosion Mapping and Management, p.140-157.
Sallenger, A. H., Krabill, W., Brock, J., Swift, R., Jansen, M., Manizade, S., Richmond, B., Hampton, M., and Eslinger, D., 1999, Airborne laser study quantifies El Niño-induced coastal change: Eos, Transactions, American Geophysical Union, v. 80, p. 89-93.
Sallenger, A. H., Krabill, W., Brock, J., Swift, R., Jansen, M., Manizade, S., and Stockdon, H., 2002, Sea-cliff erosion as a function of beach changes and extreme wave runup during the 1997-98 El Nino: Marine Geology, v. 187, no. 3-4, p. 279-297.
Shalowitz, A.L., 1964, Shore and Sea Boundaries (Vol. 2): U.S. Dept. of Commerce, U.S. Coast and Geodetic Survey, 420 p.
Shepard, F.P., and Grant, U.S. IV, 1947, Wave erosion along the southern California coast: Bulletin of the Geological Society of America, v. 58, p. 919-926.
Slama, C., ed., 1980, Manual of Photogrammetry (4th ed.): Falls Church, Virginia, American Society of Photogrammetry.
Sunamura, T., 1980, Processes of sea cliff and platform erosion: CRC Handbook of Coastal Processes and Erosion, chapter 12, p. 233-265.
Thieler, E. R., and Danforth, W. W., 1994, Historical shoreline mapping (I)—improving techniques and reducing po-sitioning errors: Journal of Coastal Research, v. 10, p. 549-563.
Thorton, E.B., McGee, T., Tucker, S.P., and Burych, D.M., 1987, Predicting erosion on the recessive Monterey Bay shore-line: in Coastal Sediments, New Orleans, 1987, Conference Proceedings, p. 1809-1824.
U.S. Army Corp of Engineers, 1946, Beach erosion study—Lake Michigan shorelines of Milwaukee County, Wisconsin: Washington, D.C., House Document no. 526, 146 p.
U.S. Army Corp of Engineers, 1985, Shoreline movement data report, Portuguese Point to Mexican Border (1852-1982): Vicksburg, Mississippi, Coastal Engineering Research Center, 49 p.
Vaughan, T.W., 1932, Rate of sea-cliff recession on the property of the Scripps Institution of Oceanography, La Jolla, Cali-fornia: Science, v. 75, p. 250.
Wolf, P.R., and Dewitt, B.A., 2000, Elements of photogrammetry with applications in GIS (3rd ed.): Boston, McGraw Hill, 608 p.
51 U.S. Geological Survey Professional Paper 1693
REGIONAL ISSUES

52 Formation, Evolution, and Stability of Coastal Cliffs—Status and Trends
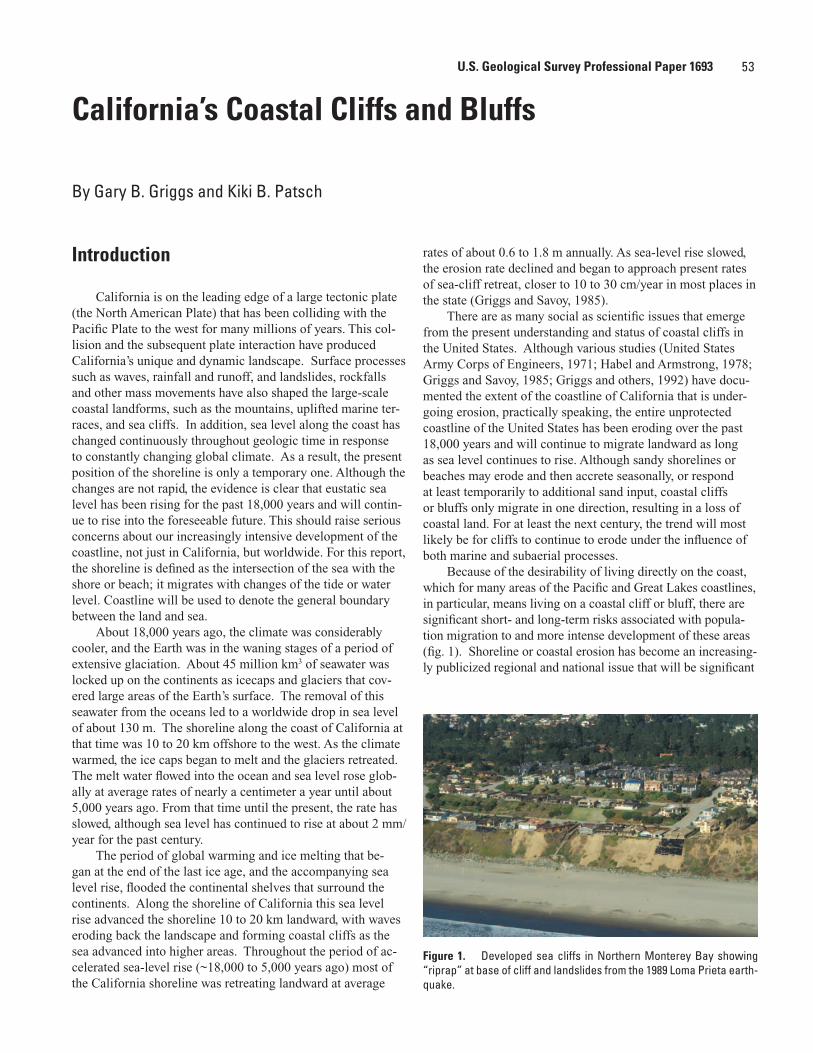
53
Introduction
California is on the leading edge of a large tectonic plate (the North American Plate) that has been colliding with the Pacific Plate to the west for many millions of years. This col-lision and the subsequent plate interaction have produced California’s unique and dynamic landscape. Surface processes such as waves, rainfall and runoff, and landslides, rockfalls and other mass movements have also shaped the large-scale coastal landforms, such as the mountains, uplifted marine ter-races, and sea cliffs. In addition, sea level along the coast has changed continuously throughout geologic time in response to constantly changing global climate. As a result, the present position of the shoreline is only a temporary one. Although the changes are not rapid, the evidence is clear that eustatic sea level has been rising for the past 18,000 years and will contin-ue to rise into the foreseeable future. This should raise serious concerns about our increasingly intensive development of the coastline, not just in California, but worldwide. For this report, the shoreline is defined as the intersection of the sea with the shore or beach; it migrates with changes of the tide or water level. Coastline will be used to denote the general boundary between the land and sea.
About 18,000 years ago, the climate was considerably cooler, and the Earth was in the waning stages of a period of extensive glaciation. About 45 million km3 of seawater was locked up on the continents as icecaps and glaciers that cov-ered large areas of the Earth’s surface. The removal of this seawater from the oceans led to a worldwide drop in sea level of about 130 m. The shoreline along the coast of California at that time was 10 to 20 km offshore to the west. As the climate warmed, the ice caps began to melt and the glaciers retreated. The melt water flowed into the ocean and sea level rose glob-ally at average rates of nearly a centimeter a year until about 5,000 years ago. From that time until the present, the rate has slowed, although sea level has continued to rise at about 2 mm/year for the past century.
The period of global warming and ice melting that be-gan at the end of the last ice age, and the accompanying sea level rise, flooded the continental shelves that surround the continents. Along the shoreline of California this sea level rise advanced the shoreline 10 to 20 km landward, with waves eroding back the landscape and forming coastal cliffs as the sea advanced into higher areas. Throughout the period of ac-celerated sea-level rise (~18,000 to 5,000 years ago) most of the California shoreline was retreating landward at average
rates of about 0.6 to 1.8 m annually. As sea-level rise slowed, the erosion rate declined and began to approach present rates of sea-cliff retreat, closer to 10 to 30 cm/year in most places in the state (Griggs and Savoy, 1985).
There are as many social as scientific issues that emerge from the present understanding and status of coastal cliffs in the United States. Although various studies (United States Army Corps of Engineers, 1971; Habel and Armstrong, 1978; Griggs and Savoy, 1985; Griggs and others, 1992) have docu-mented the extent of the coastline of California that is under-going erosion, practically speaking, the entire unprotected coastline of the United States has been eroding over the past 18,000 years and will continue to migrate landward as long as sea level continues to rise. Although sandy shorelines or beaches may erode and then accrete seasonally, or respond at least temporarily to additional sand input, coastal cliffs or bluffs only migrate in one direction, resulting in a loss of coastal land. For at least the next century, the trend will most likely be for cliffs to continue to erode under the influence of both marine and subaerial processes.
Because of the desirability of living directly on the coast, which for many areas of the Pacific and Great Lakes coastlines, in particular, means living on a coastal cliff or bluff, there are significant short- and long-term risks associated with popula-tion migration to and more intense development of these areas (fig. 1). Shoreline or coastal erosion has become an increasing-ly publicized regional and national issue that will be significant
California’s Coastal Cliffs and Bluffs
By Gary B. Griggs and Kiki B. Patsch
Figure 1. Developed sea cliffs in Northern Monterey Bay showing “riprap” at base of cliff and landslides from the 1989 Loma Prieta earth-quake.
U.S. Geological Survey Professional Paper 1693
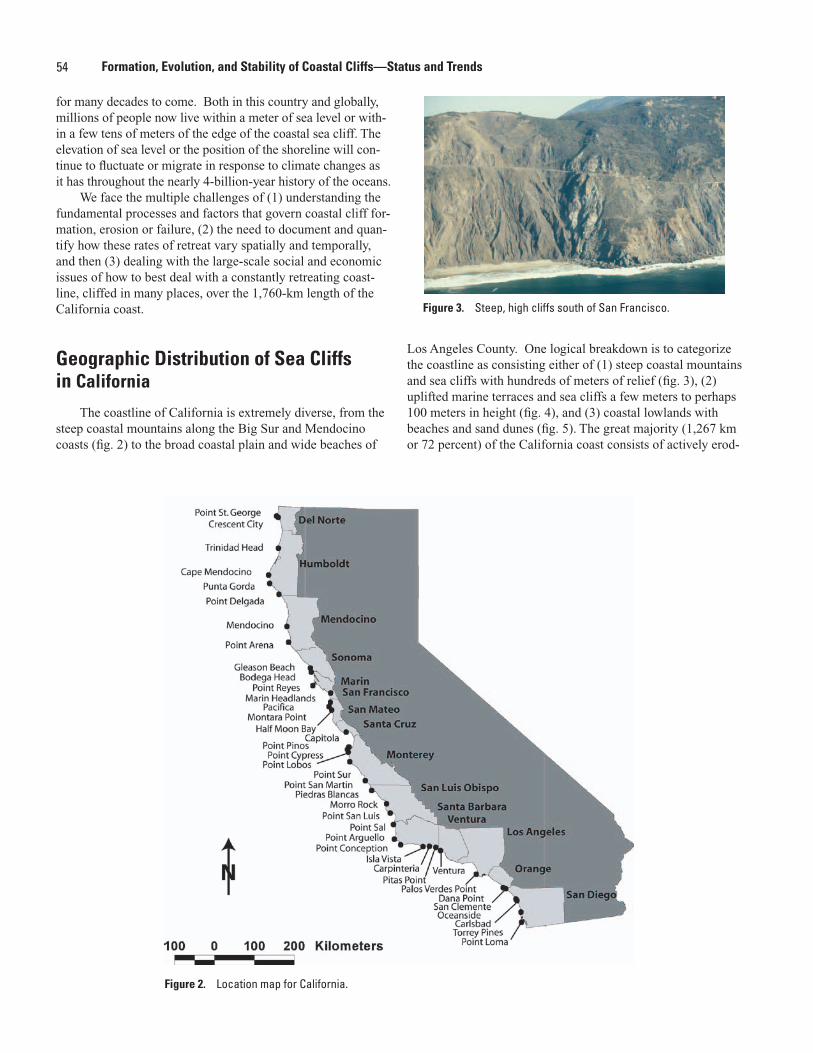
54 Formation, Evolution, and Stability of Coastal Cliffs—Status and Trends
for many decades to come. Both in this country and globally, millions of people now live within a meter of sea level or with-in a few tens of meters of the edge of the coastal sea cliff. The elevation of sea level or the position of the shoreline will con-tinue to fluctuate or migrate in response to climate changes as it has throughout the nearly 4-billion-year history of the oceans.
We face the multiple challenges of (1) understanding the fundamental processes and factors that govern coastal cliff for-mation, erosion or failure, (2) the need to document and quan-tify how these rates of retreat vary spatially and temporally, and then (3) dealing with the large-scale social and economic issues of how to best deal with a constantly retreating coast-line, cliffed in many places, over the 1,760-km length of the California coast.
Geographic Distribution of Sea Cliffs in California
The coastline of California is extremely diverse, from the steep coastal mountains along the Big Sur and Mendocino coasts (fig. 2) to the broad coastal plain and wide beaches of
Figure 2. Location map for California.
Figure 3. Steep, high cliffs south of San Francisco.
Los Angeles County. One logical breakdown is to categorize the coastline as consisting either of (1) steep coastal mountains and sea cliffs with hundreds of meters of relief (fig. 3), (2) uplifted marine terraces and sea cliffs a few meters to perhaps 100 meters in height (fig. 4), and (3) coastal lowlands with beaches and sand dunes (fig. 5). The great majority (1,267 km or 72 percent) of the California coast consists of actively erod-
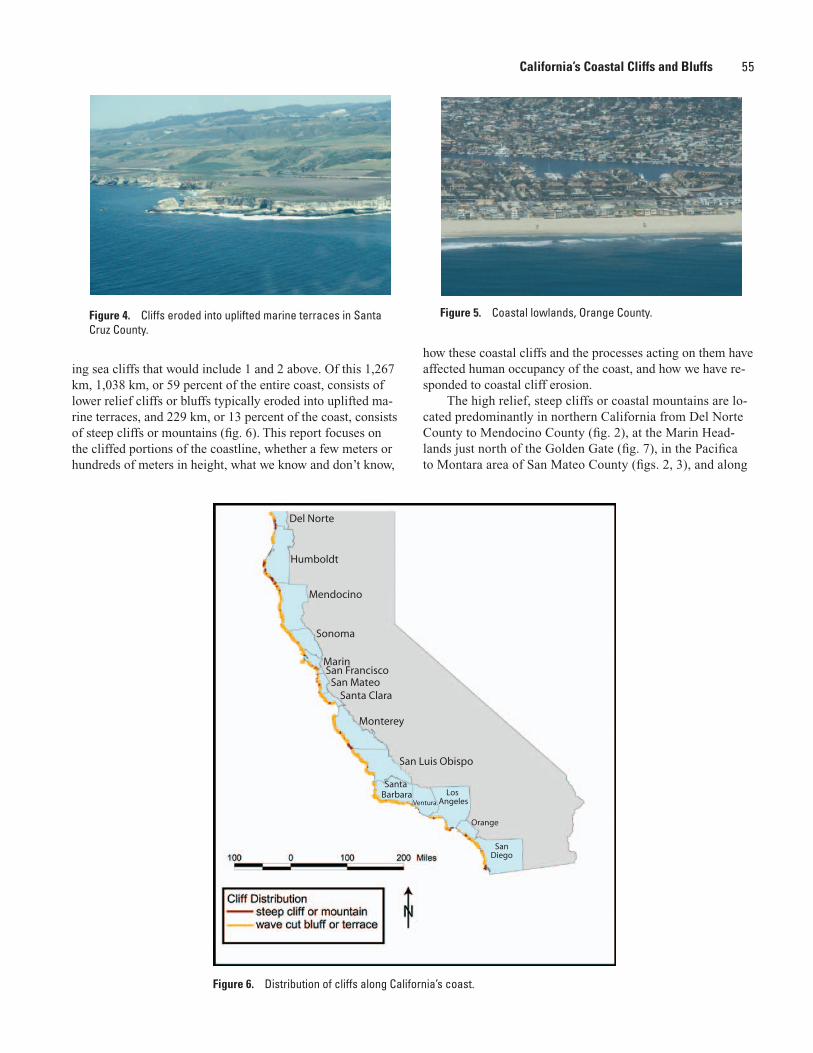
55
Figure 4. Cliffs eroded into uplifted marine terraces in Santa Cruz County.
Figure 5. Coastal lowlands, Orange County.
ing sea cliffs that would include 1 and 2 above. Of this 1,267 km, 1,038 km, or 59 percent of the entire coast, consists of lower relief cliffs or bluffs typically eroded into uplifted ma-rine terraces, and 229 km, or 13 percent of the coast, consists of steep cliffs or mountains (fig. 6). This report focuses on the cliffed portions of the coastline, whether a few meters or hundreds of meters in height, what we know and don’t know,
Del Norte
Humboldt
Mendocino
Sonoma
MarinSan Francisco
San MateoSanta Clara
Monterey
San Luis Obispo
Santa Barbara
Ventura
Los Angeles
Orange
SanDiego
Figure 6. Distribution of cliffs along California’s coast.
California’s Coastal Cliffs and Bluffs
how these coastal cliffs and the processes acting on them have affected human occupancy of the coast, and how we have re-sponded to coastal cliff erosion.
The high relief, steep cliffs or coastal mountains are lo-cated predominantly in northern California from Del Norte County to Mendocino County (fig. 2), at the Marin Head-lands just north of the Golden Gate (fig. 7), in the Pacifica to Montara area of San Mateo County (figs. 2, 3), and along
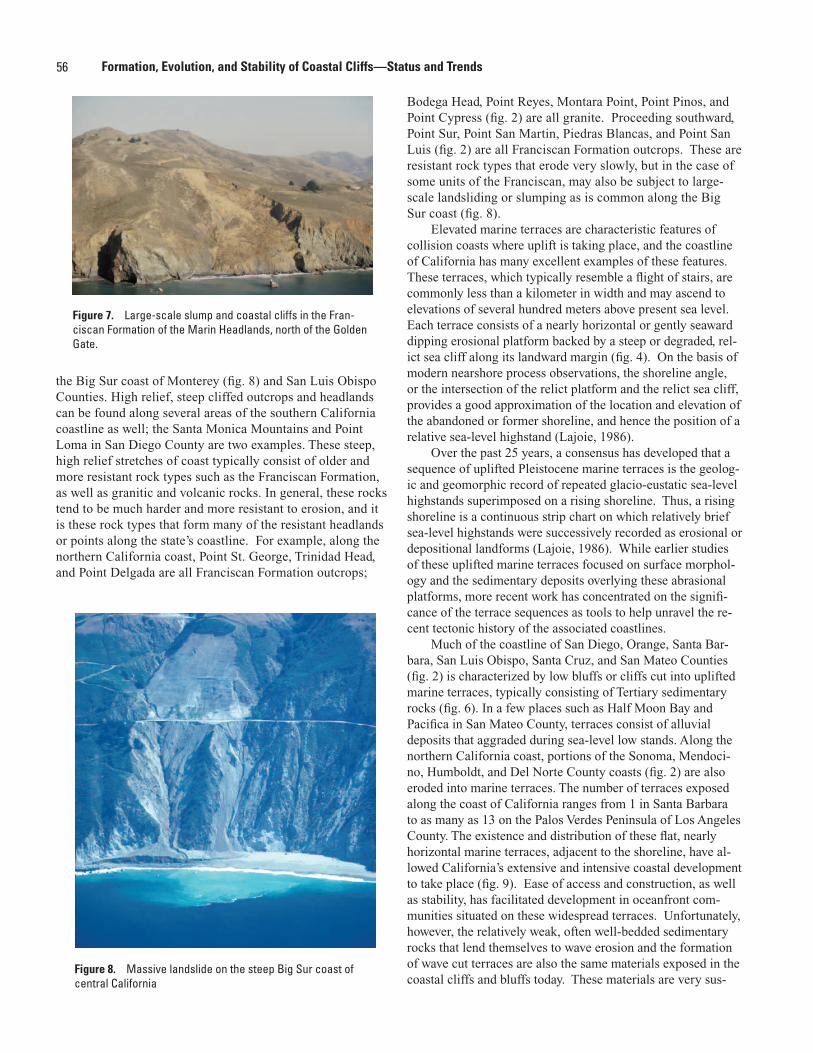
56 Formation, Evolution, and Stability of Coastal Cliffs—Status and Trends
the Big Sur coast of Monterey (fig. 8) and San Luis Obispo Counties. High relief, steep cliffed outcrops and headlands can be found along several areas of the southern California coastline as well; the Santa Monica Mountains and Point Loma in San Diego County are two examples. These steep, high relief stretches of coast typically consist of older and more resistant rock types such as the Franciscan Formation, as well as granitic and volcanic rocks. In general, these rocks tend to be much harder and more resistant to erosion, and it is these rock types that form many of the resistant headlands or points along the state’s coastline. For example, along the northern California coast, Point St. George, Trinidad Head, and Point Delgada are all Franciscan Formation outcrops;
Bodega Head, Point Reyes, Montara Point, Point Pinos, and Point Cypress (fig. 2) are all granite. Proceeding southward, Point Sur, Point San Martin, Piedras Blancas, and Point San Luis (fig. 2) are all Franciscan Formation outcrops. These are resistant rock types that erode very slowly, but in the case of some units of the Franciscan, may also be subject to large-scale landsliding or slumping as is common along the Big Sur coast (fig. 8).
Elevated marine terraces are characteristic features of collision coasts where uplift is taking place, and the coastline of California has many excellent examples of these features. These terraces, which typically resemble a flight of stairs, are commonly less than a kilometer in width and may ascend to elevations of several hundred meters above present sea level. Each terrace consists of a nearly horizontal or gently seaward dipping erosional platform backed by a steep or degraded, rel-ict sea cliff along its landward margin (fig. 4). On the basis of modern nearshore process observations, the shoreline angle, or the intersection of the relict platform and the relict sea cliff, provides a good approximation of the location and elevation of the abandoned or former shoreline, and hence the position of a relative sea-level highstand (Lajoie, 1986).
Over the past 25 years, a consensus has developed that a sequence of uplifted Pleistocene marine terraces is the geolog-ic and geomorphic record of repeated glacio-eustatic sea-level highstands superimposed on a rising shoreline. Thus, a rising shoreline is a continuous strip chart on which relatively brief sea-level highstands were successively recorded as erosional or depositional landforms (Lajoie, 1986). While earlier studies of these uplifted marine terraces focused on surface morphol-ogy and the sedimentary deposits overlying these abrasional platforms, more recent work has concentrated on the signifi-cance of the terrace sequences as tools to help unravel the re-cent tectonic history of the associated coastlines.
Much of the coastline of San Diego, Orange, Santa Bar-bara, San Luis Obispo, Santa Cruz, and San Mateo Counties (fig. 2) is characterized by low bluffs or cliffs cut into uplifted marine terraces, typically consisting of Tertiary sedimentary rocks (fig. 6). In a few places such as Half Moon Bay and Pacifica in San Mateo County, terraces consist of alluvial deposits that aggraded during sea-level low stands. Along the northern California coast, portions of the Sonoma, Mendoci-no, Humboldt, and Del Norte County coasts (fig. 2) are also eroded into marine terraces. The number of terraces exposed along the coast of California ranges from 1 in Santa Barbara to as many as 13 on the Palos Verdes Peninsula of Los Angeles County. The existence and distribution of these flat, nearly horizontal marine terraces, adjacent to the shoreline, have al-lowed California’s extensive and intensive coastal development to take place (fig. 9). Ease of access and construction, as well as stability, has facilitated development in oceanfront com-munities situated on these widespread terraces. Unfortunately, however, the relatively weak, often well-bedded sedimentary rocks that lend themselves to wave erosion and the formation of wave cut terraces are also the same materials exposed in the coastal cliffs and bluffs today. These materials are very sus-
Figure 8. Massive landslide on the steep Big Sur coast of central California
Figure 7. Large-scale slump and coastal cliffs in the Fran-ciscan Formation of the Marin Headlands, north of the Golden Gate.
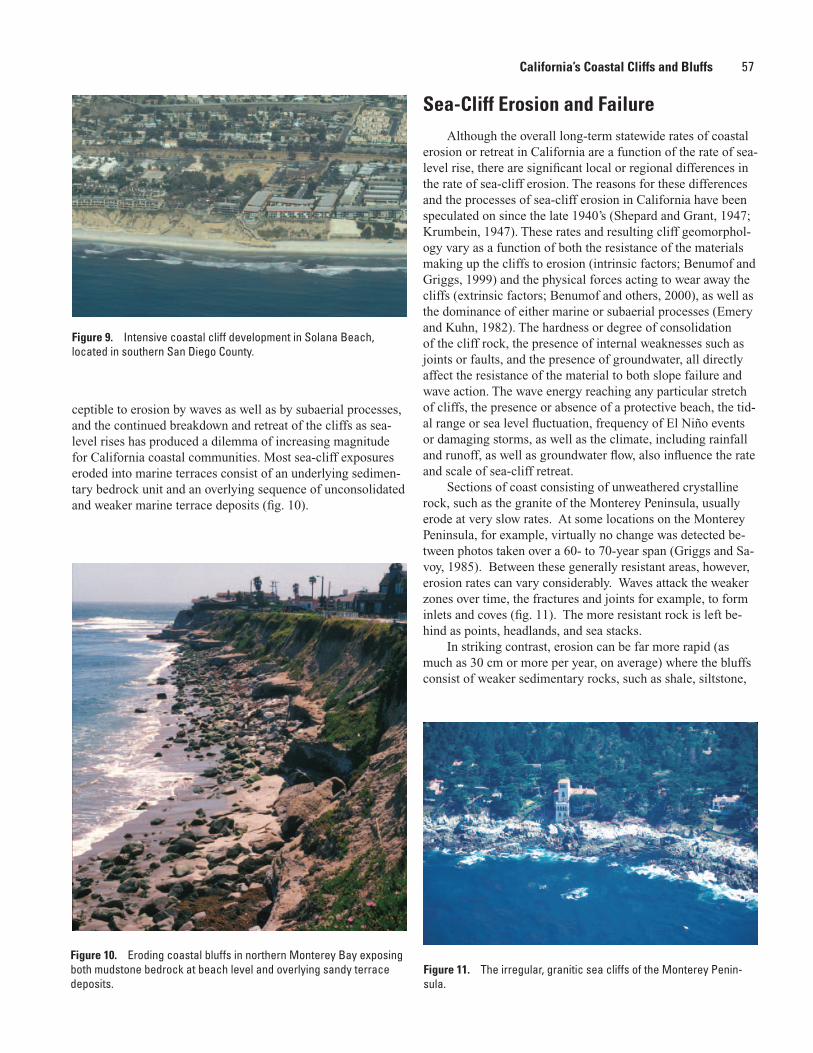
57
ceptible to erosion by waves as well as by subaerial processes, and the continued breakdown and retreat of the cliffs as sea-level rises has produced a dilemma of increasing magnitude for California coastal communities. Most sea-cliff exposures eroded into marine terraces consist of an underlying sedimen-tary bedrock unit and an overlying sequence of unconsolidated and weaker marine terrace deposits (fig. 10).
Figure 11. The irregular, granitic sea cliffs of the Monterey Penin-sula.
California’s Coastal Cliffs and Bluffs
Figure 10. Eroding coastal bluffs in northern Monterey Bay exposing both mudstone bedrock at beach level and overlying sandy terrace deposits.
Figure 9. Intensive coastal cliff development in Solana Beach, located in southern San Diego County.
Sea-Cliff Erosion and FailureAlthough the overall long-term statewide rates of coastal
erosion or retreat in California are a function of the rate of sea-level rise, there are significant local or regional differences in the rate of sea-cliff erosion. The reasons for these differences and the processes of sea-cliff erosion in California have been speculated on since the late 1940’s (Shepard and Grant, 1947; Krumbein, 1947). These rates and resulting cliff geomorphol-ogy vary as a function of both the resistance of the materials making up the cliffs to erosion (intrinsic factors; Benumof and Griggs, 1999) and the physical forces acting to wear away the cliffs (extrinsic factors; Benumof and others, 2000), as well as the dominance of either marine or subaerial processes (Emery and Kuhn, 1982). The hardness or degree of consolidation of the cliff rock, the presence of internal weaknesses such as joints or faults, and the presence of groundwater, all directly affect the resistance of the material to both slope failure and wave action. The wave energy reaching any particular stretch of cliffs, the presence or absence of a protective beach, the tid-al range or sea level fluctuation, frequency of El Niño events or damaging storms, as well as the climate, including rainfall and runoff, as well as groundwater flow, also influence the rate and scale of sea-cliff retreat.
Sections of coast consisting of unweathered crystalline rock, such as the granite of the Monterey Peninsula, usually erode at very slow rates. At some locations on the Monterey Peninsula, for example, virtually no change was detected be-tween photos taken over a 60- to 70-year span (Griggs and Sa-voy, 1985). Between these generally resistant areas, however, erosion rates can vary considerably. Waves attack the weaker zones over time, the fractures and joints for example, to form inlets and coves (fig. 11). The more resistant rock is left be-hind as points, headlands, and sea stacks.
In striking contrast, erosion can be far more rapid (as much as 30 cm or more per year, on average) where the bluffs consist of weaker sedimentary rocks, such as shale, siltstone,
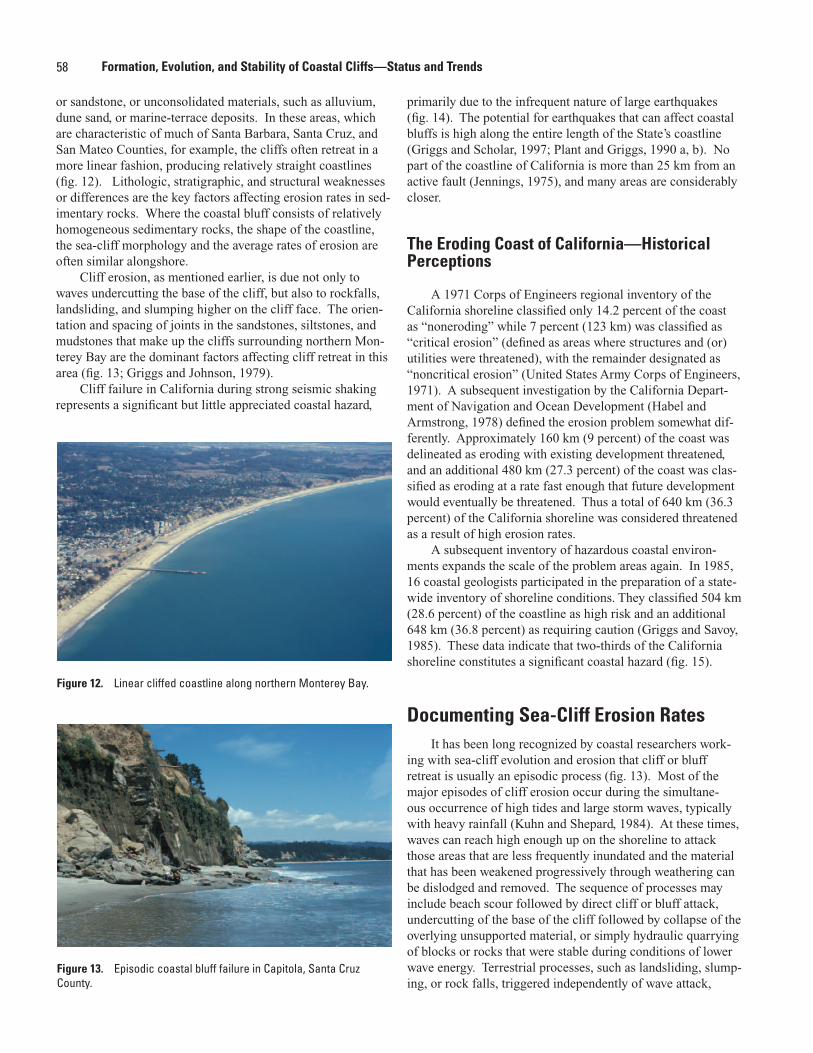
58 Formation, Evolution, and Stability of Coastal Cliffs—Status and Trends
or sandstone, or unconsolidated materials, such as alluvium, dune sand, or marine-terrace deposits. In these areas, which are characteristic of much of Santa Barbara, Santa Cruz, and San Mateo Counties, for example, the cliffs often retreat in a more linear fashion, producing relatively straight coastlines (fig. 12). Lithologic, stratigraphic, and structural weaknesses or differences are the key factors affecting erosion rates in sed-imentary rocks. Where the coastal bluff consists of relatively homogeneous sedimentary rocks, the shape of the coastline, the sea-cliff morphology and the average rates of erosion are often similar alongshore.
Cliff erosion, as mentioned earlier, is due not only to waves undercutting the base of the cliff, but also to rockfalls, landsliding, and slumping higher on the cliff face. The orien-tation and spacing of joints in the sandstones, siltstones, and mudstones that make up the cliffs surrounding northern Mon-terey Bay are the dominant factors affecting cliff retreat in this area (fig. 13; Griggs and Johnson, 1979).
Cliff failure in California during strong seismic shaking represents a significant but little appreciated coastal hazard,
Figure 12. Linear cliffed coastline along northern Monterey Bay.
Figure 13. Episodic coastal bluff failure in Capitola, Santa Cruz County.
primarily due to the infrequent nature of large earthquakes (fig. 14). The potential for earthquakes that can affect coastal bluffs is high along the entire length of the State’s coastline (Griggs and Scholar, 1997; Plant and Griggs, 1990 a, b). No part of the coastline of California is more than 25 km from an active fault (Jennings, 1975), and many areas are considerably closer.
The Eroding Coast of California—Historical Perceptions
A 1971 Corps of Engineers regional inventory of the California shoreline classified only 14.2 percent of the coast as “noneroding” while 7 percent (123 km) was classified as “critical erosion” (defined as areas where structures and (or) utilities were threatened), with the remainder designated as “noncritical erosion” (United States Army Corps of Engineers, 1971). A subsequent investigation by the California Depart-ment of Navigation and Ocean Development (Habel and Armstrong, 1978) defined the erosion problem somewhat dif-ferently. Approximately 160 km (9 percent) of the coast was delineated as eroding with existing development threatened, and an additional 480 km (27.3 percent) of the coast was clas-sified as eroding at a rate fast enough that future development would eventually be threatened. Thus a total of 640 km (36.3 percent) of the California shoreline was considered threatened as a result of high erosion rates.
A subsequent inventory of hazardous coastal environ-ments expands the scale of the problem areas again. In 1985, 16 coastal geologists participated in the preparation of a state-wide inventory of shoreline conditions. They classified 504 km (28.6 percent) of the coastline as high risk and an additional 648 km (36.8 percent) as requiring caution (Griggs and Savoy, 1985). These data indicate that two-thirds of the California shoreline constitutes a significant coastal hazard (fig. 15).
Documenting Sea-Cliff Erosion RatesIt has been long recognized by coastal researchers work-
ing with sea-cliff evolution and erosion that cliff or bluff retreat is usually an episodic process (fig. 13). Most of the major episodes of cliff erosion occur during the simultane-ous occurrence of high tides and large storm waves, typically with heavy rainfall (Kuhn and Shepard, 1984). At these times, waves can reach high enough up on the shoreline to attack those areas that are less frequently inundated and the material that has been weakened progressively through weathering can be dislodged and removed. The sequence of processes may include beach scour followed by direct cliff or bluff attack, undercutting of the base of the cliff followed by collapse of the overlying unsupported material, or simply hydraulic quarrying of blocks or rocks that were stable during conditions of lower wave energy. Terrestrial processes, such as landsliding, slump-ing, or rock falls, triggered independently of wave attack,
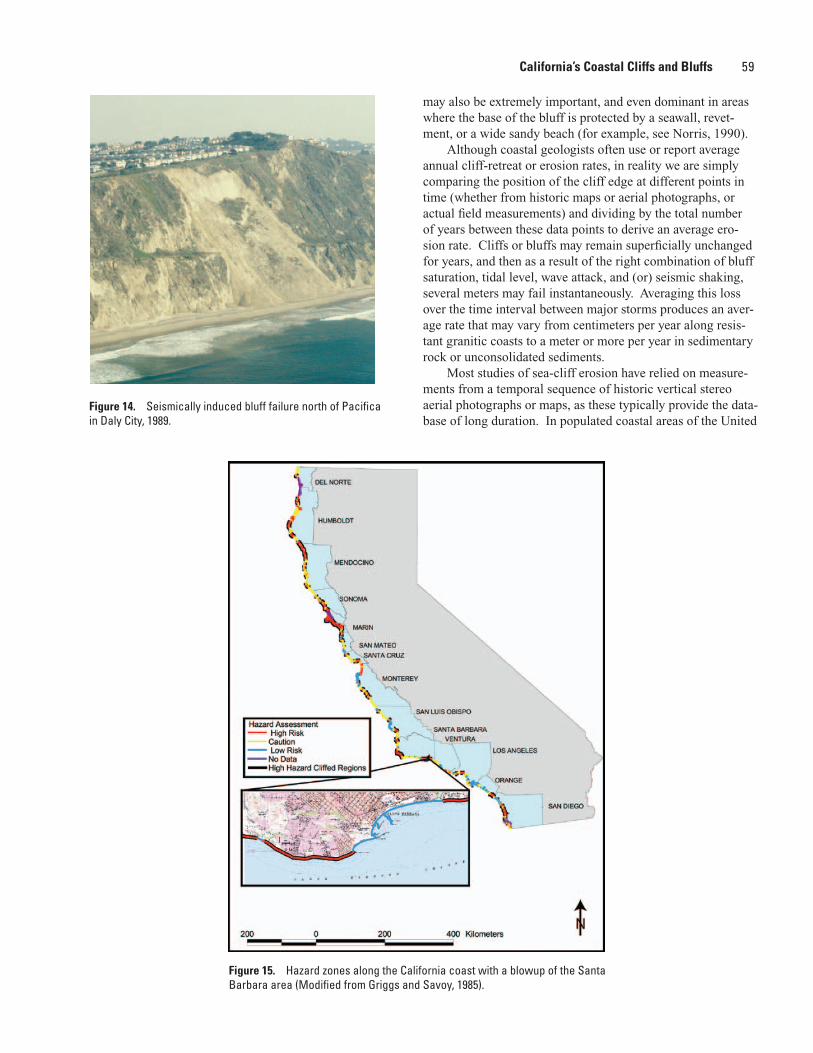
59
Figure 15. Hazard zones along the California coast with a blowup of the Santa Barbara area (Modified from Griggs and Savoy, 1985).
Figure 14. Seismically induced bluff failure north of Pacifica in Daly City, 1989.
may also be extremely important, and even dominant in areas where the base of the bluff is protected by a seawall, revet-ment, or a wide sandy beach (for example, see Norris, 1990).
Although coastal geologists often use or report average annual cliff-retreat or erosion rates, in reality we are simply comparing the position of the cliff edge at different points in time (whether from historic maps or aerial photographs, or actual field measurements) and dividing by the total number of years between these data points to derive an average ero-sion rate. Cliffs or bluffs may remain superficially unchanged for years, and then as a result of the right combination of bluff saturation, tidal level, wave attack, and (or) seismic shaking, several meters may fail instantaneously. Averaging this loss over the time interval between major storms produces an aver-age rate that may vary from centimeters per year along resis-tant granitic coasts to a meter or more per year in sedimentary rock or unconsolidated sediments.
Most studies of sea-cliff erosion have relied on measure-ments from a temporal sequence of historic vertical stereo aerial photographs or maps, as these typically provide the data-base of long duration. In populated coastal areas of the United
California’s Coastal Cliffs and Bluffs
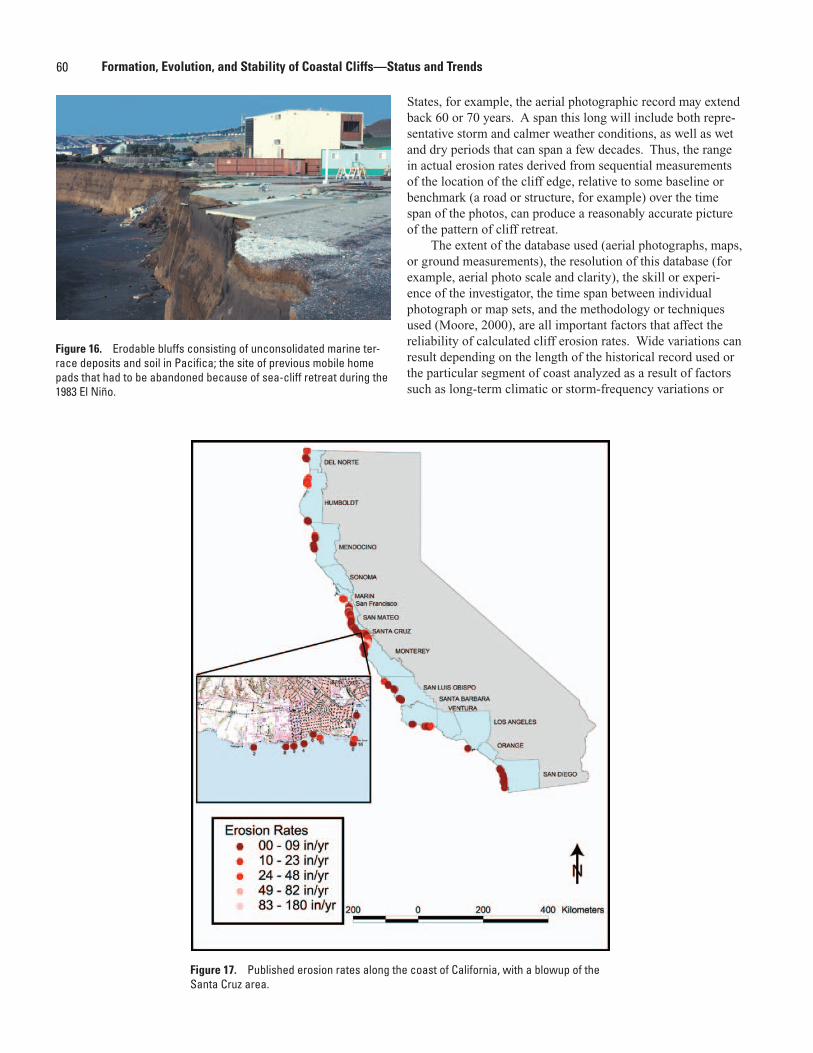
60 Formation, Evolution, and Stability of Coastal Cliffs—Status and Trends
States, for example, the aerial photographic record may extend back 60 or 70 years. A span this long will include both repre-sentative storm and calmer weather conditions, as well as wet and dry periods that can span a few decades. Thus, the range in actual erosion rates derived from sequential measurements of the location of the cliff edge, relative to some baseline or benchmark (a road or structure, for example) over the time span of the photos, can produce a reasonably accurate picture of the pattern of cliff retreat.
The extent of the database used (aerial photographs, maps, or ground measurements), the resolution of this database (for example, aerial photo scale and clarity), the skill or experi-ence of the investigator, the time span between individual photograph or map sets, and the methodology or techniques used (Moore, 2000), are all important factors that affect the reliability of calculated cliff erosion rates. Wide variations can result depending on the length of the historical record used or the particular segment of coast analyzed as a result of factors such as long-term climatic or storm-frequency variations or
Figure 16. Erodable bluffs consisting of unconsolidated marine ter-race deposits and soil in Pacifica; the site of previous mobile home pads that had to be abandoned because of sea-cliff retreat during the 1983 El Niño.
Figure 17. Published erosion rates along the coast of California, with a blowup of the Santa Cruz area.
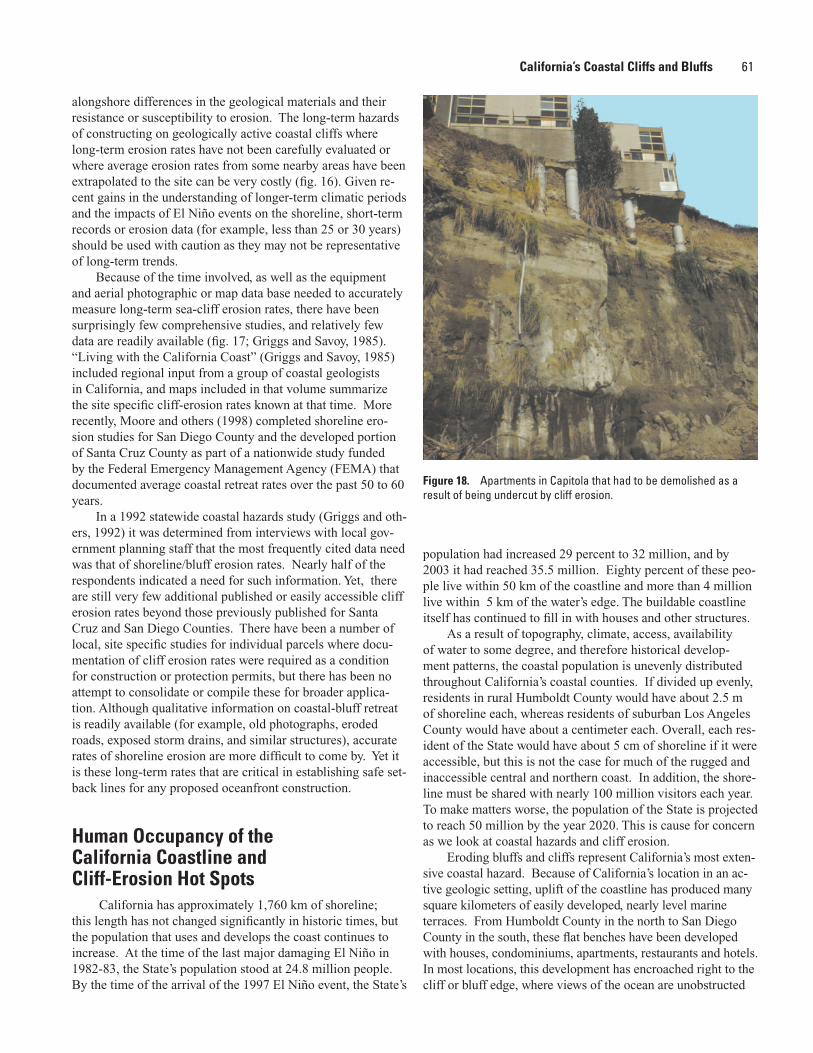
61
Figure 18. Apartments in Capitola that had to be demolished as a result of being undercut by cliff erosion.
alongshore differences in the geological materials and their resistance or susceptibility to erosion. The long-term hazards of constructing on geologically active coastal cliffs where long-term erosion rates have not been carefully evaluated or where average erosion rates from some nearby areas have been extrapolated to the site can be very costly (fig. 16). Given re-cent gains in the understanding of longer-term climatic periods and the impacts of El Niño events on the shoreline, short-term records or erosion data (for example, less than 25 or 30 years) should be used with caution as they may not be representative of long-term trends.
Because of the time involved, as well as the equipment and aerial photographic or map data base needed to accurately measure long-term sea-cliff erosion rates, there have been surprisingly few comprehensive studies, and relatively few data are readily available (fig. 17; Griggs and Savoy, 1985). “Living with the California Coast” (Griggs and Savoy, 1985) included regional input from a group of coastal geologists in California, and maps included in that volume summarize the site specific cliff-erosion rates known at that time. More recently, Moore and others (1998) completed shoreline ero-sion studies for San Diego County and the developed portion of Santa Cruz County as part of a nationwide study funded by the Federal Emergency Management Agency (FEMA) that documented average coastal retreat rates over the past 50 to 60 years.
In a 1992 statewide coastal hazards study (Griggs and oth-ers, 1992) it was determined from interviews with local gov-ernment planning staff that the most frequently cited data need was that of shoreline/bluff erosion rates. Nearly half of the respondents indicated a need for such information. Yet, there are still very few additional published or easily accessible cliff erosion rates beyond those previously published for Santa Cruz and San Diego Counties. There have been a number of local, site specific studies for individual parcels where docu-mentation of cliff erosion rates were required as a condition for construction or protection permits, but there has been no attempt to consolidate or compile these for broader applica-tion. Although qualitative information on coastal-bluff retreat is readily available (for example, old photographs, eroded roads, exposed storm drains, and similar structures), accurate rates of shoreline erosion are more difficult to come by. Yet it is these long-term rates that are critical in establishing safe set-back lines for any proposed oceanfront construction.
Human Occupancy of the California Coastline and Cliff-Erosion Hot Spots
California has approximately 1,760 km of shoreline; this length has not changed significantly in historic times, but the population that uses and develops the coast continues to increase. At the time of the last major damaging El Niño in 1982-83, the State’s population stood at 24.8 million people. By the time of the arrival of the 1997 El Niño event, the State’s
population had increased 29 percent to 32 million, and by 2003 it had reached 35.5 million. Eighty percent of these peo-ple live within 50 km of the coastline and more than 4 million live within 5 km of the water’s edge. The buildable coastline itself has continued to fill in with houses and other structures.
As a result of topography, climate, access, availability of water to some degree, and therefore historical develop-ment patterns, the coastal population is unevenly distributed throughout California’s coastal counties. If divided up evenly, residents in rural Humboldt County would have about 2.5 m of shoreline each, whereas residents of suburban Los Angeles County would have about a centimeter each. Overall, each res-ident of the State would have about 5 cm of shoreline if it were accessible, but this is not the case for much of the rugged and inaccessible central and northern coast. In addition, the shore-line must be shared with nearly 100 million visitors each year. To make matters worse, the population of the State is projected to reach 50 million by the year 2020. This is cause for concern as we look at coastal hazards and cliff erosion.
Eroding bluffs and cliffs represent California’s most exten-sive coastal hazard. Because of California’s location in an ac-tive geologic setting, uplift of the coastline has produced many square kilometers of easily developed, nearly level marine terraces. From Humboldt County in the north to San Diego County in the south, these flat benches have been developed with houses, condominiums, apartments, restaurants and hotels. In most locations, this development has encroached right to the cliff or bluff edge, where views of the ocean are unobstructed
California’s Coastal Cliffs and Bluffs
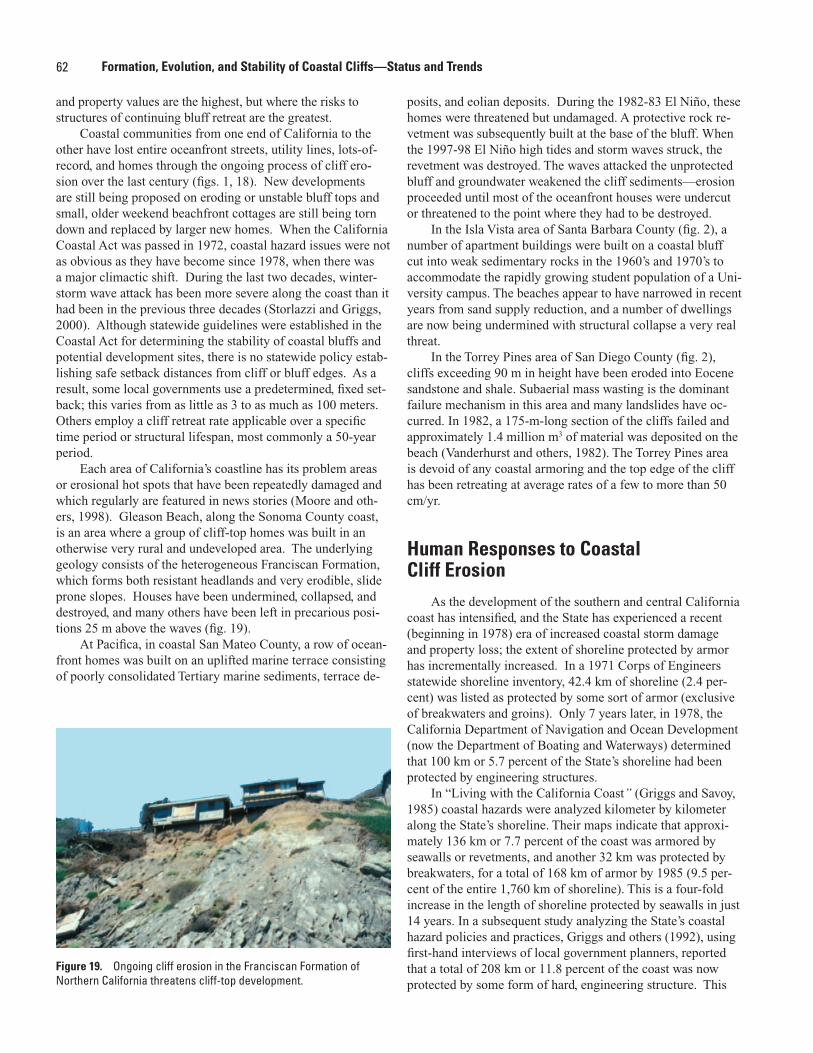
62 Formation, Evolution, and Stability of Coastal Cliffs—Status and Trends
and property values are the highest, but where the risks to structures of continuing bluff retreat are the greatest.
Coastal communities from one end of California to the other have lost entire oceanfront streets, utility lines, lots-of-record, and homes through the ongoing process of cliff ero-sion over the last century (figs. 1, 18). New developments are still being proposed on eroding or unstable bluff tops and small, older weekend beachfront cottages are still being torn down and replaced by larger new homes. When the California Coastal Act was passed in 1972, coastal hazard issues were not as obvious as they have become since 1978, when there was a major climactic shift. During the last two decades, winter-storm wave attack has been more severe along the coast than it had been in the previous three decades (Storlazzi and Griggs, 2000). Although statewide guidelines were established in the Coastal Act for determining the stability of coastal bluffs and potential development sites, there is no statewide policy estab-lishing safe setback distances from cliff or bluff edges. As a result, some local governments use a predetermined, fixed set-back; this varies from as little as 3 to as much as 100 meters. Others employ a cliff retreat rate applicable over a specific time period or structural lifespan, most commonly a 50-year period.
Each area of California’s coastline has its problem areas or erosional hot spots that have been repeatedly damaged and which regularly are featured in news stories (Moore and oth-ers, 1998). Gleason Beach, along the Sonoma County coast, is an area where a group of cliff-top homes was built in an otherwise very rural and undeveloped area. The underlying geology consists of the heterogeneous Franciscan Formation, which forms both resistant headlands and very erodible, slide prone slopes. Houses have been undermined, collapsed, and destroyed, and many others have been left in precarious posi-tions 25 m above the waves (fig. 19).
At Pacifica, in coastal San Mateo County, a row of ocean-front homes was built on an uplifted marine terrace consisting of poorly consolidated Tertiary marine sediments, terrace de-
posits, and eolian deposits. During the 1982-83 El Niño, these homes were threatened but undamaged. A protective rock re-vetment was subsequently built at the base of the bluff. When the 1997-98 El Niño high tides and storm waves struck, the revetment was destroyed. The waves attacked the unprotected bluff and groundwater weakened the cliff sediments—erosion proceeded until most of the oceanfront houses were undercut or threatened to the point where they had to be destroyed.
In the Isla Vista area of Santa Barbara County (fig. 2), a number of apartment buildings were built on a coastal bluff cut into weak sedimentary rocks in the 1960’s and 1970’s to accommodate the rapidly growing student population of a Uni-versity campus. The beaches appear to have narrowed in recent years from sand supply reduction, and a number of dwellings are now being undermined with structural collapse a very real threat.
In the Torrey Pines area of San Diego County (fig. 2), cliffs exceeding 90 m in height have been eroded into Eocene sandstone and shale. Subaerial mass wasting is the dominant failure mechanism in this area and many landslides have oc-curred. In 1982, a 175-m-long section of the cliffs failed and approximately 1.4 million m3 of material was deposited on the beach (Vanderhurst and others, 1982). The Torrey Pines area is devoid of any coastal armoring and the top edge of the cliff has been retreating at average rates of a few to more than 50 cm/yr.
Human Responses to Coastal Cliff Erosion
As the development of the southern and central California coast has intensified, and the State has experienced a recent (beginning in 1978) era of increased coastal storm damage and property loss; the extent of shoreline protected by armor has incrementally increased. In a 1971 Corps of Engineers statewide shoreline inventory, 42.4 km of shoreline (2.4 per-cent) was listed as protected by some sort of armor (exclusive of breakwaters and groins). Only 7 years later, in 1978, the California Department of Navigation and Ocean Development (now the Department of Boating and Waterways) determined that 100 km or 5.7 percent of the State’s shoreline had been protected by engineering structures.
In “Living with the California Coast” (Griggs and Savoy, 1985) coastal hazards were analyzed kilometer by kilometer along the State’s shoreline. Their maps indicate that approxi-mately 136 km or 7.7 percent of the coast was armored by seawalls or revetments, and another 32 km was protected by breakwaters, for a total of 168 km of armor by 1985 (9.5 per-cent of the entire 1,760 km of shoreline). This is a four-fold increase in the length of shoreline protected by seawalls in just 14 years. In a subsequent study analyzing the State’s coastal hazard policies and practices, Griggs and others (1992), using first-hand interviews of local government planners, reported that a total of 208 km or 11.8 percent of the coast was now protected by some form of hard, engineering structure. This
Figure 19. Ongoing cliff erosion in the Franciscan Formation of Northern California threatens cliff-top development.
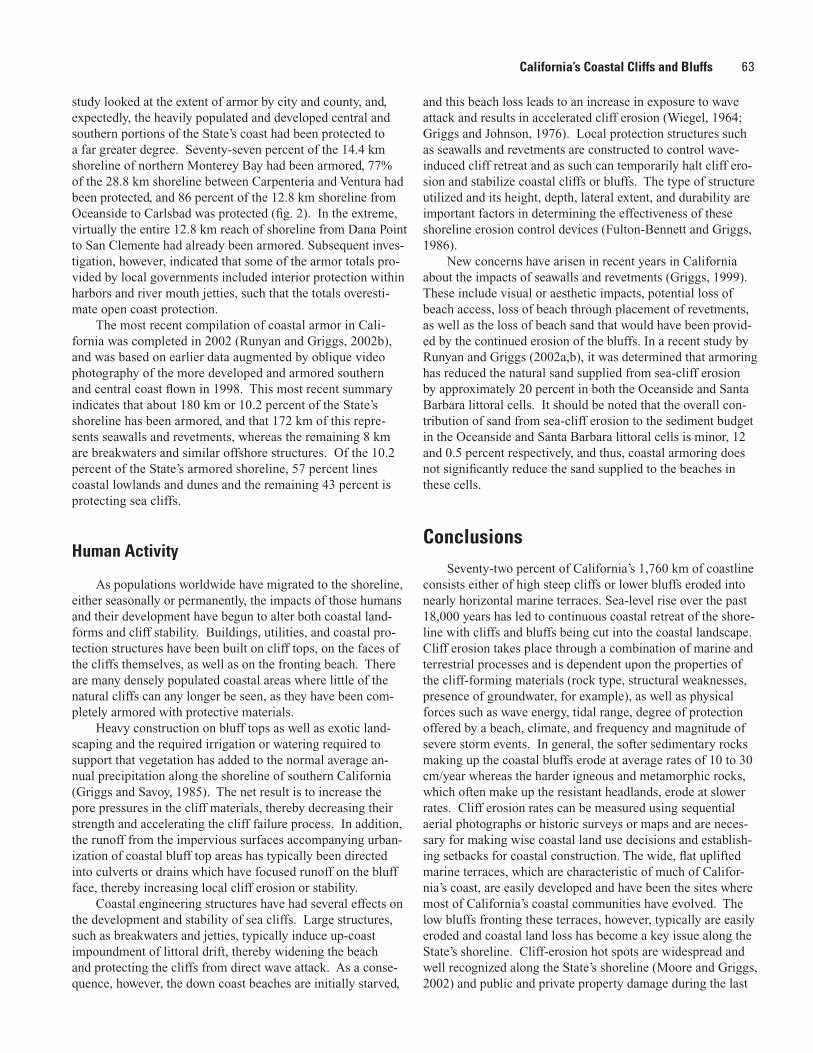
63
study looked at the extent of armor by city and county, and, expectedly, the heavily populated and developed central and southern portions of the State’s coast had been protected to a far greater degree. Seventy-seven percent of the 14.4 km shoreline of northern Monterey Bay had been armored, 77% of the 28.8 km shoreline between Carpenteria and Ventura had been protected, and 86 percent of the 12.8 km shoreline from Oceanside to Carlsbad was protected (fig. 2). In the extreme, virtually the entire 12.8 km reach of shoreline from Dana Point to San Clemente had already been armored. Subsequent inves-tigation, however, indicated that some of the armor totals pro-vided by local governments included interior protection within harbors and river mouth jetties, such that the totals overesti-mate open coast protection.
The most recent compilation of coastal armor in Cali-fornia was completed in 2002 (Runyan and Griggs, 2002b), and was based on earlier data augmented by oblique video photography of the more developed and armored southern and central coast flown in 1998. This most recent summary indicates that about 180 km or 10.2 percent of the State’s shoreline has been armored, and that 172 km of this repre-sents seawalls and revetments, whereas the remaining 8 km are breakwaters and similar offshore structures. Of the 10.2 percent of the State’s armored shoreline, 57 percent lines coastal lowlands and dunes and the remaining 43 percent is protecting sea cliffs.
Human Activity
As populations worldwide have migrated to the shoreline, either seasonally or permanently, the impacts of those humans and their development have begun to alter both coastal land-forms and cliff stability. Buildings, utilities, and coastal pro-tection structures have been built on cliff tops, on the faces of the cliffs themselves, as well as on the fronting beach. There are many densely populated coastal areas where little of the natural cliffs can any longer be seen, as they have been com-pletely armored with protective materials.
Heavy construction on bluff tops as well as exotic land-scaping and the required irrigation or watering required to support that vegetation has added to the normal average an-nual precipitation along the shoreline of southern California (Griggs and Savoy, 1985). The net result is to increase the pore pressures in the cliff materials, thereby decreasing their strength and accelerating the cliff failure process. In addition, the runoff from the impervious surfaces accompanying urban-ization of coastal bluff top areas has typically been directed into culverts or drains which have focused runoff on the bluff face, thereby increasing local cliff erosion or stability.
Coastal engineering structures have had several effects on the development and stability of sea cliffs. Large structures, such as breakwaters and jetties, typically induce up-coast impoundment of littoral drift, thereby widening the beach and protecting the cliffs from direct wave attack. As a conse-quence, however, the down coast beaches are initially starved,
and this beach loss leads to an increase in exposure to wave attack and results in accelerated cliff erosion (Wiegel, 1964; Griggs and Johnson, 1976). Local protection structures such as seawalls and revetments are constructed to control wave-induced cliff retreat and as such can temporarily halt cliff ero-sion and stabilize coastal cliffs or bluffs. The type of structure utilized and its height, depth, lateral extent, and durability are important factors in determining the effectiveness of these shoreline erosion control devices (Fulton-Bennett and Griggs, 1986).
New concerns have arisen in recent years in California about the impacts of seawalls and revetments (Griggs, 1999). These include visual or aesthetic impacts, potential loss of beach access, loss of beach through placement of revetments, as well as the loss of beach sand that would have been provid-ed by the continued erosion of the bluffs. In a recent study by Runyan and Griggs (2002a,b), it was determined that armoring has reduced the natural sand supplied from sea-cliff erosion by approximately 20 percent in both the Oceanside and Santa Barbara littoral cells. It should be noted that the overall con-tribution of sand from sea-cliff erosion to the sediment budget in the Oceanside and Santa Barbara littoral cells is minor, 12 and 0.5 percent respectively, and thus, coastal armoring does not significantly reduce the sand supplied to the beaches in these cells.
ConclusionsSeventy-two percent of California’s 1,760 km of coastline
consists either of high steep cliffs or lower bluffs eroded into nearly horizontal marine terraces. Sea-level rise over the past 18,000 years has led to continuous coastal retreat of the shore-line with cliffs and bluffs being cut into the coastal landscape. Cliff erosion takes place through a combination of marine and terrestrial processes and is dependent upon the properties of the cliff-forming materials (rock type, structural weaknesses, presence of groundwater, for example), as well as physical forces such as wave energy, tidal range, degree of protection offered by a beach, climate, and frequency and magnitude of severe storm events. In general, the softer sedimentary rocks making up the coastal bluffs erode at average rates of 10 to 30 cm/year whereas the harder igneous and metamorphic rocks, which often make up the resistant headlands, erode at slower rates. Cliff erosion rates can be measured using sequential aerial photographs or historic surveys or maps and are neces-sary for making wise coastal land use decisions and establish-ing setbacks for coastal construction. The wide, flat uplifted marine terraces, which are characteristic of much of Califor-nia’s coast, are easily developed and have been the sites where most of California’s coastal communities have evolved. The low bluffs fronting these terraces, however, typically are easily eroded and coastal land loss has become a key issue along the State’s shoreline. Cliff-erosion hot spots are widespread and well recognized along the State’s shoreline (Moore and Griggs, 2002) and public and private property damage during the last
California’s Coastal Cliffs and Bluffs
64 Formation, Evolution, and Stability of Coastal Cliffs—Status and Trends
two major El Niño events (1982-83 and 1997-98) was high. Historical approaches to dealing with the ongoing erosion of the State’s cliffs and bluffs have focused on seawalls and revetments, but concerns with the effectiveness and impacts of these structures have begun to restrict additional armor em-placement.
ReferencesBenumof, B.T. and Griggs, G.B., 1999, The relationship between
seacliff erosion rates, cliff material properties, and physical processes: Shore and Beach, v. 67, no. 4, p. 29-41.
Benumof, B.T., Storlazzi, C.D., Seymour, R.J., and Griggs, G.B., 2000, The relationship between incident wave energy and seacliff erosion rates, San Diego County, California: Jour-nal of Coastal Research, v. 16, no. 4, p. 1162-1178.
Emery, K.O., and Kuhn, G.G., 1982, Sea cliffs—their processes, profiles, and classification: Geological Society of America Bulletin, v. 93, p. 644-654.
Fulton-Bennett, K.W., and Griggs, G.B., 1986, Coastal protec-tion structures and their effectiveness: Joint Publication of California State Department of Boating and Waterways and Institute of Marine Sciences, University of California, Santa Cruz, 48 p.
Griggs, G.B., 1999, The protection of California’s coast; past, present and future: Shore and Beach v. 67, p.18-28.
Griggs, G.B., and Johnson, R.E., 1976, The effects of the Santa Cruz Small Craft Harbor on coastal processes in northern Monterey Bay, California: Environmental Geology, v.1, p. 229-312.
Griggs, G.B., and Johnson. R.E., 1979, Coastline erosion, Santa Cruz County: California Geology, v. 32, no. 4. p. 67-76.
Griggs, G.B., and Savoy, L.E., 1985, Living with the California Coast: Durham, North Carolina, Duke University Press, 393 p.
Griggs, G.B., and Scholar, D., 1997, Coastal erosion caused by earthquake-induced slope failure: Shore and Beach, v. 65, no.4, p. 2-7.
Griggs, G.B., Pepper, J.E., and Jordan, M.E., 1992, California’s coastal hazards; a critical assessment of existing land-use policies and practices: Berkeley, California, Special Pub-lication of California Policy Seminar Program, 224 p.
Habel, J.S., and Armstrong, G.A., 1978, Assessment and atlas of shoreline erosion along the California coast: Sacramento, California, State of California, Department of Navigation and Ocean Development.
Jennings, C.S.,1975, Fault map of California: California Division of Mines and Geology, 1 sheet .
Krumbein, W.C., 1947, Shore processes and beach characteris-tics: U.S. Army Corps of Engineers, Technical Memoran-
dum No. 3, 35 p.Kuhn, G.G., and Shepard, F.P., 1984, Sea cliffs, beaches and
coastal valleys of San Diego County: Berkeley, California, University of California Press, 193 p.
Lajoie, K.R., 1986, Coastal tectonics, in Active tectonics: Wash-ington, D.C., National Academy of Sciences, p. 95-124.
Moore, L.J., 2000, Shoreline mapping techniques: Journal of Coastal Research, v.16, no.1, p. 111-124.
Moore, L.J., and Griggs, G.B., 2002, Long-term cliff retreat and erosion hotspots along the central shores of the Mon-terey Bay National Marine Sanctuary: Marine Geology, Special Issue on Seafloor Geology and Natural Environ-ment of the Monterey Bay National Marine Sanctuary, p. 265-284.
Moore, L.J., Benumof, B.K., and Griggs, G.B., 1998, Coastal erosion hazards in Santa Cruz and San Diego counties, California: Journal of Coastal Research, Special Issue no. 28, p. 121-139.
Norris, R.M., 1990, Sea cliff erosion—a major dilemma: Geo-times, v. 11, p. 16-17.
Plant, N.G., and Griggs, G.B., 1990a, Coastal landslides caused by the October 17, 1989 earthquake, Santa Cruz County, California: California Geology, v.43, p.75-84.
Plant, N.G., and Griggs, G.B., 1990b, Coastal landslides and the Loma Prieta earthquake: Earth Science, v. 43, p. 12-17.
Runyan, K.B., and Griggs, G.B., 2002a, Chapter 8—Contri-butions from coastal cliff erosion to the littoral budget, in Coyne, M., and Sterrett, K., eds., California Beach Restoration Study: Sacramento, California, California Department of Boating and Waterways and State Coastal Conservancy.
Runyan, K.B., and Griggs, G.B., 2002b, The effects of armoring sea-cliffs on the natural sand supply to beaches of Califor-nia: Journal of Coastal Reseach, v. 19, no. 2, p. 336-347.
Shepard, F.P. and Grant, U.S., IV, 1947, Wave erosion along the southern California coast: Geological Society of America Bulletin, v. 58, p. 919-926.
Storlazzi, C.D. and Griggs, G.B., 2000, The influence of El Nino-Southern oscillation (ENSO) events on the evolution of California’s shoreline: Geological Society of America Bulletin, v. 112, no. 2, p. 236-249.
U.S. Army Corps of Engineers (USACOE), San Francisco Dis-trict, 1971, National Shoreline Study—California Regional Inventory: San Francisco, California, Corps of Engineers District Office, 105 p.
Vanderhurst, M.L., McCarthy, R.J., and Hannan, D.L.,1982, Black’s Beach landslide, in Geologic studies in San Diego: San Diego, California, San Diego Association of Geolo-gists, p. 46-56.
Wiegel, R.L., 1964, Oceanographical engineering: Englewood Cliffs, New Jersey, Prentice-Hall, 532 p.
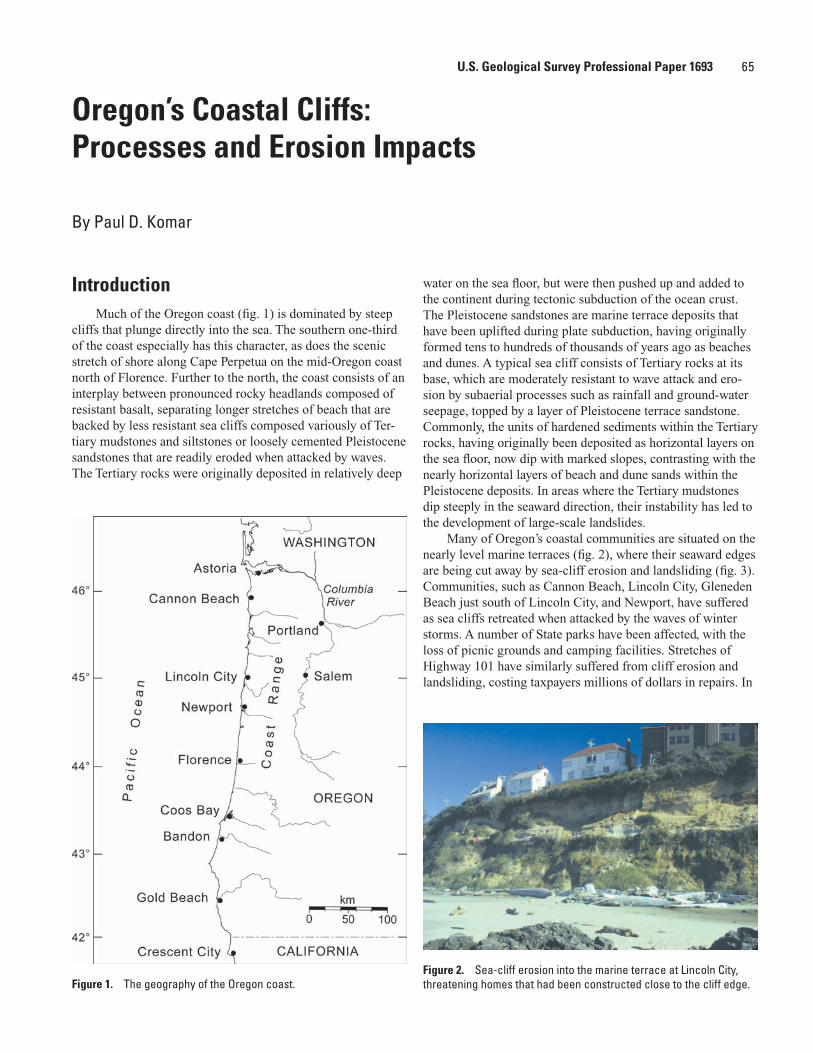
65
IntroductionMuch of the Oregon coast (fig. 1) is dominated by steep
cliffs that plunge directly into the sea. The southern one-third of the coast especially has this character, as does the scenic stretch of shore along Cape Perpetua on the mid-Oregon coast north of Florence. Further to the north, the coast consists of an interplay between pronounced rocky headlands composed of resistant basalt, separating longer stretches of beach that are backed by less resistant sea cliffs composed variously of Ter-tiary mudstones and siltstones or loosely cemented Pleistocene sandstones that are readily eroded when attacked by waves. The Tertiary rocks were originally deposited in relatively deep
water on the sea floor, but were then pushed up and added to the continent during tectonic subduction of the ocean crust. The Pleistocene sandstones are marine terrace deposits that have been uplifted during plate subduction, having originally formed tens to hundreds of thousands of years ago as beaches and dunes. A typical sea cliff consists of Tertiary rocks at its base, which are moderately resistant to wave attack and ero-sion by subaerial processes such as rainfall and ground-water seepage, topped by a layer of Pleistocene terrace sandstone. Commonly, the units of hardened sediments within the Tertiary rocks, having originally been deposited as horizontal layers on the sea floor, now dip with marked slopes, contrasting with the nearly horizontal layers of beach and dune sands within the Pleistocene deposits. In areas where the Tertiary mudstones dip steeply in the seaward direction, their instability has led to the development of large-scale landslides.
Many of Oregon’s coastal communities are situated on the nearly level marine terraces (fig. 2), where their seaward edges are being cut away by sea-cliff erosion and landsliding (fig. 3). Communities, such as Cannon Beach, Lincoln City, Gleneden Beach just south of Lincoln City, and Newport, have suffered as sea cliffs retreated when attacked by the waves of winter storms. A number of State parks have been affected, with the loss of picnic grounds and camping facilities. Stretches of Highway 101 have similarly suffered from cliff erosion and landsliding, costing taxpayers millions of dollars in repairs. In
Oregon’s Coastal Cliffs:Processes and Erosion Impacts
By Paul D. Komar
Figure 1. The geography of the Oregon coast.Figure 2. Sea-cliff erosion into the marine terrace at Lincoln City, threatening homes that had been constructed close to the cliff edge.
U.S. Geological Survey Professional Paper 1693
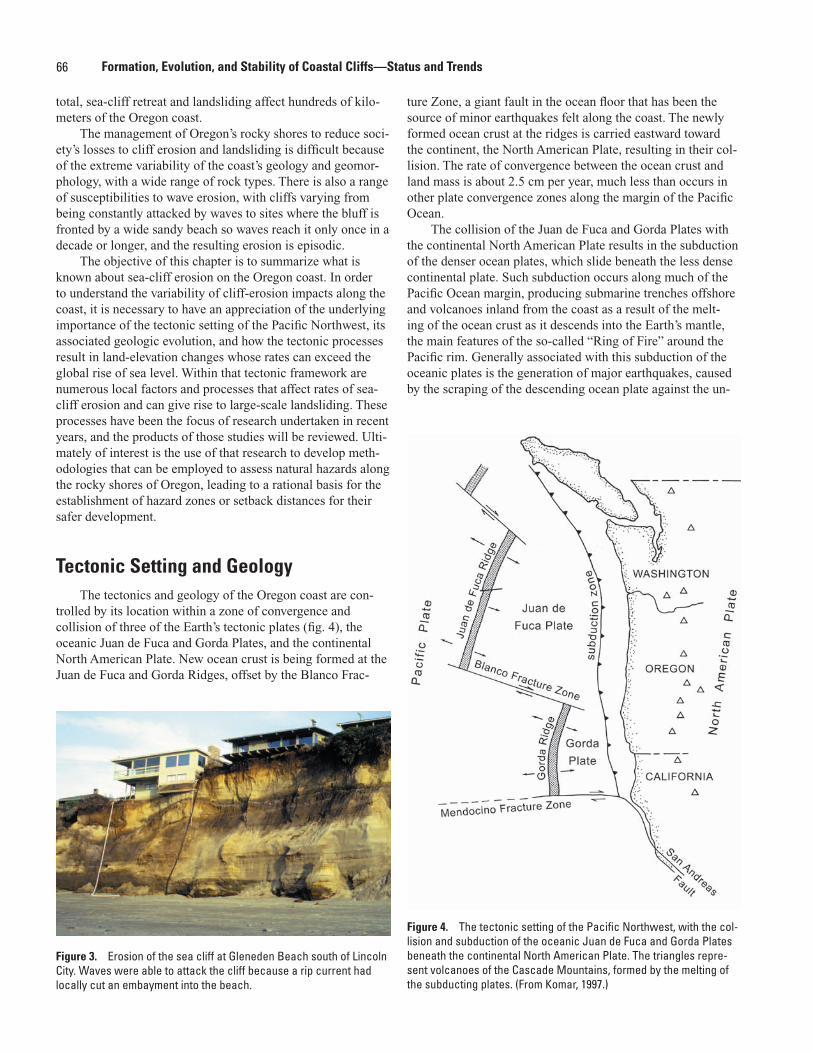
66 Formation, Evolution, and Stability of Coastal Cliffs—Status and Trends
total, sea-cliff retreat and landsliding affect hundreds of kilo-meters of the Oregon coast.
The management of Oregon’s rocky shores to reduce soci-ety’s losses to cliff erosion and landsliding is difficult because of the extreme variability of the coast’s geology and geomor-phology, with a wide range of rock types. There is also a range of susceptibilities to wave erosion, with cliffs varying from being constantly attacked by waves to sites where the bluff is fronted by a wide sandy beach so waves reach it only once in a decade or longer, and the resulting erosion is episodic.
The objective of this chapter is to summarize what is known about sea-cliff erosion on the Oregon coast. In order to understand the variability of cliff-erosion impacts along the coast, it is necessary to have an appreciation of the underlying importance of the tectonic setting of the Pacific Northwest, its associated geologic evolution, and how the tectonic processes result in land-elevation changes whose rates can exceed the global rise of sea level. Within that tectonic framework are numerous local factors and processes that affect rates of sea-cliff erosion and can give rise to large-scale landsliding. These processes have been the focus of research undertaken in recent years, and the products of those studies will be reviewed. Ulti-mately of interest is the use of that research to develop meth-odologies that can be employed to assess natural hazards along the rocky shores of Oregon, leading to a rational basis for the establishment of hazard zones or setback distances for their safer development.
Tectonic Setting and GeologyThe tectonics and geology of the Oregon coast are con-
trolled by its location within a zone of convergence and collision of three of the Earth’s tectonic plates (fig. 4), the oceanic Juan de Fuca and Gorda Plates, and the continental North American Plate. New ocean crust is being formed at the Juan de Fuca and Gorda Ridges, offset by the Blanco Frac-
ture Zone, a giant fault in the ocean floor that has been the source of minor earthquakes felt along the coast. The newly formed ocean crust at the ridges is carried eastward toward the continent, the North American Plate, resulting in their col-lision. The rate of convergence between the ocean crust and land mass is about 2.5 cm per year, much less than occurs in other plate convergence zones along the margin of the Pacific Ocean.
The collision of the Juan de Fuca and Gorda Plates with the continental North American Plate results in the subduction of the denser ocean plates, which slide beneath the less dense continental plate. Such subduction occurs along much of the Pacific Ocean margin, producing submarine trenches offshore and volcanoes inland from the coast as a result of the melt-ing of the ocean crust as it descends into the Earth’s mantle, the main features of the so-called “Ring of Fire” around the Pacific rim. Generally associated with this subduction of the oceanic plates is the generation of major earthquakes, caused by the scraping of the descending ocean plate against the un-
Figure 3. Erosion of the sea cliff at Gleneden Beach south of Lincoln City. Waves were able to attack the cliff because a rip current had locally cut an embayment into the beach.
Figure 4. The tectonic setting of the Pacific Northwest, with the col-lision and subduction of the oceanic Juan de Fuca and Gorda Plates beneath the continental North American Plate. The triangles repre-sent volcanoes of the Cascade Mountains, formed by the melting of the subducting plates. (From Komar, 1997.)
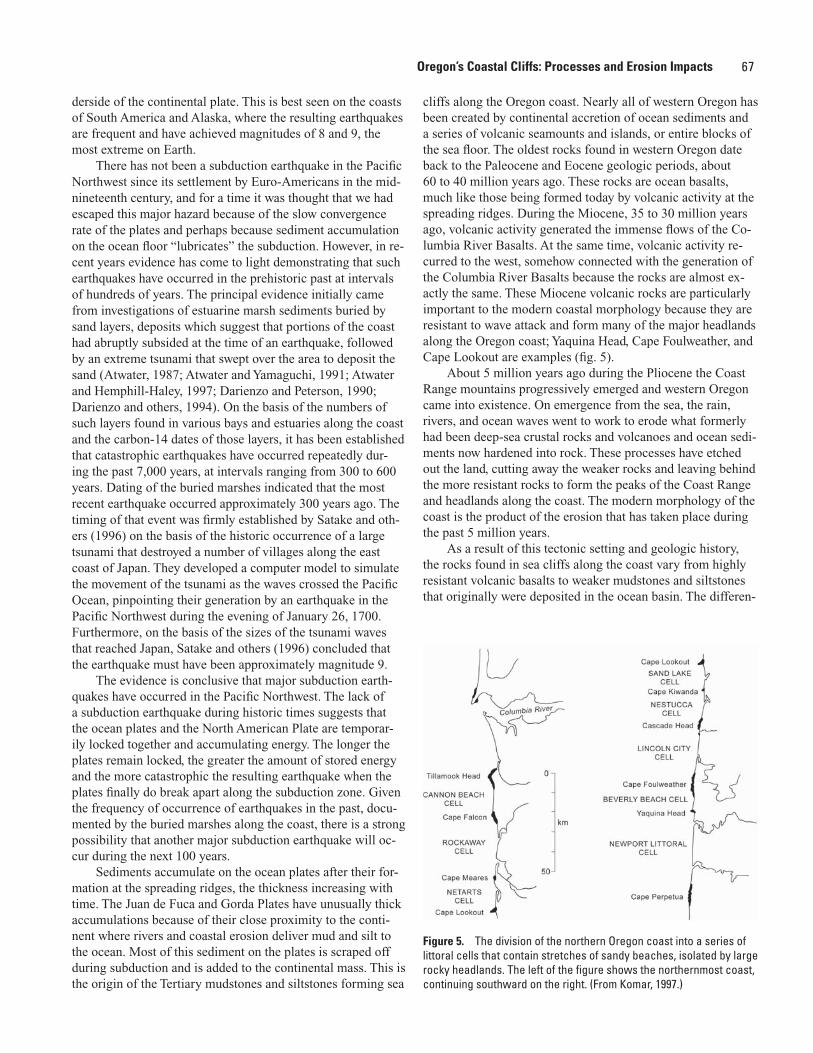
67
derside of the continental plate. This is best seen on the coasts of South America and Alaska, where the resulting earthquakes are frequent and have achieved magnitudes of 8 and 9, the most extreme on Earth.
There has not been a subduction earthquake in the Pacific Northwest since its settlement by Euro-Americans in the mid-nineteenth century, and for a time it was thought that we had escaped this major hazard because of the slow convergence rate of the plates and perhaps because sediment accumulation on the ocean floor “lubricates” the subduction. However, in re-cent years evidence has come to light demonstrating that such earthquakes have occurred in the prehistoric past at intervals of hundreds of years. The principal evidence initially came from investigations of estuarine marsh sediments buried by sand layers, deposits which suggest that portions of the coast had abruptly subsided at the time of an earthquake, followed by an extreme tsunami that swept over the area to deposit the sand (Atwater, 1987; Atwater and Yamaguchi, 1991; Atwater and Hemphill-Haley, 1997; Darienzo and Peterson, 1990; Darienzo and others, 1994). On the basis of the numbers of such layers found in various bays and estuaries along the coast and the carbon-14 dates of those layers, it has been established that catastrophic earthquakes have occurred repeatedly dur-ing the past 7,000 years, at intervals ranging from 300 to 600 years. Dating of the buried marshes indicated that the most recent earthquake occurred approximately 300 years ago. The timing of that event was firmly established by Satake and oth-ers (1996) on the basis of the historic occurrence of a large tsunami that destroyed a number of villages along the east coast of Japan. They developed a computer model to simulate the movement of the tsunami as the waves crossed the Pacific Ocean, pinpointing their generation by an earthquake in the Pacific Northwest during the evening of January 26, 1700. Furthermore, on the basis of the sizes of the tsunami waves that reached Japan, Satake and others (1996) concluded that the earthquake must have been approximately magnitude 9.
The evidence is conclusive that major subduction earth-quakes have occurred in the Pacific Northwest. The lack of a subduction earthquake during historic times suggests that the ocean plates and the North American Plate are temporar-ily locked together and accumulating energy. The longer the plates remain locked, the greater the amount of stored energy and the more catastrophic the resulting earthquake when the plates finally do break apart along the subduction zone. Given the frequency of occurrence of earthquakes in the past, docu-mented by the buried marshes along the coast, there is a strong possibility that another major subduction earthquake will oc-cur during the next 100 years.
Sediments accumulate on the ocean plates after their for-mation at the spreading ridges, the thickness increasing with time. The Juan de Fuca and Gorda Plates have unusually thick accumulations because of their close proximity to the conti-nent where rivers and coastal erosion deliver mud and silt to the ocean. Most of this sediment on the plates is scraped off during subduction and is added to the continental mass. This is the origin of the Tertiary mudstones and siltstones forming sea
cliffs along the Oregon coast. Nearly all of western Oregon has been created by continental accretion of ocean sediments and a series of volcanic seamounts and islands, or entire blocks of the sea floor. The oldest rocks found in western Oregon date back to the Paleocene and Eocene geologic periods, about 60 to 40 million years ago. These rocks are ocean basalts, much like those being formed today by volcanic activity at the spreading ridges. During the Miocene, 35 to 30 million years ago, volcanic activity generated the immense flows of the Co-lumbia River Basalts. At the same time, volcanic activity re-curred to the west, somehow connected with the generation of the Columbia River Basalts because the rocks are almost ex-actly the same. These Miocene volcanic rocks are particularly important to the modern coastal morphology because they are resistant to wave attack and form many of the major headlands along the Oregon coast; Yaquina Head, Cape Foulweather, and Cape Lookout are examples (fig. 5).
About 5 million years ago during the Pliocene the Coast Range mountains progressively emerged and western Oregon came into existence. On emergence from the sea, the rain, rivers, and ocean waves went to work to erode what formerly had been deep-sea crustal rocks and volcanoes and ocean sedi-ments now hardened into rock. These processes have etched out the land, cutting away the weaker rocks and leaving behind the more resistant rocks to form the peaks of the Coast Range and headlands along the coast. The modern morphology of the coast is the product of the erosion that has taken place during the past 5 million years.
As a result of this tectonic setting and geologic history, the rocks found in sea cliffs along the coast vary from highly resistant volcanic basalts to weaker mudstones and siltstones that originally were deposited in the ocean basin. The differen-
Figure 5. The division of the northern Oregon coast into a series of littoral cells that contain stretches of sandy beaches, isolated by large rocky headlands. The left of the figure shows the northernmost coast, continuing southward on the right. (From Komar, 1997.)
Oregon’s Coastal Cliffs: Processes and Erosion Impacts
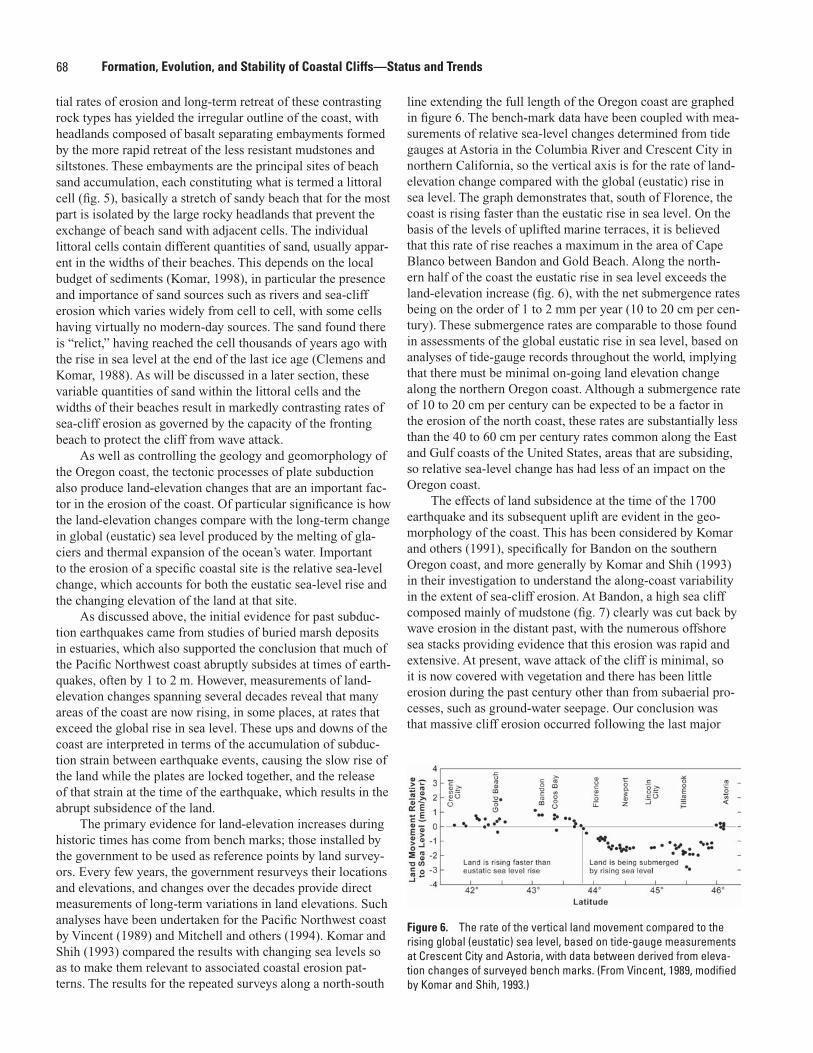
68 Formation, Evolution, and Stability of Coastal Cliffs—Status and Trends
tial rates of erosion and long-term retreat of these contrasting rock types has yielded the irregular outline of the coast, with headlands composed of basalt separating embayments formed by the more rapid retreat of the less resistant mudstones and siltstones. These embayments are the principal sites of beach sand accumulation, each constituting what is termed a littoral cell (fig. 5), basically a stretch of sandy beach that for the most part is isolated by the large rocky headlands that prevent the exchange of beach sand with adjacent cells. The individual littoral cells contain different quantities of sand, usually appar-ent in the widths of their beaches. This depends on the local budget of sediments (Komar, 1998), in particular the presence and importance of sand sources such as rivers and sea-cliff erosion which varies widely from cell to cell, with some cells having virtually no modern-day sources. The sand found there is “relict,” having reached the cell thousands of years ago with the rise in sea level at the end of the last ice age (Clemens and Komar, 1988). As will be discussed in a later section, these variable quantities of sand within the littoral cells and the widths of their beaches result in markedly contrasting rates of sea-cliff erosion as governed by the capacity of the fronting beach to protect the cliff from wave attack.
As well as controlling the geology and geomorphology of the Oregon coast, the tectonic processes of plate subduction also produce land-elevation changes that are an important fac-tor in the erosion of the coast. Of particular significance is how the land-elevation changes compare with the long-term change in global (eustatic) sea level produced by the melting of gla-ciers and thermal expansion of the ocean’s water. Important to the erosion of a specific coastal site is the relative sea-level change, which accounts for both the eustatic sea-level rise and the changing elevation of the land at that site.
As discussed above, the initial evidence for past subduc-tion earthquakes came from studies of buried marsh deposits in estuaries, which also supported the conclusion that much of the Pacific Northwest coast abruptly subsides at times of earth-quakes, often by 1 to 2 m. However, measurements of land-elevation changes spanning several decades reveal that many areas of the coast are now rising, in some places, at rates that exceed the global rise in sea level. These ups and downs of the coast are interpreted in terms of the accumulation of subduc-tion strain between earthquake events, causing the slow rise of the land while the plates are locked together, and the release of that strain at the time of the earthquake, which results in the abrupt subsidence of the land.
The primary evidence for land-elevation increases during historic times has come from bench marks; those installed by the government to be used as reference points by land survey-ors. Every few years, the government resurveys their locations and elevations, and changes over the decades provide direct measurements of long-term variations in land elevations. Such analyses have been undertaken for the Pacific Northwest coast by Vincent (1989) and Mitchell and others (1994). Komar and Shih (1993) compared the results with changing sea levels so as to make them relevant to associated coastal erosion pat-terns. The results for the repeated surveys along a north-south
line extending the full length of the Oregon coast are graphed in figure 6. The bench-mark data have been coupled with mea-surements of relative sea-level changes determined from tide gauges at Astoria in the Columbia River and Crescent City in northern California, so the vertical axis is for the rate of land-elevation change compared with the global (eustatic) rise in sea level. The graph demonstrates that, south of Florence, the coast is rising faster than the eustatic rise in sea level. On the basis of the levels of uplifted marine terraces, it is believed that this rate of rise reaches a maximum in the area of Cape Blanco between Bandon and Gold Beach. Along the north-ern half of the coast the eustatic rise in sea level exceeds the land-elevation increase (fig. 6), with the net submergence rates being on the order of 1 to 2 mm per year (10 to 20 cm per cen-tury). These submergence rates are comparable to those found in assessments of the global eustatic rise in sea level, based on analyses of tide-gauge records throughout the world, implying that there must be minimal on-going land elevation change along the northern Oregon coast. Although a submergence rate of 10 to 20 cm per century can be expected to be a factor in the erosion of the north coast, these rates are substantially less than the 40 to 60 cm per century rates common along the East and Gulf coasts of the United States, areas that are subsiding, so relative sea-level change has had less of an impact on the Oregon coast.
The effects of land subsidence at the time of the 1700 earthquake and its subsequent uplift are evident in the geo-morphology of the coast. This has been considered by Komar and others (1991), specifically for Bandon on the southern Oregon coast, and more generally by Komar and Shih (1993) in their investigation to understand the along-coast variability in the extent of sea-cliff erosion. At Bandon, a high sea cliff composed mainly of mudstone (fig. 7) clearly was cut back by wave erosion in the distant past, with the numerous offshore sea stacks providing evidence that this erosion was rapid and extensive. At present, wave attack of the cliff is minimal, so it is now covered with vegetation and there has been little erosion during the past century other than from subaerial pro-cesses, such as ground-water seepage. Our conclusion was that massive cliff erosion occurred following the last major
Figure 6. The rate of the vertical land movement compared to the rising global (eustatic) sea level, based on tide-gauge measurements at Crescent City and Astoria, with data between derived from eleva-tion changes of surveyed bench marks. (From Vincent, 1989, modified by Komar and Shih, 1993.)
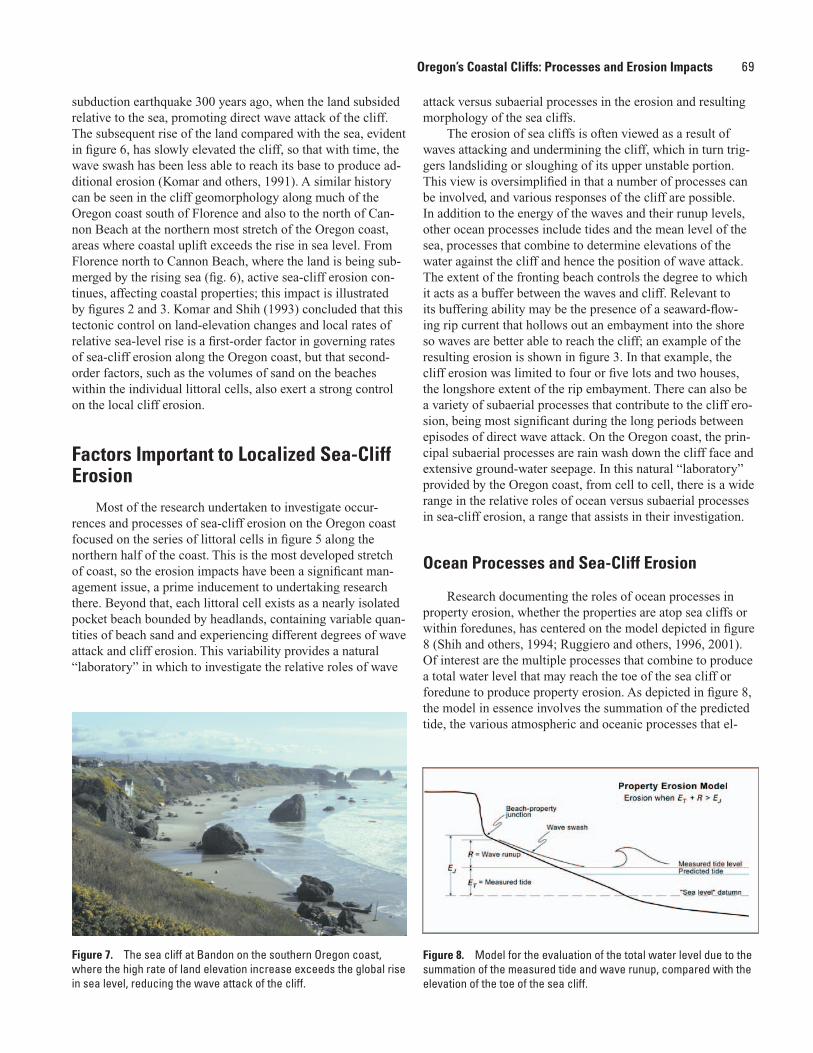
69
subduction earthquake 300 years ago, when the land subsided relative to the sea, promoting direct wave attack of the cliff. The subsequent rise of the land compared with the sea, evident in figure 6, has slowly elevated the cliff, so that with time, the wave swash has been less able to reach its base to produce ad-ditional erosion (Komar and others, 1991). A similar history can be seen in the cliff geomorphology along much of the Oregon coast south of Florence and also to the north of Can-non Beach at the northern most stretch of the Oregon coast, areas where coastal uplift exceeds the rise in sea level. From Florence north to Cannon Beach, where the land is being sub-merged by the rising sea (fig. 6), active sea-cliff erosion con-tinues, affecting coastal properties; this impact is illustrated by figures 2 and 3. Komar and Shih (1993) concluded that this tectonic control on land-elevation changes and local rates of relative sea-level rise is a first-order factor in governing rates of sea-cliff erosion along the Oregon coast, but that second- order factors, such as the volumes of sand on the beaches within the individual littoral cells, also exert a strong control on the local cliff erosion.
Factors Important to Localized Sea-Cliff Erosion
Most of the research undertaken to investigate occur-rences and processes of sea-cliff erosion on the Oregon coast focused on the series of littoral cells in figure 5 along the northern half of the coast. This is the most developed stretch of coast, so the erosion impacts have been a significant man-agement issue, a prime inducement to undertaking research there. Beyond that, each littoral cell exists as a nearly isolated pocket beach bounded by headlands, containing variable quan-tities of beach sand and experiencing different degrees of wave attack and cliff erosion. This variability provides a natural “laboratory” in which to investigate the relative roles of wave
attack versus subaerial processes in the erosion and resulting morphology of the sea cliffs.
The erosion of sea cliffs is often viewed as a result of waves attacking and undermining the cliff, which in turn trig-gers landsliding or sloughing of its upper unstable portion. This view is oversimplified in that a number of processes can be involved, and various responses of the cliff are possible. In addition to the energy of the waves and their runup levels, other ocean processes include tides and the mean level of the sea, processes that combine to determine elevations of the water against the cliff and hence the position of wave attack. The extent of the fronting beach controls the degree to which it acts as a buffer between the waves and cliff. Relevant to its buffering ability may be the presence of a seaward-flow-ing rip current that hollows out an embayment into the shore so waves are better able to reach the cliff; an example of the resulting erosion is shown in figure 3. In that example, the cliff erosion was limited to four or five lots and two houses, the longshore extent of the rip embayment. There can also be a variety of subaerial processes that contribute to the cliff ero-sion, being most significant during the long periods between episodes of direct wave attack. On the Oregon coast, the prin-cipal subaerial processes are rain wash down the cliff face and extensive ground-water seepage. In this natural “laboratory” provided by the Oregon coast, from cell to cell, there is a wide range in the relative roles of ocean versus subaerial processes in sea-cliff erosion, a range that assists in their investigation.
Ocean Processes and Sea-Cliff Erosion
Research documenting the roles of ocean processes in property erosion, whether the properties are atop sea cliffs or within foredunes, has centered on the model depicted in figure 8 (Shih and others, 1994; Ruggiero and others, 1996, 2001). Of interest are the multiple processes that combine to produce a total water level that may reach the toe of the sea cliff or foredune to produce property erosion. As depicted in figure 8, the model in essence involves the summation of the predicted tide, the various atmospheric and oceanic processes that el-
Figure 7. The sea cliff at Bandon on the southern Oregon coast, where the high rate of land elevation increase exceeds the global rise in sea level, reducing the wave attack of the cliff.
Figure 8. Model for the evaluation of the total water level due to the summation of the measured tide and wave runup, compared with the elevation of the toe of the sea cliff.
Oregon’s Coastal Cliffs: Processes and Erosion Impacts
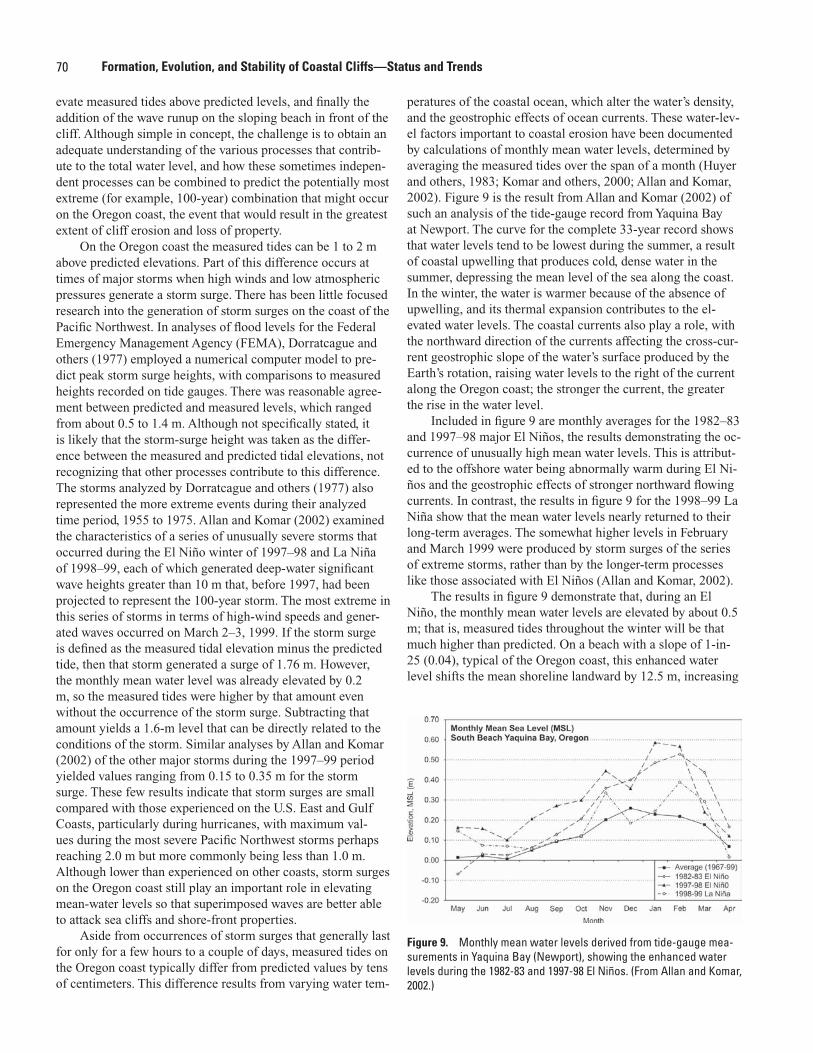
70 Formation, Evolution, and Stability of Coastal Cliffs—Status and Trends
evate measured tides above predicted levels, and finally the addition of the wave runup on the sloping beach in front of the cliff. Although simple in concept, the challenge is to obtain an adequate understanding of the various processes that contrib-ute to the total water level, and how these sometimes indepen-dent processes can be combined to predict the potentially most extreme (for example, 100-year) combination that might occur on the Oregon coast, the event that would result in the greatest extent of cliff erosion and loss of property.
On the Oregon coast the measured tides can be 1 to 2 m above predicted elevations. Part of this difference occurs at times of major storms when high winds and low atmospheric pressures generate a storm surge. There has been little focused research into the generation of storm surges on the coast of the Pacific Northwest. In analyses of flood levels for the Federal Emergency Management Agency (FEMA), Dorratcague and others (1977) employed a numerical computer model to pre-dict peak storm surge heights, with comparisons to measured heights recorded on tide gauges. There was reasonable agree-ment between predicted and measured levels, which ranged from about 0.5 to 1.4 m. Although not specifically stated, it is likely that the storm-surge height was taken as the differ-ence between the measured and predicted tidal elevations, not recognizing that other processes contribute to this difference. The storms analyzed by Dorratcague and others (1977) also represented the more extreme events during their analyzed time period, 1955 to 1975. Allan and Komar (2002) examined the characteristics of a series of unusually severe storms that occurred during the El Niño winter of 1997–98 and La Niña of 1998–99, each of which generated deep-water significant wave heights greater than 10 m that, before 1997, had been projected to represent the 100-year storm. The most extreme in this series of storms in terms of high-wind speeds and gener-ated waves occurred on March 2–3, 1999. If the storm surge is defined as the measured tidal elevation minus the predicted tide, then that storm generated a surge of 1.76 m. However, the monthly mean water level was already elevated by 0.2 m, so the measured tides were higher by that amount even without the occurrence of the storm surge. Subtracting that amount yields a 1.6-m level that can be directly related to the conditions of the storm. Similar analyses by Allan and Komar (2002) of the other major storms during the 1997–99 period yielded values ranging from 0.15 to 0.35 m for the storm surge. These few results indicate that storm surges are small compared with those experienced on the U.S. East and Gulf Coasts, particularly during hurricanes, with maximum val-ues during the most severe Pacific Northwest storms perhaps reaching 2.0 m but more commonly being less than 1.0 m. Although lower than experienced on other coasts, storm surges on the Oregon coast still play an important role in elevating mean-water levels so that superimposed waves are better able to attack sea cliffs and shore-front properties.
Aside from occurrences of storm surges that generally last for only for a few hours to a couple of days, measured tides on the Oregon coast typically differ from predicted values by tens of centimeters. This difference results from varying water tem-
peratures of the coastal ocean, which alter the water’s density, and the geostrophic effects of ocean currents. These water-lev-el factors important to coastal erosion have been documented by calculations of monthly mean water levels, determined by averaging the measured tides over the span of a month (Huyer and others, 1983; Komar and others, 2000; Allan and Komar, 2002). Figure 9 is the result from Allan and Komar (2002) of such an analysis of the tide-gauge record from Yaquina Bay at Newport. The curve for the complete 33-year record shows that water levels tend to be lowest during the summer, a result of coastal upwelling that produces cold, dense water in the summer, depressing the mean level of the sea along the coast. In the winter, the water is warmer because of the absence of upwelling, and its thermal expansion contributes to the el-evated water levels. The coastal currents also play a role, with the northward direction of the currents affecting the cross-cur-rent geostrophic slope of the water’s surface produced by the Earth’s rotation, raising water levels to the right of the current along the Oregon coast; the stronger the current, the greater the rise in the water level.
Included in figure 9 are monthly averages for the 1982–83 and 1997–98 major El Niños, the results demonstrating the oc-currence of unusually high mean water levels. This is attribut-ed to the offshore water being abnormally warm during El Ni-ños and the geostrophic effects of stronger northward flowing currents. In contrast, the results in figure 9 for the 1998–99 La Niña show that the mean water levels nearly returned to their long-term averages. The somewhat higher levels in February and March 1999 were produced by storm surges of the series of extreme storms, rather than by the longer-term processes like those associated with El Niños (Allan and Komar, 2002).
The results in figure 9 demonstrate that, during an El Niño, the monthly mean water levels are elevated by about 0.5 m; that is, measured tides throughout the winter will be that much higher than predicted. On a beach with a slope of 1-in-25 (0.04), typical of the Oregon coast, this enhanced water level shifts the mean shoreline landward by 12.5 m, increasing
Figure 9. Monthly mean water levels derived from tide-gauge mea-surements in Yaquina Bay (Newport), showing the enhanced water levels during the 1982-83 and 1997-98 El Niños. (From Allan and Komar, 2002.)
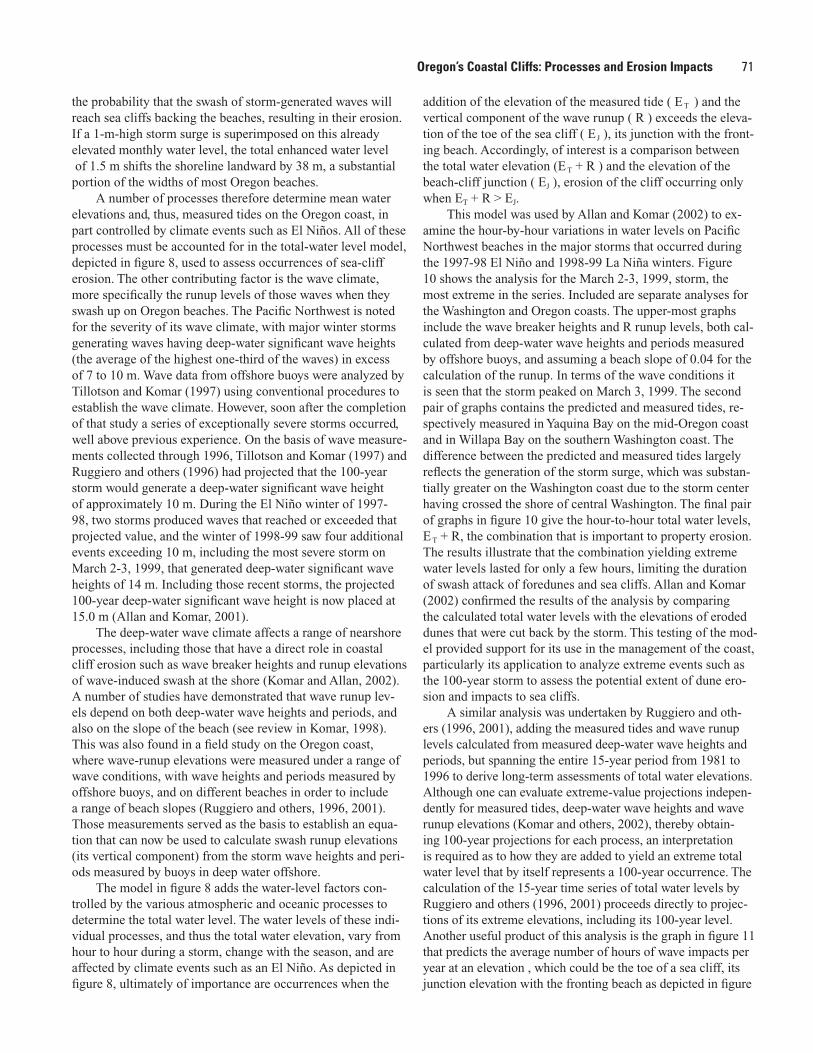
71
the probability that the swash of storm-generated waves will reach sea cliffs backing the beaches, resulting in their erosion. If a 1-m-high storm surge is superimposed on this already elevated monthly water level, the total enhanced water level of 1.5 m shifts the shoreline landward by 38 m, a substantial portion of the widths of most Oregon beaches.
A number of processes therefore determine mean water elevations and, thus, measured tides on the Oregon coast, in part controlled by climate events such as El Niños. All of these processes must be accounted for in the total-water level model, depicted in figure 8, used to assess occurrences of sea-cliff erosion. The other contributing factor is the wave climate, more specifically the runup levels of those waves when they swash up on Oregon beaches. The Pacific Northwest is noted for the severity of its wave climate, with major winter storms generating waves having deep-water significant wave heights (the average of the highest one-third of the waves) in excess of 7 to 10 m. Wave data from offshore buoys were analyzed by Tillotson and Komar (1997) using conventional procedures to establish the wave climate. However, soon after the completion of that study a series of exceptionally severe storms occurred, well above previous experience. On the basis of wave measure-ments collected through 1996, Tillotson and Komar (1997) and Ruggiero and others (1996) had projected that the 100-year storm would generate a deep-water significant wave height of approximately 10 m. During the El Niño winter of 1997-98, two storms produced waves that reached or exceeded that projected value, and the winter of 1998-99 saw four additional events exceeding 10 m, including the most severe storm on March 2-3, 1999, that generated deep-water significant wave heights of 14 m. Including those recent storms, the projected 100-year deep-water significant wave height is now placed at 15.0 m (Allan and Komar, 2001).
The deep-water wave climate affects a range of nearshore processes, including those that have a direct role in coastal cliff erosion such as wave breaker heights and runup elevations of wave-induced swash at the shore (Komar and Allan, 2002). A number of studies have demonstrated that wave runup lev-els depend on both deep-water wave heights and periods, and also on the slope of the beach (see review in Komar, 1998). This was also found in a field study on the Oregon coast, where wave-runup elevations were measured under a range of wave conditions, with wave heights and periods measured by offshore buoys, and on different beaches in order to include a range of beach slopes (Ruggiero and others, 1996, 2001). Those measurements served as the basis to establish an equa-tion that can now be used to calculate swash runup elevations (its vertical component) from the storm wave heights and peri-ods measured by buoys in deep water offshore.
The model in figure 8 adds the water-level factors con-trolled by the various atmospheric and oceanic processes to determine the total water level. The water levels of these indi-vidual processes, and thus the total water elevation, vary from hour to hour during a storm, change with the season, and are affected by climate events such as an El Niño. As depicted in figure 8, ultimately of importance are occurrences when the
addition of the elevation of the measured tide ( E T ) and the
vertical component of the wave runup ( R ) exceeds the eleva-tion of the toe of the sea cliff ( EJ ), its junction with the front-ing beach. Accordingly, of interest is a comparison between the total water elevation (E T + R ) and the elevation of the beach-cliff junction ( EJ ), erosion of the cliff occurring only when ET + R > EJ.
This model was used by Allan and Komar (2002) to ex-amine the hour-by-hour variations in water levels on Pacific Northwest beaches in the major storms that occurred during the 1997-98 El Niño and 1998-99 La Niña winters. Figure 10 shows the analysis for the March 2-3, 1999, storm, the most extreme in the series. Included are separate analyses for the Washington and Oregon coasts. The upper-most graphs include the wave breaker heights and R runup levels, both cal-culated from deep-water wave heights and periods measured by offshore buoys, and assuming a beach slope of 0.04 for the calculation of the runup. In terms of the wave conditions it is seen that the storm peaked on March 3, 1999. The second pair of graphs contains the predicted and measured tides, re-spectively measured in Yaquina Bay on the mid-Oregon coast and in Willapa Bay on the southern Washington coast. The difference between the predicted and measured tides largely reflects the generation of the storm surge, which was substan-tially greater on the Washington coast due to the storm center having crossed the shore of central Washington. The final pair of graphs in figure 10 give the hour-to-hour total water levels, E T + R, the combination that is important to property erosion. The results illustrate that the combination yielding extreme water levels lasted for only a few hours, limiting the duration of swash attack of foredunes and sea cliffs. Allan and Komar (2002) confirmed the results of the analysis by comparing the calculated total water levels with the elevations of eroded dunes that were cut back by the storm. This testing of the mod-el provided support for its use in the management of the coast, particularly its application to analyze extreme events such as the 100-year storm to assess the potential extent of dune ero-sion and impacts to sea cliffs.
A similar analysis was undertaken by Ruggiero and oth-ers (1996, 2001), adding the measured tides and wave runup levels calculated from measured deep-water wave heights and periods, but spanning the entire 15-year period from 1981 to 1996 to derive long-term assessments of total water elevations. Although one can evaluate extreme-value projections indepen-dently for measured tides, deep-water wave heights and wave runup elevations (Komar and others, 2002), thereby obtain-ing 100-year projections for each process, an interpretation is required as to how they are added to yield an extreme total water level that by itself represents a 100-year occurrence. The calculation of the 15-year time series of total water levels by Ruggiero and others (1996, 2001) proceeds directly to projec-tions of its extreme elevations, including its 100-year level. Another useful product of this analysis is the graph in figure 11 that predicts the average number of hours of wave impacts per year at an elevation , which could be the toe of a sea cliff, its junction elevation with the fronting beach as depicted in figure
Oregon’s Coastal Cliffs: Processes and Erosion Impacts
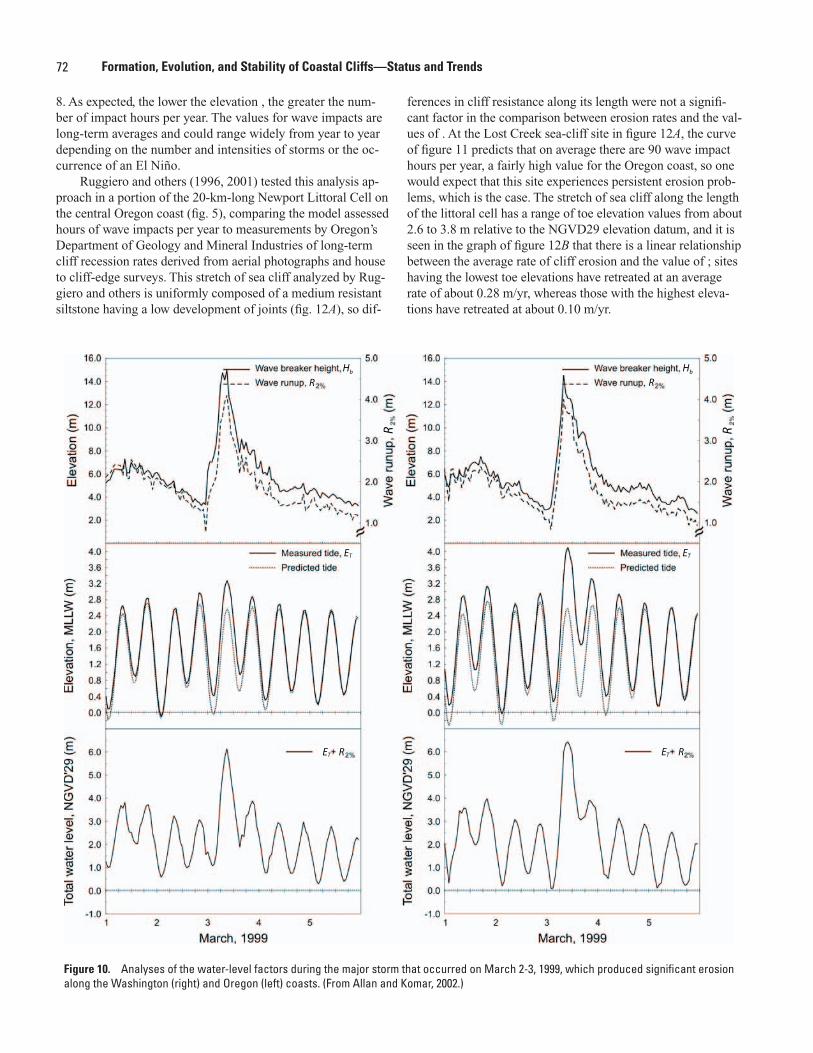
72 Formation, Evolution, and Stability of Coastal Cliffs—Status and Trends
8. As expected, the lower the elevation , the greater the num-ber of impact hours per year. The values for wave impacts are long-term averages and could range widely from year to year depending on the number and intensities of storms or the oc-currence of an El Niño.
Ruggiero and others (1996, 2001) tested this analysis ap-proach in a portion of the 20-km-long Newport Littoral Cell on the central Oregon coast (fig. 5), comparing the model assessed hours of wave impacts per year to measurements by Oregon’s Department of Geology and Mineral Industries of long-term cliff recession rates derived from aerial photographs and house to cliff-edge surveys. This stretch of sea cliff analyzed by Rug-giero and others is uniformly composed of a medium resistant siltstone having a low development of joints (fig. 12A), so dif-
ferences in cliff resistance along its length were not a signifi-cant factor in the comparison between erosion rates and the val-ues of . At the Lost Creek sea-cliff site in figure 12A, the curve of figure 11 predicts that on average there are 90 wave impact hours per year, a fairly high value for the Oregon coast, so one would expect that this site experiences persistent erosion prob-lems, which is the case. The stretch of sea cliff along the length of the littoral cell has a range of toe elevation values from about 2.6 to 3.8 m relative to the NGVD29 elevation datum, and it is seen in the graph of figure 12B that there is a linear relationship between the average rate of cliff erosion and the value of ; sites having the lowest toe elevations have retreated at an average rate of about 0.28 m/yr, whereas those with the highest eleva-tions have retreated at about 0.10 m/yr.
Hb
R
Hb
R
ET ET
ET R ET R
R R
Figure 10. Analyses of the water-level factors during the major storm that occurred on March 2-3, 1999, which produced significant erosion along the Washington (right) and Oregon (left) coasts. (From Allan and Komar, 2002.)
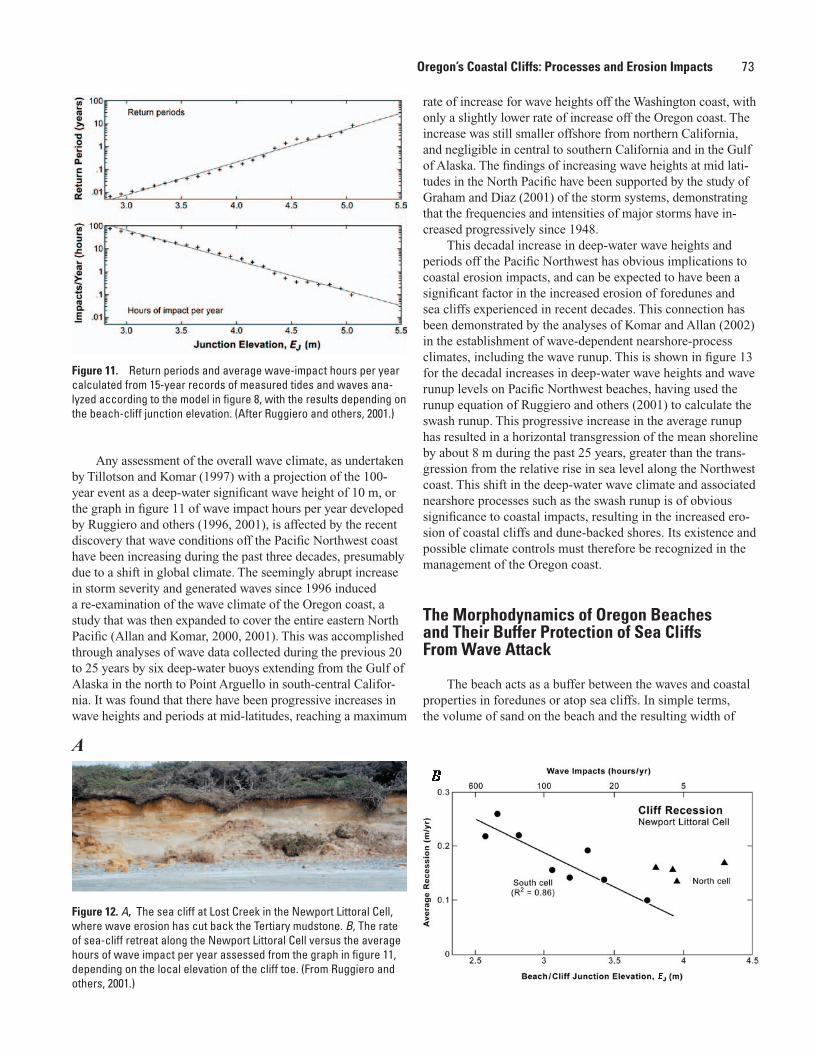
73
rate of increase for wave heights off the Washington coast, with only a slightly lower rate of increase off the Oregon coast. The increase was still smaller offshore from northern California, and negligible in central to southern California and in the Gulf of Alaska. The findings of increasing wave heights at mid lati-tudes in the North Pacific have been supported by the study of Graham and Diaz (2001) of the storm systems, demonstrating that the frequencies and intensities of major storms have in-creased progressively since 1948.
This decadal increase in deep-water wave heights and periods off the Pacific Northwest has obvious implications to coastal erosion impacts, and can be expected to have been a significant factor in the increased erosion of foredunes and sea cliffs experienced in recent decades. This connection has been demonstrated by the analyses of Komar and Allan (2002) in the establishment of wave-dependent nearshore-process climates, including the wave runup. This is shown in figure 13 for the decadal increases in deep-water wave heights and wave runup levels on Pacific Northwest beaches, having used the runup equation of Ruggiero and others (2001) to calculate the swash runup. This progressive increase in the average runup has resulted in a horizontal transgression of the mean shoreline by about 8 m during the past 25 years, greater than the trans-gression from the relative rise in sea level along the Northwest coast. This shift in the deep-water wave climate and associated nearshore processes such as the swash runup is of obvious significance to coastal impacts, resulting in the increased ero-sion of coastal cliffs and dune-backed shores. Its existence and possible climate controls must therefore be recognized in the management of the Oregon coast.
The Morphodynamics of Oregon Beaches and Their Buffer Protection of Sea Cliffs From Wave Attack
The beach acts as a buffer between the waves and coastal properties in foredunes or atop sea cliffs. In simple terms, the volume of sand on the beach and the resulting width of
Figure 11. Return periods and average wave-impact hours per year calculated from 15-year records of measured tides and waves ana-lyzed according to the model in figure 8, with the results depending on the beach-cliff junction elevation. (After Ruggiero and others, 2001.)
Figure 12. A, The sea cliff at Lost Creek in the Newport Littoral Cell, where wave erosion has cut back the Tertiary mudstone. B, The rate of sea-cliff retreat along the Newport Littoral Cell versus the average hours of wave impact per year assessed from the graph in figure 11, depending on the local elevation of the cliff toe. (From Ruggiero and others, 2001.)
Any assessment of the overall wave climate, as undertaken by Tillotson and Komar (1997) with a projection of the 100-year event as a deep-water significant wave height of 10 m, or the graph in figure 11 of wave impact hours per year developed by Ruggiero and others (1996, 2001), is affected by the recent discovery that wave conditions off the Pacific Northwest coast have been increasing during the past three decades, presumably due to a shift in global climate. The seemingly abrupt increase in storm severity and generated waves since 1996 induced a re-examination of the wave climate of the Oregon coast, a study that was then expanded to cover the entire eastern North Pacific (Allan and Komar, 2000, 2001). This was accomplished through analyses of wave data collected during the previous 20 to 25 years by six deep-water buoys extending from the Gulf of Alaska in the north to Point Arguello in south-central Califor-nia. It was found that there have been progressive increases in wave heights and periods at mid-latitudes, reaching a maximum
Oregon’s Coastal Cliffs: Processes and Erosion Impacts
A
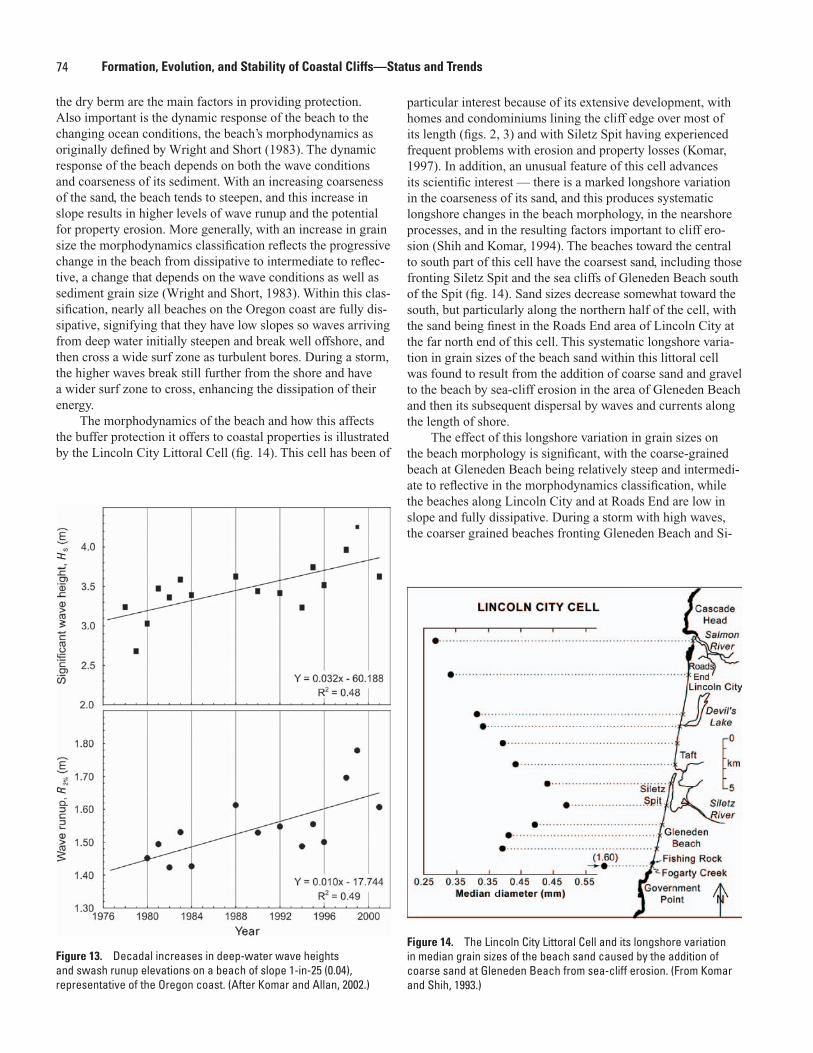
74 Formation, Evolution, and Stability of Coastal Cliffs—Status and Trends
the dry berm are the main factors in providing protection. Also important is the dynamic response of the beach to the changing ocean conditions, the beach’s morphodynamics as originally defined by Wright and Short (1983). The dynamic response of the beach depends on both the wave conditions and coarseness of its sediment. With an increasing coarseness of the sand, the beach tends to steepen, and this increase in slope results in higher levels of wave runup and the potential for property erosion. More generally, with an increase in grain size the morphodynamics classification reflects the progressive change in the beach from dissipative to intermediate to reflec-tive, a change that depends on the wave conditions as well as sediment grain size (Wright and Short, 1983). Within this clas-sification, nearly all beaches on the Oregon coast are fully dis-sipative, signifying that they have low slopes so waves arriving from deep water initially steepen and break well offshore, and then cross a wide surf zone as turbulent bores. During a storm, the higher waves break still further from the shore and have a wider surf zone to cross, enhancing the dissipation of their energy.
The morphodynamics of the beach and how this affects the buffer protection it offers to coastal properties is illustrated by the Lincoln City Littoral Cell (fig. 14). This cell has been of
particular interest because of its extensive development, with homes and condominiums lining the cliff edge over most of its length (figs. 2, 3) and with Siletz Spit having experienced frequent problems with erosion and property losses (Komar, 1997). In addition, an unusual feature of this cell advances its scientific interest — there is a marked longshore variation in the coarseness of its sand, and this produces systematic longshore changes in the beach morphology, in the nearshore processes, and in the resulting factors important to cliff ero-sion (Shih and Komar, 1994). The beaches toward the central to south part of this cell have the coarsest sand, including those fronting Siletz Spit and the sea cliffs of Gleneden Beach south of the Spit (fig. 14). Sand sizes decrease somewhat toward the south, but particularly along the northern half of the cell, with the sand being finest in the Roads End area of Lincoln City at the far north end of this cell. This systematic longshore varia-tion in grain sizes of the beach sand within this littoral cell was found to result from the addition of coarse sand and gravel to the beach by sea-cliff erosion in the area of Gleneden Beach and then its subsequent dispersal by waves and currents along the length of shore.
The effect of this longshore variation in grain sizes on the beach morphology is significant, with the coarse-grained beach at Gleneden Beach being relatively steep and intermedi-ate to reflective in the morphodynamics classification, while the beaches along Lincoln City and at Roads End are low in slope and fully dissipative. During a storm with high waves, the coarser grained beaches fronting Gleneden Beach and Si-
HR
Figure 13. Decadal increases in deep-water wave heights and swash runup elevations on a beach of slope 1-in-25 (0.04), representative of the Oregon coast. (After Komar and Allan, 2002.)
Figure 14. The Lincoln City Littoral Cell and its longshore variation in median grain sizes of the beach sand caused by the addition of coarse sand at Gleneden Beach from sea-cliff erosion. (From Komar and Shih, 1993.)
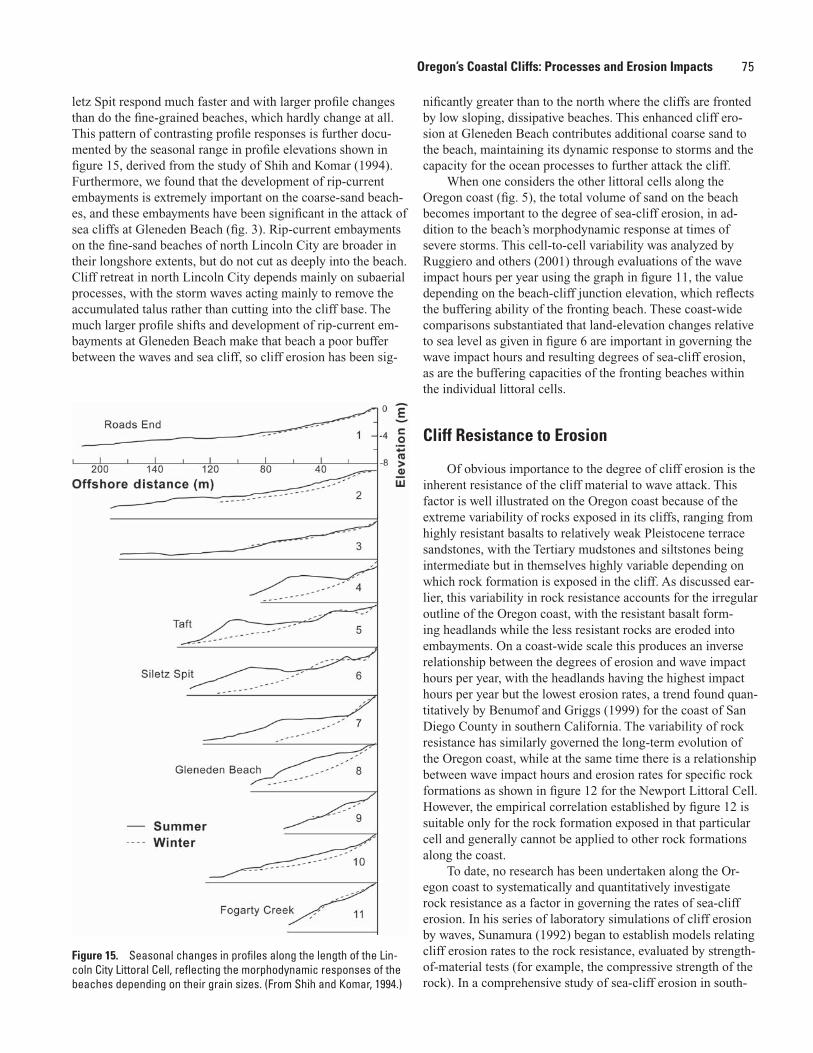
75
letz Spit respond much faster and with larger profile changes than do the fine-grained beaches, which hardly change at all. This pattern of contrasting profile responses is further docu-mented by the seasonal range in profile elevations shown in figure 15, derived from the study of Shih and Komar (1994). Furthermore, we found that the development of rip-current embayments is extremely important on the coarse-sand beach-es, and these embayments have been significant in the attack of sea cliffs at Gleneden Beach (fig. 3). Rip-current embayments on the fine-sand beaches of north Lincoln City are broader in their longshore extents, but do not cut as deeply into the beach. Cliff retreat in north Lincoln City depends mainly on subaerial processes, with the storm waves acting mainly to remove the accumulated talus rather than cutting into the cliff base. The much larger profile shifts and development of rip-current em-bayments at Gleneden Beach make that beach a poor buffer between the waves and sea cliff, so cliff erosion has been sig-
nificantly greater than to the north where the cliffs are fronted by low sloping, dissipative beaches. This enhanced cliff ero-sion at Gleneden Beach contributes additional coarse sand to the beach, maintaining its dynamic response to storms and the capacity for the ocean processes to further attack the cliff.
When one considers the other littoral cells along the Oregon coast (fig. 5), the total volume of sand on the beach becomes important to the degree of sea-cliff erosion, in ad-dition to the beach’s morphodynamic response at times of severe storms. This cell-to-cell variability was analyzed by Ruggiero and others (2001) through evaluations of the wave impact hours per year using the graph in figure 11, the value depending on the beach-cliff junction elevation, which reflects the buffering ability of the fronting beach. These coast-wide comparisons substantiated that land-elevation changes relative to sea level as given in figure 6 are important in governing the wave impact hours and resulting degrees of sea-cliff erosion, as are the buffering capacities of the fronting beaches within the individual littoral cells.
Cliff Resistance to Erosion
Of obvious importance to the degree of cliff erosion is the inherent resistance of the cliff material to wave attack. This factor is well illustrated on the Oregon coast because of the extreme variability of rocks exposed in its cliffs, ranging from highly resistant basalts to relatively weak Pleistocene terrace sandstones, with the Tertiary mudstones and siltstones being intermediate but in themselves highly variable depending on which rock formation is exposed in the cliff. As discussed ear-lier, this variability in rock resistance accounts for the irregular outline of the Oregon coast, with the resistant basalt form-ing headlands while the less resistant rocks are eroded into embayments. On a coast-wide scale this produces an inverse relationship between the degrees of erosion and wave impact hours per year, with the headlands having the highest impact hours per year but the lowest erosion rates, a trend found quan-titatively by Benumof and Griggs (1999) for the coast of San Diego County in southern California. The variability of rock resistance has similarly governed the long-term evolution of the Oregon coast, while at the same time there is a relationship between wave impact hours and erosion rates for specific rock formations as shown in figure 12 for the Newport Littoral Cell. However, the empirical correlation established by figure 12 is suitable only for the rock formation exposed in that particular cell and generally cannot be applied to other rock formations along the coast.
To date, no research has been undertaken along the Or-egon coast to systematically and quantitatively investigate rock resistance as a factor in governing the rates of sea-cliff erosion. In his series of laboratory simulations of cliff erosion by waves, Sunamura (1992) began to establish models relating cliff erosion rates to the rock resistance, evaluated by strength-of-material tests (for example, the compressive strength of the rock). In a comprehensive study of sea-cliff erosion in south-
Figure 15. Seasonal changes in profiles along the length of the Lin-coln City Littoral Cell, reflecting the morphodynamic responses of the beaches depending on their grain sizes. (From Shih and Komar, 1994.)
Oregon’s Coastal Cliffs: Processes and Erosion Impacts
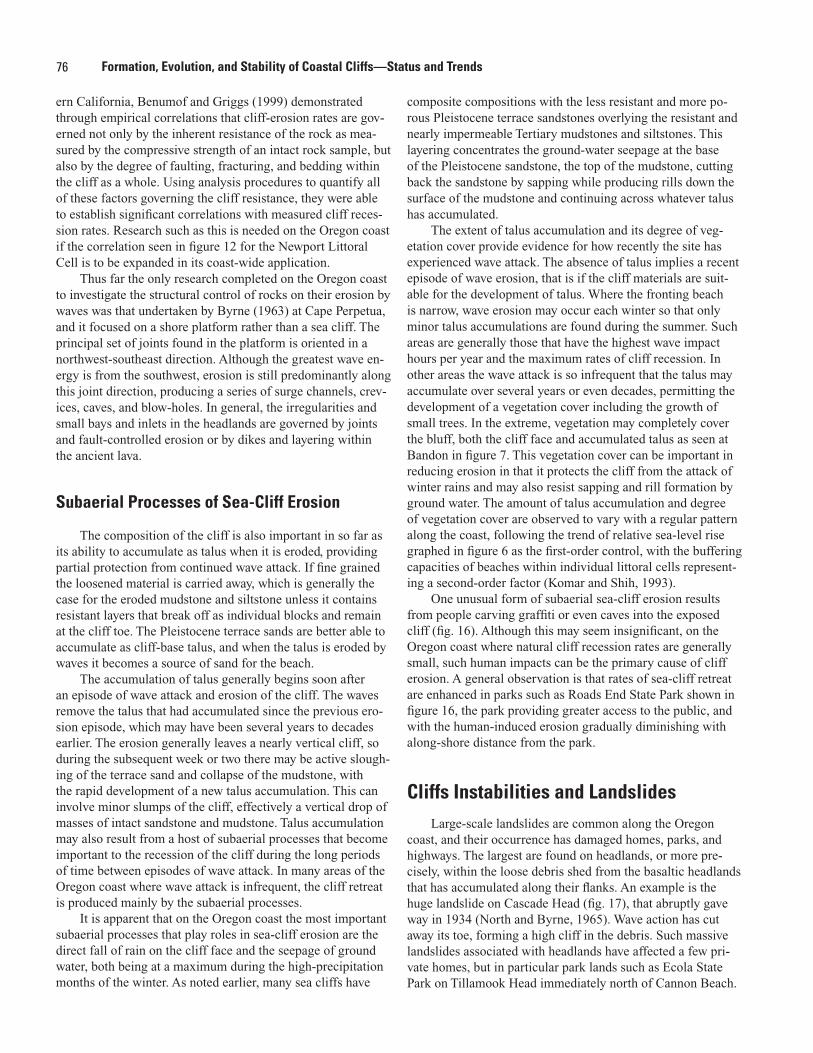
76 Formation, Evolution, and Stability of Coastal Cliffs—Status and Trends
ern California, Benumof and Griggs (1999) demonstrated through empirical correlations that cliff-erosion rates are gov-erned not only by the inherent resistance of the rock as mea-sured by the compressive strength of an intact rock sample, but also by the degree of faulting, fracturing, and bedding within the cliff as a whole. Using analysis procedures to quantify all of these factors governing the cliff resistance, they were able to establish significant correlations with measured cliff reces-sion rates. Research such as this is needed on the Oregon coast if the correlation seen in figure 12 for the Newport Littoral Cell is to be expanded in its coast-wide application.
Thus far the only research completed on the Oregon coast to investigate the structural control of rocks on their erosion by waves was that undertaken by Byrne (1963) at Cape Perpetua, and it focused on a shore platform rather than a sea cliff. The principal set of joints found in the platform is oriented in a northwest-southeast direction. Although the greatest wave en-ergy is from the southwest, erosion is still predominantly along this joint direction, producing a series of surge channels, crev-ices, caves, and blow-holes. In general, the irregularities and small bays and inlets in the headlands are governed by joints and fault-controlled erosion or by dikes and layering within the ancient lava.
Subaerial Processes of Sea-Cliff Erosion
The composition of the cliff is also important in so far as its ability to accumulate as talus when it is eroded, providing partial protection from continued wave attack. If fine grained the loosened material is carried away, which is generally the case for the eroded mudstone and siltstone unless it contains resistant layers that break off as individual blocks and remain at the cliff toe. The Pleistocene terrace sands are better able to accumulate as cliff-base talus, and when the talus is eroded by waves it becomes a source of sand for the beach.
The accumulation of talus generally begins soon after an episode of wave attack and erosion of the cliff. The waves remove the talus that had accumulated since the previous ero-sion episode, which may have been several years to decades earlier. The erosion generally leaves a nearly vertical cliff, so during the subsequent week or two there may be active slough-ing of the terrace sand and collapse of the mudstone, with the rapid development of a new talus accumulation. This can involve minor slumps of the cliff, effectively a vertical drop of masses of intact sandstone and mudstone. Talus accumulation may also result from a host of subaerial processes that become important to the recession of the cliff during the long periods of time between episodes of wave attack. In many areas of the Oregon coast where wave attack is infrequent, the cliff retreat is produced mainly by the subaerial processes.
It is apparent that on the Oregon coast the most important subaerial processes that play roles in sea-cliff erosion are the direct fall of rain on the cliff face and the seepage of ground water, both being at a maximum during the high-precipitation months of the winter. As noted earlier, many sea cliffs have
composite compositions with the less resistant and more po-rous Pleistocene terrace sandstones overlying the resistant and nearly impermeable Tertiary mudstones and siltstones. This layering concentrates the ground-water seepage at the base of the Pleistocene sandstone, the top of the mudstone, cutting back the sandstone by sapping while producing rills down the surface of the mudstone and continuing across whatever talus has accumulated.
The extent of talus accumulation and its degree of veg-etation cover provide evidence for how recently the site has experienced wave attack. The absence of talus implies a recent episode of wave erosion, that is if the cliff materials are suit-able for the development of talus. Where the fronting beach is narrow, wave erosion may occur each winter so that only minor talus accumulations are found during the summer. Such areas are generally those that have the highest wave impact hours per year and the maximum rates of cliff recession. In other areas the wave attack is so infrequent that the talus may accumulate over several years or even decades, permitting the development of a vegetation cover including the growth of small trees. In the extreme, vegetation may completely cover the bluff, both the cliff face and accumulated talus as seen at Bandon in figure 7. This vegetation cover can be important in reducing erosion in that it protects the cliff from the attack of winter rains and may also resist sapping and rill formation by ground water. The amount of talus accumulation and degree of vegetation cover are observed to vary with a regular pattern along the coast, following the trend of relative sea-level rise graphed in figure 6 as the first-order control, with the buffering capacities of beaches within individual littoral cells represent-ing a second-order factor (Komar and Shih, 1993).
One unusual form of subaerial sea-cliff erosion results from people carving graffiti or even caves into the exposed cliff (fig. 16). Although this may seem insignificant, on the Oregon coast where natural cliff recession rates are generally small, such human impacts can be the primary cause of cliff erosion. A general observation is that rates of sea-cliff retreat are enhanced in parks such as Roads End State Park shown in figure 16, the park providing greater access to the public, and with the human-induced erosion gradually diminishing with along-shore distance from the park.
Cliffs Instabilities and LandslidesLarge-scale landslides are common along the Oregon
coast, and their occurrence has damaged homes, parks, and highways. The largest are found on headlands, or more pre-cisely, within the loose debris shed from the basaltic headlands that has accumulated along their flanks. An example is the huge landslide on Cascade Head (fig. 17), that abruptly gave way in 1934 (North and Byrne, 1965). Wave action has cut away its toe, forming a high cliff in the debris. Such massive landslides associated with headlands have affected a few pri-vate homes, but in particular park lands such as Ecola State Park on Tillamook Head immediately north of Cannon Beach.
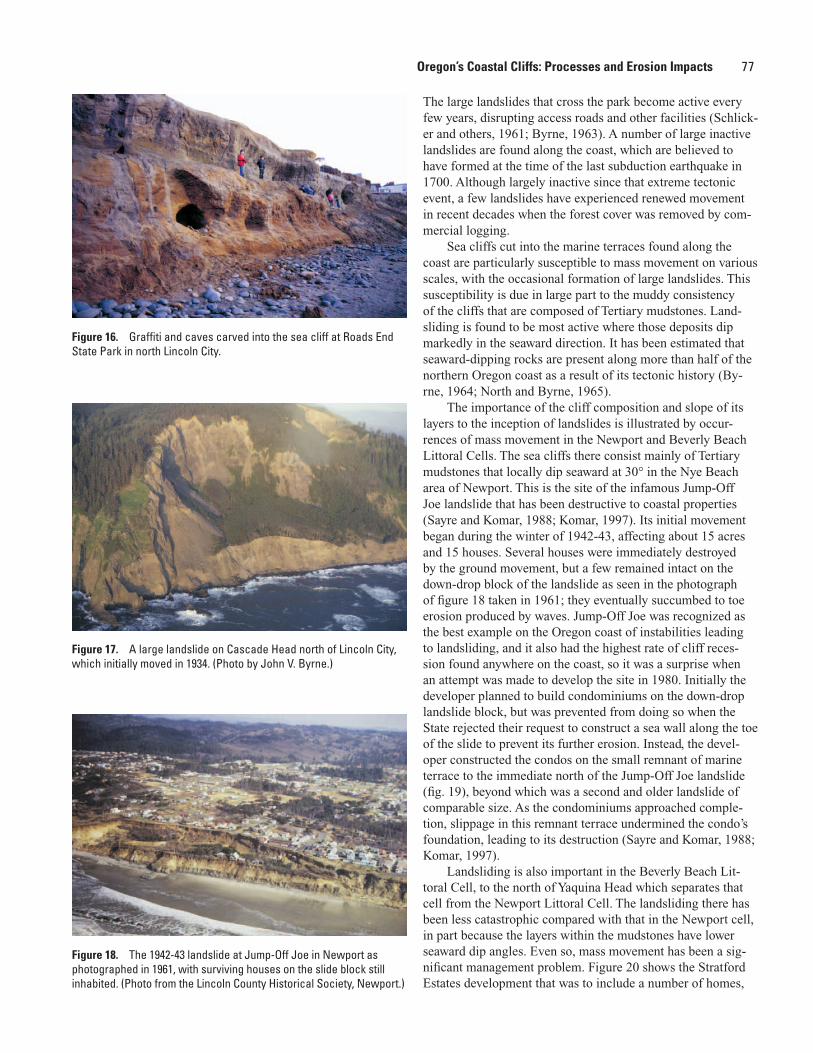
77
The large landslides that cross the park become active every few years, disrupting access roads and other facilities (Schlick-er and others, 1961; Byrne, 1963). A number of large inactive landslides are found along the coast, which are believed to have formed at the time of the last subduction earthquake in 1700. Although largely inactive since that extreme tectonic event, a few landslides have experienced renewed movement in recent decades when the forest cover was removed by com-mercial logging.
Sea cliffs cut into the marine terraces found along the coast are particularly susceptible to mass movement on various scales, with the occasional formation of large landslides. This susceptibility is due in large part to the muddy consistency of the cliffs that are composed of Tertiary mudstones. Land-sliding is found to be most active where those deposits dip markedly in the seaward direction. It has been estimated that seaward-dipping rocks are present along more than half of the northern Oregon coast as a result of its tectonic history (By-rne, 1964; North and Byrne, 1965).
The importance of the cliff composition and slope of its layers to the inception of landslides is illustrated by occur-rences of mass movement in the Newport and Beverly Beach Littoral Cells. The sea cliffs there consist mainly of Tertiary mudstones that locally dip seaward at 30° in the Nye Beach area of Newport. This is the site of the infamous Jump-Off Joe landslide that has been destructive to coastal properties (Sayre and Komar, 1988; Komar, 1997). Its initial movement began during the winter of 1942-43, affecting about 15 acres and 15 houses. Several houses were immediately destroyed by the ground movement, but a few remained intact on the down-drop block of the landslide as seen in the photograph of figure 18 taken in 1961; they eventually succumbed to toe erosion produced by waves. Jump-Off Joe was recognized as the best example on the Oregon coast of instabilities leading to landsliding, and it also had the highest rate of cliff reces-sion found anywhere on the coast, so it was a surprise when an attempt was made to develop the site in 1980. Initially the developer planned to build condominiums on the down-drop landslide block, but was prevented from doing so when the State rejected their request to construct a sea wall along the toe of the slide to prevent its further erosion. Instead, the devel-oper constructed the condos on the small remnant of marine terrace to the immediate north of the Jump-Off Joe landslide (fig. 19), beyond which was a second and older landslide of comparable size. As the condominiums approached comple-tion, slippage in this remnant terrace undermined the condo’s foundation, leading to its destruction (Sayre and Komar, 1988; Komar, 1997).
Landsliding is also important in the Beverly Beach Lit-toral Cell, to the north of Yaquina Head which separates that cell from the Newport Littoral Cell. The landsliding there has been less catastrophic compared with that in the Newport cell, in part because the layers within the mudstones have lower seaward dip angles. Even so, mass movement has been a sig-nificant management problem. Figure 20 shows the Stratford Estates development that was to include a number of homes,
Figure 16. Graffiti and caves carved into the sea cliff at Roads End State Park in north Lincoln City.
Figure 17. A large landslide on Cascade Head north of Lincoln City, which initially moved in 1934. (Photo by John V. Byrne.)
Figure 18. The 1942-43 landslide at Jump-Off Joe in Newport as photographed in 1961, with surviving houses on the slide block still inhabited. (Photo from the Lincoln County Historical Society, Newport.)
Oregon’s Coastal Cliffs: Processes and Erosion Impacts
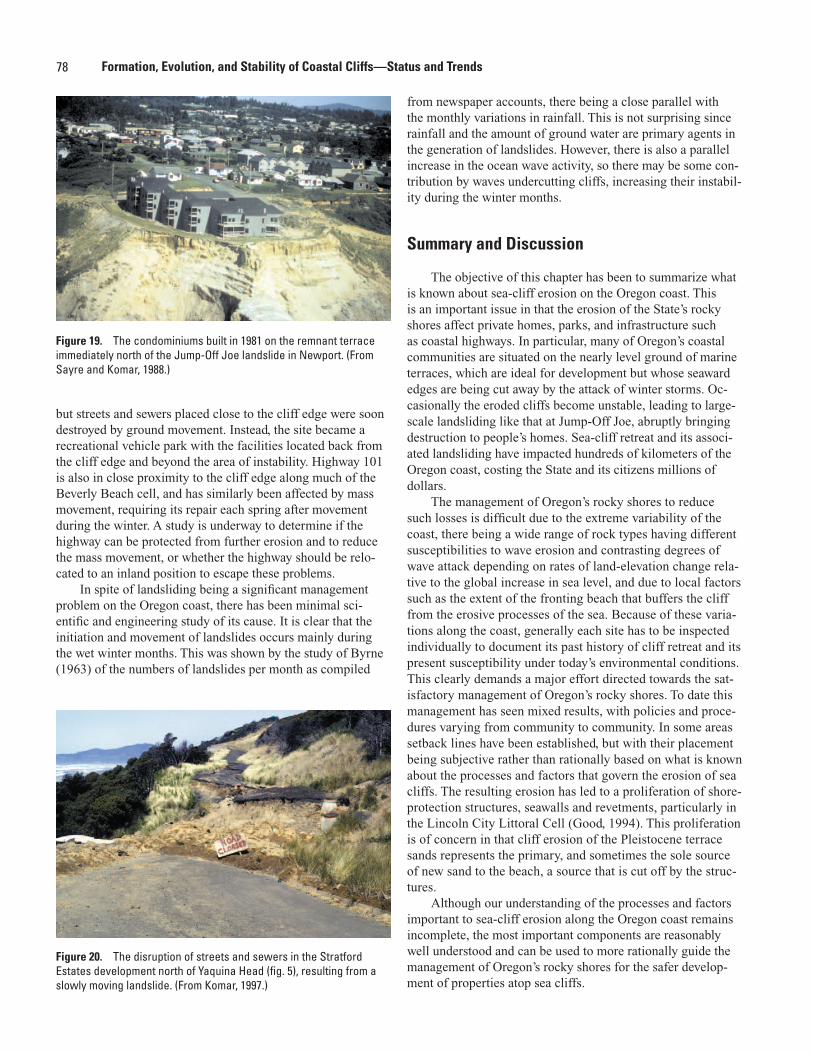
78 Formation, Evolution, and Stability of Coastal Cliffs—Status and Trends
from newspaper accounts, there being a close parallel with the monthly variations in rainfall. This is not surprising since rainfall and the amount of ground water are primary agents in the generation of landslides. However, there is also a parallel increase in the ocean wave activity, so there may be some con-tribution by waves undercutting cliffs, increasing their instabil-ity during the winter months.
Summary and Discussion
The objective of this chapter has been to summarize what is known about sea-cliff erosion on the Oregon coast. This is an important issue in that the erosion of the State’s rocky shores affect private homes, parks, and infrastructure such as coastal highways. In particular, many of Oregon’s coastal communities are situated on the nearly level ground of marine terraces, which are ideal for development but whose seaward edges are being cut away by the attack of winter storms. Oc-casionally the eroded cliffs become unstable, leading to large-scale landsliding like that at Jump-Off Joe, abruptly bringing destruction to people’s homes. Sea-cliff retreat and its associ-ated landsliding have impacted hundreds of kilometers of the Oregon coast, costing the State and its citizens millions of dollars.
The management of Oregon’s rocky shores to reduce such losses is difficult due to the extreme variability of the coast, there being a wide range of rock types having different susceptibilities to wave erosion and contrasting degrees of wave attack depending on rates of land-elevation change rela-tive to the global increase in sea level, and due to local factors such as the extent of the fronting beach that buffers the cliff from the erosive processes of the sea. Because of these varia-tions along the coast, generally each site has to be inspected individually to document its past history of cliff retreat and its present susceptibility under today’s environmental conditions. This clearly demands a major effort directed towards the sat-isfactory management of Oregon’s rocky shores. To date this management has seen mixed results, with policies and proce-dures varying from community to community. In some areas setback lines have been established, but with their placement being subjective rather than rationally based on what is known about the processes and factors that govern the erosion of sea cliffs. The resulting erosion has led to a proliferation of shore-protection structures, seawalls and revetments, particularly in the Lincoln City Littoral Cell (Good, 1994). This proliferation is of concern in that cliff erosion of the Pleistocene terrace sands represents the primary, and sometimes the sole source of new sand to the beach, a source that is cut off by the struc-tures.
Although our understanding of the processes and factors important to sea-cliff erosion along the Oregon coast remains incomplete, the most important components are reasonably well understood and can be used to more rationally guide the management of Oregon’s rocky shores for the safer develop-ment of properties atop sea cliffs.
Figure 19. The condominiums built in 1981 on the remnant terrace immediately north of the Jump-Off Joe landslide in Newport. (From Sayre and Komar, 1988.)
Figure 20. The disruption of streets and sewers in the Stratford Estates development north of Yaquina Head (fig. 5), resulting from a slowly moving landslide. (From Komar, 1997.)
but streets and sewers placed close to the cliff edge were soon destroyed by ground movement. Instead, the site became a recreational vehicle park with the facilities located back from the cliff edge and beyond the area of instability. Highway 101 is also in close proximity to the cliff edge along much of the Beverly Beach cell, and has similarly been affected by mass movement, requiring its repair each spring after movement during the winter. A study is underway to determine if the highway can be protected from further erosion and to reduce the mass movement, or whether the highway should be relo-cated to an inland position to escape these problems.
In spite of landsliding being a significant management problem on the Oregon coast, there has been minimal sci-entific and engineering study of its cause. It is clear that the initiation and movement of landslides occurs mainly during the wet winter months. This was shown by the study of Byrne (1963) of the numbers of landslides per month as compiled
79
ReferencesAllan, J.C., and Komar, P.D., 2000, Are ocean wave heights
increasing in the eastern North Pacific? EOS, Transac-tions American Geophysical Union, v. 81, no. 47, p. 561, 566-7.
Allan, J.C, and Komar, P.D., 2001, Wave climate change and coast-al erosion in the US Pacific Northwest, in WAVES2001, Proceedings of the Fourth International Symposium on Ocean Wave Measurement and Analysis, San Francisco, American Society of Civil Engineers, p. 680-689.
Allan, J. C., and Komar, P.D., 2002, Extreme storms on the Pacific Northwest coast during the 1997-98 El Niño and 1998-99 La Niña: Journal of Coastal Research, v. 18, no. 1, p. 175-193.
Atwater, B.F., 1987, Evidence for great Holocene earthquakes along the outer coast of Washington state: Science, v. 236, p. 942-944.
Atwater, B.F., and Hemphill-Haley, E., 1997, Recurrence in-tervals for great earthquakes of the past 3,500 years at northeastern Willapa Bay, Washington: USGS Professional Paper 1576, 108 p.
Atwater, B.F., and Yamaguchi, D.K., 1991, Sudden, probably coseismic submergence of Holocene trees and grass in coastal Washington state: Geology, v. 19, p. 706-709.
Benumof, B.T., and Griggs, G.B., 1999, The dependence of sea-cliff erosion rates on cliff material properties and physical processes, San Diego County, California: Shore & Beach, v. 67, n. 4, p. 29-41.
Byrne, J. V., 1963, Coastal erosion, northern Oregon, in Essays in marine geology in honor of K.O. Emery: Los Angeles, California, University of Southern California Press, p. 11-33.
Byrne, J. V.,1964, An erosional classification for the northern Oregon coast: Association of American Geographers An-nals, v. 54, p. 329-335.
Clemens, K.E., and Komar, P.D., 1988, Oregon beach-sand compositions produced by the mixing of sediments under a transgressing sea: Journal of Sedimentary Petrology, v. 56, p. 15-22.
Darienzo, M.E., and Peterson, C.D., 1990, Episodic tectonic subsidence of late Holocene salt marshes, northern Oregon central Cascadia margin: Tectonics, v. 9, p. 1-22.
Darienzo, M.E., Peterson, C.D., and Clough, C., 1994, Strati-graphic evidence for great subduction-zone earthquakes for four estuaries in northern Oregon, U.S.A.: Journal of Coastal Research, v. 10, p. 850-876.
Dorratcague, D.E., Humphrey, J.H., and Black, R.D., 1977, De-termination of flood levels on the Pacific Northwest coast for federal insurance studies, in Hydraulics ‘77, American Society of Civil Engineers, p. 73-81.
Good, J.W.,1994, Shore protection policy and practices in Oregon; an evaluation of implementation success: Coastal Manage-ment, v. 22, p. 325-352.
Graham, N.E., and Diaz, H.F., 2001, Evidence for intensification of North Pacific winter cyclones since 1948: Bulletin of the
American Meteorological Society, v.82, p. 1869-1893.Huyer, A., Gilbert, W.E., and Pittock, H.L., 1983, Anomalous
sea levels at Newport, Oregon, during the 1982-83 El Niño: Coastal Oceanography and Climatology News, v. 5, p. 37-39.
Komar, P.D., 1997, The Pacific Northwest coast—living with the shores of Oregon and Washington: Durham, North Carolina, Duke University Press, 195 p.
Komar, P.D., 1998, Beach processes and sedimentation: Engle-wood Cliffs, New Jersey, Prentice-Hall Inc., 544 p.
Komar, P.D., and Allan, J.C., 2002, Nearshore-process climates related to their potential for causing beach and property erosion: Shore & Beach, v. 70, no. 3, p. 31-40.
Komar, P.D., and Shih, S.-M., 1993, Cliff erosion along the Or-egon coast; A tectonic-sea level imprint plus local controls by beach processes: Journal of Coastal Research, v. 9, p. 747-765.
Komar, P.D., Torstenson, R.W., and Shih, S.-M., 1991, Bandon, Oregon; coastal development and the potential for extreme ocean hazards: Shore & Beach, v. 59, p. 14-22.
Komar, P.D., Allan, J., Dias-Mendez, G.M., Marra, J.J., and Ruggiero, P., 2000, El Niño and La Niña; erosion processes and impacts: Proceedings of the 27th International Coastal Engineering Conference, p. 2414-2427.
Komar, P.D., Marra, J.J., and Allan, J. C., 2002, Coastal-erosion processes and assessments of setback distances: American Society of Civil Engineers, Solutions to Coastal Disasters Conference, Proceedings.
Mitchell, C.E., Vincent, P., Weldon, R.J., and Richards, M.A., 1994, Present-day vertical deformation of the Cascadia margin, Pacific Northwest, United States: Journal of Geo-physical Research, v. 99, no. B6, p. 12257-12277.
North, W.B., and Byrne, J.V., 1965, Coastal landslides in northern Oregon: The Ore Bin (Oregon Department of Geology and Mineral Industries), v. 27, n. 11, p. 217-241.
Ruggiero, P., Komar, P.D., McDougal, W.G., and Beach, R.A., 1996, Extreme water levels, wave runup and coastal ero-sion: American Society of Civil Engineers, 25th Coastal Engineering Conference, Proceedings, p. 2793-2805.
Ruggiero, P., Komar, P.D., McDougal, W.G., Marra, J.J., and Beach, R.A., 2001, Wave runup, extreme water levels and the erosion of properties backing beaches: Journal of Coastal Research, v. 17, no. 2, p. 407-419.
Satake, K., Shimazaki, K., Tsuji, Y., and Ueda, K., 1996, Time and size of a giant earthquake in Cascadia inferred from Japanese tsunami records of January 1700: Nature, v. 379, p. 246-249.
Sayre, W.O., and Komar, P.D., 1988, The Jump-Off Joe landslide at Newport, Oregon; history of erosion, development and destruction: Shore & Beach, v. 56, p. 15-22.
Schlicker, H. G., Corcoran, R.E., and Bowen, R.G. 1961, Geol-ogy of the Ecola State Park landslide area, Oregon: The Ore Bin, (Oregon Department of Geology and Mineral Industries), v. 23, no. 9, p. 85-90.
Shih, S.-M., and Komar, P.D., 1994, Sediments, beach morphol-ogy and sea cliff erosion within an Oregon Coast littoral
Oregon’s Coastal Cliffs: Processes and Erosion Impacts

80 Formation, Evolution, and Stability of Coastal Cliffs—Status and Trends
cell: Journal of Coastal Research, v. 10, p. 144-157.Shih, S.-M., Komar, P.D., Tillotson, K., McDougal, W.G., and
Ruggiero, P., 1994, Wave run-up and sea-cliff erosion: American Society of Civil Engineers, 24th Coastal Engi-neering Conference, Proceedings, p. 2170-2184.
Sunamura, T., 1992, Geomorphology of rocky coasts: New York, John Wiley and Sons, 302 p.
Tillotson, K.J., and Komar, P.D.,1997, The wave climate of the Pacific Northwest (Oregon and Washington); a compari-
son of data sources: Journal of Coastal Research, v. 13, p. 440-452.
Vincent, P., 1989, Geodetic Deformation of the Oregon Cascadia Margin: Eugene, Oregon, University of Oregon, Masters thesis, 86 p.
Wright, L.D., and Short, A., 1983, Morphodynamics of beaches and surf zones in Australia, in Komar, P.D., ed., Handbook of coastal processes and erosion: Boca Raton, Florida,
CRC Press, p. 35-64.
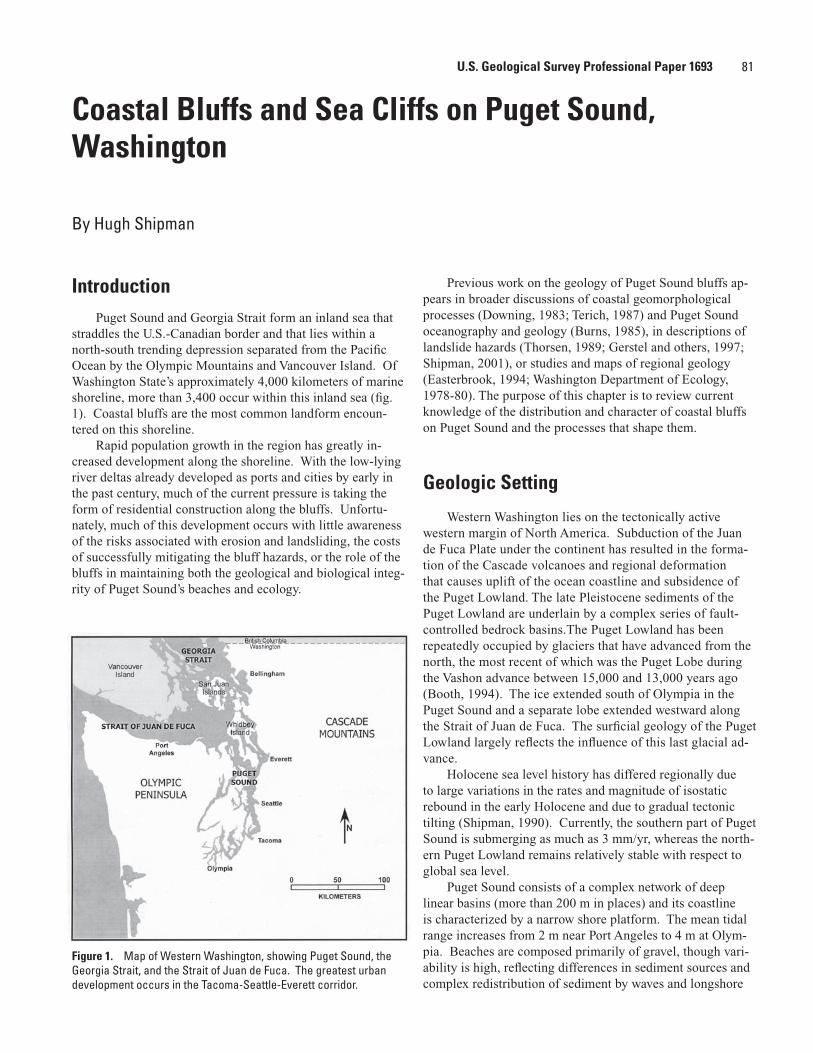
81
IntroductionPuget Sound and Georgia Strait form an inland sea that
straddles the U.S.-Canadian border and that lies within a north-south trending depression separated from the Pacific Ocean by the Olympic Mountains and Vancouver Island. Of Washington State’s approximately 4,000 kilometers of marine shoreline, more than 3,400 occur within this inland sea (fig. 1). Coastal bluffs are the most common landform encoun-tered on this shoreline.
Rapid population growth in the region has greatly in-creased development along the shoreline. With the low-lying river deltas already developed as ports and cities by early in the past century, much of the current pressure is taking the form of residential construction along the bluffs. Unfortu-nately, much of this development occurs with little awareness of the risks associated with erosion and landsliding, the costs of successfully mitigating the bluff hazards, or the role of the bluffs in maintaining both the geological and biological integ-rity of Puget Sound’s beaches and ecology.
Previous work on the geology of Puget Sound bluffs ap-pears in broader discussions of coastal geomorphological processes (Downing, 1983; Terich, 1987) and Puget Sound oceanography and geology (Burns, 1985), in descriptions of landslide hazards (Thorsen, 1989; Gerstel and others, 1997; Shipman, 2001), or studies and maps of regional geology (Easterbrook, 1994; Washington Department of Ecology, 1978-80). The purpose of this chapter is to review current knowledge of the distribution and character of coastal bluffs on Puget Sound and the processes that shape them.
Geologic Setting
Western Washington lies on the tectonically active western margin of North America. Subduction of the Juan de Fuca Plate under the continent has resulted in the forma-tion of the Cascade volcanoes and regional deformation that causes uplift of the ocean coastline and subsidence of the Puget Lowland. The late Pleistocene sediments of the Puget Lowland are underlain by a complex series of fault-controlled bedrock basins.The Puget Lowland has been repeatedly occupied by glaciers that have advanced from the north, the most recent of which was the Puget Lobe during the Vashon advance between 15,000 and 13,000 years ago (Booth, 1994). The ice extended south of Olympia in the Puget Sound and a separate lobe extended westward along the Strait of Juan de Fuca. The surficial geology of the Puget Lowland largely reflects the influence of this last glacial ad-vance.
Holocene sea level history has differed regionally due to large variations in the rates and magnitude of isostatic rebound in the early Holocene and due to gradual tectonic tilting (Shipman, 1990). Currently, the southern part of Puget Sound is submerging as much as 3 mm/yr, whereas the north-ern Puget Lowland remains relatively stable with respect to global sea level.
Puget Sound consists of a complex network of deep linear basins (more than 200 m in places) and its coastline is characterized by a narrow shore platform. The mean tidal range increases from 2 m near Port Angeles to 4 m at Olym-pia. Beaches are composed primarily of gravel, though vari-ability is high, reflecting differences in sediment sources and complex redistribution of sediment by waves and longshore
Coastal Bluffs and Sea Cliffs on Puget Sound, Washington
By Hugh Shipman
Figure 1. Map of Western Washington, showing Puget Sound, the Georgia Strait, and the Strait of Juan de Fuca. The greatest urban development occurs in the Tacoma-Seattle-Everett corridor.
U.S. Geological Survey Professional Paper 1693
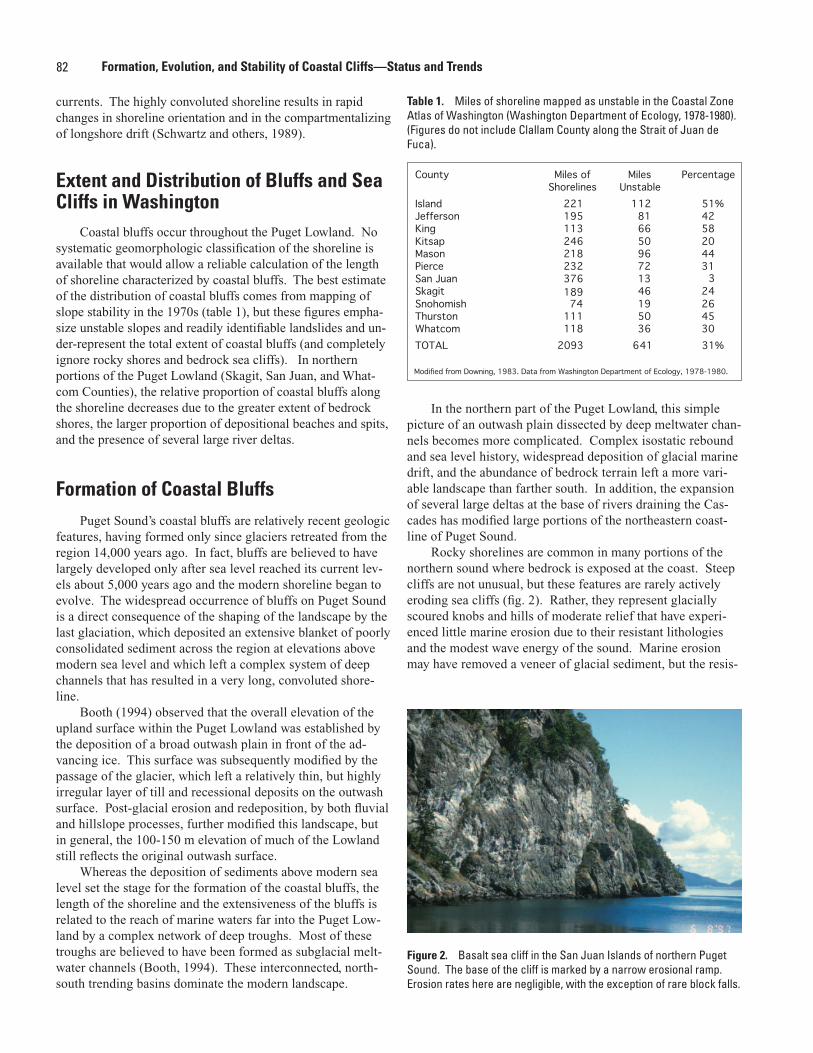
82 Formation, Evolution, and Stability of Coastal Cliffs—Status and Trends
currents. The highly convoluted shoreline results in rapid changes in shoreline orientation and in the compartmentalizing of longshore drift (Schwartz and others, 1989).
Extent and Distribution of Bluffs and Sea Cliffs in Washington
Coastal bluffs occur throughout the Puget Lowland. No systematic geomorphologic classification of the shoreline is available that would allow a reliable calculation of the length of shoreline characterized by coastal bluffs. The best estimate of the distribution of coastal bluffs comes from mapping of slope stability in the 1970s (table 1), but these figures empha-size unstable slopes and readily identifiable landslides and un-der-represent the total extent of coastal bluffs (and completely ignore rocky shores and bedrock sea cliffs). In northern portions of the Puget Lowland (Skagit, San Juan, and What-com Counties), the relative proportion of coastal bluffs along the shoreline decreases due to the greater extent of bedrock shores, the larger proportion of depositional beaches and spits, and the presence of several large river deltas.
Formation of Coastal BluffsPuget Sound’s coastal bluffs are relatively recent geologic
features, having formed only since glaciers retreated from the region 14,000 years ago. In fact, bluffs are believed to have largely developed only after sea level reached its current lev-els about 5,000 years ago and the modern shoreline began to evolve. The widespread occurrence of bluffs on Puget Sound is a direct consequence of the shaping of the landscape by the last glaciation, which deposited an extensive blanket of poorly consolidated sediment across the region at elevations above modern sea level and which left a complex system of deep channels that has resulted in a very long, convoluted shore-line.
Booth (1994) observed that the overall elevation of the upland surface within the Puget Lowland was established by the deposition of a broad outwash plain in front of the ad-vancing ice. This surface was subsequently modified by the passage of the glacier, which left a relatively thin, but highly irregular layer of till and recessional deposits on the outwash surface. Post-glacial erosion and redeposition, by both fluvial and hillslope processes, further modified this landscape, but in general, the 100-150 m elevation of much of the Lowland still reflects the original outwash surface.
Whereas the deposition of sediments above modern sea level set the stage for the formation of the coastal bluffs, the length of the shoreline and the extensiveness of the bluffs is related to the reach of marine waters far into the Puget Low-land by a complex network of deep troughs. Most of these troughs are believed to have been formed as subglacial melt-water channels (Booth, 1994). These interconnected, north-south trending basins dominate the modern landscape.
County Miles ofShorelines
MilesUnstable
Percentage
Island 221 112 51%Jefferson 195 81 42King 113 66 58Kitsap 246 50 20Mason 218 96 44Pierce 232 72 31San Juan 376 13Skagit 189 46 24Snohomish 19 26Thurston 111 50 45Whatcom 118 36 30TOTAL 2093 641 31%
Modified from Downing, 1983. Data from Washington Department of Ecology, 1978-1980.
74
3
Table 1. Miles of shoreline mapped as unstable in the Coastal Zone Atlas of Washington (Washington Department of Ecology, 1978-1980). (Figures do not include Clallam County along the Strait of Juan de Fuca).
In the northern part of the Puget Lowland, this simple picture of an outwash plain dissected by deep meltwater chan-nels becomes more complicated. Complex isostatic rebound and sea level history, widespread deposition of glacial marine drift, and the abundance of bedrock terrain left a more vari-able landscape than farther south. In addition, the expansion of several large deltas at the base of rivers draining the Cas-cades has modified large portions of the northeastern coast-line of Puget Sound.
Rocky shorelines are common in many portions of the northern sound where bedrock is exposed at the coast. Steep cliffs are not unusual, but these features are rarely actively eroding sea cliffs (fig. 2). Rather, they represent glacially scoured knobs and hills of moderate relief that have experi-enced little marine erosion due to their resistant lithologies and the modest wave energy of the sound. Marine erosion may have removed a veneer of glacial sediment, but the resis-
Figure 2. Basalt sea cliff in the San Juan Islands of northern Puget Sound. The base of the cliff is marked by a narrow erosional ramp. Erosion rates here are negligible, with the exception of rare block falls.
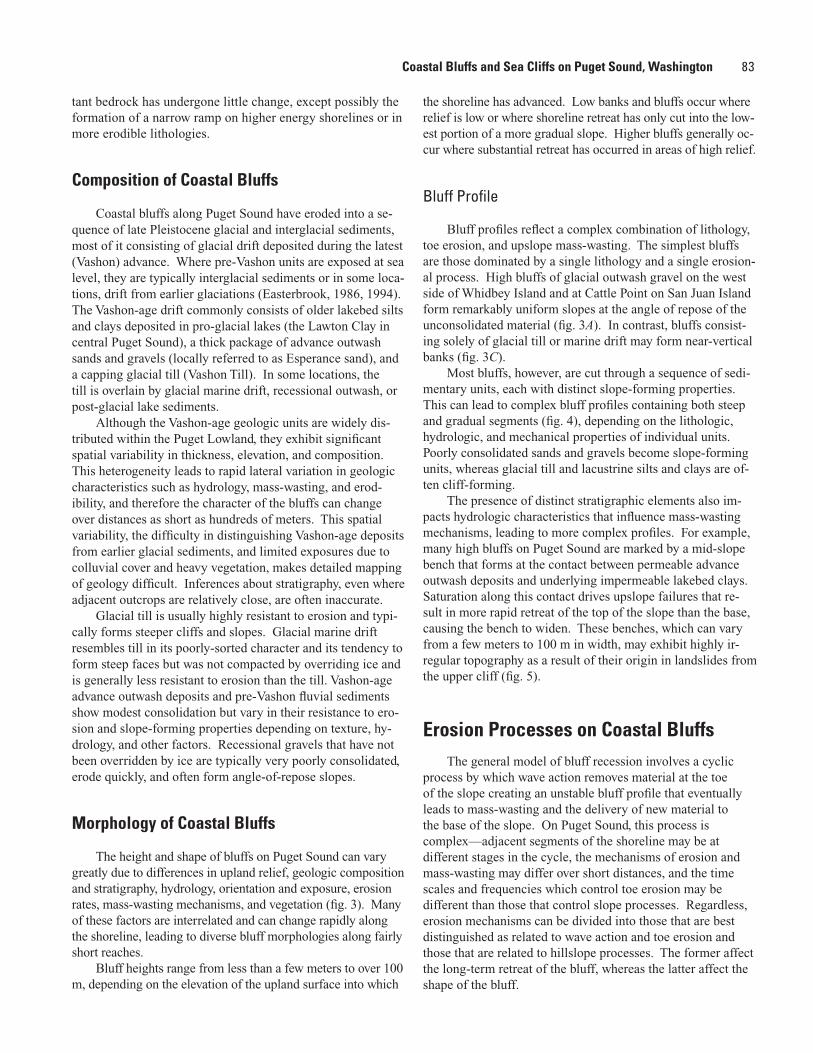
83
tant bedrock has undergone little change, except possibly the formation of a narrow ramp on higher energy shorelines or in more erodible lithologies.
Composition of Coastal Bluffs
Coastal bluffs along Puget Sound have eroded into a se-quence of late Pleistocene glacial and interglacial sediments, most of it consisting of glacial drift deposited during the latest (Vashon) advance. Where pre-Vashon units are exposed at sea level, they are typically interglacial sediments or in some loca-tions, drift from earlier glaciations (Easterbrook, 1986, 1994). The Vashon-age drift commonly consists of older lakebed silts and clays deposited in pro-glacial lakes (the Lawton Clay in central Puget Sound), a thick package of advance outwash sands and gravels (locally referred to as Esperance sand), and a capping glacial till (Vashon Till). In some locations, the till is overlain by glacial marine drift, recessional outwash, or post-glacial lake sediments.
Although the Vashon-age geologic units are widely dis-tributed within the Puget Lowland, they exhibit significant spatial variability in thickness, elevation, and composition. This heterogeneity leads to rapid lateral variation in geologic characteristics such as hydrology, mass-wasting, and erod-ibility, and therefore the character of the bluffs can change over distances as short as hundreds of meters. This spatial variability, the difficulty in distinguishing Vashon-age deposits from earlier glacial sediments, and limited exposures due to colluvial cover and heavy vegetation, makes detailed mapping of geology difficult. Inferences about stratigraphy, even where adjacent outcrops are relatively close, are often inaccurate.
Glacial till is usually highly resistant to erosion and typi-cally forms steeper cliffs and slopes. Glacial marine drift resembles till in its poorly-sorted character and its tendency to form steep faces but was not compacted by overriding ice and is generally less resistant to erosion than the till. Vashon-age advance outwash deposits and pre-Vashon fluvial sediments show modest consolidation but vary in their resistance to ero-sion and slope-forming properties depending on texture, hy-drology, and other factors. Recessional gravels that have not been overridden by ice are typically very poorly consolidated, erode quickly, and often form angle-of-repose slopes.
Morphology of Coastal Bluffs
The height and shape of bluffs on Puget Sound can vary greatly due to differences in upland relief, geologic composition and stratigraphy, hydrology, orientation and exposure, erosion rates, mass-wasting mechanisms, and vegetation (fig. 3). Many of these factors are interrelated and can change rapidly along the shoreline, leading to diverse bluff morphologies along fairly short reaches.
Bluff heights range from less than a few meters to over 100 m, depending on the elevation of the upland surface into which
the shoreline has advanced. Low banks and bluffs occur where relief is low or where shoreline retreat has only cut into the low-est portion of a more gradual slope. Higher bluffs generally oc-cur where substantial retreat has occurred in areas of high relief.
Bluff Profile
Bluff profiles reflect a complex combination of lithology, toe erosion, and upslope mass-wasting. The simplest bluffs are those dominated by a single lithology and a single erosion-al process. High bluffs of glacial outwash gravel on the west side of Whidbey Island and at Cattle Point on San Juan Island form remarkably uniform slopes at the angle of repose of the unconsolidated material (fig. 3A). In contrast, bluffs consist-ing solely of glacial till or marine drift may form near-vertical banks (fig. 3C).
Most bluffs, however, are cut through a sequence of sedi-mentary units, each with distinct slope-forming properties. This can lead to complex bluff profiles containing both steep and gradual segments (fig. 4), depending on the lithologic, hydrologic, and mechanical properties of individual units. Poorly consolidated sands and gravels become slope-forming units, whereas glacial till and lacustrine silts and clays are of-ten cliff-forming.
The presence of distinct stratigraphic elements also im-pacts hydrologic characteristics that influence mass-wasting mechanisms, leading to more complex profiles. For example, many high bluffs on Puget Sound are marked by a mid-slope bench that forms at the contact between permeable advance outwash deposits and underlying impermeable lakebed clays. Saturation along this contact drives upslope failures that re-sult in more rapid retreat of the top of the slope than the base, causing the bench to widen. These benches, which can vary from a few meters to 100 m in width, may exhibit highly ir-regular topography as a result of their origin in landslides from the upper cliff (fig. 5).
Erosion Processes on Coastal BluffsThe general model of bluff recession involves a cyclic
process by which wave action removes material at the toe of the slope creating an unstable bluff profile that eventually leads to mass-wasting and the delivery of new material to the base of the slope. On Puget Sound, this process is complex—adjacent segments of the shoreline may be at different stages in the cycle, the mechanisms of erosion and mass-wasting may differ over short distances, and the time scales and frequencies which control toe erosion may be different than those that control slope processes. Regardless, erosion mechanisms can be divided into those that are best distinguished as related to wave action and toe erosion and those that are related to hillslope processes. The former affect the long-term retreat of the bluff, whereas the latter affect the shape of the bluff.
Coastal Bluffs and Sea Cliffs on Puget Sound, Washington
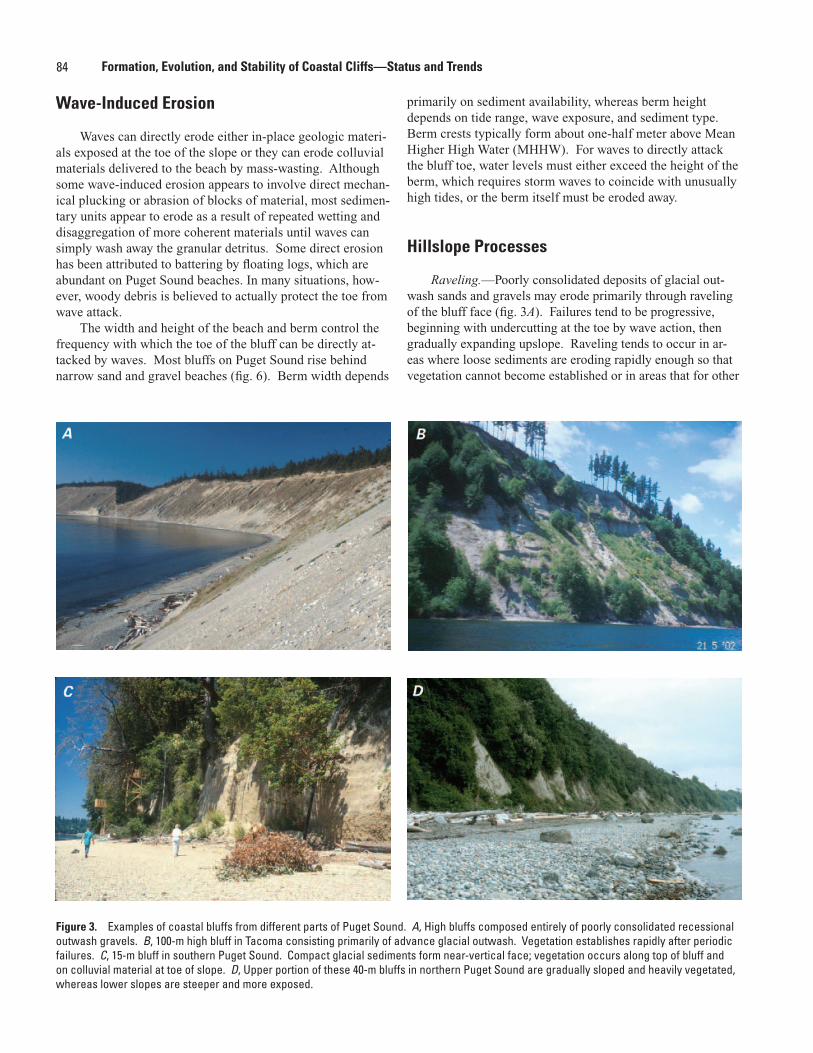
84 Formation, Evolution, and Stability of Coastal Cliffs—Status and Trends
Wave-Induced Erosion
Waves can directly erode either in-place geologic materi-als exposed at the toe of the slope or they can erode colluvial materials delivered to the beach by mass-wasting. Although some wave-induced erosion appears to involve direct mechan-ical plucking or abrasion of blocks of material, most sedimen-tary units appear to erode as a result of repeated wetting and disaggregation of more coherent materials until waves can simply wash away the granular detritus. Some direct erosion has been attributed to battering by floating logs, which are abundant on Puget Sound beaches. In many situations, how-ever, woody debris is believed to actually protect the toe from wave attack.
The width and height of the beach and berm control the frequency with which the toe of the bluff can be directly at-tacked by waves. Most bluffs on Puget Sound rise behind narrow sand and gravel beaches (fig. 6). Berm width depends
primarily on sediment availability, whereas berm height depends on tide range, wave exposure, and sediment type. Berm crests typically form about one-half meter above Mean Higher High Water (MHHW). For waves to directly attack the bluff toe, water levels must either exceed the height of the berm, which requires storm waves to coincide with unusually high tides, or the berm itself must be eroded away.
Hillslope Processes
Raveling.—Poorly consolidated deposits of glacial out-wash sands and gravels may erode primarily through raveling of the bluff face (fig. 3A). Failures tend to be progressive, beginning with undercutting at the toe by wave action, then gradually expanding upslope. Raveling tends to occur in ar-eas where loose sediments are eroding rapidly enough so that vegetation cannot become established or in areas that for other
Figure 3. Examples of coastal bluffs from different parts of Puget Sound. A, High bluffs composed entirely of poorly consolidated recessional outwash gravels. B, 100-m high bluff in Tacoma consisting primarily of advance glacial outwash. Vegetation establishes rapidly after periodic failures. C, 15-m bluff in southern Puget Sound. Compact glacial sediments form near-vertical face; vegetation occurs along top of bluff and on colluvial material at toe of slope. D, Upper portion of these 40-m bluffs in northern Puget Sound are gradually sloped and heavily vegetated, whereas lower slopes are steeper and more exposed.
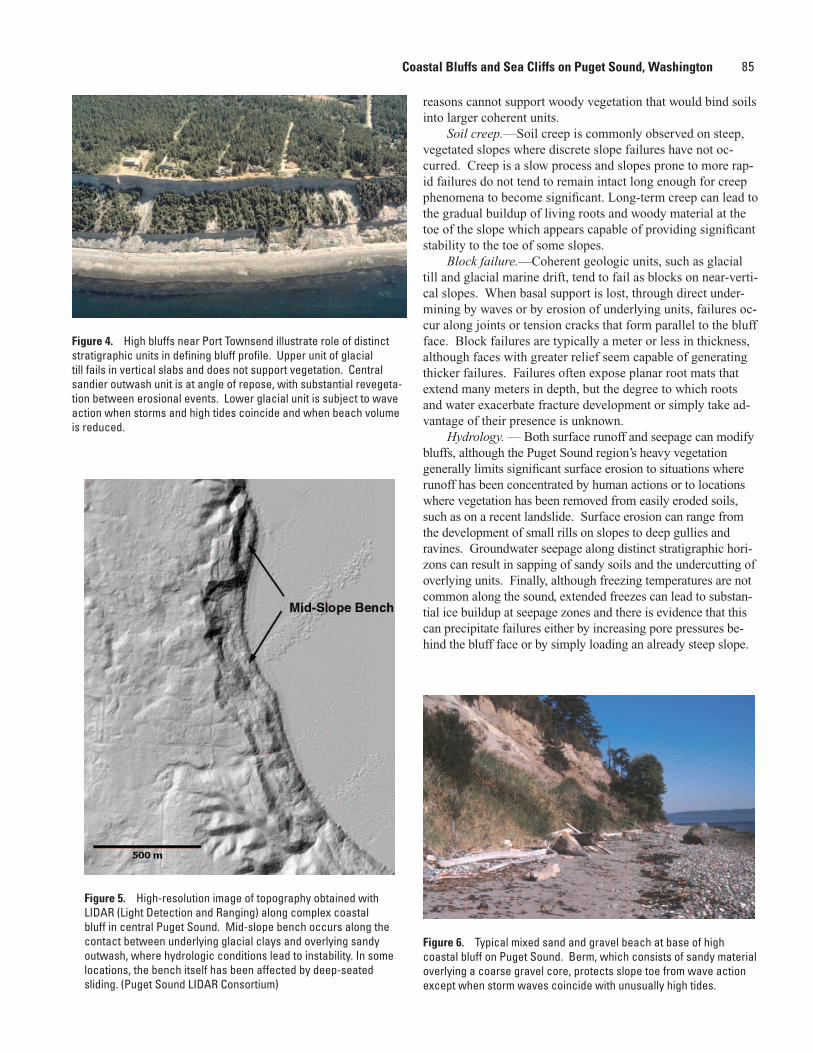
85
reasons cannot support woody vegetation that would bind soils into larger coherent units.
Soil creep.—Soil creep is commonly observed on steep, vegetated slopes where discrete slope failures have not oc-curred. Creep is a slow process and slopes prone to more rap-id failures do not tend to remain intact long enough for creep phenomena to become significant. Long-term creep can lead to the gradual buildup of living roots and woody material at the toe of the slope which appears capable of providing significant stability to the toe of some slopes.
Block failure.—Coherent geologic units, such as glacial till and glacial marine drift, tend to fail as blocks on near-verti-cal slopes. When basal support is lost, through direct under-mining by waves or by erosion of underlying units, failures oc-cur along joints or tension cracks that form parallel to the bluff face. Block failures are typically a meter or less in thickness, although faces with greater relief seem capable of generating thicker failures. Failures often expose planar root mats that extend many meters in depth, but the degree to which roots and water exacerbate fracture development or simply take ad-vantage of their presence is unknown.
Hydrology. — Both surface runoff and seepage can modify bluffs, although the Puget Sound region’s heavy vegetation generally limits significant surface erosion to situations where runoff has been concentrated by human actions or to locations where vegetation has been removed from easily eroded soils, such as on a recent landslide. Surface erosion can range from the development of small rills on slopes to deep gullies and ravines. Groundwater seepage along distinct stratigraphic hori-zons can result in sapping of sandy soils and the undercutting of overlying units. Finally, although freezing temperatures are not common along the sound, extended freezes can lead to substan-tial ice buildup at seepage zones and there is evidence that this can precipitate failures either by increasing pore pressures be-hind the bluff face or by simply loading an already steep slope.
Figure 4. High bluffs near Port Townsend illustrate role of distinct stratigraphic units in defining bluff profile. Upper unit of glacial till fails in vertical slabs and does not support vegetation. Central sandier outwash unit is at angle of repose, with substantial revegeta-tion between erosional events. Lower glacial unit is subject to wave action when storms and high tides coincide and when beach volume is reduced.
Figure 5. High-resolution image of topography obtained with LIDAR (Light Detection and Ranging) along complex coastal bluff in central Puget Sound. Mid-slope bench occurs along the contact between underlying glacial clays and overlying sandy outwash, where hydrologic conditions lead to instability. In some locations, the bench itself has been affected by deep-seated sliding. (Puget Sound LIDAR Consortium)
Figure 6. Typical mixed sand and gravel beach at base of high coastal bluff on Puget Sound. Berm, which consists of sandy material overlying a coarse gravel core, protects slope toe from wave action except when storm waves coincide with unusually high tides.
Coastal Bluffs and Sea Cliffs on Puget Sound, Washington
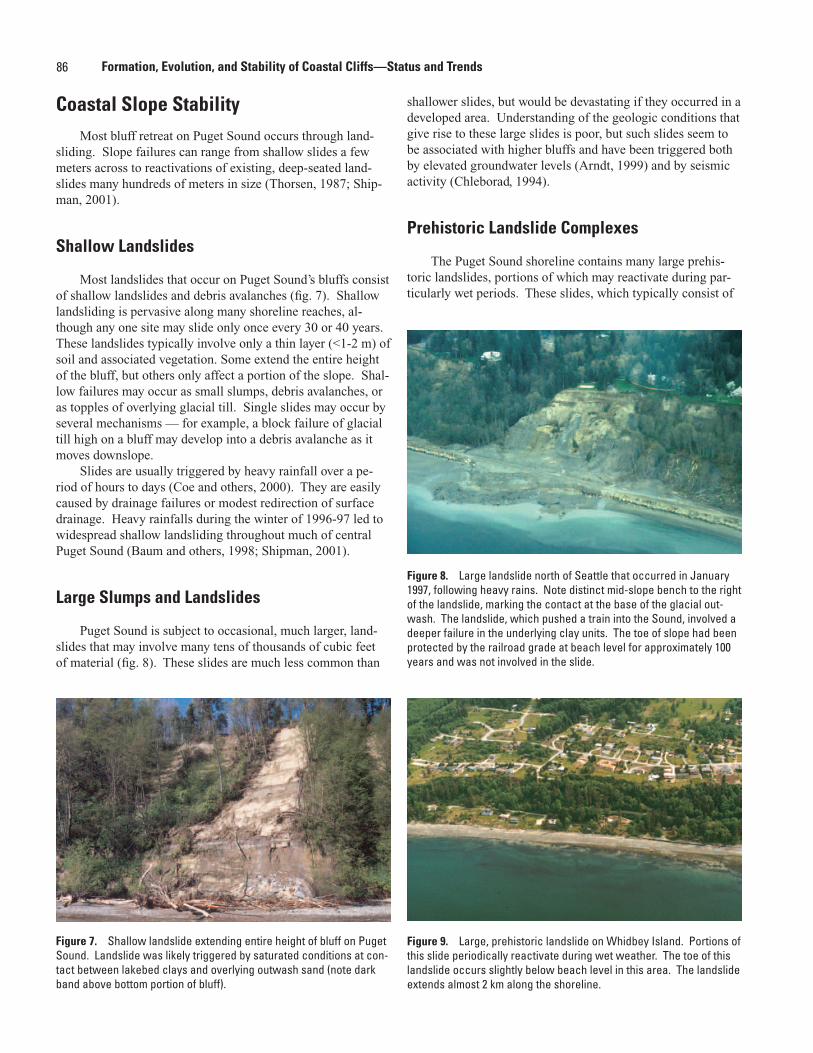
86 Formation, Evolution, and Stability of Coastal Cliffs—Status and Trends
Coastal Slope StabilityMost bluff retreat on Puget Sound occurs through land-
sliding. Slope failures can range from shallow slides a few meters across to reactivations of existing, deep-seated land-slides many hundreds of meters in size (Thorsen, 1987; Ship-man, 2001).
Shallow Landslides
Most landslides that occur on Puget Sound’s bluffs consist of shallow landslides and debris avalanches (fig. 7). Shallow landsliding is pervasive along many shoreline reaches, al-though any one site may slide only once every 30 or 40 years. These landslides typically involve only a thin layer (<1-2 m) of soil and associated vegetation. Some extend the entire height of the bluff, but others only affect a portion of the slope. Shal-low failures may occur as small slumps, debris avalanches, or as topples of overlying glacial till. Single slides may occur by several mechanisms — for example, a block failure of glacial till high on a bluff may develop into a debris avalanche as it moves downslope.
Slides are usually triggered by heavy rainfall over a pe-riod of hours to days (Coe and others, 2000). They are easily caused by drainage failures or modest redirection of surface drainage. Heavy rainfalls during the winter of 1996-97 led to widespread shallow landsliding throughout much of central Puget Sound (Baum and others, 1998; Shipman, 2001).
Large Slumps and Landslides
Puget Sound is subject to occasional, much larger, land-slides that may involve many tens of thousands of cubic feet of material (fig. 8). These slides are much less common than
Figure 7. Shallow landslide extending entire height of bluff on Puget Sound. Landslide was likely triggered by saturated conditions at con-tact between lakebed clays and overlying outwash sand (note dark band above bottom portion of bluff).
Figure 8. Large landslide north of Seattle that occurred in January 1997, following heavy rains. Note distinct mid-slope bench to the right of the landslide, marking the contact at the base of the glacial out-wash. The landslide, which pushed a train into the Sound, involved a deeper failure in the underlying clay units. The toe of slope had been protected by the railroad grade at beach level for approximately 100 years and was not involved in the slide.
Figure 9. Large, prehistoric landslide on Whidbey Island. Portions of this slide periodically reactivate during wet weather. The toe of this landslide occurs slightly below beach level in this area. The landslide extends almost 2 km along the shoreline.
shallower slides, but would be devastating if they occurred in a developed area. Understanding of the geologic conditions that give rise to these large slides is poor, but such slides seem to be associated with higher bluffs and have been triggered both by elevated groundwater levels (Arndt, 1999) and by seismic activity (Chleborad, 1994).
Prehistoric Landslide Complexes
The Puget Sound shoreline contains many large prehis-toric landslides, portions of which may reactivate during par-ticularly wet periods. These slides, which typically consist of
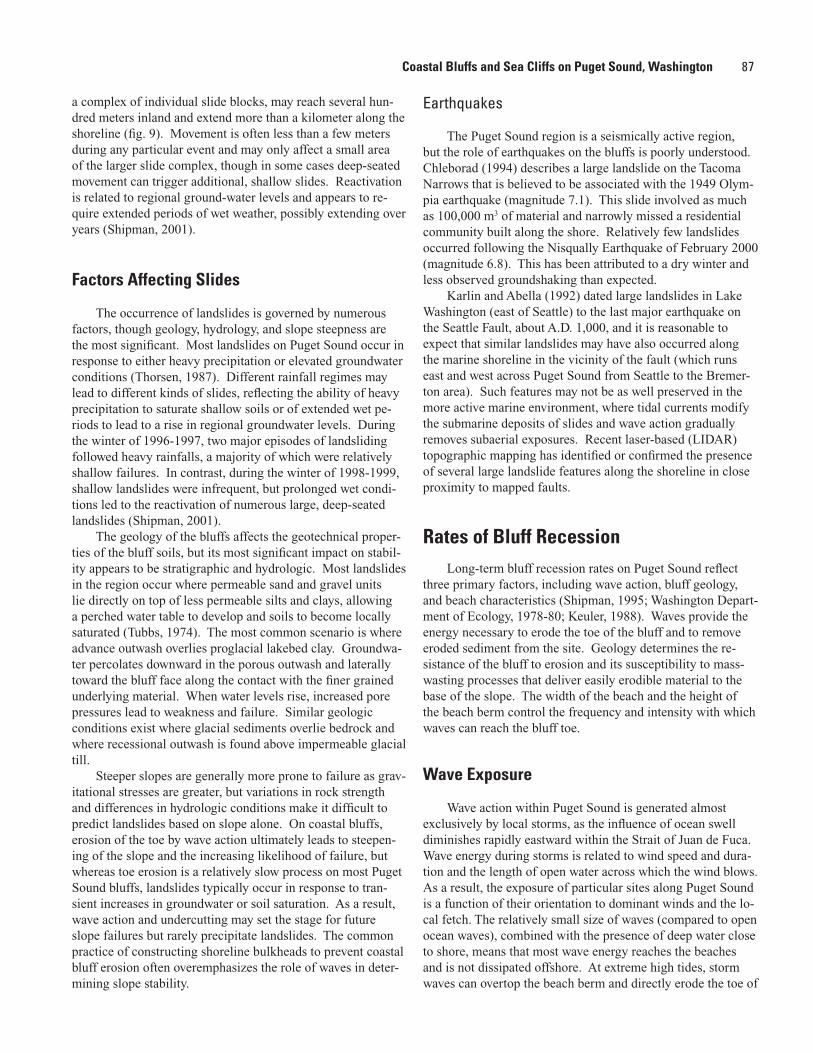
87
a complex of individual slide blocks, may reach several hun-dred meters inland and extend more than a kilometer along the shoreline (fig. 9). Movement is often less than a few meters during any particular event and may only affect a small area of the larger slide complex, though in some cases deep-seated movement can trigger additional, shallow slides. Reactivation is related to regional ground-water levels and appears to re-quire extended periods of wet weather, possibly extending over years (Shipman, 2001).
Factors Affecting Slides
The occurrence of landslides is governed by numerous factors, though geology, hydrology, and slope steepness are the most significant. Most landslides on Puget Sound occur in response to either heavy precipitation or elevated groundwater conditions (Thorsen, 1987). Different rainfall regimes may lead to different kinds of slides, reflecting the ability of heavy precipitation to saturate shallow soils or of extended wet pe-riods to lead to a rise in regional groundwater levels. During the winter of 1996-1997, two major episodes of landsliding followed heavy rainfalls, a majority of which were relatively shallow failures. In contrast, during the winter of 1998-1999, shallow landslides were infrequent, but prolonged wet condi-tions led to the reactivation of numerous large, deep-seated landslides (Shipman, 2001).
The geology of the bluffs affects the geotechnical proper-ties of the bluff soils, but its most significant impact on stabil-ity appears to be stratigraphic and hydrologic. Most landslides in the region occur where permeable sand and gravel units lie directly on top of less permeable silts and clays, allowing a perched water table to develop and soils to become locally saturated (Tubbs, 1974). The most common scenario is where advance outwash overlies proglacial lakebed clay. Groundwa-ter percolates downward in the porous outwash and laterally toward the bluff face along the contact with the finer grained underlying material. When water levels rise, increased pore pressures lead to weakness and failure. Similar geologic conditions exist where glacial sediments overlie bedrock and where recessional outwash is found above impermeable glacial till.
Steeper slopes are generally more prone to failure as grav-itational stresses are greater, but variations in rock strength and differences in hydrologic conditions make it difficult to predict landslides based on slope alone. On coastal bluffs, erosion of the toe by wave action ultimately leads to steepen-ing of the slope and the increasing likelihood of failure, but whereas toe erosion is a relatively slow process on most Puget Sound bluffs, landslides typically occur in response to tran-sient increases in groundwater or soil saturation. As a result, wave action and undercutting may set the stage for future slope failures but rarely precipitate landslides. The common practice of constructing shoreline bulkheads to prevent coastal bluff erosion often overemphasizes the role of waves in deter-mining slope stability.
Earthquakes
The Puget Sound region is a seismically active region, but the role of earthquakes on the bluffs is poorly understood. Chleborad (1994) describes a large landslide on the Tacoma Narrows that is believed to be associated with the 1949 Olym-pia earthquake (magnitude 7.1). This slide involved as much as 100,000 m3 of material and narrowly missed a residential community built along the shore. Relatively few landslides occurred following the Nisqually Earthquake of February 2000 (magnitude 6.8). This has been attributed to a dry winter and less observed groundshaking than expected.
Karlin and Abella (1992) dated large landslides in Lake Washington (east of Seattle) to the last major earthquake on the Seattle Fault, about A.D. 1,000, and it is reasonable to expect that similar landslides may have also occurred along the marine shoreline in the vicinity of the fault (which runs east and west across Puget Sound from Seattle to the Bremer-ton area). Such features may not be as well preserved in the more active marine environment, where tidal currents modify the submarine deposits of slides and wave action gradually removes subaerial exposures. Recent laser-based (LIDAR) topographic mapping has identified or confirmed the presence of several large landslide features along the shoreline in close proximity to mapped faults.
Rates of Bluff RecessionLong-term bluff recession rates on Puget Sound reflect
three primary factors, including wave action, bluff geology, and beach characteristics (Shipman, 1995; Washington Depart-ment of Ecology, 1978-80; Keuler, 1988). Waves provide the energy necessary to erode the toe of the bluff and to remove eroded sediment from the site. Geology determines the re-sistance of the bluff to erosion and its susceptibility to mass-wasting processes that deliver easily erodible material to the base of the slope. The width of the beach and the height of the beach berm control the frequency and intensity with which waves can reach the bluff toe.
Wave Exposure
Wave action within Puget Sound is generated almost exclusively by local storms, as the influence of ocean swell diminishes rapidly eastward within the Strait of Juan de Fuca. Wave energy during storms is related to wind speed and dura-tion and the length of open water across which the wind blows. As a result, the exposure of particular sites along Puget Sound is a function of their orientation to dominant winds and the lo-cal fetch. The relatively small size of waves (compared to open ocean waves), combined with the presence of deep water close to shore, means that most wave energy reaches the beaches and is not dissipated offshore. At extreme high tides, storm waves can overtop the beach berm and directly erode the toe of
Coastal Bluffs and Sea Cliffs on Puget Sound, Washington
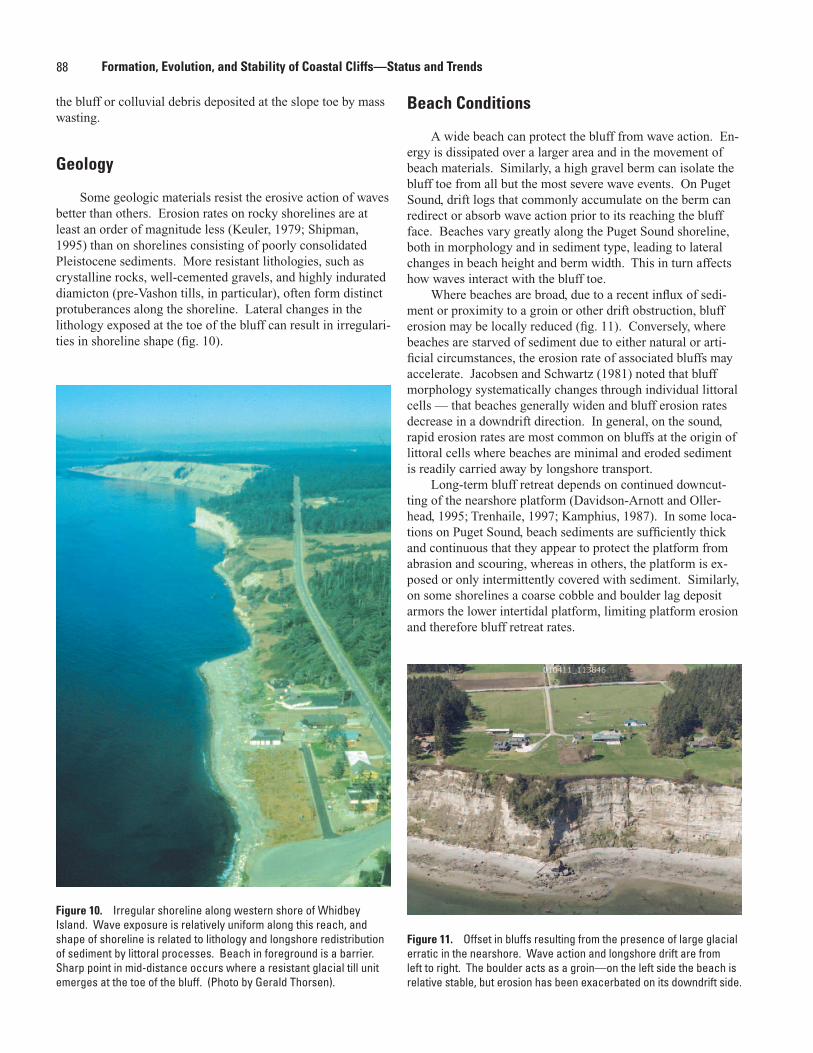
88 Formation, Evolution, and Stability of Coastal Cliffs—Status and Trends
the bluff or colluvial debris deposited at the slope toe by mass wasting.
Geology
Some geologic materials resist the erosive action of waves better than others. Erosion rates on rocky shorelines are at least an order of magnitude less (Keuler, 1979; Shipman, 1995) than on shorelines consisting of poorly consolidated Pleistocene sediments. More resistant lithologies, such as crystalline rocks, well-cemented gravels, and highly indurated diamicton (pre-Vashon tills, in particular), often form distinct protuberances along the shoreline. Lateral changes in the lithology exposed at the toe of the bluff can result in irregulari-ties in shoreline shape (fig. 10).
Beach Conditions
A wide beach can protect the bluff from wave action. En-ergy is dissipated over a larger area and in the movement of beach materials. Similarly, a high gravel berm can isolate the bluff toe from all but the most severe wave events. On Puget Sound, drift logs that commonly accumulate on the berm can redirect or absorb wave action prior to its reaching the bluff face. Beaches vary greatly along the Puget Sound shoreline, both in morphology and in sediment type, leading to lateral changes in beach height and berm width. This in turn affects how waves interact with the bluff toe.
Where beaches are broad, due to a recent influx of sedi-ment or proximity to a groin or other drift obstruction, bluff erosion may be locally reduced (fig. 11). Conversely, where beaches are starved of sediment due to either natural or arti-ficial circumstances, the erosion rate of associated bluffs may accelerate. Jacobsen and Schwartz (1981) noted that bluff morphology systematically changes through individual littoral cells — that beaches generally widen and bluff erosion rates decrease in a downdrift direction. In general, on the sound, rapid erosion rates are most common on bluffs at the origin of littoral cells where beaches are minimal and eroded sediment is readily carried away by longshore transport.
Long-term bluff retreat depends on continued downcut-ting of the nearshore platform (Davidson-Arnott and Oller-head, 1995; Trenhaile, 1997; Kamphius, 1987). In some loca-tions on Puget Sound, beach sediments are sufficiently thick and continuous that they appear to protect the platform from abrasion and scouring, whereas in others, the platform is ex-posed or only intermittently covered with sediment. Similarly, on some shorelines a coarse cobble and boulder lag deposit armors the lower intertidal platform, limiting platform erosion and therefore bluff retreat rates.
Figure 10. Irregular shoreline along western shore of Whidbey Island. Wave exposure is relatively uniform along this reach, and shape of shoreline is related to lithology and longshore redistribution of sediment by littoral processes. Beach in foreground is a barrier. Sharp point in mid-distance occurs where a resistant glacial till unit emerges at the toe of the bluff. (Photo by Gerald Thorsen).
Figure 11. Offset in bluffs resulting from the presence of large glacial erratic in the nearshore. Wave action and longshore drift are from left to right. The boulder acts as a groin—on the left side the beach is relative stable, but erosion has been exacerbated on its downdrift side.
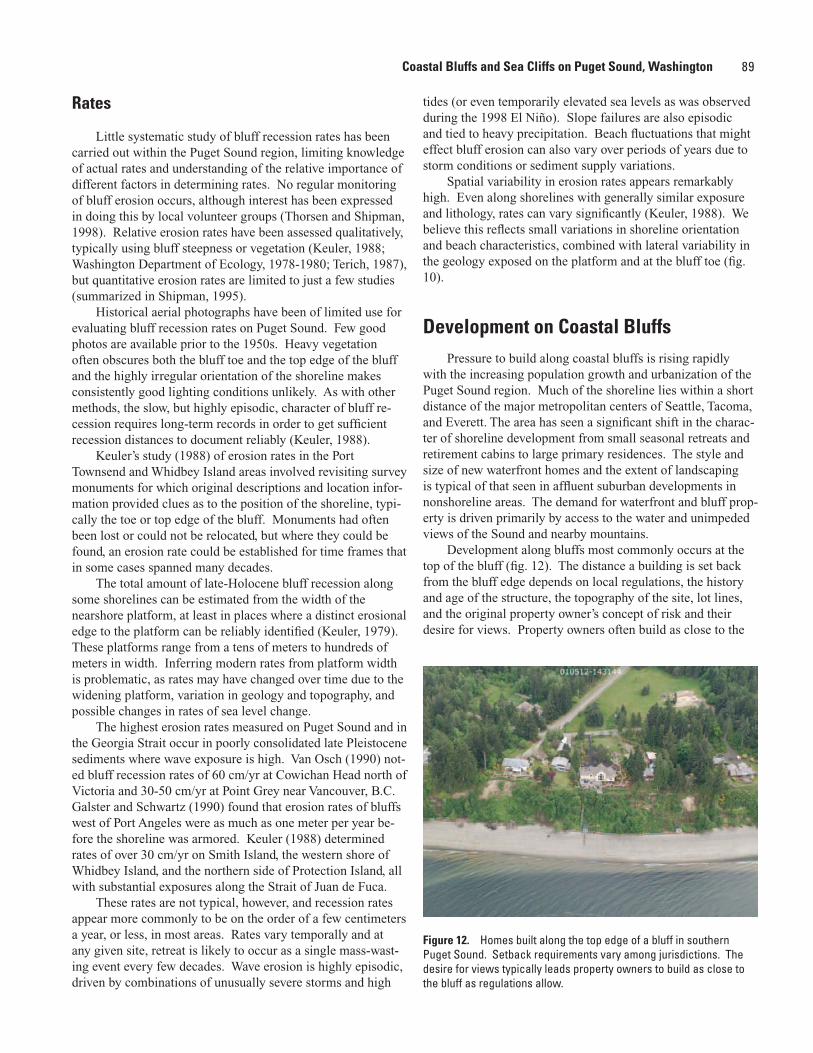
89
Rates
Little systematic study of bluff recession rates has been carried out within the Puget Sound region, limiting knowledge of actual rates and understanding of the relative importance of different factors in determining rates. No regular monitoring of bluff erosion occurs, although interest has been expressed in doing this by local volunteer groups (Thorsen and Shipman, 1998). Relative erosion rates have been assessed qualitatively, typically using bluff steepness or vegetation (Keuler, 1988; Washington Department of Ecology, 1978-1980; Terich, 1987), but quantitative erosion rates are limited to just a few studies (summarized in Shipman, 1995).
Historical aerial photographs have been of limited use for evaluating bluff recession rates on Puget Sound. Few good photos are available prior to the 1950s. Heavy vegetation often obscures both the bluff toe and the top edge of the bluff and the highly irregular orientation of the shoreline makes consistently good lighting conditions unlikely. As with other methods, the slow, but highly episodic, character of bluff re-cession requires long-term records in order to get sufficient recession distances to document reliably (Keuler, 1988).
Keuler’s study (1988) of erosion rates in the Port Townsend and Whidbey Island areas involved revisiting survey monuments for which original descriptions and location infor-mation provided clues as to the position of the shoreline, typi-cally the toe or top edge of the bluff. Monuments had often been lost or could not be relocated, but where they could be found, an erosion rate could be established for time frames that in some cases spanned many decades.
The total amount of late-Holocene bluff recession along some shorelines can be estimated from the width of the nearshore platform, at least in places where a distinct erosional edge to the platform can be reliably identified (Keuler, 1979). These platforms range from a tens of meters to hundreds of meters in width. Inferring modern rates from platform width is problematic, as rates may have changed over time due to the widening platform, variation in geology and topography, and possible changes in rates of sea level change.
The highest erosion rates measured on Puget Sound and in the Georgia Strait occur in poorly consolidated late Pleistocene sediments where wave exposure is high. Van Osch (1990) not-ed bluff recession rates of 60 cm/yr at Cowichan Head north of Victoria and 30-50 cm/yr at Point Grey near Vancouver, B.C. Galster and Schwartz (1990) found that erosion rates of bluffs west of Port Angeles were as much as one meter per year be-fore the shoreline was armored. Keuler (1988) determined rates of over 30 cm/yr on Smith Island, the western shore of Whidbey Island, and the northern side of Protection Island, all with substantial exposures along the Strait of Juan de Fuca.
These rates are not typical, however, and recession rates appear more commonly to be on the order of a few centimeters a year, or less, in most areas. Rates vary temporally and at any given site, retreat is likely to occur as a single mass-wast-ing event every few decades. Wave erosion is highly episodic, driven by combinations of unusually severe storms and high
tides (or even temporarily elevated sea levels as was observed during the 1998 El Niño). Slope failures are also episodic and tied to heavy precipitation. Beach fluctuations that might effect bluff erosion can also vary over periods of years due to storm conditions or sediment supply variations.
Spatial variability in erosion rates appears remarkably high. Even along shorelines with generally similar exposure and lithology, rates can vary significantly (Keuler, 1988). We believe this reflects small variations in shoreline orientation and beach characteristics, combined with lateral variability in the geology exposed on the platform and at the bluff toe (fig. 10).
Development on Coastal BluffsPressure to build along coastal bluffs is rising rapidly
with the increasing population growth and urbanization of the Puget Sound region. Much of the shoreline lies within a short distance of the major metropolitan centers of Seattle, Tacoma, and Everett. The area has seen a significant shift in the charac-ter of shoreline development from small seasonal retreats and retirement cabins to large primary residences. The style and size of new waterfront homes and the extent of landscaping is typical of that seen in affluent suburban developments in nonshoreline areas. The demand for waterfront and bluff prop-erty is driven primarily by access to the water and unimpeded views of the Sound and nearby mountains.
Development along bluffs most commonly occurs at the top of the bluff (fig. 12). The distance a building is set back from the bluff edge depends on local regulations, the history and age of the structure, the topography of the site, lot lines, and the original property owner’s concept of risk and their desire for views. Property owners often build as close to the
Figure 12. Homes built along the top edge of a bluff in southern Puget Sound. Setback requirements vary among jurisdictions. The desire for views typically leads property owners to build as close to the bluff as regulations allow.
Coastal Bluffs and Sea Cliffs on Puget Sound, Washington
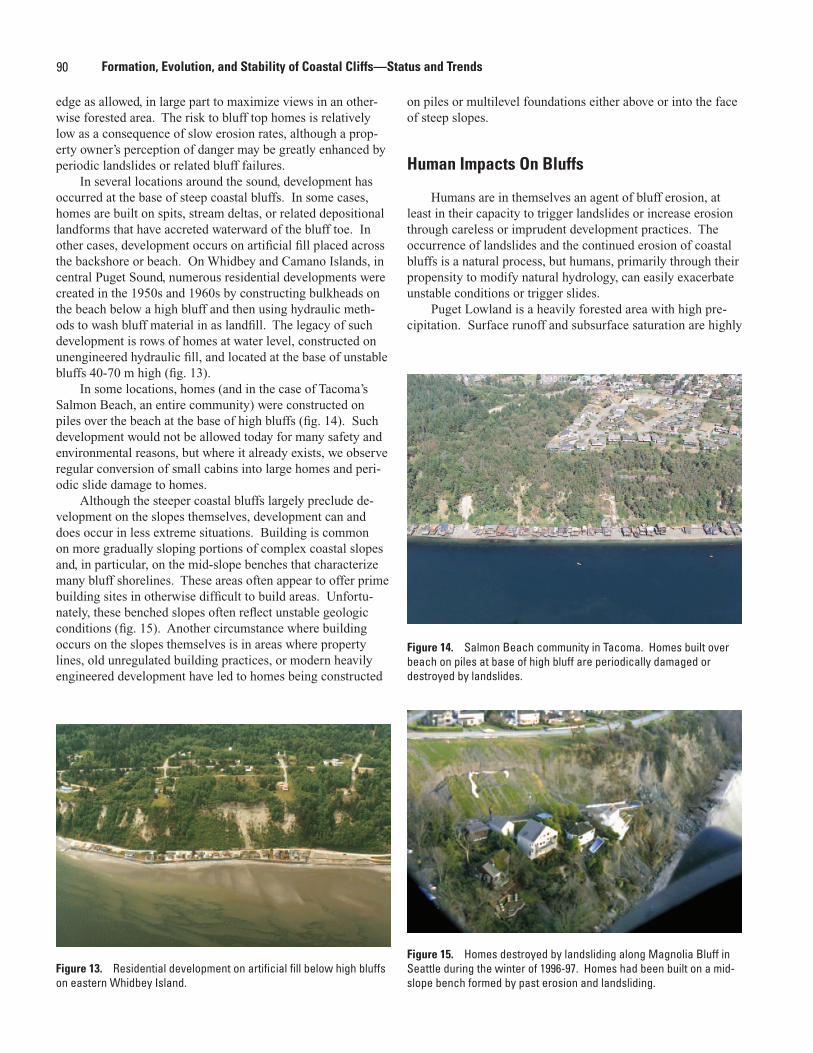
90 Formation, Evolution, and Stability of Coastal Cliffs—Status and Trends
edge as allowed, in large part to maximize views in an other-wise forested area. The risk to bluff top homes is relatively low as a consequence of slow erosion rates, although a prop-erty owner’s perception of danger may be greatly enhanced by periodic landslides or related bluff failures.
In several locations around the sound, development has occurred at the base of steep coastal bluffs. In some cases, homes are built on spits, stream deltas, or related depositional landforms that have accreted waterward of the bluff toe. In other cases, development occurs on artificial fill placed across the backshore or beach. On Whidbey and Camano Islands, in central Puget Sound, numerous residential developments were created in the 1950s and 1960s by constructing bulkheads on the beach below a high bluff and then using hydraulic meth-ods to wash bluff material in as landfill. The legacy of such development is rows of homes at water level, constructed on unengineered hydraulic fill, and located at the base of unstable bluffs 40-70 m high (fig. 13).
In some locations, homes (and in the case of Tacoma’s Salmon Beach, an entire community) were constructed on piles over the beach at the base of high bluffs (fig. 14). Such development would not be allowed today for many safety and environmental reasons, but where it already exists, we observe regular conversion of small cabins into large homes and peri-odic slide damage to homes.
Although the steeper coastal bluffs largely preclude de-velopment on the slopes themselves, development can and does occur in less extreme situations. Building is common on more gradually sloping portions of complex coastal slopes and, in particular, on the mid-slope benches that characterize many bluff shorelines. These areas often appear to offer prime building sites in otherwise difficult to build areas. Unfortu-nately, these benched slopes often reflect unstable geologic conditions (fig. 15). Another circumstance where building occurs on the slopes themselves is in areas where property lines, old unregulated building practices, or modern heavily engineered development have led to homes being constructed
on piles or multilevel foundations either above or into the face of steep slopes.
Human Impacts On Bluffs
Humans are in themselves an agent of bluff erosion, at least in their capacity to trigger landslides or increase erosion through careless or imprudent development practices. The occurrence of landslides and the continued erosion of coastal bluffs is a natural process, but humans, primarily through their propensity to modify natural hydrology, can easily exacerbate unstable conditions or trigger slides.
Puget Lowland is a heavily forested area with high pre-cipitation. Surface runoff and subsurface saturation are highly
Figure 13. Residential development on artificial fill below high bluffs on eastern Whidbey Island.
Figure 14. Salmon Beach community in Tacoma. Homes built over beach on piles at base of high bluff are periodically damaged or destroyed by landslides.
Figure 15. Homes destroyed by landsliding along Magnolia Bluff in Seattle during the winter of 1996-97. Homes had been built on a mid-slope bench formed by past erosion and landsliding.
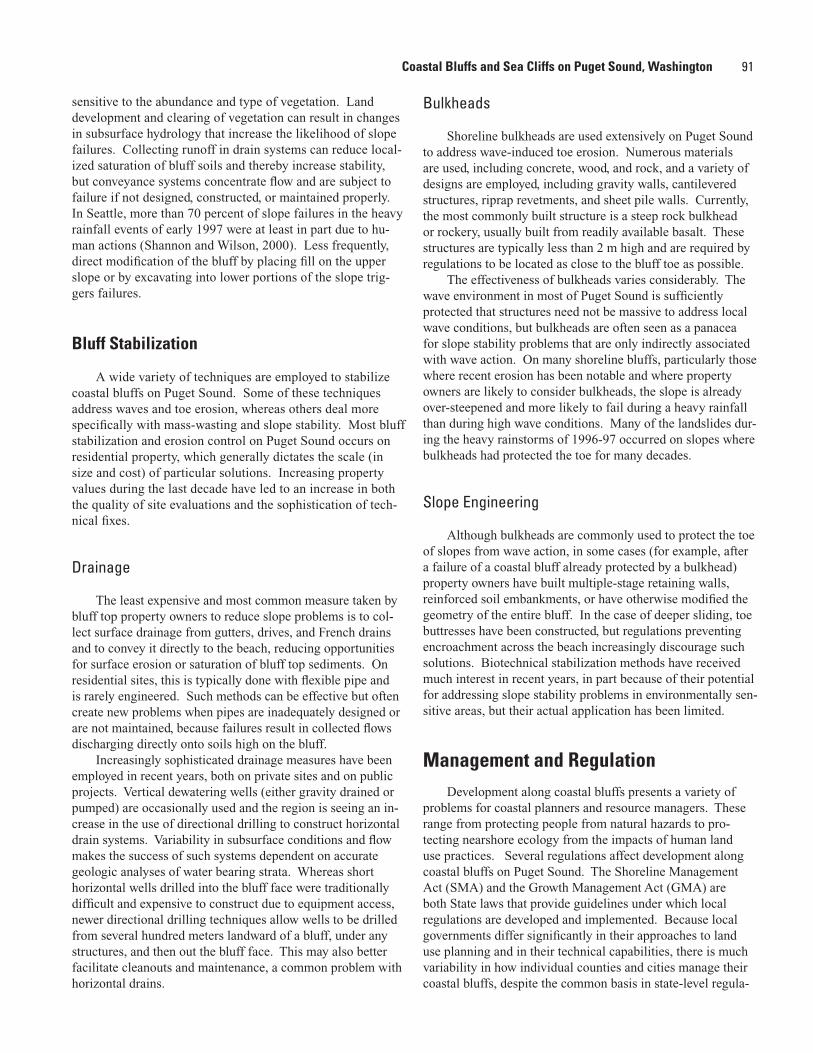
91
sensitive to the abundance and type of vegetation. Land development and clearing of vegetation can result in changes in subsurface hydrology that increase the likelihood of slope failures. Collecting runoff in drain systems can reduce local-ized saturation of bluff soils and thereby increase stability, but conveyance systems concentrate flow and are subject to failure if not designed, constructed, or maintained properly. In Seattle, more than 70 percent of slope failures in the heavy rainfall events of early 1997 were at least in part due to hu-man actions (Shannon and Wilson, 2000). Less frequently, direct modification of the bluff by placing fill on the upper slope or by excavating into lower portions of the slope trig-gers failures.
Bluff Stabilization
A wide variety of techniques are employed to stabilize coastal bluffs on Puget Sound. Some of these techniques address waves and toe erosion, whereas others deal more specifically with mass-wasting and slope stability. Most bluff stabilization and erosion control on Puget Sound occurs on residential property, which generally dictates the scale (in size and cost) of particular solutions. Increasing property values during the last decade have led to an increase in both the quality of site evaluations and the sophistication of tech-nical fixes.
Drainage
The least expensive and most common measure taken by bluff top property owners to reduce slope problems is to col-lect surface drainage from gutters, drives, and French drains and to convey it directly to the beach, reducing opportunities for surface erosion or saturation of bluff top sediments. On residential sites, this is typically done with flexible pipe and is rarely engineered. Such methods can be effective but often create new problems when pipes are inadequately designed or are not maintained, because failures result in collected flows discharging directly onto soils high on the bluff.
Increasingly sophisticated drainage measures have been employed in recent years, both on private sites and on public projects. Vertical dewatering wells (either gravity drained or pumped) are occasionally used and the region is seeing an in-crease in the use of directional drilling to construct horizontal drain systems. Variability in subsurface conditions and flow makes the success of such systems dependent on accurate geologic analyses of water bearing strata. Whereas short horizontal wells drilled into the bluff face were traditionally difficult and expensive to construct due to equipment access, newer directional drilling techniques allow wells to be drilled from several hundred meters landward of a bluff, under any structures, and then out the bluff face. This may also better facilitate cleanouts and maintenance, a common problem with horizontal drains.
Bulkheads
Shoreline bulkheads are used extensively on Puget Sound to address wave-induced toe erosion. Numerous materials are used, including concrete, wood, and rock, and a variety of designs are employed, including gravity walls, cantilevered structures, riprap revetments, and sheet pile walls. Currently, the most commonly built structure is a steep rock bulkhead or rockery, usually built from readily available basalt. These structures are typically less than 2 m high and are required by regulations to be located as close to the bluff toe as possible.
The effectiveness of bulkheads varies considerably. The wave environment in most of Puget Sound is sufficiently protected that structures need not be massive to address local wave conditions, but bulkheads are often seen as a panacea for slope stability problems that are only indirectly associated with wave action. On many shoreline bluffs, particularly those where recent erosion has been notable and where property owners are likely to consider bulkheads, the slope is already over-steepened and more likely to fail during a heavy rainfall than during high wave conditions. Many of the landslides dur-ing the heavy rainstorms of 1996-97 occurred on slopes where bulkheads had protected the toe for many decades.
Slope Engineering
Although bulkheads are commonly used to protect the toe of slopes from wave action, in some cases (for example, after a failure of a coastal bluff already protected by a bulkhead) property owners have built multiple-stage retaining walls, reinforced soil embankments, or have otherwise modified the geometry of the entire bluff. In the case of deeper sliding, toe buttresses have been constructed, but regulations preventing encroachment across the beach increasingly discourage such solutions. Biotechnical stabilization methods have received much interest in recent years, in part because of their potential for addressing slope stability problems in environmentally sen-sitive areas, but their actual application has been limited.
Management and RegulationDevelopment along coastal bluffs presents a variety of
problems for coastal planners and resource managers. These range from protecting people from natural hazards to pro-tecting nearshore ecology from the impacts of human land use practices. Several regulations affect development along coastal bluffs on Puget Sound. The Shoreline Management Act (SMA) and the Growth Management Act (GMA) are both State laws that provide guidelines under which local regulations are developed and implemented. Because local governments differ significantly in their approaches to land use planning and in their technical capabilities, there is much variability in how individual counties and cities manage their coastal bluffs, despite the common basis in state-level regula-
Coastal Bluffs and Sea Cliffs on Puget Sound, Washington
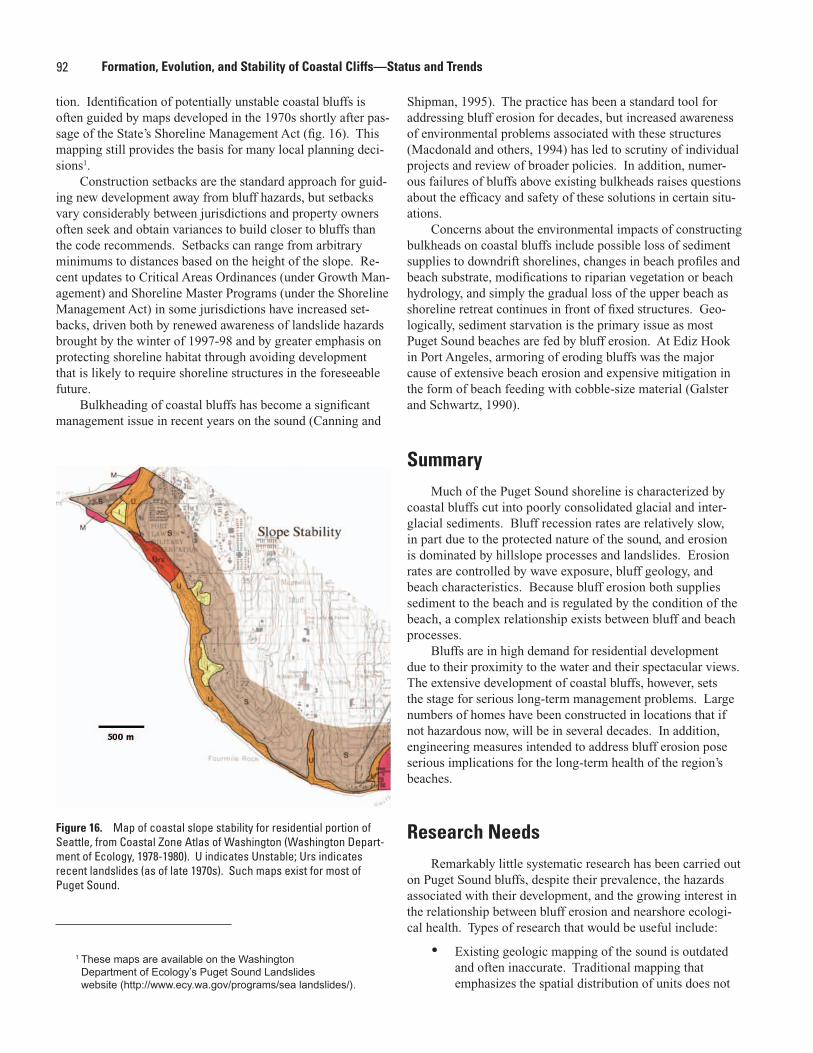
92 Formation, Evolution, and Stability of Coastal Cliffs—Status and Trends
tion. Identification of potentially unstable coastal bluffs is often guided by maps developed in the 1970s shortly after pas-sage of the State’s Shoreline Management Act (fig. 16). This mapping still provides the basis for many local planning deci-sions1.
Construction setbacks are the standard approach for guid-ing new development away from bluff hazards, but setbacks vary considerably between jurisdictions and property owners often seek and obtain variances to build closer to bluffs than the code recommends. Setbacks can range from arbitrary minimums to distances based on the height of the slope. Re-cent updates to Critical Areas Ordinances (under Growth Man-agement) and Shoreline Master Programs (under the Shoreline Management Act) in some jurisdictions have increased set-backs, driven both by renewed awareness of landslide hazards brought by the winter of 1997-98 and by greater emphasis on protecting shoreline habitat through avoiding development that is likely to require shoreline structures in the foreseeable future.
Bulkheading of coastal bluffs has become a significant management issue in recent years on the sound (Canning and
Shipman, 1995). The practice has been a standard tool for addressing bluff erosion for decades, but increased awareness of environmental problems associated with these structures (Macdonald and others, 1994) has led to scrutiny of individual projects and review of broader policies. In addition, numer-ous failures of bluffs above existing bulkheads raises questions about the efficacy and safety of these solutions in certain situ-ations.
Concerns about the environmental impacts of constructing bulkheads on coastal bluffs include possible loss of sediment supplies to downdrift shorelines, changes in beach profiles and beach substrate, modifications to riparian vegetation or beach hydrology, and simply the gradual loss of the upper beach as shoreline retreat continues in front of fixed structures. Geo-logically, sediment starvation is the primary issue as most Puget Sound beaches are fed by bluff erosion. At Ediz Hook in Port Angeles, armoring of eroding bluffs was the major cause of extensive beach erosion and expensive mitigation in the form of beach feeding with cobble-size material (Galster and Schwartz, 1990).
SummaryMuch of the Puget Sound shoreline is characterized by
coastal bluffs cut into poorly consolidated glacial and inter-glacial sediments. Bluff recession rates are relatively slow, in part due to the protected nature of the sound, and erosion is dominated by hillslope processes and landslides. Erosion rates are controlled by wave exposure, bluff geology, and beach characteristics. Because bluff erosion both supplies sediment to the beach and is regulated by the condition of the beach, a complex relationship exists between bluff and beach processes.
Bluffs are in high demand for residential development due to their proximity to the water and their spectacular views. The extensive development of coastal bluffs, however, sets the stage for serious long-term management problems. Large numbers of homes have been constructed in locations that if not hazardous now, will be in several decades. In addition, engineering measures intended to address bluff erosion pose serious implications for the long-term health of the region’s beaches.
Research NeedsRemarkably little systematic research has been carried out
on Puget Sound bluffs, despite their prevalence, the hazards associated with their development, and the growing interest in the relationship between bluff erosion and nearshore ecologi-cal health. Types of research that would be useful include:
• Existing geologic mapping of the sound is outdated and often inaccurate. Traditional mapping that emphasizes the spatial distribution of units does not
1 These maps are available on the Washington Department of Ecology’s Puget Sound Landslides website (http://www.ecy.wa.gov/programs/sea landslides/).
Figure 16. Map of coastal slope stability for residential portion of Seattle, from Coastal Zone Atlas of Washington (Washington Depart-ment of Ecology, 1978-1980). U indicates Unstable; Urs indicates recent landslides (as of late 1970s). Such maps exist for most of Puget Sound.
93
necessarily present stratigraphic information well. New mapping, including more detailed examination and portrayal of shoreline stratigraphy, is critical to understanding coastal bluff processes.
• Recently, high resolution topographic data have been collected for much of the Puget Lowland using LIDAR (Light Detection and Ranging) technology. These data provide valuable information about bluff morphology and slope processes that were not avail-able before. Little detailed analysis of these data has been carried out so far.
• Erosion rates have been acquired for only a few loca-tions. A long-term monitoring program, coupled with detailed studies of specific sites, could provide a basis for estimating erosion rates throughout the Puget Sound region.
• Little is understood of littoral processes, sediment budgets, or of shoreline evolution on the sound. What information is available is largely qualitative. Quantitative, process-oriented studies will greatly improve our understanding of the bluffs and their change over time.
ReferencesArndt, B., 1999, Determination of the conditions necessary
for slope failure of a deep-seated landslide at Woodway, Washington: Golden, Colorado, Colorado School of Mines, Masters thesis.
Baum, R.L., Chleborad, A.F., and Schuster, R.L., 1998, Land-slides triggered by the winter 1996-97 storms in the Puget Lowland, Washington: United States Geological Survey Open File Report 98-239, 16 p.
Booth, D.B., 1994, Glaciofluvial infilling and scour of the Puget Lowland, Washington, during ice-sheet glaciation: Geol-ogy, v. 22, p. 695-698.
Burns, R., 1985, The shape and form of Puget Sound: Seattle, Washington Sea Grant, University of Washington Press, 100 p.
Canning, D.J. and Shipman, H., 1995, Coastal erosion manage-ment studies in Puget Sound, Washington — executive summary: Washington Department of Ecology, Shorelands and Water Resources Program.
Chleborad, A.F., 1994, Modeling and analysis of the 1949 Nar-rows Landslide, Tacoma, Washington: Bulletin of the As-sociation of Engineering Geologists, v. 31, p. 305-327.
Coe, J.A., Michael, J.A., Crovelli, R.A., and Savage, W.Z., 2000, Preliminary map showing landslide densities, mean recur-rence intervals, and exceedance probabilities as determined from historic records, Seattle, Washington: United States Geological Survey Open File Report 00-303, 25 p., map sheet scale 1:25,000.
Davidson-Arnott, R.G.D., and Ollerhead, J., 1995, Nearshore erosion on a cohesive shoreline: Marine Geology, v. 122, p. 349-365.
Downing, J., 1983, The Coast of Puget Sound — its processes and development: Seattle, Washington, Washington Sea Grant, University of Washington Press.
Easterbrook, D.J., 1986, Stratigraphy and chronology of Qua-ternary deposits of the Puget Lowland and Olympic Mountains of Washington and the Cascade Mountains of Washington and Oregon: Quaternary Science Reviews, v. 5, p. 145-159.
Easterbrook, D.J., 1994, Chronology of pre-late Wisconsin Pleistocene sediments in the Puget Lowland, Washington, in Lasmanis, R. and Cheney, E.S., eds., Regional geology of Washington State: Washington Division of Geology and Earth Resources, Bulletin 80, p. 191-206.
Galster, R.W., and Schwartz, M.L., 1990, Ediz Hook — a case history of coastal erosion and rehabilitation: Journal of Coastal Research, Special Issue, no. 6, p. 103-113.
Gerstel, W.J., Brunengo, M.J., Lingley, W.S., Jr., Logan, R.L., Shipman, H. and Walsh, T.J., 1997, Puget Sound bluffs — the where, why, and when of landslides following the holiday 1996/97 storms: Washington Geology, v. 25, no. 1, p. 17-31.
Jacobsen, E.E. and Schwartz, M.L., 1981, The use of geomorphic indicators to determine the direction of net shore-drift: Shore and Beach, v. 49, p. 38-43.
Kamphuis, J.W., 1987, Recession rate of glacial till bluffs: Jour-nal of Waterway, Port, Coastal and Ocean Engineering, v. 113, p. 60-73.
Karlin, R.E. and Abella, S.E.B., 1992, Paleoearthquakes in the Puget Sound region recorded in sediments from Lake Washington: Science, v. 258, p. 1617-1620.
Keuler, R.F., 1979, Coastal zone processes and geomorphol-ogy of Skagit County, Washington: Bellingham, Western Washington University, Masters thesis.
Keuler, R.F., 1988, Map showing coastal erosion, sediment sup-ply, and longshore transport in the Port Townsend 30- by 60-minute quadrangle, Puget Sound Region, Washington: United States Geological Survey Miscellaneous Investiga-tion I-1198-E.
Macdonald, K., Simpson, D., Paulsen, B., Cox, J., and Gendron, J., 1994, Shoreline armoring effects on physical coastal processes in Puget Sound, Washington: Shorelands and Water Resources Program, Washington Department of Ecology.
Schwartz, M.L., Wallace, R.S., and Jacobsen, E.E., 1989, Net Shore-Drift in Puget Sound, in Engineering Geology in Washington: Washington Division of Geology and Earth Resources Bulletin 78, p. 1137-1146.
Shannon and Wilson, Inc., 2000, Seattle landslide study (prepared for Seattle Public Utilities): Seattle, Washington.
Shipman, H., 1990, Vertical land movement in coastal Washing-ton: Washington Geologic Newsletter, v. 18, p. 26-33.
Shipman, H., 1995, The rate and character of shoreline erosion on Puget Sound: Olympia, Washington, Puget Sound Water Quality Action Team, Puget Sound Research ‘95, p. 77-83.
Shipman, H., 2001, Coastal landsliding on Puget Sound — a
Coastal Bluffs and Sea Cliffs on Puget Sound, Washington
94 Formation, Evolution, and Stability of Coastal Cliffs—Status and Trends
review of landslides occurring between 1996 and 1999: Washington Department of Ecology, Shorelands and Environmental Assistance Program, Publication No. 01-06-019.
Terich, T.A., 1987, Living with the Shore of Puget Sound and the Georgia Strait: Durham, N.C., Duke University Press, 165 p.
Thorsen, G.W., 1987, Soil bluffs + rain = slide hazards: Wash-ington Geologic Newsletter, v. 15, p. 3-11.
Thorsen, G.W., 1989, Landslide provinces in Washington, in Engineering Geology in Washington: Washington Division of Geology and Earth Resources Bulletin 78, p. 71-89.
Thorsen, G., and Shipman, H., 1998, Bluff erosion monitoring on Puget Sound — a guide for volunteers (prepared for
Island County Beach Watchers): Washington Department of Ecology, Shorelands and Environmental Assistance Program.
Trenhaile, A.S., 1997, Coastal Dynamics and Landforms: Ox-ford, Oxford University Press, 366 p.
Tubbs, D., 1974, Landslides in Seattle: Department of Natural Resources, Division of Geology and Earth Resources, Information Circular 52.
Van Osch, E., 1990, Coastal bluff erosion in the Strait of Georgia region — geomorphology and management: Vancouver, Simon Fraser University, Masters thesis.
Washington Department of Ecology, 1978-1980, Washington State Coastal Zone Atlas (12 volumes): Washington Shore-lands and Coastal Zone Management Program.
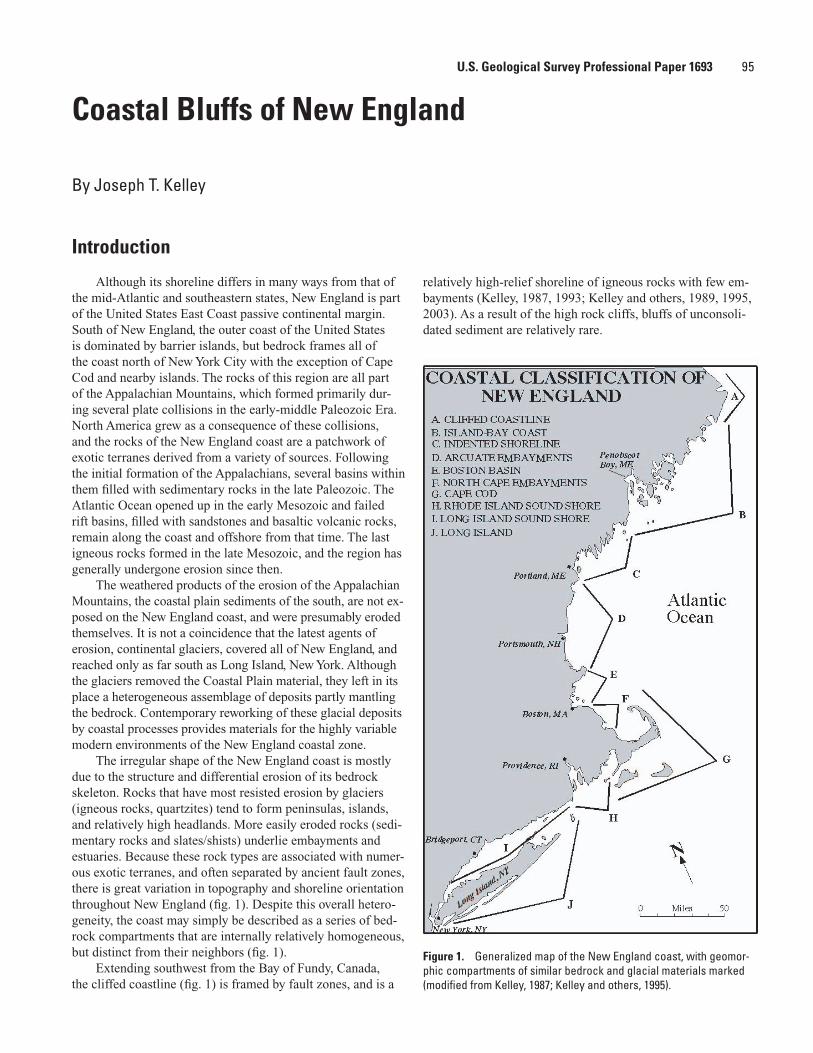
95
Although its shoreline differs in many ways from that of the mid-Atlantic and southeastern states, New England is part of the United States East Coast passive continental margin. South of New England, the outer coast of the United States is dominated by barrier islands, but bedrock frames all of the coast north of New York City with the exception of Cape Cod and nearby islands. The rocks of this region are all part of the Appalachian Mountains, which formed primarily dur-ing several plate collisions in the early-middle Paleozoic Era. North America grew as a consequence of these collisions, and the rocks of the New England coast are a patchwork of exotic terranes derived from a variety of sources. Following the initial formation of the Appalachians, several basins within them filled with sedimentary rocks in the late Paleozoic. The Atlantic Ocean opened up in the early Mesozoic and failed rift basins, filled with sandstones and basaltic volcanic rocks, remain along the coast and offshore from that time. The last igneous rocks formed in the late Mesozoic, and the region has generally undergone erosion since then.
The weathered products of the erosion of the Appalachian Mountains, the coastal plain sediments of the south, are not ex-posed on the New England coast, and were presumably eroded themselves. It is not a coincidence that the latest agents of erosion, continental glaciers, covered all of New England, and reached only as far south as Long Island, New York. Although the glaciers removed the Coastal Plain material, they left in its place a heterogeneous assemblage of deposits partly mantling the bedrock. Contemporary reworking of these glacial deposits by coastal processes provides materials for the highly variable modern environments of the New England coastal zone.
The irregular shape of the New England coast is mostly due to the structure and differential erosion of its bedrock skeleton. Rocks that have most resisted erosion by glaciers (igneous rocks, quartzites) tend to form peninsulas, islands, and relatively high headlands. More easily eroded rocks (sedi-mentary rocks and slates/shists) underlie embayments and estuaries. Because these rock types are associated with numer-ous exotic terranes, and often separated by ancient fault zones, there is great variation in topography and shoreline orientation throughout New England (fig. 1). Despite this overall hetero-geneity, the coast may simply be described as a series of bed-rock compartments that are internally relatively homogeneous, but distinct from their neighbors (fig. 1).
Extending southwest from the Bay of Fundy, Canada, the cliffed coastline (fig. 1) is framed by fault zones, and is a
relatively high-relief shoreline of igneous rocks with few em-bayments (Kelley, 1987, 1993; Kelley and others, 1989, 1995, 2003). As a result of the high rock cliffs, bluffs of unconsoli-dated sediment are relatively rare.
Coastal Bluffs of New England
By Joseph T. Kelley
Introduction
Figure 1. Generalized map of the New England coast, with geomor-phic compartments of similar bedrock and glacial materials marked (modified from Kelley, 1987; Kelley and others, 1995).
U.S. Geological Survey Professional Paper 1693
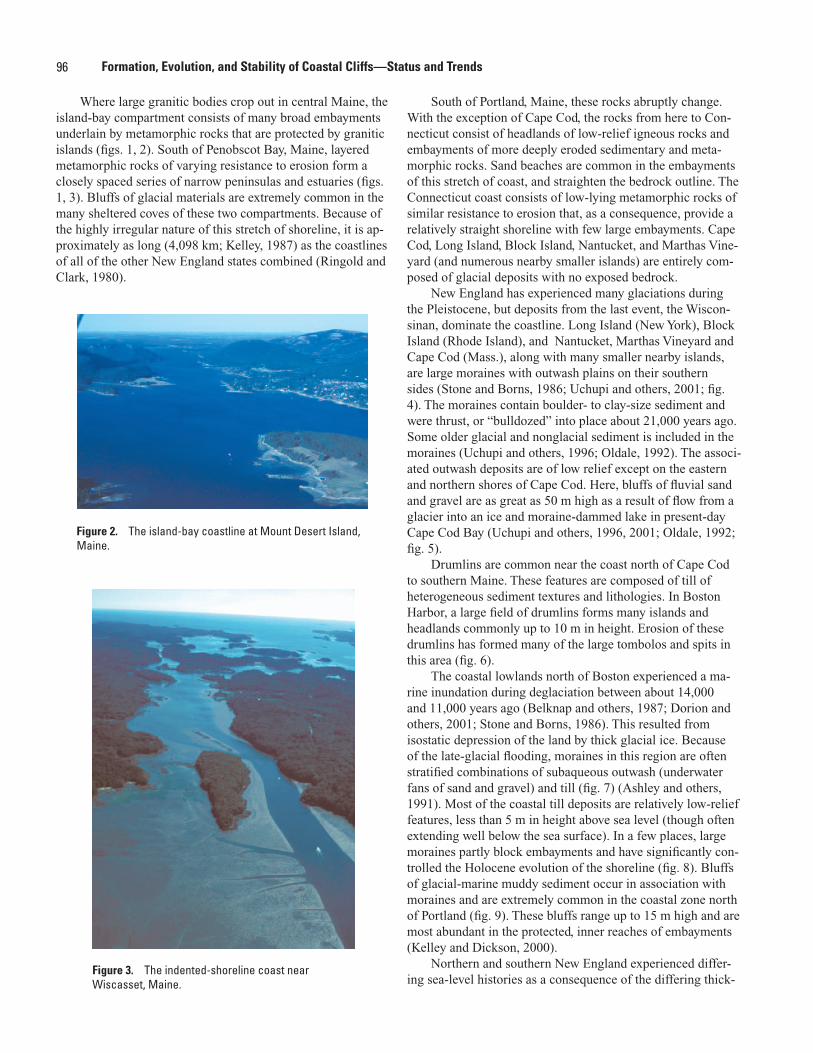
96 Formation, Evolution, and Stability of Coastal Cliffs—Status and Trends
Where large granitic bodies crop out in central Maine, the island-bay compartment consists of many broad embayments underlain by metamorphic rocks that are protected by granitic islands (figs. 1, 2). South of Penobscot Bay, Maine, layered metamorphic rocks of varying resistance to erosion form a closely spaced series of narrow peninsulas and estuaries (figs. 1, 3). Bluffs of glacial materials are extremely common in the many sheltered coves of these two compartments. Because of the highly irregular nature of this stretch of shoreline, it is ap-proximately as long (4,098 km; Kelley, 1987) as the coastlines of all of the other New England states combined (Ringold and Clark, 1980).
South of Portland, Maine, these rocks abruptly change. With the exception of Cape Cod, the rocks from here to Con-necticut consist of headlands of low-relief igneous rocks and embayments of more deeply eroded sedimentary and meta-morphic rocks. Sand beaches are common in the embayments of this stretch of coast, and straighten the bedrock outline. The Connecticut coast consists of low-lying metamorphic rocks of similar resistance to erosion that, as a consequence, provide a relatively straight shoreline with few large embayments. Cape Cod, Long Island, Block Island, Nantucket, and Marthas Vine-yard (and numerous nearby smaller islands) are entirely com-posed of glacial deposits with no exposed bedrock.
New England has experienced many glaciations during the Pleistocene, but deposits from the last event, the Wiscon-sinan, dominate the coastline. Long Island (New York), Block Island (Rhode Island), and Nantucket, Marthas Vineyard and Cape Cod (Mass.), along with many smaller nearby islands, are large moraines with outwash plains on their southern sides (Stone and Borns, 1986; Uchupi and others, 2001; fig. 4). The moraines contain boulder- to clay-size sediment and were thrust, or “bulldozed” into place about 21,000 years ago. Some older glacial and nonglacial sediment is included in the moraines (Uchupi and others, 1996; Oldale, 1992). The associ-ated outwash deposits are of low relief except on the eastern and northern shores of Cape Cod. Here, bluffs of fluvial sand and gravel are as great as 50 m high as a result of flow from a glacier into an ice and moraine-dammed lake in present-day Cape Cod Bay (Uchupi and others, 1996, 2001; Oldale, 1992; fig. 5).
Drumlins are common near the coast north of Cape Cod to southern Maine. These features are composed of till of heterogeneous sediment textures and lithologies. In Boston Harbor, a large field of drumlins forms many islands and headlands commonly up to 10 m in height. Erosion of these drumlins has formed many of the large tombolos and spits in this area (fig. 6).
The coastal lowlands north of Boston experienced a ma-rine inundation during deglaciation between about 14,000 and 11,000 years ago (Belknap and others, 1987; Dorion and others, 2001; Stone and Borns, 1986). This resulted from isostatic depression of the land by thick glacial ice. Because of the late-glacial flooding, moraines in this region are often stratified combinations of subaqueous outwash (underwater fans of sand and gravel) and till (fig. 7) (Ashley and others, 1991). Most of the coastal till deposits are relatively low-relief features, less than 5 m in height above sea level (though often extending well below the sea surface). In a few places, large moraines partly block embayments and have significantly con-trolled the Holocene evolution of the shoreline (fig. 8). Bluffs of glacial-marine muddy sediment occur in association with moraines and are extremely common in the coastal zone north of Portland (fig. 9). These bluffs range up to 15 m high and are most abundant in the protected, inner reaches of embayments (Kelley and Dickson, 2000).
Northern and southern New England experienced differ-ing sea-level histories as a consequence of the differing thick-
Figure 2. The island-bay coastline at Mount Desert Island, Maine.
Figure 3. The indented-shoreline coast near Wiscasset, Maine.
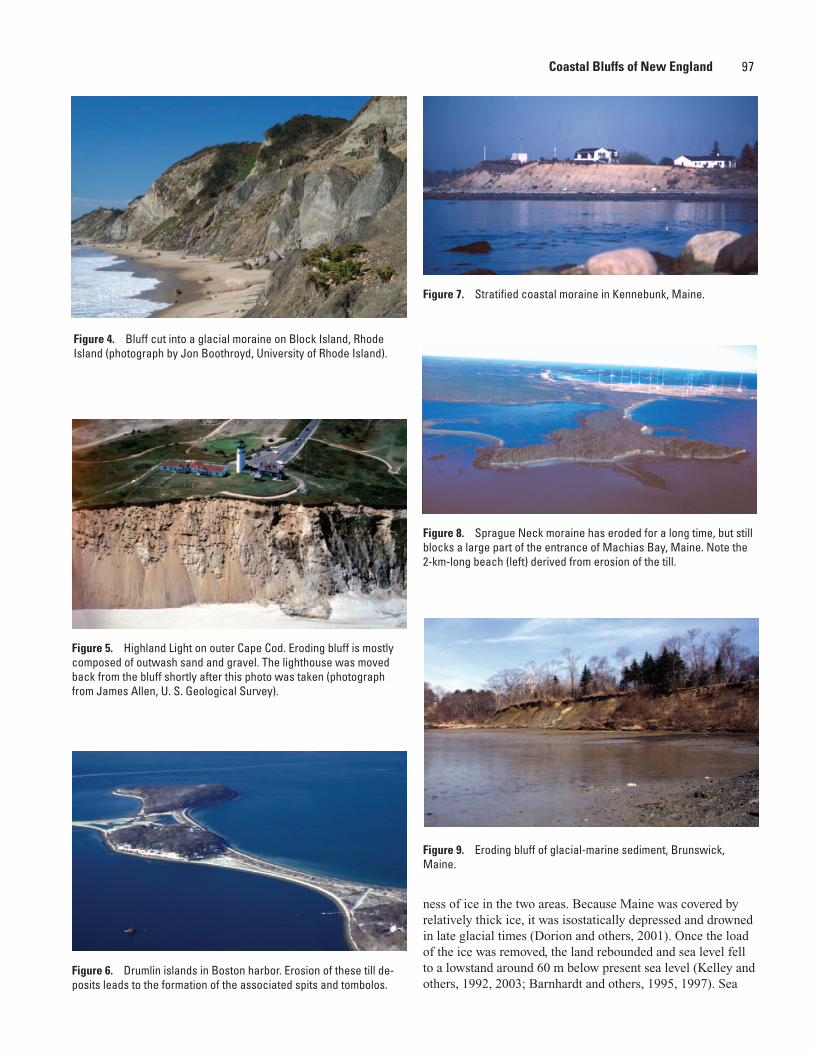
97
ness of ice in the two areas. Because Maine was covered by relatively thick ice, it was isostatically depressed and drowned in late glacial times (Dorion and others, 2001). Once the load of the ice was removed, the land rebounded and sea level fell to a lowstand around 60 m below present sea level (Kelley and others, 1992, 2003; Barnhardt and others, 1995, 1997). Sea
Figure 4. Bluff cut into a glacial moraine on Block Island, Rhode Island (photograph by Jon Boothroyd, University of Rhode Island).
Figure 5. Highland Light on outer Cape Cod. Eroding bluff is mostly composed of outwash sand and gravel. The lighthouse was moved back from the bluff shortly after this photo was taken (photograph from James Allen, U. S. Geological Survey).
Figure 6. Drumlin islands in Boston harbor. Erosion of these till de-posits leads to the formation of the associated spits and tombolos.
Figure 7. Stratified coastal moraine in Kennebunk, Maine.
Figure 8. Sprague Neck moraine has eroded for a long time, but still blocks a large part of the entrance of Machias Bay, Maine. Note the 2-km-long beach (left) derived from erosion of the till.
Figure 9. Eroding bluff of glacial-marine sediment, Brunswick, Maine.
Coastal Bluffs of New England
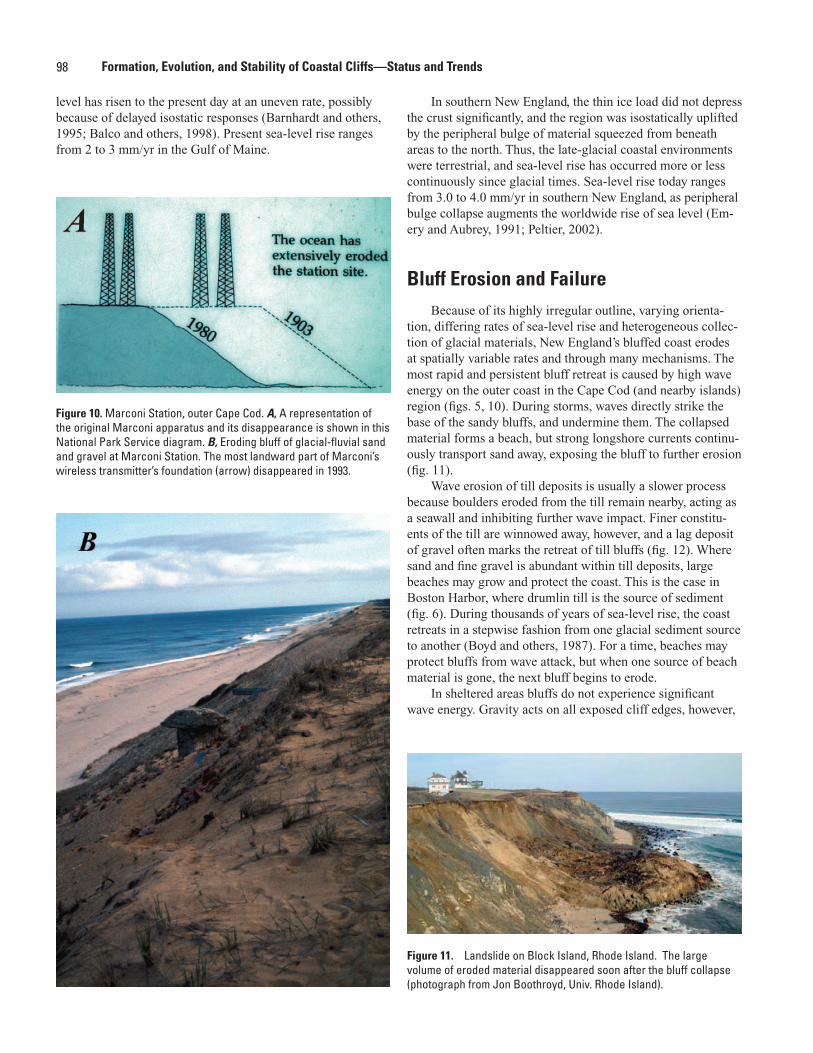
98 Formation, Evolution, and Stability of Coastal Cliffs—Status and Trends
level has risen to the present day at an uneven rate, possibly because of delayed isostatic responses (Barnhardt and others, 1995; Balco and others, 1998). Present sea-level rise ranges from 2 to 3 mm/yr in the Gulf of Maine.
In southern New England, the thin ice load did not depress the crust significantly, and the region was isostatically uplifted by the peripheral bulge of material squeezed from beneath areas to the north. Thus, the late-glacial coastal environments were terrestrial, and sea-level rise has occurred more or less continuously since glacial times. Sea-level rise today ranges from 3.0 to 4.0 mm/yr in southern New England, as peripheral bulge collapse augments the worldwide rise of sea level (Em-ery and Aubrey, 1991; Peltier, 2002).
Bluff Erosion and FailureBecause of its highly irregular outline, varying orienta-
tion, differing rates of sea-level rise and heterogeneous collec-tion of glacial materials, New England’s bluffed coast erodes at spatially variable rates and through many mechanisms. The most rapid and persistent bluff retreat is caused by high wave energy on the outer coast in the Cape Cod (and nearby islands) region (figs. 5, 10). During storms, waves directly strike the base of the sandy bluffs, and undermine them. The collapsed material forms a beach, but strong longshore currents continu-ously transport sand away, exposing the bluff to further erosion (fig. 11).
Wave erosion of till deposits is usually a slower process because boulders eroded from the till remain nearby, acting as a seawall and inhibiting further wave impact. Finer constitu-ents of the till are winnowed away, however, and a lag deposit of gravel often marks the retreat of till bluffs (fig. 12). Where sand and fine gravel is abundant within till deposits, large beaches may grow and protect the coast. This is the case in Boston Harbor, where drumlin till is the source of sediment (fig. 6). During thousands of years of sea-level rise, the coast retreats in a stepwise fashion from one glacial sediment source to another (Boyd and others, 1987). For a time, beaches may protect bluffs from wave attack, but when one source of beach material is gone, the next bluff begins to erode.
In sheltered areas bluffs do not experience significant wave energy. Gravity acts on all exposed cliff edges, however,
Figure 10. Marconi Station, outer Cape Cod. A, A representation of the original Marconi apparatus and its disappearance is shown in this National Park Service diagram. B, Eroding bluff of glacial-fluvial sand and gravel at Marconi Station. The most landward part of Marconi’s wireless transmitter’s foundation (arrow) disappeared in 1993.
Figure 11. Landslide on Block Island, Rhode Island. The large volume of eroded material disappeared soon after the bluff collapse (photograph from Jon Boothroyd, Univ. Rhode Island).
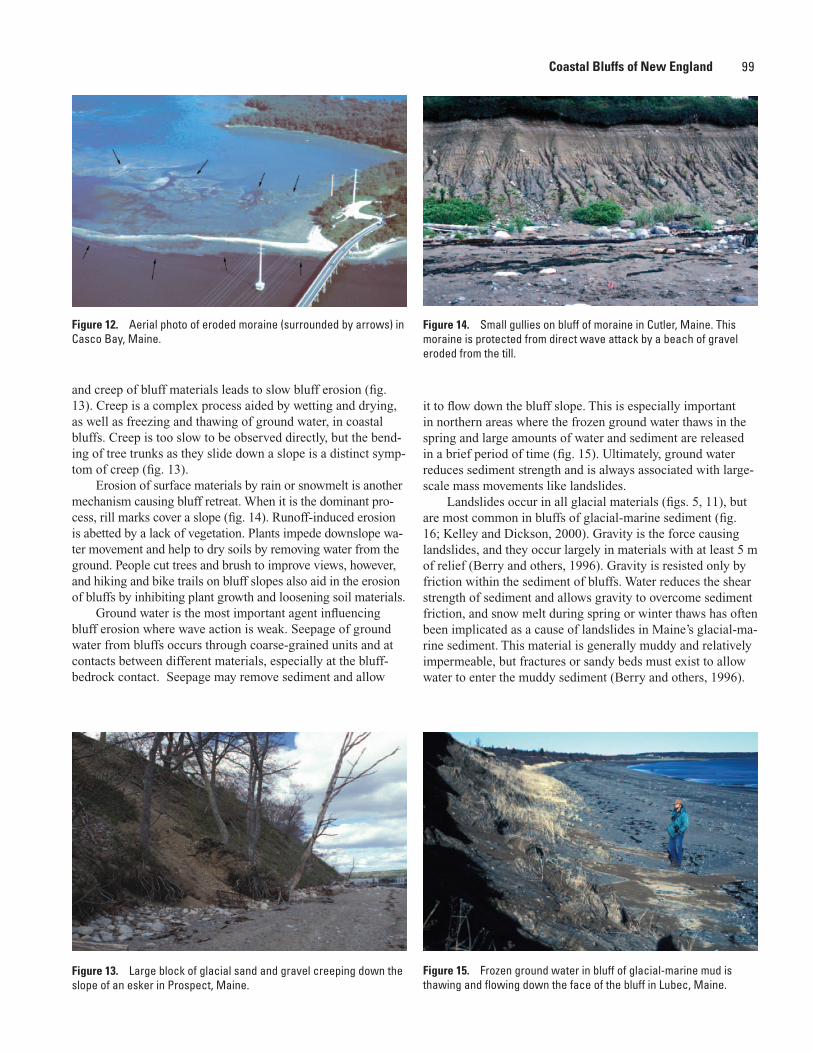
99
and creep of bluff materials leads to slow bluff erosion (fig. 13). Creep is a complex process aided by wetting and drying, as well as freezing and thawing of ground water, in coastal bluffs. Creep is too slow to be observed directly, but the bend-ing of tree trunks as they slide down a slope is a distinct symp-tom of creep (fig. 13).
Erosion of surface materials by rain or snowmelt is another mechanism causing bluff retreat. When it is the dominant pro-cess, rill marks cover a slope (fig. 14). Runoff-induced erosion is abetted by a lack of vegetation. Plants impede downslope wa-ter movement and help to dry soils by removing water from the ground. People cut trees and brush to improve views, however, and hiking and bike trails on bluff slopes also aid in the erosion of bluffs by inhibiting plant growth and loosening soil materials.
Ground water is the most important agent influencing bluff erosion where wave action is weak. Seepage of ground water from bluffs occurs through coarse-grained units and at contacts between different materials, especially at the bluff-bedrock contact. Seepage may remove sediment and allow
it to flow down the bluff slope. This is especially important in northern areas where the frozen ground water thaws in the spring and large amounts of water and sediment are released in a brief period of time (fig. 15). Ultimately, ground water reduces sediment strength and is always associated with large-scale mass movements like landslides.
Landslides occur in all glacial materials (figs. 5, 11), but are most common in bluffs of glacial-marine sediment (fig. 16; Kelley and Dickson, 2000). Gravity is the force causing landslides, and they occur largely in materials with at least 5 m of relief (Berry and others, 1996). Gravity is resisted only by friction within the sediment of bluffs. Water reduces the shear strength of sediment and allows gravity to overcome sediment friction, and snow melt during spring or winter thaws has often been implicated as a cause of landslides in Maine’s glacial-ma-rine sediment. This material is generally muddy and relatively impermeable, but fractures or sandy beds must exist to allow water to enter the muddy sediment (Berry and others, 1996).
Figure 12. Aerial photo of eroded moraine (surrounded by arrows) in Casco Bay, Maine.
Figure 13. Large block of glacial sand and gravel creeping down the slope of an esker in Prospect, Maine.
Figure 14. Small gullies on bluff of moraine in Cutler, Maine. This moraine is protected from direct wave attack by a beach of gravel eroded from the till.
Figure 15. Frozen ground water in bluff of glacial-marine mud is thawing and flowing down the face of the bluff in Lubec, Maine.
Coastal Bluffs of New England
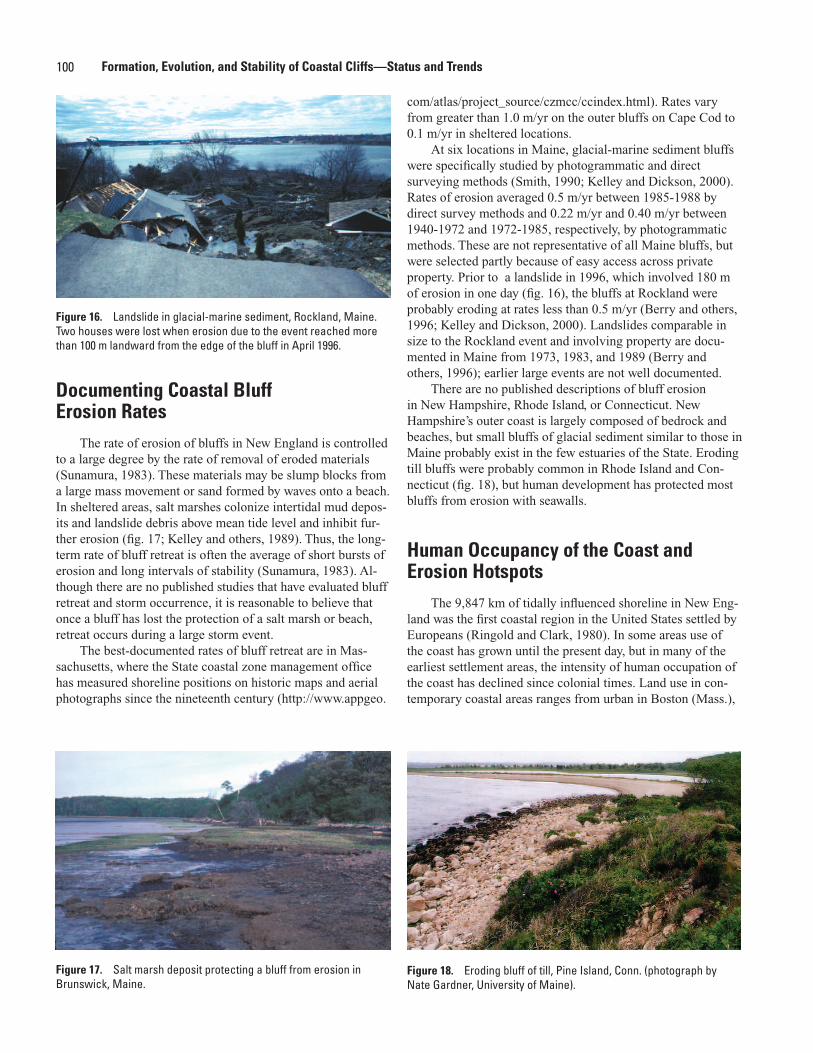
100 Formation, Evolution, and Stability of Coastal Cliffs—Status and Trends
Documenting Coastal Bluff Erosion Rates
The rate of erosion of bluffs in New England is controlled to a large degree by the rate of removal of eroded materials (Sunamura, 1983). These materials may be slump blocks from a large mass movement or sand formed by waves onto a beach. In sheltered areas, salt marshes colonize intertidal mud depos-its and landslide debris above mean tide level and inhibit fur-ther erosion (fig. 17; Kelley and others, 1989). Thus, the long-term rate of bluff retreat is often the average of short bursts of erosion and long intervals of stability (Sunamura, 1983). Al-though there are no published studies that have evaluated bluff retreat and storm occurrence, it is reasonable to believe that once a bluff has lost the protection of a salt marsh or beach, retreat occurs during a large storm event.
The best-documented rates of bluff retreat are in Mas-sachusetts, where the State coastal zone management office has measured shoreline positions on historic maps and aerial photographs since the nineteenth century (http://www.appgeo.
com/atlas/project_source/czmcc/ccindex.html). Rates vary from greater than 1.0 m/yr on the outer bluffs on Cape Cod to 0.1 m/yr in sheltered locations.
At six locations in Maine, glacial-marine sediment bluffs were specifically studied by photogrammatic and direct surveying methods (Smith, 1990; Kelley and Dickson, 2000). Rates of erosion averaged 0.5 m/yr between 1985-1988 by direct survey methods and 0.22 m/yr and 0.40 m/yr between 1940-1972 and 1972-1985, respectively, by photogrammatic methods. These are not representative of all Maine bluffs, but were selected partly because of easy access across private property. Prior to a landslide in 1996, which involved 180 m of erosion in one day (fig. 16), the bluffs at Rockland were probably eroding at rates less than 0.5 m/yr (Berry and others, 1996; Kelley and Dickson, 2000). Landslides comparable in size to the Rockland event and involving property are docu-mented in Maine from 1973, 1983, and 1989 (Berry and others, 1996); earlier large events are not well documented.
There are no published descriptions of bluff erosion in New Hampshire, Rhode Island, or Connecticut. New Hampshire’s outer coast is largely composed of bedrock and beaches, but small bluffs of glacial sediment similar to those in Maine probably exist in the few estuaries of the State. Eroding till bluffs were probably common in Rhode Island and Con-necticut (fig. 18), but human development has protected most bluffs from erosion with seawalls.
Human Occupancy of the Coast and Erosion Hotspots
The 9,847 km of tidally influenced shoreline in New Eng-land was the first coastal region in the United States settled by Europeans (Ringold and Clark, 1980). In some areas use of the coast has grown until the present day, but in many of the earliest settlement areas, the intensity of human occupation of the coast has declined since colonial times. Land use in con-temporary coastal areas ranges from urban in Boston (Mass.),
Figure 17. Salt marsh deposit protecting a bluff from erosion in Brunswick, Maine.
Figure 16. Landslide in glacial-marine sediment, Rockland, Maine. Two houses were lost when erosion due to the event reached more than 100 m landward from the edge of the bluff in April 1996.
Figure 18. Eroding bluff of till, Pine Island, Conn. (photograph by Nate Gardner, University of Maine).
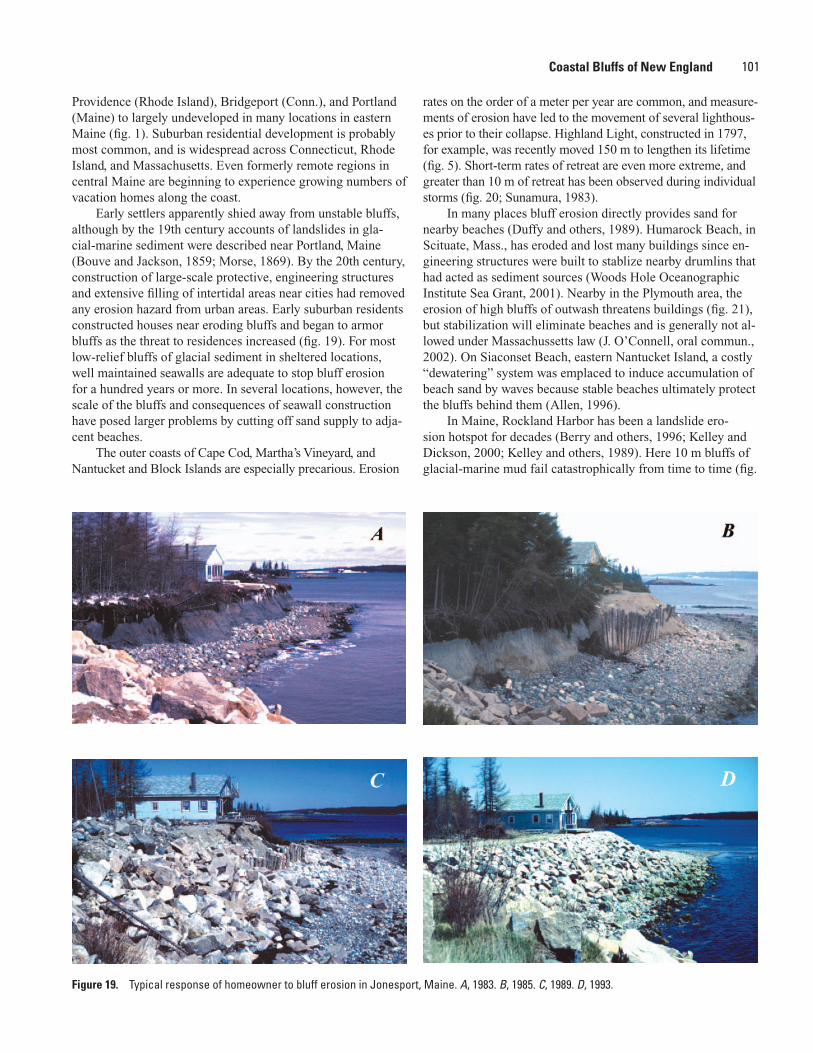
101
Providence (Rhode Island), Bridgeport (Conn.), and Portland (Maine) to largely undeveloped in many locations in eastern Maine (fig. 1). Suburban residential development is probably most common, and is widespread across Connecticut, Rhode Island, and Massachusetts. Even formerly remote regions in central Maine are beginning to experience growing numbers of vacation homes along the coast.
Early settlers apparently shied away from unstable bluffs, although by the 19th century accounts of landslides in gla-cial-marine sediment were described near Portland, Maine (Bouve and Jackson, 1859; Morse, 1869). By the 20th century, construction of large-scale protective, engineering structures and extensive filling of intertidal areas near cities had removed any erosion hazard from urban areas. Early suburban residents constructed houses near eroding bluffs and began to armor bluffs as the threat to residences increased (fig. 19). For most low-relief bluffs of glacial sediment in sheltered locations, well maintained seawalls are adequate to stop bluff erosion for a hundred years or more. In several locations, however, the scale of the bluffs and consequences of seawall construction have posed larger problems by cutting off sand supply to adja-cent beaches.
The outer coasts of Cape Cod, Martha’s Vineyard, andNantucket and Block Islands are especially precarious. Erosion
rates on the order of a meter per year are common, and measure-ments of erosion have led to the movement of several lighthous-es prior to their collapse. Highland Light, constructed in 1797, for example, was recently moved 150 m to lengthen its lifetime (fig. 5). Short-term rates of retreat are even more extreme, and greater than 10 m of retreat has been observed during individual storms (fig. 20; Sunamura, 1983).
In many places bluff erosion directly provides sand for nearby beaches (Duffy and others, 1989). Humarock Beach, in Scituate, Mass., has eroded and lost many buildings since en-gineering structures were built to stablize nearby drumlins that had acted as sediment sources (Woods Hole Oceanographic Institute Sea Grant, 2001). Nearby in the Plymouth area, the erosion of high bluffs of outwash threatens buildings (fig. 21), but stabilization will eliminate beaches and is generally not al-lowed under Massachussetts law (J. O’Connell, oral commun., 2002). On Siaconset Beach, eastern Nantucket Island, a costly “dewatering” system was emplaced to induce accumulation of beach sand by waves because stable beaches ultimately protect the bluffs behind them (Allen, 1996).
In Maine, Rockland Harbor has been a landslide ero-sion hotspot for decades (Berry and others, 1996; Kelley and Dickson, 2000; Kelley and others, 1989). Here 10 m bluffs of glacial-marine mud fail catastrophically from time to time (fig.
Figure 19. Typical response of homeowner to bluff erosion in Jonesport, Maine. A, 1983. B, 1985. C, 1989. D, 1993.
Coastal Bluffs of New England
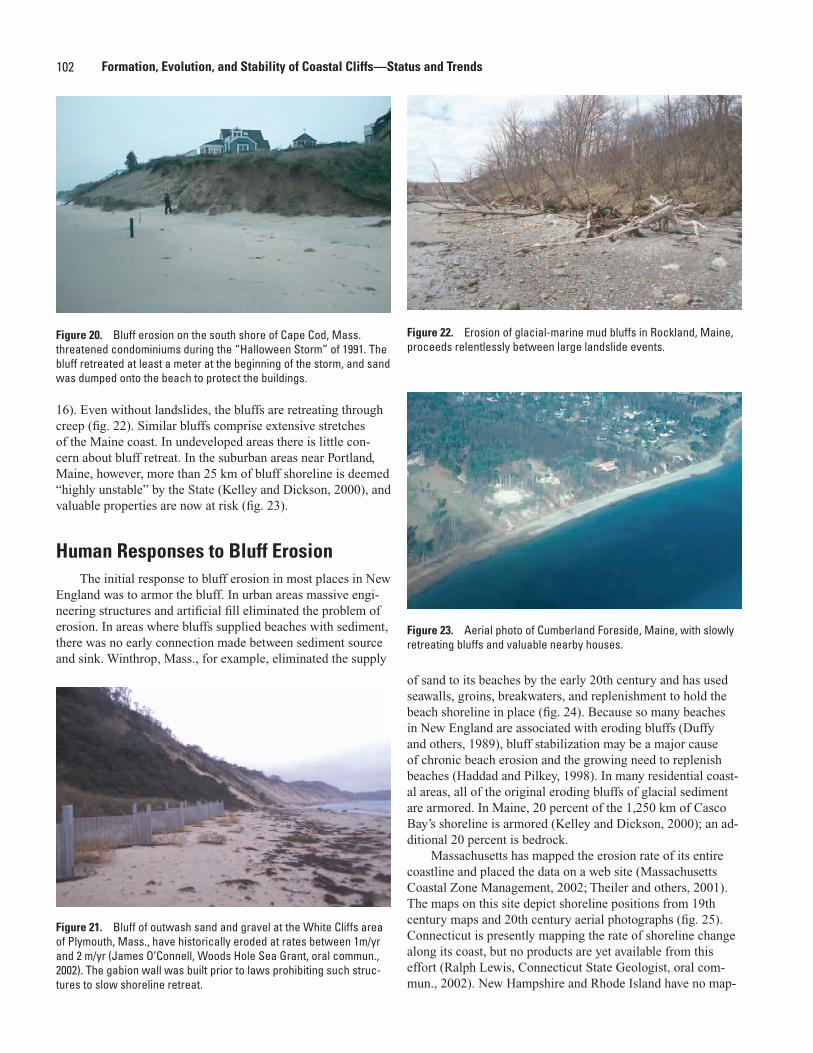
102 Formation, Evolution, and Stability of Coastal Cliffs—Status and Trends
16). Even without landslides, the bluffs are retreating through creep (fig. 22). Similar bluffs comprise extensive stretches of the Maine coast. In undeveloped areas there is little con-cern about bluff retreat. In the suburban areas near Portland, Maine, however, more than 25 km of bluff shoreline is deemed “highly unstable” by the State (Kelley and Dickson, 2000), and valuable properties are now at risk (fig. 23).
Human Responses to Bluff ErosionThe initial response to bluff erosion in most places in New
England was to armor the bluff. In urban areas massive engi-neering structures and artificial fill eliminated the problem of erosion. In areas where bluffs supplied beaches with sediment, there was no early connection made between sediment source and sink. Winthrop, Mass., for example, eliminated the supply
of sand to its beaches by the early 20th century and has used seawalls, groins, breakwaters, and replenishment to hold the beach shoreline in place (fig. 24). Because so many beaches in New England are associated with eroding bluffs (Duffy and others, 1989), bluff stabilization may be a major cause of chronic beach erosion and the growing need to replenish beaches (Haddad and Pilkey, 1998). In many residential coast-al areas, all of the original eroding bluffs of glacial sediment are armored. In Maine, 20 percent of the 1,250 km of Casco Bay’s shoreline is armored (Kelley and Dickson, 2000); an ad-ditional 20 percent is bedrock.
Massachusetts has mapped the erosion rate of its entire coastline and placed the data on a web site (Massachusetts Coastal Zone Management, 2002; Theiler and others, 2001). The maps on this site depict shoreline positions from 19th century maps and 20th century aerial photographs (fig. 25). Connecticut is presently mapping the rate of shoreline change along its coast, but no products are yet available from this effort (Ralph Lewis, Connecticut State Geologist, oral com-mun., 2002). New Hampshire and Rhode Island have no map-
Figure 20. Bluff erosion on the south shore of Cape Cod, Mass. threatened condominiums during the “Halloween Storm” of 1991. The bluff retreated at least a meter at the beginning of the storm, and sand was dumped onto the beach to protect the buildings.
Figure 21. Bluff of outwash sand and gravel at the White Cliffs area of Plymouth, Mass., have historically eroded at rates between 1m/yr and 2 m/yr (James O’Connell, Woods Hole Sea Grant, oral commun., 2002). The gabion wall was built prior to laws prohibiting such struc-tures to slow shoreline retreat.
Figure 22. Erosion of glacial-marine mud bluffs in Rockland, Maine, proceeds relentlessly between large landslide events.
Figure 23. Aerial photo of Cumberland Foreside, Maine, with slowly retreating bluffs and valuable nearby houses.
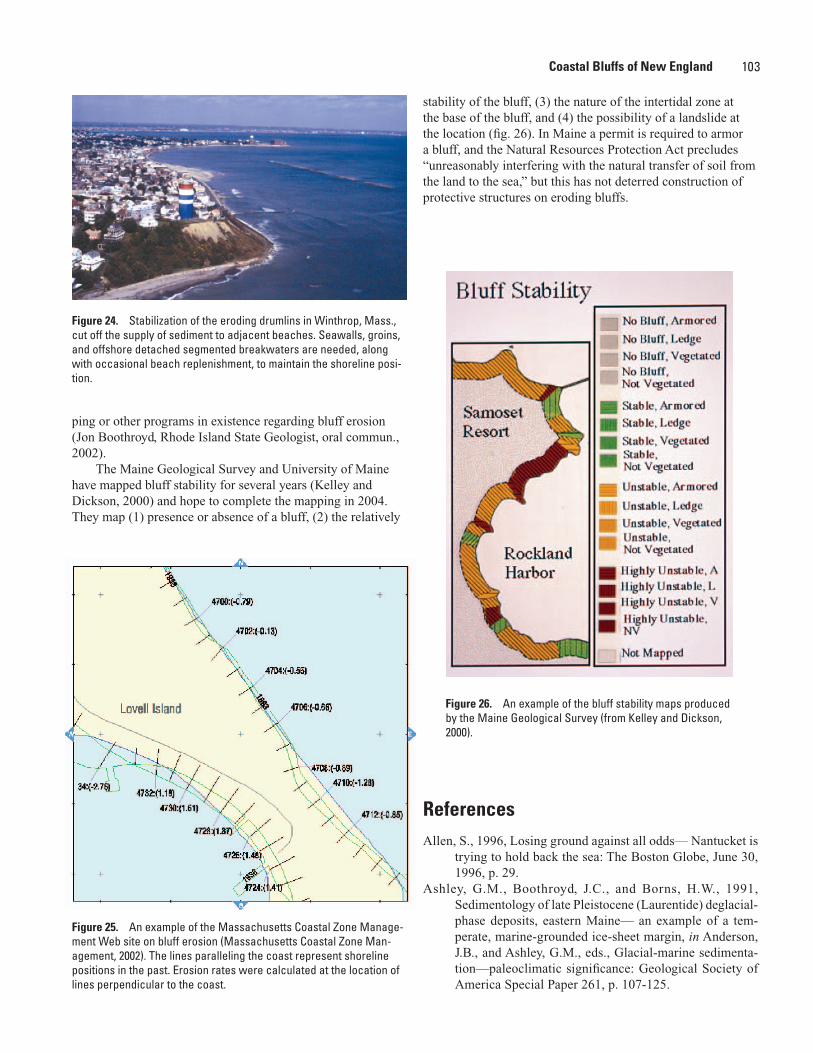
103
ping or other programs in existence regarding bluff erosion (Jon Boothroyd, Rhode Island State Geologist, oral commun., 2002).
The Maine Geological Survey and University of Maine have mapped bluff stability for several years (Kelley and Dickson, 2000) and hope to complete the mapping in 2004. They map (1) presence or absence of a bluff, (2) the relatively
Figure 24. Stabilization of the eroding drumlins in Winthrop, Mass., cut off the supply of sediment to adjacent beaches. Seawalls, groins, and offshore detached segmented breakwaters are needed, along with occasional beach replenishment, to maintain the shoreline posi-tion.
Figure 25. An example of the Massachusetts Coastal Zone Manage-ment Web site on bluff erosion (Massachusetts Coastal Zone Man-agement, 2002). The lines paralleling the coast represent shoreline positions in the past. Erosion rates were calculated at the location of lines perpendicular to the coast.
stability of the bluff, (3) the nature of the intertidal zone at the base of the bluff, and (4) the possibility of a landslide at the location (fig. 26). In Maine a permit is required to armor a bluff, and the Natural Resources Protection Act precludes “unreasonably interfering with the natural transfer of soil from the land to the sea,” but this has not deterred construction of protective structures on eroding bluffs.
Figure 26. An example of the bluff stability maps produced by the Maine Geological Survey (from Kelley and Dickson, 2000).
ReferencesAllen, S., 1996, Losing ground against all odds— Nantucket is
trying to hold back the sea: The Boston Globe, June 30, 1996, p. 29.
Ashley, G.M., Boothroyd, J.C., and Borns, H.W., 1991, Sedimentology of late Pleistocene (Laurentide) deglacial-phase deposits, eastern Maine— an example of a tem-perate, marine-grounded ice-sheet margin, in Anderson, J.B., and Ashley, G.M., eds., Glacial-marine sedimenta-tion—paleoclimatic significance: Geological Society of America Special Paper 261, p. 107-125.
Coastal Bluffs of New England
104 Formation, Evolution, and Stability of Coastal Cliffs—Status and Trends
Balco, G., Belknap, D.F., and Kelley, J.T., 1998, Glacioisostasy and lake-level change, Moosehead Lake, Maine: Quater-nary Research v. 49, p. 157-170.
Barnhardt, W.A., Gehrels, W.R., Belknap, D.F., and Kelley, J.T., 1995, Late Quaternary relative sea-level change in the western Gulf of Maine— evidence for a migrating glacial forebulge: Geology, v. 23, p. 317-320.
Barnhardt, W.A., Belknap, D.F., and Kelley, J.T., 1997, Sequence stratigraphy of submerged river-mouth deposits in the northwestern Gulf of Maine— responses to relative sea-level changes: Geological Society of America Bulletin, v. 109, p. 612-630.
Belknap, D.F., Andersen, B.G., Andersen, R.S., Anderson, W.A., Borns, H.W., Jr., Jacobsen, G.W., Kelley, J.T., Shipp, R.C., Smith, D.C., Struckenrath, R., Jr., Thompson, W.B., and Tyler, D.A., 1987, Late Quaternary sea-level changes in Maine, in Nummedal, D., Pilkey, O.H., Jr., and Howard, J.D., eds., Sea level rise and coastal evolution: Society of Economic Paleontologists and Mineralogists Publication 41, p. 71-85.
Berry, H. N., Dickson, S.D., Kelley, J.T., Locke, D.B., Marvin-ney, R.G., Thompson, W.B., Weddle, T.K., Reynolds, R.T., and Belknap, D.F., 1996, The April 1996 Rockland landslide: Maine Geological Survey Open-File Report 98-18, 55 p.
Bouve, T.T., and Jackson, C.T., 1859, On the landslide in Westbrook, Maine, and theories of the formation of clay concretions: Boston Society of Natural History Proceed-ings, v. 6, p. 133-134.
Boyd, R., Bowen, A.J., and Hall, R.K., 1987, An evolutionary model for transgressive sedimentation on the eastern shore of Nova Scotia, in FitzGerald, D.M., and Rosen, P.S., eds., Glaciated coasts: San Diego, California, Academic Press, p. 87-114.
Dorion, C.C., Balco, G.A., Kaplan, M.R., Kreutz, K.J., Wright, J.D., and Borns, H.W., 2001, Stratigraphy, paleoceanog-raphy, chronology and environment during deglciation of eastern Maine, in Weddle, T.K., and Retelle, M.J., eds., Deglacial history and relative sea-level changes, northern New England and adjacent Canada: Geological Society of America Special Paper 351, p. 215-242.
Duffy, W., Belknap, D.F., and Kelley, J.T., 1989, Morphology and stratigraphy of small barrier-lagoon systems in Maine: Marine Geology, v. 88, p. 243-262.
Emery, K.O., and Aubrey, D.G., 1991, Sea levels, land levels and tide gauges: New York, Springer-Verlag, 237 p.
Haddad, T.C., and Pilkey, O.H., 1998, Summary of the New England beach experience (1935-1996): Journal of Coastal Research, v. 14, p. 1395-1404.
Kelley, J.T., 1987, An inventory of environments and classifica-tion of Maine’s estuarine coastline, in FitzGerald, D.M., and Rosen, P.S., eds., Glaciated coasts: San Diego, Cali-fornia, Academic Press, p. 151-176.
Kelley, J.T., 1993, Old rocks, young gulf: Island Journal, v. 10, p.14-19.
Kelley, J.T., and Dickson, S.M., 2000, Low-cost bluff stability
mapping in coastal Maine— providing geological hazard information without alarming the public: Environmental Geosciences, v. 7, p. 46-56.
Kelley, J.T., Kelley, A.R., and Pilkey, O. H., 1989, Living with the Maine coast: Duke University Press, 174 p.
Kelley, J.T., Dickson, S.M., Belknap, D.F., and Stuckenrath, R., 1992, Sea-level change and the introduction of Late Qua-ternary sediment to the southern Maine inner continental shelf, in Wehmiller, J. and Fletcher, C., eds., Quaternary coasts of the United States, Society of Economic Paleon-tologists and Mineralogists, Special Paper 48, p. 23-34.
Kelley, J.T., Kelley, A.R., and Apollonio, S., 1995, Landforms of the Gulf of Maine, in Conkling, P., ed., From Cape Cod to the Bay of Fundy; an environmental atlas of the Gulf of Maine: Cambridge, Mass., The MIT Press, p. 19-39.
Kelley, J.T., Dickson, S.M., Belknap, D.F., Barnhardt, W.A., and Barber, D.C., 2003, Distribution and volume of sand bodies on the rocky, glaciated inner continental shelf of the northwestern Gulf of Maine: Journal of Coastal Research, v. 19, p. 41-56.
Massachusetts Coastal Zone Management, 2002, Shoreline changes in Massachusetts: http://www.appgeo.com/atlas/project_source/czmcc/ccindex.html.
Morse, E.S., 1869, On the landslides in the vicinity of Portland, Maine: Boston Society of Natural History Proceedings, v. 12, p. 235-244.
O’Connell, J., 2000, Focal points: Woods Hole Oceanographic Institute Sea Grant Publication.
Oldale, R.N., 1992, Cape Cod and the Islands— the geologic story: East Orleans, Mass., Parnassus Imprints, 208 p.
Peltier, W.R., 2002, On eustatic sea level history— last glacial maximum to Holocene: Quaternary Science Reviews v. 21, p. 377-396.
Ringold, P.L., and Clark, J., 1980, The coastal almanac: San Francisco, Calif., W.H. Freeman and Company, 172 p.
Smith, R.V., 1990, Geomorphic trends and shoreline dynamics in three Maine embayments: University of Maine, Orono, Masters thesis, 337 p.
Stone, R.D., and Borns, H.W., Jr., 1986, Pleistocene glacial and interglacial stratigraphy of New England, Long Island, and adjacent Georges Bank and Gulf of Maine, in Sibrava, V., Bowen, D.Q., and Richmond, G.M., eds., Quaternary glaciations in the northern hemisphere: Quaternary Sci-ence Review, v. 5, p. 39-52.
Sunamura, T., 1983, Processes of seacliff and platform erosion, in Komar, P.D., ed., CRC handbook of coastal processes and erosion: Boca Raton, Fla., CRC Press, p. 233-265.
Theiler, E.R., O‘Connell, J.R., and Shupp, C.A., 2001, The Massachusetts coastal zone change project—1800’s to 1994: Woods Hole Oceanographic Institute Sea Grant, WHOI-T-01-001, 39 p.
Uchupi, E., Giese, G.S., Aubrey, D.G., and Kim, D.J., 1996, The Late Quaternary construction of Cape Cod, Mas-sachusetts— a reconsideration of the W.M. Davis model: Geological Society of America Special Paper 309, 69 p.
Uchupi, E., Driscoll, N., Ballard, R.D., and Bolmer, S.T., 2001,

105
Drainage of late Wisconsin glacial lakes and the morphol-ogy and late Quaternary stratigraphy of the New Jersey-southern new England continental shelf and slope: Marine Geology, v. 172, p. 117-145.
Woods Hole Oceanographic Institute Sea Grant, 2001, Evalua-tion of coastal hazards—results from a national study with a Massachusetts perspective: Woods Hole Oceanographic Institute Sea Grant Program, WHOI-G-01-003.
Coastal Bluffs of New England

106 Formation, Evolution, and Stability of Coastal Cliffs—Status and Trends
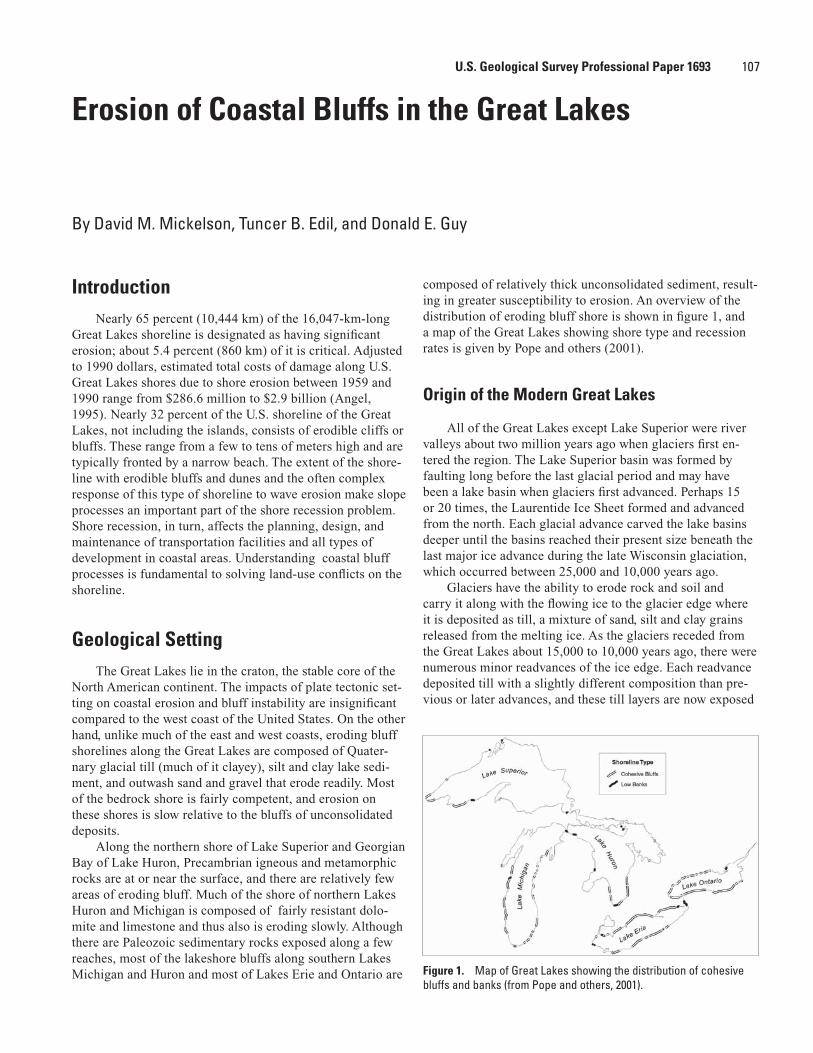
107
IntroductionNearly 65 percent (10,444 km) of the 16,047-km-long
Great Lakes shoreline is designated as having significant erosion; about 5.4 percent (860 km) of it is critical. Adjusted to 1990 dollars, estimated total costs of damage along U.S. Great Lakes shores due to shore erosion between 1959 and 1990 range from $286.6 million to $2.9 billion (Angel, 1995). Nearly 32 percent of the U.S. shoreline of the Great Lakes, not including the islands, consists of erodible cliffs or bluffs. These range from a few to tens of meters high and are typically fronted by a narrow beach. The extent of the shore-line with erodible bluffs and dunes and the often complex response of this type of shoreline to wave erosion make slope processes an important part of the shore recession problem. Shore recession, in turn, affects the planning, design, and maintenance of transportation facilities and all types of development in coastal areas. Understanding coastal bluff processes is fundamental to solving land-use conflicts on the shoreline.
Geological SettingThe Great Lakes lie in the craton, the stable core of the
North American continent. The impacts of plate tectonic set-ting on coastal erosion and bluff instability are insignificant compared to the west coast of the United States. On the other hand, unlike much of the east and west coasts, eroding bluff shorelines along the Great Lakes are composed of Quater-nary glacial till (much of it clayey), silt and clay lake sedi-ment, and outwash sand and gravel that erode readily. Most of the bedrock shore is fairly competent, and erosion on these shores is slow relative to the bluffs of unconsolidated deposits.
Along the northern shore of Lake Superior and Georgian Bay of Lake Huron, Precambrian igneous and metamorphic rocks are at or near the surface, and there are relatively few areas of eroding bluff. Much of the shore of northern Lakes Huron and Michigan is composed of fairly resistant dolo-mite and limestone and thus also is eroding slowly. Although there are Paleozoic sedimentary rocks exposed along a few reaches, most of the lakeshore bluffs along southern Lakes Michigan and Huron and most of Lakes Erie and Ontario are
composed of relatively thick unconsolidated sediment, result-ing in greater susceptibility to erosion. An overview of the distribution of eroding bluff shore is shown in figure 1, and a map of the Great Lakes showing shore type and recession rates is given by Pope and others (2001).
Origin of the Modern Great Lakes
All of the Great Lakes except Lake Superior were river valleys about two million years ago when glaciers first en-tered the region. The Lake Superior basin was formed by faulting long before the last glacial period and may have been a lake basin when glaciers first advanced. Perhaps 15 or 20 times, the Laurentide Ice Sheet formed and advanced from the north. Each glacial advance carved the lake basins deeper until the basins reached their present size beneath the last major ice advance during the late Wisconsin glaciation, which occurred between 25,000 and 10,000 years ago.
Glaciers have the ability to erode rock and soil and carry it along with the flowing ice to the glacier edge where it is deposited as till, a mixture of sand, silt and clay grains released from the melting ice. As the glaciers receded from the Great Lakes about 15,000 to 10,000 years ago, there were numerous minor readvances of the ice edge. Each readvance deposited till with a slightly different composition than pre-vious or later advances, and these till layers are now exposed
Erosion of Coastal Bluffs in the Great Lakes
By David M. Mickelson, Tuncer B. Edil, and Donald E. Guy
Figure 1. Map of Great Lakes showing the distribution of cohesive bluffs and banks (from Pope and others, 2001).
U.S. Geological Survey Professional Paper 1693
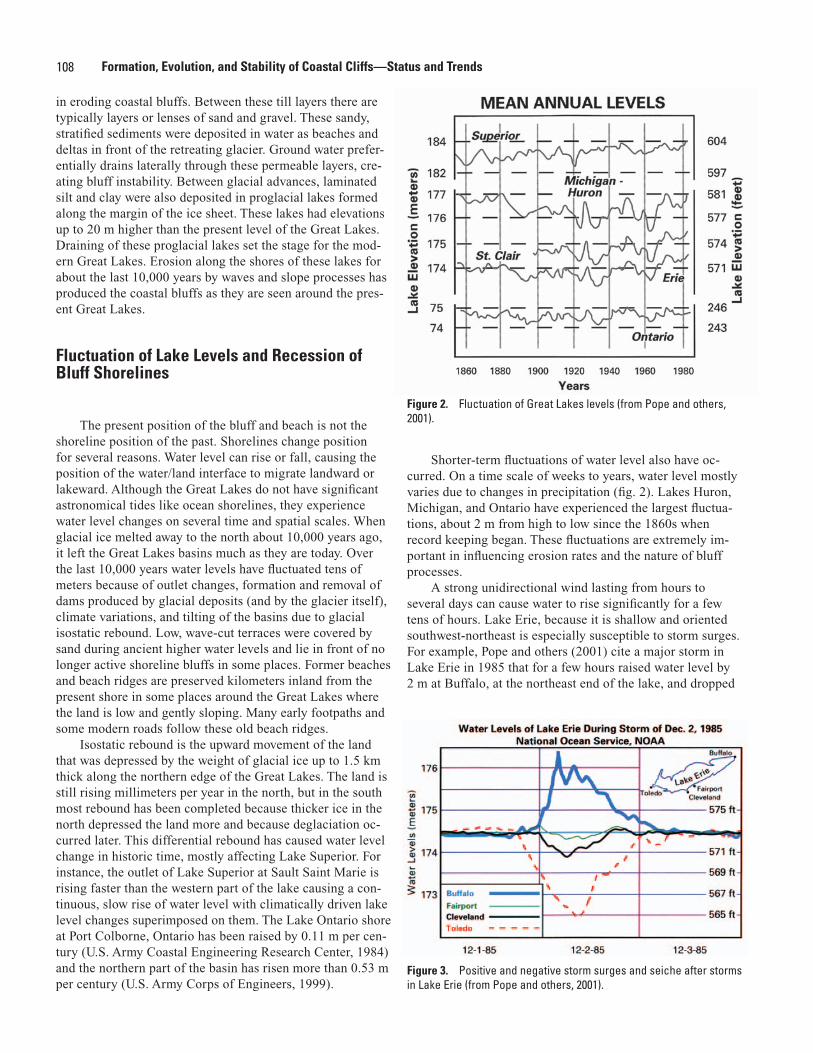
108 Formation, Evolution, and Stability of Coastal Cliffs—Status and Trends
in eroding coastal bluffs. Between these till layers there are typically layers or lenses of sand and gravel. These sandy, stratified sediments were deposited in water as beaches and deltas in front of the retreating glacier. Ground water prefer-entially drains laterally through these permeable layers, cre-ating bluff instability. Between glacial advances, laminated silt and clay were also deposited in proglacial lakes formed along the margin of the ice sheet. These lakes had elevations up to 20 m higher than the present level of the Great Lakes. Draining of these proglacial lakes set the stage for the mod-ern Great Lakes. Erosion along the shores of these lakes for about the last 10,000 years by waves and slope processes has produced the coastal bluffs as they are seen around the pres-ent Great Lakes.
Fluctuation of Lake Levels and Recession of Bluff Shorelines
The present position of the bluff and beach is not the shoreline position of the past. Shorelines change position for several reasons. Water level can rise or fall, causing the position of the water/land interface to migrate landward or lakeward. Although the Great Lakes do not have significant astronomical tides like ocean shorelines, they experience water level changes on several time and spatial scales. When glacial ice melted away to the north about 10,000 years ago, it left the Great Lakes basins much as they are today. Over the last 10,000 years water levels have fluctuated tens of meters because of outlet changes, formation and removal of dams produced by glacial deposits (and by the glacier itself), climate variations, and tilting of the basins due to glacial isostatic rebound. Low, wave-cut terraces were covered by sand during ancient higher water levels and lie in front of no longer active shoreline bluffs in some places. Former beaches and beach ridges are preserved kilometers inland from the present shore in some places around the Great Lakes where the land is low and gently sloping. Many early footpaths and some modern roads follow these old beach ridges.
Isostatic rebound is the upward movement of the land that was depressed by the weight of glacial ice up to 1.5 km thick along the northern edge of the Great Lakes. The land is still rising millimeters per year in the north, but in the south most rebound has been completed because thicker ice in the north depressed the land more and because deglaciation oc-curred later. This differential rebound has caused water level change in historic time, mostly affecting Lake Superior. For instance, the outlet of Lake Superior at Sault Saint Marie is rising faster than the western part of the lake causing a con-tinuous, slow rise of water level with climatically driven lake level changes superimposed on them. The Lake Ontario shore at Port Colborne, Ontario has been raised by 0.11 m per cen-tury (U.S. Army Coastal Engineering Research Center, 1984) and the northern part of the basin has risen more than 0.53 m per century (U.S. Army Corps of Engineers, 1999).
Shorter-term fluctuations of water level also have oc-curred. On a time scale of weeks to years, water level mostly varies due to changes in precipitation (fig. 2). Lakes Huron, Michigan, and Ontario have experienced the largest fluctua-tions, about 2 m from high to low since the 1860s when record keeping began. These fluctuations are extremely im-portant in influencing erosion rates and the nature of bluff processes.
A strong unidirectional wind lasting from hours to several days can cause water to rise significantly for a few tens of hours. Lake Erie, because it is shallow and oriented southwest-northeast is especially susceptible to storm surges. For example, Pope and others (2001) cite a major storm in Lake Erie in 1985 that for a few hours raised water level by 2 m at Buffalo, at the northeast end of the lake, and dropped
Figure 2. Fluctuation of Great Lakes levels (from Pope and others, 2001).
Figure 3. Positive and negative storm surges and seiche after storms in Lake Erie (from Pope and others, 2001).
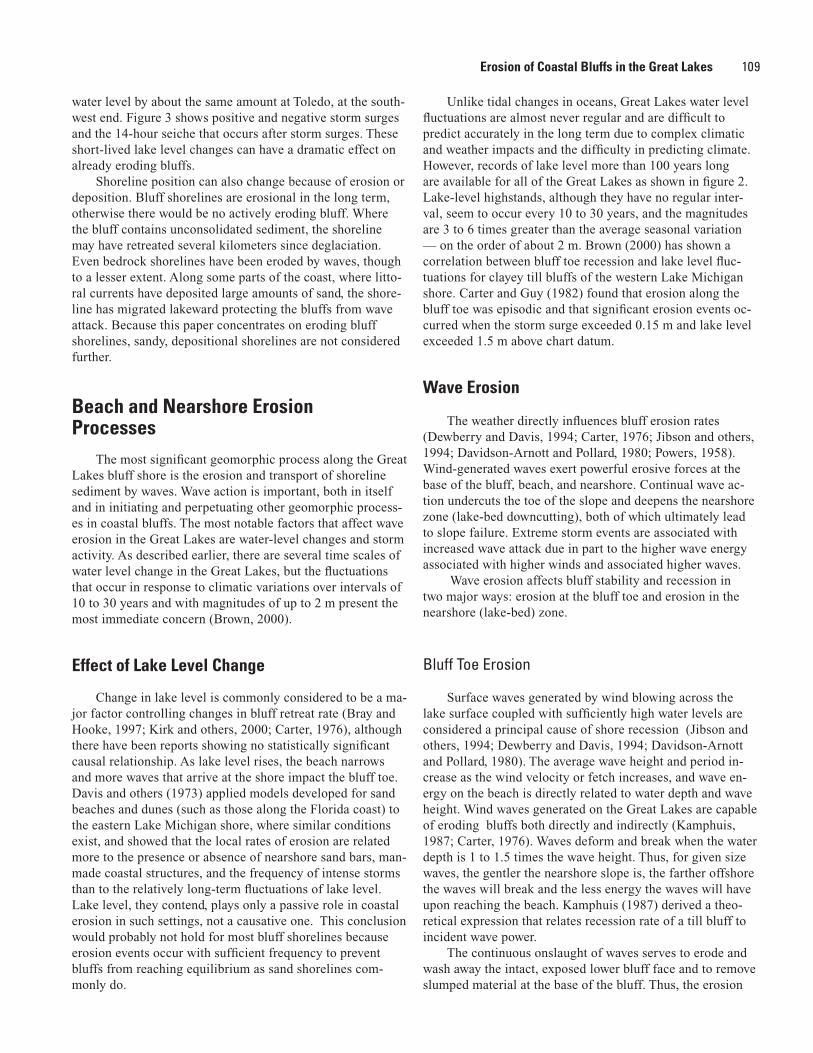
109
water level by about the same amount at Toledo, at the south-west end. Figure 3 shows positive and negative storm surges and the 14-hour seiche that occurs after storm surges. These short-lived lake level changes can have a dramatic effect on already eroding bluffs.
Shoreline position can also change because of erosion or deposition. Bluff shorelines are erosional in the long term, otherwise there would be no actively eroding bluff. Where the bluff contains unconsolidated sediment, the shoreline may have retreated several kilometers since deglaciation. Even bedrock shorelines have been eroded by waves, though to a lesser extent. Along some parts of the coast, where litto-ral currents have deposited large amounts of sand, the shore-line has migrated lakeward protecting the bluffs from wave attack. Because this paper concentrates on eroding bluff shorelines, sandy, depositional shorelines are not considered further.
Beach and Nearshore Erosion Processes
The most significant geomorphic process along the Great Lakes bluff shore is the erosion and transport of shoreline sediment by waves. Wave action is important, both in itself and in initiating and perpetuating other geomorphic process-es in coastal bluffs. The most notable factors that affect wave erosion in the Great Lakes are water-level changes and storm activity. As described earlier, there are several time scales of water level change in the Great Lakes, but the fluctuations that occur in response to climatic variations over intervals of 10 to 30 years and with magnitudes of up to 2 m present the most immediate concern (Brown, 2000).
Effect of Lake Level Change
Change in lake level is commonly considered to be a ma-jor factor controlling changes in bluff retreat rate (Bray and Hooke, 1997; Kirk and others, 2000; Carter, 1976), although there have been reports showing no statistically significant causal relationship. As lake level rises, the beach narrows and more waves that arrive at the shore impact the bluff toe. Davis and others (1973) applied models developed for sand beaches and dunes (such as those along the Florida coast) to the eastern Lake Michigan shore, where similar conditions exist, and showed that the local rates of erosion are related more to the presence or absence of nearshore sand bars, man-made coastal structures, and the frequency of intense storms than to the relatively long-term fluctuations of lake level. Lake level, they contend, plays only a passive role in coastal erosion in such settings, not a causative one. This conclusion would probably not hold for most bluff shorelines because erosion events occur with sufficient frequency to prevent bluffs from reaching equilibrium as sand shorelines com-monly do.
Unlike tidal changes in oceans, Great Lakes water level fluctuations are almost never regular and are difficult to predict accurately in the long term due to complex climatic and weather impacts and the difficulty in predicting climate. However, records of lake level more than 100 years long are available for all of the Great Lakes as shown in figure 2. Lake-level highstands, although they have no regular inter-val, seem to occur every 10 to 30 years, and the magnitudes are 3 to 6 times greater than the average seasonal variation — on the order of about 2 m. Brown (2000) has shown a correlation between bluff toe recession and lake level fluc-tuations for clayey till bluffs of the western Lake Michigan shore. Carter and Guy (1982) found that erosion along the bluff toe was episodic and that significant erosion events oc-curred when the storm surge exceeded 0.15 m and lake level exceeded 1.5 m above chart datum.
Wave Erosion
The weather directly influences bluff erosion rates (Dewberry and Davis, 1994; Carter, 1976; Jibson and others, 1994; Davidson-Arnott and Pollard, 1980; Powers, 1958). Wind-generated waves exert powerful erosive forces at the base of the bluff, beach, and nearshore. Continual wave ac-tion undercuts the toe of the slope and deepens the nearshore zone (lake-bed downcutting), both of which ultimately lead to slope failure. Extreme storm events are associated with increased wave attack due in part to the higher wave energy associated with higher winds and associated higher waves.
Wave erosion affects bluff stability and recession in two major ways: erosion at the bluff toe and erosion in the nearshore (lake-bed) zone.
Bluff Toe Erosion
Surface waves generated by wind blowing across the lake surface coupled with sufficiently high water levels are considered a principal cause of shore recession (Jibson and others, 1994; Dewberry and Davis, 1994; Davidson-Arnott and Pollard, 1980). The average wave height and period in-crease as the wind velocity or fetch increases, and wave en-ergy on the beach is directly related to water depth and wave height. Wind waves generated on the Great Lakes are capable of eroding bluffs both directly and indirectly (Kamphuis, 1987; Carter, 1976). Waves deform and break when the water depth is 1 to 1.5 times the wave height. Thus, for given size waves, the gentler the nearshore slope is, the farther offshore the waves will break and the less energy the waves will have upon reaching the beach. Kamphuis (1987) derived a theo-retical expression that relates recession rate of a till bluff to incident wave power.
The continuous onslaught of waves serves to erode and wash away the intact, exposed lower bluff face and to remove slumped material at the base of the bluff. Thus, the erosion
Erosion of Coastal Bluffs in the Great Lakes
110 Formation, Evolution, and Stability of Coastal Cliffs—Status and Trends
of the bluffs is a continuing, but not a continuous, process. Oversteepening of the wave-cut lower bluff then leads to slid-ing, which may retrogressively move up the bluff or result in a single large slide that reaches the bluff top. Concurrently, native vegetation is lost and the bluff face becomes open to many erosional processes.
Lake Bed Downcutting
For cohesive shorelines, nearshore downcutting im-pacts bluff stability indirectly. The nearshore zone is compositionally and geotechnically closely related to the lower layers of the bluff, but can be weathered and covered discontinuously with deposits of sand or gravel of varying thickness (Kamphuis, 1987). Nearshore downcutting is the general planing down of the lake bed due to (1) drag forces on the particles caused by foreshore wave motion and (2) abrasion by coarse sediments over the cohesive lake bed (Davidson-Arnott and Askin, 1980). Kamphuis (1987) and Nairn and others (1999) showed that the wave-related pro-cesses taking place on the foreshore could actually control the long-term rate of bluff erosion.
Lake-bed and flume tests by Bishop and others (1992) also clearly document the importance of lake bed downcut-ting in determining recession rate. Significant downcutting produces deeper water closer to the beach. This creates a condition where, for a given size wave, more wave energy impacts the bluff toe than previously would have taken place. For any given lake level, if downcutting of the nearshore did not take place, waves would break farther and farther from the bluff toe as the bluff receded, and bluff retreat would eventually stop as a very wide, gently sloping wave cut platform developed. This clearly does not happen, so down-cutting of the wave cut platform must keep pace with bluff recession. However, the real threat of nearshore downcutting exists for all till shorelines where there is an insufficient sand supply to provide adequate protection of the cohesive-till lake bed from wave action. Kamphuis and others (1990) have quantified the importance of the abrasion of granular mate-rial as it moves in the waves on the erosion rate of a platform of cohesive till or lake sediment. The amount of sand on the lake bottom has a significant effect on the nearshore erosion rate. A limited amount of sand, acting as an abrasive, causes a much higher erosion rate than on bare cohesive sediment, whereas a 15-to-20-cm thickness of sandy sediment protects the cohesive sediment from erosion (Davidson-Arnott and Askin, 1980).
Wind Erosion
Wind erosion along the Great Lakes is most prevalent on sandy slopes, such as those along the eastern and south-eastern Lake Michigan shore, where sand dunes are im-pacted and shaped significantly by wind action. Deflation of
mechanically weathered material from the face of cohesive bluffs on Lake Erie was also reported by Carter and Guy (1988). The process occurred during the winter months when repeated cycles of freeze/thaw and dehydration created a me-chanically weathered surface layer 5 to 10 mm thick on the face of the bluff. This weathered surficial sediment then was dislodged by wind and accumulated at the toe of the bluff in a small talus slope. As a process, deflation of grains from the face of cohesive bluffs is likely of minor importance.
Ice Erosion
A nearshore ice complex consisting of several parts of-ten develops on the Great Lakes in the winter. On beaches exposed to waves, an ice foot forms against the beach as slush ice is driven to shore by waves. Ice ridges form where waves break, such as over nearshore sandbars, and may pro-vide a lakeward boundary to the ice. The outer ice ridges at times rise to 5 m by slush ice driven onto them by waves. They may disappear abruptly during major storm events and can be destroyed and rebuilt several times during the winter. During winter months, the nearshore ice complex tends to protect the beach and bluff from wave erosion. Because the largest wave heights on the Great Lakes generally occur be-tween November and March, freeze-up and break-up dates can substantially affect the extent of wave action at the shore. This protection of the beach by the nearshore ice complex is offset by incorporation of sand and gravel particles by ice. Barnes and others (1994) showed that coastal ice plays a significant role in removing and transporting sediment from the coast, at least along the southern Lake Michigan shore. In addition, waves breaking against grounded ice ridges scour the lakebed. The lake-bed sediment is often gouged by con-tact with the keels of ice blocks moved by the wind. Some of this sediment is frozen into the ice and drifts into deeper wa-ter, transporting significant quantities of sediment out of the beach/nearshore system. Ice shove may also occur when lake ice, moved by water currents or wind, comes into contact with the shore and bluffs (Keillor, 2003).
Bluff Erosion Processes
The interaction between driving forces (gravity and cli-mate) and shear resistance of the soils that form the coastal bluffs results in a number of processes that produce and remove debris from bluffs. This erosion is an important pro-cess, not only because it leads to conflict with human activity on the bluff top, but because the sediment produced feeds the beach and nearshore with sand and gravel. The commonly encountered processes in Great Lakes coastal bluffs can be separated into two broad groups — individual particle and mass movements. Sediment transport by waves, currents, rain, groundwater, wind, and ice is generally as single par-
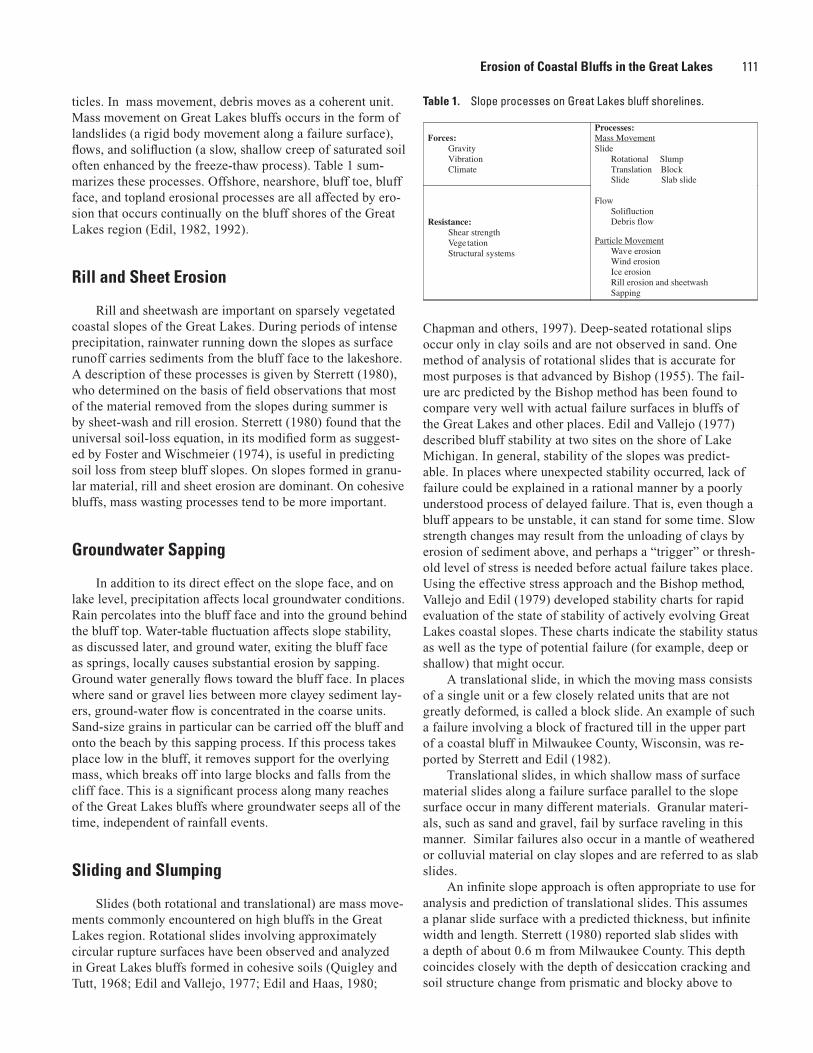
111
ticles. In mass movement, debris moves as a coherent unit. Mass movement on Great Lakes bluffs occurs in the form of landslides (a rigid body movement along a failure surface), flows, and solifluction (a slow, shallow creep of saturated soil often enhanced by the freeze-thaw process). Table 1 sum-marizes these processes. Offshore, nearshore, bluff toe, bluff face, and topland erosional processes are all affected by ero-sion that occurs continually on the bluff shores of the Great Lakes region (Edil, 1982, 1992).
Rill and Sheet Erosion
Rill and sheetwash are important on sparsely vegetated coastal slopes of the Great Lakes. During periods of intense precipitation, rainwater running down the slopes as surface runoff carries sediments from the bluff face to the lakeshore. A description of these processes is given by Sterrett (1980), who determined on the basis of field observations that most of the material removed from the slopes during summer is by sheet-wash and rill erosion. Sterrett (1980) found that the universal soil-loss equation, in its modified form as suggest-ed by Foster and Wischmeier (1974), is useful in predicting soil loss from steep bluff slopes. On slopes formed in granu-lar material, rill and sheet erosion are dominant. On cohesive bluffs, mass wasting processes tend to be more important.
Groundwater Sapping
In addition to its direct effect on the slope face, and on lake level, precipitation affects local groundwater conditions. Rain percolates into the bluff face and into the ground behind the bluff top. Water-table fluctuation affects slope stability, as discussed later, and ground water, exiting the bluff face as springs, locally causes substantial erosion by sapping. Ground water generally flows toward the bluff face. In places where sand or gravel lies between more clayey sediment lay-ers, ground-water flow is concentrated in the coarse units. Sand-size grains in particular can be carried off the bluff and onto the beach by this sapping process. If this process takes place low in the bluff, it removes support for the overlying mass, which breaks off into large blocks and falls from the cliff face. This is a significant process along many reaches of the Great Lakes bluffs where groundwater seeps all of the time, independent of rainfall events.
Sliding and Slumping
Slides (both rotational and translational) are mass move-ments commonly encountered on high bluffs in the Great Lakes region. Rotational slides involving approximately circular rupture surfaces have been observed and analyzed in Great Lakes bluffs formed in cohesive soils (Quigley and Tutt, 1968; Edil and Vallejo, 1977; Edil and Haas, 1980;
Chapman and others, 1997). Deep-seated rotational slips occur only in clay soils and are not observed in sand. One method of analysis of rotational slides that is accurate for most purposes is that advanced by Bishop (1955). The fail-ure arc predicted by the Bishop method has been found to compare very well with actual failure surfaces in bluffs of the Great Lakes and other places. Edil and Vallejo (1977) described bluff stability at two sites on the shore of Lake Michigan. In general, stability of the slopes was predict-able. In places where unexpected stability occurred, lack of failure could be explained in a rational manner by a poorly understood process of delayed failure. That is, even though a bluff appears to be unstable, it can stand for some time. Slow strength changes may result from the unloading of clays by erosion of sediment above, and perhaps a “trigger” or thresh-old level of stress is needed before actual failure takes place. Using the effective stress approach and the Bishop method, Vallejo and Edil (1979) developed stability charts for rapid evaluation of the state of stability of actively evolving Great Lakes coastal slopes. These charts indicate the stability status as well as the type of potential failure (for example, deep or shallow) that might occur.
A translational slide, in which the moving mass consists of a single unit or a few closely related units that are not greatly deformed, is called a block slide. An example of such a failure involving a block of fractured till in the upper part of a coastal bluff in Milwaukee County, Wisconsin, was re-ported by Sterrett and Edil (1982).
Translational slides, in which shallow mass of surface material slides along a failure surface parallel to the slope surface occur in many different materials. Granular materi-als, such as sand and gravel, fail by surface raveling in this manner. Similar failures also occur in a mantle of weathered or colluvial material on clay slopes and are referred to as slab slides.
An infinite slope approach is often appropriate to use for analysis and prediction of translational slides. This assumes a planar slide surface with a predicted thickness, but infinite width and length. Sterrett (1980) reported slab slides with a depth of about 0.6 m from Milwaukee County. This depth coincides closely with the depth of desiccation cracking and soil structure change from prismatic and blocky above to
Forces:GravityVibrationClimate
Resistance:Shear strengthVegetationStructural systems
Processes:Mass MovementSlide
Rotational SlumpTranslation BlockSlide Slab slide
FlowSolifluctionDebris flow
Particle MovementWave erosionWind erosionIce erosionRill erosion and sheetwashSapping
Table 1. Slope processes on Great Lakes bluff shorelines.
Erosion of Coastal Bluffs in the Great Lakes
112 Formation, Evolution, and Stability of Coastal Cliffs—Status and Trends
massive intact blocks below. This upper sediment is softened by freeze-thaw and desiccation, so when it is again saturated it tends to fail readily. Sterrett (1980) also observed that fro-zen slabs of soil measuring about 0.6 m x 10 m x 10 m failed in early spring, and he attributed this failure to surface thaw-ing of bluff sediment and accumulation of pore water above still frozen ground. Along the north shore of Lake Erie, midway between Port Stanley and Port Bruce, Ontario, high velocity slides have been observed generating debris fans that extend 90 m offshore, more than twice the bluff height (Quigley and others, 1977).
Flows and Solifluction
Flows commonly result from heavy precipitation and thaw of snow or frozen soil and they can be rapid (mud or debris flow) or slow (solifluction or creep). The flows observed in the Great Lakes bluffs occur mostly in spring and result primarily from ground thawing and snow and ice melting. Many of them begin as shallow slides high on the bluff and become flows lower on the slope. The size of the flows along the western Lake Michigan shoreline varies from less than 1 m wide to as much as 15 to 20 m wide and 20 m long. Many large ones are mobile enough to cross beaches more than 10 m wide.
Solifluction is the slow down-slope movement of water-saturated materials that follows thawing in previously frozen slopes. Like flows, they take place almost exclusively in the Spring. Vegetation that is deep-rooted appears to provide the most resistance to failure by this process. Very slow creep prob-ably is most active in spring as well, but it may occur through-out the year on moist, steep slopes. A number of approaches for the analysis of solifluction failures have been suggested. Vallejo (1980) introduced a new approach to the analysis of solifluction that reflects the particulate structure of the flow-ing mass. Vallejo and Edil (1981) applied this analysis, with successful field verification, to a coastal bluff in Kewaukee, Wisconsin. The critical depth of thaw normal to the slope face above which failure occurred was found to be about 0.25 m.
Bluff Types and Recession Rates
Recession Rates
Erosion of bluffs by waves supplies sediment that nour-ishes the longshore transport system in all of the Great Lakes basins. Although lake bed downcutting certainly takes place, its volumetric contribution varies based on the relief and geol-ogy. Recession of the Ohio lakeshore introduced 1.19 million cubic yards to the lake between 1876/77 and 1973; of this total, about 27 percent came from subaqueous erosion (Carter, 1977). The volume of sediment derived from subaqueous erosion constituted a larger percentage, as high as 73 percent, of the total sediment load along low-relief reaches. Converse-ly, subaqueous erosion contributed a smaller percentage, less
than 21 percent, of the total sediment load along high-relief reaches or where the nearshore substrate was shale. In areas of low bluff, or where bluffs are protected or for other reasons not eroding, lake bed erosion is a more significant source of sedi-ment. Thus, other things being equal, the volume and coarse grain-size distribution of sediment produced from eroding bluffs determines the grain-size character of the beach and therefore the response of the shoreline to big waves.
In a much more immediate sense, bluff shorelines are a focus of attention, because recession of the bluff top often threatens houses and other buildings, roads, and other com-ponents of our infrastructure. Any prediction of potential risk must include recognition of bluff processes and the response of the bluff top to wave erosion and other processes on the bluff face. Although instability on the Great Lakes bluff shore-lines is ultimately perpetuated by the wave erosion that takes place at the base of the bluff, the actual delivery of sediment to the beach and the longshore drift system and the rate of retreat of the bluff top is complex. Factors such as engineering prop-erties of soils, water-table elevation, bluff height, and nature of failure dramatically influence the rate at which the bluff top recedes.
Rates of bluff erosion vary substantially from place to place and over different time periods. The cumulative aver-age annual rate of change for all shorelines on the Great Lakes is between 0.1 and 0.29 m per year (Pope and others, 2001). Lake Erie has the highest rates of erosion, with long stretches of shoreline having erosion rates greater than 2 m per year. Many eroding bluffs have average recession rates of 0.5 to more than 1 m per year. Maps of generalized recession rates are shown for all of the Great Lakes shorelines in Pope and others (2001).
Determining Recession Rates
Bluff recession has grown in importance as urban and suburban development has increased in the coastal zone. For example, about 25 percent of the lakefront homes in Ohio are within 7.5 m of the bluff edge. There is no way to measure rates of bluff recession over periods longer than the last 150 years (when original surveys were made), because there is no geologic record of bluff position before that time; all trace has been eroded. Therefore, “long-term” measurements are really no longer than 150 years, and those are only at widely spaced points where survey lines actually measure the distance from section corners or other survey markers. In some cases, old maps provide some information as well, but they are gener-ally crude and of limited value (Haras and others, 1976). For example, Gelinas and Quigley (1973) compared early survey maps of the north shore of Lake Erie with aerial photos to determine recession at 3-km intervals for a period of more than 150 years. They estimated a maximum probable error of about 0.25 m/year. Berg and Collinson (1976) used the distance measured from old topographic maps between cul-tural features such as roads and railroad tracks and the bluff
113
edge over a 4-km stretch of bluff in northern Illinois. In Ohio, surveys conducted in the mid 1870s as part of the Survey of the Northwest Territories by the U.S. Topographic Engineers contain sufficient geographic features that the maps can be referenced to aerial photographs taken in the 1930s, and thus provide a means of measuring recession of the Ohio lakeshore between 1876 and the present (Carter, 1976; Benson, 1978; Carter and Guy, 1980, 1986).
Much more detailed information is obtained from aerial photographs (see, for example, Sunamura and Horikawa, 1969; Bird and Armstrong, 1970; Carter, 1976; Berg and Collinson, 1976; Mackey and Guy, 1994; Guy, 1999; Kruepke, 2000; Brown, 2000). Since the late 1930s and early 1940s, vertical photos have been taken at irregular intervals. The distance be-tween bluff top or bluff base as identified on two sets of photos is used to calculate a recession rate. Early studies used unrecti-fied imagery, whereas more recent studies use orthorectified imagery to provide more accurate measurements. This process requires that the bluff toe or bluff base be clearly visible on the photos used. Technology developed in the last 10 years allows orthophotos to be constructed from scanned older imagery, improving accuracy and greatly reducing the time necessary to make spatial corrections (Burrough and McDonnell, 1998; Brown, 2000) and putting the data in digital form, so that numerous closely spaced measurements can be made using Arcview and Arcinfo or other software packages. Brown (2000) calculated recession rates at 10 to 20 m intervals along the bluff over a distance of several hundred meters to compare with each measured profile. In the future, this approach will greatly sim-plify measurements from aerial photos (Hapke, this volume). The methodology is, however, still limited by the quality of the airphotos, by how well the top and base of the bluff can be discerned, and by the resolution of the digital elevation model (DEM) used for the corrections. In addition, correlation of re-cession rates with wave data are limited by the rather large time intervals between photos. This is especially problematic in high bluff areas where failure is episodic, with a low frequency of occurrence, but a high magnitude of failure.
Finally, an analysis of recession rate can also be made by frequent measurement from a monument or even pegs on the bluff that are surveyed. These can be used to produce high-frequency data over relatively short time periods that air-photo studies generally cannot produce (Keillor and DeGroot, 1978; Carter and Guy, 1988; Amin, 1991; Highman and Shakoor, 1998). Although great accuracy can be obtained, these mea-surements are time consuming and pegs or rods are subject to loss due to large wave-erosion events, slope failures, or van-dalism.
Interpretation and Prediction of Recession Rates for Different Bluff Types
One can argue that over a fairly long time period, bluff top recession is equal to recession at the base of the bluff because unless materials or ground-water level change, there is no
reason to think that the bluff angle was substantially different at times in the past than it is now. Thus, for periods of hun-dreds of years, the rate of retreat of the bluff top can be taken as equal to the amount of erosion at the base of the bluff. On shorter time scales and especially for high bluffs, this is often not the case.
Table 2 lists bluff types recognized particularly on Lake Michigan, but on the other Great Lakes as well. Figures 4 through 10 show examples of these bluff types. This list does not include some erodible bluff shore types, such as uncon-solidated sediment over rock, which occurs along parts of the Lake Erie and Lake Ontario shorelines. A critical consider-ation when estimating bluff recession rates is the frequency at which failure takes place and whether bluff face recession is parallel or if slope angle changes with time. If slope angle is constant, then bluff-top recession rate measured over relatively short times (but long enough to include one or two high/low water cycles) may be representative of long-term behavior and could be used to forecast future bluff recession rate. This is because failure mode is dominated by creep, solifluction, shal-low slides, and flows that occur frequently. Bluffs in categories L2 and H2 (table 2; figs. 5, 8) are composed of sand that is noncohesive and that fails as shallow slides that occur fre-quently unless the slope is vegetation covered. Bluffs in cat-egories L1 and H1 (table 2; figs. 4, 7) are composed at least in part of cohesive sediments but fail by shallow slides and flows. These are frequent and shallow, producing parallel re-treat. Reasonable recession rate measurements can probably be made over relatively short periods for these bluffs as well. However, if the bluff fails primarily by large, episodic slumps, then bluff-top recession rates are probably not meaningful, even if measured over 50 years (categories L3 and H3 in table 2; figs. 6, 9).
High bluffs (many over 35 m high) north of Milwaukee on Lake Michigan are particularly good examples of bluff category H3. They contain clayey till and lake sediment. They are subject to failure by large (50-100 m wide), deep-seated slumps that occur infrequently. This is the most difficult bluff type in which to predict future recession rates because of the episodic nature of slumping. Bluff top recession measure-ments from vertical air photos in many places indicate no bluff top recession, yet these bluffs are obviously subject to failure. Using the same sets of photos, adjacent properties that have undergone failure between times the airphotos were taken have high recession rates (Brown, 2000). Even for high lake-level periods as were experienced in the mid 1970s and late 1980s, the main bluff top in many places was unaffected by wave ero-sion because of the protection offered by a slump block at the base. Many bluff profiles have safety factors greater than 1.0 for large deep-seated slumps, giving a false sense of security (Mickelson and others, 1977; Chapman, 1996; Chapman and others, 1997).
These high, complex bluffs appear to evolve through time and the factors of safety change as the slope evolves as described in figure 11. The cycle begins with a steep, unstable bluff having a low factor of safety. After a large-scale slump
Erosion of Coastal Bluffs in the Great Lakes
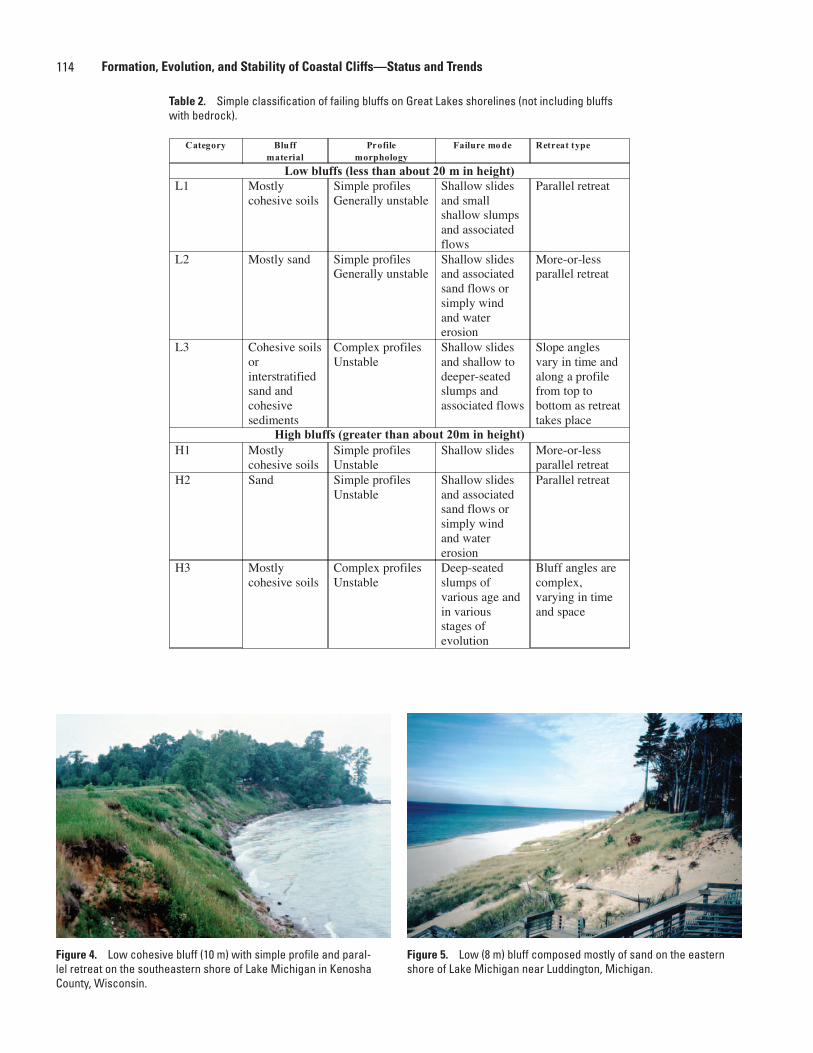
114 Formation, Evolution, and Stability of Coastal Cliffs—Status and Trends
Table 2. Simple classification of failing bluffs on Great Lakes shorelines (not including bluffs with bedrock).
Category Bluffmaterial
Profilemorphology
Failure mo de Retreat type
Low bluffs (less than about 20 m in height)L1 Mostly
cohesive soilsSimple profilesGenerally unstable
Shallow slidesand smallshallow slumpsand associatedflows
Parallel retreat
L2 Mostly sand Simple profilesGenerally unstable
Shallow slidesand associatedsand flows orsimply windand watererosion
More-or-lessparallel retreat
L3 Cohesive soilsorinterstratifiedsand andcohesivesediments
Complex profilesUnstable
Shallow slidesand shallow todeeper-seatedslumps andassociated flows
Slope anglesvary in time andalong a profilefrom top tobottom as retreattakes place
High bluffs (greater than about 20m in height)H1 Mostly
cohesive soilsSimple profilesUnstable
Shallow slides More-or-lessparallel retreat
H2 Sand Simple profilesUnstable
Shallow slidesand associatedsand flows orsimply windand watererosion
Parallel retreat
H3 Mostlycohesive soils
Complex profilesUnstable
Deep-seatedslumps ofvarious age andin variousstages ofevolution
Bluff angles arecomplex,varying in timeand space
Figure 4. Low cohesive bluff (10 m) with simple profile and paral-lel retreat on the southeastern shore of Lake Michigan in Kenosha County, Wisconsin.
Figure 5. Low (8 m) bluff composed mostly of sand on the eastern shore of Lake Michigan near Luddington, Michigan.
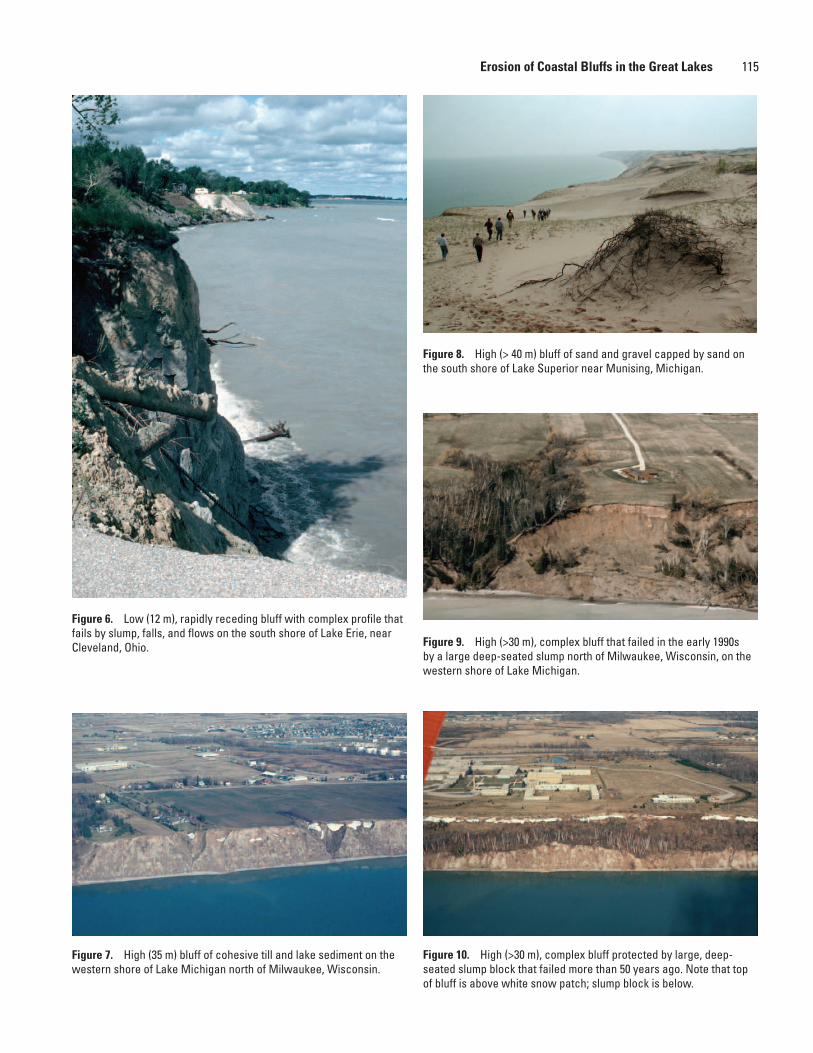
115
Figure 6. Low (12 m), rapidly receding bluff with complex profile that fails by slump, falls, and flows on the south shore of Lake Erie, near Cleveland, Ohio.
Figure 7. High (35 m) bluff of cohesive till and lake sediment on the western shore of Lake Michigan north of Milwaukee, Wisconsin.
Figure 8. High (> 40 m) bluff of sand and gravel capped by sand on the south shore of Lake Superior near Munising, Michigan.
Figure 9. High (>30 m), complex bluff that failed in the early 1990s by a large deep-seated slump north of Milwaukee, Wisconsin, on the western shore of Lake Michigan.
Figure 10. High (>30 m), complex bluff protected by large, deep- seated slump block that failed more than 50 years ago. Note that top of bluff is above white snow patch; slump block is below.
Erosion of Coastal Bluffs in the Great Lakes
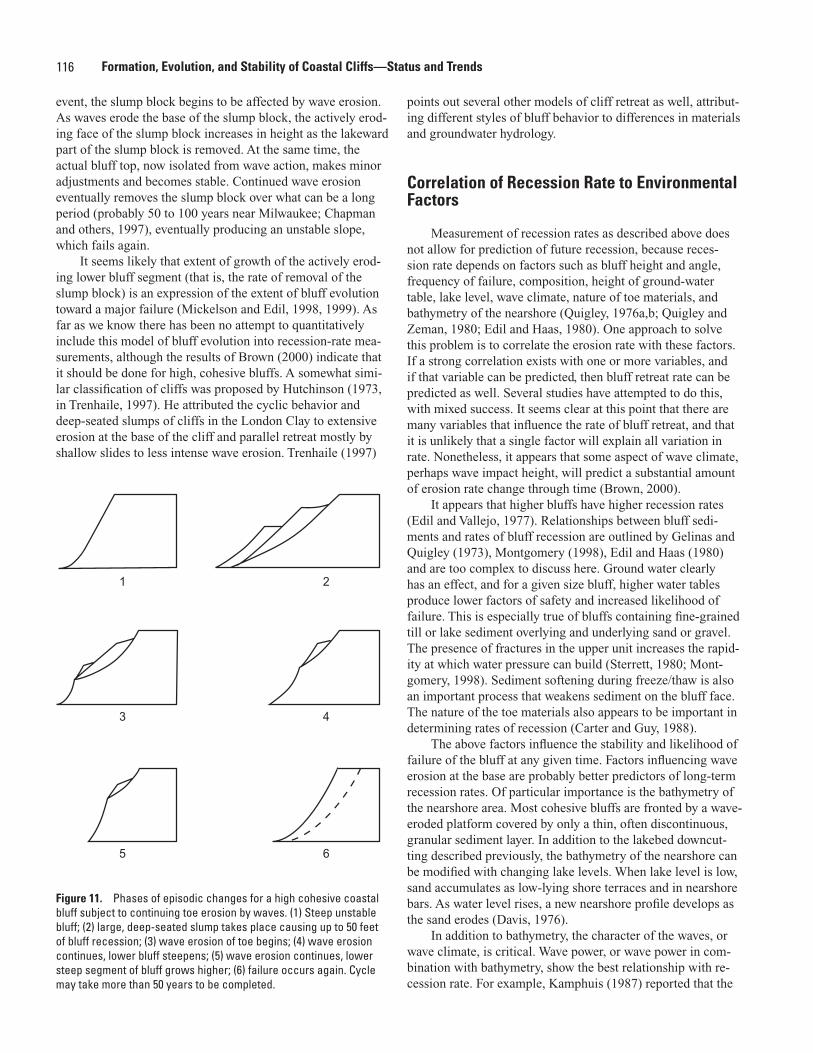
116 Formation, Evolution, and Stability of Coastal Cliffs—Status and Trends
event, the slump block begins to be affected by wave erosion. As waves erode the base of the slump block, the actively erod-ing face of the slump block increases in height as the lakeward part of the slump block is removed. At the same time, the actual bluff top, now isolated from wave action, makes minor adjustments and becomes stable. Continued wave erosion eventually removes the slump block over what can be a long period (probably 50 to 100 years near Milwaukee; Chapman and others, 1997), eventually producing an unstable slope, which fails again.
It seems likely that extent of growth of the actively erod-ing lower bluff segment (that is, the rate of removal of the slump block) is an expression of the extent of bluff evolution toward a major failure (Mickelson and Edil, 1998, 1999). As far as we know there has been no attempt to quantitatively include this model of bluff evolution into recession-rate mea-surements, although the results of Brown (2000) indicate that it should be done for high, cohesive bluffs. A somewhat simi-lar classification of cliffs was proposed by Hutchinson (1973, in Trenhaile, 1997). He attributed the cyclic behavior and deep-seated slumps of cliffs in the London Clay to extensive erosion at the base of the cliff and parallel retreat mostly by shallow slides to less intense wave erosion. Trenhaile (1997)
points out several other models of cliff retreat as well, attribut-ing different styles of bluff behavior to differences in materials and groundwater hydrology.
Correlation of Recession Rate to Environmental Factors
Measurement of recession rates as described above does not allow for prediction of future recession, because reces-sion rate depends on factors such as bluff height and angle, frequency of failure, composition, height of ground-water table, lake level, wave climate, nature of toe materials, and bathymetry of the nearshore (Quigley, 1976a,b; Quigley and Zeman, 1980; Edil and Haas, 1980). One approach to solve this problem is to correlate the erosion rate with these factors. If a strong correlation exists with one or more variables, and if that variable can be predicted, then bluff retreat rate can be predicted as well. Several studies have attempted to do this, with mixed success. It seems clear at this point that there are many variables that influence the rate of bluff retreat, and that it is unlikely that a single factor will explain all variation in rate. Nonetheless, it appears that some aspect of wave climate, perhaps wave impact height, will predict a substantial amount of erosion rate change through time (Brown, 2000).
It appears that higher bluffs have higher recession rates (Edil and Vallejo, 1977). Relationships between bluff sedi-ments and rates of bluff recession are outlined by Gelinas and Quigley (1973), Montgomery (1998), Edil and Haas (1980) and are too complex to discuss here. Ground water clearly has an effect, and for a given size bluff, higher water tables produce lower factors of safety and increased likelihood of failure. This is especially true of bluffs containing fine-grained till or lake sediment overlying and underlying sand or gravel. The presence of fractures in the upper unit increases the rapid-ity at which water pressure can build (Sterrett, 1980; Mont-gomery, 1998). Sediment softening during freeze/thaw is also an important process that weakens sediment on the bluff face. The nature of the toe materials also appears to be important in determining rates of recession (Carter and Guy, 1988).
The above factors influence the stability and likelihood of failure of the bluff at any given time. Factors influencing wave erosion at the base are probably better predictors of long-term recession rates. Of particular importance is the bathymetry of the nearshore area. Most cohesive bluffs are fronted by a wave-eroded platform covered by only a thin, often discontinuous, granular sediment layer. In addition to the lakebed downcut-ting described previously, the bathymetry of the nearshore can be modified with changing lake levels. When lake level is low, sand accumulates as low-lying shore terraces and in nearshore bars. As water level rises, a new nearshore profile develops as the sand erodes (Davis, 1976).
In addition to bathymetry, the character of the waves, or wave climate, is critical. Wave power, or wave power in com-bination with bathymetry, show the best relationship with re-cession rate. For example, Kamphuis (1987) reported that the
1 2
3 4
5 6
Figure 11. Phases of episodic changes for a high cohesive coastal bluff subject to continuing toe erosion by waves. (1) Steep unstable bluff; (2) large, deep-seated slump takes place causing up to 50 feet of bluff recession; (3) wave erosion of toe begins; (4) wave erosion continues, lower bluff steepens; (5) wave erosion continues, lower steep segment of bluff grows higher; (6) failure occurs again. Cycle may take more than 50 years to be completed.
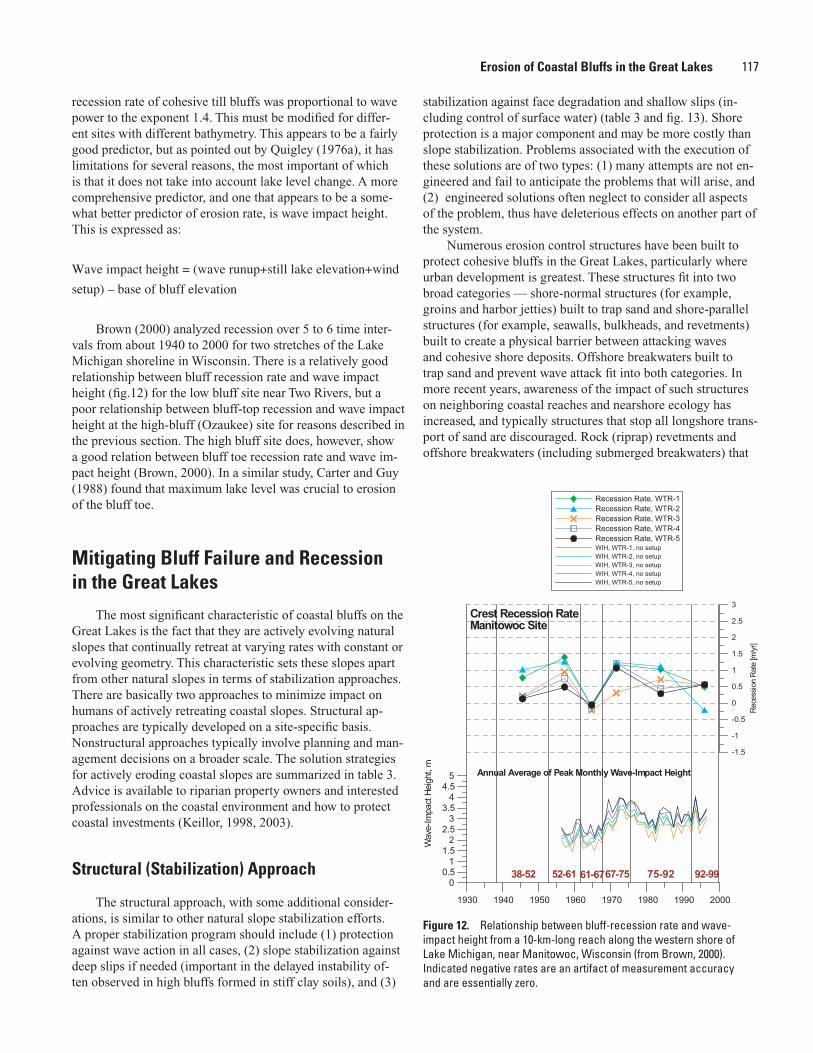
117
recession rate of cohesive till bluffs was proportional to wave power to the exponent 1.4. This must be modified for differ-ent sites with different bathymetry. This appears to be a fairly good predictor, but as pointed out by Quigley (1976a), it has limitations for several reasons, the most important of which is that it does not take into account lake level change. A more comprehensive predictor, and one that appears to be a some-what better predictor of erosion rate, is wave impact height. This is expressed as:
Wave impact height = (wave runup+still lake elevation+wind
setup) – base of bluff elevation
Brown (2000) analyzed recession over 5 to 6 time inter-vals from about 1940 to 2000 for two stretches of the Lake Michigan shoreline in Wisconsin. There is a relatively good relationship between bluff recession rate and wave impact height (fig.12) for the low bluff site near Two Rivers, but a poor relationship between bluff-top recession and wave impact height at the high-bluff (Ozaukee) site for reasons described in the previous section. The high bluff site does, however, show a good relation between bluff toe recession rate and wave im-pact height (Brown, 2000). In a similar study, Carter and Guy (1988) found that maximum lake level was crucial to erosion of the bluff toe.
Mitigating Bluff Failure and Recession in the Great Lakes
The most significant characteristic of coastal bluffs on the Great Lakes is the fact that they are actively evolving natural slopes that continually retreat at varying rates with constant or evolving geometry. This characteristic sets these slopes apart from other natural slopes in terms of stabilization approaches. There are basically two approaches to minimize impact on humans of actively retreating coastal slopes. Structural ap-proaches are typically developed on a site-specific basis. Nonstructural approaches typically involve planning and man-agement decisions on a broader scale. The solution strategies for actively eroding coastal slopes are summarized in table 3. Advice is available to riparian property owners and interested professionals on the coastal environment and how to protect coastal investments (Keillor, 1998, 2003).
Structural (Stabilization) Approach
The structural approach, with some additional consider-ations, is similar to other natural slope stabilization efforts. A proper stabilization program should include (1) protection against wave action in all cases, (2) slope stabilization against deep slips if needed (important in the delayed instability of-ten observed in high bluffs formed in stiff clay soils), and (3)
stabilization against face degradation and shallow slips (in-cluding control of surface water) (table 3 and fig. 13). Shore protection is a major component and may be more costly than slope stabilization. Problems associated with the execution of these solutions are of two types: (1) many attempts are not en-gineered and fail to anticipate the problems that will arise, and (2) engineered solutions often neglect to consider all aspects of the problem, thus have deleterious effects on another part of the system.
Numerous erosion control structures have been built to protect cohesive bluffs in the Great Lakes, particularly where urban development is greatest. These structures fit into two broad categories — shore-normal structures (for example, groins and harbor jetties) built to trap sand and shore-parallel structures (for example, seawalls, bulkheads, and revetments) built to create a physical barrier between attacking waves and cohesive shore deposits. Offshore breakwaters built to trap sand and prevent wave attack fit into both categories. In more recent years, awareness of the impact of such structures on neighboring coastal reaches and nearshore ecology has increased, and typically structures that stop all longshore trans-port of sand are discouraged. Rock (riprap) revetments and offshore breakwaters (including submerged breakwaters) that
00.5
11.5
22.5
33.5
44.5
5
Wav
e-Im
pact
Hei
ght,
m
1930 1940 1950 1960 1970 1980 1990 2000
Recession Rate, WTR-1Recession Rate, WTR-2 Recession Rate, WTR-3Recession Rate, WTR-4 Recession Rate, WTR-5 WIH, WTR-1, no setupWIH, WTR-2, no setupWIH, WTR-3, no setupWIH, WTR-4, no setupWIH, WTR-5, no setup
-1.5
-1
-0.5
0
0.5
1
1.5
2
2.5
3
Rec
essi
on R
ate
[m/y
r]
38-52 52-61 61-6767-75 92-9975-92
Annual Average of Peak Monthly Wave-Impact Height
Crest Recession RateManitowoc Site
Figure 12. Relationship between bluff-recession rate and wave- impact height from a 10-km-long reach along the western shore of Lake Michigan, near Manitowoc, Wisconsin (from Brown, 2000). Indicated negative rates are an artifact of measurement accuracy and are essentially zero.
Erosion of Coastal Bluffs in the Great Lakes
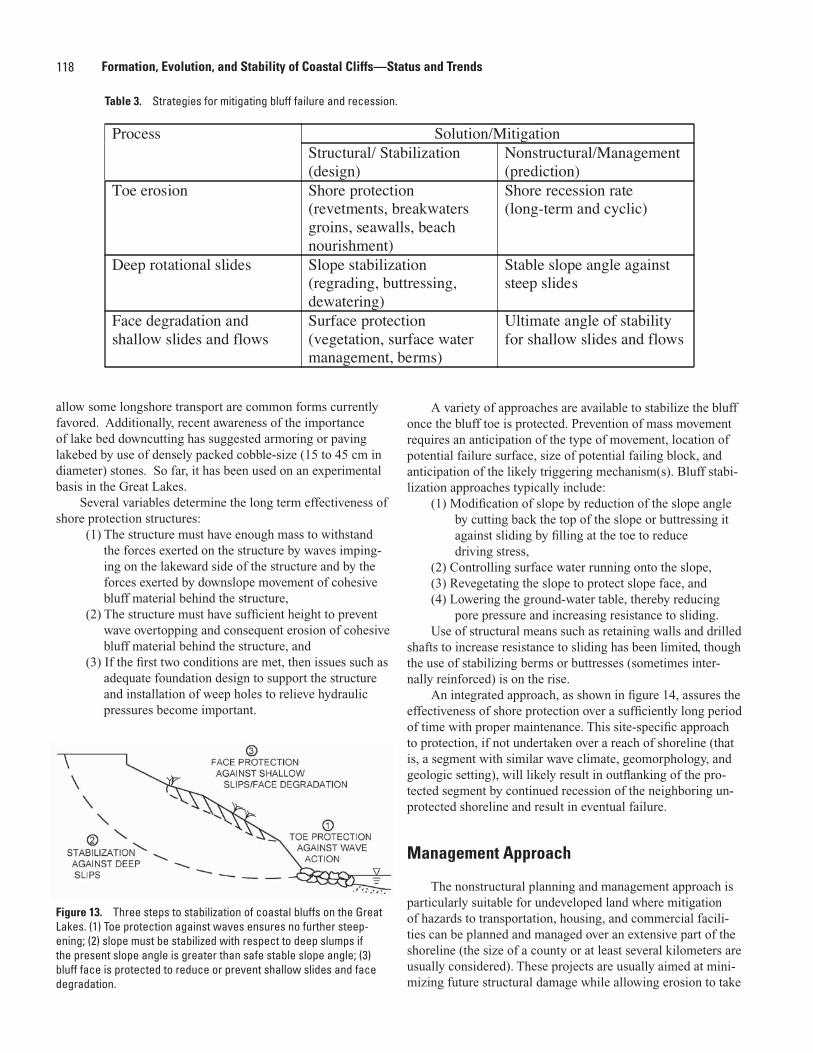
118 Formation, Evolution, and Stability of Coastal Cliffs—Status and Trends
allow some longshore transport are common forms currently favored. Additionally, recent awareness of the importance of lake bed downcutting has suggested armoring or paving lakebed by use of densely packed cobble-size (15 to 45 cm in diameter) stones. So far, it has been used on an experimental basis in the Great Lakes. Several variables determine the long term effectiveness of shore protection structures:
(1) The structure must have enough mass to withstand the forces exerted on the structure by waves imping- ing on the lakeward side of the structure and by the forces exerted by downslope movement of cohesive bluff material behind the structure,(2) The structure must have sufficient height to prevent wave overtopping and consequent erosion of cohesive bluff material behind the structure, and(3) If the first two conditions are met, then issues such as adequate foundation design to support the structure and installation of weep holes to relieve hydraulic pressures become important.
A variety of approaches are available to stabilize the bluff once the bluff toe is protected. Prevention of mass movement requires an anticipation of the type of movement, location of potential failure surface, size of potential failing block, and anticipation of the likely triggering mechanism(s). Bluff stabi-lization approaches typically include:
(1) Modification of slope by reduction of the slope angle by cutting back the top of the slope or buttressing it against sliding by filling at the toe to reduce
driving stress,(2) Controlling surface water running onto the slope, (3) Revegetating the slope to protect slope face, and(4) Lowering the ground-water table, thereby reducing
pore pressure and increasing resistance to sliding.Use of structural means such as retaining walls and drilled
shafts to increase resistance to sliding has been limited, though the use of stabilizing berms or buttresses (sometimes inter-nally reinforced) is on the rise.
An integrated approach, as shown in figure 14, assures the effectiveness of shore protection over a sufficiently long period of time with proper maintenance. This site-specific approach to protection, if not undertaken over a reach of shoreline (that is, a segment with similar wave climate, geomorphology, and geologic setting), will likely result in outflanking of the pro-tected segment by continued recession of the neighboring un-protected shoreline and result in eventual failure.
Management Approach
The nonstructural planning and management approach is particularly suitable for undeveloped land where mitigation of hazards to transportation, housing, and commercial facili-ties can be planned and managed over an extensive part of the shoreline (the size of a county or at least several kilometers are usually considered). These projects are usually aimed at mini-mizing future structural damage while allowing erosion to take
Solution/MitigationProcessStructural/ Stabilization(design)
Nonstructural/Management(prediction)
Toe erosion Shore protection(revetments, breakwatersgroins, seawalls, beachnourishment)
Shore recession rate(long-term and cyclic)
Deep rotational slides Slope stabilization(regrading, buttressing,dewatering)
Stable slope angle againststeep slides
Face degradation andshallow slides and flows
Surface protection(vegetation, surface watermanagement, berms)
Ultimate angle of stabilityfor shallow slides and flows
Table 3. Strategies for mitigating bluff failure and recession.
Figure 13. Three steps to stabilization of coastal bluffs on the Great Lakes. (1) Toe protection against waves ensures no further steep-ening; (2) slope must be stabilized with respect to deep slumps if the present slope angle is greater than safe stable slope angle; (3) bluff face is protected to reduce or prevent shallow slides and face degradation.
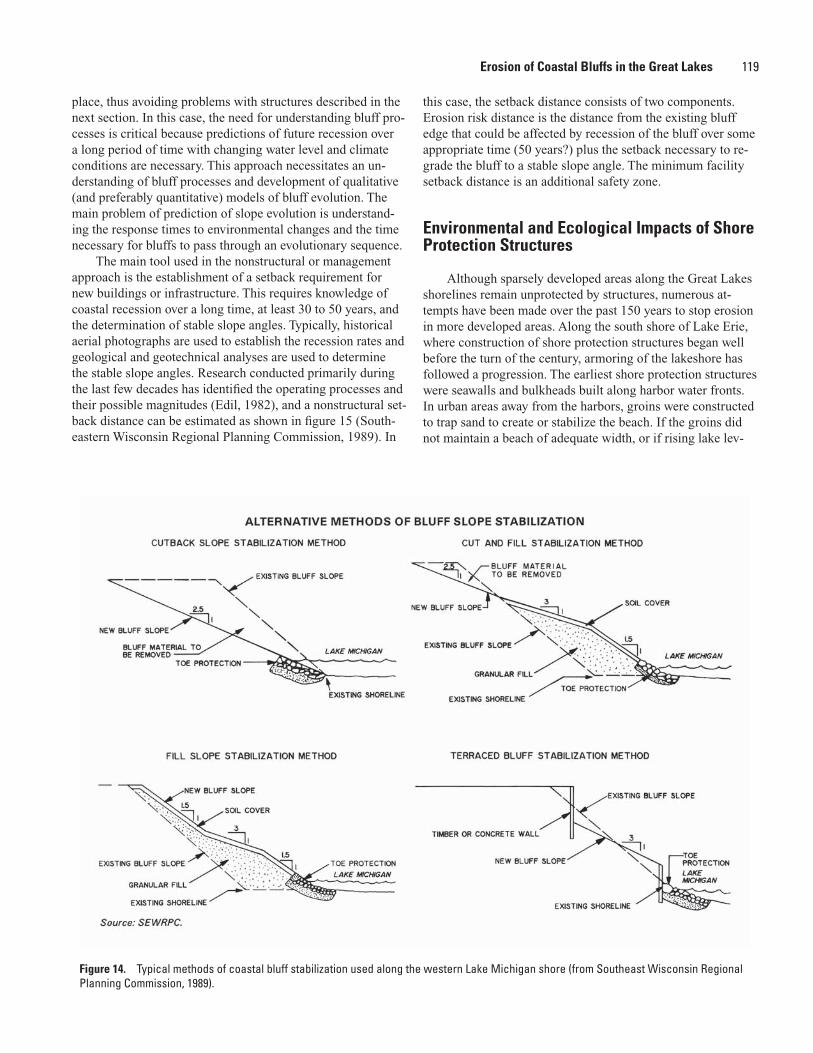
119
place, thus avoiding problems with structures described in the next section. In this case, the need for understanding bluff pro-cesses is critical because predictions of future recession over a long period of time with changing water level and climate conditions are necessary. This approach necessitates an un-derstanding of bluff processes and development of qualitative (and preferably quantitative) models of bluff evolution. The main problem of prediction of slope evolution is understand-ing the response times to environmental changes and the time necessary for bluffs to pass through an evolutionary sequence.
The main tool used in the nonstructural or management approach is the establishment of a setback requirement for new buildings or infrastructure. This requires knowledge of coastal recession over a long time, at least 30 to 50 years, and the determination of stable slope angles. Typically, historical aerial photographs are used to establish the recession rates and geological and geotechnical analyses are used to determine the stable slope angles. Research conducted primarily during the last few decades has identified the operating processes and their possible magnitudes (Edil, 1982), and a nonstructural set-back distance can be estimated as shown in figure 15 (South-eastern Wisconsin Regional Planning Commission, 1989). In
this case, the setback distance consists of two components. Erosion risk distance is the distance from the existing bluff edge that could be affected by recession of the bluff over some appropriate time (50 years?) plus the setback necessary to re-grade the bluff to a stable slope angle. The minimum facility setback distance is an additional safety zone.
Environmental and Ecological Impacts of Shore Protection Structures
Although sparsely developed areas along the Great Lakes shorelines remain unprotected by structures, numerous at-tempts have been made over the past 150 years to stop erosion in more developed areas. Along the south shore of Lake Erie, where construction of shore protection structures began well before the turn of the century, armoring of the lakeshore has followed a progression. The earliest shore protection structures were seawalls and bulkheads built along harbor water fronts. In urban areas away from the harbors, groins were constructed to trap sand to create or stabilize the beach. If the groins did not maintain a beach of adequate width, or if rising lake lev-
Figure 14. Typical methods of coastal bluff stabilization used along the western Lake Michigan shore (from Southeast Wisconsin Regional Planning Commission, 1989).
Erosion of Coastal Bluffs in the Great Lakes
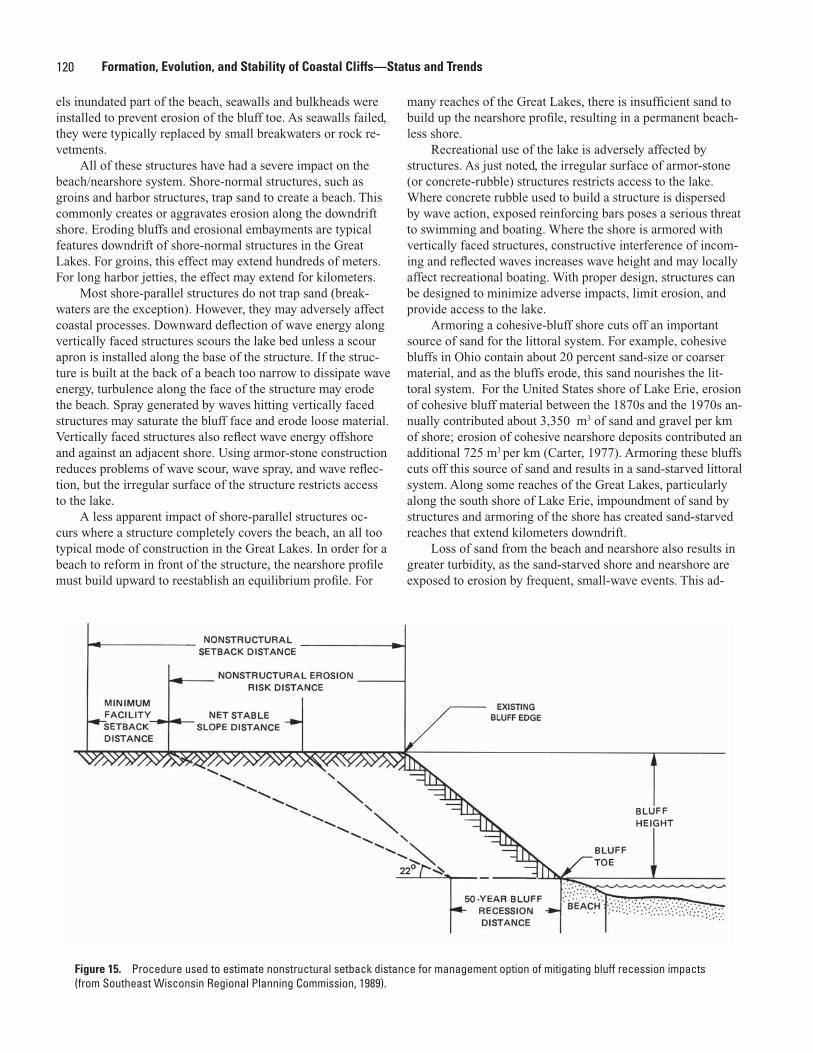
120 Formation, Evolution, and Stability of Coastal Cliffs—Status and Trends
els inundated part of the beach, seawalls and bulkheads were installed to prevent erosion of the bluff toe. As seawalls failed, they were typically replaced by small breakwaters or rock re-vetments.
All of these structures have had a severe impact on the beach/nearshore system. Shore-normal structures, such as groins and harbor structures, trap sand to create a beach. This commonly creates or aggravates erosion along the downdrift shore. Eroding bluffs and erosional embayments are typical features downdrift of shore-normal structures in the Great Lakes. For groins, this effect may extend hundreds of meters. For long harbor jetties, the effect may extend for kilometers.
Most shore-parallel structures do not trap sand (break-waters are the exception). However, they may adversely affect coastal processes. Downward deflection of wave energy along vertically faced structures scours the lake bed unless a scour apron is installed along the base of the structure. If the struc-ture is built at the back of a beach too narrow to dissipate wave energy, turbulence along the face of the structure may erode the beach. Spray generated by waves hitting vertically faced structures may saturate the bluff face and erode loose material. Vertically faced structures also reflect wave energy offshore and against an adjacent shore. Using armor-stone construction reduces problems of wave scour, wave spray, and wave reflec-tion, but the irregular surface of the structure restricts access to the lake.
A less apparent impact of shore-parallel structures oc-curs where a structure completely covers the beach, an all too typical mode of construction in the Great Lakes. In order for a beach to reform in front of the structure, the nearshore profile must build upward to reestablish an equilibrium profile. For
many reaches of the Great Lakes, there is insufficient sand to build up the nearshore profile, resulting in a permanent beach-less shore.
Recreational use of the lake is adversely affected by structures. As just noted, the irregular surface of armor-stone (or concrete-rubble) structures restricts access to the lake. Where concrete rubble used to build a structure is dispersed by wave action, exposed reinforcing bars poses a serious threat to swimming and boating. Where the shore is armored with vertically faced structures, constructive interference of incom-ing and reflected waves increases wave height and may locally affect recreational boating. With proper design, structures can be designed to minimize adverse impacts, limit erosion, and provide access to the lake.
Armoring a cohesive-bluff shore cuts off an important source of sand for the littoral system. For example, cohesive bluffs in Ohio contain about 20 percent sand-size or coarser material, and as the bluffs erode, this sand nourishes the lit-toral system. For the United States shore of Lake Erie, erosion of cohesive bluff material between the 1870s and the 1970s an-nually contributed about 3,350 m3 of sand and gravel per km of shore; erosion of cohesive nearshore deposits contributed an additional 725 m3 per km (Carter, 1977). Armoring these bluffs cuts off this source of sand and results in a sand-starved littoral system. Along some reaches of the Great Lakes, particularly along the south shore of Lake Erie, impoundment of sand by structures and armoring of the shore has created sand-starved reaches that extend kilometers downdrift.
Loss of sand from the beach and nearshore also results in greater turbidity, as the sand-starved shore and nearshore are exposed to erosion by frequent, small-wave events. This ad-
Figure 15. Procedure used to estimate nonstructural setback distance for management option of mitigating bluff recession impacts (from Southeast Wisconsin Regional Planning Commission, 1989).
121
versely affects water quality. Loss of sand from the nearshore also alters the nearshore biologic habitat. Many organisms that inhabit the nearshore are adapted to a mobile sand substrate and the bar and trough system that forms where sand is pres-ent. Loss of this sand and replacement by a cobble and boulder covered wave-cut platform has a negative effect on these or-ganisms and encourages growth of nuisance species like zebra mussels. Armoring the lakeshore to prevent shore erosion has had significant impacts on coastal sand resources and coastal habitats. The full extent and nature of these impacts are still not fully understood.
Future Research NeedsSeveral areas seem to have great promise as future av-
enues of research. Prediction of future recession is an over-arching concern for coastal planners and managers, and listed below are several ways in which our ability to predict reces-sion could be improved:
(1) One approach is to keep better track of what is hap pening now on the shoreline. Advanced digital technologies provide a much greater capability of determining past rates of recession, limited only by the availability of aerial photos or satellite im ages, the frequency at which they have been taken, and geomorphic interpretation of changes. Frequency could be increased by regular, high quality air photography by drones. (2) Our ability to connect lake level and more complex variables, such as wave impact height, to beach and bluff-toe erosion can be improved. This would help with prediction of future bluff recession, if lake level changes could be predicted. That presumably would require linking lake level to climate change models and using this approach to forecast potential scenarios.(3) Although there are models of sediment transport in the nearshore zone, there still is no comprehensive model that integrates bluff process with processes with beach and nearshore processes. (4) In order to predict future behavior of high, cohesive bluffs, we must understand the geomorphic changes that take place as the bluff shape evolves after a massive failure. We must also understand the timescale over which these changes take place.
Another important future research need is quantifying the cumulative and secondary impacts of armoring cohesive bluffs on coastal sand budgets. Most Great Lakes shorelines are still not protected, but as population increases, more and more of the shoreline will be protected from erosion, thus reducing sand supply. We don’t fully understand the physical and bio-logical impacts of this trend.
There may be ways of minimizing the impacts of shore protection by changing the way we solve problems of slope instability. For instance, it may be possible to identify incipi-
ent bluff failure, so that remedial measures can be taken to locally stabilize the bluff. One example would be to map the topography on cohesive bluff materials that underlie sandy stratigraphic units, so that one or two strategically placed wells might be used to dewater the bluff, thereby increasing bluff stability without building structures that interfere with the beach/nearshore system.
Finally, geologists and engineers need to research better ways to educate the public about hazard and resource issues along the Great Lakes shores. Most negative impacts result from conflicts between human and natural process, and a bet-ter educated public might lead to a reduction of these conflicts.
AcknowledgementsWe would like to thank A.S. Trenhaile and Laura Moore
for very helpful comments during the review process. E.A. (Lisa) Brown was helpful in assembling some of the back-ground information that is not specifically cited in the text. Anoushka Sarrazin and Leslie Pearson helped with an exten-sive literature search. Lindsay Anderson and Jessica Darter provided helpful comments on the manuscript. Mary Diman and Adam Kiehn provided excellent graphics and editorial support.
References CitedAmin, S.M.N., 1991, Bluff toe erosion along a section of the
Lake Erie south shore: Kent State University, Ohio, Ph.D. dissertation, 238 p.
Angel, J.R., 1995, Large-scale storm damage on the U.S. shores of the Great Lakes: Journal of Great lakes Research, v. 21, no. 3, p. 287-293.
Barnes, P.W., Kempema, E.W., Reimnitz, E., and McCormick, M., 1994, The influence of ice on southern Lake Michigan coastal erosion: Journal of Great Lakes Research, v. 20, p. 179-195.
Benson, D.J., 1978, Lake Erie shore erosion and flooding, Lucas County, Ohio: Ohio Geological Survey Report of Inves-tigations 107, 99 p.
Berg, R.C., and Collinson, C., 1976, Bluff erosion, recession rates and volumetric losses on the Lake Michigan shore in Illinois: Illinois State Geological Survey Environmental Geology Note 76, 33 p.
Bird, S.J., and Armstrong, J.L., 1970, Scarborough Bluffs–a recessional study: 13th Conference on Great Lakes Re-search, International Association for Great Lakes Research, Proceedings, p. 187-197.
Bishop, A.W., 1955, The use of the slip circle in the stability analysis of slopes: Geotechnique, v. 5, no. 1, p. 7-17.
Bishop, C., Skafel, M., and Nairn, R., 1992, Cohesive profile erosion by waves: Coastal Engineering, v. 228, p. 2976-2989.
Bray, M.J., and Hooke, J.M., 1997, Prediction of soft-cliff re-
Erosion of Coastal Bluffs in the Great Lakes
122 Formation, Evolution, and Stability of Coastal Cliffs—Status and Trends
treat with accelerating sea-level rise: Journal of Coastal Research, v. 13, no. 2, p. 453-467.
Brown, E.A., 2000, Influence of water level, wave climate, and weather on coastal recession along a Great Lakes shoreline: Madison, University of Wisconsin, M.S. thesis, 176 p.
Burrough, P.A., and McDonnell, R.A., 1998, Principles of Geographical Information Systems: New York, Oxford University Press, 333 p.
Carter, C.H., 1976, Lake shore erosion, Lake County, Ohio — set-ting, processes, and recession rates from 1876-1973: Ohio Geological Survey Report 99, 105 p.
Carter, C.H., 1977, Sediment-load measurements along the United States shore of Lake Erie: Ohio Geological Survey Report of Investigations 102, 24 p.
Carter, C.H., and Guy, D.E., Jr., 1980, Lake Erie shore ero-sion and flooding, Erie and Sandusky Counties, Ohio — setting, processes and recession rates from 1977 to 1973: Ohio Geological Survey Report of Investigations 115, 130 p.
Carter, C.H., and Guy, D.E., Jr., 1982, Erosion in the Lake Erie wave erosion zone nearVermilion, Ohio [abs.]: Burlington, Ontario, National Water Research Institute Coastal Work-shop 3, Proceedings.
Carter, C.H., and Guy, D.E., Jr., 1986, Lake Erie shore erosion, Ashtabula County, Ohio — setting, processes and recession rates from 1977 to 1973: Ohio Geological Survey Report of Investigations 122, 107 p.
Carter, C.H., and Guy, D.E., Jr., 1988, Coastal erosion — process-es, timing and magnitudes at the bluff toe: Marine Geology, v. 84, p.1-17.
Chapman, J.A., 1996, Predictive capability of stability analysis methods for Lake Michigan shoreline slopes: Madison, University of Wisconsin, M.S. thesis, 203 p.
Chapman, J.A., Edil, T.B., and Mickelson, D.M., 1997, Lake Michigan shoreline recession and bluff stability in south-eastern Wisconsin, 1995: Southeast Wisconsin Regional Planning Commission, Technical Report 36, 162 p. plus appendices.
Davidson-Arnott, R.G.D., and Askin, R.W., 1980, Factors control-ling erosion of the nearshore profile in overconsolidated till, Grimsby, Lake Ontario: Ottawa, National Research Council, Canadian Coastal Conference, Proceedings, p. 185-199.
Davidson-Arnott, R.G.D., and Pollard, W.H., 1980, Wave climate and potential longshore sediment transport patterns, Not-tawasaga Bay, Ontario: Journal of Great Lakes Research, v. 6, no. 1, p. 54-67.
Davis, R.A., Jr., 1976, Lake Michigan erosion; have we learned anything? in Rukavina, N.A., ed., Workshop on Great Lakes coastal erosion and, sedimentation: Burlington, Ontario, Canadian Center for Inland Waters, Proceedings, p. 75-79.
Davis, R.A., Seibel, E., and Fox, W.T., 1973, Coastal Erosion in Eastern Lake Michigan — causes and effects: International Association for Great Lakes Research, 16th Conference of Great Lakes Research, Proceedings, p. 404-412.
Dewberry and Davis, 1994, Basic analyses of wave action and erosion with extreme floods on Great Lakes shores, draft report for Federal Emergency Management Agency, Miti-gation Directorate, National Flood Insurance: Prepared by Dewberry and Davis, Program Management Engineering and Technical Services Division, Fairfax, Virginia.
Edil, T.B., 1982, Causes and mechanics of coastal bluff recession in the Great Lakes: Michigan Sea Grant Institute, Bluff Slumping Workshop, MICHU-SG-82-901, Proceedings, p. 1-48.
Edil, T.B., 1992, Landslide cases in the Great Lakes — issues and approaches: Transportation Research Record, no. 1343, p. 87-94.
Edil, T.B., and Haas, B.J., 1980, Proposed criteria for interpreting stability of lakeshore bluffs, in Koh, S.L., ed., Mechanics of landslides and slope stability: Engineering Geology, no. 16, p. 97-110.
Edil, T.B., and Vallejo, L.E., 1977, Shoreline erosion and land-slides in the Great Lakes: International Conference on Soil Mechanics and Foundation Engineering, Tokyo, Japan, Proceedings, v. 2, p. 51-58.
Foster, G.R., and Wischmeier, W. H., 1974, Evaluating irregular slopes for soil loss prediction: Transactions, American Society of Agricultural Engineers, v. 17, p. 305-309.
Gelinas, P.J., and Quigley, R.M., 1973, The influence of geol-ogy on erosion rates along the north shore of Lake Erie: International Association of Great Lakes Research, 16th Conference on Great Lakes Research, Proceedings, p. 421-430.
Guy, D.E., Jr., 1999, Erosion hazard area mapping, Lake County, Ohio: Journal of Coastal Research, v. 28, p. 185-196.
Haras, W.S., Bukata, R.P., and Tsui, K.K., 1976, Methods for recording Great Lakes shoreline change: Geoscience Canada, v. 3, no. 3, p. 174-184.
Highman, T.A., and Shakoor, A., 1998, Role of soil joints in caus-ing bluff erosion along the Lake Erie shoreline, Northeast Ohio: Environmental and Engineering Geoscience, v. 4, no. 2, p. 195-207.
Hutchinson, J.N., 1973, The response of London Clay cliffs to differing rates of toe erosion: Geologia Applicata e Idro-geologica, v. 8, p. 221-239.
Jibson, R.W., Odum, J.K., and Staude, J.M.G., 1994, Rates and processes of bluff recession along the Lake Michigan shoreline in Illinois, in Folger, D.W., Colman, S.M., and Barnes, P.W., eds., The southern Lake Michigan coastal erosion study: Shelburne, Ontario, Canada, International Association for Great Lakes Research, p. 135-152.
Kamphuis, J.W., 1987, Recession rate of glacial till bluffs: Journal of Waterway, Port, Coastal and Ocean Engineering, v. 113, no. 5, p. 60-73.
Kamphuis, J.W., Gaskin, P.N., Hoogendoorn, E., 1990, Erosion tests on four intact Ontario clays: Canadian Geotechnical Journal, v. 27, no. 5, p. 692-696.
Keillor, J.P., 1998, Coastal processes manual: Madison, Univer-sity of Wisconsin Sea Grant Institute, WISCU-H-98-003, 128 p.
123
Keillor, J.P., 2003, Living on the coast — protecting invest-ments in shore property on the Great Lakes: U.S. Corps of Engineers, 49 p.
Keillor, J.P., and DeGroot, R., 1978, Recent recession in Racine County, Wisconsin: University of Wisconsin Sea Grant Institute, unpub. report.
Kirk, R.M., Komar, P.D., Allan, J.D., and Stephenson, W.J., 2000, Shoreline erosion on Lake Hawea, New Zealand, caused by high lake levels and storm-wave runup: Journal of Coastal Research, v. 16, no. 2, p. 346-356.
Kruepke, J.J., 2000, Understanding and monitoring coastal bluff erosion using aerial photography, a case study — Western Lake Michigan shoreline, Two Creeks Shoreline, Two Creeks, Wisconsin: University of Wisconsin, M.S. thesis, 102 p.
Mackey, S.D., and Guy, D.E., Jr., 1994, A different approach to mapping coastal recession — combining the old with the new [abs.]: Geological Society of America Abstracts with Programs, v. 26, no. 5, p. 52.
Mickelson, D.M., and Edil, T.B., 1998, Evolution of form and process on high bluffs subject to large-scale slumping along Wisconsin’s Lake Michigan shoreline [abs.]: Geo-logical Society of America Abstracts with Programs, v. 30, p. 251.
Mickelson, D.M., and Edil, T.B., 1999, Episodic large-scale slumping and sediment delivery to lower slopes on high Lake Michigan bluffs [abs.]: International Association for Great Lakes Research, 42nd Conference on Great lakes Research, Program and Abstracts, p. A-79.
Mickelson, D.M., Acomb, L., Brouwer, N., Edil, T.B., Fricke, C., Haas, B., Hadley, D., Hess, C., Klauk, R., Lasca, N., and Schneider, A.F., 1977, Shoreline erosion and bluff stabil-ity along Lake Michigan and Lake Superior shorelines of Wisconsin: Shore Erosion Technical Study Technical Report, Coastal Management Program, State Planning Office, 199 p. plus appendices.
Montgomery, W.W., 1998, Groundwater hydraulics and slope stability analysis — elements for prediction of shore re-cession: Kalamazoo, Western Michigan University, Ph.D. dissertation, 246 p.
Nairn, R. B., Davis, J. E., and Thieme, S. J., 1999, A GIS-linked flood and erosion prediction system for Lake Michigan, in Kraus, N.C., and McDougal, W.G., eds., Coastal sediments ‘99: American Society of Civil Engineers Symposium on Coastal Engineering and Science of Coastal Sediment Processes, Proceedings, v. 4, p. 1978-1993.
Pope, J., Stewart, C., Dolan, R., Peatross, J., and Thompson, C., 2001, The Great Lakes shoreline type, erosion, and accre-tion: U.S. Army Corps of Engineers, Open-File Map.
Powers, W.E., 1958, Geomorphology of the Lake Michigan shoreline, final report: Evanston, Illinois, Northwestern University, Department of Geography, 103 p.
Quigley, R.M., 1976a, Processes of bluff recession — a discus-sion, in Rukavina, N. A., ed., Workshop on Great Lakes
coastal erosion and sedimentation: Burlington, Ontario, Canada Centre for Inland Waters, Proceedings, p. 101-107.
Quigley, R.M., 1976b, The University of Western Ontario; Soil Mechanics Section-Faculty of Engineering Science coastal research activities, in Rukavina, N. A., ed., Workshop on Great Lakes coastal erosion and sedimentation: Burlington, Ontario, Canada Centre for Inland Waters, Proceedings, p. 89-92.
Quigley, R.M., and Tutt, D.B., 1968, Stability–Lake Erie North Shore bluffs: International Association for Great Lakes Research, 11th Conference on Great Lakes Research, Proceedings, p. 230- 238.
Quigley, R.M., and Zeman, A.J., 1980, Strategy for hydraulic, geologic and geotechnical assessment of Great Lakes shoreline bluffs, in McCann, S.B., ed., The coastline of Canada: Geological Survey of Canada, p. 397-406.
Quigley, R.M., Gelinas, P.J., Bou, W.T., and Packer, R.W., 1977, Cyclic erosion instability relationships—Lake Erie north shore bluffs: Canadian Geotechnical Journal, v. 14, p. 310-323.
Southeastern Wisconsin Regional Planning Commission, 1989, A Lake Michigan shoreline erosion management plan for Milwaukee County, Wisconsin: Southeastern Wisconsin Regional Planning Commission, Report 163, 536 p.
Sterrett, R.J., 1980, Factors and mechanics of bluff erosion on Wisconsin’s Great Lakes shorelines: Madison, University of Wisconsin, Ph.D. dissertation, 372 p.
Sterrett, R.J., and Edil, T.B., 1982, Ground-water flow systems and stability of a slope: Ground Water, v. 20, no. 1, p. 5-11.
Sunamura, T., and Horikawa, K., 1969, A study on erosion of coastal cliffs by using aerial photography: Coastal Engi-neering in Japan, v. 12, p. 99-120.
Trenhaile, A.S., 1997, Coastal dynamics and landforms: Oxford, U.K., Oxford University Press, 366 p.
U.S. Army Coastal Engineering Research Center, 1984, Shore Protection Manual, 4th ed.: Washington, D.C., U.S. Govern-ment Printing Office, 2 volumes.
U.S. Army Corps of Engineers, 1999, Living with the Lakes — understanding and adapting to Great Lakes water level changes: Ann Arbor, Michigan, Great Lakes Commission and U.S. Army Corps of Engineers, Detroit District, 39 p.
Vallejo, L.E., 1980, A new approach to the stability analysis of thawing slopes: Canadian Geotechnical Journal, v. 1, no. 3, p. 231-252.
Vallejo, L.E., and Edil, T.B., 1979, Design charts for development and stability of evolving slopes: Journal of Civil Engineer-ing Design, v. 1, no. 3, p. 231-252.
Vallejo, L.E., and Edil, T.B., 1981, Stability of thawing slopes—field and theoretical investigations: Stockholm, Sweden, 10th International Conference Soil Mechanics and Founda-tion Engineering, Proceedings, v. 3, p. 545-548.
Erosion of Coastal Bluffs in the Great Lakes