for life - dräger
TRANSCRIPT
ANNUAL REPORT 2008(AMENDED VERSION)
Technologyfor Life
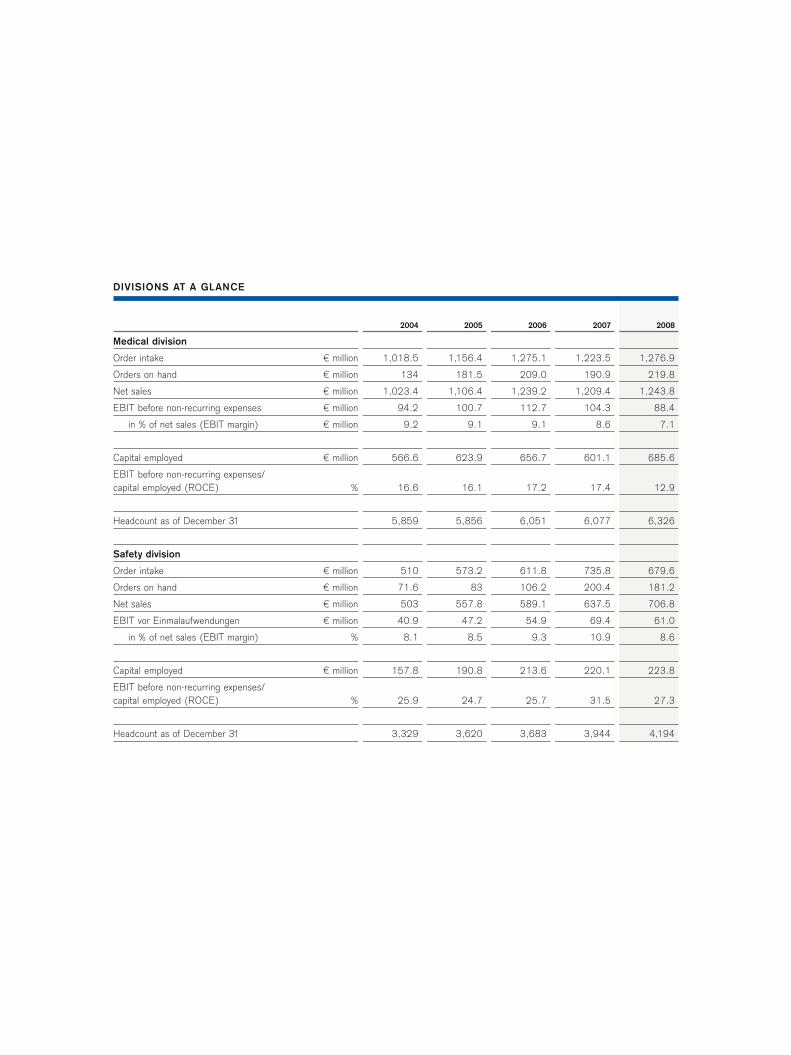
2004 2005 2006 2007 2008
Medical division
Order intake € million 1,018.5 1,156.4 1,275.1 1,223.5 1,276.9
Orders on hand € million 134 181.5 209.0 190.9 219.8
Net sales € million 1,023.4 1,106.4 1,239.2 1,209.4 1,243.8
EBIT before non-recurring expenses € million 94.2 100.7 112.7 104.3 88.4
in % of net sales (EBIT margin) € million 9.2 9.1 9.1 8.6 7.1
Capital employed € million 566.6 623.9 656.7 601.1 685.6
EBIT before non-recurring expenses/ capital employed (ROCE) % 16.6 16.1 17.2 17.4 12.9
Headcount as of December 31 5,859 5,856 6,051 6,077 6,326
Safety division
Order intake € million 510 573.2 611.8 735.8 679.6
Orders on hand € million 71.6 83 106.2 200.4 181.2
Net sales € million 503 557.8 589.1 637.5 706.8
EBIT vor Einmalaufwendungen € million 40.9 47.2 54.9 69.4 61.0
in % of net sales (EBIT margin) % 8.1 8.5 9.3 10.9 8.6
Capital employed € million 157.8 190.8 213.6 220.1 223.8
EBIT before non-recurring expenses/ capital employed (ROCE) % 25.9 24.7 25.7 31.5 27.3
Headcount as of December 31 3,329 3,620 3,683 3,944 4,194
DIVISIONS AT A GLANCE
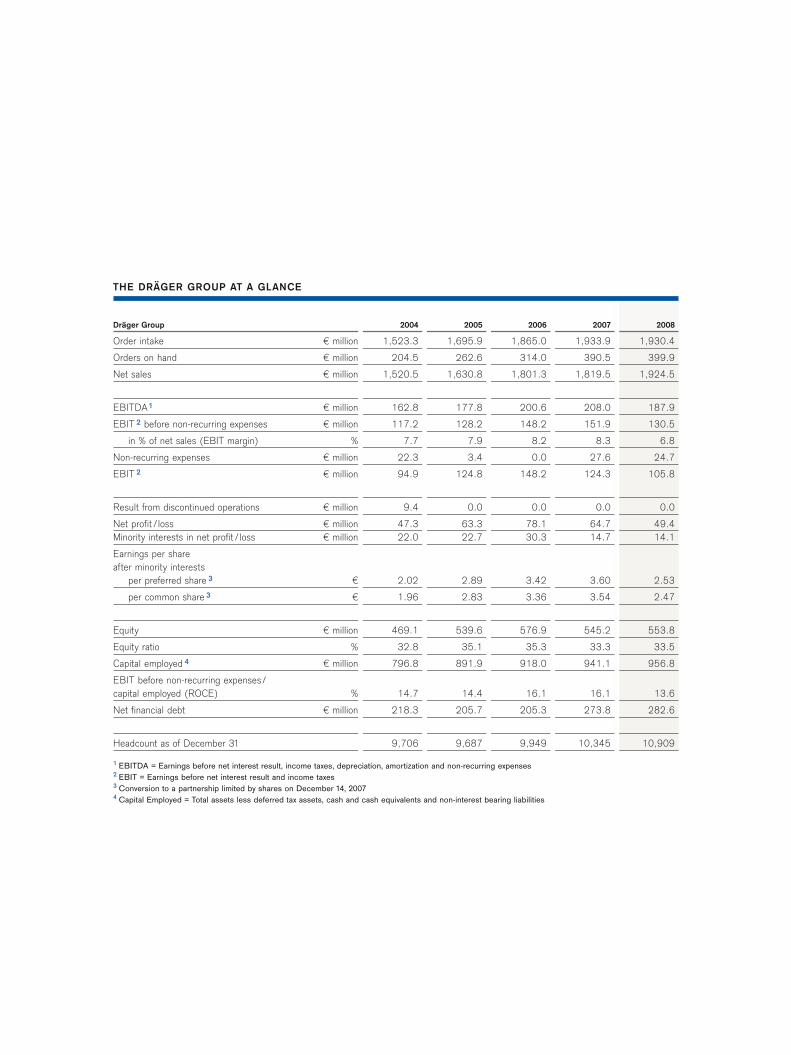
Dräger Group 2004 2005 2006 2007 2008
Order intake € million 1,523.3 1,695.9 1,865.0 1,933.9 1,930.4
Orders on hand € million 204.5 262.6 314.0 390.5 399.9
Net sales € million 1,520.5 1,630.8 1,801.3 1,819.5 1,924.5
EBITDA1 € million 162.8 177.8 200.6 208.0 187.9
EBIT 2 before non-recurring expenses € million 117.2 128.2 148.2 151.9 130.5
in % of net sales (EBIT margin) % 7.7 7.9 8.2 8.3 6.8
Non-recurring expenses € million 22.3 3.4 0.0 27.6 24.7
EBIT 2 € million 94.9 124.8 148.2 124.3 105.8
Result from discontinued operations € million 9.4 0.0 0.0 0.0 0.0
Net profit / loss € million 47.3 63.3 78.1 64.7 49.4Minority interests in net profit / loss € million 22.0 22.7 30.3 14.7 14.1
Earnings per share after minority interests
per preferred share 3 € 2.02 2.89 3.42 3.60 2.53
per common share 3 € 1.96 2.83 3.36 3.54 2.47
Equity € million 469.1 539.6 576.9 545.2 553.8
Equity ratio % 32.8 35.1 35.3 33.3 33.5
Capital employed 4 € million 796.8 891.9 918.0 941.1 956.8
EBIT before non-recurring expenses/capital employed (ROCE) % 14.7 14.4 16.1 16.1 13.6
Net financial debt € million 218.3 205.7 205.3 273.8 282.6
Headcount as of December 31 9,706 9,687 9,949 10,345 10,909
1 EBITDA = Earnings before net interest result, income taxes, depreciation, amortization and non-recurring expenses2 EBIT = Earnings before net interest result and income taxes3 Conversion to a partnership limited by shares on December 14, 20074 Capital Employed = Total assets less deferred tax assets, cash and cash equivalents and non-interest bearing liabilities
THE DRÄGER GROUP AT A GLANCE
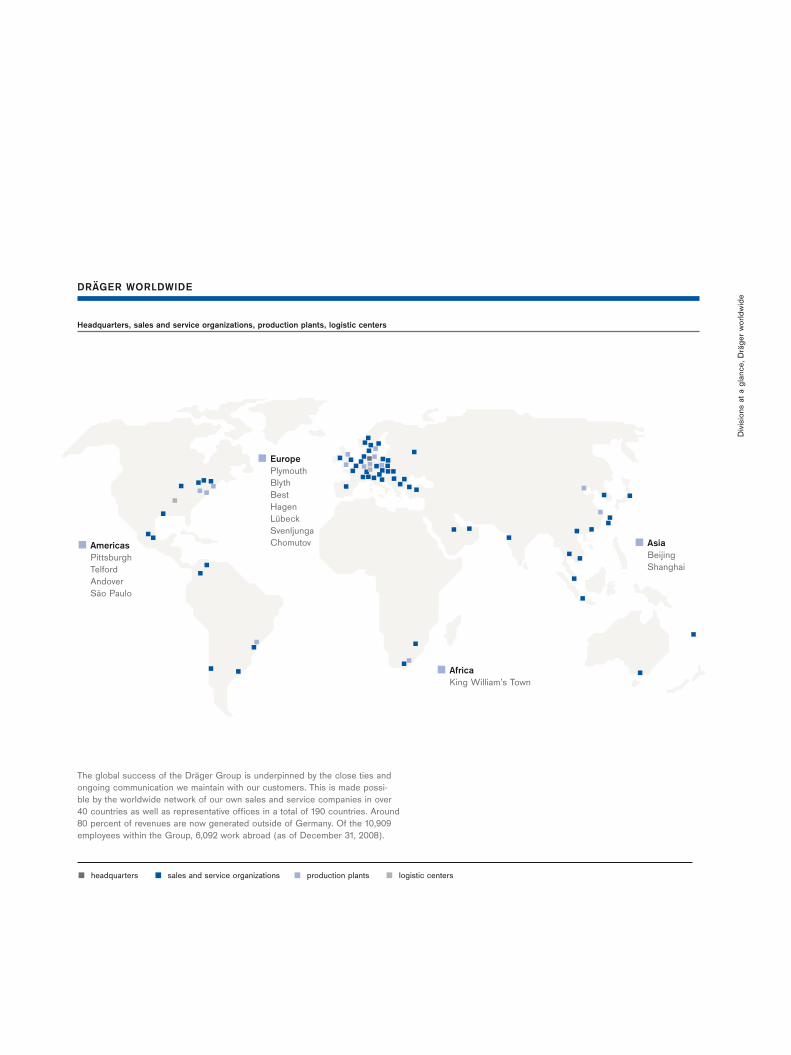
EuropePlymouthBlyth BestHagen Lübeck SvenljungaChomutovAmericas
PittsburghTelfordAndoverSão Paulo
Asia Beijing Shanghai
AfricaKing William’s Town
DRÄGER WORLDWIDE
Headquarters, sales and service organizations, production plants, logistic centers
Div
isio
ns a
t a
glan
ce, D
räge
r w
orld
wid
e
headquarters sales and service organizations production plants logistic centers
The global success of the Dräger Group is underpinned by the close ties andongoing communication we maintain with our customers. This is made possi-ble by the worldwide network of our own sales and service companies in over 40 countries as well as representative offices in a total of 190 countries. Around 80 percent of revenues are now generated outside of Germany. Of the 10,909employees within the Group, 6,092 work abroad (as of December 31, 2008).
In the past fiscal year, we failed to meet your expectations – with the very weak
performance of our share as well as with a profit warning in December. We
actually reduced our earnings forecast by 15 percent and before non-recurring
expenses generated EBIT of only EUR 130.7 million. There are numerous factors
which together are responsible for this significant deviation.
For example, cost pressure on customers at the end of the year was much higher
than we had expected. Since we normally generate some 50 percent of the operating
result in the fourth quarter, this effect had a particularly significant impact.
Furthermore, the relative strength of the US dollar in the US business lowered our
margins more than we had predicted. Another negative currency effect hit us in
Brazil where the depreciation of the Brazilian real affected our earnings in the fourth
quarter. In addition, bad debt allowances were necessary in relation to two major
customers.
That is disappointing. There is no nice way of putting it. We know that we have to
regain your trust.
We have, however, made significant progress which will improve our prospects: We
started with the Group Executive Board and created areas of responsibility for all
of the major functions of the Company to be represented there. The team has been
established and the positive effects of the structure are beginning to unfold.
At the same time, we began reducing the complexity of development, introducing
more efficient production processes, lowering production costs and introducing
strategic purchasing and more efficient logistics. A holistic customer management
system will put sales in a position to better take advantage of the potential of our
broad customer base.
We are successfully combining new technological developments and possibilities with
our in-depth knowledge of our customers’ requirements to make their everyday
lives even more successful. By doing so, we continuously set standards for the future
and shape the market.
In 2008, the safety division not only confirmed its positive sales and earnings trend,
but it also tapped into new markets. The basis for this sustainable development was
the functional structure introduced in 2006.
This structure was not introduced in the medical division until 2008, which means
that this division has left an eventful year behind it and is looking forward to a year
that will be just as exciting. The newly introduced regions for the safety and medical
divisions ensure that customer requirements and market potential around the
world are identified early so that the right innovations can be developed and quickly
launched in the markets. We will also be able to use cross-border shared services
in the future and relieve the sales companies of administrative tasks. We are very
confident that in this manner we can put the medical division on the same course
for earnings and growth that the safety division is on.
We will continue to make investments despite the challenges of trying to save.
This is one of the reasons why we are currently considering acquiring the 25 percent
share which Siemens AG still holds in our medical division. We would like to tap
this business segment’s potential for the sake of our customers, our employees and
for you as our shareholders. This acquisition would enable us to reduce complexity
and become an integrated technology group which makes full use of economies of
scope. This is an attractive opportunity, because we know the company we are
buying extremely well, there is no integration risk and we are convinced that we
would be able to considerably boost net sales and income in the medium term.
We would therefore like to ask for your understanding that we will be proposing a
dividend of EUR 0.35 per preferred share for fiscal year 2008 at the annual general
meeting, compared with EUR 0.55 in fiscal year 2007. We would like to invest the
capital you have entrusted us with to generate value. A lower dividend would make
this possible even if our earnings are lower.
We will rely on our proven strengths: customer intimacy, our employees, innovation
and quality. And we will draw on our proven decision-making structures to respond
quickly and decisively to changing conditions. If we are to achieve a sustained upswing
in the Dräger share price, we need to restore confidence in the capital market by
explaining our long-term prospects more convincingly. The continued development
of Dräger over 120 years shows how this is possible.
Thank you for placing your trust in us!
Sincerely, Stefan Dräger
SHAREHOLDER INFORMATION
Interview with the Executive Board 5The Executive Board 13Report of the Supervisory Board 14Report of the Joint Committee 19Corporate governance report 20The Dräger share 30
5
ANNUAL FINANCIAL STATEMENTS
Consolidated income statement of the Dräger Group –January 1 to December 31, 2008 129Consolidated balance sheet of the DrägerGroup as of December 31, 2008 130Consolidated statement of recognized income and expenses of the Dräger Group 132Consolidated cash flow statement of the Dräger Group 133
Notes of the Dräger Group for 2008 134Management compliance statement 203Auditor’s opinion 204Forward-looking statements 206
Single entity financial statements of Drägerwerk AG & Co. KGaA for 2008(condensed) 207The Company’s Boards 210Consolidated companies of the Dräger Group 214
129
ADDITIONAL INFORMATION
Glossary 221Imprint 226Financial calendar back coverReview of key events in 2008 back cover
PotentialOpportunities and risksrelating to future development 115
Disclosures pursuant to Sec. 315 (4) HGB and explanations by the general partner 119Subsequent events 123Outlook 124
221
MANAGEMENT REPORT
Market environmentChanges to the financial statements 2008 75Important changes in fiscal year 2008 75German Financial Reporting Enforcement Panel 76Group structure 76Control systems 78Overall economic environment 79
Business performanceBusiness performance of the Dräger Group 82Financial management of the Dräger Group 89Business performance of the medical division 92Business performance of the safety division 98Business performance of Drägerwerk AG & Co. KGaA/ other companies 104
Functional areasResearch and development 106Personnel 108Procurement, manufacturing and logistics 110Corporate IT 112Environmental protection 113
75
Contents2
Shareholder informationThe turbulent year on the stock market that was2008 posed significant challenges to Dräger.
Interview with the Executive Board 5The Executive Board 13Report of the Supervisory Board 14Report of the Joint Committee 19Corporate governance report 20The Dräger share 30
5
5The Executive Board The Dräger shareCorporate governance Interview Report of the Supervisory Board Joint Committee
Mr. Dräger, you reduced your earnings target by 15 percent.At least in the first half of the year, you had an economictailwind. What were the reasons for that? And what have youdone in order to “weatherproof” the Company for theimpending recession and the coming fiscal year? DRÄGER: As our business is not as sensitive to economic
conditions as other companies, the tailwind did not have
any notable impact on us. Conversely, we also face less
headwind in difficult periods. There were various aspects
which triggered the profit warning in December: the lag
in product development, the strong US dollar and higher
bad debt allowances. This is frustrating, but we responded
by increasing our research and development activities.
In the long term, the earnings prospects should of course
improve – and we want to achieve sustainable, profitable
growth. In the new functional areas we have much more
critical mass to maneuver than in the small, vertical units.
There is a good reason why the interaction and cooperation
of colleagues is focused on much more than before. All in
all, even more opportunities are open to Dräger.
A recession can also provide an opportunity to actively consolidate the market and take over less successful com-petitors in order to achieve more growth together. You are currently considering acquiring the 25 percent shareSiemens AG holds in your medical subsidiary.
DRÄGER: Acquiring the 25 percent share is a very attrac-
tive opportunity for us, because we believe that our medical
division still harbors an immense amount of untapped
potential. With the acquisition, we will decrease complexi-
ty and become an integrated technology group, making
full use of economies of scope. This is a far more attractive
prospect than taking over another market player: we
know the company we are buying extremely well, there is
no integration risk and we are convinced that we would
be able to considerably boost net sales and income in the
medium term.
Mr. Lescow, could Dräger actually realize major takeovers in the current refinancing environment? How secure is long-term financing? The share price performance was again disappointing in 2008 and a capital increase as a refinanc-ing instrument for takeovers is certainly not an option atthese prices. What criteria do you believe are necessary fora takeover and how do you see Dräger’s financing com-pared with that of the competition? LESCOW: We are always willing to participate in M&A
activities – assuming that we can expand our product
portfolio regionally or in terms of technology by doing so.
We will always be in a position to make smaller acquisi-
tions, even after acquiring the 25 percent share. Our long-
term financing is secure and stable – which is good news
It is in our hands
Dräger was faced with difficult tasks in fiscal year 2008. The membersof the Executive Board speak about the challenges and opportunities forthe Company.
Interview with the Executive Board6
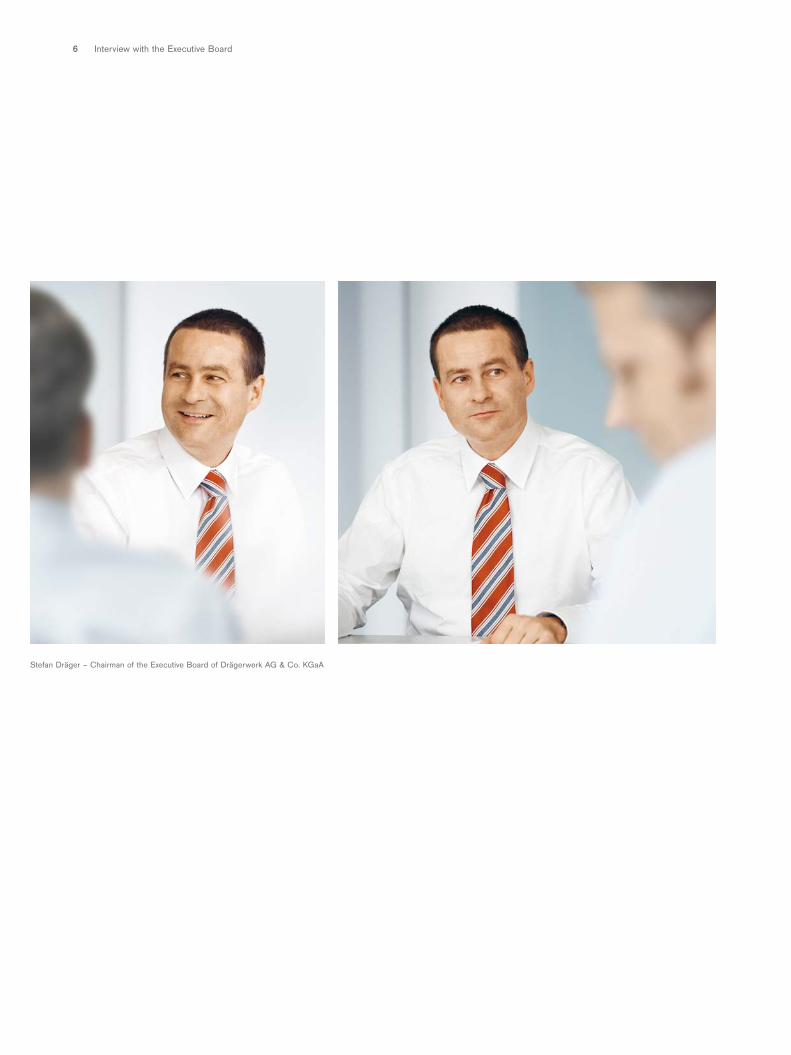
Stefan Dräger – Chairman of the Executive Board of Drägerwerk AG & Co. KGaA
7The Executive Board The Dräger shareCorporate governance Interview Report of the Supervisory Board Joint Committee
We will continue to deliver Technology for Life and will have customers in more countries than today. We will translate their require-ments into innovative solutions – by working better behind the scenes and by working together in close networks. We want to be the first choicefor all customers in all markets. Stefan Dräger
in these times. It comprises note loans or bilateral agree-
ments with reputable German banks and does not include
any ordinary termination rights, so there is no potential
risk from follow-up financing. I believe this is a definite
competitive advantage! I also believe that a ratio of 2.5
for net debt to earnings before interest, taxes, depreciation
and amortization (EBITDA) is most acceptable in the
medium term. Currently this ratio is 1.5, but a higher ratio
of 3.5 to 4.0 for a reasonable period of time would also
be feasible. It generally also makes good sense to be guided
by the dynamic level of debt, which shows the period of
time in which the debt could, in theory, be repaid using the
cash flow. Our goal should be not to exceed four years
medium term.
As a listed family-run company, how will you make yourselfattractive again, particularly for major institutional investors? A lower dividend is not really appealing. LESCOW: That’s true. But what matters to the sharehold-
ers is that we invest the capital they entrust us with in a
way that generates value. The lower dividend will make this
possible even if our earnings are lower. No argument is
more convincing for an investor than sustainable earnings
growth. We hope to achieve this primarily through
the measures introduced in the medical division – an opti-
mized process landscape and increased profitability. In
the safety division we have already proved that we can do
this. A policy of providing clear information still remains
important.
Mr. Dräger, you made fundamental changes to the Group’svalue chain between 2000 and 2007. These changes playeda key role in making the Company particularly attractive toinvestors in the past. A comparable theme seems to be miss-ing in your capital market communication. Can earnings beincreased again through similar restructuring?DRÄGER: We have focused on our core competencies and
outsourced some areas of production and support, which
has seen some some 1,200 employees from our headquar-
ters here in Lübeck transferred to suppliers. This signifi-
cantly reduced the added value of our own production: in
the medical division, it fell to 7 percent and in the safety
division to 9 percent. I am convinced that productivity can
be increased further if we all work even better together
under the motto: if Dräger knew what Dräger knows… I
know what knowledge and skills are available in the indi-
vidual areas, but unfortunately, this knowledge is not fully
accessible around the world.
That sounds like limited potential. What other opportunitiesdo you see instead? The restructuring of the medical divi-sion’s US business has not yet resulted in any measurablesuccess.
Interview with the Executive Board8
DRÄGER: We are taking advantage of numerous opportu-
nities, and improving idea management across the entire
Group makes a considerable contribution. Of course
we are also working on creating momentum again for the
medical division’s US business. In certain terms, we had
more than a 50 percent share of the market there several
years ago. It will just take some more time until we have
regained our old strength again. There are also a number
of other challenges which hold similar significant poten-
tial. Look at Japan, for example, the second largest single
market for medical technology.
In Japan, it appears that international providers still have adifficult time competing with the Japanese producers.Which attractive niches could Dräger still tap into in addi-tion to its current business?DRÄGER: Outside of the current business and customer
structure, there is very little likelihood of success accord-
ing to Ansoff’s product/market matrix. We would be
more likely to focus on the current customer requirements,
applications and technologies. Our thermal imaging
camera for firefighters is a good example of this: this prod-
uct was particularly interesting for this special group of
customers. But unfortunately, we did not have the technol-
ogy at our Company so we developed and produced it with
suppliers from the US in a strategic partnership.
Is Dräger indivisible, or are there areas that you can imagineselling?DRÄGER: The Company is not for sale as a whole and it
would not make sense to split it into two parts. However,
as in other companies, occasionally there are areas which
do not fit together as well anymore and have significantly
better opportunities for development elsewhere. In such
steps we focus more on the market and less on the cur-
rent structure of our legal entities. These entities all func-
tion according to defined processes and industry stan-
dards, which of course simplifies a carve-out. A generation
ago already, my father sold the autogenous welding and
the pneumatic regulating technology operations.
Dr. Thibaut, is it actually realistic to start joint developmentprojects i.e., for both the medical and the safety divisions?What does the breathalyzer from the safety division have incommon with the ventilator from the medical division?THIBAUT: Well, at first glance, those types of devices natu-
rally appear very different in terms of size and area of
application as well as the life cycle or the requirements for
licensing. Both devices, however, have gas sensors, con-
trol electronics and software, power supplies, user inter-
faces and much more which could be housed under the
same technology and application umbrella. If we look more
in depth, there are certainly features and components
which are found in both divisions. In the future, we will use
economies of scale here and focus our know-how fur-
ther in order to generate additional contributions to added
value with our existing employees and budgets. Just
think about the issue of technology platforms: today we use
a very wide range of software development and design
tools as well as strategic suppliers who would work more
efficiently if working methods were converged more.
Now you want to actually function across divisions, butapparently have already had difficulties with the introductionof the product components of “Infinity ACS”, which wassupposed to be “the first standardized platform with particu-larly high-performance individual components for patientmonitoring, therapy functions and information management.”THIBAUT: “Infinity ACS” was and still is indeed a very
complex project which poses significant challenges for our
entire organization. It will bear fruit when new devices
and combinations are created based on the developed mod-
ule, also in terms of speed and efficiency. Lasting one
year, the development of a new acute ventilator for infants
based on the “Infinity ACS” platform will then take
less time than a new development. We have also already
demonstrated the coupling of devices, such as the inte-
gration of monitoring and ventilation, on the basis of this
system architecture. By re-using components, we can
drive future developments more quickly. This is clear in
9The Executive Board The Dräger shareCorporate governance Interview Report of the Supervisory Board Joint Committee
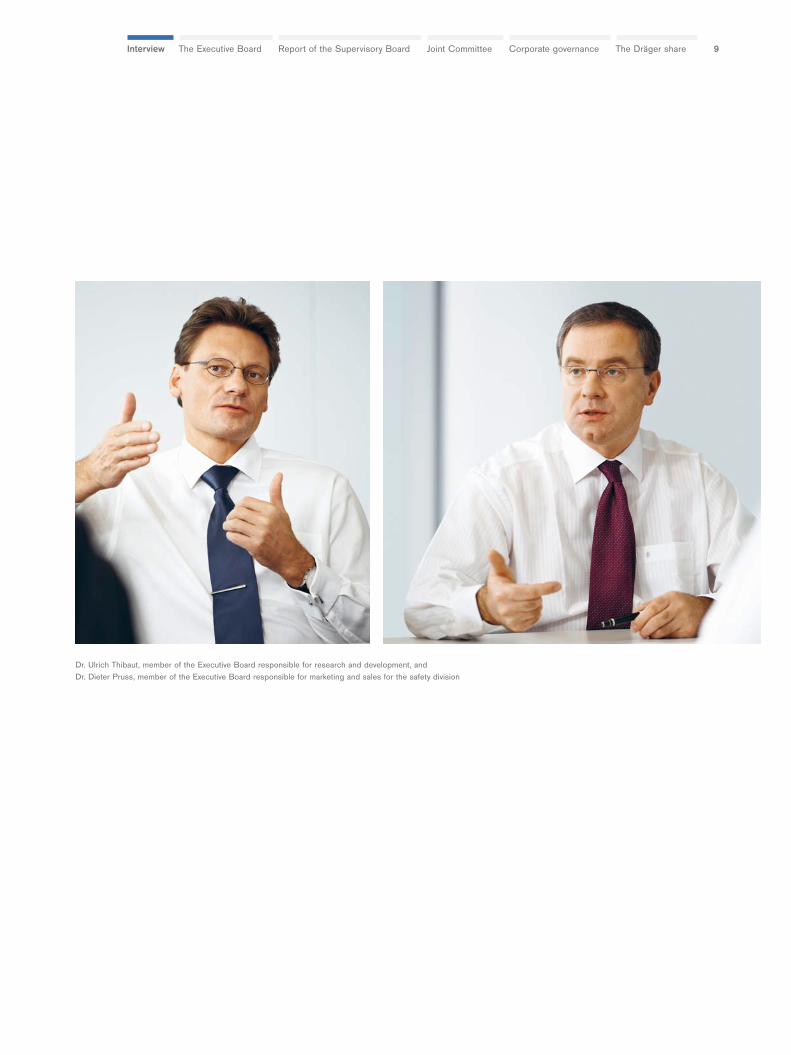
Dr. Ulrich Thibaut, member of the Executive Board responsible for research and development, and Dr. Dieter Pruss, member of the Executive Board responsible for marketing and sales for the safety division
Interview with the Executive Board10
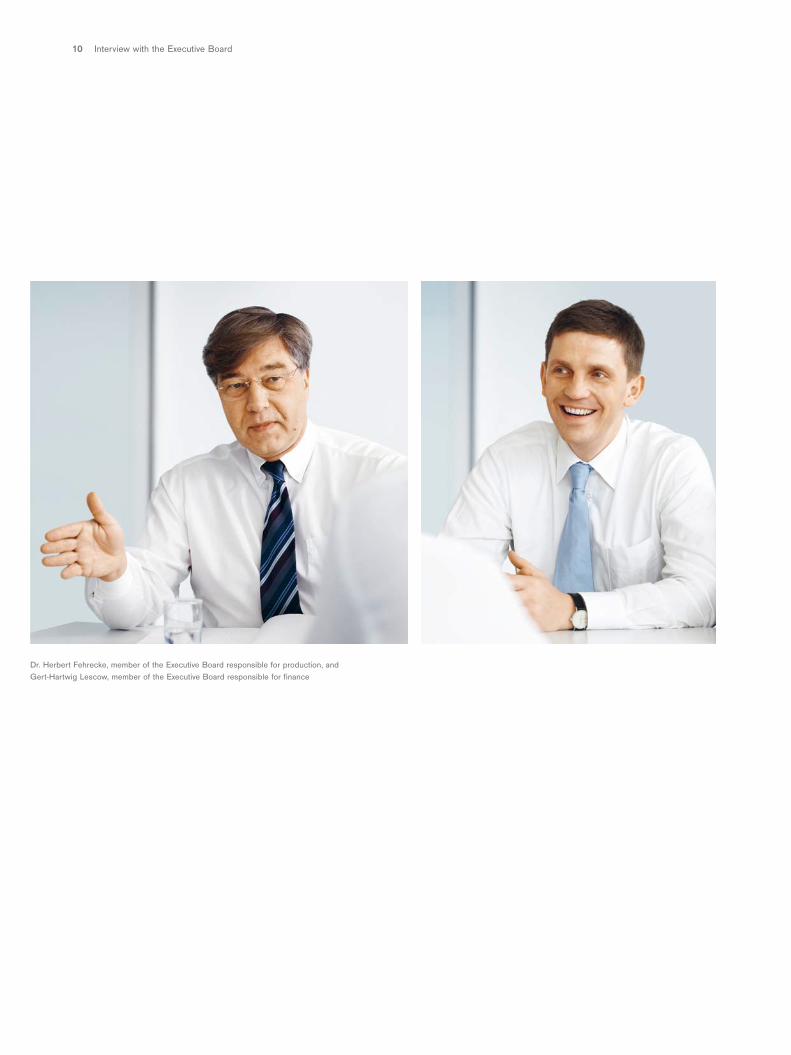
Dr. Herbert Fehrecke, member of the Executive Board responsible for production, and Gert-Hartwig Lescow, member of the Executive Board responsible for finance
The Executive Board The Dräger shareCorporate governance Interview Report of the Supervisory Board Joint Committee 11
the product roadmap recently prepared by the medical
division. This way, the medical “Cockpit C500” introduced
with “Evita Infinity V500” will also be found in other
devices. We are also putting this modular principle to use
in the safety division: a platform has also been created
for respiratory protection systems such as the “Dräger PSS
7000”, which can be expanded continuously and adjusted
to meet customer requirements.
Dräger has again invested some 7 percent in research anddevelopment. Does this not limit profitability?THIBAUT: Exactly the opposite is true: profitability increas-
es when new products are launched. That is why we are
continuously investing in product development. Profit mar-
gins for new products are usually significantly higher
than those that have been on the market for a long time
and are often under constant price pressure. In the past
few years, we actually had to struggle with a lower percent-
age of new products, based on the entire portfolio and
total sales. We are trying to offset this development by bet-
ter synchronizing market launches and making targeted
investments in new devices and accessories as well as less
extensive model upgrading of aging products.
Dr. Fehrecke, what contributions can production make tohigher profitability in light of this?
FEHRECKE: Production, logistics and quality are the
bottleneck when it comes to processing orders quickly,
flexibly and by the desired delivery date. Of course the
quality of Technology for Life will be maintained. The
goal is zero errors, irrespective of whether the issue
is product quality, life cycle, cost, delivery or service. The
closer we get to this goal, the bigger the resulting
competitive advantage.
As a manager from the automotive industry, you are used to creating efficient production structures with low margins of error and cost-effective platform strategies. Doesmedical technology still have a long way to go?FEHRECKE: At Dräger, we have introduced the Kaizen
method of continual and rapid improvement together with
the employees. And this has been very successful, increas-
ing productivity at some sites by 25 percent. We are aim-
ing for between 3 percent and 5 percent for the Company.
We are now introducing this method, which we call
PRIME, around the world in the administrative and IT-
based units.
Dr. Pruss, what were the most important milestones for you in the safety division and which products and customersegments actually still promise to stimulate growth in 2009?PRUSS: We look back at a very successful fiscal year.
We reached our strategic goal of net sales growth of 10 per-
Of course the quality of Technology for Life will be maintained.The goal is zero errors, irrespective of whether the issue is product quality, life cycle, cost, delivery or service. The closer we get to this goal,the bigger the resulting competitive advantage. Dr. Herbert Fehrecke
Interview with the Executive Board I The Executive Board12
cent, which would have been higher had it not been for the
dampening effects of exchange rates. Furthermore, we
maintained our strong market position in Europe and even
significantly expanded in the Asia/Pacific region. Profi-
tability improved overall in China in particular. In addition,
orders from Indonesia (stationary gas detection prod-
ucts), Taiwan (semi-conductor industry) and China (min-
ing) also contributed to this trend. The first saturation
diving equipment for a diving support vessel of a Norwe-
gian customer was launched in April 2008. In the US,
we successfully launched a new self-contained breathing
apparatus on the market after we obtained approval from
the National Fire Protection Association (NFPA) in May
2008 and won some significant major orders from fire
services (US state of Arizona). In 2009, we want to set fur-
ther standards with our range of products for fire serv-
ices. High hopes are also placed on alcohol and drug mea-
sur-ing instruments and the new drug screening device
introduced in May, the “Dräger DrugTest 5000.”
Do you think that the competitive environment will remainthe same or do you think that the emerging countries such as India or China will soon produce strong new com-petitors?PRUSS: We have found that other global players are
investing in exactly those markets that are attractive for
us. Of course, this spurs us on, even though these com-
panies are significantly larger than us. We will focus on
those areas where we can become the global market
leader. Chinese and Indian providers currently pose less
of a threat than joint ventures comprised of US, Tai-
wanese and Chinese companies whose success we moni-
tor very carefully.
Mr. Dräger, are the market entry barriers in medical tech-nology high enough and will you be able to maintain yourcompetitive headstart in the IT-intensive areas? After all, you are up against significantly larger groups with “deeppockets.”
DRÄGER: The market entry barriers for medical devices
tend to be lower and the competition from China or other
emerging markets will come to a head. We are also
expanding our system solution competence further. This
is particularly challenging for IT-intensive areas, for
everyone involved. This market is also not yet fully formed.
Evidently, large, all-encompassing solutions are so
complex that nobody is currently in a position to manage
them. The trend is moving toward special solutions,
which also offers us several interesting opportunities.
You said that you will avoid getting drawn into thinking inquarters and that instead the Company wants to focus onlong-term development trends. What will Dräger look like in20 to 25 years?DRÄGER: We will continue to deliver Technology for Life
and will have customers in more countries than today.
We will translate their requirements into innovative solu-
tions – by working better behind the scenes and by
working together in close networks. We want to be the first
choice for all customers in all markets.
13The Executive Board The Dräger shareCorporate governance Interview Report of the Supervisory Board Joint Committee
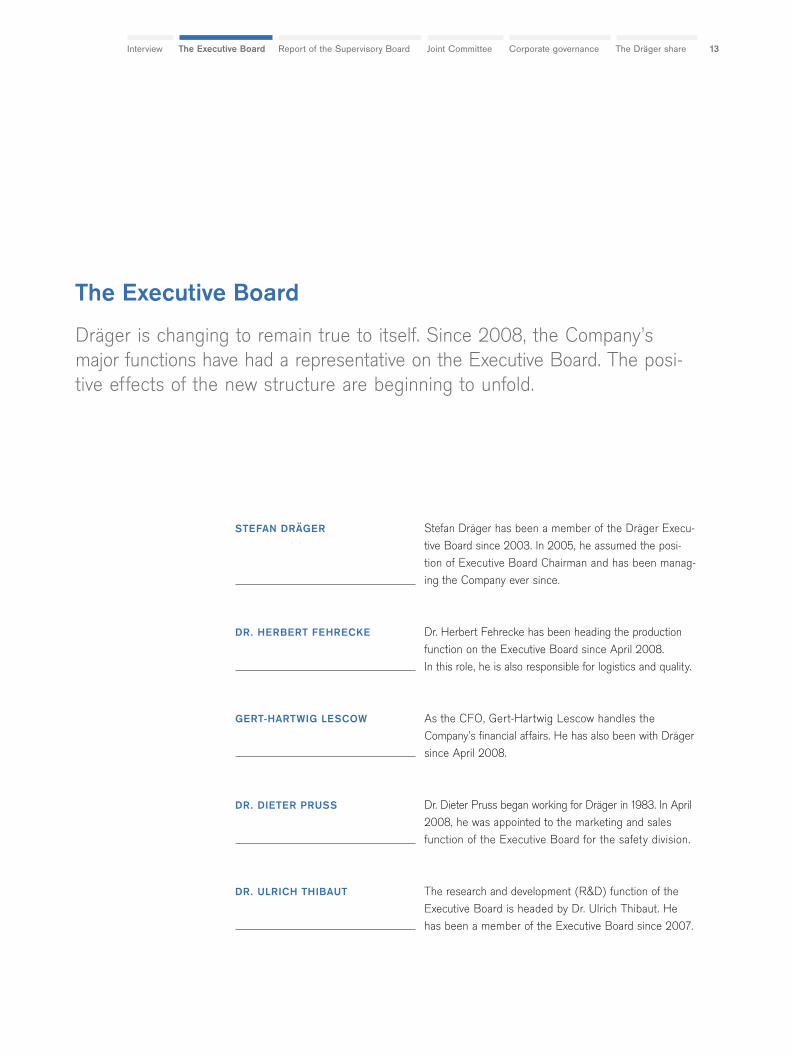
The Executive Board
Dräger is changing to remain true to itself. Since 2008, the Company’smajor functions have had a representative on the Executive Board. The posi-tive effects of the new structure are beginning to unfold.
STEFAN DRÄGER
DR. HERBERT FEHRECKE
GERT-HARTWIG LESCOW
DR. DIETER PRUSS
DR. ULRICH THIBAUT
Stefan Dräger has been a member of the Dräger Execu-tive Board since 2003. In 2005, he assumed the posi-tion of Executive Board Chairman and has been manag-ing the Company ever since.
Dr. Herbert Fehrecke has been heading the productionfunction on the Executive Board since April 2008. In this role, he is also responsible for logistics and quality.
As the CFO, Gert-Hartwig Lescow handles the Company’s financial affairs. He has also been with Drägersince April 2008.
Dr. Dieter Pruss began working for Dräger in 1983. In April2008, he was appointed to the marketing and salesfunction of the Executive Board for the safety division.
The research and development (R&D) function of theExecutive Board is headed by Dr. Ulrich Thibaut. Hehas been a member of the Executive Board since 2007.
14
Dear shareholders,
In fiscal year 2008 we continued to carefully and regularly monitor the work of the man-
agement, performed by the Executive Board of the general partner, in accordance
with the law, the articles of association and the corporate governance code, and provide
advice on the strategic development of the Company as well as all major individual
measures. The Supervisory Board was involved in all decisions of importance to the Com-
pany. The basis for these decisions were the extensive written and oral reports by the
management. Even outside of the Supervisory Board meetings, the Chairman of the Super-
visory Board was regularly informed by the Chairman of the Executive Board about the
current business developments and major transactions.
MEETINGS
At five regular meetings and two special meetings, the Supervisory Board dealt in
detail with the business and strategic development of the Dräger Group, the divisions
and their German and foreign subsidiaries and closely advised the Executive Board
on such matters. All meetings were, with a few exceptions, attended by all Supervisory
Board members. No member took part in less than half of the Supervisory Board’s
meetings.
FOCAL POINTS OF THE SUPERVISORY BOARD DELIBERATIONS
The further development of the Group, particularly the creation of a functional struc-
ture, was one of the focuses of our discussions. Another focus was the improvement
of the existing IT system landscape with the aim of eliminating the current heterogene-
ity and creating an effective tool for customer management.
The business performance of the medical division in the US was another major focus.
Report of the Supervisory Board
The Supervisory Board of Drägerwerk AG & Co. KGaA convened in May2008 after the ordinary election of new members. In the fiscal year, the trust-based working relationship between the Supervisory Board andthe Executive Board was once again testimony to a corporate culture based on transparency and mutual respect.
Report of the Supervisory Board
15The Executive Board The Dräger shareCorporate governance Interview Report of the Supervisory Board Joint Committee
The Supervisory Board discussed the issue of product development for the medical division
in detail and the possibility of accelerating the launch of some products.
The Supervisory Board held a joint all-day strategic meeting with the management in the
fall to discuss the medium and long-term prospects of the Company and its divisions.
We were particularly interested in the cost and earnings situation of the various product
groups and opportunities and risks in the various regions.
The planning presented for fiscal year 2009 was approved by the Joint Committee, which is
responsible for approving the catalog of transactions requiring approval, in its meeting
on December 15, 2008. In connection with the discussion of the planning for the individ-
ual divisions, potential effects from the global financial crisis were also discussed in
depth. Furthermore, the management provided an overview of the Company’s financing.
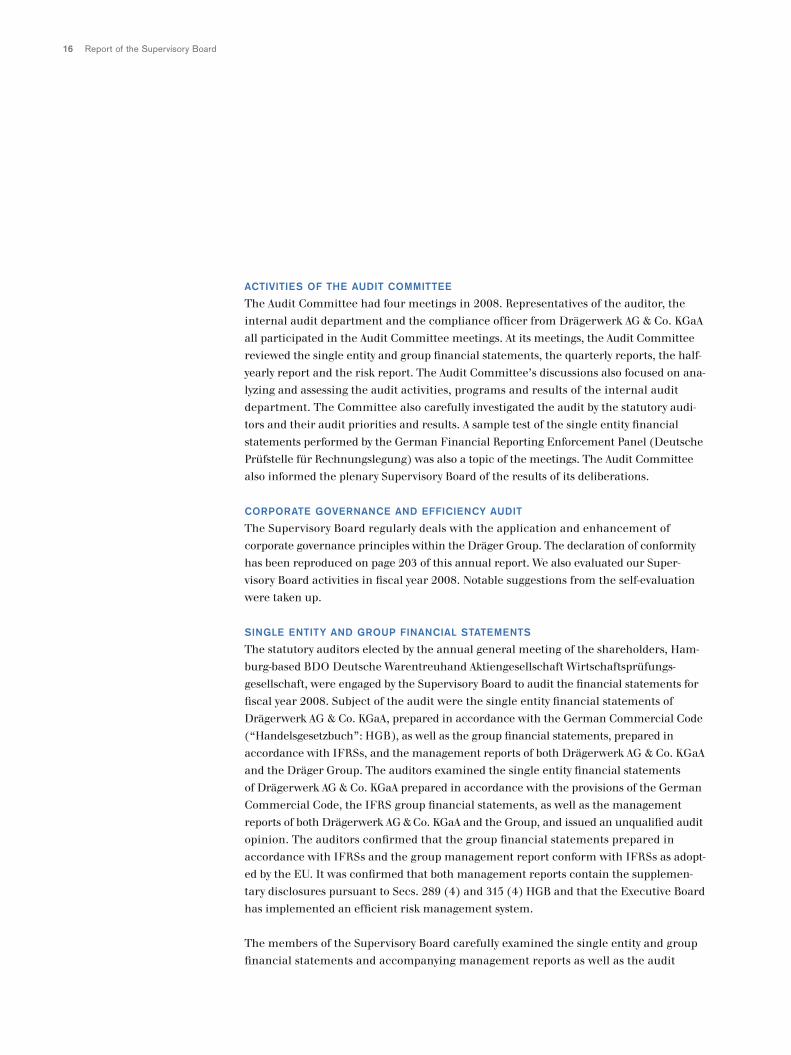
Prof. Dr. Nikolaus Schweickart – Chairman of the Supervisory Board
Report of the Supervisory Board16
ACTIVITIES OF THE AUDIT COMMITTEE
The Audit Committee had four meetings in 2008. Representatives of the auditor, the
internal audit department and the compliance officer from Drägerwerk AG & Co. KGaA
all participated in the Audit Committee meetings. At its meetings, the Audit Committee
reviewed the single entity and group financial statements, the quarterly reports, the half-
yearly report and the risk report. The Audit Committee’s discussions also focused on ana-
lyzing and assessing the audit activities, programs and results of the internal audit
department. The Committee also carefully investigated the audit by the statutory audi-
tors and their audit priorities and results. A sample test of the single entity financial
statements performed by the German Financial Reporting Enforcement Panel (Deutsche
Prüfstelle für Rechnungslegung) was also a topic of the meetings. The Audit Committee
also informed the plenary Supervisory Board of the results of its deliberations.
CORPORATE GOVERNANCE AND EFFICIENCY AUDIT
The Supervisory Board regularly deals with the application and enhancement of
corporate governance principles within the Dräger Group. The declaration of conformity
has been reproduced on page 203 of this annual report. We also evaluated our Super-
visory Board activities in fiscal year 2008. Notable suggestions from the self-evaluation
were taken up.
SINGLE ENTITY AND GROUP FINANCIAL STATEMENTS
The statutory auditors elected by the annual general meeting of the shareholders, Ham-
burg-based BDO Deutsche Warentreuhand Aktiengesellschaft Wirtschaftsprüfungs-
gesellschaft, were engaged by the Supervisory Board to audit the financial statements for
fiscal year 2008. Subject of the audit were the single entity financial statements of
Drägerwerk AG & Co. KGaA, prepared in accordance with the German Commercial Code
(“Handelsgesetzbuch”: HGB), as well as the group financial statements, prepared in
accordance with IFRSs, and the management reports of both Drägerwerk AG & Co. KGaA
and the Dräger Group. The auditors examined the single entity financial statements
of Drägerwerk AG & Co. KGaA prepared in accordance with the provisions of the German
Commercial Code, the IFRS group financial statements, as well as the management
reports of both Drägerwerk AG & Co. KGaA and the Group, and issued an unqualified audit
opinion. The auditors confirmed that the group financial statements prepared in
accordance with IFRSs and the group management report conform with IFRSs as adopt-
ed by the EU. It was confirmed that both management reports contain the supplemen-
tary disclosures pursuant to Secs. 289 (4) and 315 (4) HGB and that the Executive Board
has implemented an efficient risk management system.
The members of the Supervisory Board carefully examined the single entity and group
financial statements and accompanying management reports as well as the audit
17The Executive Board The Dräger shareCorporate governance Interview Report of the Supervisory Board Joint Committee
reports. Representatives of the statutory auditors attended the Audit Committee’s meet-
ing on March 11, 2009 during which Dräger’s single entity and group financial
statements were deliberated on as well as the Supervisory Board’s meeting on March 12,
2009 to discuss the financial statements. These representatives reported on the per-
formance of the audit and were available to provide additional information. At these
meetings, the Executive Board elucidated the single entity financial statements of
Drägerwerk AG & Co. KGaA and the group financial statements along with the risk man-
agement system. On the basis of the audit reports on the single entity and group
financial statements and the management report, the Audit Committee came to the con-
clusion that both sets of financial statements with their respective management
reports give a true and fair view of the net assets, financial position and results of opera-
tions in accordance with the applicable financial reporting framework. To do so, the
Audit Committee deliberated on significant asset and liability items and their valuation
as well as the presentation of the results of operations and the development of certain
key figures. The chairman of the Audit Committee reported on the discussions to the
Supervisory Board. Further questions by members of the Supervisory Board led to a
more detailed discussion of the results. The Supervisory Board was convinced that the
dividend recommendation was fitting considering the net assets, financial position
and results of operations. The liquidity of the Company and the interests of the sharehold-
ers have been taken into account in equal measure and the decision does not impede
the Company’s conservative accounting policies. There were no reservations concerning
the efficiency of management’s actions. Based on the conclusions drawn by the Audit
Committee following its own preliminary review and its own examination, the Super-
visory Board agrees with the audit conclusion reached by the statutory auditors on
the single entity and group financial statements and management reports of Drägerwerk
AG & Co. KGaA. Following our own final examination, we raise no objections to the sub-
mitted sets of financial statements and management reports.
We reviewed and approved the single entity financial statements of Drägerwerk AG &
Co. KGaA prepared by the general partner and the group financial statements of
Drägerwerk AG & Co. KGaA as well as the management reports submitted to us. The
financial statements of Drägerwerk AG & Co. KGaA must be approved by the annual
general meeting of the shareholders. We agree with the recommendation made by the
general partner to approve the financial statements of Drägerwerk AG & Co. KGaA.
This also applies to the general partner’s proposal concerning the appropriation of net
earnings.
MEMBERS OF MANAGEMENT
In fiscal year 2008, three new members were appointed to the Executive Board of
Drägerwerk Verwaltungs AG, which functions as the general partner. Dr. Herbert Fehrecke
18 Report of the Supervisory Board I Report of the Joint Committee
took charge of production, logistics and IT, Gert-Hartwig Lescow took over the manage-
ment of finance and Dr. Dieter Pruss became the head of marketing and sales for the safety
division. We wish them every success in their positions. Prof. Albert Jugel and Hans-Oskar
Sulzer resigned as members of the Executive Board as of March 31, 2008. The Supervisory
Board would like to take this opportunity to thank these gentlemen for their service.
NEW ELECTION OF SUPERVISORY BOARD MEMBERS
After the expiration of the five-year term of office of the previous Supervisory Board, the
annual general meeting of Drägerwerk AG & Co. KGaA on May 9, 2008 elected Prof.
Nikolaus Schweickart, Dr. Thorsten Grenz, Uwe Lüders, Jürgen Peddinghaus, Dr. Klaus
Rauscher and Dr. Reinhard Zinkann to the Supervisory Board. Daniel Friedrich,
Siegfried Kasang, Bernd Mussmann, Walter Neundorf, Thomas Rickers and Ulrike
Tinnefeld were elected as employee representatives on April 8, 2008 in accordance with
the provisions of the German Codetermination Act (“Mitbestimmungsgesetz”:
MitbestG). At its constituent meeting, the newly appointed Supervisory Board elected
Prof. Nikolaus Schweickart as Chairman. The six newly elected shareholder representa-
tives also make up the Supervisory Board of the general partner, Drägerwerk Verwaltungs
AG, with Prof. Nikolaus Schweickart as the Chairman. This Supervisory Board performs
the function of the former Executive Committee (Executive Board matters). It held three
meetings.
CONFLICTS OF INTEREST
There were no conflicts of interests involving members of the Executive and Supervisory
Boards, which must be disclosed to the Supervisory Board without delay and about which
the annual general meeting of the shareholders must be informed. The Supervisory
Board would like to express its recognition of the Executive Board for its successful work
in the fiscal year. Furthermore, the Supervisory Board thanks the management and
all employees, including employee representatives, for their hard work in fiscal year 2008.
Lübeck, Germany, March 12, 2009
Prof. Nikolaus Schweickart
Supervisory Board Chairman
19The Executive Board The Dräger shareCorporate governance Interview Report of the Supervisory Board Joint Committee
Dear shareholders,
Since the change in legal form to a partnership limited by shares in 2007, the Com-
pany has had a Joint Committee as an additional voluntary body which comprises four
members of the Supervisory Board of the general partner and two members repre-
senting the shareholders and the employee representatives of the Supervisory Board of
Drägerwerk AG & Co. KGaA. The Chairman of the Supervisory Board is Prof. Nikolaus
Schweickart. This committee is responsible for the catalog of management transactions
requiring approval (pursuant to Sec. 111 (4) Sentence 2 AktG [“Aktiengesetz”: German
Stock Corporation Act]). The Joint Committee convened three times in 2008.
Lübeck, Germany, March 12, 2009
Prof. Nikolaus Schweickart
Supervisory Board Chairman
Report of the Joint Committee
Partnership limited by shares I Declaration of conformity20
Dräger has always attached great importance to corporate
governance as management and control which is focused
on a responsible, transparent and long-term increase in
the value of the Company. To emphasize this, we will con-
tinue to apply the German Corporate Governance Code –
which is only aimed at stock corporations – even after the
transformation of Drägerwerk AG into Drägerwerk AG &
Co. KGaA. The corporate governance report describes the
features of the management and control structure and
the significant rights of the shareholders in Drägerwerk
AG & Co. KGaA and explains the special features com-
pared to a stock company.
Partnership limited by shares
“A partnership limited by shares (KGaA) is a company
with a separate legal personality where at least one part-
ner is fully liable to the company’s creditors (general
partner) and the remaining shareholders have a financial
interest in the capital stock, which is divided into shares,
without being personally liable for the company’s liabilities
(limited shareholders)” (Sec. 278 [1] AktG). Hence it
is a hybrid between a stock corporation and a limited part-
nership, with a greater emphasis on the stock corpora-
tion side.
As is the case in a stock corporation, a partnership limited
by shares has a two-tier management and oversight struc-
ture by law. The general partner manages the company and
its operations, and the supervisory board oversees the
company’s management. Significant differences compared
to a stock corporation are the existence of a general
partner, which manages operations, the absence of an
executive board, and the restriction of the rights and
obligations of the supervisory board. The supervisory board
is not responsible for appointing the general partner or
its management bodies or for determining their contractu-
al conditions, whereas in a stock corporation it appoints
the executive board. In a partnership limited by shares, the
supervisory board is not legally authorized to adopt rules
of procedure for the company’s management or a catalog
of transactions requiring approval. There are also differ-
ences relating to the annual general meeting of the share-
holders. Certain of its resolutions must be approved by
the general partner (Sec. 285 [2] AktG), in particular the
resolution to approve the financial statements (Sec. 286
[1] AktG). Many of the recommendations of the German
Corporate Governance Code (hereinafter also referred
to as the “Code”), which is designed for stock corporations,
can thus only be applied by analogy to a partnership lim-
ited by shares.
Corporate governance report
Corporate governance at Dräger represents responsible business manage-ment. It promotes the confidence of investors, customers, employees and the public. The recommendations of the German Corporate Governance CodeGovernment Commission are applied with only a few exceptions.
21The Executive Board The Dräger shareCorporate governance Interview Report of the Supervisory Board Joint Committee
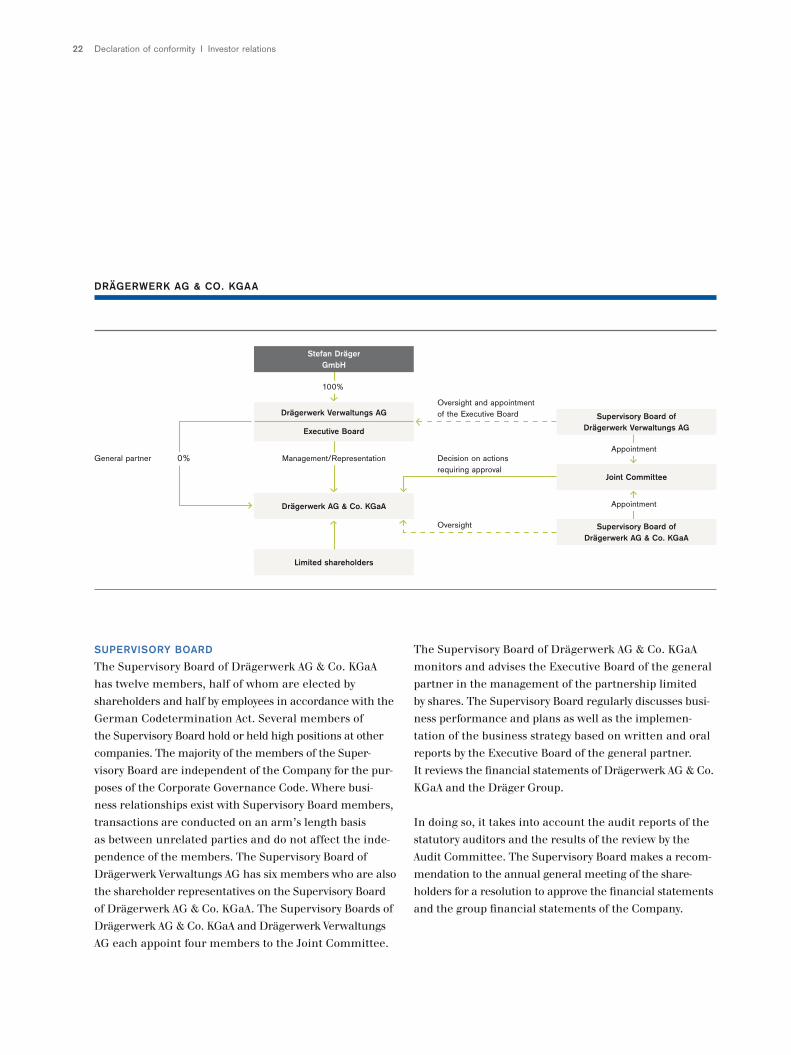
The sole general partner of Drägerwerk AG & Co. KGaA is
Dräger Verwaltungs AG, which does not hold an equity
interest and is a wholly-owned company of Stefan Dräger
GmbH. Drägerwerk Verwaltungs AG manages the oper-
ations of Drägerwerk AG & Co. KGaA and represents it. It
acts through its Executive Board.
Stefan Dräger GmbH appoints the six members of the
Supervisory Board of Drägerwerk Verwaltungs AG. They are
currently identical to the shareholder representatives
on the Supervisory Board of Drägerwerk AG & Co. KGaA.
The Supervisory Board of Drägerwerk Verwaltungs AG
does not have any employee representatives. It appoints
the Executive Board of Drägerwerk Verwaltungs AG.
The Supervisory Board of Drägerwerk AG & Co. KGaA,
which has twelve members, has half of its members elect-
ed by employees. Its chief purpose is to oversee the
management by the general partner. It cannot appoint or
remove the general partner or its Executive Board. Nor is
it authorized to define a catalog of management transac-
tions for the general partner which require the approval
of the Supervisory Board. Moreover, it is not the Super-
visory Board but the annual general meeting of the share-
holders that must approve the financial statements of
Drägerwerk AG & Co. KGaA.
Pursuant to Art. 22 of the Company’s articles of associa-
tion, a Joint Committee has been set up as a voluntary,
additional body. It comprises eight members. Four mem-
bers each are appointed by the Supervisory Boards of
Drägerwerk Verwaltungs AG and Drägerwerk AG & Co.
KGaA. The Supervisory Board of Drägerwerk AG & Co.
KGaA must appoint two shareholder representatives and
two employee representatives. The Joint Committee
decides on the extraordinary management transactions by
the general partner which require approval as set out
in Art. 23 (2) of the articles of association of Drägerwerk
AG & Co. KGaA.
Declaration of conformity
The joint declaration of conformity by the general partner
and the Supervisory Board of Drägerwerk AG & Co. KGaA
was discussed and approved in the meeting of the Super-
visory Board of the Company on December 15, 2008. It
states that the recommendations of the German Corporate
Governance Code Government Commission were applied
with only a few exceptions.
The following declaration was published on December
19, 2008:
“The general partner, represented by its Executive Board,
and the Supervisory Board, declare that Drägerwerk AG &
Co. KGaA acted on the recommendations of the German
Corporate Governance Code Government Commission,
as amended on June 14, 2007, from the date of the issue of
its previous declaration of conformity on December 19,
2007 until August 8, 2008 and that since August 9, 2008, it
has acted on the recommendations as amended on June
6, 2008. This applies subject to the following exceptions:
1. The voting (limited) capital stock is solely owned directly
or indirectly by the Dräger family. Therefore, the rec-
ommendation to appoint a corporate voting proxy for
exercising the voting right of shareholders on their
instructions at the annual general meeting of the share-
holders is unnecessary (2.3.3 clause 3 of the Code).
2. No age limit has been specified for Supervisory Board
members, nor will it be (5.4.1 of the Code). In view of
the knowledge, abilities and professional experience
required in 5.4.1 sentence 1 of the Code, the specifica-
tion of an age limit does not appear appropriate.”
The reasons for the aforesaid exceptions from certain
recommendations of the Code are largely explained in the
declaration of conformity.
Declaration of conformity I Investor relations22
SUPERVISORY BOARD
The Supervisory Board of Drägerwerk AG & Co. KGaA
has twelve members, half of whom are elected by
shareholders and half by employees in accordance with the
German Codetermination Act. Several members of
the Supervisory Board hold or held high positions at other
companies. The majority of the members of the Super-
visory Board are independent of the Company for the pur-
poses of the Corporate Governance Code. Where busi-
ness relationships exist with Supervisory Board members,
transactions are conducted on an arm’s length basis
as between unrelated parties and do not affect the inde-
pendence of the members. The Supervisory Board of
Drägerwerk Verwaltungs AG has six members who are also
the shareholder representatives on the Supervisory Board
of Drägerwerk AG & Co. KGaA. The Supervisory Boards of
Drägerwerk AG & Co. KGaA and Drägerwerk Verwaltungs
AG each appoint four members to the Joint Committee.
The Supervisory Board of Drägerwerk AG & Co. KGaA
monitors and advises the Executive Board of the general
partner in the management of the partnership limited
by shares. The Supervisory Board regularly discusses busi-
ness performance and plans as well as the implemen-
tation of the business strategy based on written and oral
reports by the Executive Board of the general partner.
It reviews the financial statements of Drägerwerk AG & Co.
KGaA and the Dräger Group.
In doing so, it takes into account the audit reports of the
statutory auditors and the results of the review by the
Audit Committee. The Supervisory Board makes a recom-
mendation to the annual general meeting of the share-
holders for a resolution to approve the financial statements
and the group financial statements of the Company.
DRÄGERWERK AG & CO. KGAA
Drägerwerk AG & Co. KGaA
Supervisory Board of Drägerwerk Verwaltungs AG
Stefan Dräger GmbH
100%
Management/Representation
Drägerwerk Verwaltungs AG
Executive Board
General partner Decision on actions requiring approval
Oversight and appointment of the Executive Board
Oversight
Limited shareholders
Appointment
Appointment
Joint Committee
Supervisory Board of Drägerwerk AG & Co. KGaA
0%
23The Executive Board The Dräger shareCorporate governance Interview Report of the Supervisory Board Joint Committee
The Joint Committee makes decisions on extraordinary
management transactions by the general partner. The
individual transactions requiring approval are defined in
Art. 23 (2) of the articles of association of the Company.
They mainly relate to the same transactions that required
the approval of the Supervisory Board of Drägerwerk
AG prior to the change in legal form, although different
thresholds apply.
Appointing and removing members of the Executive
Board of Drägerwerk Verwaltungs AG, which manages the
operations of Drägerwerk AG & Co. KGaA as the legal
representative of the general partner, is the task of the
Supervisory Board of Drägerwerk Verwaltungs AG.
To improve its effectiveness and efficiency, the Supervisory
Board of Drägerwerk AG & Co. KGaA established an
Audit Committee. It comprises two shareholder represen-
tatives and two employee representatives. The Super-
visory Board ensures that the committee members are
independent and places great emphasis on their par-
ticular knowledge and experience of application of account-
ing standards and internal control processes. The Audit
Committee monitors the adequacy and functionality of
the Company’s external and internal financial report-
ing system. Together with the statutory auditors, the Audit
Committee discusses the reports drawn up by the
Executive Board during the year, the Company’s financial
statements and audit reports. On this basis, the Audit
Committee draws up recommendations for the approval
of the financial statements by the annual general
meeting of the shareholders. It deals with the Company’s
internal control system and with the procedure for
recording risks, for risk control and risk management. The
internal audit department reports regularly to the Audit
Committee, and is engaged by this Committee to carry out
audits as is deemed necessary. Reference is also made
to the report of the Supervisory Board.
In addition, the Supervisory Board also established a Nomi-
nation Committee in accordance with 5.3.3 of the Code.
This Committee is charged with proposing suitable candi-
dates for election to the Supervisory Board. On this basis,
the Supervisory Board compiles suggestions for the annu-
al general meeting of the shareholders.
MANAGEMENT
Drägerwerk Verwaltungs AG manages the operations of
Drägerwerk AG & Co. KGaA.
In its role as managing body of Drägerwerk AG & Co.
KGaA and of the Dräger Group, the Executive Board of
Drägerwerk Verwaltungs AG governs corporate policy.
It determines the Company’s strategic focus, plans and
sets budgets, approves resource allocation and monitors
business performance. The Executive Board compiles
the Company’s quarterly reports, the financial statements
of Drägerwerk AG & Co. KGaA and the group financial
statements. It works closely with the oversight bodies. The
Chairman of the Supervisory Boards of the Company
and of the general partner works closely with the Chair-
man of the Executive Board of the general partner. He
regularly provides up-to-date and comprehensive informa-
tion on all issues relevant to the Company: strategy and
its implementation, planning, business performance, fin-
ancial position and results of operations and business
risk. The Supervisory Board of Drägerwerk Verwaltungs AG
approved the rules of procedure for the Executive Board
at its meeting on December 14, 2008.
Investor relations
Of Drägerwerk AG & Co. KGaA’s 12,700,000 shares,
6,350,000 are common shares held by the Dräger family.
6,350,000 non-voting preferred shares are traded on
German stock exchanges. Dräger reports to its sharehold-
ers on business performance, net assets, financial
position and results of operations in two quarterly reports,
one half-yearly report and the annual report.
The annual general meeting of the shareholders is held
in the first eight months of the fiscal year. Following the
change in legal form, the resolution on the approval of
the financial statements of Drägerwerk AG & Co. KGaA is
adopted at the annual general meeting of the share-
holders. In addition, the annual general meeting of the
shareholders votes on profit appropriation, the exoner-
ation of the general partner and of the Supervisory Board
and the election of the statutory auditors. In addition,
it also elects the shareholder representatives to the Super-
visory Board, approves amendments to the articles of
association and changes in capital, which the general part-
ner implements. The shareholders exercise their rights
at the annual general meeting of the shareholders in accor-
dance with the legal requirements and the Company’s
articles of association. Insofar as resolutions of the annual
general meeting of the shareholders relate to extraordi-
nary transactions and core business, they also require the
approval of the general partner.
In the course of our investor relations work, the Chairman
of the Executive Board and the CFO, as well as the other
Executive Board members hold regular meetings with ana-
lysts and institutional investors. Besides an annual ana-
lysts’ conference, a conference call also takes place when
the quarterly figures are announced or for other impor-
tant events.
Compliance
The general partner of Drägerwerk AG & Co. KGaA has
established guidelines in the form of business policies
and a code of conduct which should ensure that business
is conducted responsibly and in accordance with legal
requirements. These binding policies on law-abiding con-
duct, conflicts of interest, company property and insider
trading apply to all employees, as well as the Executive and
Supervisory Boards.
Remuneration report
EXECUTIVE BOARD REMUNERATION
Since the change in legal form to a partnership limited by
shares, the Supervisory Board of Drägerwerk Verwaltungs
AG has been responsible for determining the remuneration
of the general partner’s Executive Board members. All of
the employment contracts of the members of the Executive
Board of Drägerwerk Verwaltungs AG have been conclud-
ed with Drägerwerk Verwaltungs AG.
Obligations to the members of the Executive Board from
the pension plan, however, remain at Drägerwerk AG &
Co. KGaA.
Remuneration is based on the size and the global activities
of the Company, its economic and financial position,
and on the amount of remuneration paid by peer group
companies. The duties of the respective Executive Board
member are also taken into consideration. When determin-
ing the remuneration, it is also possible to grant a special
performance-related bonus as a component of the variable
remuneration.
Defined benefit plans for members of the Executive Boards
are agreed individually.
The remuneration of Executive Board members consists
of fixed and variable components. The variable component
of the remuneration of the active Executive Board mem-
bers is pegged to the Group’s net profit. If a retired Execu-
tive Board member concurrently chaired an executive
board of a division, their remuneration is mainly pegged to
the respective division’s earnings and only to a minor
Investor relations I Compliance I Remuneration report24
25The Executive Board The Dräger shareCorporate governance Interview Report of the Supervisory Board Joint Committee
degree to the Group’s net profit. In addition, certain Exec-
utive Board members’ contracts provide for the payment
of an annual discretionary bonus. There are no long-term
incentive components of remuneration.
The fixed remuneration is paid monthly as a salary.
The Executive Board remuneration is illustrated in the
table below.
Fringe benefits awarded to members of the Executive
Board encompass private use of the company car they
are each provided with and payment of accident insur-
ance, health insurance and pension insurance premiums.
The defined benefits under the pension plans offered
to the members of the Executive Board are either fixed or
based on the basic annual salary and years of service
on the Executive Board. The defined benefit is based on an
annual contribution of 15 percent of his basic annual
salary. Under the deferred compensation option, an addi-
tional annual contribution of up to 20 percent of the
basic annual salary can be made. Stefan Dräger receives a
further contribution of 50 percent from the Company on
deferred compensation, but no more than 8 percent of his
basic annual salary. This top-up payment is only made if
consolidated EBIT equals 8 percent or more of net sales.
EUR 458,984 in pension obligations for Executive Board
members was accrued in the financial statements for
fiscal year 2008 (2007: EUR 192,363), EUR 258,655 of
which for the Chairman of the Executive Board (2007:
EUR 186,696). Pension obligations of EUR 2,126,062 (2007:
EUR 1,790,799) were recognized for those members of
the Executive Board who left the Executive Board during
the fiscal year.
In fiscal year 2008, EUR 266,621 (2007: EUR 96,852) was
allocated to the pension provisions for active members of
the Executive Board and EUR 335,263 (2007: EUR 0) for
those who left the Executive Board during the fiscal year.
In fiscal year 2008, EUR 71,959 (2007: EUR 39,251) was
allocated to the pension provisions for the Chairman of
the Executive Board.
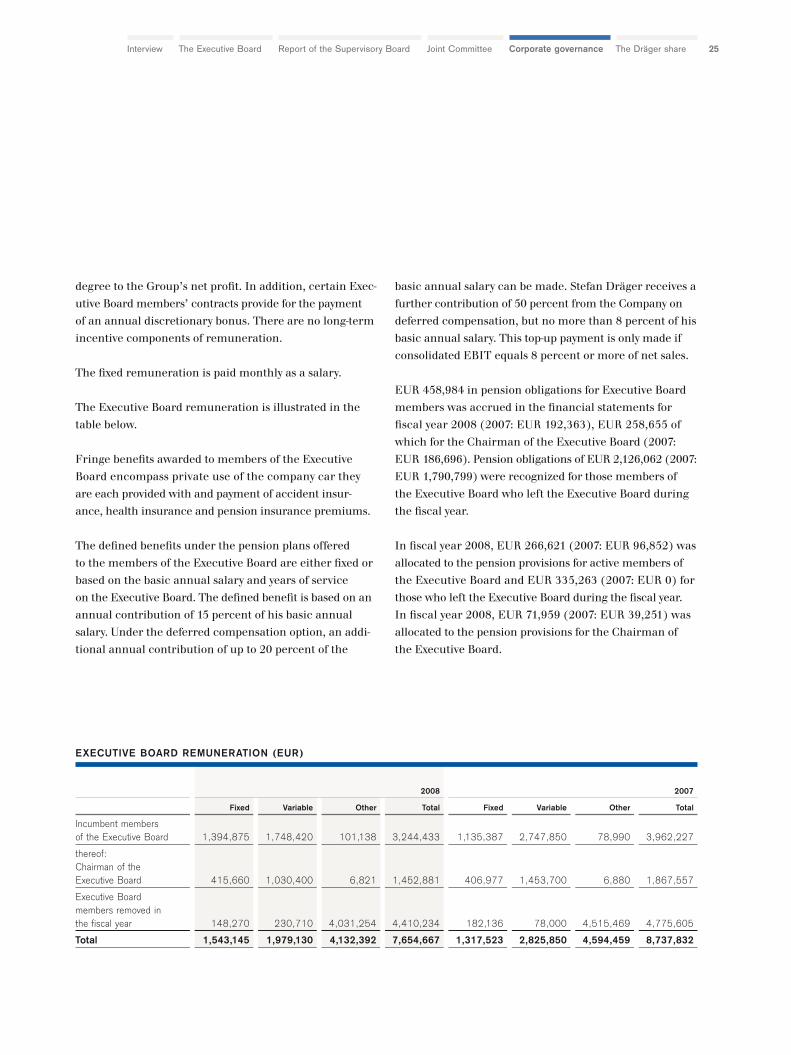
2008 2007
Fixed Variable Other Total Fixed Variable Other Total
Incumbent membersof the Executive Board 1,394,875 1,748,420 101,138 3,244,433 1,135,387 2,747,850 78,990 3,962,227
thereof:Chairman of the Executive Board 415,660 1,030,400 6,821 1,452,881 406,977 1,453,700 6,880 1,867,557
Executive Board members removed inthe fiscal year 148,270 230,710 4,031,254 4,410,234 182,136 78,000 4,515,469 4,775,605
Total 1,543,145 1,979,130 4,132,392 7,654,667 1,317,523 2,825,850 4,594,459 8,737,832
EXECUTIVE BOARD REMUNERATION (EUR)
Remuneration report I Directors’ dealings I Related-party transactions26
The Company pays the premium for the D&O liability
insurance policy and legal expense insurance policy for
economic loss claims for members of the Executive
Board. In the opinion of the German tax authorities, this
does not constitute part of the Executive Board’s remu-
neration.
No further payments have been promised in the event of
termination of appointment to the Executive Board. The
Executive Board contracts do not provide for any sever-
ance entitlements. However, a severance payment may be
agreed under an individual severance agreement.
EUR 2,733,628.67 was paid to former members of the
Executive Board and their surviving dependants (2007:
EUR 5,762,929.44). The prior-year figure includes pay-
ments to those who left the Executive Board in fiscal year
2006.
A total EUR 34,830,298 provides for the pension obliga-
tions to former Executive Board members and their sur-
viving dependants (2007: EUR 34,587,869).
In fiscal year 2008, severance payments of EUR 4,020,109
were defined in severance agreements (2007:
EUR 6,403,838.92), which are included in the other remu-
neration of those who left the Executive Board in the
fiscal year. In fiscal year 2007, the severance payments were
in part included in the other remuneration of those who
left the Executive Board in 2007 and in part in the remune-
ration of former Executive Board members.
In the fiscal year, no payments were made or promised by
a third party to any member of the Executive Board in
relation to his duties as member of the Executive Board.
If Executive Board remuneration is paid by Drägerwerk
Verwaltungs AG, pursuant to Art. 11 (1) and (3) of the arti-
cles of association of Drägerwerk AG & Co. KGaA it is
entitled to claim reimbursement from Drägerwerk AG &
Co. KGaA monthly. Pursuant to Art. 11 (4) of the Com-
pany’s articles of association, for the management of the
Company and the assumption of personal liability the
general partner receives a fee, independent of profit and
loss, of 6 percent of the equity disclosed in its financial
statements, payable one week after the general partner
prepares its financial statements. For fiscal year 2008,
this remuneration amounts to EUR 63 thousand (2007:
EUR 60 thousand) plus any VAT incurred.
SUPERVISORY BOARD REMUNERATION
On May 9, 2008, the annual general meeting of
Drägerwerk AG & Co. KG resolved to replace the share-
holder representatives on the Supervisory Board. As a
result, the remuneration of the former members of the
Supervisory Board and of those elected in May 2008
is calculated pro rata. At the annual general meeting of
Drägerwerk AG & Co. KGaA on May 8, 2009, a proposal
awarding the Supervisory Board total remuneration
of EUR 310,360,00 (2007: EUR 509,500.00) will be put to
vote. Every member of the Supervisory Board receives
basic remuneration which is composed of a fixed amount
of EUR 10,000.00 (2007: EUR 10,000.00) and a dividend-
based amount of EUR 5,400.00 (2007: EUR 17,400.00), the
latter being the product of EUR 600.00 for each EUR 0.01
above a preferred dividend of EUR 0.26, on the basis of a
dividend of EUR 0.35 per preferred share as proposed for
the year under review. The change against the prior year is
due to the reduction in variable remuneration as a re-
sult of its dependency on the dividend per preferred share.
Pursuant to Art. 21 (1) of the articles of association of
Drägerwerk AG & Co. KGaA, the distribution of the remu-
neration of members of the Supervisory Board is deter-
mined by a Supervisory Board resolution. To date, the
Supervisory Board has adopted the following principles
for distribution: its chairman is entitled to four times, any
vice-chairman two times, the other members of the
27The Executive Board The Dräger shareCorporate governance Interview Report of the Supervisory Board Joint Committee
Executive Committee 1.5 times the set amount. The mem-
bers of the Audit Committee receive an additional
EUR 5,000.00, and the chairman of the Audit Committee
an additional EUR 10,000.00. Moreover, a total per diem of
EUR 2,640.00 (2007: EUR 3,420.00) was paid in fiscal
year 2008. Since the change in legal form to a partnership
limited by shares, the Executive Committee no longer
exists, as the Supervisory Board of Drägerwerk Verwaltungs
AG now appoints the Executive Board members.
In the opinion of the German tax authorities, the premi-
um for a D&O liability insurance policy and a legal
expense insurance policy for economic loss claims is not
part of the Supervisory Board’s remuneration.
In addition, in the year under review a legal consulting
fee of EUR 56,330.25 (2007: EUR 93,725.00) was
paid to the law firm Feddersen Heuer & Partner. Professor
Dr. Feddersen was the Chairman of the Supervisory
Board of Drägerwerk AG & Co. KGaA until May 9, 2008.
These amounts do not include VAT. An agreement was
concluded with Mr. Theo Dräger, who was a member of the
Supervisory Board until May 9, 2008 allowing him to
represent the Company in Germany and abroad. His servic-
es under this agreement are not remunerated; however,
he shall be reimbursed for any out-of-pocket expenses and
provided with secretarial services and transportation.
Certain Supervisory Board members received an addition-
al aggregate EUR 179,800.00 (2007: EUR 177,600.00) for
their membership in supervisory boards of group compa-
nies.
SHARES OWNED BY THE EXECUTIVE
AND SUPERVISORY BOARDS
As of December 31, 2008, the members of the Executive
Board of Drägerwerk AG & Co. KGaA and their related par-
ties still directly or indirectly held 6,000 preferred shares,
equivalent to 0.05 percent of the total, and the members
of the Supervisory Board and their related parties a total
of 1,152 preferred shares, equivalent to 0.01 percent of the
total.
Altogether, 97.87 percent of Drägerwerk AG & Co. KGaA’s
limited common stock is held via Dr. Heinrich Dräger
GmbH and the same percentage of voting rights is attribut-
able to Executive Board member Stefan Dräger under
the terms of Sec. 22 (1) Sentence 1 No. 1 WpHG (“Wert-
papierhandelsgesetz”: German Securities Trading Act).
Directors’ dealings
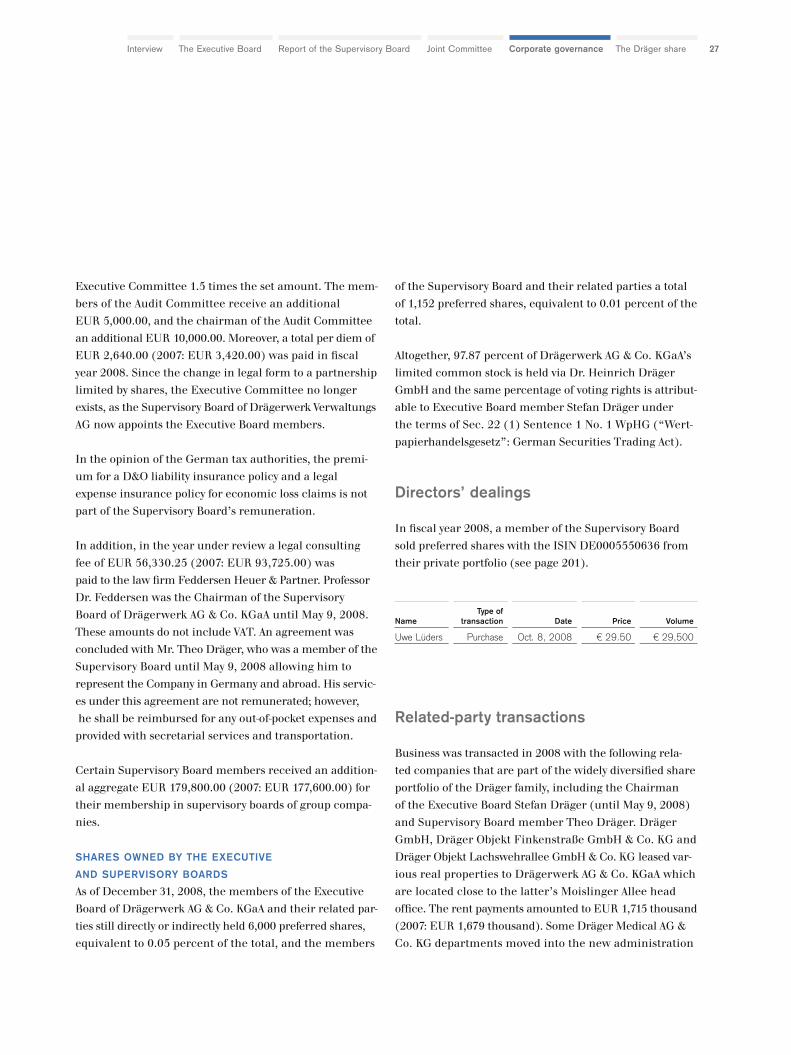
In fiscal year 2008, a member of the Supervisory Board
sold preferred shares with the ISIN DE0005550636 from
their private portfolio (see page 201).
Related-party transactions
Business was transacted in 2008 with the following rela-
ted companies that are part of the widely diversified share
portfolio of the Dräger family, including the Chairman
of the Executive Board Stefan Dräger (until May 9, 2008)
and Supervisory Board member Theo Dräger. Dräger
GmbH, Dräger Objekt Finkenstraße GmbH & Co. KG and
Dräger Objekt Lachswehrallee GmbH & Co. KG leased var-
ious real properties to Drägerwerk AG & Co. KGaA which
are located close to the latter’s Moislinger Allee head
office. The rent payments amounted to EUR 1,715 thousand
(2007: EUR 1,679 thousand). Some Dräger Medical AG &
Co. KG departments moved into the new administration
Type ofName transaction Date Price Volume
Uwe Lüders Purchase Oct. 8, 2008 € 29.50 € 29,500
Related-party transactions28
building in fiscal year 2008. As a portion of the land and
buildings with long-term rental agreements is therefore no
longer likely be able to be fully used, there is a provision
of EUR 9.7 million (2007: EUR 10.0 million) as of Decem-
ber 31, 2008. The tax department of the Company provid-
ed tax services amounting to EUR 82 thousand (2007:
EUR 50 thousand) to Dr. Heinrich Dräger GmbH and the
Dräger Foundation Munich/Lübeck. In addition, Herbert
Rehn GmbH generated net sales of EUR 1.8 million (2007:
EUR 1.5 million) from glass products and installation
contracts. This resulted in receivables of EUR 63 thousand
(2007: EUR 22.7 thousand) from Dräger Group compa-
nies.
Mrs. Claudia Dräger is an employee of Drägerwerk AG &
Co. KGaA.
Supervisory Board member Theo Dräger (until May 9,
2009) has a 44 percent share in Dräger Objekt Lachswehr-
allee GmbH & Co. KG, the remaining share (56 percent)
is held by siblings of Stefan Dräger. Mr. Theo Dräger has
an 18.6 percent share in Dräger Objekt Finkenstraße
GmbH & Co. KG, the remaining 81.4 percent is held by
other Dräger family members who have no managerial
position within the Dräger Group. Other Dräger family
members hold a share in Dräger GmbH and in Herbert
Rehn GmbH but they do not hold a managerial position
within the Dräger Group either.
All transactions were conducted at arm’s length terms
and conditions.
Lübeck, Germany, February 24, 2009
Drägerwerk AG & Co. KGaA
The general partner
Drägerwerk Verwaltungs AG
The Executive Board

29The Executive Board The Dräger shareCorporate governance Interview Report of the Supervisory Board Joint Committee
The Dräger share30
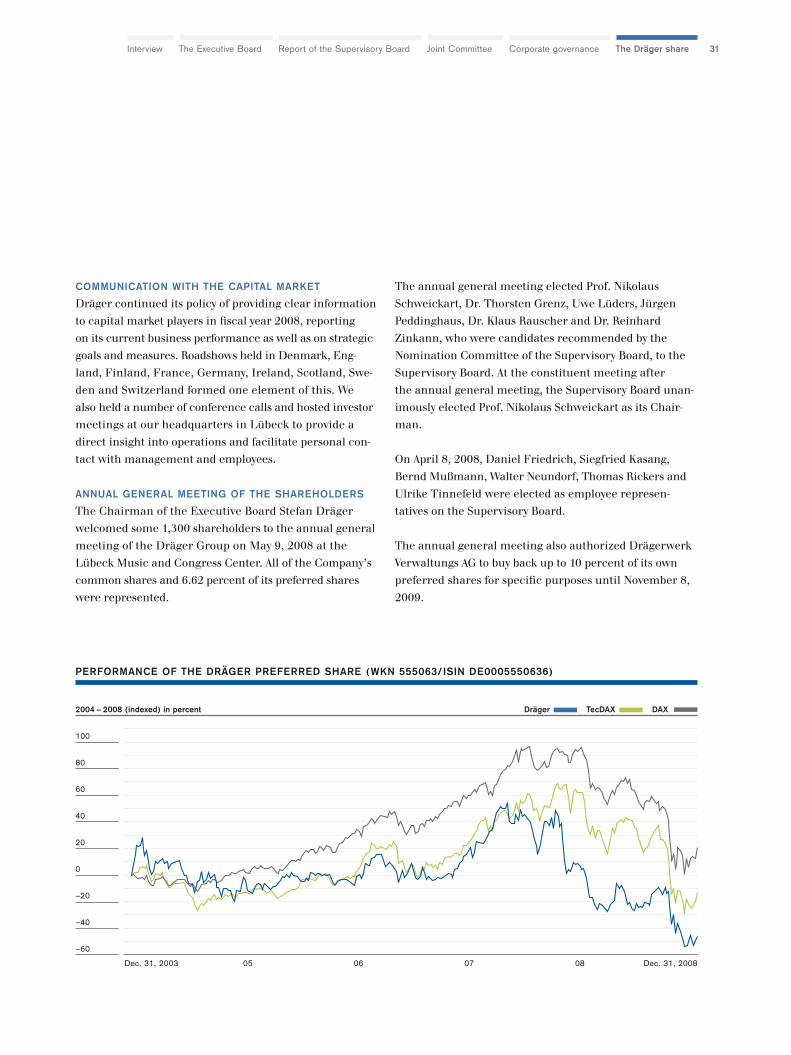
SHARE PRICE
In 2008, the performance of the Dräger preferred shares
in an extremely volatile market environment was again
unsatisfactory.
The closing price of EUR 26.20 on December 30, 2008
represents a drop of approximately 48 percent since the
beginning of the year. Thus, the Dräger share performed
in line with the TECDAX (down 48 percent) but weaker
than the DAX (down 40 percent).
The Dräger preferred share opened at EUR 50.37 on the
first trading day of 2008, and on January 3 it achieved
its annual high of EUR 50.63. The stock exchanges were
shaken up by the US sub-prime crisis and increases in
commodity and energy prices. The Dräger preferred shares
were no exception: the price had fallen to EUR 35.82 by
mid-February and on the day Dräger presented its prelim-
inary figures for 2007, February 21, it stood at EUR 37.84.
When the final figures for 2007 were presented at the annu-
al accounts press conference on March 18, the share price
was EUR 37.01. The share price rose to EUR 44.13 on the
back of a slight improvement in the market in April and
the publication of the figures for the first quarter on May
8. After a rather subdued performance on the market in
the months of May, June and July, the share stood at EUR
40.37 on August 7, the day the figures for the first half of
2008 were reported, and even increased to EUR 45.83 by
the beginning of September. From this point on, however,
the Dräger share succumbed to another downward
trend on the capital market as a result of the global finan-
cial crisis and came in at EUR 28.49 on November 6,
which is the day the third-quarter figures were reported.
On November 21, the Dräger share hit its annual low
of EUR 22.47. After a short-lived recovery in the price to
approximately EUR 27 by the beginning of December,
the Dräger preferred shares closed 2008 at a disappoint-
ing EUR 26.20 in connection with a profit warning by
the Dräger Group on December 15, when the share stood
at EUR 22.75.
MARKET CAPITALIZATION AND TRADING VOLUME
The price of the Dräger preferred share has almost halved
in comparison with December 31, 2007, dropping from
EUR 49.80 to EUR 26.20, primarily as a result of the weak
market environment. The market capitalization of com-
mon and preferred shares therefore fell from around EUR
632 million to around EUR 333 million.
The average daily trading volume fell from 39,466 shares
in 2007 to 32,549 shares for the same period in 2008.
The Dräger share
The development of the Dräger share was disappointing in fiscal year2008. Dräger continued its policy of providing clear information to capitalmarket players and and reported on current developments and strategicgoals and measures.
31The Executive Board The Dräger shareCorporate governance Interview Report of the Supervisory Board Joint Committee
COMMUNICATION WITH THE CAPITAL MARKET
Dräger continued its policy of providing clear information
to capital market players in fiscal year 2008, reporting
on its current business performance as well as on strategic
goals and measures. Roadshows held in Denmark, Eng-
land, Finland, France, Germany, Ireland, Scotland, Swe-
den and Switzerland formed one element of this. We
also held a number of conference calls and hosted investor
meetings at our headquarters in Lübeck to provide a
direct insight into operations and facilitate personal con-
tact with management and employees.
ANNUAL GENERAL MEETING OF THE SHAREHOLDERS
The Chairman of the Executive Board Stefan Dräger
welcomed some 1,300 shareholders to the annual general
meeting of the Dräger Group on May 9, 2008 at the
Lübeck Music and Congress Center. All of the Company’s
common shares and 6.62 percent of its preferred shares
were represented.
The annual general meeting elected Prof. Nikolaus
Schweickart, Dr. Thorsten Grenz, Uwe Lüders, Jürgen
Peddinghaus, Dr. Klaus Rauscher and Dr. Reinhard
Zinkann, who were candidates recommended by the
Nomination Committee of the Supervisory Board, to the
Supervisory Board. At the constituent meeting after
the annual general meeting, the Supervisory Board unan-
imously elected Prof. Nikolaus Schweickart as its Chair-
man.
On April 8, 2008, Daniel Friedrich, Siegfried Kasang,
Bernd Mußmann, Walter Neundorf, Thomas Rickers and
Ulrike Tinnefeld were elected as employee represen-
tatives on the Supervisory Board.
The annual general meeting also authorized Drägerwerk
Verwaltungs AG to buy back up to 10 percent of its own
preferred shares for specific purposes until November 8,
2009.
PERFORMANCE OF THE DRÄGER PREFERRED SHARE (WKN 555063/ISIN DE0005550636)
2004 – 2008 (indexed) in percent Dräger TecDAX DAX
100
80
60
40
20
0
–20
–40
–60
Dec. 31, 200807 080605Dec. 31, 2003
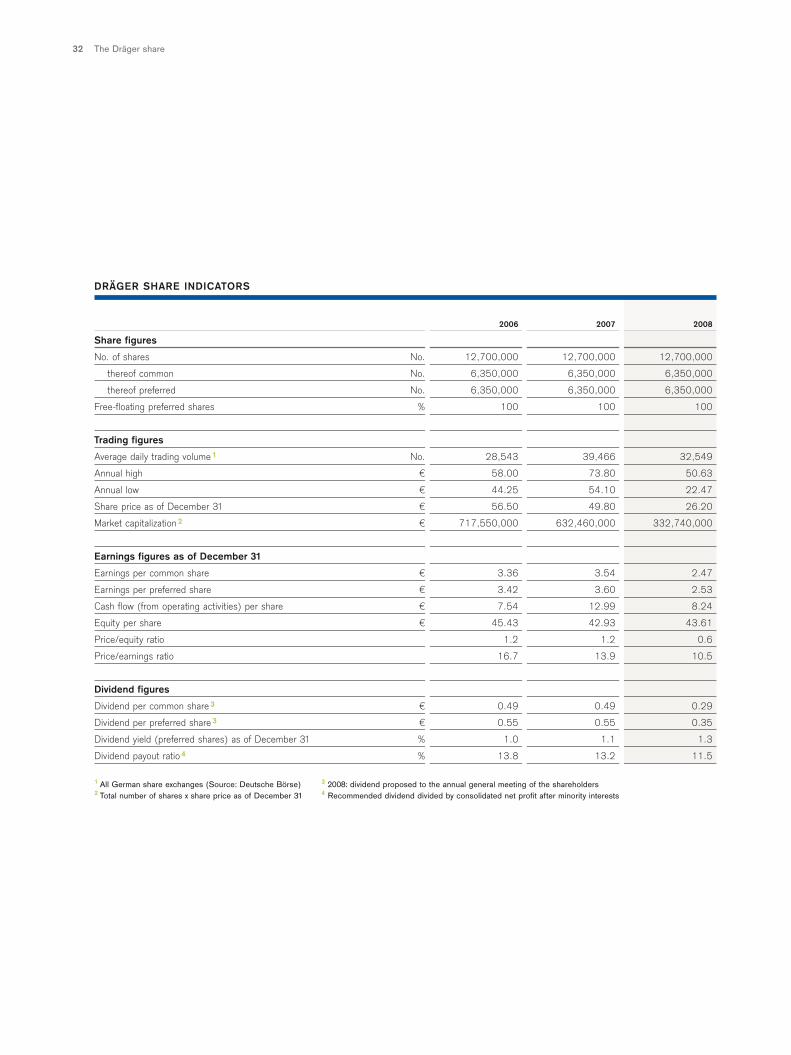
The Dräger share32
2006 2007 2008
Share figures
No. of shares No. 12,700,000 12,700,000 12,700,000
thereof common No. 6,350,000 6,350,000 6,350,000
thereof preferred No. 6,350,000 6,350,000 6,350,000
Free-floating preferred shares % 100 100 100
Trading figures
Average daily trading volume1 No. 28,543 39,466 32,549
Annual high € 58.00 73.80 50.63
Annual low € 44.25 54.10 22.47
Share price as of December 31 € 56.50 49.80 26.20
Market capitalization2 € 717,550,000 632,460,000 332,740,000
Earnings figures as of December 31
Earnings per common share € 3.36 3.54 2.47
Earnings per preferred share € 3.42 3.60 2.53
Cash flow (from operating activities) per share € 7.54 12.99 8.24
Equity per share € 45.43 42.93 43.61
Price/equity ratio 1.2 1.2 0.6
Price/earnings ratio 16.7 13.9 10.5
Dividend figures
Dividend per common share3 € 0.49 0.49 0.29
Dividend per preferred share3 € 0.55 0.55 0.35
Dividend yield (preferred shares) as of December 31 % 1.0 1.1 1.3
Dividend payout ratio4 % 13.8 13.2 11.5
1 All German share exchanges (Source: Deutsche Börse) 3 2008: dividend proposed to the annual general meeting of the shareholders2 Total number of shares x share price as of December 31 4 Recommended dividend divided by consolidated net profit after minority interests
DRÄGER SHARE INDICATORS
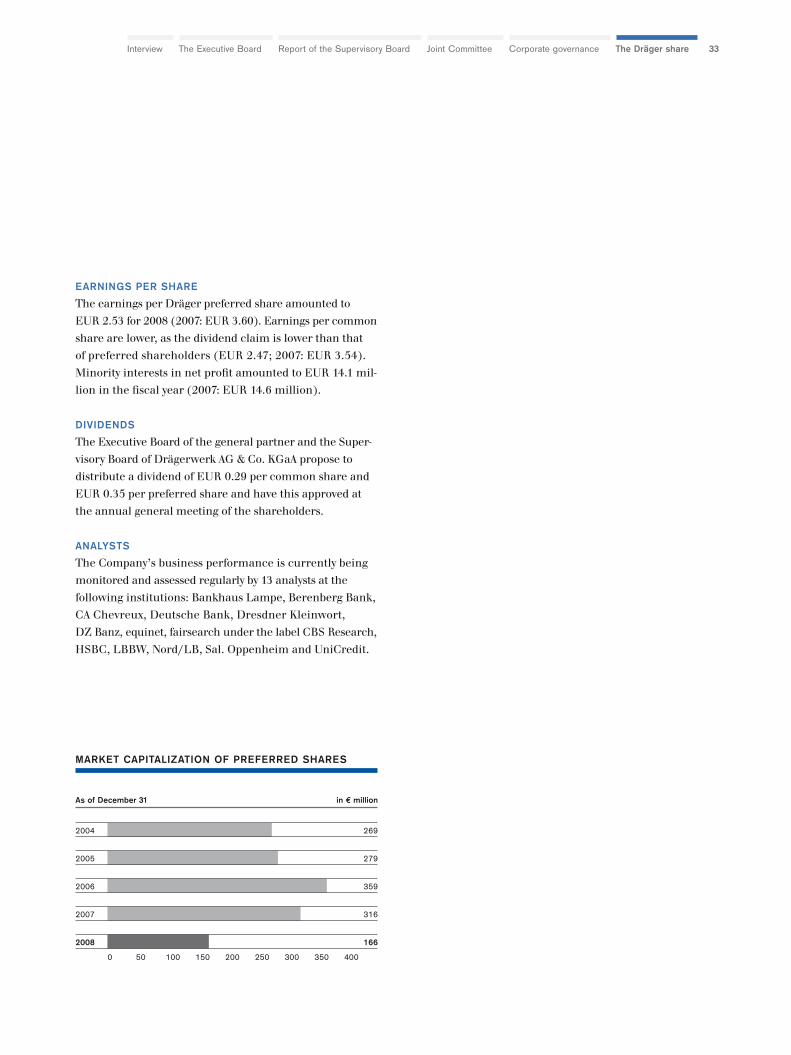
33The Executive Board The Dräger shareCorporate governance Interview Report of the Supervisory Board Joint Committee
EARNINGS PER SHARE
The earnings per Dräger preferred share amounted to
EUR 2.53 for 2008 (2007: EUR 3.60). Earnings per common
share are lower, as the dividend claim is lower than that
of preferred shareholders (EUR 2.47; 2007: EUR 3.54).
Minority interests in net profit amounted to EUR 14.1 mil-
lion in the fiscal year (2007: EUR 14.6 million).
DIVIDENDS
The Executive Board of the general partner and the Super-
visory Board of Drägerwerk AG & Co. KGaA propose to
distribute a dividend of EUR 0.29 per common share and
EUR 0.35 per preferred share and have this approved at
the annual general meeting of the shareholders.
ANALYSTS
The Company’s business performance is currently being
monitored and assessed regularly by 13 analysts at the
following institutions: Bankhaus Lampe, Berenberg Bank,
CA Chevreux, Deutsche Bank, Dresdner Kleinwort,
DZ Banz, equinet, fairsearch under the label CBS Research,
HSBC, LBBW, Nord/LB, Sal. Oppenheim and UniCredit.
MARKET CAPITALIZATION OF PREFERRED SHARES
As of December 31 in € million
2004 269
2005 279
2006 359
2007 316
2008 166
0 50 100 150 200 250 300 350 400
Technology for Life34
The interplay of all links along the valuechain determines a company’s success:forward-looking developments, innovative marketing, efficient production processes andmodern logistics from purchasing through to use of the product on site by the customerinterlock seamlessly.
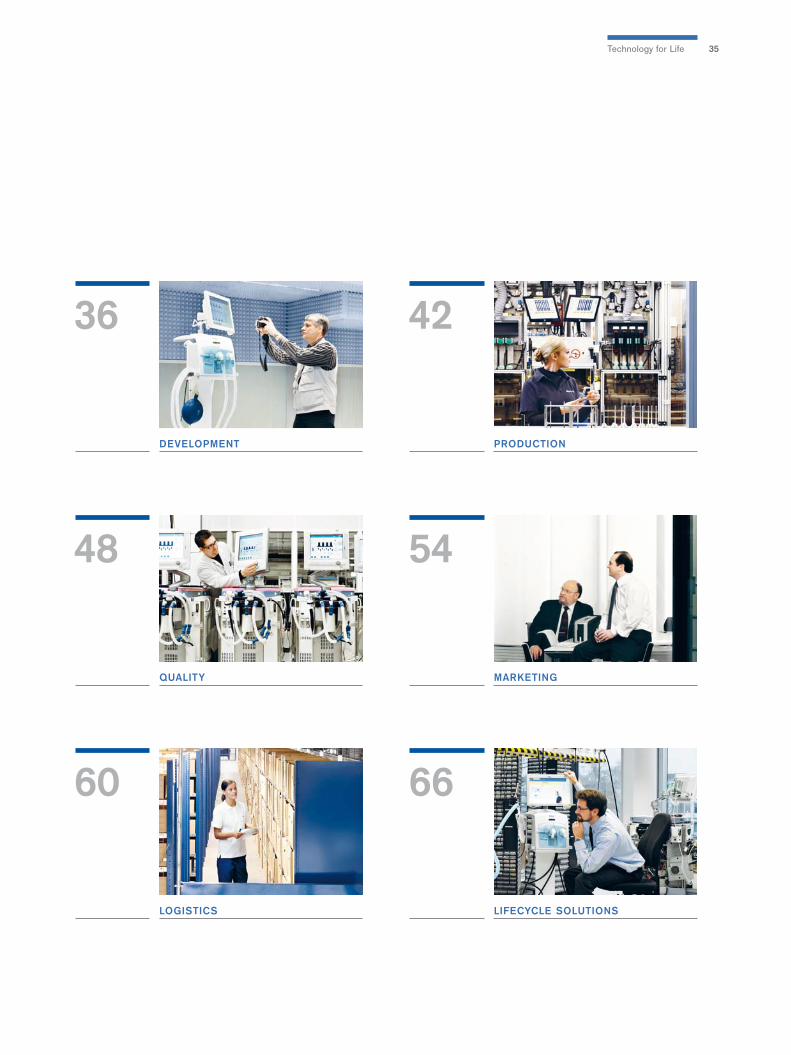
Technology for Life 35
36
DEVELOPMENT
42
PRODUCTION
48
QUALITY
54
MARKETING
60
LOGISTICS
66
LIFECYCLE SOLUTIONS
Development – Evita Infinity V50036
When lungs go on strike andbreath is short
Breathe in, breathe out, breathe in, breathe out: when the human respiratory system requires support, Dräger’s modern ventilation tech-nology takes over and gently supports its regeneration and recovery.Together with the patient.
DEVELOPMENT
New in Dräger’s range of ventilation units:“Evita Infinity V500”
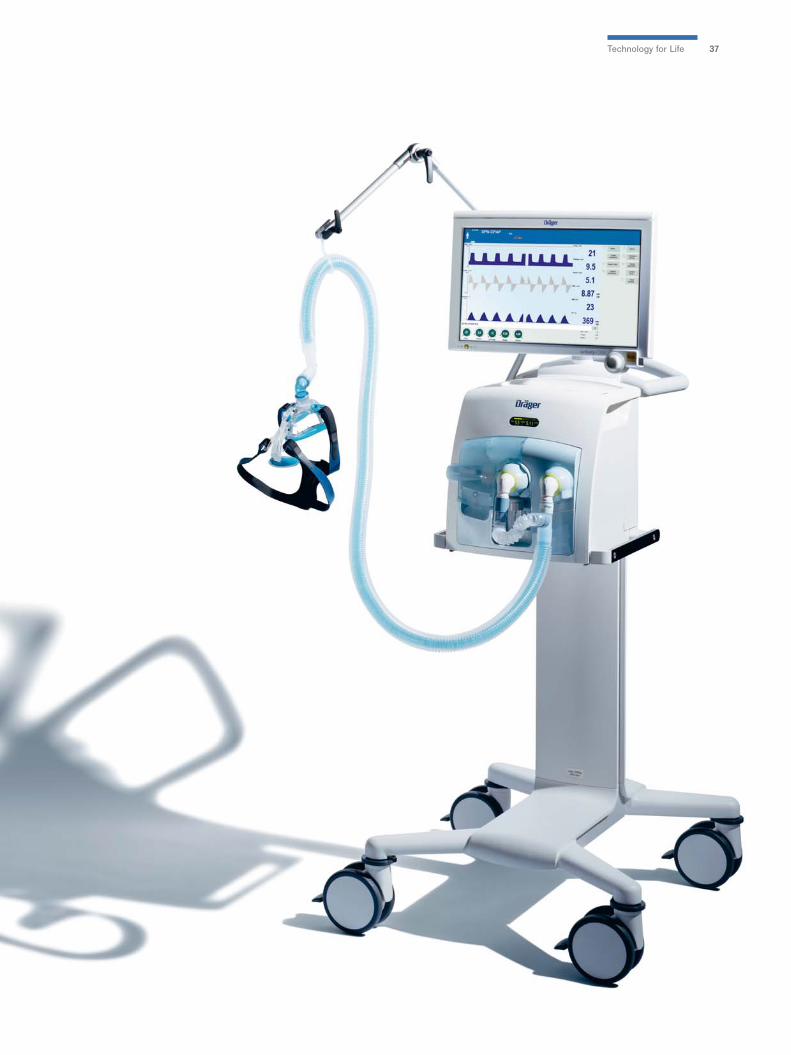
37Technology for Life
38
The Dräger Pulmotor set global benchmarks in emergency ventilation back in 1907. The latest ventilation unit “Evita Infinity V500”maintains this long-standing tradition, an example of Dräger’s successfuland consistent development.
“Shortly before Christmas, we sent out the first devices of our new ventilation system to customers. That was a special moment, which the 260 employees from allfunctional areas of the medical division worked towards with great commitmentover the past three years,” recounts Karsten Dieckmann, project manager responsi-ble for this development of an entirely new generation of devices. “Evita InfinityV500” is the result of a completely restructured development process. “We have notdeveloped a single device, but for the first time a device platform consisting of individual modules. These modules can also be used in connection with other newDräger products to accelerate innovation cycles and reduce development costsgoing forward. Certain modules can be used in ventilation as well as anesthesia devices.For example, we do not need to develop a new adaptor or ventilation control foreach new device.”
Here, there is also added value for the customer. “To continue improving quality andefficiency with respect to acute treatment, hospitals endeavor to standardizeprocesses and reduce complexity. This also relates in particular to the environmenton the intensive care units,” explains Frank Ralfs, product manager responsible for the new Dräger ventilation unit. “We aim to contribute towards making intensivetherapy more effective and more reliable.” “Evita Infinity V500” lays the future foundations for standardized patient monitoring and therapy in the whole acute pointof care segment. The aim is to establish harmonized terminology, standardized user interfaces and a clearer and more intuitive illustration of patient monitoring dataon the monitors, regardless of whether in devices for emergency admission, onintensive care stations or during anesthesia in the operating room. This ensures thatDräger devices speak to the anesthetists or intensive care staff in a common “language” and display all the information required for the therapy. At present, thesoftware for “Evita Infinity V500” is available in 23 languages.
NEW: MODULAR DEVICE
PLATFORM ACCELERATES
INNOVATION CYCLES
INCREASED EFFICIENCY
AND RELIABILITY
IN INTENSIVE THERAPY
Development – Evita Infinity V500
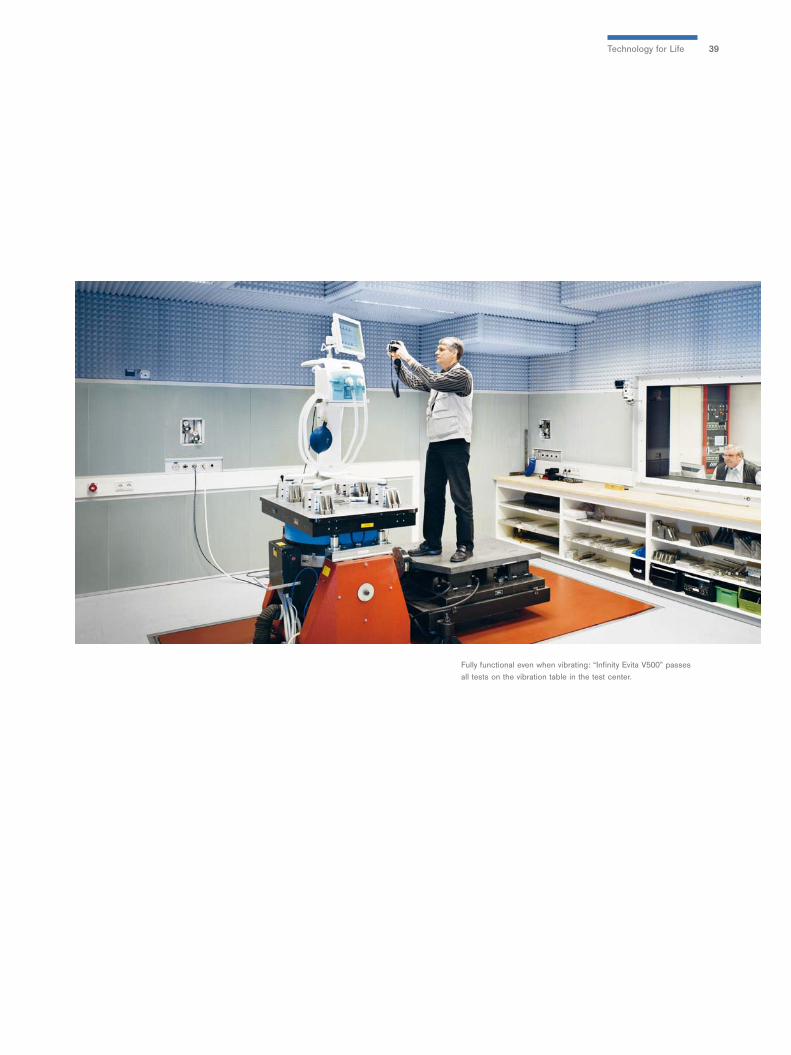
39
Fully functional even when vibrating: “Infinity Evita V500” passesall tests on the vibration table in the test center.
Technology for Life
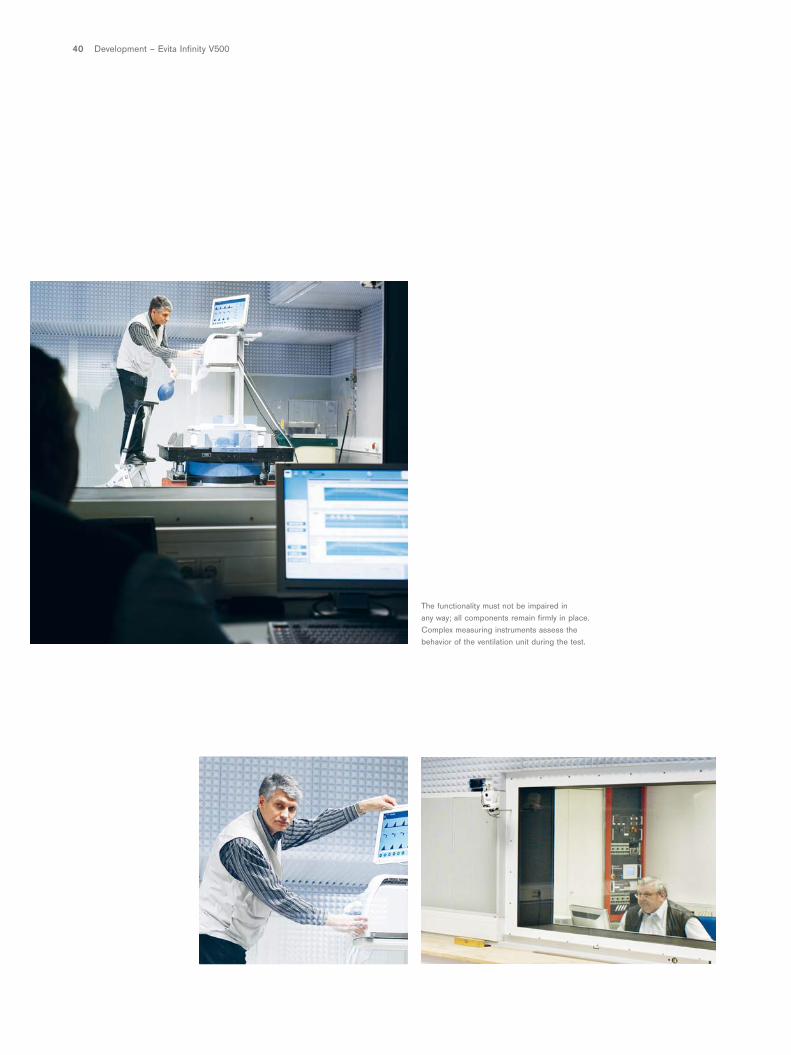
40 Development – Evita Infinity V500
The functionality must not be impaired in any way; all components remain firmly in place.Complex measuring instruments assess thebehavior of the ventilation unit during the test.
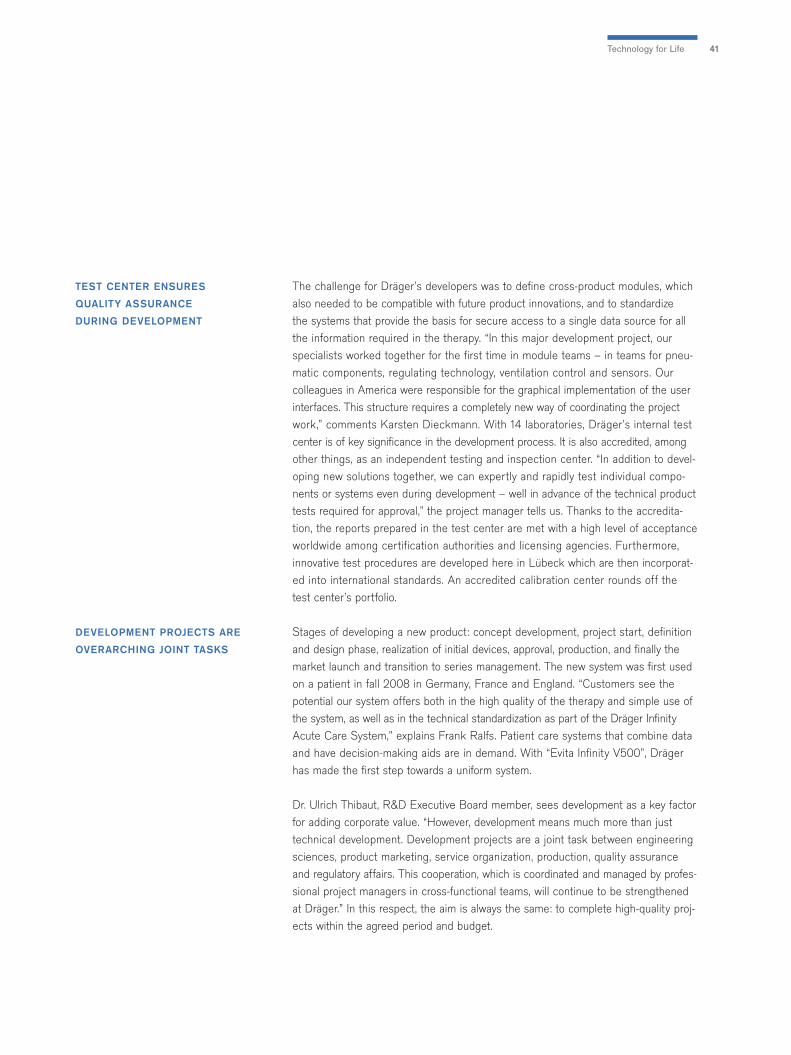
41
The challenge for Dräger’s developers was to define cross-product modules, whichalso needed to be compatible with future product innovations, and to standardize the systems that provide the basis for secure access to a single data source for allthe information required in the therapy. “In this major development project, ourspecialists worked together for the first time in module teams – in teams for pneu-matic components, regulating technology, ventilation control and sensors. Ourcolleagues in America were responsible for the graphical implementation of the userinterfaces. This structure requires a completely new way of coordinating the projectwork,” comments Karsten Dieckmann. With 14 laboratories, Dräger’s internal testcenter is of key significance in the development process. It is also accredited, amongother things, as an independent testing and inspection center. “In addition to devel-oping new solutions together, we can expertly and rapidly test individual compo-nents or systems even during development – well in advance of the technical producttests required for approval,” the project manager tells us. Thanks to the accredita-tion, the reports prepared in the test center are met with a high level of acceptanceworldwide among certification authorities and licensing agencies. Furthermore,innovative test procedures are developed here in Lübeck which are then incorporat-ed into international standards. An accredited calibration center rounds off the test center’s portfolio.
Stages of developing a new product: concept development, project start, definitionand design phase, realization of initial devices, approval, production, and finally themarket launch and transition to series management. The new system was first usedon a patient in fall 2008 in Germany, France and England. “Customers see thepotential our system offers both in the high quality of the therapy and simple use ofthe system, as well as in the technical standardization as part of the Dräger InfinityAcute Care System,” explains Frank Ralfs. Patient care systems that combine dataand have decision-making aids are in demand. With “Evita Infinity V500”, Drägerhas made the first step towards a uniform system.
Dr. Ulrich Thibaut, R&D Executive Board member, sees development as a key factorfor adding corporate value. “However, development means much more than justtechnical development. Development projects are a joint task between engineeringsciences, product marketing, service organization, production, quality assuranceand regulatory affairs. This cooperation, which is coordinated and managed by profes-sional project managers in cross-functional teams, will continue to be strengthened at Dräger.” In this respect, the aim is always the same: to complete high-quality proj-ects within the agreed period and budget.
TEST CENTER ENSURES
QUALITY ASSURANCE
DURING DEVELOPMENT
DEVELOPMENT PROJECTS ARE
OVERARCHING JOINT TASKS
Technology for Life
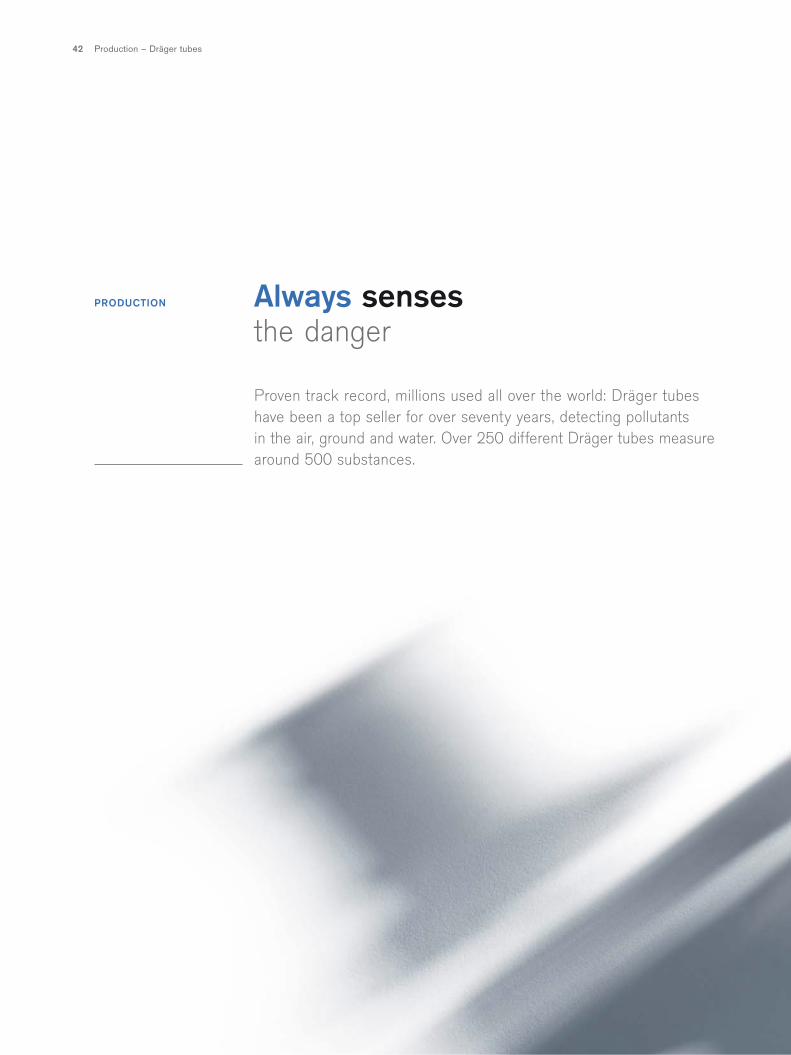
Production – Dräger tubes42
Always sensesthe danger
Proven track record, millions used all over the world: Dräger tubeshave been a top seller for over seventy years, detecting pollutants in the air, ground and water. Over 250 different Dräger tubes measurearound 500 substances.
PRODUCTION
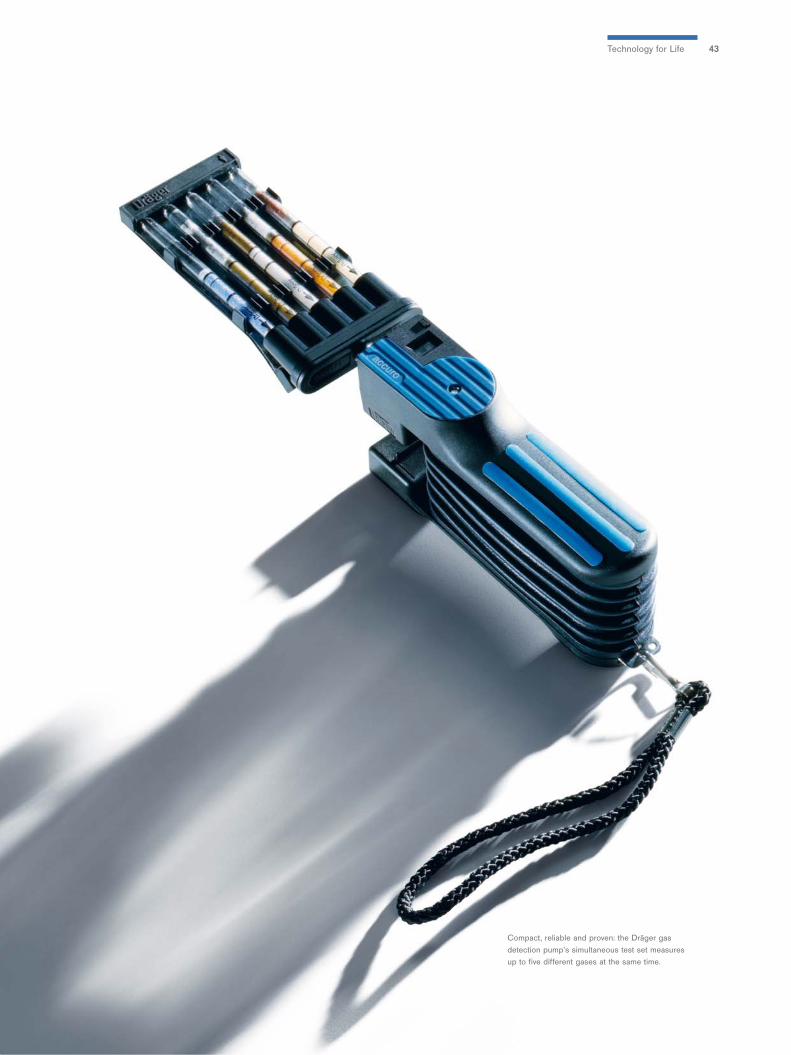
Compact, reliable and proven: the Dräger gas detection pump’s simultaneous test set measures up to five different gases at the same time.
43Technology for Life
44
8,032,080 per year, 669,340 each month, 167,335 per week,22,311 every day, 930 per hour, 15.5 every minute. Dräger has been producing the “laboratory behind glass” using glass, chemicalsand empty glass tubes since 1937. These tubes are one example of Dräger’s state-of-the-art and tried and tested production.
“The production of Dräger tubes is something special, since it is diverse and has anextremely high level of vertical manufacturing,” explains Bernd Wittfoth, head of thetubes, chips and chemistry production line. “From the raw materials through to thechemically reactive substance, we perform each individual step ourselves. We pro-duce a wide variety of products in a very short time and fill the tubes manually orusing the latest automated and process-monitored machines. In doing so, quality is the utmost priority.”
The computer-controlled tube-filling machine for example is globally unique. The plant,which has been in use since 2005, was developed and manufactured in accor-dance with Dräger’s specifications. “Tube production has already been automated foraround three decades, although we set new standards with the filling machine,”comments Andreas Seeck, production technologist. The complex plant is specialbecause the filling of the tubes, which are 125 millimeters long and seven millime-ters in diameter, is supported by image processing. “We have to be extremely precisewhen producing the Dräger tubes. Aided by the image processing, it comes down to a few tenths of a millimeter if discrepancies occur,” explains Seeck. The plant isequipped with data set support, meaning it can produce 170 different Dräger tubes. In addition, it enables a combination of automatic and manual processes. After all,tube production is not possible without some handiwork. Employees ascertain the display behavior of a tube for each batch of tubes manufactured in the substancelaboratory and apply a corresponding scale to the tube displaying the concentration of gas. When they are ready, the batches then go to the filling area where the emptyglass tubes are made into a Dräger tube with both a closed and open end alongwith the substance and intermediate elements. “The majority of tubes are filled hereusing the various machines. However, for small numbers of tubes or special ordersfrom our customers, we also still fill the tubes manually,” explains Seeck.
QUALITY IS THE
MAIN PRIORITY
GLOBALLY UNIQUE
TUBE-FILLING MACHINE
Production – Dräger tubes
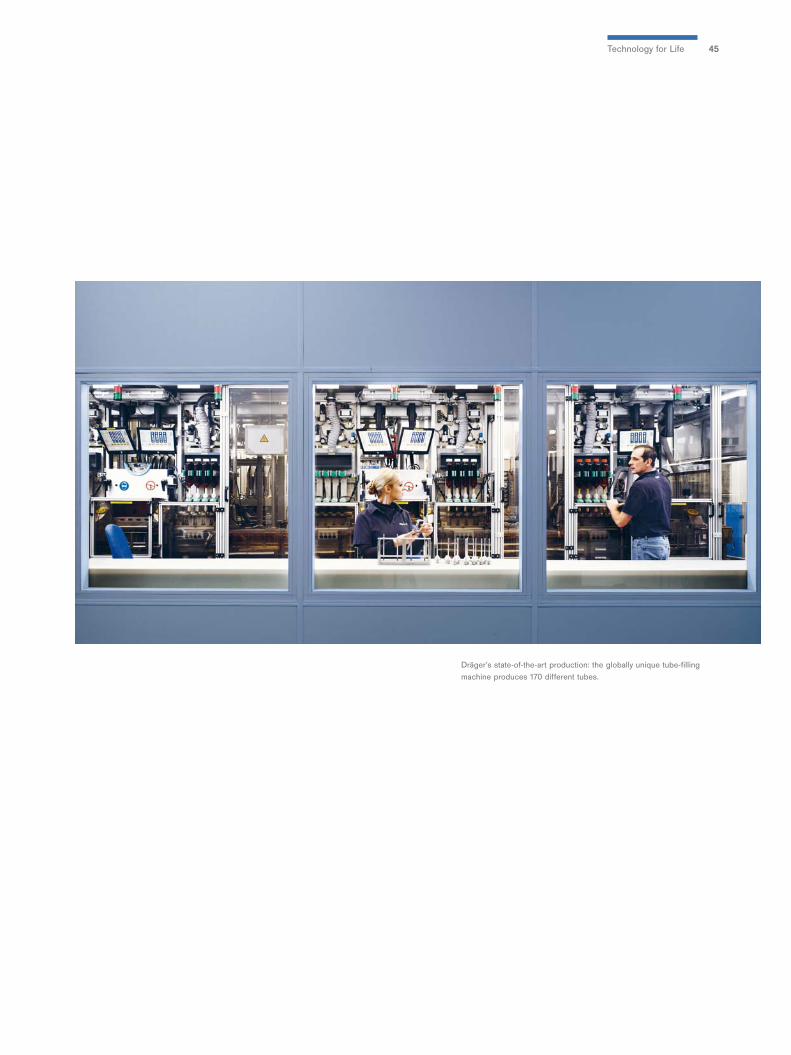
45
Dräger’s state-of-the-art production: the globally unique tube-fillingmachine produces 170 different tubes.
Technology for Life
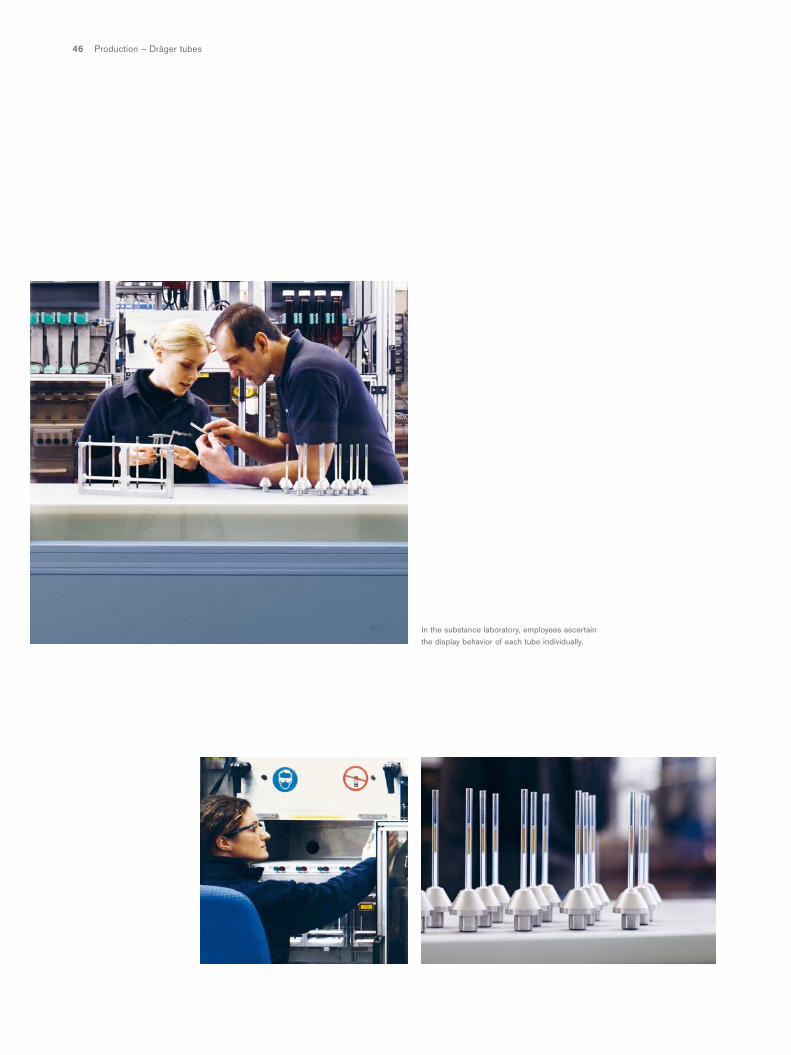
46 Production – Dräger tubes
In the substance laboratory, employees ascertain the display behavior of each tube individually.
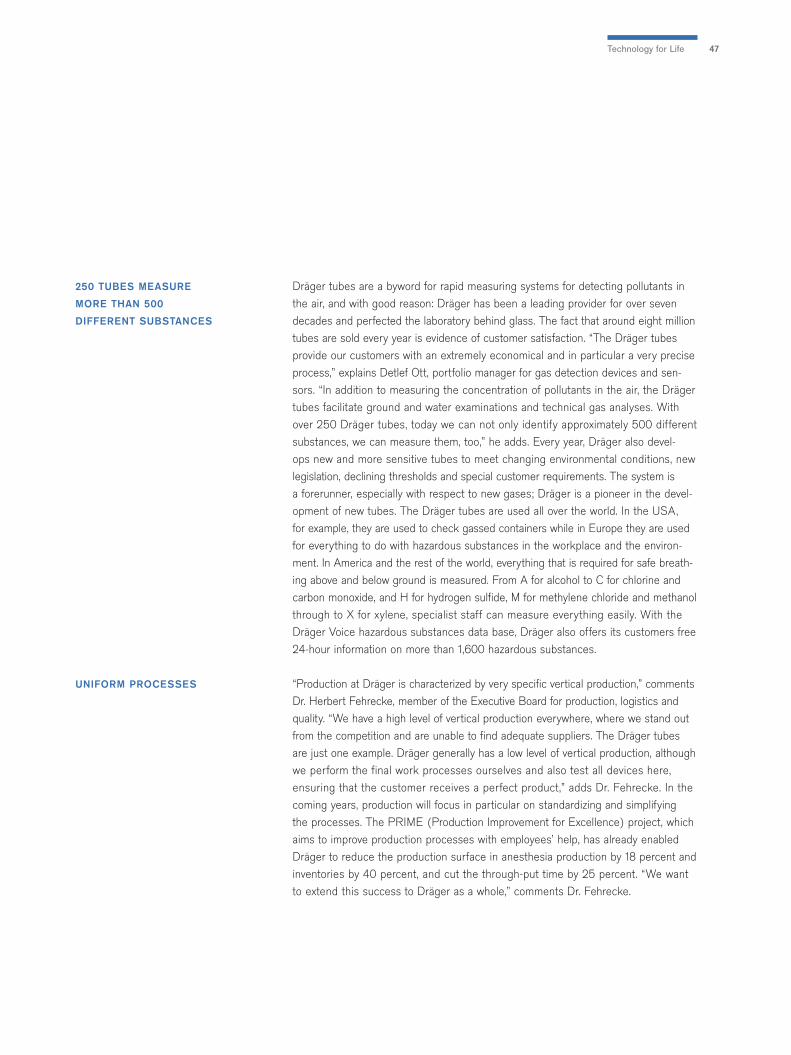
47
Dräger tubes are a byword for rapid measuring systems for detecting pollutants inthe air, and with good reason: Dräger has been a leading provider for over sevendecades and perfected the laboratory behind glass. The fact that around eight milliontubes are sold every year is evidence of customer satisfaction. “The Dräger tubesprovide our customers with an extremely economical and in particular a very preciseprocess,” explains Detlef Ott, portfolio manager for gas detection devices and sen-sors. “In addition to measuring the concentration of pollutants in the air, the Drägertubes facilitate ground and water examinations and technical gas analyses. Withover 250 Dräger tubes, today we can not only identify approximately 500 differentsubstances, we can measure them, too,” he adds. Every year, Dräger also devel-ops new and more sensitive tubes to meet changing environmental conditions, newlegislation, declining thresholds and special customer requirements. The system is a forerunner, especially with respect to new gases; Dräger is a pioneer in the devel-opment of new tubes. The Dräger tubes are used all over the world. In the USA, for example, they are used to check gassed containers while in Europe they are usedfor everything to do with hazardous substances in the workplace and the environ-ment. In America and the rest of the world, everything that is required for safe breath-ing above and below ground is measured. From A for alcohol to C for chlorine andcarbon monoxide, and H for hydrogen sulfide, M for methylene chloride and methanolthrough to X for xylene, specialist staff can measure everything easily. With theDräger Voice hazardous substances data base, Dräger also offers its customers free24-hour information on more than 1,600 hazardous substances.
“Production at Dräger is characterized by very specific vertical production,” commentsDr. Herbert Fehrecke, member of the Executive Board for production, logistics andquality. “We have a high level of vertical production everywhere, where we stand outfrom the competition and are unable to find adequate suppliers. The Dräger tubesare just one example. Dräger generally has a low level of vertical production, althoughwe perform the final work processes ourselves and also test all devices here,ensuring that the customer receives a perfect product,” adds Dr. Fehrecke. In thecoming years, production will focus in particular on standardizing and simplifying the processes. The PRIME (Production Improvement for Excellence) project, whichaims to improve production processes with employees’ help, has already enabledDräger to reduce the production surface in anesthesia production by 18 percent andinventories by 40 percent, and cut the through-put time by 25 percent. “We wantto extend this success to Dräger as a whole,” comments Dr. Fehrecke.
250 TUBES MEASURE
MORE THAN 500
DIFFERENT SUBSTANCES
UNIFORM PROCESSES
Technology for Life
Quality – Primus Infinity Empowered48
Functionality even under extreme conditions
The fundamental rule: whatever happens, the anesthetist must be in a position to provide the patient with oxygen and maintain theanesthesia.
QUALITY
Dräger’s “Primus” anesthesia device can be reliedupon during anesthesia in the operating room.
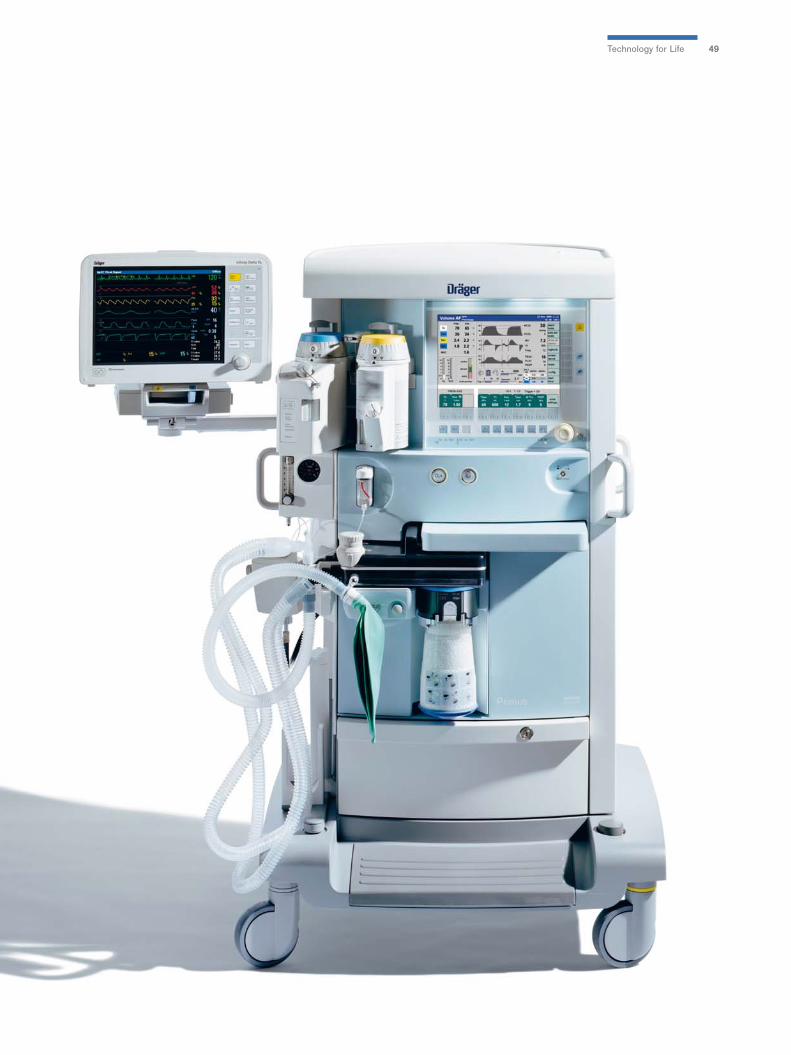
49Technology for Life
Quality – Primus Infinity Empowered50
Customers have associated the Dräger brand with outstandingproduct quality for 120 years. Surgeons rely on the patient sleepingsafely and pain-free during an operation. One example of excellent quality“made by Dräger” is the “Primus” anesthesia workstation system.
“Various indicators are used to assess Dräger’s quality, and we set ourselves veryambitious targets to achieve the highest ratings. However, what really counts is the “feel” of quality which our customers use to assess products. Reliability, durabilityand simple use are some of the criteria used to assess our devices,” explains Dr. Christian Engeln, product manager for the “Primus” anesthesia devices range.“After all, we are talking about life-saving systems. The quality has to be right.”
Good quality can only be achieved if it is focused on across the entire product lifecycle. As early as the concept phase, the system’s architecture is oriented aroundseamless interplay between the individual components. Where anesthesia worksta-tions 25 years ago comprised numerous individual devices, the standard today is for functions to be integrated in one system. This simplifies the usage of the device.Monitoring of the patient and technology has become more intelligent. However, this interplay of functions requires a sophisticated safety concept. Faults during use,however, can never be completely ruled out and therefore it is crucial how the devicereacts in such a case. “Over the years, we have learnt that it is not enough to simplyspecify the device’s reaction to the fault, for example gas or power supply cut, oreven failure of device components. We have to look at these cases from the user’spoint of view and understand how he or she intuitively reacts to unwanted situa-tions. Only in this way can the safe status be defined correctly in case of an error.”The measure for quality as far as the anesthetist is concerned is therefore not only the reliability of the technology, but also the availability of the maximum possiblefunctions if the device malfunctions. Dräger ensures its products are reliable anddurable by carefully selecting materials, technologies and components. At the sametime, expertise, experience and smooth processes are preconditions for high quality. This starts with the suppliers of individual components. Only those who fulfillDräger’s high standards are likely to be chosen as one of the few strategic partners
QUALITY IS RELIABILITY,
DURABILITY AND SIMPLE USE
INTEGRATION OF FUNCTIONS
IN ONE SYSTEM
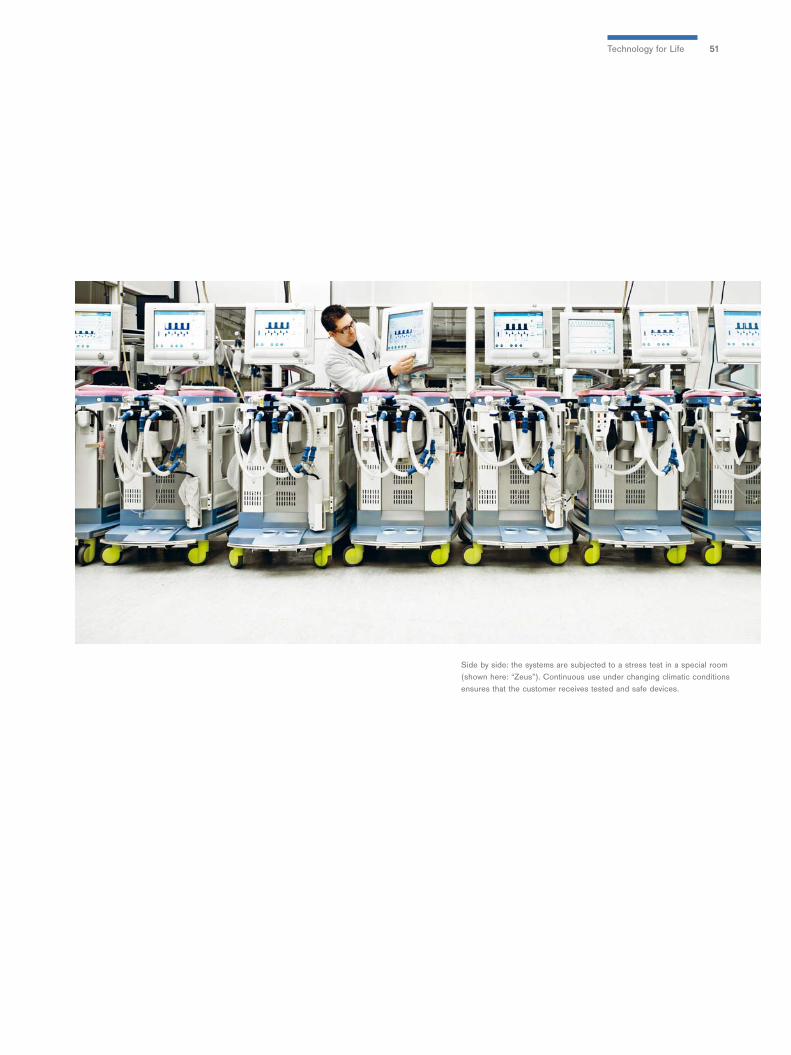
51
Side by side: the systems are subjected to a stress test in a special room(shown here: “Zeus”). Continuous use under changing climatic conditionsensures that the customer receives tested and safe devices.
Technology for Life
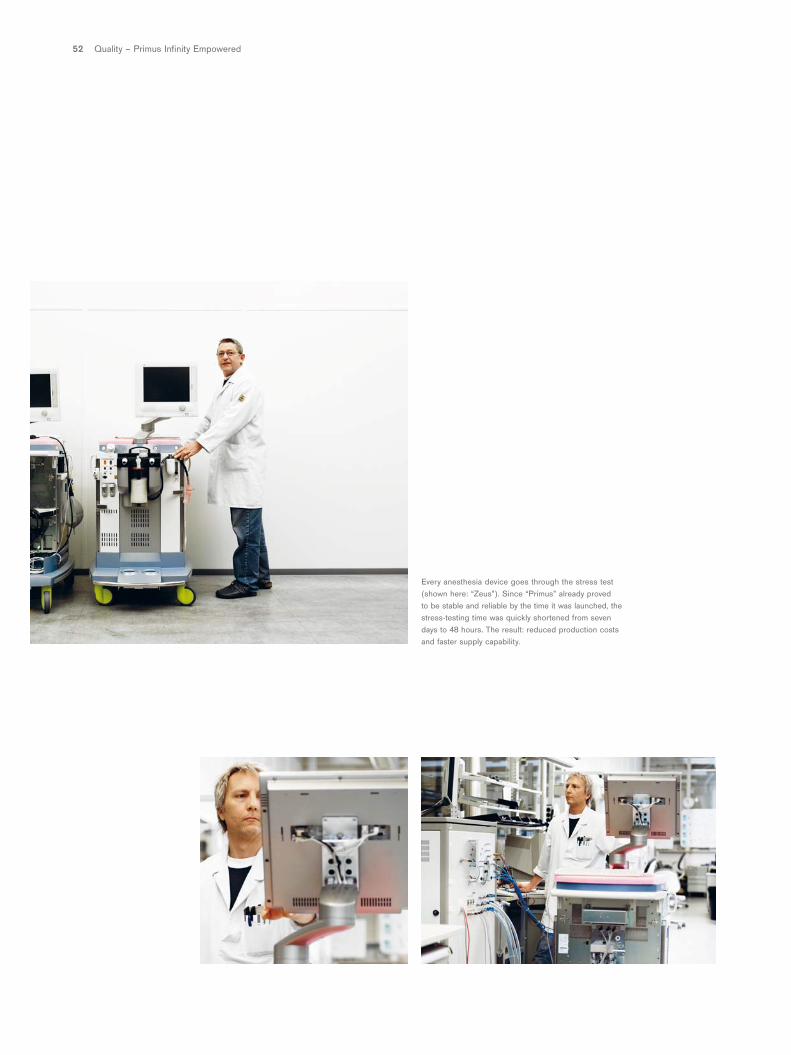
Quality – Primus Infinity Empowered52
Every anesthesia device goes through the stress test(shown here: “Zeus”). Since “Primus” already proved to be stable and reliable by the time it was launched, thestress-testing time was quickly shortened from sevendays to 48 hours. The result: reduced production costsand faster supply capability.
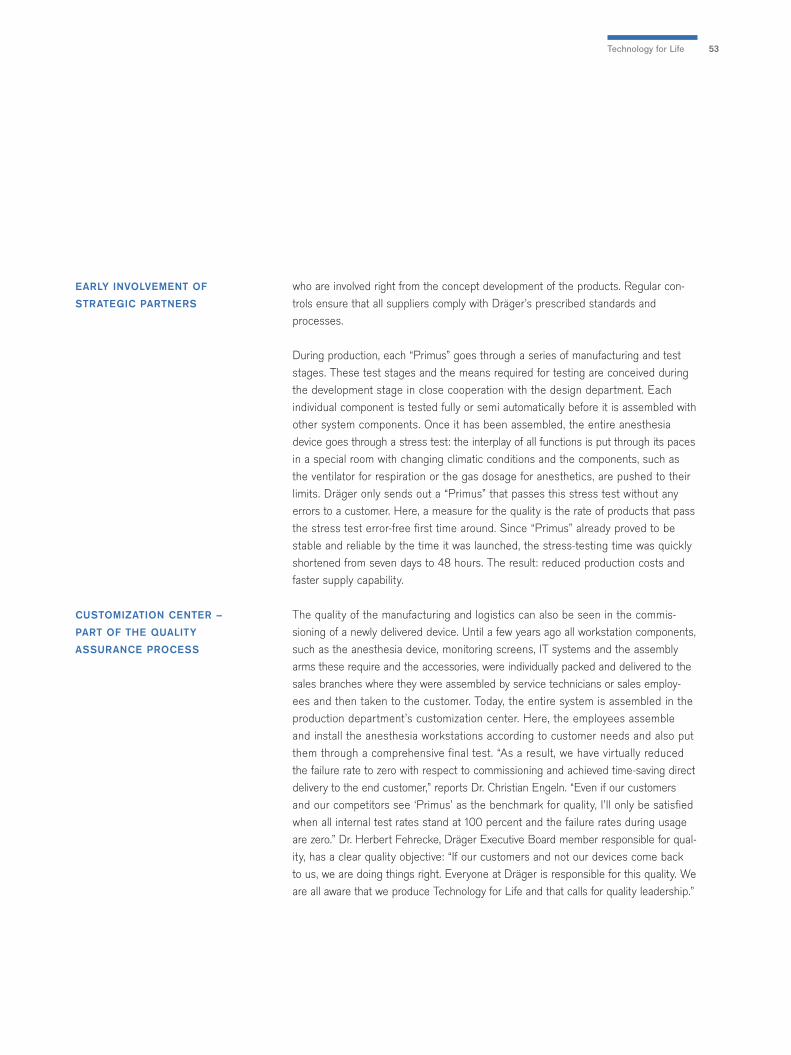
53
who are involved right from the concept development of the products. Regular con-trols ensure that all suppliers comply with Dräger’s prescribed standards andprocesses.
During production, each “Primus” goes through a series of manufacturing and teststages. These test stages and the means required for testing are conceived duringthe development stage in close cooperation with the design department. Each individual component is tested fully or semi automatically before it is assembled withother system components. Once it has been assembled, the entire anesthesiadevice goes through a stress test: the interplay of all functions is put through its pacesin a special room with changing climatic conditions and the components, such asthe ventilator for respiration or the gas dosage for anesthetics, are pushed to theirlimits. Dräger only sends out a “Primus” that passes this stress test without anyerrors to a customer. Here, a measure for the quality is the rate of products that passthe stress test error-free first time around. Since “Primus” already proved to be stable and reliable by the time it was launched, the stress-testing time was quicklyshortened from seven days to 48 hours. The result: reduced production costs andfaster supply capability.
The quality of the manufacturing and logistics can also be seen in the commis-sioning of a newly delivered device. Until a few years ago all workstation components,such as the anesthesia device, monitoring screens, IT systems and the assemblyarms these require and the accessories, were individually packed and delivered to thesales branches where they were assembled by service technicians or sales employ-ees and then taken to the customer. Today, the entire system is assembled in theproduction department’s customization center. Here, the employees assemble and install the anesthesia workstations according to customer needs and also putthem through a comprehensive final test. “As a result, we have virtually reducedthe failure rate to zero with respect to commissioning and achieved time-saving directdelivery to the end customer,” reports Dr. Christian Engeln. “Even if our customers and our competitors see ‘Primus’ as the benchmark for quality, I’ll only be satisfiedwhen all internal test rates stand at 100 percent and the failure rates during usageare zero.” Dr. Herbert Fehrecke, Dräger Executive Board member responsible for qual-ity, has a clear quality objective: “If our customers and not our devices come back to us, we are doing things right. Everyone at Dräger is responsible for this quality. Weare all aware that we produce Technology for Life and that calls for quality leadership.”
EARLY INVOLVEMENT OF
STRATEGIC PARTNERS
CUSTOMIZATION CENTER –
PART OF THE QUALITY
ASSURANCE PROCESS
Technology for Life
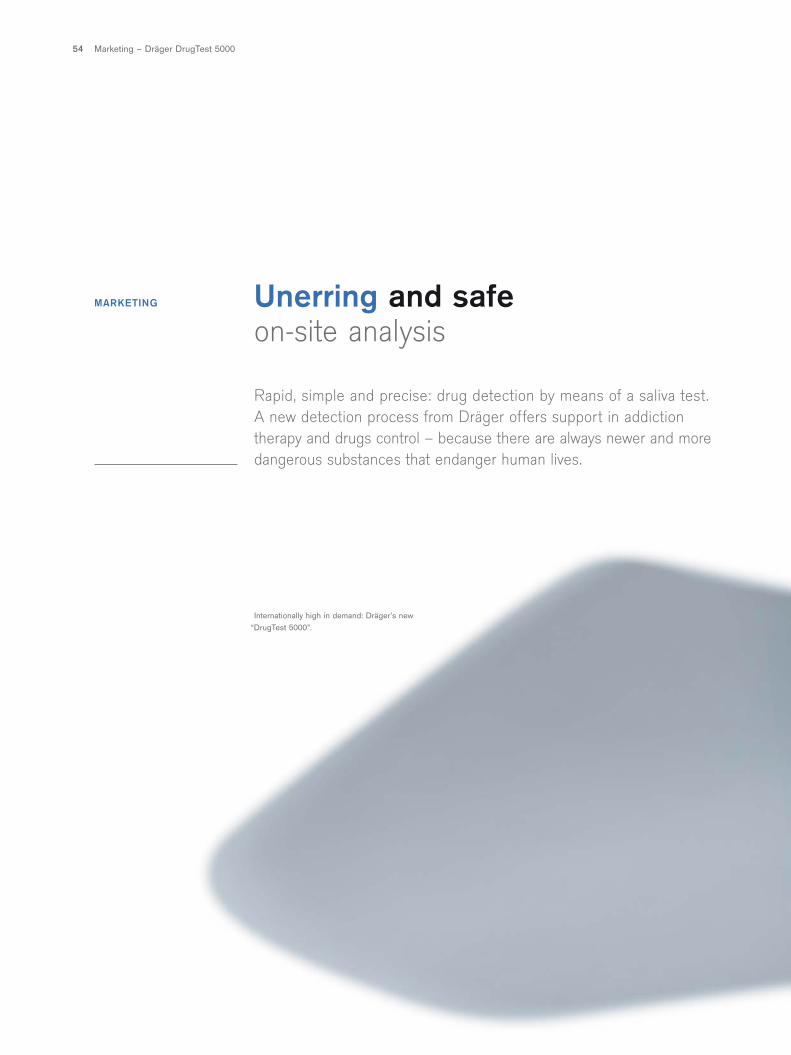
Marketing – Dräger DrugTest 500054
Unerring and safeon-site analysis
Rapid, simple and precise: drug detection by means of a saliva test. A new detection process from Dräger offers support in addiction therapy and drugs control – because there are always newer and moredangerous substances that endanger human lives.
MARKETING
Internationally high in demand: Dräger’s new “DrugTest 5000”.
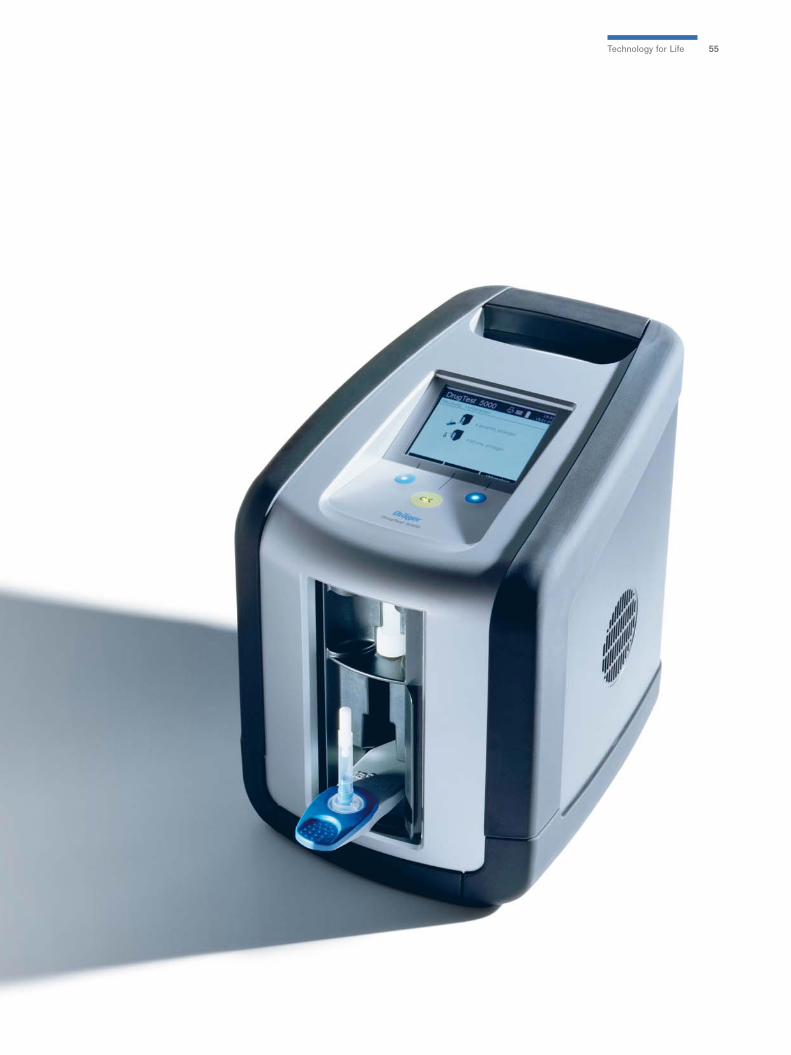
55Technology for Life
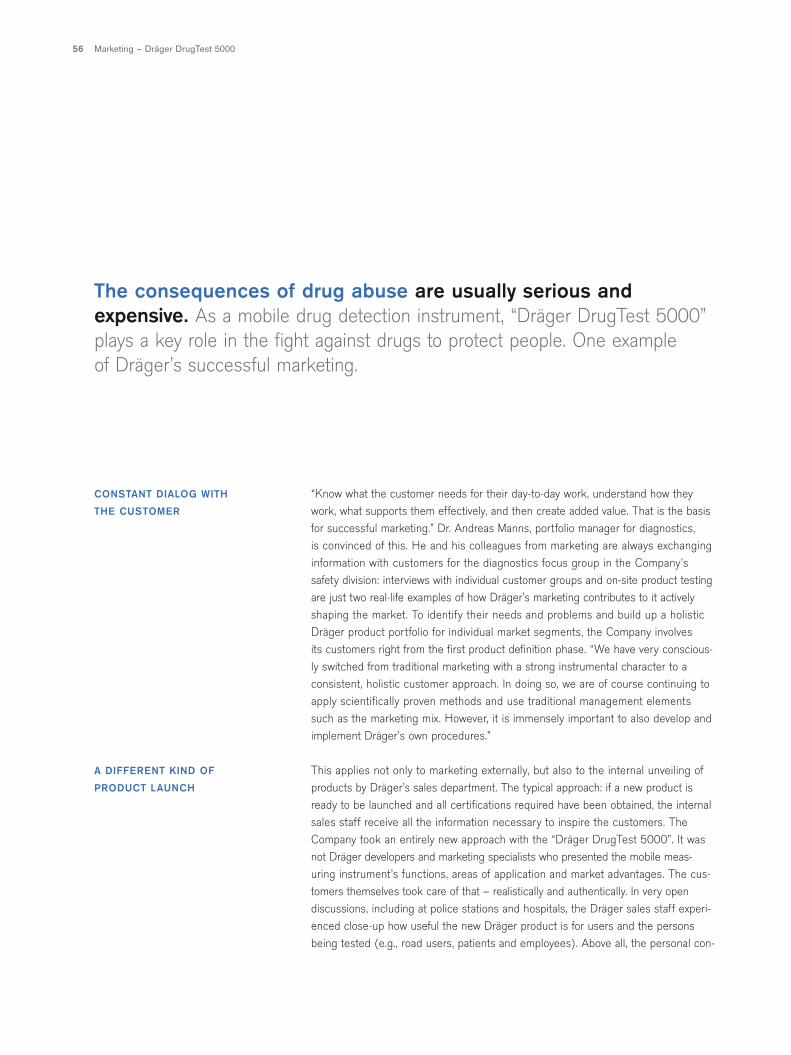
56
The consequences of drug abuse are usually serious and expensive. As a mobile drug detection instrument, “Dräger DrugTest 5000”plays a key role in the fight against drugs to protect people. One example of Dräger’s successful marketing.
“Know what the customer needs for their day-to-day work, understand how theywork, what supports them effectively, and then create added value. That is the basisfor successful marketing.” Dr. Andreas Manns, portfolio manager for diagnostics, is convinced of this. He and his colleagues from marketing are always exchanginginformation with customers for the diagnostics focus group in the Company’ssafety division: interviews with individual customer groups and on-site product testingare just two real-life examples of how Dräger’s marketing contributes to it activelyshaping the market. To identify their needs and problems and build up a holisticDräger product portfolio for individual market segments, the Company involves its customers right from the first product definition phase. “We have very conscious-ly switched from traditional marketing with a strong instrumental character to a consistent, holistic customer approach. In doing so, we are of course continuing toapply scientifically proven methods and use traditional management elements such as the marketing mix. However, it is immensely important to also develop andimplement Dräger’s own procedures.”
This applies not only to marketing externally, but also to the internal unveiling ofproducts by Dräger’s sales department. The typical approach: if a new product isready to be launched and all certifications required have been obtained, the internalsales staff receive all the information necessary to inspire the customers. The Company took an entirely new approach with the “Dräger DrugTest 5000”. It wasnot Dräger developers and marketing specialists who presented the mobile meas-uring instrument’s functions, areas of application and market advantages. The cus-tomers themselves took care of that – realistically and authentically. In very open discussions, including at police stations and hospitals, the Dräger sales staff experi-enced close-up how useful the new Dräger product is for users and the personsbeing tested (e.g., road users, patients and employees). Above all, the personal con-
CONSTANT DIALOG WITH
THE CUSTOMER
A DIFFERENT KIND OF
PRODUCT LAUNCH
Marketing – Dräger DrugTest 5000
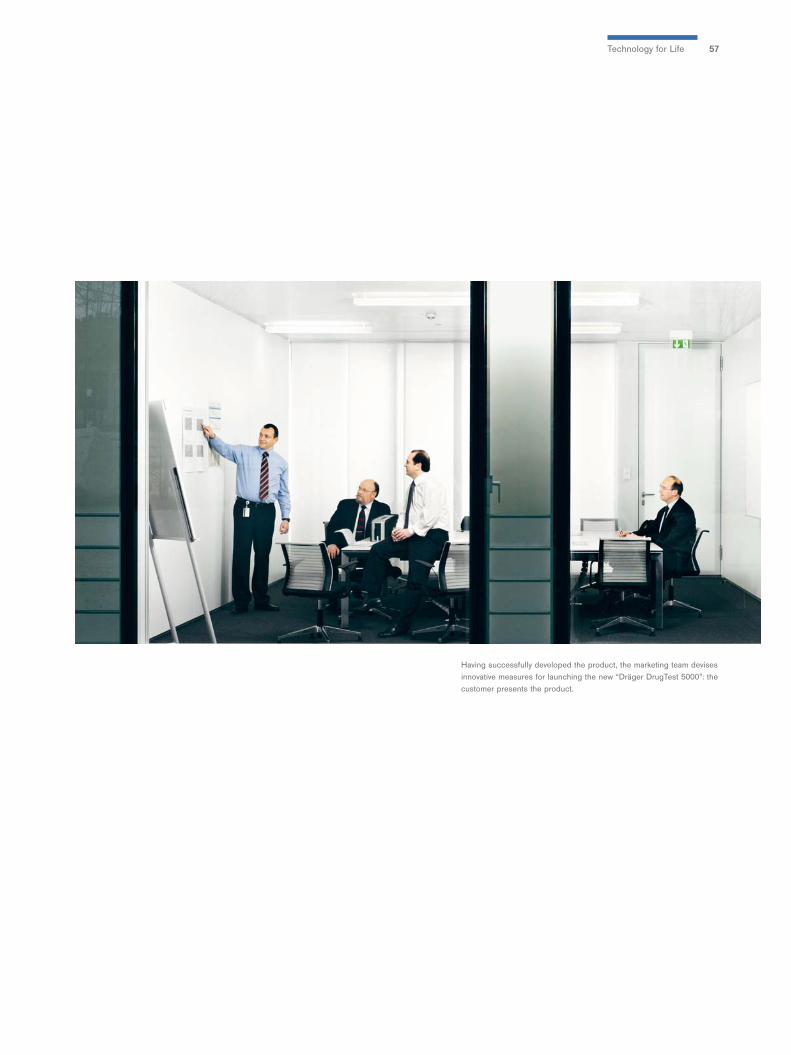
57
Having successfully developed the product, the marketing team devisesinnovative measures for launching the new “Dräger DrugTest 5000”: thecustomer presents the product.
Technology for Life
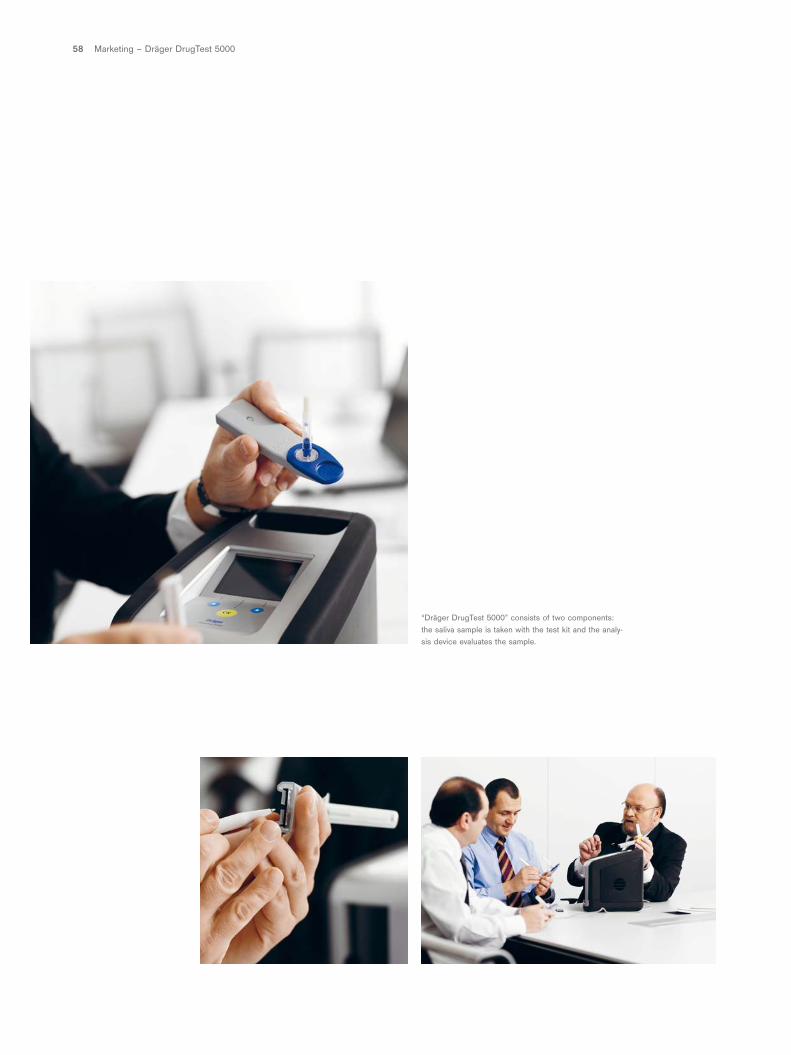
58 Marketing – Dräger DrugTest 5000
“Dräger DrugTest 5000” consists of two components:the saliva sample is taken with the test kit and the analy-sis device evaluates the sample.
59
tact with those affected who reported on their experiences with drugs left a long-lasting impression. Emotions and personal experience made clear how significantthe “Dräger DrugTest 5000” is for the market.
The “Dräger DrugTest 5000” analyzes saliva samples for six different classes ofsubstances and is just as uncomplicated and reliable for road-side tests conductedby police as for regular checks on clinical patients during detoxification. The newdrug test can identify traces of opiates, cocaine, cannabis, amphetamines and design-er drugs and tranquilizers from the benzodiazepine group. In total, the test system is comprised of two main components: the actual “sensor” – the “Dräger DrugTest5000 Test Kit” (saliva swab and the test cartridge) – and the analysis unit, the“Dräger DrugTest 5000 Analyzer”. The test kit is used to collect and analyze the sali-va sample. Compared to the urine or blood samples that have been used to date, the new Dräger process is more convenient and more discrete for both the user andthe person being tested. The evaluation of the saliva sample is ready within ten minutes. “With the ‘Dräger DrugTest 5000’, we have created a process platformwhich is extremely precise and allows for the desired mobility, on-site documen-tation and electronic data management,” says Dr. Mann as he describes the innova-tive product.
For more than 60 years, Dräger has been developing methods for breath alco-hol testing and is one of the most successful and largest providers of breath alcoholtesting technology. Today there is a complete range of different applications. “With the Alcotest devices and our vehicle immobilizer, the ‘Dräger Interlock’, Drägerhas become the global market and technology leader. It made sense to expand our analysis knowledge in order to develop a practical rapid test for drugs as welland to offer a comprehensive solution to the various market segments,” Dr. Mann continues. “Customers have confirmed the significant advantages of the new ‘DrägerDrugTest 5000’.” As a simple rapid test, it has proven itself already in the sevenmonths that it has been in use. “With the ‘Dräger DrugTest 5000’ we have alsoachieved something new within the Group. What was originally developed for customers of the safety division has also resulted in sales opportunities for the med-ical division,” reports Dr. Dieter Pruss, Executive Board member for marketing and sales at the safety division. “Our colleagues from the medical division are alsoselling this product to hospitals.” What is the key to successful marketing? “The proximity to customers and in-depth understanding of their tasks are the startingpoints for every successful product,” explains the Executive Board member. “The safety division’s strategic goal is to become number one on the global market. The‘Dräger DrugTest 5000’ is making its own contribution to that goal.”
ANALYSIS RESULTS IN
ONLY TEN MINUTES
GLOBAL MARKET AND
TECHNOLOGY LEADER
Technology for Life
Logistics – FPS 7000, PSS 7000 mask60
Protects against thick smokeand poisonous gases
Save, protect, rescue: on-duty firefighters take great risks and pushtheir limits when they save lives, rescue people from dangerous situa-tions and secure buildings and installations. They have to be able to rely one hundred percent on their equipment. A clear view and a suffi-cient air supply are prerequisites for action. Worldwide.
LOGISTICS
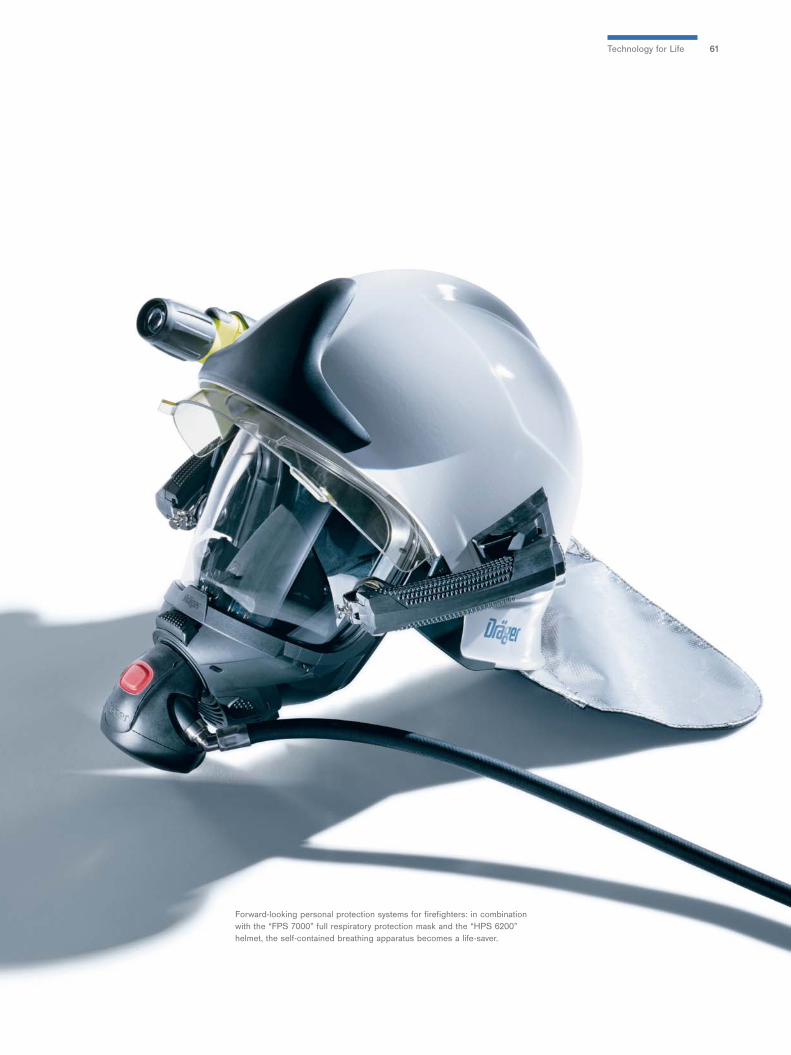
61
Forward-looking personal protection systems for firefighters: in combinationwith the “FPS 7000” full respiratory protection mask and the “HPS 6200” helmet, the self-contained breathing apparatus becomes a life-saver.
Technology for Life
62
Fire departments place their trust in Dräger’s personal pro-tection equipment, such as the new “PSS 7000” self-con-tained breathing apparatus with the “FPS 7000” respiratoryprotection mask. The apparatus features a carrying system for the air, mask, helmet and a monitoring unit. In many different variations.An example of Dräger’s challenging logistics.
“Only a few products and models achieve large-scale production status or are con-tinuously supplied to customers in the safety division. In Lübeck alone, over 12,000marketable products, often in many thousands of variations are delivered to over 30 subsidiaries and to several tens of thousands of direct end customers and special-ist dealers in Europe and more than 400,000 deliveries per year are sent around the world,” explains Jürgen Gerhold, manager of the logistics center at Dräger SafetyAG & Co. KGaA. This presents production and logistics with major challenges asboth departments often have to react to considerable fluctuations in demand at veryshort notice.
One example is the self-contained breathing apparatus “Dräger PSS 7000”: thebreathing apparatus is available in a total of approximately 120 variations. It is theplatform and centerpiece of a personal protection system for firefighters. Theself-contained breathing apparatus can be upgraded through a variety of individualsettings in the electronic monitoring unit “Bodyguard 7000” and related acces-sories: the customer has a choice between various masks, helmets, air cylinders andbreathing regulators. And with the “Dräger FPS 7000” full face mask, for example, the “PSS 7000” sets new standards for protection and comfort in the respiratory pro-tection industry.
This equipment, which was launched on the market in January 2008, is particularlyspecial because for the very first time, the safety division has developed a self-contained breathing apparatus which can be used worldwide and, at the same time,complies with local standards. The advantages: more competitive costs, more choice for customers, better international configuration options around the world andmore flexible production.
400,000 ITEMS SUPPLIED
PER YEAR
THINK GLOBALLY, ACT LOCALLY
Logistics – FPS 7000, PSS 7000 mask
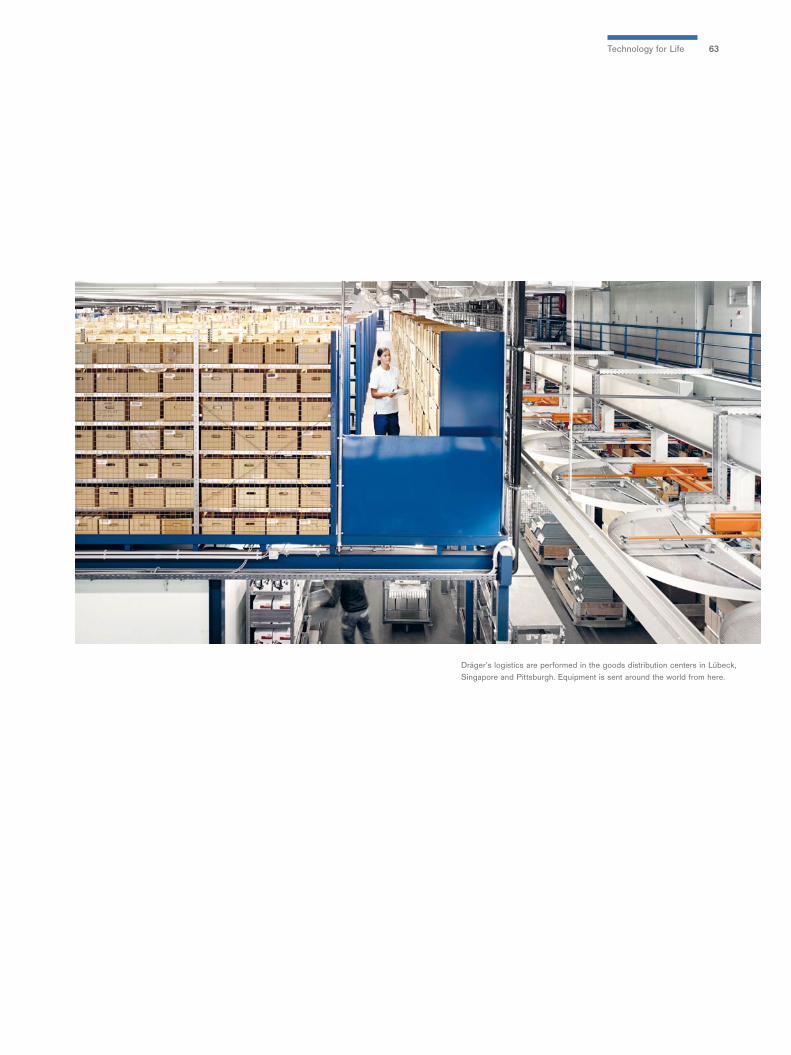
63
Dräger’s logistics are performed in the goods distribution centers in Lübeck,Singapore and Pittsburgh. Equipment is sent around the world from here.
Technology for Life
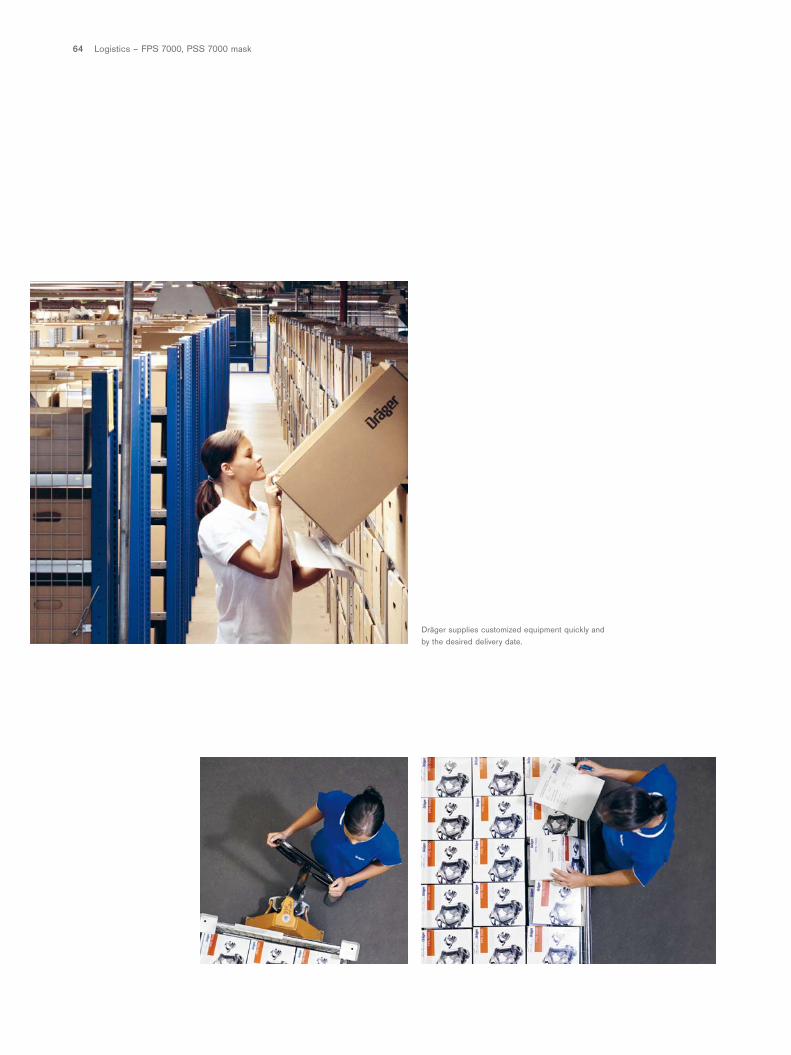
64 Logistics – FPS 7000, PSS 7000 mask
Dräger supplies customized equipment quickly and by the desired delivery date.
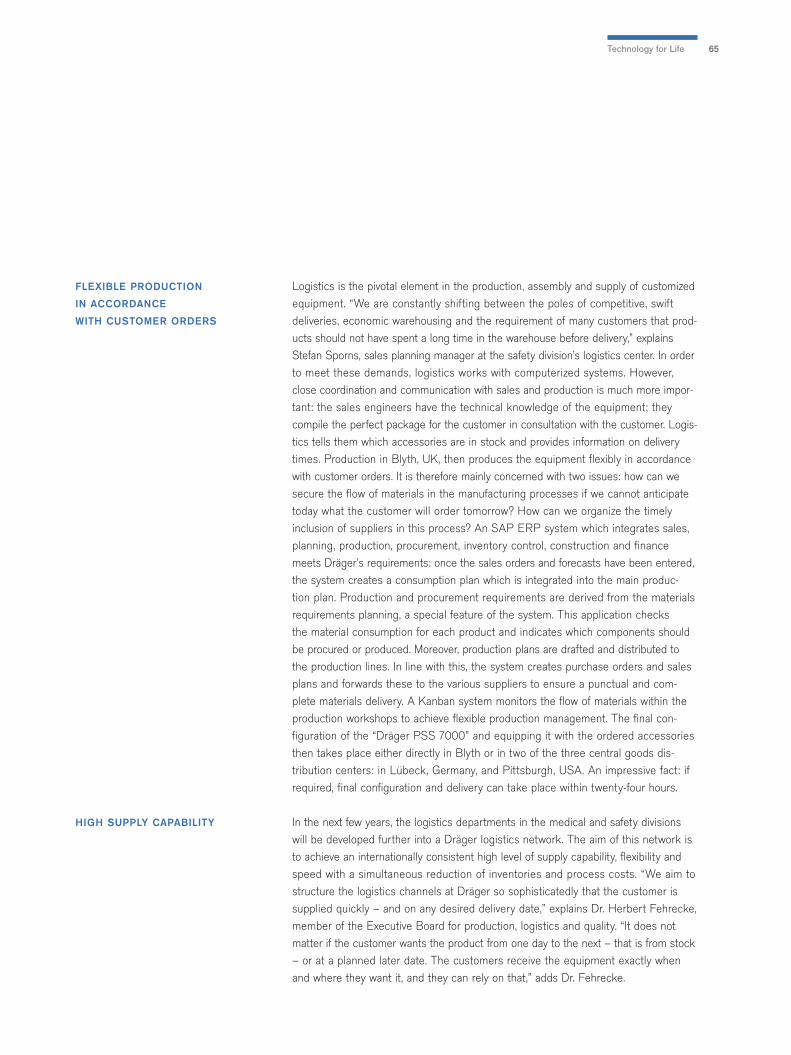
65
Logistics is the pivotal element in the production, assembly and supply of customizedequipment. “We are constantly shifting between the poles of competitive, swiftdeliveries, economic warehousing and the requirement of many customers that prod-ucts should not have spent a long time in the warehouse before delivery,” explains Stefan Sporns, sales planning manager at the safety division’s logistics center. In orderto meet these demands, logistics works with computerized systems. However,close coordination and communication with sales and production is much more impor-tant: the sales engineers have the technical knowledge of the equipment; theycompile the perfect package for the customer in consultation with the customer. Logis-tics tells them which accessories are in stock and provides information on deliverytimes. Production in Blyth, UK, then produces the equipment flexibly in accordancewith customer orders. It is therefore mainly concerned with two issues: how can wesecure the flow of materials in the manufacturing processes if we cannot anticipatetoday what the customer will order tomorrow? How can we organize the timely inclusion of suppliers in this process? An SAP ERP system which integrates sales,planning, production, procurement, inventory control, construction and finance meets Dräger’s requirements: once the sales orders and forecasts have been entered,the system creates a consumption plan which is integrated into the main produc-tion plan. Production and procurement requirements are derived from the materialsrequirements planning, a special feature of the system. This application checks the material consumption for each product and indicates which components shouldbe procured or produced. Moreover, production plans are drafted and distributed tothe production lines. In line with this, the system creates purchase orders and salesplans and forwards these to the various suppliers to ensure a punctual and com-plete materials delivery. A Kanban system monitors the flow of materials within theproduction workshops to achieve flexible production management. The final con-figuration of the “Dräger PSS 7000” and equipping it with the ordered accessoriesthen takes place either directly in Blyth or in two of the three central goods dis-tribution centers: in Lübeck, Germany, and Pittsburgh, USA. An impressive fact: ifrequired, final configuration and delivery can take place within twenty-four hours.
In the next few years, the logistics departments in the medical and safety divisionswill be developed further into a Dräger logistics network. The aim of this network isto achieve an internationally consistent high level of supply capability, flexibility andspeed with a simultaneous reduction of inventories and process costs. “We aim tostructure the logistics channels at Dräger so sophisticatedly that the customer issupplied quickly – and on any desired delivery date,” explains Dr. Herbert Fehrecke,member of the Executive Board for production, logistics and quality. “It does notmatter if the customer wants the product from one day to the next – that is from stock– or at a planned later date. The customers receive the equipment exactly whenand where they want it, and they can rely on that,” adds Dr. Fehrecke.
FLEXIBLE PRODUCTION
IN ACCORDANCE
WITH CUSTOMER ORDERS
HIGH SUPPLY CAPABILITY
Technology for Life
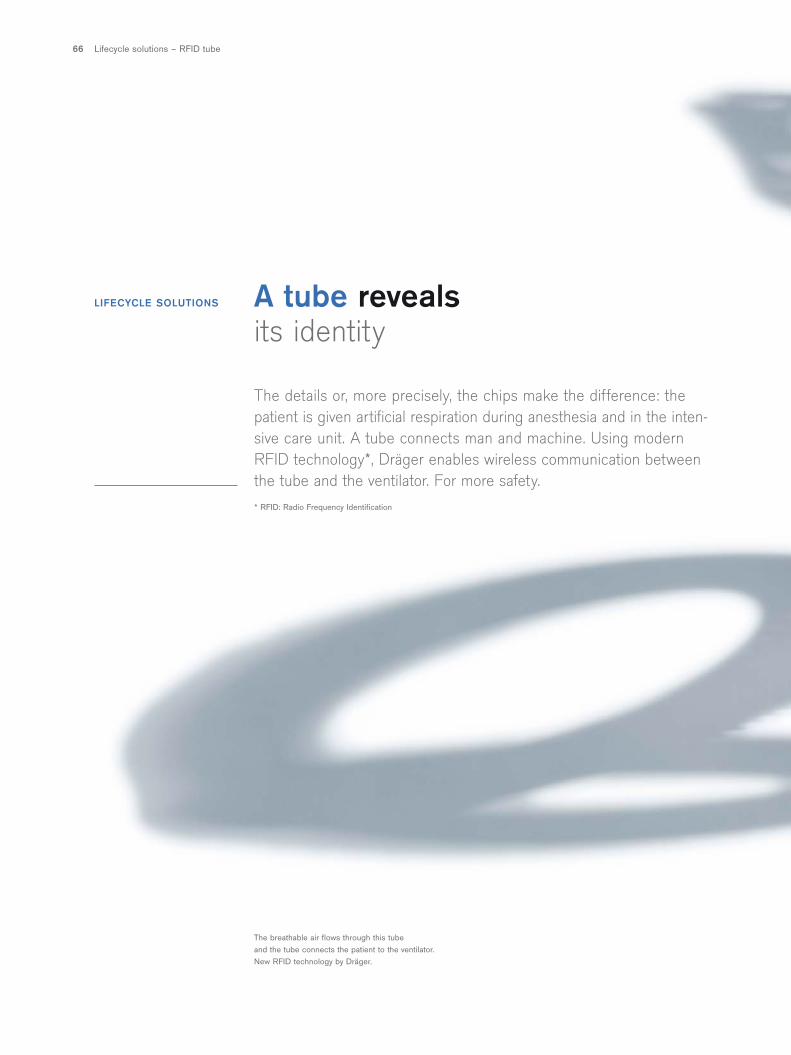
Lifecycle solutions – RFID tube 66
A tube revealsits identity
The details or, more precisely, the chips make the difference: thepatient is given artificial respiration during anesthesia and in the inten-sive care unit. A tube connects man and machine. Using modernRFID technology*, Dräger enables wireless communication betweenthe tube and the ventilator. For more safety.* RFID: Radio Frequency Identification
LIFECYCLE SOLUTIONS
The breathable air flows through this tube and the tube connects the patient to the ventilator.New RFID technology by Dräger.
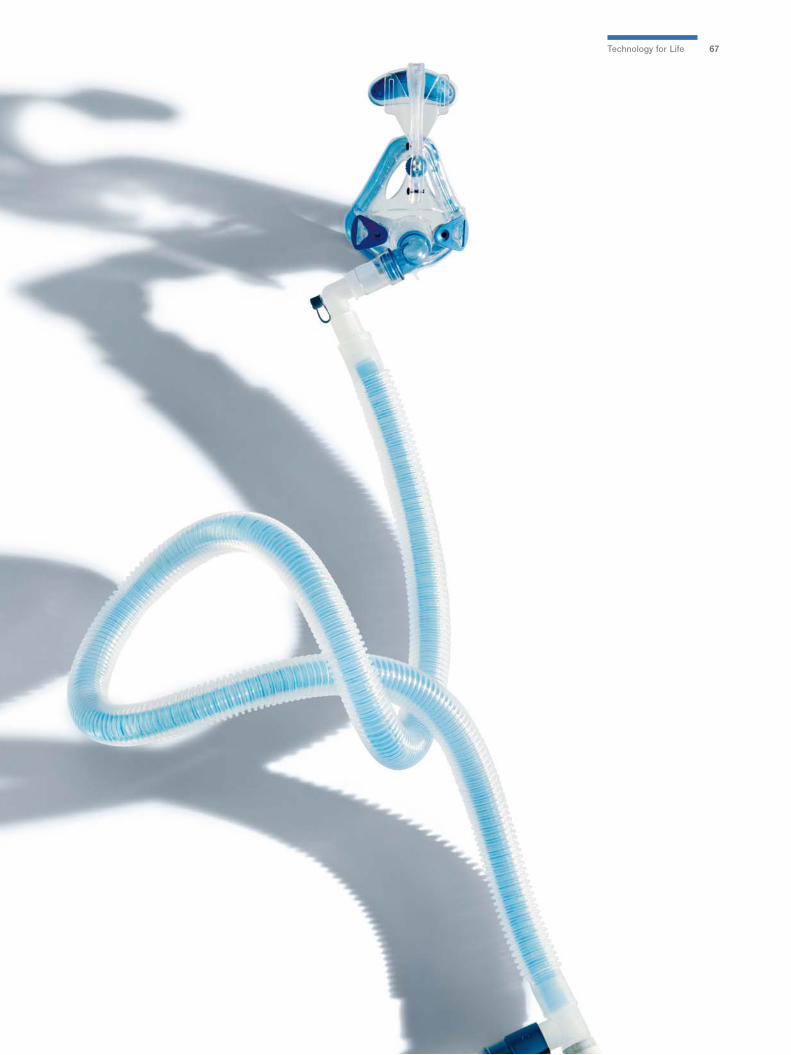
67Technology for Life
Lifecycle solutions – RFID tube 68
Even after the purchase decision, delivery, instruction and training,Dräger is there for its customers, with innovative solutions for the day-to-day use of anesthesia equipment, ventilation and monitoring systems,with intelligent accessories and comprehensive service, with lifecycle solutions.
Small, unobtrusive, but tremendously effective. These are the products of the lifecyclesolutions segment of the medical division. It is one of six newly-formed strategic business segments of the medical division and includes the service organisation inaddition to the whole accessories portfolio. Over 100 employees look after morethan 10,000 products.
For many years, Dräger has offered accessories and disposable materials for day-to-day use in hospitals in addition to the medical equipment and systems for anesthe-sia and critical and emergency ventilation. A business with international growthpotential, in particular if, like Dräger, you have precise knowledge of the processesand requirements of hospitals.
“We intend to provide additional added value to therapy with our products. We focuson our customers’ requirements to improve and become more efficient in the acutepoint of care area. In particular, this applies to the quality of therapy, patient safetyand well-structured daily routines in hospital wards,” reports Brigitte Dautzenberg,manager of this expanding business segment. “And we have ideas for further growth,primarily for our business with Dräger medical equipment which is installed all over the world,” says Brigitte Dautzenberg. “This means that we develop and produceaccessories for the whole product life cycle. We accompany Dräger products fromtheir launch on the market to the day we remove them from our active product range.”
The RFID tubes, as the latest innovation from this segment, are the gateway to a total-ly new generation of intelligent equipment and patient accessories. “Small thingssometimes make the decisive difference,” says Andreas Otto, product manager forthe new intelligent accessories at Dräger, describing the effect of this product portfolio in practice. “Infinity ID accessories offer added value for customers in theirdaily work.”
OVER 10,000 PRODUCTS IN
THE PORTFOLIO
ADDITIONAL INNOVATIVE PRODUCT
IDEAS FOR APPLICATION
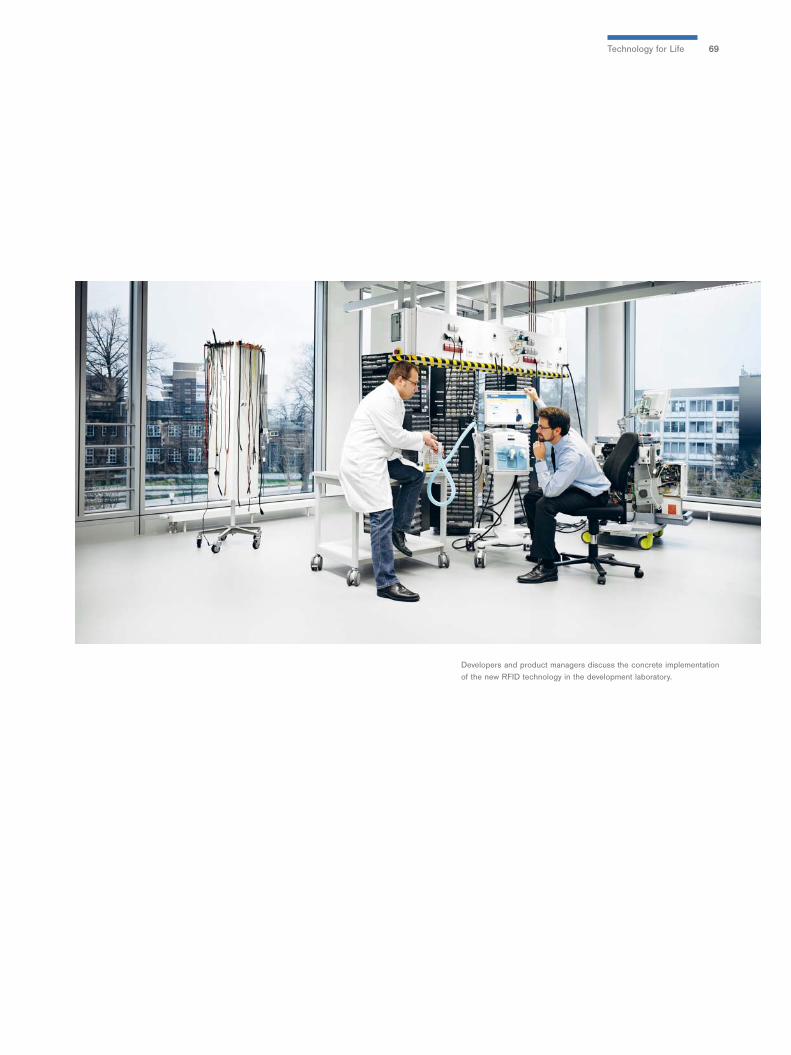
69
Developers and product managers discuss the concrete implementation of the new RFID technology in the development laboratory.
Technology for Life
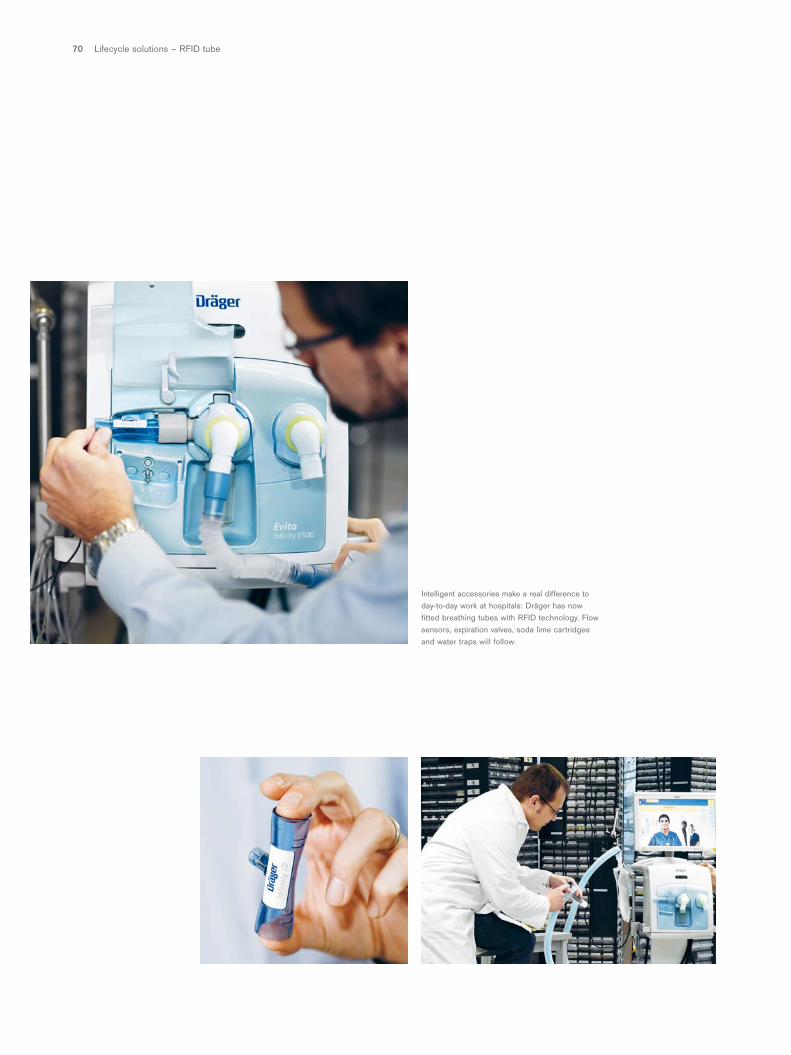
70 Lifecycle solutions – RFID tube
Intelligent accessories make a real difference to day-to-day work at hospitals: Dräger has now fitted breathing tubes with RFID technology. Flow sensors, expiration valves, soda lime cartridges and water traps will follow.
71
The disposable tubes which facilitate ventilation and therefore the airflow between the device and the patient can now communicate wirelessly thanks to a small chipand a miniature antenna.
The result: the new RFID technology stores data and provides more safety in theday-to-day running of hospitals and simpler, quicker and more reliable operation ofthe equipment. The user receives reports via the device’s display as to whether thetube is connected properly, whether it is compatible with the selected device config-uration and whether the user should change the tube because it has exceededits useful life. In addition, the chip in the breathing tube is later able to transfer theventilator settings of the patient from one device to the next when the equipment is changed. An example: following an operation, the new “Evita Infinity V500” takesover the ventilation of a patient who has previously been connected to the “PrimusInfinity Empowered” anesthesia device. Without RFID technology, the ventilation para-meters need to be completely reset, for example, how much oxygen should flow into the patients’ lungs, at what pressure and at what intervals. The new Dräger InfinityID tube brings this information with it.
In the future, it will not only be tubes that are fitted with RFID technology, but also flow sensors, which measure the flow of air, expiration valves, which control expiration, soda lime cartridges, which absorb exhaled carbon dioxide, and water traps, which are a key component in measuring anesthetic gas while a patient is under anesthesia.Wireless communication is possible between all of these and the Infinity system.
With this product range, Andreas Otto and his colleagues have supported the hospitaltrend to intensify the use of non-invasive methods in medical treatment, patientmonitoring and diagnostics. For every invasion of the body opens a door to infections.And: invasive treatment usually causes pain and stress for patients in a situationwhich is already intrinsically stressful. And this also applies to diagnostics and moni-toring.
Dräger offers comprehensive solutions for both non-invasive ventilation and non-invasive monitoring.
“Many of our accessories are outstanding in combination with Dräger devices. Fromour perspective, they represent a competitive advantage and from the customer’s perspective, added value if they opt for Dräger devices,” says Dr. Christian Hauer,marketing and sales manager in the medical division.
THE ADDED VALUE FOR THE
CUSTOMER IS IN THE DETAIL
EXTENSIVE PRODUCT
PORTFOLIO
Technology for Life
NON-INVASIVE METHODS OF
MEDICAL TREATMENT

72
Management report 2008 (amended version)The management report documents and comments on the Dräger Group’s performance in fiscal year 2008.
Functional areasResearch and development 106Personnel 108Procurement, manufacturing and logistics 110Corporate IT 112Environmental protection 113
PotentialOpportunities and risks relating to future development 115Disclosures pursuant to Sec. 315 (4) HGB and explanations by the general partner 119Subsequent events 123Outlook 124
Market environmentChanges to the financial statements 2008 75Important changes in fiscal year 2008 75German Financial Reporting Enforcement Panel 76Group structure 76Control systems 78Overall economic environment 79
Business performanceBusiness performance of the Dräger Group 82Financial management of the Dräger Group 89Business performance of the medical division 92Business performance of the safety division 98Business performance of Drägerwerk AG & Co. KGaA/ other companies 104
75
PotentialFunctional areasBusiness performanceMarket environment 75
Changes to the financial statements 2008
In order to comply with the new statutory provisions of
IAS 32 on the classification of equity and debt, Dräger
evaluated its reporting methods for participation capital
and decided they should be amended. As a result and
in accordance with IAS 32 and IAS 39, an equity and debt
component for each series of participation capital has
been retrospectively recognized and measured by choice
in the financial statements 2008.
The total amount of obligations from participation certifi-
cates recognized as liabilities decreased by EUR 36.2
as of December 31, 2007 as a result of the changes applied
to the presentation of participation certificates in the
IFRS group financial statements. This decrease is caused
by a decline of Liabilities from participation certificates
by EUR 47.2 million (December 31, 2007: EUR 48.2 mil-
lion) and of Other current financial liabilities by
EUR 4.4 million (December 31, 2007: EUR 7.2 million)
whereas the Deferred tax liabilities increased by EUR
15.4 million (December 31, 2007: EUR 15.7 million). The
net profit for the fiscal years 2008 and 2007 increased
by a total of EUR 2.8 million (2007: EUR 3.9 million) due
to the interest result, which improved by EUR 3.3 mil-
lion (2007: EUR 6.2 million), and income taxes, which
went up by EUR 0.5 million (2007: EUR 2.3 million).
The increase in equity attributable to participation cer-
tificates comes to EUR 36.2 million as of December
31, 2008 and EUR 39.7 million as of December 31, 2007.
Important changes in fiscal year 2008
CHANGES IN THE EXECUTIVE BOARD OF DRÄGERWERK
VERWALTUNGS AG
On March 17, 2008, the Supervisory Board of Drägerwerk
Verwaltungs AG appointed three new members to the
Company’s Executive Board effective as of April 1, 2008:
– Dr. Dieter Pruss (52) is responsible for sales and mar-
keting for the safety division. Previously, he had headed
two of safety’s four strategic business segments. He is
the first internal candidate the Supervisory Board has
appointed to the Executive Board for some time.
– Gert-Hartwig Lescow (41) is the new CFO. Since Sep-
Management report 2008 of the Dräger Group(amended version)
The Dräger Group achieved its target of increasing net sales in fiscalyear 2008, but it missed its earnings target of steady EBIT before non-recurring expenses. The business performance of the medical andthe safety divisions varied.
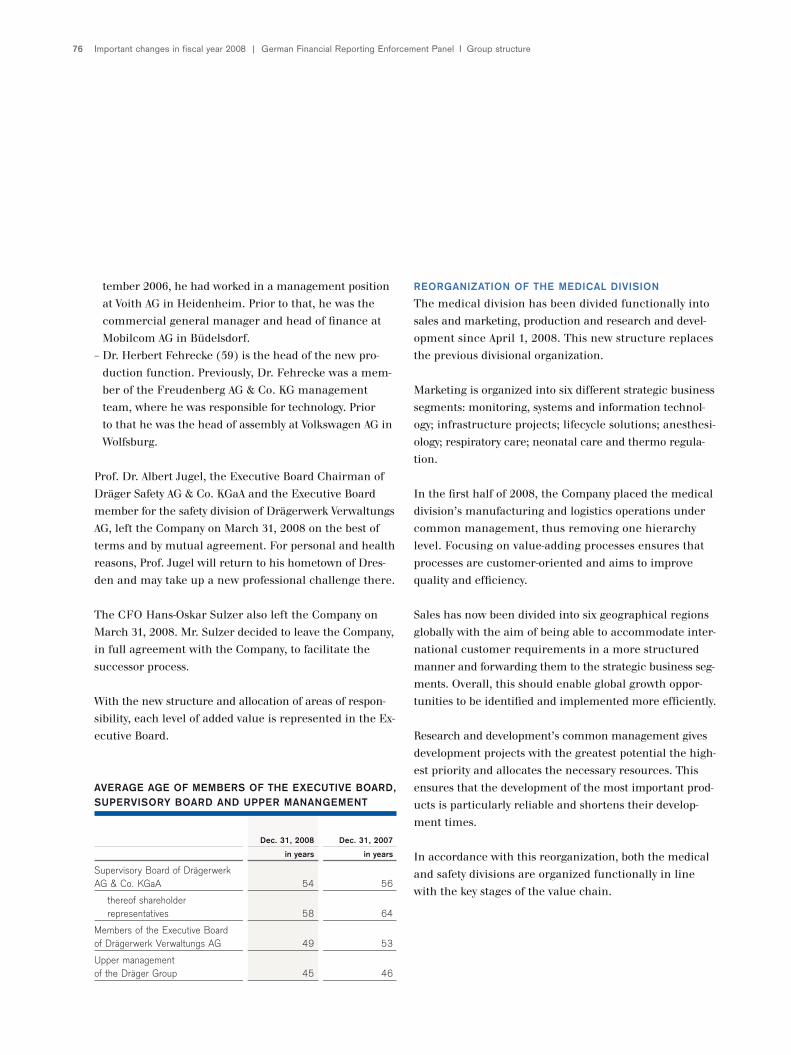
Important changes in fiscal year 2008 | German Financial Reporting Enforcement Panel I Group structure76
tember 2006, he had worked in a management position
at Voith AG in Heidenheim. Prior to that, he was the
commercial general manager and head of finance at
Mobilcom AG in Büdelsdorf.
– Dr. Herbert Fehrecke (59) is the head of the new pro-
duction function. Previously, Dr. Fehrecke was a mem-
ber of the Freudenberg AG & Co. KG management
team, where he was responsible for technology. Prior
to that he was the head of assembly at Volkswagen AG in
Wolfsburg.
Prof. Dr. Albert Jugel, the Executive Board Chairman of
Dräger Safety AG & Co. KGaA and the Executive Board
member for the safety division of Drägerwerk Verwaltungs
AG, left the Company on March 31, 2008 on the best of
terms and by mutual agreement. For personal and health
reasons, Prof. Jugel will return to his hometown of Dres-
den and may take up a new professional challenge there.
The CFO Hans-Oskar Sulzer also left the Company on
March 31, 2008. Mr. Sulzer decided to leave the Company,
in full agreement with the Company, to facilitate the
successor process.
With the new structure and allocation of areas of respon-
sibility, each level of added value is represented in the Ex-
ecutive Board.
REORGANIZATION OF THE MEDICAL DIVISION
The medical division has been divided functionally into
sales and marketing, production and research and devel-
opment since April 1, 2008. This new structure replaces
the previous divisional organization.
Marketing is organized into six different strategic business
segments: monitoring, systems and information technol-
ogy; infrastructure projects; lifecycle solutions; anesthesi-
ology; respiratory care; neonatal care and thermo regula-
tion.
In the first half of 2008, the Company placed the medical
division’s manufacturing and logistics operations under
common management, thus removing one hierarchy
level. Focusing on value-adding processes ensures that
processes are customer-oriented and aims to improve
quality and efficiency.
Sales has now been divided into six geographical regions
globally with the aim of being able to accommodate inter-
national customer requirements in a more structured
manner and forwarding them to the strategic business seg-
ments. Overall, this should enable global growth oppor-
tunities to be identified and implemented more efficiently.
Research and development’s common management gives
development projects with the greatest potential the high-
est priority and allocates the necessary resources. This
ensures that the development of the most important prod-
ucts is particularly reliable and shortens their develop-
ment times.
In accordance with this reorganization, both the medical
and safety divisions are organized functionally in line
with the key stages of the value chain.
AVERAGE AGE OF MEMBERS OF THE EXECUTIVE BOARD,SUPERVISORY BOARD AND UPPER MANANGEMENT
Dec. 31, 2008 Dec. 31, 2007
in years in years
Supervisory Board of DrägerwerkAG & Co. KGaA 54 56
thereof shareholder representatives 58 64
Members of the Executive Board of Drägerwerk Verwaltungs AG 49 53
Upper management of the Dräger Group 45 46
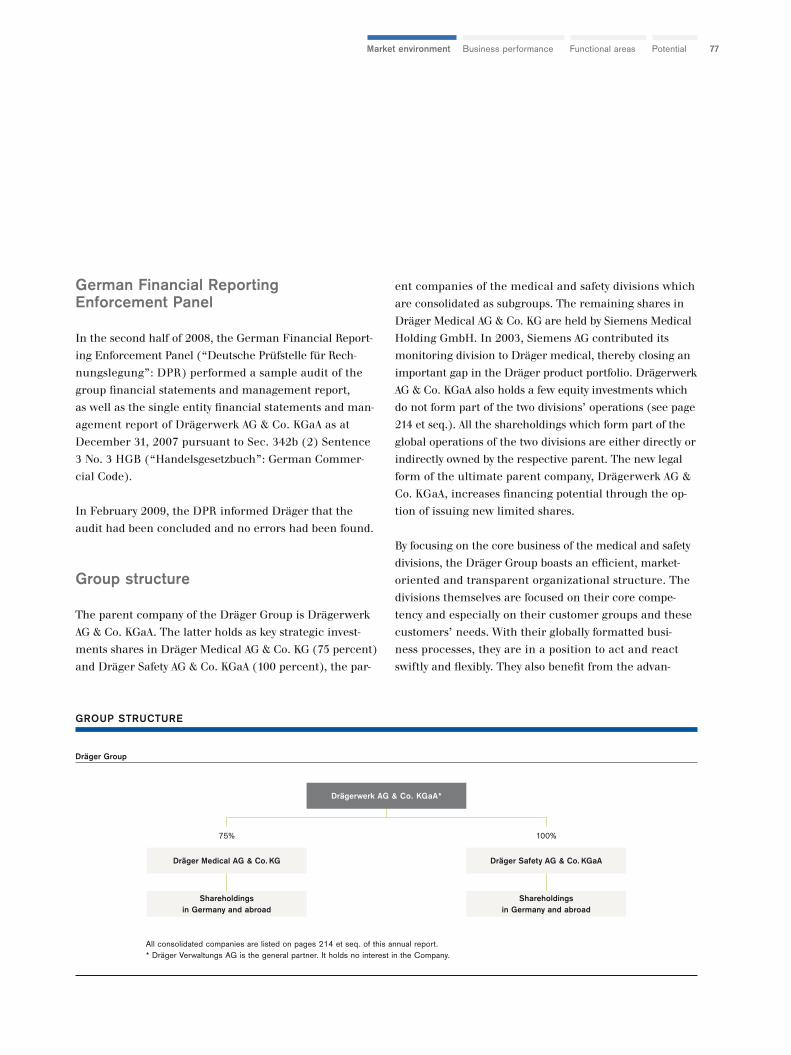
77PotentialFunctional areasBusiness performanceMarket environment
German Financial Reporting Enforcement Panel
In the second half of 2008, the German Financial Report-
ing Enforcement Panel (“Deutsche Prüfstelle für Rech-
nungslegung”: DPR) performed a sample audit of the
group financial statements and management report,
as well as the single entity financial statements and man-
agement report of Drägerwerk AG & Co. KGaA as at
December 31, 2007 pursuant to Sec. 342b (2) Sentence
3 No. 3 HGB (“Handelsgesetzbuch”: German Commer-
cial Code).
In February 2009, the DPR informed Dräger that the
audit had been concluded and no errors had been found.
Group structure
The parent company of the Dräger Group is Drägerwerk
AG & Co. KGaA. The latter holds as key strategic invest-
ments shares in Dräger Medical AG & Co. KG (75 percent)
and Dräger Safety AG & Co. KGaA (100 percent), the par-
ent companies of the medical and safety divisions which
are consolidated as subgroups. The remaining shares in
Dräger Medical AG & Co. KG are held by Siemens Medical
Holding GmbH. In 2003, Siemens AG contributed its
monitoring division to Dräger medical, thereby closing an
important gap in the Dräger product portfolio. Drägerwerk
AG & Co. KGaA also holds a few equity investments which
do not form part of the two divisions’ operations (see page
214 et seq.). All the shareholdings which form part of the
global operations of the two divisions are either directly or
indirectly owned by the respective parent. The new legal
form of the ultimate parent company, Drägerwerk AG &
Co. KGaA, increases financing potential through the op-
tion of issuing new limited shares.
By focusing on the core business of the medical and safety
divisions, the Dräger Group boasts an efficient, market-
oriented and transparent organizational structure. The
divisions themselves are focused on their core compe-
tency and especially on their customer groups and these
customers’ needs. With their globally formatted busi-
ness processes, they are in a position to act and react
swiftly and flexibly. They also benefit from the advan-
GROUP STRUCTURE
Dräger Group
Dräger Medical AG & Co. KG
Shareholdingsin Germany and abroad
Dräger Safety AG & Co. KGaA
Shareholdingsin Germany and abroad
75%
All consolidated companies are listed on pages 214 et seq. of this annual report.* Dräger Verwaltungs AG is the general partner. It holds no interest in the Company.
100%
Drägerwerk AG & Co. KGaA*
Group structure I Control systems I Overall economic environment78
tages of group membership which enables them to share
know-how. Aside from tax, legal and insurance, which
are already central departments, corporate IT, corporate
communications and subgroups of human resources
will be organized as shared services in order to increase
efficiency. Dräger also expects significant effects from the
coordination of research and development units by the
new research and development function on the Executive
Board of Drägerwerk AG & Co. KGaA.
OPERATING ACTIVITIES OF THE MEDICAL DIVISION
The medical division develops, produces, and markets
medical equipment, system solutions and services for the
acute point of care (APOC) process chain. These include
emergency care, perioperative care (in connection with the
operation), critical care and perinatal care (in connec-
tion with childbirth) and ventilation in home care. The
product portfolio enables the highest quality of treat-
ment in ventilation and anesthesia as well as ongoing sur-
veillance of patients’ vital signs using Dräger monitors.
Equipment and systems (for example gas management sys-
tems) and an extensive range of accessories round off
the product portfolio.
The Dräger Infinity network, the first standardized plat-
form connecting patient monitoring, therapy functions and
information management, will ensure effective and effi-
cient processes in clinics.
The key business processes for the medical division are
developing, marketing as well as selling and servicing
products. Of the 6,326 people employed by the division
worldwide (December 31, 2008), 54 percent work in
sales, marketing and service, 23 percent in production,
quality assurance, logistics and procurement, 12 per-
cent in research and development, and 11 percent in
administration. Procurement and logistics processes are
becoming increasingly important given that production is
focused on assembling and testing equipment.
The medical division has development centers and pro-
duction plants in Germany (Lübeck), the Netherlands
(Best), the US (Telford and Danvers), and China (Shang-
hai). The sales and service companies with the highest
net sales are in Germany as well as the US, France, Italy,
Spain, the UK, China and Japan. The division has sales
and service subsidiaries in over 40 countries on all conti-
nents and is represented in around 190 countries.
The division’s products and services are designed to im-
prove patient care and increase the efficiency of clinical
processes. By doing so, Dräger helps abate healthcare
costs and at the same time secures long-term business
success. Medical division is one of the world’s leading
providers in its key market, the APOC area in hospitals.
OPERATING ACTIVITIES OF THE SAFETY DIVISION
The safety division develops, produces, and markets safety
products, system solutions and services for personal
protection, gas detection technology and extensive hazard
management. It provides equipment, systems and com-
prehensive solutions to customers in industry, public disas-
ter protection, mining and other sectors. These warn and
protect against hazards that threaten the life and health
of people as well as facilities and production plants.
Numerous safety products serve to detect gaseous contami-
nants and protect the human respiratory system. Dräger
is one of the world’s leading suppliers in these markets,
with sales and service subsidiaries in over 30 countries
on all continents and representative offices in around 100
countries. The companies with the highest net sales are
in Germany as well as the US, France, the UK, Spain, the
Netherlands, Australia and Singapore. Of the 4,194 peo-
ple employed by the division worldwide (December 31,
2008), 48 percent work in sales, marketing and service,
36 percent in production, quality assurance, logistics
and procurement, 6 percent in research and development,
and 10 percent in administration. The safety division
produces in Lübeck as well as in key growth markets such
as the US (Pittsburgh) and China (Beijing), as well as in
PotentialFunctional areasBusiness performanceMarket environment
the UK (Blyth), Sweden (Svenljunga), Brazil (São Paulo)
and South Africa (King Williams Town).
Control systems
The internal control system supports management in
securing the long-term success of the Company. It com-
prises budgets, actual cost calculations and forecasts
with strategic and operative elements.
The control system is based on the Dräger Group’s strate-
gic plan, which is revised annually and reflects expected
market developments, technological trends and their influ-
ence on products and services, as well as the financial
means of the Dräger Group. The results are condensed in
a five-year plan, the first year of which is developed into
a detailed budget for the coming year. The monthly group
reporting includes the IFRS financial statements of all
of the group companies and shows the development of the
net assets, financial position and results of operations
of the Group, the divisions and other controlling units.
These data are supplemented by detailed information
required for the management of the Group’s operating
activities. Forecasts for estimating the overall net earn-
ings for the year are produced at regular intervals during
the fiscal year. Reports prepared every six months which
address the Company’s significant risks are a further com-
ponent of the control system. These reports are discussed
during Executive and Supervisory Board meetings and are
important as a basis for key decisions.
The most important key figures used to monitor the Com-
pany’s development are net sales, EBIT, EBIT margin,
return on capital expenditure (ROCE), as well as cash flow
and key figures for the capital tie-up. The volume and
composition of order intake and orders on hand are impor-
tant indicators of current performance. Early indicators
for strategic development are development projects and
their status, market response to new products and the
Company’s development and competitive position within
the various regional markets.
Further information on the management and control
structure can be found in the corporate governance report
(page 20 et seq.).
Overall economic environment
HIGH RISKS FOR THE GLOBAL ECONOMY
According to the International Monetary Fund (IMF), the
global economy is heading towards the greatest recession
since the 1930s. 2008 was shaped by the consequences of
the financial crisis which the central banks met with
hefty interest rate reductions to between 0 percent and
0.25 percent (for example in the US), guarantees for
banks and investments in banks at risk in order to combat
the breakdown of confidence and also to give positive
impulses to interbank trade. In addition, ongoing adjust-
ments on residential real estate markets, sharp fluctua-
tions in the price of crude oil and other commodities and
volatile currency exchange rates also characterized 2008.
Although the global economy still recorded overall growth
of 3.4 percent in 2008 (2007: 5.2 percent), the financial
crisis spread to the real economy in the second six months
of the year and led to negative development. The recession
in the US intensified significantly towards the end of the
year. As announced by the US Department of Commerce
at the end of January 2009 as part of a first publication,
the gross domestic product (GDP) fell by 3.8 percent (an-
nualized) between October and December. This was
the largest reduction in US economic output since the first
quarter of 1982 when GDP shrank by 6.4 percent (annu-
alized). On an annual basis, US economic growth was still
at 1.1 percent, according to IMF data. Due to the weak
performance in the second half of the year, economic out-
put also fell significantly in the eurozone, such that the
growth rate decreased to 1.0 percent. Italy’s economy even
fell by 0.6 percent in 2008. The financial crisis not only
79
Overall economic environment80
lamed the real economy in the US and Europe, but also in
Japan. According to the IMF, Japanese GDP decreased
by 0.3 percent. Only developing and emerging countries
recorded relatively strong growth of 6.3 percent, al-
though this was considerably weaker than in the prior
year (up 8.3 percent).
COMMODITIES MARKETS
At the end of December 2008, the oil price stood at USD
39.50, which was 58 percent lower than at the start of the
year. Translated into euros, this represents a decrease of
around 54 percent. According to the German Institute for
Economic Research (“Deutsches Institut für Wirtschafts-
forschung”: DIW), the low oil price in the second half of
2008 stabilized the economy. In Germany alone, the
decrease in the price of oil and petrol saved the economy
and consumers at least EUR 10 billion in the second
half of 2008. In aggregate terms, the price index for non-
energy commodities (denominated in US dollars) was
approximately 23 percent lower at the end of December
2008 than in the prior year, although it had still been
approximately 10 percent higher at the end of September,
according to a report by the European Central Bank
(ECB). Metal prices in particular also fell due to fears of
a global economic slowdown and considerably reduced
freight costs.
INFLATION
On a global scale, consumer prices rose by 3.5 percent in
industrial countries, according to the IMF. The upward
trend slowed down considerably in the second half of the
year. Inflation was at 4.8 percent in July. In the eurozone,
annual inflation amounted to only 1.6 percent in December
2008 and therefore had continued to decrease following
its dramatic drop to 2.1 percent in November 2008. At the
same time, there are signs that the price pressure on the
production chain has decreased very sharply, according to
the ECB. The annual rate of change of industrial manu-
facturer’s prices (excluding the building trade) fell signif-
icantly to 3.4 percent in November (October: 6.3 percent).
In contrast, labor cost growth accelerated in the eurozone
in the third quarter of 2008. The significant decrease in
overall inflation in the second half of 2008 was chiefly at-
tributable to considerably lower global commodity prices
in the last few months.
EXCHANGE RATE
According to the European Central Bank, the euro’s
nominal effective exchange rate (measured against the
currencies of 21 important eurozone trade partners)
was at an index value of 113.0 (base value Q1 1999: 100)
on average in 2008. Compared to the average value
of 107.5 in 2007, the value of the euro therefore rose by
5.1 percentage points – a significant burden on export
business. In the first quarter, the average value of the euro
had already risen to an index value of 112.9, and even
increased to 116.0 in the second quarter. In the third quar-
ter, the euro began to fall in value (114.1), before the
value decreased significantly to 109.1 in the fourth quarter.
In the fourth quarter, the bilateral exchange rates of the
euro posted considerable deviations with extensive volatil-
ity. In nominal effective terms, the euro fell in October,
remained predominately stable in November and recouped
some of its previous losses in December. From a bilateral
perspective, the development of the euro varies. Strong
devaluation of the euro against the US dollar, the Japanese
yen, the Swiss franc and the Chinese renminbi was con-
trasted by currency gains against most other important
currencies, which applies in particular to pound sterling,
the Swedish krona and the currencies of some new EU
member states. The extreme values of the euro against
the US dollar document the high volatility in the course of
the year. At the beginning of the year, the euro was val-
ued at 1.4602 against the US dollar. The annual high was
at USD 1.6039 (July 15, 2008) and it reached an annual
low of USD 1.2328 on October 28, 2008. The exchange
rate was USD 1.3919 as of December 31, 2008. Overall, the
euro therefore fell by 4.7 percent against the US dollar
in the course of the year.
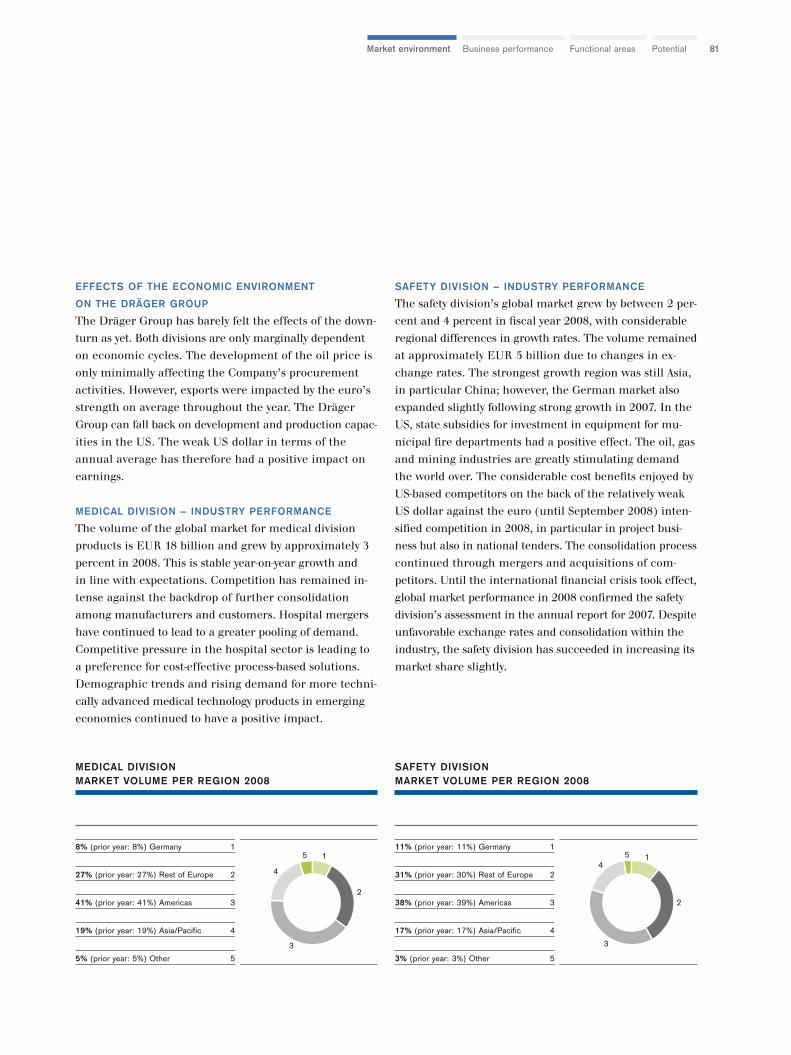
81PotentialFunctional areasBusiness performanceMarket environment
EFFECTS OF THE ECONOMIC ENVIRONMENT
ON THE DRÄGER GROUP
The Dräger Group has barely felt the effects of the down-
turn as yet. Both divisions are only marginally dependent
on economic cycles. The development of the oil price is
only minimally affecting the Company’s procurement
activities. However, exports were impacted by the euro’s
strength on average throughout the year. The Dräger
Group can fall back on development and production capac-
ities in the US. The weak US dollar in terms of the
annual average has therefore had a positive impact on
earnings.
MEDICAL DIVISION – INDUSTRY PERFORMANCE
The volume of the global market for medical division
products is EUR 18 billion and grew by approximately 3
percent in 2008. This is stable year-on-year growth and
in line with expectations. Competition has remained in-
tense against the backdrop of further consolidation
among manufacturers and customers. Hospital mergers
have continued to lead to a greater pooling of demand.
Competitive pressure in the hospital sector is leading to
a preference for cost-effective process-based solutions.
Demographic trends and rising demand for more techni-
cally advanced medical technology products in emerging
economies continued to have a positive impact.
SAFETY DIVISION – INDUSTRY PERFORMANCE
The safety division’s global market grew by between 2 per-
cent and 4 percent in fiscal year 2008, with considerable
regional differences in growth rates. The volume remained
at approximately EUR 5 billion due to changes in ex-
change rates. The strongest growth region was still Asia,
in particular China; however, the German market also
expanded slightly following strong growth in 2007. In the
US, state subsidies for investment in equipment for mu-
nicipal fire departments had a positive effect. The oil, gas
and mining industries are greatly stimulating demand
the world over. The considerable cost benefits enjoyed by
US-based competitors on the back of the relatively weak
US dollar against the euro (until September 2008) inten-
sified competition in 2008, in particular in project busi-
ness but also in national tenders. The consolidation process
continued through mergers and acquisitions of com-
petitors. Until the international financial crisis took effect,
global market performance in 2008 confirmed the safety
division’s assessment in the annual report for 2007. Despite
unfavorable exchange rates and consolidation within the
industry, the safety division has succeeded in increasing its
market share slightly.
MEDICAL DIVISIONMARKET VOLUME PER REGION 2008
8% (prior year: 8%) Germany 1
27% (prior year: 27%) Rest of Europe 2
41% (prior year: 41%) Americas 3
19% (prior year: 19%) Asia/Pacific 4
5% (prior year: 5%) Other 5
1
2
3
4
5
SAFETY DIVISIONMARKET VOLUME PER REGION 2008
11% (prior year: 11%) Germany 1
31% (prior year: 30%) Rest of Europe 2
38% (prior year: 39%) Americas 3
17% (prior year: 17%) Asia/Pacific 4
3% (prior year: 3%) Other 5
1
2
3
45
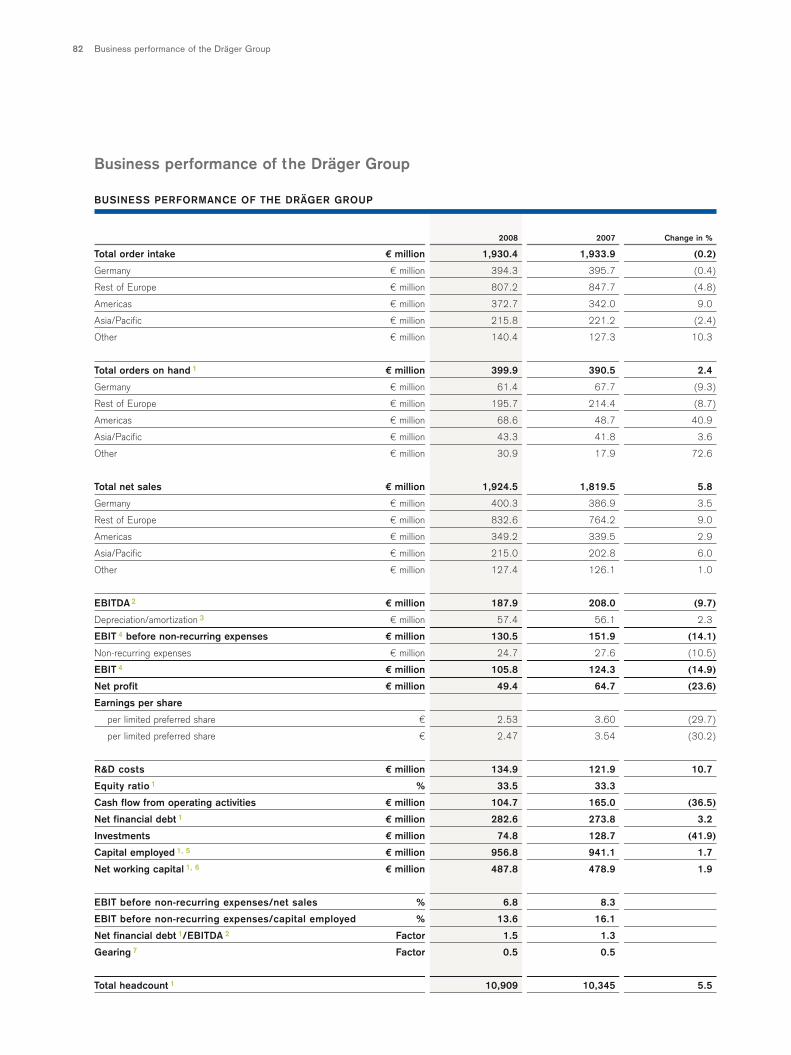
Business performance of the Dräger Group82
Business performance of the Dräger Group
2008 2007 Change in %
Total order intake € million 1,930.4 1,933.9 (0.2)
Germany € million 394.3 395.7 (0.4)
Rest of Europe € million 807.2 847.7 (4.8)
Americas € million 372.7 342.0 9.0
Asia/Pacific € million 215.8 221.2 (2.4)
Other € million 140.4 127.3 10.3
Total orders on hand 1 € million 399.9 390.5 2.4
Germany € million 61.4 67.7 (9.3)
Rest of Europe € million 195.7 214.4 (8.7)
Americas € million 68.6 48.7 40.9
Asia/Pacific € million 43.3 41.8 3.6
Other € million 30.9 17.9 72.6
Total net sales € million 1,924.5 1,819.5 5.8
Germany € million 400.3 386.9 3.5
Rest of Europe € million 832.6 764.2 9.0
Americas € million 349.2 339.5 2.9
Asia/Pacific € million 215.0 202.8 6.0
Other € million 127.4 126.1 1.0
EBITDA 2 € million 187.9 208.0 (9.7)
Depreciation/amortization 3 € million 57.4 56.1 2.3
EBIT 4 before non-recurring expenses € million 130.5 151.9 (14.1)
Non-recurring expenses € million 24.7 27.6 (10.5)
EBIT 4 € million 105.8 124.3 (14.9)
Net profit € million 49.4 64.7 (23.6)
Earnings per share
per limited preferred share € 2.53 3.60 (29.7)
per limited preferred share € 2.47 3.54 (30.2)
R&D costs € million 134.9 121.9 10.7
Equity ratio 1 % 33.5 33.3
Cash flow from operating activities € million 104.7 165.0 (36.5)
Net financial debt 1 € million 282.6 273.8 3.2
Investments € million 74.8 128.7 (41.9)
Capital employed 1, 5 € million 956.8 941.1 1.7
Net working capital 1, 6 € million 487.8 478.9 1.9
EBIT before non-recurring expenses/net sales % 6.8 8.3
EBIT before non-recurring expenses/capital employed % 13.6 16.1
Net financial debt 1/EBITDA 2 Factor 1.5 1.3
Gearing 7 Factor 0.5 0.5
Total headcount 1 10,909 10,345 5.5
BUSINESS PERFORMANCE OF THE DRÄGER GROUP
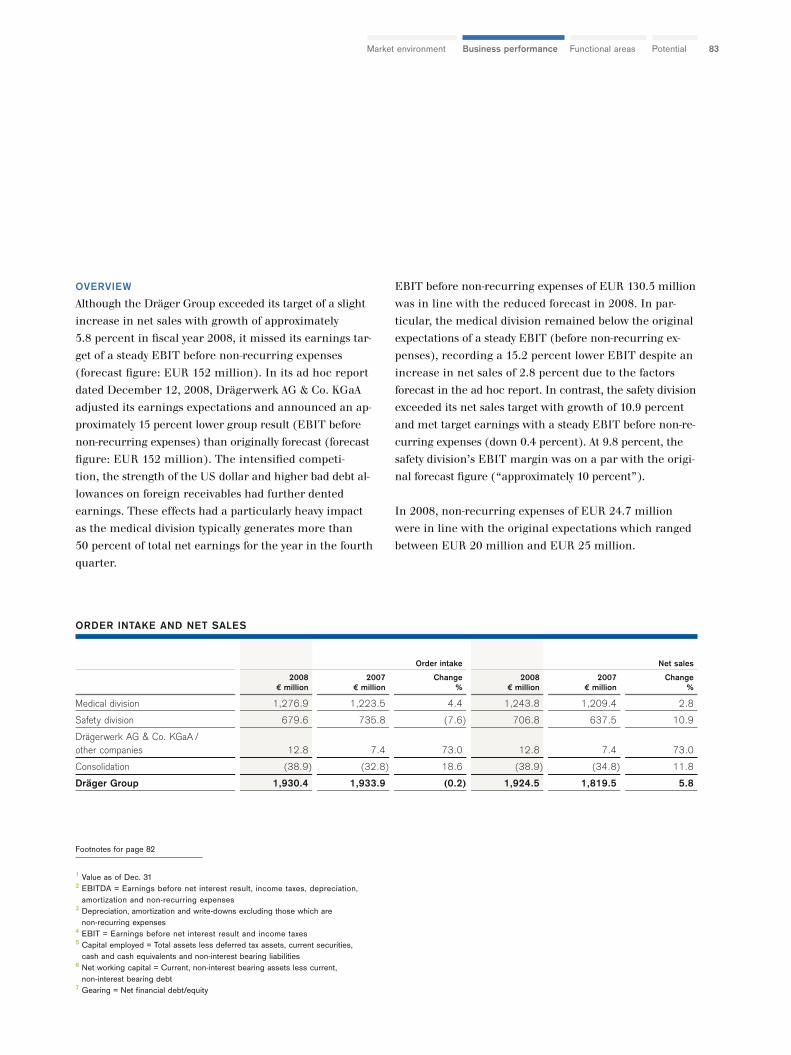
83PotentialFunctional areasBusiness performanceMarket environment
OVERVIEW
Although the Dräger Group exceeded its target of a slight
increase in net sales with growth of approximately
5.8 percent in fiscal year 2008, it missed its earnings tar-
get of a steady EBIT before non-recurring expenses
(forecast figure: EUR 152 million). In its ad hoc report
dated December 12, 2008, Drägerwerk AG & Co. KGaA
adjusted its earnings expectations and announced an ap-
proximately 15 percent lower group result (EBIT before
non-recurring expenses) than originally forecast (forecast
figure: EUR 152 million). The intensified competi-
tion, the strength of the US dollar and higher bad debt al-
lowances on foreign receivables had further dented
earnings. These effects had a particularly heavy impact
as the medical division typically generates more than
50 percent of total net earnings for the year in the fourth
quarter.
EBIT before non-recurring expenses of EUR 130.5 million
was in line with the reduced forecast in 2008. In par-
ticular, the medical division remained below the original
expectations of a steady EBIT (before non-recurring ex-
penses), recording a 15.2 percent lower EBIT despite an
increase in net sales of 2.8 percent due to the factors
forecast in the ad hoc report. In contrast, the safety division
exceeded its net sales target with growth of 10.9 percent
and met target earnings with a steady EBIT before non-re-
curring expenses (down 0.4 percent). At 9.8 percent, the
safety division’s EBIT margin was on a par with the origi-
nal forecast figure (“approximately 10 percent”).
In 2008, non-recurring expenses of EUR 24.7 million
were in line with the original expectations which ranged
between EUR 20 million and EUR 25 million.
1 Value as of Dec. 312 EBITDA = Earnings before net interest result, income taxes, depreciation,
amortization and non-recurring expenses3 Depreciation, amortization and write-downs excluding those which are
non-recurring expenses 4 EBIT = Earnings before net interest result and income taxes5 Capital employed = Total assets less deferred tax assets, current securities,
cash and cash equivalents and non-interest bearing liabilities6 Net working capital = Current, non-interest bearing assets less current,
non-interest bearing debt7 Gearing = Net financial debt/equity
Footnotes for page 82
Order intake Net sales
2008 2007 Change 2008 2007 Change€ million € million % € million € million %
Medical division 1,276.9 1,223.5 4.4 1,243.8 1,209.4 2.8
Safety division 679.6 735.8 (7.6) 706.8 637.5 10.9
Drägerwerk AG & Co. KGaA /other companies 12.8 7.4 73.0 12.8 7.4 73.0
Consolidation (38.9) (32.8) 18.6 (38.9) (34.8) 11.8
Dräger Group 1,930.4 1,933.9 (0.2) 1,924.5 1,819.5 5.8
ORDER INTAKE AND NET SALES
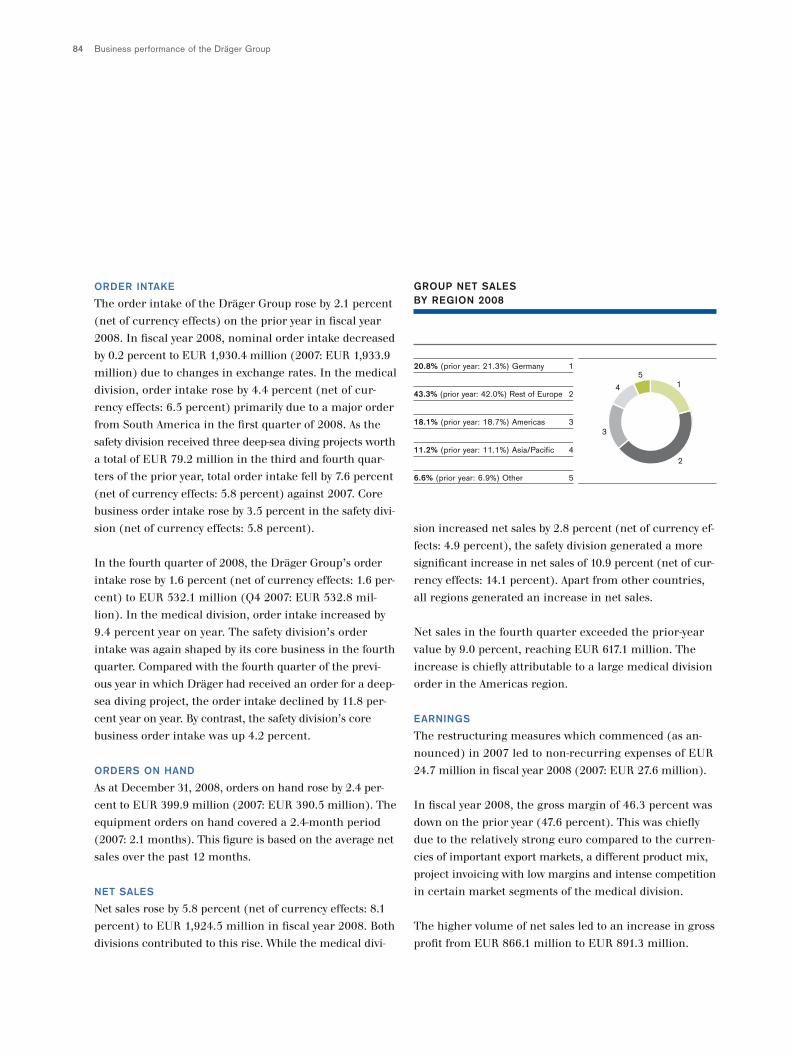
Business performance of the Dräger Group84
GROUP NET SALES BY REGION 2008
20.8% (prior year: 21.3%) Germany 1
43.3% (prior year: 42.0%) Rest of Europe 2
18.1% (prior year: 18.7%) Americas 3
11.2% (prior year: 11.1%) Asia/Pacific 4
6.6% (prior year: 6.9%) Other 5
1
2
3
4
5
ORDER INTAKE
The order intake of the Dräger Group rose by 2.1 percent
(net of currency effects) on the prior year in fiscal year
2008. In fiscal year 2008, nominal order intake decreased
by 0.2 percent to EUR 1,930.4 million (2007: EUR 1,933.9
million) due to changes in exchange rates. In the medical
division, order intake rose by 4.4 percent (net of cur-
rency effects: 6.5 percent) primarily due to a major order
from South America in the first quarter of 2008. As the
safety division received three deep-sea diving projects worth
a total of EUR 79.2 million in the third and fourth quar-
ters of the prior year, total order intake fell by 7.6 percent
(net of currency effects: 5.8 percent) against 2007. Core
business order intake rose by 3.5 percent in the safety divi-
sion (net of currency effects: 5.8 percent).
In the fourth quarter of 2008, the Dräger Group’s order
intake rose by 1.6 percent (net of currency effects: 1.6 per-
cent) to EUR 532.1 million (Q4 2007: EUR 532.8 mil-
lion). In the medical division, order intake increased by
9.4 percent year on year. The safety division’s order
intake was again shaped by its core business in the fourth
quarter. Compared with the fourth quarter of the previ-
ous year in which Dräger had received an order for a deep-
sea diving project, the order intake declined by 11.8 per-
cent year on year. By contrast, the safety division’s core
business order intake was up 4.2 percent.
ORDERS ON HAND
As at December 31, 2008, orders on hand rose by 2.4 per-
cent to EUR 399.9 million (2007: EUR 390.5 million). The
equipment orders on hand covered a 2.4-month period
(2007: 2.1 months). This figure is based on the average net
sales over the past 12 months.
NET SALES
Net sales rose by 5.8 percent (net of currency effects: 8.1
percent) to EUR 1,924.5 million in fiscal year 2008. Both
divisions contributed to this rise. While the medical divi-
sion increased net sales by 2.8 percent (net of currency ef-
fects: 4.9 percent), the safety division generated a more
significant increase in net sales of 10.9 percent (net of cur-
rency effects: 14.1 percent). Apart from other countries,
all regions generated an increase in net sales.
Net sales in the fourth quarter exceeded the prior-year
value by 9.0 percent, reaching EUR 617.1 million. The
increase is chiefly attributable to a large medical division
order in the Americas region.
EARNINGS
The restructuring measures which commenced (as an-
nounced) in 2007 led to non-recurring expenses of EUR
24.7 million in fiscal year 2008 (2007: EUR 27.6 million).
In fiscal year 2008, the gross margin of 46.3 percent was
down on the prior year (47.6 percent). This was chiefly
due to the relatively strong euro compared to the curren-
cies of important export markets, a different product mix,
project invoicing with low margins and intense competition
in certain market segments of the medical division.
The higher volume of net sales led to an increase in gross
profit from EUR 866.1 million to EUR 891.3 million.
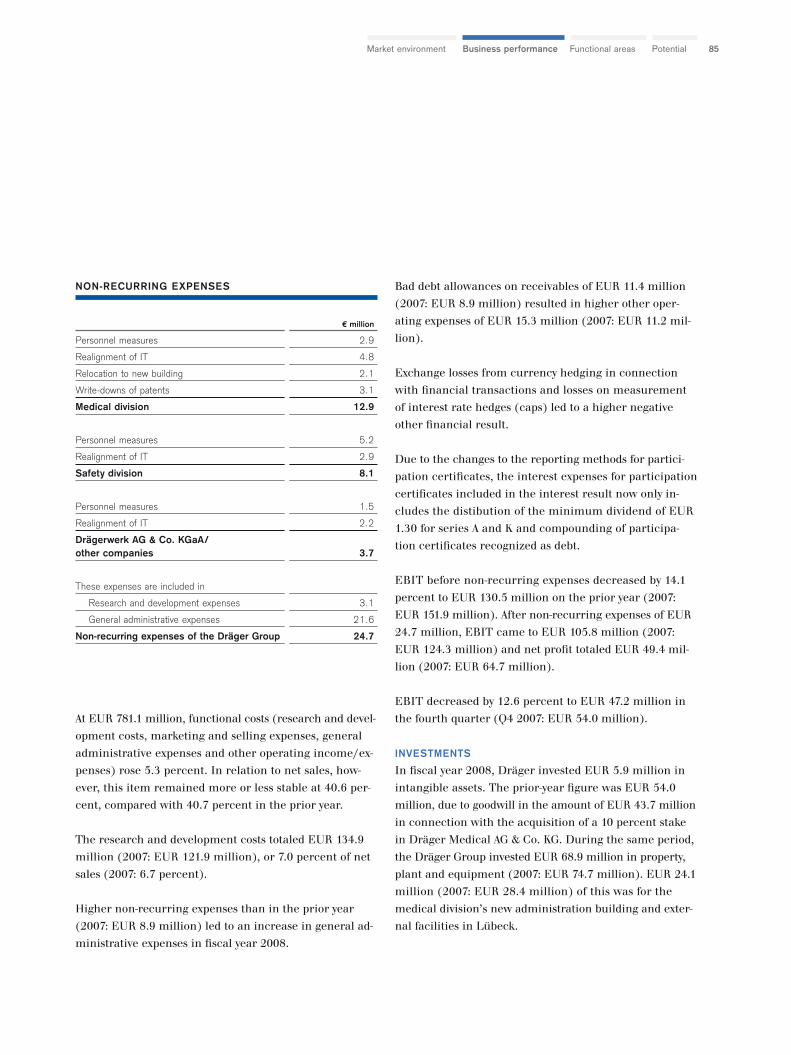
85PotentialFunctional areasBusiness performanceMarket environment
NON-RECURRING EXPENSES
€ million
Personnel measures 2.9
Realignment of IT 4.8
Relocation to new building 2.1
Write-downs of patents 3.1
Medical division 12.9
Personnel measures 5.2
Realignment of IT 2.9
Safety division 8.1
Personnel measures 1.5
Realignment of IT 2.2
Drägerwerk AG & Co. KGaA/other companies 3.7
These expenses are included in
Research and development expenses 3.1
General administrative expenses 21.6
Non-recurring expenses of the Dräger Group 24.7
Bad debt allowances on receivables of EUR 11.4 million
(2007: EUR 8.9 million) resulted in higher other oper-
ating expenses of EUR 15.3 million (2007: EUR 11.2 mil-
lion).
Exchange losses from currency hedging in connection
with financial transactions and losses on measurement
of interest rate hedges (caps) led to a higher negative
other financial result.
Due to the changes to the reporting methods for partici-
pation certificates, the interest expenses for participation
certificates included in the interest result now only in-
cludes the distibution of the minimum dividend of EUR
1.30 for series A and K and compounding of participa-
tion certificates recognized as debt.
EBIT before non-recurring expenses decreased by 14.1
percent to EUR 130.5 million on the prior year (2007:
EUR 151.9 million). After non-recurring expenses of EUR
24.7 million, EBIT came to EUR 105.8 million (2007:
EUR 124.3 million) and net profit totaled EUR 49.4 mil-
lion (2007: EUR 64.7 million).
EBIT decreased by 12.6 percent to EUR 47.2 million in
the fourth quarter (Q4 2007: EUR 54.0 million).
INVESTMENTS
In fiscal year 2008, Dräger invested EUR 5.9 million in
intangible assets. The prior-year figure was EUR 54.0
million, due to goodwill in the amount of EUR 43.7 million
in connection with the acquisition of a 10 percent stake
in Dräger Medical AG & Co. KG. During the same period,
the Dräger Group invested EUR 68.9 million in property,
plant and equipment (2007: EUR 74.7 million). EUR 24.1
million (2007: EUR 28.4 million) of this was for the
medical division’s new administration building and exter-
nal facilities in Lübeck.
At EUR 781.1 million, functional costs (research and devel-
opment costs, marketing and selling expenses, general
administrative expenses and other operating income/ex-
penses) rose 5.3 percent. In relation to net sales, how-
ever, this item remained more or less stable at 40.6 per-
cent, compared with 40.7 percent in the prior year.
The research and development costs totaled EUR 134.9
million (2007: EUR 121.9 million), or 7.0 percent of net
sales (2007: 6.7 percent).
Higher non-recurring expenses than in the prior year
(2007: EUR 8.9 million) led to an increase in general ad-
ministrative expenses in fiscal year 2008.
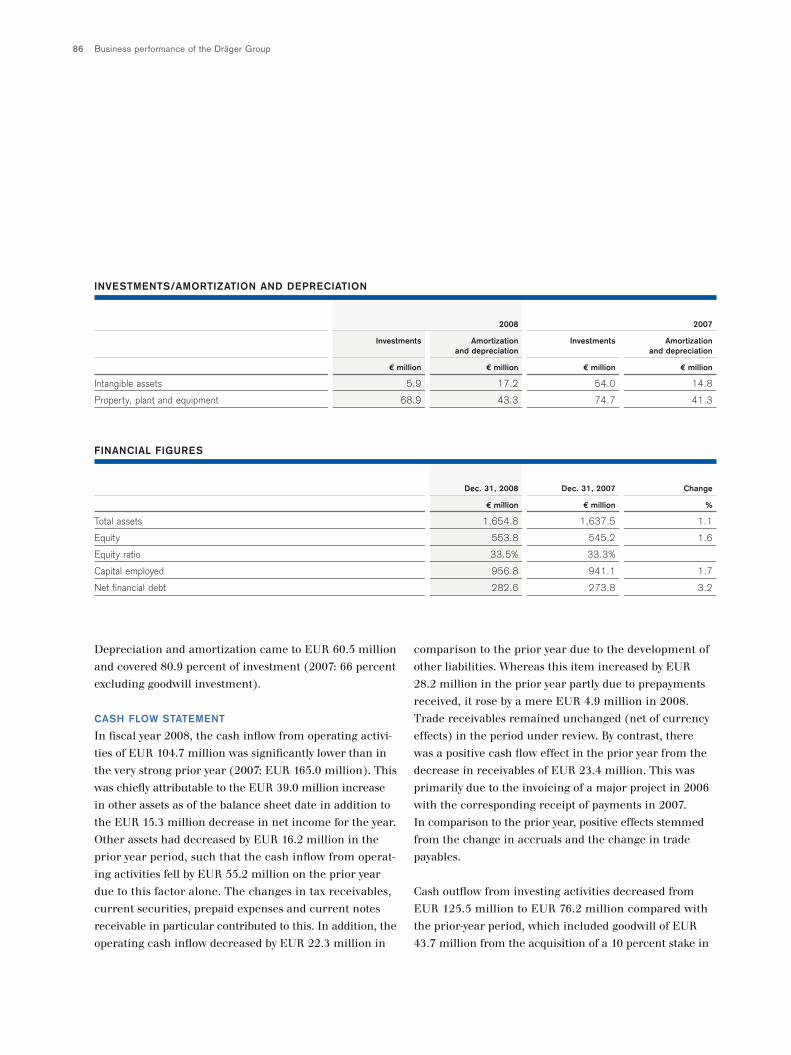
Business performance of the Dräger Group86
Depreciation and amortization came to EUR 60.5 million
and covered 80.9 percent of investment (2007: 66 percent
excluding goodwill investment).
CASH FLOW STATEMENT
In fiscal year 2008, the cash inflow from operating activi-
ties of EUR 104.7 million was significantly lower than in
the very strong prior year (2007: EUR 165.0 million). This
was chiefly attributable to the EUR 39.0 million increase
in other assets as of the balance sheet date in addition to
the EUR 15.3 million decrease in net income for the year.
Other assets had decreased by EUR 16.2 million in the
prior year period, such that the cash inflow from operat-
ing activities fell by EUR 55.2 million on the prior year
due to this factor alone. The changes in tax receivables,
current securities, prepaid expenses and current notes
receivable in particular contributed to this. In addition, the
operating cash inflow decreased by EUR 22.3 million in
comparison to the prior year due to the development of
other liabilities. Whereas this item increased by EUR
28.2 million in the prior year partly due to prepayments
received, it rose by a mere EUR 4.9 million in 2008.
Trade receivables remained unchanged (net of currency
effects) in the period under review. By contrast, there
was a positive cash flow effect in the prior year from the
decrease in receivables of EUR 23.4 million. This was
primarily due to the invoicing of a major project in 2006
with the corresponding receipt of payments in 2007.
In comparison to the prior year, positive effects stemmed
from the change in accruals and the change in trade
payables.
Cash outflow from investing activities decreased from
EUR 125.5 million to EUR 76.2 million compared with
the prior-year period, which included goodwill of EUR
43.7 million from the acquisition of a 10 percent stake in
2008 2007
Investments Amortization Investments Amortizationand depreciation and depreciation
€ million € million € million € million
Intangible assets 5.9 17.2 54.0 14.8
Property, plant and equipment 68.9 43.3 74.7 41.3
Dec. 31, 2008 Dec. 31, 2007 Change
€ million € million %
Total assets 1,654.8 1,637.5 1.1
Equity 553.8 545.2 1.6
Equity ratio 33.5% 33.3%
Capital employed 956.8 941.1 1.7
Net financial debt 282.6 273.8 3.2
FINANCIAL FIGURES
INVESTMENTS/AMORTIZATION AND DEPRECIATION
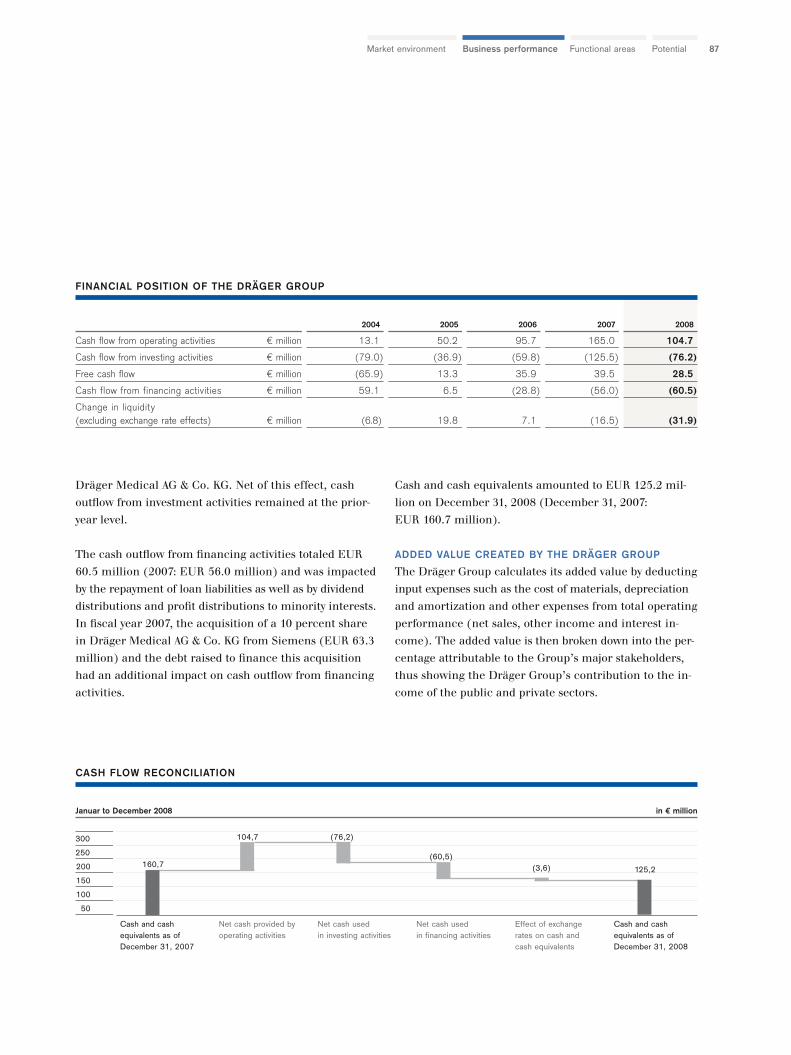
87PotentialFunctional areasBusiness performanceMarket environment
Dräger Medical AG & Co. KG. Net of this effect, cash
outflow from investment activities remained at the prior-
year level.
The cash outflow from financing activities totaled EUR
60.5 million (2007: EUR 56.0 million) and was impacted
by the repayment of loan liabilities as well as by dividend
distributions and profit distributions to minority interests.
In fiscal year 2007, the acquisition of a 10 percent share
in Dräger Medical AG & Co. KG from Siemens (EUR 63.3
million) and the debt raised to finance this acquisition
had an additional impact on cash outflow from financing
activities.
Cash and cash equivalents amounted to EUR 125.2 mil-
lion on December 31, 2008 (December 31, 2007:
EUR 160.7 million).
ADDED VALUE CREATED BY THE DRÄGER GROUP
The Dräger Group calculates its added value by deducting
input expenses such as the cost of materials, depreciation
and amortization and other expenses from total operating
performance (net sales, other income and interest in-
come). The added value is then broken down into the per-
centage attributable to the Group’s major stakeholders,
thus showing the Dräger Group’s contribution to the in-
come of the public and private sectors.
CASH FLOW RECONCILIATION
Januar to December 2008 in € million
300
250
200
150
100
50
Cash and cash equivalents as of December 31, 2007
Net cash provided byoperating activities
Net cash used in investing activities
Net cash used in financing activities
Effect of exchange rates on cash andcash equivalents
Cash and cash equivalents as of December 31, 2008
2004 2005 2006 2007 2008
Cash flow from operating activities € million 13.1 50.2 95.7 165.0 104.7
Cash flow from investing activities € million (79.0) (36.9) (59.8) (125.5) (76.2)
Free cash flow € million (65.9) 13.3 35.9 39.5 28.5
Cash flow from financing activities € million 59.1 6.5 (28.8) (56.0) (60.5)
Change in liquidity (excluding exchange rate effects) € million (6.8) 19.8 7.1 (16.5) (31.9)
FINANCIAL POSITION OF THE DRÄGER GROUP
160,7
104,7 (76,2)
(60,5)(3,6) 125,2
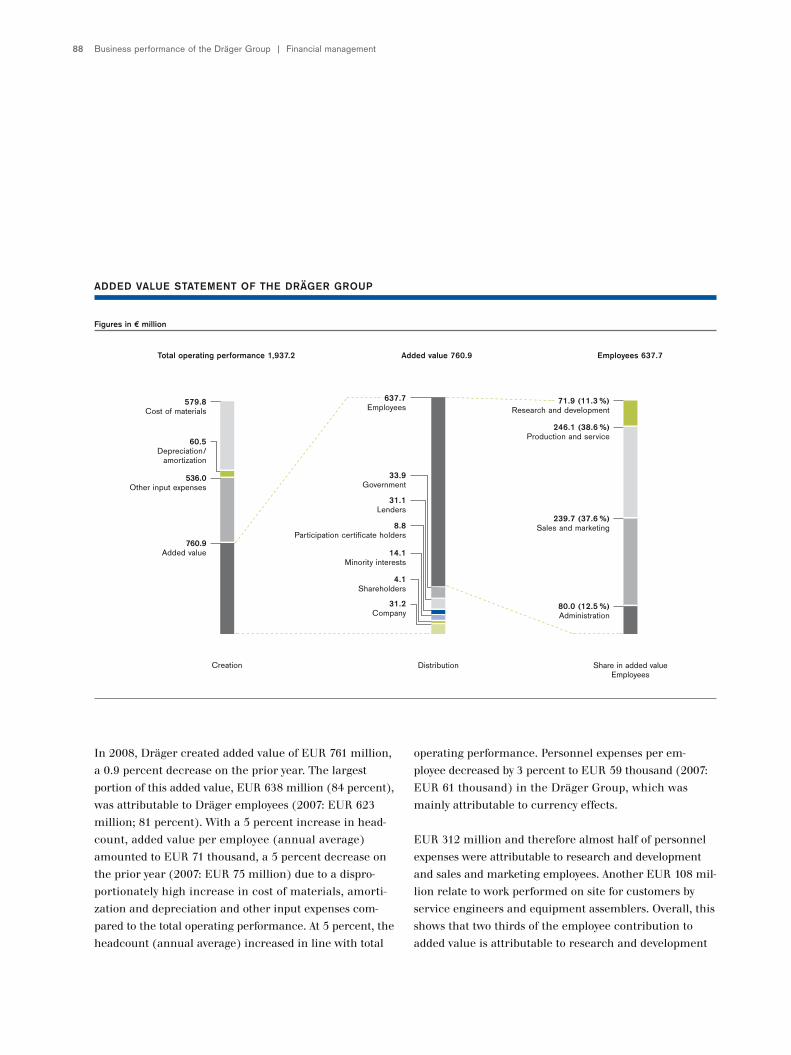
Business performance of the Dräger Group | Financial management88
In 2008, Dräger created added value of EUR 761 million,
a 0.9 percent decrease on the prior year. The largest
portion of this added value, EUR 638 million (84 percent),
was attributable to Dräger employees (2007: EUR 623
million; 81 percent). With a 5 percent increase in head-
count, added value per employee (annual average)
amounted to EUR 71 thousand, a 5 percent decrease on
the prior year (2007: EUR 75 million) due to a dispro-
portionately high increase in cost of materials, amorti-
zation and depreciation and other input expenses com-
pared to the total operating performance. At 5 percent, the
headcount (annual average) increased in line with total
operating performance. Personnel expenses per em-
ployee decreased by 3 percent to EUR 59 thousand (2007:
EUR 61 thousand) in the Dräger Group, which was
mainly attributable to currency effects.
EUR 312 million and therefore almost half of personnel
expenses were attributable to research and development
and sales and marketing employees. Another EUR 108 mil-
lion relate to work performed on site for customers by
service engineers and equipment assemblers. Overall, this
shows that two thirds of the employee contribution to
added value is attributable to research and development
ADDED VALUE STATEMENT OF THE DRÄGER GROUP
Figures in € million
Total operating performance 1,937.2 Added value 760.9 Employees 637.7
Creation Distribution Share in added valueEmployees
637.7Employees
33.9Government
31.1Lenders
8.8Participation certificate holders
14.1Minority interests
71.9 (11.3 %) Research and development
246.1 (38.6 %)Production and service
239.7 (37.6 %)Sales and marketing
31.2Company
4.1Shareholders
80.0 (12.5 %)Administration
579.8Cost of materials
60.5Depreciation/
amortization
536.0Other input expenses
760.9 Added value
89PotentialFunctional areasBusiness performanceMarket environment
and customer-related activities, thus highlighting the
knowledge and customer-oriented focus of the Company.
Financial management
BORROWING
Dräger did not raise any significant new financing funds
in 2008. However, with the acceptance of the new ad-
ministrative building for Dräger Medical AG & Co. KG,
non-current loans replaced the existing short-term
interim financing. The non-current financing comprises
two loan tranches, the first of which (EUR 26 million)
was granted from funds of the European Recovery Pro-
gram (KfW/ERP) environmental protection program.
A banking syndicate provided the second loan tranche of
EUR 19.4 million.
The KfW funds carry a fixed interest rate of 4.45 percent
for ten years. The bank funds have a variable interest rate;
however, they have been hedged by means of an interest
rate swap (variable to fixed) for the whole term as well
(15 years).
In the course of the financial markets crisis, Dräger is
continuously observing the credit ratings of the main
banks with which it cooperates in order to identify poten-
tial financing risks promptly and to take appropriate
action. Alternative forms of financing are also being as-
sessed.
TASKS AND STRUCTURE OF THE TREASURY
DEPARTMENT
The treasury department secures liquidity and credit facil-
ities to enable the settlement of payments. In doing so,
treasury takes into account the inherent interest and cur-
rency risks and secures financing with national and
international banking partners with high credit ratings.
The treasury department acts as a service center with a
constant focus on the corporate risks, providing the
highest level of transparency and therefore security. A
treasury back office checks and confirms all transac-
tions; treasury controlling monitors compliance with the
limits available and that the conditions agreed are in
line with market requirements.
PRINCIPLES AND OBJECTIVES OF FINANCIAL
MANAGEMENT
One of the main principles of financial management is
to guarantee Dräger’s independence with regard to poten-
tial equity and debt measures. In the case of debt financ-
ing, the Company achieves this by working together with
numerous national and international banks, such that
no dependencies can arise. In addition, Dräger uses capi-
tal market-related instruments which are as fungible as
possible (for example note loans) for group financing. The
appropriate financial instrument is always selected based
on the underlying transaction and concluded at the best
possible conditions.
DERIVATIVE FINANCIAL INSTRUMENTS
Dräger generally uses financial instruments for hedging
purposes and not to optimize earnings, although the
principles of economic efficiency are also applied to such
decisions. Transactions of this type are selected and con-
cluded in a uniform manner throughout the Group and
are transparent at all times.
NET ASSETS
The Dräger Group’s equity rose by EUR 8.6 million to
EUR 553.8 million in fiscal year 2008, with the equity ratio
increasing from 33.3 percent to 33.5 percent. The main
factors that reduced equity were dividend payments and
distributions to minority interests of EUR 26.5 million
(2007: EUR 38.6 million) and the change from currency
translation of EUR –14.2 million (2007: EUR –12.0 mil-
lion). By contrast, the consolidated net profit of EUR 49.4
million (2007: EUR 64.7 million) boosted equity. Total
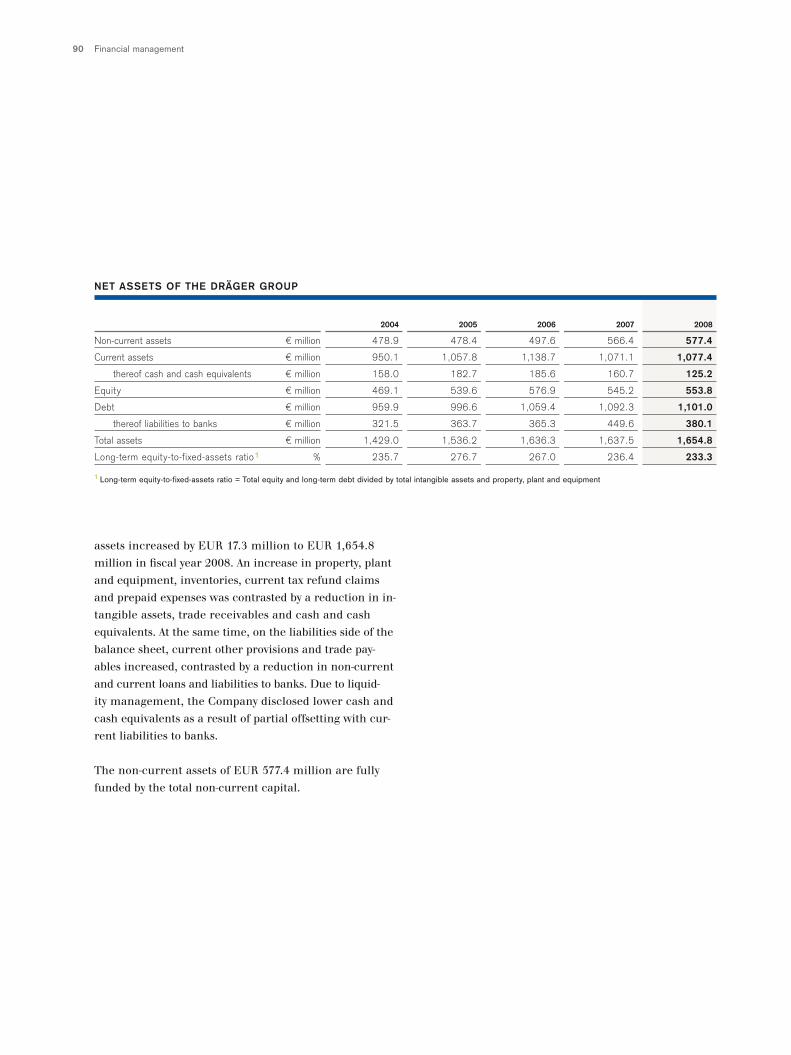
Financial management90
assets increased by EUR 17.3 million to EUR 1,654.8
million in fiscal year 2008. An increase in property, plant
and equipment, inventories, current tax refund claims
and prepaid expenses was contrasted by a reduction in in-
tangible assets, trade receivables and cash and cash
equivalents. At the same time, on the liabilities side of the
balance sheet, current other provisions and trade pay-
ables increased, contrasted by a reduction in non-current
and current loans and liabilities to banks. Due to liquid-
ity management, the Company disclosed lower cash and
cash equivalents as a result of partial offsetting with cur-
rent liabilities to banks.
The non-current assets of EUR 577.4 million are fully
funded by the total non-current capital.
2004 2005 2006 2007 2008
Non-current assets € million 478.9 478.4 497.6 566.4 577.4
Current assets € million 950.1 1,057.8 1,138.7 1,071.1 1,077.4
thereof cash and cash equivalents € million 158.0 182.7 185.6 160.7 125.2
Equity € million 469.1 539.6 576.9 545.2 553.8
Debt € million 959.9 996.6 1,059.4 1,092.3 1,101.0
thereof liabilities to banks € million 321.5 363.7 365.3 449.6 380.1
Total assets € million 1,429.0 1,536.2 1,636.3 1,637.5 1,654.8
Long-term equity-to-fixed-assets ratio1 % 235.7 276.7 267.0 236.4 233.3
1 Long-term equity-to-fixed-assets ratio = Total equity and long-term debt divided by total intangible assets and property, plant and equipment
NET ASSETS OF THE DRÄGER GROUP

91PotentialFunctional areasBusiness performanceMarket environment
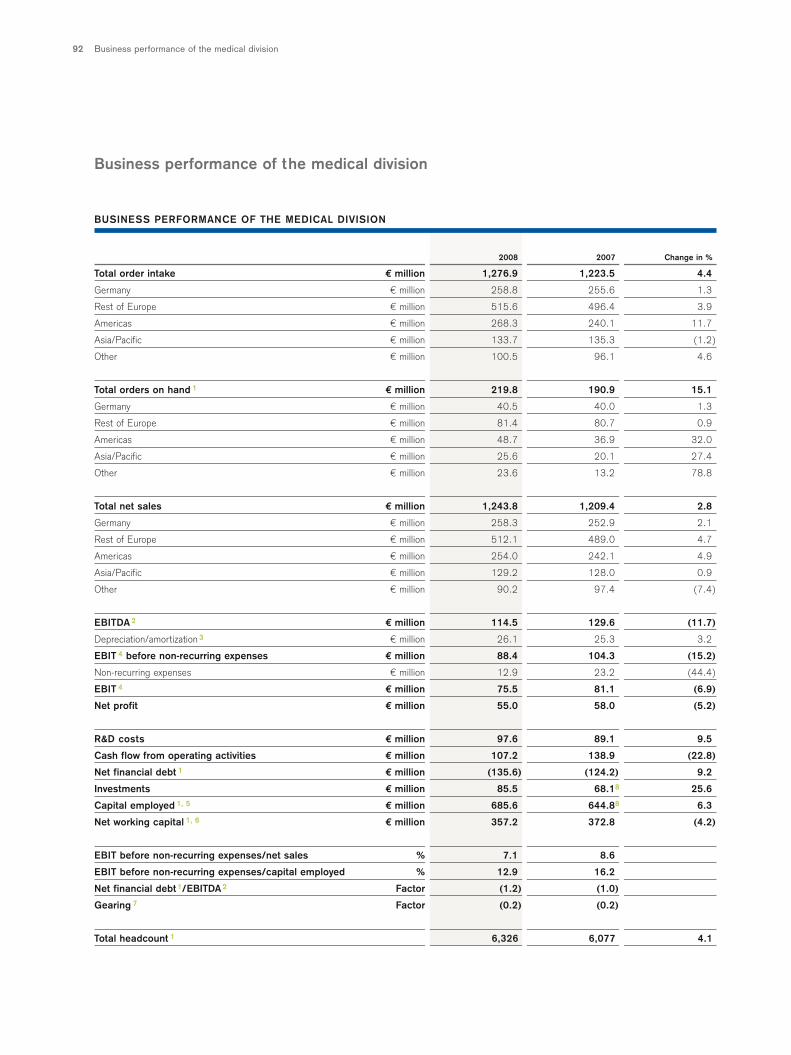
Business performance of the medical division92
Business performance of the medical division
2008 2007 Change in %
Total order intake € million 1,276.9 1,223.5 4.4
Germany € million 258.8 255.6 1.3
Rest of Europe € million 515.6 496.4 3.9
Americas € million 268.3 240.1 11.7
Asia/Pacific € million 133.7 135.3 (1.2)
Other € million 100.5 96.1 4.6
Total orders on hand 1 € million 219.8 190.9 15.1
Germany € million 40.5 40.0 1.3
Rest of Europe € million 81.4 80.7 0.9
Americas € million 48.7 36.9 32.0
Asia/Pacific € million 25.6 20.1 27.4
Other € million 23.6 13.2 78.8
Total net sales € million 1,243.8 1,209.4 2.8
Germany € million 258.3 252.9 2.1
Rest of Europe € million 512.1 489.0 4.7
Americas € million 254.0 242.1 4.9
Asia/Pacific € million 129.2 128.0 0.9
Other € million 90.2 97.4 (7.4)
EBITDA 2 € million 114.5 129.6 (11.7)
Depreciation/amortization3 € million 26.1 25.3 3.2
EBIT 4 before non-recurring expenses € million 88.4 104.3 (15.2)
Non-recurring expenses € million 12.9 23.2 (44.4)
EBIT 4 € million 75.5 81.1 (6.9)
Net profit € million 55.0 58.0 (5.2)
R&D costs € million 97.6 89.1 9.5
Cash flow from operating activities € million 107.2 138.9 (22.8)
Net financial debt 1 € million (135.6) (124.2) 9.2
Investments € million 85.5 68.18 25.6
Capital employed 1, 5 € million 685.6 644.88 6.3
Net working capital 1, 6 € million 357.2 372.8 (4.2)
EBIT before non-recurring expenses/net sales % 7.1 8.6
EBIT before non-recurring expenses/capital employed % 12.9 16.2
Net financial debt1/EBITDA2 Factor (1.2) (1.0)
Gearing 7 Factor (0.2) (0.2)
Total headcount 1 6,326 6,077 4.1
BUSINESS PERFORMANCE OF THE MEDICAL DIVISION
93PotentialFunctional areasBusiness performanceMarket environment
1 Value as of Dec. 312 EBITDA = Earnings before net interest result, income taxes, depreciation,
amortization and non-recurring expenses3 Depreciation, amortization and write-downs excluding those which are
non-recurring expenses 4 EBIT = Earnings before net interest result and income taxes5 Capital employed = Total assets less deferred tax assets, current securities,
cash and cash equivalents and non-interest bearing liabilities6 Net working capital = Current, non-interest bearing assets less current,
non-interest bearing debt7 Gearing = Net financial debt/equity8 The goodwill from the acquisition of the 10 percent share in Dräger Medical AG &
Co. KGaA from Siemens in 2007 is recognized in the medical segment. The prior-year figures were adjusted accordingly.
Footnotes for page 92
PRODUCTS LAUNCHED/CHANGES TO PRODUCTS
In November 2008, Dräger presented “Evita Infinity V500”,
the ventilation components of the Infinity Acute Care
System, in Düsseldorf at Medica, the world’s most impor-
tant trade fair. Infinity ACS, the complete system, will
be the first standardized platform with particularly high-
performance individual components for patient monitor-
ing, therapy functions and information management world-
wide. The multi-component system can optimize clinical
processes, therapy and diagnostics functions as a whole.
The ambulatory telemetry system “Infinity M300”, an-
other component of the Infinity Acute Care (ACS) System,
which was also launched in 2008, transmits the patient’s
vital signs without restricting their movement, thus accel-
erating their recovery. Dräger already launched the first
components of the Infinity ACS with the medical cockpit
“Infinity C700” back in 2007. Additional monitoring and
therapy components of the Infinity ACS will follow.
The enhanced “Evita XL” ventilator was launched interna-
tionally on the market in 2008. “Evita XL”, which in-
cludes improved mask functionality, updated software and
the latest design, is one of the main ventilation products.
The “Fabius MRI” anesthesia device was also approved
by the Food and Drug Administration (FDA) in 2008. The
device is specifically for use in magnetic resonance im-
aging environments and completes the medical division’s
portfolio, which now covers all areas of anesthesia.
In 2008, the Company was able to increase the accessories
and consumables business, adding newly developed fil-
ters and tubes to the product range. Due to the large num-
ber of our devices that are in use, the expansion of this
product range opens up additional possibilities for tapping
market potential.
TAPPING NEW MARKETS
In 2008, the medical division established subsidiaries for
sales and service in Colombia, Venezuela and Vietnam
in order to respond better to the growing business volume
and to participate in national tenders. Dräger expanded
the subsidiary in India due to the growing service business.
ORDER INTAKE
At EUR 1,276.9 million, order intake was 4.4 percent
(net of currency effects: 6.6 percent) above the prior-year
level (2007: EUR 1,223.5 million), primarily due to a
major order from South America in the first quarter of
2008.
The lifecycle solutions (accessories and consumables),
infrastructure projects and neonatal care and thermo reg-
ulation segments generated the largest increase in ab-
solute terms.
At EUR 258.8 million, order intake in Germany was 1.3
percent above the prior-year figure (2007: EUR 255.6
million). Growth was considerably slower than in the no-
tably strong first quarter of 2008 (up 15.4 percent) due
to additional caution surrounding customers’ investment
in the course of the year.
In the rest of Europe, order intake increased by a pleas-
ing 3.9 percent to EUR 515.6 million (2007: EUR 496.4
million), primarily boosted by tender business in south-
Business performance of the medical division94
east Europe and infrastructure projects in the Netherlands.
In comparison with the first quarter of 2008 (up 8.1 per-
cent), however, growth has slowed here, too.
In the Americas, order intake rose by 11.7 percent (net of
currency effects: 18.1 percent) to EUR 268.3 million (2007:
EUR 240.1 million), thanks primarily to the major order
already mentioned and positive business performance in
Brazil. In addition, a slight rise in monitoring project
business led to a 0.8 percent (net of currency effects: 7.7
percent) increase in order intake in the US compared
with the prior year in 2008. Furthermore, Dräger con-
cluded a framework agreement with the US Department
of Defense (DoD) to supply all DoD hospitals worldwide
with the “Innovian” patient data management system.
At EUR 133.7 million (down 1.2 percent), the Asia/Pacific
region did not quite match the prior-year order intake
(2007: EUR 135.3 million). Positive performance in China
was unable to offset the lower project volume in Australia.
In other countries, order intake of EUR 100.5 million
was 4.6 percent above the prior year (2007: EUR 96.1
million), as the same prior-year period saw stronger proj-
ect business in Arab countries.
Order intake of EUR 369.1 million in the fourth quarter
of 2008 was 9.4 percent above the same prior-year period
(Q4 2007: EUR 337.4 million). Order intake was partic-
ularly positive in other countries due to a major order
from the Saudi-Arabian health authorities and two larger
government orders from the United Arab Emirates and
Qatar.
ORDERS ON HAND
Orders on hand as at December 31, 2008 exceeded the
prior year by 15.1 percent (EUR 219.8 million; December
31, 2007: EUR 190.9 million) and even rose by 16.0 per-
cent net of currency effects. The equipment orders on
hand covered a 2.5-month period (December 31, 2007:
2.1 months). Orders on hand grew predominately in the
Americas and other countries.
NET SALES
Net sales rose by 2.8 percent (net of currency effects:
5.0 percent) to EUR 1,243.8 million in fiscal year 2008
(2007: EUR 1,209.4 million). Lifecycle solutions and
infrastructure projects contributed to pleasing core busi-
ness growth worldwide. Net sales therefore developed
in accordance with the forecast from the annual report
for 2007.
The Company asserted its position in Germany with net
sales growth of 2.1 percent to EUR 258.3 million (2007:
EUR 252.9 million). The good development of the acces-
sories business and the equipment rental and supply
business was responsible for the lion’s share, with archi-
tectural systems also recording substantial growth.
Net sales in the rest of Europe (excluding Germany)
rose by 4.7 percent to EUR 512.1 million in fiscal year 2008
(2007: EUR 489.0 million). The expanding market in
Russia and tender business in southeast Europe were the
main contributors.
Net sales in the Americas grew by 4.9 percent (net of
currency effects: 11.0 percent) to EUR 254.0 million
(2007: EUR 242.1 million), which was largely attributa-
ble to a major order in South America which was par-
tially invoiced in the fourth quarter, and to the positive
business performance in Brazil. Net sales in the US
were around the prior-year level, up 0.5 percent (net of
currency effects up 6.3 percent) on 2007, as the moni-
toring projects were also partially invoiced in the fourth
quarter.
Net sales increased by 0.9 percent to EUR 129.2 million
(2007: EUR 128.0 million) in the Asia/Pacific region.
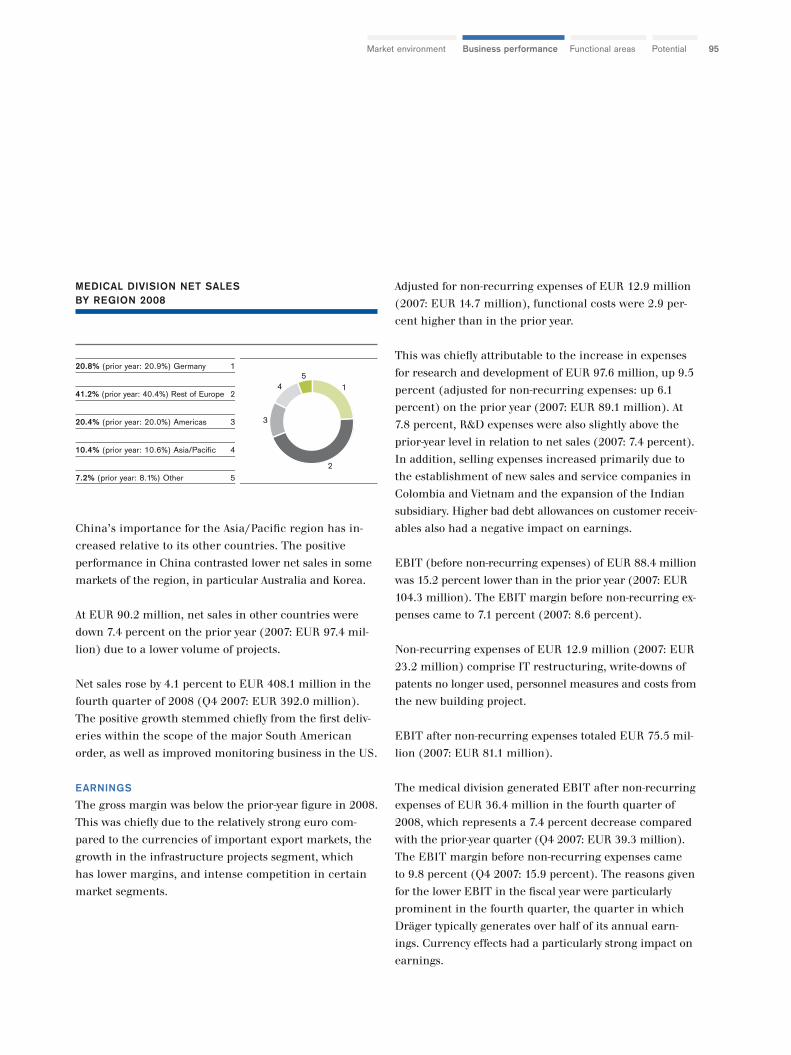
95PotentialFunctional areasBusiness performanceMarket environment
China’s importance for the Asia/Pacific region has in-
creased relative to its other countries. The positive
performance in China contrasted lower net sales in some
markets of the region, in particular Australia and Korea.
At EUR 90.2 million, net sales in other countries were
down 7.4 percent on the prior year (2007: EUR 97.4 mil-
lion) due to a lower volume of projects.
Net sales rose by 4.1 percent to EUR 408.1 million in the
fourth quarter of 2008 (Q4 2007: EUR 392.0 million).
The positive growth stemmed chiefly from the first deliv-
eries within the scope of the major South American
order, as well as improved monitoring business in the US.
EARNINGS
The gross margin was below the prior-year figure in 2008.
This was chiefly due to the relatively strong euro com-
pared to the currencies of important export markets, the
growth in the infrastructure projects segment, which
has lower margins, and intense competition in certain
market segments.
Adjusted for non-recurring expenses of EUR 12.9 million
(2007: EUR 14.7 million), functional costs were 2.9 per-
cent higher than in the prior year.
This was chiefly attributable to the increase in expenses
for research and development of EUR 97.6 million, up 9.5
percent (adjusted for non-recurring expenses: up 6.1
percent) on the prior year (2007: EUR 89.1 million). At
7.8 percent, R&D expenses were also slightly above the
prior-year level in relation to net sales (2007: 7.4 percent).
In addition, selling expenses increased primarily due to
the establishment of new sales and service companies in
Colombia and Vietnam and the expansion of the Indian
subsidiary. Higher bad debt allowances on customer receiv-
ables also had a negative impact on earnings.
EBIT (before non-recurring expenses) of EUR 88.4 million
was 15.2 percent lower than in the prior year (2007: EUR
104.3 million). The EBIT margin before non-recurring ex-
penses came to 7.1 percent (2007: 8.6 percent).
Non-recurring expenses of EUR 12.9 million (2007: EUR
23.2 million) comprise IT restructuring, write-downs of
patents no longer used, personnel measures and costs from
the new building project.
EBIT after non-recurring expenses totaled EUR 75.5 mil-
lion (2007: EUR 81.1 million).
The medical division generated EBIT after non-recurring
expenses of EUR 36.4 million in the fourth quarter of
2008, which represents a 7.4 percent decrease compared
with the prior-year quarter (Q4 2007: EUR 39.3 million).
The EBIT margin before non-recurring expenses came
to 9.8 percent (Q4 2007: 15.9 percent). The reasons given
for the lower EBIT in the fiscal year were particularly
prominent in the fourth quarter, the quarter in which
Dräger typically generates over half of its annual earn-
ings. Currency effects had a particularly strong impact on
earnings.
MEDICAL DIVISION NET SALESBY REGION 2008
20.8% (prior year: 20.9%) Germany 1
41.2% (prior year: 40.4%) Rest of Europe 2
20.4% (prior year: 20.0%) Americas 3
10.4% (prior year: 10.6%) Asia/Pacific 4
7.2% (prior year: 8.1%) Other 5
1
2
3
45
Business performance of the medical division96
Net profit fell by 5.2 percent to EUR 55.0 million in fiscal
year 2008 (2007: EUR 58.0 million). Due to the lower
earnings before tax, tax expenses decreased by 10.3 percent
to EUR 19.0 million (2007: EUR 21.1 million).
INVESTMENTS
The medical division invested EUR 85.5 million in intan-
gible assets and property, plant and equipment in 2008
(2007: EUR 68.1 million including goodwill). The goodwill
of EUR 43.7 million recognized in the consolidation
column of the segment report from the acquisition of a
10 percent interest in Dräger Medical AG & Co. KG has
been reclassified into the medical segment. The goodwill
is to be allocated to the medical division. The increase is
mainly due to the new administration building in Lübeck
having been taken over from MOLVINA Vermietungsge-
sellschaft mbH und Co. Objekt Finkenstraße KG (Dräger
Group real estate company) in May 2008. The invest-
ment in the building, in the form of a finance lease, totaled
EUR 47.2 million plus improvements and operational
facilities amounting to EUR 12.1 million.
In 2008, Dräger invested EUR 4.0 million (2007: 2.3
million) in the Chinese sales and manufacturing compa-
nies’ new building which was completed in September
2008 and will enable Dräger to operate more efficiently
in China, putting it on course for further growth.
Dräger invested EUR 1.8 million in the modernization of
company buildings in Spain.
Amortization and depreciation (excluding write-downs of
patents) of EUR 26.1 million covered 31 percent of invest-
ments, chiefly due to the recognition of a finance lease
for the new administration building. Adjusted for the new
building, the investments are covered almost in full by
depreciation and amortization. In 2007, investments (ex-
cluding goodwill) were also almost fully covered by depre-
ciation and amortization.
NET ASSETS
In fiscal year 2008, capital employed increased by 6.3
percent to EUR 685.6 million (2007: EUR 644.8 million).
This higher capital tie-up was mainly attributable to the
increase in property, plant and equipment in connection
with the new building. This effect was contrasted by
higher current provisions.
Cash and cash equivalents increased by 20.9 percent to
EUR 82.4 million (2007: EUR 68.2 million) due to im-
proved receivables management.
The decrease in EBIT (before non-recurring expenses)
year on year and the rise in capital employed (new build-
ing) led to a lower return on capital employed (ROCE)
of 12.9 percent (2007: 16.2 percent) on the prior year.
NON-RECURRING EXPENSES
€ million
Personnel measures 2.9
Realignment of IT 4.8
Relocation to new building 2.1
Write-downs of patents 3.1
Medical division 12.9

97PotentialFunctional areasBusiness performanceMarket environment
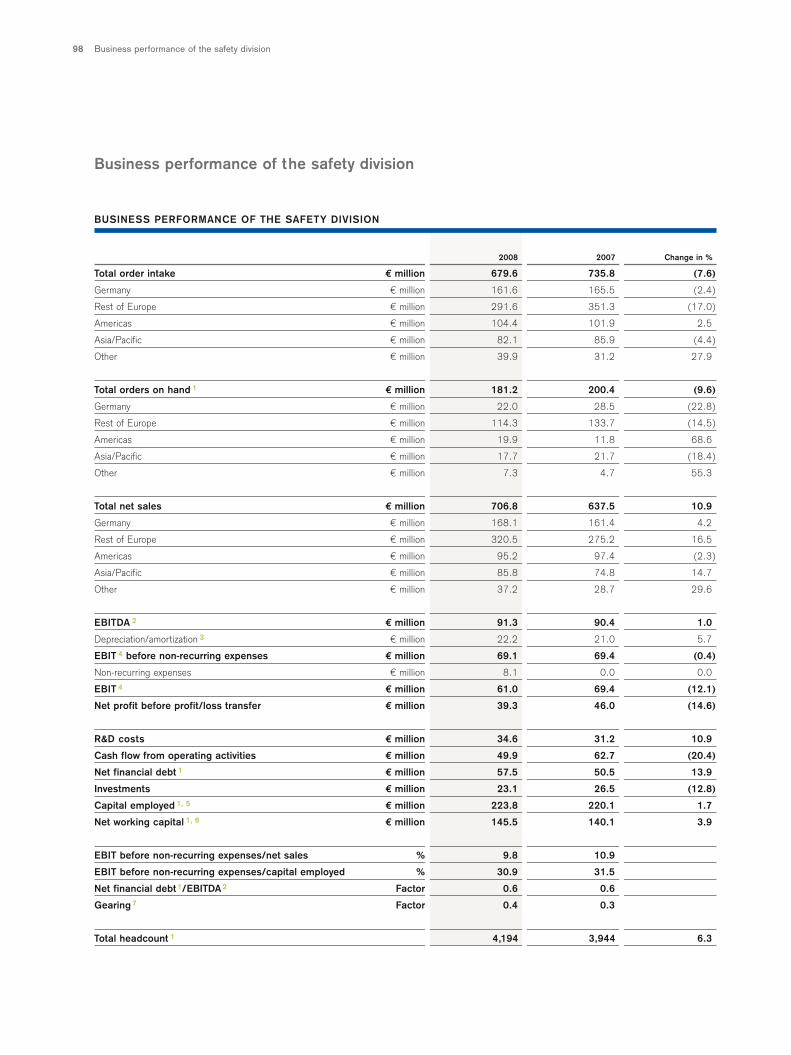
Business performance of the safety division98
2008 2007 Change in %
Total order intake € million 679.6 735.8 (7.6)
Germany € million 161.6 165.5 (2.4)
Rest of Europe € million 291.6 351.3 (17.0)
Americas € million 104.4 101.9 2.5
Asia/Pacific € million 82.1 85.9 (4.4)
Other € million 39.9 31.2 27.9
Total orders on hand 1 € million 181.2 200.4 (9.6)
Germany € million 22.0 28.5 (22.8)
Rest of Europe € million 114.3 133.7 (14.5)
Americas € million 19.9 11.8 68.6
Asia/Pacific € million 17.7 21.7 (18.4)
Other € million 7.3 4.7 55.3
Total net sales € million 706.8 637.5 10.9
Germany € million 168.1 161.4 4.2
Rest of Europe € million 320.5 275.2 16.5
Americas € million 95.2 97.4 (2.3)
Asia/Pacific € million 85.8 74.8 14.7
Other € million 37.2 28.7 29.6
EBITDA 2 € million 91.3 90.4 1.0
Depreciation/amortization 3 € million 22.2 21.0 5.7
EBIT 4 before non-recurring expenses € million 69.1 69.4 (0.4)
Non-recurring expenses € million 8.1 0.0 0.0
EBIT 4 € million 61.0 69.4 (12.1)
Net profit before profit/loss transfer € million 39.3 46.0 (14.6)
R&D costs € million 34.6 31.2 10.9
Cash flow from operating activities € million 49.9 62.7 (20.4)
Net financial debt 1 € million 57.5 50.5 13.9
Investments € million 23.1 26.5 (12.8)
Capital employed 1, 5 € million 223.8 220.1 1.7
Net working capital 1, 6 € million 145.5 140.1 3.9
EBIT before non-recurring expenses/net sales % 9.8 10.9
EBIT before non-recurring expenses/capital employed % 30.9 31.5
Net financial debt1/EBITDA2 Factor 0.6 0.6
Gearing7 Factor 0.4 0.3
Total headcount 1 4,194 3,944 6.3
BUSINESS PERFORMANCE OF THE SAFETY DIVISION
Business performance of the safety division
99PotentialFunctional areasBusiness performanceMarket environment
PRODUCTS LAUNCHED/NEW MARKETS TAPPED
The safety division tapped additional market potential in
fiscal year 2008 with the new “Dräger PSS 7000” self-
contained breathing apparatus and its electronic modules
“Dräger Bodyguard 7000” and “Dräger Sentinel 7000”.
The devices are particularly comfortable to wear, offer op-
timum weight distribution, have improved airline posi-
tioning and include many other innovations to improve
customer value. Dräger has developed a more cost-effec-
tive breath alcohol testing device for the Swedish market
based on the “Dräger Alcotest 6510”. This device, which
can also be used in other countries, is suitable for personal
use and preventative applications. In addition, safety’s
Shutdown & Rental Management for the crude oil refining
and chemical industry won new customers in Germany,
the Netherlands and France. In this connection, Dräger
offers safety management to ensure that occupational
health and safety standards are maintained during the
temporary shutdown of refineries or chemical produc-
tion plants. This ranges from providing safety compliance
officers through to a complete organization with staff
and a management team and comprehensive safety equip-
ment for their personal protection.
ORDER INTAKE
The safety division’s order intake amounted to EUR 679.6
million in fiscal year 2008 (2007: EUR 735.8 million).
Adjusted for the impact of three deep-sea diving projects
worth a total of EUR 79.2 million in the third and fourth
quarters of 2007, order intake rose by 3.5 percent (net of
currency effects: 6.0 percent). The safety division’s order
intake (net of currency effects) therefore grew faster than
the market (2 to 4 percent). This core business growth
was fuelled by the development of business in the rest of
Europe, Asia/Pacific and Americas regions as well as in
parts of the other countries region which includes, for ex-
ample, African and Middle-Eastern countries.
At EUR 161.6 million, order intake in Germany was 2.4
percent below that of the prior year (EUR 165.5 million).
This was chiefly due to the prior-year figure containing a
major order which will be processed over a period of four
years. Demand for respiratory protection equipment
and training galleries for fire departments, industry and
mines developed well. In addition, the Company took
orders for Shutdown & Rental Management from the
petrochemical and chemical industries. The new gen-
eration of gas detection devices has been a roaring success.
The rest of Europe region posted an order volume of EUR
291.6 million (prior year: EUR 351.3 million); adjusted
for the special effects of the three deep-sea diving proj-
ects of EUR 79.2 million included in the prior year, this
equates to strong growth of approximately 7.2 percent
(adjusted for currency effects: 9.0 percent). The significant
growth was primarily as a result of high demand for res-
piratory protection and gas detection equipment. The Nor-
wegian offshore industry ordered stationary gas detection
devices which were supplied in the third quarter. Dräger
received a major order in Italy to supply the police and
carabinieri with the tried-and-tested “Dräger 7110” breath-
alyzer. Within the scope of the European Druid project
(Driving under the Influence of Drugs, Alcohol and Med-
icine), the central traffic authority and the Guardia Civil
in Spain placed an order with Dräger for the Dräger drug-
testing device. The long-term goal of the project is to
1 Value as of Dec. 312 EBITDA = Earnings before net interest result, income taxes, depreciation,
amortization and non-recurring expenses3 Depreciation, amortization and write-downs excluding those which are
non-recurring expenses 4 EBIT = Earnings before net interest result and income taxes5 Capital employed = Total assets less deferred tax assets, current securities,
cash and cash equivalents and non-interest bearing liabilities6 Net working capital = Current, non-interest bearing assets less current,
non-interest bearing debt7 Gearing = Net financial debt/equity
Footnotes for page 98
Business performance of the safety division100
make road traffic safer within the EU. Polish mining com-
panies ordered the “Dräger X-am 5000” gas detector.
The Company received an order from the mining indus-
try in the Czech Republic to supply our tried and tested
oxygen self-rescuer “Dräger Oxy K50”.
Order intake in the Americas region rose by 2.5 percent
to EUR 104.4 million (2007: EUR 101.9 million; net of cur-
rency effects: up 8.5 percent). The Company has again
proven its competitiveness in a difficult market environ-
ment. Dräger met the extremely tough North American
National Fire Protection Association standards for the new
self-contained breathing apparatus “Dräger PSS 7000”
and the electronic module “Dräger Sentinel 7000” and
received approval in May 2008. Both devices are expected
to make a significant contribution to growth in the
Americas in the future. The fire services in Phoenix and
Vancouver have already placed large orders. The Canadian
navy placed an order for the “Dräger PSS 100” Dräger
breathing apparatus. Fire services showed particular in-
terest in real fire training systems for firefighters. In
particular, “Dräger Interlock” business performed well
despite strong competition in the US. The two subsidiaries
in Mexico and Brazil performed very well. A petroleum
corporation in Mexico will be using safety division breath-
ing apparatus in the future.
In the Asia/Pacific region, order intake amounted to EUR
82.1 million (2007: EUR 85.9 million). Currency effects
and project orders placed with the stationary gas detection
segment by the semi-conductor industry in Taiwan in
the prior year also had a negative impact on the rate of
change and disguise the positive performance of core
business in this region. Excluding the aforementioned
projects and adjusted for currency effects, order intake
was 6.2 percent higher than in the prior year. In Australia,
Dräger breathalyzers beat strong competitors in tenders.
The New Zealand fire service ordered large volumes of
Dräger thermal imaging cameras. Dräger received an
order for breathing apparatus from the mining industry
in New Caledonia. For the first time, an order was also
received from China for a fire training system. Indonesian
oil and gas companies ordered an integrated fire and
gas detection system.
Growth of 27.9 percent (net of currency effects: 37.8
percent) has considerably increased the other countries
region’s market share. It achieved order intake of EUR
39.9 million (2007: EUR 31.2 million), which was chiefly
due to strong demand for Dräger breathing apparatus
in the Middle East, Kazakhstan and South Africa where
the safety division won orders for the “Oxyboks K35” oxy-
gen self-rescuer and the “Dräger PSS BG 4” breathing
apparatus from the mining industry.
Order intake amounted to EUR 170.4 million (Q4 2007:
EUR 193.2 million) in the fourth quarter. As the prior-
year value included a further deep-sea diving project worth
EUR 29.7 million, the calculated change was down 11.8
percent on 2007. Adjusted for the effect of this major proj-
ect, core business order intake increased by 4.2 percent.
ORDERS ON HAND
Orders on hand as at December 31, 2008 fell to
EUR 181.2 million (2007: EUR 200.4 million). Despite
this decrease, the safety division has a good foundation
on which to build. The decrease was chiefly in the rest of
Europe region, where orders for deep-sea diving systems
totaling approximately EUR 69.3 million (2007: EUR 89.5
million) were included. The equipment orders on hand
cover a 2.2-month period (2007: 2.2 months).
NET SALES
Safety’s net sales grew by 10.9 percent (net of currency
effects: 13.4 percent) to EUR 706.8 million (2007: EUR
637.5 million) and surpassed the forecast of a slight
increase in the annual report for 2007. The Company
achieved this growth thanks to its innovative products
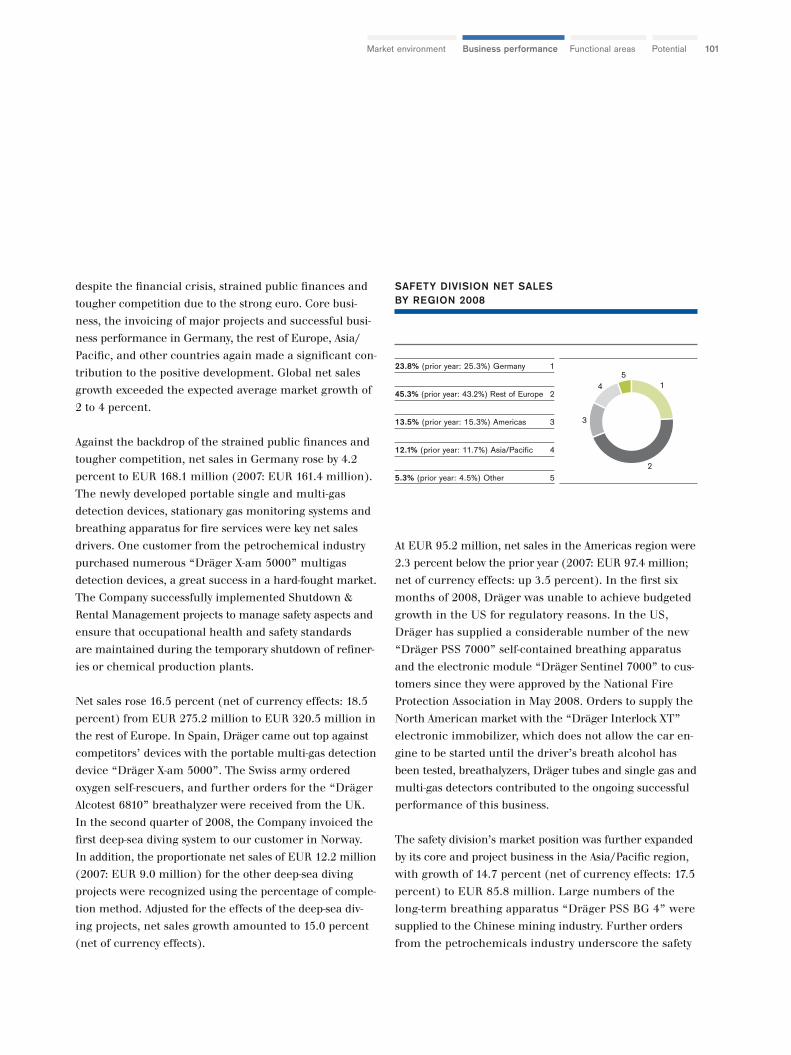
101PotentialFunctional areasBusiness performanceMarket environment
despite the financial crisis, strained public finances and
tougher competition due to the strong euro. Core busi-
ness, the invoicing of major projects and successful busi-
ness performance in Germany, the rest of Europe, Asia/
Pacific, and other countries again made a significant con-
tribution to the positive development. Global net sales
growth exceeded the expected average market growth of
2 to 4 percent.
Against the backdrop of the strained public finances and
tougher competition, net sales in Germany rose by 4.2
percent to EUR 168.1 million (2007: EUR 161.4 million).
The newly developed portable single and multi-gas
detection devices, stationary gas monitoring systems and
breathing apparatus for fire services were key net sales
drivers. One customer from the petrochemical industry
purchased numerous “Dräger X-am 5000” multigas
detection devices, a great success in a hard-fought market.
The Company successfully implemented Shutdown &
Rental Management projects to manage safety aspects and
ensure that occupational health and safety standards
are maintained during the temporary shutdown of refiner-
ies or chemical production plants.
Net sales rose 16.5 percent (net of currency effects: 18.5
percent) from EUR 275.2 million to EUR 320.5 million in
the rest of Europe. In Spain, Dräger came out top against
competitors’ devices with the portable multi-gas detection
device “Dräger X-am 5000”. The Swiss army ordered
oxygen self-rescuers, and further orders for the “Dräger
Alcotest 6810” breathalyzer were received from the UK.
In the second quarter of 2008, the Company invoiced the
first deep-sea diving system to our customer in Norway.
In addition, the proportionate net sales of EUR 12.2 million
(2007: EUR 9.0 million) for the other deep-sea diving
projects were recognized using the percentage of comple-
tion method. Adjusted for the effects of the deep-sea div-
ing projects, net sales growth amounted to 15.0 percent
(net of currency effects).
At EUR 95.2 million, net sales in the Americas region were
2.3 percent below the prior year (2007: EUR 97.4 million;
net of currency effects: up 3.5 percent). In the first six
months of 2008, Dräger was unable to achieve budgeted
growth in the US for regulatory reasons. In the US,
Dräger has supplied a considerable number of the new
“Dräger PSS 7000” self-contained breathing apparatus
and the electronic module “Dräger Sentinel 7000” to cus-
tomers since they were approved by the National Fire
Protection Association in May 2008. Orders to supply the
North American market with the “Dräger Interlock XT”
electronic immobilizer, which does not allow the car en-
gine to be started until the driver’s breath alcohol has
been tested, breathalyzers, Dräger tubes and single gas and
multi-gas detectors contributed to the ongoing successful
performance of this business.
The safety division’s market position was further expanded
by its core and project business in the Asia/Pacific region,
with growth of 14.7 percent (net of currency effects: 17.5
percent) to EUR 85.8 million. Large numbers of the
long-term breathing apparatus “Dräger PSS BG 4” were
supplied to the Chinese mining industry. Further orders
from the petrochemicals industry underscore the safety
SAFETY DIVISION NET SALESBY REGION 2008
23.8% (prior year: 25.3%) Germany 1
45.3% (prior year: 43.2%) Rest of Europe 2
13.5% (prior year: 15.3%) Americas 3
12.1% (prior year: 11.7%) Asia/Pacific 4
5.3% (prior year: 4.5%) Other 5
1
2
3
45
Business performance of the safety division102
division’s strong market position and customer con-
fidence in stationary gas detection systems equipment.
Net sales in the other countries region grew by 29.6 per-
cent (net of currency effects: 40.1 percent) to EUR 37.2
million, not least thanks to the particularly successful
South African subsidiary which supplied high quantities
of the “Dräger Oxyboks K35” oxygen self-rescuer and the
“Dräger PSS BG 4” breathing apparatus. Dräger invoiced
an order for a respiratory air system for an entire on-
shore plant for a petrochemical company in the Middle
East. Dräger breathing apparatus was supplied to Saudi
Arabia, the United Arab Emirates and also to Kazakhstan.
Net sales in the fourth quarter of 2008 amounted to EUR
216.3 million (Q4 2007: EUR 181.2 million), an increase
of 19.3 percent year-on-year. In particular, the rest of
Europe, Americas, Asia/Pacific and other countries regions
contributed to the increase.
EARNINGS
Shifts in the product mix, project invoicing with low mar-
gins and the strong euro led to a weaker gross margin.
Adjusted for non-recurring expenses of EUR 8.1 million
(2007: EUR 0 million), functional costs in fiscal year 2008
were 8.8 percent higher than in the prior year.
Higher bad debt allowances on customer receivables also
had a negative impact on earnings.
At EUR 69.1 million, EBIT (before non-recurring expenses)
was on the same level as the prior year (2007: EUR 69.4
million). The safety division’s EBIT margin before non-
recurring expenses came to 9.8 percent (2007: 10.9 per-
cent). Following the excellent year in 2007, it stabilized
at 10 percent (before non-recurring expenses). Non-
recurring expenses amounted to EUR 8.1 million (2007:
EUR 0 million).
In the fourth quarter of 2008, the safety division posted
EBIT before non-recurring expenses of EUR 25.3 mil-
lion (Q4 2007: EUR 27.6 million), 8.3 percent down on
the prior-year. The EBIT margin before non-recurring
expenses came to 11.7 percent (Q4 2007: 15.2 percent).
INVESTMENTS
The safety division is investing increasingly in modern
manufacturing technologies, with investment in intangible
assets totaling EUR 2.0 million (2007: EUR 6.0 million)
and property, plant and equipment EUR 21.1 million
(2007: EUR 20.5 million). Depreciation and amortization
of EUR 22.2 million (2007: EUR 21.0 million) covered
96.1 percent (2007: 79.2 percent) of the investment vol-
ume.
NET ASSETS
Accordingly, at EUR 223.8 million (2007: EUR 220.1 mil-
lion), the increase in capital employed as of the balance
sheet date was disproportionately lower year on year. The
safety division continued to improve the production and
organization processes as planned and therefore reduced
the capital tie-up, in particular.
EBIT before non-recurring expenses came in at EUR 69.1
million, producing a return on capital employed (ROCE)
of 30.9 percent (2007: 31.5 percent).

103PotentialFunctional areasBusiness performanceMarket environment
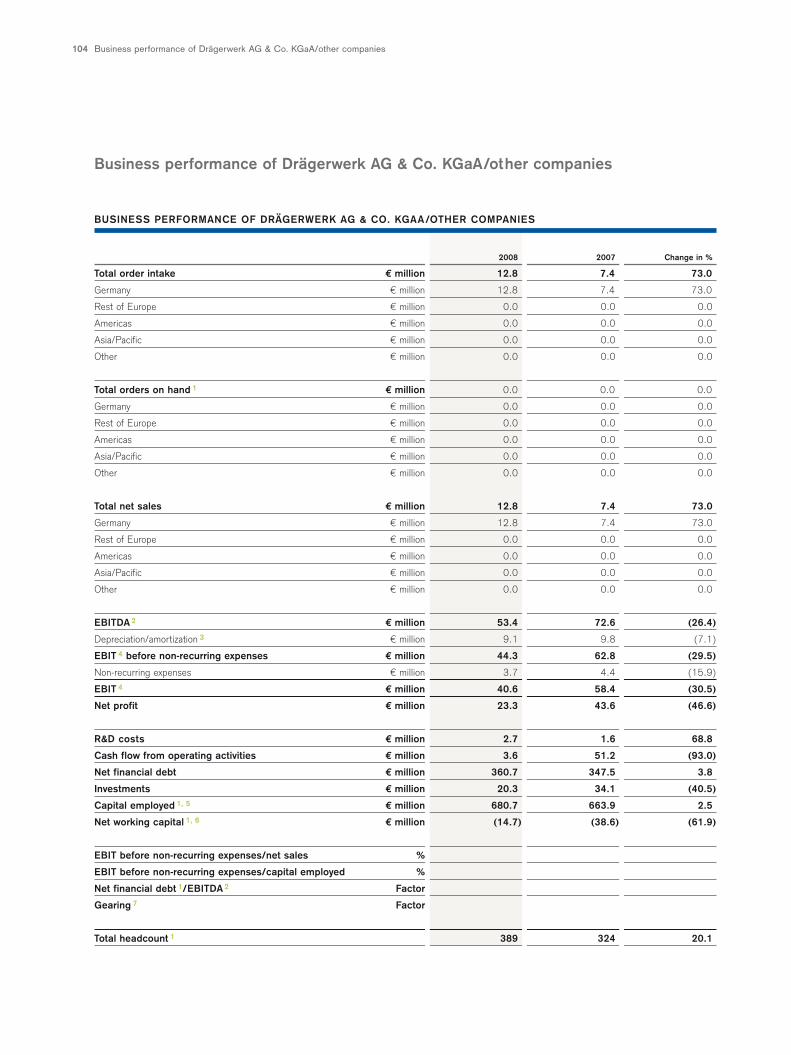
Business performance of Drägerwerk AG & Co. KGaA/other companies104
Business performance of Drägerwerk AG & Co. KGaA/other companies
2008 2007 Change in %
Total order intake € million 12.8 7.4 73.0
Germany € million 12.8 7.4 73.0
Rest of Europe € million 0.0 0.0 0.0
Americas € million 0.0 0.0 0.0
Asia/Pacific € million 0.0 0.0 0.0
Other € million 0.0 0.0 0.0
Total orders on hand 1 € million 0.0 0.0 0.0
Germany € million 0.0 0.0 0.0
Rest of Europe € million 0.0 0.0 0.0
Americas € million 0.0 0.0 0.0
Asia/Pacific € million 0.0 0.0 0.0
Other € million 0.0 0.0 0.0
Total net sales € million 12.8 7.4 73.0
Germany € million 12.8 7.4 73.0
Rest of Europe € million 0.0 0.0 0.0
Americas € million 0.0 0.0 0.0
Asia/Pacific € million 0.0 0.0 0.0
Other € million 0.0 0.0 0.0
EBITDA 2 € million 53.4 72.6 (26.4)
Depreciation/amortization 3 € million 9.1 9.8 (7.1)
EBIT 4 before non-recurring expenses € million 44.3 62.8 (29.5)
Non-recurring expenses € million 3.7 4.4 (15.9)
EBIT 4 € million 40.6 58.4 (30.5)
Net profit € million 23.3 43.6 (46.6)
R&D costs € million 2.7 1.6 68.8
Cash flow from operating activities € million 3.6 51.2 (93.0)
Net financial debt € million 360.7 347.5 3.8
Investments € million 20.3 34.1 (40.5)
Capital employed 1, 5 € million 680.7 663.9 2.5
Net working capital 1, 6 € million (14.7) (38.6) (61.9)
EBIT before non-recurring expenses/net sales %
EBIT before non-recurring expenses/capital employed %
Net financial debt 1/EBITDA 2 Factor
Gearing 7 Factor
Total headcount 1 389 324 20.1
BUSINESS PERFORMANCE OF DRÄGERWERK AG & CO. KGAA/OTHER COMPANIES
105PotentialFunctional areasBusiness performanceMarket environment
EARNINGS OF DRÄGERWERK AG & CO. KGAA/
OTHER COMPANIES
Drägerwerk AG & Co. KGaA provides services to the divi-
sions and their subsidiaries. This includes the services
provided by the legal, tax, insurance, treasury, corporate
communications, investor relations, financial control,
group accounting, corporate IT, HR, internal audit and
basic research departments. The services to our divi-
sions are closely coordinated with them and invoiced in
accordance with arm’s length principles, as between
unrelated parties.
Corporate communications and corporate IT have already
been established at Drägerwerk AG & Co. KGaA as shared
services for all group companies. In order to make better
use of economies of scope it is planned to extend
the shared service activities to other suitable functions.
EBIT before non-recurring expenses decreased by 29.5
percent to EUR 44.3 million on the prior year (2007:
EUR 62.8 million) and is the product of the operating
results of the companies grouped here and the invest-
ment result of EUR 71.8 million (2007: EUR 82.9 million).
It includes the distribution of EUR 34.4 million by
Dräger Medical AG & Co. KG to Dräger Medical Holding
GmbH (2007: EUR 33.1 million). This is dependent on
the medical division’s result. The result excluding invest-
ment income is negative, as Drägerwerk AG & Co. KGaA
in particular performs group functions.
Drägerwerk AG & Co. KGaA spent EUR 2.7 million (2007:
EUR 1.6 million) on research and development in fiscal
year 2008. 53 employees currently work in the development
department in Lübeck (2007: 47 employees).
INVESTMENTS
In fiscal year 2008, investments in intangible assets and
property, plant and equipment totaled EUR 20.3 million
(2007: EUR 34.1 million). EUR 12.0 million (2007: EUR
16.7 million) of this was for the new administration
building and external facilities of the medical division in
Lübeck.
RECONCILIATION OF FIGURES AT GROUP LEVEL
To reconcile figures at group level, consolidations between
medical, safety and Drägerwerk AG & Co. KGaA and
other companies have to be accounted for. These are de-
tailed in the segment report of the notes to this report.
1 Value as of Dec. 312 EBITDA = Earnings before net interest result, income taxes, depreciation,
amortization and non-recurring expenses3 Depreciation, amortization and write-downs excluding those which are
non-recurring expenses 4 EBIT = Earnings before net interest result and income taxes5 Capital employed = Total assets less deferred tax assets, current securities,
cash and cash equivalents and non-interest bearing liabilities6 Net working capital = Current, non-interest bearing assets less current,
non-interest bearing debt7 Gearing = Net financial debt/equity
Footnotes for page 104
Research and development 106
Research and development
Expenses for research and development (R&D) remained
high in 2008. The Dräger Group’s total R&D expenditure
amounted to EUR 134.9 million, which corresponds to 7
percent of net sales (2007: EUR 121.9 million; 6.7 percent
of net sales).
The development departments of the medical and safety
divisions employ 1,005 people worldwide and 53 people
work at Drägerwerk AG & Co. KGaA’s research and devel-
opment (basic research) department in Lübeck.
Research and development expenses in the medical divi-
sion amounted to EUR 97.6 million, which equals 7.8 per-
cent of net sales (2007: EUR 89.1 million; 7.4 percent).
Research and development expenses in the safety division
rose to EUR 34.6 million and remained constant at 4.9
percent relative to net sales (2007: EUR 31.2 million; 4.9
percent). Expenses not allocated to projects in the divi-
sions and long-term research activities at Drägerwerk AG &
Co. KGaA came to EUR 2.7 million (2007: EUR 1.6
million).
In fiscal year 2008, Dräger filed a total of 82 applications
for new patents with the German Patent and Trade-
mark Office and with international patent offices. Inven-
tors from the basic research department in Lübeck were
again involved in more than 50 percent of the applications
filed in Germany.
The specialists from Drägerwerk AG & Co. KGaA’s basic
research department work closely with the subsidiaries’
development departments in Germany, Europe, China
and the US. Our basic research department’s main task
is to investigate new technologies and develop technical
solutions for potential applications. Theses technologies are
not transferred to product development until they reach
a sufficiently high level of maturity, which reduces the de-
velopment risk. All research and development depart-
ments cooperate internationally with universities, research
institutes and other innovative companies. The trans-
parently-structured innovation processes facilitate the in-
clusion of the latest research findings and cutting-edge
technologies that meet our high quality standards in the
product development process. The procurement, quality
assurance and production departments are also included
in the comprehensive innovation processes. This means
that strategic suppliers are also increasingly being trained
together with the procurement department, enabling
them to expertly and systematically contribute to develop-
ment projects. This accelerates the development proj-
ects and means the products are ready for series production
using state-of-the-art production methods more rapidly.
Customer value is always our key focus when developing a
product. Information and communication technologies
are becoming increasingly important, in particular in the
development of software for integrated products, systems
and services.
MEDICAL DIVISION
Medical division’s R&D projects involve system solutions
for acute and subacute points of care in hospitals and
transport solutions for continuous therapy and therapy
control. Dräger launched a greatly improved anesthesia
workstation version of one of its most successful anesthetic
devices in April. The new “Primus IE” (Infinity Empow-
ered) has a wider range of functions and is now much eas-
ier to integrate. Dräger completely overhauled the
proven “Evita XL” intensive care ventilator. It received a
new design and additional functions, and was supplied
in the second quarter of 2008 once it had been fully devel-
oped and approved.
Dräger is currently developing the “Infinity Acute Care
System” which is a product family of integrated worksta-
tions for operating rooms and intensive care units that
structure workflows in hospitals more efficiently, more
easily and to a better standard. The first portable patient
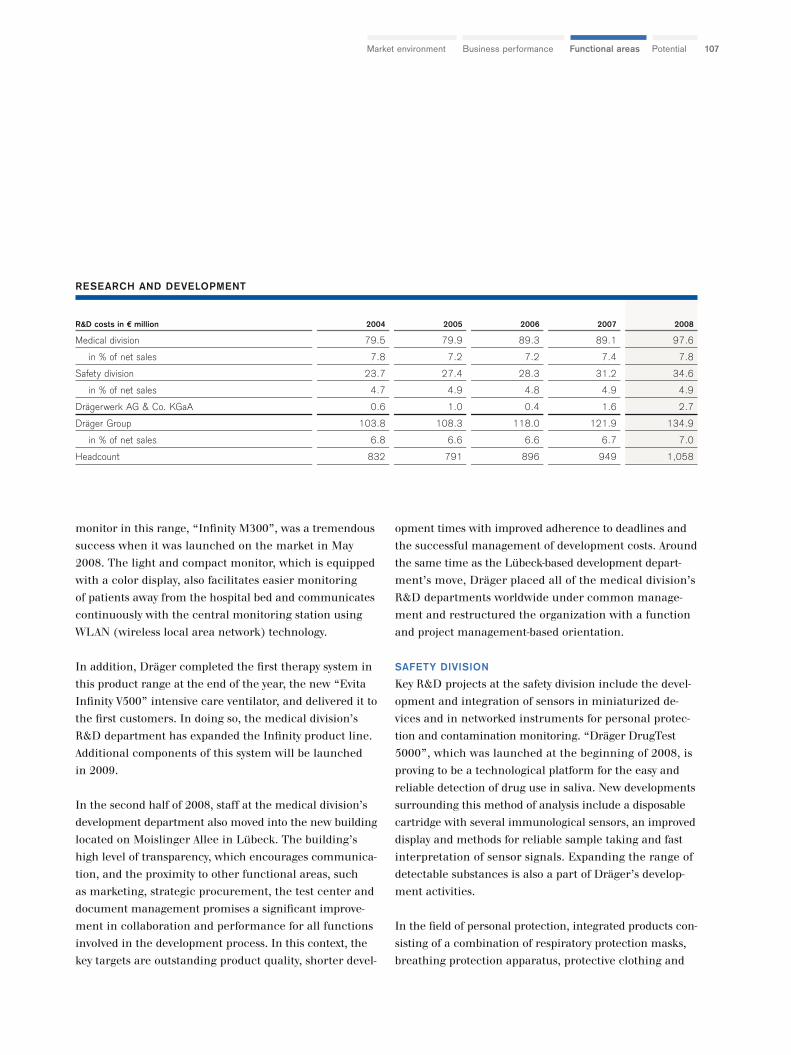
107PotentialFunctional areasBusiness performanceMarket environment
monitor in this range, “Infinity M300”, was a tremendous
success when it was launched on the market in May
2008. The light and compact monitor, which is equipped
with a color display, also facilitates easier monitoring
of patients away from the hospital bed and communicates
continuously with the central monitoring station using
WLAN (wireless local area network) technology.
In addition, Dräger completed the first therapy system in
this product range at the end of the year, the new “Evita
Infinity V500” intensive care ventilator, and delivered it to
the first customers. In doing so, the medical division’s
R&D department has expanded the Infinity product line.
Additional components of this system will be launched
in 2009.
In the second half of 2008, staff at the medical division’s
development department also moved into the new building
located on Moislinger Allee in Lübeck. The building’s
high level of transparency, which encourages communica-
tion, and the proximity to other functional areas, such
as marketing, strategic procurement, the test center and
document management promises a significant improve-
ment in collaboration and performance for all functions
involved in the development process. In this context, the
key targets are outstanding product quality, shorter devel-
opment times with improved adherence to deadlines and
the successful management of development costs. Around
the same time as the Lübeck-based development depart-
ment’s move, Dräger placed all of the medical division’s
R&D departments worldwide under common manage-
ment and restructured the organization with a function
and project management-based orientation.
SAFETY DIVISION
Key R&D projects at the safety division include the devel-
opment and integration of sensors in miniaturized de-
vices and in networked instruments for personal protec-
tion and contamination monitoring. “Dräger DrugTest
5000”, which was launched at the beginning of 2008, is
proving to be a technological platform for the easy and
reliable detection of drug use in saliva. New developments
surrounding this method of analysis include a disposable
cartridge with several immunological sensors, an improved
display and methods for reliable sample taking and fast
interpretation of sensor signals. Expanding the range of
detectable substances is also a part of Dräger’s develop-
ment activities.
In the field of personal protection, integrated products con-
sisting of a combination of respiratory protection masks,
breathing protection apparatus, protective clothing and
R&D costs in € million 2004 2005 2006 2007 2008
Medical division 79.5 79.9 89.3 89.1 97.6
in % of net sales 7.8 7.2 7.2 7.4 7.8
Safety division 23.7 27.4 28.3 31.2 34.6
in % of net sales 4.7 4.9 4.8 4.9 4.9
Drägerwerk AG & Co. KGaA 0.6 1.0 0.4 1.6 2.7
Dräger Group 103.8 108.3 118.0 121.9 134.9
in % of net sales 6.8 6.6 6.6 6.7 7.0
Headcount 832 791 896 949 1,058
RESEARCH AND DEVELOPMENT
Research and development I Personnel108
sensors are being developed. Our developers use suitable
technologies for voice and data communication between
firefighters and the command center in the new genera-
tions of devices.
Personnel
Headcount rose from 10,345 to 10,909 in fiscal year 2008.
This increase is attributable to newly-formed entities
and the expansion of companies outside of Germany, as
well as new hires in Germany. On December 31, 2008,
a total of 55.8 percent (2007: 55.6 percent) of employees
were working outside Germany.
In Germany, the number of employees rose by 65 due to
the expansion of shared services at Drägerwerk AG & Co.
KGaA. 103 people work for the safety division in Germany,
primarily in research and development, production and
marketing and sales.
The establishment of companies in Colombia and Vietnam
during the past twelve months and the expansion of busi-
ness operations in India, Poland, Brazil, China and the US
led to the number of employees in the Dräger Group in-
creasing by 184. The remaining increase is attributable to
the expansion of subsidiaries worldwide.
The turnover rate and the number of sick days have in-
creased slightly year-on-year. The sick rate in the Dräger
Group (3.0 percent) is 33 percent below the sector aver-
age for the German metal and electronics industry (4.5
percent). In fiscal year 2008, 148 employees in Germany
(2007: 230) celebrated their 10th, 25th or 40th year with
the Company.
Personnel development costs of EUR 12.6 million (up
EUR 0.5 million) include expenses for apprenticeships and
the remuneration of apprentices.
The proportion of temporary staff at Dräger companies
with production operations totaled 9.5 percent in 2008
(2007: 8.5 percent). The proportion in the medical
division in 2008 rose to 10.3 percent (2007: 9.9 percent).
This makes it possible for the Dräger Group to react
quickly to capacity fluctuations, thus giving the Company
flexible capacity and the ability to reach full capacity.
OCCUPATIONAL HEALTH MANAGEMENT (OHM)
Dräger products protect, support and save lives. Following
on from this, the Company has a special responsibility
for its employees’ health, which is why Dräger sees foster-
ing occupational health and safety as an important part
of its corporate culture. Occupational health management
pursues the aim of ensuring the sustainability of employ-
ees’ performance and well-being, thus contributing towards
the Company’s competitiveness. As part of a health day
attended by 800 employees, a wide-reaching health promo-
tion program was presented. A steering committee sets
targets, defines, measures and organizes occupational
health and safety activities on an annual basis. A team
of experts aids management in implementing the meas-
ures. By providing a range of health promotion offer-
ings, such as training on movement, diet and relaxation,
Dräger gives its employees the opportunity to counteract
work-related stress.
TRAINING AT DRÄGER
On December 31, 2008, there were 194 apprentices
(2007: 177) in Germany, of which 67 (2007: 64) began
their training in fiscal year 2008. The Company trains
apprentices in 13 different fields, ranging from mecha-
tronics and logistics management through to industrial
engineering and medical technology. Around 90 percent
of apprentices are offered at least temporary employ-
ment and 50 percent to 60 percent permanent employ-
ment. Almost all of the engineers are offered employ-
ment.
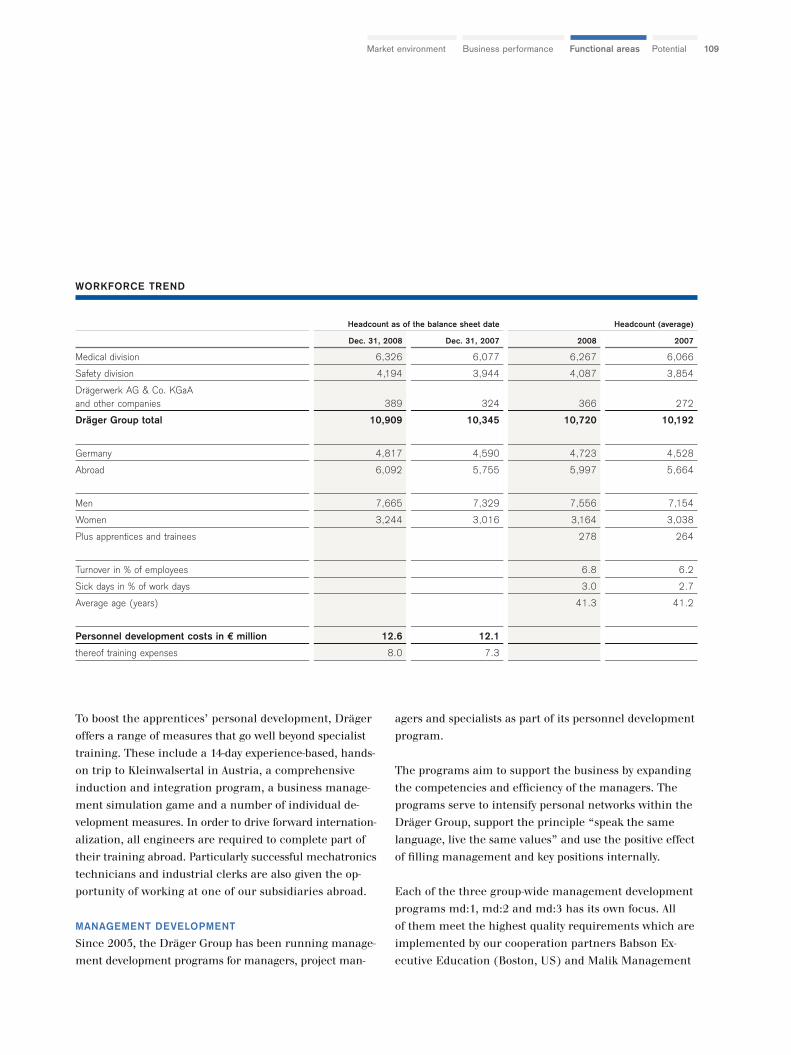
109PotentialFunctional areasBusiness performanceMarket environment
Headcount as of the balance sheet date Headcount (average)
Dec. 31, 2008 Dec. 31, 2007 2008 2007
Medical division 6,326 6,077 6,267 6,066
Safety division 4,194 3,944 4,087 3,854
Drägerwerk AG & Co. KGaAand other companies 389 324 366 272
Dräger Group total 10,909 10,345 10,720 10,192
Germany 4,817 4,590 4,723 4,528
Abroad 6,092 5,755 5,997 5,664
Men 7,665 7,329 7,556 7,154
Women 3,244 3,016 3,164 3,038
Plus apprentices and trainees 278 264
Turnover in % of employees 6.8 6.2
Sick days in % of work days 3.0 2.7
Average age (years) 41.3 41.2
Personnel development costs in € million 12.6 12.1
thereof training expenses 8.0 7.3
To boost the apprentices’ personal development, Dräger
offers a range of measures that go well beyond specialist
training. These include a 14-day experience-based, hands-
on trip to Kleinwalsertal in Austria, a comprehensive
induction and integration program, a business manage-
ment simulation game and a number of individual de-
velopment measures. In order to drive forward internation-
alization, all engineers are required to complete part of
their training abroad. Particularly successful mechatronics
technicians and industrial clerks are also given the op-
portunity of working at one of our subsidiaries abroad.
MANAGEMENT DEVELOPMENT
Since 2005, the Dräger Group has been running manage-
ment development programs for managers, project man-
agers and specialists as part of its personnel development
program.
The programs aim to support the business by expanding
the competencies and efficiency of the managers. The
programs serve to intensify personal networks within the
Dräger Group, support the principle “speak the same
language, live the same values” and use the positive effect
of filling management and key positions internally.
Each of the three group-wide management development
programs md:1, md:2 and md:3 has its own focus. All
of them meet the highest quality requirements which are
implemented by our cooperation partners Babson Ex-
ecutive Education (Boston, US) and Malik Management
WORKFORCE TREND
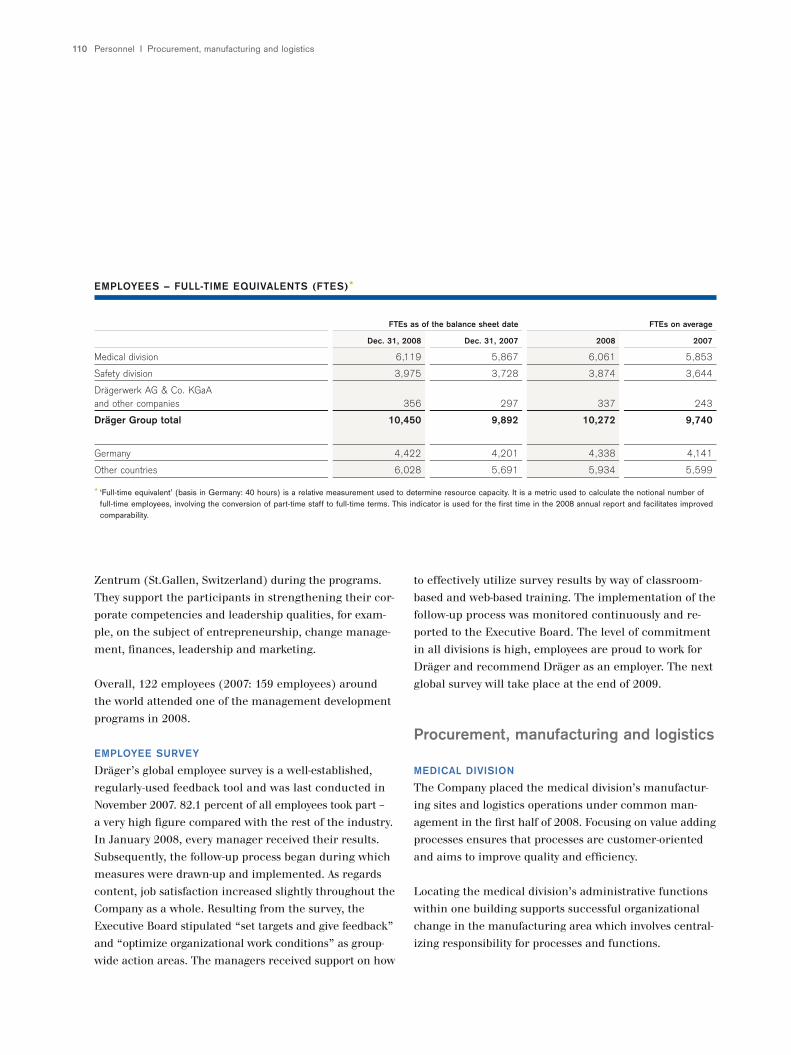
Personnel I Procurement, manufacturing and logistics110
Zentrum (St.Gallen, Switzerland) during the programs.
They support the participants in strengthening their cor-
porate competencies and leadership qualities, for exam-
ple, on the subject of entrepreneurship, change manage-
ment, finances, leadership and marketing.
Overall, 122 employees (2007: 159 employees) around
the world attended one of the management development
programs in 2008.
EMPLOYEE SURVEY
Dräger’s global employee survey is a well-established,
regularly-used feedback tool and was last conducted in
November 2007. 82.1 percent of all employees took part –
a very high figure compared with the rest of the industry.
In January 2008, every manager received their results.
Subsequently, the follow-up process began during which
measures were drawn-up and implemented. As regards
content, job satisfaction increased slightly throughout the
Company as a whole. Resulting from the survey, the
Executive Board stipulated “set targets and give feedback”
and “optimize organizational work conditions” as group-
wide action areas. The managers received support on how
to effectively utilize survey results by way of classroom-
based and web-based training. The implementation of the
follow-up process was monitored continuously and re-
ported to the Executive Board. The level of commitment
in all divisions is high, employees are proud to work for
Dräger and recommend Dräger as an employer. The next
global survey will take place at the end of 2009.
Procurement, manufacturing and logistics
MEDICAL DIVISION
The Company placed the medical division’s manufactur-
ing sites and logistics operations under common man-
agement in the first half of 2008. Focusing on value adding
processes ensures that processes are customer-oriented
and aims to improve quality and efficiency.
Locating the medical division’s administrative functions
within one building supports successful organizational
change in the manufacturing area which involves central-
izing responsibility for processes and functions.
FTEs as of the balance sheet date FTEs on average
Dec. 31, 2008 Dec. 31, 2007 2008 2007
Medical division 6,119 5,867 6,061 5,853
Safety division 3,975 3,728 3,874 3,644
Drägerwerk AG & Co. KGaAand other companies 356 297 337 243
Dräger Group total 10,450 9,892 10,272 9,740
Germany 4,422 4,201 4,338 4,141
Other countries 6,028 5,691 5,934 5,599
* ‘Full-time equivalent’ (basis in Germany: 40 hours) is a relative measurement used to determine resource capacity. It is a metric used to calculate the notional number of full-time employees, involving the conversion of part-time staff to full-time terms. This indicator is used for the first time in the 2008 annual report and facilitates improved comparability.
EMPLOYEES – FULL-TIME EQUIVALENTS (FTES)*
111PotentialFunctional areasBusiness performanceMarket environment
Dräger has successfully initiated an ongoing improvement
process called Dräger PRIME (Production Improvement
for Excellence), which is intended to further increase the
efficiency of the medical division’s manufacturing. The
aim is to improve processes and reduce costs by restruc-
turing procedures with the help of employees and the
works council (Kaizen) in order to cater to customer re-
quirements faster and more cost effectively. Infrastruc-
ture projects and monitoring in Lübeck are piloting the
process. As a result, Dräger has reduced floor space,
through-put times, inventories and personnel expenses in
production by over 20 percent on average. In 2009, the
Company will start to systematically roll-out PRIME in all
production segments and locations worldwide. This is
expected to result in savings for the medical division in
Lübeck and Danvers of approximately EUR 2 million per
year as of 2009.
The first stage of the “Infinity Acute Care System” in pro-
duction has successfully commenced series production.
Dräger has also set up customer-specific configuration of
the new monitoring generation in Lübeck and relocated
this final production phase from Danvers to Lübeck for the
existing monitors.
In China, the medical division doubled its production
space in Shanghai by commissioning a new production
building in preparation for further growth in the Asian
market.
In December 2008, the Executive Board resolved to relo-
cate the production site in Danvers, US, 30 kilometers
away to Andover where the development and marketing
departments of the strategic business field (SBF) moni-
toring, systems and IT are based. The move will take place
in 2009. By consolidating the US sites, Dräger will re-
duce costs each year, use equipment and resources more
efficiently and improve communication between devel-
opment and production.
SAFETY DIVISION
In line with the safety division’s growth strategy, the
manufacturing and logistics function area further devel-
oped its global production locations.
The site in Brazil was expanded and produces a rapidly
increasing number of respiratory protection masks for
the local markets. The plant in China produces a small
range of products at close to full capacity for the Asian
market using mid-range technology and will be expanded
in 2009. Safety helmet production in the Czech Republic
commenced operations in February 2009. Dräger holds a
majority share. Dräger manufactures all new genera-
tions of helmets and head protection systems at the cost-
effective location in Chomutov.
Thanks to investment in a third production line in 2008,
production capacity for soda lime will increase by 35
percent from March 2009 to enable Dräger to supply the
market with the additional volumes it requires. The cost
reduction measures will be accelerated both by the expan-
sion of production in eastern Europe, China and Brazil
and through PRIME. The Company laid the foundations
for this in 2008. In 2009, projects in Lübeck and Blyth
will result in savings of EUR 0.5 million per year.
QUALITY SYSTEMS AND CERTIFICATION
Since 2006, the safety division has had a global quality
management system in place which includes all sales
companies and the production companies. In 2008, both
customers and licensing agency employees again
satisfied themselves of its effectiveness at different loca-
tions. The audit by TÜV Nord, as the external certifier,
took place at three different production sites and several
sales companies in North and South America and
Europe. No discrepancies were found during the audit,
which confirmed the effectiveness of the global quality
management system.
Procurement, manufacturing and logistics | Corporate IT I Environmental protection
The safety division uses the Six Sigma method to systemat-
ically improve quality and solve problems and concluded
the training initiative in production, logistics and quality
management at the sites in Lübeck and Blyth in 2008.
The medical division expanded the global quality manage-
ment system to include 29 sales and service companies
which also passed the audit by TÜV Product Service GmbH
without any discrepancies in 2008. Dräger has imple-
mented this quality system at all newly-formed subsidiaries.
In addition, at the development and production sites in the
US, Dräger has integrated the quality management sys-
tem into medical’s global system. This comprised the com-
prehensive revision of all processes, such as the design
and implementation of a comprehensive training program
for all employees of the US companies. The focus was
on the development process, as well as the corrective and
preventative measures. Dräger has therefore rolled out
the IT system of the parent in Lübeck in order to achieve
effective collaboration in all aspects of quality manage-
ment. In doing so, Dräger has concluded a two-year inte-
gration program.
Dräger also implemented the global quality management
system at the development and production site in Shang-
hai, China. The adaptation of the process to local condi-
tions and a comprehensive training program have led
to an increase in the employees’ quality awareness. This
site has therefore also achieved full FDA compliance
and a high standard of quality.
The medical division successfully passed the certification
audits conducted by TÜV Product Service GmbH at all
development and production sites and by FDA Inspection
at the US site. Dräger therefore confirmed the effec-
tiveness of its quality management system and compliance
with all regulatory requirements.
LOGISTICS
The logistics functions of the medical and safety divisions
follow identical strategies in order to increase delivery
flexibility and adherence to delivery dates. In 2008, the
divisions improved their adherence to delivery dates by
4 percent on the prior year.
Corporate IT
IT STRATEGY
The most important strategic areas of action for IT this
year and in the coming years are to:
– Establish a standardized group-wide IT infrastructure
– Harmonize and standardize the group-wide
application landscape
– Optimize procurement
– Establish a global IT organization
Dräger has taken the first organizational step by inte-
grating medical and safety’s US IT departments into cor-
porate IT in Germany. A region-based IT structure is to
be introduced around the world in the first quarter of 2009
(America, Europe/Middle East/Africa and Asia/Pacific).
In 2009 and 2010, the existing local IT organizations will
be integrated into their respective regions in a common
functional IT organization.
IT HEADCOUNT
The corporate IT shared service was expanded both in
Lübeck and internationally, taking its headcount to
around 88 in Germany (2007: 48) and around 20 in the
US (2007: 24) in December 2008.
MAJOR IT PROJECTS
In the US, safety’s sales staff in the Texas sales region have
been testing a pilot version of the new customer rela-
tionship management (CRM) system since the end of De-
cember 2008. This system was set up in close collabora-
112
PotentialFunctional areasBusiness performanceMarket environment
tion between medical and safety employees in the US, the
UK, the Netherlands and Germany. This sub-project was
successfully executed on time and on budget. The solution
will be rolled out in other regions and subsidiaries over
the next few months to support sales processes.
The integration of the international SAP systems in an-
other sub-project reduces the risk arising from using cus-
tomized software from a small provider. The software
survey is running according to plan and is due to be con-
cluded in the first half of 2009.
The managed desktop project harmonized infrastructure,
which included establishing a standardized hardware
and software environment. In total, 2,000 desktop com-
puters and notebooks were exchanged and the required
infrastructure was set up in the computer center of the
new outsourcing partner, EDS.
The new structure of Dräger’s internet portal will be
launched in Germany and the US in the first half of 2009.
The marketing operations management (MOM) project
comprises an image database which contributes to safe-
guarding the guidelines for brand communication.
IT COSTS
A total of 27 IT projects were completed in fiscal year 2008.
IT costs for the Dräger Group stood at approximately EUR
81.5 million in 2008. This represents some 4.2 percent of
total net sales of the Dräger Group (2007: 4.2 percent)
and breaks down between operating expenses of EUR 67.4
million and project expenses of EUR 14.1 million.
Environmental protection
Over the past six years, Dräger has managed to cut direct
CO2 emissions from production and administration at its
Lübeck site by 22.9 percent overall and by 20.3 percent
when adjusted for climatic conditions. This equals an an-
nual reduction of almost 2,750 metric tons (mt) of CO2
compared to 2002. Dräger companies are directly respon-
sible for around 70 percent of these emissions. Major
suppliers at the same site produced the remaining 30 per-
cent. In order to achieve these drastic savings, Dräger has
invested heavily in heat supply facilities and distribution
networks, as well as building maintenance. Medical’s
move into the new building, which was completed in 2008,
will generate additional savings as energy consumption
for this building is 25 percent below the legal limit and
Dräger employees working in less energy-efficient build-
ings have been relocated to the new building.
The Dräger environmental management system will
gather data from all subsidiaries in the future in order
to determine their direct and indirect CO2 emissions
through their local energy consumption, use of company
vehicles, and business trips, and will assess their savings
potential.
As a manufacturer and seller of medical and safety equip-
ment, our production is only relevant for the environ-
ment and climate change to a minor extent. It is predom-
inated by non-energy-intensive assembly processes. Only
in the manufacture of soda lime and impregnated acti-
vated carbon for breathing filters by safety’s departments
are raw materials and intermediate products produced
in the middle-tonnage band. The related production lines
have been built and extended in the last five years and are
distinguished by their high efficiency and environmental
standards as well as extremely low emissions, which are
far below legal limits. In production units with increased
water consumption, Dräger uses recycling systems.
Since 1998, the environmental management systems of
Dräger’s companies in Lübeck have been certified in ac-
cordance with DIN EN ISO 14001:2005 as part of the
113
Environmental protection I Opportunities and risks relating to future development114
group certification held by the parent Drägerwerk AG &
Co. KGaA. Following the successful conclusion of the
third recertification audit in February 2008, the environ-
mental certificates are valid until 2011. The current
group certification covers not only Dräger companies but
also two third-party companies operating on our site in
Lübeck. In this way, Dräger boosts Lübeck as a business
location and at the same time imposes its high environ-
mental standards on these third-party companies.
Furthermore, some of our subsidiaries also hold ISO 14001
or OHSAS (Occupational Health and Safety Assessment
Series) certification; namely the safety division in Blyth,
UK, and Dietlikon, Switzerland, as well as the medical
division in Madrid, Spain, and Danvers, USA.
Dräger hopes to extend the ISO certification to additional
subsidiaries. As part of group-wide certification, Dräger
Safety AG & Co. KGaA plans to include the subsidiaries in
Sweden, Spain, Australia, Singapore and Indonesia in
2009. Dräger will then consolidate the previously independ-
ently certified subsidiaries in Switzerland and the UK
under the group certification.
Electricity, water, natural gas and heating oil consumption
as well as total solid waste remain the most important
measures of direct environmental considerations at the
Lübeck site. This consumption also includes the energy
used to produce compressed air. The major environmental
data are presented in the adjacent figure. They under-
score the fact that consumption in fiscal year 2008 leveled
off at or below the prior-year level. It is particularly pleas-
ing that with its block-type thermal power station, Dräger
has generated almost 5 million kWh of electricity from
combined heat and power and thereby not only covered
nearly 15 percent of its own electricity requirements but
also contributed to a reduction in external CO2 emissions.
Overall, the electricity consumption in fiscal year 2008
only climbed by a slight 2 percent, with the Dräger compa-
nies accounting for 55 percent of the consumption on site.
Electricity consumption, which has a greater effect on
the climate, accounts for roughly 45 percent of total energy
consumption.
Due to its production, the safety division is the major elec-
tricity user (approximately 10 million kWh p.a.), and
is therefore central to our future measures to reduce elec-
tricity consumption.
Water consumption at the Lübeck site in fiscal year 2008
was practically unchanged, standing at 82,000 m3, of
which 15 percent is attributable to the medical division
and 50 percent to the safety division. Despite some recy-
cling, the production of filter paper and suction filters still
requires high volumes of water in order to meet the pro-
duction targets for light-duty breathing apparatus, for ex-
ample. The average water consumption per employee at
the other Dräger companies is around 35 liters per day,
which is on a par with standard household consumption.
At the Lübeck site, the waste recorded by the Dräger waste
disposal association (Dräger Abfallwirtschaftsverband
e.V.) rose by around 7 percent to 4,633 mt in 2008. Over
98 percent of this waste was recycled; just 59.2 mt had
to be disposed of that had mainly been incurred in surface
treatment processes. There was no change in the types
or the majority of volumes of waste per company. Card-
board and paper waste and waste wood are responsible
for the increasing volume. Waste wood alone rose by almost
200 mt to a total of 770 mt. This is attributable to the
increase in the number of quality parts and components
sent overseas in wooden crates (environmentally friendly
sea freight) for production at the medical division and was
unable to be compensated by the use of returnable pack-
aging which we usually prefer.
In a major group-wide project, Dräger is going to improve
the systematic recording and evaluation of its products’
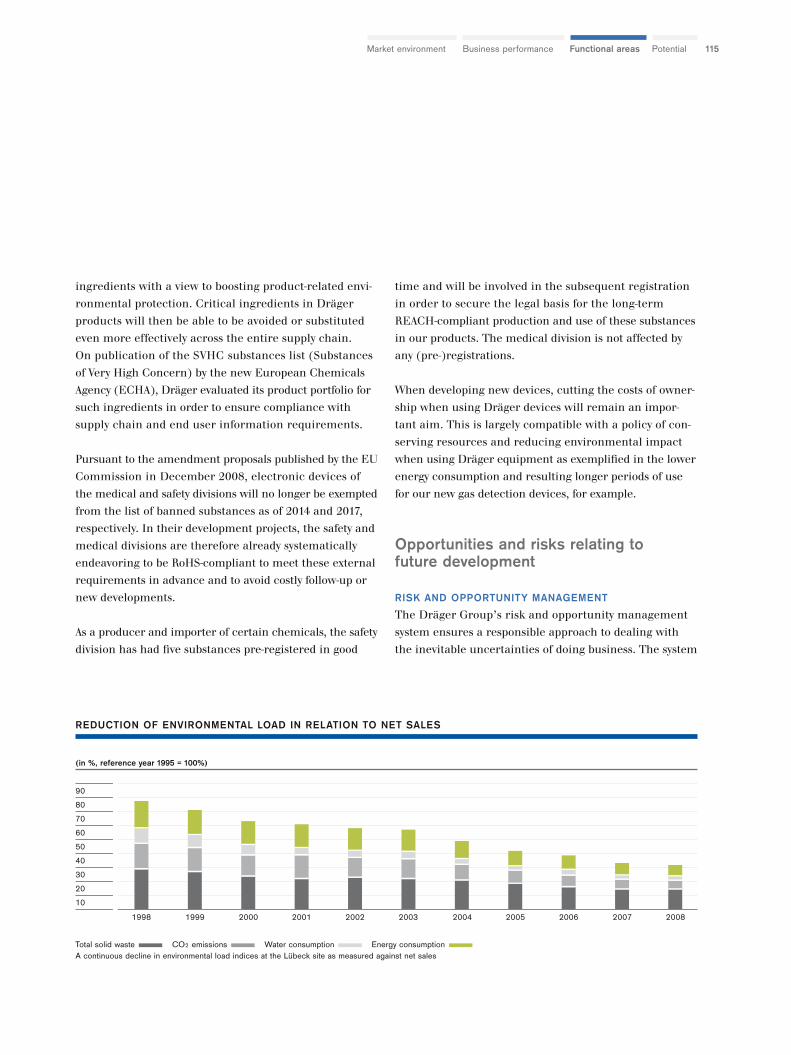
115PotentialFunctional areasBusiness performanceMarket environment
ingredients with a view to boosting product-related envi-
ronmental protection. Critical ingredients in Dräger
products will then be able to be avoided or substituted
even more effectively across the entire supply chain.
On publication of the SVHC substances list (Substances
of Very High Concern) by the new European Chemicals
Agency (ECHA), Dräger evaluated its product portfolio for
such ingredients in order to ensure compliance with
supply chain and end user information requirements.
Pursuant to the amendment proposals published by the EU
Commission in December 2008, electronic devices of
the medical and safety divisions will no longer be exempted
from the list of banned substances as of 2014 and 2017,
respectively. In their development projects, the safety and
medical divisions are therefore already systematically
endeavoring to be RoHS-compliant to meet these external
requirements in advance and to avoid costly follow-up or
new developments.
As a producer and importer of certain chemicals, the safety
division has had five substances pre-registered in good
time and will be involved in the subsequent registration
in order to secure the legal basis for the long-term
REACH-compliant production and use of these substances
in our products. The medical division is not affected by
any (pre-)registrations.
When developing new devices, cutting the costs of owner-
ship when using Dräger devices will remain an impor-
tant aim. This is largely compatible with a policy of con-
serving resources and reducing environmental impact
when using Dräger equipment as exemplified in the lower
energy consumption and resulting longer periods of use
for our new gas detection devices, for example.
Opportunities and risks relating to future development
RISK AND OPPORTUNITY MANAGEMENT
The Dräger Group’s risk and opportunity management
system ensures a responsible approach to dealing with
the inevitable uncertainties of doing business. The system
REDUCTION OF ENVIRONMENTAL LOAD IN RELATION TO NET SALES
(in %, reference year 1995 = 100%)
90
80
70
60
50
40
30
20
10
Total solid waste CO2 emissions Water consumption Energy consumption A continuous decline in environmental load indices at the Lübeck site as measured against net sales
1998 1999 2000 2001 2002 2003 2004 2005 2006 2007 2008
Opportunities and risks relating to future development116
enables Dräger to meet its targets by consistently taking
advantage of opportunities without losing sight of the as-
sociated risks.
The Dräger Group’s risk policies are based on the goal of
securing and – by exploiting our opportunities – building
on our market position and increasing the value of the
Group on a sustainable basis. This involves doing our
utmost to avoid or insure against risk, and responsibly
managing those risks which we have to bear.
The risk management system comprises all measures that
allow us to identify, measure, monitor and manage
potential strategic and operational risks at an early stage.
Based on the Group’s and divisions’ annually revised
strategic plans and the resultant short and medium-term
plans, systematic risk control covers business units,
companies and regions, divisions and the Group through
monthly reports. Our risk reports, which are routinely
compiled twice a year or ad hoc as required and detail
economic, market and currency risks, the competitive
situation and environment, as well as risks specific to the
business segments, are a key part of this process. Risk
management is rounded off by the activities of the group
internal audit function and the statutory audit of the fi-
nancial statements.
As a matter of course, the medical and safety divisions
submit their products and services to quality inspections
and ongoing checks in accordance with stringent na-
tional and international standards and always with the
special quality and risk orientation of these sectors in
mind.
The long-term basis for our opportunity management is
the strategic planning process and the resulting develop-
ment and market positioning plans for products over
their respective life cycles. This includes regularly adapt-
ing and improving our structure. The greater use of
shared services within the Group is an example of this.
There are also significant opportunities within the
measures to strengthen the Dräger brand which, together
with the guiding philosophy “Technology for Life”,
conveys the high standard of technology, quality and relia-
bility. Short-term options are identified by regularly
monitoring the market and the competition.
Our systems ensure that opportunities and risks are iden-
tified, measured, managed and monitored. Information
on risks and opportunities flows to the respective process
owners, the Executive and Supervisory Boards and, if nec-
essary, enables action to be taken at short notice.
The Dräger Group’s risk management process complies
fully with the objectives of the German Act on Corporate
Control and Transparency (“Gesetz zur Kontrolle
und Transparenz im Unternehmensbereich”: KonTraG).
Both the risks presented below and risks of which we
may currently be unaware can have an impact on the
Dräger Group.
OVERALL ECONOMIC RISKS
The precarious situation on the real estate market in the
USA triggered a crisis in the financial markets and led
to a global financial and economic crisis in 2008. Against
the backdrop of a severe global economic recession, eco-
nomic activity in most industrialized nations is shaped by
huge uncertainties.
If the fluctuations and distortions resulting from the finan-
cial crisis continue or worsen, the Dräger Group cannot
guarantee that its net assets, financial position and results
of operations or its ability to secure financing will not
be affected. For example, the current credit crunch could
make it more difficult for our customers to obtain fi-
nancing, which could mean that they might change, delay
or abandon plans to purchase our products and services.
Furthermore, if our customers generate inadequate net
sales or have restricted access to the capital markets they
117PotentialFunctional areasBusiness performanceMarket environment
may be unable to settle outstanding invoices on time or
in full. Our earnings and cash flows could be negatively
impacted as a result.
By strengthening its global business, Dräger has achieved
a broad regional diversification of net sales. Our growth
targets are still focused on the Americas and Asia. Key
manufacturing sites in the US, the UK and China are in-
strumental in reducing the currency risks associated
with global business.
Numerous other factors such as global, political and cul-
tural conflicts, including the situation in the Middle East,
can affect macroeconomic factors and international
capital markets and shape demand for our products and
services.
STRATEGIC RISKS
The industries in which Dräger operates are considered
future-oriented. Within each industry, further consoli-
dation processes are expected that are likely to affect the
structure and intensity of competition. Dräger is up
against strong competitors, some of whom have access to
extensive resources. In both divisions, the Dräger Group
is dependent on the investment capacity of public bodies,
since the majority of customers both in Germany and
abroad are public hospitals and other institutions, for ex-
ample the fire service, the police force, the military
and public disaster response. A trend toward lower public
spending has emerged in many industrialized nations in
the past years, for example in the US, China and also in
Germany. This trend could continue given the current
market environment. In response to these challenges, the
Dräger Group is cementing and further expanding its
position in the traditional and emerging markets through
customer focus, innovation, the high quality and relia-
bility of its products and services and, where expedient to
business, active involvement in the consolidation process.
SUPPLIER RISKS
In order to maintain the current product portfolio and
those products that are being developed, we need to work
closely with reliable, competent suppliers. Our suppliers
are integrated into our processes, since the level of vertical
production in our business model has been reduced to
the necessary core technologies and the assembly of pur-
chased parts and components. To manage the risks this
entails, information processes are structured, the neces-
sary internal and external interfaces in the global pro-
cesses are optimized and the performance of external part-
ners is carefully reviewed. Quality standards safeguard
the supplier selection and procurement processes. Our
operating processes are continuously being improved.
PRODUCT LIFECYCLE RISKS
One important challenge is keeping the product portfolio
of the Dräger Group divisions up to date. This necessi-
tates making both technologically innovative products and
products which appeal to a large section of the market
available in good time. Together with technology, excellent
cost structures are important for the market position
and business success of the Dräger Group. This requires
not only a high quality product portfolio in line with
market requirements but also the ability to control oper-
ating processes, from development, sales and order ful-
fillment through to maintenance of the product portfolio.
In line with the increase in project business in the divi-
sions of the Dräger Group, cost accounting and cost-related
risks for single orders are increasing.
IT RISKS
Our business processes require reliable, cost-effective IT
systems.
As a shared service, corporate IT at Drägerwerk AG & Co.
KGaA provides IT services to all group companies.
In this connection, Dräger also took over parts of the IT
services that had been outsourced to external providers.
Opportunities and risks relating to future development I Disclosures pursuant to Sec. 315 (4) HGB and explanations by the general partner118
IT management, coordination, project management and
control are the functions which will first and foremost
be strengthened. Defined roles ensure that the business
and IT processes are linked. Coordination with external
service providers is still of prime importance. These serv-
ice providers are highly competent companies. Dräger
is still dependent on individual providers for IT services.
Problems with the provision of these services could seri-
ously interfere with our business processes.
PERSONNEL RISKS
Competition for highly qualified staff is fierce in the indus-
tries in which our divisions operate. Recruiting and re-
taining well-qualified staff for all functions and regions
is crucial for our further development. It is therefore
very important to cultivate and improve our attractiveness
as an employer.
REGULATORY AND LEGAL RISKS
The companies of the Dräger Group are subject to varying
and ever-increasing regulation in all of the countries
they operate in, regardless of the extent of their operations.
The extensive measures necessary to comply can gener-
ate considerable operating costs. The obligations can arise
from public law, such as tax law, or civil law. Also impor-
tant for our business are laws to protect intellectual prop-
erty and third-party concessions, varying licensing reg-
ulations for products, competition law regulations, regula-
tions in connection with awarding contracts, provisions
on export control, and much more. Drägerwerk AG & Co.
KGaA is also subject to legal regulations governing capital
markets.
Companies in the Dräger Group are currently and may
in the future be involved in lawsuits in connection with
their business activities. To counter such legal risks, Dräger
has taken out liability insurance policies with coverage
which the Executive Board of the general partner consid-
ers appropriate and customary for the industry.
In some regions, legal uncertainty could result from us
only having limited possibilities to assert our rights.
The Dräger Group endeavors to comply with all legal
and regulatory obligations and corresponding internal
regulations and directives are in place.
RISKS FROM FINANCIAL INSTRUMENTS
The aim of the Dräger Group is to control liquidity risk
and risk from financial instruments, i.e. interest rate,
currency and credit risk. Liquidity risk and the interest
rate risk are hedged centrally by Drägerwerk AG & Co.
KGaA, whereas currency risk is the joint responsibility
of Drägerwerk AG & Co. KGaA and the divisions. The
credit risk with regard to cash investments and derivatives
is mitigated centrally, while the credit risk from receiv-
ables from operating activities is the responsibility of the
divisions.
Marketable hedging instruments contracted with reputable
banks as counterparties are the only financial derivatives
we use. Derivatives may only be traded by members of the
Dräger Group if they have been approved beforehand.
Dräger mitigates its liquidity risk by diversifying the matu-
rity structure of its financing instruments. In addition
to participation certificates, the Dräger Group has also
raised note loans which are due in one to seven years.
Dräger also has non-current and current liabilities to banks
as well as a liquidity reserve comprising freely available
credit facilities with numerous banks with which bilateral
agreements have been concluded. Due to the maturity
structure of these financing instruments, there is only a
limited repricing risk.
Substantial cash and cash equivalents and current trade
receivables also provide us with additional financial scope.
119PotentialFunctional areasBusiness performanceMarket environment
The solid financing structure of the Dräger Group is
also evidenced by our equity ratio of 33.5 percent (2007:
33.3 percent).
The Dräger Group is mainly exposed to interest rate risks
in relation to the euro. Dräger counters these risks using
a combination of fixed and variable-interest financial
liabilities, hedging a portion of the variable interest with
interest rate caps. Cash investments are made exclusively
on the money market or in short-term, fixed-income invest-
ment grade securities.
The Dräger Group counteracts the currency risk by hedg-
ing – based on the net balances of budgeted income and
expenses as well as on receivables and liabilities in foreign
currencies. Production in the US has proven a favorable
factor by almost zeroing the net balance of US dollar in-
come and expenses of the medical division. Production
in the US is also bolstering the safety division.
Going by our experience over the last few years, the credit
risk from operating activities is low given the customer
structure of the Dräger Group, however the financial crisis
could have negative repercussions.
The management of financial risks is detailed under Note
45 of the notes to the financial statements.
The joint venture agreement between the participating
companies of Drägerwerk AG & Co. KGaA (Dräger) and
Siemens AG (Siemens) and the articles of association of
Dräger Medical AG & Co. KG originally granted Siemens
a put option upon whose exercise Dräger would have to buy
the entire stake held by Siemens in the limited partner-
ship at a determined formula price. In fiscal year 2006, the
agreement was amended to the effect that Dräger is no
longer obligated to buy the limited shares. Now, Dräger
has the option to either agree to buy the limited shares
offered by Siemens at the formula price or else support a
sale by Siemens to a third party by selling some of its
own limited shares if necessary. Both parties agreed in
this connection that Dräger would increase its stake in
Dräger Medical AG & Co. KG from 65 percent to 75 percent
in 2007 by acquiring limited shares held by Siemens. It
was agreed that Siemens would have the option of acquir-
ing 2.5 percent of Drägerwerk AG & Co. KGaA. If Siemens
offers to sell back its remaining shares in Drägerwerk
Medical AG & Co. KG and Drägerwerk AG & Co. KGaA ac-
cepts this offer, it could result in a high financial liability.
Following its transformation into a partnership limited
by shares, Dräger is permitted to finance such a purchase
using debt and, to a considerable extent, equity.
OVERALL RISK
Overall, the most important of all risks facing the Group
are the strategic risks, especially those stemming from
consolidation processes that affect the competitive struc-
ture, and the current state of the economy. However, this
risk is mitigated both by the regional spread and the
diversification of the product and service offerings of the
Dräger Group. The performance risks from the comple-
tion of orders are well spread and are therefore limited.
All in all, the risks to the Dräger Group are limited and,
based on the information currently known to us, the
Group’s management, the Dräger Group’s continued
existence as a going concern is not at risk.
Disclosures pursuant to Sec. 315 (4) HGBand explanations by the general partner
The following disclosures pursuant to Secs. 289 (4) and
315 (4) HGB describe the conditions as they were on
the balance sheet date. These disclosures are explained in
individual sections in accordance with Sec. 120 (3)
Sentence 2 AktG (“Aktiengesetz”: German Stock Corpora-
tion Act).
Disclosures pursuant to Sec. 315 (4) HGB and explanations by the general partner120
COMPOSITION OF CAPITAL STOCK
The capital stock of Drägerwerk AG & Co. KGaA amounts
to EUR 32,512,000. It consists of 6,350,000 voting bearer
common shares and 6,350,000 non-voting bearer preferred
shares each with a EUR 2.56 share in capital stock.
Shares of the same type carry the same rights and obli-
gations. The rights and obligations of the shareholders
are laid down in the German Stock Corporation Act, in par-
ticular in Secs. 12, 53a et seq., 118 et seq. and 186 AktG,
as well as in the articles of association of the Company. As
compensation for the lack of voting rights, an advance
dividend of EUR 0.13 per preferred share is distributed
from net earnings. If sufficient profits are available, a
dividend of EUR 0.13 per common share is then paid. Any
profit in excess of this amount, if distributed, is allocated
so that preferred shares receive EUR 0.06 more than com-
mon shares. If the profit is not sufficient to distribute the
advance dividend for preferred shares in one or more
years, the amounts are paid from the profit of subsequent
fiscal years before a dividend is paid on common shares.
If amounts in arrears are not paid in the next year along
with the full preferred dividend for that year, the pre-
ferred shareholders have voting rights until the arrears
have been paid. In the event of liquidation, the preferred
shareholders receive 25 percent of net liquidation proceeds
in advance. The remaining liquidation proceeds are dis-
tributed evenly to all shares.
RESTRICTIONS RELATING TO VOTING RIGHTS OR THE
TRANSFER OF SHARES
Legal structures at Dr. Heinrich Dräger GmbH mean
that neither Stefan Dräger nor Stefan Dräger GmbH, which
he controls, have any influence on the exercise of the vot-
ing rights of common shares held by Dr. Heinrich Dräger
GmbH at the annual general meeting of Drägerwerk
AG & Co. KGaA for resolutions within the meaning of Sec.
285 (1) Sentence 2 AktG. There are no further restric-
tions which relate to voting rights or the transfer of shares,
even though they could arise from agreements between
shareholders.
DIRECT OR INDIRECT SHAREHOLDINGS EXCEEDING
10 PERCENT
97.87 percent of the common shares of Drägerwerk
AG & Co. KGaA, equivalent to 6,215,000 common shares
or 48.94 percent of the total capital stock, belong to
Dr. Heinrich Dräger GmbH, Lübeck. 58.73 percent of its
shares are held by Stefan Dräger GmbH, Lübeck, 23.15
percent by the Dräger Foundation Munich/Lübeck, and
the remainder by various members of the Dräger
family. Stefan Dräger GmbH is wholly owned by Stefan
Dräger, Lübeck. Stefan Dräger, Stefan Dräger GmbH,
the Dräger Foundation Munich/Lübeck, and Dr. Heinrich
Dräger GmbH informed us in accordance with Sec. 21
WpHG (“Wertpapierhandelsgesetz”: German Securities
Trading Act) that their share in the voting rights of
Drägerwerk AG & Co. KGaA, Lübeck, equals 97.87 per-
cent. The voting rights are attributed to Stefan Dräger
GmbH and the Dräger Foundation Munich/Lübeck via
the jointly controlled company Dr. Heinrich Dräger
GmbH; the voting rights are attributed to Stefan Dräger
via Stefan Dräger GmbH and Dr. Heinrich Dräger
GmbH, which he controls. Through Stefan Dräger GmbH,
Stefan Dräger also holds all shares in Drägerwerk
Verwaltungs AG, Lübeck, the general partner of
Drägerwerk AG & Co. KGaA. Thus Stefan Dräger is both
the shareholder of the general partner and also
common shareholder of Drägerwerk AG & Co. KGaA. In
the cases covered by Sec. 285 (1) Sentence 2 AktG he
would therefore not be entitled to vote. Legal structures
at Dr. Heinrich Dräger GmbH ensure that, for such
resolutions, Stefan Dräger does not exert any influence
on the exercise of the voting rights of limited shares
held by Dr. Heinrich Dräger GmbH.
SHARES WITH SPECIAL RIGHTS CONFERRING CONTROL
There are no shares with special rights conferring control
or special controls over voting rights.
121PotentialFunctional areasBusiness performanceMarket environment
NATURE OF CONTROL OVER VOTING RIGHTS BY
EMPLOYEE SHAREHOLDERS WHO DO NOT DIRECTLY
EXERCISE THEIR CONTROL RIGHTS
No employees hold voting shares in the capital stock of
the Company. If employees of the Company or the Dräger
Group wish to acquire shares in the Company, they can
purchase preferred shares on the stock exchange. Preferred
shares do not confer any control rights.
APPOINTMENT AND REMOVAL OF MANAGEMENT AND
AMENDMENTS TO THE ARTICLES OF ASSOCIATION
In the legal form of a partnership limited by shares
(KGaA), the general partner is authorized to manage and
represent the Company, a regulation derived from part-
nership law. Drägerwerk Verwaltungs AG is the general
partner of Drägerwerk AG & Co. KGaA, and acts through
its Executive Board. The Supervisory Board of Drägerwerk
AG & Co. KGaA, which has half of its members elected
by employees, is not authorized to appoint or remove the
general partner or its Executive Board. The general part-
ner joined the Company by declaration of accession; it
withdraws from the Company in the cases defined under
Art. 14 (1) of the articles of association.
The general partner’s Executive Board, which is authorized
to manage and represent Drägerwerk AG & Co. KGaA, is
appointed and removed pursuant to Secs. 84 and 85 AktG
and Art. 8 of the articles of incorporation and bylaws of
Drägerwerk Verwaltungs AG. The Executive Board of the
general partner comprises at least two persons, the Super-
visory Board of the general partner determines how many
other members there are. The Supervisory Board of the
general partner, elected by its annual general meeting,
is responsible for appointing and removing members of
the Executive Board. It appoints members of the Executive
Board for a maximum of five years. Repeat appointments
or extensions of the term of office are permissible.
The Supervisory Board of Drägerwerk AG & Co. KGaA is
not authorized to adopt rules of procedure for manage-
ment or to define a catalog of management transactions
requiring approval. The Joint Committee – comprising
four members of each of the Supervisory Boards of the
Company and its general partner – and not the annual
general meeting, decides on the management transactions
by the general partner which require approval as set out
in Art. 23 (2) of the articles of association of Drägerwerk
AG & Co. KGaA. The Supervisory Board of Drägerwerk
AG & Co. KGaA represents the Company in dealings with
the general partner.
Pursuant to Secs. 133, 179, 278 (3) AktG, amendments to
the articles of association must be approved by the annual
general meeting, which requires a simple majority of
votes cast as well as a majority of at least three quarters of
the capital stock represented upon adoption of the reso-
lution. The articles of association may stipulate a different
majority of capital stock, but for changes in the purpose
of the Company this can only be a greater majority (Sec.
179 [2] Sentence 2 AktG). At Drägerwerk AG & Co. KGaA,
pursuant to Art. 30 (3) of the articles of association, reso-
lutions by the annual general meeting are adopted by a
simple majority of votes cast (simple voting majority) if this
does not conflict with any legal provisions, and if the law
additionally requires a majority of capital they are adopted
by a simple majority of the capital stock represented
upon adoption of the resolution (simple capital majority).
The Company has not made use of the possibility pur-
suant to Sec. 179 (2) Sentence 3 AktG to define further
requirements in the articles of association for amend-
ments to the same agreement. As well as the relevant ma-
jority of limited shareholders, amendments to the arti-
cles of association also require the approval of the general
partner (Sec. 285 [2] AktG). Pursuant to Art. 20 (7) of the
articles of association of the Company, the Supervisory
Board is authorized to make amendments and additions to
the articles of association which relate only to its wording.
Disclosures pursuant to Sec. 315 (4) HGB and explanations by the general partner I Subsequent events122
POWER OF THE GENERAL PARTNER TO ISSUE OR
BUY BACK SHARES
At present, Drägerwerk AG & Co. KGaA has neither ap-
proved nor conditional capital at its disposal. As such, the
general partner is currently not in a position to increase
the Company’s capital unless this is agreed by resolution
at the annual general meeting and, if applicable, ap-
proved by the Supervisory Board.
In accordance with the resolution of the annual general
meeting of May 9, 2008, the general partner is authorized
to buy back preferred shares of up to 10 percent of the
capital stock until November 8, 2009. The authorization
can be exercised fully or in partial amounts, on one or
more occasions, for one or more purposes, by the Company
or group companies or for their account by a third party.
The purchase is made, as elected by the general partner,
either on the stock exchange or by means of a public
purchase offer to all preferred shareholders or a public
request for the submission of such an offer. If the pur-
chase is made on the stock exchange, the price paid for
each share (excluding acquisition charges) may not be
more than 5 percent above or below the stock market price.
The stock market price for this purpose is the price of
the preferred shares in Xetra trading (or a comparable suc-
cessor system) on the Frankfurt Stock Exchange in the
opening auction. If the purchase is made by means of a
public purchase offer to all preferred shareholders or a
public request for the submission of a purchase offer, the
purchase price offered or the start or end values of the
purchase price range per share (excluding acquisition
charges) may not be more than 10 percent above or below
the stock market price. The stock market price for this
purpose is the mean of the closing prices of the preferred
shares in Xetra trading (or a comparable successor sys-
tem) on the Frankfurt Stock Exchange during the last five
trading days preceding the announcement of the pur-
chase offer or the public request for the submission of a
purchase offer. If, following the announcement of a
purchase offer or its publication or the public request for
the submission of a purchase offer, significant changes
occur in the underlying stock market price, the offer or the
request for the submission of such an offer can be ad-
justed. In this case, the mean of the closing prices of the
preferred shares in Xetra trading (or a comparable suc-
cessor system) on the Frankfurt Stock Exchange during the
last five trading days preceding the announcement of
the purchase offer may be adjusted. If the offer is over-
subscribed or if, following a request for the submission
of an offer, not all of several offers submitted of the same
value are accepted, such offers may be accepted on a pro-
portionate basis. It is permitted to give preferential treat-
ment to small volumes of up to 100 preferred shares per
shareholder.
In respect of treasury shares acquired pursuant to the
abovementioned authorization, the general partner is also
authorized, with the approval of the Supervisory Board,
to either redeem them without a further annual general
meeting resolution being necessary for the execution of
the redemption, or to dispose of the shares again in a way
other than on the stock exchange or by means of an offer
to all shareholders, i.e. as consideration to a third party as
part of a business combination or the acquisition of eq-
uity investments, or, if the sale price payable in cash per
share is not significantly lower than the mean of the
closing prices in Xetra trading (or a comparable successor
system) of substantially equivalent shares already listed
on the Frankfurt Stock Exchange during the last five trad-
ing days preceding the sale of the shares and the number
of the shares sold in this way, together with the number of
new shares which are issued from approved capital as a
result of concurrently existing authorizations under exclu-
sion of subscription rights pursuant to Sec. 186 (3)
Sentence 4 AktG and the number of new shares which
are issued during the term of this authorization through
the exercise of options or conversion rights or the fulfill-
ment of conversion obligations from options or convertible
123PotentialFunctional areasBusiness performanceMarket environment
bonds and/or participation certificates, under exclusion
of subscription rights pursuant to Sec. 186 (3) Sentence 4
AktG, does not exceed 10 percent of the capital stock.
The authorization can also be exercised fully or in partial
amounts, once or several times, by the Company or
group companies, or for their account by a third party.
The annual general meeting granting authorization to
purchase treasury shares is common practice at listed
stock corporations in Germany. The authorization to buy
and sell treasury shares is intended to enable the Com-
pany to quickly and flexibly offer treasury shares to national
and international investors, to extend its group of in-
vestors and stabilize share value. In addition, the Company
can use treasury shares in order to offer these as consid-
eration for business combinations or equity investments.
As of December 31, 2008, the Company had no treasury
shares.
MATERIAL ARRANGEMENTS MADE BY THE COMPANY
SUBJECT TO A CHANGE OF CONTROL IN THE WAKE OF
A TAKEOVER BID
In a joint venture agreement dated December 28, 2006
regarding Dräger Medical AG & Co. KG, the limited part-
ners Dräger Medical Holding GmbH and Siemens Medical
Holding GmbH agreed to grant each other an option to
purchase the limited shares. This option will take effect if
more than 50 percent of the voting rights of one of the
limited partners is directly or indirectly acquired by one
or more third parties and a limited partner falls under
the influence of one or more third parties to the extent
that the third party or parties are in a position to appoint
the majority of the members of the executive board of said
limited partner. An alternative option is also granted to
the other limited partner, whereby it may demand that the
limited partner under the influence of a third party ac-
quires its shares in the partnership.
COMPENSATION AGREEMENTS MADE BY THE COMPANY
WITH MEMBERS OF THE EXECUTIVE BOARD OF THE
GENERAL PARTNER OR EMPLOYEES IN THE EVENT OF
A TAKEOVER BID
There are no agreements in place in the Dräger Group
with members of the Executive Board of the general part-
ner or employees in the event of a takeover bid.
Subsequent events
DRÄGER CONSIDERS THE REPURCHASE OF THE SHARE
HELD BY SIEMENS IN DRÄGER MEDICAL AG & CO. KG
Drägerwerk AG & Co. KGaA (Dräger) is considering
acquiring the 25 percent share in Dräger Medical AG &
Co. KG currently held by Siemens Medical Holding
GmbH (Siemens). This would increase Dräger’s stake in
its medical subsidiary to 100 percent. Dräger is currently
negotiating financing in connection with this.
Initial exploratory talks between Siemens and Dräger have
shown that a repurchase may lead to a provisional total
financial burden of approximately EUR 300 million for
Dräger.
Dräger and Siemens will intensify their discussion on the
possible share acquisition over the next few weeks. In
addition, both companies agree that they should continue
to collaborate.
DISTRIBUTIONS
The general partner and the Supervisory Board of Lübeck-
based Drägerwerk AG & Co. KGaA propose to distribute
out of the net earnings of Drägerwerk AG & Co. KGaA of
EUR 86.2 million for fiscal year 2008 a cash dividend of
EUR 0.35 per preferred share and EUR 0.29 per common
share, hence a total EUR 4.1 million, and carry forward
the balance of EUR 82.1 million. The preferred share divi-
dend also governs the dividend for participation certifi-
Subsequent events I Outlook124
cates, which will amount to EUR 3.50 each. Participation
certificates entitle the holder to a dividend 10 times the
preferred share dividend since their arithmetic par value
is 10 times that of a preferred share.
Outlook
FUTURE MARKET ENVIRONMENT
The global economy grew by approximately 5 percent in
2006 and 2007. Leading economic institutes had expected
the growth rate to slow to between 3.5 percent and 3.9
percent in 2008 and 2009, but the outlook has clouded con-
siderably since then. The International Monetary Fund
(IMF) believes that, in the wake of the financial crisis, the
US and Europe are on the brink of a rapid economic
downturn in 2009. Since October 2008, the only way to
combat the global financial crisis which began in the
US in the summer of 2007 has been by means of colossal,
concerted state rescue packages for banks. The IMF
now anticipates losses totaling USD 2.2 trillion as a result
of the financial crisis, far higher than had been feared
(estimate in October 2008: USD 1.4 trillion). The banks
are therefore facing the threat of new write-downs
worldwide. They will probably need even more capital as
further losses are expected, according to the updated
IMF report on the global stability of the financial markets.
As credit default has not yet peaked, refinancing could
become even more expensive for companies despite lower
key interest rates.
Against this backdrop, the IMF slashed its prognosis for
global economic growth in 2009 from 3.0 percent to 0.5
percent on January 28, 2009. In 2009, industrialized coun-
tries can expect a drop of approximately 2 percent in
their economic output. In Europe, this will probably have
the greatest impact on the UK (2.8 percent), Germany
(2.5 percent) and Italy (2.1 percent). The IMF now even
expects a reduction in GDP of 2.8 percent in Japan. The
IMF again drastically reduced its economic forecast for a
number of countries and regions. In July, the IMF still
anticipated an increase of 1.0 percent in Germany. Even
for the developing and emerging countries with particu-
larly high-growth over recent years, the IMF only expects
growth of 3.3 percent.
The IMF warned that in the face of the most dangerous
financial crisis on established markets since the 1930s, the
global economy is at the start of a considerable down-
turn. The IMF anticipates that global trade in goods and
services will slow dramatically as a result of the crisis,
and has forecast a decline of around 2.8 percent for 2009
compared with the 7.2 percent growth recorded in 2007.
Whereas worries about inflation, primarily due to rising
energy prices, were the focus of attention until the first
half of 2008, the risks which could arise if the financial cri-
sis spills over into the real economy now top the agenda.
In 2009, the IMF expects consumer prices to rise by a mere
0.3 percent in industrialized nations. Interest policy as a
method of providing economic stimulus is now only avail-
able in Europe (key interest rate as of January 31, 2009:
2.0 percent), as the central banks in the US (0 to 0.25 per-
cent) and Japan (0.1 percent) have already made use of
this instrument. The US central bank is therefore already
increasing the money supply by buying securities in order
to stabilize the market.
The IMF expects Asia to lead the global recovery towards
the end of 2009 and return to growth of 5 percent in 2010.
To this end, however, the governments of those coun-
tries need to increase their state spending, further decrease
the key interest rate and stabilize their banking systems.
Overall, the IMF expects growth in economic output of 3.0
percent and expansion of global trade of 3.2 percent in
2010. According to the IMF, inflation risks are extremely
low for 2009 and 2010.
125PotentialFunctional areasBusiness performanceMarket environment
Although the economic situation is having an overall neg-
ative impact on expectations for 2009, the effect is much
less dramatic than on the automotive sector or the total
capital goods market. The medical and safety divisions’
markets are also expected to remain relatively stable in
2009 and grow faster than the global economy again from
2010.
FUTURE SITUATION OF THE
MEDICAL TECHNOLOGY INDUSTRY
The growing demand for cost-effective solutions and demo-
graphic development remain the basic trends in the
medical technology industry. The World Bank assumes
that the world’s population will rise to approximately nine
billion people by 2050. At the same time, a pronounced
demographic change will take place in the industrialized
countries: in Germany, for example, the proportion of
the population aged over 65 will increase from the current
19 percent to 33 percent by 2050. Both of these trends will
increase demand for medical technology significantly.
According to estimates of the Hamburg Institute of Inter-
national Economics (“Hamburgisches WeltWirtschafts-
Institut”: HWWI), the percentage of the gross domestic
product of OECD countries attributable to healthcare
spending will continue to rise in future. An increase from
the current 16 percent to over 20 percent in the US and
from an average of approximately 9 percent to around 15
percent in the other OECD countries is forecast by 2020.
Rising income and an increase in spending are therefore
both boosting demand for healthcare. The medical divi-
sion is benefiting from these positive factors.
Nonetheless, Dräger expects a slight overall increase in
investment volume of approximately 3 percent globally
in the medical division. Despite the US economic stimulus
package worth approximately USD 800 billion, down-
ward economic development is still a possibility as the new
US president Barack Obama has announced aggressive
measures to cut costs in healthcare. Dräger expects steady
development in western Europe. Despite the difficult
economic situation, Germany is also expected to make a
significant contribution. In January, the German govern-
ment confirmed its intention to approve a comprehensive
investment package of EUR 3.5 billion for hospitals. At
approximately 13 percent, growth is expected to remain
strongest in emerging countries. In 2009, gross fixed in-
vestment in healthcare is expected to grow by 12 percent
for China, for example. Germany Trade and Invest, the
business promotion agency of the Federal Republic of
Germany, also expects the Russian medical technology
market to post double-digit growth rates in 2009.
In a study, Deutsche Bank (DB Research) anticipates
strong growth of 7 percent per year from 2008 to 2015 for
German medical technology companies. This would
take the net sales volume of German medical companies
to over EUR 30 billion in 2015. Foreign sales are likely
to continue to grow at a higher rate than on the domestic
market in future, according to the Deutsche Bank.
Deutsche Bank highlights the fact that German companies
are focusing on customized solutions for hospitals and
medical care centers because competition is significantly
less intense in this sector, the price is based primarily
on the benefit to customers rather than the costs and com-
panies are therefore less exposed to price competition.
This strategy entails high research and development ex-
penses.
Dräger expects that the medical technology market will
grow steadily in the medium term despite the economic
crisis. The consolidation trend among competitors and
customers will continue in future. Demand for products
which improve clinical workflows and the efficiency of
medical care will increase.
In the short term, demand could become significantly
more subdued as refinancing costs increase and gov-
ernment subsidies are reduced. However, government in-
Outlook126
vestment programs and additional funds for healthcare, as
in Germany and the US, may stimulate demand. For 2009,
the risks due to the spill-over of the financial crisis into the
real economy should be taken very seriously. Bearing this
in mind, a decline in the overall market cannot be ruled
out for 2009.
FUTURE SITUATION OF THE
SAFETY TECHNOLOGY INDUSTRY
The market for safety technology, which includes fire de-
partments, police forces, the military, civil defense and the
oil, gas, chemical, mining, sewerage, metal and electri-
cal industries, as well as utilities, transport and logistics
companies, is balanced thus preventing high levels of
volatility. Overall, the market is largely developing at the
same pace as global economic development. Demand
in the safety technology sector could also become signifi-
cantly more subdued as refinancing costs increase and
government subsidies are reduced. Government invest-
ment programs could, however, have a positive effect.
Individual industries have reduced their budgets for safety
technology while others are taking Shutdown & Rental
Management measures, for example due to temporary shut-
downs, such that no uniform trend can be
recognized.
FUTURE SITUATION OF THE COMPANY
The range of market forecasts reflects the uncertainty in
the current environment. Although neither of the Dräger
Group’s two divisions is directly dependent on the devel-
opment of the economy, it is possible that the effects of the
financial crisis could impact customers’ investment
decisions. Government investment programs may have a
positive effect on the demand for medical and safety
technology products, but this effect should not be overesti-
mated. The tight financial situation of private and public
clinics and institutions, as well as banks’ hesitant lending
increase the uncertainty in the investment budgets of
the customers of both divisions for 2009. In addition, a
strengthening euro could have a negative impact on
international demand. Due to its innovative products and
relatively balanced customer structure, the divisions
expect net sales to develop slightly better than the market.
However, Dräger will not be immune to the economic
developments. In the event that the market contracts, the
Company forecasts a drop in net sales of up to 5 percent.
However, the Dräger Group could still achieve a positive
EBIT, even if net sales were to fall by up to 15 percent.
Dräger will continuously report on the two division’s cur-
rent development and may announce a more detailed
forecast for fiscal year 2009 at a later date. Provided that
the economic situation in the markets relevant to Dräger
does not get any worse, Dräger forecasts net sales and
earnings growth slightly above the market level for 2010.
The Dräger Group’s medium-term goal is to achieve net
sales which are at least in line with the market, an EBIT
margin of 10 percent and an ROCE of 20 percent.
FORWARD-LOOKING STATEMENTS
This management report contains forward-looking state-
ments. The statements are based on the current expecta-
tions, presumptions, and forecasts of the Executive Board
of Dräger Verwaltungs AG as well as the information
available to it to date. The forward-looking statements do
not provide any warranty for the future developments
and results contained therein. Rather, the future develop-
ments and results are dependent on a number of factors;
they entail various risks and uncertainties and are based
on assumptions which could prove to be incorrect. We
are under no obligation to update the forward-looking state-
ments contained in this report.
Group financial statements 2008 (amended version)The group financial statements were audited by the statutory auditors and an unqualified opinion was rendered thereon.
Consolidated income statementof the Dräger Group – January 1 to December 31, 2008 129Consolidated balance sheet of the Dräger Group – as of December 31, 2008 130Consolidated statement of recognized income and expensesof the Dräger Group 132Consolidated cash flow statementof the Dräger Group 133
Notes of the Dräger Group 2008 134Management compliance statement 203Auditor’s opinion 204Forward-looking statements 206
Single entity financial statements 2008 ofDrägerwerk AG & Co. KGaA (condensed) 207The Company’s Boards 210Consolidated companies of the Dräger Group 214
129
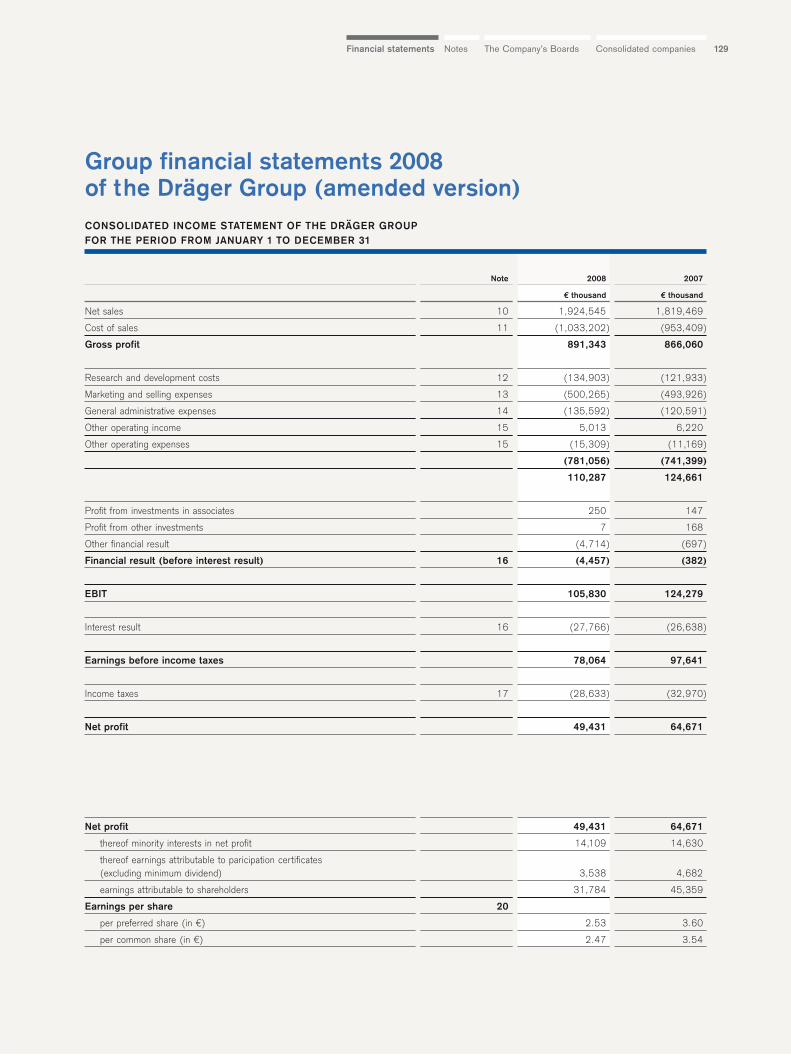
129The Company’s Boards Consolidated companiesNotesFinancial statements
Group financial statements 2008 of the Dräger Group (amended version)
Note 2008 2007
€ thousand € thousand
Net sales 10 1,924,545 1,819,469
Cost of sales 11 (1,033,202) (953,409)
Gross profit 891,343 866,060
Research and development costs 12 (134,903) (121,933)
Marketing and selling expenses 13 (500,265) (493,926)
General administrative expenses 14 (135,592) (120,591)
Other operating income 15 5,013 6,220
Other operating expenses 15 (15,309) (11,169)
(781,056) (741,399)
110,287 124,661
Profit from investments in associates 250 147
Profit from other investments 7 168
Other financial result (4,714) (697)
Financial result (before interest result) 16 (4,457) (382)
EBIT 105,830 124,279
Interest result 16 (27,766) (26,638)
Earnings before income taxes 78,064 97,641
Income taxes 17 (28,633) (32,970)
Net profit 49,431 64,671
Net profit 49,431 64,671
thereof minority interests in net profit 14,109 14,630
thereof earnings attributable to paricipation certificates (excluding minimum dividend) 3,538 4,682
earnings attributable to shareholders 31,784 45,359
Earnings per share 20
per preferred share (in €) 2.53 3.60
per common share (in €) 2.47 3.54
CONSOLIDATED INCOME STATEMENT OF THE DRÄGER GROUP FOR THE PERIOD FROM JANUARY 1 TO DECEMBER 31
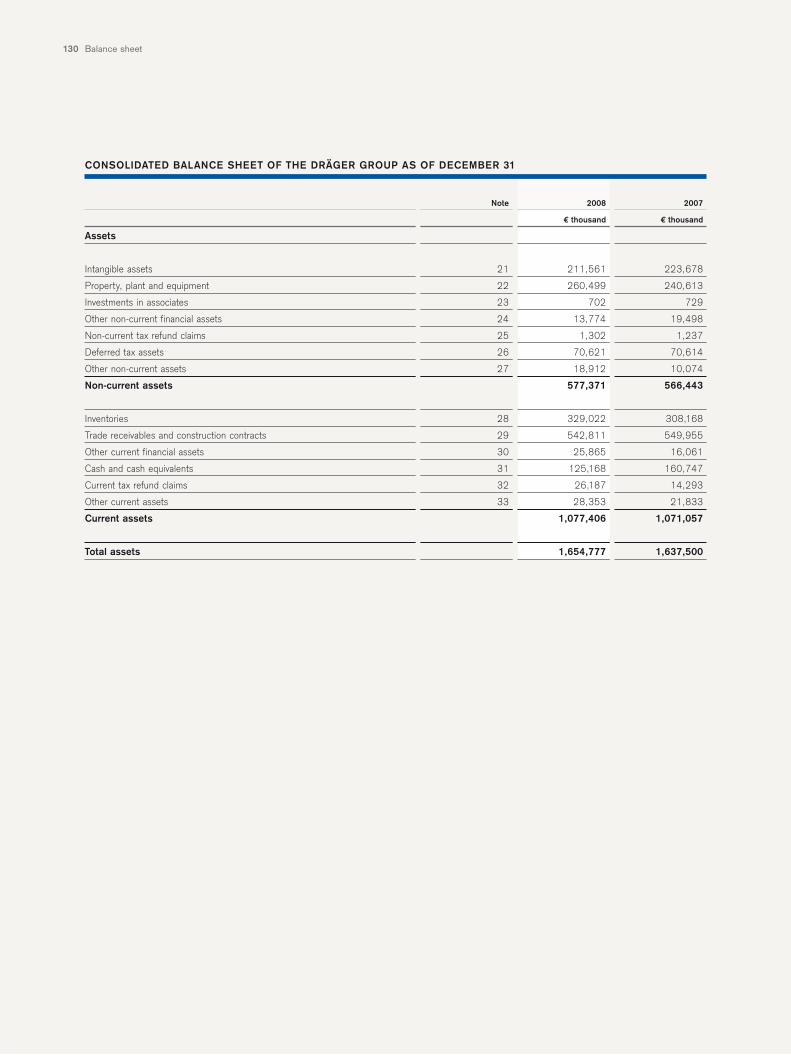
Balance sheet 130
Note 2008 2007
€ thousand € thousand
Assets
Intangible assets 21 211,561 223,678
Property, plant and equipment 22 260,499 240,613
Investments in associates 23 702 729
Other non-current financial assets 24 13,774 19,498
Non-current tax refund claims 25 1,302 1,237
Deferred tax assets 26 70,621 70,614
Other non-current assets 27 18,912 10,074
Non-current assets 577,371 566,443
Inventories 28 329,022 308,168
Trade receivables and construction contracts 29 542,811 549,955
Other current financial assets 30 25,865 16,061
Cash and cash equivalents 31 125,168 160,747
Current tax refund claims 32 26,187 14,293
Other current assets 33 28,353 21,833
Current assets 1,077,406 1,071,057
Total assets 1,654,777 1,637,500
CONSOLIDATED BALANCE SHEET OF THE DRÄGER GROUP AS OF DECEMBER 31
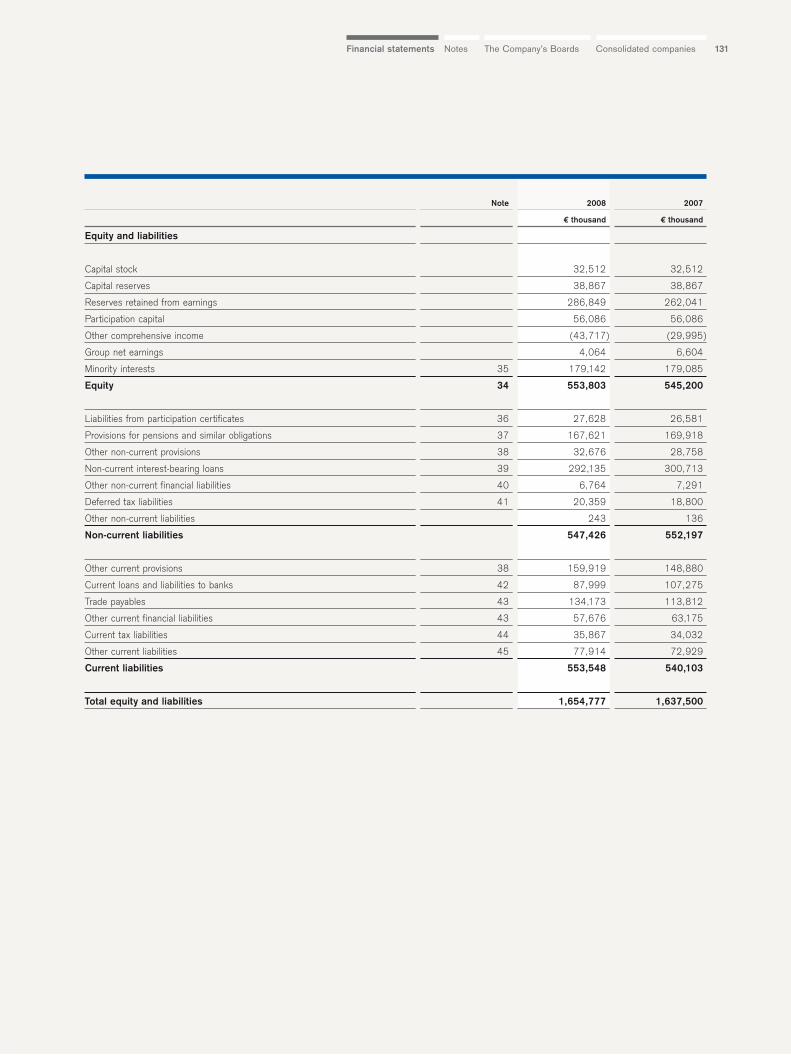
131The Company’s Boards Consolidated companiesNotesFinancial statements
Note 2008 2007
€ thousand € thousand
Equity and liabilities
Capital stock 32,512 32,512
Capital reserves 38,867 38,867
Reserves retained from earnings 286,849 262,041
Participation capital 56,086 56,086
Other comprehensive income (43,717) (29,995)
Group net earnings 4,064 6,604
Minority interests 35 179,142 179,085
Equity 34 553,803 545,200
Liabilities from participation certificates 36 27,628 26,581
Provisions for pensions and similar obligations 37 167,621 169,918
Other non-current provisions 38 32,676 28,758
Non-current interest-bearing loans 39 292,135 300,713
Other non-current financial liabilities 40 6,764 7,291
Deferred tax liabilities 41 20,359 18,800
Other non-current liabilities 243 136
Non-current liabilities 547,426 552,197
Other current provisions 38 159,919 148,880
Current loans and liabilities to banks 42 87,999 107,275
Trade payables 43 134,173 113,812
Other current financial liabilities 43 57,676 63,175
Current tax liabilities 44 35,867 34,032
Other current liabilities 45 77,914 72,929
Current liabilities 553,548 540,103
Total equity and liabilities 1,654,777 1,637,500
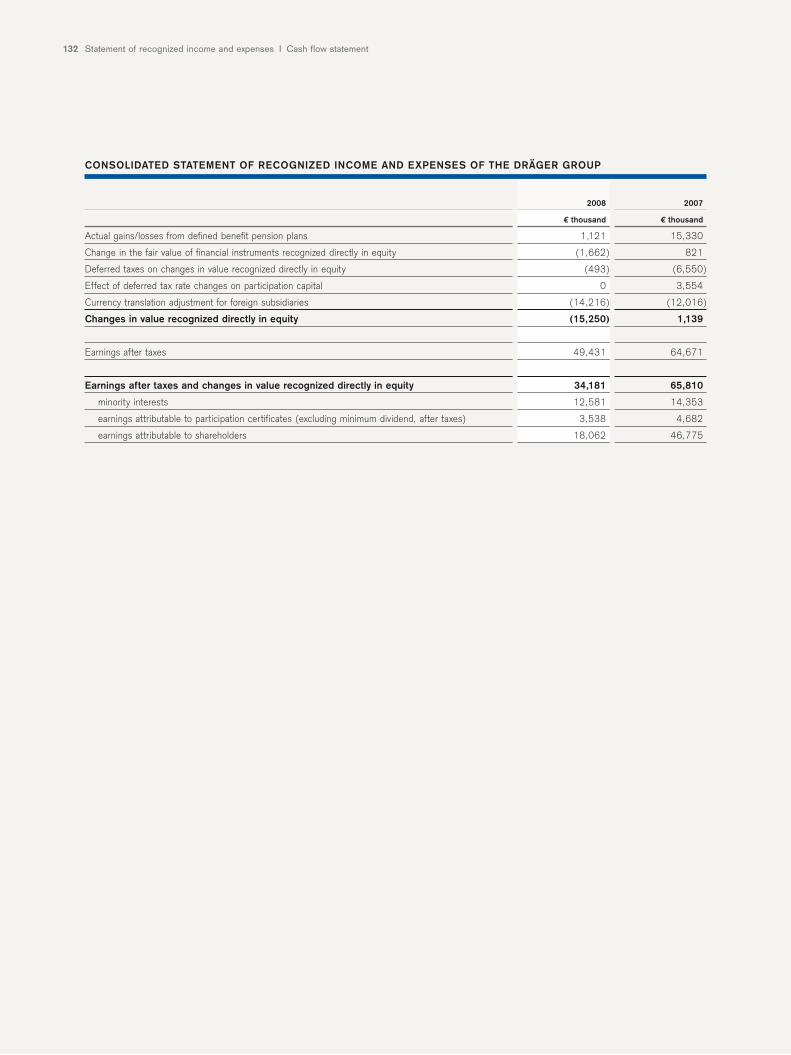
Statement of recognized income and expenses I Cash flow statement132
2008 2007
€ thousand € thousand
Actual gains/losses from defined benefit pension plans 1,121 15,330
Change in the fair value of financial instruments recognized directly in equity (1,662) 821
Deferred taxes on changes in value recognized directly in equity (493) (6,550)
Effect of deferred tax rate changes on participation capital 0 3,554
Currency translation adjustment for foreign subsidiaries (14,216) (12,016)
Changes in value recognized directly in equity (15,250) 1,139
Earnings after taxes 49,431 64,671
Earnings after taxes and changes in value recognized directly in equity 34,181 65,810
minority interests 12,581 14,353
earnings attributable to participation certificates (excluding minimum dividend, after taxes) 3,538 4,682
earnings attributable to shareholders 18,062 46,775
CONSOLIDATED STATEMENT OF RECOGNIZED INCOME AND EXPENSES OF THE DRÄGER GROUP
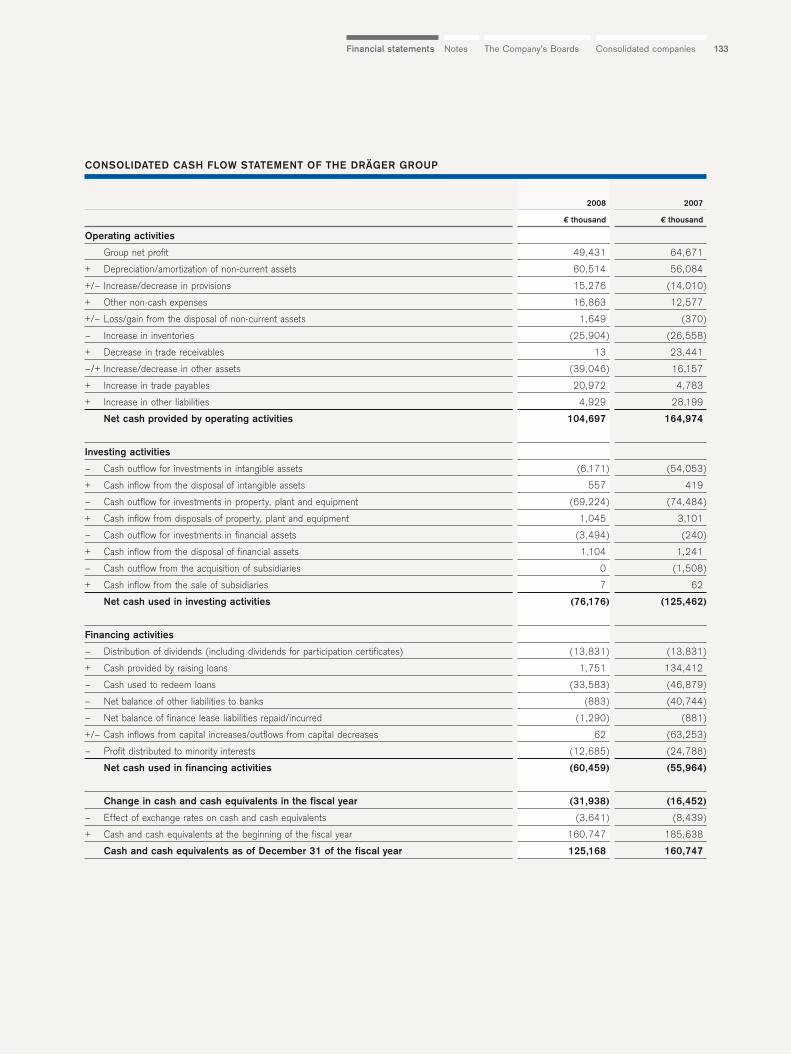
133The Company’s Boards Consolidated companiesNotesFinancial statements
2008 2007
€ thousand € thousand
Operating activities
Group net profit 49,431 64,671
+ Depreciation/amortization of non-current assets 60,514 56,084
+/– Increase/decrease in provisions 15,276 (14,010)
+ Other non-cash expenses 16,863 12,577
+/– Loss/gain from the disposal of non-current assets 1,649 (370)
– Increase in inventories (25,904) (26,558)
+ Decrease in trade receivables 13 23,441
–/+ Increase/decrease in other assets (39,046) 16,157
+ Increase in trade payables 20,972 4,783
+ Increase in other liabilities 4,929 28,199
Net cash provided by operating activities 104,697 164,974
Investing activities
– Cash outflow for investments in intangible assets (6,171) (54,053)
+ Cash inflow from the disposal of intangible assets 557 419
– Cash outflow for investments in property, plant and equipment (69,224) (74,484)
+ Cash inflow from disposals of property, plant and equipment 1,045 3,101
– Cash outflow for investments in financial assets (3,494) (240)
+ Cash inflow from the disposal of financial assets 1,104 1,241
– Cash outflow from the acquisition of subsidiaries 0 (1,508)
+ Cash inflow from the sale of subsidiaries 7 62
Net cash used in investing activities (76,176) (125,462)
Financing activities
– Distribution of dividends (including dividends for participation certificates) (13,831) (13,831)
+ Cash provided by raising loans 1,751 134,412
– Cash used to redeem loans (33,583) (46,879)
– Net balance of other liabilities to banks (883) (40,744)
– Net balance of finance lease liabilities repaid/incurred (1,290) (881)
+/– Cash inflows from capital increases/outflows from capital decreases 62 (63,253)
– Profit distributed to minority interests (12,685) (24,788)
Net cash used in financing activities (60,459) (55,964)
Change in cash and cash equivalents in the fiscal year (31,938) (16,452)
– Effect of exchange rates on cash and cash equivalents (3,641) (8,439)
+ Cash and cash equivalents at the beginning of the fiscal year 160,747 185,638
Cash and cash equivalents as of December 31 of the fiscal year 125,168 160,747
CONSOLIDATED CASH FLOW STATEMENT OF THE DRÄGER GROUP
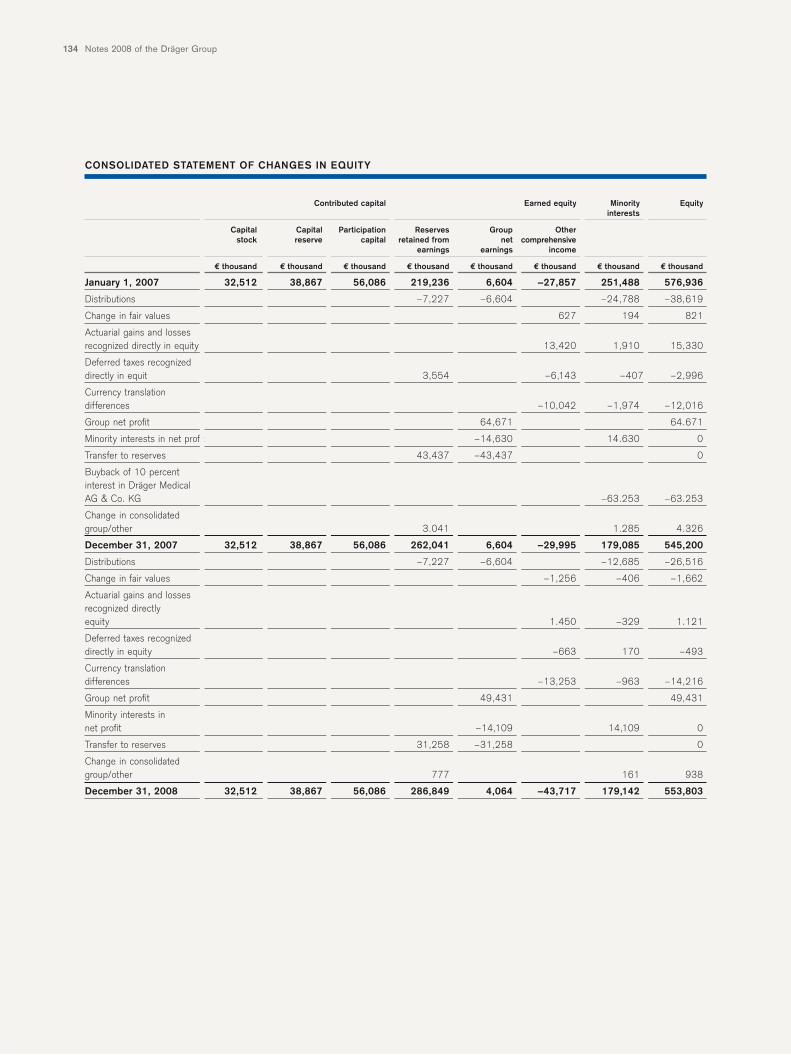
Notes 2008 of the Dräger Group134
Contributed capital Earned equity Minority Equityinterests
Capital Capital Participation Reserves Group Other stock reserve capital retained from net comprehensive
earnings earnings income
€ thousand € thousand € thousand € thousand € thousand € thousand € thousand € thousand
January 1, 2007 32,512 38,867 56,086 219,236 6,604 –27,857 251,488 576,936
Distributions –7,227 –6,604 –24,788 –38,619
Change in fair values 627 194 821
Actuarial gains and lossesrecognized directly in equity 13,420 1,910 15,330
Deferred taxes recognizeddirectly in equit 3,554 –6,143 –407 –2,996
Currency translationdifferences –10,042 –1,974 –12,016
Group net profit 64,671 64.671
Minority interests in net profit –14,630 14.630 0
Transfer to reserves 43,437 –43,437 0
Buyback of 10 percent interest in Dräger Medical AG & Co. KG –63.253 –63.253
Change in consolidatedgroup/other 3.041 1.285 4.326
December 31, 2007 32,512 38,867 56,086 262,041 6,604 –29,995 179,085 545,200
Distributions –7,227 –6,604 –12,685 –26,516
Change in fair values –1,256 –406 –1,662
Actuarial gains and lossesrecognized directly equity 1.450 –329 1.121
Deferred taxes recognizeddirectly in equity –663 170 –493
Currency translation differences –13,253 –963 –14,216
Group net profit 49,431 49,431
Minority interests in net profit –14,109 14,109 0
Transfer to reserves 31,258 –31,258 0
Change in consolidatedgroup/other 777 161 938
December 31, 2008 32,512 38,867 56,086 286,849 4,064 –43,717 179,142 553,803
CONSOLIDATED STATEMENT OF CHANGES IN EQUITY
135The Company’s Boards Consolidated companiesNotesFinancial statements
Notes Dräger Group 2008
GENERAL
The Dräger Group is managed by Drägerwerk AG & Co. KGaA, Moislinger Allee 53–55,
D-23542 Lübeck, Germany. Drägerwerk AG & Co. KGaA is entered in the commercial
register of the Local Court of Lübeck under HR B No. 7903 HL. The financial statements
are published in electronic form in the Federal Gazette.
The Group’s business activities are described in the management report of this annual
report.
BASIS OF PREPARATION OF THE GROUP FINANCIAL STATEMENTS
As in 2008, Drägerwerk AG & Co. KGaA prepared its group financial statements for fiscal
year 2007 in accordance with International Financial Reporting Standards (IFRSs)
promulgated by the International Accounting Standards Boards (IASB) and the interpre-
tations of the International Financial Reporting Interpretations Committee (IFRIC).
As regards the effects of first-time adoption of IFRSs as of the transition date (January 1,
2003), we refer to our annual report 2004.
Drägerwerk AG & Co. KGaA applied all the IASs/IFRSs adopted by the IASB as of
December 31, 2008 to its 2008 group financial statements provided that these standards
were endorsed by the European Commission and published in the Official Journal of
the European Union by the date of publication of the group financial statements and appli-
cation of such standards is mandatory for fiscal year 2008. The following new standards
and amendments to existing standards issued by the IASB which become effective for fis-
cal years beginning on or after July 1, 2008 were not applied in these financial statements:
– Improvements to IFRSs (published in May 2008)
– IFRS 1, “First-time Adoption of International Financial Reporting Standards” (revised
in May 2008)
– IFRS 2, “Share-based Payment” (revised in January 2008)
– IFRS 7, “Financial Instruments: Disclosures” (revised in October 2008)
– IFRS 8, “Operating Segments” (issued in November 2006)
– IAS 1, “Presentation of Financial Statements” (revised in September 2007)
– IAS 27, “Consolidated and Separate Financial Statements” (revised in January 2008)
– IAS 32, “Financial Instruments: Presentation” (revised in February 2008)
– IAS 39, “Financial Instruments: Recognition and Measurement” (revised in October
2008)
Voluntary early adoption would not have had any significant effects on the financial
statements.
IAS 23, “Borrowing Costs” (revised in March 2007), which did not have to be applied
until January 1, 2009, was voluntarily applied in fiscal year 2008.
The provisions of Art. 4 EC Regulation No. 1606/2002 of the European Parliament in
conjunction with Sec. 315a HGB (“Handelsgesetzbuch”: German Commercial Code)
governing a company’s exemption from its obligation to prepare group financial state-
ments in accordance with German commercial law have been met. To ensure that
1
2
Notes 2008 of the Dräger Group136
the group financial statements are equivalent to consolidated accounts prepared in
accordance with the German Commercial Code, all disclosures and explanations required
by German commercial law above and beyond the provisions of the IFRSs have been
provided in accordance with Sec. 315a HGB.
The group financial statements were prepared in euros. Unless stated otherwise, all
figures are disclosed in thousands of euros (EUR thousand); rounding differences may
arise as a result. The balance sheet is classified according to the current/non-current
distinction; the income statement was prepared according to the cost of sales method.
Where certain items of the financial statements have been grouped with a view to
enhancing the transparency of presentation, they are disclosed separately in these notes.
The single entity financial statements of the companies included in consolidation,
with the exception of two minor companies (2007: two), were prepared as of the balance
sheet date of the group financial statements on the basis of uniform accounting policies.
CHANGES TO THE FINANCIAL STATEMENTS 2008
In order to comply with the new statutory provisions of IAS 32 on the classification of
equity and debt, Dräger evaluated its reporting methods for participation capital
and decided they should be amended. As a result and in accordance with IAS 32 and IAS
39, an equity and debt component for each series of participation capital has been
retrospectively recognized and measured by choice in the financial statements 2008 (see
also Note 9).
The total amount of obligations from participation certificates recognized as liabili-
ties decreased by EUR 36.2 as of December 31, 2008 and by EUR 39.7 as of December 31,
2007 as a result of the changes applied to the presentation of participation certificates
in the IFRS group financial statements. This decrease is caused by a decline of Liabilities
from participation certification by EUR 47.2 million (December 31, 2007: EUR 48.2
million) and of Other current financial liabilities by EUR 4.4 million (December 31, 2007:
EUR 7.2 million) whereas the Deferred tax liabilities increased by EUR 15.4 million
(December 31, 2007 EUR 15.7 million). The net profit for the fiscal years 2008 and 2007
increased by a total of EUR 2.8 million (2007: EUR 3.9 million), due to the interest
result, which improved by EUR 3.3 million (2007: EUR 6.2 million), and income taxes,
which went up by EUR 0.5 million (2007: EUR 2.3 million). The increase in equity
attributable to participation certificates comes to EUR 36.2 million as of December 31,
2008 and EUR 39.7 million as of December 31, 2007.
RECOGNITION OF EQUITY/DISCLOSURE OF MINORITY INTERESTS WITHIN
THE SCOPE OF CHANGES TO IAS 32
On October 31, 2005, Dräger Medical AG & Co. KGaA was transformed into Dräger
Medical AG & Co. KG. The accepted recognition of limited shares as equity in the single
entity financial statements of this entity in accordance with German commercial law
was maintained in the IFRS group financial statements even after the amendment of
IAS 32. Dräger Medical Verwaltungs AG as general partner of Dräger Medical AG &
Co. KG, its shareholder Drägerwerk AG & Co. KGaA, Siemens AG and the limited partners
Dräger Medical Holding GmbH and Siemens Medical Holding GmbH agreed in the
partnership agreement to waive all termination options with the exception of those due
to the basis of the company’s business ceasing to exist. Accordingly, the limited liability
3
4
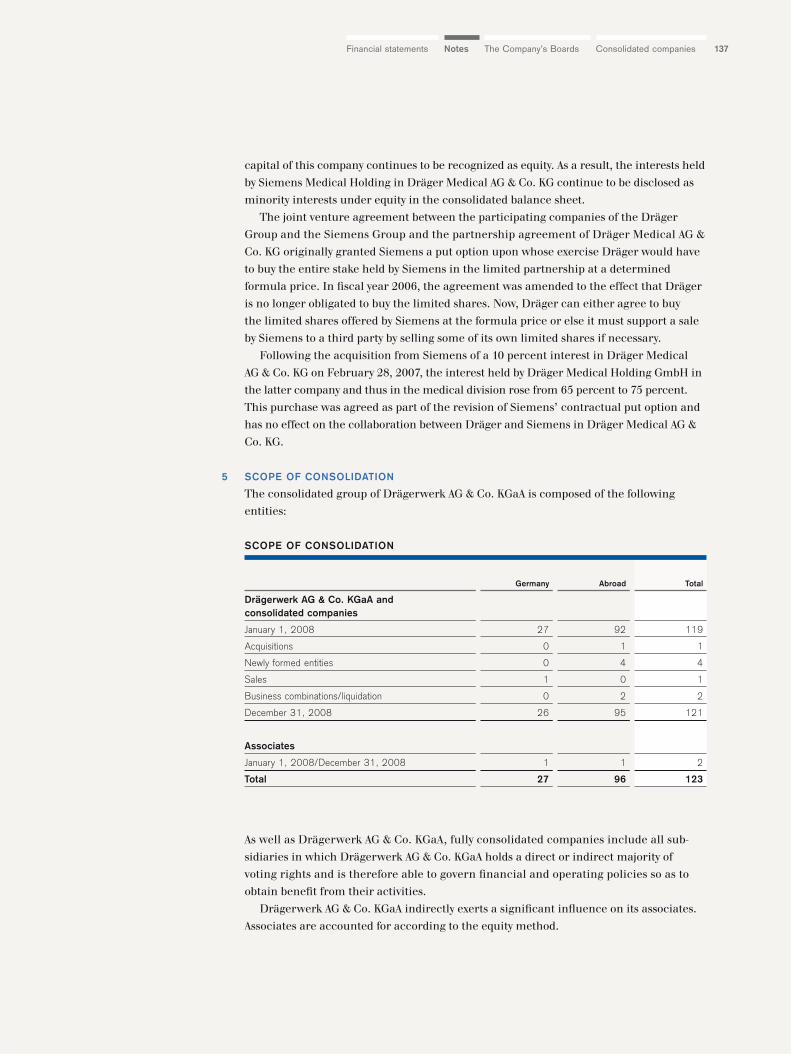
137The Company’s Boards Consolidated companiesNotesFinancial statements
capital of this company continues to be recognized as equity. As a result, the interests held
by Siemens Medical Holding in Dräger Medical AG & Co. KG continue to be disclosed as
minority interests under equity in the consolidated balance sheet.
The joint venture agreement between the participating companies of the Dräger
Group and the Siemens Group and the partnership agreement of Dräger Medical AG &
Co. KG originally granted Siemens a put option upon whose exercise Dräger would have
to buy the entire stake held by Siemens in the limited partnership at a determined
formula price. In fiscal year 2006, the agreement was amended to the effect that Dräger
is no longer obligated to buy the limited shares. Now, Dräger can either agree to buy
the limited shares offered by Siemens at the formula price or else it must support a sale
by Siemens to a third party by selling some of its own limited shares if necessary.
Following the acquisition from Siemens of a 10 percent interest in Dräger Medical
AG & Co. KG on February 28, 2007, the interest held by Dräger Medical Holding GmbH in
the latter company and thus in the medical division rose from 65 percent to 75 percent.
This purchase was agreed as part of the revision of Siemens’ contractual put option and
has no effect on the collaboration between Dräger and Siemens in Dräger Medical AG &
Co. KG.
SCOPE OF CONSOLIDATION
The consolidated group of Drägerwerk AG & Co. KGaA is composed of the following
entities:
As well as Drägerwerk AG & Co. KGaA, fully consolidated companies include all sub-
sidiaries in which Drägerwerk AG & Co. KGaA holds a direct or indirect majority of
voting rights and is therefore able to govern financial and operating policies so as to
obtain benefit from their activities.
Drägerwerk AG & Co. KGaA indirectly exerts a significant influence on its associates.
Associates are accounted for according to the equity method.
5
Germany Abroad Total
Drägerwerk AG & Co. KGaA and consolidated companies
January 1, 2008 27 92 119
Acquisitions 0 1 1
Newly formed entities 0 4 4
Sales 1 0 1
Business combinations/liquidation 0 2 2
December 31, 2008 26 95 121
Associates
January 1, 2008/December 31, 2008 1 1 2
Total 27 96 123
SCOPE OF CONSOLIDATION
Notes 2008 of the Dräger Group138
The consolidated group includes three real estate companies (2007: four) and two other
special purpose entities (SPEs) (2007: two) whose assets are attributable in substance to
the Group.
The consolidated companies of the Dräger Group as of December 31, 2008 are listed
on pages 214 to 217 of the annual report.
EFFECTS OF THE CHANGE IN THE SCOPE OF CONSOLIDATION
There was no significant impact on the Group’s net assets, financial position and results
of operations as a result of the change to the scope of consolidation in fiscal year 2008.
CONSOLIDATION PRINCIPLES
Acquisitions are accounted for according to the purchase method. On initial consolida-
tion of subsidiaries, the identifiable assets and liabilities are measured at their fair
values at the date on which control of the subsidiary is obtained. The excess of the cost of
the investment over the acquirer’s interest in the net fair value of the identifiable assets
and liabilities is recognized as goodwill. Goodwill is subject to an annual impairment test
pursuant to IAS 36 (impairment-only approach). Any excess of the Group’s share in
equity over the cost of the investment is recognized in profit or loss at the date of acquisi-
tion after reassessment.
Any minority interests in equity are shown in the consolidated balance sheet as such
(see Note 35).
When swapping or exchanging shares or in similar transactions, the fair value of the
shares given is attributed to the shares received. Any resulting step-ups in fair value are
transferred to retained earnings.
The cost of investments accounted for according to the equity method is adjusted
to reflect the Group’s share in net profit or loss for the period and dividend distributions.
The goodwill is included in the carrying values of the investments. Impairments are
accounted for separately.
Intercompany receivables and liabilities are netted (elimination of intercompany
balances). The carrying values of assets from intercompany goods and services are
adjusted for unrealized intercompany profits and losses (elimination of intercompany
profits and losses); therefore, these assets are measured at group cost. For associates,
elimination of intercompany profits and losses is waived due to immateriality.
Internal net sales are eliminated. Any other intercompany income and expenses are
mutually offset (elimination of income and expenses). Deferred tax assets or liabilities
from consolidation entries that affect profit or loss are recognized whenever differences
in tax expenses or income are expected to reverse in subsequent years.
Group net earnings agree with Drägerwerk AG & Co. KGaA’s distributable earnings.
The portion of net profit not destined for distribution or attributable to minority inter-
ests is transferred to retained earnings. The capital reserves of the Dräger Group and of
Drägerwerk AG & Co. KGaA reflect the share premiums earned from increases in
capital. Contributed capital and earned equity are thus disclosed separately in the consoli-
dated balance sheet.
6
7
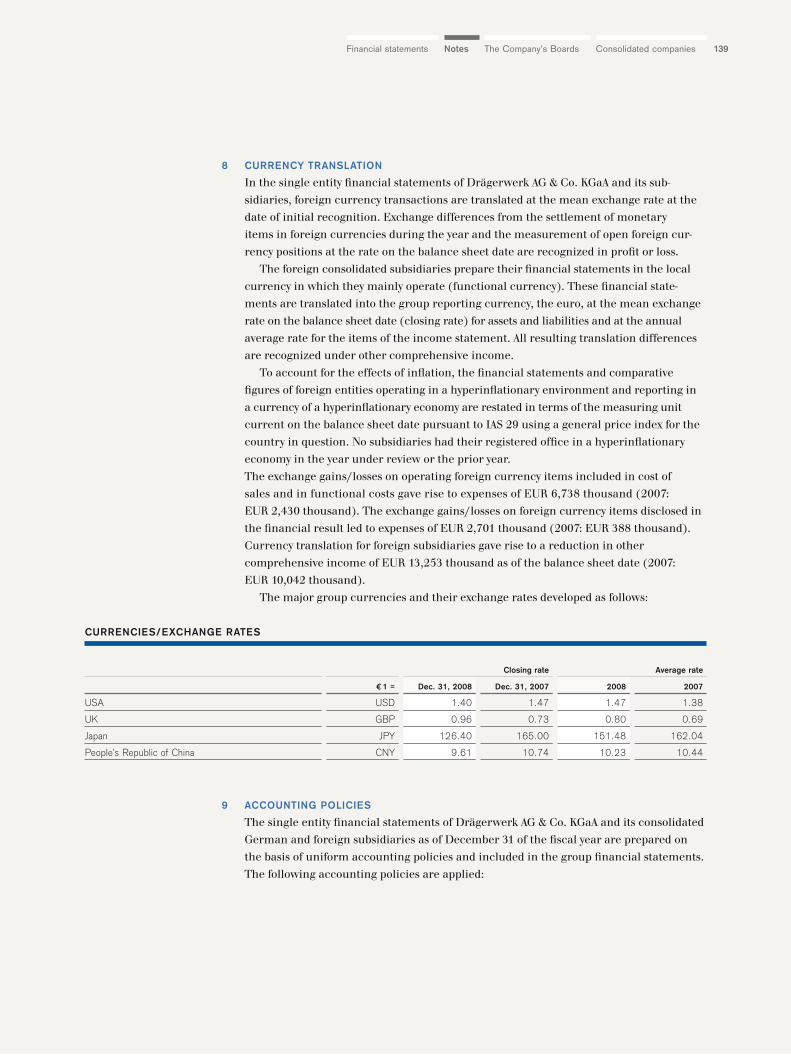
139The Company’s Boards Consolidated companiesNotesFinancial statements
9
CURRENCY TRANSLATION
In the single entity financial statements of Drägerwerk AG & Co. KGaA and its sub-
sidiaries, foreign currency transactions are translated at the mean exchange rate at the
date of initial recognition. Exchange differences from the settlement of monetary
items in foreign currencies during the year and the measurement of open foreign cur-
rency positions at the rate on the balance sheet date are recognized in profit or loss.
The foreign consolidated subsidiaries prepare their financial statements in the local
currency in which they mainly operate (functional currency). These financial state-
ments are translated into the group reporting currency, the euro, at the mean exchange
rate on the balance sheet date (closing rate) for assets and liabilities and at the annual
average rate for the items of the income statement. All resulting translation differences
are recognized under other comprehensive income.
To account for the effects of inflation, the financial statements and comparative
figures of foreign entities operating in a hyperinflationary environment and reporting in
a currency of a hyperinflationary economy are restated in terms of the measuring unit
current on the balance sheet date pursuant to IAS 29 using a general price index for the
country in question. No subsidiaries had their registered office in a hyperinflationary
economy in the year under review or the prior year.
The exchange gains/losses on operating foreign currency items included in cost of
sales and in functional costs gave rise to expenses of EUR 6,738 thousand (2007:
EUR 2,430 thousand). The exchange gains/losses on foreign currency items disclosed in
the financial result led to expenses of EUR 2,701 thousand (2007: EUR 388 thousand).
Currency translation for foreign subsidiaries gave rise to a reduction in other
comprehensive income of EUR 13,253 thousand as of the balance sheet date (2007:
EUR 10,042 thousand).
The major group currencies and their exchange rates developed as follows:
ACCOUNTING POLICIES
The single entity financial statements of Drägerwerk AG & Co. KGaA and its consolidated
German and foreign subsidiaries as of December 31 of the fiscal year are prepared on
the basis of uniform accounting policies and included in the group financial statements.
The following accounting policies are applied:
Closing rate Average rate
€ 1 = Dec. 31, 2008 Dec. 31, 2007 2008 2007
USA USD 1.40 1.47 1.47 1.38
UK GBP 0.96 0.73 0.80 0.69
Japan JPY 126.40 165.00 151.48 162.04
People’s Republic of China CNY 9.61 10.74 10.23 10.44
CURRENCIES/EXCHANGE RATES
8
Notes 2008 of the Dräger Group140
Intangible assetsGroup-controlled intangible assets from which future economic benefits are expected to
flow to the Group and which can be reliably measured are recognized at cost less straight-
line amortization over their expected useful lives. Borrowing costs that are material
and directly attributable to the acquisition, construction or production of a qualifying
asset are capitalized as part of the cost of that asset in accordance with IAS 23.
Purchased and internally developed software not disclosed under inventories is
recognized as a separate asset unless it is an integral part of the related hardware. Costs
incurred for the continuing use of an existing software system are recognized as an
expense (e.g. a new release).
Internal development costs are recognized as an asset if the asset’s future economic
benefit is sufficiently probable. However, due to the strict safety requirements for Dräger
Group products, this means that the product must have already been approved for
sale in the major markets. Until all criteria for recognition as an asset are met, internal
development costs and research costs are expensed as incurred.
Intangible assets generally have a useful life of four years, patents and trademarks
are amortized over their term (eleven years on average). Amortization is charged straight-
line.
Goodwill recognized as an intangible asset is disclosed at cost less accumulated
impairment losses. Under IAS 36, amortization is no longer charged on a systematic basis.
Property, plant and equipmentItems of property, plant and equipment are stated at cost less accumulated depreciation
and accumulated impairment losses.
The cost of purchase of an item of property, plant and equipment includes its purchase
price and any costs directly attributable to bringing the asset to the location and condi-
tion necessary for it to be capable of operating in the manner intended. The cost of conver-
sion comprises all direct and overhead costs, including depreciation, attributable to
production. Borrowing costs that are material and directly attributable to the acquisition,
construction or production of a qualifying asset are capitalized as part of the cost of
that asset in accordance with IAS 23. Subsequent expenditure incurred after the assets
have been put into operation, such as repairs and maintenance and overhaul costs, is
charged to income in the period in which the costs are incurred. Whenever it is probable
that the expenditure will result in future economic benefits in excess of the originally
assessed standard of performance of the existing asset flowing to the Company, the expen-
diture is recognized as an additional cost of property, plant and equipment.
Depreciation is computed on a straight-line basis over the following estimated useful
lives:
– Office and factory buildings 20 to 40 years
– Other buildings 15 to 20 years
– Production plant and machinery 5 to 8 years
– Other plant, factory and office equipment 2 to 15 years
141The Company’s Boards Consolidated companiesNotesFinancial statements
Where significant parts of property, plant and equipment contain components with
substantially different useful lives, such components are recorded separately and depre-
ciated over their useful lives.
The useful life and depreciation methods used for property, plant and equipment are
reviewed annually to ensure that the method and period of depreciation are consis-
tent with the expected pattern of economic benefits from items of property, plant and
equipment.
Assets under construction are stated at cost. Low-value assets are fully expensed in
the year of their addition and recognized as disposals in the statement of changes in non-
current assets.
Investment allowances Investment allowances (government grants) for assets are deducted from the carrying
value of the relevant asset. Grants are therefore recognized in profit or loss through a
reduced depreciation charge over the useful life of the depreciable asset.
Impairment losses on intangible assets and property, plant and equipmentIf there are signs of impairment of intangible assets or property, plant and equipment
due to reduced technical or economic use on the balance sheet date, these items are sub-
jected to an impairment test pursuant to IAS 36. If the carrying value of the asset
exceeds its recoverable amount (the higher of its value in use and net realizable value),
an impairment loss is charged. If no cash flows independently generated from other
assets can be attributed to individual assets, the recoverable amount is tested for impair-
ment on the basis of the cash-generating unit to which the asset belongs.
An impairment test is performed annually on goodwill and intangible assets with
indefinite useful lives. The impairment test for goodwill is performed on the basis of cash
generating units. The discounted cash flow method based on the operational five-year
plan without assuming further growth in the subsequent period is used to test the good-
will of the individual cash generating units. A risk-adjusted interest rate is used for
discounting. The business segments form the basis for the cash generating units for the
purposes of goodwill.
If the reasons for an impairment loss cease to apply, write-ups are performed, except
in the case of goodwill.
Financial instrumentsA financial instrument is any contract that gives rise to a financial asset of one entity and
a financial liability or equity instrument of another entity.
The following items in particular are recognized as financial assets: investments in
associates, other investments, securities, loans and other receivables, derivative financial
assets, other financial assets and cash and cash equivalents.
The following items are recognized as financial liabilities: liabilities to banks, loan
liabilities, trade payables, derivative financial liabilities and other financial liabilities.
All financial assets and liabilities may be classified, upon initial recognition, at fair
value through profit or loss if they fulfill the requirements of the IASB (fair value option).
This option has not been exercised by the Dräger Group to date.
Notes 2008 of the Dräger Group142
Financial assetsLoans and receivables are non-derivative financial assets with fixed or determinable pay-
ments that are not quoted in an active market. After initial recognition, loans and
receivables are recognized at amortized cost less any impairment losses and discounting
(effective interest method).
Impairment losses are charged on loans and receivables when there is objective evi-
dence that the amount is not fully recoverable (i.e. it is highly probable that the
borrower will become insolvent or the obligor is in considerable financial difficulties).
The carrying values of loans and receivables are generally adjusted through the use
of allowance accounts. If loans and receivables are classified as having a high probability
of being uncollectible, they are derecognized.
The effects of the impairment loss and of the application of the effective interest method
are recognized in profit or loss.
Securities with fixed or determinable payments and fixed maturity that the Dräger
Group has the positive intent and ability to hold to maturity are classified as held-to-matu-
rity investments and recognized at amortized cost using the effective interest method.
Available-for-sale financial assets are those non-derivative financial assets that are des-
ignated as available for sale and are not classified as belonging to any of the other cate-
gories. This category comprises investments in associates that are not accounted for in
accordance with the equity method due to immateriality as well as other investments
and securities. They are measured at fair value or, if not determinable, at amortized cost.
Unrealized gains and losses from the change in fair value are recorded in equity, taking
the tax effects into account. Changes in fair value are not recognized in profit or loss
until the asset is permanently impaired or sold.
Financial assets held for or due in more than twelve months are disclosed as non-
current financial assets.
Financial liabilitiesAfter initial recognition, financial liabilities are disclosed at amortized cost (amount
repayable).
Non-current liabilities that do not bear interest or bear interest at a rate substantially
below market rates are disclosed at present value. Premiums and discounts are allocated
over the term of the liability using the effective interest method.
Financial liabilities due in more than twelve months are disclosed as non-current
financial liabilities.
Fair value of financial assets and liabilitiesWhere the fair value of financial assets and liabilities is disclosed or stated, it is derived
from the market or stock exchange value. In the absence of an active market, the fair value
is determined according to recognized methods of financial mathematics.
Derivative financial instrumentsThe Dräger Group uses derivatives as part of its risk management to hedge currency and
interest rate risks.
Derivatives are recognized at fair value. For derivative financial instruments that
meet the hedge accounting criteria of IAS 39, the changes in fair value are recognized
depending on the type of hedge.
143The Company’s Boards Consolidated companiesNotesFinancial statements
In a hedge of the exposure to changes in fair value of a recognized asset or liability (fair
value hedge), the changes in the fair value of both the hedged item and the derivative
are recognized in profit or loss. Changes in the fair value of the exposure to variability in
future cash flows (cash flow hedge) are recognized directly under equity, taking tax
effects into account, if the hedge is effective. These amounts are not removed from equi-
ty and recognized in profit or loss until the hedged item affects profit or loss. Changes
in the fair value of derivatives used to hedge future cash flows between group companies
are recognized as cash flow hedges if they fulfill the relevant criteria.
Derivative financial instruments that are not designated as effective hedging instru-
ments in accordance with IAS 39 are classified as held for trading and recognized at
fair value, or, if not determinable, at amortized cost. The fair value of listed derivatives is
the positive or negative market value. In the absence of a market value, the fair value is
determined according to recognized methods of financial mathematics.
In hedging foreign currency risks posed by recognized assets or recognized liabilities,
the Dräger Group does not use hedge accounting in accordance with IAS 39 to recog-
nize hedges as the profit or loss from the currency translation of the hedged item pursuant
to IAS 21 affects the income statement at the same time as the profit or loss from the
measurement of the hedging instrument.
We refer to Note 46 for details of the nature and scope of the Dräger Group’s existing
financial instruments.
Construction contractsIn accordance with IAS 11, construction contracts are recognized using the stage of com-
pletion method. The stage of completion which has to be established to this end in
the case of fixed price contracts is determined using the cost-to-cost method (input-based
method). This method determines the stage of completion based on the costs incurred
as of the balance sheet date in relation to the estimated total cost. If the outcome of a con-
struction contract can be estimated reliably, the revenues are recorded at the amount
of contract costs incurred plus a profit margin. The contracts are recognized under receiv-
ables from construction contracts or, if a loss is expected, under liabilities from con-
struction contracts. Prepayments are deducted from the receivable. If the prepayments
exceed the receivable, the balance is recognized under liabilities.
InventoriesInventories comprise raw materials, consumables and supplies, work in process and
finished goods and merchandise. They are measured at the lower of average cost and net
realizable value. Cost comprises production-related full costs calculated on the basis
of normal capacity utilization. In addition to direct materials and production costs, it
includes materials and production overheads as well as special direct production
costs allocable to the manufacturing process. Depreciation on items of property, plant
and equipment used in the production process is also included. Borrowing costs that
are material and directly attributable to the acquisition, construction or production of a
qualifying asset are capitalized as part of the cost of that asset in accordance with IAS 23.
Net realizable value is the estimated selling price in the ordinary course of business
less the estimated costs of completion and the estimated costs necessary to make the
sale. Unrealizable inventories are written off.
Notes 2008 of the Dräger Group144
Finished goods and merchandise comprise loan and demo equipment. Two percent
straight-line depreciation is charged monthly for the decrease in the net realizable value
of these items.
Cash and cash equivalentsCash and cash equivalents comprise cash in hand and bank balances, including short-
term deposits.
Participation capitalIn accordance with IAS 32 and IAS 39, the individual Dräger participation certificate
series are recognized pursuant to the commercial value of their contractual agreements.
Series A certificates must generally be classified as equity; however, they include an
obligation with a value to the amount of the minimum return which is recognized as
liability.
Series K und D certificates are always classified as debt, but the premium on the issue
price exceeding Dräger’s obligation is recognized as equity.
Effects recognized in equity reflect the participation certificates’ equity component
(including deferred tax effects) and corresponding past compounding effects.
The components recognized as debt are measured at amortized cost using the effective
interest method (present value of repayment obligation using an interest rate of 6 per-
cent). Please refer to Note 35 for further information on the individual Dräger participa-
tion certificate series.
The compounding of liabilities from participation certificates to the amout of the
effective interest rate and the minimum dividend for series A and K are included in
the interest expenses of the period in question. The dividend for series D certificates and
the amound exceeding the minimum dividend for series A and K certificates are paid
with equity capital.
Provisions for pensions and similar obligationsProvisions for pension obligations and similar obligations are calculated according to
IAS 19 using the projected unit credit method allowing for future adjustments to salaries
and pensions and employee turnover.
The provisions were measured on the basis of pension reports. The Dräger Group has
decided to exercise the option under IAS 19.93A of fully recognizing actuarial gains or
losses in equity immediately, taking account of deferred taxes. The actuarial gains or
losses recognized in equity are reconciled in a separate statement of recognized income
and expenses presented before the notes.
The interest portions contained in pension expenses are disclosed in interest and sim-
ilar expenses and netted with the expected return on plan assets.
With effect as of December 2007, funds from the German pension plan were paid into
a new fund including a settlement account and secured in favor of the employees via a
contractual trust arrangement (CTA), meaning that they only serve to cover and finance
the Company’s direct pension obligations in Germany.
Any excess of plan assets over the pension obligations is recognized as an asset at a
maximum of the present value of the economic benefit to the Company (due to a refund
of contributions or reduction of future contributions) plus any past service cost not yet
recognized (asset ceiling).
145The Company’s Boards Consolidated companiesNotesFinancial statements
Other provisionsA provision is recognized when, and only when, the entity has a present obligation (legal
or constructive) to a third party as a result of a past event and it is probable that an
outflow of resources embodying economic benefits will be required to settle the obliga-
tion, and a reliable estimate can be made of the amount of the obligation. Provisions
are stated at the amount expected to be required to settle the obligation. Non-current provi-
sions are discounted to the balance sheet date using appropriate market rates.
Deferred taxesDeferred taxes are recognized for differences between the IFRS financial statements and
the tax accounts of the consolidated companies as well as for consolidation entries and
loss carryforwards.
The deferred taxes are measured at the amount expected to be paid or recovered in
subsequent fiscal years. Deferred tax assets are only recognized if it is sufficiently proba-
ble that they will be realized. Deferred tax assets and liabilities are only netted if they
relate to the same taxation authority.
LeasesLeases are all agreements whereby the lessor conveys to the lessee in return for payment
the right to use an asset for an agreed period of time.
A) FINANCE LEASES
Dräger Group as lesseeAt inception of the lease, finance leases are recognized as assets and liabilities in the bal-
ance sheet at amounts equal at the inception of the lease to the fair value of the leased
property or, if lower, at the present value of the minimum lease payments. In calculating
the present value of the minimum lease payments, the discount factor is the interest rate
implicit in the lease if this is practicable to determine. If this is not the case, the lessee’s
incremental borrowing rate is used. Initial direct costs are included as part of the asset.
Lease payments are apportioned between the finance charge and the reduction of the out-
standing liability. The finance charge is allocated to periods during the lease term so
as to produce a constant periodic rate of interest on the remaining balance of the liabili-
ty for each period.
A finance lease gives rise to a depreciation expense for the recognized asset as well as
a finance expense for each period. The depreciation policy for leased assets is consistent
with that for corresponding depreciable assets which are owned by the Company.
Dräger Group as lessorAssets held under a finance lease are recognized in the balance sheet and presented as
a receivable at an amount equal to the net investment (present value of the gross
investment) in the lease. The recognition of finance income is based on a pattern reflect-
ing a constant periodic rate of return on the lessor’s net investment outstanding in
respect of the finance lease. Initial direct costs are capitalized and allocated as an expense
over the term of the lease.
Notes 2008 of the Dräger Group146
B) OPERATING LEASES
Dräger Group as lesseeLeases of assets under which substantially all the risks and rewards of ownership are
effectively retained by the lessor are classified as operating leases. Lease payments under
an operating lease are recognized as an expense.
Dräger Group as lessorAssets subject to operating leases are presented in the balance sheet according to the
nature of the asset. Lease income from operating leases is recognized in profit or loss on
a straight-line basis over the lease term.
Use of estimates and assumptionsIn preparing the group financial statements in accordance with IFRSs, assumptions and
estimates have to be made which have an effect on the recognition of assets and liabil-
ities, the disclosure of contingent liabilities as of the balance sheet date and the recogni-
tion of income and expenses. Actual amounts may differ from these assumptions and
estimates.
Significant accounting policies and consolidation methods that differ from German law– Development costs and internally developed software are recognized as an asset if their
future economic benefit is sufficiently probable.
– Goodwill undergoes an annual impairment test according to the impairment-only
approach.
– The pension provisions are calculated according to IAS 19 based on the projected unit
credit method taking future salary and pension increases into account. Actuarial gains
or losses are recognized directly in equity.
– Qualifying plan assets (including assets secured by a contractual trust arrangement)
may be netted with the related pension obligations.
– Participation certificates are recognized as equity or debt pursuant to the commercial
value of their contractual agreements.
– Non-current provisions are carried at their present value.
– Provisions for accrued expenses may not be recognized.
– Deferred taxes are calculated according to the temporary concept, with deferred tax
assets recognized for loss carryforwards that are highly likely to be used in the future.
– Derivatives are recognized at fair value even if their cost is lower. The gains and losses
on the measurement of financial derivatives used to hedge balance sheet items (fair
value hedges) are recognized immediately in profit or loss. The effective portion of gains
and losses on the measurement of derivative financial instruments used to hedge
future cash flows (cash flow hedge) is recognized directly in equity.
– Securities are recognized as available-for-sale financial assets at fair value, which may
exceed cost.
147The Company’s Boards Consolidated companiesNotesFinancial statements
– Receivables and liabilities in foreign currencies are measured at the mean exchange
rate on the balance sheet date, contrary to the German imparity principle.
– General bad debt allowances are not recognized.
– Inventories are measured at the lower of average cost and net realizable value.
– Net sales and profit from construction contracts are recognized using the percentage of
completion method.
– Special purpose entities are included in the consolidated group.
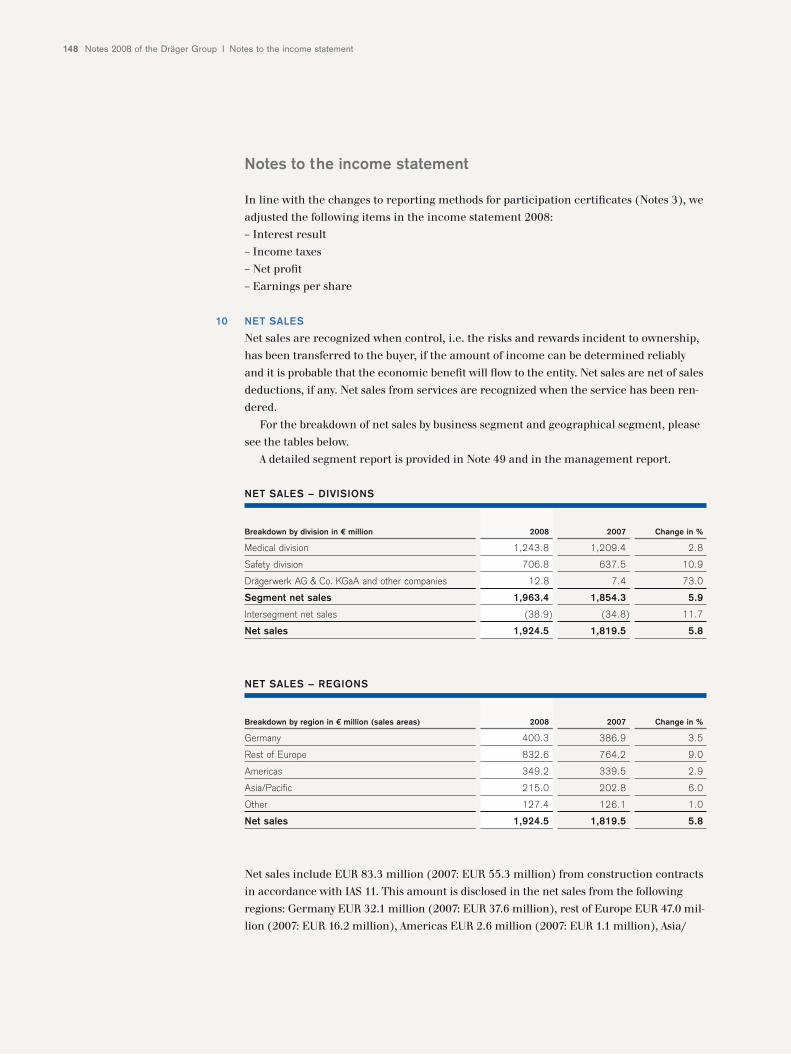
Notes 2008 of the Dräger Group I Notes to the income statement148
Notes to the income statement
In line with the changes to reporting methods for participation certificates (Notes 3), we
adjusted the following items in the income statement 2008:
– Interest result
– Income taxes
– Net profit
– Earnings per share
NET SALES
Net sales are recognized when control, i.e. the risks and rewards incident to ownership,
has been transferred to the buyer, if the amount of income can be determined reliably
and it is probable that the economic benefit will flow to the entity. Net sales are net of sales
deductions, if any. Net sales from services are recognized when the service has been ren-
dered.
For the breakdown of net sales by business segment and geographical segment, please
see the tables below.
A detailed segment report is provided in Note 49 and in the management report.
Net sales include EUR 83.3 million (2007: EUR 55.3 million) from construction contracts
in accordance with IAS 11. This amount is disclosed in the net sales from the following
regions: Germany EUR 32.1 million (2007: EUR 37.6 million), rest of Europe EUR 47.0 mil-
lion (2007: EUR 16.2 million), Americas EUR 2.6 million (2007: EUR 1.1 million), Asia/
10
Breakdown by division in € million 2008 2007 Change in %
Medical division 1,243.8 1,209.4 2.8
Safety division 706.8 637.5 10.9
Drägerwerk AG & Co. KGaA and other companies 12.8 7.4 73.0
Segment net sales 1,963.4 1,854.3 5.9
Intersegment net sales (38.9) (34.8) 11.7
Net sales 1,924.5 1,819.5 5.8
Breakdown by region in € million (sales areas) 2008 2007 Change in %
Germany 400.3 386.9 3.5
Rest of Europe 832.6 764.2 9.0
Americas 349.2 339.5 2.9
Asia/Pacific 215.0 202.8 6.0
Other 127.4 126.1 1.0
Net sales 1,924.5 1,819.5 5.8
NET SALES – DIVISIONS
NET SALES – REGIONS
149The Company’s Boards Consolidated companiesNotesFinancial statements
Pacific EUR 0.6 million (2007: EUR 0.4 million) and other countries EUR 1.0 million
(2007: EUR 0.0 million).
COST OF SALES
Cost of sales comprises direct materials, direct labor, special direct production costs,
inventory allowances, production overheads (including amortization of production relat-
ed intangible assets and depreciation of property, plant and equipment as well as costs
of internal transportation until delivery to the sales depot), materials overheads, cost of
warranties and other cost of sales.
The cost of sales also includes price differences, consumption variances, cost of
underutilization, inventory variances, measurement differences and scrapping. Income
from the reversal of previously impaired inventories reduces the cost of sales.
Any borrowing costs included in the valuation of inventories are contained in the cost
of sales at the time of delivery or performance.
RESEARCH AND DEVELOPMENT COSTS
Research and development costs comprise all costs incurred during the research and
development process, including registration costs, costs of prototypes and the costs of the
first series, if they are not capitalized as separate development costs.
MARKETING AND SELLING EXPENSES
Marketing expenses comprise all costs associated with corporate marketing and product
marketing, including expenses for advertising and trade fairs.
Selling expenses include the costs of sales management, logistics costs, where they
relate to the sales depot or shipping, and the costs of the internal and external sales
force, including order processing. The costs of the sales companies are allocated to sell-
ing expenses, unless they belong to the cost of sales.
Income arising in direct connection with the costs is netted.
GENERAL ADMINISTRATIVE EXPENSES
General administrative expenses comprise the costs of administrative activities not
related to other functions. This includes in particular the cost of management,
corporate controlling, legal, accounting and consulting fees, audit fees, general infra-
structure costs, etc.
Income arising in direct connection with the costs is netted.
11
12
13
14
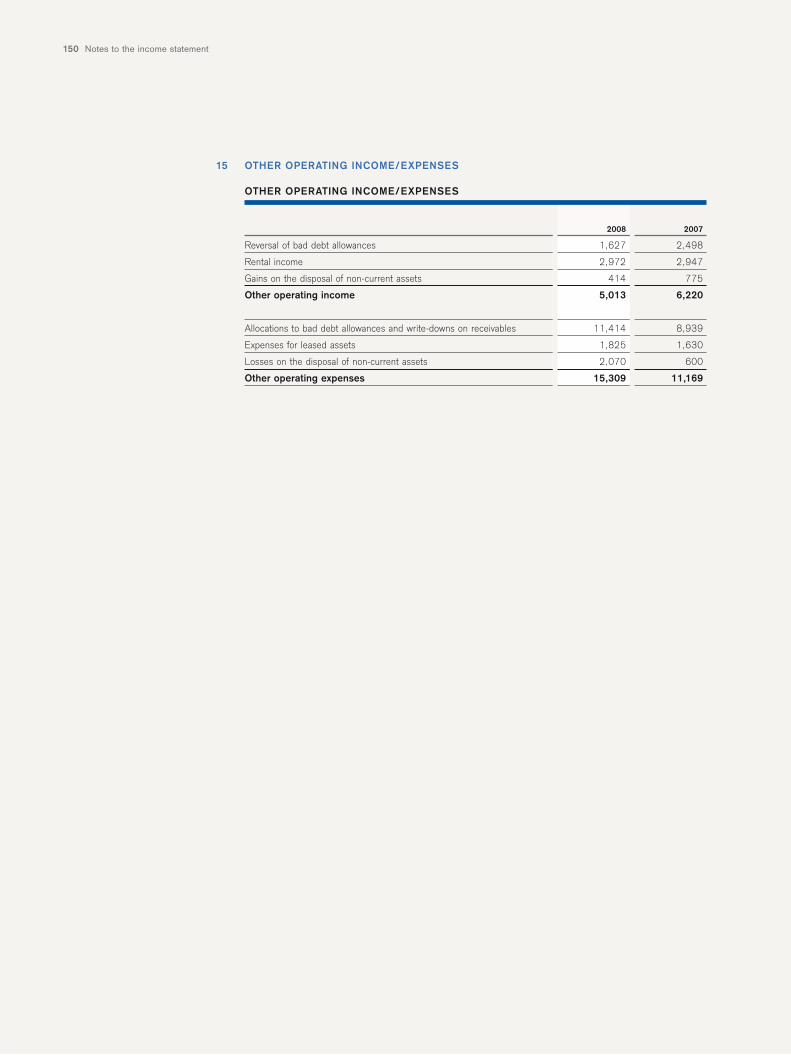
Notes to the income statement150
OTHER OPERATING INCOME/EXPENSES15
2008 2007
Reversal of bad debt allowances 1,627 2,498
Rental income 2,972 2,947
Gains on the disposal of non-current assets 414 775
Other operating income 5,013 6,220
Allocations to bad debt allowances and write-downs on receivables 11,414 8,939
Expenses for leased assets 1,825 1,630
Losses on the disposal of non-current assets 2,070 600
Other operating expenses 15,309 11,169
OTHER OPERATING INCOME/EXPENSES
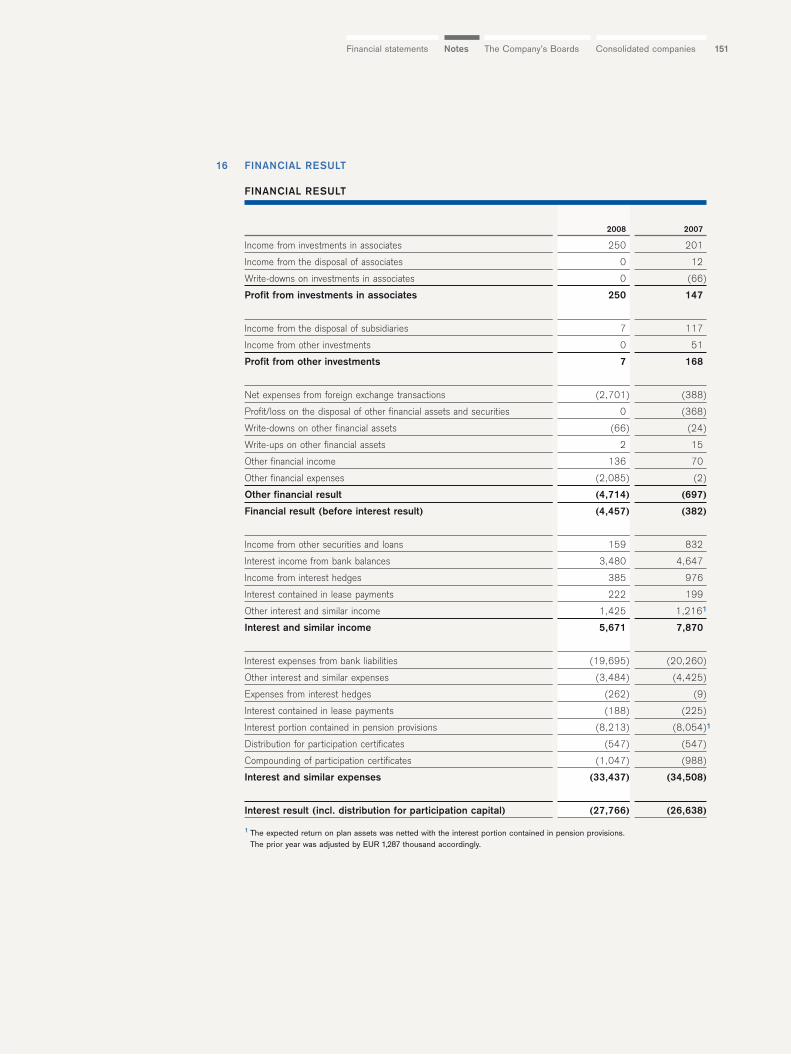
151The Company’s Boards Consolidated companiesNotesFinancial statements
FINANCIAL RESULT16
2008 2007
Income from investments in associates 250 201
Income from the disposal of associates 0 12
Write-downs on investments in associates 0 (66)
Profit from investments in associates 250 147
Income from the disposal of subsidiaries 7 117
Income from other investments 0 51
Profit from other investments 7 168
Net expenses from foreign exchange transactions (2,701) (388)
Profit/loss on the disposal of other financial assets and securities 0 (368)
Write-downs on other financial assets (66) (24)
Write-ups on other financial assets 2 15
Other financial income 136 70
Other financial expenses (2,085) (2)
Other financial result (4,714) (697)
Financial result (before interest result) (4,457) (382)
Income from other securities and loans 159 832
Interest income from bank balances 3,480 4,647
Income from interest hedges 385 976
Interest contained in lease payments 222 199
Other interest and similar income 1,425 1,2161
Interest and similar income 5,671 7,870
Interest expenses from bank liabilities (19,695) (20,260)
Other interest and similar expenses (3,484) (4,425)
Expenses from interest hedges (262) (9)
Interest contained in lease payments (188) (225)
Interest portion contained in pension provisions (8,213) (8,054)
Distribution for participation certificates (547) (547)
Compounding of participation certificates (1,047) (988)
Interest and similar expenses (33,437) (34,508)
Interest result (incl. distribution for participation capital) (27,766) (26,638)
1 The expected return on plan assets was netted with the interest portion contained in pension provisions. The prior year was adjusted by EUR 1,287 thousand accordingly.
FINANCIAL RESULT
1
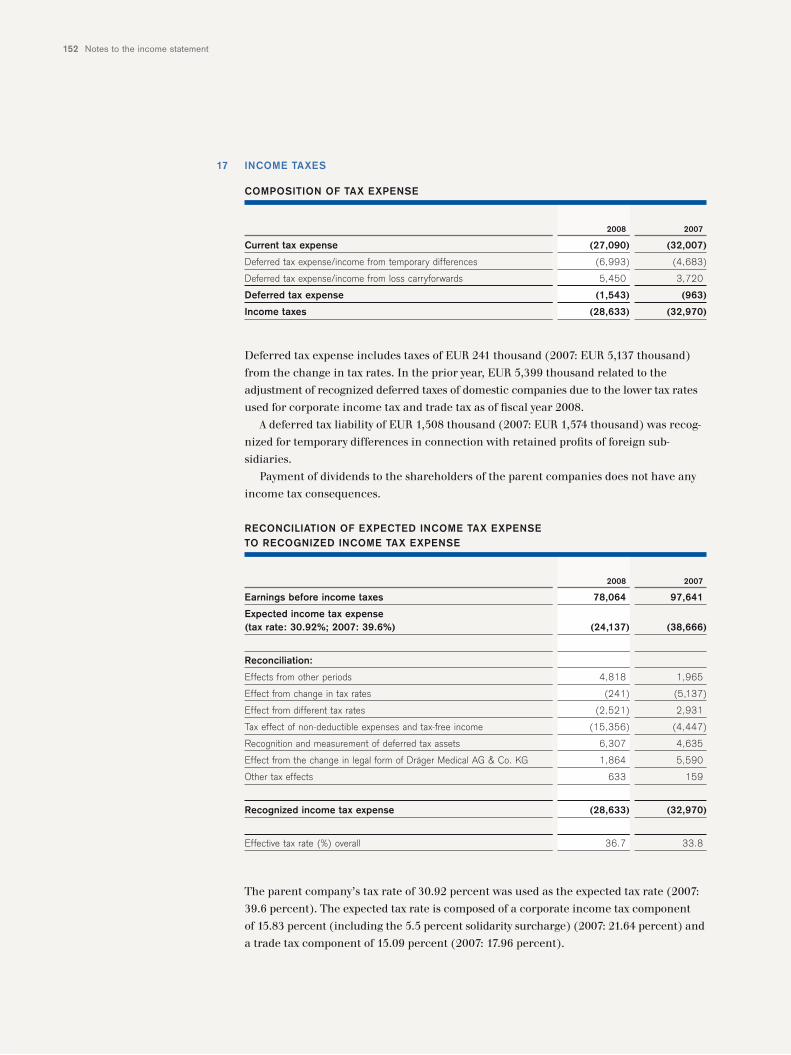
Notes to the income statement152
INCOME TAXES
Deferred tax expense includes taxes of EUR 241 thousand (2007: EUR 5,137 thousand)
from the change in tax rates. In the prior year, EUR 5,399 thousand related to the
adjustment of recognized deferred taxes of domestic companies due to the lower tax rates
used for corporate income tax and trade tax as of fiscal year 2008.
A deferred tax liability of EUR 1,508 thousand (2007: EUR 1,574 thousand) was recog-
nized for temporary differences in connection with retained profits of foreign sub-
sidiaries.
Payment of dividends to the shareholders of the parent companies does not have any
income tax consequences.
The parent company’s tax rate of 30.92 percent was used as the expected tax rate (2007:
39.6 percent). The expected tax rate is composed of a corporate income tax component
of 15.83 percent (including the 5.5 percent solidarity surcharge) (2007: 21.64 percent) and
a trade tax component of 15.09 percent (2007: 17.96 percent).
17
2008 2007
Current tax expense (27,090) (32,007)
Deferred tax expense/income from temporary differences (6,993) (4,683)
Deferred tax expense/income from loss carryforwards 5,450 3,720
Deferred tax expense (1,543) (963)
Income taxes (28,633) (32,970)
COMPOSITION OF TAX EXPENSE
2008 2007
Earnings before income taxes 78,064 97,641
Expected income tax expense(tax rate: 30.92%; 2007: 39.6%) (24,137) (38,666)
Reconciliation:
Effects from other periods 4,818 1,965
Effect from change in tax rates (241) (5,137)
Effect from different tax rates (2,521) 2,931
Tax effect of non-deductible expenses and tax-free income (15,356) (4,447)
Recognition and measurement of deferred tax assets 6,307 4,635
Effect from the change in legal form of Dräger Medical AG & Co. KG 1,864 5,590
Other tax effects 633 159
Recognized income tax expense (28,633) (32,970)
Effective tax rate (%) overall 36.7 33.8
RECONCILIATION OF EXPECTED INCOME TAX EXPENSE TO RECOGNIZED INCOME TAX EXPENSE
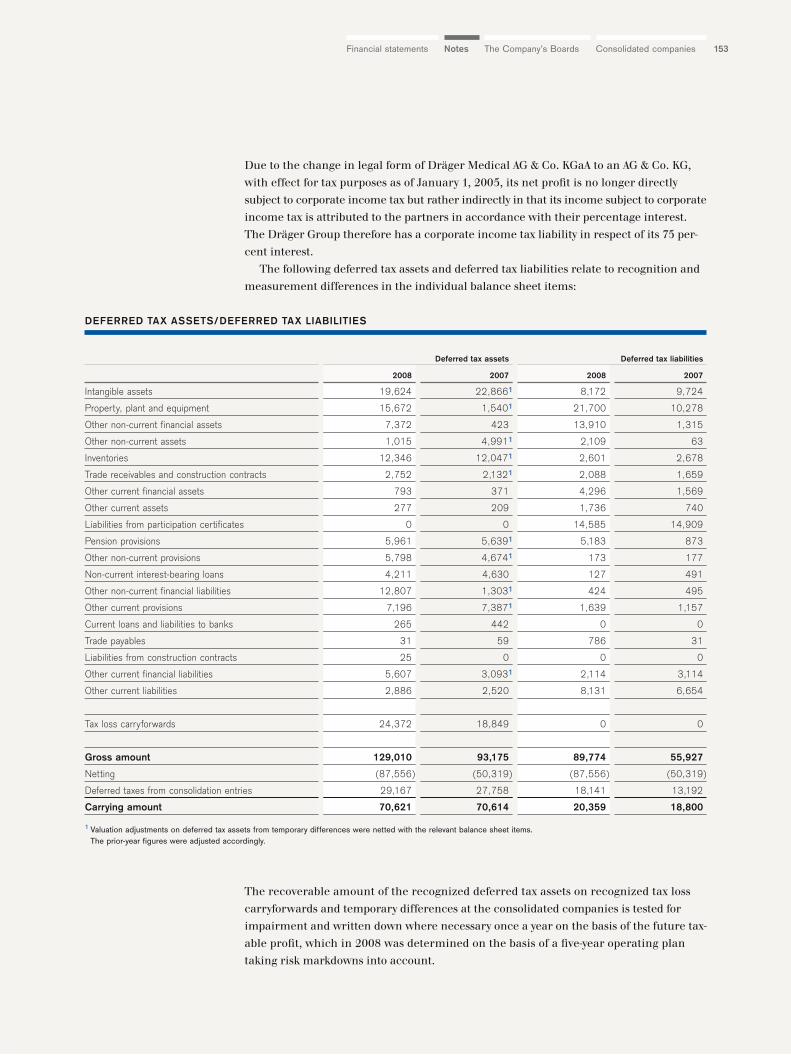
153The Company’s Boards Consolidated companiesNotesFinancial statements
Due to the change in legal form of Dräger Medical AG & Co. KGaA to an AG & Co. KG,
with effect for tax purposes as of January 1, 2005, its net profit is no longer directly
subject to corporate income tax but rather indirectly in that its income subject to corporate
income tax is attributed to the partners in accordance with their percentage interest.
The Dräger Group therefore has a corporate income tax liability in respect of its 75 per-
cent interest.
The following deferred tax assets and deferred tax liabilities relate to recognition and
measurement differences in the individual balance sheet items:
The recoverable amount of the recognized deferred tax assets on recognized tax loss
carryforwards and temporary differences at the consolidated companies is tested for
impairment and written down where necessary once a year on the basis of the future tax-
able profit, which in 2008 was determined on the basis of a five-year operating plan
taking risk markdowns into account.
Deferred tax assets Deferred tax liabilities
2008 2007 2008 2007
Intangible assets 19,624 22,8661 8,172 9,724
Property, plant and equipment 15,672 1,5401 21,700 10,278
Other non-current financial assets 7,372 423 13,910 1,315
Other non-current assets 1,015 4,9911 2,109 63
Inventories 12,346 12,0471 2,601 2,678
Trade receivables and construction contracts 2,752 2,1321 2,088 1,659
Other current financial assets 793 371 4,296 1,569
Other current assets 277 209 1,736 740
Liabilities from participation certificates 0 0 14,585 14,909
Pension provisions 5,961 5,6391 5,183 873
Other non-current provisions 5,798 4,6741 173 177
Non-current interest-bearing loans 4,211 4,630 127 491
Other non-current financial liabilities 12,807 1,3031 424 495
Other current provisions 7,196 7,3871 1,639 1,157
Current loans and liabilities to banks 265 442 0 0
Trade payables 31 59 786 31
Liabilities from construction contracts 25 0 0 0
Other current financial liabilities 5,607 3,0931 2,114 3,114
Other current liabilities 2,886 2,520 8,131 6,654
Tax loss carryforwards 24,372 18,849 0 0
Gross amount 129,010 93,175 89,774 55,927
Netting (87,556) (50,319) (87,556) (50,319)
Deferred taxes from consolidation entries 29,167 27,758 18,141 13,192
Carrying amount 70,621 70,614 20,359 18,800
1 Valuation adjustments on deferred tax assets from temporary differences were netted with the relevant balance sheet items. The prior-year figures were adjusted accordingly.
DEFERRED TAX ASSETS/DEFERRED TAX LIABILITIES
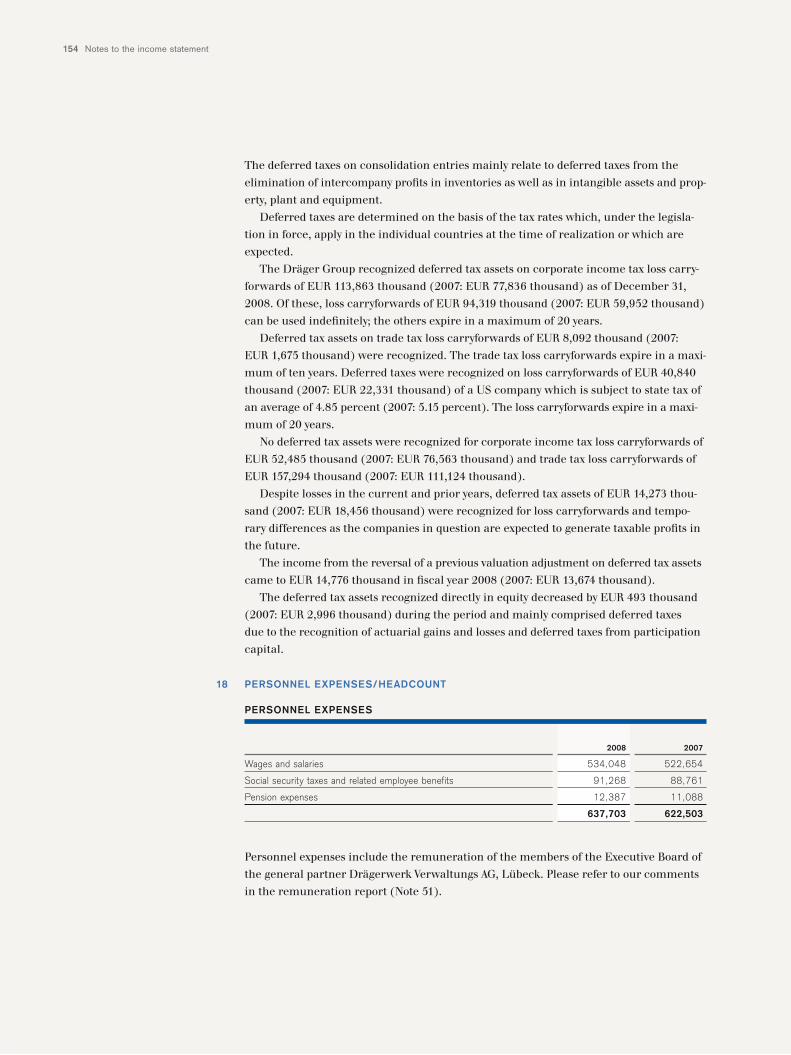
Notes to the income statement154
The deferred taxes on consolidation entries mainly relate to deferred taxes from the
elimination of intercompany profits in inventories as well as in intangible assets and prop-
erty, plant and equipment.
Deferred taxes are determined on the basis of the tax rates which, under the legisla-
tion in force, apply in the individual countries at the time of realization or which are
expected.
The Dräger Group recognized deferred tax assets on corporate income tax loss carry-
forwards of EUR 113,863 thousand (2007: EUR 77,836 thousand) as of December 31,
2008. Of these, loss carryforwards of EUR 94,319 thousand (2007: EUR 59,952 thousand)
can be used indefinitely; the others expire in a maximum of 20 years.
Deferred tax assets on trade tax loss carryforwards of EUR 8,092 thousand (2007:
EUR 1,675 thousand) were recognized. The trade tax loss carryforwards expire in a maxi-
mum of ten years. Deferred taxes were recognized on loss carryforwards of EUR 40,840
thousand (2007: EUR 22,331 thousand) of a US company which is subject to state tax of
an average of 4.85 percent (2007: 5.15 percent). The loss carryforwards expire in a maxi-
mum of 20 years.
No deferred tax assets were recognized for corporate income tax loss carryforwards of
EUR 52,485 thousand (2007: EUR 76,563 thousand) and trade tax loss carryforwards of
EUR 157,294 thousand (2007: EUR 111,124 thousand).
Despite losses in the current and prior years, deferred tax assets of EUR 14,273 thou-
sand (2007: EUR 18,456 thousand) were recognized for loss carryforwards and tempo-
rary differences as the companies in question are expected to generate taxable profits in
the future.
The income from the reversal of a previous valuation adjustment on deferred tax assets
came to EUR 14,776 thousand in fiscal year 2008 (2007: EUR 13,674 thousand).
The deferred tax assets recognized directly in equity decreased by EUR 493 thousand
(2007: EUR 2,996 thousand) during the period and mainly comprised deferred taxes
due to the recognition of actuarial gains and losses and deferred taxes from participation
capital.
PERSONNEL EXPENSES/HEADCOUNT
Personnel expenses include the remuneration of the members of the Executive Board of
the general partner Drägerwerk Verwaltungs AG, Lübeck. Please refer to our comments
in the remuneration report (Note 51).
18
2008 2007
Wages and salaries 534,048 522,654
Social security taxes and related employee benefits 91,268 88,761
Pension expenses 12,387 11,088
637,703 622,503
PERSONNEL EXPENSES
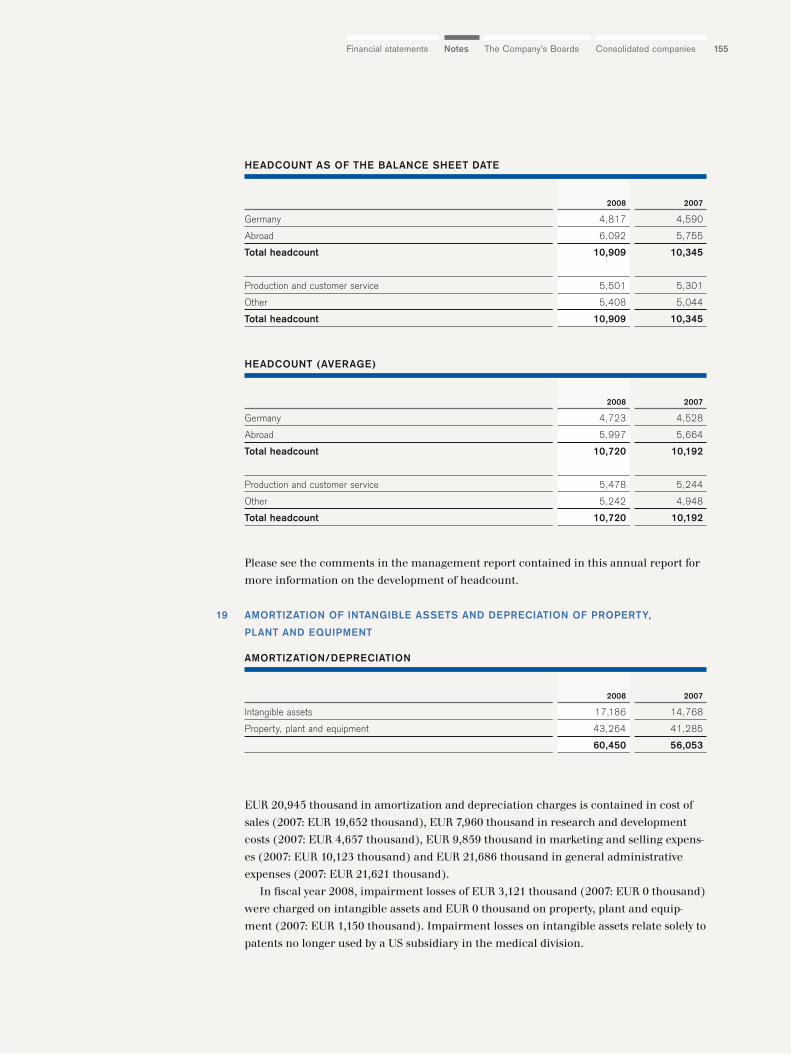
155The Company’s Boards Consolidated companiesNotesFinancial statements
Please see the comments in the management report contained in this annual report for
more information on the development of headcount.
AMORTIZATION OF INTANGIBLE ASSETS AND DEPRECIATION OF PROPERTY,
PLANT AND EQUIPMENT
EUR 20,945 thousand in amortization and depreciation charges is contained in cost of
sales (2007: EUR 19,652 thousand), EUR 7,960 thousand in research and development
costs (2007: EUR 4,657 thousand), EUR 9,859 thousand in marketing and selling expens-
es (2007: EUR 10,123 thousand) and EUR 21,686 thousand in general administrative
expenses (2007: EUR 21,621 thousand).
In fiscal year 2008, impairment losses of EUR 3,121 thousand (2007: EUR 0 thousand)
were charged on intangible assets and EUR 0 thousand on property, plant and equip-
ment (2007: EUR 1,150 thousand). Impairment losses on intangible assets relate solely to
patents no longer used by a US subsidiary in the medical division.
19
2008 2007
Germany 4,817 4,590
Abroad 6,092 5,755
Total headcount 10,909 10,345
Production and customer service 5,501 5,301
Other 5,408 5,044
Total headcount 10,909 10,345
HEADCOUNT AS OF THE BALANCE SHEET DATE
2008 2007
Germany 4,723 4,528
Abroad 5,997 5,664
Total headcount 10,720 10,192
Production and customer service 5,478 5,244
Other 5,242 4,948
Total headcount 10,720 10,192
HEADCOUNT (AVERAGE)
2008 2007
Intangible assets 17,186 14,768
Property, plant and equipment 43,264 41,285
60,450 56,053
AMORTIZATION/DEPRECIATION
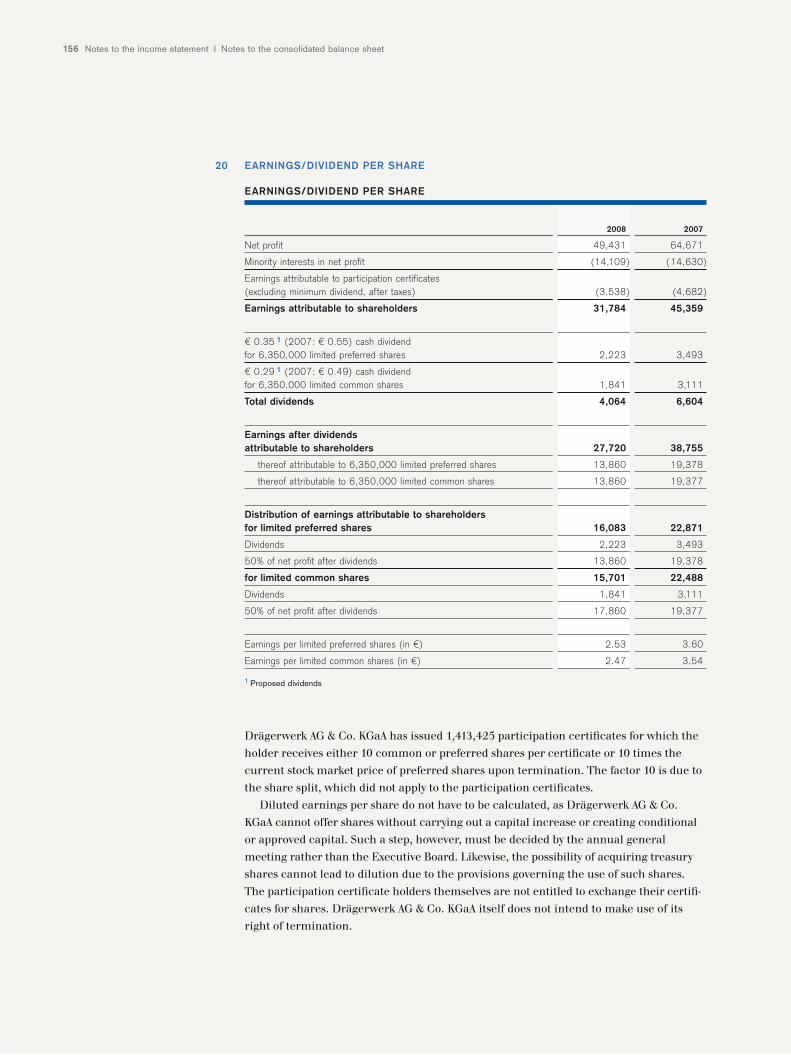
Notes to the income statement I Notes to the consolidated balance sheet156
EARNINGS/DIVIDEND PER SHARE
Drägerwerk AG & Co. KGaA has issued 1,413,425 participation certificates for which the
holder receives either 10 common or preferred shares per certificate or 10 times the
current stock market price of preferred shares upon termination. The factor 10 is due to
the share split, which did not apply to the participation certificates.
Diluted earnings per share do not have to be calculated, as Drägerwerk AG & Co.
KGaA cannot offer shares without carrying out a capital increase or creating conditional
or approved capital. Such a step, however, must be decided by the annual general
meeting rather than the Executive Board. Likewise, the possibility of acquiring treasury
shares cannot lead to dilution due to the provisions governing the use of such shares.
The participation certificate holders themselves are not entitled to exchange their certifi-
cates for shares. Drägerwerk AG & Co. KGaA itself does not intend to make use of its
right of termination.
20
2008 2007
Net profit 49,431 64,671
Minority interests in net profit (14,109) (14,630)
Earnings attributable to participation certificates (excluding minimum dividend, after taxes) (3,538) (4,682)
Earnings attributable to shareholders 31,784 45,359
€ 0.35 1 (2007: € 0.55) cash dividend for 6,350,000 limited preferred shares 2,223 3,493
€ 0.29 1 (2007: € 0.49) cash dividendfor 6,350,000 limited common shares 1,841 3,111
Total dividends 4,064 6,604
Earnings after dividendsattributable to shareholders 27,720 38,755
thereof attributable to 6,350,000 limited preferred shares 13,860 19,378
thereof attributable to 6,350,000 limited common shares 13,860 19,377
Distribution of earnings attributable to shareholdersfor limited preferred shares 16,083 22,871
Dividends 2,223 3,493
50% of net profit after dividends 13,860 19,378
for limited common shares 15,701 22,488
Dividends 1,841 3,111
50% of net profit after dividends 17,860 19,377
Earnings per limited preferred shares (in €) 2.53 3.60
Earnings per limited common shares (in €) 2.47 3.54
1 Proposed dividends
EARNINGS/DIVIDEND PER SHARE
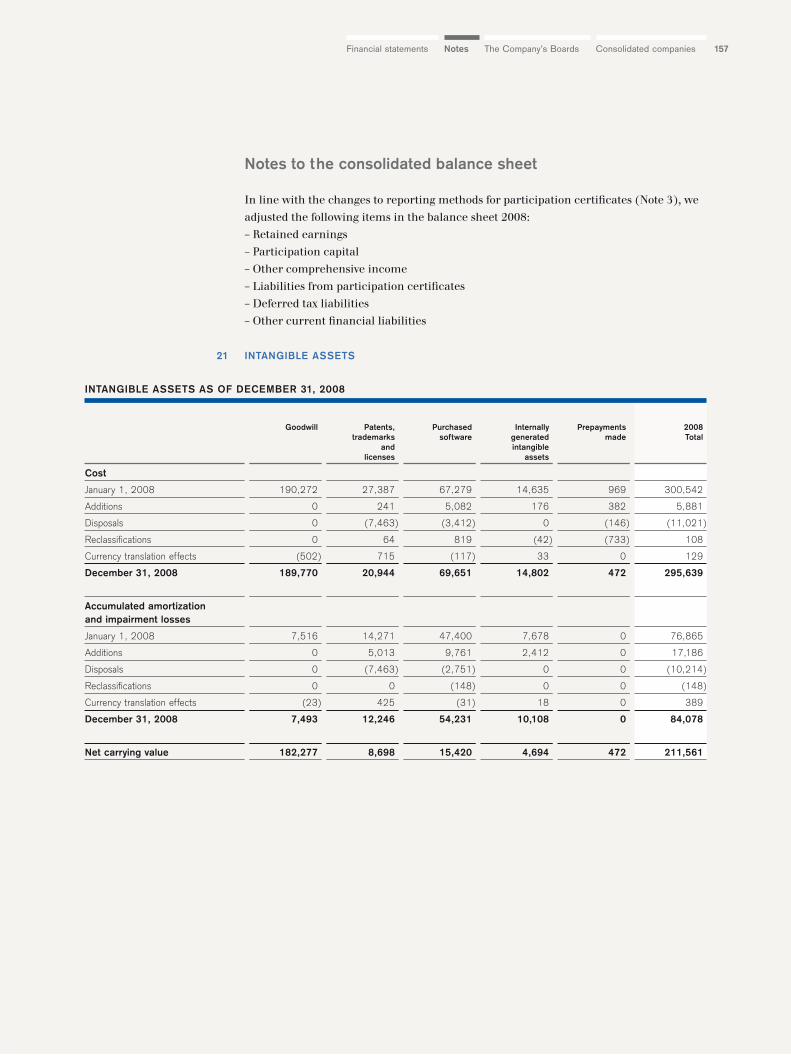
157The Company’s Boards Consolidated companiesNotesFinancial statements
Notes to the consolidated balance sheet
In line with the changes to reporting methods for participation certificates (Note 3), we
adjusted the following items in the balance sheet 2008:
– Retained earnings
– Participation capital
– Other comprehensive income
– Liabilities from participation certificates
– Deferred tax liabilities
– Other current financial liabilities
INTANGIBLE ASSETS21
Goodwill Patents, Purchased Internally Prepayments 2008trademarks software generated made Total
and intangible licenses assets
Cost
January 1, 2008 190,272 27,387 67,279 14,635 969 300,542
Additions 0 241 5,082 176 382 5,881
Disposals 0 (7,463) (3,412) 0 (146) (11,021)
Reclassifications 0 64 819 (42) (733) 108
Currency translation effects (502) 715 (117) 33 0 129
December 31, 2008 189,770 20,944 69,651 14,802 472 295,639
Accumulated amortizationand impairment losses
January 1, 2008 7,516 14,271 47,400 7,678 0 76,865
Additions 0 5,013 9,761 2,412 0 17,186
Disposals 0 (7,463) (2,751) 0 0 (10,214)
Reclassifications 0 0 (148) 0 0 (148)
Currency translation effects (23) 425 (31) 18 0 389
December 31, 2008 7,493 12,246 54,231 10,108 0 84,078
Net carrying value 182,277 8,698 15,420 4,694 472 211,561
INTANGIBLE ASSETS AS OF DECEMBER 31, 2008
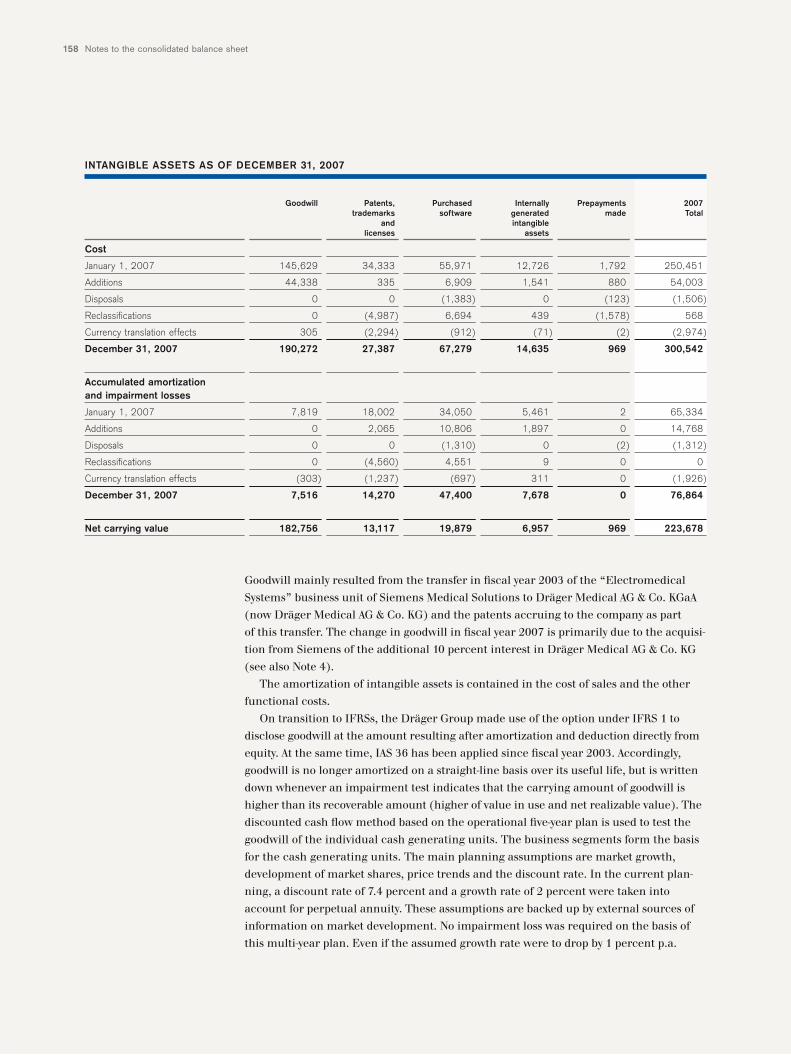
Notes to the consolidated balance sheet158
Goodwill mainly resulted from the transfer in fiscal year 2003 of the “Electromedical
Systems” business unit of Siemens Medical Solutions to Dräger Medical AG & Co. KGaA
(now Dräger Medical AG & Co. KG) and the patents accruing to the company as part
of this transfer. The change in goodwill in fiscal year 2007 is primarily due to the acquisi-
tion from Siemens of the additional 10 percent interest in Dräger Medical AG & Co. KG
(see also Note 4).
The amortization of intangible assets is contained in the cost of sales and the other
functional costs.
On transition to IFRSs, the Dräger Group made use of the option under IFRS 1 to
disclose goodwill at the amount resulting after amortization and deduction directly from
equity. At the same time, IAS 36 has been applied since fiscal year 2003. Accordingly,
goodwill is no longer amortized on a straight-line basis over its useful life, but is written
down whenever an impairment test indicates that the carrying amount of goodwill is
higher than its recoverable amount (higher of value in use and net realizable value). The
discounted cash flow method based on the operational five-year plan is used to test the
goodwill of the individual cash generating units. The business segments form the basis
for the cash generating units. The main planning assumptions are market growth,
development of market shares, price trends and the discount rate. In the current plan-
ning, a discount rate of 7.4 percent and a growth rate of 2 percent were taken into
account for perpetual annuity. These assumptions are backed up by external sources of
information on market development. No impairment loss was required on the basis of
this multi-year plan. Even if the assumed growth rate were to drop by 1 percent p.a.
Goodwill Patents, Purchased Internally Prepayments 2007trademarks software generated made Total
and intangible licenses assets
Cost
January 1, 2007 145,629 34,333 55,971 12,726 1,792 250,451
Additions 44,338 335 6,909 1,541 880 54,003
Disposals 0 0 (1,383) 0 (123) (1,506)
Reclassifications 0 (4,987) 6,694 439 (1,578) 568
Currency translation effects 305 (2,294) (912) (71) (2) (2,974)
December 31, 2007 190,272 27,387 67,279 14,635 969 300,542
Accumulated amortizationand impairment losses
January 1, 2007 7,819 18,002 34,050 5,461 2 65,334
Additions 0 2,065 10,806 1,897 0 14,768
Disposals 0 0 (1,310) 0 (2) (1,312)
Reclassifications 0 (4,560) 4,551 9 0 0
Currency translation effects (303) (1,237) (697) 311 0 (1,926)
December 31, 2007 7,516 14,270 47,400 7,678 0 76,864
Net carrying value 182,756 13,117 19,879 6,957 969 223,678
INTANGIBLE ASSETS AS OF DECEMBER 31, 2007
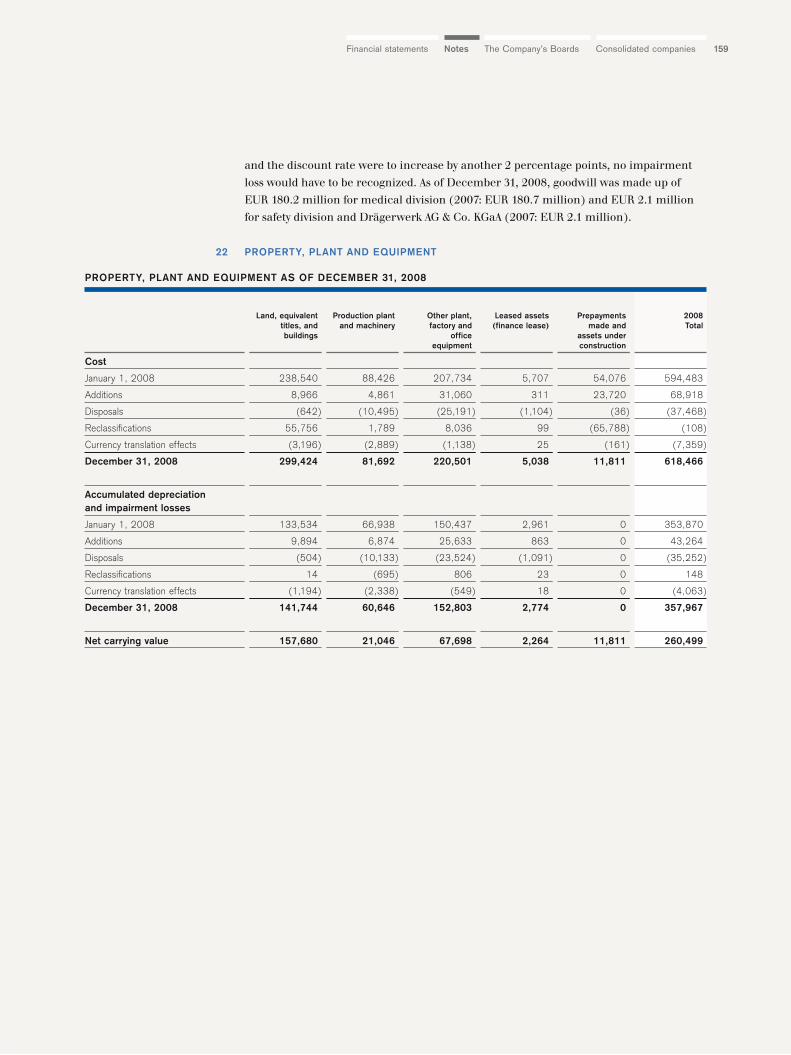
159The Company’s Boards Consolidated companiesNotesFinancial statements
and the discount rate were to increase by another 2 percentage points, no impairment
loss would have to be recognized. As of December 31, 2008, goodwill was made up of
EUR 180.2 million for medical division (2007: EUR 180.7 million) and EUR 2.1 million
for safety division and Drägerwerk AG & Co. KGaA (2007: EUR 2.1 million).
PROPERTY, PLANT AND EQUIPMENT22
Land, equivalent Production plant Other plant, Leased assets Prepayments 2008titles, and and machinery factory and (finance lease) made and Totalbuildings office assets under
equipment construction
Cost
January 1, 2008 238,540 88,426 207,734 5,707 54,076 594,483
Additions 8,966 4,861 31,060 311 23,720 68,918
Disposals (642) (10,495) (25,191) (1,104) (36) (37,468)
Reclassifications 55,756 1,789 8,036 99 (65,788) (108)
Currency translation effects (3,196) (2,889) (1,138) 25 (161) (7,359)
December 31, 2008 299,424 81,692 220,501 5,038 11,811 618,466
Accumulated depreciationand impairment losses
January 1, 2008 133,534 66,938 150,437 2,961 0 353,870
Additions 9,894 6,874 25,633 863 0 43,264
Disposals (504) (10,133) (23,524)) (1,091) 0 (35,252)
Reclassifications 14 (695) 806 23 0 148
Currency translation effects (1,194) (2,338) (549) 18 0 (4,063)
December 31, 2008 141,744 60,646 152,803 2,774 0 357,967
Net carrying value 157,680 21,046 67,698 2,264 11,811 260,499
PROPERTY, PLANT AND EQUIPMENT AS OF DECEMBER 31, 2008
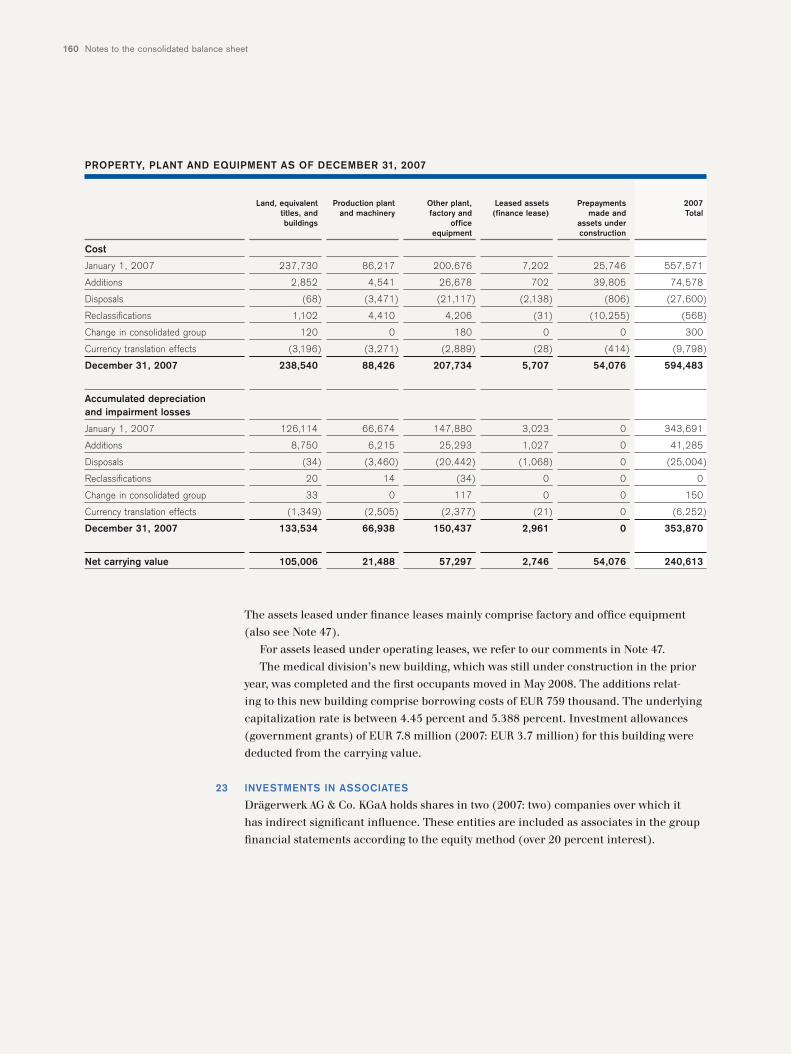
Notes to the consolidated balance sheet160
The assets leased under finance leases mainly comprise factory and office equipment
(also see Note 47).
For assets leased under operating leases, we refer to our comments in Note 47.
The medical division’s new building, which was still under construction in the prior
year, was completed and the first occupants moved in May 2008. The additions relat-
ing to this new building comprise borrowing costs of EUR 759 thousand. The underlying
capitalization rate is between 4.45 percent and 5.388 percent. Investment allowances
(government grants) of EUR 7.8 million (2007: EUR 3.7 million) for this building were
deducted from the carrying value.
INVESTMENTS IN ASSOCIATES
Drägerwerk AG & Co. KGaA holds shares in two (2007: two) companies over which it
has indirect significant influence. These entities are included as associates in the group
financial statements according to the equity method (over 20 percent interest).
23
Land, equivalent Production plant Other plant, Leased assets Prepayments 2007titles, and and machinery factory and (finance lease) made and Totalbuildings office assets under
equipment construction
Cost
January 1, 2007 237,730 86,217 200,676 7,202 25,746 557,571
Additions 2,852 4,541 26,678 702 39,805 74,578
Disposals (68) (3,471) (21,117) (2,138) (806) (27,600)
Reclassifications 1,102 4,410 4,206 (31) (10,255) (568)
Change in consolidated group 120 0 180 0 0 300
Currency translation effects (3,196) (3,271) (2,889) (28) (414) (9,798)
December 31, 2007 238,540 88,426 207,734 5,707 54,076 594,483
Accumulated depreciationand impairment losses
January 1, 2007 126,114 66,674 147,880 3,023 0 343,691
Additions 8,750 6,215 25,293 1,027 0 41,285
Disposals (34) (3,460) (20,442) (1,068) 0 (25,004)
Reclassifications 20 14 (34) 0 0 0
Change in consolidated group 33 0 117 0 0 150
Currency translation effects (1,349) (2,505) (2,377)) (21) 0 (6,252)
December 31, 2007 133,534 66,938 150,437 2,961 0 353,870
Net carrying value 105,006 21,488 57,297 2,746 54,076 240,613
PROPERTY, PLANT AND EQUIPMENT AS OF DECEMBER 31, 2007
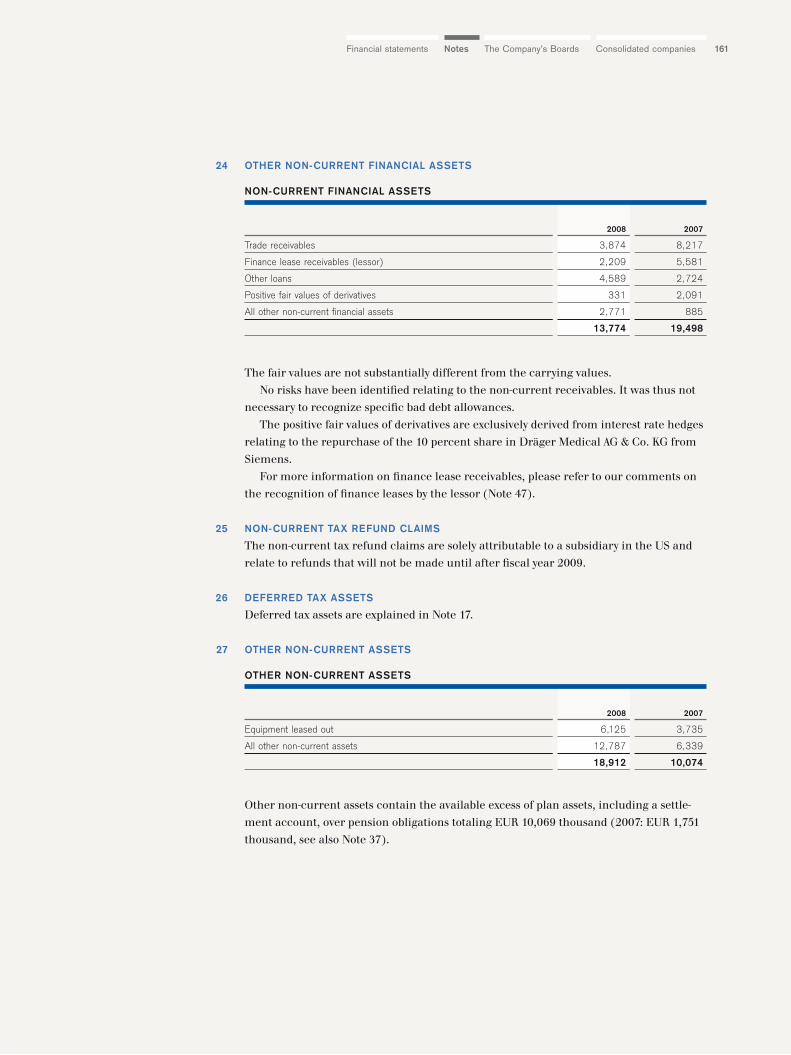
161The Company’s Boards Consolidated companiesNotesFinancial statements
OTHER NON-CURRENT FINANCIAL ASSETS
The fair values are not substantially different from the carrying values.
No risks have been identified relating to the non-current receivables. It was thus not
necessary to recognize specific bad debt allowances.
The positive fair values of derivatives are exclusively derived from interest rate hedges
relating to the repurchase of the 10 percent share in Dräger Medical AG & Co. KG from
Siemens.
For more information on finance lease receivables, please refer to our comments on
the recognition of finance leases by the lessor (Note 47).
NON-CURRENT TAX REFUND CLAIMS
The non-current tax refund claims are solely attributable to a subsidiary in the US and
relate to refunds that will not be made until after fiscal year 2009.
DEFERRED TAX ASSETS
Deferred tax assets are explained in Note 17.
OTHER NON-CURRENT ASSETS
Other non-current assets contain the available excess of plan assets, including a settle-
ment account, over pension obligations totaling EUR 10,069 thousand (2007: EUR 1,751
thousand, see also Note 37).
24
25
26
27
2008 2007
Trade receivables 3,874 8,217
Finance lease receivables (lessor) 2,209 5,581
Other loans 4,589 2,724
Positive fair values of derivatives 331 2,091
All other non-current financial assets 2,771 885
13,774 19,498
NON-CURRENT FINANCIAL ASSETS
2008 2007
Equipment leased out 6,125 3,735
All other non-current assets 12,787 6,339
18,912 10,074
OTHER NON-CURRENT ASSETS
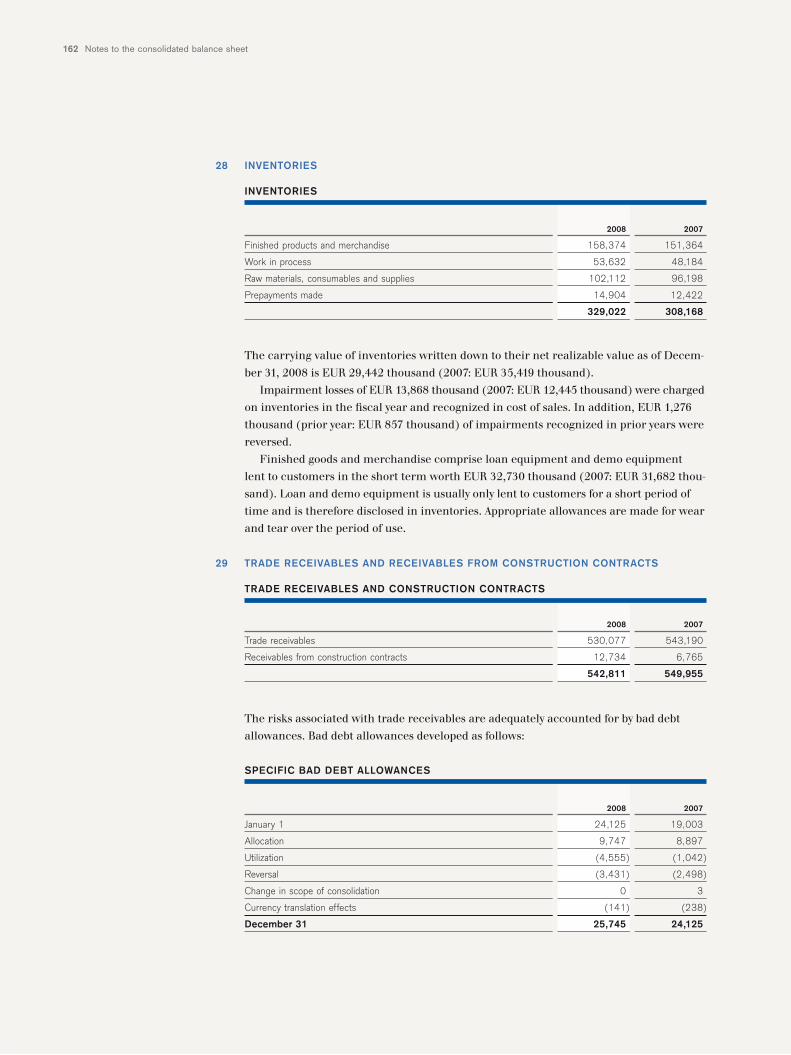
Notes to the consolidated balance sheet162
INVENTORIES
The carrying value of inventories written down to their net realizable value as of Decem-
ber 31, 2008 is EUR 29,442 thousand (2007: EUR 35,419 thousand).
Impairment losses of EUR 13,868 thousand (2007: EUR 12,445 thousand) were charged
on inventories in the fiscal year and recognized in cost of sales. In addition, EUR 1,276
thousand (prior year: EUR 857 thousand) of impairments recognized in prior years were
reversed.
Finished goods and merchandise comprise loan equipment and demo equipment
lent to customers in the short term worth EUR 32,730 thousand (2007: EUR 31,682 thou-
sand). Loan and demo equipment is usually only lent to customers for a short period of
time and is therefore disclosed in inventories. Appropriate allowances are made for wear
and tear over the period of use.
TRADE RECEIVABLES AND RECEIVABLES FROM CONSTRUCTION CONTRACTS
The risks associated with trade receivables are adequately accounted for by bad debt
allowances. Bad debt allowances developed as follows:
28
29
2008 2007
Finished products and merchandise 158,374 151,364
Work in process 53,632 48,184
Raw materials, consumables and supplies 102,112 96,198
Prepayments made 14,904 12,422
329,022 308,168
INVENTORIES
2008 2007
Trade receivables 530,077 543,190
Receivables from construction contracts 12,734 6,765
542,811 549,955
TRADE RECEIVABLES AND CONSTRUCTION CONTRACTS
2008 2007
January 1 24,125 19,003
Allocation 9,747 8,897
Utilization (4,555) (1,042)
Reversal (3,431) (2,498)
Change in scope of consolidation 0 3
Currency translation effects (141) (238)
December 31 25,745 24,125
SPECIFIC BAD DEBT ALLOWANCES
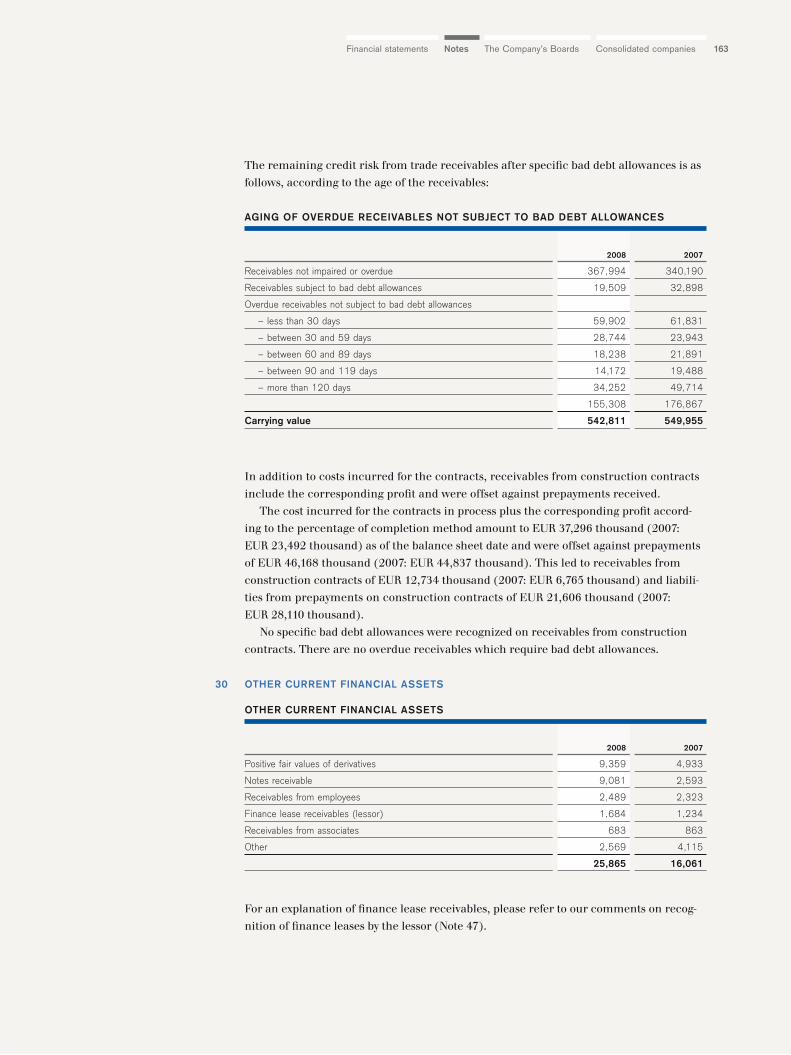
163The Company’s Boards Consolidated companiesNotesFinancial statements
The remaining credit risk from trade receivables after specific bad debt allowances is as
follows, according to the age of the receivables:
In addition to costs incurred for the contracts, receivables from construction contracts
include the corresponding profit and were offset against prepayments received.
The cost incurred for the contracts in process plus the corresponding profit accord-
ing to the percentage of completion method amount to EUR 37,296 thousand (2007:
EUR 23,492 thousand) as of the balance sheet date and were offset against prepayments
of EUR 46,168 thousand (2007: EUR 44,837 thousand). This led to receivables from
construction contracts of EUR 12,734 thousand (2007: EUR 6,765 thousand) and liabili-
ties from prepayments on construction contracts of EUR 21,606 thousand (2007:
EUR 28,110 thousand).
No specific bad debt allowances were recognized on receivables from construction
contracts. There are no overdue receivables which require bad debt allowances.
OTHER CURRENT FINANCIAL ASSETS
For an explanation of finance lease receivables, please refer to our comments on recog-
nition of finance leases by the lessor (Note 47).
30
2008 2007
Receivables not impaired or overdue 367,994 340,190
Receivables subject to bad debt allowances 19,509 32,898
Overdue receivables not subject to bad debt allowances
– less than 30 days 59,902 61,831
– between 30 and 59 days 28,744 23,943
– between 60 and 89 days 18,238 21,891
– between 90 and 119 days 14,172 19,488
– more than 120 days 34,252 49,714
155,308 176,867
Carrying value 542,811 549,955
AGING OF OVERDUE RECEIVABLES NOT SUBJECT TO BAD DEBT ALLOWANCES
2008 2007
Positive fair values of derivatives 9,359 4,933
Notes receivable 9,081 2,593
Receivables from employees 2,489 2,323
Finance lease receivables (lessor) 1,684 1,234
Receivables from associates 683 863
Other 2,569 4,115
25,865 16,061
OTHER CURRENT FINANCIAL ASSETS
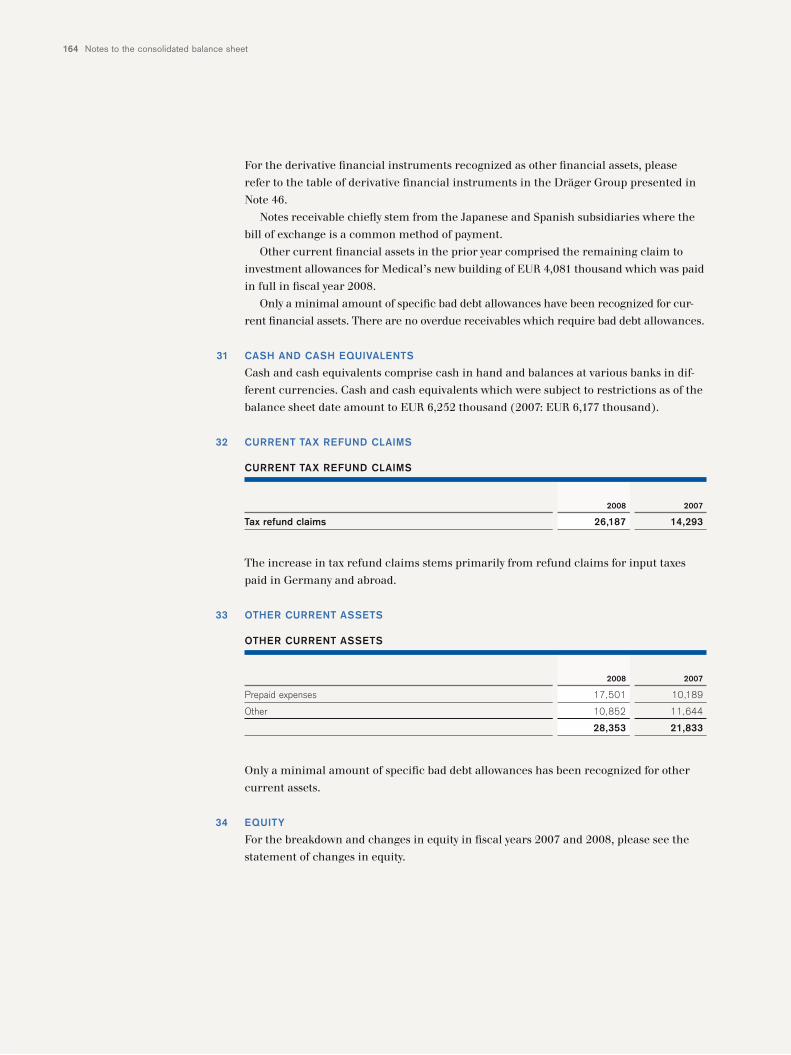
Notes to the consolidated balance sheet164
For the derivative financial instruments recognized as other financial assets, please
refer to the table of derivative financial instruments in the Dräger Group presented in
Note 46.
Notes receivable chiefly stem from the Japanese and Spanish subsidiaries where the
bill of exchange is a common method of payment.
Other current financial assets in the prior year comprised the remaining claim to
investment allowances for Medical’s new building of EUR 4,081 thousand which was paid
in full in fiscal year 2008.
Only a minimal amount of specific bad debt allowances have been recognized for cur-
rent financial assets. There are no overdue receivables which require bad debt allowances.
CASH AND CASH EQUIVALENTS
Cash and cash equivalents comprise cash in hand and balances at various banks in dif-
ferent currencies. Cash and cash equivalents which were subject to restrictions as of the
balance sheet date amount to EUR 6,252 thousand (2007: EUR 6,177 thousand).
CURRENT TAX REFUND CLAIMS
The increase in tax refund claims stems primarily from refund claims for input taxes
paid in Germany and abroad.
OTHER CURRENT ASSETS
Only a minimal amount of specific bad debt allowances has been recognized for other
current assets.
EQUITY
For the breakdown and changes in equity in fiscal years 2007 and 2008, please see the
statement of changes in equity.
31
32
33
34
2008 2007
Tax refund claims 26,187 14,293
CURRENT TAX REFUND CLAIMS
2008 2007
Prepaid expenses 17,501 10,189
Other 10,852 11,644
28,353 21,833
OTHER CURRENT ASSETS
165The Company’s Boards Consolidated companiesNotesFinancial statements
Capital stockThe capital stock of Drägerwerk AG & Co. KGaA remains unchanged at EUR 32,512 thou-
sand. The capital stock is divided into 6,350,000 limited no-par bearer shares each of
common and non-voting preferred shares. Drägerwerk Verwaltungs AG, the general part-
ner, holds no shares in capital.
All shares have been fully paid in. As before, the preferred shares are traded on the
capital market.
Other than voting rights, the preferred shares have the same rights as those attached
to the common shares. As compensation for the lack of voting rights, an advance divi-
dend of EUR 0.13 per preferred share is distributed from net earnings.
If sufficient profits are available, a dividend of EUR 0.13 per common share is then
paid. Any profit in excess of this amount, if distributed, is allocated so preferred shares
receive EUR 0.06 more than common shares.
If the profit is not sufficient to distribute the advance dividend for preferred shares
in one or more years, the amounts are paid from the profit of subsequent fiscal years
before a dividend is paid on common shares.
If amounts in arrears are not paid in the next year along with the full preferred dividend
for that year, the preferred shareholders have voting rights until the arrears have been
paid.
In the event of liquidation, the preferred shareholders receive 25 percent of net liqui-
dation proceeds in advance. The remaining liquidation proceeds are distributed evenly
to all shares.
At the time of preparing the financial statements for fiscal year 2008, Drägerwerk AG &
Co. KGaA had neither conditional nor approved capital at its disposal.
Drägerwerk AG & Co. KGaA does not grant any share-based payments (share option
plan).
Capital reservesThe capital reserves originated from share premiums from Drägerwerk AG & Co. KGaA’s
(trans)formation in 1970 and from capital increases in 1979, 1981 and 1991.
Retained earningsRetained earnings comprise the earnings generated until fiscal year 2008 by the com-
panies included in the group financial statements, where they were not attributed
to minority interests or paid as a dividend by Drägerwerk AG & Co. KGaA. The portion of
group earnings for fiscal year 2008 to be distributed as a dividend by Drägerwerk AG &
Co. KGaA is disclosed under group net earnings rather than under this item.
Participation capitalIn terms of the recognized equity component for each participation certificate series
in the financial statements we refer to our comments in Notes 3 and 36 for more infor-
mation.
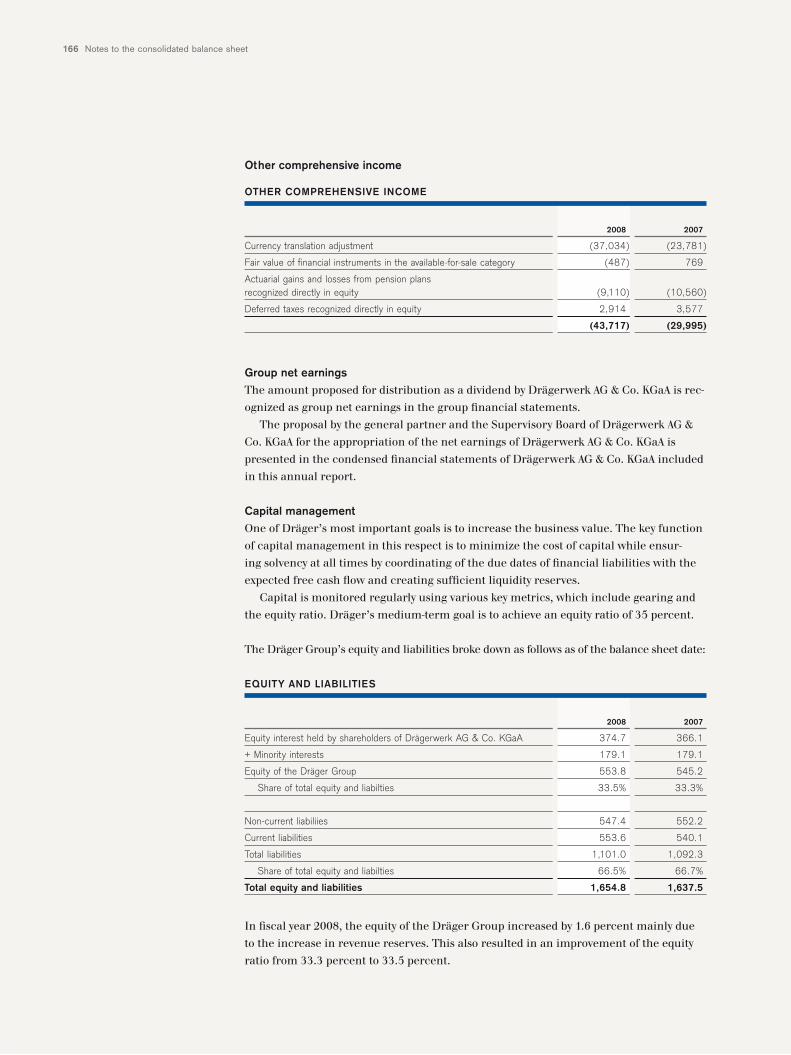
Notes to the consolidated balance sheet166
Other comprehensive income
Group net earningsThe amount proposed for distribution as a dividend by Drägerwerk AG & Co. KGaA is rec-
ognized as group net earnings in the group financial statements.
The proposal by the general partner and the Supervisory Board of Drägerwerk AG &
Co. KGaA for the appropriation of the net earnings of Drägerwerk AG & Co. KGaA is
presented in the condensed financial statements of Drägerwerk AG & Co. KGaA included
in this annual report.
Capital managementOne of Dräger’s most important goals is to increase the business value. The key function
of capital management in this respect is to minimize the cost of capital while ensur-
ing solvency at all times by coordinating of the due dates of financial liabilities with the
expected free cash flow and creating sufficient liquidity reserves.
Capital is monitored regularly using various key metrics, which include gearing and
the equity ratio. Dräger’s medium-term goal is to achieve an equity ratio of 35 percent.
The Dräger Group’s equity and liabilities broke down as follows as of the balance sheet date:
In fiscal year 2008, the equity of the Dräger Group increased by 1.6 percent mainly due
to the increase in revenue reserves. This also resulted in an improvement of the equity
ratio from 33.3 percent to 33.5 percent.
2008 2007
Currency translation adjustment (37,034) (23,781)
Fair value of financial instruments in the available-for-sale category (487) 769
Actuarial gains and losses from pension plansrecognized directly in equity (9,110) (10,560)
Deferred taxes recognized directly in equity 2,914 3,577
(43,717) (29,995)
OTHER COMPREHENSIVE INCOME
2008 2007
Equity interest held by shareholders of Drägerwerk AG & Co. KGaA 374.7 366.1
+ Minority interests 179.1 179.1
Equity of the Dräger Group 553.8 545.2
Share of total equity and liabilties 33.5% 33.3%
Non-current liabiliies 547.4 552.2
Current liabilities 553.6 540.1
Total liabilities 1,101.0 1,092.3
Share of total equity and liabilties 66.5% 66.7%
Total equity and liabilities 1,654.8 1,637.5
EQUITY AND LIABILITIES
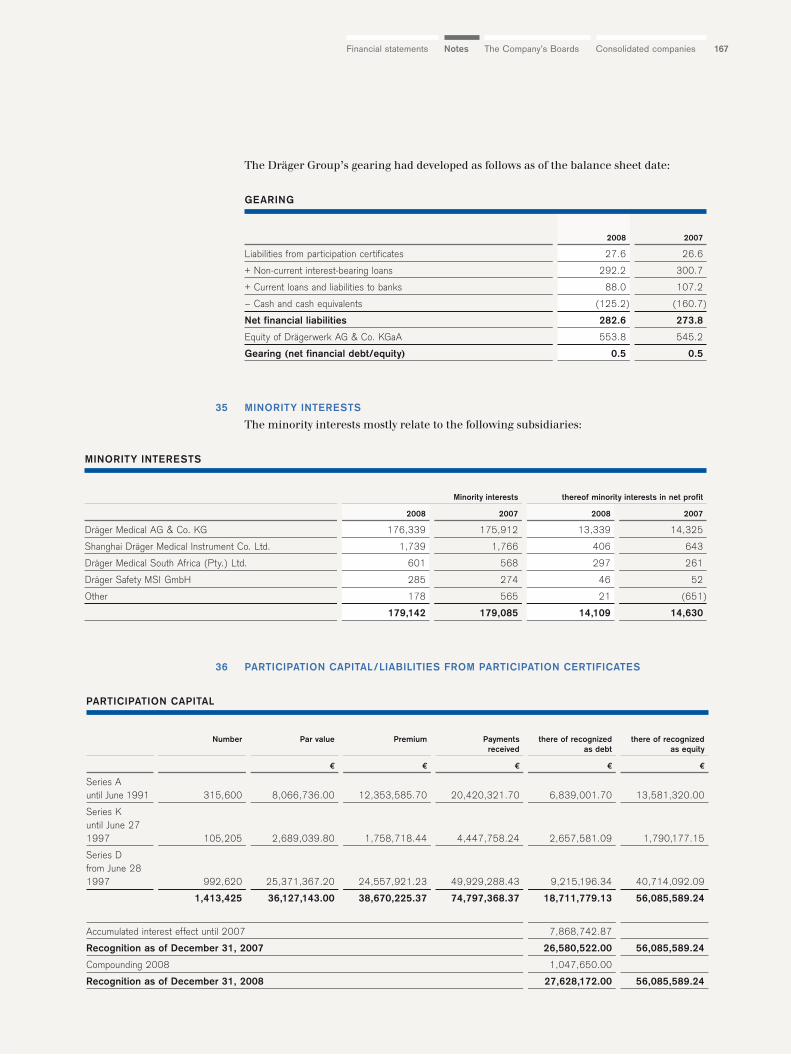
The Dräger Group’s gearing had developed as follows as of the balance sheet date:
MINORITY INTERESTS
The minority interests mostly relate to the following subsidiaries:
PARTICIPATION CAPITAL/LIABILITIES FROM PARTICIPATION CERTIFICATES
167The Company’s Boards Consolidated companiesNotesFinancial statements
35
2008 2007
Liabilities from participation certificates 27.6 26.6
+ Non-current interest-bearing loans 292.2 300.7
+ Current loans and liabilities to banks 88.0 107.2
– Cash and cash equivalents (125.2) (160.7)
Net financial liabilities 282.6 273.8
Equity of Drägerwerk AG & Co. KGaA 553.8 545.2
Gearing (net financial debt/equity) 0.5 0.5
GEARING
Minority interests thereof minority interests in net profit
2008 2007 2008 2007
Dräger Medical AG & Co. KG 176,339 175,912 13,339 14,325
Shanghai Dräger Medical Instrument Co. Ltd. 1,739 1,766 406 643
Dräger Medical South Africa (Pty.) Ltd. 601 568 297 261
Dräger Safety MSI GmbH 285 274 46 52
Other 178 565 21 (651)
179,142 179,085 14,109 14,630
MINORITY INTERESTS
36
Number Par value Premium Payments there of recognized there of recognizedreceived as debt as equity
€ € € € €
Series Auntil June 1991 315,600 8,066,736.00 12,353,585.70 20,420,321.70 6,839,001.70 13,581,320.00
Series Kuntil June 27 1997 105,205 2,689,039.80 1,758,718.44 4,447,758.24 2,657,581.09 1,790,177.15
Series Dfrom June 28 1997 992,620 25,371,367.20 24,557,921.23 49,929,288.43 9,215,196.34 40,714,092.09
1,413,425 36,127,143.00 38,670,225.37 74,797,368.37 18,711,779.13 56,085,589.24
Accumulated interest effect until 2007 7,868,742.87
Recognition as of December 31, 2007 26,580,522.00 56,085,589.24
Compounding 2008 1,047,650.00
Recognition as of December 31, 2008 27,628,172.00 56,085,589.24
PARTICIPATION CAPITAL
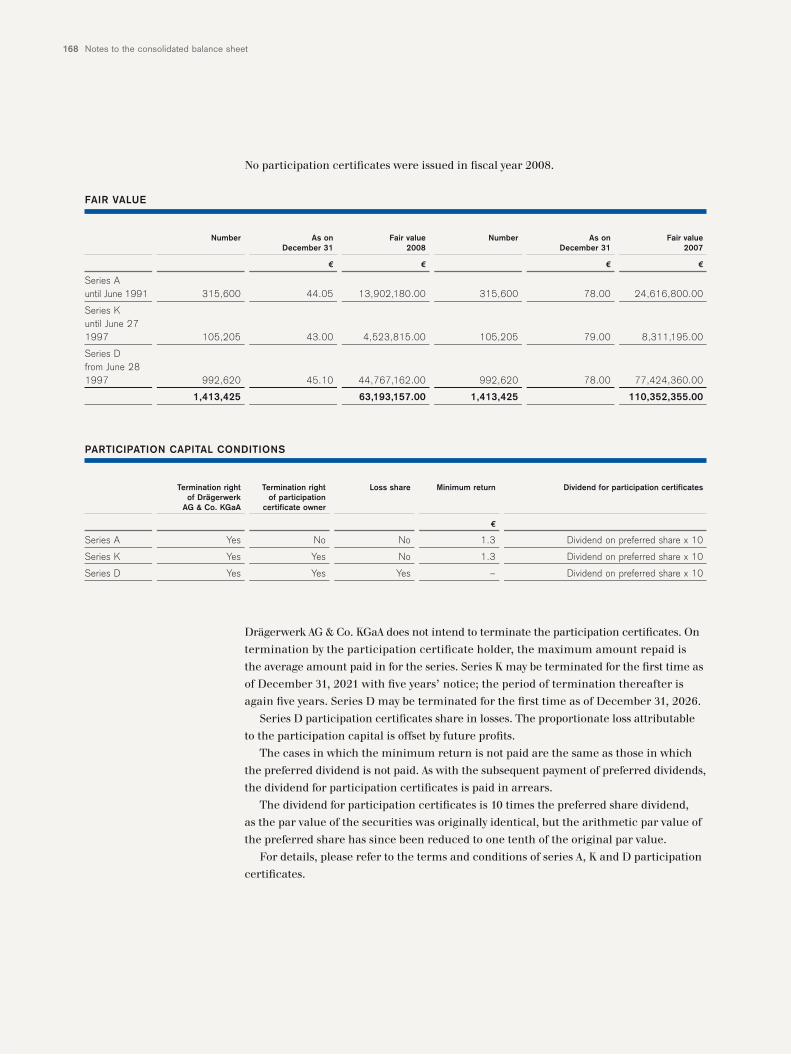
Notes to the consolidated balance sheet168
No participation certificates were issued in fiscal year 2008.
Drägerwerk AG & Co. KGaA does not intend to terminate the participation certificates. On
termination by the participation certificate holder, the maximum amount repaid is
the average amount paid in for the series. Series K may be terminated for the first time as
of December 31, 2021 with five years’ notice; the period of termination thereafter is
again five years. Series D may be terminated for the first time as of December 31, 2026.
Series D participation certificates share in losses. The proportionate loss attributable
to the participation capital is offset by future profits.
The cases in which the minimum return is not paid are the same as those in which
the preferred dividend is not paid. As with the subsequent payment of preferred dividends,
the dividend for participation certificates is paid in arrears.
The dividend for participation certificates is 10 times the preferred share dividend,
as the par value of the securities was originally identical, but the arithmetic par value of
the preferred share has since been reduced to one tenth of the original par value.
For details, please refer to the terms and conditions of series A, K and D participation
certificates.
Termination right Termination right Loss share Minimum return Dividend for participation certificatesof Drägerwerk of participation
AG & Co. KGaA certificate owner
€
Series A Yes No No 1.3 Dividend on preferred share x 10
Series K Yes Yes No 1.3 Dividend on preferred share x 10
Series D Yes Yes Yes – Dividend on preferred share x 10
PARTICIPATION CAPITAL CONDITIONS
Number As on Fair value Number As on Fair valueDecember 31 2008 December 31 2007
€ € € €
Series Auntil June 1991 315,600 44.05 13,902,180.00 315,600 78.00 24,616,800.00
Series Kuntil June 27 1997 105,205 43.00 4,523,815.00 105,205 79.00 8,311,195.00
Series Dfrom June 28 1997 992,620 45.10 44,767,162.00 992,620 78.00 77,424,360.00
1,413,425 63,193,157.00 1,413,425 110,352,355.00
FAIR VALUE
169The Company’s Boards Consolidated companiesNotesFinancial statements
PROVISIONS FOR PENSIONS AND SIMILAR OBLIGATIONS
As of December 31, 2008, the Dräger Group mainly had defined benefit pension plans
and similar obligations in addition to a small number of defined contribution pension
plans.
Defined benefit pension plans and similar obligationsUnder the Group’s defined benefit pension plans, provisions for pensions and similar
obligations have been accrued for benefits payable in the form of old-age, disability
and surviving dependent pensions. The amount of the obligations is determined using
the projected unit credit method. The obligations are partly funded by plan assets.
The Dräger Group has decided to exercise the option under IAS 19.93A of disregard-
ing the ten percent corridor and fully recognizing actuarial gains or losses in equity
immediately, taking account of deferred taxes. The actuarial gains or losses recognized
in equity are reconciled in the separate statement of recognized income and expenses.
The defined benefit pension plans of the German companies account for some 94 per-
cent (2007: 97 percent) of the provisions for pensions and similar obligations dis-
closed as of the balance sheet date. As of January 1, 2005, the new company pension plans
“Rentenplan 2005” for almost all employees of the Dräger Group’s German subsidiaries
and “Führungskräfteversorgung 2005” for management came into effect, superseding
the former “Versorgungsordnung ’90” and “Ruhegeldordnung ’90” schemes.
Under the old pension plan, employees received pensions based on their salaries and
period of employment. As part of the transition to the new plan, employees were
guaranteed a pension based on the old plan for their years of service prior to the transi-
tion.
The new plan is now composed of three levels: the employer-funded basic level, the
employee-funded top-up level (deferred compensation) and the employer-funded supple-
mentary level.
The pension cost for the employer-funded basic level is based on the respective employ-
ee’s income.
The employee funded top-up level allows employees to increase their pension entitle-
ment through deferred compensation.
The contribution made at the employer-funded supplementary level depends on the
employee contribution through deferred compensation and on the Company’s business
performance (EBIT).
Since December 2007, these funds from the pension plan as well as the employee
contributions from the respective fiscal year have been paid into a new fund (WKN
[securities identification number] AOHG1B) and secured in favor of the employees via a
contractual trust arrangement (CTA), meaning that they only serve to cover and finance
the Company’s direct pension obligations. The employees’ pension accounts have a mini-
mum guaranteed return of 2.75 percent. Hence, the assets of this fund fulfill the crite-
ria of plan assets pursuant to IAS 19, the EUR 15,546 thousand (2007: EUR 12,095 thou-
sand) in assets secured by the CTA were offset against the gross pension obligations in
fiscal year 2008.
The available excess of plan assets over the relevant pension obligations totaling
EUR 10,069 thousand (2007: EUR 1,751 thousand) is disclosed under other non-current
assets.
37
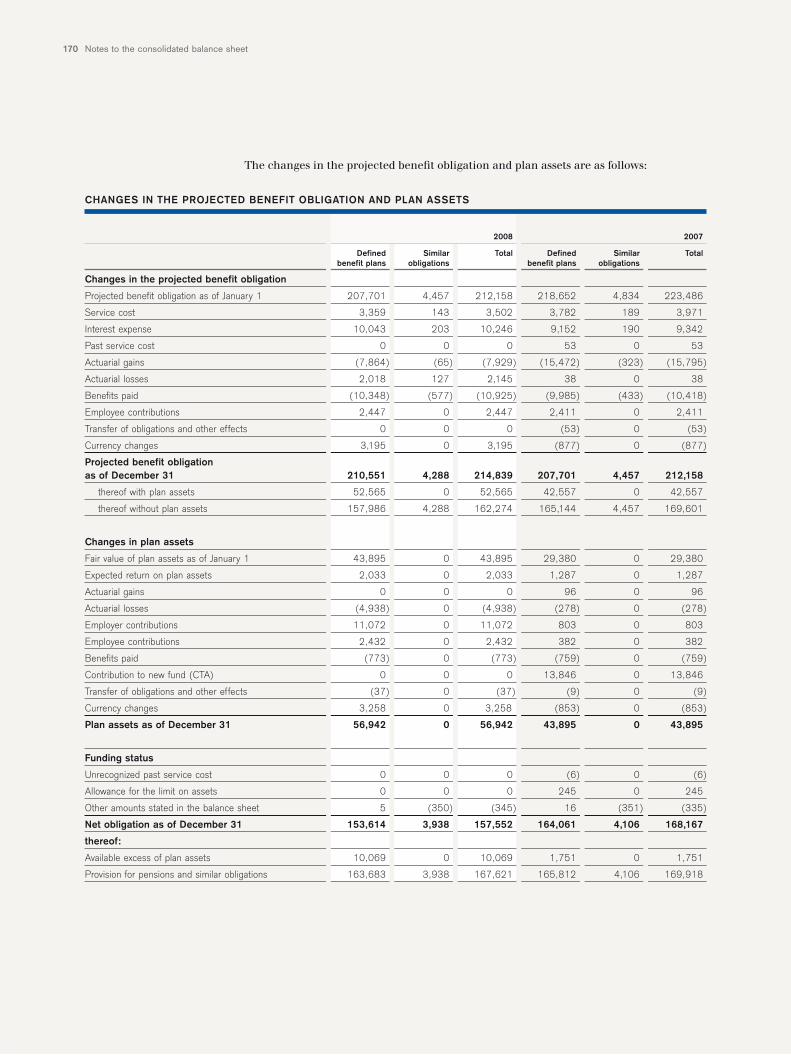
Notes to the consolidated balance sheet170
The changes in the projected benefit obligation and plan assets are as follows:
2008 2007
Defined Similar Total Defined Similar Totalbenefit plans obligations benefit plans obligations
Changes in the projected benefit obligation
Projected benefit obligation as of January 1 207,701 4,457 212,158 218,652 4,834 223,486
Service cost 3,359 143 3,502 3,782 189 3,971
Interest expense 10,043 203 10,246 9,152 190 9,342
Past service cost 0 0 0 53 0 53
Actuarial gains (7,864) (65) (7,929) (15,472) (323) (15,795)
Actuarial losses 2,018 127 2,145 38 0 38
Benefits paid (10,348) (577) (10,925) (9,985) (433) (10,418)
Employee contributions 2,447 0 2,447 2,411 0 2,411
Transfer of obligations and other effects 0 0 0 (53) 0 (53)
Currency changes 3,195 0 3,195 (877) 0 (877)
Projected benefit obligation as of December 31 210,551 4,288 214,839 207,701 4,457 212,158
thereof with plan assets 52,565 0 52,565 42,557 0 42,557
thereof without plan assets 157,986 4,288 162,274 165,144 4,457 169,601
Changes in plan assets
Fair value of plan assets as of January 1 43,895 0 43,895 29,380 0 29,380
Expected return on plan assets 2,033 0 2,033 1,287 0 1,287
Actuarial gains 0 0 0 96 0 96
Actuarial losses (4,938) 0 (4,938) (278) 0 (278)
Employer contributions 11,072 0 11,072 803 0 803
Employee contributions 2,432 0 2,432 382 0 382
Benefits paid (773) 0 (773) (759) 0 (759)
Contribution to new fund (CTA) 0 0 0 13,846 0 13,846
Transfer of obligations and other effects (37) 0 (37) (9) 0 (9)
Currency changes 3,258 0 3,258 (853) 0 (853)
Plan assets as of December 31 56,942 0 56,942 43,895 0 43,895
Funding status
Unrecognized past service cost 0 0 0 (6) 0 (6)
Allowance for the limit on assets 0 0 0 245 0 245
Other amounts stated in the balance sheet 5 (350) (345) 16 (351) (335)
Net obligation as of December 31 153,614 3,938 157,552 164,061 4,106 168,167
thereof:
Available excess of plan assets 10,069 0 10,069 1,751 0 1,751
Provision for pensions and similar obligations 163,683 3,938 167,621 165,812 4,106 169,918
CHANGES IN THE PROJECTED BENEFIT OBLIGATION AND PLAN ASSETS
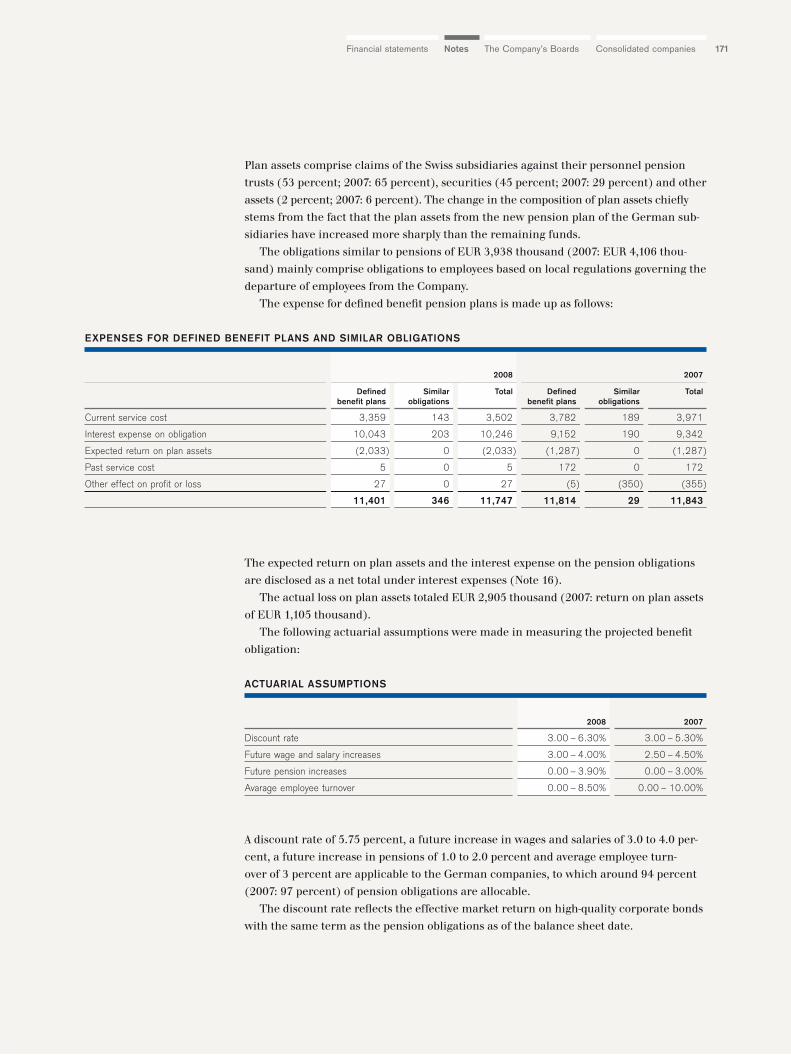
171The Company’s Boards Consolidated companiesNotesFinancial statements
Plan assets comprise claims of the Swiss subsidiaries against their personnel pension
trusts (53 percent; 2007: 65 percent), securities (45 percent; 2007: 29 percent) and other
assets (2 percent; 2007: 6 percent). The change in the composition of plan assets chiefly
stems from the fact that the plan assets from the new pension plan of the German sub-
sidiaries have increased more sharply than the remaining funds.
The obligations similar to pensions of EUR 3,938 thousand (2007: EUR 4,106 thou-
sand) mainly comprise obligations to employees based on local regulations governing the
departure of employees from the Company.
The expense for defined benefit pension plans is made up as follows:
The expected return on plan assets and the interest expense on the pension obligations
are disclosed as a net total under interest expenses (Note 16).
The actual loss on plan assets totaled EUR 2,905 thousand (2007: return on plan assets
of EUR 1,105 thousand).
The following actuarial assumptions were made in measuring the projected benefit
obligation:
A discount rate of 5.75 percent, a future increase in wages and salaries of 3.0 to 4.0 per-
cent, a future increase in pensions of 1.0 to 2.0 percent and average employee turn-
over of 3 percent are applicable to the German companies, to which around 94 percent
(2007: 97 percent) of pension obligations are allocable.
The discount rate reflects the effective market return on high-quality corporate bonds
with the same term as the pension obligations as of the balance sheet date.
2008 2007
Defined Similar Total Defined Similar Totalbenefit plans obligations benefit plans obligations
Current service cost 3,359 143 3,502 3,782 189 3,971
Interest expense on obligation 10,043 203 10,246 9,152 190 9,342
Expected return on plan assets (2,033) 0 (2,033) (1,287) 0 (1,287)
Past service cost 5 0 5 172 0 172
Other effect on profit or loss 27 0 27 (5) (350) (355)
11,401 346 11,747 11,814 29 11,843
EXPENSES FOR DEFINED BENEFIT PLANS AND SIMILAR OBLIGATIONS
2008 2007
Discount rate 3.00 – 6.30% 3.00 – 5.30%
Future wage and salary increases 3.00 – 4.00% 2.50 – 4.50%
Future pension increases 0.00 – 3.90% 0.00 – 3.00%
Avarage employee turnover 0.00 – 8.50% 0.00 – 10.00%
ACTUARIAL ASSUMPTIONS
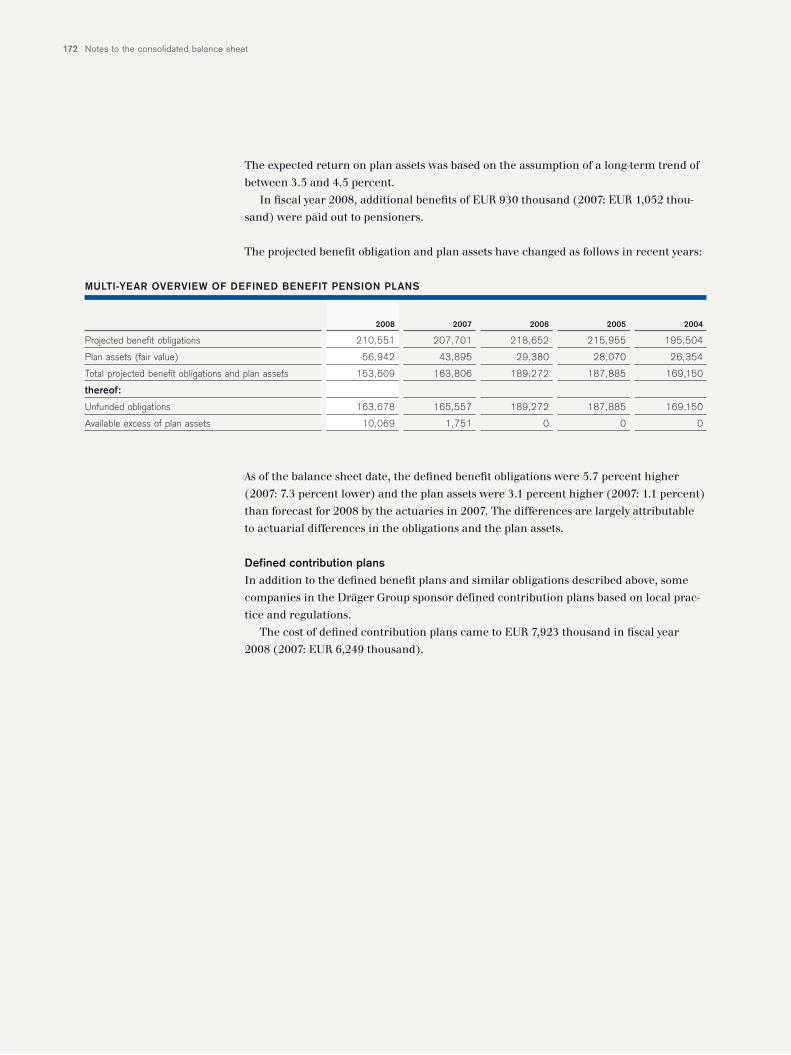
Notes to the consolidated balance sheet172
The expected return on plan assets was based on the assumption of a long-term trend of
between 3.5 and 4.5 percent.
In fiscal year 2008, additional benefits of EUR 930 thousand (2007: EUR 1,052 thou-
sand) were paid out to pensioners.
The projected benefit obligation and plan assets have changed as follows in recent years:
As of the balance sheet date, the defined benefit obligations were 5.7 percent higher
(2007: 7.3 percent lower) and the plan assets were 3.1 percent higher (2007: 1.1 percent)
than forecast for 2008 by the actuaries in 2007. The differences are largely attributable
to actuarial differences in the obligations and the plan assets.
Defined contribution plansIn addition to the defined benefit plans and similar obligations described above, some
companies in the Dräger Group sponsor defined contribution plans based on local prac-
tice and regulations.
The cost of defined contribution plans came to EUR 7,923 thousand in fiscal year
2008 (2007: EUR 6,249 thousand).
2008 2007 2006 2005 2004
Projected benefit obligations 210,551 207,701 218,652 215,955 195,504
Plan assets (fair value) 56,942 43,895 29,380 28,070 26,354
Total projected benefit obligations and plan assets 153,609 163,806 189,272 187,885 169,150
thereof:
Unfunded obligations 163,678 165,557 189,272 187,885 169,150
Available excess of plan assets 10,069 1,751 0 0 0
MULTI-YEAR OVERVIEW OF DEFINED BENEFIT PENSION PLANS
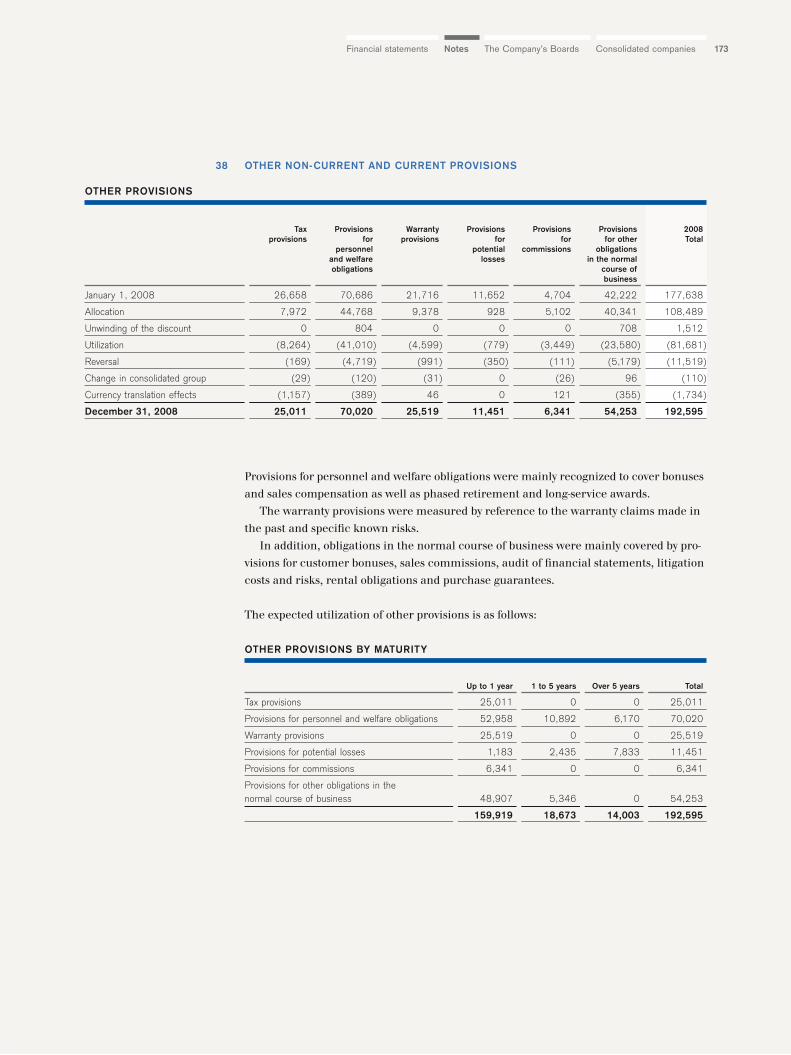
173The Company’s Boards Consolidated companiesNotesFinancial statements
OTHER NON-CURRENT AND CURRENT PROVISIONS
Provisions for personnel and welfare obligations were mainly recognized to cover bonuses
and sales compensation as well as phased retirement and long-service awards.
The warranty provisions were measured by reference to the warranty claims made in
the past and specific known risks.
In addition, obligations in the normal course of business were mainly covered by pro-
visions for customer bonuses, sales commissions, audit of financial statements, litigation
costs and risks, rental obligations and purchase guarantees.
The expected utilization of other provisions is as follows:
38
Tax Provisions Warranty Provisions Provisions Provisions 2008provisions for provisions for for for other Total
personnel potential commissions obligationsand welfare losses in the normalobligations course of
business
January 1, 2008 26,658 70,686 21,716 11,652 4,704 42,222 177,638
Allocation 7,972 44,768 9,378 928 5,102 40,341 108,489
Unwinding of the discount 0 804 0 0 0 708 1,512
Utilization (8,264) (41,010) (4,599) (779) (3,449) (23,580) (81,681)
Reversal (169) (4,719) (991) (350) (111) (5,179) (11,519)
Change in consolidated group (29) (120) (31) 0 (26) 96 (110)
Currency translation effects (1,157) (389) 46 0 121 (355) (1,734)
December 31, 2008 25,011 70,020 25,519 11,451 6,341 54,253 192,595
OTHER PROVISIONS
Up to 1 year 1 to 5 years Over 5 years Total
Tax provisions 25,011 0 0 25,011
Provisions for personnel and welfare obligations 52,958 10,892 6,170 70,020
Warranty provisions 25,519 0 0 25,519
Provisions for potential losses 1,183 2,435 7,833 11,451
Provisions for commissions 6,341 0 0 6,341
Provisions for other obligations in thenormal course of business 48,907 5,346 0 54,253
159,919 18,673 14,003 192,595
OTHER PROVISIONS BY MATURITY
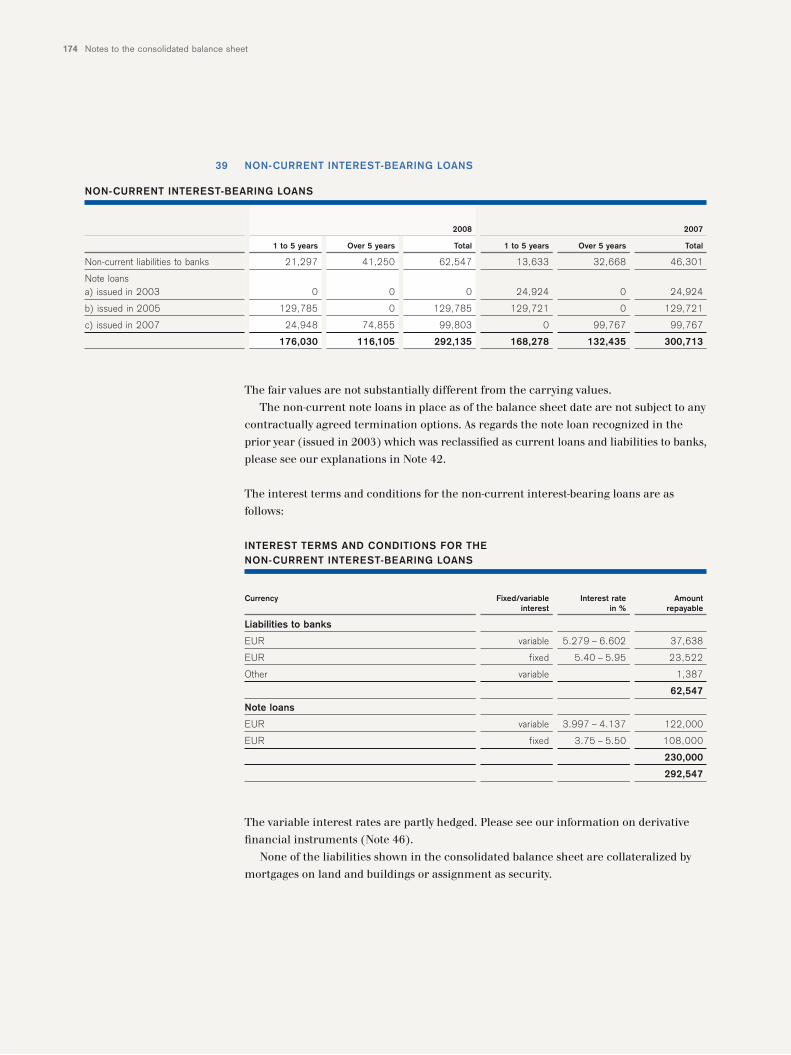
Notes to the consolidated balance sheet174
NON-CURRENT INTEREST-BEARING LOANS
The fair values are not substantially different from the carrying values.
The non-current note loans in place as of the balance sheet date are not subject to any
contractually agreed termination options. As regards the note loan recognized in the
prior year (issued in 2003) which was reclassified as current loans and liabilities to banks,
please see our explanations in Note 42.
The interest terms and conditions for the non-current interest-bearing loans are as
follows:
The variable interest rates are partly hedged. Please see our information on derivative
financial instruments (Note 46).
None of the liabilities shown in the consolidated balance sheet are collateralized by
mortgages on land and buildings or assignment as security.
39
2008 2007
1 to 5 years Over 5 years Total 1 to 5 years Over 5 years Total
Non-current liabilities to banks 21,297 41,250 62,547 13,633 32,668 46,301
Note loansa) issued in 2003 0 0 0 24,924 0 24,924
b) issued in 2005 129,785 0 129,785 129,721 0 129,721
c) issued in 2007 24,948 74,855 99,803 0 99,767 99,767
176,030 116,105 292,135 168,278 132,435 300,713
NON-CURRENT INTEREST-BEARING LOANS
Currency Fixed/variable Interest rate Amountinterest in % repayable
Liabilities to banks
EUR variable 5.279 – 6.602 37,638
EUR fixed 5.40 – 5.95 23,522
Other variable 1,387
62,547
Note loans
EUR variable 3.997 – 4.137 122,000
EUR fixed 3.75 – 5.50 108,000
230,000
292,547
INTEREST TERMS AND CONDITIONS FOR THENON-CURRENT INTEREST-BEARING LOANS
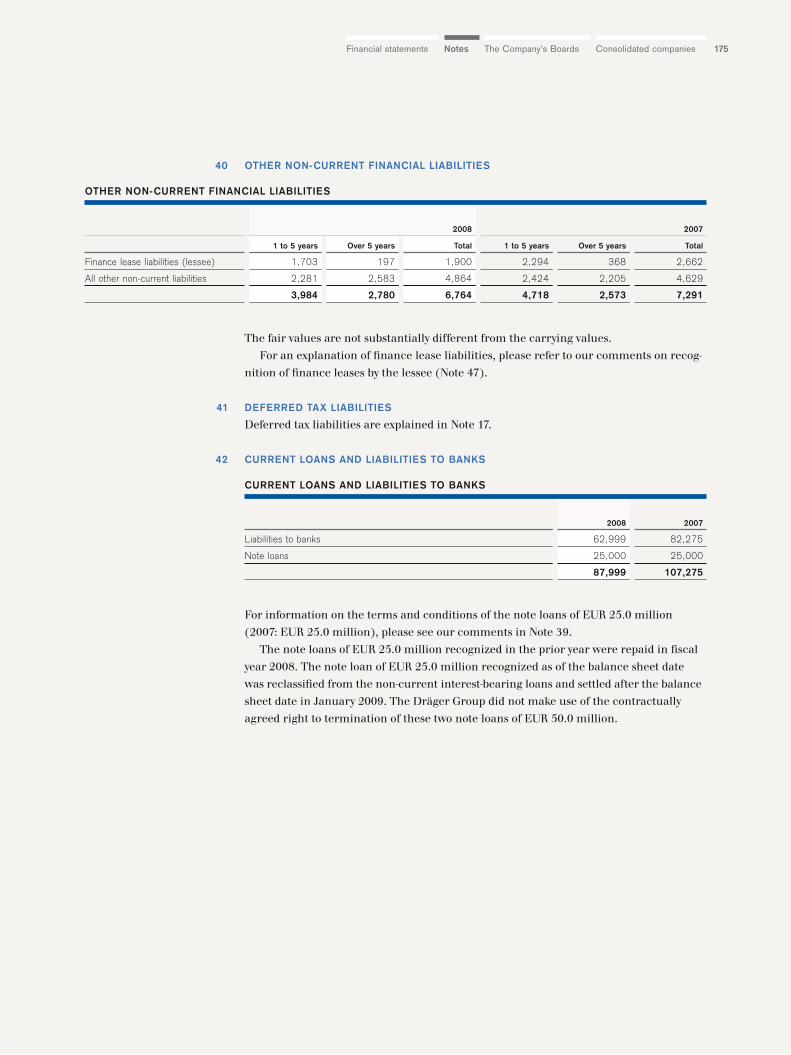
175The Company’s Boards Consolidated companiesNotesFinancial statements
OTHER NON-CURRENT FINANCIAL LIABILITIES
The fair values are not substantially different from the carrying values.
For an explanation of finance lease liabilities, please refer to our comments on recog-
nition of finance leases by the lessee (Note 47).
DEFERRED TAX LIABILITIES
Deferred tax liabilities are explained in Note 17.
CURRENT LOANS AND LIABILITIES TO BANKS
For information on the terms and conditions of the note loans of EUR 25.0 million
(2007: EUR 25.0 million), please see our comments in Note 39.
The note loans of EUR 25.0 million recognized in the prior year were repaid in fiscal
year 2008. The note loan of EUR 25.0 million recognized as of the balance sheet date
was reclassified from the non-current interest-bearing loans and settled after the balance
sheet date in January 2009. The Dräger Group did not make use of the contractually
agreed right to termination of these two note loans of EUR 50.0 million.
40
41
42
2008 2007
1 to 5 years Over 5 years Total 1 to 5 years Over 5 years Total
Finance lease liabilities (lessee) 1,703 197 1,900 2,294 368 2,662
All other non-current liabilities 2,281 2,583 4,864 2,424 2,205 4,629
3,984 2,780 6,764 4,718 2,573 7,291
OTHER NON-CURRENT FINANCIAL LIABILITIES
2008 2007
Liabilities to banks 62,999 82,275
Note loans 25,000 25,000
87,999 107,275
CURRENT LOANS AND LIABILITIES TO BANKS
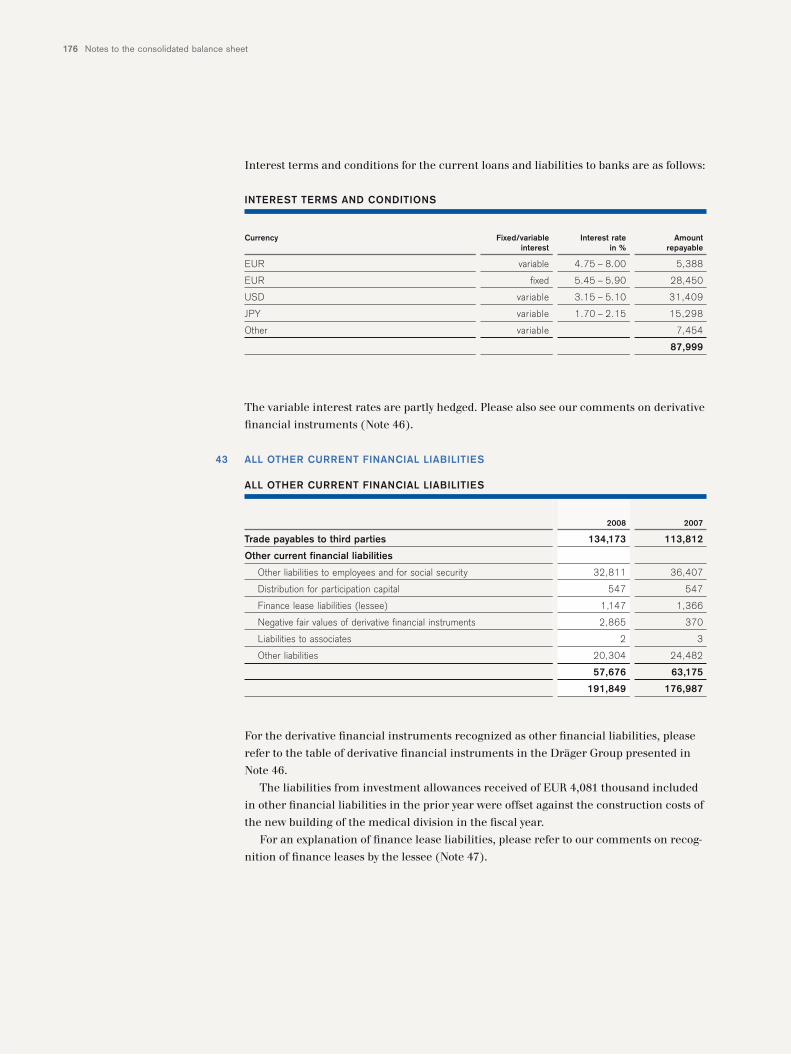
Notes to the consolidated balance sheet176
Interest terms and conditions for the current loans and liabilities to banks are as follows:
The variable interest rates are partly hedged. Please also see our comments on derivative
financial instruments (Note 46).
ALL OTHER CURRENT FINANCIAL LIABILITIES
For the derivative financial instruments recognized as other financial liabilities, please
refer to the table of derivative financial instruments in the Dräger Group presented in
Note 46.
The liabilities from investment allowances received of EUR 4,081 thousand included
in other financial liabilities in the prior year were offset against the construction costs of
the new building of the medical division in the fiscal year.
For an explanation of finance lease liabilities, please refer to our comments on recog-
nition of finance leases by the lessee (Note 47).
43
Currency Fixed/variable Interest rate Amountinterest in % repayable
EUR variable 4.75 – 8.00 5,388
EUR fixed 5.45 – 5.90 28,450
USD variable 3.15 – 5.10 31,409
JPY variable 1.70 – 2.15 15,298
Other variable 7,454
87,999
INTEREST TERMS AND CONDITIONS
2008 2007
Trade payables to third parties 134,173 113,812
Other current financial liabilities
Other liabilities to employees and for social security 32,811 36,407
Distribution for participation capital 547 547
Finance lease liabilities (lessee) 1,147 1,366
Negative fair values of derivative financial instruments 2,865 370
Liabilities to associates 2 3
Other liabilities 20,304 24,482
57,676 63,175
191,849 176,987
ALL OTHER CURRENT FINANCIAL LIABILITIES
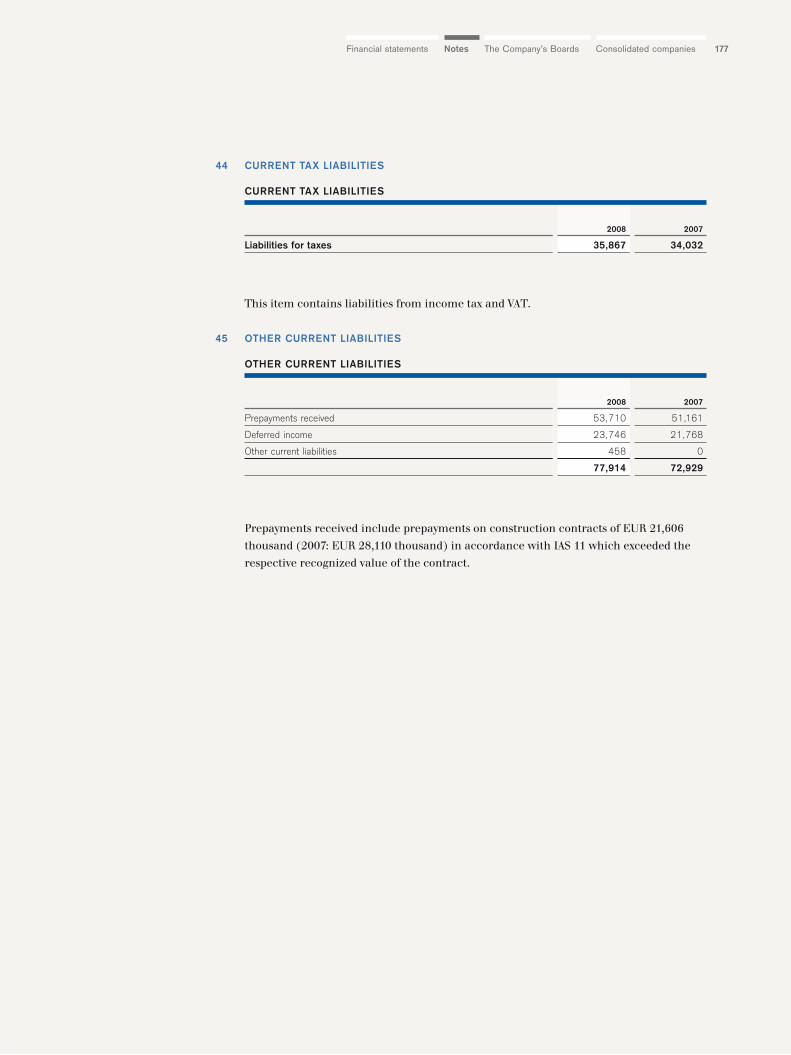
177The Company’s Boards Consolidated companiesNotesFinancial statements
CURRENT TAX LIABILITIES
This item contains liabilities from income tax and VAT.
OTHER CURRENT LIABILITIES
Prepayments received include prepayments on construction contracts of EUR 21,606
thousand (2007: EUR 28,110 thousand) in accordance with IAS 11 which exceeded the
respective recognized value of the contract.
44
45
2008 2007
Liabilities for taxes 35,867 34,032
CURRENT TAX LIABILITIES
2008 2007
Prepayments received 53,710 51,161
Deferred income 23,746 21,768
Other current liabilities 458 0
77,914 72,929
OTHER CURRENT LIABILITIES
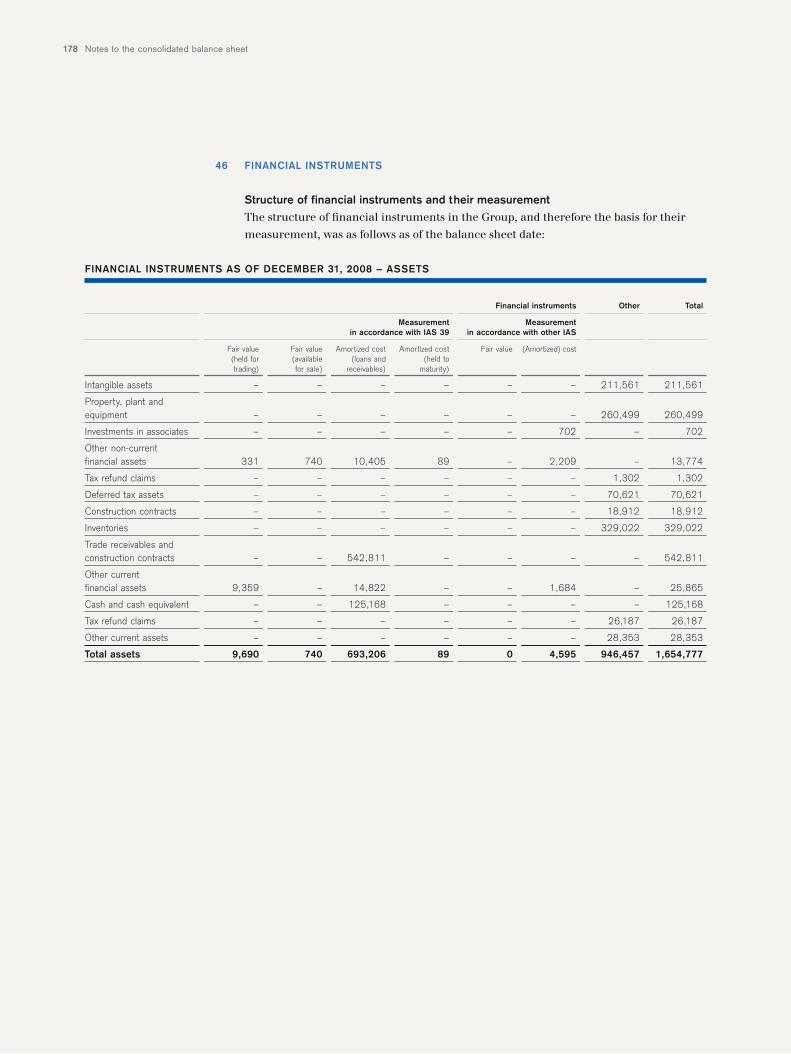
Notes to the consolidated balance sheet178
FINANCIAL INSTRUMENTS
Structure of financial instruments and their measurementThe structure of financial instruments in the Group, and therefore the basis for their
measurement, was as follows as of the balance sheet date:
46
Financial instruments Other Total
Measurement Measurement in accordance with IAS 39 in accordance with other IAS
Fair value Fair value Amortized cost Amortized cost Fair value (Amortized) cost(held for (available (loans and (held totrading) for sale) receivables) maturity)
Intangible assets – – – – – – 211,561 211,561
Property, plant andequipment – – – – – – 260,499 260,499
Investments in associates – – – – – 702 – 702
Other non-currentfinancial assets 331 740 10,405 89 – 2,209 – 13,774
Tax refund claims – – – – – – 1,302 1,302
Deferred tax assets – – – – – – 70,621 70,621
Construction contracts – – – – – – 18,912 18,912
Inventories – – – – – – 329,022 329,022
Trade receivables and construction contracts – – 542,811 – – – – 542,811
Other current financial assets 9,359 – 14,822 – – 1,684 – 25,865
Cash and cash equivalent – – 125,168 – – – – 125,168
Tax refund claims – – – – – – 26,187 26,187
Other current assets – – – – – – 28,353 28,353
Total assets 9,690 740 693,206 89 0 4,595 946,457 1,654,777
FINANCIAL INSTRUMENTS AS OF DECEMBER 31, 2008 – ASSETS
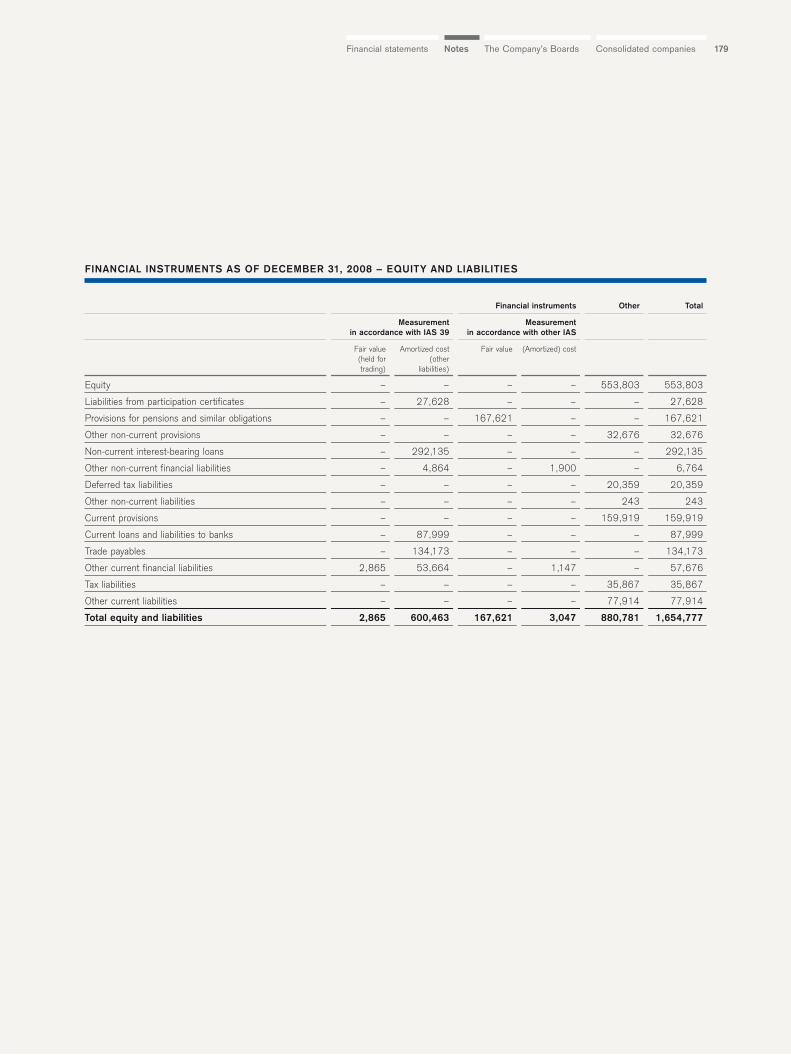
179The Company’s Boards Consolidated companiesNotesFinancial statements
Financial instruments Other Total
Measurement Measurement in accordance with IAS 39 in accordance with other IAS
Fair value Amortized cost Fair value (Amortized) cost(held for (othertrading) liabilities)
Equity – – – – 553,803 553,803
Liabilities from participation certificates – 27,628 – – – 27,628
Provisions for pensions and similar obligations – – 167,621 – – 167,621
Other non-current provisions – – – – 32,676 32,676
Non-current interest-bearing loans – 292,135 – – – 292,135
Other non-current financial liabilities – 4,864 – 1,900 – 6,764
Deferred tax liabilities – – – – 20,359 20,359
Other non-current liabilities – – – – 243 243
Current provisions – – – – 159,919 159,919
Current loans and liabilities to banks – 87,999 – – – 87,999
Trade payables – 134,173 – – – 134,173
Other current financial liabilities 2,865 53,664 – 1,147 – 57,676
Tax liabilities – – – – 35,867 35,867
Other current liabilities – – – – 77,914 77,914
Total equity and liabilities 2,865 600,463 167,621 3,047 880,781 1,654,777
FINANCIAL INSTRUMENTS AS OF DECEMBER 31, 2008 – EQUITY AND LIABILITIES
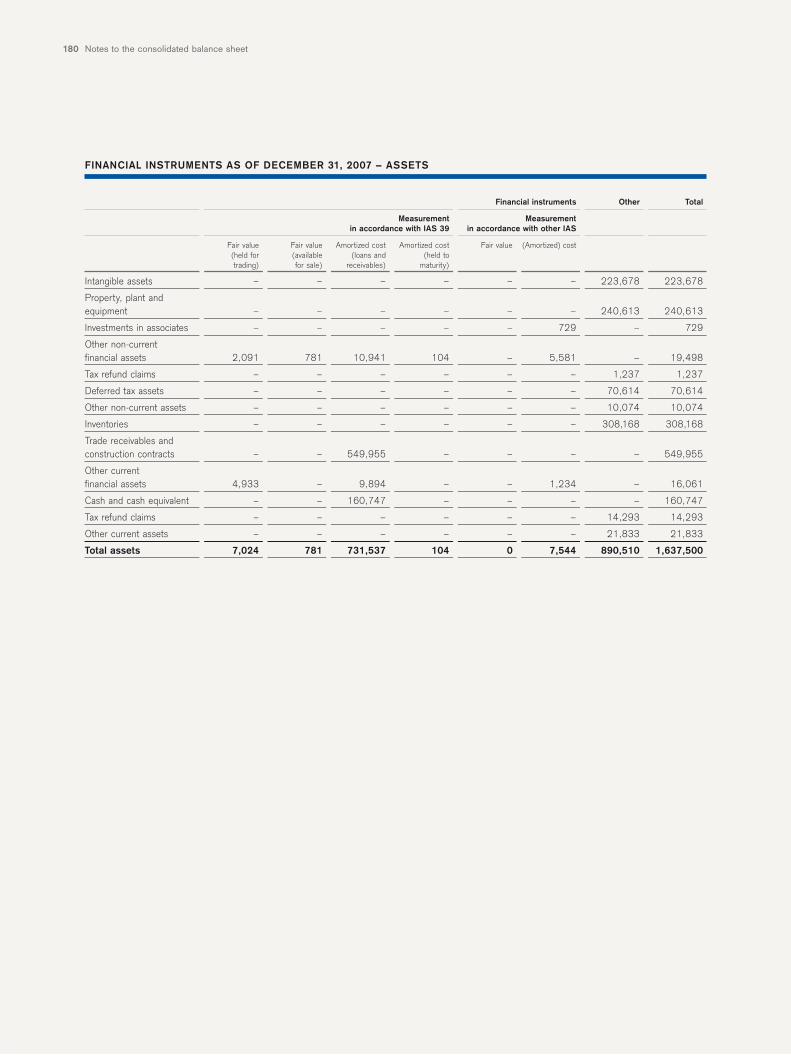
Notes to the consolidated balance sheet180
Financial instruments Other Total
Measurement Measurement in accordance with IAS 39 in accordance with other IAS
Fair value Fair value Amortized cost Amortized cost Fair value (Amortized) cost(held for (available (loans and (held totrading) for sale) receivables) maturity)
Intangible assets – – – – – – 223,678 223,678
Property, plant andequipment – – – – – – 240,613 240,613
Investments in associates – – – – – 729 – 729
Other non-currentfinancial assets 2,091 781 10,941 104 – 5,581 – 19,498
Tax refund claims – – – – – – 1,237 1,237
Deferred tax assets – – – – – – 70,614 70,614
Other non-current assets – – – – – – 10,074 10,074
Inventories – – – – – – 308,168 308,168
Trade receivables and construction contracts – – 549,955 – – – – 549,955
Other current financial assets 4,933 – 9,894 – – 1,234 – 16,061
Cash and cash equivalent – – 160,747 – – – – 160,747
Tax refund claims – – – – – – 14,293 14,293
Other current assets – – – – – – 21,833 21,833
Total assets 7,024 781 731,537 104 0 7,544 890,510 1,637,500
FINANCIAL INSTRUMENTS AS OF DECEMBER 31, 2007 – ASSETS
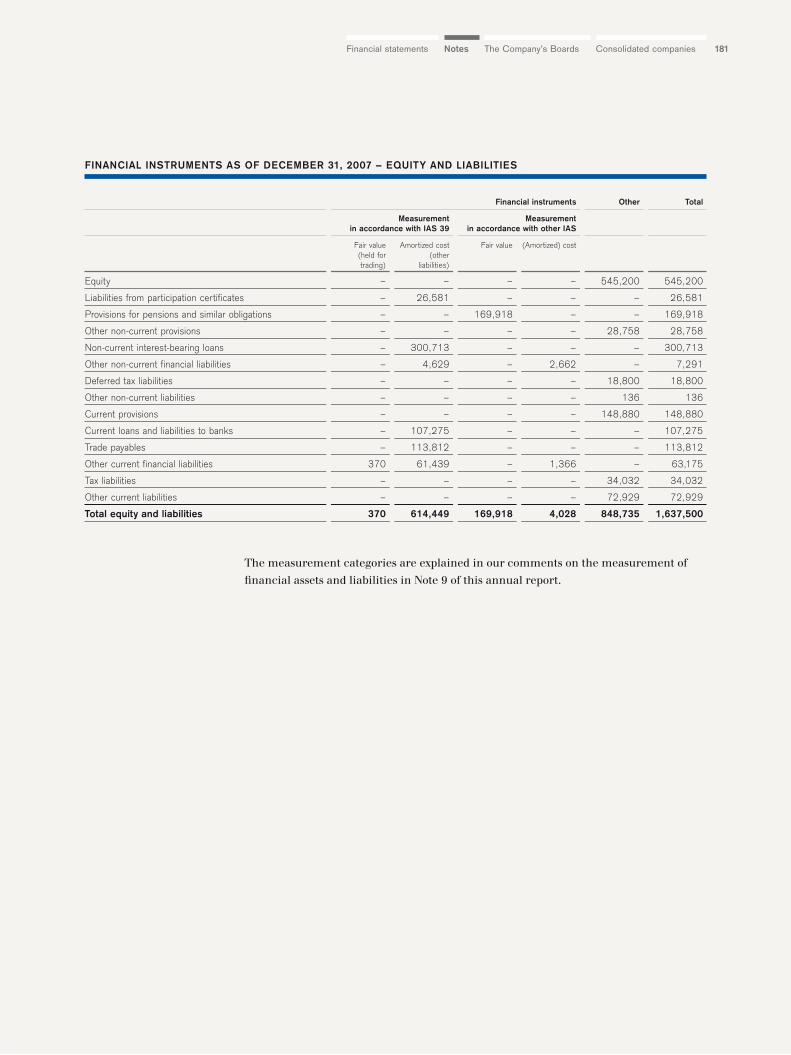
181The Company’s Boards Consolidated companiesNotesFinancial statements
The measurement categories are explained in our comments on the measurement of
financial assets and liabilities in Note 9 of this annual report.
Financial instruments Other Total
Measurement Measurement in accordance with IAS 39 in accordance with other IAS
Fair value Amortized cost Fair value (Amortized) cost(held for (othertrading) liabilities)
Equity – – – – 545,200 545,200
Liabilities from participation certificates – 26,581 – – – 26,581
Provisions for pensions and similar obligations – – 169,918 – – 169,918
Other non-current provisions – – – – 28,758 28,758
Non-current interest-bearing loans – 300,713 – – – 300,713
Other non-current financial liabilities – 4,629 – 2,662 – 7,291
Deferred tax liabilities – – – – 18,800 18,800
Other non-current liabilities – – – – 136 136
Current provisions – – – – 148,880 148,880
Current loans and liabilities to banks – 107,275 – – – 107,275
Trade payables – 113,812 – – – 113,812
Other current financial liabilities 370 61,439 – 1,366 – 63,175
Tax liabilities – – – – 34,032 34,032
Other current liabilities – – – – 72,929 72,929
Total equity and liabilities 370 614,449 169,918 4,028 848,735 1,637,500
FINANCIAL INSTRUMENTS AS OF DECEMBER 31, 2007 – EQUITY AND LIABILITIES
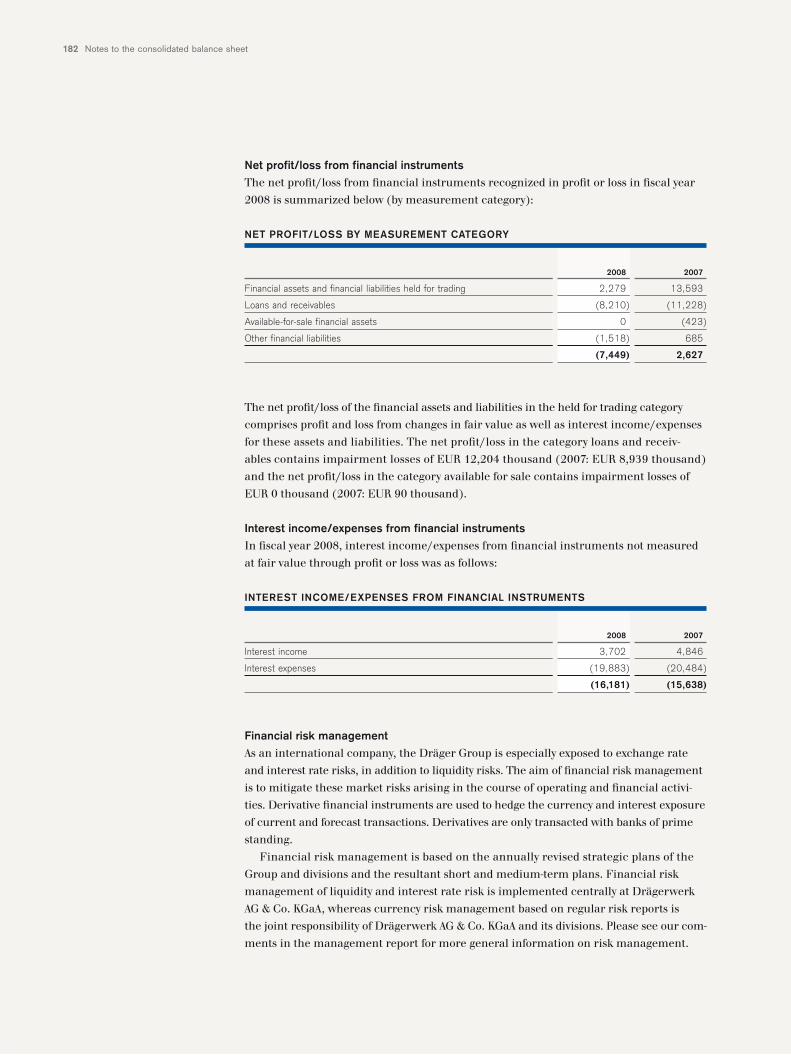
Notes to the consolidated balance sheet182
Net profit/loss from financial instrumentsThe net profit/loss from financial instruments recognized in profit or loss in fiscal year
2008 is summarized below (by measurement category):
The net profit/loss of the financial assets and liabilities in the held for trading category
comprises profit and loss from changes in fair value as well as interest income/expenses
for these assets and liabilities. The net profit/loss in the category loans and receiv-
ables contains impairment losses of EUR 12,204 thousand (2007: EUR 8,939 thousand)
and the net profit/loss in the category available for sale contains impairment losses of
EUR 0 thousand (2007: EUR 90 thousand).
Interest income/expenses from financial instrumentsIn fiscal year 2008, interest income/expenses from financial instruments not measured
at fair value through profit or loss was as follows:
Financial risk managementAs an international company, the Dräger Group is especially exposed to exchange rate
and interest rate risks, in addition to liquidity risks. The aim of financial risk management
is to mitigate these market risks arising in the course of operating and financial activi-
ties. Derivative financial instruments are used to hedge the currency and interest exposure
of current and forecast transactions. Derivatives are only transacted with banks of prime
standing.
Financial risk management is based on the annually revised strategic plans of the
Group and divisions and the resultant short and medium-term plans. Financial risk
management of liquidity and interest rate risk is implemented centrally at Drägerwerk
AG & Co. KGaA, whereas currency risk management based on regular risk reports is
the joint responsibility of Drägerwerk AG & Co. KGaA and its divisions. Please see our com-
ments in the management report for more general information on risk management.
2008 2007
Financial assets and financial liabilities held for trading 2,279 13,593
Loans and receivables (8,210) (11,228)
Available-for-sale financial assets 0 (423)
Other financial liabilities (1,518) 685
(7,449) 2,627
NET PROFIT/LOSS BY MEASUREMENT CATEGORY
2008 2007
Interest income 3,702 4,846
Interest expenses (19,883) (20,484)
(16,181) (15,638)
INTEREST INCOME/EXPENSES FROM FINANCIAL INSTRUMENTS
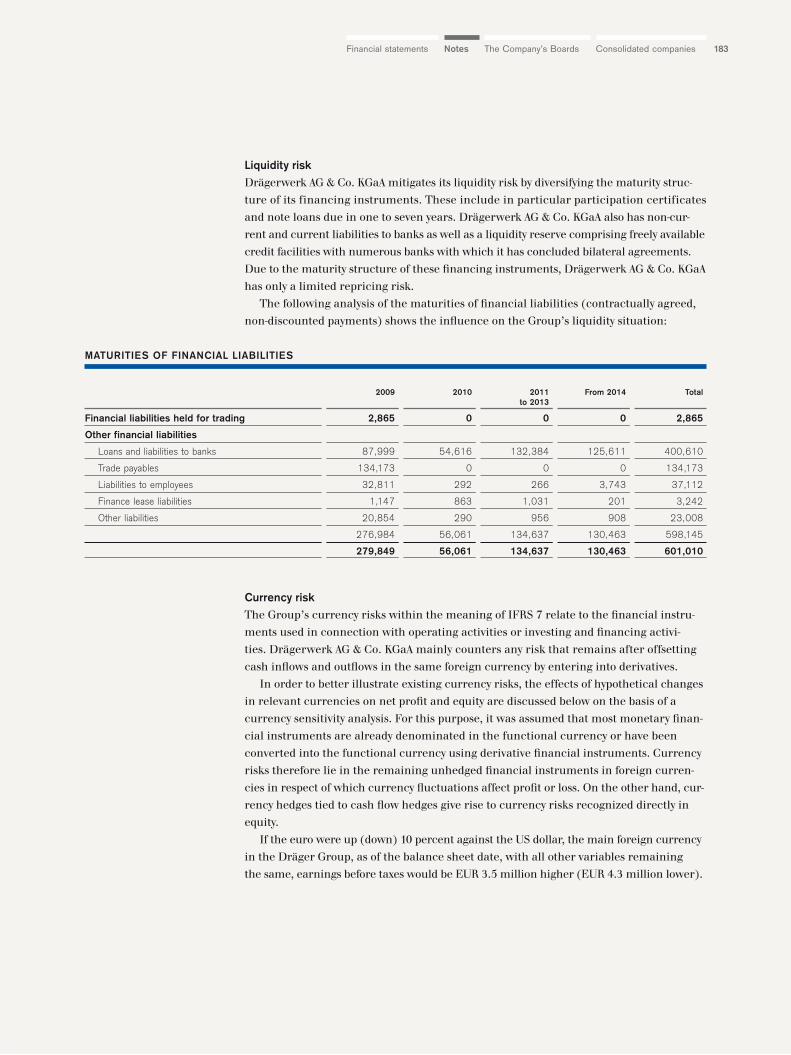
183The Company’s Boards Consolidated companiesNotesFinancial statements
Liquidity riskDrägerwerk AG & Co. KGaA mitigates its liquidity risk by diversifying the maturity struc-
ture of its financing instruments. These include in particular participation certificates
and note loans due in one to seven years. Drägerwerk AG & Co. KGaA also has non-cur-
rent and current liabilities to banks as well as a liquidity reserve comprising freely available
credit facilities with numerous banks with which it has concluded bilateral agreements.
Due to the maturity structure of these financing instruments, Drägerwerk AG & Co. KGaA
has only a limited repricing risk.
The following analysis of the maturities of financial liabilities (contractually agreed,
non-discounted payments) shows the influence on the Group’s liquidity situation:
Currency riskThe Group’s currency risks within the meaning of IFRS 7 relate to the financial instru-
ments used in connection with operating activities or investing and financing activi-
ties. Drägerwerk AG & Co. KGaA mainly counters any risk that remains after offsetting
cash inflows and outflows in the same foreign currency by entering into derivatives.
In order to better illustrate existing currency risks, the effects of hypothetical changes
in relevant currencies on net profit and equity are discussed below on the basis of a
currency sensitivity analysis. For this purpose, it was assumed that most monetary finan-
cial instruments are already denominated in the functional currency or have been
converted into the functional currency using derivative financial instruments. Currency
risks therefore lie in the remaining unhedged financial instruments in foreign curren-
cies in respect of which currency fluctuations affect profit or loss. On the other hand, cur-
rency hedges tied to cash flow hedges give rise to currency risks recognized directly in
equity.
If the euro were up (down) 10 percent against the US dollar, the main foreign currency
in the Dräger Group, as of the balance sheet date, with all other variables remaining
the same, earnings before taxes would be EUR 3.5 million higher (EUR 4.3 million lower).
2009 2010 2011 From 2014 Totalto 2013
Financial liabilities held for trading 2,865 0 0 0 2,865
Other financial liabilities
Loans and liabilities to banks 87,999 54,616 132,384 125,611 400,610
Trade payables 134,173 0 0 0 134,173
Liabilities to employees 32,811 292 266 3,743 37,112
Finance lease liabilities 1,147 863 1,031 201 3,242
Other liabilities 20,854 290 956 908 23,008
276,984 56,061 134,637 130,463 598,145
279,849 56,061 134,637 130,463 601,010
MATURITIES OF FINANCIAL LIABILITIES
Notes to the consolidated balance sheet184
Interest rate riskAs well as variable rate non-current receivables and liabilities from operations, variable
rate non-current loan liabilities also give rise to an interest rate risk due to changes in
market rates. Drägerwerk AG & Co. KGaA counters this risk with a combination of fixed
and variable rate financial liabilities and by using interest rate caps.
Changes in the market interest rates for primary financial instruments with fixed
interest only affect the Group’s profit or loss if such instruments are recognized at
fair value. Thus none of the fixed-interest financial instruments recognized at amortized
cost poses an interest rate risk for the purposes of IFRS 7.
In order to better illustrate existing interest rate risks, the effects of hypothetical
changes in market interest rates on net profit and equity are discussed below on the basis
of an interest rate sensitivity analysis. For this purpose, it was assumed that interest
rate changes affect primary financial instruments measured at fair value and derivative
financial instruments that are not part of a hedging relationship, whose changes in
value are recognized in profit or loss. Derivative financial instruments that are part of a
cash flow hedge are also affected by interest rate changes, with the changes in value
recognized directly in equity.
Due to the fact that the existing variable rate net financial debt was fully hedged by
interest rate caps as of the balance sheet date, a hypothetical increase/decrease of
100 basis points in market interest rates as of the balance sheet date, with all other vari-
ables remaining the same, would not have any effect on earnings after taxes or the
remaining components of equity.
Credit riskThe maximum exposure to credit risk is represented by the carrying value of each finan-
cial asset, including financial derivatives, in the balance sheet. Because counterparties
to derivatives consist of prime financial institutions, the Group does not expect any coun-
terparties to fail to meet their obligations. Consequently, the Group considers that
its maximum exposure is reflected by the amount of trade receivables and other current
assets, net of valuation adjustments recognized as of the balance sheet date.
Derivative financial instrumentsLike the hedged items, derivative financial instruments are recognized at fair value,
and resulting unrealized gains and losses are recognized in profit or loss as part of the
cost of sales or the financial result providing the instruments are not part of a cash
flow hedge. If a derivative financial instrument serves as a cash flow hedge, the unreal-
ized gains and losses are recognized directly in equity.
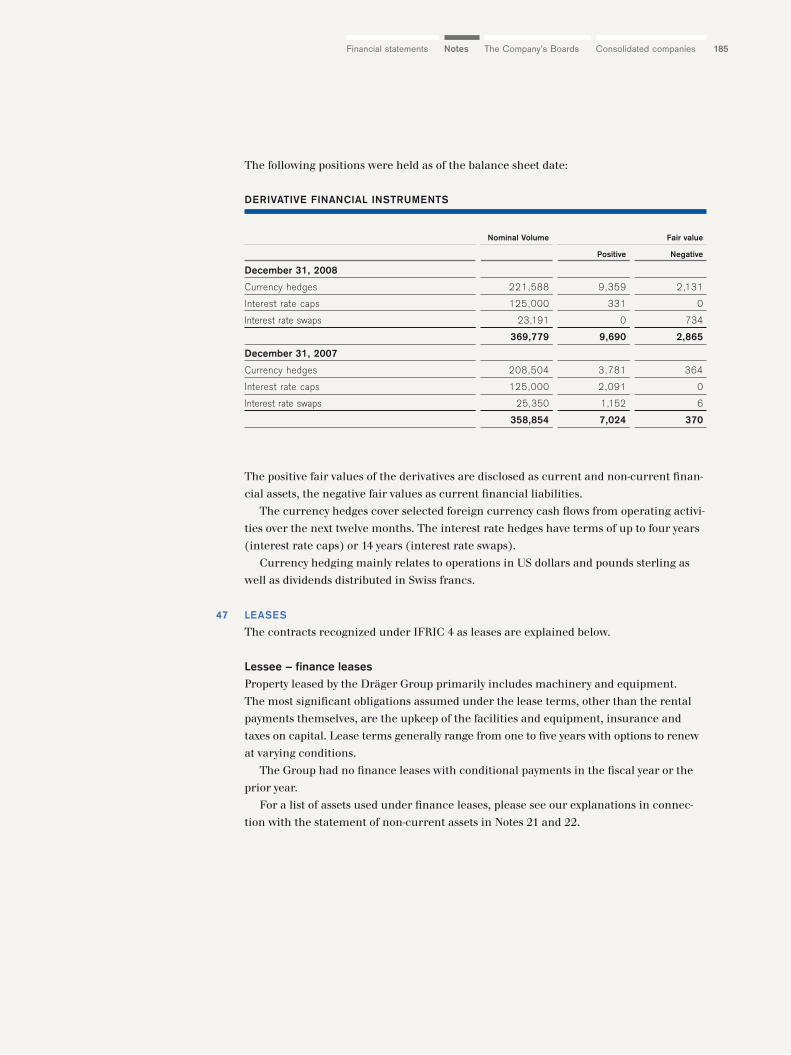
The following positions were held as of the balance sheet date:
The positive fair values of the derivatives are disclosed as current and non-current finan-
cial assets, the negative fair values as current financial liabilities.
The currency hedges cover selected foreign currency cash flows from operating activi-
ties over the next twelve months. The interest rate hedges have terms of up to four years
(interest rate caps) or 14 years (interest rate swaps).
Currency hedging mainly relates to operations in US dollars and pounds sterling as
well as dividends distributed in Swiss francs.
LEASES
The contracts recognized under IFRIC 4 as leases are explained below.
Lessee – finance leasesProperty leased by the Dräger Group primarily includes machinery and equipment.
The most significant obligations assumed under the lease terms, other than the rental
payments themselves, are the upkeep of the facilities and equipment, insurance and
taxes on capital. Lease terms generally range from one to five years with options to renew
at varying conditions.
The Group had no finance leases with conditional payments in the fiscal year or the
prior year.
For a list of assets used under finance leases, please see our explanations in connec-
tion with the statement of non-current assets in Notes 21 and 22.
185The Company’s Boards Consolidated companiesNotesFinancial statements
47
Nominal Volume Fair value
Positive Negative
December 31, 2008
Currency hedges 221,588 9,359 2,131
Interest rate caps 125,000 331 0
Interest rate swaps 23,191 0 734
369,779 9,690 2,865
December 31, 2007
Currency hedges 208,504 3,781 364
Interest rate caps 125,000 2,091 0
Interest rate swaps 25,350 1,152 6
358,854 7,024 370
DERIVATIVE FINANCIAL INSTRUMENTS
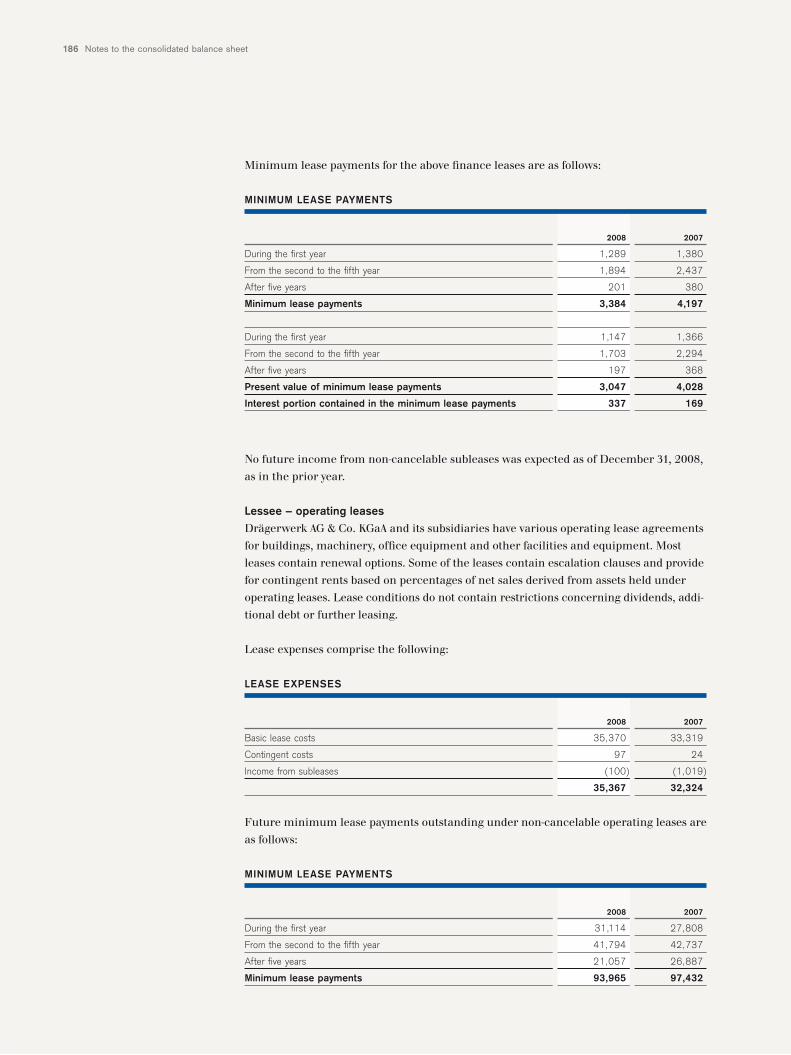
Notes to the consolidated balance sheet186
Minimum lease payments for the above finance leases are as follows:
No future income from non-cancelable subleases was expected as of December 31, 2008,
as in the prior year.
Lessee – operating leasesDrägerwerk AG & Co. KGaA and its subsidiaries have various operating lease agreements
for buildings, machinery, office equipment and other facilities and equipment. Most
leases contain renewal options. Some of the leases contain escalation clauses and provide
for contingent rents based on percentages of net sales derived from assets held under
operating leases. Lease conditions do not contain restrictions concerning dividends, addi-
tional debt or further leasing.
Lease expenses comprise the following:
Future minimum lease payments outstanding under non-cancelable operating leases are
as follows:
2008 2007
During the first year 1,289 1,380
From the second to the fifth year 1,894 2,437
After five years 201 380
Minimum lease payments 3,384 4,197
During the first year 1,147 1,366
From the second to the fifth year 1,703 2,294
After five years 197 368
Present value of minimum lease payments 3,047 4,028
Interest portion contained in the minimum lease payments 337 169
MINIMUM LEASE PAYMENTS
2008 2007
Basic lease costs 35,370 33,319
Contingent costs 97 24
Income from subleases (100) (1,019)
35,367 32,324
LEASE EXPENSES
2008 2007
During the first year 31,114 27,808
From the second to the fifth year 41,794 42,737
After five years 21,057 26,887
Minimum lease payments 93,965 97,432
MINIMUM LEASE PAYMENTS
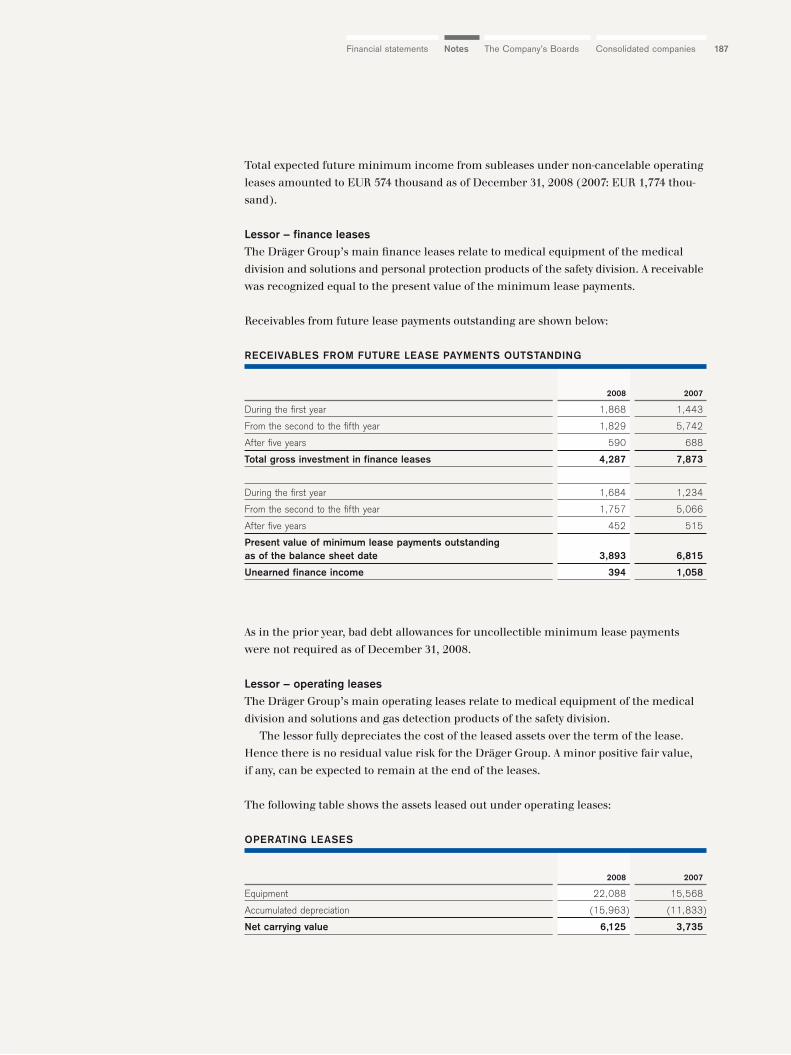
187The Company’s Boards Consolidated companiesNotesFinancial statements
Total expected future minimum income from subleases under non-cancelable operating
leases amounted to EUR 574 thousand as of December 31, 2008 (2007: EUR 1,774 thou-
sand).
Lessor – finance leasesThe Dräger Group’s main finance leases relate to medical equipment of the medical
division and solutions and personal protection products of the safety division. A receivable
was recognized equal to the present value of the minimum lease payments.
Receivables from future lease payments outstanding are shown below:
As in the prior year, bad debt allowances for uncollectible minimum lease payments
were not required as of December 31, 2008.
Lessor – operating leasesThe Dräger Group’s main operating leases relate to medical equipment of the medical
division and solutions and gas detection products of the safety division.
The lessor fully depreciates the cost of the leased assets over the term of the lease.
Hence there is no residual value risk for the Dräger Group. A minor positive fair value,
if any, can be expected to remain at the end of the leases.
The following table shows the assets leased out under operating leases:
2008 2007
During the first year 1,868 1,443
From the second to the fifth year 1,829 5,742
After five years 590 688
Total gross investment in finance leases 4,287 7,873
During the first year 1,684 1,234
From the second to the fifth year 1,757 5,066
After five years 452 515
Present value of minimum lease payments outstandingas of the balance sheet date 3,893 6,815
Unearned finance income 394 1,058
RECEIVABLES FROM FUTURE LEASE PAYMENTS OUTSTANDING
2008 2007
Equipment 22,088 15,568
Accumulated depreciation (15,963) (11,833)
Net carrying value 6,125 3,735
OPERATING LEASES
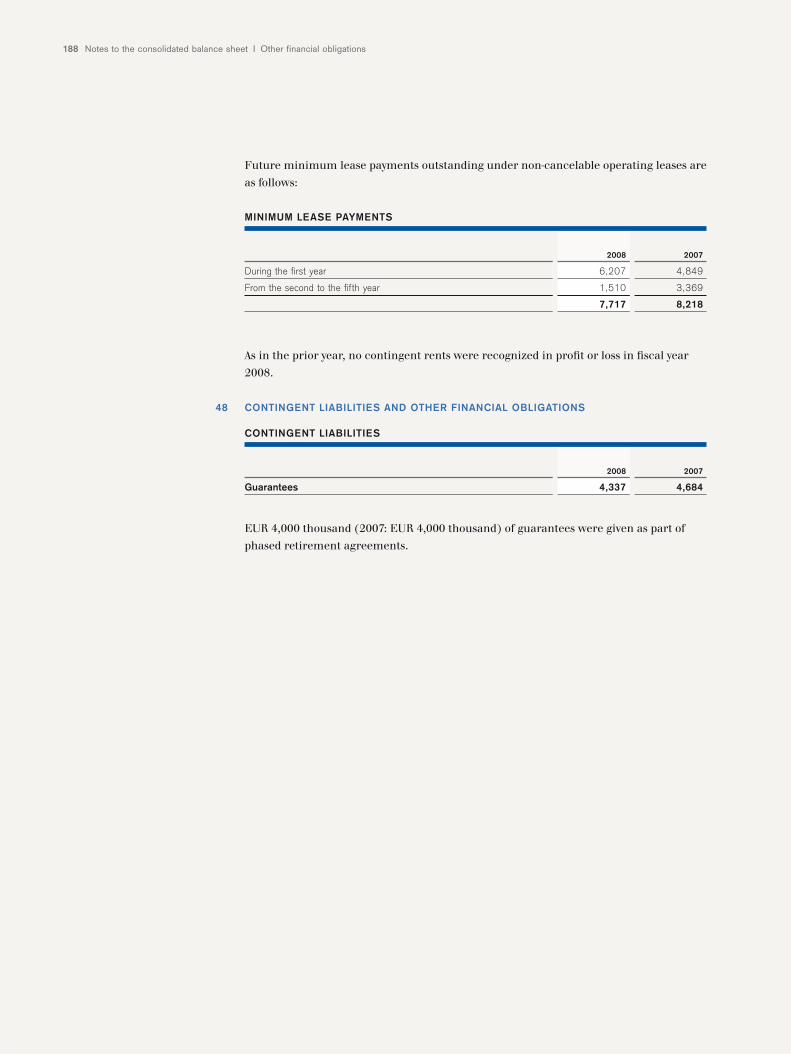
Notes to the consolidated balance sheet I Other financial obligations188
Future minimum lease payments outstanding under non-cancelable operating leases are
as follows:
As in the prior year, no contingent rents were recognized in profit or loss in fiscal year
2008.
CONTINGENT LIABILITIES AND OTHER FINANCIAL OBLIGATIONS
EUR 4,000 thousand (2007: EUR 4,000 thousand) of guarantees were given as part of
phased retirement agreements.
48
2008 2007
During the first year 6,207 4,849
From the second to the fifth year 1,510 3,369
7,717 8,218
MINIMUM LEASE PAYMENTS
2008 2007
Guarantees 4,337 4,684
CONTINGENT LIABILITIES
189The Company’s Boards Consolidated companiesNotesFinancial statements
Other financial obligations
A) RENTAL AND LEASE AGREEMENTS
For other financial obligations from rental and lease agreements, please refer to our
comments in Note 47 (lessee – operating leases).
B) PURCHASE OBLIGATIONS
As part of the sale of the IT companies in fiscal year 2004, Drägerwerk AG, Dräger
Medical AG & Co. KG and Dräger Safety AG & Co. KGaA agreed with an IT services com-
pany to purchase IT services for the entire Dräger Group until February 2009. The
remaining obligation amounted to EUR 2.0 million as of December 31, 2008. In line with
the usual requirements, Drägerwerk AG & Co. KGaA has also entered into purchase
obligations with other service providers in order to guarantee the availability of IT services.
As a result of outstanding orders, the Group has obligations to purchase intangible
assets of EUR 978 thousand (2007: EUR 333 thousand) and items of property, plant and
equipment of EUR 7,497 thousand (2007: EUR 4,006 thousand) as of December 31, 2008.
C) INVESTMENT ALLOWANCE FOR MOLVINA
Based on the decision of Investitionsbank Schleswig Holstein on November 1, 2005,
Dräger Medical AG & Co. KG and MOLVINA Vermietungsgesellschaft mbH & Co. Finken-
straße KG, both jointly and severally liable, were granted an allowance for investment
costs of EUR 7,829 thousand for the medical division’s new building which had been paid
out as of the balance sheet date 2008 (2007: EUR 3,748 thousand). The allowance can
only be used for this specific purpose and is subject to the fulfillment of specific conditions,
all of which relate to Dräger’s use of the building. If these conditions are not fulfilled,
the amount paid out must be repaid.
D) ACQUISITION OF A COMPANY
There are outstanding purchase price payments from the acquisition of a company effec-
tive January 1, 2009. EUR 400 thousand of this is due 30 days after the annual general
meeting at which the 2008 financial statements are approved and a further EUR 250 thou-
sand is due following the review of the adequate valuation of the assets as of December
31, 2008 and by December 31, 2009 at the latest. In addition, there are variable purchase
price payments of 2.5 percent of the net sales in 2009 and 2010 which are due 30 days
after the annual general meeting at which the financial statements for 2009 and 2010
are approved.
E) LITIGATION
Companies of the Dräger Group are involved in litigation and claims for damages in con-
nection with business activities as of December 31, 2008. The Executive Board of the
general partner believes that the outcome of such litigation and claims will not have any
further material adverse effect on the Company’s net assets, financial position or results
of operations over and above the provisions which have already been recognized.
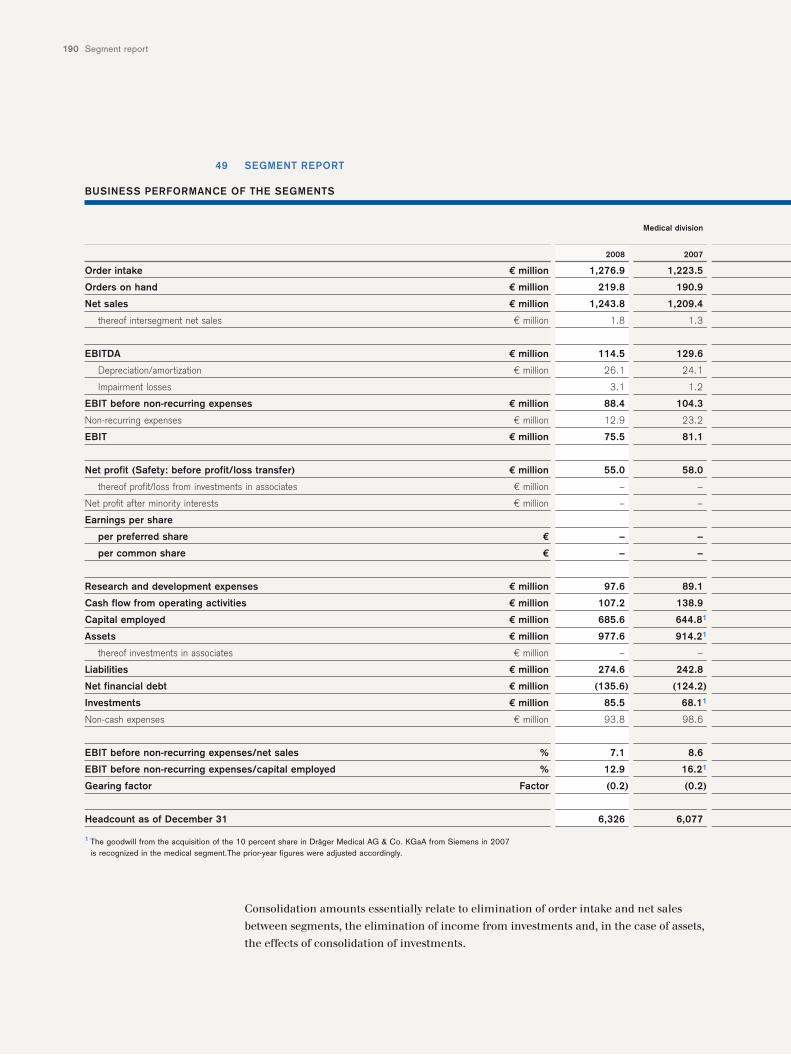
Segment report190
SEGMENT REPORT
Consolidation amounts essentially relate to elimination of order intake and net sales
between segments, the elimination of income from investments and, in the case of assets,
the effects of consolidation of investments.
49
Medical division
2008 2007
Order intake € million 1,276.9 1,223.5
Orders on hand € million 219.8 190.9
Net sales € million 1,243.8 1,209.4
thereof intersegment net sales € million 1.8 1.3
EBITDA € million 114.5 129.6
Depreciation/amortization € million 26.1 24.1
Impairment losses 3.1 1.2
EBIT before non-recurring expenses € million 88.4 104.3
Non-recurring expenses € million 12.9 23.2
EBIT € million 75.5 81.1
Net profit (Safety: before profit/loss transfer) € million 55.0 58.0
thereof profit/loss from investments in associates € million – –
Net profit after minority interests € million – –
Earnings per share
per preferred share € – –
per common share € – –
Research and development expenses € million 97.6 89.1
Cash flow from operating activities € million 107.2 138.9
Capital employed € million 685.6 644.81
Assets € million 977.6 914.21
thereof investments in associates € million – –
Liabilities € million 274.6 242.8
Net financial debt € million (135.6) (124.2)
Investments € million 85.5 68.11
Non-cash expenses € million 93.8 98.6
EBIT before non-recurring expenses/net sales % 7.1 8.6
EBIT before non-recurring expenses/capital employed % 12.9 16.21
Gearing factor Factor (0.2) (0.2)
Headcount as of December 31 6,326 6,077
1 The goodwill from the acquisition of the 10 percent share in Dräger Medical AG & Co. KGaA from Siemens in 2007 is recognized in the medical segment.The prior-year figures were adjusted accordingly.
BUSINESS PERFORMANCE OF THE SEGMENTS
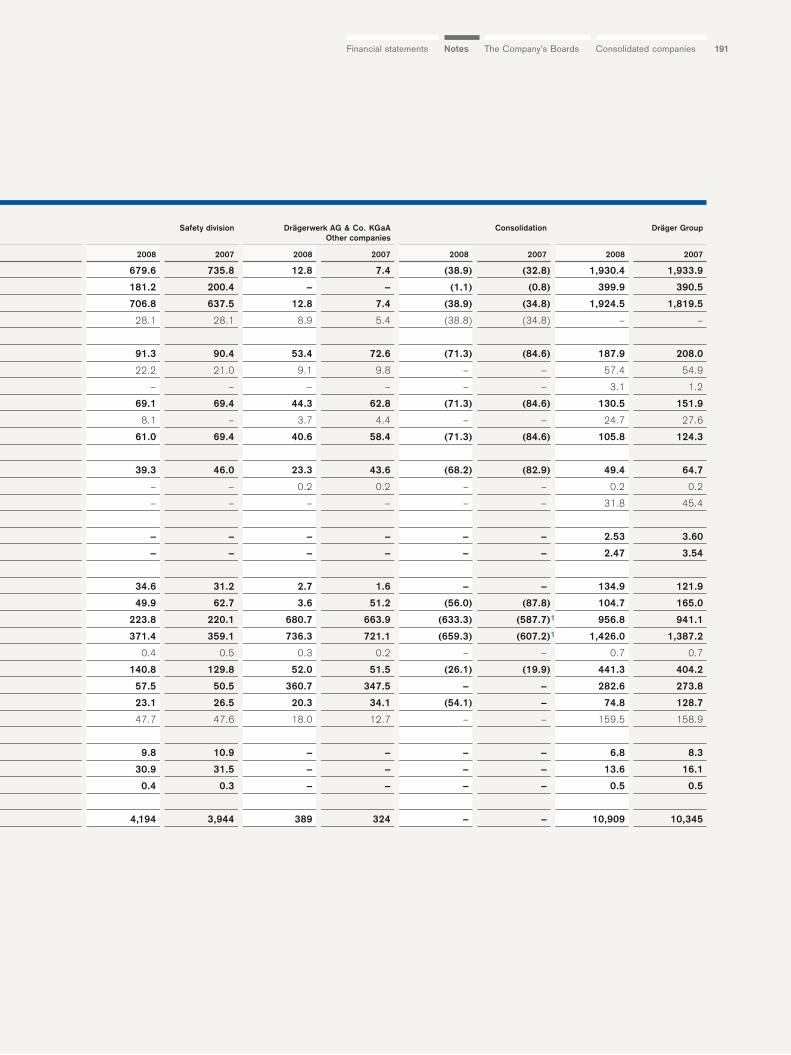
191The Company’s Boards Consolidated companiesNotesFinancial statements
Safety division Drägerwerk AG & Co. KGaA Consolidation Dräger GroupOther companies
2008 2007 2008 2007 2008 2007 2008 2007
679.6 735.8 12.8 7.4 (38.9) (32.8) 1,930.4 1,933.9
181.2 200.4 – – (1.1) (0.8) 399.9 390.5
706.8 637.5 12.8 7.4 (38.9) (34.8) 1,924.5 1,819.5
28.1 28.1 8.9 5.4 (38.8) (34.8) – –
91.3 90.4 53.4 72.6 (71.3) (84.6) 187.9 208.0
22.2 21.0 9.1 9.8 – – 57.4 54.9
– – – – – – 3.1 1.2
69.1 69.4 44.3 62.8 (71.3) (84.6) 130.5 151.9
8.1 – 3.7 4.4 – – 24.7 27.6
61.0 69.4 40.6 58.4 (71.3) (84.6) 105.8 124.3
39.3 46.0 23.3 43.6 (68.2) (82.9) 49.4 64.7
– – 0.2 0.2 – – 0.2 0.2
– – – – – – 31.8 45.4
– – – – – – 2.53 3.60
– – – – – – 2.47 3.54
34.6 31.2 2.7 1.6 – – 134.9 121.9
49.9 62.7 3.6 51.2 (56.0) (87.8) 104.7 165.0
223.8 220.1 680.7 663.9 (633.3) (587.7) 956.8 941.1
371.4 359.1 736.3 721.1 (659.3) (607.2) 1,426.0 1,387.2
0.4 0.5 0.3 0.2 – – 0.7 0.7
140.8 129.8 52.0 51.5 (26.1) (19.9) 441.3 404.2
57.5 50.5 360.7 347.5 – – 282.6 273.8
23.1 26.5 20.3 34.1 (54.1) – 74.8 128.7
47.7 47.6 18.0 12.7 – – 159.5 158.9
9.8 10.9 – – – – 6.8 8.3
30.9 31.5 – – – – 13.6 16.1
0.4 0.3 – – – – 0.5 0.5
4,194 3,944 389 324 – – 10,909 10,345
1
1
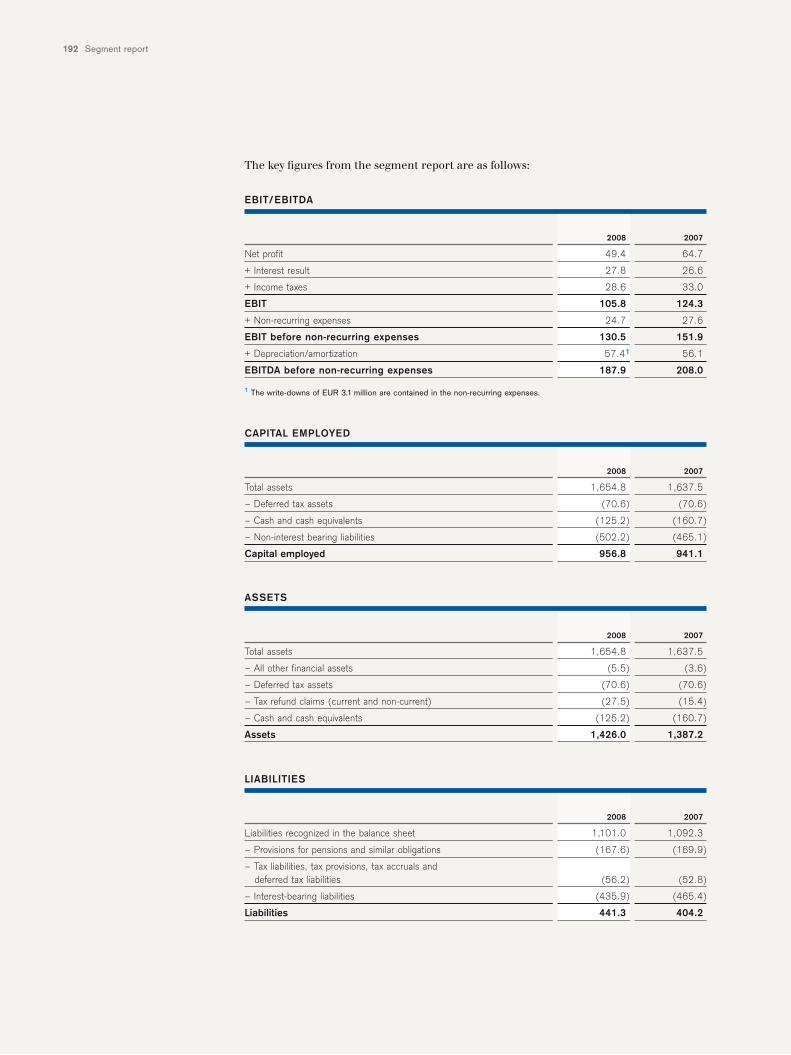
Segment report192
The key figures from the segment report are as follows:
2008 2007
Net profit 49.4 64.7
+ Interest result 27.8 26.6
+ Income taxes 28.6 33.0
EBIT 105.8 124.3
+ Non-recurring expenses 24.7 27.6
EBIT before non-recurring expenses 130.5 151.9
+ Depreciation/amortization 57.41 56.1
EBITDA before non-recurring expenses 187.9 208.0
1 The write-downs of EUR 3.1 million are contained in the non-recurring expenses.
EBIT/EBITDA
2008 2007
Total assets 1,654.8 1,637.5
– Deferred tax assets (70.6) (70.6)
– Cash and cash equivalents (125.2) (160.7)
– Non-interest bearing liabilities (502.2) (465.1)
Capital employed 956.8 941.1
CAPITAL EMPLOYED
2008 2007
Total assets 1,654.8 1,637.5
– All other financial assets (5.5) (3.6)
– Deferred tax assets (70.6) (70.6)
– Tax refund claims (current and non-current) (27.5) (15.4)
– Cash and cash equivalents (125.2) (160.7)
Assets 1,426.0 1,387.2
ASSETS
2008 2007
Liabilities recognized in the balance sheet 1,101.0 1,092.3
– Provisions for pensions and similar obligations (167.6) (169.9)
– Tax liabilities, tax provisions, tax accruals and deferred tax liabilities (56.2) (52.8)
– Interest-bearing liabilities (435.9) (465.4)
Liabilities 441.3 404.2
LIABILITIES
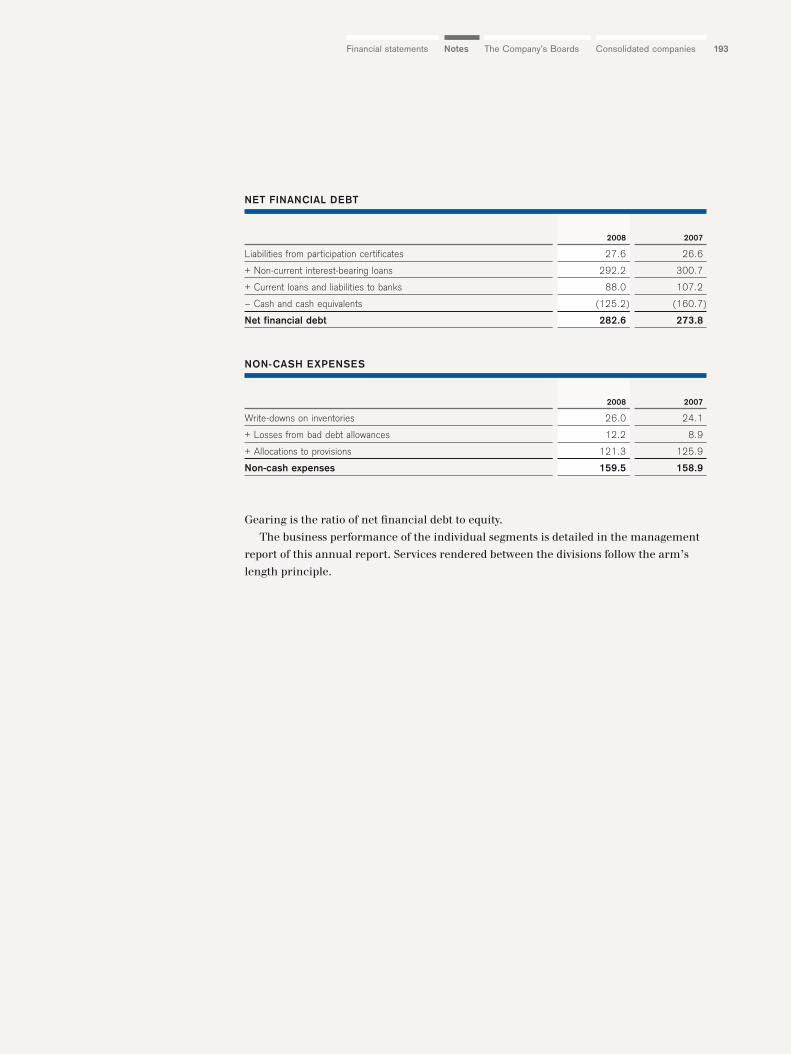
193The Company’s Boards Consolidated companiesNotesFinancial statements
Gearing is the ratio of net financial debt to equity.
The business performance of the individual segments is detailed in the management
report of this annual report. Services rendered between the divisions follow the arm’s
length principle.
2008 2007
Liabilities from participation certificates 27.6 26.6
+ Non-current interest-bearing loans 292.2 300.7
+ Current loans and liabilities to banks 88.0 107.2
– Cash and cash equivalents (125.2) (160.7)
Net financial debt 282.6 273.8
NET FINANCIAL DEBT
2008 2007
Write-downs on inventories 26.0 24.1
+ Losses from bad debt allowances 12.2 8.9
+ Allocations to provisions 121.3 125.9
Non-cash expenses 159.5 158.9
NON-CASH EXPENSES
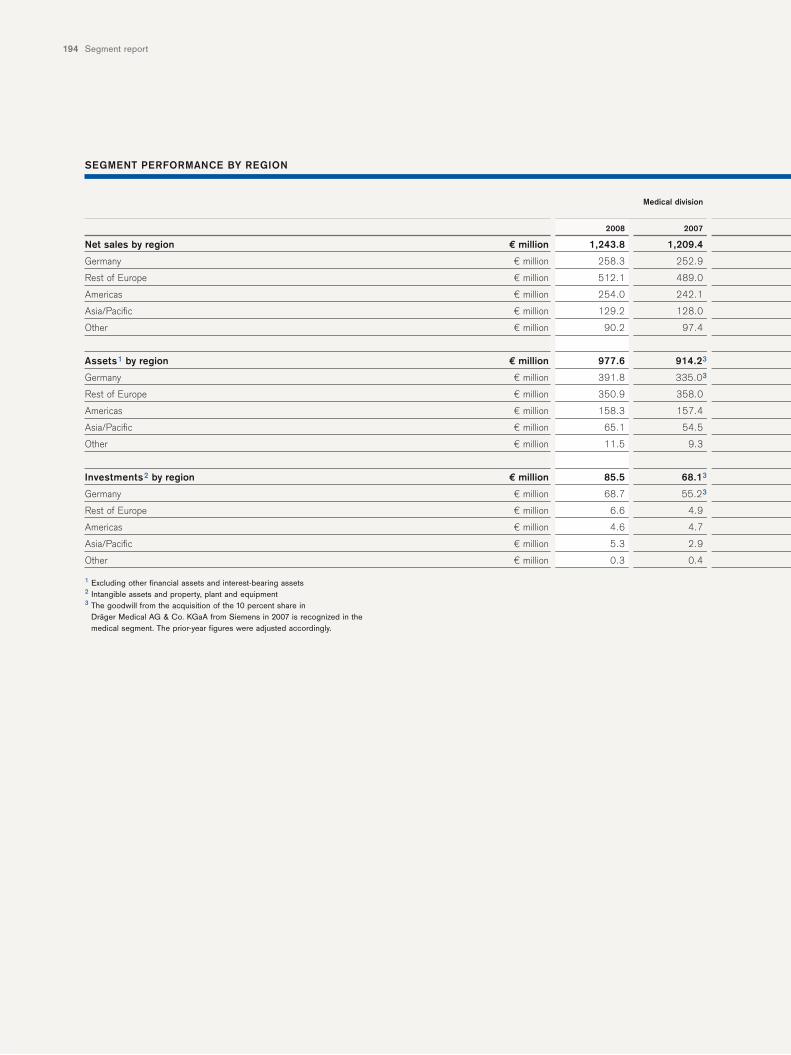
Segment report194
Medical division
2008 2007
Net sales by region € million 1,243.8 1,209.4
Germany € million 258.3 252.9
Rest of Europe € million 512.1 489.0
Americas € million 254.0 242.1
Asia/Pacific € million 129.2 128.0
Other € million 90.2 97.4
Assets1 by region € million 977.6 914.23
Germany € million 391.8 335.03
Rest of Europe € million 350.9 358.0
Americas € million 158.3 157.4
Asia/Pacific € million 65.1 54.5
Other € million 11.5 9.3
Investments2 by region € million 85.5 68.13
Germany € million 68.7 55.23
Rest of Europe € million 6.6 4.9
Americas € million 4.6 4.7
Asia/Pacific € million 5.3 2.9
Other € million 0.3 0.4
1 Excluding other financial assets and interest-bearing assets2 Intangible assets and property, plant and equipment3 The goodwill from the acquisition of the 10 percent share in
Dräger Medical AG & Co. KGaA from Siemens in 2007 is recognized in the medical segment. The prior-year figures were adjusted accordingly.
SEGMENT PERFORMANCE BY REGION
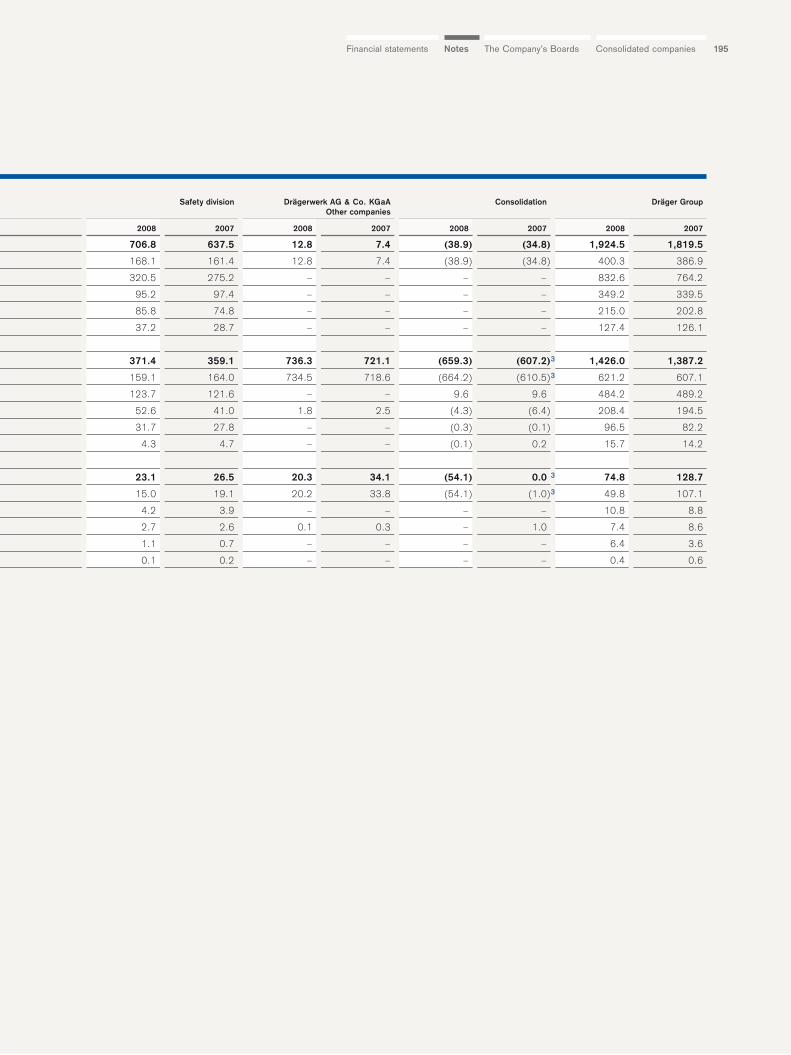
195The Company’s Boards Consolidated companiesNotesFinancial statements
Safety division Drägerwerk AG & Co. KGaA Consolidation Dräger GroupOther companies
2008 2007 2008 2007 2008 2007 2008 2007
706.8 637.5 12.8 7.4 (38.9) (34.8) 1,924.5 1,819.5
168.1 161.4 12.8 7.4 (38.9) (34.8) 400.3 386.9
320.5 275.2 – – – – 832.6 764.2
95.2 97.4 – – – – 349.2 339.5
85.8 74.8 – – – – 215.0 202.8
37.2 28.7 – – – – 127.4 126.1
371.4 359.1 736.3 721.1 (659.3) (607.2) 1,426.0 1,387.2
159.1 164.0 734.5 718.6 (664.2) (610.5) 621.2 607.1
123.7 121.6 – – 9.6 9.6 484.2 489.2
52.6 41.0 1.8 2.5 (4.3) (6.4) 208.4 194.5
31.7 27.8 – – (0.3) (0.1) 96.5 82.2
4.3 4.7 – – (0.1) 0.2 15.7 14.2
23.1 26.5 20.3 34.1 (54.1) 0.0 74.8 128.7
15.0 19.1 20.2 33.8 (54.1) (1.0) 49.8 107.1
4.2 3.9 – – – – 10.8 8.8
2.7 2.6 0.1 0.3 – 1.0 7.4 8.6
1.1 0.7 – – – – 6.4 3.6
0.1 0.2 – – – – 0.4 0.6
3
3
3
3
Notes to the consolidated balance sheet196
NOTES TO THE CASH FLOW STATEMENT
The consolidated cash flow statement is presented separately in this annual report on
page 133.
The cash flows are broken down according to net cash provided by/used in operating
activities (using the indirect method), investing activities and financing activities. Due
to the elimination of exchange rate effects, the underlying changes recognized in the cash
flow statement cannot be directly reconciled with the items of the published balance
sheet.
The cash flow from operating activities includes EUR 25,935 thousand (2007:
EUR 34,087 thousand) in income taxes paid, EUR 6,947 thousand (2007: EUR 7,408 thou-
sand) in interest received, and EUR 24,402 thousand (2007: EUR 21,389 thousand) in
interest paid.
Cash and cash equivalents include EUR 6,252 thousand in cash (2007: EUR 6,177 thou-
sand) which is subject to restrictions.
The changes in the cash flow statement are explained in the management report of
this annual report.
TOTAL REMUNERATION OF AND SHARES OWNED BY THE EXECUTIVE AND
SUPERVISORY BOARDS
The members of the Executive and Supervisory Boards of Drägerwerk AG & Co. KGaA
and their memberships are presented in “The Company’s Boards”.
Remuneration reportThe Company still compiles a remuneration report following the change in legal form to
a partnership limited by shares. Executive Board remuneration refers to remuneration
of members of the Executive Board of Drägerwerk AG up to the date the change in legal
form took effect. After that date, it refers to remuneration of members of the Executive
Board of Drägerwerk Verwaltungs AG. Supervisory Board remuneration is the remunera-
tion of the members of the Supervisory Board of Drägerwerk AG & Co. KGaA. The remu-
neration report also includes information on the shares owned by the members of the
Executive and Supervisory Boards as defined above.
Based on the resolution adopted at the annual general meeting of Drägerwerk AG on
June 2, 2006, the remuneration of individual members of the Executive Board is not
disclosed, with the exception of that of the Chairman. The remuneration report provides
this information accordingly. The remuneration of the Supervisory Board is also stated
in total.
Executive Board remunerationSince the change in legal form to a partnership limited by shares, the Supervisory Board
of Drägerwerk Verwaltungs AG has been responsible for determining the remuneration
of the general partner’s Executive Board members. All of the employment contracts of
the members of the Executive Board of Drägerwerk Verwaltungs AG have been concluded
with Drägerwerk Verwaltungs AG.
Obligations to the members of the Executive Board from the pension plan, however,
remain at Drägerwerk AG & Co. KGaA.
Remuneration is based on the size and the global activities of the Company, its eco-
nomic and financial position, and on the amount of remuneration paid by peer group
50
51
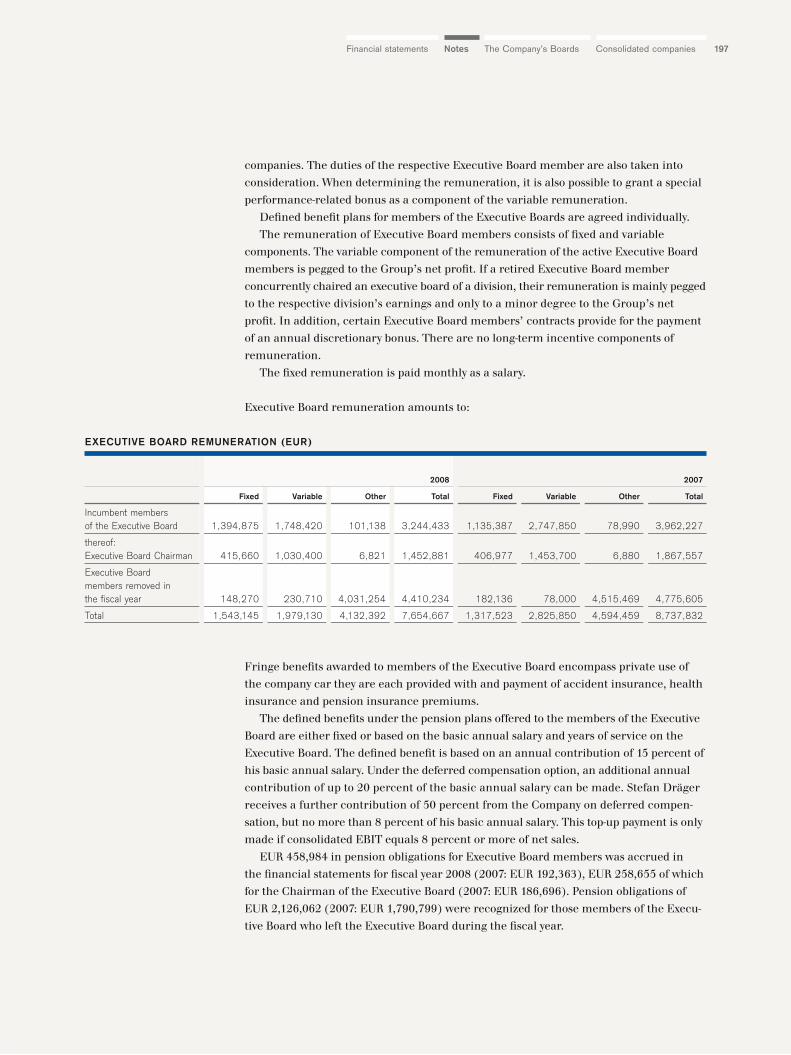
197The Company’s Boards Consolidated companiesNotesFinancial statements
companies. The duties of the respective Executive Board member are also taken into
consideration. When determining the remuneration, it is also possible to grant a special
performance-related bonus as a component of the variable remuneration.
Defined benefit plans for members of the Executive Boards are agreed individually.
The remuneration of Executive Board members consists of fixed and variable
components. The variable component of the remuneration of the active Executive Board
members is pegged to the Group’s net profit. If a retired Executive Board member
concurrently chaired an executive board of a division, their remuneration is mainly pegged
to the respective division’s earnings and only to a minor degree to the Group’s net
profit. In addition, certain Executive Board members’ contracts provide for the payment
of an annual discretionary bonus. There are no long-term incentive components of
remuneration.
The fixed remuneration is paid monthly as a salary.
Executive Board remuneration amounts to:
Fringe benefits awarded to members of the Executive Board encompass private use of
the company car they are each provided with and payment of accident insurance, health
insurance and pension insurance premiums.
The defined benefits under the pension plans offered to the members of the Executive
Board are either fixed or based on the basic annual salary and years of service on the
Executive Board. The defined benefit is based on an annual contribution of 15 percent of
his basic annual salary. Under the deferred compensation option, an additional annual
contribution of up to 20 percent of the basic annual salary can be made. Stefan Dräger
receives a further contribution of 50 percent from the Company on deferred compen-
sation, but no more than 8 percent of his basic annual salary. This top-up payment is only
made if consolidated EBIT equals 8 percent or more of net sales.
EUR 458,984 in pension obligations for Executive Board members was accrued in
the financial statements for fiscal year 2008 (2007: EUR 192,363), EUR 258,655 of which
for the Chairman of the Executive Board (2007: EUR 186,696). Pension obligations of
EUR 2,126,062 (2007: EUR 1,790,799) were recognized for those members of the Execu-
tive Board who left the Executive Board during the fiscal year.
2008 2007
Fixed Variable Other Total Fixed Variable Other Total
Incumbent members of the Executive Board 1,394,875 1,748,420 101,138 3,244,433 1,135,387 2,747,850 78,990 3,962,227
thereof:Executive Board Chairman 415,660 1,030,400 6,821 1,452,881 406,977 1,453,700 6,880 1,867,557
Executive Board members removed in the fiscal year 148,270 230,710 4,031,254 4,410,234 182,136 78,000 4,515,469 4,775,605
Total 1,543,145 1,979,130 4,132,392 7,654,667 1,317,523 2,825,850 4,594,459 8,737,832
EXECUTIVE BOARD REMUNERATION (EUR)
Notes to the consolidated balance sheet198
In fiscal year 2008, EUR 266,621 (2007: EUR 96,852) was allocated to the pension provi-
sions for active members of the Executive Board and EUR 335,263 (2007: EUR 0) for
those who left the Executive Board during the fiscal year. In fiscal year 2008, EUR 71,959
(2007: EUR 39,251) was allocated to the pension provisions for the Chairman of the
Executive Board.
The Company pays the premium for the D&O liability insurance policy and legal
expense insurance policy for economic loss claims for members of the Executive
Board. In the opinion of the German tax authorities, this does not constitute part of the
Executive Board’s remuneration.
No further payments have been promised in the event of termination of appointment
to the Executive Board. The Executive Board contracts do not provide for any sever-
ance entitlements. However, a severance payment may be agreed under an individual
severance agreement.
EUR 2,733,628.67 was paid to former members of the Executive Board and their sur-
viving dependants (2007: EUR 5,762,929.44). The prior-year figure includes payments
to those who left the Executive Board in fiscal year 2006. A total EUR 34,830,298 provides
for the pension obligations to former Executive Board members and their surviving
dependants (2007: EUR 34,587,869).
In fiscal year 2008, severance payments of EUR 4,020,109 were defined in severance
agreements (2007: EUR 6,403,838), which are included in the other remuneration of
those who left the Executive Board in the fiscal year. In fiscal year 2007, the severance
payments were in part included in the other remuneration of those who left the Executive
Board in 2007 and in part in the remuneration of former Executive Board members.
In the fiscal year, no payments were made or promised by a third party to any member
of the Executive Board in relation to his duties as member of the Executive Board.
If Executive Board remuneration is paid by Drägerwerk Verwaltungs AG, pursuant to
Art. 11 (1) and (3) of the articles of association of Drägerwerk AG & Co. KGaA it is enti-
tled to claim reimbursement from Drägerwerk AG & Co. KGaA monthly. Pursuant to Art.
11 (4) of the Company’s articles of association, for the management of the Company
and the assumption of personal liability the general partner receives a fee, independent
of profit and loss, of 6 percent of the equity disclosed in its financial statements, payable
one week after the general partner prepares its financial statements. For fiscal year 2008,
this remuneration amounts to EUR 63 thousand (2007: EUR 60 thousand) plus any VAT
incurred.
Supervisory Board remunerationOn May 9, 2008, the annual general meeting of Drägerwerk AG & Co. KGaA resolved to
replace the shareholder representatives on the Supervisory Board. As a result, the remu-
neration of the former members of the Supervisory Board and of those elected in May
2008 is calculated pro rata. At the annual general meeting of Drägerwerk AG & Co. KGaA
on May 8, 2009, a proposal awarding the Supervisory Board total remuneration of
EUR 310,360,00 (2007: EUR 509,500.00) will be put to vote. Every member of the Super-
visory Board receives basic remuneration which is composed of a fixed amount of
EUR 10,000.00 (2007: EUR 10,000.00) and a dividend-based amount of EUR 5,400.00
(2007: EUR 17,400.00), the latter being the product of EUR 600.00 for each EUR 0.01
above a preferred dividend of EUR 0.26, on the basis of a dividend of EUR 0.35 per pre-
ferred share as proposed for the year under review. The change against the prior year
The Company’s Boards Consolidated companiesNotesFinancial statements 199
is due to the reduction in variable remuneration as a result of its dependency on the divi-
dend per preferred share.
Pursuant to Art. 21 (1) of the articles of association of Drägerwerk AG & Co. KGaA, the
distribution of the remuneration of members of the Supervisory Board is determined
by a Supervisory Board resolution. To date, the Supervisory Board has adopted the follow-
ing principles for distribution: its chairman is entitled to four times, any vice-chairman
two times, the other members of the Executive Committee 1.5 times the set amount. The
members of the Audit Committee receive an additional EUR 5,000.00, and the chair-
man of the Audit Committee an additional EUR 10,000.00. Moreover, a total per diem of
EUR 2,640.00 (2007: EUR 3,420.00) was paid in fiscal year 2008. Since the change in
legal form to a partnership limited by shares, the Executive Committee no longer exists,
as the Supervisory Board of Drägerwerk Verwaltungs AG now appoints the Executive
Board members.
In the opinion of the German tax authorities, the premium for a D&O liability insur-
ance policy and a legal expense insurance policy for economic loss claims is not part of
the Supervisory Board’s remuneration.
In addition, in the year under review a legal consulting fee of EUR 56,330.25 (2007:
EUR 93,725.00) was paid to the law firm Feddersen Heuer & Partner. Professor Dr.
Feddersen was the Chairman of the Supervisory Board of Drägerwerk AG & Co. KGaA
until May 9, 2008. These amounts do not include VAT. An agreement was concluded
with Mr. Theo Dräger, who was a member of the Supervisory Board until May 9, 2008,
allowing him to represent the Company in Germany and abroad. His services under
this agreement are not remunerated; however, he shall be reimbursed for any out-of-pocket
expenses and provided with secretarial services and transportation.
Certain Supervisory Board members received an additional aggregate EUR 179,800.00
(2007: EUR 177,600.00) for their membership in supervisory boards of group companies.
Shares owned by the Executive and Supervisory BoardsAs of December 31, 2008, the members of the Executive Board of Drägerwerk AG & Co.
KGaA and their related parties still directly or indirectly held 6,000 preferred shares,
equivalent to 0.05 percent of the total, and the members of the Supervisory Board and
their related parties a total of 1,152 preferred shares, equivalent to 0.01 percent of the
total.
Altogether, 97.87 percent of Drägerwerk AG & Co. KGaA’s limited common stock is
held via Dr. Heinrich Dräger GmbH and the same percentage of voting rights is attrib-
utable to Executive Board member Stefan Dräger under the terms of Sec. 22 (1) Sentence
1 No. 1 WpHG (“Wertpapierhandelsgesetz”: German Securities Trading Act).
FURTHER INFORMATION ON THE CORPORATE GOVERNANCE CODE
Directors’ dealingsIn fiscal year 2008, a member of the Supervisory Board sold preferred shares with the
ISIN DE0005550636 from their private portfolio (see page 201).
52
Notes to the consolidated balance sheet200
Related-party transactionsBusiness was transacted in 2008 with the following related companies that are part of
the widely diversified share portfolio of the Dräger family, including the Chairman of
the Executive Board Stefan Dräger (until May 9, 2008) and Supervisory Board member
Theo Dräger. Dräger GmbH, Dräger Objekt Finkenstraße GmbH & Co. KG and Dräger
Objekt Lachswehrallee GmbH & Co. KG leased various real properties to Drägerwerk AG
& Co. KGaA which are located close to the latter’s Moislinger Allee head office. The rent
payments amounted to EUR 1,715 thousand (2007: EUR 1,679 thousand). Some Dräger
Medical AG & Co. KG departments moved into the new administration building in fiscal
year 2008. As a portion of the land and buildings with long-term rental agreements is
therefore no longer likely be able to be fully used, there is a provision of EUR 9.7 million
(2007: EUR 10.0 million) as of December 31, 2008. The tax department of the Com-
pany provided tax services amounting to EUR 82 thousand (2007: EUR 50 thousand) to
Dr. Heinrich Dräger GmbH and the Dräger Foundation Munich/Lübeck. In addition,
Herbert Rehn GmbH generated net sales of EUR 1.8 million (2007: EUR 1.5 million) from
glass products and installation contracts. This resulted in receivables of EUR 63 thou-
sand (2007: EUR 22.7 thousand) from Dräger Group companies.
Mrs. Claudia Dräger is an employee of Drägerwerk AG & Co. KGaA.
Supervisory Board member Theo Dräger (until May 9, 2009) has a 44 percent share in
Dräger Objekt Lachswehrallee GmbH & Co. KG, the remaining share (56 percent) is
held by siblings of Stefan Dräger. Mr. Theo Dräger has an 18.6 percent share in Dräger
Objekt Finkenstraße GmbH & Co. KG, the remaining 81.4 percent is held by other
Dräger family members who have no managerial position within the Dräger Group. Other
Dräger family members hold a share in Dräger GmbH and in Herbert Rehn GmbH but
they do not hold a managerial position within the Dräger Group either.
All transactions were conducted at arm’s length terms and conditions.
Auditor’s feeThe fee expensed in fiscal year 2008 for the audit of the group financial statements
amounted to EUR 1,243 thousand (2007: EUR 1,359 thousand) for the audit of the finan-
cial statements of Drägerwerk AG & Co. KGaA and its subsidiaries. In the prior year,
the amount also included the fee for the audit of the stock exchange prospectus for the
transformation of Drägerwerk AG into Drägerwerk AG & Co. KGaA. Fees for further
audit work were not incurred.
Corporate governance declarationDrägerwerk AG & Co. KGaA’s declaration of conformity under the terms of Sec. 161 AktG
(“Aktiengesetz”: German Stock Corporation Act) has been issued and made available to
the shareholders at www.draeger.com (please also see the corporate governance report).
Annual document in accordance with Sec. 10 WpPG (“Wertpapierprospektgesetz”: German Securities Prospectus Act)The German Securities Prospectus Act came into force on July 1, 2005. Under Sec. 10
WpPG, listed companies are obligated to inform investors at least once a year of the capi-
tal market publications they have issued over the last twelve months. For this reason,
all the information required by Sec. 10 WpPG that Drägerwerk AG & Co. KGaA published
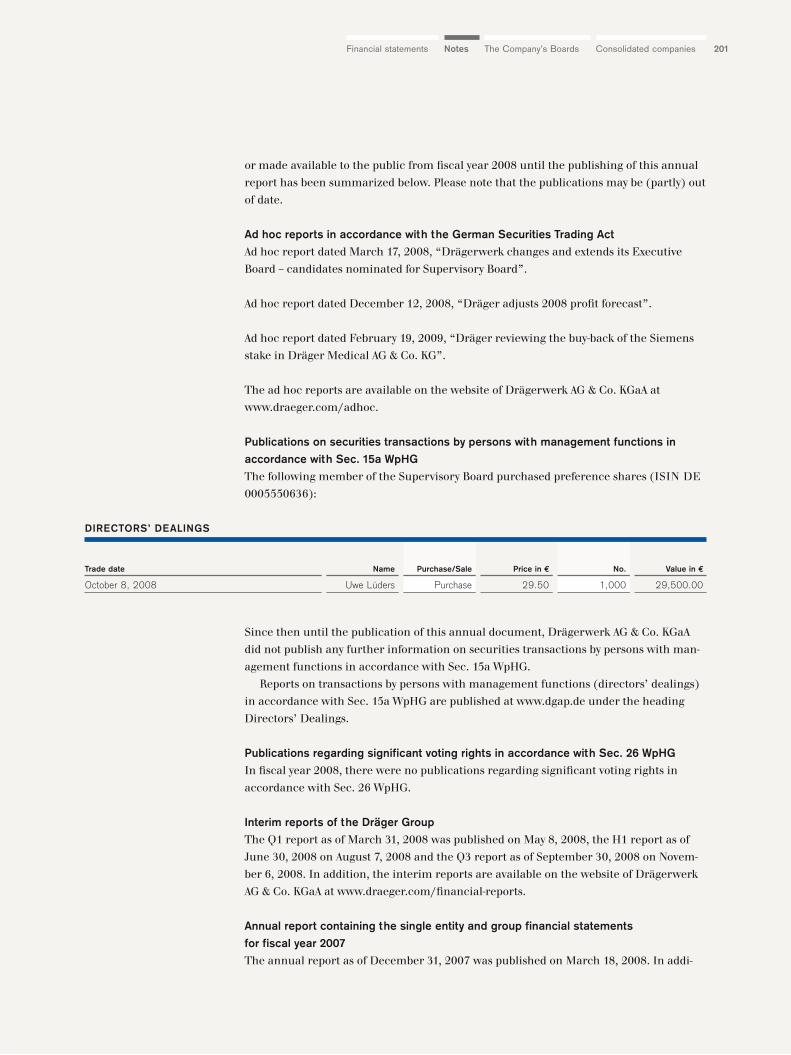
The Company’s Boards Consolidated companiesNotesFinancial statements 201
or made available to the public from fiscal year 2008 until the publishing of this annual
report has been summarized below. Please note that the publications may be (partly) out
of date.
Ad hoc reports in accordance with the German Securities Trading ActAd hoc report dated March 17, 2008, “Drägerwerk changes and extends its Executive
Board – candidates nominated for Supervisory Board”.
Ad hoc report dated December 12, 2008, “Dräger adjusts 2008 profit forecast”.
Ad hoc report dated February 19, 2009, “Dräger reviewing the buy-back of the Siemens
stake in Dräger Medical AG & Co. KG”.
The ad hoc reports are available on the website of Drägerwerk AG & Co. KGaA at
www.draeger.com/adhoc.
Publications on securities transactions by persons with management functions inaccordance with Sec. 15a WpHGThe following member of the Supervisory Board purchased preference shares (ISIN DE
0005550636):
Since then until the publication of this annual document, Drägerwerk AG & Co. KGaA
did not publish any further information on securities transactions by persons with man-
agement functions in accordance with Sec. 15a WpHG.
Reports on transactions by persons with management functions (directors’ dealings)
in accordance with Sec. 15a WpHG are published at www.dgap.de under the heading
Directors’ Dealings.
Publications regarding significant voting rights in accordance with Sec. 26 WpHGIn fiscal year 2008, there were no publications regarding significant voting rights in
accordance with Sec. 26 WpHG.
Interim reports of the Dräger GroupThe Q1 report as of March 31, 2008 was published on May 8, 2008, the H1 report as of
June 30, 2008 on August 7, 2008 and the Q3 report as of September 30, 2008 on Novem-
ber 6, 2008. In addition, the interim reports are available on the website of Drägerwerk
AG & Co. KGaA at www.draeger.com/financial-reports.
Annual report containing the single entity and group financial statements for fiscal year 2007The annual report as of December 31, 2007 was published on March 18, 2008. In addi-
Trade date Name Purchase/Sale Price in € No. Value in €
October 8, 2008 Uwe Lüders Purchase 29.50 1,000 29,500.00
DIRECTORS’ DEALINGS
Notes to the consolidated balance sheet I Management compliance statement202
tion, the annual reports are available on the website of Drägerwerk AG & Co. KGaA at
www.draeger.com/financial-reports.
Preliminary announcements for financial reportsThe publications in accordance with Sec. 37v, 37w, 37x et seq. WpHG (preliminary
announcements on the publication of financial reports) were made on March 7, 2008 at
www.dgap.de under the heading Preliminary Announcements.
Other publications pursuant to Sec. 30b et seq. WpHGThe convocation and agenda of the 2008 annual general meeting was published on
March 27, 2008 in the electronic version of the German Federal Gazette and a short ver-
sion on March 27, 2008 in the Börsen-Zeitung. In addition, the current agenda of the
annual general meeting is available on the website of Drägerwerk AG & Co. KGaA at
www.draeger.com/annual-shareholders-meeting.
Notification of the distribution of dividends for 2008 was published in the Börsen-
Zeitung on May 10, 2008.
Company calendarThe company calendar is available on the website of Drägerwerk AG & Co. KGaA at
www.draeger.com/financial-calendar.
If the respective internet link or path is not available or not working, you can obtain a
free printed copy from Drägerwerk AG & Co. KGaA.
SUBSEQUENT EVENTS
The Executive and Supervisory Boards of Lübeck-based Drägerwerk AG & Co. KGaA
will propose to distribute out of the net earnings of Drägerwerk AG & Co. KGaA of
EUR 86.2 million for fiscal year 2008 a cash dividend of EUR 0.35 per preferred share
(2007: EUR 0.55) and EUR 0.29 per common share (2007: EUR 0.49), hence a total
EUR 4.1 million, and carry forward the balance of EUR 82.1 million to new account. The
preferred share dividend also governs the dividend for participation certificates,
which will amount to EUR 3.50 each (2007: EUR 5.50). Participation certificates entitle
the holder to a dividend 10 times the preferred share dividend since their arithmetic
par value is 10 times that of a preferred share.
Lübeck, Germany, April 28, 2010
The general partner
Drägerwerk Verwaltungs AG
represented by its Executive Board
Stefan Dräger
Herbert Fehrecke
Gert-Hartwig Lescow
Dieter Pruss
Ulrich Thibaut
53
The Company’s Boards Consolidated companiesNotesFinancial statements 203
Management compliance statement
We confirm to the best of our knowledge that, in accordance with the applicable financial
reporting framework, the group financial statements give a true and fair view of the
net assets, financial position and results of operations of the Group, the group manage-
ment report presents business performance including business results and the situation
of the Group so as to give a true and fair view, and that the significant opportunities and
risks relating to the Group’s development have been described.
Lübeck, Germany, April 28, 2010
The general partner
Drägerwerk Verwaltungs AG
represented by its Executive Board
Stefan Dräger
Herbert Fehrecke
Gert-Hartwig Lescow
Dieter Pruss
Ulrich Thibaut
Auditor’s opinion204
AUDITOR’S OPINION
We have audited the group financial statements prepared by Drägerwerk AG & Co. KGaA,
Lübeck, comprising the balance sheet, the income statement, the statement of recog-
nized income and expenses, the cash flow statement, and the notes to the financial state-
ments, together with the group management report for the fiscal year from January 1,
2008 to December 31, 2008. The preparation of the group financial statements and the
group management report in accordance with IFRSs as adopted by the EU, the addi-
tional requirements of German commercial law pursuant to Sec. 315a (1) HGB (“Handels-
gesetzbuch”: German Commercial Code) and supplementary provisions of the articles
of association, is the responsibility of the Company’s management. Our responsibility is
to express an opinion on the group financial statements and the group management
report based on our audit.
We conducted our audit of the group financial statements in accordance with Sec. 317
HGB and German generally accepted standards for the audit of financial statements
promulgated by the Institut der Wirtschaftsprüfer (Institute of Public Auditors in Ger-
many) (IDW). Those standards require that we plan and perform the audit such that
misstatements materially affecting the presentation of the net assets, financial position
and results of operations in the group financial statements in accordance with the
applicable financial reporting framework and in the group management report are detect-
ed with reasonable assurance. Knowledge of the business activities and the economic
and legal environment of the Group and expectations as to possible misstatements are
taken into account in the determination of audit procedures. The effectiveness of the
accounting-related internal control system and the evidence supporting the disclosures
in the group financial statements and the group management report are examined
primarily on a test basis within the framework of the audit. The audit includes assessing
the annual financial statements of those entities included in consolidation, the determi-
nation of entities to be included in consolidation, the accounting and consolidation prin-
ciples used and significant estimates made by management, as well as evaluating the
overall presentation of the group financial statements and the group management report.
We believe that our audit provides a reasonable basis for our opinion.
Our audit has not led to any reservations.
205The Company’s Boards Consolidated companiesNotesFinancial statements
In our opinion, based on the findings of our audit, the group financial statements comply
with IFRSs as adopted by the EU, the additional requirements of German commercial
law pursuant to Sec. 315a (1) HGB and supplementary provisions of the articles of associ-
ation and give a true and fair view of the net assets, financial position and results of
operations of the Group in accordance with these requirements. The group management
report is consistent with the group financial statements and as a whole provides a suit-
able view of the Group’s position and suitably presents the opportunities and risks relat-
ing to future development.
We are issuing this auditor’s opinion after duly concluding our audit of the group financial
statements on March 4, 2009 and our subsequent audit, which focused on changes to
the items “Liabilities from participation certificates”, “Equity”, “Deferred tax liabilities”,
“Other current financial liabilities”, “Interest result”, “Income taxes”, “Net profit”
and the resulting changes to the group financial statements and group management
report. Please refer to the reasons given by the Group for these changes in the amended
notes to the group financial statements, Sec. 3. Our subsequent audit has not led to any
reservations.
Hamburg, March 4, 2009 / April 29, 2010
BDO Deutsche Warentreuhand
Aktiengesellschaft
Wirtschaftsprüfungsgesellschaft
Dyckerhoff Dr. Probst
Wirtschaftsprüfer Wirtschaftsprüfer
(German Public Auditor) (German Public Auditor)
Forward-looking statements206
FORWARD-LOOKING STATEMENTS
This report contains forward-looking statements. The statements are based on the current
expectations, presumptions, and forecasts of the Executive Board as well as the infor-
mation available to it to date. The forward-looking statements do not provide any warran-
ty for the future developments and results contained therein. Rather, the future devel-
opments and results are dependent on a number of factors; they entail various risks and
uncertainties and are based on assumptions which could prove to be incorrect. We are
under no obligation to update the forward-looking statements contained in this report.
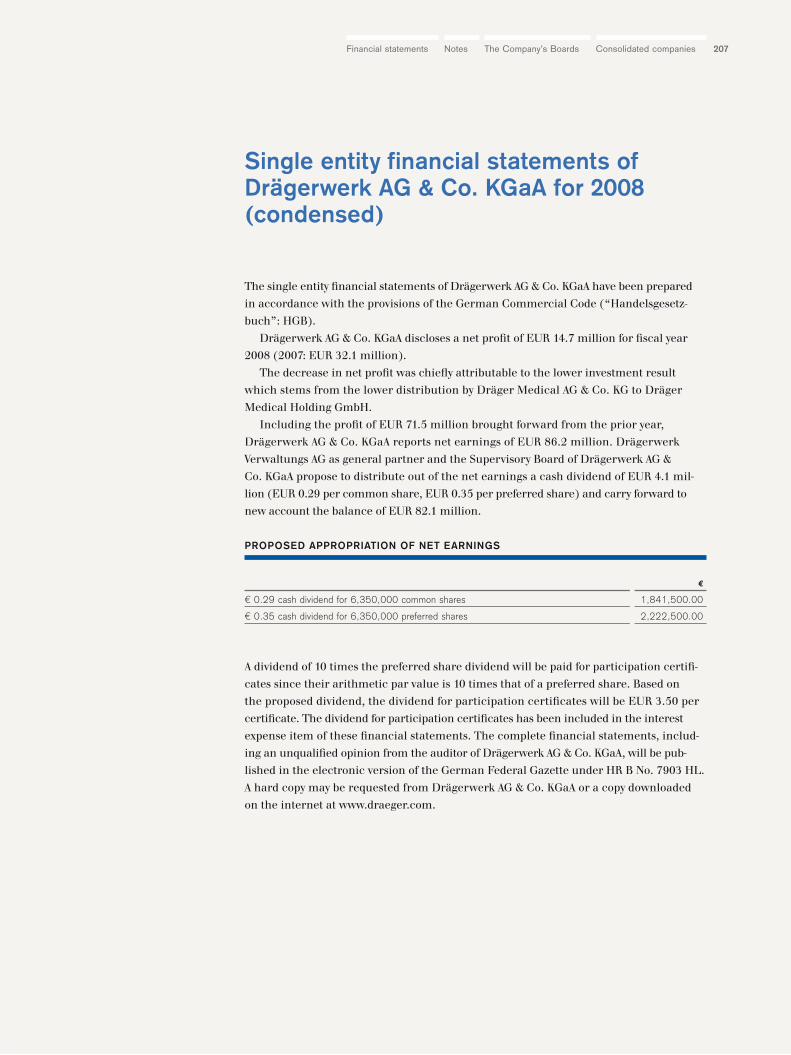
207The Company’s Boards Consolidated companiesNotesFinancial statements
The single entity financial statements of Drägerwerk AG & Co. KGaA have been prepared
in accordance with the provisions of the German Commercial Code (“Handelsgesetz-
buch”: HGB).
Drägerwerk AG & Co. KGaA discloses a net profit of EUR 14.7 million for fiscal year
2008 (2007: EUR 32.1 million).
The decrease in net profit was chiefly attributable to the lower investment result
which stems from the lower distribution by Dräger Medical AG & Co. KG to Dräger
Medical Holding GmbH.
Including the profit of EUR 71.5 million brought forward from the prior year,
Drägerwerk AG & Co. KGaA reports net earnings of EUR 86.2 million. Drägerwerk
Verwaltungs AG as general partner and the Supervisory Board of Drägerwerk AG &
Co. KGaA propose to distribute out of the net earnings a cash dividend of EUR 4.1 mil-
lion (EUR 0.29 per common share, EUR 0.35 per preferred share) and carry forward to
new account the balance of EUR 82.1 million.
A dividend of 10 times the preferred share dividend will be paid for participation certifi-
cates since their arithmetic par value is 10 times that of a preferred share. Based on
the proposed dividend, the dividend for participation certificates will be EUR 3.50 per
certificate. The dividend for participation certificates has been included in the interest
expense item of these financial statements. The complete financial statements, includ-
ing an unqualified opinion from the auditor of Drägerwerk AG & Co. KGaA, will be pub-
lished in the electronic version of the German Federal Gazette under HR B No. 7903 HL.
A hard copy may be requested from Drägerwerk AG & Co. KGaA or a copy downloaded
on the internet at www.draeger.com.
Single entity financial statements of Drägerwerk AG & Co. KGaA for 2008(condensed)
€
€ 0.29 cash dividend for 6,350,000 common shares 1,841,500.00
€ 0.35 cash dividend for 6,350,000 preferred shares 2,222,500.00
PROPOSED APPROPRIATION OF NET EARNINGS
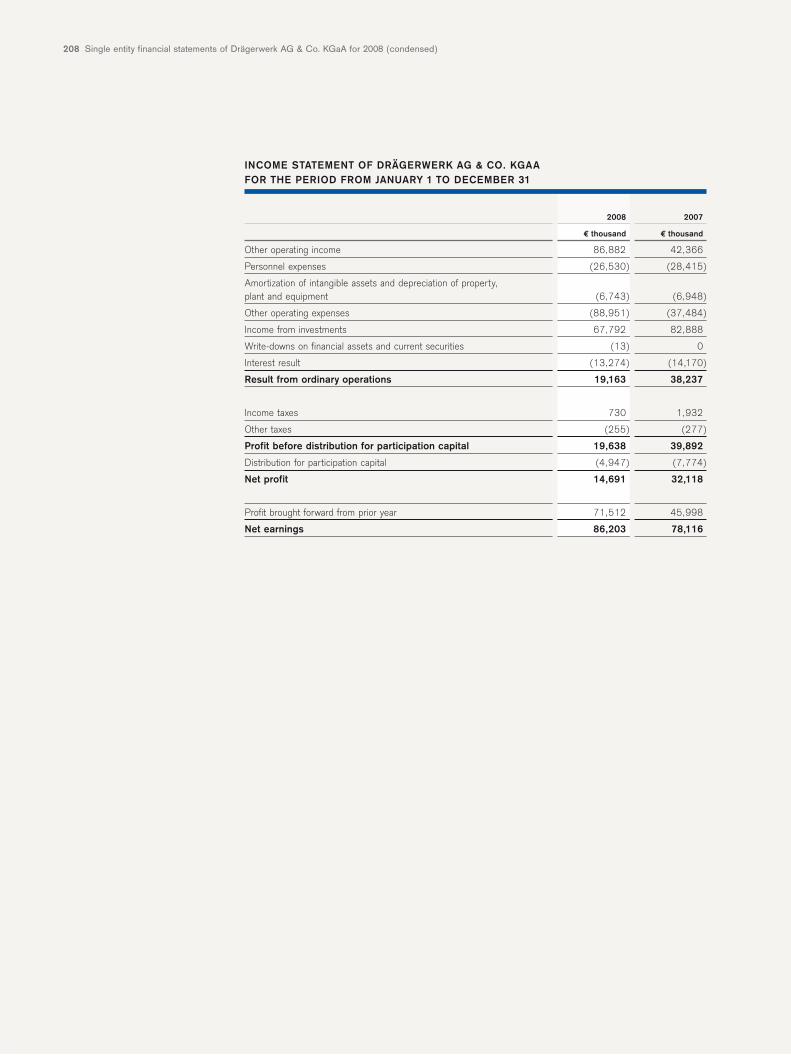
Single entity financial statements of Drägerwerk AG & Co. KGaA for 2008 (condensed)208
2008 2007
€ thousand € thousand
Other operating income 86,882 42,366
Personnel expenses (26,530) (28,415)
Amortization of intangible assets and depreciation of property,plant and equipment (6,743) (6,948)
Other operating expenses (88,951) (37,484)
Income from investments 67,792 82,888
Write-downs on financial assets and current securities (13) 0
Interest result (13,274) (14,170)
Result from ordinary operations 19,163 38,237
Income taxes 730 1,932
Other taxes (255) (277)
Profit before distribution for participation capital 19,638 39,892
Distribution for participation capital (4,947) (7,774)
Net profit 14,691 32,118
Profit brought forward from prior year 71,512 45,998
Net earnings 86,203 78,116
INCOME STATEMENT OF DRÄGERWERK AG & CO. KGAA FOR THE PERIOD FROM JANUARY 1 TO DECEMBER 31
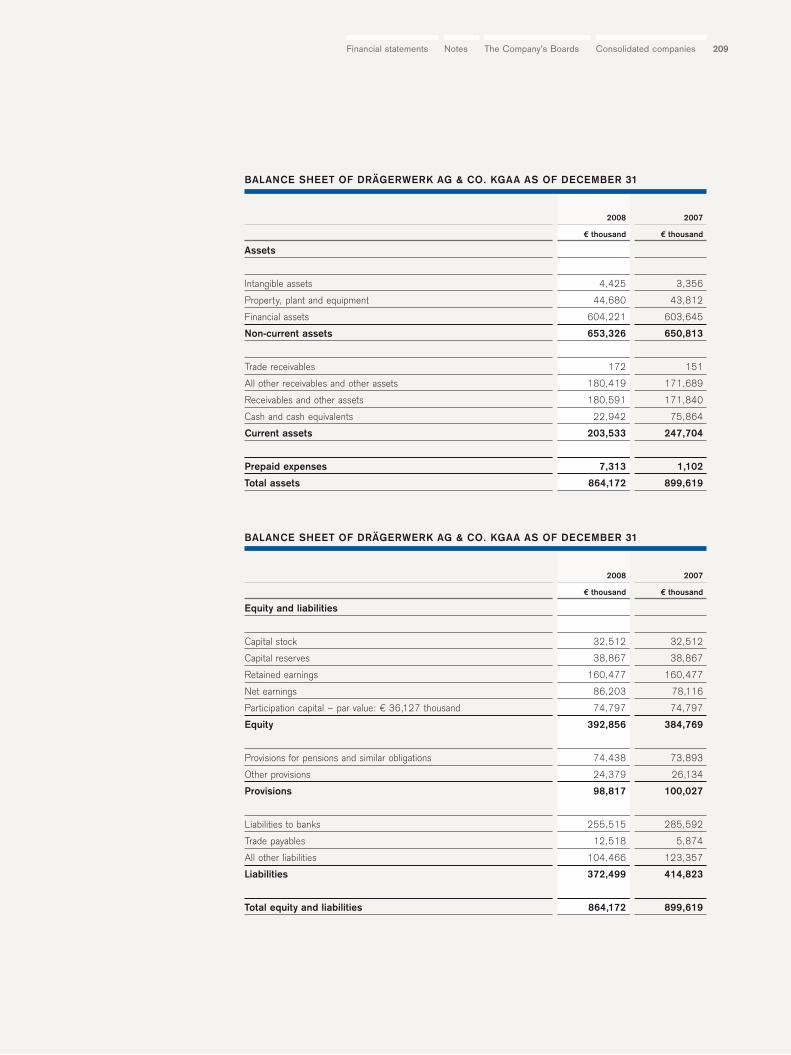
209The Company’s Boards Consolidated companiesNotesFinancial statements
2008 2007
€ thousand € thousand
Assets
Intangible assets 4,425 3,356
Property, plant and equipment 44,680 43,812
Financial assets 604,221 603,645
Non-current assets 653,326 650,813
Trade receivables 172 151
All other receivables and other assets 180,419 171,689
Receivables and other assets 180,591 171,840
Cash and cash equivalents 22,942 75,864
Current assets 203,533 247,704
Prepaid expenses 7,313 1,102
Total assets 864,172 899,619
BALANCE SHEET OF DRÄGERWERK AG & CO. KGAA AS OF DECEMBER 31
2008 2007
€ thousand € thousand
Equity and liabilities
Capital stock 32,512 32,512
Capital reserves 38,867 38,867
Retained earnings 160,477 160,477
Net earnings 86,203 78,116
Participation capital – par value: € 36,127 thousand 74,797 74,797
Equity 392,856 384,769
Provisions for pensions and similar obligations 74,438 73,893
Other provisions 24,379 26,134
Provisions 98,817 100,027
Liabilities to banks 255,515 285,592
Trade payables 12,518 5,874
All other liabilities 104,466 123,357
Liabilities 372,499 414,823
Total equity and liabilities 864,172 899,619
BALANCE SHEET OF DRÄGERWERK AG & CO. KGAA AS OF DECEMBER 31
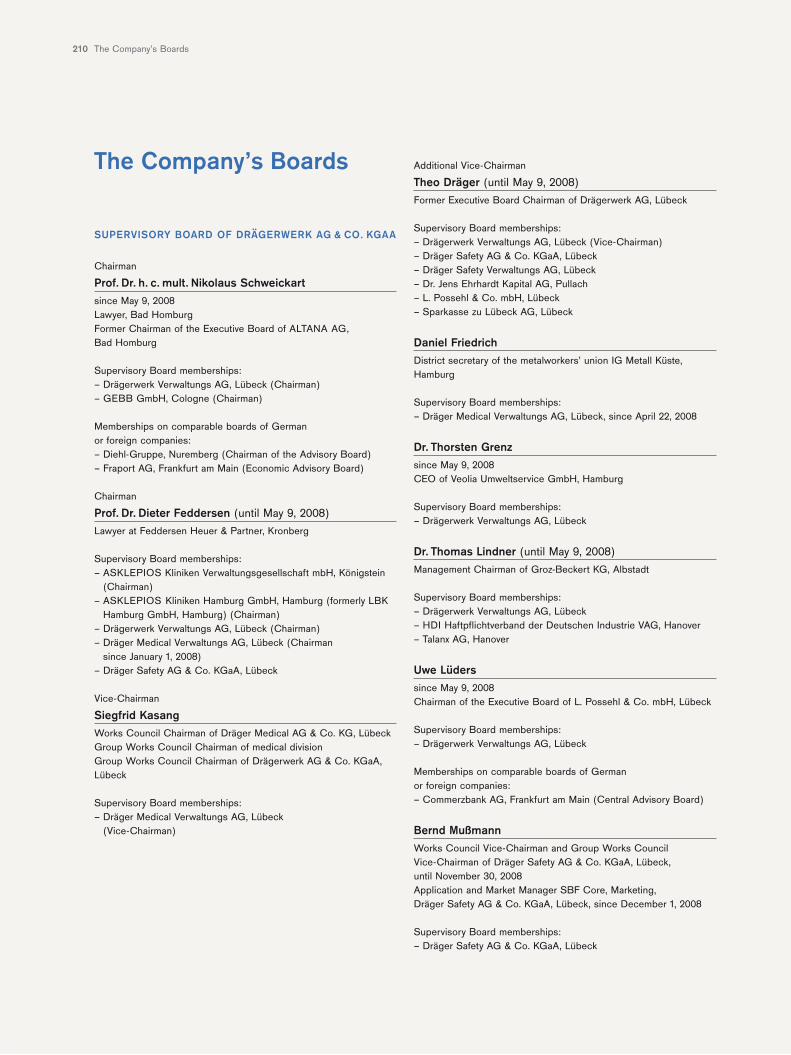
The Company’s Boards210
The Company’s Boards
SUPERVISORY BOARD OF DRÄGERWERK AG & CO. KGAA
Chairman
Prof. Dr. h. c. mult. Nikolaus Schweickartsince May 9, 2008Lawyer, Bad HomburgFormer Chairman of the Executive Board of ALTANA AG, Bad Homburg
Supervisory Board memberships:– Drägerwerk Verwaltungs AG, Lübeck (Chairman)– GEBB GmbH, Cologne (Chairman)
Memberships on comparable boards of Germanor foreign companies:– Diehl-Gruppe, Nuremberg (Chairman of the Advisory Board)– Fraport AG, Frankfurt am Main (Economic Advisory Board)
Chairman
Prof. Dr. Dieter Feddersen (until May 9, 2008)
Lawyer at Feddersen Heuer & Partner, Kronberg
Supervisory Board memberships:– ASKLEPIOS Kliniken Verwaltungsgesellschaft mbH, Königstein
(Chairman)– ASKLEPIOS Kliniken Hamburg GmbH, Hamburg (formerly LBK
Hamburg GmbH, Hamburg) (Chairman)– Drägerwerk Verwaltungs AG, Lübeck (Chairman)– Dräger Medical Verwaltungs AG, Lübeck (Chairman
since January 1, 2008)– Dräger Safety AG & Co. KGaA, Lübeck
Vice-Chairman
Siegfrid KasangWorks Council Chairman of Dräger Medical AG & Co. KG, LübeckGroup Works Council Chairman of medical divisionGroup Works Council Chairman of Drägerwerk AG & Co. KGaA,Lübeck
Supervisory Board memberships:– Dräger Medical Verwaltungs AG, Lübeck
(Vice-Chairman)
Additional Vice-Chairman
Theo Dräger (until May 9, 2008)
Former Executive Board Chairman of Drägerwerk AG, Lübeck
Supervisory Board memberships:– Drägerwerk Verwaltungs AG, Lübeck (Vice-Chairman)– Dräger Safety AG & Co. KGaA, Lübeck– Dräger Safety Verwaltungs AG, Lübeck– Dr. Jens Ehrhardt Kapital AG, Pullach– L. Possehl & Co. mbH, Lübeck– Sparkasse zu Lübeck AG, Lübeck
Daniel FriedrichDistrict secretary of the metalworkers’ union IG Metall Küste,Hamburg
Supervisory Board memberships:– Dräger Medical Verwaltungs AG, Lübeck, since April 22, 2008
Dr. Thorsten Grenzsince May 9, 2008CEO of Veolia Umweltservice GmbH, Hamburg
Supervisory Board memberships:– Drägerwerk Verwaltungs AG, Lübeck
Dr. Thomas Lindner (until May 9, 2008)
Management Chairman of Groz-Beckert KG, Albstadt
Supervisory Board memberships:– Drägerwerk Verwaltungs AG, Lübeck– HDI Haftpflichtverband der Deutschen Industrie VAG, Hanover– Talanx AG, Hanover
Uwe Lüderssince May 9, 2008Chairman of the Executive Board of L. Possehl & Co. mbH, Lübeck
Supervisory Board memberships:– Drägerwerk Verwaltungs AG, Lübeck
Memberships on comparable boards of German or foreign companies:– Commerzbank AG, Frankfurt am Main (Central Advisory Board)
Bernd MußmannWorks Council Vice-Chairman and Group Works Council Vice-Chairman of Dräger Safety AG & Co. KGaA, Lübeck, until November 30, 2008Application and Market Manager SBF Core, Marketing, Dräger Safety AG & Co. KGaA, Lübeck, since December 1, 2008
Supervisory Board memberships:– Dräger Safety AG & Co. KGaA, Lübeck
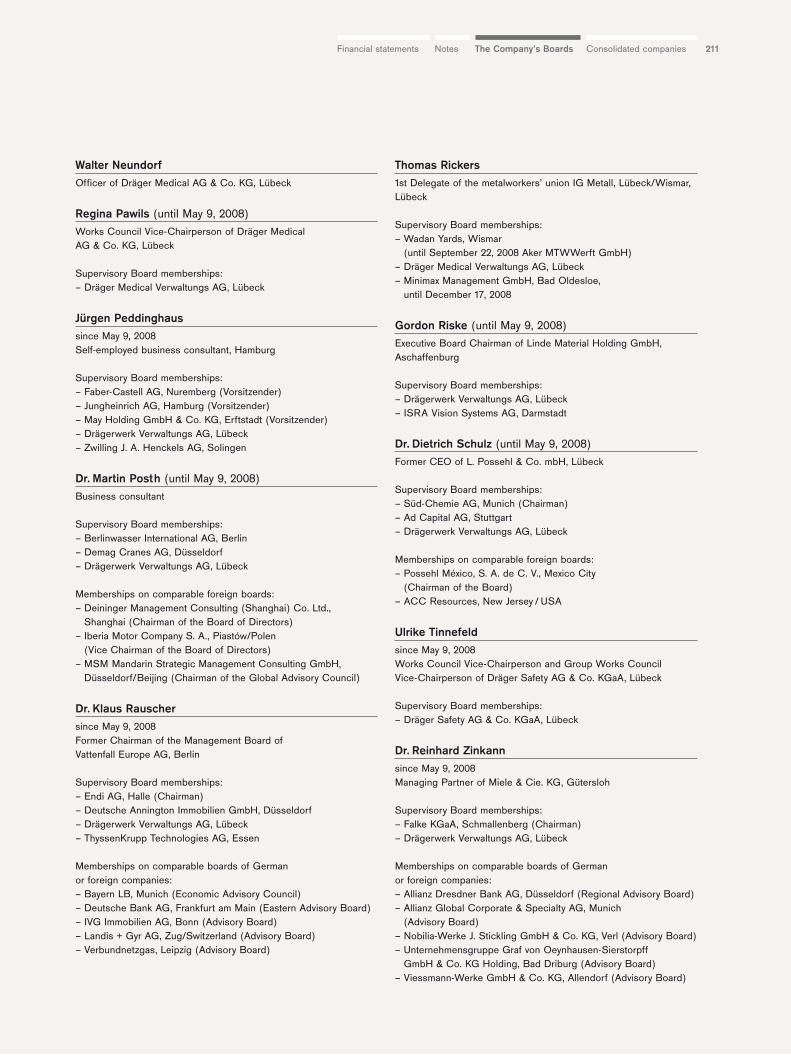
The Company’s Boards Consolidated companiesNotesFinancial statements 211
Walter Neundorf Officer of Dräger Medical AG & Co. KG, Lübeck
Regina Pawils (until May 9, 2008)
Works Council Vice-Chairperson of Dräger MedicalAG & Co. KG, Lübeck
Supervisory Board memberships:– Dräger Medical Verwaltungs AG, Lübeck
Jürgen Peddinghaussince May 9, 2008Self-employed business consultant, Hamburg
Supervisory Board memberships:– Faber-Castell AG, Nuremberg (Vorsitzender)– Jungheinrich AG, Hamburg (Vorsitzender)– May Holding GmbH & Co. KG, Erftstadt (Vorsitzender)– Drägerwerk Verwaltungs AG, Lübeck– Zwilling J. A. Henckels AG, Solingen
Dr. Martin Posth (until May 9, 2008)
Business consultant
Supervisory Board memberships:– Berlinwasser International AG, Berlin– Demag Cranes AG, Düsseldorf– Drägerwerk Verwaltungs AG, Lübeck
Memberships on comparable foreign boards:– Deininger Management Consulting (Shanghai) Co. Ltd.,
Shanghai (Chairman of the Board of Directors)– Iberia Motor Company S. A., Piastów/Polen
(Vice Chairman of the Board of Directors)– MSM Mandarin Strategic Management Consulting GmbH,
Düsseldorf/Beijing (Chairman of the Global Advisory Council)
Dr. Klaus Rauschersince May 9, 2008Former Chairman of the Management Board of Vattenfall Europe AG, Berlin
Supervisory Board memberships:– Endi AG, Halle (Chairman)– Deutsche Annington Immobilien GmbH, Düsseldorf– Drägerwerk Verwaltungs AG, Lübeck– ThyssenKrupp Technologies AG, Essen
Memberships on comparable boards of German or foreign companies:– Bayern LB, Munich (Economic Advisory Council)– Deutsche Bank AG, Frankfurt am Main (Eastern Advisory Board)– IVG Immobilien AG, Bonn (Advisory Board)– Landis + Gyr AG, Zug/Switzerland (Advisory Board)– Verbundnetzgas, Leipzig (Advisory Board)
Thomas Rickers1st Delegate of the metalworkers’ union IG Metall, Lübeck/Wismar,Lübeck
Supervisory Board memberships:– Wadan Yards, Wismar
(until September 22, 2008 Aker MTWWerft GmbH)– Dräger Medical Verwaltungs AG, Lübeck– Minimax Management GmbH, Bad Oldesloe,
until December 17, 2008
Gordon Riske (until May 9, 2008)
Executive Board Chairman of Linde Material Holding GmbH,Aschaffenburg
Supervisory Board memberships:– Drägerwerk Verwaltungs AG, Lübeck– ISRA Vision Systems AG, Darmstadt
Dr. Dietrich Schulz (until May 9, 2008)
Former CEO of L. Possehl & Co. mbH, Lübeck
Supervisory Board memberships:– Süd-Chemie AG, Munich (Chairman)– Ad Capital AG, Stuttgart– Drägerwerk Verwaltungs AG, Lübeck
Memberships on comparable foreign boards:– Possehl México, S. A. de C. V., Mexico City
(Chairman of the Board)– ACC Resources, New Jersey / USA
Ulrike Tinnefeldsince May 9, 2008Works Council Vice-Chairperson and Group Works Council Vice-Chairperson of Dräger Safety AG & Co. KGaA, Lübeck
Supervisory Board memberships:– Dräger Safety AG & Co. KGaA, Lübeck
Dr. Reinhard Zinkannsince May 9, 2008Managing Partner of Miele & Cie. KG, Gütersloh
Supervisory Board memberships:– Falke KGaA, Schmallenberg (Chairman)– Drägerwerk Verwaltungs AG, Lübeck
Memberships on comparable boards of German or foreign companies:– Allianz Dresdner Bank AG, Düsseldorf (Regional Advisory Board)– Allianz Global Corporate & Specialty AG, Munich
(Advisory Board)– Nobilia-Werke J. Stickling GmbH & Co. KG, Verl (Advisory Board)– Unternehmensgruppe Graf von Oeynhausen-Sierstorpff
GmbH & Co. KG Holding, Bad Driburg (Advisory Board)– Viessmann-Werke GmbH & Co. KG, Allendorf (Advisory Board)
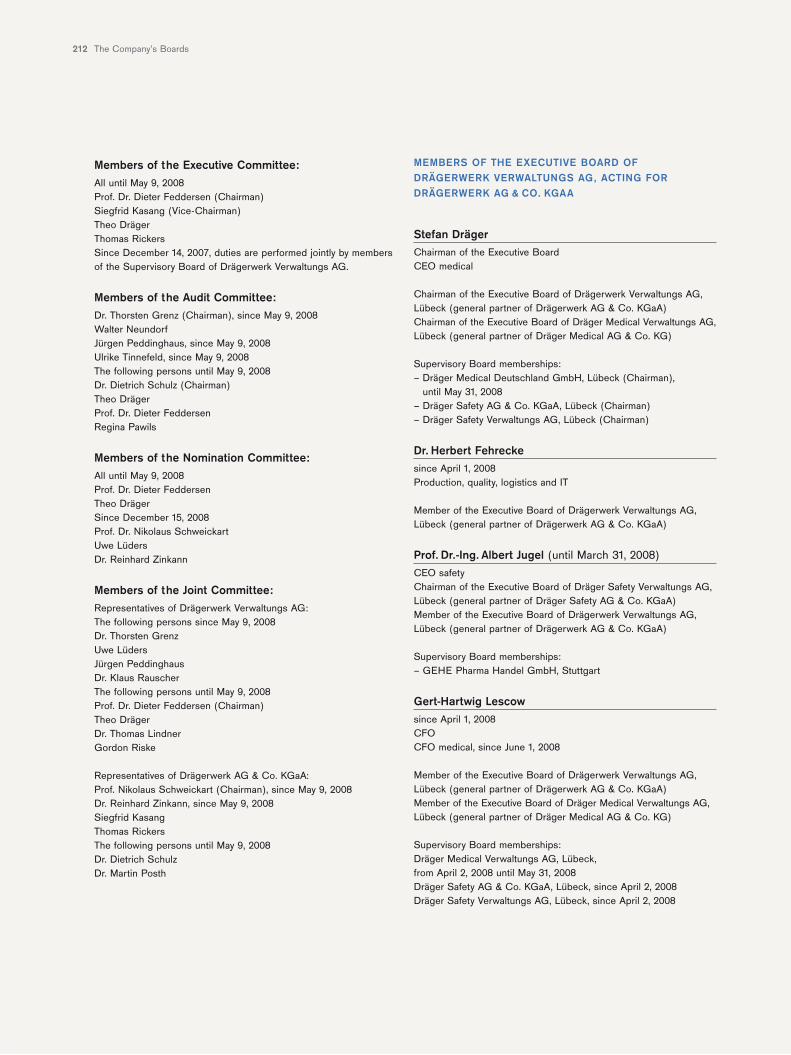
The Company’s Boards212
Members of the Executive Committee:All until May 9, 2008Prof. Dr. Dieter Feddersen (Chairman)Siegfrid Kasang (Vice-Chairman)Theo DrägerThomas RickersSince December 14, 2007, duties are performed jointly by membersof the Supervisory Board of Drägerwerk Verwaltungs AG.
Members of the Audit Committee:Dr. Thorsten Grenz (Chairman), since May 9, 2008Walter NeundorfJürgen Peddinghaus, since May 9, 2008Ulrike Tinnefeld, since May 9, 2008The following persons until May 9, 2008Dr. Dietrich Schulz (Chairman)Theo DrägerProf. Dr. Dieter FeddersenRegina Pawils
Members of the Nomination Committee:All until May 9, 2008Prof. Dr. Dieter FeddersenTheo DrägerSince December 15, 2008Prof. Dr. Nikolaus SchweickartUwe LüdersDr. Reinhard Zinkann
Members of the Joint Committee:Representatives of Drägerwerk Verwaltungs AG:The following persons since May 9, 2008Dr. Thorsten Grenz Uwe LüdersJürgen PeddinghausDr. Klaus RauscherThe following persons until May 9, 2008Prof. Dr. Dieter Feddersen (Chairman)Theo DrägerDr. Thomas LindnerGordon Riske
Representatives of Drägerwerk AG & Co. KGaA:Prof. Nikolaus Schweickart (Chairman), since May 9, 2008Dr. Reinhard Zinkann, since May 9, 2008Siegfrid KasangThomas RickersThe following persons until May 9, 2008Dr. Dietrich SchulzDr. Martin Posth
MEMBERS OF THE EXECUTIVE BOARD OFDRÄGERWERK VERWALTUNGS AG, ACTING FORDRÄGERWERK AG & CO. KGAA
Stefan DrägerChairman of the Executive BoardCEO medical
Chairman of the Executive Board of Drägerwerk Verwaltungs AG,Lübeck (general partner of Drägerwerk AG & Co. KGaA)Chairman of the Executive Board of Dräger Medical Verwaltungs AG,Lübeck (general partner of Dräger Medical AG & Co. KG)
Supervisory Board memberships:– Dräger Medical Deutschland GmbH, Lübeck (Chairman),
until May 31, 2008– Dräger Safety AG & Co. KGaA, Lübeck (Chairman)– Dräger Safety Verwaltungs AG, Lübeck (Chairman)
Dr. Herbert Fehreckesince April 1, 2008Production, quality, logistics and IT
Member of the Executive Board of Drägerwerk Verwaltungs AG,Lübeck (general partner of Drägerwerk AG & Co. KGaA)
Prof. Dr.-Ing. Albert Jugel (until March 31, 2008)
CEO safetyChairman of the Executive Board of Dräger Safety Verwaltungs AG,Lübeck (general partner of Dräger Safety AG & Co. KGaA)Member of the Executive Board of Drägerwerk Verwaltungs AG,Lübeck (general partner of Drägerwerk AG & Co. KGaA)
Supervisory Board memberships:– GEHE Pharma Handel GmbH, Stuttgart
Gert-Hartwig Lescow since April 1, 2008CFOCFO medical, since June 1, 2008
Member of the Executive Board of Drägerwerk Verwaltungs AG,Lübeck (general partner of Drägerwerk AG & Co. KGaA)Member of the Executive Board of Dräger Medical Verwaltungs AG,Lübeck (general partner of Dräger Medical AG & Co. KG)
Supervisory Board memberships:Dräger Medical Verwaltungs AG, Lübeck,from April 2, 2008 until May 31, 2008Dräger Safety AG & Co. KGaA, Lübeck, since April 2, 2008Dräger Safety Verwaltungs AG, Lübeck, since April 2, 2008
213The Company’s Boards Consolidated companiesNotesFinancial statements 213
Dr. Dieter Pruss since April 1, 2008Marketing and sales safetyMember of the Executive Board of Dräger Safety Verwaltungs AG,Lübeck, since April 1, 2008(general partner of Dräger Safety AG & Co. KGaA)
Supervisory Board memberships:Dräger Medical Verwaltungs AG, Lübeck, since June 1, 2008Dräger Medical Deutschland GmbH, Lübeck, since June 1, 2008
Hans-Oskar Sulzer (until March 31, 2008)
CFOMember of the Executive Board of Drägerwerk Verwaltungs AG,Lübeck (general partner of Drägerwerk AG & Co. KGaA)
Supervisory Board memberships:– Dräger Medical Verwaltungs AG, Lübeck– Dräger Safety AG & Co. KGaA, Lübeck– Dräger Safety Verwaltungs AG, Lübeck
Dr. Ulrich Thibaut Research and developmentMember of the Executive Board of Drägerwerk Verwaltungs AG,Lübeck (general partner of Drägerwerk AG & Co. KGaA)
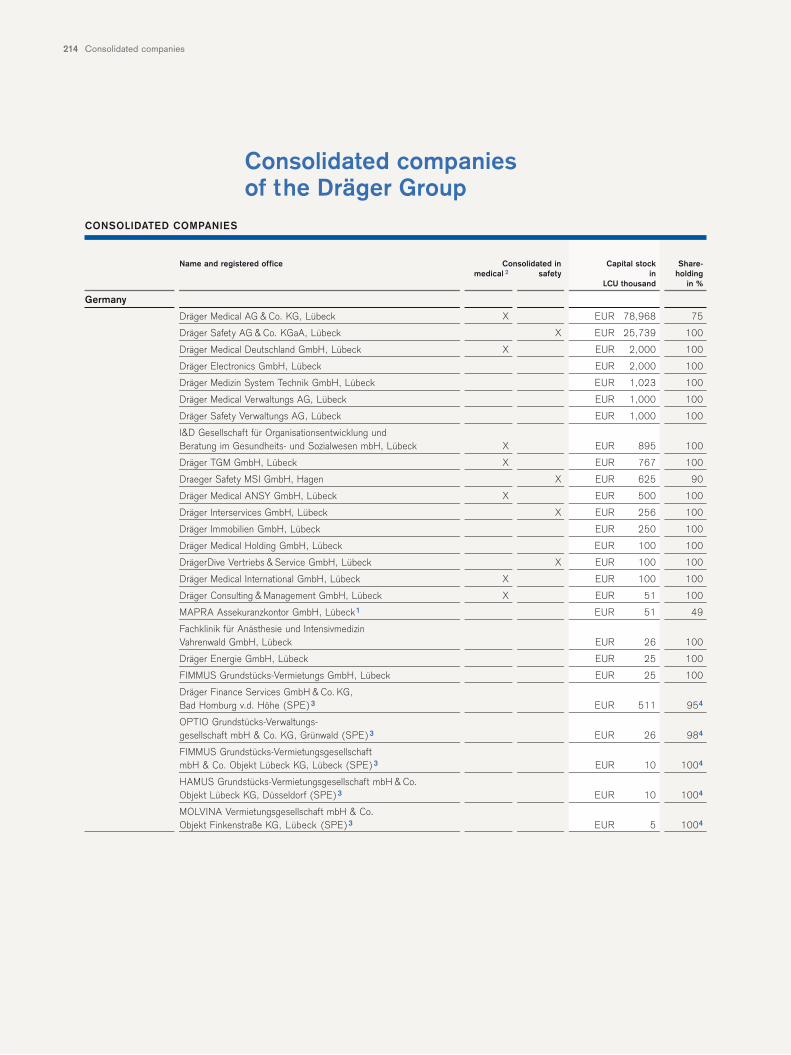
Consolidated companies214
Consolidated companiesof the Dräger Group
Name and registered office Consolidated in Capital stock Share-medical 2 safety in holding
LCU thousand in %
Germany
Dräger Medical AG & Co. KG, Lübeck X EUR 78,968 75
Dräger Safety AG & Co. KGaA, Lübeck X EUR 25,739 100
Dräger Medical Deutschland GmbH, Lübeck X EUR 2,000 100
Dräger Electronics GmbH, Lübeck EUR 2,000 100
Dräger Medizin System Technik GmbH, Lübeck EUR 1,023 100
Dräger Medical Verwaltungs AG, Lübeck EUR 1,000 100
Dräger Safety Verwaltungs AG, Lübeck EUR 1,000 100
I&D Gesellschaft für Organisationsentwicklung undBeratung im Gesundheits- und Sozialwesen mbH, Lübeck X EUR 895 100
Dräger TGM GmbH, Lübeck X EUR 767 100
Draeger Safety MSI GmbH, Hagen X EUR 625 90
Dräger Medical ANSY GmbH, Lübeck X EUR 500 100
Dräger Interservices GmbH, Lübeck X EUR 256 100
Dräger Immobilien GmbH, Lübeck EUR 250 100
Dräger Medical Holding GmbH, Lübeck EUR 100 100
DrägerDive Vertriebs & Service GmbH, Lübeck X EUR 100 100
Dräger Medical International GmbH, Lübeck X EUR 100 100
Dräger Consulting & Management GmbH, Lübeck X EUR 51 100
MAPRA Assekuranzkontor GmbH, Lübeck1 EUR 51 49
Fachklinik für Anästhesie und Intensivmedizin Vahrenwald GmbH, Lübeck EUR 26 100
Dräger Energie GmbH, Lübeck EUR 25 100
FIMMUS Grundstücks-Vermietungs GmbH, Lübeck EUR 25 100
Dräger Finance Services GmbH & Co. KG, Bad Homburg v.d. Höhe (SPE)3 EUR 511 954
OPTIO Grundstücks-Verwaltungs- gesellschaft mbH & Co. KG, Grünwald (SPE)3 EUR 26 984
FIMMUS Grundstücks-Vermietungsgesellschaft mbH & Co. Objekt Lübeck KG, Lübeck (SPE)3 EUR 10 1004
HAMUS Grundstücks-Vermietungsgesellschaft mbH & Co. Objekt Lübeck KG, Düsseldorf (SPE)3 EUR 10 1004
MOLVINA Vermietungsgesellschaft mbH & Co.Objekt Finkenstraße KG, Lübeck (SPE)3 EUR 5 1004
CONSOLIDATED COMPANIES
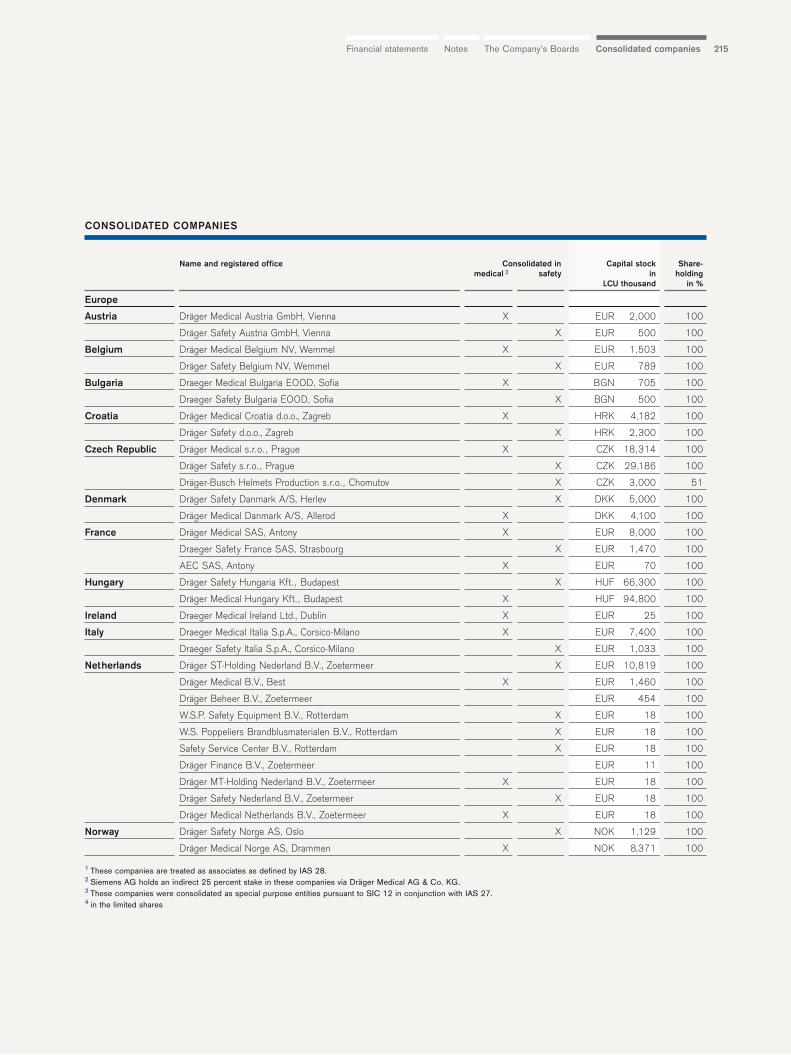
215The Company’s Boards Consolidated companiesNotesFinancial statements
Name and registered office Consolidated in Capital stock Share-medical 2 safety in holding
LCU thousand in %
Europe
Austria Dräger Medical Austria GmbH, Vienna X EUR 2,000 100
Dräger Safety Austria GmbH, Vienna X EUR 500 100
Belgium Dräger Medical Belgium NV, Wemmel X EUR 1,503 100
Dräger Safety Belgium NV, Wemmel X EUR 789 100
Bulgaria Draeger Medical Bulgaria EOOD, Sofia X BGN 705 100
Draeger Safety Bulgaria EOOD, Sofia X BGN 500 100
Croatia Dräger Medical Croatia d.o.o., Zagreb X HRK 4,182 100
Dräger Safety d.o.o., Zagreb X HRK 2,300 100
Czech Republic Dräger Medical s.r.o., Prague X CZK 18,314 100
Dräger Safety s.r.o., Prague X CZK 29,186 100
Dräger-Busch Helmets Production s.r.o., Chomutov X CZK 3,000 51
Denmark Dräger Safety Danmark A/S, Herlev X DKK 5,000 100
Dräger Medical Danmark A/S, Allerod X DKK 4,100 100
France Dräger Médical SAS, Antony X EUR 8,000 100
Draeger Safety France SAS, Strasbourg X EUR 1,470 100
AEC SAS, Antony X EUR 70 100
Hungary Dräger Safety Hungaria Kft., Budapest X HUF 66,300 100
Dräger Medical Hungary Kft., Budapest X HUF 94,800 100
Ireland Draeger Medical Ireland Ltd., Dublin X EUR 25 100
Italy Draeger Medical Italia S.p.A., Corsico-Milano X EUR 7,400 100
Draeger Safety Italia S.p.A., Corsico-Milano X EUR 1,033 100
Netherlands Dräger ST-Holding Nederland B.V., Zoetermeer X EUR 10,819 100
Dräger Medical B.V., Best X EUR 1,460 100
Dräger Beheer B.V., Zoetermeer EUR 454 100
W.S.P. Safety Equipment B.V., Rotterdam X EUR 18 100
W.S. Poppeliers Brandblusmaterialen B.V., Rotterdam X EUR 18 100
Safety Service Center B.V., Rotterdam X EUR 18 100
Dräger Finance B.V., Zoetermeer EUR 11 100
Dräger MT-Holding Nederland B.V., Zoetermeer X EUR 18 100
Dräger Safety Nederland B.V., Zoetermeer X EUR 18 100
Dräger Medical Netherlands B.V., Zoetermeer X EUR 18 100
Norway Dräger Safety Norge AS, Oslo X NOK 1,129 100
Dräger Medical Norge AS, Drammen X NOK 8,371 100
1 These companies are treated as associates as defined by IAS 28.2 Siemens AG holds an indirect 25 percent stake in these companies via Dräger Medical AG & Co. KG.3 These companies were consolidated as special purpose entities pursuant to SIC 12 in conjunction with IAS 27.4 in the limited shares
CONSOLIDATED COMPANIES
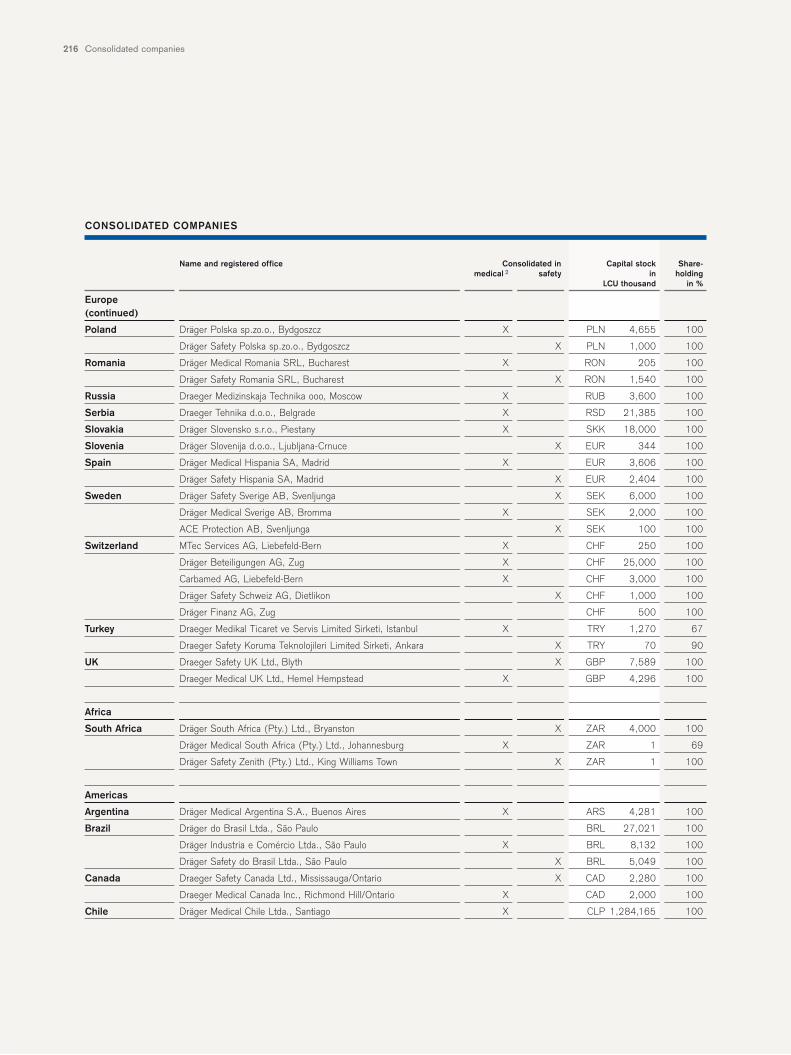
Consolidated companies216
Name and registered office Consolidated in Capital stock Share-medical 2 safety in holding
LCU thousand in %
Europe (continued)
Poland Dräger Polska sp.zo.o., Bydgoszcz X PLN 4,655 100
Dräger Safety Polska sp.zo.o., Bydgoszcz X PLN 1,000 100
Romania Dräger Medical Romania SRL, Bucharest X RON 205 100
Dräger Safety Romania SRL, Bucharest X RON 1,540 100
Russia Draeger Medizinskaja Technika ooo, Moscow X RUB 3,600 100
Serbia Draeger Tehnika d.o.o., Belgrade X RSD 21,385 100
Slovakia Dräger Slovensko s.r.o., Piestany X SKK 18,000 100
Slovenia Dräger Slovenija d.o.o., Ljubljana-Crnuce X EUR 344 100
Spain Dräger Medical Hispania SA, Madrid X EUR 3,606 100
Dräger Safety Hispania SA, Madrid X EUR 2,404 100
Sweden Dräger Safety Sverige AB, Svenljunga X SEK 6,000 100
Dräger Medical Sverige AB, Bromma X SEK 2,000 100
ACE Protection AB, Svenljunga X SEK 100 100
Switzerland MTec Services AG, Liebefeld-Bern X CHF 250 100
Dräger Beteiligungen AG, Zug X CHF 25,000 100
Carbamed AG, Liebefeld-Bern X CHF 3,000 100
Dräger Safety Schweiz AG, Dietlikon X CHF 1,000 100
Dräger Finanz AG, Zug CHF 500 100
Turkey Draeger Medikal Ticaret ve Servis Limited Sirketi, Istanbul X TRY 1,270 67
Draeger Safety Koruma Teknolojileri Limited Sirketi, Ankara X TRY 70 90
UK Draeger Safety UK Ltd., Blyth X GBP 7,589 100
Draeger Medical UK Ltd., Hemel Hempstead X GBP 4,296 100
Africa
South Africa Dräger South Africa (Pty.) Ltd., Bryanston X ZAR 4,000 100
Dräger Medical South Africa (Pty.) Ltd., Johannesburg X ZAR 1 69
Dräger Safety Zenith (Pty.) Ltd., King Williams Town X ZAR 1 100
Americas
Argentina Dräger Medical Argentina S.A., Buenos Aires X ARS 4,281 100
Brazil Dräger do Brasil Ltda., São Paulo BRL 27,021 100
Dräger Industria e Comércio Ltda., São Paulo X BRL 8,132 100
Dräger Safety do Brasil Ltda., São Paulo X BRL 5,049 100
Canada Draeger Safety Canada Ltd., Mississauga/Ontario X CAD 2,280 100
Draeger Medical Canada Inc., Richmond Hill/Ontario X CAD 2,000 100
Chile Dräger Medical Chile Ltda., Santiago X CLP 1,284,165 100
CONSOLIDATED COMPANIES
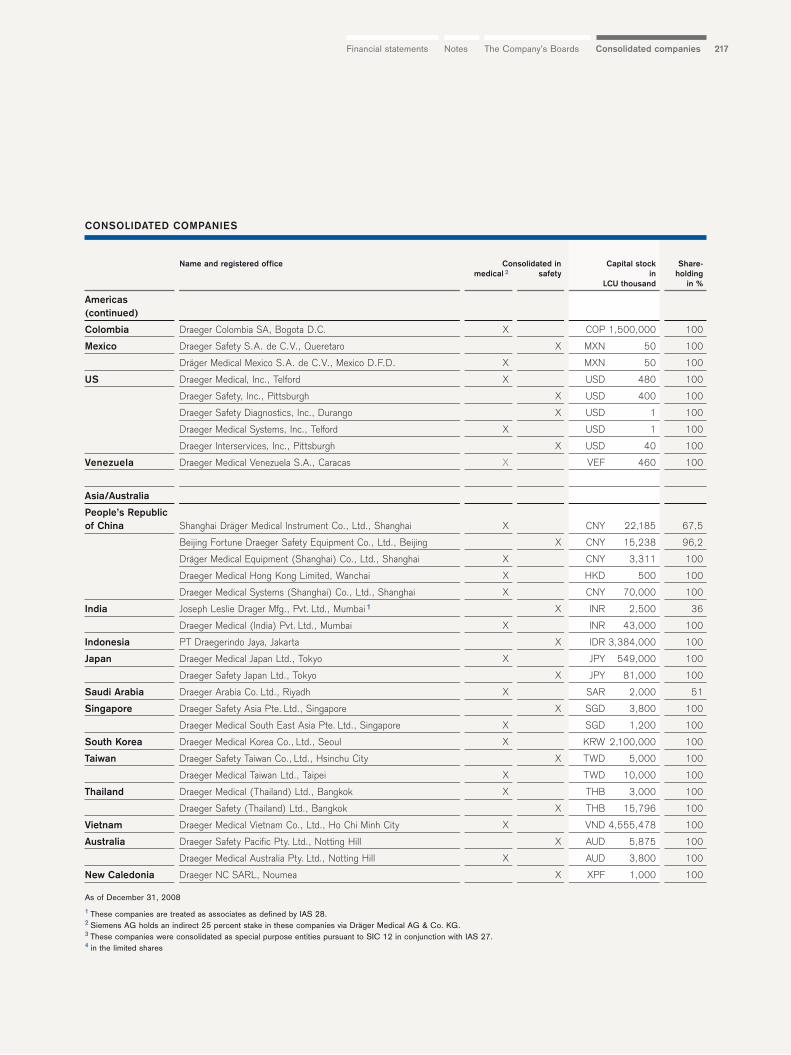
217The Company’s Boards Consolidated companiesNotesFinancial statements
Name and registered office Consolidated in Capital stock Share-medical 2 safety in holding
LCU thousand in %
Americas(continued)
Colombia Draeger Colombia SA, Bogota D.C. X COP 1,500,000 100
Mexico Draeger Safety S.A. de C.V., Queretaro X MXN 50 100
Dräger Medical Mexico S.A. de C.V., Mexico D.F.D. X MXN 50 100
US Draeger Medical, Inc., Telford X USD 480 100
Draeger Safety, Inc., Pittsburgh X USD 400 100
Draeger Safety Diagnostics, Inc., Durango X USD 1 100
Draeger Medical Systems, Inc., Telford X USD 1 100
Draeger Interservices, Inc., Pittsburgh X USD 40 100
Venezuela Draeger Medical Venezuela S.A., Caracas X VEF 460 100
Asia/Australia
People’s Republicof China Shanghai Dräger Medical Instrument Co., Ltd., Shanghai X CNY 22,185 67,5
Beijing Fortune Draeger Safety Equipment Co., Ltd., Beijing X CNY 15,238 96,2
Dräger Medical Equipment (Shanghai) Co., Ltd., Shanghai X CNY 3,311 100
Draeger Medical Hong Kong Limited, Wanchai X HKD 500 100
Draeger Medical Systems (Shanghai) Co., Ltd., Shanghai X CNY 70,000 100
India Joseph Leslie Drager Mfg., Pvt. Ltd., Mumbai1 X INR 2,500 36
Draeger Medical (India) Pvt. Ltd., Mumbai X INR 43,000 100
Indonesia PT Draegerindo Jaya, Jakarta X IDR 3,384,000 100
Japan Draeger Medical Japan Ltd., Tokyo X JPY 549,000 100
Draeger Safety Japan Ltd., Tokyo X JPY 81,000 100
Saudi Arabia Draeger Arabia Co. Ltd., Riyadh X SAR 2,000 51
Singapore Draeger Safety Asia Pte. Ltd., Singapore X SGD 3,800 100
Draeger Medical South East Asia Pte. Ltd., Singapore X SGD 1,200 100
South Korea Draeger Medical Korea Co., Ltd., Seoul X KRW 2,100,000 100
Taiwan Draeger Safety Taiwan Co., Ltd., Hsinchu City X TWD 5,000 100
Draeger Medical Taiwan Ltd., Taipei X TWD 10,000 100
Thailand Draeger Medical (Thailand) Ltd., Bangkok X THB 3,000 100
Draeger Safety (Thailand) Ltd., Bangkok X THB 15,796 100
Vietnam Draeger Medical Vietnam Co., Ltd., Ho Chi Minh City X VND 4,555,478 100
Australia Draeger Safety Pacific Pty. Ltd., Notting Hill X AUD 5,875 100
Draeger Medical Australia Pty. Ltd., Notting Hill X AUD 3,800 100
New Caledonia Draeger NC SARL, Noumea X XPF 1,000 100
As of December 31, 2008
1 These companies are treated as associates as defined by IAS 28.2 Siemens AG holds an indirect 25 percent stake in these companies via Dräger Medical AG & Co. KG.3 These companies were consolidated as special purpose entities pursuant to SIC 12 in conjunction with IAS 27.4 in the limited shares
CONSOLIDATED COMPANIES

218
Further informationThe Dräger review provides an easy-to-readsummary of the highlights of 2008.
Glossary 221Imprint 226Financial calendar back coverReview of key events in 2008 back cover
221
221
Glossary
AktGAbbreviation of “Aktiengesetz” (German Stock Corporation Act)
Anesthesia stationsSystems for administering anesthetic gas including the related moni-toring, alarm and protection equipment.
Arm’s length principlePrinciple used in tax law for business conducted as if betweenunrelated parties.
Audit Committee Supervisory Board committee which deals with audit matters.
Audit of financial statementsThe audit of a company’s annual financial statements by a publicauditor.
Capital employedThe interest-bearing capital used in a company. At Dräger, this istotal assets less deferred tax assets, cash and cash equivalents,other interest-bearing assets, and non-interest-bearing liabilities.
Capital stockCapital stock is the nominal value of all shares issued by a stockcorporation or partnership limited by shares. At Drägerwerk AG & Co. KGaA, the capital stock is the nominal value of all com-mon and preferred shares issued.
Cash flowShows the change in cash and cash equivalents during a specificreporting period, and provides information on a company’s financialstrength.
Cash managementAll measures taken as part of short-term financial management ofcash investments with the aim of safeguarding liquidity and achiev-ing the highest possible efficiency in payment transactions.
Change managementAll tasks, measures and activities which are intended to bring aboutcomprehensive, cross-departmental and substantial change within the company (e.g. the implementation of new strategies orstructures).
Common shareCommon shares (or stock) guarantee the shareholder the share-holder rights defined in the German Stock Corporation Act, in par-ticular the right to vote at the annual general meeting.
ComplianceCompliance is the adherence by a company, its bodies andemployees to all legal obligations and prohibitions, corporate valuesand policies, and general morals and ethics.
Corporate governanceInternational parlance, meaning the responsible governance andcontrol of a company with the sustained creation and addition ofvalue in mind.
Credit rating/creditworthinessCredit rating/creditworthiness is the credit standing of an individ-ual or legal entity and forms the basis of a third-party decision onwhether to grant the person/entity credit.
Currency optionRisks from exchange rate fluctuations can be hedged using a cur-rency option. When purchasing a currency option, the buyer acquiresthe right, but not the obligation, to buy or sell a currency at a definedexchange rate on a defined date.
Current assetsAccounting term used in the German Commercial Code (“Handels-gesetzbuch”: HGB) for assets which are not destined for long-term use in and by the company (e.g. inventories, receivables, cashand cash equivalents). This term is not exactly equivalent to thesame term used in IFRSs.
DAXAbbreviation of “Deutscher Aktienindex” (German stock index). TheDAX comprises the 30 largest (in terms of trading volume and market capitalization) listed companies on the Prime Standard of theFrankfurt Stock Exchange.
Declaration of conformityDeclaration by the Executive Board and Supervisory Board on the current and future extent of conformity with the German CorporateGovernance Code.
DerivativesInstruments whose value is mainly derived from a specified priceand price fluctuations and expectations of an underlying asset (e.g.shares, foreign currency, interest securities).
ImprintGlossary
Glossary222
Directors’ dealingsDirectors’ dealings are securities transactions conducted by per-sons with management functions at a listed stock corporation in that corporation’s own shares or in related financial instruments.According to Sec. 15a WpHG (“Wertpapierhandelsgesetz”: GermanSecurities Trading Act), these persons, including those who are closely related to them, must report securities transactions of thiskind immediately.
DividendsPortion of net earnings distributed to shareholders.
EBITAbbreviation of “earnings before interest and taxes”. Earnings before net interest result and income taxes. Any earnings from dis-continued operations are not included in this item.
EBITDAAbbreviation of “earnings before interest, taxes, depreciation andamortization”. Earnings before net interest result, income taxes,depreciation, amortization and non-recurring expenses. Any earningsfrom discontinued operations are not included in this item.
EBIT marginFigure used to evaluate the profitability of a company. The EBITmargin is given in percent and is the EBIT (if applicable, beforenon-recurring expenses) divided by net sales.
Emerging marketUp-and-coming markets in emerging economies whose economic strength is growing steadily and which are on the verge of becom-ing a modern industrial or service economy.
Environmental management systemAn environmental management system is the part of a company’s management system which defines in a structured manner areas ofresponsibility, conduct, processes and provisions for the implemen-tation of the corporate environmental policy.
EquityA company’s net assets equal to the balance of assets and liabili-ties. Equity is made available by the owners on the foundation of a company and changes over time, mainly as a result of retainedearnings.
Equity ratioThe equity ratio is the ratio of equity to total capital. The more equitya company has, the better its credit rating, the greater its financialstability and independence from external lenders.
Financial statementsThe financial statements are the accounts that must be prepared by a company at the end of each fiscal year according to commer-cial law. Under HGB, the financial statements for stock corporationscomprise a balance sheet, income statement and notes, as well as a management report. Under IFRSs, they also include a cash flowstatement and a statement of changes in equity.
Forward exchange contractRisks from exchange rate fluctuations can be hedged using a for-ward exchange contract. This is a binding agreement to exchangeone currency for another currency on a date and at an exchangerate fixed when the contract is entered into.
Free floatShares of a company which are traded freely on the stock exchange.
GDPAbbreviation of “gross domestic product”. GDP is a measure of thetotal output of an economy. It is the value, expressed in terms of a monetary unit, of all goods and services produced within a year.
General partnerPartner of a limited partnership with full personal liability.
German Corporate Governance CodeThe German Corporate Governance Code is an important piece oflegislation governing the management and oversight of German listed companies and contains nationally and internationally recog-nized standards for proper and responsible corporate governance.The purpose of the Code is to make the corporate governance sys-tem clearer and easier to understand and to foster the trust ofinvestors, customers, employees and the public in the managementand oversight of German stock corporations.
HGBAbbreviation of “Handelsgesetzbuch” (German Commercial Code).
IFRSsAbbreviation of “International Financial Reporting Standards”. Standards for the preparation of financial statements by companies.In the EU, the application of IFRSs for the consolidated financialstatements of listed companies has been mandatory since 2005.
Income statementThe income statement is a comparison of expenses and income used to determine the earnings of a company. It is a mandatory ele-ment of the financial statements under HGB and IFRSs.
IncubatorSelf-contained incubator for premature and sick babies which regu-lates the microclimate (including temperature, humidity, concentra-tion of oxygen, light, noise level).
223
Interest rate capInterest rate caps are interest derivatives which offer an upper ceiling on the variable interest rate on underlying transactions.
Interest rate swapsAn interest rate swap is an agreement between two contractual parties to exchange different interest cash flows with each other. Asan interest rate derivative, it can be used both to hedge interest rate risk and as a speculative investment which benefits from certainchanges in interest rates.
Joint ventureIn this instance, the term joint venture refers to the collaboration between Siemens and the medical division, in which Siemens has a25 percent stake via the parent company.
KaizenKaizen (continual improvement process) is a Japanese philosophygoverning the spheres of personal life and work. Its central theme is the pursuit of continual improvement. Industry has developed thisconcept into a management system which involves both managersand employees. The main aims of Kaizen are high customer satisfac-tion, the reduction of costs, quality assurance and efficiency.
KGaAAbbreviation of “Kommanditgesellschaft auf Aktien” (partnership limited by shares).
KonTraGAbbreviation of “Gesetz zur Kontrolle und Transparenz imUnternehmensbereich” (German Act on Corporate Control andTransparency).
Market capitalizationThe current stock market value of a company. The stock market value is the number of shares issued multiplied by the share price.Market capitalization gives an indication of the price payable or realizable by a company for all of its outstanding shares. It shouldbe noted, however, that the purchase or sale of large quantities ofshares tends to make the share price rise or fall.
“Mark to market” valuationThe valuation of financial instruments at current market prices.
MonitoringDisplaying and monitoring patient data.
Net earningsNet earnings (or accumulated loss) pursuant to Sec. 158 AktG(“Aktiengesetz”: German Stock Corporation Act) is the netprofit/loss for the year plus/minus the following items: +/– Profit/loss brought forward from prior year+ Transfers from additional paid-in capital+/– Transfers from/to retained earnings
Net financial debtInterest-bearing debt (e.g. participation capital, loans, other liabilitiesto banks) less cash and cash equivalents and interest-bearingassets.
Net lossThe net loss is the negative result of a fiscal year, disclosed in theincome statement. It is the (negative) difference between theincome and expenses of the fiscal year in question.
Net profitThe net profit is the positive result of a fiscal year, disclosed in the income statement.
Net profit marginThe net profit margin is the ratio of net profit to net sales. It is the percentage share of net sales left over as profit for a company.
Non-current assets Accounting term used in the German Commercial Code (“Handels-gesetzbuch”: HGB) for assets which are destined for long-term use in and by the company. This includes property, plant and equip-ment, long-term financial assets and intangible assets. This term isnot exactly equivalent to the same term used in IFRSs.
OutsourcingSubcontracting company services or functions to specialized service providers.
Participation certificateParticipation certificates are a type of investment somewhere bet-ween a share and a bond. They entitle the bearer to redeem thenominal amount and usually also grant a share in net profits or liqui-dation proceeds. Voting and other rights granted to shareholders,however, are excluded. The profit participation of these certificatesusually exceeds the return on fixed-interest securities. Participationcapital is subordinate to all other company creditors. Consequently,in the event of liquidation all of the company’s other creditors aresatisfied first. Under HGB, participation certificates are recognizedin equity; under IFRSs, they are disclosed in debt.
ImprintGlossary
Glossary224
Partnership limited by sharesA partnership limited by shares is a form of corporation of which atleast one partner (general partner), which can also be a legal entitysuch as a stock corporation, is fully liable. The remaining partners(limited shareholders) have an interest in the capital stock, which isdivided into shares, and are only liable up to the amount of theirinvestment. The company is managed and represented by the gen-eral partner.
R&DAbbreviation of “research and development”.
Preferred shareThe preferred share grants the bearer preferences compared to a common share, which can involve a certain type of voting right (butnot a majority voting right), the dividend claim or the distribution ofliquidation assets. The Dräger preferred shares traded on the stockexchange are non-voting preferred shares with a cumulative prefer-ential right to the distribution of profit. No more than half of the capi-tal stock may be issued as non-voting preferred shares.
PremiumPremium is a markup on the nominal value of a security and isgenerally quoted in percent.
REACHAbbreviation of “registration, evaluation, authorization and restrictionof chemicals”. EC regulation.
Resource allocationThe allocation of scarce resources (e.g. raw materials, energy, cash)to various uses.
Retained earningsRetained earnings are amounts disclosed under equity recognizedfrom earnings which were not distributed in the current or past fiscal years.
Risk managementSystematic approach to identifying and evaluating potential risks andselecting and implementing steps to address such risks.
ROCEAbbreviation of “return on capital employed”. The figure shows howeffectively and profitably a company employs its capital. It is theratio of EBIT before non-recurring expenses to capital employed.
RoHSAbbreviation of “restriction of the use of certain hazardous substan-ces in electrical and electronic equipment”. EC directive.
Shared services Centralized service processes within a company. Similar processesfrom different areas of a company are pooled and provided by acentralized department.
Supply chain managementProcess-oriented, effective and efficient management of the supply chain. The aim is to optimize procurement, production and the sup-ply of products and services to the customer.
TecDAXLeading stock index for the technology sector, which reflects the value growth of the 30 largest technology stocks, in terms of tradingvolume and market capitalization, on the Prime Standard of theFrankfurt Stock Exchange.
WpHGAbbreviation of “Wertpapierhandelsgesetz” (German Securities Trading Act).
XetraElectronic trading platform operated by Deutsche Börse AG for shares, exchange-traded funds and subscription rights.

225ImprintGlossary
226 Imprint
Imprint
Drägerwerk AG & Co. KGaACorporate CommunicationsMoislinger Allee 53–5523558 Lübeck, Germanywww.draeger.com
Concept and designHeisters & Partner, Büro für Kommunikationsdesign, Mainz, Germany
PublicationMarch 19, 2008
ReproductionsGold GmbH, Munich, GermanyKoch Lichtsatz und Scan GmbH, Wiesbaden, Germany
Printed byDräger + Wullenwever pm GmbH & Co. KG, Lübeck
PhotosRobert Brembeck, Munich, GermanyMichael Rast, St.Gallen, Switzerland
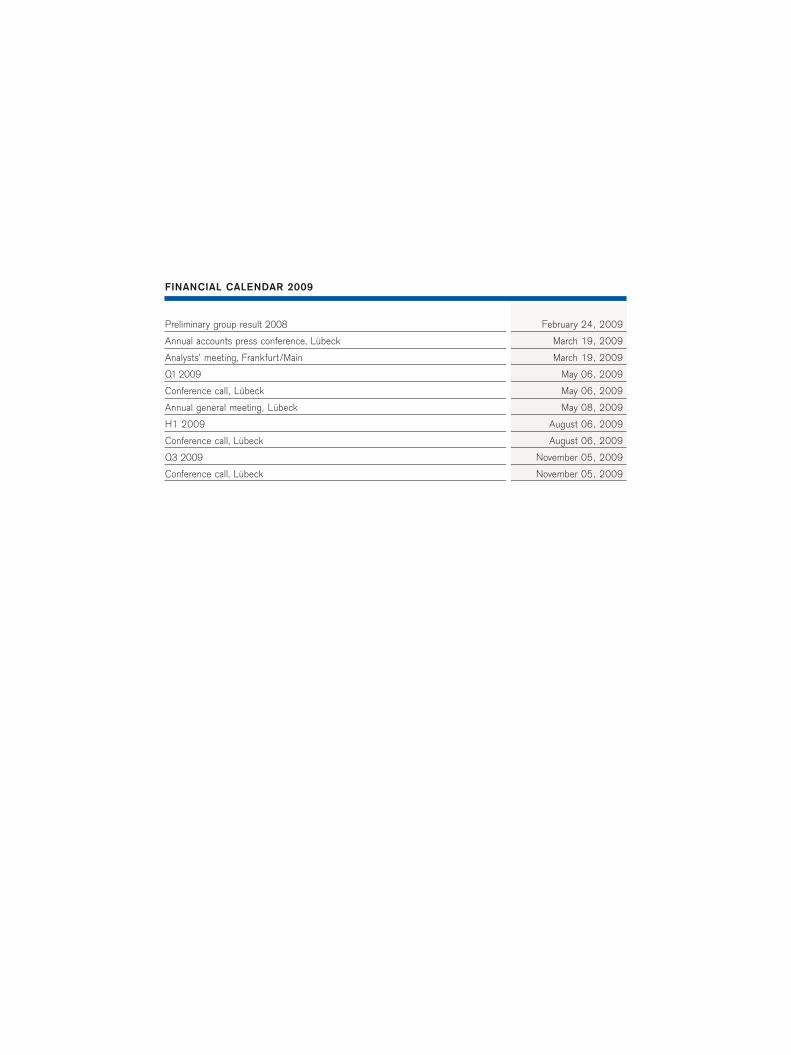
Preliminary group result 2008 February 24, 2009
Annual accounts press conference, Lübeck March 19, 2009
Analysts’ meeting, Frankfurt/Main March 19, 2009
Q1 2009 May 06, 2009
Conference call, Lübeck May 06, 2009
Annual general meeting, Lübeck May 08, 2009
H1 2009 August 06, 2009
Conference call, Lübeck August 06, 2009
Q3 2009 November 05, 2009
Conference call, Lübeck November 05, 2009
FINANCIAL CALENDAR 2009
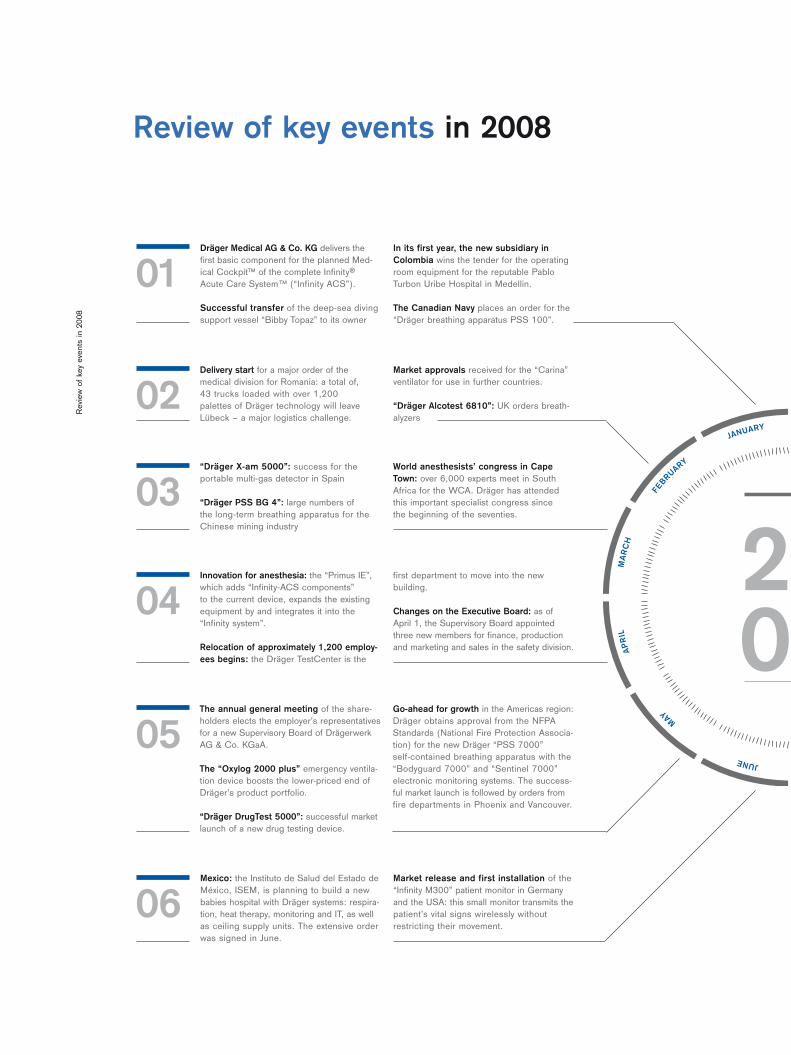
Review of key events in 2008
Rev
iew
of
key
even
ts in
200
8
In its first year, the new subsidiary inColombia wins the tender for the operatingroom equipment for the reputable Pablo Turbon Uribe Hospital in Medellin.
The Canadian Navy places an order for the“Dräger breathing apparatus PSS 100”.
Dräger Medical AG & Co. KG delivers the first basic component for the planned Med-ical Cockpit™ of the complete Infinity® Acute Care System™ (“Infinity ACS”).
Successful transfer of the deep-sea divingsupport vessel “Bibby Topaz” to its owner
Delivery start for a major order of themedical division for Romania: a total of, 43 trucks loaded with over 1,200 palettes of Dräger technology will leaveLübeck – a major logistics challenge.
Market approvals received for the “Carina”ventilator for use in further countries.
“Dräger Alcotest 6810”: UK orders breath-alyzers
World anesthesists’ congress in CapeTown: over 6,000 experts meet in SouthAfrica for the WCA. Dräger has attendedthis important specialist congress since the beginning of the seventies.
“Dräger X-am 5000”: success for theportable multi-gas detector in Spain
“Dräger PSS BG 4”: large numbers of the long-term breathing apparatus for theChinese mining industry
first department to move into the new building.
Changes on the Executive Board: as of April 1, the Supervisory Board appointedthree new members for finance, productionand marketing and sales in the safety division.
Innovation for anesthesia: the “Primus IE”,which adds “Infinity-ACS components” to the current device, expands the existingequipment by and integrates it into the“Infinity system”.
Relocation of approximately 1,200 employ-ees begins: the Dräger TestCenter is the
The annual general meeting of the share-holders elects the employer’s representativesfor a new Supervisory Board of DrägerwerkAG & Co. KGaA.
The “Oxylog 2000 plus” emergency ventila-tion device boosts the lower-priced end ofDräger’s product portfolio.
“Dräger DrugTest 5000”: successful marketlaunch of a new drug testing device.
Go-ahead for growth in the Americas region:Dräger obtains approval from the NFPAStandards (National Fire Protection Associa-tion) for the new Dräger “PSS 7000” self-contained breathing apparatus with the“Bodyguard 7000” and “Sentinel 7000”electronic monitoring systems. The success-ful market launch is followed by orders fromfire departments in Phoenix and Vancouver.
Mexico: the Instituto de Salud del Estado deMéxico, ISEM, is planning to build a newbabies hospital with Dräger systems: respira-tion, heat therapy, monitoring and IT, as wellas ceiling supply units. The extensive orderwas signed in June.
Market release and first installation of the“Infinity M300” patient monitor in Germanyand the USA: this small monitor transmits thepatient’s vital signs wirelessly withoutrestricting their movement.
02
04
05
06
03
01
JANUARY
FEBRUARY
MA
RC
HA
PR
IL
MAY
JUNE
20
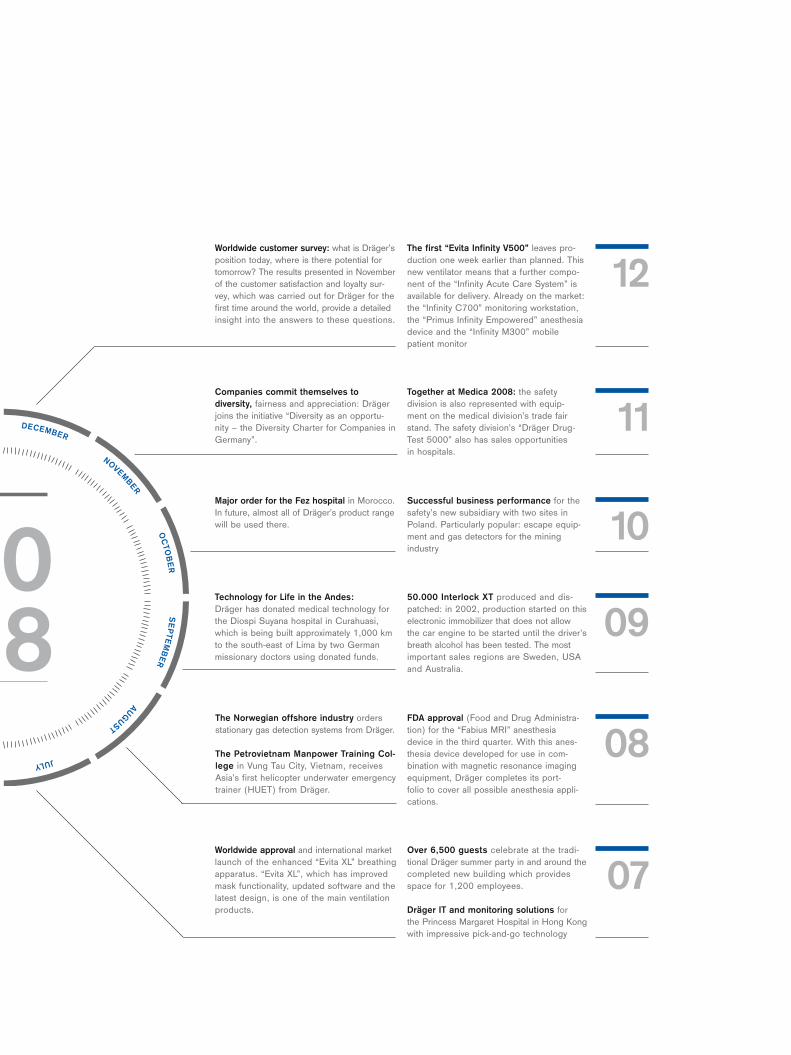
Worldwide customer survey: what is Dräger’sposition today, where is there potential fortomorrow? The results presented in Novemberof the customer satisfaction and loyalty sur-vey, which was carried out for Dräger for thefirst time around the world, provide a detailedinsight into the answers to these questions.
The first “Evita Infinity V500” leaves pro-duction one week earlier than planned. Thisnew ventilator means that a further compo-nent of the “Infinity Acute Care System” isavailable for delivery. Already on the market:the “Infinity C700” monitoring workstation,the “Primus Infinity Empowered” anesthesiadevice and the “Infinity M300” mobilepatient monitor
Companies commit themselves to diversity, fairness and appreciation: Drägerjoins the initiative “Diversity as an opportu-nity – the Diversity Charter for Companies inGermany”.
Together at Medica 2008: the safety division is also represented with equip-ment on the medical division’s trade fair stand. The safety division’s “Dräger Drug-Test 5000” also has sales opportunities in hospitals.
Major order for the Fez hospital in Morocco.In future, almost all of Dräger’s product rangewill be used there.
Successful business performance for thesafety’s new subsidiary with two sites inPoland. Particularly popular: escape equip-ment and gas detectors for the miningindustry
50.000 Interlock XT produced and dis-patched: in 2002, production started on thiselectronic immobilizer that does not allow the car engine to be started until the driver’sbreath alcohol has been tested. The mostimportant sales regions are Sweden, USAand Australia.
Technology for Life in the Andes: Dräger has donated medical technology forthe Diospi Suyana hospital in Curahuasi,which is being built approximately 1,000 kmto the south-east of Lima by two Germanmissionary doctors using donated funds.
FDA approval (Food and Drug Administra-tion) for the “Fabius MRI” anesthesia device in the third quarter. With this anes-thesia device developed for use in com-bination with magnetic resonance imagingequipment, Dräger completes its port-folio to cover all possible anesthesia appli-cations.
The Norwegian offshore industry ordersstationary gas detection systems from Dräger.
The Petrovietnam Manpower Training Col-lege in Vung Tau City, Vietnam, receivesAsia’s first helicopter underwater emergencytrainer (HUET) from Dräger.
Over 6,500 guests celebrate at the tradi-tional Dräger summer party in and around thecompleted new building which providesspace for 1,200 employees.
Dräger IT and monitoring solutions for the Princess Margaret Hospital in Hong Kongwith impressive pick-and-go technology
Worldwide approval and international marketlaunch of the enhanced “Evita XL” breathingapparatus. “Evita XL”, which has improvedmask functionality, updated software and thelatest design, is one of the main ventilationproducts.
11
09
08
07
10
12JULY
AUGUST
SE
PTE
MB
ER
OC
TOB
ER
NOVEMBER
DECEMBER
08
Drägerwerk AG & Co. KGaAMoislinger Allee 53–5523558 Lübeck, Germanywww.draeger.com
Corporate CommunicationsTel +49 451 882–2185Fax +49 451 882–3944
Investor RelationsTel +49 451 882–2685Fax +49 451 882–3296 90
7027
6