food&nutrition bulletin 3/98 - united nations university
TRANSCRIPT
Food and Nutrition Bulletin, vo. 19, no. 1 © 1998, The United Nations University. 1
Public health nutrition
Vitamin A reduces the inhibition of iron absorption by phytates and polyphenols—M. Layrisse, M. N. García-Casal, L. Solano, M. A. Barón, F. Arguello, D. Llovera,J. Ramírez, I. Leets, and E. Tropper ....................................................................................................................... 3
Maternal preferences for consistency of complementary foods in Guatemala—M. E. Parker, D. G. Schroeder, F. Begin, and E. Hurtado ................................................................................. 6
Yearly household record of food from the forest for home consumption by rural villagers innorth-east Thailand —K. Kunarattanapruk, J. Chokkanapitak, P. Uttamavatin, B. Muktabhant,S. Lowirakorn, and S. Saowakontha .................................................................................................................... 13
Food aversions and cravings during pregnancy: Prevalence and significance for maternal nutritionin Ethiopia —Tsegaye Demissie, N. M. Muroki, and Wambui Kogi-Makau ............................................ 20
Weaning foods in West Africa: Nutritional problems and possible solutions—N. O. Onofiok and D. O. Nnanyelugo ............................................................................................................ 27
Home gardening and access to animals in households with xerophthalmic children in rural Nepal—A. V. Shankar, J. Gittelsohn, E. K. Pradhan, C. Dhungel, and K. P. West, Jr. ................................................. 34
Determinants of the nutritional status of children in a rural African setting:The case of Chobe District, Botswana —Kesitegile Gobotswang ............................................................. 42
Emergency nutrition —Judit Katona-Apte .................................................................................................... 46
Food science
Food fortification: A tool for fighting hidden hunger —Alberto Nilson and Jaime Piza ............................ 49A lesser-known grain, Chenopodium quinoa: Review of the chemical composition of its edible parts
—N. T. Ahamed, R. S. Singhal, P. R. Kulkarni, and M. Pal ................................................................................ 61
IFPRI Report
Intrahousehold resource allocation in developing countries: Models, methods, and policies—L. Haddad, J. Hoddinott, and H. Alderman, editors ...................................................................................... 71
Books received ......................................................................................................................................................... 73
News and notes ....................................................................................................................................................... 75
UNU Programme on Food and Nutrition for Human and Social Development ................................................... 77
Contents
Editor: Dr. Nevin S. ScrimshawAssistant Editor: Ms. Edwina B. MurrayManuscripts Editor: Mr. Jonathan HarringtonSenior Associate Editor—Clinical and Human Nutrition:Dr. Cutberto Garza, Director and Professor, Division of Nutritional Sciences,
Cornell University, Ithaca, N.Y., USASenior Associate Editor—Food Science and Technology:Dr. Ricardo Bressani, Institute de Investigaciones, Universidad del Valle de
Guatemala, Guatemala City, GuatemalaAssociate Editors:Dr. Abraham Besrat, Senior Academic Officer, United Nations University,
Tokyo, JapanDr. Hernán Delgado, Director, Institute of Nutrition of Central America and
Panama (INCAP), Guatemala City, GuatemalaDr. Joseph Hautvast, Secretary General, IUNS, Department of Human
Nutrition, Agricultural University, Wageningen, NetherlandsDr. Peter Pellett, Professor, Department of Food Science and Nutrition,
University of Massachusetts, Amherst, Mass., USADr. Zewdie Wolde-Gabreil, Director, Ethiopian Nutrition Institute, Addis
Ababa, EthiopiaDr. Aree Valyasevi, Professor and Institute Consultant, Mahidol University,
Bangkok, Thailand
Food and Nutrition Bulletin
Food and Nutrition Bulletin, vol. 19, no. 1
© The United Nations University, 1998
United Nations University PressThe United Nations University53-70 Jingumae 5-chome, Shibuya-ku, Tokyo 150-8925, JapanTel.: (03) 3499-2811 Fax: (03) 3406-7345E-mail: [email protected]
ISSN 0379-5721
Design and Production by Desktop Publising & Design Co., Newton, MA USAPrinted by Rivkind Associates, Stoughton, MA USA
Food and Nutrition Bulletin, vo. 19, no. 1 © 1998, The United Nations University. 3
Vitamin A reduces the inhibition of iron absorptionby phytates and polyphenols
Miguel Layrisse, María Nieves García-Casal, Liseti Solano, María Adela Barón,Franklin Arguello, Daisy Llovera, José Ramírez, Irene Leets, and Eleonora Tropper
Abstract
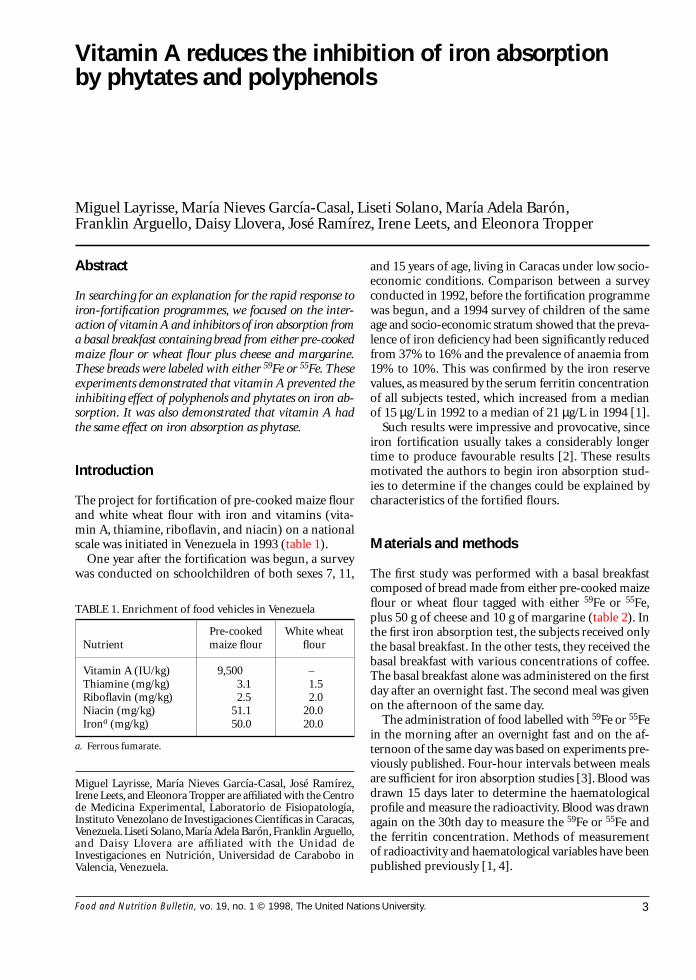
In searching for an explanation for the rapid response toiron-fortification programmes, we focused on the inter-action of vitamin A and inhibitors of iron absorption froma basal breakfast containing bread from either pre-cookedmaize flour or wheat flour plus cheese and margarine.These breads were labeled with either 59Fe or 55Fe. Theseexperiments demonstrated that vitamin A prevented theinhibiting effect of polyphenols and phytates on iron ab-sorption. It was also demonstrated that vitamin A hadthe same effect on iron absorption as phytase.
Introduction
The project for fortification of pre-cooked maize flourand white wheat flour with iron and vitamins (vita-min A, thiamine, riboflavin, and niacin) on a nationalscale was initiated in Venezuela in 1993 (table 1).
One year after the fortification was begun, a surveywas conducted on schoolchildren of both sexes 7, 11,
Miguel Layrisse, María Nieves García-Casal, José Ramírez,Irene Leets, and Eleonora Tropper are affiliated with the Centrode Medicina Experimental, Laboratorio de Fisiopatología,Instituto Venezolano de Investigaciones Científicas in Caracas,Venezuela. Liseti Solano, María Adela Barón, Franklin Arguello,and Daisy Llovera are affiliated with the Unidad deInvestigaciones en Nutrición, Universidad de Carabobo inValencia, Venezuela.
and 15 years of age, living in Caracas under low socio-economic conditions. Comparison between a surveyconducted in 1992, before the fortification programmewas begun, and a 1994 survey of children of the sameage and socio-economic stratum showed that the preva-lence of iron deficiency had been significantly reducedfrom 37% to 16% and the prevalence of anaemia from19% to 10%. This was confirmed by the iron reservevalues, as measured by the serum ferritin concentrationof all subjects tested, which increased from a medianof 15 µg/L in 1992 to a median of 21 µg/L in 1994 [1].
Such results were impressive and provocative, sinceiron fortification usually takes a considerably longertime to produce favourable results [2]. These resultsmotivated the authors to begin iron absorption stud-ies to determine if the changes could be explained bycharacteristics of the fortified flours.
Materials and methods
The first study was performed with a basal breakfastcomposed of bread made from either pre-cooked maizeflour or wheat flour tagged with either 59Fe or 55Fe,plus 50 g of cheese and 10 g of margarine (table 2). Inthe first iron absorption test, the subjects received onlythe basal breakfast. In the other tests, they received thebasal breakfast with various concentrations of coffee.The basal breakfast alone was administered on the firstday after an overnight fast. The second meal was givenon the afternoon of the same day.
The administration of food labelled with 59Fe or 55Fein the morning after an overnight fast and on the af-ternoon of the same day was based on experiments pre-viously published. Four-hour intervals between mealsare sufficient for iron absorption studies [3]. Blood wasdrawn 15 days later to determine the haematologicalprofile and measure the radioactivity. Blood was drawnagain on the 30th day to measure the 59Fe or 55Fe andthe ferritin concentration. Methods of measurementof radioactivity and haematological variables have beenpublished previously [1, 4].
TABLE 1. Enrichment of food vehicles in Venezuela
Pre-cooked White wheatNutrient maize flour flour
Vitamin A (IU/kg) 9,500 –Thiamine (mg/kg) 3.1 1.5Riboflavin (mg/kg) 2.5 2.0Niacin (mg/kg) 51.1 20.0Irona (mg/kg) 50.0 20.0
a. Ferrous fumarate.
4
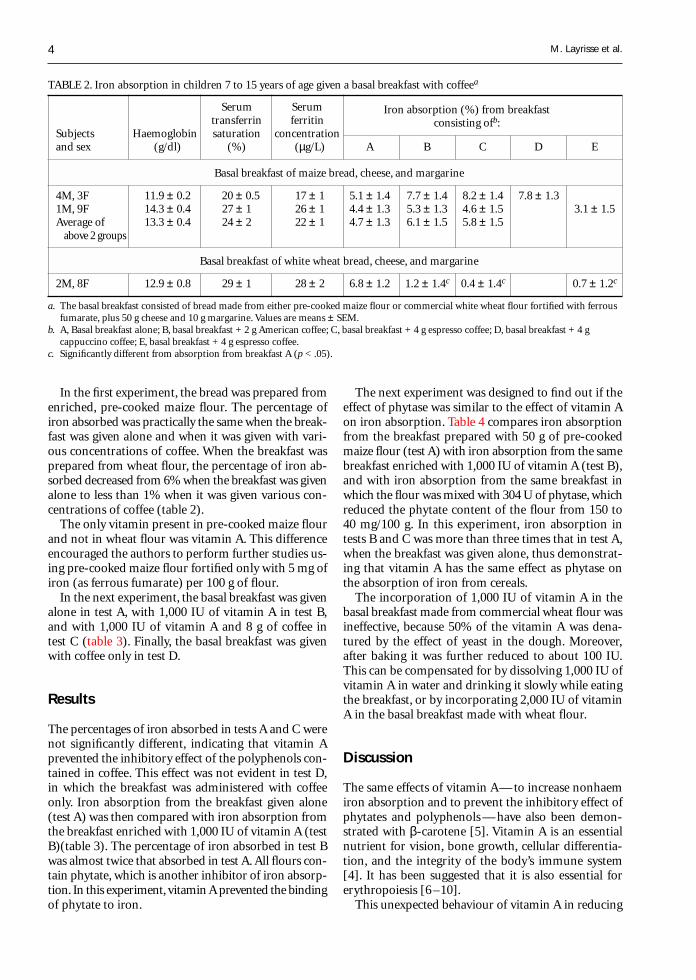
In the first experiment, the bread was prepared fromenriched, pre-cooked maize flour. The percentage ofiron absorbed was practically the same when the break-fast was given alone and when it was given with vari-ous concentrations of coffee. When the breakfast wasprepared from wheat flour, the percentage of iron ab-sorbed decreased from 6% when the breakfast was givenalone to less than 1% when it was given various con-centrations of coffee (table 2).
The only vitamin present in pre-cooked maize flourand not in wheat flour was vitamin A. This differenceencouraged the authors to perform further studies us-ing pre-cooked maize flour fortified only with 5 mg ofiron (as ferrous fumarate) per 100 g of flour.
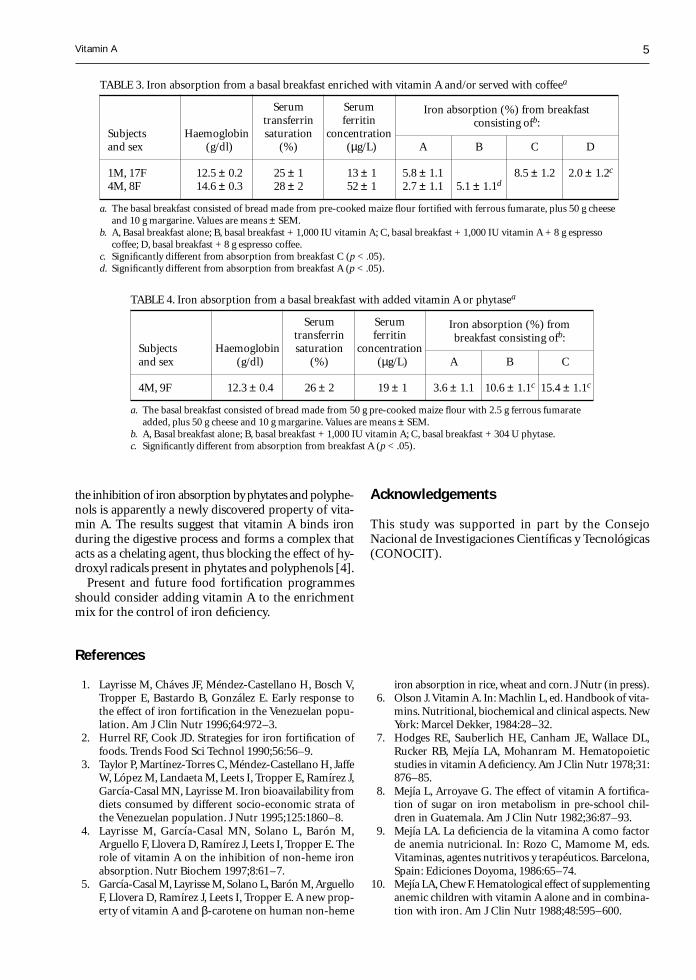
In the next experiment, the basal breakfast was givenalone in test A, with 1,000 IU of vitamin A in test B,and with 1,000 IU of vitamin A and 8 g of coffee intest C (table 3). Finally, the basal breakfast was givenwith coffee only in test D.
Results
The percentages of iron absorbed in tests A and C werenot significantly different, indicating that vitamin Aprevented the inhibitory effect of the polyphenols con-tained in coffee. This effect was not evident in test D,in which the breakfast was administered with coffeeonly. Iron absorption from the breakfast given alone(test A) was then compared with iron absorption fromthe breakfast enriched with 1,000 IU of vitamin A (testB)(table 3). The percentage of iron absorbed in test Bwas almost twice that absorbed in test A. All flours con-tain phytate, which is another inhibitor of iron absorp-tion. In this experiment, vitamin A prevented the bindingof phytate to iron.
The next experiment was designed to find out if theeffect of phytase was similar to the effect of vitamin Aon iron absorption. Table 4 compares iron absorptionfrom the breakfast prepared with 50 g of pre-cookedmaize flour (test A) with iron absorption from the samebreakfast enriched with 1,000 IU of vitamin A (test B),and with iron absorption from the same breakfast inwhich the flour was mixed with 304 U of phytase, whichreduced the phytate content of the flour from 150 to40 mg/100 g. In this experiment, iron absorption intests B and C was more than three times that in test A,when the breakfast was given alone, thus demonstrat-ing that vitamin A has the same effect as phytase onthe absorption of iron from cereals.
The incorporation of 1,000 IU of vitamin A in thebasal breakfast made from commercial wheat flour wasineffective, because 50% of the vitamin A was dena-tured by the effect of yeast in the dough. Moreover,after baking it was further reduced to about 100 IU.This can be compensated for by dissolving 1,000 IU ofvitamin A in water and drinking it slowly while eatingthe breakfast, or by incorporating 2,000 IU of vitaminA in the basal breakfast made with wheat flour.
Discussion
The same effects of vitamin A— to increase nonhaemiron absorption and to prevent the inhibitory effect ofphytates and polyphenols — have also been demon-strated with β-carotene [5]. Vitamin A is an essentialnutrient for vision, bone growth, cellular differentia-tion, and the integrity of the body’s immune system[4]. It has been suggested that it is also essential forerythropoiesis [6 –10].
This unexpected behaviour of vitamin A in reducing
TABLE 2. Iron absorption in children 7 to 15 years of age given a basal breakfast with coffeea
Serum Serumtransferrin ferritin
Iron absorption (%) from breakfast
Subjects Haemoglobin saturation concentrationconsisting ofb:
and sex (g/dl) (%) (µg/L) A B C D E
Basal breakfast of maize bread, cheese, and margarine
4M, 3F 11.9 ± 0.2 20 ± 0.5 17 ± 1 5.1 ± 1.4 7.7 ± 1.4 8.2 ± 1.4 7.8 ± 1.31M, 9F 14.3 ± 0.4 27 ± 1 26 ± 1 4.4 ± 1.3 5.3 ± 1.3 4.6 ± 1.5 3.1 ± 1.5Average of 13.3 ± 0.4 24 ± 2 22 ± 1 4.7 ± 1.3 6.1 ± 1.5 5.8 ± 1.5
above 2 groups
Basal breakfast of white wheat bread, cheese, and margarine
2M, 8F 12.9 ± 0.8 29 ± 1 28 ± 2 6.8 ± 1.2 1.2 ± 1.4c 0.4 ± 1.4c 0.7 ± 1.2c
a. The basal breakfast consisted of bread made from either pre-cooked maize flour or commercial white wheat flour fortified with ferrousfumarate, plus 50 g cheese and 10 g margarine. Values are means ± SEM.
b. A, Basal breakfast alone; B, basal breakfast + 2 g American coffee; C, basal breakfast + 4 g espresso coffee; D, basal breakfast + 4 gcappuccino coffee; E, basal breakfast + 4 g espresso coffee.
c. Significantly different from absorption from breakfast A (p < .05).
M. Layrisse et al.
5
References
1. Layrisse M, Cháves JF, Méndez-Castellano H, Bosch V,Tropper E, Bastardo B, González E. Early response tothe effect of iron fortification in the Venezuelan popu-lation. Am J Clin Nutr 1996;64:972–3.
2. Hurrel RF, Cook JD. Strategies for iron fortification offoods. Trends Food Sci Technol 1990;56:56–9.
3. Taylor P, Martínez-Torres C, Méndez-Castellano H, JaffeW, López M, Landaeta M, Leets I, Tropper E, Ramírez J,García-Casal MN, Layrisse M. Iron bioavailability fromdiets consumed by different socio-economic strata ofthe Venezuelan population. J Nutr 1995;125:1860–8.
4. Layrisse M, García-Casal MN, Solano L, Barón M,Arguello F, Llovera D, Ramírez J, Leets I, Tropper E. Therole of vitamin A on the inhibition of non-heme ironabsorption. Nutr Biochem 1997;8:61–7.
5. García-Casal M, Layrisse M, Solano L, Barón M, ArguelloF, Llovera D, Ramírez J, Leets I, Tropper E. A new prop-erty of vitamin A and β-carotene on human non-heme
iron absorption in rice, wheat and corn. J Nutr (in press).6. Olson J. Vitamin A. In: Machlin L, ed. Handbook of vita-
mins. Nutritional, biochemical and clinical aspects. NewYork: Marcel Dekker, 1984:28–32.
7. Hodges RE, Sauberlich HE, Canham JE, Wallace DL,Rucker RB, Mejía LA, Mohanram M. Hematopoieticstudies in vitamin A deficiency. Am J Clin Nutr 1978;31:876–85.
8. Mejía L, Arroyave G. The effect of vitamin A fortifica-tion of sugar on iron metabolism in pre-school chil-dren in Guatemala. Am J Clin Nutr 1982;36:87–93.
9. Mejía LA. La deficiencia de la vitamina A como factorde anemia nutricional. In: Rozo C, Mamome M, eds.Vitaminas, agentes nutritivos y terapéuticos. Barcelona,Spain: Ediciones Doyoma, 1986:65–74.
10. Mejía LA, Chew F. Hematological effect of supplementinganemic children with vitamin A alone and in combina-tion with iron. Am J Clin Nutr 1988;48:595–600.
the inhibition of iron absorption by phytates and polyphe-nols is apparently a newly discovered property of vita-min A. The results suggest that vitamin A binds ironduring the digestive process and forms a complex thatacts as a chelating agent, thus blocking the effect of hy-droxyl radicals present in phytates and polyphenols [4].
Present and future food fortification programmesshould consider adding vitamin A to the enrichmentmix for the control of iron deficiency.
TABLE 3. Iron absorption from a basal breakfast enriched with vitamin A and/or served with coffeea
Serum Serumtransferrin ferritin
Iron absorption (%) from breakfast
Subjects Haemoglobin saturation concentrationconsisting ofb:
and sex (g/dl) (%) (µg/L) A B C D
1M, 17F 12.5 ± 0.2 25 ± 1 13 ± 1 5.8 ± 1.1 8.5 ± 1.2 2.0 ± 1.2c
4M, 8F 14.6 ± 0.3 28 ± 2 52 ± 1 2.7 ± 1.1 5.1 ± 1.1d
a. The basal breakfast consisted of bread made from pre-cooked maize flour fortified with ferrous fumarate, plus 50 g cheeseand 10 g margarine. Values are means ± SEM.
b. A, Basal breakfast alone; B, basal breakfast + 1,000 IU vitamin A; C, basal breakfast + 1,000 IU vitamin A + 8 g espressocoffee; D, basal breakfast + 8 g espresso coffee.
c. Significantly different from absorption from breakfast C (p < .05).d. Significantly different from absorption from breakfast A (p < .05).
TABLE 4. Iron absorption from a basal breakfast with added vitamin A or phytasea
Serum Serumtransferrin ferritin
Iron absorption (%) from
Subjects Haemoglobin saturation concentrationbreakfast consisting ofb:
and sex (g/dl) (%) (µg/L) A B C
4M, 9F 12.3 ± 0.4 26 ± 2 19 ± 1 3.6 ± 1.1 10.6 ± 1.1c 15.4 ± 1.1c
a. The basal breakfast consisted of bread made from 50 g pre-cooked maize flour with 2.5 g ferrous fumarateadded, plus 50 g cheese and 10 g margarine. Values are means ± SEM.
b. A, Basal breakfast alone; B, basal breakfast + 1,000 IU vitamin A; C, basal breakfast + 304 U phytase.c. Significantly different from absorption from breakfast A (p < .05).
Acknowledgements
This study was supported in part by the ConsejoNacional de Investigaciones Científicas y Tecnológicas(CONOCIT).
Vitamin A
6 Food and Nutrition Bulletin, vo. 19, no. 1 © 1998, The United Nations University.
Abstract
Increasing the nutrient density of complementary foodmixtures is a common strategy for improving child nu-trition in developing countries. Such modification, how-ever, typically increases the viscosity of the mixtures, whichmay not appeal to caretakers or children. To assess ma-ternal preference for complementary food consistency, 46rural Guatemalan mothers, each of whom had a childbetween 6 and 14 months of age, were interviewed bytrained data collectors and participated in focus groupdiscussions. Strong opinions regarding consistencies ofcomplementary foods were identified, which varied ac-cording to the child’s age and health status. Mothers pre-ferred thinner complementary foods for children less thanone year old and thicker foods for children more thanone year old. When the child had a cough or fever, mostmothers preferred thin, liquid complementary foods. Whenthe child had diarrhoea, about half of the mothers be-lieved thinner complementary foods would replace thewater the child lost with diarrhoea, whereas other mothersbelieved that thicker complementary foods would hardenthe stool or stop diarrhoea. This information will helpguide efforts to develop improved complementary foods,particularly those for use during illness in underprivi-leged populations of developing countries.
Introduction
The World Health Organization (WHO) recommendsthat children begin complementary feeding in addi-tion to breastmilk between four and six months of agein order to ensure adequate growth and nourishment
Maternal preferences for consistency ofcomplementary foods in Guatemala
Megan E. Parker, Dirk G. Schroeder, France Begin, and Elena Hurtado
Megan Parker and Dirk Schroeder are affiliated with the RollinsSchool of Public Health of Emory University in Atlanta,Georgia, USA. France Begin is affiliated with the Universityof California at Davis, California, USA, and the Institute ofNutrition of Central America and Panama (INCAP) inGuatemala City, Guatemala. Elena Hurtado is affiliated withINCAP.
[1]. In many developing countries, however, traditionalcomplementary food gruels are based on starchy staplefoods, such as wheat, rice, maize, or sorghum, that pro-duce viscous porridges that are difficult for childrento consume [2, 3]. As a result, mothers commonly di-lute the porridge with water to reduce its viscosity [4,5]. Such dilution, however, also reduces the energy den-sity of the mixture [3]. Since young children have smallgastric capacities, they are unable to consume enoughof the diluted porridge to meet their energy require-ments and consequently may become malnourished.This problem of high viscosity, low energy density, orboth in complementary food is often referred to as “di-etary bulk” [3]. Children consuming these foods growpoorly [6] and have higher mortality rates [7].
Increasing the nutrient density of complementaryfoods is a strategy commonly recommended for im-proving child nutrition [5, 8]. However, increasing thenutrient density of a complementary food may changeits consistency from liquid or easily spoonable to thickerand dough-like. It is commonly suggested that foodsof higher viscosity are less acceptable to the mother orto the child [9–12], although no published studies couldbe identified that specifically attempted to quantify thisperception. The inadequacy of the information in thisarea is particularly striking, because a great deal of ef-fort has already been invested in strategies to reducethe viscosity of complementary foods of high nutrientdensity, most commonly with the use of amylase-richflours [5, 9, 13–16].
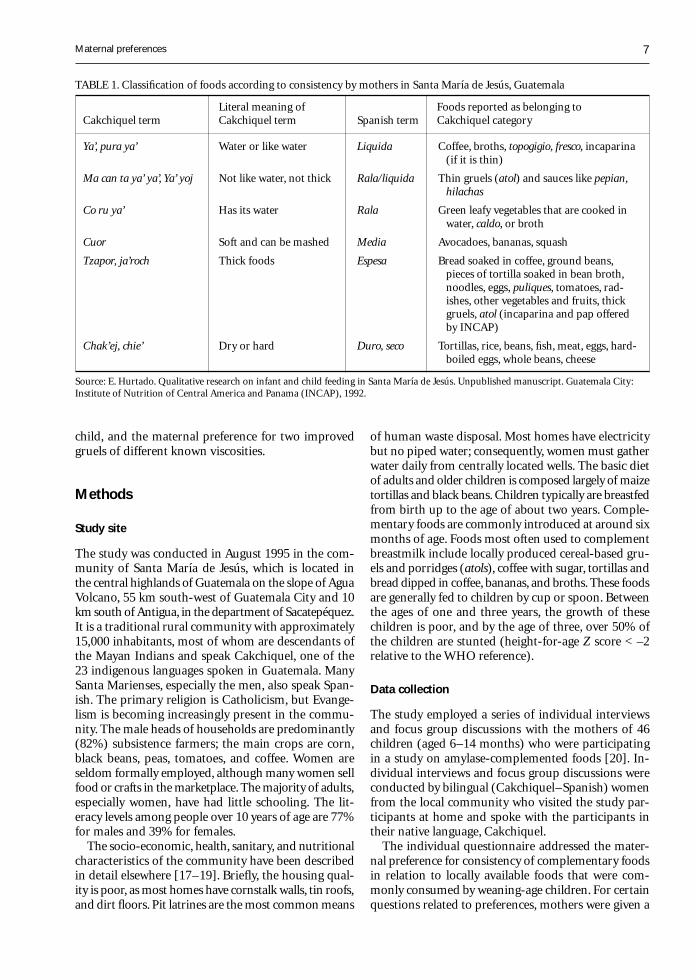
Qualitative research carried out in the same com-munity where the current study was conducted foundthat indigenous Cakchiquel-speaking Guatemalanmothers displayed unexpectedly well-defined and de-tailed notions of food consistency (personal commu-nication, E. Hurtado, 1992). Table 1 summarizes theseclassifications and provides examples of foods associ-ated with various local terms for consistency. The ob-jective of the current study was to measure more ac-curately, both qualitatively and quantitatively, thematernal preference for consistency of complementaryfoods in relation to the age and health status of the
7
child, and the maternal preference for two improvedgruels of different known viscosities.
Methods
Study site
The study was conducted in August 1995 in the com-munity of Santa María de Jesús, which is located inthe central highlands of Guatemala on the slope of AguaVolcano, 55 km south-west of Guatemala City and 10km south of Antigua, in the department of Sacatepéquez.It is a traditional rural community with approximately15,000 inhabitants, most of whom are descendants ofthe Mayan Indians and speak Cakchiquel, one of the23 indigenous languages spoken in Guatemala. ManySanta Marienses, especially the men, also speak Span-ish. The primary religion is Catholicism, but Evange-lism is becoming increasingly present in the commu-nity. The male heads of households are predominantly(82%) subsistence farmers; the main crops are corn,black beans, peas, tomatoes, and coffee. Women areseldom formally employed, although many women sellfood or crafts in the marketplace. The majority of adults,especially women, have had little schooling. The lit-eracy levels among people over 10 years of age are 77%for males and 39% for females.
The socio-economic, health, sanitary, and nutritionalcharacteristics of the community have been describedin detail elsewhere [17–19]. Briefly, the housing qual-ity is poor, as most homes have cornstalk walls, tin roofs,and dirt floors. Pit latrines are the most common means
of human waste disposal. Most homes have electricitybut no piped water; consequently, women must gatherwater daily from centrally located wells. The basic dietof adults and older children is composed largely of maizetortillas and black beans. Children typically are breastfedfrom birth up to the age of about two years. Comple-mentary foods are commonly introduced at around sixmonths of age. Foods most often used to complementbreastmilk include locally produced cereal-based gru-els and porridges (atols), coffee with sugar, tortillas andbread dipped in coffee, bananas, and broths. These foodsare generally fed to children by cup or spoon. Betweenthe ages of one and three years, the growth of thesechildren is poor, and by the age of three, over 50% ofthe children are stunted (height-for-age Z score < –2relative to the WHO reference).
Data collection
The study employed a series of individual interviewsand focus group discussions with the mothers of 46children (aged 6–14 months) who were participatingin a study on amylase-complemented foods [20]. In-dividual interviews and focus group discussions wereconducted by bilingual (Cakchiquel–Spanish) womenfrom the local community who visited the study par-ticipants at home and spoke with the participants intheir native language, Cakchiquel.
The individual questionnaire addressed the mater-nal preference for consistency of complementary foodsin relation to locally available foods that were com-monly consumed by weaning-age children. For certainquestions related to preferences, mothers were given a
Maternal preferences
TABLE 1. Classification of foods according to consistency by mothers in Santa María de Jesús, Guatemala
Literal meaning of Foods reported as belonging toCakchiquel term Cakchiquel term Spanish term Cakchiquel category
Ya’, pura ya’ Water or like water Liquida Coffee, broths, topogigio, fresco, incaparina(if it is thin)
Ma can ta ya’ ya’, Ya’ yoj Not like water, not thick Rala/liquida Thin gruels (atol) and sauces like pepian,hilachas
Co ru ya’ Has its water Rala Green leafy vegetables that are cooked inwater, caldo, or broth
Cuor Soft and can be mashed Media Avocadoes, bananas, squash
Tzapor, ja’roch Thick foods Espesa Bread soaked in coffee, ground beans,pieces of tortilla soaked in bean broth,noodles, eggs, puliques, tomatoes, rad-ishes, other vegetables and fruits, thickgruels, atol (incaparina and pap offeredby INCAP)
Chak’ej, chie’ Dry or hard Duro, seco Tortillas, rice, beans, fish, meat, eggs, hard-boiled eggs, whole beans, cheese
Source: E. Hurtado. Qualitative research on infant and child feeding in Santa María de Jesús. Unpublished manuscript. Guatemala City:Institute of Nutrition of Central America and Panama (INCAP), 1992.
8
choice of five answers: thick, like corn dough (Span-ish: espeso como masa de maiz; Cakchiquel: tzapor); thin,like a liquid drink (Spanish: ralo como atol; Cakchiquel:ya’ yoj); medium, semi-liquid consistency, thinner thancorn dough but thicker than a liquid (Spanish: medio;Cakchiquel: cuor); no preference; or other. The foodsassociated with the terms “thick” and “thin” (masa demaiz and atol, respectively) were well known in the com-munity, and there was minimal variation in their prepa-ration. Masa de maiz is maize dough used to make tor-tillas and is similar in consistency to cookie or breaddough. Atol is a liquid drink made with water, cerealgrains, and sugar and is similar in consistency to creamor thin gravy.
The first part of the individual questionnaire ad-dressed maternal preference for the consistency oflocally provided complementary foods according to thefollowing categories: in general (without specifying ageor health status); according to specific age categories(six months to one year [the early weaning period] andolder than one year [mid to late weaning period]); andaccording to the health status of the child (healthy, coughor fever, diarrhoea). The second part of the interviewquestionnaire asked about the consistency of two ex-perimental complementary food gruels of known vis-cosity that were being used in the larger intake study(table 2). The mothers were shown the two experimentalgruels and instructed to stir them with a spoon, com-ment on their differences, judge their consistency, andselect the preferred gruel, in response to specific ques-tions.
Upon completion of the individual questionnaireinterviews, four focus group discussions were conducted,with the objective of soliciting additional qualitativeinformation on preferences. All 46 mothers who wereinterviewed were invited to participate in the focus groupdiscussions; 39 (85%) of the mothers participated. Theywere randomly assigned to focus groups in accordancewith their work schedules. The questions asked by themoderator mirrored those asked during the individualinterviews. The focus group discussions were tape-re-corded and translated into Spanish by the moderator.
Results
The participant mothers ranged in age from 16 to 39years (mean, 28.8 years), had had a mean number of5.1 pregnancies (range, 1–12), and had completed amean of 1.3 grades (range, 0–6) in primary school.Thirty-three (72%) of the mothers spoke Spanish flu-ently. The children ranged in age from 6 to 14 months(mean, 9.1 months). The questionnaire results revealedthat most mothers (77%) preferred to spoon-feed theirchildren, 15% preferred to use a cup or bottle, and 8%preferred to feed by hand.
Age of the child
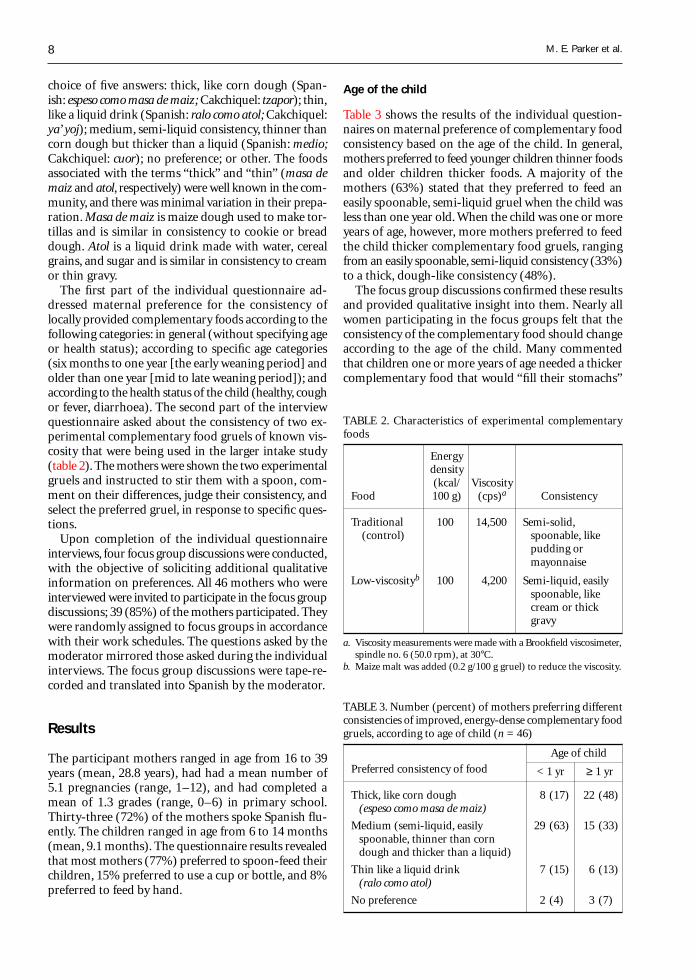
Table 3 shows the results of the individual question-naires on maternal preference of complementary foodconsistency based on the age of the child. In general,mothers preferred to feed younger children thinner foodsand older children thicker foods. A majority of themothers (63%) stated that they preferred to feed aneasily spoonable, semi-liquid gruel when the child wasless than one year old. When the child was one or moreyears of age, however, more mothers preferred to feedthe child thicker complementary food gruels, rangingfrom an easily spoonable, semi-liquid consistency (33%)to a thick, dough-like consistency (48%).
The focus group discussions confirmed these resultsand provided qualitative insight into them. Nearly allwomen participating in the focus groups felt that theconsistency of the complementary food should changeaccording to the age of the child. Many commentedthat children one or more years of age needed a thickercomplementary food that would “fill their stomachs”
TABLE 2. Characteristics of experimental complementaryfoods
Energydensity(kcal/ Viscosity
Food 100 g) (cps)a Consistency
Traditional 100 14,500 Semi-solid, (control) spoonable, like
pudding ormayonnaise
Low-viscosityb 100 4,200 Semi-liquid, easilyspoonable, likecream or thickgravy
a. Viscosity measurements were made with a Brookfield viscosimeter,spindle no. 6 (50.0 rpm), at 30°C.
b. Maize malt was added (0.2 g/100 g gruel) to reduce the viscosity.
TABLE 3. Number (percent) of mothers preferring differentconsistencies of improved, energy-dense complementary foodgruels, according to age of child (n = 46)
Age of child
Preferred consistency of food < 1 yr ≥ 1 yr
Thick, like corn dough 8 (17) 22 (48)(espeso como masa de maiz)
Medium (semi-liquid, easily 29 (63) 15 (33)spoonable, thinner than corndough and thicker than a liquid)
Thin like a liquid drink 7 (15) 6 (13)(ralo como atol)
No preference 2 (4) 3 (7)
M. E. Parker et al.
9
because their “stomachs are large and they normallyeat very little.” Notably, in Cakchiquel the same expres-sion, ni nim rupan, means “large stomach” and “bigappetite.” Other mothers reasoned that “older childrencould take hold of the complementary food and eat itif it was thick.” The following are examples of responsesto the question “Do you believe that the consistencyof a complementary food mix should change accord-ing to the age of the child?”:» Yes. Depending on the age of the child, the consis-
tency of the food will change. As the child grows, hewants very thick complementary food so that it willsustain him. If it is thin, it is the same as breastfeedingor nursing, and that is not going to fill him.
» Yes. The consistency of complementary food shouldchange, because large children are not the same assmall children. When children are small, I give themcomplementary food that is a little thin so that theycan eat it, but when they are large, I give them comple-mentary food that is thick so that it sustains the stom-ach, because the stomach is already large.
Health status of the child
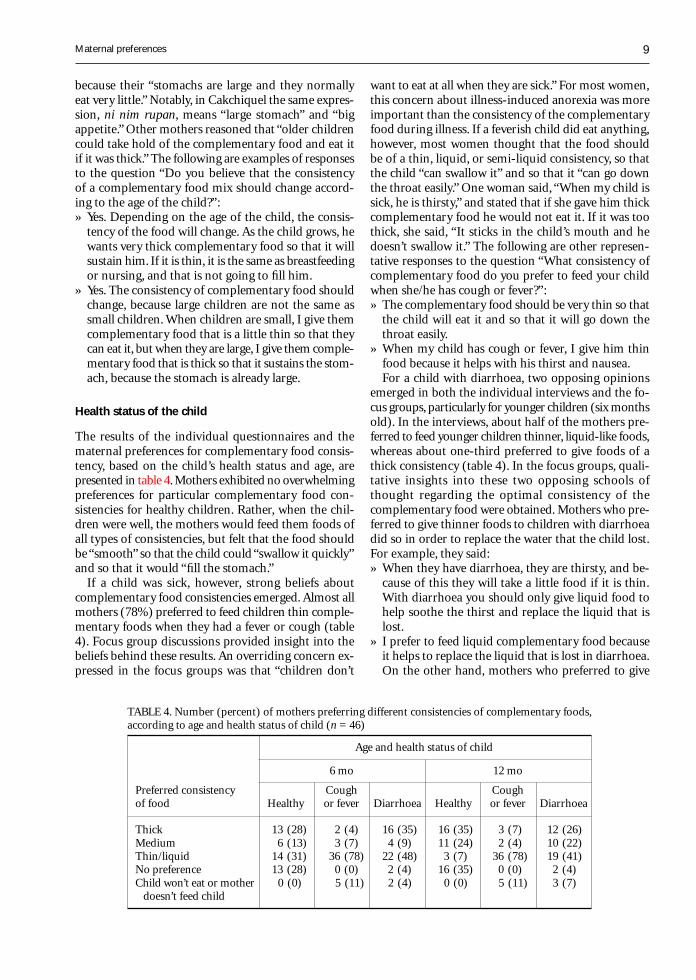
The results of the individual questionnaires and thematernal preferences for complementary food consis-tency, based on the child’s health status and age, arepresented in table 4. Mothers exhibited no overwhelmingpreferences for particular complementary food con-sistencies for healthy children. Rather, when the chil-dren were well, the mothers would feed them foods ofall types of consistencies, but felt that the food shouldbe “smooth” so that the child could “swallow it quickly”and so that it would “fill the stomach.”
If a child was sick, however, strong beliefs aboutcomplementary food consistencies emerged. Almost allmothers (78%) preferred to feed children thin comple-mentary foods when they had a fever or cough (table4). Focus group discussions provided insight into thebeliefs behind these results. An overriding concern ex-pressed in the focus groups was that “children don’t
want to eat at all when they are sick.” For most women,this concern about illness-induced anorexia was moreimportant than the consistency of the complementaryfood during illness. If a feverish child did eat anything,however, most women thought that the food shouldbe of a thin, liquid, or semi-liquid consistency, so thatthe child “can swallow it” and so that it “can go downthe throat easily.” One woman said, “When my child issick, he is thirsty,” and stated that if she gave him thickcomplementary food he would not eat it. If it was toothick, she said, “It sticks in the child’s mouth and hedoesn’t swallow it.” The following are other represen-tative responses to the question “What consistency ofcomplementary food do you prefer to feed your childwhen she/he has cough or fever?”:» The complementary food should be very thin so that
the child will eat it and so that it will go down thethroat easily.
» When my child has cough or fever, I give him thinfood because it helps with his thirst and nausea.For a child with diarrhoea, two opposing opinions
emerged in both the individual interviews and the fo-cus groups, particularly for younger children (six monthsold). In the interviews, about half of the mothers pre-ferred to feed younger children thinner, liquid-like foods,whereas about one-third preferred to give foods of athick consistency (table 4). In the focus groups, quali-tative insights into these two opposing schools ofthought regarding the optimal consistency of thecomplementary food were obtained. Mothers who pre-ferred to give thinner foods to children with diarrhoeadid so in order to replace the water that the child lost.For example, they said:» When they have diarrhoea, they are thirsty, and be-
cause of this they will take a little food if it is thin.With diarrhoea you should only give liquid food tohelp soothe the thirst and replace the liquid that islost.
» I prefer to feed liquid complementary food becauseit helps to replace the liquid that is lost in diarrhoea.On the other hand, mothers who preferred to give
TABLE 4. Number (percent) of mothers preferring different consistencies of complementary foods,according to age and health status of child (n = 46)
Age and health status of child
6 mo 12 mo
Preferred consistency Cough Coughof food Healthy or fever Diarrhoea Healthy or fever Diarrhoea
Thick 13 (28) 2 (4) 16 (35) 16 (35) 3 (7) 12 (26)Medium 6 (13) 3 (7) 4 (9) 11 (24) 2 (4) 10 (22)Thin/liquid 14 (31) 36 (78) 22 (48) 3 (7) 36 (78) 19 (41)No preference 13 (28) 0 (0) 2 (4) 16 (35) 0 (0) 2 (4)Child won’t eat or mother 0 (0) 5 (11) 2 (4) 0 (0) 5 (11) 3 (7)
doesn’t feed child
Maternal preferences
10
children with diarrhoea thicker complementary foodsdid so because they felt it hardened the stool and stoppedthe diarrhoea:» I give him thick food because it helps to plug up the
child and stop the diarrhoea. If I give liquid food itmakes the child worse. I also give thick food duringdiarrhoea because it helps to calm him and alleviatethe diarrhoea.
» I prefer to feed my child thick food because it hard-ens the stomach. If I give him liquid food I thinkthat it could make him worse because it loosens thestomach.Finally, when the mothers were shown the two semi-
liquid complementary gruels used in the energy-intakestudy (table 2), 22 (48%) reported they would preferto feed their well children the thicker of the two gru-els, 17 (37%) said they would prefer the thinner, and 7(15%) had no preference. Unfortunately, the motherswere not asked which of the foods they would preferto give their sick children.
Discussion
This study was conducted to better understand ma-ternal preferences for consistency of complementaryfoods and to determine if and how maternal prefer-ence varied according to the age and health status ofthe child. The results suggested that indigenous mothersin this rural Guatemalan community made clear dis-tinctions among food consistencies and had strong pref-erences for different consistencies according to the ageand health status of their children. The mothers pre-ferred to feed older children thicker foods because theyfelt that these foods better filled the stomachs of larger,older children. When a child was well, food consistencywas not a major concern. When a child was ill, how-ever, the mothers had strong opinions regarding foodconsistency according to the type of illness. When achild had cough or fever, the mothers consistently pre-ferred to give thinner foods. When a child had diar-rhoea, some mothers preferred to give thin foods toreplace the water lost, whereas others preferred to feedthicker foods to harden the stool or “stop up the child.”The lack of apparent preference for either of the twoexperimental foods may be due to the similarity in theirconsistency: both were semi-liquid, differing in viscosityby only 10,000 cps.
Few published studies specifically report maternalpreferences for complementary food consistency. A fewstudies have some anecdotal information on maternalpreferences [10, 11, 13] but it is difficult to draw con-clusions about maternal preferences on the basis of thesestudies. For example, the terms used to describe vari-ous consistencies of complementary foods (e.g., thick,thin, or smooth) are often ambiguous and poorly de-fined, and often no measurements of viscosity are given.
Additionally, the classification of consistency and vis-cosity is not standardized across studies; for example,gruels of similar viscosity are described as “thick” inone study and “thin” in another. In one of the few quan-titative studies identified [9], the mothers of 78 severelymalnourished children five to eight months of age re-covering from diarrhoea in a nutrition rehabilitationunit in Bangladesh were asked whether complemen-tary foods should be “liquid” or “semi-solid.” Approxi-mately 60% of the mothers said that the consistencyshould be “liquid,” but no viscosity measurements werereported, nor were mothers asked to explain the rea-sons for their preferences. In Peru, Creed de Kanashiroet al. [10] found that “mothers had very definite ideasabout the required thickness for each type of comple-mentary food preparation,” and during recipe trials“mothers were reluctant to prepare complementary foodmixes with a thicker consistency than customary.” Thesemothers gave their children mostly soft, smooth comple-mentary foods, such as soups or puddings, because theywere easy to swallow. Bentley et al. [11] reported thatNigerian mothers who commonly “hand feed” preferredthin, liquid foods for children up to 35 months of agebecause they felt that a child “could not swallow foodsof a solid or semi-solid consistency.” In India, Gopaldaset al. [13] reported that mothers preferred gruel (830cps) thinned with amylase-rich flour, a malted flour,because it was “smooth and fairly free-flowing,” whereasthe gruel without amylase-rich flour (2,800 cps) wasperceived by mothers to be “lumpy.”
The age effects seen in the current study are consis-tent with reports by Gopaldas et al. [12, 21] who re-ported that Indian mothers preferred to give older chil-dren (10 months of age or older) thicker porridges ofspoonable consistency (2,000–6,000 cps) rather thanthin, free-flowing gruels (1,000 cps) like those fed toyounger children.
The effect of a child’s health status on maternal pref-erence for complementary food consistency found inthe current study is also consistent with other reports.In Peru, mothers preferred to give children with diar-rhoea mashed rather than fried potatoes, toasted orroasted cereals and legumes rather than the coarser fresh,dried, or whole-grain forms, and hard foods that hadbeen peeled or ground [10]. In Nigeria, Bentley et al.[11] found that maternal encouragement as well as childacceptance increased when children with diarrhoea weregiven “liquid or semi-solid food” rather than “solid food.”
The significance of the current study relates to on-going efforts to improve the dietary quality of comple-mentary foods in developing countries [22]. A greatdeal of effort has been invested in trying to increasethe nutrient density of such foods without increasingtheir consistency to a point that is unacceptable tomothers or children [5, 9, 14–16]. The potential im-portance of such organoleptic characteristics of foodshas been noted [23], but few studies have been done
M. E. Parker et al.

11
on maternal or child preferences for such characteris-tics. The current study suggests that these preferencesare strong and vary according to the age and healthstatus of the child. To permit comparisons across studiesto be made, future studies of the consistency of comple-mentary foods should try to standardize terms and labo-ratory methods, since measured viscosity depends ontemperature, spindle reading, speed, and other factors.
Our results are specific to one rural Mayan commu-nity in Guatemala, and preferences will be different inother settings. Moreover, the results are based on themothers’ reported preferences, and more studies areneeded to confirm these reports by observation.
In conclusion, the results of this study will increasethe likelihood that efforts to develop improved comple-mentary foods will not be contradictory to the moth-ers’ preferences. They are particularly relevant for on-going efforts to improve feeding during illness [24–26].
References
1. World Health Assembly. Infant and young child nutri-tion, resolution 45, 34. Geneva: World Health Organi-zation, 1992.
2. Hellstrom A, Hermansson A, Karlsson A, Ljungqvist B,Mellander O, Svanberg U. Dietary bulk as a limiting factorfor nutrient intake—with special reference to the feed-ing of pre-school children II. Consistency as related todietary bulk — a model study. J Trop Paediatr1981;27:127–35.
3. Ljungqvist BG, Mellander O, Svanberg U. Dietary bulkas a limiting factor for nutrient intake in pre-school chil-dren. I. A problem description. J Trop Paediatr 1981;27:68–73.
4. Mosha AC, Svanberg U. Preparation of weaning foodswith high nutrient density using flour of germinatedcereals. Food Nutr Bull 1983;5(2):10–4.
5. Ashworth A, Draper A. The potential of traditional tech-nologies for increasing the energy density of weaningfoods. A critical review of existing knowledge with par-ticular reference to malting and fermentation. Geneva:World Health Organization, Diarrhoeal Disease Con-trol Programme, 1992.
6. Allen LH. Nutritional influences on linear growth: a gen-eral review. Eur J Clin Nutr 1994;48(suppl 1):S75–89.
7. Pelletier DL, Frongillo EA, Schroeder DG, Habicht J-P.The effects of malnutrition on child mortality in devel-oping countries. Bull WHO 1995;7:443–8.
8. Cameron M, Hofvander Y. Manual on feeding infantsand young children. 3rd ed. New York: Oxford Univer-sity Press, 1983.
9. Rahman MM, Islam MA, Mahalanabis D, Biswas E, MajidN, Wahed MA. Intake from an energy-dense porridgeliquefied by amylase of germinated wheat: a controlledtrial in severely malnourished children during conva-lescence from diarrhoea. Eur J Clin Nutr 1994;48:46–53.
10. Creed de Kanashiro H, Fukumoto M, Bentley ME, JacobyE, Verzosa C, Brown KH. Use of recipe trials and an-thropological techniques for the development of a home-
Improved effectiveness of such efforts will contributeto better growth and health status of children in de-veloping countries.
Acknowledgements
We gratefully acknowledge the community field workerswho were instrumental in data collection and the In-stitute of Nutrition of Central America and Panama(INCAP) for providing field support and technical anddata entry assistance. We would also like to thank Dr.Claudia Parvanta for her guidance in analysing the fo-cus group data and comments on early drafts of thepaper. This work was supported by the Charles A. andAnne Morrow Lindbergh Fund, the Emory UniversityResearch Committee, and the National Institutes ofHealth (R29-HD33468).
prepared weaning food in the central highlands of Peru.J Nutr Educ 1991;23:30–5.
11. Bentley ME, Dickin KL, Mebrahtu S, Kayode B, Oni GA,Verzosa CC, Brown KH, Idowu JR. Development of anutritionally adequate and culturally appropriate weaningfood in Kwara State, Nigeria: an interdisciplinary ap-proach. Soc Sci Med 1991;33:1103–11.
12. Gopaldas T, Mehta P, John C. Bulk reduction of tradi-tional Indian weaning gruels. In: Alnwick D, Moses S,Schmidt OG, eds. Improving young child feeding in East-ern and Southern Africa. Proceedings of a workshopon Household Level Food Technology held in Nairobi,Kenya, 12–16 October 1987. Ottawa: International De-velopment Research Centre, 1988;330–9.
13. Gopaldas T, Mehta P, Patil A, Gandhi H. Studies on re-duction in viscosity of thick rice gruels with small quan-tities of an amylase-rich cereal malt. Food Nutr Bull1986;8(4):42–7.
14. John C, Gopaldas T. Evaluation of the impact on growthof a controlled 6-month feeding trial on children (6–24 months) fed a complementary feed of a high energy–low bulk gruel versus a high energy–high bulk gruel inaddition to their habitual home diet. J Trop Paediatr1993;39:16–22.
15. Darling JC, Kitundu JA, Kingamkono RR, Msengi AE,Mduma B, Sullivan KR, Tomkins AM. Improved energyintakes using amylase-digested weaning foods in Tan-zanian children with acute diarrhea. J PediatrGastroenterol Nutr 1995;1:73–81.
16. Kibona N, Donald C, Watson FE, Alnwick D, TomkinsA. An evaluation of a project to improve child nutri-tion in Tanzania. Int J Food Sci Nutr 1995; 46:233–9.
17. Cruz JR, Bartlett AV, Mendez H, Sibrian R. Epidemiol-ogy of persistent diarrhea among Guatemalan rural chil-dren. Acta Paediatr 1992;381(suppl):22–6.
18. Bartlett AV, Hurtado E, Schroeder DG, Mendez H. As-sociation of indicators of hygiene behavior with persis-tent diarrhea of young children. Acta Paediatr1992;381(suppl):66–71.
Maternal preferences

12
19. Schroeder DG. Dietary management of acute diarrheain rural Guatemalan community. Doctoral thesis, JohnsHopkins University, Baltimore, Md, USA, 1993.
20. Schroeder DG, Torún B, Begin F, Ruel M, Molina M,Sanchez C. Germinated corn amylase and weaning food/energy intake of infants in a traditional Guatemalan com-munity (abstract). FASEB J 1996;10(3):A1669.
21. Gopaldas T, Deshpande S, John C. Studies on a wheat-based amylase-rich food. Food Nutr Bull 1988;10(3):55–9.
22. Brown KH, Creed-Kanashiro H, Dewey KG. Optimalcomplementary feeding practices to prevent childhoodmalnutrition in developing countries. Food Nutr Bull1995;16:320–39.
23. Brown KH. The importance of dietary quality versusquantity for weanlings in less developed countries. Aframework for discussion. Food Nutr Bull 1991;13:86–94.
24. Brown KH. Dietary management of acute childhood di-arrhea disease: contemporary scientific issues. J Nutr1994;24:1455S–60S.
25. Lifshitz F, Maggioni A. The management of acute diar-rhea in young infants. J Pediatr 1994;19:148–50.
26. World Health Organization. A manual for the treatmentand prevention of acute diarrhea. Practical guidelines.2nd ed. Geneva: WHO, 1989.
M. E. Parker et al.
Food and Nutrition Bulletin, vo. 19, no. 1 © 1998, The United Nations University. 13
Abstract
Forests provide food and resources that are used in thedaily life of the rural villagers who live nearby. This studyexplored the contribution of forest food to household nu-trition and food security of these people. The study fo-cused on the frequency, varieties, and amounts of forestfood gathered for consumption in the household, and thereduction in food expenditure resulting from using for-est food. Seven households in a village near a forest innorth-east Thailand were selected for a one-year studyof forest food consumption using household food records.The data were collected from May 1988 to April 1989.Forest food was gathered for consumption an average ofthree days a week. One hundred twenty-six kinds of for-est food were gathered. The amount gathered for con-sumption was highest in May and lowest in December,with an average of 126.6 kg per household per year. Theuse of forest food could reduce food expenditure for therural villagers.
Introduction
In the past, forests were very important to rural villag-ers. They were sources of foods and resources that wereused daily. They provided animal foods, vegetables, fruits,medicines, household building materials, householdequipment, wood for fuel, and products for cash sale[1, 2]. Food from the forest was particularly impor-tant for the villagers, some of whom went to the forestfrequently to collect food [1].
Food from the forest supplied nutrients. Wild ani-
Yearly household record of food from the forestfor home consumption by rural villagers innorth-east Thailand
Kiatirat Kunarattanapruk, Juruwan Chokkanapitak, Pissanu Uttamavatin,Benja Muktabhant, Suwalee Lowirakorn, and Sastri Saowakontha
The authors are affiliated with Khon Kaen University in KhonKaen, Thailand. Kiatirat Kunarattanapruk, PissanuUttamavatin, Benja Muktabhant, and Suwalee Lowirakornare in the Department of Nutrition, Faculty of Public Health;Juruwan Chokkanapitak is in the Department of Biostatisticsand Demography, Faculty of Public Health; and SastriSaowakontha is in the Department of Medicine, Faculty ofMedicine.
mals provided protein and were good sources of iron,vitamin A, and vitamin B. Wild leaves and fruits con-tained vitamins and minerals. Seeds, nuts, roots, andtubers supplied fats, carbohydrates, and minerals. Mush-rooms provided protein and minerals [2–4]. Forest foodprovided supplemental, seasonal, and emergency con-tributions to household food supplies [2].
In earlier times, villagers who lived near the forestsof north-east Thailand were engaged in a self-subsis-tent economy, with a stable crop of paddy rice, supple-mented by hunting wildlife and gathering food andwood from the forests surrounding the settlements. Anysurplus from household production and collection wasshared among villagers or bartered with outsiders [1,2]. In the past 40 years, the growing population hasresulted in an increased demand for food, includingforest foods, as well as more land for cultivation. Somehouseholds that did not have enough land for cultiva-tion moved to the forest for cash crop cultivation. Thiswas one of the events that contributed to the decreasein forest area [5, 6]. From 1961 to 1985, the forest areain Thailand decreased from 53% to 29% of the totalarea of the country [7]. Because of the rapid decreasein forest area, in 1987 the Thai Government enacted aforest-closing law that prohibited cultivation in the forestbut still allowed the villagers to collect forest food.
This study was conducted in a village located near aforest in north-east Thailand. It began a few monthsafter the prohibition of cultivation in the forest. Theobjective was to study the use of food from the forestfor home consumption by the rural villagers duringone year by focusing on the kinds of foods gatheredfrom the forest for consumption in the household, thefrequency with which they were gathered, the amountsgathered, and the reduction in food expenditures re-sulting from using forest food.
14
Methods
Village selection and characteristics
The criteria for village selection were that it be near aforest and be classified as a poor, remote, rural villagewith insufficient rice production and crop land.
The selected village was small, with only 59 house-holds in 1987. Most of the population was Thai-Laosand Buddhist. Most families were nuclear families withapproximately five or six persons in a household. Thevillage was situated in a valley in Khon Kaen Provincein north-east Thailand. It was located near a forest areaand was approximately 14 km from the district centre.The village was isolated from others in the valley. Clustersof households were located on the high land surroundedby rice fields (most of which belonged to other vil-lages) and mountains. It was difficult to travel to orfrom the village, because no minibus passed throughthe village, and the gravel road was muddy during therainy season. Normally, the villagers took a minibusfrom a neighbouring village about 2 km away, and therewere two or three minibus trips to the district centreeach day. At the beginning of the study, there was noelectricity in the village.
Compared with other villages in the valley, the studiedvillage was poor, with low income and the least agricul-tural land per household. Rice was cultivated only forhome consumption, and even this amount was insuffi-cient for the people’s needs because their rice fields weretoo small. The main source of cash income was cassava.Before the forest was closed, most of the villagers en-croached on the forest reserve to grow cassava. In 1987the Government banned cultivation in the forest, althoughvillagers could still collect food from the forest.
Household selection and characteristics
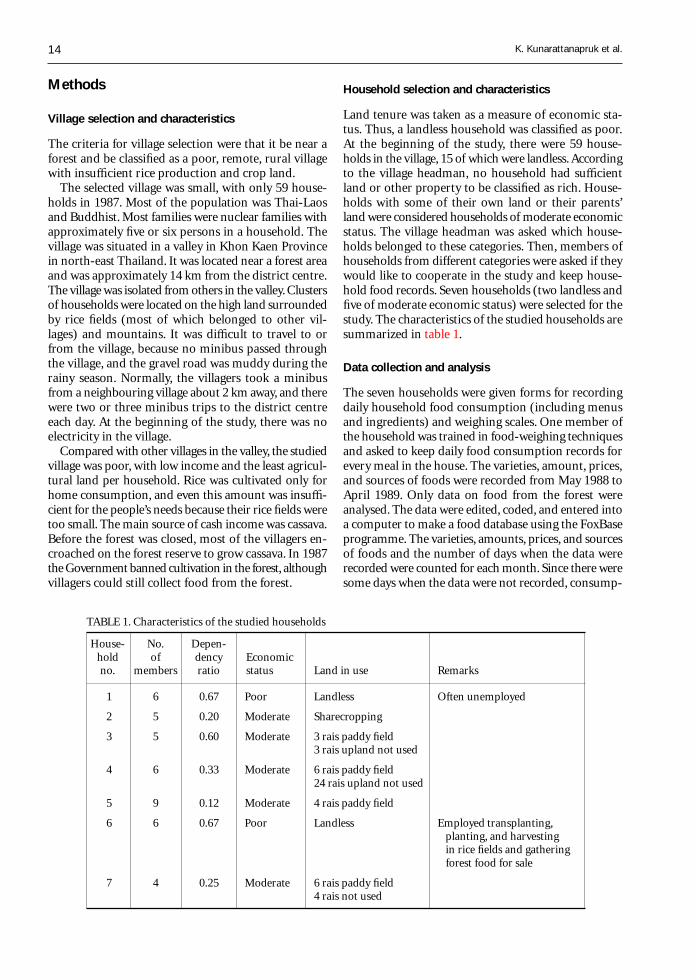
Land tenure was taken as a measure of economic sta-tus. Thus, a landless household was classified as poor.At the beginning of the study, there were 59 house-holds in the village, 15 of which were landless. Accordingto the village headman, no household had sufficientland or other property to be classified as rich. House-holds with some of their own land or their parents’land were considered households of moderate economicstatus. The village headman was asked which house-holds belonged to these categories. Then, members ofhouseholds from different categories were asked if theywould like to cooperate in the study and keep house-hold food records. Seven households (two landless andfive of moderate economic status) were selected for thestudy. The characteristics of the studied households aresummarized in table 1.
Data collection and analysis
The seven households were given forms for recordingdaily household food consumption (including menusand ingredients) and weighing scales. One member ofthe household was trained in food-weighing techniquesand asked to keep daily food consumption records forevery meal in the house. The varieties, amount, prices,and sources of foods were recorded from May 1988 toApril 1989. Only data on food from the forest wereanalysed. The data were edited, coded, and entered intoa computer to make a food database using the FoxBaseprogramme. The varieties, amounts, prices, and sourcesof foods and the number of days when the data wererecorded were counted for each month. Since there weresome days when the data were not recorded, consump-
TABLE 1. Characteristics of the studied households
House- No. Depen-hold of dency Economicno. members ratio status Land in use Remarks
1 6 0.67 Poor Landless Often unemployed
2 5 0.20 Moderate Sharecropping
3 5 0.60 Moderate 3 rais paddy field3 rais upland not used
4 6 0.33 Moderate 6 rais paddy field24 rais upland not used
5 9 0.12 Moderate 4 rais paddy field
6 6 0.67 Poor Landless Employed transplanting,planting, and harvestingin rice fields and gatheringforest food for sale
7 4 0.25 Moderate 6 rais paddy field4 rais not used
K. Kunarattanapruk et al.
15
tion for that month was calculated proportionally tothe amount of food consumed on the recorded days.
Definition of forest food
Forest food consisted of all the kinds of food that couldbe found in the deep forest (dong in Thai), on the hill-sides or hilltops (khok), or in the shrublands (lon). Somekinds of forest food came from trees, and others werefound in or near ponds or streams in the deep forest.
Results
Frequency of gathering of forest foodfor consumption
On average, households living near the forest gatheredforest food for home consumption three days a week.The poor, landless households whose members werefrequently unemployed gathered forest food an aver-age of five days a week, as compared with householdsof moderate economic status, which gathered food twoor three days a week. The poor, landless householdswhose members were employed gathered forest foodas frequently as those of moderate economic status.The average frequency of gathering forest food for homeconsumption was highest in May and lowest in De-cember (table 2).
Varieties of forest food gathered for consumption
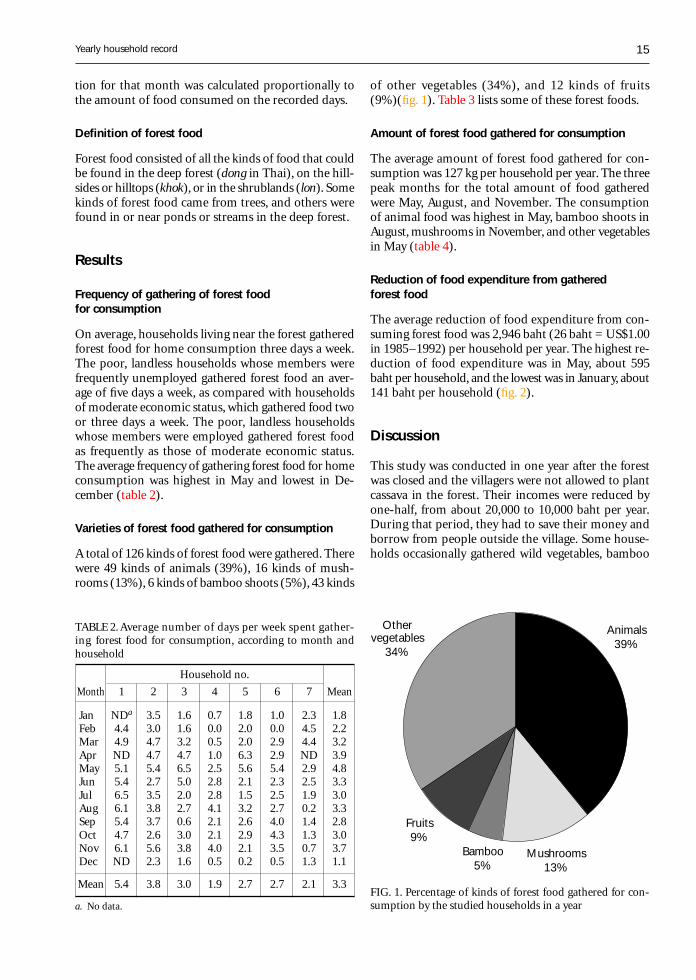
A total of 126 kinds of forest food were gathered. Therewere 49 kinds of animals (39%), 16 kinds of mush-rooms (13%), 6 kinds of bamboo shoots (5%), 43 kinds
of other vegetables (34%), and 12 kinds of fruits(9%)(fig. 1). Table 3 lists some of these forest foods.
Amount of forest food gathered for consumption
The average amount of forest food gathered for con-sumption was 127 kg per household per year. The threepeak months for the total amount of food gatheredwere May, August, and November. The consumptionof animal food was highest in May, bamboo shoots inAugust, mushrooms in November, and other vegetablesin May (table 4).
Reduction of food expenditure from gatheredforest food
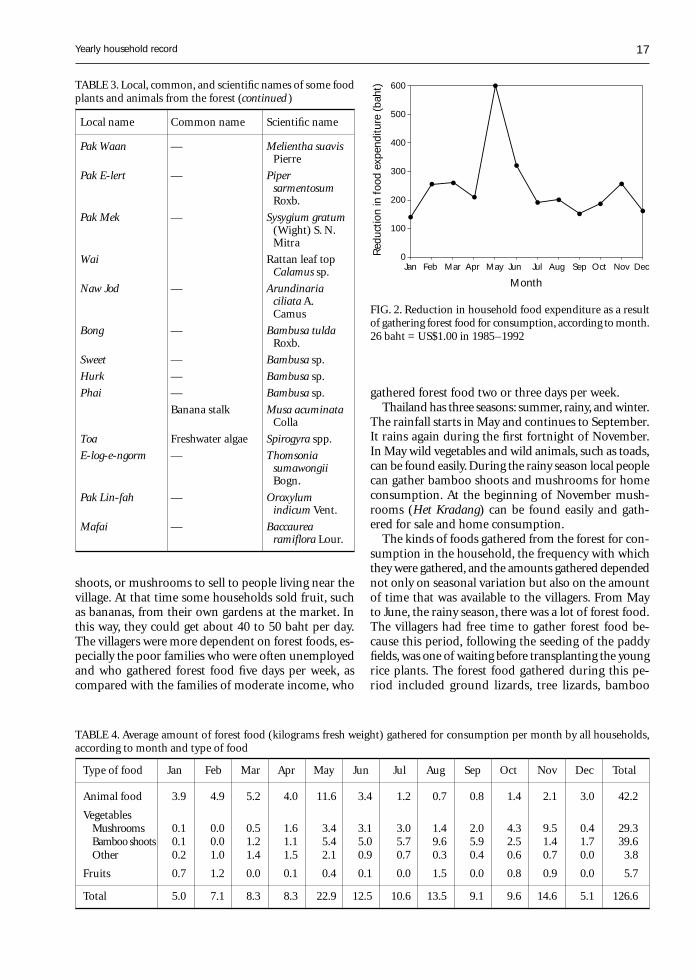
The average reduction of food expenditure from con-suming forest food was 2,946 baht (26 baht = US$1.00in 1985–1992) per household per year. The highest re-duction of food expenditure was in May, about 595baht per household, and the lowest was in January, about141 baht per household (fig. 2).
Discussion
This study was conducted in one year after the forestwas closed and the villagers were not allowed to plantcassava in the forest. Their incomes were reduced byone-half, from about 20,000 to 10,000 baht per year.During that period, they had to save their money andborrow from people outside the village. Some house-holds occasionally gathered wild vegetables, bamboo
TABLE 2. Average number of days per week spent gather-ing forest food for consumption, according to month andhousehold
Household no.
Month 1 2 3 4 5 6 7 Mean
Jan NDa 3.5 1.6 0.7 1.8 1.0 2.3 1.8Feb 4.4 3.0 1.6 0.0 2.0 0.0 4.5 2.2Mar 4.9 4.7 3.2 0.5 2.0 2.9 4.4 3.2Apr ND 4.7 4.7 1.0 6.3 2.9 ND 3.9May 5.1 5.4 6.5 2.5 5.6 5.4 2.9 4.8Jun 5.4 2.7 5.0 2.8 2.1 2.3 2.5 3.3Jul 6.5 3.5 2.0 2.8 1.5 2.5 1.9 3.0Aug 6.1 3.8 2.7 4.1 3.2 2.7 0.2 3.3Sep 5.4 3.7 0.6 2.1 2.6 4.0 1.4 2.8Oct 4.7 2.6 3.0 2.1 2.9 4.3 1.3 3.0Nov 6.1 5.6 3.8 4.0 2.1 3.5 0.7 3.7Dec ND 2.3 1.6 0.5 0.2 0.5 1.3 1.1
Mean 5.4 3.8 3.0 1.9 2.7 2.7 2.1 3.3
a. No data.
Yearly household record
FIG. 1. Percentage of kinds of forest food gathered for con-sumption by the studied households in a year
Animals39%
Mushrooms13%
Bamboo5%
Fruits9%
Othervegetables
34%

16
TABLE 3. Local, common, and scientific names of some food plants and animals from the forest
Mangda Giant water bug Lethocerusindicus
Khai Ja-kajan Cicada egg Magicicada spp.
Mim Little honey bee Apis florea
Khai Mod-dang Ant eggs —
Kung Freshwater prawn Macrobrachiumlanchesteri
— Shrimp —
Hoi-Joob Pond snail Sintaiaingallsiana
Pla Ta-pean Small carp Puntiusgonionotus
Pla Ngarm Small carp —
Pla Khow Jullien’s mud carp Cirrhina jullieni
Pla E-Thai Small carp Osteochilus spp.
Pla Chon Snakehead fish Ophicephalusstriatus
— Rasbora Rasbora spp.
Pla Duk Freshwater catfish Clarias spp.
Pla Nin Nile tilapia Tilapia nilotica
Pla Lai Swamp eel Fluta alba
Kob Frog Rana spp.
Ngod Frog Rana spp.
Kaet Small toad Oocidozyga lima
Ung Bullfrog Kaloulan spp.
Dtow Tortoise —
Yar Ground lizard Liolepis belliana
Lan Tree monitor Varanusnebulosus
Kee-kra-porm Tree lizard Calotes spp.
Nok-kao Dove Macropygiaruficeps
Kai-pah Jungle fowl Gallus gallus
Kra-jaun Chipmunk Menetesberdmorei
Kra-rauk Squirrel Callosciurus spp.
Kra-tae Tree shew Tupaia spp.
Bang Flying lemur Cynocephalusvariegatus
Noo-na Field rat Rattus rattus
Noo-wai Field rat Leopoldamyssabanus
Moo-pah Boar Sus scrofa
E-hen Palm civet —
Lin Pangolin Manis spp.
Ma-muang Mango Mangifera indicaLinn.
Mak-mee Ripe jackfruit ArtocarpusheterophyllusLamk.
Mak-waa Java plum Syzygium cuminiDruce
Ma-kang Ma Kue Phuang Solanum torvumSw.
Mak-ben Small thorn tree Flacourtia indicaMerr.
Mak-keng Kleng DialiumcochinchinensePierre
Het Kradang Het Khan LentinuspraerigidusBerk.
Het Ghaw — Lentinus edodes
Het Takai — Russula delica Fr.
Het Teenhad — Russulanigricanus Fr.
Het Plorg — TermitomycesfuliginosusHeim
Het Pung — Boletus edulisBull.
Het Pungkam — —
Het Ra-ngok — Amanita vaginataFr. Var. alb (Fr.)Gill
Het Larp — —
Het Hoo-noo — Aureculariaauriculasis (S. F.Gray) Martin
Het Po — Astreaushygrometricus(Pers.) Morg.
Het Ploag-dong — TermitomycesfuliginosusHeim.
Pak Kra-jeaw — Curcuma sp.
Pak Kra-don — Careya arboreaRoxb.
Pak Karn-trong — Ottelia alismoidesPers.
Pak Kaaw Paracress Spilanthesacmella Murr.
Pak Ngoo-haa Ivy gourd —
Pak Tiu — Cratoxylumformosum Dyer
Pak Lin-laen — NaraveliaZeylanica DC.
Neem Pag Sadao Azadirachtaindica Juss.
Pak Sarb — Adenia viridifloraCraib.
Pak Nam Thorny vegetable Lasia spinosaThw.
Local name Common name Scientific name Local name Common name Scientific name
K. Kunarattanapruk et al.
17
gathered forest food two or three days per week.Thailand has three seasons: summer, rainy, and winter.
The rainfall starts in May and continues to September.It rains again during the first fortnight of November.In May wild vegetables and wild animals, such as toads,can be found easily. During the rainy season local peoplecan gather bamboo shoots and mushrooms for homeconsumption. At the beginning of November mush-rooms (Het Kradang) can be found easily and gath-ered for sale and home consumption.
The kinds of foods gathered from the forest for con-sumption in the household, the frequency with whichthey were gathered, and the amounts gathered dependednot only on seasonal variation but also on the amountof time that was available to the villagers. From Mayto June, the rainy season, there was a lot of forest food.The villagers had free time to gather forest food be-cause this period, following the seeding of the paddyfields, was one of waiting before transplanting the youngrice plants. The forest food gathered during this pe-riod included ground lizards, tree lizards, bamboo
shoots, or mushrooms to sell to people living near thevillage. At that time some households sold fruit, suchas bananas, from their own gardens at the market. Inthis way, they could get about 40 to 50 baht per day.The villagers were more dependent on forest foods, es-pecially the poor families who were often unemployedand who gathered forest food five days per week, ascompared with the families of moderate income, who
Jan Mar May Jul Sep NovFeb Apr Jun Aug Oct Dec0
100
200
300
400
500
600
Month
Red
uctio
n in
foo
d ex
pend
iture
(ba
ht)
FIG. 2. Reduction in household food expenditure as a resultof gathering forest food for consumption, according to month.26 baht = US$1.00 in 1985–1992
TABLE 4. Average amount of forest food (kilograms fresh weight) gathered for consumption per month by all households,according to month and type of food
Type of food Jan Feb Mar Apr May Jun Jul Aug Sep Oct Nov Dec Total
Animal food 3.9 4.9 5.2 4.0 11.6 3.4 1.2 0.7 0.8 1.4 2.1 3.0 42.2
VegetablesMushrooms 0.1 0.0 0.5 1.6 3.4 3.1 3.0 1.4 2.0 4.3 9.5 0.4 29.3Bamboo shoots 0.1 0.0 1.2 1.1 5.4 5.0 5.7 9.6 5.9 2.5 1.4 1.7 39.6Other 0.2 1.0 1.4 1.5 2.1 0.9 0.7 0.3 0.4 0.6 0.7 0.0 3.8
Fruits 0.7 1.2 0.0 0.1 0.4 0.1 0.0 1.5 0.0 0.8 0.9 0.0 5.7
Total 5.0 7.1 8.3 8.3 22.9 12.5 10.6 13.5 9.1 9.6 14.6 5.1 126.6
Yearly household record
TABLE 3. Local, common, and scientific names of some foodplants and animals from the forest (continued )
Local name Common name Scientific name
Pak Waan — Melientha suavisPierre
Pak E-lert — PipersarmentosumRoxb.
Pak Mek — Sysygium gratum(Wight) S. N.Mitra
Wai Rattan leaf topCalamus sp.
Naw Jod — Arundinariaciliata A.Camus
Bong — Bambusa tuldaRoxb.
Sweet — Bambusa sp.
Hurk — Bambusa sp.
Phai — Bambusa sp.
Banana stalk Musa acuminataColla
Toa Freshwater algae Spirogyra spp.
E-log-e-ngorm — ThomsoniasumawongiiBogn.
Pak Lin-fah — Oroxylumindicum Vent.
Mafai — Baccaurearamiflora Lour.
18
shoots, E-log-e-ngorms (vegetable), morning glories, PakNam (vegetable), and Het Po (mushroom).
From July to September, a lot of forest foods, suchas bamboo shoots, mushrooms, Het Takai, Het Ra-ngok,fish, snakehead fish, and swamp eel, were available.However, since this was the time to transplant the youngrice plants, some family members would gather or catchforest food, while others continued with their farm work.
During October and November, forest foods suchas bamboo shoots, mushrooms, and Het Kradang wereavailable. In this period the farmers were busy harvestingrice, so only some members of the family gathered forestfood for home consumption or for sale.
December to February was the cold and dry season.The farmers who did not migrate to work outside thevillage had free time to go to the forest, but less forestfood was available during this period. They could findsome animals, such as Ngod (frogs), fresh-water prawns,ant eggs, minnows, and some kinds of fish.
March and April were dry and most of the naturalponds had no water. At this time it was difficult to findforest food. Although the farmers had free time, veryfew people went to the forest during this period be-cause of the hot weather and the difficulty of findingforest food. They might find some kinds of mushrooms,bamboo shoots, toads, and frogs, but the amounts wereless than during the rainy season. Other forest foodsfound in this period were ant eggs and Pak Waan (veg-etable).
Since the villagers earned an average of only 45 bahtper day, the use of forest food could substantially re-duce food costs. Consumption of forest food by thevillagers is traditional. If they cannot gather forest foodthemselves, they have to buy it in the market, wherethe prices are very high. Some villagers, especially thepoor families, may not be able to buy forest food forhome consumption.
Forest food was important for rural villagers livingnear a forest. The study conducted in this village fromJanuary to September 1988 found that except for rice,the staple food, the forest was the main source of house-hold food. In terms of kilograms, 31% of all house-hold food came from the forest, 22% was produced bythe household, 31% came from the paddy fields, 13%was purchased, and 3% came from gifts [1].
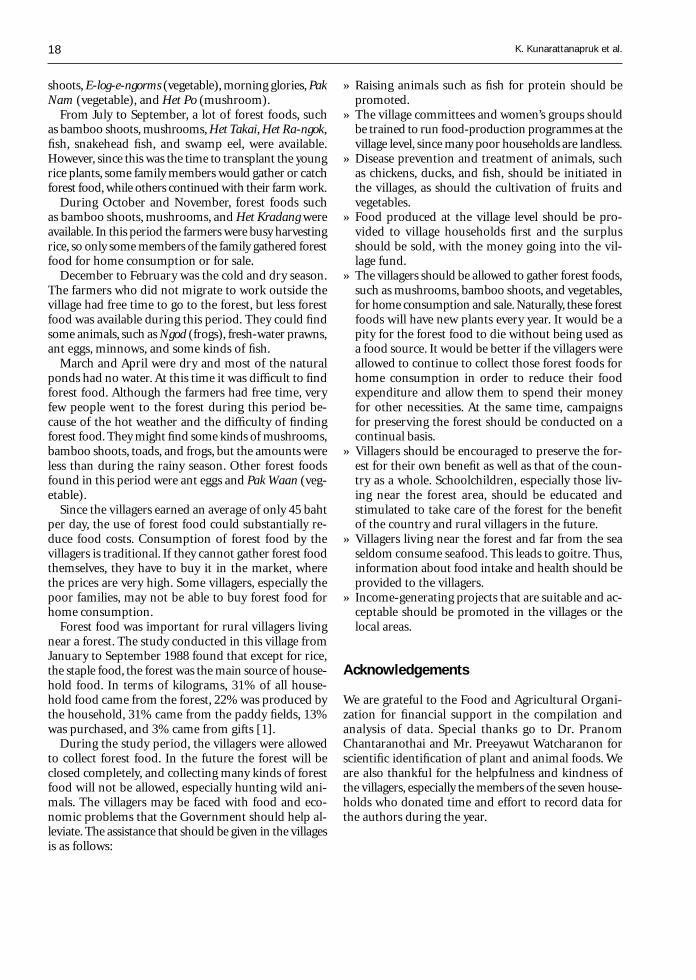
During the study period, the villagers were allowedto collect forest food. In the future the forest will beclosed completely, and collecting many kinds of forestfood will not be allowed, especially hunting wild ani-mals. The villagers may be faced with food and eco-nomic problems that the Government should help al-leviate. The assistance that should be given in the villagesis as follows:
» Raising animals such as fish for protein should bepromoted.
» The village committees and women’s groups shouldbe trained to run food-production programmes at thevillage level, since many poor households are landless.
» Disease prevention and treatment of animals, suchas chickens, ducks, and fish, should be initiated inthe villages, as should the cultivation of fruits andvegetables.
» Food produced at the village level should be pro-vided to village households first and the surplusshould be sold, with the money going into the vil-lage fund.
» The villagers should be allowed to gather forest foods,such as mushrooms, bamboo shoots, and vegetables,for home consumption and sale. Naturally, these forestfoods will have new plants every year. It would be apity for the forest food to die without being used asa food source. It would be better if the villagers wereallowed to continue to collect those forest foods forhome consumption in order to reduce their foodexpenditure and allow them to spend their moneyfor other necessities. At the same time, campaignsfor preserving the forest should be conducted on acontinual basis.
» Villagers should be encouraged to preserve the for-est for their own benefit as well as that of the coun-try as a whole. Schoolchildren, especially those liv-ing near the forest area, should be educated andstimulated to take care of the forest for the benefitof the country and rural villagers in the future.
» Villagers living near the forest and far from the seaseldom consume seafood. This leads to goitre. Thus,information about food intake and health should beprovided to the villagers.
» Income-generating projects that are suitable and ac-ceptable should be promoted in the villages or thelocal areas.
Acknowledgements
We are grateful to the Food and Agricultural Organi-zation for financial support in the compilation andanalysis of data. Special thanks go to Dr. PranomChantaranothai and Mr. Preeyawut Watcharanon forscientific identification of plant and animal foods. Weare also thankful for the helpfulness and kindness ofthe villagers, especially the members of the seven house-holds who donated time and effort to record data forthe authors during the year.
K. Kunarattanapruk et al.

19
References
1. Brinkman W, ed. Why natural forests are linked withnutrition, health and self reliance of villagers in North-east Thailand: a collection of papers. Rome: Food andAgriculture Organization, 1989.
2. Food and Agriculture Organization. Forestry and nu-trition: a reference manual. Rome: FAO, 1989.
3. Food and Agriculture Organization. Forestry and foodsecurity. Rome: FAO, 1989.
4. Nutrition Division, Department of Health, Ministry ofPublic Health, Thailand. Nutritive values of Thai foods.Bangkok: War Veterans Association of Thailand Pub-lishing Co., 1992.
5. North-East Thailand Upland Social Forestry Project.Summary report: human–forest interactions in North-East Thailand. Bangkok: Kasetsart University, 1987.
6. Leungaramsri P, Rajesh N, eds. The future of people andforests in Thailand after the logging ban. Bangkok: PaapPim Printing, 1992.
7. Chuntanaparb L, Wood HI. Management of degradedforest land in Thailand. Bangkok: Kasetsart University,1986.
Yearly household record
20 Food and Nutrition Bulletin, vo. 19, no. 1 © 1998, The United Nations University.
Abstract
A cross-sectional study of the nutritional significance offood aversions and cravings during pregnancy was con-ducted on 295 women in southern Ethiopia between Feb-ruary and May 1995. A questionnaire was used to collectdata on dietary practices. Mid-upper-arm circumference(MUAC), triceps skinfold thickness (TSFT), and weightmeasurements were used to assess nutritional status.Slightly fewer than three-quarters (71%) of the womencraved one or more foods, whereas about two-thirds (65%)avoided at least one food. Cereal foods, despite being staplefoods in the area, were avoided by more women (41%)than any other foods. Livestock products, which were scarceat the time of the study, were craved by more women(55%) than any other foods. Comparisons using variousanthropometric indicators revealed that women whoavoided foods had significantly higher MUAC and TSFTthan those who did not (p < .05), whereas there was nodifference in nutritional status between women who cravedfoods and those who did not. However, those cravingwomen who managed to get the desired foods hadsignificantly higher weight gain (p < .05), but not sig-nificantly higher MUAC or TSFT, than those who didnot. Aversion and craving were positively associated(χ2 = 10.66, p < .001; odds ratio, 2.36). Thus, womenwho avoided foods were 2.4 times more likely to cravefoods than those who did not avoid foods. This impliesthat aversion and craving are complementary processesgeared towards ensuring optimal nutrition during preg-nancy. Aversion results in the avoidance of monotonousdiets, whereas craving calls for varied and nutritious foods.More research, however, is needed before such a conclu-sion is warranted.
Food aversions and cravings during pregnancy:Prevalence and significance for maternal nutritionin Ethiopia
Tsegaye Demissie, N. M. Muroki, and Wambui Kogi-Makau
Tsegaye Demissie is affiliated with the Health and NutritionResearch Institute, Department of Nutrition and Food Science,in Addis Ababa, Ethiopia. N. M. Muroki and Wambui Kogi-Makau are affiliated with the Applied Human NutritionProgramme, Department of Food Technology and Nutrition,University of Nairobi, in Nairobi, Kenya.
Introduction
It is common to hear pregnant women complain aboutchanges in their appetites. Whereas some women re-port a dislike of or total aversion to specific foods, othersreport a strong craving for specific foods and non-fooditems, which are usually not readily accessible. Foodaversions and cravings during pregnancy are knownall over the world [1, 2], but despite their ubiquity, nei-ther their causes nor their ultimate effects on mater-nal nutrition have been well established scientifically.The opinions that have been documented so far arespeculative, contradictory, or inconclusive.
Some researchers argue that aversions and cravingsare idiosyncratic, learned behaviours, which thereforeshould be considered extrinsic, exogenous phenomena[2]. Other researchers attribute aversions and cravingsto intrinsic physiological processes geared towards en-suring the optimal growth and development of the foetus[1]. According to the latter opinion, aversions are aphysiological mechanism that protects the foetus ei-ther from nutrient deficiencies (by prompting moth-ers away from low-quality and monotonous foods) orfrom excess foeto-toxic substances present in the foods;thus, aversion would be beneficial [3, 4]. The evidencethat the most commonly avoided foods or substancesare staple foods, alcoholic beverages, coffee, and ciga-rettes appears to support this opinion.
Several studies have observed that women usuallyavoid staple or commonly consumed foods [2]. Stud-ies also indicate that relatively high proportions of preg-nant women avoid alcoholic beverages. In a study inthe United States, 21% of pregnant women avoided al-coholic beverages and 13% avoided cigarettes [5]. Simi-larly, in Ethiopia almost 20% of the women studiedshowed an aversion to coffee and 35% showed an aver-sion to alcoholic beverages [F. Alemu and Z. Wolde-Gabreil, personal communication, 1995]. These find-ings appear to support the opinion that aversions areintrinsic and beneficial.
Some researchers, however, believe that aversions playa negative role in maternal nutrition because they re-
21
duce the mother’s food options [1] by causing her todecrease her intake of certain foods. Thus, opinionson the importance of aversion to maternal nutritionare contradictory.
Researchers who believe that craving is physiologi-cal argue that it is a mechanism to protect the foetusand the mother from nutrient deficiencies [6] and sug-gest that craving is triggered when a deficiency in oneor more nutrients arises. Hence, they argue that womenwho experience cravings increase dietary intake [1]. Thisopinion appears to be supported by the observationthat, in general, women crave nutritious foods that arelacking in their diets. In an Ethiopian study, about 43%of the women craved milk and meat [F. Alemu and Z.Wolde-Gabreil, personal communication, 1995]. Simi-larly, in the United States 47% of the respondents cravedfruits and 34% craved dairy products [7].
The literature on aversion and craving clearly indi-cates that knowledge of these behaviours, especiallyaversion, is far from complete. Since aversions andcravings are closely linked to the dietary intake of preg-nant women, understanding these behaviours is im-portant in addressing the issue of maternal nutrition.This paper is intended to contribute to the understand-ing of the role of aversion and craving during preg-nancy, to identify foods commonly avoided or craved,and to determine the relationship of aversion and crav-ing to maternal nutrition, using the Hadiya Zone inEthiopia as a case study.
Materials and methods
Study site
The Hadiya Zone was selected as the study site on thebasis of the opinions of nutritionists regarding the oc-currence and magnitude of qualitative changes in foodsconsumed during pregnancy and the presence of thefacilities necessary to carry out the study. In this site, asingle Mother and Child Health Clinic was randomlyselected.
Study respondents
The study enrolled all of the healthy pregnant womenwho came to the clinic for antenatal checkups betweenFebruary and May 1995. A total of 295 women (usinga prevalence of 45% for both aversion and craving)were studied.
Study instruments and procedures
A questionnaire was designed to gather demographicand socio-economic data, information on the women’sdietary modifications (aversion and craving), and the
reasons for them. Nurses working in the clinic weretrained to use the study instruments and tools. A pilotstudy was conducted, and the questionnaire was modi-fied appropriately.
Body weight measurements were taken to the near-est 100 g following standard procedures, using a beamscale. In addition to the body weight measured duringthe interview session, one other recent body weightmeasurement for each subject was retrieved from clinicrecords. Mid-upper-arm circumference (MUAC) andtriceps skinfold thickness (TSFT) measurements weretaken using the standard methods described by Gibson[8]. A non-stretchable tape, calibrated to the nearest0.1 cm, was used to measure MUAC, and a Holtaincaliper, calibrated to the nearest 0.2 mm, was used tomeasure TSFT.
Data analysis
The data were processed and analysed using SPSS sta-tistical software. Food types were divided into majorfood categories: staples, legumes, vegetables and fruits,and livestock products. Weight gain per week was cal-culated by subtracting the weight measurement takenfrom the patient’s clinic records from the measurementtaken on the date of interview.
Results
Demographic and reproductive characteristicsof the women
Table 1 shows the demographic and reproductive char-acteristics of the study women. Almost equal numbersof women from rural and urban communities (51%and 49%, respectively) participated. Nearly all of thewomen (92%) were housewives; 6% were civil servants,and only 2% were self-employed. The majority (88%)of the women were Protestant Christians of variousdenominations; the remainder belonged to other reli-gions, such as the Eastern Orthodox and Roman CatholicChurches or Islam.
None of the women came from the upper-incomeclass. About two-thirds (65%) were from the lower-income group, and the rest were from the middle-in-come group. About a quarter (24%) had not attendedschool, close to a half (46%) had completed some levelof elementary school, and about a third (30%) had gonebeyond elementary school.
The low mean age (25 years) and gravidity (3.6) in-dicate that the respondents were mostly young women.Only about 13% of the women were over 30 years ofage. There were no respondents in their first trimester,whereas 30% and 71% were in their second and thirdtrimesters, respectively. Women go for antenatal check-
Food aversions and cravings
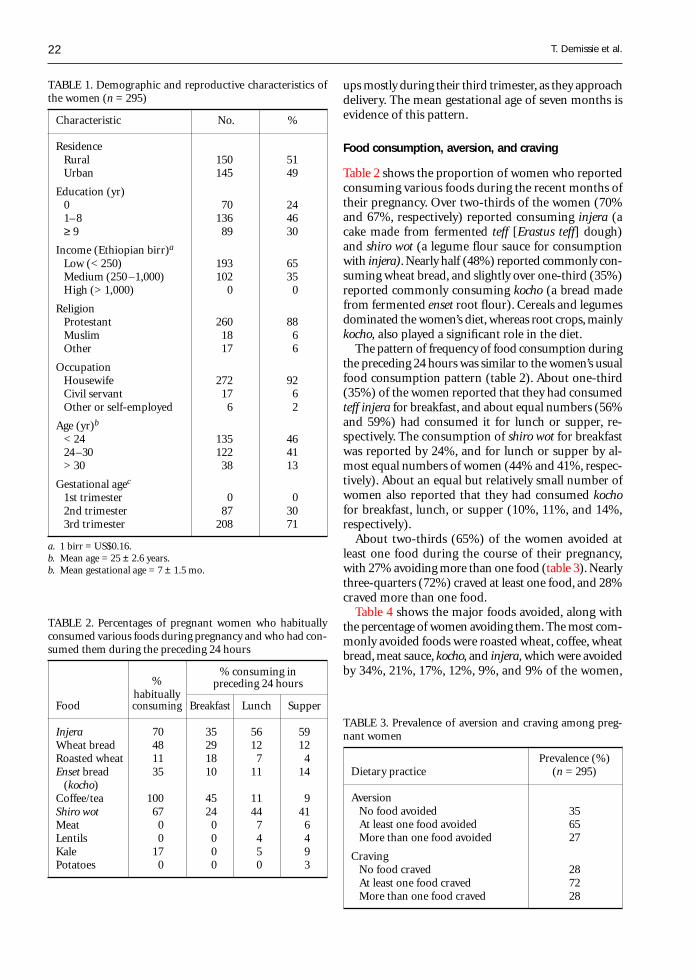
22
ups mostly during their third trimester, as they approachdelivery. The mean gestational age of seven months isevidence of this pattern.
Food consumption, aversion, and craving
Table 2 shows the proportion of women who reportedconsuming various foods during the recent months oftheir pregnancy. Over two-thirds of the women (70%and 67%, respectively) reported consuming injera (acake made from fermented teff [Erastus teff] dough)and shiro wot (a legume flour sauce for consumptionwith injera). Nearly half (48%) reported commonly con-suming wheat bread, and slightly over one-third (35%)reported commonly consuming kocho (a bread madefrom fermented enset root flour). Cereals and legumesdominated the women’s diet, whereas root crops, mainlykocho, also played a significant role in the diet.
The pattern of frequency of food consumption duringthe preceding 24 hours was similar to the women’s usualfood consumption pattern (table 2). About one-third(35%) of the women reported that they had consumedteff injera for breakfast, and about equal numbers (56%and 59%) had consumed it for lunch or supper, re-spectively. The consumption of shiro wot for breakfastwas reported by 24%, and for lunch or supper by al-most equal numbers of women (44% and 41%, respec-tively). About an equal but relatively small number ofwomen also reported that they had consumed kochofor breakfast, lunch, or supper (10%, 11%, and 14%,respectively).
About two-thirds (65%) of the women avoided atleast one food during the course of their pregnancy,with 27% avoiding more than one food (table 3). Nearlythree-quarters (72%) craved at least one food, and 28%craved more than one food.
Table 4 shows the major foods avoided, along withthe percentage of women avoiding them. The most com-monly avoided foods were roasted wheat, coffee, wheatbread, meat sauce, kocho, and injera, which were avoidedby 34%, 21%, 17%, 12%, 9%, and 9% of the women,
TABLE 3. Prevalence of aversion and craving among preg-nant women
Prevalence (%)Dietary practice (n = 295)
AversionNo food avoided 35At least one food avoided 65More than one food avoided 27
CravingNo food craved 28At least one food craved 72More than one food craved 28
TABLE 1. Demographic and reproductive characteristics ofthe women (n = 295)
Characteristic No. %
ResidenceRural 150 51Urban 145 49
Education (yr)0 70 241–8 136 46≥ 9 89 30
Income (Ethiopian birr)a
Low (< 250) 193 65Medium (250 –1,000) 102 35High (> 1,000) 0 0
ReligionProtestant 260 88Muslim 18 6Other 17 6
OccupationHousewife 272 92Civil servant 17 6Other or self-employed 6 2
Age (yr)b
< 24 135 4624–30 122 41> 30 38 13
Gestational agec
1st trimester 0 02nd trimester 87 303rd trimester 208 71
a. 1 birr = US$0.16.b. Mean age = 25 ± 2.6 years.b. Mean gestational age = 7 ± 1.5 mo.
T. Demissie et al.
TABLE 2. Percentages of pregnant women who habituallyconsumed various foods during pregnancy and who had con-sumed them during the preceding 24 hours
%% consuming in
habituallypreceding 24 hours
Food consuming Breakfast Lunch Supper
Injera 70 35 56 59Wheat bread 48 29 12 12Roasted wheat 11 18 7 4Enset bread 35 10 11 14
(kocho)Coffee/tea 100 45 11 9Shiro wot 67 24 44 41Meat 0 0 7 6Lentils 0 0 4 4Kale 17 0 5 9Potatoes 0 0 0 3
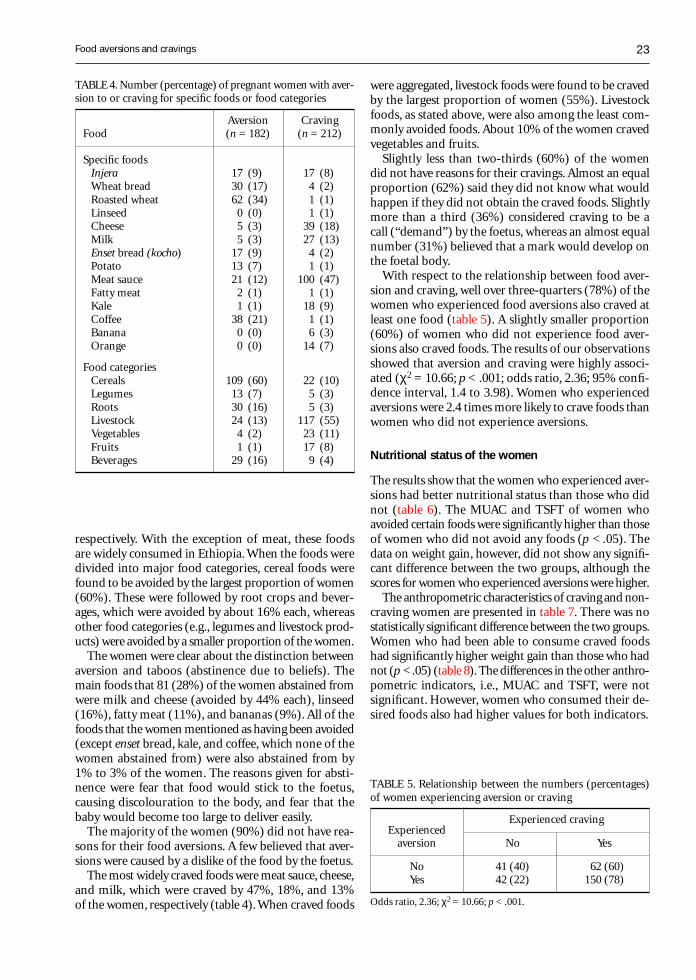
23
respectively. With the exception of meat, these foodsare widely consumed in Ethiopia. When the foods weredivided into major food categories, cereal foods werefound to be avoided by the largest proportion of women(60%). These were followed by root crops and bever-ages, which were avoided by about 16% each, whereasother food categories (e.g., legumes and livestock prod-ucts) were avoided by a smaller proportion of the women.
The women were clear about the distinction betweenaversion and taboos (abstinence due to beliefs). Themain foods that 81 (28%) of the women abstained fromwere milk and cheese (avoided by 44% each), linseed(16%), fatty meat (11%), and bananas (9%). All of thefoods that the women mentioned as having been avoided(except enset bread, kale, and coffee, which none of thewomen abstained from) were also abstained from by1% to 3% of the women. The reasons given for absti-nence were fear that food would stick to the foetus,causing discolouration to the body, and fear that thebaby would become too large to deliver easily.
The majority of the women (90%) did not have rea-sons for their food aversions. A few believed that aver-sions were caused by a dislike of the food by the foetus.
The most widely craved foods were meat sauce, cheese,and milk, which were craved by 47%, 18%, and 13%of the women, respectively (table 4). When craved foods
were aggregated, livestock foods were found to be cravedby the largest proportion of women (55%). Livestockfoods, as stated above, were also among the least com-monly avoided foods. About 10% of the women cravedvegetables and fruits.
Slightly less than two-thirds (60%) of the womendid not have reasons for their cravings. Almost an equalproportion (62%) said they did not know what wouldhappen if they did not obtain the craved foods. Slightlymore than a third (36%) considered craving to be acall (“demand”) by the foetus, whereas an almost equalnumber (31%) believed that a mark would develop onthe foetal body.
With respect to the relationship between food aver-sion and craving, well over three-quarters (78%) of thewomen who experienced food aversions also craved atleast one food (table 5). A slightly smaller proportion(60%) of women who did not experience food aver-sions also craved foods. The results of our observationsshowed that aversion and craving were highly associ-ated (χ2 = 10.66; p < .001; odds ratio, 2.36; 95% confi-dence interval, 1.4 to 3.98). Women who experiencedaversions were 2.4 times more likely to crave foods thanwomen who did not experience aversions.
Nutritional status of the women
The results show that the women who experienced aver-sions had better nutritional status than those who didnot (table 6). The MUAC and TSFT of women whoavoided certain foods were significantly higher than thoseof women who did not avoid any foods (p < .05). Thedata on weight gain, however, did not show any signifi-cant difference between the two groups, although thescores for women who experienced aversions were higher.
The anthropometric characteristics of craving and non-craving women are presented in table 7. There was nostatistically significant difference between the two groups.Women who had been able to consume craved foodshad significantly higher weight gain than those who hadnot (p < .05) (table 8). The differences in the other anthro-pometric indicators, i.e., MUAC and TSFT, were notsignificant. However, women who consumed their de-sired foods also had higher values for both indicators.
TABLE 4. Number (percentage) of pregnant women with aver-sion to or craving for specific foods or food categories
Aversion CravingFood (n = 182) (n = 212)
Specific foodsInjera 17 (9) 17 (8)Wheat bread 30 (17) 4 (2)Roasted wheat 62 (34) 1 (1)Linseed 0 (0) 1 (1)Cheese 5 (3) 39 (18)Milk 5 (3) 27 (13)Enset bread (kocho) 17 (9) 4 (2)Potato 13 (7) 1 (1)Meat sauce 21 (12) 100 (47)Fatty meat 2 (1) 1 (1)Kale 1 (1) 18 (9)Coffee 38 (21) 1 (1)Banana 0 (0) 6 (3)Orange 0 (0) 14 (7)
Food categoriesCereals 109 (60) 22 (10)Legumes 13 (7) 5 (3)Roots 30 (16) 5 (3)Livestock 24 (13) 117 (55)Vegetables 4 (2) 23 (11)Fruits 1 (1) 17 (8)Beverages 29 (16) 9 (4)
TABLE 5. Relationship between the numbers (percentages)of women experiencing aversion or craving
ExperiencedExperienced craving
aversion No Yes
No 41 (40) 62 (60)Yes 42 (22) 150 (78)
Odds ratio, 2.36; χ2 = 10.66; p < .001.
Food aversions and cravings
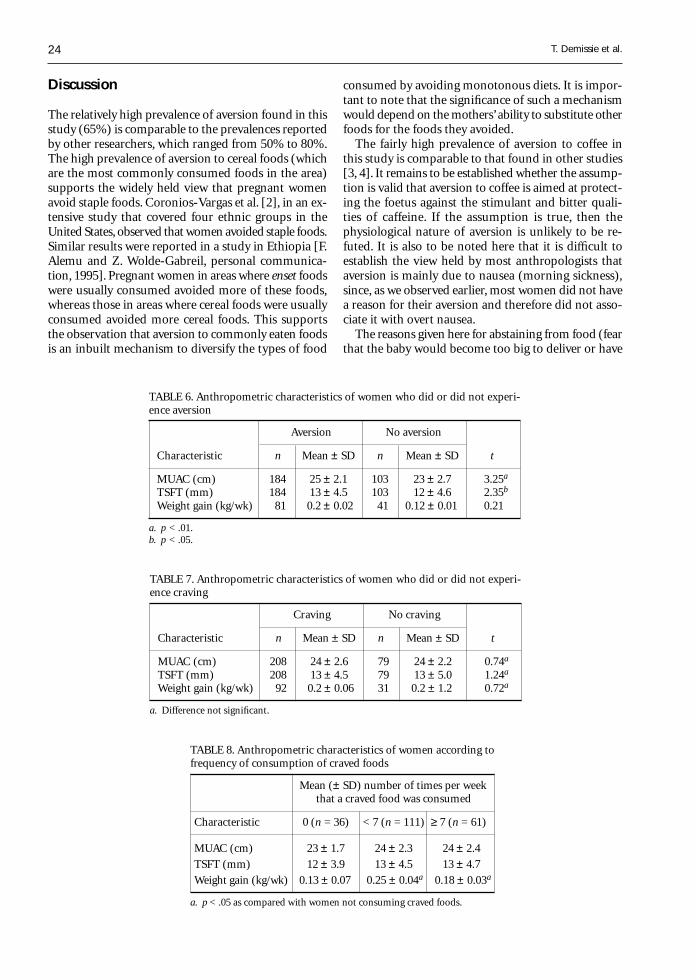
24
Discussion
The relatively high prevalence of aversion found in thisstudy (65%) is comparable to the prevalences reportedby other researchers, which ranged from 50% to 80%.The high prevalence of aversion to cereal foods (whichare the most commonly consumed foods in the area)supports the widely held view that pregnant womenavoid staple foods. Coronios-Vargas et al. [2], in an ex-tensive study that covered four ethnic groups in theUnited States, observed that women avoided staple foods.Similar results were reported in a study in Ethiopia [F.Alemu and Z. Wolde-Gabreil, personal communica-tion, 1995]. Pregnant women in areas where enset foodswere usually consumed avoided more of these foods,whereas those in areas where cereal foods were usuallyconsumed avoided more cereal foods. This supportsthe observation that aversion to commonly eaten foodsis an inbuilt mechanism to diversify the types of food
consumed by avoiding monotonous diets. It is impor-tant to note that the significance of such a mechanismwould depend on the mothers’ ability to substitute otherfoods for the foods they avoided.
The fairly high prevalence of aversion to coffee inthis study is comparable to that found in other studies[3, 4]. It remains to be established whether the assump-tion is valid that aversion to coffee is aimed at protect-ing the foetus against the stimulant and bitter quali-ties of caffeine. If the assumption is true, then thephysiological nature of aversion is unlikely to be re-futed. It is also to be noted here that it is difficult toestablish the view held by most anthropologists thataversion is mainly due to nausea (morning sickness),since, as we observed earlier, most women did not havea reason for their aversion and therefore did not asso-ciate it with overt nausea.
The reasons given here for abstaining from food (fearthat the baby would become too big to deliver or have
TABLE 6. Anthropometric characteristics of women who did or did not experi-ence aversion
Aversion No aversion
Characteristic n Mean ± SD n Mean ± SD t
MUAC (cm) 184 25 ± 2.1 103 23 ± 2.7 3.25a
TSFT (mm) 184 13 ± 4.5 103 12 ± 4.6 2.35b
Weight gain (kg/wk) 81 0.2 ± 0.02 41 0.12 ± 0.01 0.21
a. p < .01.b. p < .05.
TABLE 7. Anthropometric characteristics of women who did or did not experi-ence craving
Craving No craving
Characteristic n Mean ± SD n Mean ± SD t
MUAC (cm) 208 24 ± 2.6 79 24 ± 2.2 0.74a
TSFT (mm) 208 13 ± 4.5 79 13 ± 5.0 1.24a
Weight gain (kg/wk) 92 0.2 ± 0.06 31 0.2 ± 1.2 0.72a
a. Difference not significant.
TABLE 8. Anthropometric characteristics of women according tofrequency of consumption of craved foods
Mean (± SD) number of times per weekthat a craved food was consumed
Characteristic 0 (n = 36) < 7 (n = 111) ≥ 7 (n = 61)
MUAC (cm) 23 ± 1.7 24 ± 2.3 24 ± 2.4
TSFT (mm) 12 ± 3.9 13 ± 4.5 13 ± 4.7
Weight gain (kg/wk) 0.13 ± 0.07 0.25 ± 0.04a 0.18 ± 0.03a
a. p < .05 as compared with women not consuming craved foods.
T. Demissie et al.
25
discolouration on its body) have been reported by others[9, 10].
The high prevalence of craving found in the study(72%) was also not unexpected, since other studies inboth developed and developing countries have also ob-served a high rate of craving among pregnant women,ranging from 43% to 98%. This indicates that povertyand underdevelopment are not the only determinantsof the incidence of craving. The high prevalence of crav-ing for livestock foods and vegetables that were largelyunavailable at the time of the study appears to sup-port the commonly held view that women crave scarceand nutritious foods. This appears to support the ob-servation by the Canadian Federal Committee on Nu-trition that craving is a mechanism geared towards aug-menting nutritional deficiencies [6]. This also appearsto support the hypothesis that craving is induced byintrinsic (endogenous) biological processes rather thanby exogenous factors [1]. These hypotheses, however,have yet to be confirmed by in-depth studies.
The data cannot be used to establish whether thewomen craved status foods (a view held by many an-thropologists), because the issue was not addressed di-rectly. Because scarce and nutritious foods are likelyto be considered status foods in this community, it isimportant to distinguish between the determining fac-tors in craving. Specific studies should be undertakento establish whether high-status foods, per se, are cravedby pregnant women in this community.
The absence of a difference in nutritional status be-tween the craving and non-craving groups can prob-ably be explained by the fact that most of the cravingwomen were able to consume what they desired. Thesignificantly higher weight gain of women who obtainedtheir craved foods compared with those who did notget them seems to support this observation. The formergroup could have been of marginally better nutritionalstatus. Most of that group could also have been in thegroup of women who experienced food aversions, whohave been observed to enjoy better nutritional statusthan the group that did not experience aversions. Theabsence of statistically significant differences betweencraving and non-craving women (who, as observedabove, could have been in a position to obtain the cravedfoods) also supports the view, held by many authors,that craving could be an intrinsic mechanism set bythe body to correct nutrient deficiencies. These obser-vations underscore the importance to maternal nutri-tion of fulfilling cravings.
Many authors assume that aversions decrease foodchoices and, thus, lead to reduced dietary intake, whichwould obviously affect nutritional status negatively.However, this assumption runs contrary to this study’sfinding that women who experienced food aversionswere better nourished than women who did not. Similarobservations were made in the Ethiopian study by F.Alemu and Z. Wolde-Gabreil [personal communica-
tion, 1995], who observed higher birthweights in in-fants born to mothers who had experienced food aver-sions than in infants born to mothers who had not.Because the available information is so limited, morearguments are required in support of observations ofthe better nutritional status of women who experiencefood aversions. One explanation is that, although preg-nant women may dislike a specific food, whether ornot they avoid it depends on the other food optionsavailable. Poor women with few food options are un-likely to avoid specific foods as commonly as womenwho have more choices. This would imply that womenwho avoid foods are better off economically and nu-tritionally. Another possible explanation based on theresults of this study is that the correlation of food aver-sion with food craving (which was also observed byCoronios-Vargas et al. [2] and Alemu and Wolde-Gabreil[personal communication, 1995]) might account forthe better nutritional status of those women who avoidedspecific foods.
The positive relationship suggests that women whoexperience food aversions also crave more, not only tocompensate but to diversify their diets and to consumehigher-quality foods. This suggestion is supported bythe findings that more women avoided cereal foods andcraved livestock products, which implies that monoto-nous staple diets are avoided, whereas nutritious andless common foods are desired. What becomes impor-tant in this scenario is the women’s ability to avoid thefoods they dislike and to obtain the foods they crave.
Since most of the women in this study claimed thatthey received what they desired, it is quite logical toexpect better nutritional status in the women who ex-perience aversions.
Conclusions and recommendations
Although aversions and cravings are considered un-desirable, the few data available and the results obtainedin this study strongly indicate that this view may haveto change. The two should always be studied togetherin any community in order to establish whether theyhave complementary or similar effects on the nutri-tional status of pregnant women. Aversions and cravingsshould be investigated during antenatal follow-up, andadvice should be offered.
Acknowledgements
We express our sincere appreciation to the UnitedNations University, Tokyo, for financing this research,and to the Applied Human Nutrition Programme,University of Nairobi, and the Ethiopian Health andNutrition Research Institute for providing all the as-sistance we needed.
Food aversions and cravings
26
References
1. Tierson D, Olson L, Hook B. Influence of cravings andaversions on diet in pregnancy. Ecol Food Nutr1985;17:117–29.
2. Coronios-Vargas M, Toma RB, Tuveson RV, Schutz M.Cultural influences on food craving and aversions dur-ing pregnancy. Ecol Food Nutr 1991;27:47–9.
3. Rush D. Cigarette smoking during pregnancy: the rela-tionship with depressed weight gain and birth weight.In: Kelly S, Hook EB, Janerich D, Porter I, eds. Birthdefects, risk and consequences. New York: Academic Press,1976:161–72.
4. Abel L. Consumption of alcohol during pregnancy: areview of effects on growth and development of off-spring. Hum Biol 1982;54:421–53.
5. Worthington-Roberts B, Williams R. Nutrition in preg-nancy and lactation. St. Louis, Mo, USA: Times Mir-ror/Mosby College Publishing, 1985.
6. Canada Federal-Provincial Subcommittee on Nutrition.Nutrition in pregnancy: national guidelines. Ottawa:Ministry of National Health and Welfare, 1987.
7. Hook EB. Dietary cravings and aversions during preg-nancy. Am J Clin Nutr 1978;31:1355–62.
8. Gibson S. Principles of nutritional assessment. London:Oxford University Press, 1990.
9. Ojofeitimi E, Ehigie I, Babafemi J. Diet restriction by preg-nant women in Nigeria. Int J Gynaecol Obstet 1982; 18:66–9.
10. Boucher BA. Maternity care in the Sudd, Southern Sudan.Trop Doct 1984;14:32–3.
T. Demissie et al.
Food and Nutrition Bulletin, vo. 19, no. 1 © 1998, The United Nations University. 27
Weaning foods in West Africa:Nutritional problems and possible solutions
N. O. Onofiok and D. O. Nnanyelugo
Abstract
Weaning practices and the problems of weaning foods inWest Africa are reviewed. The low nutrient density andhigh bulk of the weaning foods, early introduction of solidfoods, and unhygienic practices predispose infants tomalnutrition, growth retardation, infection, and highmortality. Multi-approach strategies, involving the de-velopment of improved recipes and processing, nutritioneducation, access to safe water, good sanitation, economicempowerment of women, reduction in workload, andpromotion of breastfeeding, are recommended solutionsto the problems.
Introduction
In many West African countries, exclusive breastfeedingis usually adequate up to three to four months of age,but after this period it may become increasingly inad-equate to support the nutritional demands of the grow-ing infant. Thus, in a weaning process there is alwaysthe need to introduce soft, easily swallowed foods tosupplement the infant’s feeding early in life.
The weaning process may be gradual, lasting formonths until the infant is finally introduced to the familydiet. On the other hand, in abrupt weaning, the infantis introduced straight into the family menu. This lat-ter option creates a problem, as the child may not beable to eat enough of the adult diet to meet his or hernutritional needs.
In West African countries, weaning can be a periodof problems and vulnerability for the survival of a child.We looked at the conventional or traditional weaningfoods and weaning practices in some West African na-tions. The nutritive values, nutritional problems, andpossible solutions are presented.
The authors are lecturers in the Department of Home Scienceand Nutrition at the University of Nigeria in Nsukka, Nigeria.
Weaning practices and weaning foodsin West Africa
According to the available literature, West African moth-ers usually breastfeed for 12 months. Many urban poorand rural women breastfeed for up to 18 to 24 months[1, 2]. These reports indicate that there is early supple-mentation with solid foods or early weaning. Althoughthe majority of women start weaning their infants atthe age of three to four months, a few begin withinthe first two months of life. The first solid food andthe most popular weaning food is a thin cereal gruelthat is called by different names depending on the typeof cereal or the West African country.
In Nigeria the usual first weaning food is called pap,akamu, ogi, or koko and is made from maize (Zea mays),millet (Pennisetum americanum), or guinea corn (Sor-ghum spp.) [3–6]. In Anambra State most mothers in-troduce the thin gruel at three to six months of age[3]. The baby is fed on demand with a spoon or a cup,although in certain parts of the country, a few moth-ers use the traditional forced hand-feeding method [6].
After the successful introduction of cereal gruel, otherstaple foods in the family menu are given to the child.These foods include yam (Dioscorea spp.), rice (Oryzasativa), gari (fermented cassava grits), and cocoyam(Xanthosoma sagittifolium), which may be eaten withsauce or soup [7, 8]. These foods are usually mashed,thinned, or pre-chewed. As soon as a child can chew, heor she is given pieces of food from the family pot. Someauthors observed that in certain communities the low-income families do not make a special effort to pre-pare weaning foods for the infants, who are fed modi-fied or unmodified food from the family pot [9, 10].
People from low-income groups seldom feed meat,eggs, or fish to their infants, because of socio-economicfactors, taboos, and ignorance [11–13]. Cherian reportedthat people from high-income groups used these foodsmore often and tended to add variety to their weaningfoods [5].
Legumes are rarely used for weaning and are intro-duced much later (after six months of age) because of
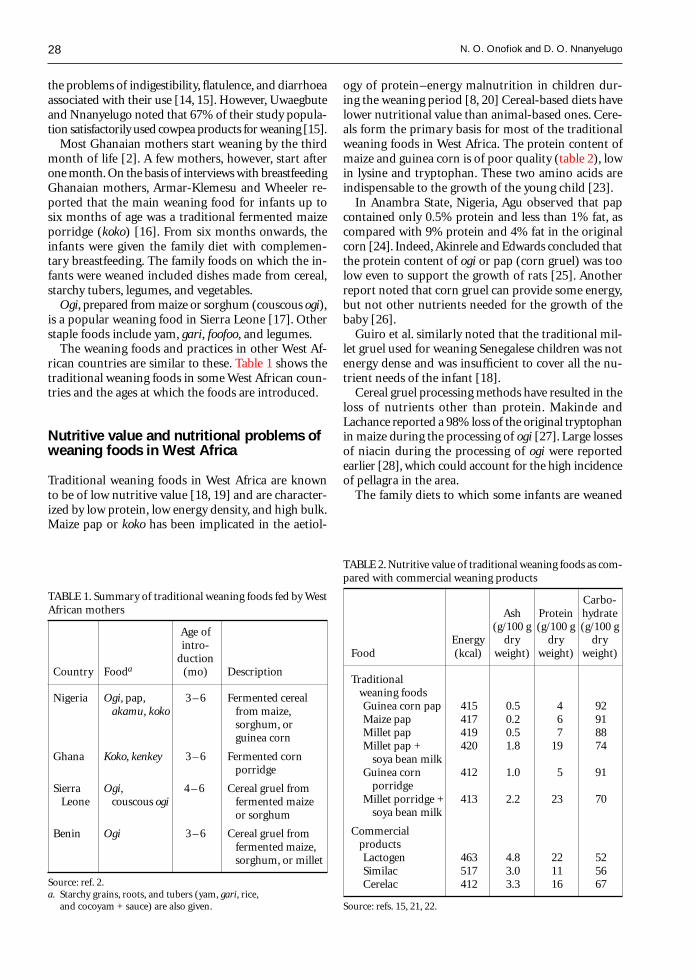
28
the problems of indigestibility, flatulence, and diarrhoeaassociated with their use [14, 15]. However, Uwaegbuteand Nnanyelugo noted that 67% of their study popula-tion satisfactorily used cowpea products for weaning [15].
Most Ghanaian mothers start weaning by the thirdmonth of life [2]. A few mothers, however, start afterone month. On the basis of interviews with breastfeedingGhanaian mothers, Armar-Klemesu and Wheeler re-ported that the main weaning food for infants up tosix months of age was a traditional fermented maizeporridge (koko) [16]. From six months onwards, theinfants were given the family diet with complemen-tary breastfeeding. The family foods on which the in-fants were weaned included dishes made from cereal,starchy tubers, legumes, and vegetables.
Ogi, prepared from maize or sorghum (couscous ogi),is a popular weaning food in Sierra Leone [17]. Otherstaple foods include yam, gari, foofoo, and legumes.
The weaning foods and practices in other West Af-rican countries are similar to these. Table 1 shows thetraditional weaning foods in some West African coun-tries and the ages at which the foods are introduced.
Nutritive value and nutritional problems ofweaning foods in West Africa
Traditional weaning foods in West Africa are knownto be of low nutritive value [18, 19] and are character-ized by low protein, low energy density, and high bulk.Maize pap or koko has been implicated in the aetiol-
ogy of protein–energy malnutrition in children dur-ing the weaning period [8, 20] Cereal-based diets havelower nutritional value than animal-based ones. Cere-als form the primary basis for most of the traditionalweaning foods in West Africa. The protein content ofmaize and guinea corn is of poor quality (table 2), lowin lysine and tryptophan. These two amino acids areindispensable to the growth of the young child [23].
In Anambra State, Nigeria, Agu observed that papcontained only 0.5% protein and less than 1% fat, ascompared with 9% protein and 4% fat in the originalcorn [24]. Indeed, Akinrele and Edwards concluded thatthe protein content of ogi or pap (corn gruel) was toolow even to support the growth of rats [25]. Anotherreport noted that corn gruel can provide some energy,but not other nutrients needed for the growth of thebaby [26].
Guiro et al. similarly noted that the traditional mil-let gruel used for weaning Senegalese children was notenergy dense and was insufficient to cover all the nu-trient needs of the infant [18].
Cereal gruel processing methods have resulted in theloss of nutrients other than protein. Makinde andLachance reported a 98% loss of the original tryptophanin maize during the processing of ogi [27]. Large lossesof niacin during the processing of ogi were reportedearlier [28], which could account for the high incidenceof pellagra in the area.
The family diets to which some infants are weaned
TABLE 1. Summary of traditional weaning foods fed by WestAfrican mothers
Age ofintro-
ductionCountry Fooda (mo) Description
Nigeria Ogi, pap, 3 – 6 Fermented cereal akamu, koko from maize,
sorghum, orguinea corn
Ghana Koko, kenkey 3 – 6 Fermented cornporridge
Sierra Ogi, 4 – 6 Cereal gruel from Leone couscous ogi fermented maize
or sorghum
Benin Ogi 3 – 6 Cereal gruel fromfermented maize,sorghum, or millet
Source: ref. 2.a. Starchy grains, roots, and tubers (yam, gari, rice,
and cocoyam + sauce) are also given.
TABLE 2. Nutritive value of traditional weaning foods as com-pared with commercial weaning products
Carbo-Ash Protein hydrate
(g/100 g (g/100 g (g/100 gEnergy dry dry dry
Food (kcal) weight) weight) weight)
Traditional weaning foods
Guinea corn pap 415 0.5 4 92Maize pap 417 0.2 6 91Millet pap 419 0.5 7 88Millet pap + 420 1.8 19 74
soya bean milkGuinea corn 412 1.0 5 91
porridgeMillet porridge + 413 2.2 23 70
soya bean milk
Commercial products
Lactogen 463 4.8 22 52Similac 517 3.0 11 56Cerelac 412 3.3 16 67
Source: refs. 15, 21, 22.
N. O. Onofiok and D. O. Nnanyelugo
29
are also low in nutritional value. Indeed, many inves-tigators [23, 25, 29] have reported that these traditionalfoods are low in protein and that other nutrients arelost due to poor processing. Bulk is a major problemof the traditional West African weaning foods [8, 20,30]. For adults and older children, it is usually pos-sible to achieve an adequate protein–energy intake byincreasing the daily intake of starchy foods of low nu-trient density. For infants and small children, however,the volume of the traditional diets may be too large toallow the child to ingest all the food necessary to coverhis or her energy needs. A baby aged four to six monthswould need 920 g of corn gruel to meet daily needs ofenergy (740 kcal) and protein (13 g) [31]. This is animpossible task, considering the size of an infant’s stom-ach. However, the use of foods of high nutrient den-sity and frequent feeding schedules can help provideadequate food for growth and activity.
The problems inherent in the traditional West Afri-can weaning foods and feeding practices predispose theinfant to malnutrition, growth retardation, infection,and high mortality. Guiro et al. rightly observed thatone major cause of weaning-age malnutrition is comple-mentation of breastmilk with cereal gruels that are oflow energy density [18]. Thus, protein–energy malnu-trition is a common problem among infants and chil-dren in the poor socio-economic groups of developingcountries [32].
Severe protein–energy malnutrition results in kwash-iorkor and marasmus. The inadequate growth or stunt-ing produced as a result of poor supplementation isbest described as hidden malnutrition. This is becausethe child may appear healthy while being severely mal-nourished.
According to the 1987 Ghanaian National Survey,58% of the children were below 80% of the NationalCenter for Health Statistics (NCHS) weight-for-age, 8%suffered from severe malnutrition, 40% were wasted,and 52% were stunted [33]. Amar-Klemesu and Wheelerobserved that 30% of the infants who were fed cerealporridge and adult foods as weaning foods were mal-nourished [16]. They attributed this to inadequatecomplementation with breastmilk. In Nigeria, Akineleand Omotola investigated the energy and protein in-take of infants and children of the low-income group[34]. They reported that about one-third to one-halfof the infants suffered varying degrees of malnutritionand 10% were wasted and stunted. A more recent Ni-gerian National Survey conducted by the Demographicand Health Survey (DHS) in 1990 placed the propor-tion of underweight children under five years of age(those below –2 SD weight-for-age) at 36%, including12% severely underweight (below –3 SD). The preva-lence of stunting (below –2 SD height-for-age) was 43%,including 22% severe stunting (below –3 SD), whilethe levels of wasting and severe wasting were 9% and2%, respectively [35].
An earlier 1986 DHS survey of children aged 6 to 36months in Ondo State, Nigeria, found a 28% preva-lence for underweight, 32% for stunting, and 7% forwasting. It is therefore clear that during the period ofweaning, children in West Africa are very vulnerableto malnutrition, and one of the major factors that causesstunting or what makes some children appear stuntedcan be traced to inadequate food intake.
Children in West Africa are at high risk of infectionduring weaning. Malnutrition increases susceptibilityto infectious diseases and affects child mortality fromdiseases such as diarrhoea, whooping cough, and acuterespiratory infection [36]. It reduces the capacity ofthe host to resist the consequences of such infection,making death inevitable for some. As solid foods areintroduced, infection with germs that cause diarrhoeaor other diseases is more likely to occur [37]. The foodis often contaminated because of poor handling, useof dirty water and utensils, and poor storage by ruraland poor urban mothers. The story is similar for workingmothers, who leave infants in the care of maids whoare usually ignorant and inexperienced, and sometimesvery unhygienic. Because of its poor nutritional sta-tus, the infant can hardly resist these infections. Thefrequent occurrence of such infections leads to mal-nutrition because of increased energy and nutrient re-quirements coupled with poor absorptive capacity. Thisin turn affects the nutritional status of the child andfurther lowers resistance to infection.
According to the available statistics from Nigeria,infant mortality is responsible for almost 50% of alldeaths in children up to 14 years of age, and under-five mortality accounts for 93% of these deaths, 70%of which are attributed to preventable diseases [35].
Strategies for solving weaning foodproblems in West Africa
Many issues need to be addressed to solve the prob-lems of weaning foods in West Africa. These includeimproving the quality of traditional weaning foods,ensuring household food security, providing nutritioneducation, and improving the income-generating ac-tivities of women.
Formulation and development of weaning foods ofhigh nutritive value
Several strategies may be used to improve the nutri-tive value of weaning foods. The traditional West Afri-can weaning foods could be improved by combininglocally available foods that complement each other insuch a way that the new pattern of amino acids cre-ated by this combination is similar to that recommendedfor infants [21]. Cereals are deficient in lysine but havesufficient sulphur-containing amino acids that are lim-
Weaning foods
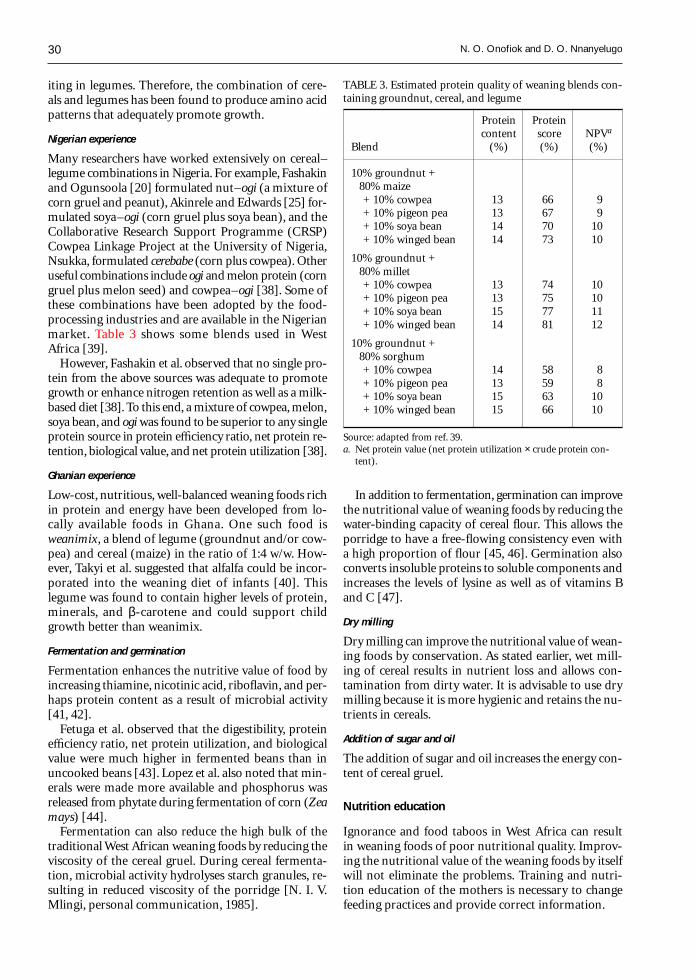
30
iting in legumes. Therefore, the combination of cere-als and legumes has been found to produce amino acidpatterns that adequately promote growth.
Nigerian experience
Many researchers have worked extensively on cereal–legume combinations in Nigeria. For example, Fashakinand Ogunsoola [20] formulated nut–ogi (a mixture ofcorn gruel and peanut), Akinrele and Edwards [25] for-mulated soya–ogi (corn gruel plus soya bean), and theCollaborative Research Support Programme (CRSP)Cowpea Linkage Project at the University of Nigeria,Nsukka, formulated cerebabe (corn plus cowpea). Otheruseful combinations include ogi and melon protein (corngruel plus melon seed) and cowpea–ogi [38]. Some ofthese combinations have been adopted by the food-processing industries and are available in the Nigerianmarket. Table 3 shows some blends used in WestAfrica [39].
However, Fashakin et al. observed that no single pro-tein from the above sources was adequate to promotegrowth or enhance nitrogen retention as well as a milk-based diet [38]. To this end, a mixture of cowpea, melon,soya bean, and ogi was found to be superior to any singleprotein source in protein efficiency ratio, net protein re-tention, biological value, and net protein utilization [38].
Ghanian experience
Low-cost, nutritious, well-balanced weaning foods richin protein and energy have been developed from lo-cally available foods in Ghana. One such food isweanimix, a blend of legume (groundnut and/or cow-pea) and cereal (maize) in the ratio of 1:4 w/w. How-ever, Takyi et al. suggested that alfalfa could be incor-porated into the weaning diet of infants [40]. Thislegume was found to contain higher levels of protein,minerals, and β-carotene and could support childgrowth better than weanimix.
Fermentation and germination
Fermentation enhances the nutritive value of food byincreasing thiamine, nicotinic acid, riboflavin, and per-haps protein content as a result of microbial activity[41, 42].
Fetuga et al. observed that the digestibility, proteinefficiency ratio, net protein utilization, and biologicalvalue were much higher in fermented beans than inuncooked beans [43]. Lopez et al. also noted that min-erals were made more available and phosphorus wasreleased from phytate during fermentation of corn (Zeamays) [44].
Fermentation can also reduce the high bulk of thetraditional West African weaning foods by reducing theviscosity of the cereal gruel. During cereal fermenta-tion, microbial activity hydrolyses starch granules, re-sulting in reduced viscosity of the porridge [N. I. V.Mlingi, personal communication, 1985].
In addition to fermentation, germination can improvethe nutritional value of weaning foods by reducing thewater-binding capacity of cereal flour. This allows theporridge to have a free-flowing consistency even witha high proportion of flour [45, 46]. Germination alsoconverts insoluble proteins to soluble components andincreases the levels of lysine as well as of vitamins Band C [47].
Dry milling
Dry milling can improve the nutritional value of wean-ing foods by conservation. As stated earlier, wet mill-ing of cereal results in nutrient loss and allows con-tamination from dirty water. It is advisable to use drymilling because it is more hygienic and retains the nu-trients in cereals.
Addition of sugar and oil
The addition of sugar and oil increases the energy con-tent of cereal gruel.
Nutrition education
Ignorance and food taboos in West Africa can resultin weaning foods of poor nutritional quality. Improv-ing the nutritional value of the weaning foods by itselfwill not eliminate the problems. Training and nutri-tion education of the mothers is necessary to changefeeding practices and provide correct information.
TABLE 3. Estimated protein quality of weaning blends con-taining groundnut, cereal, and legume
Protein Proteincontent score NPVa
Blend (%) (%) (%)
10% groundnut + 80% maize
+ 10% cowpea 13 66 9+ 10% pigeon pea 13 67 9+ 10% soya bean 14 70 10+ 10% winged bean 14 73 10
10% groundnut + 80% millet
+ 10% cowpea 13 74 10+ 10% pigeon pea 13 75 10+ 10% soya bean 15 77 11+ 10% winged bean 14 81 12
10% groundnut + 80% sorghum
+ 10% cowpea 14 58 8+ 10% pigeon pea 13 59 8+ 10% soya bean 15 63 10+ 10% winged bean 15 66 10
Source: adapted from ref. 39.a. Net protein value (net protein utilization × crude protein con-
tent).
N. O. Onofiok and D. O. Nnanyelugo
31
Nutrition education can easily be incorporated intoprimary health care programmes. Health workers andnutritionists can educate rural mothers about the im-portance of adequate weaning foods and practices, in-fant health, host defense systems, home-scale drying,processing, and so on. The importance of varying thebaby’s diet and practising good hygiene when handlingand storing the baby’s food can be included as well.
The teaching and training of rural mothers can havea long-term impact on weaning practices and nutri-tional status of West African children. In the Philip-pines a weaning education programme led to a reduc-tion in the prevalence of malnutrition from 64% to42% [48]. In Nigeria the Africare Child SurvivalProgramme yielded similar results. The governmentsof some West African nations have yet to realize theimportance of training and education.
Access to safe water and sanitation
The provision of water is perceived as a governmentresponsibility. The governments of all West Africancountries should intensify their efforts to provide safe,pipe-borne water and proper sewage disposal in ruralcommunities. These measures would go a long way toreduce the incidence of food contamination and in-fectious diseases in West Africa.
In 1989 about 70% of urban Nigerian populations,50% of semi-urban populations, and 22% of rural popu-lations had access to safe water, according to the Fed-eral Office of Statistics [35]. Forty-eight percent of ru-ral populations and 11% of semi-urban and urbanpopulations named the “bush” as their place for wastedisposal. Sixty-five percent of urban populations, 84%of semi-urban populations, and 49% of rural popula-tions used pit toilets. Only 18% of urban households,3% of semi-urban households, and no rural householdshad water closets. There is a need for improvement inthis area, and many West African governments haveintensified their efforts, in some cases with externalassistance.
Development of recipe books
The development of books of recipes for weaning foodsof high nutrient density using locally available foodsis useful. Where recipe books are available, they shouldbe properly distributed to mothers. For the rural illit-erate mother, nutrition counselling and demonstrationsare appropriate. The Nigerian Ministry of Health pro-duced a booklet called “Nigerian Weaning Diets” thatcontains more than 40 recipes for weaning foods. WHO/UNICEF have produced similar booklets for health andcommunity workers. The University of Nigeria Cow-pea Research Project has also developed a book con-taining recipes for weaning and adult foods.
Improvement of purchasing power of women
The socio-economic status of women should be im-proved by increasing their purchasing power, which willensure household food security. This can be achievedby improving income-generating activities for women.When there is enough food at home, some mothersmay be able to make blends or mixes that are morenutritious than the conventional weaning foods alone.Improvement can be brought about through skill ac-quisition. The availability of appropriate ready-to-useflour from a village mill process will increase the useof weaning foods and decrease costs [48].
Appropriate time allocation for women
Rural women spend about three hours a day in mealpreparation, as against one hour for child care [49]. Re-ducing the workload of rural West African mothers wouldsave time and energy for tending the children. A typi-cal rural African woman spends 14 to 18 hours perday (an average of 17 hours) working. African womenare the key to household food security and nutrition.They form 47% of the continent’s agricultural labourforce and account for two-thirds of food production[50]. With such time- and energy-consuming activities,these rural women are not able to prepare nutritiousweaning foods. Time- and energy-saving processingmethods and equipment are needed for both agricul-tural and domestic uses in the rural communities.
Breastfeeding promotion
Mothers should practise exclusive breastfeeding for thefirst four to six months, and complementarybreastfeeding should continue into the second year.
Summary and conclusions
Many of the traditional weaning foods used in WestAfrican countries are of low nutrient density. Cerealgruels and starchy roots and tubers continue to formthe bulk of the weaning foods. Some children, how-ever, are weaned directly onto the family diet early inlife. Infant-feeding practices are not fully developed.Infection and malnutrition are problems associated withpoor weaning methods.
A number of convenient commercial weaning foodsare now available, but they are very expensive and outof the reach of the target populations. A different ap-proach may be developed to offer rural and poor urbanwomen the opportunity to feed their infants properly,perhaps through appropriate household- or village-scaletechnology. The governments of the West African coun-tries need to address these problems seriously.
Weaning foods

32
References
1. Kazimi J, Kazimi HR. Infant feeding practices of the Igbo.Ecol Food Nutr 1979;8:111–6.
2. Armar MA. Maternal energy status, lactational capac-ity and infant growth in rural Ghana: a study of theinteraction of cultural and biological. Doctoral thesis,University of London, 1989.
3. King J, Ashworth A. Changes in infant feeding practicesin Nigeria: an historical review. Occasional Paper No.9. London: Centre for Human Nutrition, London Schoolof Hygiene and Tropical Medicine, 1987.
4. Longhurst R. The energy trap. Work, nutrition and child-hood malnutrition in Northern Nigeria. InternationalMonograph Series 13. Ithaca, NY, USA: Cornell Uni-versity, 1984.
5. Cherian A. Attitudes and practices of infant feeding inZaria. Ecol Food Nutr 1981;11:75–80.
6. Osuhor PC. Weaning practices amongst the Hausas. JHum Nutr 1980;34:273–80.
7. Morley D, Bicknell H, Woodland M. Factors influenc-ing the growth and nutritional status of infants and youngchildren in a Nigerian village. Trans R Soc Trop MedHyg 1968;62:164–95.
8. Naismith DJ. Kwashiorkor in Western Nigeria: a studyof traditional weaning foods with particular respect toenergy and linoleic acid. Br J Nutr 1973;80:567–76.
9. Okeke EC, Okafor US. Current breast-feeding and wean-ing practices in Anambra State. Nigerian J Nutr Sci1989;10:21–3.
10. Arinze PC. The pattern of weaning in different socio-economic groups in Nsukka. Bachelor of Science de-gree thesis, University of Nigeria, Nsukka, 1984.
11. Uwaegbute AC. Infant feeding patterns and compara-tive assessment of formulated weaning foods based onvegetable proteins. Doctoral thesis, University of Nige-ria, Nsukka, 1982.
12. Onofiok N, Nnanyelugo DO. Nutrient intake of infantsof high and low socio-economic groups in Nsukka, Ni-geria. Occasional Paper. Nsukka: Department of HomeScience and Nutrition, University of Nigeria, 1992.
13. Nnanyelugo DO. Nutritional status of children inAnambra State: a comprehensive treatise. Nsukka: Uni-versity of Nigeria Press, 1985.
14. King J, Nnanyelugo DO, Ene-Obong HN, Ngoddy PO.Household consumption profile of cowpea (Vignaunguiculata) among low income families of Nigeria. EcolFood Nutr 1985;16:209–21.
15. Uwaegbute AC, Nnanyelugo DO. Usage patterns of cow-peas (Vigna unguiculata) for infant feeding in Nigeria.In: Kwik Whei L, Kiang Ai K, eds. Trends in nutritionand food policy. Proceedings of the 7th World Congressof Food Science and Technology. Singapore: Instituteof Food Science and Technology, 1987:201–5.
16. Armar-Klemesu MA, Wheeler EF. Weaning practices andtheir outcome: a critical look with special reference toGhana. Bulletin of Noguchi Memorial Institute for Medi-cal Research 1991;4:3–24.
17. Jonsyn FE. Fungi associated with selected fermented food-stuffs in Sierra Leone. In: Prage L, ed. Development ofindigenous fermented food and food technology in Af-rica. Proceedings of the IFS/UNU Workshop held in
Duala, Cameroon, October 1985. Provisional Report No.20. Stockholm: International Foundation for Science,1985:169–81.
18. Guiro AT, Sall MG, Kane O, Ndiaye AM, Diarra D, SyMTA. Protein-calorie malnutrition in Senegalese chil-dren. Effects of rehabilitation with a pearl millet wean-ing food. Nutr Rep Int 1987;36:1071–9.
19. Akinrele IA, Bassir O. Nutritional value of “ogi,” a Ni-gerian infant food. J Trop Med Hyg 1967;70:279–81.
20. Fashakin JB, Ogunsoola F. The utilization of local foodsin fermentation of weaning foods. Trop Paediatr (Lond)1982;28:93–6.
21. Uwaegbute AC, Nnanyelugo DO. Towards improvingthe nutritional value of traditional weaning foods. In:Fashakin JB, ed. Proceedings of the workshop on presentknowledge on weaning foods in Nigeria, held in Lagos,29–30 August 1989. Oshodi-Lagos: Federal Institute forIndustrial Research, 1989:63–85.
22. Fashakin JB. Nutritional evaluation of weaning foods.In: Fashakin JB, ed. Proceedings of the workshop onpresent knowledge on weaning foods in Nigeria, heldin Lagos, 29–30 August 1989. Oshodi-Lagos: Federal In-stitute for Industrial Research, 1989:115–20.
23. Oyenuga VA. Nigeria’s foods and feeding stuffs: theirchemistry and nutritive value. Ibadan: University Press,1968.
24. Agu VC. Feeding and weaning practices in Enugu, ur-ban and rural. Bachelor of Science thesis, University ofNigeria, Nsukka, 1976.
25. Akinrele IA, Edwards CCA. An assessment of the nu-tritional value of maize-soy mixture “soy-ogi” as a wean-ing food in Nigeria. Br J Nutr 1971;26:172–85.
26. Ketiku A, Ayoku S. Nutritional studies of a Nigerianmultimix weaning food—Apapa multimix. Nigerian JNutr Sci 1984;5:39–45.
27. Makinde MA, Lachance PA. Tryptophan, the first lim-iting amino acid in “ogi.” Nutr Rep Int 1976;14:671–9.
28. Osifo BOA. Vitamin B content of maize and maize prod-ucts—riboflavin and niacin. Indian J Nutr Diet 1971;8:17–21.
29. Akinrele IA. Biochemical study of traditional methodof preparation of “ogi” and its effects on the nutritivevalue of corn. Doctoral thesis, University of Ibadan, Ni-geria, 1966.
30. Eka OU. Nutritive value of “tuwo”—Shinkafa Da-Taushe,a traditional rice meal of the Hausas of Northern Nige-ria. Nigerian J Nutr Sci 1982;3:87–90.
31. Eka OU, Edijala JK. Chemical composition of some tra-ditionally prepared Nigerian foods. Nigerian J Sci1972;6:157–62.
32. Gopalan C, Srikantia SG. Nutrition and disease. WorldRev Nutr Diet 1973;16:97–140.
33. Agyepong E, Valle A. Improvement of weaning prac-tices for the future. Bulletin of Noguchi Memorial In-stitute for Medical Research 1991;4:82–92.
34. Akinele TO, Omotola BO. Energy and protein intake ofinfants and children from the low income group ofIbadan. Nutr Res 1986;26:129–37.
35. ACC/SCN. Nigeria: Report on the nutrition situation.Geneva: United Nations Administrative Committee on
N. O. Onofiok and D. O. Nnanyelugo
33
Coordination/Sub-Committee on Nutrition, 1992.36. Scrimshaw NS, Taylor CE, Gordon JE. Interactions of
nutrition and infection. WHO Monograph Series No.57. Geneva: World Health Organization, 1968.
37. WHO/UNICEF. Weaning from breast milk to family food.A guide for health and community workers. Geneva:World Health Organization, 1988.
38. Fashakin JB, Awayefa MB, Furst P. The application ofprotein concentrates from locally available legumes indevelopment of weaning foods. J Nutr Sci Ernahrungs-wisse 1986;25:220–7.
39. Plahar WA, Hoyle NT. Estimated protein quality of wean-ing blends from local cereals and legumes. In: Sefa-DedehS, ed. The development of high protein-energy foodsfrom grain legumes. Proceedings of the AAU/UNU in-ternational seminar held in Accra, Ghana, 5–7 Febru-ary 1991. Accra: University of Ghana, 1991:75–87.
40. Takyi EEK, Kido Y, Rikimaru T, Kennedy DO. The useof alfalfa as a supplement in infant feeding. Bulletin ofNoguchi Memorial Institute for Medical Research1991;4:35–47.
41. Steinkraus KH. Potential of African indigenous fermentedfoods. In: Prague L, ed. Development of indigenous fer-mented foods and food technology in Africa. Proceed-ings of the IFS/UNU Workshop held in Duala, Cameroon,October 1985. Provisional Report No. 20. Stockholm:International Foundation for Science, 1985:35–71.
42. Odunfa SA. African fermented foods: from art to sci-ence. In: Prague L, ed. Development of indigenous fer-mented foods and food technology in Africa. Proceed-ings of the IFS/UNU Workshop held in Duala, Cameroon,October 1985. Provisional Report No. 20. Stockholm:International Foundation for Science, 1985:17–33.
43. Fetuga BL, Babatunde G, Oyenuga VA. Protein quality
of some Nigerian foodstuffs. 1. Chemical assay of nu-trients and amino acid composition. J Sci Food Agric1973;24:1505–14.
44. Lopez Y, Gordon DT, Field ML. Release of phosphorusfrom phytate by natural lactic acid fermentation. J FoodSci 1983;48:933–54.
45. Svanberg U. Dietary bulk in weaning foods and its ef-fect on food and energy intake. In: Alnwick D, Moses S,Schmidt OG, eds. Improving young child feeding in East-ern and Southern Africa. Nairobi, New York, Stockholm:IDRC, UNICEF, SIDA, 1987:272–87.
46. Mosha AC, Lorri WSM. High-nutrient-density wean-ing foods from germinated cereals. In: Alnwick D, MosesS, Schmidt OG, eds. Improving young child feeding inEastern and Southern Africa. Nairobi, New York,Stockholm: IDRC, UNICEF, SIDA, 1987:288–99.
47. Brandtzaeg B, Makeshi MG, Grandberg U, DesikacharHSR, Mellanden O. Dietary bulk as a limiting factor fornutrient intake in pre-school children. II. Studies onmalted flours from ragi, sorghum and green grass. J TropPaediatr 1981;27:184–7.
48. Nnanyelugo DO, Ngoddy PO, Uwaegbute AC, OkekeEC, Ene-Obong HN, Ngwu EK, McWalters K, PhillipsD. Impact of village mill technology in Nigeria. In: Barnes-McConnell P, ed. Ten years of collaborative research onbeans and cowpeas. Proceedings of the InternationalSeminar on Beans/Cowpea CRSP held in East Lansing,Michigan, April 30–May 3, 1990. East Lansing, Mich,USA: Michigan State University, 1990:46–9.
49. McGuire JS, Austin JE. Beyond survival. Children’s growthfor national development. New York: UNICEF, 1987.
50. Advocates for African Food Security Task Force. Women,key to African food security. New York: United NationsFund for Women (UNIFEM), 1988.
Weaning foods
34 Food and Nutrition Bulletin, vo. 19, no. 1 © 1998, The United Nations University.
Abstract
This case–control study compares the home garden andanimal husbandry practices of households with and with-out xerophthalmic children in south-central Nepal, focus-ing on the relationship between these practices and house-hold intake of vitamin A–rich foods. Eighty-one householdswith a child between the ages of one and six years diag-nosed with xerophthalmia (cases) and 81 households withan age-matched, non-xerophthalmic child (controls) werestudied. There was little difference between case and controlhouseholds in the size of their gardens. However, casehouseholds were significantly less likely to plant carotenoid-rich vegetables from October to March than were controlhouseholds (odds ratio, 0.39; 95% confidence interval,0.16 to 0.96). The mean consumption of non-carotenoid-rich vegetables, but not of carotenoid-rich vegetables, in-creased linearly with garden size. Case households weresignificantly more likely than control households to rentdomesticated animals from others (χ2 = 5.91; p < .05).Control households were more likely than case householdsto own chickens and pigeons (χ2 = 6.6–9.2; p < .05).During specific seasons, household meat consumption wassignificantly lower in case households, regardless of accessto animals. Case households appeared to have significantlylower intakes of key vitamin A–rich foods, particularlygreen leaves and meat, regardless of their socio-economiclevel (as determined by ownership of material goods),access to animals, or availability of home gardens.
Introduction
In areas where vitamin A deficiency is a serious publichealth problem, childhood xerophthalmia is known tocluster at the regional, district, village, and householdlevels [1]. This clustering is thought to be the result ofpockets of relative poverty and/or poor access to vita-min A–rich food sources [2–5]. Despite this, there area number of households living in these same high-riskclusters that do not experience xerophthalmia. One ex-planation is that these households have developed strat-egies that allow greater access to vitamin A–rich foods.
Cultivation of home gardens and ownership of do-mesticated animals are potential ways of increasinghousehold access to foods rich in vitamin A and caro-tenoids. Numerous attempts have been made to imple-ment gardening programmes towards such a goal [6,7]. Indeed, several studies have found that the pres-ence of a home garden is a strong predictor of the qualityof child nutrition, particularly during seasons whenemployment opportunities are few [8–10].
Although home gardens have been shown to providea number of economic and dietary advantages to poorfamilies, the evidence linking home gardens to reducedvitamin A deficiency in vulnerable household mem-bers is equivocal. In Bangladesh, analyses indicate thateven a small household garden affords protection againstchildhood xerophthalmia [4]. More recent work fromthis region [11] shows that the variety of plants in agarden, and not its size, is associated with reduced riskof xerophthalmia. Other studies, however, show thatvitamin A status may not improve despite successfulhome gardening efforts [12, 13]. In West Java, well-offhouseholds (those with home gardens and land) werefound to consume more of all nutrients than did poorerhouseholds, except for vitamin A and calcium [14].
Household-level interventions directed towards im-proving vitamin A status have focused on increasingplant sources of vitamin A by encouraging home gar-dens, which require a relatively small investment andcan be a source of abundant carotenoid-rich foods.Domestic animals are an additional source of home
Home gardening and access to animals in householdswith xerophthalmic children in rural Nepal
Anita V. Shankar, Joel Gittelsohn, Elizabeth K. Pradhan, Chandra Dhungel,and Keith P. West, Jr.
Anita V. Shankar, Joel Gittelsohn, Elizabeth K. Pradhan, andKeith P. West, Jr., are affiliated with the Division of HumanNutrition, Department of International Health, in the Schoolof Hygiene and Public Health at the Johns Hopkins Universityin Baltimore, Maryland, USA. Chandra Dhungel is affiliatedwith the Nepal Nutrition Intervention Project-Sarlahi inKathmandu, Nepal.
Mention of the names of firms and commercial productsdoes not imply endorsement by the United Nations University.
35
food that intervention studies and programmes oftenoverlook. Domestic animals provide milk, eggs, and meatthat may help protect household members from vita-min A deficiency.
In this study we explore the variations in access todomesticated animals and differences in home gardeningpractices in households with and without xerophthalmicchildren in rural Nepal. These practices are then ex-amined with respect to the changes in intake of caro-tenoid- and retinol-rich foods at the household levelover a one-year period.
Methods
A community-wide ocular survey was conducted inJanuary 1992 on 3,735 pre-school children living inthree Village Development Committees with a popu-lation of approximately 15,000 in Sarlahi District inthe central lowland region of Nepal. The survey iden-tified 86 households with children aged 12 to 72 monthswho had clinical signs of xerophthalmia or a currenthistory of night-blindness. Five households were lostbecause of migration or refusal to participate, result-ing in 81 case households participating in the study.Thirty-three of the children had guardian-reportednight-blindness alone, 33 had Bitot’s spots alone, and10 children had both night-blindness and Bitot’s spots.The remaining five were diagnosed with corneal xero-sis alone or with Bitot’s spots or night-blindness.
From the pool of neighbouring households (within5 km of the case), 81 control households were selectedthat had a child of the same age as the case child (withinthree months) and a younger sibling of similar age(within four months), if a younger sibling was presentin the case household. In control households, there wereno clinical signs of xerophthalmia in any child in thehousehold and no reported history of night-blindnessin children or their mothers. Both case and controlhouseholds were studied prospectively from March 1993to June 1994.
A recall of home gardening practices was obtainedfrom the head of the household, usually a male, threetimes during the year: April–May 1993 (three-monthrecall period), August–September 1993 (four-monthrecall period), and February–March 1994 (five-monthrecall period). For the purposes of this study, a homegarden was defined to include all plants (fruits and veg-etables) grown in and around the homestead. We usedspecific local terms to distinguish home gardens fromagricultural plots. During each round of interviews, recalldata were collected on which vegetable and fruit plantswere grown in the home garden, the quantity grown,and about how much of the produce was consumedin the household. Harvesting and consumption of greenleaves associated with gourds (such as pumpkin leaves)were also noted.
The size of the vegetable garden was calculated bysumming the total plot sizes used for each type of plantgrown. If one plot area was used for two different crops(planted simultaneously or at different times), the to-tal garden size equalled twice the actual land area usedby the plants. In addition, individual vines and plants,such as gourds and tomatoes, grown outside a formalplot were counted separately and assigned an averagevalue of 0.5 square feet (464 cm2) per plant. As a resultof varying planting and harvesting intervals during therecall period, the calculation of garden size is not rep-resentative of the actual amount of cultivated land.
Only fruit plants and trees that produced fruit dur-ing the year surveyed were counted. The informantswere asked to recall all vegetables and fruit plants towhich their family had access and from which they wereable to obtain some produce, such as plants shared withrelatives or neighbours. Fruits or leaves found in thewild were not included within our definition of homegarden.
Possession of domesticated animals was determinedonce by a survey conducted with the head of the house-hold in January 1993. In Nepal there are several formsof animal ownership, ranging from outright ownershipto renting and raising animals for a pre-determined por-tion of the meat or milk produced. Ownership of ananimal, for this study, means that the owner has accessto all milk or eggs produced by the animal and all themeat if the animal is slaughtered. Rental of an animalmeans that part of the animal products are kept by theowner and part by the household renting the animal.The numbers of animals owned, rented from others, andrented to others were determined for each household.
Household dietary intake was assessed with a previ-ously described seven-day food-frequency questionnaire[15]. The food-frequency questionnaire was adminis-tered four times during the year beginning in July 1993:July to September, October to December, January toMarch, and April to June. Dietary recalls were conductedon individuals knowledgeable about the household andthe food intake of the children, usually the mothers.Household intake was defined as foods consumed byany member of the household, focusing on foods con-sumed during the primary mealtimes.
Fruits and vegetables were classified as carotenoid-richor non-carotenoid-rich on the basis of regional and in-ternational food composition tables [16, 17]. Vegetablesclassified as carotenoid-rich included dark-green leafyvegetables and ripe pumpkin; fruits classified as caro-tenoid-rich included papayas, mangoes, and jackfruit.
Matched-pair odds ratios and 95% confidence in-tervals were derived by conditional logistic regressionto compare household characteristics according to xe-rophthalmia status. All odds ratios were adjusted forsocio-economic status, which was a scaled variable basedon the number of different types of material possessionsnot related to either home gardening efforts or the up-
Home gardening and access to animals
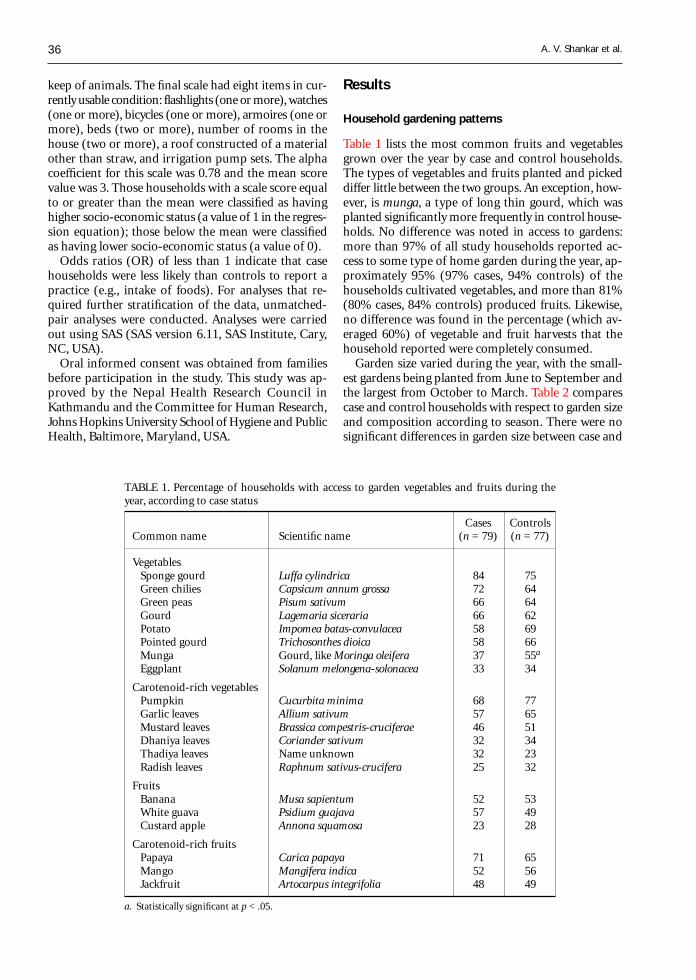
36
keep of animals. The final scale had eight items in cur-rently usable condition: flashlights (one or more), watches(one or more), bicycles (one or more), armoires (one ormore), beds (two or more), number of rooms in thehouse (two or more), a roof constructed of a materialother than straw, and irrigation pump sets. The alphacoefficient for this scale was 0.78 and the mean scorevalue was 3. Those households with a scale score equalto or greater than the mean were classified as havinghigher socio-economic status (a value of 1 in the regres-sion equation); those below the mean were classifiedas having lower socio-economic status (a value of 0).
Odds ratios (OR) of less than 1 indicate that casehouseholds were less likely than controls to report apractice (e.g., intake of foods). For analyses that re-quired further stratification of the data, unmatched-pair analyses were conducted. Analyses were carriedout using SAS (SAS version 6.11, SAS Institute, Cary,NC, USA).
Oral informed consent was obtained from familiesbefore participation in the study. This study was ap-proved by the Nepal Health Research Council inKathmandu and the Committee for Human Research,Johns Hopkins University School of Hygiene and PublicHealth, Baltimore, Maryland, USA.
Results
Household gardening patterns
Table 1 lists the most common fruits and vegetablesgrown over the year by case and control households.The types of vegetables and fruits planted and pickeddiffer little between the two groups. An exception, how-ever, is munga, a type of long thin gourd, which wasplanted significantly more frequently in control house-holds. No difference was noted in access to gardens:more than 97% of all study households reported ac-cess to some type of home garden during the year, ap-proximately 95% (97% cases, 94% controls) of thehouseholds cultivated vegetables, and more than 81%(80% cases, 84% controls) produced fruits. Likewise,no difference was found in the percentage (which av-eraged 60%) of vegetable and fruit harvests that thehousehold reported were completely consumed.
Garden size varied during the year, with the small-est gardens being planted from June to September andthe largest from October to March. Table 2 comparescase and control households with respect to garden sizeand composition according to season. There were nosignificant differences in garden size between case and
TABLE 1. Percentage of households with access to garden vegetables and fruits during theyear, according to case status
Cases ControlsCommon name Scientific name (n = 79) (n = 77)
VegetablesSponge gourd Luffa cylindrica 84 75Green chilies Capsicum annum grossa 72 64Green peas Pisum sativum 66 64Gourd Lagemaria siceraria 66 62Potato Impomea batas-convulacea 58 69Pointed gourd Trichosonthes dioica 58 66Munga Gourd, like Moringa oleifera 37 55a
Eggplant Solanum melongena-solonacea 33 34
Carotenoid-rich vegetablesPumpkin Cucurbita minima 68 77Garlic leaves Allium sativum 57 65Mustard leaves Brassica compestris-cruciferae 46 51Dhaniya leaves Coriander sativum 32 34Thadiya leaves Name unknown 32 23Radish leaves Raphnum sativus-crucifera 25 32
FruitsBanana Musa sapientum 52 53White guava Psidium guajava 57 49Custard apple Annona squamosa 23 28
Carotenoid-rich fruitsPapaya Carica papaya 71 65Mango Mangifera indica 52 56Jackfruit Artocarpus integrifolia 48 49
a. Statistically significant at p < .05.
A. V. Shankar et al.

37
control households over the whole year; however, controlhouseholds tended to have larger gardens than casehouseholds from October to March (OR, 0.41; 95%CI, 0.17 to 1.01). From October to March only, con-trol households were significantly more likely than casehouseholds to plant and consume at least one caro-tenoid-rich vegetable (OR, 0.39; 95% CI, 0.16 to 0.96).This difference is mainly a result of the greater num-ber of garlic leaves and onion greens consumed in con-trol households during this period.
Figure 1 shows the relationship between average cu-mulative garden size and vegetable consumption forthe year for both vitamin A–rich foods and those lackingsignificant amounts of vitamin A. Pooled data were usedfor these comparisons, as garden size did not signifi-cantly differ between cases and controls. Consumptionof non–vitamin A–rich vegetables was found to in-crease with garden size, whereas consumption of vita-min A–rich vegetables remained low across the observedrange of garden sizes. A similar analysis was performedfor fruit consumption (fig. 2). In this case, householdswithout gardens had roughly half the mean intake ofcarotenoid-rich fruits as households with large gardens,although this difference was not statistically significant.
Patterns of animal husbandry
Table 3 compares case and control households with re-spect to their access to domesticated animals. Nearly
all households (90% of cases and 95% of controls) hadat least one animal in their home, and nearly 50% ofcase and control households had a milk-producing ani-mal. However, case households were more likely thancontrols to have rented animals from others, especiallycows. Moreover, nearly twice as many control house-holds as case households had chickens, and three timesas many control households as case households had
TABLE 2. Matched-pair adjusted odds ratios of garden characteristics for case and control households
Feb–May 1993 Jun–Sep 1993 Oct 1993–Mar 1994
Case– Case– Case–control control control
pairs pairs pairs(n = 78) (n = 78) (n = 77)
Garden characteristic (%) ORa 95% CI (%) OR 95% CI (%) OR 95% CI
Cumulative plot sizeb 63 59 1.49 0.74–3.02 22 16 1.80 0.75–4.32 58 71 0.41 0.17–1.01(> 1 katha of land)
> 10 single vines, bushes 44 49 0.84 0.44–1.61 62 58 1.27 0.62–2.62 43 46 0.95 0.47–1.94
> 10 harvesting fruit 17 21 0.86 0.36–2.02 33 41 0.87 0.45–1.69 22 36 0.67 0.33–1.35plants
Carotenoid-rich 64 71 0.82 0.41–1.65 24 27 0.92 0.45–1.92 72 87 0.39 0.16–0.96c
vegetables harvestedand consumed inhousehold
Carotenoid-rich fruits 39 45 0.82 0.43–1.57 39 45 0.70 0.36–1.39 47 42 1.40 0.74–2.65harvested andconsumed inhousehold
a. OR, odds ratio; OR < 1 indicates that case households are less likely than control households to report a practice.b. 1 katha = 0.083 acres = 0.034 hectares. Garden size includes calculation of single vines and bushes with designated plot size of
0.5 sq. ft. (464 cm2) per plant.c. p < .05.
No garden 1–4 katha< 1 katha > 4 katha0
2
4
6
8
10
12
14
Cumulative vegetable garden size
No.
of
times
eat
en in
the
pre
cedi
ng w
eek
FIG. 1. Average weekly household consumption of low-carotenoid (grey bars) and carotenoid-rich (black bars) veg-etables by all study households over the year. according tosize of vegetable garden. 1 katha = 0.083 acres = 0.034 hectares
Home gardening and access to animals

38
pigeons. Chickens and pigeons are both good sourcesof vitamin A–rich eggs and meat, including liver.
Using household food-frequency data, table 4 exam-ines differences in milk consumption by any house-hold member in the previous week, stratified by ac-cess to milk-producing animals. Comparisons are madefor three groups: (1) households with no milk-producinganimals, (2) households with milk-producing animals(either rented or owned), and (3) households that ownedbut did not rent milk-producing animals (a subset ofgroup 2). Preliminary unadjusted odds ratios indicatedthat regardless of access to milk-producing animals(rented or owned), case households were significantlyless likely than control households to have consumedmilk during the periods from July to September and
from October to December (odds ratios ranged from0.16 to 0.33). However, adjustment for socio-economicstatus removed any significant differences in milk con-sumption between case and control households.
Meat (including liver) and eggs are also good sourcesof pre-formed vitamin A. Animals most likely to bedomesticated for consumption include chickens, pigs,goats, and pigeons. Table 5 compares case and controlhouseholds with and without access to these animalswith respect to their consumption of meat and eggs.Among households without access to animals, casehouseholds were much less likely to report consump-tion of meat or eggs in the preceding week than con-trols (odds ratios ranged from 0.07 to 0.69), with sig-nificant differences during the period from January toMarch. Among households with access to animals, casehouseholds were significantly less likely than controlsto report consumption of meat or eggs in the precedingweek during the period from October to December (OR,0.41; 95% CI, 0.20 to 0.82).
Discussion
In this paper we differentiate households with a xe-rophthalmic child from those having a non-xe-rophthalmic child of the same age, with respect to twofactors that could influence the intake of vitamin A–rich foods: home gardens and access to domesticatedanimals. After controlling for socio-economic status andseason, the presence or absence of these factors wasrelated to household intake of vitamin A–rich foods.
Previous dietary analyses from this study indicatedthat control households consumed more carotenoid-rich vegetables from July to December than case house-holds [15]. The current data corroborate previous find-
FIG. 2. Average weekly household consumption of low-caro-tenoid (grey bars) and carotenoid-rich (black bars) fruits byall study households over the year. according to number offruit plants
No garden 6–20 plants1–5 plants 21+ plants0
0.5
1
1.5
2
2.5
Number of harvesting fruit plants
No.
of
times
eat
en in
the
pre
cedi
ng w
eek
TABLE 3. Percentage of case (n = 81) and control (n = 81) households raising ani-mals, renting animals from others, or renting animals to others
Renting animals Renting animalsRaising animals from others to others
Animal Case Control Case Control Case Control
Cows 25 26 11 0a 3 7Bulls and calves 56 58 10 7 3 4Buffaloes (female) 6 9 0 0 0 0Buffaloes (males and calves) 21 35 9 9 3 5Goats (female) 24 25 4 4 1 0Goats (males and kids) 56 58 23 20 5 12Pigs 4 6 2 0 0 2Chickens 26 46a 6 5 1 4Pigeons 6 20a 0 0 0 0Any milk-producing animal 48 47 15 4a 4 7
(cows, buffaloes, goats)Any animal 90 95 43 31 11 24a
a. p < .05 (unmatched pair analyses).
A. V. Shankar et al.
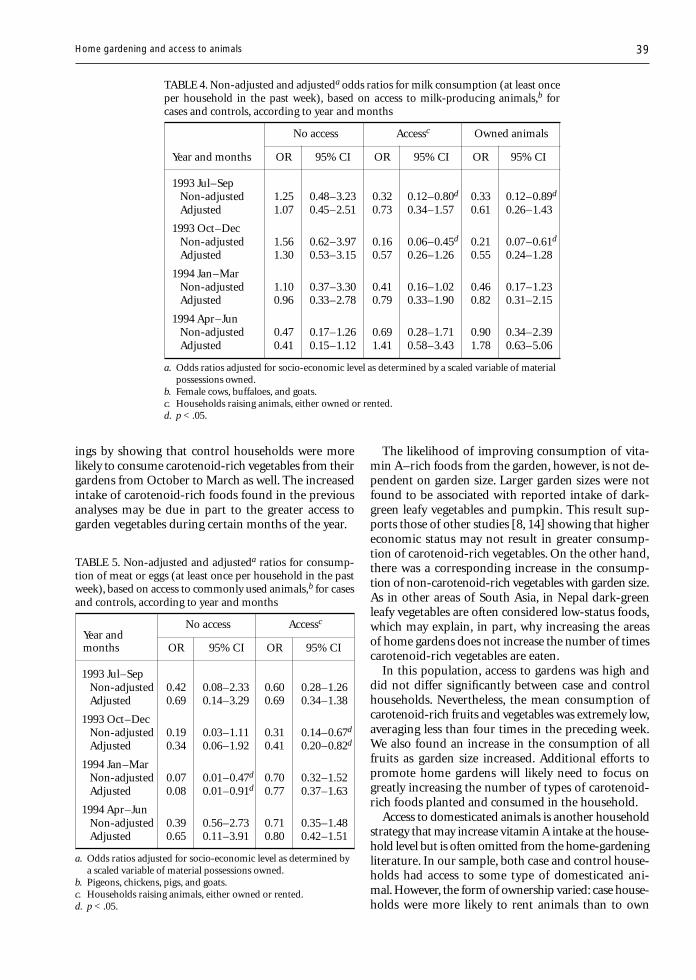
39
ings by showing that control households were morelikely to consume carotenoid-rich vegetables from theirgardens from October to March as well. The increasedintake of carotenoid-rich foods found in the previousanalyses may be due in part to the greater access togarden vegetables during certain months of the year.
The likelihood of improving consumption of vita-min A–rich foods from the garden, however, is not de-pendent on garden size. Larger garden sizes were notfound to be associated with reported intake of dark-green leafy vegetables and pumpkin. This result sup-ports those of other studies [8, 14] showing that highereconomic status may not result in greater consump-tion of carotenoid-rich vegetables. On the other hand,there was a corresponding increase in the consump-tion of non-carotenoid-rich vegetables with garden size.As in other areas of South Asia, in Nepal dark-greenleafy vegetables are often considered low-status foods,which may explain, in part, why increasing the areasof home gardens does not increase the number of timescarotenoid-rich vegetables are eaten.
In this population, access to gardens was high anddid not differ significantly between case and controlhouseholds. Nevertheless, the mean consumption ofcarotenoid-rich fruits and vegetables was extremely low,averaging less than four times in the preceding week.We also found an increase in the consumption of allfruits as garden size increased. Additional efforts topromote home gardens will likely need to focus ongreatly increasing the number of types of carotenoid-rich foods planted and consumed in the household.
Access to domesticated animals is another householdstrategy that may increase vitamin A intake at the house-hold level but is often omitted from the home-gardeningliterature. In our sample, both case and control house-holds had access to some type of domesticated ani-mal. However, the form of ownership varied: case house-holds were more likely to rent animals than to own
TABLE 4. Non-adjusted and adjusteda odds ratios for milk consumption (at least onceper household in the past week), based on access to milk-producing animals,b forcases and controls, according to year and months
No access Accessc Owned animals
Year and months OR 95% CI OR 95% CI OR 95% CI
1993 Jul–SepNon-adjusted 1.25 0.48–3.23 0.32 0.12–0.80d 0.33 0.12–0.89d
Adjusted 1.07 0.45–2.51 0.73 0.34–1.57 0.61 0.26–1.43
1993 Oct–DecNon-adjusted 1.56 0.62–3.97 0.16 0.06–0.45d 0.21 0.07–0.61d
Adjusted 1.30 0.53–3.15 0.57 0.26–1.26 0.55 0.24–1.28
1994 Jan–MarNon-adjusted 1.10 0.37–3.30 0.41 0.16–1.02 0.46 0.17–1.23Adjusted 0.96 0.33–2.78 0.79 0.33–1.90 0.82 0.31–2.15
1994 Apr–JunNon-adjusted 0.47 0.17–1.26 0.69 0.28–1.71 0.90 0.34–2.39Adjusted 0.41 0.15–1.12 1.41 0.58–3.43 1.78 0.63–5.06
a. Odds ratios adjusted for socio-economic level as determined by a scaled variable of materialpossessions owned.
b. Female cows, buffaloes, and goats.c. Households raising animals, either owned or rented.d. p < .05.
TABLE 5. Non-adjusted and adjusteda ratios for consump-tion of meat or eggs (at least once per household in the pastweek), based on access to commonly used animals,b for casesand controls, according to year and months
Year andNo access Accessc
months OR 95% CI OR 95% CI
1993 Jul–SepNon-adjusted 0.42 0.08–2.33 0.60 0.28–1.26Adjusted 0.69 0.14–3.29 0.69 0.34–1.38
1993 Oct–DecNon-adjusted 0.19 0.03–1.11 0.31 0.14–0.67d
Adjusted 0.34 0.06–1.92 0.41 0.20–0.82d
1994 Jan–MarNon-adjusted 0.07 0.01–0.47d 0.70 0.32–1.52Adjusted 0.08 0.01–0.91d 0.77 0.37–1.63
1994 Apr–JunNon-adjusted 0.39 0.56–2.73 0.71 0.35–1.48Adjusted 0.65 0.11–3.91 0.80 0.42–1.51
a. Odds ratios adjusted for socio-economic level as determined bya scaled variable of material possessions owned.
b. Pigeons, chickens, pigs, and goats.c. Households raising animals, either owned or rented.d. p < .05.
Home gardening and access to animals

40
them. In addition, control households were significantlymore likely than case households to own chickens andpigeons. This may be indicative of the slightly bettersocio-economic status of the control households, a find-ing consistent with other research in the area [3].
In an effort to control for the effects of socio-economic status on diet, we devised a socio-economicstatus scale that could serve as a proxy for householdincome but would not include items on ownership ofland or animals. When this variable was included inthe regression analysis, we found that socio-economicstatus did influence the odds ratios of household milkconsumption but not those of consumption of meatand eggs. In the case of milk consumption, the oddsratios adjusted for socio-economic status were higher(0.5 to 0.7) than the unadjusted odds ratios (0.2 to 0.3),which implies that although control households hadgreater reported milk intake than cases, this was prob-ably due in part to the slightly higher economic statusof these households.
This was not true with consumption of meat or eggs;case households consumed meat or eggs significantlyless frequently than controls in certain seasons, regardlessof access to animals or socio-economic status. In house-holds with no access to animals, the odds ratios forconsumption of meat or eggs were low (0.07 to 0.69),suggesting that control households, even those with-out direct access to meat or eggs at home, were stillable to obtain and consume meat or eggs more oftenthan case households.
As efforts continue to identify household strategiesthat increase the intake of vitamin A–rich foods [18,19], understanding the intricacies of current house-hold practices and their relationship to diet is critical.This study demonstrates that household-level accessto home gardens or domesticated animals does notensure that vulnerable members within the householdwill be able to obtain a diet adequate to prevent clinical
signs of vitamin A deficiency. In addition, the size of agarden did not appear to be related to the intake of caro-tenoid-rich vegetables in this population. From previ-ous analyses [15] we learned that case households andindex children were significantly less likely to consumemeat, liver, and eggs. This finding holds true in the cur-rent analysis, which indicates that other factors besideshousehold access to domesticated animals or socio-eco-nomic level (as determined by ownership of materialgoods) may influence household intake during criti-cal periods of the year. This study is a first step in ex-amining household strategies and their effect on house-hold intake. Further research to identify other typesof household strategies and characteristics importantfor increased consumption of vitamin A–rich foods iswarranted.
Acknowledgements
The study group in Sarlahi included the authors andDr. Rajendra Pradhan, Dr. Subarna Khatry, Mr. StevenLeClerq, Mr. Sharada Ram Shrestha, Mr. NoorNathAcharya, and Dr. R. P. Pokhrel. The study is a collabora-tive effort between the Johns Hopkins University, Balti-more, Maryland, USA, the Nepal Netra Jyoti Sangh (Na-tional Society for the Prevention of Blindness), and theNepal Eye Hospital. The authors express their sincereappreciation and thanks to the DIVA interviewers, ShishirShrestha, Ramekwal Chaudhary, Sulochana Chaudhary,and Ishwari Shrestha. The project was funded throughCooperative Agreement No. DAN 0045-A-00-5094-00between the Center for Human Nutrition/Dana Cen-ter for Preventive Ophthalmology of the Johns HopkinsUniversity and the Office of Health and Nutrition ofthe US Agency for International Development, with ad-ditional support from Task Force Sight and Life (Roche,Basel, Switzerland) and National Institutes of Healthshared instrument grant No. S10-RR 04060.
References
1. Katz J, Zeger SL, West KP, Tielsch JM, Sommer A. Clus-tering of xerophthalmia within households and villages.Int J Epidemiol 1993;22:709–15.
2. Mele L, West KP Jr, Kusdiono, Pandji A, Nendrawati H,Tilden RL, Tarwotjo I. Nutritional and household riskfactors for xerophthalmia in Aceh, Indonesia: a case-control study. Am J Clin Nutr 1991;53:1460–5.
3. Khatry SK, West KP Jr, Katz J, LeClerq SC, Pradhan EK,Wuls Thapa MD, Pokhrel RP. Epidemiology of xeroph-thalmia in Nepal. Arch Ophthalmol 1995; 113:425–9.
4. Cohen N, Jalil MA, Rahman H, Matin MA, Sprague J,Islam J, Davison J. Landholding, wealth and risk of blind-ing malnutrition in rural Bangladeshi households. SocSci Med 1985;21:1269–72.
5. Sommer A, West KP Jr. Vitamin A deficiency: health, sur-vival and vision. New York: Oxford University Press, 1996.
6. Swedberg EA, Stetson V, Adrian JM, Zayan A. Multipleapproaches to vitamin A (abstract). Report of the XVIIVACG Meeting, Chiang Rai, Thailand. Washington, DC:Nutrition Foundation, 1996:92.
7. Talukder A, Bloem MW. Home gardening activities inBangladesh. Dhaka: Helen Keller International, 1992.
8. Kumar SK. Role of the household economy in child nu-trition at low-incomes: case study in Kerala. OccasionalPaper No. 95. Ithaca, NY, USA: Department of Agricul-tural Economics, Cornell University, 1978.
9. Ensing B, Sangers S. Home gardening in a Sri Lankanwet zone village: Can it contribute to improved nutri-tion? Wageningen, Netherlands: Wageningen Agricul-tural University, 1986.
10. Immink MDC, Sanjur D, Colon M. Home gardens andthe energy and nutrient intakes of women and pre-
A. V. Shankar et al.
41
schoolers in rural Puerto Rico. Ecol Food Nutr 1991;11:191–9.
11. Talukder A, Islam N, Tabibul AK, Desilles S, Bloem MW.Results and lessons learned from Helen Keller Interna-tional’s home gardening activities in Bangladesh (ab-stract). Report of the XVI IVACG Meeting, Chiang Rai,Thailand. Washington, DC: Nutrition Foundation,1994:92.
12. Smitasiri S. Nutri-action analysis: going beyond goodpeople and adequate resources. Bangkok: Amarin Printingand Publishing Public Company, 1994.
13. Smitasiri S. Advocating a multidimensional evaluationapproach for comprehensive nutrition communicationprograms. INMU Special Publication Series No. 1.Bangkok: Institute of Nutrition, Mahidol University, andUNICEF East Asia and Pacific Regional Office, 1994.
14. Abdoellah OS, Marten G. The complementary roles ofhome gardens, upland fields, and rice fields for meet-ing nutritional needs in West Java. In: Marten GG, ed.
Traditional agriculture in South-east Asia: a human ecol-ogy perspective. Boulder, Col, USA: Westview, 1986:293–325.
15. Shankar AV, West KP Jr, Gittelsohn J, Katz J, PradhanR. Chronic low intakes of vitamin A–rich foods in house-holds with xerophthalmic children: a case-control studyin Nepal. Am J Clin Nutr 1996;64:242–8.
16. Gopalan C, Ramasastri BV, Balasubramanian SC. Nu-tritive value of Indian foods. Hyderabad: National In-stitute of Nutrition, 1989.
17. West CE, Poorvliet E. The carotenoid content of foodswith special reference to developing countries. Alexan-dria, Va, USA: VITAL, International Science and Tech-nology Institute, 1993.
18. Stoler A. Garden use and household economy in ruralJava. Bull Indones Econ Stud 1978;14:85–101.
19. Wasantwisut E, Attig G. Empowering vitamin A foods:a food-based process for Asia and the Pacific region.Bangkok: Institute of Nutrition, Mahidol University, 1995.
Home gardening and access to animals

42 Food and Nutrition Bulletin, vo. 19, no. 1 © 1998, The United Nations University.
Abstract
Variations in interdistrict nutritional status have puzzledboth social policy makers and health workers in Botswana.A total of 643 households and 898 pre-school childrenwere surveyed to determine factors that are associatedwith the nutritional status of children below the age offive years in the north-western District of Chobe. Exceptfor those in remote and difficult-to-reach places, all house-holds with a pre-school child were selected for the study.The results showed that the nutritioneal status of the pre-school children had a strong positive correlation with accessto a latrine (r = 0.52) and ownership of cattle (r = 0.27).Age was negatively correlated with the child’s nutritionalstatus (r = – 0.02).
Introduction
Botswana has shown impressive improvements in thenutritional status of children below the age of five years.The prevalence of undernutrition declined from 25%in 1985 to about 13% in 1996. However, the westerndistricts, which include Chobe District, have consis-tently performed poorly in almost all basic health andnutrition indicators. Unlike the other poor and remotedesert areas of Gantsi and Kgalagadi, Chobe is endowedwith rich natural resources and is one of the attractivedestinations for tourists in Botswana. The district alsohas the highest annual rainfall in the country.
The contradictions between the rich resources andthe poor health and nutritional status of children un-der five years of age in Chobe are a concern to districtand central level health workers. Hence there is a needto study some of the underlying factors associated withchild undernutrition in this district. The survey waspart of a food and nutrition security project supported
Determinants of the nutritionalstatus of children in a rural African setting:The case of Chobe District, Botswana
Kesitegile Gobotswang
Kesitegile Gobotswang is affiliated with the National Instituteof Development Research and Documentation in theUniversity of Botswana in Gaborone, Botswana.
through a collaborative agreement between the NationalInstitute of Development Research and Documenta-tion (NIR) of the University of Botswana and the Centrefor Development and the Environment (SUM) of theUniversity of Oslo. A similar study was conducted inLetlhakeng District. This paper presents findings onthe association between selected variables and the nu-tritional status of children under five years of age.
Materials and methods
This cross-sectorial study covered eight villages and one“village town” in the north-western District of Chobe.Non-village settlements (areas with less than 500 in-habitants) were excluded from the study. These areasinclude the underserved and difficult-to-reach placesmainly inhabited by the Basarwa (San) people, whoare among the poorest in Botswana. For convenience,all households with a pre-school child were selectedfor the study. A total of 643 households and 898 chil-dren under five years of age were surveyed during thestudy period. According to the 1991 census, 14,126people lived in Chobe.
Data collection
Structured interviews were conducted using pre-testedquestionnaires administered to heads of households.Information was collected on the demographic char-acteristics of household members and socio-economicfactors. Child-related data, such as breastfeeding, childfeeding, nutritional status, and sanitary conditions, werealso collected. Five female national service participants(Tirelo Sechaba) associated with the National Instituteof Development Research and Documentation wereused as field assistants. They were trained in basic in-terviewing techniques and in taking weight measure-ments. Translations of questions into Setswana, the locallanguage, were agreed upon to ensure consistency.
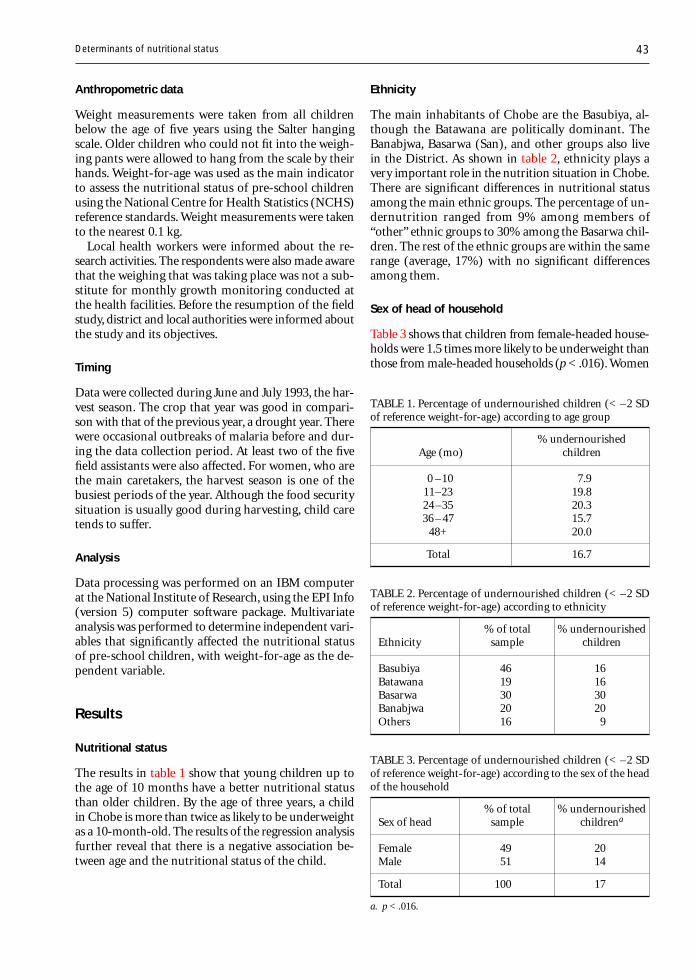
43
Anthropometric data
Weight measurements were taken from all childrenbelow the age of five years using the Salter hangingscale. Older children who could not fit into the weigh-ing pants were allowed to hang from the scale by theirhands. Weight-for-age was used as the main indicatorto assess the nutritional status of pre-school childrenusing the National Centre for Health Statistics (NCHS)reference standards. Weight measurements were takento the nearest 0.1 kg.
Local health workers were informed about the re-search activities. The respondents were also made awarethat the weighing that was taking place was not a sub-stitute for monthly growth monitoring conducted atthe health facilities. Before the resumption of the fieldstudy, district and local authorities were informed aboutthe study and its objectives.
Timing
Data were collected during June and July 1993, the har-vest season. The crop that year was good in compari-son with that of the previous year, a drought year. Therewere occasional outbreaks of malaria before and dur-ing the data collection period. At least two of the fivefield assistants were also affected. For women, who arethe main caretakers, the harvest season is one of thebusiest periods of the year. Although the food securitysituation is usually good during harvesting, child caretends to suffer.
Analysis
Data processing was performed on an IBM computerat the National Institute of Research, using the EPI Info(version 5) computer software package. Multivariateanalysis was performed to determine independent vari-ables that significantly affected the nutritional statusof pre-school children, with weight-for-age as the de-pendent variable.
Results
Nutritional status
The results in table 1 show that young children up tothe age of 10 months have a better nutritional statusthan older children. By the age of three years, a childin Chobe is more than twice as likely to be underweightas a 10-month-old. The results of the regression analysisfurther reveal that there is a negative association be-tween age and the nutritional status of the child.
Ethnicity
The main inhabitants of Chobe are the Basubiya, al-though the Batawana are politically dominant. TheBanabjwa, Basarwa (San), and other groups also livein the District. As shown in table 2, ethnicity plays avery important role in the nutrition situation in Chobe.There are significant differences in nutritional statusamong the main ethnic groups. The percentage of un-dernutrition ranged from 9% among members of“other” ethnic groups to 30% among the Basarwa chil-dren. The rest of the ethnic groups are within the samerange (average, 17%) with no significant differencesamong them.
Sex of head of household
Table 3 shows that children from female-headed house-holds were 1.5 times more likely to be underweight thanthose from male-headed households (p < .016). Women
TABLE 2. Percentage of undernourished children (< –2 SDof reference weight-for-age) according to ethnicity
% of total % undernourishedEthnicity sample children
Basubiya 46 16Batawana 19 16Basarwa 30 30Banabjwa 20 20Others 16 9
TABLE 1. Percentage of undernourished children (< –2 SDof reference weight-for-age) according to age group
% undernourishedAge (mo) children
0 –10 7.911–23 19.824 –35 20.336 – 47 15.7
48+ 20.0
Total 16.7
TABLE 3. Percentage of undernourished children (< –2 SDof reference weight-for-age) according to the sex of the headof the household
% of total % undernourishedSex of head sample childrena
Female 49 20Male 51 14
Total 100 17
a. p < .016.
Determinants of nutritional status
44
constitute the bulk of people living in poverty inBotswana.
Educational level of head of household
Table 4 shows that 23% of children from householdsheaded by a person with no education were underweight,as compared with 15% and 12% of children from house-holds headed by a person with some primary or sec-ondary education, respectively (p < .0019). Educationis often associated with higher socio-economic status.
Presence of a latrine
An estimated 58% of the children lived in householdswith latrines. Of those who had no latrine, 28% wereunderweight, as compared with 25% of children fromhouseholds with a latrine.
Other factors
The study also considered possible associations of thenutritional status of children under five with the numberof people in the household and the number and sex ofthe working adults in the household. The results showedno significant relation (p < .276) between the size ofthe household and the nutritional status of the chil-dren. Ownership of cattle was found to be more im-portant (p < .015) in determining the nutritional sta-tus of the children. This suggests that the asset base of
a household is more important than its size. However,the family size structure can have a positive effect onchild nutrition in some instances [1].
A multiple regression model was run to determinethe most important factors that affect the nutritionalstatus of pre-school children. Variables considered in-cluded ownership of cattle, educational level of the headof the household, presence of a latrine, sex of the headof the household, and age of the child. Table 5 shows arelatively strong positive correlation between nutritionalstatus and the presence of a latrine, followed by own-ership of cattle. Age has a negative association withnutritional status: older children are more likely to beunderweight than younger children.
Children from households with one or more work-ing adults were less likely to be underweight (table 6).
Conclusions and discussion
Data from the survey revealed that poor nutrition mainlyaffects children between the ages of one and three years.The results confirm findings from previous surveys. Oneof the studies showed that the prevalence of moderateand severe forms of malnutrition was high in childrenaged 13 to 36 months [2]. A study that looked at therelationship between maternal use of time and children’shealth and nutritional status found that at two yearsof age, toddlers begin to receive less intensive care, freeingthe principal caretakers, mostly mothers, for economicactivities [1]. Participation of the principal caretakersin economic activities outside the household could havea negative effect on child nutrition, depending on theage of the child. Another study, in the Rukwa regionof western Tanzania, reported that women spent lesstime cooking and feeding their children during the peaklabour seasons [3]. Although the Chobe study was car-ried out in a high-activity season, the findings fromRukwa are relevant to this study.
Children in female-headed households were morelikely to be malnourished than those in households witha male head. Ownership of cattle was positively asso-ciated with better child nutrition. Cattle are the most
TABLE 4. Percentage of undernourished children (< –2 SDof reference weight-for-age) according to the educational levelof the head of the household
Education % of total % undernourishedof head sample childrena
None 32 23Primary 49 15Secondary 18 12Post-secondary 1 0
a. p < 0.0019.
TABLE 5. Variables affecting nutritional status of children under five years old
95% CI
Variable B Lower Upper SE
Ownership of cattle 0.2700719 0.083527 0.456617 0.95176Educational level 0.1072027 –0.033098 0.247504 0.071582
of head of householdPresence of a latrine 0.5197920 0.315638 0.723946 0.104160Sex of head 0.1500735 –0.037895 0.338042 0.095902
of householdAge of child –0.0242134 –0.029894 –0.018533 0.002898
K. Gobotswang

45
important economic asset in Botswana, in the sameway that land ownership is critical in the Medak Dis-trict of Andhra Pradesh, India [2]. Since women inBotswana generally have a poor asset base, malnutri-tion is most likely to affect children from female-headedhouseholds. The results of the multiple regression modelshowed an even stronger correlation between the pres-
References
1. Ricci JA, Jerome NW, Sirageldin HA, Aly H, Moussa W,Galal O, Harrison GG, Kirksely A. The significance ofchildren’s age in estimating the effect of maternal timeuse on children’s well-being. Soc Sci Med 1996;42:651–9.
2. Devi PY, Geervani P. Determinants of nutrition statusof rural pre-school children in Andhra Pradesh, India.Food Nutr Bull 1994;15:335– 42.
3. Wandel M, Holmboe-Ottesen G. Women’s work in ag-riculture and child nutrition in Tanzania. J Trop Pediatr1992;38:252–5.
4. Mbago MCY, Namfua PP. Some determinants of nutri-tional status of one-to-four-year-old children in low in-come urban areas in Tanzania. J Trop Pediatr1992;38:299–306.
TABLE 6. Percentage of undernourished children (< –2 SDof reference weight-for-age) according to the number of work-ing adults in the household
No. of % undernourishedworking adults children
0 231 202 173 13
a. χ2 = 3.67; p = .30.
ence of a latrine and the nutritional status of pre-schoolchildren. However, households with better socio-eco-nomic status are also likely to have latrines.
The educational background of the head of the house-hold had an important influence on child nutrition inChobe. This is in line with the findings from a studyof selected low-income urban areas in Tanzania thatshowed that mothers with secondary education wereabout 2.2 and 3.4 times more likely to have adequatelynourished normal children than those with 5 to 8 and0 to 4 years of schooling, respectively [4]. Educationalattainment is generally associated with improved socio-economic status.
Improvement of the socio-economic status of theprincipal child caretakers, who are mostly mothers, couldgo a long way towards improving the nutritional sta-tus of children. However, any intervention that seeksto improve income levels, particularly those of female-headed households, is likely to have a beneficial effecton child health and nutrition.
Determinants of nutritional status

46 Food and Nutrition Bulletin, vo. 19, no. 1 © 1998, The United Nations University.
Abstract
Emergency nutrition is a specialization for strengthen-ing the training and research capacities of developing coun-tries to meet nutritional needs during natural and man-made disasters. Efforts are being made to prevent famines,especially those arising from natural disasters. However,there will be less food available in the future, althoughnew emergency situations are developing constantly andlasting longer. It is important to train nutritionists, ad-ministrators, policy and decision makers, and others tobe able to prioritize food needs and make the best use ofavailable resources. Methodologies, techniques, expertise,and even theoretical frameworks that can be used in train-ing programmes must be developed and strengthened. Thepaper discusses four areas where expertise in nutrition isweak and could be strengthened through short courses,workshops, and internships: assessment methodologies,monitoring and evaluation, conflict and post-conflict situ-ations, and advocacy.
Introduction
Institutional capacity-building and training must alsoinclude meeting the nutritional needs of populationsduring disasters. This requires competence in a newspecialization, “emergency nutrition.” “Emergency” isa relative term: rather than referring to a specific setof conditions, an emergency may be defined as any se-rious disruption of the functioning of a society thatexceeds the ability of an affected people to cope solelyby means of its own resources.
There are more than 50 million people in the worldwho are affected by war or civil conflict and countlessothers who are affected by floods, droughts, hurricanes,and other natural disasters. A large number of these
people depend on external assistance for at least a partof the duration of their displacement. Governments,(national, local, and bilateral), non-governmental or-ganizations, international government organizations,and the United Nations all provide nutritional supportto these populations at one time or another. However,without the benefit of appropriately trained nutritionalexperts, this support is often poorly provided.
Efforts are being made to prevent famines, especiallythose that result from natural disasters. During thedrought in South Africa in the early 1990s, for instance,deaths from famine were averted by a massive ship-ment of food into the region. At times of conflict, suchas the tragedy in the Great Lakes region of Africa, inSomalia, or in the former Yugoslavia, food has beenprovided to keep populations from starvation.
However, the donor agencies should not become com-placent about their ability to provide assistance dur-ing emergencies. It is predicted that there will be lessfood available for such purposes in the future, eventhough new emergency situations are constantly de-veloping and tend to last longer. These factors presenta growing challenge to relief delivery services to pro-vide services both cost-effectively and efficiently. To meetthis challenge, it will be necessary to create a criticalmass of nutritional experts—administrators, doctors,and others—who are able to assess and prioritize foodneeds and to make decisions about the best use of avail-able resources. In order to equip nutritionists with theknowledge and skills required to carry out such respon-sibilities, it is necessary to identify, develop, andstrengthen methodologies, techniques, expertise, andeven theoretical frameworks that can be used in train-ing programmes.
The first step in positioning ourselves to meet thesechallenges is to improve existing human resource ca-pacity by initiating specific training opportunities forthose already involved in the administration of emer-gency nutrition services, i.e., policy makers, technicalexperts, and fieldworkers. Policy and decision makersmust be among those targeted for training, becausewithout their informed support, nutritional experts may
Emergency nutrition
Judit Katona-Apte
Judit Katona-Apte is a Senior Humanitarian Affairs Officer inthe Department of Humanitarian Affairs and a Senior Pro-gramme Advisor for the World Food Programme in New York.
47
not be included in emergency teams. It is essential thatmembers of emergency nutrition teams be trained inthe skills necessary to define objectives, reach consen-sus, and carry out effective advocacy.
There are four subject areas in which a working bodyof emergency nutrition expertise should be developed,which could easily be transmitted through short courses,workshops, and internships: (1) assessment method-ologies, (2) monitoring and evaluation, (3) conflict andpost-conflict situations, and (4) advocacy. This is notto imply that these are the only areas where nutritionexpertise is needed. Programme design and projectmanagement, for example, are not addressed here. Forthe sake of brevity, however, only the above-mentionedsubjects will be discussed here.
Nor do I wish to imply that the core of profession-als needs to be competent in all of these areas, althoughthis would be ideal. Not every emergency requires thesame specific expertise. Rather, individuals who workin the field of emergency nutrition should be aware ofthe importance of each of these perspectives. If indi-viduals could be trained to become proficient in any ofthese aspects, this would be a step in the right direction.
Methodological needs
During emergencies populations that are dependenton external assistance usually receive food aid. Deliv-ery of appropriate rations is difficult for a variety ofreasons (logistics, resource shortages, etc.). Designingthose rations in terms of quantities and types of foodaid commodities, however, is a task that falls withinthe domain of nutritionists. There has to be justifica-tion for initiating and phasing down food assistance.However, there are currently no training programmesin the methods of assessment for food aid needs orfor estimating the levels of food security.
Nutritional requirements, although acknowledged toexist, are not often considered important enough towarrant seeking specific technical input in times ofemergency. The number of qualified experts workingfor United Nations agencies and non-governmentalorganizations in the area of emergency nutrition is verysmall. Yet the nutritional well-being of populationsduring emergencies depends on valid assessments oftheir food needs and dependence on external food as-sistance. Such assessments are usually carried out bynational governments, United Nations agencies, andnon-governmental organizations. These activities, how-ever, do not make use of existing dietary assessmenttheories, methods, guidelines, or short- or long-termtraining courses.
The same situation is true of methods for establish-ing the degree of food security, an indicator for deter-mining when food aid could be phased out. Currentlythere are no reliable methods or guidelines for these
assessments. It is important that these be established,because the availability of food resources is diminish-ing in comparison to the need for them. Energy ex-perts should be involved in such assessments, but inorder to be effective they need to be trained how todesign and initiate surveys, analyse the data, and makeimplementable recommendations.
Monitoring and evaluation
After emergency programmes are implemented, theymust be carefully monitored and then evaluated. Emer-gency nutrition is applied nutrition; we are interestedin monitoring the process and the outcome of nutri-tional intervention as well as the impact on the targetpopulation.
In emergencies very large quantities of food commodi-ties are shipped, stored, and distributed. Although it ispossible to track the food to distribution points, it ismuch more difficult to know what happens to the foodafter it is dispensed: who gets what and how much. Itis essential, therefore, to monitor every stage in the move-ment of food commodities and nutritional outcomes.
Food monitors are often placed in refugee camps tohelp authorities to be certain that the distributed goodsactually reach their targeted destinations. Monitors needto acquire the skills to fulfill the following responsi-bilities, among others: (1) checking transport and dis-tribution records and other aspects of the food distri-bution process, (2) determining household-level foodavailability and consumption, (3) identifying essentialinputs for food security interventions, (4) trackingchanges in the nutritional status of the population, and(5) identifying those at risk for malnutrition and per-suading them to seek assistance. All of these tasks aremost efficiently accomplished by persons familiar withthe population. Thus, training programmes to improvelocal capacity (including members of the affected popu-lations) are urgently recommended.
The quantity and type of external food assistancedepend on donor perceptions of need and impact. Itis important, therefore, to document that training andresearch programmes, along with proper interventions,do result in reduced malnutrition rates or that theyare, at least, successful in the prevention of further de-terioration of nutritional status, if that is the objec-tive. Otherwise, future donor response to nutritionalneeds will decline.
Potential roles for nutritionists inpreparedness and post-conflictpeace-building
There are important ethical, conceptual, and policy issuesto be clarified in the work of nutritionists, who must
Emergency nutrition
48
be able to translate humanitarian principles into ac-tions appropriate to the needs of the victims. One ofthe dangers of working in emergency nutrition is a ten-dency to focus on the immediate needs of the victims—perhaps because so much bureaucracy stands betweenthose entitled to receive assistance and its actual deliv-ery. To do this properly requires support of food as ahuman right and opposition to the use of food as aweapon.
Nutritionists should be on the forefront of negotia-tions that affect the availability of food to populationsduring emergencies. They should be trained in meth-ods of improving disaster preparedness, the early warn-ing indicators of impending crises (such as deteriora-tion of the food supply), the art of negotiating for thesafe passage of food (as in Sudan and Bosnia), findingresources for victims of natural disaster (such as arecurrently needed for North Korea), and designing ex-emption programmes for government-imposed sanc-tions. Each of these areas of activity requires specialskills—including diplomatic and political adeptness—which are not currently included in nutrition trainingprogrammes.
During post-conflict peace-building and reconstruc-tion activities, the objectives are to sustain safe and pro-ductive livelihoods as well as lives. This requires a long-term perspective, the opposite of the perspective ofemergency relief, which is perceived as temporary. Thus,policy makers and planners may not regard nutritionas a priority in their post-crisis endeavours; after all,the immediate danger of death from starvation haspassed. However, the inclusion of nutritional consid-erations in the design of development programmes isimportant, as the recovering population is still vulnerableand may not be able to cope with the next crisis.
Nutritionists should be active participants in all stagesof planning to ensure that government programmesare created that will assess and correct deficiencies andthat safety nets are provided for groups vulnerable tomalnutrition. It is highly desirable to train nutrition-ists to communicate and interact effectively with policymakers and planners in order to make convincing ar-guments for including nutritional concerns in acountry’s strategy. In this way they could share the com-mon goal of safeguarding the welfare of the popula-tion and improving the quality of life during recon-struction.
Advocacy
It is essential to promote, support, and advance the causeof nutrition if nutrition programmes and considerations
are to move forward. When nutrition is not perceivedas a priority, it does not receive the prominence neces-sary to get the job accomplished. This may be becausenutritionists do not know how to “sell” their discipline.Excellent technical capacity and expertise are not enough.
The communication gap between nutritionists andpolicy makers must be closed. Policy makers requireeasily understood and implementable recommendations.Nutritionists must be able to prepare documents thatalso serve advocacy purposes. It is also important thatnutritionists be able to convince decision makers thatthere are structural uncertainties that cannot be solvedby simple technical recommendations and that requiremore extensive input.
Training programmes must, therefore, not only stresstechnical report-writing skills, but should explore themethods to accomplish the objectives of advocacy. Suchskills would eventually help to create a policy environ-ment conducive to incorporating nutrition in a country’splanning strategies.
Conclusions
There is little appropriate training available in the man-agement of emergency nutrition. This deficiency canbe met by including additional courses in existing ad-vanced programmes or by creating special courses inuniversities and institutes. In some areas, such as Af-rica, because of the frequency of their emergencies andthe necessity for capacity-building in preparedness,emergency nutrition programmes should be developedthat would strengthen local institutions and train lo-cal persons. There is a special need to build up the nu-tritional capacity of these non-governmental organi-zations, because such organizations are on the spot anddeal with emergencies as they arise. Recipient countrygovernments are the appropriate organizations to carryout the necessary assessments, monitoring, and evalu-ations, as they have the advantage of being on site andof knowing the local languages, customs, and conditions.
A quick and easy way to improve the level of exper-tise and communication skills in emergency nutritionwould be to develop course modules designed for dif-ferent sorts of professionals, e.g., policy makers, tech-nical experts, and food monitors. These modules wouldbe used in workshops and/or training courses in a va-riety of settings. These should then be followed by theestablishment of more elaborate and expensive train-ing opportunities, which would offer field and otheron-site experience. It is most important to establishemergency nutrition as a specialized field and to pro-vide opportunities for specific training in this area.
J. Katona-Apte
Food and Nutrition Bulletin, vo. 19, no. 1 © 1998, The United Nations University. 49
Abstract
This paper reviews the fortification of staple food as atool to prevent micronutrient deficiencies. The rationalefor fortifying salt, wheat flour, milk, and margarine wasdeveloped in the 1920s and 1940s, mainly in industrial-ized countries. At that time, fortification of staple foodswas considered by only a few developing countries. Re-cent research has shown that the prevalences of somedeficiencies (clinical and marginal) in some developingcountries are higher than expected. Even more impor-tant has been the realization that the impact of marginaldeficiencies on health and socio-economic developmentis considerably more important than the impact of clini-cal deficiencies. Iron, vitamin A, and iodine have gainedmore attention, but deficiencies of other micronutrientsare also relevant. This paper shows that fortification ofstaple foods to prevent micronutrient deficiencies is ef-fective, easy, fast, safe, and relatively inexpensive.
Introduction
The scientific rationale, including technology, stability,interactions, and effectiveness, for fortifying staple foodswas developed early this century. In the 1920s and 1940sfortification of salt with iodine, fortification of wheatflour with iron, vitamins B1 and B2, and niacin,fortification of milk with vitamins A and D, andfortification of margarine with vitamins A and D werefully evaluated and included as part of national inter-vention programmes in several countries. For whateverreason, these strategies were adopted only by some de-veloped countries.
Food fortification:A tool for fighting hidden hunger
Alberto Nilson and Jaime Piza
Alberto Nilson is based in São Paulo, Brazil, and is Directorof the Regional Center for Latin America of the VitaminDivision of F. Hoffmann-La Roche Ltd., Basel, Switzerland.Jaime Piza is based in San José, Costa Rica, and is Managerfor Central America and the Caribbean of the Vitamin Divisionof F. Hoffmann-La Roche.
This paper was presented at the Latin American Congressof Nutrition in Guatemala on November 12, 1997.
In the following decades, developing countries gavetheir attention mainly to clinical deficiencies, using themedical approach of supplementing the population athighest risk as soon as symptoms appeared. The mostchallenging problems have been xerophthalmia,anaemia, and goitre. Consequently, attention to othermicronutrients has been practically nil.
Later research has shown that marginal deficiencyis even more important than clinical deficiency, as itcovers larger percentages of the population. Evidencehas been accumulating showing the enormous impactof marginal deficiencies of vitamin A on infant andmaternal mortality and morbidity, of iron on IQ inchildren and working capacity in the whole popula-tion, and of folic acid on neural tube defects.
Furthermore, there is growing evidence that micro-nutrients interact positively with each other. For ex-ample, vitamin C improves the absorption of non-haemiron from foods or supplements, and vitamin A togetherwith supplementary iron is more effective than ironalone in reducing the prevalence of iron deficiency.
Although not the objective of this paper, it is worthmentioning that an adequate intake of some micro-nutrients, mainly vitamins E and C, sometimes at lev-els higher than the established recommended dietaryallowances (RDAs), may play an important role in re-ducing the prevalence of cancer, cardiovascular diseases,and other health problems.
The above facts and the cost of potential interven-tion programmes show that the cost-benefit ratio ofsuch programmes is highly favourable, motivating thescientific community, international agencies, and gov-ernments to seek alternatives for preventing micronu-trient deficiencies through supplementation, fortifica-tion, and dietary diversification.
Staple foods such as wheat flour, milk, and marga-rine traditionally have been considered for fortification.Recent research has looked at alternative vehicles forone or more micronutrients, such as rice, oils, tea, maize,weaning foods, beverages, and foods for complemen-tary feeding programmes [1].
Some more recent successful examples of efforts to
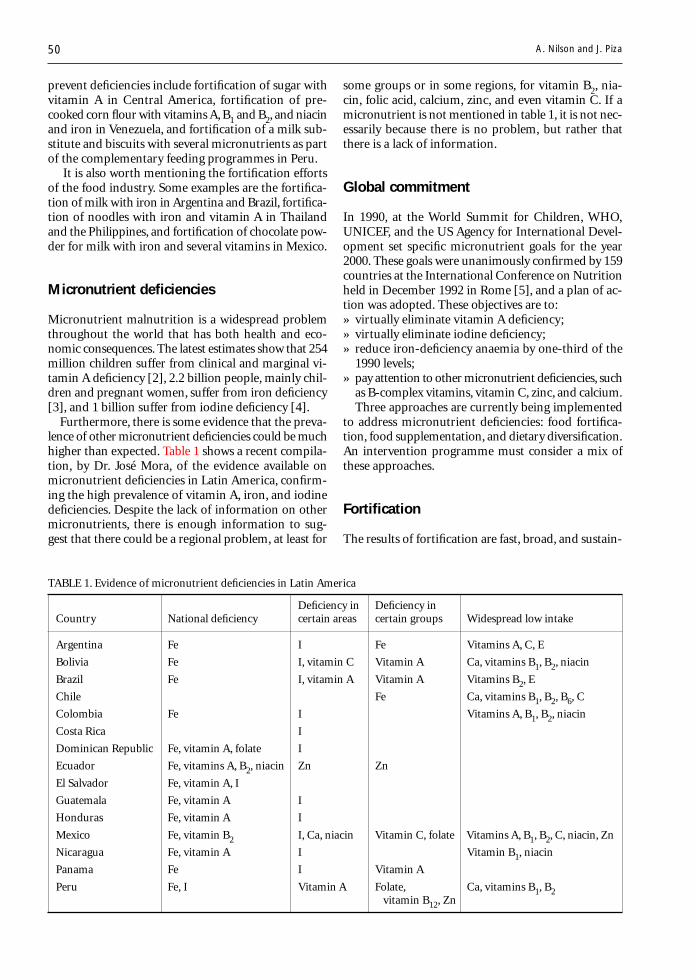
50
prevent deficiencies include fortification of sugar withvitamin A in Central America, fortification of pre-cooked corn flour with vitamins A, B1 and B2, and niacinand iron in Venezuela, and fortification of a milk sub-stitute and biscuits with several micronutrients as partof the complementary feeding programmes in Peru.
It is also worth mentioning the fortification effortsof the food industry. Some examples are the fortifica-tion of milk with iron in Argentina and Brazil, fortifica-tion of noodles with iron and vitamin A in Thailandand the Philippines, and fortification of chocolate pow-der for milk with iron and several vitamins in Mexico.
Micronutrient deficiencies
Micronutrient malnutrition is a widespread problemthroughout the world that has both health and eco-nomic consequences. The latest estimates show that 254million children suffer from clinical and marginal vi-tamin A deficiency [2], 2.2 billion people, mainly chil-dren and pregnant women, suffer from iron deficiency[3], and 1 billion suffer from iodine deficiency [4].
Furthermore, there is some evidence that the preva-lence of other micronutrient deficiencies could be muchhigher than expected. Table 1 shows a recent compila-tion, by Dr. José Mora, of the evidence available onmicronutrient deficiencies in Latin America, confirm-ing the high prevalence of vitamin A, iron, and iodinedeficiencies. Despite the lack of information on othermicronutrients, there is enough information to sug-gest that there could be a regional problem, at least for
some groups or in some regions, for vitamin B2, nia-cin, folic acid, calcium, zinc, and even vitamin C. If amicronutrient is not mentioned in table 1, it is not nec-essarily because there is no problem, but rather thatthere is a lack of information.
Global commitment
In 1990, at the World Summit for Children, WHO,UNICEF, and the US Agency for International Devel-opment set specific micronutrient goals for the year2000. These goals were unanimously confirmed by 159countries at the International Conference on Nutritionheld in December 1992 in Rome [5], and a plan of ac-tion was adopted. These objectives are to:» virtually eliminate vitamin A deficiency;» virtually eliminate iodine deficiency;» reduce iron-deficiency anaemia by one-third of the
1990 levels;» pay attention to other micronutrient deficiencies, such
as B-complex vitamins, vitamin C, zinc, and calcium.Three approaches are currently being implemented
to address micronutrient deficiencies: food fortifica-tion, food supplementation, and dietary diversification.An intervention programme must consider a mix ofthese approaches.
Fortification
The results of fortification are fast, broad, and sustain-
A. Nilson and J. Piza
TABLE 1. Evidence of micronutrient deficiencies in Latin America
Deficiency in Deficiency inCountry National deficiency certain areas certain groups Widespread low intake
Argentina Fe I Fe Vitamins A, C, E
Bolivia Fe I, vitamin C Vitamin A Ca, vitamins B1, B2, niacin
Brazil Fe I, vitamin A Vitamin A Vitamins B2, E
Chile Fe Ca, vitamins B1, B2, B6, C
Colombia Fe I Vitamins A, B1, B2, niacin
Costa Rica I
Dominican Republic Fe, vitamin A, folate I
Ecuador Fe, vitamins A, B2, niacin Zn Zn
El Salvador Fe, vitamin A, I
Guatemala Fe, vitamin A I
Honduras Fe, vitamin A I
Mexico Fe, vitamin B2 I, Ca, niacin Vitamin C, folate Vitamins A, B1, B2, C, niacin, Zn
Nicaragua Fe, vitamin A I Vitamin B1, niacin
Panama Fe I Vitamin A
Peru Fe, I Vitamin A Folate, Ca, vitamins B1, B2 vitamin B12, Zn
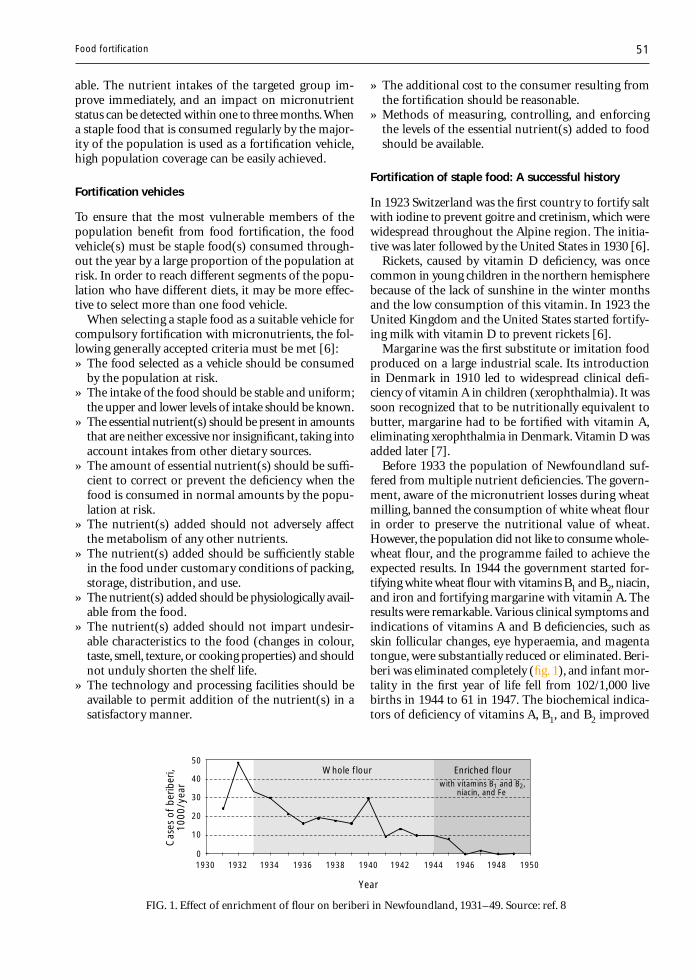
51
able. The nutrient intakes of the targeted group im-prove immediately, and an impact on micronutrientstatus can be detected within one to three months. Whena staple food that is consumed regularly by the major-ity of the population is used as a fortification vehicle,high population coverage can be easily achieved.
Fortification vehicles
To ensure that the most vulnerable members of thepopulation benefit from food fortification, the foodvehicle(s) must be staple food(s) consumed through-out the year by a large proportion of the population atrisk. In order to reach different segments of the popu-lation who have different diets, it may be more effec-tive to select more than one food vehicle.
When selecting a staple food as a suitable vehicle forcompulsory fortification with micronutrients, the fol-lowing generally accepted criteria must be met [6]:» The food selected as a vehicle should be consumed
by the population at risk.» The intake of the food should be stable and uniform;
the upper and lower levels of intake should be known.» The essential nutrient(s) should be present in amounts
that are neither excessive nor insignificant, taking intoaccount intakes from other dietary sources.
» The amount of essential nutrient(s) should be suffi-cient to correct or prevent the deficiency when thefood is consumed in normal amounts by the popu-lation at risk.
» The nutrient(s) added should not adversely affectthe metabolism of any other nutrients.
» The nutrient(s) added should be sufficiently stablein the food under customary conditions of packing,storage, distribution, and use.
» The nutrient(s) added should be physiologically avail-able from the food.
» The nutrient(s) added should not impart undesir-able characteristics to the food (changes in colour,taste, smell, texture, or cooking properties) and shouldnot unduly shorten the shelf life.
» The technology and processing facilities should beavailable to permit addition of the nutrient(s) in asatisfactory manner.
» The additional cost to the consumer resulting fromthe fortification should be reasonable.
» Methods of measuring, controlling, and enforcingthe levels of the essential nutrient(s) added to foodshould be available.
Fortification of staple food: A successful history
In 1923 Switzerland was the first country to fortify saltwith iodine to prevent goitre and cretinism, which werewidespread throughout the Alpine region. The initia-tive was later followed by the United States in 1930 [6].
Rickets, caused by vitamin D deficiency, was oncecommon in young children in the northern hemispherebecause of the lack of sunshine in the winter monthsand the low consumption of this vitamin. In 1923 theUnited Kingdom and the United States started fortify-ing milk with vitamin D to prevent rickets [6].
Margarine was the first substitute or imitation foodproduced on a large industrial scale. Its introductionin Denmark in 1910 led to widespread clinical defi-ciency of vitamin A in children (xerophthalmia). It wassoon recognized that to be nutritionally equivalent tobutter, margarine had to be fortified with vitamin A,eliminating xerophthalmia in Denmark. Vitamin D wasadded later [7].
Before 1933 the population of Newfoundland suf-fered from multiple nutrient deficiencies. The govern-ment, aware of the micronutrient losses during wheatmilling, banned the consumption of white wheat flourin order to preserve the nutritional value of wheat.However, the population did not like to consume whole-wheat flour, and the programme failed to achieve theexpected results. In 1944 the government started for-tifying white wheat flour with vitamins B1 and B2, niacin,and iron and fortifying margarine with vitamin A. Theresults were remarkable. Various clinical symptoms andindications of vitamins A and B deficiencies, such asskin follicular changes, eye hyperaemia, and magentatongue, were substantially reduced or eliminated. Beri-beri was eliminated completely (fig. 1), and infant mor-tality in the first year of life fell from 102/1,000 livebirths in 1944 to 61 in 1947. The biochemical indica-tors of deficiency of vitamins A, B1, and B2 improved
FIG. 1. Effect of enrichment of flour on beriberi in Newfoundland, 1931–49. Source: ref. 8
50
40
30
20
10
01930 1932 1934 1936 1938 1940 1942 1944 1946 1948 1950
Enriched flourwith vitamins B1 and B2,
niacin, and Fe
Whole flour
Cas
es o
f be
riber
i, 10
00/y
ear
Year
Food fortification

52
dramatically as well (fig. 2).In the United States during the late 1930s, pellagra
caused more than 3,000 deaths annually, mainly in thesouthern states among a population relying on maizeas the main staple food. In 1938, three years before themandatory introduction of flour enrichment, bakersvoluntarily began enriching flour with B vitamins andiron. This measure was associated with a rapid and dra-matic decline in pellagra mortality to zero by 1954 (fig. 3).
The introduction of polished rice in the Philippinesat the turn of the century led to large outbreaks of beri-
beri. In 1947, in the Province of Bataan, more than 12%of the population was affected by the disease. The distri-bution of thiamine-fortified rice began on October 1, 1948.This measure was followed by a spectacular reductionin deaths from beriberi from 254/100,000 to 80 (fig. 4).
Fortification of sugar with vitamin A was initiatedin Guatemala in 1974. Sugar was selected because re-searchers from the Institute of Nutrition of CentralAmerica and Panama (INCAP) realized that there wasno other staple food reaching all target groups in thecountry. The prevalence of deficient retinol plasma levelsin children (less than 10 µg per 100 ml) was reducedfrom 3.3% to less than 0.2% within two years (fig. 5).
In 1993 Venezuela started fortifying pre-cooked yellowand white corn flour with vitamins A, B1, and B2, nia-cin, and iron. At the same time wheat flour was forti-fied with vitamins B1 and B2, niacin, and iron. Thesetwo cereals were selected as vehicles because they ac-counted for 45% of the total caloric intake of the popu-lation. A survey carried out in Caracas on 397 chil-dren showed that the prevalence of iron deficiency (asmeasured by serum ferritin concentration) and theprevalence of anaemia were reduced from 37% and 19%,respectively, in 1992 to 15% and 10% in 1994 [12].
In 1994 Guatemala revised the fortification of wheatflour, previously fortified with vitamins B1 and B2, niacin,and iron, to include folic acid, on the basis of availableinformation on the high prevalence of deficiency ofthis vitamin and its function in preventing foetal neu-ral tube defects and some anaemias. This measure waslater followed by nearly all Central American countries.
In 1998 the United States will include folic acid inthe fortification of wheat flour (1.54 mg/kg flour) inorder to prevent the high prevalence of pregnanciesaffected by spina bifida and other neural tube defects.Most of the newborns affected by this problem die. TheUS Public Health Service has recommended that womenof childbearing age consume at least 400 µg of folicacid daily to prevent neural tube defects [13].
Several technologies are available for fortifying rice.Using the technology of simulated kernels, Dr. H. Flores
FIG. 2. Biochemical deficiencies of vitamins in Newfound-land before (1944: grey bars) and after (1948: black bars) en-richment of flour. Source: ref. 8
25
20
15
10
5
0Vitamin A Vitamin B1 Vitamin B2
Bioc
hem
ical
def
icie
ncy
(%)
FIG. 3. Effect of enrichment of flour on deaths from pella-gra in the United States, 1938–54. Source: ref. 9
2500
2000
1500
1000
500
01938 1940 1942 1944 1946 1948 1950 1952 1954
Mandatory enrichment in 22 statesN
umbe
r of
dea
ths
Year
3500
3000
Mandatory enrichment for some states
Bread enrichment
FIG. 4. Effect of enrichment of rice on deaths from beriberi in Bataan, Philippines, 1947– 50. Grey bars:experimental area; black bars: control area. Source: ref. 10
250
200
150
100
50
0
Dea
ths
per
100,
000
peop
le
350
300
Enrichment started in 1 department
Enrichment started in 2 of 5 departments
Jul1947
Oct1947
Jan1948
Apr1948
Jul1948
Oct1948
Jan1949
Apr1949
Jul1949
Oct1949
Jan1950
Apr1950
A. Nilson and J. Piza
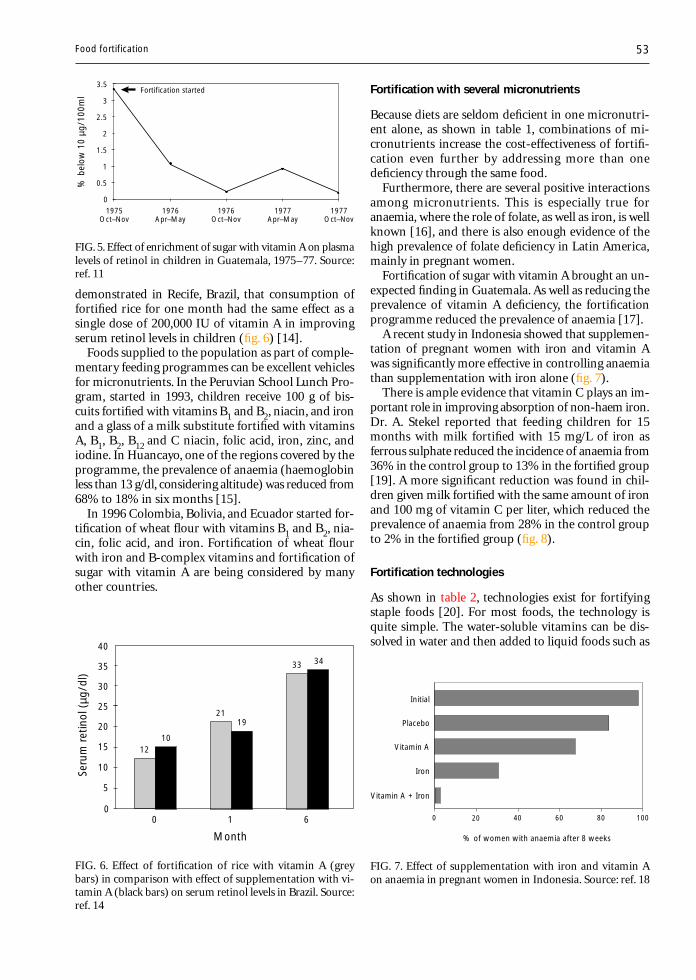
53
demonstrated in Recife, Brazil, that consumption offortified rice for one month had the same effect as asingle dose of 200,000 IU of vitamin A in improvingserum retinol levels in children (fig. 6) [14].
Foods supplied to the population as part of comple-mentary feeding programmes can be excellent vehiclesfor micronutrients. In the Peruvian School Lunch Pro-gram, started in 1993, children receive 100 g of bis-cuits fortified with vitamins B1 and B2, niacin, and ironand a glass of a milk substitute fortified with vitaminsA, B1, B2, B12 and C niacin, folic acid, iron, zinc, andiodine. In Huancayo, one of the regions covered by theprogramme, the prevalence of anaemia (haemoglobinless than 13 g/dl, considering altitude) was reduced from68% to 18% in six months [15].
In 1996 Colombia, Bolivia, and Ecuador started for-tification of wheat flour with vitamins B1 and B2, nia-cin, folic acid, and iron. Fortification of wheat flourwith iron and B-complex vitamins and fortification ofsugar with vitamin A are being considered by manyother countries.
Fortification with several micronutrients
Because diets are seldom deficient in one micronutri-ent alone, as shown in table 1, combinations of mi-cronutrients increase the cost-effectiveness of fortifi-cation even further by addressing more than onedeficiency through the same food.
Furthermore, there are several positive interactionsamong micronutrients. This is especially true foranaemia, where the role of folate, as well as iron, is wellknown [16], and there is also enough evidence of thehigh prevalence of folate deficiency in Latin America,mainly in pregnant women.
Fortification of sugar with vitamin A brought an un-expected finding in Guatemala. As well as reducing theprevalence of vitamin A deficiency, the fortificationprogramme reduced the prevalence of anaemia [17].
A recent study in Indonesia showed that supplemen-tation of pregnant women with iron and vitamin Awas significantly more effective in controlling anaemiathan supplementation with iron alone (fig. 7).
There is ample evidence that vitamin C plays an im-portant role in improving absorption of non-haem iron.Dr. A. Stekel reported that feeding children for 15months with milk fortified with 15 mg/L of iron asferrous sulphate reduced the incidence of anaemia from36% in the control group to 13% in the fortified group[19]. A more significant reduction was found in chil-dren given milk fortified with the same amount of ironand 100 mg of vitamin C per liter, which reduced theprevalence of anaemia from 28% in the control groupto 2% in the fortified group (fig. 8).
Fortification technologies
As shown in table 2, technologies exist for fortifyingstaple foods [20]. For most foods, the technology isquite simple. The water-soluble vitamins can be dis-solved in water and then added to liquid foods such as
FIG. 5. Effect of enrichment of sugar with vitamin A on plasmalevels of retinol in children in Guatemala, 1975–77. Source:ref. 11
2.5
2
1.5
1
0.5
01975
Oct–Nov
% b
elow
10
µg/1
00m
l3.5
3Fortification started
1976Apr–May
1976Oct–Nov
1977Apr–May
1977Oct–Nov
FIG. 6. Effect of fortification of rice with vitamin A (greybars) in comparison with effect of supplementation with vi-tamin A (black bars) on serum retinol levels in Brazil. Source:ref. 14
25
20
15
10
5
0
Seru
m r
etin
ol (
µg/d
l)
35
30
0 1 6
40
1210
2119
33 34
Month
FIG. 7. Effect of supplementation with iron and vitamin Aon anaemia in pregnant women in Indonesia. Source: ref. 18
% of women with anaemia after 8 weeks
0 20 40 60 80 100
Initial
Placebo
Vitamin A
Iron
Vitamin A + Iron
Food fortification
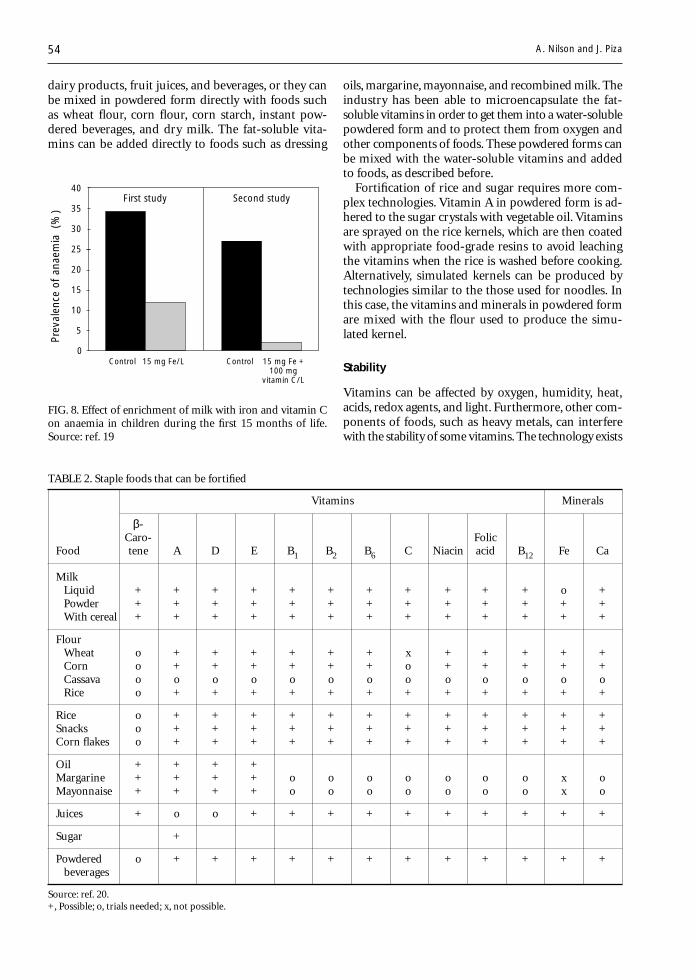
54
oils, margarine, mayonnaise, and recombined milk. Theindustry has been able to microencapsulate the fat-soluble vitamins in order to get them into a water-solublepowdered form and to protect them from oxygen andother components of foods. These powdered forms canbe mixed with the water-soluble vitamins and addedto foods, as described before.
Fortification of rice and sugar requires more com-plex technologies. Vitamin A in powdered form is ad-hered to the sugar crystals with vegetable oil. Vitaminsare sprayed on the rice kernels, which are then coatedwith appropriate food-grade resins to avoid leachingthe vitamins when the rice is washed before cooking.Alternatively, simulated kernels can be produced bytechnologies similar to the those used for noodles. Inthis case, the vitamins and minerals in powdered formare mixed with the flour used to produce the simu-lated kernel.
Stability
Vitamins can be affected by oxygen, humidity, heat,acids, redox agents, and light. Furthermore, other com-ponents of foods, such as heavy metals, can interferewith the stability of some vitamins. The technology exists
FIG. 8. Effect of enrichment of milk with iron and vitamin Con anaemia in children during the first 15 months of life.Source: ref. 19
Prev
alen
ce o
f an
aem
ia (
%)
25
20
15
10
5
0
35
30
40Second study
Control 15 mg Fe/L Control 15 mg Fe +100 mg
vitamin C/L
First study
TABLE 2. Staple foods that can be fortified
Vitamins Minerals
β-Caro- Folic
Food tene A D E B1 B2 B6 C Niacin acid B12 Fe Ca
MilkLiquid + + + + + + + + + + + o +Powder + + + + + + + + + + + + +With cereal + + + + + + + + + + + + +
FlourWheat o + + + + + + x + + + + +Corn o + + + + + + o + + + + +Cassava o o o o o o o o o o o o oRice o + + + + + + + + + + + +
Rice o + + + + + + + + + + + +Snacks o + + + + + + + + + + + +Corn flakes o + + + + + + + + + + + +
Oil + + + +Margarine + + + + o o o o o o o x oMayonnaise + + + + o o o o o o o x o
Juices + o o + + + + + + + + + +
Sugar +
Powdered o + + + + + + + + + + + + beverages
Source: ref. 20.+, Possible; o, trials needed; x, not possible.
dairy products, fruit juices, and beverages, or they canbe mixed in powdered form directly with foods suchas wheat flour, corn flour, corn starch, instant pow-dered beverages, and dry milk. The fat-soluble vita-mins can be added directly to foods such as dressing
A. Nilson and J. Piza

55
to prevent losses, but losses cannot be totally avoided.To ensure that the food contains the declared vitaminlevels when it is ingested, the food industry adds extranutrients to compensate for losses during processingand over the shelf life of the finished product.
Figure 9 shows that vitamin A is very stable whenmicroencapsulated in powdered form and added todifferent flours, even when the flours are fortified withiron at the same time. When wheat flour is fortified,the typical losses during the production of bread andbiscuits are 30% to 40% for vitamin A, 20% to 30%for vitamin B1, 15% to 20% for vitamin B2, 5% to 10%for niacin, and 15% to 20% for folic acid.
Figure 10 shows the stability of vitamins in pre-cookedcorn flour during the production of arepas (corn bread),according to results from our laboratories in Switzer-land. It is worth mentioning that the flour was alsofortified with iron.
Bioavailabilty
It is generally recognized that the bioavailability of vi-tamins added to foods is about the same as for thoseoriginally present in foods. Carotenoids and iron, how-ever, require more attention. β-Carotene present in foodsis less bioavailable than β-carotene added as a colouror fortificant. The bioavailability of iron depends onseveral factors. For reduced iron, the most importantfactor is the mesh size of the form used, the smallestsize being the best. Figure 11 shows the relativebioavailability of some typical forms of iron used tofortify foods. As mentioned before, vitamin C signifi-cantly improves the bioavailability of non-haem formsof iron.
When selecting the form of iron to be used in thefortification of a food, in addition to its relativebioavailability, the food industry has to consider its costand potential interactions with the food. Table 3 showsthe relative cost of typical forms of iron.
FIG. 9. Stability of 11,000 IU/kg vitamin A added to flours at 27°C after one month(white bars), three months (grey bars), and six months (black bars). Source: ref. 21
Ret
entio
n (%
)
80
40
20
0
100
60
Wheat Wheat (cake) Corn (flour) Corn (meal)
FIG. 10. Stability of vitamins in pre-cooked corn flour (grey bars) and corn bread(arepas)(black bars) in Venezuela. White bars, percentage at addition. Source: unpub-lished data of the authors
Ret
entio
n (%
)
Vitamin A Vitamin B1 Vitamin B2 Niacin
80
40
20
0
100
60
1207.4 mg/kg1550 IU/kg 3.4 mg/kg 53 mg/kg
Food fortification
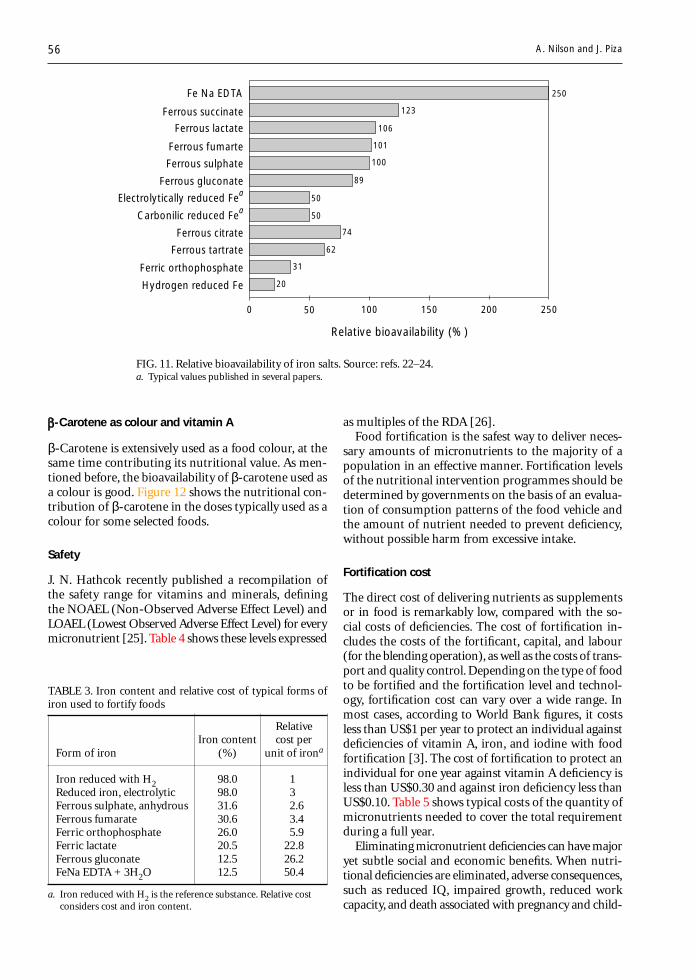
56
-Carotene as colour and vitamin A
β-Carotene is extensively used as a food colour, at thesame time contributing its nutritional value. As men-tioned before, the bioavailability of β-carotene used asa colour is good. Figure 12 shows the nutritional con-tribution of β-carotene in the doses typically used as acolour for some selected foods.
Safety
J. N. Hathcok recently published a recompilation ofthe safety range for vitamins and minerals, definingthe NOAEL (Non-Observed Adverse Effect Level) andLOAEL (Lowest Observed Adverse Effect Level) for everymicronutrient [25]. Table 4 shows these levels expressed
as multiples of the RDA [26].Food fortification is the safest way to deliver neces-
sary amounts of micronutrients to the majority of apopulation in an effective manner. Fortification levelsof the nutritional intervention programmes should bedetermined by governments on the basis of an evalua-tion of consumption patterns of the food vehicle andthe amount of nutrient needed to prevent deficiency,without possible harm from excessive intake.
Fortification cost
The direct cost of delivering nutrients as supplementsor in food is remarkably low, compared with the so-cial costs of deficiencies. The cost of fortification in-cludes the costs of the fortificant, capital, and labour(for the blending operation), as well as the costs of trans-port and quality control. Depending on the type of foodto be fortified and the fortification level and technol-ogy, fortification cost can vary over a wide range. Inmost cases, according to World Bank figures, it costsless than US$1 per year to protect an individual againstdeficiencies of vitamin A, iron, and iodine with foodfortification [3]. The cost of fortification to protect anindividual for one year against vitamin A deficiency isless than US$0.30 and against iron deficiency less thanUS$0.10. Table 5 shows typical costs of the quantity ofmicronutrients needed to cover the total requirementduring a full year.
Eliminating micronutrient deficiencies can have majoryet subtle social and economic benefits. When nutri-tional deficiencies are eliminated, adverse consequences,such as reduced IQ, impaired growth, reduced workcapacity, and death associated with pregnancy and child-
FIG. 11. Relative bioavailability of iron salts. Source: refs. 22–24.a. Typical values published in several papers.
0 50 100 150 200 250
Ferrous succinate
Ferrous lactate
Ferrous fumarte
Ferrous sulphate
Ferrous gluconate
250
123
106
101
100
89
50
50
74
62
31
20
Fe Na EDTA
Electrolytically reduced Fea
Carbonilic reduced Fea
Ferrous citrate
Ferrous tartrate
Ferric orthophosphate
Hydrogen reduced Fe
Relative bioavailability (%)
TABLE 3. Iron content and relative cost of typical forms ofiron used to fortify foods
RelativeIron content cost per
Form of iron (%) unit of irona
Iron reduced with H2 98.0 1Reduced iron, electrolytic 98.0 3Ferrous sulphate, anhydrous 31.6 2.6Ferrous fumarate 30.6 3.4Ferric orthophosphate 26.0 5.9Ferric lactate 20.5 22.8Ferrous gluconate 12.5 26.2FeNa EDTA + 3H2O 12.5 50.4
a. Iron reduced with H2 is the reference substance. Relative costconsiders cost and iron content.
A. Nilson and J. Piza
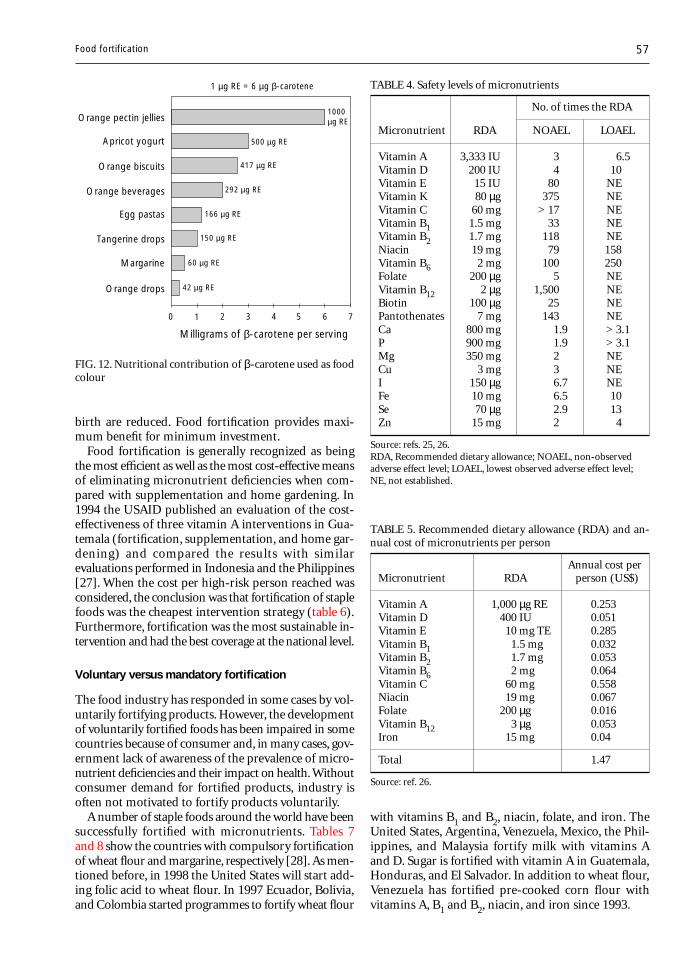
57
birth are reduced. Food fortification provides maxi-mum benefit for minimum investment.
Food fortification is generally recognized as beingthe most efficient as well as the most cost-effective meansof eliminating micronutrient deficiencies when com-pared with supplementation and home gardening. In1994 the USAID published an evaluation of the cost-effectiveness of three vitamin A interventions in Gua-temala (fortification, supplementation, and home gar-dening) and compared the results with similarevaluations performed in Indonesia and the Philippines[27]. When the cost per high-risk person reached wasconsidered, the conclusion was that fortification of staplefoods was the cheapest intervention strategy (table 6).Furthermore, fortification was the most sustainable in-tervention and had the best coverage at the national level.
Voluntary versus mandatory fortification
The food industry has responded in some cases by vol-untarily fortifying products. However, the developmentof voluntarily fortified foods has been impaired in somecountries because of consumer and, in many cases, gov-ernment lack of awareness of the prevalence of micro-nutrient deficiencies and their impact on health. Withoutconsumer demand for fortified products, industry isoften not motivated to fortify products voluntarily.
A number of staple foods around the world have beensuccessfully fortified with micronutrients. Tables 7and 8 show the countries with compulsory fortificationof wheat flour and margarine, respectively [28]. As men-tioned before, in 1998 the United States will start add-ing folic acid to wheat flour. In 1997 Ecuador, Bolivia,and Colombia started programmes to fortify wheat flour
with vitamins B1 and B2, niacin, folate, and iron. TheUnited States, Argentina, Venezuela, Mexico, the Phil-ippines, and Malaysia fortify milk with vitamins Aand D. Sugar is fortified with vitamin A in Guatemala,Honduras, and El Salvador. In addition to wheat flour,Venezuela has fortified pre-cooked corn flour withvitamins A, B1 and B2, niacin, and iron since 1993.
TABLE 4. Safety levels of micronutrients
No. of times the RDA
Micronutrient RDA NOAEL LOAEL
Vitamin A 3,333 IU 3 6.5Vitamin D 200 IU 4 10Vitamin E 15 IU 80 NEVitamin K 80 µg 375 NEVitamin C 60 mg > 17 NEVitamin B1 1.5 mg 33 NEVitamin B2 1.7 mg 118 NENiacin 19 mg 79 158Vitamin B6 2 mg 100 250Folate 200 µg 5 NEVitamin B12 2 µg 1,500 NEBiotin 100 µg 25 NEPantothenates 7 mg 143 NECa 800 mg 1.9 > 3.1P 900 mg 1.9 > 3.1Mg 350 mg 2 NECu 3 mg 3 NEI 150 µg 6.7 NEFe 10 mg 6.5 10Se 70 µg 2.9 13Zn 15 mg 2 4
Source: refs. 25, 26.RDA, Recommended dietary allowance; NOAEL, non-observedadverse effect level; LOAEL, lowest observed adverse effect level;NE, not established.
FIG. 12. Nutritional contribution of β-carotene used as foodcolour
0 1
Milligrams of β-carotene per serving
2 3 4 765
Orange pectin jellies
Apricot yogurt
Orange biscuits
Orange beverages
Orange drops
Margarine
Tangerine drops
Egg pastas
1000 µg RE
292 µg RE
166 µg RE
150 µg RE
500 µg RE
417 µg RE
60 µg RE
42 µg RE
1 µg RE = 6 µg β-carotene
TABLE 5. Recommended dietary allowance (RDA) and an-nual cost of micronutrients per person
Annual cost perMicronutrient RDA person (US$)
Vitamin A 1,000 µg RE 0.253Vitamin D 400 IU 0.051Vitamin E 10 mg TE 0.285Vitamin B1 1.5 mg 0.032Vitamin B2 1.7 mg 0.053Vitamin B6 2 mg 0.064Vitamin C 60 mg 0.558Niacin 19 mg 0.067Folate 200 µg 0.016Vitamin B12 3 µg 0.053Iron 15 mg 0.04
Total 1.47
Source: ref. 26.
Food fortification
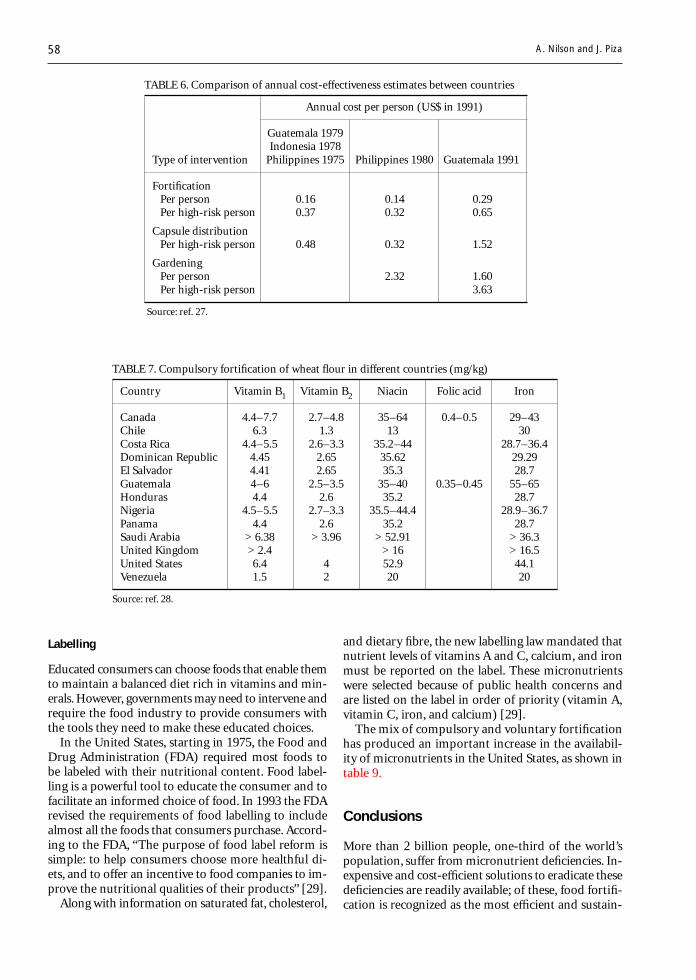
58
TABLE 6. Comparison of annual cost-effectiveness estimates between countries
Annual cost per person (US$ in 1991)
Guatemala 1979Indonesia 1978
Type of intervention Philippines 1975 Philippines 1980 Guatemala 1991
FortificationPer person 0.16 0.14 0.29Per high-risk person 0.37 0.32 0.65
Capsule distributionPer high-risk person 0.48 0.32 1.52
GardeningPer person 2.32 1.60Per high-risk person 3.63
Source: ref. 27.
and dietary fibre, the new labelling law mandated thatnutrient levels of vitamins A and C, calcium, and ironmust be reported on the label. These micronutrientswere selected because of public health concerns andare listed on the label in order of priority (vitamin A,vitamin C, iron, and calcium) [29].
The mix of compulsory and voluntary fortificationhas produced an important increase in the availabil-ity of micronutrients in the United States, as shown intable 9.
Conclusions
More than 2 billion people, one-third of the world’spopulation, suffer from micronutrient deficiencies. In-expensive and cost-efficient solutions to eradicate thesedeficiencies are readily available; of these, food fortifi-cation is recognized as the most efficient and sustain-
TABLE 7. Compulsory fortification of wheat flour in different countries (mg/kg)
Country Vitamin B1 Vitamin B2 Niacin Folic acid Iron
Canada 4.4–7.7 2.7–4.8 35–64 0.4–0.5 29–43Chile 6.3 1.3 13 30Costa Rica 4.4–5.5 2.6–3.3 35.2–44 28.7–36.4Dominican Republic 4.45 2.65 35.62 29.29El Salvador 4.41 2.65 35.3 28.7Guatemala 4–6 2.5–3.5 35–40 0.35–0.45 55–65Honduras 4.4 2.6 35.2 28.7Nigeria 4.5–5.5 2.7–3.3 35.5–44.4 28.9–36.7Panama 4.4 2.6 35.2 28.7Saudi Arabia > 6.38 > 3.96 > 52.91 > 36.3United Kingdom > 2.4 > 16 > 16.5United States 6.4 4 52.9 44.1Venezuela 1.5 2 20 20
Source: ref. 28.
A. Nilson and J. Piza
Labelling
Educated consumers can choose foods that enable themto maintain a balanced diet rich in vitamins and min-erals. However, governments may need to intervene andrequire the food industry to provide consumers withthe tools they need to make these educated choices.
In the United States, starting in 1975, the Food andDrug Administration (FDA) required most foods tobe labeled with their nutritional content. Food label-ling is a powerful tool to educate the consumer and tofacilitate an informed choice of food. In 1993 the FDArevised the requirements of food labelling to includealmost all the foods that consumers purchase. Accord-ing to the FDA, “The purpose of food label reform issimple: to help consumers choose more healthful di-ets, and to offer an incentive to food companies to im-prove the nutritional qualities of their products” [29].
Along with information on saturated fat, cholesterol,
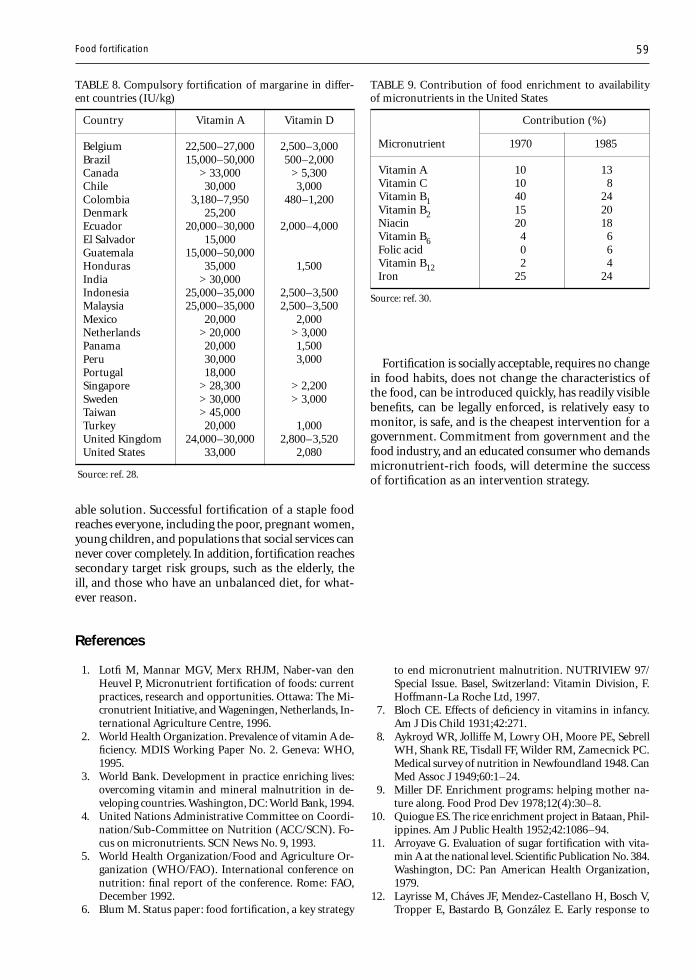
59
able solution. Successful fortification of a staple foodreaches everyone, including the poor, pregnant women,young children, and populations that social services cannever cover completely. In addition, fortification reachessecondary target risk groups, such as the elderly, theill, and those who have an unbalanced diet, for what-ever reason.
TABLE 8. Compulsory fortification of margarine in differ-ent countries (IU/kg)
Country Vitamin A Vitamin D
Belgium 22,500–27,000 2,500–3,000Brazil 15,000–50,000 500–2,000Canada > 33,000 > 5,300Chile 30,000 3,000Colombia 3,180–7,950 480–1,200Denmark 25,200Ecuador 20,000–30,000 2,000–4,000El Salvador 15,000Guatemala 15,000–50,000Honduras 35,000 1,500India > 30,000Indonesia 25,000–35,000 2,500–3,500Malaysia 25,000–35,000 2,500–3,500Mexico 20,000 2,000Netherlands > 20,000 > 3,000Panama 20,000 1,500Peru 30,000 3,000Portugal 18,000Singapore > 28,300 > 2,200Sweden > 30,000 > 3,000Taiwan > 45,000Turkey 20,000 1,000United Kingdom 24,000–30,000 2,800–3,520United States 33,000 2,080
Source: ref. 28.
TABLE 9. Contribution of food enrichment to availabilityof micronutrients in the United States
Contribution (%)
Micronutrient 1970 1985
Vitamin A 10 13Vitamin C 10 8Vitamin B1 40 24Vitamin B2 15 20Niacin 20 18Vitamin B6 4 6Folic acid 0 6Vitamin B12 2 4Iron 25 24
Source: ref. 30.
References
1. Lotfi M, Mannar MGV, Merx RHJM, Naber-van denHeuvel P, Micronutrient fortification of foods: currentpractices, research and opportunities. Ottawa: The Mi-cronutrient Initiative, and Wageningen, Netherlands, In-ternational Agriculture Centre, 1996.
2. World Health Organization. Prevalence of vitamin A de-ficiency. MDIS Working Paper No. 2. Geneva: WHO,1995.
3. World Bank. Development in practice enriching lives:overcoming vitamin and mineral malnutrition in de-veloping countries. Washington, DC: World Bank, 1994.
4. United Nations Administrative Committee on Coordi-nation/Sub-Committee on Nutrition (ACC/SCN). Fo-cus on micronutrients. SCN News No. 9, 1993.
5. World Health Organization/Food and Agriculture Or-ganization (WHO/FAO). International conference onnutrition: final report of the conference. Rome: FAO,December 1992.
6. Blum M. Status paper: food fortification, a key strategy
to end micronutrient malnutrition. NUTRIVIEW 97/Special Issue. Basel, Switzerland: Vitamin Division, F.Hoffmann-La Roche Ltd, 1997.
7. Bloch CE. Effects of deficiency in vitamins in infancy.Am J Dis Child 1931;42:271.
8. Aykroyd WR, Jolliffe M, Lowry OH, Moore PE, SebrellWH, Shank RE, Tisdall FF, Wilder RM, Zamecnick PC.Medical survey of nutrition in Newfoundland 1948. CanMed Assoc J 1949;60:1–24.
9. Miller DF. Enrichment programs: helping mother na-ture along. Food Prod Dev 1978;12(4):30–8.
10. Quiogue ES. The rice enrichment project in Bataan, Phil-ippines. Am J Public Health 1952;42:1086–94.
11. Arroyave G. Evaluation of sugar fortification with vita-min A at the national level. Scientific Publication No. 384.Washington, DC: Pan American Health Organization,1979.
12. Layrisse M, Cháves JF, Mendez-Castellano H, Bosch V,Tropper E, Bastardo B, González E. Early response to
Fortification is socially acceptable, requires no changein food habits, does not change the characteristics ofthe food, can be introduced quickly, has readily visiblebenefits, can be legally enforced, is relatively easy tomonitor, is safe, and is the cheapest intervention for agovernment. Commitment from government and thefood industry, and an educated consumer who demandsmicronutrient-rich foods, will determine the successof fortification as an intervention strategy.
Food fortification

60
the effect of iron fortification in the Venezuelan popu-lation. Am J Clin Nutr 1996;64:903–7.
13. US Federal Register, 1996; Vol. 61, No. 173.14. Flores H. Fortification of rice with vitamin A. NUTRIVIEW
3/96. Basel, Switzerland: Vitamin Division, F. Hoffmann-La Roche Ltd, 1996.
15. Pollitt E, Jacoby E, Cueto S. School breakfast and cog-nition among nutritionally at-risk children in the Pe-ruvian Andes. Nutr Rev 1996;54:5522–6.
16. Machiln LJ, ed. Handbook of vitamins. 2nd ed. NewYork: Marcel Dekker, 1991.
17. Mejía L. Vitamin A deficiency as a factor in nutritionalanemia. In: Hanck A, Hornig D, eds. Vitamins: nutri-ents and therapeutic agents. J Vit Nutr Res (suppl 27).Bern, Stuttgart, Toronto: Hans Huber, 1985:75–84.
18. Suharno D, West CE, Karyadi D, Hautvast JGAJ. Supple-mentation with vitamin A and iron for nutritional anemiain pregnant women in West Java, Indonesia. Lancet1993;342:1325–8.
19. Stekel A. The role of ascorbic acid in the bioavailabilityof iron from infant foods. In: Hanck A, Hornig D, eds.Vitamins: nutrients and therapeutic agents. J Vit NutrRes (suppl 27). Bern, Stuttgart, Toronto: Hans Huber,1985:165–75.
20. Nilson A. Fortification of staple food. NUTRIVIEW 3/94. Basel, Switzerland: Vitamin Division, F. Hoffmann-La Roche Ltd, 1994.
21. Parrish DB, Eustace WD, Ponte JG, Herod LH. Distri-bution of vitamin A fortified flours and effect of pro-cessing, simulated shipping and storage. Cereal Chem1980;57:284–7.
22. Iron EDTA for food fortification. A report of the Inter-national Anemia Consultative Group (INACG). Wash-ington, DC: INACG, 1993.
23. Hurrell RF. Nonelemental sources. In: Clydesdale FM,Wiemer KL, eds. Iron fortification of foods. Orlando,Fla, USA: Academic Press, 1985:39–53.
24. Shah BG, Giroux A, Belonje B. Specifications for reducediron as a food additive. J Agric Food Chem 1977;25:592–4.
25. Hathcok JN. Vitamin and mineral safety. Washington,DC: Council for Responsible Nutrition, 1997.
26. Food and Nutrition Board, National Research Council.Recommended dietary allowances. 10th ed. Washing-ton, DC: National Academy Press, 1989.
27. Phillips M, Sanghvi T, Suárez R, McKigney J, Vargas V,Wickham C. The costs and effectiveness of three vita-min A interventions in Guatemala. Washington, DC: USAgency for International Development, 1994.
28. Raunhardt O, Bowley A. Mandatory food enrichment.NUTRIVIEW, Supplement to 1/1996. Basel, Switzerland:Vitamin Division, F. Hoffmann-La Roche Ltd, 1996.
29. US Federal Register, 1993; Vol. 58, No. 3, January 6.30. LaChance PA, Bauernfeind J. Concepts and practices of
nutrifying foods. In: Bauernfeind J, LaChance PA, eds.Nutrient additions to food. Trumbull, Conn, USA: Foodand Nutrition Press, 1991:19–86.
A. Nilson and J. Piza
Food and Nutrition Bulletin, vo. 19, no. 1 © 1998, The United Nations University. 61
Abstract
In this era of ever-increasing world population, newerfood and feed crops that have been hitherto neglected aregaining recognition. The rejection of such lesser-knownfood crops has been due not to any inferiority but to thelack of research resources in the place of origin and oftento their being scorned as “poor people’s plants.” The ge-nus Chenopodium supplies tasty and nutritious leavesas well as pink- to cream-coloured edible seeds. Toler-ance to cold, drought, and salinity and the high lysinecontent of the seed protein are the attractive features ofquinoa (Chenopodium quinoa), the most frequently con-sumed species in the Andean regions of South America,Africa, some parts of Asia, and Europe. This review com-pares and evaluates the nutritional and antinutritionalconstituents of the leaves and seeds of C. quinoa vis-à-vis their conventional counterparts and argues for theacceptance of this plant in human diets.
Introduction
Most of the world’s food today comes from a mere 20or so plant species. Throughout history mankind hasused some 3,000 plant species for food, but over thecenturies the tendency has been to concentrate on fewerand fewer. The rejection of lesser-known food cropshas not been due to any inherent inferiority. Many havebeen overlooked merely because they are native to thetropics, a region generally neglected because the world’sresearch resources are concentrated in the temperatezones. Others are neglected because they are scornedas “poor people’s plants.”
Quinoa (Chenopodium quinoa) is one of the lesser-known food crops, a poor people’s crop that is native
A lesser-known grain, Chenopodium quinoa:Review of the chemical composition of its edible parts
N. Thoufeek Ahamed, Rekha S. Singhal, Pushpa R. Kulkarni, and Mohinder Pal
N. Thoufeek Ahamed, Rekha S. Singhal, and Pushpa R.Kulkarni are affiliated with the Food and FermentationTechnology Division in the University Department of ChemicalTechnology in Bombay, India. Mohinder Pal is affiliated withthe National Botanical Research Institute in Lucknow, India.
to the Andean regions of South America [1]. In con-trast to maize, potatoes, and Phaseolus beans, all of whichare staple crops originating from the Andes, quinoahas not attained global importance, possibly becausethe bitter, antinutritional saponins [2] need to be re-moved from the seed before cooking or processing [3].
Quinoa has an exceptionally attractive amino acidbalance for human nutrition because of its high levelof lysine. The tasty and nutritious leaves and seeds areconsumed frequently in the Andean regions of SouthAmerica, Africa, some parts of Asia, and Europe. Theplant is native to Peru, and the seeds are used whole insoups or ground into flour to make bread and cakes[4]. The seeds are also used as poultry feed, in medi-cine, and for making beer.
Agronomic aspects of Chenopodium
C. quinoa is a dicotyledonous plant and is botanicallyclassified as follows [5]:
Subclass: DicotyledoneaeGroup: ThalamifloraeOrder: CaryophyllalesFamily: ChenopodiaceaeGenus: ChenopodiumSpecies: quinoa
The family Chenopodiaceae is composed of herbsand shrubs, or rarely small trees, that usually grow inalkaline soil. The plants are usually scruffy because oftheir external cells that dry into white flakes. The leavesare simple, sometimes more or less succulent or re-duced to small scales, and usually alternate but rarelyopposite. There are no stipules and the flowers are bi-sexual or rarely unisexual [6].
The family is found worldwide but it is centred inalkaline areas. Some species are restricted to wet, salty,or alkaline soil, such as that of coastal marshes or al-kaline plains and desert areas. On the whole, the familyis made up of weedy plants. Some of the more impor-tant genera are Chenopodium (goosefoot, pigweed, orlamb’s quarters), Kochia (red sage), and Salsola [5].
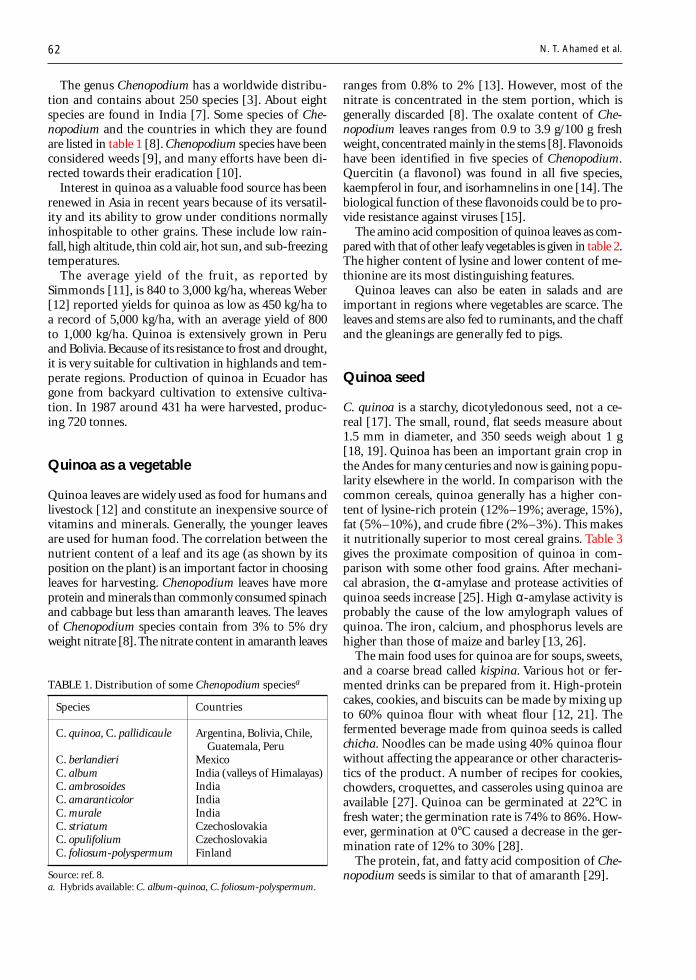
62
The genus Chenopodium has a worldwide distribu-tion and contains about 250 species [3]. About eightspecies are found in India [7]. Some species of Che-nopodium and the countries in which they are foundare listed in table 1 [8]. Chenopodium species have beenconsidered weeds [9], and many efforts have been di-rected towards their eradication [10].
Interest in quinoa as a valuable food source has beenrenewed in Asia in recent years because of its versatil-ity and its ability to grow under conditions normallyinhospitable to other grains. These include low rain-fall, high altitude, thin cold air, hot sun, and sub-freezingtemperatures.
The average yield of the fruit, as reported bySimmonds [11], is 840 to 3,000 kg/ha, whereas Weber[12] reported yields for quinoa as low as 450 kg/ha toa record of 5,000 kg/ha, with an average yield of 800to 1,000 kg/ha. Quinoa is extensively grown in Peruand Bolivia. Because of its resistance to frost and drought,it is very suitable for cultivation in highlands and tem-perate regions. Production of quinoa in Ecuador hasgone from backyard cultivation to extensive cultiva-tion. In 1987 around 431 ha were harvested, produc-ing 720 tonnes.
Quinoa as a vegetable
Quinoa leaves are widely used as food for humans andlivestock [12] and constitute an inexpensive source ofvitamins and minerals. Generally, the younger leavesare used for human food. The correlation between thenutrient content of a leaf and its age (as shown by itsposition on the plant) is an important factor in choosingleaves for harvesting. Chenopodium leaves have moreprotein and minerals than commonly consumed spinachand cabbage but less than amaranth leaves. The leavesof Chenopodium species contain from 3% to 5% dryweight nitrate [8]. The nitrate content in amaranth leaves
ranges from 0.8% to 2% [13]. However, most of thenitrate is concentrated in the stem portion, which isgenerally discarded [8]. The oxalate content of Che-nopodium leaves ranges from 0.9 to 3.9 g/100 g freshweight, concentrated mainly in the stems [8]. Flavonoidshave been identified in five species of Chenopodium.Quercitin (a flavonol) was found in all five species,kaempferol in four, and isorhamnelins in one [14]. Thebiological function of these flavonoids could be to pro-vide resistance against viruses [15].
The amino acid composition of quinoa leaves as com-pared with that of other leafy vegetables is given in table 2.The higher content of lysine and lower content of me-thionine are its most distinguishing features.
Quinoa leaves can also be eaten in salads and areimportant in regions where vegetables are scarce. Theleaves and stems are also fed to ruminants, and the chaffand the gleanings are generally fed to pigs.
Quinoa seed
C. quinoa is a starchy, dicotyledonous seed, not a ce-real [17]. The small, round, flat seeds measure about1.5 mm in diameter, and 350 seeds weigh about 1 g[18, 19]. Quinoa has been an important grain crop inthe Andes for many centuries and now is gaining popu-larity elsewhere in the world. In comparison with thecommon cereals, quinoa generally has a higher con-tent of lysine-rich protein (12%–19%; average, 15%),fat (5%–10%), and crude fibre (2%–3%). This makesit nutritionally superior to most cereal grains. Table 3gives the proximate composition of quinoa in com-parison with some other food grains. After mechani-cal abrasion, the α-amylase and protease activities ofquinoa seeds increase [25]. High α-amylase activity isprobably the cause of the low amylograph values ofquinoa. The iron, calcium, and phosphorus levels arehigher than those of maize and barley [13, 26].
The main food uses for quinoa are for soups, sweets,and a coarse bread called kispina. Various hot or fer-mented drinks can be prepared from it. High-proteincakes, cookies, and biscuits can be made by mixing upto 60% quinoa flour with wheat flour [12, 21]. Thefermented beverage made from quinoa seeds is calledchicha. Noodles can be made using 40% quinoa flourwithout affecting the appearance or other characteris-tics of the product. A number of recipes for cookies,chowders, croquettes, and casseroles using quinoa areavailable [27]. Quinoa can be germinated at 22°C infresh water; the germination rate is 74% to 86%. How-ever, germination at 0°C caused a decrease in the ger-mination rate of 12% to 30% [28].
The protein, fat, and fatty acid composition of Che-nopodium seeds is similar to that of amaranth [29].
TABLE 1. Distribution of some Chenopodium speciesa
Species Countries
C. quinoa, C. pallidicaule Argentina, Bolivia, Chile,Guatemala, Peru
C. berlandieri MexicoC. album India (valleys of Himalayas)C. ambrosoides IndiaC. amaranticolor IndiaC. murale IndiaC. striatum CzechoslovakiaC. opulifolium CzechoslovakiaC. foliosum-polyspermum Finland
Source: ref. 8.a. Hybrids available: C. album-quinoa, C. foliosum-polyspermum.
N. T. Ahamed et al.
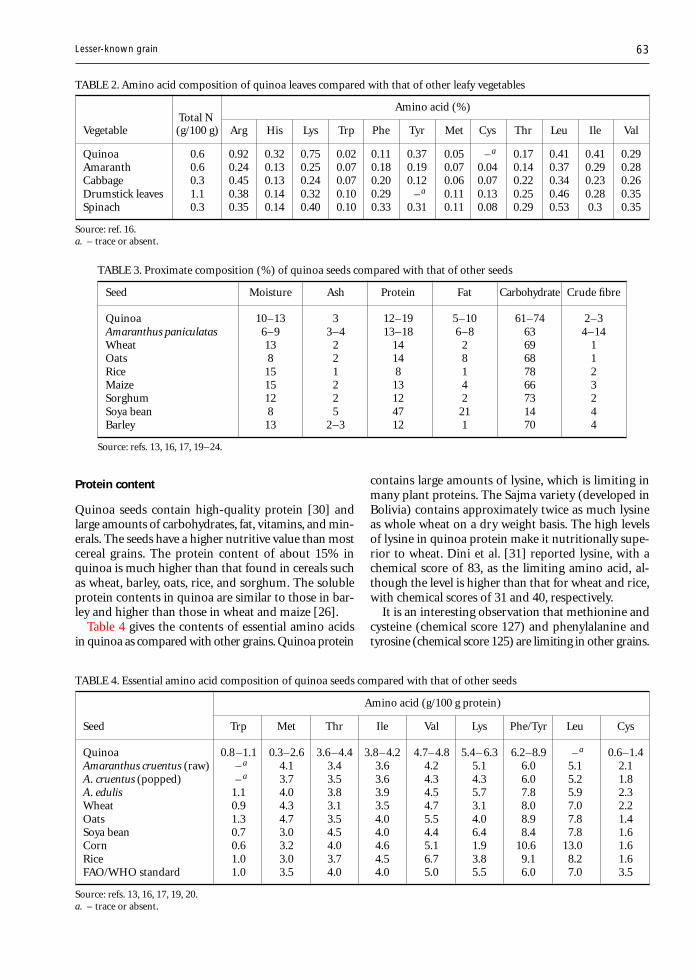
63
Protein content
Quinoa seeds contain high-quality protein [30] andlarge amounts of carbohydrates, fat, vitamins, and min-erals. The seeds have a higher nutritive value than mostcereal grains. The protein content of about 15% inquinoa is much higher than that found in cereals suchas wheat, barley, oats, rice, and sorghum. The solubleprotein contents in quinoa are similar to those in bar-ley and higher than those in wheat and maize [26].
Table 4 gives the contents of essential amino acidsin quinoa as compared with other grains. Quinoa protein
contains large amounts of lysine, which is limiting inmany plant proteins. The Sajma variety (developed inBolivia) contains approximately twice as much lysineas whole wheat on a dry weight basis. The high levelsof lysine in quinoa protein make it nutritionally supe-rior to wheat. Dini et al. [31] reported lysine, with achemical score of 83, as the limiting amino acid, al-though the level is higher than that for wheat and rice,with chemical scores of 31 and 40, respectively.
It is an interesting observation that methionine andcysteine (chemical score 127) and phenylalanine andtyrosine (chemical score 125) are limiting in other grains.
TABLE 2. Amino acid composition of quinoa leaves compared with that of other leafy vegetables
Total NAmino acid (%)
Vegetable (g/100 g) Arg His Lys Trp Phe Tyr Met Cys Thr Leu Ile Val
Quinoa 0.6 0.92 0.32 0.75 0.02 0.11 0.37 0.05 – a 0.17 0.41 0.41 0.29Amaranth 0.6 0.24 0.13 0.25 0.07 0.18 0.19 0.07 0.04 0.14 0.37 0.29 0.28Cabbage 0.3 0.45 0.13 0.24 0.07 0.20 0.12 0.06 0.07 0.22 0.34 0.23 0.26Drumstick leaves 1.1 0.38 0.14 0.32 0.10 0.29 –a 0.11 0.13 0.25 0.46 0.28 0.35Spinach 0.3 0.35 0.14 0.40 0.10 0.33 0.31 0.11 0.08 0.29 0.53 0.3 0.35
Source: ref. 16.a. – trace or absent.
TABLE 3. Proximate composition (%) of quinoa seeds compared with that of other seeds
Seed Moisture Ash Protein Fat Carbohydrate Crude fibre
Quinoa 10–13 3 12–19 5–10 61–74 2–3Amaranthus paniculatas 6–9 3–4 13–18 6–8 63 4–14Wheat 13 2 14 2 69 1Oats 8 2 14 8 68 1Rice 15 1 8 1 78 2Maize 15 2 13 4 66 3Sorghum 12 2 12 2 73 2Soya bean 8 5 47 21 14 4Barley 13 2–3 12 1 70 4
Source: refs. 13, 16, 17, 19–24.
TABLE 4. Essential amino acid composition of quinoa seeds compared with that of other seeds
Amino acid (g/100 g protein)
Seed Trp Met Thr Ile Val Lys Phe/Tyr Leu Cys
Quinoa 0.8 –1.1 0.3–2.6 3.6–4.4 3.8–4.2 4.7–4.8 5.4– 6.3 6.2–8.9 – a 0.6–1.4Amaranthus cruentus (raw) – a 4.1 3.4 3.6 4.2 5.1 6.0 5.1 2.1A. cruentus (popped) – a 3.7 3.5 3.6 4.3 4.3 6.0 5.2 1.8A. edulis 1.1 4.0 3.8 3.9 4.5 5.7 7.8 5.9 2.3Wheat 0.9 4.3 3.1 3.5 4.7 3.1 8.0 7.0 2.2Oats 1.3 4.7 3.5 4.0 5.5 4.0 8.9 7.8 1.4Soya bean 0.7 3.0 4.5 4.0 4.4 6.4 8.4 7.8 1.6Corn 0.6 3.2 4.0 4.6 5.1 1.9 10.6 13.0 1.6Rice 1.0 3.0 3.7 4.5 6.7 3.8 9.1 8.2 1.6FAO/WHO standard 1.0 3.5 4.0 4.0 5.0 5.5 6.0 7.0 3.5
Source: refs. 13, 16, 17, 19, 20.a. – trace or absent.
Lesser-known grain
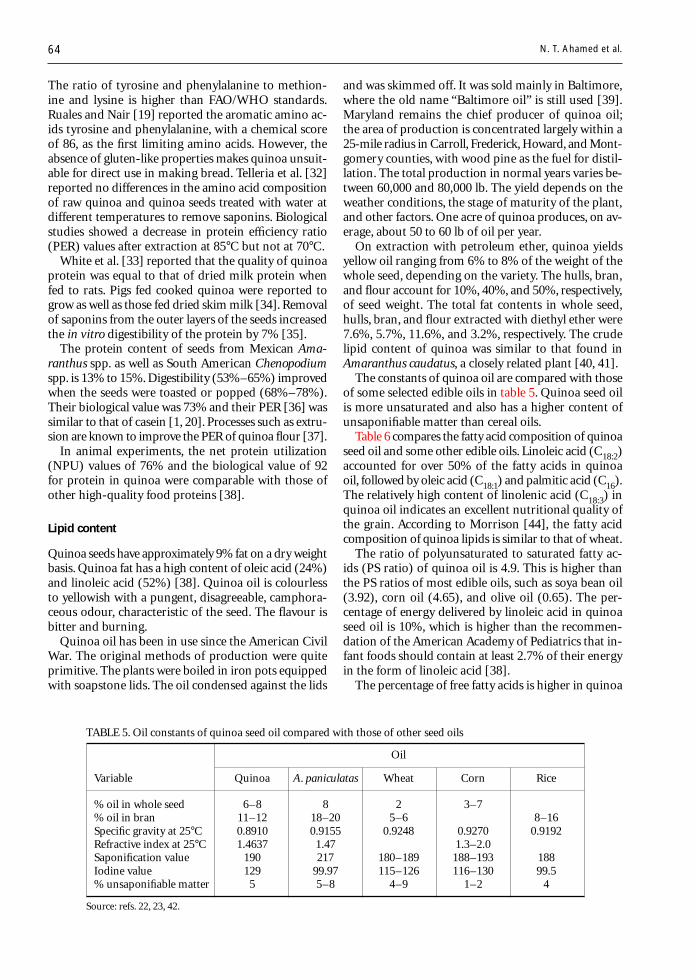
64
The ratio of tyrosine and phenylalanine to methion-ine and lysine is higher than FAO/WHO standards.Ruales and Nair [19] reported the aromatic amino ac-ids tyrosine and phenylalanine, with a chemical scoreof 86, as the first limiting amino acids. However, theabsence of gluten-like properties makes quinoa unsuit-able for direct use in making bread. Telleria et al. [32]reported no differences in the amino acid compositionof raw quinoa and quinoa seeds treated with water atdifferent temperatures to remove saponins. Biologicalstudies showed a decrease in protein efficiency ratio(PER) values after extraction at 85°C but not at 70°C.
White et al. [33] reported that the quality of quinoaprotein was equal to that of dried milk protein whenfed to rats. Pigs fed cooked quinoa were reported togrow as well as those fed dried skim milk [34]. Removalof saponins from the outer layers of the seeds increasedthe in vitro digestibility of the protein by 7% [35].
The protein content of seeds from Mexican Ama-ranthus spp. as well as South American Chenopodiumspp. is 13% to 15%. Digestibility (53%–65%) improvedwhen the seeds were toasted or popped (68%–78%).Their biological value was 73% and their PER [36] wassimilar to that of casein [1, 20]. Processes such as extru-sion are known to improve the PER of quinoa flour [37].
In animal experiments, the net protein utilization(NPU) values of 76% and the biological value of 92for protein in quinoa were comparable with those ofother high-quality food proteins [38].
Lipid content
Quinoa seeds have approximately 9% fat on a dry weightbasis. Quinoa fat has a high content of oleic acid (24%)and linoleic acid (52%) [38]. Quinoa oil is colourlessto yellowish with a pungent, disagreeable, camphora-ceous odour, characteristic of the seed. The flavour isbitter and burning.
Quinoa oil has been in use since the American CivilWar. The original methods of production were quiteprimitive. The plants were boiled in iron pots equippedwith soapstone lids. The oil condensed against the lids
and was skimmed off. It was sold mainly in Baltimore,where the old name “Baltimore oil” is still used [39].Maryland remains the chief producer of quinoa oil;the area of production is concentrated largely within a25-mile radius in Carroll, Frederick, Howard, and Mont-gomery counties, with wood pine as the fuel for distil-lation. The total production in normal years varies be-tween 60,000 and 80,000 lb. The yield depends on theweather conditions, the stage of maturity of the plant,and other factors. One acre of quinoa produces, on av-erage, about 50 to 60 lb of oil per year.
On extraction with petroleum ether, quinoa yieldsyellow oil ranging from 6% to 8% of the weight of thewhole seed, depending on the variety. The hulls, bran,and flour account for 10%, 40%, and 50%, respectively,of seed weight. The total fat contents in whole seed,hulls, bran, and flour extracted with diethyl ether were7.6%, 5.7%, 11.6%, and 3.2%, respectively. The crudelipid content of quinoa was similar to that found inAmaranthus caudatus, a closely related plant [40, 41].
The constants of quinoa oil are compared with thoseof some selected edible oils in table 5. Quinoa seed oilis more unsaturated and also has a higher content ofunsaponifiable matter than cereal oils.
Table 6 compares the fatty acid composition of quinoaseed oil and some other edible oils. Linoleic acid (C18:2)accounted for over 50% of the fatty acids in quinoaoil, followed by oleic acid (C18:1) and palmitic acid (C16).The relatively high content of linolenic acid (C18:3) inquinoa oil indicates an excellent nutritional quality ofthe grain. According to Morrison [44], the fatty acidcomposition of quinoa lipids is similar to that of wheat.
The ratio of polyunsaturated to saturated fatty ac-ids (PS ratio) of quinoa oil is 4.9. This is higher thanthe PS ratios of most edible oils, such as soya bean oil(3.92), corn oil (4.65), and olive oil (0.65). The per-centage of energy delivered by linoleic acid in quinoaseed oil is 10%, which is higher than the recommen-dation of the American Academy of Pediatrics that in-fant foods should contain at least 2.7% of their energyin the form of linoleic acid [38].
The percentage of free fatty acids is higher in quinoa
TABLE 5. Oil constants of quinoa seed oil compared with those of other seed oils
Oil
Variable Quinoa A. paniculatas Wheat Corn Rice
% oil in whole seed 6–8 8 2 3–7% oil in bran 11–12 18–20 5–6 8–16Specific gravity at 25°C 0.8910 0.9155 0.9248 0.9270 0.9192Refractive index at 25°C 1.4637 1.47 1.3–2.0Saponification value 190 217 180–189 188–193 188Iodine value 129 99.97 115–126 116–130 99.5% unsaponifiable matter 5 5–8 4–9 1–2 4
Source: refs. 22, 23, 42.
N. T. Ahamed et al.
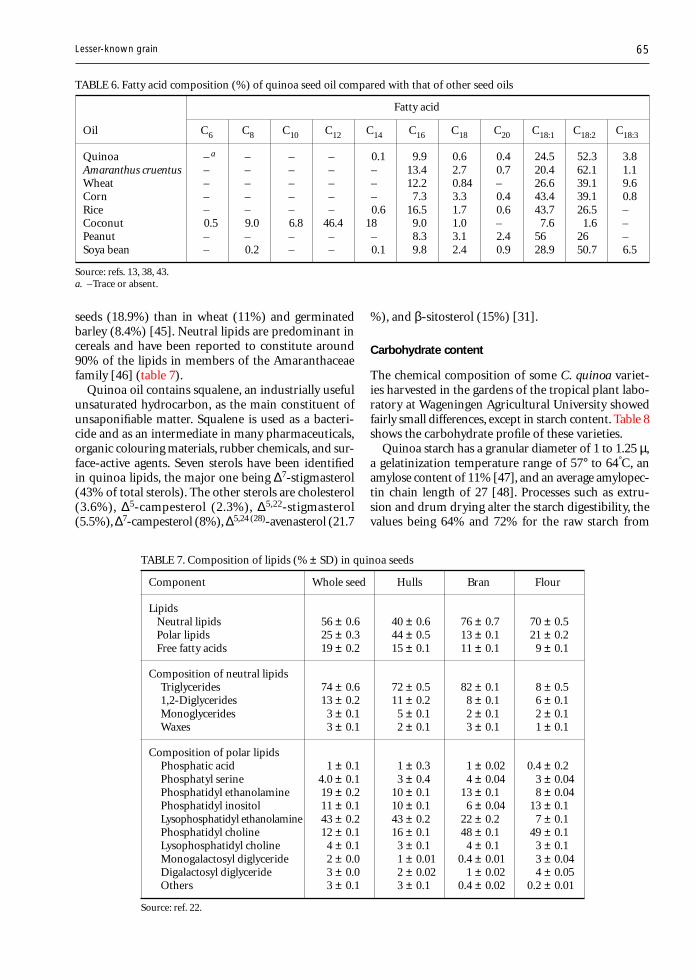
65
seeds (18.9%) than in wheat (11%) and germinatedbarley (8.4%) [45]. Neutral lipids are predominant incereals and have been reported to constitute around90% of the lipids in members of the Amaranthaceaefamily [46] (table 7).
Quinoa oil contains squalene, an industrially usefulunsaturated hydrocarbon, as the main constituent ofunsaponifiable matter. Squalene is used as a bacteri-cide and as an intermediate in many pharmaceuticals,organic colouring materials, rubber chemicals, and sur-face-active agents. Seven sterols have been identifiedin quinoa lipids, the major one being ∆7-stigmasterol(43% of total sterols). The other sterols are cholesterol(3.6%), ∆5-campesterol (2.3%), ∆5,22-stigmasterol(5.5%), ∆7-campesterol (8%), ∆5,24 (28)-avenasterol (21.7
%), and β-sitosterol (15%) [31].
Carbohydrate content
The chemical composition of some C. quinoa variet-ies harvested in the gardens of the tropical plant labo-ratory at Wageningen Agricultural University showedfairly small differences, except in starch content. Table 8shows the carbohydrate profile of these varieties.
Quinoa starch has a granular diameter of 1 to 1.25 µ,a gelatinization temperature range of 57° to 64°C, anamylose content of 11% [47], and an average amylopec-tin chain length of 27 [48]. Processes such as extru-sion and drum drying alter the starch digestibility, thevalues being 64% and 72% for the raw starch from
TABLE 6. Fatty acid composition (%) of quinoa seed oil compared with that of other seed oils
Fatty acid
Oil C6 C8 C10 C12 C14 C16 C18 C20 C18:1 C18:2 C18:3
Quinoa – .a – – – 0.1 9.9 0.6 0.4 24.5 52.3 3.8Amaranthus cruentus – – – – – 13.4 2.7 0.7 20.4 62.1 1.1Wheat – – – – – 12.2 0.84 – 26.6 39.1 9.6Corn – – – – – 7.3 3.3 0.4 43.4 39.1 0.8Rice – – – – 0.6 16.5 1.7 0.6 43.7 26.5 –Coconut 0.5 9.0 6.8 46.4 18 9.0 1.0 – 7.6 1.6 –Peanut – – – – – 8.3 3.1 2.4 56 26 –Soya bean – 0.2 – – 0.1 9.8 2.4 0.9 28.9 50.7 6.5
Source: refs. 13, 38, 43.a. –Trace or absent.
Lesser-known grain
TABLE 7. Composition of lipids (% ± SD) in quinoa seeds
Component Whole seed Hulls Bran Flour
LipidsNeutral lipids 56 ± 0.6 40 ± 0.6 76 ± 0.7 70 ± 0.5Polar lipids 25 ± 0.3 44 ± 0.5 13 ± 0.1 21 ± 0.2Free fatty acids 19 ± 0.2 15 ± 0.1 11 ± 0.1 9 ± 0.1
Composition of neutral lipidsTriglycerides 74 ± 0.6 72 ± 0.5 82 ± 0.1 8 ± 0.51,2-Diglycerides 13 ± 0.2 11 ± 0.2 8 ± 0.1 6 ± 0.1Monoglycerides 3 ± 0.1 5 ± 0.1 2 ± 0.1 2 ± 0.1Waxes 3 ± 0.1 2 ± 0.1 3 ± 0.1 1 ± 0.1
Composition of polar lipidsPhosphatic acid 1 ± 0.1 1 ± 0.3 1 ± 0.02 0.4 ± 0.2Phosphatyl serine 4.0 ± 0.1 3 ± 0.4 4 ± 0.04 3 ± 0.04Phosphatidyl ethanolamine 19 ± 0.2 10 ± 0.1 13 ± 0.1 8 ± 0.04Phosphatidyl inositol 11 ± 0.1 10 ± 0.1 6 ± 0.04 13 ± 0.1Lysophosphatidyl ethanolamine 43 ± 0.2 43 ± 0.2 22 ± 0.2 7 ± 0.1Phosphatidyl choline 12 ± 0.1 16 ± 0.1 48 ± 0.1 49 ± 0.1Lysophosphatidyl choline 4 ± 0.1 3 ± 0.1 4 ± 0.1 3 ± 0.1Monogalactosyl diglyceride 2 ± 0.0 1 ± 0.01 0.4 ± 0.01 3 ± 0.04Digalactosyl diglyceride 3 ± 0.0 2 ± 0.02 1 ± 0.02 4 ± 0.05Others 3 ± 0.1 3 ± 0.1 0.4 ± 0.02 0.2 ± 0.01
Source: ref. 22.
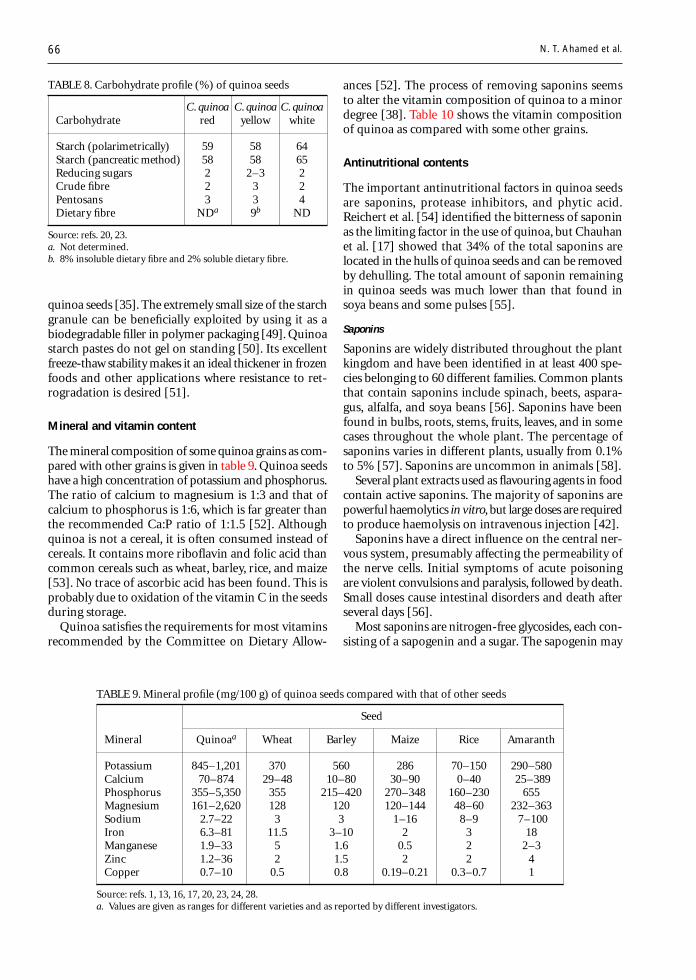
66
quinoa seeds [35]. The extremely small size of the starchgranule can be beneficially exploited by using it as abiodegradable filler in polymer packaging [49]. Quinoastarch pastes do not gel on standing [50]. Its excellentfreeze-thaw stability makes it an ideal thickener in frozenfoods and other applications where resistance to ret-rogradation is desired [51].
Mineral and vitamin content
The mineral composition of some quinoa grains as com-pared with other grains is given in table 9. Quinoa seedshave a high concentration of potassium and phosphorus.The ratio of calcium to magnesium is 1:3 and that ofcalcium to phosphorus is 1:6, which is far greater thanthe recommended Ca:P ratio of 1:1.5 [52]. Althoughquinoa is not a cereal, it is often consumed instead ofcereals. It contains more riboflavin and folic acid thancommon cereals such as wheat, barley, rice, and maize[53]. No trace of ascorbic acid has been found. This isprobably due to oxidation of the vitamin C in the seedsduring storage.
Quinoa satisfies the requirements for most vitaminsrecommended by the Committee on Dietary Allow-
ances [52]. The process of removing saponins seemsto alter the vitamin composition of quinoa to a minordegree [38]. Table 10 shows the vitamin compositionof quinoa as compared with some other grains.
Antinutritional contents
The important antinutritional factors in quinoa seedsare saponins, protease inhibitors, and phytic acid.Reichert et al. [54] identified the bitterness of saponinas the limiting factor in the use of quinoa, but Chauhanet al. [17] showed that 34% of the total saponins arelocated in the hulls of quinoa seeds and can be removedby dehulling. The total amount of saponin remainingin quinoa seeds was much lower than that found insoya beans and some pulses [55].
Saponins
Saponins are widely distributed throughout the plantkingdom and have been identified in at least 400 spe-cies belonging to 60 different families. Common plantsthat contain saponins include spinach, beets, aspara-gus, alfalfa, and soya beans [56]. Saponins have beenfound in bulbs, roots, stems, fruits, leaves, and in somecases throughout the whole plant. The percentage ofsaponins varies in different plants, usually from 0.1%to 5% [57]. Saponins are uncommon in animals [58].
Several plant extracts used as flavouring agents in foodcontain active saponins. The majority of saponins arepowerful haemolytics in vitro, but large doses are requiredto produce haemolysis on intravenous injection [42].
Saponins have a direct influence on the central ner-vous system, presumably affecting the permeability ofthe nerve cells. Initial symptoms of acute poisoningare violent convulsions and paralysis, followed by death.Small doses cause intestinal disorders and death afterseveral days [56].
Most saponins are nitrogen-free glycosides, each con-sisting of a sapogenin and a sugar. The sapogenin may
TABLE 8. Carbohydrate profile (%) of quinoa seeds
C. quinoa C. quinoa C. quinoaCarbohydrate red yellow white
Starch (polarimetrically) 59 58 64Starch (pancreatic method) 58 58 65Reducing sugars 2 2–3 2Crude fibre 2 3 2Pentosans 3 3 4Dietary fibre NDa 9b ND
Source: refs. 20, 23.a. Not determined.b. 8% insoluble dietary fibre and 2% soluble dietary fibre.
N. T. Ahamed et al.
TABLE 9. Mineral profile (mg/100 g) of quinoa seeds compared with that of other seeds
Seed
Mineral Quinoaa Wheat Barley Maize Rice Amaranth
Potassium 845–1,201 370 560 286 70–150 290–580Calcium 70–874 29–48 10–80 30–90 0–40 25–389Phosphorus 355–5,350 355 215–420 270–348 160–230 655Magnesium 161–2,620 128 120 120–144 48–60 232–363Sodium 2.7–22 3 3 1–16 8–9 7–100Iron 6.3–81 11.5 3–10 2 3 18Manganese 1.9–33 5 1.6 0.5 2 2–3Zinc 1.2–36 2 1.5 2 2 4Copper 0.7–10 0.5 0.8 0.19–0.21 0.3–0.7 1
Source: refs. 1, 13, 16, 17, 20, 23, 24, 28.a. Values are given as ranges for different varieties and as reported by different investigators.
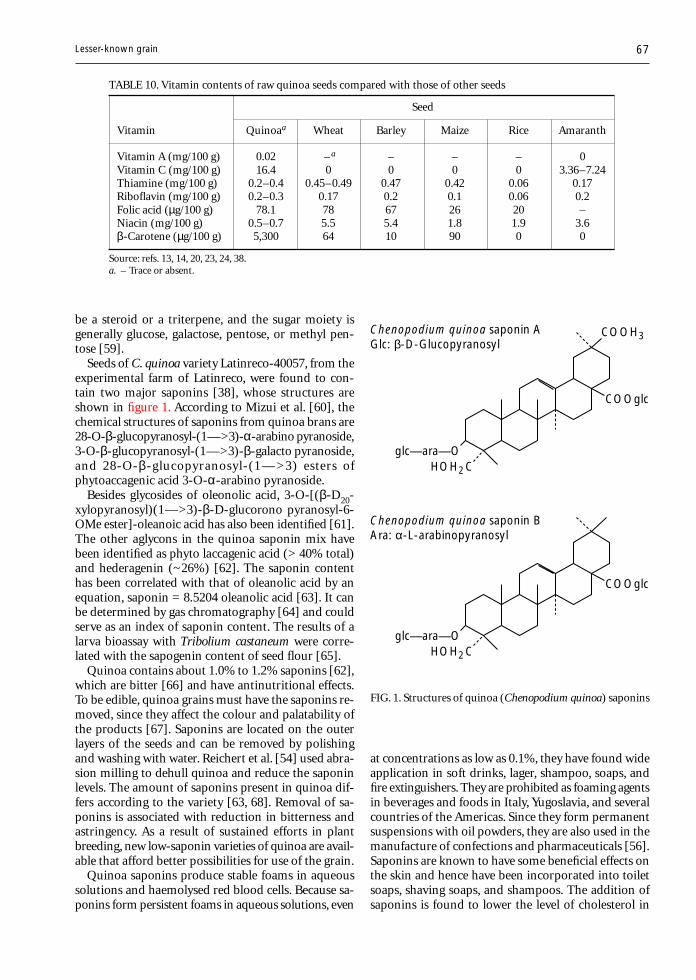
67
be a steroid or a triterpene, and the sugar moiety isgenerally glucose, galactose, pentose, or methyl pen-tose [59].
Seeds of C. quinoa variety Latinreco-40057, from theexperimental farm of Latinreco, were found to con-tain two major saponins [38], whose structures areshown in figure 1. According to Mizui et al. [60], thechemical structures of saponins from quinoa brans are28-O-β-glucopyranosyl-(1—>3)-α-arabino pyranoside,3-O-β-glucopyranosyl-(1—>3)-β-galacto pyranoside,and 28-O-β-glucopyranosyl-(1— >3) esters ofphytoaccagenic acid 3-O-α-arabino pyranoside.
Besides glycosides of oleonolic acid, 3-O-[(β-D20-xylopyranosyl)(1—>3)-β-D-glucorono pyranosyl-6-OMe ester]-oleanoic acid has also been identified [61].The other aglycons in the quinoa saponin mix havebeen identified as phyto laccagenic acid (> 40% total)and hederagenin (~26%) [62]. The saponin contenthas been correlated with that of oleanolic acid by anequation, saponin = 8.5204 oleanolic acid [63]. It canbe determined by gas chromatography [64] and couldserve as an index of saponin content. The results of alarva bioassay with Tribolium castaneum were corre-lated with the sapogenin content of seed flour [65].
Quinoa contains about 1.0% to 1.2% saponins [62],which are bitter [66] and have antinutritional effects.To be edible, quinoa grains must have the saponins re-moved, since they affect the colour and palatability ofthe products [67]. Saponins are located on the outerlayers of the seeds and can be removed by polishingand washing with water. Reichert et al. [54] used abra-sion milling to dehull quinoa and reduce the saponinlevels. The amount of saponins present in quinoa dif-fers according to the variety [63, 68]. Removal of sa-ponins is associated with reduction in bitterness andastringency. As a result of sustained efforts in plantbreeding, new low-saponin varieties of quinoa are avail-able that afford better possibilities for use of the grain.
Quinoa saponins produce stable foams in aqueoussolutions and haemolysed red blood cells. Because sa-ponins form persistent foams in aqueous solutions, even
at concentrations as low as 0.1%, they have found wideapplication in soft drinks, lager, shampoo, soaps, andfire extinguishers. They are prohibited as foaming agentsin beverages and foods in Italy, Yugoslavia, and severalcountries of the Americas. Since they form permanentsuspensions with oil powders, they are also used in themanufacture of confections and pharmaceuticals [56].Saponins are known to have some beneficial effects onthe skin and hence have been incorporated into toiletsoaps, shaving soaps, and shampoos. The addition ofsaponins is found to lower the level of cholesterol in
Lesser-known grain
TABLE 10. Vitamin contents of raw quinoa seeds compared with those of other seeds
Seed
Vitamin Quinoaa Wheat Barley Maize Rice Amaranth
Vitamin A (mg/100 g) 0.02 –a – – – 0Vitamin C (mg/100 g) 16.4 0 0 0 0 3.36–7.24Thiamine (mg/100 g) 0.2–0.4 0.45–0.49 0.47 0.42 0.06 0.17Riboflavin (mg/100 g) 0.2–0.3 0.17 0.2 0.1 0.06 0.2Folic acid (µg/100 g) 78.1 78 67 26 20 –Niacin (mg/100 g) 0.5–0.7 5.5 5.4 1.8 1.9 3.6β-Carotene (µg/100 g) 5,300 64 10 90 0 0
Source: refs. 13, 14, 20, 23, 24, 38.a. – Trace or absent.
FIG. 1. Structures of quinoa (Chenopodium quinoa) saponins
COOH3
HOH2Cglc—ara—O
COOglc
HOH2Cglc—ara—O
COOglc
Chenopodium quinoa saponin AGlc: β-D-Glucopyranosyl
Chenopodium quinoa saponin BAra: α-L-arabinopyranosyl
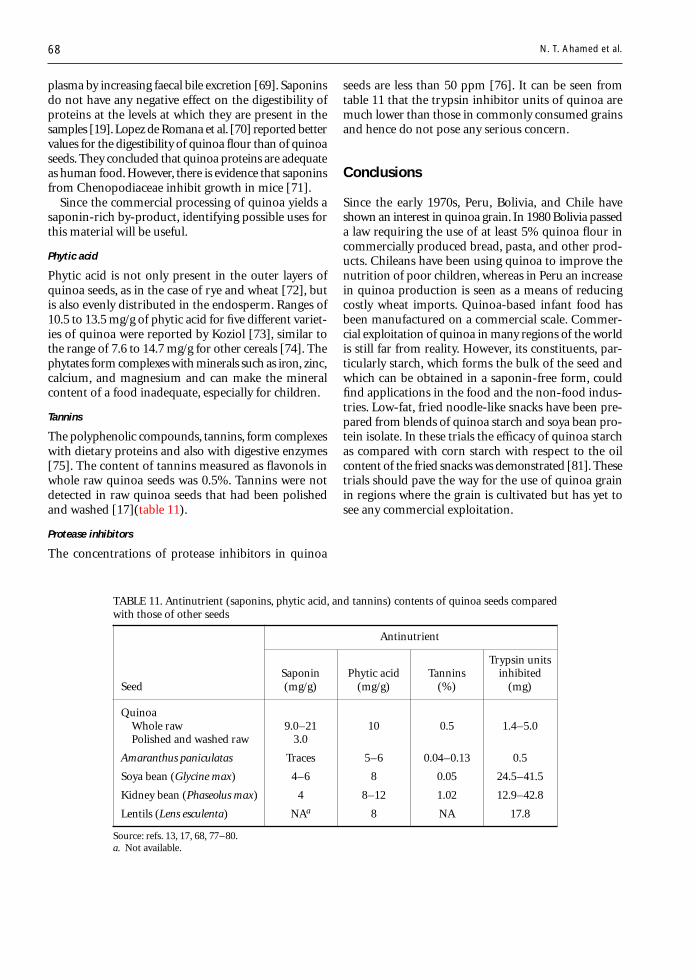
68
TABLE 11. Antinutrient (saponins, phytic acid, and tannins) contents of quinoa seeds comparedwith those of other seeds
Antinutrient
Trypsin unitsSaponin Phytic acid Tannins inhibited
Seed (mg/g) (mg/g) (%) (mg)
QuinoaWhole raw 9.0–21 10 0.5 1.4–5.0Polished and washed raw 3.0
Amaranthus paniculatas Traces 5–6 0.04–0.13 0.5
Soya bean (Glycine max) 4–6 8 0.05 24.5–41.5
Kidney bean (Phaseolus max) 4 8–12 1.02 12.9–42.8
Lentils (Lens esculenta) NAa 8 NA 17.8
Source: refs. 13, 17, 68, 77–80.a. Not available.
N. T. Ahamed et al.
plasma by increasing faecal bile excretion [69]. Saponinsdo not have any negative effect on the digestibility ofproteins at the levels at which they are present in thesamples [19]. Lopez de Romana et al. [70] reported bettervalues for the digestibility of quinoa flour than of quinoaseeds. They concluded that quinoa proteins are adequateas human food. However, there is evidence that saponinsfrom Chenopodiaceae inhibit growth in mice [71].
Since the commercial processing of quinoa yields asaponin-rich by-product, identifying possible uses forthis material will be useful.
Phytic acid
Phytic acid is not only present in the outer layers ofquinoa seeds, as in the case of rye and wheat [72], butis also evenly distributed in the endosperm. Ranges of10.5 to 13.5 mg/g of phytic acid for five different variet-ies of quinoa were reported by Koziol [73], similar tothe range of 7.6 to 14.7 mg/g for other cereals [74]. Thephytates form complexes with minerals such as iron, zinc,calcium, and magnesium and can make the mineralcontent of a food inadequate, especially for children.
Tannins
The polyphenolic compounds, tannins, form complexeswith dietary proteins and also with digestive enzymes[75]. The content of tannins measured as flavonols inwhole raw quinoa seeds was 0.5%. Tannins were notdetected in raw quinoa seeds that had been polishedand washed [17](table 11).
Protease inhibitors
The concentrations of protease inhibitors in quinoa
seeds are less than 50 ppm [76]. It can be seen fromtable 11 that the trypsin inhibitor units of quinoa aremuch lower than those in commonly consumed grainsand hence do not pose any serious concern.
Conclusions
Since the early 1970s, Peru, Bolivia, and Chile haveshown an interest in quinoa grain. In 1980 Bolivia passeda law requiring the use of at least 5% quinoa flour incommercially produced bread, pasta, and other prod-ucts. Chileans have been using quinoa to improve thenutrition of poor children, whereas in Peru an increasein quinoa production is seen as a means of reducingcostly wheat imports. Quinoa-based infant food hasbeen manufactured on a commercial scale. Commer-cial exploitation of quinoa in many regions of the worldis still far from reality. However, its constituents, par-ticularly starch, which forms the bulk of the seed andwhich can be obtained in a saponin-free form, couldfind applications in the food and the non-food indus-tries. Low-fat, fried noodle-like snacks have been pre-pared from blends of quinoa starch and soya bean pro-tein isolate. In these trials the efficacy of quinoa starchas compared with corn starch with respect to the oilcontent of the fried snacks was demonstrated [81]. Thesetrials should pave the way for the use of quinoa grainin regions where the grain is cultivated but has yet tosee any commercial exploitation.
69
References
1. Sanchez-Marroquin A. Doscultivos olivados deimportancia agroindustrial. El amaranto y la quinoa.Arch Latinoam Nutr 1983;33:11–32.
2. Morales PP, Curl C. A physicochemical method for to-tal saponin determination in quinoa samples. Rev Bo-livia Quim 1983;6:13–9.
3. Risic J, Galwey NW. The chenopodium grains of theAndes. Inca crops for modern agriculture. Adv Appl Biol1984;10:145–61.
4. Chauhan GS, Zillman RR, Eskin MNA. Dough mixingand bread making properties of quinoa-wheat flourblends. Int J Food Sci Tech 1992;27:701–5.
5. Benson L. Manual of the orders and families of dicoty-ledons. Plant classification (chapter 10). New Delhi: Ox-ford and IBH, 1957:109–325.
6. Trease GE, Evans WC. The pharmacological action ofplant drugs. In: Pharmacognosy. 12th ed. London: BallièreTindall/English Language Book Society, 1983:147–54.
7. Wealth of India. Raw materials. Vol IIC. New Delhi: Coun-cil of Scientific and Industrial Research, 1950.
8. Prakash D, Nath P, Pal M. Composition, variation ofnutritional contents of leaves, seed protein, fat, and fattyacid profile of Chenopodium species. J Sci Food Agric1993;63:203–5.
9. Khurana SC, Malik YS, Pandita ML. Herbicidal controlof weeds in potato c.v. kufri badshah. Pesticides1986;20(11):55–6.
10. Sarmah SC, Borgohain M, Pathak AK. A note on herbi-cidal control of weeds in summer soyabean. Pesticides1986;20(11):56–9.
11. Simmonds SC. The grain chenopods of the tropicalAmerican highlands. Econ Bot 1965;19:223–35.
12. Weber EJ. The Inca’s ancient answer to food shortage.Nature 1978;272:486.
13. Singhal RS, Kulkarni PR. Amaranths—an underutilizedresource. Int J Food Sci Tech 1988;23:125–39.
14. Bahrman N, Jay M, Gorenflot R. Contribution to thechemosystematic knowledge of some species of the ge-nus Chenopodium. Lett Bot 1985;2:107–13.
15. French CJ, Towers GHN. Inhibition of infectivity ofpotato virus X by flavonoids. Phytochemistry 1992;31:3017–20.
16. Gopalan CC, Ramastri BV, Balasubramanian SC. Nu-tritive value of Indian Foods. Hyderabad: National Insti-tute of Nutrition, Indian Council of Medical Research,1985.
17. Chauhan GS, Eskin NAM, Tkachuk R. Nutrients andantinutrients in quinoa seed. Cereal Chem 1992;69:85–8.
18. Varriano-Marston E, De Francisco A. Ultrastructure ofquinoa fruit (Chenopodium quinoa, Willd.). Food Mi-crostructure 1984;3:165–73.
19. Ruales J, Nair BM. Nutritional quality of the proteinsin quinoa (Chenopodium quinoa, Willd). Plant FoodsHum Nutr 1992;42:1–11.
20. Ranhotra GS, Gelroth JA, Glaser BK, Lorenz KH, JohnsonDL. Composition and protein nutritional quality ofquinoa. Cereal Chem 1993;70:303–5.
21. Lorenz K, Coulter L. Quinoa flour in baked products.Plant Foods Hum Nutr 1991:41:213–23.
22. Przybylski R, Chauhan GS, Eskin NAM. Characteriza-
tion of quinoa (Chenopodium quinoa) lipids. Food Chem1994;51:187–92.
23. DeBruin A. Investigation of the food value of quinoaand canihua seed. J Food Sci 1963;28:872–6.
24. Pomeranz Y. Cereal and cereal products. In: GerhartzW, ed. Ullmann’s encyclopedia of industrial chemistry.Vol A6. Weinheim, Germany: VCH Verlagsgesellschaft,1986:104–5.
25. Lorenz K, Nyanzi F. Enzyme activities in quinoa (Che-nopodium quinoa). Int J Food Sci Tech 1989;24:543–51.
26. Gonzalez JA, Roldan A, Gallardo M, Escudero T, PradoEF. Quantitative determination of chemical compoundswith nutritional value from Inca crops: Chenopodiumquinoa (‘quinoa’). Plant Foods Hum Nutr 1989;39:331–7.
27. Gorad SL. Quinoa—ancient harvest: recipes. Boulder,Col, USA: Quinoa Corporation, 1986.
28. Gonzalez JA, Prado EF. Germination in relation to sa-linity and temperature in Chenopodium quinoa (Willd.).Agrochimica 1992;36:101–7.
29. Prakash D, Pal M. Nutritional and antinutritional com-position of vegetable and grain amaranth leaves. J SciFood Agric 1991;57:573–83.
30. Quiros-Perez F, Elvehjem CA. Nutritive value of quinoaproteins. Agric Food Chem 1957;5:538–41.
31. Dini N, Rastrilli L, Saturnino P, Schittino A. Composi-tional study of Chenopodium quinoa seeds. Nahrung1992;36:400–4.
32. Telleria ML, Sgarbieri BC, Amaya JF. Evaluación químicay biológica de la quinoa (Chenopodium quinoa Willd.).Influencia de la extracción de las saponinas por tratami-ento térmico. Arch Latinoam Nutr 1978;28:253–63.
33. White PL, Alvistur E, Dias C, Vinas E, White NS, CollazosC. Nutrient content and protein quality of quinoa andcanihua, edible seed products of the Andes mountains.J Agric Food Chem 1955;3:531–4.
34. Mahoney AW, Lopez JG, Hendricks DG. An evaluationof the protein quality of quinoa. J Agric Food Chem1975;23:190–3.
35. Ruales J, Nair BM. Effect of processing on in vitro di-gestibility of protein and starch in quinoa seeds. Int JFood Sci Tech 1994;29:449–56.
36. Gross GS, Koch F, Malaga I, de Miranda AF,Schoeneberger H, Trugo LC. Chemical composition andprotein quality of some local Andean food sources. FoodChem 1989;34:25–34.
37. Romero A, Basigalapo H, Bressani R. Effects of extru-sion on the functional characteristics and protein qual-ity of C. quinoa. Arch Latinoam Nutr 1985;35:148–62.
38. Ruales J, Nair BM. Contents of fat, vitamins and min-erals in quinoa (Chenopodium quinoa Willd.) seeds. FoodChem 1993;48:131–7.
39. Guenther E. Essential oils of the plant familyChenopodiaceae. In: Essential oils. Vol 6. Toronto, NewYork, London: AD Van Nostrand, 1952:151–61.
40. Saunders RM, Becker E. Amaranthus: a potential foodand feed resource. In: Pomeranz Y, ed. Advances in ce-real science and technology. Vol II. St. Paul, Minn, USA:American Association of Cereal Chemists, 1978:357–96.
41. Fernando T, Bean G. Fatty acids and sterols of Amaranthustricolor L. Food Chem 1984;15:233–7.
Lesser-known grain
70
42. George AJ. Legal status and toxicity of saponins. FoodCosmet Toxicol 1965;3:85–91.
43. Eckey EW. Vegetable fats and oils. New York: Reinhold,1954.
44. Morrison WR. Cereal lipids. In: Pomeranz Y, ed. Ad-vances in cereal science and technology. Vol VI. St. Paul,Minn, USA: American Association of Cereal Chemists,1 9 8 4 :221–348.
45. Holmer G, Ory RL, Hoy CE. Changes in lipid composi-tion of germinating barley embryo. Lipids 1973;8:277–83.
46. Opute FI. Seed lipids of the grain amaranths. J Exp Bot1979:30:601–6.
47. Lorenz K. Quinoa (Chenopodium quinoa) starch—physi-cochemical properties and functional characteristics.Starke 1990;42:81–6.
48. Atwell WA, Hyldon WG, Godfret PD, Galle El, SperberWH, Pedersen DC, Evans WD, Rabe GO. Germinatedquinoa flour to reduce the viscosity of starchy foods.Cereal Chem 1988;65:508–9.
49. Ahamed NT, Singhal RS, Kulkarni PR, Kale DD, Pal M.Studies on Chenopodium quinoa and Amaranthuspaniculatas starch as biodegradable fillers in LDPE films.Carbohyd Polym 1996;31:157–60.
50. Wolf JM, MacMasters MM, Rist CE. Some characteris-tics of three South American seeds used for food. Ce-real Chem 1950;27:219–22.
51. Ahamed NT, Singhal RS, Kulkarni PR, Pal M. Physico-chemical and functional properties of Chenopodiumquinoa starch. Carbohyd Polym 1996;31:99–103.
52. National Research Council. Recommended dietary al-lowances. Washington, DC: National Academy Press,1989.
53. Kent NL. Chemical composition of cereals. In: Kent NL,ed. Technology of cereals. 3rd ed. Oxford: Pergamon Press,1984:27–48.
54. Reichert RD, Tatarynovich JT, Tyler RT. Abrasive dehullingof quinoa (Chenopodium quinoa): effect on saponin con-tent as determined by an adapted hemolytic assay. Ce-real Chem 1986;63:471–5.
55. Jood S, Chauhan BM, Kapoor AC. Saponin content ofchickpea and black gram: varietal differences and effectof processing and cooking methods. J Sci Food Agric1986;37:1121–4.
56. Sollamann T. A manual of pharmacology. 8th ed. Phila-delphia, Pa, USA: WB Saunders, 1957.
57. Ewart AJ. The poisonous action of ingested saponins.Bulletin No. 50. Melbourne, Australia: Council of Sci-entific and Industrial Research Organization (CSIRO),1931.
58. Hashimoto Y. Marine toxins and other marine metabo-lites. Tokyo: Japan Scientific Society Press, 1979.
59. Merck index of chemicals and drugs. 7th ed. Rahway,NJ, USA: Merck, 1960.
60. Mizui F, Kasai R, Ohtani K, Tanaka O. Saponins frombran of quinoa, Chenopodium quinoa Willd. Chem PharmBull 1988;36:415–8.
61. Ma WW, Heinstein PT, McLaughlin JL. Additional toxic,bitter saponins from the seeds of Chenopodium quinoa.J Nat Prod 1989;52:1132–5.
62. Ridout CL, Price LR, DuPont MS, Parker ML, FenwickGR. Quinoa saponins—analysis and preliminary inves-tigations into effects of reduction by processing. J Sci
Food Agric 1991;54:165–76.63. Aguilar RH, Guevara L, Alvarez JO. A new procedure
for the quantitative determination of saponins and itsapplication to several types of Peruvian quinoa. ActaCient Venez 1979;30:167–71.
64. Ruiz WA, Fartan JA. Evaluation of flour gas chroma-tography methods for determining oleanolic acid in C.quinoa Willd. var. kancolla. Bol Soc Quim Peru1980;44:76–84.
65. Becker R, Hanners GD. Compositional and nutritionalevaluation of quinoa whole grain flour and mill frac-tions. Lebensm Wiss Tech 1990;23:441–4.
66. Koziol MJ. Afrosimetric estimation of threshold sapo-nin concentration for bitterness in quinoa (Chenopo-dium quinoa Willd.). J Sci Food Agric 1991;54:211–9.
67. Coulter L, Lorenz K. Quinoa—composition, nutritionalvalue, food applications. Lebensm Wiss Tech 1990;23:203–7.
68. Ruales J, Nair BM. Saponins, phytic acid, tannins andprotease inhibitors in quinoa (Chenopodium quinoa,Willd.) seeds. Food Chem 1993;48:137–43.
69. Oakenfull D. Saponins in food—a review. Food Chem1981;6:19–40.
70. Lopez de Romana G, Graham GG, Rojas MMW Jr.Digestibilidad y calidad proteica de la quinoa: estudiocomparativo en niños entre semilla y harina de quinoa.Arch Latinoam Nutr 1981;31:405–97.
71. Cheeke PR. Nutritional and physiological properties ofsaponins. Nutr Rep Int 1976;13:315–25.
72. Hallberg L, Rossander L, Skanberg AB. Phytates and theinhibitory effect of bran on iron absorption in man. AmJ Clin Nutr 1987;45:988–96.
73. Koziol MJ. Chemical composition and nutritional evalu-ation of quinoa (Chenopodium quinoa Willd.). J FoodComp Anal 1992;5:35–68.
74. Fretzdorff B. Phytic acid in grains: survey and possi-bilities for reduction. Veroeff Arbeitsgem Gebreideforsch1992;240:15–28.
75. Singh U, Eggum BO. Factors affecting the quality ofpigeonpea (Cajanus cajan L.). Plant Food Hum Nutr1984;34:273–83.
76. Kakade ML, Simons N, Liener IE. An evaluation of naturalvs. synthetic substrates for measuring the antitryptic ac-tivity of soybean samples. Cereal Chem 1969;46:518–25.
77. Curl CL, Price KR, Fenwick GR. The quantitative esti-mation of saponin in pea (Pisum sativum) and soya (Gly-cine max). Food Chem 1985;18:241–50.
78. Koeppe SJ, Rupnow JH, Walker CE, Davis A. Isolationand heat stability of trypsin inhibitors in amaranth (Ama-ranthus hypochondriacus). J Food Sci 1985;50:1519–21.
79. Adsule RN, Kadam SS, Leung HK. Lentils. In: SalunkheDK, Kadam SS, eds. CRC handbook of world food le-gumes: nutritional chemistry, processing technology andutilization. Vol 2. Boca Raton, Fla, USA: CRC Press,1989:131–52.
80. Salunkhe DK, Kadam SS, eds. CRC handbook of worldfood legumes: nutritional chemistry, processing tech-nology and utilization. Vol 1. Boca Raton, Fla, USA: CRCPress, 1989.
81. Ahamed NT, Singhal RS, Kulkarni PR, Pal M. Deep fatfried snacks from blends of soya flour and corn, ama-ranth and chenopodium starches. Food Chem 1997;58:313–7.
N. T. Ahamed et al.

Food and Nutrition Bulletin, vo. 19, no. 1 © 1998, The United Nations University. 71
IFPRI Report
Intrahousehold resource allocation in developingcountries: Models, methods, and policies
Most development policies focus on improving the well-being of individuals. But the welfare of an individualis, in large part, based on complex interactions withinthat individual’s family or household. The processesby which time, money, and other resources are allo-cated among individuals—commonly referred to as“intrahousehold resource allocation”—are the focusof a new volume published jointly by the InternationalFood Policy Research Institute (IFPRI) and the JohnsHopkins University Press. Intrahousehold ResourceAllocation in Developing Countries: Models, Methods,and Policy, edited by Lawrence Haddad, John Hoddinott,and Harold Alderman, examines the many complexfactors that influence decisions made by householdsabout how they spend time, money, and other resources.It shows that a more complete understanding ofintrahousehold behaviour can increase the likelihoodthat policies will reach the people they are intended toaffect, leading to better policies in areas such as foodproduction and consumption, nutrition, and naturalresource management.
Surveying a broad body of theory and evidence, the19 contributors to the book, who include economists,demographers, sociologists, and anthropologists, ex-amine the many economic, social, and cultural factorsthat influence decisions at the household level.
How allocation issues affect policy
Policy makers typically assume that by reducing pov-erty for an individual, they can alleviate poverty forthe household, or that individual poverty can be re-duced without taking the actions of other householdmembers into account. These assumptions are erro-neous. Neglecting or misunderstanding household de-cision-making processes can cause well-intentionedpolicies to backfire.
Several theories of household decision-making havebeen posited over the decades. One theory holds thathouseholds act as single or “unitary” decision-makingbodies. This theory assumes either that all household
members have the same preferences or that the headof the household acts completely dictatorially, neitherof which is likely. Another theory looks at the house-hold as a “collective” entity where the sometimes con-flicting preferences of individuals within the householdare combined in various ways to reach a collective choice.This theory holds that the identity of the person tar-geted by policy will affect how benefits for the house-hold are used, and that decisions often reflect the bar-gaining power of different household members. Forexample, when women have control over resources, theytend to use them differently than men, often spendingmore on the children, with differing results for the wel-fare of the household.
The two theories suggest different outcomes for wel-fare and development policies. The unitary approachpredicts that the success rate will be the same regard-less of whom in the household a policy targets. Thecollective approach to the household suggests that theidentity of the recipient (man, woman, or child, forexample) will affect how this transfer is used and whobenefits. The book presents evidence showing thathousehold decisions in fact depend greatly on the iden-tity of the individual being targeted.
This consideration plays an important role in, forexample, the design of public works programmes. Whenthe nature of the work and the level of the wage of-fered are such that the participants are predominantlymale, policy makers often assume that the benefits ofthis intervention will trickle down to wives, mothers,children, and other household members. One way toensure that this occurs may be to pay with food stampsrather than cash, for in many areas women are the mainfood purchasers.
A deeper understanding of household decision-mak-ing helps policies target individuals in the most effec-tive way. The book cites a Zambian example wherehouseholds were encouraged to grow maize, a crop typi-cally grown by men, in the same fields as beans, awoman’s crop. The researchers hoped that the house-holds would take advantage of the complementarynutritional benefits of the two crops. In addition, they
Lawrence Haddad, John Hoddinott, and Harold Alderman, editors
72
hoped that the overall weeding time would be reducedbecause both crops could be weeded simultaneously.Women, however, opposed this innovation because ifbeans were planted on land normally allocated to maize,they would lose ownership of the beans and the menwould benefit from the cash generated by their sale. Incontrast, a project in Togo to encourage soya bean pro-duction succeeded precisely because it took into ac-count the collective nature of household behaviour. Atthe outset, the project was targeted to women. Work-shops were organized in women’s homes, and womenreturned to their villages after these workshops to trainother women. Soya beans were not introduced as a cashcrop but were promoted as legumes that could be usedto make sauces. As a result, men did not become inter-ested in cultivating soya beans and even allowed womento use small plots of land for soya bean cultivation.
Policies can also be weakened or enhanced by indi-viduals who are not targeted by policy, depending onthe interactions among household members. For ex-ample, if a school meal programme is targeted to un-dernourished children, a household may respond byreducing the amount of food the child receives at homeand increasing the amount of food consumed by otherhousehold members.
Policies may also influence allocation decisions in-directly in important ways. The editors argue thatchanges in the legal environment, such as divorce andchild-support laws, affect family allocation decisionsnot only through their direct impact when the lawsare applied, but also through changes in the relativebargaining positions of household members. Of course,legal and social inequalities often reflect the percep-tions of both men and women. Women often do notsee themselves as entitled to a larger share of house-hold resources. This, in turn, leads to unequal invest-ments in, for example, education for males and females,and a persistent cycle emerges that reinforces inequalities.
Caveats
Although a number of policy measures fail to reachtheir potential because of neglect of intrahouseholddecision-making processes, policies that attempt to takethese processes into account also pose risks. Individu-als and households will change their behaviour in re-sponse to new approaches taken by governments andnon-governmental organizations. Given the difficultyof anticipating all of these responses, there is a risk thatpolicies will fail, even when efforts have been made toaddress intrahousehold allocation.
To illustrate, the editors cite a Gambian project. Inthe early 1980s, irrigation was introduced to an areaof swamp rice production in order to raise yields, com-mercialize the product, and raise women’s share ofhousehold income. However, an initiative intended to
raise female income ended up reducing it. Initially,women were the rice growers. But as the yields grew,rice was transformed from a private crop under thecontrol of women into a communal crop under thecontrol of men. Although project designers had stud-ied past household decisions, which had left rice pro-duction under the control of women, they did not fullyunderstand the process of decision-making and did notsufficiently protect the women’s rights. A fuller appre-ciation of the dynamics of household resource alloca-tion might not have prevented this outcome, but a per-spective that viewed the women as interdependentmembers of the community (rather than as indepen-dent agents) might have led project managers to ex-pect the men’s response.
Although more experience and research onintrahousehold allocation will lessen the probability ofsimilar unwanted results, this area of research is stillat an early stage. (Indeed, one of the contributions ofthe volume is to outline the “state of the art” and tosuggest where future work would be especially valu-able.) Does this suggest that intrahousehold consider-ations should not yet be incorporated in policy designand implementation? Although the risk of incorrectlyanalysing complex policy measures, as well as the ex-tra costs of applying intrahousehold analysis, must al-ways be carefully assessed, the editors argue that ana-lysts and policy makers must also consider the oftenserious consequences of not taking into accountintrahousehold decision-making.
Conclusion
It is incorrect to assume that policies designed to re-duce household poverty are sufficient to lower indi-vidual poverty, and that individual poverty can be al-leviated without due regard to actions and attitudesof other household members. Moreover, errors in un-derstanding household allocation processes may resultin beneficial policies not being adopted and in poli-cies having unintended consequences.
When research on intrahousehold allocation beganin the mid-1980s, researchers wondered whether go-ing inside the “black box” of the household would yieldany useful insights. This book argues that from a policyperspective, the answer is an emphatic “yes.” A morecomplete understanding of intrahousehold behaviourcan increase the likelihood that policies will reach thepeople they are intended to affect.
Intrahousehold Resource Allocation in Developing Coun-tries: Models, Methods, and Policy, edited by LawrenceHaddad, John Hoddinott, and Harold Alderman, isavailable from the Johns Hopkins University Press, 2715North Charles St., Baltimore, MD 21218-4319, USA.US$55.00.
IFPRI Report
Food and Nutrition Bulletin, vo. 19, no. 1 © 1998, The United Nations University. 73
Books received
Agricultural uses of by-products and wastes. Editedby Jack E. Rechcigl and Herbert C. MacKinnon. ACSSymposium Series 668. American Chemical Society,Washington, D.C., 1997. (ISBN 0-8412-3514-7) 284pages, hardcover. US$99.95.
In the 1970s there was a great deal of interest in therecycling of the world’s enormous quantities of organicwaste for the production of food and feed. As popula-tion continues to increase, so do agricultural and in-dustrial by-products. This volume, developed from a1996 symposium, Uses of By-Products and Wastes inAgriculture, lives up to its title by focusing on agricul-tural uses for these wastes as fertilizer. Therefore, it isof primary interest to agricultural specialists.
The potential of organic wastes from agriculture,industry, and municipalities to be used as substratesfor the production of biomass through fermentationreceives only brief mention in one chapter. For read-ers interested in the production of food and feed fromorganic wastes, the United Nations University mono-graph Bioconversion of Organic Residues for Rural Com-munities is still recommended, even though it was pub-lished in 1978.
Field guide on rapid nutritional assessment in emer-gencies. World Health Organization Regional Office forthe Eastern Mediterranean, P.O. Box 1517, Alexandria21511, Egypt, 1995. (ISBN 92-9021-198-9) 63 pages,spiral-bound paperback. US$6.00.
This concise and clearly written field guide is basedon a consultation with experts and is intended for allwho are faced with the need to make rapid but reliableestimates of nutritional status in emergencies, as a basisfor subsequent action. Clear instructions are providedfor diagnosing the extent of the problem, identifyinggroups at highest risk, and monitoring the effectivenessof interventions. Chapter topics include planning thesurvey, selection of subjects, sampling procedures, surveymethodology, data recording, training and supervision,
interpretation of results, and reporting findings. An-nexes include the CDC/WHO normalized reference tableof weight-for-height, instructions for using the Epi-Info computer programme, a list of requisite equip-ment, and other useful information.
Handbook of antioxidants. Edited by Enrique Cadenasand Lester Packer. Marcel Dekker, New York, 1996. (ISBN0-8247-9298-X) 602 pages, hardcover. US$150.00.
This book reviews the growing evidence now availablethat antioxidants play a critical role in wellness, healthmaintenance, and the prevention of chronic degenerativedisease. Four chapters deal with the antioxidant func-tions of vitamin E, three with carotenoids, and two withascorbic acid. The current knowledge of antioxidantcharacteristics of coenzyme Q, uric acid, vitamin A,flavonoids and polyphenols, the herbal antioxidants,tea, gingko extract, α-lipoic acid, and melatonin andaminoindoles receives one chapter for each. Althoughthe volume discusses general current aspects of anti-oxidant therapy for each of these antioxidant substances,it tends to focus mainly on the positive evidence. How-ever, the specific chapters dealing with the clinical sig-nificance of the principal dietary antioxidants, vitaminE, carotenoids, and vitamin C, are more comprehen-sive. This is a useful current reference book but shouldnot be used as the sole source of information on thehealth aspects of this important subject.
Introduction to nutrition and metabolism. Secondedition. David A. Bender. Taylor and Francis, Bristol,Pa., USA, 1997. (ISBN 0-7484-0781-2) 335 pages, pa-perback. US$17.95.
This is a well-presented introduction to the principlesof nutritional biochemistry and metabolism, with em-phasis on the integration and control of metabolic func-tions. It is written at a level appropriate for undergradu-ate students with little previous knowledge except fororganic chemistry. It serves this purpose well.
74
Mineral elements. Edited by Boyd L. O’Dell and RogerA. Sunde. Marcel Dekker, New York, 1997. (ISBN 0-8247-9312-9) 691 pages, hardcover. US$195.00.
Although this handbook is designed primarily for stu-dents and professionals in all aspects of nutrition, it isalso a valuable source of information for professionalsin all areas of biology. Authoritatively written individualchapters on each of 22 minerals cover the full range ofthese minerals’ biological functions in animals and,where appropriate, in plants and microorganisms. Prac-tising physicians may need to supplement this hand-book with more comprehensive clinical examinations,but they will find this book invaluable for the basicinformation it provides on what is known about themetabolism of all the minerals of established or po-tential biological significance. This book should be avail-able, at the very least, in every academic and medicallibrary.
Sight and life manual on vitamin A deficiency disor-ders (VADD). Donald S. McLaren and Martin Frigg.Task Force SIGHT AND LIFE, P.O. Box 2116, 4002,Basel, Switzerland, 1997. (ISBN 3-906412-00-8) 138pages, paperback. Limited distribution without charge.
This is a clearly written and well-illustrated compre-hensive summary of current knowledge of vitamin Afunctions, food sources, and deficiency and of the meth-ods of assessing vitamin A deficiency. There is also ex-cellent coverage of the ocular complications as well asthe effects on morbidity, mortality, growth, and im-mune response, and other functional consequences ofvitamin A deficiency. The book also briefly but effec-tively discusses the epidemiology and control of vita-min A deficiency. This volume is highly recommendedfor its readability, authority, and choice of content.
Vitamin C in health and disease. Edited by Lester Packerand Jürgen Fuchs. Marcel Dekker, New York, 1997. (ISBN0-8247-9313-7) 538 pages, hardcover. US$150.00.
This book provides excellent and balanced coverage ofits subject and includes an initial chapter on the his-tory of scurvy and vitamin C, 7 chapters on the chem-istry and biochemistry of vitamin C, 11 on physiologicaland biomedical aspects, and 10 on nutrition and health.This is an adequate and balanced single source of in-formation on this topic and should be available to allprofessionals concerned with any aspect of nutritionand related health issues.
Books received
Food and Nutrition Bulletin, vo. 19, no. 1 © 1998, The United Nations University. 75
IUNS Award
The IUNS Award, sponsored by the International Nu-trition Foundation for Developing Countries, is givenevery four years at the International Congress of Nu-trition. The 1997 IUNS Award was presented at the 16thInternational Congress of Nutrition in Montreal in July1997 to Dr. Noel W. Solomons. Dr. Solomons was pre-sented with a plaque that read “in recognition oflongstanding dedication to improvement in the healthof populations around the world through nutritionresearch and training” and a check for US$5,000. Thenext award will be presented at the 17th InternationalCongress of Nutrition in Vienna in 2001. Past awardswere given to Dr. T. N. Maletnlema, Tanzania (1985),Prof. C. Gopalan, India (1989), and Dr. FernandoMönckeberg, Venezuela (1993).
Course announcement
The Graduate School for Advanced Studies in Nutri-tion, Food Technology, Agrobiotechnology, and HealthSciences, the Netherlands, in cooperation with theUnited Nations University, the Food and AgricultureOrganization of the United Nations, the COSTProgramme of the European Union, and the Interna-tional Union of Nutritional Sciences, announce theFourth International Graduate Course on Productionand Use of Food Composition Data in Nutrition(FoodComp’98).
The course, directed by Professor D. A. T. Southgateand Professor C. E. West, will be held in Wageningen,Netherlands, 5–23 October 1998. It is intended for thoseinvolved in nutritional database programmes as ana-lysts, compilers, or users and will be of value to thoseteaching nutrition and nutritional aspects of food chem-istry. The aim of the course is to show how those in-volved in the production of analytical data for nutri-ents in foods and the compilation of these data intofood composition tables and nutritional databases con-tribute to the quality and usefulness of these compila-
News and notes
tions in nutrition. The course will be based on the phi-losophy that the preparation of nutritional databasesrequires close understanding of the needs of the usersby both compilers and producers of analytical data. Thecourse will show how this understanding can be achievedand the benefits that flow from the collaboration ofusers, analysts, and compilers. Stages in the produc-tion of a nutrient database will be examined.
The course will consist of lectures, seminars, andgroup work. The course fee is Dfl 6,800, including anon-refundable deposit of Dfl 680. The fee covers ac-commodation and meals at the Wageningen Interna-tional Congress Centre, course materials, tuition fees,and excursions. The closing date for application is 1July 1998, but candidates are recommended to applyas soon as possible.
Further information can be obtained from Mrs. L.Duym, Secretariat FoodComp’98, Division of HumanNutrition and Epidemiology, Wageningen AgriculturalUniversity, P.O. Box 8129, 6700 EV Wageningen, Neth-erlands; telephone +31 317 483054; telefax +31 317483342; E-mail [email protected] information about the course can also be foundon the World Wide Web: http://www.wau.nl/vlag/foodcomp.html.
The State of the World’s Children 1998
Malnutrition is largely a silent and invisible emergency,exacting a terrible toll on children and their families.The result of multiple causes, including a lack of food,common and preventable infections, inadequate care,and unsafe water, it plays a role in more than half ofthe nearly 12 million deaths each year of children un-der five in developing countries, a proportion un-matched since the Black Death ravaged Europe in thefourteenth century. Malnutrition blunts intellects andsaps the productivity and potential of entire societies.Poverty, one of the causes of malnutrition, is also aconsequence, a tragic bequest by malnourished par-ents to the next generation.

76
UNICEF’S State of the World’s Children 1998 reportdetails the scale of the problems caused by malnutri-tion and the steps being taken to solve them. It con-tains chapters on the causes of malnutrition, trends inchild malnutrition by region, and recognizing the rightto nutrition. Three-quarters of the children who dieworldwide of causes related to malnutrition are whatnutritionists describe as “mildly to moderately malnour-ished” and show no outward signs of the problems.No less than half of all children under the age of fivein South Asia and one-third of those in sub-SaharanAfrica, as well as millions of children in industrializedcountries, are malnourished, says the report.
The UNICEF report, however, details progress incombating malnutrition: nearly 60% of the world’s saltis now iodized, and millions of children every year arespared mental retardation as a result. Vitamin A supple-mentation is helping bolster disease resistance in chil-dren and may soon become an important measure forhelping to reduce maternal deaths around the world.The report cites examples of UNICEF projects aroundthe world that are successfully taking on the problemscaused by malnutrition.
The State of the World’s Children 1998 also containsthe traditional statistical tables that help chart progresstowards the goals set by country governments at the1990 World Summit for Children. The eight tables inthis report have been expanded to give the broadestpossible coverage of important basic indicators fornutrition, health, education, demographics, economy,and the situation of women, plus rates of progress andregional summaries.
The Report is available from:
UNICEF Headquarters in New YorkUNICEF House3 UN PlazaNew York, NY 10017 USATelephone: (212) 326-7278Fax: (212) 326-7768E-mail: [email protected]
UNICEF Geneva Regional Office5–7 avenue de la Paix1211 Geneva, SwitzerlandTelephone: 22 909 5519Fax: 22 909 5907E-mail: [email protected]
Books available
A limited number of copies of the following books areavailable for the cost of postage and handling from theInternational Nutrition Foundation, Charles St. Sta.,P. O. Box 500, Boston, MA 02114-0500, USA; fax (617)227-9405; E-mail [email protected].
Single-cell protein—Safety for animal and human feed-ing. Edited by Silvio Garattini, Silvio Paglialunga, andNevin S. Scrimshaw. Pergamon Press, New York, 1979.Paperback, 213 pages. Postage and handling: US$4.00.
Nutrition and agricultural development. Significanceand potential for the tropics. Edited by Nevin S.Scrimshaw and M. Béhar. Plenum Press, New York, 1976.Hardcover, 500 pages. Postage and handling: US$8.50.
Nutrition policy implementation. Issues and experi-ence. Edited by Nevin S. Scrimshaw and Mitchel B.Wallerstein. Plenum Press, New York, 1982. Hardcover,558 pages. Postage and handling: US$8.50.
News and notes
Food and Nutrition Bulletin, vo. 19, no. 1 © 1998, The United Nations University. 77
Programme Coordinating Office
Charles Street Station, P.O. Box 500Boston, MA 02114-0500, USATelephone: (617) 277-8747. Fax: (617) 277-9405E-mail: [email protected] Advisor: Dr. Nevin S. ScrimshawProgramme Assistant: Ms. Edwina B. Murray
At the UNU Centre, Tokyo:Vice-Rector: Dr. Abraham Besrat
At the Division of Nutritional Sciences, Cornell University,Ithaca, NY, USA:
Programme Director: Dr. Cutberto Garza
Associated institutions
CENTRAL FOOD TECHNOLOGICAL RESEARCH INSTITUTE (CFTRI).Mysore 570013, India. Tel. 22298.Cable: UNVERCENT MYSORE.Telex: 0846-241. Ftri In. Coordinator: Dr. D. Rajagopal Rao
DEPARTMENT OF FOOD TECHNOLOGY AND NUTRITION, AmericanUniversity of Beirut, Beirut, Lebanon. Tel: 961 1 343002.Fax: 961 1 744460. E-mail: [email protected]. Coordi-nator: D. Raja I. Tannous
DEPARTMENT OF NUTRITION AND FOOD SCIENCE, University ofGhana (DNFS). P.O. Box 134, Legon, Ghana. Tel. 233 27553090. Fax: 233 21 774880. Telex: 2446 UGL GH. Coordi-nator: Dr. Samuel Sefa-Dedeh
INSTITUTE OF NUTRITION, MAHIDOL UNIVERSITY (INMU). SalayaCampus, c/o Research Centre, Faculty of Medicine,Ramathibodi Hospital, Rama VI Road, Bangkok 4, Thai-land. Tel. 282-6435. Coordinator: Dr. Kraisid Tontisirin
INSTITUTE OF NUTRITION AND FOOD TECHNOLOGY (INTA). Uni-versity of Chile, Casilla 15138, Santiago 11, Chile. Tel. 214105,214030. Cable: INTA CHILE. Coordinator: Dr. Ricardo Uauy
INSTITUTE OF NUTRITION OF CENTRAL AMERICA AND PANAMA
(INCAP). Carretera Roosevelt, Zona 11, Guatemala City,Guatemala. Tel. 43762. Cable: INCAP GUATEMALA. Coordi-nator: Dr. Hernán Delgado
INSTITUTE OF NUTRITION, CHINESE ACADEMY OF PREVENTIVE MEDI-CINE. 29 Nan Wei Road, Beijing 100050, People’s Republicof China. Tel. 8610 3022960. Fax: 8610 3170892. Coordi-nator: Dr. Keyou Ge
INSTITUTE OF NUTRITION. Klochkova 66, 480008 Almaty,Kazakhstan. Tel. 7 3272 429-203. Fax: 7 3272 420-720. Co-ordinator: Dr. Turgeldy Sharmanov
LONDON SCHOOL OF HYGIENE AND TROPICAL MEDICINE (LSHTM).Keppel Street (Gower Street), London WC1E 7HT, UK.Tel. 01-636 8636. Coordinator: Dr. Prakash Shetty
UNU Programme on Food and Nutritionfor Human and Social Development
NATIONAL FOOD RESEARCH INSTITUTE (NFRI). 2-1-2 Kannondai,Yatabe-machi, Tsukuba-gun, Ibaraki-ken 300-21, Japan. Tel.02875-6-8011. Coordinator: Dr. Keiji Umeda
NETHERLANDS INTERNATIONAL NUTRITION INSTITUTE (NINI).Lawickse Alle 11, P.O. Box 88, 6700 AB, Wageningen, Neth-erlands. Tel. (08370) 19040. Coordinator: Dr. JosephHautvast
NUTRITION CENTER OF THE PHILIPPINES (NCP). South Super High-way, Nichols Interchange, Makati, Metro Manila 3116, Phil-ippines. Tel. 85-30-71 to -79. Cable: NUTRICEN MANILA. Co-ordinator: Dr. Mercedes de Solon
REGIONAL CENTER FOR COMMUNITY NUTRITION (RCCN).SEAMEO-TROPMED, Bldg. JL, Salemba Raya 4, Jakarta10430, Indonesia. Tel. 62 21 330205. Fax: 62 21 3913933.Coordinator: Dr. Darwin Karyadi
UNIVERSITY OF NAIROBI (UNK). Department of Food Technologyand Nutrition, Faculty of Agriculture, Kabete Campus, P.O.Box 41670, Nairobi, Kenya
Other cooperating organizations
ArgentinaCentro de Estudios sobre Nutrición Infantil (CESNI), Buenos
Aires, Argentina (Dr. Alejandro O’Donnell)
BrazilState University of Campinas (UNICAMP). Campinas, BrazilUniversity of São Paulo. Ribeirão Prêto, Brazil (Dr. José Dutra
de Oliveira)
GuatemalaCenter for Studies of Sensory Impairment, Aging and Me-
tabolism (CeSSIAM), Guatemala City, Guatemala (Dr. NoelW. Solomons)
IndiaNational Institute of Nutrition (NIN), Indian Council of
Medical Research, Hyderabad, India (Dr. KamalaKrishnaswamy)
KoreaKorea Food Research Institute (KFRI), 148-1 Dangsu, Bagwol,
Hwaseong, Kyonggi, Korea 445-820 (Dr. Chung Yun Park)
NetherlandsDepartment of Human Nutrition, Agricultural University,
Wageningen, Netherlands (Dr. P. Middelburg)Department of Tropical Nutrition, Royal Tropical Institute,
Amsterdam, Netherlands (Prof. J. Kusin)Division for Nutrition and Food Research, TNO, Zeist, Neth-
erlands (Prof. B. Krol)

78
International Course in Food Science and Nutrition (ICFSN),Wageningen, Netherlands (Dr. M. L. J. Mertens)
Netherlands Universities Foundation for International Co-operation (NUFFIC), The Hague, Netherlands (Dr. C. W.Klugkist)
PhilippinesFood and Nutrition Research Institute, Manila, Philippines
(Dr. Rodolfo Florentino)University of the Philippines at Los Baños, Los Baños, Philip-
pines (Dr. Cora Barbera)
SpainInstituto de Nutrición, Consejo Superior de Investigaciones
Científicos de España, Madrid, Spain (Dr. Gregorio Varela)
United KingdomAgricultural Research Council, Food Research Institute,
Norwich, UKDepartment of Food Science, University of Reading, Reading,
UK (Dr. Harry Nursten)Food Research Institute, Norwich, UK (Dr. David Southgate)Institute of Development Studies, University of Sussex,
Brighton, UK
United StatesDepartment of Food Science and Nutrition, University of
Massachusetts, Amherst, Mass., USA (Dr. Peter Pellett)Program in International Nutrition, University of Califor-
nia, Davis, Calif., USA (Dr. Lindsay Allen)School of Public Health, Johns Hopkins University, Baltimore,
Md., USA (Dr. Benjamin Caballero)School of Public Health, University of California, Los Ange-
les, Calif., USA (Dr. Osman Galal)Center for International Health, Emory University School of
Public Health, Atlanta, Ga., USA. (Dr. Reynaldo Martorell)Tufts University School of Nutrition Science and Policy,
Medford, Mass., USA (Dr. Beatrice Rogers)USDA Human Nutrition Research Center on Aging, Boston,
Mass., USA (Dr. Irwin Rosenberg)
West IndiesCaribbean Food and Nutrition Institute (CFNI), Kingston,
Jamaica (Dr. Fitzroy Henry)
International organizationInternational Food Policy Research Institute (IFPRI), Wash-
ington, D.C., USA
International scientific unionsInternational Union of Food Science and Technology (IUFoST)International Union of Nutrition Sciences (IUNS)
The United Nations systemThe UNU Programme of Food and Nutrition for Human
and Social Development cooperates with the appropriateunits or divisions of the following organizations, amongothers:
Food and Agriculture Organization (FAO)International Atomic Energy Agency (IAEA)United Nations Children’s Fund (UNICEF)World Bank (IBRD)World Food Programme (WFP)World Health Organization (WHO)
The University is represented on the Sub-Committee on Nu-trition (SCN) of the United Nations Administrative Com-mittee on Coordination.
Research networks
Chronic energy deficiency
International Dietary Energy Consultative Group (IDECG).Secretariat: Nestlé Foundation, 4 Place de la Gare, Lausanne,Switzerland. Executive Secretary: Dr. Beat Schürch. Tel. 4121320 3351. Fax: 4121 320 3392. Executive committee: Dr.Nevin S. Scrimshaw, Chairman; Dr. Joseph Hautvast, Dr.Beat Schürch
Division of Nutrition, National Institute of Nutrition, CalleVasco de Quiroga No. 15 Col. y Deleg. Tlalpan, 14000 Mexico,D.F., Mexico. Principal investigator: Dr. Héctor Bourges
Ethiopian Nutrition Institute, Addis Ababa, Ethiopia. Prin-cipal investigator: Dr. Teshome Demeke
Institute of Nutrition and Food Hygiene, Chinese Academyof Preventive Medicine, 29 Nan Wei Road, Beijing 100050,China. Principal investigator: Dr. Chen Xue-Cun
Instituto de Nutrición y Tecnología de los Alimentos,Universidad de Chile, Casilla 15138, Santiago 11, Chile.Principal investigator: Dr. Ricardo Uauy
Medical College in Wisconsin, Milwaukee, WI 53226, USA.Principal investigator: Dr. Gerald B. Spurr
National Institute of Nutrition, Via Ardeatina 546, Rome, Italy.Principal investigator: Dr. Anna Ferro-Luzzi
Universidad del Valle, Departamento de Pediatría, Facultadde Medicina. Apartado Aéreo 2188, Cali, Colombia. Prin-cipal investigator: Dr. Julio C. Reina
University of Glasgow, Glasgow G12 8QQ, Scotland, UK. Prin-cipal investigator: Dr. John Durnin
Amino acid requirements
Massachusetts Institute of Technology, Cambridge, MA 02139,USA. Principal investigator: Dr. Vernon R. Young
Nutrition Research Centre, St. John’s Medical College, Ban-galore 560 034, India. Principal investigator: Dr. AnuraKurpad
Iron-deficiency anaemia
Group for the Control of Iron Deficiency (GCID). Secretariat:Department of Nutrition Sciences, 119 Morgan Hall, Uni-versity of California, Berkeley, CA 94270, USA. Tel. (510)642-6900. Executive Secretary: Dr. Fernando Viteri. Chair-man: Dr. Nevin S. Scrimshaw
Beijing Medical College—UNICEF, Department of Nutri-tion and Food Hygiene, Beijing, China. Principal investi-gator: Dr. Shiu-yun Liu
Ecole Nationale de Médecine et de Pharmacie du Mali, Ser-vice Hématologie, Bamako, Mali. Principal investigator: Dr.Dapa Diallo
Food and Nutrition Research Institute, Manila, Philippines.Principal investigator: Dr. Rodolfo Florentino
Institute for Medical Research, Kuala Lumpur, Malaysia. Prin-cipal investigator: Dr. T. E. Siong
Institute of Nutrition, Mahidol University (INMU), SalayaCampus, c/o Research Centre, Faculty of Medicine,Ramathibodi Hospital, Rama VI Road, Bangkok 4, Thai-land. Principal investigator: Dr. Kraisid Tontisrin
Institute of Nutrition and Food Technology (INTA), Uni-versity of Chile, Casilla 15138, Santiago 11, Chile. Princi-pal investigator: Dr. Tomas Walter
Institute of Nutrition of Central America and Panama(INCAP), Carretera Roosevelt, Zona 11, Guatemala City,Guatemala. Principal investigator: Dr. Benjamín Torún
Laboratory of Iron Deficiency Study (LIDS), Department ofPediatrics, First Clinical College, Beijing Medical Univer-sity, West City, Beijing 100034, China. Principal investiga-tor: Dr. Chen-Ting Chin
UNU Programme on Food and Nutrition for Human and Social Development
79
National Institute of Nutrition, Cairo, Egypt. Principal in-vestigator: Dr. Mohammed A. Hussein
National Institute of Nutrition, ICMR, Hyderabad, India.Principal investigator: Dr. Vinodini Reddy
National Research Centre, National Academy of Sciences, Cairo,Egypt. Principal investigator: Sohair Salem
Nutrition Research and Development Centre, Komplek GIZI,Jalan Semboja, Bogor, Indonesia. Principal investigator: Dr.Mahdin Husaini
Tanzania Food and Nutrition Centre, Dar es Salaam, Tanza-nia. Principal investigator: Dr. F. P. Kavishe
Venezuelan Institute of Scientific Research (IVIC), Apartado1827, Caracas, Venezuela. Principal investigator: Dr. MiguelLayrisse
Rapid assessment procedures for nutrition and primary healthcare—Anthropological approaches to improving programmeeffectiveness
Secretariat: UNU Boston Programme Office, Charles St. Sta.,P.O. Box 500, Boston, MA 02114-0500, USA. Tel. (617) 227-8747; fax (617) 227-9405; E-mail [email protected] coordinator: Dr. Nevin S. Scrimshaw
Cooperating investigators and advisers:Dr. Simi Afonia, Department of Sociology and Anthropol-
ogy, University of Ife, Ile-Ife, NigeriaDr. Margaret Bentley, Johns Hopkins University, 615 N. Wolfe
St., Baltimore, MD 21205, USADr. Michael Cernea. Sociology Advisor, World Bank, 1818 H
St., NW, Washington, DC 20433, USADr. Robert Chambers, Institute of Development Studies,
University of Sussex, Brighton BN1 9RE, EnglandJasmina Estupinan, Psiconsult, Apdo. Postal 148C, Batan 124
y Eloy Alfaro, Quito, EcuadorDr. Peter Heywood. World Bank, 1818 H St., NW, Washing-
ton, DC 20433, USADr. Pamela Hunte, UNDP, Islamabad, PakistanLic. Elena Hurtado, Institute of Nutrition of Central America
and Panama, P.O. Box 1188, Guatemala City, GuatemalaDr. Susi Kessler, Evaluation Division. UNICEF:USA, 3 United
Nations Plaza, New York, NY 10017, USADr. Yongyout Kachondham, Institute of Nutrition, Mahidol
University, Salaya Campus, c/o Research Centre, Facultyof Medicine, Ramathibodi Hospital, Rama VI Rd., Bangkok4. Thailand
Dr. Christine Lamba, Centre for Social Research and Chan-cellor College, University of Malawi, Box 278 Zomba, Malawi
Dr. Sandra Lane, Department of Anthropology, Case West-ern Reserve University, 10900 Euclid Avenue, Cleveland,OH 44106-7126, USA
Dr. María de la Luz Alvarez, Instituto de Nutrición y Tecnologíade los Alimentos, Universidad de Chile, Casilla 15138,Santiago 11, Chile
Dr. Lenore Manderson, Tropical Health Program, Universityof Queensland Medical School, Brisbane, Queensland 4006,Australia
Dr. Ellen Messer, World Hunger Program, Brown University,Box 1831, Providence, RI 02912, USA
Dra. Clarice Mota, Instituo de Filosofia e Ciências Sociais,Universidade Federal do Rio de Janeiro, Brazil
Dr. David O. Nyamwaya, Institute of African Studies, Uni-versity of Nairobi, Nairobi, Kenya
Dr. A. W. Patterson, Caribbean Food and Nutrition Institute,P.O. Box 140, Kingston 17, Jamaica
Dr. Gretel Pelto, Nutrition Division, World Health Organi-zation, Geneva, Switzerland
Dr. D. Raghunandan, Society for Economic and Social Stud-ies, B-1 2nd floor LSC, J Block, Saket, New Delhi 110 017,India
Dr. Kong-Kyun Ro, Department of Management Science, KoreaAdvanced Institute of Science and Technology, P.O. Box131, Cheongryang, Seoul, Korea
María E. Romero, Independent Consultant, Bogotá, Co-lombia
Dr. Susan C. Scrimshaw, School of Public Health, Universityof Illinois, Chicago, Ill., USA
Dr. Vijaya Shrestha, Box 3067, Kathmandu, NepalDr. Ngokwey Ndolamb, UNICEF, Dakar, Senegal
International Network of Food Data Systems(INFOODS)
Secretariat: Charles St. Sta., P.O. Box 500, Boston, MA 02114-0500, USA. Tel. (617) 227-8747; fax (617) 227-9405; E-mail:[email protected]. Managing director: Dr. BarbaraBurlingame, New Zealand Institute for Crop & Food Re-search, Palmerston North, New Zealand. Tel. (063) 68019;fax: (063) 61130; E-mail: [email protected]
Food and Agriculture Organization of the United Nations (FAO):Dr. John Lupien, Viale delle Terme di Caracalla 00100, Rome,Italy. Tel. (396) 52251. Fax: (396) 52253152
Regional liaison groups:AFROFOODS. Coordinator: Dr. Lilian Marovatsanga, Uni-
versity of Zimbabwe, P.O. Box MP 167, Mount Pleasant,Harare, Zimbabwe
ECSAFOODS. Coordinator: Dr. Lilian Marovatsanga, Uni-versity of Zimbabwe, P.O. MP Box 167, Mount Pleasant,Harare, Zimbabwe
NAFOODS. Coordinator: Mr. Chekib Alguemi, Institut Na-tional de Nutrition et de Technologie Alimentaire, Ministèrede la Santé Publique, 11 Rue Djebel Lakhdar (Bab Saadoun),Tunis, Tunisia
OCAFOODS. Coordinator: Mr. Moussa Soune, Biotech Unit,Institut de Technologie Alimentaire (ITA), B.P. 2765 HannMaristes, Dakar, Senegal
WAFOODS. Coordinator: Dr. Samuel Sefa-Dedeh, Depart-ment of Nutrition and Food Science, University of Ghana,P.O. Box 134, Legon, Accra, Ghana
ARABFOODS. Coordinator: Dr. Raja Tannous, Faculty ofAgriculture and Food Science, American University ofBeirut, Lebanon
ASEANFOODS. Coordinator: Dr. Aree Valyasevi, Institute ofNutrition, Mahidol University, Bangkok, Thailand. Nationalcoordinators: Dr. Prapasri Puwastien, INMU, Bangkok,Thailand; Dr. Tee E. Siong, Institute for Medical Research,Kuala Lumpur, Malaysia; Dr. Aida Aguinaldo, Food andNutrition Research Institute, Manila, Philippines
CARICOMFOODS. Coordinator: Dr. Fitzroy Henry, Carib-bean Food and Nutrition Institute, Kingston, Jamaica
EUROFOODS. Coordinator: Dr. Clive West, Department ofHuman Nutrition, Agricultural University, Wageningen,Netherlands
GULFOODS. Coordinator: Dr. Abdulrahman O. Musaiger,Arab Nutrition Society, Al-Ain, United Arab Emirates
LATINFOODS. Coordinator: Dr. Ricardo Bressani, Instituteof Nutrition of Central America and Panama, GuatemalaCity, Guatemala
MASIAFOODS. Coordinator: Dr. Wang Guang-ya, Instituteof Nutrition and Food Hygiene, Chinese Academy of Pre-ventive Medicine, Beijing, People’s Republic of China
MEFOODS. Coordinator: To be designated, National ResearchCenter/National Institute of Nutrition, Cairo, Egypt
MEXCARIBEFOODS. Coordinator: Dr. Miriam Chavez, Na-tional Institute of Nutrition, Mexico City, Mexico
UNU Programme on Food and Nutrition for Human and Social Development

80
NORAMFOODS. Coordinator: Dr. Joanne Holden, Agricul-tural Research Service, USDA, Riverdale MD 20736, USA
NORDICFOODS. Coordinator: Dr. Åke Bruce, Swedish Na-tional Food Administration, Uppsala, Sweden
OCEANIAFOODS. Coordinator: Dr. Barbara Burlingame,New Zealand Institute for Crop & Food Research, PrivateBag, Palmerston North, New Zealand
SAARCFOODS. Coordinator: Dr. Mushtaq A. Khan, Nutri-tion Section, Planning Commission, Islamabad, Pakistan
Joint AAU/UNU Regional Food and Nutrition Projectfor Africa
The Federal Institute of Industrial Research (FIIRO), Oshodi,Nigeria
Institut de Technologie Alimentaire (ITA), Dakar, SenegalFood Research Institute (FRI), Accra, GhanaDepartment of Nutrition and Food Science (DFNS), Uni-
versity of Ghana, Accra, Ghana
Global Cereal Fortification InitiativeSecretariat: Dr. Junji Nakamura, Ajinomoto Building, 15-1
Kyobashi 1-chome, Chuo-ku, Tokyo 104, Japan
UNU Programme on Food and Nutrition for Human and Social Development
The editors of the Food and Nutrition Bulletin welcomecontributions of relevance to its concerns (see the state-ment of editorial policy on the inside of the front cover).Submission of an article does not guarantee publication—which depends on the judgement of the editors and re-viewers as to its relevance and quality. All potentially ac-ceptable manuscripts are peer-reviewed. Contributors shouldexamine recent issues of the Bulletin for content and style.
Language. Contributions may be in English, French,or Spanish. If French or Spanish is used, the author shouldsubmit an abstract in English if possible.
Format. Manuscripts should be typed or printed on aword processor, double-spaced, and with ample margins.Only an original typed copy or a photocopy of equiva-lent quality should be submitted; photocopies on thinor shiny paper are not acceptable.
When the manuscript has been prepared on a wordprocessor, a diskette, either 31⁄2- or 51⁄4-inch, should beincluded with the manuscript, with an indication of thedisk format and the word-processing program used.
Length. Ordinarily contributions should not exceed 4,000words.
Abstract. An abstract of not more that 150 words shouldbe included with the manuscript, stating the purposesof the study or investigation, basic procedures (study subjectsor experimental animals and observational and analyti-cal methods), main findings (give specific data and theirstatistical significance if possible), and the principal con-clusions. Emphasize new and important aspects of thestudy or observations. Do not include any informationthat is not given in the body of the article. Do not citereferences or use abbreviations or acronyms in the abstract.
Tables and Figures. Tables and figures should be onseparate pages. Tables should be typed or printed outdouble-spaced. Submit only original figures, original linedrawings in India ink, or glossy photographs. Labels onthe figures should be typed or professionally letteredor printed, not handwritten.
Photographs. Ideally photographic materials should besubmitted in the form of black and white negatives orblack and white glossy prints. Photographs will not bereturned unless a specific request is made.
Units of measurement. Preferably all measurements shouldbe expressed in metric units. If other units are used, theirmetric equivalents should be indicated.
Abbreviations. Please explain any abbreviations usedunless they are immediately obvious.
References. References should be listed at the end ofthe article, also double-spaced. Unpublished papers shouldnot be listed in references, nor should papers submittedfor publication but not yet accepted.
Number references consecutively in the order in whichthey are first mentioned in the text. Identify referencesin the text and in tables and figure legends by arabic nu-
Note for contributors
merals enclosed in square brackets. References cited onlyin tables or figure legends should be numbered in accor-dance with the first mention of the relevant table or fig-ure in the text. Be sure references are complete.
Reference citations should follow the format illustratedbelow.Journal reference—standard journal article (list all authors):
1. Alvarez ML, Mikasic D, Ottenberger A, Salazar ME.Caracteristicas de familias urbanas con lactantedesnutrido: un análisis critico. Arch Latinoam Nutr1979;29:220–30.
—corporate author:2. Committee on Enzymes of the Scandinavian Soci-
ety for Clinical Chemistry and Clinical Physiology.Recommended method for the determination ofgammaglutamyltransferase in blood. Scand J ClinLab Invest 1976;36:119–25.
Book or other monograph reference—personal author(s):
3. Brozek J. Malnutrition and human behavior: experi-mental, clinical and community studies. New York:Van Nostrand Reinhold, 1985.
—corporate author:4. American Medical Association, Department of Drugs.
AMA drug evaluations. 3rd ed. Littleton, Mass, USA:Publishing Sciences Group, 1977.
—editor, compiler, chairman as author:5. Medioni J, Boesinger E, eds. Mécanismes éthologiques
de l’évolution. Paris: Masson, 1977.—chapter in book:
6. Barnett HG. Compatibility and compartmentaliza-tion in cultural change. In: Desai AR, ed. Essays onmodernization of underdeveloped societies. Bombay:Thacker, 1971:20–35.
Identification. Please give the full name and highest degreeof all the authors, the name of departments and institu-tions to which the work should be attributed, the name,address, and fax number of the author responsible forcorrespondence about the manuscript, and sources of sup-port for the work. If the material in the article has beenpreviously presented or is planned to be published else-where—in the same or modified form—a note shouldbe included giving the details.
Manuscript copies. The contributor should keep a du-plicate copy of the manuscript. Manuscripts will not bereturned unless specifically requested. Proofs will be sentto the authors only in exceptional circumstances.
Contributions should be addressed to:The EditorFood and Nutrition BulletinCharles Street Sta., P.O. Box 500Boston, MA 02114-0500, USA
La rédaction du Food and Nutrition Bulletin recherchedes articles traitant de sujets correspondant à ses thèmes(voir au vérso de la couverture la politique éditoriale decette revue). La remise d’un manuscrit ne signifie pas sapublication, qui dépend de l’opinion de la rédaction etdes réviseurs sur son intérêt et sa qualité. Tous les ma-nuscrits susceptibles d’être acceptés sent révisés par despairs. Les auteurs sent invités à se pencher sur les récentsnuméros du Bulletin pour prendre connaissance de soncontenu et de son style.
Langues. Les manuscrits peuvent être rédigés en anglais,en français ou en espagnol, et dans ces deux derniers cas,I’auteur ajoutera, si possible, un résumé en anglais.
Format. Les manuscrits doivent être dactylographiésou imprimés sur une machine de traitement de texte, endouble interligne, avec une marge suffisante. Ne doit êtreprésenté qu’un exemplaire original dactylographié ou unephotocopie de qualité équivalente.
Lorsque le manuscrit a été préparé sur une machinede traitement de texte, une disquette de 3,50 ou de 5,25pouces devrait dans toute la mesure possible y être jointeen précisant son format et le programme utilisé.
Longueur. Les manuscrits ne doivent pas, normalement,dépasser 4000 mots.
Résumé: Un résumé de 150 mots maximum doit ac-compagner le manuscrit. Il devra donner les buts de l’étudeou des recherches, les procédures de base (sujets de l’étudeou animaux expérimentaux et méthodes d’observationet d’analyse), les principaux résultats (fournir des don-nées spécifiques et indiquer dans la mesure du possibleleur importance statistique) ainsi que les principales con-clusions. Veuillez mettre en relief les aspects nouveauxet importants de l’étude ou des observations. Prière dene pas inclure des informations qui ne figurent pas dansle corps de l’article. Dans le résumé, ne citez aucun ouvragede référence et n’utilisez ni abréviations ni sigles.
Tableaux et figures. Ils doivent être reportés sur des feuilletsséparés. Les tableaux doivent être dactylographiés ouimprimés en double interligne. Veuillez soumettre uni-quement des figures originales, des dessins à l’encre deChine ou des photographies tirées sur papier glacé. Leslabels qui apparaissent sur les figures doivent être dacty-lographiés ou gravé ou imprimés de manière professionnelleet non pas écrits à la main.
Photographies. En principe, les matériaux photographi-ques doivent être remis sous forme de négatifs noir etblanc ou d’épreuves noir et blanc sur papier brillant. Saufdemande expresse les photographies ne seront pas ren-voyées.
Unités de mesure. On utilisera de préférence le systèmemétrique. Si d’autres systèmes sent utilisés, l’équivalentmétrique doit être indiqué.
Abréviations. Prière d’expliquer les abréviations utili-sées à moins qu’elles ne soient évidentes.
Références. Les références doivent apparaître à la finde l’article, en double interligne également. Les documentsnon publiés ne doivent pas figurer dans les références pasdavantage que les documents présentés à des fins de pu-blication mais qui n’ont pas encore été acceptés.
Note à l’intention des auteurs
Veuillez numéroter les références dans l’ordre où ellessent mentionnées dans le texte. Identifiez au moyen d’unchiffre arabe placé entre crochets les références dans letexte, les tableaux et les légendes des figures. Les référen-ces citées uniquement dans les tableaux ou les légendesdes figures doivent être numérotées en fonction de la pre-mière fois où il est fait mention du tableau ou de la fi-gure appropriée dans le texte. Assurez-vous que les réfé-rences sont complètes.
Les références citées doivent suivre le format décrit ci-dessous.Journal—article de journal type (énumérer tous les auteurs):
1. Alvarez ML, Mikasic D, Ottenberger A, Salazar ME.Caracteristicas de familias urbanas con lactantedesnutrido: un análisis critico. Arch Latinoam Nutr1979;29:220–30.
—auteur d’une société:2. Committee on Enzymes of the Scandinavian Soci-
ety for Clinical Chemistry and Clinical Physiology.Recommended method for the determination ofgammaglutamyltransferase in blood. Scand J ClinLab Invest 1976;36:119–25. Livre ou autre monographie
—auteur(s) à titre personnel:3. Brozek J. Malnutrition and human behavior: experi-
mental, clinical and community studies. New York:Van Nostrand Reinhold, 1985.
—auteur d’une société:4. American Medical Association, Department of Drugs.
AMA drug evaluations. 3e éd. Littleton, Mass.(E.-U.): Publishing Sciences Group, 1977.
—éditeur, compilateur, président en tant qu’auteur:5. Medioni J, Boesinger E, éds. Mécanismes éthologiques
de l’évolution. Paris: Masson, 1977.—chapitre d’un ouvrage:
6. Barnett HG. Compatibility and compartmentaliza-tion in cultural change. Dans: Desai AR, éd. Essayson modernization of underdeveloped societies.Bombay: Thacker, 1971:20–35.
Identification. Prière de donner le nom complet et legrade universitaire le plus élevé de tous les auteurs, lenom des départements et des institutions auxquels le travaildoit être attribué, le nom, l’adresse et le numéro de télé-copieur de l’auteur chargé de la correspondance sur lemanuscrit ainsi que les sources de financement du tra-vail. Si l’article a déjà été remis auparavant ou est retenupour une autre publication—sous la même forme ou sousune forme modifiée—on l’indiquera de façon détaillée.
Copies du manuscrit. L’auteur doit conserver un dou-ble. Les manuscrits ne seront pas retournés à moins queleurs auteurs n’en fassent expressément la demande. Lesépreuves seront envoyées aux auteurs dans des circons-tances exceptionnelles seulement.
Les auteurs s’adresseront à:The EditorFood and Nutrition BulletinCharles Street Sta., P.O. Box 500Boston, MA 02114-0500, USA
Los editores del Food and Nutrition Bulletin agradecenel envío de contribuciones pertinentes al tema de la revista(vea la política editorial de esta revista en el interior dela tapa anterior). La presentación de un artículo no esgarantía de su publicación, la cual dependerá del criteriode los editores y evaluadores en lo que respecta a supertinencia y calidad. Los manuscritos con posibilidadesde ser aceptados serán sometidos a evaluación por pares.Se ruega a quienes deseen colaborar que consulten númerosrecientes de Food and Nutrition Bulletin para cerciorarsede su contenido y estilo.
Idioma. Las contribuciones podrán remitirse en español,francés o inglés. De usar si es español o francés, el autordeberá incluir, posible, un resumen en inglés.
Formato. Los manuscritos deberán presentarse mecano-grafiado o impresos en tratamiento de textos, a doble espacio,con márgenes amplios. Solamente se presentarán originalesmecanografiados o una fotocopia de los mismos de calidadequivalente. No se admitirán fotocopias en papel fine osatinado.
Cuando el manuscrito ha sido preparado usando trata-miento de textos, deberá enviarse junto al manuscrito undisco floppy, bien en 31⁄2 pulgadas, bien en 51⁄4 pulgadas,indicando el formato del disco y el programa de tratamientode textos que ha utilizado.
Longitud. Las contribuciones ordinarias no deberánexceder las 4.000 palabras.
Resúmenes. Se adjuntará al manuscrito un resumen queno exceda de 150 palabras, y que indicará el objetivo delestudio o investigacion, métodos básicos (individuos,animales seleccionados en experimentos y métodos deobservación y análisis), descubrimientos principales (sifuera posible aportando datos específicos y su significadoestadístico), y las conclusiones principales. Se enfatizaránlos aspectos nuevos e importantes del estudio u observa-ciones. Rogamos no incluya informaciones que no se hayandado en el cuerpo del artículo. En el resumen no se citaránreferencias ni se usarán abreviaturas ni siglas.
Cuadros y figuras. Todos los cuadros y figuras deberánpresentarse en hojas de papel por separado. Los cuadrosse mecanografiarán o imprimirán a doble espacio. Sepresentarán solamente figuras originales, esquemasoriginales en tinta china o fotografías en papel brillo. Losnombres de las figuras estarán mecanografiados o impresoso rotulados profesionalmente, y no manuscritos.
Fotografías. El material fotográfico se presentará preferen-temente en bianco y negro, en negativos o en impresiónsobre papel brillante. No se devolverá este material foto-gráfico a no ser que así lo solicite el remitente.
Abreviaturas. Rogamos que expliquen todas las abrevia-turas que utilicen, a menos que éstas sean evidentes oimmediatamente reconocibles.
Unidades de medida. Se utilizará preferentemente elsistema métrico decimal. De utilizarse otras unidades,deberán indicarse sus equivalentes en el sistema métricodecimal.
Referencias. Al final del artículo deberán consignarselas referencias, también en doble espacio. En las referenciasno se consignarán documentos que no se hayan publicado,ni aquellos que hayan solicitado su publicación pero queno se han aceptado todavía.
Nota para los posibles autores
Las referencias se numerarán consecutivamente en elorden en que aparecen en el texto. Las referencias en eltexto, en los cuadros y en los epígrafes de figuras se identi-ficarán con números arábigos encerrados entre paréntesisrectangulares. Las referencias que se citan solamente encuadros o epígrafes de figuras se numerarán de acuerdocon la primera mención que se haga en el texto del cuadroo figura pertinente. Asegúrese de que todas las referendasse dan de forma completa.
Las citas hechas a referencias deben adjustarse al formatoindicado a continuación.Referencia a publicación periódica—articulo modelo de publicación periódica (consignar todoslos autores):
1. Alvarez ML, Mikasic D, Ottenberger A, Salazar ME.Caracteristicas de familias urbanas con lactantedesnutrido: un análisis critico. Arch Latinoam Nutr1979;29:220–30.
—autor corporativo:2. Committee on Enzymes of the Scandinavian Soci-
ety for Clinical Chemistry and Clinical Physiology.Recommended method for the determination ofgammaglutamyltransferase in blood. Scand J ClinLab Invest 1976;36:119–25.
Referencia a libro u otra monografía—autor(es) personal(es):
3. Brozek J. Malnutrition and human behavior: experi-mental, clinical and community studies. Nueva York:Van Nostrand Reinhold, 1985.
—autor corporativo:4. American Medical Association, Department of Drugs.
AMA drug evaluations. 3ra edición, Littleton, Mass.,EE.UU.: Publishing Sciences Group, 1977.
—editor, recopilador, presidente de consejo como autor :5. Medioni J, Boesinger E, editores, Mécanismes étholo-
giques de l’évolution. París: Masson, 1977.—capitulo de libro:
6. Barnett HG. Compatibility and compartmentaliza-tion in cultural change. En: Desai AR, editor. Essayson modernization of underdeveloped societies.Bombay: Thacker, 1971:20–35.
Identificación. Rogamos consignen el nombre completoy la titulación más alta de todos los autores, nombre deldepartamento e instituciones a las que se atribuirá el trabajo,el nombre, la dirección y el número de fax del autorresponsable de la correspondencia del manuscrito, y fuentesde sustentación del trabajo. Si el material del artículo hasido presentado previamente o se prevé publicación enotra parte, en forma igual o modificada, se deberá agregaruna nota dando detalles.
Copias de la contribución. El contribuyente deberáconservar una copia del material que envíe. No se devolveránlos manuscritos a no ser que se pida su devolución. Lascorrecciones de prueba se enviarán a los autores solamenteen casos excepcionales.
Las contribuciones deberán dirigirse a:The EditorFood and Nutrition BulletinCharles Street Sta., P.O. Box 500Boston, MA 02114-0500, USA


Food and Nutrition Bulletin Subscription Form
■ Please enter my subscription to the Food and Nutrition Bulletin, vol. 19, 1998 (four issues).■ Please register my standing order to the Food and Nutrition Bulletin from vol. 19 onwards.
Regular rates: 1 year, US$40 2 years, US$75 3 years, US$100Developing country rates: 1 year, US$25 2 years, US$45 3 years, US$60All rates include delivery by surface mail. Add US$10 per year for air mail.
Please send me the following back volumes:■ Vol. 1 ■ Vol. 4 ■ Vol. 7 ■ Vol. 10 ■ Vol. 13 ■ Vol. 16■ Vol. 2 ■ Vol. 5 ■ Vol. 8 ■ Vol. 11 ■ Vol. 14 ■ Vol. 17■ Vol. 3 ■ Vol. 6 ■ Vol. 9 ■ Vol. 12 ■ Vol. 15 ■ Vol. 18
Rates per volume— Vols. 1–11 Vols. 12–regular: US$30 US$40 Totaldeveloping country: US$25 US$25 payment
Add US$10 per volume for air mail. enclosed:
Individuals are requested to enclose payment with their orders. Prices are quoted subject to changewithout notice. Payment must be made in US dollars only. Cheques should be made payable to:International Nutrition Foundation, Inc.
Send to: International Nutrition Foundation, Inc., Charles Street Station,P.O. Box 500, Boston, MA 02114-0500, USA
Name:
Address:
