foliar deposition and pesticide losses from three air-assisted sprayers in a hedgerow vineyard
TRANSCRIPT
ELSEVIER
Foliar deposition and pesticide losses from three air-assisted sprayers in a hedgerow vineyard Gianfranco Pergher, Rino Gubiani and Gianni Tonetto Dipartimento di Produzione Vegetale e Tecnologie Agrarie, Universitd degli Studi di Udine, Via
delle Scienze 208, 33100 Udine, Italy
Three commercial air-assisted sprayers were tested in a hedgerow vineyard, at full vegetative development (end of July; leaf area index = 1.94), using a water-soluble food dye as a tracer. The spraying equipment used was (1) a high-volume (1355 I ha-‘) axial-fan sprayer; (2) a low-volume
(246 I ha-‘) compressed-air sprayer (3) a sprayer fitted with deflectable air outlets, allowing an
adjustment of the output angle. relative to the row direction. from 90” to 118”. All application techniques appeared to be capable of delivering more than 64% of the sprayed material onto the leaves
and grapes. The high-volume sprayer provided the most uniform distribution over the foliage. The
change of the output angle from 90” to 118” did not significantly affect total leaf deposition, but increased the overall variability of the deposits. Copyright @ 1996 Elsevier Science Ltd
Keywords: sprayer; vineyard; tracer; losses; uniformity
The efficiency of chemical application in orchards and vineyards depends on many factors, such as the timing of the application, choice of spray formulation, type of equipment, and calibration. The sprayer should uni- formly deposit material on the tree canopy, with a minimum of off-target loss (Derksen and Gray, 1995). Uneven distribution on the foliage and high drift losses may lead to inadequate pest control, that may then require repeated applications; additional treatments will increase chemical costs, fuel, labour, and machinery expenses (Derksen and Breth, 1994).
Pesticide losses during application may also increase environmental pollution and result in adverse effects to living organisms. This is particularly true for airborne drift losses, which can deposit at large distances downwind from the application site (Fox, Reichard, Brazee, Krause and Hall 1993; Salyani and Cromwell, 1992), but also losses to the ground within the field are potentially dangerous.
Therefore, pesticide drift has raised world-wide concern and many researchers are involved in studies to minimise drift losses from all pesticidal applications. However, little effort has been devoted to assessing the actual accuracy of fruit tree or vineyard spraying operations under commonly practised operational conditions.
Uneven distribution on the foliage (Cross,, 1991; Derksen and Gray, 1995; Giles, Delwiche and Dodd, 1980; Salyani and McCoy, 1989) can be attributed to the difficulty of controlling the directions of spray and air flows from a conventional sprayer, in order to match the plant geometry and target distribution (Hislop, 1991). In recent years, several procedures and devices have been proposed to improve sprayer calibration (Ktimmel and Gohlich, 1988; Pergher, Gubiani,
Gasparinetti and Del Cont Bernard, 1994; Porskamp and Michielsen, 1992). After using a special test rig to calibrate the vertical spray distribution from an axial- fan sprayer, Pergher et al. (1994) found, however, that deposition was still not satisfactory, as leaves on top of vines had two to three times more deposit than the bottom leaves. In apple orchards, pesticide losses to the ground ranged from 14 to 39% of the total dose applied (Buisman, Sundaram, Sundaram and Trammel, 1989; Raisigl, Felber, Siegfried and Krebs, 1991), and drift losses ranging from 23% to 45% (Planas and Pons, 1991; Siegfried and Raisigl, 1991) have been reported. In vineyards, total losses ranging from 46-69%, during the early growth stages of the vines (May to June), to 43-67% at full foliage development (July to August) have been recorded for conventional axial-fan sprayers (Pergher and Gubiani, 1995; Siegfried and Raisigl, 1991; Siegfried and Holliger, 1992).
Considerable effort has been devoted in recent years to the development of sprayers with reduced drift, as an alternative to the traditional air-carrier sprayers with either hydraulic or air-shear nozzles. Cross-flow-fans sprayers, or axial-fan sprayers fitted with adjustable air outlets, have been devised to direct sprays at a reward angle of 30” to 45”, relative to the lateral target; this increases the number of leaf layers the droplets are forced to pass through, and has been found to reduce drift in hedgerow plantations (Backer, 1993; Pergher and Gubiani, 1996; Peterson and Hogmire, 1994; Van Ee, Ledebuhr and Potter, 1984).
Tunnel sprayers, either with no air-assistance or with air-assistance, have been proposed (Matthews, de Schaetzen, John and De Schaetzen, 1992; Schmidt, 1980; Siegfried and Raisigl, 1991); reductions of pesticide losses ranging from 15% to 50% of the dose applied
Crop Protection 1997 Volume 16 Number 1 25
Foliar deposition and pesticide losses in a hedgerow vineyard: G. Pergher et al.
have been reported, but evenness of deposition is, in some cases, less satisfactory than that from conven- tional, axial-fan sprayers (de Schaetzen, and De Schaetzen, 1993; Siegfried and Holliger, 1992; Siegfried and Raisigl, 1991). In general, results from non- conventional sprayers are still debatable, partly because of different testing on environmental condi- tions, but to some extent also because of the different experimental methods used.
The purpose of this research was to compare three air-assisted sprayers in a typical hedgerow vineyard in N.E. Italy, and to analyse: (1) the percentages of spray deposited on foliage, grapes, and the ground; (2) the effect of changing the spray output angle, relative to the row direction; and (3) the uniformity of foliar deposition, as affected by the height and the exposure of the leaves.
Materials and methods
The sprayers
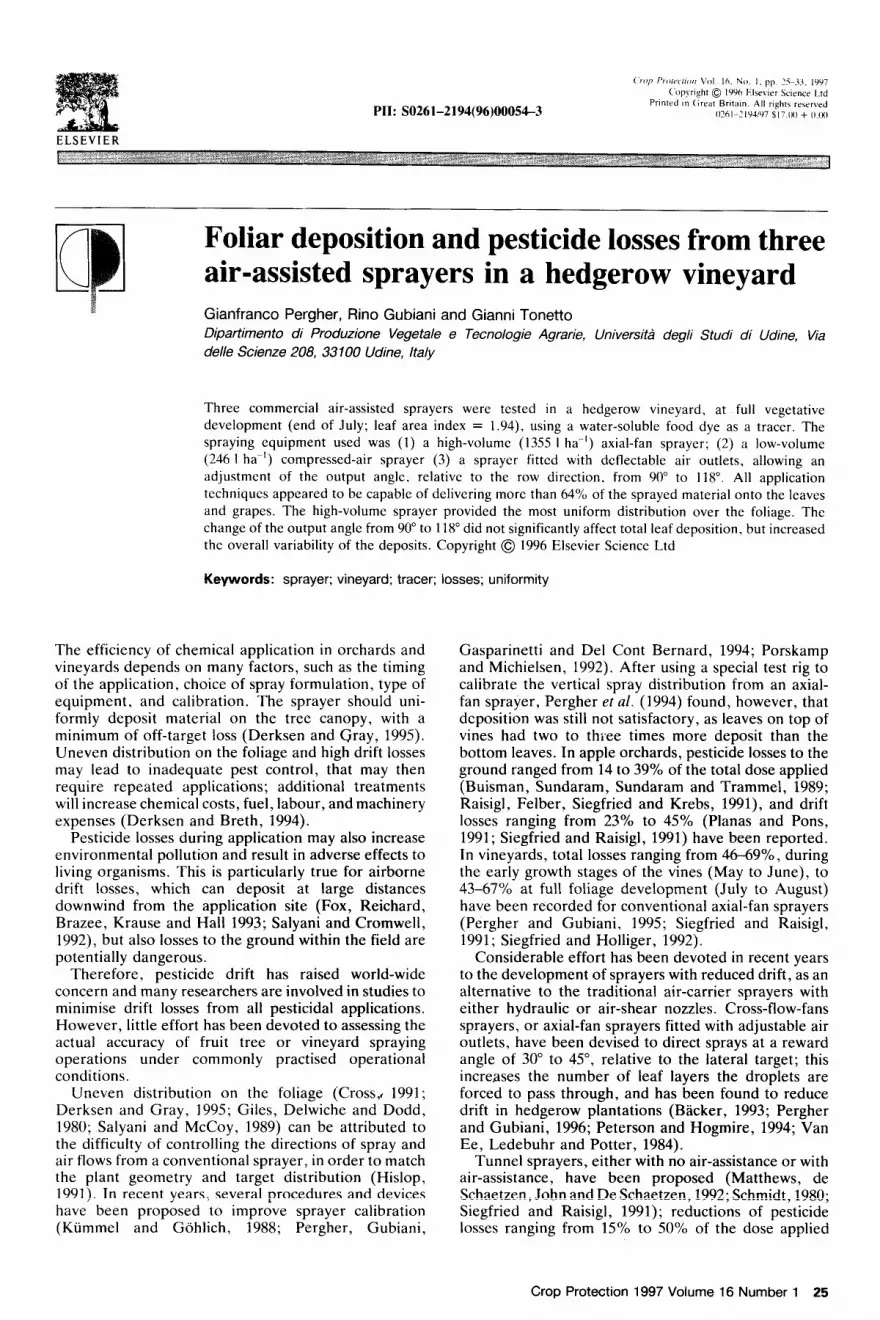
Three different sprayers were tested. Sprayer (A) was an air-carrier, axial-fan sprayer (Europiave Mod. 2000, Figure I), designed for high-volume applications. According to a previous investigation, nearly 90% of all
Figure 1. Sprayer (A): Europiave 2000 air-carrier, axial-fan sprayer
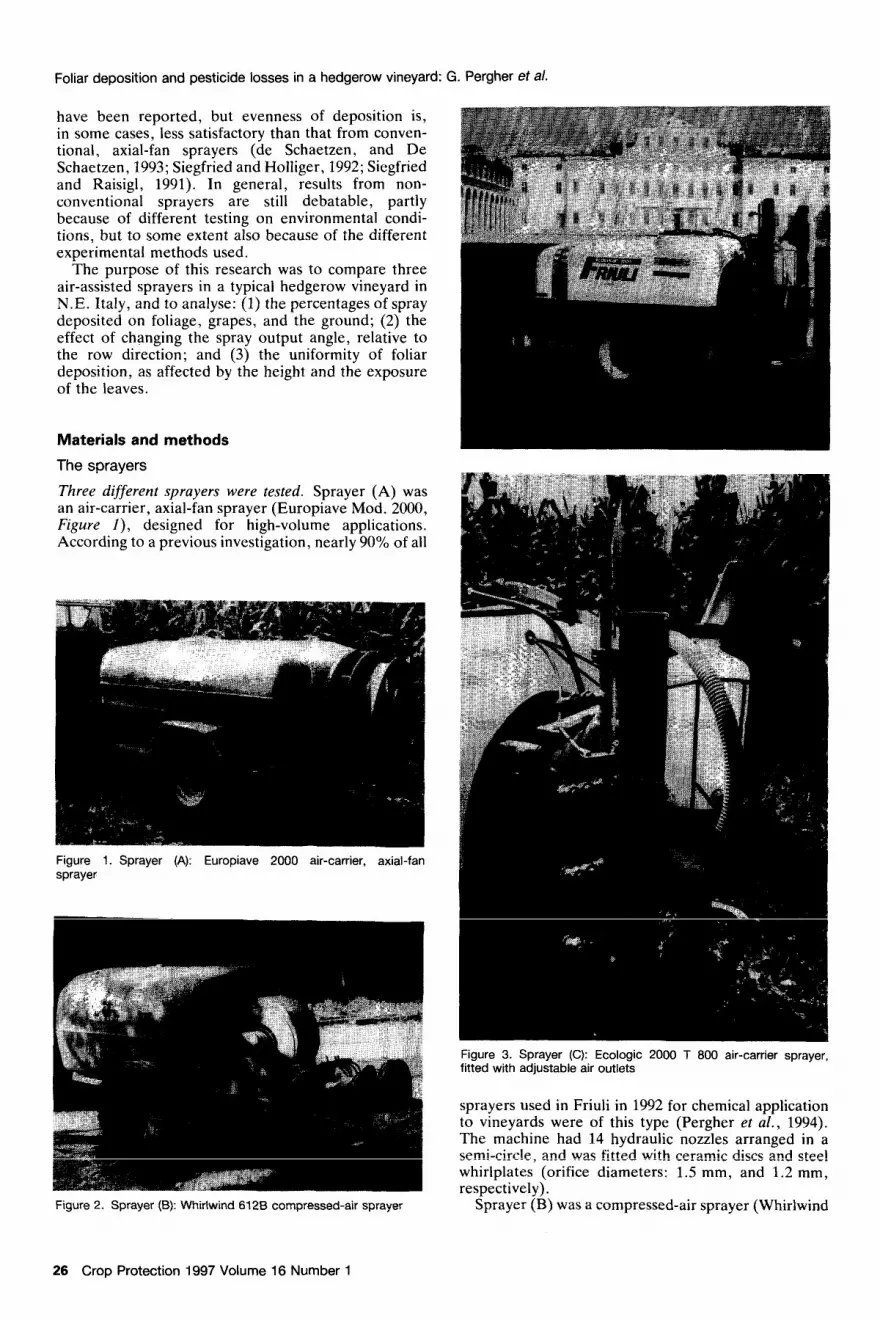
Figure 2. Sprayer (B): Whirlwind 6128 compressed-air sprayer
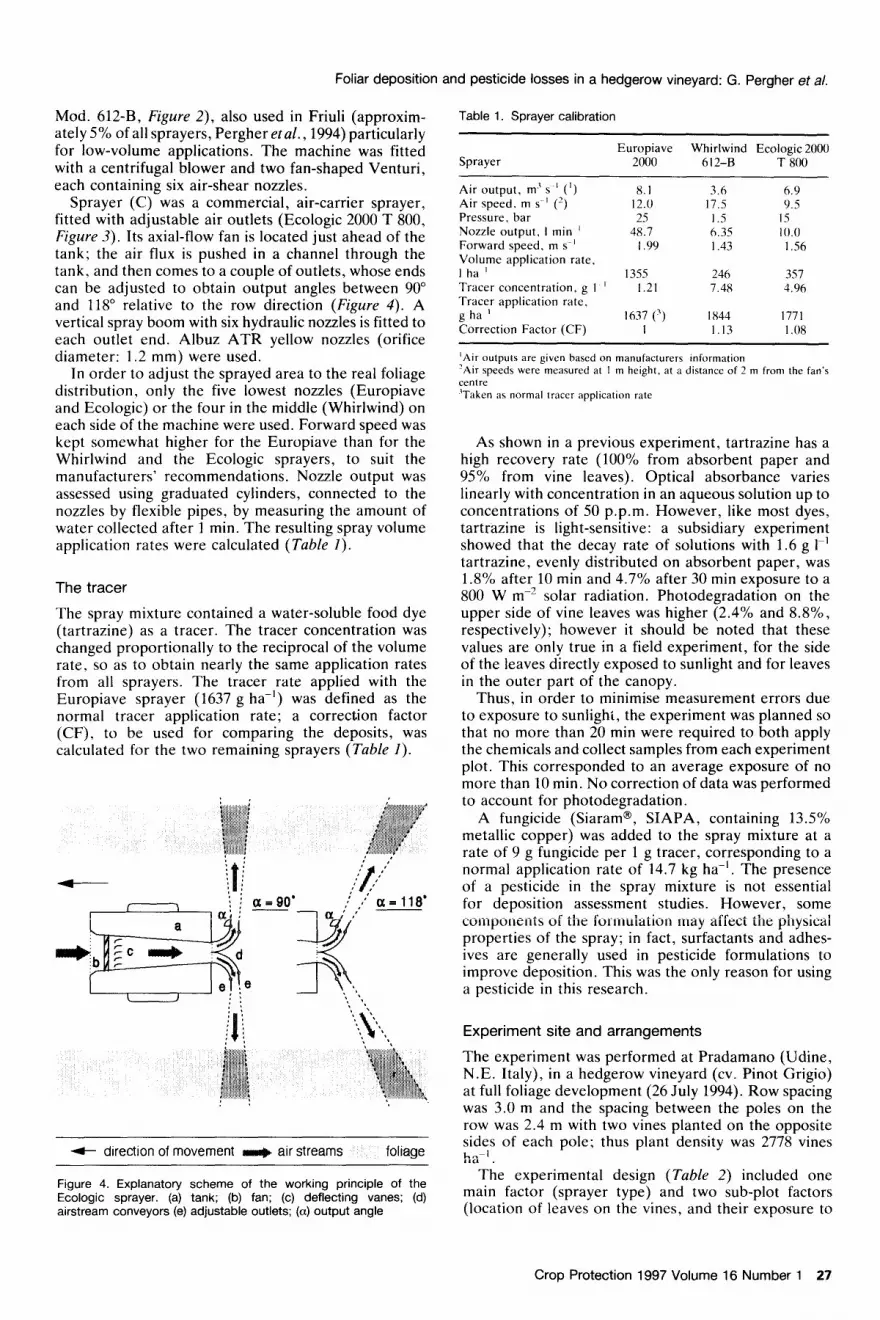
Figure 3. Sprayer (C): Ecologic 2000 T 800 air-carrier sprayer, fitted with adjustable air outlets
sprayers used in Friuli in 1992 for chemical application to vineyards were of this type (Pergher et al., 1994). The machine had 14 hydraulic nozzles arranged in a semi-circle, and was fitted with ceramic discs and steel whirlplates (orifice diameters: 1.5 mm, and 1.2 mm, respectively).
Sprayer (B) was a compressed-air sprayer (Whirlwind
26 Crop Protection 1997 Volume 16 Number 1
Foliar deposition and pesticide losses in a hedgerow vineyard: G. Pergher et a/.
Mod. 612-B, Figure 2), also used in Friuli (approxim- ately 5% of all sprayers, Pergher etal., 1994) particularly for low-volume applications. The machine was fitted with a centrifugal blower and two fan-shaped Venturi, each containing six air-shear nozzles.
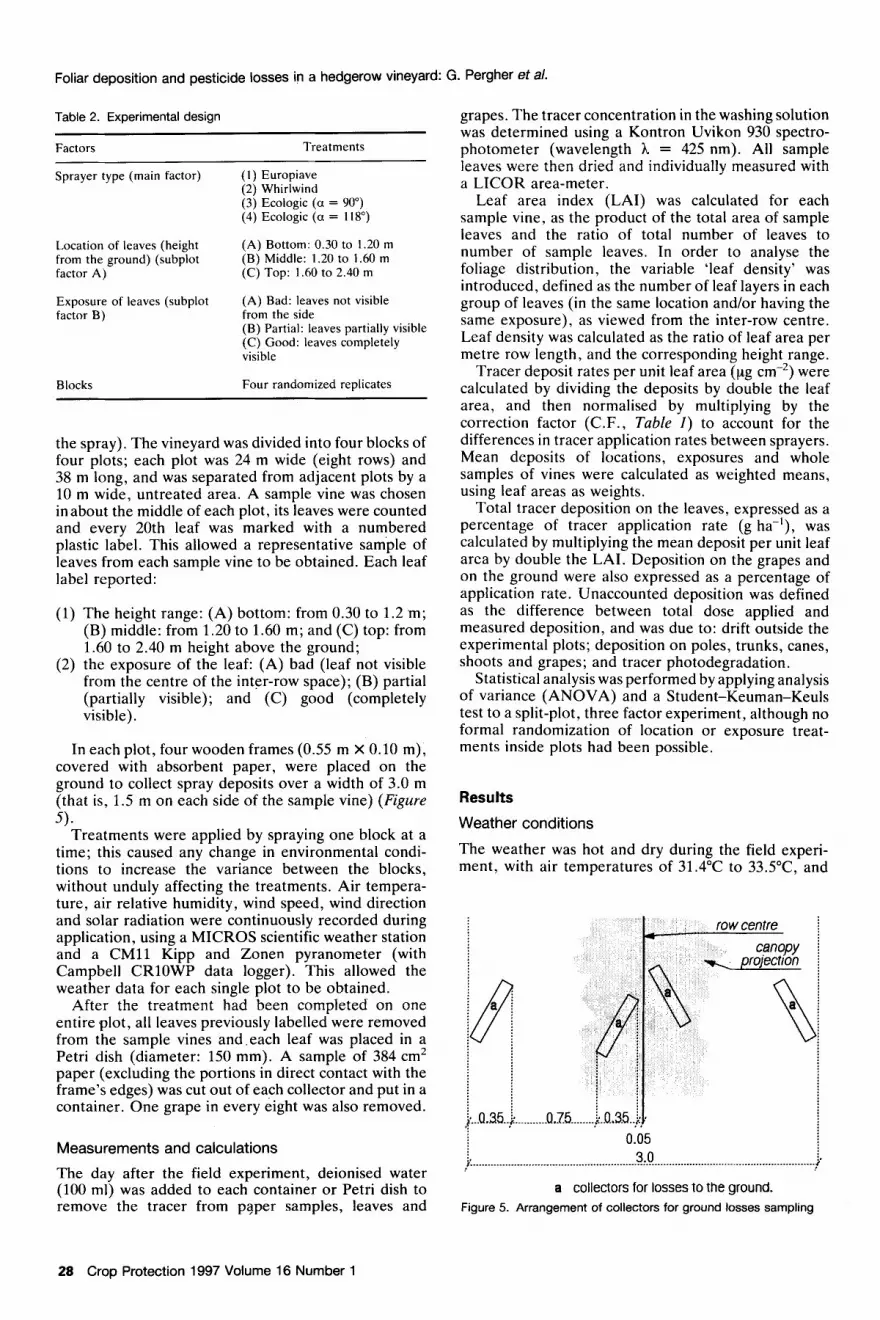
Sprayer (C) was a commercial, air-carrier sprayer, fitted with adjustable air outlets (Ecologic 2000 T 800, Figure 3). Its axial-flow fan is located just ahead of the tank; the air flux is pushed in a channel through the tank. and then comes to a couple of outlets, whose ends can be adjusted to obtain output angles between 90 and 118” relative to the row direction (Figure 4). A vertical spray boom with six hydraulic nozzles is fitted to each outlet end. Albuz ATR yellow nozzles (orifice diameter: 1.2 mm) were used.
In order to adjust the sprayed area to the real foliage distribution, only the five lowest nozzles (Europiave and Ecologic) or the four in the middle (Whirlwind) on each side of the machine were used. Forward speed was kept somewhat higher for the Europiave than for the Whirlwind and the Ecologic sprayers, to suit the manufacturers’ recommendations. Nozzle output was assessed using graduated cylinders, connected to the nozzles by flexible pipes, by measuring the amount of water collected after 1 min. The resulting spray volume application rates were calculated (Table I).
The tracer
The spray mixture contained a water-soluble food dye (tartrazine) as a tracer. The tracer concentration was changed proportionally to the reciprocal of the volume rate, so as to obtain nearly the same application rates from all sprayers. The tracer rate applied with the Europiave sprayer (1637 g ha-‘) was defined as the normal tracer application rate; a correction factor (CF), to be used for comparing the deposits, was calculated for the two remaining sprayers (Table 1).
,
tank; (b) (c) deflecting (d) airstream (e) adjustable (a) output
Table 1. calibration
Europiave Ecologic 2000 Sprayer 2000 612-B T 800
Air output, m’s ’ (‘) 8.1 3.6 6.9 Air speed. m s I (‘) 12.0 17.5 Y.5 Pressure, bar 2s I .5 IS Nozzle output, I min 48.7 10.0
speed. S-I I 1.56
’ 1.21 7.48 4.96 Tracer application rate. g ha ’ 1637 (2) 1771
I .08
‘Air outputs are given based on manufacturers mformation
‘Air
As shown in a previous experiment, has a high recovery rate (100% from paper and 95% from vine leaves). Optical absorbance
tartrazine is light-sensitive: subsidiary experiment solutions with 1.6 g I-’
tartrazine, evenly distributed on paper, was 1.8% after 10 min and 4.7% after 30 min exposure to a 800 W m-’ solar radiation. Photodegradation on the upper side of vine leaves was higher (2.4% and 8.8%, respectively);
sunlight, the experiment
chemicals and collect samples from each experiment
correction of data was to account for photodegradation.
fungicide SIAPA, containing
fungicide per 1 g tracer, corresponding
pesticide in the spray mixture is not for deposition assessment studies. However, some components properties of the spray; in fact, surfactants and adhes- ives are used in formulations
pesticide in this
site and arrangements
experiment was at (Udine, N.E. Italy), in a hedgerow vineyard (cv. Pinot Grigio) at full foliage development (26 July 1994). Row spacing was 3.0 m and the spacing between the poles on the row was 2.4 m with two vines planted on the opposite sides of each pole; thus plant density was 2778 vines ha-‘.
The experimental
(location of leaves on the vines, and their exposure to
Crop Protection
Foliar deposition and pesticide losses in a hedgerow vineyard: G. Pergher et al.
Table 2. Experimental design
Factors
Sprayer type (main factor)
Treatments
(I) Europiave (2) Whirlwind (3) Ecologic (a = 90”) (4) Ecologic (a = 118”)
Location of leaves (height
from the ground) (subplot factor A)
Exposure of leaves (subplot factor B)
(A) Bottom: 0.30 to 1.20 m (B) Middle: 1.20 to 1.60 m (C) Top: 1.60 to 2.40 m
(A) Bad: leaves not visible from the side (B) Partial: leaves partially visible (C) Good: leaves completely
visible
Blocks Four randomized replicates
the spray), The vineyard was divided into four blocks of four plots; each plot was 24 m wide (eight rows) and 38 m long, and was separated from adjacent plots by a 10 m wide, untreated area. A sample vine was chosen in about the middle of each plot, its leaves were counted and every 20th leaf was marked with a numbered plastic label. This allowed a representative sample of leaves from each sample vine to be obtained. Each leaf label reported:
(1) The height range: (A) bottom: from 0.30 to 1.2 m; (B) middle: from 1.20 to 1.60 m; and (C) top: from 1.60 to 2.40 m height above the ground;
(2) the exposure of the leaf: (A) bad (leaf not visible from the centre of the inter-row space); (B) partial (partially visible); and (C) good (completely visible).
In each plot, four wooden frames (0.55 m X 0.10 m), covered with absorbent paper, were placed on the ground to collect spray deposits over a width of 3.0 m (that is, 1.5 m on each side of the sample vine) (Figure
5). Treatments were applied by spraying one block at a
time; this caused any change in environmental condi- tions to increase the variance between the blocks, without unduly affecting the treatments. Air tempera- ture, air relative humidity, wind speed, wind direction and solar radiation were continuously recorded during application, using a MICROS scientific weather station and a CM11 Kipp and Zonen pyranometer (with Campbell CRlOWP data logger). This allowed the weather data for each single plot to be obtained.
After the treatment had been completed on one entire plot, all leaves previously labelled were removed from the sample vines and, each leaf was placed in a Petri dish (diameter: 150 mm). A sample of 384 cm2 paper (excluding the portions in direct contact with the frame’s edges) was cut out of each collector and put in a container. One grape in every eight was also removed.
Measurements and calculations
The day after the field experiment, deionised water (100 ml) was added to each container or Petri dish to remove the tracer from pqper samples, leaves and
28 Crop Protection 1997 Volume 16 Number 1
grapes. The tracer concentration in the washing solution was determined using a Kontron Uvikon 930 spectro- photometer (wavelength h = 425 nm). All sample leaves were then dried and individually measured with a LICOR area-meter.
Leaf area index (LAI) was calculated for each sample vine, as the product of the total area of sample leaves and the ratio of total number of leaves to number of sample leaves. In order to analyse the foliage distribution, the variable ‘leaf density’ was introduced, defined as the number of leaf layers in each group of leaves (in the same location and/or having the same exposure), as viewed from the inter-row centre. Leaf density was calculated as the ratio of leaf area per metre row length, and the corresponding height range.
Tracer deposit rates per unit leaf area (pg cm-‘) were calculated by dividing the deposits by double the leaf area, and then normalised by multiplying by the correction factor (C.F., Table I) to account for the differences in tracer application rates between sprayers. Mean deposits of locations, exposures and whole samples of vines were calculated as weighted means, using leaf areas as weights.
Total tracer deposition on the leaves, expressed as a percentage of tracer application rate (g ha-‘), was calculated by multiplying the mean deposit per unit leaf area by double the LAI. Deposition on the grapes and on the ground were also expressed as a percentage of application rate. Unaccounted deposition was defined as the difference between total dose applied and measured deposition, and was due to: drift outside the experimental plots; deposition on poles, trunks, canes, shoots and grapes; and tracer photodegradation.
Statistical analysis was performed by applying analysis of variance (ANOVA) and a Student-Keuman-Keuls test to a split-plot, three factor experiment, although no formal randomization of location or exposure treat- ments inside plots had been possible.
Results
Weather conditions
The weather was hot and dry during the field experi- ment, with air temperatures of 31.4”C to 33.5”C, and
,;...Q.35..; _..___._._. Q.25 ________ j..Q.3.5.j:)
0.05 i. 30 $ . . . . . . . . . .._.._.._......................................... f ._.......................................................
a collecrors for losses to the ground.
Figure 5. Arrangement of collectors for ground Josses sampling
Foliar deposition and pesticide losses in a hedgerow vineyard: G. Pergher et al.
air humidities of 37.5% to 48.4%. Wind speed ranged from 0.0 to 1.9 m SK’ (average: 0.7 m SS’), and solar radiation decreased from 806 W mm2 (at the start of the experiment. 12.00 h) to 643 W m-* (at the end, 15.10 h).
Analysis of variance showed no statistically significant differences between the sprayers for all climatic vari- ables; however, significant differences between blocks were recorded for air temperature and humidity.
Leaf area index and foliage distribution
The leaf area index (LAI) of the vineyard averaged 1.94 k 0.23 (mean + standard deviation), with no significant differences between sprayers. Each sample vine had 795 + 130 leaves, with an average surface area of 88.6 * 8.5 cm2 per leaf.
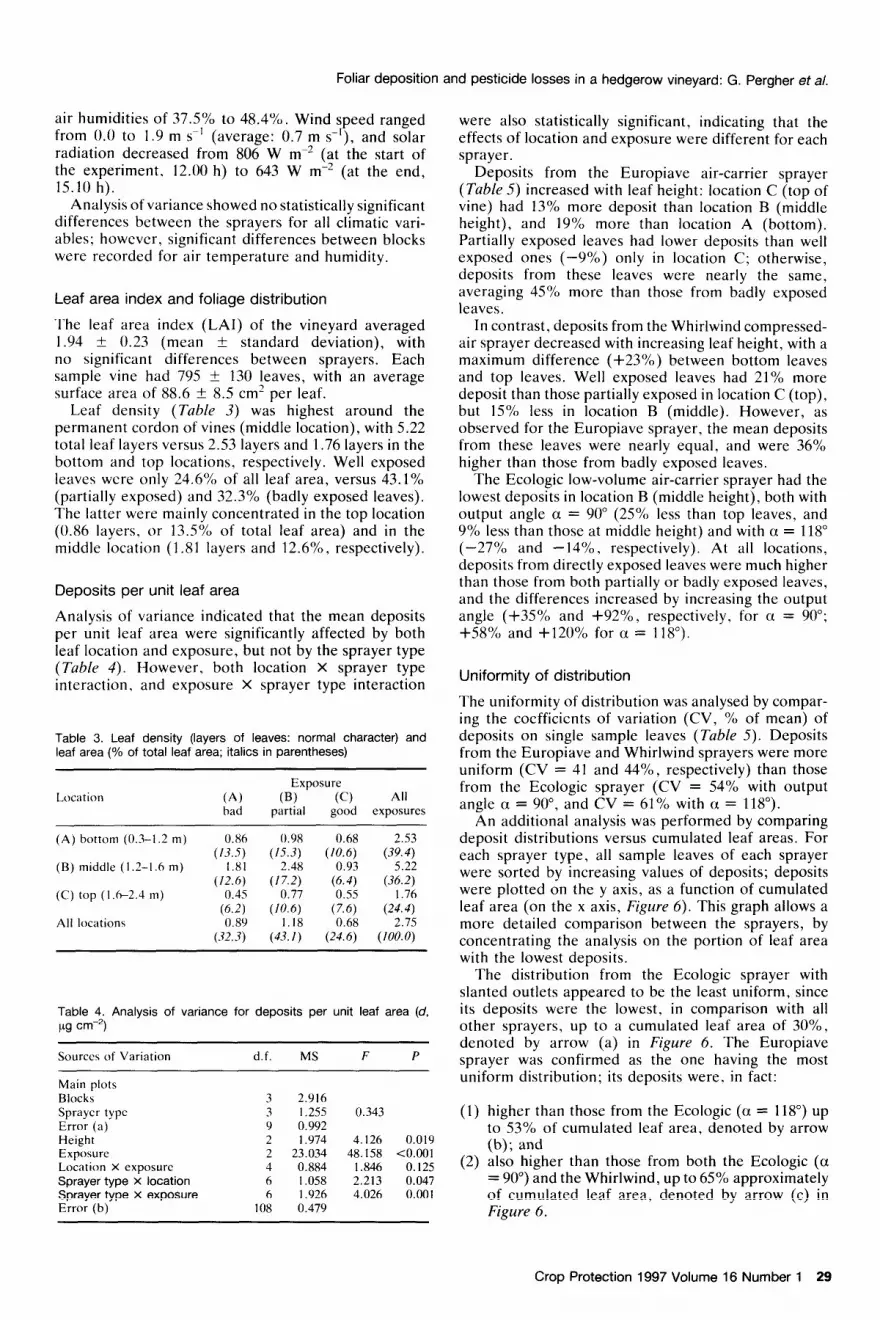
Leaf density (Table 3) was highest around the permanent cordon of vines (middle location), with 5.22 total leaf layers versus 2.53 layers and 1.76 layers in the bottom and top locations. respectively. Well exposed leaves were only 24.6% of all leaf area, versus 43.1% (partially exposed) and 32.3% (badly exposed leaves). The latter were mainly concentrated in the top location (0.86 layers, or 13.5% of total leaf area) and in the middle location (1.81 layers and 12.6%, respectively).
Deposits per unit leaf area
Analysis of variance indicated that the mean deposits per unit leaf area were significantly affected by both leaf location and exposure, but not by the sprayer type (Table 4). However, both location X sprayer type interaction, and exposure X sprayer type interaction
Table 3. Leaf density (layers of leaves: normal character) and leaf area (% of total leaf area; italics in parentheses)
Location
(A) bottom (0.3-l .2 m)
(B) middle (I .2-l .6
(C)
d.f. MS F P
Main plots Blocks Sprayer type Error (a) Height Exposure Location X exposure Sprayer type X location Sprayer type X exposure Error (b)
3 2.916 3 1.255 0.343 9 0.992 2 1.974 4.126 0.019 2 23.034 48.158 <O.OOl 4 0.884 1.846 0.125 6 I.058 2.213 0.047 6 1.926 4.026 0.001
108 0.479
were also statistically significant, indicating that the effects of location and exposure were different for each sprayer.
Deposits from the Europiave air-carrier sprayer (Table 5) increased with leaf height: location C (top of vine) had 13% more deposit than location B (middle height), and 19% more than location A (bottom). Partially exposed leaves had lower deposits than well exposed ones (-9%) only in location C; otherwise, deposits from these leaves were nearly the same, averaging 45% more than those from badly exposed leaves.
In contrast, deposits from the Whirlwind compressed- air sprayer decreased with increasing leaf height, with a maximum difference (+23%) between bottom leaves and top leaves. Well exposed leaves had 21% more deposit than those partially exposed in location C (top), but 15% less in location B (middle). However, as observed for the Europiave sprayer, the mean deposits from these leaves were nearly equal, and were 36% higher than those from badly exposed leaves.
The Ecologic low-volume air-carrier sprayer had the lowest deposits in location B (middle height), both with output angle a = 90” (25% less than top leaves, and 9% less than those at middle height) and with a = 118 (-27% and --14%, respectively). At all locations, deposits from directly exposed leaves were much higher than those from both partially or badly exposed leaves, and the differences increased by increasing the output angle (+35% and +92%, respectively, for u = 90”; +58% and +120% for a = 118”).
Uniformity of distribution
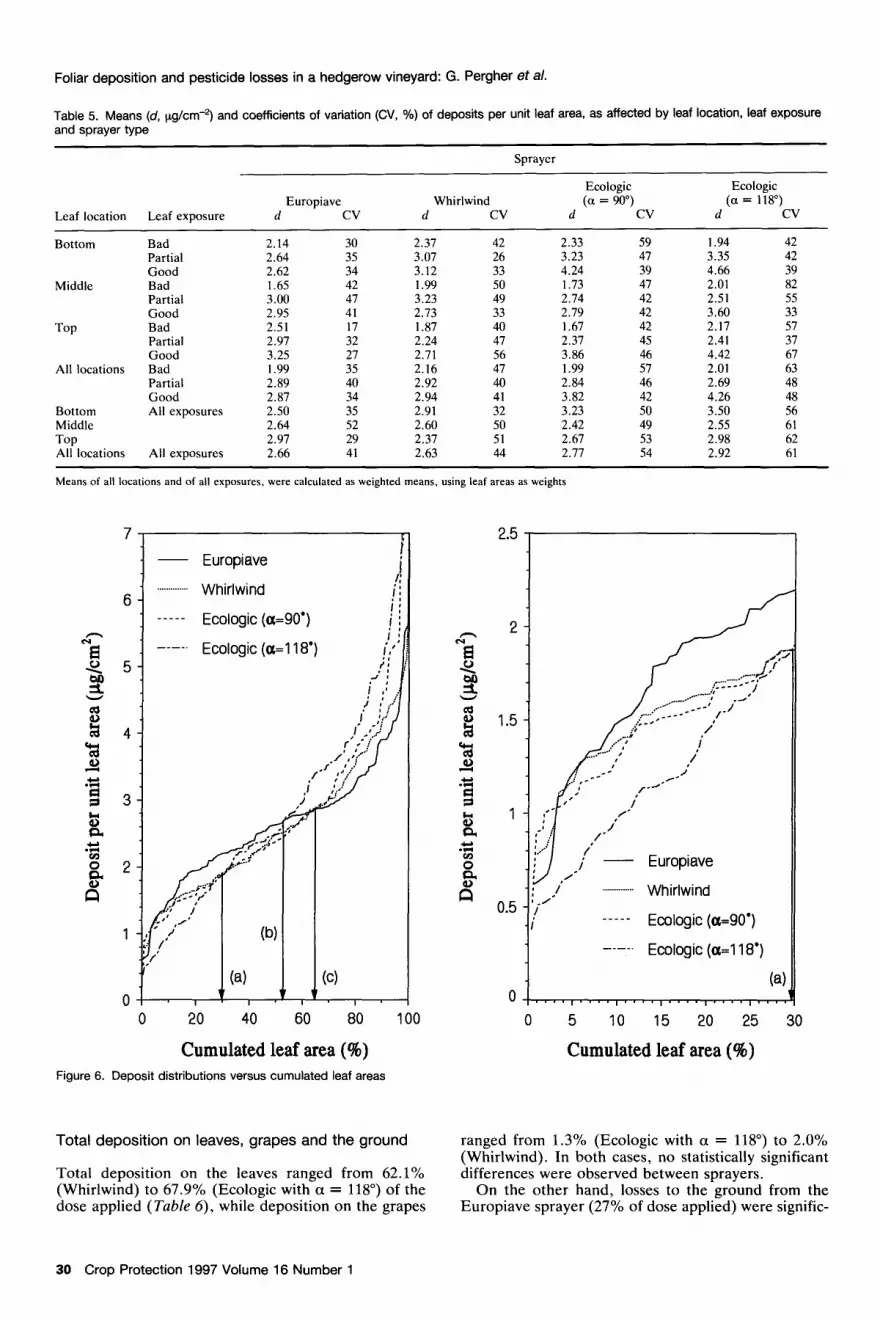
The uniformity of distribution was analysed by compar- ing the coefficients of variation (CV, % of mean) of deposits on single sample leaves (Table 5). Deposits from the Europiave and Whirlwind sprayers were more uniform (CV = 41 and 44%, respectively) than those from the Ecologic sprayer (CV = 54% with output angle a = 90”, and CV = 61% with a = 11%‘).
An additional analysis was performed by comparing deposit distributions versus cumulated leaf areas. For each sprayer type, all sample leaves of each sprayer were sorted by increasing values of deposits; deposits were plotted on the y axis, as a function of cumulated leaf area (on the x axis, Figure 6). This graph allows a more detailed comparison between the sprayers, by concentrating the analysis on the portion of leaf area with the lowest deposits.
The distribution from the Ecologic sprayer with slanted outlets appeared to be the least uniform, since its deposits were the lowest, in comparison with all other sprayers, up to a cumulated leaf area of 3O%, denoted by arrow (a) in Figure 6. The Europiave sprayer was confirmed as the one having the most uniform distribution; its deposits were, in fact:
(1)
(2)
higher than those from the Ecologic (a = 118”) up to 53% of cumulated leaf area, denoted by arrow (b); and also higher than those from both the Ecologic (a = 90”) and the Whirlwind, up to 65% approximately of cumulated leaf area, denoted by arrow (c) in Figure 6.
Crop Protection 1997 Volume 16 Number 1 29
Foliar deposition and pesticide losses in a hedgerow vineyard: G. Pergher et al.
Table 5. Means (d, pg/cm-2) and coefficients of variation (CV, %) of deposits per unit leaf area, as affected by leaf location, leaf exposure and sprayer type
Sprayer
Ecologic Ecologic
Europiave Whirlwind
Leaf location Leaf exposure d cv d CV d (a = 90") CV dta = "8") cv
Bottom
Middle
Top
All locations
Bottom Middle Top All locations
Bad Partial Good Bad Partial Good Bad Partial Good Bad Partial Good All exposures
All exposures
2.14 30 2.37 42 2.33 59 1.94 42 2.64 35 3.07 26 3.23 47 3.35 42 2.62 34 3.12 33 4.24 39 4.66 39 1.65 42 1.99 50 1.73 47 2.01 82 3.00 47 3.23 49 2.74 42 2.51 55 2.95 41 2.73 33 2.79 42 3.60 33 2.51 17 I .87 40 1.67 42 2.17 57 2.97 32 2.24 47 2.37 45 2.41 37 3.25 27 2.71 56 3.86 46 4.42 67 I .99 35 2.16 47 1.99 57 2.01 63 2.89 40 2.92 40 2.84 46 2.69 48 2.87 34 2.94 41 3.82 42 4.26 48 2.50 35 2.91 32 3.23 50 3.50 56 2.64 52 2.60 50 2.42 49 2.55 61 2.97 29 2.37 51 2.67 53 2.98 62 2.66 41 2.63 44 2.77 54 2.92 61
Means of all locations and of all exposures, were calculated as weighted means, using leaf areas as weights
- Europiave
Whirlwind
----- Ecologic(a=90')
----. Ecologic(a=l18')
0 20 40 60 -I
80 100
Cumulated leaf area (%) Figure 6. Deposit distributions versus cumulated leaf areas
Total deposition on leaves, grapes and the ground
Total deposition on the leaves ranged from 62.1% (Whirlwind) to 67.9% (Ecologic with a = 118”) of the dose applied (Table 6), while deposition on the grapes
2.5
2
1.5
1
0.5
0
_ .’ j /* : ! I ..?
/-
8.. /*
i - Europiave
/- ’ / . . . . . . . . . . . : _/-
Whirlwind -1 -i ----- Ecologic(a=90')
0 5 10 15 20 25 30
Cumulated leaf area (%)
ranged from 1.3% (Ecologic with a = llS”) to 2.0% (Whirlwind). In both cases, no statistically significant differences were observed between sprayers.
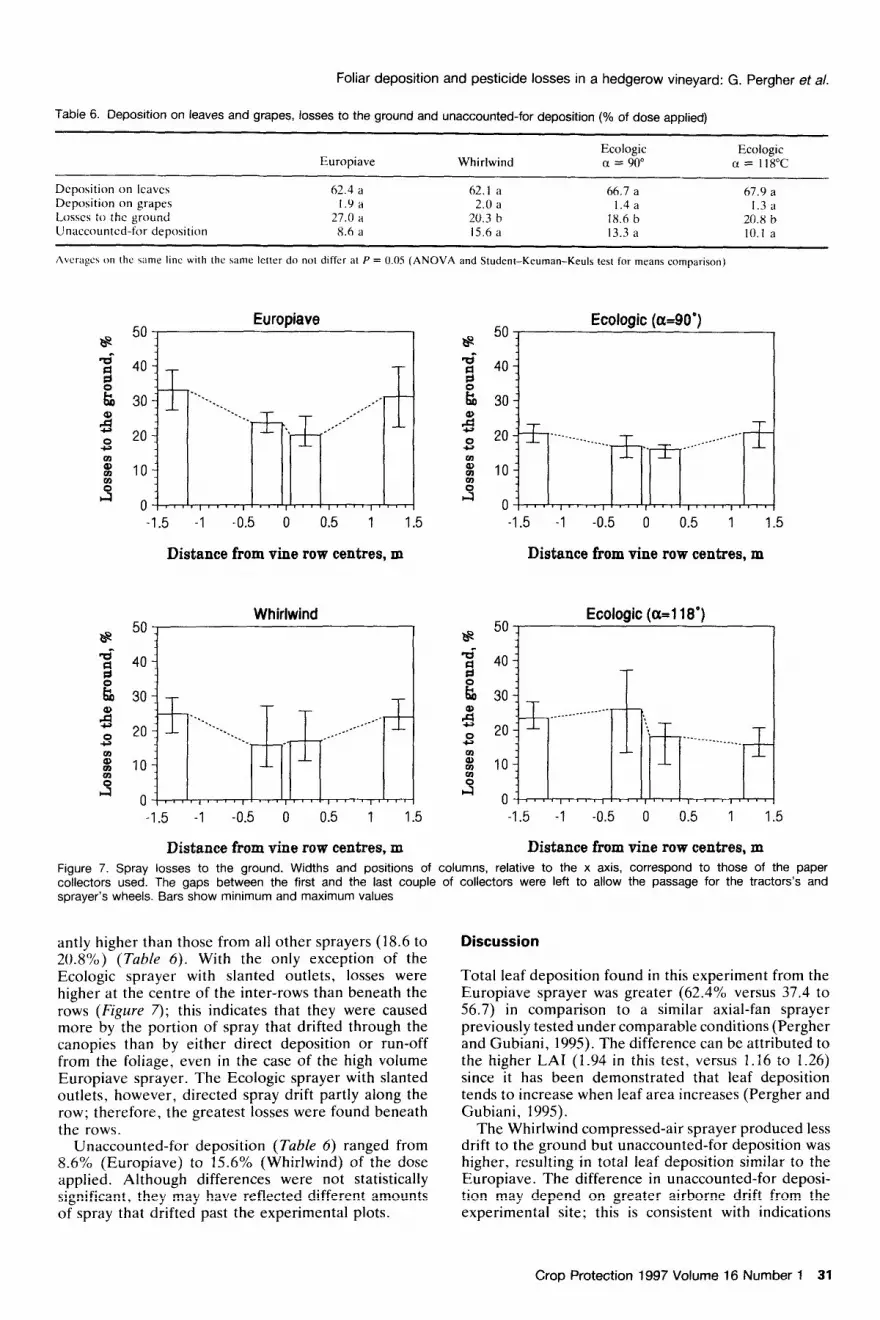
On the other hand, losses to the ground from the Europiave sprayer (27% of dose applied) were signific-
30 Crop Protection 1997 Volume 16 Number 1
Foliar deposition and pesticide losses in a hedgerow vineyard: G. Pergher et al.
Table 6. DepOSitiOn on leaves and grapes, losses to the ground and unaccounted-for deposition (% of dose applied)
Ecologic Europiave
Ecologic Whirlwind a = 90” a= Ilx”C
Deposition on leaves 62.4 a 62.1 a 66.7 a 67.9 a Deposition on grapes 1.9 a 2.0 a 1.4 a 1.3 a Losses to the ground 27.0 a 20.3 b 18.6 b 20.8 b Unaccounted-for deposition 8.6 a 15.6 a 13.3 a 10.1 a
Average\ on the wme lint with the same letter do not differ at P = 0.0.5 (ANOVA and Student-Keuman-Keuls test for means comparison)
Europiave
* 50?
Ecologic @x=90’)
ts 50$
40
30
20
10
0 -1.5 -1 -0.5 0 0.5 1 1.5 -1.5 -1 -0.5 0 0.5 1 1.5
Distance from vine row centres, m Distance from vine row centres, m
-1 Whirlwind
-1.5 -1 -0.5 0 0.5 1 1.5 -1.5 -1 -0.5 0 0.5 1 1.5
Distance from vine row eentres, m Distance from vine row centres, m
* 50s Ecologic (a=1 18”)
Figure 7. Spray losses to the ground. Widths and positions of columns, relative to the x axis, correspond to those of the paper collectors used. The gaps between the first and the last couple of collectors were left to allow the passage for the tractors’s and sprayer’s wheels. Bars show minimum and maximum values
antly higher than those from all other sprayers (18.6 to 20.8%) (T&e 6). With the only exception of the Ecologic sprayer with slanted outlets, losses were higher at the centre of the inter-rows than beneath the rows (Figure 7); this indicates that they were caused more by the portion of spray that drifted through the canopies than by either direct deposition or run-off from the foliage, even in the case of the high volume Europiave sprayer. The Ecologic sprayer with slanted outlets, however, directed spray drift partly along the row; therefore, the greatest losses were found beneath the rows.
Unaccounted-for deposition (Table 6) ranged from 8.6% (Europiave) to 15.6% (Whirlwind) of the dose applied. Although differences were not statistically significant, they may have reflected different amounts of spray that drifted past the experimental plots.
Discussion
Total leaf deposition found in this experiment from the Europiave sprayer was greater (62.4% versus 37.4 to 56.7) in comparison to a similar axial-fan sprayer previously tested under comparable conditions (Pergher and Gubiani, 1995). The difference can be attributed to the higher LA1 (1.94 in this test, versus 1.16 to 1.26) since it has been demonstrated that leaf deposition tends to increase when leaf area increases (Pergher and Gubiani, 1995).
The Whirlwind compressed-air sprayer produced less drift to the ground but unaccounted-for deposition was higher, resulting in total leaf deposition similar to the Europiave. The difference in unaccounted-for deposi- tion may depend on greater airborne drift from the experimental site; this is consistent with indications
Crop Protection 1997 Volume 16 Number 1 31
Foliar deposition and pesticide losses in a hedgerow vineyard: G. Pergher et al.
from other researchers, who have reported greater drift from low-volume, small-droplets sprayers than from high-volume, coarse-droplets sprayers (Salyani and Cromwell, 1992; Bode and Mohammad, 1987).
The change of the output angle from 90” to 118”, relative to the row direction, had been found effective in increasing leaf deposition from the Ecologic sprayer (from 55% to 61% of dose applied) in a previous test (Pergher and Gubiani, 1996), conducted in the same vineyard at an earlier date (end of blossom, LA1 = 1.40). However, this did not affect total leaf deposition in the present test, but increased both the overall variability of deposits and the differences between leaf exposures. It may be concluded that a greater output angle can only be recommended in the earlier growth stages of vines, when the hedgerow is not fully covered with foliage and drift can be reduced by partially directing the air flow along the row.
Deposits differed between leaf locations or exposure for all sprayers. Further research is needed to investigate whether underapplication at some locations, can be corrected by changing the position and/or orientation of some of the nozzles, or by increasing the airflow rates.
The variability of deposits distribution from all sprayers tested (CV ranging from 41% to 61%) was comparable, or in some cases lower, in comparison with other studies performed in vineyards (CV = 30% to 41%; Pergher and Gubiani, 1995), apple orchards
(CV = 21% to 137% ; Peterson and Hogmire, 1994; Planas and Pons, 1991) or citrus tree plantations (CV = 42 to 80%; Salyani and McCoy, 1989). However such variability is great enough to make any statistical analysis, based on traditional tests for means compari- son, hardly significant or difficult to interpret. A comparison of deposits from the least treated leaves from each sample may improve the evaluation of sprayer distribution efficiency.
Conclusions
There were no substantial differences in total pesticide losses between the sprayers tested. All application techniques appeared to be capable of delivering more than 64% of the sprayed material onto the leaves and the grapes. The change of the output angle, relative to the row direction, did not affect total leaf deposition from the Ecologic air-carrier sprayer, fitted with adjust- able air outlets, but changing the output angle from 90” to 118” increased deposit variability. The Europiave air-carrier, high-volume sprayer provided the best uniform distribution over the foliage.
References
Bicker, G. (1993) Cross-flow fans for vineyard spraying. Landtechnik 38, 1.59-W
Bode, L. E. and Mohammad Zain, S. B. (1987) Spray drift deposits from low volume applications using oil and water carriers. ASTM STP 968: Pest. Form. Appl. Sys. 7, 93-103
B&man, P., Sundaram, K. M. S., Sundaram, A. and Trammel, K.
(1989) Field deposit patterns of a diflubenzuron spray mix, after application to an apple orchard using an air-blast sprayer; and a laboratory evaluation of physlcal properties and atomization charac- teristics. j. Env. Sci. Hfth 2414). 38941 I
Cross, J. V. (1991) Deposits on apple leaves from medium volume, low volume and very low volume spray applications with an axial fan sprayer, In: Air-assisted Spraying in Crop Protection (Ed. by A.
Lavers, P. Herrington and E. S. E. Southcombe) pp 263-268. British
Crop Protection Council, UK
Derksen, R. C. and Breth, D. I. (1994) Orchard air-carrier sprayer
application accuracy and spray coverage evaluations. App. Eng.
Agri. lO(4). 463-470
Derksen, R. C. and Gray, R. L. (1995) Deposition and air speed patterns of air-carrier apple orchard sprayers. Trans. ASAE 38(l), 5-11
de Schaetzen, N. and De Schaetzen, N. (1993) Spray drift reduction in orchard with ‘tunnel sprayer’. Comments on 4 years of testing with CDUC (Controlled Droplet under Cover). Paper - Am. Sot. Agric.
Engin. 93(1077), 1-18
Fox, R. D., Reichard, D. L., Brazee, R. D., Krause, C. R. and Hall, F. R. (1993) Downwind residues from spraying a semi-dwarf apple orchard. Trans. ASAE 36(2), 333-340
Giles, D. K., Delwiche, M. J. and Dodd, R. B. (1989) Spatial
distribution of spray deposition from an air-carrier sprayer. Trans. ASAE 32(3), 807-811
Hislop, E. C. (1991) Air-assisted crop spraying: an introductory review. In: Air-assisted Spraying in Crop Protection (Ed. by
A. Lavers. P. Herrington and E. S. E. Southcombe) pp 3-14. British Crop Protection Council, UK
Kiirnmel, K. and Giihlich, H. (1988) Der Lamellenpriifstand zur Beurteilung von Geblisespriihgeraten (Lamellar test rig for evalu- ation of blower sprayers). Mitteilungen des Obstbauversuchsringes des A/ten Landes 43(11 I), 27-35
Matthews, G. A., de Schaetzen, N.,, John, F. and De Schaetzen, N. (1992) Tunnel spraying: an environment-favourable approach for pesticide application in orchards. Pest. Outlook 3(3), 13-16
Pergher, G. and Guhiani, R. (1995) The effect of spray application rate and airflow rate on foliar deposition in a hedgerow vineyard. J. Agric. Engm. Res. 61, 205-216
Pergher, G. and Gubiani, R. (1996) Analisi della deposizione fogliare e delle perdite di distribuzione di una irroratrice ad aeroconvezione a deflettori orientabili (Foliar deposition and spray losses from an air-
assisted sprayer fitted with adjustable air outlets). Riv. di Ing. Agr., (in press)
Pergher, G., Gubiani, R., Gasparinetti, P. and Del Cont Bernard, D. (1994) Voluntary testing of plant protection equipment in Northern Italy. Acta Hort. 372, 59-66
Peterson, D. L. and Hogmire, H. W. (1994) Tunnel sprayer for dwarf fruit trees. Trans. ASAE, 37(3), 709-715
Planas, S. and Pons, L. (1991) Practical considerations concerning pesticide application in intensive apple and pear orchards. In: Air- assisted Spraying in Crop Protection (Ed. by A. Lavers, P. Herrington and E. S. E. Southcombe) pp 45-52. British Crop Protection Council, UK
Porskamp, H. and Michielsen, J. M. (1992) Spuitmeetmast maakt verschillen in vloeistofverdeling duidelijk zichtbaar (Spray measuring post makes differences in fluid distribution clearly visible). Fruitweft 82(33), 22-23
Raisigl, U., Felber, H., Siegfried, W. and Krebs, C. (1991) Comparison of different mistblowers and volume rates for orchard spraying. In: Air-assisted Spraying in Crop Protection (Ed. by A. Lavers, P. Herrington and E. S. E. Southcombe) pp 185-196. British Crop Protection Council, UK
Salyani, M. and Cromwell, R. P. (1993) Spray drift from ground and aerial applications. Trans. ASA E 35(4), 1113-1220
Salyani, M. and McCoy, C. W. (1989) Deposition of different spray volumes on citrus trees. Proc. Fla. State Hort. Sot. 102, 32-36
Schmidt, K. (1989) JOCO - Tunnelspritzgerat (JOCO tunnel sprayer). Besseres Obst 35(6), l&l I
Siegfried, W. and Holliger, E. (1992) Tunnel-Recyclinggerlte - die
32 Crop Protection 1997 Volume 16 Number 1
Foliar deposition and pesticide losses in a hedgerow vineyard: G. Pergher et a/.
neue Sprdhtechnik im Obsr- und Rebbau (Tunnel recycling machines
- The new spraying technique for horticulture and viticulture). Schweizrrische Zeitschrift fiir Ohst- md Weinbau 129(7), 36-43
Van Ee, G. R., Ledebuhr, R. L. and Potter, H. S. (1084) Develop-
ment of a CDA/air carrier sprayer. ASAE Papers 84(1507), l-8
Siegfried, W. and Raisigl, U. (100 I) Erste Erfahrungen mit dem Joco-
Recyclinggerlt im Rebbau (First experiences with the Joko recycling
sprayer in vineyards). Schweizerische Zeitschrift fiir Obst- und Weinbau 127(6). 151-l 60
Received II April 1996 Accepted 20 May 1096
Crop Protection 1997 Volume 16 Number 1 33