the vineyard yeast microbiome, a mixed model microbial map
TRANSCRIPT
The Vineyard Yeast Microbiome, a Mixed ModelMicrobial MapMathabatha Evodia Setati*, Daniel Jacobson, Ursula-Claire Andong, Florian Bauer
Institute for Wine Biotechnology, Stellenbosch University, Stellenbosch, Western Cape, South Africa
Abstract
Vineyards harbour a wide variety of microorganisms that play a pivotal role in pre- and post-harvest grape quality and willcontribute significantly to the final aromatic properties of wine. The aim of the current study was to investigate the spatialdistribution of microbial communities within and between individual vineyard management units. For the first time in sucha study, we applied the Theory of Sampling (TOS) to sample gapes from adjacent and well established commercial vineyardswithin the same terroir unit and from several sampling points within each individual vineyard. Cultivation-based andmolecular data sets were generated to capture the spatial heterogeneity in microbial populations within and betweenvineyards and analysed with novel mixed-model networks, which combine sample correlations and microbial communitydistribution probabilities. The data demonstrate that farming systems have a significant impact on fungal diversity but moreimportantly that there is significant species heterogeneity between samples in the same vineyard. Cultivation-basedmethods confirmed that while the same oxidative yeast species dominated in all vineyards, the least treated vineyarddisplayed significantly higher species richness, including many yeasts with biocontrol potential. The cultivatable yeastpopulation was not fully representative of the more complex populations seen with molecular methods, and only themolecular data allowed discrimination amongst farming practices with multivariate and network analysis methods.Importantly, yeast species distribution is subject to significant intra-vineyard spatial fluctuations and the frequently reportedheterogeneity of tank samples of grapes harvested from single vineyards at the same stage of ripeness might therefore, atleast in part, be due to the differing microbiota in different sections of the vineyard.
Citation: Setati ME, Jacobson D, Andong U-C, Bauer F (2012) The Vineyard Yeast Microbiome, a Mixed Model Microbial Map. PLoS ONE 7(12): e52609.doi:10.1371/journal.pone.0052609
Editor: Jack Anthony Gilbert, Argonne National Laboratory, United States of America
Received September 13, 2012; Accepted November 20, 2012; Published December 26, 2012
Copyright: � 2012 Setati et al. This is an open-access article distributed under the terms of the Creative Commons Attribution License, which permitsunrestricted use, distribution, and reproduction in any medium, provided the original author and source are credited.
Funding: This work was supported by Stellenbosch University (Subcom- B fund), WineTech and the National Research Foundation (THRIP programme). Thefunders had no role in study design, data collection and analysis, decision to publish, or preparation of the manuscript.
Competing Interests: The authors have declared that no competing interests exist.
* E-mail: [email protected]
Introduction
Vineyards and grape berry surfaces provide a physical
environment on which complex microbial communities compris-
ing yeasts, bacteria and filamentous fungi establish themselves. In
the wine industry, the species composition of these communities is
of significant importance since the microbial species that are
present on the berry may contribute to the fermentative process
and therefore the aromatic properties of the resulting wine. This is
of particular relevance in cases where the oenological practice
includes spontaneous fermentations, as is the case in many
wineries.
Data indicate that yeast populations on wine grapes increase
from 102–103 cfu/g on immature berries to 103–106 cfu/g on
mature berries. Yeast are spatially distributed over the grape
berries and grape bunches, and also display temporal fluctuations
in diversity over the course of grape berry development [1–4].
Species present on intact undamaged berries after veraison and
until full ripeness have been reported to mainly belong to the
group of oxidative basidiomycetous yeasts such as Cryptococcus spp.,
Rhodotorula spp., Sporobolomyces spp., and Filobasidium spp., as well as
to the dimorphic ascomycetous black yeast, Aureobasidium pullulans
[1,4,5]. In the vineyard environment, these yeasts are typically
associated with the phyllosphere, grapes and soil [1]. The
oxidative ascomycetous yeasts (e.g. Candida spp., Pichia spp., and
Metschnikowia spp.), and the fermentative ascomycetous yeasts (e.g.
Hanseniaspora/Kloeckera spp.) have been found to be present at low
concentrations on undamaged berries and appear often localized
in those areas of the grape surface where some juice might escape
[6,7]. The incidence of these yeasts on damaged grapes increases
rapidly and 10 fold increases have been reported [5,7]. In contrast,
the most relevant fermentative wine yeast, Saccharomyces cerevisiae
only occurs at concentrations of less than 10–100 cfu/g berry [8].
The density and diversity of the grape microbiota may be
influenced by many factors including climatic conditions, diseases,
insect pests and viticultural practices [9–11]. Recently, differences
in yeast populations associated with grapes obtained from organic
and conventional farms have been reported [12–14], thus alluding
to the possible impact of farming methods on grape microbiota.
However, in these studies microbial diversity was only analysed
after grapes were crushed and blended, thus using the juice as
auto-enrichment, and either after 70 g/L of sugar was consumed
or in the middle and end of alcoholic fermentation, when many
species have been eliminated due to the high alcohol content. Such
a strategy will have led to a significant enrichment of some species,
and the elimination of many other species that were initially
present on the grape. Furthermore, such an approach precludes a
statistical validation of inter- and intra-vineyard variability.
In South Africa, wine grapes are produced using a range of
farming methods from conventional to biodynamic farming. The
PLOS ONE | www.plosone.org 1 December 2012 | Volume 7 | Issue 12 | e52609
majority of grapes are produced through what can be described as
an intermediate scheme, the Integrated Production of Wine (IPW),
which was established by the South African wine industry in 1998
[15]. This scheme embraces a more environmentally friendly
farming system, including careful monitoring and understanding
of diseases resulting in reduced input of biocides in the vineyard
when compared with conventional farming [16]. The system also
promotes the use of hay mulches and oats cover crops to improve
soil moisture and fertility, as well as bait, ducks and other
biocontrol strategies for pest control. However, integrated farming
systems are not fully codified into rules, and do not have a
regulated certification system [16]. In contrast, biodynamic
farming is a specialised type of organic farming which prohibits
any use of chemical fertilizers and pesticides as stipulated under
the Demeter regulations [17]. In addition, biodynamic farming
includes the use of specific fermented herbal and mineral
preparations as compost additives and field sprays which are
applied into the soil in animal organs e.g. bladder and cow horn
[18].
Organic and biodynamic farming systems have been shown to
enhance soil fertility and increase biodiversity [19–21]. In wheat
plantations, microbial diversity has been found to be highest in
biodynamic areas, followed by organically farmed and finally
conventional plantations [19]. Although organic and biodynamic
systems are globally becoming of increasing economic interest to
wine producers, their impact on general vineyard health and wine
quality has been the subject of relatively few studies. In particular,
the impact of these practices on the vineyard ecosystem (including
microbial diversity) is poorly understood.
The current study was aimed at evaluating microbial diversity
associated with grapes obtained from conventional, biodynamic
and integrated pest management vineyards, with a focus on
epiphytic yeasts. The study also appears to be the first to assess
intra-vineyard variability of microbial diversity. The data confirm
previous results (on other crops) that biodynamic farming leads to
a higher microbial diversity. It also shows that this diversity is
unevenly distributed within individual vineyards, thus highlighting
the importance of sampling multiple locations in the vineyard to
assess the biodiversity of the ecosystem. From a wine making
perspective, the data suggest that spatial fluctuations in microbial
diversity might have a significant impact on downstream processes
and analyses.
Materials and Methods
Vineyard Locations and TreatmentsCabernet sauvignon grape samples were collected from three
directly adjacent vineyards. The vineyards, located in the
Polkadraai region in Stellenbosch, South Africa (Fig. S1), were
carefully selected to allow conclusive assessment of the impact of
farming practices on both intra- and inter-vineyard microbial
biodiversity. In particular, the vineyards are positioned on the
same slope and aspect, and were all established in the same period
(1994 and 1995). All vineyards also use the same trellising system
(Perold 4 wire), row width (2.5 m) and vine interspacing width
(1.4 m). However, each vineyard has been managed consistently
and over a long period through strongly divergent farming
methods, referred to as ‘‘conventional’’ (33u 57941.5099 S, 18u45911.8799 E elev 179 m), ‘‘Integrated production’’ (33u57940.6599
S 18u 45908.2399 E elev 184 m) and ‘‘biodynamic’’ (33u57939.3399
S 18u 45913.4699 E elev 183 m). The conventional and
biodynamic vineyard had the same cabernet sauvignon rootstock
(R101-14) while the integrated vineyard has rootstock R110-
CS23A. Management practices were as follows (see Table S1 for
details): The ‘‘biodynamic’’ vineyard, was converted to ‘‘biody-
namic’’ farming principles in 2000, and certified by Demeter
International in 2006. The vineyard was treated regularly with
Kumulus (sulphur), nordox (copper oxide), striker (organic
fungicide with chitosan) and lime for the protection of powdery
mildew and downy mildew, from leaf-fall until full bloom. The
‘‘integrated production’’ vineyard has been managed through the
integrated pest and vineyard management system since its
inception, which includes the use of chicken manure, inoculation
of mycorrhizae and Trichoderma spp. into the soil, as well as the use
of oats as cover crops. Pest management consisted of a
combination of fungicides including hyperphos (mono- and
dipotassium hydrogen phosphate), dithane (ethylene bisdithiocar-
bamate), Kumulus (80% sulphur), acrobat MZ (dimethomorph/
mancozeb), talendo (proquinazid), curzate (cymoxanil/mancozeb)
and stroby (kresoximethyl); and insecticides such as vantex
(pyrethroid) and delmathrin, based on recommendations from
an annual evaluation of the vineyard as per IPW guidelines. In
contrast, the vines in the conventional vineyard were treated with
chemical fertilizers applied when necessary and the vines were
consistently treated with a combination of fungicides including
folpan (N-(trichloromethyl)thio) phthalimide, rootex (phosphorous
acid), cumulus, dithane, acrobat, talendo, cungfu (copper hydrox-
ide) and topaz (mono- and di-potassium salts of phosphorous acid),
and different stages from leaf-fall to full bloom (Table S1). Sprays
1, 2 and 3 were applied with designer, a non-ionic sticker to
improve the spread, coverage and retention of the fungicides and
insecticides. No specific permits were required for the described
field studies as they do not form part of protected land or
conservation areas, and have not been reported to contain any
endangered species. The three vineyards are privately owned
commercial entities consequently, permission to use them as a
study site and to sample the grapes was granted independently by
each of the owners.
Sampling DesignAccording to the Theory of Sampling (TOS) [22–24], the most
efficient manner to sample a two-dimensional lot is to linearise it
(aka to ‘unfold’ or to ‘vectorize’ it), into an elongated one-
dimensional lot from which to extract increments at equidistant
intervals [25,26]. This approach is optimal with respect to
capturing and characterizing the heterogeneity present within
the lot, offering a way to derive a minimum number of increments
needed (Q) if based variographic analysis [27]; alternatively the
number Q may reflect local logistical and/or economic con-
straints. From a sampling design perspective a vineyard block can
be likened to a two-dimensional lot, where rows are easily
unfolded into continuous series, in which panels (each containing 6
vines) make up a ‘group’. At each vine location, the increments
were defined to equal bunches. In the present study, one
increment (bunch) was collected from each group, with groups
regularly spaced throughout the unfolded linear lot. Thus in the
conventional vineyard six rows (no.s 9, 11, 13, 15, 17 and 19) were
sampled, where bunches were collected between panel 3, 7 and 11.
In the biodynamic vineyard seven rows (no.s 1, 4, 7, 10, 13, 16, 19)
were sampled while in the integrated vineyard only three rows
were targeted (no.s 115, 117 and 119); here the bunches were
collected from panels 1, 3, 5, 7, 9 and 11 respectively (Fig. S1).
Grape bunches were placed in sterile bags and transported to the
laboratory and processed within 1 hour after harvest.
Pseudoreplicaton TestIn order to test for pseudoreplication effects the following
approach was implemented in Perl. A Cartesian coordinate system
The Vineyard Microbiome
PLOS ONE | www.plosone.org 2 December 2012 | Volume 7 | Issue 12 | e52609
was created for each of the three vineyards utilizing the fact that
the row width is 2.5 meters and the panel width is 9 meters. Given
this each sampling point can be described as a two point vector
and the distance between two sampling points can be calculated as
follows:
Distance ~ffiffiffiffiffiffiffiffiffiffiffiffiffiffiffiffiffidx2zdy
p
Where dx is the difference between the x coordinates and dy is the
difference between the y coordinates. For each possible pair of
sampling points within each vineyard the Pearson correlation of
species detected via ARISA analysis was plotted against the
distance between the sampling points and the R2 value calculated
for each plot.
Yeast Enumeration and IsolationThirty undamaged berries were collected from each bunch of
grapes by using scissors cleaned with 70% ethanol and placed in
250 ml sterile pre-weighed Erlenmeyer flasks. The berries were
then washed with 50 ml of saline solution comprising 0.9% w/v
NaCl and 0.2% (v/v) Tween 80 to release the microorganisms [3].
This step was carried out at 30uC for 3 h with agitation on an
Innova 5000 Gyrotory tier shaker (New Brunswick Scientific,
Edison, New Jersey, USA) at 170 rpm. The washing solution was
placed in 50 ml centrifuge tubes, followed by a centrifugation step
at 56306g for 10 min. The pellet was re-suspended in 10 ml fresh
solution and used for yeast enumeration and community profiling
using automated ribosomal intergenic spacer analysis (ARISA).
For yeast isolation and enumeration, decimal dilutions (1021 to
1023) were prepared from the wash solutions, and 100 ml samples
of each dilution were spread-plated in duplicate on Wallerstein
nutrient agar (Sigma-Aldrich) supplemented with 34 mg/L
chloramphenicol (Sigma-Aldrich) and 150 mg/L biphenyl (Rie-
del-deHaen, Seelze, Germany) to inhibit bacterial and mould
growth, respectively. The plates were incubated at 30uC and
examined daily for growth until the colonies were easily
distinguishable. Where possible, 4–6 representatives of each
colony-morphology were isolated from plates with #250 colonies
and purified through two rounds of streak plating onto fresh agar
plates. In addition, unique but infrequent colonies that were
observed on plates with .250 colonies were also isolated. The
isolates were maintained in 20% (v/v) glycerol at 280uC.
DNA Extraction and ARISA FingerprintingThe yeast communities associated with grapes were analyzed
using PCR and ARISA. The remaining wash solutions were
centrifuged at 56306 g for 10 min to collect microbial biomass.
The pellet was re-suspended in lysis buffer and DNA was extracted
as previously described by Hoffman [28]. The ITS1-5.8S-ITS2
rRNA region was amplified with the FAM labelled ITS1 primer
(59-TCCGTAGGTGAACCTGCGG-39) and ITS4 (59-
TCCTCCGCTTATTGATATGC-39), using the PhireH Plant
Direct PCR kit (FINNZYMES OY, Espoo, Finland) under the
following conditions: an initial denaturation of 6 min at 98uC,
followed by 40 cycles of 98uC for 20 s, 54uC for 30 s, 72uC 1 min,
and a final extension of 10 min at 72uC. The ARISA-PCR
fragments were separated by capillary electrophoresis on an
ABI3010xl Genetic Analyzer (Applied Biosystems, CA, USA) to
obtain electropherograms of the different fragment lengths and
fluorescent intensities. A ROX1.1 size standard was used [29].
The ARISA data was analysed using Genemapper 4.1 software
(Applied Biosystems). A threshold of 50 fluorescent units was used
to exclude background fluorescence. The software converted the
fluorescence data into electropherograms, where the peaks
represent fragments of different sizes, and the peak areas represent
the relative proportion of these fragments. The number of peaks in
each electropherogram was interpreted as the OTU richness in the
community. The fragment lengths and fluorescence for each
sample were aligned using an Excel Macro. Only fragment sizes
larger than 0.5% of the total fluorescence and between 300 and
1000 bp in length were considered for analysis. A bin size of 3 bp
for fragments below 700 bp and 5 bp for fragments above 700 bp
was employed to minimize the inaccuracies in the ARISA profiles
[30]. All elution points in the electropherograms that did not
contain a peak in at least one sample were removed with the use of
a custom built Perl program. This process resulted in a matrix in
which each row represented a sample and each column
represented an OTU (species). Principal component analysis
(PCA) of the ARISA profile matrix was performed in STATIS-
TICA software Version 10 [31].
Vineyard Sampling Point NetworksAn all-against-all comparison was done calculating the Pearson
correlation between each and every sample vector in the ARISA
matrix. As such, one is able to determine the correlation in
population structure within and across vineyards. The relation-
ships between samples were represented as a mathematical graph
in order to form a correlation network with the nodes representing
sampling point locations in each vineyard and the edges weighted
with the Pearson correlations between the sampling point vectors.
In order to select the highest correlations between sampling points
a maximum spanning tree was created by transforming the edge
weights into inverse correlations (by taking the difference between
the number 1 and the absolute correlation values) and the
subsequent use of a minimum spanning tree (mst) algorithm [32]
on this inverse correlation network. A minimum spanning tree
represents the shortest possible path through a graph and, as such,
selects for the smallest inverse correlation (i.e highest correlation)
pairs between all nodes in the network. The nodes were annotated
with colours based on the vineyards the samples were taken from
and the edge widths scaled with respect to the level of the original
correlation values between the samples. The resulting network was
visualized in Cytoscape [32].
OTU Probability NetworksA probability matrix was created by dividing each element of a
sample vector by the sum of all of the elements in the vector. Thus
each resulting element represented the probability of that sample
containing that particular OTU. A probability network was then
created by creating edges between each sample and the OTUs for
which there was a probability value .0 were used as edge weights.
The sample nodes were annotated with colours based on the
vineyards the samples were taken from. An edge-based spring
embedded layout algorithm was applied to the resulting network
which was then visualized in Cytoscape [32].
Mixed-model Networks: Combining Correlation andProbability Networks
In order to represent the most probable microbial community
structure of each sampling point a mixed-model network was
developed as follows. The edge weights of the Vineyard Sampling
point maximum spanning tree network described above were
multiplied by 10 and the resulting re-weighted network Unioned
with the probability network described above.
In order to select the highest probability edges between
sampling points and OTUs a maximum spanning tree was
The Vineyard Microbiome
PLOS ONE | www.plosone.org 3 December 2012 | Volume 7 | Issue 12 | e52609
created by transforming the edge weights into inverse values (by
calculating the absolute difference between the number 1 and
the edge weights) and the subsequent use of a minimum
spanning tree (mst) algorithm [33] on this inverse edge-weighted
network. After the mst algorithm was applied the original
weights from both the correlation and probability networks were
used as edge weights of the surviving edges. Edge thicknesses
were then scale with respect to the edge weights and sampling
point node sizes were scale with regard to degree (i.e. the
number of edges incident to a node). OTU node sizes were
scaled with regard to the probability of them occurring in the
sample that they shared and edge with. The resulting network
was then visualized in Cytoscape [32].
Molecular Yeast IdentificationSelected colonies were picked from the plate by using a sterile
inoculating loop and DNA was extracted from the colonies using
the protocol for rapid isolation of yeast DNA [28]. The isolates
were then identified by amplifying the ITS1-5.8S-ITS2 rRNA
region using the ITS1 and ITS4. PCR amplifications were carried
out in a final volume of 25 ml containing 0.25 mM of each primer,
16 PCR reaction buffer, 1 mM MgCl2, 200 mM dNTPs, 1U
Takara Ex TaqTM DNA polymerase (TaKaRa Bio Inc., Olsu,
Shiga, Japan), 100 ng of DNA and sterilized de-ionized H2O. The
PCR reaction was carried out using the following conditions:
initial denaturation at 94uC for 2 min; 35 cycles of denaturing at
94uC for 30 s; annealing at 54uC for 45 s; an extension at 72uC for
1 min; and a final extension step of 10 min at 72uC. The PCR
products were analysed by agarose gel electrophoresis; purified
using the ZymocleanTM Gel DNA recovery kit (Zymo Research
Corporation, Irvine, CA, USA), following the manufacture’s
instruction, and then sequenced. The sequences obtained were
assembled using BioEdit [34], and compared with sequences
available in GenBank database available at the National Centre
for Biotechnology Information (NCBI) http://www.ncbi.nlm.nih.
gov/genbank/index.html using the basic local alignment search
tool (BLAST) algorithm [35]. Sequences which displayed 98–99%
identity to previously published species available at NCBI were
binned into the same species. Sequences obtained in this study
were deposited in NCBI GenBank database under accession
numbers: JQ993367– JQ993394.
Statistical AnalysisRelative abundance of species was calculated as a proportion
of a particular species in the samples based on colony counts
and frequency of isolation. Species richness was assessed using
the Menhinick’s index while species evenness was assessed using
Pielou index [36]. Shannon diversity index was used to assess
the level of diversity in the three vineyards [12].
Results
Quantitative Analysis of Grape-associated YeastCommunities
The impact of farming systems on yeast population density was
evaluated by culture-dependent methods following a 3 h rinsing of
sound grape berries obtained from the conventional, biodynamic
and integrated vineyards. The total yeast populations were higher
in the biodynamic and conventional vineyard than in the
integrated vineyard (Fig. S2). The total yeast population ranged
from 4–86104 CFU/g on all vineyards, and the enumeration of
cultivable population revealed no significant differences between
the farming systems (P = 0,225).
Inter- and Intra-vineyard Variability of the Total FungalCommunity
ARISA analysis was used to unravel fungal community
structures associated with healthy/sound grapes in conventional,
biodynamic and integrated pest management farming systems.
Similar electropherograms were obtained from all the samples.
Bands between 500 and 600 bp were dominant in all the
vineyards, however, differences in fungal community structures
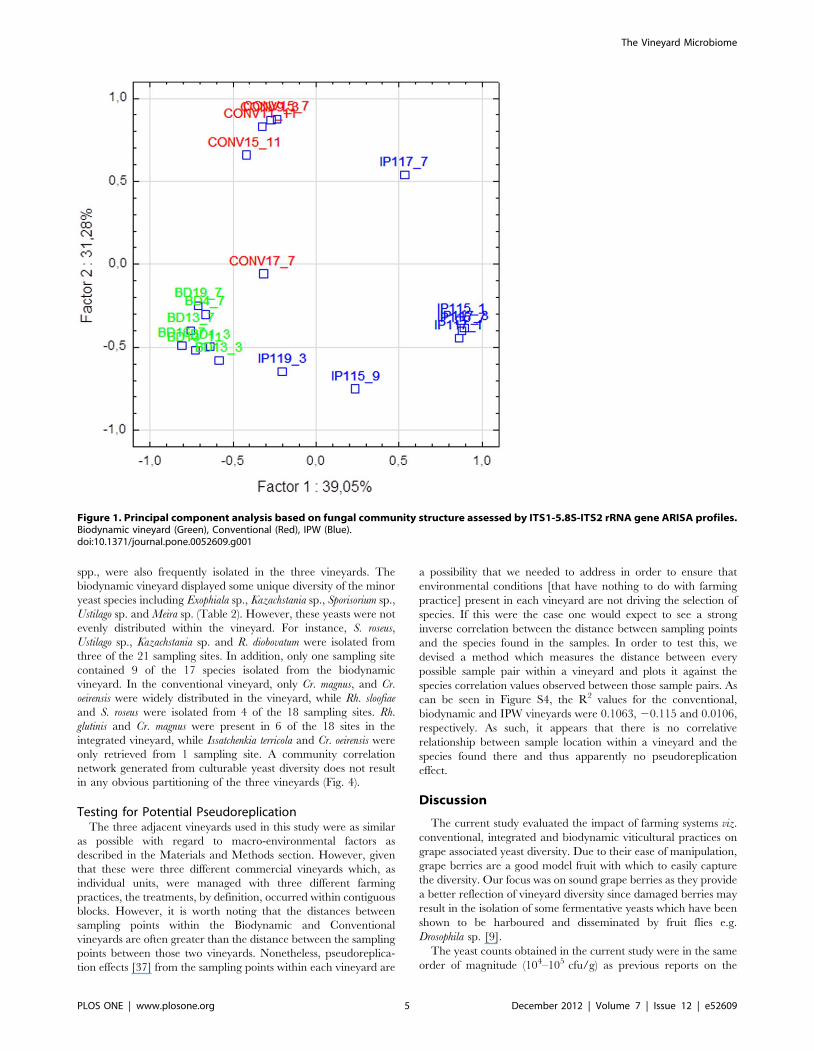
were evident in the three vineyards. PCA analysis was performed
on ARISA profiles to evaluate inter-vineyard variation. Each
vineyard could be differentiated on the basis of the ARISA
fingerprints (Fig. 1). The biodynamic and integrated vineyard
could be separated on the first axis, with the integrated vineyard
samples mainly clustered on the right hand side of the first factorial
plane while the biodynamic vineyard samples clustered on the left
hand side. In addition, the biodynamic and conventional vineyard
could be further separated on the second axis which explained
31.2% of the total variance. The conventional vineyard samples
mainly clustered in the top plane while the biodynamic vineyard
samples were located in the lower factorial plane (Fig. 1).
Community networks derived from the same ARISA data showed
higher correlation between the biodynamic farming system and
the integrated pest management system (Fig. S3). The community
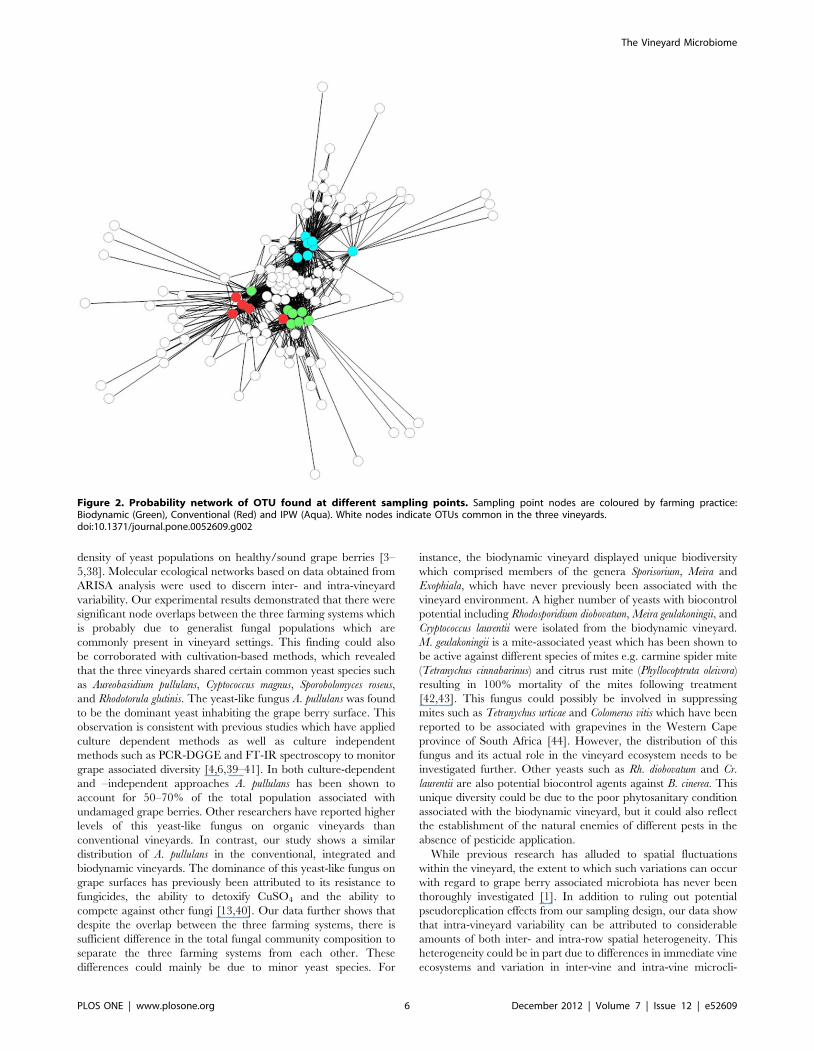
network of the three farming systems comprised highly connected
OTUs revealing significant overlap between the three systems
(Fig. 2), but also showing that there are several OTUs which are
unique to specific farming systems. Once the link between
microbial diversity and farming practices was established, we
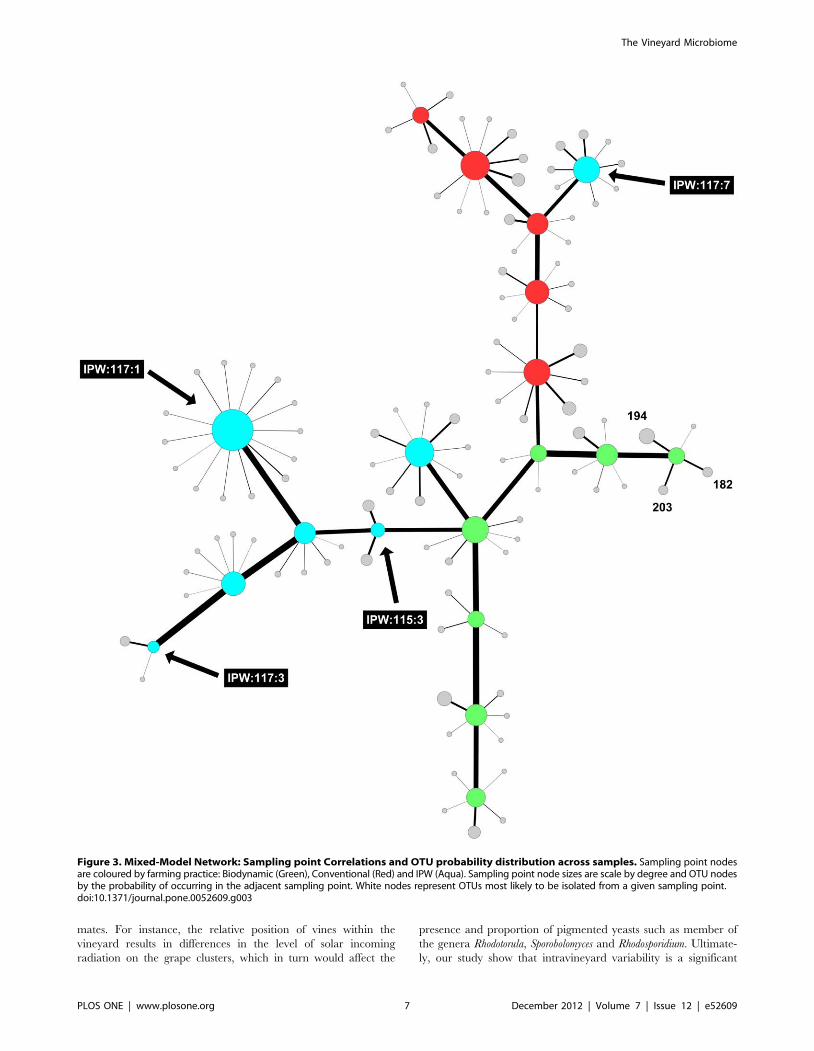
further explored intra-vineyard variability by evaluating the
probability of certain OTUs being present in specific locations
in the vineyard. The probabilistic species distribution patterns
revealed interesting ecological patterns and for the first time
confirmed intra-vineyard variability. For instance, in the integrat-
ed vineyard, row 117:panel 1 displayed a higher level of diversity,
while row 115:panel 3 and row 117:panel 3, displayed the lowest
diversity. Row 117:panel 7 comprised a unique fungal community
which seemed more similar to the communities present in the
conventional vineyard (Fig. 3). In contrast, in the biodynamic and
conventional vineyard, the level of diversity within the rows and
panels were similar, however, the OTUs represented at each site
differed, such that the likelihood of isolating certain species from
specific locations were variable. For instance, peaks 182 (518 bp),
194 (545 bp) and 203 (568 bp) are strongly associated with row
4:panel (7–8) in the biodynamic vineyard and therefore, the
probability of isolating from this area is higher than with other
sites. Similar observations were made for the conventional
vineyard.
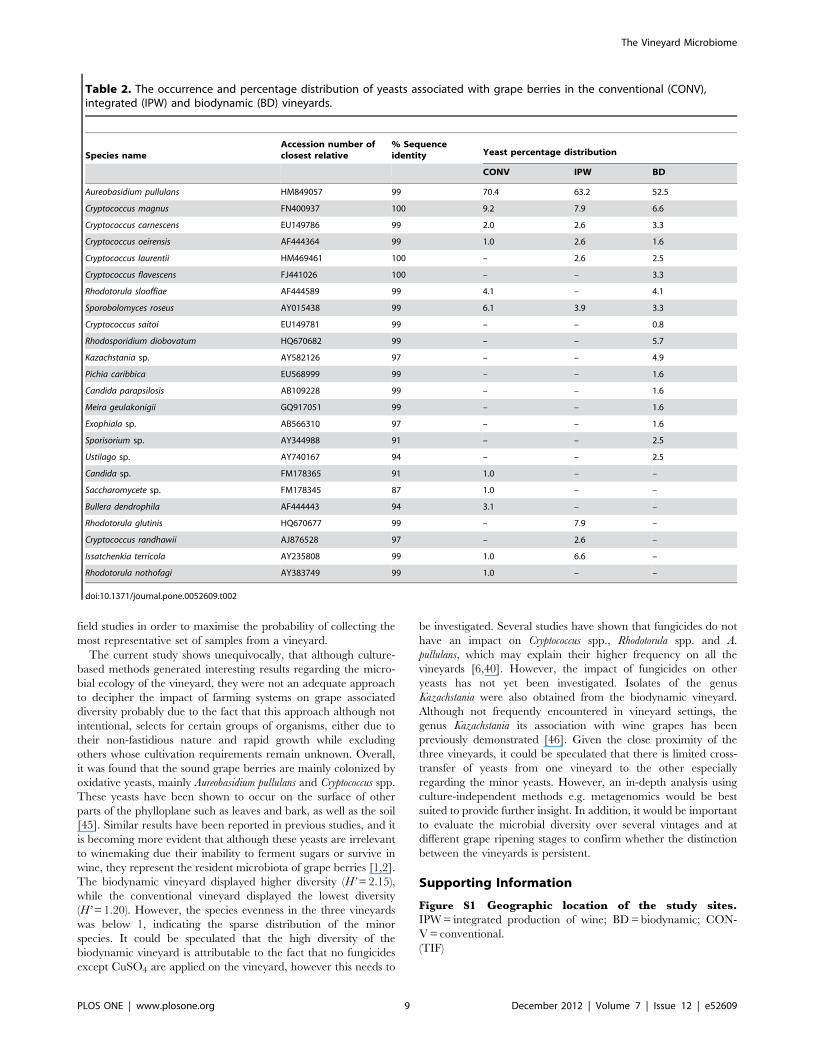
Qualitative Diversity AnalysisA total of 628 yeast isolates from the three vineyards were
analysed. Eleven species representing 8 genera were isolated from
the conventional vineyard; the yeast isolated from the integrated
vineyard represented 8 genera and 9 species, while 17 species
representing 12 genera were isolated from the biodynamic
vineyard. The biodynamic vineyard displayed a higher species
richness and biodiversity than both the conventional and
integrated vineyard (Table 1). Species evenness below 1 was
found in all the vineyards. The dimorphic ascomycetous black
yeast-like fungus, Aureobasidium pullulans, was widely distributed in
the three vineyards (Table 2). Cryptococcus spp. were the second
most prevalent yeast group with Cr. magnus, Cr. carnescens and Cr.
oeirensis present in the three vineyards, while Cr. laurentii was only
isolated from the integrated and biodynamic vineyard. The red
pigmented yeasts including Sporobolomyces roseus and Rhodotorula
The Vineyard Microbiome
PLOS ONE | www.plosone.org 4 December 2012 | Volume 7 | Issue 12 | e52609
spp., were also frequently isolated in the three vineyards. The
biodynamic vineyard displayed some unique diversity of the minor
yeast species including Exophiala sp., Kazachstania sp., Sporisorium sp.,
Ustilago sp. and Meira sp. (Table 2). However, these yeasts were not
evenly distributed within the vineyard. For instance, S. roseus,
Ustilago sp., Kazachstania sp. and R. diobovatum were isolated from
three of the 21 sampling sites. In addition, only one sampling site
contained 9 of the 17 species isolated from the biodynamic
vineyard. In the conventional vineyard, only Cr. magnus, and Cr.
oeirensis were widely distributed in the vineyard, while Rh. sloofiae
and S. roseus were isolated from 4 of the 18 sampling sites. Rh.
glutinis and Cr. magnus were present in 6 of the 18 sites in the
integrated vineyard, while Issatchenkia terricola and Cr. oeirensis were
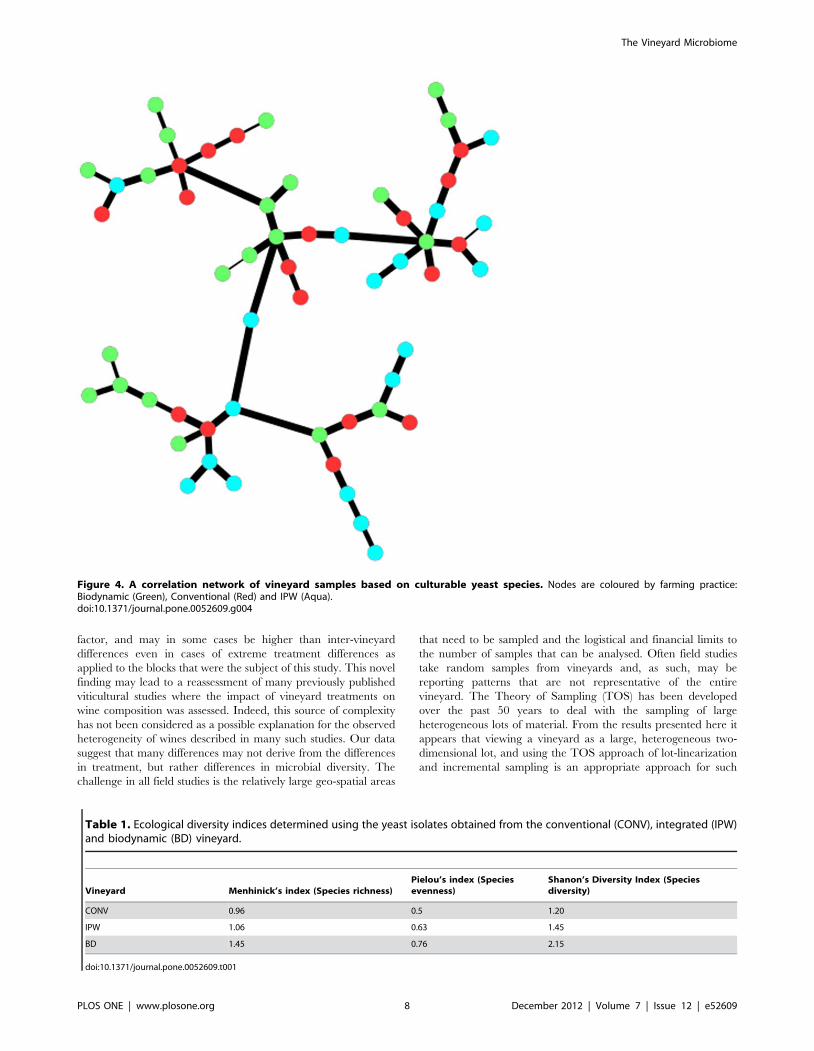
only retrieved from 1 sampling site. A community correlation
network generated from culturable yeast diversity does not result
in any obvious partitioning of the three vineyards (Fig. 4).
Testing for Potential PseudoreplicationThe three adjacent vineyards used in this study were as similar
as possible with regard to macro-environmental factors as
described in the Materials and Methods section. However, given
that these were three different commercial vineyards which, as
individual units, were managed with three different farming
practices, the treatments, by definition, occurred within contiguous
blocks. However, it is worth noting that the distances between
sampling points within the Biodynamic and Conventional
vineyards are often greater than the distance between the sampling
points between those two vineyards. Nonetheless, pseudoreplica-
tion effects [37] from the sampling points within each vineyard are
a possibility that we needed to address in order to ensure that
environmental conditions [that have nothing to do with farming
practice] present in each vineyard are not driving the selection of
species. If this were the case one would expect to see a strong
inverse correlation between the distance between sampling points
and the species found in the samples. In order to test this, we
devised a method which measures the distance between every
possible sample pair within a vineyard and plots it against the
species correlation values observed between those sample pairs. As
can be seen in Figure S4, the R2 values for the conventional,
biodynamic and IPW vineyards were 0.1063, 20.115 and 0.0106,
respectively. As such, it appears that there is no correlative
relationship between sample location within a vineyard and the
species found there and thus apparently no pseudoreplication
effect.
Discussion
The current study evaluated the impact of farming systems viz.
conventional, integrated and biodynamic viticultural practices on
grape associated yeast diversity. Due to their ease of manipulation,
grape berries are a good model fruit with which to easily capture
the diversity. Our focus was on sound grape berries as they provide
a better reflection of vineyard diversity since damaged berries may
result in the isolation of some fermentative yeasts which have been
shown to be harboured and disseminated by fruit flies e.g.
Drosophila sp. [9].
The yeast counts obtained in the current study were in the same
order of magnitude (104–105 cfu/g) as previous reports on the
Figure 1. Principal component analysis based on fungal community structure assessed by ITS1-5.8S-ITS2 rRNA gene ARISA profiles.Biodynamic vineyard (Green), Conventional (Red), IPW (Blue).doi:10.1371/journal.pone.0052609.g001
The Vineyard Microbiome
PLOS ONE | www.plosone.org 5 December 2012 | Volume 7 | Issue 12 | e52609
density of yeast populations on healthy/sound grape berries [3–
5,38]. Molecular ecological networks based on data obtained from
ARISA analysis were used to discern inter- and intra-vineyard
variability. Our experimental results demonstrated that there were
significant node overlaps between the three farming systems which
is probably due to generalist fungal populations which are
commonly present in vineyard settings. This finding could also
be corroborated with cultivation-based methods, which revealed
that the three vineyards shared certain common yeast species such
as Aureobasidium pullulans, Cyptococcus magnus, Sporobolomyces roseus,
and Rhodotorula glutinis. The yeast-like fungus A. pullulans was found
to be the dominant yeast inhabiting the grape berry surface. This
observation is consistent with previous studies which have applied
culture dependent methods as well as culture independent
methods such as PCR-DGGE and FT-IR spectroscopy to monitor
grape associated diversity [4,6,39–41]. In both culture-dependent
and –independent approaches A. pullulans has been shown to
account for 50–70% of the total population associated with
undamaged grape berries. Other researchers have reported higher
levels of this yeast-like fungus on organic vineyards than
conventional vineyards. In contrast, our study shows a similar
distribution of A. pullulans in the conventional, integrated and
biodynamic vineyards. The dominance of this yeast-like fungus on
grape surfaces has previously been attributed to its resistance to
fungicides, the ability to detoxify CuSO4 and the ability to
compete against other fungi [13,40]. Our data further shows that
despite the overlap between the three farming systems, there is
sufficient difference in the total fungal community composition to
separate the three farming systems from each other. These
differences could mainly be due to minor yeast species. For
instance, the biodynamic vineyard displayed unique biodiversity
which comprised members of the genera Sporisorium, Meira and
Exophiala, which have never previously been associated with the
vineyard environment. A higher number of yeasts with biocontrol
potential including Rhodosporidium diobovatum, Meira geulakoningii, and
Cryptococcus laurentii were isolated from the biodynamic vineyard.
M. geulakoningii is a mite-associated yeast which has been shown to
be active against different species of mites e.g. carmine spider mite
(Tetranychus cinnabarinus) and citrus rust mite (Phyllocoptruta oleivora)
resulting in 100% mortality of the mites following treatment
[42,43]. This fungus could possibly be involved in suppressing
mites such as Tetranychus urticae and Colomerus vitis which have been
reported to be associated with grapevines in the Western Cape
province of South Africa [44]. However, the distribution of this
fungus and its actual role in the vineyard ecosystem needs to be
investigated further. Other yeasts such as Rh. diobovatum and Cr.
laurentii are also potential biocontrol agents against B. cinerea. This
unique diversity could be due to the poor phytosanitary condition
associated with the biodynamic vineyard, but it could also reflect
the establishment of the natural enemies of different pests in the
absence of pesticide application.
While previous research has alluded to spatial fluctuations
within the vineyard, the extent to which such variations can occur
with regard to grape berry associated microbiota has never been
thoroughly investigated [1]. In addition to ruling out potential
pseudoreplication effects from our sampling design, our data show
that intra-vineyard variability can be attributed to considerable
amounts of both inter- and intra-row spatial heterogeneity. This
heterogeneity could be in part due to differences in immediate vine
ecosystems and variation in inter-vine and intra-vine microcli-
Figure 2. Probability network of OTU found at different sampling points. Sampling point nodes are coloured by farming practice:Biodynamic (Green), Conventional (Red) and IPW (Aqua). White nodes indicate OTUs common in the three vineyards.doi:10.1371/journal.pone.0052609.g002
The Vineyard Microbiome
PLOS ONE | www.plosone.org 6 December 2012 | Volume 7 | Issue 12 | e52609
mates. For instance, the relative position of vines within the
vineyard results in differences in the level of solar incoming
radiation on the grape clusters, which in turn would affect the
presence and proportion of pigmented yeasts such as member of
the genera Rhodotorula, Sporobolomyces and Rhodosporidium. Ultimate-
ly, our study show that intravineyard variability is a significant
Figure 3. Mixed-Model Network: Sampling point Correlations and OTU probability distribution across samples. Sampling point nodesare coloured by farming practice: Biodynamic (Green), Conventional (Red) and IPW (Aqua). Sampling point node sizes are scale by degree and OTU nodesby the probability of occurring in the adjacent sampling point. White nodes represent OTUs most likely to be isolated from a given sampling point.doi:10.1371/journal.pone.0052609.g003
The Vineyard Microbiome
PLOS ONE | www.plosone.org 7 December 2012 | Volume 7 | Issue 12 | e52609
factor, and may in some cases be higher than inter-vineyard
differences even in cases of extreme treatment differences as
applied to the blocks that were the subject of this study. This novel
finding may lead to a reassessment of many previously published
viticultural studies where the impact of vineyard treatments on
wine composition was assessed. Indeed, this source of complexity
has not been considered as a possible explanation for the observed
heterogeneity of wines described in many such studies. Our data
suggest that many differences may not derive from the differences
in treatment, but rather differences in microbial diversity. The
challenge in all field studies is the relatively large geo-spatial areas
that need to be sampled and the logistical and financial limits to
the number of samples that can be analysed. Often field studies
take random samples from vineyards and, as such, may be
reporting patterns that are not representative of the entire
vineyard. The Theory of Sampling (TOS) has been developed
over the past 50 years to deal with the sampling of large
heterogeneous lots of material. From the results presented here it
appears that viewing a vineyard as a large, heterogeneous two-
dimensional lot, and using the TOS approach of lot-linearization
and incremental sampling is an appropriate approach for such
Figure 4. A correlation network of vineyard samples based on culturable yeast species. Nodes are coloured by farming practice:Biodynamic (Green), Conventional (Red) and IPW (Aqua).doi:10.1371/journal.pone.0052609.g004
Table 1. Ecological diversity indices determined using the yeast isolates obtained from the conventional (CONV), integrated (IPW)and biodynamic (BD) vineyard.
Vineyard Menhinick’s index (Species richness)Pielou’s index (Speciesevenness)
Shanon’s Diversity Index (Speciesdiversity)
CONV 0.96 0.5 1.20
IPW 1.06 0.63 1.45
BD 1.45 0.76 2.15
doi:10.1371/journal.pone.0052609.t001
The Vineyard Microbiome
PLOS ONE | www.plosone.org 8 December 2012 | Volume 7 | Issue 12 | e52609
field studies in order to maximise the probability of collecting the
most representative set of samples from a vineyard.
The current study shows unequivocally, that although culture-
based methods generated interesting results regarding the micro-
bial ecology of the vineyard, they were not an adequate approach
to decipher the impact of farming systems on grape associated
diversity probably due to the fact that this approach although not
intentional, selects for certain groups of organisms, either due to
their non-fastidious nature and rapid growth while excluding
others whose cultivation requirements remain unknown. Overall,
it was found that the sound grape berries are mainly colonized by
oxidative yeasts, mainly Aureobasidium pullulans and Cryptococcus spp.
These yeasts have been shown to occur on the surface of other
parts of the phylloplane such as leaves and bark, as well as the soil
[45]. Similar results have been reported in previous studies, and it
is becoming more evident that although these yeasts are irrelevant
to winemaking due their inability to ferment sugars or survive in
wine, they represent the resident microbiota of grape berries [1,2].
The biodynamic vineyard displayed higher diversity (H’ = 2.15),
while the conventional vineyard displayed the lowest diversity
(H’ = 1.20). However, the species evenness in the three vineyards
was below 1, indicating the sparse distribution of the minor
species. It could be speculated that the high diversity of the
biodynamic vineyard is attributable to the fact that no fungicides
except CuSO4 are applied on the vineyard, however this needs to
be investigated. Several studies have shown that fungicides do not
have an impact on Cryptococcus spp., Rhodotorula spp. and A.
pullulans, which may explain their higher frequency on all the
vineyards [6,40]. However, the impact of fungicides on other
yeasts has not yet been investigated. Isolates of the genus
Kazachstania were also obtained from the biodynamic vineyard.
Although not frequently encountered in vineyard settings, the
genus Kazachstania its association with wine grapes has been
previously demonstrated [46]. Given the close proximity of the
three vineyards, it could be speculated that there is limited cross-
transfer of yeasts from one vineyard to the other especially
regarding the minor yeasts. However, an in-depth analysis using
culture-independent methods e.g. metagenomics would be best
suited to provide further insight. In addition, it would be important
to evaluate the microbial diversity over several vintages and at
different grape ripening stages to confirm whether the distinction
between the vineyards is persistent.
Supporting Information
Figure S1 Geographic location of the study sites.IPW = integrated production of wine; BD = biodynamic; CON-
V = conventional.
(TIF)
Table 2. The occurrence and percentage distribution of yeasts associated with grape berries in the conventional (CONV),integrated (IPW) and biodynamic (BD) vineyards.
Species nameAccession number ofclosest relative
% Sequenceidentity Yeast percentage distribution
CONV IPW BD
Aureobasidium pullulans HM849057 99 70.4 63.2 52.5
Cryptococcus magnus FN400937 100 9.2 7.9 6.6
Cryptococcus carnescens EU149786 99 2.0 2.6 3.3
Cryptococcus oeirensis AF444364 99 1.0 2.6 1.6
Cryptococcus laurentii HM469461 100 – 2.6 2.5
Cryptococcus flavescens FJ441026 100 – – 3.3
Rhodotorula slooffiae AF444589 99 4.1 – 4.1
Sporobolomyces roseus AY015438 99 6.1 3.9 3.3
Cryptococcus saitoi EU149781 99 – – 0.8
Rhodosporidium diobovatum HQ670682 99 – – 5.7
Kazachstania sp. AY582126 97 – – 4.9
Pichia caribbica EU568999 99 – – 1.6
Candida parapsilosis AB109228 99 – – 1.6
Meira geulakonigii GQ917051 99 – – 1.6
Exophiala sp. AB566310 97 – – 1.6
Sporisorium sp. AY344988 91 – – 2.5
Ustilago sp. AY740167 94 – – 2.5
Candida sp. FM178365 91 1.0 – –
Saccharomycete sp. FM178345 87 1.0 – –
Bullera dendrophila AF444443 94 3.1 – –
Rhodotorula glutinis HQ670677 99 – 7.9 –
Cryptococcus randhawii AJ876528 97 – 2.6 –
Issatchenkia terricola AY235808 99 1.0 6.6 –
Rhodotorula nothofagi AY383749 99 1.0 – –
doi:10.1371/journal.pone.0052609.t002
The Vineyard Microbiome
PLOS ONE | www.plosone.org 9 December 2012 | Volume 7 | Issue 12 | e52609
Figure S2 Total yeast populations enumerated on grapeberry surfaces from biodynamic (BD), integrated pro-duction (IPW) and conventional (CONV) vineyards. The
results were averaged from duplicate dilutions and are expressed
as means 6 SE of total samples. Error bars represent the standard
error of means.
(TIF)
Figure S3 Correlation Network of Microbial Popula-tions at different Sampling Points. Nodes are coloured by
farming practice: Biodynamic (Green), Conventional (Red) and
IPW (Aqua). Edge width is scaled to correlation value, so the
thicker the edge the stronger the correlation.
(TIF)
Figure S4 Species Correlation vs Spatial Distributionfor each sample pair within vineyards for A) Conven-tional, B) Biodynamic and C) IPW vineyards.
(TIF)
Table S1 Spray programme for the biodynamic, con-ventional and integrated vineyard from leaf-fall till fullbloom.(DOCX)
Acknowledgments
We thank Dr. Etiene Slabbert (Department of Microbiology, Stellenbosch
University) for his assistance with ARISA analyses. We would also like to
thank Kim Esbensen for advice on the Theory of Sampling and Piet Jones
and Debbie Weighill for useful discussions about the networks used in this
study. We also thank Mr. Johan Reyneke, Mr. Deon Joubert as well as Mr
and Mrs Emil and Sonet den Dulk for granting us permission to sample
their vineyards.
Author Contributions
Conceived and designed the experiments: MES DJ FB. Performed the
experiments: MES U-CA DJ. Analyzed the data: MES U-CA DJ.
Contributed reagents/materials/analysis tools: MES DJ FB. Wrote the
paper: MES DJ FB.
References
1. Barata A, Malfeito-Ferreira M, Loureiro V (2012) The microbial ecology of wine
grape berries. Int J Food Microbiol 153: 243–259.
2. Barata A, Malfeito-Ferreira M, Loureiro V (2012) Changes in sour rotten grape
berry microbiota during ripening and wine fermentation. Int J Food Microbiol
154: 152–161.
3. Renouf V, Claisse O, Lonvaud-Funel A (2005) Understanding the microbial
ecosystem on the grape berry surface through numeration and identification of
yeast and bacteria. Aust J Grape Wine Res 11: 316–327.
4. Prakitchaiwattana CJ, Fleet GH, Heard GM (2004) Application and evaluation
of denaturing gradient gel electrophoresis to analyse the yeast ecology of wine
grapes. FEMS Yeast Res 4: 865–877.
5. Barata A, Gonzalez S, Malfeito-Ferreira M, Querol A, Loureiro V (2008) Sour
rot-damaged grapes are sources of wine spoilage yeasts. FEMS Yeast Res 8:
1008–1017.
6. Cadez N, Zupan J, Raspor P (2010) The effect of fungicides on yeast
communities associated with grape berries. FEMS Yeast Res 10: 619–630.
7. Nisiotou AA, Nychas G-JE (2007) Yeast Populations Residing on Healthy or
Botrytis-Infected Grapes from a Vineyard in Attica, Greece. Appl Environ
Microbiol 73: 2765–2768.
8. Fleet GH (2003) Yeast interactions and wine flavour. Int J Food Microbiol 86:
11–22.
9. Barata A, Santos S, Malfeito-Ferreira M, Loureiro V (2012) New Insights into
the Ecological Interaction Between Grape Berry Microorganisms and
Drosophila Flies During the Development of Sour Rot. Microb Ecol 64: 416–
430.
10. Regueiro LA, Costas CL, Rubio JELP (1993) Influence of Viticultural and
Enological Practices on the Development of Yeast Populations During
Winemaking. Am J Enol Vitic 44: 405–408.
11. Barata A, Seborro F, Belloch C, Malfeito-Ferreira M, Loureiro V (2008)
Ascomycetous yeast species recovered from grapes damaged by honeydew and
sour rot. J Appl Microbiol 104: 1182–1191.
12. Cordero-Bueso G, Arroyo T, Serrano A, Tello J, Aporta I, et al. (2011) Influence
of the farming system and vine variety on yeast communities associated with
grape berries. Int J Food Microbiol 145: 132–139.
13. Schmid F, Moser G, Muller H, Berg G (2011) Functional and Structural
Microbial Diversity in Organic and Conventional Viticulture: Organic Farming
Benefits Natural Biocontrol Agents. Appl Environ Microbiol 77: 2188–2191.
14. Tofalo R, Schirone M, Telera G, Manetta A, Corsetti A, et al. (2010) Influence
of organic viticulture on non-Saccharomyces wine yeast populations. Ann
Microbiol 61: 57–66.
15. Infruitec-Nietvoorbij Agricultural Research Council (2010) Integrated produc-
tion of wine: Guidelines for farms. Available: http://www.ipw.co.za/guidelines.
php. Accessed 14 June 2012.
16. Lamine C (2011) Transition pathways towards a robust ecologization of
agriculture and the need for system redesign. Cases from organic farming and
IPM. J Rural Stud 27: 209–219.
17. Demeter (2010) Demeter production standards for the use of Demeter,
Biodynamic and related trademarks. Available: www.demeter.net/node/494.
Accessed 14 August 2012.
18. Reeve JR, Carpenter-Boggs L, Reganold JP, York AL, Brinton WF (2010)
Influence of biodynamic preparations on compost development and resultant
compost extracts on wheat seedling growth. Bioresource Technol 101: 5658–
5666.
19. Maeder P, Fliessbach A, Dubois D, Gunst L, Fried P, et al. (2002) Soil Fertility
and Biodiversity in Organic Farming. Science 296: 1694–1697.
20. Probst B, Schuler C, Joergensen R (2008) Vineyard soils under organic andconventional management–microbial biomass and activity indices and their
relation to soil chemical properties. Biol Fertil Soils 44: 443–450.
21. Reeve JR, Carpenter-Boggs L, Reganold JP, York AL, McGourty G, et al.
(2005) Soil and Winegrape Quality in Biodynamically and Organically ManagedVineyards. Am J Enol Vitic 56: 367–376.
22. Gy P (1998) Sampling for Analytical Purposes, Wiley.
23. Pitard F (1993) Pierre Gy’s Sampling Theory and Sampling Practice:
Heterogeneity, Sampling Correctness, and Statistical Process Control.CRCPress.
24. Esbensen KH, Minkkinen P (2004) 50 years of Pierre Gy’s Theory of Sampling.
Proceedings: First World Conference on Sampling and Blending (WCSB1).Tutorials on Sampling: Theory and Practise. Chemometr Intell Lab Systems 74:
236.
25. Esbensen KH, Mortensen P (2010) Process Sampling (Theory of Sampling,TOS) - the Missing Link in Process Analytical Technology (PAT). In Bakeev
KA, editor. Process Analytical Technology.Wiley.
26. Esbensen KH, Paoletti C, Minkkinen P (2012) Representative sampling of largekernel lots - I. Theory of Sampling and variographic analysis. Trends Anal
Chem (TrAC) 32: 154–165.
27. EsbensenKH, Friis-Petersen HH, Petersen L, Holm-Nielsen JB, Mortensen PP(2007) Representative process sampling - in practise: Variographic analysis and
estimation of Total Sampling Errors (TSE). Chemometr Intell Lab Systems 88:
41–49.
28. Hoffman S (2003) Rapid isolation of yeast chromosomal DNA, In Ausubel FM,
Brent R, Kingston RE, Moore DD, Seidman JG, Smith JA, Struhl K, editors.
Current Protocols in Molecular Biology. John Wiley & Sons Inc.
29. Slabbert E, van Heerden CJ, Jacobs K (2010) Optimisation of automatedribosomal intergenic spacer analysis for the estimation of microbial diversity in
fynbos soil. S Afr J Sci 106: 1–4.
30. Slabbert E, Kongor RY, Esler KJ, Jacobs K (2010) Microbial diversity andcommunity structure in Fynbos soil. Mol Ecol 19: 1031–1041.
31. StatSoft Inc (2011) Statistica data analysis software system. Version 10.
Available: http://www.statsoft.com.
32. Shannon P, Markiel A, Ozier O, Baliga NS, Wang JT, et al. (2003) Cytoscape: asoftware environment for integrated models of biomolecular interaction
networks. Genome Res 13: 2498–2504.
33. Dijkstra EW (1959) A note on two problems in connexion with graphs. NumerMath1: 269–271.
34. Hall TA (1999) BioEdit: a user-friendly biological sequence alignment editor and
analysis program for Windows 95/98/NT. Nucl Acids Symp Ser 41: 95–98.
35. Altschul SF, Madden TL, Schaeffer AA, Zhang J, Zhang Z, et al. (1997) GappedBLAST and PSI-BLAST: a new generation of protein database search
programs. Nucleic Acids Res 25: 3389–3402.
36. Pielou E (1966) The measurement of diversity in different types of biologicalcollections. J Theor Biol 13: 131–144.
37. Hurlbert S (1984) Pseudoreplication and the design of ecological field
experiments. Ecological Monographs 54(2): 187–211.
38. Combina M, Mercado L, Borgo P, Elia A, Jofre V, et al. (2005) Yeasts associatedto Malbec grape berries from Mendoza, Argentina. J Appl Microbiol 98: 1055–
1061.
39. Raspor P, Milek DM, Polanc J, Mozina SS, Cadez N, et al. (2006) Yeastsisolated from three varieties of grapes cultivated in different locations of the
Dolenjska vine-growing region, Slovenia. Int J Food Microbiol 109: 97–102.
40. Comitini F, Ciani M (2008) Influence of fungicide treatments on the occurrenceof yeast flora associated with wine grapes. Ann Microbiol 58: 489–493.
The Vineyard Microbiome
PLOS ONE | www.plosone.org 10 December 2012 | Volume 7 | Issue 12 | e52609
41. Gerhards D, Lehnigk C, Buchl N, Wenning M, Scherer S, et al. (2011)
Biodiversity and development of yeasts from Riesling vines to wines monitoredby FT-IR. In Darriet P, Geny L, Lonvaud A, Lucas P, de Revel G, Teissedre P-
L, editors. 9th International Symposium of Oenology-Bordeaux.Dunod: Paris.
263–268.42. Paz Z, Burdman S, Gerson U, Sztejnberg A (2007) Antagonistic effects of the
endophytic fungus Meira geulakonigii on the citrus rust mite Phyllocoptruta oleivora.J Appl Microbiol 103: 2570–2579.
43. Sztejnberg A, Paz Z, Boekhout T, Gafni A, Gerson U (2004) A new fungus with
dual biocontrol capabilities: reducing the numbers of phytophagous mites andpowdery mildew disease damage. Crop Prot 23: 1125–1129.
44. Schwartz A (1993) Occurence of natural enemies of phytophagous mites on
grape-vine leaves following application of fungicides for disease control.
S Afr J Eno Vit 14: 16–17.
45. Sabate J, Cano J, Esteve-Zarzoso B, Guillamon JM (2002) Isolation and
identification of yeasts associated with vineyard and winery by RFLP analysis of
ribosomal genes and mitochondrial DNA. Microbiol Res 157: 267–274.
46. Nisiotou AA, Nychas G-JE (2008) Kazachstania hellenica sp. nov., a novel
ascomycetous yeast from a Botrytis-affected grape must fermentation. Int J Syst
Evo Microbiol 58: 1263–1267.
The Vineyard Microbiome
PLOS ONE | www.plosone.org 11 December 2012 | Volume 7 | Issue 12 | e52609