flowfield characteristics on a vent slot mixer in supersonic flow
TRANSCRIPT

Shock Waves (2010) 20:559–569DOI 10.1007/s00193-010-0280-0
ORIGINAL ARTICLE
Flowfield characteristics on a vent slot mixer in supersonic flow
C. Kim · K. Sung · I.-S. Jeung · B. Choi · T. Kouchi ·G. Masuya
Received: 31 October 2009 / Revised: 3 July 2010 / Accepted: 2 September 2010 / Published online: 29 September 2010© Springer-Verlag 2010
Abstract A research was conducted on a new mixing devicereferred as a “vent slot mixer”, using experimental andcomputational methods. The experiment was conducted ina laboratory-scale supersonic wind-tunnel of Mach number2. Inflow air was under atmospheric air condition, and hydro-gen gas was used as fuel. In addition, the computationalsimulation approach was performed to support the experi-mental result. The vent slot mixer can directly entrain themain airflow into the recirculation region, inducing com-plex flow structures in the recirculation region. This alsoleads to gradual development of the shear layer to reducethe total pressure loss mainly induced by a recompressionshock. Contrary to typical shear layers of step mixer, for thevent slot mixer, two-dimensional large-scale structures andweak shocks were clearly identified around the shear layerthrough experimental and computational methods. When thefuel was injected from one circular injector in the recircula-tion region, the high fuel concentration of the vent slot mixerwas evenly distributed along the spanwise direction, but withthe step mixer the fuel was highly concentrated along the
Communicated by L. Bauwens.
This paper is based on work that was presented at the 22ndInternational Colloquium on the Dynamics of Explosions andReactive Systems, Minsk, Belarus, July 27–31, 2009.
C. Kim · K. Sung · I.-S. Jeung (B)School of Mechanical and Aerospace Engineering,Seoul National University, 599 Gwanak-ro Gwanak-gu,Seoul 151-744, Koreae-mail: [email protected]
B. Choi · T. Kouchi · G. MasuyaDepartment of Aerospace Engineering,Tohoku University, Sendai, Miyagi 980-8579, Japan
region downstream of the injector. Therefore, the vent slotmixer is effective to uniformly spread the fuel toward thespanwise direction in the recirculation region. As the fuelinjection rate increased, the shear layer downstream of thevent slot mixer grew uniformly along the spanwise direc-tion; consequently, shock structures such as a recompressionshock and weak shocks on the shear layer were significantlymitigated at J = 3.2.
Keywords Vent slot mixer · Step mixer · Total pressureloss · Weak shocks · Recompression shock
List of symbols
F1 Switching function for Menter’s SSTmodel
J Momentum flux ratiok Turbulent kinetic energyM Mach numberP0 Total pressurePk Production of turbulent kinetic energyp Static pressureu, v x and y velocity componentsx, y, z Cartesian coordinatesα Shock angleβ, γ, σω 1, σω 2 Closure coefficients in the specific
dissipation rate equationβ∗, σk Closure coefficients in the turbulent
kinetic energy equationμ,μt Molecular and turbulent dynamic viscosityνt Kinematic viscosity� Total pressure loss ratioρ Densityω Specific dissipation rate
123

560 C. Kim et al.
1 Introduction
Supersonic combustion ramjet (scramjet) is expected to beone of the promising propulsion systems for hypersonic air-breathing vehicles and space planes [1,2]. In the scramjetengine, air velocity to the combustor is supersonic flow,resulting in poor air-fuel mixing due to extremely shortresidence time. Therefore, it is necessary to develop a mix-ing method for very fast air-fuel mixing and stable flame-holding.
Seiner et al. [3] categorized various mixing devices forthe scramjet engine into two types: passive and active mix-ing devices. The passive mixing devices are using the geom-etry designs that utilize vortices or flame-holder induced byramps, tabs, lobe mixers, chevrons, steps [4–6], and cavities[7]. Such vortices lead to perturbations on the mixing layersconsequently enhancing mixing efficiency. The active mix-ing devices are based on forced acoustic oscillation producedby acoustic generators such as Helmholtz resonators, piezo-electric actuators, and wavy walls. The acoustic excitationdrives shear layer instability waves and increases the growthof large-scale structures, and then mixing is enhanced. Seineret al. [3] concluded that the mixing devices for the practi-cal scramjet engine should have satisfied rapid macro- andmicro-scale mixings, smooth aerodynamic shapes for lowerpressure loss, and flame-holding capabilities.
Kalt et al. [8] reported that the distribution of combus-tion products in the recirculation region was mainly influ-enced by mixing conditions. Also, Driscoll and Rasmussen[9] investigated the correlation between flame blowout limitsand modified Damköhler number in non-premixed flames inthe recirculation region. When an excess of fuel was suppliedinto the recirculation region, the recirculation region becameflooded with fuel-rich mixture and rapidly cooled leadingthe flame blowout. Thayer and Corlett [10] thus suggestedthe “well mixed” model for the ratio of air and injectantin the recirculation region. Air and injectant enter the recir-culation region through shear layers by the turbulent mixingprocess, and the air-injectant mixture of equal mass simulta-neously leaves the recirculation region through shear layers.It is thus considered that effective gas entrainment into therecirculation is one of the important factors to increase themixing efficiency.
These previous researches commonly proposed that mix-ing devices should have high entrainment rate in a mixingzone and lower pressure loss. In this study, a step mixer wasselected as a base line to compare with a new mixing devicesatisfying these fundamental requisites. The step mixer hasbeen comprehensively studied to extend the residence timeand to hold fuel and flame in a supersonic flow during thelast several decades [3–6]. The step mixer can hold injec-tant in the recirculation region, but its mixing performanceis not considered to be effective due to low air entrainment
Fig. 1 Laboratory-scale supersonic wind tunnel (unit: mm)
rate into the recirculation region. To enhance the entrainmentrates, considering the geometric features of vent slot mixer,air is directly supplied into the recirculation region. The pur-pose of current work is to understand characteristics of a newmixing device, a vent slot mixer, including flow dynamicsand mixing efficiency in the recirculation region. In additionto the experimental method, a computational simulation wascarried out to investigate flowfield near the mixing devicesin detail.
2 Experimental and computational method
2.1 Supersonic wind tunnel and mixer models
The overall configuration of experimental apparatuses isshown in Fig. 1. Atmospheric air under the stagnation con-dition of 292 K and 99.3 kPa was inhaled to a vacuumtank through the Mach number 2 nozzle with a test sec-tion composed of an isolator and a combustor. The lowerwall was embedded with mixer models, a fuel port, pressureports, and a plasma jet torch which was not used in the non-reacting experiment. The isolator was 30 mm wide, 30.7 mmhigh, and 50 mm long. The combustor was a constant rect-angular duct 30 mm wide, 36.7 mm high, and 210 mm longwithout a diffuser. The vacuum tank of 8 m3 was evacuatedto about 5 kPa before each run. Room temperature hydrogengas was injected normal to the lower wall through a 1 mm-diameter injector located at 2 mm from a step wall. The dura-tion of each run and data recording time were about 20 and4 s, respectively.
Figure 2 depicts a step mixer and a vent slot mixer. Theheight of the step mixer is 6 mm. Fuel was injected at 2 mmfrom the step wall of both mixers. The vent slot mixer hassimilar geometry features compared with the step mixer; inparticular, a 2 mm thick plate, which was referred as thejut, was extended from the step wall having a 2 mm wideslot, which was referred as the vent slot, in the center ofthe extended plate, favoring two-dimensional flow behavior.Here, the vent slot is considered to entrain air into the recir-culation region and to enhance the mixing efficiency. In the
123

Flowfield characteristics on a vent slot mixer 561
Fig. 2 Schematic diagram of two mixers: SM and VSM (unit: mm)
Fig. 3 Experimental setup: a schlieren visualization, b static wall pres-sure measurement, and c gas chromatograph method
current work, the step mixer and the vent slot mixer werereferred to as “SM” and “VSM”, respectively.
2.2 Data acquisitions
Figure 3 depicts the experimental measurement system. Thewindows on both sides of the test section were made of Pyrexglass for schlieren visualization using a stroboscope lamp of180 ns pulse time. The schlieren photographs were taken bya digital camera, Canon EOS-D30. These schlieren photo-graphs were rendered by a digital imaging software package,Adobe Photoshop CS, with a digital unsharp masking filterfor clear figures. The static wall pressure was measured withstrain-gauge type pressure transducer (PDCR23D-200psi:Scanivalve Inc) attached in a mechanical pressure scan-ner with a tap-scanning frequency of 10 Hz, as shown inFig. 1. Another strain-gauge type pressure transducer (PAB-A200KP: Kyowa Inc) was used to measure the injectant totalpressure. The accuracy of the pressure measurement systemwas estimated at ±1% for the injectant total pressure and±2% for the static wall pressure. Experimental uncertaintyon the measured pressure data was evaluated based on the
sample uncertainty analysis with 95% confidence, and thenthe standard deviation was calculated to quantify the fluctu-ations in pressure [11], i.e.,
(Total error)2 = (2 σ /
√n)2
+ (2% experimental uncertainty)2 (1)
Gas chromatograph measurement in the recirculationregion [6,10,12] was implemented along spanwise pressureports (span 1) shown in Fig. 1. Sampling tubes with an outerdiameter of 2 mm were connected from each pressure portto small gas sampling bottles evacuated to 0.4 kPa throughsolenoid valves, which was open for about 10 s for each run.The gas mixture in the small bottle was sampled with a 5 mlgas syringe (VICI Precision Sampling: Valco InstrumentsCo. Inc). The sampled gas was then manually injected intoa gas chromatograph analyzer (CP-4900 Micro-GC: VarianInc). The uncertainty in mole fraction was less than 1% in N2
and about 6% in O2 and H2.
2.3 Numerical methods
Numerical simulations were conducted to understand flowstructures of the two mixers without fuel injection. Althoughthe flow structures near the two mixers have naturallythree-dimensional geometries, the current experimentalresults show that dominant flow structures such as a shearlayer considered holding two-dimensional characteristics.Because the work is mainly interested in the dominant flowstructures, compressible two-dimensional Navier–Stokesequations were used for the computational simulation. Thegoverning equations are summarized in a conservative vectorform as:
∂Q∂t
+ ∂E∂x
+ ∂F∂y
= ∂Ev
∂x+ ∂Fv
∂y+ W (2)
Q =
⎡
⎢⎢⎢⎢⎢⎢⎣
ρiρuρv
eρkρω
⎤
⎥⎥⎥⎥⎥⎥⎦
, E =
⎡
⎢⎢⎢⎢⎢⎢⎣
ρi uρu2 + p
ρuv
(e + p)uρukρuω
⎤
⎥⎥⎥⎥⎥⎥⎦
, F =
⎡
⎢⎢⎢⎢⎢⎢⎣
ρi v
ρvuρv2 + p(e + p)v
ρvkρvω
⎤
⎥⎥⎥⎥⎥⎥⎦
(3a)
Ev =
⎡
⎢⎢⎢⎢⎢⎢⎣
−ρi udi
τxxτxyβx
μk∂k/∂xμw∂ω/∂x
⎤
⎥⎥⎥⎥⎥⎥⎦
, Fv =
⎡
⎢⎢⎢⎢⎢⎢⎣
−ρi vdi
τyxτyyβy
μk∂k/∂yμw∂ω/∂y
⎤
⎥⎥⎥⎥⎥⎥⎦
, W =
⎡
⎢⎢⎢⎢⎣
wi00sksω
⎤
⎥⎥⎥⎥⎦
(3b)
where Q is the conservative variable vector, E and F arethe convective flux vectors, Ev and Fv are the viscous fluxvectors, and W is the turbulence source term.
123

562 C. Kim et al.
Fig. 4 Computational domainsof the SM and the VSM
The finite-volume approach is used for the spatial dis-cretization of the governing equations. The viscous termsare discretized by the central difference method and theconvective terms are expressed as a difference in the numer-ical fluxes at the cell interface. The numerical fluxes con-taining artificial dissipation are formulated using Roe’s fluxdifference splitting (FDS) method. The MUSCL (monotoneupstream-centered schemes for conservation laws) schemeis used for the extrapolation of primitive variables at the cellinterface. The Chakravarthy–Osher limiter function is usedto overcome the dispersion error that is introduced by thethird-order extrapolation and to preserve the total-variation-diminishing property. The discretized equations are tempo-rally integrated using a fully implicit lower upper symmetricGauss–Seidel (LU-SGS) method. The detailed governingequations and numerical formulations are described in pre-vious studies [13,14]. Turbulence closure is achieved usingMenter’s SST model [15], which combines with severaldesirable features of the existing two-equation models. TheMenter’s SST model is characterized by a zonal weightingof model coefficients and a limitation on the growth of eddyviscosity in rapidly-strained flow regions. The zonal mod-eling uses the Wilcox k–ω model near solid walls and thestandard k–ε model (reformulated in a k–ω form) near theouter region of the boundary layer and in free-shear layer.The switching is dependent on model coefficients of a flow-dependent blending function. The classical formulation ofMenter’s SST model is given by:
D
Dt(ρk) = ∂
∂x j
[(μ + σkμt )
∂k
∂x j
]+ Pk − β∗ρωk (4)
D
Dt(ρω) = ∂
∂x j
[(μ + σω1μt )
∂ω
∂x j
]+ γ
vtPk − βρω2
+2(1 − F1)ρσω21
ω
∂k
∂x j
∂ω
∂x j(5)
2.4 Numerical modeling
Figure 4 shows computational domains which are based on aportion of the experimental facility in Fig. 1. Computationalgrids are too dense to hold in the manuscript; thus, every 20thgrid point and every 5th grid point are represented in over-all computational domains and model parts, respectively, asshown in Fig. 4. The computational domain is composed ofzone 1 (end region of the isolator, 77 × 614 meshes), zone 2(the combustor, 1629×904 meshes) for the SM. Also, domainof the VSM is made up of zone 1 (end region of the isola-tor, 289 × 614 meshes), zone 2 (the combustor, 1569 × 904meshes), zone 3 (recirculation region below the jut, 290×191meshes), zone 4 (the vent slot, 97×99 meshes). The first gridpoint placement from the wall at y+ is less than unity and thelargest cell size is 30 μm to capture small-scale flow struc-tures. The computational domain of the combustor (zone 2)followed the experimental result that was measured from theflowfield around the two mixers to a confliction region of arecompression shock developed from a shear layer againstthe upper wall, which was about x = 110 mm. A boundarylayer develops passing through the nozzle and the isolator;moreover, the boundary layer affects flow structures of thetwo mixers. Thus, in order to consider the development of theboundary layer to the combustor, a rectangular duct havingthe same length of the nozzle and the isolator is preliminary
123

Flowfield characteristics on a vent slot mixer 563
Fig. 5 Schlieren photographs(left) and sketched images(right) without fuel injection:a the SM and b the VSM
computed; inflow condition of the rectangular duct is set asMach number 2 for total temperature 292 K and total pressure99.3 kPa. After the boundary layer of the rectangular duct isfully developed, exit properties of the rectangular duct aretransferred to the inlet of zone 1. Outlet property of the zone2 is extrapolated from the interior of zone 2. The upper andlower walls of the zones 1 and 2 are regarded as adiabaticno-slip walls.
3 Results and discussion
3.1 Flowfield characteristics without fuel injection
Flowfield around the SM and the VSM is shown in Fig. 5.Thickness of inflow boundary layer is approximately 2 mm.Approaching airflow boundary layer separates at the edgeof the SM and then forms a shear layer toward the lowerwall in Fig. 5a. Also, airflow accelerates through an expan-sion fan on the shear layer until it decelerates by a recom-pression shock. A recompression shock starts in the vicinityof the shear layer near the lower wall. For the VSM, com-plex flow structures can be seen around the VSM; in par-ticular, an oblique shock and expansion fans are observedaround the vent slot and the jut in Fig. 5b. A shear layerfor the VSM extends gently toward the lower wall. Espe-cially, weak shocks are clearly found above the shear layerunder expanding region. These structures were reportedlyobserved on the shear layer when two gases with differ-ent parameters such as velocities or densities were injectedparallel to the flow direction [16–19]. The previous liter-atures suggested that pressure unbalance on two sides ofthe shear layer generated the two-dimensional large-scalestructures on one side of the shear layer; subsequently,weak shocks were created by the large-scale structures. Withthe same reason, in this work, the extended shear layerfor the VSM is considered to act as the turbulent shear layer;thus, the weak shocks are strongly developed from large-
Fig. 6 Schematic diagram of ideal flowfield near the VSM
scale structures on the shear layer in Fig. 5b, but it is rel-atively difficult to clearly see these structures on the shearlayer downstream of the SM in Fig. 5a. Furthermore, therecompression shock of the VSM starts from approximatelyx = 60 mm, but that of the SM begins from about x = 30 mmdue to the different shear layer development.
Figure 6 represents an ideal flow topology around theVSM. The Prandtl–Meyer function [20] was used to estimatethe flowfield conditions around the boundary layer separationregion of the VSM. For the Prandtl–Meyer function, the slopeof the shear layer was assumed to be constant, and flow struc-ture parameters such as a forward Mach line angle (μ1), arearward Mach line angle (μ2) and a slope angle of the shearlayer (θs) were directly measured from the schlieren photo-graphs. Inlet Mach number (Mi) and starting Mach numberon the shear layer (Ms) obtained from the Prandtl–Meyerfunction mainly affects the development of the shear layer[4–6] and flow structures around the SM and the VSM. Espe-cially, for the VSM, gently developing shear layer induceslarge-scale structures, which will be mentioned later. Theestimated parameters of the VSM are displayed in Table 1,compared with that of the SM.
In the case of the VSM, the inlet Mach number (Mi) isreduced by the oblique shock developed from the vent slot,thus the starting Mach number on the shear layer is slowerthan that of the SM, indicating that the airflow downstreamof the VSM is gently expanded.
123
564 C. Kim et al.
Table 1 Flow conditions around the boundary layer separation regionof the SM and the VSM
SM VSM
Slope angle of shear layer (θs) 13◦ 7◦Forward Mach line angle (μ1) 32◦ 33◦Rearward Mach line angle (μ2) 25◦ 29◦Inlet Mach number (Mi) 1.9 1.8Starting Mach number on the shear layer (Ms) 2.4 2.1
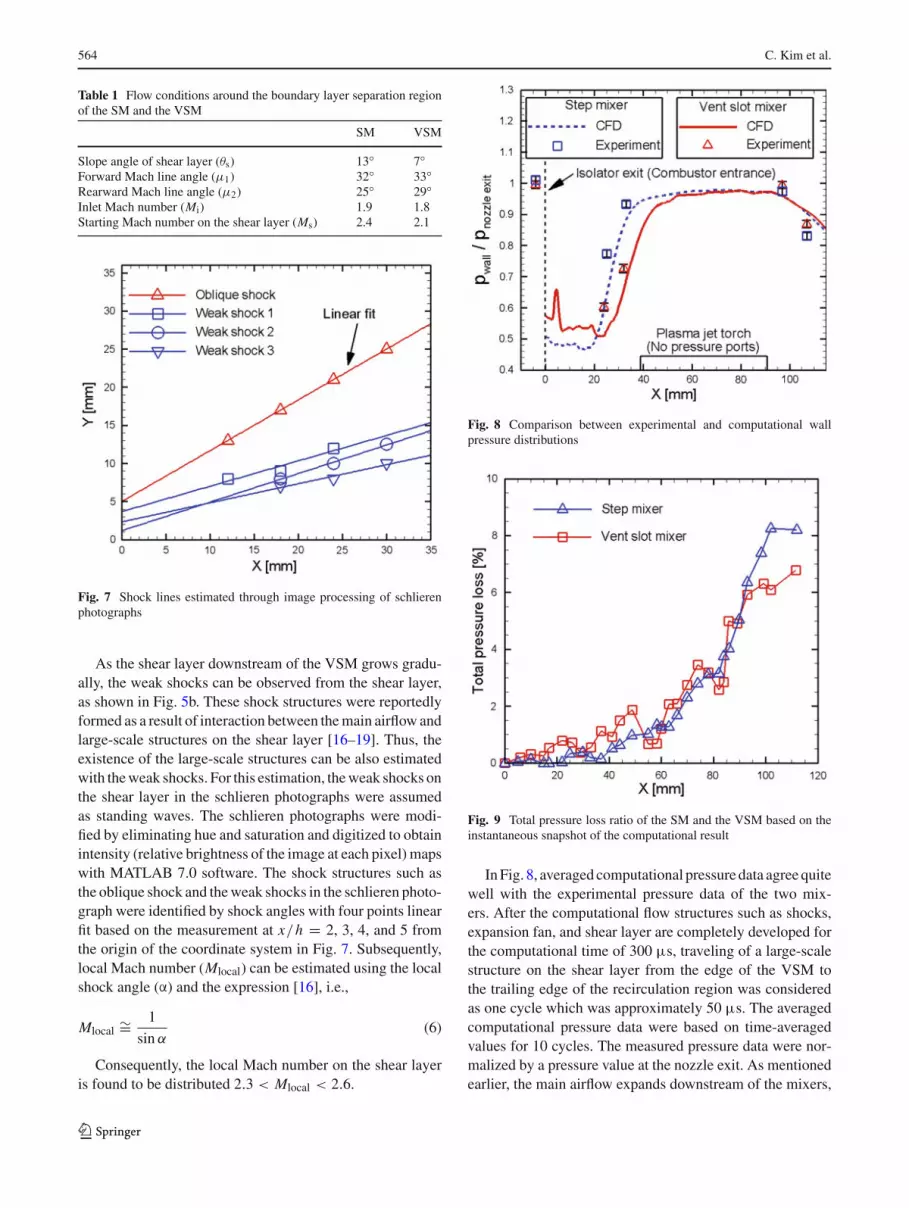
Fig. 7 Shock lines estimated through image processing of schlierenphotographs
As the shear layer downstream of the VSM grows gradu-ally, the weak shocks can be observed from the shear layer,as shown in Fig. 5b. These shock structures were reportedlyformed as a result of interaction between the main airflow andlarge-scale structures on the shear layer [16–19]. Thus, theexistence of the large-scale structures can be also estimatedwith the weak shocks. For this estimation, the weak shocks onthe shear layer in the schlieren photographs were assumedas standing waves. The schlieren photographs were modi-fied by eliminating hue and saturation and digitized to obtainintensity (relative brightness of the image at each pixel) mapswith MATLAB 7.0 software. The shock structures such asthe oblique shock and the weak shocks in the schlieren photo-graph were identified by shock angles with four points linearfit based on the measurement at x/h = 2, 3, 4, and 5 fromthe origin of the coordinate system in Fig. 7. Subsequently,local Mach number (Mlocal) can be estimated using the localshock angle (α) and the expression [16], i.e.,
Mlocal ∼= 1
sin α(6)
Consequently, the local Mach number on the shear layeris found to be distributed 2.3 < Mlocal < 2.6.
Fig. 8 Comparison between experimental and computational wallpressure distributions
Fig. 9 Total pressure loss ratio of the SM and the VSM based on theinstantaneous snapshot of the computational result
In Fig. 8, averaged computational pressure data agree quitewell with the experimental pressure data of the two mix-ers. After the computational flow structures such as shocks,expansion fan, and shear layer are completely developed forthe computational time of 300 μs, traveling of a large-scalestructure on the shear layer from the edge of the VSM tothe trailing edge of the recirculation region was consideredas one cycle which was approximately 50 μs. The averagedcomputational pressure data were based on time-averagedvalues for 10 cycles. The measured pressure data were nor-malized by a pressure value at the nozzle exit. As mentionedearlier, the main airflow expands downstream of the mixers,
123

Flowfield characteristics on a vent slot mixer 565
Fig. 10 Instantaneous snapshotof the computational result:a Mach contours withstreamlines of the SM,b computational schlieren imageof the SM, c Machcontours with streamlines of theVSM, and d computationalschlieren image of the VSM
causing the sharp drop in pressure in the recirculation region,as shown in Fig. 8. For the SM, the wall pressure distribu-tion is shown to be uniform in the recirculation region andsteeply increases through the recompression shock. On theother hand, for the VSM, the peak pressure can be seen atx = 5 mm due to the confliction of inflow air through the vent
slot against the lower wall, and then the pressure recovers bypassing the recompression shock. In this case, the slope ofincreasing curve is rather gentler compared with that of theSM. This tendency is considered to be related with the rel-atively longer development of the shear layer and multipleweak shock trains in Fig. 5.
123

566 C. Kim et al.
Fig. 11 Schlieren photographsof the SM (left) and the VSM(right) with hydrogen fuelinjection
Figure 9 illustrates the total pressure loss ratio along thex-coordinate based on the instantaneous snapshot of the com-putational result. The total pressure is reduced by flow sep-aration, shock waves, fuel-air mixing, etc [21]. To identifythe total pressure qualities, the total pressure loss ratio �(x)
(Eq. 7) was calculated from the mass averaged integral oftotal pressure (Eq. 8):
�(x) = 1 − P0,avg(x)
P0,avg(0)(7)
P0,avg(x) =∫∫
ρu P0 dy dz|x∫∫ρu dy dz|x
(8)
For the VSM, the total pressure loss ratio fluctuatesincreasingly due to the weak shocks on the shear layer, butit consequently leads to lower total pressure loss ratio com-pared with that of the SM. Therefore, it is considered that themany distributed weak shocks have better pressure recoverythan single strong shock.
Flowfield downstream of the two mixer parts are extractedfrom the instantaneous snapshot of the computational resultsin Fig. 10. For the SM, the computational simulation cap-tures several circular bubbles in the recirculation region inFig. 10a, and only a few weak shocks are developed from theshear layer in Fig. 10b. General flow structures around the
recirculation region are shown to be stable and match wellwith previous literatures [4–6]. On the contrary, for the VSM,complex circular bubbles exist in the recirculation regiondue to the interaction of the inflow air with high velocities(from Mach number 0.6 up to 1.6) through the vent slot inFig. 10c. In particular, two large circular bubbles (B1 andB2) can be seen in the vicinity of the inflow air (a whitearrow line) which separates upstream and downstream direc-tions after impinging against the lower wall; subsequently,another large circular bubble (B3) is formed downstream ofthe impingement location on the lower wall turning the inflowair toward the shear layer. Especially, the circular bubble(B3) is dominantly distributed downstream of the recircula-tion region, attributing to the gradual slope of the shear layer.In Fig. 10d, as the shear layer runs downstream, small-scalestructures grow to be large-scale structures with the weakshocks on the shear layer. The weak shocks are also identi-fied in the schlieren image even though it is little clear, asshown in Fig. 5b. Based on the computational simulationresults, the VSM shows high compressibility flow with con-vective Mach number [18] of 0.8, but the convective Machnumber of the SM is 0.5. In the high compressibility flow,complex turbulent structures have been reportedly developedon the shear layer, resulting in high mass exchange throughthe shear layer [16–19].
123
Flowfield characteristics on a vent slot mixer 567
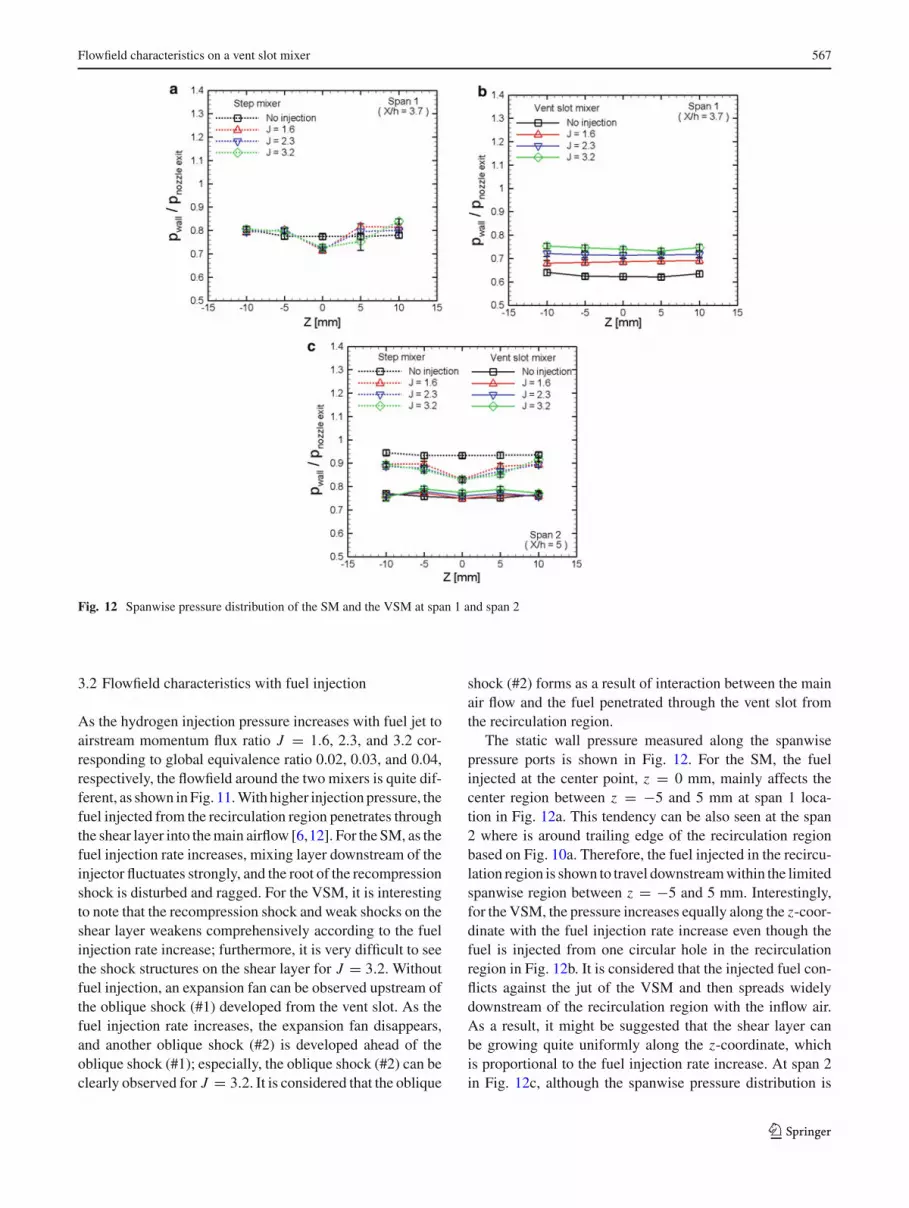
Fig. 12 Spanwise pressure distribution of the SM and the VSM at span 1 and span 2
3.2 Flowfield characteristics with fuel injection
As the hydrogen injection pressure increases with fuel jet toairstream momentum flux ratio J = 1.6, 2.3, and 3.2 cor-responding to global equivalence ratio 0.02, 0.03, and 0.04,respectively, the flowfield around the two mixers is quite dif-ferent, as shown in Fig. 11. With higher injection pressure, thefuel injected from the recirculation region penetrates throughthe shear layer into the main airflow [6,12]. For the SM, as thefuel injection rate increases, mixing layer downstream of theinjector fluctuates strongly, and the root of the recompressionshock is disturbed and ragged. For the VSM, it is interestingto note that the recompression shock and weak shocks on theshear layer weakens comprehensively according to the fuelinjection rate increase; furthermore, it is very difficult to seethe shock structures on the shear layer for J = 3.2. Withoutfuel injection, an expansion fan can be observed upstream ofthe oblique shock (#1) developed from the vent slot. As thefuel injection rate increases, the expansion fan disappears,and another oblique shock (#2) is developed ahead of theoblique shock (#1); especially, the oblique shock (#2) can beclearly observed for J = 3.2. It is considered that the oblique
shock (#2) forms as a result of interaction between the mainair flow and the fuel penetrated through the vent slot fromthe recirculation region.
The static wall pressure measured along the spanwisepressure ports is shown in Fig. 12. For the SM, the fuelinjected at the center point, z = 0 mm, mainly affects thecenter region between z = −5 and 5 mm at span 1 loca-tion in Fig. 12a. This tendency can be also seen at the span2 where is around trailing edge of the recirculation regionbased on Fig. 10a. Therefore, the fuel injected in the recircu-lation region is shown to travel downstream within the limitedspanwise region between z = −5 and 5 mm. Interestingly,for the VSM, the pressure increases equally along the z-coor-dinate with the fuel injection rate increase even though thefuel is injected from one circular hole in the recirculationregion in Fig. 12b. It is considered that the injected fuel con-flicts against the jut of the VSM and then spreads widelydownstream of the recirculation region with the inflow air.As a result, it might be suggested that the shear layer canbe growing quite uniformly along the z-coordinate, whichis proportional to the fuel injection rate increase. At span 2in Fig. 12c, although the spanwise pressure distribution is
123

568 C. Kim et al.
Fig. 13 Gas mole fraction andlocal equivalence ratio alongspanwise ports (span 1) forJ = 1.6 (or global equivalenceratio of 0.02)
somewhat affected by the fuel injection rate increase, its dis-tribution is still uniform along the z-coordinate, comparedwith the case of the SM.
Hydrogen gas was injected for J = 1.6 corresponding tothe global equivalence ratio of 0.02 without reaction, and gasconcentration was measured through the span 1 in the recir-culation region. For the SM, most of the fuel remains at thecenter region between z = −5 and 5 mm; in particular, thehydrogen concentration peaks at z = 0 and then decreasesalong the z-coordinate, as shown in Fig. 13a. However, forthe VSM, the hydrogen concentration distributes quite uni-formly along the z-coordinate with the high local equivalenceratio of 2 relative to the global equivalence ratio of 0.02, asshown in Fig. 13b. From the results of the wall pressure mea-surement and the gas concentration in spanwise direction, itcan be understood that the VSM would be very effective toenhance the mixing in the recirculation region.
4 Conclusion
The performance of the VSM, compared with the SM, wasinvestigated through a series of experiments and supportedby computational simulation approaches. The experimentswere conducted in the laboratory-scale supersonic wind tun-nel of Mach number 2 both without fuel injection and withfuel injection. Inflow air to the facility was under atmosphericair conditions, and hydrogen gas was used as the fuel withoutchemical reaction. The results are summarized as follows:
1. The VSM directly provides main airflow into the recir-culation region through the vent slot, which generatescomplex flow structures to enhance the mixing of airand fuel in the recirculation region.
2. The dominant bubble zone is found to be largely devel-oped downstream of the recirculation region of the VSM.This is considered to affect the gradual development ofthe shear layer, resulting in the smooth dynamic nature
on the shear layer and the reduction of the total pressureloss by the weak recompression shock.
3. The VSM has large-scale structures on the shear layer,which was identified through experimental and compu-tational methods. This can increase the mass exchangerate through the shear layer.
4. When the fuel is injected in the recirculation region ofthe VSM, the fuel in the recirculation region is quite uni-formly distributed along the spanwise direction with highlocal equivalence ratio of 2, compared with the globalequivalence ratio of 0.02.
5. As the fuel injection rate increases, the shear layer ofthe VSM grows evenly along the spanwise direction, andshock structures such as a recompression shock and weakshocks on the shear layer were mitigated.
Acknowledgments The authors gratefully acknowledge the finan-cial support from the second stage of the BK 21 in 2009, Mid-career Researcher Program through NRF grant funded by the MEST(K20713000013-07B0100-01310), the 11th Grand Challenge Projectfrom the KISTI, the Institute of Advanced Aerospace Technologyof Seoul National University in Korea, and Global COE program ofTohoku University in Japan.
References
1. Charles, J.T.: An air-breathing launch vehicle concept for single-stage-to-orbit. In: AIAA-99-2730 (1999)
2. Edward, T.C.: Scramjet engines: the first forty years. J. Propuls.Power 17(6), 1138–1148 (2001)
3. Seiner, J.M., Dash, S.M., Kenzakowski, D.C.: Historical surveyon enhanced mixing in scramjet engines. J. Propuls. Power 17(6),1273–1286 (2001)
4. Roshko, A., Thomke, G.J.: Observations of turbulent reattach-ment behind an axisymmetric downstream-facing step in super-sonic flow. AIAA J. 4(6), 975–980 (1966)
5. Loth, E., Kailasanath, K., Lohner, R.: Supersonic flow over anaxisymmetric backward-facing step. J. Space Rockets 29(3), 352–359 (1992)
6. Thakur, A., Segal, C.: Concentration distribution in a supersonicflow recirculation region. J. Propuls. Power 24(1), 64–73 (2008)
123

Flowfield characteristics on a vent slot mixer 569
7. Gruber, M.R., Baurle, R.A., Mathur, T., Hsu, K.-Y.: Fundamentalstudies of cavity based flameholder concepts for supersonic com-bustors. J. Propuls. Power 17(1), 146–153 (2001)
8. Kalt, P.A., Al-Abdeli, Y.M., Masri, A.R., Barlow, R.S.: Swirlingturbulent non-premixed flames of methane: flow field and compo-sitional structure. Proc. Combust. Inst. 29, 1913–1919 (2002)
9. Driscoll, J.F., Rasmussen, C.C.: Correlation and analysis ofblowout limits of flames in high-speed airflows. J. Propuls.Power 21(6), 1035–1044 (2005)
10. Thayer, W.J., Corlett, R.C.: Gas dynamic and transport phe-nomena in the two-dimensional jet interaction flowfield. AIAAJ. 10(4), 488–493 (1972)
11. Coleman, H.W., Steele, W.G.: Engineering application of experi-mental uncertainty analysis. AIAA J. 33(10), 1888–1896 (1995)
12. Kobayashi, K., Tomioka, S., Mitani, T.: Supersonic flow ignitionby plasma torch and H2/O2 torch. J. Propuls. Power 20(2), 294–301 (2004)
13. Choi, J.-Y., Jeung, I.-S., Yoon, Y.: Computational fluid dynamicsalgorithms for unsteady shock-induced combustion. Part 1: valida-tion. AIAA J. 38(7), 1179–1187 (2000)
14. Won, S.-H., Jeung, I.-S., Parent B. Choi, J.-Y.: Numerical investi-gation of transverse hydrogen jet into supersonic crossflow usingdetached-eddy simulation. AIAA J. 48(6), 1047–1058 (2010)
15. Menter, F.R.: Two-equation eddy-viscosity turbulence models forengineering applications. AIAA J. 32(8), 1598–1605 (1994)
16. Hall, J.L., Dimotakis, P.E., Rosemann, H.: Experiments in non-reacting compressible shear layers. AIAA J. 31(12), 2247–2254 (1993)
17. Dimotakis, P.E.: Two dimensional shear layer entrainment. AIAAJ. 24(11), 1791–1799 (1986)
18. Papamoschou, D.: Structure of the compressible turbulent shearlayer. AIAA J. 29(5), 680–681 (1991)
19. Huang, L.S., Ho, C.M.: Small scale transition in a plane mixinglayer. J. Fluid Mech. 210, 475–498 (1990)
20. Anderson, J.D. Jr.: Modern Compressible Flow with Historical Per-spective. McGraw-Hill, Boston (1990)
21. Kim, J.-H., Yoon, Y., Jeung, I.-S., Huh, H., Choi, J.-Y.: Numericalstudy of mixing enhancement by shock waves in model scramjetengine. AIAA J. 41(6), 1074–1080 (2003)
123