floods and climate: emerging perspectives for flood risk assessment and management
TRANSCRIPT
NHESSD2, 1559–1612, 2014
Floods and climate
B. Merz et al.
Title Page
Abstract Introduction
Conclusions References
Tables Figures
J I
J I
Back Close
Full Screen / Esc
Printer-friendly Version
Interactive Discussion
Discussion
Paper
|D
iscussionP
aper|
Discussion
Paper
|D
iscussionP
aper|
Nat. Hazards Earth Syst. Sci. Discuss., 2, 1559–1612, 2014www.nat-hazards-earth-syst-sci-discuss.net/2/1559/2014/doi:10.5194/nhessd-2-1559-2014© Author(s) 2014. CC Attribution 3.0 License.
Natural Hazards and Earth System
Sciences
Open A
ccess
Discussions
This discussion paper is/has been under review for the journal Natural Hazards and EarthSystem Sciences (NHESS). Please refer to the corresponding final paper in NHESS if available.
Floods and climate: emergingperspectives for flood risk assessmentand management
B. Merz1, J. Aerts2, K. Arnbjerg-Nielsen3, M. Baldi4, A. Becker5, A. Bichet6,G. Blöschl7, L. M. Bouwer8, A. Brauer1, F. Cioffi9, J. M. Delgado10, M. Gocht11,F. Guzzetti12, S. Harrigan13, K. Hirschboeck14, C. Kilsby15, W. Kron16,H.-H. Kwon17, U. Lall18, R. Merz19, K. Nissen20, P. Salvatti12, T. Swierczynski1,U. Ulbrich20, A. Viglione7, P. J. Ward2, M. Weiler21, B. Wilhelm22, and M. Nied1
1GFZ German Research Centre for Geosciences, 14473 Potsdam, Germany2Institute for Environmental Studies, VU University Amsterdam, 1081HV Amsterdam, theNetherlands3Dept. of Env. Eng., Technical University of Denmark, Lyngby, Denmark4CNR-Institute of Biometeorology, 00185 Rome, Italy5Deutscher Wetterdienst, Offenbach am Main, Germany6University of Toronto, Physics Department Toronto, Canada7Institute of Hydraulic Engineering and Water Resources Management, Vienna University ofTechnology, Vienna, Austria8Deltares, Delft, the Netherlands
1559

NHESSD2, 1559–1612, 2014
Floods and climate
B. Merz et al.
Title Page
Abstract Introduction
Conclusions References
Tables Figures
J I
J I
Back Close
Full Screen / Esc
Printer-friendly Version
Interactive Discussion
Discussion
Paper
|D
iscussionP
aper|
Discussion
Paper
|D
iscussionP
aper|
9DICEA, Department of Civil, Constructional & Environmental Engineering, University ofRome, La Sapienza, Rome, Italy10University of Potsdam, Institute of Earth and Environmental Science, Potsdam, Germany11Technische Universität Braunschweig, 38106 Braunschweig, Germany12CNR IRPI, 06128 Perugia, Italy13ICARUS, Dept. of Geography, National University of Ireland Maynooth, Ireland14Laboratory of Tree-Ring Research, University of Arizona, Tucson, Arizona, USA15School of Civil Engineering and Geosciences, Newcastle University, Newcastle, UK16Munich Re, 80802 Munich, Germany17Department of Civil Engineering, Chonbuk University, Korea18Dept. of Earth & Env. Eng., Columbia University, New York, USA19Helmholtz Centre for Environmental Research, Leipzig, Germany20Institute for Meteorology, Freie Universität Berlin, 12165 Berlin, Germany21Chair of Hydrology, Faculty of Environment and Natural Resources, University of Freiburg,Freiburg, Germany22EDYTEM, Université de Savoie, 73376 Le Bourget-du-Lac, France
Received: 24 January 2014 – Accepted: 31 January 2014 – Published: 14 February 2014
Correspondence to: B. Merz ([email protected])
Published by Copernicus Publications on behalf of the European Geosciences Union.
1560
NHESSD2, 1559–1612, 2014
Floods and climate
B. Merz et al.
Title Page
Abstract Introduction
Conclusions References
Tables Figures
J I
J I
Back Close
Full Screen / Esc
Printer-friendly Version
Interactive Discussion
Discussion
Paper
|D
iscussionP
aper|
Discussion
Paper
|D
iscussionP
aper|
Abstract
Flood estimation and flood management have traditionally been the domain of hydrol-ogists, water resources engineers and statisticians, and disciplinary approaches haveabound. Dominant views have been shaped; one example is the catchment perspec-tive: floods are formed and influenced by the interaction of local, catchment-specific5
characteristics, such as meteorology, topography and geology. These traditional viewshave been beneficial, but they have a narrow framing. In this paper we contrast tradi-tional views with broader perspectives that are emerging from an improved understand-ing of the climatic context of floods. We conclude: (1) extending the traditional systemboundaries (local catchment, recent decades, hydrological/hydraulic processes) opens10
up exciting possibilities for better understanding and improved tools for flood risk as-sessment and management. (2) Statistical approaches in flood estimation need to becomplemented by the search for the causal mechanisms and dominant processes inthe atmosphere, catchment and river system that leave their fingerprints on flood char-acteristic. (3) Natural climate variability leads to time-varying flood characteristics, and15
this variation may be partially quantifiable and predictable, with the perspective of a dy-namic, climate informed flood risk management. (4) Efforts are needed to fully accountfor factors that contribute to changes in all three risk components (hazard, exposure,vulnerability), and to better understand the interactions between society and floods. (5)Given the global scale and societal importance, we call for the organization of an inter-20
national multidisciplinary collaboration and data sharing initiative to understand furtherthe links between climate and flooding and to advance flood research.
1 Introduction
Flood estimation and flood management have a long history during which dominantviews have been shaped. One example is the river basin paradigm. In this, floods25
are seen from the catchment perspective; they are formed and influenced by the in-
1561

NHESSD2, 1559–1612, 2014
Floods and climate
B. Merz et al.
Title Page
Abstract Introduction
Conclusions References
Tables Figures
J I
J I
Back Close
Full Screen / Esc
Printer-friendly Version
Interactive Discussion
Discussion
Paper
|D
iscussionP
aper|
Discussion
Paper
|D
iscussionP
aper|
teraction of local, i.e. catchment-specific characteristics of meteorology, topography,geology, vegetation etc. Another traditional view is that floods are essentially randomevents: typically, for statistical convenience, extreme flood occurrence and magnitudeare assumed to correspond to an independent, identically distributed (iid) random pro-cess represented by an appropriate probability density function.5
During the EGU Topical Meeting “Floods and Climate: understanding and exploitingthe link between floods and climate” on 4–5 October 2012 in Potsdam, the climatecontext of floods was discussed: how are floods related to climate, and in particular toclimate variability? To what extent can we take advantage of linkages between climateand floods? The workshop participants felt that, although the traditional views have10
been beneficial, they have a narrow framing, and that flood estimation and flood man-agement could benefit from a broader perspective. For instance, the local catchmentperspective needs to be complemented by the global view, since floods are embeddedin a global climate context. The actual flood potential of a catchment and the character-istics of floods may be influenced by global climate mechanisms. Hirschboeck (1987)15
offered the hypothesis that unusually large floods in drainage basins of all sizes maybe related to large-scale atmospheric circulation anomalies. Nakamura et al. (2013)show that 20 major flood events over the last 100 yr in the Ohio River Basin havenearly identical storm tracks, moisture source and delivery patterns. Such persistentanomalies may in turn reflect modulation of the storm tracks by identifiable climate20
phenomena such as the El Niño Southern Oscillation (ENSO) and Pacific Decadal Os-cillation (PDO). Consequently, it seems necessary to complement the local catchmentperspective with a global view, to investigate whether floods are purely random andwhether the widespread iid assumption holds, and to develop flood risk assessmentmethods which are capable of taking advantage of such extended perspectives.25
New perspectives are emerging even more clearly in the field of flood risk manage-ment. Traditionally, flood management strategies have focused on reducing the floodhazard, i.e. the probability of flooding. Hence, flood research has centred on the phys-ical processes within catchments and river systems. Over the past two decades there
1562

NHESSD2, 1559–1612, 2014
Floods and climate
B. Merz et al.
Title Page
Abstract Introduction
Conclusions References
Tables Figures
J I
J I
Back Close
Full Screen / Esc
Printer-friendly Version
Interactive Discussion
Discussion
Paper
|D
iscussionP
aper|
Discussion
Paper
|D
iscussionP
aper|
has been a shift from the hazard-focused view to the broader risk-based perspective,including societal processes and implications (Merz et al., 2010). Flood disaster risk re-sults from the interaction of hazard, exposure and vulnerability. Hazard represents theprobability and intensity of flooding, exposure describes the elements-at-risk, for ex-ample, the people and their assets that may be affected by flooding, and vulnerability5
describes the susceptibility or propensity of elements-at-risk to be adversely affected.This concept is at the heart of the Global Assessment Reports of the United NationsOffice for Disaster Risk Reduction (UNISDR, 2011, 2013), and the IPCC SREX report(2012) adopted it for analysing risks related to climate change.
It is taken for granted that changes in climate or human interventions in catch-10
ments and river systems may change flood hazard and, as a consequence, flood risk.Within this view, floods are evaluated from a hazard perspective, focusing on hydro-logic/hydraulic parameters such as discharge, water level or inundation extent. Societalprocesses are often neglected, which implicitly means they are assumed to be constantor, if random, a stationary process. However, some socio-economic processes, like15
population growth and economic development, may change at a faster pace than long-term physical changes (for example, the impacts of climate change on discharge), andexposure and vulnerability to floods can be highly dynamic. Against this background,societal processes need to be addressed within a risk-based approach, where next tothe hazard, societal exposure and vulnerability play a decisive role. A particularly in-20
teresting question is how space-time variations in flood hazard that may be related toclimate variability and change intersect with the changing nature of the flood exposureand vulnerability. As an example, globalization leads to potential pathways of supplychain disruption as seen with the long duration floods in Thailand (2011), Queensland(2010, 2011), Indus (2010), and Mississippi (2012), that led to significant local and25
global economic impacts.Table 1 contrasts the traditional narrow framing of floods with the broader perspec-
tive that is emerging from an improved understanding of the climatic context of floodgeneration. The different aspects of Table 1 are closely linked. This becomes obvi-
1563

NHESSD2, 1559–1612, 2014
Floods and climate
B. Merz et al.
Title Page
Abstract Introduction
Conclusions References
Tables Figures
J I
J I
Back Close
Full Screen / Esc
Printer-friendly Version
Interactive Discussion
Discussion
Paper
|D
iscussionP
aper|
Discussion
Paper
|D
iscussionP
aper|
ous in Sect. 2 which focuses on understanding climate–flood linkages. In Sect. 3, wediscuss how this broader framing may be used for improved flood estimation and riskmanagement. In particular, we explore how an improved process-based understandingof climate–flood linkages at multiple scales can be exploited to address critical man-agement and societal issues in a rapidly changing world.5
2 Understanding climate–flood linkages
Climate–flood linkages operate across multiple spatial and temporal scales determinedby (i) the nature of the meteorological and climatic processes that drive the atmosphericcomponents of the hydrologic cycle and (ii) the nature of the hydrologic land-surfaceand subsurface processes within which a flood develops. As implied in Table 1, the10
traditional approach for linking atmospheric components to flood analysis has beenprimarily hydro-meteorological, i.e., framed by local weather events of recent decadesinteracting with current catchment characteristics. The emerging view of climate–floodlinkages is process driven and seeks to understand and analyze flood events in thecontext of their long-term history of variation – in magnitude, frequency, and seasonality15
– and within the climatic framework of the global and regional atmospheric circulationpatterns and processes that drive changing combinations of meteorological elementsat the catchment scale. In the following, we discuss these contrasting perspectives.
2.1 Randomness or causality?
Floods are typically seen as events that are generated by the random superposition of20
processes in the atmosphere, catchment and river system. The idea of very strong oreven complete randomness prevails in the history of flood prediction. Much effort hasbeen spent on describing flood occurrence and magnitude by probability distributions,a large share of the flood research has been focused on statistical aspects, and the roleof randomness has been emphasised. This avenue has been shaped by the pioneers25
1564

NHESSD2, 1559–1612, 2014
Floods and climate
B. Merz et al.
Title Page
Abstract Introduction
Conclusions References
Tables Figures
J I
J I
Back Close
Full Screen / Esc
Printer-friendly Version
Interactive Discussion
Discussion
Paper
|D
iscussionP
aper|
Discussion
Paper
|D
iscussionP
aper|
of flood frequency analysis; for example, in 1941 Emil Julius Gumbel mentioned aboutthe flood estimation problem: “The author believes it is possible to give exact solu-tions, exactitude being interpreted from the standpoint of the calculus of probabilities.”,(Gumbel, 1941, p. 163).
Figure 1 provides examples of the atmospheric moisture transport averaged across5
the top 10 floods over a 60 yr period in 4 regions of North America. It is clear that thereis a distinct large-scale circulation pattern with different moisture sources and stormtracks associated with these extreme events. Such determinism is not restricted tothe mid-latitudes. The 2011 persistent flooding in Thailand was marked by 5 typhoonlandings over a period of 100 days, and the typhoon tracks were very similar over10
this period with a similar area of origin and path. The prevailing La Niña conditionsin the Western Pacific (the source region of the storms) and phase of the MaddenJulian Oscillation (20–40 day) period are thought to have interacted to produce theconvergence of moisture into Thailand per event. To be sure, causality may also befound in other aspects of the climate-catchment system. For example, Nied et al. (2013)15
show that floods in the Elbe catchment in Central Europe are preferably initiated byspecific large-scale soil moisture patterns, and Sivapalan et al. (2005) demonstrate thatthe flood peaks increase notably if seasonality of rainfall and antecedent soil moistureare in phase.
If one takes a causal approach, arguing that flood occurrence and magnitude con-20
tain a significant fraction of determinism, then identifying the signatures of major floodsin terms of the associated climatic and catchment mechanisms becomes important.A fruitful direction of research could be to identify the dominant mechanisms associ-ated with regional floods, and to see how the occurrence and intensity of those mech-anisms lead to the space and time expression of floods. The analysis would move from25
annual maximum or peak over threshold floods to looking at extreme floods in termsof discharge, volume and duration and their space and time structure over perhapsa season or a decade or longer as could be informed by the nature of the underly-ing mechanisms. The volume and duration of flooding are directly tied to inundation
1565

NHESSD2, 1559–1612, 2014
Floods and climate
B. Merz et al.
Title Page
Abstract Introduction
Conclusions References
Tables Figures
J I
J I
Back Close
Full Screen / Esc
Printer-friendly Version
Interactive Discussion
Discussion
Paper
|D
iscussionP
aper|
Discussion
Paper
|D
iscussionP
aper|
characteristics and hence represent how the strength and recurrence characteristicsof the large-scale atmospheric fluxes that bring moisture into the region interact withcatchment hydrologic processes. These, in turn, determine how the static and dynamicaspects of topography, soils, channel networks and flood control infrastructure processthe atmospheric inputs. Given the uncertainties attendant to all these processes, the5
integrated causal view could provide a basis for better probabilistic modelling of floodsfrom a physical as well as statistical perspective.
2.2 Local or global?
Frequently, floods have been understood as local phenomena, driven by the perspec-tive of flood management at the local level, e.g. at the municipal or county scale. Within10
the last two decades there have been many attempts to reconcile the spatial frameof this societal lens with the traditional hydrological view. Here, floods are consideredthrough the local catchment lens, and are shaped by catchment meteorology, hydrol-ogy and river processes. The emerging view extends this spatial framework to thecontinental and global scale to accommodate the interactions between local flooding15
and global climate mechanisms.Probably the most famous and well-studied global linkage between large-scale
climate oscillations and hydro-meteorological variables is ENSO, with variations ona 2–7 yr time scale. For example, linkages can clearly be seen between ENSO in-dices and gridded precipitation datasets. Such an analysis has been carried out by20
Becker et al. (2013) using global land-surface precipitation of the past 110 yr at a spa-tial resolution of 0.5◦ (Schneider et al., 2011). At this scale, the data are capableof resolving global and synoptic-scale precipitation patterns. Over this longer thancentennial time period, the correlation of each grid cell against the negative South-ern Oscillation Index (i.e. the occurrence of La Niña events) reveals that years with25
strong ENSO phases (such as the La Niña years 2010 and 2011) feature precipitationanomaly patterns in the same overall ENSO sensitive regions. Therefore, these pre-dictable anomaly patterns point to regions where extreme precipitation events (Thai-
1566

NHESSD2, 1559–1612, 2014
Floods and climate
B. Merz et al.
Title Page
Abstract Introduction
Conclusions References
Tables Figures
J I
J I
Back Close
Full Screen / Esc
Printer-friendly Version
Interactive Discussion
Discussion
Paper
|D
iscussionP
aper|
Discussion
Paper
|D
iscussionP
aper|
land, Queensland/Australia, El Salvador) or droughts (Northern Mexico, Southern US,South-East Africa, Hong Kong) have also occurred (Fig. 2) during a specific year orperiod.
ENSO has been linked to floods in Peru (Waylen and Caviedes, 1986), the UnitedStates (Cayan et al., 1999; Jain and Lall, 2000, 2001; Pizaro and Lall, 2002; Sankara-5
subramanian and Lall, 2003), China (Lin et al., 2005; Zhang et al., 2007), Australia(Kiem et al., 2003) and generally to the extra tropics (Ward et al., 2010), as well asto precipitation anomalies in Europe (Bichet et al., 2014). PDO and the North AtlanticOscillation (NAO) have been shown to influence precipitation and flood regimes and tolead to flood episodes of varying intensity in various regions (e.g. Cayan, 1996; Jain10
and Lall, 2000; Bouwer et al., 2006; Kingston et al., 2006; Maraun et al., 2010; Bichetet al., 2011; Rana et al., 2011; Gregersen et al., 2013). Moreover, Ward et al. (2010,2014) examine correlations between observed peak discharge and the Southern Os-cillation Index (SOI) at the global scale and show that peak discharges have a strongsensitivity to ENSO in catchments over large parts of the globe.15
In Mediterranean Europe, most of the weather systems causing intense and/or per-sistent rainfall originate over the Atlantic Ocean and are carried towards the Mediter-ranean region by westerly winds. These systems can interact with regional topographyand produce localised extreme precipitation (Rudari et al., 2005; Pinto et al., 2013), in-ducing severe river floods. In the upper troposphere over the Euro-Atlantic region, the20
westerly flow is characterised by two jets: the Atlantic jet, which crosses the ocean witha north-easterly trajectory, and the African jet, which flows above the coast of NorthAfrica. The cross-jet circulation of the Atlantic jet favours storm activity in its exit re-gion, while the cross-jet circulation of the African jet suppresses this kind of activity inits entrance region. It follows that the rainfall distribution downstream of these cross-25
jet circulations is strongly influenced by their relative positions (Gaetani et al., 2011;Toreti et al., 2010). Specifically, in autumn, rainfall is copious and more persistent inthe western Mediterranean basin, when the Atlantic jet is relatively strong but its north-easterly tilt is small, and the African jet is in its easternmost position. In winter, rainfall
1567
NHESSD2, 1559–1612, 2014
Floods and climate
B. Merz et al.
Title Page
Abstract Introduction
Conclusions References
Tables Figures
J I
J I
Back Close
Full Screen / Esc
Printer-friendly Version
Interactive Discussion
Discussion
Paper
|D
iscussionP
aper|
Discussion
Paper
|D
iscussionP
aper|
is abundant in the eastern Mediterranean basin; this is when the Atlantic jet reachesthe Scandinavian peninsula and the African jet is in its westernmost position. In spring,when the two jets weaken, the Atlantic jet retreats over the ocean, but the African jetstays in its winter position, and rainfall is more persistent and abundant in the Alpineregion and in the Balkans. Therefore, the origin for many floods is not necessarily local,5
but is related to large-scale circulation patterns like ENSO or jet stream tracks.These examples show that the investigation of global climate processes might help
to understand and predict local floods. However, the potential benefit goes further. Link-ages across different hazards and across large distances are possible, since the floodand drought potential for far catchments may be related. Specifically, one can hypoth-10
esize that persistent spatial patterns of surface temperature in the tropical oceans leadto enhanced probabilities of regions where strong convection takes place and providesa moisture source that could lead to floods in certain areas. The same anomalous sur-face temperature patterns could also lead to suppression of convection in other tropicalareas, and also to changes in the position and strength of the mid-latitude jet stream15
and the eddies that are coupled to it. The net result could be that persistent centersof low and high pressure are set up in the mid-latitudes, such that tropical moistureis funnelled repeatedly into the persistent low pressure regions leading to floods, anddroughts persist associated with the atmospheric blocks associated with the high pres-sure centers. The net result may be synchronous flooding and drought patterns at20
seasonal to annual scales across the world. Some examples are indicated in Sect. 2.2.The potential dynamics of such a system at a global scale under a changing climateare discussed in Karamperidou et al. (2012, 2013).
2.3 Stationary or time-varying random variables?
Traditional flood frequency analysis assumes stationarity. This assumption implies that25
flood characteristics fluctuate around a constant value, and that flood quantiles canbe determined from data collected over relatively short time periods, typically a fewdecades. It is assumed that the flood generating processes remain constant in time,
1568
NHESSD2, 1559–1612, 2014
Floods and climate
B. Merz et al.
Title Page
Abstract Introduction
Conclusions References
Tables Figures
J I
J I
Back Close
Full Screen / Esc
Printer-friendly Version
Interactive Discussion
Discussion
Paper
|D
iscussionP
aper|
Discussion
Paper
|D
iscussionP
aper|
and that flood probability represents the long-term natural variability of the climate-catchment system. Changes in flood characteristics are expected to result from anthro-pogenic interventions in this system, such as human-induced climate change, land-usechange or river training.
Stationarity implies that each flood record has the same probability of occurrence at5
any time. However, Sects. 2.1 and 2.2 suggest that there may be periods with distinctflood peak distributions for catchments with strong climate–flood links. Analyses of longobservation data and historical flood records give evidence that floods tend to cluster intime in many regions, and hence, that the traditional assumption of time-invariant prob-ability distribution does not hold. Periods with higher or more frequent floods can be dif-10
ferentiated from periods with minor flood activity (e.g. Jacobeit et al., 2003; Schmocker-Fackel and Naef, 2010). This is attributed to low-frequency climate variability, as climatehas well organized modes of interannual, interdecadal and lower-frequency variabilitymodulating atmospheric moisture uptake, transport and deposition (precipitation) pro-cesses, and hence, flood conditions (Hirschboeck, 1988). Knox (2000) studied the ef-15
fect of climate variability on flood probability at the Mississippi River. He divided the120 yr long observation period into four decadal-scale sub-periods according to theirprevailing global circulation patterns and calculated flood quantiles for each sub-periodseparately. The 50 yr-flood was approximately 50 % larger during episodes with morefrequent meridional circulation patterns than in periods with more common zonal cir-20
culation patterns. This approach of stratifying the flood sample into sub-samples withdifferent climate modes has been repeated, for example, by Kiem et al. (2003) for 40flood gauges in New South Wales, Australia. The stratification of a regional flood indexaccording to ENSO and the Interdecadal Pacific Oscillation (IPO) leads to very markeddifferences in flood quantiles. In flood frequency estimation such variations will show25
up as a bias as well as an underestimation of the uncertainty of projecting future floodhazards because the interdecadal and longer oscillations are ignored.
Consequently, even in the absence of human-induced changes, the statistical prop-erties of flood time series may vary significantly over time. Flood characteristics may
1569
NHESSD2, 1559–1612, 2014
Floods and climate
B. Merz et al.
Title Page
Abstract Introduction
Conclusions References
Tables Figures
J I
J I
Back Close
Full Screen / Esc
Printer-friendly Version
Interactive Discussion
Discussion
Paper
|D
iscussionP
aper|
Discussion
Paper
|D
iscussionP
aper|
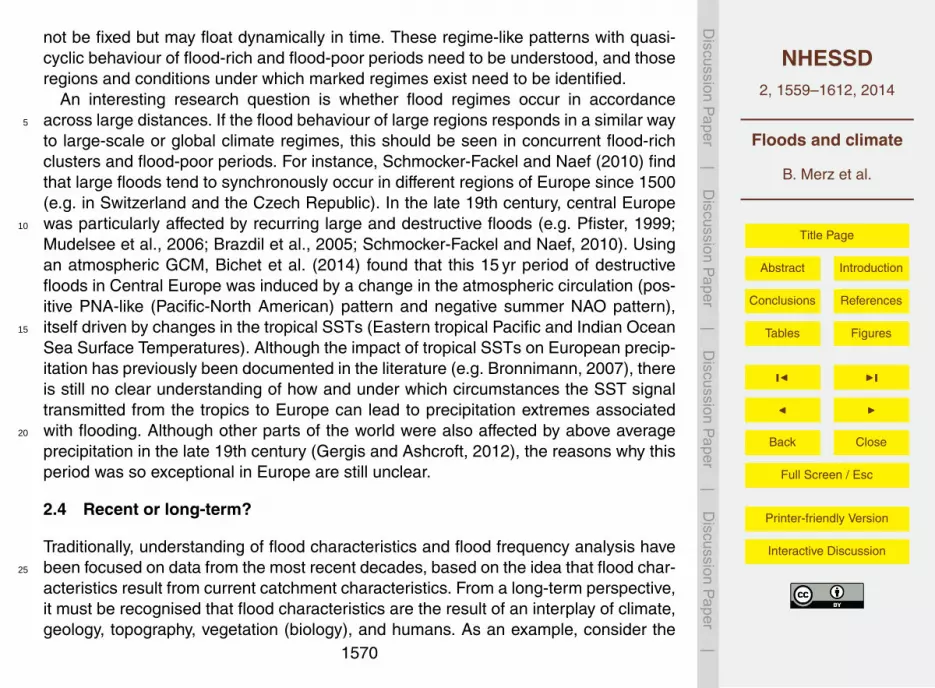
not be fixed but may float dynamically in time. These regime-like patterns with quasi-cyclic behaviour of flood-rich and flood-poor periods need to be understood, and thoseregions and conditions under which marked regimes exist need to be identified.
An interesting research question is whether flood regimes occur in accordanceacross large distances. If the flood behaviour of large regions responds in a similar way5
to large-scale or global climate regimes, this should be seen in concurrent flood-richclusters and flood-poor periods. For instance, Schmocker-Fackel and Naef (2010) findthat large floods tend to synchronously occur in different regions of Europe since 1500(e.g. in Switzerland and the Czech Republic). In the late 19th century, central Europewas particularly affected by recurring large and destructive floods (e.g. Pfister, 1999;10
Mudelsee et al., 2006; Brazdil et al., 2005; Schmocker-Fackel and Naef, 2010). Usingan atmospheric GCM, Bichet et al. (2014) found that this 15 yr period of destructivefloods in Central Europe was induced by a change in the atmospheric circulation (pos-itive PNA-like (Pacific-North American) pattern and negative summer NAO pattern),itself driven by changes in the tropical SSTs (Eastern tropical Pacific and Indian Ocean15
Sea Surface Temperatures). Although the impact of tropical SSTs on European precip-itation has previously been documented in the literature (e.g. Bronnimann, 2007), thereis still no clear understanding of how and under which circumstances the SST signaltransmitted from the tropics to Europe can lead to precipitation extremes associatedwith flooding. Although other parts of the world were also affected by above average20
precipitation in the late 19th century (Gergis and Ashcroft, 2012), the reasons why thisperiod was so exceptional in Europe are still unclear.
2.4 Recent or long-term?
Traditionally, understanding of flood characteristics and flood frequency analysis havebeen focused on data from the most recent decades, based on the idea that flood char-25
acteristics result from current catchment characteristics. From a long-term perspective,it must be recognised that flood characteristics are the result of an interplay of climate,geology, topography, vegetation (biology), and humans. As an example, consider the
1570

NHESSD2, 1559–1612, 2014
Floods and climate
B. Merz et al.
Title Page
Abstract Introduction
Conclusions References
Tables Figures
J I
J I
Back Close
Full Screen / Esc
Printer-friendly Version
Interactive Discussion
Discussion
Paper
|D
iscussionP
aper|
Discussion
Paper
|D
iscussionP
aper|
way precipitation and catchment time scales are related to flood time scales. Figure 3(from Gaál et al., 2012) illustrates some of the factors that influence these three timescales. Note that Fig. 3 could be extended by feedbacks in the climate system andthe role of humans as strong floods may lead people to build flood control systemsthat modify hydrology (Di Baldassarre et al., 2013). The time scales shown in Fig. 35
are not independent and the interplay amongst them can be interpreted differently atdifferent time scales, from hours to millennia. The events that produce the maximumannual floods are those for which the storm duration is close to the concentration timeof the catchment, because the catchment-response time scales filter the distribution ofall storms to produce the distribution of flood-producing storms (Viglione and Blöschl,10
2009). This is the reasoning behind the rational method for flood estimation and it ap-plies at the event scale (e.g. Pilgrim and Cordery, 1993, p. 9.13). At the seasonal timescale, flood characteristics tend to be closely related to the seasonal water balanceand, conversely, runoff event types affect the seasonal water balance through rainfalland snowmelt (Sivapalan et al., 2005). At the time scale of decades, however, the flow15
paths as well as soil moisture affect erosion during floods and soil evolution (modulatedby differences in geology), while soil depth and permeability affect flow paths and there-fore the flood response at the event scale. At the landscape evolution time scale thereare further interactions (Abrahams and Ponczynski, 1984; Tucker and Bras, 2000). Tofully understand floods, this long-term interplay has to be disentangled. Because of the20
coupling between different processes across many spatial and temporal scales, theinterplay between climate and catchments has to be seen as complex system (Rihani,2002; Raupach, 2005; Kumar, 2007; Blöschl and Merz, 2010), i.e., systems with a largenumber of strongly interdependent variables at multiple space and time scales.
One promising avenue to better understand this long-term interplay and the role of25
climate for flood characteristics is the use of historical and geological archives (e.g.Kochel and Baker, 1982; Baker, 2008; Glaser et al., 2010; Gilli et al., 2012). Histor-ical archives provide exact dates of catastrophic floods often together with detaileddescriptions of the hydro-meteorological conditions and the resulting damage. How-
1571

NHESSD2, 1559–1612, 2014
Floods and climate
B. Merz et al.
Title Page
Abstract Introduction
Conclusions References
Tables Figures
J I
J I
Back Close
Full Screen / Esc
Printer-friendly Version
Interactive Discussion
Discussion
Paper
|D
iscussionP
aper|
Discussion
Paper
|D
iscussionP
aper|
ever, these archives are limited to regions that were populated over a long period andonly reach back a couple of centuries. Millennial-scale variations from potentially allregions world-wide can be revealed from river and lake sediment records (e.g. Benitoet al., 2003c; Swierczynski et al., 2012, 2013; Wilhelm et al., 2012, 2013). While riversediments typically reflect periods of both accumulation and erosion and thus mainly5
reflect highest-amplitude floods, lakes represent ideal natural traps which continuouslycollect suspended detrital sediments transported by floods. In case of annually lami-nated sediments even the seasons of paleofloods can be precisely determined by themicro-stratigraphic position of a detrital layer within the annual succession of lake de-position (Mangili et al., 2005; Czymzik et al., 2010).10
Figure 4 shows exemplarily the reconstruction of spring and summer floods from lam-inated sediments of Lake Mondsee, Austria. The amount of temporal variability in theoccurrence of floods is striking. There is a period of more than 200 yr (21 BC–216 AD)without any flood documented, whereas the average frequency is 0.04 floods yr−1 yield-ing 9 floods for such a time interval. Similar fluctuations are seen in other paleoflood15
records (e.g. Ely et al.,1993; Knox, 2000; Benito et al., 2003a, b).Combining flood reconstructions with climate reconstructions has a great potential
to better understand climate–flood linkages. However, interpreting sedimentary pale-ofloods records requires the precise timing of detrital flood layer deposition and a de-tailed understanding of the mechanisms from the sediment source to the sink. The20
entire chain of processes needs to be captured, from the hydro-meteorological eventand the resulting erosion in the catchment to sediment transport into the lake and distri-bution of suspended material within the lake basin. This, in turn, requires both detailedinvestigation of the lacustrine sediment formation including the influence of land-useand vegetation changes on catchment erosion and sedimentation, and calibration of25
flood layer deposits with meteorological and hydrological observations. Such a detailedunderstanding allows an assessment of the completeness of the paleoflood record andwhether certain flood types are missing.
1572

NHESSD2, 1559–1612, 2014
Floods and climate
B. Merz et al.
Title Page
Abstract Introduction
Conclusions References
Tables Figures
J I
J I
Back Close
Full Screen / Esc
Printer-friendly Version
Interactive Discussion
Discussion
Paper
|D
iscussionP
aper|
Discussion
Paper
|D
iscussionP
aper|
Where very long flood time series extending over millennia can be reconstructedwith sufficient reliability, they provide a data-based approach to separate the impactof anthropogenic climate change on floods from natural climate variability. Given thelarge uncertainty of today’s models to simulate floods under changing climate, reliablepaleoflood reconstructions have an exciting potential to determine the natural variability5
of the flood activity, to better constrain flood projections under climate change, and tobetter assess flood recurrence times and flood–climate relations for various climatestates and time scales.
This long-term view has been successfully used for flood management in dam safetyconsiderations by defining upper limits of flooding through paleoflood and documen-10
tary studies (Enzel et al., 1993; Levish, 2002). However, the systematic integration ofpaleo and historical records into flood frequency analysis has been limited. An argu-ment that is often raised is that if climate is now changing, the long-term record is oflittle benefit because the past is no longer the key to the present. However, even witha changing climate, from a meteorological/mechanistic perspective, the laws of physics15
which result in rain, snow and floods are time invariant. Non-stationarity is produced bychanges of these processes in their frequency, magnitude, location, persistence, inten-sity, and clustering. These are driven by the interplay described earlier and are partiallydeterministic (Sect. 2.1). Hence the extreme events of the past are indeed importantindicators of what the atmosphere-catchment system is capable of, given the right in-20
terplay of factors. They have left evidence in the landscape of the occurrence of a realevent (not something emerging from modeling). Floods – by their very nature – are rareevents, hence there is a need to identify them in all temporal contexts (paleo, histori-cal and systematically gauged) and explain them from a mechanistic understanding ofcausal drivers.25
1573

NHESSD2, 1559–1612, 2014
Floods and climate
B. Merz et al.
Title Page
Abstract Introduction
Conclusions References
Tables Figures
J I
J I
Back Close
Full Screen / Esc
Printer-friendly Version
Interactive Discussion
Discussion
Paper
|D
iscussionP
aper|
Discussion
Paper
|D
iscussionP
aper|
3 Exploiting climate–flood linkages to better manage flood risk
How can a better understanding of climate–flood linkages be used for improved floodrisk management? In the following we contrast the traditional approaches for floodestimation, flood projections under climate change, and for flood management withemerging perspectives based on this improved understanding of floods in their climatic5
context.
3.1 Flood estimation: process-neutral or process-based?
Flood estimation does not traditionally differentiate between flood event types and floodgeneration processes and can be termed process-neutral. The main approach to es-timate flood probabilities is based on extreme value statistics, i.e. fitting distribution10
functions to ordered sequences of observed flood peaks, ignoring the underlying pro-cesses, and extrapolating the tails of the distribution to low exceedance probabilities.It is typically assumed that the flood data used are independent and identically dis-tributed. This has been popular largely because most common statistical methods forthe analysis of extreme values make this assumption. Consequently, even in locations15
where a mix of mechanisms such as frontal storms, localized thunderstorms and rain-on-snow events, that have very different space and time attributes, lead to floods, mostanalyses focus on finding a single best distribution to fit them instead of identifying andmodelling the mixtures. Flood heterogeneity has been shown to invalidate the iid as-sumption in different catchments (e.g. Murphy, 2001; Todhunter, 2012). Further, flood20
clustering may introduce serial correlation in the time series and may invalidate theindependence assumption.
Even more disturbing is the possibility that climate-related fluctuations may signifi-cantly bias flood quantile estimates. Franks and Kuczera (2002) point to the need todistinguish between conditional and unconditional flood probability. The unconditional,25
long-term probability averages across different climate states, whereas the conditionalprobability depends on the current climate state. Traditional flood frequency analysis
1574
NHESSD2, 1559–1612, 2014
Floods and climate
B. Merz et al.
Title Page
Abstract Introduction
Conclusions References
Tables Figures
J I
J I
Back Close
Full Screen / Esc
Printer-friendly Version
Interactive Discussion
Discussion
Paper
|D
iscussionP
aper|
Discussion
Paper
|D
iscussionP
aper|
results in sound estimates of unconditional flood probability only if the observed dataaccurately represent the different climate states. Moreover, it may seriously over- orunderestimate flood probability in a given year. In a comparison of unconditional andconditional flood probability, Kwon et al. (2008) found that the conditional 100 yr floodfell outside the confidence interval of the unconditional estimate. Jain and Lall (2001)5
explore how the long-term, ENSO-related climate variability impacts the exceedancesof flood thresholds. From their bootstrap analysis they conclude that there is a muchhigher chance of obtaining substantially different numbers of exceedances of the de-sign flood derived from the iid assumption. Hence, low-frequency fluctuations may leadto fat tails of flood distributions and may increase the potential for surprise.10
The contrasting, process-based perspective is founded in the premise that floodevents of different types occur in a given catchment, and that flood characteristics arelinked to the hydro-meteorological processes driving the water input into catchments, tothe runoff generation processes, and to the flood routing processes. The expectation isthat process-based approaches can inform flood probability estimation and allow more15
reliable and catchment-specific characterisation of the flood hazard.The analysis of flood events in terms of their meteorological causes is an impor-
tant starting point for understanding how flood-climate linkages can influence floodprobability distribution functions (Hirschboeck, 1988). Different storm types can triggercompletely different flood processes in the same catchment. For example, in the South-20
western United States (Fig. 5), intense summer convective thunderstorm cells interactselectively with a watershed’s drainage network and topography, typically generatingflashy flood hydrographs. In contrast, synoptic-scale winter storms deliver snow andrain to large areas and tend to generate flood hydrographs characterized by sustainedand cumulative flows. Catchments with flood peaks generated by a mix of climatic25
mechanisms may exhibit complex heterogeneous frequency distributions, but stratify-ing the flood record according to climatic cause (Fig. 5) reveals useful information aboutthe individual processes that shape the catchment’s overall flood frequency distribution.If marked climate–flood linkages can be identified, it allows improving flood estimation
1575

NHESSD2, 1559–1612, 2014
Floods and climate
B. Merz et al.
Title Page
Abstract Introduction
Conclusions References
Tables Figures
J I
J I
Back Close
Full Screen / Esc
Printer-friendly Version
Interactive Discussion
Discussion
Paper
|D
iscussionP
aper|
Discussion
Paper
|D
iscussionP
aper|
and design. Kwon et al. (2008) stress the reduction in uncertainty of the 100 yr esti-mate when they include climate information. This reduction can be used to decreasethe costs of over- or underdesign. However, in order to benefit, there is a need for morestatistical and theoretical analysis of temporal variability in extremes, to understandhow temporal clustering or existence of a range of stochastic processes or mixture of5
distributions affect the tails of flood distributions.The reasoning that better process understanding improves flood estimation can be
extended further along the chain of flood processes. Runoff able to generate floods isproduced in three main ways: (1) at the surface by infiltration excess (Hortonian over-land flow) due to low or no infiltration intensities of the soil or surface, (2) by saturation10
excess (saturation overland flow) due to saturating the porous soil matrix, or (3) by fastsubsurface flow, usually triggered by a variety of mechanism and conditions (Bachmairand Weiler, 2011). Based on the specific setting of a given catchment (geology, soils,topography, vegetation cover, land-use, etc.), the three processes interact differently,therefore in conjunction with the hydro-meteorological conditions, different runoff gen-15
eration processes can dominate the flood generation (Weiler et al., 2009; Steinbrichand Weiler, 2012). Rogger et al. (2012) give the following example which illustrates thebenefits of understanding the dominant controls on flood probability. Empirical distri-bution functions of flood peaks in small catchments sometimes show discontinuitiesin the slope, that is, the largest flood peaks are significantly larger than the rest of20
the record. For Austrian alpine catchments Rogger et al. (2012) suggest that thesestep changes are the consequence of a threshold of storage capacity being exceeded,which causes fast surface runoff in large parts of the catchments. This step changeeffect is not captured by flood frequency statistics which tends to underestimate floodsin these catchments.25
Another example of the effect of runoff processes on the flood distribution functionis shown in Fig. 6. The left graphs show the flood frequency curve and the associatedevent runoff coefficients for the Weißach catchment at Zwing located in West-Austria(Merz and Blöschl, 2008a). Owing to orographic enhancement of north-westerly air-
1576

NHESSD2, 1559–1612, 2014
Floods and climate
B. Merz et al.
Title Page
Abstract Introduction
Conclusions References
Tables Figures
J I
J I
Back Close
Full Screen / Esc
Printer-friendly Version
Interactive Discussion
Discussion
Paper
|D
iscussionP
aper|
Discussion
Paper
|D
iscussionP
aper|
flows, rainfall is high and persistent and runoff coefficients tend to be constantly high. Asrainfall becomes more extreme, runoff coefficients only increase moderately as they arealready close to unity, and the flood frequency curve of the catchment shows a down-ward curvature. Assuming that the rainfall regime remains similar, and on the basis ofthe runoff coefficients, one would expect that the trend continues as one extrapolates5
to higher return periods. In contrast, runoff coefficients of Wulka at Schützen in thedryer eastern part of Austria are much lower and increase with increasing return pe-riods. The flood frequency curve shows an upward curvature and, on the basis of theanalysis of the runoff coefficients, one would expect that this trend continues, assumingthe rainfall regime remains similar. Hence, the information on runoff coefficients gives10
more confidence in extrapolating to higher return periods.The idea that the flood frequency curve is a fingerprint of important processes can
finally be extended to flood routing and river-floodplain interactions. Apel et al. (2009)show for the Lower Rhine in Germany that dike breaches lead to significant retentioneffects by pruning the flood waves which, in turn, modify the flood frequency curve15
downstream of breach locations. This effect only occurs beyond a certain (extreme)threshold, and it is typically not contained in observed time series. Hence, a process-neutral, purely statistical approach, i.e. not including this specific process in the extrap-olation to extreme floods, results in significant overestimation of large flood quantiles.
We conclude that the past dominance of process-neutral approaches to the flood20
estimation problem should be substituted by more process-based avenues. We sup-port the reasoning of Merz and Blöschl (2008a, b) who argue that much better useshould be made of the wealth of knowledge on hydrological processes in estimatingflood probabilities and have introduced the concept of flood frequency hydrology. It isbased on a systematic expansion of information on flood processes beyond the flood25
sample at the site of interest, in order to derive more informed estimates of flood fre-quencies. By combining local flood data statistics with additional temporal informationon historic floods, spatial information on floods in neighbouring catchments, and causalinformation on the flood processes, the subtleties of the flood characteristics at the site
1577

NHESSD2, 1559–1612, 2014
Floods and climate
B. Merz et al.
Title Page
Abstract Introduction
Conclusions References
Tables Figures
J I
J I
Back Close
Full Screen / Esc
Printer-friendly Version
Interactive Discussion
Discussion
Paper
|D
iscussionP
aper|
Discussion
Paper
|D
iscussionP
aper|
of interest can be more fully captured and the uncertainty of the flood quantile es-timation reduced. It is important to note that the complete spectrum of processes –in the atmosphere, catchment, river system and floodplains – should be included ina process-based flood estimation. This is a very broad definition of flood frequency hy-drology and subsumes, for example, elements of the flood hydro-climatology concept5
of Hirschboeck (1988).
3.2 Climate change: model chain vs. model chain augmented?
Anthropogenic climate change is perceived as particularly relevant by authorities re-sponsible for flood design and management. Therefore, in this section the benefit of un-derstanding climate–flood linkages for projections of future floods under climate change10
is elaborated.The typical approach for deriving future flood hazard scenarios under climate change
is to implement model chains consisting of the elements: “emission scenario → generalcirculation model (GCM) → downscaling, possibly including bias correction → hydro-logical catchment model → flood frequency analysis” (e.g. Dankers and Feyen, 2009;15
Kay et al., 2009; Ott et al., 2013), with the emission scenarios stemming from scenariosof future economic and social development (Nakicenovic and Swart, 2000). IPCC haschanged the climate change impact modelling concept slightly with the introduction ofthe concept of representative concentration pathways (Moss et al., 2008), but this willnot affect the above mentioned modelling chain except replacing the initial element from20
“emission scenario” to “representative concentration pathways” (Moss et al., 2010). Ineither case the natural variability in the general circulation models is produced withouta link to the observed timing of variability mode stages. The “pure” climate change sig-nal can thus be analysed in ensembles of model simulations. Multi-model ensemblescan reduce the uncertainties associated with deviations of individual model climatolo-25
gies. However, uncertainty is still large in projected flood changes, and IPCC SREX(2012, p. 178) states that “overall there is low confidence in projections of changesin fluvial floods.” One of the main uncertainty sources is the problem all GCMs have
1578

NHESSD2, 1559–1612, 2014
Floods and climate
B. Merz et al.
Title Page
Abstract Introduction
Conclusions References
Tables Figures
J I
J I
Back Close
Full Screen / Esc
Printer-friendly Version
Interactive Discussion
Discussion
Paper
|D
iscussionP
aper|
Discussion
Paper
|D
iscussionP
aper|
in simulating regional and local rainfall. Causes for these shortcomings are influencesof local orography and land-surface that are not resolved and small-scale processeswhich cannot be represented by a GCM. It is thus not recommendable to infer futurechanges in flooding directly from the GCM produced rainfall at individual grid points.
Statistical downscaling can be used to estimate the local rainfall from large-scale5
parameters. It can, for example, be based on the relationship between extreme rain-fall and large-scale atmospheric circulation patterns (Arnbjerg-Nielsen et al., 2013).Circulation patterns or weather types, either subjectively (e.g. Hess and Brezowsky,1952) or objectively (e.g. Philipp et al., 2007) derived, can take different atmosphericvariables into account (e.g. direction of flow, atmospheric humidity, temperature). Cli-10
mate change signals in the relevant weather types, in particular in the frequency ofoccurrence and persistence, can then be identified for the individual climate changesimulations. Instead of (or in addition to) using weather types, it is also possible toidentify cyclone tracks which are associated with extreme precipitation and enhancedflood risk in specific regions. A well-known example of a pathway associated with major15
flooding in Central Europe during summer is van Bebbers Vb track (e.g. Kundzewiczet al., 2005).
Where a strong climate–flood link can be identified for a given catchment, this linkcan be used to directly project future flood changes. For river gauges in the Mekongbasin, Delgado et al. (2012) identify a statistical relationship between flood variance20
and the Western Pacific monsoon variance. A non-stationary flood frequency modelis developed where the monsoon variance drives temporal changes in flood quantiles(Delgado et al., 2013). For climate change scenarios, the variance of the monsoon isextracted from GCM runs. The simplicity of the monsoon–flood link allows the deriva-tion of large ensembles of flood projections under climate change almost immediately,25
when GCM output is available. Such approaches are promising – and complementthe above mentioned climate change model chains – because they bypass precipita-tion which is poorly simulated by global and regional climate models. Rather, they arebased on circulation-linked atmospheric variables, such as large-scale pressure fields
1579

NHESSD2, 1559–1612, 2014
Floods and climate
B. Merz et al.
Title Page
Abstract Introduction
Conclusions References
Tables Figures
J I
J I
Back Close
Full Screen / Esc
Printer-friendly Version
Interactive Discussion
Discussion
Paper
|D
iscussionP
aper|
Discussion
Paper
|D
iscussionP
aper|
and wind velocities, which are frequently much better represented by climate models.Problems with this approach, as in all statistical downscaling procedures, occur whenthere is non-stationarity in the link between the scales and parameters, a lack of datafor estimating them, or a need of extrapolation to situations far from the area for whichthe statistical link has been derived.5
Notwithstanding the approach that is selected, one has to be aware of the currentlimitations of global and regional climate models which go beyond errors in simulatingprecipitation. For example, SSTs are one of the most important drivers for precipita-tion on decadal timescales (e.g. Bichet et al., 2011). The spatial patterns of SSTs areparticularly relevant in driving regional precipitation. This is an issue of concern, consid-10
ering that coupled atmosphere-ocean GCMs from the Coupled Model IntercomparisonProject Phase CMIP3 and CMIP5 globally predict warming of SSTs that is too uniform(e.g. Shin and Sardeshmukh, 2011).
Another approach with great potential beyond the typical use of model chains is thedevelopment of process-based scenarios of flood response to realistic shifts in climate.15
For instance, in the US Southwest, where different flood-generating storm types dom-inate in different seasons (Fig. 5), the circulation features associated with each stormtype are distinctly different. This information can be used to design alternative scenar-ios for a catchment’s flood response to climate change. A poleward shift in the latitudeof the current winter storm track, an increase or decrease in the magnitude or frequency20
of eastern North Pacific tropical cyclones, or an expansion of the low latitude tropicalmoisture belt that enhances the summer thunderstorm season would each have a pro-found impact on the overall probability distribution of flood peaks in southwestern USwatersheds. Catchment-based future flooding situations, constructed by sampling ob-served floods within each of these flood types could be used to develop alternative25
planning scenarios for different regional atmospheric circulation responses to chang-ing global climate drivers based on GCM output or projected circulation regime shifts(Fig. 7).
1580

NHESSD2, 1559–1612, 2014
Floods and climate
B. Merz et al.
Title Page
Abstract Introduction
Conclusions References
Tables Figures
J I
J I
Back Close
Full Screen / Esc
Printer-friendly Version
Interactive Discussion
Discussion
Paper
|D
iscussionP
aper|
Discussion
Paper
|D
iscussionP
aper|
Such scenarios could be derived via simulation or via data analysis, for example re-lying on historical periods with analogous conditions in the same catchment. Or onecould derive possible future flood changes by investigating catchments which havea climatic regime that is similar to the regime we expect in the future in a specificcatchment. Such process-based scenario approaches do not need to be based on the5
relation between floods and atmospheric moisture transport or storm tracks. They canbe applied more directly to surface hydro-meteorological variables. For example, in sev-eral European regions human-induced climate change is associated with an increasein winter precipitation and a higher snow line. Although we may not be very confidentabout the actual future precipitation, we might be confident about the general trend of10
increasing winter precipitation and decreasing fraction of snowfall. Indeed watershedsin mountainous areas of the Western United States that rely on seasonal snowpacksare already vulnerable to shifts in the timing of runoff and increases in early springflooding because warmer temperatures promote an earlier snowmelt season and moreprecipitation falling as rain instead of snow.15
Such process-based scenarios might provide a space of possible future flood charac-teristics, conditioned on our current knowledge. This possibility space of flooding char-acteristics in a given catchment could be compared to the vulnerability of the elements-at-risk, separating catchments which require special attention from those which areless vulnerable to the conceivable changes in climate. Prudhomme et al. (2010) have20
introduced the closely related “scenario-neutral approach to climate change impactstudies”. It is based on sensitivity analyses of catchment response to a plausible rangeof climate changes. An advantage of this approach and related ideas, such as what-if analysis or cause-and-effect analysis, is that it is much easier to understand andinterpret changes in flood behaviour. On the contrary, the complexity of the typical cli-25
mate model chains impedes the understanding of how changes in climate propagate tochanges in flood characteristics. Hence, in parallel to improving climate model chainsand their reliability for flood projections under climate change, a better understandingof climate–flood linkages has a large potential for flooding under climate change.
1581

NHESSD2, 1559–1612, 2014
Floods and climate
B. Merz et al.
Title Page
Abstract Introduction
Conclusions References
Tables Figures
J I
J I
Back Close
Full Screen / Esc
Printer-friendly Version
Interactive Discussion
Discussion
Paper
|D
iscussionP
aper|
Discussion
Paper
|D
iscussionP
aper|
Currently, human-induced climate change and natural climate variability are not oper-ationally incorporated into flood management practice, in part because floodplain man-agers are constrained by the absence of accepted alternatives to standard stochasticmethods. To overcome this impasse, there is a need for methods that can incorporaterealistic, process-based climate change scenarios into the statistics of gauge records5
in ways that demonstrate an improvement on the traditional flood frequency analysisapproach. Probabilistic methods now being used with paleoflood data present one ap-proach, but they are not directed toward future climate change and are limited by theavailability of paleoflood indicators in the landscape. Methods are needed that can aug-ment existing flood peak records in ways that reflect how the climatic drivers of local10
hydro-meteorological processes have changed and will change in the past, presentand future.
3.3 Flood risk management
What is the benefit of an improved understanding of climate–flood linkages for flood riskmanagement? In the last two decades, flood change research has been dominated by15
studies looking at changes in flood hazard, for instance due to human-induced climatechange (e.g. Feyen et al., 2012; Ott et al., 2013; Ward et al., 2013a), land-use changeor river training (e.g. Bronstert et al., 2007). Today it is recognized that all risk ele-ments are dynamic through time, not only hazard (IPCC, 2012; Jongman et al., 2012).Amongst other factors, the vulnerability and exposure of people and economic assets20
are determined by phases of development. Further, a single driver may influence differ-ent risk components. For example, the societal perception of flood risk may be stronglyinfluenced by a damaging flood which may trigger investments in structural flood de-fence, such as flood retention basins, and may change flood hazard. In parallel, it maychange exposure by flood-affected companies and private households migrating out of25
heavily flooded areas, and vulnerability by triggering private precaution in the floodedareas (Petrow et al., 2006; Kreibich et al., 2011). Bubeck et al. (2012) show that so-cietal responses are critical in understanding how vulnerability to floods changes over
1582
NHESSD2, 1559–1612, 2014
Floods and climate
B. Merz et al.
Title Page
Abstract Introduction
Conclusions References
Tables Figures
J I
J I
Back Close
Full Screen / Esc
Printer-friendly Version
Interactive Discussion
Discussion
Paper
|D
iscussionP
aper|
Discussion
Paper
|D
iscussionP
aper|
time. This study surveyed 752 households along the River Rhine in Germany that ex-perienced floods, with two major floods in 1993 and 1995. The results indicate thatflood damage mitigation measures were implemented by households gradually overtime, with major flood events being important triggers for an accelerated implementa-tion. Especially in the aftermath of the severe flood in 1993, a remarkable increase in5
the number of undertaken measures was observed.In addition, spatio-temporal interdependencies between vulnerability, exposure, and
hazard have to be expected. Current risk assessments, if they include dynamics at all,often examine dynamics in one of the components, whereas the interdependenciescould be crucial (Di Baldassarre et al., 2013). For example, flood protection by dikes10
aimed at reducing the flood hazard can lead to increased development behind dikes,thus increasing exposure, the so-called levee effect (Tobin, 1995). In areas with highprotection standards by dikes, individuals and societies may have low risk perceptions,and thus be less prepared for floods, in other words, they may have high vulnerability(Bubeck et al., 2012; Zaalberg and Midden, 2013). Spatio-temporal changes in all of15
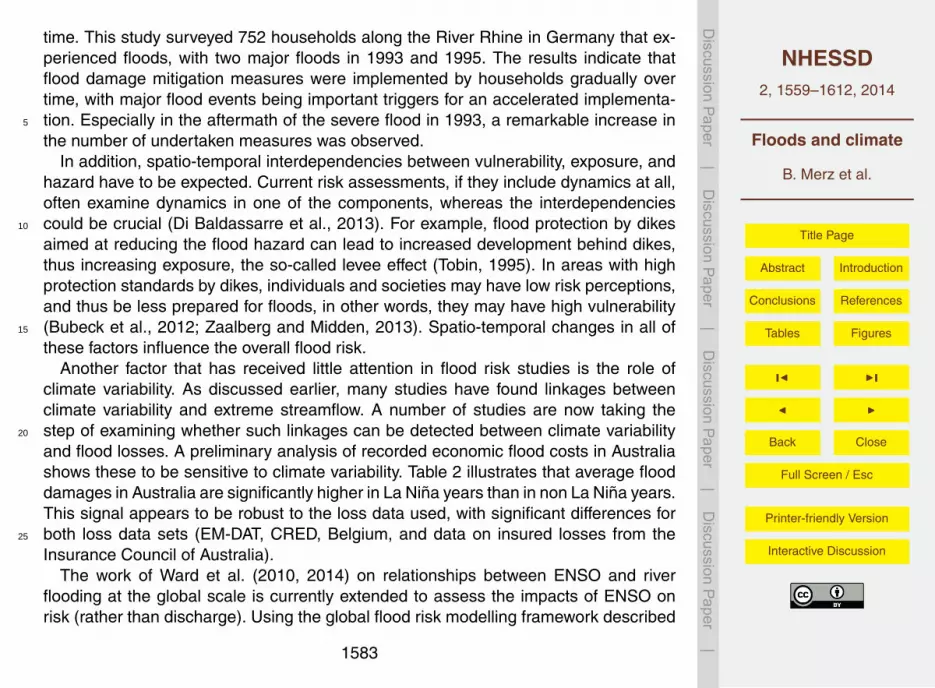
these factors influence the overall flood risk.Another factor that has received little attention in flood risk studies is the role of
climate variability. As discussed earlier, many studies have found linkages betweenclimate variability and extreme streamflow. A number of studies are now taking thestep of examining whether such linkages can be detected between climate variability20
and flood losses. A preliminary analysis of recorded economic flood costs in Australiashows these to be sensitive to climate variability. Table 2 illustrates that average flooddamages in Australia are significantly higher in La Niña years than in non La Niña years.This signal appears to be robust to the loss data used, with significant differences forboth loss data sets (EM-DAT, CRED, Belgium, and data on insured losses from the25
Insurance Council of Australia).The work of Ward et al. (2010, 2014) on relationships between ENSO and river
flooding at the global scale is currently extended to assess the impacts of ENSO onrisk (rather than discharge). Using the global flood risk modelling framework described
1583
NHESSD2, 1559–1612, 2014
Floods and climate
B. Merz et al.
Title Page
Abstract Introduction
Conclusions References
Tables Figures
J I
J I
Back Close
Full Screen / Esc
Printer-friendly Version
Interactive Discussion
Discussion
Paper
|D
iscussionP
aper|
Discussion
Paper
|D
iscussionP
aper|
in Ward et al. (2013b), preliminary results presented at the EGU Topical Meeting inPotsdam show that there are clear and significant regional patterns of ENSO influenceon disaster risk, in terms of both affected population and economic damage. Hence,socio-economic risks may to some extent be linked to climate regimes which could havemajor implications for the insurance and re-insurance industry. For example, clustering5
of flood events increases the likelihood of a high number of damage claims withina short period of time – an issue which is aggravated if clustering is spatially coherentand damaging events occur at different locations within a short time interval.
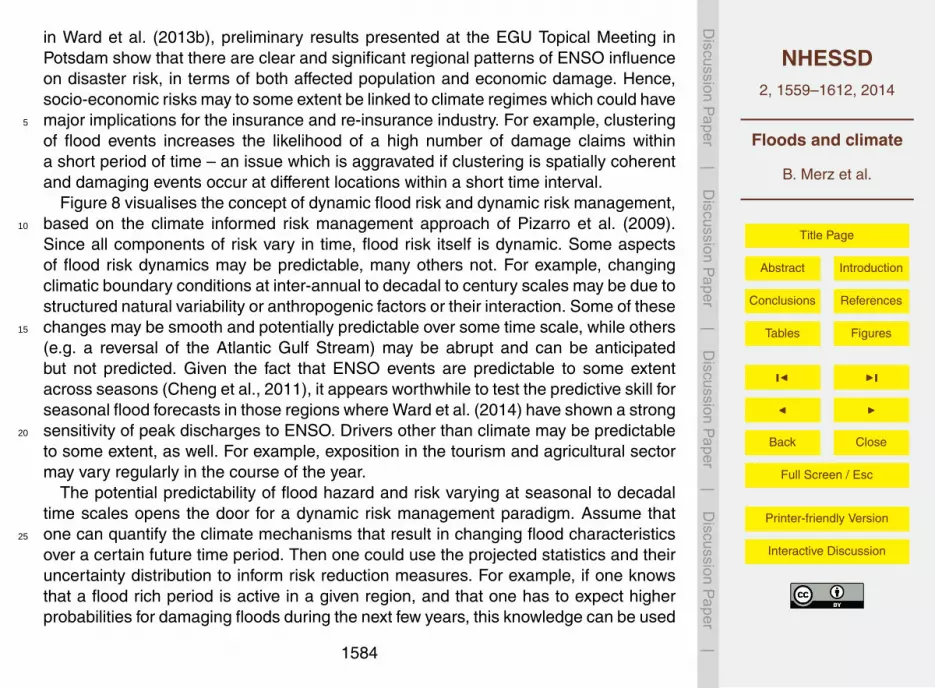
Figure 8 visualises the concept of dynamic flood risk and dynamic risk management,based on the climate informed risk management approach of Pizarro et al. (2009).10
Since all components of risk vary in time, flood risk itself is dynamic. Some aspectsof flood risk dynamics may be predictable, many others not. For example, changingclimatic boundary conditions at inter-annual to decadal to century scales may be due tostructured natural variability or anthropogenic factors or their interaction. Some of thesechanges may be smooth and potentially predictable over some time scale, while others15
(e.g. a reversal of the Atlantic Gulf Stream) may be abrupt and can be anticipatedbut not predicted. Given the fact that ENSO events are predictable to some extentacross seasons (Cheng et al., 2011), it appears worthwhile to test the predictive skill forseasonal flood forecasts in those regions where Ward et al. (2014) have shown a strongsensitivity of peak discharges to ENSO. Drivers other than climate may be predictable20
to some extent, as well. For example, exposition in the tourism and agricultural sectormay vary regularly in the course of the year.
The potential predictability of flood hazard and risk varying at seasonal to decadaltime scales opens the door for a dynamic risk management paradigm. Assume thatone can quantify the climate mechanisms that result in changing flood characteristics25
over a certain future time period. Then one could use the projected statistics and theiruncertainty distribution to inform risk reduction measures. For example, if one knowsthat a flood rich period is active in a given region, and that one has to expect higherprobabilities for damaging floods during the next few years, this knowledge can be used
1584

NHESSD2, 1559–1612, 2014
Floods and climate
B. Merz et al.
Title Page
Abstract Introduction
Conclusions References
Tables Figures
J I
J I
Back Close
Full Screen / Esc
Printer-friendly Version
Interactive Discussion
Discussion
Paper
|D
iscussionP
aper|
Discussion
Paper
|D
iscussionP
aper|
to optimize disaster management (optimized strategies in Fig. 8). Relief stocks andemergency capabilities could be temporarily increased, reservoir water levels could betemporarily lowered to allow for more flood retention volume, temporary levees couldbe built or floodplain zoning rules for different activities could be temporarily imposed.The predictability of the climate–flood link would allow optimizing the portfolio of risk5
reduction measures.On the other hand, many future flood risk changes are expected to be severe but are
not predictable. In such cases robustness is an important criterion for designing riskmanagement strategies. Robustness describes how well a measure performs underdifferent possible but initially uncertain future developments. Flood proofing strategies,10
such as elevated configuration of buildings, sealing of buildings to prevent water en-trance, or the use of building materials in such a way that the impact of inundation isminimized, are robust in the sense that these measures will lower the damage in caseof flooding, regardless of the exact future development of the flood hazard (Merz et al.,2010). Another example is the enhancement of risk awareness and self-protecting be-15
havior of people at risk. If residents are aware of their flood risk and of their possibilitiesto undertake effective precautionary, adverse flood impacts will be reduced under differ-ent possible but initially uncertain future developments. Risk reduction measures thatare designed to be robust differ from measures that are the result of an optimization forthe most likely future development. They represent trade-offs and are associated with20
real or opportunity costs (Heltbert et al., 2009). Hence, the degree of predictability offuture changes in flood hazard and risk influences the role that different criteria play indesigning risk management measures (Blöschl et al., 2013).
As an example, consider seasonal flood forecasts in the insurance and reinsuranceindustry. Companies try to take short-term changes in loss probabilities into account25
in managing their lines of business. If, for instance, a wet year with above-averageflood losses is expected in a certain region (such as in Northeastern Australia dur-ing La Niña), less business may be written to reduce accumulation risks. Apart fromunderwriting-related reactions on seasonal forecasts, preparation on high/low losses
1585

NHESSD2, 1559–1612, 2014
Floods and climate
B. Merz et al.
Title Page
Abstract Introduction
Conclusions References
Tables Figures
J I
J I
Back Close
Full Screen / Esc
Printer-friendly Version
Interactive Discussion
Discussion
Paper
|D
iscussionP
aper|
Discussion
Paper
|D
iscussionP
aper|
in terms of management of reserves may be done; short-term liquidity for flood lossescan be raised or reduced. Also, reinsurers and insurers “like” to provide services totheir clients in the form of recommendations based on the characteristics of the up-coming flood season, not least to show their expertise. The advantage the insurancesector derives from seasonal forecasts results from the fact that it does not deal with5
a specific, localized issue. For an emergency planner in a city a shift in event probabilityof a few percent is almost without meaning; in the case of a (re-)insurance companythis shift concerns a whole portfolio with a large number of exposed items, hence evena small shift in probability may be traced in the total amount of losses.
4 Conclusions: broader framing and global initiatives10
Traditionally, flood estimation and flood management have mainly been the domain ofhydrologists, water resources engineers and statisticians, and disciplinary approacheshave abound. Embedding floods in the climate context, as laid out in this paper, re-quires to extend this narrow framing. It is timely to bring together the different aspectsof floods at the interfaces of the climate–catchment–society system. The discussions15
during the EGU Topical Meeting on “Floods and Climate” converged to a common un-derstanding that extending the perspectives in flood research opens up exciting possi-bilities for better understanding and for providing improved tools to flood risk assess-ment and management. The conclusions can be summarized as follows:
4.1 Extend the system boundaries20
We argue for extending the traditional system boundaries (local catchment, recentdecades, hydrological/hydraulic processes) in flood estimation and management. Ex-tension in space goes beyond the inclusion of regional information which has provenbeneficial in regional flood frequency analysis. Floods are embedded in global climatemechanisms, and deciphering these relations promises to improve flood estimation25
1586

NHESSD2, 1559–1612, 2014
Floods and climate
B. Merz et al.
Title Page
Abstract Introduction
Conclusions References
Tables Figures
J I
J I
Back Close
Full Screen / Esc
Printer-friendly Version
Interactive Discussion
Discussion
Paper
|D
iscussionP
aper|
Discussion
Paper
|D
iscussionP
aper|
and management, such as better understanding the tail behaviour of flood distributionsor improved flood forecasting. However, it has been found that catchments respondrather differently to global climate variability (e.g. Glaser et al., 2010, for 12 major riversin Europe for 1500–today). Hence, there exists a large variety of climate–flood link-ages, and the existence of a marked climate–flood relation within one catchment does5
not automatically allow transferring it to other catchments in the same region. This ex-tension of perspective concerns the temporal system boundaries as well. For example,new technological developments allow reconstructing millennial-scale flood time seriesdifferentiating between floods in different seasons. The integration of systematic mea-surements with historical and paleo-data offers exciting prospects for quantifying flood10
variability and extremes at very different time scales, from the decadal to the millennialtime scale. And finally, it is noted that a richer understanding of floods requires consid-ering the interplay of climate, geology, topography, vegetation (biology), and humans.Experiences, methods and data from a variety of scientific disciplines, e.g. meteorol-ogy, climatology, paleo-hydrology, geography, economics, and from practitioners, e.g.15
insurance, disaster management, water authorities, need to be integrated.
4.2 Understand the dominant processes
We argue that different societal needs, such as flood estimation and forecasting, benefitfrom better understanding the processes that dominate the tail behaviour of flood dis-tributions. Although statistical approaches have played and will play an important role,20
they have to be complemented by the search for the causal mechanisms and domi-nant processes in the atmosphere, catchment and river system that leave their finger-prints on flood characteristics. Understanding the dominant processes is expected toincrease the reliability of extrapolation to rare floods and to reduce the potential for sur-prise. It is also an avenue for flood projections under climate change – complementing25
the widespread model chain approach. Understanding the different flood event typesthat occur in a given catchment and their dominant processes may provide an opportu-nity to hypothesize from a causal, mechanistic perspective about possible future flood
1587
NHESSD2, 1559–1612, 2014
Floods and climate
B. Merz et al.
Title Page
Abstract Introduction
Conclusions References
Tables Figures
J I
J I
Back Close
Full Screen / Esc
Printer-friendly Version
Interactive Discussion
Discussion
Paper
|D
iscussionP
aper|
Discussion
Paper
|D
iscussionP
aper|
changes. For example, spatial shifts in storm tracks or changes in the snowfall fractionmay impact flood characteristics in certain ways.
4.3 Quantify the role of natural variability
One of the core concepts of this paper is that natural variability has an important roleto play in flood estimation and flood management – besides delivering the random5
component. We argue that flood characteristics vary in time, that this variation may bepartially quantifiable and predictable, and that knowledge about this structured variabil-ity may be exploited in flood estimation and management. It is necessary to understandthe ratio of structured variability to random variability, and how this ratio varies in space,with flood types, with flood magnitude. For example, the structured variability for most10
regions in Europe is significantly smaller than in the US. One task is to identify regionsfor which predictable climate–flood links play a significant role and regions where ran-domness dominates. Another mainly open question is how the type and strength ofclimate–flood linkages vary with flood magnitude. Floods of different magnitude maycorrespond to different climate modes (for an illustrative example see Jain and Lall,15
2000), and these variations need to be understood. Maybe the most important aspect isthe persistence of climate–flood linkages: how stable are linkages between climate andfloods? Results are mixed: for instance, flood favouring circulation patterns have beenfound in many studies, but it has been found as well that during different flood-rich pe-riods of a given river different circulation patterns have dominated (Schmocker-Faeckel20
and Naef, 2010). This is part of the more general discussion on the evidence of cyclesin climate phenomena: as Burroughs (2003, p. 5) states in his comprehensive treatiseon such cycles: “. . . a fundamental weakness of many apparently convincing exam-ples of ‘weather cycles’: they come and go in a most tantalising manner.” The centralquestion for a dynamic flood risk management concept which considers climate–flood25
linkages is, whether these linkages constitute a sufficiently large part of the observedvariability to be exploited in risk management strategies. Although there are some con-
1588

NHESSD2, 1559–1612, 2014
Floods and climate
B. Merz et al.
Title Page
Abstract Introduction
Conclusions References
Tables Figures
J I
J I
Back Close
Full Screen / Esc
Printer-friendly Version
Interactive Discussion
Discussion
Paper
|D
iscussionP
aper|
Discussion
Paper
|D
iscussionP
aper|
vincing examples, the potential of climate informed risk management needs still to beexplored.
4.4 Integrate hazard with societal aspects
Although the focus of this paper is on the role of climate, we stress the tremendousrole of society. Ideally, risk assessment and management consider changes in hazard5
and societal aspects, and varies according to the predictability with which short- andlong-term changes in flood risk can be quantified. Increasing efforts are needed to fullyaccount for factors that contribute to changes in risk, which implies that changes invulnerability (e.g. early warning, building codes) and exposure (e.g. population growth,spatial planning) need to be considered when interpreting records of observed flood10
losses. However, the understanding of the interplay between changes in hazard, expo-sure and vulnerability is hampered by data scarcity. The knowledge on disaster costs isincomplete and fragmented, with many cost types unaccounted for in current analyses,and a heavy focus on direct losses and less complete understanding of longer-term im-pacts and indirect costs (Merz et al., 2010b). While changes in the number of exposed15
assets and people can be reasonably accounted for, temporal changes in vulnerabilitythat are critically important are poorly understood and quantified. The interactions andfeedbacks between society and floods are little understood. For instance, is the societalresponse to floods different for clustered events compared to random events? Here, wesupport the call for socio-hydrology which explicitly studies the co-evolution of humans20
and water (Sivapalan et al., 2012).
4.5 Organize data and knowledge exchange globally
The advancement of flood research in the discussed broader framework is fundamen-tally dependant on (1) access to and exchange of fit-for-purpose data on a global scaleand (2) increased international and national collaboration between different disciplines,25
in particular hydrologists and meteorologists/climatologists. On a global level the iden-
1589

NHESSD2, 1559–1612, 2014
Floods and climate
B. Merz et al.
Title Page
Abstract Introduction
Conclusions References
Tables Figures
J I
J I
Back Close
Full Screen / Esc
Printer-friendly Version
Interactive Discussion
Discussion
Paper
|D
iscussionP
aper|
Discussion
Paper
|D
iscussionP
aper|
tification of climate-driven changes in river flow is hindered due to a lack of long qual-ity data from rivers limited from artificial human disturbances (Whitfield et al., 2012).Therefore, in the past 15 yr several countries have established reference hydrologicnetworks (RHN) with the sole purpose of assessing hydrological responses to fluctu-ations in climate (Hannaford and Marsh, 2008; Whitfield et al., 2012; Murphy et al.,5
2013). Despite these efforts the majority of regions across the globe have yet to es-tablish such databases. Data users have a responsibility to promote the need of suchdata for their analyses in order to increase the global distribution of RHN like networks.However, significant economic and institutional barriers to the open access of hydro-meteorological data remain (Viglione et al., 2010; Hannah et al., 2011) and need to10
first be overcome. Hydrologists could learn from the climate community that activelyadvocate open data access and support data exchange (Hannah et al., 2011). Giventhe global scale and societal importance, we call for the organization of an internationalmultidisciplinary collaboration and data sharing initiative to understand further the linksbetween climate and flooding. This would require the integration of meteorological, cli-15
matological and hydrological expertise in conjunction with increased access to coupledRHN and meteorological databases. While this is ambitious, discussions need to takeplace now for such an initiative to ever be realised even within medium-term flood riskplanning horizons.
There have been some initiatives for studying floods in their global context. One of20
the earliest was the Natural Disaster Hotspots study of the World Bank (Arnold et al.,2005), which prepared a preliminary map of global flood hazard frequency, and exam-ined mortality and economic risk. Recently, modelling efforts are undertaken with theaim of assessing global flood hazard and risk (UNISDR, 2011; Hirabayashi et al., 2013;Ward et al., 2013b; Winsemius et al., 2013). A different and very interesting path has25
been initiated by the earthquake risk community by launching the Global EarthquakeModel (GEM, www.globalquakemodel.org). GEM is a collaborative effort and involvesscientists and stakeholders from around the globe. Data, models, open-source soft-ware, and knowledge are shared with the final aim of expanding the science of earth-
1590

NHESSD2, 1559–1612, 2014
Floods and climate
B. Merz et al.
Title Page
Abstract Introduction
Conclusions References
Tables Figures
J I
J I
Back Close
Full Screen / Esc
Printer-friendly Version
Interactive Discussion
Discussion
Paper
|D
iscussionP
aper|
Discussion
Paper
|D
iscussionP
aper|
quake risk, informing decision making and increasing earthquake resilience worldwide.We feel that the flood research community should foster global approaches and shouldstudy physical and societal mechanisms of flooding within their global interconnected-ness. This global perspective would not only improve our understanding and exploita-tion of linkages between climate and flooding, but would also help to understand and5
mitigate far-distance impacts of flooding, such as the disruption of global supply chains.
Acknowledgements. This paper is a result of the EGU Topical Meeting “Floods and Climate:understanding and exploiting the link between floods and climate” held on 4–5 October 2012,at GFZ German Research Center for Geosciences in Potsdam. Financial support for thismeeting by European Geosciences Union, AXA Research Fund, Free University Berlin and10
geo.X is gratefully acknowledged.
The service charges for this open access publicationhave been covered by a Research Centre of theHelmholtz Association.15
References
Abrahams, A. D. and Ponczynski, J. J.: Drainage density in relation to precipitation intensity inthe USA, J. Hydrol., 75, 383–388, 1984.
Apel, H., Merz, B., and Thieken, A. H.: Influence of dike breaches on flood frequency estimation,Comput. Geosci., 35, 907–923, doi:10.1016/j.cageo.2007.11.003, 2009.20
Arnbjerg-Nielsen, K., Willems, P., Olsson, J., Beecham, S., Pathirana. A., Gregersen, I. B.,Madsen, H., and Nguyen, V.-T.-V.: Impacts of climate change on rainfall extremes and ur-ban drainage systems: a review, Water Sci. Technol., 68, 16–28, doi:10.2166/wst.2013.251,2013.
Arnold, M., Dilley, M., Deichmann, U., Chen, R. S., and Lerner-Lam, A. L.: Natural Disaster25
Hotspots: a Global Risk Analysis, World Bank, Washington DC, 2005.Bachmair, S. and Weiler, M.: New dimensions of hillslope hydrology, in: Forest Hydrology and
Biogeochemistry: Synthesis of Research and Future Directions, edited by: Levia, D., Carlyle-Moses, D., and Tanaka, T., Springer, 455–481, 2011.
1591
NHESSD2, 1559–1612, 2014
Floods and climate
B. Merz et al.
Title Page
Abstract Introduction
Conclusions References
Tables Figures
J I
J I
Back Close
Full Screen / Esc
Printer-friendly Version
Interactive Discussion
Discussion
Paper
|D
iscussionP
aper|
Discussion
Paper
|D
iscussionP
aper|
Baker, V. R.: Paleoflood hydrology: origin, progress, prospects, Geomorphology, 101, 1–13,doi:10.1016/j.geomorph.2008.05.016, 2008.
Becker, A., Finger, P., Meyer-Christoffer, A., Rudolf, B., Schamm, K., Schneider, U., andZiese, M.: A description of the global land-surface precipitation data products of the GlobalPrecipitation Climatology Centre with sample applications including centennial (trend) analy-5
sis from 1901–present, Earth Syst. Sci. Data, 5, 71–99, doi:10.5194/essd-5-71-2013, 2013.Benito, G., Sopena, A., Sanchez-Moya, Y., Machado, M. J., and Perez-Gonzalez, A.: Palae-
oflood record of the Tagus River (Central Spain) during the Late Pleistocene and Holocene,Quaternary Sci. Rev., 22, 1737–1756, 2003a.
Benito, G., Sanchez-Moya, Y., and Soena, A.: Sedimentology of high-stage flood deposits of10
the Tagus River, central Spain, Sedimentology, 157, 107–132, 2003b.Benito, G., Díez-Herrero, A., and Fernández de Villalta, M.: Magnitude and frequency of flood-
ing in the Tagus Basin (Central Spain) over the last millennium, Climatic Change, 58, 171–192, 2003c.
Bichet, A., Wild, M., Folini, D., and Schär, C.: Global precipitation response to changing forcings15
since 1870, Atmos. Chem. Phys., 11, 9961–9970, doi:10.5194/acp-11-9961-2011, 2011.Bichet, A., Folini, D., Wild, M., and Schär, C.: Enhanced Central European summer precipita-
tion in the late 19th century: a link to the Tropics, Q. J. Roy. Meteor., 140, 111–123, Soc.,doi:10.1002/qj.2111, 2013.
Blöschl, G. and Merz, R.: Landform–hydrology feedbacks, in: Landform: Structure, Evolution,20
Process Control, edited by: Otto, J.-C. and Dikau, R., Springer, Wien, Heidelberg, 117–126,2010.
Blöschl, G., Viglione, A., and Montanari, A.: Emerging approaches to hydrological risk manage-ment in a changing world, in: Climate Vulnerability, edited by: Pielke Sr., R. A., Elsevier Inc.,Academic Press, 3–10, chap. 5.05, doi:10.1016/B978-0-12-384703-4.00505-0, 2013.25
Bouwer, L. M., Vermaat, J. E., and Aerts, J. C. J. H.: Winter atmospheric circulation and river dis-charge in northwest Europe, Geophys. Res. Lett., 33, L06403, doi:10.1029/2005GL025548,2006.
Brazdil, R., Pfister, C., Wanner, H., Storch, H. V., and Luterbacher, J.: Historical climatology inEurope: the state of the art, Climate Change, 70, 363–430, 2005.30
Bronnimann, S.: Impact of El Niño–Southern Oscillation on European climate, Rev. Geophys.,45, RG3003, doi:10.1029/2006RG000199, 2007.
1592
NHESSD2, 1559–1612, 2014
Floods and climate
B. Merz et al.
Title Page
Abstract Introduction
Conclusions References
Tables Figures
J I
J I
Back Close
Full Screen / Esc
Printer-friendly Version
Interactive Discussion
Discussion
Paper
|D
iscussionP
aper|
Discussion
Paper
|D
iscussionP
aper|
Bronstert, A., Bárdossy, A., Bismuth, C., Buiteveld, H., Disse, M., Engel, H., Fritsch, U., Hun-decha, Y., Lammersen, R., Niehoff, D., and Ritter, N.: Multi-scale modelling of land-usechange and river training effects on floods in the Rhine basin, River Res. Appl., 23, 1102–1125, 2007.
Bubeck, P., Botzen, W. J. W., and Aerts, J. C. J. H.: A review of risk perceptions and other5
factors that influence mitigation behaviour?, Risk Anal., 32, 1481–1495, doi:10.1111/j.1539-6924.2011.01783.x, 2012.
Burroughs, W. J.: Weather Cycles, Real or Imaginary?, 2nd edn., Cambridge University Press,Cambridge, 317 pp., 2003.
Cayan, D. R.: Interannual climate variability and snowpack in the Western United States, J.10
Climate, 9, 928–948, 1996.Cayan, D. R., Redmond, K. T., and Riddle, L. G.: ENSO and hydrologic extremes in the Western
United States, J. Climate, 12, 2881–2893, 1999.Cheng, Y., Tang, Y., and Chen, D.: Relationship between predictability and forecast skill of
ENSO on various time scales, J. Geophys. Res., 116, C12006, doi:10.1029/2011JC007249,15
2011.Crompton, R. P. and McAneney, K. J.: Normalised Australian insured losses from meteorologi-
cal hazards: 1967–2006, Environ. Sci. Policy, 11, 371–378, 2008.Czymzik, M., Dulski, P., Plessen, B., von Grafenstein, U., Naumann, R., and Brauer, A.:
A 450-year record of spring/summer flood layers in annually laminated sediments20
from Lake Ammersee (southern Germany), Water Resour. Res., 46, W11528,doi:10.1029/2009WR008360, 2010.
Dankers, R. and Feyen, L.: Flood hazard in Europe in an ensemble of regional climate scenar-ios, J. Geophys. Res.-Atmos., 114, D16108, doi:10.1029/2008JD011523, 2009.
Delgado, J. M., Merz, B., and Apel, H.: A climate-flood link for the lower Mekong River, Hydrol.25
Earth Syst. Sci., 16, 1533–1541, doi:10.5194/hess-16-1533-2012, 2012.Delgado, J. M., Merz, B., and Apel, H.: Projecting flood hazard under climate change: an al-
ternative approach to model chains, Nat. Hazards Earth Syst. Sci. Discuss., 1, 7357–7385,doi:10.5194/nhessd-1-7357-2013, 2013.
Di Baldassarre, G., Viglione, A., Carr, G., Kuil, L., Salinas, J. L., and Blöschl, G.: Socio-30
hydrology: conceptualising human-flood interactions, Hydrol. Earth Syst. Sci., 17, 3295–3303, doi:10.5194/hess-17-3295-2013, 2013.
1593

NHESSD2, 1559–1612, 2014
Floods and climate
B. Merz et al.
Title Page
Abstract Introduction
Conclusions References
Tables Figures
J I
J I
Back Close
Full Screen / Esc
Printer-friendly Version
Interactive Discussion
Discussion
Paper
|D
iscussionP
aper|
Discussion
Paper
|D
iscussionP
aper|
Ely, L., Enzel, Y., Baker, V. R., and Cayan, D. R.: A 5000-year record of extreme floods andclimate change in the southwestern United States, Science, 262, 410–412, 1993.
Enzel, Y., Ely, L., House, P. K., Baker, V. R., and Webb, R. H.: Paleoflood evidence for a naturalupper bound to flood magnitudes in the Colorado River Basin, Water Resour. Res., 29, 2287–2297, doi:10.1029/93WR00411, 1993.5
Feyen, L., Dankers, R., Bódis, K., Salamon, P., and Barredo, J.: Fluvial flood risk in Europe inpresent and future climates, Climate Change, 112, 47–62, doi:10.1007/s10584-011-0339-7,2012.
Franks, S. W. and Kuczera, G.: Flood frequency analysis: evidence and implicationsof secular climate variability, New South Wales, Water Resour. Res., 38, 1062,10
doi:10.1029/2001WR000232, 2002.Gaál, L., Szolgay, J, Kohnová, S., Parajka, J., Merz, R., Viglione, A., and Blöschl, G.: Flood
timescales: understanding the interplay of climate and catchment processes through com-parative hydrology, Water Resour. Res., 48, W04511, doi:10.1029/2011WR011509, 2012.
Gaetani, M., Baldi, M., Dalu, G. A., and Maracchi, G.: Jetstream and rainfall distribution in the15
Mediterranean region, Nat. Hazards Earth Syst. Sci., 11, 2469–2481, doi:10.5194/nhess-11-2469-2011, 2011.
Gergis, J. and Ashcroft, L.: Rainfall variations in south-eastern Australia part 2: a comparisonof documentary, early instrumental and palaeoclimate records, 1788–2008, Int. J. Climatol.,33, 2973–2987, doi:10.1002/joc.3639, 2012.20
Gilli, A., Anselmetti, F. S., Glur, L., and Wirth, S. B.: Lake sediments as archives of recurrencerates and intensities of past flood events, in: Dating Torrential Processes on Fans and Cones– Methods and their Application for Hazard and Risk Assessment, edited by: Schneuwly-Bollschweiler, M., Stoffel, M., and Rudolf-Miklau, F., Advances in Global Change Research,Springer, 47, 225–242, 2012.25
Glaser, R., Riemann, D., Schönbein J., Barriendos, M., Brázdil R., Bertolin, C., Camuffo, D.,Deutsch, M., Dobrovolny P., van Engelen, A., Enzi, S., Halícková M., Koenig, S. J., Kotyza, O.,Limanówka D., Macková J., Sghedoni, M., Martin, B., and Himmelsbach, I.: The variability ofEuropean floods since AD 1500, Climatic Change, 101, 235–256, 2010.
Gregersen, I. B., Madsen, H., Rosbjerg, D., and Arnbjerg-Nielsen, K.: A spatial and non-30
stationary model for the frequency of extreme rainfall events, Water Resour. Res., 49, 127–136, doi:10.1029/2012WR012570, 2013.
Gumbel, E. J.: The return period of flood flows, Ann. Math. Stat., 12, 163–190, 1941.
1594
NHESSD2, 1559–1612, 2014
Floods and climate
B. Merz et al.
Title Page
Abstract Introduction
Conclusions References
Tables Figures
J I
J I
Back Close
Full Screen / Esc
Printer-friendly Version
Interactive Discussion
Discussion
Paper
|D
iscussionP
aper|
Discussion
Paper
|D
iscussionP
aper|
Hannaford, J. and Marsh, T. J.: High flow and flood trends in a network of undisturbed catch-ments in the UK, Int. J. Climatol., 28, 1325–1338., 2008.
Hannah, D. M., Demuth, S., van Lanen, H. A. J., Looser, U., Prudhomme, C., Rees, G., Stahl, K.,and Tallaksen, L. M.: Large-scale river flow archives: importance, current status and futureneeds, Hydrol. Process., 25, 1191–1200, doi:10.1002/hyp.7794, 2011.5
Heltbert, R., Siegel, P. B., and Jorgensen, S. L.: Addressing human vulnerability to climatechange: toward a “no-regrets” approach, Global Environ. Chang., 19, 89–99, 2009.
Hess, P. and Brezowsky, H.: Katalog der Großwetterlagen Europas, Ber. Dt. Wetterd. in derUS-Zone 33, 1952.
Hirabayashi, Y., Roobavannan, M., Sujan, K., Lisako, K., Dai, Y., Satoshi, W., Hyungjun, K., and10
Shinjiro, K.: Global flood risk under climate change, Nature Climate Change, 3, 816–821,doi:10.1038/nclimate1911, 2013.
Hirschboeck, K. K.: Catastrophic flooding and atmospheric circulation anomalies, in: Catas-trophic Flooding, edited by: Mayer, L. and Nash, D. B., Allen & Unwin, 23–56, 1987.
Hirschboeck, K. K.: Flood hydroclimatology, in: Flood Geomorphology, edited by: Baker, V. R.,15
Kochel, R. C., and Pattern, P. C., Wiley, NY, 27–49, 1988.House, P. K. and Hirschboeck, K. K.: Hydroclimatological and paleohydrological context of ex-
treme winter flooding in Arizona, 1993, in: Storm-Induced Geological Hazards: Case His-tories from the 1992–1993 Winter Storm in Southern California and Arizona, edited by:Larson, R. A. and Slosson, J. E., Geological Society of America Reviews in Engineering20
Geology, Boulder, Colorado, vol. XI, 1–24, 1997.IPCC: Managing the Risks of Extreme Events and Disasters to Advance Climate Change Adap-
tation. A Special Report of Working Groups I and II of the Intergovernmental Panel on ClimateChange, Cambridge University Press, Cambridge, New York, 2012.
Jacobeit, J., Glaser, R., Luterbacher, J., and Wanner, H.: Links between flood events in central25
Europe since AD 1500 and large-scale atmospheric circulation modes, Geophys. Res. Lett.,30, 1172, doi:10.1029/2002GL016433, 2003.
Jain, S. and Lall, U.: Magnitude and timing of annual maximum floods: trends and large-scaleclimatic associations for the Blacksmith Fork River, Utah, Water Resour. Res., 36, 3641–3651, 2000.30
Jain, S. and Lall, U.: Floods in a changing climate: does the past represent the future?, WaterResour. Res., 37, 3193–3205, 2001.
1595

NHESSD2, 1559–1612, 2014
Floods and climate
B. Merz et al.
Title Page
Abstract Introduction
Conclusions References
Tables Figures
J I
J I
Back Close
Full Screen / Esc
Printer-friendly Version
Interactive Discussion
Discussion
Paper
|D
iscussionP
aper|
Discussion
Paper
|D
iscussionP
aper|
Jongman, B., Ward, P. J., and Aerts, J. C. J. H.: Global exposure to river andcoastal flooding: long term trends and changes, Global Environ. Chang., 22, 823–835,doi:10.1016/j.gloenvcha.2012.07.004, 2012.
Karamperidou, C., Cioffi, F., and Lall, U.: Surface temperature gradients as diagnostic indicatorsof midlatitude circulation dynamics, J. Climate, 25, 4154–4171, 2012.5
Karamperidou, C., Cane, M. A., Lall, U., and Wittenberg, A. T.: Intrinsic modulation of ENSOpredictability viewed through a local Lyapunov lens, Clim. Dynam., 25, 4154–4171, 2013.
Kay, A. L., Davies, H. N., Bell, V. A., and Jones, R. G.: Comparison of uncertainty sources forclimate change impacts: flood frequency in England, Climatic Change, 92, 41–63, 2009.
Kerr, R. A.: Time to adapt to a warming world, but where’s the science?, Science, 334, 1052–10
1053, 2011.Kiem, A. S., Franks, S. W., and Kuczera, G.: Multi-decadal variability of flood risk, Geophys.
Res. Lett., 30, 1035, doi:10.1029/2002GL015992, 2003.Kingston, D. G., Lawler, D. M., and McGregor, G. R.: Linkages between atmospheric circula-
tion, climate and streamflow in the northern North Atlantic: research prospects, Prog. Phys.15
Geog., 30, 143–174, 2006.Knox, J. C.: Sensitivity of modern and Holocene floods to climate change, Quaternary Sci. Rev.,
19, 439–457, 2000.Kochel, R. C. and Baker, V. R.: Paleoflood hydrology, Science, 215, 353–361,
doi:10.1126/science.215.4531.353, 1982.20
Kreibich, H., Seifert, I., Thieken, A. H., Lindquist, E., Wagner, K., and Merz, B.: Recent changesin flood preparedness of private households and businesses in Germany, Reg. Environ.Change, 11, 59–71, doi:10.1007/s10113-010-0119-3, 2011.
Kumar, P.: Variability, feedback, and cooperative process dynamics: elements of a uni-fying hydrologic theory, Geography Compass, 1, 1338–1360, doi:10.1111/j.1749-25
8198.2007.00068.x, 2007.Kundzewicz, Z. W., Ulbrich, U., Brucher, T., Graczyk, D., Kruger, A., Leckebusch, G. C., Men-
zel, L., Pinskwar, I., Radziejewski, M., and Szwed, M.: Summer floods in central europe –climate change track?, Nat. Hazards, 36, 165–189, 2005.
Kwon, H.-H., Brown, C., and Lall, U.: Climate informed flood frequency analysis and predic-30
tion in Montana using hierarchical Bayesian modeling, Geophys. Res. Lett., 35, L05404,doi:10.1029/2007GL032220, 2008.
1596

NHESSD2, 1559–1612, 2014
Floods and climate
B. Merz et al.
Title Page
Abstract Introduction
Conclusions References
Tables Figures
J I
J I
Back Close
Full Screen / Esc
Printer-friendly Version
Interactive Discussion
Discussion
Paper
|D
iscussionP
aper|
Discussion
Paper
|D
iscussionP
aper|
Levish, D. R.: Paleohydrologic bounds-nonexceedance information for flood hazard assess-ment, in: Ancient Floods, Modern Hazards: Principles and Applications of Paleoflood Hy-drology, edited by: House, P. K., Webb, R. H., Baker, V. R., and Levish, D. R., AmericanGeophysical Union Water Science and Application Series, vol. 5, 175–190., 2002.
Lin, Z., Levy, J. K., Xu, X., Zhao, S., and Hartmann, J.: “Weather and seasional climate predic-5
tion for flood planning in the Yangtze River Basin”, Stoch. Env. Res Risk A., 19, 428–437,2005.
Mangili, C., Brauer, A., Moscariello, A., and Naumann, R.: Microfacies of detrital event layersdeposited in Quaternary varved lake sediments of the Piànico-Sèllere Basin (northern Italy),Sedimentology, 52, 927–943, 2005.10
Maraun, D., Rust, H. W., and Osborn, T. J.: Synoptic airflow and UK daily precipitation extremes:development and validation of a vector generalised linear model, Extremes, 13, 133–153,doi:10.1007/s10687-010-0102-x, 2010.
Merz, B., Hall, J., Disse, M., and Schumann, A.: Fluvial flood risk management in a changingworld, Nat. Hazards Earth Syst. Sci., 10, 509–527, doi:10.5194/nhess-10-509-2010, 2010a.15
Merz, B., Kreibich, H., Schwarze, R., and Thieken, A.: Review article “Assessment of economicflood damage”, Nat. Hazards Earth Syst. Sci., 10, 1697–1724, doi:10.5194/nhess-10-1697-2010, 2010b.
Merz, R. and Blöschl, G.: Flood frequency hydrology 1: Temporal, spatial and causal expansionof information, Water Resour. Res., 44, W08432, doi:10.1029/2007WR006744, 2008a.20
Merz, R. and Blöschl, G.: Flood frequency hydrology 2: Combining data evidence, Water Re-sour. Res., 44, W08433, doi:10.1029/2007WR006745, 2008b.
Moss, R., Babiker, M., Brinkman, S., Calvo, E., Carter, T., Edmonds, J., Elgizouli, I., Emori, S.,Erda, L., Hibbard, K., Jones, R., Kainuma, M., Kelleher, J., Lamarque, J. F., Manning, M.,Matthews, B., Meehl, J., Meyer, L., Mitchell, J., Nakicenovic, N., O’Neill, B., Pichs, R., Ri-25
ahi, K., Rose, S., Runci, P., Stouffer, R., van Vuuren, D., Weyant, J., Wilbanks, T., van Yper-sele, J. P., and Zurek, M.: Towards new scenarios for analysis of emissions, climate change,impacts and response strategies, Technical Summary, Intergovernmental Panel on ClimateChange, Geneva, 25 pp., 2008.
Moss, R. H., Edmonds, J. A., Hibbard, K. A., Manning, M. R., Rose, S. K., van Vuuren, D. P.,30
Carter, T. R., Emori, S., Kainuma, M., Kram, T., Meehl, G. A., Mitchell, J. F. B., Naki-cenovic, N., Riahi, K., Smith, S. J., Stouffer, R. J., Thomson, A. M., Weyant, J. P., and
1597

NHESSD2, 1559–1612, 2014
Floods and climate
B. Merz et al.
Title Page
Abstract Introduction
Conclusions References
Tables Figures
J I
J I
Back Close
Full Screen / Esc
Printer-friendly Version
Interactive Discussion
Discussion
Paper
|D
iscussionP
aper|
Discussion
Paper
|D
iscussionP
aper|
Wilbanks, T. J.: The next generation of scenarios for climate change research and assess-ment, Nature, 463, 747–756, doi:10.1038/nature08823, 2010.
Mudelsee, M., Deutsch, M., Borngen, M., and Tetzlaff, G.: Trends in flood risk of the River Werra(Germany) over the past 500 years, Hydrolog. Sci. J., 51, 818–833, 2006.
Murphy, P.: Evaluation of mixed-population flood frequency analysis, J. Hydrol. Eng., 6, 62–70,5
2001.Murphy, C., Harrigan, S., Hall, J., and Wilby, R. L.: Climate-driven trends in mean and high flows
from a network of reference stations in Ireland, Hydrolog. Sci. J., 58, 755–772, 2013.Nakamura, J., Lall, U., Kushnir, Y., Robertson, A. W., and Seager, R.: Dynamical structure of
extreme floods in the US Midwest and the United Kingdom, J. Hydrometeorol., 14, 485–504,10
doi:10.1175/JHM-D-12-059.1, 2013.Nakicenovic, N. and Swart, R.: IPCC Special Report on Emissions Scenarios, Cambridge Uni-
versity Press, Cambridge, UK, 2000.Nied, M., Hundecha, Y., and Merz, B.: Flood-initiating catchment conditions: a spatio-temporal
analysis of large-scale soil moisture patterns in the Elbe River basin, Hydrol. Earth Syst. Sci.,15
17, 1401–1414, doi:10.5194/hess-17-1401-2013, 2013.Ott, I., Duethmann, D., Liebert, J., Berg, P., Feldmann, H., Ihringer, J., Kunstmann, H., Merz, B.,
Schaedler, G., and Wagner, S.: High-resolution climate change impact analysis on medium-sized river catchments in Germany: an ensemble assessment, J. Hydrometeorol., 14, 1175–1193, doi:10.1175/JHM-D-12-091.1, 2013.20
Petrow, T., Thieken, A. H., Kreibich, H., Merz, B., and Bahlburg, C. H.: Improvements on floodalleviation in Germany: lessons learned from the Elbe flood in August 2002, Environ. Man-age., 38, 717–732, doi:10.1007/s00267-005-6291-4, 2006.
Pfister, C.: Wetternachhersage 500 Jahre Klimavariationen und Naturkatastrophen (1496–1995), Phaupt, Bern, 1999.25
Philipp, A., Della-Marta, P. M., Jacobeit, J., Fereday, D. R., Jones, P. D., Moberg, A., and Wan-ner, H.: Long-term variability of daily north atlantic–european pressure patterns since 1850classified by simulated annealing clustering, J. Climate, 20, 4065–4095, 2007.
Phillips, D. H., Reinink, Y., Skarupa, T. E., Ester III, C. E., and Skindlov, J. A.: Water resourcesplanning and management at the Salt River Project, Arizona, USA, Irrigation and Drainage30
Systems, 23, 109–124, doi:10.1007/s10795-009-9063-0, 2009.Pilgrim, D. H. and Cordery, I.: Flood runoff, in: Handbook of Hydrology, edited by: Maid-
ment, D. R., McGraw-Hill Companies, International Edn., chap. 9, 42 pp., 1993.
1598
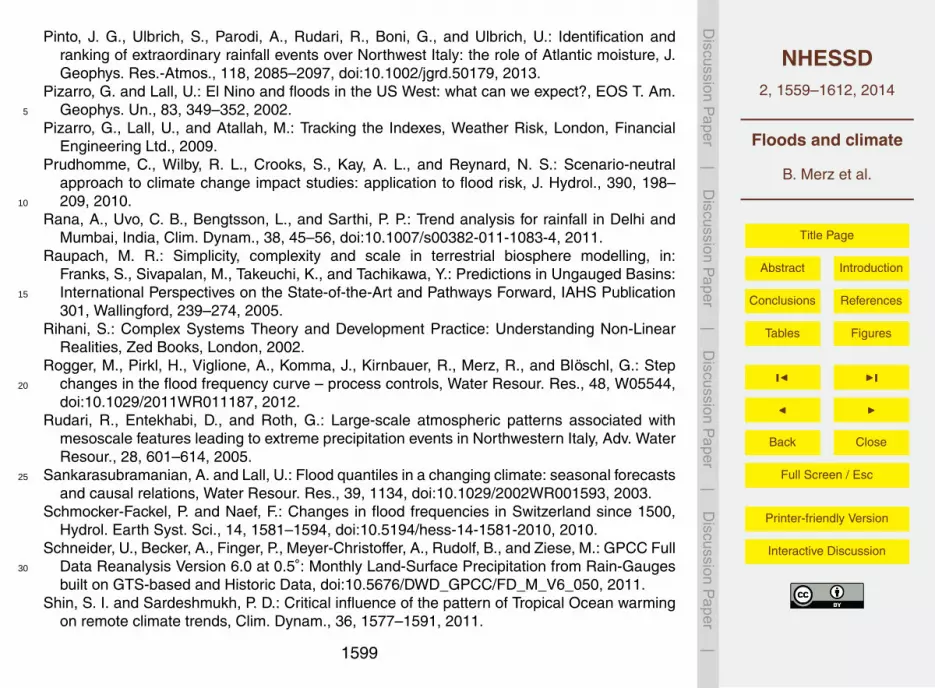
NHESSD2, 1559–1612, 2014
Floods and climate
B. Merz et al.
Title Page
Abstract Introduction
Conclusions References
Tables Figures
J I
J I
Back Close
Full Screen / Esc
Printer-friendly Version
Interactive Discussion
Discussion
Paper
|D
iscussionP
aper|
Discussion
Paper
|D
iscussionP
aper|
Pinto, J. G., Ulbrich, S., Parodi, A., Rudari, R., Boni, G., and Ulbrich, U.: Identification andranking of extraordinary rainfall events over Northwest Italy: the role of Atlantic moisture, J.Geophys. Res.-Atmos., 118, 2085–2097, doi:10.1002/jgrd.50179, 2013.
Pizarro, G. and Lall, U.: El Nino and floods in the US West: what can we expect?, EOS T. Am.Geophys. Un., 83, 349–352, 2002.5
Pizarro, G., Lall, U., and Atallah, M.: Tracking the Indexes, Weather Risk, London, FinancialEngineering Ltd., 2009.
Prudhomme, C., Wilby, R. L., Crooks, S., Kay, A. L., and Reynard, N. S.: Scenario-neutralapproach to climate change impact studies: application to flood risk, J. Hydrol., 390, 198–209, 2010.10
Rana, A., Uvo, C. B., Bengtsson, L., and Sarthi, P. P.: Trend analysis for rainfall in Delhi andMumbai, India, Clim. Dynam., 38, 45–56, doi:10.1007/s00382-011-1083-4, 2011.
Raupach, M. R.: Simplicity, complexity and scale in terrestrial biosphere modelling, in:Franks, S., Sivapalan, M., Takeuchi, K., and Tachikawa, Y.: Predictions in Ungauged Basins:International Perspectives on the State-of-the-Art and Pathways Forward, IAHS Publication15
301, Wallingford, 239–274, 2005.Rihani, S.: Complex Systems Theory and Development Practice: Understanding Non-Linear
Realities, Zed Books, London, 2002.Rogger, M., Pirkl, H., Viglione, A., Komma, J., Kirnbauer, R., Merz, R., and Blöschl, G.: Step
changes in the flood frequency curve – process controls, Water Resour. Res., 48, W05544,20
doi:10.1029/2011WR011187, 2012.Rudari, R., Entekhabi, D., and Roth, G.: Large-scale atmospheric patterns associated with
mesoscale features leading to extreme precipitation events in Northwestern Italy, Adv. WaterResour., 28, 601–614, 2005.
Sankarasubramanian, A. and Lall, U.: Flood quantiles in a changing climate: seasonal forecasts25
and causal relations, Water Resour. Res., 39, 1134, doi:10.1029/2002WR001593, 2003.Schmocker-Fackel, P. and Naef, F.: Changes in flood frequencies in Switzerland since 1500,
Hydrol. Earth Syst. Sci., 14, 1581–1594, doi:10.5194/hess-14-1581-2010, 2010.Schneider, U., Becker, A., Finger, P., Meyer-Christoffer, A., Rudolf, B., and Ziese, M.: GPCC Full
Data Reanalysis Version 6.0 at 0.5◦: Monthly Land-Surface Precipitation from Rain-Gauges30
built on GTS-based and Historic Data, doi:10.5676/DWD_GPCC/FD_M_V6_050, 2011.Shin, S. I. and Sardeshmukh, P. D.: Critical influence of the pattern of Tropical Ocean warming
on remote climate trends, Clim. Dynam., 36, 1577–1591, 2011.
1599

NHESSD2, 1559–1612, 2014
Floods and climate
B. Merz et al.
Title Page
Abstract Introduction
Conclusions References
Tables Figures
J I
J I
Back Close
Full Screen / Esc
Printer-friendly Version
Interactive Discussion
Discussion
Paper
|D
iscussionP
aper|
Discussion
Paper
|D
iscussionP
aper|
Sivapalan, M., Blöschl, G., Merz, R., and Gutknecht, D.: Linking flood frequency to long-term water balance: incorporating effects of seasonality, Water Resour. Res., 41, W06012,doi:10.1029/2004WR003439, 2005.
Sivapalan, M., Savenije, H. H. G., and Blöschl, G.: Socio-hydrology: a new science of peopleand water, Hydrol. Process., 26, 1270–1276, doi:10.1002/hyp.8426, 2012.5
Steinbrich, A. and Weiler, M.: Ausweisung der für die Hochwasserentstehung wichtigenAbflussbildungsprozesse für Baden-Württemberg, in: Forum für Hydrologie und Wasserbe-wirtschaftung Hydrologische Wissenschaften, edited by: Caspar, M. and Gronz, O., Fachge-meinschaft in der DWA, 2010, 171–185, 2012.
Swierczynski, T., Brauer, A., Lauterbach, S., Martín-Puertas, C., Dulski, P., von Grafenstein U.,10
and Rohr, C.: A 1600 yr seasonally resolved record of decadal-scale flood variability from theAustrian Pre-Alps, Geology, 40, 1047–1050, doi:10.1130/G33493.1, 2012.
Swierczynski, T., Lauterbach, S., Dulski, P., Delgado, J., Merz, B., and Brauer, A.: Mid- to lateHolocene flood frequency changes in the northeastern Alps as recorded in varved sedimentsof Lake Mondsee (Upper Austria), Quaternary Sci. Rev., 80, 78–90, 2013.15
Tobin, G. A.: The levee love affair: a stormy relationship, Water Resour. Bull., 31, 359–367,1995.
Todhunter, P.: Uncertainty of the assumptions required for estimating the regulatory flood: RedRiver of the North, J. Hydrol. Eng., 17, 1011–1020, 2012.
Toreti, A., Xoplaki, E., Maraun, D., Kuglitsch, F. G., Wanner, H., and Luterbacher, J.: Char-20
acterisation of extreme winter precipitation in Mediterranean coastal sites and associatedanomalous atmospheric circulation patterns, Nat. Hazards Earth Syst. Sci., 10, 1037–1050,doi:10.5194/nhess-10-1037-2010, 2010.
Tucker, G. and Bras, R.: A stochastic approach to modeling the role of rainfall variability indrainage basin evolution, Water Resour. Res., 36, 1953–1964, 2000.25
UNISDR: Global Assessment Report on Disaster Risk Reduction 2011, Revealing Risk, Re-defining Development, United Nations International Strategy for Disaster Reduction Secre-tariat, Geneva, 2011.
UNISDR: Global Assessment Report on Disaster Risk Reduction 2013, from Shared Risk toShared Value: the Business Case for Disaster Risk Reduction, United Nations International30
Strategy for Disaster Reduction Secretariat, Geneva, 2013.Viglione, A. and Blöschl, G.: On the role of storm duration in the mapping of rainfall to flood
return periods, Hydrol. Earth Syst. Sci., 13, 205–216, doi:10.5194/hess-13-205-2009, 2009.
1600

NHESSD2, 1559–1612, 2014
Floods and climate
B. Merz et al.
Title Page
Abstract Introduction
Conclusions References
Tables Figures
J I
J I
Back Close
Full Screen / Esc
Printer-friendly Version
Interactive Discussion
Discussion
Paper
|D
iscussionP
aper|
Discussion
Paper
|D
iscussionP
aper|
Viglione, A., Borga, M., Balabanis, P., and Blöschl, G.: Barriers to the exchange of hydromete-orological data in Europe: results from a survey and implications for data policy, J. Hydrol.,394, 63–77, 2010.
Viglione, A., Merz, R., Salinas, J., and Blöschl, G.: Flood frequency hydrology: 3. Bayesianframework, Water Resour. Res., 49, 1–18, doi:10.1029/2011WR010782, 2013.5
Ward, P. J., Beets, W., Bouwer, L. M., Aerts, J. C. J. H., and Renssen, H.: Sensitivity of riverdischarge to ENSO, Geophys. Res. Lett., 37, L12402, doi:10.1029/2010GL043215, 2010.
Ward, P. J., Van Pelt, S. C., De Keizer, O., Aerts, J. C. J. H., Beersma, J. J., Van denHurk, B. J. J. M., and Te Linde, A.: Including climate change projections in probabilistic floodrisk assessment, J. Flood Risk Manage., doi:10.1111/jfr3.12029, 2013a.10
Ward, P. J., Jongman, B., Sperna Weiland, F., Bouwman, A., Van Beek, R., Bierkens, M. F. P.,Ligtvoet, W., and Winsemius, H. C.: Assessing flood risk at the global scale: model setup,results, and sensitivity, Environ. Res. Lett., 8, 044019, doi:10.1088/1748-9326/8/4/044019,2013b.
Ward, P. J., Eisner, S., Flörke, M., Dettinger, M. D., and Kummu, M.: Annual flood sensitivities15
to El Niño–Southern Oscillation at the global scale, Hydrol. Earth Syst. Sci., 18, 47–66,doi:10.5194/hess-18-47-2014, 2014.
Waylen, P. R. and Caviedes, C. N.: El Niño and annual floods on the north Peruvian littoral, J.Hydrol., 89, 141–156, 1986.
Weiler, M., Scheffler, C., Tautz, A., and Rosin, K.: Development of a hydrologic process model20
for mountain pine beetle affected areas in British Columbia, Report to the Fraser Salmon andWatersheds Program, Pacific Salmon Foundation, Vancouver, 2009.
Whitfield, P. H., Burn, D. H., Hannaford, J., Higgins, H., Hodgkins, G. A., Marsh, T., andLooser, U.: Reference hydrologic networks I. The status and potential future directions of na-tional reference hydrologic networks for detecting trends, Hydrolog. Sci. J., 57, 1562–1579,25
2012.Wilhelm, B., Arnaud, F., Sabatier, P., Crouzet, C., Brisset, E., Chaumillon, E., Disnar, J. R.,
Guiter, F., Malet, E., Reyss, J. L., Tachikawa, K., Bard, E., and Delannoy, J. J.: 1400 yearsof extreme precipitation patterns over the Mediterranean French Alps and possible forcingmechanisms, Quaternary Res., 78, 1–12, 2012.30
Wilhelm, B., Arnaud, F., Sabatier, P., Magand, O., Chapron, E., Courp, T., Tachikawa, K.,Fanget, B., Malet, E., Pignol, C., Bard, E., and Delannoy, J. J.: Palaeoflood activity and cli-
1601

NHESSD2, 1559–1612, 2014
Floods and climate
B. Merz et al.
Title Page
Abstract Introduction
Conclusions References
Tables Figures
J I
J I
Back Close
Full Screen / Esc
Printer-friendly Version
Interactive Discussion
Discussion
Paper
|D
iscussionP
aper|
Discussion
Paper
|D
iscussionP
aper|
mate change over the last 1400 years recorded by lake sediments in the NW European Alps,J. Quaternary Sci., 28, 189–199, 2013.
Winsemius, H. C., Van Beek, L. P. H., Jongman, B., Ward, P. J., and Bouwman, A.: A frame-work for global river flood risk assessments, Hydrol. Earth Syst. Sci., 17, 1871–1892,doi:10.5194/hess-17-1871-2013, 2013.5
Zaalberg, R. and Midden, C. J. H.: Living behind dikes: mimicking flooding experiences, RiskAnal., 33, 866–876, doi:10.1111/j.1539-6924.2012.01868.x, 2012.
Zhang, Q., Xu, C.-Y., Jiang, T., and Wu, Y.: Possible influence of ENSO on annual maximumstreamflow of the Yangtze River, China, J. Hydrol., 333, 265–274, 2007.
1602

NHESSD2, 1559–1612, 2014
Floods and climate
B. Merz et al.
Title Page
Abstract Introduction
Conclusions References
Tables Figures
J I
J I
Back Close
Full Screen / Esc
Printer-friendly Version
Interactive Discussion
Discussion
Paper
|D
iscussionP
aper|
Discussion
Paper
|D
iscussionP
aper|
Table 1. Contrasting traditional views with emerging perspectives on flood hazard and risk.
Aspect Traditional view Emerging perspective
Und
erst
andi
ngcl
imat
e–flo
odlin
kage
s
Randomness Random: Floods are random events withflood magnitude quantified by a probabilitydistribution.
Causal: Flood occurrence and magnitude depend ona causal network of processes in atmosphere, catch-ment and river system. A fraction of the flood variabil-ity is described by deterministic processes, for exam-ple, by using climate information as co-variates in floodprobability distributions.
Spatial per-spective
Local: Floods are events that can be de-scribed fully by processes on a catchmentscale.
Global: Floods occur within spatial framework of large-scale circulation patterns, and global climate mecha-nisms.
Natural variabil-ity and floods
Stationary: Flood characteristics are sta-tionary and represent the long-term naturalvariability of the climate-catchment system.
Time-varying: Flood characteristics change in timedue to climate variability at different time scales.
Temporal per-spective
Recent: Flood characteristics result fromcurrent catchment characteristics and arederived from recent observations.
Long-term: Flood characteristics result from the long-term interplay of climate, geology, topography, vegeta-tion (biology), and humans. To fully understand floods,this long-term interplay has to be disentangled.
Exp
loiti
ngcl
imat
e–flo
odlin
kage
s
Flood estima-tion
Process-neutral: Flood estimation doesnot differentiate between different floodevent types and processes. Flood fre-quency analysis is based on iid assump-tion.
Process-based: Flood events of different types occurin a given catchment. Knowledge on flood generationprocesses informs flood probability estimation.
Flood projec-tions underclimate change
Model chain: Flood scenarios are the re-sult of model chains, from emission sce-narios through climate models to flood fre-quency estimation.
Model chain augmented: In addition to model chains,a range of approaches for assessing climate-relatedflood changes are used, such as assessing historicalclimate variability, or using ocean source –atmosphericmoisture transport – flood linkages.
Flood risk man-agement
Hazard-focused, static: Flood manage-ment focusses on flood hazard reductionwithin a static framework, principally usingstructural or zoning flood proofing or finan-cial instruments (insurance).
Risk-oriented, dynamic: Risk management takes intoaccount changing hazard, exposure and vulnerability,and the combined application of financial, structuraland non-structural measures. The best way to mitigatefloods depends on how well changes in flood risk canbe predicted at short and long time scales.
1603

NHESSD2, 1559–1612, 2014
Floods and climate
B. Merz et al.
Title Page
Abstract Introduction
Conclusions References
Tables Figures
J I
J I
Back Close
Full Screen / Esc
Printer-friendly Version
Interactive Discussion
Discussion
Paper
|D
iscussionP
aper|
Discussion
Paper
|D
iscussionP
aper|
Table 2. Average economic flood losses in Australia stratified according to ENSO phase. Anal-ysis based on data from EM-DAT (CRED, Belgium) for 1971–2010, and insured loss datanormalised for changes in wealth from the Insurance Council of Australia, for 1967–2010 (formethod see Crompton et al., 2008). T test and Mann–Whitney U test were applied indicatingthe significance of the differences in average losses.
Dataset N Average damage t test MWU testLa Niña Non La Niña
EM-DAT [mn US$] 57 1070 142 p = 0.026 p = 0.014
Insurance Council of50 369 61 p = 0.014 p = 0.024
Australia [mn AUS$]
1604
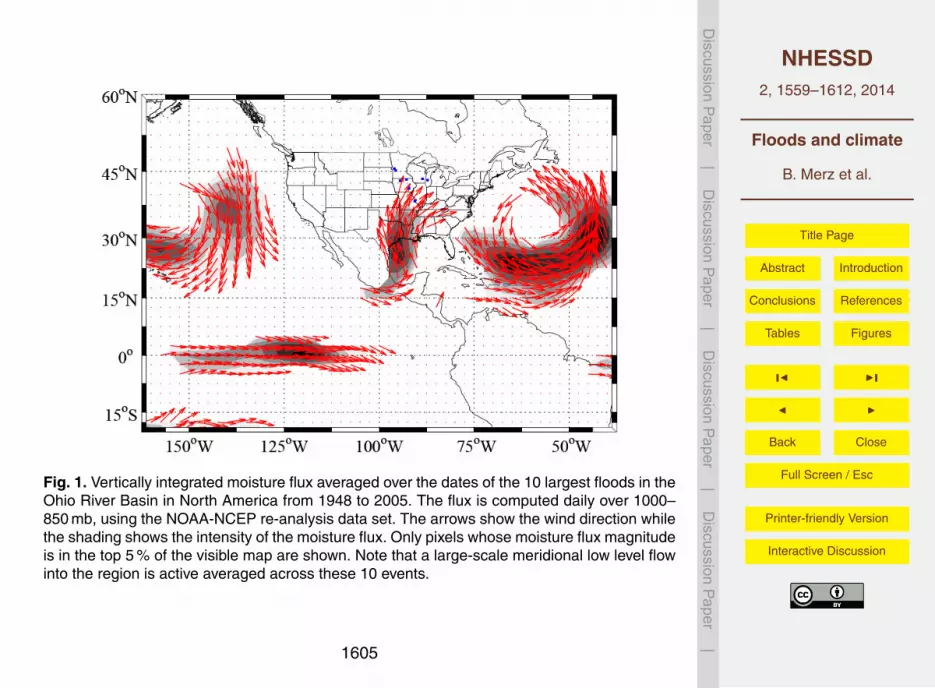
NHESSD2, 1559–1612, 2014
Floods and climate
B. Merz et al.
Title Page
Abstract Introduction
Conclusions References
Tables Figures
J I
J I
Back Close
Full Screen / Esc
Printer-friendly Version
Interactive Discussion
Discussion
Paper
|D
iscussionP
aper|
Discussion
Paper
|D
iscussionP
aper|
Fig. 1. Vertically integrated moisture flux averaged over the dates of the 10 largest floods in theOhio River Basin in North America from 1948 to 2005. The flux is computed daily over 1000–850 mb, using the NOAA-NCEP re-analysis data set. The arrows show the wind direction whilethe shading shows the intensity of the moisture flux. Only pixels whose moisture flux magnitudeis in the top 5 % of the visible map are shown. Note that a large-scale meridional low level flowinto the region is active averaged across these 10 events.
1605

NHESSD2, 1559–1612, 2014
Floods and climate
B. Merz et al.
Title Page
Abstract Introduction
Conclusions References
Tables Figures
J I
J I
Back Close
Full Screen / Esc
Printer-friendly Version
Interactive Discussion
Discussion
Paper
|D
iscussionP
aper|
Discussion
Paper
|D
iscussionP
aper|
Fig. 2. Centennial climatology of ENSO sensitive regions with regard to the global land-surfaceprecipitation from 1901–2010. Blue (red) areas have enhanced (reduced) precipitation duringLa Niña periods. In addition, the circles and boxes point to extreme hydro-meteorological events(including devastating floods) which occurred during the strong La Niña year 2011.
1606
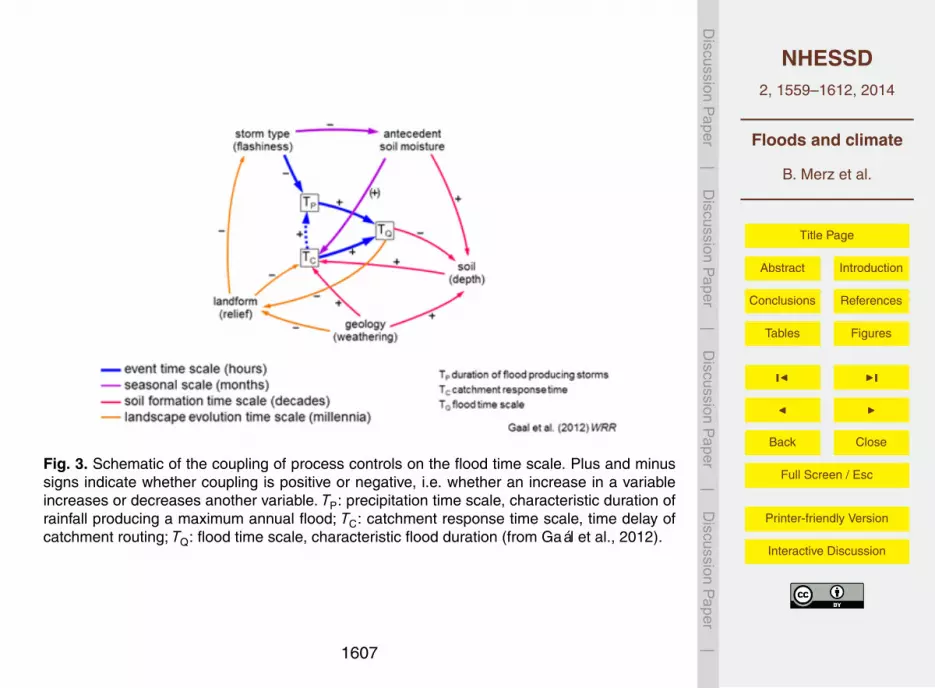
NHESSD2, 1559–1612, 2014
Floods and climate
B. Merz et al.
Title Page
Abstract Introduction
Conclusions References
Tables Figures
J I
J I
Back Close
Full Screen / Esc
Printer-friendly Version
Interactive Discussion
Discussion
Paper
|D
iscussionP
aper|
Discussion
Paper
|D
iscussionP
aper|
Fig. 3. Schematic of the coupling of process controls on the flood time scale. Plus and minussigns indicate whether coupling is positive or negative, i.e. whether an increase in a variableincreases or decreases another variable. TP: precipitation time scale, characteristic duration ofrainfall producing a maximum annual flood; TC: catchment response time scale, time delay ofcatchment routing; TQ: flood time scale, characteristic flood duration (from Gaál et al., 2012).
1607

NHESSD2, 1559–1612, 2014
Floods and climate
B. Merz et al.
Title Page
Abstract Introduction
Conclusions References
Tables Figures
J I
J I
Back Close
Full Screen / Esc
Printer-friendly Version
Interactive Discussion
Discussion
Paper
|D
iscussionP
aper|
Discussion
Paper
|D
iscussionP
aper|
Fig. 4. 7000 yr reconstruction of flood events from Lake Mondsee, Upper Austria. Lower panel:occurrence of flood events. Upper panel: occurrence rate calculated by using a Gaussian kernelregression with a 30 yr bandwidth (data from Swierczynski et al., 2013).
1608

NHESSD2, 1559–1612, 2014
Floods and climate
B. Merz et al.
Title Page
Abstract Introduction
Conclusions References
Tables Figures
J I
J I
Back Close
Full Screen / Esc
Printer-friendly Version
Interactive Discussion
Discussion
Paper
|D
iscussionP
aper|
Discussion
Paper
|D
iscussionP
aper|
Fig. 5. Stratification of flood events according to climatic mechanism. Climate-based flood het-erogeneity is evident in two Arizona watersheds when observed flood peak distributions arestratified according to the three dominant flood-producing mechanisms in the SouthwesternUnited States. Shown are histograms of instantaneous peaks-above-base, plotted as stan-dardized dimensionless z-scores for comparison. The Santa Cruz River at Tucson floods mostfrequently in response to summer convective thunderstorm rainfall, but the two largest peaks ofrecord were produced by tropical cyclone-enhanced rainfall and precipitation from winter syn-optic storms, respectively. In contrast, in the Verde River below Tangle Creek, some 300 kmto the north, the most frequent and largest floods are produced by winter precipitation events(based on House and Hirschboeck, 1997).
1609

NHESSD2, 1559–1612, 2014
Floods and climate
B. Merz et al.
Title Page
Abstract Introduction
Conclusions References
Tables Figures
J I
J I
Back Close
Full Screen / Esc
Printer-friendly Version
Interactive Discussion
Discussion
Paper
|D
iscussionP
aper|
Discussion
Paper
|D
iscussionP
aper|
Fig. 6. Flood frequency plots (top) and runoff coefficients (bottom) of the associated floodevents for (left) Weißach at Zwing (199 km2) and (right) Wulka at Schützen (383 km2) (fromMerz and Blöschl, 2008a).
1610
NHESSD2, 1559–1612, 2014
Floods and climate
B. Merz et al.
Title Page
Abstract Introduction
Conclusions References
Tables Figures
J I
J I
Back Close
Full Screen / Esc
Printer-friendly Version
Interactive Discussion
Discussion
Paper
|D
iscussionP
aper|
Discussion
Paper
|D
iscussionP
aper|
Fig. 7. Schematic illustration of a proposed method for the development of process-based flood-ing scenarios by re-sampling distinctive segments of the observed flood record. Extreme flood-ing variability often occurs as clusters or episodes of high or low magnitudes of annual floodmaxima (left-hand side of figure), and/or high or low frequencies of flood peaks that exceeda defined threshold (right-hand side of figure). To use these modes of variability in scenario de-velopment, the flood record can be partitioned into separate time series for each atmosphericcirculation-linked flood-generating process (i.e., winter synoptic, convective, or tropical storm),and then analysed using subjective and objective methods (e.g., change-point analysis) toidentify statistically significant and climatically unique episodes of extreme flooding behaviour(shaded segments of flood time series). The magnitude and frequency attributes of the floodpeaks in each unique episode can then be iteratively sampled and recombined to simulate newmodes of flood-generating behaviour during plausible projected climatic shifts (e.g., increasedmagnitude and frequency of winter synoptic storms combined with decreased frequency ofconvective activity).
1611

NHESSD2, 1559–1612, 2014
Floods and climate
B. Merz et al.
Title Page
Abstract Introduction
Conclusions References
Tables Figures
J I
J I
Back Close
Full Screen / Esc
Printer-friendly Version
Interactive Discussion
Discussion
Paper
|D
iscussionP
aper|
Discussion
Paper
|D
iscussionP
aper|
Fig. 8. Drivers of flood risk change, dynamic risk and dynamic flood risk management.
1612