first report on interspecies quantitative correlation of ecotoxicity of pharmaceuticals
TRANSCRIPT
Chemosphere 81 (2010) 738–747
Contents lists available at ScienceDirect
Chemosphere
journal homepage: www.elsevier .com/locate /chemosphere
First report on interspecies quantitative correlation of ecotoxicityof pharmaceuticals
Supratik Kar, Kunal Roy *
Drug Theoretics and Cheminformatics Laboratory, Department of Pharmaceutical Technology, Jadavpur University, Kolkata 700 032, India
a r t i c l e i n f o a b s t r a c t
Article history:Received 25 May 2010Received in revised form 8 July 2010Accepted 12 July 2010Available online 9 August 2010
Keywords:QSAREcotoxicityPharmaceuticalsInterspecies correlation
0045-6535/$ - see front matter � 2010 Elsevier Ltd. Adoi:10.1016/j.chemosphere.2010.07.019
E-mail address: [email protected] (K. Roy).URL: http://sites.google.com/site/kunalroyindia/ (K
Pharmaceuticals being extensively and progressively used in human and veterinary medicine are emerg-ing as significant environmental contaminants. Pharmaceuticals are designed to have a specific mode ofaction and many of them are persistent in the body. These features among others make pharmaceuticalsto be evaluated for potential effects on aquatic flora and fauna. Low levels of pharmaceuticals have beendetected in many countries in sewage treatment plant effluents, surface waters, groundwater and drink-ing waters. In contrast, there is a general scarcity of publicly available ecotoxicological data concerningpharmaceuticals. Interspecies toxicity correlations provide a tool for estimating contaminant sensitivitywith known levels of uncertainty for a diversity of wildlife species. In this context, we have developedinterspecies toxicity correlation between Daphnia magna (zooplankton) and fish (species according toOECD guidelines) assessing the ecotoxicological hazard potential of diverse 77 pharmaceuticals. Thedeveloped models are validated and consensus models are presented to predict toxicity of the individualcompounds for any one species when the data for the other species are available. Informative illustrationsof the contributing structural fragments which are responsible for the greater toxicity of the diverse phar-maceuticals are identified by the developed models. Developed models are also used to predict fish tox-icities of 59 pharmaceuticals (for which Daphnia toxicities are present) and Daphnia toxicities of 30pharmaceuticals (for which fish toxicities are present). This study will allow a better and comprehensiverisk assessment of pharmaceuticals for which toxicity data is missing for a particular endpoint.
� 2010 Elsevier Ltd. All rights reserved.
1. Introduction
Residues of pharmaceuticals in surface and drinking watershave increased in recent time immeasurably (Ternes et al., 2001).Major pharmaceuticals are frequently detected in rivers, streams,sewage effluents, surface water, and groundwater and even indrinking water (Ternes, 1998; Daughton and Jones-Lepp, 2001).This is creating a big dilemma as drinking water treatment dimin-ishes residues, but it is not able to remove those substances en-tirely (Heberer et al., 1997). In a 2002 nationwide study of‘‘emerging pollutants” in waters, the US Geological Survey (USGS)tested for pharmaceuticals and personal care products (PPCPs) inseveral US locations in 139 rivers in 30 states detecting a widerange of biologically active compounds (Kolpin et al., 2002). Somemajorly found drugs in rivers were beta blockers (e.g. Metoprololup to 1.54 lg L�1) and beta-sympathomimetics (Sedlak andPinkston, 2001), analgesic and anti-inflammatory drugs (e.g.Diclofenac up to 1.2 lg L�1) (Ternes, 1998; Buser et al., 1999),
ll rights reserved.
. Roy).
estrogens (e.g. 17b-estradiol up to 0.013 lg L�1) (Adler et al.,2001; Huang and Sedlak, 2001) and also antibiotics (e.g. Erythro-mycin up to 1.7 lg L�1) (Adler et al., 2001; Lindsey et al., 2001)as well as lipid lowering agents (e.g. Clofibrinic acid up to0.2 lg L�1) (Ahrer et al., 2001) and anti-epileptic drugs (e.g.Carbamazepine up to 2.1 lg L�1) (Ternes, 1998; Seiler et al., 1999).
Even in tap water, pharmaceuticals like Clofibric acid could bedetected in concentrations up to 270 ng L�1 (Heberer et al., 1997;Ternes et al., 2001). A number of reservoirs tapped for drinkingwater were monitored along the Lergue River in Southern Francewhere pharmaceuticals such as paracetamol, Diclofenac, andCarbamazepine were found (Rabiet et al., 2006). Clofibric acidand diazepam were detected in treated drinking water in Milan,Italy (Zuccato et al., 2000). Heberer and colleagues (Hebereret al., 2001; Heberer, 2002) have reported the presence of Clofibricacid, propylphenazone, and Diclofenac in the drinking water ofBerlin in the concentration range of several hundreds of nano-grams per liter. Frick detected three widely used nonprescriptiondrugs, caffeine, cotinine, and acetaminophenone, in samples ofpotable water collected near Atlanta, Georgia (Frick et al., 2001).Stackelberg and colleagues identified 17 organic contaminantsincluding Carbamazepine (0.258 lg L�1) in the finished water of
S. Kar, K. Roy / Chemosphere 81 (2010) 738–747 739
a drinking water treatment plant (Stackelberg et al., 2004). Loraineand colleagues identified and quantified ibuprofen (0.93 lg L�1)and ibuprofen methyl ester (4.95 lg L�1) in finished water (Loraineand Pettigrove, 2006). Tauber detected Carbamazepine and gemfi-brozil in used drinking waters in ten cities in Canada that wereexamined for a 44-drug subset consisting of commonly used neu-tral and acidic pharmaceuticals including sulfonamides, quino-lones, tetracyclines, and macrolide antibiotics and varioustransformation products (Tauber, 2003). Ye and colleagues de-tected several antibiotics from the finished water samples col-lected from five drinking water treatment plants (WTP) in NorthCarolina that use conventional treatment processes (Ye et al.,2004). Before treatment, occurrences of fluoroquinolones werethe most frequent in the source waters, followed by sulfonamides,lincomycin, tetracyclines, and macrolides, all in low nanogram perliter concentrations. In the finished water, some of these werepresent in much lower levels, indicating their partial removal.However, the incomplete removal of antibiotics, such as ciproflox-acin, is a fact and a matter of health concern due to their unknownhealth effects if they do persist in finished waters even at nano-gram per liter levels. 17a-Ethinyloestradiol (EE2) used as a compo-nent of contraceptive pill (Seiler, 2002), antibiotics, disinfectants,clofibrate (a lipid lowering agent) have been identified in groundand tap water samples (Kümmerer, 2001).
The major routes of entry of pharmaceuticals into the environ-ment are from their use by individuals either dispersed throughoutthe community or concentrated in medical centres of hospitals,and the disposal of unwanted or expired drugs by users. Afteruse, pharmaceuticals are excreted in urine or faeces as a mixtureof unchanged substance, metabolites or conjugated with an inacti-vating substituent attached to the molecule. These processes yieldpolar metabolites excreted in the urine, which normally exhibitinsignificant pharmacological activity (Halling-Sørensen et al.,1998). Due to their specific mode of action and the fact that thesecompounds are intentionally designed to exert an effect on hu-mans, mammals or other vertebrates, residues of pharmaceuticalscould be as or even more important for human health than those ofpesticides, which are created to affect weeds, fungi and inverte-brate varmints (Halling-Sørensen et al., 1998).
Reviewing the available published reports and scientific publi-cations, it is revealed that acute toxic effects of pharmaceuticalsubstances on various types of organisms in environment are dueto their persistent, bio-accumulative and toxic effects. The growingconcern over the release of pharmaceutically active compoundsused by humans or veterinary medicines (Halling-Sørensen et al.,1998) and personal care products into waste water, air and soilof the environment has prompted the introduction of risk assess-ment guidelines in the European Union by the European MedicinesEvaluation Agency (EMEA) and in the United States by the Foodand Drug Administration (FDA) and also in other countries by cor-responding regulatory bodies.
The European Agency for the Evaluation of Medicinal Products(EMEA) has proposed a draft guideline for the environmental riskassessment of human pharmaceuticals (EMEA, 2005). It is basedon the accepted risk assessment paradigms for industrial chemicalsand biocides (European Commission Technical Guidance Docu-ment in Support of Commission Directive 93/67/EEC, 2003), butit also considers the specific features of pharmaceuticals, e.g. theuse of available pharmacological information, especially at highertiers. Risk assessments performed so far have relied mainly onacute ecotoxicity data, and they have usually concluded that thereis no immediate risk (Stuer-Laudridson et al., 2000), but the mostrecent EMEA draft has proposed to include pharmacokinetic andpharmacodynamic data for environmental risk assessment (EMEA,2005). Such an approach is presently also taken within the Euro-pean Union project ERA Pharm (Knacker et al., 2005).
In the US, an assessment of risk to the environment is requiredfor manufacture, use and distribution of human drugs under theNational Environment Policy Act of 1969. An environmentalassessment procedure was developed by the Food and DrugAdministration (FDA) some 20 years ago as part of the registrationprocedure for new human pharmaceutical drugs (FDA, 1985,1987). In addition, in 1995, the FDA Center for Drug Evaluationand Research (CDER) issued a new guidance document ‘Guidancefor Industry for the Submission of an Environmental Assessment in Hu-man drug Application and Supplements’ (FDA, 1995).
Although pharmaceuticals receive extensive pharmacologicaland clinical testing, information on the ecotoxicity of these biolog-ically active compounds is in general very limited. Ecotoxicologicaldata are available only for a few pharmaceuticals in the open peer-reviewed literature and ecotoxicological databases (ECETOX (EU)and ECOTOX (US)) (Sanderson et al., 2003) and only a small num-ber of new pharmaceuticals have been subjected to a complete riskassessment, including a battery of appropriate ecotoxicologicaltests in the EU (Halling-Sørensen et al., 1998). This is primarilydue to low values of the predicted or measured environmental con-centrations (PEC or MEC) as the cut-off value for triggering ecotox-icological risk assessment (Sanderson et al., 2003).
Quantitative structure–activity relationship (QSAR) is the firststep in gaining more general knowledge on this issue (Jørgensenand Halling-Sørensen, 2000; González-Díaz et al., 2007, 2008,2010; Khan, 2010) as an alternative to non-animal method. TheEuropean Union Commission’s scientific committee on toxicity,ecotoxicity and environment (CSTEE) has identified the need fora proactive approach in obtaining data on the environmental ef-fects of pharmaceuticals. Thus, it is recognized that a prioritizationprocedure needs to be developed for environmental risk assess-ment of pharmaceuticals, and that this should follow the generalscheme for chemicals described in the White Paper for future EUchemicals policy (Walker et al., 1999; European Commission. Reg-ulation (EC) No. 1907/2006), i.e., REACH guideline, where the usesof QSARs are stressed. More recently Duardo-Sánchez et al. havereviewed legal issues related to QSAR including REACH guidelineand other topics (Duardo-Sánchez et al., 2008). In contrast to theamount of analytical data, information about the ecotoxicologicaleffects of drug residues is scrubby (Cleuvers, 2002). To create abroader basis for the evaluation of the ecotoxicological relevanceof pharmaceutical compounds, proper documentation of their ef-fects and the reason should be identified.
Reviewing the literature, we have found that very limited num-ber of QSAR models have been constructed on ecotoxicity of phar-maceuticals (Escher et al., 2006; Sanderson and Thomsen, 2007).Again, all these models contain limited number of compoundsand only internal validations have been performed. On the otherhand, going through the publications, though we found a few pa-pers on interspecies correlation of ecotoxicity of chemicals (onlyinternal validation were evaluated) (Delistraty, 2000; Raimondoet al., 2007; Devillers and Devillers, 2009), we could not trace evena single publication on interspecies correlation of ecotoxicity ofpharmaceuticals. An interesting point regarding interspecies corre-lation is that some time toxicity of a compound to a particular bio-logical species is reported but its quantitative toxicity to anotherbiological species is not known. Interspecies toxicity correlationsprovide a tool for estimating contaminant sensitivity with knownlevels of uncertainty for a diversity of different species. (Raimondoet al., 2007) So, we find this subject quite interesting and it moti-vates us to construct interspecies (here, using Daphnia magnaand fish toxicity as endpoints) correlation models for ecotoxicityof pharmaceuticals considering different validation aspects. Wehave also predicted toxicity data of pharmaceuticals against a par-ticular endpoint (when such experimental data are not available)using experimental data against another endpoint.
740 S. Kar, K. Roy / Chemosphere 81 (2010) 738–747
2. Materials and methods
2.1. Dataset
Sanderson and Thomsen (2009) compiled a database containingexperimental ecotoxicological data of pharmaceuticals by combin-ing seven publicly available databases (Ayscough et al., 2000; Park,2005; Cunningham et al., 2006; NOAA, 2006; Cemagref, 2007; GSK,2007; Roche, 2007). The data set contains aquatic toxicity of a totalof 275 pharmaceuticals against three endpoints D. magna, fish andalgae. Quantitative toxicity values of some compounds for somespecific endpoints were not available in this dataset. In the presentwork, we have considered toxicity values to Daphnia and fish only.Daphnia and fish endpoints have been selected because of highernumber of common compounds for these two endpoints than theother two possibilities (i.e., Daphnia–algae and algae–fish). Toxic-ity data of different compounds were taken from seven differentlaboratories. On the other hand, for a particular compound toxicitydata to all three endpoints were taken from a single laboratory. So,we opted for interspecies quantitative toxicity correlation modeldevelopment to avoid the effects of laboratory variations. Definitequantitative toxicity values of 175 pharmaceuticals for D. magnaand 147 pharmaceuticals for fish are present in this data set. Fewpharmaceuticals were excluded from the modeling exercise dueto their atypical nature (metal containing compounds, salts, dis-connected compounds, water containing compounds and ionizedcompounds). Finally, we took aquatic toxicity values of 142 phar-maceuticals for D. magna and 113 pharmaceuticals for fish.Eighty-three pharmaceuticals have aquatic toxicity values for boththe endpoints. For 59 pharmaceuticals, toxicity data to D. magnaare present but toxicity data to fish are absent, and on the otherhand, 30 pharmaceuticals have toxicity data to fish but their toxic-ity data to D. magna are absent.
In the source dataset (Sanderson and Thomsen, 2009), the acuteaquatic toxicity data of Daphnia and fish were reported to be mea-sured for 48 h in LC50 (mg L�1) and 96 h in LC50 (mg L�1), respec-tively. For the development of QSAR models, LC50 values (mg L�1)were converted to molar basis and then the log transformed data[�log LC50] were used as response variables.
2.2. Descriptor calculation
Compounds structures were imported from the Pubchem site(http://pubchem.ncbi.nlm.nih.gov). To validate the structures ofthe Pubchem site, the structures were checked by their individualCAS numbers from the following sites http://webbook.nist.gov/chemistry/cas-ser.html and http://www.lookchem.com. A totalof 206 descriptors (topological, structural, electronic, spatial andthermodynamic descriptors) were calculated for each moleculeusing Cerius2 Version 4.10 software. The categorical list of alldescriptors used in the development of QSAR models is reportedin Table 1. The listed descriptors have been selected for the pres-ent study for their wide spread use and easy interpretability interms of mechanism of action and/or physical meaning. For thecalculation of 3D descriptors, multiple conformations of eachmolecule were generated using the optimal search as the confor-mational search method. Each conformer was subjected to an en-ergy minimization procedure using smart minimizer under openforce field (OFF) to generate the lowest energy conformation foreach structure. The charges were calculated according to theGasteiger method. All the descriptors were calculated usingdescriptor+ module of the Cerius2 version 4.10 software (AccelrysInc., San Diego, CA) under QSAR+ environment on a SiliconGraphics O2 workstation running under the IRIX 6.5 operatingsystem.
2.3. Training and test set selection
The main target of any QSAR modeling is that the developedmodel should be robust enough to be capable of making accurateand reliable predictions of biological activities of new compounds(Leonard and Roy, 2006; Roy, 2007; Roy and Mandal, 2008). So,QSAR models that are developed from a training set should be val-idated using new chemical entities for checking the predictivecapacity of the developed models. The validation strategies checkthe reliability of the developed models for their possible applica-tion on a new set of data, and confidence of prediction can thusbe judged (Roy and Mandal, 2008).
In our present work initially 83 compounds have been consid-ered to build quantitative interspecies correlation. But, before thedivision of compounds into training and test sets we obtained aprincipal component analysis (PCA) score plot (Fig. S1 in Supple-mentary materials) of the first three components of the standard-ized topological, spatial, electronic, thermodynamic and structuraldescriptor matrix to check the applicability domain and identifythe outlier compounds. Six compounds were left out as they weredistinctly located separately from the other compounds. Thesecompounds were Cyclosporine, Digitoxin, Erythromycin, Erythro-mycin base, Orlistat and Saquinavir amorphous. So, final quantita-tive interspecies correlation modeling work was carried out with77 pharmaceuticals. For the division of the dataset into trainingand test sets, the compounds were randomly selected. 50% com-pounds were selected for the training set and 50% compounds wereselected for the test set. Though the test set compounds were ran-domly selected, Fig. S1 in Supplementary materials shows thateach test set compound is close to at least one training set com-pound in the descriptor space. The number of compounds in thetraining set was 38 and that in the test set were 39. Identificationnumbers of compounds of the training and test sets are shown inTables S1 and S2, respectively in Supplementary materials.
2.4. Chemometric tools
Statistical techniques like stepwise regression (Darlington,1990), genetic function approximation (GFA-MLR) followed bymultiple linear regression (Rogers and Hopfinger, 1994) and genet-ic partial least squares (G/PLS) (Wold, 1995; Fan et al., 2001) wereapplied to identify the structural and physicochemical featurescontributing to the toxicity of pharmaceuticals. The details of thechemometric tools are discussed in Supplementary materials.
2.5. Software
MINITAB (Minitab Inc., USA) was used for stepwise regressionmethod. Cerius2 version 4.10 (Accelrys Inc., San Diego, CA) wasused for GFA and G/PLS analyses. SPSS (SPSS Inc., Chicago, IL)was used for generation of PCA score plot. STATISTICA (STATSOFTInc.; USA) was used to determine the LOO calculated values oftraining set compounds. Variable ranking, model randomizationand test for applicability domain for G/PLS models were performedusing SIMCA-P 10.0 (Umetrics, Sweden, 2002).
2.6. Validation methods
The robustness of the models was verified by using differenttypes of validation criteria. For validation of QSAR models, threestrategies (Roy et al., 2008) were adopted: (1) leave-one-out(LOO) internal validation or cross-validation, (2) validation bydividing the data set into training and test compounds, and (3)data/model randomization.
For all the developed models we have reported the coefficient ofvariation (R2), leave-one-out cross-validation R2 (Q2) and r2
mðLOOÞ for
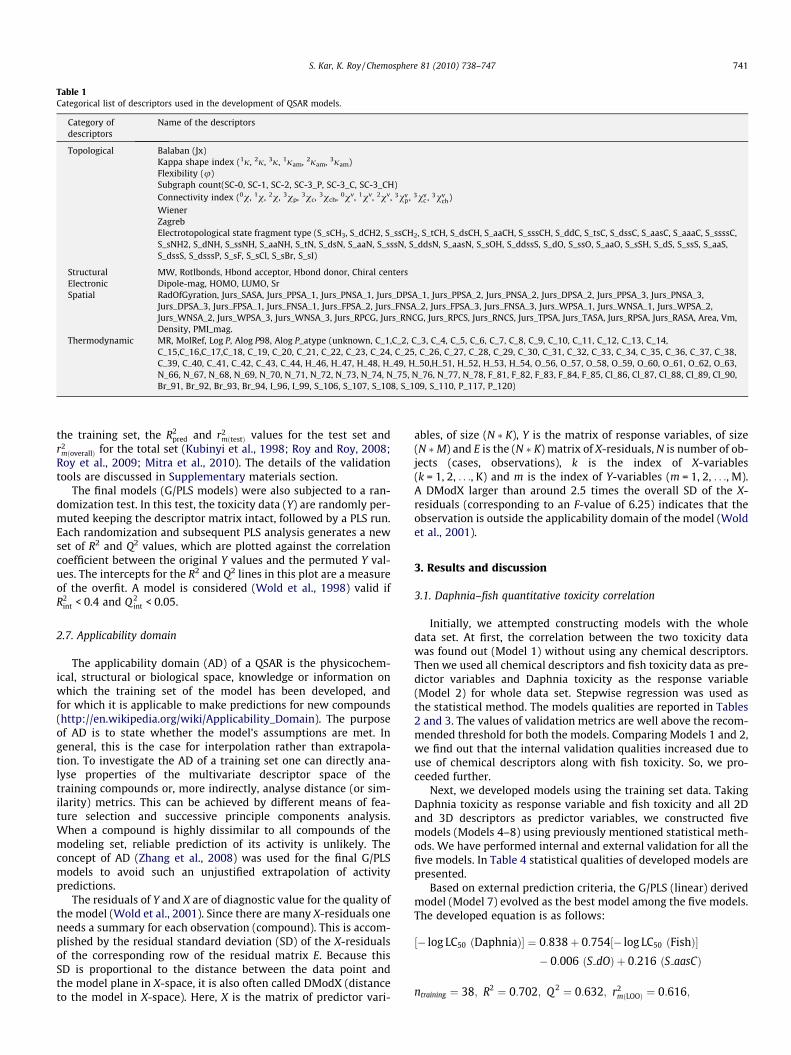
Table 1Categorical list of descriptors used in the development of QSAR models.
Category ofdescriptors
Name of the descriptors
Topological Balaban (Jx)Kappa shape index (1j, 2j, 3j, 1jam, 2jam, 3jam)Flexibility (u)Subgraph count(SC-0, SC-1, SC-2, SC-3_P, SC-3_C, SC-3_CH)Connectivity index (0v, 1v, 2v, 3vp, 3vc, 3vch, 0vv, 1vv, 2vv, 3vv
p, 3vvc , 3vv
ch)WienerZagrebElectrotopological state fragment type (S_sCH3, S_dCH2, S_ssCH2, S_tCH, S_dsCH, S_aaCH, S_sssCH, S_ddC, S_tsC, S_dssC, S_aasC, S_aaaC, S_ssssC,S_sNH2, S_dNH, S_ssNH, S_aaNH, S_tN, S_dsN, S_aaN, S_sssN, S_ddsN, S_aasN, S_sOH, S_ddssS, S_dO, S_ssO, S_aaO, S_sSH, S_dS, S_ssS, S_aaS,S_dssS, S_dsssP, S_sF, S_sCl, S_sBr, S_sI)
Structural MW, Rotlbonds, Hbond acceptor, Hbond donor, Chiral centersElectronic Dipole-mag, HOMO, LUMO, SrSpatial RadOfGyration, Jurs_SASA, Jurs_PPSA_1, Jurs_PNSA_1, Jurs_DPSA_1, Jurs_PPSA_2, Jurs_PNSA_2, Jurs_DPSA_2, Jurs_PPSA_3, Jurs_PNSA_3,
Jurs_DPSA_3, Jurs_FPSA_1, Jurs_FNSA_1, Jurs_FPSA_2, Jurs_FNSA_2, Jurs_FPSA_3, Jurs_FNSA_3, Jurs_WPSA_1, Jurs_WNSA_1, Jurs_WPSA_2,Jurs_WNSA_2, Jurs_WPSA_3, Jurs_WNSA_3, Jurs_RPCG, Jurs_RNCG, Jurs_RPCS, Jurs_RNCS, Jurs_TPSA, Jurs_TASA, Jurs_RPSA, Jurs_RASA, Area, Vm,Density, PMI_mag.
Thermodynamic MR, MolRef, Log P, Alog P98, Alog P_atype (unknown, C_1,C_2, C_3, C_4, C_5, C_6, C_7, C_8, C_9, C_10, C_11, C_12, C_13, C_14,C_15,C_16,C_17,C_18, C_19, C_20, C_21, C_22, C_23, C_24, C_25, C_26, C_27, C_28, C_29, C_30, C_31, C_32, C_33, C_34, C_35, C_36, C_37, C_38,C_39, C_40, C_41, C_42, C_43, C_44, H_46, H_47, H_48, H_49, H_50,H_51, H_52, H_53, H_54, O_56, O_57, O_58, O_59, O_60, O_61, O_62, O_63,N_66, N_67, N_68, N_69, N_70, N_71, N_72, N_73, N_74, N_75, N_76, N_77, N_78, F_81, F_82, F_83, F_84, F_85, Cl_86, Cl_87, Cl_88, Cl_89, Cl_90,Br_91, Br_92, Br_93, Br_94, I_96, I_99, S_106, S_107, S_108, S_109, S_110, P_117, P_120)
S. Kar, K. Roy / Chemosphere 81 (2010) 738–747 741
the training set, the R2pred and r2
mðtestÞ values for the test set andr2
mðoverallÞ for the total set (Kubinyi et al., 1998; Roy and Roy, 2008;Roy et al., 2009; Mitra et al., 2010). The details of the validationtools are discussed in Supplementary materials section.
The final models (G/PLS models) were also subjected to a ran-domization test. In this test, the toxicity data (Y) are randomly per-muted keeping the descriptor matrix intact, followed by a PLS run.Each randomization and subsequent PLS analysis generates a newset of R2 and Q2 values, which are plotted against the correlationcoefficient between the original Y values and the permuted Y val-ues. The intercepts for the R2 and Q2 lines in this plot are a measureof the overfit. A model is considered (Wold et al., 1998) valid ifR2
int < 0.4 and Q 2int < 0.05.
2.7. Applicability domain
The applicability domain (AD) of a QSAR is the physicochem-ical, structural or biological space, knowledge or information onwhich the training set of the model has been developed, andfor which it is applicable to make predictions for new compounds(http://en.wikipedia.org/wiki/Applicability_Domain). The purposeof AD is to state whether the model’s assumptions are met. Ingeneral, this is the case for interpolation rather than extrapola-tion. To investigate the AD of a training set one can directly ana-lyse properties of the multivariate descriptor space of thetraining compounds or, more indirectly, analyse distance (or sim-ilarity) metrics. This can be achieved by different means of fea-ture selection and successive principle components analysis.When a compound is highly dissimilar to all compounds of themodeling set, reliable prediction of its activity is unlikely. Theconcept of AD (Zhang et al., 2008) was used for the final G/PLSmodels to avoid such an unjustified extrapolation of activitypredictions.
The residuals of Y and X are of diagnostic value for the quality ofthe model (Wold et al., 2001). Since there are many X-residuals oneneeds a summary for each observation (compound). This is accom-plished by the residual standard deviation (SD) of the X-residualsof the corresponding row of the residual matrix E. Because thisSD is proportional to the distance between the data point andthe model plane in X-space, it is also often called DModX (distanceto the model in X-space). Here, X is the matrix of predictor vari-
ables, of size (N � K), Y is the matrix of response variables, of size(N �M) and E is the (N � K) matrix of X-residuals, N is number of ob-jects (cases, observations), k is the index of X-variables(k = 1, 2, . . ., K) and m is the index of Y-variables (m = 1, 2, . . ., M).A DModX larger than around 2.5 times the overall SD of the X-residuals (corresponding to an F-value of 6.25) indicates that theobservation is outside the applicability domain of the model (Woldet al., 2001).
3. Results and discussion
3.1. Daphnia–fish quantitative toxicity correlation
Initially, we attempted constructing models with the wholedata set. At first, the correlation between the two toxicity datawas found out (Model 1) without using any chemical descriptors.Then we used all chemical descriptors and fish toxicity data as pre-dictor variables and Daphnia toxicity as the response variable(Model 2) for whole data set. Stepwise regression was used asthe statistical method. The models qualities are reported in Tables2 and 3. The values of validation metrics are well above the recom-mended threshold for both the models. Comparing Models 1 and 2,we find out that the internal validation qualities increased due touse of chemical descriptors along with fish toxicity. So, we pro-ceeded further.
Next, we developed models using the training set data. TakingDaphnia toxicity as response variable and fish toxicity and all 2Dand 3D descriptors as predictor variables, we constructed fivemodels (Models 4–8) using previously mentioned statistical meth-ods. We have performed internal and external validation for all thefive models. In Table 4 statistical qualities of developed models arepresented.
Based on external prediction criteria, the G/PLS (linear) derivedmodel (Model 7) evolved as the best model among the five models.The developed equation is as follows:
½� log LC50 ðDaphniaÞ� ¼ 0:838þ 0:754½� log LC50 ðFishÞ�� 0:006 ðS dOÞ þ 0:216 ðS aasCÞ
ntraining ¼ 38; R2 ¼ 0:702; Q 2 ¼ 0:632; r2mðLOOÞ ¼ 0:616;
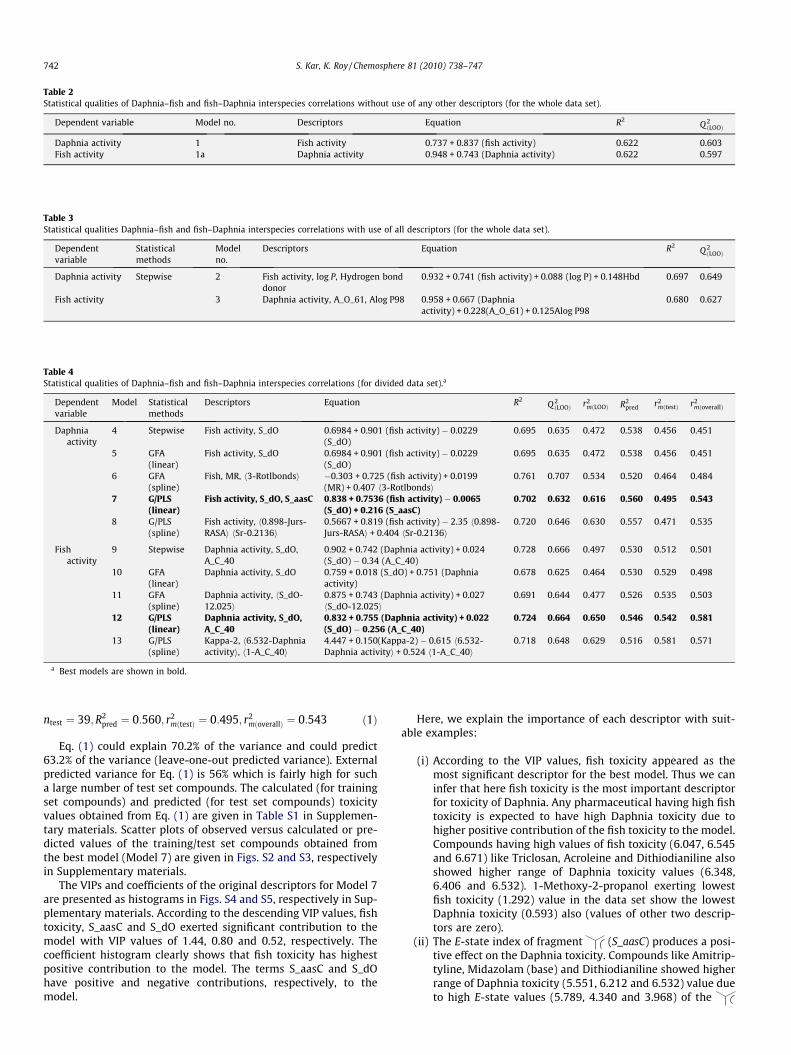
Table 2Statistical qualities of Daphnia–fish and fish–Daphnia interspecies correlations without use of any other descriptors (for the whole data set).
Dependent variable Model no. Descriptors Equation R2Q2ðLOOÞ
Daphnia activity 1 Fish activity 0.737 + 0.837 (fish activity) 0.622 0.603Fish activity 1a Daphnia activity 0.948 + 0.743 (Daphnia activity) 0.622 0.597
Table 3Statistical qualities Daphnia–fish and fish–Daphnia interspecies correlations with use of all descriptors (for the whole data set).
Dependentvariable
Statisticalmethods
Modelno.
Descriptors Equation R2Q2ðLOOÞ
Daphnia activity Stepwise 2 Fish activity, log P, Hydrogen bonddonor
0.932 + 0.741 (fish activity) + 0.088 (log P) + 0.148Hbd 0.697 0.649
Fish activity 3 Daphnia activity, A_O_61, Alog P98 0.958 + 0.667 (Daphniaactivity) + 0.228(A_O_61) + 0.125Alog P98
0.680 0.627
Table 4Statistical qualities of Daphnia–fish and fish–Daphnia interspecies correlations (for divided data set).a
Dependentvariable
Model Statisticalmethods
Descriptors Equation R2Q2ðLOOÞ r2
mðLOOÞ R2pred r2
mðtestÞ r2mðoverallÞ
Daphniaactivity
4 Stepwise Fish activity, S_dO 0.6984 + 0.901 (fish activity) � 0.0229(S_dO)
0.695 0.635 0.472 0.538 0.456 0.451
5 GFA(linear)
Fish activity, S_dO 0.6984 + 0.901 (fish activity) � 0.0229(S_dO)
0.695 0.635 0.472 0.538 0.456 0.451
6 GFA(spline)
Fish, MR, h3-Rotlbondsi �0.303 + 0.725 (fish activity) + 0.0199(MR) + 0.407 h3-Rotlbondsi
0.761 0.707 0.534 0.520 0.464 0.484
7 G/PLS(linear)
Fish activity, S_dO, S_aasC 0.838 + 0.7536 (fish activity) � 0.0065(S_dO) + 0.216 (S_aasC)
0.702 0.632 0.616 0.560 0.495 0.543
8 G/PLS(spline)
Fish activity, h0.898-Jurs-RASAi hSr-0.2136i
0.5667 + 0.819 (fish activity) � 2.35 h0.898-Jurs-RASAi + 0.404 hSr-0.2136i
0.720 0.646 0.630 0.557 0.471 0.535
Fishactivity
9 Stepwise Daphnia activity, S_dO,A_C_40
0.902 + 0.742 (Daphnia activity) + 0.024(S_dO) � 0.34 (A_C_40)
0.728 0.666 0.497 0.530 0.512 0.501
10 GFA(linear)
Daphnia activity, S_dO 0.759 + 0.018 (S_dO) + 0.751 (Daphniaactivity)
0.678 0.625 0.464 0.530 0.529 0.498
11 GFA(spline)
Daphnia activity, hS_dO-12.025i
0.875 + 0.743 (Daphnia activity) + 0.027hS_dO-12.025i
0.691 0.644 0.477 0.526 0.535 0.503
12 G/PLS(linear)
Daphnia activity, S_dO,A_C_40
0.832 + 0.755 (Daphnia activity) + 0.022(S_dO) � 0.256 (A_C_40)
0.724 0.664 0.650 0.546 0.542 0.581
13 G/PLS(spline)
Kappa-2, h6.532-Daphniaactivityi, h1-A_C_40i
4.447 + 0.150(Kappa-2) � 0.615 h6.532-Daphnia activityi + 0.524 h1-A_C_40i
0.718 0.648 0.629 0.516 0.581 0.571
a Best models are shown in bold.
742 S. Kar, K. Roy / Chemosphere 81 (2010) 738–747
ntest ¼ 39;R2pred ¼ 0:560; r2
mðtestÞ ¼ 0:495; r2mðoverallÞ ¼ 0:543 ð1Þ
Eq. (1) could explain 70.2% of the variance and could predict63.2% of the variance (leave-one-out predicted variance). Externalpredicted variance for Eq. (1) is 56% which is fairly high for sucha large number of test set compounds. The calculated (for trainingset compounds) and predicted (for test set compounds) toxicityvalues obtained from Eq. (1) are given in Table S1 in Supplemen-tary materials. Scatter plots of observed versus calculated or pre-dicted values of the training/test set compounds obtained fromthe best model (Model 7) are given in Figs. S2 and S3, respectivelyin Supplementary materials.
The VIPs and coefficients of the original descriptors for Model 7are presented as histograms in Figs. S4 and S5, respectively in Sup-plementary materials. According to the descending VIP values, fishtoxicity, S_aasC and S_dO exerted significant contribution to themodel with VIP values of 1.44, 0.80 and 0.52, respectively. Thecoefficient histogram clearly shows that fish toxicity has highestpositive contribution to the model. The terms S_aasC and S_dOhave positive and negative contributions, respectively, to themodel.
Here, we explain the importance of each descriptor with suit-able examples:
(i) According to the VIP values, fish toxicity appeared as themost significant descriptor for the best model. Thus we caninfer that here fish toxicity is the most important descriptorfor toxicity of Daphnia. Any pharmaceutical having high fishtoxicity is expected to have high Daphnia toxicity due tohigher positive contribution of the fish toxicity to the model.Compounds having high values of fish toxicity (6.047, 6.545and 6.671) like Triclosan, Acroleine and Dithiodianiline alsoshowed higher range of Daphnia toxicity values (6.348,6.406 and 6.532). 1-Methoxy-2-propanol exerting lowestfish toxicity (1.292) value in the data set show the lowestDaphnia toxicity (0.593) also (values of other two descrip-tors are zero).
(ii) The E-state index of fragment (S_aasC) produces a posi-tive effect on the Daphnia toxicity. Compounds like Amitrip-tyline, Midazolam (base) and Dithiodianiline showed higherrange of Daphnia toxicity (5.551, 6.212 and 6.532) value dueto high E-state values (5.789, 4.340 and 3.968) of the
S. Kar, K. Roy / Chemosphere 81 (2010) 738–747 743
fragment. The diverse compounds like 1-Methoxy-2-propa-nol, Capecitabine and ethyl bromide showed lower rangeof Daphnia toxicity (0.593, 2.626 and 2.745) due to zerovalue of the S_aasC descriptor.
(iii) The E-state index of keto group (@O) can be expressed asS_dO. The fragment has negative contribution to the Daphniatoxicity. Dithiodianiline, Fluoxetine and Triclosan showedtoxicity values in higher range (6.532, 5.783 and 6.348)due to corresponding value of S_dO descriptor being zerofor each compound. On the contrary, compounds like Pheno-barbital, Iopromide and Betariboacetate showed toxicity val-ues in lower range (2.201, 2.891 and 3.424) due to highvalues (35.007, 38.252 and 44.389) of S_dO for correspond-ing compounds.
Model 7 was validated using a randomization test through ran-domly reordering (100 permutations) the response data (default is20) using SIMCA 10.0 (Umetrics, Sweden, 2002). Fig. S6 in Supple-mentary materials presents the result of randomization of Model 7showing satisfactory intercept values (Daphnia toxicity interceptsvalues are R2 = (0.0, �0.0209), Q2 = (0.0, �0.169)) and indicatingthat the model is not obtained by chance.
Fig. S7 in Supplementary materials presents the residual SD ofX-residuals (DModX) of the test set compounds for Model 7 (Eq.(1)). At 99% confidence level, DModX values of all test compoundsare under the critical value of 2.912. So, predictions of all 39 testcompounds are reliable.
3.2. Fish�Daphnia quantitative toxicity correlation
The simple correlation between fish and Daphnia toxicities wasalready obtained in Model 1; we also obtained a relationship (Mod-el 1a) using fish toxicity as response variable and Daphnia toxicityas the predictor variable. Like Daphnia–fish toxicity correlation,initially we have constructed models (Models 1a and 3) using thewhole data set: we developed a model (Model 3) using Daphniatoxicity and all chemical descriptors as predictor variables withstepwise regression technique. Both the models (Models 1a and3) showed quite acceptable validation results. The models qualitiesare reported in Table 2 and Table 3. Comparing Models 1a and 3,we find out that the internal validation qualities increased due tothe use of chemical descriptors along with Daphnia toxicity.
Next, we developed models using the training set data. We usedfish toxicity as the response variable and Daphnia toxicity wasused as a predictor variable along with all chemical descriptors.We constructed five models (Models 10–14) using the mentionedstatistical methods. In Table 4, statistical qualities of developedmodels are presented. Based on external prediction criteria, theG/PLS (linear) (Model 13) derived model evolved as the best modelamong the five models. The developed equation is as follows:
½� log LC50 ðFishÞ� ¼ 0:832þ 0:755½� log LC50 ðDaphniaÞ�þ 0:022 ðS dOÞ � 0:256 ðA C 40Þ
ntraining ¼ 38; R2 ¼ 0:724; Q 2 ¼ 0:664; r2mLOOÞ ¼ 0:650
ntest ¼ 39R2pred ¼ 0:546; r2
mðtestÞ ¼ 0:542; r2mðoverallÞ ¼ 0:581 ð2Þ
Table 5Statistical qualities of consensus models for Daphnia and fish toxicities using the interspe
Dependent variable Statistical methods Mode
Daphnia activity Consensus model using all statistical methods 14Fish activity 15
Eq. (2) could explain 72.4% of the variance and predict 66.4% ofthe variance (leave-one-out predicted variance). External predictedvariance for Eq. (2) is 54.6% which is fairly high for such a largenumber of test set compounds. The calculated (for training setcompounds) and predicted (for test set compounds) toxicity valuesobtained from Eq. (2) are given in Table S2 in Supplementary mate-rials. Scatter plots of observed versus calculated or predicted val-ues of the training/test set compounds obtained from the bestmodel (Model 13) are given in Figs. S8 and S9, respectively in Sup-plementary materials.
The VIPs and coefficients of the original descriptors are pre-sented as histograms in Figs. S10 and S11, respectively in Supple-mentary materials for Model 12. According to the descending VIPvalues, Daphnia toxicity, Atype_C_40 and S_dO exerted significantcontributions to the model with VIP values of 1.50, 0.70 and 0.60,respectively. According to coefficient histogram, fish toxicity hashighest positive contribution to the Model 9. The parametersS_dO and Atype_C_40 have positive and negative contributions,respectively, to the model.
Here, we explain the importance of each descriptor with suit-able examples:
(i) Daphnia toxicity evolved as the most important descriptorfor the fish toxicity in Model 12 according to Fig. S10 inSupplementary materials. As expected, Daphnia toxicityhas positive contribution to the fish toxicity. Compoundshaving high values of Daphnia toxicity (6.348, 6.406 and6.532) like Triclosan, Acroleine and Dithiodianiline alsoshowed higher range of fish toxicity (6.047, 6.545 and6.671) values. On the other hand, 1-Methoxy-2-propanoland Phenobarbital having low values of Daphnia toxicity(0.593 and 2.201) also showed lower range of fish toxicity(1.292 and 2.681).
(ii) The index Atype_C_40 is calculated based on fragment basedapproach for log P (octanol–water partition coefficient as ameasure of hydrophobicity or lipophilicity) prediction(Ghose et al., 1998). A_C_40 specifies hydrophobicity mea-sure of C in X@C@X, R–C(@X)–X, R–C„X fragments (whereR – represents any group linked through carbon, X – repre-sents any heteroatom (O, N, S, P, Se, and halogens), (@) rep-resents double bond, „ represents triple bond). Thisfragment produces detrimental effect to the fish toxicity.Compounds like Phenobarbital, Iopromide and Betariboace-tate showed lower range of fish toxicity values (2.681,2.915 and 3.424) due to high values (2, 3 and 4) of Aty-pe_C_40 descriptors. Dithiodianiline, Acroleine and Triclosanshowed higher range of fish toxicity value (6.671, 6.545 and6.047) due to zero value of Atype_C_40 descriptor.
(iii) The E-state index of fragment keto group (=O) can beexpressed as S_dO. The fragment has a positive contributionto the fish toxicity. Nitroglycerin, Nisolfipine and Tolcaponeshowed higher range of fish toxicity (4.879, 5.112 and 5.260)because of high values (61.958, 48.5766 and 33.687) of theS_dO descriptor. Compounds like 1-Methoxy-2-propanol,Diethanolamine and Anisol showed lower range of fish tox-icity (1.292, 2.119 and 2.955) due to zero value of the S_dOdescriptor.
cies correlation models.
l R2Q2ðLOOÞ r2
mðLOOÞ R2pred r2
mðtestÞ r2mðoverallÞ
0.750 0.748 0.720 0.593 0.525 0.6230.724 0.723 0.700 0.552 0.564 0.616
744 S. Kar, K. Roy / Chemosphere 81 (2010) 738–747
Model 12 was validated using a randomization test throughrandomly reordering (100 permutations) response data (defaultis 20) using SIMCA 10.0 (Umetrics, Sweden, 2002).
Fig. S12 in Supplementary materials presents the result of ran-domization result of Model 12 showing satisfactory intercept val-ues (Daphnia toxicity intercepts values are R2 = (0.0, �0.0193),
Table 6Prediction of probable fish toxicity values for 59 compounds having Daphnia toxicity data
CompoundID
Slno.a
Name Daphniatoxicity
Fish toxicity
Stepwise(Model 9)
GFA (li(Model
1 6 2-Methyl-5-ethylpyridine 3.481 3.485 3.3742 9 Acebutolol 3.819 3.959 4.0503 16 Albendazole 7.044 6.394 6.2484 28 Atenolol 3.902 3.715 3.8835 30 Azithromycin 3.795 3.719 3.8656 33 Benzimidazolepropylamine 3.562 3.545 3.4347 44 Busulphan 4.391 5.166 4.8118 49 Carazolol 4.305 4.096 3.9929 51 Carbamazepine 4.234 4.325 4.150
10 62 Chlortetracycline 3.573 4.511 4.16111 64 Cilazapril 2.626 2.733 3.40812 65 Cimetidine 2.533 2.781 2.66113 66 Ciprofloxacin 3.742 3.909 3.99714 68 Citalopram 4.920 4.213 4.45415 69 Clarithromycin 4.602 4.652 4.72216 79 Diclofenac 4.121 3.880 4.04917 84 Digoxin 4.566 4.237 4.40318 85 Dimethylethanolamine 2.959 3.098 2.98119 99 Ethyl-4-methyl-5-oxazole
carboxylate2.668 2.805 2.960
20 100 Etidronic acid 2.592 3.317 3.07521 103 Fenofibrate 3.858 4.012 4.09722 108 Flumequine 3.433 3.667 3.75523 113 Fluorouracil 3.716 3.808 3.91624 115 Flutamide 5.301 5.274 5.32425 123 GPS-cyanopyrimidine 3.340 3.041 3.26826 125 Griseofulvin (microsize) 2.506 3.364 3.09327 129 Ibandronate 5.358 5.411 5.18328 133 Isopropyldioxepen 2.272 2.588 2.46529 135 Ketoprofen 3.599 3.790 3.88030 141 Lapatinib 6.534 6.292 6.07331 145 Lincomycin 5.777 5.157 5.32932 147 Loracarbef 2.560 2.642 3.32733 150 Maleic acid 2.764 2.731 3.17834 157 Metformin 1.983 2.373 2.24835 163 Metoprolol 4.483 4.228 4.12636 168 m-Phenylenediamine 4.263 4.065 3.96137 171 Nadolol 3.277 3.334 3.22038 189 Ofloxacin 4.317 4.341 4.43339 190 Omeprazole 3.594 3.873 3.68640 194 Oxymetholone 4.535 4.561 4.38541 206 Prednisone 3.822 4.635 4.30242 214 Pyrogallolaldehyde 3.669 3.868 3.69743 218 Ranitidine 2.685 3.391 3.14844 219 Retapamolin 4.112 4.259 4.33245 222 Ropinirole 2.953 3.029 3.18346 228 Sertraline 6.407 5.656 5.57147 229 Shikimic acid 3.177 3.168 3.33148 233 Sotalol 2.958 3.626 3.37749 235 Stavudine 2.359 2.857 2.93950 236 Streptomycin 3.077 3.475 3.28751 237 Sulfadiazine 3.349 3.957 3.70252 242 Sulfamethoxazole 4.404 4.740 4.49453 244 Sumatriptan 3.008 3.692 3.43654 246 Testosterone 5.170 5.021 4.85455 252 Thioguanine 4.006 3.534 3.76756 255 Tiotepa 2.540 2.787 2.66657 267 Triphenylphosphine 4.720 4.404 4.30458 268 Tylosin 3.130 3.839 3.82559 274 Zalcitabine 2.072 2.374 2.521
a According to the source paper [Sanderson and Thomsen (2009)].b The best model among the five models.
Q2 = (0.0, �0.161)) and thus indicating that the model is not ob-tained by chance.
Fig. S13 in Supplementary materials represents the residual SDof X-residuals (DModX) of the test set compounds for Model 12(Eq. (2)). At 99% confidence level, DModX value of one test com-pound (Betariboacetate) is above the critical value of 3.785. This
.
near)10)
GFA (spline)(Model 11)
G/PLS (linear)(Model 12)b
G/PLS (spline)(Model 13)
Consensus valueusing all five models
3.462 3.460 3.581 3.4724.022 4.232 4.516 4.1566.108 6.393 6.015 6.2323.774 4.014 4.184 3.9143.754 4.010 5.540 4.1773.522 3.522 3.817 3.5684.944 5.069 4.521 4.9024.073 4.082 4.758 4.2004.021 4.287 4.390 4.2354.283 4.408 4.433 4.3593.517 3.642 3.890 3.4382.757 2.744 3.862 2.9613.972 4.180 3.775 3.9674.531 4.547 4.675 4.4844.730 4.926 6.036 5.0133.937 4.182 4.035 4.0164.268 4.542 5.607 4.6123.073 3.066 3.254 3.0942.858 3.088 2.691 2.880
3.030 3.240 2.923 3.1174.078 4.284 4.194 4.1333.728 3.935 3.303 3.6783.861 4.086 3.124 3.7595.365 5.548 4.685 5.2393.357 3.354 2.951 3.1943.090 3.277 3.539 3.2735.131 5.366 5.319 5.2822.563 2.547 2.951 2.6233.851 4.060 3.714 3.8596.015 6.262 7.169 6.3625.189 5.476 5.506 5.3313.420 3.553 3.161 3.2203.120 3.339 2.720 3.0182.348 2.329 2.761 2.4124.206 4.216 5.186 4.3924.043 4.051 3.954 4.0153.310 3.306 4.126 3.4594.406 4.619 4.201 4.4003.563 3.824 4.384 3.8664.250 4.525 4.567 4.4584.400 4.540 4.242 4.4243.601 3.825 3.750 3.7483.104 3.314 4.207 3.4334.332 4.529 4.440 4.3793.069 3.314 3.400 3.1995.635 5.669 5.855 5.6773.235 3.459 2.954 3.2303.344 3.551 3.818 3.5432.915 3.112 2.647 2.8943.162 3.421 4.975 3.6643.680 3.883 3.878 3.8204.464 4.680 4.461 4.5683.413 3.614 3.830 3.5974.716 4.995 4.845 4.8863.851 3.856 3.314 3.6652.762 2.750 2.791 2.7514.382 4.395 4.927 4.4823.950 4.070 6.215 4.3802.414 2.648 2.437 2.479
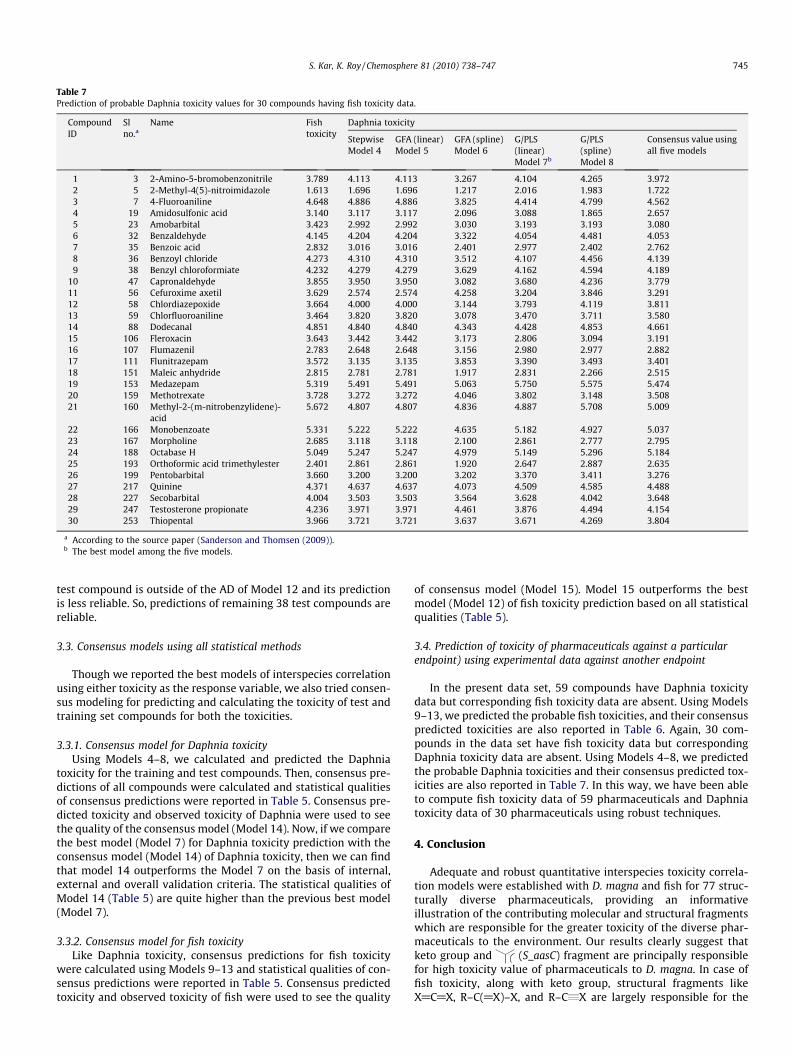
Table 7Prediction of probable Daphnia toxicity values for 30 compounds having fish toxicity data.
CompoundID
Slno.a
Name Fishtoxicity
Daphnia toxicity
StepwiseModel 4
GFA (linear)Model 5
GFA (spline)Model 6
G/PLS(linear)Model 7b
G/PLS(spline)Model 8
Consensus value usingall five models
1 3 2-Amino-5-bromobenzonitrile 3.789 4.113 4.113 3.267 4.104 4.265 3.9722 5 2-Methyl-4(5)-nitroimidazole 1.613 1.696 1.696 1.217 2.016 1.983 1.7223 7 4-Fluoroaniline 4.648 4.886 4.886 3.825 4.414 4.799 4.5624 19 Amidosulfonic acid 3.140 3.117 3.117 2.096 3.088 1.865 2.6575 23 Amobarbital 3.423 2.992 2.992 3.030 3.193 3.193 3.0806 32 Benzaldehyde 4.145 4.204 4.204 3.322 4.054 4.481 4.0537 35 Benzoic acid 2.832 3.016 3.016 2.401 2.977 2.402 2.7628 36 Benzoyl chloride 4.273 4.310 4.310 3.512 4.107 4.456 4.1399 38 Benzyl chloroformiate 4.232 4.279 4.279 3.629 4.162 4.594 4.189
10 47 Capronaldehyde 3.855 3.950 3.950 3.082 3.680 4.236 3.77911 56 Cefuroxime axetil 3.629 2.574 2.574 4.258 3.204 3.846 3.29112 58 Chlordiazepoxide 3.664 4.000 4.000 3.144 3.793 4.119 3.81113 59 Chlorfluoroaniline 3.464 3.820 3.820 3.078 3.470 3.711 3.58014 88 Dodecanal 4.851 4.840 4.840 4.343 4.428 4.853 4.66115 106 Fleroxacin 3.643 3.442 3.442 3.173 2.806 3.094 3.19116 107 Flumazenil 2.783 2.648 2.648 3.156 2.980 2.977 2.88217 111 Flunitrazepam 3.572 3.135 3.135 3.853 3.390 3.493 3.40118 151 Maleic anhydride 2.815 2.781 2.781 1.917 2.831 2.266 2.51519 153 Medazepam 5.319 5.491 5.491 5.063 5.750 5.575 5.47420 159 Methotrexate 3.728 3.272 3.272 4.046 3.802 3.148 3.50821 160 Methyl-2-(m-nitrobenzylidene)-
acid5.672 4.807 4.807 4.836 4.887 5.708 5.009
22 166 Monobenzoate 5.331 5.222 5.222 4.635 5.182 4.927 5.03723 167 Morpholine 2.685 3.118 3.118 2.100 2.861 2.777 2.79524 188 Octabase H 5.049 5.247 5.247 4.979 5.149 5.296 5.18425 193 Orthoformic acid trimethylester 2.401 2.861 2.861 1.920 2.647 2.887 2.63526 199 Pentobarbital 3.660 3.200 3.200 3.202 3.370 3.411 3.27627 217 Quinine 4.371 4.637 4.637 4.073 4.509 4.585 4.48828 227 Secobarbital 4.004 3.503 3.503 3.564 3.628 4.042 3.64829 247 Testosterone propionate 4.236 3.971 3.971 4.461 3.876 4.494 4.15430 253 Thiopental 3.966 3.721 3.721 3.637 3.671 4.269 3.804
a According to the source paper (Sanderson and Thomsen (2009)).b The best model among the five models.
S. Kar, K. Roy / Chemosphere 81 (2010) 738–747 745
test compound is outside of the AD of Model 12 and its predictionis less reliable. So, predictions of remaining 38 test compounds arereliable.
3.3. Consensus models using all statistical methods
Though we reported the best models of interspecies correlationusing either toxicity as the response variable, we also tried consen-sus modeling for predicting and calculating the toxicity of test andtraining set compounds for both the toxicities.
3.3.1. Consensus model for Daphnia toxicityUsing Models 4–8, we calculated and predicted the Daphnia
toxicity for the training and test compounds. Then, consensus pre-dictions of all compounds were calculated and statistical qualitiesof consensus predictions were reported in Table 5. Consensus pre-dicted toxicity and observed toxicity of Daphnia were used to seethe quality of the consensus model (Model 14). Now, if we comparethe best model (Model 7) for Daphnia toxicity prediction with theconsensus model (Model 14) of Daphnia toxicity, then we can findthat model 14 outperforms the Model 7 on the basis of internal,external and overall validation criteria. The statistical qualities ofModel 14 (Table 5) are quite higher than the previous best model(Model 7).
3.3.2. Consensus model for fish toxicityLike Daphnia toxicity, consensus predictions for fish toxicity
were calculated using Models 9–13 and statistical qualities of con-sensus predictions were reported in Table 5. Consensus predictedtoxicity and observed toxicity of fish were used to see the quality
of consensus model (Model 15). Model 15 outperforms the bestmodel (Model 12) of fish toxicity prediction based on all statisticalqualities (Table 5).
3.4. Prediction of toxicity of pharmaceuticals against a particularendpoint) using experimental data against another endpoint
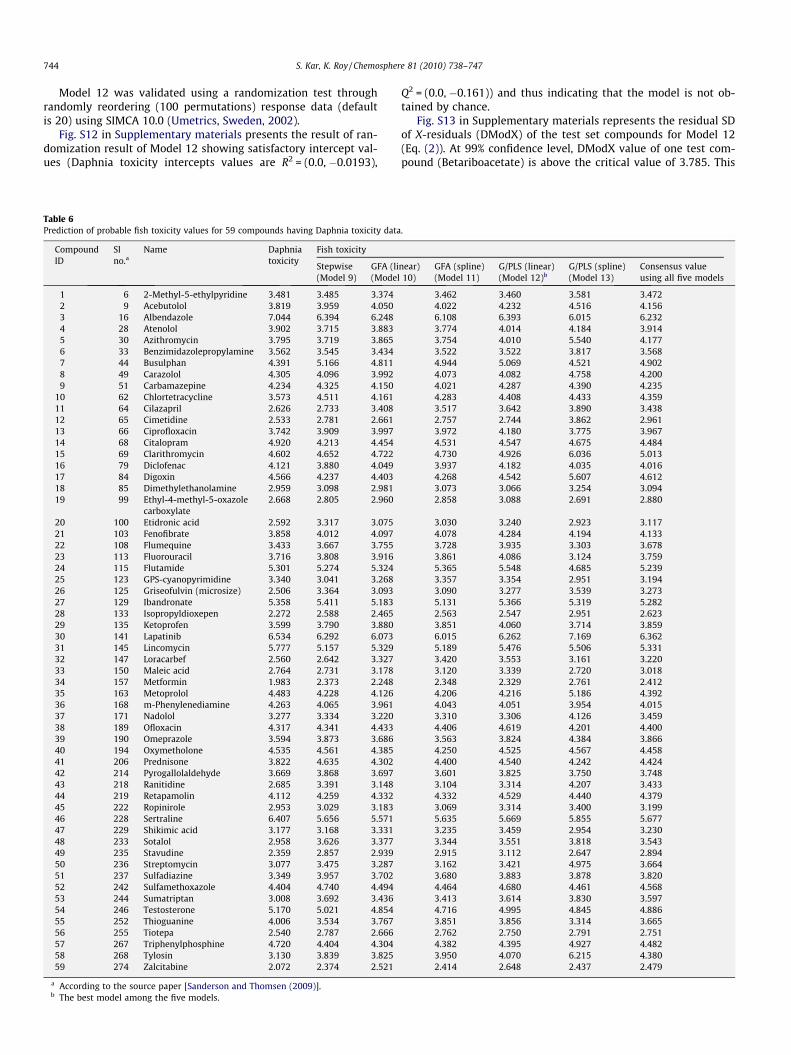
In the present data set, 59 compounds have Daphnia toxicitydata but corresponding fish toxicity data are absent. Using Models9–13, we predicted the probable fish toxicities, and their consensuspredicted toxicities are also reported in Table 6. Again, 30 com-pounds in the data set have fish toxicity data but correspondingDaphnia toxicity data are absent. Using Models 4–8, we predictedthe probable Daphnia toxicities and their consensus predicted tox-icities are also reported in Table 7. In this way, we have been ableto compute fish toxicity data of 59 pharmaceuticals and Daphniatoxicity data of 30 pharmaceuticals using robust techniques.
4. Conclusion
Adequate and robust quantitative interspecies toxicity correla-tion models were established with D. magna and fish for 77 struc-turally diverse pharmaceuticals, providing an informativeillustration of the contributing molecular and structural fragmentswhich are responsible for the greater toxicity of the diverse phar-maceuticals to the environment. Our results clearly suggest thatketo group and (S_aasC) fragment are principally responsiblefor high toxicity value of pharmaceuticals to D. magna. In case offish toxicity, along with keto group, structural fragments likeX@C@X, R–C(@X)–X, and R–C„X are largely responsible for the
746 S. Kar, K. Roy / Chemosphere 81 (2010) 738–747
toxicity. The success of the present study lies in the development ofglobal models (involving three descriptors and two latent variablesfor the best model of each endpoint) applicable for diverse classesof pharmaceuticals. Efficiency of the models in predicting D. magnaand fish toxicity of new pharmaceuticals has been adequately val-idated. The QSAR models described in the present paper for diversepharmaceuticals may be useful for ecotoxicological hazard assess-ment for pharmaceuticals against either of D. magna and fish incases when toxicity data to the other species are available. In thisstudy, we successfully predicted fish toxicity of 59 pharmaceuti-cals using experimental toxicity data to D. magna and predictedD. magna toxicity of 30 pharmaceuticals with experimental toxicitydata to fish.
Declaration of conflicts of interest
The authors declare no conflict of interest.
Acknowledgement
Financial assistance from the Ministry of Human ResourceDevelopment, Govt. of India, New Delhi in the form of a scholarshipto S.K. is thankfully acknowledged.
Appendix A. Supplementary data
Supplementary data associated with this article can be found, inthe online version, at doi:10.1016/j.chemosphere.2010.07.019.
References
Adler, P., Steger-Hartmann, T., Kalbfus, W., 2001. Distribution of natural andsynthetic estrogenic steroid hormones in water samples from southern andmiddle Germany. Acta Hydrochim. Hydrobiol. 29, 227–241.
Ahrer, W., Scherwenk, E., Buchberger, W., 2001. Occurence and fate offluoroquinolone, macrolide, and sulphonamide antibiotics during wastewatertreatment and in ambient waters in Switzerland. In: Daughton, C.G., Jones-Lepp,T. (Eds.), Pharmaceuticals and Personal care Products in the Environment:Scientific and Regulatory Issues. Symposium Series, vol. 791. AmericanChemical Society, Washington DC, pp. 56–69.
Ayscough, N.J., Fawell, J., Franklin, G., Young, W., 2000. Review of humanpharmaceutical in the environment. R&D Technical Report, p. 390. <http://publications.environment-agency.gov.uk/pdf/STRP390-e-p.pdf> (accessed on08.07.10).
Buser, H.R., Poiger, T., Müller, M.D., 1999. Occurence and experimental behaviour ofthe pharmaceutical drug ibuprofen in surface waters and in wastewater.Environ. Sci. Technol. 33, 2529–2535.
Cemagref, 2007. Environmental Database for Pharmaceuticals. <http://pharmaecobase.lyon.cemagref.fr/> (accessed 23.04.10).
Cerius2 Version 4.10 Software is a Product of Accelrys Inc., San Diego, CA, USA,<http://www.accelrys.com/cerius2>.
Cleuvers, M., 2002. Aquatic ecotoxicology of selected pharmaceutical agents algaland acute Daphnia tests. UWSE-Z Umweltchem Ökotox 14, 85–89.
Cunningham, V.L., Buzby, M., Huthcinson, T., Mastrocco, F., Parke, N., Roden, N.,2006. Effects of human pharmaceuticals on aquatic life: next steps. Environ. Sci.Technol. 40, 3456–3462.
Darlington, R.B., 1990. Regression and Linear Models. McGrawHill, New York.Daughton, C.G., Jones-Lepp, T. (Eds.), 2001. Pharmaceuticals and Personal care
Products in the Environment Scientific and Regulatory Issues. SymposiumSeries, vol. 791. American Chemical Society, Washington DC, pp. 56–69.
Delistraty, D., 2000. Acute toxicity to rats and trout with a focus on inhalation andaquatic exposures. Ecotoxicol. Environ. Saf. 46, 225–233.
Devillers, J., Devillers, H., 2009. Prediction of acute mammalian toxicity from QSARsand interspecies correlations. SAR QSAR Environ Res. 20 (5), 467–500.
Duardo-Sánchez, A., Patlewicz, G., López-Díaz, A., 2008. Current topics on softwareuse in medicinal chemistry: intellectual property, taxes, and regulatory issues.Curr. Top. Med. Chem. 8, 1666–1675.
EMEA, 2005. Draft Guideline on the Environmental Risk Assessment of MedicinalProducts for Human Use CHMP/SWP/4447/00. The European Agency for theEvaluation of Medicinal Products, <ttp://www.ema.europa.eu/pdfs/human/swp/444700en.pdf> (accessed on 08.07.10).
Escher, B.I., Bramaz, N., Richter, M., Lienert, J., 2006. Comparative ecotoxicologicalhazard assessment of beta-blockers and their human metabolites using a mode-of-action-based test battery and a QSAR approach. Environ. Sci. Technol. 40,7402–7408.
European Commission Technical Guidance Document in Support of CommissionDirective 93/67/EEC, 2003, on Risk Assessment for NewNotified Substances,Commission Regulation (EC) No. 1488/94 on Risk Assessment for ExistingSubstances, and Directive 98/8/EC of the European Parliament and of theCouncil Concerning the Placing of Biocidal Products on the Market, Office forOfficial Publications of the European Communities, <http://ecbjrcit/> (accessedon 08.07.10).
European Commission. Regulation (EC) No. 1907/2006 of the European Parliamentand of the Council of 18 December2006 concerning the Registration, Evaluation,Authorisation and Restriction of Chemicals (REACH), establishing a EuropeanChemicals Agency, amending Directive 1999/45/EC and repealing CouncilRegulation (EEC) No. 793/93 and Commission Regulation (EC) No. 1488/94 aswell as Council Directive 76/769/EEC and Commission Directives 91/155/EEC,93/67/EEC, 93/105/EC and 2000/21/EC. Office for Official Publications of theEuropean Communities (OPOCE). Off J Eur Union 2006, L 396/1 of 30.12.2006,<http://publications.europa.eu>.
Fan, Y., Shi, L.M., Kohn, K.W., Pommier, Y., Weinstein, J.N., 2001. Quantitativestructure–antitumor activity relationships of camptothecin analogues: clusteranalysis and genetic algorithm-based studies. J. Med. Chem. 44, 3254–3263.
Food and Drug Administration, 1985. FDA Final Rule for Compliance with NationalEnvironmental Policy Act: Policy and Procedures, Federal Register 50 FR 16636,21 CFR 25, 26 April 1985.
Food and Drug Administration, 1987. Environmental Assessment TechnicalAssistance Handbook (FDA Centre for Food Safety and Applied Nutrition,Environmental Impact Section, March 1987). NTIS PB87-175345.
Food and Drug Administration, 1995. Center for Drug Evaluation and Research(CDER). Guidance for Industry for the Submission of an EnvironmentalAssessment in Human Drug Applications and Supplements. Food and DrugAdministration, November, CMC 6.
Frick, E.A., Henderson, A.K., Moll, D.M., Furlong, E.T., Meyer, M.T., 2001. In:Presented at the 2001 Georgia Water Resources Conference, Athens, GA.
Ghose, A.K., Viswanadhan, V.N., Wendoloski, J.J., 1998. Prediction of hydrophobic(lipophilic) properties of small organic molecules using fragmental methods: ananalysis of ALOGP and CLOGP methods. J. Phys. Chem. A 102, 3762–3772.
González-Díaz, H., Vilar, S., Santana, L., Uriarte, E., 2007. Medicinal chemistry andbioinformatics-current trends in drugs discovery with networks topologicalindices. Curr. Top. Med. Chem. 7, 1015–1029.
González-Díaz, H., Prado-Prado, F., Ubeira, F.M., 2008. Predicting antimicrobialdrugs and targets with the MARCH-INSIDE approach. Curr. Top. Med. Chem. 8,1676–1690.
González-Díaz, H., Duardo-Sanchez, A., Ubeira, F.M., Prado-Prado, F., Pérez-Montoto,L.G., Concu, R., Podda, G., Shen, B., 2010. Review of MARCH-INSIDE & complexnetworks prediction of drugs: ADMET, anti-parasite activity, metabolizingenzymes and cardiotoxicity proteome biomarkers. Curr. Drug Metab. 11, 379–406.
GSK, 2007. Materials Safety Data Sheets from GlaxoSmithKline (GSK), <http://www.msds-gsk.com/ExtMSDSlist.asp> (accessed 23.04.10).
Halling-Sørensen, B., Nors Nielsen, S., Lanzky, P.F., Ingerslev, F., Holten Lützhøft,H.C., Jørgensen, S.E., 1998. Occurrence, fate and effects of pharmaceuticalsubstances in the environment – a review. Chemosphere 36 (2), 357–393.
Heberer, Th., Dünnbier, U., Reilich, Ch., Stan, H.J., 1997. Detection of drugs and drugmetabolites in ground water samples of a drinking water treatment plant.Fresenius Environ. Bull. 6, 438–443.
Heberer, T., Fuhrmann, B., Schmidt-Baumler, K., Tsipi, D., Koutsouba, V., Hiskia, A.,2001. In: Daughton, C.G., Jones-Lepp, T.L. (Eds.), Pharmaceuticals and PersonalCare Products in the Environment: Scientific and Regulatory Issues. AmericanChemical Society, Washington, DC.
Heberer, T., 2002. Tracking persistent pharmaceutical residues from municipalsewage to drinking water. J. Hydrol. 266, 175–189.
Huang, C.H., Sedlak, D.L., 2001. Analysis of estrogenic hormones in municipalwastewater effluent and surface water using enzyme-linked immune adsorbentassay and gas chromatography/tandem mass spectrometry. Environ. Toxicol.Chem. 20, 133–139.
Jørgensen, S.E., Halling-Sørensen, B., 2000. Drugs in the environment. Chemosphere40 (7), 691–699.
Khan, M.T., 2010. Predictions of the ADMET properties of candidate drug moleculesutilizing different QSAR/QSPR modelling approaches. Curr. Drug Metab. 11,285–295.
Knacker, T., Duis, K., Ternes, T., Fenner, K., Escher, B., Schmitt, H., Römbke, J., Garric, J.,Hutchinson, T., Boxall, A.B.A., 2005. The EU-project ERAPharmsIncentives for thefurther development of guidance documents? Environ. Sci. Pollut. Res. 12, 62–65.
Kolpin, D.W., Furlong, E.T., Meyer, M.T., Thurman, E.M., Zaugg, S.D., Barber, L.B.,Buxton, H.T., 2002. Pharmaceuticals, hormones, and other organic wastewatercontaminants in US streams, 1999–2000: a national reconnaissance. Environ.Sci. Technol. 36 (6), 1202–1211.
Kubinyi, H., Hamprecht, F.A., Mietzner, T., 1998. Three-dimensional quantitativesimilarity–activity relationships (3D QSiAR) from SEAL similarity matrices. J.Med. Chem. 41, 2553–2564.
Kümmerer, K., 2001. Pharmaceuticals in the Environment: Sources, Fate, Effects andRisks. Springer-Verlag, Berlin.
Leonard, J.T., Roy, K., 2006. On selection of training and test sets for thedevelopment of predictive QSAR models. QSAR Comb. Sci. 25, 235–251.
Lindsey, M.E., Meyer, M., Thurman, E.M., 2001. Analysis of trace levels ofsulfonamide and tetracycline antimicrobials in groundwater and surface waterusing solid-phase extraction and liquid chromatography/mass spectrometry.Anal. Chem. 73, 4640–4646.
S. Kar, K. Roy / Chemosphere 81 (2010) 738–747 747
Loraine, G.A., Pettigrove, M.E., 2006. Seasonal variations in concentrations ofpharmaceuticals and personal care products in drinking water and reclaimedwastewater in Southern California. Environ. Sci. Technol. 40, 687–695.
MINITAB is a Statistical Software of Minitab Inc., USA, <http://www.minitab.com>.Mitra, I., Roy, P.P., Kar, S., Ojha, P.K., Roy, K., 2010. On further application of r2
m as ametric for validation of QSAR models. J. Chemom. 24, 22–33.
NOAA, 2006. United States National Oceanic and Atmospheric Administration(NOAA), Pharmaceuticals in the Environment, <http://www.chbr.noaa.gov/peiar/> (accessed 23.04.10).
Park, J., 2005. Pharmaceuticals in the Environment and Management Approaches inKorea. KEI, 2005, RE-12, <http://www.kei.re.kr/04publ/pdf/report/05RE12.pdf>(accessed 07.16.07).
Rabiet, M., Togola, A., Brissaud, F., Seidel, J.L., Budzinski, H., Elbaz-Poulichet, F., 2006.Consequence of wastewater disposal on the contamination of the waterresource by pharmaceuticals in a Mediterranean basin. Environ. Sci. Technol.40, 5282–5288.
Raimondo, S., Mineau, P., Barron, M.G., 2007. Estimation of chemical toxicity towildlife species using interspecies correlation models. Environ. Sci. Technol. 41,5888–5894.
Roche, 2007. Pharmaceuticals Sustainability Database. <http://www.roche.com/home/sustainability/sus_env/sus_sds_search/sus_sds_search_result.htm?sds-search_name=&sdssearch_sum=%25&sdssearch_cas=&submit=ShowSDS>(accessed 16.07.07).
Rogers, D., Hopfinger, A.J., 1994. Application of genetic function approximation toquantitative structure activity relationships and quantitative structure propertyrelationships. J. Chem. Inf. Comput. Sci. 34, 854–866.
Roy, K., 2007. On some aspects of validation of predictive quantitative structure–activity relationship models. Expert Opin. Drug. Discov. 2, 1567–1577.
Roy, P.P., Roy, K., 2008. On some aspects of variable selection for partial leastsquares regression models. QSAR Comb. Sci. 27, 302–313.
Roy, K., Mandal, A.S., 2008. Development of linear and nonlinear predictive QSARmodels and their external validation using molecular similarity principle foranti-HIV indolyl aryl sulfones. J. Enzyme Inhib. Med. Chem. 23, 980–995.
Roy, P.P., Leonard, J.T., Roy, K., 2008. Exploring the impact of the size of training setsfor the development of predictive QSAR models. Chemom. Intell. Lab. Syst. 90,31–42.
Roy, P.P., Paul, S., Mitra, I., Roy, K., 2009. On two novel parameters for validation ofpredictive QSAR models. Molecules 14, 1660–1701.
Sanderson, H., Johnson, D.J., Wilson, C.J., Brain, R.A., Solomon, K.R., 2003.Probabilistic hazard assessment of environmentally occurringpharmaceuticals toxicity to fish, daphnids and algae by ECOSAR screening.Toxicol. Lett. 144, 383–395.
Sanderson, H., Thomsen, M., 2007. Ecotoxicological quantitative structure–activityrelationships for pharmaceuticals. Bull. Environ. Contam. Toxicol. 79, 331–335.
Sanderson, H., Thomsen, M., 2009. Comparative analysis of pharmaceuticals versusindustrial chemicals acute aquatic toxicity classification according to the UnitedNations classification system for chemicals. Assessment of the (Q)SARpredictability of pharmaceuticals acute aquatic toxicity and theirpredominant acute toxic mode-of-action. Toxicol. Lett. 187, 84–93.
Sedlak, D.L., Pinkston, K.E., 2001. Factors affecting the concentrations ofpharmaceuticals released to the aquatic environment. Water Resour. Update120, 56–64.
Seiler, R.L., Zaugg, S.D., Thomas, J.M., Howcroft, D.L., 1999. Caffeine andpharmaceuticals as indicators of waste water contamination in wells. GroundWater 37, 405–410.
Seiler, J.P., 2002. Pharmacodynamic activity of drugs and ecotoxicology – can thetwo be connected? Toxicol. Lett. 131 (1–2), 105–115.
SPSS is a Statistical Software of SPSS Inc., Chicago, IL, <http://www.spss.com>.Stackelberg, P.E., Furlong, E.T., Meyer, M.T., Zaugg, S.D., Henderson, A.K., Reissman,
D.B., 2004. Persistence of pharmaceutical compounds and other organicwastewater contaminants in a conventional drinking-water-treatment plant.Sci. Total Environ. 329 (1–3), 99–113.
STATISTICA is a Statistical Software of STATSOFT Inc., USA, <http://www.statsoft.com/>.
Stuer-Laudridson, F., Birkved, M., Hansen, L., Holten Lützhoft, H., Halling-Sorensen,B., 2000. Environmental risk assessment of human pharmaceuticals in Denmarkafter normal therapeutic use. Chemosphere 40, 783–793.
Tauber, R., 2003. Quantitative Analysis of Pharmaceuticals in Drinking Water fromTen Canadian Cities. Enviro-Test Laboratories, Winnipeg, Manitoba.
Ternes, T., 1998. Occurence of drugs in German sewage treatment plants and rivers.Water Res. 32, 3245–3260.
Ternes, T.A., Bonerz, M., Schmidt, T., 2001. Determination of neutralpharmaceuticals in wastewater and rivers by liquid chromatographyelectrospray tandem mass spectrometry. J. Chromatogr. A 938, 175–185.
UMETRICS SIMCA-P 10.0, [email protected], Umea, Sweden, 2002,<www.umetrics.com>.
Walker, J.D., Gray, D.A., Pepling, M., 1999. Past and future strategies for sorting andranking chemicals: applications to the 1998 drinking water contaminants listchemicals. Identifying Future Drinking Water Contaminants. National AcademyPress, Washington, DC. pp. 51–102.
Wold, S., 1995. PLS for multivariate linear modelling. In: van de Waterbeemd, H.(Ed.), Chemometric Methods in Molecular Design. VCH, Weinheim, Germany,pp. 195–218.
Wold, S., Sjostrom, M., Eriksson, L., 1998. Partial least squares projections to latentstructures (PLS) in chemistry. In: Schleyer, P.V.R. (Ed.), Encyclopedia ofComparative Chemistry, vol. 3. Wiley, Chichester, GB, p. 2006.
Wold, S., Sjostrom, M., Eriksson, L., 2001. PLS-regression: a basic tool ofchemometrics. Chemom. Intell. Lab. Syst. 58, 109–130.
Ye, Z., Weinberg, H.S., Meyer, M.T., 2004. In: Presented at NGWA 4th InternationalConference on Pharmaceuticals and Endocrine Disrupting Chemicals in Water;Minneapolis, MN.
Zhang, L., Zhu, H., Oprea, T., Golbraikh, A., Tropsha, A., 2008. QSAR modeling of theblood–brain barrier permeability for diverse organic compounds. Pharm. Res.25, 1902–1914.
Zuccato, E., Calamari, D., Natangelo, M., Fanelli, R., 2000. Presence of therapeuticdrugs in the environment. Lancet 355, 1789–1790.