first financial holding - todayir.com
TRANSCRIPT

This English version annual report is a summary translation of the Chinese
version and is not an official document of the shareholders’ meeting. If
there is any discrepancy between the English version and Chinese version,
the Chinese version shall prevail.
Disclaimer: This shareholder report cannot be expected to provide as full understanding of the financial performance, financial position, operating, financing and investment activities of the First Financial Group as the 2009 FFHC annual report in Chinese and the full annual financial statements. This publication contains certain forward-looking statements and future expectations. These expectations are based on management’s current views and assumptions and involve known and unknown risks and uncertainties. Actual results, performance or events may differ materially from those expressed or implied in such statements. There can be no assurance that actual outcomes will not differ materially from these statements. FFHC assumes no obligation to update any forward-looking information contained in this report.

First Financial Holding Co., Ltd. First Financial Holding Co., Ltd. First Financial Holding Co., Ltd. First Financial Holding Co., Ltd. First Financial Holding Co., Ltd. First Financial Holding Co., Ltd. First Financial Holding Co., Ltd. First Financial Holding Co., Ltd. First Financial Holding Co., Ltd. First Financial Holding Co., Ltd. First Financial Holding Co., Ltd. First Financial Holding Co., Ltd. First Financial Holding Co., Ltd. First Financial Holding Co., Ltd. First Financial Holding Co., Ltd. First Financial Holding Co., Ltd. First Financial Holding Co., Ltd. First Financial Holding Co., Ltd. First Financial Holding Co., Ltd. First Financial Holding Co., Ltd. First Financial Holding Co., Ltd. First Financial Holding Co., Ltd. First Financial Holding Co., Ltd. First Financial Holding Co., Ltd. First Financial Holding Co., Ltd. First Financial Holding Co., Ltd. First Financial Holding Co., Ltd. First Financial Holding Co., Ltd. First Financial Holding Co., Ltd. First Financial Holding Co., Ltd. First Financial Holding Co., Ltd. First Financial Holding Co., Ltd. First Financial Holding Co., Ltd. First Financial Holding Co., Ltd. First Financial Holding Co., Ltd. First Financial Holding Co., Ltd. First Financial Holding Co., Ltd. First Financial Holding Co., Ltd. First Financial Holding Co., Ltd. First Financial Holding Co., Ltd. First Financial Holding Co., Ltd. First Financial Holding Co., Ltd. First Financial Holding Co., Ltd. First Financial Holding Co., Ltd. First Financial Holding Co., Ltd. First Financial Holding Co., Ltd. First Financial Holding Co., Ltd. First Financial Holding Co., Ltd. First Financial Holding Co., Ltd. First Financial Holding Co., Ltd. First Financial Holding Co., Ltd. First Financial Holding Co., Ltd. First Financial Holding Co., Ltd. First Financial Holding Co., Ltd. First Financial Holding Co., Ltd. First Financial Holding Co., Ltd. First Financial Holding Co., Ltd. First Financial Holding Co., Ltd. First Financial Holding Co., Ltd. First Financial Holding
Letter to Shareholders 02
Company Profile 07
Financial Highlights 08
Corporate Governance 12
Capital Overview 28
Subsidiaries Overview 32
Corporate Social Responsibilities 42
Financial Information 44
General Information 155
Contents

2
Letter to Shareholders
Dear Shareholders,
Looking back in 2009, thanks to stimulus actions taken by governments around the world, the economy progressively stabilized. Nevertheless, the recent Dubai standstill and sovereign debt crisis of the Southern Europe countries showed that the risks of a relapse were high. Excess liquidity triggered fears over inflation and asset bubble, while capital injections into the financial systems widened budget deficit and threatened to undermine the still fragile economy. Unemployment rates remained high, leaving central banks around the world in a dilemma over when to unwind their stimulus measures, fiscal- and monetary-wise.
In Taiwan, starting from the third quarter 2009, the capital market regained momentum and the GDP growth turned positive in the fourth quarter at an estimated 9.22%, as Government’s economic stimulus actions fueled trade activities and capital inflows from overseas. Increased export demand drove up capacity utilization rates at major technology and electronics manufacture facilities, triggering a new wave of capital raising plans in the private sector. On the domestic front, consumer confidence firmed up and brought forth the growth of private consumption back to positive territory at an estimated 1.48%. Benefiting from export volumes arising from strong bounce-back in Emerging-Asia economies, Taiwan’s GDP was expected to shrink by 1.87% for 2009, better than the previous forecast of -2.53%, according to Directorate-General of Budget, Accounting and Statistic. Statistics also indicated positive signs of recovery in financial and insurance sector, with a 2.8% growth projected for the fourth quarter of 2009, versus double-digit contraction seen in the first and second quarter of 2009.
Uncertainty Lays Still AheadWhile signs of a global recovery were observed in 2009, we remain cautious about the high level of uncertainty in a number of respects. The financial crisis has not only helped materialize the rise of world’s new economic power, the change in global business structure, but further addressed the power of emerging economic entities, such as China and India, will impact the global economy. In the wake of the financial crisis, the “jobless” recovery in developed economies appears inevitable. Capital injections into the global financial system have accelerated the expansion of debt at an alarming rate. Increasing liquidity that resulted from “loose” monetary and fiscal policy now risks new wave of asset bubbles. Growing needs for raw materials such as petros and minerals from developing economies are heightening inflationary pressure. While the “imbalances” described above might worsen or even cause further fluctuations in the global economic cycles, the key to stabilize and sustain the economy can not be short-lived fiscal or monetary initiatives alone, but continued innovation and governmental incentives that encourage investments and consumption.
Operating Strategy: from Stable to StrongIn the backdrop of an economic upturn and thawing relations between Taiwan and China, First Financial Holdings gradually climbed out of the trough in 2008. Thanks to a combination of sound risk oversight, improving margin expansion, earnings recovery for the banking business and subsidiaries profit growth aided by market rebounds and revived investor optimism, the group reported consolidated net revenue of NT$29,573 million. Net Income was NT$2,689 million, of which NT$2,779 million was attributable to equity holders of parent company and a loss of NT$90 million to minority shareholders. Post-tax EPS was NT$0.44. In light of the adoption of SFAS Article 34 (which requires a general provision to be made against all outstanding loans), First Financial Holdings moved to further set aside provisions for its bank subsidiary to lower NPL ratio and improve Bad-Debt Coverage. Although undertaking such precaution delivered an adverse impact on bottom-line, it was understood by institutional investors at home and abroad that such action was taken for a necessary cause in order to strengthen the group’s financial soundness as well as China deployment plan.
The 2009 operating performance of group subsidiaries is described separately below:
In 2009, First Bank benefited from a rebound in Net Interest Margin and steady recovery of Net Interest Income, started from the third quarter. Though Fee Income contracted due to financial crisis and structured note compensation during the first half of 2009, fee momentum resumed in the second half of the year and still accounted for as much as 15% of net

3
Lette
r to Sha
reho
lde
rs2009 A
nnual Re
po
rt
revenue for the full year. Increased Bad-Debt Provision in response to new regulations governing banks’ financial viability led to a 77.09% decrease in net income to NT$2,054 million, or NT$0.42 per share, meeting just 26.84% of First Bank’s budget goal. However, with delinquency rate cut down to 1.32% and coverage ratio raised to 84.75%, First Bank’s restored financial strength has laid the ground work for its China expansion and profit growth plans.
Riding on a wave of liquidity momentum and stock market rallies, Taiwan stock market saw brokerage volumes grow by 38.47% to NT$1,226,107 million in 2009. The brokerage market share of First Securities jumped to 1.723% from 1.465% a year earlier. In addition, it was ranked No.1 in broking volumes on the Emerging Board. During 2009, First Securities actively explored the new business of advising Taiwanese corporations that operate overseas for local listings, and advanced strongly in the competition for IPO and SPO underwriting – with 7 cases acting as a lead underwriter and 27 cases as a co-manager, doubling its record of the prior year. Its bottom-line performance underscored the result of its optimization of risk management and modular portfolios to maximize proprietary trading profit: 2009 net income was NT$912 million or NT$1.55 per share, exceeding its budget goal by 51.05%.
Yuh-Chang ChenChairman, First Financial
4
Letter to Shareholders
With investor optimism surging back in the second quarter, combined with Government’s stimulus actions, First Securities Investment Trust’s Asset Under Management increased to NT$106.8 billion for 2009. Public-offering fund assets increased by NT$14.6 billion to NT$99.6 billion, with stock funds registering the strongest growth rate of 112.5% to NT$22.1 billion. As of end of 2009, the account of First Securities Investment Trust’s investors grew by 3.7% to 55,064, while the size of regular investor plans grew by 35.8% to 13,386 from the prior year. The company’s profit returned to the historical baseline, with net income of NT$152 million, or NT$2.53 per share, beating its budget goal by 26.25%.
In 2009, First-Aviva shifted its product focus to traditional life policies and retirement-plan programs, steering away from investment-linked and interest-sensitive annuity insurance products against an unfavorable interest rate environment. By leveraging cross-sell efforts on mortgage insurance and accident insurance through First Bank’s branch networks, First-Aviva achieved first-year premium of NT$3.34 billion. The company was ranked the 16th insurer in terms of bancassurance with a 0.56% market share. Improved investment returns and stringent cost control helped narrow 2009 net loss to NT$184 million, or -NT$0.82 per share, easing the pressure for re-capitalization.
As for other subsidiaries with smaller-scale operations, First AMC, First Consulting and First P & C Insurance Agency met earnings targets on the back of cost-cutting measures and upward volume and price movement in markets– except for First Venture Capital, which dragged by impairment losses on its equity portfolio under volatile market conditions. For 2009, First AMC reported net income of NT$43.58 million, exceeding its budget goal by 1.29%; First Venture Capital reported NT$25.98 million, short of its budget goal by 35.74%; First Consulting reported net income of NT$8.97 million, exceeding its budget goal by 24.22%; First P & C Insurance Agency reported net income of NT$6.51 million, exceeding its budget goal by 29.07%.
China Reach, Taiwan Experience We see 2010 as a year of new opportunities given a turnaround in the economy at home and abroad, and gradually tie-up between Taiwan and China. A number of focal points are identified to guide our business strategy and forward-looking initiatives in the coming year; implement joint-marketing and resources integration across group subsidiaries; pioneer overseas expansion; establish a group-wide financial products and services platform to enhance one-stop shopping for customers; reinforce the compliance regime and strengthen risk management practices; optimize processes and procedures to manage the group’s asset and liability profile; target to act as a benchmark for best corporate citizen. To conclude, our vision is firmly rooted in our bank franchise, through which we will continue to promote joint marketing, integrate resources, innovate on customer services, sustain profitability and maximize value for the group and shareholders.
To ensure compliance with changing legal and financial regulations, we will continue to educate employees, management and directors about the latest reforms via periodical training to enhance corporate governance. We have put into place an IFRS (International Financial Reporting Standards) task force responsible for the implementation and personnel training relating to IFRS. Yet another dedicated team was established to be responsible for the origination, review and monitoring of China business plans for the group’s subsidiaries, while devising strategies through our in-house policy research into the financial Memorandum of Understanding (MOU) and Economic Cooperation Framework Agreement(ECFA) between Taiwan and China.
To lead the race of human capital, we will accelerate the development of talent for core businesses important to sustain our competitive advantages for the future. In addition, we will proactively recruit, train and deploy management associates, equipping them with certificates applicable to financial professions in China, Hong Kong and Macau to support China expansion strategy.
For risk management, we will incorporate risk monitoring from subsidiaries’ ALM (Asset and Liability Management)

5
Lette
r to Sha
reho
lde
rs2009 A
nnual Re
po
rt
commissions into the group’s risk management regime. A regular review and update of our internal control processes and procedures will be in place to ensure the validity and effectiveness of such controls. We will also continue to strengthen internal control at subsidiary levels and on-going employee training to raise awareness of ethical behavior as part of the group-wide efforts to reinforce risk management.
In light of the signing of the financial MOU and negotiations over the “early harvest list” of industries under the ECFA framework between Taiwan and China, we have set forth the priority of establishing a bank branch in Shanghai, followed by a securities brokerage representative office, as early preparatory steps to build a financial service platform for Taiwanese businesses that operate overseas. As we are positive on the potentials of emerging markets in the Asia-Pacific region, our goal for the next stage of China business development will be incorporating a subsidiary company in China after the Shanghai branch’s operation gets on track.
With regard to marketing, core banking business shall continue to act as the foundation from which to tap into stock broking, asset management and insurance, so as to solidify primary profit sources such as corporate banking, retail banking, foreign exchange and wealth management. To help our customers meet their financial goals as well as to
Ming-Ren ChienPresident, First Financial
6
discover cross-sell opportunities for the group, we will continue promoting our unique “Financial Services Integration System”, which integrates a wide range of financial products alongside a sales referral platform in a bid to boost business volume.
Meanwhile, to fortify corporate image and fulfill social responsibilities, we will adhere to our centennial corporate tradition and virtue by gaining clients trust through persistent quality financial services and products, which better safeguard the First Financial brand. Based on existing ample resources and business franchise, we manage to integrate group sales and upgrade brand awareness by consolidating subsidiaries business and CSR campaign as a whole. We believe our brand re-engineering efforts will pay off and bring to the attention of our customers, shareholders and employees the compelling advantages that keep First Financial ahead in the financial industry.
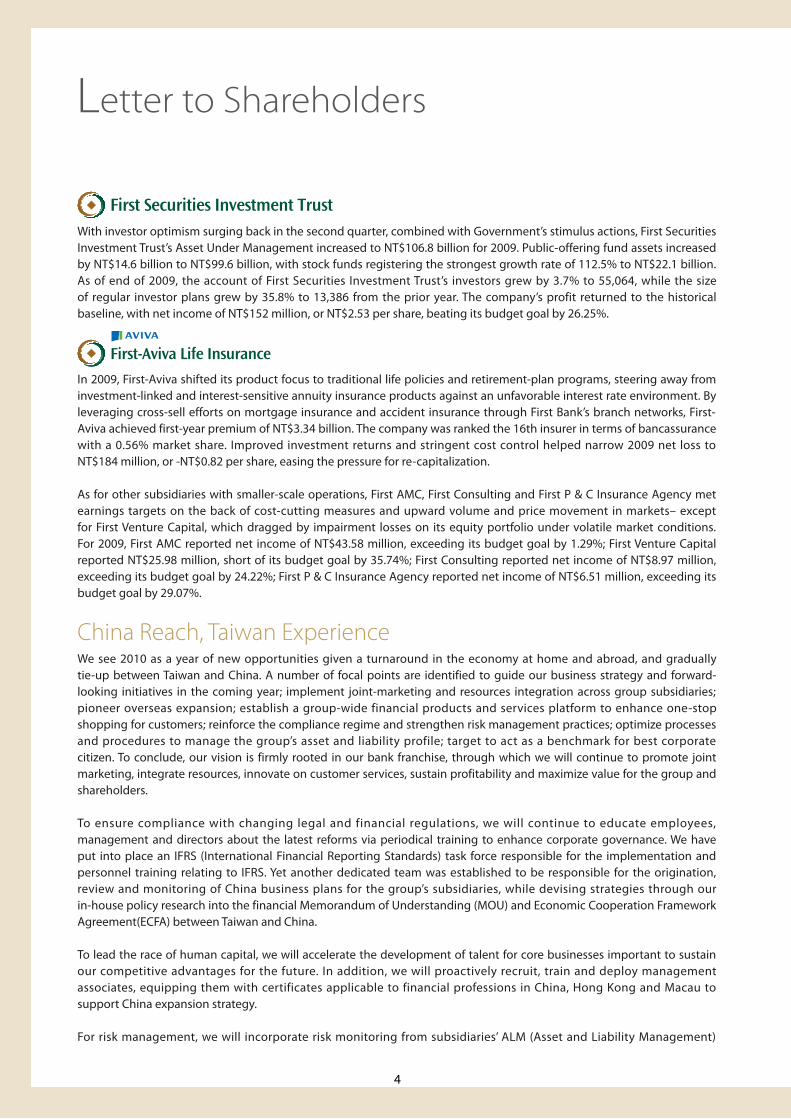
Last year, we received favorable ratings from various rating agencies. All their credit reports pointed to First Financial Holding’s enduring market standing, a large customer base, solid asset quality, adequate financial structure and sound risk management practice. A detailed review and outlook for First Financial Holding and its principal subsidiaries are set out in the table below:
The ratings of various rating agencies in 2009 are as follows:
First Financial Holding First Bank First Securities
ST LT Outlook ST LT Outlook ST LT Outlook
Taiwan ratings -- -- -- twA-1+ twAA- Stable -- -- --
S&P -- -- -- A-2 BBB+ Stable -- -- --
Moody’s -- -- -- P-1 A3 Stable -- -- --
Fitch F2 BBB+ Stable F2 BBB+ Stable -- -- --
Fitch(Local) F1(twn) AA-(twn) Stable F1(twn) AA-(twn) Stable F1(twn) A+(twn) Stable
A New Stage for 2010We thank all of our shareholders for their guidance and support in leading us through the unprecedented financial challenges in 2009 that could hinder growth in the financial sector. As we enter the new stage of China market expansion starting from 2010, with our well-preparation in capital structure and asset quality, we will continue to target ourselves becoming one of the regional leading financial institutions by expanding our Greater China business, enlarging business scale and enhancing operating results.
Yuh-Chang ChenChairman, First Financial
Ming-Ren ChienPresident, First Financial
7
Co
mp
any Pro
file2009 A
nnual Re
po
rt
First Financial Holding Co., Ltd. was incorporated on January 2, 2003 with First Commercial Bank as its flagship entity. It is
listed on Taiwan Stock Exchange under the stock code 2892.
Founded in 1899, First Bank was one of the three government-affiliated banks with the mission to allocate credit to
underserved industrial and commercial businesses, finance national infrastructure, and serve as an underlying force of
Taiwan’s great economic advancement. In 1998, First Bank became the largest private-owned bank on the island after
privatization. Since then it has been able to secure leadership positions in such selected areas as the corporate banking,
SME business, home mortgages, mutual-fund distribution, trade finance, deposit and lending. It currently owns 190
branches at home along with 26 overseas branches and representative offices including the U.S. subsidiary of First
Commercial Bank (USA).
With the historical groundwork well laid by First Bank, First Financial Holding Co. further diversified its business portfolio
into securities trading, property and casualty insurance and asset management on July 31, 2003, by acquiring First Taisec
Securities Co., Ltd., Mingtai Fire & Marine Insurance Co., Ltd. and National Investment Trust Co., Ltd. On July 28, 2003, it
successfully raised the equivalent of NT$17.3 billion via a global depository receipt program, the first ever issued by a
Taiwanese financial institution, which significantly shored up capital bases of the group and its subsidiaries. From May
through September of 2004, in its second round of penetrating into new markets to deliver full product range and high
quality services, First Financial Holding Co. established First Financial Asset Management Co., Ltd., First Venture Capital Co.,
Ltd., First Financial Management Consulting Co., Ltd., and First P&C Insurance Agency Co., Ltd.
First Financial Holding, in an aim to capture growth in wealth management, expand product offerings, retain clients and
address personal retirement planning needs, sought to form a joint venture with U.K’s largest insurer Aviva in 2007. First-
Aviva Life, a 51:49 joint-venture between the two companies, was incorporated on December 11, 2007.
In order to solidify group image, raise popular awareness of its subsidiaries and promote employee loyalty, First Financial
Holding rebranded subsidiaries First Taisec Securities, National Securities Investment Trust and First Taisec Capital
Management under the names “First Securities”, “First Securities Investment Trust” and “First Capital Management” on
December 31, 2008. And in September of 2009, First-Aviva’s Chinese brand was successfully renamed.
With NT$1.96 trillion in assets, over five million customer accounts and strong client relationships, First Financial Holding
operates across multiple financial sectors. The holding company enhances efficiency via economies of scale and allows
for effective joint marketing, resource sharing and personnel assignment within the group. First Financial Holding will
continue to leverage its diversified scope to create greater value for clients, shareholders and employees, with the goal of
becoming the most competitive financial institution in Taiwan and across the Asian-Pacific region.
Company Profile
8
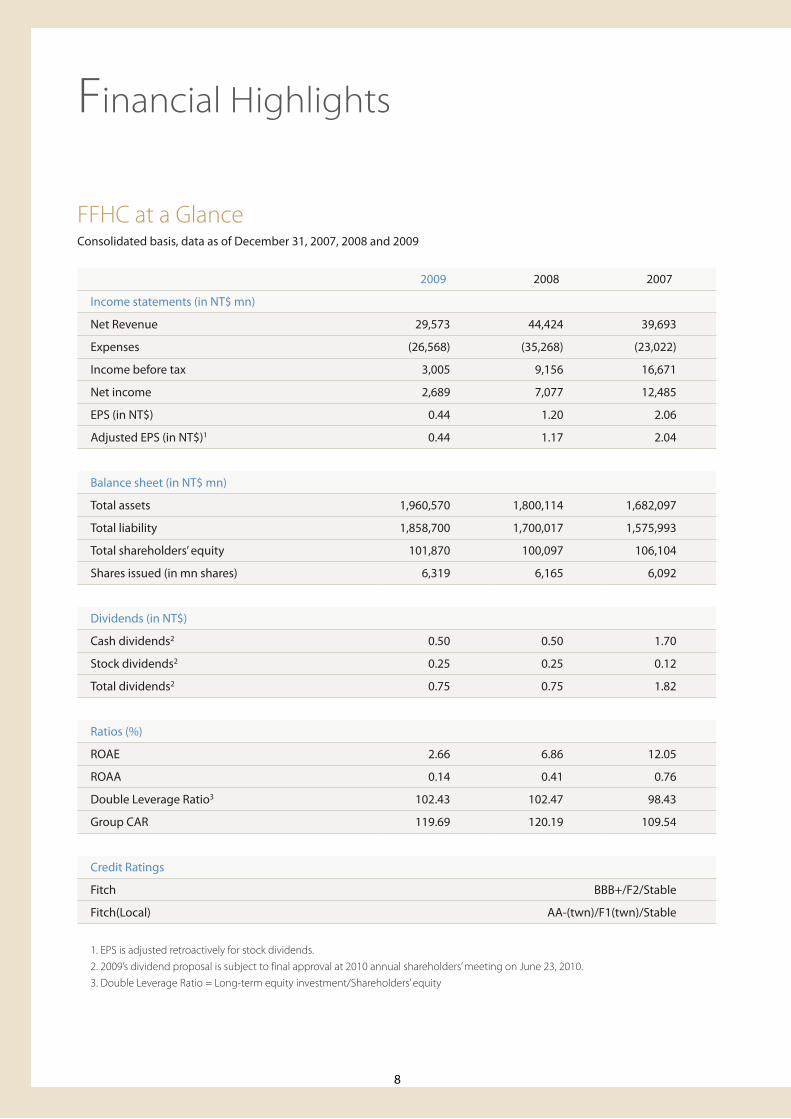
FFHC at a GlanceConsolidated basis, data as of December 31, 2007, 2008 and 2009
2009 2008 2007
Income statements (in NT$ mn)
Net Revenue 29,573 44,424 39,693
Expenses (26,568) (35,268) (23,022)
Income before tax 3,005 9,156 16,671
Net income 2,689 7,077 12,485
EPS (in NT$) 0.44 1.20 2.06
Adjusted EPS (in NT$)1 0.44 1.17 2.04
Balance sheet (in NT$ mn)
Total assets 1,960,570 1,800,114 1,682,097
Total liability 1,858,700 1,700,017 1,575,993
Total shareholders’ equity 101,870 100,097 106,104
Shares issued (in mn shares) 6,319 6,165 6,092
Dividends (in NT$)
Cash dividends2 0.50 0.50 1.70
Stock dividends2 0.25 0.25 0.12
Total dividends2 0.75 0.75 1.82
Ratios (%)
ROAE 2.66 6.86 12.05
ROAA 0.14 0.41 0.76
Double Leverage Ratio3 102.43 102.47 98.43
Group CAR 119.69 120.19 109.54
Credit Ratings
Fitch BBB+/F2/Stable
Fitch(Local) AA-(twn)/F1(twn)/Stable
1. EPS is adjusted retroactively for stock dividends. 2. 2009’s dividend proposal is subject to final approval at 2010 annual shareholders’ meeting on June 23, 2010.3. Double Leverage Ratio = Long-term equity investment/Shareholders’ equity
Financial Highlights
9
Financ
ial H
ighlig
hts2009 A
nnual Re
po
rt
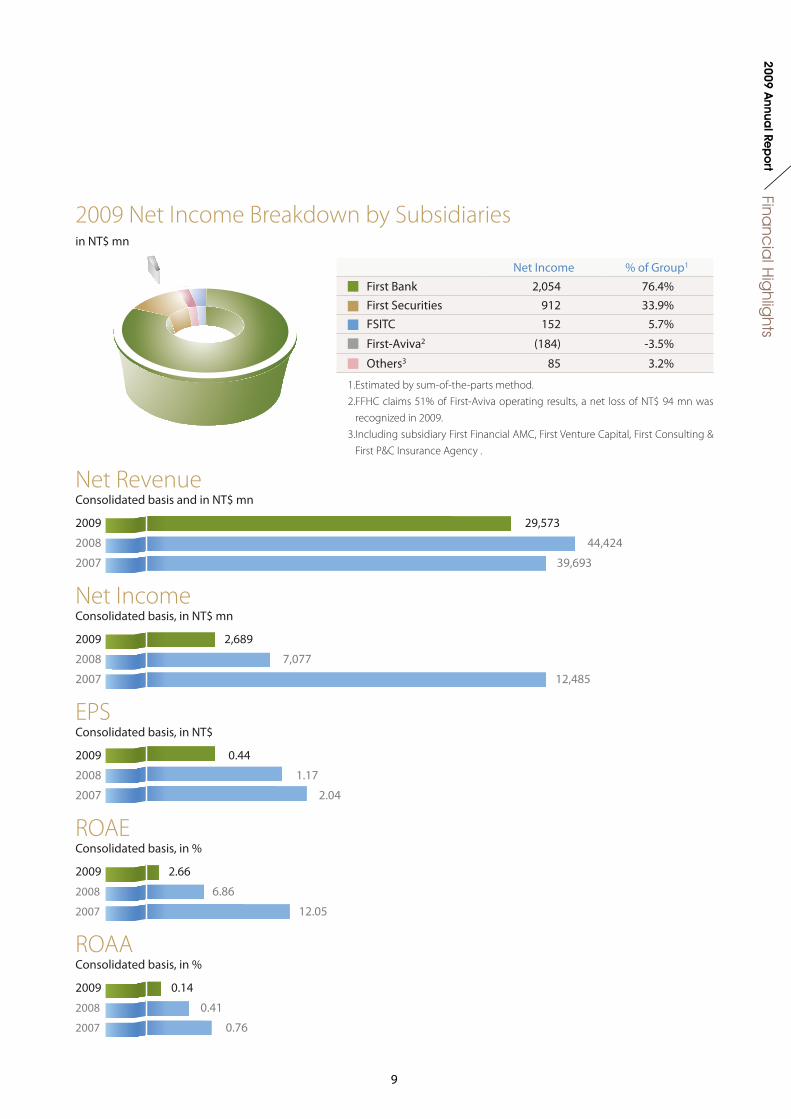
2009 Net Income Breakdown by Subsidiariesin NT$ mn
1.Estimated by sum-of-the-parts method.2. FFHC claims 51% of First-Aviva operating results, a net loss of NT$ 94 mn was
recognized in 2009.3. Including subsidiary First Financial AMC, First Venture Capital, First Consulting &
First P&C Insurance Agency .
Net Income % of Group1
First Bank 2,054 76.4%First Securities 912 33.9%FSITC 152 5.7%
First-Aviva2 (184) -3.5%
Others3 85 3.2%
Net RevenueConsolidated basis and in NT$ mn
2009 29,573
2008 44,424
2007 39,693
Net Income Consolidated basis, in NT$ mn
2009 2,689
2008 7,077
2007 12,485
EPSConsolidated basis, in NT$
2009 0.44
2008 1.17
2007 2.04
ROAEConsolidated basis, in %
2009 2.66
2008 6.86
2007 12.05
ROAAConsolidated basis, in %
2009 0.14
2008 0.41
2007 0.76
10
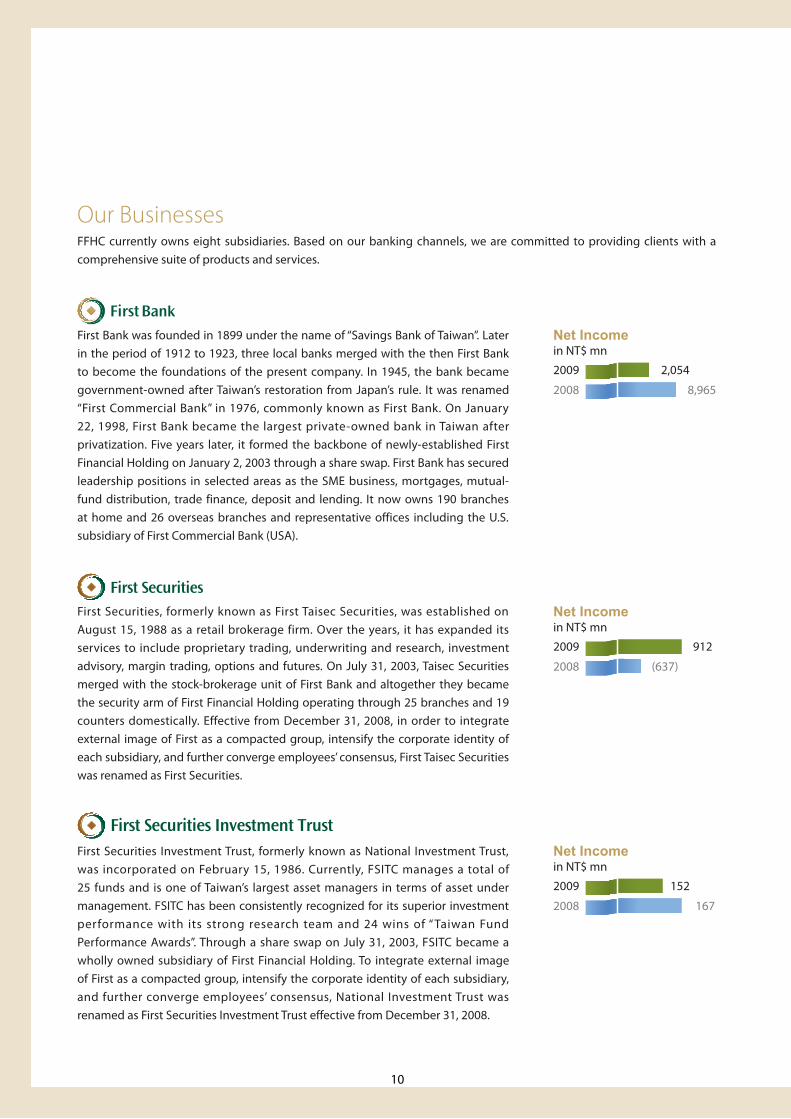
Our BusinessesFFHC currently owns eight subsidiaries. Based on our banking channels, we are committed to providing clients with a comprehensive suite of products and services.
First Bank was founded in 1899 under the name of “Savings Bank of Taiwan”. Later in the period of 1912 to 1923, three local banks merged with the then First Bank to become the foundations of the present company. In 1945, the bank became government-owned after Taiwan’s restoration from Japan’s rule. It was renamed “First Commercial Bank” in 1976, commonly known as First Bank. On January 22, 1998, First Bank became the largest private-owned bank in Taiwan after privatization. Five years later, it formed the backbone of newly-established First Financial Holding on January 2, 2003 through a share swap. First Bank has secured leadership positions in selected areas as the SME business, mortgages, mutual-fund distribution, trade finance, deposit and lending. It now owns 190 branches at home and 26 overseas branches and representative offices including the U.S. subsidiary of First Commercial Bank (USA).
First Securities, formerly known as First Taisec Securities, was established on August 15, 1988 as a retail brokerage firm. Over the years, it has expanded its services to include proprietary trading, underwriting and research, investment advisory, margin trading, options and futures. On July 31, 2003, Taisec Securities merged with the stock-brokerage unit of First Bank and altogether they became the security arm of First Financial Holding operating through 25 branches and 19 counters domestically. Effective from December 31, 2008, in order to integrate external image of First as a compacted group, intensify the corporate identity of each subsidiary, and further converge employees’ consensus, First Taisec Securities was renamed as First Securities.
First Securities Investment Trust, formerly known as National Investment Trust, was incorporated on February 15, 1986. Currently, FSITC manages a total of 25 funds and is one of Taiwan’s largest asset managers in terms of asset under management. FSITC has been consistently recognized for its superior investment performance with its strong research team and 24 wins of “Taiwan Fund Performance Awards”. Through a share swap on July 31, 2003, FSITC became a wholly owned subsidiary of First Financial Holding. To integrate external image of First as a compacted group, intensify the corporate identity of each subsidiary, and further converge employees’ consensus, National Investment Trust was renamed as First Securities Investment Trust effective from December 31, 2008.
2009 2,054
2008 8,965
2009 912
2008 (637)
2009 152
2008 167
Net Incomein NT$ mn
Net Incomein NT$ mn
Net Incomein NT$ mn
11
Financ
ial H
ighlig
hts2009 A
nnual Re
po
rt
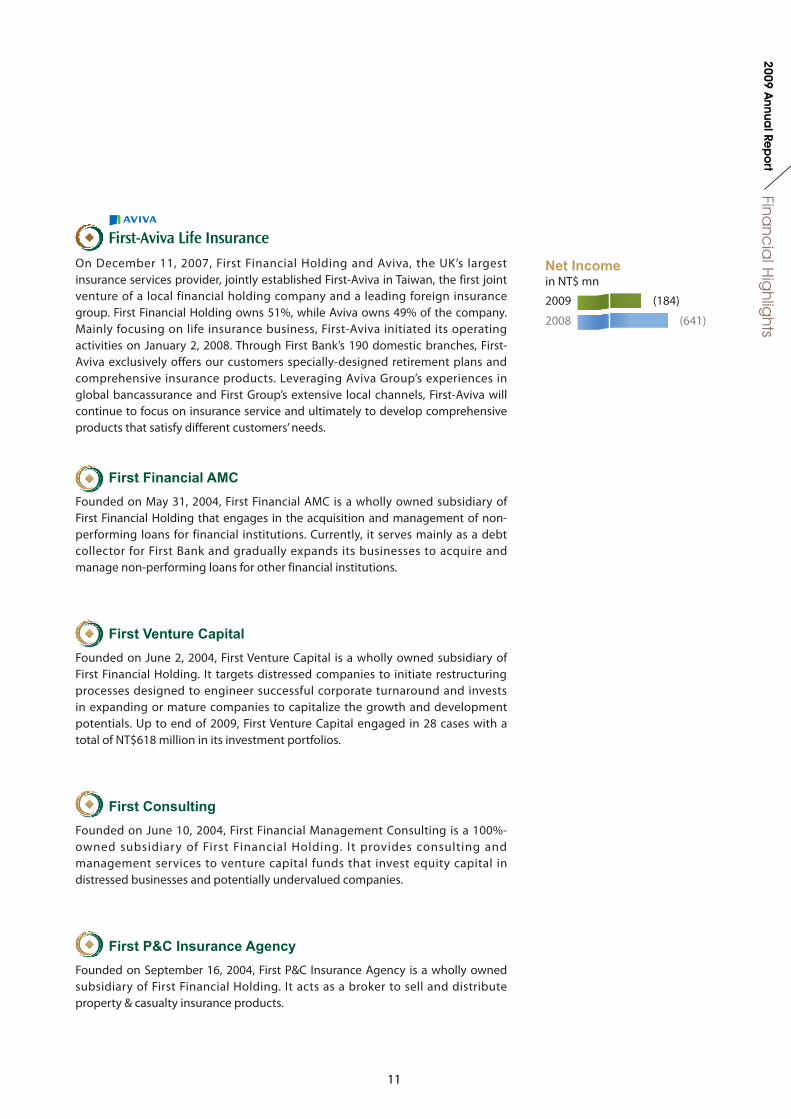
On December 11, 2007, First Financial Holding and Aviva, the UK’s largest insurance services provider, jointly established First-Aviva in Taiwan, the first joint venture of a local financial holding company and a leading foreign insurance group. First Financial Holding owns 51%, while Aviva owns 49% of the company. Mainly focusing on life insurance business, First-Aviva initiated its operating activities on January 2, 2008. Through First Bank’s 190 domestic branches, First-Aviva exclusively offers our customers specially-designed retirement plans and comprehensive insurance products. Leveraging Aviva Group’s experiences in global bancassurance and First Group’s extensive local channels, First-Aviva will continue to focus on insurance service and ultimately to develop comprehensive products that satisfy different customers’ needs.
First Financial AMC
Founded on May 31, 2004, First Financial AMC is a wholly owned subsidiary of First Financial Holding that engages in the acquisition and management of non-performing loans for financial institutions. Currently, it serves mainly as a debt collector for First Bank and gradually expands its businesses to acquire and manage non-performing loans for other financial institutions.
First Venture Capital
Founded on June 2, 2004, First Venture Capital is a wholly owned subsidiary of First Financial Holding. It targets distressed companies to initiate restructuring processes designed to engineer successful corporate turnaround and invests in expanding or mature companies to capitalize the growth and development potentials. Up to end of 2009, First Venture Capital engaged in 28 cases with a total of NT$618 million in its investment portfolios.
First Consulting
Founded on June 10, 2004, First Financial Management Consulting is a 100%-owned subsidiary of First Financial Holding. It provides consulting and management services to venture capital funds that invest equity capital in distressed businesses and potentially undervalued companies.
First P&C Insurance Agency Founded on September 16, 2004, First P&C Insurance Agency is a wholly owned subsidiary of First Financial Holding. It acts as a broker to sell and distribute property & casualty insurance products.
2009 (184)
2008 (641)
Net Incomein NT$ mn
12
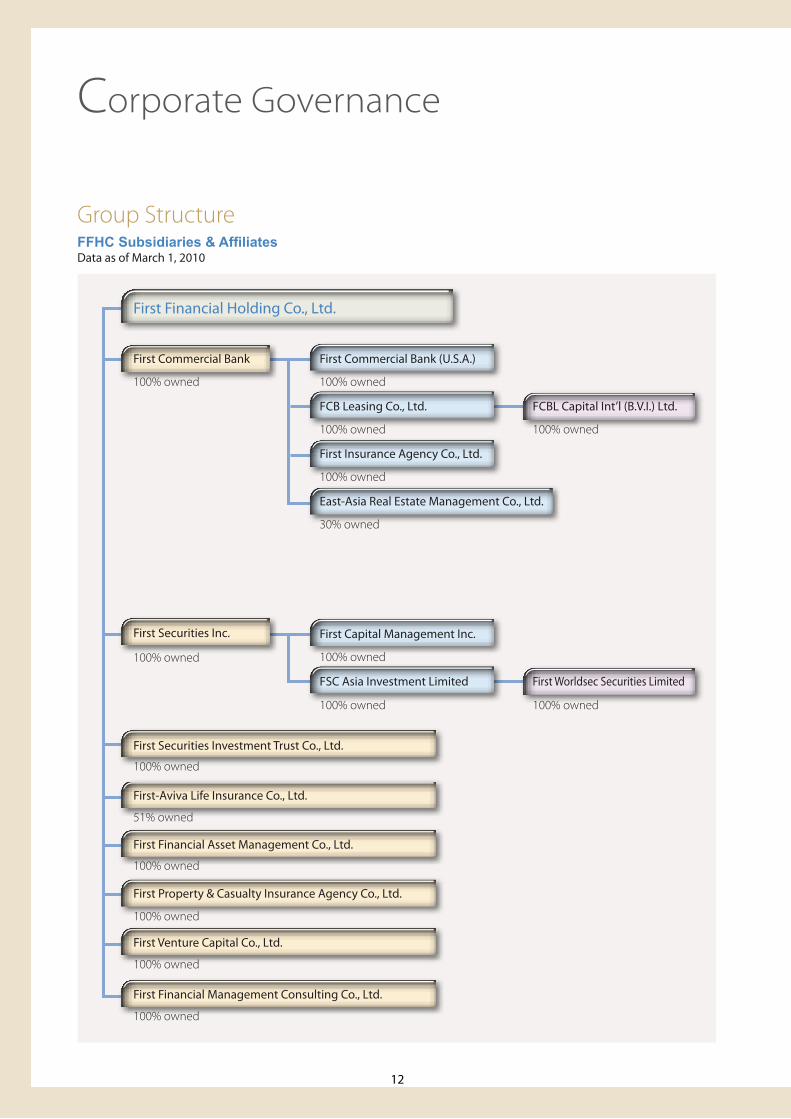
Group StructureFFHC Subsidiaries & AffiliatesData as of March 1, 2010
Corporate Governance
First Financial Holding Co., Ltd.
100% owned
100% owned
51% owned
100% owned
100% owned
100% owned
100% owned
First Securities Investment Trust Co., Ltd.
First-Aviva Life Insurance Co., Ltd.
First Financial Asset Management Co., Ltd.
First Property & Casualty Insurance Agency Co., Ltd.
First Financial Management Consulting Co., Ltd.
First Venture Capital Co., Ltd.
First Commercial Bank First Commercial Bank (U.S.A.)
First Capital Management Inc.
FCB Leasing Co., Ltd.
FSC Asia Investment Limited
FCBL Capital Int’l (B.V.I.) Ltd.
First Worldsec Securities Limited
First Insurance Agency Co., Ltd.
East-Asia Real Estate Management Co., Ltd.
100% owned 100% owned
100% owned
100% owned 100% owned
100% owned 100% owned
100% owned
30% owned
First Securities Inc.
13
Co
rpo
rate
Go
verna
nce
2009 Annua
l Rep
ort
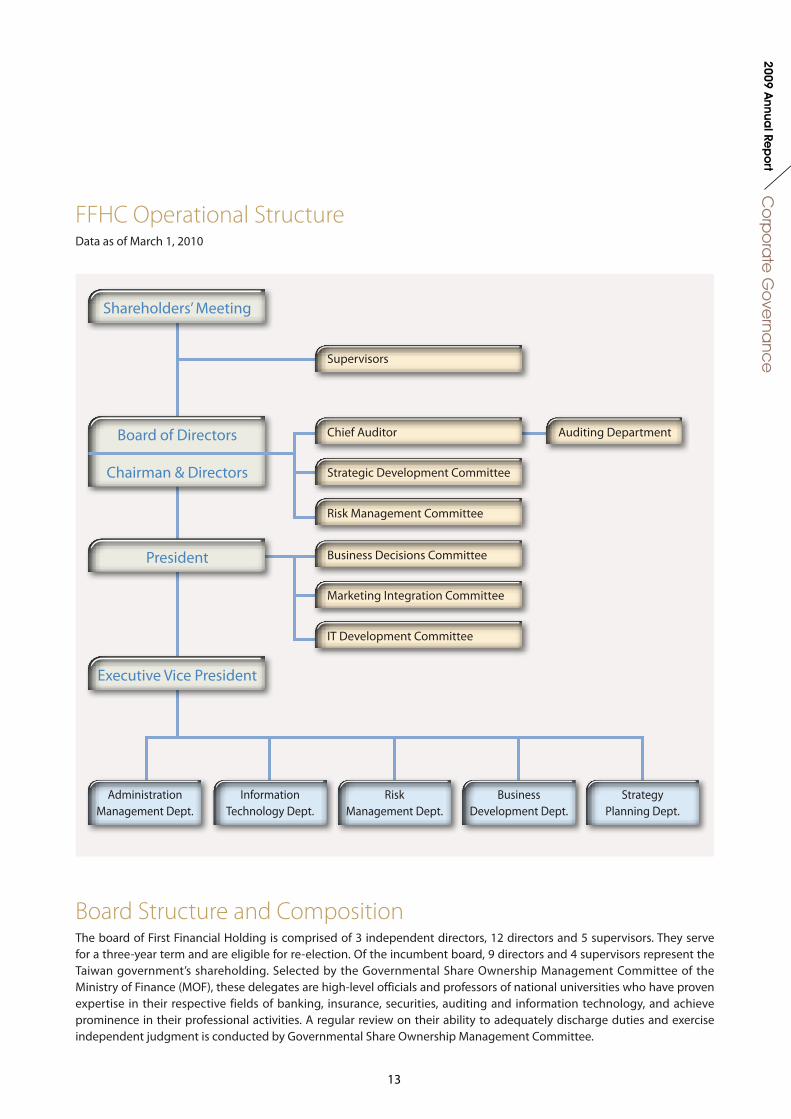
FFHC Operational StructureData as of March 1, 2010
Shareholders’ Meeting
Board of Directors
Chairman & Directors
President
Executive Vice President
Supervisors
Chief Auditor
Business Decisions Committee
Auditing Department
Strategic Development Committee
Marketing Integration Committee
Risk Management Committee
IT Development Committee
Administration Management Dept.
Information Technology Dept.
Risk Management Dept.
Business Development Dept.
Strategy Planning Dept.
Board Structure and CompositionThe board of First Financial Holding is comprised of 3 independent directors, 12 directors and 5 supervisors. They serve for a three-year term and are eligible for re-election. Of the incumbent board, 9 directors and 4 supervisors represent the Taiwan government’s shareholding. Selected by the Governmental Share Ownership Management Committee of the Ministry of Finance (MOF), these delegates are high-level officials and professors of national universities who have proven expertise in their respective fields of banking, insurance, securities, auditing and information technology, and achieve prominence in their professional activities. A regular review on their ability to adequately discharge duties and exercise independent judgment is conducted by Governmental Share Ownership Management Committee.
14
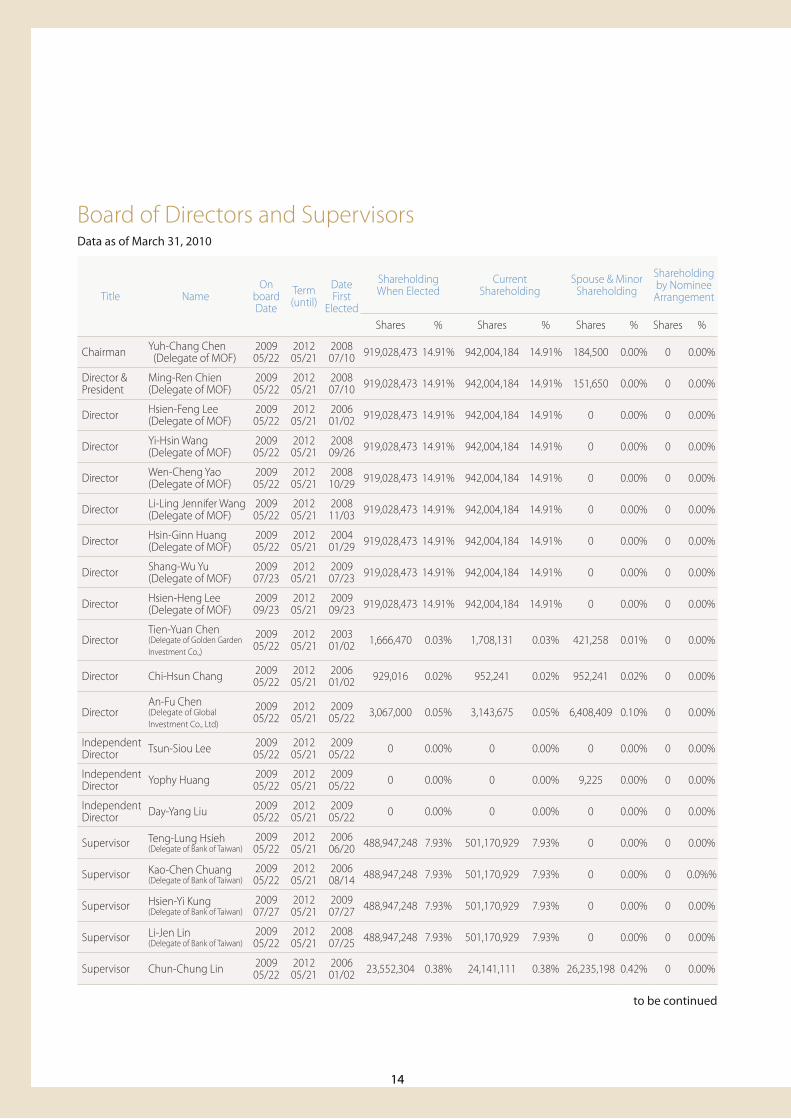
Board of Directors and SupervisorsData as of March 31, 2010
to be continued
Title NameOn
boardDate
Term(until)
Date First
Elected
ShareholdingWhen Elected
CurrentShareholding
Spouse & Minor Shareholding
Shareholding by Nominee
Arrangement
Shares % Shares % Shares % Shares %
Chairman Yuh-Chang Chen (Delegate of MOF)
200905/22
201205/21
200807/10 919,028,473 14.91% 942,004,184 14.91% 184,500 0.00% 0 0.00%
Director & President
Ming-Ren Chien(Delegate of MOF)
200905/22
201205/21
200807/10 919,028,473 14.91% 942,004,184 14.91% 151,650 0.00% 0 0.00%
Director Hsien-Feng Lee(Delegate of MOF)
200905/22
201205/21
200601/02 919,028,473 14.91% 942,004,184 14.91% 0 0.00% 0 0.00%
Director Yi-Hsin Wang(Delegate of MOF)
200905/22
201205/21
200809/26 919,028,473 14.91% 942,004,184 14.91% 0 0.00% 0 0.00%
Director Wen-Cheng Yao(Delegate of MOF)
200905/22
201205/21
200810/29 919,028,473 14.91% 942,004,184 14.91% 0 0.00% 0 0.00%
Director Li-Ling Jennifer Wang(Delegate of MOF)
200905/22
201205/21
200811/03 919,028,473 14.91% 942,004,184 14.91% 0 0.00% 0 0.00%
Director Hsin-Ginn Huang(Delegate of MOF)
200905/22
201205/21
200401/29 919,028,473 14.91% 942,004,184 14.91% 0 0.00% 0 0.00%
Director Shang-Wu Yu(Delegate of MOF)
200907/23
201205/21
200907/23 919,028,473 14.91% 942,004,184 14.91% 0 0.00% 0 0.00%
Director Hsien-Heng Lee(Delegate of MOF)
200909/23
201205/21
200909/23 919,028,473 14.91% 942,004,184 14.91% 0 0.00% 0 0.00%
DirectorTien-Yuan Chen(Delegate of Golden Garden Investment Co.,)
200905/22
201205/21
200301/02 1,666,470 0.03% 1,708,131 0.03% 421,258 0.01% 0 0.00%
Director Chi-Hsun Chang 200905/22
201205/21
200601/02 929,016 0.02% 952,241 0.02% 952,241 0.02% 0 0.00%
DirectorAn-Fu Chen(Delegate of Global Investment Co., Ltd)
200905/22
201205/21
200905/22 3,067,000 0.05% 3,143,675 0.05% 6,408,409 0.10% 0 0.00%
Independent Director Tsun-Siou Lee 2009
05/22201205/21
200905/22 0 0.00% 0 0.00% 0 0.00% 0 0.00%
Independent Director Yophy Huang 2009
05/22201205/21
200905/22 0 0.00% 0 0.00% 9,225 0.00% 0 0.00%
Independent Director Day-Yang Liu 2009
05/22201205/21
200905/22 0 0.00% 0 0.00% 0 0.00% 0 0.00%
Supervisor Teng-Lung Hsieh(Delegate of Bank of Taiwan)
200905/22
201205/21
200606/20 488,947,248 7.93% 501,170,929 7.93% 0 0.00% 0 0.00%
Supervisor Kao-Chen Chuang(Delegate of Bank of Taiwan)
200905/22
201205/21
200608/14 488,947,248 7.93% 501,170,929 7.93% 0 0.00% 0 0.0%%
Supervisor Hsien-Yi Kung(Delegate of Bank of Taiwan)
200907/27
201205/21
200907/27 488,947,248 7.93% 501,170,929 7.93% 0 0.00% 0 0.00%
Supervisor Li-Jen Lin(Delegate of Bank of Taiwan)
200905/22
201205/21
200807/25 488,947,248 7.93% 501,170,929 7.93% 0 0.00% 0 0.00%
Supervisor Chun-Chung Lin 200905/22
201205/21
200601/02 23,552,304 0.38% 24,141,111 0.38% 26,235,198 0.42% 0 0.00%
15
Co
rpo
rate
Go
verna
nce
2009 Annua
l Rep
ort
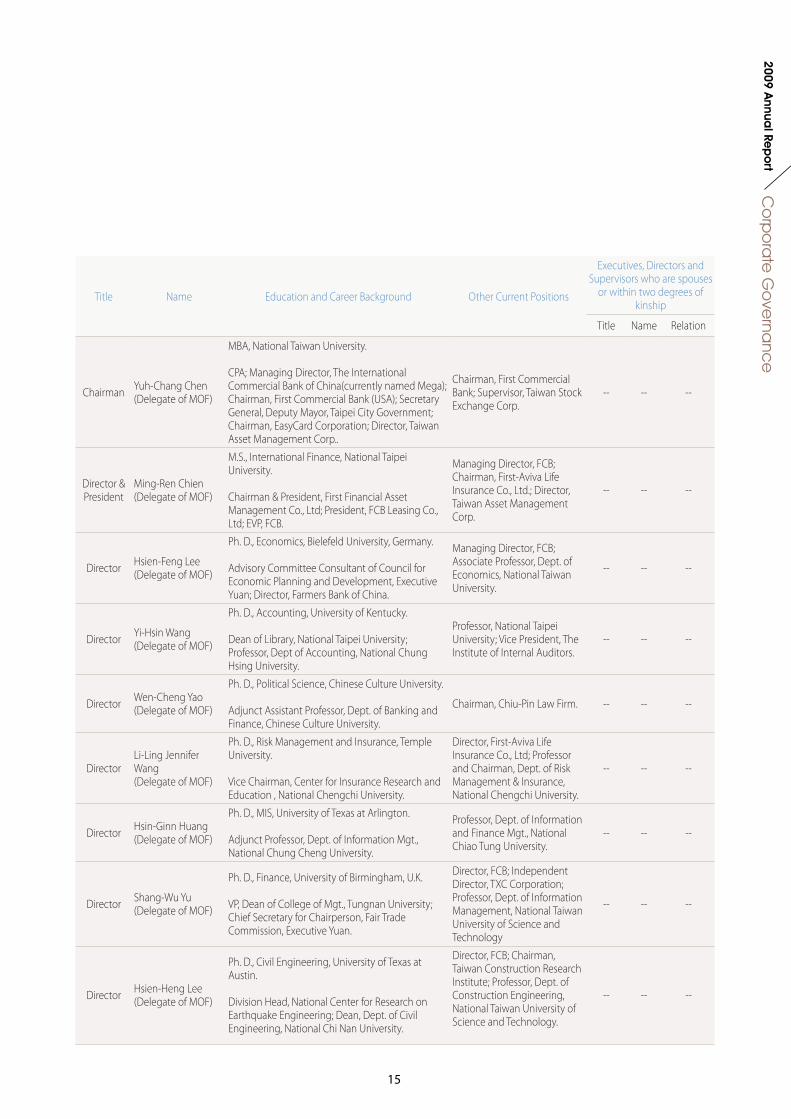
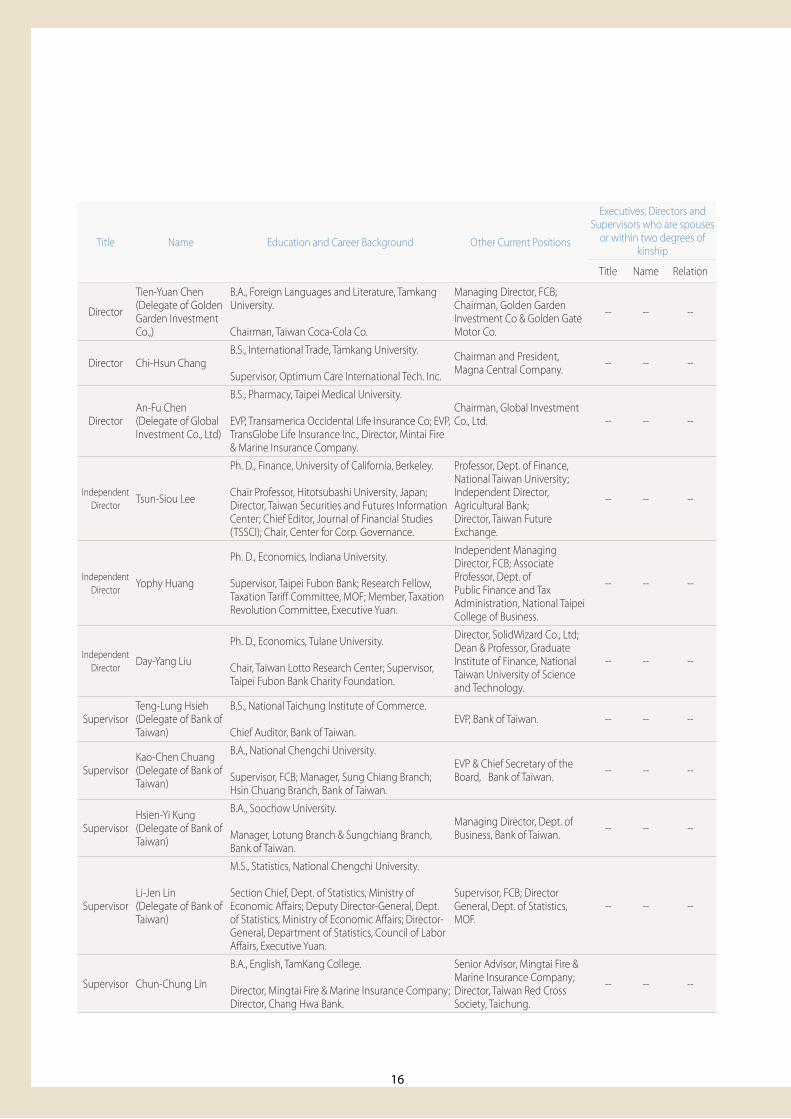
Title Name Education and Career Background Other Current Positions
Executives, Directors and Supervisors who are spouses
or within two degrees of kinship
Title Name Relation
Chairman Yuh-Chang Chen(Delegate of MOF)
MBA, National Taiwan University.
CPA; Managing Director, The International Commercial Bank of China(currently named Mega); Chairman, First Commercial Bank (USA); Secretary General, Deputy Mayor, Taipei City Government; Chairman, EasyCard Corporation; Director, Taiwan Asset Management Corp..
Chairman, First Commercial Bank; Supervisor, Taiwan Stock Exchange Corp.
-- -- --
Director & President
Ming-Ren Chien(Delegate of MOF)
M.S., International Finance, National Taipei University.
Chairman & President, First Financial Asset Management Co., Ltd; President, FCB Leasing Co., Ltd; EVP, FCB.
Managing Director, FCB; Chairman, First-Aviva Life Insurance Co., Ltd.; Director, Taiwan Asset Management Corp.
-- -- --
Director Hsien-Feng Lee(Delegate of MOF)
Ph. D., Economics, Bielefeld University, Germany.
Advisory Committee Consultant of Council for Economic Planning and Development, Executive Yuan; Director, Farmers Bank of China.
Managing Director, FCB; Associate Professor, Dept. of Economics, National Taiwan University.
-- -- --
Director Yi-Hsin Wang(Delegate of MOF)
Ph. D., Accounting, University of Kentucky.
Dean of Library, National Taipei University; Professor, Dept of Accounting, National Chung Hsing University.
Professor, National Taipei University; Vice President, The Institute of Internal Auditors.
-- -- --
Director Wen-Cheng Yao(Delegate of MOF)
Ph. D., Political Science, Chinese Culture University.
Adjunct Assistant Professor, Dept. of Banking and Finance, Chinese Culture University.
Chairman, Chiu-Pin Law Firm. -- -- --
DirectorLi-Ling Jennifer Wang(Delegate of MOF)
Ph. D., Risk Management and Insurance, Temple University.
Vice Chairman, Center for Insurance Research and Education , National Chengchi University.
Director, First-Aviva Life Insurance Co., Ltd; Professor and Chairman, Dept. of Risk Management & Insurance, National Chengchi University.
-- -- --
Director Hsin-Ginn Huang(Delegate of MOF)
Ph. D., MIS, University of Texas at Arlington.
Adjunct Professor, Dept. of Information Mgt., National Chung Cheng University.
Professor, Dept. of Information and Finance Mgt., National Chiao Tung University.
-- -- --
Director Shang-Wu Yu(Delegate of MOF)
Ph. D., Finance, University of Birmingham, U.K.
VP, Dean of College of Mgt., Tungnan University; Chief Secretary for Chairperson, Fair Trade Commission, Executive Yuan.
Director, FCB; Independent Director, TXC Corporation; Professor, Dept. of Information Management, National Taiwan University of Science and Technology
-- -- --
Director Hsien-Heng Lee(Delegate of MOF)
Ph. D., Civil Engineering, University of Texas at Austin.
Division Head, National Center for Research on Earthquake Engineering; Dean, Dept. of Civil Engineering, National Chi Nan University.
Director, FCB; Chairman, Taiwan Construction Research Institute; Professor, Dept. of Construction Engineering, National Taiwan University of Science and Technology.
-- -- --
16
Director
Tien-Yuan Chen(Delegate of Golden Garden Investment Co.,)
B.A., Foreign Languages and Literature, Tamkang University.
Chairman, Taiwan Coca-Cola Co.
Managing Director, FCB; Chairman, Golden Garden Investment Co & Golden Gate Motor Co.
-- -- --
Director Chi-Hsun ChangB.S., International Trade, Tamkang University.
Supervisor, Optimum Care International Tech. Inc.
Chairman and President, Magna Central Company. -- -- --
DirectorAn-Fu Chen(Delegate of Global Investment Co., Ltd)
B.S., Pharmacy, Taipei Medical University.
EVP, Transamerica Occidental Life Insurance Co; EVP, TransGlobe Life Insurance Inc., Director, Mintai Fire & Marine Insurance Company.
Chairman, Global Investment Co., Ltd. -- -- --
Independent Director Tsun-Siou Lee
Ph. D., Finance, University of California, Berkeley.
Chair Professor, Hitotsubashi University, Japan; Director, Taiwan Securities and Futures Information Center; Chief Editor, Journal of Financial Studies (TSSCI); Chair, Center for Corp. Governance.
Professor, Dept. of Finance, National Taiwan University; Independent Director, Agricultural Bank; Director, Taiwan Future Exchange.
-- -- --
Independent Director Yophy Huang
Ph. D., Economics, Indiana University.
Supervisor, Taipei Fubon Bank; Research Fellow, Taxation Tariff Committee, MOF; Member, Taxation Revolution Committee, Executive Yuan.
Independent Managing Director, FCB; Associate Professor, Dept. of Public Finance and Tax Administration, National Taipei College of Business.
-- -- --
Independent Director Day-Yang Liu
Ph. D., Economics, Tulane University.
Chair, Taiwan Lotto Research Center; Supervisor, Taipei Fubon Bank Charity Foundation.
Director, SolidWizard Co., Ltd; Dean & Professor, Graduate Institute of Finance, National Taiwan University of Science and Technology.
-- -- --
SupervisorTeng-Lung Hsieh(Delegate of Bank of Taiwan)
B.S., National Taichung Institute of Commerce.
Chief Auditor, Bank of Taiwan. EVP, Bank of Taiwan. -- -- --
SupervisorKao-Chen Chuang(Delegate of Bank of Taiwan)
B.A., National Chengchi University.
Supervisor, FCB; Manager, Sung Chiang Branch; Hsin Chuang Branch, Bank of Taiwan.
EVP & Chief Secretary of the Board, Bank of Taiwan. -- -- --
SupervisorHsien-Yi Kung(Delegate of Bank of Taiwan)
B.A., Soochow University.
Manager, Lotung Branch & Sungchiang Branch, Bank of Taiwan.
Managing Director, Dept. of Business, Bank of Taiwan. -- -- --
SupervisorLi-Jen Lin(Delegate of Bank of Taiwan)
M.S., Statistics, National Chengchi University.
Section Chief, Dept. of Statistics, Ministry of Economic Affairs; Deputy Director-General, Dept. of Statistics, Ministry of Economic Affairs; Director-General, Department of Statistics, Council of Labor Affairs, Executive Yuan.
Supervisor, FCB; Director General, Dept. of Statistics, MOF.
-- -- --
Supervisor Chun-Chung Lin
B.A., English, TamKang College.
Director, Mingtai Fire & Marine Insurance Company; Director, Chang Hwa Bank.
Senior Advisor, Mingtai Fire & Marine Insurance Company; Director, Taiwan Red Cross Society, Taichung.
-- -- --
Title Name Education and Career Background Other Current Positions
Executives, Directors and Supervisors who are spouses
or within two degrees of kinship
Title Name Relation
17
Co
rpo
rate
Go
verna
nce
2009 Annua
l Rep
ort
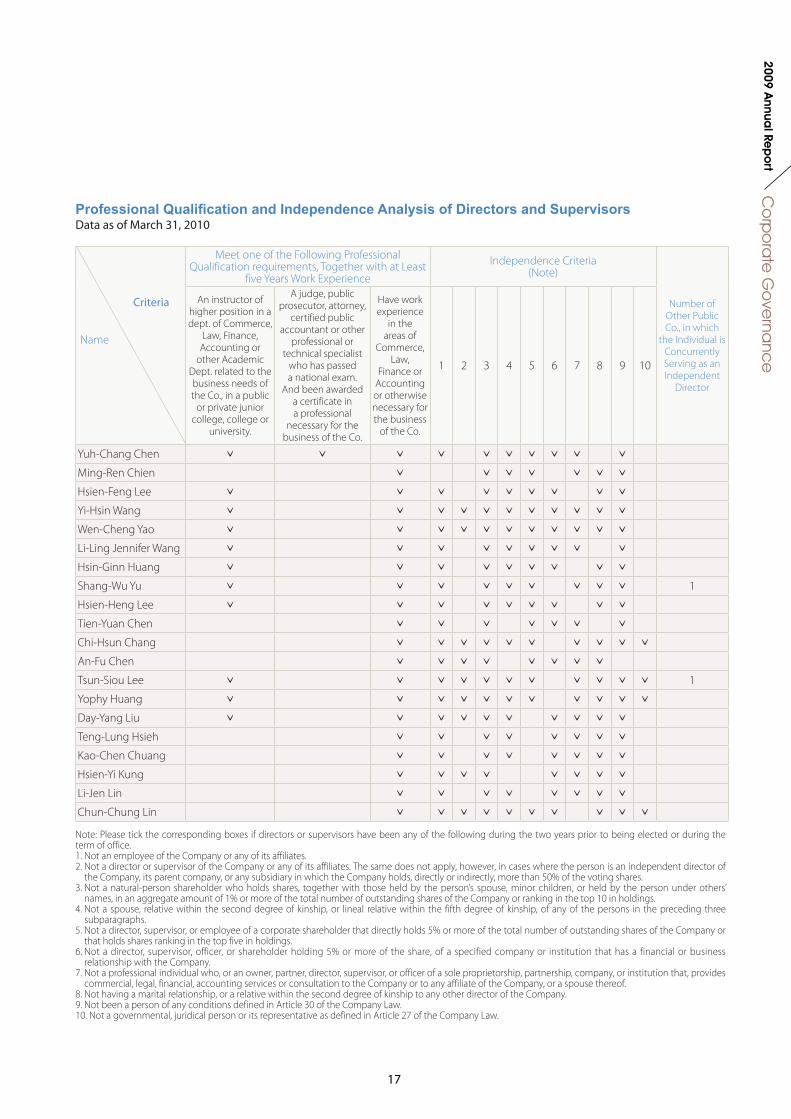
Professional Qualification and Independence Analysis of Directors and SupervisorsData as of March 31, 2010
Name
Meet one of the Following Professional Qualification requirements, Together with at Least
five Years Work Experience
Independence Criteria(Note)
Number of Other Public Co., in which
the Individual is Concurrently Serving as an Independent
Director
An instructor of higher position in a dept. of Commerce,
Law, Finance, Accounting or
other Academic Dept. related to the business needs of the Co., in a public
or private junior college, college or
university.
A judge, public prosecutor, attorney,
certified public accountant or other
professional or technical specialist
who has passed a national exam.
And been awarded a certificate in a professional
necessary for the business of the Co.
Have work experience
in the areas of
Commerce, Law,
Finance or Accounting or otherwise necessary for the business
of the Co.
1 2 3 4 5 6 7 8 9 10
Yuh-Chang Chen ˇ ˇ ˇ ˇ ˇ ˇ ˇ ˇ ˇ ˇ
Ming-Ren Chien ˇ ˇ ˇ ˇ ˇ ˇ ˇ
Hsien-Feng Lee ˇ ˇ ˇ ˇ ˇ ˇ ˇ ˇ ˇ
Yi-Hsin Wang ˇ ˇ ˇ ˇ ˇ ˇ ˇ ˇ ˇ ˇ ˇ
Wen-Cheng Yao ˇ ˇ ˇ ˇ ˇ ˇ ˇ ˇ ˇ ˇ ˇ
Li-Ling Jennifer Wang ˇ ˇ ˇ ˇ ˇ ˇ ˇ ˇ ˇ
Hsin-Ginn Huang ˇ ˇ ˇ ˇ ˇ ˇ ˇ ˇ ˇ
Shang-Wu Yu ˇ ˇ ˇ ˇ ˇ ˇ ˇ ˇ ˇ 1
Hsien-Heng Lee ˇ ˇ ˇ ˇ ˇ ˇ ˇ ˇ ˇ
Tien-Yuan Chen ˇ ˇ ˇ ˇ ˇ ˇ ˇ
Chi-Hsun Chang ˇ ˇ ˇ ˇ ˇ ˇ ˇ ˇ ˇ ˇ
An-Fu Chen ˇ ˇ ˇ ˇ ˇ ˇ ˇ ˇ
Tsun-Siou Lee ˇ ˇ ˇ ˇ ˇ ˇ ˇ ˇ ˇ ˇ ˇ 1
Yophy Huang ˇ ˇ ˇ ˇ ˇ ˇ ˇ ˇ ˇ ˇ ˇ
Day-Yang Liu ˇ ˇ ˇ ˇ ˇ ˇ ˇ ˇ ˇ ˇ
Teng-Lung Hsieh ˇ ˇ ˇ ˇ ˇ ˇ ˇ ˇ
Kao-Chen Chuang ˇ ˇ ˇ ˇ ˇ ˇ ˇ ˇ
Hsien-Yi Kung ˇ ˇ ˇ ˇ ˇ ˇ ˇ ˇ
Li-Jen Lin ˇ ˇ ˇ ˇ ˇ ˇ ˇ ˇ
Chun-Chung Lin ˇ ˇ ˇ ˇ ˇ ˇ ˇ ˇ ˇ ˇ
Criteria
Note: Please tick the corresponding boxes if directors or supervisors have been any of the following during the two years prior to being elected or during the term of office.1. Not an employee of the Company or any of its affiliates.2. Not a director or supervisor of the Company or any of its affiliates. The same does not apply, however, in cases where the person is an independent director of
the Company, its parent company, or any subsidiary in which the Company holds, directly or indirectly, more than 50% of the voting shares.3. Not a natural-person shareholder who holds shares, together with those held by the person’s spouse, minor children, or held by the person under others’
names, in an aggregate amount of 1% or more of the total number of outstanding shares of the Company or ranking in the top 10 in holdings.4. Not a spouse, relative within the second degree of kinship, or lineal relative within the fifth degree of kinship, of any of the persons in the preceding three
subparagraphs.5. Not a director, supervisor, or employee of a corporate shareholder that directly holds 5% or more of the total number of outstanding shares of the Company or
that holds shares ranking in the top five in holdings.6. Not a director, supervisor, officer, or shareholder holding 5% or more of the share, of a specified company or institution that has a financial or business
relationship with the Company.7. Not a professional individual who, or an owner, partner, director, supervisor, or officer of a sole proprietorship, partnership, company, or institution that, provides
commercial, legal, financial, accounting services or consultation to the Company or to any affiliate of the Company, or a spouse thereof.8. Not having a marital relationship, or a relative within the second degree of kinship to any other director of the Company.9. Not been a person of any conditions defined in Article 30 of the Company Law.10. Not a governmental, juridical person or its representative as defined in Article 27 of the Company Law.
18
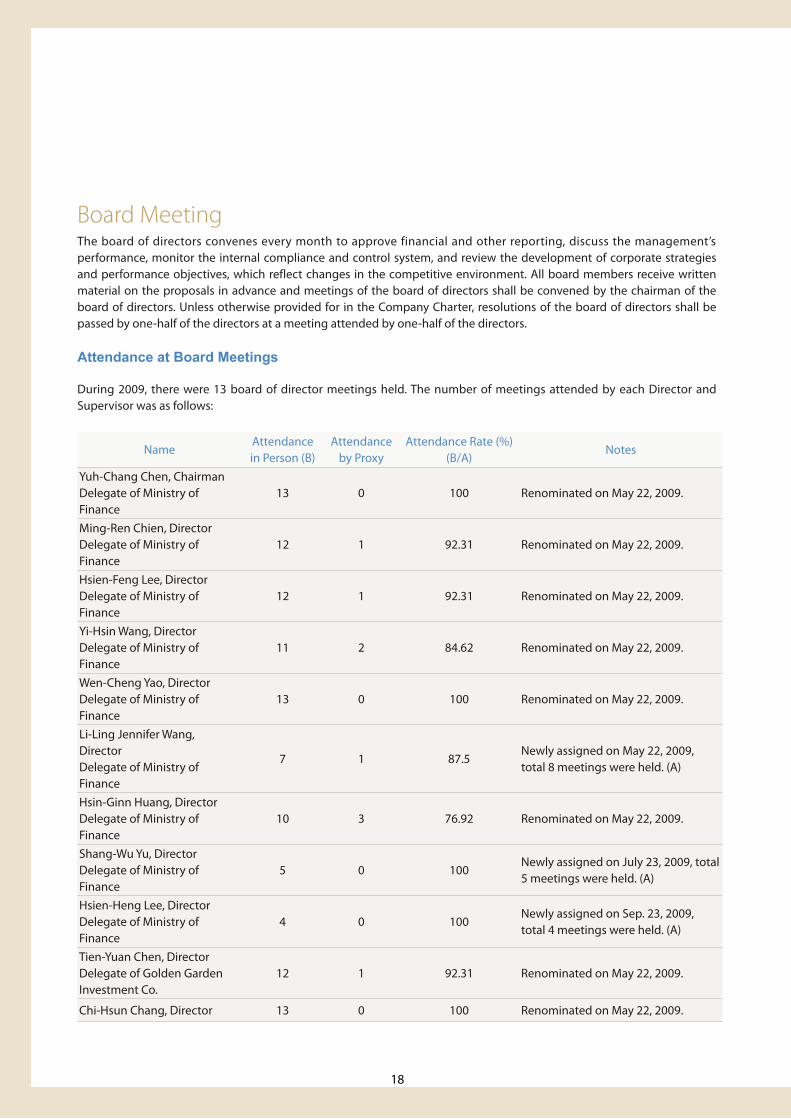
Board MeetingThe board of directors convenes every month to approve financial and other reporting, discuss the management’s performance, monitor the internal compliance and control system, and review the development of corporate strategies and performance objectives, which reflect changes in the competitive environment. All board members receive written material on the proposals in advance and meetings of the board of directors shall be convened by the chairman of the board of directors. Unless otherwise provided for in the Company Charter, resolutions of the board of directors shall be passed by one-half of the directors at a meeting attended by one-half of the directors.
Attendance at Board Meetings
During 2009, there were 13 board of director meetings held. The number of meetings attended by each Director and Supervisor was as follows:
NameAttendancein Person (B)
Attendance by Proxy
Attendance Rate (%)(B/A)
Notes
Yuh-Chang Chen, ChairmanDelegate of Ministry of Finance
13 0 100 Renominated on May 22, 2009.
Ming-Ren Chien, DirectorDelegate of Ministry of Finance
12 1 92.31 Renominated on May 22, 2009.
Hsien-Feng Lee, DirectorDelegate of Ministry of Finance
12 1 92.31 Renominated on May 22, 2009.
Yi-Hsin Wang, DirectorDelegate of Ministry of Finance
11 2 84.62 Renominated on May 22, 2009.
Wen-Cheng Yao, DirectorDelegate of Ministry of Finance
13 0 100 Renominated on May 22, 2009.
Li-Ling Jennifer Wang, DirectorDelegate of Ministry of Finance
7 1 87.5Newly assigned on May 22, 2009, total 8 meetings were held. (A)
Hsin-Ginn Huang, DirectorDelegate of Ministry of Finance
10 3 76.92 Renominated on May 22, 2009.
Shang-Wu Yu, DirectorDelegate of Ministry of Finance
5 0 100Newly assigned on July 23, 2009, total 5 meetings were held. (A)
Hsien-Heng Lee, DirectorDelegate of Ministry of Finance
4 0 100Newly assigned on Sep. 23, 2009, total 4 meetings were held. (A)
Tien-Yuan Chen, DirectorDelegate of Golden Garden Investment Co.
12 1 92.31 Renominated on May 22, 2009.
Chi-Hsun Chang, Director 13 0 100 Renominated on May 22, 2009.
19
Co
rpo
rate
Go
verna
nce
2009 Annua
l Rep
ort
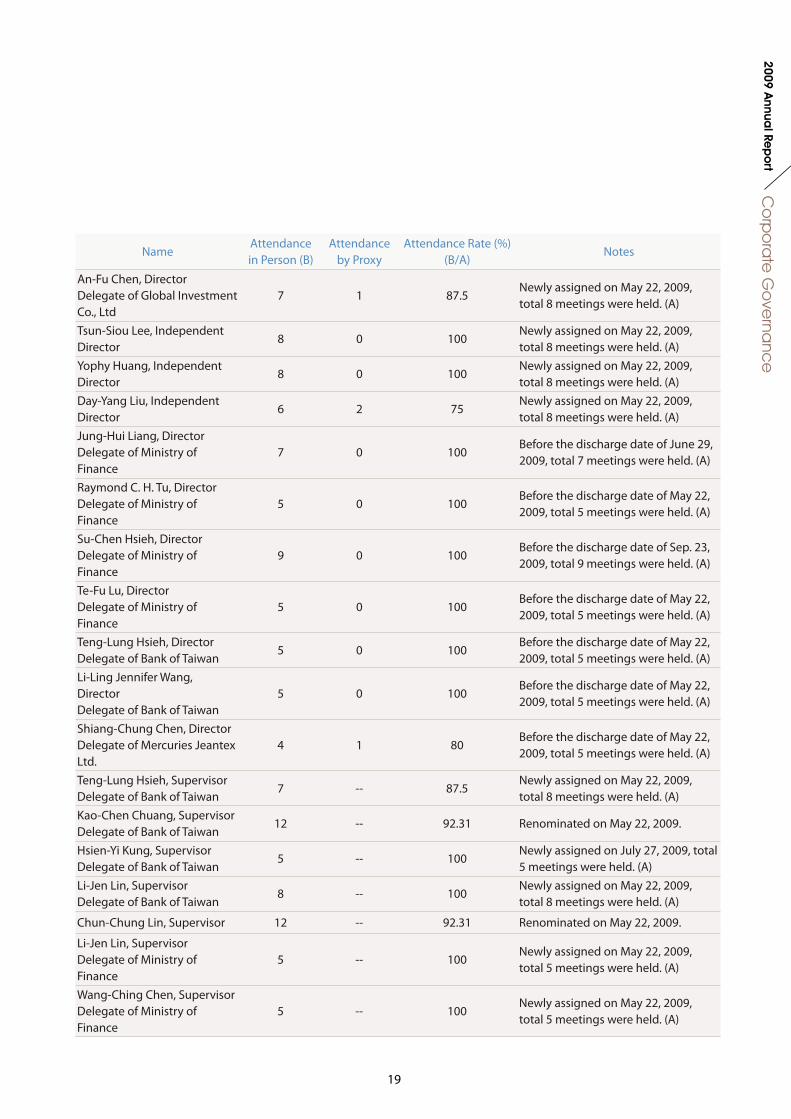
An-Fu Chen, DirectorDelegate of Global Investment Co., Ltd
7 1 87.5Newly assigned on May 22, 2009, total 8 meetings were held. (A)
Tsun-Siou Lee, Independent Director
8 0 100Newly assigned on May 22, 2009, total 8 meetings were held. (A)
Yophy Huang, Independent Director
8 0 100Newly assigned on May 22, 2009, total 8 meetings were held. (A)
Day-Yang Liu, Independent Director
6 2 75Newly assigned on May 22, 2009, total 8 meetings were held. (A)
Jung-Hui Liang, DirectorDelegate of Ministry of Finance
7 0 100Before the discharge date of June 29, 2009, total 7 meetings were held. (A)
Raymond C. H. Tu, DirectorDelegate of Ministry of Finance
5 0 100Before the discharge date of May 22, 2009, total 5 meetings were held. (A)
Su-Chen Hsieh, DirectorDelegate of Ministry of Finance
9 0 100Before the discharge date of Sep. 23, 2009, total 9 meetings were held. (A)
Te-Fu Lu, DirectorDelegate of Ministry of Finance
5 0 100Before the discharge date of May 22, 2009, total 5 meetings were held. (A)
Teng-Lung Hsieh, DirectorDelegate of Bank of Taiwan
5 0 100Before the discharge date of May 22, 2009, total 5 meetings were held. (A)
Li-Ling Jennifer Wang, DirectorDelegate of Bank of Taiwan
5 0 100Before the discharge date of May 22, 2009, total 5 meetings were held. (A)
Shiang-Chung Chen, DirectorDelegate of Mercuries Jeantex Ltd.
4 1 80Before the discharge date of May 22, 2009, total 5 meetings were held. (A)
Teng-Lung Hsieh, SupervisorDelegate of Bank of Taiwan
7 -- 87.5Newly assigned on May 22, 2009, total 8 meetings were held. (A)
Kao-Chen Chuang, SupervisorDelegate of Bank of Taiwan
12 -- 92.31 Renominated on May 22, 2009.
Hsien-Yi Kung, SupervisorDelegate of Bank of Taiwan
5 -- 100Newly assigned on July 27, 2009, total 5 meetings were held. (A)
Li-Jen Lin, SupervisorDelegate of Bank of Taiwan
8 -- 100Newly assigned on May 22, 2009, total 8 meetings were held. (A)
Chun-Chung Lin, Supervisor 12 -- 92.31 Renominated on May 22, 2009.
Li-Jen Lin, SupervisorDelegate of Ministry of Finance
5 -- 100Newly assigned on May 22, 2009, total 5 meetings were held. (A)
Wang-Ching Chen, SupervisorDelegate of Ministry of Finance
5 -- 100Newly assigned on May 22, 2009, total 5 meetings were held. (A)
NameAttendancein Person (B)
Attendance by Proxy
Attendance Rate (%)(B/A)
Notes
20
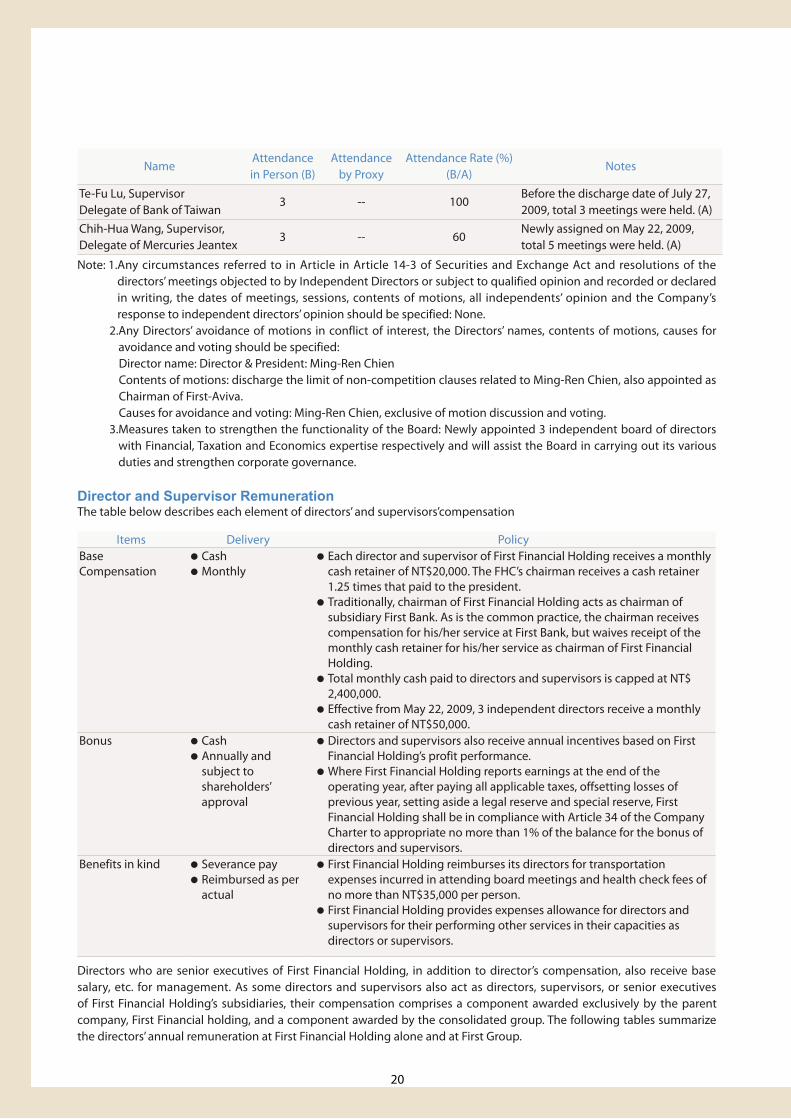
Director and Supervisor RemunerationThe table below describes each element of directors’ and supervisors’compensation
Items Delivery PolicyBase Compensation
● Cash ● Monthly
● Each director and supervisor of First Financial Holding receives a monthly cash retainer of NT$20,000. The FHC’s chairman receives a cash retainer 1.25 times that paid to the president.
● Traditionally, chairman of First Financial Holding acts as chairman of subsidiary First Bank. As is the common practice, the chairman receives compensation for his/her service at First Bank, but waives receipt of the monthly cash retainer for his/her service as chairman of First Financial Holding.
● Total monthly cash paid to directors and supervisors is capped at NT$ 2,400,000.
● Effective from May 22, 2009, 3 independent directors receive a monthly cash retainer of NT$50,000.
Bonus ● Cash ● Annually and
subject to shareholders’ approval
● Directors and supervisors also receive annual incentives based on First Financial Holding’s profit performance.
● Where First Financial Holding reports earnings at the end of the operating year, after paying all applicable taxes, offsetting losses of previous year, setting aside a legal reserve and special reserve, First Financial Holding shall be in compliance with Article 34 of the Company Charter to appropriate no more than 1% of the balance for the bonus of directors and supervisors.
Benefits in kind ● Severance pay ● Reimbursed as per
actual
● First Financial Holding reimburses its directors for transportation expenses incurred in attending board meetings and health check fees of no more than NT$35,000 per person.
● First Financial Holding provides expenses allowance for directors and supervisors for their performing other services in their capacities as directors or supervisors.
Directors who are senior executives of First Financial Holding, in addition to director’s compensation, also receive base salary, etc. for management. As some directors and supervisors also act as directors, supervisors, or senior executives of First Financial Holding’s subsidiaries, their compensation comprises a component awarded exclusively by the parent company, First Financial holding, and a component awarded by the consolidated group. The following tables summarize the directors’ annual remuneration at First Financial Holding alone and at First Group.
Te-Fu Lu, SupervisorDelegate of Bank of Taiwan
3 -- 100Before the discharge date of July 27, 2009, total 3 meetings were held. (A)
Chih-Hua Wang, Supervisor, Delegate of Mercuries Jeantex
3 -- 60Newly assigned on May 22, 2009, total 5 meetings were held. (A)
Note: 1. Any circumstances referred to in Article in Article 14-3 of Securities and Exchange Act and resolutions of the directors’ meetings objected to by Independent Directors or subject to qualified opinion and recorded or declared in writing, the dates of meetings, sessions, contents of motions, all independents’ opinion and the Company’s response to independent directors’ opinion should be specified: None.
2. Any Directors’ avoidance of motions in conflict of interest, the Directors’ names, contents of motions, causes for avoidance and voting should be specified: Director name: Director & President: Ming-Ren ChienContents of motions: discharge the limit of non-competition clauses related to Ming-Ren Chien, also appointed as Chairman of First-Aviva.Causes for avoidance and voting: Ming-Ren Chien, exclusive of motion discussion and voting.
3. Measures taken to strengthen the functionality of the Board: Newly appointed 3 independent board of directors with Financial, Taxation and Economics expertise respectively and will assist the Board in carrying out its various duties and strengthen corporate governance.
NameAttendancein Person (B)
Attendance by Proxy
Attendance Rate (%)(B/A)
Notes
21
Co
rpo
rate
Go
verna
nce
2009 Annua
l Rep
ort
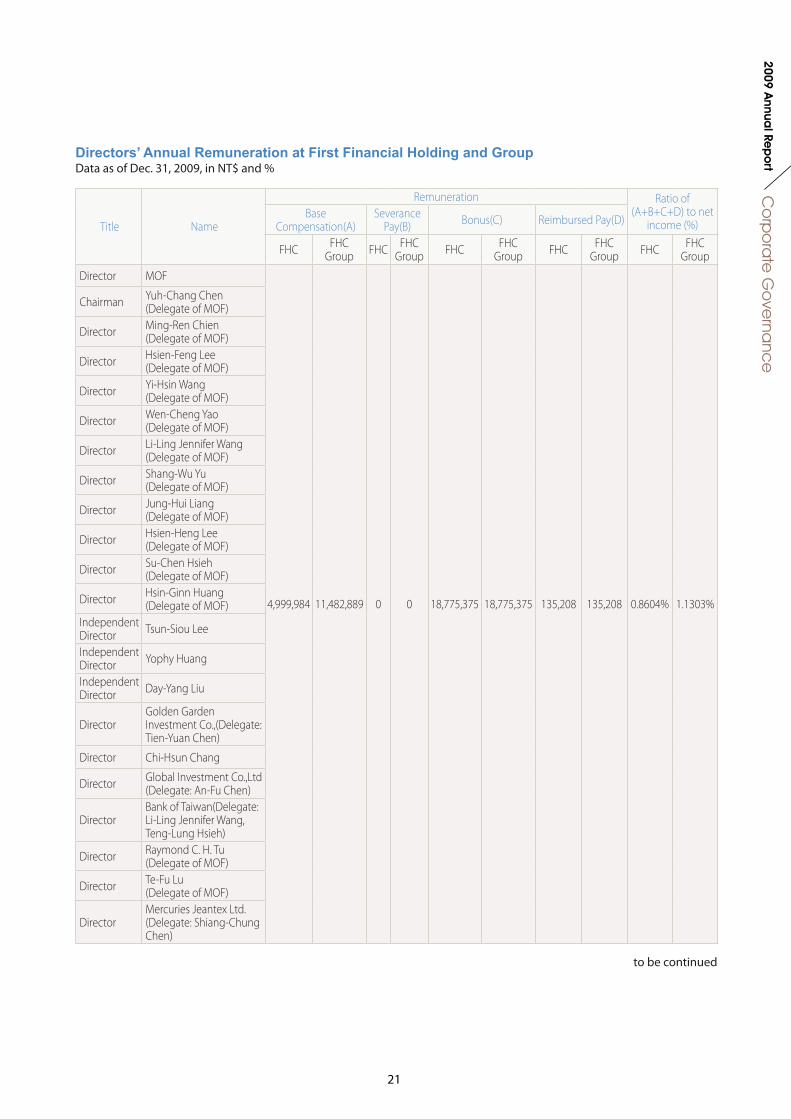
Title Name
Remuneration Ratio of (A+B+C+D) to net
income (%)Base
Compensation(A)Severance
Pay(B) Bonus(C) Reimbursed Pay(D)
FHC FHC Group FHC FHC
Group FHC FHC Group FHC FHC
Group FHC FHC Group
Director MOF
4,999,984 11,482,889 0 0 18,775,375 18,775,375 135,208 135,208 0.8604% 1.1303%
Chairman Yuh-Chang Chen(Delegate of MOF)
Director Ming-Ren Chien(Delegate of MOF)
Director Hsien-Feng Lee(Delegate of MOF)
Director Yi-Hsin Wang(Delegate of MOF)
Director Wen-Cheng Yao(Delegate of MOF)
Director Li-Ling Jennifer Wang(Delegate of MOF)
Director Shang-Wu Yu(Delegate of MOF)
Director Jung-Hui Liang (Delegate of MOF)
Director Hsien-Heng Lee(Delegate of MOF)
Director Su-Chen Hsieh(Delegate of MOF)
Director Hsin-Ginn Huang(Delegate of MOF)
IndependentDirector Tsun-Siou Lee
IndependentDirector Yophy Huang
IndependentDirector Day-Yang Liu
DirectorGolden Garden Investment Co.,(Delegate: Tien-Yuan Chen)
Director Chi-Hsun Chang
Director Global Investment Co.,Ltd (Delegate: An-Fu Chen)
DirectorBank of Taiwan(Delegate: Li-Ling Jennifer Wang, Teng-Lung Hsieh)
Director Raymond C. H. Tu(Delegate of MOF)
Director Te-Fu Lu(Delegate of MOF)
DirectorMercuries Jeantex Ltd. (Delegate: Shiang-Chung Chen)
Directors’ Annual Remuneration at First Financial Holding and GroupData as of Dec. 31, 2009, in NT$ and %
to be continued
22
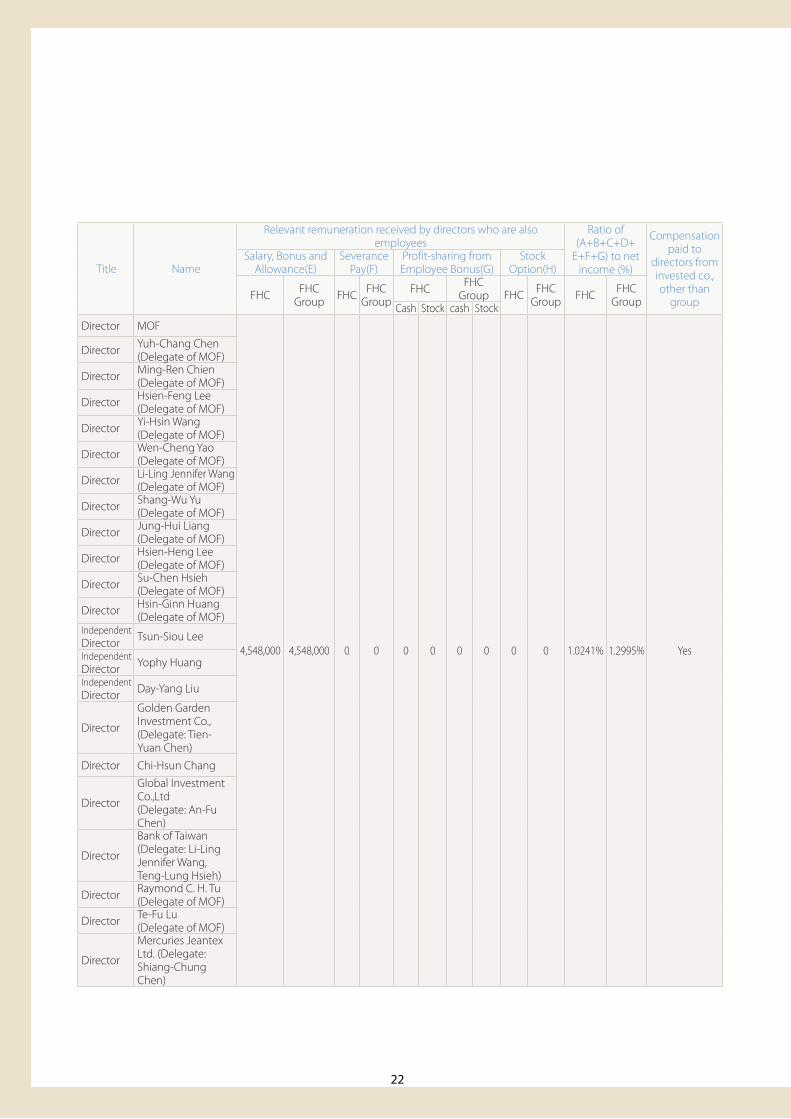
Title Name
Relevant remuneration received by directors who are also employees
Ratio of (A+B+C+D+
E+F+G) to net income (%)
Compensation paid to
directors from invested co., other than
group
Salary, Bonus and Allowance(E)
Severance Pay(F)
Profit-sharing from Employee Bonus(G)
Stock Option(H)
FHC FHC Group FHC FHC
GroupFHC FHC
Group FHC FHC Group FHC FHC
GroupCash Stock cash StockDirector MOF
4,548,000 4,548,000 0 0 0 0 0 0 0 0 1.0241% 1.2995% Yes
Director Yuh-Chang Chen(Delegate of MOF)
Director Ming-Ren Chien(Delegate of MOF)
Director Hsien-Feng Lee(Delegate of MOF)
Director Yi-Hsin Wang(Delegate of MOF)
Director Wen-Cheng Yao(Delegate of MOF)
Director Li-Ling Jennifer Wang(Delegate of MOF)
Director Shang-Wu Yu(Delegate of MOF)
Director Jung-Hui Liang (Delegate of MOF)
Director Hsien-Heng Lee(Delegate of MOF)
Director Su-Chen Hsieh(Delegate of MOF)
Director Hsin-Ginn Huang(Delegate of MOF)
IndependentDirector Tsun-Siou Lee
IndependentDirector Yophy Huang
IndependentDirector Day-Yang Liu
Director
Golden Garden Investment Co.,(Delegate: Tien-Yuan Chen)
Director Chi-Hsun Chang
Director
Global Investment Co.,Ltd (Delegate: An-Fu Chen)
Director
Bank of Taiwan(Delegate: Li-Ling Jennifer Wang, Teng-Lung Hsieh)
Director Raymond C. H. Tu(Delegate of MOF)
Director Te-Fu Lu(Delegate of MOF)
Director
Mercuries Jeantex Ltd. (Delegate: Shiang-Chung Chen)
23
Co
rpo
rate
Go
verna
nce
2009 Annua
l Rep
ort
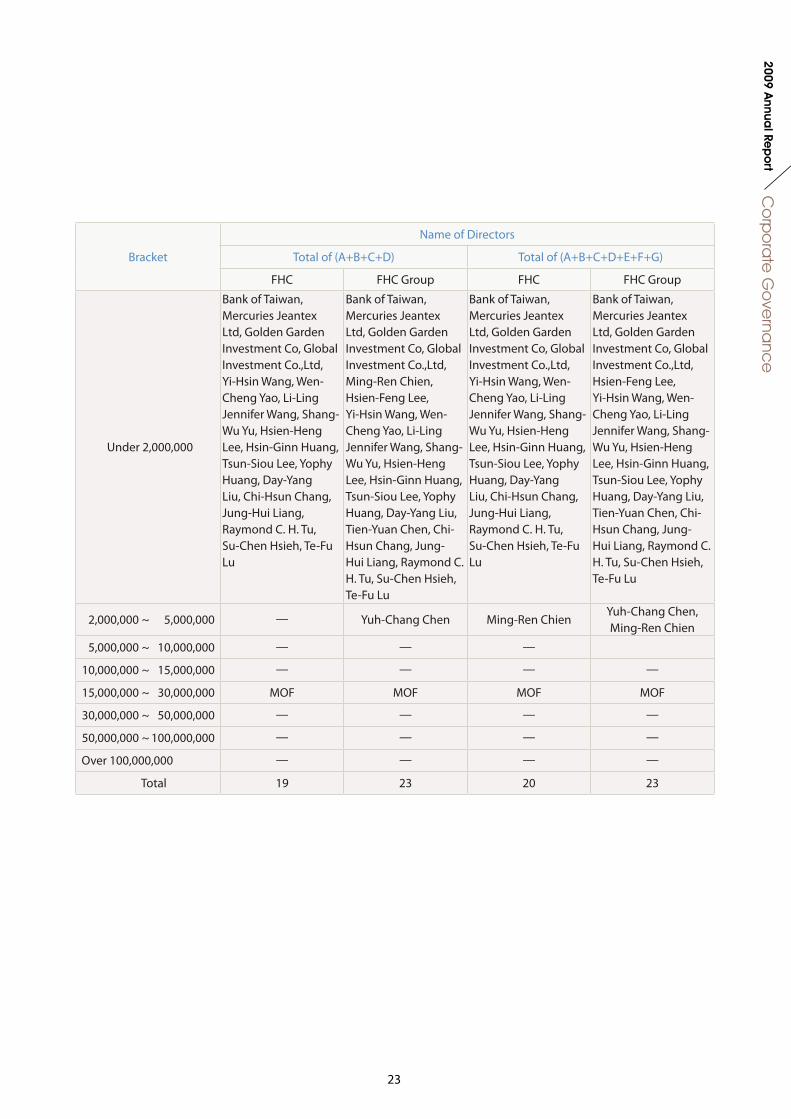
Bracket
Name of Directors
Total of (A+B+C+D) Total of (A+B+C+D+E+F+G)
FHC FHC Group FHC FHC Group
Under 2,000,000
Bank of Taiwan, Mercuries Jeantex Ltd, Golden Garden Investment Co, Global Investment Co.,Ltd, Yi-Hsin Wang, Wen-Cheng Yao, Li-Ling Jennifer Wang, Shang-Wu Yu, Hsien-Heng Lee, Hsin-Ginn Huang, Tsun-Siou Lee, Yophy Huang, Day-Yang Liu, Chi-Hsun Chang, Jung-Hui Liang, Raymond C. H. Tu, Su-Chen Hsieh, Te-Fu Lu
Bank of Taiwan, Mercuries Jeantex Ltd, Golden Garden Investment Co, Global Investment Co.,Ltd, Ming-Ren Chien, Hsien-Feng Lee, Yi-Hsin Wang, Wen-Cheng Yao, Li-Ling Jennifer Wang, Shang-Wu Yu, Hsien-Heng Lee, Hsin-Ginn Huang, Tsun-Siou Lee, Yophy Huang, Day-Yang Liu, Tien-Yuan Chen, Chi-Hsun Chang, Jung-Hui Liang, Raymond C. H. Tu, Su-Chen Hsieh, Te-Fu Lu
Bank of Taiwan, Mercuries Jeantex Ltd, Golden Garden Investment Co, Global Investment Co.,Ltd, Yi-Hsin Wang, Wen-Cheng Yao, Li-Ling Jennifer Wang, Shang-Wu Yu, Hsien-Heng Lee, Hsin-Ginn Huang, Tsun-Siou Lee, Yophy Huang, Day-Yang Liu, Chi-Hsun Chang, Jung-Hui Liang, Raymond C. H. Tu, Su-Chen Hsieh, Te-Fu Lu
Bank of Taiwan, Mercuries Jeantex Ltd, Golden Garden Investment Co, Global Investment Co.,Ltd, Hsien-Feng Lee, Yi-Hsin Wang, Wen-Cheng Yao, Li-Ling Jennifer Wang, Shang-Wu Yu, Hsien-Heng Lee, Hsin-Ginn Huang, Tsun-Siou Lee, Yophy Huang, Day-Yang Liu, Tien-Yuan Chen, Chi-Hsun Chang, Jung-Hui Liang, Raymond C. H. Tu, Su-Chen Hsieh, Te-Fu Lu
2,000,000 ~ 5,000,000 — Yuh-Chang Chen Ming-Ren ChienYuh-Chang Chen, Ming-Ren Chien
5,000,000 ~ 10,000,000 — — —
10,000,000 ~ 15,000,000 — — — —
15,000,000 ~ 30,000,000 MOF MOF MOF MOF
30,000,000 ~ 50,000,000 — — — —
50,000,000 ~ 100,000,000 — — — —
Over 100,000,000 — — — —
Total 19 23 20 23
24
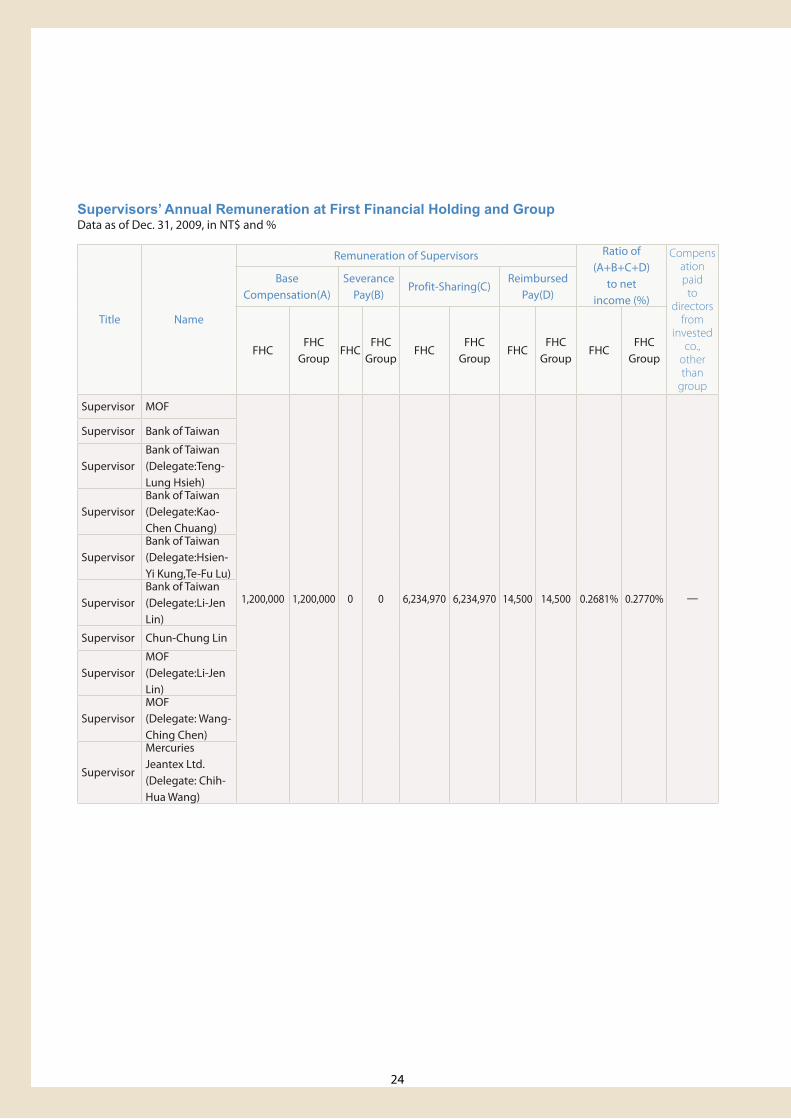
Supervisors’ Annual Remuneration at First Financial Holding and GroupData as of Dec. 31, 2009, in NT$ and %
Title Name
Remuneration of Supervisors Ratio of (A+B+C+D)
to net income (%)
Compensation paid
to directors
from invested
co., other than
group
Base Compensation(A)
Severance Pay(B)
Profit-Sharing(C)Reimbursed
Pay(D)
FHCFHC
GroupFHC
FHC Group
FHCFHC
GroupFHC
FHC Group
FHCFHC
Group
Supervisor MOF
1,200,000 1,200,000 0 0 6,234,970 6,234,970 14,500 14,500 0.2681% 0.2770% —
Supervisor Bank of Taiwan
SupervisorBank of Taiwan(Delegate:Teng-Lung Hsieh)
SupervisorBank of Taiwan(Delegate:Kao-Chen Chuang)
SupervisorBank of Taiwan(Delegate:Hsien-Yi Kung,Te-Fu Lu)
SupervisorBank of Taiwan(Delegate:Li-Jen Lin)
Supervisor Chun-Chung Lin
SupervisorMOF(Delegate:Li-Jen Lin)
SupervisorMOF(Delegate: Wang-Ching Chen)
Supervisor
Mercuries Jeantex Ltd.(Delegate: Chih-Hua Wang)
25
Co
rpo
rate
Go
verna
nce
2009 Annua
l Rep
ort
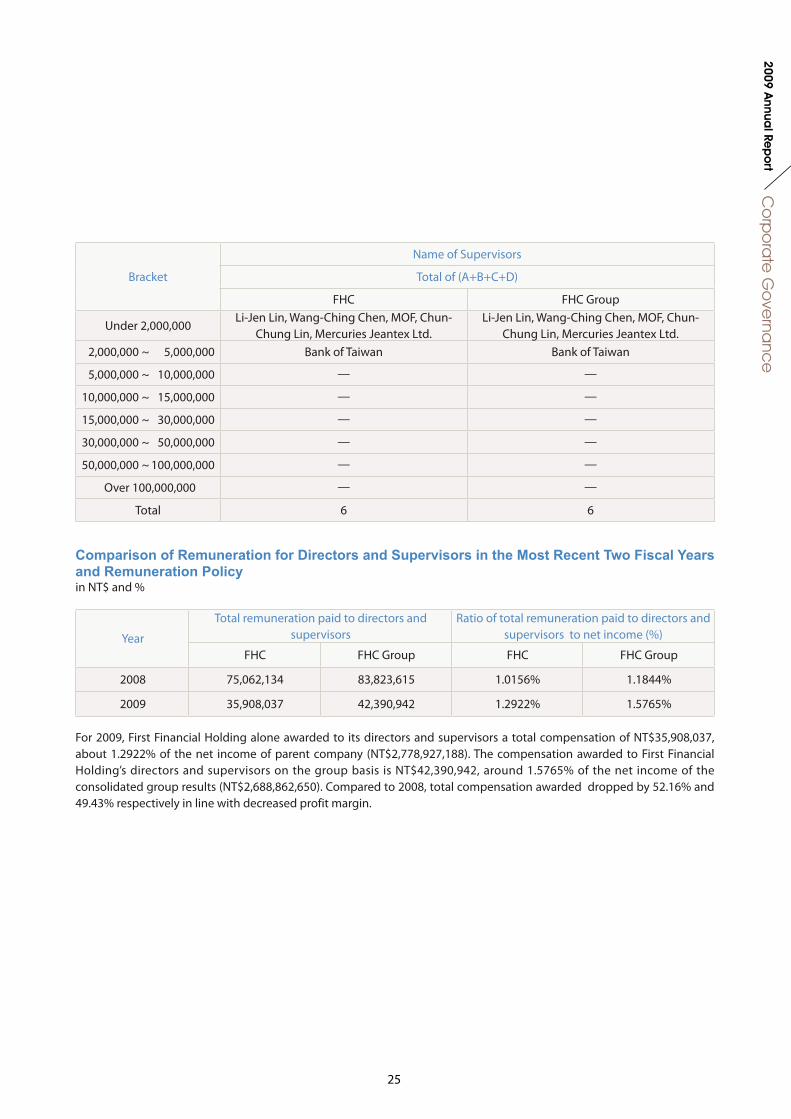
Bracket
Name of Supervisors
Total of (A+B+C+D)
FHC FHC Group
Under 2,000,000Li-Jen Lin, Wang-Ching Chen, MOF, Chun-
Chung Lin, Mercuries Jeantex Ltd.Li-Jen Lin, Wang-Ching Chen, MOF, Chun-
Chung Lin, Mercuries Jeantex Ltd. 2,000,000 ~ 5,000,000 Bank of Taiwan Bank of Taiwan
5,000,000 ~ 10,000,000 — —
10,000,000 ~ 15,000,000 — —
15,000,000 ~ 30,000,000 — —
30,000,000 ~ 50,000,000 — —
50,000,000 ~ 100,000,000 — —
Over 100,000,000 — —
Total 6 6
Year
Total remuneration paid to directors and supervisors
Ratio of total remuneration paid to directors and supervisors to net income (%)
FHC FHC Group FHC FHC Group
2008 75,062,134 83,823,615 1.0156% 1.1844%
2009 35,908,037 42,390,942 1.2922% 1.5765%
Comparison of Remuneration for Directors and Supervisors in the Most Recent Two Fiscal Years and Remuneration Policyin NT$ and %
For 2009, First Financial Holding alone awarded to its directors and supervisors a total compensation of NT$35,908,037, about 1.2922% of the net income of parent company (NT$2,778,927,188). The compensation awarded to First Financial Holding’s directors and supervisors on the group basis is NT$42,390,942, around 1.5765% of the net income of the consolidated group results (NT$2,688,862,650). Compared to 2008, total compensation awarded dropped by 52.16% and 49.43% respectively in line with decreased profit margin.
26
Title Name Date EffectiveShareholding
Spouse & Minor Shareholding
Shareholding by Nominee
Arrangement Education & Experience Other Position
Managers who are spouses or within 2 degrees of kinship
Shares % Shares % Shares % Title Name Relation
President Ming-Ren Chien 2008.7.10 151,650 0% 0 0% 0 0%M.S. International finance, National Taipei University; President, FCB Leasing Co.; EVP, FCB; Chairman & President, First Financial Asset Mgt. Co., Ltd.
Managing Director, FCB; Chairman, First Aviva Life Insurance Co., Ltd; Director, TWN Asset Mgt. Corp.
- - -
EVP Hsin-Shih Hung 2007.6.25 56,938 0% 0 0% 0 0%B.S., International Trade, National Taiwan University; EVP, Financial Markets BU of FCB; Director, FS Inc.
Chairman, FSITC Co., Ltd. - - -
EVP Jin-Der Chiang 2009.7.1 294 0% 847 0% 0 0%M.S., Banking and Finance, Tam Kang University; Head of IT Center of FCB; Director of FSITC.
EVP, FCB; Chairman, First Venture Capital and First Financial Mgt. Consulting Co.; Supervisor, FS Inc; Director, TWN Financial Asset Service Corp.
- - -
Chief Auditor Wen-Chang Tu 2009.10.1 57,792 0% 186 0% 0 0%LL.B., Soochow University; Chief Auditor of FCB; AVP & Manager, Credit Approval Division of FCB.
Supervisor, FS Inc., First Venture Capital and First Financial Mgt. Consulting Co.
- - -
VP & Acting Head of Auditing Dept.
Ding-Ming Liao 2009.10.1 33,349 0% 0 0% 0 0%B.S., Economics, Soochow University; Head of Taichung Regional Center of FCB.
Head of Auditing Dept, FCB. - - -
Advisor & Head of Admin. Mgt. Dept.
Po-Chiao Chou 2008.1.2 54,248 0% 159 0% 0 0%B.S., Accounting, National Cheng Kung University; SAVP & Manager, General Affair Division of FCB.
EVP, General Admin. Center of FCB; Supervisor, FSITC Co. and Tang Eng Iron Works; Director, TWN Asset Mgt. Corp.
- - -
VP & Acting Head of Business Development Dept.
Irene Chen 2008.12.30 48,039 0% 0 0% 0 0%B.A., National Taiwan University; Senior Manager, Marketing Integration Unit, Business Development Dept. and Admin. & Planning Dept.
Director of FSITC Co. - - -
Advisor & Head of Risk Mgt. Dept.
Jeff Chen 2008.1.2 0 0% 0 0% 0 0%B.S., International trade, Feng Chia College of Engineering and Business; SVP, Credit Approval Division and Credit Analysis Division of FCB
EVP, Risk Mgt. Center of FCB. - - -
Advisor & Head of IT Dept.
Jason Ko 2004.10.14 31,119 0% 0 0% 0 0%M.S., Computer Science, George Washington University; SVP, IT Division of FCB
EVP, IT Center of FCB. - - -
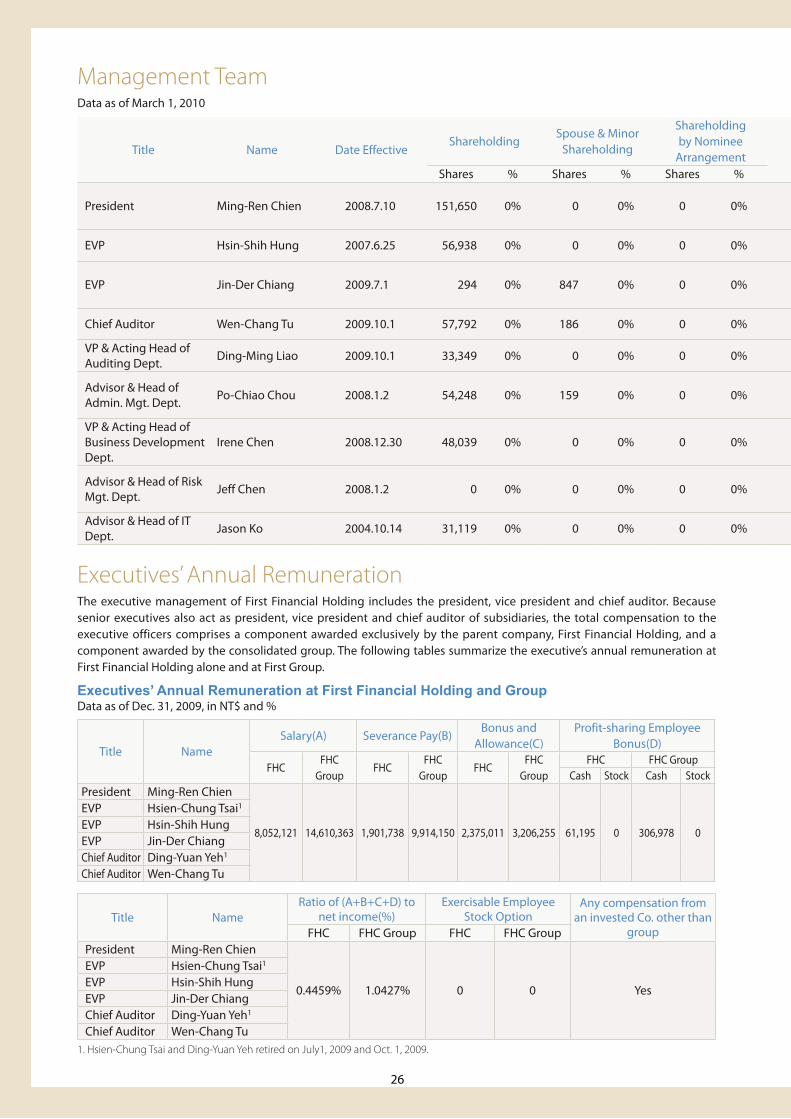
Management TeamData as of March 1, 2010
Title NameRatio of (A+B+C+D) to
net income(%)Exercisable Employee
Stock OptionAny compensation from
an invested Co. other than groupFHC FHC Group FHC FHC Group
President Ming-Ren Chien
0.4459% 1.0427% 0 0 Yes
EVP Hsien-Chung Tsai1
EVP Hsin-Shih HungEVP Jin-Der ChiangChief Auditor Ding-Yuan Yeh1
Chief Auditor Wen-Chang Tu1. Hsien-Chung Tsai and Ding-Yuan Yeh retired on July1, 2009 and Oct. 1, 2009.
Executives’ Annual RemunerationThe executive management of First Financial Holding includes the president, vice president and chief auditor. Because senior executives also act as president, vice president and chief auditor of subsidiaries, the total compensation to the executive officers comprises a component awarded exclusively by the parent company, First Financial Holding, and a component awarded by the consolidated group. The following tables summarize the executive’s annual remuneration at First Financial Holding alone and at First Group.
Executives’ Annual Remuneration at First Financial Holding and GroupData as of Dec. 31, 2009, in NT$ and %
Title NameSalary(A) Severance Pay(B)
Bonus and Allowance(C)
Profit-sharing Employee Bonus(D)
FHCFHC
GroupFHC
FHC Group
FHCFHC
GroupFHC FHC Group
Cash Stock Cash StockPresident Ming-Ren Chien
8,052,121 14,610,363 1,901,738 9,914,150 2,375,011 3,206,255 61,195 0 306,978 0
EVP Hsien-Chung Tsai1
EVP Hsin-Shih HungEVP Jin-Der ChiangChief Auditor Ding-Yuan Yeh1
Chief Auditor Wen-Chang Tu
27
Co
rpo
rate
Go
verna
nce
2009 Annua
l Rep
ort
Title Name Date EffectiveShareholding
Spouse & Minor Shareholding
Shareholding by Nominee
Arrangement Education & Experience Other Position
Managers who are spouses or within 2 degrees of kinship
Shares % Shares % Shares % Title Name Relation
President Ming-Ren Chien 2008.7.10 151,650 0% 0 0% 0 0%M.S. International finance, National Taipei University; President, FCB Leasing Co.; EVP, FCB; Chairman & President, First Financial Asset Mgt. Co., Ltd.
Managing Director, FCB; Chairman, First Aviva Life Insurance Co., Ltd; Director, TWN Asset Mgt. Corp.
- - -
EVP Hsin-Shih Hung 2007.6.25 56,938 0% 0 0% 0 0%B.S., International Trade, National Taiwan University; EVP, Financial Markets BU of FCB; Director, FS Inc.
Chairman, FSITC Co., Ltd. - - -
EVP Jin-Der Chiang 2009.7.1 294 0% 847 0% 0 0%M.S., Banking and Finance, Tam Kang University; Head of IT Center of FCB; Director of FSITC.
EVP, FCB; Chairman, First Venture Capital and First Financial Mgt. Consulting Co.; Supervisor, FS Inc; Director, TWN Financial Asset Service Corp.
- - -
Chief Auditor Wen-Chang Tu 2009.10.1 57,792 0% 186 0% 0 0%LL.B., Soochow University; Chief Auditor of FCB; AVP & Manager, Credit Approval Division of FCB.
Supervisor, FS Inc., First Venture Capital and First Financial Mgt. Consulting Co.
- - -
VP & Acting Head of Auditing Dept.
Ding-Ming Liao 2009.10.1 33,349 0% 0 0% 0 0%B.S., Economics, Soochow University; Head of Taichung Regional Center of FCB.
Head of Auditing Dept, FCB. - - -
Advisor & Head of Admin. Mgt. Dept.
Po-Chiao Chou 2008.1.2 54,248 0% 159 0% 0 0%B.S., Accounting, National Cheng Kung University; SAVP & Manager, General Affair Division of FCB.
EVP, General Admin. Center of FCB; Supervisor, FSITC Co. and Tang Eng Iron Works; Director, TWN Asset Mgt. Corp.
- - -
VP & Acting Head of Business Development Dept.
Irene Chen 2008.12.30 48,039 0% 0 0% 0 0%B.A., National Taiwan University; Senior Manager, Marketing Integration Unit, Business Development Dept. and Admin. & Planning Dept.
Director of FSITC Co. - - -
Advisor & Head of Risk Mgt. Dept.
Jeff Chen 2008.1.2 0 0% 0 0% 0 0%B.S., International trade, Feng Chia College of Engineering and Business; SVP, Credit Approval Division and Credit Analysis Division of FCB
EVP, Risk Mgt. Center of FCB. - - -
Advisor & Head of IT Dept.
Jason Ko 2004.10.14 31,119 0% 0 0% 0 0%M.S., Computer Science, George Washington University; SVP, IT Division of FCB
EVP, IT Center of FCB. - - -
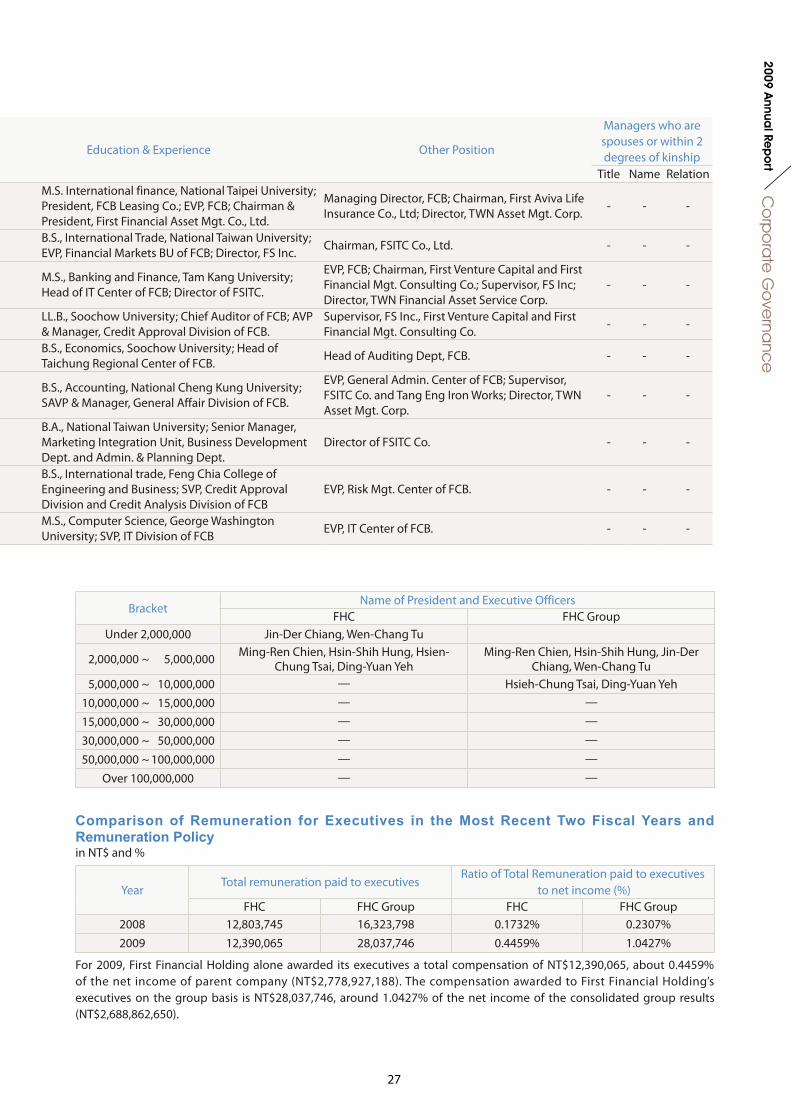
BracketName of President and Executive Officers
FHC FHC GroupUnder 2,000,000 Jin-Der Chiang, Wen-Chang Tu
2,000,000 ~ 5,000,000 Ming-Ren Chien, Hsin-Shih Hung, Hsien-Chung Tsai, Ding-Yuan Yeh
Ming-Ren Chien, Hsin-Shih Hung, Jin-Der Chiang, Wen-Chang Tu
5,000,000 ~ 10,000,000 — Hsieh-Chung Tsai, Ding-Yuan Yeh 10,000,000 ~ 15,000,000 — — 15,000,000 ~ 30,000,000 — — 30,000,000 ~ 50,000,000 — — 50,000,000 ~ 100,000,000 — —
Over 100,000,000 — —
Comparison of Remuneration for Executives in the Most Recent Two Fiscal Years and Remuneration Policyin NT$ and %
YearTotal remuneration paid to executives
Ratio of Total Remuneration paid to executives to net income (%)
FHC FHC Group FHC FHC Group2008 12,803,745 16,323,798 0.1732% 0.2307%2009 12,390,065 28,037,746 0.4459% 1.0427%
For 2009, First Financial Holding alone awarded its executives a total compensation of NT$12,390,065, about 0.4459% of the net income of parent company (NT$2,778,927,188). The compensation awarded to First Financial Holding’s executives on the group basis is NT$28,037,746, around 1.0427% of the net income of the consolidated group results (NT$2,688,862,650).
28
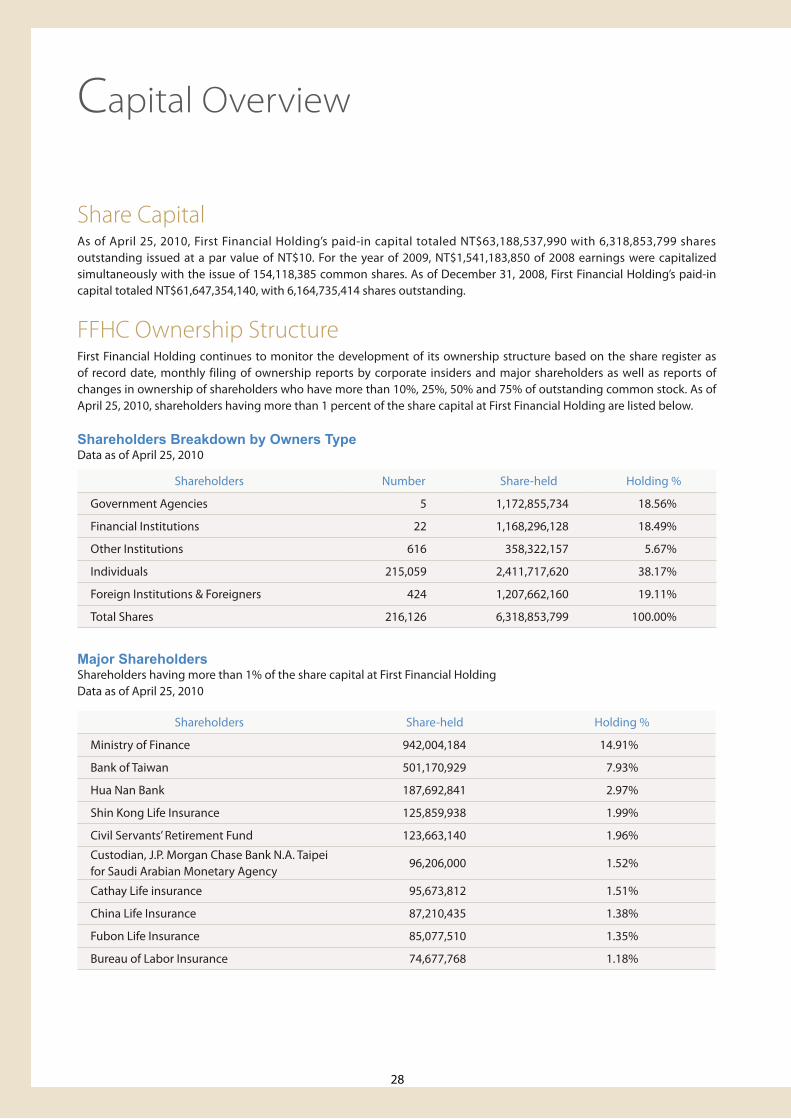
Shareholders Share-held Holding %
Ministry of Finance 942,004,184 14.91%
Bank of Taiwan 501,170,929 7.93%
Hua Nan Bank 187,692,841 2.97%
Shin Kong Life Insurance 125,859,938 1.99%
Civil Servants’ Retirement Fund 123,663,140 1.96%
Custodian, J.P. Morgan Chase Bank N.A. Taipei for Saudi Arabian Monetary Agency
96,206,000 1.52%
Cathay Life insurance 95,673,812 1.51%
China Life Insurance 87,210,435 1.38%
Fubon Life Insurance 85,077,510 1.35%
Bureau of Labor Insurance 74,677,768 1.18%
Share CapitalAs of April 25, 2010, First Financial Holding’s paid-in capital totaled NT$63,188,537,990 with 6,318,853,799 shares outstanding issued at a par value of NT$10. For the year of 2009, NT$1,541,183,850 of 2008 earnings were capitalized simultaneously with the issue of 154,118,385 common shares. As of December 31, 2008, First Financial Holding’s paid-in capital totaled NT$61,647,354,140, with 6,164,735,414 shares outstanding.
FFHC Ownership StructureFirst Financial Holding continues to monitor the development of its ownership structure based on the share register as of record date, monthly filing of ownership reports by corporate insiders and major shareholders as well as reports of changes in ownership of shareholders who have more than 10%, 25%, 50% and 75% of outstanding common stock. As of April 25, 2010, shareholders having more than 1 percent of the share capital at First Financial Holding are listed below.
Shareholders Breakdown by Owners TypeData as of April 25, 2010
Capital Overview
Shareholders Number Share-held Holding %
Government Agencies 5 1,172,855,734 18.56%
Financial Institutions 22 1,168,296,128 18.49%
Other Institutions 616 358,322,157 5.67%
Individuals 215,059 2,411,717,620 38.17%
Foreign Institutions & Foreigners 424 1,207,662,160 19.11%
Total Shares 216,126 6,318,853,799 100.00%
Major ShareholdersShareholders having more than 1% of the share capital at First Financial HoldingData as of April 25, 2010
29
Ca
pita
l Ove
rview
2009 Annua
l Rep
ort
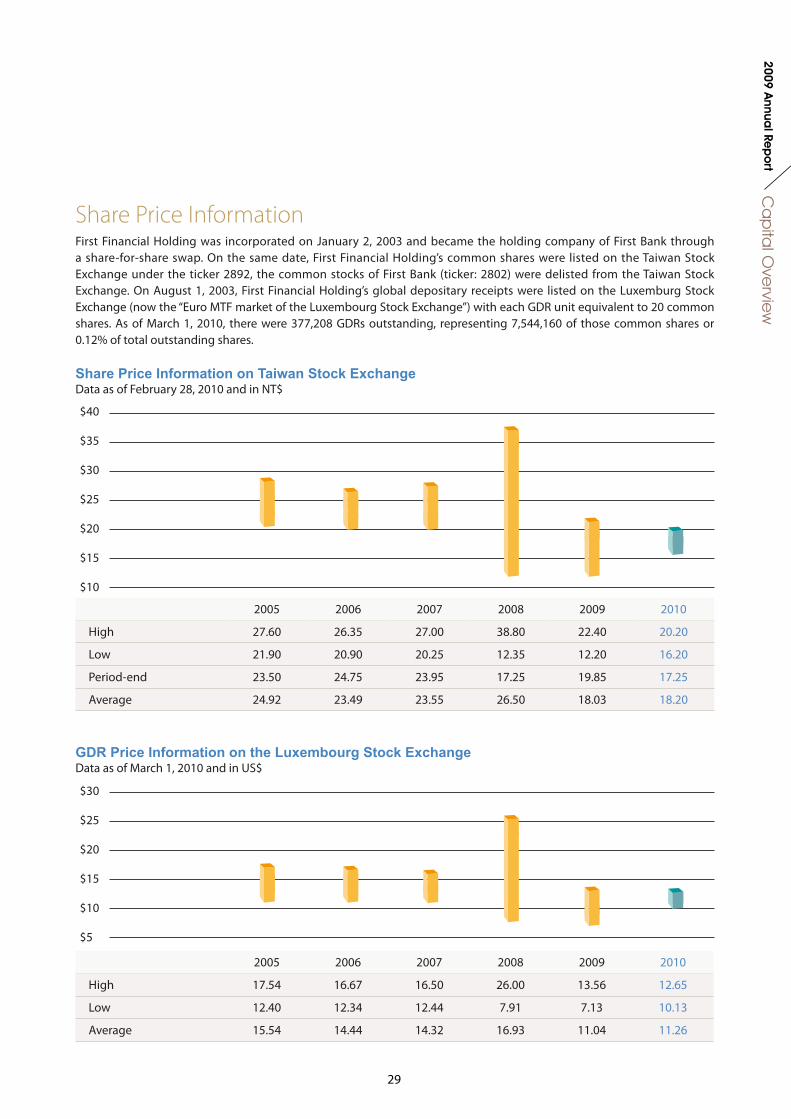
2005 2006 2007 2008 2009 2010
High 27.60 26.35 27.00 38.80 22.40 20.20
Low 21.90 20.90 20.25 12.35 12.20 16.20
Period-end 23.50 24.75 23.95 17.25 19.85 17.25
Average 24.92 23.49 23.55 26.50 18.03 18.20
2005 2006 2007 2008 2009 2010
High 17.54 16.67 16.50 26.00 13.56 12.65
Low 12.40 12.34 12.44 7.91 7.13 10.13
Average 15.54 14.44 14.32 16.93 11.04 11.26
Share Price InformationFirst Financial Holding was incorporated on January 2, 2003 and became the holding company of First Bank through a share-for-share swap. On the same date, First Financial Holding’s common shares were listed on the Taiwan Stock Exchange under the ticker 2892, the common stocks of First Bank (ticker: 2802) were delisted from the Taiwan Stock Exchange. On August 1, 2003, First Financial Holding’s global depositary receipts were listed on the Luxemburg Stock Exchange (now the “Euro MTF market of the Luxembourg Stock Exchange”) with each GDR unit equivalent to 20 common shares. As of March 1, 2010, there were 377,208 GDRs outstanding, representing 7,544,160 of those common shares or 0.12% of total outstanding shares.
Share Price Information on Taiwan Stock ExchangeData as of February 28, 2010 and in NT$
GDR Price Information on the Luxembourg Stock ExchangeData as of March 1, 2010 and in US$
$40
$35
$30
$25
$20
$15
$10
$30
$25
$20
$15
$10
$5
30
Dividend First Financial Holding’s board of directors has the right to propose an annual dividend, which becomes effective after
being approved by the shareholders’ meeting. The dividend scheme takes into account the operating and investment
requirements of the company, the profit performance of the current year, cost of capital, taxation, the overall financial
industry development and the movement of the money market, and shareholders’ interests.
To finance new capital investments, enhance earnings capacity and comply with local regulations, First Financial Holding
uses the residual dividend policy. If First Financial Holding reports a net income at the end of the operating year, the
net income shall be used to pay relevant taxes, offset cumulative losses of previous years (if any), and set aside a legal
reserve and special capital reserve as required by local regulations. After the distribution of the aforementioned items, the
balance shall be appropriated as follows:
(1) 0.02%~0.16% for bonuses to employees;
(2) no more than 1% for compensation for directors and supervisors;
The remainder after deducting employee bonuses and directors’ compensation, plus cumulative undistributed earnings
of the previous year, make up the total amount available for the distribution of shareholder dividends. The board has the
discretion to propose shareholder dividends equivalent to 30%-100% of that available amount, pending the approval of
shareholders’ meeting. Subjects eligible to participate in the employee stock bonus plan may include employees of First
Financial Holding’s affiliated companies, with the stock bonus plan set forth by the board.
According to First Financial Holding’s operating scheme, the amount of cash dividend must exceed 10% of the total
amount available for the distribution of shareholder dividends. A cash dividend of less than NT$0.1 per share need not be
distributed unless otherwise provided for in the resolution of the shareholder’s meeting.
For the fiscal year 2007 and 2008, First Financial Holding’s dividend payout ratio was 88.35% and 62.50%, respectively.
Retroactively adjusted for cash dividend payout ratio would be 82.52% and 41.67%.
31
Ca
pita
l Ove
rview
2009 Annua
l Rep
ort
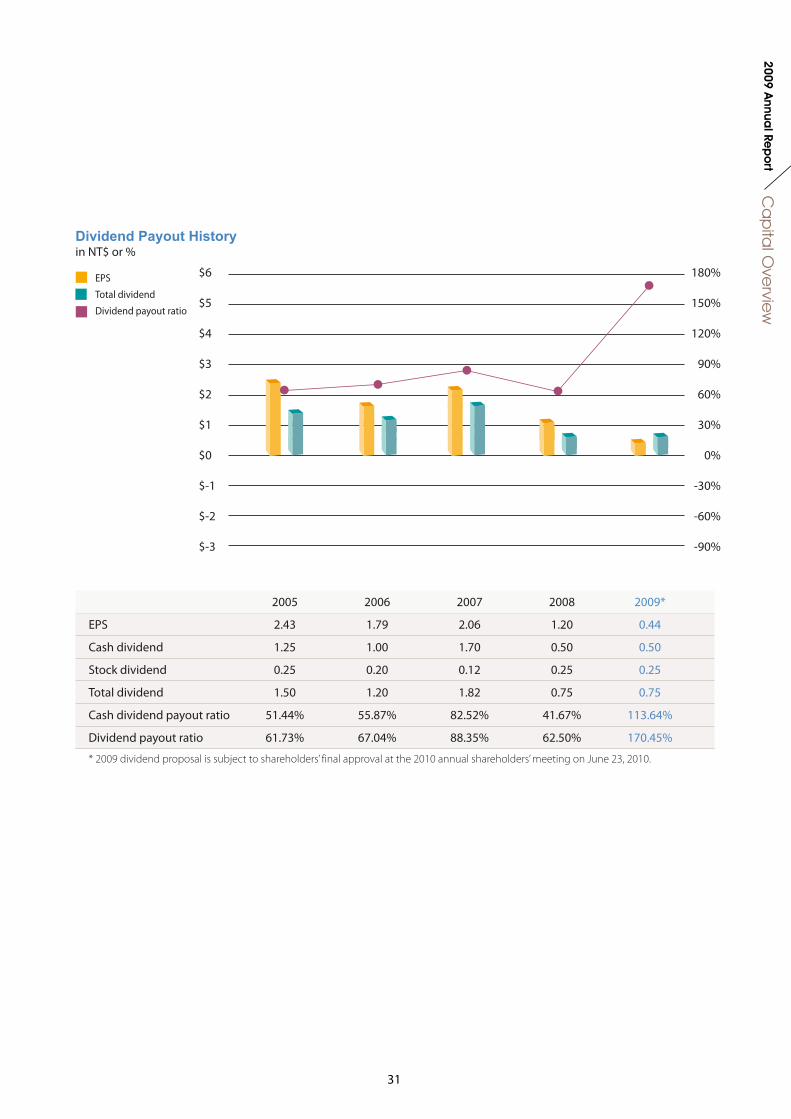
Dividend Payout Historyin NT$ or %
2005 2006 2007 2008 2009*
EPS 2.43 1.79 2.06 1.20 0.44
Cash dividend 1.25 1.00 1.70 0.50 0.50
Stock dividend 0.25 0.20 0.12 0.25 0.25
Total dividend 1.50 1.20 1.82 0.75 0.75
Cash dividend payout ratio 51.44% 55.87% 82.52% 41.67% 113.64%
Dividend payout ratio 61.73% 67.04% 88.35% 62.50% 170.45%
* 2009 dividend proposal is subject to shareholders’ final approval at the 2010 annual shareholders’ meeting on June 23, 2010.
$6
$5
$4
$3
$2
$1
$0
$-1
$-2
$-3
180%
150%
120%
90%
60%
30%
0%
-30%
-60%
-90%
EPS
Total dividend
Dividend payout ratio
32
First Bank Overview*Despite a bleak financial environment and spread compression, First Bank remained dedicated to its customer-centric approach and secured leading position in financing urban renewal schemes as the premier player for the project of Shanghua Ren-ai Building. It saw a decline in net income to NT$2,054 million, due primarily to increased provisions aimed at lowering delinquency rates and improving bad-debt coverage to meet Financial Supervision Commission’s qualification criterion for expansion in China.
2009 Net Revenue Breakdownin NT$ mn
Subsidiaries Overview
Net interest income Net fee income Other income
16,011 4,071 6,361
60.55% 15.40% 24.05%
Financial Highlights First BankNon-consolidated basis, data as of December 31, 2007, 2008 and 2009
2009 2008 2007
Income statements (in NT$ mn)
Net interest income 16,011 23,952 21,941
Net fee income 4,071 5,041 6,884
Other income 6,361 3,586 7,109
Net revenue 26,443 32,579 35,934
Provision expenses (10,621) (7,130) (6,062)
Operating expenses (13,807) (14,438) (14,200)
Income before tax 2,015 11,011 15,672
Income tax expenses 38 (2,046) (3,646)Cumulative effect of change in accounting principles
0 0 0
Net income 2,054 8,965 12,026
Balance sheet (in NT$ mn)
Total assets 1,921,430 1,765,541 1,653,984
Total liabilities 1,831,518 1,676,084 1,564,242
Total shareholders’ equity 89,913 89,457 89,742
Ratios (%)
ROE 2.29 10.01 13.60
ROA 0.11 0.52 0.75
Tier-1 ratio 7.45 7.10 7.30
Capital adequacy ratio 11.01 10.88 10.80
* There are currently eight subsidiaries under the First Financial Holding umbrella. In this section, only four primary subsidiaries are introduced as their combined net income for 2009 constituting the major portion of the First Group’s profits.
**Figures may not match due to rounding.
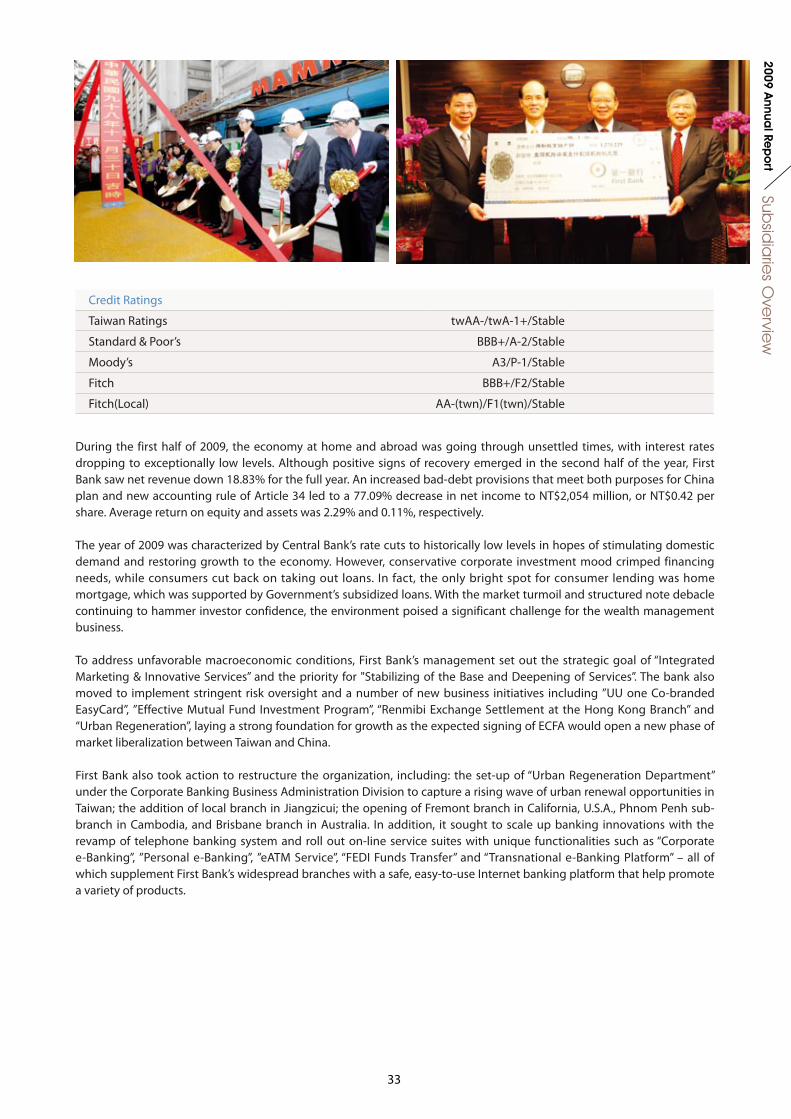
33
Subsid
iarie
s Ove
rview
2009 Annua
l Rep
ort
Credit Ratings
Taiwan Ratings twAA-/twA-1+/Stable
Standard & Poor’s BBB+/A-2/Stable
Moody’s A3/P-1/Stable
Fitch BBB+/F2/Stable
Fitch(Local) AA-(twn)/F1(twn)/Stable
During the first half of 2009, the economy at home and abroad was going through unsettled times, with interest rates dropping to exceptionally low levels. Although positive signs of recovery emerged in the second half of the year, First Bank saw net revenue down 18.83% for the full year. An increased bad-debt provisions that meet both purposes for China plan and new accounting rule of Article 34 led to a 77.09% decrease in net income to NT$2,054 million, or NT$0.42 per share. Average return on equity and assets was 2.29% and 0.11%, respectively.
The year of 2009 was characterized by Central Bank’s rate cuts to historically low levels in hopes of stimulating domestic demand and restoring growth to the economy. However, conservative corporate investment mood crimped financing needs, while consumers cut back on taking out loans. In fact, the only bright spot for consumer lending was home mortgage, which was supported by Government’s subsidized loans. With the market turmoil and structured note debacle continuing to hammer investor confidence, the environment poised a significant challenge for the wealth management business.
To address unfavorable macroeconomic conditions, First Bank’s management set out the strategic goal of “Integrated Marketing & Innovative Services” and the priority for "Stabilizing of the Base and Deepening of Services”. The bank also moved to implement stringent risk oversight and a number of new business initiatives including ”UU one Co-branded EasyCard”, ”Effective Mutual Fund Investment Program”, “Renmibi Exchange Settlement at the Hong Kong Branch” and “Urban Regeneration”, laying a strong foundation for growth as the expected signing of ECFA would open a new phase of market liberalization between Taiwan and China.
First Bank also took action to restructure the organization, including: the set-up of “Urban Regeneration Department” under the Corporate Banking Business Administration Division to capture a rising wave of urban renewal opportunities in Taiwan; the addition of local branch in Jiangzicui; the opening of Fremont branch in California, U.S.A., Phnom Penh sub-branch in Cambodia, and Brisbane branch in Australia. In addition, it sought to scale up banking innovations with the revamp of telephone banking system and roll out on-line service suites with unique functionalities such as “Corporate e-Banking”, ”Personal e-Banking”, ”eATM Service”, “FEDI Funds Transfer” and “Transnational e-Banking Platform” – all of which supplement First Bank’s widespread branches with a safe, easy-to-use Internet banking platform that help promote a variety of products.
34
First Bank Business Units & Functional CentersData as of March, 2010
First BankPresident
Corporate Banking BUCorporate Banking Business Administration Division
Corporate Banking Business Marketing Division
International Business BUInternational Banking Division
Overseas Business Admin. Division
Personal Banking BU
Consumer Banking Business Administration Division
Credit Card Division
Trust Division
Personal Banking Business Administration Division
Operation Management BUOperation Planning & Administration Division
Electronic Banking Division
Financial Markets BU
Trading Division
Treasury Division
Financial Markets Business Administration Division
Risk Management Center
Regional Center
Risk Management Division
Credit Approval Division
Credit Analysis Division
Special Asset Management Division
General Administration Center
Accounting Division
General Affair Division
Human Resource Division
Public Relations Office
Information Technology Center
IT Operation Division
IT Application Division
On the front of risk management, First Bank was awarded “2009 The 2nd Information Security Awards” and “Enterprise PMP Benchmarking Awards” in recognition of its sound risk oversight. It also attained ISO 27001 recertification over three year certificate cycle. It moved to review the internal control practices and operational risk processes, so as to optimize risk control over asset and liability that appropriately reflects changes in the financial and economic environment and enhances risk-adjusted profitability. As of end of 2009, First Bank recorded NPL ratio of 1.32%, coverage ratio of 84.75% and capital adequacy ratio of 11.01%.
35
Subsid
iarie
s Ove
rview
2009 Annua
l Rep
ort
First Bank Capital Adequacy Data as of December 31, 2007, 2008 and 2009; in NT$ mn or %
2009 2008 2007
Tier-1 capital 75,512 73,940 76,139
Tier-2 capital 36,056 39,397 36,485
Total capital 111,568 113,337 112,624
Total risk-weighted assets 1,013,336 1,041,892 1,043,279
Tier-1 capital ratio 7.45 7.10 7.30
Capital adequacy ratio 11.01 10.88 10.80
Enabled by a bedrock of solid risk management, First Bank made meaningful progresses in 2009 as follows:
Deposit and lending: the average outstanding balance of deposit was NT$1,442,237 million and the average outstanding balance of loans was NT$1,100,936 million, representing an increase of 12.14 % and 1.03% from year-ago levels, separately.
Custodian business: as of end of 2009, assets under custody totaled NT$324,779 million, a 26.31% increase over the prior year. Assets under custody for discretionary management totaled NT$140,341 million, a 130.36% increase over the prior year.
Cross-strait financial service: First Bank launched “Trade Finance for Taiwanese Businesses”, “International Factoring”, ”Supply Chain Finance” and ”Corporate Syndicated Loan” to serve the needs for Taiwanese businesses that operate in China.
Corporate citizenship: First Bank, First Financial Holdings and First Bank Foundation together mobilized a donation to victims of Morakot Typhoon in 2009, building the corporate image and setting an example for community engagement.
First Bank now embarks on a recovery path amid signs of improvement in the domestic and global economy. The bank will continue to strengthen its core franchise, while enhancing added value within and across its principal lines of business. With an MOU on banking supervision signed in November 2009, a milestone in the history of cross-strait financial cooperation, First Bank will respond actively to new opportunities with an objective of upgrading the Shanghai Representative Office to branch status. China, as a new realm from the overly competitive and saturated Taiwan market, is of primary importance to the integrity of First Bank’s global operations.
Looking AheadGoing into 2010, First bank expects to strive for important strategic initiatives, including: integrate marketing with other subsidiaries of First Financial Holdings to offer one-stop shopping of services; continue to optimize risk management system and improve risk oversight; maintain its "Customer First, Service Foremost” customer-centric focus to become the most proficient financial player in the Greater China region.
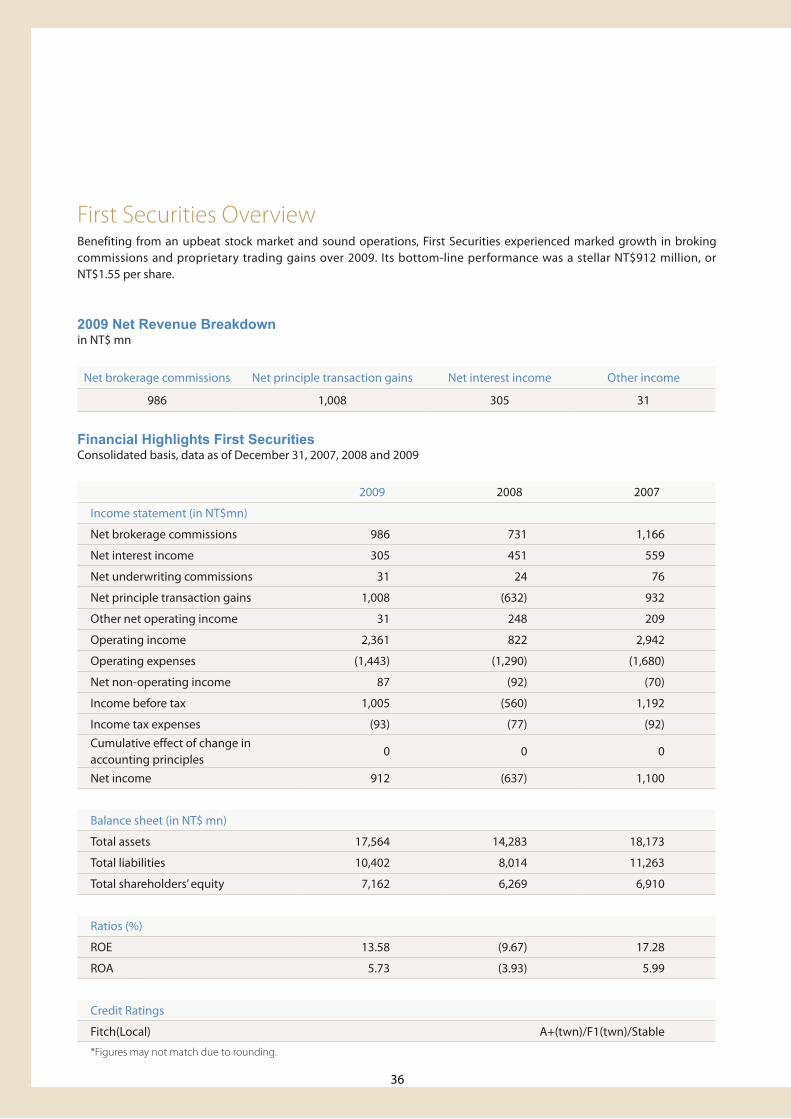
36
First Securities OverviewBenefiting from an upbeat stock market and sound operations, First Securities experienced marked growth in broking commissions and proprietary trading gains over 2009. Its bottom-line performance was a stellar NT$912 million, or NT$1.55 per share.
2009 Net Revenue Breakdownin NT$ mn
Net brokerage commissions Net principle transaction gains Net interest income Other income
986 1,008 305 31
Financial Highlights First SecuritiesConsolidated basis, data as of December 31, 2007, 2008 and 2009
2009 2008 2007
Income statement (in NT$mn)
Net brokerage commissions 986 731 1,166
Net interest income 305 451 559
Net underwriting commissions 31 24 76
Net principle transaction gains 1,008 (632) 932
Other net operating income 31 248 209
Operating income 2,361 822 2,942
Operating expenses (1,443) (1,290) (1,680)
Net non-operating income 87 (92) (70)
Income before tax 1,005 (560) 1,192
Income tax expenses (93) (77) (92)Cumulative effect of change in accounting principles
0 0 0
Net income 912 (637) 1,100
Balance sheet (in NT$ mn)
Total assets 17,564 14,283 18,173
Total liabilities 10,402 8,014 11,263
Total shareholders’ equity 7,162 6,269 6,910
Ratios (%)
ROE 13.58 (9.67) 17.28
ROA 5.73 (3.93) 5.99
Credit Ratings
Fitch(Local) A+(twn)/F1(twn)/Stable
*Figures may not match due to rounding.
37
Subsid
iarie
s Ove
rview
2009 Annua
l Rep
ort
Taiwan’s GDP stumbled into negative territory, contracting by a record-low 9.06% in the first quarter of 2009. The economy hit bottom and stabilized in the mid-year, aided by China stimulus package, then recovered following export growth. The capital market also staged a strong surge: after falling below 4,000 in early 2009, the TAIEX, thereafter, rebounded and rallied to a high of 8,188 at the year-end, up 78.35%, or 3,597 points, from the beginning of the year. Although capital inflows and the ultra-low interest rate environment sparked fears of bubble in capital markets, fluctuations in New Taiwan Dollar was relatively mild compared with Asian countries, thanks to Central Bank’s move to curb excess liquidity.
Buoyed by Taiwan’s stock market rallies, combined with management’s endeavor, First Securities was able to expand its market share in retail broking to 1.723% in 2009, up 17.6% from 1.465% a year earlier. The addition of five branches and five broking service points at First Bank’s branches helped drive a 34.9% increase in broking commissions and 52.4% increase in proprietary trading volumes. Profitability improved significantly, with net income of NT$912 million compared with net loss of NT$637 million in 2008. The average return on equity and assets resumed to positive territory at 13.58% and 5.73%, compared with -9.67% and -3.93% in the prior year.
First Securities originated and executed several underwriting in 2009, including six cases of capital raising (Cub ElecParts Inc., for instance), signing of management contract for two primary listings and two secondary listings on over-the-counter market for Taiwanese businesses that operate overseas.
With respect to bond transactions, bond yield saw sharp moves downward amid a recession in the first half of the year, before firming up as investors cashed out of bonds into stocks in the second half of the year. For the full year of 2009, First Securities completed repurchase of NT$187,158 million and outright purchases and sales of NT$29,985 million.
Meanwhile, First Securities demonstrated its strength in in-house research, proprietary trading and derivative products. The combination of enhanced hedging techniques and a shrewd selection of 200 stocks that comprised 70% of the proprietary trading portfolio contributed to marked performance improvement. First Securities also turned active in warrant issues, having offered a total of 36 call warrants with premium income of NT$261 million during 2009. Warrants will likely become a key earnings driver if demand persists.
Looking Ahead2010 is a year of rapid, dramatic changes in the economic, financial and regulatory environment. First Securities will capitalize on the newly liberalized cross-strait relation to expand business in mainland China, firstly with the set-up of a representative office in Shanghai. It will sustain its superb management quality, extensive product mix and advantageous geographic extension to concentrate on several priorities, including: advise on the local listings of Taiwanese businesses that operate overseas; introduce China QDII funds into Taiwan; set up a futures subsidiary; align further with First Bank to maximize synergies, boost revenues and enhance efficiency via enlarged economies of scale. First Securities remains committed to its goal of being a full-function broker with comprehensive capital market services, personal financial solutions and trading platforms.

38
First Securities Investment Trust OverviewBenefiting from revived investor confidence, a buoyant stock market, favorable regulatory changes and successful fund launches (including one on the “China theme” stock investments), First Securities Investment Trust reported net income of NT$152 million, or NT$2.53 per share, for 2009.
Financial Highlights First Securities Investment TrustNon-consolidated basis, data as of December 31, 2007, 2008 and 2009
2009 2008 2007
Income statement (in NT$ mn)
Management fee 433 444 600
Sales service fee 2 4 13
Operating income 435 448 613
Operating expenses (288) (276) (328)
Net non-operating income 6 (38) 22
Income before tax 153 134 307
Income tax expenses (1) 33 (73)
Cumulative effect of change in accounting principles
0 0 0
Net income 152 167 234
Balance sheet (in NT$ mn)Total assets 1,109 1,053 1,185
Total liabilities 127 82 183
Total shareholders’ equity 982 972 1,003
Ratios (%)ROE 15.51 16.95 23.58
ROA 14.02 14.95 19.89
Asset under managementAUM(in NT$ mn) 106,850 91,238 100,565
AUM rank 8 7 12
*Figures may not match due to rounding.
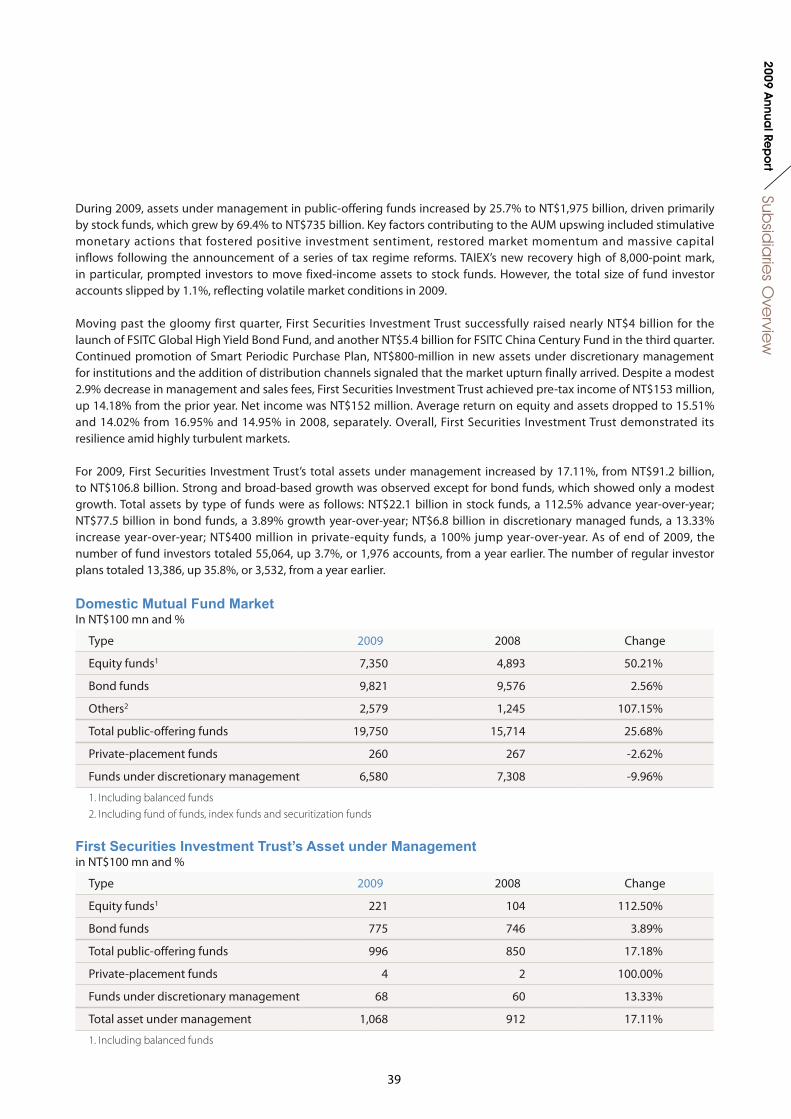
39
Subsid
iarie
s Ove
rview
2009 Annua
l Rep
ort
During 2009, assets under management in public-offering funds increased by 25.7% to NT$1,975 billion, driven primarily by stock funds, which grew by 69.4% to NT$735 billion. Key factors contributing to the AUM upswing included stimulative monetary actions that fostered positive investment sentiment, restored market momentum and massive capital inflows following the announcement of a series of tax regime reforms. TAIEX’s new recovery high of 8,000-point mark, in particular, prompted investors to move fixed-income assets to stock funds. However, the total size of fund investor accounts slipped by 1.1%, reflecting volatile market conditions in 2009.
Moving past the gloomy first quarter, First Securities Investment Trust successfully raised nearly NT$4 billion for the launch of FSITC Global High Yield Bond Fund, and another NT$5.4 billion for FSITC China Century Fund in the third quarter. Continued promotion of Smart Periodic Purchase Plan, NT$800-million in new assets under discretionary management for institutions and the addition of distribution channels signaled that the market upturn finally arrived. Despite a modest 2.9% decrease in management and sales fees, First Securities Investment Trust achieved pre-tax income of NT$153 million, up 14.18% from the prior year. Net income was NT$152 million. Average return on equity and assets dropped to 15.51% and 14.02% from 16.95% and 14.95% in 2008, separately. Overall, First Securities Investment Trust demonstrated its resilience amid highly turbulent markets.
For 2009, First Securities Investment Trust’s total assets under management increased by 17.11%, from NT$91.2 billion, to NT$106.8 billion. Strong and broad-based growth was observed except for bond funds, which showed only a modest growth. Total assets by type of funds were as follows: NT$22.1 billion in stock funds, a 112.5% advance year-over-year; NT$77.5 billion in bond funds, a 3.89% growth year-over-year; NT$6.8 billion in discretionary managed funds, a 13.33% increase year-over-year; NT$400 million in private-equity funds, a 100% jump year-over-year. As of end of 2009, the number of fund investors totaled 55,064, up 3.7%, or 1,976 accounts, from a year earlier. The number of regular investor plans totaled 13,386, up 35.8%, or 3,532, from a year earlier.
Domestic Mutual Fund MarketIn NT$100 mn and %
Type 2009 2008 Change
Equity funds1 7,350 4,893 50.21%
Bond funds 9,821 9,576 2.56%
Others2 2,579 1,245 107.15%
Total public-offering funds 19,750 15,714 25.68%
Private-placement funds 260 267 -2.62%
Funds under discretionary management 6,580 7,308 -9.96%
1. Including balanced funds2. Including fund of funds, index funds and securitization funds
First Securities Investment Trust’s Asset under Managementin NT$100 mn and %
Type 2009 2008 Change
Equity funds1 221 104 112.50%
Bond funds 775 746 3.89%
Total public-offering funds 996 850 17.18%
Private-placement funds 4 2 100.00%
Funds under discretionary management 68 60 13.33%
Total asset under management 1,068 912 17.11%
1. Including balanced funds
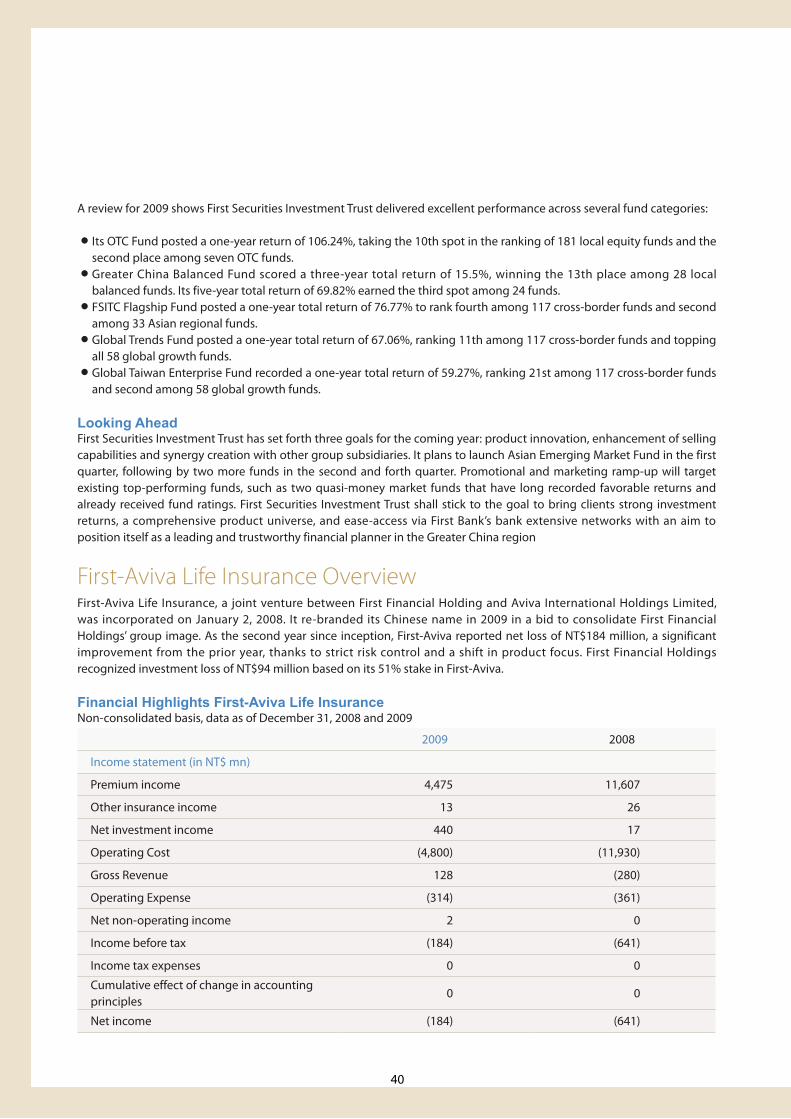
40
A review for 2009 shows First Securities Investment Trust delivered excellent performance across several fund categories:
● Its OTC Fund posted a one-year return of 106.24%, taking the 10th spot in the ranking of 181 local equity funds and the second place among seven OTC funds.
● Greater China Balanced Fund scored a three-year total return of 15.5%, winning the 13th place among 28 local balanced funds. Its five-year total return of 69.82% earned the third spot among 24 funds.
● FSITC Flagship Fund posted a one-year total return of 76.77% to rank fourth among 117 cross-border funds and second among 33 Asian regional funds.
● Global Trends Fund posted a one-year total return of 67.06%, ranking 11th among 117 cross-border funds and topping all 58 global growth funds.
● Global Taiwan Enterprise Fund recorded a one-year total return of 59.27%, ranking 21st among 117 cross-border funds and second among 58 global growth funds.
Looking AheadFirst Securities Investment Trust has set forth three goals for the coming year: product innovation, enhancement of selling capabilities and synergy creation with other group subsidiaries. It plans to launch Asian Emerging Market Fund in the first quarter, following by two more funds in the second and forth quarter. Promotional and marketing ramp-up will target existing top-performing funds, such as two quasi-money market funds that have long recorded favorable returns and already received fund ratings. First Securities Investment Trust shall stick to the goal to bring clients strong investment returns, a comprehensive product universe, and ease-access via First Bank’s bank extensive networks with an aim to position itself as a leading and trustworthy financial planner in the Greater China region
First-Aviva Life Insurance OverviewFirst-Aviva Life Insurance, a joint venture between First Financial Holding and Aviva International Holdings Limited, was incorporated on January 2, 2008. It re-branded its Chinese name in 2009 in a bid to consolidate First Financial Holdings’ group image. As the second year since inception, First-Aviva reported net loss of NT$184 million, a significant improvement from the prior year, thanks to strict risk control and a shift in product focus. First Financial Holdings recognized investment loss of NT$94 million based on its 51% stake in First-Aviva.
Financial Highlights First-Aviva Life InsuranceNon-consolidated basis, data as of December 31, 2008 and 2009
2009 2008
Income statement (in NT$ mn)
Premium income 4,475 11,607
Other insurance income 13 26
Net investment income 440 17
Operating Cost (4,800) (11,930)
Gross Revenue 128 (280)
Operating Expense (314) (361)
Net non-operating income 2 0
Income before tax (184) (641)
Income tax expenses 0 0
Cumulative effect of change in accounting principles
0 0
Net income (184) (641)
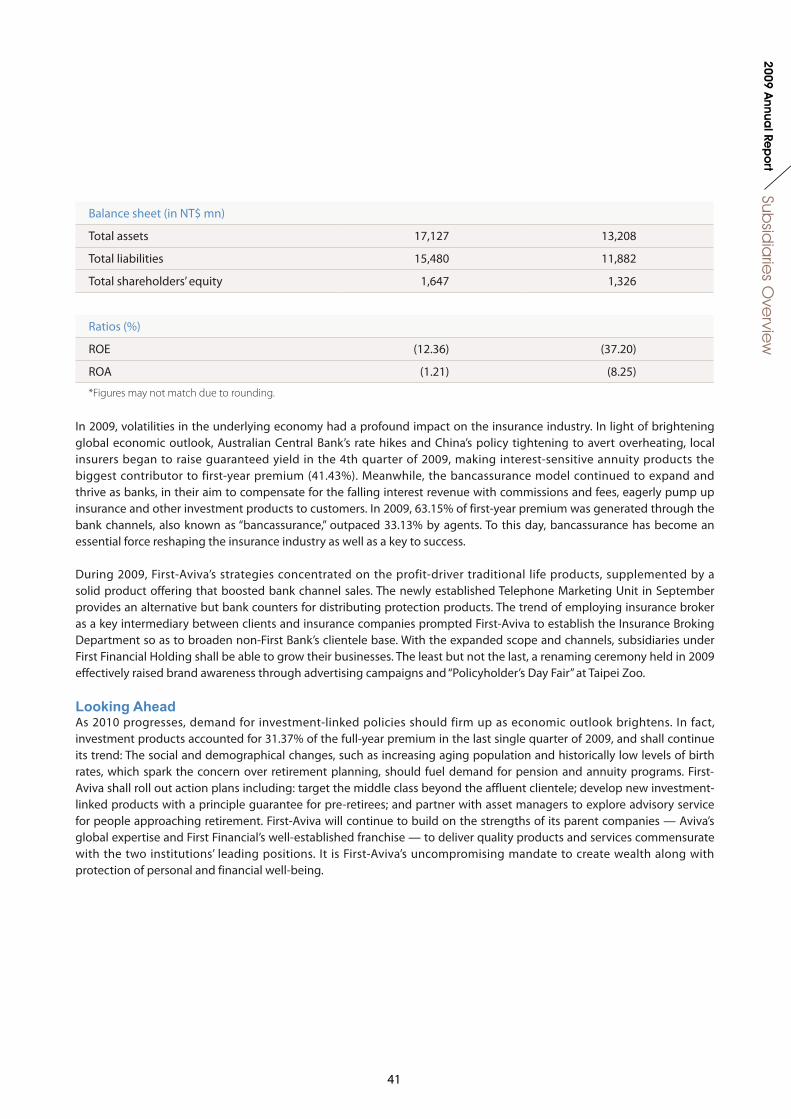
41
Subsid
iarie
s Ove
rview
2009 Annua
l Rep
ort
Balance sheet (in NT$ mn)
Total assets 17,127 13,208
Total liabilities 15,480 11,882
Total shareholders’ equity 1,647 1,326
Ratios (%)
ROE (12.36) (37.20)
ROA (1.21) (8.25)
*Figures may not match due to rounding.
In 2009, volatilities in the underlying economy had a profound impact on the insurance industry. In light of brightening global economic outlook, Australian Central Bank’s rate hikes and China’s policy tightening to avert overheating, local insurers began to raise guaranteed yield in the 4th quarter of 2009, making interest-sensitive annuity products the biggest contributor to first-year premium (41.43%). Meanwhile, the bancassurance model continued to expand and thrive as banks, in their aim to compensate for the falling interest revenue with commissions and fees, eagerly pump up insurance and other investment products to customers. In 2009, 63.15% of first-year premium was generated through the bank channels, also known as “bancassurance,” outpaced 33.13% by agents. To this day, bancassurance has become an essential force reshaping the insurance industry as well as a key to success.
During 2009, First-Aviva’s strategies concentrated on the profit-driver traditional life products, supplemented by a solid product offering that boosted bank channel sales. The newly established Telephone Marketing Unit in September provides an alternative but bank counters for distributing protection products. The trend of employing insurance broker as a key intermediary between clients and insurance companies prompted First-Aviva to establish the Insurance Broking Department so as to broaden non-First Bank’s clientele base. With the expanded scope and channels, subsidiaries under First Financial Holding shall be able to grow their businesses. The least but not the last, a renaming ceremony held in 2009 effectively raised brand awareness through advertising campaigns and “Policyholder’s Day Fair” at Taipei Zoo.
Looking AheadAs 2010 progresses, demand for investment-linked policies should firm up as economic outlook brightens. In fact, investment products accounted for 31.37% of the full-year premium in the last single quarter of 2009, and shall continue its trend: The social and demographical changes, such as increasing aging population and historically low levels of birth rates, which spark the concern over retirement planning, should fuel demand for pension and annuity programs. First-Aviva shall roll out action plans including: target the middle class beyond the affluent clientele; develop new investment-linked products with a principle guarantee for pre-retirees; and partner with asset managers to explore advisory service for people approaching retirement. First-Aviva will continue to build on the strengths of its parent companies — Aviva’s global expertise and First Financial’s well-established franchise — to deliver quality products and services commensurate with the two institutions’ leading positions. It is First-Aviva’s uncompromising mandate to create wealth along with protection of personal and financial well-being.
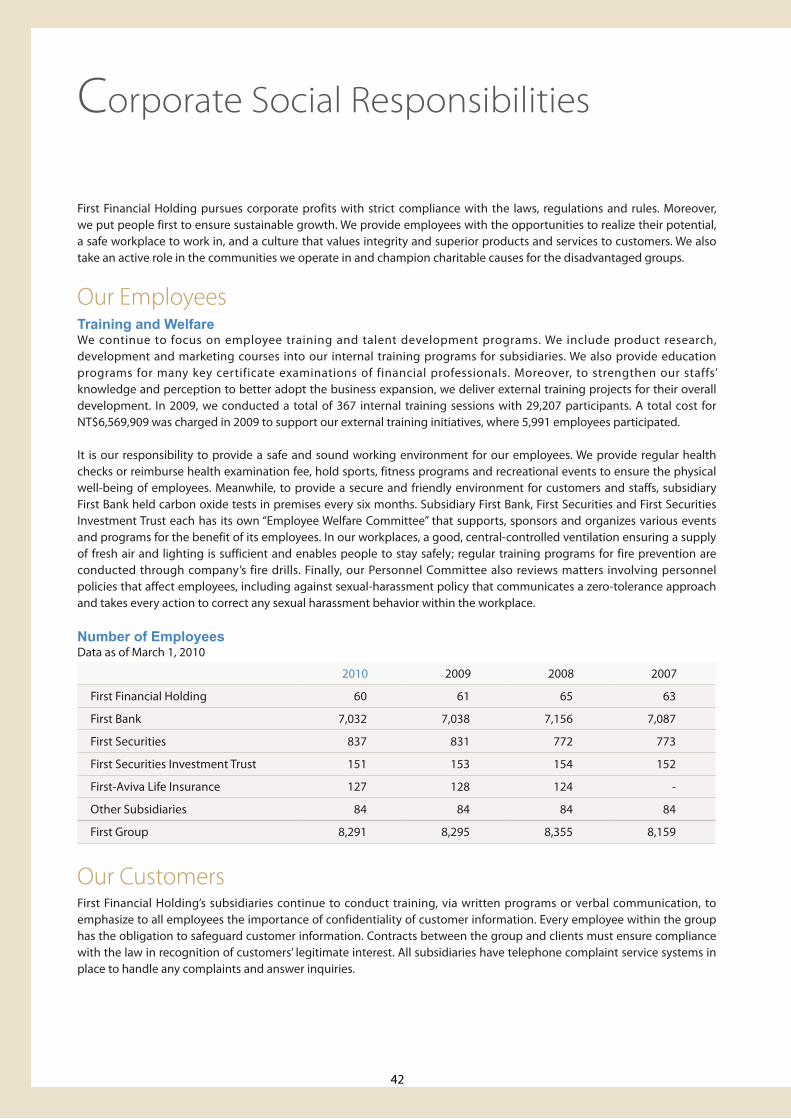
42
First Financial Holding pursues corporate profits with strict compliance with the laws, regulations and rules. Moreover, we put people first to ensure sustainable growth. We provide employees with the opportunities to realize their potential, a safe workplace to work in, and a culture that values integrity and superior products and services to customers. We also take an active role in the communities we operate in and champion charitable causes for the disadvantaged groups.
Our EmployeesTraining and WelfareWe continue to focus on employee training and talent development programs. We include product research, development and marketing courses into our internal training programs for subsidiaries. We also provide education programs for many key certificate examinations of financial professionals. Moreover, to strengthen our staffs’ knowledge and perception to better adopt the business expansion, we deliver external training projects for their overall development. In 2009, we conducted a total of 367 internal training sessions with 29,207 participants. A total cost for NT$6,569,909 was charged in 2009 to support our external training initiatives, where 5,991 employees participated.
It is our responsibility to provide a safe and sound working environment for our employees. We provide regular health checks or reimburse health examination fee, hold sports, fitness programs and recreational events to ensure the physical well-being of employees. Meanwhile, to provide a secure and friendly environment for customers and staffs, subsidiary First Bank held carbon oxide tests in premises every six months. Subsidiary First Bank, First Securities and First Securities Investment Trust each has its own “Employee Welfare Committee” that supports, sponsors and organizes various events and programs for the benefit of its employees. In our workplaces, a good, central-controlled ventilation ensuring a supply of fresh air and lighting is sufficient and enables people to stay safely; regular training programs for fire prevention are conducted through company’s fire drills. Finally, our Personnel Committee also reviews matters involving personnel policies that affect employees, including against sexual-harassment policy that communicates a zero-tolerance approach and takes every action to correct any sexual harassment behavior within the workplace.
Number of EmployeesData as of March 1, 2010
2010 2009 2008 2007
First Financial Holding 60 61 65 63
First Bank 7,032 7,038 7,156 7,087
First Securities 837 831 772 773
First Securities Investment Trust 151 153 154 152
First-Aviva Life Insurance 127 128 124 -
Other Subsidiaries 84 84 84 84
First Group 8,291 8,295 8,355 8,159
Our CustomersFirst Financial Holding’s subsidiaries continue to conduct training, via written programs or verbal communication, to emphasize to all employees the importance of confidentiality of customer information. Every employee within the group has the obligation to safeguard customer information. Contracts between the group and clients must ensure compliance with the law in recognition of customers’ legitimate interest. All subsidiaries have telephone complaint service systems in place to handle any complaints and answer inquiries.
Corporate Social Responsibilities

43
Co
rpo
rate
Soc
ial Re
spo
nsibilitie
s2009 A
nnual Re
po
rt
Our CSR ActivitiesThe First Commercial Bank FoundationTo fulfill corporate social responsibilities, First Financial Holding Company carried out the CSR activities based on the value of “what is obtained from the society is used in the interest of the society.” In addition to participating in various charity events and donating to social welfare organizations, we also have been operating a non-profit foundation to actively involve in different programs to provide cultural, educational and emotional support- The First Commercial Bank Foundation, founded in 1999 and its primary purposes are to improve quality of life for people in Taiwan and foster a harmonious society. By holding a series of activities, First Commercial Bank Foundation promotes educational and charitable programs with special focuses on supporting disadvantaged groups, musical events, children caring, and upholding the mind of modern Taiwan.
What We have Achieved in 2009First Financial Holding believes a key aspect of corporate citizenship is community engagement. The group and its subsidiaries took an active role in 2009 with events summarized below:
First Financial Holding: ● donated NT$ 20 million and conducted “Employee Salary Donation” in support of “Philanthropy for Typhoon Morakot”,
which flooded southern Taiwan on Aug. 8, 2009. ● mobilized “Energy-saving and Carbon emission-reducing” across the group offices by adopting water-saving faucets &
toilets, recycling and promoting self-prepared dishware. ● sponsored ” Welcoming Twilight of the New Year” at Fulong Beach with co-host Northeast and Yilan Coast National
Scenic Area Administration and subsidiaries on January 1, 2010. ● sponsored “Walking through Financial Turmoil Seminar” held by National Chengchi University, Dept. of Economics to
assist domestic academic research toward financial crisis.
First Bank ● donated “Ministry of Education” in support of 49 schools, 89 cases of children for education and life-improving. ● sponsored “2009 Wan-li Marathon”, “2009 Hengchun Marathon Swimming” and “2009 Yi-Lan International Marathon” in
support of domestic sports activities and promoting tourism. ● FB Foundation hosted “Let’s be Braver” charity concert in support of community hospitals and invited disabled people
for participation.
Other subsidiaries: ● Sponsored Movie-“ The Reader” co-hosting with “Happy Gifts of Social Service Association” in support of children with
reading-obstruction. ● Awarded in 2008 & 2009 by FSC, Executive Yuan for promoting “Better Protection Life Insurance Project” in attracting
society’s attention to insurance protection.
44
Report of Independent Accountants
To: First Financial Holding Co., Ltd.
We have audited the accompanying consolidated balance sheets of First Financial Holding Co., Ltd. (the “Company”) and its subsidiaries (collectively the “First Group”) as of December 31, 2009 and 2008, and the related consolidated statements of income, of changes in stockholders’ equity and of cash flows for the years then ended. These consolidated financial statements are the responsibility of the First Group’s management. Our responsibility is to express an opinion on these consolidated financial statements based on our audits.
We conducted our audits in accordance with the “Regulations Governing Auditing and Certification of Financial Statements by Certified Public Accountants”, ”Regulations Governing Auditing and Certification of Financial Statements of Financial Institutions by Certified Public Accountants” and generally accepted auditing standards in the Republic of China. Those standards require that we plan and perform the audits to obtain reasonable assurance about whether the financial statements are free from material misstatement. An audit includes examining, on a test basis, evidence supporting the amounts and disclosures in the financial statements. An audit also includes assessing the accounting principles used and significant estimates made by management, as well as evaluating the overall financial statement presentation. We believe that our audits provide a reasonable basis for our opinion.
In our opinion, the consolidated financial statements referred to above present fairly, in all material respects, the financial position of First Financial Holding Co., Ltd. and its subsidiaries as of December 31, 2009 and 2008, and the results of their operations and their cash flows for the years then ended in conformity with the “Regulations Governing the Preparation of Financial Reports by Financial Holding Companies”, “Regulations Governing the Preparation of Financial Reports by Securities Issuers”, “Regulations Governing the Preparation of Financial Reports by Public Banks”, “Regulations Governing the Preparation of Financial Reports by Securities Firms”, “Regulations Governing the Preparation of Financial Reports by Life Insurance Companies”, “Regulations Governing the Preparation of Financial Reports by Futures Commission Merchants”, “Business Accounting Act”, “Regulation on Business Entity Accounting Handling”, and generally accepted accounting principles in the Republic of China.
Financial Information
March 22, 2010
The accompanying consolidated financial statements are not intended to present the financial position and results of operations and of cash flows in accordance with accounting principles generally accepted in countries and jurisdictions other than the Republic of China. The standards, procedures and practices in the Republic of China governing the audit of such financial statements may differ from those generally accepted in countries and jurisdictions other than the Republic of China. Accordingly, the accompanying consolidated financial statements and report of independent accountants are not intended for use by those who are not informed about the accounting principles or auditing standards generally accepted in the Republic of China, and their applications in practice.
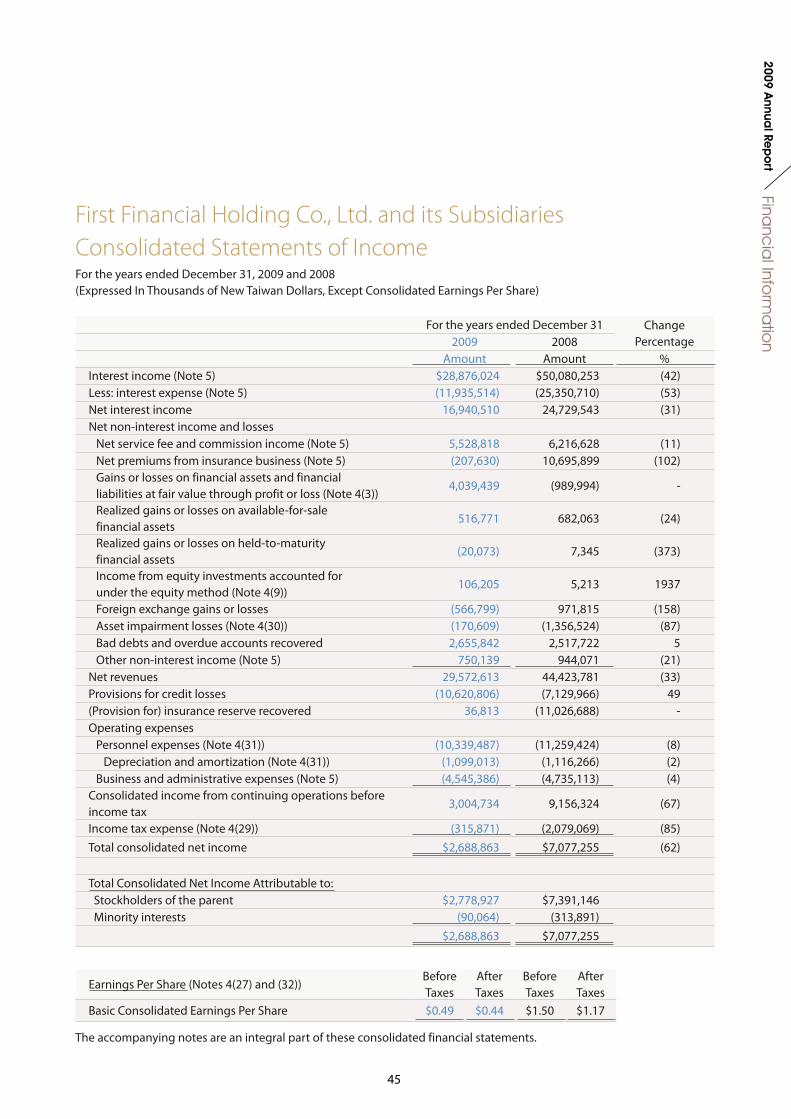
45
Financ
ial Info
rma
tion
2009 Annua
l Rep
ort
First Financial Holding Co., Ltd. and its SubsidiariesConsolidated Statements of IncomeFor the years ended December 31, 2009 and 2008(Expressed In Thousands of New Taiwan Dollars, Except Consolidated Earnings Per Share)
Earnings Per Share (Notes 4(27) and (32))Before Taxes
After Taxes
Before Taxes
After Taxes
Basic Consolidated Earnings Per Share $0.49 $0.44 $1.50 $1.17
For the years ended December 31 ChangePercentage2009 2008
Amount Amount % Interest income (Note 5) $28,876,024 $50,080,253 (42)Less: interest expense (Note 5) (11,935,514) (25,350,710) (53)Net interest income 16,940,510 24,729,543 (31)Net non-interest income and losses
Net service fee and commission income (Note 5) 5,528,818 6,216,628 (11)Net premiums from insurance business (Note 5) (207,630) 10,695,899 (102)Gains or losses on financial assets and financial liabilities at fair value through profit or loss (Note 4(3))
4,039,439 (989,994) -
Realized gains or losses on available-for-sale financial assets
516,771 682,063 (24)
Realized gains or losses on held-to-maturity financial assets
(20,073) 7,345 (373)
Income from equity investments accounted for under the equity method (Note 4(9))
106,205 5,213 1937
Foreign exchange gains or losses (566,799) 971,815 (158)Asset impairment losses (Note 4(30)) (170,609) (1,356,524) (87)Bad debts and overdue accounts recovered 2,655,842 2,517,722 5Other non-interest income (Note 5) 750,139 944,071 (21)
Net revenues 29,572,613 44,423,781 (33)Provisions for credit losses (10,620,806) (7,129,966) 49(Provision for) insurance reserve recovered 36,813 (11,026,688) -Operating expenses
Personnel expenses (Note 4(31)) (10,339,487) (11,259,424) (8)Depreciation and amortization (Note 4(31)) (1,099,013) (1,116,266) (2)
Business and administrative expenses (Note 5) (4,545,386) (4,735,113) (4)Consolidated income from continuing operations before income tax
3,004,734 9,156,324 (67)
Income tax expense (Note 4(29)) (315,871) (2,079,069) (85)Total consolidated net income $2,688,863 $7,077,255 (62)
Total Consolidated Net Income Attributable to: Stockholders of the parent $2,778,927 $7,391,146 Minority interests (90,064) (313,891)
$2,688,863 $7,077,255
The accompanying notes are an integral part of these consolidated financial statements.
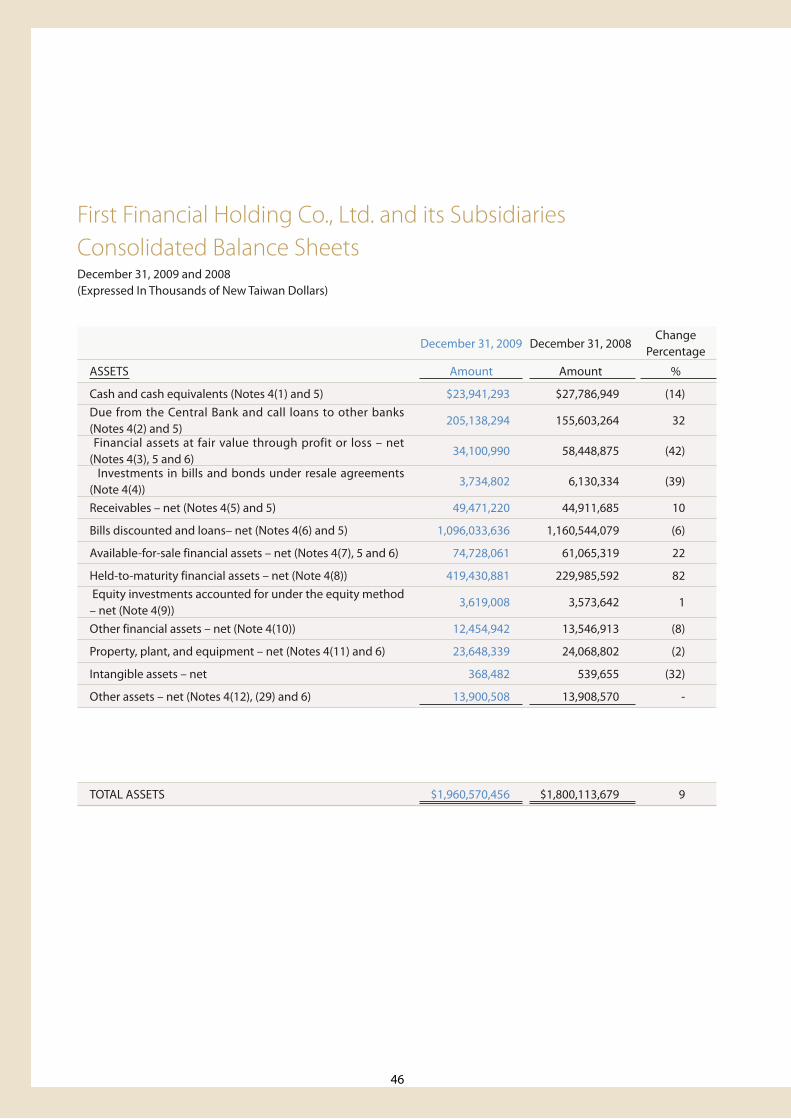
46
First Financial Holding Co., Ltd. and its SubsidiariesConsolidated Balance SheetsDecember 31, 2009 and 2008(Expressed In Thousands of New Taiwan Dollars)
December 31, 2009 December 31, 2008Change
Percentage
ASSETS Amount Amount %
Cash and cash equivalents (Notes 4(1) and 5) $23,941,293 $27,786,949 (14)Due from the Central Bank and call loans to other banks (Notes 4(2) and 5)
205,138,294 155,603,264 32
Financial assets at fair value through profit or loss – net (Notes 4(3), 5 and 6)
34,100,990 58,448,875 (42)
Investments in bills and bonds under resale agreements (Note 4(4))
3,734,802 6,130,334 (39)
Receivables – net (Notes 4(5) and 5) 49,471,220 44,911,685 10
Bills discounted and loans– net (Notes 4(6) and 5) 1,096,033,636 1,160,544,079 (6)
Available-for-sale financial assets – net (Notes 4(7), 5 and 6) 74,728,061 61,065,319 22
Held-to-maturity financial assets – net (Note 4(8)) 419,430,881 229,985,592 82 Equity investments accounted for under the equity method – net (Note 4(9))
3,619,008 3,573,642 1
Other financial assets – net (Note 4(10)) 12,454,942 13,546,913 (8)
Property, plant, and equipment – net (Notes 4(11) and 6) 23,648,339 24,068,802 (2)
Intangible assets – net 368,482 539,655 (32)
Other assets – net (Notes 4(12), (29) and 6) 13,900,508 13,908,570 -
TOTAL ASSETS $1,960,570,456 $1,800,113,679 9
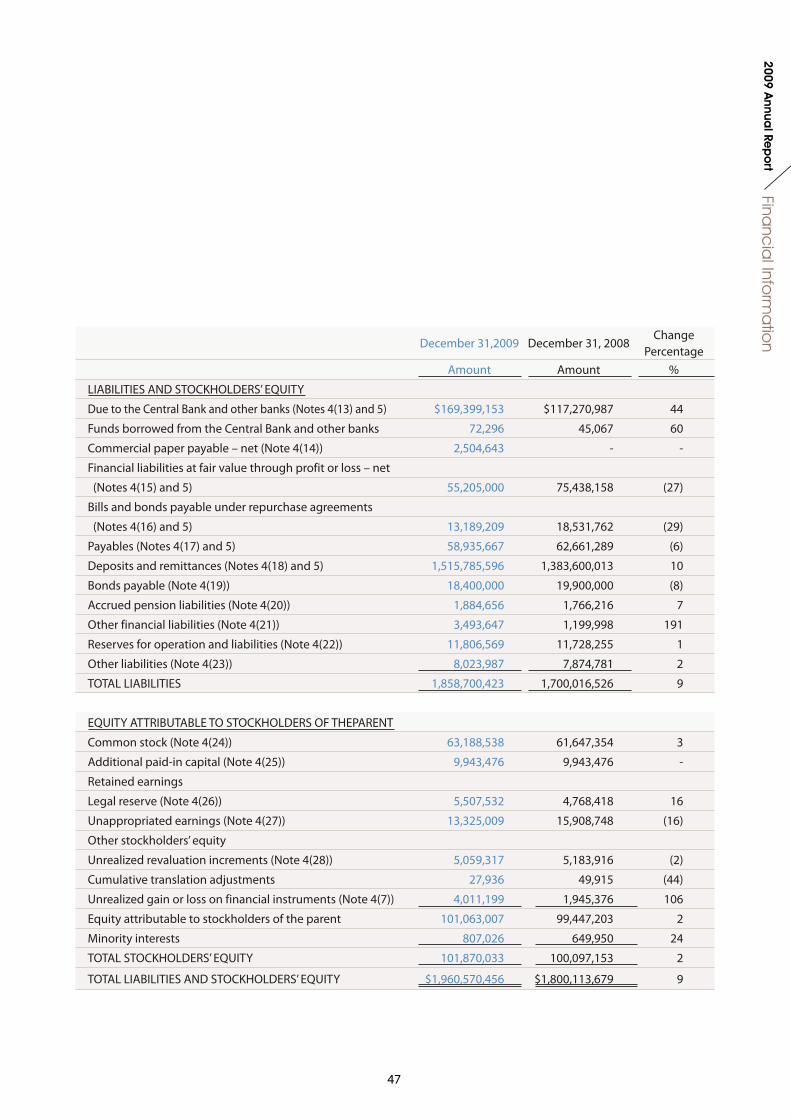
47
Financ
ial Info
rma
tion
2009 Annua
l Rep
ort
December 31,2009 December 31, 2008Change
PercentageAmount Amount %
LIABILITIES AND STOCKHOLDERS’ EQUITY
Due to the Central Bank and other banks (Notes 4(13) and 5) $169,399,153 $117,270,987 44
Funds borrowed from the Central Bank and other banks 72,296 45,067 60
Commercial paper payable – net (Note 4(14)) 2,504,643 - -
Financial liabilities at fair value through profit or loss – net
(Notes 4(15) and 5) 55,205,000 75,438,158 (27)
Bills and bonds payable under repurchase agreements
(Notes 4(16) and 5) 13,189,209 18,531,762 (29)
Payables (Notes 4(17) and 5) 58,935,667 62,661,289 (6)
Deposits and remittances (Notes 4(18) and 5) 1,515,785,596 1,383,600,013 10
Bonds payable (Note 4(19)) 18,400,000 19,900,000 (8)
Accrued pension liabilities (Note 4(20)) 1,884,656 1,766,216 7
Other financial liabilities (Note 4(21)) 3,493,647 1,199,998 191
Reserves for operation and liabilities (Note 4(22)) 11,806,569 11,728,255 1
Other liabilities (Note 4(23)) 8,023,987 7,874,781 2
TOTAL LIABILITIES 1,858,700,423 1,700,016,526 9
EQUITY ATTRIBUTABLE TO STOCKHOLDERS OF THEPARENT
Common stock (Note 4(24)) 63,188,538 61,647,354 3
Additional paid-in capital (Note 4(25)) 9,943,476 9,943,476 -
Retained earnings
Legal reserve (Note 4(26)) 5,507,532 4,768,418 16
Unappropriated earnings (Note 4(27)) 13,325,009 15,908,748 (16)
Other stockholders’ equity
Unrealized revaluation increments (Note 4(28)) 5,059,317 5,183,916 (2)
Cumulative translation adjustments 27,936 49,915 (44)
Unrealized gain or loss on financial instruments (Note 4(7)) 4,011,199 1,945,376 106
Equity attributable to stockholders of the parent 101,063,007 99,447,203 2
Minority interests 807,026 649,950 24
TOTAL STOCKHOLDERS’ EQUITY 101,870,033 100,097,153 2
TOTAL LIABILITIES AND STOCKHOLDERS’ EQUITY $1,960,570,456 $1,800,113,679 9
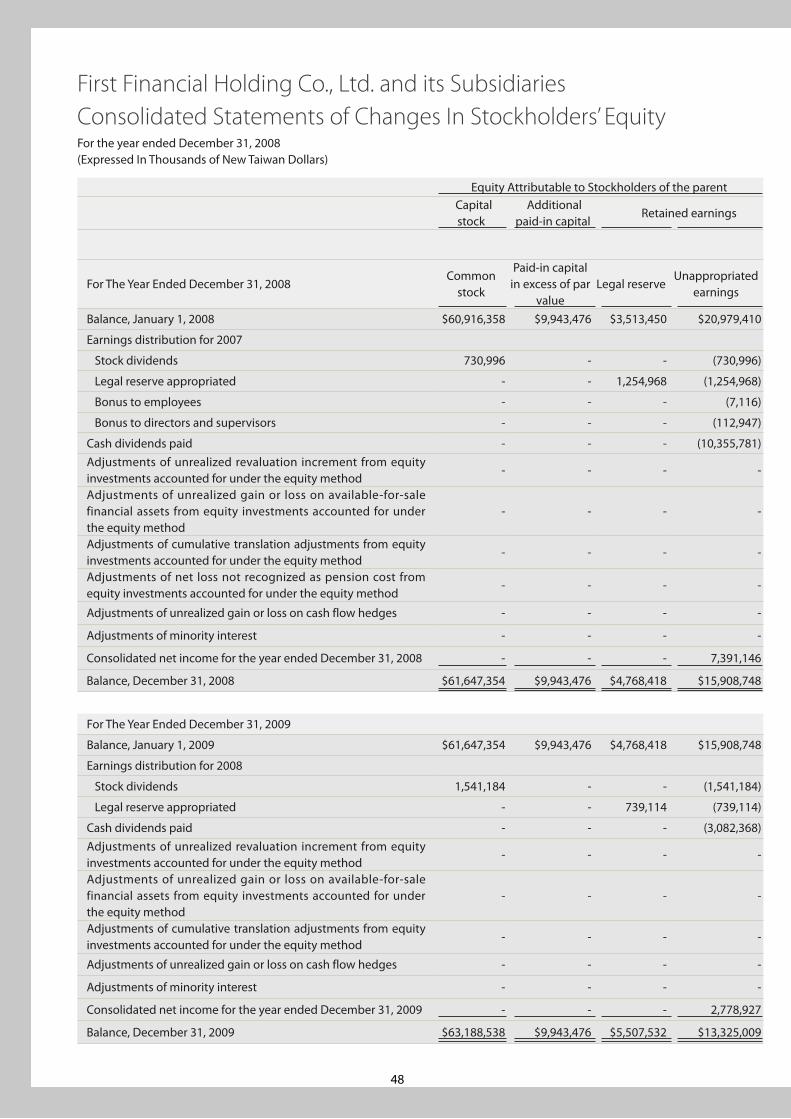
48
First Financial Holding Co., Ltd. and its SubsidiariesConsolidated Statements of Changes In Stockholders’ EquityFor the year ended December 31, 2008(Expressed In Thousands of New Taiwan Dollars)
Equity Attributable to Stockholders of the parent Capital
stock Additional
paid-in capital Retained earnings
For The Year Ended December 31, 2008Common
stock
Paid-in capital in excess of par
valueLegal reserve
Unappropriated earnings
Balance, January 1, 2008 $60,916,358 $9,943,476 $3,513,450 $20,979,410
Earnings distribution for 2007
Stock dividends 730,996 - - (730,996)
Legal reserve appropriated - - 1,254,968 (1,254,968)
Bonus to employees - - - (7,116)
Bonus to directors and supervisors - - - (112,947)
Cash dividends paid - - - (10,355,781)Adjustments of unrealized revaluation increment from equity investments accounted for under the equity method
- - - -
Adjustments of unrealized gain or loss on available-for-sale financial assets from equity investments accounted for under the equity method
- - - -
Adjustments of cumulative translation adjustments from equity investments accounted for under the equity method
- - - -
Adjustments of net loss not recognized as pension cost from equity investments accounted for under the equity method
- - - -
Adjustments of unrealized gain or loss on cash flow hedges - - - -
Adjustments of minority interest - - - -
Consolidated net income for the year ended December 31, 2008 - - - 7,391,146
Balance, December 31, 2008 $61,647,354 $9,943,476 $4,768,418 $15,908,748
For The Year Ended December 31, 2009
Balance, January 1, 2009 $61,647,354 $9,943,476 $4,768,418 $15,908,748
Earnings distribution for 2008
Stock dividends 1,541,184 - - (1,541,184)
Legal reserve appropriated - - 739,114 (739,114)
Cash dividends paid - - - (3,082,368)Adjustments of unrealized revaluation increment from equity investments accounted for under the equity method
- - - -
Adjustments of unrealized gain or loss on available-for-sale financial assets from equity investments accounted for under the equity method
- - - -
Adjustments of cumulative translation adjustments from equity investments accounted for under the equity method
- - - -
Adjustments of unrealized gain or loss on cash flow hedges - - - -
Adjustments of minority interest - - - -
Consolidated net income for the year ended December 31, 2009 - - - 2,778,927
Balance, December 31, 2009 $63,188,538 $9,943,476 $5,507,532 $13,325,009
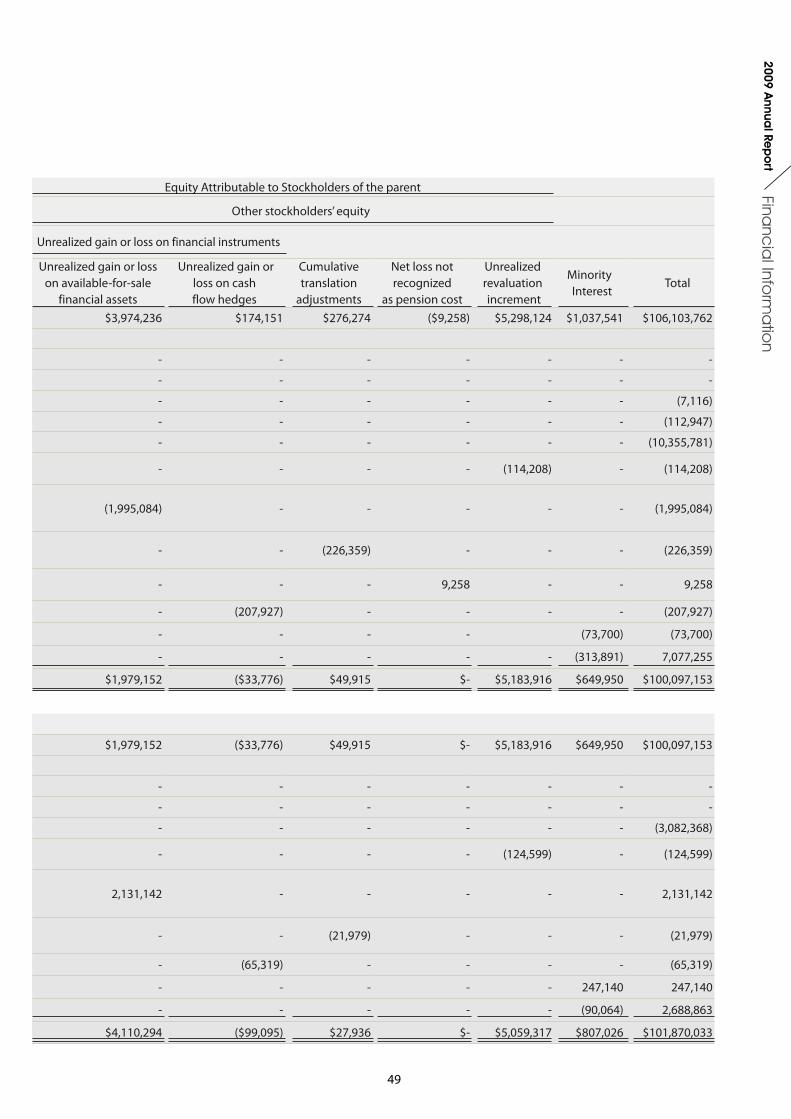
49
Financ
ial Info
rma
tion
2009 Annua
l Rep
ort
Equity Attributable to Stockholders of the parent
Other stockholders’ equity
Unrealized gain or loss on financial instruments
Unrealized gain or loss on available-for-sale
financial assets
Unrealized gain or loss on cash flow hedges
Cumulativetranslation
adjustments
Net loss not recognized
as pension cost
Unrealized revaluation increment
Minority Interest
Total
$3,974,236 $174,151 $276,274 ($9,258) $5,298,124 $1,037,541 $106,103,762
- - - - - - -
- - - - - - -
- - - - - - (7,116)
- - - - - - (112,947)
- - - - - - (10,355,781)
- - - - (114,208) - (114,208)
(1,995,084) - - - - - (1,995,084)
- - (226,359) - - - (226,359)
- - - 9,258 - - 9,258
- (207,927) - - - - (207,927)
- - - - (73,700) (73,700)
- - - - - (313,891) 7,077,255
$1,979,152 ($33,776) $49,915 $- $5,183,916 $649,950 $100,097,153
$1,979,152 ($33,776) $49,915 $- $5,183,916 $649,950 $100,097,153
- - - - - - -
- - - - - - -
- - - - - - (3,082,368)
- - - - (124,599) - (124,599)
2,131,142 - - - - - 2,131,142
- - (21,979) - - - (21,979)
- (65,319) - - - - (65,319)
- - - - - 247,140 247,140
- - - - - (90,064) 2,688,863
$4,110,294 ($99,095) $27,936 $- $5,059,317 $807,026 $101,870,033
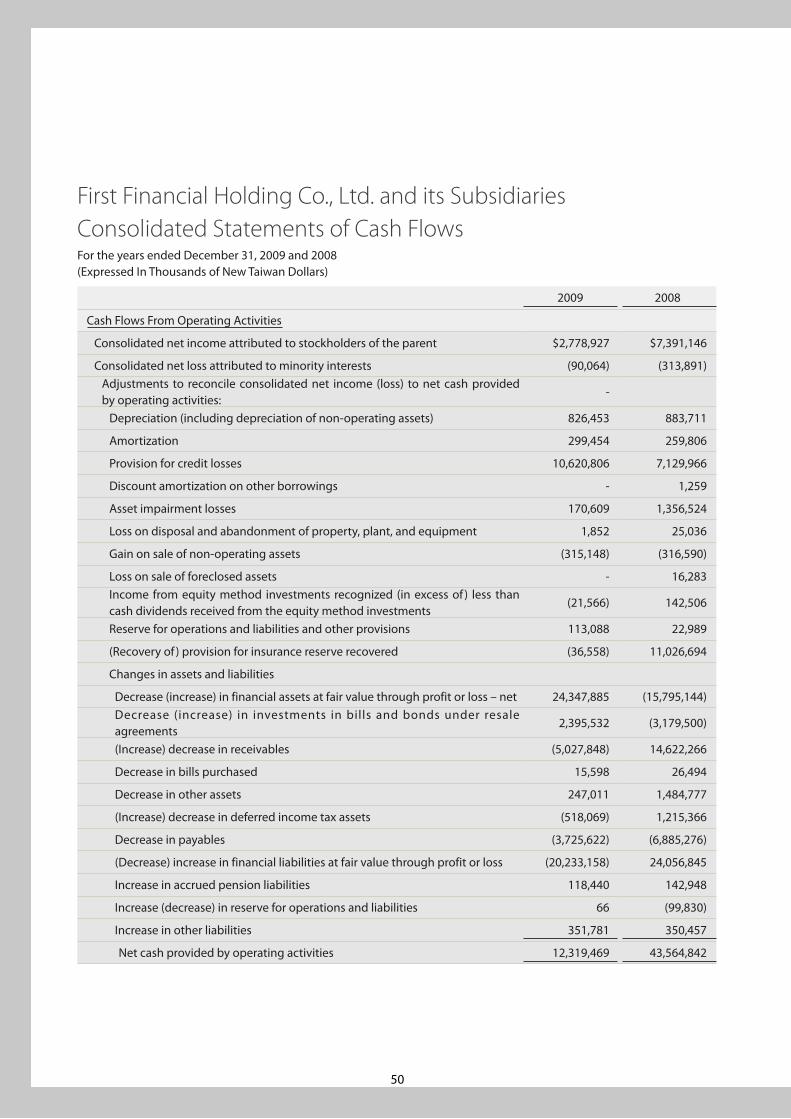
50
2009 2008
Cash Flows From Operating Activities
Consolidated net income attributed to stockholders of the parent $2,778,927 $7,391,146
Consolidated net loss attributed to minority interests (90,064) (313,891) Adjustments to reconcile consolidated net income (loss) to net cash provided by operating activities:
-
Depreciation (including depreciation of non-operating assets) 826,453 883,711
Amortization 299,454 259,806
Provision for credit losses 10,620,806 7,129,966
Discount amortization on other borrowings - 1,259
Asset impairment losses 170,609 1,356,524
Loss on disposal and abandonment of property, plant, and equipment 1,852 25,036
Gain on sale of non-operating assets (315,148) (316,590)
Loss on sale of foreclosed assets - 16,283 Income from equity method investments recognized (in excess of ) less than cash dividends received from the equity method investments
(21,566) 142,506
Reserve for operations and liabilities and other provisions 113,088 22,989
(Recovery of ) provision for insurance reserve recovered (36,558) 11,026,694
Changes in assets and liabilities
Decrease (increase) in financial assets at fair value through profit or loss – net 24,347,885 (15,795,144) Decrease (increase) in investments in bills and bonds under resale agreements
2,395,532 (3,179,500)
(Increase) decrease in receivables (5,027,848) 14,622,266
Decrease in bills purchased 15,598 26,494
Decrease in other assets 247,011 1,484,777
(Increase) decrease in deferred income tax assets (518,069) 1,215,366
Decrease in payables (3,725,622) (6,885,276)
(Decrease) increase in financial liabilities at fair value through profit or loss (20,233,158) 24,056,845
Increase in accrued pension liabilities 118,440 142,948
Increase (decrease) in reserve for operations and liabilities 66 (99,830)
Increase in other liabilities 351,781 350,457
Net cash provided by operating activities 12,319,469 43,564,842
First Financial Holding Co., Ltd. and its SubsidiariesConsolidated Statements of Cash FlowsFor the years ended December 31, 2009 and 2008(Expressed In Thousands of New Taiwan Dollars)
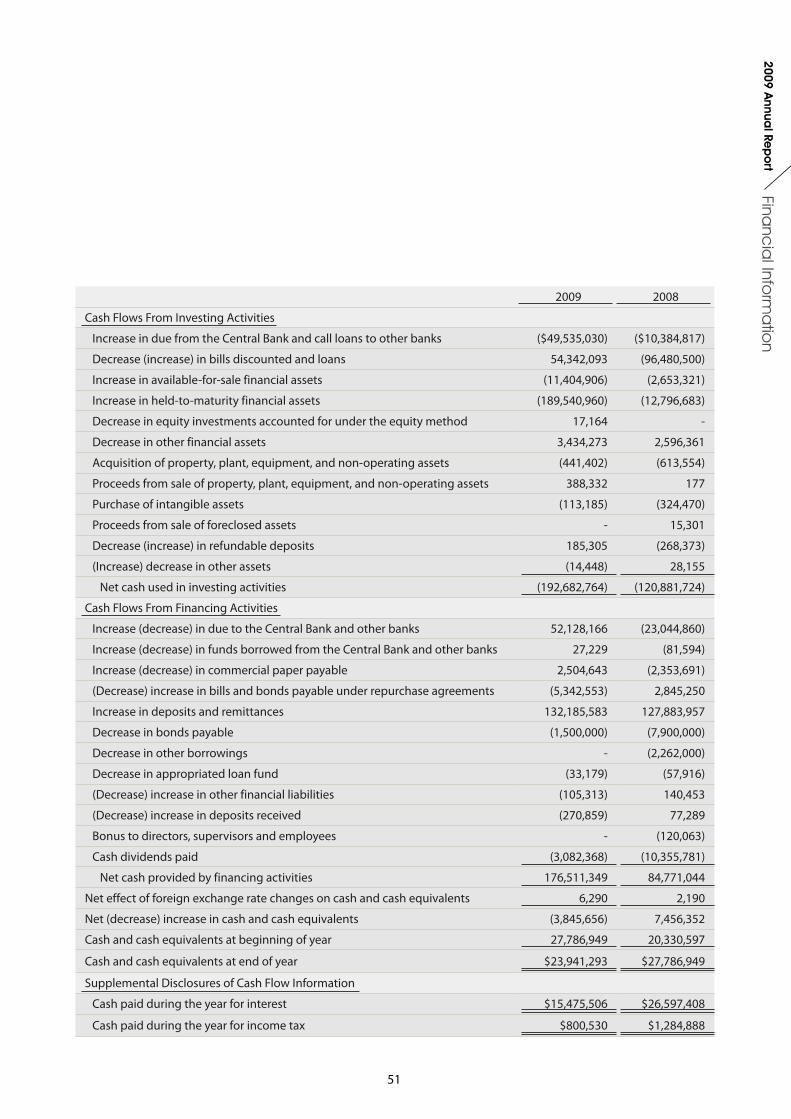
51
Financ
ial Info
rma
tion
2009 Annua
l Rep
ort
2009 2008
Cash Flows From Investing Activities
Increase in due from the Central Bank and call loans to other banks ($49,535,030) ($10,384,817)
Decrease (increase) in bills discounted and loans 54,342,093 (96,480,500)
Increase in available-for-sale financial assets (11,404,906) (2,653,321)
Increase in held-to-maturity financial assets (189,540,960) (12,796,683)
Decrease in equity investments accounted for under the equity method 17,164 -
Decrease in other financial assets 3,434,273 2,596,361
Acquisition of property, plant, equipment, and non-operating assets (441,402) (613,554)
Proceeds from sale of property, plant, equipment, and non-operating assets 388,332 177
Purchase of intangible assets (113,185) (324,470)
Proceeds from sale of foreclosed assets - 15,301
Decrease (increase) in refundable deposits 185,305 (268,373)
(Increase) decrease in other assets (14,448) 28,155
Net cash used in investing activities (192,682,764) (120,881,724)
Cash Flows From Financing Activities
Increase (decrease) in due to the Central Bank and other banks 52,128,166 (23,044,860)
Increase (decrease) in funds borrowed from the Central Bank and other banks 27,229 (81,594)
Increase (decrease) in commercial paper payable 2,504,643 (2,353,691)
(Decrease) increase in bills and bonds payable under repurchase agreements (5,342,553) 2,845,250
Increase in deposits and remittances 132,185,583 127,883,957
Decrease in bonds payable (1,500,000) (7,900,000)
Decrease in other borrowings - (2,262,000)
Decrease in appropriated loan fund (33,179) (57,916)
(Decrease) increase in other financial liabilities (105,313) 140,453
(Decrease) increase in deposits received (270,859) 77,289
Bonus to directors, supervisors and employees - (120,063)
Cash dividends paid (3,082,368) (10,355,781)
Net cash provided by financing activities 176,511,349 84,771,044
Net effect of foreign exchange rate changes on cash and cash equivalents 6,290 2,190
Net (decrease) increase in cash and cash equivalents (3,845,656) 7,456,352
Cash and cash equivalents at beginning of year 27,786,949 20,330,597
Cash and cash equivalents at end of year $23,941,293 $27,786,949
Supplemental Disclosures of Cash Flow Information
Cash paid during the year for interest $15,475,506 $26,597,408
Cash paid during the year for income tax $800,530 $1,284,888

52
First Financial Holding Co., Ltd. and its SubsidiariesNotes to the Consolidated Financial StatementsFor the years ended December 31, 2009 and 2008(Expressed in Thousands of New Taiwan Dollars, Unless Otherwise Indicated)
1.Organization and business1) First Financial Holding Co., Ltd. (the “Company” or “FFHC”) commenced the preparation for its incorporation on
November 27, 2001. On January 2, 2003, the Company was established through a share swap with First Commercial Bank Co., Ltd. (“FCB”) in accordance with the Financial Holding Company Act and other related regulations, whereby FCB has become its wholly-owned subsidiary, and with the approval from the Securities and Futures Commission (“SFC”), renamed as the Securities and Futures Bureau, Financial Supervisory Commission, Executive Yuan, R.O.C. (“SFB”) from July 1, 2004, the Company was listed on the Taiwan Stock Exchange (“TSE”) on the same date. On July 31, 2003, the Company acquired First Securities Inc. (“FS”), Mingtai Fire & Marine Insurance Co., Ltd. (“MFMI”) and First Securities Investment Trust Co., Ltd. (FSIT), as wholly owned subsidiaries. On May 31, June 2, June 10, September 16, 2004 and November 19, 2007, the Company established subsidiaries named First Financial Asset Management Co., Ltd., (“FFAM”), First Venture Capital Co., Ltd., (“FVC”), First Financial Management Consulting Co., Ltd. (“FFMC”), First P&C Insurance Agency Co., Ltd. (“FPCIA”) and First-Aviva Life Insurance Co., Ltd. (“FALI”), respectively. The Company engages mainly in the investment and management of financial institutions as approved by the authorities. As of December 31, 2009 and 2008, the Company and its subsidiaries had 8,485 and 8,355 employees, respectively.
2) On September 2, 2005, the Company completed the sale of all its common stocks of Mingtai Fire & Marine Insurance Co., Ltd. to Mitsui Sumitomo Insurance Co., Ltd.
3) The following directly and indirectly owned subsidiaries have been included in the consolidated financial statements.
Investor name
Subsidiary name Major business activities
Percentage of holding shares (%)
2009/12/31 2008/12/31
FFHC FCB Note (1) 100 100
FFHC FS Note (2) 100 100
FFHC FSIT Note (3) 100 100
FFHC FALI Note (4) 51 51
FS First Capital Management Inc. (“FCMI”) Securities investment consulting service 100 100
FSFirst Taisec Securities (Asia) Limited
(“FTSL”)Securities investment holding 100 100
FTSLFirst Worldsec Securities Limited
(‘FWSL”)Marketable securities brokerage and
investment consulting service100 100
Note (1): FCB was established in 1899 and had been a listed company since February 9, 1962. It was privatized on January 22, 1998. On January 2, 2003, FCB became the subsidiary of First Financial Holding Co., Ltd. through a share swap and was de-listed from the TSE to become a public company in accordance with the related regulations set forth by the SFB. As of December 31, 2009, FCB comprises various Divisions, including Operation Division, Trust Division, International Business Division, Offshore Banking Unit, domestic and overseas branches, and representative offices. FCB engages mainly in the following business activities:
1) Business activities provided by the Banking Law; 2) Trust business as authorized by the authorities; 3) Establishing overseas branches to engage in those business activities as approved by the respective local
governments; 4) Other business activities approved by the authorities.
Note (2): FS was established in August 1988 and became a subsidiary of FFHC on July 31, 2003. FS is authorized to engage in the following business activities:
1) Brokerage and proprietary trading of marketable securities at the securities exchange markets; 2) Underwriting of marketable securities; 3) Registration and transfer agency service for securities;
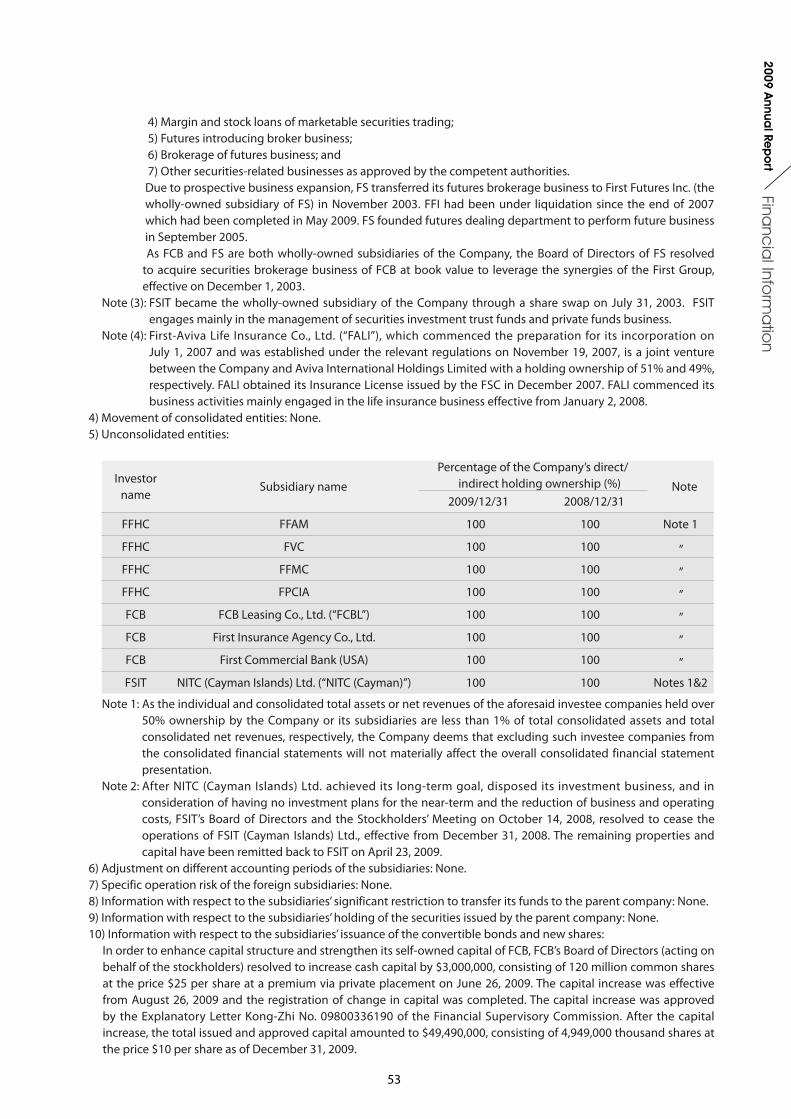
53
Financ
ial Info
rma
tion
2009 Annua
l Rep
ort
4) Margin and stock loans of marketable securities trading; 5) Futures introducing broker business; 6) Brokerage of futures business; and 7) Other securities-related businesses as approved by the competent authorities. Due to prospective business expansion, FS transferred its futures brokerage business to First Futures Inc. (the wholly-owned subsidiary of FS) in November 2003. FFI had been under liquidation since the end of 2007 which had been completed in May 2009. FS founded futures dealing department to perform future business in September 2005. As FCB and FS are both wholly-owned subsidiaries of the Company, the Board of Directors of FS resolved to acquire securities brokerage business of FCB at book value to leverage the synergies of the First Group, effective on December 1, 2003.
Note (3): FSIT became the wholly-owned subsidiary of the Company through a share swap on July 31, 2003. FSIT engages mainly in the management of securities investment trust funds and private funds business.
Note (4) : First-Aviva Life Insurance Co., Ltd. (“FALI”), which commenced the preparation for its incorporation on July 1, 2007 and was established under the relevant regulations on November 19, 2007, is a joint venture between the Company and Aviva International Holdings Limited with a holding ownership of 51% and 49%, respectively. FALI obtained its Insurance License issued by the FSC in December 2007. FALI commenced its business activities mainly engaged in the life insurance business effective from January 2, 2008.
4) Movement of consolidated entities: None.5) Unconsolidated entities:
Investor name
Subsidiary name
Percentage of the Company’s direct/ indirect holding ownership (%) Note 2009/12/31 2008/12/31
FFHC FFAM 100 100 Note 1
FFHC FVC 100 100 ”
FFHC FFMC 100 100 ”
FFHC FPCIA 100 100 ”
FCB FCB Leasing Co., Ltd. (“FCBL”) 100 100 ”
FCB First Insurance Agency Co., Ltd. 100 100 ”
FCB First Commercial Bank (USA) 100 100 ”
FSIT NITC (Cayman Islands) Ltd. (“NITC (Cayman)”) 100 100 Notes 1&2
Note 1: As the individual and consolidated total assets or net revenues of the aforesaid investee companies held over 50% ownership by the Company or its subsidiaries are less than 1% of total consolidated assets and total consolidated net revenues, respectively, the Company deems that excluding such investee companies from the consolidated financial statements will not materially affect the overall consolidated financial statement presentation.
Note 2: After NITC (Cayman Islands) Ltd. achieved its long-term goal, disposed its investment business, and in consideration of having no investment plans for the near-term and the reduction of business and operating costs, FSIT’s Board of Directors and the Stockholders’ Meeting on October 14, 2008, resolved to cease the operations of FSIT (Cayman Islands) Ltd., effective from December 31, 2008. The remaining properties and capital have been remitted back to FSIT on April 23, 2009.
6) Adjustment on different accounting periods of the subsidiaries: None.7) Specific operation risk of the foreign subsidiaries: None.8) Information with respect to the subsidiaries’ significant restriction to transfer its funds to the parent company: None.9) Information with respect to the subsidiaries’ holding of the securities issued by the parent company: None.10) Information with respect to the subsidiaries’ issuance of the convertible bonds and new shares:
In order to enhance capital structure and strengthen its self-owned capital of FCB, FCB’s Board of Directors (acting on behalf of the stockholders) resolved to increase cash capital by $3,000,000, consisting of 120 million common shares at the price $25 per share at a premium via private placement on June 26, 2009. The capital increase was effective from August 26, 2009 and the registration of change in capital was completed. The capital increase was approved by the Explanatory Letter Kong-Zhi No. 09800336190 of the Financial Supervisory Commission. After the capital increase, the total issued and approved capital amounted to $49,490,000, consisting of 4,949,000 thousand shares at the price $10 per share as of December 31, 2009.
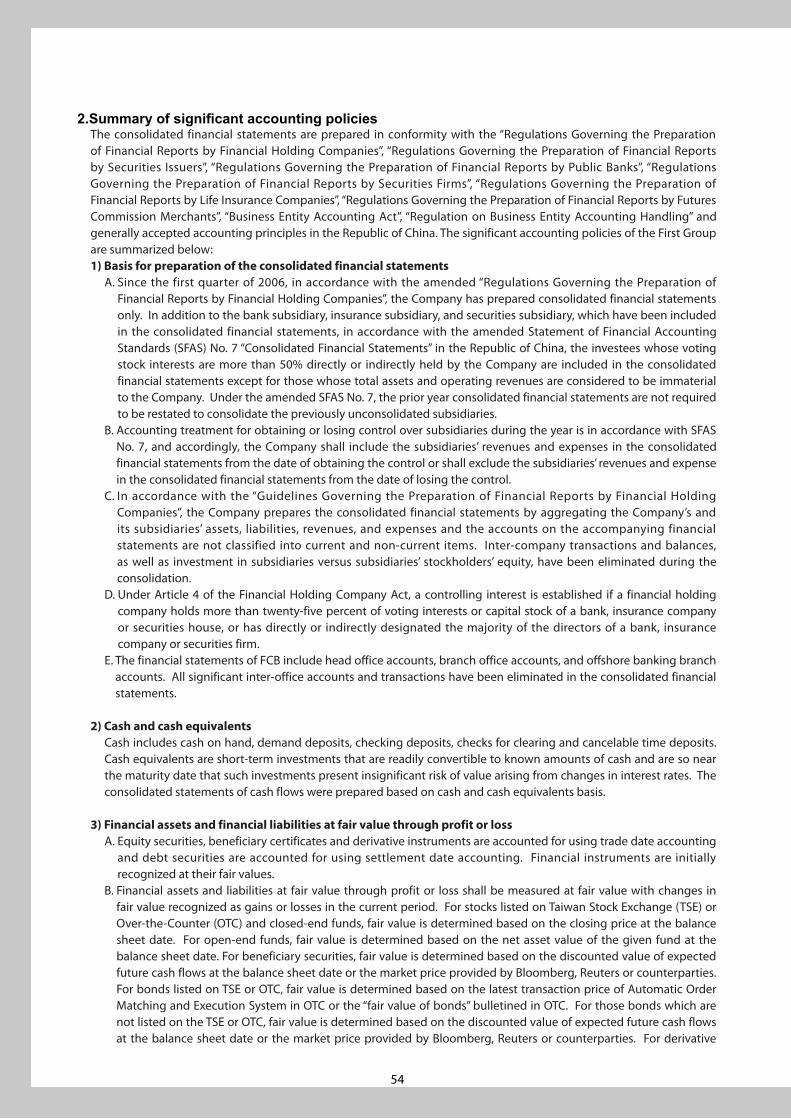
54
2.Summary of significant accounting policiesThe consolidated financial statements are prepared in conformity with the “Regulations Governing the Preparation of Financial Reports by Financial Holding Companies”, “Regulations Governing the Preparation of Financial Reports by Securities Issuers”, “Regulations Governing the Preparation of Financial Reports by Public Banks”, “Regulations Governing the Preparation of Financial Reports by Securities Firms”, “Regulations Governing the Preparation of Financial Reports by Life Insurance Companies”, “Regulations Governing the Preparation of Financial Reports by Futures Commission Merchants”, “Business Entity Accounting Act”, “Regulation on Business Entity Accounting Handling” and generally accepted accounting principles in the Republic of China. The significant accounting policies of the First Group are summarized below:1) Basis for preparation of the consolidated financial statements
A. Since the first quarter of 2006, in accordance with the amended “Regulations Governing the Preparation of Financial Reports by Financial Holding Companies”, the Company has prepared consolidated financial statements only. In addition to the bank subsidiary, insurance subsidiary, and securities subsidiary, which have been included in the consolidated financial statements, in accordance with the amended Statement of Financial Accounting Standards (SFAS) No. 7 “Consolidated Financial Statements” in the Republic of China, the investees whose voting stock interests are more than 50% directly or indirectly held by the Company are included in the consolidated financial statements except for those whose total assets and operating revenues are considered to be immaterial to the Company. Under the amended SFAS No. 7, the prior year consolidated financial statements are not required to be restated to consolidate the previously unconsolidated subsidiaries.
B. Accounting treatment for obtaining or losing control over subsidiaries during the year is in accordance with SFAS No. 7, and accordingly, the Company shall include the subsidiaries’ revenues and expenses in the consolidated financial statements from the date of obtaining the control or shall exclude the subsidiaries’ revenues and expense in the consolidated financial statements from the date of losing the control.
C. In accordance with the “Guidelines Governing the Preparation of Financial Reports by Financial Holding Companies”, the Company prepares the consolidated financial statements by aggregating the Company’s and its subsidiaries’ assets, liabilities, revenues, and expenses and the accounts on the accompanying financial statements are not classified into current and non-current items. Inter-company transactions and balances, as well as investment in subsidiaries versus subsidiaries’ stockholders’ equity, have been eliminated during the consolidation.
D. Under Article 4 of the Financial Holding Company Act, a controlling interest is established if a financial holding company holds more than twenty-five percent of voting interests or capital stock of a bank, insurance company or securities house, or has directly or indirectly designated the majority of the directors of a bank, insurance company or securities firm.
E. The financial statements of FCB include head office accounts, branch office accounts, and offshore banking branch accounts. All significant inter-office accounts and transactions have been eliminated in the consolidated financial statements.
2) Cash and cash equivalentsCash includes cash on hand, demand deposits, checking deposits, checks for clearing and cancelable time deposits. Cash equivalents are short-term investments that are readily convertible to known amounts of cash and are so near the maturity date that such investments present insignificant risk of value arising from changes in interest rates. The consolidated statements of cash flows were prepared based on cash and cash equivalents basis.
3) Financial assets and financial liabilities at fair value through profit or lossA. Equity securities, beneficiary certificates and derivative instruments are accounted for using trade date accounting
and debt securities are accounted for using settlement date accounting. Financial instruments are initially recognized at their fair values.
B. Financial assets and liabilities at fair value through profit or loss shall be measured at fair value with changes in fair value recognized as gains or losses in the current period. For stocks listed on Taiwan Stock Exchange (TSE) or Over-the-Counter (OTC) and closed-end funds, fair value is determined based on the closing price at the balance sheet date. For open-end funds, fair value is determined based on the net asset value of the given fund at the balance sheet date. For beneficiary securities, fair value is determined based on the discounted value of expected future cash flows at the balance sheet date or the market price provided by Bloomberg, Reuters or counterparties. For bonds listed on TSE or OTC, fair value is determined based on the latest transaction price of Automatic Order Matching and Execution System in OTC or the “fair value of bonds” bulletined in OTC. For those bonds which are not listed on the TSE or OTC, fair value is determined based on the discounted value of expected future cash flows at the balance sheet date or the market price provided by Bloomberg, Reuters or counterparties. For derivative
55
Financ
ial Info
rma
tion
2009 Annua
l Rep
ort
financial instruments held for trading purpose, fair value is determined based on a quoted market price in an active market at the balance sheet date. If a quoted market price in an active market is not available, fair value is determined by applying other valuation techniques, such as discounted cash flow analysis or option pricing models.
C. Criteria to designate financial assets and financial liabilities as at fair value through profit or loss are as follows:A) Hybrid (combined) instruments;B) The designation can eliminate or significantly reduce a measurement or recognition inconsistency; orC) The designation is in compliance with a documented risk management or investment strategy of the First
Group to evaluate the performance of assets and liabilities based on a fair value.
4) Bills and bonds under repurchase or resale agreementsBills and bonds under repurchase or resale agreements are accounted for under the financing method. Bills and bonds sold under repurchase agreements are recorded as “Bills and bonds payable under repurchase agreements” at the sale date. Bills and bonds invested under resale agreements are recorded as “Investments in bills and bonds under resale agreements” at the purchase date. The difference between the cost and the repurchase price is recorded as interest expense over the period between the sale date and the purchase date. The difference between the cost and the resale price is recorded as interest income over the period between the purchase date and the sell date.
5) Margin loans, stock loans and refinancingA. FS conducts margin loan business to provide funds to its customers to purchase securities. The margin loans
given to customers are recorded as “margin loans receivable” and are collateralized by the securities that the customers purchase. The collateral securities are recorded through memorandum accounts and are returned to customers when the loans are repaid.
B. FS conducts stock loan business to lend securities to its customers to sell short. The deposits received from customers are recorded as “deposits received on securities lending”. Proceeds from sales of securities lent to customers less any securities exchange taxes, dealer’s commissions, and financing charges are used as the collateral for securities lent and are recorded under “collateralized proceeds payable from securities lending”. The securities lent to customers to sell short are recorded through memorandum accounts. When the customers return the securities, FS gives the deposits received and the proceeds from securities sold back to customers.
C. The “refinancing of margin loans” refers to refinancing to borrow funds from securities finance companies when there are insufficient funds to conduct margin loan business. The refinancing of margin loans is recorded as “refinancing borrowing” and is collateralized by the securities purchased by customers on margin loans.
D. The “refinancing of stock loans” refers to refinancing to borrow securities from securities finance companies when there are insufficient securities to conduct securities lending business. The deposits or collateral given to securities finance companies by FS are recorded as “refinancing margin deposits”. The proceeds from securities lent to customer to sell short are given to the securities finance companies as the collateral and are recorded as “collateralized proceeds payable from securities lending” and “refinancing deposits receivable”, respectively.
6) Bills discounted and loansA. Bills discounted and loans (including non-accrual loans) are recorded at the amounts of principal outstanding.
Interest income is recognized on an accrual basis except for interest on non-accrual loans. B. For all bills discounted and loans under which there is no principal payment after the lapse of six months, lawsuits
are filed against the borrowers and guarantors or the collaterals are executed. Such non-performing loans are transferred to the non-accrual loans account. Interest shall cease to be accrued for non-performing loans that are transferred to the non-accrual loans account. Such interest receivable will be recognized after cash is received.
C. When there is postponement or modification of the credit terms for the debtors, and the Bank agrees to receive partial interest, the remaining interest will cease to be accrued and will be recognized after cash is received.
D. Loans from FALI include insurance premium loans and automatic premium loans (APL). Insurance premium loans are loans pledged by insurance policy; automatic premium loans, pursuant to insurance contracts, are advance premiums when premiums are not paid on time and there is sufficient cash value in the policy, the APL feature will automatically use the cash value of the policy to pay for the outstanding premiums.
7) Available-for-sale financial assetsA. Equity securities are accounted for using trade date accounting; Debt securities are accounted for using
settlement date accounting. Such financial instruments are initially recognized at fair value plus the acquisition or issuance cost.
56
B. Available-for-sale financial assets are measured at fair value with changes in fair value recognized as an adjustment account in the stockholders’ equity. When the financial asset is derecognized, the cumulative unrealized gain or loss that was previously recognized in equity is recognized in profit or loss in the statement of income. For stocks listed on the TSE or OTC and closed-end funds, fair value is determined based on the closing price at the balance sheet date. For open-end funds, fair value is determined based on the net asset value of the given fund at the balance sheet date. For beneficiary securities, fair value is determined based on the discounted value of expected future cash flows at the balance sheet date or the market price provided by Bloomberg or Reuters. For bonds listed on TSE or OTC, fair value is determined based on the fair value of bonds bulletined in OTC. For those bonds not listed on the TSE and OTC, fair value is determined based on discounted value of expected future cash flows at the balance sheet date or the market price provided by Bloomberg or Reuters.
C. An impairment loss is recognized when there is an objective evidence of impairment. In the subsequent period, if the amount of the impairment loss decreases due to an event occurring after the impairment was originally recognized, for equity instruments, the decrease shall be recognized as an adjustment account in the stockholders’ equity; and for debt instruments, the previously recognized impairment loss is reversed through profit or loss.
8) Held-to-maturity financial assetsA. Held-to-maturity financial assets are accounted for using settlement date accounting and are initially recognized
at fair value plus the acquisition or issuance cost. Gains or losses are recognized in the statement of income when the investments are derecognized.
B. Held-to-maturity financial assets are measured at amortized cost using the interest method at the balance sheet date.
C. An impairment loss is recognized when there is an objective evidence of impairment. In the subsequent period, if the amount of the impairment loss decreases due to an event occurring after the impairment was originally recognized, the previously recognized impairment loss is reversed through profit and loss to the extent that the carrying amounts do not exceed the amortized cost that would have been determined had no impairment loss been recognized in prior years.
9)Equity investments accounted for under the equity methodA. The Company was formed by FCB pursuant to the Explanatory Note (90) No. 182 of the Accounting Research and
Development Foundation of the R.O.C. dated October 29, 2001. Capital expenditure incurred by the Company to acquire equity interest in a financial institution through share swap is stated at the book value of the respective financial institution’s assets less the book value of liabilities. The par value of the new shares issued is recorded as common stock, and the amount in excess of the par value is recorded as capital surplus. Subsequently, the Explanatory Note (96) No. 0000000344 dated December 12, 2007 replaced the aforesaid Explanatory Note (90) No. 182 with respect to the recognition of capital expenditure incurred by the Company to acquire equity interest in a financial institution. In accordance with Explanatory Note (90) No. 182, capital surplus recognized due to share swap whose asset and liability accounts included in FCB’s stockholders’ equity were reclassified to adjustment account in the stockholders’ equity, effective from the released date of the Explanatory Note (96) No. 0000000344.
B. Long-term equity investments in which the First Group owns at least 20% of the investees’ voting stock interests or can exercise significant influence over the investees are accounted for under the equity method. The carrying amount of such equity investments are evaluated pursuant to the investment costs plus or minus the net income or loss and changes in stockholders’ equity of the investee recognized in proportion to the percentage of the investee’s ownership held by the First Group. The cash dividends received from investees are recorded as deduction from the investment cost. For the stock dividends received from investees, the investment amount is not increased and the investment income is not recognized. A memorandum entry is made to record the additional shares received. When there is sufficient evidence to indicate that the fair value of the investment is impaired and the probability of the recovery is remote, the loss on investments is recognized in the current period. If such equity investments are disposed of, the cost is calculated under the weighted average method.
C. Effective from January 1, 2006, for an investee company accounted for under the equity method, if the First Group does not have control interests but can exercise significant influence over the investee, investment losses are recognized to the extent that the balance of the investment plus advances to the investee is reduced to zero, unless the First Group guarantees the debts of investee company or has a commitment or intention to provide financial support to the investee company. In such cases, the investment loss is recognized in proportion to the investee company’s ownership held by the First Group. However, if the First Group has control interests over the investee company, the investment losses in excess of the investee’s stockholders equity’s balance shall be fully recognized, unless other stockholders of the investee company have the obligation and ability to provide

57
Financ
ial Info
rma
tion
2009 Annua
l Rep
ort
additional capital to take the losses. When the investee company begins to make a profit in the subsequent periods, the earnings are attributed to the First Group until the originally recognized excess losses are fully recovered.
D. For unrealized gain or loss from the downstream transactions between the Company and an investee accounted for under the equity method, if the Company has control interests over the investee, unrealized gain or loss shall be fully eliminated; if the Company does not have control interests over the investee, unrealized gain or loss shall be eliminated in proportion of the investee’s ownership held by the Company at the year end. For the unrealized gain or loss on transactions between investees accounted for under the equity method, if the Company has control interest over both the investees, unrealized gain or loss is eliminated in proportion of the ownership held by the Company in the investee generating the unrealized gain or loss, otherwise, it shall be eliminated according to the proportion of each investee’s ownership held by the Company. Unrealized gain or loss is not recognized until it is realized.
E. The cumulative translation adjustment resulting from translation of the financial statements of foreign equity investments accounted for under the equity method is recognized proportionally in the stockholders’ equity account based on the percentage of the investees’ ownership held by the First Group.
10) Other financial assets and financial liabilitiesA. Financial assets measured at cost
A) Long-term investments in equity securities, which are not listed on the TSE or OTC, are accounted for using trade date accounting. Such financial instruments are initially recognized at fair value plus the acquisition or issuance cost and are subsequently carried at cost at the balance sheet date.
B) For financial assets measured at cost, an impairment loss shall be recognized if there is an objective evidence of impairment. The impairment loss shall not be reversed.
B. Bond investments with no active marketA) Bond investments with no active market are accounted for using settlement date accounting. Such financial
instruments are initially recognized at fair value plus acquisition or issuance cost. Gains or losses are recognized in the income statement when the investments are derecognized.
B) Bond investments with no active market shall be subsequently measured at amortized cost using the interest method.
C) An impairment loss is recognized when there is an objective evidence of impairment. In the subsequent period, if the amount of the impairment loss decreases due to an event occurring after the impairment loss was originally recognized, the previously recognized impairment loss is reversed through profit or loss to the extent that the carrying amounts shall not exceed the amortized cost that would have been determined had no impairment loss been recognized in prior years.
C. Derivative financial assets and financial liabilities held for hedgingDerivative financial assets and financial liabilities held for hedging are those derivative financial assets and financial liabilities that are designated as effective hedging instruments under hedge accounting and are measured at fair value.
11) Hedge accountingA. Fair value hedge
When all the criteria of fair value hedge accounting are met, it recognizes the offsetting effects on gains or losses of changes in the fair values of the hedging instrument and the hedged item. Any gain or loss from remeasuring the hedging instrument at fair value or the foreign currency component of its carrying amount shall be recognized immediately in the statement of income. Any gain or loss attributable to the hedged risk shall be adjusted in the carrying amount of the hedged item and be recognized immediately in the statement of income.
B. Cash flow hedgeA) When all the criteria of cash flow hedge accounting are met, the effective hedge portion of the gain or loss
on the hedging instrument shall be recognized directly in the stockholders’ equity, and the ineffective hedge portion of the gain or loss on the hedging instrument shall be recognized in the statement of income.
B) The accounting treatment for a forecast transaction is as follows:a. If a hedge of a forecast transaction subsequently results in the recognition of a financial asset or a financial
liability, the related gains or losses that were originally recognized directly in the stockholders’ equity shall be reclassified into the statement of income in the same period or periods during which the asset acquired or liability assumed affects profit or loss. However, if it is expected that all or a portion of a loss recognized directly in stockholders’ equity will not be recovered in one or more future periods, the amount that is not expected to be recovered shall be reclassified into the statement of income immediately.
58
b. If a hedge of a forecast transaction subsequently results in the recognition of a non-financial asset or a non-financial liability, or if a forecast transaction for a non-financial asset or non-financial liability becomes a firm commitment for which fair value hedge accounting is applied, then the associated gains and losses that were originally recognized in stockholders’ equity can either be reclassified into the statement of income in the same period or in the periods during which the asset acquired or liability assumed affects profit or loss or can be adjusted to the initial cost or other carrying amount of the asset or liability. Once the policy has been adopted, the accounting treatment shall be applied consistently.
12) Allowance for doubtful accounts and credit lossesA. FCB classifies on and off balance sheet credit assets and determines the allowance for credit losses by evaluating
the recoverability of the outstanding balances of various loans at the balance sheet date according to “Guidance for Credit Assets Risk Assessment”. For non-credit assets, FCB evaluates the possible risks based on the characteristics of the assets in accordance with “Guidance for Non-Credit Assets Risk Assessment” and generally accepted accounting principles in the Republic of China.According to the amended “Regulations Governing the Procedures for Banking Institutions to Evaluate Assets and Deal with Non-performing / Non-accrual Loans” of the Ministry of Finance (MOF) and “Guidance for Credit Assets Risk Assessment” of the Bank, loans are classified into five categories: (1) normal (2) special attention (3) substandard (4) doubtful and (5) unrecoverable. Except for the normal loans classified under category 1, the abnormal loans shall be evaluated based on the status of the loan collateral and the length of time overdue. The allowance for credit losses for abnormal loans is provided at 2%, 10%, 50%, and 100% on loans classified under categories 2, 3, 4, and 5, respectively. Furthermore, an additional reserve is provided for specific loans as needed if the aforementioned allowance is insufficient according to the recoverability.Upon the approval of the Board of Directors and the notice to the supervisors of FCB, the overdue loans are written-off in accordance with the guidelines of the “Regulations Governing the Procedures for Banking Institutions to Evaluate Assets and Deal with Non-performing / Non-accrual Loans”.
B. Allowance for doubtful accounts of FS is evaluated based on the collectibility of the notes and accounts receivable at the period-end. Securities dealing department’s allowance for bad debts is evaluated based on the Explanatory Letter Tai-Tsai-Jen (2) No. 82416 dated September 29, 1999 of the Securities and Futures Commission.(1) Margin trading:
(a) When the Margin Ratio of a margin loan receivable is lower than the regulated minimum ratio and the balance of the margin loan receivable has not been partially collected to the extent that the margin ratio reaches the minimum ratio by the scheduled time, the related receivable should be transferred to and recorded as “overdue receivables”. The allowance for doubtful debts should be at least 50% and action should be taken to collect the receivable within 6 months. Additional allowance for bad debts within 6 months may need to be provided based on facts and circumstances if the receivable cannot be collected.
(b) If the marketable securities in customers’ margin trading account are not disposable, the balance of the related margin loan receivable should be transferred to and recorded as “other receivables” immediately and 100% allowance for doubtful debts should be provided. Action should be taken to collect the receivable and review the appropriateness of its classification. Receivables not collected after further action has been taken should be transferred to and recorded as “overdue receivables”.
(c) For those margin loan receivables, for which an agreement has been reached with customers and the customers have fulfilled the obligation according to the agreement, no allowance for doubtful debts needs to be provided. However, if there is any default on the subsequent payments, additional allowance for doubtful debts should be provided according to the above (a) or (b).
(2) Normal trading part:The receivables generated from contracts breached by customers, should be transferred to and recorded as “other receivables” and a 100% allowance for doubtful debts should be provided. Actions should be taken to collect the receivable and review the appropriateness of its classification. Receivables not collected after further actions should be transferred to “overdue receivables”.In accordance with the Value-added and Non-value-added Business Tax Law (the “Business Tax Law”), the business tax rate was adjusted from 5% to 2%, effective from July 1, 1999. The 3% tax reduction shall be set aside as additional allowance for doubtful accounts or be used to write-off overdue accounts within four years, starting from July 1, 1999. If a company does not follow the above regulations, the tax authorities will impose 3% business taxes on the sales violating the “Business Tax Law”.According to the Explanatory Letter Tai-Tsai-Jen Ruling (2) No.0920002964 of the MOF dated July 17, 2003, effective from July 1, 2003, the aforementioned regulation is no longer applicable to securities firms.
59
Financ
ial Info
rma
tion
2009 Annua
l Rep
ort
However, if there is an outstanding balance of the aforesaid allowance for doubtful accounts on June 30, 2003, securities firms should comply with the Explanatory Letter Tai-Tsai-Jen (2) No.82416 dated September 29, 1999 to retain such a balance to write-off overdue accounts in the future.
(3) FALI’s allowance for doubtful accounts are determined based on the “Guidelines for Handling Assessment of Assets, Loans Overdue, Delinquent Accounts Receivable on Demand by Insurance enterprises” issued by the Insurance Bureau of Financial Supervisory Commission, Executive Yuan and are recorded and evaluated based on the collectibility of accounts receivable and delinquent accounts receivable.
13) Property, plant and equipment/ non-operating assets ( including leased or idle assets )A. Property, plant and equipment / non-operating assets are stated at cost except for appraisal increment as
permitted under the relevant regulations. Provision for depreciation of non-operating assets is recorded under “other non-interest income or loss” and at the balance sheet date, the non-operating assets are valued at the lower of carrying amount or net realizable value. Depreciation is provided on a straight-line basis over the estimated service lives of the assets plus an additional year as salvage value. The service lives of major properties and equipment are as follows:
Land and improvements 3 ~ 30 years
Buildings 5 ~ 60 years
Transportation equipment 3 ~15 years
Miscellaneous assets 3 ~17 years
Leasehold improvements are depreciated over the lease terms of the lease agreements or 2~5 years.
B. Major renewals and improvements, which are incurred to increase the future economic benefits of the assets, are capitalized and depreciated. Routine maintenance and repairs are charged to expense as incurred.
C. When property, plant and equipment, and non-operating assets are sold or abandoned, the cost and accumulated depreciation are deducted from the respective accounts and the related gain or loss is recorded as ”other non-interest income or loss”.
D. The residual value of property and equipment that is still in use at the end of its original estimated useful life is depreciated using the straight-line method over its revised estimated useful life.
14) Other assetsOther assets mainly comprise of non-operating assets, foreclosed assets, refundable deposits, operating guarantee deposits and settlement clearing funds, restricted assets, prepayments, temporary payments and suspense accounts, and other assets to be adjusted.Foreclosed assets are recorded at acquisition costs and are revalued at the lower of carrying amount or recoverable amount as of the balance sheet date. If the foreclosed assets are impaired, an impairment loss is recognized in the current period. In the subsequent period, if the recoverable amount increases, the previously recognized impairment loss is reversed to the extent that the carrying amounts, after the reversal, shall not exceed the carrying amounts that would have been determined had no impairment loss been recognized in the prior years.
15) Intangible assetsIntangible assets, mainly comprising of computer software costs, are initially recorded at cost and are amortized over 3 to 5 years under the straight-line method.
16) Reserve for guaranteesReserves for guarantees of FCB are determined based on the estimated losses arising from possible default of bills accepted receivable, guarantees receivable and letters of credit receivable, net of the margin deposits received from customers as at the balance sheet date.
17) Reserve for defaultAs required by Article 12 of the “Rules Governing Securities Firms”, FS should allocate 0.0028% of the amounts of monthly securities consignment trading as the reserves for losses from default, and such reserves are recorded under reserve for operation and liabilities. The reserves should only be used for recovering the losses caused by default on such consignment trading or for other purposes as approved by the SFB. When the accumulated reserve balances reach $200,000, no further reserve provision is required.

60
18) Reserve for securities trading lossesAs required by the “Regulations Governing Securities Firms”, a securities firm should set aside 10% of the excess of monthly gains over losses from “trading securities – proprietary trading” and “ issuance of call (put) warrants” as the reserves for securities trading losses while engaging in proprietary trading business. Such reserves can only be used to offset losses over gains arising from the aforesaid securities trading. The reserves must be provided until the accumulated reserve balances reach $200,000.Futures commission merchants should set aside 10% of monthly net realized gains from trading futures as the reserve for futures trading losses while engaging in proprietary trading business. The reserve must be provided until the accumulated reserve reaches the regulated minimum issued capital stock, working capital or operating capital. Such reserve can only be used to offset losses over gains arising from the aforesaid futures trading.
19) Reserves for operations and liabilitiesReserves for operations and liabilities of FALI, includes reserve for insurance liabilities, reserve for unearned premiums, reserve for catastrophic losses and reserve for outstanding losses, and are provided for in accordance with the Insurance Act and relevant regulations as well as based on an actuarial report.
20) Retirement plan and pension costA. In compliance with the Statement of Financial Accounting Standards No.18, “Accounting for Pensions”, if the
retirement plan is a defined benefit pension plan, the First Group recognizes the difference as the minimum pension liability when the accumulated benefit obligation exceeds the fair value of plan assets. For interim financial statements, minimum pension liability is adjusted for the difference between the net periodic pension costs and the appropriated funds. The net periodic pension costs, which include the service cost, interest cost, expected return on plan assets, amortization of unrecognized net transition asset or obligation, amortization of pension gains or losses, and amortization of prior period service cost, are recognized based on an actuarial report.
B. If the retirement plan is a defined contribution pension plan, the contributions are based on an accrual basis and are recognized as pension costs in the current period. Effective from July 1, 2005, the contributions made pursuant to the Labor Pension Act are under the defined contribution pension plan. Such contributions are made monthly based on not less than 6% of the employees’ salaries and are deposited in the employee’s individual pension fund account at the Bureau of Labor Insurance.
21) Foreign currency transactions and translations of foreign currency financial statementsThe First Group’s foreign currency transactions are recorded in New Taiwan dollars at the spot rates of the transaction dates. Differences between actual payments or receipts and recorded transaction amounts are recognized as foreign exchange gains or losses in the current period. The revaluation of the foreign currency assets and liabilities at the balance sheet date is as follows: A. Except that a cash flow hedge or a hedge of a net investment in a foreign operation is accounted for under the
hedge accounting, monetary assets and liabilities denominated in foreign currencies are revalued using the spot foreign exchange rates at the balance sheet date, and the resulting foreign exchange gain or loss on the revaluation is included in current income.
B. Non-monetary assets and non-monetary liabilities denominated in foreign currencies that are financial assets or financial liabilities at fair value through profit or loss are revalued using the spot foreign exchange rates at the balance sheet date, and the related foreign exchange gains or losses are recorded as gains or losses in the current period. Available-for-sale financial assets are revalued using the spot foreign exchange rates at the balance sheet date, and the related foreign exchange gains or losses are recorded in the stockholders’ equity. Financial assets or financial liabilities carried at cost are stated using the historical foreign exchange rates of the transaction dates.
C. For equity investments accounted for under the equity method whose functional currency is foreign currency, the translation differences arising from the foreign currency financial statements translated into domestic currency financial statements are recognized proportionally as the cumulative translation adjustment in the stockholders’ equity based on the percentage of the investees’ ownership held by the First Group.
D. When the financial statements of a foreign operation are translated into domestic currency financial statements, all asset and liability accounts are translated using the spot foreign exchange rate at the balance sheet date, and the stockholders’ equity accounts are translated at the historical foreign exchange rate except that the beginning retained earnings are stated at the translated carrying amount of the ending retained earnings in the prior year and the profit and loss accounts are translated at the average foreign exchange rate in the reporting period. The final translation differences are recorded as the cumulative translation adjustments in the stockholders’ equity.
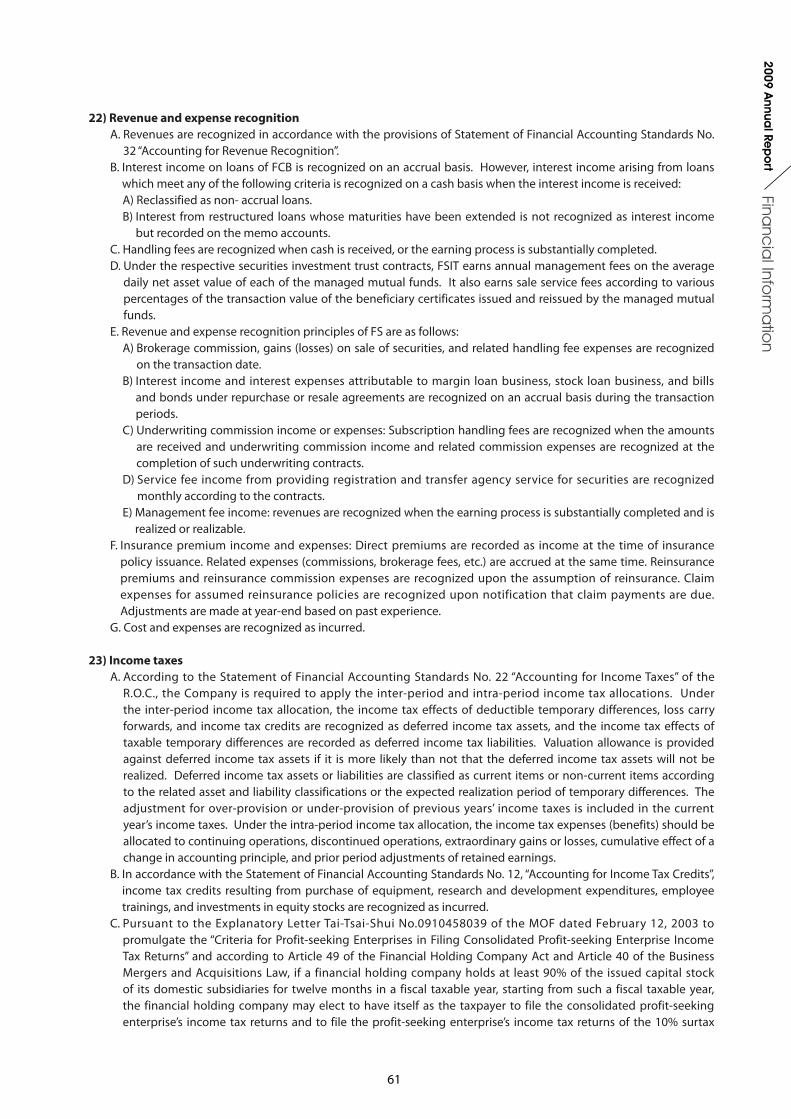
61
Financ
ial Info
rma
tion
2009 Annua
l Rep
ort
22) Revenue and expense recognitionA. Revenues are recognized in accordance with the provisions of Statement of Financial Accounting Standards No.
32 “Accounting for Revenue Recognition”.B. Interest income on loans of FCB is recognized on an accrual basis. However, interest income arising from loans
which meet any of the following criteria is recognized on a cash basis when the interest income is received:A) Reclassified as non- accrual loans.B) Interest from restructured loans whose maturities have been extended is not recognized as interest income
but recorded on the memo accounts.C. Handling fees are recognized when cash is received, or the earning process is substantially completed.D. Under the respective securities investment trust contracts, FSIT earns annual management fees on the average
daily net asset value of each of the managed mutual funds. It also earns sale service fees according to various percentages of the transaction value of the beneficiary certificates issued and reissued by the managed mutual funds.
E. Revenue and expense recognition principles of FS are as follows:A) Brokerage commission, gains (losses) on sale of securities, and related handling fee expenses are recognized
on the transaction date.B) Interest income and interest expenses attributable to margin loan business, stock loan business, and bills
and bonds under repurchase or resale agreements are recognized on an accrual basis during the transaction periods.
C) Underwriting commission income or expenses: Subscription handling fees are recognized when the amounts are received and underwriting commission income and related commission expenses are recognized at the completion of such underwriting contracts.
D) Service fee income from providing registration and transfer agency service for securities are recognized monthly according to the contracts.
E) Management fee income: revenues are recognized when the earning process is substantially completed and is realized or realizable.
F. Insurance premium income and expenses: Direct premiums are recorded as income at the time of insurance policy issuance. Related expenses (commissions, brokerage fees, etc.) are accrued at the same time. Reinsurance premiums and reinsurance commission expenses are recognized upon the assumption of reinsurance. Claim expenses for assumed reinsurance policies are recognized upon notification that claim payments are due. Adjustments are made at year-end based on past experience.
G. Cost and expenses are recognized as incurred.
23) Income taxesA. According to the Statement of Financial Accounting Standards No. 22 “Accounting for Income Taxes” of the
R.O.C., the Company is required to apply the inter-period and intra-period income tax allocations. Under the inter-period income tax allocation, the income tax effects of deductible temporary differences, loss carry forwards, and income tax credits are recognized as deferred income tax assets, and the income tax effects of taxable temporary differences are recorded as deferred income tax liabilities. Valuation allowance is provided against deferred income tax assets if it is more likely than not that the deferred income tax assets will not be realized. Deferred income tax assets or liabilities are classified as current items or non-current items according to the related asset and liability classifications or the expected realization period of temporary differences. The adjustment for over-provision or under-provision of previous years’ income taxes is included in the current year’s income taxes. Under the intra-period income tax allocation, the income tax expenses (benefits) should be allocated to continuing operations, discontinued operations, extraordinary gains or losses, cumulative effect of a change in accounting principle, and prior period adjustments of retained earnings.
B. In accordance with the Statement of Financial Accounting Standards No. 12, “Accounting for Income Tax Credits”, income tax credits resulting from purchase of equipment, research and development expenditures, employee trainings, and investments in equity stocks are recognized as incurred.
C. Pursuant to the Explanatory Letter Tai-Tsai-Shui No.0910458039 of the MOF dated February 12, 2003 to promulgate the “Criteria for Profit-seeking Enterprises in Filing Consolidated Profit-seeking Enterprise Income Tax Returns” and according to Article 49 of the Financial Holding Company Act and Article 40 of the Business Mergers and Acquisitions Law, if a financial holding company holds at least 90% of the issued capital stock of its domestic subsidiaries for twelve months in a fiscal taxable year, starting from such a fiscal taxable year, the financial holding company may elect to have itself as the taxpayer to file the consolidated profit-seeking enterprise’s income tax returns and to file the profit-seeking enterprise’s income tax returns of the 10% surtax
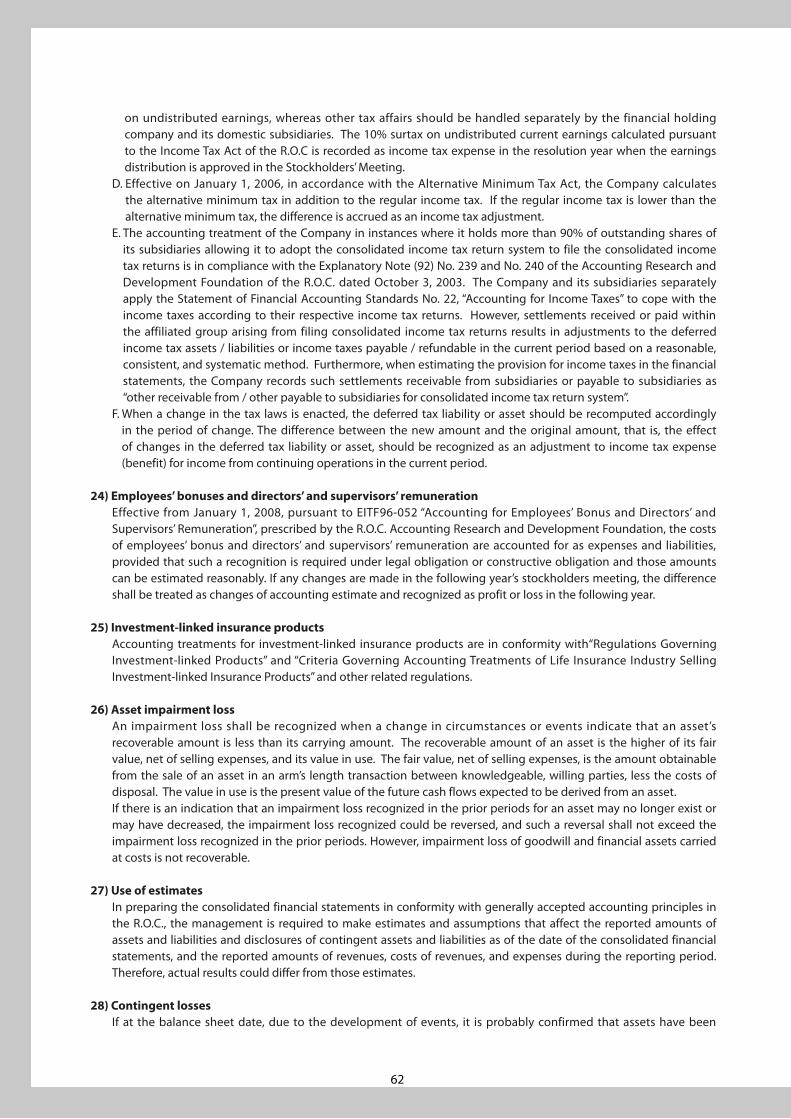
62
on undistributed earnings, whereas other tax affairs should be handled separately by the financial holding company and its domestic subsidiaries. The 10% surtax on undistributed current earnings calculated pursuant to the Income Tax Act of the R.O.C is recorded as income tax expense in the resolution year when the earnings distribution is approved in the Stockholders’ Meeting.
D. Effective on January 1, 2006, in accordance with the Alternative Minimum Tax Act, the Company calculates the alternative minimum tax in addition to the regular income tax. If the regular income tax is lower than the alternative minimum tax, the difference is accrued as an income tax adjustment.
E. The accounting treatment of the Company in instances where it holds more than 90% of outstanding shares of its subsidiaries allowing it to adopt the consolidated income tax return system to file the consolidated income tax returns is in compliance with the Explanatory Note (92) No. 239 and No. 240 of the Accounting Research and Development Foundation of the R.O.C. dated October 3, 2003. The Company and its subsidiaries separately apply the Statement of Financial Accounting Standards No. 22, “Accounting for Income Taxes” to cope with the income taxes according to their respective income tax returns. However, settlements received or paid within the affiliated group arising from filing consolidated income tax returns results in adjustments to the deferred income tax assets / liabilities or income taxes payable / refundable in the current period based on a reasonable, consistent, and systematic method. Furthermore, when estimating the provision for income taxes in the financial statements, the Company records such settlements receivable from subsidiaries or payable to subsidiaries as “other receivable from / other payable to subsidiaries for consolidated income tax return system”.
F. When a change in the tax laws is enacted, the deferred tax liability or asset should be recomputed accordingly in the period of change. The difference between the new amount and the original amount, that is, the effect of changes in the deferred tax liability or asset, should be recognized as an adjustment to income tax expense (benefit) for income from continuing operations in the current period.
24) Employees’ bonuses and directors’ and supervisors’ remunerationEffective from January 1, 2008, pursuant to EITF96-052 “Accounting for Employees’ Bonus and Directors’ and Supervisors’ Remuneration”, prescribed by the R.O.C. Accounting Research and Development Foundation, the costs of employees’ bonus and directors’ and supervisors’ remuneration are accounted for as expenses and liabilities, provided that such a recognition is required under legal obligation or constructive obligation and those amounts can be estimated reasonably. If any changes are made in the following year’s stockholders meeting, the difference shall be treated as changes of accounting estimate and recognized as profit or loss in the following year.
25) Investment-linked insurance productsAccounting treatments for investment-linked insurance products are in conformity with“Regulations Governing Investment-linked Products” and “Criteria Governing Accounting Treatments of Life Insurance Industry Selling Investment-linked Insurance Products” and other related regulations.
26) Asset impairment lossAn impairment loss shall be recognized when a change in circumstances or events indicate that an asset’s recoverable amount is less than its carrying amount. The recoverable amount of an asset is the higher of its fair value, net of selling expenses, and its value in use. The fair value, net of selling expenses, is the amount obtainable from the sale of an asset in an arm’s length transaction between knowledgeable, willing parties, less the costs of disposal. The value in use is the present value of the future cash flows expected to be derived from an asset.If there is an indication that an impairment loss recognized in the prior periods for an asset may no longer exist or may have decreased, the impairment loss recognized could be reversed, and such a reversal shall not exceed the impairment loss recognized in the prior periods. However, impairment loss of goodwill and financial assets carried at costs is not recoverable.
27) Use of estimatesIn preparing the consolidated financial statements in conformity with generally accepted accounting principles in the R.O.C., the management is required to make estimates and assumptions that affect the reported amounts of assets and liabilities and disclosures of contingent assets and liabilities as of the date of the consolidated financial statements, and the reported amounts of revenues, costs of revenues, and expenses during the reporting period. Therefore, actual results could differ from those estimates.
28) Contingent lossesIf at the balance sheet date, due to the development of events, it is probably confirmed that assets have been
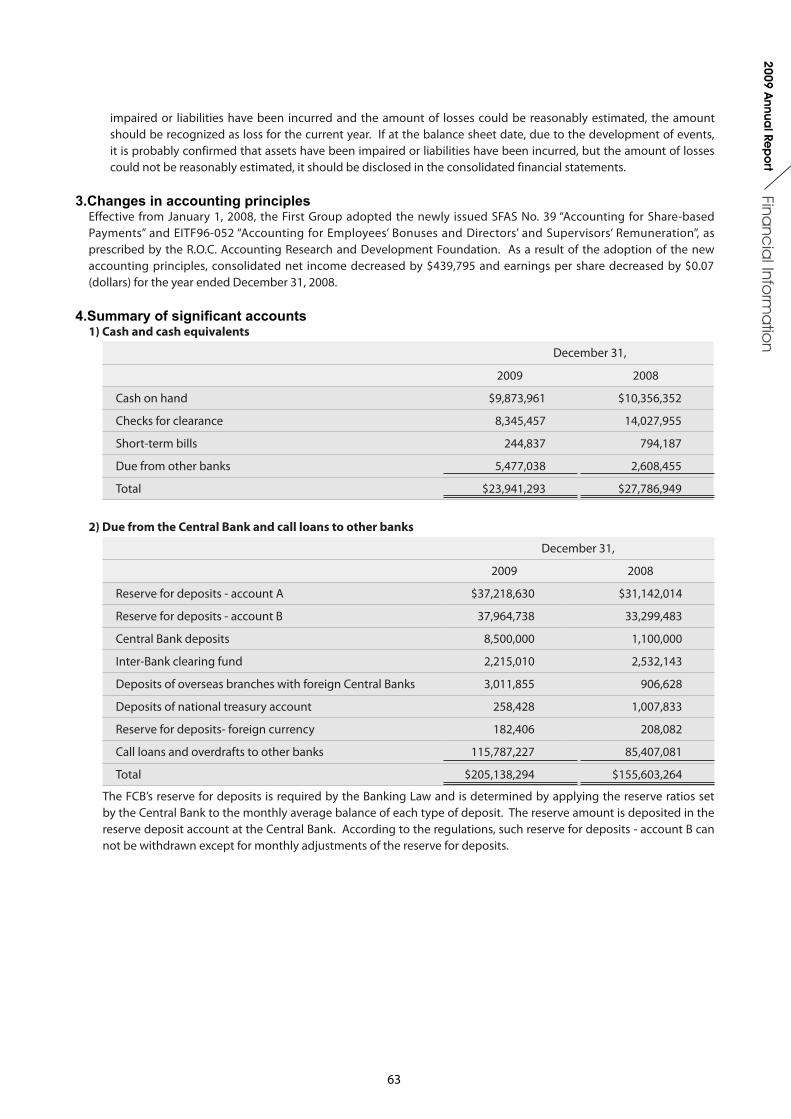
63
Financ
ial Info
rma
tion
2009 Annua
l Rep
ort
impaired or liabilities have been incurred and the amount of losses could be reasonably estimated, the amount should be recognized as loss for the current year. If at the balance sheet date, due to the development of events, it is probably confirmed that assets have been impaired or liabilities have been incurred, but the amount of losses could not be reasonably estimated, it should be disclosed in the consolidated financial statements.
3.Changes in accounting principlesEffective from January 1, 2008, the First Group adopted the newly issued SFAS No. 39 “Accounting for Share-based Payments” and EITF96-052 “Accounting for Employees’ Bonuses and Directors’ and Supervisors’ Remuneration”, as prescribed by the R.O.C. Accounting Research and Development Foundation. As a result of the adoption of the new accounting principles, consolidated net income decreased by $439,795 and earnings per share decreased by $0.07 (dollars) for the year ended December 31, 2008.
4.Summary of significant accounts1) Cash and cash equivalents
December 31,
2009 2008
Cash on hand $9,873,961 $10,356,352
Checks for clearance 8,345,457 14,027,955
Short-term bills 244,837 794,187
Due from other banks 5,477,038 2,608,455
Total $23,941,293 $27,786,949
2) Due from the Central Bank and call loans to other banks
December 31,
2009 2008
Reserve for deposits - account A $37,218,630 $31,142,014
Reserve for deposits - account B 37,964,738 33,299,483
Central Bank deposits 8,500,000 1,100,000
Inter-Bank clearing fund 2,215,010 2,532,143
Deposits of overseas branches with foreign Central Banks 3,011,855 906,628
Deposits of national treasury account 258,428 1,007,833
Reserve for deposits- foreign currency 182,406 208,082
Call loans and overdrafts to other banks 115,787,227 85,407,081
Total $205,138,294 $155,603,264
The FCB’s reserve for deposits is required by the Banking Law and is determined by applying the reserve ratios set by the Central Bank to the monthly average balance of each type of deposit. The reserve amount is deposited in the reserve deposit account at the Central Bank. According to the regulations, such reserve for deposits - account B can not be withdrawn except for monthly adjustments of the reserve for deposits.
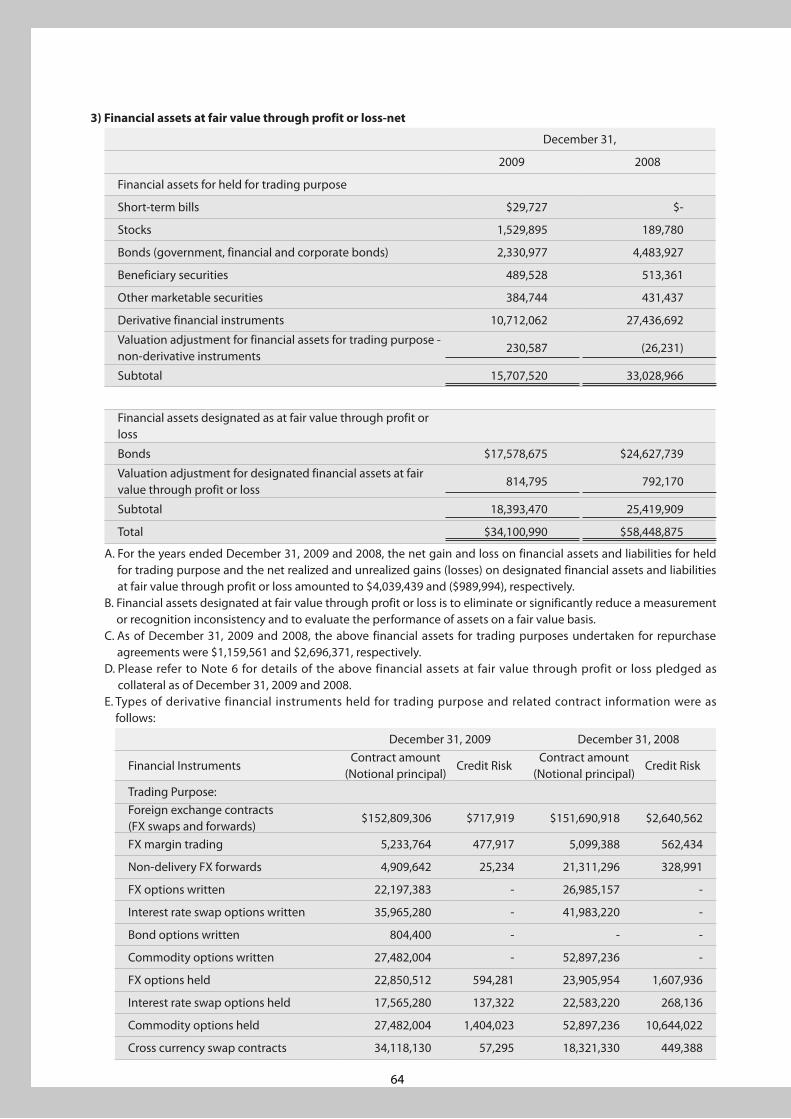
64
3) Financial assets at fair value through profit or loss-net
December 31,
2009 2008
Financial assets for held for trading purpose
Short-term bills $29,727 $-
Stocks 1,529,895 189,780
Bonds (government, financial and corporate bonds) 2,330,977 4,483,927
Beneficiary securities 489,528 513,361
Other marketable securities 384,744 431,437
Derivative financial instruments 10,712,062 27,436,692
Valuation adjustment for financial assets for trading purpose - non-derivative instruments
230,587 (26,231)
Subtotal 15,707,520 33,028,966
Financial assets designated as at fair value through profit or loss
Bonds $17,578,675 $24,627,739
Valuation adjustment for designated financial assets at fair value through profit or loss
814,795 792,170
Subtotal 18,393,470 25,419,909
Total $34,100,990 $58,448,875
A. For the years ended December 31, 2009 and 2008, the net gain and loss on financial assets and liabilities for held for trading purpose and the net realized and unrealized gains (losses) on designated financial assets and liabilities at fair value through profit or loss amounted to $4,039,439 and ($989,994), respectively.
B. Financial assets designated at fair value through profit or loss is to eliminate or significantly reduce a measurement or recognition inconsistency and to evaluate the performance of assets on a fair value basis.
C. As of December 31, 2009 and 2008, the above financial assets for trading purposes undertaken for repurchase agreements were $1,159,561 and $2,696,371, respectively.
D. Please refer to Note 6 for details of the above financial assets at fair value through profit or loss pledged as collateral as of December 31, 2009 and 2008.
E. Types of derivative financial instruments held for trading purpose and related contract information were as follows:
December 31, 2009 December 31, 2008
Financial InstrumentsContract amount
(Notional principal)Credit Risk
Contract amount(Notional principal)
Credit Risk
Trading Purpose:Foreign exchange contracts(FX swaps and forwards)
$152,809,306 $717,919 $151,690,918 $2,640,562
FX margin trading 5,233,764 477,917 5,099,388 562,434
Non-delivery FX forwards 4,909,642 25,234 21,311,296 328,991
FX options written 22,197,383 - 26,985,157 -
Interest rate swap options written 35,965,280 - 41,983,220 -
Bond options written 804,400 - - -
Commodity options written 27,482,004 - 52,897,236 -
FX options held 22,850,512 594,281 23,905,954 1,607,936
Interest rate swap options held 17,565,280 137,322 22,583,220 268,136
Commodity options held 27,482,004 1,404,023 52,897,236 10,644,022
Cross currency swap contracts 34,118,130 57,295 18,321,330 449,388
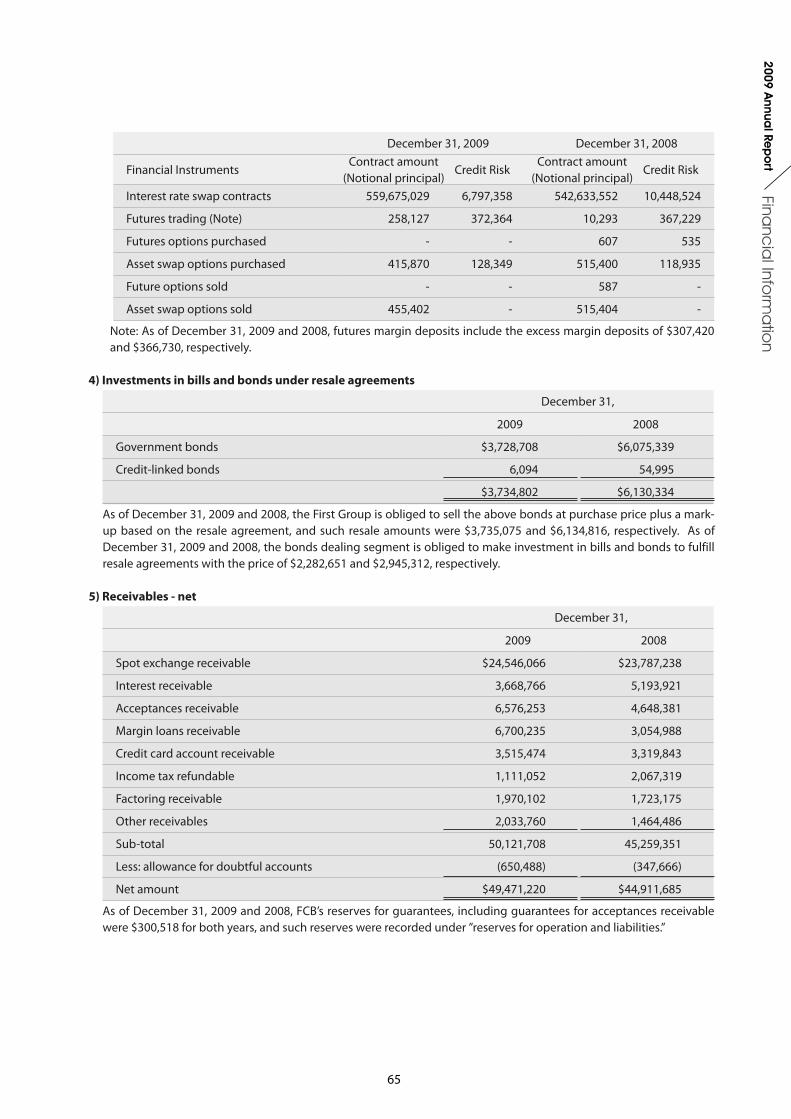
65
Financ
ial Info
rma
tion
2009 Annua
l Rep
ort
December 31, 2009 December 31, 2008
Financial InstrumentsContract amount
(Notional principal)Credit Risk
Contract amount(Notional principal)
Credit Risk
Interest rate swap contracts 559,675,029 6,797,358 542,633,552 10,448,524
Futures trading (Note) 258,127 372,364 10,293 367,229
Futures options purchased - - 607 535
Asset swap options purchased 415,870 128,349 515,400 118,935
Future options sold - - 587 -
Asset swap options sold 455,402 - 515,404 -
Note: As of December 31, 2009 and 2008, futures margin deposits include the excess margin deposits of $307,420 and $366,730, respectively.
4) Investments in bills and bonds under resale agreements
December 31,
2009 2008
Government bonds $3,728,708 $6,075,339
Credit-linked bonds 6,094 54,995
$3,734,802 $6,130,334
As of December 31, 2009 and 2008, the First Group is obliged to sell the above bonds at purchase price plus a mark-up based on the resale agreement, and such resale amounts were $3,735,075 and $6,134,816, respectively. As of December 31, 2009 and 2008, the bonds dealing segment is obliged to make investment in bills and bonds to fulfill resale agreements with the price of $2,282,651 and $2,945,312, respectively.
5) Receivables - net
December 31,
2009 2008
Spot exchange receivable $24,546,066 $23,787,238
Interest receivable 3,668,766 5,193,921
Acceptances receivable 6,576,253 4,648,381
Margin loans receivable 6,700,235 3,054,988
Credit card account receivable 3,515,474 3,319,843
Income tax refundable 1,111,052 2,067,319
Factoring receivable 1,970,102 1,723,175
Other receivables 2,033,760 1,464,486
Sub-total 50,121,708 45,259,351
Less: allowance for doubtful accounts (650,488) (347,666)
Net amount $49,471,220 $44,911,685
As of December 31, 2009 and 2008, FCB’s reserves for guarantees, including guarantees for acceptances receivable were $300,518 for both years, and such reserves were recorded under ”reserves for operation and liabilities.”
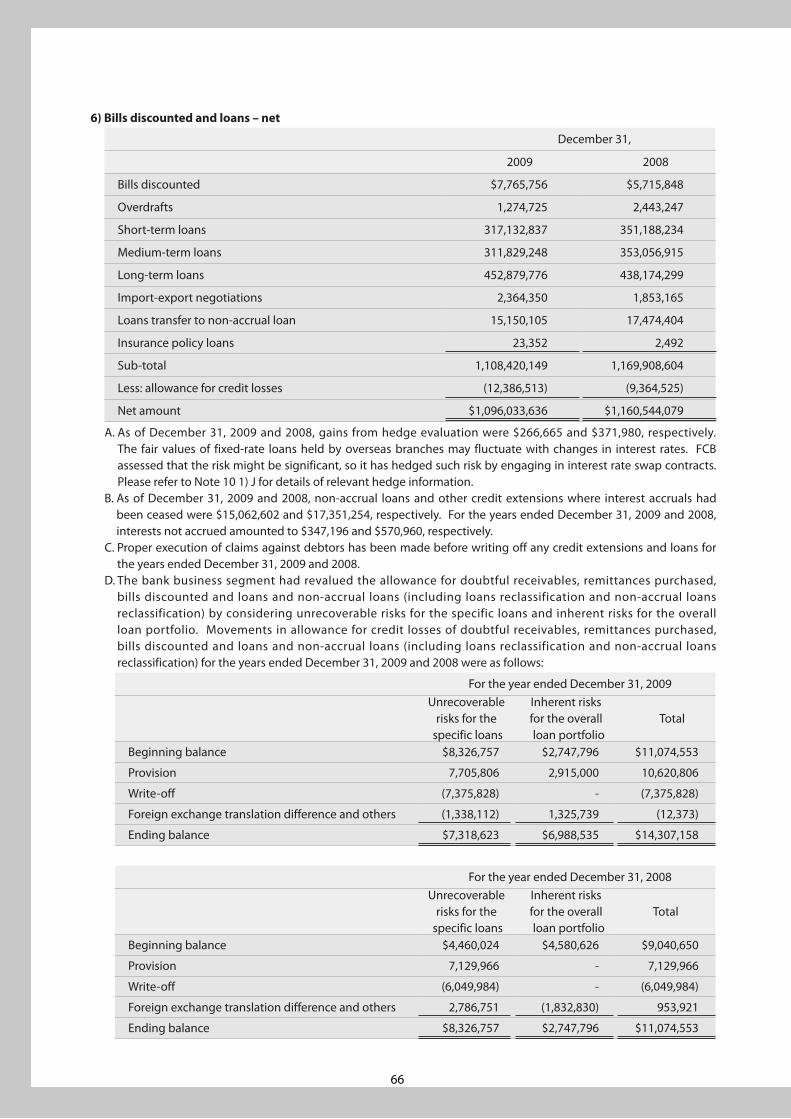
66
6) Bills discounted and loans – net
December 31,
2009 2008
Bills discounted $7,765,756 $5,715,848
Overdrafts 1,274,725 2,443,247
Short-term loans 317,132,837 351,188,234
Medium-term loans 311,829,248 353,056,915
Long-term loans 452,879,776 438,174,299
Import-export negotiations 2,364,350 1,853,165
Loans transfer to non-accrual loan 15,150,105 17,474,404
Insurance policy loans 23,352 2,492
Sub-total 1,108,420,149 1,169,908,604
Less: allowance for credit losses (12,386,513) (9,364,525)
Net amount $1,096,033,636 $1,160,544,079
A. As of December 31, 2009 and 2008, gains from hedge evaluation were $266,665 and $371,980, respectively. The fair values of fixed-rate loans held by overseas branches may fluctuate with changes in interest rates. FCB assessed that the risk might be significant, so it has hedged such risk by engaging in interest rate swap contracts. Please refer to Note 10 1) J for details of relevant hedge information.
B. As of December 31, 2009 and 2008, non-accrual loans and other credit extensions where interest accruals had been ceased were $15,062,602 and $17,351,254, respectively. For the years ended December 31, 2009 and 2008, interests not accrued amounted to $347,196 and $570,960, respectively.
C. Proper execution of claims against debtors has been made before writing off any credit extensions and loans for the years ended December 31, 2009 and 2008.
D. The bank business segment had revalued the allowance for doubtful receivables, remittances purchased, bills discounted and loans and non-accrual loans (including loans reclassification and non-accrual loans reclassification) by considering unrecoverable risks for the specific loans and inherent risks for the overall loan portfolio. Movements in allowance for credit losses of doubtful receivables, remittances purchased, bills discounted and loans and non-accrual loans (including loans reclassification and non-accrual loans reclassification) for the years ended December 31, 2009 and 2008 were as follows:
For the year ended December 31, 2009Unrecoverable
risks for the specific loans
Inherent risksfor the overall loan portfolio
Total
Beginning balance $8,326,757 $2,747,796 $11,074,553
Provision 7,705,806 2,915,000 10,620,806
Write-off (7,375,828) - (7,375,828)
Foreign exchange translation difference and others (1,338,112) 1,325,739 (12,373)
Ending balance $7,318,623 $6,988,535 $14,307,158
For the year ended December 31, 2008Unrecoverable
risks for the specific loans
Inherent risksfor the overall loan portfolio
Total
Beginning balance $4,460,024 $4,580,626 $9,040,650
Provision 7,129,966 - 7,129,966
Write-off (6,049,984) - (6,049,984)
Foreign exchange translation difference and others 2,786,751 (1,832,830) 953,921
Ending balance $8,326,757 $2,747,796 $11,074,553
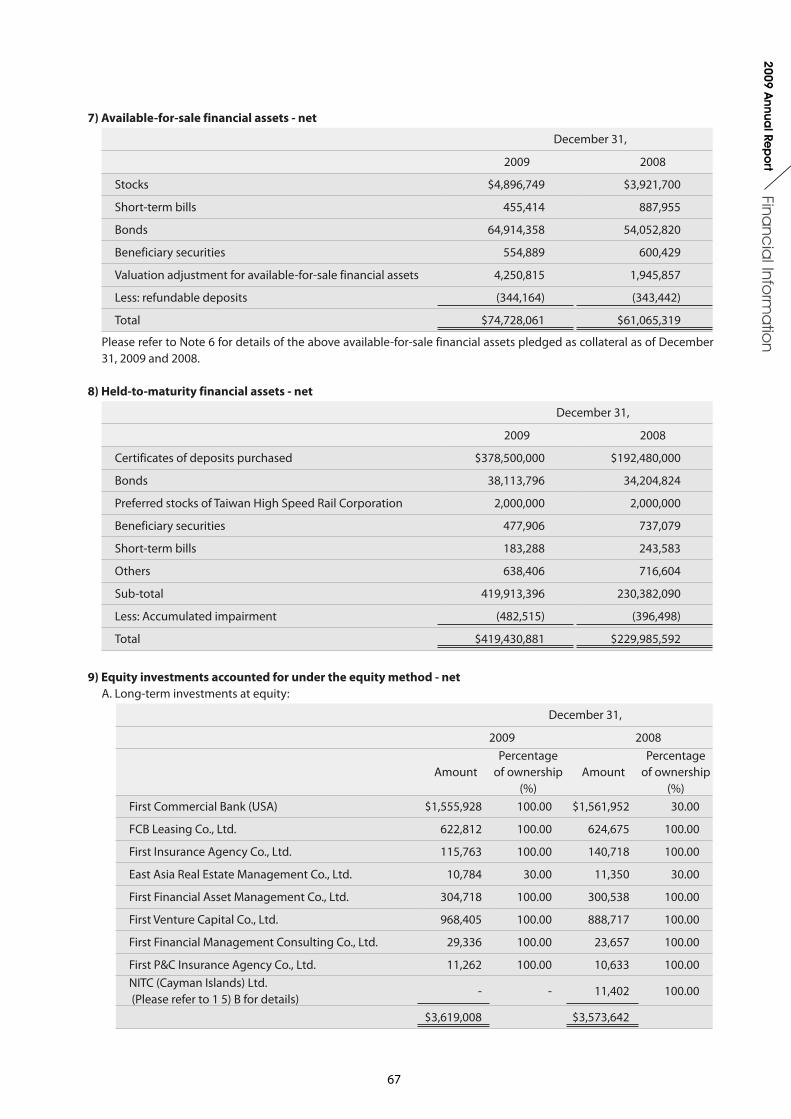
67
Financ
ial Info
rma
tion
2009 Annua
l Rep
ort
7) Available-for-sale financial assets - net
December 31,
2009 2008
Stocks $4,896,749 $3,921,700
Short-term bills 455,414 887,955
Bonds 64,914,358 54,052,820
Beneficiary securities 554,889 600,429
Valuation adjustment for available-for-sale financial assets 4,250,815 1,945,857
Less: refundable deposits (344,164) (343,442)
Total $74,728,061 $61,065,319
Please refer to Note 6 for details of the above available-for-sale financial assets pledged as collateral as of December 31, 2009 and 2008.
8) Held-to-maturity financial assets - net
December 31,
2009 2008
Certificates of deposits purchased $378,500,000 $192,480,000
Bonds 38,113,796 34,204,824
Preferred stocks of Taiwan High Speed Rail Corporation 2,000,000 2,000,000
Beneficiary securities 477,906 737,079
Short-term bills 183,288 243,583
Others 638,406 716,604
Sub-total 419,913,396 230,382,090
Less: Accumulated impairment (482,515) (396,498)
Total $419,430,881 $229,985,592
9) Equity investments accounted for under the equity method - netA. Long-term investments at equity:
December 31,
2009 2008
Amount Percentage
of ownership(%)
Amount Percentage
of ownership(%)
First Commercial Bank (USA) $1,555,928 100.00 $1,561,952 30.00
FCB Leasing Co., Ltd. 622,812 100.00 624,675 100.00
First Insurance Agency Co., Ltd. 115,763 100.00 140,718 100.00
East Asia Real Estate Management Co., Ltd. 10,784 30.00 11,350 30.00
First Financial Asset Management Co., Ltd. 304,718 100.00 300,538 100.00
First Venture Capital Co., Ltd. 968,405 100.00 888,717 100.00
First Financial Management Consulting Co., Ltd. 29,336 100.00 23,657 100.00
First P&C Insurance Agency Co., Ltd. 11,262 100.00 10,633 100.00NITC (Cayman Islands) Ltd. (Please refer to 1 5) B for details)
- - 11,402 100.00
$3,619,008 $3,573,642
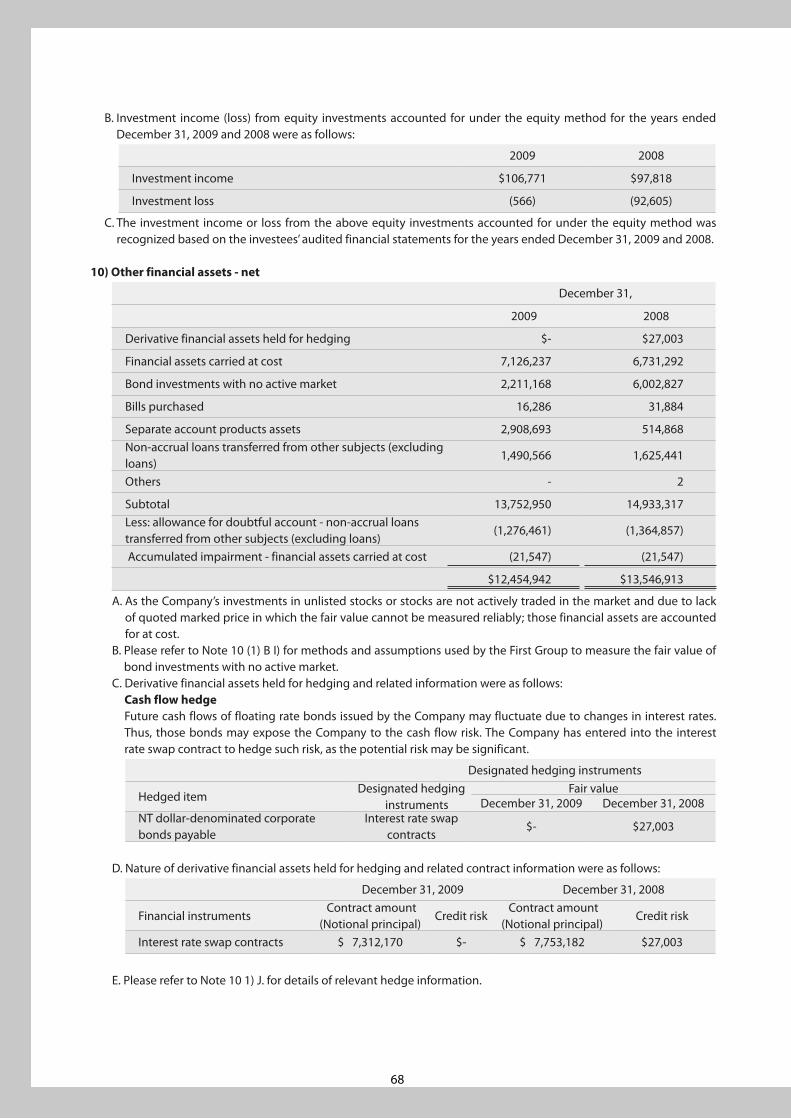
68
B. Investment income (loss) from equity investments accounted for under the equity method for the years ended December 31, 2009 and 2008 were as follows:
2009 2008
Investment income $106,771 $97,818
Investment loss (566) (92,605)
C. The investment income or loss from the above equity investments accounted for under the equity method was recognized based on the investees’ audited financial statements for the years ended December 31, 2009 and 2008.
10) Other financial assets - net
December 31,
2009 2008
Derivative financial assets held for hedging $- $27,003
Financial assets carried at cost 7,126,237 6,731,292
Bond investments with no active market 2,211,168 6,002,827
Bills purchased 16,286 31,884
Separate account products assets 2,908,693 514,868Non-accrual loans transferred from other subjects (excluding loans)
1,490,566 1,625,441
Others - 2
Subtotal 13,752,950 14,933,317Less: allowance for doubtful account - non-accrual loans transferred from other subjects (excluding loans)
(1,276,461) (1,364,857)
Accumulated impairment - financial assets carried at cost (21,547) (21,547)
$12,454,942 $13,546,913
A. As the Company’s investments in unlisted stocks or stocks are not actively traded in the market and due to lack of quoted marked price in which the fair value cannot be measured reliably; those financial assets are accounted for at cost.
B. Please refer to Note 10 (1) B I) for methods and assumptions used by the First Group to measure the fair value of bond investments with no active market.
C. Derivative financial assets held for hedging and related information were as follows:Cash flow hedgeFuture cash flows of floating rate bonds issued by the Company may fluctuate due to changes in interest rates. Thus, those bonds may expose the Company to the cash flow risk. The Company has entered into the interest rate swap contract to hedge such risk, as the potential risk may be significant.
Designated hedging instruments
Hedged item Designated hedging
instrumentsFair value
December 31, 2009 December 31, 2008NT dollar-denominated corporate bonds payable
Interest rate swap contracts
$- $27,003
D. Nature of derivative financial assets held for hedging and related contract information were as follows:
December 31, 2009 December 31, 2008
Financial instruments Contract amount
(Notional principal)Credit risk
Contract amount(Notional principal)
Credit risk
Interest rate swap contracts $ 7,312,170 $- $ 7,753,182 $27,003
E. Please refer to Note 10 1) J. for details of relevant hedge information.
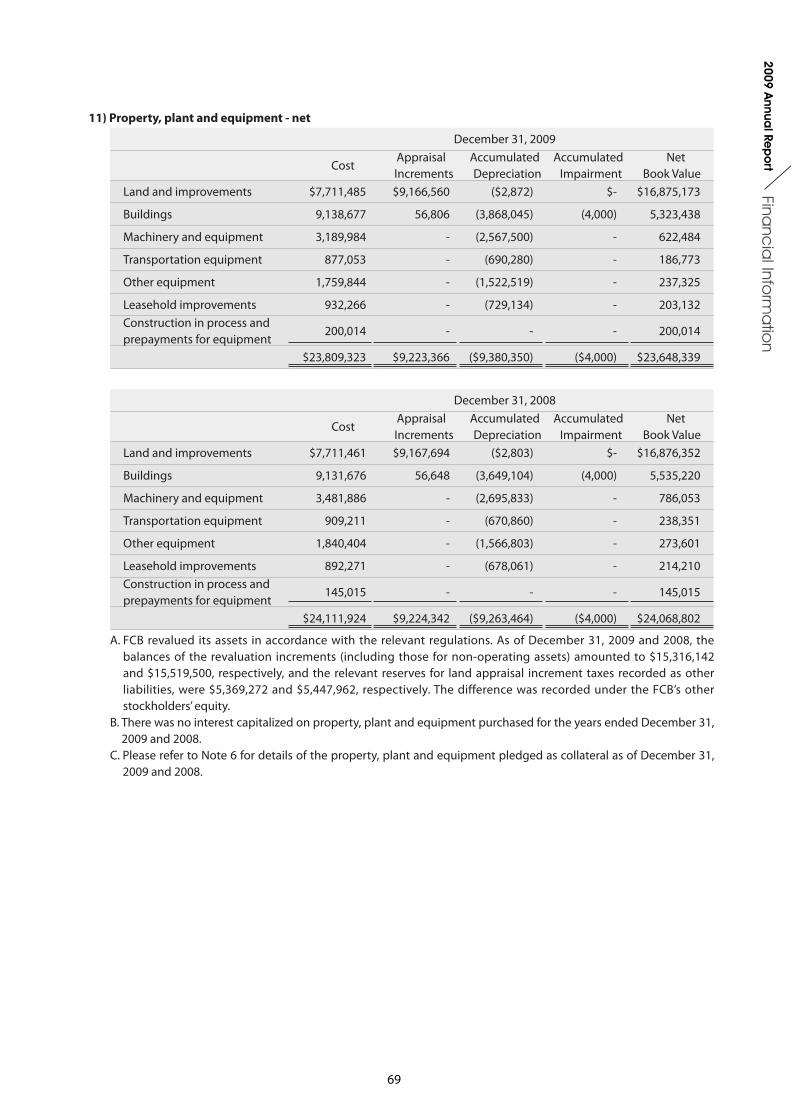
69
Financ
ial Info
rma
tion
2009 Annua
l Rep
ort
11) Property, plant and equipment - net
December 31, 2009
Cost Appraisal
Increments Accumulated Depreciation
Accumulated Impairment
Net Book Value
Land and improvements $7,711,485 $9,166,560 ($2,872) $- $16,875,173
Buildings 9,138,677 56,806 (3,868,045) (4,000) 5,323,438
Machinery and equipment 3,189,984 - (2,567,500) - 622,484
Transportation equipment 877,053 - (690,280) - 186,773
Other equipment 1,759,844 - (1,522,519) - 237,325
Leasehold improvements 932,266 - (729,134) - 203,132Construction in process and prepayments for equipment
200,014 - - - 200,014
$23,809,323 $9,223,366 ($9,380,350) ($4,000) $23,648,339
December 31, 2008
Cost Appraisal
Increments Accumulated Depreciation
Accumulated Impairment
Net Book Value
Land and improvements $7,711,461 $9,167,694 ($2,803) $- $16,876,352
Buildings 9,131,676 56,648 (3,649,104) (4,000) 5,535,220
Machinery and equipment 3,481,886 - (2,695,833) - 786,053
Transportation equipment 909,211 - (670,860) - 238,351
Other equipment 1,840,404 - (1,566,803) - 273,601
Leasehold improvements 892,271 - (678,061) - 214,210Construction in process and prepayments for equipment
145,015 - - - 145,015
$24,111,924 $9,224,342 ($9,263,464) ($4,000) $24,068,802
A. FCB revalued its assets in accordance with the relevant regulations. As of December 31, 2009 and 2008, the balances of the revaluation increments (including those for non-operating assets) amounted to $15,316,142 and $15,519,500, respectively, and the relevant reserves for land appraisal increment taxes recorded as other liabilities, were $5,369,272 and $5,447,962, respectively. The difference was recorded under the FCB’s other stockholders’ equity.
B. There was no interest capitalized on property, plant and equipment purchased for the years ended December 31, 2009 and 2008.
C. Please refer to Note 6 for details of the property, plant and equipment pledged as collateral as of December 31, 2009 and 2008.
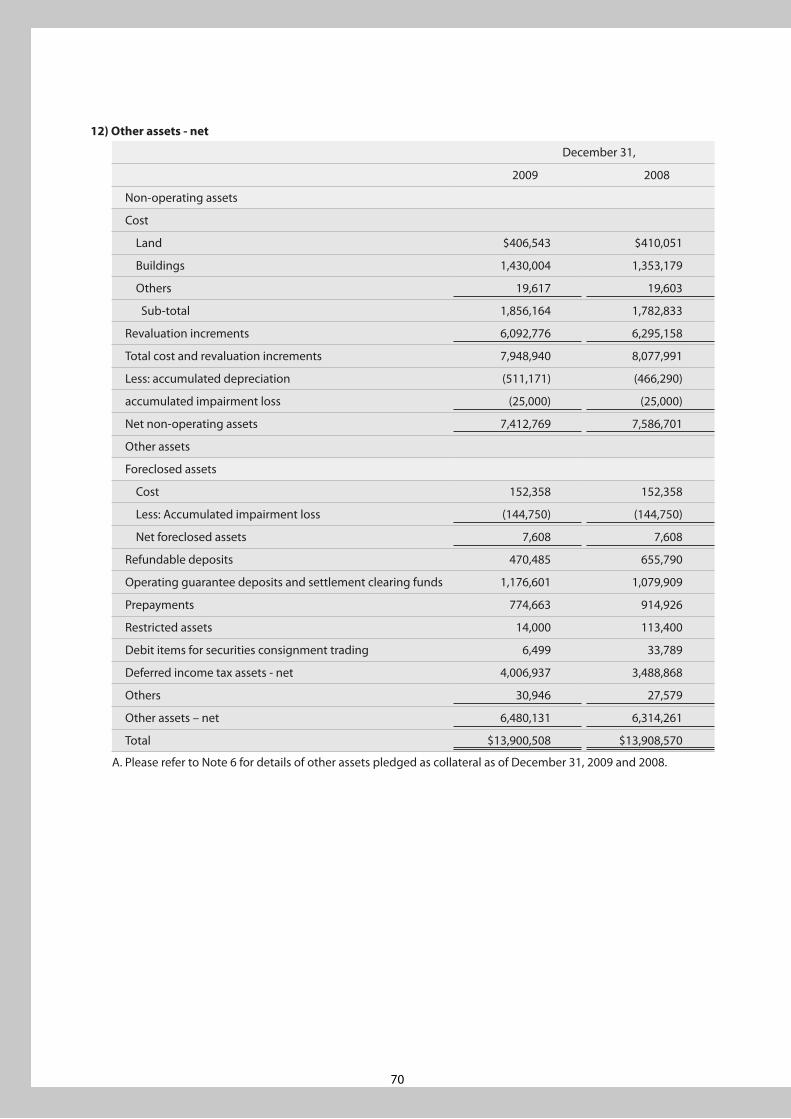
70
12) Other assets - net
December 31,
2009 2008
Non-operating assets
Cost
Land $406,543 $410,051
Buildings 1,430,004 1,353,179
Others 19,617 19,603
Sub-total 1,856,164 1,782,833
Revaluation increments 6,092,776 6,295,158
Total cost and revaluation increments 7,948,940 8,077,991
Less: accumulated depreciation (511,171) (466,290)
accumulated impairment loss (25,000) (25,000)
Net non-operating assets 7,412,769 7,586,701
Other assets
Foreclosed assets
Cost 152,358 152,358
Less: Accumulated impairment loss (144,750) (144,750)
Net foreclosed assets 7,608 7,608
Refundable deposits 470,485 655,790
Operating guarantee deposits and settlement clearing funds 1,176,601 1,079,909
Prepayments 774,663 914,926
Restricted assets 14,000 113,400
Debit items for securities consignment trading 6,499 33,789
Deferred income tax assets - net 4,006,937 3,488,868
Others 30,946 27,579
Other assets – net 6,480,131 6,314,261
Total $13,900,508 $13,908,570
A. Please refer to Note 6 for details of other assets pledged as collateral as of December 31, 2009 and 2008.
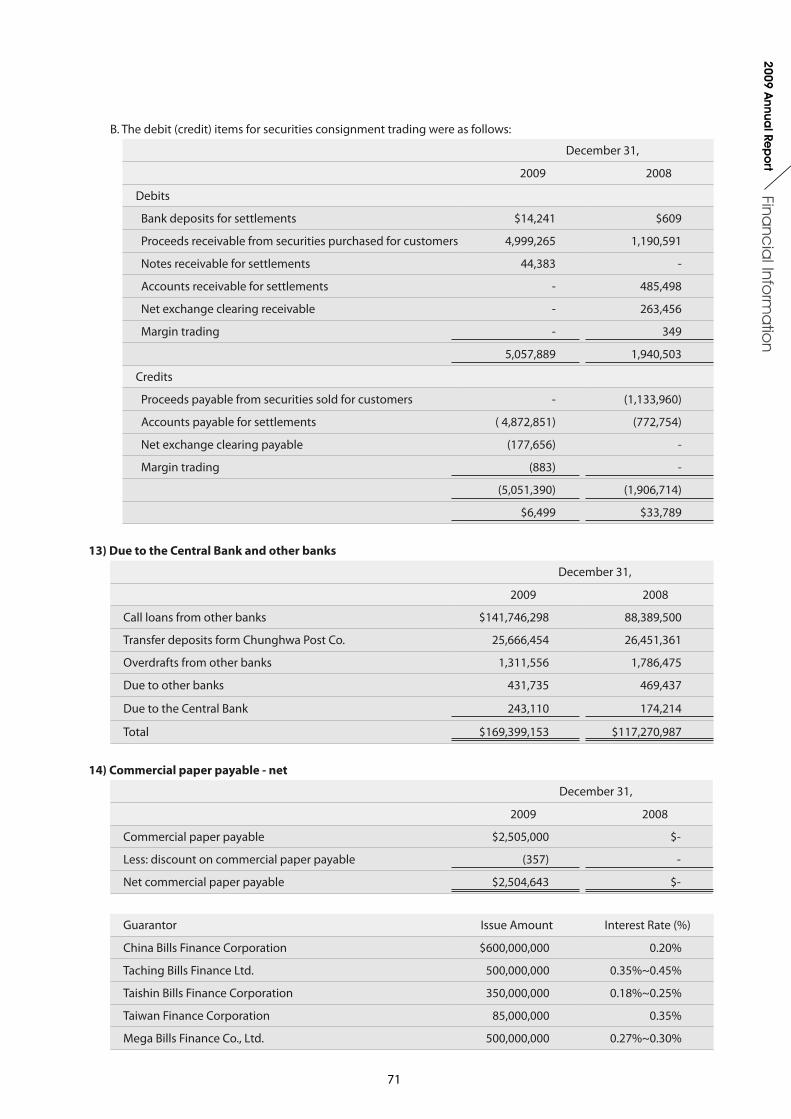
71
Financ
ial Info
rma
tion
2009 Annua
l Rep
ort
B. The debit (credit) items for securities consignment trading were as follows:
December 31,
2009 2008
Debits
Bank deposits for settlements $14,241 $609
Proceeds receivable from securities purchased for customers 4,999,265 1,190,591
Notes receivable for settlements 44,383 -
Accounts receivable for settlements - 485,498
Net exchange clearing receivable - 263,456
Margin trading - 349
5,057,889 1,940,503
Credits
Proceeds payable from securities sold for customers - (1,133,960)
Accounts payable for settlements ( 4,872,851) (772,754)
Net exchange clearing payable (177,656) -
Margin trading (883) -
(5,051,390) (1,906,714)
$6,499 $33,789
13) Due to the Central Bank and other banks
December 31,
2009 2008
Call loans from other banks $141,746,298 88,389,500
Transfer deposits form Chunghwa Post Co. 25,666,454 26,451,361
Overdrafts from other banks 1,311,556 1,786,475
Due to other banks 431,735 469,437
Due to the Central Bank 243,110 174,214
Total $169,399,153 $117,270,987
14) Commercial paper payable - net
December 31,
2009 2008
Commercial paper payable $2,505,000 $-
Less: discount on commercial paper payable (357) -
Net commercial paper payable $2,504,643 $-
Guarantor Issue Amount Interest Rate (%)
China Bills Finance Corporation $600,000,000 0.20%
Taching Bills Finance Ltd. 500,000,000 0.35%~0.45%
Taishin Bills Finance Corporation 350,000,000 0.18%~0.25%
Taiwan Finance Corporation 85,000,000 0.35%
Mega Bills Finance Co., Ltd. 500,000,000 0.27%~0.30%
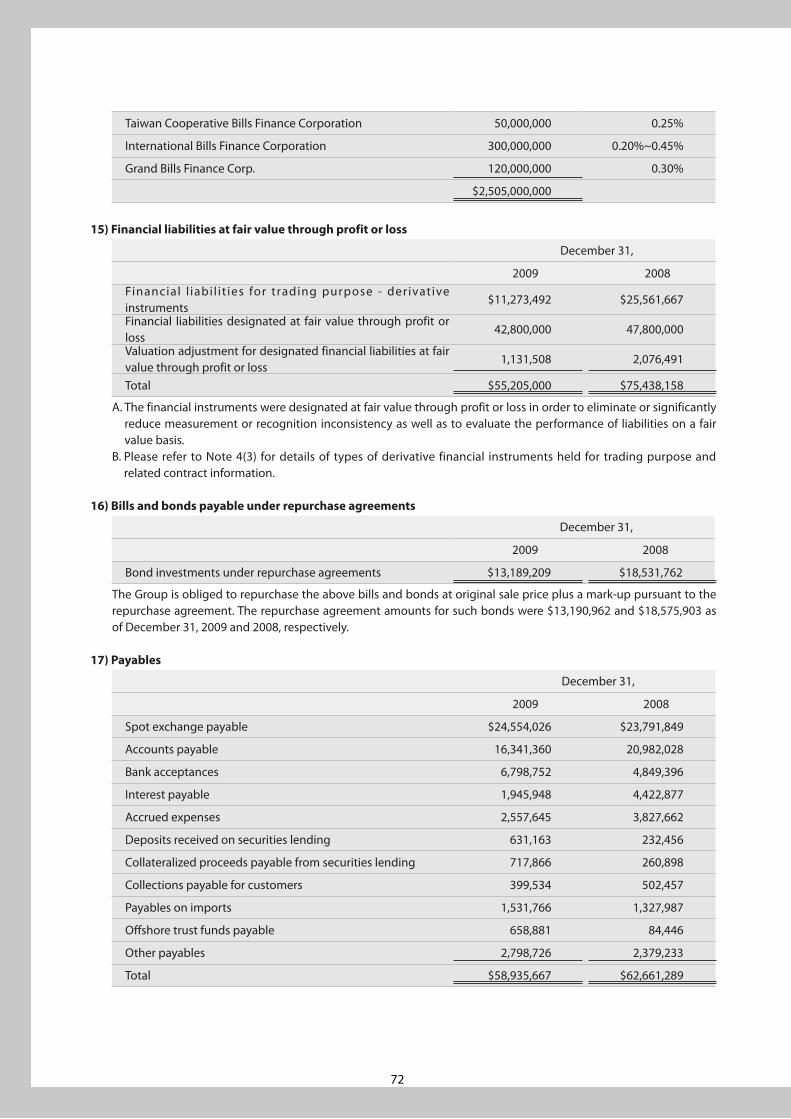
72
Taiwan Cooperative Bills Finance Corporation 50,000,000 0.25%
International Bills Finance Corporation 300,000,000 0.20%~0.45%
Grand Bills Finance Corp. 120,000,000 0.30%
$2,505,000,000
15) Financial liabilities at fair value through profit or loss
December 31,
2009 2008Financial l iabi l it ies for trading purpose - derivative instruments
$11,273,492 $25,561,667
Financial liabilities designated at fair value through profit or loss
42,800,000 47,800,000
Valuation adjustment for designated financial liabilities at fair value through profit or loss
1,131,508 2,076,491
Total $55,205,000 $75,438,158
A. The financial instruments were designated at fair value through profit or loss in order to eliminate or significantly reduce measurement or recognition inconsistency as well as to evaluate the performance of liabilities on a fair value basis.
B. Please refer to Note 4(3) for details of types of derivative financial instruments held for trading purpose and related contract information.
16) Bills and bonds payable under repurchase agreements
December 31,
2009 2008
Bond investments under repurchase agreements $13,189,209 $18,531,762
The Group is obliged to repurchase the above bills and bonds at original sale price plus a mark-up pursuant to the repurchase agreement. The repurchase agreement amounts for such bonds were $13,190,962 and $18,575,903 as of December 31, 2009 and 2008, respectively.
17) Payables
December 31,
2009 2008
Spot exchange payable $24,554,026 $23,791,849
Accounts payable 16,341,360 20,982,028
Bank acceptances 6,798,752 4,849,396
Interest payable 1,945,948 4,422,877
Accrued expenses 2,557,645 3,827,662
Deposits received on securities lending 631,163 232,456
Collateralized proceeds payable from securities lending 717,866 260,898
Collections payable for customers 399,534 502,457
Payables on imports 1,531,766 1,327,987
Offshore trust funds payable 658,881 84,446
Other payables 2,798,726 2,379,233
Total $58,935,667 $62,661,289
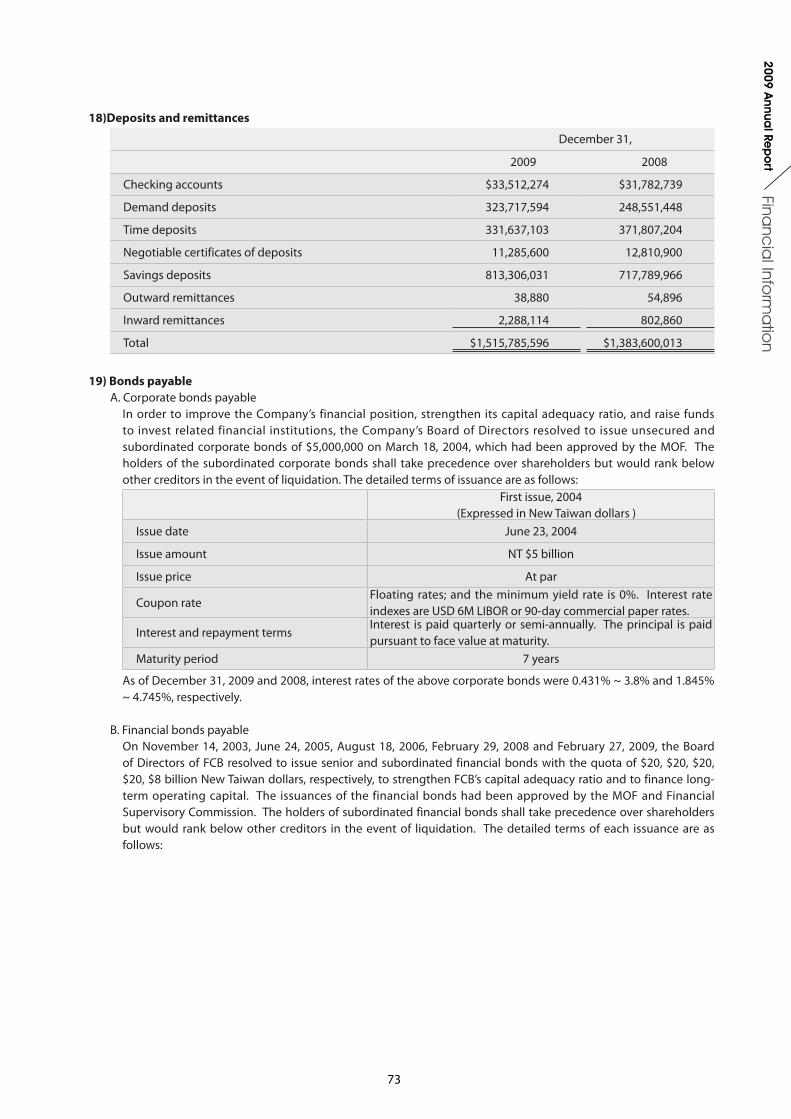
73
Financ
ial Info
rma
tion
2009 Annua
l Rep
ort
18)Deposits and remittances
December 31,
2009 2008
Checking accounts $33,512,274 $31,782,739
Demand deposits 323,717,594 248,551,448
Time deposits 331,637,103 371,807,204
Negotiable certificates of deposits 11,285,600 12,810,900
Savings deposits 813,306,031 717,789,966
Outward remittances 38,880 54,896
Inward remittances 2,288,114 802,860
Total $1,515,785,596 $1,383,600,013
19) Bonds payableA. Corporate bonds payable
In order to improve the Company’s financial position, strengthen its capital adequacy ratio, and raise funds to invest related financial institutions, the Company’s Board of Directors resolved to issue unsecured and subordinated corporate bonds of $5,000,000 on March 18, 2004, which had been approved by the MOF. The holders of the subordinated corporate bonds shall take precedence over shareholders but would rank below other creditors in the event of liquidation. The detailed terms of issuance are as follows:
First issue, 2004 (Expressed in New Taiwan dollars )
Issue date June 23, 2004
Issue amount NT $5 billion
Issue price At par
Coupon rateFloating rates; and the minimum yield rate is 0%. Interest rate indexes are USD 6M LIBOR or 90-day commercial paper rates.
Interest and repayment termsInterest is paid quarterly or semi-annually. The principal is paid pursuant to face value at maturity.
Maturity period 7 years
As of December 31, 2009 and 2008, interest rates of the above corporate bonds were 0.431% ~ 3.8% and 1.845% ~ 4.745%, respectively.
B. Financial bonds payableOn November 14, 2003, June 24, 2005, August 18, 2006, February 29, 2008 and February 27, 2009, the Board of Directors of FCB resolved to issue senior and subordinated financial bonds with the quota of $20, $20, $20, $20, $8 billion New Taiwan dollars, respectively, to strengthen FCB’s capital adequacy ratio and to finance long-term operating capital. The issuances of the financial bonds had been approved by the MOF and Financial Supervisory Commission. The holders of subordinated financial bonds shall take precedence over shareholders but would rank below other creditors in the event of liquidation. The detailed terms of each issuance are as follows:
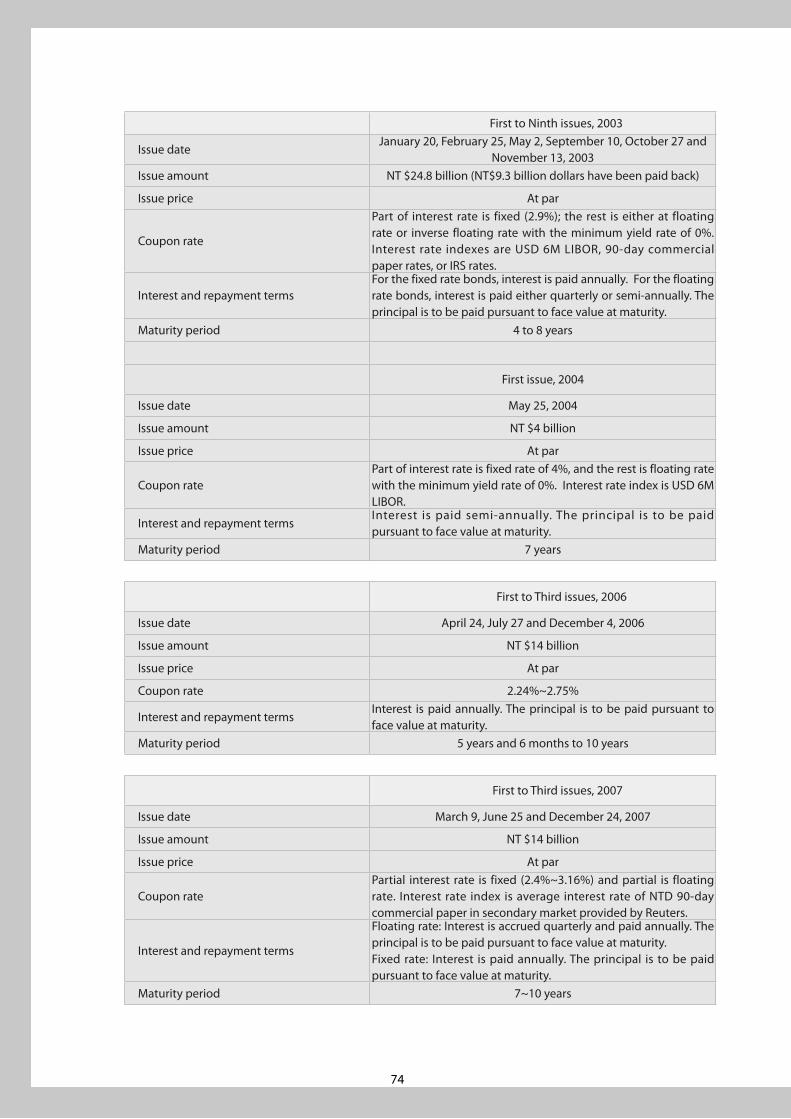
74
First to Ninth issues, 2003
Issue dateJanuary 20, February 25, May 2, September 10, October 27 and
November 13, 2003Issue amount NT $24.8 billion (NT$9.3 billion dollars have been paid back)
Issue price At par
Coupon rate
Part of interest rate is fixed (2.9%); the rest is either at floating rate or inverse floating rate with the minimum yield rate of 0%. Interest rate indexes are USD 6M LIBOR, 90-day commercial paper rates, or IRS rates.
Interest and repayment termsFor the fixed rate bonds, interest is paid annually. For the floating rate bonds, interest is paid either quarterly or semi-annually. The principal is to be paid pursuant to face value at maturity.
Maturity period 4 to 8 years
First issue, 2004
Issue date May 25, 2004
Issue amount NT $4 billion
Issue price At par
Coupon ratePart of interest rate is fixed rate of 4%, and the rest is floating rate with the minimum yield rate of 0%. Interest rate index is USD 6M LIBOR.
Interest and repayment termsInterest is paid semi-annually. The principal is to be paid pursuant to face value at maturity.
Maturity period 7 years
First to Third issues, 2006
Issue date April 24, July 27 and December 4, 2006
Issue amount NT $14 billion
Issue price At par
Coupon rate 2.24%~2.75%
Interest and repayment termsInterest is paid annually. The principal is to be paid pursuant to face value at maturity.
Maturity period 5 years and 6 months to 10 years
First to Third issues, 2007
Issue date March 9, June 25 and December 24, 2007
Issue amount NT $14 billion
Issue price At par
Coupon ratePartial interest rate is fixed (2.4%~3.16%) and partial is floating rate. Interest rate index is average interest rate of NTD 90-day commercial paper in secondary market provided by Reuters.
Interest and repayment terms
Floating rate: Interest is accrued quarterly and paid annually. The principal is to be paid pursuant to face value at maturity.Fixed rate: Interest is paid annually. The principal is to be paid pursuant to face value at maturity.
Maturity period 7~10 years
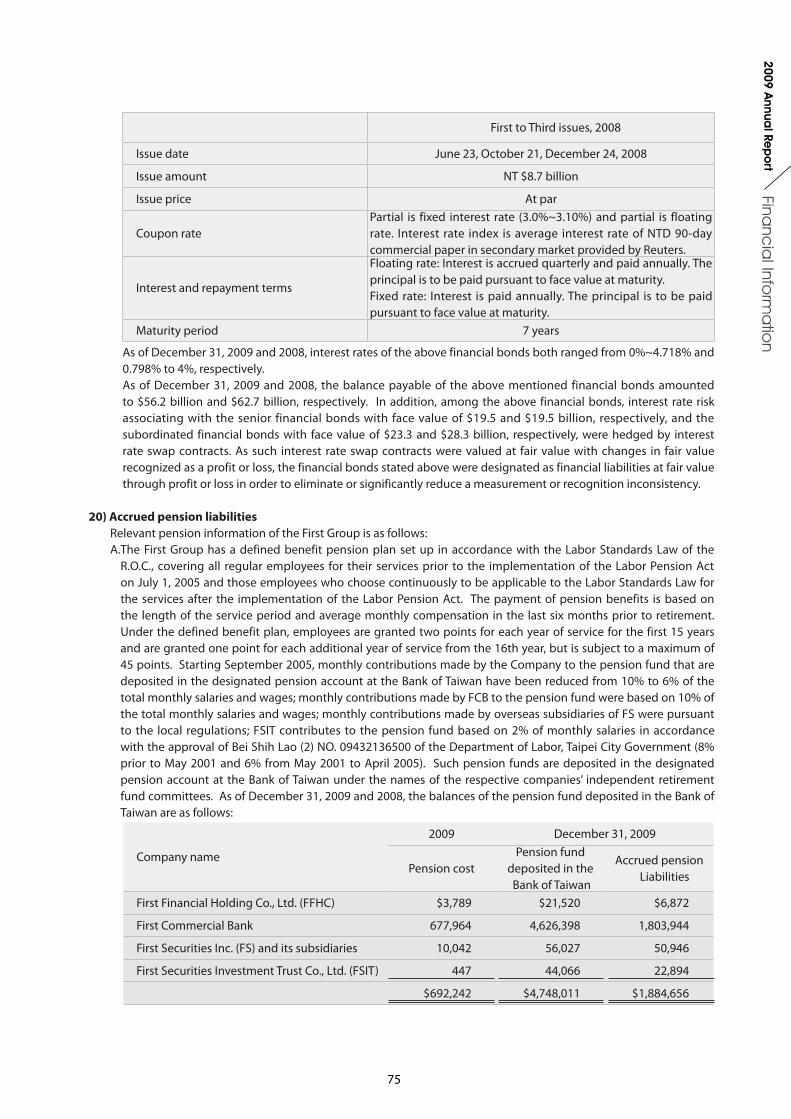
75
Financ
ial Info
rma
tion
2009 Annua
l Rep
ort
First to Third issues, 2008
Issue date June 23, October 21, December 24, 2008
Issue amount NT $8.7 billion
Issue price At par
Coupon ratePartial is fixed interest rate (3.0%~3.10%) and partial is floating rate. Interest rate index is average interest rate of NTD 90-day commercial paper in secondary market provided by Reuters.
Interest and repayment terms
Floating rate: Interest is accrued quarterly and paid annually. The principal is to be paid pursuant to face value at maturity.Fixed rate: Interest is paid annually. The principal is to be paid pursuant to face value at maturity.
Maturity period 7 years
As of December 31, 2009 and 2008, interest rates of the above financial bonds both ranged from 0%~4.718% and 0.798% to 4%, respectively.As of December 31, 2009 and 2008, the balance payable of the above mentioned financial bonds amounted to $56.2 billion and $62.7 billion, respectively. In addition, among the above financial bonds, interest rate risk associating with the senior financial bonds with face value of $19.5 and $19.5 billion, respectively, and the subordinated financial bonds with face value of $23.3 and $28.3 billion, respectively, were hedged by interest rate swap contracts. As such interest rate swap contracts were valued at fair value with changes in fair value recognized as a profit or loss, the financial bonds stated above were designated as financial liabilities at fair value through profit or loss in order to eliminate or significantly reduce a measurement or recognition inconsistency.
20) Accrued pension liabilitiesRelevant pension information of the First Group is as follows:A. The First Group has a defined benefit pension plan set up in accordance with the Labor Standards Law of the
R.O.C., covering all regular employees for their services prior to the implementation of the Labor Pension Act on July 1, 2005 and those employees who choose continuously to be applicable to the Labor Standards Law for the services after the implementation of the Labor Pension Act. The payment of pension benefits is based on the length of the service period and average monthly compensation in the last six months prior to retirement. Under the defined benefit plan, employees are granted two points for each year of service for the first 15 years and are granted one point for each additional year of service from the 16th year, but is subject to a maximum of 45 points. Starting September 2005, monthly contributions made by the Company to the pension fund that are deposited in the designated pension account at the Bank of Taiwan have been reduced from 10% to 6% of the total monthly salaries and wages; monthly contributions made by FCB to the pension fund were based on 10% of the total monthly salaries and wages; monthly contributions made by overseas subsidiaries of FS were pursuant to the local regulations; FSIT contributes to the pension fund based on 2% of monthly salaries in accordance with the approval of Bei Shih Lao (2) NO. 09432136500 of the Department of Labor, Taipei City Government (8% prior to May 2001 and 6% from May 2001 to April 2005). Such pension funds are deposited in the designated pension account at the Bank of Taiwan under the names of the respective companies’ independent retirement fund committees. As of December 31, 2009 and 2008, the balances of the pension fund deposited in the Bank of Taiwan are as follows:
Company name
2009 December 31, 2009
Pension costPension fund
deposited in the Bank of Taiwan
Accrued pension Liabilities
First Financial Holding Co., Ltd. (FFHC) $3,789 $21,520 $6,872
First Commercial Bank 677,964 4,626,398 1,803,944
First Securities Inc. (FS) and its subsidiaries 10,042 56,027 50,946
First Securities Investment Trust Co., Ltd. (FSIT) 447 44,066 22,894
$692,242 $4,748,011 $1,884,656
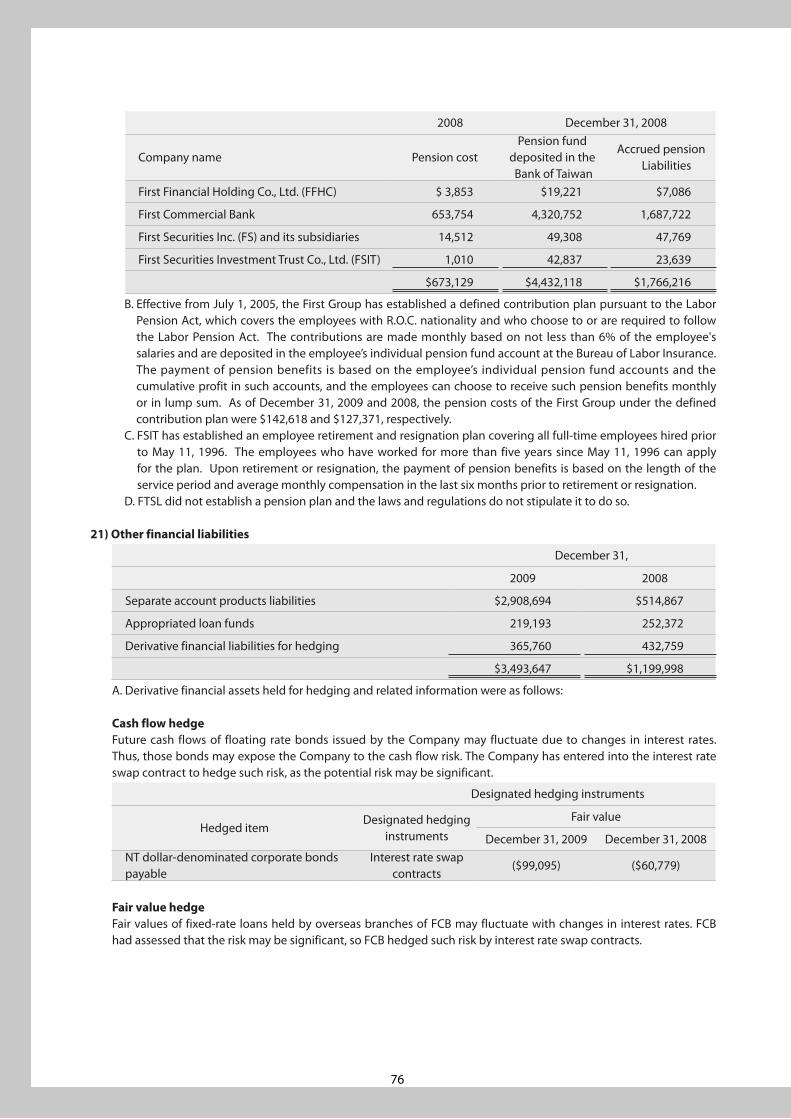
76
2008 December 31, 2008
Company name Pension costPension fund
deposited in the Bank of Taiwan
Accrued pension Liabilities
First Financial Holding Co., Ltd. (FFHC) $ 3,853 $19,221 $7,086
First Commercial Bank 653,754 4,320,752 1,687,722
First Securities Inc. (FS) and its subsidiaries 14,512 49,308 47,769
First Securities Investment Trust Co., Ltd. (FSIT) 1,010 42,837 23,639
$673,129 $4,432,118 $1,766,216
B. Effective from July 1, 2005, the First Group has established a defined contribution plan pursuant to the Labor Pension Act, which covers the employees with R.O.C. nationality and who choose to or are required to follow the Labor Pension Act. The contributions are made monthly based on not less than 6% of the employee's salaries and are deposited in the employee’s individual pension fund account at the Bureau of Labor Insurance. The payment of pension benefits is based on the employee’s individual pension fund accounts and the cumulative profit in such accounts, and the employees can choose to receive such pension benefits monthly or in lump sum. As of December 31, 2009 and 2008, the pension costs of the First Group under the defined contribution plan were $142,618 and $127,371, respectively.
C. FSIT has established an employee retirement and resignation plan covering all full-time employees hired prior to May 11, 1996. The employees who have worked for more than five years since May 11, 1996 can apply for the plan. Upon retirement or resignation, the payment of pension benefits is based on the length of the service period and average monthly compensation in the last six months prior to retirement or resignation.
D. FTSL did not establish a pension plan and the laws and regulations do not stipulate it to do so.
21) Other financial liabilities
December 31,
2009 2008
Separate account products liabilities $2,908,694 $514,867
Appropriated loan funds 219,193 252,372
Derivative financial liabilities for hedging 365,760 432,759
$3,493,647 $1,199,998
A. Derivative financial assets held for hedging and related information were as follows:
Cash flow hedgeFuture cash flows of floating rate bonds issued by the Company may fluctuate due to changes in interest rates. Thus, those bonds may expose the Company to the cash flow risk. The Company has entered into the interest rate swap contract to hedge such risk, as the potential risk may be significant.
Designated hedging instruments
Hedged itemDesignated hedging
instruments
Fair value
December 31, 2009 December 31, 2008NT dollar-denominated corporate bonds payable
Interest rate swap contracts
($99,095) ($60,779)
Fair value hedgeFair values of fixed-rate loans held by overseas branches of FCB may fluctuate with changes in interest rates. FCB had assessed that the risk may be significant, so FCB hedged such risk by interest rate swap contracts.
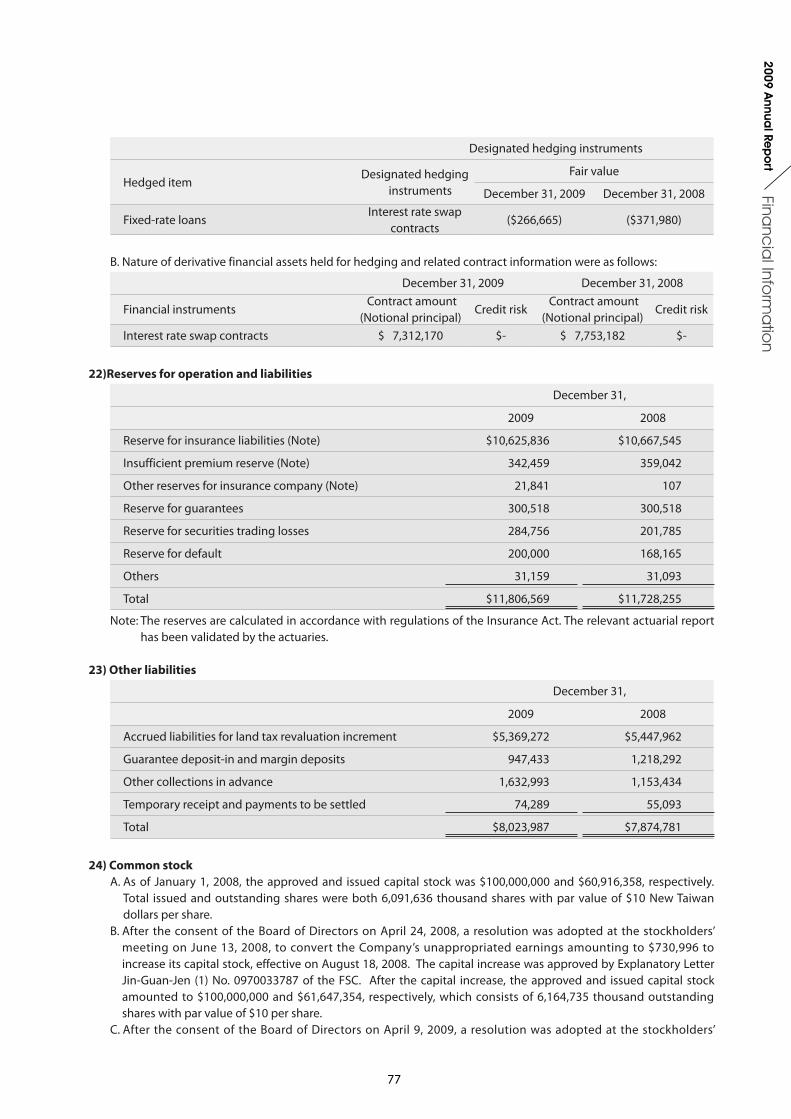
77
Financ
ial Info
rma
tion
2009 Annua
l Rep
ort
Designated hedging instruments
Hedged itemDesignated hedging
instruments
Fair value
December 31, 2009 December 31, 2008
Fixed-rate loansInterest rate swap
contracts($266,665) ($371,980)
B. Nature of derivative financial assets held for hedging and related contract information were as follows:
December 31, 2009 December 31, 2008
Financial instruments Contract amount
(Notional principal)Credit risk
Contract amount(Notional principal)
Credit risk
Interest rate swap contracts $ 7,312,170 $- $ 7,753,182 $-
22)Reserves for operation and liabilities
December 31,
2009 2008
Reserve for insurance liabilities (Note) $10,625,836 $10,667,545
Insufficient premium reserve (Note) 342,459 359,042
Other reserves for insurance company (Note) 21,841 107
Reserve for guarantees 300,518 300,518
Reserve for securities trading losses 284,756 201,785
Reserve for default 200,000 168,165
Others 31,159 31,093
Total $11,806,569 $11,728,255
Note: The reserves are calculated in accordance with regulations of the Insurance Act. The relevant actuarial report has been validated by the actuaries.
23) Other liabilities
December 31,
2009 2008
Accrued liabilities for land tax revaluation increment $5,369,272 $5,447,962
Guarantee deposit-in and margin deposits 947,433 1,218,292
Other collections in advance 1,632,993 1,153,434
Temporary receipt and payments to be settled 74,289 55,093
Total $8,023,987 $7,874,781
24) Common stockA. As of January 1, 2008, the approved and issued capital stock was $100,000,000 and $60,916,358, respectively.
Total issued and outstanding shares were both 6,091,636 thousand shares with par value of $10 New Taiwan dollars per share.
B. After the consent of the Board of Directors on April 24, 2008, a resolution was adopted at the stockholders’ meeting on June 13, 2008, to convert the Company’s unappropriated earnings amounting to $730,996 to increase its capital stock, effective on August 18, 2008. The capital increase was approved by Explanatory Letter Jin-Guan-Jen (1) No. 0970033787 of the FSC. After the capital increase, the approved and issued capital stock amounted to $100,000,000 and $61,647,354, respectively, which consists of 6,164,735 thousand outstanding shares with par value of $10 per share.
C. After the consent of the Board of Directors on April 9, 2009, a resolution was adopted at the stockholders’
78
meeting on May 22, 2009, to convert the Company’s unappropriated earnings amounting to $1,541,184 to increase its capital stock, effective on July 13, 2009. The capital increase was approved by Explanatory Letter Jin-Guan-Jen (Fa) No. 0980028027 of the FSC. After the capital increase, the approved and issued capital stock amounted to $100,000,000 and $63,188,538, respectively, which consists of 6,318,854 thousand outstanding shares with par value of $10 per share.
25) Additional paid-in capitalA. In accordance with Article 47 of the Financial Holding Company Act and the Explanatory Letter Tai-Tsai-Jen
(6) No.0910003413 of the SFC in 2002, if a financial institution coverts into a financial holding company, the retained earnings of the financial institution is recorded as capital reserves, namely additional paid-in capital, in the financial holding company’s book after such conversion. Such capital reserves may be distributed by the financial holding company as cash dividends, and the restrictions under Article 241, Paragraph 1 of the Company Law shall not be applicable to such distribution of capital reserves. In addition, such capital reserves may be also converted into capital stock during the year of conversion, and the ratio of conversion into capital stock is not subject to the restrictions of capitalized ratios prescribed in Article 41, Paragraph 2 of the Securities and Exchange Act and Article 8 of the Securities and Exchange Act Enforcement Rules. According to the Explanatory Letter Tai-Tsai-Jung (1) No.0910016280 of the Bureau of Monetary Affairs in 2002, as the aforementioned capital reserves are not generated from the business operation results of the financial holding company, such capital reserves cannot be used for the distribution of remuneration to Directors and Supervisors or bonuses to employees.
B. The “Regulations Governing the Offering and Issuance of Securities by Securities Issuers” and the Company Law of the R.O.C. require that capital reserves, namely additional paid-in capital, resulting from price received in excess of par value of the issuance of capital stock and donation income received should be used only to recover losses or to increase the capital stock of a company pursuant to a maximum limit of 10% of the issued capital stock per year while the company has no accumulated deficits. The capital reserves cannot be used to recover losses unless the special and legal reserves are insufficient to recover the accumulated deficits.
C. As of December 31, 2009, while the Company converted from a financial institution into a financial holding company, the Company recognized less capital reserves, namely additional paid-in capital, as a result of absorbing the accumulated deficits of the financial institution before such conversion. On June 20, 2003, the Board of Directors of FCB decided, based on the resolution adopted at the Stockholders’ Meeting of FCB, to use the legal reserve of $15,268,422, special reserve of $3,695,364, and capital reserve of $4,075,242, to recover its accumulated deficits. After the FCB’s accumulated deficits were recovered, the Company’s additional paid-in capital, other than those generated from the additional paid-in capital of the original financial institution, consisted of only the FCB’s cumulative translation adjustment of $247,091. At the end of 2007, the aforesaid capital reserve - cumulative translation adjustment was transferred to other stockholders’ equity - cumulative translation adjustment in accordance with Ji-Mi-Zhi (96) No.000000344 of Accounting Research and Development Foundation.
26) Legal reserve and special reserveA. Legal reserve
According to the Company Law of the R.O.C., legal reserve can be used only to recover accumulated deficits or to increase capital stock and shall not be used for any other purposes. However, it is permitted that the legal reserve be used to increase capital stock if the balance of the legal reserve has reached fifty percent of the issued capital stock, and only half of the legal reserve can be capitalized.
B. Special reserveIn compliance with the Explanatory Letter Tai-Tsai-Jen (1) No.100116 of the former SFC in 2000 and the Explanatory Letter Jin-Guan-Jen (1) No. 0950000507 of the FSC dated 27 January, 2006, except for appropriating legal reserve in accordance with the law, if the current year-end contra accounts in the stockholders’ equity, such as unrealized loss on available-for-sale financial assets, unrealized loss on cash flow, net loss not recognized as pension cost and cumulative translation adjustment, have negative / debit balances, listed or OTC companies are required to appropriate a special reserve equaling such negative / debit balances before distributing the undistributed earnings. Such appropriation of the special reserve should be subject to the following restrictions in accordance with the aforesaid regulations. (a) If the amounts of the contra accounts in the stockholders’ equity result from the current year, the amount of the special reserve to be set aside should not exceed the current net income after income taxes plus the accumulated undistributed earnings of the prior years. (b) If the amounts of the contra accounts in the stockholders’ equity result from the prior years, the amount of the special
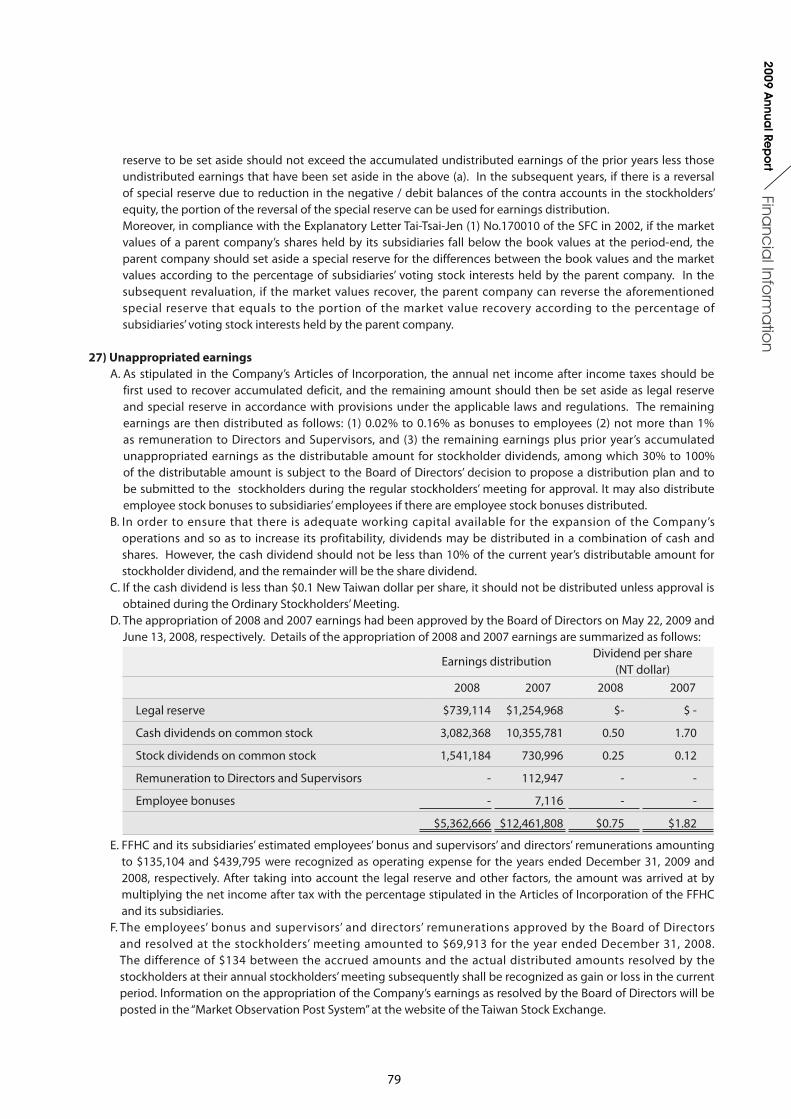
79
Financ
ial Info
rma
tion
2009 Annua
l Rep
ortreserve to be set aside should not exceed the accumulated undistributed earnings of the prior years less those
undistributed earnings that have been set aside in the above (a). In the subsequent years, if there is a reversal of special reserve due to reduction in the negative / debit balances of the contra accounts in the stockholders’ equity, the portion of the reversal of the special reserve can be used for earnings distribution. Moreover, in compliance with the Explanatory Letter Tai-Tsai-Jen (1) No.170010 of the SFC in 2002, if the market values of a parent company’s shares held by its subsidiaries fall below the book values at the period-end, the parent company should set aside a special reserve for the differences between the book values and the market values according to the percentage of subsidiaries’ voting stock interests held by the parent company. In the subsequent revaluation, if the market values recover, the parent company can reverse the aforementioned special reserve that equals to the portion of the market value recovery according to the percentage of subsidiaries’ voting stock interests held by the parent company.
27) Unappropriated earningsA. As stipulated in the Company’s Articles of Incorporation, the annual net income after income taxes should be
first used to recover accumulated deficit, and the remaining amount should then be set aside as legal reserve and special reserve in accordance with provisions under the applicable laws and regulations. The remaining earnings are then distributed as follows: (1) 0.02% to 0.16% as bonuses to employees (2) not more than 1% as remuneration to Directors and Supervisors, and (3) the remaining earnings plus prior year’s accumulated unappropriated earnings as the distributable amount for stockholder dividends, among which 30% to 100% of the distributable amount is subject to the Board of Directors’ decision to propose a distribution plan and to be submitted to the stockholders during the regular stockholders’ meeting for approval. It may also distribute employee stock bonuses to subsidiaries’ employees if there are employee stock bonuses distributed.
B. In order to ensure that there is adequate working capital available for the expansion of the Company’s operations and so as to increase its profitability, dividends may be distributed in a combination of cash and shares. However, the cash dividend should not be less than 10% of the current year’s distributable amount for stockholder dividend, and the remainder will be the share dividend.
C. If the cash dividend is less than $0.1 New Taiwan dollar per share, it should not be distributed unless approval is obtained during the Ordinary Stockholders’ Meeting.
D. The appropriation of 2008 and 2007 earnings had been approved by the Board of Directors on May 22, 2009 and June 13, 2008, respectively. Details of the appropriation of 2008 and 2007 earnings are summarized as follows:
Earnings distribution Dividend per share
(NT dollar) 2008 2007 2008 2007
Legal reserve $739,114 $1,254,968 $- $ -
Cash dividends on common stock 3,082,368 10,355,781 0.50 1.70
Stock dividends on common stock 1,541,184 730,996 0.25 0.12
Remuneration to Directors and Supervisors - 112,947 - -
Employee bonuses - 7,116 - -
$5,362,666 $12,461,808 $0.75 $1.82
E. FFHC and its subsidiaries’ estimated employees’ bonus and supervisors’ and directors’ remunerations amounting to $135,104 and $439,795 were recognized as operating expense for the years ended December 31, 2009 and 2008, respectively. After taking into account the legal reserve and other factors, the amount was arrived at by multiplying the net income after tax with the percentage stipulated in the Articles of Incorporation of the FFHC and its subsidiaries.
F. The employees’ bonus and supervisors’ and directors’ remunerations approved by the Board of Directors and resolved at the stockholders’ meeting amounted to $69,913 for the year ended December 31, 2008. The difference of $134 between the accrued amounts and the actual distributed amounts resolved by the stockholders at their annual stockholders’ meeting subsequently shall be recognized as gain or loss in the current period. Information on the appropriation of the Company’s earnings as resolved by the Board of Directors will be posted in the “Market Observation Post System” at the website of the Taiwan Stock Exchange.
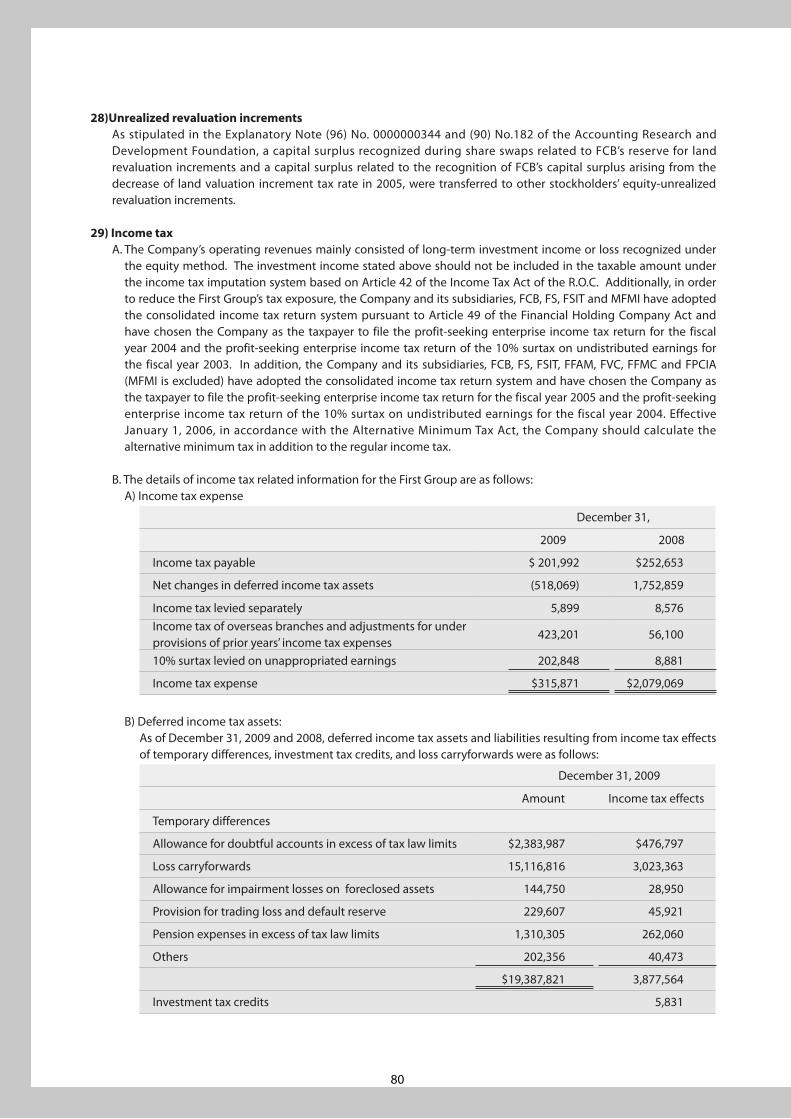
80
28)Unrealized revaluation incrementsAs stipulated in the Explanatory Note (96) No. 0000000344 and (90) No.182 of the Accounting Research and Development Foundation, a capital surplus recognized during share swaps related to FCB’s reserve for land revaluation increments and a capital surplus related to the recognition of FCB’s capital surplus arising from the decrease of land valuation increment tax rate in 2005, were transferred to other stockholders’ equity-unrealized revaluation increments.
29) Income taxA. The Company’s operating revenues mainly consisted of long-term investment income or loss recognized under
the equity method. The investment income stated above should not be included in the taxable amount under the income tax imputation system based on Article 42 of the Income Tax Act of the R.O.C. Additionally, in order to reduce the First Group’s tax exposure, the Company and its subsidiaries, FCB, FS, FSIT and MFMI have adopted the consolidated income tax return system pursuant to Article 49 of the Financial Holding Company Act and have chosen the Company as the taxpayer to file the profit-seeking enterprise income tax return for the fiscal year 2004 and the profit-seeking enterprise income tax return of the 10% surtax on undistributed earnings for the fiscal year 2003. In addition, the Company and its subsidiaries, FCB, FS, FSIT, FFAM, FVC, FFMC and FPCIA (MFMI is excluded) have adopted the consolidated income tax return system and have chosen the Company as the taxpayer to file the profit-seeking enterprise income tax return for the fiscal year 2005 and the profit-seeking enterprise income tax return of the 10% surtax on undistributed earnings for the fiscal year 2004. Effective January 1, 2006, in accordance with the Alternative Minimum Tax Act, the Company should calculate the alternative minimum tax in addition to the regular income tax.
B. The details of income tax related information for the First Group are as follows:A) Income tax expense
December 31,
2009 2008
Income tax payable $ 201,992 $252,653
Net changes in deferred income tax assets (518,069) 1,752,859
Income tax levied separately 5,899 8,576Income tax of overseas branches and adjustments for under provisions of prior years’ income tax expenses
423,201 56,100
10% surtax levied on unappropriated earnings 202,848 8,881
Income tax expense $315,871 $2,079,069
B) Deferred income tax assets:As of December 31, 2009 and 2008, deferred income tax assets and liabilities resulting from income tax effects of temporary differences, investment tax credits, and loss carryforwards were as follows:
December 31, 2009
Amount Income tax effects
Temporary differences
Allowance for doubtful accounts in excess of tax law limits $2,383,987 $476,797
Loss carryforwards 15,116,816 3,023,363
Allowance for impairment losses on foreclosed assets 144,750 28,950
Provision for trading loss and default reserve 229,607 45,921
Pension expenses in excess of tax law limits 1,310,305 262,060
Others 202,356 40,473
$19,387,821 3,877,564
Investment tax credits 5,831
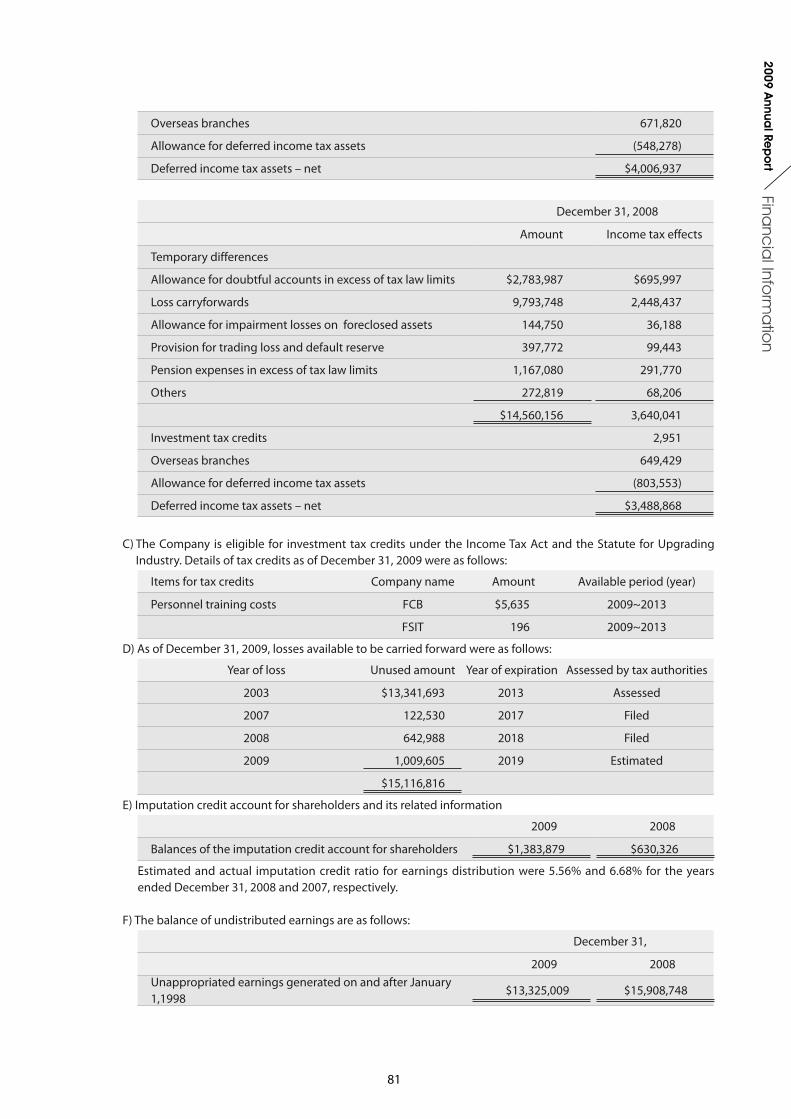
81
Financ
ial Info
rma
tion
2009 Annua
l Rep
ort
Overseas branches 671,820
Allowance for deferred income tax assets (548,278)
Deferred income tax assets – net $4,006,937
December 31, 2008
Amount Income tax effects
Temporary differences
Allowance for doubtful accounts in excess of tax law limits $2,783,987 $695,997
Loss carryforwards 9,793,748 2,448,437
Allowance for impairment losses on foreclosed assets 144,750 36,188
Provision for trading loss and default reserve 397,772 99,443
Pension expenses in excess of tax law limits 1,167,080 291,770
Others 272,819 68,206
$14,560,156 3,640,041
Investment tax credits 2,951
Overseas branches 649,429
Allowance for deferred income tax assets (803,553)
Deferred income tax assets – net $3,488,868
C) The Company is eligible for investment tax credits under the Income Tax Act and the Statute for Upgrading Industry. Details of tax credits as of December 31, 2009 were as follows:
Items for tax credits Company name Amount Available period (year)
Personnel training costs FCB $5,635 2009~2013
FSIT 196 2009~2013
D) As of December 31, 2009, losses available to be carried forward were as follows:
Year of loss Unused amount Year of expiration Assessed by tax authorities
2003 $13,341,693 2013 Assessed
2007 122,530 2017 Filed
2008 642,988 2018 Filed
2009 1,009,605 2019 Estimated
$15,116,816
E) Imputation credit account for shareholders and its related information
2009 2008
Balances of the imputation credit account for shareholders $1,383,879 $630,326
Estimated and actual imputation credit ratio for earnings distribution were 5.56% and 6.68% for the years ended December 31, 2008 and 2007, respectively.
F) The balance of undistributed earnings are as follows:
December 31,
2009 2008 Unappropriated earnings generated on and after January 1,1998
$13,325,009 $15,908,748
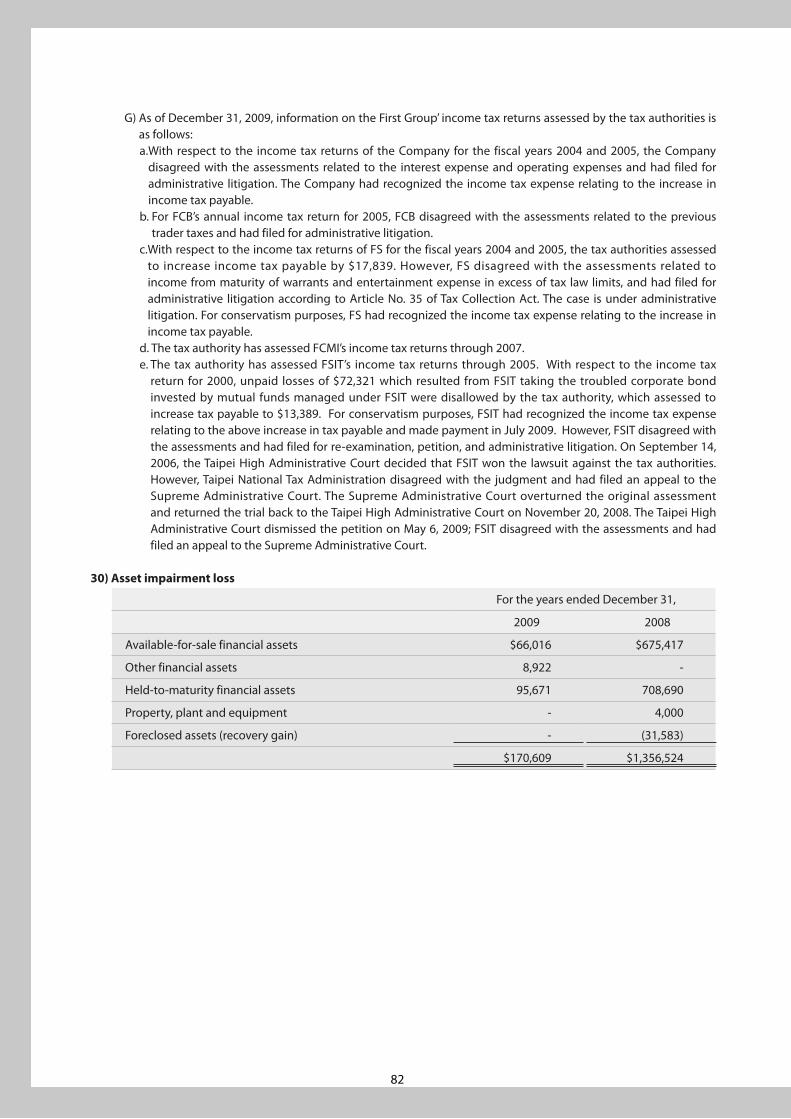
82
G) As of December 31, 2009, information on the First Group’ income tax returns assessed by the tax authorities is as follows:a. With respect to the income tax returns of the Company for the fiscal years 2004 and 2005, the Company
disagreed with the assessments related to the interest expense and operating expenses and had filed for administrative litigation. The Company had recognized the income tax expense relating to the increase in income tax payable.
b. For FCB’s annual income tax return for 2005, FCB disagreed with the assessments related to the previous trader taxes and had filed for administrative litigation.
c. With respect to the income tax returns of FS for the fiscal years 2004 and 2005, the tax authorities assessed to increase income tax payable by $17,839. However, FS disagreed with the assessments related to income from maturity of warrants and entertainment expense in excess of tax law limits, and had filed for administrative litigation according to Article No. 35 of Tax Collection Act. The case is under administrative litigation. For conservatism purposes, FS had recognized the income tax expense relating to the increase in income tax payable.
d. The tax authority has assessed FCMI’s income tax returns through 2007.e. The tax authority has assessed FSIT’s income tax returns through 2005. With respect to the income tax
return for 2000, unpaid losses of $72,321 which resulted from FSIT taking the troubled corporate bond invested by mutual funds managed under FSIT were disallowed by the tax authority, which assessed to increase tax payable to $13,389. For conservatism purposes, FSIT had recognized the income tax expense relating to the above increase in tax payable and made payment in July 2009. However, FSIT disagreed with the assessments and had filed for re-examination, petition, and administrative litigation. On September 14, 2006, the Taipei High Administrative Court decided that FSIT won the lawsuit against the tax authorities. However, Taipei National Tax Administration disagreed with the judgment and had filed an appeal to the Supreme Administrative Court. The Supreme Administrative Court overturned the original assessment and returned the trial back to the Taipei High Administrative Court on November 20, 2008. The Taipei High Administrative Court dismissed the petition on May 6, 2009; FSIT disagreed with the assessments and had filed an appeal to the Supreme Administrative Court.
30) Asset impairment loss
For the years ended December 31,
2009 2008
Available-for-sale financial assets $66,016 $675,417
Other financial assets 8,922 -
Held-to-maturity financial assets 95,671 708,690
Property, plant and equipment - 4,000
Foreclosed assets (recovery gain) - (31,583)
$170,609 $1,356,524
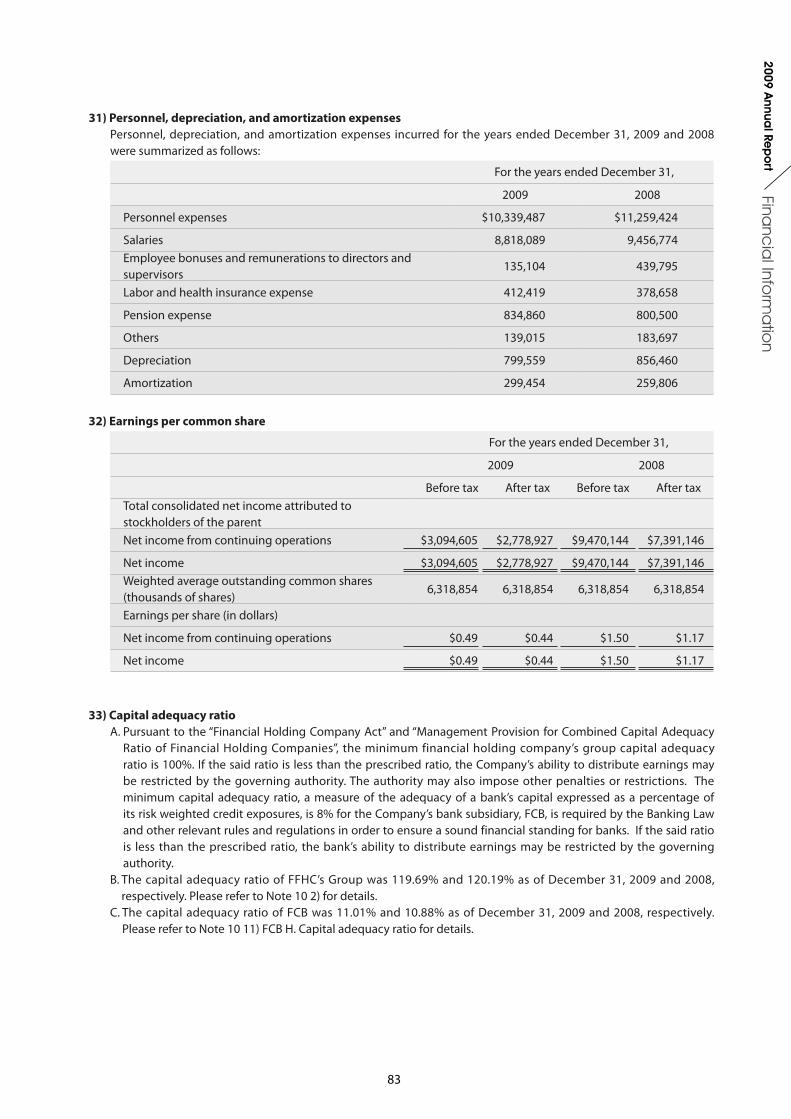
83
Financ
ial Info
rma
tion
2009 Annua
l Rep
ort
31) Personnel, depreciation, and amortization expensesPersonnel, depreciation, and amortization expenses incurred for the years ended December 31, 2009 and 2008 were summarized as follows:
For the years ended December 31,
2009 2008
Personnel expenses $10,339,487 $11,259,424
Salaries 8,818,089 9,456,774Employee bonuses and remunerations to directors and supervisors
135,104 439,795
Labor and health insurance expense 412,419 378,658
Pension expense 834,860 800,500
Others 139,015 183,697
Depreciation 799,559 856,460
Amortization 299,454 259,806
32) Earnings per common share
For the years ended December 31,
2009 2008
Before tax After tax Before tax After tax Total consolidated net income attributed to stockholders of the parentNet income from continuing operations $3,094,605 $2,778,927 $9,470,144 $7,391,146
Net income $3,094,605 $2,778,927 $9,470,144 $7,391,146Weighted average outstanding common shares (thousands of shares)
6,318,854 6,318,854 6,318,854 6,318,854
Earnings per share (in dollars)
Net income from continuing operations $0.49 $0.44 $1.50 $1.17
Net income $0.49 $0.44 $1.50 $1.17
33) Capital adequacy ratioA. Pursuant to the “Financial Holding Company Act” and “Management Provision for Combined Capital Adequacy
Ratio of Financial Holding Companies”, the minimum financial holding company’s group capital adequacy ratio is 100%. If the said ratio is less than the prescribed ratio, the Company’s ability to distribute earnings may be restricted by the governing authority. The authority may also impose other penalties or restrictions. The minimum capital adequacy ratio, a measure of the adequacy of a bank’s capital expressed as a percentage of its risk weighted credit exposures, is 8% for the Company’s bank subsidiary, FCB, is required by the Banking Law and other relevant rules and regulations in order to ensure a sound financial standing for banks. If the said ratio is less than the prescribed ratio, the bank’s ability to distribute earnings may be restricted by the governing authority.
B. The capital adequacy ratio of FFHC’s Group was 119.69% and 120.19% as of December 31, 2009 and 2008, respectively. Please refer to Note 10 2) for details.
C. The capital adequacy ratio of FCB was 11.01% and 10.88% as of December 31, 2009 and 2008, respectively. Please refer to Note 10 11) FCB H. Capital adequacy ratio for details.
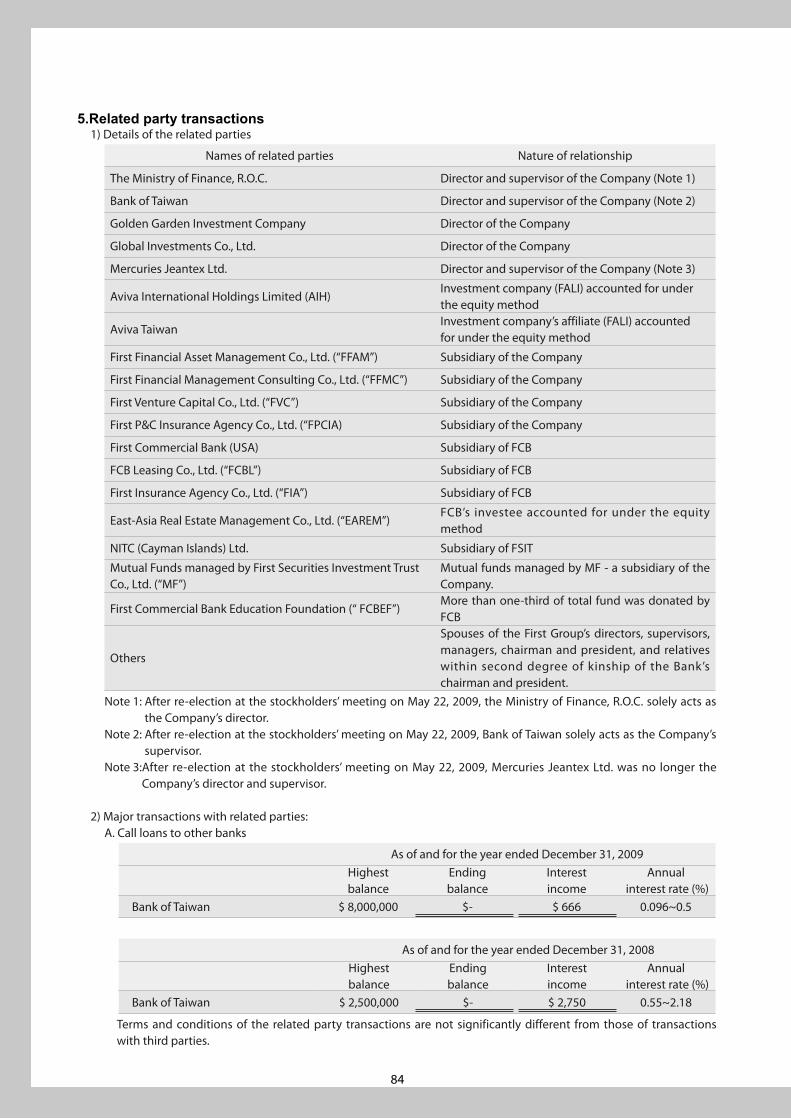
84
5.Related party transactions1) Details of the related parties
Names of related parties Nature of relationship
The Ministry of Finance, R.O.C. Director and supervisor of the Company (Note 1)
Bank of Taiwan Director and supervisor of the Company (Note 2)
Golden Garden Investment Company Director of the Company
Global Investments Co., Ltd. Director of the Company
Mercuries Jeantex Ltd. Director and supervisor of the Company (Note 3)
Aviva International Holdings Limited (AIH)Investment company (FALI) accounted for under the equity method
Aviva TaiwanInvestment company’s affiliate (FALI) accounted for under the equity method
First Financial Asset Management Co., Ltd. (“FFAM”) Subsidiary of the Company
First Financial Management Consulting Co., Ltd. (“FFMC”) Subsidiary of the Company
First Venture Capital Co., Ltd. (“FVC”) Subsidiary of the Company
First P&C Insurance Agency Co., Ltd. (“FPCIA) Subsidiary of the Company
First Commercial Bank (USA) Subsidiary of FCB
FCB Leasing Co., Ltd. (“FCBL”) Subsidiary of FCB
First Insurance Agency Co., Ltd. (“FIA”) Subsidiary of FCB
East-Asia Real Estate Management Co., Ltd. (“EAREM”)FCB’s investee accounted for under the equity method
NITC (Cayman Islands) Ltd. Subsidiary of FSIT
Mutual Funds managed by First Securities Investment Trust Co., Ltd. (“MF”)
Mutual funds managed by MF - a subsidiary of the Company.
First Commercial Bank Education Foundation (“ FCBEF”)More than one-third of total fund was donated by FCB
Others
Spouses of the First Group’s directors, supervisors, managers, chairman and president, and relatives within second degree of kinship of the Bank’s chairman and president.
Note 1: After re-election at the stockholders’ meeting on May 22, 2009, the Ministry of Finance, R.O.C. solely acts as the Company’s director.
Note 2: After re-election at the stockholders’ meeting on May 22, 2009, Bank of Taiwan solely acts as the Company’s supervisor.
Note 3: After re-election at the stockholders’ meeting on May 22, 2009, Mercuries Jeantex Ltd. was no longer the Company’s director and supervisor.
2) Major transactions with related parties:A. Call loans to other banks
As of and for the year ended December 31, 2009Highest balance
Ending balance
Interestincome
Annual interest rate (%)
Bank of Taiwan $ 8,000,000 $- $ 666 0.096~0.5
As of and for the year ended December 31, 2008 Highest balance
Ending balance
Interestincome
Annual interest rate (%)
Bank of Taiwan $ 2,500,000 $- $ 2,750 0.55~2.18
Terms and conditions of the related party transactions are not significantly different from those of transactions with third parties.

85
Financ
ial Info
rma
tion
2009 Annua
l Rep
ort
B. Call loans from other banks
As of and for the year ended December 31, 2009 Highest balance
Ending balance
Interest income
Annual interest rate (%)
Bank of Taiwan $2,000,000 $- $49 0.098~0.1
As of and for the year ended December 31, 2008 Highest balance
Ending balance
Interestincome
Annual interest rate (%)
Bank of Taiwan $2,000,000 $2,000,000 $693 0.75~2.22
Terms and conditions of the related party transactions are not significantly different from those of transactions with third parties.
C. Deposits
December 31,
2009 2008
Ending balance Percentage
(Note 1) Ending balance
Percentage (Note 1)
FIA $98,575 0.01 $122,759 0.01
FVC 304,789 0.02 310,244 0.02
Others(Note 2) 1,025,809 0.06 683,673 0.05
$1,429,173 0.09 $1,116,676 0.08
The interest expense paid to the above related parties for the years ended December 31, 2009 and 2008 were $2,542 and $6,961, respectively.Note 1: Represents percentage accounted for of deposits and remittances.Note 2: Staff savings accounts are provided to the directors, supervisors and managers with interest rate of 13%
p.a. and limited to a balance of $480. Deposits exceeding $480 is calculated at demand savings deposit rate. Interest rates for others are the same as those offered to other customers.
D. LoansDecember 31, 2009
(Expressed in thousands of New Taiwan Dollars)
Items
Number or name
of related party
Maximum balance
for current period
Ending balance
Status of performance
Collateral
Difference with
transaction terms for third
parties
Performing loans
Non-performing
loans
Consumer loans 24 $10,697 $10,170 $10,170 $- None NoneResidential mortgage loans
95 347,720 328,412 328,412 - Real estate None
Other loans FCBL 2,646,000 1,450,000 1,450,000 -Bills of
exchangeNone
Other loans (Note)
5 3,794 3,440 3,440 -Certificates of deposits
of FCBNone
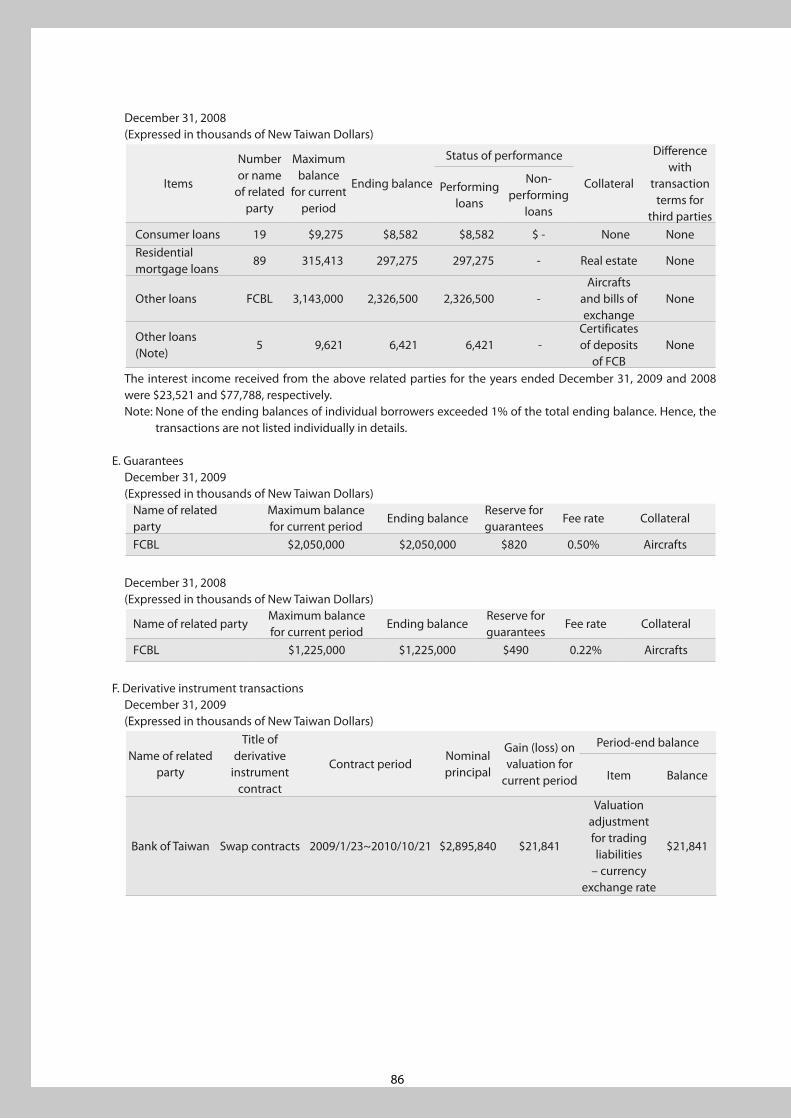
86
December 31, 2008(Expressed in thousands of New Taiwan Dollars)
Items
Number or name
of related party
Maximum balance
for current period
Ending balance
Status of performance
Collateral
Difference with
transaction terms for
third parties
Performing loans
Non-performing
loans
Consumer loans 19 $9,275 $8,582 $8,582 $ - None NoneResidential mortgage loans
89 315,413 297,275 297,275 - Real estate None
Other loans FCBL 3,143,000 2,326,500 2,326,500 -Aircrafts
and bills of exchange
None
Other loans (Note)
5 9,621 6,421 6,421 -Certificates of deposits
of FCBNone
The interest income received from the above related parties for the years ended December 31, 2009 and 2008 were $23,521 and $77,788, respectively.Note: None of the ending balances of individual borrowers exceeded 1% of the total ending balance. Hence, the
transactions are not listed individually in details.
E. GuaranteesDecember 31, 2009(Expressed in thousands of New Taiwan Dollars)
Name of related party
Maximum balance for current period
Ending balanceReserve for guarantees
Fee rate Collateral
FCBL $2,050,000 $2,050,000 $820 0.50% Aircrafts
December 31, 2008(Expressed in thousands of New Taiwan Dollars)
Name of related partyMaximum balance for current period
Ending balanceReserve for guarantees
Fee rate Collateral
FCBL $1,225,000 $1,225,000 $490 0.22% Aircrafts
F. Derivative instrument transactionsDecember 31, 2009(Expressed in thousands of New Taiwan Dollars)
Name of related party
Title of derivative
instrument contract
Contract periodNominal principal
Gain (loss) on valuation for
current period
Period-end balance
Item Balance
Bank of Taiwan Swap contracts 2009/1/23~2010/10/21 $2,895,840 $21,841
Valuation adjustment for trading liabilities
– currency exchange rate
$21,841
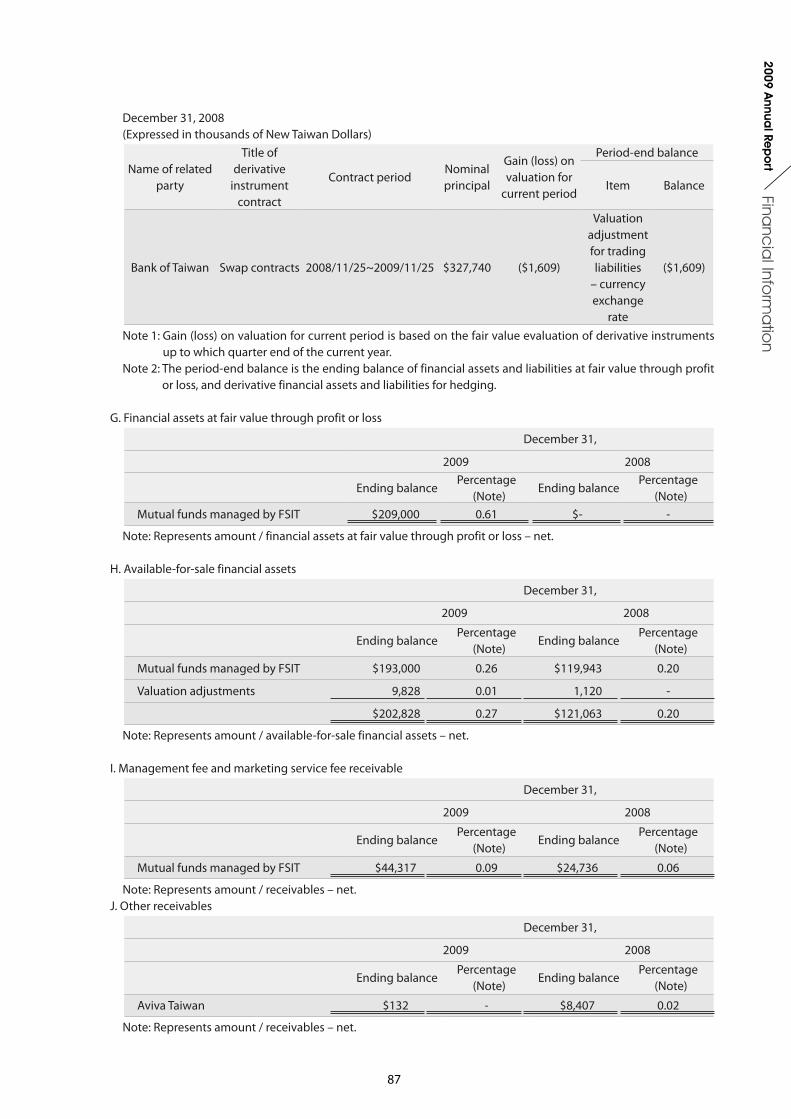
87
Financ
ial Info
rma
tion
2009 Annua
l Rep
ort
December 31, 2008(Expressed in thousands of New Taiwan Dollars)
Name of related party
Title of derivative
instrument contract
Contract periodNominal principal
Gain (loss) on valuation for
current period
Period-end balance
Item Balance
Bank of Taiwan Swap contracts 2008/11/25~2009/11/25 $327,740 ($1,609)
Valuation adjustment for trading liabilities
– currency exchange
rate
($1,609)
Note 1: Gain (loss) on valuation for current period is based on the fair value evaluation of derivative instruments up to which quarter end of the current year.
Note 2: The period-end balance is the ending balance of financial assets and liabilities at fair value through profit or loss, and derivative financial assets and liabilities for hedging.
G. Financial assets at fair value through profit or loss
December 31,
2009 2008
Ending balance Percentage
(Note) Ending balance
Percentage (Note)
Mutual funds managed by FSIT $209,000 0.61 $- -
Note: Represents amount / financial assets at fair value through profit or loss – net.
H. Available-for-sale financial assets
December 31,
2009 2008
Ending balance Percentage
(Note) Ending balance
Percentage (Note)
Mutual funds managed by FSIT $193,000 0.26 $119,943 0.20
Valuation adjustments 9,828 0.01 1,120 -
$202,828 0.27 $121,063 0.20
Note: Represents amount / available-for-sale financial assets – net.
I. Management fee and marketing service fee receivable
December 31,
2009 2008
Ending balance Percentage
(Note) Ending balance
Percentage (Note)
Mutual funds managed by FSIT $44,317 0.09 $24,736 0.06
Note: Represents amount / receivables – net. J. Other receivables
December 31,
2009 2008
Ending balance Percentage
(Note) Ending balance
Percentage (Note)
Aviva Taiwan $132 - $8,407 0.02
Note: Represents amount / receivables – net.
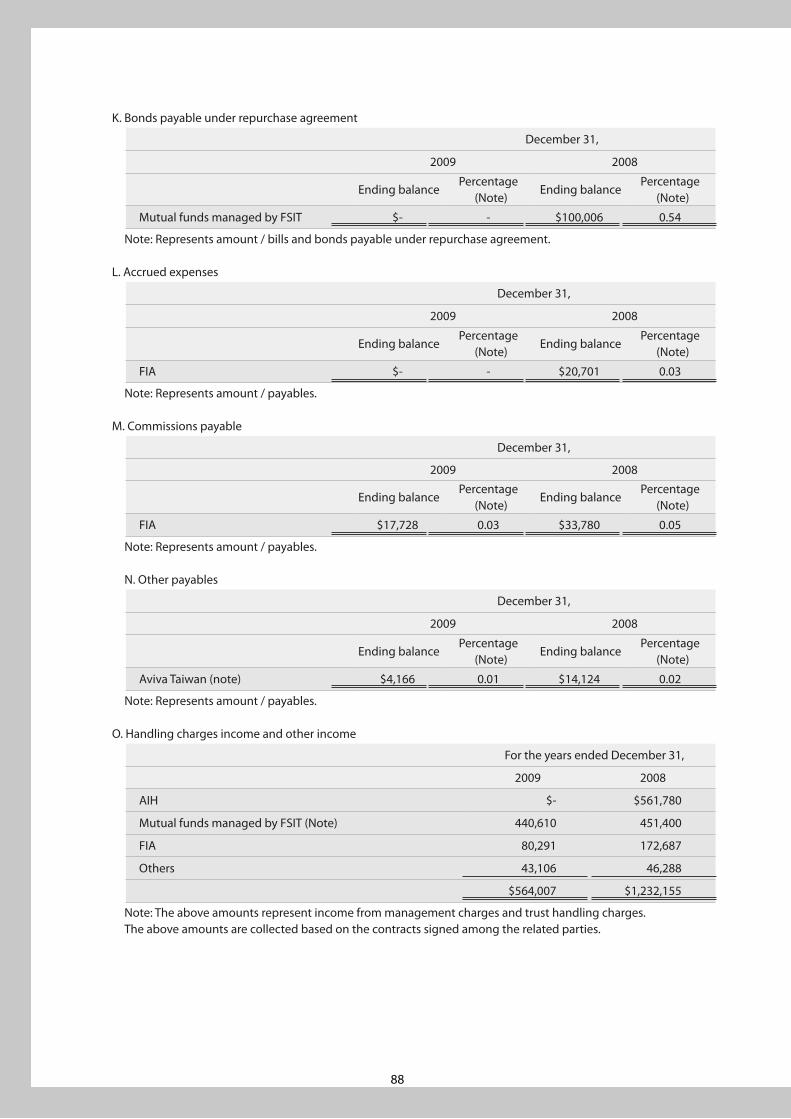
88
K. Bonds payable under repurchase agreement
December 31,
2009 2008
Ending balance Percentage
(Note) Ending balance
Percentage (Note)
Mutual funds managed by FSIT $- - $100,006 0.54
Note: Represents amount / bills and bonds payable under repurchase agreement.
L. Accrued expenses
December 31,
2009 2008
Ending balance Percentage
(Note) Ending balance
Percentage (Note)
FIA $- - $20,701 0.03
Note: Represents amount / payables.
M. Commissions payable
December 31,
2009 2008
Ending balance Percentage
(Note) Ending balance
Percentage (Note)
FIA $17,728 0.03 $33,780 0.05
Note: Represents amount / payables.
N. Other payables
December 31,
2009 2008
Ending balance Percentage
(Note) Ending balance
Percentage (Note)
Aviva Taiwan (note) $4,166 0.01 $14,124 0.02
Note: Represents amount / payables.
O. Handling charges income and other income
For the years ended December 31,
2009 2008
AIH $- $561,780
Mutual funds managed by FSIT (Note) 440,610 451,400
FIA 80,291 172,687
Others 43,106 46,288
$564,007 $1,232,155
Note: The above amounts represent income from management charges and trust handling charges. The above amounts are collected based on the contracts signed among the related parties.
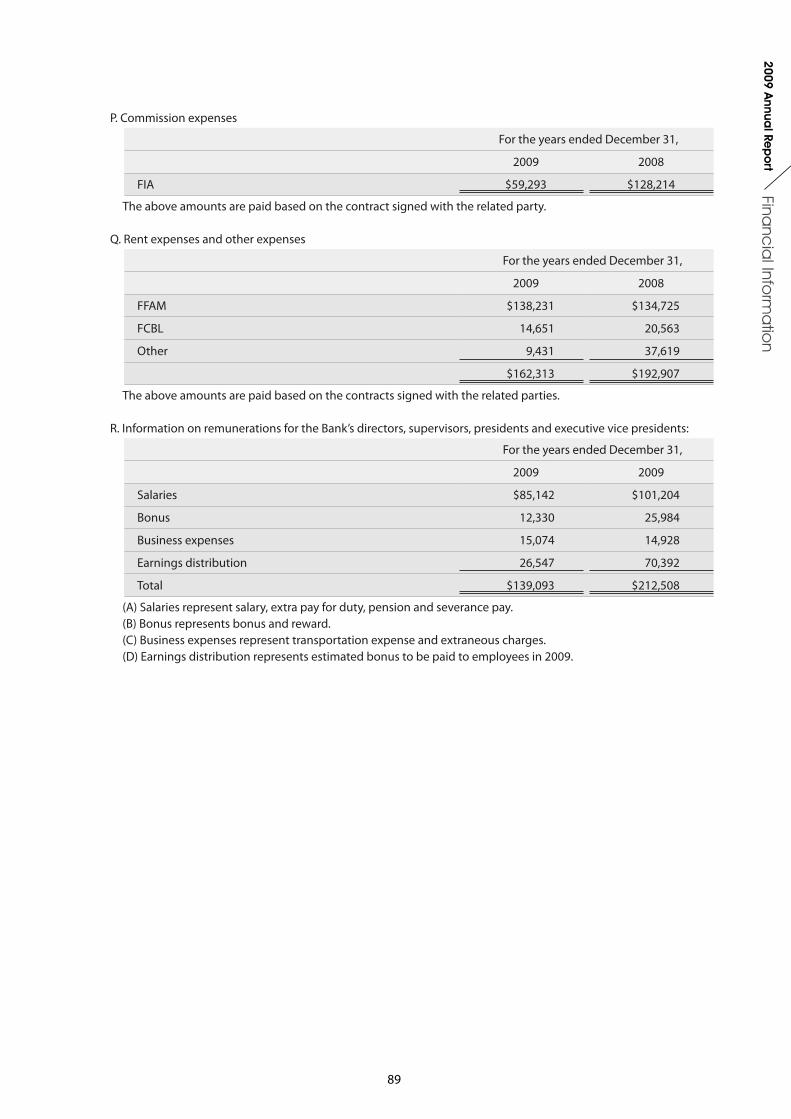
89
Financ
ial Info
rma
tion
2009 Annua
l Rep
ort
P. Commission expenses
For the years ended December 31,
2009 2008
FIA $59,293 $128,214
The above amounts are paid based on the contract signed with the related party.
Q. Rent expenses and other expenses
For the years ended December 31,
2009 2008
FFAM $138,231 $134,725
FCBL 14,651 20,563
Other 9,431 37,619
$162,313 $192,907
The above amounts are paid based on the contracts signed with the related parties.
R. Information on remunerations for the Bank’s directors, supervisors, presidents and executive vice presidents:
For the years ended December 31,
2009 2009
Salaries $85,142 $101,204
Bonus 12,330 25,984
Business expenses 15,074 14,928
Earnings distribution 26,547 70,392
Total $139,093 $212,508
(A) Salaries represent salary, extra pay for duty, pension and severance pay.(B) Bonus represents bonus and reward.(C) Business expenses represent transportation expense and extraneous charges.(D) Earnings distribution represents estimated bonus to be paid to employees in 2009.
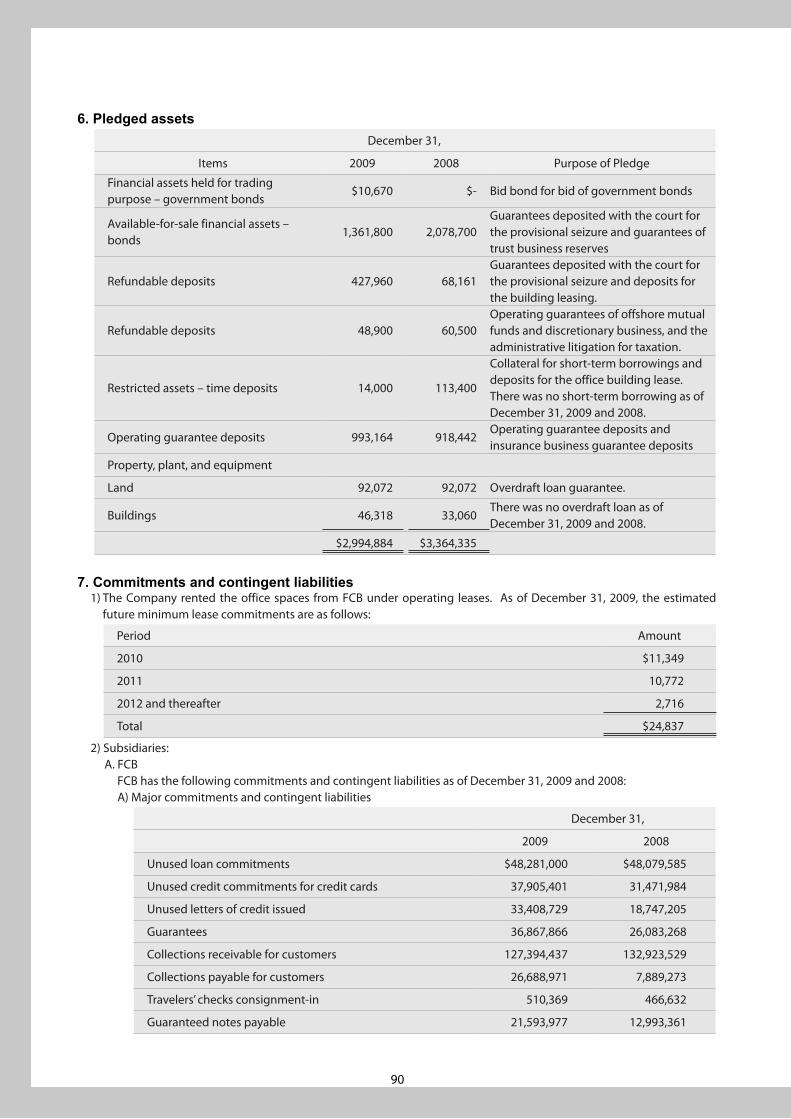
90
6. Pledged assetsDecember 31,
Items 2009 2008 Purpose of Pledge
Financial assets held for trading purpose – government bonds
$10,670 $- Bid bond for bid of government bonds
Available-for-sale financial assets – bonds
1,361,800 2,078,700Guarantees deposited with the court for the provisional seizure and guarantees of trust business reserves
Refundable deposits 427,960 68,161Guarantees deposited with the court for the provisional seizure and deposits for the building leasing.
Refundable deposits 48,900 60,500Operating guarantees of offshore mutual funds and discretionary business, and the administrative litigation for taxation.
Restricted assets – time deposits 14,000 113,400
Collateral for short-term borrowings and deposits for the office building lease. There was no short-term borrowing as of December 31, 2009 and 2008.
Operating guarantee deposits 993,164 918,442Operating guarantee deposits and insurance business guarantee deposits
Property, plant, and equipment
Land 92,072 92,072 Overdraft loan guarantee.
Buildings 46,318 33,060There was no overdraft loan as of December 31, 2009 and 2008.
$2,994,884 $3,364,335
7. Commitments and contingent liabilities1) The Company rented the office spaces from FCB under operating leases. As of December 31, 2009, the estimated
future minimum lease commitments are as follows:
Period Amount
2010 $11,349
2011 10,772
2012 and thereafter 2,716
Total $24,837
2) Subsidiaries:A. FCB
FCB has the following commitments and contingent liabilities as of December 31, 2009 and 2008: A) Major commitments and contingent liabilities
December 31,
2009 2008
Unused loan commitments $48,281,000 $48,079,585
Unused credit commitments for credit cards 37,905,401 31,471,984
Unused letters of credit issued 33,408,729 18,747,205
Guarantees 36,867,866 26,083,268
Collections receivable for customers 127,394,437 132,923,529
Collections payable for customers 26,688,971 7,889,273
Travelers’ checks consignment-in 510,369 466,632
Guaranteed notes payable 21,593,977 12,993,361
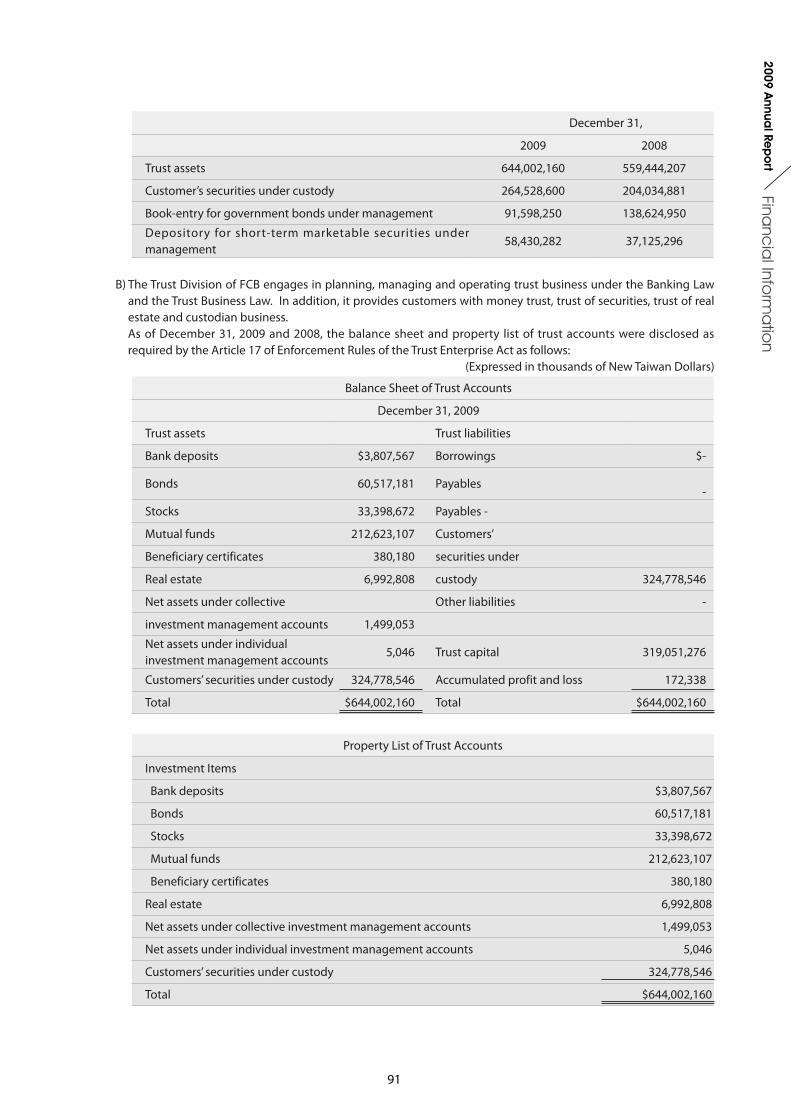
91
Financ
ial Info
rma
tion
2009 Annua
l Rep
ort
December 31,
2009 2008
Trust assets 644,002,160 559,444,207
Customer’s securities under custody 264,528,600 204,034,881
Book-entry for government bonds under management 91,598,250 138,624,950
Depository for short-term marketable securities under management
58,430,282 37,125,296
B) The Trust Division of FCB engages in planning, managing and operating trust business under the Banking Law and the Trust Business Law. In addition, it provides customers with money trust, trust of securities, trust of real estate and custodian business.
As of December 31, 2009 and 2008, the balance sheet and property list of trust accounts were disclosed as required by the Article 17 of Enforcement Rules of the Trust Enterprise Act as follows:
(Expressed in thousands of New Taiwan Dollars)
Balance Sheet of Trust Accounts
December 31, 2009
Trust assets Trust liabilities
Bank deposits $3,807,567 Borrowings $-
Bonds 60,517,181 Payables -
Stocks 33,398,672 Payables -
Mutual funds 212,623,107 Customers’
Beneficiary certificates 380,180 securities under
Real estate 6,992,808 custody 324,778,546
Net assets under collective Other liabilities -
investment management accounts 1,499,053
Net assets under individual investment management accounts
5,046 Trust capital 319,051,276
Customers’ securities under custody 324,778,546 Accumulated profit and loss 172,338
Total $644,002,160 Total $644,002,160
Property List of Trust Accounts
Investment Items
Bank deposits $3,807,567
Bonds 60,517,181
Stocks 33,398,672
Mutual funds 212,623,107
Beneficiary certificates 380,180
Real estate 6,992,808
Net assets under collective investment management accounts 1,499,053
Net assets under individual investment management accounts 5,046
Customers’ securities under custody 324,778,546
Total $644,002,160
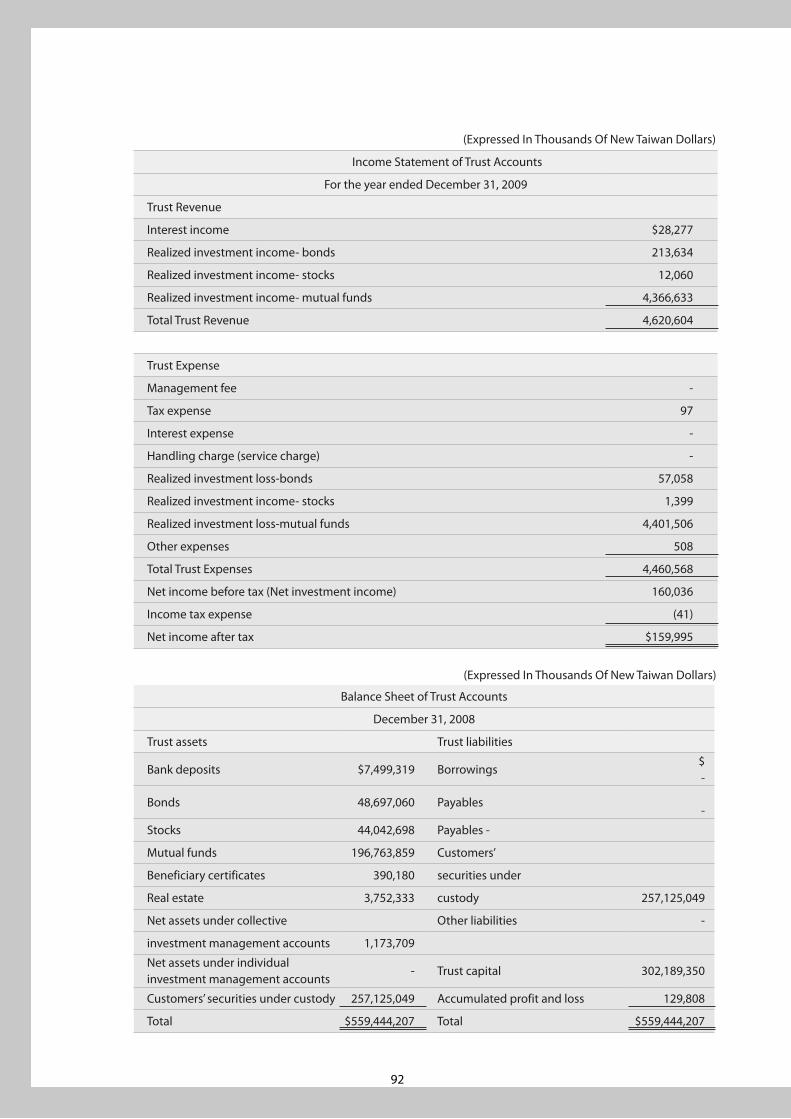
92
(Expressed In Thousands Of New Taiwan Dollars)
Income Statement of Trust Accounts
For the year ended December 31, 2009
Trust Revenue
Interest income $28,277
Realized investment income- bonds 213,634
Realized investment income- stocks 12,060
Realized investment income- mutual funds 4,366,633
Total Trust Revenue 4,620,604
Trust Expense
Management fee -
Tax expense 97
Interest expense -
Handling charge (service charge) -
Realized investment loss-bonds 57,058
Realized investment income- stocks 1,399
Realized investment loss-mutual funds 4,401,506
Other expenses 508
Total Trust Expenses 4,460,568
Net income before tax (Net investment income) 160,036
Income tax expense (41)
Net income after tax $159,995
(Expressed In Thousands Of New Taiwan Dollars)
Balance Sheet of Trust Accounts
December 31, 2008
Trust assets Trust liabilities
Bank deposits $7,499,319 Borrowings$ -
Bonds 48,697,060 Payables -
Stocks 44,042,698 Payables -
Mutual funds 196,763,859 Customers’
Beneficiary certificates 390,180 securities under
Real estate 3,752,333 custody 257,125,049
Net assets under collective Other liabilities -
investment management accounts 1,173,709
Net assets under individual investment management accounts
- Trust capital 302,189,350
Customers’ securities under custody 257,125,049 Accumulated profit and loss 129,808
Total $559,444,207 Total $559,444,207
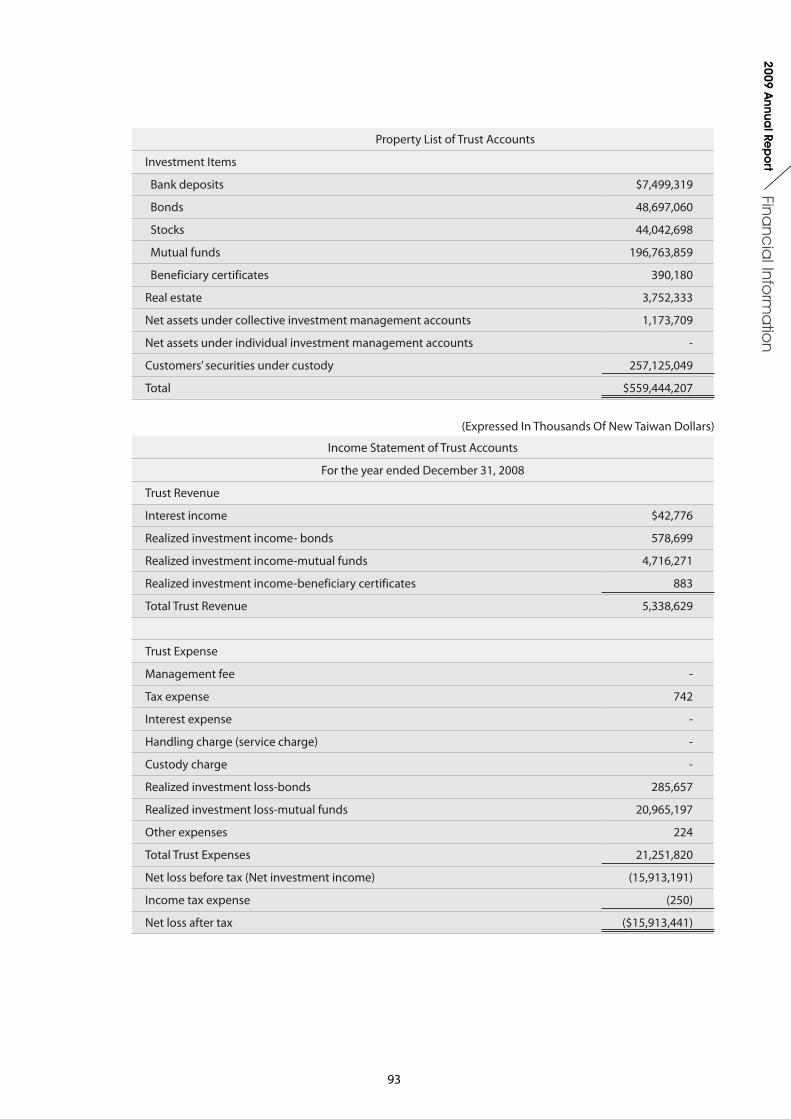
93
Financ
ial Info
rma
tion
2009 Annua
l Rep
ort
Property List of Trust Accounts
Investment Items
Bank deposits $7,499,319
Bonds 48,697,060
Stocks 44,042,698
Mutual funds 196,763,859
Beneficiary certificates 390,180
Real estate 3,752,333
Net assets under collective investment management accounts 1,173,709
Net assets under individual investment management accounts -
Customers’ securities under custody 257,125,049
Total $559,444,207
(Expressed In Thousands Of New Taiwan Dollars)
Income Statement of Trust Accounts
For the year ended December 31, 2008
Trust Revenue
Interest income $42,776
Realized investment income- bonds 578,699
Realized investment income-mutual funds 4,716,271
Realized investment income-beneficiary certificates 883
Total Trust Revenue 5,338,629
Trust Expense
Management fee -
Tax expense 742
Interest expense -
Handling charge (service charge) -
Custody charge -
Realized investment loss-bonds 285,657
Realized investment loss-mutual funds 20,965,197
Other expenses 224
Total Trust Expenses 21,251,820
Net loss before tax (Net investment income) (15,913,191)
Income tax expense (250)
Net loss after tax ($15,913,441)
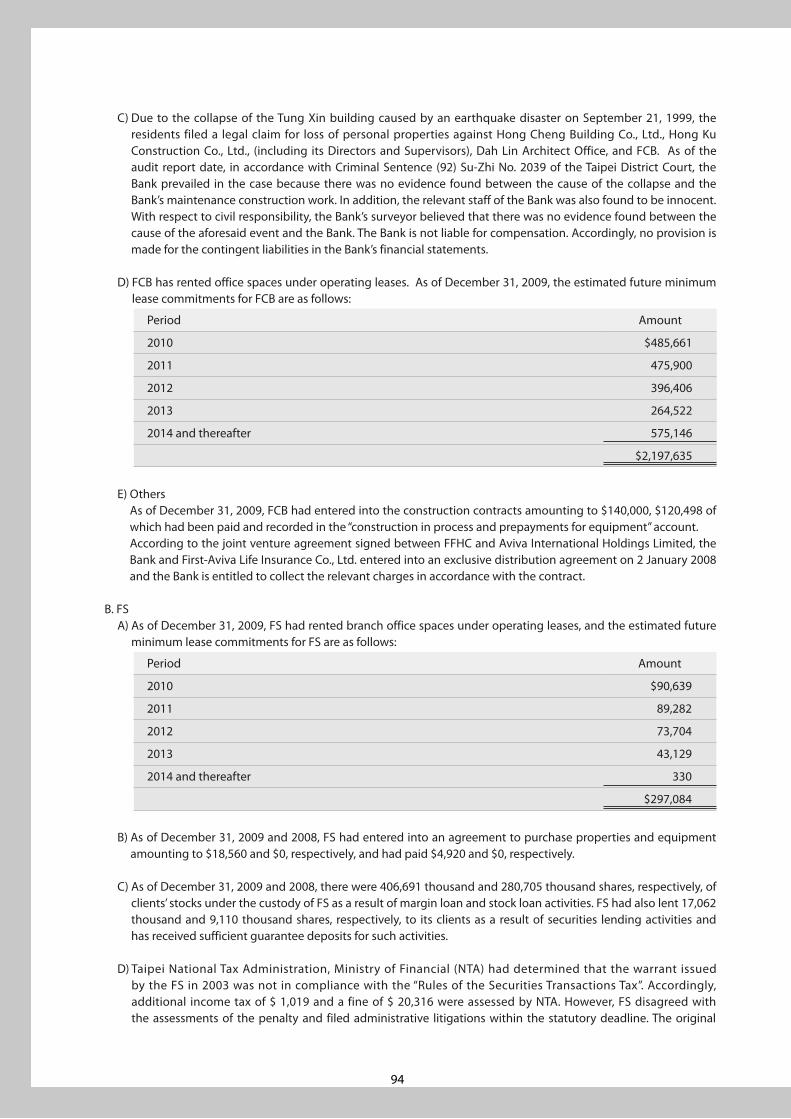
94
C) Due to the collapse of the Tung Xin building caused by an earthquake disaster on September 21, 1999, the residents filed a legal claim for loss of personal properties against Hong Cheng Building Co., Ltd., Hong Ku Construction Co., Ltd., (including its Directors and Supervisors), Dah Lin Architect Office, and FCB. As of the audit report date, in accordance with Criminal Sentence (92) Su-Zhi No. 2039 of the Taipei District Court, the Bank prevailed in the case because there was no evidence found between the cause of the collapse and the Bank’s maintenance construction work. In addition, the relevant staff of the Bank was also found to be innocent. With respect to civil responsibility, the Bank’s surveyor believed that there was no evidence found between the cause of the aforesaid event and the Bank. The Bank is not liable for compensation. Accordingly, no provision is made for the contingent liabilities in the Bank’s financial statements.
D) FCB has rented office spaces under operating leases. As of December 31, 2009, the estimated future minimum lease commitments for FCB are as follows:
Period Amount
2010 $485,661
2011 475,900
2012 396,406
2013 264,522
2014 and thereafter 575,146
$2,197,635
E) Others As of December 31, 2009, FCB had entered into the construction contracts amounting to $140,000, $120,498 of which had been paid and recorded in the “construction in process and prepayments for equipment” account.
According to the joint venture agreement signed between FFHC and Aviva International Holdings Limited, the Bank and First-Aviva Life Insurance Co., Ltd. entered into an exclusive distribution agreement on 2 January 2008 and the Bank is entitled to collect the relevant charges in accordance with the contract.
B. FS A) As of December 31, 2009, FS had rented branch office spaces under operating leases, and the estimated future
minimum lease commitments for FS are as follows:
Period Amount
2010 $90,639
2011 89,282
2012 73,704
2013 43,129
2014 and thereafter 330
$297,084
B) As of December 31, 2009 and 2008, FS had entered into an agreement to purchase properties and equipment amounting to $18,560 and $0, respectively, and had paid $4,920 and $0, respectively.
C) As of December 31, 2009 and 2008, there were 406,691 thousand and 280,705 thousand shares, respectively, of clients’ stocks under the custody of FS as a result of margin loan and stock loan activities. FS had also lent 17,062 thousand and 9,110 thousand shares, respectively, to its clients as a result of securities lending activities and has received sufficient guarantee deposits for such activities.
D) Taipei National Tax Administration, Ministry of Financial (NTA) had determined that the warrant issued by the FS in 2003 was not in compliance with the “Rules of the Securities Transactions Tax”. Accordingly, additional income tax of $ 1,019 and a fine of $ 20,316 were assessed by NTA. However, FS disagreed with the assessments of the penalty and filed administrative litigations within the statutory deadline. The original
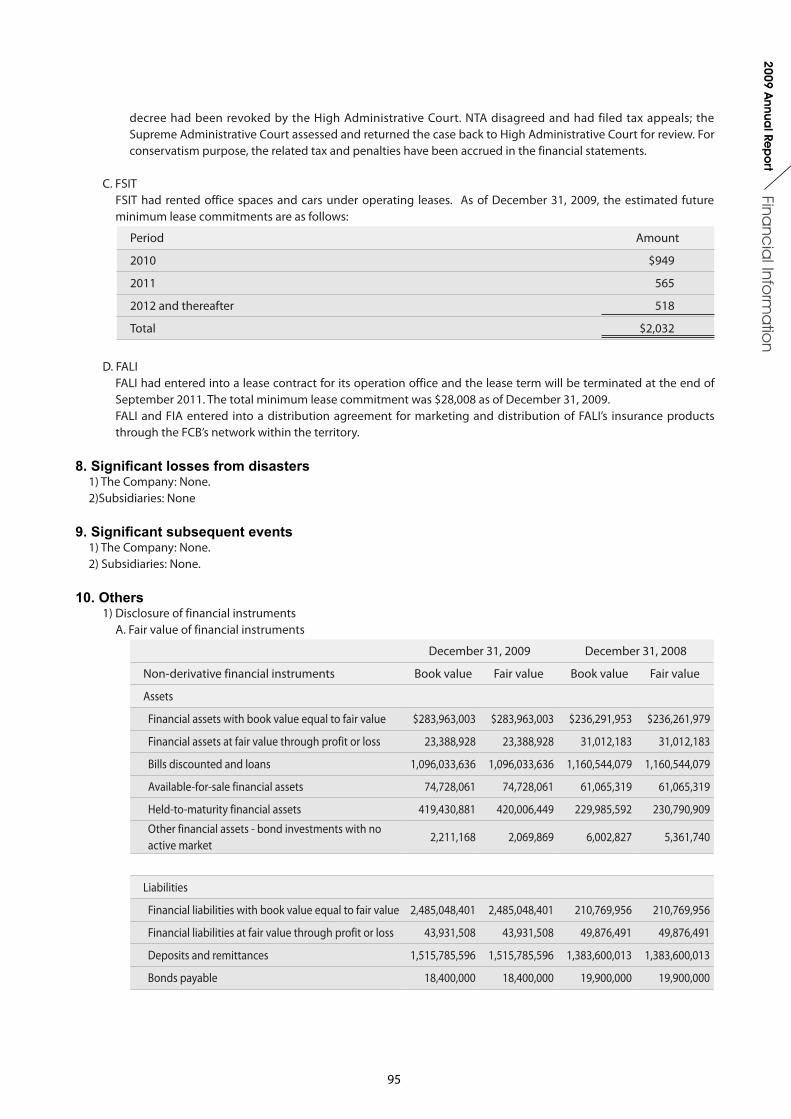
95
Financ
ial Info
rma
tion
2009 Annua
l Rep
ort
decree had been revoked by the High Administrative Court. NTA disagreed and had filed tax appeals; the Supreme Administrative Court assessed and returned the case back to High Administrative Court for review. For conservatism purpose, the related tax and penalties have been accrued in the financial statements.
C. FSIT FSIT had rented office spaces and cars under operating leases. As of December 31, 2009, the estimated future minimum lease commitments are as follows:
Period Amount
2010 $949
2011 565
2012 and thereafter 518
Total $2,032
D. FALI FALI had entered into a lease contract for its operation office and the lease term will be terminated at the end of September 2011. The total minimum lease commitment was $28,008 as of December 31, 2009.
FALI and FIA entered into a distribution agreement for marketing and distribution of FALI’s insurance products through the FCB’s network within the territory.
8. Significant losses from disasters1) The Company: None.2)Subsidiaries: None
9. Significant subsequent events1) The Company: None.2) Subsidiaries: None.
10. Others1) Disclosure of financial instruments
A. Fair value of financial instruments
December 31, 2009 December 31, 2008
Non-derivative financial instruments Book value Fair value Book value Fair value
Assets
Financial assets with book value equal to fair value $283,963,003 $283,963,003 $236,291,953 $236,261,979
Financial assets at fair value through profit or loss 23,388,928 23,388,928 31,012,183 31,012,183
Bills discounted and loans 1,096,033,636 1,096,033,636 1,160,544,079 1,160,544,079
Available-for-sale financial assets 74,728,061 74,728,061 61,065,319 61,065,319
Held-to-maturity financial assets 419,430,881 420,006,449 229,985,592 230,790,909
Other financial assets - bond investments with no active market
2,211,168 2,069,869 6,002,827 5,361,740
Liabilities
Financial liabilities with book value equal to fair value 2,485,048,401 2,485,048,401 210,769,956 210,769,956
Financial liabilities at fair value through profit or loss 43,931,508 43,931,508 49,876,491 49,876,491
Deposits and remittances 1,515,785,596 1,515,785,596 1,383,600,013 1,383,600,013
Bonds payable 18,400,000 18,400,000 19,900,000 19,900,000
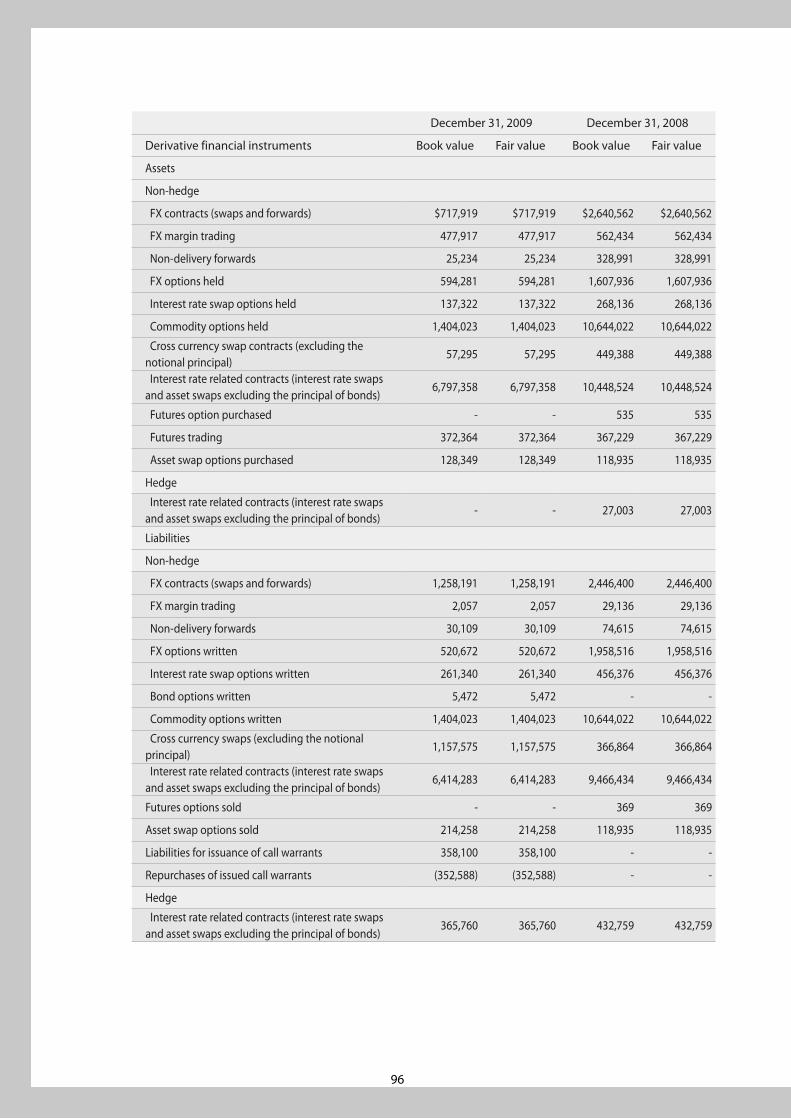
96
December 31, 2009 December 31, 2008
Derivative financial instruments Book value Fair value Book value Fair value
Assets
Non-hedge
FX contracts (swaps and forwards) $717,919 $717,919 $2,640,562 $2,640,562
FX margin trading 477,917 477,917 562,434 562,434
Non-delivery forwards 25,234 25,234 328,991 328,991
FX options held 594,281 594,281 1,607,936 1,607,936
Interest rate swap options held 137,322 137,322 268,136 268,136
Commodity options held 1,404,023 1,404,023 10,644,022 10,644,022
Cross currency swap contracts (excluding the notional principal)
57,295 57,295 449,388 449,388
Interest rate related contracts (interest rate swaps and asset swaps excluding the principal of bonds)
6,797,358 6,797,358 10,448,524 10,448,524
Futures option purchased - - 535 535
Futures trading 372,364 372,364 367,229 367,229
Asset swap options purchased 128,349 128,349 118,935 118,935
Hedge
Interest rate related contracts (interest rate swaps and asset swaps excluding the principal of bonds)
- - 27,003 27,003
Liabilities
Non-hedge
FX contracts (swaps and forwards) 1,258,191 1,258,191 2,446,400 2,446,400
FX margin trading 2,057 2,057 29,136 29,136
Non-delivery forwards 30,109 30,109 74,615 74,615
FX options written 520,672 520,672 1,958,516 1,958,516
Interest rate swap options written 261,340 261,340 456,376 456,376
Bond options written 5,472 5,472 - -
Commodity options written 1,404,023 1,404,023 10,644,022 10,644,022
Cross currency swaps (excluding the notional principal)
1,157,575 1,157,575 366,864 366,864
Interest rate related contracts (interest rate swaps and asset swaps excluding the principal of bonds)
6,414,283 6,414,283 9,466,434 9,466,434
Futures options sold - - 369 369
Asset swap options sold 214,258 214,258 118,935 118,935
Liabilities for issuance of call warrants 358,100 358,100 - -
Repurchases of issued call warrants (352,588) (352,588) - -
Hedge
Interest rate related contracts (interest rate swaps and asset swaps excluding the principal of bonds)
365,760 365,760 432,759 432,759
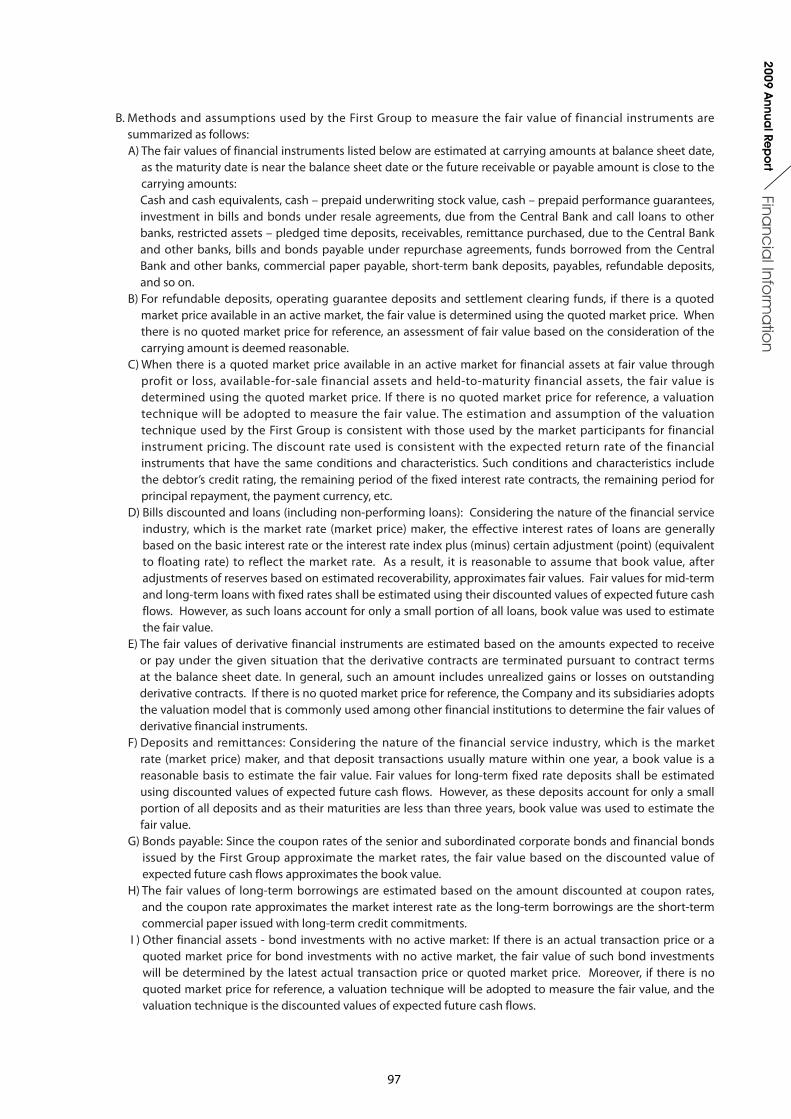
97
Financ
ial Info
rma
tion
2009 Annua
l Rep
ort
B. Methods and assumptions used by the First Group to measure the fair value of financial instruments are summarized as follows:
A) The fair values of financial instruments listed below are estimated at carrying amounts at balance sheet date, as the maturity date is near the balance sheet date or the future receivable or payable amount is close to the carrying amounts:
Cash and cash equivalents, cash – prepaid underwriting stock value, cash – prepaid performance guarantees, investment in bills and bonds under resale agreements, due from the Central Bank and call loans to other banks, restricted assets – pledged time deposits, receivables, remittance purchased, due to the Central Bank and other banks, bills and bonds payable under repurchase agreements, funds borrowed from the Central Bank and other banks, commercial paper payable, short-term bank deposits, payables, refundable deposits, and so on.
B) For refundable deposits, operating guarantee deposits and settlement clearing funds, if there is a quoted market price available in an active market, the fair value is determined using the quoted market price. When there is no quoted market price for reference, an assessment of fair value based on the consideration of the carrying amount is deemed reasonable.
C) When there is a quoted market price available in an active market for financial assets at fair value through profit or loss, available-for-sale financial assets and held-to-maturity financial assets, the fair value is determined using the quoted market price. If there is no quoted market price for reference, a valuation technique will be adopted to measure the fair value. The estimation and assumption of the valuation technique used by the First Group is consistent with those used by the market participants for financial instrument pricing. The discount rate used is consistent with the expected return rate of the financial instruments that have the same conditions and characteristics. Such conditions and characteristics include the debtor’s credit rating, the remaining period of the fixed interest rate contracts, the remaining period for principal repayment, the payment currency, etc.
D) Bills discounted and loans (including non-performing loans): Considering the nature of the financial service industry, which is the market rate (market price) maker, the effective interest rates of loans are generally based on the basic interest rate or the interest rate index plus (minus) certain adjustment (point) (equivalent to floating rate) to reflect the market rate. As a result, it is reasonable to assume that book value, after adjustments of reserves based on estimated recoverability, approximates fair values. Fair values for mid-term and long-term loans with fixed rates shall be estimated using their discounted values of expected future cash flows. However, as such loans account for only a small portion of all loans, book value was used to estimate the fair value.
E) The fair values of derivative financial instruments are estimated based on the amounts expected to receive or pay under the given situation that the derivative contracts are terminated pursuant to contract terms at the balance sheet date. In general, such an amount includes unrealized gains or losses on outstanding derivative contracts. If there is no quoted market price for reference, the Company and its subsidiaries adopts the valuation model that is commonly used among other financial institutions to determine the fair values of derivative financial instruments.
F) Deposits and remittances: Considering the nature of the financial service industry, which is the market rate (market price) maker, and that deposit transactions usually mature within one year, a book value is a reasonable basis to estimate the fair value. Fair values for long-term fixed rate deposits shall be estimated using discounted values of expected future cash flows. However, as these deposits account for only a small portion of all deposits and as their maturities are less than three years, book value was used to estimate the fair value.
G) Bonds payable: Since the coupon rates of the senior and subordinated corporate bonds and financial bonds issued by the First Group approximate the market rates, the fair value based on the discounted value of expected future cash flows approximates the book value.
H) The fair values of long-term borrowings are estimated based on the amount discounted at coupon rates, and the coupon rate approximates the market interest rate as the long-term borrowings are the short-term commercial paper issued with long-term credit commitments.
I ) Other financial assets - bond investments with no active market: If there is an actual transaction price or a quoted market price for bond investments with no active market, the fair value of such bond investments will be determined by the latest actual transaction price or quoted market price. Moreover, if there is no quoted market price for reference, a valuation technique will be adopted to measure the fair value, and the valuation technique is the discounted values of expected future cash flows.
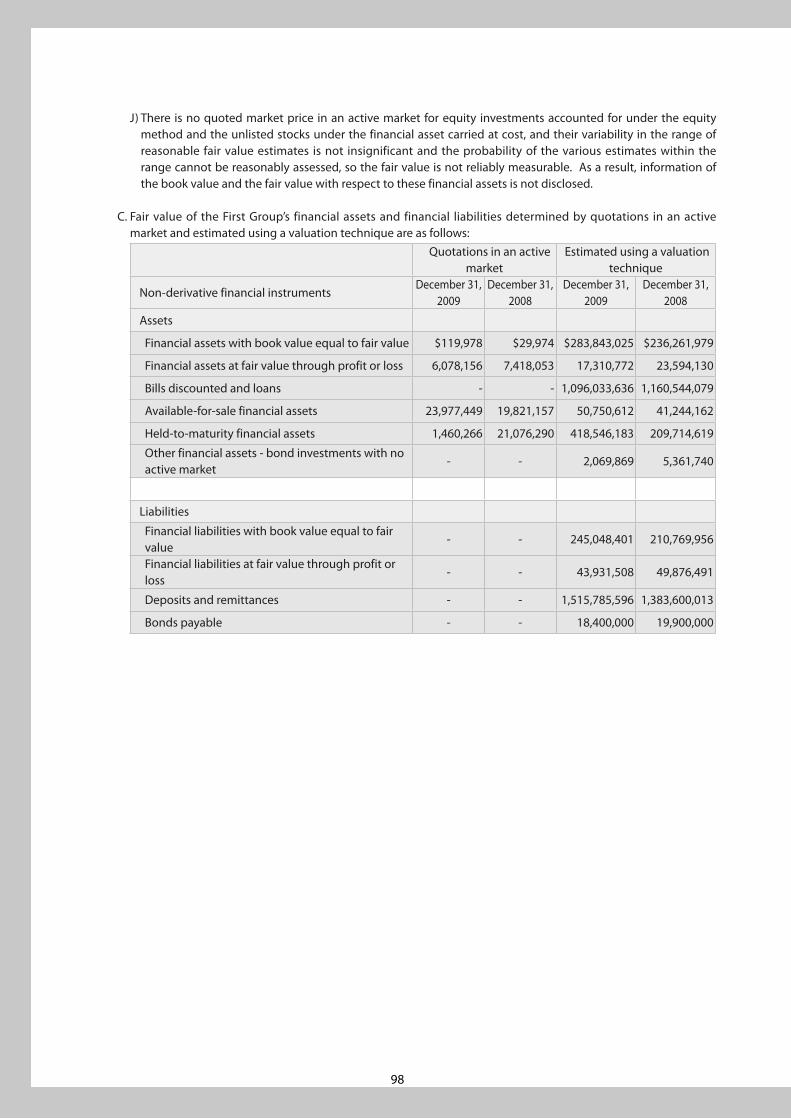
98
J) There is no quoted market price in an active market for equity investments accounted for under the equity method and the unlisted stocks under the financial asset carried at cost, and their variability in the range of reasonable fair value estimates is not insignificant and the probability of the various estimates within the range cannot be reasonably assessed, so the fair value is not reliably measurable. As a result, information of the book value and the fair value with respect to these financial assets is not disclosed.
C. Fair value of the First Group’s financial assets and financial liabilities determined by quotations in an active market and estimated using a valuation technique are as follows:
Quotations in an active market
Estimated using a valuation technique
Non-derivative financial instrumentsDecember 31,
2009December 31,
2008December 31,
2009December 31,
2008
Assets
Financial assets with book value equal to fair value $119,978 $29,974 $283,843,025 $236,261,979
Financial assets at fair value through profit or loss 6,078,156 7,418,053 17,310,772 23,594,130
Bills discounted and loans - - 1,096,033,636 1,160,544,079
Available-for-sale financial assets 23,977,449 19,821,157 50,750,612 41,244,162
Held-to-maturity financial assets 1,460,266 21,076,290 418,546,183 209,714,619
Other financial assets - bond investments with no active market
- - 2,069,869 5,361,740
Liabilities
Financial liabilities with book value equal to fair value
- - 245,048,401 210,769,956
Financial liabilities at fair value through profit or loss
- - 43,931,508 49,876,491
Deposits and remittances - - 1,515,785,596 1,383,600,013
Bonds payable - - 18,400,000 19,900,000

99
Financ
ial Info
rma
tion
2009 Annua
l Rep
ort
Quotations in an active market
Estimated using a valuation technique
Derivative financial instrumentsDecember 31,
2009December 31,
2008December 31,
2009December 31,
2008
Assets
Non-hedge
FX contracts (swaps and forwards) $ - $- $717,919 $2,640,562
FX margin trading - - 477,917 562,434
Non-delivery forwards - - 25,234 328,991
FX options held - - 594,281 1,607,936
Interest rate swap options held - - 137,322 268,136
Commodity options held - - 1,404,023 10,644,022
Cross currency swap contracts (excluding the notional principal)
- - 57,295 449,388
Interest rate related contracts (interest rate swaps and asset swaps excluding the principal of bonds)
- - 6,797,358 10,448,524
Futures option purchased - 535 - -
Futures trading 112,556 56,085 259,808 311,144
Asset swap options purchased - - 128,349 118,935
Hedge
Interest rate related contracts (interest rate swaps and asset swaps excluding the principal of bonds)
- - - 27,003
Liabilities
Non-hedge
FX contracts (swaps and forwards) - - 1,258,191 2,446,400
FX margin trading - - 2,057 29,136
Non-delivery forwards - - 30,109 74,615
FX options written - - 520,672 1,958,516
Interest rate swap options written - - 261,340 456,376
Bond options written - - 5,472 -
Commodity options written - - 1,404,023 10,644,022
Cross currency swaps (excluding the notional principal) - - 1,157,575 366,864
Interest rate related contracts (interest rate swaps and asset swaps excluding the principal of bonds)
- - 6,414,283 9,466,434
Futures options sold - 369 - -
Asset swap options sold - - 214,258 118,935
Liabilities for issuance of call warrants 358,100 - - -
Repurchases of issued call warrants (352,588) - - -
Hedge
Interest rate related contracts (interest rate swaps and asset swaps excluding the principal of bonds)
- - 365,760 432,759

100
D. The First Group has recognized $72,914 and $1,118,913, respectively, of current net loss on changes in fair value arising from valuation techniques for the years ended December 31, 2009 and 2008.
E. As of December 31, 2009 and 2008, the First Group has financial assets with fair value risk arising from interest rate changes amounting to $76,182,301 and $72,042,291, respectively.
F. As of December 31, 2009 and 2008, the First Group has financial assets with cash flow risk arising from interest rate changes amounting to $13,378,540 and $15,673,404, respectively.
G. For the years ended December 31, 2009 and 2008, the First Group has recognized interest income from the financial assets or financial liabilities not at fair value through profit or loss amounting to $28,876,024 and $50,080,253, respectively, and interest expense from the financial assets or financial liabilities not at fair value through profit or loss amounting to $11,935,514 and $25,350,710, respectively. The First Group has recognized the change in fair value of available-for-sale financial assets and has recorded an adjustment account in the stockholders’ equity amounting to $4,110,294 and $1,979,152, respectively, and the amount of gain on fair value change reclassified from the stockholders’ equity into the statement of income was $516,771 and $682,063, respectively, for the years ended December 31, 2009 and 2008.
H. Risk management and hedging strategy (including financial hedge) The Company A) The Company established written risk management policies and guidelines which are approved by the
Board of Directors, in order to identify, measure, monitor and control credit risk, market risk, liquidity risk, interest rate risk and operational risk. The Company’s Board of Directors has the ultimate approval right in risk management. Major risk management includes risk tolerance limit and authority which must be approved by the Board of Directors. Under the Board of Directors, there is a risk management committee, which is responsible to set up risk management system, policies and monitoring indicators.
B) The Company’s Board of Directors has the ultimate approval right in risk management. Under the Board of Directors, there is a risk management committee which is responsible to sets up group-wide risk management system, including risk authorized limits, risk tolerance limits, monitoring indicators and excessive indicators, as well as coordinates and monitors risk management events associated with subsidiaries in compliance with risk management policies and guidelines approved by the Board of Directors.
C) The Audit Department should audit risk management procedures and internal controls on a regular basis, in order to ensure that risk management mechanism and control procedures function effectively.
D) In addition to complying with the relevant laws and regulations, the hedging strategies adopted by the Company must be approved by the Board of Directors. The floating rate corporate bonds issued by the Company may fluctuate due to changes in interest rates. Thus, those bonds may expose the Company to cash flow risk. The Company has entered into interest rate swap contracts with counterparties to hedge such risk.
FCB A) FCB engages in risk management and hedge under the principles of not only serving customers but also
conforming to the bank operational goal, overall risk tolerance limits, and legal compliance to achieve risk diversification, risk transfer, and risk avoidance, and to maximize the benefits of customers, shareholders, and employees. FCB is mainly exposed to credit risk, market risk (including the interest rate, foreign exchange rate, equity securities, and instrument risks), operation risk, and liquidity risk regardless whether they are on or off balance sheets.
B) FCB’s Board of Directors has the ultimate approval right in risk management. Major management risk items that include the company-wide risk management policy, risk tolerance limit, and authority must be approved by the Board of Directors. Under the Board of Directors, there is a risk management committee, which is responsible to review, supervise, report, and coordinate company-wide risk management. Besides, Risk Management Center, which is independent from business units, is comprised of Regional Center, Risk Management Division, Credit Approval Division and Loan Management Division, and is responsible for implementing the risk management strategy of FCB.
C) The goal of market risk management of FCB is to achieve optimal risk position, maintain proper liquidity position, and manage all market risk centralized by considering the economic environment, competition condition, market value risk, and impact on net interest income. In order to achieve this goal, FCB’s hedging activities concentrate on risk transfer and risk management of net interest income and market value risk.
101
Financ
ial Info
rma
tion
2009 Annua
l Rep
ort
FCB has set the strategy of fair value hedge of interest rate exposure according to the fund transfer pricing principle. FCB primarily uses interest rate swaps to hedge fair value changes, and FCB also hedges the interest rate exposure of partial fixed-rate loans and fixed-rate liabilities.
FS and subsidiaries A) Financial risk control
Enterprise Information System and daily risk management report monitor FS’s risk. FS also establishes timely, accurate, effective risk management indicators to identify, measure, and monitor various business and company-wide risks of FS and its subsidiaries, and to cope with market changes. Therefore, it enables management to control risk effectively, and can be used as the operation basis for capital allocation.
FS established a Risk Management Committee to implement the overall monitoring, preventing, and controlling by setting risk limits. In addition, FS established a risk management system, composed of risk control personnel from the chairman’s office and each business unit, to assure effective control.
FS’s Risk Management Committee has an executive secretary, appointed by the Board of Directors, to take charge of all risk management strategies. The primary responsibilities of this committee are as follows:
a. Setting up the risk management policies and procedures, operating standards, and risk management indicators;
b. Setting up the evaluation, management and schemes of capital adequacy of FS; c. Review each risk limit, model analyses and evaluation methods, and risk management control steps and
organization structures; d. Monitoring various risks of FS, operating processes, and the compliance with related laws. The committee
quarterly reports the result to the Chairman of the Board of Directors; e. Other affairs related to the risk management of FS. Except for the aforementioned matters, the executive secretary shall also assist the Board of Directors to
designate appropriate business units to manage together the unquantifiable risks; including making an emergency contingency plan.
In accordance with FS’s “Risk Management Procedures and Execution Standards”, FS and its subsidiaries plan and execute the risk management procedures as follows:
a. Complying with FS’s “Risk Management Procedures and Execution Standards” to establish a comprehensive risk management procedures with detailed requirements for each business unit;
b. Complying with the related laws and regulations issued by competent authority, internal control system, and risk management policies and procedures of each business unit, while conducting business;
c. Taking related risk factors into consideration and establishing the transaction limit or authorization limit and risk tolerance limit. In order to apply and monitor the control of such limits, FS and its subsidiaries directly control the transaction limit of traders through the online trading system. In addition, FS and its subsidiaries quantify the market risk and estimate potential losses for each position by using Value-at-Risk (VaR) taken as the risk management information;
d. All open positions are mark-to-market on a daily basis unless otherwise stipulated by the related regulations;
e. Establishing the qualification condition and credit limit of the counterparty and granting different credit limits by referring to information from domestic and foreign credit rating institutions or by establishing its own rating system;
f. Avoiding the concentration risk, that is, through limiting the amount of financing to or investing in a single customer, single industry, single conglomerate, single stock, or related parties;
g. Evaluating the liquidity risk related to the market, instruments, or funds, and focusing on the size and liquidity of specific market or specific instruments to set the liquidity risk limit.
h. Making significant changes on techniques, model and assumptions of risk management and controlling procedures, both Risk Management Committee and Internal Auditing Committee shall take part in it.
i. Developing new products and new business projects, Risk Management Committee and Internal Auditing Committee shall involve in related authorization and approval procedures.
Furthermore, in accordance with the different requirements from department heads, President, Chairman, or the Board of Directors, to present daily, weekly, monthly, or quarterly risk management reports and to provide timely warning report based on periodic monitoring.
B) Hedging strategy (financial hedge) a. Warrants FS sets its hedging strategy based on the conservation principle after taking into consideration the
market risk, liquidity risk of underlying securities, liquidity risk of funds, current regulations, and trading
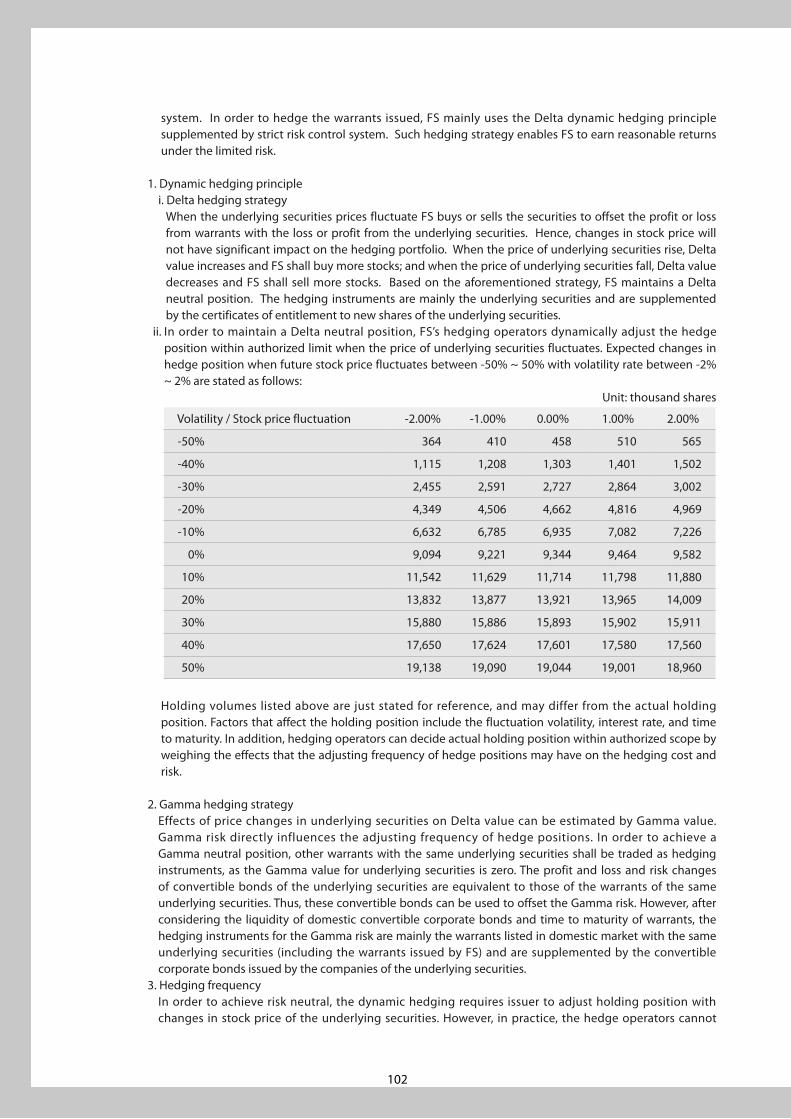
102
system. In order to hedge the warrants issued, FS mainly uses the Delta dynamic hedging principle supplemented by strict risk control system. Such hedging strategy enables FS to earn reasonable returns under the limited risk.
1. Dynamic hedging principle i. Delta hedging strategy When the underlying securities prices fluctuate FS buys or sells the securities to offset the profit or loss
from warrants with the loss or profit from the underlying securities. Hence, changes in stock price will not have significant impact on the hedging portfolio. When the price of underlying securities rise, Delta value increases and FS shall buy more stocks; and when the price of underlying securities fall, Delta value decreases and FS shall sell more stocks. Based on the aforementioned strategy, FS maintains a Delta neutral position. The hedging instruments are mainly the underlying securities and are supplemented by the certificates of entitlement to new shares of the underlying securities.
ii. In order to maintain a Delta neutral position, FS’s hedging operators dynamically adjust the hedge position within authorized limit when the price of underlying securities fluctuates. Expected changes in hedge position when future stock price fluctuates between -50% ~ 50% with volatility rate between -2% ~ 2% are stated as follows:
Unit: thousand shares
Volatility / Stock price fluctuation -2.00% -1.00% 0.00% 1.00% 2.00%
-50% 364 410 458 510 565
-40% 1,115 1,208 1,303 1,401 1,502
-30% 2,455 2,591 2,727 2,864 3,002
-20% 4,349 4,506 4,662 4,816 4,969
-10% 6,632 6,785 6,935 7,082 7,226
0% 9,094 9,221 9,344 9,464 9,582
10% 11,542 11,629 11,714 11,798 11,880
20% 13,832 13,877 13,921 13,965 14,009
30% 15,880 15,886 15,893 15,902 15,911
40% 17,650 17,624 17,601 17,580 17,560
50% 19,138 19,090 19,044 19,001 18,960
Holding volumes listed above are just stated for reference, and may differ from the actual holding position. Factors that affect the holding position include the fluctuation volatility, interest rate, and time to maturity. In addition, hedging operators can decide actual holding position within authorized scope by weighing the effects that the adjusting frequency of hedge positions may have on the hedging cost and risk.
2. Gamma hedging strategy Effects of price changes in underlying securities on Delta value can be estimated by Gamma value.
Gamma risk directly influences the adjusting frequency of hedge positions. In order to achieve a Gamma neutral position, other warrants with the same underlying securities shall be traded as hedging instruments, as the Gamma value for underlying securities is zero. The profit and loss and risk changes of convertible bonds of the underlying securities are equivalent to those of the warrants of the same underlying securities. Thus, these convertible bonds can be used to offset the Gamma risk. However, after considering the liquidity of domestic convertible corporate bonds and time to maturity of warrants, the hedging instruments for the Gamma risk are mainly the warrants listed in domestic market with the same underlying securities (including the warrants issued by FS) and are supplemented by the convertible corporate bonds issued by the companies of the underlying securities.
3. Hedging frequency In order to achieve risk neutral, the dynamic hedging requires issuer to adjust holding position with
changes in stock price of the underlying securities. However, in practice, the hedge operators cannot
103
Financ
ial Info
rma
tion
2009 Annua
l Rep
ort
immediately adjust the position because the stock price might abruptly rise or fall. In order to react to the aforementioned deficiency, FS set upper and lower limits for value at risk; that is, risk management officers timely monitor whether Delta value fluctuates within certain percentage range. Traders can adjust the positions within their authorities according to their judgments on the trend of the market and the underlying securities.
b. Options FS engages in bond options hedge transactions, which primarily consist of delta-neutral transactions.
FSIT In order to integrate the operation mechanism of FSIT’s risk management practice, FSIT has established a Risk
Management Committee. In accordance with the risk management policies and guidelines set by the Board of Directors, the committee established risk management procedures, valuation method, and management indicators. In addition, the committee monitors the quality of risk management procedures and the risk exposure to assure the effectiveness of implementing risk management and control policy.
The Chairman of Board of Directors of FSIT acts as the Chairman of the committee, and President, Executive Vice President, Vice President of each department, and Chief Auditor act as committee members. The committee calls an ordinary quarterly meeting and, if needed, a special meeting. Missions and responsibilities of the committee are as follows:
A) Setting up the risk management policies and procedures, operating standards, and risk management indicators;
B) Setting up the schemes of asset and liability management and capital adequacy of FSIT; C) Review each risk limit, model analyses and evaluation methods, and risk management control steps and
organization structures; D) Monitoring various risks of FSIT, operating processes, and the compliance with relevant laws. The committee
quarterly reports the results to the Chairman of the Board of Directors; E) Other affairs related to the risk management of FSIT.
All business units under FSIT comply with laws issued by the authorities, related management rules for subsidiaries set by the Company, and FSIT’s internal control system and operation regulations. When establishing the internal control system, FSIT had taken into consideration the possible risks (including the market risk, credit risk, liquidity risk, and operation risk) to frame the practical compliance procedures and management steps. In addition, FSIT draws up the trading authority and risk tolerance limit to be a basis of implementation.
In compliance with the related risk management regulations, operation departments regularly or irregularly present related statements to FSIT’s management, the Company, and the authorities. Risk control officers regularly trace the related risk indicators and, if necessary, present a warning report to assure timely and appropriate treatment.
FALI The primary risks for financial instruments held by FALI are cash flow risk arising from changes in interest
rates, foreign exchange risk, fair value risk arising from changes in interest rates, credit risk and liquidity risk. Authorized and approved risk management policies are as follows:
A) Cash flow risk arising from changes in interest rates FALI mainly engages in life insurance services, and its main liabilities derives from long-term policy reserves,
the reserve provision is calculated by an actuary in accordance with the fixed shadow interest stated in the insurance regulations and the related provisions. The future cash flow does not fluctuate due to volatility of the market interest rates. Most of FALI’s bond investments are stated in fixed interest rate, thus the risk of volatile future cash flow is limited.
B) Foreign exchange risk As a result of significant investment operations with foreign currency risk, FALI’s balance sheets can be
affected significantly by movements in the currency exchange rate. FALI seeks to mitigate the effect of its structural currency exposure by using forward currency contracts. All investments denominated in foreign currencies held by FALI are hedged; thus, the foreign currency risk is insignificant.
C) Fair value risk arising from changes in interest rates The fixed interest rate debentures and other equity investments could fluctuate in value due to change
in government currency policy, institution credit rating, economic conditions, industry business cycles, operating status of the offering institution, or public market information; loss could be generated during the

104
change. FALI seeks stability and consistency in profit as their priority; the investment department diversified its portfolios among various industries with different backgrounds and properties, and observes closely on both domestic and foreign significant economic events as indicator for adjustment and effectively separate and maintain risk.
D) Credit risk Credit risk that arises from bond investments exists for individuals or groups of counterparties when they fail
to meet contractual obligations. FALI has complied with Article 146 of Insurance Act, related regulations and the Company’s internal control policies. In addition, individuals or group of counterparties of FALI are all with good credit rating or well-known financial institutions, so liquidity risk of FALI is low.
E) Liquidity risk FALI mainly engages in life insurance services, and its main liabilities are derived from long-term policy
reserves, current liabilities are relatively low. As a result, value of cash and financial instruments with active market are sufficient to pay off short-term liabilities with one year maturity; liquidity risk is insignificant.
I. Financial risk informationThe CompanyA) Credit risk
Financial instruments held by the Company may incur losses if its counterparties are not able to fulfill their obligations at the maturity date. In order to control credit risk of the underlying investments, the Company established control procedures, authorization criteria, assessments, control measures and credit management.
B) Cash flow risk arising from changes in interest rates Corporate bonds payable with floating interest rate expose the Company to cash flow risk arising from changes in interest rates. The Company entered into the swap contracts to hedge such risk.
C) Liquidity risk The Company has sufficient operating capital to meet all contract obligations. Therefore, liquidity risk is considered low.
FCBA) Market risk
FCB sets the specific trade period, position limit, and stop loss limit for its investments in marketable securities according to different degrees of risk for each specific product. FCB monitors those limitations by various risk indicators such as value at risk and DV01. In addition, FCB periodically conducts the risk sensitivity analysis of company-wide positions.Each derivative financial instrument transaction undertaken by FCB has set Greeks, the open aggregate position limit and maximum loss tolerance amount to control the market risk of derivative financial instruments. In addition, the profit or loss arising from fluctuations in the market interest rate or foreign exchange rate will be substantially offset by the profit and loss from hedged items, and thus those instruments would not expose FCB to significant market risk.FCB calculates the capital requirements of financial instruments in compliance with the Standardized Approach, and the estimated values of the risk-weighted assets are stated as follows:
Type of market risk December 31, 2009 December 31, 2008
Interest rate risk $1,084,096 $1,122,196
Equity securities risk 427,988 105,248
Foreign exchange risk 36,390 453,527
B) Credit riskFinancial instruments held by FCB may incur losses if counterparties are not able to fulfill their obligations at the maturity date. In order to prevent investments from significant credit risk concentration, FCB sets up the upper credit tolerance limits for investment in stocks by industries and conglomerates. Bond investments are primarily composed of government bonds, financial bonds, and investment-grade corporate bonds. Each corporate bond is reviewed individually to control the credit risk. Counterparties in FCB’s derivative financial instrument transactions are all financial institutions with good credit ratings. FCB controls credit exposures of its counterparties by giving different risk limits to different counterparties based on their credit ratings.The credit risk amounts stated below are for those with positive fair values as of the balance sheet date and

105
Financ
ial Info
rma
tion
2009 Annua
l Rep
ort
those contracts with off-balance sheet commitments and guarantees.
For all financial instruments held by FCB, the maximum credit exposures are as follows:
December 31, 2009
Items Book value Maximum credit
exposure
Non-derivative financial instruments
Financial assets for trading purpose
Bonds $478,915 $478,915
Short-term bills 29,786 29,786
Other marketable securities 329,553 329,553
Financial assets designated for trading purpose
Bonds 17,916,144 17,916,144
Bills discounted and loans 1,096,010,284 1,096,010,284
Available-for-sale financial assets
Bonds 56,098,070 56,098,070
Short-term bills 449,475 449,475
Held-to-maturity financial assets 419,430,881 419,430,881
Debt instruments in non-active markets
Bonds 1,723,815 1,723,815
Beneficiary securities 287,353 287,353
Derivative financial instruments
Non-hedging purpose
FX contracts (swaps and forwards) 702,216 702,216
FX margin trading 477,917 477,917
Non-delivery forwards 25,234 25,234
FX options held 594,281 594,281
Interest rate swap options held 137,322 137,322
Commodity options held 1,404,023 1,404,023
Cross currency swap contracts (excluding the notional principal)
57,295 57,295
Interest rate related contracts (interest rate swap and asset swaps excluding the principal of bonds)
6,797,358 6,797,358
Futures trading 112,556 112,556
Hedging purpose
Interest rate related contracts (interest rate swaps and asset swaps excluding the principal of bonds)
- -
Letter of credit and guarantees - 70,276,595
Note:The maximum credit exposures of derivative instruments stated is for those with positive fair values.
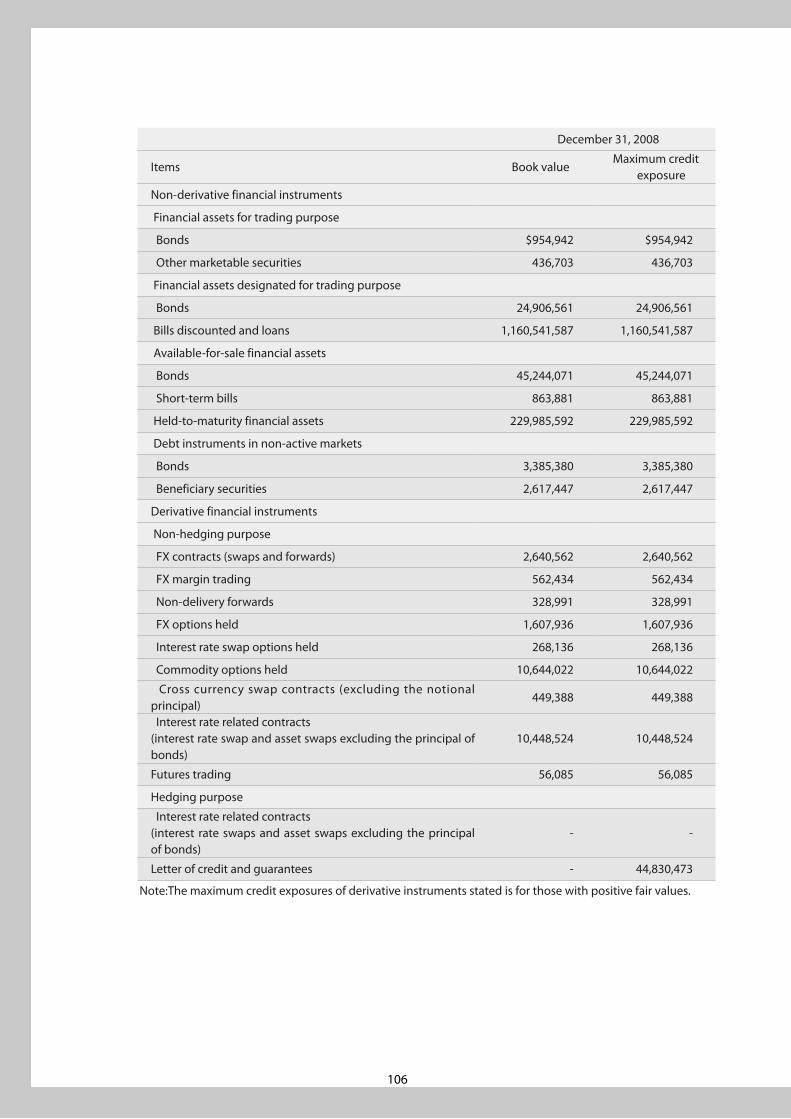
106
December 31, 2008
Items Book value Maximum credit
exposure
Non-derivative financial instruments
Financial assets for trading purpose
Bonds $954,942 $954,942
Other marketable securities 436,703 436,703
Financial assets designated for trading purpose
Bonds 24,906,561 24,906,561
Bills discounted and loans 1,160,541,587 1,160,541,587
Available-for-sale financial assets
Bonds 45,244,071 45,244,071
Short-term bills 863,881 863,881
Held-to-maturity financial assets 229,985,592 229,985,592
Debt instruments in non-active markets
Bonds 3,385,380 3,385,380
Beneficiary securities 2,617,447 2,617,447
Derivative financial instruments
Non-hedging purpose
FX contracts (swaps and forwards) 2,640,562 2,640,562
FX margin trading 562,434 562,434
Non-delivery forwards 328,991 328,991
FX options held 1,607,936 1,607,936
Interest rate swap options held 268,136 268,136
Commodity options held 10,644,022 10,644,022
Cross currency swap contracts (excluding the notional principal)
449,388 449,388
Interest rate related contracts (interest rate swap and asset swaps excluding the principal of bonds)
10,448,524 10,448,524
Futures trading 56,085 56,085
Hedging purpose
Interest rate related contracts (interest rate swaps and asset swaps excluding the principal of bonds)
- -
Letter of credit and guarantees - 44,830,473
Note:The maximum credit exposures of derivative instruments stated is for those with positive fair values.
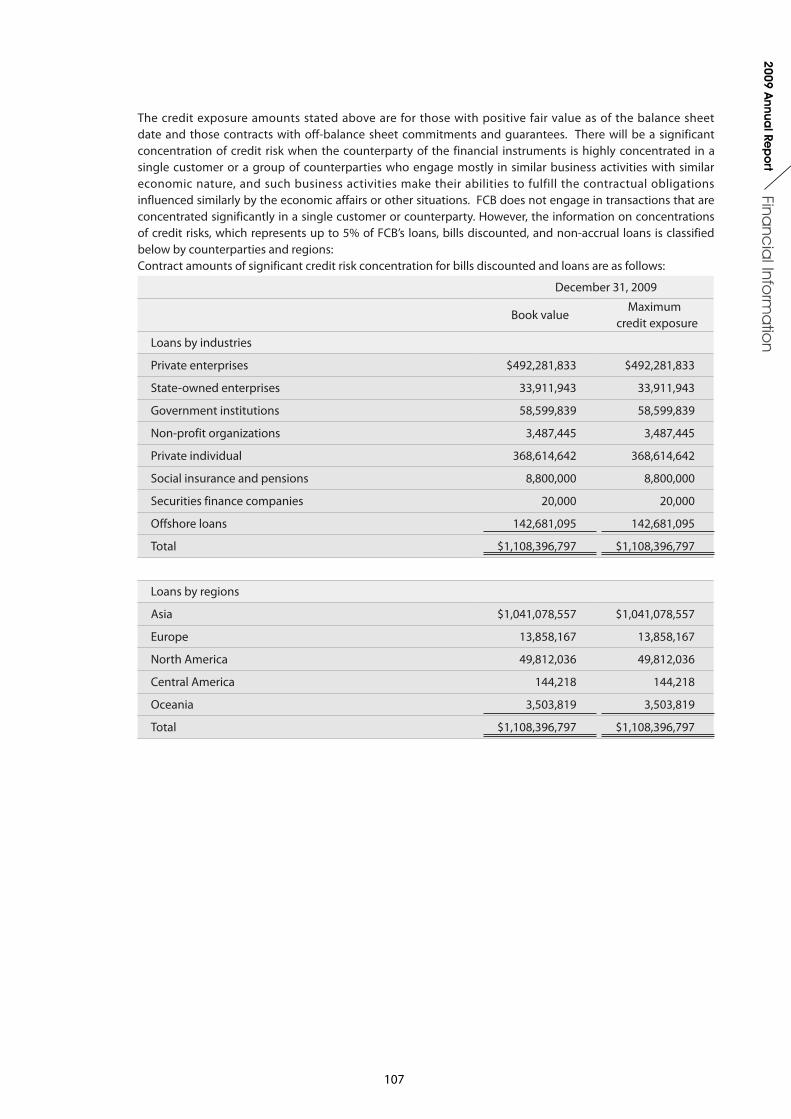
107
Financ
ial Info
rma
tion
2009 Annua
l Rep
ort
The credit exposure amounts stated above are for those with positive fair value as of the balance sheet date and those contracts with off-balance sheet commitments and guarantees. There will be a significant concentration of credit risk when the counterparty of the financial instruments is highly concentrated in a single customer or a group of counterparties who engage mostly in similar business activities with similar economic nature, and such business activities make their abilities to fulfill the contractual obligations influenced similarly by the economic affairs or other situations. FCB does not engage in transactions that are concentrated significantly in a single customer or counterparty. However, the information on concentrations of credit risks, which represents up to 5% of FCB’s loans, bills discounted, and non-accrual loans is classified below by counterparties and regions:Contract amounts of significant credit risk concentration for bills discounted and loans are as follows:
December 31, 2009
Book value Maximum
credit exposure
Loans by industries
Private enterprises $492,281,833 $492,281,833
State-owned enterprises 33,911,943 33,911,943
Government institutions 58,599,839 58,599,839
Non-profit organizations 3,487,445 3,487,445
Private individual 368,614,642 368,614,642
Social insurance and pensions 8,800,000 8,800,000
Securities finance companies 20,000 20,000
Offshore loans 142,681,095 142,681,095
Total $1,108,396,797 $1,108,396,797
Loans by regions
Asia $1,041,078,557 $1,041,078,557
Europe 13,858,167 13,858,167
North America 49,812,036 49,812,036
Central America 144,218 144,218
Oceania 3,503,819 3,503,819
Total $1,108,396,797 $1,108,396,797
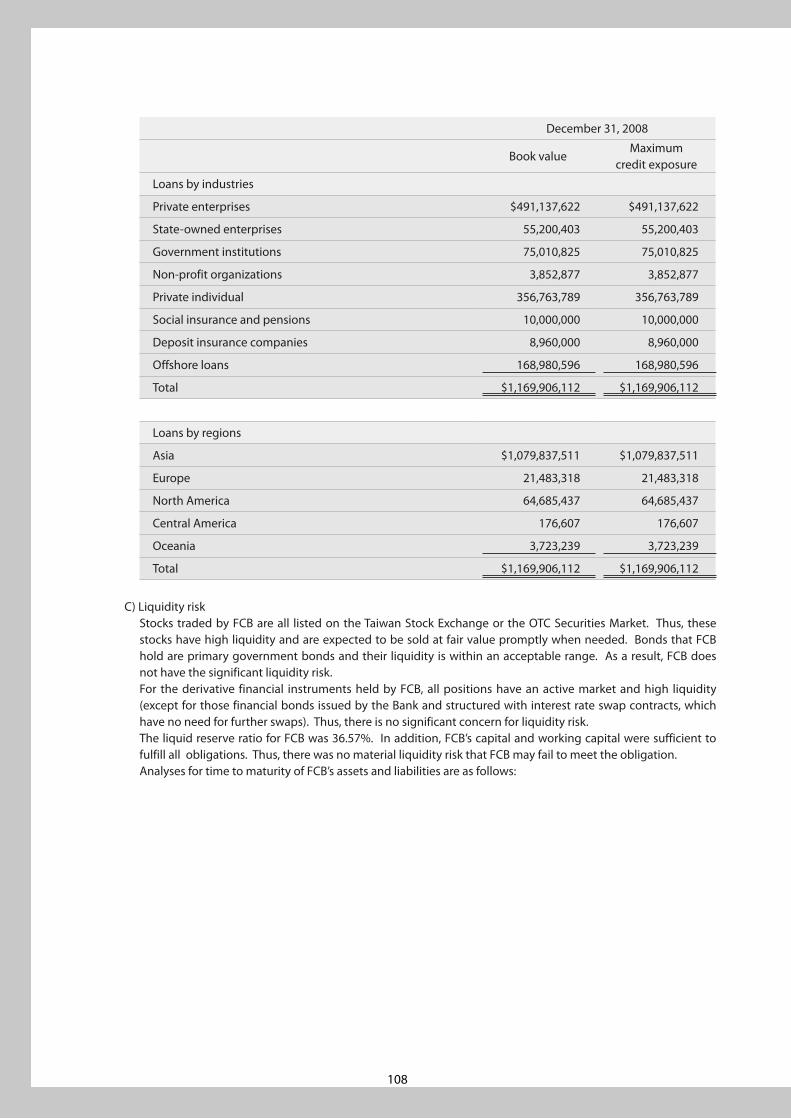
108
December 31, 2008
Book value Maximum
credit exposure
Loans by industries
Private enterprises $491,137,622 $491,137,622
State-owned enterprises 55,200,403 55,200,403
Government institutions 75,010,825 75,010,825
Non-profit organizations 3,852,877 3,852,877
Private individual 356,763,789 356,763,789
Social insurance and pensions 10,000,000 10,000,000
Deposit insurance companies 8,960,000 8,960,000
Offshore loans 168,980,596 168,980,596
Total $1,169,906,112 $1,169,906,112
Loans by regions
Asia $1,079,837,511 $1,079,837,511
Europe 21,483,318 21,483,318
North America 64,685,437 64,685,437
Central America 176,607 176,607
Oceania 3,723,239 3,723,239
Total $1,169,906,112 $1,169,906,112
C) Liquidity riskStocks traded by FCB are all listed on the Taiwan Stock Exchange or the OTC Securities Market. Thus, these stocks have high liquidity and are expected to be sold at fair value promptly when needed. Bonds that FCB hold are primary government bonds and their liquidity is within an acceptable range. As a result, FCB does not have the significant liquidity risk.For the derivative financial instruments held by FCB, all positions have an active market and high liquidity (except for those financial bonds issued by the Bank and structured with interest rate swap contracts, which have no need for further swaps). Thus, there is no significant concern for liquidity risk.The liquid reserve ratio for FCB was 36.57%. In addition, FCB’s capital and working capital were sufficient to fulfill all obligations. Thus, there was no material liquidity risk that FCB may fail to meet the obligation. Analyses for time to maturity of FCB’s assets and liabilities are as follows:
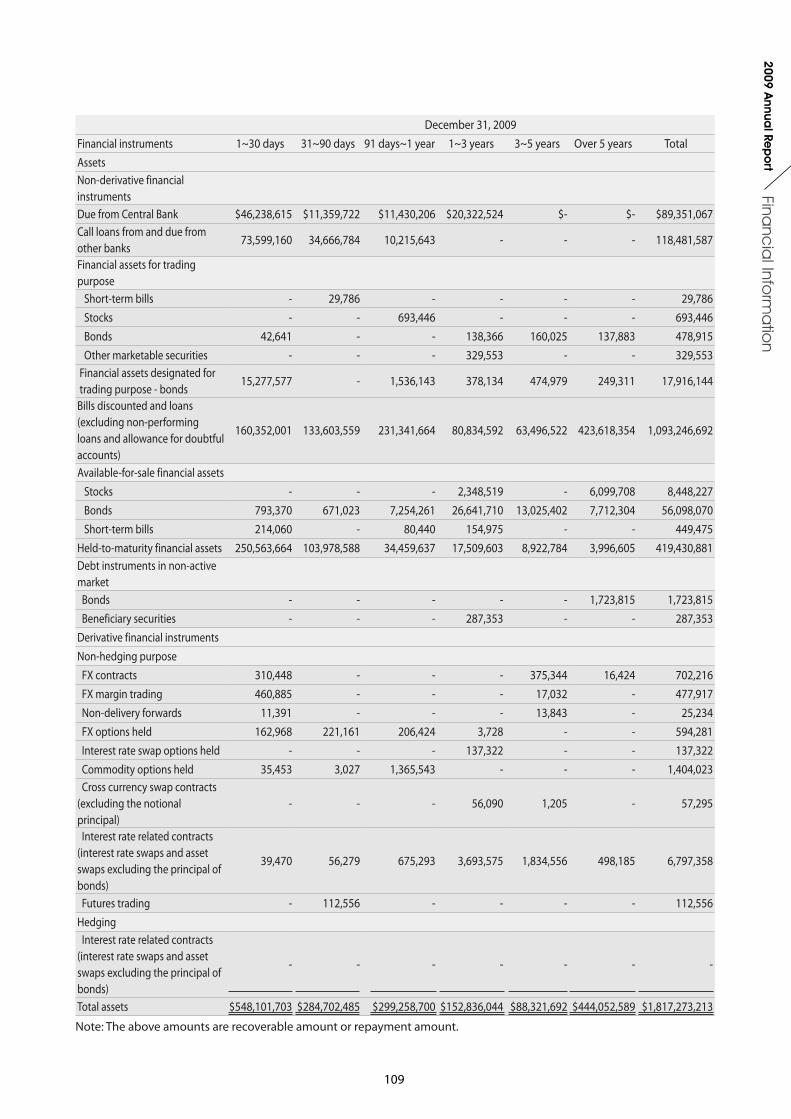
109
Financ
ial Info
rma
tion
2009 Annua
l Rep
ort
December 31, 2009Financial instruments 1~30 days 31~90 days 91 days~1 year 1~3 years 3~5 years Over 5 years TotalAssetsNon-derivative financial instrumentsDue from Central Bank $46,238,615 $11,359,722 $11,430,206 $20,322,524 $- $- $89,351,067Call loans from and due from other banks
73,599,160 34,666,784 10,215,643 - - - 118,481,587
Financial assets for trading purpose Short-term bills - 29,786 - - - - 29,786 Stocks - - 693,446 - - - 693,446 Bonds 42,641 - - 138,366 160,025 137,883 478,915 Other marketable securities - - - 329,553 - - 329,553 Financial assets designated for trading purpose - bonds
15,277,577 - 1,536,143 378,134 474,979 249,311 17,916,144
Bills discounted and loans (excluding non-performing loans and allowance for doubtful accounts)
160,352,001 133,603,559 231,341,664 80,834,592 63,496,522 423,618,354 1,093,246,692
Available-for-sale financial assets Stocks - - - 2,348,519 - 6,099,708 8,448,227 Bonds 793,370 671,023 7,254,261 26,641,710 13,025,402 7,712,304 56,098,070 Short-term bills 214,060 - 80,440 154,975 - - 449,475Held-to-maturity financial assets 250,563,664 103,978,588 34,459,637 17,509,603 8,922,784 3,996,605 419,430,881Debt instruments in non-active market Bonds - - - - - 1,723,815 1,723,815 Beneficiary securities - - - 287,353 - - 287,353Derivative financial instrumentsNon-hedging purpose FX contracts 310,448 - - - 375,344 16,424 702,216 FX margin trading 460,885 - - - 17,032 - 477,917 Non-delivery forwards 11,391 - - - 13,843 - 25,234 FX options held 162,968 221,161 206,424 3,728 - - 594,281 Interest rate swap options held - - - 137,322 - - 137,322 Commodity options held 35,453 3,027 1,365,543 - - - 1,404,023 Cross currency swap contracts (excluding the notional principal)
- - - 56,090 1,205 - 57,295
Interest rate related contracts (interest rate swaps and asset swaps excluding the principal of bonds)
39,470 56,279 675,293 3,693,575 1,834,556 498,185 6,797,358
Futures trading - 112,556 - - - - 112,556Hedging Interest rate related contracts (interest rate swaps and asset swaps excluding the principal of bonds)
- - - - - - -
Total assets $548,101,703 $284,702,485 $299,258,700 $152,836,044 $88,321,692 $444,052,589 $1,817,273,213
Note: The above amounts are recoverable amount or repayment amount.
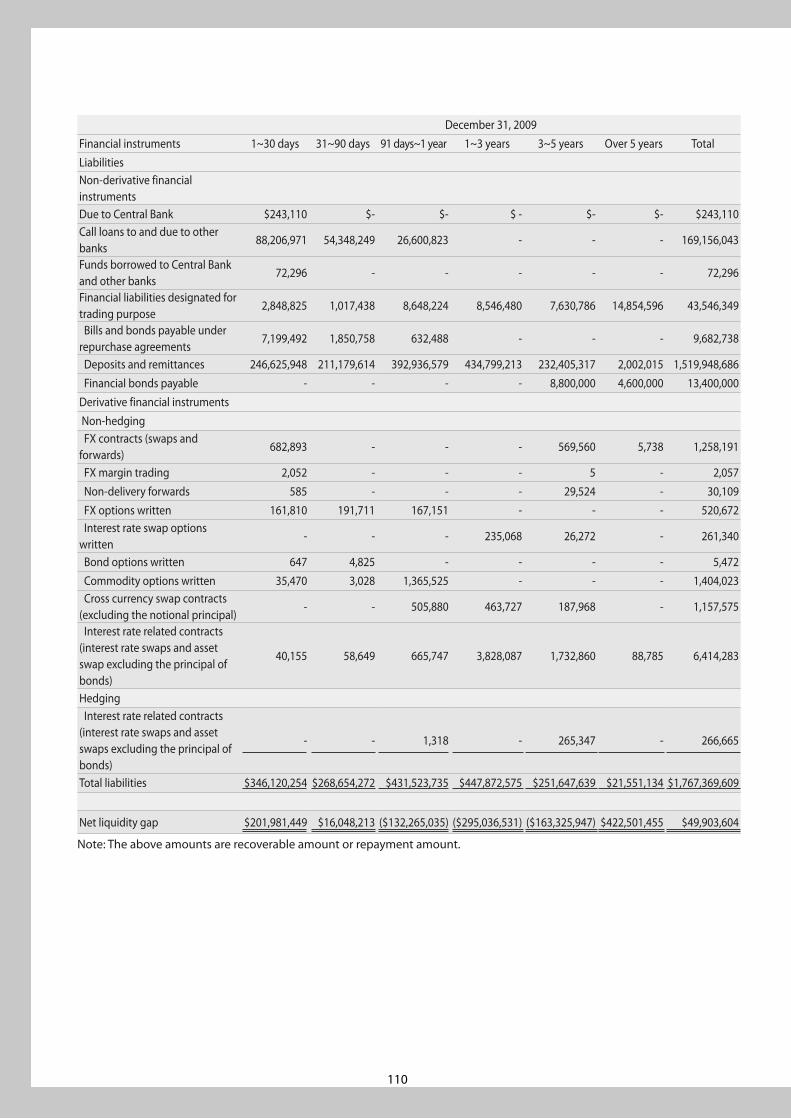
110
December 31, 2009Financial instruments 1~30 days 31~90 days 91 days~1 year 1~3 years 3~5 years Over 5 years TotalLiabilitiesNon-derivative financial instrumentsDue to Central Bank $243,110 $- $- $ - $- $- $243,110Call loans to and due to other banks
88,206,971 54,348,249 26,600,823 - - - 169,156,043
Funds borrowed to Central Bank and other banks
72,296 - - - - - 72,296
Financial liabilities designated for trading purpose
2,848,825 1,017,438 8,648,224 8,546,480 7,630,786 14,854,596 43,546,349
Bills and bonds payable under repurchase agreements
7,199,492 1,850,758 632,488 - - - 9,682,738
Deposits and remittances 246,625,948 211,179,614 392,936,579 434,799,213 232,405,317 2,002,015 1,519,948,686 Financial bonds payable - - - - 8,800,000 4,600,000 13,400,000Derivative financial instruments Non-hedging FX contracts (swaps and forwards)
682,893 - - - 569,560 5,738 1,258,191
FX margin trading 2,052 - - - 5 - 2,057 Non-delivery forwards 585 - - - 29,524 - 30,109 FX options written 161,810 191,711 167,151 - - - 520,672 Interest rate swap options written
- - - 235,068 26,272 - 261,340
Bond options written 647 4,825 - - - - 5,472 Commodity options written 35,470 3,028 1,365,525 - - - 1,404,023 Cross currency swap contracts (excluding the notional principal)
- - 505,880 463,727 187,968 - 1,157,575
Interest rate related contracts (interest rate swaps and asset swap excluding the principal of bonds)
40,155 58,649 665,747 3,828,087 1,732,860 88,785 6,414,283
Hedging Interest rate related contracts (interest rate swaps and asset swaps excluding the principal of bonds)
- - 1,318 - 265,347 - 266,665
Total liabilities $346,120,254 $268,654,272 $431,523,735 $447,872,575 $251,647,639 $21,551,134 $1,767,369,609
Net liquidity gap $201,981,449 $16,048,213 ($132,265,035) ($295,036,531) ($163,325,947) $422,501,455 $49,903,604
Note: The above amounts are recoverable amount or repayment amount.
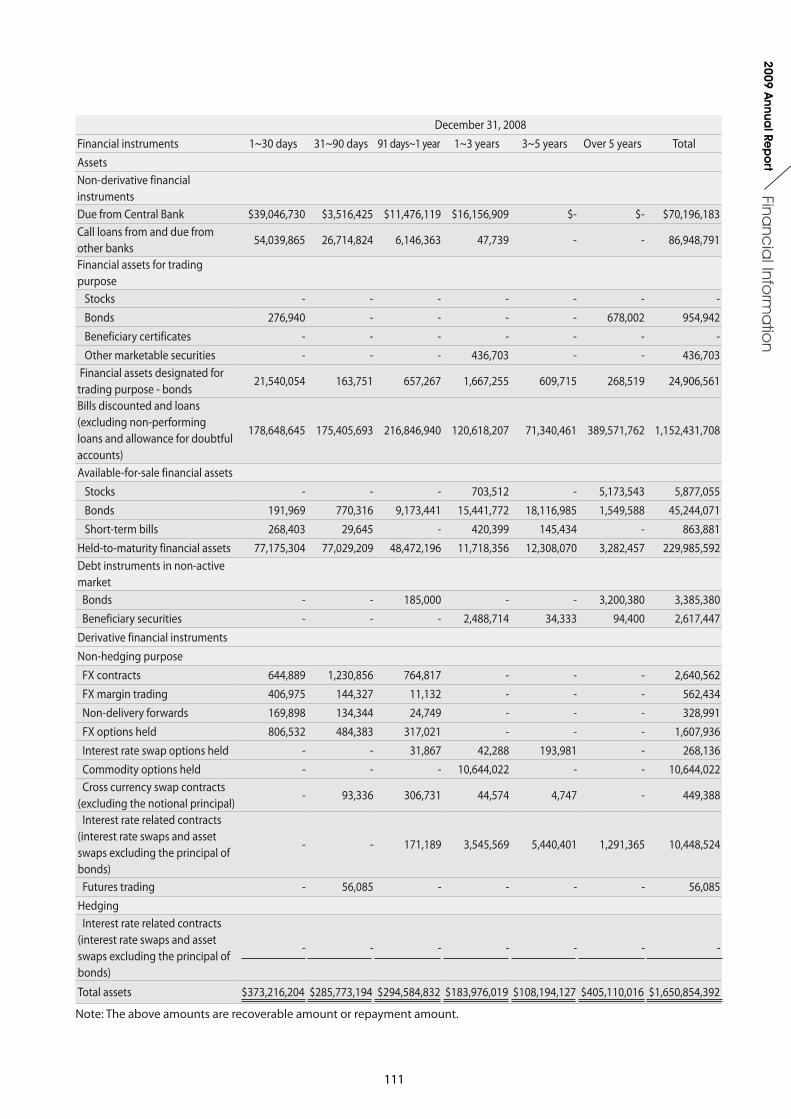
111
Financ
ial Info
rma
tion
2009 Annua
l Rep
ort
December 31, 2008Financial instruments 1~30 days 31~90 days 91 days~1 year 1~3 years 3~5 years Over 5 years Total AssetsNon-derivative financial instrumentsDue from Central Bank $39,046,730 $3,516,425 $11,476,119 $16,156,909 $- $- $70,196,183Call loans from and due from other banks
54,039,865 26,714,824 6,146,363 47,739 - - 86,948,791
Financial assets for trading purpose Stocks - - - - - - - Bonds 276,940 - - - - 678,002 954,942 Beneficiary certificates - - - - - - - Other marketable securities - - - 436,703 - - 436,703 Financial assets designated for trading purpose - bonds
21,540,054 163,751 657,267 1,667,255 609,715 268,519 24,906,561
Bills discounted and loans (excluding non-performing loans and allowance for doubtful accounts)
178,648,645 175,405,693 216,846,940 120,618,207 71,340,461 389,571,762 1,152,431,708
Available-for-sale financial assets Stocks - - - 703,512 - 5,173,543 5,877,055 Bonds 191,969 770,316 9,173,441 15,441,772 18,116,985 1,549,588 45,244,071 Short-term bills 268,403 29,645 - 420,399 145,434 - 863,881Held-to-maturity financial assets 77,175,304 77,029,209 48,472,196 11,718,356 12,308,070 3,282,457 229,985,592Debt instruments in non-active market Bonds - - 185,000 - - 3,200,380 3,385,380 Beneficiary securities - - - 2,488,714 34,333 94,400 2,617,447Derivative financial instrumentsNon-hedging purpose FX contracts 644,889 1,230,856 764,817 - - - 2,640,562 FX margin trading 406,975 144,327 11,132 - - - 562,434 Non-delivery forwards 169,898 134,344 24,749 - - - 328,991 FX options held 806,532 484,383 317,021 - - - 1,607,936 Interest rate swap options held - - 31,867 42,288 193,981 - 268,136 Commodity options held - - - 10,644,022 - - 10,644,022 Cross currency swap contracts (excluding the notional principal)
- 93,336 306,731 44,574 4,747 - 449,388
Interest rate related contracts (interest rate swaps and asset swaps excluding the principal of bonds)
- - 171,189 3,545,569 5,440,401 1,291,365 10,448,524
Futures trading - 56,085 - - - - 56,085Hedging Interest rate related contracts (interest rate swaps and asset swaps excluding the principal of bonds)
- - - - - - -
Total assets $373,216,204 $285,773,194 $294,584,832 $183,976,019 $108,194,127 $405,110,016 $1,650,854,392
Note: The above amounts are recoverable amount or repayment amount.
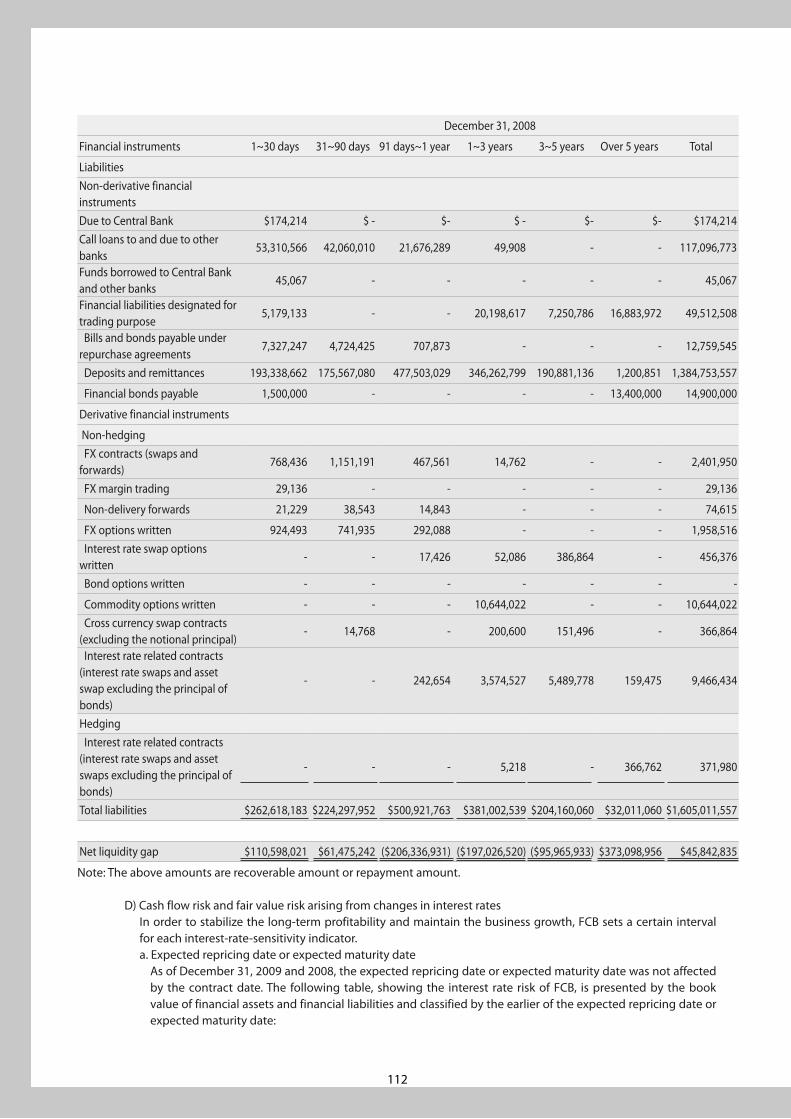
112
December 31, 2008
Financial instruments 1~30 days 31~90 days 91 days~1 year 1~3 years 3~5 years Over 5 years Total
LiabilitiesNon-derivative financial instrumentsDue to Central Bank $174,214 $ - $- $ - $- $- $174,214Call loans to and due to other banks
53,310,566 42,060,010 21,676,289 49,908 - - 117,096,773
Funds borrowed to Central Bank and other banks
45,067 - - - - - 45,067
Financial liabilities designated for trading purpose
5,179,133 - - 20,198,617 7,250,786 16,883,972 49,512,508
Bills and bonds payable under repurchase agreements
7,327,247 4,724,425 707,873 - - - 12,759,545
Deposits and remittances 193,338,662 175,567,080 477,503,029 346,262,799 190,881,136 1,200,851 1,384,753,557
Financial bonds payable 1,500,000 - - - - 13,400,000 14,900,000
Derivative financial instruments
Non-hedging FX contracts (swaps and forwards)
768,436 1,151,191 467,561 14,762 - - 2,401,950
FX margin trading 29,136 - - - - - 29,136
Non-delivery forwards 21,229 38,543 14,843 - - - 74,615
FX options written 924,493 741,935 292,088 - - - 1,958,516 Interest rate swap options written
- - 17,426 52,086 386,864 - 456,376
Bond options written - - - - - - -
Commodity options written - - - 10,644,022 - - 10,644,022 Cross currency swap contracts (excluding the notional principal)
- 14,768 - 200,600 151,496 - 366,864
Interest rate related contracts (interest rate swaps and asset swap excluding the principal of bonds)
- - 242,654 3,574,527 5,489,778 159,475 9,466,434
Hedging Interest rate related contracts (interest rate swaps and asset swaps excluding the principal of bonds)
- - - 5,218 - 366,762 371,980
Total liabilities $262,618,183 $224,297,952 $500,921,763 $381,002,539 $204,160,060 $32,011,060 $1,605,011,557
Net liquidity gap $110,598,021 $61,475,242 ($206,336,931) ($197,026,520) ($95,965,933) $373,098,956 $45,842,835
Note: The above amounts are recoverable amount or repayment amount.
D) Cash flow risk and fair value risk arising from changes in interest ratesIn order to stabilize the long-term profitability and maintain the business growth, FCB sets a certain interval for each interest-rate-sensitivity indicator.a. Expected repricing date or expected maturity date As of December 31, 2009 and 2008, the expected repricing date or expected maturity date was not affected
by the contract date. The following table, showing the interest rate risk of FCB, is presented by the book value of financial assets and financial liabilities and classified by the earlier of the expected repricing date or expected maturity date:

113
Financ
ial Info
rma
tion
2009 Annua
l Rep
ort
December 31, 2009
Financial instruments 1~30 days 31~90 days 91 days~1 year 1~3 years 3~5 years Over 5 years Total
Assets
Non-derivative financial instruments
Due from Central Bank $46,238,615 $11,359,722 $11,430,206 $20,322,524 $- $- $89,351,067
Call loans from and due from other banks
73,599,160 34,666,784 10,215,643 - - - 118,481,587
Financial assets designated for trading purpose
Short-term bills - 29,786 - - - - 29,786
Bonds 42,641 - - 138,366 160,025 137,883 478,915
Financial assets designated for trading purpose - bonds
15,277,577 1,502,537 381,760 171,554 333,405 249,311 17,916,144
Bills discounted and loans (excluding non-performing loans and allowance for doubtful accounts)
478,712,043 485,673,743 94,320,322 4,695,895 7,959,991 21,884,698 1,093,246,692
Available-for-sale financial assets
Bonds 3,198,005 5,565,424 5,869,138 21,173,593 12,579,606 7,712,304 56,098,070
Short-term bills 214,060 154,975 80,440 - - - 449,475
Held-to-maturity financial assets
261,347,959 115,271,101 32,736,651 7,430,072 2,238,188 406,910 419,430,881
Debt instruments in non-active market – bonds
1,723,815 - - - - - 1,723,815
Derivative financial instruments
Interest rate swap option held - - - 137,322 - - 137,322
Cross currency swap contracts (excluding the notional principal)
- - 9,997 47,298 - - 57,295
Interest rate related contracts (interest rate swaps and asset swaps excluding the principal of bonds)
2,752,683 3,664,936 172,592 15,519 139,605 52,023 6,797,358
Futures trading - 112,556 - - - - 112,556
Hedging Interest rate related contracts
- - - - - - -
Total assets $883,106,558 $658,001,564 $155,216,749 $54,132,143 $23,410,820 $30,443,129 $1,804,310,963
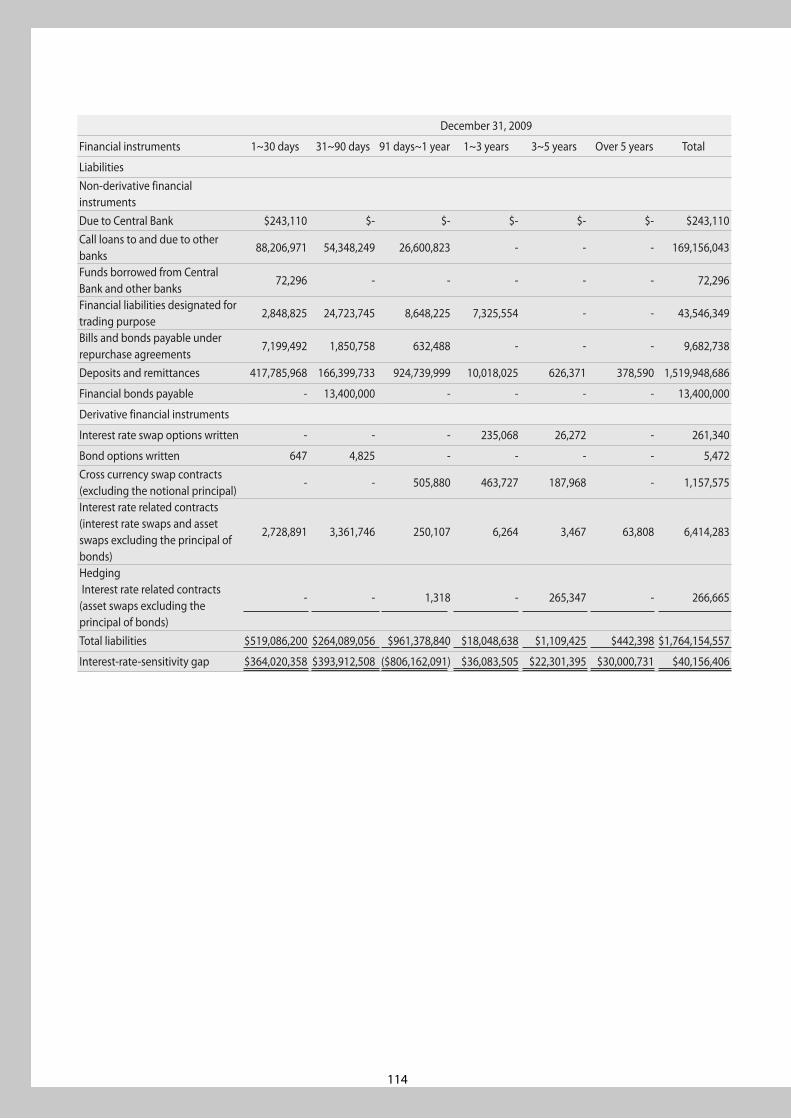
114
December 31, 2009
Financial instruments 1~30 days 31~90 days 91 days~1 year 1~3 years 3~5 years Over 5 years Total
LiabilitiesNon-derivative financial instrumentsDue to Central Bank $243,110 $- $- $- $- $- $243,110Call loans to and due to other banks
88,206,971 54,348,249 26,600,823 - - - 169,156,043
Funds borrowed from Central Bank and other banks
72,296 - - - - - 72,296
Financial liabilities designated for trading purpose
2,848,825 24,723,745 8,648,225 7,325,554 - - 43,546,349
Bills and bonds payable under repurchase agreements
7,199,492 1,850,758 632,488 - - - 9,682,738
Deposits and remittances 417,785,968 166,399,733 924,739,999 10,018,025 626,371 378,590 1,519,948,686
Financial bonds payable - 13,400,000 - - - - 13,400,000
Derivative financial instruments
Interest rate swap options written - - - 235,068 26,272 - 261,340
Bond options written 647 4,825 - - - - 5,472Cross currency swap contracts (excluding the notional principal)
- - 505,880 463,727 187,968 - 1,157,575
Interest rate related contracts (interest rate swaps and asset swaps excluding the principal of bonds)
2,728,891 3,361,746 250,107 6,264 3,467 63,808 6,414,283
Hedging Interest rate related contracts (asset swaps excluding the principal of bonds)
- - 1,318 - 265,347 - 266,665
Total liabilities $519,086,200 $264,089,056 $961,378,840 $18,048,638 $1,109,425 $442,398 $1,764,154,557
Interest-rate-sensitivity gap $364,020,358 $393,912,508 ($806,162,091) $36,083,505 $22,301,395 $30,000,731 $40,156,406
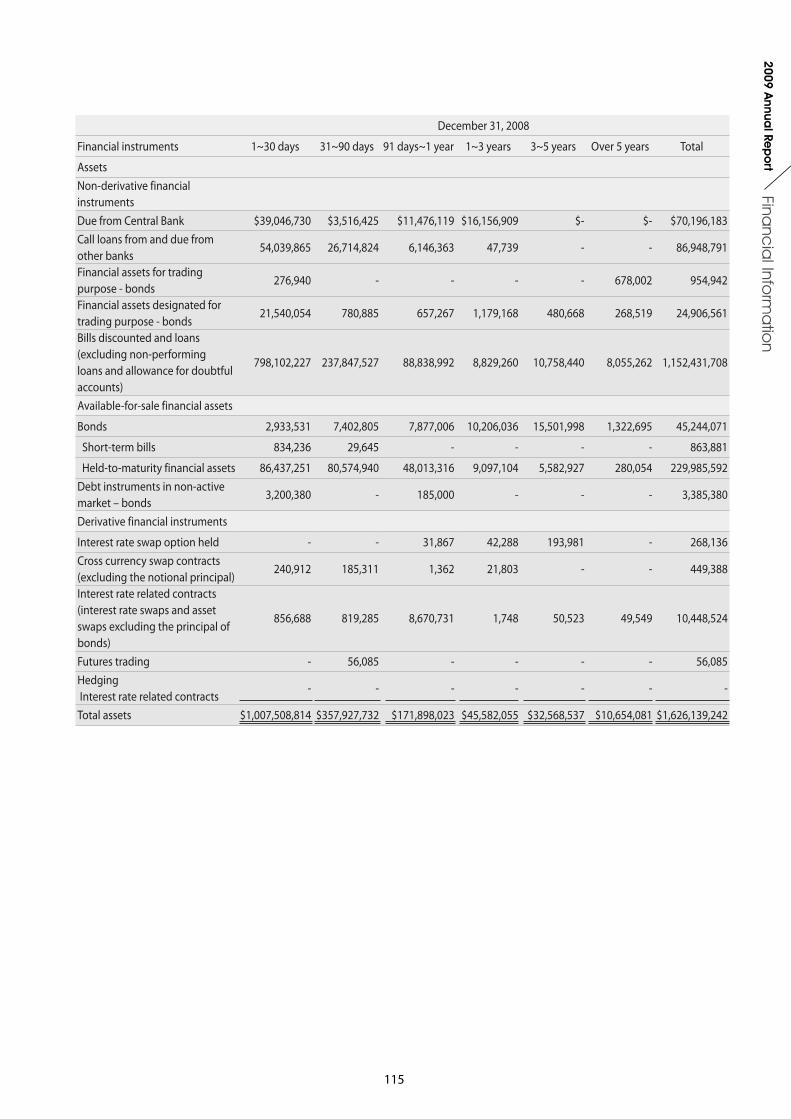
115
Financ
ial Info
rma
tion
2009 Annua
l Rep
ort
December 31, 2008
Financial instruments 1~30 days 31~90 days 91 days~1 year 1~3 years 3~5 years Over 5 years Total
AssetsNon-derivative financial instrumentsDue from Central Bank $39,046,730 $3,516,425 $11,476,119 $16,156,909 $- $- $70,196,183Call loans from and due from other banks
54,039,865 26,714,824 6,146,363 47,739 - - 86,948,791
Financial assets for trading purpose - bonds
276,940 - - - - 678,002 954,942
Financial assets designated for trading purpose - bonds
21,540,054 780,885 657,267 1,179,168 480,668 268,519 24,906,561
Bills discounted and loans (excluding non-performing loans and allowance for doubtful accounts)
798,102,227 237,847,527 88,838,992 8,829,260 10,758,440 8,055,262 1,152,431,708
Available-for-sale financial assets
Bonds 2,933,531 7,402,805 7,877,006 10,206,036 15,501,998 1,322,695 45,244,071
Short-term bills 834,236 29,645 - - - - 863,881
Held-to-maturity financial assets 86,437,251 80,574,940 48,013,316 9,097,104 5,582,927 280,054 229,985,592Debt instruments in non-active market – bonds
3,200,380 - 185,000 - - - 3,385,380
Derivative financial instruments
Interest rate swap option held - - 31,867 42,288 193,981 - 268,136Cross currency swap contracts (excluding the notional principal)
240,912 185,311 1,362 21,803 - - 449,388
Interest rate related contracts (interest rate swaps and asset swaps excluding the principal of bonds)
856,688 819,285 8,670,731 1,748 50,523 49,549 10,448,524
Futures trading - 56,085 - - - - 56,085Hedging Interest rate related contracts
- - - - - - -
Total assets $1,007,508,814 $357,927,732 $171,898,023 $45,582,055 $32,568,537 $10,654,081 $1,626,139,242
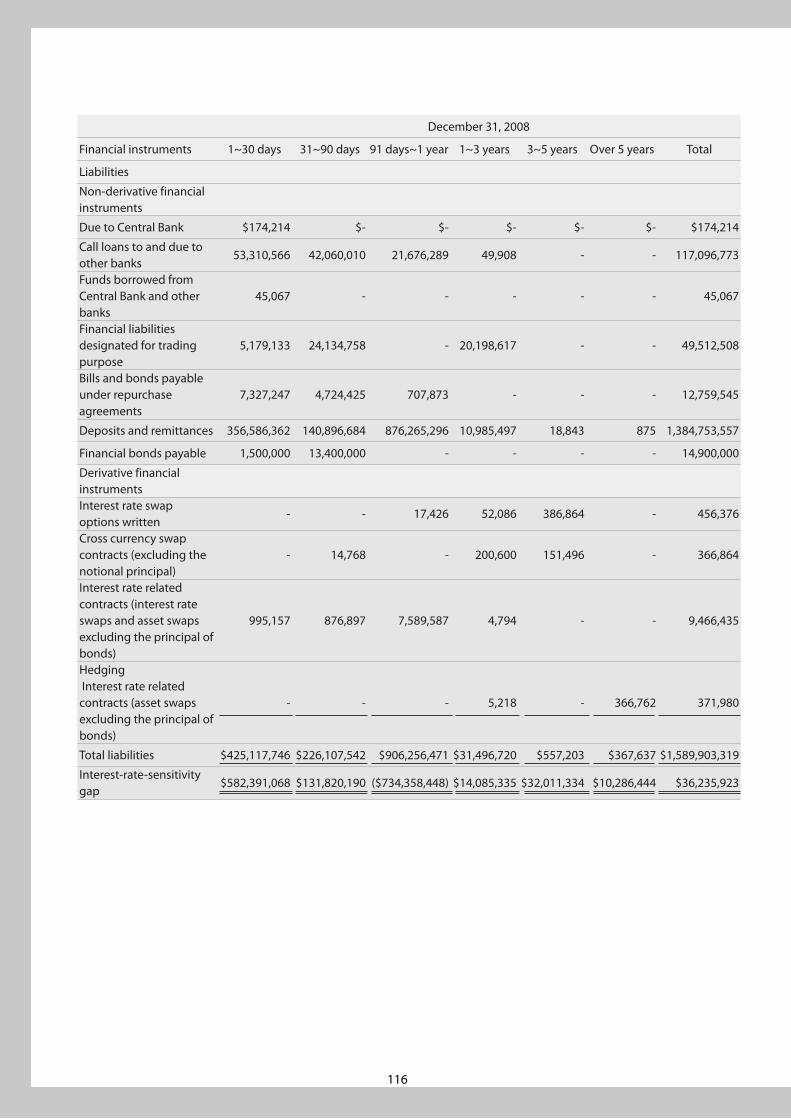
116
December 31, 2008
Financial instruments 1~30 days 31~90 days 91 days~1 year 1~3 years 3~5 years Over 5 years Total
Liabilities
Non-derivative financial instruments
Due to Central Bank $174,214 $- $- $- $- $- $174,214
Call loans to and due to other banks
53,310,566 42,060,010 21,676,289 49,908 - - 117,096,773
Funds borrowed from Central Bank and other banks
45,067 - - - - - 45,067
Financial liabilities designated for trading purpose
5,179,133 24,134,758 - 20,198,617 - - 49,512,508
Bills and bonds payable under repurchase agreements
7,327,247 4,724,425 707,873 - - - 12,759,545
Deposits and remittances 356,586,362 140,896,684 876,265,296 10,985,497 18,843 875 1,384,753,557
Financial bonds payable 1,500,000 13,400,000 - - - - 14,900,000
Derivative financial instrumentsInterest rate swap options written
- - 17,426 52,086 386,864 - 456,376
Cross currency swap contracts (excluding the notional principal)
- 14,768 - 200,600 151,496 - 366,864
Interest rate related contracts (interest rate swaps and asset swaps excluding the principal of bonds)
995,157 876,897 7,589,587 4,794 - - 9,466,435
Hedging Interest rate related contracts (asset swaps excluding the principal of bonds)
- - - 5,218 - 366,762 371,980
Total liabilities $425,117,746 $226,107,542 $906,256,471 $31,496,720 $557,203 $367,637 $1,589,903,319
Interest-rate-sensitivity gap
$582,391,068 $131,820,190 ($734,358,448) $14,085,335 $32,011,334 $10,286,444 $36,235,923
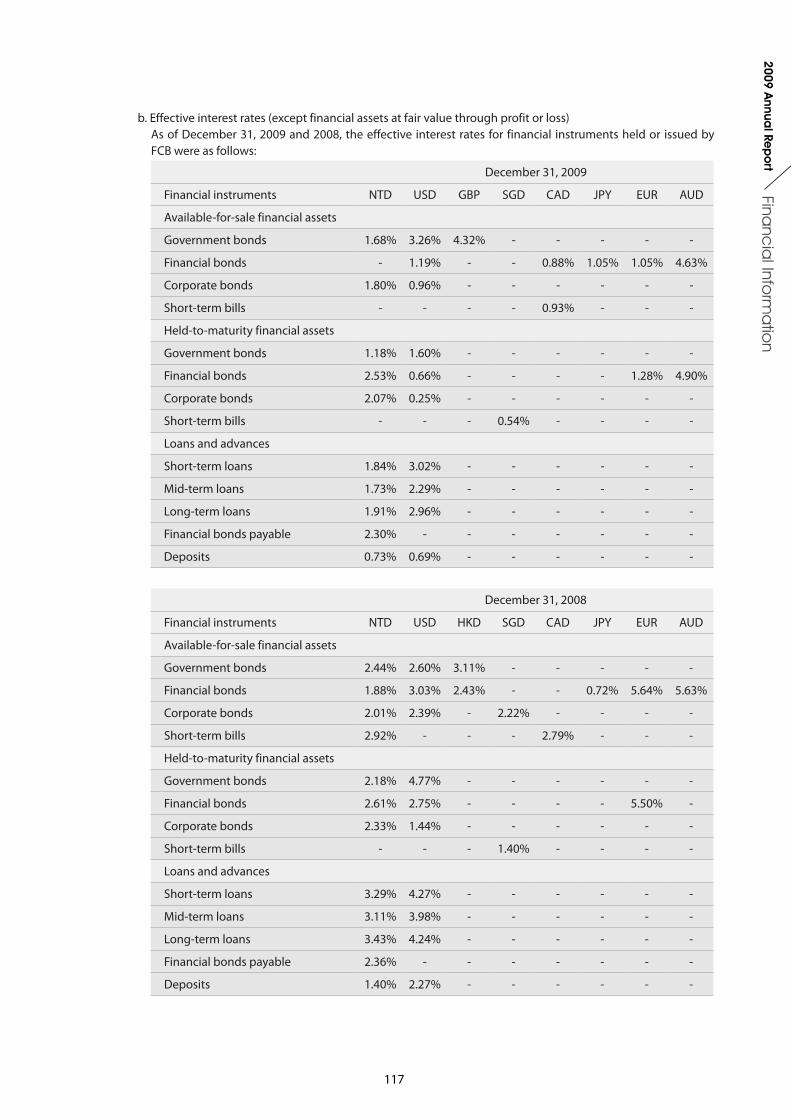
117
Financ
ial Info
rma
tion
2009 Annua
l Rep
ort
b. Effective interest rates (except financial assets at fair value through profit or loss) As of December 31, 2009 and 2008, the effective interest rates for financial instruments held or issued by
FCB were as follows:
December 31, 2009
Financial instruments NTD USD GBP SGD CAD JPY EUR AUD
Available-for-sale financial assets
Government bonds 1.68% 3.26% 4.32% - - - - -
Financial bonds - 1.19% - - 0.88% 1.05% 1.05% 4.63%
Corporate bonds 1.80% 0.96% - - - - - -
Short-term bills - - - - 0.93% - - -
Held-to-maturity financial assets
Government bonds 1.18% 1.60% - - - - - -
Financial bonds 2.53% 0.66% - - - - 1.28% 4.90%
Corporate bonds 2.07% 0.25% - - - - - -
Short-term bills - - - 0.54% - - - -
Loans and advances
Short-term loans 1.84% 3.02% - - - - - -
Mid-term loans 1.73% 2.29% - - - - - -
Long-term loans 1.91% 2.96% - - - - - -
Financial bonds payable 2.30% - - - - - - -
Deposits 0.73% 0.69% - - - - - -
December 31, 2008
Financial instruments NTD USD HKD SGD CAD JPY EUR AUD
Available-for-sale financial assets
Government bonds 2.44% 2.60% 3.11% - - - - -
Financial bonds 1.88% 3.03% 2.43% - - 0.72% 5.64% 5.63%
Corporate bonds 2.01% 2.39% - 2.22% - - - -
Short-term bills 2.92% - - - 2.79% - - -
Held-to-maturity financial assets
Government bonds 2.18% 4.77% - - - - - -
Financial bonds 2.61% 2.75% - - - - 5.50% -
Corporate bonds 2.33% 1.44% - - - - - -
Short-term bills - - - 1.40% - - - -
Loans and advances
Short-term loans 3.29% 4.27% - - - - - -
Mid-term loans 3.11% 3.98% - - - - - -
Long-term loans 3.43% 4.24% - - - - - -
Financial bonds payable 2.36% - - - - - - -
Deposits 1.40% 2.27% - - - - - -
118
FS and its subsidiariesA) Credit risk
Financial instruments held by FS and its subsidiaries may be exposed to losses if counterparties are not able to fulfill their obligations at the maturity date. FS deposits its cash in different financial institutions to control risk. Financial assets at fair value through profit or loss such as bond investments held by FS are purchase of government bonds and OTC corporate bonds with a good credit rating. The maximum exposure risk of the financial assets is for those with the positive fair value at the balance sheet date. FS and its subsidiaries always pre-evaluate the counterparty’s credit and updates periodically. It predetermines the credit limit of each counterparty to control credit limit. Thus, no significant credit risk is expected. Besides, FS does not offer any financial guarantees.
B) Market risk a. FS holds a short position after issuing warrants. Such a position has the potential market risk that warrant
holders may exercise such warrants before maturity arising from changes in fair value of the underlying securities. Based on the conservatism principle, FS reduces such risk by hedging strategies.
b. FS undertake bond option transactions. Premium for the bond options are collected/paid from/to counterparties on contract date; interests for the bond options are collected/paid from/to counterparties or settled by substance on settlement date or maturity date. The return at maturity may fluctuate based on changes in interest rates. The purpose is to earn price spread arising from fluctuations of interest rates.
c. FS and its subsidiaries undertake futures transactions of index options and stock index options in the domestic futures market. Prices of those futures fluctuate with the stock market. FS has set and complied with a stop-loss point, so it does not expect significant market risk.
d. FS undertakes bond option transactions, and its main risk is change in values of options arising from change in market interest rate. The Company hedges options and set up a stop-loss point to control the risk; loss is controlled under the predetermined limit, so it does not expect significant market risk.
e. Financial assets held by FS and its subsidiaries for trading purposes are stocks listed on the Taiwan Stock Exchange or the GreTai Securities Market, open-end funds, convertible corporate bonds, government bonds, OTC corporate bonds and financial bonds. Values of those assets fluctuate with the market interest rate and stock price. FS controls the market risk by position limit management, an investment review, and a stop- loss mechanism.
C) Cash flow risk arising from changes in interest rates FS’s borrowings are renewable loans or short-term commercial paper. Future cash flows of those borrowings may fluctuate with the market interest rate, and thus it exposes FS to the cash flow risk arising from change in interest rates.
D) Liquidity riskFS and its subsidiaries have no liquidity risk arising from insolvency due to its sufficient working capital. There is no active market or limited trade volume for certain financial instruments such as unlisted stocks, corporate bonds and financial bonds held by FS, which result in liquidity risk of FS. However, FS and its subsidiaries do not expect to dispose such investments in short-term and have sufficient working capital; there is no significant cash flow risk.
FSITA) Market risk
FSIT engages in beneficiary certificate transactions, whose primary market risk comes from price changes in those instruments. FSIT has no significant market risk, as each mutual fund has set up a stop-loss point and its changes in the fair value are controlled under the predetermined limit.
B) Credit riskAll counterparties of FSIT are mutual funds managed by FSIT. The possibility of those counterparties to default is insignificant, as those funds have offer prices in an open market. Book value of financial assets with credit risk held by FSIT can reflect credit exposures after deducting a proper valuation allowance, and thus the credit exposure information is not separately disclosed. FSIT does not provide financial guarantees for anyone.
C) Liquidity riskFSIT has no liquidity risk arising from insolvency due to its sufficient working capital. There is an active market for open-end beneficiary certificates held by FSIT, so those certificates can be sold at fair value promptly.
D) Cash flow risk arising from changes in interest ratesFSIT has no cash flow risk arising from changes in interest rates, since it does not hold any interest-rate-linked products.
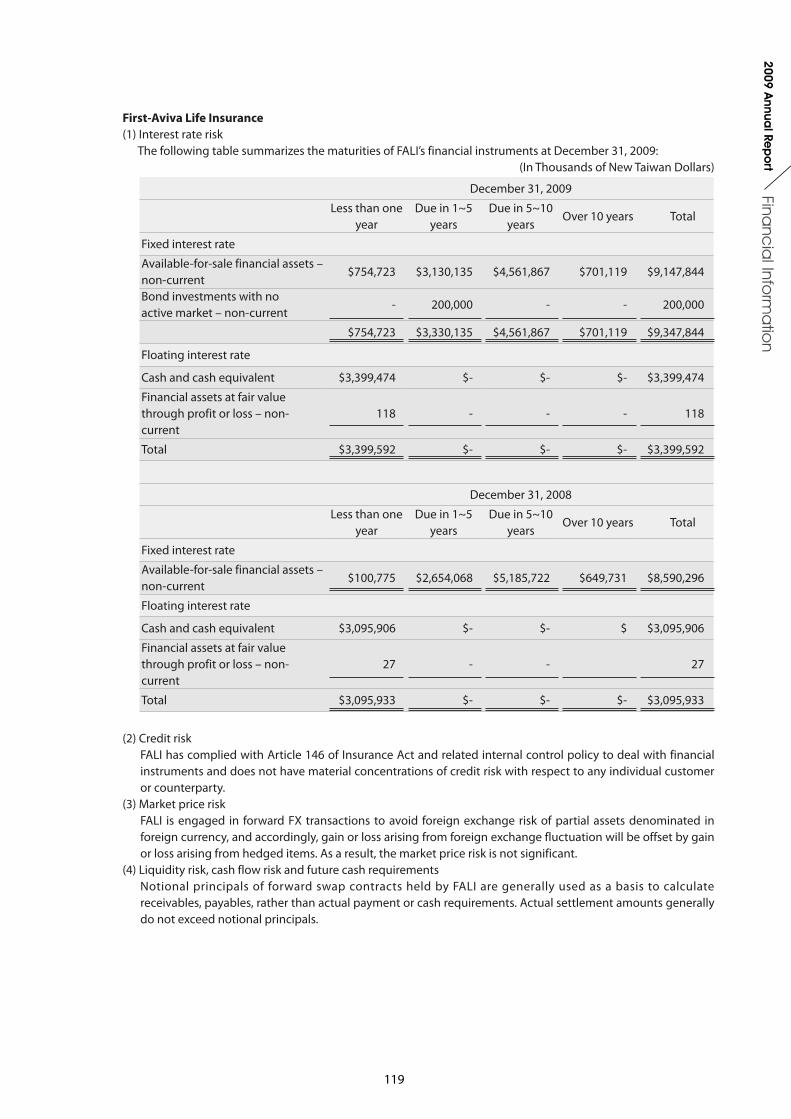
119
Financ
ial Info
rma
tion
2009 Annua
l Rep
ort
First-Aviva Life Insurance(1) Interest rate risk
The following table summarizes the maturities of FALI’s financial instruments at December 31, 2009: (In Thousands of New Taiwan Dollars)
December 31, 2009
Less than one year
Due in 1~5 years
Due in 5~10 years
Over 10 years Total
Fixed interest rate
Available-for-sale financial assets – non-current
$754,723 $3,130,135 $4,561,867 $701,119 $9,147,844
Bond investments with no active market – non-current
- 200,000 - - 200,000
$754,723 $3,330,135 $4,561,867 $701,119 $9,347,844
Floating interest rate
Cash and cash equivalent $3,399,474 $- $- $- $3,399,474
Financial assets at fair value through profit or loss – non-current
118 - - - 118
Total $3,399,592 $- $- $- $3,399,592
December 31, 2008
Less than one year
Due in 1~5 years
Due in 5~10 years
Over 10 years Total
Fixed interest rate
Available-for-sale financial assets – non-current
$100,775 $2,654,068 $5,185,722 $649,731 $8,590,296
Floating interest rate
Cash and cash equivalent $3,095,906 $- $- $ $3,095,906
Financial assets at fair value through profit or loss – non-current
27 - - 27
Total $3,095,933 $- $- $- $3,095,933
(2) Credit risk FALI has complied with Article 146 of Insurance Act and related internal control policy to deal with financial instruments and does not have material concentrations of credit risk with respect to any individual customer or counterparty.
(3) Market price risk FALI is engaged in forward FX transactions to avoid foreign exchange risk of partial assets denominated in foreign currency, and accordingly, gain or loss arising from foreign exchange fluctuation will be offset by gain or loss arising from hedged items. As a result, the market price risk is not significant.
(4) Liquidity risk, cash flow risk and future cash requirements Notional principals of forward swap contracts held by FALI are generally used as a basis to calculate receivables, payables, rather than actual payment or cash requirements. Actual settlement amounts generally do not exceed notional principals.
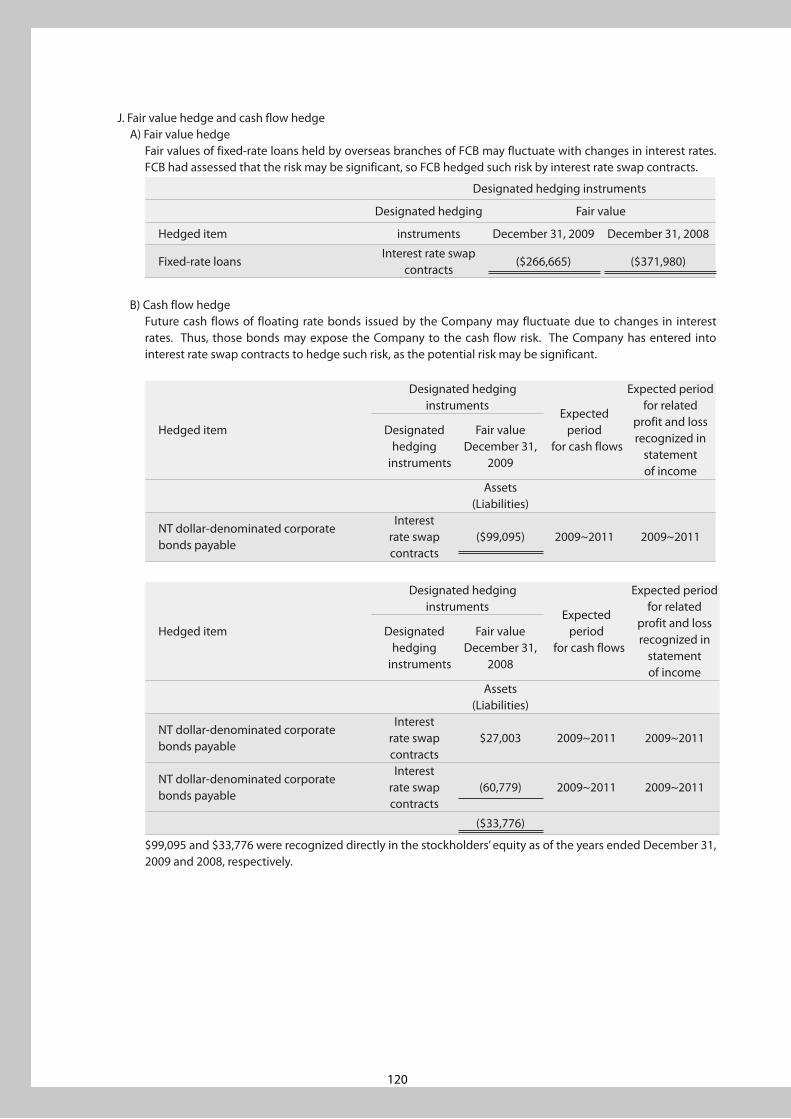
120
J. Fair value hedge and cash flow hedge A) Fair value hedge
Fair values of fixed-rate loans held by overseas branches of FCB may fluctuate with changes in interest rates. FCB had assessed that the risk may be significant, so FCB hedged such risk by interest rate swap contracts.
Designated hedging instruments
Designated hedging Fair value
Hedged item instruments December 31, 2009 December 31, 2008
Fixed-rate loansInterest rate swap
contracts($266,665) ($371,980)
B) Cash flow hedge Future cash flows of floating rate bonds issued by the Company may fluctuate due to changes in interest rates. Thus, those bonds may expose the Company to the cash flow risk. The Company has entered into interest rate swap contracts to hedge such risk, as the potential risk may be significant.
Hedged item
Designated hedging instruments
Expected period
for cash flows
Expected period for related
profit and loss recognized in
statement of income
Designated hedging
instruments
Fair valueDecember 31,
2009
Assets (Liabilities)
NT dollar-denominated corporate bonds payable
Interest rate swap contracts
($99,095) 2009~2011 2009~2011
Hedged item
Designated hedging instruments
Expected period
for cash flows
Expected period for related
profit and loss recognized in
statement of income
Designated hedging
instruments
Fair valueDecember 31,
2008
Assets (Liabilities)
NT dollar-denominated corporate bonds payable
Interest rate swap contracts
$27,003 2009~2011 2009~2011
NT dollar-denominated corporate bonds payable
Interest rate swap contracts
(60,779) 2009~2011 2009~2011
($33,776)
$99,095 and $33,776 were recognized directly in the stockholders’ equity as of the years ended December 31, 2009 and 2008, respectively.
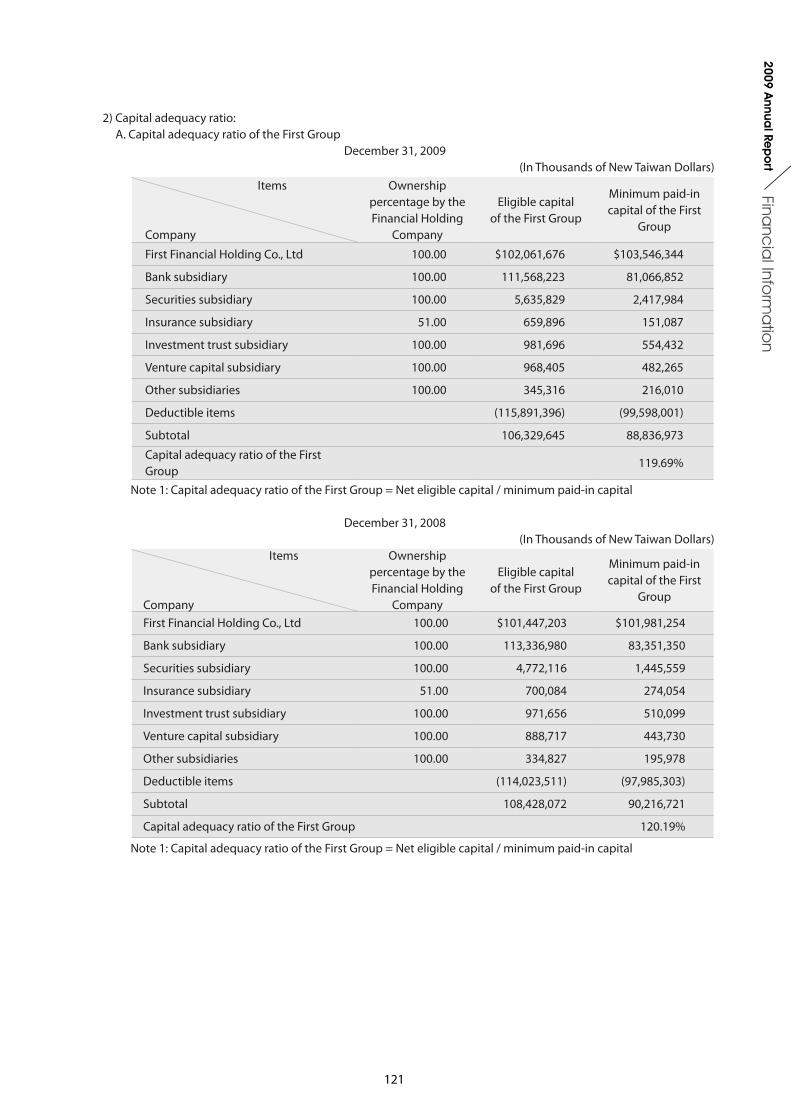
121
Financ
ial Info
rma
tion
2009 Annua
l Rep
ort
2) Capital adequacy ratio: A. Capital adequacy ratio of the First Group
December 31, 2009 (In Thousands of New Taiwan Dollars)
Items
Company
Ownership percentage by the Financial Holding
Company
Eligible capitalof the First Group
Minimum paid-in capital of the First
Group
First Financial Holding Co., Ltd 100.00 $102,061,676 $103,546,344
Bank subsidiary 100.00 111,568,223 81,066,852
Securities subsidiary 100.00 5,635,829 2,417,984
Insurance subsidiary 51.00 659,896 151,087
Investment trust subsidiary 100.00 981,696 554,432
Venture capital subsidiary 100.00 968,405 482,265
Other subsidiaries 100.00 345,316 216,010
Deductible items (115,891,396) (99,598,001)
Subtotal 106,329,645 88,836,973
Capital adequacy ratio of the First Group
119.69%
Note 1: Capital adequacy ratio of the First Group = Net eligible capital / minimum paid-in capital
December 31, 2008(In Thousands of New Taiwan Dollars)
Items
Company
Ownership percentage by the Financial Holding
Company
Eligible capitalof the First Group
Minimum paid-in capital of the First
Group
First Financial Holding Co., Ltd 100.00 $101,447,203 $101,981,254
Bank subsidiary 100.00 113,336,980 83,351,350
Securities subsidiary 100.00 4,772,116 1,445,559
Insurance subsidiary 51.00 700,084 274,054
Investment trust subsidiary 100.00 971,656 510,099
Venture capital subsidiary 100.00 888,717 443,730
Other subsidiaries 100.00 334,827 195,978
Deductible items (114,023,511) (97,985,303)
Subtotal 108,428,072 90,216,721
Capital adequacy ratio of the First Group 120.19%
Note 1: Capital adequacy ratio of the First Group = Net eligible capital / minimum paid-in capital
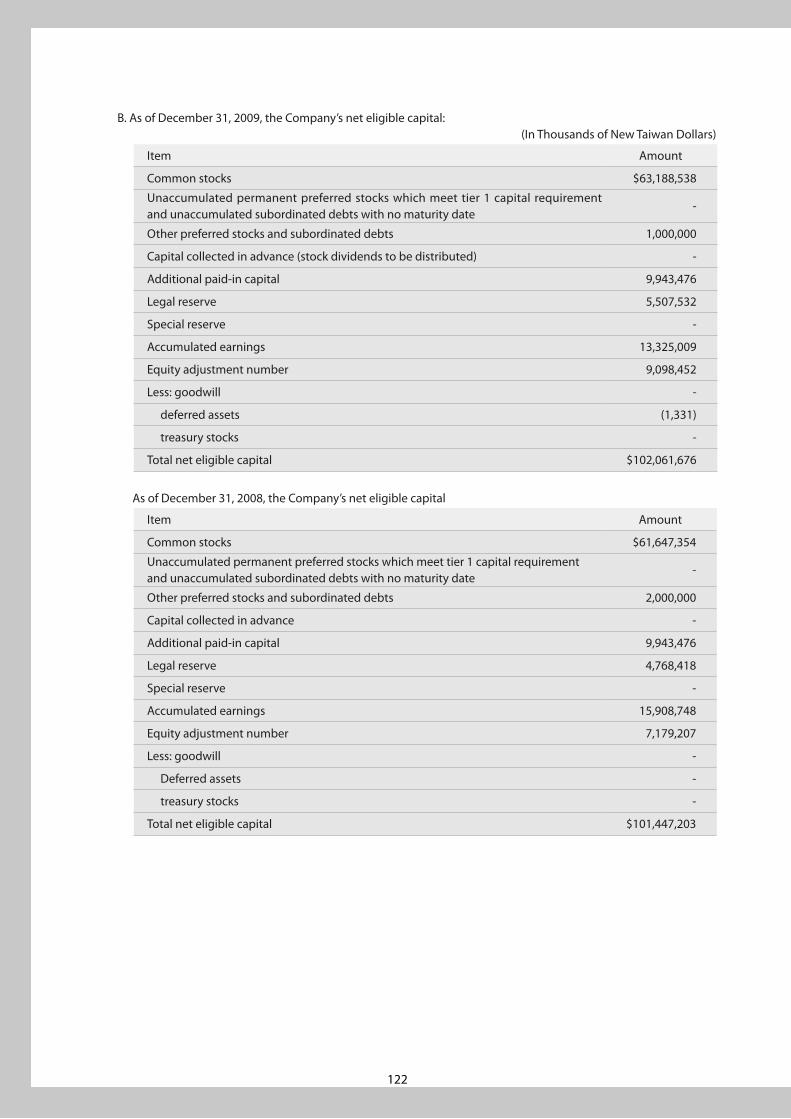
122
B. As of December 31, 2009, the Company’s net eligible capital:(In Thousands of New Taiwan Dollars)
Item Amount
Common stocks $63,188,538
Unaccumulated permanent preferred stocks which meet tier 1 capital requirement and unaccumulated subordinated debts with no maturity date
-
Other preferred stocks and subordinated debts 1,000,000
Capital collected in advance (stock dividends to be distributed) -
Additional paid-in capital 9,943,476
Legal reserve 5,507,532
Special reserve -
Accumulated earnings 13,325,009
Equity adjustment number 9,098,452
Less: goodwill -
deferred assets (1,331)
treasury stocks -
Total net eligible capital $102,061,676
As of December 31, 2008, the Company’s net eligible capital
Item Amount
Common stocks $61,647,354
Unaccumulated permanent preferred stocks which meet tier 1 capital requirement and unaccumulated subordinated debts with no maturity date
-
Other preferred stocks and subordinated debts 2,000,000
Capital collected in advance -
Additional paid-in capital 9,943,476
Legal reserve 4,768,418
Special reserve -
Accumulated earnings 15,908,748
Equity adjustment number 7,179,207
Less: goodwill -
Deferred assets -
treasury stocks -
Total net eligible capital $101,447,203
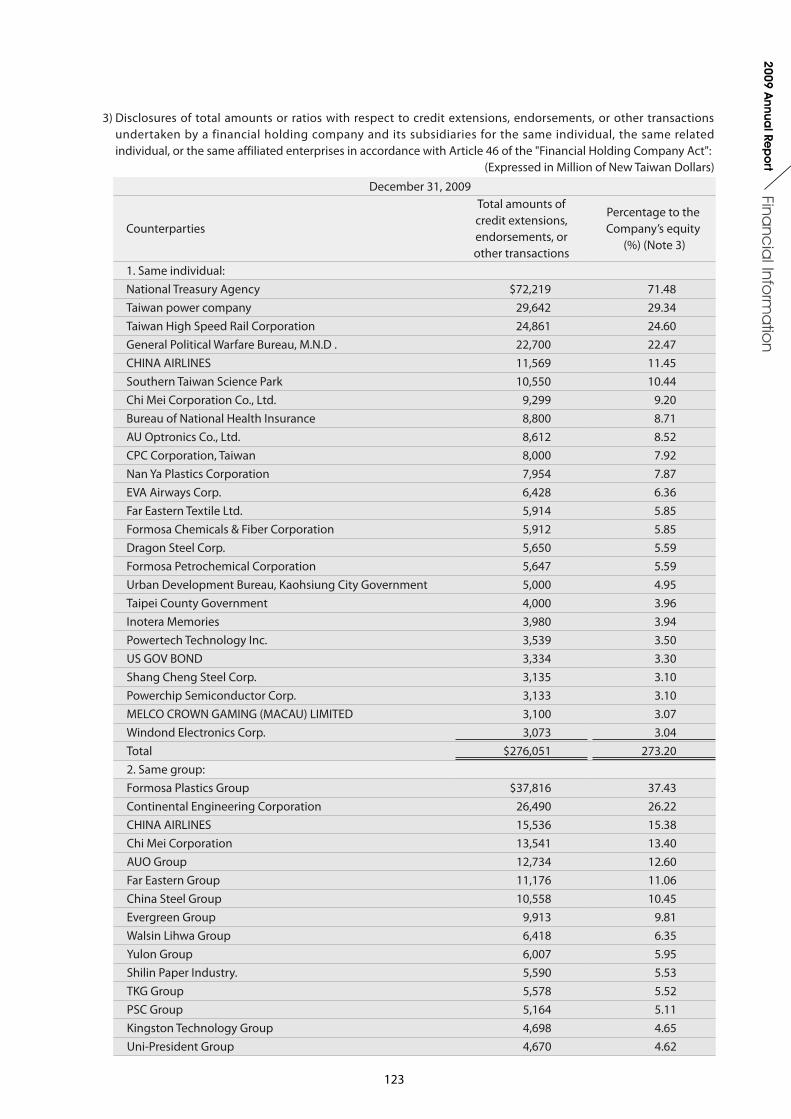
123
Financ
ial Info
rma
tion
2009 Annua
l Rep
ort
3) Disclosures of total amounts or ratios with respect to credit extensions, endorsements, or other transactions undertaken by a financial holding company and its subsidiaries for the same individual, the same related individual, or the same affiliated enterprises in accordance with Article 46 of the "Financial Holding Company Act":
(Expressed in Million of New Taiwan Dollars)
December 31, 2009
Counterparties
Total amounts of credit extensions, endorsements, or other transactions
Percentage to the Company’s equity
(%) (Note 3)
1. Same individual:National Treasury Agency $72,219 71.48Taiwan power company 29,642 29.34Taiwan High Speed Rail Corporation 24,861 24.60General Political Warfare Bureau, M.N.D . 22,700 22.47CHINA AIRLINES 11,569 11.45Southern Taiwan Science Park 10,550 10.44Chi Mei Corporation Co., Ltd. 9,299 9.20Bureau of National Health Insurance 8,800 8.71AU Optronics Co., Ltd. 8,612 8.52CPC Corporation, Taiwan 8,000 7.92Nan Ya Plastics Corporation 7,954 7.87EVA Airways Corp. 6,428 6.36Far Eastern Textile Ltd. 5,914 5.85Formosa Chemicals & Fiber Corporation 5,912 5.85Dragon Steel Corp. 5,650 5.59Formosa Petrochemical Corporation 5,647 5.59Urban Development Bureau, Kaohsiung City Government 5,000 4.95Taipei County Government 4,000 3.96Inotera Memories 3,980 3.94Powertech Technology Inc. 3,539 3.50US GOV BOND 3,334 3.30Shang Cheng Steel Corp. 3,135 3.10Powerchip Semiconductor Corp. 3,133 3.10MELCO CROWN GAMING (MACAU) LIMITED 3,100 3.07Windond Electronics Corp. 3,073 3.04Total $276,051 273.202. Same group:Formosa Plastics Group $37,816 37.43Continental Engineering Corporation 26,490 26.22CHINA AIRLINES 15,536 15.38Chi Mei Corporation 13,541 13.40AUO Group 12,734 12.60Far Eastern Group 11,176 11.06China Steel Group 10,558 10.45Evergreen Group 9,913 9.81Walsin Lihwa Group 6,418 6.35Yulon Group 6,007 5.95Shilin Paper Industry. 5,590 5.53TKG Group 5,578 5.52PSC Group 5,164 5.11Kingston Technology Group 4,698 4.65Uni-President Group 4,670 4.62
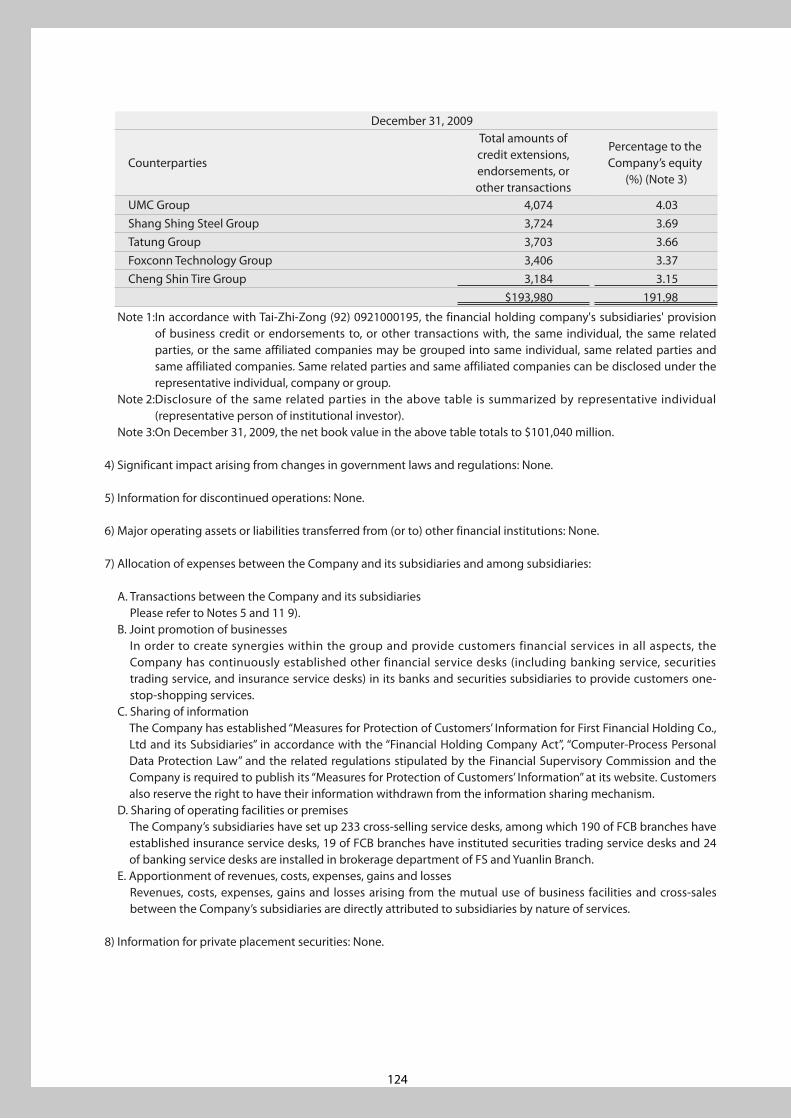
124
December 31, 2009
Counterparties
Total amounts of credit extensions, endorsements, or other transactions
Percentage to the Company’s equity
(%) (Note 3)
UMC Group 4,074 4.03Shang Shing Steel Group 3,724 3.69Tatung Group 3,703 3.66Foxconn Technology Group 3,406 3.37Cheng Shin Tire Group 3,184 3.15
$193,980 191.98
Note 1: In accordance with Tai-Zhi-Zong (92) 0921000195, the financial holding company's subsidiaries' provision of business credit or endorsements to, or other transactions with, the same individual, the same related parties, or the same affiliated companies may be grouped into same individual, same related parties and same affiliated companies. Same related parties and same affiliated companies can be disclosed under the representative individual, company or group.
Note 2: Disclosure of the same related parties in the above table is summarized by representative individual (representative person of institutional investor).
Note 3: On December 31, 2009, the net book value in the above table totals to $101,040 million.
4) Significant impact arising from changes in government laws and regulations: None.
5) Information for discontinued operations: None.
6) Major operating assets or liabilities transferred from (or to) other financial institutions: None.
7) Allocation of expenses between the Company and its subsidiaries and among subsidiaries:
A. Transactions between the Company and its subsidiaries Please refer to Notes 5 and 11 9).
B. Joint promotion of businesses In order to create synergies within the group and provide customers financial services in all aspects, the Company has continuously established other financial service desks (including banking service, securities trading service, and insurance service desks) in its banks and securities subsidiaries to provide customers one-stop-shopping services.
C. Sharing of information The Company has established “Measures for Protection of Customers’ Information for First Financial Holding Co., Ltd and its Subsidiaries” in accordance with the “Financial Holding Company Act”, “Computer-Process Personal Data Protection Law” and the related regulations stipulated by the Financial Supervisory Commission and the Company is required to publish its “Measures for Protection of Customers’ Information” at its website. Customers also reserve the right to have their information withdrawn from the information sharing mechanism.
D. Sharing of operating facilities or premises The Company’s subsidiaries have set up 233 cross-selling service desks, among which 190 of FCB branches have established insurance service desks, 19 of FCB branches have instituted securities trading service desks and 24 of banking service desks are installed in brokerage department of FS and Yuanlin Branch.
E. Apportionment of revenues, costs, expenses, gains and losses Revenues, costs, expenses, gains and losses arising from the mutual use of business facilities and cross-sales between the Company’s subsidiaries are directly attributed to subsidiaries by nature of services.
8) Information for private placement securities: None.
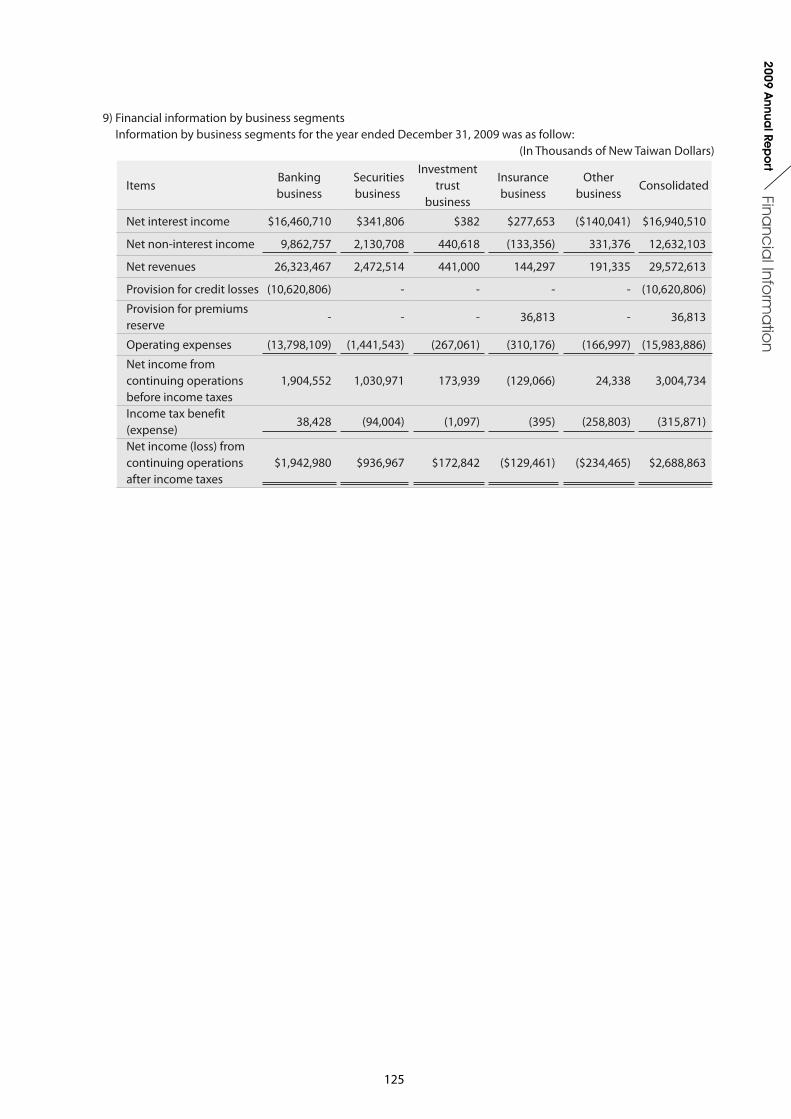
125
Financ
ial Info
rma
tion
2009 Annua
l Rep
ort
9) Financial information by business segments Information by business segments for the year ended December 31, 2009 was as follow:
(In Thousands of New Taiwan Dollars)
ItemsBanking business
Securities business
Investment trust
business
Insurancebusiness
Other business
Consolidated
Net interest income $16,460,710 $341,806 $382 $277,653 ($140,041) $16,940,510
Net non-interest income 9,862,757 2,130,708 440,618 (133,356) 331,376 12,632,103
Net revenues 26,323,467 2,472,514 441,000 144,297 191,335 29,572,613
Provision for credit losses (10,620,806) - - - - (10,620,806)
Provision for premiums reserve
- - - 36,813 - 36,813
Operating expenses (13,798,109) (1,441,543) (267,061) (310,176) (166,997) (15,983,886)
Net income from continuing operations before income taxes
1,904,552 1,030,971 173,939 (129,066) 24,338 3,004,734
Income tax benefit (expense)
38,428 (94,004) (1,097) (395) (258,803) (315,871)
Net income (loss) from continuing operations after income taxes
$1,942,980 $936,967 $172,842 ($129,461) ($234,465) $2,688,863
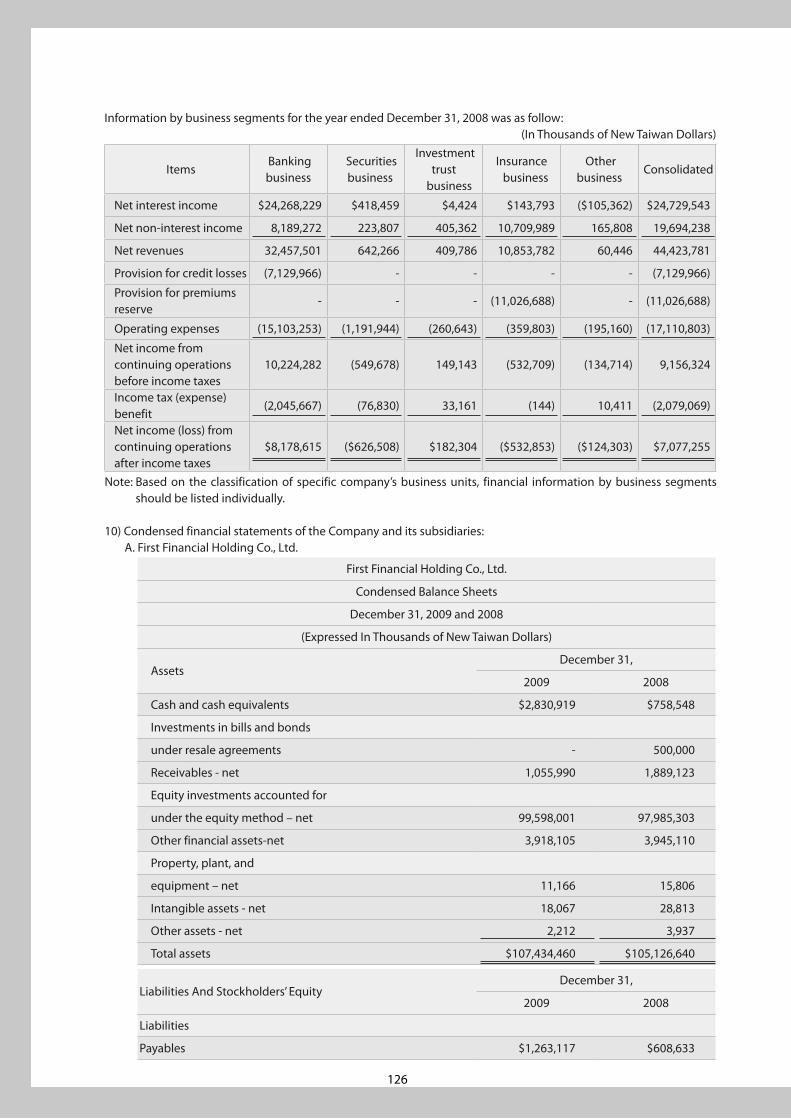
126
Information by business segments for the year ended December 31, 2008 was as follow:(In Thousands of New Taiwan Dollars)
Items Banking business
Securities business
Investment trust
business
Insurance business
Other business
Consolidated
Net interest income $24,268,229 $418,459 $4,424 $143,793 ($105,362) $24,729,543
Net non-interest income 8,189,272 223,807 405,362 10,709,989 165,808 19,694,238
Net revenues 32,457,501 642,266 409,786 10,853,782 60,446 44,423,781
Provision for credit losses (7,129,966) - - - - (7,129,966)
Provision for premiums reserve
- - - (11,026,688) - (11,026,688)
Operating expenses (15,103,253) (1,191,944) (260,643) (359,803) (195,160) (17,110,803)
Net income from continuing operations before income taxes
10,224,282 (549,678) 149,143 (532,709) (134,714) 9,156,324
Income tax (expense) benefit
(2,045,667) (76,830) 33,161 (144) 10,411 (2,079,069)
Net income (loss) from continuing operations after income taxes
$8,178,615 ($626,508) $182,304 ($532,853) ($124,303) $7,077,255
Note: Based on the classification of specific company’s business units, financial information by business segments should be listed individually.
10) Condensed financial statements of the Company and its subsidiaries:A. First Financial Holding Co., Ltd.
First Financial Holding Co., Ltd.
Condensed Balance Sheets
December 31, 2009 and 2008
(Expressed In Thousands of New Taiwan Dollars)
Assets December 31,
2009 2008
Cash and cash equivalents $2,830,919 $758,548
Investments in bills and bonds
under resale agreements - 500,000
Receivables - net 1,055,990 1,889,123
Equity investments accounted for
under the equity method – net 99,598,001 97,985,303
Other financial assets-net 3,918,105 3,945,110
Property, plant, and
equipment – net 11,166 15,806
Intangible assets - net 18,067 28,813
Other assets - net 2,212 3,937
Total assets $107,434,460 $105,126,640
Liabilities And Stockholders’ Equity December 31,
2009 2008
Liabilities
Payables $1,263,117 $608,633

127
Financ
ial Info
rma
tion
2009 Annua
l Rep
ort
Corporate bonds payable 5,000,000 5,000,000
Accrued pension liabilities 6,872 7,085
Other financial liabilities 99,095 60,779
Other liabilities 2,369 2,940
Total liabilities 6,371,453 5,679,437
Stockholders’ Equity
Common stock 63,188,538 61,647,354
Additional paid-in capital 9,943,476 9,943,476
Retained earnings
Legal reserve 5,507,532 4,768,418
Unappropriated earnings 13,325,009 15,908,748
Other stockholders’ equity
Unrealized revaluation increments 5,059,317 5,183,916
Cumulative translation adjustments 27,936 49,915
Unrealized gain or loss on financial instruments 4,011,199 1,945,376
Total stockholders’ equity 101,063,007 99,447,203
Total liabilities and stockholders’ equity $107,434,460 $105,126,640
First Financial Holding Co., Ltd.
Condensed Statements of Income
For the years ended December 31, 2009 and 2008
(Expressed In Thousands of New Taiwan Dollars)
Accounts 2009 2008
Revenues
Investment income accounted for under the equity method $3,201,995 $8,512,707
Other revenues 258,325 279,534
Net revenues 3,460,320 8,792,241
Expenses and losses
Investment losses accounted for under the equity method (93,741) (1,056,551)
Operating expenses (187,994) (213,981)
Other expenses and losses (140,854) (140,973)
Total expenses and losses (422,589) (1,411,505)
Income from continuing operations before income taxes 3,037,731 7,380,736
Income tax (expense) benefit (258,804) 10,410
Income from continuing operations after income taxes 2,778,927 7,391,146
Net income $2,778,927 $7,391,146
Earnings Per Share (in NT dollars)
Continuing operations (Before Taxes) $0.48 $1.17
Continuing operations (After Taxes) $0.44 $1.17
Net income (After Taxes) $0.44 $1.17
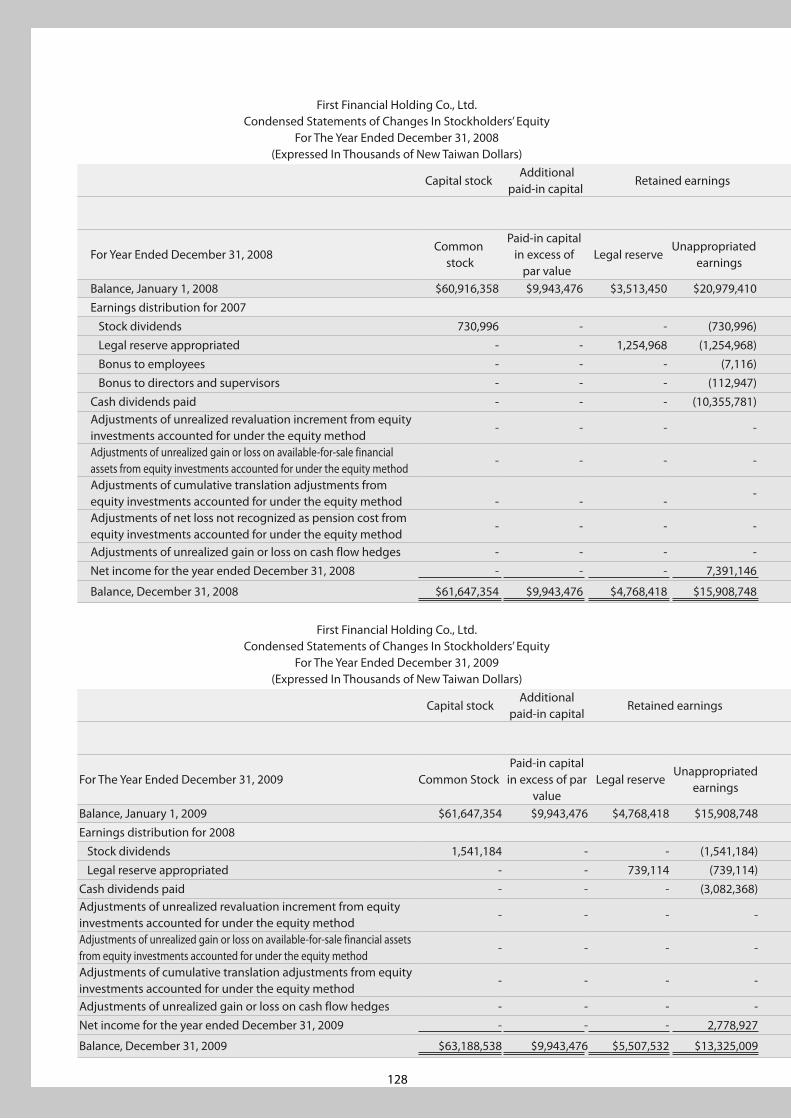
128
First Financial Holding Co., Ltd.Condensed Statements of Changes In Stockholders’ Equity
For The Year Ended December 31, 2008(Expressed In Thousands of New Taiwan Dollars)
Capital stock Additional
paid-in capital Retained earnings Other stockholders’ equity
Unrealized gain or loss on financial instruments
For Year Ended December 31, 2008Common
stock
Paid-in capital in excess of par value
Legal reserve Unappropriated
earnings
Unrealized gain or loss onavailable-for-sale financial
assets
Unrealized gain or loss on cash flow
hedges
Cumulativetranslation
adjustments
Net loss not recognized
as pension cost
Unrealized revaluation increment
Total
Balance, January 1, 2008 $60,916,358 $9,943,476 $3,513,450 $20,979,410 $3,974,236 $174,151 $276,274 ($9,258) $5,298,124 $105,066,221Earnings distribution for 2007 Stock dividends 730,996 - - (730,996) - - - - - - Legal reserve appropriated - - 1,254,968 (1,254,968) - - - - - - Bonus to employees - - - (7,116) - - - - - (7,116) Bonus to directors and supervisors - - - (112,947) - - - - - (112,947)Cash dividends paid - - - (10,355,781) - - - - - (10,355,781)Adjustments of unrealized revaluation increment from equity investments accounted for under the equity method
- - - - - - - - (114,208) (114,208)
Adjustments of unrealized gain or loss on available-for-sale financial assets from equity investments accounted for under the equity method
- - - - (1,995,084) - - - - (1,995,084)
Adjustments of cumulative translation adjustments from equity investments accounted for under the equity method
-
-
-
- - - (226,359) - - (226,359)
Adjustments of net loss not recognized as pension cost from equity investments accounted for under the equity method
- - - - - - - 9,258 - 9,258
Adjustments of unrealized gain or loss on cash flow hedges - - - - - (207,927) - - - (207,927)Net income for the year ended December 31, 2008 - - - 7,391,146 - - - - - 7,391,146
Balance, December 31, 2008 $61,647,354 $9,943,476 $4,768,418 $15,908,748 $1,979,152 ($33,776) $49,915 $- $5,183,916 $99,447,203
First Financial Holding Co., Ltd.Condensed Statements of Changes In Stockholders’ Equity
For The Year Ended December 31, 2009(Expressed In Thousands of New Taiwan Dollars)
Capital stock Additional
paid-in capital Retained earnings Other stockholders’ equity
Unrealized gain or loss on financial instruments
For The Year Ended December 31, 2009 Common Stock Paid-in capital
in excess of par value
Legal reserve Unappropriated
earnings
Unrealizedgain or loss onavailable-for-sale financial
assets
Unrealized gain or loss on cash flow
hedges
Cumulativetranslation
adjustments
Net loss not recognized
as pension cost
Unrealized revaluation increment
Total
Balance, January 1, 2009 $61,647,354 $9,943,476 $4,768,418 $15,908,748 $1,979,152 ($33,776) $49,915 $- $5,183,916 $99,447,203Earnings distribution for 2008 Stock dividends 1,541,184 - - (1,541,184) - - - - - - Legal reserve appropriated - - 739,114 (739,114) - - - - - -Cash dividends paid - - - (3,082,368) - - - - - (3,082,368)Adjustments of unrealized revaluation increment from equity investments accounted for under the equity method
- - - - - - - - (124,599) (124,599)
Adjustments of unrealized gain or loss on available-for-sale financial assets from equity investments accounted for under the equity method
- - - - 2,131,142 - - - - 2,131,142
Adjustments of cumulative translation adjustments from equity investments accounted for under the equity method
- - - - - - (21,979) - - (21,979)
Adjustments of unrealized gain or loss on cash flow hedges - - - - - (65,319) - - - (65,319)Net income for the year ended December 31, 2009 - - - 2,778,927 - - - - - 2,778,927
Balance, December 31, 2009 $63,188,538 $9,943,476 $5,507,532 $13,325,009 $4,110,294 ($99,095) $27,936 $- $5,059,317 $101,063,007
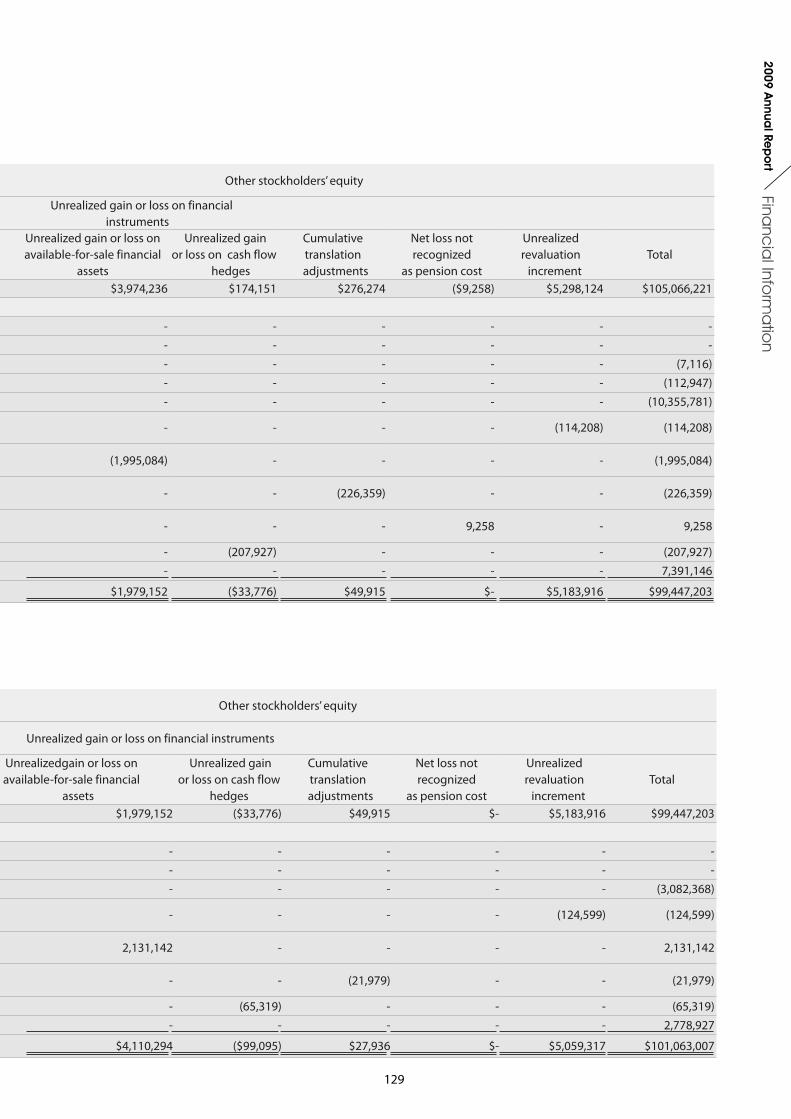
129
Financ
ial Info
rma
tion
2009 Annua
l Rep
ort
First Financial Holding Co., Ltd.Condensed Statements of Changes In Stockholders’ Equity
For The Year Ended December 31, 2008(Expressed In Thousands of New Taiwan Dollars)
Capital stock Additional
paid-in capital Retained earnings Other stockholders’ equity
Unrealized gain or loss on financial instruments
For Year Ended December 31, 2008Common
stock
Paid-in capital in excess of par value
Legal reserve Unappropriated
earnings
Unrealized gain or loss onavailable-for-sale financial
assets
Unrealized gain or loss on cash flow
hedges
Cumulativetranslation
adjustments
Net loss not recognized
as pension cost
Unrealized revaluation increment
Total
Balance, January 1, 2008 $60,916,358 $9,943,476 $3,513,450 $20,979,410 $3,974,236 $174,151 $276,274 ($9,258) $5,298,124 $105,066,221Earnings distribution for 2007 Stock dividends 730,996 - - (730,996) - - - - - - Legal reserve appropriated - - 1,254,968 (1,254,968) - - - - - - Bonus to employees - - - (7,116) - - - - - (7,116) Bonus to directors and supervisors - - - (112,947) - - - - - (112,947)Cash dividends paid - - - (10,355,781) - - - - - (10,355,781)Adjustments of unrealized revaluation increment from equity investments accounted for under the equity method
- - - - - - - - (114,208) (114,208)
Adjustments of unrealized gain or loss on available-for-sale financial assets from equity investments accounted for under the equity method
- - - - (1,995,084) - - - - (1,995,084)
Adjustments of cumulative translation adjustments from equity investments accounted for under the equity method
-
-
-
- - - (226,359) - - (226,359)
Adjustments of net loss not recognized as pension cost from equity investments accounted for under the equity method
- - - - - - - 9,258 - 9,258
Adjustments of unrealized gain or loss on cash flow hedges - - - - - (207,927) - - - (207,927)Net income for the year ended December 31, 2008 - - - 7,391,146 - - - - - 7,391,146
Balance, December 31, 2008 $61,647,354 $9,943,476 $4,768,418 $15,908,748 $1,979,152 ($33,776) $49,915 $- $5,183,916 $99,447,203
First Financial Holding Co., Ltd.Condensed Statements of Changes In Stockholders’ Equity
For The Year Ended December 31, 2009(Expressed In Thousands of New Taiwan Dollars)
Capital stock Additional
paid-in capital Retained earnings Other stockholders’ equity
Unrealized gain or loss on financial instruments
For The Year Ended December 31, 2009 Common Stock Paid-in capital
in excess of par value
Legal reserve Unappropriated
earnings
Unrealizedgain or loss onavailable-for-sale financial
assets
Unrealized gain or loss on cash flow
hedges
Cumulativetranslation
adjustments
Net loss not recognized
as pension cost
Unrealized revaluation increment
Total
Balance, January 1, 2009 $61,647,354 $9,943,476 $4,768,418 $15,908,748 $1,979,152 ($33,776) $49,915 $- $5,183,916 $99,447,203Earnings distribution for 2008 Stock dividends 1,541,184 - - (1,541,184) - - - - - - Legal reserve appropriated - - 739,114 (739,114) - - - - - -Cash dividends paid - - - (3,082,368) - - - - - (3,082,368)Adjustments of unrealized revaluation increment from equity investments accounted for under the equity method
- - - - - - - - (124,599) (124,599)
Adjustments of unrealized gain or loss on available-for-sale financial assets from equity investments accounted for under the equity method
- - - - 2,131,142 - - - - 2,131,142
Adjustments of cumulative translation adjustments from equity investments accounted for under the equity method
- - - - - - (21,979) - - (21,979)
Adjustments of unrealized gain or loss on cash flow hedges - - - - - (65,319) - - - (65,319)Net income for the year ended December 31, 2009 - - - 2,778,927 - - - - - 2,778,927
Balance, December 31, 2009 $63,188,538 $9,943,476 $5,507,532 $13,325,009 $4,110,294 ($99,095) $27,936 $- $5,059,317 $101,063,007

130
First Financial Holding Co., Ltd.
Condensed Statements of Cash Flows
For the years ended December 31, 2009 and 2008
(Expressed In Thousands of New Taiwan Dollars)
Accounts 2009 2008
Cash Flows From Operating Activities
Net income $2,778,927 $7,391,146
Adjustments to reconcile net income to net cash provided by operating activities:
Other adjustments not affecting cash flows
Depreciation and other amortization expenses 16,485 9,897
Loss on abandonment of property, plant, and equipment - 120
Income from equity method investments recognized less than (in excess of ) cash dividends received from the equity method investments
3,371,866 (809,497)
Changes in assets and liabilities
Decrease in investments in bills and bonds under resale agreements 500,000 2,350,000
Decrease (increase) in receivables 833,133 (307,307)
Decrease (increase) in other assets and other financial assets 1,488 (844)
Increase in payables 654,484 204,918
(Decrease) increase in accrued pension liabilities (213) 1,906
Net cash provided by operating activities 8,156,170 8,840,339
Cash Flows From Investing Activities
Increase in equity investments accounted for under the equity method (3,000,000) -
Acquisition of property, plant and equipment (860) (13,959)
Purchase of intangible assets - (19,154)
Net cash used in investing activities (3,000,860) (33,113)
Cash Flows From Financing Activities
Cash dividends paid (3,082,368) (10,355,781)
Bonus to employees and directors and supervisors - (120,063)
(Decrease) increase in other liabilities (571) 1,746
Net cash used in financing activities (3,082,939) (10,474,098)
Net decrease in cash and cash equivalents 2,072,371 (1,666,872)
Cash and cash equivalents at beginning of year 758,548 2,425,420
Cash and cash equivalents at end of year $2,830,919 $758,548
Supplemental Disclosures of Cash Flow Information
Cash paid during the year for interest $140,841 $140,859
Cash paid during the year for income tax $1,605 $173,697
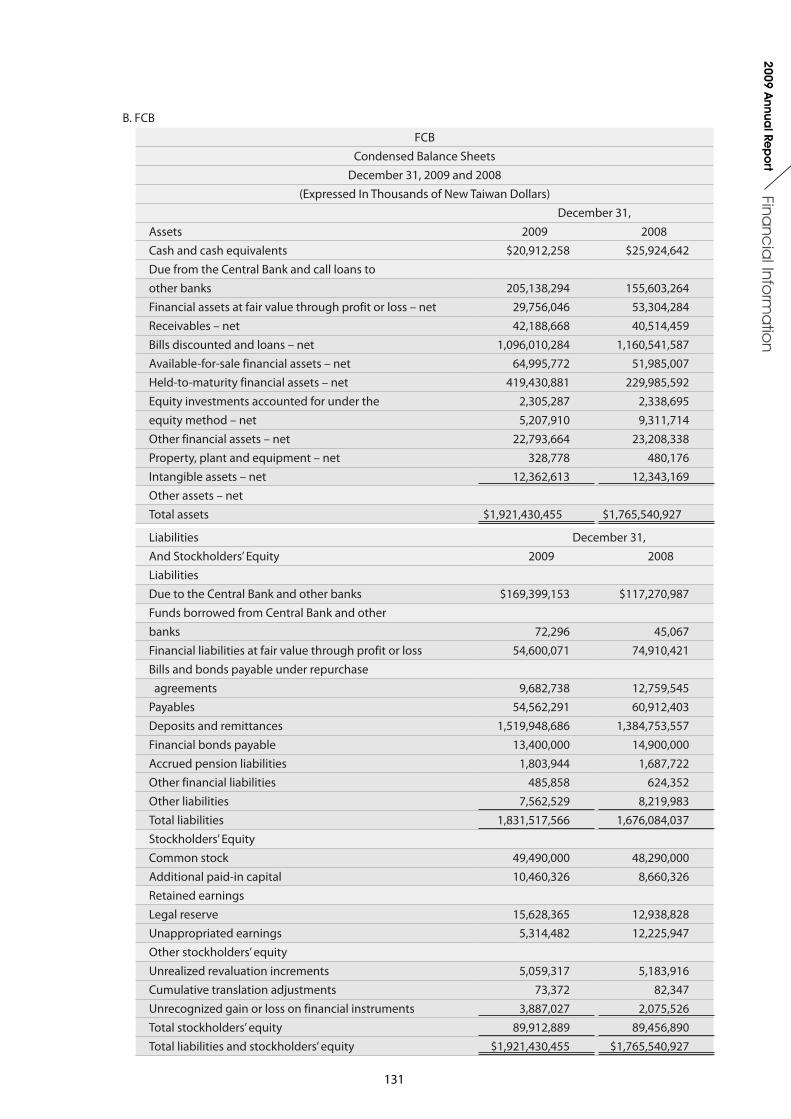
131
Financ
ial Info
rma
tion
2009 Annua
l Rep
ort
B. FCB
FCBCondensed Balance Sheets
December 31, 2009 and 2008(Expressed In Thousands of New Taiwan Dollars)
December 31,Assets 2009 2008Cash and cash equivalents $20,912,258 $25,924,642Due from the Central Bank and call loans toother banks 205,138,294 155,603,264Financial assets at fair value through profit or loss – net 29,756,046 53,304,284Receivables – net 42,188,668 40,514,459Bills discounted and loans – net 1,096,010,284 1,160,541,587Available-for-sale financial assets – net 64,995,772 51,985,007Held-to-maturity financial assets – net 419,430,881 229,985,592Equity investments accounted for under the 2,305,287 2,338,695equity method – net 5,207,910 9,311,714Other financial assets – net 22,793,664 23,208,338Property, plant and equipment – net 328,778 480,176Intangible assets – net 12,362,613 12,343,169Other assets – net Total assets $1,921,430,455 $1,765,540,927
Liabilities December 31, And Stockholders’ Equity 2009 2008LiabilitiesDue to the Central Bank and other banks $169,399,153 $117,270,987Funds borrowed from Central Bank and otherbanks 72,296 45,067Financial liabilities at fair value through profit or loss 54,600,071 74,910,421Bills and bonds payable under repurchase agreements 9,682,738 12,759,545Payables 54,562,291 60,912,403Deposits and remittances 1,519,948,686 1,384,753,557Financial bonds payable 13,400,000 14,900,000Accrued pension liabilities 1,803,944 1,687,722Other financial liabilities 485,858 624,352Other liabilities 7,562,529 8,219,983Total liabilities 1,831,517,566 1,676,084,037Stockholders’ EquityCommon stock 49,490,000 48,290,000Additional paid-in capital 10,460,326 8,660,326Retained earningsLegal reserve 15,628,365 12,938,828Unappropriated earnings 5,314,482 12,225,947Other stockholders’ equityUnrealized revaluation increments 5,059,317 5,183,916Cumulative translation adjustments 73,372 82,347Unrecognized gain or loss on financial instruments 3,887,027 2,075,526Total stockholders’ equity 89,912,889 89,456,890Total liabilities and stockholders’ equity $1,921,430,455 $1,765,540,927
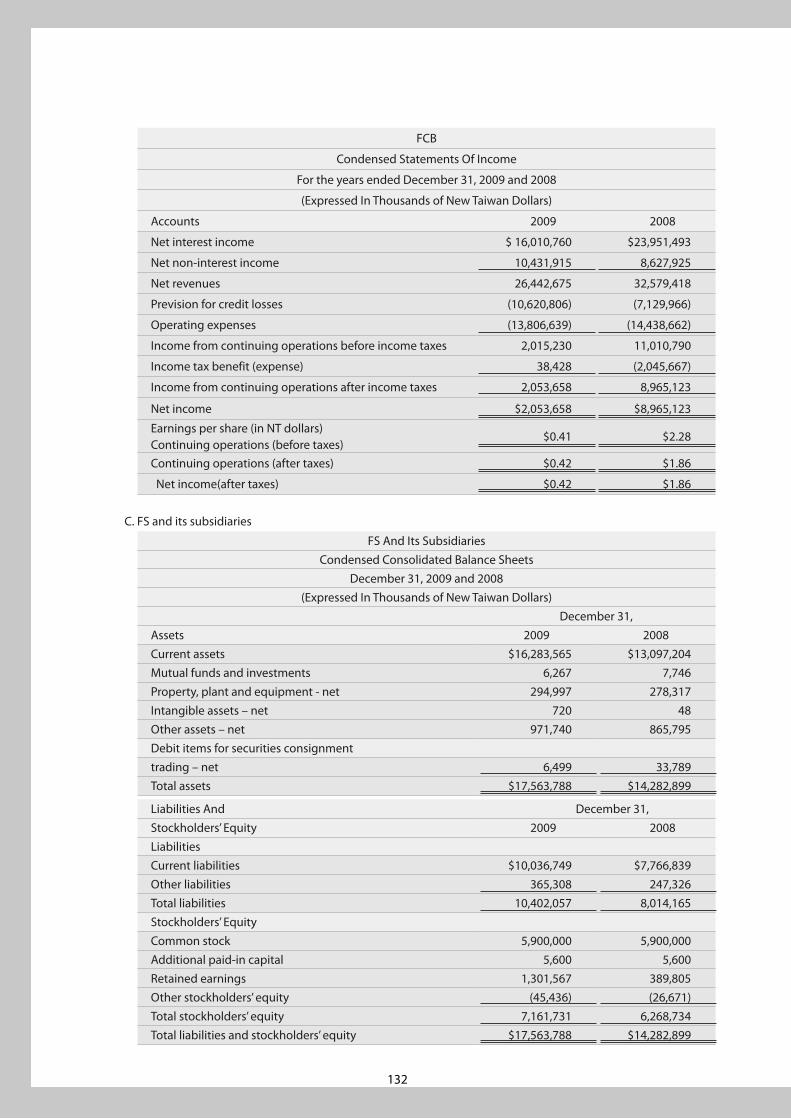
132
FCB
Condensed Statements Of Income
For the years ended December 31, 2009 and 2008
(Expressed In Thousands of New Taiwan Dollars)
Accounts 2009 2008
Net interest income $ 16,010,760 $23,951,493
Net non-interest income 10,431,915 8,627,925
Net revenues 26,442,675 32,579,418
Prevision for credit losses (10,620,806) (7,129,966)
Operating expenses (13,806,639) (14,438,662)
Income from continuing operations before income taxes 2,015,230 11,010,790
Income tax benefit (expense) 38,428 (2,045,667)
Income from continuing operations after income taxes 2,053,658 8,965,123
Net income $2,053,658 $8,965,123
Earnings per share (in NT dollars)Continuing operations (before taxes)
$0.41 $2.28
Continuing operations (after taxes) $0.42 $1.86
Net income(after taxes) $0.42 $1.86
C. FS and its subsidiaries
FS And Its SubsidiariesCondensed Consolidated Balance Sheets
December 31, 2009 and 2008(Expressed In Thousands of New Taiwan Dollars)
December 31, Assets 2009 2008 Current assets $16,283,565 $13,097,204Mutual funds and investments 6,267 7,746Property, plant and equipment - net 294,997 278,317Intangible assets – net 720 48Other assets – net 971,740 865,795Debit items for securities consignmenttrading – net 6,499 33,789Total assets $17,563,788 $14,282,899
Liabilities And December 31, Stockholders’ Equity 2009 2008LiabilitiesCurrent liabilities $10,036,749 $7,766,839Other liabilities 365,308 247,326Total liabilities 10,402,057 8,014,165Stockholders’ EquityCommon stock 5,900,000 5,900,000Additional paid-in capital 5,600 5,600Retained earnings 1,301,567 389,805Other stockholders’ equity (45,436) (26,671)Total stockholders’ equity 7,161,731 6,268,734Total liabilities and stockholders’ equity $17,563,788 $14,282,899

133
Financ
ial Info
rma
tion
2009 Annua
l Rep
ort
FS And Its SubsidiariesCondensed Consolidated Statements of Income
For the years ended December 31, 2009 and 2008(Expressed In Thousands of New Taiwan Dollars)
Accounts 2009 2008Revenues $2,829,299 $2,206,478Expenses (1,823,533) (2,766,814)Income (loss) from continuing operations beforeincome taxes
1,005,766 (560,336)
Income tax expenses (94,004) (76,830)Income (loss) from continuing operations after income taxes 911,762 (637,166)Net income (loss) $911,762 ($637,166)
Earnings per share (in NT dollars) Continuing operations (before taxes)
$1.70 ($0.95)
Continuing operations (after taxes) $1.55 ($1.08) Net income (loss) (after taxes) $1.55 ($1.08)
D. FSIT
FSITCondensed Balance Sheets
December 31, 2009 and 2008(Expressed In Thousands of New Taiwan Dollars)
December 31, 2009 2008
AssetsCurrent assets $386,623 $303,659Equity investments accounted for under the equitymethod - 11,402Property, plant and equipment – net 518,254 522,261Other assets 203,987 215,842Total assets $1,108,864 $1,053,164
Liabilities And December 31, Stockholders’ Equity 2009 2008LiabilitiesCurrent liabilities $102,984 $56,125Other liabilities 24,184 25,383Total liabilities 127,168 81,508Stockholders’ EquityCommon stock 600,000 600,000Retained earnings 371,868 376,297Other stockholders’equity 9,828 (4,641)Total stockholders’ equity 981,696 971,656Total liabilities and stockholders’ equity
$1,108,864 $1,053,164
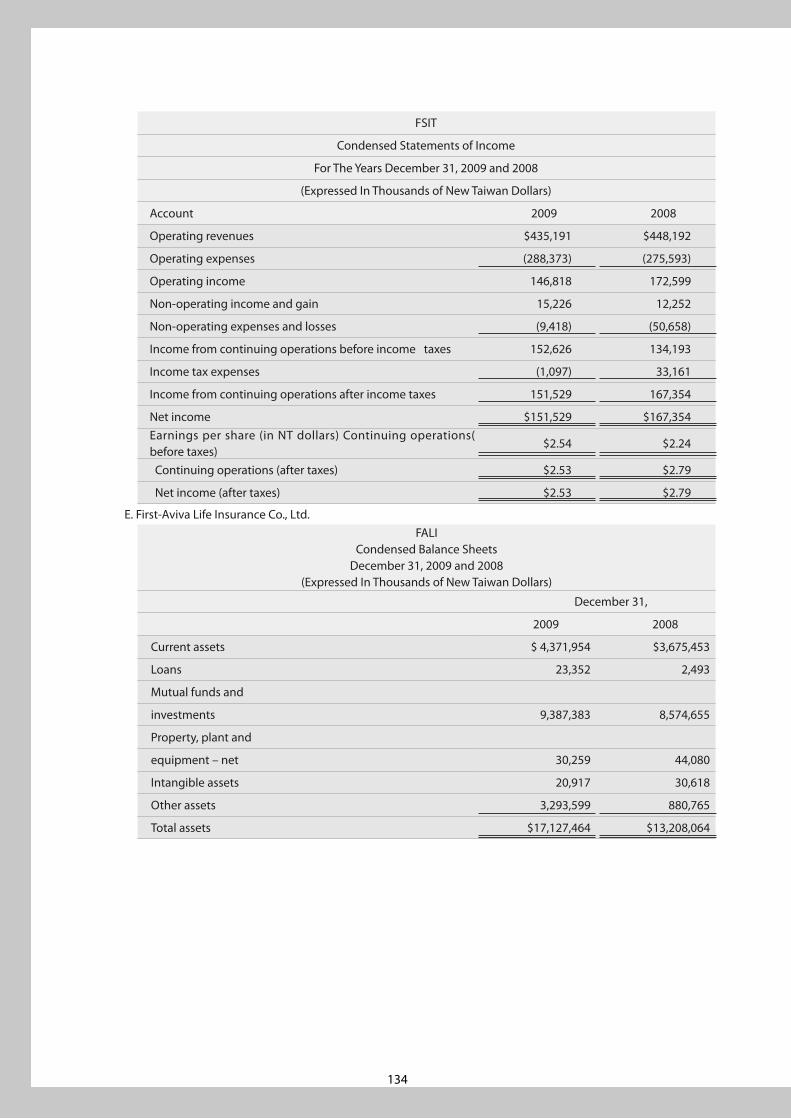
134
FSIT
Condensed Statements of Income
For The Years December 31, 2009 and 2008
(Expressed In Thousands of New Taiwan Dollars)
Account 2009 2008
Operating revenues $435,191 $448,192
Operating expenses (288,373) (275,593)
Operating income 146,818 172,599
Non-operating income and gain 15,226 12,252
Non-operating expenses and losses (9,418) (50,658)
Income from continuing operations before income taxes 152,626 134,193
Income tax expenses (1,097) 33,161
Income from continuing operations after income taxes 151,529 167,354
Net income $151,529 $167,354Earnings per share (in NT dollars) Continuing operations( before taxes)
$2.54 $2.24
Continuing operations (after taxes) $2.53 $2.79
Net income (after taxes) $2.53 $2.79
E. First-Aviva Life Insurance Co., Ltd.FALI
Condensed Balance SheetsDecember 31, 2009 and 2008
(Expressed In Thousands of New Taiwan Dollars)
December 31,
2009 2008
Current assets $ 4,371,954 $3,675,453
Loans 23,352 2,493
Mutual funds and
investments 9,387,383 8,574,655
Property, plant and
equipment – net 30,259 44,080
Intangible assets 20,917 30,618
Other assets 3,293,599 880,765
Total assets $17,127,464 $13,208,064
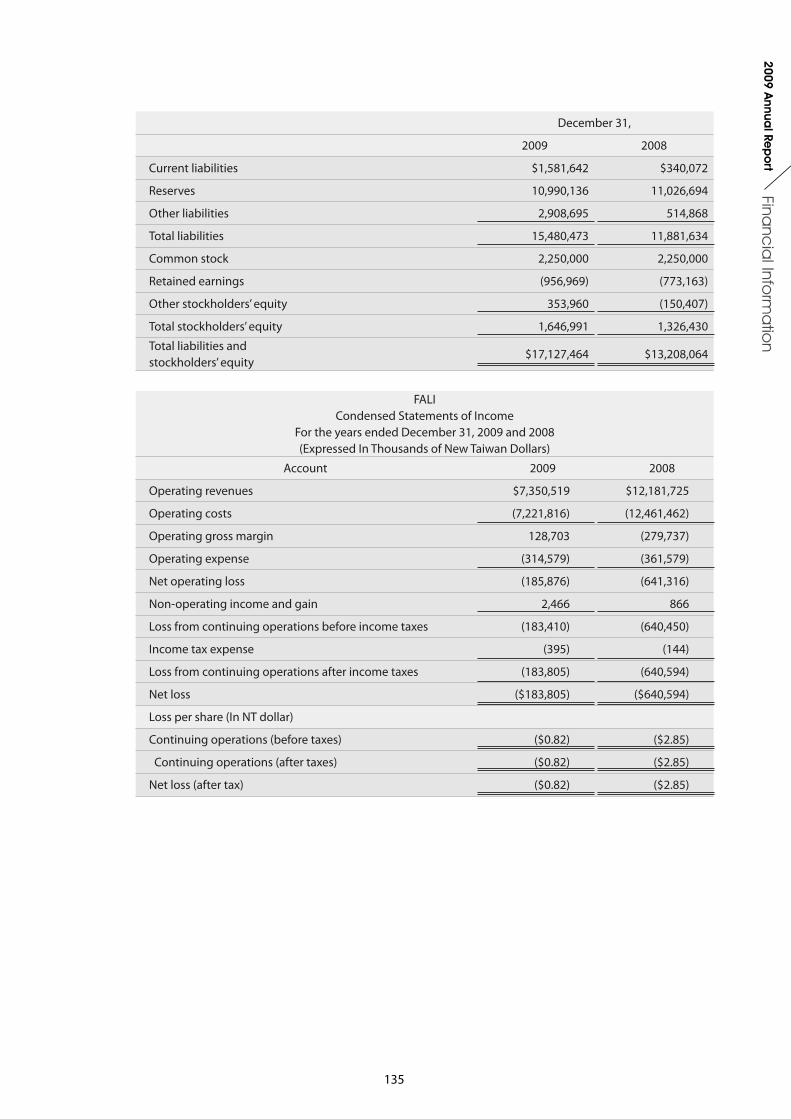
135
Financ
ial Info
rma
tion
2009 Annua
l Rep
ort
December 31,
2009 2008
Current liabilities $1,581,642 $340,072
Reserves 10,990,136 11,026,694
Other liabilities 2,908,695 514,868
Total liabilities 15,480,473 11,881,634
Common stock 2,250,000 2,250,000
Retained earnings (956,969) (773,163)
Other stockholders’ equity 353,960 (150,407)
Total stockholders’ equity 1,646,991 1,326,430
Total liabilities and stockholders’ equity
$17,127,464 $13,208,064
FALICondensed Statements of Income
For the years ended December 31, 2009 and 2008(Expressed In Thousands of New Taiwan Dollars)
Account 2009 2008
Operating revenues $7,350,519 $12,181,725
Operating costs (7,221,816) (12,461,462)
Operating gross margin 128,703 (279,737)
Operating expense (314,579) (361,579)
Net operating loss (185,876) (641,316)
Non-operating income and gain 2,466 866
Loss from continuing operations before income taxes (183,410) (640,450)
Income tax expense (395) (144)
Loss from continuing operations after income taxes (183,805) (640,594)
Net loss ($183,805) ($640,594)
Loss per share (In NT dollar)
Continuing operations (before taxes) ($0.82) ($2.85)
Continuing operations (after taxes) ($0.82) ($2.85)
Net loss (after tax) ($0.82) ($2.85)
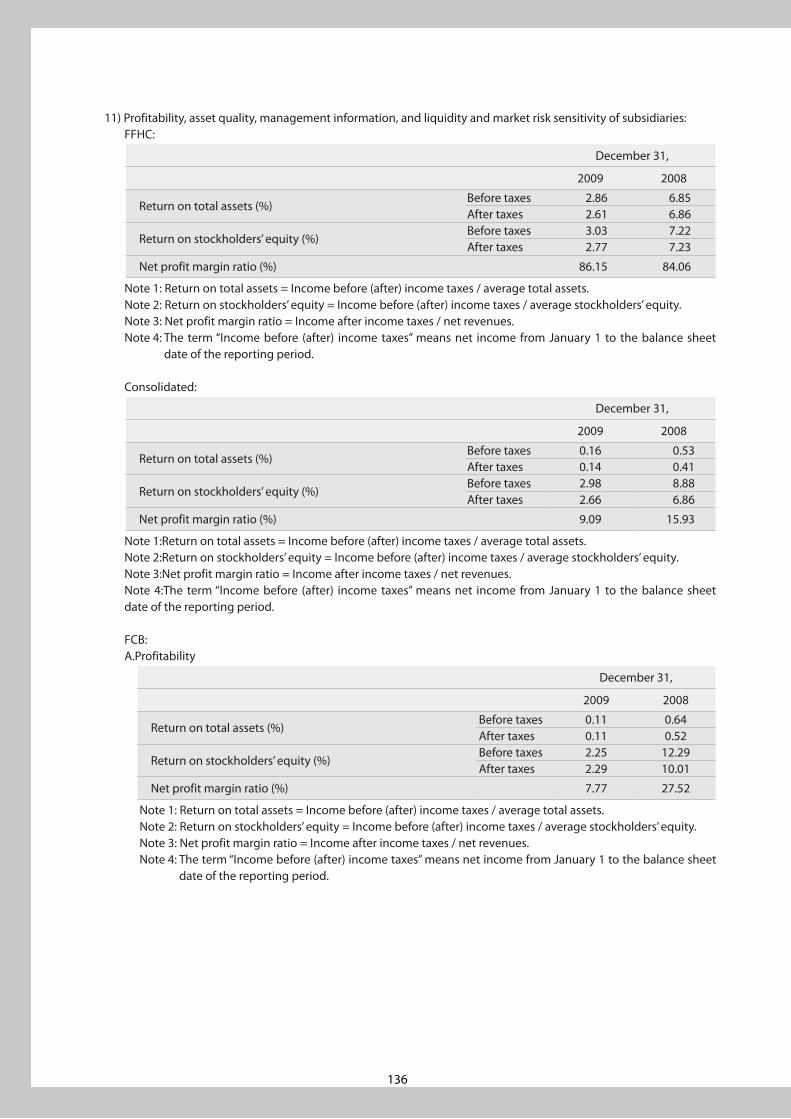
136
11) Profitability, asset quality, management information, and liquidity and market risk sensitivity of subsidiaries:FFHC:
December 31,
2009 2008
Return on total assets (%)Before taxes 2.86 6.85After taxes 2.61 6.86
Return on stockholders’ equity (%)Before taxes 3.03 7.22After taxes 2.77 7.23
Net profit margin ratio (%) 86.15 84.06
Note 1: Return on total assets = Income before (after) income taxes / average total assets. Note 2: Return on stockholders’ equity = Income before (after) income taxes / average stockholders’ equity.Note 3: Net profit margin ratio = Income after income taxes / net revenues.Note 4: The term “Income before (after) income taxes” means net income from January 1 to the balance sheet
date of the reporting period.
Consolidated:
December 31,
2009 2008
Return on total assets (%)Before taxes 0.16 0.53After taxes 0.14 0.41
Return on stockholders’ equity (%)Before taxes 2.98 8.88After taxes 2.66 6.86
Net profit margin ratio (%) 9.09 15.93
Note 1:Return on total assets = Income before (after) income taxes / average total assets. Note 2:Return on stockholders’ equity = Income before (after) income taxes / average stockholders’ equity.Note 3:Net profit margin ratio = Income after income taxes / net revenues.Note 4:The term “Income before (after) income taxes” means net income from January 1 to the balance sheet date of the reporting period.
FCB:A.Profitability
December 31,
2009 2008
Return on total assets (%)Before taxes 0.11 0.64After taxes 0.11 0.52
Return on stockholders’ equity (%)Before taxes 2.25 12.29After taxes 2.29 10.01
Net profit margin ratio (%) 7.77 27.52
Note 1: Return on total assets = Income before (after) income taxes / average total assets. Note 2: Return on stockholders’ equity = Income before (after) income taxes / average stockholders’ equity.Note 3: Net profit margin ratio = Income after income taxes / net revenues.Note 4: The term “Income before (after) income taxes” means net income from January 1 to the balance sheet
date of the reporting period.
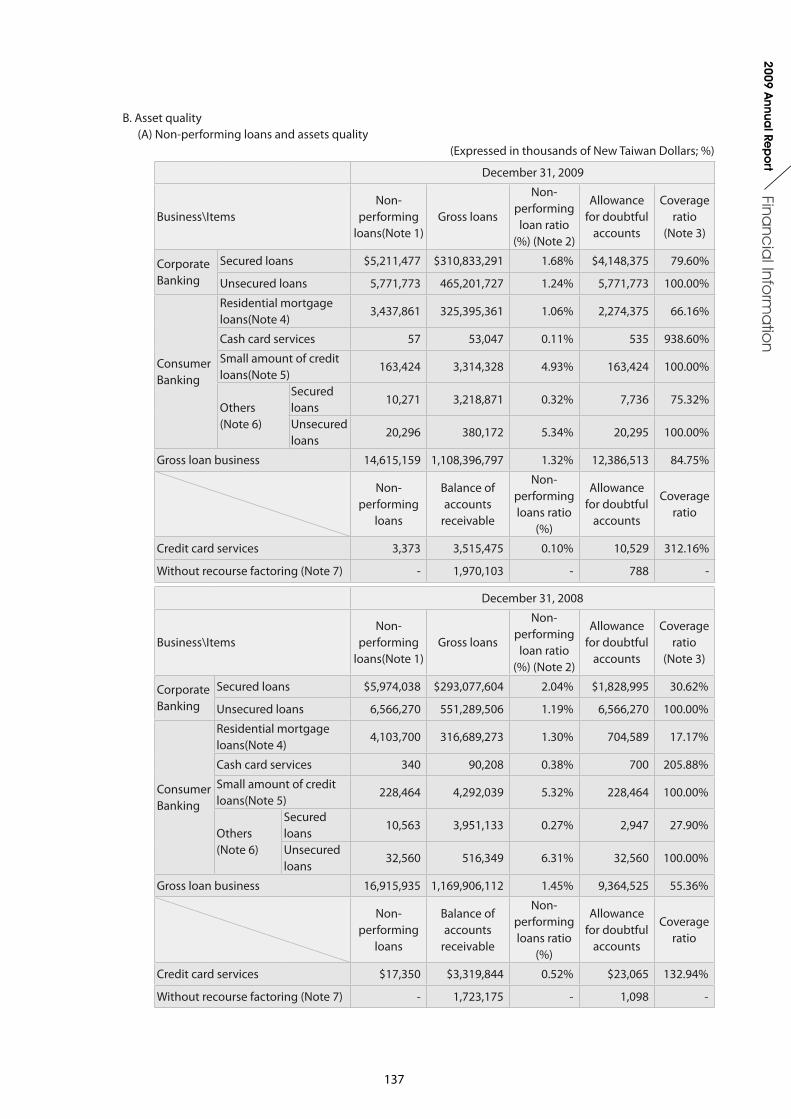
137
Financ
ial Info
rma
tion
2009 Annua
l Rep
ort
B. Asset quality(A) Non-performing loans and assets quality
(Expressed in thousands of New Taiwan Dollars; %)
December 31, 2009
Business\ItemsNon-
performing loans(Note 1)
Gross loans
Non-performing loan ratio
(%) (Note 2)
Allowance for doubtful
accounts
Coverage ratio
(Note 3)
Corporate Banking
Secured loans $5,211,477 $310,833,291 1.68% $4,148,375 79.60%
Unsecured loans 5,771,773 465,201,727 1.24% 5,771,773 100.00%
Consumer Banking
Residential mortgage loans(Note 4)
3,437,861 325,395,361 1.06% 2,274,375 66.16%
Cash card services 57 53,047 0.11% 535 938.60%
Small amount of credit loans(Note 5)
163,424 3,314,328 4.93% 163,424 100.00%
Others (Note 6)
Secured loans
10,271 3,218,871 0.32% 7,736 75.32%
Unsecured loans
20,296 380,172 5.34% 20,295 100.00%
Gross loan business 14,615,159 1,108,396,797 1.32% 12,386,513 84.75%
Non-performing
loans
Balance of accounts
receivable
Non-performing loans ratio
(%)
Allowance for doubtful
accounts
Coverage ratio
Credit card services 3,373 3,515,475 0.10% 10,529 312.16%
Without recourse factoring (Note 7) - 1,970,103 - 788 -
December 31, 2008
Business\ItemsNon-
performing loans(Note 1)
Gross loans
Non-performing loan ratio
(%) (Note 2)
Allowance for doubtful
accounts
Coverage ratio
(Note 3)
Corporate Banking
Secured loans $5,974,038 $293,077,604 2.04% $1,828,995 30.62%
Unsecured loans 6,566,270 551,289,506 1.19% 6,566,270 100.00%
Consumer Banking
Residential mortgage loans(Note 4)
4,103,700 316,689,273 1.30% 704,589 17.17%
Cash card services 340 90,208 0.38% 700 205.88%
Small amount of credit loans(Note 5)
228,464 4,292,039 5.32% 228,464 100.00%
Others (Note 6)
Secured loans
10,563 3,951,133 0.27% 2,947 27.90%
Unsecured loans
32,560 516,349 6.31% 32,560 100.00%
Gross loan business 16,915,935 1,169,906,112 1.45% 9,364,525 55.36%
Non-performing
loans
Balance of accounts
receivable
Non-performing loans ratio
(%)
Allowance for doubtful
accounts
Coverage ratio
Credit card services $17,350 $3,319,844 0.52% $23,065 132.94%
Without recourse factoring (Note 7) - 1,723,175 - 1,098 -
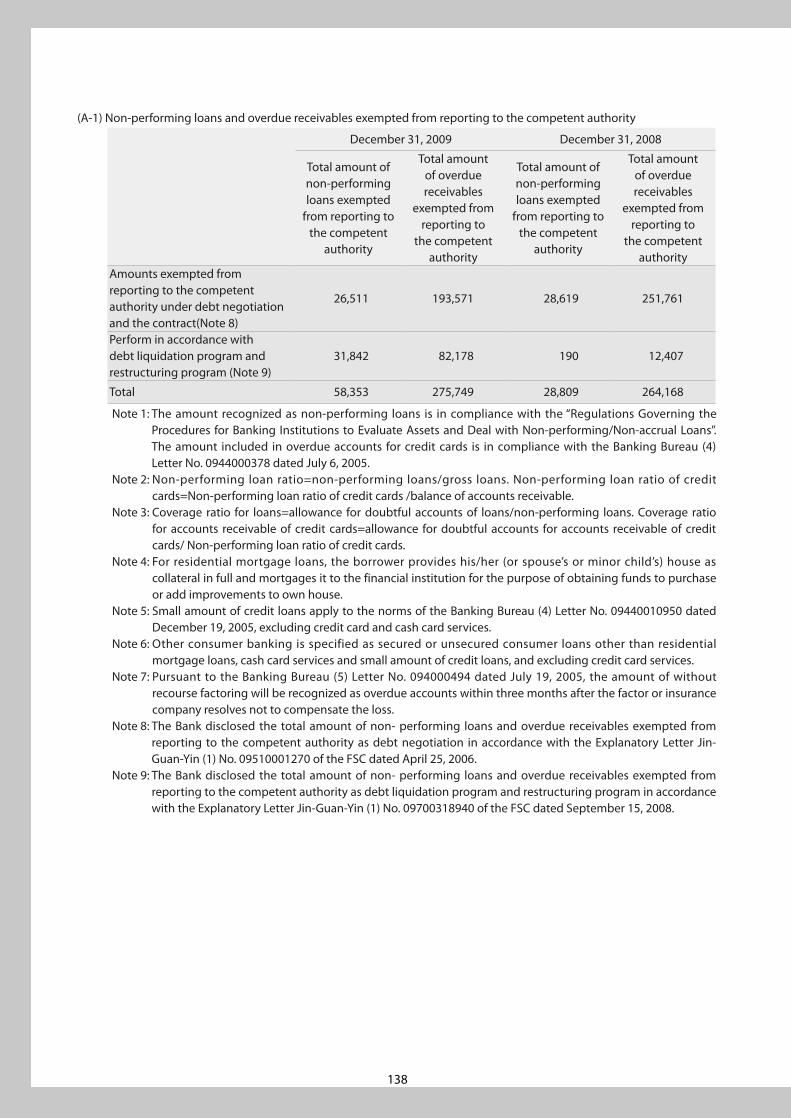
138
(A-1) Non-performing loans and overdue receivables exempted from reporting to the competent authority
December 31, 2009 December 31, 2008
Total amount of non-performing loans exempted
from reporting to the competent
authority
Total amount of overdue receivables
exempted from reporting to
the competent authority
Total amount of non-performing loans exempted
from reporting to the competent
authority
Total amount of overdue receivables
exempted from reporting to
the competent authority
Amounts exempted from reporting to the competent authority under debt negotiation and the contract(Note 8)
26,511 193,571 28,619 251,761
Perform in accordance with debt liquidation program and restructuring program (Note 9)
31,842 82,178 190 12,407
Total 58,353 275,749 28,809 264,168
Note 1: The amount recognized as non-performing loans is in compliance with the “Regulations Governing the Procedures for Banking Institutions to Evaluate Assets and Deal with Non-performing/Non-accrual Loans”. The amount included in overdue accounts for credit cards is in compliance with the Banking Bureau (4) Letter No. 0944000378 dated July 6, 2005.
Note 2: Non-performing loan ratio=non-performing loans/gross loans. Non-performing loan ratio of credit cards=Non-performing loan ratio of credit cards /balance of accounts receivable.
Note 3: Coverage ratio for loans=allowance for doubtful accounts of loans/non-performing loans. Coverage ratio for accounts receivable of credit cards=allowance for doubtful accounts for accounts receivable of credit cards/ Non-performing loan ratio of credit cards.
Note 4: For residential mortgage loans, the borrower provides his/her (or spouse’s or minor child’s) house as collateral in full and mortgages it to the financial institution for the purpose of obtaining funds to purchase or add improvements to own house.
Note 5: Small amount of credit loans apply to the norms of the Banking Bureau (4) Letter No. 09440010950 dated December 19, 2005, excluding credit card and cash card services.
Note 6: Other consumer banking is specified as secured or unsecured consumer loans other than residential mortgage loans, cash card services and small amount of credit loans, and excluding credit card services.
Note 7: Pursuant to the Banking Bureau (5) Letter No. 094000494 dated July 19, 2005, the amount of without recourse factoring will be recognized as overdue accounts within three months after the factor or insurance company resolves not to compensate the loss.
Note 8: The Bank disclosed the total amount of non- performing loans and overdue receivables exempted from reporting to the competent authority as debt negotiation in accordance with the Explanatory Letter Jin-Guan-Yin (1) No. 09510001270 of the FSC dated April 25, 2006.
Note 9: The Bank disclosed the total amount of non- performing loans and overdue receivables exempted from reporting to the competent authority as debt liquidation program and restructuring program in accordance with the Explanatory Letter Jin-Guan-Yin (1) No. 09700318940 of the FSC dated September 15, 2008.
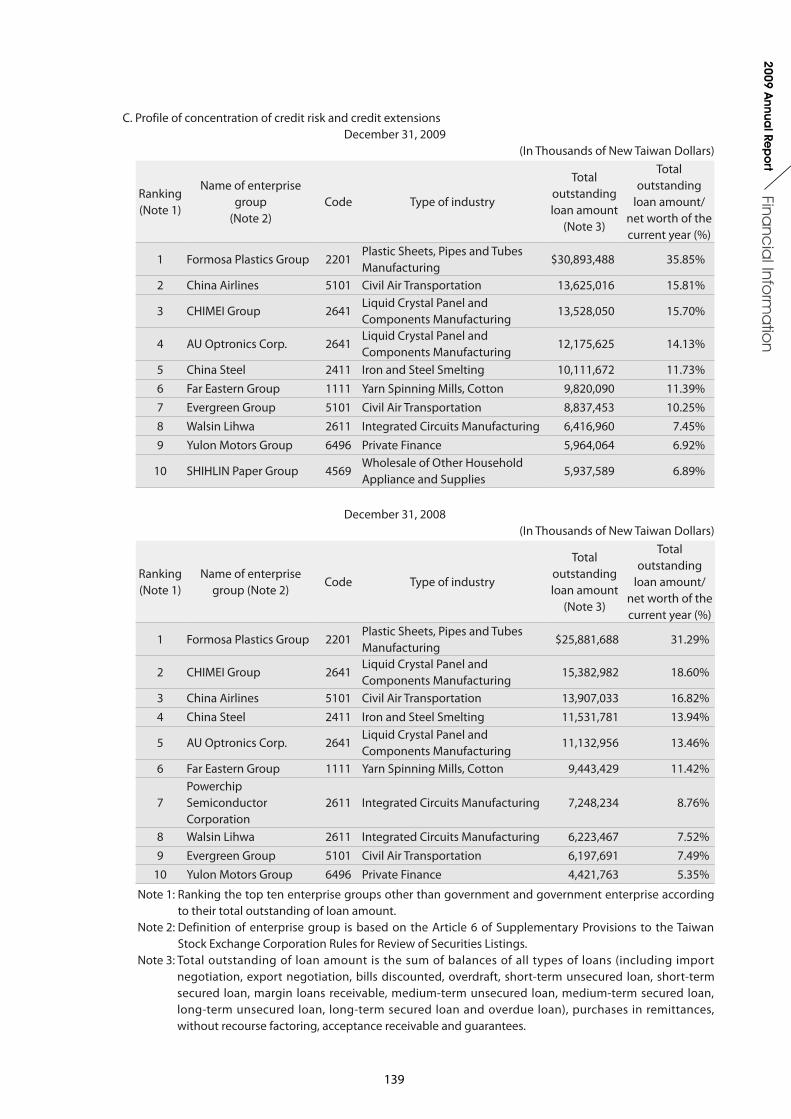
139
Financ
ial Info
rma
tion
2009 Annua
l Rep
ort
C. Profile of concentration of credit risk and credit extensionsDecember 31, 2009
(In Thousands of New Taiwan Dollars)
Ranking (Note 1)
Name of enterprise group
(Note 2)Code Type of industry
Total outstanding loan amount
(Note 3)
Total outstanding
loan amount/net worth of the current year (%)
1 Formosa Plastics Group 2201Plastic Sheets, Pipes and Tubes Manufacturing
$30,893,488 35.85%
2 China Airlines 5101 Civil Air Transportation 13,625,016 15.81%
3 CHIMEI Group 2641Liquid Crystal Panel and Components Manufacturing
13,528,050 15.70%
4 AU Optronics Corp. 2641Liquid Crystal Panel and Components Manufacturing
12,175,625 14.13%
5 China Steel 2411 Iron and Steel Smelting 10,111,672 11.73%6 Far Eastern Group 1111 Yarn Spinning Mills, Cotton 9,820,090 11.39%7 Evergreen Group 5101 Civil Air Transportation 8,837,453 10.25%8 Walsin Lihwa 2611 Integrated Circuits Manufacturing 6,416,960 7.45%9 Yulon Motors Group 6496 Private Finance 5,964,064 6.92%
10 SHIHLIN Paper Group 4569Wholesale of Other Household Appliance and Supplies
5,937,589 6.89%
December 31, 2008(In Thousands of New Taiwan Dollars)
Ranking (Note 1)
Name of enterprise group (Note 2)
Code Type of industry
Total outstanding loan amount
(Note 3)
Total outstanding
loan amount/net worth of the current year (%)
1 Formosa Plastics Group 2201Plastic Sheets, Pipes and Tubes Manufacturing
$25,881,688 31.29%
2 CHIMEI Group 2641Liquid Crystal Panel and Components Manufacturing
15,382,982 18.60%
3 China Airlines 5101 Civil Air Transportation 13,907,033 16.82%4 China Steel 2411 Iron and Steel Smelting 11,531,781 13.94%
5 AU Optronics Corp. 2641Liquid Crystal Panel and Components Manufacturing
11,132,956 13.46%
6 Far Eastern Group 1111 Yarn Spinning Mills, Cotton 9,443,429 11.42%
7Powerchip Semiconductor Corporation
2611 Integrated Circuits Manufacturing 7,248,234 8.76%
8 Walsin Lihwa 2611 Integrated Circuits Manufacturing 6,223,467 7.52%9 Evergreen Group 5101 Civil Air Transportation 6,197,691 7.49%
10 Yulon Motors Group 6496 Private Finance 4,421,763 5.35%
Note 1: Ranking the top ten enterprise groups other than government and government enterprise according to their total outstanding of loan amount.
Note 2: Definition of enterprise group is based on the Article 6 of Supplementary Provisions to the Taiwan Stock Exchange Corporation Rules for Review of Securities Listings.
Note 3: Total outstanding of loan amount is the sum of balances of all types of loans (including import negotiation, export negotiation, bills discounted, overdraft, short-term unsecured loan, short-term secured loan, margin loans receivable, medium-term unsecured loan, medium-term secured loan, long-term unsecured loan, long-term secured loan and overdue loan), purchases in remittances, without recourse factoring, acceptance receivable and guarantees.
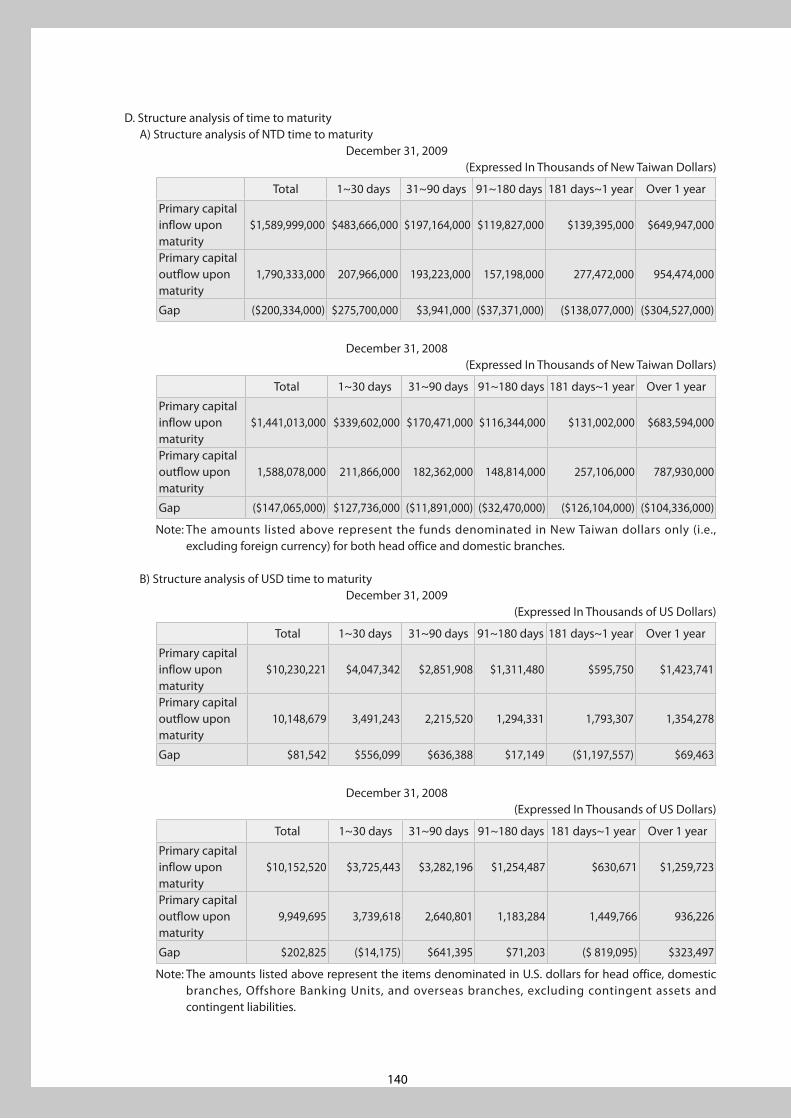
140
D. Structure analysis of time to maturityA) Structure analysis of NTD time to maturity
December 31, 2009(Expressed In Thousands of New Taiwan Dollars)
Total 1~30 days 31~90 days 91~180 days 181 days~1 year Over 1 year
Primary capital inflow upon maturity
$1,589,999,000 $483,666,000 $197,164,000 $119,827,000 $139,395,000 $649,947,000
Primary capital outflow upon maturity
1,790,333,000 207,966,000 193,223,000 157,198,000 277,472,000 954,474,000
Gap ($200,334,000) $275,700,000 $3,941,000 ($37,371,000) ($138,077,000) ($304,527,000)
December 31, 2008(Expressed In Thousands of New Taiwan Dollars)
Total 1~30 days 31~90 days 91~180 days 181 days~1 year Over 1 year
Primary capital inflow upon maturity
$1,441,013,000 $339,602,000 $170,471,000 $116,344,000 $131,002,000 $683,594,000
Primary capital outflow upon maturity
1,588,078,000 211,866,000 182,362,000 148,814,000 257,106,000 787,930,000
Gap ($147,065,000) $127,736,000 ($11,891,000) ($32,470,000) ($126,104,000) ($104,336,000)
Note: The amounts listed above represent the funds denominated in New Taiwan dollars only (i.e., excluding foreign currency) for both head office and domestic branches.
B) Structure analysis of USD time to maturityDecember 31, 2009
(Expressed In Thousands of US Dollars)
Total 1~30 days 31~90 days 91~180 days 181 days~1 year Over 1 year
Primary capital inflow upon maturity
$10,230,221 $4,047,342 $2,851,908 $1,311,480 $595,750 $1,423,741
Primary capital outflow upon maturity
10,148,679 3,491,243 2,215,520 1,294,331 1,793,307 1,354,278
Gap $81,542 $556,099 $636,388 $17,149 ($1,197,557) $69,463
December 31, 2008 (Expressed In Thousands of US Dollars)
Total 1~30 days 31~90 days 91~180 days 181 days~1 year Over 1 year
Primary capital inflow upon maturity
$10,152,520 $3,725,443 $3,282,196 $1,254,487 $630,671 $1,259,723
Primary capital outflow upon maturity
9,949,695 3,739,618 2,640,801 1,183,284 1,449,766 936,226
Gap $202,825 ($14,175) $641,395 $71,203 ($ 819,095) $323,497
Note: The amounts listed above represent the items denominated in U.S. dollars for head office, domestic branches, Offshore Banking Units, and overseas branches, excluding contingent assets and contingent liabilities.
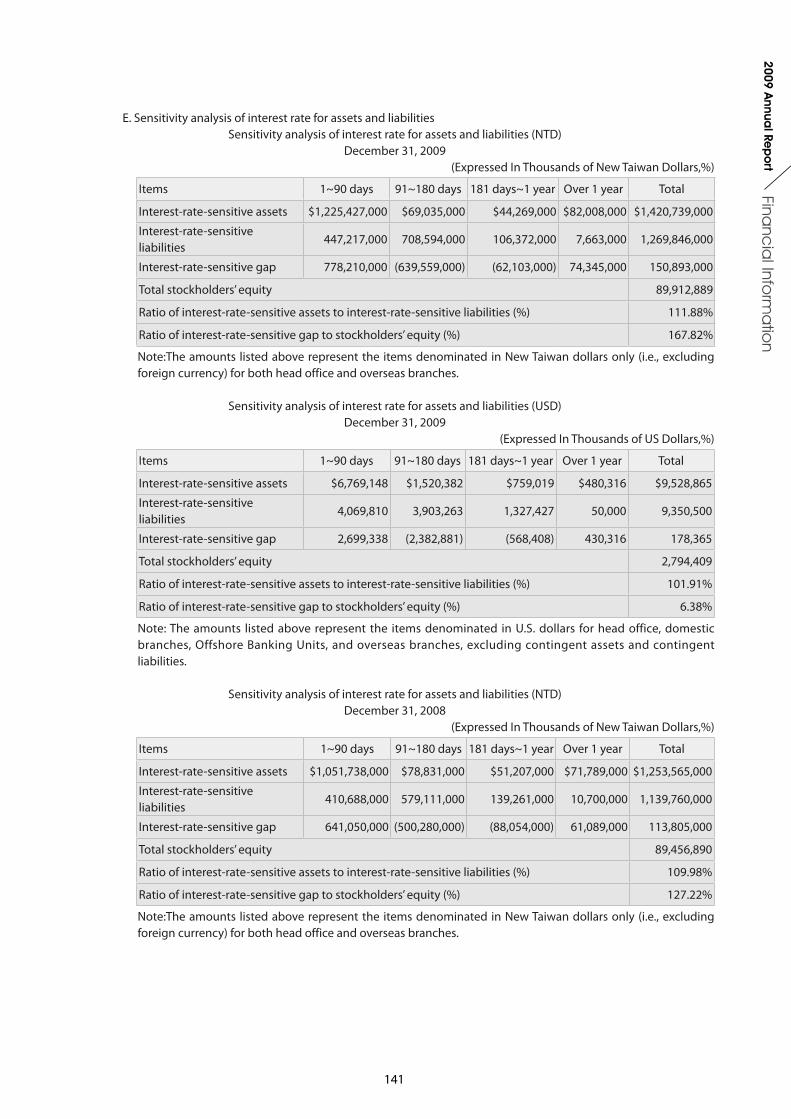
141
Financ
ial Info
rma
tion
2009 Annua
l Rep
ort
E. Sensitivity analysis of interest rate for assets and liabilitiesSensitivity analysis of interest rate for assets and liabilities (NTD)
December 31, 2009(Expressed In Thousands of New Taiwan Dollars,%)
Items 1~90 days 91~180 days 181 days~1 year Over 1 year Total
Interest-rate-sensitive assets $1,225,427,000 $69,035,000 $44,269,000 $82,008,000 $1,420,739,000
Interest-rate-sensitive liabilities
447,217,000 708,594,000 106,372,000 7,663,000 1,269,846,000
Interest-rate-sensitive gap 778,210,000 (639,559,000) (62,103,000) 74,345,000 150,893,000
Total stockholders’ equity 89,912,889
Ratio of interest-rate-sensitive assets to interest-rate-sensitive liabilities (%) 111.88%
Ratio of interest-rate-sensitive gap to stockholders’ equity (%) 167.82%
Note:The amounts listed above represent the items denominated in New Taiwan dollars only (i.e., excluding foreign currency) for both head office and overseas branches.
Sensitivity analysis of interest rate for assets and liabilities (USD)December 31, 2009
(Expressed In Thousands of US Dollars,%)
Items 1~90 days 91~180 days 181 days~1 year Over 1 year Total
Interest-rate-sensitive assets $6,769,148 $1,520,382 $759,019 $480,316 $9,528,865
Interest-rate-sensitive liabilities
4,069,810 3,903,263 1,327,427 50,000 9,350,500
Interest-rate-sensitive gap 2,699,338 (2,382,881) (568,408) 430,316 178,365
Total stockholders’ equity 2,794,409
Ratio of interest-rate-sensitive assets to interest-rate-sensitive liabilities (%) 101.91%
Ratio of interest-rate-sensitive gap to stockholders’ equity (%) 6.38%
Note: The amounts listed above represent the items denominated in U.S. dollars for head office, domestic branches, Offshore Banking Units, and overseas branches, excluding contingent assets and contingent liabilities.
Sensitivity analysis of interest rate for assets and liabilities (NTD)December 31, 2008
(Expressed In Thousands of New Taiwan Dollars,%)
Items 1~90 days 91~180 days 181 days~1 year Over 1 year Total
Interest-rate-sensitive assets $1,051,738,000 $78,831,000 $51,207,000 $71,789,000 $1,253,565,000
Interest-rate-sensitive liabilities
410,688,000 579,111,000 139,261,000 10,700,000 1,139,760,000
Interest-rate-sensitive gap 641,050,000 (500,280,000) (88,054,000) 61,089,000 113,805,000
Total stockholders’ equity 89,456,890
Ratio of interest-rate-sensitive assets to interest-rate-sensitive liabilities (%) 109.98%
Ratio of interest-rate-sensitive gap to stockholders’ equity (%) 127.22%
Note:The amounts listed above represent the items denominated in New Taiwan dollars only (i.e., excluding foreign currency) for both head office and overseas branches.
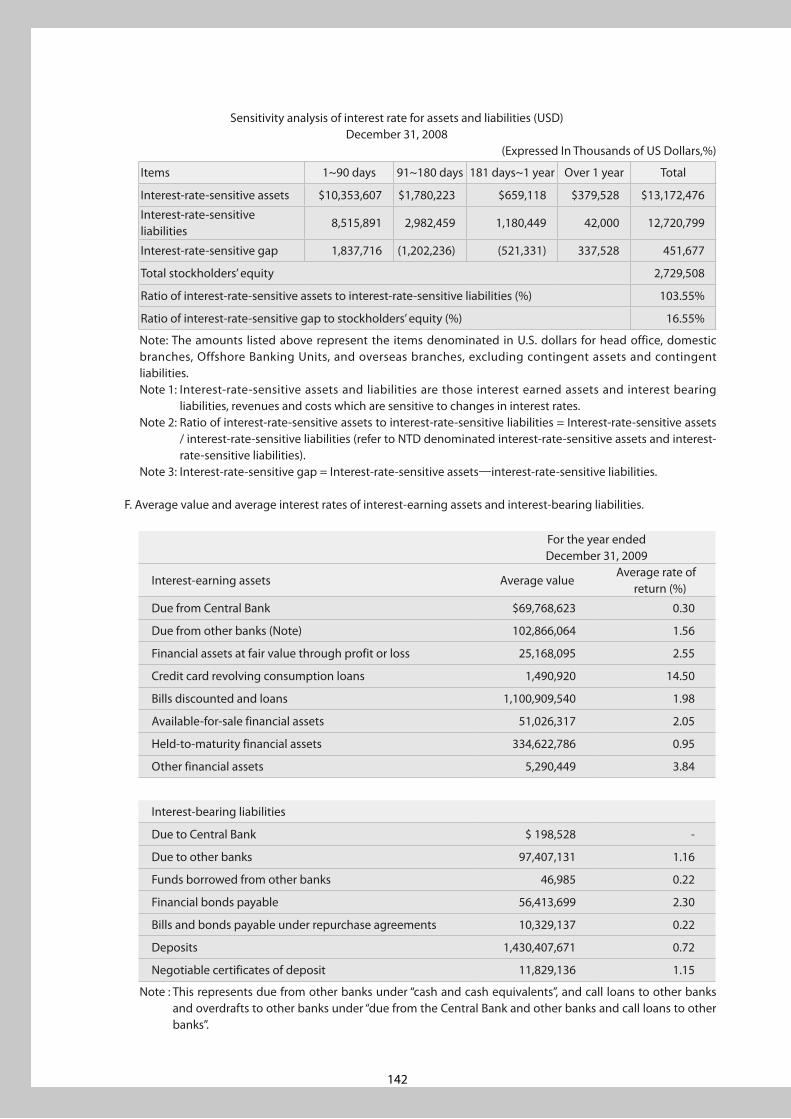
142
Sensitivity analysis of interest rate for assets and liabilities (USD)December 31, 2008
(Expressed In Thousands of US Dollars,%)
Items 1~90 days 91~180 days 181 days~1 year Over 1 year Total
Interest-rate-sensitive assets $10,353,607 $1,780,223 $659,118 $379,528 $13,172,476
Interest-rate-sensitive liabilities
8,515,891 2,982,459 1,180,449 42,000 12,720,799
Interest-rate-sensitive gap 1,837,716 (1,202,236) (521,331) 337,528 451,677
Total stockholders’ equity 2,729,508
Ratio of interest-rate-sensitive assets to interest-rate-sensitive liabilities (%) 103.55%
Ratio of interest-rate-sensitive gap to stockholders’ equity (%) 16.55%
Note: The amounts listed above represent the items denominated in U.S. dollars for head office, domestic branches, Offshore Banking Units, and overseas branches, excluding contingent assets and contingent liabilities. Note 1: Interest-rate-sensitive assets and liabilities are those interest earned assets and interest bearing
liabilities, revenues and costs which are sensitive to changes in interest rates.Note 2: Ratio of interest-rate-sensitive assets to interest-rate-sensitive liabilities = Interest-rate-sensitive assets
/ interest-rate-sensitive liabilities (refer to NTD denominated interest-rate-sensitive assets and interest-rate-sensitive liabilities).
Note 3: Interest-rate-sensitive gap = Interest-rate-sensitive assets—interest-rate-sensitive liabilities.
F. Average value and average interest rates of interest-earning assets and interest-bearing liabilities.
For the year endedDecember 31, 2009
Interest-earning assets Average valueAverage rate of
return (%)
Due from Central Bank $69,768,623 0.30
Due from other banks (Note) 102,866,064 1.56
Financial assets at fair value through profit or loss 25,168,095 2.55
Credit card revolving consumption loans 1,490,920 14.50
Bills discounted and loans 1,100,909,540 1.98
Available-for-sale financial assets 51,026,317 2.05
Held-to-maturity financial assets 334,622,786 0.95
Other financial assets 5,290,449 3.84
Interest-bearing liabilities
Due to Central Bank $ 198,528 -
Due to other banks 97,407,131 1.16
Funds borrowed from other banks 46,985 0.22
Financial bonds payable 56,413,699 2.30
Bills and bonds payable under repurchase agreements 10,329,137 0.22
Deposits 1,430,407,671 0.72
Negotiable certificates of deposit 11,829,136 1.15
Note : This represents due from other banks under “cash and cash equivalents”, and call loans to other banks and overdrafts to other banks under “due from the Central Bank and other banks and call loans to other banks”.

143
Financ
ial Info
rma
tion
2009 Annua
l Rep
ort
For the year ended December 31, 2008
Interest-earning assets Average valueAverage rate of
return (%)
Due from Central Bank $57,623,890 0.76
Due from other banks (Note) 86,850,867 4.16
Financial assets at fair value through profit or loss 27,168,864 2.66
Credit card revolving consumption loans 1,821,074 14.71
Bills discounted and loans 1,089,677,778 3.47
Available-for-sale financial assets 50,030,052 2.74
Held-to-maturity financial assets 221,134,403 2.45
Other financial assets 9,075,605 3.89
Interest-bearing liabilities
Due to Central Bank $256,615 -
Due to other banks 141,413,932 3.50
Funds borrowed from other banks 61,724 1.58
Financial bonds payable 62,345,082 2.36
Bills and bonds payable under repurchase agreements 11,740,727 1.58
Deposits 1,275,699,872 1.56
Negotiable certificates of deposit 10,429,525 2.07
Note : This represents due from other banks under “cash and cash equivalents”, and call loans to other banks and overdrafts to other banks under “due from the Central Bank and other banks and call loans to other banks”.
G. Net position for major foreign currency transactions
December 31, 2009 December 31, 2008
Currency(in thousands)
NTD(in thousands)
Currency(in thousands)
NTD(in thousands)
Net position for major foreign currency transactions (Market Risk)
USD $34,609 $1,113,581 USD $74,717 $2,448,763
CAD 29,725 909,157 CAD 29,337 788,364
AUD 19,929 575,380 JPY 981,605 355,832
HKD 107,788 447,212 GBP 6,181 292,479
GBP 5,858 303,068 SGD 10,115 230,327
Note 1: The major foreign currencies are the top 5 currencies by position, which is expressed in New Taiwan dollars after exchange rate conversion.
Note 2: Net position represents an absolute value of each currency.
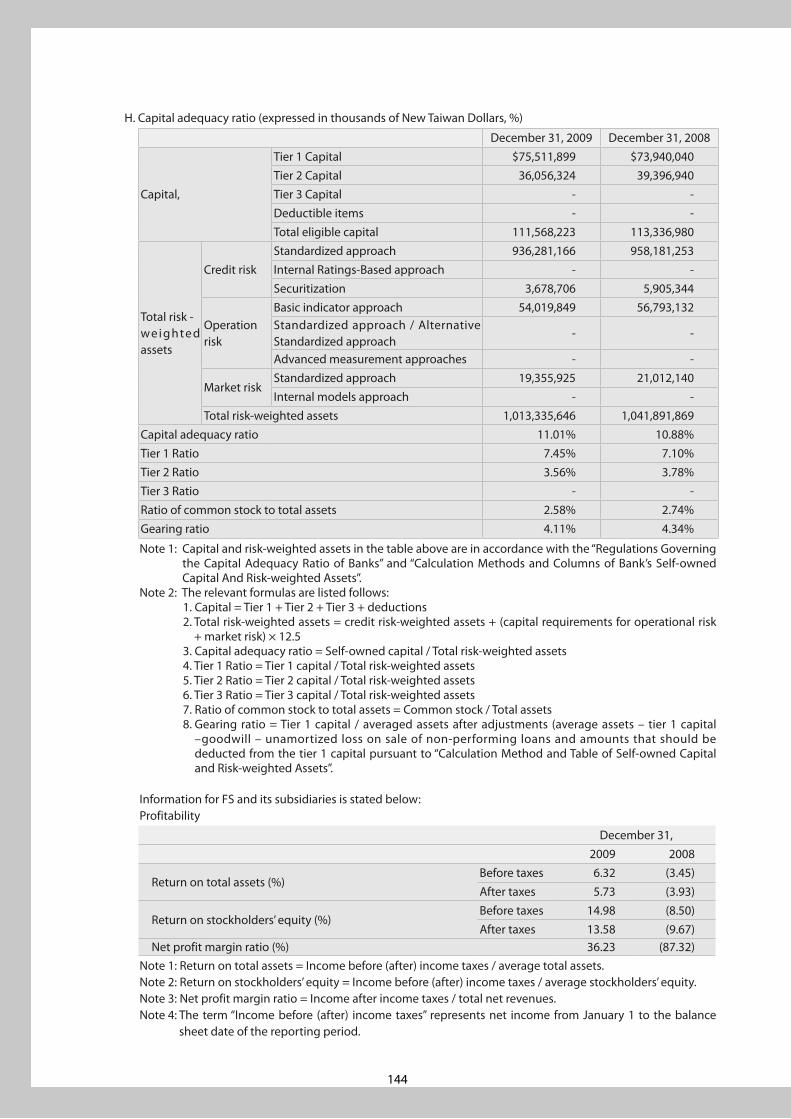
144
H. Capital adequacy ratio (expressed in thousands of New Taiwan Dollars, %)
December 31, 2009 December 31, 2008
Capital,
Tier 1 Capital $75,511,899 $73,940,040Tier 2 Capital 36,056,324 39,396,940Tier 3 Capital - -Deductible items - -Total eligible capital 111,568,223 113,336,980
Total risk -wei ghte d assets
Credit riskStandardized approach 936,281,166 958,181,253Internal Ratings-Based approach - -Securitization 3,678,706 5,905,344
Operationrisk
Basic indicator approach 54,019,849 56,793,132Standardized approach / Alternative Standardized approach
- -
Advanced measurement approaches - -
Market riskStandardized approach 19,355,925 21,012,140Internal models approach - -
Total risk-weighted assets 1,013,335,646 1,041,891,869Capital adequacy ratio 11.01% 10.88%Tier 1 Ratio 7.45% 7.10%Tier 2 Ratio 3.56% 3.78%Tier 3 Ratio - -Ratio of common stock to total assets 2.58% 2.74%Gearing ratio 4.11% 4.34%
Note 1: Capital and risk-weighted assets in the table above are in accordance with the “Regulations Governing the Capital Adequacy Ratio of Banks” and “Calculation Methods and Columns of Bank’s Self-owned Capital And Risk-weighted Assets”.
Note 2: The relevant formulas are listed follows:1. Capital = Tier 1 + Tier 2 + Tier 3 + deductions 2. Total risk-weighted assets = credit risk-weighted assets + (capital requirements for operational risk
+ market risk) × 12.53. Capital adequacy ratio = Self-owned capital / Total risk-weighted assets4. Tier 1 Ratio = Tier 1 capital / Total risk-weighted assets5. Tier 2 Ratio = Tier 2 capital / Total risk-weighted assets6. Tier 3 Ratio = Tier 3 capital / Total risk-weighted assets7. Ratio of common stock to total assets = Common stock / Total assets8. Gearing ratio = Tier 1 capital / averaged assets after adjustments (average assets – tier 1 capital
–goodwill – unamortized loss on sale of non-performing loans and amounts that should be deducted from the tier 1 capital pursuant to “Calculation Method and Table of Self-owned Capital and Risk-weighted Assets”.
Information for FS and its subsidiaries is stated below:Profitability
December 31, 2009 2008
Return on total assets (%)Before taxes 6.32 (3.45)After taxes 5.73 (3.93)
Return on stockholders’ equity (%)Before taxes 14.98 (8.50)After taxes 13.58 (9.67)
Net profit margin ratio (%) 36.23 (87.32)Note 1: Return on total assets = Income before (after) income taxes / average total assets. Note 2: Return on stockholders’ equity = Income before (after) income taxes / average stockholders’ equity.Note 3: Net profit margin ratio = Income after income taxes / total net revenues.Note 4: The term “Income before (after) income taxes” represents net income from January 1 to the balance
sheet date of the reporting period.
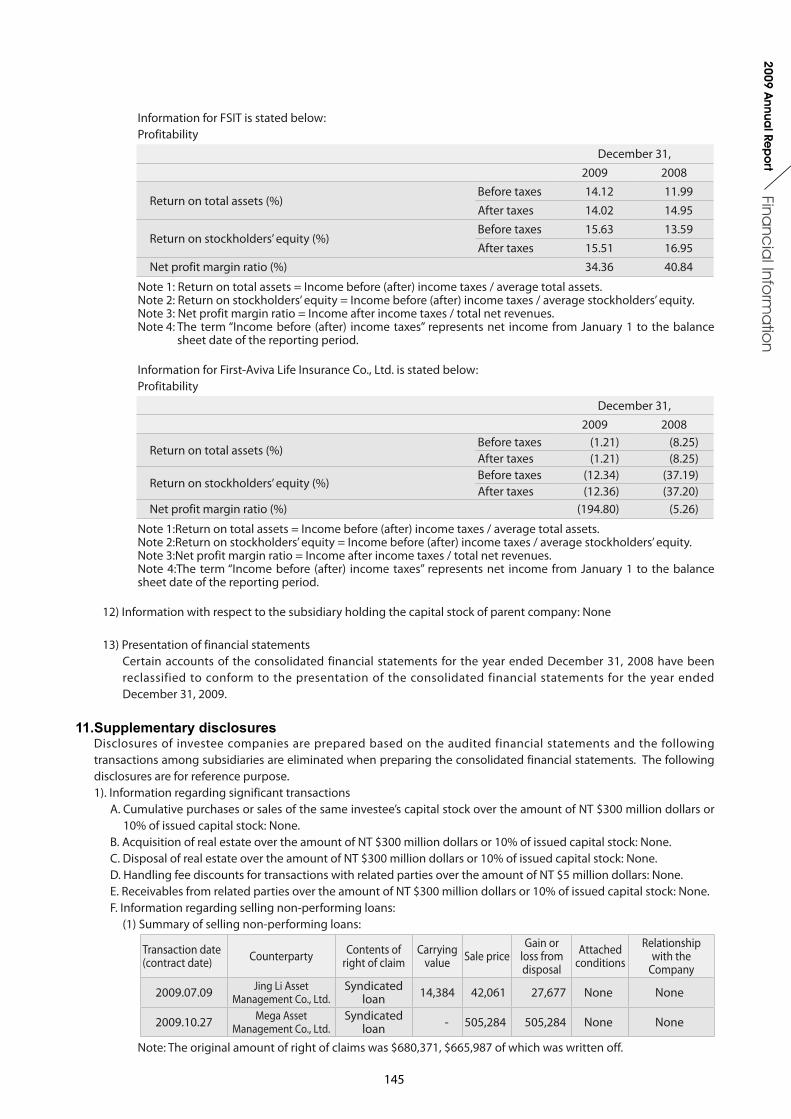
145
Financ
ial Info
rma
tion
2009 Annua
l Rep
ort
Information for FSIT is stated below:Profitability
December 31, 2009 2008
Return on total assets (%)Before taxes 14.12 11.99After taxes 14.02 14.95
Return on stockholders’ equity (%)Before taxes 15.63 13.59After taxes 15.51 16.95
Net profit margin ratio (%) 34.36 40.84
Note 1: Return on total assets = Income before (after) income taxes / average total assets. Note 2: Return on stockholders’ equity = Income before (after) income taxes / average stockholders’ equity.Note 3: Net profit margin ratio = Income after income taxes / total net revenues.Note 4: The term “Income before (after) income taxes” represents net income from January 1 to the balance
sheet date of the reporting period.
Information for First-Aviva Life Insurance Co., Ltd. is stated below:Profitability
December 31, 2009 2008
Return on total assets (%)Before taxes (1.21) (8.25)After taxes (1.21) (8.25)
Return on stockholders’ equity (%)Before taxes (12.34) (37.19)After taxes (12.36) (37.20)
Net profit margin ratio (%) (194.80) (5.26)
Note 1:Return on total assets = Income before (after) income taxes / average total assets. Note 2:Return on stockholders’ equity = Income before (after) income taxes / average stockholders’ equity.Note 3:Net profit margin ratio = Income after income taxes / total net revenues.Note 4:The term “Income before (after) income taxes” represents net income from January 1 to the balance sheet date of the reporting period.
12) Information with respect to the subsidiary holding the capital stock of parent company: None
13) Presentation of financial statementsCertain accounts of the consolidated financial statements for the year ended December 31, 2008 have been reclassified to conform to the presentation of the consolidated financial statements for the year ended December 31, 2009.
11.Supplementary disclosures Disclosures of investee companies are prepared based on the audited financial statements and the following transactions among subsidiaries are eliminated when preparing the consolidated financial statements. The following disclosures are for reference purpose.
1). Information regarding significant transactionsA. Cumulative purchases or sales of the same investee’s capital stock over the amount of NT $300 million dollars or
10% of issued capital stock: None.B. Acquisition of real estate over the amount of NT $300 million dollars or 10% of issued capital stock: None.C. Disposal of real estate over the amount of NT $300 million dollars or 10% of issued capital stock: None.D. Handling fee discounts for transactions with related parties over the amount of NT $5 million dollars: None.E. Receivables from related parties over the amount of NT $300 million dollars or 10% of issued capital stock: None. F. Information regarding selling non-performing loans:
(1) Summary of selling non-performing loans:
Transaction date (contract date) Counterparty Contents of
right of claimCarrying
value Sale priceGain or
loss from disposal
Attached conditions
Relationship with the
Company
2009.07.09 Jing Li Asset Management Co., Ltd.
Syndicated loan 14,384 42,061 27,677 None None
2009.10.27 Mega Asset Management Co., Ltd.
Syndicated loan - 505,284 505,284 None None
Note: The original amount of right of claims was $680,371, $665,987 of which was written off.
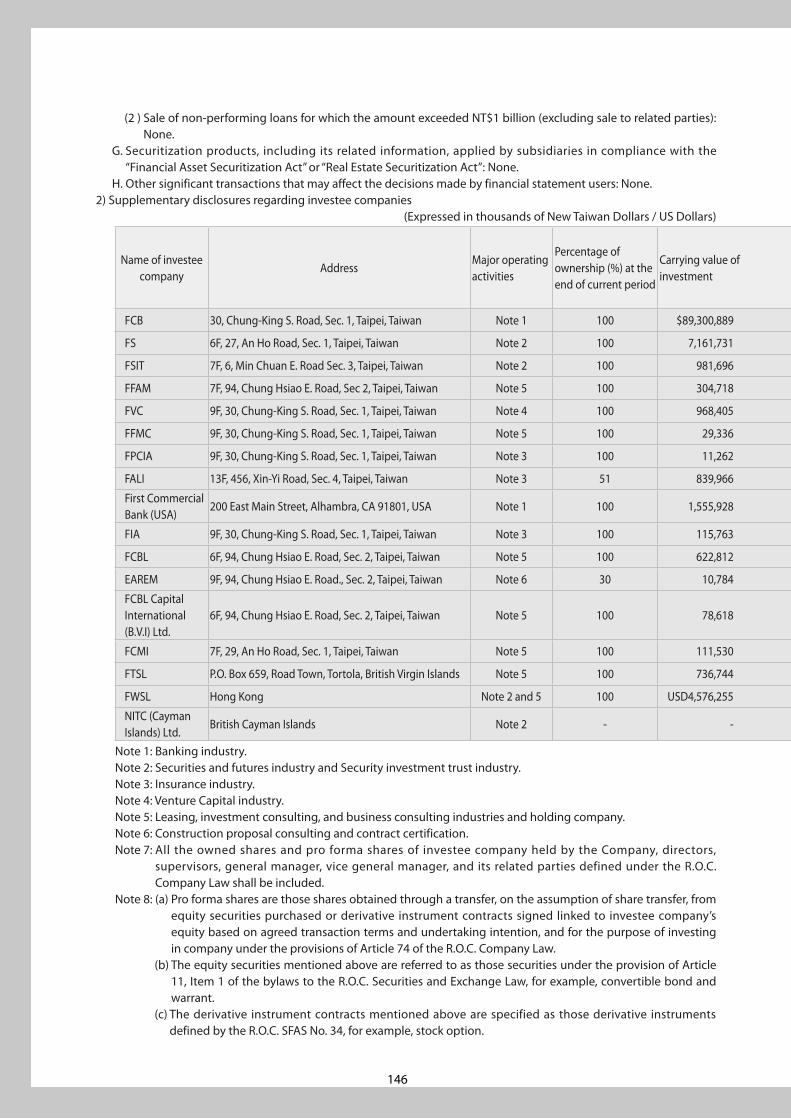
146
(2 ) Sale of non-performing loans for which the amount exceeded NT$1 billion (excluding sale to related parties): None.
G. Securitization products, including its related information, applied by subsidiaries in compliance with the “Financial Asset Securitization Act” or “Real Estate Securitization Act”: None.
H. Other significant transactions that may affect the decisions made by financial statement users: None. 2) Supplementary disclosures regarding investee companies
(Expressed in thousands of New Taiwan Dollars / US Dollars)
Name of investee company
AddressMajor operating activities
Percentage of ownership (%) at the end of current period
Carrying value of investment
Investment income (loss) recognized by the Company
for current period
The combined ownership of the investee company’s common shares held by the Company and its related parties (Note 7)
FootnoteNumber of owned shares
(in thousands)
Number of pro forma shares (Note 8)
TotalNumber of shares
(in thousands)Percentage of ownership (%)
FCB 30, Chung-King S. Road, Sec. 1, Taipei, Taiwan Note 1 100 $89,300,889 $2,053,658 4,949,000 - 4,949,000 100
FS 6F, 27, An Ho Road, Sec. 1, Taipei, Taiwan Note 2 100 7,161,731 911,762 590,000 - 590,000 100
FSIT 7F, 6, Min Chuan E. Road Sec. 3, Taipei, Taiwan Note 2 100 981,696 151,529 60,000 - 60,000 100
FFAM 7F, 94, Chung Hsiao E. Road, Sec 2, Taipei, Taiwan Note 5 100 304,718 43,581 25,000 - 25,000 100
FVC 9F, 30, Chung-King S. Road, Sec. 1, Taipei, Taiwan Note 4 100 968,405 25,980 100,000 - 100,000 100
FFMC 9F, 30, Chung-King S. Road, Sec. 1, Taipei, Taiwan Note 5 100 29,336 8,971 2,000 - 2,000 100
FPCIA 9F, 30, Chung-King S. Road, Sec. 1, Taipei, Taiwan Note 3 100 11,262 6,513 300 - 300 100
FALI 13F, 456, Xin-Yi Road, Sec. 4, Taipei, Taiwan Note 3 51 839,966 (93,741) 114,750 - 114,750 51
First Commercial Bank (USA)
200 East Main Street, Alhambra, CA 91801, USA Note 1 100 1,555,928 11,036 3,000 - 3,000 100
FIA 9F, 30, Chung-King S. Road, Sec. 1, Taipei, Taiwan Note 3 100 115,763 6,906 5,000 - 5,000 100
FCBL 6F, 94, Chung Hsiao E. Road, Sec. 2, Taipei, Taiwan Note 5 100 622,812 3,783 50,000 - 50,000 100
EAREM 9F, 94, Chung Hsiao E. Road., Sec. 2, Taipei, Taiwan Note 6 30 10,784 (566) 1,500 - 1,500 30
FCBL Capital International (B.V.I) Ltd.
6F, 94, Chung Hsiao E. Road, Sec. 2, Taipei, Taiwan Note 5 100 78,618 299 50 - 50 100
FCMI 7F, 29, An Ho Road, Sec. 1, Taipei, Taiwan Note 5 100 111,530 3,053 10,000 - 10,000 100
FTSL P.O. Box 659, Road Town, Tortola, British Virgin Islands Note 5 100 736,744 15,050 1,000 - 1,000 100
FWSL Hong Kong Note 2 and 5 100 USD4,576,255 USD444,513 30,000 - 30,000 100
NITC (Cayman Islands) Ltd.
British Cayman Islands Note 2 - - 1 - - - - Note 9
Note 1: Banking industry.Note 2: Securities and futures industry and Security investment trust industry.Note 3: Insurance industry.Note 4: Venture Capital industry.Note 5: Leasing, investment consulting, and business consulting industries and holding company.Note 6: Construction proposal consulting and contract certification.Note 7: All the owned shares and pro forma shares of investee company held by the Company, directors,
supervisors, general manager, vice general manager, and its related parties defined under the R.O.C. Company Law shall be included.
Note 8: (a) Pro forma shares are those shares obtained through a transfer, on the assumption of share transfer, from equity securities purchased or derivative instrument contracts signed linked to investee company’s equity based on agreed transaction terms and undertaking intention, and for the purpose of investing in company under the provisions of Article 74 of the R.O.C. Company Law.
(b) The equity securities mentioned above are referred to as those securities under the provision of Article 11, Item 1 of the bylaws to the R.O.C. Securities and Exchange Law, for example, convertible bond and warrant.
(c) The derivative instrument contracts mentioned above are specified as those derivative instruments defined by the R.O.C. SFAS No. 34, for example, stock option.

147
Financ
ial Info
rma
tion
2009 Annua
l Rep
ort
(2 ) Sale of non-performing loans for which the amount exceeded NT$1 billion (excluding sale to related parties): None.
G. Securitization products, including its related information, applied by subsidiaries in compliance with the “Financial Asset Securitization Act” or “Real Estate Securitization Act”: None.
H. Other significant transactions that may affect the decisions made by financial statement users: None. 2) Supplementary disclosures regarding investee companies
(Expressed in thousands of New Taiwan Dollars / US Dollars)
Name of investee company
AddressMajor operating activities
Percentage of ownership (%) at the end of current period
Carrying value of investment
Investment income (loss) recognized by the Company
for current period
The combined ownership of the investee company’s common shares held by the Company and its related parties (Note 7)
FootnoteNumber of owned shares
(in thousands)
Number of pro forma shares (Note 8)
TotalNumber of shares
(in thousands)Percentage of ownership (%)
FCB 30, Chung-King S. Road, Sec. 1, Taipei, Taiwan Note 1 100 $89,300,889 $2,053,658 4,949,000 - 4,949,000 100
FS 6F, 27, An Ho Road, Sec. 1, Taipei, Taiwan Note 2 100 7,161,731 911,762 590,000 - 590,000 100
FSIT 7F, 6, Min Chuan E. Road Sec. 3, Taipei, Taiwan Note 2 100 981,696 151,529 60,000 - 60,000 100
FFAM 7F, 94, Chung Hsiao E. Road, Sec 2, Taipei, Taiwan Note 5 100 304,718 43,581 25,000 - 25,000 100
FVC 9F, 30, Chung-King S. Road, Sec. 1, Taipei, Taiwan Note 4 100 968,405 25,980 100,000 - 100,000 100
FFMC 9F, 30, Chung-King S. Road, Sec. 1, Taipei, Taiwan Note 5 100 29,336 8,971 2,000 - 2,000 100
FPCIA 9F, 30, Chung-King S. Road, Sec. 1, Taipei, Taiwan Note 3 100 11,262 6,513 300 - 300 100
FALI 13F, 456, Xin-Yi Road, Sec. 4, Taipei, Taiwan Note 3 51 839,966 (93,741) 114,750 - 114,750 51
First Commercial Bank (USA)
200 East Main Street, Alhambra, CA 91801, USA Note 1 100 1,555,928 11,036 3,000 - 3,000 100
FIA 9F, 30, Chung-King S. Road, Sec. 1, Taipei, Taiwan Note 3 100 115,763 6,906 5,000 - 5,000 100
FCBL 6F, 94, Chung Hsiao E. Road, Sec. 2, Taipei, Taiwan Note 5 100 622,812 3,783 50,000 - 50,000 100
EAREM 9F, 94, Chung Hsiao E. Road., Sec. 2, Taipei, Taiwan Note 6 30 10,784 (566) 1,500 - 1,500 30
FCBL Capital International (B.V.I) Ltd.
6F, 94, Chung Hsiao E. Road, Sec. 2, Taipei, Taiwan Note 5 100 78,618 299 50 - 50 100
FCMI 7F, 29, An Ho Road, Sec. 1, Taipei, Taiwan Note 5 100 111,530 3,053 10,000 - 10,000 100
FTSL P.O. Box 659, Road Town, Tortola, British Virgin Islands Note 5 100 736,744 15,050 1,000 - 1,000 100
FWSL Hong Kong Note 2 and 5 100 USD4,576,255 USD444,513 30,000 - 30,000 100
NITC (Cayman Islands) Ltd.
British Cayman Islands Note 2 - - 1 - - - - Note 9
Note 1: Banking industry.Note 2: Securities and futures industry and Security investment trust industry.Note 3: Insurance industry.Note 4: Venture Capital industry.Note 5: Leasing, investment consulting, and business consulting industries and holding company.Note 6: Construction proposal consulting and contract certification.Note 7: All the owned shares and pro forma shares of investee company held by the Company, directors,
supervisors, general manager, vice general manager, and its related parties defined under the R.O.C. Company Law shall be included.
Note 8: (a) Pro forma shares are those shares obtained through a transfer, on the assumption of share transfer, from equity securities purchased or derivative instrument contracts signed linked to investee company’s equity based on agreed transaction terms and undertaking intention, and for the purpose of investing in company under the provisions of Article 74 of the R.O.C. Company Law.
(b) The equity securities mentioned above are referred to as those securities under the provision of Article 11, Item 1 of the bylaws to the R.O.C. Securities and Exchange Law, for example, convertible bond and warrant.
(c) The derivative instrument contracts mentioned above are specified as those derivative instruments defined by the R.O.C. SFAS No. 34, for example, stock option.
Note 9: On October 14, 2008, FSIT resolved to cease operations of NITC (Cayman Islands) Ltd., effective from December 31, 2008. The residual funds were remitted back to FSIT on April 23, 2009.
Note 10: The Board of Directors exercised the authority on behalf of the Stockholders’ Meeting and resolved to cease FFI’s operation in September 2007. The liquidation procedures of FFI were completed in May 2009.
3) Significant transactions regarding investee companiesA. Cumulative purchases or sales of the stocks for the same investee’s capital stock up to NT$300 million or over 10%
of the issued capital stock: None.B. Acquisition of real estate over the amount of NT $300 million dollars or 10% of issued capital stock: NoneC. Disposal of real estate over the amount of NT$300 million dollars or 10% of issued capital stock: None.D. Handling fee discounts for transactions with related parties over the amount of NT $5 million dollars: None.E. Receivables from related parties up to NT $300 million dollars or 10% of issued capital stock: None.F. Disposal of non-performing loans of subsidiaries: please refer to Note 11 (1) F for details.G. Securitization products and its related information that applied by subsidiaries in compliance with the “Financial
Asset Securitization Act” or “Real Estate Securitization Act”: None.H. Other significant transactions that may affect the decisions made by financial statement users: None. I. Funds lent to others:
FCB engages in the loan and credit business regulated by the Banking Law and is classified as a financial service
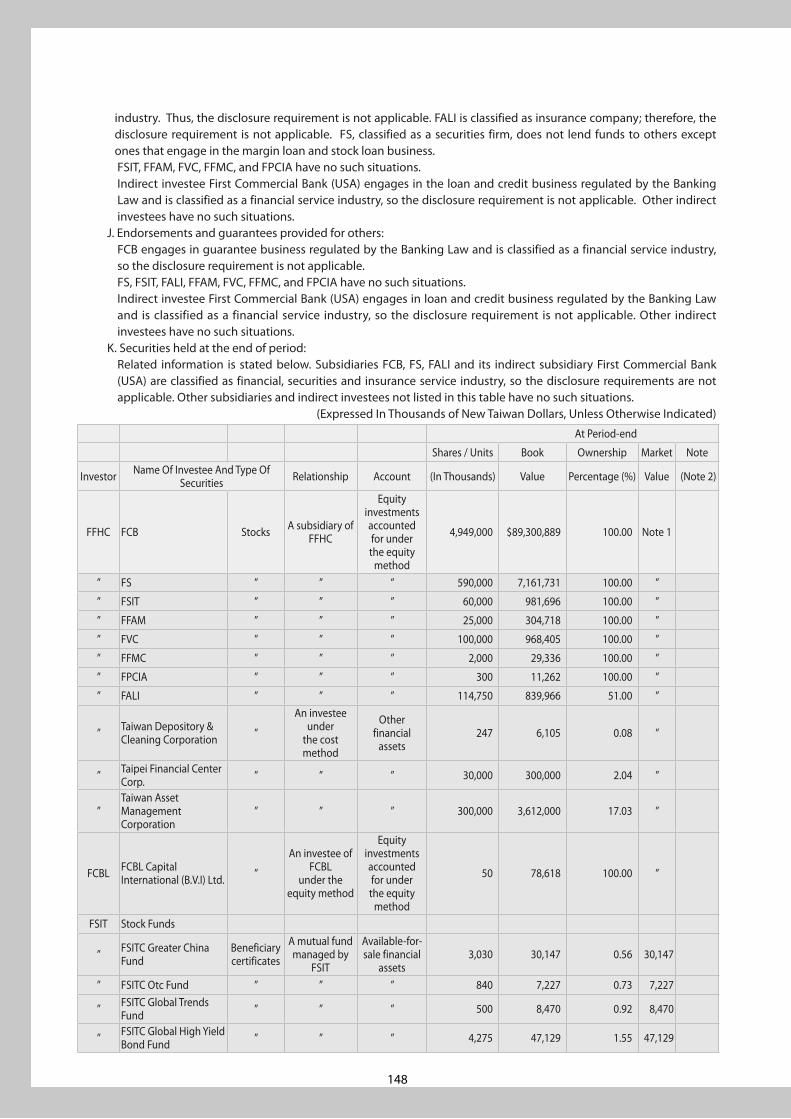
148
industry. Thus, the disclosure requirement is not applicable. FALI is classified as insurance company; therefore, the disclosure requirement is not applicable. FS, classified as a securities firm, does not lend funds to others except ones that engage in the margin loan and stock loan business. FSIT, FFAM, FVC, FFMC, and FPCIA have no such situations. Indirect investee First Commercial Bank (USA) engages in the loan and credit business regulated by the Banking Law and is classified as a financial service industry, so the disclosure requirement is not applicable. Other indirect investees have no such situations.
J. Endorsements and guarantees provided for others: FCB engages in guarantee business regulated by the Banking Law and is classified as a financial service industry, so the disclosure requirement is not applicable.
FS, FSIT, FALI, FFAM, FVC, FFMC, and FPCIA have no such situations. Indirect investee First Commercial Bank (USA) engages in loan and credit business regulated by the Banking Law and is classified as a financial service industry, so the disclosure requirement is not applicable. Other indirect investees have no such situations.
K. Securities held at the end of period: Related information is stated below. Subsidiaries FCB, FS, FALI and its indirect subsidiary First Commercial Bank (USA) are classified as financial, securities and insurance service industry, so the disclosure requirements are not applicable. Other subsidiaries and indirect investees not listed in this table have no such situations.
(Expressed In Thousands of New Taiwan Dollars, Unless Otherwise Indicated)
At Period-end
Shares / Units Book Ownership Market Note
Investor Name Of Investee And Type Of Securities Relationship Account (In Thousands) Value Percentage (%) Value (Note 2)
FFHC FCB Stocks A subsidiary of FFHC
Equity investments accounted for under the equity
method
4,949,000 $89,300,889 100.00 Note 1
” FS ” ” ” 590,000 7,161,731 100.00 ”
” FSIT ” ” ” 60,000 981,696 100.00 ”
” FFAM ” ” ” 25,000 304,718 100.00 ”
” FVC ” ” ” 100,000 968,405 100.00 ”
” FFMC ” ” ” 2,000 29,336 100.00 ”
” FPCIA ” ” ” 300 11,262 100.00 ”
” FALI ” ” ” 114,750 839,966 51.00 ”
” Taiwan Depository & Cleaning Corporation ”
An investee under
the cost method
Other financial
assets247 6,105 0.08 ”
” Taipei Financial Center Corp. ” ” ” 30,000 300,000 2.04 ”
”Taiwan Asset Management Corporation
” ” ” 300,000 3,612,000 17.03 ”
FCBL FCBL Capital International (B.V.I) Ltd. ”
An investee of FCBL
under the equity method
Equity investments accounted for under the equity
method
50 78,618 100.00 ”
FSIT Stock Funds
” FSITC Greater China Fund
Beneficiary certificates
A mutual fund managed by
FSIT
Available-for- sale financial
assets3,030 30,147 0.56 30,147
” FSITC Otc Fund ” ” ” 840 7,227 0.73 7,227
” FSITC Global Trends Fund ” ” ” 500 8,470 0.92 8,470
” FSITC Global High Yield Bond Fund ” ” ” 4,275 47,129 1.55 47,129
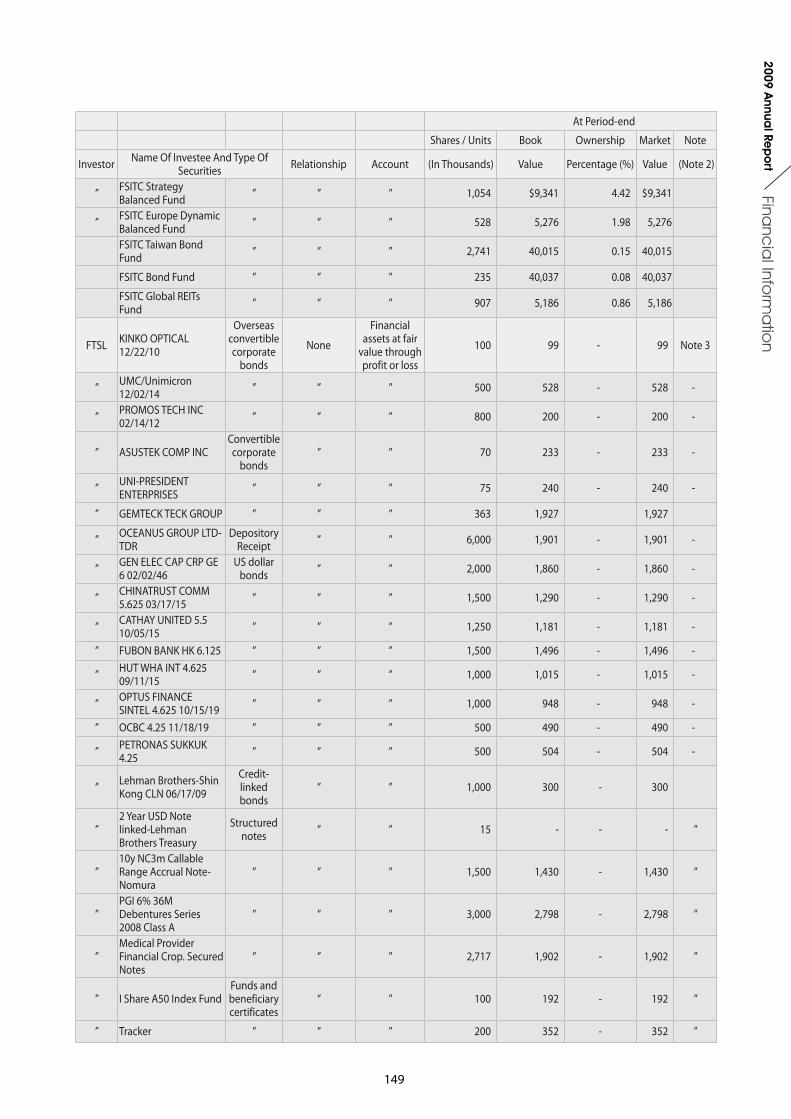
149
Financ
ial Info
rma
tion
2009 Annua
l Rep
ort
At Period-end
Shares / Units Book Ownership Market Note
Investor Name Of Investee And Type Of Securities Relationship Account (In Thousands) Value Percentage (%) Value (Note 2)
” FSITC Strategy Balanced Fund ” ” ” 1,054 $9,341 4.42 $9,341
” FSITC Europe Dynamic Balanced Fund ” ” ” 528 5,276 1.98 5,276
FSITC Taiwan Bond Fund ” ” ” 2,741 40,015 0.15 40,015
FSITC Bond Fund ” ” ” 235 40,037 0.08 40,037
FSITC Global REITs Fund ” ” ” 907 5,186 0.86 5,186
FTSL KINKO OPTICAL 12/22/10
Overseas convertible corporate
bonds
None
Financial assets at fair
value through profit or loss
100 99 - 99 Note 3
” UMC/Unimicron 12/02/14 ” ” ” 500 528 - 528 -
” PROMOS TECH INC 02/14/12 ” ” ” 800 200 - 200 -
” ASUSTEK COMP INCConvertible corporate
bonds” ” 70 233 - 233 -
” UNI-PRESIDENT ENTERPRISES ” ” ” 75 240 - 240 -
” GEMTECK TECK GROUP ” ” ” 363 1,927 1,927
” OCEANUS GROUP LTD-TDR
Depository Receipt ” ” 6,000 1,901 - 1,901 -
” GEN ELEC CAP CRP GE 6 02/02/46
US dollar bonds ” ” 2,000 1,860 - 1,860 -
” CHINATRUST COMM 5.625 03/17/15 ” ” ” 1,500 1,290 - 1,290 -
” CATHAY UNITED 5.5 10/05/15 ” ” ” 1,250 1,181 - 1,181 -
” FUBON BANK HK 6.125 ” ” ” 1,500 1,496 - 1,496 -
” HUT WHA INT 4.625 09/11/15 ” ” ” 1,000 1,015 - 1,015 -
” OPTUS FINANCE SINTEL 4.625 10/15/19 ” ” ” 1,000 948 - 948 -
” OCBC 4.25 11/18/19 ” ” ” 500 490 - 490 -
” PETRONAS SUKKUK 4.25 ” ” ” 500 504 - 504 -
” Lehman Brothers-Shin Kong CLN 06/17/09
Credit-linked bonds
” ” 1,000 300 - 300
”2 Year USD Note Iinked-Lehman Brothers Treasury
Structured notes ” ” 15 - - - ”
”10y NC3m Callable Range Accrual Note- Nomura
” ” ” 1,500 1,430 - 1,430 ”
”PGI 6% 36M Debentures Series 2008 Class A
” ” ” 3,000 2,798 - 2,798 ”
”Medical Provider Financial Crop. Secured Notes
” ” ” 2,717 1,902 - 1,902 ”
” I Share A50 Index FundFunds and beneficiary certificates
” ” 100 192 - 192 ”
” Tracker ” ” ” 200 352 - 352 ”
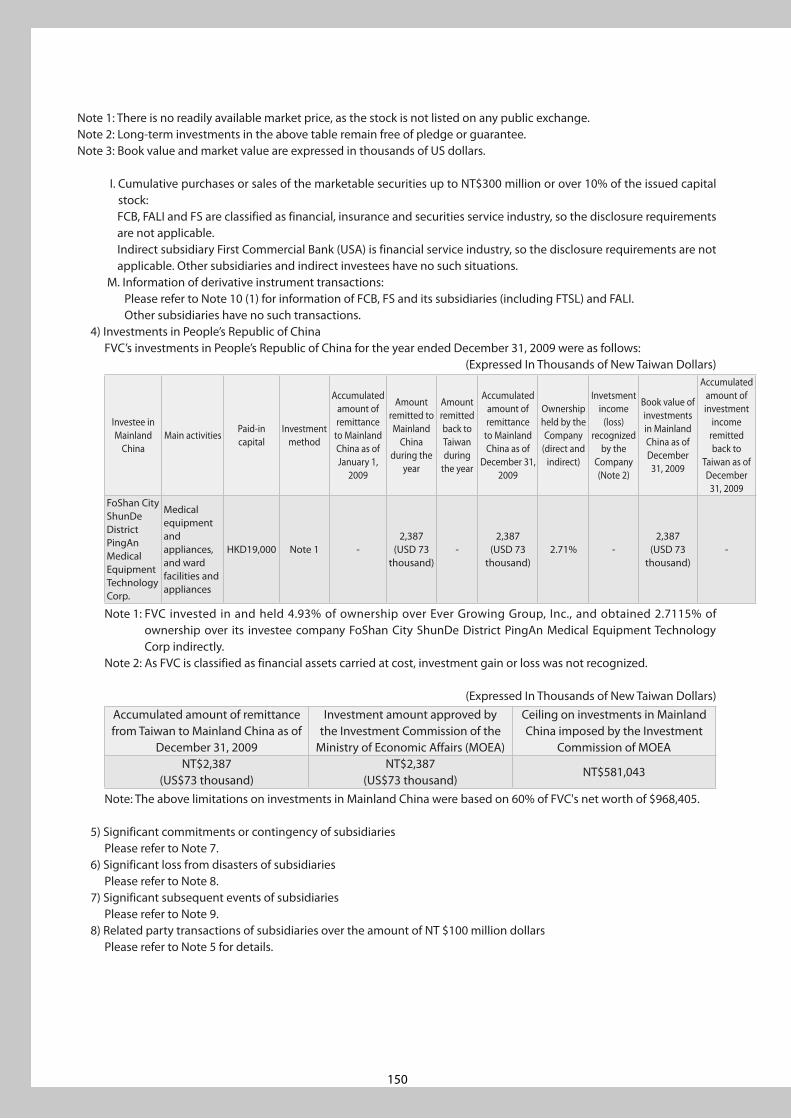
150
Note 1: There is no readily available market price, as the stock is not listed on any public exchange.Note 2: Long-term investments in the above table remain free of pledge or guarantee.Note 3: Book value and market value are expressed in thousands of US dollars.
I. Cumulative purchases or sales of the marketable securities up to NT$300 million or over 10% of the issued capital stock:
FCB, FALI and FS are classified as financial, insurance and securities service industry, so the disclosure requirements are not applicable.
Indirect subsidiary First Commercial Bank (USA) is financial service industry, so the disclosure requirements are not applicable. Other subsidiaries and indirect investees have no such situations.
M. Information of derivative instrument transactions:Please refer to Note 10 (1) for information of FCB, FS and its subsidiaries (including FTSL) and FALI. Other subsidiaries have no such transactions.
4) Investments in People’s Republic of ChinaFVC’s investments in People’s Republic of China for the year ended December 31, 2009 were as follows:
(Expressed In Thousands of New Taiwan Dollars)
Investee in Mainland
ChinaMain activities
Paid-in capital
Investment method
Accumulated amount of remittance
to Mainland China as of January 1,
2009
Amount remitted to Mainland
China during the
year
Amount remitted back to Taiwan during
the year
Accumulated amount of remittance
to Mainland China as of
December 31, 2009
Ownership held by the Company
(direct and indirect)
Invetsment income
(loss) recognized
by the Company(Note 2)
Book value of investments in Mainland China as of December 31, 2009
Accumulated amount of investment
income remitted back to
Taiwan as of December 31, 2009
FoShan City ShunDe District PingAn Medical Equipment Technology Corp.
Medical equipment and appliances, and ward facilities and appliances
HKD19,000 Note 1 -2,387
(USD 73 thousand)
-2,387
(USD 73 thousand)
2.71% -2,387
(USD 73 thousand)
-
Note 1: FVC invested in and held 4.93% of ownership over Ever Growing Group, Inc., and obtained 2.7115% of ownership over its investee company FoShan City ShunDe District PingAn Medical Equipment Technology Corp indirectly.
Note 2: As FVC is classified as financial assets carried at cost, investment gain or loss was not recognized.
(Expressed In Thousands of New Taiwan Dollars)Accumulated amount of remittance from Taiwan to Mainland China as of
December 31, 2009
Investment amount approved by the Investment Commission of the
Ministry of Economic Affairs (MOEA)
Ceiling on investments in Mainland China imposed by the Investment
Commission of MOEANT$2,387
(US$73 thousand)NT$2,387
(US$73 thousand)NT$581,043
Note: The above limitations on investments in Mainland China were based on 60% of FVC's net worth of $968,405.
5) Significant commitments or contingency of subsidiariesPlease refer to Note 7.
6) Significant loss from disasters of subsidiariesPlease refer to Note 8.
7) Significant subsequent events of subsidiariesPlease refer to Note 9.
8) Related party transactions of subsidiaries over the amount of NT $100 million dollarsPlease refer to Note 5 for details.
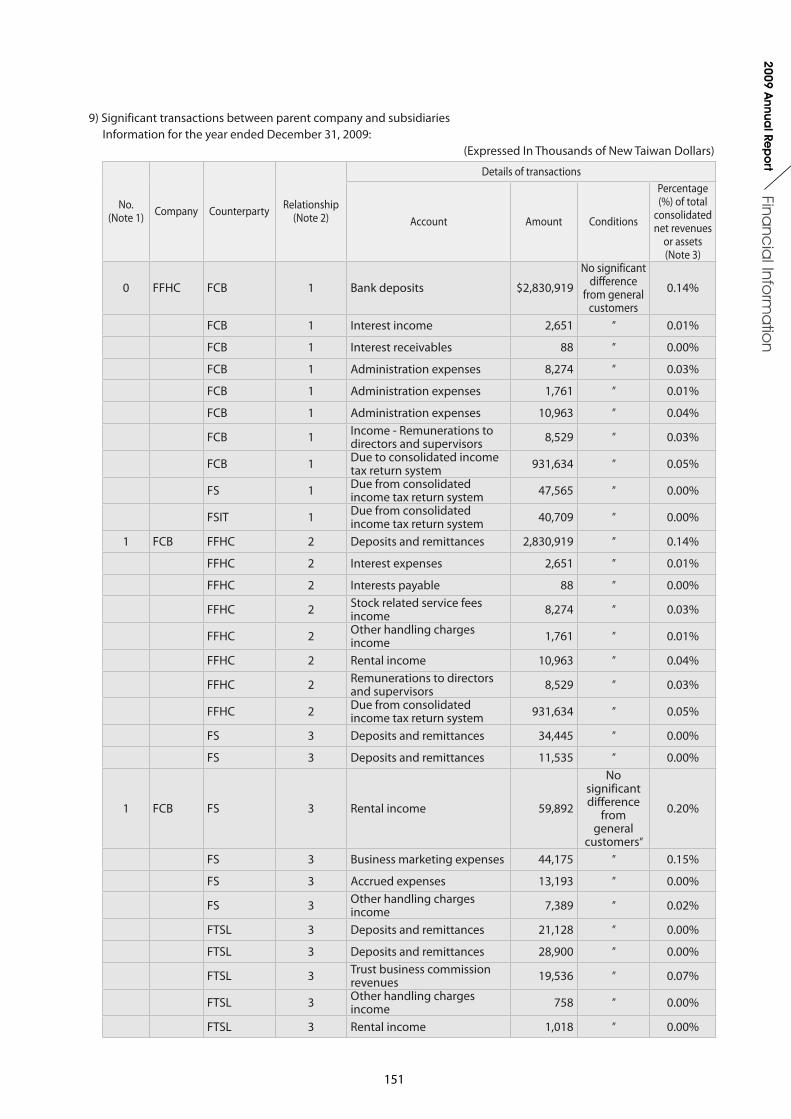
151
Financ
ial Info
rma
tion
2009 Annua
l Rep
ort
9) Significant transactions between parent company and subsidiariesInformation for the year ended December 31, 2009:
(Expressed In Thousands of New Taiwan Dollars)
No.(Note 1) Company Counterparty Relationship
(Note 2)
Details of transactions
Account Amount Conditions
Percentage (%) of total
consolidated net revenues
or assets (Note 3)
0 FFHC FCB 1 Bank deposits $2,830,919
No significant difference
from general customers
0.14%
FCB 1 Interest income 2,651 ” 0.01%
FCB 1 Interest receivables 88 ” 0.00%
FCB 1 Administration expenses 8,274 ” 0.03%
FCB 1 Administration expenses 1,761 ” 0.01%
FCB 1 Administration expenses 10,963 ” 0.04%
FCB 1 Income - Remunerations to directors and supervisors 8,529 ” 0.03%
FCB 1 Due to consolidated income tax return system 931,634 ” 0.05%
FS 1 Due from consolidated income tax return system 47,565 ” 0.00%
FSIT 1 Due from consolidated income tax return system 40,709 ” 0.00%
1 FCB FFHC 2 Deposits and remittances 2,830,919 ” 0.14%
FFHC 2 Interest expenses 2,651 ” 0.01%
FFHC 2 Interests payable 88 ” 0.00%
FFHC 2 Stock related service fees income 8,274 ” 0.03%
FFHC 2 Other handling charges income 1,761 ” 0.01%
FFHC 2 Rental income 10,963 ” 0.04%
FFHC 2 Remunerations to directors and supervisors 8,529 ” 0.03%
FFHC 2 Due from consolidated income tax return system 931,634 ” 0.05%
FS 3 Deposits and remittances 34,445 ” 0.00%
FS 3 Deposits and remittances 11,535 ” 0.00%
1 FCB FS 3 Rental income 59,892
No significant difference
from general
customers”
0.20%
FS 3 Business marketing expenses 44,175 ” 0.15%
FS 3 Accrued expenses 13,193 ” 0.00%
FS 3 Other handling charges income 7,389 ” 0.02%
FTSL 3 Deposits and remittances 21,128 ” 0.00%
FTSL 3 Deposits and remittances 28,900 ” 0.00%
FTSL 3 Trust business commission revenues 19,536 ” 0.07%
FTSL 3 Other handling charges income 758 ” 0.00%
FTSL 3 Rental income 1,018 ” 0.00%
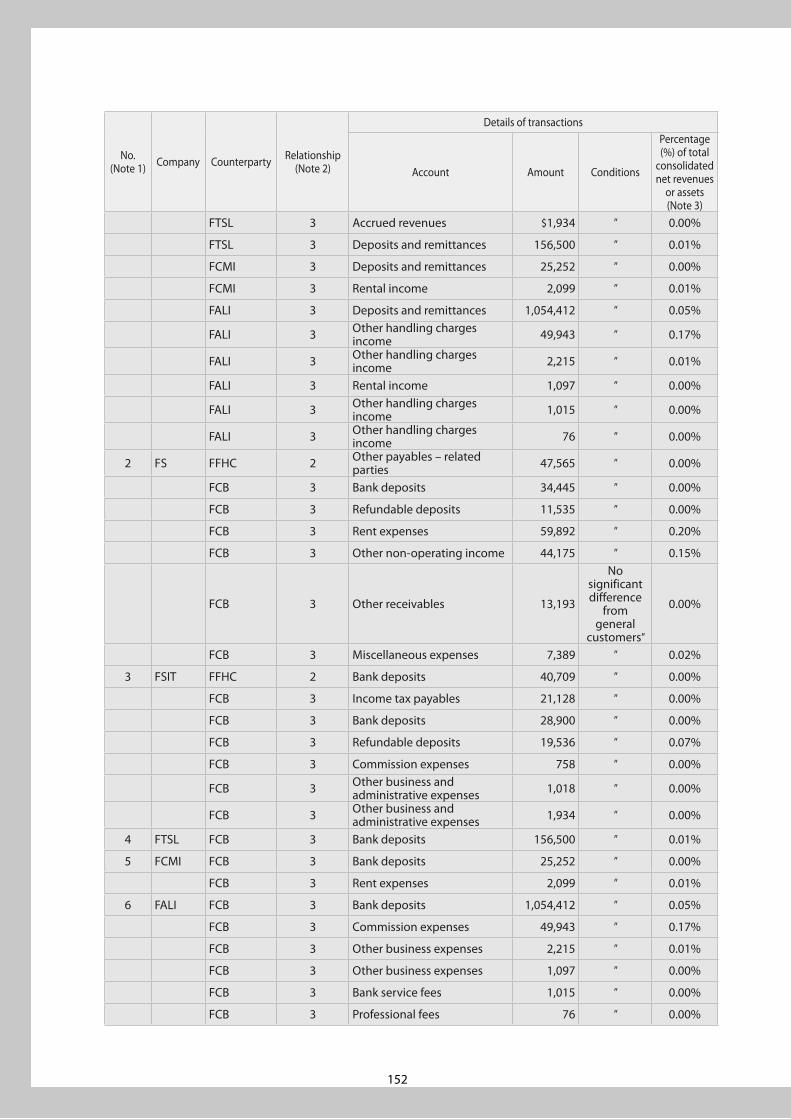
152
No.(Note 1) Company Counterparty Relationship
(Note 2)
Details of transactions
Account Amount Conditions
Percentage (%) of total
consolidated net revenues
or assets (Note 3)
FTSL 3 Accrued revenues $1,934 ” 0.00%
FTSL 3 Deposits and remittances 156,500 ” 0.01%
FCMI 3 Deposits and remittances 25,252 ” 0.00%
FCMI 3 Rental income 2,099 ” 0.01%
FALI 3 Deposits and remittances 1,054,412 ” 0.05%
FALI 3 Other handling charges income 49,943 ” 0.17%
FALI 3 Other handling charges income 2,215 ” 0.01%
FALI 3 Rental income 1,097 ” 0.00%
FALI 3 Other handling charges income 1,015 ” 0.00%
FALI 3 Other handling charges income 76 ” 0.00%
2 FS FFHC 2 Other payables – related parties 47,565 ” 0.00%
FCB 3 Bank deposits 34,445 ” 0.00%
FCB 3 Refundable deposits 11,535 ” 0.00%
FCB 3 Rent expenses 59,892 ” 0.20%
FCB 3 Other non-operating income 44,175 ” 0.15%
FCB 3 Other receivables 13,193
No significant difference
from general
customers”
0.00%
FCB 3 Miscellaneous expenses 7,389 ” 0.02%
3 FSIT FFHC 2 Bank deposits 40,709 ” 0.00%
FCB 3 Income tax payables 21,128 ” 0.00%
FCB 3 Bank deposits 28,900 ” 0.00%
FCB 3 Refundable deposits 19,536 ” 0.07%
FCB 3 Commission expenses 758 ” 0.00%
FCB 3 Other business and administrative expenses 1,018 ” 0.00%
FCB 3 Other business and administrative expenses 1,934 ” 0.00%
4 FTSL FCB 3 Bank deposits 156,500 ” 0.01%
5 FCMI FCB 3 Bank deposits 25,252 ” 0.00%
FCB 3 Rent expenses 2,099 ” 0.01%
6 FALI FCB 3 Bank deposits 1,054,412 ” 0.05%
FCB 3 Commission expenses 49,943 ” 0.17%
FCB 3 Other business expenses 2,215 ” 0.01%
FCB 3 Other business expenses 1,097 ” 0.00%
FCB 3 Bank service fees 1,015 ” 0.00%
FCB 3 Professional fees 76 ” 0.00%
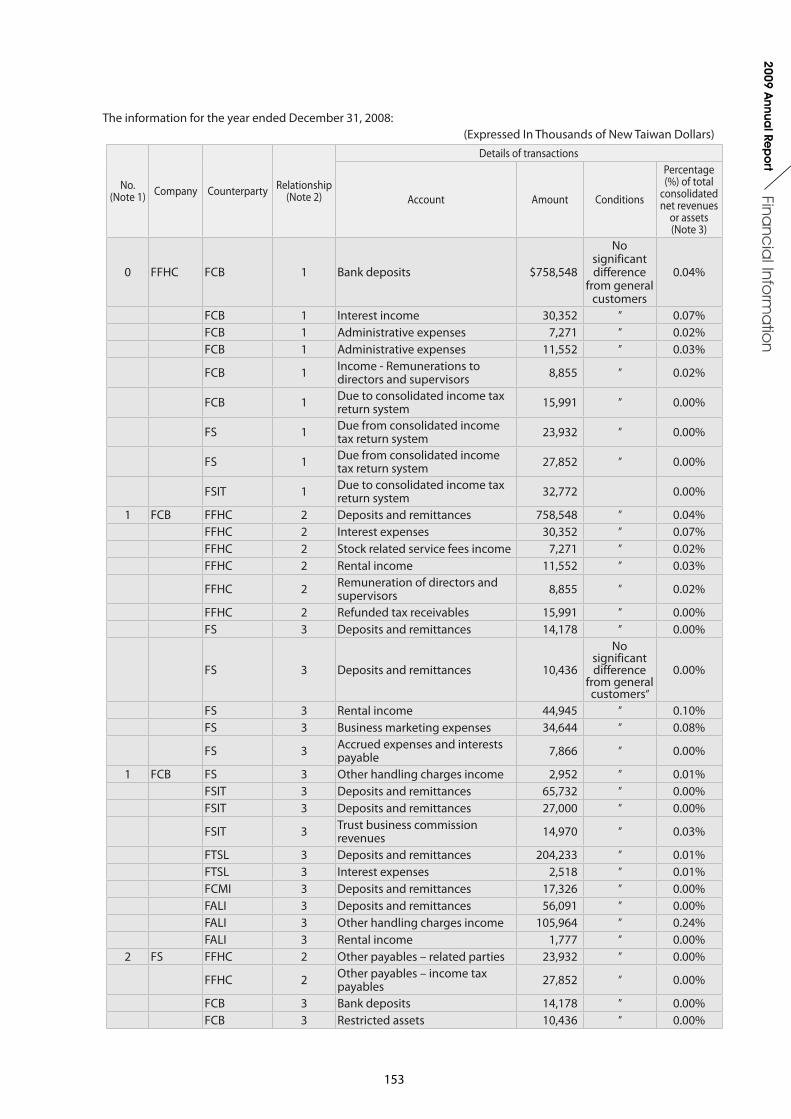
153
Financ
ial Info
rma
tion
2009 Annua
l Rep
ort
The information for the year ended December 31, 2008:(Expressed In Thousands of New Taiwan Dollars)
No.(Note 1) Company Counterparty Relationship
(Note 2)
Details of transactions
Account Amount Conditions
Percentage (%) of total
consolidated net revenues
or assets (Note 3)
0 FFHC FCB 1 Bank deposits $758,548
No significant difference
from general customers
0.04%
FCB 1 Interest income 30,352 ” 0.07%FCB 1 Administrative expenses 7,271 ” 0.02%FCB 1 Administrative expenses 11,552 ” 0.03%
FCB 1 Income - Remunerations to directors and supervisors 8,855 ” 0.02%
FCB 1 Due to consolidated income tax return system 15,991 ” 0.00%
FS 1 Due from consolidated income tax return system 23,932 ” 0.00%
FS 1 Due from consolidated income tax return system 27,852 ” 0.00%
FSIT 1 Due to consolidated income tax return system 32,772 0.00%
1 FCB FFHC 2 Deposits and remittances 758,548 ” 0.04%FFHC 2 Interest expenses 30,352 ” 0.07%FFHC 2 Stock related service fees income 7,271 ” 0.02%FFHC 2 Rental income 11,552 ” 0.03%
FFHC 2 Remuneration of directors and supervisors 8,855 ” 0.02%
FFHC 2 Refunded tax receivables 15,991 ” 0.00%FS 3 Deposits and remittances 14,178 ” 0.00%
FS 3 Deposits and remittances 10,436
No significant difference
from general customers”
0.00%
FS 3 Rental income 44,945 ” 0.10%FS 3 Business marketing expenses 34,644 ” 0.08%
FS 3 Accrued expenses and interests payable 7,866 ” 0.00%
1 FCB FS 3 Other handling charges income 2,952 ” 0.01%FSIT 3 Deposits and remittances 65,732 ” 0.00%FSIT 3 Deposits and remittances 27,000 ” 0.00%
FSIT 3 Trust business commission revenues 14,970 ” 0.03%
FTSL 3 Deposits and remittances 204,233 ” 0.01%FTSL 3 Interest expenses 2,518 ” 0.01%FCMI 3 Deposits and remittances 17,326 ” 0.00%FALI 3 Deposits and remittances 56,091 ” 0.00%FALI 3 Other handling charges income 105,964 ” 0.24%FALI 3 Rental income 1,777 ” 0.00%
2 FS FFHC 2 Other payables – related parties 23,932 ” 0.00%
FFHC 2 Other payables – income tax payables 27,852 ” 0.00%
FCB 3 Bank deposits 14,178 ” 0.00%FCB 3 Restricted assets 10,436 ” 0.00%
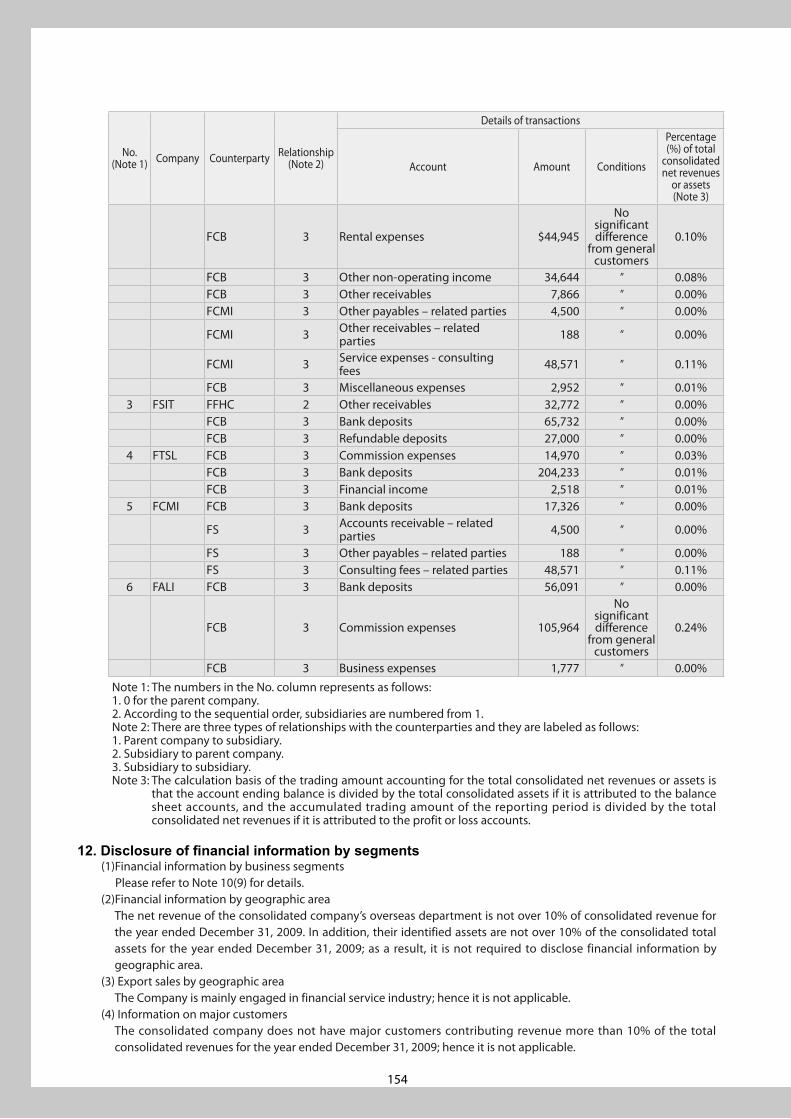
154
No.(Note 1) Company Counterparty Relationship
(Note 2)
Details of transactions
Account Amount Conditions
Percentage (%) of total
consolidated net revenues
or assets (Note 3)
FCB 3 Rental expenses $44,945
No significant difference
from general customers
0.10%
FCB 3 Other non-operating income 34,644 ” 0.08%FCB 3 Other receivables 7,866 ” 0.00%FCMI 3 Other payables – related parties 4,500 ” 0.00%
FCMI 3 Other receivables – related parties 188 ” 0.00%
FCMI 3 Service expenses - consulting fees 48,571 ” 0.11%
FCB 3 Miscellaneous expenses 2,952 ” 0.01%3 FSIT FFHC 2 Other receivables 32,772 ” 0.00%
FCB 3 Bank deposits 65,732 ” 0.00%FCB 3 Refundable deposits 27,000 ” 0.00%
4 FTSL FCB 3 Commission expenses 14,970 ” 0.03%FCB 3 Bank deposits 204,233 ” 0.01%FCB 3 Financial income 2,518 ” 0.01%
5 FCMI FCB 3 Bank deposits 17,326 ” 0.00%
FS 3 Accounts receivable – related parties 4,500 ” 0.00%
FS 3 Other payables – related parties 188 ” 0.00%FS 3 Consulting fees – related parties 48,571 ” 0.11%
6 FALI FCB 3 Bank deposits 56,091 ” 0.00%
FCB 3 Commission expenses 105,964
No significant difference
from general customers
0.24%
FCB 3 Business expenses 1,777 ” 0.00%Note 1: The numbers in the No. column represents as follows:1. 0 for the parent company.2. According to the sequential order, subsidiaries are numbered from 1.Note 2: There are three types of relationships with the counterparties and they are labeled as follows:1. Parent company to subsidiary.2. Subsidiary to parent company.3. Subsidiary to subsidiary.Note 3: The calculation basis of the trading amount accounting for the total consolidated net revenues or assets is
that the account ending balance is divided by the total consolidated assets if it is attributed to the balance sheet accounts, and the accumulated trading amount of the reporting period is divided by the total consolidated net revenues if it is attributed to the profit or loss accounts.
12. Disclosure of financial information by segments (1)Financial information by business segments
Please refer to Note 10(9) for details. (2)Financial information by geographic area
The net revenue of the consolidated company’s overseas department is not over 10% of consolidated revenue for the year ended December 31, 2009. In addition, their identified assets are not over 10% of the consolidated total assets for the year ended December 31, 2009; as a result, it is not required to disclose financial information by geographic area.
(3) Export sales by geographic area The Company is mainly engaged in financial service industry; hence it is not applicable.
(4) Information on major customers The consolidated company does not have major customers contributing revenue more than 10% of the total
consolidated revenues for the year ended December 31, 2009; hence it is not applicable.
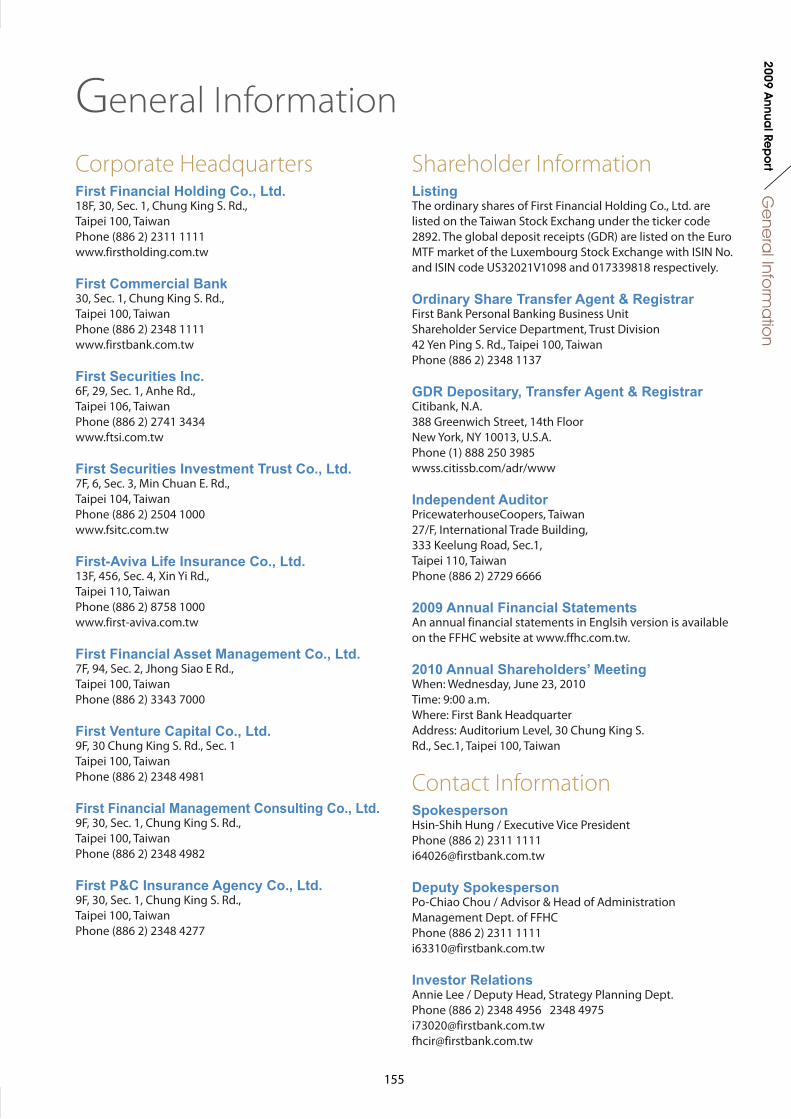
155
Ge
nera
l Inform
atio
n2009 A
nnual Re
po
rtCorporate HeadquartersFirst Financial Holding Co., Ltd.18F, 30, Sec. 1, Chung King S. Rd., Taipei 100, TaiwanPhone (886 2) 2311 1111www.firstholding.com.tw
First Commercial Bank30, Sec. 1, Chung King S. Rd., Taipei 100, TaiwanPhone (886 2) 2348 1111www.firstbank.com.tw
First Securities Inc.6F, 29, Sec. 1, Anhe Rd.,Taipei 106, TaiwanPhone (886 2) 2741 3434www.ftsi.com.tw
First Securities Investment Trust Co., Ltd.7F, 6, Sec. 3, Min Chuan E. Rd., Taipei 104, TaiwanPhone (886 2) 2504 1000www.fsitc.com.tw
First-Aviva Life Insurance Co., Ltd.13F, 456, Sec. 4, Xin Yi Rd., Taipei 110, TaiwanPhone (886 2) 8758 1000www.first-aviva.com.tw
First Financial Asset Management Co., Ltd.7F, 94, Sec. 2, Jhong Siao E Rd., Taipei 100, TaiwanPhone (886 2) 3343 7000
First Venture Capital Co., Ltd.9F, 30 Chung King S. Rd., Sec. 1Taipei 100, TaiwanPhone (886 2) 2348 4981
First Financial Management Consulting Co., Ltd.9F, 30, Sec. 1, Chung King S. Rd.,Taipei 100, TaiwanPhone (886 2) 2348 4982
First P&C Insurance Agency Co., Ltd. 9F, 30, Sec. 1, Chung King S. Rd.,Taipei 100, TaiwanPhone (886 2) 2348 4277
General Information
Shareholder InformationListingThe ordinary shares of First Financial Holding Co., Ltd. are listed on the Taiwan Stock Exchang under the ticker code 2892. The global deposit receipts (GDR) are listed on the Euro MTF market of the Luxembourg Stock Exchange with ISIN No. and ISIN code US32021V1098 and 017339818 respectively.
Ordinary Share Transfer Agent & RegistrarFirst Bank Personal Banking Business UnitShareholder Service Department, Trust Division42 Yen Ping S. Rd., Taipei 100, Taiwan Phone (886 2) 2348 1137
GDR Depositary, Transfer Agent & RegistrarCitibank, N.A.388 Greenwich Street, 14th FloorNew York, NY 10013, U.S.A.Phone (1) 888 250 3985wwss.citissb.com/adr/www
Independent AuditorPricewaterhouseCoopers, Taiwan27/F, International Trade Building, 333 Keelung Road, Sec.1,Taipei 110, TaiwanPhone (886 2) 2729 6666
2009 Annual Financial StatementsAn annual financial statements in Englsih version is available on the FFHC website at www.ffhc.com.tw.
2010 Annual Shareholders’ MeetingWhen: Wednesday, June 23, 2010Time: 9:00 a.m. Where: First Bank HeadquarterAddress: Auditorium Level, 30 Chung King S. Rd., Sec.1, Taipei 100, Taiwan
Contact Information Spokesperson Hsin-Shih Hung / Executive Vice PresidentPhone (886 2) 2311 [email protected]
Deputy SpokespersonPo-Chiao Chou / Advisor & Head of Administration Management Dept. of FFHCPhone (886 2) 2311 [email protected]
Investor RelationsAnnie Lee / Deputy Head, Strategy Planning Dept.Phone (886 2) 2348 4956 2348 [email protected]@firstbank.com.tw