firm size, technological capabilities and market-oriented policies in mauritius
TRANSCRIPT

#2001-1Firm Size, Technological Capabilities and
Market-Oriented Policies in Mauritius
Ganeshan Wignaraja*February 2001
Discussion Paper Series
United Nations University, Institute for New Technologies, Keizer Karelplein 19, 6211 TC Maastricht, The NetherlandsTel: (31) (43) 350 6300, Fax: (31) (43) 350 6399, e-mail: [email protected], URL: http://www.intech.unu.edu

Firm Size, Technological Capabilities andMarket-Oriented Policies in Mauritius
Ganeshan Wignaraja*
UNU/INTECH Discussion Papers
ISSN 1564-8370
Copyright © 2001 The United Nations University, Institute for New Technologies,UNU/INTECH
UNU/INTECH discussion papers intend to disseminate preliminary results of the researchcarried out at the institute to attract comments
• Chief Programme Officer, Export and Industrial Development Division, Commonwealth Secretariat, Pall Mall,London SW1Y 5HX, ENGLAND. Email: [email protected]. The views expressed in this paper areentirely mine and should not be attributed to the Commonwealth Secretariat. An earlier version of paper waspresented at a conference on small enterprise development at Kings College London in September 2000 andseminars at Queen Elizabeth House, Oxford in November 2000 and UNUINTECH in February 20001. Ibenefited greatly from comments received from participants at these events and am particularly grateful to HomiKatrak, Sanjaya Lall, Lynn Mytelka and Rose Kiggundu.

ABSTRACT
Mauritius is an outlier in Sub-Saharan Africa for its impressive manufactured export
performance based on garments since the adoption of market-oriented policies in the early
1980s. Little, however, is known about the role played by internal technological factors on the
exporting behaviour of enterprises of different size classes in the Mauritian garment industry.
Using recent methodological developments in the literature on industrial technological
capabilities, this paper explores this issue by constructing a technology index and conducting
econometric analysis on factors affecting enterprise-level technological development and export
performance in a sample of Mauritian garment enterprises. The econometric results show that
firm size, technical manpower, training expenditures and external technical assistance are
positively related to the technology index. This confirms that investments in human capital and
seeking information, both facilitated by size, improve technological performance. This is
strengthened by the fact that the technology index and foreign ownership have positive and
statistically significant effects on export performance of each firm. The technology index is a
robust tool of empirical research and can be used to analyse the technological record of
enterprises in adjusting developing countries.
TABLE OF CONTENTS
1. INTRODUCTION 7
2. TECHNOLOGICAL CAPABILITIES IN DEVELOPING COUNTRIES: A REVIEW OFRECENT LITERATURE 9
2.1 GENERAL FINDINGS 92.2 ECONOMETRIC ANALYSIS OF A TECHNOLOGY INDEX 11
3. MARKET-ORIENTED POLICIES AND ENTERPRISE PERFORMANCE IN MAURITIUS 15
3.1 TRADE AND INDUSTRIAL REGIME 153.2 PERFORMANCE OF LARGE FIRMS AND SMES 17
4. TECHNOLOGICAL CAPABILITIES IN THE MAURITIAN SAMPLE 19
4.1 COMPUTING THE TECHNOLOGY INDEX 194.2 FINDINGS FOR LARGE FIRMS AND SMES 20
5. ECONOMETRIC RESULTS 25
5.1 FACTORS AFFECTING THE TECHNOLOGY INDEX 255.2 FACTORS AFFECTING FIRM-LEVEL EXPORT PERFORMANCE 29
6. CONCLUSIONS 31
TTAABBLLEE AA11:: TTEECCHHNNOOLLOOGGIICCAALL CCAAPPAABBIILLIITTYY SSCCOORRIINNGG SSCCAALLEESS FFOORR MMAAUURRIITTIIUUSS SSAAMMPPLLEE 33
BIBLIOGRAPHY 35
THE UNU/INTECH DISCUSSION PAPER SERIES 39


77
1. INTRODUCTION
Mauritius is an outlier in Sub-Saharan Africa for its impressive industrial performance. During
the last two decades or so, the Mauritian economy underwent a remarkable transformation from
a mono-crop sugar producer to become one of the leading exporter of manufactures in Sub-
Saharan Africa. The share of manufacturing in GDP in Mauritius nearly doubled between 1980
and 1998 (from 15% to 25%).1 The engine of industrial growth was manufactured exports
(primarily garments), which grew at 14.8% per year during 1980-1998. By 1998, the country’s
value of manufactured exports per head (US$ 1,094) was the highest in Sub-Saharan Africa.
This striking performance has lead some to regard Mauritius as an economic miracle in paradise
(ILO, 1999). Its success in exporting garments is attributed to the adoption of a more market-
oriented development strategy since the early 1980s, which emphasised trade liberalisation and
attracting foreign investment through export processing zones and attractive investment
incentives; reasonable macroeconomic stability in terms of low inflation and a competitive real
exchange rate; a business-friendly economic environment with a bureaucrats keen to get things
done and a low level corruption; a pool of cheap, literate, bilingual labour (English and French
speaking); preferential access into the European Union market as a signatory of the Lomé
Convention and close proximity to the untapped African market; and a high degree of political
stability. 2
In contract with the attention paid to macro aspects, there are hardly any studies on micro-
economic aspects of the export record in Mauritius during the period of market-oriented
economic policies. Information on the part played by internal technological factors on the
exporting behaviour of Mauritian enterprises is particularly patchy. Enterprise-level technology
issues are attracting increasing interest in the literature on economic development. A distinct
body of research has begun to examine the nature of industrial technological development in
market-oriented developing economies (Katz, 1987; Lall, 1992; Bell and Pavitt, 1993;
Pietrobelli, 1997; Wignaraja, 1998; Romijn 1999; Metcalfe, forthcoming). This research
suggests that industrial technological development should not be viewed as a process that can be
promoted easily and quickly by investing in new equipment or buying imported technology. It
requires conscious investments by firms in their own technological capability. Technological
capability being defined here as the skills, knowledge and experience that enterprises need to
1 Calculated from World Bank, World Development Indicators 2000.2 See Woldekidan (1994), WTO (1995), Milner and Mckay (1996), ILO (1999) and UNCTAD(2000).
88
operate imported technology efficiently. This research also found that enterprises in newly
industrialising economies (NIEs) in East Asia had built up relatively good technological
capabilities in a spectrum of industries compared to international standards and that this was a
major factor in their rapid export growth and technological upgrading (Pack and Westphal,
1986; Hobday, 1995; Aw and Batra, 1998; Ernst, Ganiatsos and Mytelka, ed. 1998). The few
available studies on Mauritius indicate that firms in the garment industry acquired technological
capabilities, which enabled them to produce for international markets (World Bank 1994;
Dubois et al. 1995; Lamusse, 1995). However, little is known about the nature of technological
learning in large firms and small and medium enterprises (SMEs) and the firm-level influences
on this process. There is also a lack of statistical confirmation of the relationship between
capability building and export performance. Consequently, much of the literature on Mauritius
has only been able to provide a limited picture on the dynamics of enterprise performance
during the period of market-oriented policies.
In order to remedy these gaps, this paper attempts to shed light on the relationship between firm
size and the acquisition of technological capabilities in Mauritius. Using cross-section data for
the late 1990s, it constructs a technology index for a sample of 40 Mauritian enterprises in the
garment industry and econometrically analyses its firm-level determinants (including firm size,
ownership, employment of technical manpower, investments in enterprise training and use of
external technical assistance). 3 It goes on to examine the influence of the technology index in an
econometric analysis of firm-level export performance. Section 2 surveys recent literature on
technological capabilities in developing countries focussing on econometric work on firm size
and technology development. Section 3 briefly discusses the experience of market-oriented
policies and SME development in Mauritius. Section 4 examines the nature of technological
development in SMEs and large firms in the Mauritian sample. Section 5 presents the
econometric results and section 6 concludes.
An SME is defined here as a firm with 100 or less employees while those with over 100
employees are taken as large firms. According to this definition, there are 19 SMEs and 21 large
firms in the sample of 40 Mauritian enterprises. Moreover, 13 firms have some proportion of
foreign equity and 27 were exporting some proportion of their sales.
3 The enterprise data for this paper was collected during fieldwork in Mauritius in 1996 and1998 in the course of studies on national competitiveness strategy and SME exports (see Lalland Wignaraja, 1998; Wignaraja and O’Neil, 1999).

99
2. TECHNOLOGICAL CAPABILITIES IN DEVELOPING COUNTRIES: AREVIEW OF RECENT LITERATURE
2.1 General Findings
A common perception in the literature is that the successful accumulation of technology in a
given developing country can be encouraged by a smooth inflow of new information, ensuring
conducive macro-economic conditions and increasing expenditures on education. These factors
have a role to play but, on their own, are insufficient to ensure a continuous process of domestic
technological development in developing countries. A relatively recent development in the
literature is the emphasis on manufacturing enterprises as the main actors in the process of
accumulating technological capabilities. The capability literature emphasises the notion that
enterprises have to undertake conscious investments to convert imported technologies into
productive use.4 New technologies have a large tacit element (i.e., person embodied information
which is difficult to articulate) that can only be acquired through experience and deliberate
investments in various inputs (e.g. training, information search, engineering activities and
research and development). Five features of the process of building firm-level technological
capabilities in developing countries are particularly relevant to this study:
The process of acquiring technological capabilities is unpredictable (Lall, 1992; Metcalfe,
forthcoming). Investments in technological capabilities, like financial investments, carry
considerable risk and the outcome is uncertain. Firms face technical difficulties and financial
uncertainties especially in research activities. Moreover, rarely can firms insure against failure
in capability building. The implications of fundamental uncertainty are clear: the reality cannot
be fully modelled and the direction of change never achieves equilibrium.
Capability building is an incremental and cumulative process (Bell and Pavitt, 1993; Hobday,
1995; Aw and Batra, 1998). Enterprises rarely develop a diverse range of capabilities
simultaneously. Nor do they make jumps into completely new areas of technology. Instead, they
process in an incremental manner by building on past investments in technological capabilities
and typically move from simpler to more technological complex activities.
Capability building involves close cooperation between organisations (Lall et al. 1994; Mytelka
and Farinelli, 2000). Firms rarely acquire capabilities in isolation. When attempting to absorb
imported technologies, they interact and exchange technical inputs with other firms (e.g.
4 See Pack and Westphal (1986), Katz (1987), Lall (1992), Bell and Pavit (1993), Ernst,Ganiatsos and Mytelka (ed. 1998) and Metcalfe (forthcoming).

1100
competitors, suppliers and buyers of output) and support institutions (e.g. technology
institutions, training bodies and SME service providers) in a national innovation system. Hence,
interaction and interdependence between organisations (i.e. collective learning) in a national
innovation system is a fundamental characteristic of capability building.
Success in acquiring firm-level technological capabilities can spillover into industrial success
(Pack and Westphal, 1986; Katrak, 1986; Ernst, Ganiatsos and Mytelka, ed. 1998). Differences
in the efficiency with which firm-level capabilities are created are themselves a major source of
differences in comparative advantage between countries.
Capability building is affected by a host of national policy and institutional factors (Katz, 1987;
Lall, 1992; Westphal, 2001; Metcalfe, forthcoming). Firm-level learning can be stimulated by
the trade, industrial and macroeconomic regime well as supported by institutions of different
kinds (including those providing industrial finance, training and information and technological
support). Prominent among the factors that have a positive influence on capability building are:
macroeconomic stability, outward-oriented trade and investment policies, ample supplies of
general and technical manpower, ready access to industrial finance and comprehensive support
from technology institutions.
Bulk of the empirical work on technological capabilities in developing countries has been based
on case studies of enterprises in particular industries.5 These detailed studies of individual firms
and groups of firms have shed valuable insights into the nature of technological activities in
developing countries, the utility of different learning mechanisms and factors affecting firm-
level capability building. A significant contribution by the case study research is to suggest
ways of classifying the technical functions performed by manufacturing enterprises to assimilate
imported technology. One of the most elaborate taxonomies of technological capabilities is the
one proposed by Lall (1992), which breaks them down into investment, production and linkages
as follows:
Investment is represented by project execution activities including feasibility studies, equipment
search, assessment of equipment, employee training during start-up and involvement of the firm
in detailed engineering.
Production is sub-divided into process technology and product technology. Process technology
includes quality control, maintenance, plant layout, inventory control, and various
5 See Katz (1987) for a survey of early studies in Latin America and Bell and Pavitt (1993) forstudies on other developing countries. Recent examples include: Lall et al. (1994) on foodprocessing, wood working, textiles and garments and metal working in Ghana; Hobday (1995)on the electronics industry in East Asia; Pietrobelli (1997) on food processing and otherindustries in Chile; Wangwe (ed.1995) on food processing, wood working and metal working inseveral African economies including Mauritius, Kenya and Tanzania.
1111
improvements in equipment and processes. Product technology covers copying imports (or
buyers), improving existing products, introducing new products and licensing product
technology.
Linkages are considered under supplier firm linkages, subcontracting linkages and linkages with
institutions that provide trouble-shooting, testing, training and product design assistance.
The advantage of this framework over other approaches is that it provides a clear continuum of
technical functions from the time new technology enters a given firm to when it exits to other
firms and institutions. Furthermore, as this framework has been successfully used in past
empirical work on technological capabilities in developing countries, it will be also used here to
examine firm-level technological development in Mauritius.6
2.2 Econometric Analysis of a Technology Index
One major challenges facing researchers working on technological capabilities is to summarise
inter-firm differences in capabilities. It is convenient to develop a simple summary measure to
permit statistical analysis of the influences on capability acquisition. Recently, some studies
have begun to rank the technological capabilities of individual firms and attempt statistical
analysis of their determinants.7 The ranking integrates objective and subjective information into
measures of enterprises' capacity to set up, operate and transfer technology. To create an
enterprise score, the information in these indicators is converted into a summary measure of
capabilities. The typical approach adopted by this literature is highlight the various technical
functions performed by enterprises to manage imported technology and award a given firm a
score for each technical activity indicating its level of technical competence in that activity. An
overall capability score is obtained for a given firm by taking an average of the scores for the
different technical functions.
Some qualifications should be noted on the interpretation of the firm-level capability scores.
First, the estimates contain an element of subjectivity, which can lead to bias in the absolute
values of the technological capability scores. However, this may not matter much for the
purpose at hand — inter-firm comparisons of the relative values of the technological capability
scores. As Westphal et al. (1990) explain in the context of their study of Thailand:
6 See, for instance, Lall et al. (1994) on Ghana; Biggs et al. (1995) on Kenya, Zimbabwe andGhana; and Pietrobelli (1997) on Chile and Wignaraja (1998) on Sri Lanka.7 The pioneering work on this subject is Westphal et al. (1990) on Thailand. Subsequent workincludes SRI International (1992) on Indonesia, Gosen (1995) on Mexico, Deraniyagala (1995)and Wignaraja (1998) on Sri Lanka, Romijn (1999) on Pakistan, Deraniyagla and Semboja(1999) on Tanzania, Wignaraja and Ikiara (1999) on Kenya, Latsch and Robinson (1999) onZimbabwe.
1122
..the capability scores are biased estimates with respect to the measurement of capabilities cum
capacities per se. The degree of bias depends on the respective weights placed on capability and
sophistication in the researcher' scoring. Unfortunately, it is not possible to state these weights.
However, the bias that is present in the absolute values of the scores does not necessarily affect
the relative values obtained when the scores are considered in comparison to one another. Intra-
firm comparisons (across capabilities for one firm) and inter-firm comparisons (across firms for
one capability) are biased with respect to indicating differences in capabilities cum capacities
only to the extent that sophistication levels differ intra and inter-firm respectively. Since most of
the analysis is concerned with relative values, it is possible that the bias has minimal
consequences for the analysis (Westphal et al., 1990, pp. 87 and 91).
Second, the weights attached are subjective, with all activities given equal weights by
averaging.
Cross-section econometric work on the determinants of technological capabilities (hence, a
technology index for short) reports some interesting findings particularly in regard to the
relationship between firm size and the technology index in five developing economies which
had adopted market-oriented policies (Thailand, Pakistan, Sri Lanka, Tanzania and Kenya).8
OLS regressions were run relating technology indices to particular characteristics of enterprises.
In relation to firm size, these studies have attempted to test the hypothesis that there is a positive
relationship between the technology index and this variable. The positive relationship is based
on the argument that the returns from capability acquisition are higher where a firm has a larger
volume of sales to spread the fixed costs of capability acquisition and large firms can have more
specialised technical manpower. Moreover, it is argued that capital market imperfections confer
an advantage on large firms in securing finance for risky technological activities and size is
correlated with the availability and stability of funds.
The earliest study by Westphal et al. (1990) included firm size as one of four variables (the
others being ownership, market orientation and incentives given by the Board of Investment)
determining different technology indices for a sample of 100 Thai electronics, biotechnology
and materials technology enterprises. In a regression of a production technology index, he found
that the firm size coefficient was significant at the 10 per cent level and positive.
Using a sample of 46 engineering firms in Tanzania, Deraniyagala and Semboja (1999)
attempted to estimate the influence of several firm-level characteristics (firm size, foreign
equity, firm age, entrepreneur’s education level and a skill index) on a production-based
technology index. Interestingly, they found that firm size and foreign equity were not
1133
significant. Of the other explanatory variables, entrepreneur’s education level and the skill index
were significant (5 per cent level) and positive while firm age was also significant (5 per cent
level) but negative in sign.
Wignaraja (1998) tested an overall technology index and one for production only against several
firm-level characteristics (including firm size, foreign equity, technical manpower and
technology imports) in a sample of 27 garment and engineering enterprises in Sri Lanka. In both
regressions, firm size turned out to be significant (5 per cent level) and positive while technical
manpower and technology imports were also significant (1 per cent level) and positive.9
Using a sample of 41 Kenyan garment and engineering enterprises, Wignaraja and Ikiara (1999)
regressed an overall technology index against firm size, foreign equity, entrepreneur’s education
level, technical manpower and employee training. They report that firm size, foreign equity and
entrepreneur’s education were all significant (5 per cent level) and positive.
Finally, in a departure from the studies mentioned above, Romijn (1999) conducted econometric
work using technology indices based on the manufacturing complexity of products on a sample
of 100 engineering firms in Pakistan. In her best two regressions, firm size turns up as
significant (1 per cent level) and positive. Among the other explanatory variables, external
technical assistance and improvements made to products are both significant (1 per cent level
and positive while search for information had a positive sign but was significant at the 5 per
cent level. Surprisingly, entrepreneurs’ education level and firm age were not significant.
Thus, the handful of econometric studies seem to provide some empirical support for the
hypothesis that firm size is positively associated with the acquisition of technological
capabilities. Entrepreneur’s education level, technical manpower, external technical assistance
and foreign equity also show up as important determinants of capability building in some
studies. Building on earlier econometric work, the remainder of this paper further explores the
relationship between firm size and technological capabilities through firm studies in the garment
sector in Mauritius.
8 Lall et al. (1994) on Ghana and Latsch and Robinson (1999) on Zimbabwe also attempt torelate inter-firm differences in capabilities to firm characteristics (including firm size) using T-tests and rank correlation measures.9 In neither the Sri Lanka study nor the Kenya study did the industry dummy variable turnout tobe significant.

1155
3. MARKET-ORIENTED POLICIES AND ENTERPRISE PERFORMANCE INMAURITIUS
3.1 Trade and Industrial Regime
In terms of its trade, industrial and macroeconomic regime; Mauritius is an outlier from other
African developing economies. Unlike many African developing economies, the country did not
subscribe to the prevailing orthodoxy of inward-oriented, state dominated development
strategies of the 1960s and 1970s that emphasised stringent import substitution coupled with
heavy state intervention in the economy. Instead in the 1970s, Mauritius followed a mixed trade
policy of import substitution coupled with incentives for exports through the Export Processing
Zone (EPZ).10 These two trade regimes co-existed, influencing enterprises producing for the
small home market and those producing for export. In the early 1980s, Mauritius introduced a
stronger market-oriented stance to its economic policy. As a part of a structural adjustment loan
agreement with the World Bank, Mauritius embarked on a process of trade liberalisation and
industrial adjustment in 1983.
Three distinct phases of trade liberalisation and industrial reforms can be identified since the
mid-1980s, each with a different rate of reform and coverage.
The first episode, between 1983-85, consisted of the rapid elimination of most quantitative
restrictions on imports and their replacement by tariffs. Existing incentives for exporting --
granted via the EPZ since 1970 -- were maintained. Moreover, macroeconomic stability (low
inflation and competitive exchange rates) became an explicit policy objective. Despite these
early reforms, the domestic manufacturing sector remained relatively highly protected and
restricted by a plethora of bureaucratic regulations.
The second, between 1986-1993, tried to gradually reduce the dispersion of effective protection
among industries and to promote exports more vigorously by providing exporters with overseas
marketing support, preferential interest rates on development loans and tax concessions. Export
and investment promotion was greatly strengthened by the creation of the Mauritius Export
Development and Investment Authority (MEDIA) in 1985. Emphasis was also placed on
maintaining macroeconomic and price stability. There were also cuts in bureaucratic procedures
affecting imports, exports and foreign exchange. The net result of these reforms was that the
economy became more outward-oriented and private-sector focussed than in the past.
10 Woldekidan (1994), Milner and McKay (1996), Lall and Wignaraja (1998) and UNCTAD(2000).
1166
The third episode, from 1994 to date, cut protection further by reducing import tariffs and
attempted to develop new areas of comparative advantage. In 1995, the number of tariff bands
were reduced and the maximum import tariff rates was cut. New institutions were also
established to promote new high skill exports (e.g. the Mauritius Productivity and
Competitiveness Council was created in 2000).
By the mid-1990s, Mauritius had become considerably more open and market-friendly than in
the past and is one of the most liberal regimes Africa. By the mid-1990s, substantial progress
was made in reducing tariffs and non-tariff barriers to imports in Mauritius. One indication of
greater openness is that the average tariff for manufacturing fell from 86.2% in 1980 to 30.1%
in 1994. 11 The main changes include: quantitative restrictions have been mostly eliminated and
the few that remain are largely on health, sanitary and security grounds; there are few import
prohibitions (with the exception of commodities such as second hand motor vehicle spares and
explosives); the level of nominal tariffs has fallen as well as its dispersion (the number of rate
bands were cut from 60 to 8 and the maximum rates were reduced); there are no local content
programmes to assist local suppliers; and public procurement policies are minimal.
Progress in achieving an open, market-friendly policy regime, however, was not matched by
similar reforms in the human resource base and the technology support system for industry.12
Mauritius has a good record in educational investment that is reflected in a relatively good base
of primary and secondary educated manpower by regional standards – in 1993, its primary
enrolment ratio was 106% while its secondary enrolment ratio was 59%. This primary and
secondary level education base provided a pool of literate (bilingual), trainable workers for the
industrial sector in Mauritius. However, the country suffers from a severe shortage of tertiary-
level manpower, particularly in technical subjects (e.g. mathematics and computer science,
engineering and natural science), which is needed for technological sophisticated industries in
the future. University enrolments in these technical subjects were tiny in relation to its
population (only 0.04% in 1991 compared with 0.56% for Singapore and 1.5% for Taiwan).
Moreover, teacher quality, materials and equipment were often poor with a mismatch between
the skills produced by tertiary-level institutions and those needed by industry.
Mauritius has a reasonable technology support system for industry with several institutions
involved in providing metrology, standards and quality services; productivity improvement;
SME extension services; training; and diffusion of technologies.13 It has been improved in
recent years, particularly the Mauritius Standards Bureau and the diffusion system (the
11 WTO (1996).12 Bheenick and Hanoomanjee (1988); Lall and Wignaraja (1998).13 This assessment of the technology support system in Mauritius is drawn from Lall andWignaraja (1998).
1177
Technology Diffusion Scheme) as a part of a World Bank competitiveness project. The
productivity improvement agency for export firms (the Export Processing Zone Development
Agency) was doing a good job while the SME agency was also doing useful work but seemed
inadequate in terms of what was needed to transform SMEs into efficient sub-contractors and
make them export-oriented. The institutions in general were inadequate in terms of size,
financial resources and technical manpower to respond to the technical challenges facing the
industrial sector. Moreover, there were some functions that no institution was filling – the most
prominent among these being research, development and design – productivity improvement
and SME extension services needed to be expanded significantly.
3.2 Performance of Large Firms and SMEs
The transformation of the Mauritian economy over the last three decades from a low
productivity, subsistence base to a producer of labour-intensive manufactures for export is a
remarkable developmental achievement. It has built up a significant base of export-related
skills, information and institutions, far ahead of neighbouring countries in Africa and is
regarded by some as a candidate for newly industrialising economy (NIE) status in the 21st
century. Its manufactured exports grew at 14.8 per cent during 1980-1998 compared with 8.1
per cent for South Africa, 9.0 per cent for Zimbabwe, 4.8 per cent for Kenya and 10.2 per cent
for the Ivory Coast, 6.6 per for Nigeria and 1.7 per cent for Uganda.14 By 1998, its
manufactured exports per head ($1,094) were the highest in Africa and among the highest in the
developing world. The bulk of manufactured growth in Mauritius during this period can be
attributed to a single export item -- garments (which account for over 82 per cent of total
manufactured exports in 1998). The country’s dependence on this item is greater than that of
other garment dependent economies in South Asia (e.g. Sri Lanka and Bangladesh). To date,
there is little evidence of diversification into other labour-intensive exports (e.g. toys and
footwear) or industrial upgrading into more technologically sophisticated exports (e.g.
electronics and engineering industries) that was witnessed in East Asian economies in the 1960s
and 1970s. The high degree of dependence on garments makes the country vulnerable to
competitive pressures from cheaper producers of garments (e.g. China and Vietnam)
particularly after the expiry of the Multi-fibre Agreement in 2005.
14 Calculated from World Bank, World Development Indicators, 2000. The same data sourceshows that the 1980-1998 manufactured export growth rates achieved by Mauritius were closerto East Asian levels. For instance, Singapore experienced manufactured export growth rates of15.4 per cent, Taiwan of 11.6 per cent, Hong Kong of 15.7 per cent.
1188
There is a dearth of information on the relative economic contribution or performance of large
firms and SMEs in Mauritius. However, a recent study provides some insights:15
• there were 411 large firms and 5,320 SMEs in the manufacturing sector in Mauritius in1997;
• SMEs account for 32.1 per cent of manufacturing employment in 1997 and large firmsfor the rest;
• SMEs account for manufactured exports worth only US$ 23.1 million and large firmsfor US$ 1.1 billion in 1997 (1.9 per cent and 98.1 per cent of total manufactured exports,respectively);
• SMEs made up only 1.1 per cent of clothing exports, the dominant industry, while largefirms make up 99.9 per cent;
• In terms of labour productivity, SMEs were below large firms in most industries.
Mauritius abandoned its mixed trade policy in favour of a more liberalisation in the early 1980s.
The trade and industrial reforms shifted incentives further towards exports and away from
import substitution. Over the last two decades, the country witnessed rapid manufactured export
growth based on garments. The available evidence indicates that there is a distinct pattern of
manufactured export performance by firm size in Mauritius during the period. Large enterprises
seem to account for most of the country’s manufactured export dynamism while SMEs have
hardly participated in exports. Micro-level analysis adds considerable insights into national
export performance. In Sections 4 and 5, we examine the influence of firm-level technological
behaviour and its determinants on the export record of large firms and SMEs in Mauritius.
15 See Wignaraja and O’Neil (1999). Additional insights are provided by survey data. The DeChazal Du Mee (1998) survey of 40 Mauritian SMEs found that only 7 were engaged in exportsales (mostly towards the regional African market) and they conclude that SMEs were weakexporters relative to large firms.
1199
4. TECHNOLOGICAL CAPABILITIES IN THE MAURITIAN SAMPLE
This section examines the nature of industrial technological development in large firms and
SMEs during the market-oriented period in Mauritius in an attempt to link this to the export
record. The analysis is based on the concept of a firm-level technology index (TI), which has
been successfully used in other technology studies in developing countries (see Section 2.2).
The 40 firm garment sample used in the analysis is fairly evenly distributed between firms of
different size clases – there are 19 SMEs (<100 employees) and 21 large firms (>100
employees). The average number of employees for the large firms was 536 employees
compared with 38 employees for the SMEs. Four 4 micro-enterprises with less than 10
employees each are also included in the SME category.
There is a high propensity to export among the sample enterprises and 27 enterprises were
exporting some proportion of their sales (10 enterprises export 100% of their sales). However,
large firms were more export-oriented than SMEs (the two groups had average export to sales
ratios of 75.8% and 12.3%, respectively).
There are only 13 enterprises with some proportion of foreign equity and hence the sample
mostly consists of local firms.
4.1 Computing the Technology Index
The TI used for this study of Mauritian garment enterprises is a variant of those used by
Wignaraja (1998) for Sri Lankan enterprises and Wignaraja and Ikiara (1999) for Kenyan
enterprises. The TI used here and in the Sri Lankan and Kenyan studies draws on the three-fold
classification of firm-level technological capabilities into investment, production and linkages
activities developed by Lall (1992). In line with previous work, this study uses information on
technical functions performed within a given industrial enterprise to compute a TI (essentially, a
summary technology score) for each of the 40 garment firms in the Mauritian sample. The TI
scoring system for the Mauritian firms (given in Appendix Table A1) consists of two sets of
technical functions: production and linkages.16
16 A lack of data on investment functions performed by the Mauritian sample enterprises meantthat investment capabilities could not be incorporated into the technology index. Asachievements in investment capabilities are likely to be closely correlated with those onproduction and linkage capabilities, this is not expected to affect a given firms technologyranking.

2200
The larger category, production, is represented by ten separate technical activities, which range
from common process engineering tasks (like measurement of internal reject rates and ISO 9000
quality management status) to product engineering tasks (like copying existing products,
improving existing products and introducing new products). Productivity improvement, a key
industrial engineering activity, is also included under this heading.
The other category in the TI scoring system, linkages, is represented by two technical activities.
It highlights technology transfer via two kinds of inter-firm relationships: those with sub-
contractors and those with overseas buyers of output.
Each of the twelve technical activities can be graded according to different levels (0, 1 and 2) to
represent different levels of competence within that function. Thus, a given firm is ranked out of
a total capability score of 24 and the result is normalised to give a value between 0 and 1.
4.2 Findings for Large Firms and SMEs
Table 1 shows the frequency distribution of the overall capability scores for the 40 garment
firms in the Mauritian sample. The TI scores will be used both as a dependent variable and an
independent variable in econometric analysis in Section 5.
Table 1: Frequency Distribution of Technology Index (TI) for All Firms
TI class No. of firms % of total firms
0.0-0.20 14 35.00.21-0.40 10 25.00.41-0.60 9 22.50.61-0.80 6 15.00.81-1.00 1 2.5
Total 40 100
The data suggest that there is a wide variation in TI scores between garment firms. Only one
firm has a score in excess of 0.81, another six have scores in excess of 0.61 and the remainder
have scores well below that of the best garment firms. This seems to suggest that some
Mauritian garment firms have quite good technological capabilities, which are probably on par
with international best practice in the garment industry, but there is also a long tail of
underperformance in the sample. This technological capability gap is linked to firm size.
Table 2 shows the overall TI scores for the 21 large garment firms (>100 employees) and the 19
SMEs (<100 employees) in the Mauritian sample. It also shows scores, by firm size, for the
main sub-categories of the TI (namely individual scores for process engineering, product
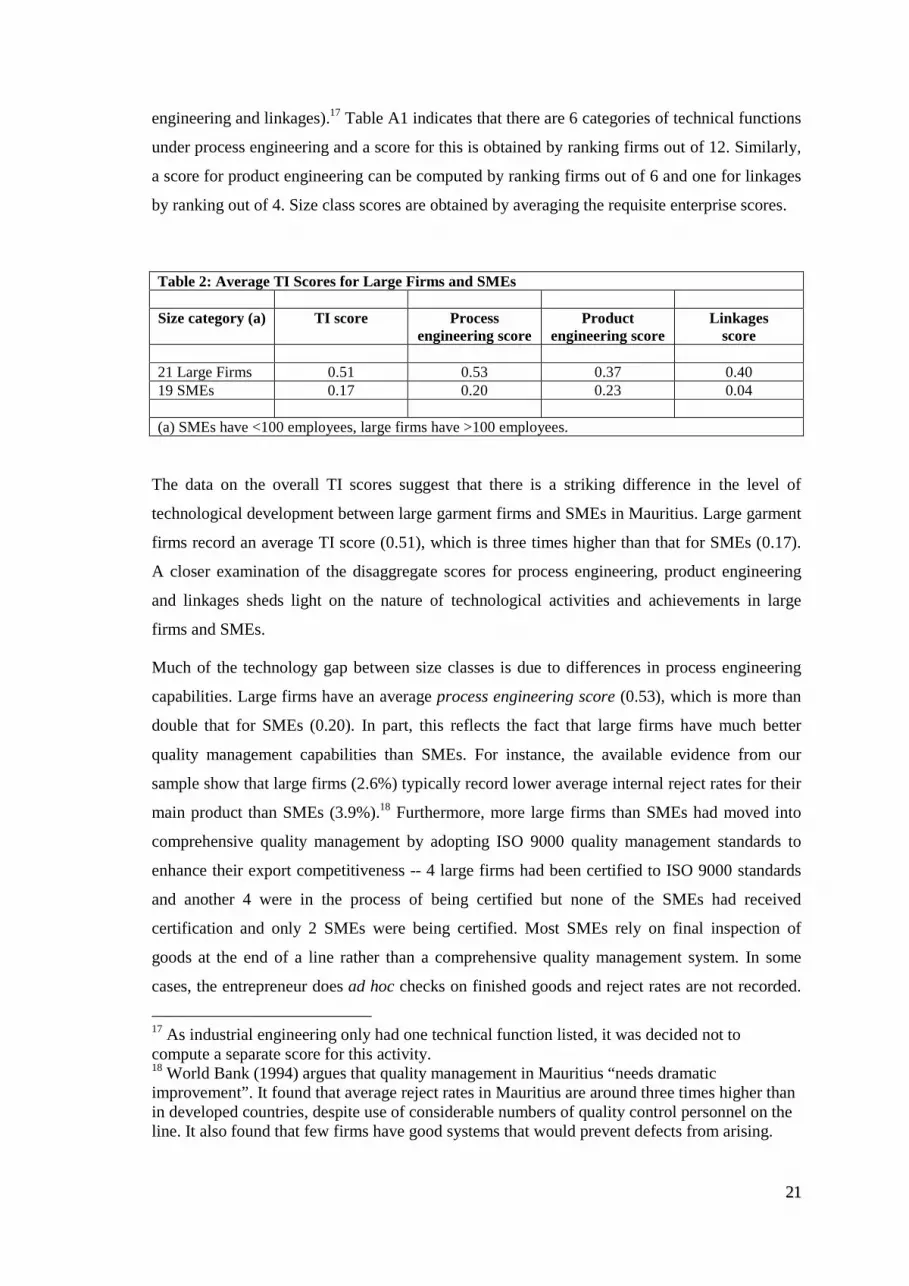
2211
engineering and linkages).17 Table A1 indicates that there are 6 categories of technical functions
under process engineering and a score for this is obtained by ranking firms out of 12. Similarly,
a score for product engineering can be computed by ranking firms out of 6 and one for linkages
by ranking out of 4. Size class scores are obtained by averaging the requisite enterprise scores.
Table 2: Average TI Scores for Large Firms and SMEs
Size category (a) TI score Processengineering score
Productengineering score
Linkagesscore
21 Large Firms 0.51 0.53 0.37 0.4019 SMEs 0.17 0.20 0.23 0.04
(a) SMEs have <100 employees, large firms have >100 employees.
The data on the overall TI scores suggest that there is a striking difference in the level of
technological development between large garment firms and SMEs in Mauritius. Large garment
firms record an average TI score (0.51), which is three times higher than that for SMEs (0.17).
A closer examination of the disaggregate scores for process engineering, product engineering
and linkages sheds light on the nature of technological activities and achievements in large
firms and SMEs.
Much of the technology gap between size classes is due to differences in process engineering
capabilities. Large firms have an average process engineering score (0.53), which is more than
double that for SMEs (0.20). In part, this reflects the fact that large firms have much better
quality management capabilities than SMEs. For instance, the available evidence from our
sample show that large firms (2.6%) typically record lower average internal reject rates for their
main product than SMEs (3.9%).18 Furthermore, more large firms than SMEs had moved into
comprehensive quality management by adopting ISO 9000 quality management standards to
enhance their export competitiveness -- 4 large firms had been certified to ISO 9000 standards
and another 4 were in the process of being certified but none of the SMEs had received
certification and only 2 SMEs were being certified. Most SMEs rely on final inspection of
goods at the end of a line rather than a comprehensive quality management system. In some
cases, the entrepreneur does ad hoc checks on finished goods and reject rates are not recorded.
17 As industrial engineering only had one technical function listed, it was decided not tocompute a separate score for this activity.18 World Bank (1994) argues that quality management in Mauritius “needs dramaticimprovement”. It found that average reject rates in Mauritius are around three times higher thanin developed countries, despite use of considerable numbers of quality control personnel on theline. It also found that few firms have good systems that would prevent defects from arising.
2222
The majority of SMEs were not aware of the existence of the ISO 9000 system and its many
advantages including the improvement of quality, more rapid productivity growth and
increasing the attractiveness to overseas buyers of output.
Moreover, large firms seemed to have better maintenance capabilities than SMEs. Nearly all the
large firms had a regular routine for maintenance and serving of equipment, a maintenance shop
and specialised maintenance manpower. Some large firms also brought in foreign maintenance
staff where required (for instance, for major repair work on computer aided design systems).
With some exceptions, SMEs did seem to conduct routine maintenance of their equipment and
tended to undertake repairs only when equipment broke down. SMEs also tended to rely on
contract maintenance staff hired from the local market and lacked in-house maintenance shops
and specialised maintenance manpower.19
Large firms were also more active than SMEs in ensuring that relevant equipment were properly
calibrated, that local raw materials were substituted for imports where possible and that
equipment was regularly upgraded through purchases of new machines and technologies.20
In the case of product engineering scores, a somewhat smaller gap between large firms (0.37)
and SMEs (0.23) is indicated by the data. This is slightly deceptive as our firm-level interviews
indicated that there is considerable variation in the emphasis paid to product technology in the
sample firms.
At one end, are large firms that typically receive new products and designs from foreign buyers
of output and periodic visits to international trade fairs. On the whole, therefore, large firms are
making garments in line with international trends and market demand. A core of large
enterprises have also tried to create independent design capabilities by hiring trained designers,
investing in computer aided design (CAD) systems and formulating strategies for interaction
with a range of foreign buyers. The enterprise survey showed that 13 large garment enterprises
World Bank (1994) concluded that the spread of ISO 9000 accredited quality managementsystems should be encouraged in Mauritius.19 Dubois et al. (1995) report that local firms (particularly SMEs) lack the ability to undertakemajor maintenance and cite the following reasons for this: unavailability of qualified manpowerand serving equipment for undertaking major maintenance work; maintenance crews beingmore oriented towards routine maintenance; few people being involved in the maintenancedepartment, poor maintenance planning; and inadequate status being allocated to the role ofmaintenance in the organisation.20 World Bank (1994) noted that a number of medium and large Mauritian firms have adoptedcomputer aided design and manufacturing. Computer aided cutting is rare since it is much moreexpensive; however, some large firms have made the necessary investment; wider application ofthis technology is, however, needed if quality is to be raised in general. The study alsocommented that some large firms have also adopted into computerised sewing and stitching inorder to reduce labour costs, cut defects and realise more complex designs. Meanwhile, the bulkof Mauritian firms (particularly SMEs) rely on outdated basic sewing machines.
2233
had full-time designers (some of them even had qualified overseas) compared with only 6 SMEs
(many of the designers in the SMEs lacked formal design qualifications).21
On the other, are SMEs which tend to copy imports or rely on local sources of information for
product information and designs. A high proportion of products from SMEs cater to consumer
tastes in the local/regional markets and are not in line with international trends. Relatively few
SMEs were engaged in long-term marketing relationships with foreign buyers of output or had
made the effort to try to develop independent design capabilities.
Finally, large firms (0.40) have better linkages scores than SMEs (0.04). There are limited
contract-based intra-firm technological transfers in Mauritius either through subcontracting
relationships or buyer-seller relationships with foreign buyers of output. To the extent that these
occur, large firms (and, to a lesser extent, medium firms) are involved in exchanges of
information, skills and technology. The lack of linkages involving small firms seems to be
related to weaknesses in their price, quality and delivery performance.22
Next, we attempt to explain the factors affecting firm-level technological behaviour and explore
the link with firm-level export performance.
21 The acquisition of design capabilities in some large local firms is impressive. One large localgarment firm had set up a fully-equipped design centre with the latest CAD facilities from Japanand employed two overseas trained designers and 10 assistants. The firm said that it was able tooffer several styles of a particular garment for foreign buyers to choose from. This was by nomeans an insolated case. Another large local garment firm had a CAD system and a nine-strongin-house design team. Such design capabilities seem to put Mauritius garment firms ahead ofrival garment exporters in competitors like Sri Lanka, Bangladesh and Vietnam.22 The interviews shed some light on this issues. Two large garment MNC affiliates said thatthey had subcontracted orders to SMEs previously, but finding that the quality of output wasbelow international standards (and the SMEs were unable to meet tight deadlines) had stoppedsubcontracting to SMEs altogether. Similarly, one large local garment firm reported that thequality of subcontractors output was very irregular; it rejects 20 per cent of its subcontractors’output on an average order.

2255
5. ECONOMETRIC RESULTS
This section presents the results of two kinds of econometric analysis for the Mauritian sample
using cross-section data for the late 1990s: (a) an investigation of the determinants of the
technology index (TI); and (b) an investigation of the determinants of firm-level export
performance. A T-test was also conducted on the means of various characteristics of large firms
and SMEs to shed further light on the technological and exporting behaviour of the two
enterprise groups.
5.1 Factors Affecting the Technology Index
The present investigation tests for the influence of firm size, ownership, age in production,
engineering and technical manpower, employee training and external technical assistance on TI.
The full linear model is:
TI = b0 + b1 SIZE + b2 FE + b3 AGE + b4 ET + b5 TB + b6 EXTA
The independent variables are as follows:
SIZE: total employment. This is expected to be positively correlated with TI. The returns from
capability acquisition are higher where a firm has a larger volume of sales to spread the fixed
costs of capability acquisition and larger firms can have more specialised manpower. Moreover,
capital market imperfections confer an advantage on large firms in securing finance for
technological activities, and size is correlated with the availability and stability of funds.
FE: the share of foreign equity. This is expected to have a positive relationship with TI. There
are two possible reasons for this. Foreign affiliates are better placed to acquire technological
capabilities because of their ready access to the “ownership advantages (e.g. technologies, skills
and marketing know-how) of their parent corporations. Moreover, foreign affiliates may have a
lengthy learning experience having been in production for several decades and may have
accumulated technological capabilities that new local firms might lack.
AGE: age in production. This is expected to have a positive sign because years of accumulated
production experience can capture “learning by doing” amongst other things.
ET: the share of engineers and technicians in employment. We can expect this to have a positive
relationship with TI. Engineers and technicians can exert a significant influence on the process
of building technological capabilities even in simple industries like garments through new
quality management methods, equipment maintenance and upgrading, productivity
2266
improvement, training and minor adaptations to process technologies (e.g. energy saving
measures).
TB: expenditure on employee training as a percentage of sales. This is expected to have a
positive sign. Explicit employee training is crucial during enterprise start-up for creating the
requisite capabilities to use new production technologies. As technologies evolve, a continuous
process of training and re-training is needed to supply the technical and managerial skills
needed by new process and product innovations.
EXTA: number of times a firm has used an external technical consultant or local technology
institution during a three-year period.23 Long-term relationships with individuals and institutions
that provide training, technical information and technical services can be a valuable input into
the acquisition of technological capabilities. Such linkages enable exchange of information,
skills and technologies and can directly contribute to improvements in productive efficiency as
well as diffusion of technologies throughout the industry.
Using these variables, we ran five different econometric investigations. We started with a
simple model consisting of SIZE, FE and AGE to explain TI. Then we ran separate models by
adding the remaining explanatory variables (ET, TB and EXTA) one by one to the simple
model. Finally, we ran a model with only the significant explanatory variables from the
previous models. The results from these econometric investigations are shown in Table 3. The
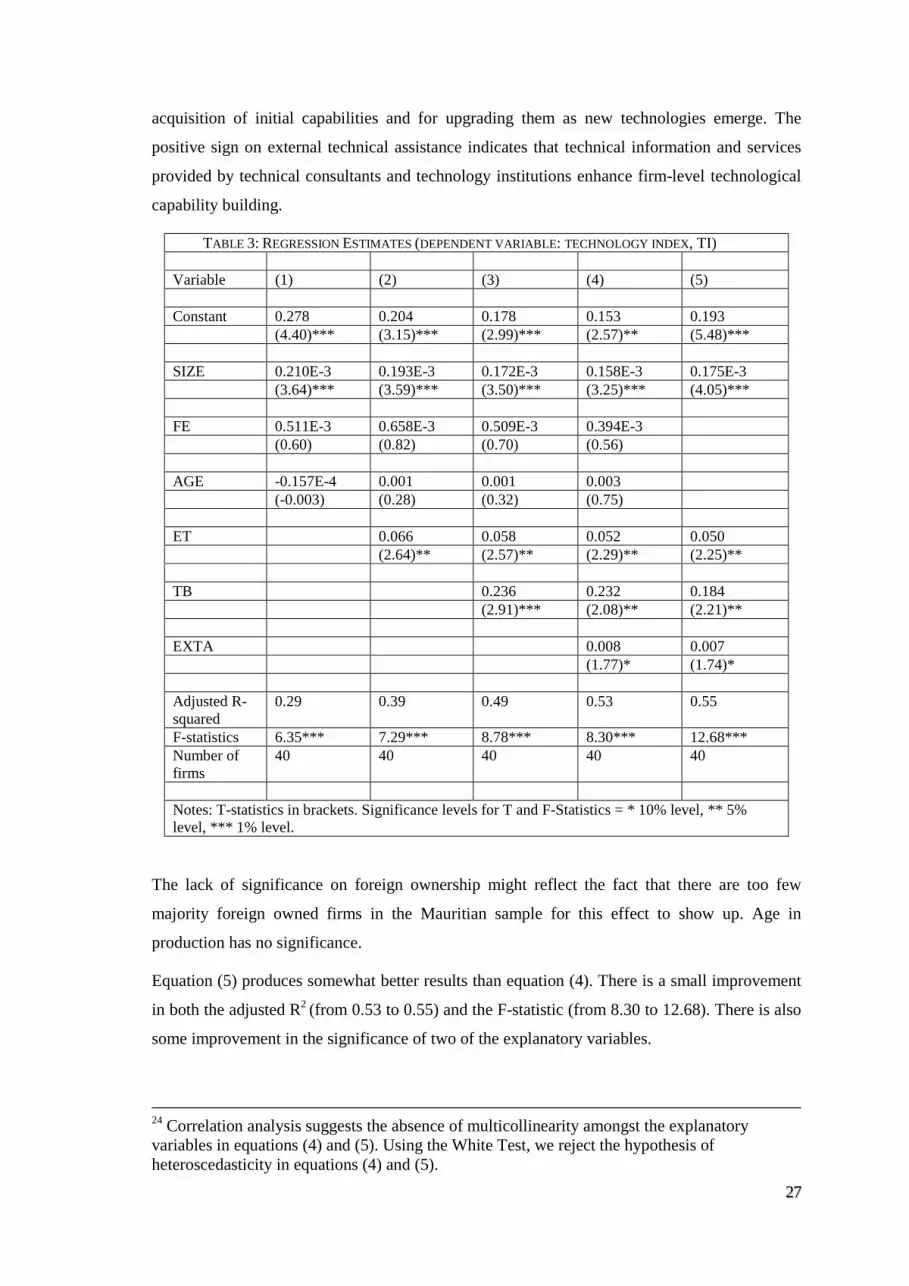
results are fairly stable across the five models. Following testing for multicollinearity and
heteroscedasticity, we consider the results of equations (4) and (5).24 The former has all the
available explanatory variables while the latter has only the statistically significant explanatory
variables.
The adjusted R2 (0.53) in equation (4) is reasonable for a cross-section study based on a small
sample. Of the six explanatory variables, four are significant (one at the 1% level, 2 at the 5%
level and one at the 10% level) and have the expected sign. Firm size, engineering and technical
manpower, employee training and external technical assistance have a positive and significant
relationship with TI. The positive sign on the firm size variable suggests that both explanations
for the firm size effect are valid. The positive sign on the engineering and technical manpower
variable indicates that technical manpower plays a fundamental role in the acquisition of firm-
level technological capabilities. The positive sign on the employee-training variable suggests
that formal in-house training programmes and on-the job training are important for both the
23 Expenditure on external technical assistance as a percentage of sales is a better measure ofexternal technical assistance than the one used here but the data were not available from theMauritian firms.
2277
acquisition of initial capabilities and for upgrading them as new technologies emerge. The
positive sign on external technical assistance indicates that technical information and services
provided by technical consultants and technology institutions enhance firm-level technological
capability building.
TABLE 3: REGRESSION ESTIMATES (DEPENDENT VARIABLE: TECHNOLOGY INDEX, TI)
Variable (1) (2) (3) (4) (5)
Constant 0.278 0.204 0.178 0.153 0.193(4.40)*** (3.15)*** (2.99)*** (2.57)** (5.48)***
SIZE 0.210E-3 0.193E-3 0.172E-3 0.158E-3 0.175E-3(3.64)*** (3.59)*** (3.50)*** (3.25)*** (4.05)***
FE 0.511E-3 0.658E-3 0.509E-3 0.394E-3(0.60) (0.82) (0.70) (0.56)
AGE -0.157E-4 0.001 0.001 0.003(-0.003) (0.28) (0.32) (0.75)
ET 0.066 0.058 0.052 0.050(2.64)** (2.57)** (2.29)** (2.25)**
TB 0.236 0.232 0.184(2.91)*** (2.08)** (2.21)**
EXTA 0.008 0.007(1.77)* (1.74)*
Adjusted R-squared
0.29 0.39 0.49 0.53 0.55
F-statistics 6.35*** 7.29*** 8.78*** 8.30*** 12.68***Number offirms
40 40 40 40 40
Notes: T-statistics in brackets. Significance levels for T and F-Statistics = * 10% level, ** 5%level, *** 1% level.
The lack of significance on foreign ownership might reflect the fact that there are too few
majority foreign owned firms in the Mauritian sample for this effect to show up. Age in
production has no significance.
Equation (5) produces somewhat better results than equation (4). There is a small improvement
in both the adjusted R2 (from 0.53 to 0.55) and the F-statistic (from 8.30 to 12.68). There is also
some improvement in the significance of two of the explanatory variables.
24 Correlation analysis suggests the absence of multicollinearity amongst the explanatoryvariables in equations (4) and (5). Using the White Test, we reject the hypothesis ofheteroscedasticity in equations (4) and (5).
2288
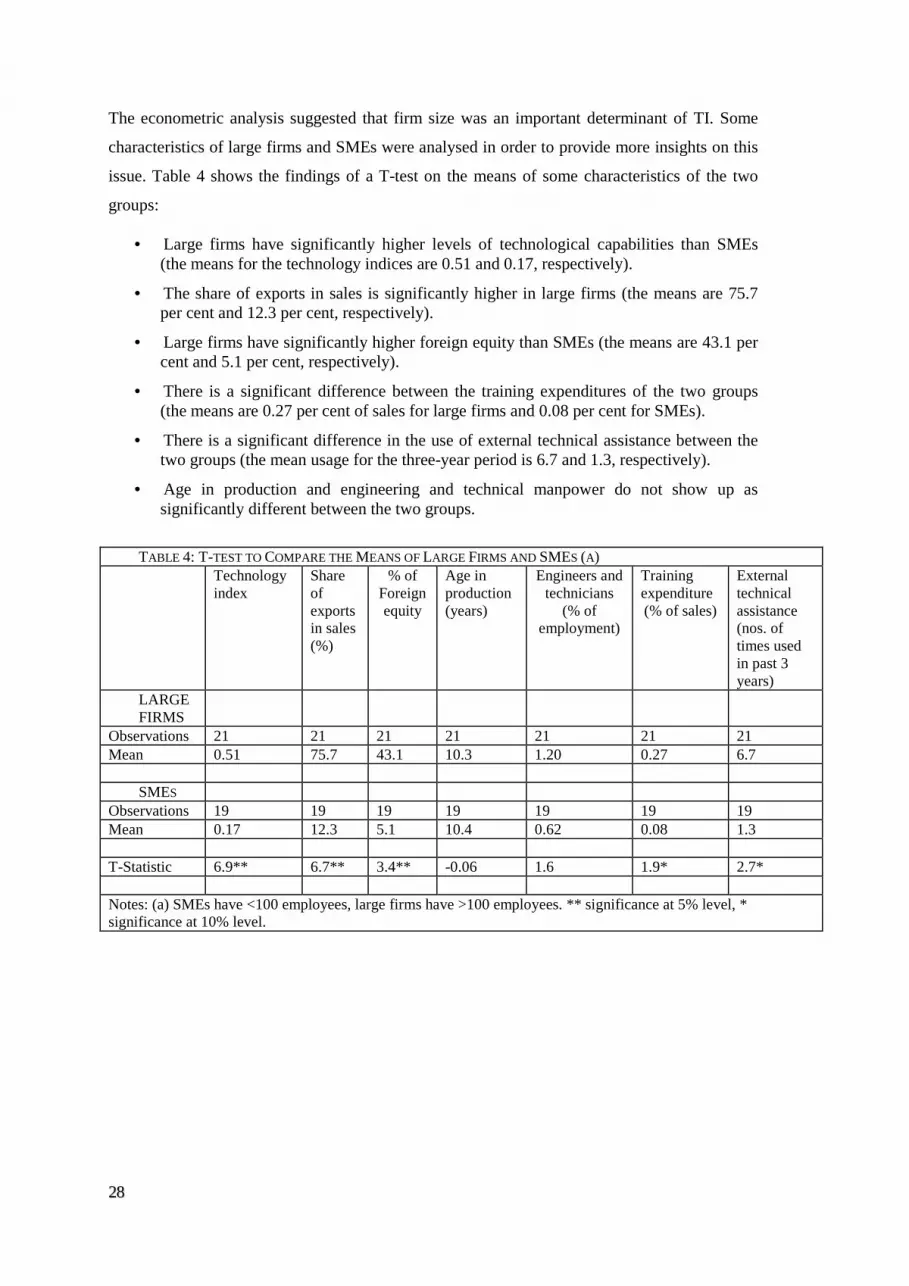
The econometric analysis suggested that firm size was an important determinant of TI. Some
characteristics of large firms and SMEs were analysed in order to provide more insights on this
issue. Table 4 shows the findings of a T-test on the means of some characteristics of the two
groups:
• Large firms have significantly higher levels of technological capabilities than SMEs(the means for the technology indices are 0.51 and 0.17, respectively).
• The share of exports in sales is significantly higher in large firms (the means are 75.7per cent and 12.3 per cent, respectively).
• Large firms have significantly higher foreign equity than SMEs (the means are 43.1 percent and 5.1 per cent, respectively).
• There is a significant difference between the training expenditures of the two groups(the means are 0.27 per cent of sales for large firms and 0.08 per cent for SMEs).
• There is a significant difference in the use of external technical assistance between thetwo groups (the mean usage for the three-year period is 6.7 and 1.3, respectively).
• Age in production and engineering and technical manpower do not show up assignificantly different between the two groups.
TABLE 4: T-TEST TO COMPARE THE MEANS OF LARGE FIRMS AND SMES (A)Technologyindex
Shareofexportsin sales(%)
% ofForeignequity
Age inproduction(years)
Engineers andtechnicians
(% ofemployment)
Trainingexpenditure(% of sales)
Externaltechnicalassistance(nos. oftimes usedin past 3years)
LARGEFIRMS
Observations 21 21 21 21 21 21 21Mean 0.51 75.7 43.1 10.3 1.20 0.27 6.7
SMESObservations 19 19 19 19 19 19 19Mean 0.17 12.3 5.1 10.4 0.62 0.08 1.3
T-Statistic 6.9** 6.7** 3.4** -0.06 1.6 1.9* 2.7*
Notes: (a) SMEs have <100 employees, large firms have >100 employees. ** significance at 5% level, *significance at 10% level.
2299
5.2 Factors Affecting Firm-Level Export Performance
The econometric analysis of firm-level export performance here is based on a tradition of work
carried out in other developing countries. This literature suggests that firm-level export
performance is influenced by factors like skills, ownership, technology and firm size.25 There is
no previous work on Mauritian manufacturing enterprises.
The linear model is as follows:
EXSH = b0 + b1 FE + b2 SIZE + b3 AGE + b4 ΤΙ + b5 ET
The independent variables are:
FE, the share of foreign equity, is expected to have a positive influence on export performance.
Access to the marketing connections and know-how of their parent companies as well as
accumulated learning experience of production and exporting make foreign affiliates better
placed to tap international markets than local firms.
SIZE, total employment. This is expected to have a positive sign because exporting allows large
firms, particularly in small economies, to exploit economies of scale in production by relieving
the disadvantage of the small home market.
AGE, age in production, is expected to have a positive sign. Accumulated experience of
different kinds (including performing repetitive technological tasks) is a means to improving
firm-level production efficiency and hence export performance.
TI, the technology index, is expected be positively associated with export performance because
the process of acquiring technological capabilities in enterprises is not just a simple function of
years of experience but more the outcome of conscious investments in creating skills and
information.
ET, the share of engineers and technicians in employment. As higher levels of technical
manpower are likely to give firms a competitive advantage in exporting, this is expected to have
a positive effect on export performance.
Four separate econometric models were run to attempt to explain firm-level export performance
using these variables and the results are shown in Table 5. Following diagnostic testing, we
25 There is a growing econometric literature on firm-level export performance in developingcountries. Recent examples include: Wilmore (1992) on Brazil; Kumar and Siddarhathan (1993)on India; and Wignaraja (1998) on Sri Lanka.
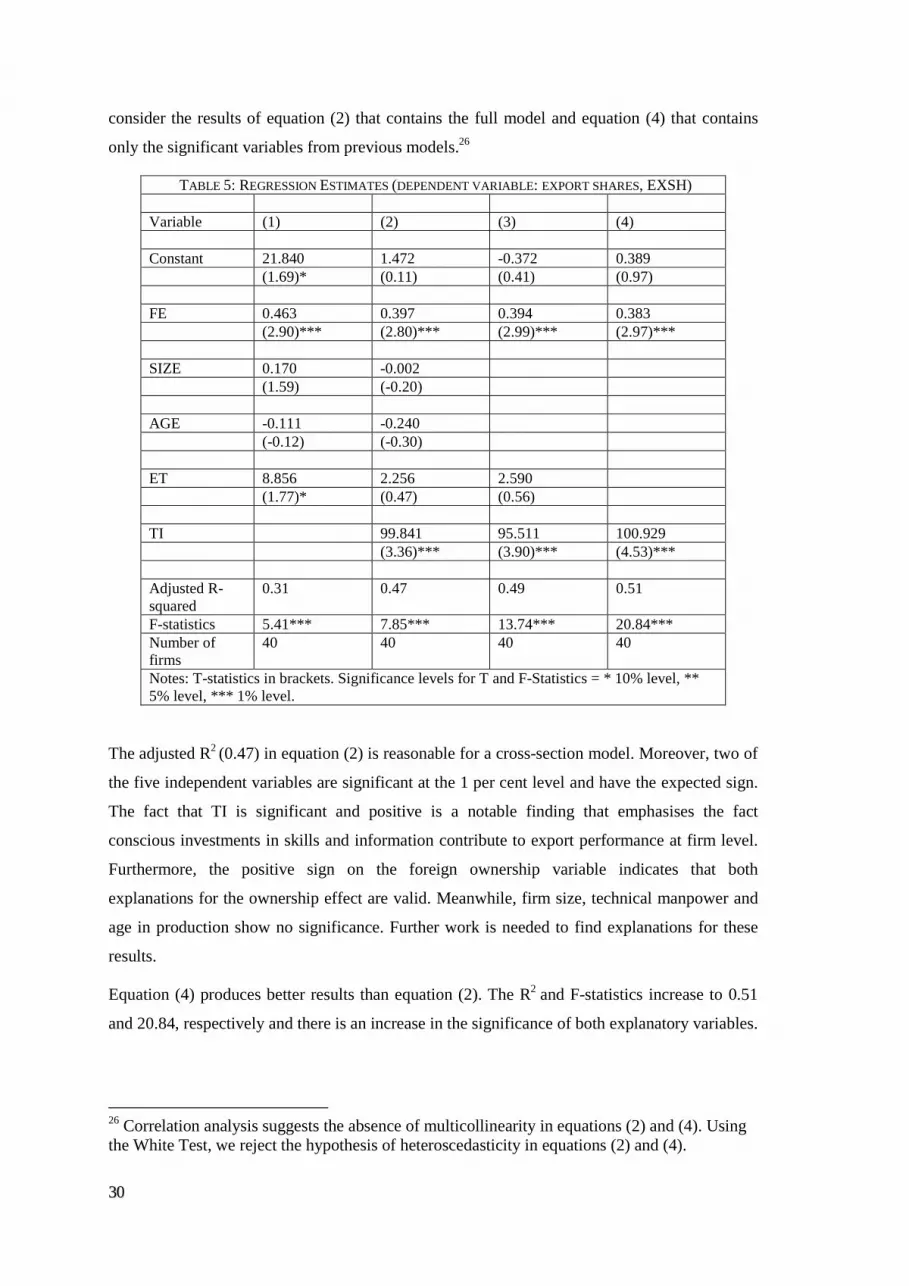
3300
consider the results of equation (2) that contains the full model and equation (4) that contains
only the significant variables from previous models.26
TABLE 5: REGRESSION ESTIMATES (DEPENDENT VARIABLE: EXPORT SHARES, EXSH)
Variable (1) (2) (3) (4)
Constant 21.840 1.472 -0.372 0.389(1.69)* (0.11) (0.41) (0.97)
FE 0.463 0.397 0.394 0.383(2.90)*** (2.80)*** (2.99)*** (2.97)***
SIZE 0.170 -0.002(1.59) (-0.20)
AGE -0.111 -0.240(-0.12) (-0.30)
ET 8.856 2.256 2.590(1.77)* (0.47) (0.56)
TI 99.841 95.511 100.929(3.36)*** (3.90)*** (4.53)***
Adjusted R-squared
0.31 0.47 0.49 0.51
F-statistics 5.41*** 7.85*** 13.74*** 20.84***Number offirms
40 40 40 40
Notes: T-statistics in brackets. Significance levels for T and F-Statistics = * 10% level, **5% level, *** 1% level.
The adjusted R2 (0.47) in equation (2) is reasonable for a cross-section model. Moreover, two of
the five independent variables are significant at the 1 per cent level and have the expected sign.
The fact that TI is significant and positive is a notable finding that emphasises the fact
conscious investments in skills and information contribute to export performance at firm level.
Furthermore, the positive sign on the foreign ownership variable indicates that both
explanations for the ownership effect are valid. Meanwhile, firm size, technical manpower and
age in production show no significance. Further work is needed to find explanations for these
results.
Equation (4) produces better results than equation (2). The R2 and F-statistics increase to 0.51
and 20.84, respectively and there is an increase in the significance of both explanatory variables.
26 Correlation analysis suggests the absence of multicollinearity in equations (2) and (4). Usingthe White Test, we reject the hypothesis of heteroscedasticity in equations (2) and (4).
3311
6. CONCLUSIONS
Drawing on the recent literature on technological development in developing countries, this
paper has attempted to provide some evidence on the relationship between firm size and the
acquisition of technological capabilities in Mauritius. Following a decade of import substitution
and export promotion via EPZs, the country began strongly emphasising market-oriented
policies in the early 1980s. By the mid-1990s, Mauritius had become considerably more open
and market-friendly than in the past and is today one of most liberal regimes in Africa. Since the
1980s, Mauritius has witnessed double-digit manufactured export growth (particularly in
garments), which has resulted in a per capita manufactured export value (US$ 1,094) that is far
ahead of other African countries. While this is a considerable industrial achievement, the
available evidence suggests that bulk of this export growth has come from large firms and that
SMEs have played little active part in this process.
Micro-level evidence from a sample of 40 garment enterprises suggests that the trends in export
performance by firm size are related to the acquisition of technological capabilities. Large firms
seem to have acquired the requisite competitive capabilities to produce to the high standards of
price, quality and delivery demanded by major foreign buyers of output. However,
technological capabilities in SMEs lag behind the achievements of large garment firms. Quality
control and quality management systems are insufficient. Few SMEs have preventative systems
for equipment maintenance. Their capacity to copy, adapt and design new products is weak.
They make little use of contractual technology imports and have few relations with foreign
technical consultants.
Using information from the sample enterprises, we constructed a technology index in an attempt
to quantify inter-firm differences in technological capabilities and conduct econometric
analysis. The econometric analysis of the determinants of the technology index and export
performance in Mauritius produced some interesting results. The econometric analysis of the
determinants of the technology index in Mauritius showed that firm size, technical manpower,
employee training and external technical assistance had a significant and positive effect whereas
firm age and foreign equity were not significant. A simple T-test was conducted to highlight
differences between large firms and SMEs. This analysis indicated that when compared with
large firms, SMEs had lower levels of technological capabilities, were less export-oriented, had
less foreign equity, conducted less employee training and made less use of external technical
assistance.
3322
The econometric analysis of the determinants of firm-level export performance indicated that
foreign equity and the technology index were significant and positively associated with export
shares. Meanwhile, firm size, firm age and technical manpower were not significant.
These results confirm the usefulness of recent attempts in the literature to quantify enterprise-
level technological capabilities in developing countries. By providing new conceptual tools and
analytical methods, this new strand of econometric research on technological capabilities nicely
complements previous work based on detailed technology case studies of individual enterprises.
Further work will lead to refinement of the technology index presented here, the collection of
larger enterprise data sets and the use of more sophisticated econometric methods such as
simultaneous equation models.
One final thought: the research on Mauritian garment enterprises re-affirms the case for policy
support to improve the competitiveness of SMEs in market-oriented developing economies.
Insertion into existing marketing relationships between large local firms and foreign buyers are
increasingly recognised as a powerful mechanism for accessing overseas markets and new
production technologies and capabilities. In this vein, it is necessary for upgrading in the
Mauritian garment industry for SMEs to be incorporated into effective clusters around the large
enterprises. This may partly occur spontaneously over time but policy policies can also induce
the process of clustering. The experience of developed and developing countries suggests that
supplier linkage programmes and focussed business development services (training,
productivity improvement, quality management and technical information) are useful ways of
connecting SMEs into clusters and improving their technological capabilities (see Altenburg
and Meyer-Stamer, 1999; Mytelka and Farinelli, 2000).

3333
TTaabbllee AA11:: TTeecchhnnoollooggiiccaall CCaappaabbiilliittyy SSccoorriinngg SSccaalleess ffoorr MMaauurriittiiuuss SSaammppllee
Production Capabilities: Linkages Capabilities:Process Engineering: Product Engineering: Industrial Engineering:INTERNAL DEFECT RATES: COPYING: PROD.VITY IMPROVEMENT SUBCONTRACTING LINKAGES:No measurement 0 none 0 none 0 none 0high (>2%) 1 ad-hoc 1 some 1 ad-hoc technology transfer 1low (<2%) 2 systematic 2 systematic 2 systematic technology transfer 2ISO 9000 STATUS IMPROVING EXISTING PRODUCTS: SYSTEMATIC RECEIPT OF TECH.no accreditation 0 none 0 FROM BUYERSISO 9000 in-progress 1 some 1 none 0ISO 9000 obtained 2 considerable 2 ad-hoc technology transfer 1MAINTENANCE AWARENESS: INTRODUCING NEW PRODUCTS IN-HOUSE systematic technology transfer 2None 0 none 0only repair when breakdown 1 some 1preventive system 2 considerable 2CALIBRATION of EQUIPMENT (b):None 0Little 1Frequently 2SUBSTITUTION OF LOCAL R.M.:None 0Little 1A lot 2BUY NEW EQUIPMENT:None 0Little 1A lot 2

3344
Table A2: Correlation MatrixTI SIZE FE AGE EXSH ET TB EXTA
TI 1SIZE 0.58 1.00FE 0.31 0.40 1.00AGE 0.08 0.15 -0.06 1.00EXSH 0.65 0.43 0.52 -0.02 1.00ET 0.37 0.08 -0.02 -0.08 0.25 1.00TB 0.48 0.20 0.14 0.01 0.37 0.12 1.00EXTA 0.51 0.25 0.23 -0.20 0.31 0.24 0.43 1
35
BIBLIOGRAPHY
Altenburg, T. and Meyer-Stamer, J. (1999), “How to Promote Clusters: Policy Experiencesfrom Latin America”, World Development, vol. 27, no.9.
Aw, Bee-Yan and Batra, G. (1998), “Technological Capabilities and Firm Efficiency in Taiwan(China)”, World Bank Economic Review, vol. 12.
Bheenick, R. and Hanoomanjee, E. (1988), Mauritius: Towards an Industrial Training Strategy:Port Louis: Ministry of Planning and Economic Development.
Bell, M. and Pavitt, K. (1993), "Technological Accumulation and Industrial Growth: ContrastsBetween Developed and Developing Countries", Industrial and Corporate Change, vol 2,no. 2.
Biggs, T., Shah, M. and Srivastava, P. (1995), “Technological Capabilities and Learning inAfrican Enterprises”, World Bank Technical Paper no. 288.
De Chazal Du Mee (1998), “Research Study on Small and Medium Enterprises in Mauritius:First Interim Report”, Port Louis: De Chazal Du Mee.
Deraniyagala, S. and Semboja, H. (1999), “Trade Liberalisation, Firm Performance andtechnology Upgrading in Tanzania”, in S. Lall (ed.), The Technological Response to ImportLiberalisation in SubSaharan Africa, London: Macmillan.
Dubois, P. R., Beedasy, J., Hurreeram, D. K., Ramgutty-Wong, A., and Seebaluck, D. (1995),“Technological Competence in Mauritian Small and Medium Enterprises”, Port Louis:University of Mauritius.
Ernst, D, Ganiatsos, T. and Mytelka, L. (ed. 1998), Technological Capabilities and ExportSuccess in Asia, London: Routledge.
Gosen, R. (1995), “Technological Capability in Developing Countries: A Case Study ofBiotechnology in Mexico”, doctoral thesis, University of Oxford.
Hobday (1995), Innovation in East Asia: The Challenge to Japan, Cheltenham: Edward Elgar.
ILO (1999), Studies in the Social Dimension of Globalisation: Mauritius, Geneva, InternationalLabour Organisation.
Katrak, H. (1996), “Trade Policies, Enterprise Characteristics and Technological Effort inDeveloping Countries”, Journal of International Development, vol.8, no. 1.
Katz, J.M. (1987), "Domestic Technology Generation in LDCs: a Review of ResearchFindings", in J. Katz (ed.), Technology Generation in Latin American ManufacturingIndustries, Basingstoke (UK): Macmillan.
Kumar, N. and Siddharthan, N.S. (1993), "Technology, Firm Size and Export Behaviour inDeveloping Countries: The Case of Indian Enterprises", UNU/INTECH Working Paper No.9, Maastricht: UNU/INTECH.
36
Lall, S. (1992), “Technological Capabilities and Industrialisation”, World Development, vol. 20.
Lall, S., Barba-Navaretti, G. Teitel, S. and Wignaraja, G. (1994), Technology and EnterpriseDevelopment: Ghana Under Structural Adjustment, London: Macmillan.
Lall, S. and Wignaraja, G. (1998), Mauritius: Dynamising Export Competitiveness,(Commonwealth Economic Paper No 33), London: Commonwealth Secretariat.
Latsch, W. and Robinson, P. (1999), “Technology and the Responses of Firms to Adjustment inZimbabwe” in S. Lall (ed.), The Technological Response to Import Liberalisation inSubSaharan Africa, London: Macmillan.
Lamusse, R. (1995), “Mauritius”, in Wangwe, S. (ed.) Exporting Africa: Technology, Trade andIndustrialisation in Sub-Saharan Africa, London: Routledge.
Milner, C. and McKay, A. (1996), ‘Real Exchange Rate Measures of Trade Liberalisation:Some Evidence for Mauritius’, Journal of African Economies, vol. 5, no. 1.
Metcalfe, S. (forthcoming), “Science, Technology and Innovation Policies in DevelopingCountries”, in G. Wignaraja (ed.) Competitiveness Strategy and Industrial Performance inDeveloping Countries: A Manual for Policy Analysis, London: Routledge.
Mytelka, L. and Farinelli. F. (2000), “Local Clusters, Innovation Systems and SustainedCompetitiveness”, Maastricht: UNUINTECH (mimeo)
Pack, H. and Westphal, L. E. (1986), "Industrial Strategy and Technological Change: Theoryversus Reality", Journal of Development Economics.
Pietrobelli, C. (1997), Industry, Competitiveness and Technological Capabilities in Chile: ANew Tiger from Latin America, London: Macmillan.
Romijn, H. (1999), Acquisition of Technological Capability in Small Firms in DevelopingCountries, London: Macmillan Press.
SRI (1992), Industrial Restructuring in the Electronics Sector, Singapore: SRI International.
UNCTAD (2000), Investment Policy Review: Mauritius, Geneva, UNCTAD.
Wangwe, S. (1995 ed.), Exporting Africa: Technology, Trade and Industrialisation in Sub-Saharan Africa, London: Routledge.
Westphal, L.E., Kritayakirana, K., Petchsuwan, K., Sutabutr, H. and Yuthavong, Y. (1990),"The Development of Technological Capability in Manufacturing: A MacroscopicApproach to Policy Research", in R.E. Evenson and G. Ranis (eds.), Science andTechnology: Lessons for Development Policy, London: Intermediate TechnologyPublications.
Westphal, L.E. (2001), “Technology Strategies for Economic Development in a Fast ChangingGlobal Economy”, Swarthmore (PA, USA): Swarthmore College (mimeo)
Wignaraja, G. (1998), Trade Liberalisation in Sri Lanka: Exports, Technology and IndustrialPolicy, London: Macmillan.
Wignaraja, G. and Ikiara (1999), “Adjustment, Technological Capabilities and EnterpriseDynamics in Kenya” in S. Lall (ed.), The Technological Response to Import Liberalisationin SubSaharan Africa, London: Macmillan.
37
Wignaraja, G. and O’Neil (1999), SME Exports and Public Policies in Mauritius,(Commonwealth Trade and Enterprise Paper No. 1), Commonwealth Secretariat: London.
Wilmore, L. (1992), "Transnationals and Foreign Trade: Evidence from Brazil", The Journal ofDevelopment Studies, 28:2
Woldekidan, B (1994), Export-led Growth in Mauritius, (Indian Ocean Policy Paper 3),National Centre for Development Studies, Australian National University: Canberra.
World Bank (1994), Mauritius: Technology Strategy for Competitiveness, Report No. 12518-MAS, Washington DC: World Bank.
World Bank (2000), World Development Indicators 2000, Washington DC: World Bank
Word Trade Organisation (1996), Trade Policy Review: Mauritius 1995, Geneva: World TradeOrganisation.

39
THE UNU/INTECH DISCUSSION PAPER SERIES
# 2001-1 Firm Size, Technological Capabilities and Market-Oriented Policies in MauritiusBy Ganeshan Wignaraja, February 2001
# 2009 Policy Instruments for Stimulating R&D in the Enterprise Sector: The ContrastingExperiences of Two MNC Dominated Economies from Southeast Asia.By Sunil Mani, December 2000.
# 2008 Industrialisation Meets Globalisation: Uncertain Reflections on East Asia Experience.By Larry Westphal, October 2000.
# 2007 The Dynamics of Technological Learning in Industrialisation. By Linsu Kim,October 2000.
# 2006 The Policy Relevance of Innovation Studies. By Anthony Bartzokas, October 2000.
# 2005 Local Clusters, Innovation Systems and Sustained Competitiveness. By Lynn Mytelka& Fulvia Farinelli, October 2000.
# 2004 Korea’s Innovation System: Challenges and New Policy Agenda. By Joonghae Suh,July 2000.
# 2003 Exploring the Challenges and Opportunities for Africa in the Information Economy.By Derrick L. Cogburn and Catherine Nyaki Adeya, July 2000.
# 2002* Special Series of UNU/INTECH Discussion Papers: Information Revolution and PolicyImplications for Developing Countries• #2000 Download the full series (274 pages, 620KB) or download your choice of
the individual papers listed below:• #2000-1 Charles Cooper, “Some Themes for the Workshop: An Outline for Policy
Analysis”• #2000-2 Constantine Vaitsos, “Policy Agenda for the Information Revolution and
Exclusion Phenomena in Developing Countries”• #2000-3 Shulin Gu and W. Edward Steinmueller, “National Innovation Systems
and the Innovative Recombination of Technological Capability in EconomicTransition in China: Getting Access to the Information Revolution”
• #2000-4 Carlos M. Correa, “Implications of Intellectual Property Rights for theAccess to and Use of Information Technologies in Developing Countries
• #2000-5 Cecilia Ng Choon Sim, “Making Women’s Voices Heard: TechnologicalChange and Women’s Employment with Special Reference to Malaysia”
• #2000-6 Ludovico Alcorta, “The Information Revolution and Economic andSocial Exclusion: The Experiences of Burkina Faso, South Africa and Tanzania”
# 2001 Exports of High Technology Products from Developing Countries: Is it Real or aStatistical Artifact. By Sunil Mani, May 2000.
# 9903 Implications of National Innovation Systems for Developing Countries--ManagingChange and Complexity in Economic Development. By Gu Shulin, November 1999.
# 9902 Public Innovation Policies and Developing Countries In a Phase of EconomicLiberalisation. By Sunil Mani, October 1999.
40
# 9901 The Determinants of Firm-level Technological Performances - A Study on the IndianCapital Goods Sector. By Mohan Babu, September 1999.
# 9805 Flexible Automation and Location of Production in Developing Countries. ByLudovico Alcorta, May 1998.
# 9804 Foreign Firms and Technology Transfer Knowledge Spillovers to IndianManufacturing Firms. By Vinish Kathuria, January 1998.
# 9803 The Experience of Technological Collaborations by Mercosur Companies. ByLudovico Alcorta, Guilherme Ary Plonski and Celso Augusto Rimoli, January 1998.
# 9802 The North-South Dimension of the Environment and Cleaner Technology Industries.By Jonathan R. Barton, January 1998.
# 9801 Environmental Regulation and International Competitiveness: A Review of Literatureand Some European Evidence. By Rhys Jenkins, January 1998.
# 9707 Inter-Firm Technological Cupertino Effects of Absorptive Capacity, Firm-Size andSpecialisation. By Frederico Rocha, December 1997.
# 9706 Technology Trends in Pollution-Intensive Industries: A Review of Sectoral Trends.By Anthony Bartzokas and Masaru Yarime, December 1997.
#9705 The World Market for Telematics Applications to Education: Challenges andOpportunities for Industrialised and Developing Countries. By Maria Bastos,November 1997.
#9704 Multinational Enterprises and export-Oriented Industrialisation in the Host Countries:An Empirical Analysis for the US and Japanese Affiliates. By Nagesh Kumar,September 1997.
#9703 Technology Acquisition, De-regulation and Competitiveness: A Study of IndianAutomobile Industry. By Krishnan. Narayanan, September 1997.
#9702 Technology Generation and Technology Transfers in the World Economy: RecentTrends and Implications for Developing Countries. By Nagesh Kumar, June 1997.
#9701 China's National Innovation System Approach to Participating in InformationTechnology: The Innovative Recombination of Technological Capability. By GuShulin and Edward Steinmueller, May 1997.
#9606 Foreign Direct Investments and Technology Transfers in Development: A Perspectiveon Recent Literature. By Nagesh Kumar, August 1996.
#9605 Toward an Analytical Framework for National Innovation Systems. By Gu Shulin,April 1996.
#9604 EST (Environmentally Sound Technologies) from the West - Asymmetry, Regimesand Polish Policy Implementation. By Mikael Sandberg, April 1996.
#9603 Environmentally Sound Technology: Is Poland Overcoming Soviet-Type LearningBarriers? By Mikael Sandberg, April 1996.
#9602 Multinational Enterprises, New Technologies and Export-Oriented Industrialisation inDeveloping Countries: Trends and Prospects. By Nagesh Kumar, January 1996.
#9601 The Relevance of Environmental Legislation for the Transfer of EnvironmentallySound Technology: The Tanzanian Experience. By Yvonne Ruijters, January 1996.(now only available as a Working Paper)

41
#9516 Changing Character of Foreign Direct Investment from Developing Countries: CaseStudies from Asia. By Nagesh Kumar, December 1995.
#9515 The Relevance of Environmental Legislation for the Transfer of EnvironmentallySound Technology: The Mexican Experience. By Yvonne Ruijters, December 1995.
#9514 The Implications of New Organisational Techniques for Developing Countries. ByRaphael Kaplinsky, 1995.
#9513 Technology, Manufactured Exports and Competitiveness. By Charles Cooper, 1995.
#9512 Does New Technology bode well for Working Women? An Evaluation and analysis.By Swasti Mitter, 1995.
#9511 Information and Communication Technologies: Growth, Competitiveness, and Policyfor Developing Nations. By Edward Steinmueller and Maria-Inês Bastos, 1995.
#9510 Technological Change and Dual Economies. By Charles Cooper, 1995.
#9509 Innovation Systems and Technological Specialisation in Latin America and theCaribbean. By Ludovico Alcorta and Wilson Peres, October 1995.
#9508 The Impact of Industrial Automation on Industrial Organisation: Implications forDeveloping Countries' Competitiveness. By Ludovico Alcorta, October 1995.
#9507 International Linkages, Technology and Exports of Developing Countries: Trends andPolicy Implications. By Nagesh Kumar, August 1995.
#9506 Technological Upgrading, Manufactured Exports and Optimal Accumulation. ByCharles Cooper and Roy Turner, September 1995.
#9505 What Hope can Democracy bring to S&T Policy Making in Latin America?. ByMaria-Inês Bastos, June 1995.
#9504 Industrialisation, Liberalisation and Two Way Flows of Foreign Direct Investment:The Case of India. By Nagesh Kumar, June 1995. [same as article published inEconomic and Political Weekly]
#9503 Telecommunication Industry in Brazil: Public-Private Relationship and TechnologyDevelopment. By Maria-Inês Bastos, April 1995.
#9502 New Technologies, Scale and Scope, and Location of Production in DevelopingCountries. By Ludovico Alcorta, March 1995.
#9501 Intellectual Property Protection, Market Orientation and Location of Overseas R&DActivities by Multinational Enterprises. By Nagesh Kumar, March 1995.