entry into new niches: the effects of firm age and the expansion of technological capabilities on...
TRANSCRIPT

Entry into New Niches
1
ENTRY INTO NEW NICHES: THE EFFECTS OF FIRM AGE AND THE EXPANSION
OF TECHNOLOGICAL CAPABILITIES ON INNOVATIVE OUTPUT AND IMPACT
REDDI KOTHA
Lee Kong Chian School of Business
Singapore Management University
50 Stamford Road
178899, Singapore
65 6828 0401
65 6828 0777 (fax)
YANFENG ZHENG
CLEMSON UNIVERSITY
College of Business
165 Sirrine Hall,
Clemson, SC 29634
864-656-1573
GERARD GEORGE
IMPERIAL COLLEGE LONDON
Business School
South Kensington, SW7 2AZ
London, U.K.
44 (0)20 7594 1876
44 (0)20 7594 5915 (fax)
Contact Author: Gerard George
KEYWORDS: Capabilities, Biotechnology, Age, Innovation, Entry, Patents
ACCEPTED FOR PUBLICATION AT STRATEGIC MANAGEMENT JOURNAL
JUNE 2010

Entry into New Niches
2
ENTRY INTO NEW NICHES: THE EFFECTS OF FIRM AGE AND THE EXPANSION
OF TECHNOLOGICAL CAPABILITIES ON INNOVATIVE OUTPUT AND IMPACT
ABSTRACT
We provide evidence that young firms systematically differ from older firms in their
innovative output when they enter ‘new to the firm’ technological niches. We analyze data from
128 biotechnology firms since their inception and track these firms over time. Our analyses
reveal that the organizational age at which the firm branches into new technological niches
significantly influences its innovative activity. We refine the focus of the extant literature by
separately examining the effects of branching on the quantity of innovative output, and the
impact that this output has on the technology domain. Subsequent to branching into new niches,
we find that older firms have a higher quantity of output than their younger counterparts;
whereas young firms tend to outpace their older rivals with higher impact. The implications of
these findings for the literature on dynamic capabilities and entrepreneurship are discussed.

Entry into New Niches
3
How does the timing of capability development matter? We examine whether the benefits
that accrue to expanding technological capabilities are contingent upon firm age. We draw on
the organizational aging and dynamic capability literatures to study how the expansion of a
firm’s capabilities by entering ‘new to the firm’ technological niches, termed as branching, at
different points in the firm’s age would vary in its influence on subsequent innovative activity.
Though commonly assumed that startups create breakthrough inventions, some contrarian
evidence suggests that mature incumbents also generate such discoveries (Dushnitsky and
Lenox, 2005; Phene et al., 2006). In a study of large chemical firms, Ahuja and Lampert (2001)
proffer evidence to suggest that mature incumbents overcome pathologies of aging by branching
into new domains and by recombining new with old knowledge. Other researchers have
investigated the temporal and structural effects of recombining new with old knowledge on
innovative output (Nerkar, 2003; Rosenkopf and Nerkar, 2001; Rothaermel and Boeker, 2008;
Yayavaram and Ahuja, 2008). We contribute to this conversation by examining the role of entry
into novel technology areas, i.e. branching, and how the effects of branching on innovative
activity vary with firm age.
To examine whether the pattern of optimal technological expansion is conditional on firm
age, we study innovative output of biotechnology firms from their inception over a twenty year
period. This sample allows us to investigate the underlying conditions when firms optimize their
output and impact by managing entry into new technological niches. The study engages the
literature on capability development, especially in young firms. The entry into new niches
corresponds with the expansion of a firm’s technological capabilities to drive innovation within
and across these technological domains. We also refine the focus of the extant literature by

Entry into New Niches
4
separately examining the effects of branching on the quantity of innovative output and the impact
that the output has on the technology domain.
Branching, Recombination, and Innovation
Scholars have posited that new knowledge is created by unique recombination of existing
knowledge repositories (Basalla, 1988; Henderson and Cockburn, 1994; Schumpeter, 1939).
Though inventors can possibly combine any prevalent technological components, what actually
gets combined is constrained by the localness of their search and the social construction on what
components can be gainfully combined. Branching into a ‘new to the firm’ technology domain
increases the stock of opportunities to which the firm has access (Fleming, 2001; Fleming and
Sorenson, 2004). The knowledge components that the firm acquires in the new domain can then
be recombined with its existing knowledge to introduce heterogeneity that facilitates problem
solving (Amabile, 1988; George, Kotha and Zheng, 2008). The variety in problem solving
approaches increases the likelihood that solutions can be found for technological bottlenecks.
Recombination can also enhance the impact of the innovation on the technology domain itself.
Indeed, it has been argued that breakthroughs result from recombining non-obvious technology
components (Basalla, 1988). Hence, when a firm branches, it could combine new knowledge
with its existing knowledge to yield radical innovation (Ahuja and Lampert, 2001; Katila and
Ahuja, 2002) that can potentially influence both domains (Ethiraj and Puranam, 2004).
Though searching widely for technology solutions has positive implications, extensive
experimentation without deep understanding of the causal relationships between components
may prove counterproductive (George et al., 2008; Lee et al., 2004; Yayavaram and Ahuja,
2008). Entering multiple new technological niches simultaneously necessitates experimentation
to understand the technology domains and their underlying science. Excessive experimentation

Entry into New Niches
5
can hurt output and quality by reducing reliability (March, 1991). To create impact, firms will
need to develop a deeper understanding of the new technical field that they enter in order to build
on existing knowledge. When firms concurrently enter multiple domains, it becomes difficult to
absorb knowledge (Cohen and Levinthal, 1990), likely reducing novelty and impact because they
fail to invest in maximizing contributions to the multiple technological fields that they enter.
Assimilating knowledge is time-consuming and expensive; a luxury ill-afforded by firms that are
resource constrained because processing knowledge for multiple domains likely increases the
coordination cost multifold. Consequently, we expect a curvilinear relationship between
branching and innovative output and its impact on the technology field, such that moderate
branching is better than low or high branching for the count of innovative output and its impact
on the technology field.
Hypothesis 1a: The relationship between the number of entries into new technological
niches (branching) and the quantity of innovative output is curvilinear (inverted U-
shaped) such that moderate branching yields optimal outcomes.
Hypothesis 1b: The relationship between the number of entries into new technological
niches (branching) and the technological impact of the innovative output is curvilinear
(inverted U-shaped) such that moderate branching yields optimal outcomes.
Branching, Firm Age, and Innovation
We posit that the relative benefit that accrues to the firm’s branching activity
systematically differs by the age at which the firm undertakes this capability expansion. The
causal mechanisms that underlie the differences in effects of branching by firm age can be traced
to the tension that arises from efficiencies in learning from cumulative output versus the
rigidities that occur with senescence (Argote, 1999; Barron, West and Hannan, 1994). Scholars
have argued that a firm’s competence to increase production output improves with age because
the firm benefits from well-embedded, robust routines derived from prior operating experiences

Entry into New Niches
6
(Nelson and Winter, 1982). Similarly, Cohen and Levinthal (1990) found that accumulation of
knowledge enhances a firm’s ability to acquire, assimilate and exploit information to generate
further innovations.
In addition, a firm’s resource endowment, especially its slack resources, may positively
influence innovative output (Nohria and Gulati, 1996) and encourage it to explore new areas for
growth (Penrose, 1959). When a firm branches into a new technological niche, the slack allows it
to divert free resources towards integrating new knowledge with existing knowledge repositories
to increase innovative output. Also, the presence of an infrastructure to innovate such as research
laboratories and scientific human capital, increase the potential for a firm to absorb information
(Zucker, Darby and Brewer, 1998). Since older firms are more likely to have accumulated
experience and slack resources (Penrose, 1959), we expect that they stand to benefit more from
branching into new niches than younger firms. Also, older firms are likely to have routinized
search strategies which further improve innovative output (Nelson and Winter, 1982;
Ronsenkopf and Nerkar, 2001). On the contrary, younger firms suffer from severe resource
constraints and lack the efficiency-enhancing experience (George, 2005; Stinchcombe, 1965).
Collectively, these arguments suggest that older firms are likely to yield higher innovative output
than younger firms when they branch into new niches.
Hypothesis 2a: The number of entries into new technological niches (branching) is more
positively related to innovative output for older firms than for younger firms.
Whereas resource and experience arguments favor older firms and their innovative
output, the impact of such output on the technological domain is likely driven by a different
causal dynamic. First, in older firms, as experience in a technology accumulates, the cognitive
maps of scientists and managers become increasingly rigid where paradigmatic solutions are
likely to further confound problems (March, 1991). In examining letters to shareholders of the 15

Entry into New Niches
7
largest pharmaceutical firms, Kaplan, Murray and Henderson (2003) found that the mental
models of senior management are partially responsible for the difficulties these firms faced when
responding to technological discontinuities. Others argue that older firms possess information-
processing routines that encourage innovation in their existing technology trajectories rather than
in new technological fields (Henderson, 1993; Nerkar, 2003). Older firms are also likely to be
constrained by ossified routines and structures that hinder exploration (Nelson & Winter, 1982).
Because heterogeneity in problem solving techniques is an important source of novel solutions
(Amabile, 1988), rigid mental models and deeply embedded routines serve to naturally limit the
mature firm’s foray into producing high impact innovation.
The presence of dominant coalitions and difficulties in sharing information in older firms
may favor younger firms that have greater flexibility when entering technological niches. In
older firms, entry into new technology domains is unlikely to receive support from the dominant
coalitions. Consequently, managers may under-allocate resources towards integrating new
knowledge, which, in turn could curtail the explorative tendencies of their scientists’ search for
new knowledge (Henderson, 1993; Kaplan et al., 2003; Pisano, 1994). Finally, the
communication of tacit technological information is critical to innovation (Cohen and Levinthal,
1990). Communication in a small firm is easier as the number of employees is fewer and
decision making systems are fluid and transparent, which allows for rich communication and
cohesion in the management team (Mosakowski, 1998). Fan (2010) finds that younger firms that
focused on explorative activities were more likely to survive. These factors suggest that tacit
knowledge-driven innovation has a more favorable environment in younger firms than in older
firms.

Entry into New Niches
8
The advantage that accrues to young firms vis-à-vis older firms in producing high impact
innovation has one important constraint. Younger firms are less likely to have the absorptive
capacity that mature firms possess. With experience, the organization develops an understanding
of its technological domain and can recognize optimal conditions for recombination (Zahra and
George, 2002). These firms develop a comprehension of the limits to component recombination
either through their own technology efforts or by observing others (Henderson and Cockburn,
1994; Powell et al., 1996). This experience helps older firms avoid ‘dead-ends’ and makes them
less likely to pursue fruitless innovation.
However, we expect that, on average, the relative benefit of higher absorptive capacity is
outweighed by the problems of rigid mental models, dominant coalitions, and restricted
communication channels that decrease the likelihood of high impact innovation in older firms.
Young startups may have lower absorptive capacity but are nimble in their decision-making, are
less constrained by routines, have fewer problems with managerial coalitions (Mosakowski,
1998), and have communication channels that foster a climate for problem solving and creativity
(Whiting, 1988), which contribute to developing innovative output with high impact (Gilad,
1984). Therefore, we posit that branching is likely to enhance the technological impact of the
firm’s innovative output for younger firms more than for older firms.
Hypothesis 2b: The number of entries into new technological niches (branching) is more
positively related to impact (the innovative output has on the technology field) for
younger firms than older firms.
Two aspects of our hypotheses merit clarification. First, our moderation arguments
suggest that increases in output and impact are higher for older and younger firms respectively.
Specifically, the change in output for older firms exceeds the corresponding change in younger
firms as branching increases (i.e. slope is steeper for older firms’ output). Conversely, the change

Entry into New Niches
9
in impact for younger firms exceeds the corresponding increase for older firms (i.e. slope is
steeper for younger firms’ impact). Second, the differences in slopes for younger and older firms
subsequent to branching are tempered by the main effect of branching. The main effect of
branching is curvilinear, i.e. moderate branching yields the highest output and impact. Would the
curvilinear relationship of the main effect of branching on impact and output shift uniformly
upwards for older firms for output and for younger firms for impact? Ex ante there is no precise
guidance of the level of branching when moderation is highest. Our predictions suggest that, on
average, we will have a positive moderation of firm age on branching and output and negative
moderation on impact respectively.
METHOD
Sample
We collected longitudinal data on startups in the biotechnology industry. The
biotechnology industry refers to the manipulation of genetic material through recombinant DNA
technology, cell fusion and monoclonal antibodies. Biotechnology is an appropriate context to
test theories of innovation as performance is largely dependent upon the firms’ technological
capabilities (Phene et al. 2006; Sorensen and Stuart, 2000; Huang and Murray, 2009). We follow
Shan, Walker and Kogut (1994) to restrict the sample to firms in human diagnostics and
therapeutics, enabling us to compare firms in a relatively homogeneous sector. We developed a
list of companies from the 1997 GEN Guides to Biotechnology Companies, a comprehensive
biotechnology industry list. From this set, we selected the publicly traded firms and then tracked
them back through to their initial founding years, consistent with other studies (George et al., 2002;
Lerner, 1994; Shan et al., 1994; Pisano, 1994). This yielded a sample size of 151 publicly traded
firms. For these firms, we collected historic data since their founding years using Bioscan,

Entry into New Niches
10
Compustat, initial public offering (IPO) disclosure filings, firm websites, and US Patent and
Trademark Office (USPTO) data on patents. We could collect complete data for 128 firms for
firms between 1980 and 1999. We curtail our sample to 1999 because it allows 20 years of
observation window and also because when we first constructed the database we were limited by
the data supplied by National Bureau of Economic Research (NBER) which was until 1999. We
then updated the patent forward citation data until 2006 using USPTO data to avoid censoring
problems.
Technological capabilities
We use patent data to track technological capability development within organizations.
Patent data were drawn from the NBER database that contains a total of 2.9 million patents issued
between 1963 and 1999 (Hall, Jaffe and Trajtenberg, 2005). Patent filing year, patent class,
assignee names, number of sub-classes, and number of claims were used to construct our patent
data. Whereas patents have been used to identify outcomes of R&D activities, patents have been
also used extensively to capture the technological capabilities or portfolios (Argyres and
Silverman, 2004; Sampson, 2005; Zheng, Liu and George, 2010).
Dependent variables
Quantity of Innovative Output is measured as the number of new patents applied for in two
subsequent years (t+1, t+2). Use of patents to study firm-level innovativeness is common (Ahuja
and Lampert, 2001; Stuart, 2000). Drug development comprises a complex approval process,
where the entire process averages twelve years. Consequently, correlating entry into new
technology domains with product introduction may prove futile. Also, capital markets are able to
value influential patents when they are granted (Hall, Jaffe and Trajtenberg, 2005). Therefore,
patent output and citations not only allow us to track knowledge usage and creation but are also

Entry into New Niches
11
correlated with the economic value of the firm. The criteria for receiving a patent, as described by
the USPTO, are that each invention should be novel, non-trivial, and have commercial application.
The innovative output variable has an average value of 4.50 and standard deviation of 13.2.
Technological Impact is measured as the average number of citations, net of self citations,
received by patents filed by the firm in years t+1 and t+2 (citations received/count of patents)
observed in five subsequent years (t+2 to t+6 and t+3 to t+7 respectively). Most patent citations
tend to occur within a few years after the grant date, peaking at the year three. Hence, our use of a
five-year window does not cause significant right censoring bias (Hall et al., 2001). To reduce the
overlap with the innovative output measure, we divide the total citations received by technology
output. The impact variable has an average value of 4.2 and standard deviation of 14.2.
Independent variables
Branching is a count of the number of entries by a firm into ‘new to the firm’ niches
measured at the patent main class level, consistent with Ahuja and Lampert (2001). We use the 3-
digit main classification followed by USPTO to identify technology domains. This measure
reflects the process of expanding the scope of a firm’s technological expertise. Corresponding to
the two year window for our dependent variables, we use the number of branching entries made by
a firm in year t-0 and t-1. The mean branching with the two-year window is 0.7 and has a
maximum value of 9. Our results are robust to using a one- or three-year prior window of
branching.
Firm Age was measured as the number of years since incorporation. The data source for the
founding year was Bioscan for the years 1988 to 2003. In a few cases where founding information
was missing in Bioscan, we used company website information to find the year.
Control variables

Entry into New Niches
12
Distance.1 To measure the proximity of technology branching by a firm we follow the
technique used by Rosenkopf and Almeida (2003). For each patent, we tabulated the technological
classes to which the patent was assigned. Aggregating the set of patents for each firm by year, we
summarized the percentage of assignments in each patent class. We then calculated the Euclidean
distances between these patent class vectors for each firm by comparing it to the preceding year.
This distance measure ranged from zero (firms with identical patenting profiles compared to past)
to 1.4 (the square root of two, where the firm continues to patent in the same classes, and each firm
is active in a different class).
Knowledge Stock is the number of patents applied in the previous three years. This
measure helps control for resource availability and size of the firm. We used the Griliches (1990)
deflator for knowledge stock that gives lower weights for the previous two years (0.8, 0.6),
suggesting that recent patents have more influence on new applications than older patents.
Achieved IPO is a time variant dummy variable that tracks if a firm achieved its initial
public offering (IPO) in the financial markets. Since we track firms beginning at their founding
year, we do not have access to data on firm size (such as assets or employees). Achieving the
IPO provides a proxy for size and resource access.
Breadth and Depth of Technological Capabilities. Breadth is measured as the total
number of technological classes in which a firm applied for patents, prior to the time window for
the construction of the branching variable. Depth is the maximum number of patents in any one
technological class as defined by the USPTO (Argyres and Silverman, 2004).
Alliances. We control for the role of alliances on innovative output (Powell et al., 2005).
We measure the number of prior alliances in that year (t0). In addition, we include a control for
1 We thank an anonymous reviewer for suggesting an alternative strategy to construct branching distance to the
citation based method used in a prior version of the manuscript.

Entry into New Niches
13
the total prior alliances formed before the past year (t-1…t-n; where n is the firm founding year).
The primary source of alliance information is rDNA.com; we corroborated these data with
Bioscan and SEC filings.
Estimation
For all estimations, we use a panel of firm-year observations. We use Fixed Effect
Poisson regression estimation for the count data (Wooldridge, 2001). We report the results of a
fixed-effects model that controls for firm-level invariant effects that accounts for both the time-
series observations and the nature of the dependent variables. In addition, we use multiple lagged
variables to parse out the temporal effects for capturing changes in technological capabilities. We
predict innovative output for two subsequent years (t+1, t+2) because capability development
may take time to materialize making it more difficult to capture in annual spells. Additionally,
we analyze models with a 3-year window and the results remained consistent with those
reported. Given the use of quadratic terms and their interactions, multicollinearity is a possible
concern. Cohen et al. (2003) prescribe testing the joint significance of highly correlated variables
if their coefficients are not significant. With the interaction terms and their interpretation, we
follow their recommendation in plotting values and not extrapolating beyond the data points
observed in our sample.
Robustness
Our sampling frame includes firms that went public; although this strategy is used in
prior studies (e.g., Phene et al., 2006; Shan et al., 2004; Sorensen and Stuart, 2000), this could
bias our sample to firms that undertook a risky strategy of entering new niches and survived. To
address this problem, we use a Heckman correction model followed by Gulati and Higgins
(2003). We find that the first-stage model is significant and the selection hazard ratio is also

Entry into New Niches
14
significant in the second-stage model. This suggests that sampling on surviving firms may indeed
lead to over estimation of the innovative activity. We include this correction in our estimation
and can say with a degree of confidence that our results are robust to survival bias. We do not
report these estimations because we use random effects models to specify the second stage
sample selection variable, as it is a firm level, time invariant variable. The pattern of results is
similar when we use fixed effects or random effects models implying that correcting for sample
selection does not change the pattern of results. We also run the Hausman test to check the
difference in using fixed effects and random effects estimations. We find that the test is not
significant indicating that using random effects may also be appropriate.
Furthermore, we conducted sensitivity analysis for the exclusion of outliers. We find that
excluding outliers does not change the significance of results for the theory variables. Also, we
checked for robustness with different conceptualizations of technological impact. We use a
simple count of citations received, net of self-citations, to compare with the average number of
citations received. These results are qualitatively similar and, in some cases, have greater
statistical significance than the average number of citations used to test our hypotheses.
Endogeneity. Our theory is conditional on the fact that a firm enters into a new domain,
i.e. it branches. Branching may be a strategic choice by a firm, which introduces a potential
endogeneity issue. Since there is no widely used standard estimation for endogeneity correction
for fixed effects Poisson models, we follow a method used by Ahuja and Lahiri (2006). In the
first stage, we estimated a probit model where the dependent variable takes the value of 1 if the
firm branches and otherwise 0. To estimate the first-stage equation, we need time varying
covariates that predict why some firms branch (and not others). These covariates should typically
be exogenous to the decision makers and the firms i.e. not in the control of managers. We use

Entry into New Niches
15
three exogenous variables constructed from longitudinal data of venture capital investment in
biotechnology to serve as identifiers for the first stage model that predicts branching.
The variables included were (1) the average investment made by a VC firm in a
biotechnology startup in the county of the firm, (2) the number of buyout and acquisition
transactions in a year in the firm’s county, and (3) the amount of annual federal funding grants
received in the firm’s county. The relevance of the instrument variables is obtained by the F-
statistic of the instruments which was 12.5. After estimating the first stage probit model with
branching as a dependent variable, we generated the Inverse Mills Ratio in STATA 9.0 using the
code by Hamilton and Nickerson (2003). In the second-stage model, we introduce the Inverse
Mills Ratio in place of the branching variable as an instrumented branching variable. When we
use the instrumented branching variable, we find that the results are qualitatively similar to
branching as a count variable (results are available from the authors).
Since we have more instruments than the instrumented variable, we also conduct an over
identification test (Stock & Watson, 2003). The chi-square statistic is 0.78, insignificant from
zero (p=0.68) with two degrees of freedom. Consequently, over identification is not rejected and
all instruments are empirically sufficient and ought to be included in the estimation. The multiple
alternative estimations we use, i.e. controlling for sample selection and endogeneity; using
different operationalizations of the dependent variable; and alternative versions of branching
distance variables, all yield qualitatively similar results. In sum, we took adequate precautions to
ensure appropriate interpretation of the results described below.
RESULTS
In Table 1, we report the descriptive statistics of the key variables by age of the firm
using three age cohorts. Though entirely possible that startups may be formed to exploit an

Entry into New Niches
16
entrepreneurial opportunity drawn from distant technological domains, our data captures this
distance by comparing the firm’s second patent application to its first application. Also, we see
that branching into a new technological niche is not necessarily prevalent only in mature firms.
In our sample, 7% of firms branched in the first year after incorporation, increasing to 26% and
38% in years two and three. On average, 41% of the firms entered a new technological niche
every year. In Table 2, we provide the descriptive statistics and correlations for all the variables
used in this study.
------------------------------------------------------
Insert Tables 1 - 3 and Figures 1 – 4 Here
------------------------------------------------------
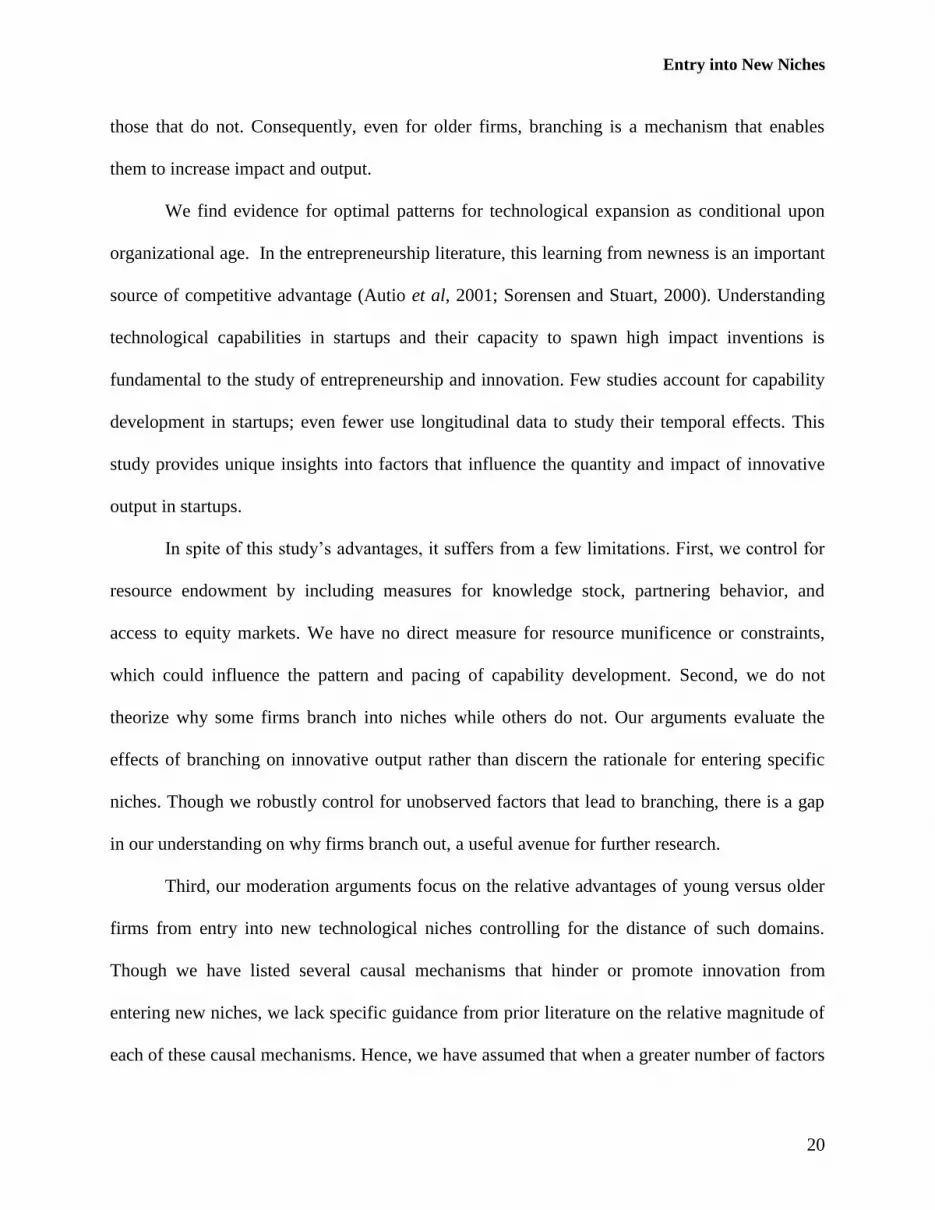
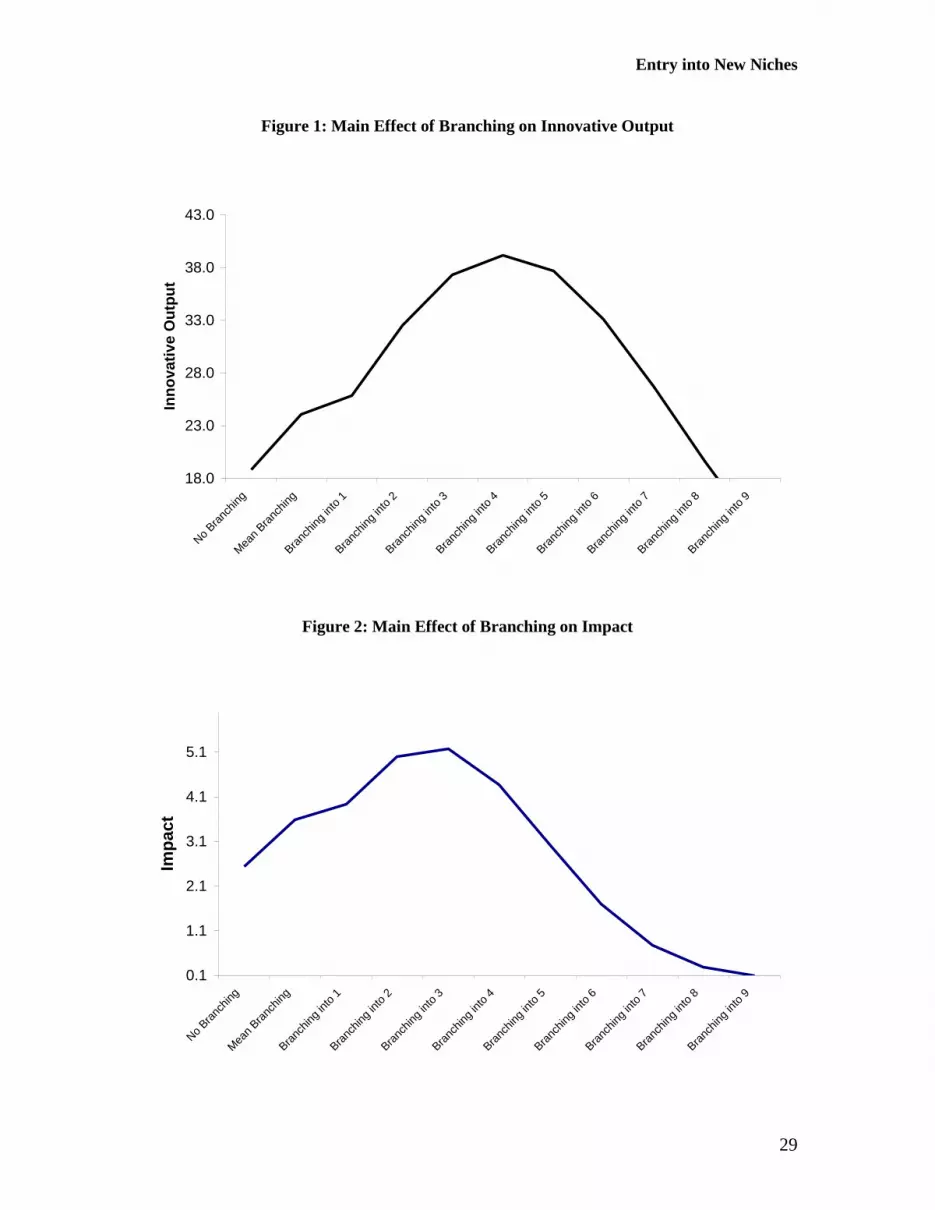
Hypotheses 1a and 1b predict the main effects of branching on innovative output and
impact. The coefficients for branching linear (b=1.924 and p<.001 in Model 3, Table 3) and
squared term (b= -.243, p<.001) are positive and negative respectively suggesting an inverse ‘U’
shaped relationship as predicted. For branching and impact, we find that coefficient of the linear
term is positive and significant (b=3.036, p <.001 in Model 6, Table 3) and squared term is
negative and significant (b= -.666, p <.001). The plots in Figures 1 and 2 support our
predictions2.
Hypothesis 2a suggests a positive moderation by firm age on the relationship between
branching and innovative output (Model 3, Table 3). Since we have a non-linear model (Poisson)
and non-linear interaction terms, we cannot determine significance from simple estimates
(Wiersema & Bowen, 2009). Instead, we employ a delta method to derive standard errors for
marginal effects of branching at different ages and then examine the difference of marginal
2 Figure 1 is drawn using the coefficient estimates from Model 3 (Table 3) and Figure 2 uses estimates
from Model 6 (Table 3). We follow Aiken, West and Reno (1991) by holding all other variables in the
estimation at their mean (average) values and plot the main effect of the branching variable on innovative
output (Figure 1) and impact (Figure 2).

Entry into New Niches
17
effects between older and younger firms. This method is useful when standard errors of estimates
are not linearly derived (Wooldridge, 2001: p. 44). First, we estimate the marginal effect of
branching from zero into one new domain on innovative output for both younger and older firms.
This marginal effect is 5.5 and 20.2 for younger and older firms respectively and is statistically
different from zero (both at p<.01). Then, we follow the same delta method to test if the slope of
the line for older firms is statistically different from the slope of the line for younger firms. The
t-statistic is significant at p<.01 level. We also test when firms branch from 1 to 2 niches, and
from 2 to 3 niches, for younger and older firms and find similar results. There is, however, no
significant difference in output as younger and older firms branch from 3 to 4 niches (p<.15). To
summarize, older firms have a higher increase in output (slope) when they enter one to three
niches (mean plus two standard deviations). This evidence supports the positive moderation of
firm age of the relationship between branching and output, when firms enter up to three new
domains and no statistically significant difference thereafter (Figure 3).
Hypothesis 2b predicts a negative moderation effect of firm age on the relationship
between branching and impact (Model 6, Table 3). That is, younger firms will have stronger
increases in impact from branching than older firms. We use the method outlined above to assess
the marginal effects and their difference. When younger firms branch from zero into one niche,
their impact increases from 1.7 to 6.8, and for older firms it increases from 1.4 to 2.2. Both
marginal effects and difference between the two marginal effects are statistically significant at
p<.05. The steepest increase occurs when younger firms expand from one to two new niches. For
younger firms, impact increases from 6.8 to 12.9, and for older firms, it increases from 2.2 to 2.9
when entering two technical niches. When firms entered three niches, there is decline in impact
for younger firms (12.9 to 11.2) and a marginal increase for older firms (2.9 to 3.2). This

Entry into New Niches
18
suggests that the positive moderation for younger firms extends only up to branching into two
niches (Figure 4).
Whereas our results appear to support the curvilinear relationship between branching and
the dependent variables, the mean value of branching is 0.7, and not many firms branch into
more than 4 technology niches in a given window. We conducted additional analyses to check if
our results are driven by one or two firms branching into many niches. We find that the
curvilinear inflection point occurs when branching from four to five niches, for innovative
output, and from two to three niches, for impact. We find that 55 unique firms, 40% of our
sample, branch into three or more niches. Consequently, the results of the impact variable are not
driven by a few firms branching often. For innovative output, 13 firms or 10% of our sample
branch into five or more niches, and may likely influence the curvilinear pattern for output.
DISCUSSION
This study adds to the literature by examining how the patterns of exploration by young
and older firms have different implications for the quantity and technological impact of the
firm’s innovative activity. The results highlight the critical role of timing on capability
development, i.e., when do organizations benefit from expanding their investments in
technological capabilities? Recent theoretical arguments posit that startups face a dilemma on
whether to invest upfront in the development of capabilities that strain the resource-constrained
young firm or have a more gradual investment in capabilities (Sapienza et al., 2006). Similarly,
researchers also question the import of timing of capability development and reconfiguration in
mature firms (Helfat and Peteraf, 2003; Lavie, 2006). In a theoretical account of early
internationalization of startups, Sapienza et al. (2006) argue that investments in developing new
capabilities to enter international markets may decrease short term survival prospects but

Entry into New Niches
19
increase long term growth potential of these nascent organizations. In contrast, older firms tend
to produce incremental innovative output and may consider expanding their technological
capabilities by entering new niches to revitalize their R&D and product pipelines (Ahuja and
Lampert, 2001). Our study reveals that when firms enter two new technological niches, younger
firms benefit greatly by enhanced impact (7.6 times more citations than younger firms that do not
branch) and older firms are able to generate more output (2.1 times more output than older firms
that do not branch).
The results provide evidence to bolster Zott (2003)’s simulation study which found that
firms that invested in early capability development sustained superior performance advantages in
subsequent years. Even in the resource-constrained environments of startups (George, 2005), we
find that the early expansion of technological capabilities by entry into two new technological
niches accrue significant advantages by enhancing innovative output (from 1.8 to 19.7 patents).
Earlier, we discussed the nearly seven-fold increase in impact for startups. Taken together,
branching increases both output and impact in younger firms, though the magnitude of benefits
for impact is manifestly higher than output. Therefore, the age at which investments in
expanding technological capabilities are made, indeed, influences the nature of the payoffs that
accrue to such investments.
Older firms are able to generate greater increase in quantity of innovative output from
entering two niches when compared to younger firms (1.6 times more patents). Although older
firms double (from 1.4 to 2.9) their impact by entering two technical niches, they have a lower
boost from branching when compared to younger firms (1.7 vs. 12.9 citations per patent). It is
important though to consider the doubling of impact when older firms branch out relative to
Entry into New Niches
20
those that do not. Consequently, even for older firms, branching is a mechanism that enables
them to increase impact and output.
We find evidence for optimal patterns for technological expansion as conditional upon
organizational age. In the entrepreneurship literature, this learning from newness is an important
source of competitive advantage (Autio et al, 2001; Sorensen and Stuart, 2000). Understanding
technological capabilities in startups and their capacity to spawn high impact inventions is
fundamental to the study of entrepreneurship and innovation. Few studies account for capability
development in startups; even fewer use longitudinal data to study their temporal effects. This
study provides unique insights into factors that influence the quantity and impact of innovative
output in startups.
In spite of this study’s advantages, it suffers from a few limitations. First, we control for
resource endowment by including measures for knowledge stock, partnering behavior, and
access to equity markets. We have no direct measure for resource munificence or constraints,
which could influence the pattern and pacing of capability development. Second, we do not
theorize why some firms branch into niches while others do not. Our arguments evaluate the
effects of branching on innovative output rather than discern the rationale for entering specific
niches. Though we robustly control for unobserved factors that lead to branching, there is a gap
in our understanding on why firms branch out, a useful avenue for further research.
Third, our moderation arguments focus on the relative advantages of young versus older
firms from entry into new technological niches controlling for the distance of such domains.
Though we have listed several causal mechanisms that hinder or promote innovation from
entering new niches, we lack specific guidance from prior literature on the relative magnitude of
each of these causal mechanisms. Hence, we have assumed that when a greater number of factors

Entry into New Niches
21
favor older or younger firms, then these firms indeed fare better. This may not be the case; for
example, we have limited information on whether the magnitude of the deleterious effects of
rigid mental models or lack of communication in mature firms compared to the benefits provided
by its higher absorptive capacity. A fruitful area for research could be to measure and test the
relative magnitude of the causal mechanisms such as the degree to which resource constraints
hamper investments in innovation in startups or the ossifying effect of rigid mental models or
routinization in more mature firms. Finally, we use patent-derived measures for technological
capabilities. Though appropriate for this study, the use of patent-based measures captures a
central, albeit partial, facet of a technological capability. An extension of this study might
consider finer-grained measures to articulate richer causal explanations on why startups enter
new niches and how these firms direct their search behavior. Additional measures may include
the publication data of scientists, the complementary assets of partners, and the capital
investments in developing products, among others.
Limitations aside, we systematically examined the influence of branching on innovative
returns for firms. Our findings add to the entrepreneurship literature by suggesting conditions
under which innovative output is influenced by firm age. The results encourage future research
into the study of knowledge recombination and the discovery of entrepreneurial opportunities as
well as the temporal dynamics of capability development and its performance consequences.

Entry into New Niches
22
ACKNOWLEDGEMENTS
An earlier version of this paper was published in the Best Paper Proceedings of the Academy of
Management. The comments of Connie Helfat and two anonymous referees helped improve the
quality of this manuscript. We thank the seminar participants at ISB, London Business School, and
Will Mitchell for comments on earlier versions. This research was supported by the Advanced
Institute of Management (AIM) Innovation Fellowship (ESRC RES 331-27-0011).

Entry into New Niches
23
REFERENCES
Ahuja, G, Lahiri, N. 2006. Does vertical integration impact technology search? Evidence from
the semiconductor industry, Working Paper, University of Michigan.
Ahuja, G, Lampert, CM. 2001. Entrepreneurship in the large corporation: A longitudinal study of
how established firms create breakthrough inventions, Strategic Management Journal,
22: 521-543.
Aiken, L., West, S., Reno, R. 1991. Multiple regression: Testing and interpreting interactions.
Thousand Oaks, CA: Sage.
Autio, E, Sapienza, HJ, Almeida, JG. 2000. Effects of age at entry, knowledge intensity, and
imitability on international growth, Academy of Management Journal, 43: 909 – 924.
Amabile, TM. 1988. A model of creativity and innovation in organizations, Research in
Organizational Behavior, 10: 123-167.
Argote L. 1999. Organizational learning: Creating, retaining and transferring knowledge.
Boston, MA: Kluwer Academic Publishing.
Argyres, NS, Silverman, BS. 2004. R&D, Organization structure, and the development of
corporate technological knowledge, Strategic Management Journal, 25(8-9): 929-958.
Balasubramanian, N., & Lee, J. 2008. Firm age and innovation, Industrial and Corporate
Change, 17(5): 1019-1047.
Barron, DN, West, E, Hannan, MT. 1994. A time to grow and a time to die - Growth and
mortality of credit unions, American Journal of Sociology, 100(2): 381-421.
Basalla, G. 1988. The Evolution of Technology. Cambridge University Press: Cambridge, MA.
Cohen, J, Cohen, P, West, SG, Aiken, LS. 2003. Applied Multiple Regression/Correlation
Analysis for the Behavioral Sciences, 3rd ed. Hillsdale: Erlbaum
Cohen, WM, Levinthal, DA. 1990. Absorptive-capacity - A new perspective on learning and
innovation. Administrative Science Quarterly, 35(1): 128-152.
Dushnitsky, G, Lenox, MJ. 2005. When do firms undertake R&D by investing in new ventures?,
Strategic Management Journal, 26(10): 947-965.
Ethiraj, S, Puranam, P. 2004. The distribution of R&D effort in systemic industries: Implications
for competitive advantage. In J. Baum and A. McGahan, Eds., Business Strategy over the
Industry Life Cycle, Advances in Strategic Management 21. Oxford, UK: Elsevier Press.
Fan, T. 2010. De novo venture strategy: Arch incumbency at inaugural entry. Strategic
Management Journal, 31: 19-38
Fleming, L. 2001. Recombinant uncertainty in technological search, Management Science, 47(1):
117-132.
Fleming, L, Sorenson, O. 2004. Science as a map in technological search, Strategic Management
Journal, 25(8-9): 909-928.
George, G. 2005. Slack resources and the performance of privately held firms, Academy of

Entry into New Niches
24
Management Journal, 48(4): 661-676.
George, G., Kotha, R., Zheng, Y. 2008. The puzzle of insular domains: a longitudinal study of
knowledge structuration and innovation in biotechnology firms. Journal of Management
Studies, 45: 1448 - 1474.
George, G., Zahra, S., Wood, D. 2002. The effects of business-university alliances on innovative
output and financial performance: A study of publicly traded biotechnology companies,
Journal of Business Venturing, 17(6): 577-609.
Gilad, B. 1984. Entrepreneurship - the issue of creativity in the marketplace, Journal of Creative
Behavior, 18(3): 151-161
Greene, W. 1998. Econometric Analysis. Prentice Hall: New Jersey.
Griliches, Z. 1990. Patent statistics as economic indicators - A survey, Journal of Economic
Literature, 28(4): 1661-1707.
Hall, BH, Jaffe, A, Trajtenberg, M. 2005. Market value and patent citations, RAND Journal of
Economics, 36(1): 16-38.
Hamilton B, Nickerson J. 2003. Correcting for endogeneity in strategic management research,
Strategic Organization, 1: 53-80
Helfat, CE., Peteraf, M. 2003. The dynamic resource-based view: Capability lifecycles, Strategic
Management Journal, 24(10): 997-1010.
Henderson, R. 1993. Underinvestment and incompetence as responses to radical innovation -
Evidence from the photolithographic equipment industry, RAND Journal of Economics,
24(2): 248-270.
Henderson, R, Cockburn, I. 1994. Measuring competence: Exploring firm effects in
pharmaceutical research, Strategic Management Journal, 15: 63-84.
Huang, K, Murray, F. 2009. Does Patent Strategy Shape the Long-run Supply of Public
Knowledge? Evidence from Human Genetics. Academy of Management Journal. 1193-
1221
Kaplan, S, Murray, F, Henderson, R. 2003. Discontinuities and senior management: Assessing
the role of recognition in pharmaceutical firm response to biotechnology, Industrial and
Corporate Change, 12(2): 203-233.
Katila, R, Ahuja, G. 2002. Something old, something new: A longitudinal study of search
behavior and new product introduction, Academy of Management Journal, 45(6): 1183-
1194.
Kogut, B, Zander, U. 1992. Knowledge of the firm, combinative capabilities, and the replication
of technology, Organization Science, 3(3): 383-397.
Lacetera, N, Cockburn, IM, Henderson, R. 2004. Do firms change capabilities by hiring new
people? A study of the adoption of science-based drug discovery. In J. Baum and A.
McGahan, Eds., Business Strategy over the Industry Life Cycle, Advances in Strategic
Management 21. Oxford, UK: Elsevier Press.
Lavie, D. 2006. Capability reconfiguration: An analysis of incumbent responses to technological

Entry into New Niches
25
change, Academy of Management Review, 31(1): 153-174.
Lee, F., Edmondson, A. C., Thomke, S., & Worline, M. 2004. The mixed effects of
inconsistency on experimentation in organizations, Organization Science, 15: 310-326.
Lerner, J. 1994. The importance of patent scope: an empirical analysis, RAND Journal of
Economics, 25(2): 319-333.
March, JG. 1991. Exploration and exploitation in organizational learning, Organization Science,
2: 71-87.
Mosakowski, E.1998. Entrepreneurial resources, organizational choices, and competitive
outcomes, Organization Science, 9(6): 625-643.
Nelson, RR, Winter, SG. 1982. An Evolutionary Theory of Economic Change. Cambridge, MA:
Belknap Press.
Nerkar, A. 2003. Old is gold? The value of temporal exploration in the creation of new
knowledge, Management Science, 49(2): 211-229.
Nohria, N, Gulati, R. 1996. Is Slack Good or Bad for Innovation?, Academy of Management
Journal, 39(5): 1245-1264.
Penrose, E.1959. The Theory of the Growth of the Firm. New York: Wiley.
Phene, A, Fladmoe-Lindquist,K, Marsh, L. 2006. Breakthrough innovations in the US
biotechnology industry: the effects of technological space and geographic origin,
Strategic Management Journal, 27(4): 369-388.
Pisano, GP. 1994. Knowledge, integration, and the locus of learning - An empirical-analysis of
process-development, Strategic Management Journal, 15: 85-100.
Powell, WW, Koput, KW, Smith-Doerr, L. 1996. Inter-organizational collaboration and the locus
of innovation: Networks of learning in biotechnology, Administrative Science Quarterly,
41(1): 116-145.
Powell, WW, White, DR, Koput, KW, Owen-Smith, J. 2005. Network dynamics and field
evolution: The growth of inter-organizational collaboration in the life sciences, American
Journal of Sociology, 110(4): 1132-1205.
Rosenkopf, L, Nerkar, A. 2001. Beyond local search: Boundary-spanning, exploration, and
impact in the optical disk industry, Strategic Management Journal, 22(4): 287-306.
Rothaermel, F. T., Boeker, W. 2008. Old technology meets new technology: Complementarities,
similarities, and alliance formation, Strategic Management Journal, 29(1): 47-77.
Sampson, RC. 2005. Experience effects and collaborative returns in R&D alliances, Strategic
Management Journal, 26(11):1009-1031.
Sapienza, HJ, Autio, E, George, G, Zahra, S. 2006. A capabilities perspective on the effects of
early internationalization on survival and growth, Academy of Management Review,
31(4): 914-933.
Schumpeter, JA. 1939. Business Cycles. New York: McGraw-Hill.
Shan, WJ, Walker,G, Kogut, B. 1994. Interfirm cooperation and startup innovation in the

Entry into New Niches
26
biotechnology industry, Strategic Management Journal, 15(5): 387-394.
Sorensen, JB, Stuart, TE. 2000. Aging, obsolescence, and organizational innovation,
Administrative Science Quarterly, 45(1): 81-112.
Stinchcombe, A. 1965. Social structure and organizations. In J.G. March, Handbook of
Organizations, 142-193, Chicago: Rand McNally.
Stock, J & Watson, M. 2003. Introduction to Econometrics, The Addison-Wesley Series in
Economics, 2nd Edition, Reading, MA: Addison Wesley.
Stuart, TE. 2000. Inter-organizational alliances and the performance of firms: A study of growth
and innovation rates in a high-technology industry, Strategic Management Journal,
21(8): 791-811.
Whiting, BG. 1988. Creativity and entrepreneurship - How do they relate?, Journal of Creative
Behavior, 22(3): 178-183.
Yayavaram, S., & Ahuja, G. 2008. Decomposability in knowledge structures and its impact on
the usefulness of inventions and knowledge-base malleability, Administrative Science
Quarterly, 53(2): 333-362.
Zahra, SA, George, G. 2002. Absorptive capacity: A review, reconceptualization, and extension,
Academy of Management Review, 27(2): 185-203.
Zheng, Y., Liu, J., George, G. 2010. The dynamic impact of innovative capability and inter-firm
network on firm valuation: A longitudinal study of biotechnology start-ups, Journal of
Business Venturing, doi:10.1016/j.jbusvent.2009.02.001
Zott, C. 2003. Dynamic capabilities and the emergence of intra-industry differential firm
performance: insights from a simulation study. Strategic Management Journal, 24: 97-
125.
Zucker, LG, Darby, MR, Brewer, MB. 1998. Intellectual human capital and the birth of US
biotechnology enterprises, American Economic Review, 88(1): 290-306.
Wooldridge, J.M. 2001. Econometric Analysis of Cross Section and Panel Data. Boston, MA:
MIT Press.

Entry into New Niches
27
TABLE 1
Descriptive Statistics by Age of the Firm
Variables
Age ≤ 5 years
(n =650)
Age 6 to 12 years
(n = 686)
Age > 12 years
(n = 183)
Mean s.d. Min Max Mean s.d. Min Max Mean s.d. Min Max
Innovative Output (t+1, t+2) 3.77 13.08 0 270 5.16 12.50 0 261 6.33 13.02 0 77
Technology Impact (5 year window) 3.21 14.58 0 184 4.87 12.69 0 137 5.04 17.47 0 172
Branching (2 year window) 0.55 0.93 0 6 0.93 1.20 0 9 0.73 1.09 0 6
Note: Data are in firm-years for panel, number of firms = 128
TABLE 2
Descriptive Statistics and Correlations
Variables Mean Std. Dev. Min. Max. 1 2 3 4 5 6 7 8 9 10 11
1 Quantity of Innovative Output 4.5 13.2 0 270 1
2 Technology Impact 4.2 14.2 0 184 .01 1
3 Knowledge Stock 5.0 11.7 0 265.8 .52 .18 1
4 Number of Alliances (t) 0.6 1.0 0 9 .28 .08 .28 1
5 Prior Alliances ( t-1….t-n) 3.0 4.3 0 27 .23 .10 .45 .29 1
6 Achieved IPO 0.6 0.5 0 1 .15 .07 .25 .10 .41 1
7 Depth of capabilities 2.5 6.2 0 71 .27 .09 .54 .10 .46 .30 1
8 Breadth of capabilities 1.1 1.7 0 12 .33 .23 .59 .14 .45 .40 .65 1
9 Age 6.9 4.2 1 18 .09 .09 .27 .03 .50 .62 .47 .48 1
10 Branching 0.7 1.1 0 9 .28 .23 .33 .13 .19 .21 .10 .26 .13 1
11 Branching Distance 0.1 0.2 0 0.9 .15 .19 .10 .07 .09 .12 -.04 .07 .05 .47 1
Year dummies not reported, Number of observations = 1519. All correlations greater than .08 are significant at .001 level.

Entry into New Niches
28
TABLE 3
Fixed-Effects Poisson Regression
Dependent Variable Innovative Output (Patent Count) Technology Impact (Citations Received/Output) Model 1 Model 2 Model 3 Model 4 Model 5 Model 6
Knowledge Stock .004*** (.001) .003*** (.001) .003*** (.001) .009*** (.001) .006*** (.001) .009*** (.001)
Number of Alliances (t) .066*** (.010) .068*** (.010) .080*** (.010) .044*** (.012) .055*** (.012) -.040** (.014)
Prior Alliances ( t-1….t-n) .060*** (.008) .058*** (.008) .063*** (.008) -.016* (.007) -.009 (.007) -.045*** (.007)
Achieved IPO .005 (.059) .063 (.059) .068 (.060) .019 (.053) .026 (.054) -.002 (.055)
Depth of capabilities -.007* (.003) -.003 (.003) .005 (.003) -.017*** (.003) -.014*** (.003) -.003 (.003)
Breadth of capabilities -.048*** (.012) -.019 (.012) -.001 (.013) .222*** (.011) .252*** (.011) .251*** (.012)
Age .451*** (.024) .404*** (.025) .758*** (.036) .051** (.019) .007 (.020) .226*** (.026)
Age-sq. -.016*** (.001) -.015*** (.001) -.034*** (.002) -.004*** (.001) -.003** (.001) -.013*** (.001)
Distance 2.856*** (.243) 2.381*** (.255) 1.944*** (.257) 4.952*** (.224) 4.074*** (.237) 3.938*** (.245)
Distance-square -2.596*** (.352) -2.214*** (.357) -1.840*** (.356) -3.197*** (.305) -2.386*** (.312) -2.703*** (.317)
Branching .238*** (.030) 1.924*** (.140) .150*** (.013) 3.036*** (.128)
Branching –square -.036*** (.006) -.243*** (.033) -.666*** (.033)
Age* Branching -.419*** (.035) -.523*** (.030)
Age-sq.*Branching .021*** (.002) .023*** (.002)
Age* Branching-sq. .054*** (.008) .117*** (.008)
Age-sq.*Branching-sq. -.003*** (.000) -.005*** (.000)
Year dummies Included Included Included Included Included Included
Chi-square 3255.1 3290.4 3145.4 3822.5 3881.4 4341.8
Log likelihood -2520.3 -2486.0 -2327.5 -6527.8 -6463.8 -6057.3
Chi-square change 66.69*** 289.48*** 448.62*** 427.30***
Standard errors in parentheses * p < 0.05, ** p < 0.01, *** p < 0.001
Entry into New Niches
29
Figure 1: Main Effect of Branching on Innovative Output
18.0
23.0
28.0
33.0
38.0
43.0
No
Branc
hing
Mea
n Bra
nching
Bra
nching
into
1
Bra
nching
into
2
Bra
nching
into
3
Bra
nching
into
4
Bra
nching
into
5
Bra
nching
into
6
Bra
nching
into
7
Bra
nching
into
8
Bra
nching
into
9
Inn
ov
ati
ve
Ou
tpu
t
Figure 2: Main Effect of Branching on Impact
0.1
1.1
2.1
3.1
4.1
5.1
No
Branc
hing
Mea
n Bra
nching
Bra
nching
into
1
Bra
nching
into
2
Bra
nching
into
3
Bra
nching
into
4
Bra
nching
into
5
Bra
nching
into
6
Bra
nching
into
7
Bra
nching
into
8
Bra
nching
into
9
Imp
act

Entry into New Niches
30
Figure 3: Moderation by Age of Relationship between Branching and Innovative Output
0.0
10.0
20.0
30.0
40.0
50.0
60.0
70.0
80.0
90.0
No
Branc
hing
Mea
n Bra
nching
Bra
nching
into
1
Bra
nching
into
2
Bra
nching
into
3
Bra
nching
into
4
Bra
nching
into
5
Bra
nching
into
6
Bra
nching
into
7
Bra
nching
into
8
Bra
nching
into
9
Inn
ov
ati
ve
Ou
tpu
t
Younger Older
Figure 4: Moderation by Age of Relationship between Branching and Impact
0.4
1.4
2.4
3.4
4.4
5.4
6.4
7.4
8.4
9.4
10.4
11.4
12.4
No
Branc
hing
Mea
n Bra
nching
Bra
nching
into
1
Bra
nching
into
2
Bra
nching
into
3
Bra
nching
into
4
Bra
nching
into
5
Bra
nching
into
6
Bra
nching
into
7
Bra
nching
into
8
Bra
nching
into
9
Imp
ac
t
Younger Older