finding the voice: planning and evaluation of social media in cultural institutions
TRANSCRIPT
MW2016: Museums and the Web 2016
The annual conference of Museums and the Web | April 6-
9, 2016 | Los Angeles, CA, USA
Finding the voice: Planning and evaluation
of social media in cultural institutions
Rod Fleming, University of Strathclyde, Glasgow, UK, Areti Damala, University of
Strathclyde, Glasgow, UK
Abstract
Cultural institutions have sought to develop social media as a means of engaging with their
audiences. However, there is a lack of guidance about how to effectively evaluate
performance. A study was carried out to explore contemporary practices in cultural
institutions to better understand the challenges, methods, and strategies. This involved in-
depth interviews with social media managers at eight Scottish institutions and a worldwide
survey of one hundred organisations. The participants were asked about how they use social
media, what their objectives are, and whether use of frameworks, toolkits, and strategies were
useful or indeed feasible. Results showed that despite various approaches, many institutions
share priorities and challenges. Although some preferred to be flexible, while others more
regimented, there is consensus that social media helps deliver on wider institutional goals and
strategies. There is also evidence that institutions want to better understand the impact of
their social media but often have problems capturing or interpreting relevant data, and all
institutions are responsive to tools that might help them do this. The research tested the
principles of one tool in particular, the Culture24 Evaluation Framework. Discussions with
participants revealed that while its concepts were relevant and valuable, there remained issues
with how it could be implemented, given incongruity with existing operations. Consequently,
the research proposes recommendations for developments in social media and evaluative
frameworks. The research concludes that institutions that have more defined strategy, even if
practices remain flexible, are more decisive and effective in their use of social media. Having
objectives and cycles allows better implementation of specific tools and frameworks.
Furthermore, careful consideration of the functionality of specific social media platforms
allows them to more effectively address specific targets and metrics.
Keywords: Social media, evaluation, strategy, digital, engagement, framework
1. Introduction
From messaging family back home to documenting a conference, and from tracking the latest
travel news to making customer enquiries of hotels and airlines, social media has become a
central part of our personal and commercial lives. We expect it—of friends, families, and
businesses. Cultural institutions are equally aware of this, and in recent years there have been
developments in the application and understanding of social media by museums, archives,

libraries, and other cultural institutions. More institutions are becoming present, recognisable,
outgoing, analytical, and tactical in their use of social media.
However, like any other businesses, these institutions have to find an approach that works for
their own particular circumstances, with few definitive rules and an ever-changing
environment. Combine this with trends within the sector towards reduced resources, a
marketplace crowded and complicated by technology, and an ethos of universality and
inclusivity, and cultural institutions face significant challenges to deploying effective social
media.
This paper focuses on devising and planning for strategic development and evaluation of
social media. Combining a thorough literature review and existing frameworks for planning
and measuring social media impact, we present the results of a survey used to explore the
current practices of cultural institutions on social media, validate a proposed tool for cultural
institutions (the Culture24 Evaluation Framework), and provide recommendations and best
practices. These include having a clear purpose and strategy for implementing social media
and analytic tools, planning for the use of functionalities of particular platforms, and sharing
knowledge and experience in order to optimise social media performance.
2. Literature review
Over the last decade, the literature has slowly developed from early exposition of the merits
and functions of social media towards more discursive consideration of planning and best
practices: we now know that that social media use is about two-way communication, and that
receipt of such user input could be used to help make strategic decisions (Fernandez, 2009,
36). With this, there was the introduction of tools to help plan social media (like SWOT and
PEST analysis), with the overall intention of securing stakeholder support and developing
loyalty to the institution. Around the same time, social media was seen as increasingly vital
for competitiveness in terms of loyalty and technology (Kho, 2011), while people were also
becoming more accustomed to participatory learning and entertainment experiences, and
expected interactivity from cultural institutions, too (Simon, 2010).
This early focus on justification prompted subsequent attention on strategy and evaluation.
Romero (2011) described how branding had been the primary goal of social media, but that
institutions now increasingly sought a return on investment (ROI) from all their activities,
including social media. As a result, institutions needed to conceive of social media
differently, exploring deeper functions of social media beyond simply marketing: there was
potential savings in terms of offering user services, and the informal tone of social media
meant it was suited for introducing new interactive provisions. Furthermore, social changes in
this time had an impact on academic discourse of social media: social media grew because it
gave the users themselves more influence (Universal McCann, 2010, 2014). Consequently,
discussions about whether and how to use social media evolved towards assessing its
effectiveness. Because of the increased possibilities seen in social media, they became like
any other institutional function that faced the “age-old challenges of demonstrating value and
assessing efforts” (Colburn & Haines, 2012). Social media was now used out of both
opportunity and obligation.
In addressing this shift in emphasis, recent literature has also reflected on the challenges in
optimising social media performance. Simon (2010, 315) notes how social media are in

“perpetual beta,” remaining a work-in-progress in order to respond to user behaviour.
Information professionals have always planned for technology, but there exists little formal
strategy for social media, because it is both new and changeable (Steiner, 2012). Institutions
now believe that technology has changed audience expectations and put pressure on them to
participate in social media, at a time when budgets and resources are limited (Thomson et al.,
2013). Sometimes the challenge is not whether to use social media, but in deciding which
other tasks have to be dropped to accommodate it (Kho, 2011). Information professionals
have also experienced problems in adapting due to misconception of the ephemeral and
reciprocal nature of social media, which contrasts with traditions of preservation (Solomon,
2011). A lack of understanding and experience extends to planning and evaluation because,
without a clear understanding of the aims for social media, it is even more difficult to plan
and evaluate appropriately (Steiner, 2012; Cadell, 2013).
Concurrently, there is also a lack of empirical examples of contemporary practice of social
media evaluation tactics in cultural institutions; evidence tends towards brief overviews of
particular initiatives, as was the case for the New York Public Library and University of
Southern California, that highlight a few examples of best practice in social media strategy
(Steiner, 2012), or with the Save Ohio Libraries campaign’s harnessing of “social capital”
(Solomon, 2011). A recent development of more detailed analysis rather than anecdotal
evidence is shown in Showers (2015), which features case studies specific to library
analytics, including in Harvard Library and the British Library. This publication shows a
more concerted effort to formalise evaluation, towards a “realization that the real power lies
in our ability to collect, share and interrogate data at ever greater scales” (Showers, 2015, 20).
Across these texts is a shift from strategy being optional or advantageous, to being essential
for ongoing management. Steiner (2012) asserts that social media strategy helps institutions
be more proactive in using and monitoring available tools. Simon (2010, 16) argues that it is
not enough to use social media just because visitors enjoy it, because it “trivialises the
mission-relevance” of the interactions. Similarly, Solomon (2011) asserts that a lack of
strategy means there is no clear picture of what success is, so no way to progress, while
Stuart (2009) argues that, without a specific purpose for social media, it is impossible to
construct useful metrics to justify or reappraise its activities.
Strategies help explain social media’s benefits, making it easier to justify evaluation; people
do not like to be measured and need to know why it is needed (Stuart, 2014). Strategies are
also essential because the key to long-term success is to know where user and institution
objectives align (Universal McCann, 2014). Organisations need to match their social media to
their users’ methods, and to identify this they require evidence.
Consequently, Web analytics tools is a growing topic. Social media is inherently intangible
and difficult to measure; therefore, both qualitative and quantitative measures are needed
(Fichter & Wisniewski, 2008). Analytics are a way of substituting the monetary factor of ROI
calculations with a different type of revenue, such as number of visitors (Romero, 2011).
While surveys can lack accuracy due to relying on self-reporting, analytics retain a degree of
neutrality (Colburn & Haines, 2012). In a more recent development, Showers (2015) argues
that metrics such as page views and likes are no longer enough, because these features are
evolving. He advocates continual questioning of the motivation behind certain measurements,
achieved by reviewing a wide range of metrics.

Inherent in this is a desire to define and measure impact. Thompson et al. (2013, 30) found
that 56% of institutions say social media has a “major impact” on boosting public profile,
while 53% say it improves their engagement with the public. Simon (2010, 172), meanwhile,
states that social media’s greatest impact comes from its “spreadability.” Flores (2014, 197)
describes impact in terms of influence, information, relationship, and trust—and interestingly
found that social media is never among the preferred “touchpoints” for any of these impact
dimensions. It is therefore evident that there is no single strategy or framework for measuring
impact, because impact can be conceived in various ways. This stands to emphasise the
importance of individual institutions planning and evaluating social media in order to
ascertain their own conception of impact. This is where frameworks, which can help
institutions do this, have begun to feature in the literature.
An early model features in Fichter and Wisniewski (2008, 55). They cite the “Trinity
Approach” developed by Avinash Kaushik as a means of measuring success based on
defining three factors: behavioural data, the outcome, and the experience. Respectively, this
means institutions should collect the data they think is suitable, answer the questions of what
this data means, and then use this to explain why this is worthwhile. The writers propose that
the approach is a way of combining both quantitative and qualitative measurements through
analytics, and thus help “chart our course”: social media can encourage, promote, innovate,
learn, adapt, improve customer service, and discover and deliver what users want. While
these motivations are not developed further, they are comparable to the “themes” that feature
in Culture24’s subsequent framework.
Another proposed framework is the Impact Toolkit designed by the Chartered Institute of
Library and Information Professionals (CILIP, 2015). This toolkit provides “courses” on six
stages of demonstrating impact that first help identify objectives and then help demonstrate
them through appropriate communications. The third course, on “impact and evidence,” uses
the Evaluating Impact Model developed by Markless and Streatfield (2013), which prescribes
two sides to evaluation: service performance measurements, which will be based on specific
activities and more statistical data; and “impact on people,” which is more qualitatively based
on criteria and collecting evidence. This toolkit is flexible in how it can be utilised, but
maintains an emphasis on having a deliberate approach to social media and use of analytics to
justify this.
A third framework has developed in Universal McCann’s annual Web behaviour research. In
Wave 7 (Universal McCann, 2014, 37), they introduce the concept that “even the most
superficial social media activity is driven by one or more ‘human needs’: learning,
relationships, diversion, progression or recognition.” The conclusion is that people value
organisations, or “brands,” that help them meet these needs, and therefore organisations
should direct their social media accordingly. By Wave 8 (Universal McCann, 2015), this has
developed to the more explicit recommendation that content is directed to specific objectives.
There is a transition from simply identifying achievements, such as retweets, to considering
the underlying purpose behind them. Universal McCann’s model is not formalised into a
framework, but it reflects a strategic shift towards evaluating performance against audience
motivations.
This study focused on Culture24’s “Let’s Get Real” project, which has focused on helping
cultural institutions engage with audiences through digital platforms. Its second publication
includes the Evaluation Framework, designed to help institutions define their objectives
across six “themes,” each with corresponding targets and metrics. The framework helps

institutions decide what to measure, so that they could judge the extent to which their users’
behaviour corresponded with their aims. This could then also be applied to setting targets for
improvement—and prompt consideration of what the institution wants out of its social media.
The six “themes” could be summarised as follows:
• Community: maximising the institution’s audience
• Brand: improving the institutions image
• Marketing and Communication: increasing attendance or use of the institution’s
resources
• Interaction: having more frequent/qualitative interactions with the institution’s
audience
• Content: creating resources through digital collaboration
• Visitor Services: providing a digital point of service for the institution’s audience
The framework indicates that institutions focus on the theme that corresponds to their social
media’s purpose, and the framework then provides you with suggestions for measuring this
objective. For instance, if your priority is to achieve a community on social media, then your
target should be the size of your following, your metric will be the number of followers you
have, and the tool you use is the relevant social media analytic application, such as Twitter
Analytics. A poignant phrase in the study is that: “understanding what success and failure
look like is the key to knowing if you have achieved either.”
In this respect, a primary application of the framework is to help facilitate this understanding.
Relatedly, the framework gets institutions to “measure what they value, not value what they
measure”: in essence, the framework is as much about deciding what matters as it is about
evaluating particular statistics. Nevertheless, the challenge of prioritising one theme is
therefore a feature of the Framework under scrutiny. Furthermore, there is ambiguity about
whether the framework is more valuable as a step-by-step reporting tool or as something
more flexible. These were considered in the current study, which explored how institutions
might use such a tool.
3. Research questions and objectives
Steiner (2012, 1) encapsulates the current challenges suggesting that, no longer the
“gatekeepers” to information, cultural institutions are faced with having to create and
evaluate their social media content, or else users will do this for them. However, participatory
engagement often requires different outcomes and evaluative methods than those to which
cultural institutions are accustomed (Simon, 2010).
This study focused on the need for more explicit guidance on how to evaluate and assess
social media use. The main research question that emerged from the literature review is how
cultural can institutions better understand social media and its evaluation. This subsequently
produced three sub-objectives for the research:
• Explore the current understanding and practices of cultural institutions using and
evaluating social media, particularly with regard to challenges and impediments to
developing these practices

• Test an existing framework as a way of exploring these challenges; namely, compare
the principles in the Culture24 Evaluation Framework to assess its efficacy and
potential improvements
• Through this research, provide recommendations for best practice and practical
solutions for cultural institutions looking to explore the use of frameworks
In fulfilling these objectives, it was hoped that the study would demonstrate the overall
context of cultural institutions’ behaviours and outlook on the topic. As a byproduct of
surveying cultural institutions, it would also be possible to collect quantitative details of the
platforms, experience, and reach of cultural institutions, and potentially demonstrate whether
there was correlation between the use of strategy and the level of success on social media.
4. Methodology
In seeking to demonstrate contemporary context, the study sought both qualitative and
quantitative evidence from cultural institutions. This paper will focus on the results obtained
through an online survey aimed at capturing the experience of institutions from a range of
sectors and locations. The survey was designed to complement separate interviews with eight
Scottish cultural institutions. The interviews with local institutions explored their current
culture of planning and measuring social media, and their reaction to the Culture24
framework. Survey questions followed a similar structure, covering current practices,
perceptions of strategy and evaluation, and overall objectives.
On this last point, one survey question was a veiled testing of the Evaluation Framework.
Interviews indicated that rather than focus on one theme, each institution considered all
themes important to some extent. In the survey, we therefore sought to quantify the extent
that each theme was important, on a five-point scale from “Not Important” to “Top Priority.”
The results could then be used to show the importance of each theme and whether any were
more commonly higher priority.
No limitations or targets were set on participant numbers, and recruitment sought to attract as
many libraries, museums, archives, and similar institutions using different communication
channels (personal contacts, JISC message boards, forums dedicated to social media).
Culture24 were also engaged to utilise their connections with the relevant institutions.
More successful, however, was recruitment through a Twitter profile, @memoryorgstudy,
that communicated directly with institutions. Tweets were used to advertise the survey and
send direct invitations, while also encouraging institutions to share the survey with others via
retweets. The rationale for Twitter advertising was identified during interviews, which
indicated the ubiquity of Twitter in relevant institutions, as well as its nature as a source of
networking amongst institutions. The account engaged museums, libraries, and archives, as
well as interest groups, conferences, and high-profile personnel. Using Twitter also allowed a
clearer picture of success rates: institutions could more easily indicate their response by
retweeting, favouriting, or replying to the invitation.
Analysis was initially carried out on the results of each question individually. Secondly,
filters were applied to explore comparative results by institution type and geographical
location. Thirdly, each question was reviewed in more granular detail, though the application
of filters. This was done for key features from each question, to gain insight into potential

effects of certain criteria. Following initial analysis of the survey results as above, there was
also comparative analysis against the interview results; both interviews and the online survey
had a similar structure and topics, in particular when testing the Evaluation Framework’s
themes and principles. This meant that interview testimony could be set against a wider
context, and survey results could be compared to more empirical examples from interviews.
5. Results
Participants
There were a total of 101 responses to the survey. Of these, 31 were incomplete, including 17
that only completed the first question. The drop-off rate after this was less pronounced,
except for the final question, which saw five participants leave. There was a total of 70
completed question sets. 33 respondents (49%) were from the United Kingdom, and 17
respondents (25%) were from the United States. 29 respondents (43%) identified themselves
as museums. 11 respondents (16%) identified themselves as libraries. 9 respondents (13%)
identified themselves as archives. A further 25 respondents (37%) fell into other categories or
could not be discerned: this included universities, heritage sites, arts and cultural
organisations, and heritage projects.
Platforms in use
Twitter is almost universally used by cultural institutions, with 96% of respondents using this
media. Facebook follows at 84%, then YouTube (57%), and an official blog (47%). Perhaps
most notable is that Instagram (45%) is now used almost as widely as blogging, while
Pinterest and Flickr are other relatively novel platforms with significant usage.
The study found that institutions use between four and five platforms on average.
Furthermore, the range indicates that institutions use a few primary platforms, most
commonly Twitter and Facebook, and then a couple of supplementary platforms. It might
also be concluded that there is a slight tendency towards visual or image-based platforms
over text. Instagram, Pinterest, Flickr, and YouTube were more common than Google+,
Tumblr, and wikis.
Strategy
The second question asked the extent to which the institution thought strategically about
social media, with no consistent pattern among responses. 40% of institutions have a social
media strategy document, compared to 45% that do not. Social media policy documents were
slightly more common, with 49% of institutions possessing this, compared to 38% that do
not. Institutions’ use of specific targets and goals is also evenly split: 42% of respondents do
not set targets compared to 39% that do. These results indicates there is a roughly even split
between formal and informal approaches to social media.
The effect that having a strategy document has on other responses is also significant. The
study found that, when an institution has a social media strategy, it is overwhelmingly more
likely to have a policy, set specific goals, use analytics, and expect to spend more time on
social media in future.

Total
Have a social
media policy
Set specific
social media
targets/ goals
Use analytic
tools to
monitor web/
social media
Expect to
spend more
time on social
media
Yes No
NA/
don’t
know
Yes No
NA/
don’t
know
Yes No
NA/
don’t
know
Yes No
NA/
don’t
know
Have a
social
media
strategy
34 29 4 1 18 9 7 32 2 0 25 1 8
Do not
have a
social
media
strategy
38 9 28 1 13 24 1 25 11 2 24 7 7
NA/Don’t
know if
have a
social
media
policy
12 3 0 9 2 2 8 6 0 6 5 0 7
Table 1: effect of strategy document on other strategic activities
There is a degree of consensus regarding both the use of analytic tools and plans to spend
more time on social media in future. 75% of respondents use analytic tools, compared to 15%
that do not. This indicates that analytics are becoming fairly standard. However, results point
towards a variety of inconsistent approaches across respondents. While it is important to
point out that these results do not reveal whether the impact of a strategy is positive or
negative, they do perhaps indicate that a strategy provides more decisiveness regarding social
media activities.
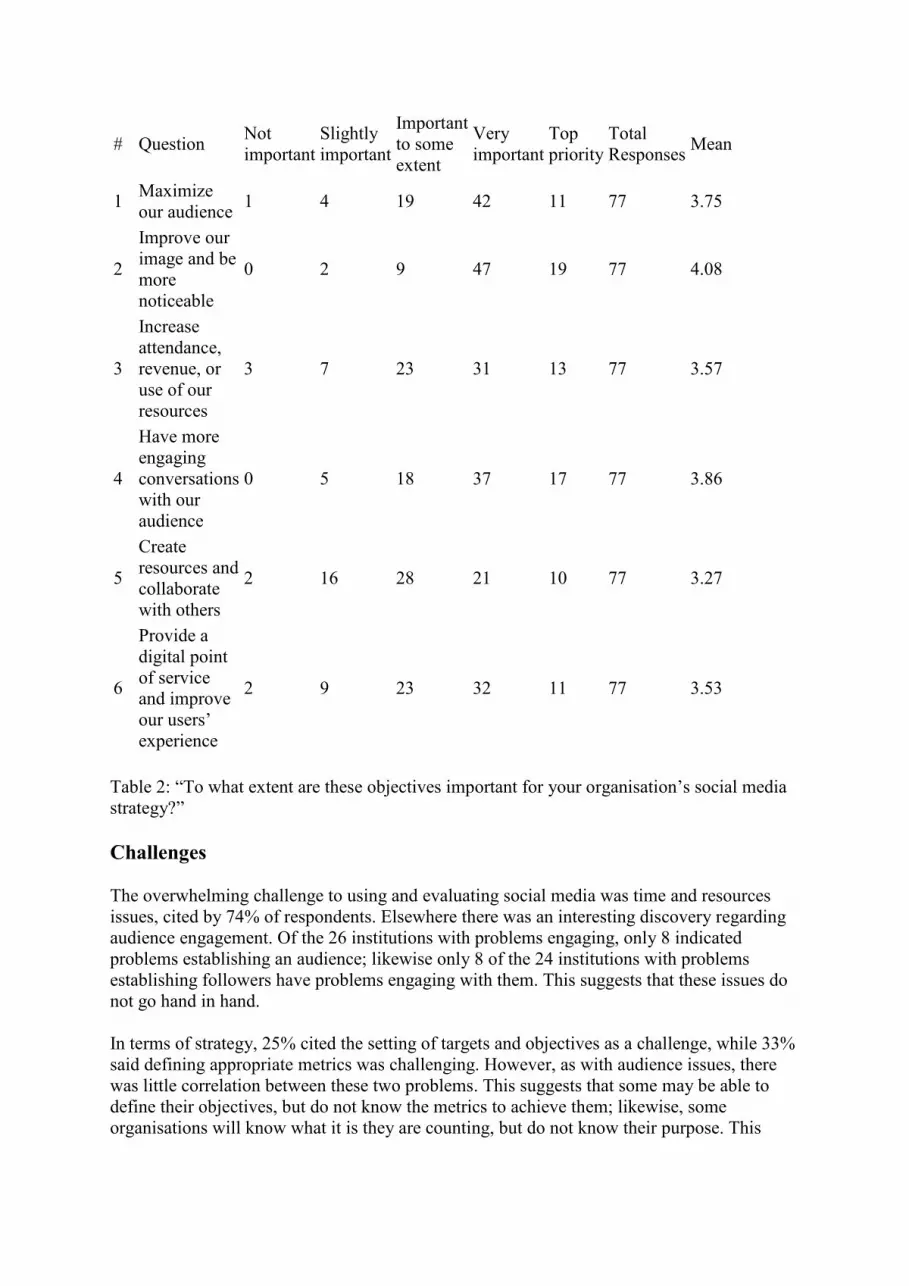
Objectives
Question 3 asked the extent to which a variety of objectives based on the themes of the
Culture24 Evaluation Framework were relevant to the institution. The first impression is that
all themes are considered important to some extent. Only six respondents chose any of the
themes, listed above, as “Not Important.”
By contrast, the most common response for five of the objectives was “Very Important”; only
the creation of resources received more responses for “Important to some extent.” The
weighting towards high importance validates each theme as appropriate, but also shows that
no single theme is predominant. Relatedly, there is significance among results for “Top
Priority” themes. Only 24 of the 77 respondents (31%) selected any of the themes as a top
priority. Furthermore, 19 of the 24 who gave a “Top Priority” selected more than one theme
as such. This indicates that, for a large majority of organisations, social media serves multiple
purposes.
# Question Not
important
Slightly
important
Important
to some
extent
Very
important
Top
priority
Total
Responses Mean
1 Maximize
our audience 1 4 19 42 11 77 3.75
2
Improve our
image and be
more
noticeable
0 2 9 47 19 77 4.08
3
Increase
attendance,
revenue, or
use of our
resources
3 7 23 31 13 77 3.57
4
Have more
engaging
conversations
with our
audience
0 5 18 37 17 77 3.86
5
Create
resources and
collaborate
with others
2 16 28 21 10 77 3.27
6
Provide a
digital point
of service
and improve
our users’
experience
2 9 23 32 11 77 3.53
Table 2: “To what extent are these objectives important for your organisation’s social media
strategy?”
Challenges
The overwhelming challenge to using and evaluating social media was time and resources
issues, cited by 74% of respondents. Elsewhere there was an interesting discovery regarding
audience engagement. Of the 26 institutions with problems engaging, only 8 indicated
problems establishing an audience; likewise only 8 of the 24 institutions with problems
establishing followers have problems engaging with them. This suggests that these issues do
not go hand in hand.
In terms of strategy, 25% cited the setting of targets and objectives as a challenge, while 33%
said defining appropriate metrics was challenging. However, as with audience issues, there
was little correlation between these two problems. This suggests that some may be able to
define their objectives, but do not know the metrics to achieve them; likewise, some
organisations will know what it is they are counting, but do not know their purpose. This

indicates that there is a clear market for the Evaluation Framework in terms of its function in
helping organisations frame their intentions.
Metrics
Results here suggest a lack of critical depth in many institutions, due to lower figures for
metrics that indicate engagement. For instance, only 52% track the number of comments,
only 33% track the bounce-rate from their site, and 32% track the use of their marketing
messages. Furthermore, only 15% identify whether the sentiment behind comments is
positive or negative, and only 13% follow the length of comments; this suggests that few
organisations measure social media qualitatively. Perhaps the clearest indication of the
superficiality of current measurements is that while 95% track their immediate followers,
only 25% go to the next stage and track their potential audience reach.
# Answer Responses
(75 total) %
1 Number of
followers/friends 71 95%
2 Number of comments 39 52%
3
Number of re-posts
(e.g., shares, likes,
retweets)
57 76%
4 Sentiment (i.e.,
Positive/Negative) 11 15%
5
Follower
demographics (e.g.,
age, gender)
19 25%
6
Use of marketing
messages (e.g.,
hashtags, keywords,
mentions)
24 32%
7
Reputation of
followers (e.g.,
famous/influential
followers)
13 17%
8
Potential audience
reach (e.g., followers
of followers)
19 25%
9
Bounce rate (i.e., how
many website visitors
arrive and then leave
without exploring site
further)
25 33%
10
Direction (i.e., where
users have come from,
such as from a Google
search)
22 29%

11
Response rate (i.e.,
how long it takes for
your institution to
reply to a message on
social media)
9 12%
12 Page views 53 71%
13 Click rate 29 39%
14 Length of comments/
conversation threads 10 13%
15 Visit duration 31 41%
16 Other 4 5%
Table 3: “Which of the following do you currently track/measure?”
A further question sought the motivation behind collection of statistics. The most common
frequency was monthly (40%), while measurement “when required” was almost as common
(37%). In total, therefore, there were 20 of 75 institutions (27%) that did not have a defined
interval for collecting statistics. Only 13 of 75 institutions (17%) currently document social
media figures annually. This could be due to the relative novelty of social media or because it
is possibly seen as redundant due to more frequent measurements. However, it also indicates
lack of long-term analysis, perhaps consequential of lack of strategy. Overall, the metrics-
based results indicate that contemporary cultural institutions remain in the early stages of
social media development.
Analytics
Results indicate that the use of analytics programmes is now widespread. As well as 85% of
institutions using social media analytics, such as Facebook Insights and Twitter Analytics,
71% use Web analytics; 45 of the 75 respondents (60%) use both of these. However, when
combined with the results of the previous questions, which indicate a lack of depth, it might
be argued that while most use analytics tools, they do not fully utilise their capabilities.
Results showed that most institutions use multiple analytics tools, with a mean of just below
three per institution. Facebook Insights (63%), Google Analytics (63%), and Twitter
Analytics (56%) are the most common tools. Results also suggest that use of commercial
analytics tools is more sporadic (e.g., Hootsuite, with 26% respondents currently using it). It
is not clear whether this is due to lack of resources or if it signifies a lack of satisfaction with
service; however, it does indicate that these platforms are waning in popularity.
It is perhaps worth comparing earlier results that indicated institutions use on average
between four and five different social media, against an average of about three analytics
tools, most likely to be Facebook, Twitter, and Google. This suggests the possibility that
analytics tools for other social media platforms are not as well developed or are not
considered as relevant by institutions.
Evaluation

Firstly, a majority of institutions confirmed that evaluation was important: 71% agreed that
they have a culture of evaluation, compared to just 11% who disagreed. Furthermore, 83%
indicated that that social media was vital to achieving institutional goals, as opposed to just
3% (2) who disagreed. However, while 43% indicated that evaluating social media was a
priority, 27% indicated that it was not a priority. This indicates that, while social media might
help achieve organisations’ objectives, this is not translated into prioritising assessment.
Tables 4 and 5 demonstrate how evaluating social media impacts other evaluative practices.
Significantly, the less important evaluation of social media was, the less likely it was that
evaluation was part of the organisation as a whole; that there were regimented approaches to
social media and evaluation; that specific social media objectives were used; and that social
media was vital to achieving organisations’ goals. The survey also found a clear preference
for flexibility. By and large, institutions consider social media and its evaluation important,
but want to pursue them in a flexible manner. These tendencies have implications for the
potential to implement the Evaluation Framework.
Strongly
Disagree Disagree
Neither
Agree Nor
Disagree
Agree Strongly
Agree
Total
responses 10 20 21 18 1
Other
statements
Proportion
who
Agree
Proportion
who
Agree
Proportion
who
Agree
Proportion
who
Agree
Proportion
who
Agree
Evaluation
important
part of
organisation
100% 90% 67% 39% NA*
Regimented
approach to
social media
40% 20% 19% 11% NA*
Flexible
approach to
social media
60% 85% 52% 78% NA*
Regimented
approach to
evaluating
social media
30% 25% 5% 11% NA*
Flexible
approach to
evaluating
social media
50% 70% 52% 44% NA*
Organisation
has specific
objectives for
social media
90% 70% 43% 17% NA*
Social media
is vital to 100% 85% 76% 78% NA*

achieve
organisation’s
goals
Table 4: level of agreement that evaluating social media is not a priority to organisation, and
corresponding proportion that agree with other statements
*NB: The figures for “Strongly Agree” have been disregarded, as the sample is too small.
There is also doubt over the intention of the respondent, who may have been meaning to
“strongly disagree,” based on responses elsewhere.
Strongly
Disagree Disagree
Neither
Agree Nor
Disagree
Agree Strongly
Agree
Total
responses 23 35 10 2 0
Other
statements
Proportion
who Agree
Proportion
who Agree
Proportion
who Agree
Proportion
who Agree
Proportion
who Agree
Evaluation
important part
of
organisation
78% 77% 50% 0% NA
Evaluating
social media
is a priority
61% 37% 20% 50% NA
Regimented
approach to
social media
26% 14% 10% 0% NA
Flexible
approach to
social media
74% 69% 70% 50% NA
Regimented
approach to
evaluating
social media
22% 14% 10% 0% NA
Flexible
approach to
evaluating
social media
56% 54% 50% 50% NA
Organisation
has specific
objectives for
social media
70% 46% 30% 0% NA
Table 5: level of agreement that social media is vital to organisational goals, and
corresponding proportion that agree with other statements

Geographical comparison
Results from North America showed more divergence from overall results than the UK
results. Firstly, American institutions used more social media: most notably all American
respondents used Facebook as well as Twitter; 60% have a blog compared to 47% overall;
60% use Instagram compared to 45% overall; and 75% use YouTube compared to 57%
overall. Conclusively, American institutions averaged 5.9 social media platforms, compared
to 4.68 overall. American institutions were also were more likely to set targets, use analytics,
and note figures more regularly. These results indicate North American institutions are much
more heavily involved in social media.
Feature N. America
Proportion
Overall
Proportion
Establishing an audience is a
challenge 20% 32%
Engaging with an audience is a
challenge 45% 34%
Setting targets and objectives is
a challenge 15% 25%
Defining appropriate metrics is a
challenge 45% 33%
Take note of metrics/figures
weekly 50% 27%
Take note of metrics/figures
monthly 50% 40%
Take note of metrics/figures
annually 30% 17%
Set specific targets for social
media 65% 39%
Use analytics tools to monitor
social media 90% 75%
Use user survey to track metrics 30% 15%
Table 6: main differences between North American and overall results
Furthermore, Table 7 also shows that North American institutions had notably different
priorities regarding objectives. Scores for interacting with audiences, increasing use of
resources, and providing digital services were all significantly increased, while the mean
score for maximising the audience fell drastically. This perhaps indicates that North
American institutions are more interested in marketing and engagements, rather than reaching
as many people as possible. On the other hand, their perspectives on evaluation, their
methods of tracking metrics, and the particular analytics tools they use are much the same as
the overall results. This indicates that while they may use more platforms and have different
objectives, the ways they assess social media are much the same.

Strategic
Objective
UK
Mean
Score
N.
America
Mean
Score
Overall
Mean
Score
UK
Ranking
N.
America
Ranking
Overall
Ranking
Maximise our
audience 3.85 3.60 3.75 2= 5 3
Improve our
image and be
more noticeable
4.00 4.00 4.08 1 2 1
Increase
attendance,
revenue or use
of our resources
3.70 3.95 3.57 4 3 4
Have more
engaging
conversations
with our
audience
3.85 4.10 3.86 2= 1 2
Create resources
and collaborate
with others
3.24 3.15 3.27 6 6 6
Provide a digital
point of service
and improve
user experience
3.55 3.75 3.53 5 4 5
Table 7: mean scores and rankings for strategic objectives: UK, North America, and overall
(mean scores on scale between 1 – Not Important and 5 – Top Priority)
Comparison of institution types
Similar to results for North America, museums also showed slightly higher proportions
actively using each social media platform, indicating a higher level of involvement. Museums
use an average of 5.72 platforms per institution and also appear more likely to have defined
strategies: 55% have a social media strategy document and set specific social media targets,
while only 7% do not use analytics.
As Table 8 shows, museums also had slightly different strategic priorities. Their highest-
ranked strategic theme was Interaction, and Marketing also had a substantively higher mean
score. Overall, results for museums indicate that they may be slightly more involved in social
media. Elsewhere, results suggested that archives are less interested in the size of their
followings than museums or libraries. Also, while museums vary in their degree of strategic
planning, libraries and archives generally prefer to be more flexible in their approach and
focus more on evaluation and audience engagement than museums, which think more about
image and attendance.

Strategic
Objective
Library
Mean
Score
Museum
Mean
Score
Archive
Mean
Score
Overall
Mean
Score
Library
Ranking
Museum
Ranking
Archive
Ranking
Overall
Ranking
Maximise
audience
(Community)
3.64 3.79 3.11 3.75 4= 4 5 3
Improve
image
(Branding)
4.27 4.00 3.56 4.08 1 2 1= 1
Increase
attendance
(Marketing)
4.00 3.83 3.56 3.57 2= 3 1= 4
More
engaging
conversations
(Interaction)
4.00 4.03 3.33 3.86 2= 1 3 2
Create
resources
(Content)
3.45 3.34 2.78 3.27 6 6 6 6
Digital point
of service
(Visitor
Serv)
3.64 3.69 3.22 3.53 4= 5 4 5
Table 8: mean scores for strategic objectives: Libraries, museums, archives, and overall
(scale between 1 – Not Important to 5 – Top Priority)
“Culture” of evaluation
Based on responses, it was calculated that 43% of respondents indicated a culture of
evaluation regarding social media, in expressing that this was a priority for their institution.
Such institutions were more likely to have key strategic features, as shown in Table 9.
On one hand, institutions with a culture of evaluation use the same tools, in much the same
ways, and towards similar objectives. However, the impact of prioritising evaluation is
perhaps indicated in the challenges they indicate: most are reported at reduced rates. For
instance, results suggests that those with a culture of evaluation have less problem engaging
with audiences and have more staff buy-in. Overall, results suggest that prioritising
evaluation of social media results in more developed or confident use of social media. Such
institutions have more formal strategies and experience fewer challenges. Furthermore, they
use more platforms and measure their impact more often.
Feature Culture of
evaluation
Less culture of
evaluation of
social media
Overall
Have a social
media strategy
document
57% 37% 40%

Have a social
media policy
document
60% 42% 49%
Set specific
social media
targets/goals
67% 16% 39%
Use analytic tools
to monitor
activity
90% 58% 75%
Take note of
metrics weekly 40% 0% 27%
Take note of
metrics monthly 47% 32% 40%
Take note of
metrics whenever
possible
(regularly)
13% 16% 21%
Take note of
metrics whenever
possible
(irregularly)
3% 32% 19%
Establishing an
audience is a
challenge
27% 16% 32%
Engaging with an
audience is a
challenge
23%
37%
34%
Setting targets
and objectives is
a challenge
20% 37% 25%
Defining
appropriate
metrics is a
challenge
40% 32% 33%
Staff cooperation
or buy-in is a
challenge
23% 42% 29%
Table 9: key differences between those who prioritise evaluation and those who do not
Conversely, 27% of respondents might be said to have less culture of evaluation, having
indicated that measuring social media is not a priority. In this case, the previous results are
flipped: they are less likely to approach social media strategically, and they experience more
challenges. Most notably, this means that just 16% set targets for social media, and only 58%
use analytics—significantly lower than in overall results. Overall, institutions that have less
social media strategy and evaluative culture show less appetite to improve. While many of
these institutions may argue that this is purely because social media is not as important to

them, it is worth considering the earlier statistics that indicated consensus that social media is
growing in importance.
Comparison with interview findings
As mentioned, this survey was designed following a series of in-depth interviews with
community managers in eight institutions. These interviews explored the variety of ways that
cultural organisations use and measure their social media presence, and received explicit
feedback on the feasibility and efficacy of the Evaluation Framework.
Among common themes in the interviews were notions that the most important thing in
practice and evaluation of social media was that the tone of the output matched the
organisation and suitable for the medium in use. Staff had to be engaged carrying out
activities, and some platforms worked differently than others. Relatedly, institutions
increasingly saw social media as not just a marketing tool, but also something that provided a
more specific or functional service. The greatest impediment to social media was lack of
resources, but this actually meant an increased focus on evaluation to justify time spent and
increase efficiency. On the other hand, the institutions generally seemed to be resigned to
sustaining current provisions rather than expanding.
Regarding the use of frameworks, interviewees were open-minded but expressed concerns
over introducing tools to established procedures and limited resources. The Culture24
Evaluation Framework was appreciated by all those interviewed, but with the caveat that it
would probably need to be adapted. First, there were some who wished for more detail on
how to implement, while other felt that it was overly proscriptive. The themes were all agreed
as relevant, but there was wariness over whether any single objective could be prioritised
over others. There was also uncertainty over whether it would work better as a step-by-step
measuring device or a more flexible guide for general strategic planning.
Overall, the interview results had more commonalities than differences with the survey
results. The key points identified from the interviews were that success on social media often
revolved around staff involvement; that many institutions had benefited from a strong
evaluative structure; that many institutions were exploring different functionality on social
media; and that institutions face difficulty staying on top of evaluation and taking social
media to the next level. In this respect, findings in the survey help reinforce this: they showed
a correlation between having more robust strategies and staff enthusiasm, and in achieving
more detail and development on social media.
Validation of Culture24 Evaluation Framework
Primarily, the survey demonstrates that there is a clear market for strategic tools: a significant
number of institutions need help defining statistics and metrics. There is also evidence that
cultural institutions lack a consistent approach for reporting and would benefit from strategies
and tools that help them concentrate and justify their efforts. In these respects, the Evaluation
Framework fills a potential need. It could benefit institutions in giving a purpose to
measurements and regular reporting, and could help offer definition to current practices.
The survey also shows that institutions show clear signs of experimentation. Technical issues
and staff buy-in were not considered an obstacle by most respondents, and with interview
testimony, there are indications that most organisations are prepared and accustomed to

trying new things that might improve their performance. On the other hand, the survey also
emphasised the suggestion during interviews that flexibility is important to the introduction
of new tools, for institutions both with and without defined strategies. This has potential
implications for the application of the framework. Half will want to adapt it to their
embedded practices. Alternately, the other half likely have neither the structure on which to
add the framework, nor the desire to introduce such a strict approach. In either case, the
application of the framework is likely to be heavily adapted.
Overall, what the survey indicates is that, while many institutions would welcome a tool that
fills gaps in their knowledge, there is less scope for each institution to implement this in the
same way. The inconsistency of results shows a level of individuality within evaluative
practices that no single framework can universally accommodate. On the other hand, the
consistency in the challenges and objectives of institutions shows that a framework that
comprehensively addresses these features would serve a real strategic purpose.
6. Recommendations
Framework recommendations
The survey results showed that the principles behind the Evaluation Framework were valid
and there was a clear market for the tool. Evidence suggested that many cultural institutions
are still in the developmental stages of planning their social media and implementing
appropriate strategies, and that the strategic themes outlined in the framework were all highly
relevant across diverse groups. Furthermore, there were clear indications that objective-
setting could prove tricky for some, and that there was a lack of experience, confidence, and
consistency in the use of appropriate metrics, analytics tools, and timeframes—all principles
the toolkit helps implement.
However, the survey results—set against the context of interview testimony—also alluded to
difficulties with the framework in terms of the practicalities of its implementation. Notably,
institutions have reduced resources, various institutional pressures and procedures, and a
widespread preference for flexibility. With the above strengths and weaknesses of the
Evaluation Framework in mind, the following recommendations are suggested for developing
and implementing the framework.
Be clear in how and why the framework should be used
Is it to measure your definition of performance or define your performance measures? The
original intent is to help direct measurements of audience behaviour related to the
institution’s social media goals. However, the interviews and survey results indicated that no
single objective or “strategic theme” was priority. Decisions should be taken on whether the
framework will be used as an ongoing procedure or as part of a periodic review; as a step-by-
step process or as scaffolding for general planning.
Offer institutions templates and examples
A related problem with the framework was that, because institutions were likely to need to
monitor more than one strategic theme, the work required became unrealistic. Furthermore,
different institutions have different reporting priorities, frequencies, and personnel. More

guidance is required on different methods for implementing the framework in a variety of
circumstances: for instance, templates for individual projects, group projects, or periodic
reviews.
Collate resources on metrics and tools
Survey results demonstrated a lack of critical depth in evaluation, despite institutions
indicating desire to know the impact of their pursuits. Interviews provided context to this,
saying that the metrics and tools were often quite difficult to interpret, and that for the sake of
simplicity and speed they would stick to those most familiar. The Culture24 website reveals a
variety of documents and links, such as the metrics toolkit, the tools comparison spreadsheet,
and the Digital Change website. However, these are dispersed and disconnected from the
framework. Combining these features would enrich the framework.
Provide evidence
Overall, the survey results showed that cultural institutions do not have a consistent approach
to strategy and evaluation, and that these concepts are still relatively unexplored by many.
There are also indications that some are turning away from tools; interviews offered that one
reason for this is that past the basics of analytics, there is little guidance and some institutions
therefore seek simply to preserve, with little motivation to explore further developments.
Evidence of other opportunities, and the impact they can have, would help reinforce the value
of implementing an additional tool like the Evaluation Framework.
Institutional recommendations
Survey results indicated that, with institutions typically using several platforms and analytic
tools, the topic of social media evaluation is progressing. On the other hand, results showed
that this development is still in early stages: there are even splits between those with and
without formal practices, and there is a predominance of mainly superficial measurements.
There is a degree of individuality in terms of reporting strategies and an overwhelming
preference for flexibility. Subsequently, the following recommendations are made for
institutions looking to develop their social media.
Consider the purpose of your social media, and build it into your content and strategy
The literature review noted that many cultural institutions jumped into social media without
thinking about how they would use it. Consequently, they faced difficulty in defining their
impact and where they could develop. On the evidence of both interviews and survey,
institutions are now beginning to think more strategically. However, framing social media
was a novel idea, and few institutions indicated that they had specific priorities or objectives.
However, there were signs that more strategic institutions were more likely to be active in
more areas and more decisive in identifying what worked for them, and would face less
challenges.
Utilise the strengths and functionality of each resource
The survey results showed that institutions typically stick to the tools, features, and metrics
with which they are most familiar, possibly due to a lack of experience and understanding of
technical aspects. However, there is also growing evidence of experimentation with different

tools and platforms. Testimony from interviews suggested this was because institutions were
now looking for social media platforms to perform more functional roles, like cataloguing or
visitor services, and that such diversification was giving them increased confidence in
technical aspects. Institutions should think about what each platform offers them, how this
contributes to their purpose, and how this can be incorporated into evaluation.
Evaluation is measurement with a purpose
Evidence suggests that some institutions collect statistics without a purpose, similar to getting
involved on social media without a clear intention. While many institutions made
measurements and evaluated social media, this did not correspond with a specific strategy or
plan. This perhaps explains why many do not develop more in-depth analyses or
technologies. Furthermore, evidence showed that institutions are often restricted in how they
report, sometimes only doing it when time permits. Having a clear and regular structure for
measurements can help institutions stay on top of things, so that when evaluation does take
place, it can focus on what matters.
Share the load, share the knowledge
The survey demonstrated that resource issues were the top impediment to developing social
media, while there were other indications throughout the research that there was also a lack of
understanding or guidance. Those that spent more time on social media were more likely to
have plans and policies and to benefit from the increased structure and collaboration that
these encourage.
Work with what you enjoy, and enjoy what works
It was clear that every institution has different approaches and universality is elusive. For
most survey respondents, flexibility was preferable in social media; but some of these also
sought more defined evaluative practices. Social media is an ongoing experiment, and not
everything will always succeed, but what was learned from interviews was that success was
built on staff doing what they love. The research indicated that although evaluation of social
media can identify success, it should not end up taking away the fun of social media that
helped achieve that success. To do so, institutions, perhaps with the help of frameworks or
toolkits, need to find the right evaluative formula that suits the institution, its personnel, and
its audience: the “voice” of the institution.
7. Conclusion
Overall, the research helped validate the place of social media evaluation and tools that
facilitate this. However, it also demonstrated that this need cannot be met in straightforward
or universal ways: each institution works differently under its own set of constraints and
expectations. Institutions need something flexible enough to adapt to their needs, but also
something that has clear justification and proven efficacy, to justify the time and effort.
The research noted with interest how commonly institutions refer to maintaining the “voice”
of the institution or allusion to remaining true to their overall mission and values. Social
media is something that must complement this, and is therefore unique to every institution—
and therefore there is necessarily no single method, objective, or framework for how to

approach social media. Despite this, this study has shown that it does not mean that having
some sort of theoretical or strategic outlook for social media is undoubtedly beneficial in
providing the structure, decisiveness, and confidence that allow the institution to continually
develop this individual voice. Strategy and evaluation do not constrain the voice of the
institution; they are part of how the institution finds its voice.
Such theoretical basis, however, is predicated on access to practical guidelines and evidence
such as relevant, feasible frameworks. Ultimately, cultural institutions need more guidance in
this topic, with access to a range of options from which they can select, adapt, and draw
inspiration. This research has validated the principles of the Culture24 Evaluation Framework
as a good starting point and provided recommendations for both this framework and for
institutions themselves, to continue to develop evaluative best practices—and thereby
improve performance on social media.
Acknowledgements
The research described in this paper was conducted within the EU-funded Material
Encounters with Digital Cultural Heritage (meSch) project, ICT Call 9: FP7-ICT-2011-9, GA
600851.
The authors would like to thank all institutions who took part in the survey, and the following
institutions who were interview participants:
• Glasgow Museums
• Glasgow University Archives Service
• Glasgow Women’s Library
• Lost Glasgow
• National Library of Scotland
• Royal College of Physicians and Surgeons Glasgow Library and Archives
• Scottish Political Archive
• Scottish Screen Archive
• University of Stirling Art Collection
References
Cadell, L. (2013). “Socially practical or practically unsociable? A study into social media
policy experiences in Queensland cultural heritage institutions.” Australian Academic &
Research Libraries 44(1): 3–13.
Cahill, K. (2011). “Going social at Vancouver Public Library: what the virtual branch did
next.” Program: electronic library and information systems 45(3): 259–278.
CILIP. (2015a). “Impact Toolkit” [website]. Chartered Institute of Library and Information
Professionals. Last accessed January 31, 2016. Available
http://vle.cilip.org.uk/course/index.php?categoryid=30
Colburn, S., & L. Haines. (2012). “Measuring libraries’ use of YouTube as a promotional
tool: An exploratory study and proposed best practices.” Journal of Web Librarianship 6(1):
5–31.
Culture24. (2014). “Let’s Get Real 2: A journey towards understanding and measuring digital
engagement.” Last accessed January 31, 2016. Available
http://weareculture24.org.uk/projects/action-research/phase-2-digital-engagement/
Fernandez, J. (2009). “A SWOT Analysis for social media in libraries.” Online 33(5): 35–37.
Fichter, D., & J. Wisniewski. (2008). “Social media metrics: making the case for making the
effort.” Online 32(6): 54–57.
Flores, L. (2014). How to Measure Digital Marketing: Metrics for Assessing Impact and
Designing Success. London: Palgrave Macmillan.
Kho, N.D. (2011). “Social Media in Libraries: Keys to Deeper Engagement.” Information
Today 28(6): 1, 31–32.
Markless, S., & D. Streatfield. (2013). Evaluating the Impact of Your Library (Second
Edition). London: Facet Publishing.
Romero, N.L. (2011). “ROI. Measuring the social media return on investment in a library.”
The Bottom Line: Managing Library Finances 24(2): 145–152.
Showers, B. (ed.) (2015). Library Analytics and Metrics: Using data to drive decisions and
services. London: Facet Publishing.
Simon, N. (2010). The Participatory Museum. Santa Cruz, CA: Museum.
Solomon, L. (2011). Doing Social Media So It Matters: A Librarian’s Guide. Chicago, IL:
American Library Association.
Steiner, S.K. (2012). Strategic Planning for Social Media in Libraries. London: Facet
Publishing.
Stuart, D. (2009). “Social media metrics.” Online 33(6): 22–24.
Stuart, D. (2014). Web Metrics for Library and Information Professionals. London: Facet
Publishing.
Thomson, K., K. Purcel, & L. Rainie. (2013). “Arts organisations and digital technologies.”
Last accessed January 31, 2016. Available http://www.pewinternet.org/files/old-
media//Files/Reports/2013/PIP_ArtsandTechnology_PDF.pdf
Universal McCann. (2010). “Wave 5: The Socialisation of Brands (Social media tracker –
2010)” [presentation]. Last accessed January 31, 2016. Available
http://www.slideshare.net/tlinz8612/wave-5-the-socialisation-of-brands-report-5465006
Universal McCann. (2014). “Wave 7: Cracking the Social Code – The Story of Why”
[presentation]. Last accessed January 31, 2016. Available
http://www.slideshare.net/tlinz8612/wave-7-crackingthesocialcode?related=1

Universal McCann. (2015). “Wave 8: The Language of Content.” Last Accessed January 28,
2016. Available http://wave.umww.com/assets/pdf/wave_8-the-language-of-content.pdf
Cite as:
Fleming, Rod and Areti Damala. "Finding the voice: Planning and evaluation of social media
in cultural institutions." MW2016: Museums and the Web 2016. Published January 31, 2016.
Consulted May 6, 2016.
http://mw2016.museumsandtheweb.com/paper/finding-the-voice-planning-and-evaluation-of-
social-media-in-cultural-institutions/