(final version)
TRANSCRIPT
Reconstruction Project for CDQ Clean Production on 6m Coke Oven in Coking Plant, Guangdong SGIS Songshan Co., Ltd.
South China Institute of Environmental Sciences, Ministry of Environmental Protection of the PRC 1
Guangdong SGIS Songshan Co., Ltd
Reconstruction Project for CDQ Clean Production on 6m Coke Oven in Coking Plant
Environmental Impact Assessment Report
(Final version)
South China Institute of Environmental Sciences, Ministry of Environmental Protection of the People’s Republic of China
May 2008
Reconstruction Project for CDQ Clean Production on 6m Coke Oven in Coking Plant, Guangdong SGIS Songshan Co., Ltd.
South China Institute of Environmental Sciences, Ministry of Environmental Protection of the PRC 2
EIA Document: Guangdong SGIS Songshan Co., Ltd
Reconstruction Project for CDQ Clean Production on 6m Coke Oven in Coking Plant
Assessment Unit: South China Institute of Environmental Sciences, Ministry of Environmental Protection of the People’s Republic of China
Document Type: Environmental Impact Assessment Report
Legal Representative: Zhang Jianming
Reconstruction Project for CDQ Clean Production on 6m Coke Oven in Coking Plant, Guangdong SGIS Songshan Co., Ltd.
South China Institute of Environmental Sciences, Ministry of Environmental Protection of the PRC 3
Project Title: Project of coke dry quenching (CDQ) clean production in 6m coke oven of Coking
Plant, SGIS Songshan Co., Ltd.
Entrusting Unit: Guangdong SGIS Songshan Co., Ltd
Assessment Unit: Assessment Unit: South China Institute of Environmental Sciences,
Ministry of Environmental Protection of the People’s Republic of China
(GuoHuanPingZhengJiaZi No. 2801)
Unit legal person: Zhang Jianming (Director)
Cooperative Unit: Shaoguan Environmental Monitoring Station
Responsible Persons: Chen Jun (Registered EIA Engineer Certificate No.: A28010160500)
Bian Guojian (Registered EIA Engineer Certificate No.: A28010480400)
Compiled by:
Name Title No. of EIA Registration Certificate or EIA Post Certificate
Compiled Chapters Signature
Chen Juan Senior Engineer
Registered EIA Certificate No.: A28010160500
Chapters 1, 3, 6and 14.
Bian Guojian Engineer Registered EIA Certificate No.: A28010480400
Chapters 1, 2, 3, 6, 7, 8, 9 and 14.
Sang Yanhong Engineer Registered EIA Certificate No. 28010381000
Chapters 12, 13 and 14.
Long Yingxian Engineer EIA Post Certificate No. 28010109
Chapters 4, 5, 11and 14.
Qu Qun Engineer EIA Post Certificate No. 28010130
Chapters 6 and 14
Checked by:
Zhong Changqin (Senior Engineer, Registered EIA Certificate No.: A28010190600), Signature:
Yang Yuqing (Senior Engineer, Registered EIA Certificate No.: A28010260500), Signature:
Approved by:
Dong Lin (Researcher, Registered EIA Certificate No.: A28010141000) Signature:
Reconstruction Project for CDQ Clean Production on 6m Coke Oven in Coking Plant, Guangdong SGIS Songshan Co., Ltd.
South China Institute of Environmental Sciences, Ministry of Environmental Protection of the PRC 4
Table of Contents
1 GENERAL PRINCIPLES.............................................................................................................................. 1 1.1 BACKGROUND .......................................................................................................................................... 1 1.2 COMPILATION BASIS ................................................................................................................................ 2
1.2.1 Nationwide Laws & Regulations ......................................................................................................... 2 1.2.2 Local Laws & Regulations .................................................................................................................. 2 1.2.3 Technical Guidelines and Criterions................................................................................................... 3 1.2.4 Other Basis........................................................................................................................................... 3
1.3 ASSESSMENT OBJECTIVE, PRINCIPLES AND METHODS .......................................................................... 3 1.3.1 Assessment Objective ........................................................................................................................... 3 1.3.2 Assessment Principles.......................................................................................................................... 4 1.3.3 Assessment Methods ............................................................................................................................ 4
1.4 OBJECTIVES FOR POLLUTION CONTROL, ENVIRONMENT ZONING AND PROTECTION ......................... 4 1.4.1 Objectives for Pollution Control.......................................................................................................... 4 1.4.2 Objectives for Environmental Protection ............................................................................................ 6
1.5 ASSESSMENT GRADES AND POINTS ......................................................................................................... 7 1.5.1 Assessment Grades............................................................................................................................... 7 1.5.2 Assessment Points ................................................................................................................................ 8
1.6 ASSESSMENT SCOPE AND ASSESSMENT FACTOR ..................................................................................... 8 1.6.1 Water environment............................................................................................................................... 8 1.6.2 Atmospheric Environment................................................................................................................... 9 1.6.3 Acoustic Environment ......................................................................................................................... 9 1.6.4 Ecological Environment and Other .................................................................................................... 9
1.7 ASSESSMENT STANDARDS ........................................................................................................................ 9 1.7.1 Standards for Environment Quality .................................................................................................... 9 1.7.2 Emission Standards ........................................................................................................................... 10
2 PROJECT OVERVIEW .............................................................................................................................. 12 2.1 PROFILES FOR THE EXISTING COKING FACTORIES OF SGIS CO., LTD................................................ 12
2.1.1 Planning for the Existing Coking Factories of SGIS....................................................................... 12 2.1.2 Existing Pollutants Discharge Situation of Coking Plant .............................................................. 13 2.1.3 Existing Environment Problems of Coking Plant ............................................................................ 19 2.1.4 Necessity of Coke Dry Quenching..................................................................................................... 19
2.2 PROJECT OVERVIEW .............................................................................................................................. 20 2.2.1 Project Title, Nature and Location .................................................................................................... 20 2.2.2 Project Scale and Project Investment................................................................................................ 22 2.2.3 Personnel quota and initiation time .................................................................................................. 22 2.2.4 Main technical and economic targets of the project ......................................................................... 22
2.3 MAIN CONSTRUCTION CONTENTS OF THE CDQ PROJECT ................................................................... 23 2.3.1 Project Setup ...................................................................................................................................... 23 2.3.2 Main construction contents ............................................................................................................... 25
2.4 GENERAL LAYOUT AND REASONABLE ANALYSIS.................................................................................. 33 2.4.1 General layout.................................................................................................................................... 33 2.4.2 Health protection zone....................................................................................................................... 34
3 ENGINEERING ANALYSIS....................................................................................................................... 36 3.1 RAW MATERIAL CONDITIONS AND PRODUCTS...................................................................................... 36 3.2 WATER BALANCE ................................................................................................................................... 36 3.3 TECHNICAL PROCESS AND POLLUTION-PRODUCING SECTIONS ANALYSIS OF THE CDQ PROJECT.... 37
3.3.1 Overall Technical Process ................................................................................................................. 37 3.3.2 Technical Process, Pollution-producing and Treatment Measures of CDQ System........................ 39 3.3.3 Technical Process, Pollution Producing and Treatment Measures of CDQ Thermodynamic System 40
Deleted: 8
Deleted: 33
Reconstruction Project for CDQ Clean Production on 6m Coke Oven in Coking Plant, Guangdong SGIS Songshan Co., Ltd.
South China Institute of Environmental Sciences, Ministry of Environmental Protection of the PRC 5
3.3.4 Technical Process, Pollution Producing and Treatment Measures of Coke Transportation System 41
3.4 ENVIRONMENTAL IMPACT IDENTIFICATION IN THE OPERATIONAL PERIOD ....................................... 41 3.5 POLLUTION RESOURCE INTENSITY ANALYSIS IN THE OPERATIONAL PERIOD OF THE CDQ PROJECT 41
3.5.1 Air Pollution Sources......................................................................................................................... 41 3.5.2 Pollution Resources ........................................................................................................................... 42 3.5.3 Solid Waste ......................................................................................................................................... 43 3.5.4 Noise................................................................................................................................................... 43 3.5.5 Statistics and Analysis of Abnormal Discharging Source Intensity ................................................. 43
3.6 OVERVIEW OF 6M COKE OVEN (BASIS OF COKE DRY QUENCHING) ................................................... 45 3.6.1 Composition and Product Plan of 6m Coke Oven Project under Construction .............................. 45 3.6.2 Analysis on Pollution Generation and Control of 6m Coke Oven Project Being Built................... 48 3.6.3 Pollutants Generation Situation of 6m Coke Oven Being Built....................................................... 56
4 GENERAL ENVIRONMENT IN THE PROJECT SURROUNDING AREA........................................ 62
4.1 NATURAL ENVIRONMENT ...................................................................................................................... 62 4.1.1 Geographical Location ...................................................................................................................... 62 4.1.2 Topography ........................................................................................................................................ 62 4.1.3 Geology............................................................................................................................................... 62 4.1.4 Hydrology ........................................................................................................................................... 62 4.1.5 Climate ............................................................................................................................................... 63 4.1.6 Vegetation and Soil ............................................................................................................................ 63 4.1.7 Aquatic organism resources and fishery resources .......................................................................... 63 4.1.8 Natural landscape .............................................................................................................................. 63
4.2 SOCIETY AND ECONOMY ........................................................................................................................ 64
5 ASSESSMENT OF THE EXISTING BASELINE ENVIRONMENTAL QUALITY ............................ 66
5.1 EXISTING BASELINE SURVEY AND ASSESSMENT OF THE AMBIENT AIR QUALITY ............................... 66 5.1.1 Monitoring point distribution ............................................................................................................ 66 5.1.2 Monitored items ................................................................................................................................. 66 5.1.3 Monitoring Time and Sampling Frequency...................................................................................... 66 5.1.4 Monitoring and analysis method....................................................................................................... 66 5.1.5 Existing Baseline Assessment of Ambient Air Quality ..................................................................... 67
5.2 INVESTIGATION OF EXISTING BASELINE OF WATER ENVIRONMENT QUALITY ................................... 70 5.2.1 Monitoring point distribution ............................................................................................................ 70 5.2.2 Monitored items ................................................................................................................................. 71 5.2.3 Monitoring Time and Sampling Frequency...................................................................................... 71 5.2.4 Monitoring and analysis method....................................................................................................... 71 5.2.5 Evaluation of existing baseline of water quality ............................................................................... 73
5.3 MONITORING AND ASSESSMENT OF EXISTING BASELINE OF ACOUSTIC ENVIRONMENT QUALITY.... 80 5.3.1 Monitoring point distribution ............................................................................................................ 80 5.3.2 Monitoring time and sampling frequency......................................................................................... 80 5.3.3 Monitoring method ............................................................................................................................ 80 5.3.4 Evaluation of existing baseline of acoustic environme nt quality.................................................... 80
5.4 MONITORING AND ASSESSMENT OF EXISTING BASELINE OF SOIL ENVIRONMENT QUALITY ............. 81 5.4.1 Monitoring point distribution ............................................................................................................ 81 5.4.2 Monitored items ................................................................................................................................. 83 5.4.3 Monitoring time and sampling frequency......................................................................................... 83 5.4.4 Monitoring and analysis method....................................................................................................... 83 5.4.5 Evaluation of existing baseline of soil environment quality .......................................................... 83
5.5 INVESTIGATION & ASSESSMENT OF FARM CROP .................................................................................. 85
6 ENVIRONMENT IMPACT ANALYSIS.................................................................................................... 87 6.1 PREDICTION AND ASSESSMENT OF AMBIENT AIR IMPACT...................................................................... 87
6.1.1 Analysis of pollution meteorological conditions ............................................................................... 87
Reconstruction Project for CDQ Clean Production on 6m Coke Oven in Coking Plant, Guangdong SGIS Songshan Co., Ltd.
South China Institute of Environmental Sciences, Ministry of Environmental Protection of the PRC 6
6.1.2 Prediction model and source strength ............................................................................................... 93 6.1.3 Prediction results and analysis and assessment................................................................................ 98 6.1.4 Environmental impact assessment under abnormal emission ....................................................... 101
6.2 RIVER ENVIRONMENT IMPACT ANALYSIS ......................................................................................... 109 6.2.1 Overview of pollutant carrying river where the project is located .................................................. 109 6.2.2 River Environment Impact Analysis................................................................................................ 110
6.3 ACOUSTIC ENVIRONMENT IMPACT ASSESSMENT................................................................................. 111 6.3.1 Noise Sources................................................................................................................................... 112 6.3.2 Patterning treatment of sound energy attenuation ......................................................................... 112 6.3.3 Forecast model................................................................................................................................. 112 6.3.4 Results of noise forecast .................................................................................................................. 113
6.4 SOLID WASTE ENVIRONMENTAL IMPACT ASSESSMENT...................................................................... 116 6.5 ANALYSIS OF IMPACT OF DUST ON CROPS SURROUNDED ................................................................... 116 6.6 ENVIRONMENTAL IMPACT ANALYSIS FOR THE CONSTRUCTION PERIOD............................................. 116
6.6.1 Environmental impact analysis for the construction sewage. ........................................................ 117 6.6.2 Environmental impact analysis for the construction dust .............................................................. 118 6.6.3 Impact analysis for construction noises .......................................................................................... 119 6.6.4 Analysis on environmental impact of solid waste ........................................................................... 125 6.6.5 Analysis on impact of soil erosion................................................................................................... 125 6.6.6 Environment supervision during construction ............................................................................... 127
7 RISK ASSESSMENT.................................................................................................................................. 129
7.1 RISK IDENTIFICATION AND ANALYSIS ................................................................................................. 129 7.1.1 Material Hazard Identification of the Project................................................................................. 129 7.1.2 Hazard identification of production facilities involved in this project ........................................... 134 7.1.3 Identification of major hazard installations.................................................................................... 134 7.1.4 Grade and scope of the assessment ................................................................................................. 135
7.2 ANALYSIS AND FORECAST ON ENVIRONMENTAL RISK IMPACT.......................................................... 136 7.2.1 Determination of Maximum Credible Accident .............................................................................. 136 7.2.2 Source Intensity of Maximum Credible Accident ........................................................................... 138 7.2.3 Accident Consequence Forecast...................................................................................................... 140 7.2.4 The Collection of Fire Water discharging for fire Accident ........................................................... 148 7.2.5 Calculation for Risk Value............................................................................................................... 148
7.3 RISK PREVENTION MEASURES ............................................................................................................. 148 7.3.1 Device selection and prevention measures on processing .............................................................. 148 7.3.2 Automatic Control System, Emergency Shutdown and Accidental Handling Devices During Production .................................................................................................................................................... 151 7.3.3 Prevention Measures to Hazardous Substances ........................................................................... 151 7.3.4 Preventive Measures of Fire Fighting System .............................................................................. 152 7.3.4 Prevention against natural disaster factors .................................................................................... 154 7.3.5 Gas Protection Area and Management Measures ........................................................................ 154 7.3.6 Environmental monitoring and environmental risk emergency monitoring ................................. 155
7.4 EMERGENCY SCHEME.......................................................................................................................... 156 7.5 “THREE SIMULTANEOUS” CHECK TABLE FOR ENVIRONMENT SAFETY .............................................. 158
8 CLEAN PRODUCTION AND MASS LOADING CONTROL.............................................................. 160
8.1 DEFINITION AND INDEX SYSTEM SELECTION ..................................................................................... 160 8.2 ANALYSIS OF CLEAN PRODUCTION LEVEL FOR PRODUCTION PROCESS ........................................... 160
8.2.1 Comparison of coke dry and wet quenching................................................................................... 160 8.2.2 Analysis of clean production process for coke dry quenching ....................................................... 161
8.3 REVIEW ON CLEAN PRODUCTION INDEXES.......................................................................................... 161 8.3.1 Production process and equipment requirements ........................................................................... 161 8.3.2 Index of Coke product ..................................................................................................................... 162 8.3.3 Waste recycling index ...................................................................................................................... 162
8.4 INDEX OF ENVIRONMENTAL MANAGEMENT REQUIREMENT ............................................................... 163 8.5 ANALYSIS ON RESOURCE UTILIZATION AND ENERGY CONSERVATION.............................................. 164
Reconstruction Project for CDQ Clean Production on 6m Coke Oven in Coking Plant, Guangdong SGIS Songshan Co., Ltd.
South China Institute of Environmental Sciences, Ministry of Environmental Protection of the PRC 7
8.6 CONCLUSION OF CLEAN PRODUCTION ASSESSMENT ........................................................................... 165 8.7 ANALYSIS OF TOTAL VOLUME CONTROL.............................................................................................. 166
9 ENVIRONMENTAL POLLUTION PREVENTION MEASURES AND TECHNICAL FEASIBILITY DEMONSTRATION........................................................................................................................................... 167
9.1 DEMONSTRATION OF EXHAUST GAS CONTROL MEASURES ................................................................. 167 9.1.1 Exhaust gas control measures taken for coke dry quenching ........................................................ 167 9.1.2 Exhaust Gas Control Measures & Environmental Protection Measures Take For CDQ System. 167 9.1.3 Feasibility analysis of exhaust control measures for coke dry quenching project ........................ 168
9.2 DEMONSTRATION OF WASTEWATER CONTROL MEASURES................................................................ 168 9.2.1 Feasibility Analysis of Production Sewage Treatment Measures................................................... 169 9.2.2 Feasibility analysis of domestic wastewater treatment measures ................................................... 170 9.2.3 Construction of sewage treatment plant of SGIS group ................................................................. 170
9.3 DEMONSTRATION OF SOLID WASTE CONTROL MEASURES ................................................................ 171 9.4 DEMONSTRATION OF NOISE CONTROL MEASURES ............................................................................ 171
10 PUBLIC PARTICIPATION ...................................................................................................................... 172 10.1 PURPOSE AND SIGNIFICANCE OF PUBLIC PARTICIPATION .................................................................. 172 10.2. STAGE AND MODE OF PUBLIC PARTICIPATION.................................................................................... 172
10.2.1 Phase I: Project EIA Information Publicity ............................................................................. 172 10.2.2 Phase II: Public Participation in Preparation Stages of Report ................................................ 172 10.2.3 Phase III: Publicity of Simplified Version of Report.................................................................. 172
10.3 MODE AND SCOPE OF INVESTIGATION ................................................................................................ 176 10.4 RESULT ANALYSIS OF PUBLIC INVESTIGATION ................................................................................... 178
10.4.1 Statistics on Investigated People Circumstances of Public Participation .................................. 178 10.4.2 Overall Findings of Public Participation Survey ....................................................................... 179 10.4.3 Opinion Survey and Clarification on Feedback ......................................................................... 182 10.4.4 Summary of Opinion Feedback and Commitment on Part of Unit of the Project .......................... 183
10.5 PUBLIC OPINIONS ON NOTICE OF SIMPLIFIED VERSION OF REPORT................................................. 183 10.6 CONCLUSION ON PUBLIC PARTICIPATION ........................................................................................... 183
11 ANALYSES OF COMPLIANCE TO INDUSTRIAL POLICIES AND LOCATION REASONABILITY ............................................................................................................................................. 185
11.1 ANALYSIS OF COMPLIANCE TO STATE INDUSTRIAL POLICY .............................................................. 185 11.1.2 Analysis of Compliance to Local Industrial Policy .................................................................... 186
11.2 REASONABILITY ANALYSIS OF FACTORY LOCATION .......................................................................... 187 11.2.1 Analysis of Layout Reasonability ................................................................................................ 187 11.2.2 Reasonability Analysis of the Overall Layout ............................................................................. 187 11.2.3 Environmental Availability Analysis ........................................................................................... 187 11.2.4 Feasibility of Prevention Distance .............................................................................................. 188
12 ANALYSIS OF ECONOMIC GAIN AND LOSS .................................................................................... 189
12.1 INVESTMENT ON ENVIRONMENTAL PROTECTION OF THE PROJECT TO BE BUILT............................. 189 12.1.1 Main Measures of Environmental Protection ............................................................................ 189 12.1.2 Investment on Environmental Protection ................................................................................... 189
12.2 ANALYSIS OF THE OVERALL ENVIRONMENT AND SOCIOECONOMIC PERFORMANCE OF THE PROJECT 190
12.2.1 Social Performance Analysis....................................................................................................... 190 12.2.2 Environmental Performance Analysis ........................................................................................ 190 12.2.3 Economic Performance Analysis ................................................................................................ 190
13 ENVIRONMENT MANGEMENT AND MONITORING PLAN.......................................................... 192
13.1 RESPONSIBILITIES OF ENVIRONMENT MANAGEMENT ORGANIZATION............................................. 192 13.2 ENVIRONMENT MONITORING SYSTEM................................................................................................ 192
13.2.1 Introduction of SGIS Environment Monitoring Station ............................................................ 192 13.2.2 Monitoring Range of SGIS Monitoring Station ......................................................................... 192
Deleted: 184
Reconstruction Project for CDQ Clean Production on 6m Coke Oven in Coking Plant, Guangdong SGIS Songshan Co., Ltd.
South China Institute of Environmental Sciences, Ministry of Environmental Protection of the PRC 8
13.3 ENVIRONMENTAL MANAGEMENT PLAN ............................................................................................... 194
14 ASSESSMENT CONCLUSIONS AND RECOMMENDATIONS......................................................... 198 14.1 PROJECT OVERVIEW............................................................................................................................ 198 14.2 ENGINEERING ANALYSIS ...................................................................................................................... 198
14.2.1 Raw Material Conditions and Products ...................................................................................... 198 14.2.2 Pollutant Discharge ..................................................................................................................... 199 14.2.3 Pollution Treatment Measures .................................................................................................... 199 14.2.4 Health protection zone................................................................................................................. 200
14.3 EXISTING BASELINE OF THE ENVIRONMENT ....................................................................................... 200 14.4 ENVIRONMENTAL IMPACT PREDICTION .............................................................................................. 202 14.5 CLEAN PRODUCTION AND MASS LOADING CONTROL .......................................................................... 203 14.6 INDUSTRIAL POLICIES ANALYSIS AND THE RATIONALITY ANALYSIS OF SITE SELECTION................... 204 14.7 PUBLIC PARTICIPATION ANALYSIS........................................................................................................ 204
Deleted: 205
Reconstruction Project for CDQ Clean Production on 6m Coke Oven in Coking Plant, Guangdong SGIS Songshan Co., Ltd.
South China Institute of Environmental Sciences, Ministry of Environmental Protection of the PRC 1
1 General Principles 1.1 Background Guangdong SGIS Songshan Co., Ltd. (hereinafter referred to as “SGIS”) locates on the east of Maba Town, Qujiang County, and Shaoguan City of Guangdong Province. Established in 1966, it has become a large million-ton integrated enterprise of steel and iron with over 40 years of development.
SGIS now boasts 5 coke ovens with annual full coke production of 1 million tons. For 1#~3# coke ovens, all coking chambers are 3.8m in height, 3×32 holes with annual full coke production of 300,000 tons; for 4#~5# coke ovens, coking chambers are both 4.3m in height, 2×55 holes with annual full coke production of 700,000 tons. The existing baseline of coking system is mainly coke wet quenching.
According to the 11th five-year plan, the adjustment scheme of SGIS Coking Plant is as follows: After the industry upgrade: wash out the No.1-3 3×32-hole alcoke oven (3.8m); keep the No.4-5 2×55-hole coke oven(4.3m); arrange the 1 X 90 t coke dry quenching device; build the 4×55-hole (6m) coke oven.
Presently, SGIS equips one of the planned 2×55 holes (6m) coke ovens with CDQ technology. The planned 1.1 million t/a coking engineering(under construction currently) adopts JN60-type 2×55-hole compound coke ovens, single gas-collecting pipes, ground station for coal loading and dust removal during coke discharge, and meanwhile builds a set of JNG90-2 type(140t/h) CDQ system and provides new coke wet quenching. In accordance with documents issued by National Development and Reform Commission, this Assessment only focuses on CDQ process of 2×55 holes (6m) coke ovens.
By adopting CDQ, heat energy could be recycled from red cokes, 88t of medium pressure (3.82MPa) steam could be acquired per hour and steam-generated power could reach 109,440×103kWh every year; Energy-saving calculation shows that, compared with coke wet quenching, adoption of CDQ could lead to energy recycling of 5,0307t standard coal, equal to energy reduction of 46kg standard coal in production of 1t coke. Full use of the foregoing energy can undoubtedly reduce enterprise cost significantly and make products more competitive, thus bringing obvious energy-reducing effects.
Whereas, the requirements of Some Opinions on Rectifying and Standardizing of Coke Industry in May 2004 jointly promulgated by National Development and Reform Commission(NDPC), Ministry of Environmental Protection of the People’s Republic of China and other ministries and commissions “Rely on the advancement of science and technology, and conduct transformation of coke ovens towards energy conservation and environmental protection. Encourage large enterprises to actively adopt new technologies such as CDQ, transform current coke enterprises, improve production and technical levels as well as products quality; to reduce energy consumption and improve the environment”
The requirements of Admittance Requisites to Coking Industry “when newly building or expanding coke ovens, in principle, construction of CDQ system should be carried out simultaneously”;
The requirements of Development Policies on Steel Industry “Steel and iron enterprises must develop power generation by recycling surplus heat and waste energy. Integrated enterprises of steel and iron with the scale of over 5 million tons should endeavour to realize the purpose of surplus power except self supply serving the outside” and “Coke ovens should synchronously equip CDQ system matching with dust collecting devices”;
The requirements of Guidance Directory for Adjustment of Industrial Structures (version of Year 2005)that the State encourages the steel and iron industry to construct CDQ system.
In accordance with the above requirements, SGIS adopts advanced CDQ process which complies with relevant industrial policies.
According to Circular on Submission of Fund Application Report for 1st Alternative Projects on Resource Saving and Environmental Protection in 2007 HuanZi(2007) No. 002, CDQ transformation project of SGIS Group Corporation has been in the list.
In accordance with Regulations on the Administration of Construction Project Environmental Protection(Decree No. 253 of the State Council in 1998) and relevant provisions of the Province on administration of construction project environmental protection, if the construction project is likely to cause serious impact on the environment, environmental impact assessment(EIA) must be conducted, EIA report must be compiled and relevant
Reconstruction Project for CDQ Clean Production on 6m Coke Oven in Coking Plant, Guangdong SGIS Songshan Co., Ltd.
South China Institute of Environmental Sciences, Ministry of Environmental Protection of the PRC 2
examination and approval system must be implemented in order to effectively control appearance of new pollution sources, protect the environment and realize sustainable development.
After receiving the entrustment, South China Institute of Environmental Sciences, a branch of Ministry of Environmental Protection of the People’s Republic of China, organizes to conduct field survey and data research on the construction project and compile the EIP report in accordance with specific requirements of the State on the compilation of the EIP reports.
1.2 Compilation Basis 1.2.1 Nationwide Laws & Regulations
(1) Environmental Protection Law of the People’s Republic of China (Dec. 1989);
(2) Law of the People's Republic of China on Prevention and Control of Water Pollution (Feb.28, 1996);
(3) Law of the People's Republic of China on Prevention and Control of Atmospheric Pollution (Revised in Apr. 2000);
(4) Law of the People's Republic of China on Prevention and Control of Noise Pollution (Otc. 1996);
(5) Law of the People's Republic of China on Prevention and Control of Environmental Pollution by Solid Wastes ;( Apr. 2005);
(6) Law of the People's Republic of China on Clean Production Promotion (2002);
(7) Decision of the State Council on Several Issues Concerning Environmental Protection; GuoFa [2205] No.39;
(8) Regulations on the Administration of Construction Project Environmental Protection (Nov. 1998);
(9) Administration of Construction Project Environmental Protection by Means of Classification Catalogue, Ministry of Environmental Protection of the People’s Republic of China, Decree No. 14;
(10) Regulations on Grading Approval for Environmental Impact Assessment Documents of Construction Project, Ministry of Environmental Protection of the People’s Republic of China, Decree No. 164;
(11) Opinions on Enforcing Water Conservation Work of Industry, GuoJingMaoZiYuan [2000] No. 1015;
(12) The State Development and Planning Commission (JiJiaoNeng [1998] No. 220) Several Provisions on Development of Combined Heat and Power Production;
(13) Regulations of the State Council on Issues Concerning Acid Rain and SO2 Control Zones, GuoHan (98) No. 5;
(14) GuoHan [2002] No. 84 Replies of the State Council on the Tenth Five-Yean Plan of Pollution Control in Acid Rain and SO2 Zones;
(15) EPA, State Economic and Trade Commission and the Ministry of Science and Technology [2002] No. 26; Policy on Technologies for Prevention and Control of SO2 Emissions from Coal Burning
(16) Development Policies for the Iron and Steel Industry (Jul. 2005);
(17) Circular on Strengthening Environmental Impact Assessment Management and Preventing Environmental Risks (HuanFa (2005) No. 152)
(18) Regulation for Public Participation in the Environmental Impact Assessment (HuanFa (2006) No. 28)
(19) Law of the People's Republic of China on Environmental Impact Assessment, Dec. 26, 1989;
1.2.2 Local Laws & Regulations
(1) Regulations of Guangdong Province on the Administration of Construction Project Environmental Protection(Sep. 1997), revised on the 31st Session of the 8th Standing Committee of Guangdong Provincial People’s Congress;
(2) Guidelines of Guangdong Province on the Administration of Construction Project Environmental Protection(trial)(Sep. 2000), Guangdong Environmental Protection Bureau YueHuanJian(2000) No.8;
(3) Scheme for Adjustment of Guangdong Industrial Structures, YueFuBan(2001) No.74;
Reconstruction Project for CDQ Clean Production on 6m Coke Oven in Coking Plant, Guangdong SGIS Songshan Co., Ltd.
South China Institute of Environmental Sciences, Ministry of Environmental Protection of the PRC 3
(4) Division of Guangdong Surface Water Environmental Function Areas, YueFuHan(1999) No.553;
(5) Guangdong Blue Sky Project, YueFuBan(2001) No.7;
(6) Guangdong Green Water Project, YueFuBan(1997) No.29
(7) Circular on Printing and Issuing Control Objectives of Total Amount of Emission from Major Pollutants in Each County (City, District) during 11th Five-Year Plan, ShaoHuan(2006) No. 178;
(8) Scheme for Adjustment of Guangdong Industrial Structures, (Apr. 2006);
(9) General Plan of Guangdong Provincial Environmental Protection (2006-2020);
(10) Circular on Printing and Issuing Guangdong Provincial Regulations on Grading Approval for Environmental Impact Assessment Documents of Construction Project, YueFu(2006) No. 122;
(11) Implementation opinion for public participation in environmental management of construction projects in Guangdong Province (Yue Huan [2007] No. 99);
(12) Outline of the Eleventh Five-Year Plan for Ecological Protection in Guangdong Province.
1.2.3 Technical Guidelines and Criterions
(1) Technical Guidelines for Environmental Impact Assessment---General Principles (HJ/T2.1-93);
(2) Technical Guidelines for Environmental Impact Assessment---Atmospheric Environment (HJ/T2.2-93);
(3) Technical Guidelines for Environmental Impact Assessment---Surface Water Environment (HJ/T2.3-93);
(4) Technical Guidelines for Environmental Impact Assessment---Acoustic Environment (HJ/T2.4-95);
(5) Technical Guidelines for Environmental Impact Assessment---Non-Polluted Ecological Impact (HJ/T19-1997);
(6) Technical Guidelines for Environmental Risks Assessment of Construction Project (HJ/T169-2004);
(7) Technical Guidelines for Environmental Impact Assessment (HJ/T2.1-2.3—93,HJ/T2.4—1995);
(8) Technical Methods for Making Local Emission Standards of Air Pollutants (GB/T13201-91);
(9) Health Protection Zone Standard for Coking Plants (GB 11661-89)
1.2.4 Other Basis
(1) Approval Report of Coking Plant
(2) Feasibility Study Report on Compiled by ACRE Coking & Refractory Engineering Consulting Corporation, MCC
1.3 Assessment Objective, Principles and Methods 1.3.1 Assessment Objective
To comprehend environmental features in regions of assessment through research on existing baselines of natural environment and social environment surrounding the site of construction project; to find out engineering features and pollutant emission features of the proposed project through analysis of engineering, pollution source and prevention and control measures.
According to local environment features and pollution source features, make a survey of pollutant emission conditions after trial production of this project, and degree and scope of impact on ambient environment as well as possible changes in environment quality; to predict the improvement degree of environment due to decreased pollutant emission after trial production of this project, probability and outcome of risk accidents, and put forward emergency response measures and precautions; in accordance with clean production and total amount control and other requirements, explain why the technologies and equipment used in this project are cutting-edge, and why the environmental facilities are reliable and reasonable, and meanwhile propose countermeasures and suggestions on prevention, control and alleviation of pollution.
Reconstruction Project for CDQ Clean Production on 6m Coke Oven in Coking Plant, Guangdong SGIS Songshan Co., Ltd.
South China Institute of Environmental Sciences, Ministry of Environmental Protection of the PRC 4
1.3.2 Assessment Principles
In order to realize the above objectives, this environmental assessment adopts the following principles: on the basis of principles such as “total amount control”, “clean production” and “specified emission” for pollutants, minimize pollutant emission amount of the project, control total amount of pollutant emission after the launch of the project in a specified range, and promote integrated and coordinated development of local economic, environmental and social performances. Try to work out the following contents:
(1) The situation survey has a specified target and practical significance;
(2) Pollution source survey and source intensity calculation embody the characteristics of the proposed project;
(3) As for the prediction and assessment of environmental risk impact, the methods are feasible and the results are reliable, and it can really prevent the potential risks and protect the environment.
(4) Obey policies and regulations of the State on environmental protection such as “control total amount of pollutants” and “specified emission”;
(5) Pollution prevention measures, implementing effects of environmental protection schemes, existing problems, and analysis and suggestions for improvement.
1.3.3 Assessment Methods
(1) Focus on assessment of existing baseline and conduct surveys to confirm environmental pollution by emission and environment quality status after trial production of the project;
(2) Make full use of environment data and information available on the region of the project;
(3) Analysis of pollution source shall be conducted by analogy analysis method, empirical coefficient method and pattern calculation method, and meanwhile check pollutant emission from transformation projects with practical evaluation results;
(4) Integrated use of qualitative and quantitative analysis;
(5) Analysis on the basis of local planning and the State’s industrial policies;
(6) Recommended assessment methods in Technical Guidelines for Environmental Impact Assessment promulgated by the State.
1.4 Objectives for Pollution Control, Environment Zoning and Protection 1.4.1 Objectives for Pollution Control
(1) All pollution sources are under reasonable and appropriate control, and their impact on the environment is minimized by strengthening of technical measures and management measures;
(2) By actively promoting the principle of clean production, each technical and economic index of clean production reaches domestic advanced level;
(3) Each pollution source realizes specified emission;
(4) Control total amount of emission from major pollutants at each pollution source;
(5) In compliance with the principle of recycling and economy, realize reasonable use of energy and resources.
Reconstruction Project for CDQ Clean Production on 6m Coke Oven in Coking Plant, Guangdong SGIS Songshan Co., Ltd.
South China Institute of Environmental Sciences, Ministry of Environmental Protection of the PRC 5
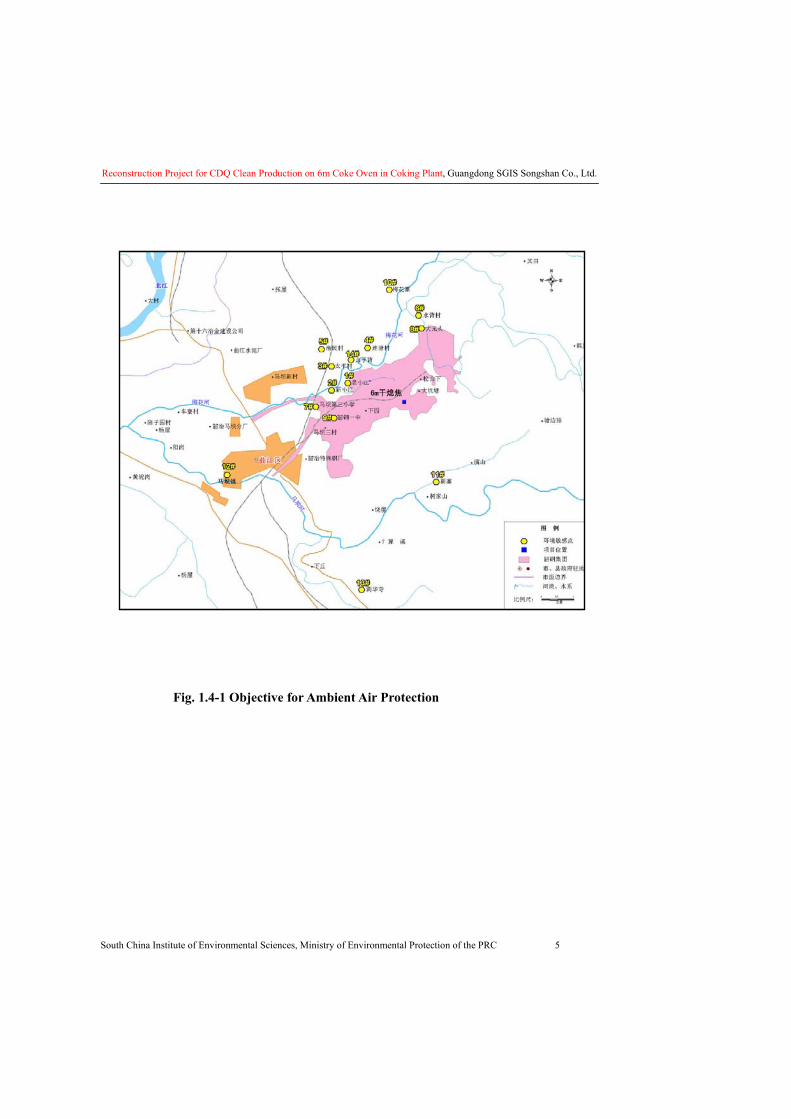
Fig. 1.4-1 Objective for Ambient Air Protection
Reconstruction Project for CDQ Clean Production on 6m Coke Oven in Coking Plant, Guangdong SGIS Songshan Co., Ltd.
South China Institute of Environmental Sciences, Ministry of Environmental Protection of the PRC 6
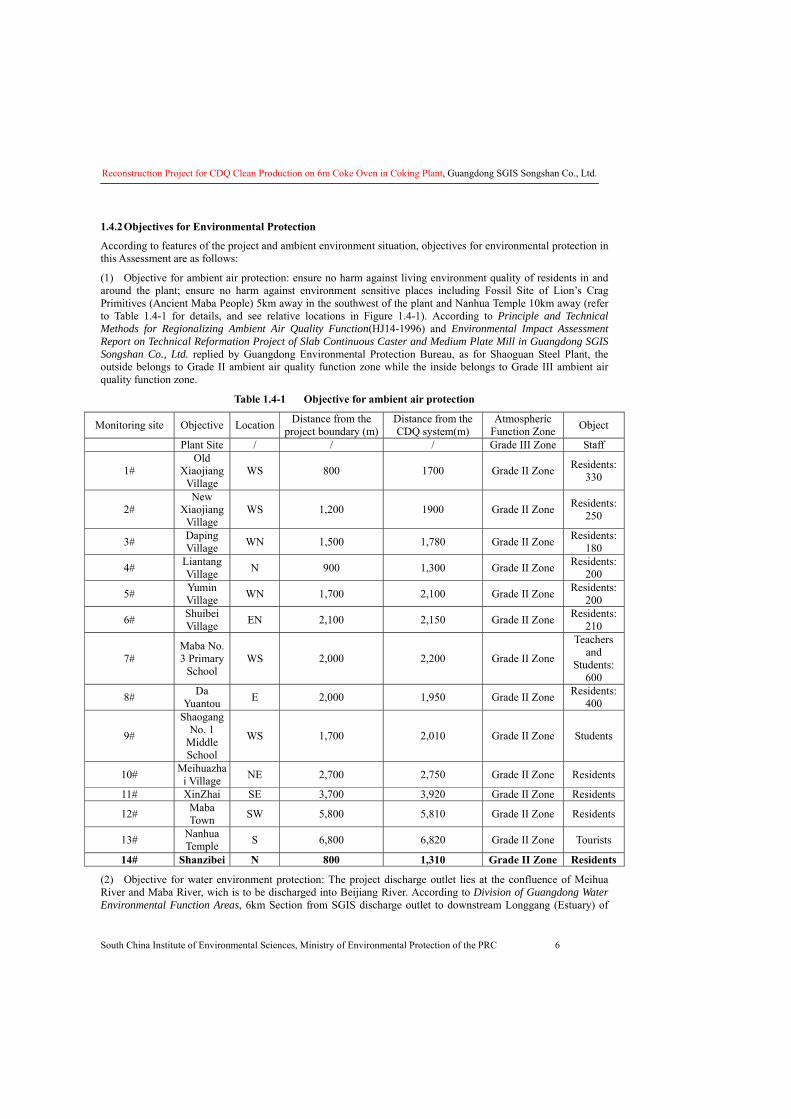
1.4.2 Objectives for Environmental Protection
According to features of the project and ambient environment situation, objectives for environmental protection in this Assessment are as follows:
(1) Objective for ambient air protection: ensure no harm against living environment quality of residents in and around the plant; ensure no harm against environment sensitive places including Fossil Site of Lion’s Crag Primitives (Ancient Maba People) 5km away in the southwest of the plant and Nanhua Temple 10km away (refer to Table 1.4-1 for details, and see relative locations in Figure 1.4-1). According to Principle and Technical Methods for Regionalizing Ambient Air Quality Function(HJ14-1996) and Environmental Impact Assessment Report on Technical Reformation Project of Slab Continuous Caster and Medium Plate Mill in Guangdong SGIS Songshan Co., Ltd. replied by Guangdong Environmental Protection Bureau, as for Shaoguan Steel Plant, the outside belongs to Grade II ambient air quality function zone while the inside belongs to Grade III ambient air quality function zone.
Table 1.4-1 Objective for ambient air protection
Monitoring site Objective Location Distance from the project boundary (m)
Distance from the CDQ system(m)
Atmospheric Function Zone Object
Plant Site / / / Grade III Zone Staff
1# Old
Xiaojiang Village
WS 800 1700 Grade II Zone Residents: 330
2# New
Xiaojiang Village
WS 1,200 1900 Grade II Zone Residents: 250
3# Daping Village WN 1,500 1,780 Grade II Zone Residents:
180
4# Liantang Village N 900 1,300 Grade II Zone Residents:
200
5# Yumin Village WN 1,700 2,100 Grade II Zone Residents:
200
6# Shuibei Village EN 2,100 2,150 Grade II Zone Residents:
210
7# Maba No. 3 Primary
School WS 2,000 2,200 Grade II Zone
Teachers and
Students: 600
8# Da Yuantou E 2,000 1,950 Grade II Zone Residents:
400
9#
Shaogang No. 1
Middle School
WS 1,700 2,010 Grade II Zone Students
10# Meihuazhai Village NE 2,700 2,750 Grade II Zone Residents
11# XinZhai SE 3,700 3,920 Grade II Zone Residents
12# Maba Town SW 5,800 5,810 Grade II Zone Residents
13# Nanhua Temple S 6,800 6,820 Grade II Zone Tourists
14# Shanzibei N 800 1,310 Grade II Zone Residents
(2) Objective for water environment protection: The project discharge outlet lies at the confluence of Meihua River and Maba River, wich is to be discharged into Beijiang River. According to Division of Guangdong Water Environmental Function Areas, 6km Section from SGIS discharge outlet to downstream Longgang (Estuary) of
Reconstruction Project for CDQ Clean Production on 6m Coke Oven in Coking Plant, Guangdong SGIS Songshan Co., Ltd.
South China Institute of Environmental Sciences, Ministry of Environmental Protection of the PRC 7
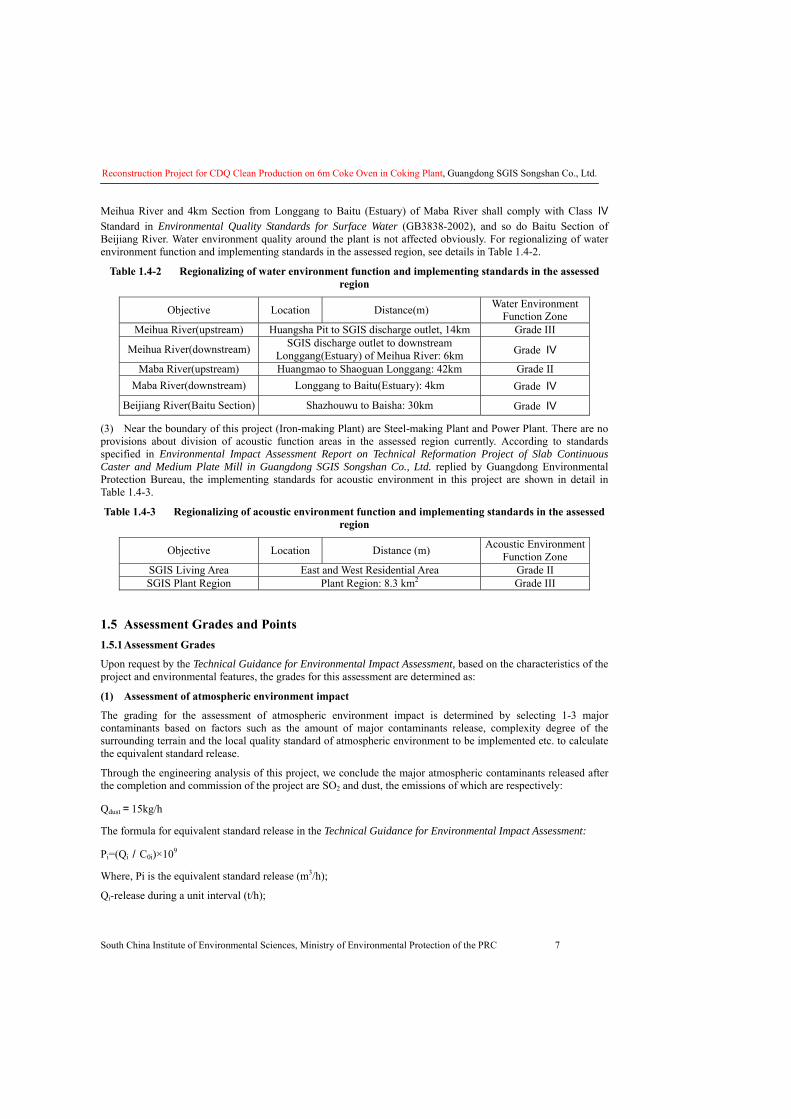
Meihua River and 4km Section from Longgang to Baitu (Estuary) of Maba River shall comply with Class Ⅳ Standard in Environmental Quality Standards for Surface Water (GB3838-2002), and so do Baitu Section of Beijiang River. Water environment quality around the plant is not affected obviously. For regionalizing of water environment function and implementing standards in the assessed region, see details in Table 1.4-2.
Table 1.4-2 Regionalizing of water environment function and implementing standards in the assessed region
Objective Location Distance(m) Water Environment Function Zone
Meihua River(upstream) Huangsha Pit to SGIS discharge outlet, 14km Grade III
Meihua River(downstream) SGIS discharge outlet to downstream Longgang(Estuary) of Meihua River: 6km Grade Ⅳ
Maba River(upstream) Huangmao to Shaoguan Longgang: 42km Grade II Maba River(downstream) Longgang to Baitu(Estuary): 4km Grade Ⅳ
Beijiang River(Baitu Section) Shazhouwu to Baisha: 30km Grade Ⅳ
(3) Near the boundary of this project (Iron-making Plant) are Steel-making Plant and Power Plant. There are no provisions about division of acoustic function areas in the assessed region currently. According to standards specified in Environmental Impact Assessment Report on Technical Reformation Project of Slab Continuous Caster and Medium Plate Mill in Guangdong SGIS Songshan Co., Ltd. replied by Guangdong Environmental Protection Bureau, the implementing standards for acoustic environment in this project are shown in detail in Table 1.4-3.
Table 1.4-3 Regionalizing of acoustic environment function and implementing standards in the assessed region
Objective Location Distance (m) Acoustic Environment Function Zone
SGIS Living Area East and West Residential Area Grade II SGIS Plant Region Plant Region: 8.3 km2 Grade III
1.5 Assessment Grades and Points 1.5.1 Assessment Grades
Upon request by the Technical Guidance for Environmental Impact Assessment, based on the characteristics of the project and environmental features, the grades for this assessment are determined as:
(1) Assessment of atmospheric environment impact
The grading for the assessment of atmospheric environment impact is determined by selecting 1-3 major contaminants based on factors such as the amount of major contaminants release, complexity degree of the surrounding terrain and the local quality standard of atmospheric environment to be implemented etc. to calculate the equivalent standard release.
Through the engineering analysis of this project, we conclude the major atmospheric contaminants released after the completion and commission of the project are SO2 and dust, the emissions of which are respectively:
Qdust=15kg/h
The formula for equivalent standard release in the Technical Guidance for Environmental Impact Assessment:
Pi=(Qi/C0i)×109
Where, Pi is the equivalent standard release (m3/h);
Qi-release during a unit interval (t/h);
Reconstruction Project for CDQ Clean Production on 6m Coke Oven in Coking Plant, Guangdong SGIS Songshan Co., Ltd.
South China Institute of Environmental Sciences, Ministry of Environmental Protection of the PRC 8
C0i=ambient air quality standard (mg/m3);
From which the equivalent standard release for dusts (PM10) can be calculated as:
Pdust =0.5×10⁷ m3/h。
The P value is less than 2.5×10⁸, which indicates the terrain around the project is valleys, plains and hills. According to the specification of the Technical Guidance for Environmental Impact Assessment, the impact on the atmospheric environment of the project is graded as grade 3.
(2) Assessment of the impact on surface water
Upon request by the Guidance, the impact on surface water is graded in accordance with the emission of polluted water, the complexity degree of the water-quality of the polluted water, the size of the water areas included, and the requirements on water-quality.
The pollution carrying water body of the project is Meihua River (downstream), which is categorized as a small river. The water quality of Meihua River (downstream) is required to be category IV. Water pollutants generated from this CDQ project is simple and is reused after treatment which is up to relevant technical requirement and realizes the zero discharge. So analysis for it only is qualitative.
(3) Acoustic Environmental Impact Assessment
The project is located within the factory, which is categorized as type 3 in acoustic function, but because the factory boundary is close to the Old Xiaojiang Village, the impact on the acoustic environment should be graded as grade 2, in accordance with the relevant prescriptions in the Technical Guidance for Environmental Impact Assessment-Acoustic Environment.
(4) Assessment of ecological environment impact
Within the area where the factory site is located, there are no animals or plants under the first or second class protection of the state, and no rare or endangered aquatic creatures live in the nearby sea area. Considering the project involves a slight amount of wastewater release, and is carried out within the factory, so the ecological environment is evaluated as general.
1.5.2 Assessment Points
This assessment has set: 13 special topics such as project summary and engineering analysis, environmental summary, monitoring and assessment of the current condition of the environmental quality, analysis of the environmental impact during the operation period, analysis of the impact on environmental risks during the operation period, the verification of the technical feasibility of environmental protection measures, and public participation etc.
According to the pilot run condition of the project and environmental characteristics, the assessment of the existing baseline of the atmospheric environment, clean projection analysis, and the assessment and analysis of the implementation effect of environmental protection measures are determined as the points of the assessment.
1.6 Assessment Scope and Assessment Factor 1.6.1 Water environment
Upon request by the Technical Guidance for Environmental Impact Assessment, we develop the scope and factor of the assessment of the environmental impact of this project.
According to the release characteristics of engineering polluted water, the assessment scope is determined as (1) from the discharge outlet of Meihua River to Meihua River, the spot where Meihua River and Maba River converge, and the entrance where Maba River enters Beijiang River, and the total length for the segment is 10km; (2) the Beijiang River segment, with a length of 5km.
Factors for existing baseline assessment: there are altogether 20 factors, including: pH, SS, sulphide, volatile hydroxybenzene, arsenic, water temperature, lead, cadmium, copper, zinc, mercury, petroleum, fluoride, cyanide, CODcr, BOD5, non-organic nitrogen, non-organic phosphor and Fe.
Reconstruction Project for CDQ Clean Production on 6m Coke Oven in Coking Plant, Guangdong SGIS Songshan Co., Ltd.
South China Institute of Environmental Sciences, Ministry of Environmental Protection of the PRC 9
Estimation factors: CODcr, petroleum
1.6.2 Atmospheric Environment
According to the request by the Technical Guidance for Environmental Impact Assessment, the release condition of Air Pollutants and the characteristics of the regional environment, the scope and factor of the assessment of the atmospheric impact in this project are determined.
Assessment scope: according to the project size, pollution release characteristics and the environment condition, the assessment scope is determined as a rectangular area in which the factory site is the center, the primary wind direction is the main axis, and the side length is 10km.
Factors for existing baseline assessment: SO2, NO2, PM10, TSP, CO
Factors for estimation assessment: PM10, TSP(in times of accidents)
1.6.3 Acoustic Environment
According to the condition of the surrounding environment, the scope for acoustic environment assessment is the area within the factory boundary in which there are noise sensitive points. The assessment factor is equivalent consecutive grade A.
1.6.4 Ecological Environment and Other
The factors for evaluating the existing baseline of land quality are: pH, Pb, Zn, Cd, Cr. Ecological Environment: animal and plant breeds, biomass, and dominant species etc. The assessment of the impact of solid wastes on the environment involves the analysis of the toxicity of the solid wastes, the authentication of the characteristics and types of the solid wastes, the analysis of the measures of comprehensively utilizing or disposing solid wastes, of the possible impacts of the solid wastes on water bodies, the atmosphere, the land, underground water and ecology etc., and the feasibility of the pollution preventing and treating measures taken.
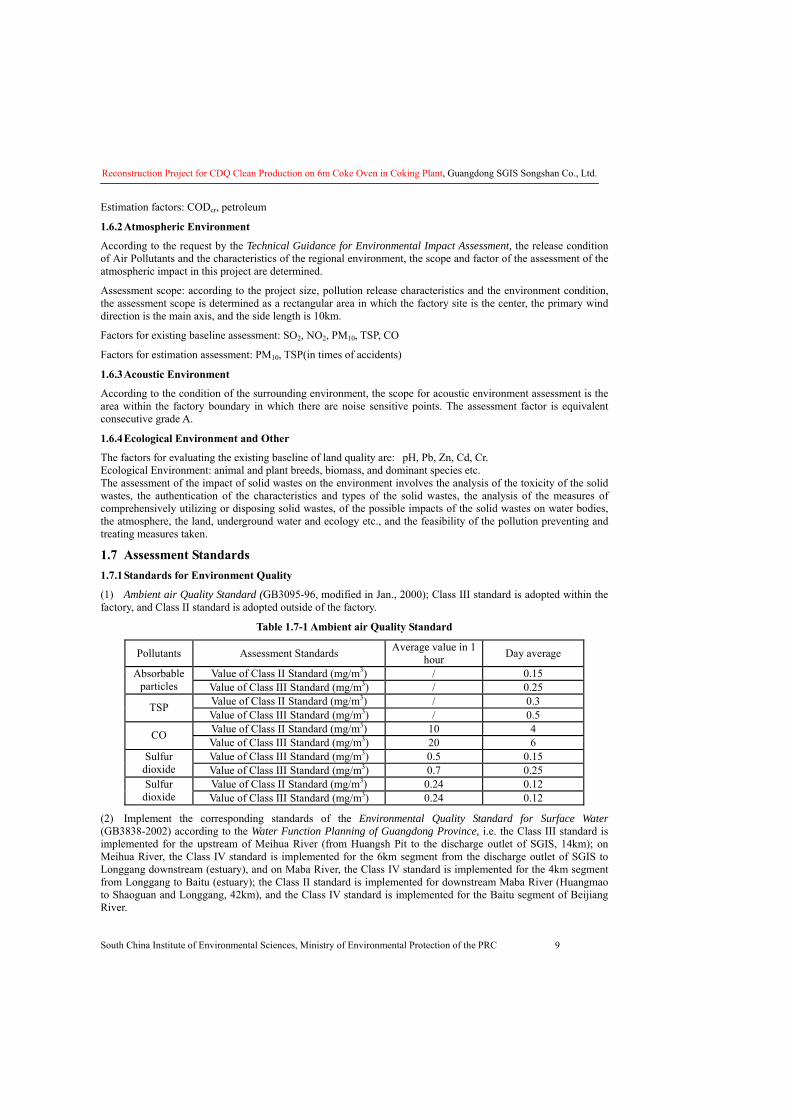
1.7 Assessment Standards 1.7.1 Standards for Environment Quality
(1) Ambient air Quality Standard (GB3095-96, modified in Jan., 2000); Class III standard is adopted within the factory, and Class II standard is adopted outside of the factory.
Table 1.7-1 Ambient air Quality Standard
Pollutants Assessment Standards Average value in 1 hour Day average
Value of Class II Standard (mg/m3) / 0.15 Absorbable particles Value of Class III Standard (mg/m3) / 0.25
Value of Class II Standard (mg/m3) / 0.3 TSP Value of Class III Standard (mg/m3) / 0.5 Value of Class II Standard (mg/m3) 10 4 CO Value of Class III Standard (mg/m3) 20 6 Value of Class III Standard (mg/m3) 0.5 0.15 Sulfur
dioxide Value of Class III Standard (mg/m3) 0.7 0.25 Value of Class II Standard (mg/m3) 0.24 0.12 Sulfur
dioxide Value of Class III Standard (mg/m3) 0.24 0.12
(2) Implement the corresponding standards of the Environmental Quality Standard for Surface Water (GB3838-2002) according to the Water Function Planning of Guangdong Province, i.e. the Class III standard is implemented for the upstream of Meihua River (from Huangsh Pit to the discharge outlet of SGIS, 14km); on Meihua River, the Class IV standard is implemented for the 6km segment from the discharge outlet of SGIS to Longgang downstream (estuary), and on Maba River, the Class IV standard is implemented for the 4km segment from Longgang to Baitu (estuary); the Class II standard is implemented for downstream Maba River (Huangmao to Shaoguan and Longgang, 42km), and the Class IV standard is implemented for the Baitu segment of Beijiang River.
Reconstruction Project for CDQ Clean Production on 6m Coke Oven in Coking Plant, Guangdong SGIS Songshan Co., Ltd.
South China Institute of Environmental Sciences, Ministry of Environmental Protection of the PRC 10
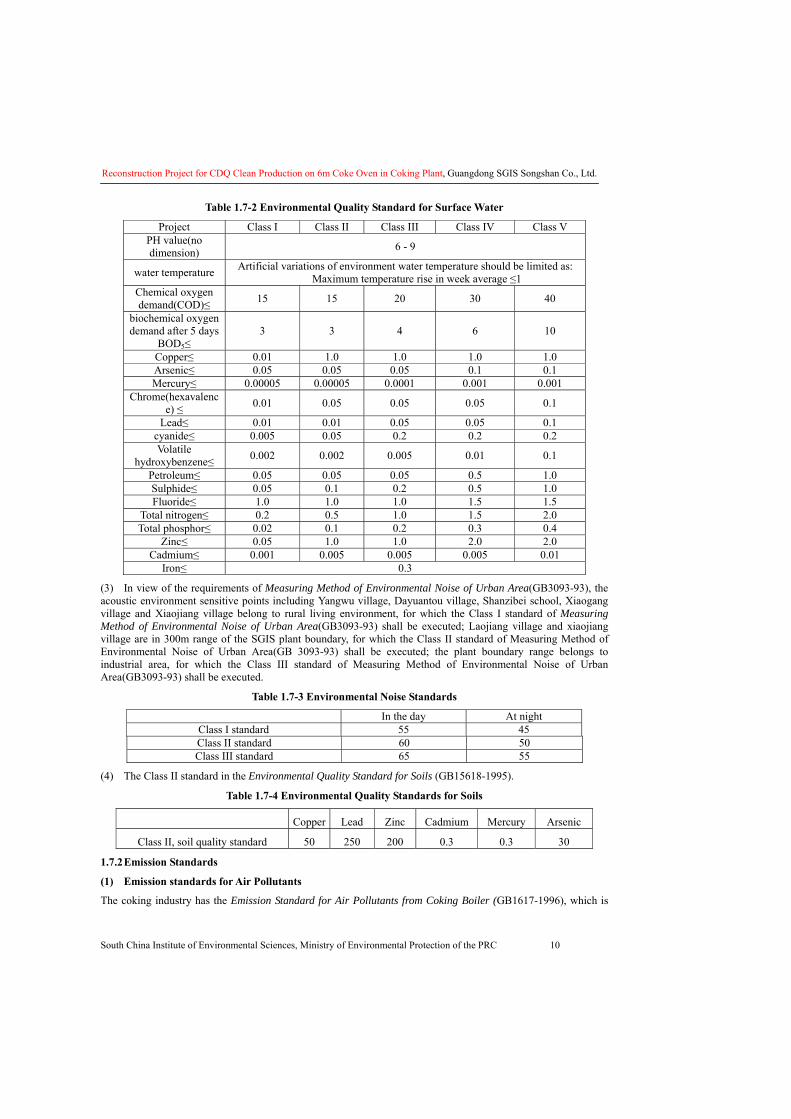
Table 1.7-2 Environmental Quality Standard for Surface Water
Project Class I Class II Class III Class IV Class V PH value(no dimension) 6 - 9
water temperature Artificial variations of environment water temperature should be limited as: Maximum temperature rise in week average ≤1
Chemical oxygen demand(COD)≤ 15 15 20 30 40
biochemical oxygen demand after 5 days
BOD5≤ 3 3 4 6 10
Copper≤ 0.01 1.0 1.0 1.0 1.0 Arsenic≤ 0.05 0.05 0.05 0.1 0.1 Mercury≤ 0.00005 0.00005 0.0001 0.001 0.001
Chrome(hexavalence) ≤ 0.01 0.05 0.05 0.05 0.1
Lead≤ 0.01 0.01 0.05 0.05 0.1 cyanide≤ 0.005 0.05 0.2 0.2 0.2 Volatile
hydroxybenzene≤ 0.002 0.002 0.005 0.01 0.1
Petroleum≤ 0.05 0.05 0.05 0.5 1.0 Sulphide≤ 0.05 0.1 0.2 0.5 1.0 Fluoride≤ 1.0 1.0 1.0 1.5 1.5
Total nitrogen≤ 0.2 0.5 1.0 1.5 2.0 Total phosphor≤ 0.02 0.1 0.2 0.3 0.4
Zinc≤ 0.05 1.0 1.0 2.0 2.0 Cadmium≤ 0.001 0.005 0.005 0.005 0.01
Iron≤ 0.3
(3) In view of the requirements of Measuring Method of Environmental Noise of Urban Area(GB3093-93), the acoustic environment sensitive points including Yangwu village, Dayuantou village, Shanzibei school, Xiaogang village and Xiaojiang village belong to rural living environment, for which the Class I standard of Measuring Method of Environmental Noise of Urban Area(GB3093-93) shall be executed; Laojiang village and xiaojiang village are in 300m range of the SGIS plant boundary, for which the Class II standard of Measuring Method of Environmental Noise of Urban Area(GB 3093-93) shall be executed; the plant boundary range belongs to industrial area, for which the Class III standard of Measuring Method of Environmental Noise of Urban Area(GB3093-93) shall be executed.
Table 1.7-3 Environmental Noise Standards
In the day At night Class I standard 55 45 Class II standard 60 50 Class III standard 65 55
(4) The Class II standard in the Environmental Quality Standard for Soils (GB15618-1995).
Table 1.7-4 Environmental Quality Standards for Soils
Copper Lead Zinc Cadmium Mercury Arsenic
Class II, soil quality standard 50 250 200 0.3 0.3 30
1.7.2 Emission Standards
(1) Emission standards for Air Pollutants
The coking industry has the Emission Standard for Air Pollutants from Coking Boiler (GB1617-1996), which is
Reconstruction Project for CDQ Clean Production on 6m Coke Oven in Coking Plant, Guangdong SGIS Songshan Co., Ltd.
South China Institute of Environmental Sciences, Ministry of Environmental Protection of the PRC 11
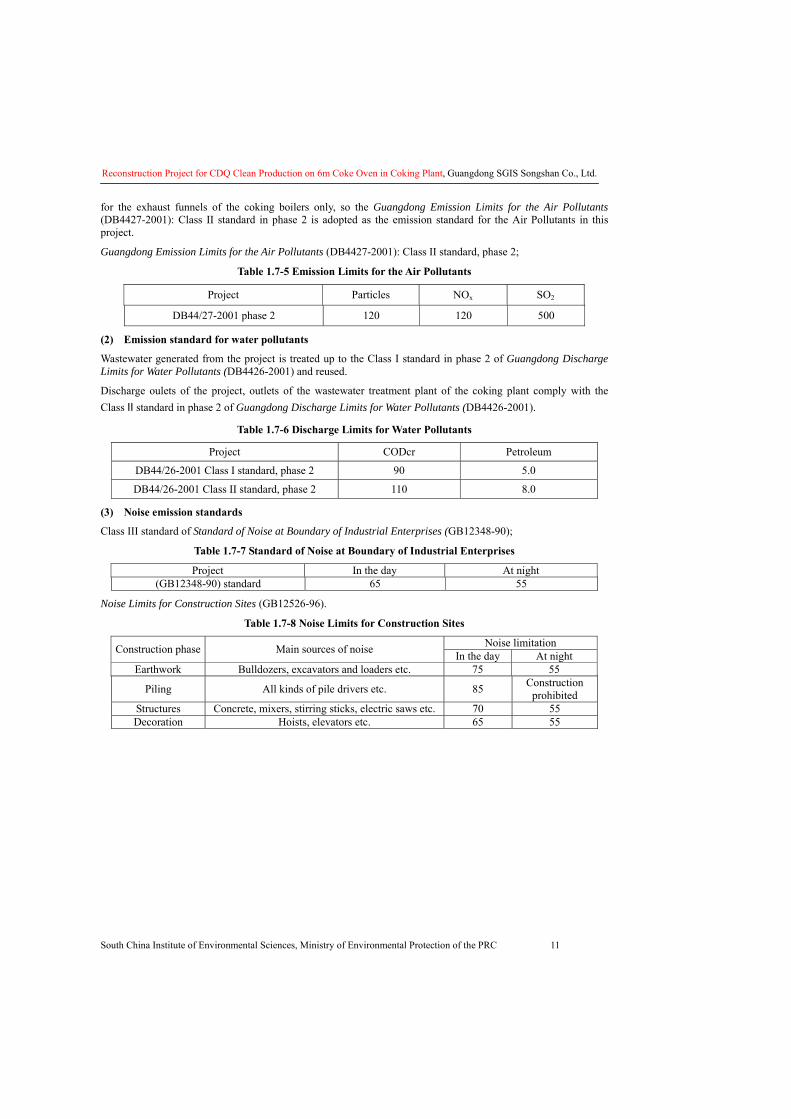
for the exhaust funnels of the coking boilers only, so the Guangdong Emission Limits for the Air Pollutants (DB4427-2001): Class II standard in phase 2 is adopted as the emission standard for the Air Pollutants in this project.
Guangdong Emission Limits for the Air Pollutants (DB4427-2001): Class II standard, phase 2;
Table 1.7-5 Emission Limits for the Air Pollutants
Project Particles NOx SO2
DB44/27-2001 phase 2 120 120 500
(2) Emission standard for water pollutants
Wastewater generated from the project is treated up to the Class I standard in phase 2 of Guangdong Discharge Limits for Water Pollutants (DB4426-2001) and reused.
Discharge oulets of the project, outlets of the wastewater treatment plant of the coking plant comply with the Class II standard in phase 2 of Guangdong Discharge Limits for Water Pollutants (DB4426-2001).
Table 1.7-6 Discharge Limits for Water Pollutants
Project CODcr Petroleum
DB44/26-2001 Class I standard, phase 2 90 5.0
DB44/26-2001 Class II standard, phase 2 110 8.0
(3) Noise emission standards
Class III standard of Standard of Noise at Boundary of Industrial Enterprises (GB12348-90);
Table 1.7-7 Standard of Noise at Boundary of Industrial Enterprises
Project In the day At night (GB12348-90) standard 65 55
Noise Limits for Construction Sites (GB12526-96).
Table 1.7-8 Noise Limits for Construction Sites
Noise limitation Construction phase Main sources of noise In the day At night Earthwork Bulldozers, excavators and loaders etc. 75 55
Piling All kinds of pile drivers etc. 85 Construction prohibited
Structures Concrete, mixers, stirring sticks, electric saws etc. 70 55 Decoration Hoists, elevators etc. 65 55
Reconstruction Project for CDQ Clean Production on 6m Coke Oven in Coking Plant, Guangdong SGIS Songshan Co., Ltd.
South China Institute of Environmental Sciences, Ministry of Environmental Protection of the PRC 12
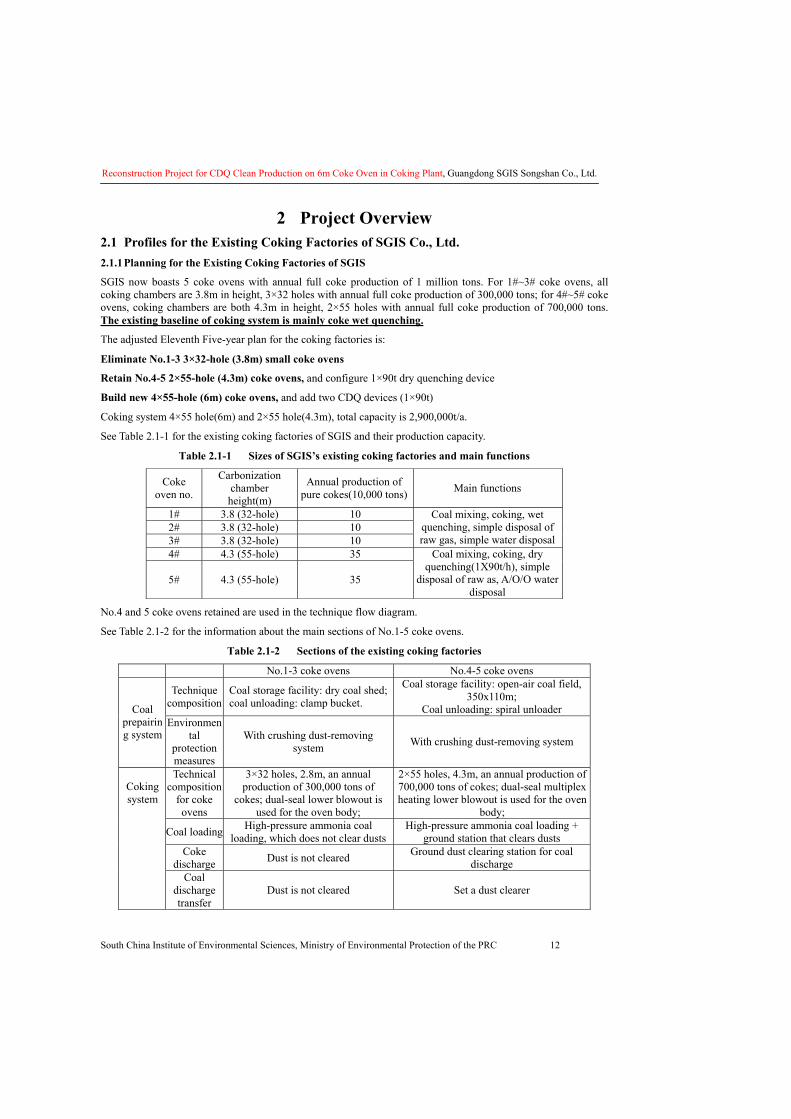
2 Project Overview 2.1 Profiles for the Existing Coking Factories of SGIS Co., Ltd. 2.1.1 Planning for the Existing Coking Factories of SGIS
SGIS now boasts 5 coke ovens with annual full coke production of 1 million tons. For 1#~3# coke ovens, all coking chambers are 3.8m in height, 3×32 holes with annual full coke production of 300,000 tons; for 4#~5# coke ovens, coking chambers are both 4.3m in height, 2×55 holes with annual full coke production of 700,000 tons. The existing baseline of coking system is mainly coke wet quenching.
The adjusted Eleventh Five-year plan for the coking factories is:
Eliminate No.1-3 3×32-hole (3.8m) small coke ovens
Retain No.4-5 2×55-hole (4.3m) coke ovens, and configure 1×90t dry quenching device
Build new 4×55-hole (6m) coke ovens, and add two CDQ devices (1×90t)
Coking system 4×55 hole(6m) and 2×55 hole(4.3m), total capacity is 2,900,000t/a.
See Table 2.1-1 for the existing coking factories of SGIS and their production capacity.
Table 2.1-1 Sizes of SGIS’s existing coking factories and main functions
Coke oven no.
Carbonization chamber height(m)
Annual production of pure cokes(10,000 tons) Main functions
1# 3.8 (32-hole) 10 2# 3.8 (32-hole) 10 3# 3.8 (32-hole) 10
Coal mixing, coking, wet quenching, simple disposal of raw gas, simple water disposal
4# 4.3 (55-hole) 35
5# 4.3 (55-hole) 35
Coal mixing, coking, dry quenching(1X90t/h), simple
disposal of raw as, A/O/O water disposal
No.4 and 5 coke ovens retained are used in the technique flow diagram.
See Table 2.1-2 for the information about the main sections of No.1-5 coke ovens.
Table 2.1-2 Sections of the existing coking factories
No.1-3 coke ovens No.4-5 coke ovens
Technique composition
Coal storage facility: dry coal shed; coal unloading: clamp bucket.
Coal storage facility: open-air coal field, 350x110m;
Coal unloading: spiral unloader Coal prepairing system
Environmental
protection measures
With crushing dust-removing system With crushing dust-removing system
Technical composition
for coke ovens
3×32 holes, 2.8m, an annual production of 300,000 tons of
cokes; dual-seal lower blowout is used for the oven body;
2×55 holes, 4.3m, an annual production of 700,000 tons of cokes; dual-seal multiplex heating lower blowout is used for the oven
body;
Coal loading High-pressure ammonia coal loading, which does not clear dusts
High-pressure ammonia coal loading + ground station that clears dusts
Coke discharge Dust is not cleared Ground dust clearing station for coal
discharge
Coking system
Coal discharge transfer
Dust is not cleared Set a dust clearer
Reconstruction Project for CDQ Clean Production on 6m Coke Oven in Coking Plant, Guangdong SGIS Songshan Co., Ltd.
South China Institute of Environmental Sciences, Ministry of Environmental Protection of the PRC 13
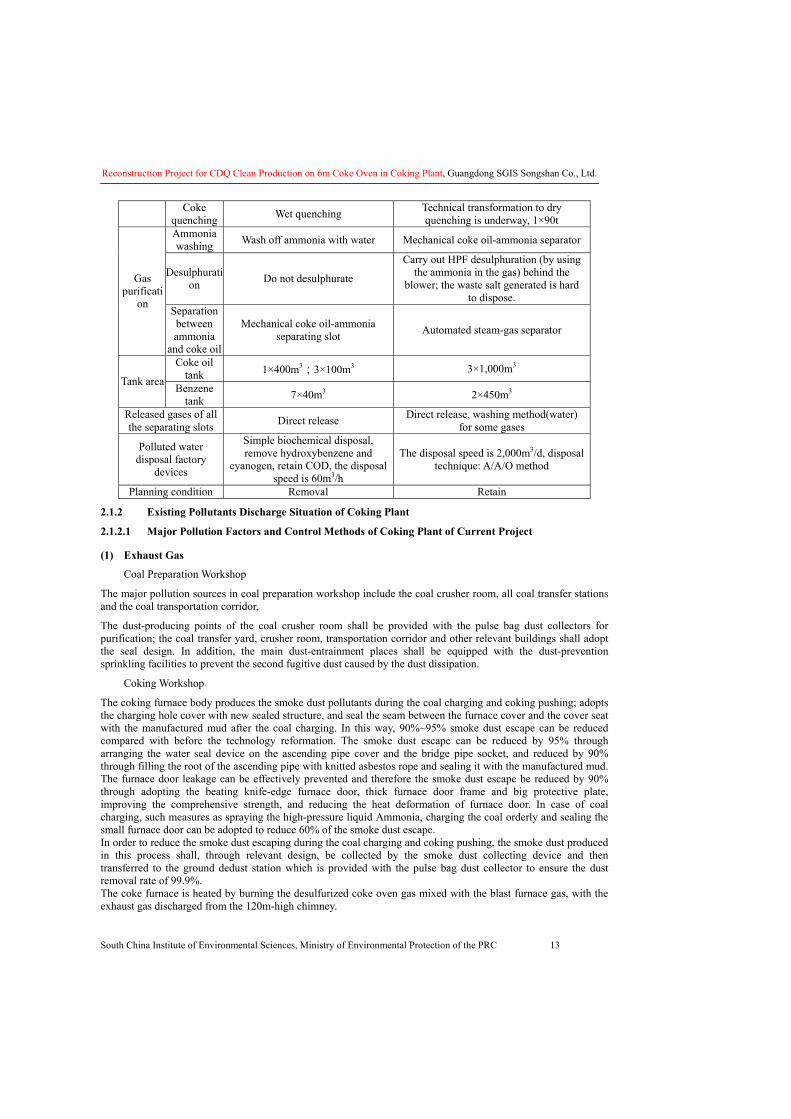
Coke quenching Wet quenching Technical transformation to dry
quenching is underway, 1×90t Ammonia washing Wash off ammonia with water Mechanical coke oil-ammonia separator
Desulphuration Do not desulphurate
Carry out HPF desulphuration (by using the ammonia in the gas) behind the
blower; the waste salt generated is hard to dispose.
Gas purificati
on Separation between ammonia
and coke oil
Mechanical coke oil-ammonia separating slot Automated steam-gas separator
Coke oil tank 1×400m3;3×100m3 3×1,000m3
Tank area Benzene tank 7×40m3 2×450m3
Released gases of all the separating slots Direct release Direct release, washing method(water)
for some gases
Polluted water disposal factory
devices
Simple biochemical disposal, remove hydroxybenzene and
cyanogen, retain COD, the disposal speed is 60m3/h
The disposal speed is 2,000m3/d, disposal technique: A/A/O method
Planning condition Removal Retain
2.1.2 Existing Pollutants Discharge Situation of Coking Plant
2.1.2.1 Major Pollution Factors and Control Methods of Coking Plant of Current Project
(1) Exhaust Gas
� Coal Preparation Workshop
The major pollution sources in coal preparation workshop include the coal crusher room, all coal transfer stations and the coal transportation corridor,
The dust-producing points of the coal crusher room shall be provided with the pulse bag dust collectors for purification; the coal transfer yard, crusher room, transportation corridor and other relevant buildings shall adopt the seal design. In addition, the main dust-entrainment places shall be equipped with the dust-prevention sprinkling facilities to prevent the second fugitive dust caused by the dust dissipation.
� Coking Workshop
The coking furnace body produces the smoke dust pollutants during the coal charging and coking pushing; adopts the charging hole cover with new sealed structure, and seal the seam between the furnace cover and the cover seat with the manufactured mud after the coal charging. In this way, 90%~95% smoke dust escape can be reduced compared with before the technology reformation. The smoke dust escape can be reduced by 95% through arranging the water seal device on the ascending pipe cover and the bridge pipe socket, and reduced by 90% through filling the root of the ascending pipe with knitted asbestos rope and sealing it with the manufactured mud. The furnace door leakage can be effectively prevented and therefore the smoke dust escape be reduced by 90% through adopting the beating knife-edge furnace door, thick furnace door frame and big protective plate, improving the comprehensive strength, and reducing the heat deformation of furnace door. In case of coal charging, such measures as spraying the high-pressure liquid Ammonia, charging the coal orderly and sealing the small furnace door can be adopted to reduce 60% of the smoke dust escape. In order to reduce the smoke dust escaping during the coal charging and coking pushing, the smoke dust produced in this process shall, through relevant design, be collected by the smoke dust collecting device and then transferred to the ground dedust station which is provided with the pulse bag dust collector to ensure the dust removal rate of 99.9%. The coke furnace is heated by burning the desulfurized coke oven gas mixed with the blast furnace gas, with the exhaust gas discharged from the 120m-high chimney.
Reconstruction Project for CDQ Clean Production on 6m Coke Oven in Coking Plant, Guangdong SGIS Songshan Co., Ltd.
South China Institute of Environmental Sciences, Ministry of Environmental Protection of the PRC 14
� Coke Wet Quenching System
The coke dust discharged from the coke quenching tower and the coke screening and storing system. This project adopts the coke wet quenching; therefore the wood-lattice dust catcher shall be arranged on the top of coke quenching tower to collect the coke dust produced in the coke quenching process; the coke screen and storing building, coke transfer station and other dust producing points shall be provided with five sets of foam dust collectors which can ensure an dust removal rate of 93%. Furthermore, every transfer station and coke transportation corridor of the coke screening and storing system shall adopt the seal design.
� Coke Oven Gas Purification Workshop
Basically, the exhaust gas of No.4 and 5 coke furnace can be discharged directly from all dispersing pipes and air outlets, with only part of it cleaned before discharge. The Coke Oven Gas shall be purified through the HPF desulphurization technology; the exhaust gas emitted from the ammonium sulfate dryer in the ammonium sulfate workshop section shall be sent to the high-performance separator to filter out the ammonium sulfate dust and then discharged into the atmosphere; the gas emitted from each oil groove separator in the crude benzene workshop section shall be linked together according to the locations and sent to the Coke Oven Gas absorbing pipe, with a purpose to prevent the discharge pollution.
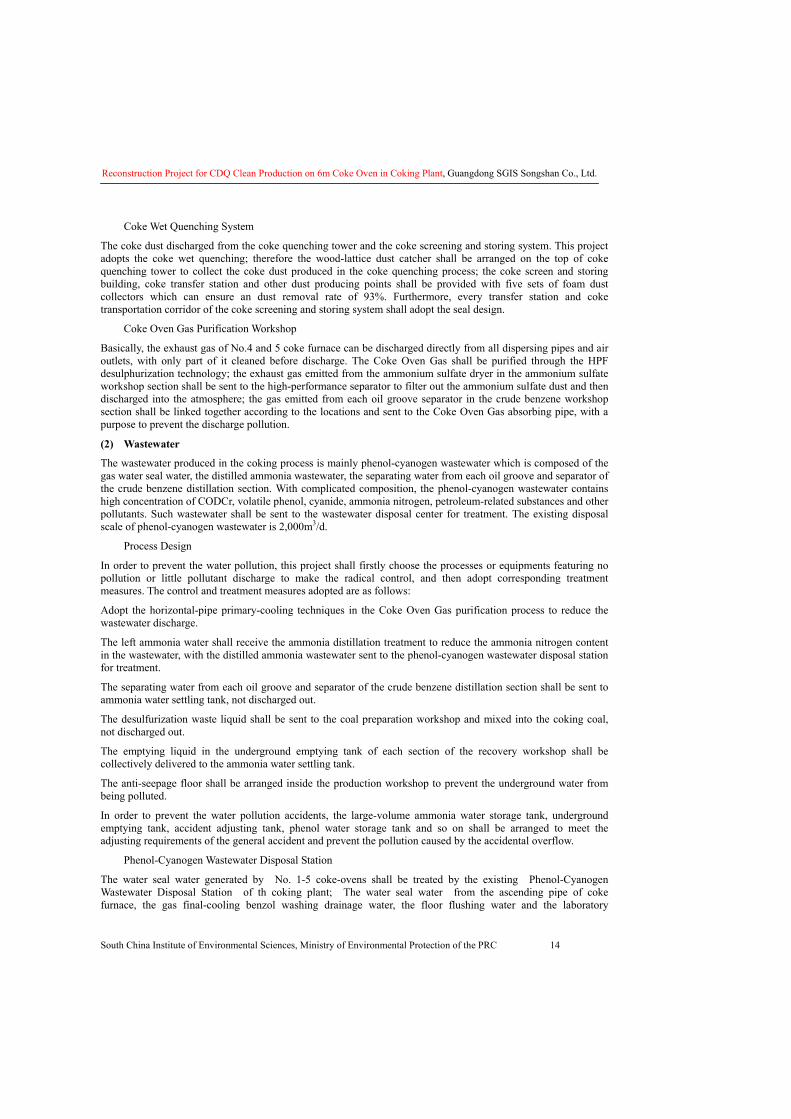
(2) Wastewater
The wastewater produced in the coking process is mainly phenol-cyanogen wastewater which is composed of the gas water seal water, the distilled ammonia wastewater, the separating water from each oil groove and separator of the crude benzene distillation section. With complicated composition, the phenol-cyanogen wastewater contains high concentration of CODCr, volatile phenol, cyanide, ammonia nitrogen, petroleum-related substances and other pollutants. Such wastewater shall be sent to the wastewater disposal center for treatment. The existing disposal scale of phenol-cyanogen wastewater is 2,000m3/d.
� Process Design
In order to prevent the water pollution, this project shall firstly choose the processes or equipments featuring no pollution or little pollutant discharge to make the radical control, and then adopt corresponding treatment measures. The control and treatment measures adopted are as follows:
Adopt the horizontal-pipe primary-cooling techniques in the Coke Oven Gas purification process to reduce the wastewater discharge.
The left ammonia water shall receive the ammonia distillation treatment to reduce the ammonia nitrogen content in the wastewater, with the distilled ammonia wastewater sent to the phenol-cyanogen wastewater disposal station for treatment.
The separating water from each oil groove and separator of the crude benzene distillation section shall be sent to ammonia water settling tank, not discharged out.
The desulfurization waste liquid shall be sent to the coal preparation workshop and mixed into the coking coal, not discharged out.
The emptying liquid in the underground emptying tank of each section of the recovery workshop shall be collectively delivered to the ammonia water settling tank.
The anti-seepage floor shall be arranged inside the production workshop to prevent the underground water from being polluted.
In order to prevent the water pollution accidents, the large-volume ammonia water storage tank, underground emptying tank, accident adjusting tank, phenol water storage tank and so on shall be arranged to meet the adjusting requirements of the general accident and prevent the pollution caused by the accidental overflow.
� Phenol-Cyanogen Wastewater Disposal Station
The water seal water generated by No. 1-5 coke-ovens shall be treated by the existing Phenol-Cyanogen Wastewater Disposal Station of th coking plant; The water seal water from the ascending pipe of coke furnace, the gas final-cooling benzol washing drainage water, the floor flushing water and the laboratory
Reconstruction Project for CDQ Clean Production on 6m Coke Oven in Coking Plant, Guangdong SGIS Songshan Co., Ltd.
South China Institute of Environmental Sciences, Ministry of Environmental Protection of the PRC 15
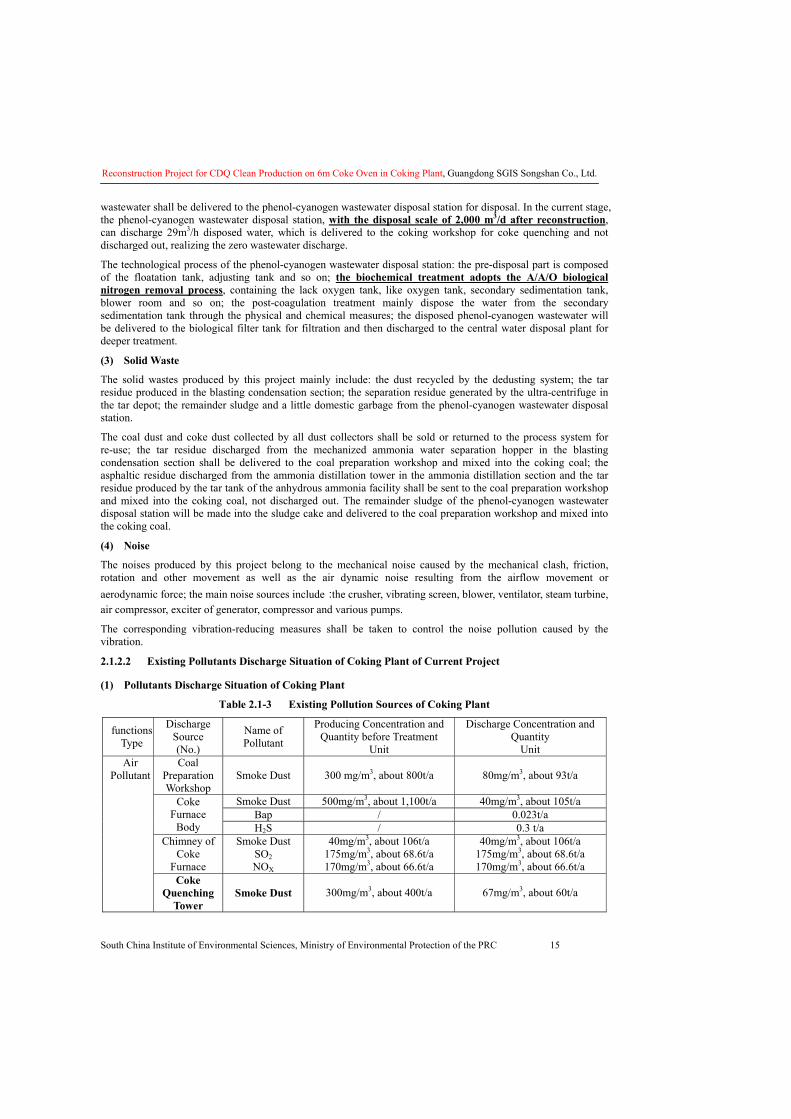
wastewater shall be delivered to the phenol-cyanogen wastewater disposal station for disposal. In the current stage, the phenol-cyanogen wastewater disposal station, with the disposal scale of 2,000 m3/d after reconstruction, can discharge 29m3/h disposed water, which is delivered to the coking workshop for coke quenching and not discharged out, realizing the zero wastewater discharge.
The technological process of the phenol-cyanogen wastewater disposal station: the pre-disposal part is composed of the floatation tank, adjusting tank and so on; the biochemical treatment adopts the A/A/O biological nitrogen removal process, containing the lack oxygen tank, like oxygen tank, secondary sedimentation tank, blower room and so on; the post-coagulation treatment mainly dispose the water from the secondary sedimentation tank through the physical and chemical measures; the disposed phenol-cyanogen wastewater will be delivered to the biological filter tank for filtration and then discharged to the central water disposal plant for deeper treatment.
(3) Solid Waste
The solid wastes produced by this project mainly include: the dust recycled by the dedusting system; the tar residue produced in the blasting condensation section; the separation residue generated by the ultra-centrifuge in the tar depot; the remainder sludge and a little domestic garbage from the phenol-cyanogen wastewater disposal station.
The coal dust and coke dust collected by all dust collectors shall be sold or returned to the process system for re-use; the tar residue discharged from the mechanized ammonia water separation hopper in the blasting condensation section shall be delivered to the coal preparation workshop and mixed into the coking coal; the asphaltic residue discharged from the ammonia distillation tower in the ammonia distillation section and the tar residue produced by the tar tank of the anhydrous ammonia facility shall be sent to the coal preparation workshop and mixed into the coking coal, not discharged out. The remainder sludge of the phenol-cyanogen wastewater disposal station will be made into the sludge cake and delivered to the coal preparation workshop and mixed into the coking coal.
(4) Noise
The noises produced by this project belong to the mechanical noise caused by the mechanical clash, friction, rotation and other movement as well as the air dynamic noise resulting from the airflow movement or aerodynamic force; the main noise sources include:the crusher, vibrating screen, blower, ventilator, steam turbine, air compressor, exciter of generator, compressor and various pumps.
The corresponding vibration-reducing measures shall be taken to control the noise pollution caused by the vibration.
2.1.2.2 Existing Pollutants Discharge Situation of Coking Plant of Current Project
(1) Pollutants Discharge Situation of Coking Plant
Table 2.1-3 Existing Pollution Sources of Coking Plant
functions Type
Discharge Source (No.)
Name of Pollutant
Producing Concentration and Quantity before Treatment
Unit
Discharge Concentration and Quantity
Unit Coal
Preparation Workshop
Smoke Dust 300 mg/m3, about 800t/a 80mg/m3, about 93t/a
Smoke Dust 500mg/m3, about 1,100t/a 40mg/m3, about 105t/a Bap / 0.023t/a
Coke Furnace
Body H2S / 0.3 t/a Chimney of
Coke Furnace
Smoke Dust SO2 NOX
40mg/m3, about 106t/a 175mg/m3, about 68.6t/a 170mg/m3, about 66.6t/a
40mg/m3, about 106t/a 175mg/m3, about 68.6t/a 170mg/m3, about 66.6t/a
Air Pollutant
Coke Quenching
Tower Smoke Dust 300mg/m3, about 400t/a 67mg/m3, about 60t/a
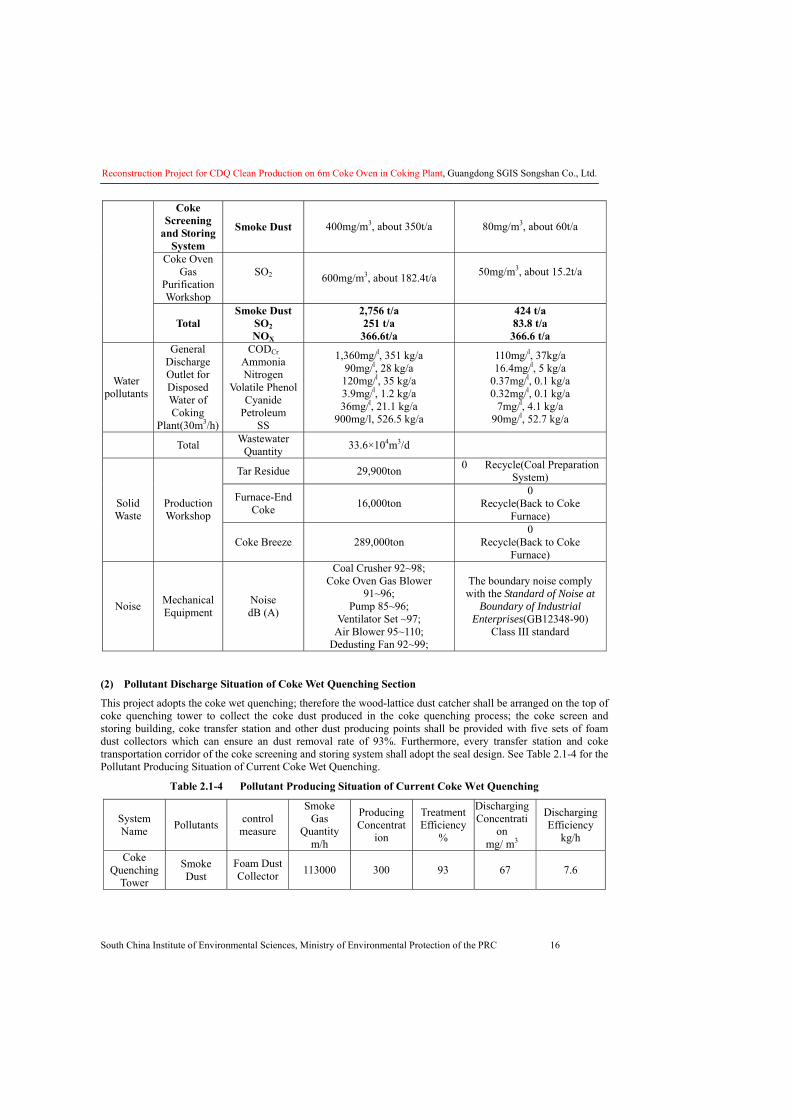
Reconstruction Project for CDQ Clean Production on 6m Coke Oven in Coking Plant, Guangdong SGIS Songshan Co., Ltd.
South China Institute of Environmental Sciences, Ministry of Environmental Protection of the PRC 16
Coke Screening
and Storing System
Smoke Dust 400mg/m3, about 350t/a 80mg/m3, about 60t/a
Coke Oven Gas
Purification Workshop
SO2 600mg/m3, about 182.4t/a 50mg/m3, about 15.2t/a
Total Smoke Dust
SO2 NOX
2,756 t/a 251 t/a 366.6t/a
424 t/a 83.8 t/a
366.6 t/a
Water pollutants
General Discharge Outlet for Disposed Water of Coking
Plant(30m3/h)
CODCr Ammonia Nitrogen
Volatile Phenol Cyanide
Petroleum SS
1,360mg/l, 351 kg/a 90mg/l, 28 kg/a 120mg/l, 35 kg/a 3.9mg/l, 1.2 kg/a 36mg/l, 21.1 kg/a
900mg/l, 526.5 kg/a
110mg/l, 37kg/a 16.4mg/l, 5 kg/a
0.37mg/l, 0.1 kg/a 0.32mg/l, 0.1 kg/a
7mg/l, 4.1 kg/a 90mg/l, 52.7 kg/a
Total Wastewater Quantity 33.6×10⁴m3/d
Tar Residue 29,900ton 0 Recycle(Coal Preparation System)
Furnace-End Coke 16,000ton
0 Recycle(Back to Coke
Furnace) Solid Waste
Production Workshop
Coke Breeze 289,000ton 0
Recycle(Back to Coke Furnace)
Noise Mechanical Equipment
Noise dB (A)
Coal Crusher 92~98; Coke Oven Gas Blower
91~96; Pump 85~96;
Ventilator Set ~97; Air Blower 95~110;
Dedusting Fan 92~99;
The boundary noise comply with the Standard of Noise at
Boundary of Industrial Enterprises(GB12348-90)
Class III standard
(2) Pollutant Discharge Situation of Coke Wet Quenching Section
This project adopts the coke wet quenching; therefore the wood-lattice dust catcher shall be arranged on the top of coke quenching tower to collect the coke dust produced in the coke quenching process; the coke screen and storing building, coke transfer station and other dust producing points shall be provided with five sets of foam dust collectors which can ensure an dust removal rate of 93%. Furthermore, every transfer station and coke transportation corridor of the coke screening and storing system shall adopt the seal design. See Table 2.1-4 for the Pollutant Producing Situation of Current Coke Wet Quenching.
Table 2.1-4 Pollutant Producing Situation of Current Coke Wet Quenching
System Name Pollutants control
measure
Smoke Gas
Quantity m/h
Producing Concentrat
ion
Treatment Efficiency
%
Discharging Concentrati
on mg/ m3
Discharging Efficiency
kg/h
Coke Quenching
Tower
Smoke Dust
Foam Dust Collector 113000 300 93 67 7.6

Reconstruction Project for CDQ Clean Production on 6m Coke Oven in Coking Plant, Guangdong SGIS Songshan Co., Ltd.
South China Institute of Environmental Sciences, Ministry of Environmental Protection of the PRC 17
Coke Screening
System
Smoke Dust 95000 400 93 80 7.6
Transfer System
Smoke Dust
Bag Dust Collector 100000 1000 98 30 3.0
So we can conclude: the dust discharge concentration of coke wet quenching<80mg/m3, the discharge quantity of existing coke quenching tower and coke screening and storing process is 18.2kg/h.
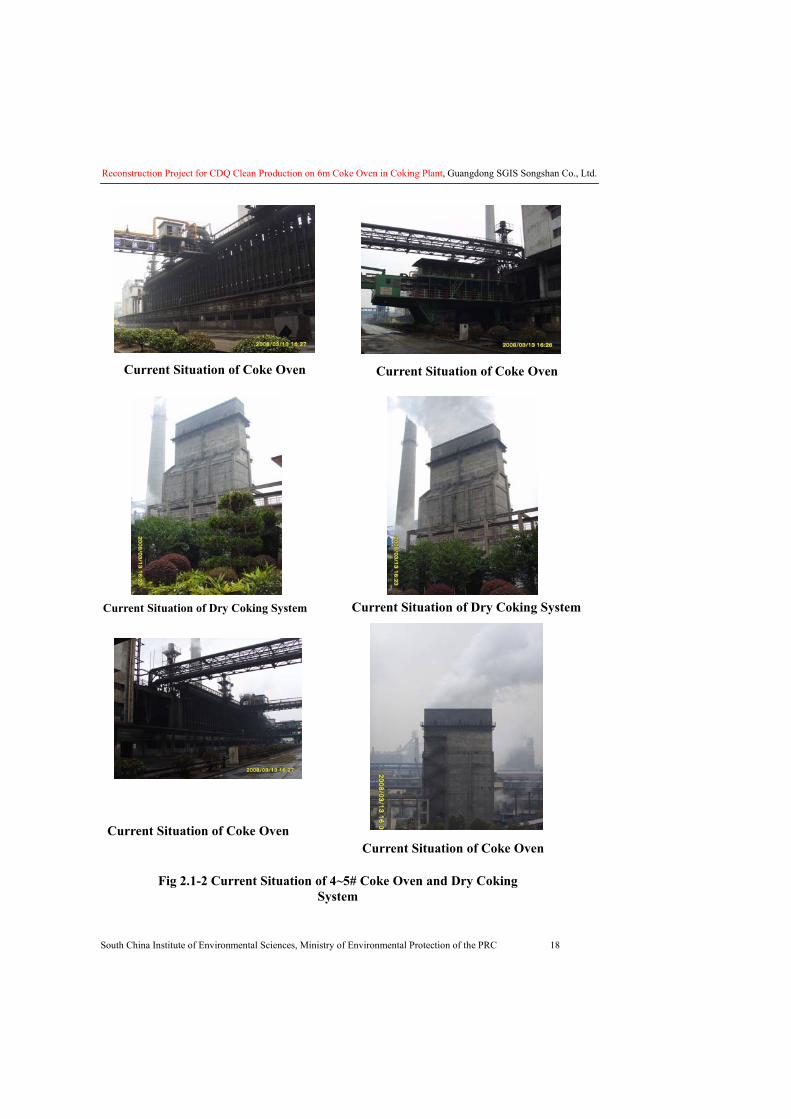
Reconstruction Project for CDQ Clean Production on 6m Coke Oven in Coking Plant, Guangdong SGIS Songshan Co., Ltd.
South China Institute of Environmental Sciences, Ministry of Environmental Protection of the PRC 18
Current Situation of Coke Oven Current Situation of Coke Oven
Current Situation of Dry Coking System Current Situation of Dry Coking System
Current Situation of Coke Oven Current Situation of Coke Oven
Fig 2.1-2 Current Situation of 4~5# Coke Oven and Dry Coking System
Reconstruction Project for CDQ Clean Production on 6m Coke Oven in Coking Plant, Guangdong SGIS Songshan Co., Ltd.
South China Institute of Environmental Sciences, Ministry of Environmental Protection of the PRC 19
2.1.3 Existing Environment Problems of Coking Plant
The No. 1~3 coke furnace of the existing coking plant will be torn down and replaced by the 2×55 holes (6m) coke furnace built in the original position.
The removed coke furnaces and supports shall be disposed as waste steel and the fire-resisting materials sold.
The existing 2×55 hole(4.3m) coke furnace is equipped with the phenol-cyanogen wastewater disposal station with the scale of 2000m3/d after the reconstruction in 2006, and the discharged water can comply with the standard and will all serve as the supplementary water for coke wet quenching.
There arranged the ground dedusting system for the coke discharging.
The existing major environment problems:
The 2×55 hole (4.3m) coke furnace adopts the coke wet quenching, so a large amount of vapor together with a little toxic gas will be produced in the process of coke quenching. Now, it is planned to adopt the 1×90t/h coke dry quenching.
The coal of the coal yard is stored in the open air, which easily causes the fugitive dust and large content of SS initial rainwater. Such situation is suggested to be rectified in the plan.
2.1.4 Necessity of Coke Dry Quenching
The coke dry quenching, CDQ for short, is defined compared with the coke wet quenching; it is such coke quenching method as adopts the inert gas to extinguish the hot coke. The coke dry quenching can recycle the sensible heat of red coke, improve the coke quality, and alleviate the environment pollution caused by the coke quenching operation.
Compared with the regular coke wet quenching, the coke dry quenching has the following three features.
(1) Recycle Sensible Heat of Red Coke
The sensible heat of red coke takes up 35%-40% of the coke furnace energy consumption; the coke dry quenching can recycle 80% sensible heat of red coke, with the average 0.45-0.55t vapor(3.9-4.0MPa and 450�) recycled by quenching 1t coke.
According to the effect analyses on all energy-saving projects in the enterprise, including the coke dry quenching and surplus heat power generation, the coke dry quenching devices can occupy 50% of the saved energy. It can be said that the coke dry quenching plays a significant role in the energy-saving projects of the steel enterprises.
(2) Improve Coke Quality
Compared with the coke wet quenching, the coke dry quenching can prevent the bad effect of the rapid cooling caused by the coke wet quenching on the cake structure, and therefore improve the mechanical strength, abrasion resistance and real specific gravity of the coke to some extent. The M40 is increased by 3%-6%, M10 reduced by 0.3%-0.8%, and the reactivity index decreased greatly. The quality improvement of metallurgical coke is very beneficial to reduce the iron making cost, enhance the pig iron output and smooth the blast furnace operation, and such effects will be more obvious in case of large blast furnace with the coal injection technology. The large blast furnace smelting of the former Soviet Union indicated that the coke dry quenching can reduce the coke ratio by 2.3%, and increase the production capacity of blast furnace by 1%-1.5%.
Meanwhile with the coke mass unchanged, the coke dry quenching can increase the proportion of weakly caking coal in the coking coal, which can reduce the coking cost. See Table 2.1-5 for the Quality Index Contrast of Cokes Produced by Two Coke Quenching Methods.
Table 2.1-5 Coke Quality Contrast between Coke Dry Quenching and Coke Wet Quenching
Quality Indexes of Coke Coke Wet Quenching Coke Dry Quenching
Moisture (%) 2-5 0.1-0.3
Reconstruction Project for CDQ Clean Production on 6m Coke Oven in Coking Plant, Guangdong SGIS Songshan Co., Ltd.
South China Institute of Environmental Sciences, Ministry of Environmental Protection of the PRC 20
Ash Content (Dry Basis) (%) 10.5 10.4
Volatile Content (%) 0.5 0.41
M40 (%) Coke dry quenching increases it by 3%-6% compared with the coke wet quenching
M10 (%) Coke dry quenching improves it by 0.3%-0.8% compared with the coke wet quenching
Sizing Component >80mm (%) 11.8 8.5
80-60mm (%) 36 34.9
60-40mm (%) 41.1 44.8
40-25mm (%) 8.7 9.5
<25mm (%) 2.4 2.3
Average height (mm) 65 55
CSR (%) Coke dry quenching increases it by about 4% compared with the coke wet quenching.
Actual density (g/cm3) 1.897 1.908
(3) Reduce Environment Pollution
Take the coking plant with the annual output of 1 million ton and adopting the regular coke wet quenching for an example, the discharge quantity of phenol, cyanide, ammonia and other toxic gases will exceed 600t, which can seriously pollute the atmosphere and surroundings. While the coke dry quenching will basically does no harm to the environment since it adopts the inert gases to cool the red coke in the sealed dry quenching tank, and is equipped with good and effective dedusting facilities.
On the other hand, when producing the same quantity of vapor for production, the coke dry quenching process can prevent the air pollution caused by the boiler smoke gas, and therefore reduce the discharge of SO2, CO2, showing the excellent social benefit. See Table 2.1-6 for the Pollution Situation of Two Types of Coke Quenching
Table 2.1-6 Pollution Contrast between Coke Dry Quenching and Coke Wet Quenching Unit: kg/h
Mode of Production Phenol Cyanide Sulphide Ammonia Coke DustCoke Wet Quenching 33 4.2 7.0 14.0 13.4 Coke Dry Quenching non non non non 7.0
Note: the above data are from the website of Steel Association
As can be known from the above, compared with the coke wet quenching, the coke dry quenching can considerably reduce the pollutant discharge. It is a clean production project and necessary for the development of enterprises.
2.2 Project overview 2.2.1 Project Title, Nature and Location
(1) Project Title:
Project of coke dry quenching (CDQ) clean production in 6m coke oven of Coking Plant, SGIS Songshan Co., Ltd.
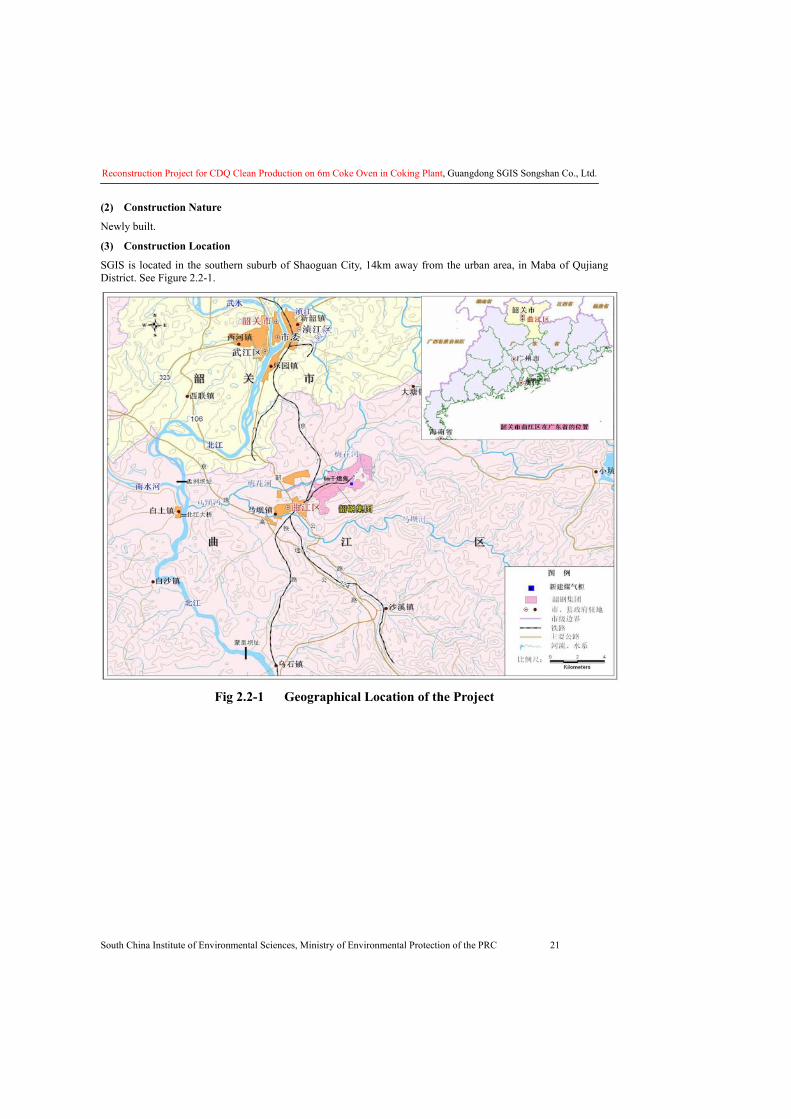
Reconstruction Project for CDQ Clean Production on 6m Coke Oven in Coking Plant, Guangdong SGIS Songshan Co., Ltd.
South China Institute of Environmental Sciences, Ministry of Environmental Protection of the PRC 21
(2) Construction Nature
Newly built.
(3) Construction Location
SGIS is located in the southern suburb of Shaoguan City, 14km away from the urban area, in Maba of Qujiang District. See Figure 2.2-1.
Fig 2.2-1 Geographical Location of the Project
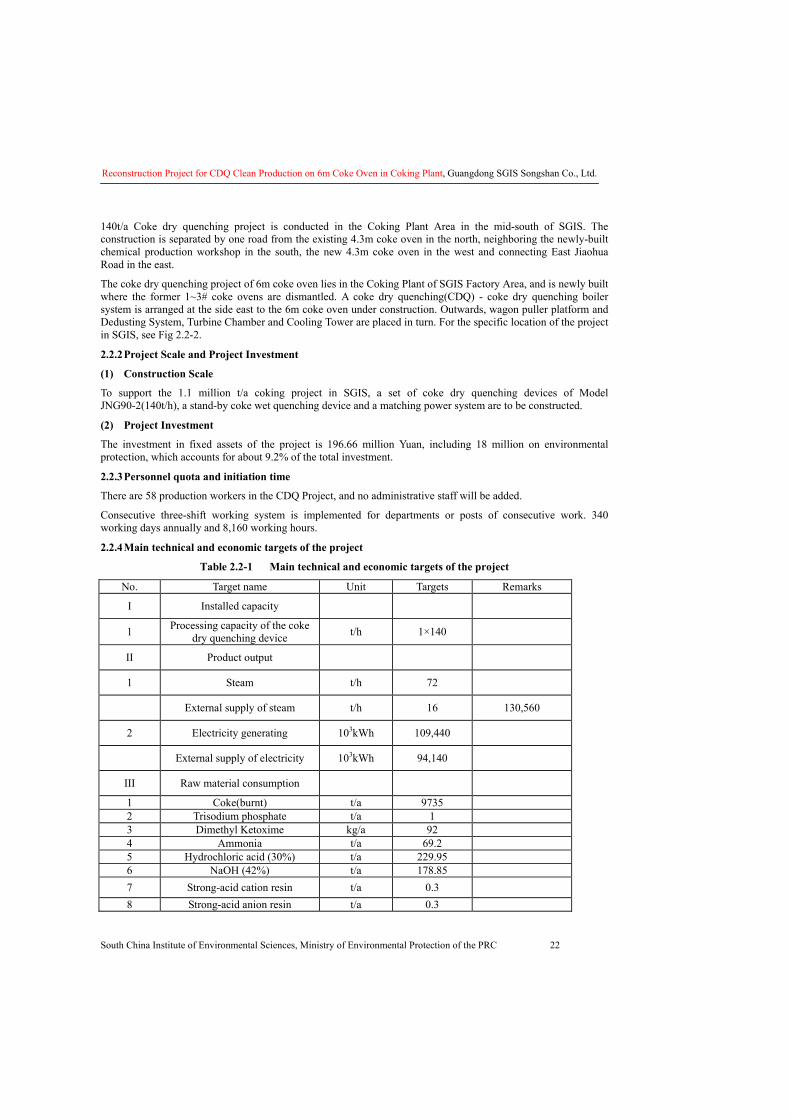
Reconstruction Project for CDQ Clean Production on 6m Coke Oven in Coking Plant, Guangdong SGIS Songshan Co., Ltd.
South China Institute of Environmental Sciences, Ministry of Environmental Protection of the PRC 22
140t/a Coke dry quenching project is conducted in the Coking Plant Area in the mid-south of SGIS. The construction is separated by one road from the existing 4.3m coke oven in the north, neighboring the newly-built chemical production workshop in the south, the new 4.3m coke oven in the west and connecting East Jiaohua Road in the east.
The coke dry quenching project of 6m coke oven lies in the Coking Plant of SGIS Factory Area, and is newly built where the former 1~3# coke ovens are dismantled. A coke dry quenching(CDQ) - coke dry quenching boiler system is arranged at the side east to the 6m coke oven under construction. Outwards, wagon puller platform and Dedusting System, Turbine Chamber and Cooling Tower are placed in turn. For the specific location of the project in SGIS, see Fig 2.2-2.
2.2.2 Project Scale and Project Investment
(1) Construction Scale
To support the 1.1 million t/a coking project in SGIS, a set of coke dry quenching devices of Model JNG90-2(140t/h), a stand-by coke wet quenching device and a matching power system are to be constructed.
(2) Project Investment
The investment in fixed assets of the project is 196.66 million Yuan, including 18 million on environmental protection, which accounts for about 9.2% of the total investment.
2.2.3 Personnel quota and initiation time
There are 58 production workers in the CDQ Project, and no administrative staff will be added.
Consecutive three-shift working system is implemented for departments or posts of consecutive work. 340 working days annually and 8,160 working hours.
2.2.4 Main technical and economic targets of the project
Table 2.2-1 Main technical and economic targets of the project
No. Target name Unit Targets Remarks
I Installed capacity
1 Processing capacity of the coke dry quenching device t/h 1×140
II Product output
1 Steam t/h 72
External supply of steam t/h 16 130,560
2 Electricity generating 103kWh 109,440
External supply of electricity 103kWh 94,140
III Raw material consumption
1 Coke(burnt) t/a 9735 2 Trisodium phosphate t/a 1 3 Dimethyl Ketoxime kg/a 92 4 Ammonia t/a 69.2 5 Hydrochloric acid (30%) t/a 229.95 6 NaOH (42%) t/a 178.85 7 Strong-acid cation resin t/a 0.3 8 Strong-acid anion resin t/a 0.3
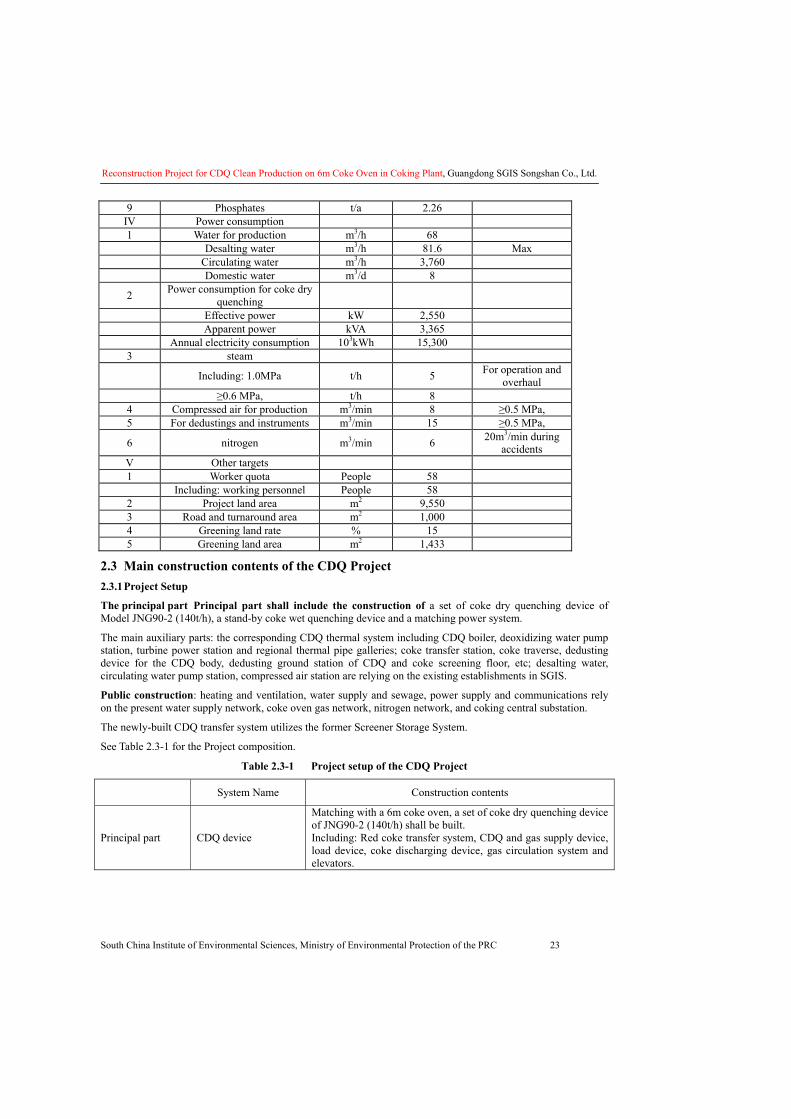
Reconstruction Project for CDQ Clean Production on 6m Coke Oven in Coking Plant, Guangdong SGIS Songshan Co., Ltd.
South China Institute of Environmental Sciences, Ministry of Environmental Protection of the PRC 23
9 Phosphates t/a 2.26 IV Power consumption 1 Water for production m3/h 68 Desalting water m3/h 81.6 Max Circulating water m3/h 3,760 Domestic water m3/d 8
2 Power consumption for coke dry quenching
Effective power kW 2,550 Apparent power kVA 3,365 Annual electricity consumption 103kWh 15,300
3 steam
Including: 1.0MPa t/h 5 For operation and overhaul
≥0.6 MPa, t/h 8 4 Compressed air for production m3/min 8 ≥0.5 MPa, 5 For dedustings and instruments m3/min 15 ≥0.5 MPa,
6 nitrogen m3/min 6 20m3/min during accidents
V Other targets 1 Worker quota People 58 Including: working personnel People 58
2 Project land area m2 9,550 3 Road and turnaround area m2 1,000 4 Greening land rate % 15 5 Greening land area m2 1,433
2.3 Main construction contents of the CDQ Project 2.3.1 Project Setup
The principal part Principal part shall include the construction of a set of coke dry quenching device of Model JNG90-2 (140t/h), a stand-by coke wet quenching device and a matching power system.
The main auxiliary parts: the corresponding CDQ thermal system including CDQ boiler, deoxidizing water pump station, turbine power station and regional thermal pipe galleries; coke transfer station, coke traverse, dedusting device for the CDQ body, dedusting ground station of CDQ and coke screening floor, etc; desalting water, circulating water pump station, compressed air station are relying on the existing establishments in SGIS.
Public construction: heating and ventilation, water supply and sewage, power supply and communications rely on the present water supply network, coke oven gas network, nitrogen network, and coking central substation.
The newly-built CDQ transfer system utilizes the former Screener Storage System.
See Table 2.3-1 for the Project composition.
Table 2.3-1 Project setup of the CDQ Project
System Name Construction contents
Principal part CDQ device
Matching with a 6m coke oven, a set of coke dry quenching device of JNG90-2 (140t/h) shall be built. Including: Red coke transfer system, CDQ and gas supply device, load device, coke discharging device, gas circulation system and elevators.
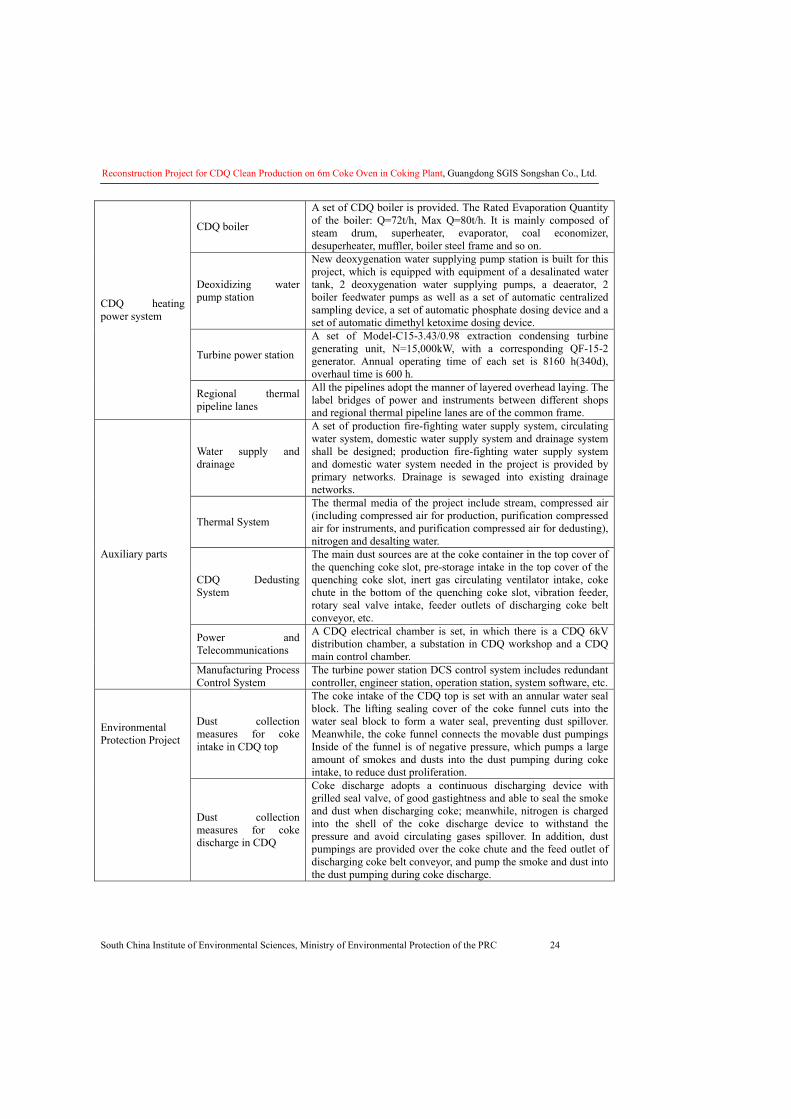
Reconstruction Project for CDQ Clean Production on 6m Coke Oven in Coking Plant, Guangdong SGIS Songshan Co., Ltd.
South China Institute of Environmental Sciences, Ministry of Environmental Protection of the PRC 24
CDQ boiler
A set of CDQ boiler is provided. The Rated Evaporation Quantity of the boiler: Q=72t/h, Max Q=80t/h. It is mainly composed of steam drum, superheater, evaporator, coal economizer, desuperheater, muffler, boiler steel frame and so on.
Deoxidizing water pump station
New deoxygenation water supplying pump station is built for this project, which is equipped with equipment of a desalinated water tank, 2 deoxygenation water supplying pumps, a deaerator, 2 boiler feedwater pumps as well as a set of automatic centralized sampling device, a set of automatic phosphate dosing device and a set of automatic dimethyl ketoxime dosing device.
Turbine power station
A set of Model-C15-3.43/0.98 extraction condensing turbine generating unit, N=15,000kW, with a corresponding QF-15-2 generator. Annual operating time of each set is 8160 h(340d), overhaul time is 600 h.
CDQ heating power system
Regional thermal pipeline lanes
All the pipelines adopt the manner of layered overhead laying. The label bridges of power and instruments between different shops and regional thermal pipeline lanes are of the common frame.
Water supply and drainage
A set of production fire-fighting water supply system, circulating water system, domestic water supply system and drainage system shall be designed; production fire-fighting water supply system and domestic water system needed in the project is provided by primary networks. Drainage is sewaged into existing drainage networks.
Thermal System
The thermal media of the project include stream, compressed air (including compressed air for production, purification compressed air for instruments, and purification compressed air for dedusting), nitrogen and desalting water.
CDQ Dedusting System
The main dust sources are at the coke container in the top cover of the quenching coke slot, pre-storage intake in the top cover of the quenching coke slot, inert gas circulating ventilator intake, coke chute in the bottom of the quenching coke slot, vibration feeder, rotary seal valve intake, feeder outlets of discharging coke belt conveyor, etc.
Power and Telecommunications
A CDQ electrical chamber is set, in which there is a CDQ 6kV distribution chamber, a substation in CDQ workshop and a CDQ main control chamber.
Auxiliary parts
Manufacturing Process Control System
The turbine power station DCS control system includes redundant controller, engineer station, operation station, system software, etc.
Dust collection measures for coke intake in CDQ top
The coke intake of the CDQ top is set with an annular water seal block. The lifting sealing cover of the coke funnel cuts into the water seal block to form a water seal, preventing dust spillover. Meanwhile, the coke funnel connects the movable dust pumpings Inside of the funnel is of negative pressure, which pumps a large amount of smokes and dusts into the dust pumping during coke intake, to reduce dust proliferation.
Environmental Protection Project
Dust collection measures for coke discharge in CDQ
Coke discharge adopts a continuous discharging device with grilled seal valve, of good gastightness and able to seal the smoke and dust when discharging coke; meanwhile, nitrogen is charged into the shell of the coke discharge device to withstand the pressure and avoid circulating gases spillover. In addition, dust pumpings are provided over the coke chute and the feed outlet of discharging coke belt conveyor, and pump the smoke and dust into the dust pumping during coke discharge.
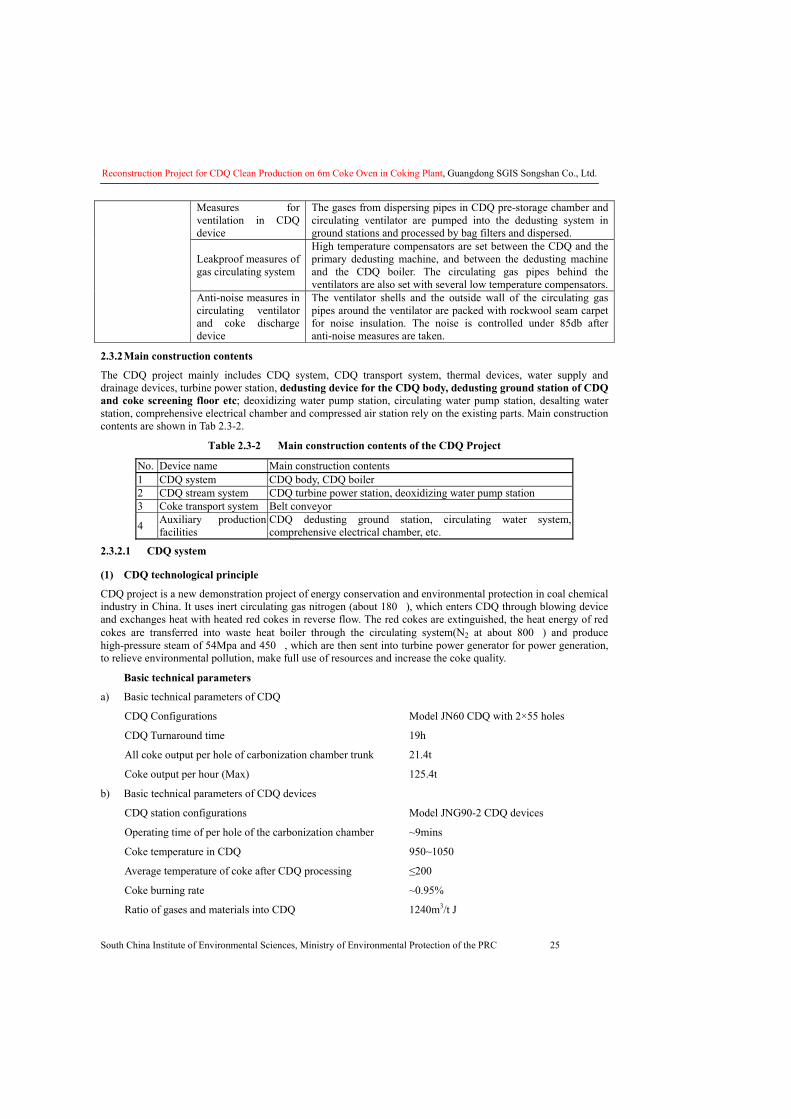
Reconstruction Project for CDQ Clean Production on 6m Coke Oven in Coking Plant, Guangdong SGIS Songshan Co., Ltd.
South China Institute of Environmental Sciences, Ministry of Environmental Protection of the PRC 25
Measures for ventilation in CDQ device
The gases from dispersing pipes in CDQ pre-storage chamber and circulating ventilator are pumped into the dedusting system in ground stations and processed by bag filters and dispersed.
Leakproof measures of gas circulating system
High temperature compensators are set between the CDQ and the primary dedusting machine, and between the dedusting machine and the CDQ boiler. The circulating gas pipes behind the ventilators are also set with several low temperature compensators.
Anti-noise measures in circulating ventilator and coke discharge device
The ventilator shells and the outside wall of the circulating gas pipes around the ventilator are packed with rockwool seam carpet for noise insulation. The noise is controlled under 85db after anti-noise measures are taken.
2.3.2 Main construction contents
The CDQ project mainly includes CDQ system, CDQ transport system, thermal devices, water supply and drainage devices, turbine power station, dedusting device for the CDQ body, dedusting ground station of CDQ and coke screening floor etc; deoxidizing water pump station, circulating water pump station, desalting water station, comprehensive electrical chamber and compressed air station rely on the existing parts. Main construction contents are shown in Tab 2.3-2.
Table 2.3-2 Main construction contents of the CDQ Project
No. Device name Main construction contents 1 CDQ system CDQ body, CDQ boiler 2 CDQ stream system CDQ turbine power station, deoxidizing water pump station 3 Coke transport system Belt conveyor
4 Auxiliary production facilities
CDQ dedusting ground station, circulating water system, comprehensive electrical chamber, etc.
2.3.2.1 CDQ system
(1) CDQ technological principle
CDQ project is a new demonstration project of energy conservation and environmental protection in coal chemical industry in China. It uses inert circulating gas nitrogen (about 180�), which enters CDQ through blowing device and exchanges heat with heated red cokes in reverse flow. The red cokes are extinguished, the heat energy of red cokes are transferred into waste heat boiler through the circulating system(N2 at about 800�) and produce high-pressure steam of 54Mpa and 450�, which are then sent into turbine power generator for power generation, to relieve environmental pollution, make full use of resources and increase the coke quality.
� Basic technical parameters
a) Basic technical parameters of CDQ
CDQ Configurations Model JN60 CDQ with 2×55 holes
CDQ Turnaround time 19h
All coke output per hole of carbonization chamber trunk 21.4t
Coke output per hour (Max) 125.4t
b) Basic technical parameters of CDQ devices
CDQ station configurations Model JNG90-2 CDQ devices
Operating time of per hole of the carbonization chamber ~9mins
Coke temperature in CDQ 950~1050�
Average temperature of coke after CDQ processing ≤200�
Coke burning rate ~0.95%
Ratio of gases and materials into CDQ 1240m3/t J
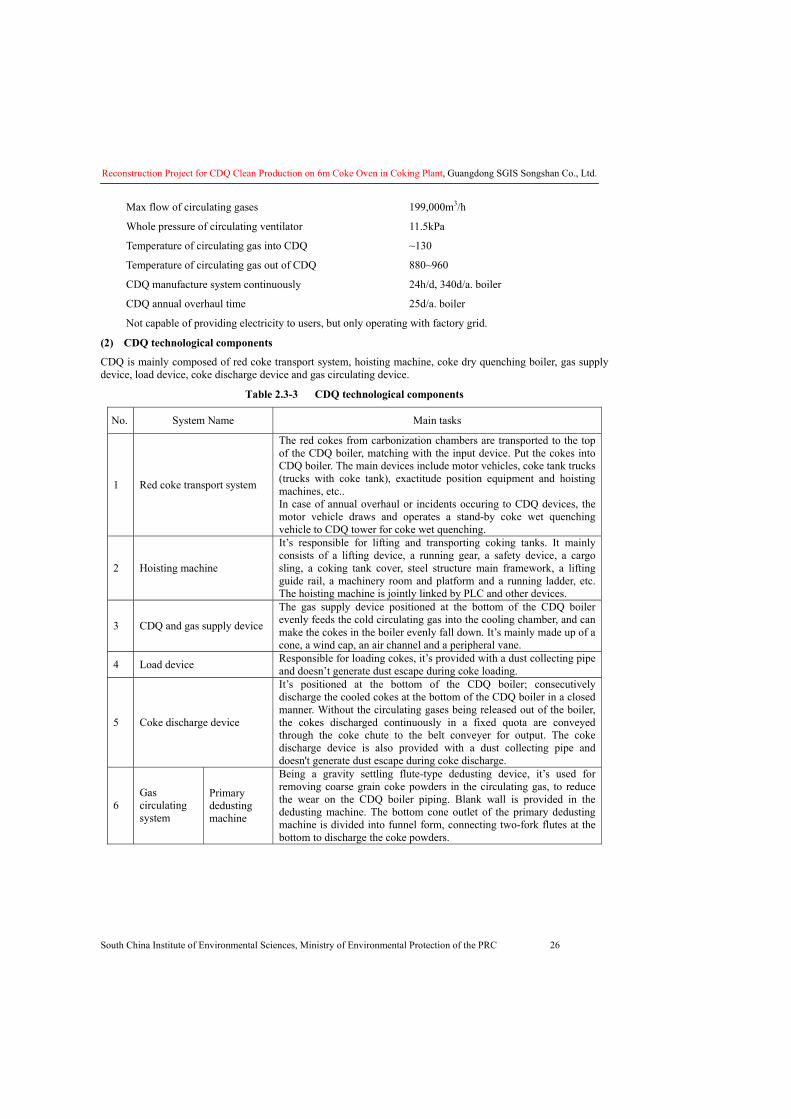
Reconstruction Project for CDQ Clean Production on 6m Coke Oven in Coking Plant, Guangdong SGIS Songshan Co., Ltd.
South China Institute of Environmental Sciences, Ministry of Environmental Protection of the PRC 26
Max flow of circulating gases 199,000m3/h
Whole pressure of circulating ventilator 11.5kPa
Temperature of circulating gas into CDQ ~130�
Temperature of circulating gas out of CDQ 880~960�
CDQ manufacture system continuously 24h/d, 340d/a. boiler
CDQ annual overhaul time 25d/a. boiler
Not capable of providing electricity to users, but only operating with factory grid.
(2) CDQ technological components
CDQ is mainly composed of red coke transport system, hoisting machine, coke dry quenching boiler, gas supply device, load device, coke discharge device and gas circulating device.
Table 2.3-3 CDQ technological components
No. System Name Main tasks
1 Red coke transport system
The red cokes from carbonization chambers are transported to the top of the CDQ boiler, matching with the input device. Put the cokes into CDQ boiler. The main devices include motor vehicles, coke tank trucks (trucks with coke tank), exactitude position equipment and hoisting machines, etc.. In case of annual overhaul or incidents occuring to CDQ devices, the motor vehicle draws and operates a stand-by coke wet quenching vehicle to CDQ tower for coke wet quenching.
2 Hoisting machine
It’s responsible for lifting and transporting coking tanks. It mainly consists of a lifting device, a running gear, a safety device, a cargo sling, a coking tank cover, steel structure main framework, a lifting guide rail, a machinery room and platform and a running ladder, etc. The hoisting machine is jointly linked by PLC and other devices.
3 CDQ and gas supply device
The gas supply device positioned at the bottom of the CDQ boiler evenly feeds the cold circulating gas into the cooling chamber, and can make the cokes in the boiler evenly fall down. It’s mainly made up of a cone, a wind cap, an air channel and a peripheral vane.
4 Load device Responsible for loading cokes, it’s provided with a dust collecting pipe and doesn’t generate dust escape during coke loading.
5 Coke discharge device
It’s positioned at the bottom of the CDQ boiler; consecutively discharge the cooled cokes at the bottom of the CDQ boiler in a closed manner. Without the circulating gases being released out of the boiler, the cokes discharged continuously in a fixed quota are conveyed through the coke chute to the belt conveyer for output. The coke discharge device is also provided with a dust collecting pipe and doesn't generate dust escape during coke discharge.
6 Gas circulating system
Primary dedusting machine
Being a gravity settling flute-type dedusting device, it’s used for removing coarse grain coke powders in the circulating gas, to reduce the wear on the CDQ boiler piping. Blank wall is provided in the dedusting machine. The bottom cone outlet of the primary dedusting machine is divided into funnel form, connecting two-fork flutes at the bottom to discharge the coke powders.
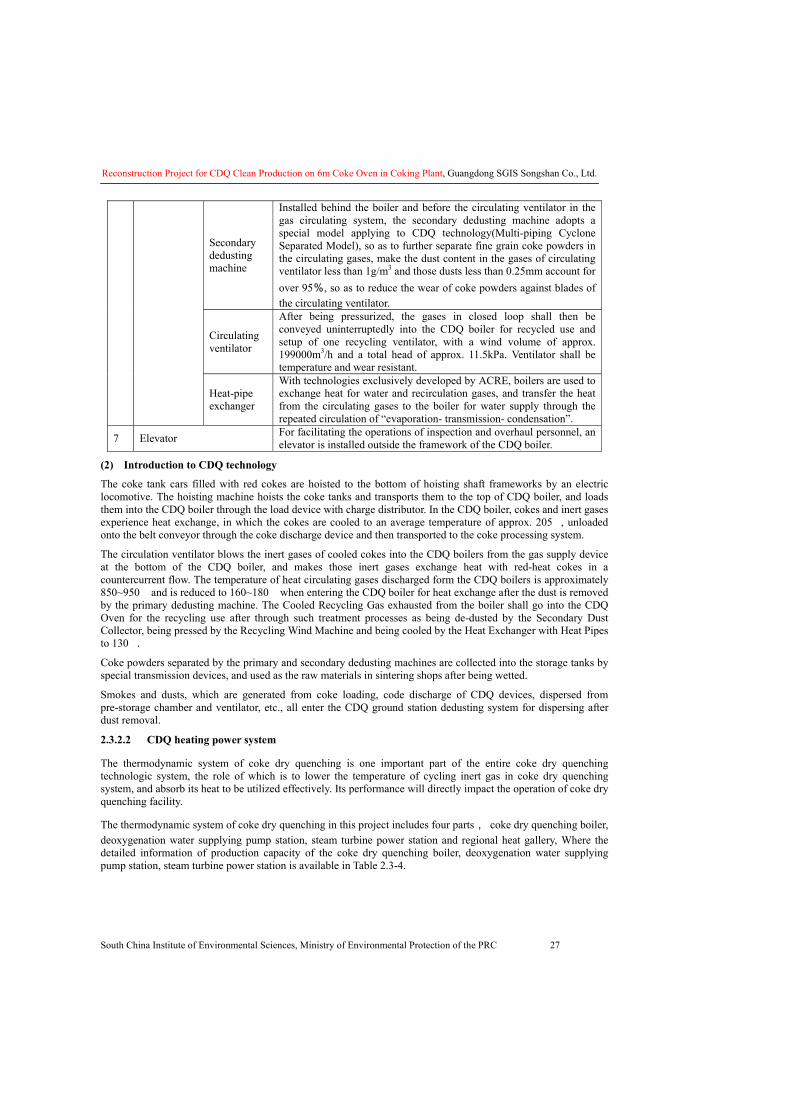
Reconstruction Project for CDQ Clean Production on 6m Coke Oven in Coking Plant, Guangdong SGIS Songshan Co., Ltd.
South China Institute of Environmental Sciences, Ministry of Environmental Protection of the PRC 27
Secondary dedusting machine
Installed behind the boiler and before the circulating ventilator in the gas circulating system, the secondary dedusting machine adopts a special model applying to CDQ technology(Multi-piping Cyclone Separated Model), so as to further separate fine grain coke powders in the circulating gases, make the dust content in the gases of circulating ventilator less than 1g/m3 and those dusts less than 0.25mm account for over 95%, so as to reduce the wear of coke powders against blades of the circulating ventilator.
Circulating ventilator
After being pressurized, the gases in closed loop shall then be conveyed uninterruptedly into the CDQ boiler for recycled use and setup of one recycling ventilator, with a wind volume of approx. 199000m3/h and a total head of approx. 11.5kPa. Ventilator shall be temperature and wear resistant.
Heat-pipe exchanger
With technologies exclusively developed by ACRE, boilers are used to exchange heat for water and recirculation gases, and transfer the heat from the circulating gases to the boiler for water supply through the repeated circulation of “evaporation- transmission- condensation”.
7 Elevator For facilitating the operations of inspection and overhaul personnel, an elevator is installed outside the framework of the CDQ boiler.
(2) Introduction to CDQ technology
The coke tank cars filled with red cokes are hoisted to the bottom of hoisting shaft frameworks by an electric locomotive. The hoisting machine hoists the coke tanks and transports them to the top of CDQ boiler, and loads them into the CDQ boiler through the load device with charge distributor. In the CDQ boiler, cokes and inert gases experience heat exchange, in which the cokes are cooled to an average temperature of approx. 205�, unloaded onto the belt conveyor through the coke discharge device and then transported to the coke processing system.
The circulation ventilator blows the inert gases of cooled cokes into the CDQ boilers from the gas supply device at the bottom of the CDQ boiler, and makes those inert gases exchange heat with red-heat cokes in a countercurrent flow. The temperature of heat circulating gases discharged form the CDQ boilers is approximately 850~950� and is reduced to 160~180� when entering the CDQ boiler for heat exchange after the dust is removed by the primary dedusting machine. The Cooled Recycling Gas exhausted from the boiler shall go into the CDQ Oven for the recycling use after through such treatment processes as being de-dusted by the Secondary Dust Collector, being pressed by the Recycling Wind Machine and being cooled by the Heat Exchanger with Heat Pipes to 130�.
Coke powders separated by the primary and secondary dedusting machines are collected into the storage tanks by special transmission devices, and used as the raw materials in sintering shops after being wetted.
Smokes and dusts, which are generated from coke loading, code discharge of CDQ devices, dispersed from pre-storage chamber and ventilator, etc., all enter the CDQ ground station dedusting system for dispersing after dust removal.
2.3.2.2 CDQ heating power system
The thermodynamic system of coke dry quenching is one important part of the entire coke dry quenching technologic system, the role of which is to lower the temperature of cycling inert gas in coke dry quenching system, and absorb its heat to be utilized effectively. Its performance will directly impact the operation of coke dry quenching facility.
The thermodynamic system of coke dry quenching in this project includes four parts, coke dry quenching boiler, deoxygenation water supplying pump station, steam turbine power station and regional heat gallery, Where the detailed information of production capacity of the coke dry quenching boiler, deoxygenation water supplying pump station, steam turbine power station is available in Table 2.3-4.
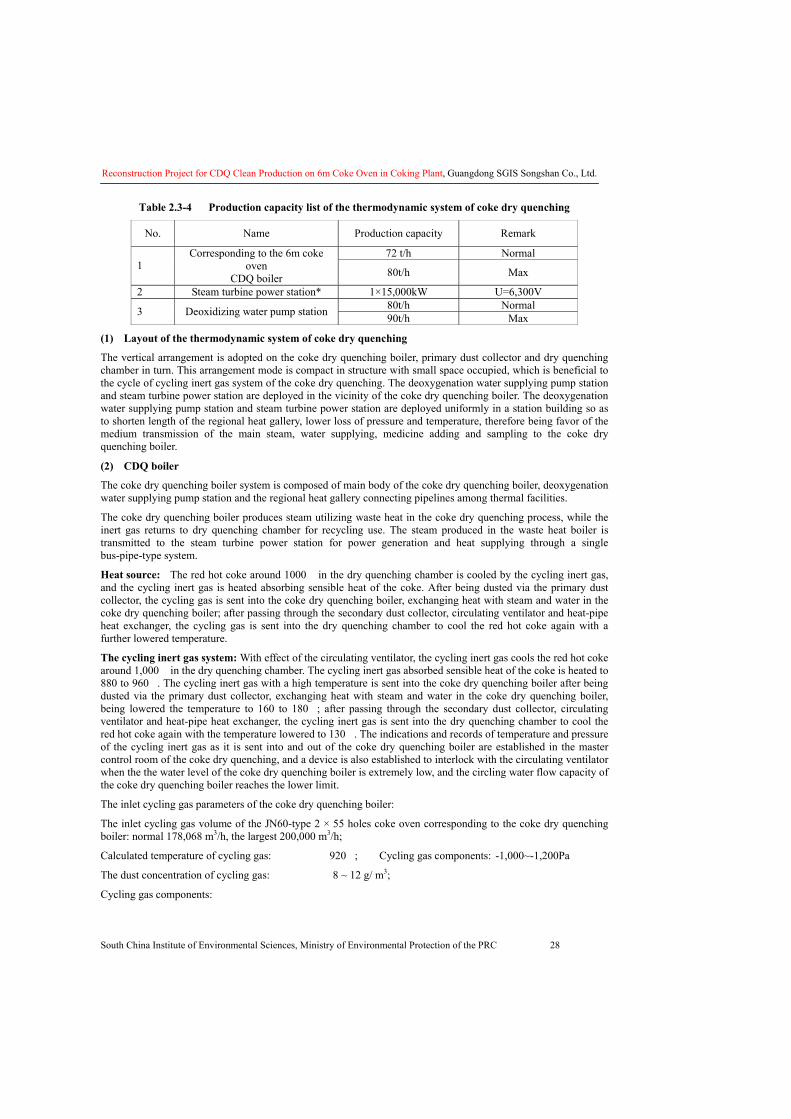
Reconstruction Project for CDQ Clean Production on 6m Coke Oven in Coking Plant, Guangdong SGIS Songshan Co., Ltd.
South China Institute of Environmental Sciences, Ministry of Environmental Protection of the PRC 28
Table 2.3-4 Production capacity list of the thermodynamic system of coke dry quenching
No. Name Production capacity Remark
72 t/h Normal 1
Corresponding to the 6m coke oven
CDQ boiler 80t/h Max
2 Steam turbine power station* 1×15,000kW U=6,300V 80t/h Normal 3 Deoxidizing water pump station 90t/h Max
(1) Layout of the thermodynamic system of coke dry quenching
The vertical arrangement is adopted on the coke dry quenching boiler, primary dust collector and dry quenching chamber in turn. This arrangement mode is compact in structure with small space occupied, which is beneficial to the cycle of cycling inert gas system of the coke dry quenching. The deoxygenation water supplying pump station and steam turbine power station are deployed in the vicinity of the coke dry quenching boiler. The deoxygenation water supplying pump station and steam turbine power station are deployed uniformly in a station building so as to shorten length of the regional heat gallery, lower loss of pressure and temperature, therefore being favor of the medium transmission of the main steam, water supplying, medicine adding and sampling to the coke dry quenching boiler.
(2) CDQ boiler
The coke dry quenching boiler system is composed of main body of the coke dry quenching boiler, deoxygenation water supplying pump station and the regional heat gallery connecting pipelines among thermal facilities.
The coke dry quenching boiler produces steam utilizing waste heat in the coke dry quenching process, while the inert gas returns to dry quenching chamber for recycling use. The steam produced in the waste heat boiler is transmitted to the steam turbine power station for power generation and heat supplying through a single bus-pipe-type system.
Heat source: The red hot coke around 1000� in the dry quenching chamber is cooled by the cycling inert gas, and the cycling inert gas is heated absorbing sensible heat of the coke. After being dusted via the primary dust collector, the cycling gas is sent into the coke dry quenching boiler, exchanging heat with steam and water in the coke dry quenching boiler; after passing through the secondary dust collector, circulating ventilator and heat-pipe heat exchanger, the cycling gas is sent into the dry quenching chamber to cool the red hot coke again with a further lowered temperature.
The cycling inert gas system: With effect of the circulating ventilator, the cycling inert gas cools the red hot coke around 1,000� in the dry quenching chamber. The cycling inert gas absorbed sensible heat of the coke is heated to 880 to 960�. The cycling inert gas with a high temperature is sent into the coke dry quenching boiler after being dusted via the primary dust collector, exchanging heat with steam and water in the coke dry quenching boiler, being lowered the temperature to 160 to 180�; after passing through the secondary dust collector, circulating ventilator and heat-pipe heat exchanger, the cycling inert gas is sent into the dry quenching chamber to cool the red hot coke again with the temperature lowered to 130�. The indications and records of temperature and pressure of the cycling inert gas as it is sent into and out of the coke dry quenching boiler are established in the master control room of the coke dry quenching, and a device is also established to interlock with the circulating ventilator when the the water level of the coke dry quenching boiler is extremely low, and the circling water flow capacity of the coke dry quenching boiler reaches the lower limit.
The inlet cycling gas parameters of the coke dry quenching boiler:
The inlet cycling gas volume of the JN60-type 2 × 55 holes coke oven corresponding to the coke dry quenching boiler: normal 178,068 m3/h, the largest 200,000 m3/h;
Calculated temperature of cycling gas: 920�; Cycling gas components: -1,000~-1,200Pa
The dust concentration of cycling gas: 8 ~ 12 g/ m3;
Cycling gas components:
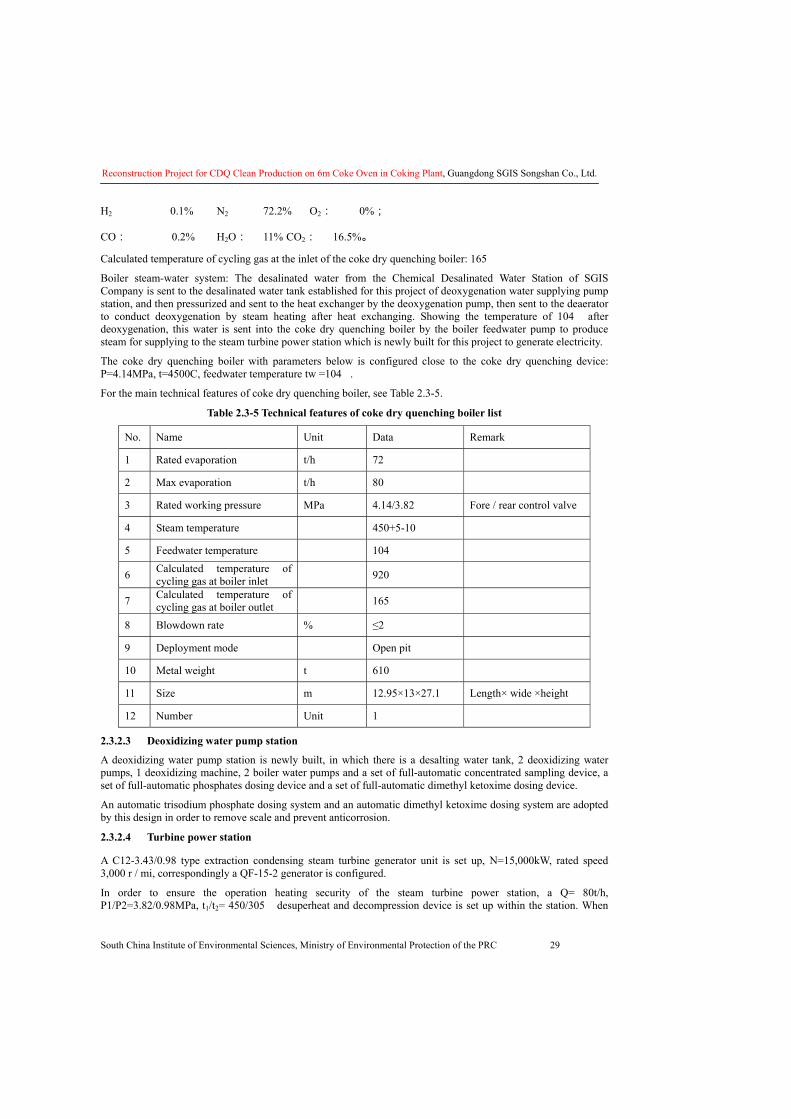
Reconstruction Project for CDQ Clean Production on 6m Coke Oven in Coking Plant, Guangdong SGIS Songshan Co., Ltd.
South China Institute of Environmental Sciences, Ministry of Environmental Protection of the PRC 29
H2 0.1% N2 72.2% O2: 0%;
CO: 0.2% H2O: 11% CO2: 16.5%。
Calculated temperature of cycling gas at the inlet of the coke dry quenching boiler: 165�
Boiler steam-water system: The desalinated water from the Chemical Desalinated Water Station of SGIS Company is sent to the desalinated water tank established for this project of deoxygenation water supplying pump station, and then pressurized and sent to the heat exchanger by the deoxygenation pump, then sent to the deaerator to conduct deoxygenation by steam heating after heat exchanging. Showing the temperature of 104� after deoxygenation, this water is sent into the coke dry quenching boiler by the boiler feedwater pump to produce steam for supplying to the steam turbine power station which is newly built for this project to generate electricity.
The coke dry quenching boiler with parameters below is configured close to the coke dry quenching device: P=4.14MPa, t=4500C, feedwater temperature tw =104�.
For the main technical features of coke dry quenching boiler, see Table 2.3-5.
Table 2.3-5 Technical features of coke dry quenching boiler list
No. Name Unit Data Remark
1 Rated evaporation t/h 72
2 Max evaporation t/h 80
3 Rated working pressure MPa 4.14/3.82 Fore / rear control valve
4 Steam temperature � 450+5-10
5 Feedwater temperature � 104
6 Calculated temperature of cycling gas at boiler inlet � 920
7 Calculated temperature of cycling gas at boiler outlet � 165
8 Blowdown rate % ≤2
9 Deployment mode Open pit
10 Metal weight t 610
11 Size m 12.95×13×27.1 Length× wide ×height
12 Number Unit 1
2.3.2.3 Deoxidizing water pump station
A deoxidizing water pump station is newly built, in which there is a desalting water tank, 2 deoxidizing water pumps, 1 deoxidizing machine, 2 boiler water pumps and a set of full-automatic concentrated sampling device, a set of full-automatic phosphates dosing device and a set of full-automatic dimethyl ketoxime dosing device.
An automatic trisodium phosphate dosing system and an automatic dimethyl ketoxime dosing system are adopted by this design in order to remove scale and prevent anticorrosion.
2.3.2.4 Turbine power station
A C12-3.43/0.98 type extraction condensing steam turbine generator unit is set up, N=15,000kW, rated speed 3,000 r / mi, correspondingly a QF-15-2 generator is configured.
In order to ensure the operation heating security of the steam turbine power station, a Q= 80t/h, P1/P2=3.82/0.98MPa, t1/t2= 450/305� desuperheat and decompression device is set up within the station. When
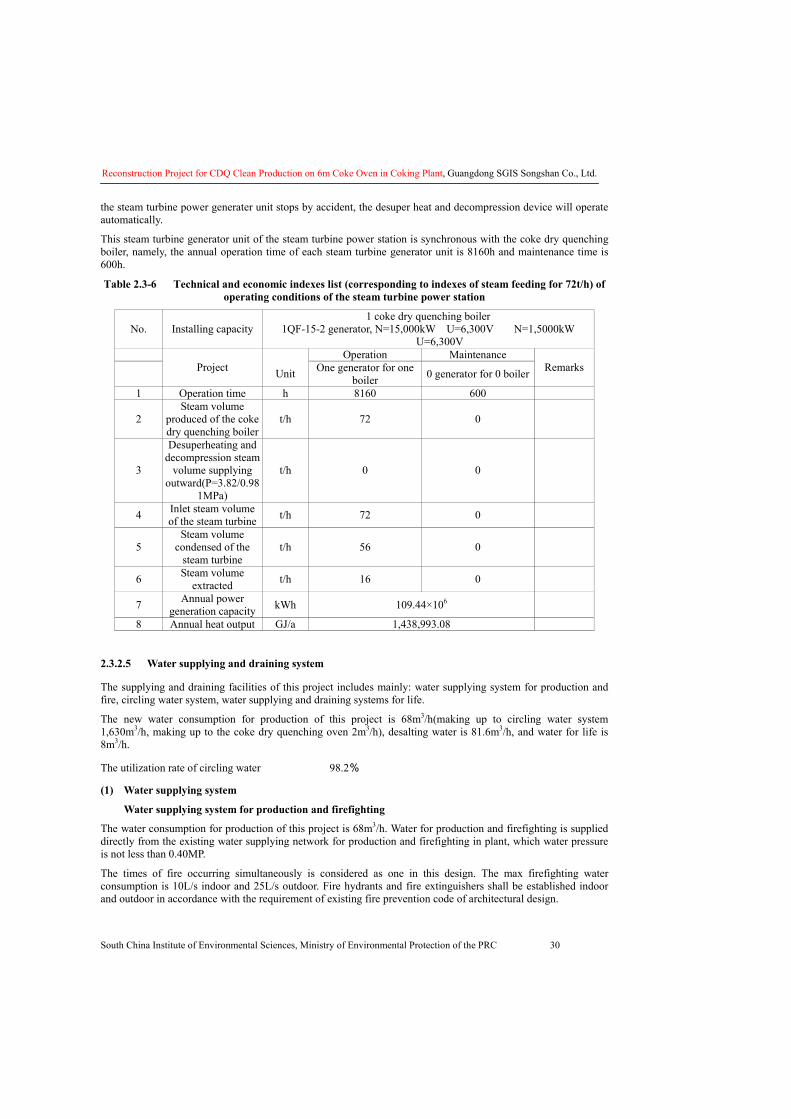
Reconstruction Project for CDQ Clean Production on 6m Coke Oven in Coking Plant, Guangdong SGIS Songshan Co., Ltd.
South China Institute of Environmental Sciences, Ministry of Environmental Protection of the PRC 30
the steam turbine power generater unit stops by accident, the desuper heat and decompression device will operate automatically.
This steam turbine generator unit of the steam turbine power station is synchronous with the coke dry quenching boiler, namely, the annual operation time of each steam turbine generator unit is 8160h and maintenance time is 600h.
Table 2.3-6 Technical and economic indexes list (corresponding to indexes of steam feeding for 72t/h) of operating conditions of the steam turbine power station
No. Installing capacity 1 coke dry quenching boiler
1QF-15-2 generator, N=15,000kW U=6,300V N=1,5000kW U=6,300V
Operation Maintenance
Project Unit One generator for one
boiler 0 generator for 0 boiler Remarks
1 Operation time h 8160 600
2 Steam volume
produced of the coke dry quenching boiler
t/h 72 0
3
Desuperheating and decompression steam
volume supplying outward(P=3.82/0.98
1MPa)
t/h 0 0
4 Inlet steam volume of the steam turbine t/h 72 0
5 Steam volume
condensed of the steam turbine
t/h 56 0
6 Steam volume extracted t/h 16 0
7 Annual power generation capacity kWh 109.44×10⁶
8 Annual heat output GJ/a 1,438,993.08
2.3.2.5 Water supplying and draining system
The supplying and draining facilities of this project includes mainly: water supplying system for production and fire, circling water system, water supplying and draining systems for life.
The new water consumption for production of this project is 68m3/h(making up to circling water system 1,630m3/h, making up to the coke dry quenching oven 2m3/h), desalting water is 81.6m3/h, and water for life is 8m3/h.
The utilization rate of circling water 98.2%
(1) Water supplying system
� Water supplying system for production and firefighting
The water consumption for production of this project is 68m3/h. Water for production and firefighting is supplied directly from the existing water supplying network for production and firefighting in plant, which water pressure is not less than 0.40MP.
The times of fire occurring simultaneously is considered as one in this design. The max firefighting water consumption is 10L/s indoor and 25L/s outdoor. Fire hydrants and fire extinguishers shall be established indoor and outdoor in accordance with the requirement of existing fire prevention code of architectural design.
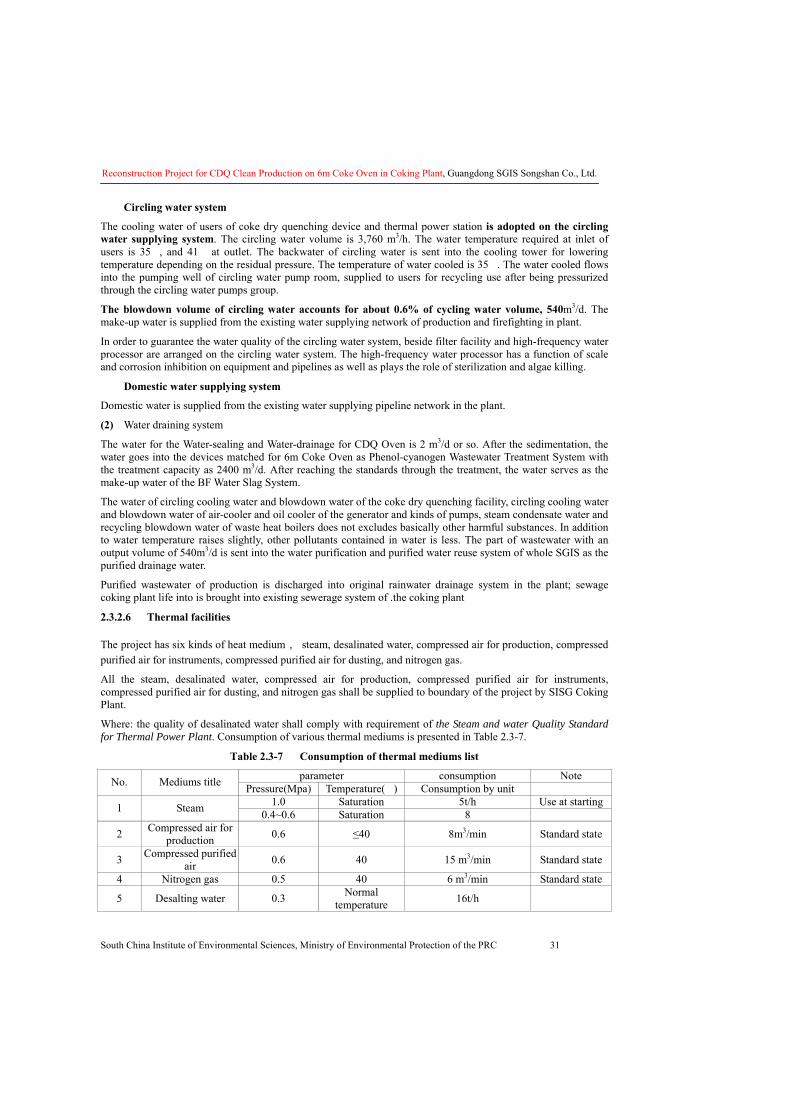
Reconstruction Project for CDQ Clean Production on 6m Coke Oven in Coking Plant, Guangdong SGIS Songshan Co., Ltd.
South China Institute of Environmental Sciences, Ministry of Environmental Protection of the PRC 31
� Circling water system
The cooling water of users of coke dry quenching device and thermal power station is adopted on the circling water supplying system. The circling water volume is 3,760 m3/h. The water temperature required at inlet of users is 35�, and 41� at outlet. The backwater of circling water is sent into the cooling tower for lowering temperature depending on the residual pressure. The temperature of water cooled is 35�. The water cooled flows into the pumping well of circling water pump room, supplied to users for recycling use after being pressurized through the circling water pumps group.
The blowdown volume of circling water accounts for about 0.6% of cycling water volume, 540m3/d. The make-up water is supplied from the existing water supplying network of production and firefighting in plant.
In order to guarantee the water quality of the circling water system, beside filter facility and high-frequency water processor are arranged on the circling water system. The high-frequency water processor has a function of scale and corrosion inhibition on equipment and pipelines as well as plays the role of sterilization and algae killing.
� Domestic water supplying system
Domestic water is supplied from the existing water supplying pipeline network in the plant.
(2) Water draining system
The water for the Water-sealing and Water-drainage for CDQ Oven is 2 m3/d or so. After the sedimentation, the water goes into the devices matched for 6m Coke Oven as Phenol-cyanogen Wastewater Treatment System with the treatment capacity as 2400 m3/d. After reaching the standards through the treatment, the water serves as the make-up water of the BF Water Slag System.
The water of circling cooling water and blowdown water of the coke dry quenching facility, circling cooling water and blowdown water of air-cooler and oil cooler of the generator and kinds of pumps, steam condensate water and recycling blowdown water of waste heat boilers does not excludes basically other harmful substances. In addition to water temperature raises slightly, other pollutants contained in water is less. The part of wastewater with an output volume of 540m3/d is sent into the water purification and purified water reuse system of whole SGIS as the purified drainage water.
Purified wastewater of production is discharged into original rainwater drainage system in the plant; sewage coking plant life into is brought into existing sewerage system of .the coking plant
2.3.2.6 Thermal facilities
The project has six kinds of heat medium, steam, desalinated water, compressed air for production, compressed purified air for instruments, compressed purified air for dusting, and nitrogen gas.
All the steam, desalinated water, compressed air for production, compressed purified air for instruments, compressed purified air for dusting, and nitrogen gas shall be supplied to boundary of the project by SISG Coking Plant.
Where: the quality of desalinated water shall comply with requirement of the Steam and water Quality Standard for Thermal Power Plant. Consumption of various thermal mediums is presented in Table 2.3-7.
Table 2.3-7 Consumption of thermal mediums list
parameter consumption Note No. Mediums title Pressure(Mpa) Temperature(�) Consumption by unit 1.0 Saturation 5t/h Use at starting 1 Steam 0.4~0.6 Saturation 8
2 Compressed air for production 0.6 ≤40 8m3/min Standard state
3 Compressed purified air 0.6 40 15 m3/min Standard state
4 Nitrogen gas 0.5 40 6 m3/min Standard state
5 Desalting water 0.3 Normal temperature 16t/h
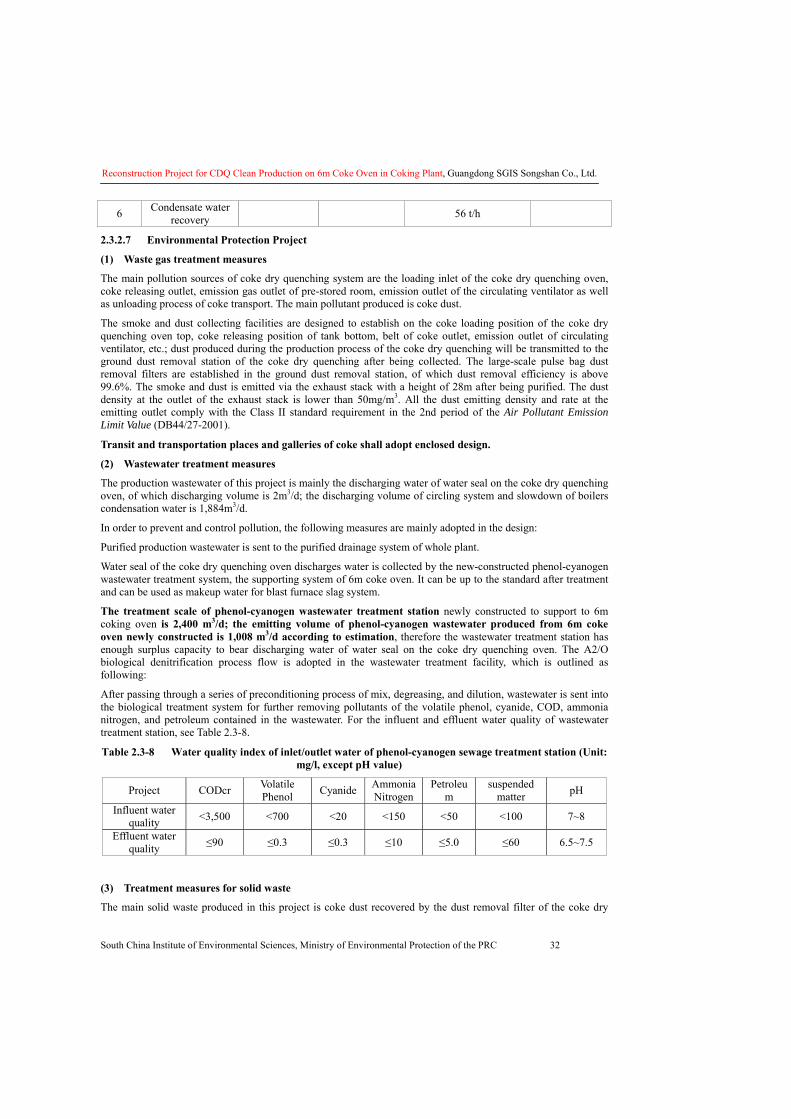
Reconstruction Project for CDQ Clean Production on 6m Coke Oven in Coking Plant, Guangdong SGIS Songshan Co., Ltd.
South China Institute of Environmental Sciences, Ministry of Environmental Protection of the PRC 32
6 Condensate water recovery 56 t/h
2.3.2.7 Environmental Protection Project
(1) Waste gas treatment measures
The main pollution sources of coke dry quenching system are the loading inlet of the coke dry quenching oven, coke releasing outlet, emission gas outlet of pre-stored room, emission outlet of the circulating ventilator as well as unloading process of coke transport. The main pollutant produced is coke dust.
The smoke and dust collecting facilities are designed to establish on the coke loading position of the coke dry quenching oven top, coke releasing position of tank bottom, belt of coke outlet, emission outlet of circulating ventilator, etc.; dust produced during the production process of the coke dry quenching will be transmitted to the ground dust removal station of the coke dry quenching after being collected. The large-scale pulse bag dust removal filters are established in the ground dust removal station, of which dust removal efficiency is above 99.6%. The smoke and dust is emitted via the exhaust stack with a height of 28m after being purified. The dust density at the outlet of the exhaust stack is lower than 50mg/m3. All the dust emitting density and rate at the emitting outlet comply with the Class II standard requirement in the 2nd period of the Air Pollutant Emission Limit Value (DB44/27-2001).
Transit and transportation places and galleries of coke shall adopt enclosed design.
(2) Wastewater treatment measures
The production wastewater of this project is mainly the discharging water of water seal on the coke dry quenching oven, of which discharging volume is 2m3/d; the discharging volume of circling system and slowdown of boilers condensation water is 1,884m3/d.
In order to prevent and control pollution, the following measures are mainly adopted in the design:
Purified production wastewater is sent to the purified drainage system of whole plant.
Water seal of the coke dry quenching oven discharges water is collected by the new-constructed phenol-cyanogen wastewater treatment system, the supporting system of 6m coke oven. It can be up to the standard after treatment and can be used as makeup water for blast furnace slag system.
The treatment scale of phenol-cyanogen wastewater treatment station newly constructed to support to 6m coking oven is 2,400 m3/d; the emitting volume of phenol-cyanogen wastewater produced from 6m coke oven newly constructed is 1,008 m3/d according to estimation, therefore the wastewater treatment station has enough surplus capacity to bear discharging water of water seal on the coke dry quenching oven. The A2/O biological denitrification process flow is adopted in the wastewater treatment facility, which is outlined as following:
After passing through a series of preconditioning process of mix, degreasing, and dilution, wastewater is sent into the biological treatment system for further removing pollutants of the volatile phenol, cyanide, COD, ammonia nitrogen, and petroleum contained in the wastewater. For the influent and effluent water quality of wastewater treatment station, see Table 2.3-8.
Table 2.3-8 Water quality index of inlet/outlet water of phenol-cyanogen sewage treatment station (Unit: mg/l, except pH value)
Project CODcr Volatile Phenol Cyanide Ammonia
Nitrogen Petroleu
m suspended
matter pH
Influent water quality <3,500 <700 <20 <150 <50 <100 7~8
Effluent water quality ≤90 ≤0.3 ≤0.3 ≤10 ≤5.0 ≤60 6.5~7.5
(3) Treatment measures for solid waste
The main solid waste produced in this project is coke dust recovered by the dust removal filter of the coke dry
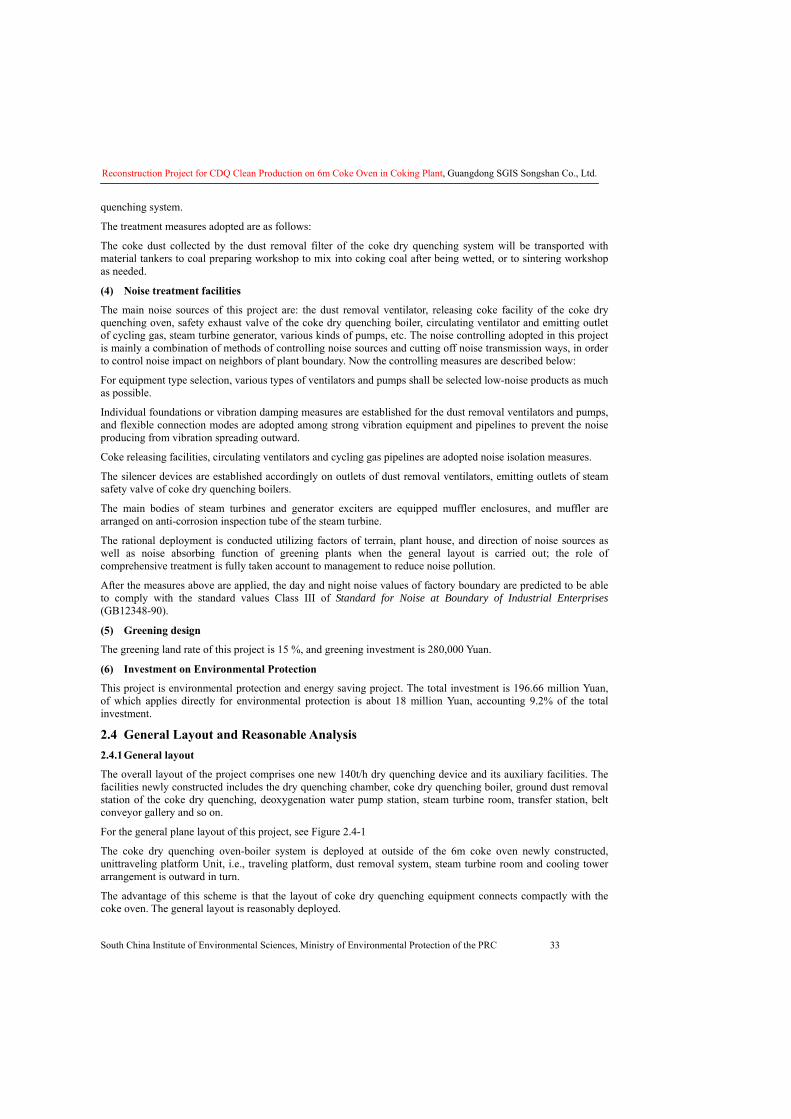
Reconstruction Project for CDQ Clean Production on 6m Coke Oven in Coking Plant, Guangdong SGIS Songshan Co., Ltd.
South China Institute of Environmental Sciences, Ministry of Environmental Protection of the PRC 33
quenching system.
The treatment measures adopted are as follows:
The coke dust collected by the dust removal filter of the coke dry quenching system will be transported with material tankers to coal preparing workshop to mix into coking coal after being wetted, or to sintering workshop as needed.
(4) Noise treatment facilities
The main noise sources of this project are: the dust removal ventilator, releasing coke facility of the coke dry quenching oven, safety exhaust valve of the coke dry quenching boiler, circulating ventilator and emitting outlet of cycling gas, steam turbine generator, various kinds of pumps, etc. The noise controlling adopted in this project is mainly a combination of methods of controlling noise sources and cutting off noise transmission ways, in order to control noise impact on neighbors of plant boundary. Now the controlling measures are described below:
For equipment type selection, various types of ventilators and pumps shall be selected low-noise products as much as possible.
Individual foundations or vibration damping measures are established for the dust removal ventilators and pumps, and flexible connection modes are adopted among strong vibration equipment and pipelines to prevent the noise producing from vibration spreading outward.
Coke releasing facilities, circulating ventilators and cycling gas pipelines are adopted noise isolation measures.
The silencer devices are established accordingly on outlets of dust removal ventilators, emitting outlets of steam safety valve of coke dry quenching boilers.
The main bodies of steam turbines and generator exciters are equipped muffler enclosures, and muffler are arranged on anti-corrosion inspection tube of the steam turbine.
The rational deployment is conducted utilizing factors of terrain, plant house, and direction of noise sources as well as noise absorbing function of greening plants when the general layout is carried out; the role of comprehensive treatment is fully taken account to management to reduce noise pollution.
After the measures above are applied, the day and night noise values of factory boundary are predicted to be able to comply with the standard values Class III of Standard for Noise at Boundary of Industrial Enterprises (GB12348-90).
(5) Greening design
The greening land rate of this project is 15 %, and greening investment is 280,000 Yuan.
(6) Investment on Environmental Protection
This project is environmental protection and energy saving project. The total investment is 196.66 million Yuan, of which applies directly for environmental protection is about 18 million Yuan, accounting 9.2% of the total investment.
2.4 General Layout and Reasonable Analysis 2.4.1 General layout
The overall layout of the project comprises one new 140t/h dry quenching device and its auxiliary facilities. The facilities newly constructed includes the dry quenching chamber, coke dry quenching boiler, ground dust removal station of the coke dry quenching, deoxygenation water pump station, steam turbine room, transfer station, belt conveyor gallery and so on.
For the general plane layout of this project, see Figure 2.4-1
The coke dry quenching oven-boiler system is deployed at outside of the 6m coke oven newly constructed, unittraveling platform Unit, i.e., traveling platform, dust removal system, steam turbine room and cooling tower arrangement is outward in turn.
The advantage of this scheme is that the layout of coke dry quenching equipment connects compactly with the coke oven. The general layout is reasonably deployed.
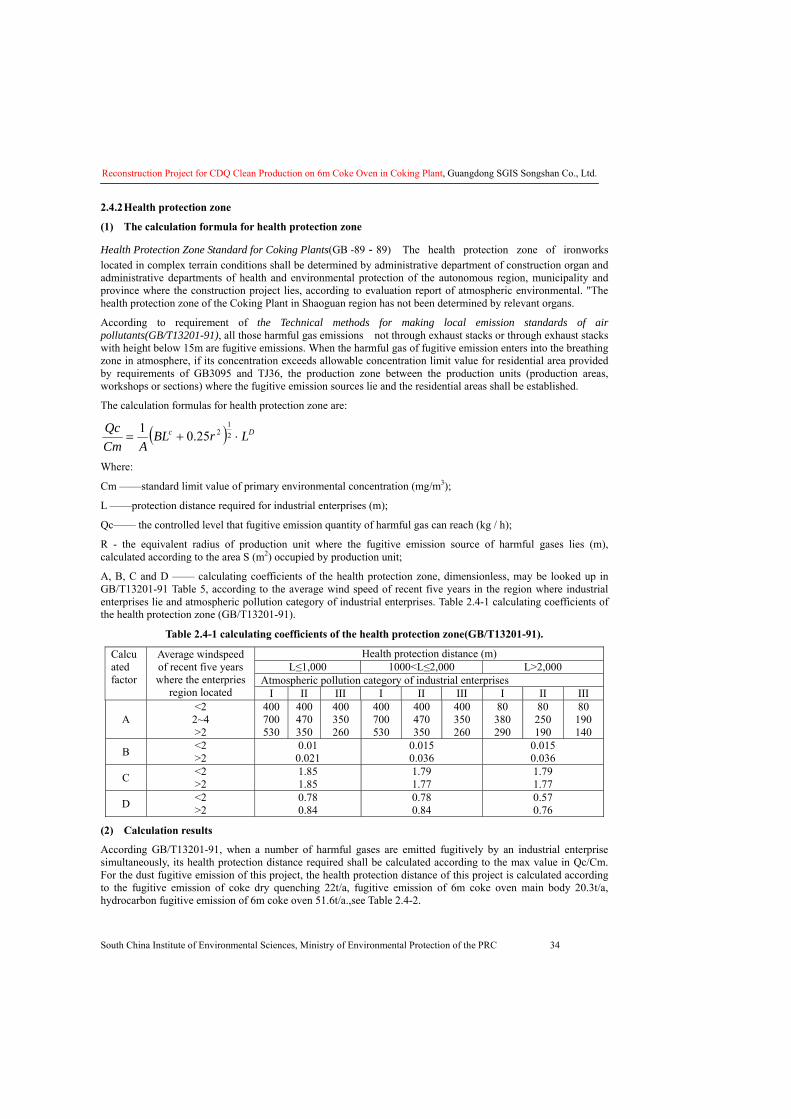
Reconstruction Project for CDQ Clean Production on 6m Coke Oven in Coking Plant, Guangdong SGIS Songshan Co., Ltd.
South China Institute of Environmental Sciences, Ministry of Environmental Protection of the PRC 34
2.4.2 Health protection zone
(1) The calculation formula for health protection zone
Health Protection Zone Standard for Coking Plants(GB -89-89) The health protection zone of ironworks located in complex terrain conditions shall be determined by administrative department of construction organ and administrative departments of health and environmental protection of the autonomous region, municipality and province where the construction project lies, according to evaluation report of atmospheric environmental. "The health protection zone of the Coking Plant in Shaoguan region has not been determined by relevant organs.
According to requirement of the Technical methods for making local emission standards of air pollutants(GB/T13201-91), all those harmful gas emissions not through exhaust stacks or through exhaust stacks with height below 15m are fugitive emissions. When the harmful gas of fugitive emission enters into the breathing zone in atmosphere, if its concentration exceeds allowable concentration limit value for residential area provided by requirements of GB3095 and TJ36, the production zone between the production units (production areas, workshops or sections) where the fugitive emission sources lie and the residential areas shall be established.
The calculation formulas for health protection zone are:
( ) Dc LrBLACm
Qc⋅+= 2
1225.01
Where:
Cm ——standard limit value of primary environmental concentration (mg/m3);
L ——protection distance required for industrial enterprises (m);
Qc—— the controlled level that fugitive emission quantity of harmful gas can reach (kg / h);
R - the equivalent radius of production unit where the fugitive emission source of harmful gases lies (m), calculated according to the area S (m2) occupied by production unit;
A, B, C and D —— calculating coefficients of the health protection zone, dimensionless, may be looked up in GB/T13201-91 Table 5, according to the average wind speed of recent five years in the region where industrial enterprises lie and atmospheric pollution category of industrial enterprises. Table 2.4-1 calculating coefficients of the health protection zone (GB/T13201-91).
Table 2.4-1 calculating coefficients of the health protection zone(GB/T13201-91).
Health protection distance (m) L≤1,000 1000<L≤2,000 L>2,000
Atmospheric pollution category of industrial enterprises
Calcuated factor
Average windspeed of recent five years where the enterpries
region located I II III I II III I II III
A <2 2~4 >2
400 700 530
400 470 350
400 350 260
400 700 530
400 470 350
400 350 260
80 380 290
80 250 190
80 190 140
B <2 >2
0.01 0.021
0.015 0.036
0.015 0.036
C <2 >2
1.85 1.85
1.79 1.77
1.79 1.77
D <2 >2
0.78 0.84
0.78 0.84
0.57 0.76
(2) Calculation results
According GB/T13201-91, when a number of harmful gases are emitted fugitively by an industrial enterprise simultaneously, its health protection distance required shall be calculated according to the max value in Qc/Cm. For the dust fugitive emission of this project, the health protection distance of this project is calculated according to the fugitive emission of coke dry quenching 22t/a, fugitive emission of 6m coke oven main body 20.3t/a, hydrocarbon fugitive emission of 6m coke oven 51.6t/a.,see Table 2.4-2.
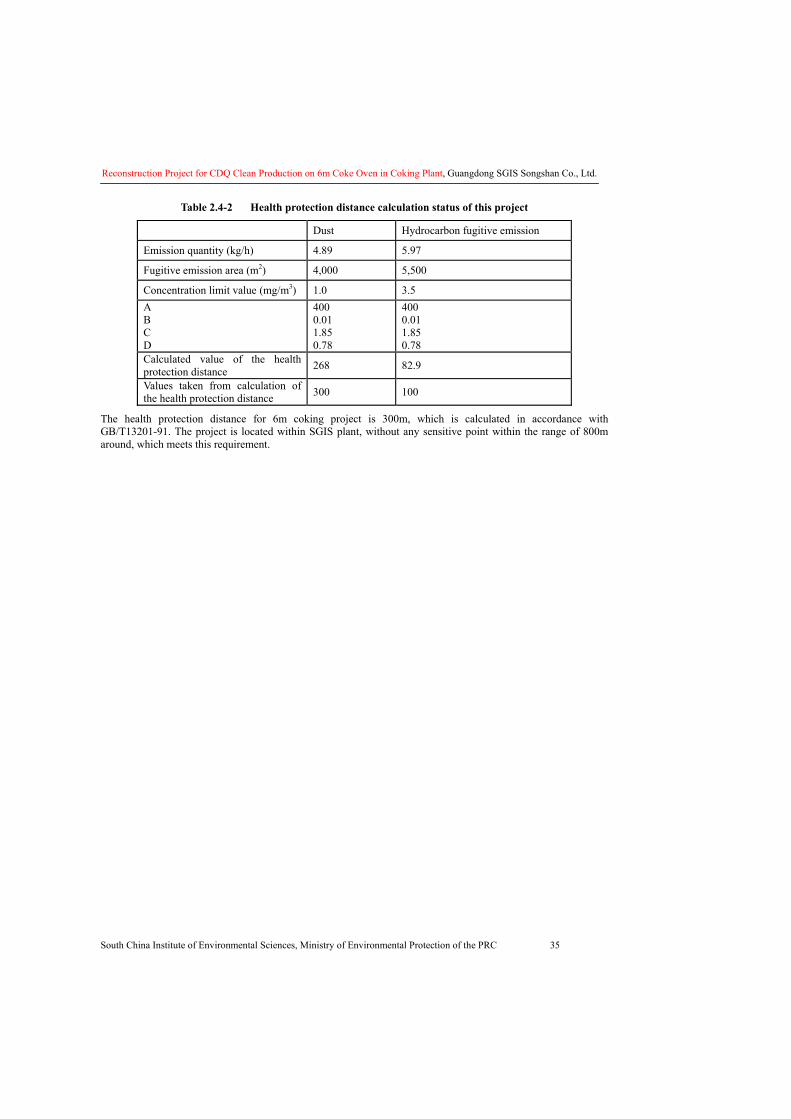
Reconstruction Project for CDQ Clean Production on 6m Coke Oven in Coking Plant, Guangdong SGIS Songshan Co., Ltd.
South China Institute of Environmental Sciences, Ministry of Environmental Protection of the PRC 35
Table 2.4-2 Health protection distance calculation status of this project
Dust Hydrocarbon fugitive emission
Emission quantity (kg/h) 4.89 5.97
Fugitive emission area (m2) 4,000 5,500
Concentration limit value (mg/m3) 1.0 3.5 A B C D
400 0.01 1.85 0.78
400 0.01 1.85 0.78
Calculated value of the health protection distance 268 82.9
Values taken from calculation of the health protection distance 300 100
The health protection distance for 6m coking project is 300m, which is calculated in accordance with GB/T13201-91. The project is located within SGIS plant, without any sensitive point within the range of 800m around, which meets this requirement.
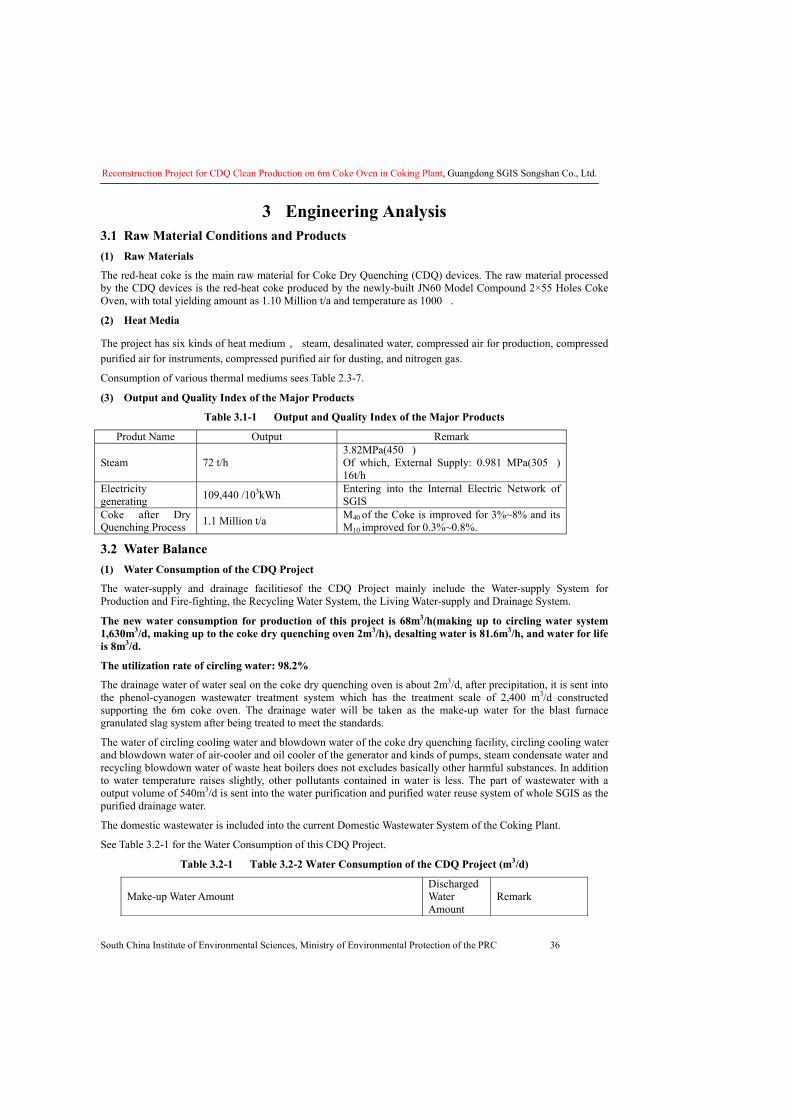
Reconstruction Project for CDQ Clean Production on 6m Coke Oven in Coking Plant, Guangdong SGIS Songshan Co., Ltd.
South China Institute of Environmental Sciences, Ministry of Environmental Protection of the PRC 36
3 Engineering Analysis 3.1 Raw Material Conditions and Products (1) Raw Materials
The red-heat coke is the main raw material for Coke Dry Quenching (CDQ) devices. The raw material processed by the CDQ devices is the red-heat coke produced by the newly-built JN60 Model Compound 2×55 Holes Coke Oven, with total yielding amount as 1.10 Million t/a and temperature as 1000�.
(2) Heat Media
The project has six kinds of heat medium, steam, desalinated water, compressed air for production, compressed purified air for instruments, compressed purified air for dusting, and nitrogen gas.
Consumption of various thermal mediums sees Table 2.3-7.
(3) Output and Quality Index of the Major Products
Table 3.1-1 Output and Quality Index of the Major Products
Produt Name Output Remark
Steam 72 t/h 3.82MPa(450�) Of which, External Supply: 0.981 MPa(305�) 16t/h
Electricity generating 109,440 /103kWh Entering into the Internal Electric Network of
SGIS Coke after Dry Quenching Process 1.1 Million t/a M40 of the Coke is improved for 3%~8% and its
M10 improved for 0.3%~0.8%.
3.2 Water Balance (1) Water Consumption of the CDQ Project
The water-supply and drainage facilitiesof the CDQ Project mainly include the Water-supply System for Production and Fire-fighting, the Recycling Water System, the Living Water-supply and Drainage System.
The new water consumption for production of this project is 68m3/h(making up to circling water system 1,630m3/d, making up to the coke dry quenching oven 2m3/h), desalting water is 81.6m3/h, and water for life is 8m3/d.
The utilization rate of circling water: 98.2%
The drainage water of water seal on the coke dry quenching oven is about 2m3/d, after precipitation, it is sent into the phenol-cyanogen wastewater treatment system which has the treatment scale of 2,400 m3/d constructed supporting the 6m coke oven. The drainage water will be taken as the make-up water for the blast furnace granulated slag system after being treated to meet the standards.
The water of circling cooling water and blowdown water of the coke dry quenching facility, circling cooling water and blowdown water of air-cooler and oil cooler of the generator and kinds of pumps, steam condensate water and recycling blowdown water of waste heat boilers does not excludes basically other harmful substances. In addition to water temperature raises slightly, other pollutants contained in water is less. The part of wastewater with a output volume of 540m3/d is sent into the water purification and purified water reuse system of whole SGIS as the purified drainage water.
The domestic wastewater is included into the current Domestic Wastewater System of the Coking Plant.
See Table 3.2-1 for the Water Consumption of this CDQ Project.
Table 3.2-1 Table 3.2-2 Water Consumption of the CDQ Project (m3/d)
Make-up Water Amount Discharged Water Amount
Remark
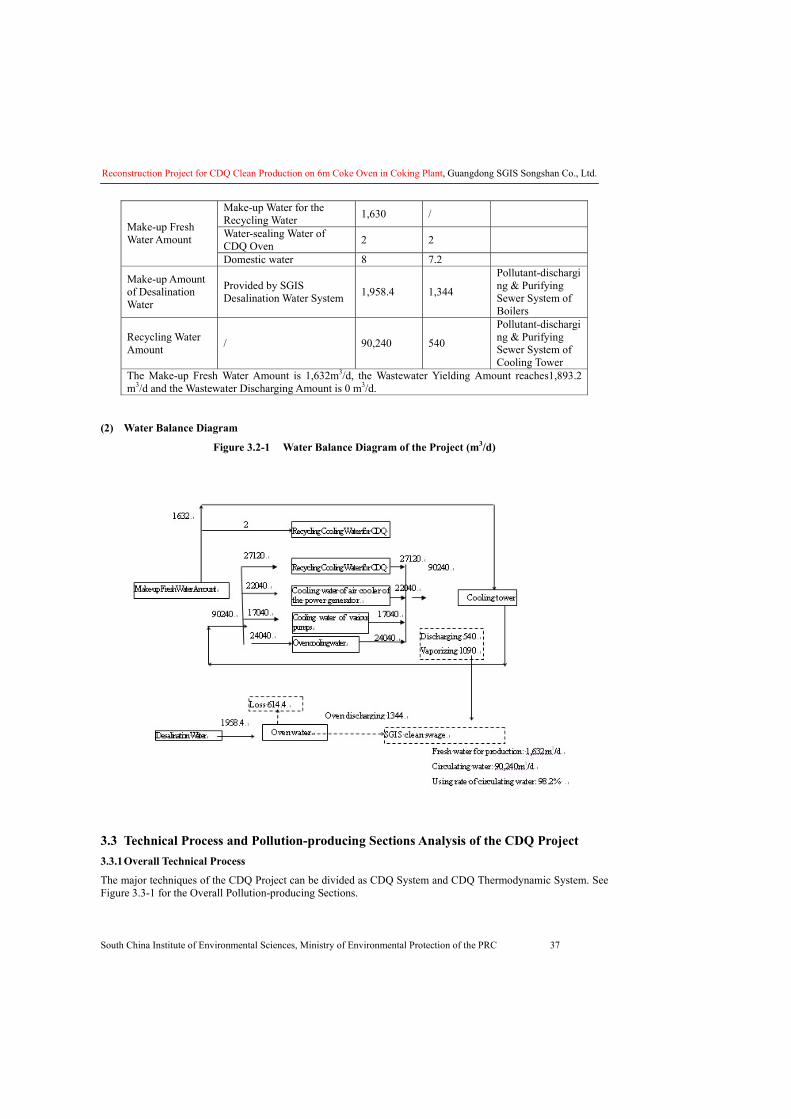
Reconstruction Project for CDQ Clean Production on 6m Coke Oven in Coking Plant, Guangdong SGIS Songshan Co., Ltd.
South China Institute of Environmental Sciences, Ministry of Environmental Protection of the PRC 37
Make-up Water for the Recycling Water 1,630 /
Water-sealing Water of CDQ Oven 2 2
Make-up Fresh Water Amount
Domestic water 8 7.2
Make-up Amount of Desalination Water
Provided by SGIS Desalination Water System 1,958.4 1,344
Pollutant-discharging & Purifying Sewer System of Boilers
Recycling Water Amount / 90,240 540
Pollutant-discharging & Purifying Sewer System of Cooling Tower
The Make-up Fresh Water Amount is 1,632m3/d, the Wastewater Yielding Amount reaches1,893.2 m3/d and the Wastewater Discharging Amount is 0 m3/d.
(2) Water Balance Diagram
Figure 3.2-1 Water Balance Diagram of the Project (m3/d)
3.3 Technical Process and Pollution-producing Sections Analysis of the CDQ Project 3.3.1 Overall Technical Process
The major techniques of the CDQ Project can be divided as CDQ System and CDQ Thermodynamic System. See Figure 3.3-1 for the Overall Pollution-producing Sections.
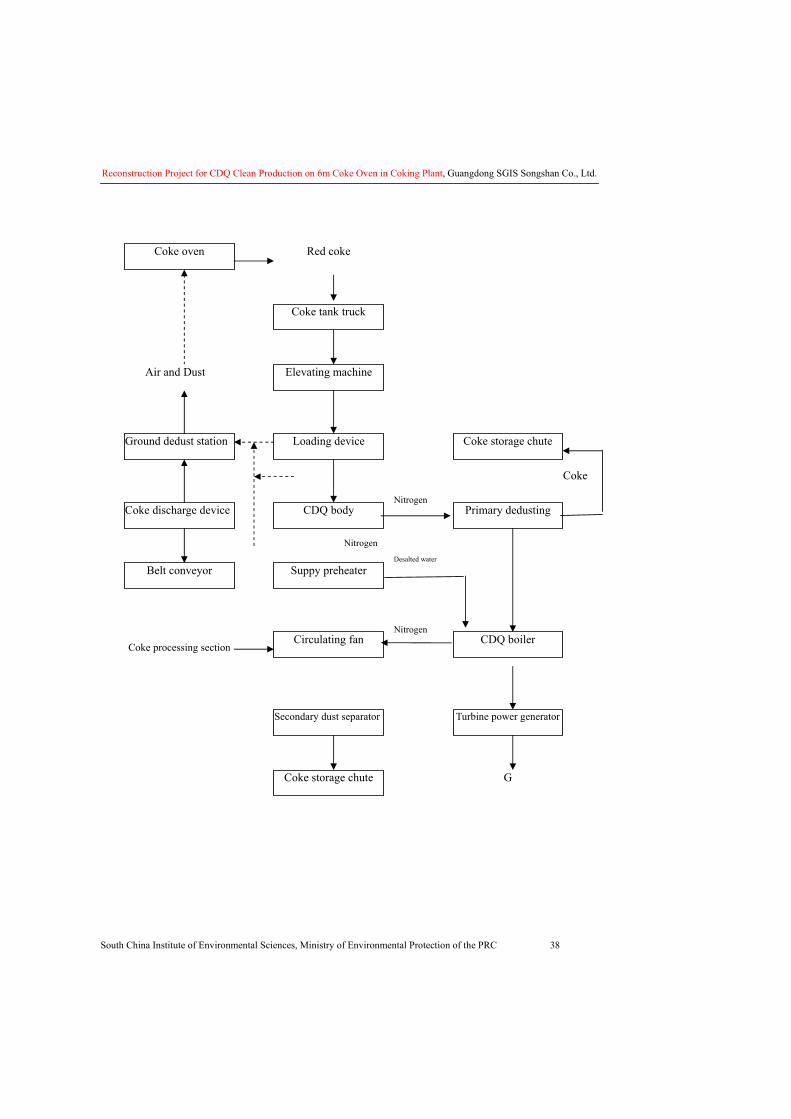
Reconstruction Project for CDQ Clean Production on 6m Coke Oven in Coking Plant, Guangdong SGIS Songshan Co., Ltd.
South China Institute of Environmental Sciences, Ministry of Environmental Protection of the PRC 38
Coke oven Red coke
Coke tank truck
Elevating machine
Ground dedust station
Coke discharge device
Loading device
Suppy preheater Belt conveyor
Coke processing section
CDQ body
Circulating fan
Secondary dust separator
Coke storage chute
Coke storage chute
Primary dedusting
CDQ boiler
Turbine power generator
G
Nitrogen
Desalted water
Nitrogen
Coke
Nitrogen
Air and Dust
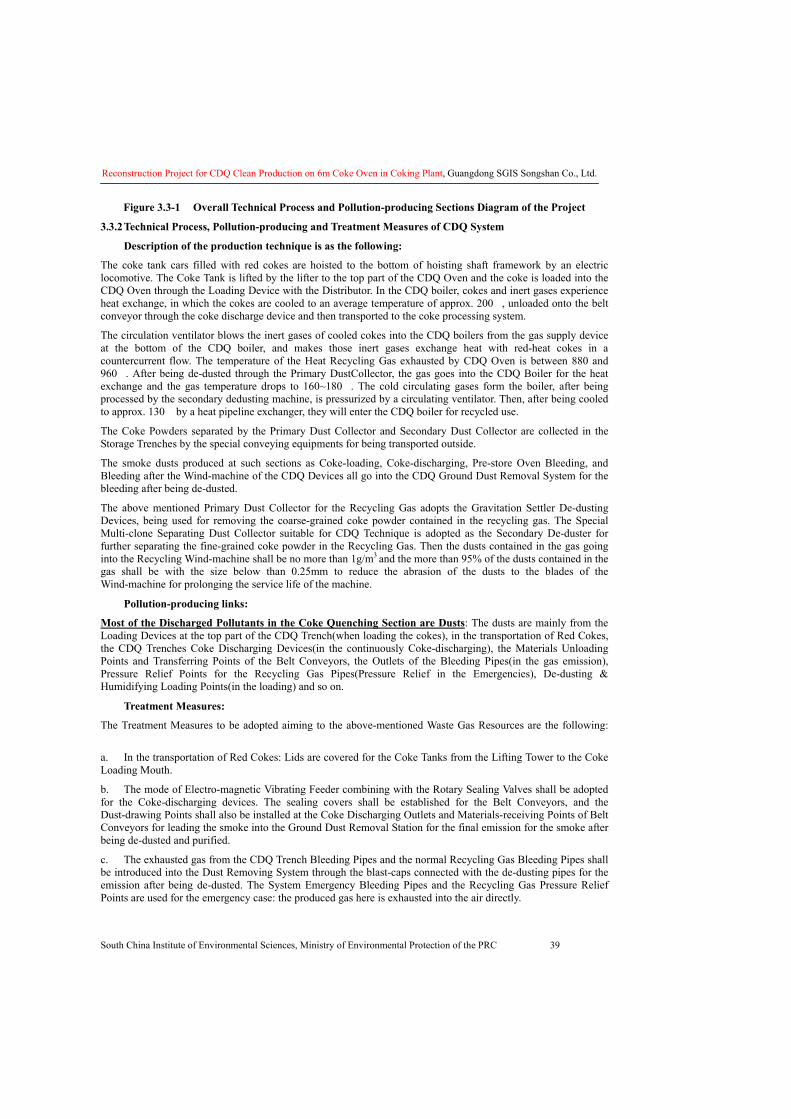
Reconstruction Project for CDQ Clean Production on 6m Coke Oven in Coking Plant, Guangdong SGIS Songshan Co., Ltd.
South China Institute of Environmental Sciences, Ministry of Environmental Protection of the PRC 39
Figure 3.3-1 Overall Technical Process and Pollution-producing Sections Diagram of the Project
3.3.2 Technical Process, Pollution-producing and Treatment Measures of CDQ System
� Description of the production technique is as the following:
The coke tank cars filled with red cokes are hoisted to the bottom of hoisting shaft framework by an electric locomotive. The Coke Tank is lifted by the lifter to the top part of the CDQ Oven and the coke is loaded into the CDQ Oven through the Loading Device with the Distributor. In the CDQ boiler, cokes and inert gases experience heat exchange, in which the cokes are cooled to an average temperature of approx. 200�, unloaded onto the belt conveyor through the coke discharge device and then transported to the coke processing system.
The circulation ventilator blows the inert gases of cooled cokes into the CDQ boilers from the gas supply device at the bottom of the CDQ boiler, and makes those inert gases exchange heat with red-heat cokes in a countercurrent flow. The temperature of the Heat Recycling Gas exhausted by CDQ Oven is between 880 and 960�. After being de-dusted through the Primary DustCollector, the gas goes into the CDQ Boiler for the heat exchange and the gas temperature drops to 160~180�. The cold circulating gases form the boiler, after being processed by the secondary dedusting machine, is pressurized by a circulating ventilator. Then, after being cooled to approx. 130� by a heat pipeline exchanger, they will enter the CDQ boiler for recycled use.
The Coke Powders separated by the Primary Dust Collector and Secondary Dust Collector are collected in the Storage Trenches by the special conveying equipments for being transported outside.
The smoke dusts produced at such sections as Coke-loading, Coke-discharging, Pre-store Oven Bleeding, and Bleeding after the Wind-machine of the CDQ Devices all go into the CDQ Ground Dust Removal System for the bleeding after being de-dusted.
The above mentioned Primary Dust Collector for the Recycling Gas adopts the Gravitation Settler De-dusting Devices, being used for removing the coarse-grained coke powder contained in the recycling gas. The Special Multi-clone Separating Dust Collector suitable for CDQ Technique is adopted as the Secondary De-duster for further separating the fine-grained coke powder in the Recycling Gas. Then the dusts contained in the gas going into the Recycling Wind-machine shall be no more than 1g/m3 and the more than 95% of the dusts contained in the gas shall be with the size below than 0.25mm to reduce the abrasion of the dusts to the blades of the Wind-machine for prolonging the service life of the machine.
� Pollution-producing links:
Most of the Discharged Pollutants in the Coke Quenching Section are Dusts: The dusts are mainly from the Loading Devices at the top part of the CDQ Trench(when loading the cokes), in the transportation of Red Cokes, the CDQ Trenches Coke Discharging Devices(in the continuously Coke-discharging), the Materials Unloading Points and Transferring Points of the Belt Conveyors, the Outlets of the Bleeding Pipes(in the gas emission), Pressure Relief Points for the Recycling Gas Pipes(Pressure Relief in the Emergencies), De-dusting & Humidifying Loading Points(in the loading) and so on.
� Treatment Measures:
The Treatment Measures to be adopted aiming to the above-mentioned Waste Gas Resources are the following:
a. In the transportation of Red Cokes: Lids are covered for the Coke Tanks from the Lifting Tower to the Coke Loading Mouth.
b. The mode of Electro-magnetic Vibrating Feeder combining with the Rotary Sealing Valves shall be adopted for the Coke-discharging devices. The sealing covers shall be established for the Belt Conveyors, and the Dust-drawing Points shall also be installed at the Coke Discharging Outlets and Materials-receiving Points of Belt Conveyors for leading the smoke into the Ground Dust Removal Station for the final emission for the smoke after being de-dusted and purified.
c. The exhausted gas from the CDQ Trench Bleeding Pipes and the normal Recycling Gas Bleeding Pipes shall be introduced into the Dust Removing System through the blast-caps connected with the de-dusting pipes for the emission after being de-dusted. The System Emergency Bleeding Pipes and the Recycling Gas Pressure Relief Points are used for the emergency case: the produced gas here is exhausted into the air directly.
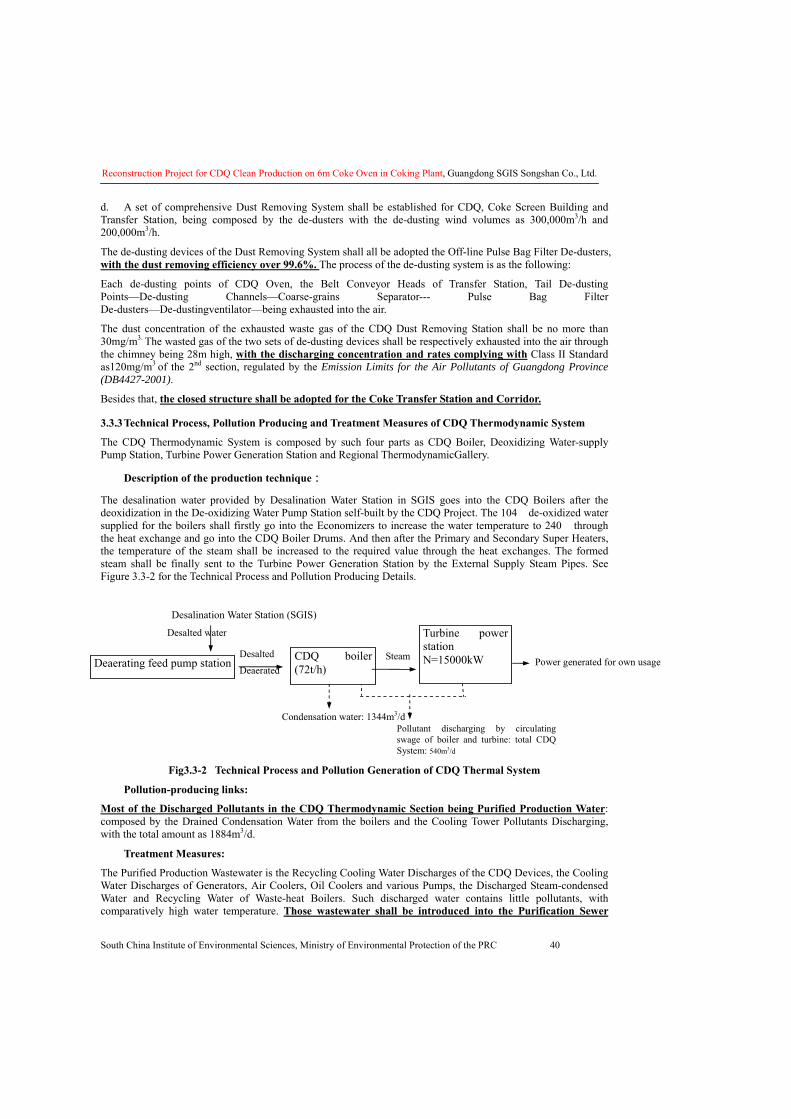
Reconstruction Project for CDQ Clean Production on 6m Coke Oven in Coking Plant, Guangdong SGIS Songshan Co., Ltd.
South China Institute of Environmental Sciences, Ministry of Environmental Protection of the PRC 40
d. A set of comprehensive Dust Removing System shall be established for CDQ, Coke Screen Building and Transfer Station, being composed by the de-dusters with the de-dusting wind volumes as 300,000m3/h and 200,000m3/h.
The de-dusting devices of the Dust Removing System shall all be adopted the Off-line Pulse Bag Filter De-dusters, with the dust removing efficiency over 99.6%. The process of the de-dusting system is as the following:
Each de-dusting points of CDQ Oven, the Belt Conveyor Heads of Transfer Station, Tail De-dusting Points—De-dusting Channels—Coarse-grains Separator--- Pulse Bag Filter De-dusters—De-dustingventilator—being exhausted into the air.
The dust concentration of the exhausted waste gas of the CDQ Dust Removing Station shall be no more than 30mg/m3. The wasted gas of the two sets of de-dusting devices shall be respectively exhausted into the air through the chimney being 28m high, with the discharging concentration and rates complying with Class II Standard as120mg/m3 of the 2nd section, regulated by the Emission Limits for the Air Pollutants of Guangdong Province (DB4427-2001).
Besides that, the closed structure shall be adopted for the Coke Transfer Station and Corridor.
3.3.3 Technical Process, Pollution Producing and Treatment Measures of CDQ Thermodynamic System
The CDQ Thermodynamic System is composed by such four parts as CDQ Boiler, Deoxidizing Water-supply Pump Station, Turbine Power Generation Station and Regional ThermodynamicGallery.
� Description of the production technique:
The desalination water provided by Desalination Water Station in SGIS goes into the CDQ Boilers after the deoxidization in the De-oxidizing Water Pump Station self-built by the CDQ Project. The 104� de-oxidized water supplied for the boilers shall firstly go into the Economizers to increase the water temperature to 240� through the heat exchange and go into the CDQ Boiler Drums. And then after the Primary and Secondary Super Heaters, the temperature of the steam shall be increased to the required value through the heat exchanges. The formed steam shall be finally sent to the Turbine Power Generation Station by the External Supply Steam Pipes. See Figure 3.3-2 for the Technical Process and Pollution Producing Details.
Fig3.3-2 Technical Process and Pollution Generation of CDQ Thermal System
� Pollution-producing links:
Most of the Discharged Pollutants in the CDQ Thermodynamic Section being Purified Production Water: composed by the Drained Condensation Water from the boilers and the Cooling Tower Pollutants Discharging, with the total amount as 1884m3/d.
� Treatment Measures:
The Purified Production Wastewater is the Recycling Cooling Water Discharges of the CDQ Devices, the Cooling Water Discharges of Generators, Air Coolers, Oil Coolers and various Pumps, the Discharged Steam-condensed Water and Recycling Water of Waste-heat Boilers. Such discharged water contains little pollutants, with comparatively high water temperature. Those wastewater shall be introduced into the Purification Sewer
Deaerating feed pump station CDQ boiler (72t/h)
Turbine power station N=15000kW Desalted
Deaerated Steam Power generated for own usage
Condensation water: 1344m3/d Pollutant discharging by circulating swage of boiler and turbine: total CDQ System: 540m3/d
Desalination Water Station (SGIS)
Desalted water
Reconstruction Project for CDQ Clean Production on 6m Coke Oven in Coking Plant, Guangdong SGIS Songshan Co., Ltd.
South China Institute of Environmental Sciences, Ministry of Environmental Protection of the PRC 41
System of the whole plant for being reused by such sections having lower requirement to the water quality, such as BF Slag Washing, Field Washing, Material Fields Wetting, Virescence and so on.
3.3.4 Technical Process, Pollution Producing and Treatment Measures of Coke Transportation System
� Description of the production technique is as the following:
The CDQ Coke Transportation System shall transport the coke processed by the CDQ Treatment to the current Stored Coke Screen System, being composed by Belt Conveyor and the corresponding Transfer Stations. The cokes in the CDQ Trenches after the Dried Quenching shall be transported to Transfer Station by the Belt Conveyors through which the cokes shall be transported to the Stored Coke Screen System of the Coke Oven for the screening and storage.
� Pollution-producing links:
Most of the Discharge Pollutants in the Coke Transportation Section are the dusts, being from the CDQ Oven Coke Outlets, each Transfer Stations and in the Coke Transportation Process.
� Treatment Measures:
The Dust Catching Devices shall be established at each Dust Producing Point. The dust collected in the Dust Transportation shall be sent to the CDQ Ground Dust Removing Station (being shared with CDQ System). The Large-scaled Pulse Bag-filter De-dusters with the de-dusting efficiency over 99.6% shall be established. After the purification, the dust shall be discharged by the Exhaust Gas Chimney. The dust condensation at the Outlet of the Exhaust Gas Chimney shall be no more than 50mg/m3. The exhausting concentration and rates at the Chimney Outlets shall comply with Class II Standard of the 2nd section, regulated by the Emission Limits for the Air Pollutants of Guangdong Province (DB4427-2001). Transit and transportation places and galleries of coke shall adopt enclosed design.
3.4 Environmental Impact Identification in the Operational Period The major environmental impacting factors in the operational period mainly include the following:
(1) Atmospheric environment Impacting Factors: Dusts are the major pollutants produced in the DCQ Producing Process, being mainly exhausted by the Ground Dust Removing Devices, having certain effect upon the ambient air. Moreover, large amounts of dusts will be discharged at the Emergency Pressure Relief of the Recycling Air Pipes Pressure Relief Points and when the Emergency occurs for the Dust Collecting Pipes.
(2) Water Environment Impacting Factors:
The Recycling Water-supply System is adopted by the Project and no Production Wastewater shall be discharged outside. The domestic wastewater produced by the working personnel shall be discharge into the Factory Water Discharge Networks after being treated by the SIGS Septic Tanks.
(3) Sounds Environment Impacting Factors: the impacts of the mechanical noise produced by each operation & transported machines, and the transportation noise on the people living nearby.
(4) Solid Wastes: referring to the Coke Dusts produced by the de-dusters. They shall be used as Sintering Raw Materials after being wetted or being reused in the Coking Process according to the relative requirements.
3.5 Pollution Resource Intensity Analysis in the Operational Period of the CDQ Project 3.5.1 Air Pollution Sources
The organized discharges of the Air Pollutants of this CDQ Project are mainly from the two newly-built Ground Dust Removing Stations. Seeing Table 3.5-1 for the Waste Air Pollutants Discharging Situations of the CDQ Project gained from the Feasibility Study Reports and the comparison with the similar projects (90t/h CDQ Project of Beitai Iron and Steel Group Company).
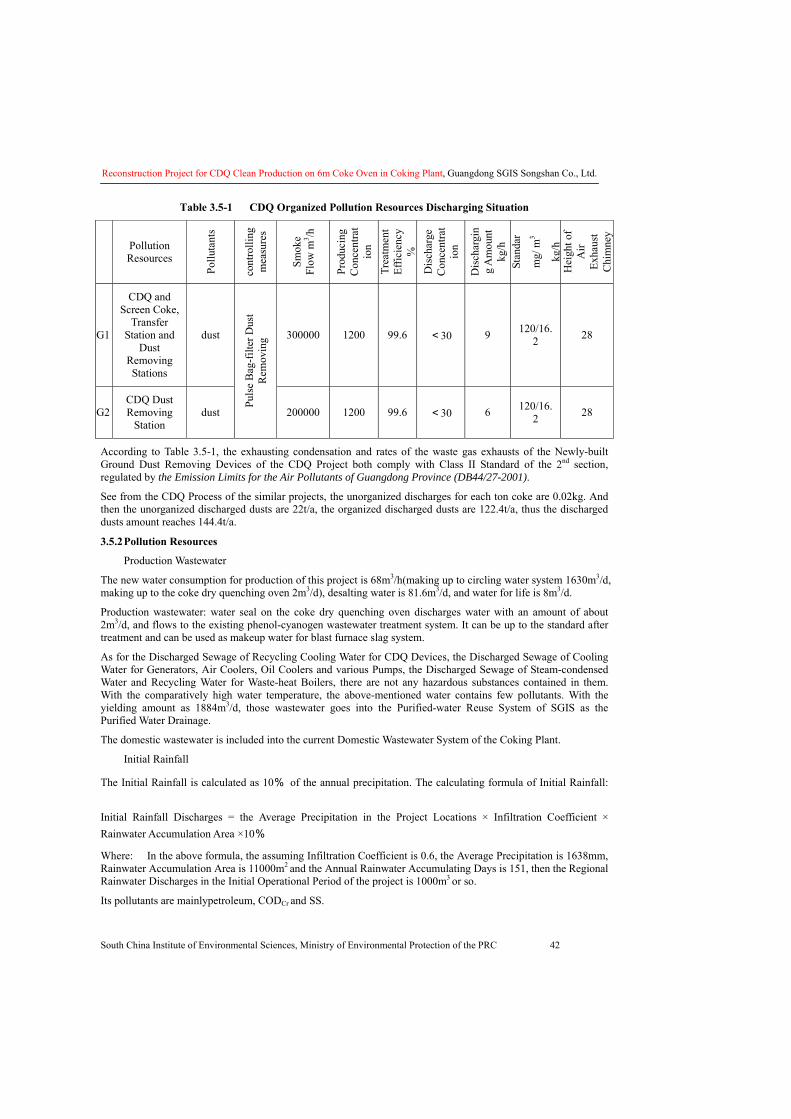
Reconstruction Project for CDQ Clean Production on 6m Coke Oven in Coking Plant, Guangdong SGIS Songshan Co., Ltd.
South China Institute of Environmental Sciences, Ministry of Environmental Protection of the PRC 42
Table 3.5-1 CDQ Organized Pollution Resources Discharging Situation
Pollution Resources
Pollu
tant
s
cont
rolli
ng
mea
sure
s
Smok
e Fl
ow m
3 /h
Prod
ucin
g C
once
ntra
tio
n Tr
eatm
ent
Effic
ienc
y %
D
isch
arge
C
once
ntra
tio
n
Dis
char
gin
g A
mou
nt
kg/h
St
anda
r
mg/
m3
k g/h
H
eigh
t of
Air
Exha
ust
Chi
mne
y
G1
CDQ and Screen Coke,
Transfer Station and
Dust Removing Stations
dust 300000 1200 99.6 <30 9 120/16.2 28
G2 CDQ Dust Removing
Station dust
Puls
e B
ag-f
ilter
Dus
t R
emov
ing
200000 1200 99.6 <30 6 120/16.2 28
According to Table 3.5-1, the exhausting condensation and rates of the waste gas exhausts of the Newly-built Ground Dust Removing Devices of the CDQ Project both comply with Class II Standard of the 2nd section, regulated by the Emission Limits for the Air Pollutants of Guangdong Province (DB44/27-2001).
See from the CDQ Process of the similar projects, the unorganized discharges for each ton coke are 0.02kg. And then the unorganized discharged dusts are 22t/a, the organized discharged dusts are 122.4t/a, thus the discharged dusts amount reaches 144.4t/a.
3.5.2 Pollution Resources
� Production Wastewater
The new water consumption for production of this project is 68m3/h(making up to circling water system 1630m3/d, making up to the coke dry quenching oven 2m3/d), desalting water is 81.6m3/d, and water for life is 8m3/d.
Production wastewater: water seal on the coke dry quenching oven discharges water with an amount of about 2m3/d, and flows to the existing phenol-cyanogen wastewater treatment system. It can be up to the standard after treatment and can be used as makeup water for blast furnace slag system.
As for the Discharged Sewage of Recycling Cooling Water for CDQ Devices, the Discharged Sewage of Cooling Water for Generators, Air Coolers, Oil Coolers and various Pumps, the Discharged Sewage of Steam-condensed Water and Recycling Water for Waste-heat Boilers, there are not any hazardous substances contained in them. With the comparatively high water temperature, the above-mentioned water contains few pollutants. With the yielding amount as 1884m3/d, those wastewater goes into the Purified-water Reuse System of SGIS as the Purified Water Drainage.
The domestic wastewater is included into the current Domestic Wastewater System of the Coking Plant.
� Initial Rainfall
The Initial Rainfall is calculated as 10% of the annual precipitation. The calculating formula of Initial Rainfall:
Initial Rainfall Discharges = the Average Precipitation in the Project Locations × Infiltration Coefficient × Rainwater Accumulation Area ×10%
Where: In the above formula, the assuming Infiltration Coefficient is 0.6, the Average Precipitation is 1638mm, Rainwater Accumulation Area is 11000m2 and the Annual Rainwater Accumulating Days is 151, then the Regional Rainwater Discharges in the Initial Operational Period of the project is 1000m3 or so.
Its pollutants are mainlypetroleum, CODCr and SS.
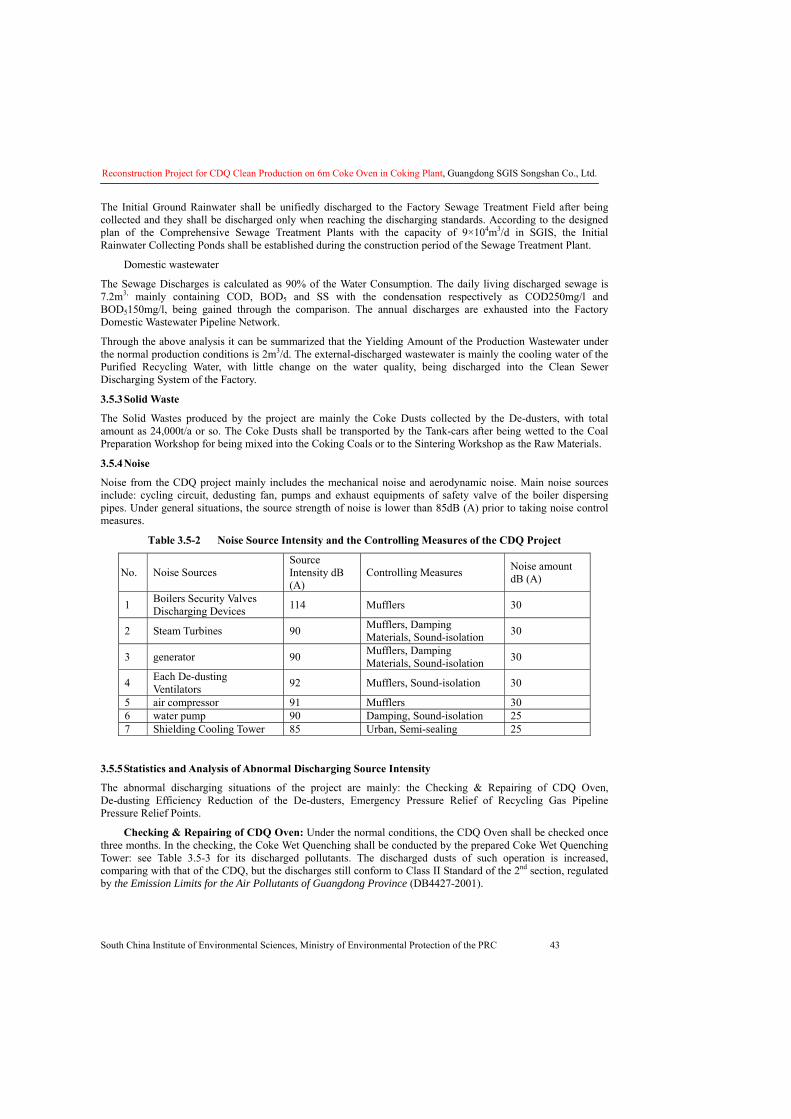
Reconstruction Project for CDQ Clean Production on 6m Coke Oven in Coking Plant, Guangdong SGIS Songshan Co., Ltd.
South China Institute of Environmental Sciences, Ministry of Environmental Protection of the PRC 43
The Initial Ground Rainwater shall be unifiedly discharged to the Factory Sewage Treatment Field after being collected and they shall be discharged only when reaching the discharging standards. According to the designed plan of the Comprehensive Sewage Treatment Plants with the capacity of 9×10⁴m3/d in SGIS, the Initial Rainwater Collecting Ponds shall be established during the construction period of the Sewage Treatment Plant.
� Domestic wastewater
The Sewage Discharges is calculated as 90% of the Water Consumption. The daily living discharged sewage is 7.2m3, mainly containing COD, BOD5 and SS with the condensation respectively as COD250mg/l and BOD5150mg/l, being gained through the comparison. The annual discharges are exhausted into the Factory Domestic Wastewater Pipeline Network.
Through the above analysis it can be summarized that the Yielding Amount of the Production Wastewater under the normal production conditions is 2m3/d. The external-discharged wastewater is mainly the cooling water of the Purified Recycling Water, with little change on the water quality, being discharged into the Clean Sewer Discharging System of the Factory.
3.5.3 Solid Waste
The Solid Wastes produced by the project are mainly the Coke Dusts collected by the De-dusters, with total amount as 24,000t/a or so. The Coke Dusts shall be transported by the Tank-cars after being wetted to the Coal Preparation Workshop for being mixed into the Coking Coals or to the Sintering Workshop as the Raw Materials.
3.5.4 Noise
Noise from the CDQ project mainly includes the mechanical noise and aerodynamic noise. Main noise sources include: cycling circuit, dedusting fan, pumps and exhaust equipments of safety valve of the boiler dispersing pipes. Under general situations, the source strength of noise is lower than 85dB (A) prior to taking noise control measures.
Table 3.5-2 Noise Source Intensity and the Controlling Measures of the CDQ Project
No. Noise Sources Source Intensity dB (A)
Controlling Measures Noise amount dB (A)
1 Boilers Security Valves Discharging Devices 114 Mufflers 30
2 Steam Turbines 90 Mufflers, Damping Materials, Sound-isolation 30
3 generator 90 Mufflers, Damping Materials, Sound-isolation 30
4 Each De-dusting Ventilators 92 Mufflers, Sound-isolation 30
5 air compressor 91 Mufflers 30 6 water pump 90 Damping, Sound-isolation 25 7 Shielding Cooling Tower 85 Urban, Semi-sealing 25
3.5.5 Statistics and Analysis of Abnormal Discharging Source Intensity
The abnormal discharging situations of the project are mainly: the Checking & Repairing of CDQ Oven, De-dusting Efficiency Reduction of the De-dusters, Emergency Pressure Relief of Recycling Gas Pipeline Pressure Relief Points.
� Checking & Repairing of CDQ Oven: Under the normal conditions, the CDQ Oven shall be checked once three months. In the checking, the Coke Wet Quenching shall be conducted by the prepared Coke Wet Quenching Tower: see Table 3.5-3 for its discharged pollutants. The discharged dusts of such operation is increased, comparing with that of the CDQ, but the discharges still conform to Class II Standard of the 2nd section, regulated by the Emission Limits for the Air Pollutants of Guangdong Province (DB4427-2001).
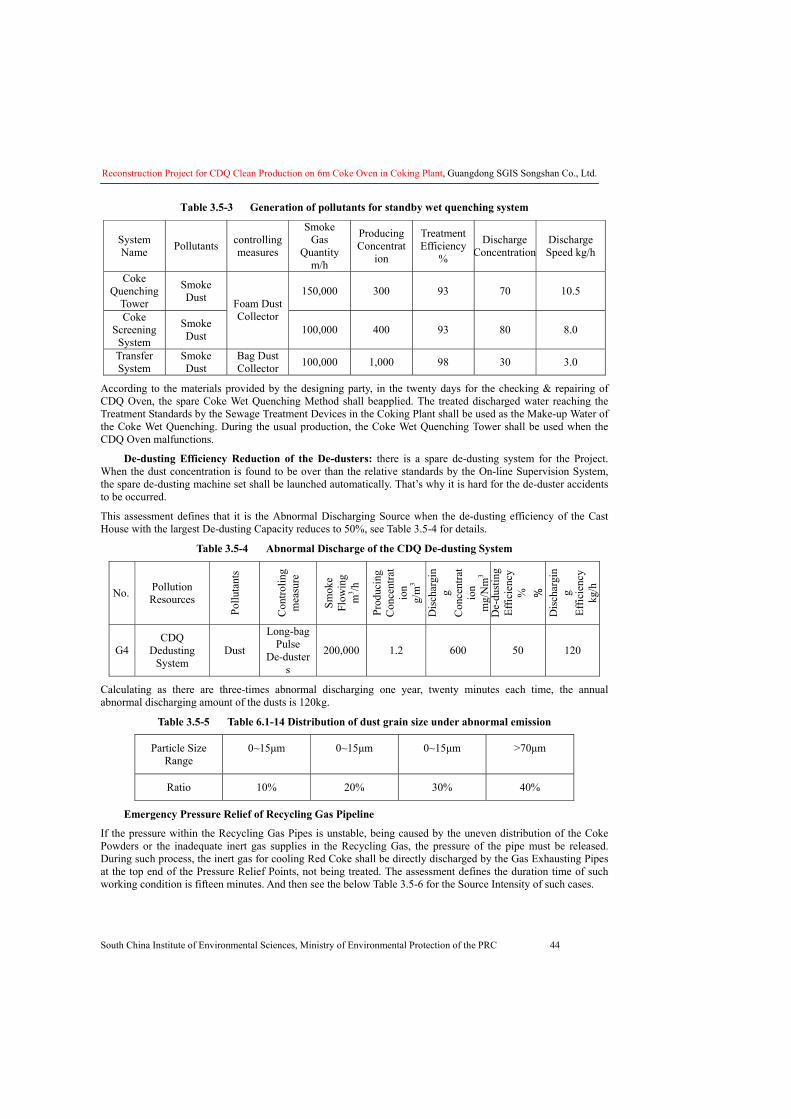
Reconstruction Project for CDQ Clean Production on 6m Coke Oven in Coking Plant, Guangdong SGIS Songshan Co., Ltd.
South China Institute of Environmental Sciences, Ministry of Environmental Protection of the PRC 44
Table 3.5-3 Generation of pollutants for standby wet quenching system
System Name Pollutants controlling
measures
Smoke Gas
Quantity m/h
Producing Concentrat
ion
Treatment Efficiency
%
Discharge Concentration
Discharge Speed kg/h
Coke Quenching
Tower
Smoke Dust 150,000 300 93 70 10.5
Coke Screening
System
Smoke Dust
Foam Dust Collector
100,000 400 93 80 8.0
Transfer System
Smoke Dust
Bag Dust Collector 100,000 1,000 98 30 3.0
According to the materials provided by the designing party, in the twenty days for the checking & repairing of CDQ Oven, the spare Coke Wet Quenching Method shall beapplied. The treated discharged water reaching the Treatment Standards by the Sewage Treatment Devices in the Coking Plant shall be used as the Make-up Water of the Coke Wet Quenching. During the usual production, the Coke Wet Quenching Tower shall be used when the CDQ Oven malfunctions.
� De-dusting Efficiency Reduction of the De-dusters: there is a spare de-dusting system for the Project. When the dust concentration is found to be over than the relative standards by the On-line Supervision System, the spare de-dusting machine set shall be launched automatically. That’s why it is hard for the de-duster accidents to be occurred.
This assessment defines that it is the Abnormal Discharging Source when the de-dusting efficiency of the Cast House with the largest De-dusting Capacity reduces to 50%, see Table 3.5-4 for details.
Table 3.5-4 Abnormal Discharge of the CDQ De-dusting System
No. Pollution Resources
Pollu
tant
s
Con
trolin
g m
easu
re
Smok
e Fl
owin
g m
3 /h
Prod
ucin
g C
once
ntra
tio
n g/
m3
Dis
char
gin
g C
once
ntra
tio
n m
g/N
m3
De-
dust
ing
Effic
ienc
y %
%
D
isch
argi
ng
Effic
ienc
y kg
/h
G4 CDQ
Dedusting System
Dust
Long-bag Pulse
De-dusters
200,000 1.2 600 50 120
Calculating as there are three-times abnormal discharging one year, twenty minutes each time, the annual abnormal discharging amount of the dusts is 120kg.
Table 3.5-5 Table 6.1-14 Distribution of dust grain size under abnormal emission
Particle Size Range
0~15μm 0~15μm 0~15μm >70μm
Ratio 10% 20% 30% 40%
� Emergency Pressure Relief of Recycling Gas Pipeline
If the pressure within the Recycling Gas Pipes is unstable, being caused by the uneven distribution of the Coke Powders or the inadequate inert gas supplies in the Recycling Gas, the pressure of the pipe must be released. During such process, the inert gas for cooling Red Coke shall be directly discharged by the Gas Exhausting Pipes at the top end of the Pressure Relief Points, not being treated. The assessment defines the duration time of such working condition is fifteen minutes. And then see the below Table 3.5-6 for the Source Intensity of such cases.
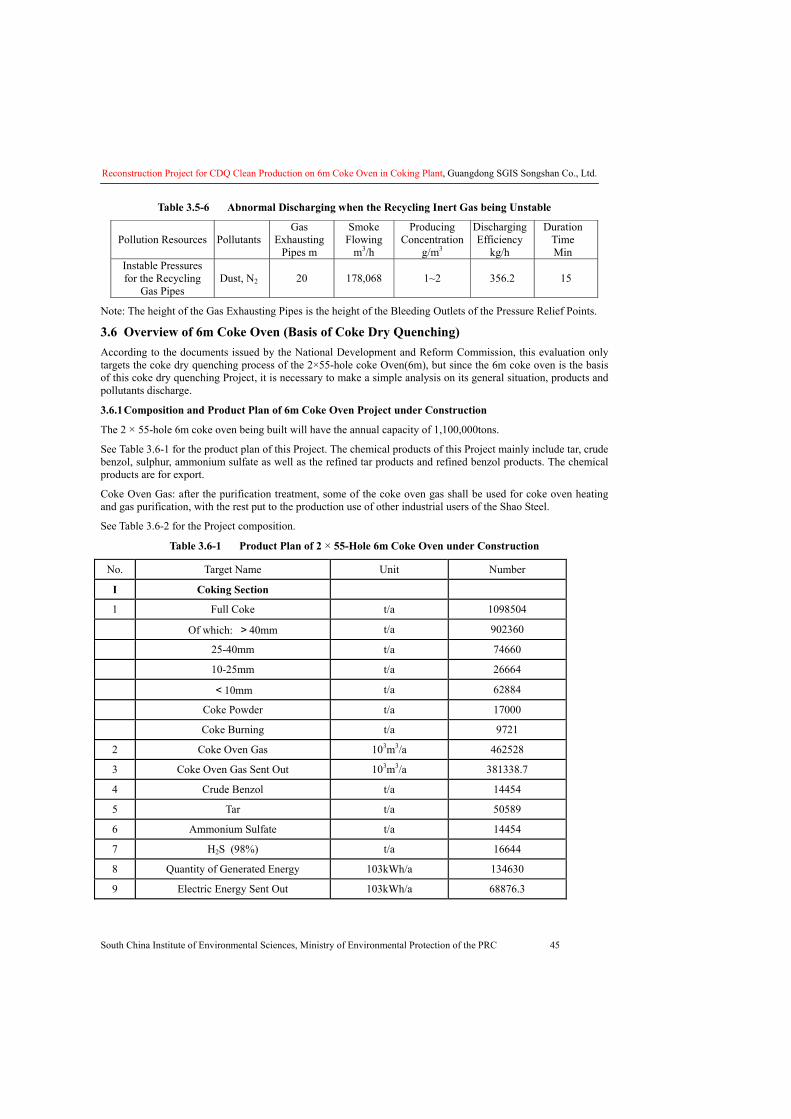
Reconstruction Project for CDQ Clean Production on 6m Coke Oven in Coking Plant, Guangdong SGIS Songshan Co., Ltd.
South China Institute of Environmental Sciences, Ministry of Environmental Protection of the PRC 45
Table 3.5-6 Abnormal Discharging when the Recycling Inert Gas being Unstable
Pollution Resources Pollutants Gas
Exhausting Pipes m
Smoke Flowing
m3/h
Producing Concentration
g/m3
Discharging Efficiency
kg/h
Duration Time Min
Instable Pressures for the Recycling
Gas Pipes Dust, N2 20 178,068 1~2 356.2 15
Note: The height of the Gas Exhausting Pipes is the height of the Bleeding Outlets of the Pressure Relief Points.
3.6 Overview of 6m Coke Oven (Basis of Coke Dry Quenching) According to the documents issued by the National Development and Reform Commission, this evaluation only targets the coke dry quenching process of the 2×55-hole coke Oven(6m), but since the 6m coke oven is the basis of this coke dry quenching Project, it is necessary to make a simple analysis on its general situation, products and pollutants discharge.
3.6.1 Composition and Product Plan of 6m Coke Oven Project under Construction
The 2 × 55-hole 6m coke oven being built will have the annual capacity of 1,100,000tons.
See Table 3.6-1 for the product plan of this Project. The chemical products of this Project mainly include tar, crude benzol, sulphur, ammonium sulfate as well as the refined tar products and refined benzol products. The chemical products are for export.
Coke Oven Gas: after the purification treatment, some of the coke oven gas shall be used for coke oven heating and gas purification, with the rest put to the production use of other industrial users of the Shao Steel.
See Table 3.6-2 for the Project composition.
Table 3.6-1 Product Plan of 2 × 55-Hole 6m Coke Oven under Construction
No. Target Name Unit Number
I Coking Section
1 Full Coke t/a 1098504
Of which: >40mm t/a 902360
25-40mm t/a 74660
10-25mm t/a 26664
<10mm t/a 62884
Coke Powder t/a 17000
Coke Burning t/a 9721
2 Coke Oven Gas 103m3/a 462528
3 Coke Oven Gas Sent Out 103m3/a 381338.7
4 Crude Benzol t/a 14454
5 Tar t/a 50589
6 Ammonium Sulfate t/a 14454
7 H2S (98%) t/a 16644
8 Quantity of Generated Energy 103kWh/a 134630
9 Electric Energy Sent Out 103kWh/a 68876.3
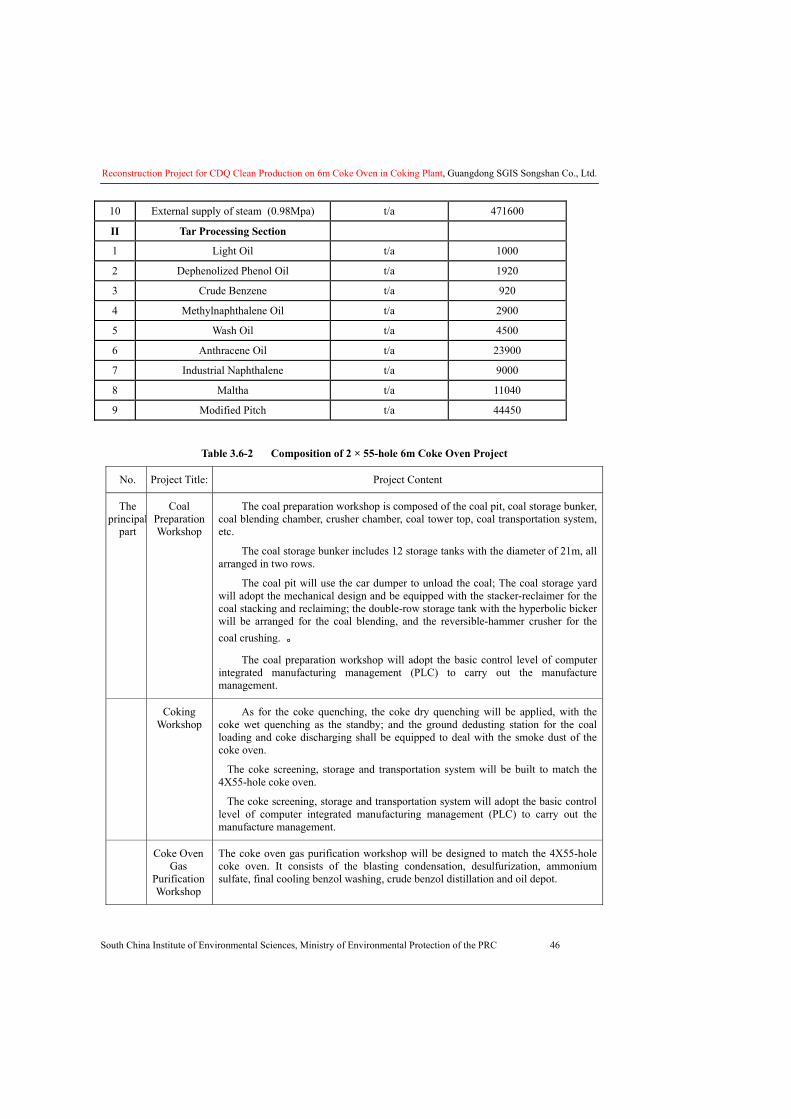
Reconstruction Project for CDQ Clean Production on 6m Coke Oven in Coking Plant, Guangdong SGIS Songshan Co., Ltd.
South China Institute of Environmental Sciences, Ministry of Environmental Protection of the PRC 46
10 External supply of steam (0.98Mpa) t/a 471600
II Tar Processing Section
1 Light Oil t/a 1000
2 Dephenolized Phenol Oil t/a 1920
3 Crude Benzene t/a 920
4 Methylnaphthalene Oil t/a 2900
5 Wash Oil t/a 4500
6 Anthracene Oil t/a 23900
7 Industrial Naphthalene t/a 9000
8 Maltha t/a 11040
9 Modified Pitch t/a 44450
Table 3.6-2 Composition of 2 × 55-hole 6m Coke Oven Project
No. Project Title: Project Content
The principal
part
Coal Preparation Workshop
� The coal preparation workshop is composed of the coal pit, coal storage bunker, coal blending chamber, crusher chamber, coal tower top, coal transportation system, etc.
� The coal storage bunker includes 12 storage tanks with the diameter of 21m, all arranged in two rows.
� The coal pit will use the car dumper to unload the coal; The coal storage yard will adopt the mechanical design and be equipped with the stacker-reclaimer for the coal stacking and reclaiming; the double-row storage tank with the hyperbolic bicker will be arranged for the coal blending, and the reversible-hammer crusher for the coal crushing. 。
� The coal preparation workshop will adopt the basic control level of computer integrated manufacturing management (PLC) to carry out the manufacture management.
Coking Workshop
� As for the coke quenching, the coke dry quenching will be applied, with the coke wet quenching as the standby; and the ground dedusting station for the coal loading and coke discharging shall be equipped to deal with the smoke dust of the coke oven.
�The coke screening, storage and transportation system will be built to match the 4X55-hole coke oven.
�The coke screening, storage and transportation system will adopt the basic control level of computer integrated manufacturing management (PLC) to carry out the manufacture management.
Coke Oven Gas
Purification Workshop
The coke oven gas purification workshop will be designed to match the 4X55-hole coke oven. It consists of the blasting condensation, desulfurization, ammonium sulfate, final cooling benzol washing, crude benzol distillation and oil depot.
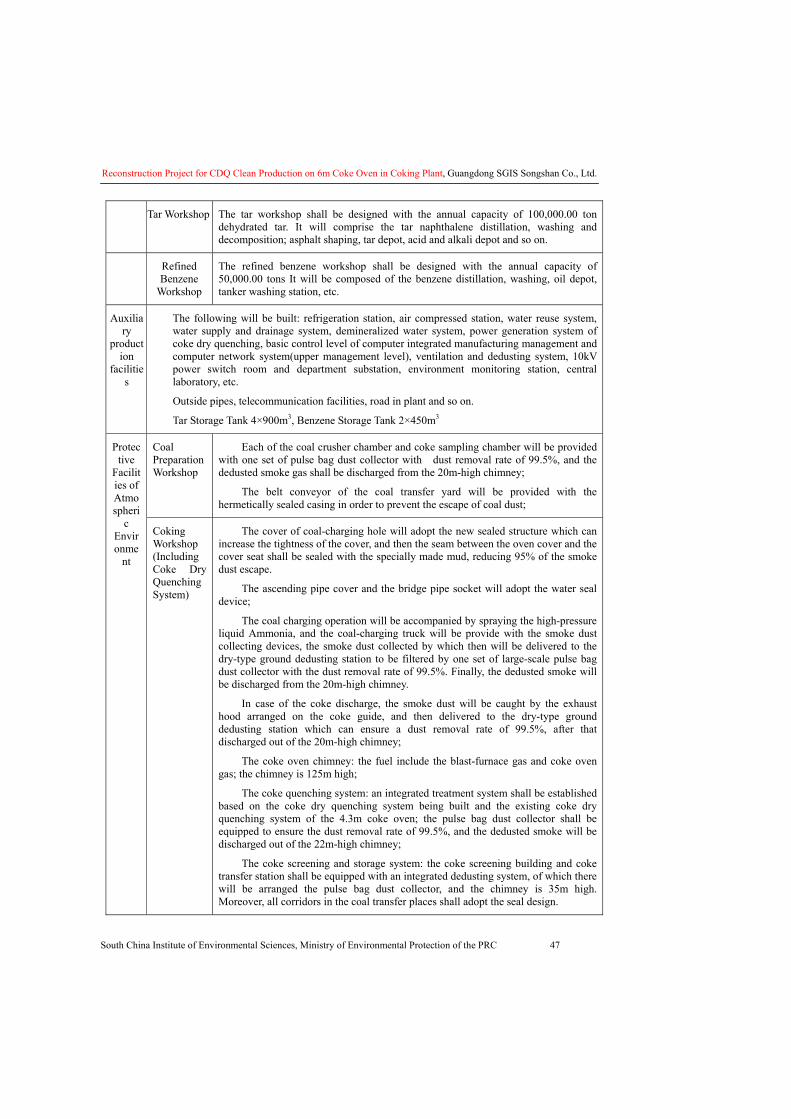
Reconstruction Project for CDQ Clean Production on 6m Coke Oven in Coking Plant, Guangdong SGIS Songshan Co., Ltd.
South China Institute of Environmental Sciences, Ministry of Environmental Protection of the PRC 47
Tar Workshop The tar workshop shall be designed with the annual capacity of 100,000.00 ton dehydrated tar. It will comprise the tar naphthalene distillation, washing and decomposition; asphalt shaping, tar depot, acid and alkali depot and so on.
Refined Benzene
Workshop
The refined benzene workshop shall be designed with the annual capacity of 50,000.00 tons It will be composed of the benzene distillation, washing, oil depot, tanker washing station, etc.
Auxiliary
production
facilities
� The following will be built: refrigeration station, air compressed station, water reuse system, water supply and drainage system, demineralized water system, power generation system of coke dry quenching, basic control level of computer integrated manufacturing management and computer network system(upper management level), ventilation and dedusting system, 10kV power switch room and department substation, environment monitoring station, central laboratory, etc.
� Outside pipes, telecommunication facilities, road in plant and so on.
� Tar Storage Tank 4×900m3, Benzene Storage Tank 2×450m3
Coal Preparation Workshop
� Each of the coal crusher chamber and coke sampling chamber will be provided with one set of pulse bag dust collector with dust removal rate of 99.5%, and the dedusted smoke gas shall be discharged from the 20m-high chimney;
� The belt conveyor of the coal transfer yard will be provided with the hermetically sealed casing in order to prevent the escape of coal dust;
Protective
Facilities of Atmospheri
c Environme
nt
Coking Workshop (Including Coke Dry Quenching System)
� The cover of coal-charging hole will adopt the new sealed structure which can increase the tightness of the cover, and then the seam between the oven cover and the cover seat shall be sealed with the specially made mud, reducing 95% of the smoke dust escape.
� The ascending pipe cover and the bridge pipe socket will adopt the water seal device;
� The coal charging operation will be accompanied by spraying the high-pressure liquid Ammonia, and the coal-charging truck will be provide with the smoke dust collecting devices, the smoke dust collected by which then will be delivered to the dry-type ground dedusting station to be filtered by one set of large-scale pulse bag dust collector with the dust removal rate of 99.5%. Finally, the dedusted smoke will be discharged from the 20m-high chimney.
� In case of the coke discharge, the smoke dust will be caught by the exhaust hood arranged on the coke guide, and then delivered to the dry-type ground dedusting station which can ensure a dust removal rate of 99.5%, after that discharged out of the 20m-high chimney;
� The coke oven chimney: the fuel include the blast-furnace gas and coke oven gas; the chimney is 125m high;
� The coke quenching system: an integrated treatment system shall be established based on the coke dry quenching system being built and the existing coke dry quenching system of the 4.3m coke oven; the pulse bag dust collector shall be equipped to ensure the dust removal rate of 99.5%, and the dedusted smoke will be discharged out of the 22m-high chimney;
� The coke screening and storage system: the coke screening building and coke transfer station shall be equipped with an integrated dedusting system, of which there will be arranged the pulse bag dust collector, and the chimney is 35m high. Moreover, all corridors in the coal transfer places shall adopt the seal design.
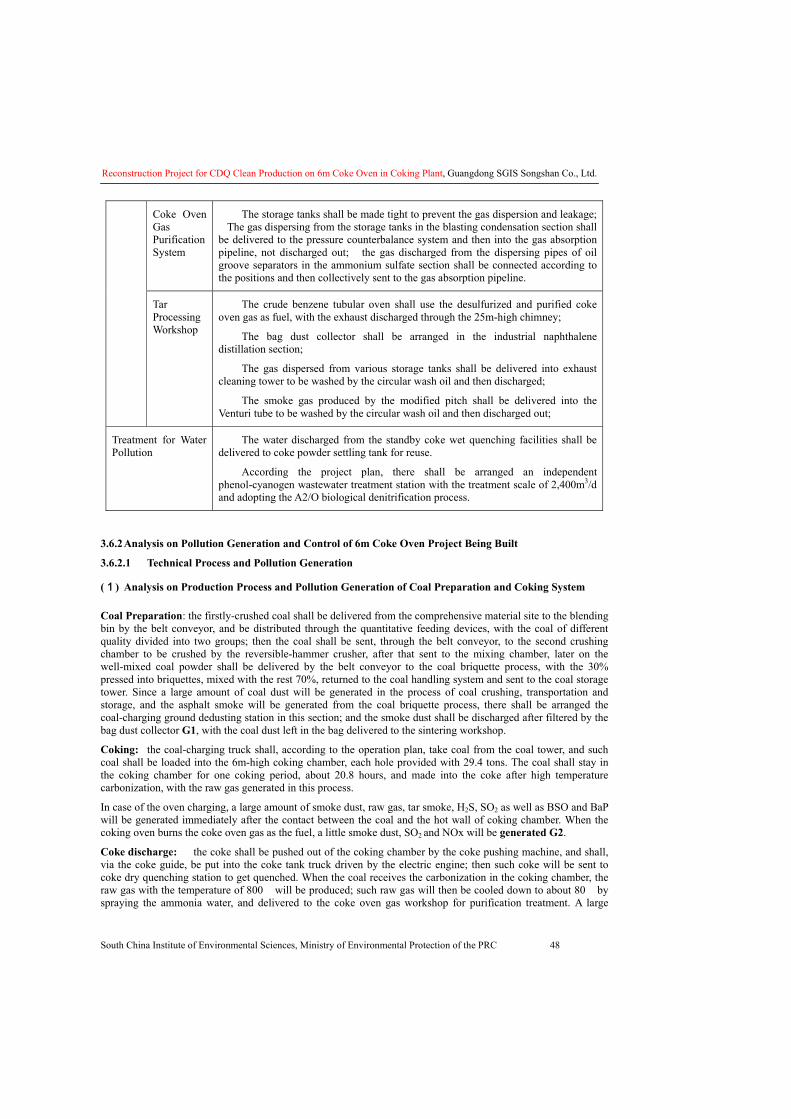
Reconstruction Project for CDQ Clean Production on 6m Coke Oven in Coking Plant, Guangdong SGIS Songshan Co., Ltd.
South China Institute of Environmental Sciences, Ministry of Environmental Protection of the PRC 48
Coke Oven Gas Purification System
� The storage tanks shall be made tight to prevent the gas dispersion and leakage; �The gas dispersing from the storage tanks in the blasting condensation section shall be delivered to the pressure counterbalance system and then into the gas absorption pipeline, not discharged out; �the gas discharged from the dispersing pipes of oil groove separators in the ammonium sulfate section shall be connected according to the positions and then collectively sent to the gas absorption pipeline.
Tar Processing Workshop
� The crude benzene tubular oven shall use the desulfurized and purified coke oven gas as fuel, with the exhaust discharged through the 25m-high chimney;
� The bag dust collector shall be arranged in the industrial naphthalene distillation section;
� The gas dispersed from various storage tanks shall be delivered into exhaust cleaning tower to be washed by the circular wash oil and then discharged;
� The smoke gas produced by the modified pitch shall be delivered into the Venturi tube to be washed by the circular wash oil and then discharged out;
Treatment for Water Pollution
� The water discharged from the standby coke wet quenching facilities shall be delivered to coke powder settling tank for reuse.
� According the project plan, there shall be arranged an independent phenol-cyanogen wastewater treatment station with the treatment scale of 2,400m3/d and adopting the A2/O biological denitrification process.
3.6.2 Analysis on Pollution Generation and Control of 6m Coke Oven Project Being Built
3.6.2.1 Technical Process and Pollution Generation
(1) Analysis on Production Process and Pollution Generation of Coal Preparation and Coking System
Coal Preparation: the firstly-crushed coal shall be delivered from the comprehensive material site to the blending bin by the belt conveyor, and be distributed through the quantitative feeding devices, with the coal of different quality divided into two groups; then the coal shall be sent, through the belt conveyor, to the second crushing chamber to be crushed by the reversible-hammer crusher, after that sent to the mixing chamber, later on the well-mixed coal powder shall be delivered by the belt conveyor to the coal briquette process, with the 30% pressed into briquettes, mixed with the rest 70%, returned to the coal handling system and sent to the coal storage tower. Since a large amount of coal dust will be generated in the process of coal crushing, transportation and storage, and the asphalt smoke will be generated from the coal briquette process, there shall be arranged the coal-charging ground dedusting station in this section; and the smoke dust shall be discharged after filtered by the bag dust collector G1, with the coal dust left in the bag delivered to the sintering workshop.
Coking: the coal-charging truck shall, according to the operation plan, take coal from the coal tower, and such coal shall be loaded into the 6m-high coking chamber, each hole provided with 29.4 tons. The coal shall stay in the coking chamber for one coking period, about 20.8 hours, and made into the coke after high temperature carbonization, with the raw gas generated in this process.
In case of the oven charging, a large amount of smoke dust, raw gas, tar smoke, H2S, SO2 as well as BSO and BaP will be generated immediately after the contact between the coal and the hot wall of coking chamber. When the coking oven burns the coke oven gas as the fuel, a little smoke dust, SO2 and NOx will be generated G2.
Coke discharge: the coke shall be pushed out of the coking chamber by the coke pushing machine, and shall, via the coke guide, be put into the coke tank truck driven by the electric engine; then such coke will be sent to coke dry quenching station to get quenched. When the coal receives the carbonization in the coking chamber, the raw gas with the temperature of 800� will be produced; such raw gas will then be cooled down to about 80� by spraying the ammonia water, and delivered to the coke oven gas workshop for purification treatment. A large
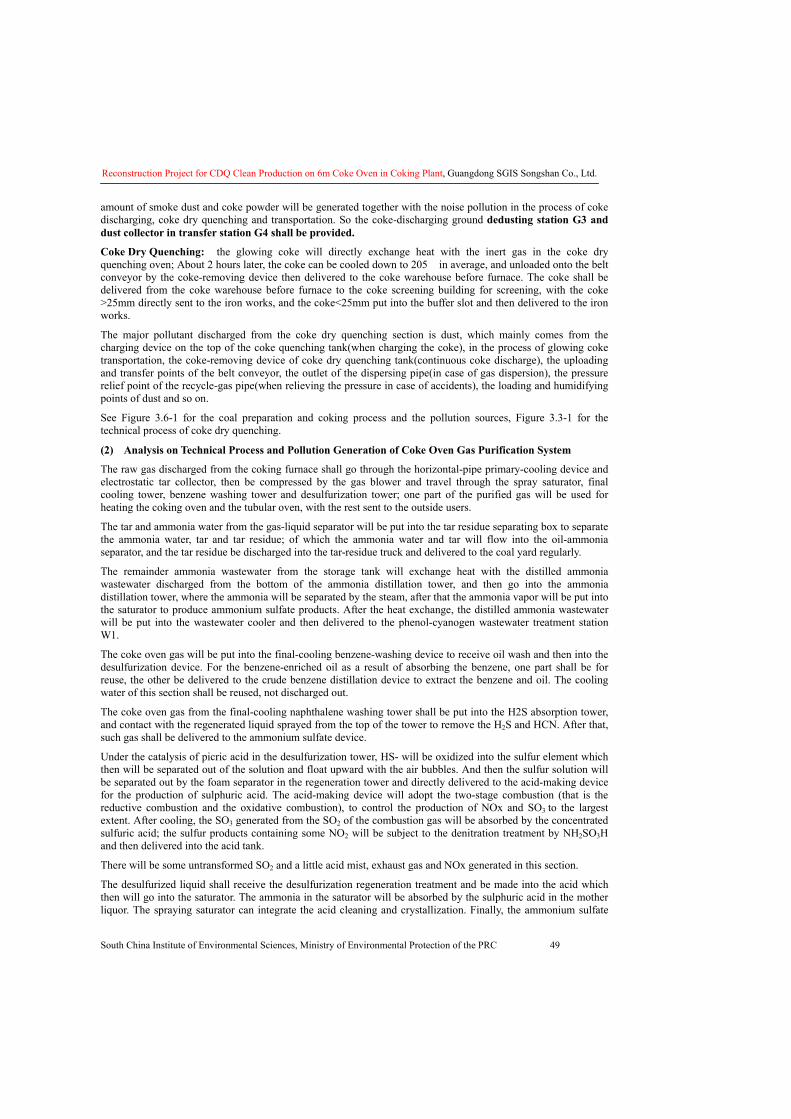
Reconstruction Project for CDQ Clean Production on 6m Coke Oven in Coking Plant, Guangdong SGIS Songshan Co., Ltd.
South China Institute of Environmental Sciences, Ministry of Environmental Protection of the PRC 49
amount of smoke dust and coke powder will be generated together with the noise pollution in the process of coke discharging, coke dry quenching and transportation. So the coke-discharging ground dedusting station G3 and dust collector in transfer station G4 shall be provided.
Coke Dry Quenching: the glowing coke will directly exchange heat with the inert gas in the coke dry quenching oven; About 2 hours later, the coke can be cooled down to 205� in average, and unloaded onto the belt conveyor by the coke-removing device then delivered to the coke warehouse before furnace. The coke shall be delivered from the coke warehouse before furnace to the coke screening building for screening, with the coke >25mm directly sent to the iron works, and the coke<25mm put into the buffer slot and then delivered to the iron works.
The major pollutant discharged from the coke dry quenching section is dust, which mainly comes from the charging device on the top of the coke quenching tank(when charging the coke), in the process of glowing coke transportation, the coke-removing device of coke dry quenching tank(continuous coke discharge), the uploading and transfer points of the belt conveyor, the outlet of the dispersing pipe(in case of gas dispersion), the pressure relief point of the recycle-gas pipe(when relieving the pressure in case of accidents), the loading and humidifying points of dust and so on.
See Figure 3.6-1 for the coal preparation and coking process and the pollution sources, Figure 3.3-1 for the technical process of coke dry quenching.
(2) Analysis on Technical Process and Pollution Generation of Coke Oven Gas Purification System
The raw gas discharged from the coking furnace shall go through the horizontal-pipe primary-cooling device and electrostatic tar collector, then be compressed by the gas blower and travel through the spray saturator, final cooling tower, benzene washing tower and desulfurization tower; one part of the purified gas will be used for heating the coking oven and the tubular oven, with the rest sent to the outside users.
The tar and ammonia water from the gas-liquid separator will be put into the tar residue separating box to separate the ammonia water, tar and tar residue; of which the ammonia water and tar will flow into the oil-ammonia separator, and the tar residue be discharged into the tar-residue truck and delivered to the coal yard regularly.
The remainder ammonia wastewater from the storage tank will exchange heat with the distilled ammonia wastewater discharged from the bottom of the ammonia distillation tower, and then go into the ammonia distillation tower, where the ammonia will be separated by the steam, after that the ammonia vapor will be put into the saturator to produce ammonium sulfate products. After the heat exchange, the distilled ammonia wastewater will be put into the wastewater cooler and then delivered to the phenol-cyanogen wastewater treatment station W1.
The coke oven gas will be put into the final-cooling benzene-washing device to receive oil wash and then into the desulfurization device. For the benzene-enriched oil as a result of absorbing the benzene, one part shall be for reuse, the other be delivered to the crude benzene distillation device to extract the benzene and oil. The cooling water of this section shall be reused, not discharged out.
The coke oven gas from the final-cooling naphthalene washing tower shall be put into the H2S absorption tower, and contact with the regenerated liquid sprayed from the top of the tower to remove the H2S and HCN. After that, such gas shall be delivered to the ammonium sulfate device.
Under the catalysis of picric acid in the desulfurization tower, HS- will be oxidized into the sulfur element which then will be separated out of the solution and float upward with the air bubbles. And then the sulfur solution will be separated out by the foam separator in the regeneration tower and directly delivered to the acid-making device for the production of sulphuric acid. The acid-making device will adopt the two-stage combustion (that is the reductive combustion and the oxidative combustion), to control the production of NOx and SO3 to the largest extent. After cooling, the SO3 generated from the SO2 of the combustion gas will be absorbed by the concentrated sulfuric acid; the sulfur products containing some NO2 will be subject to the denitration treatment by NH2SO3H and then delivered into the acid tank.
There will be some untransformed SO2 and a little acid mist, exhaust gas and NOx generated in this section.
The desulfurized liquid shall receive the desulfurization regeneration treatment and be made into the acid which then will go into the saturator. The ammonia in the saturator will be absorbed by the sulphuric acid in the mother liquor. The spraying saturator can integrate the acid cleaning and crystallization. Finally, the ammonium sulfate
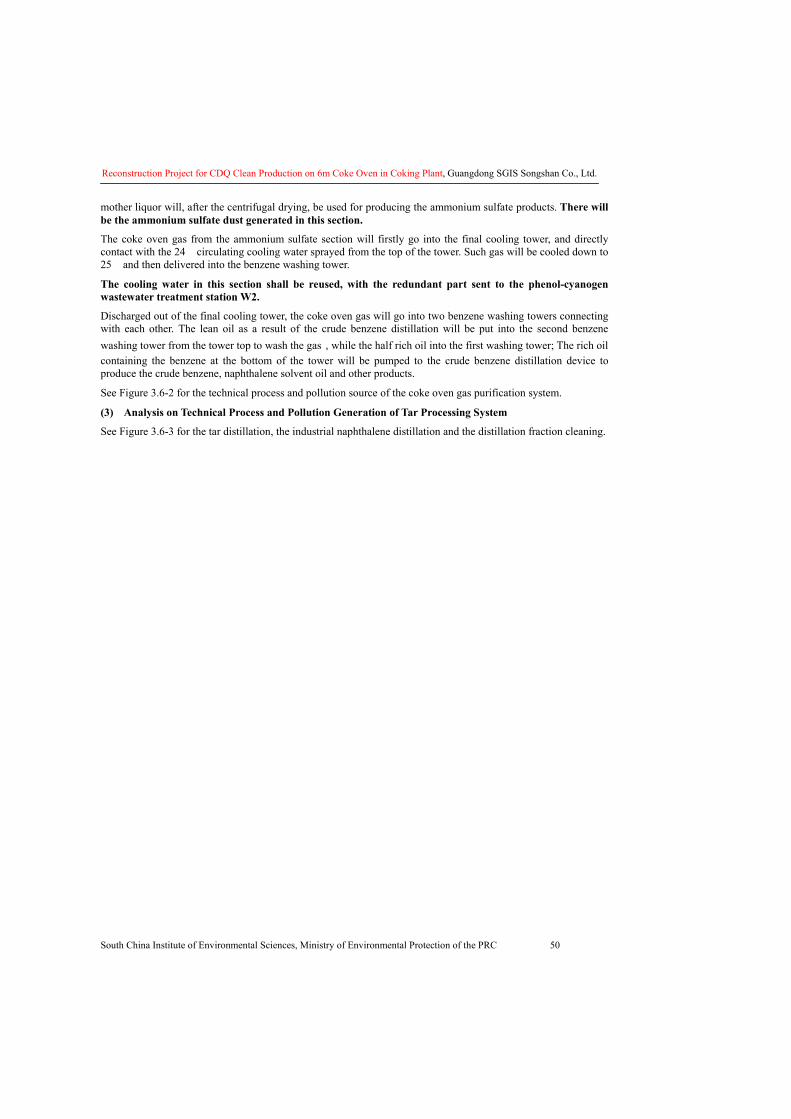
Reconstruction Project for CDQ Clean Production on 6m Coke Oven in Coking Plant, Guangdong SGIS Songshan Co., Ltd.
South China Institute of Environmental Sciences, Ministry of Environmental Protection of the PRC 50
mother liquor will, after the centrifugal drying, be used for producing the ammonium sulfate products. There will be the ammonium sulfate dust generated in this section.
The coke oven gas from the ammonium sulfate section will firstly go into the final cooling tower, and directly contact with the 24� circulating cooling water sprayed from the top of the tower. Such gas will be cooled down to 25� and then delivered into the benzene washing tower.
The cooling water in this section shall be reused, with the redundant part sent to the phenol-cyanogen wastewater treatment station W2.
Discharged out of the final cooling tower, the coke oven gas will go into two benzene washing towers connecting with each other. The lean oil as a result of the crude benzene distillation will be put into the second benzene washing tower from the tower top to wash the gas,while the half rich oil into the first washing tower; The rich oil containing the benzene at the bottom of the tower will be pumped to the crude benzene distillation device to produce the crude benzene, naphthalene solvent oil and other products.
See Figure 3.6-2 for the technical process and pollution source of the coke oven gas purification system.
(3) Analysis on Technical Process and Pollution Generation of Tar Processing System
See Figure 3.6-3 for the tar distillation, the industrial naphthalene distillation and the distillation fraction cleaning.
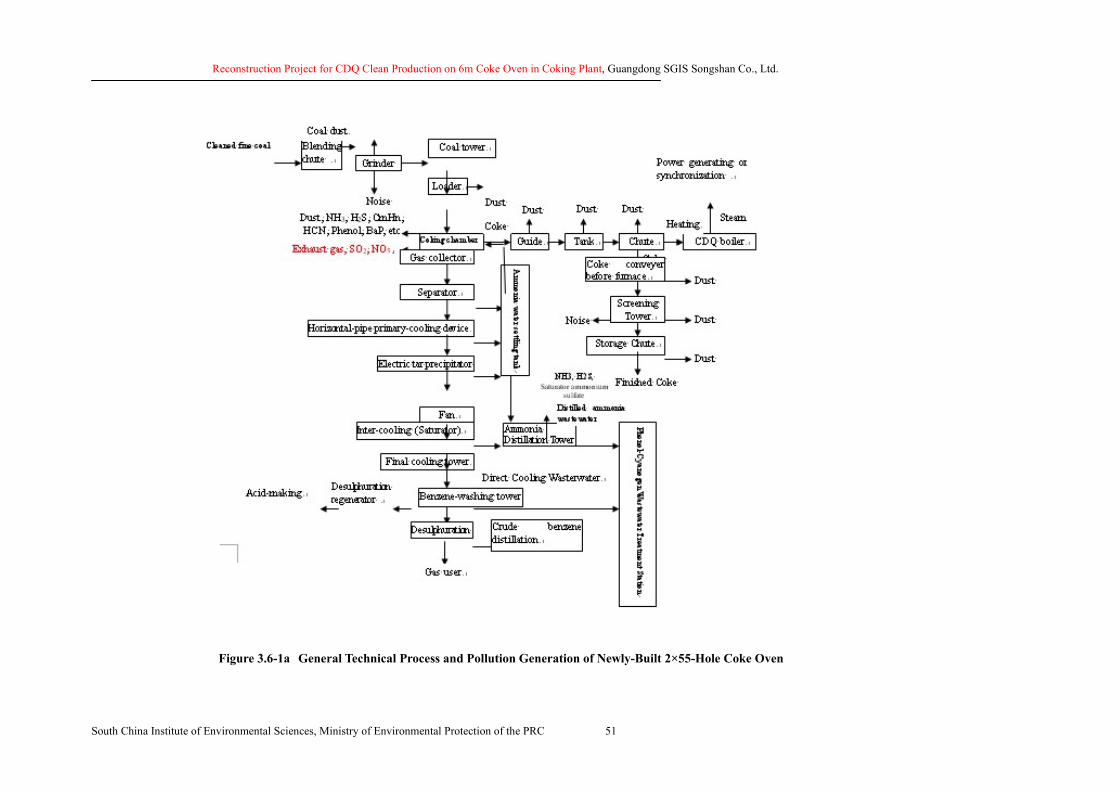
Reconstruction Project for CDQ Clean Production on 6m Coke Oven in Coking Plant, Guangdong SGIS Songshan Co., Ltd.
South China Institute of Environmental Sciences, Ministry of Environmental Protection of the PRC 51
Figure 3.6-1a General Technical Process and Pollution Generation of Newly-Built 2×55-Hole Coke Oven
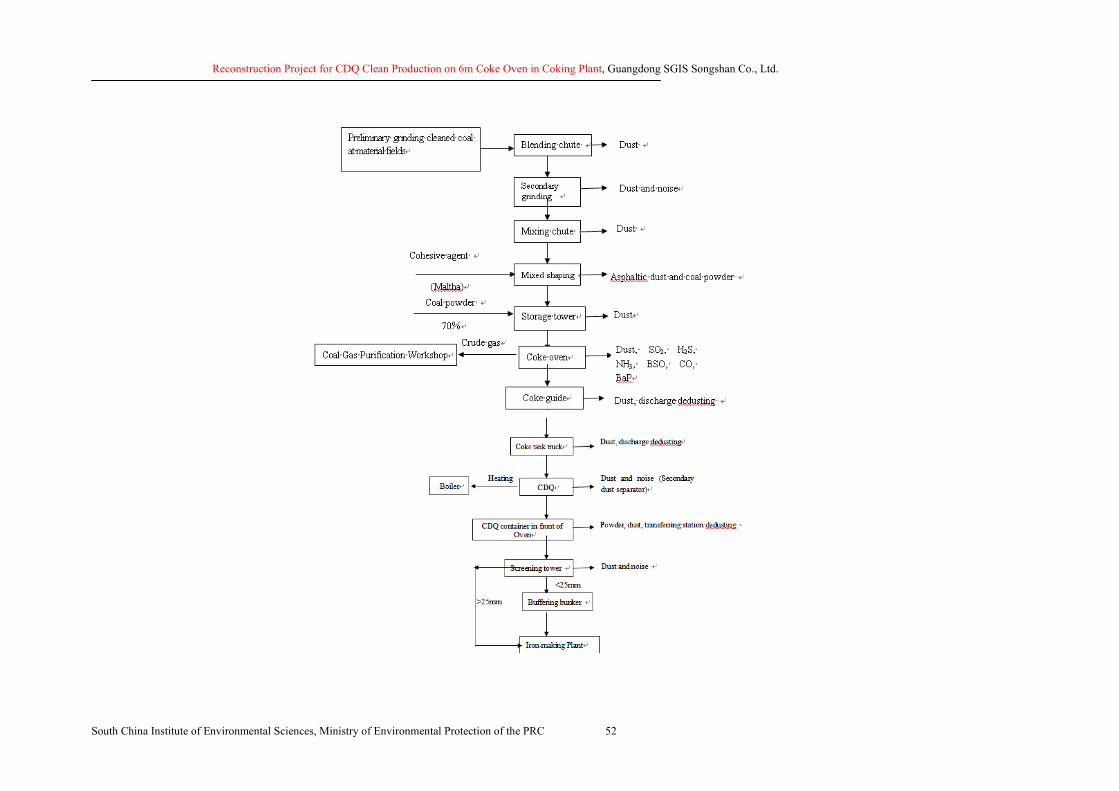
Reconstruction Project for CDQ Clean Production on 6m Coke Oven in Coking Plant, Guangdong SGIS Songshan Co., Ltd.
South China Institute of Environmental Sciences, Ministry of Environmental Protection of the PRC 52
Reconstruction Project for CDQ Clean Production on 6m Coke Oven in Coking Plant, Guangdong SGIS Songshan Co., Ltd.
South China Institute of Environmental Sciences, Ministry of Environmental Protection of the PRC 53
Figure 3.6-1b Technical Process and Pollution Generation of Coal Preparation and Coking
Figure 3.6-2 Analysis on Technical Process and Pollution Generation of Coke Oven Gas Purification System
Coke oven
Horizontal tube initial cooling
Crude gas
Gas-fluid separator Condensed water
Circulating ammonia water
Tar
Direct cooling tower
Electric tar precipitator
Gas blaster
Inter-cooling tower Sponge oilAmmonia
Condensed water
Condensed water
Sponge oil
enriched oil
Benzene-enriched oil Catalysis of picric acid
H2S absorption tower
Spraying saturator
Final cooling tower
Benzene washing tower
Gas Purification System
User
Desulphurization
Compressed air
Regenerating tower
SteamWashoil
Ammonium sulfate
Crude benzene distillation
Residua,
Centrifuge
Crud
e be
nzen
ese
parat
ing w
ater
Ammonium sulfate
Crude benzene (Excluding storage chute Residua, Benzene solution (Excluding storage chute area)
Mechanical benzene distillation chute Tar separator
Sulphide foam
Sulphide foam
Steam
Distilled ammonia wastewater (Phenol-Cyanogen Wastewater
Treatment Station)
Left ammonia water
Fine swage
Tar (To Storage Chute Area, Tar Processing)
Tar residue (To Coal field)
Ultracentrifuger
Ultracentrifuger
Dust
Dry packing system Ammonium sulfate
Acid-making device
Final-cooling sewer (Phenol-Cyanogen
Waste Water Disposal Station)
Sulfur solution
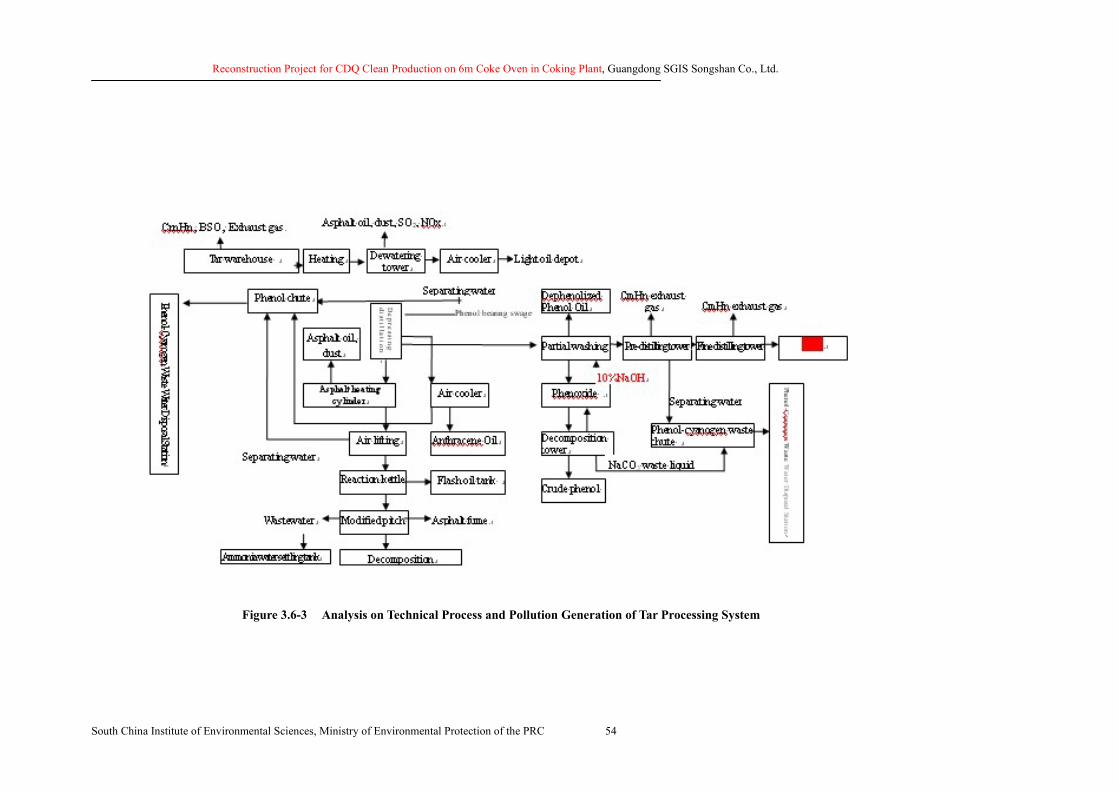
Reconstruction Project for CDQ Clean Production on 6m Coke Oven in Coking Plant, Guangdong SGIS Songshan Co., Ltd.
South China Institute of Environmental Sciences, Ministry of Environmental Protection of the PRC 54
Figure 3.6-3 Analysis on Technical Process and Pollution Generation of Tar Processing System
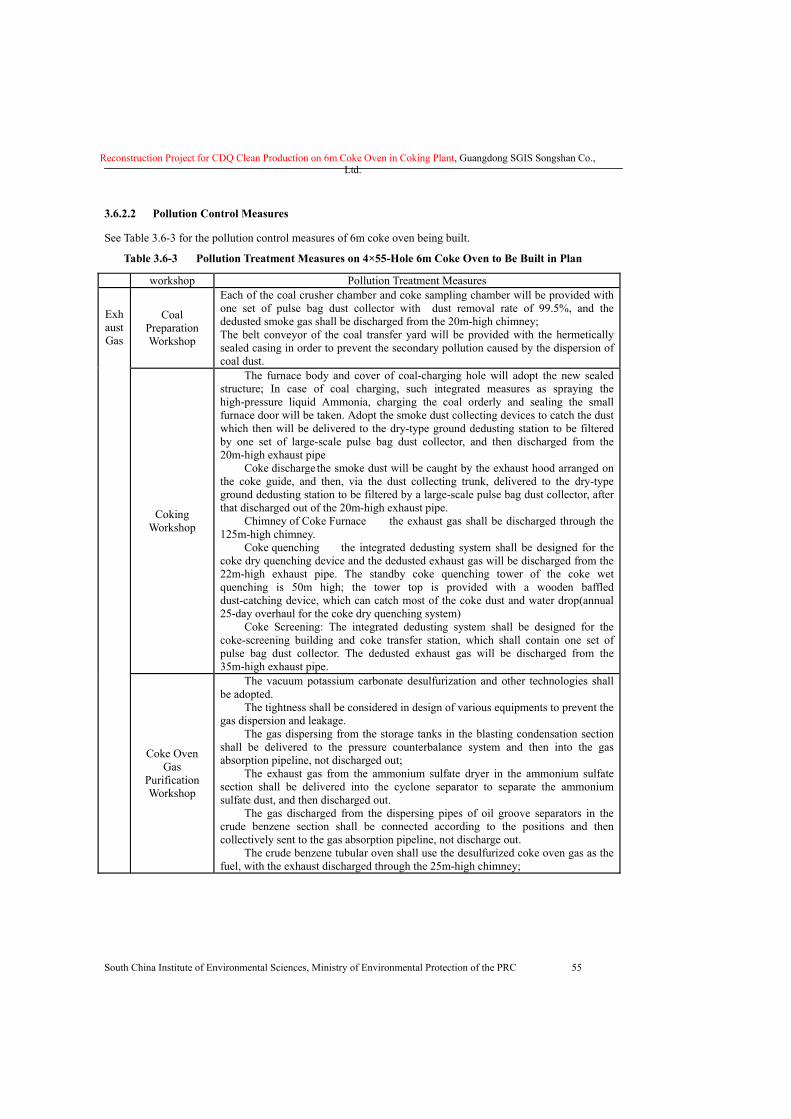
Reconstruction Project for CDQ Clean Production on 6m Coke Oven in Coking Plant, Guangdong SGIS Songshan Co., Ltd.
South China Institute of Environmental Sciences, Ministry of Environmental Protection of the PRC 55
3.6.2.2 Pollution Control Measures
See Table 3.6-3 for the pollution control measures of 6m coke oven being built.
Table 3.6-3 Pollution Treatment Measures on 4×55-Hole 6m Coke Oven to Be Built in Plan
workshop Pollution Treatment Measures
Coal Preparation Workshop
Each of the coal crusher chamber and coke sampling chamber will be provided with one set of pulse bag dust collector with dust removal rate of 99.5%, and the dedusted smoke gas shall be discharged from the 20m-high chimney; The belt conveyor of the coal transfer yard will be provided with the hermetically sealed casing in order to prevent the secondary pollution caused by the dispersion of coal dust.
Coking Workshop
� The furnace body and cover of coal-charging hole will adopt the new sealed structure; In case of coal charging, such integrated measures as spraying the high-pressure liquid Ammonia, charging the coal orderly and sealing the small furnace door will be taken. Adopt the smoke dust collecting devices to catch the dust which then will be delivered to the dry-type ground dedusting station to be filtered by one set of large-scale pulse bag dust collector, and then discharged from the 20m-high exhaust pipe � Coke discharge the smoke dust will be caught by the exhaust hood arranged on the coke guide, and then, via the dust collecting trunk, delivered to the dry-type ground dedusting station to be filtered by a large-scale pulse bag dust collector, after that discharged out of the 20m-high exhaust pipe. � Chimney of Coke Furnace the exhaust gas shall be discharged through the 125m-high chimney. � Coke quenching the integrated dedusting system shall be designed for the coke dry quenching device and the dedusted exhaust gas will be discharged from the 22m-high exhaust pipe. The standby coke quenching tower of the coke wet quenching is 50m high; the tower top is provided with a wooden baffled dust-catching device, which can catch most of the coke dust and water drop(annual 25-day overhaul for the coke dry quenching system) � Coke Screening: The integrated dedusting system shall be designed for the coke-screening building and coke transfer station, which shall contain one set of pulse bag dust collector. The dedusted exhaust gas will be discharged from the 35m-high exhaust pipe.
Exhaust Gas
Coke Oven Gas
Purification Workshop
� The vacuum potassium carbonate desulfurization and other technologies shall be adopted. � The tightness shall be considered in design of various equipments to prevent the gas dispersion and leakage. � The gas dispersing from the storage tanks in the blasting condensation section shall be delivered to the pressure counterbalance system and then into the gas absorption pipeline, not discharged out; � The exhaust gas from the ammonium sulfate dryer in the ammonium sulfate section shall be delivered into the cyclone separator to separate the ammonium sulfate dust, and then discharged out. � The gas discharged from the dispersing pipes of oil groove separators in the crude benzene section shall be connected according to the positions and then collectively sent to the gas absorption pipeline, not discharge out. � The crude benzene tubular oven shall use the desulfurized coke oven gas as the fuel, with the exhaust discharged through the 25m-high chimney;
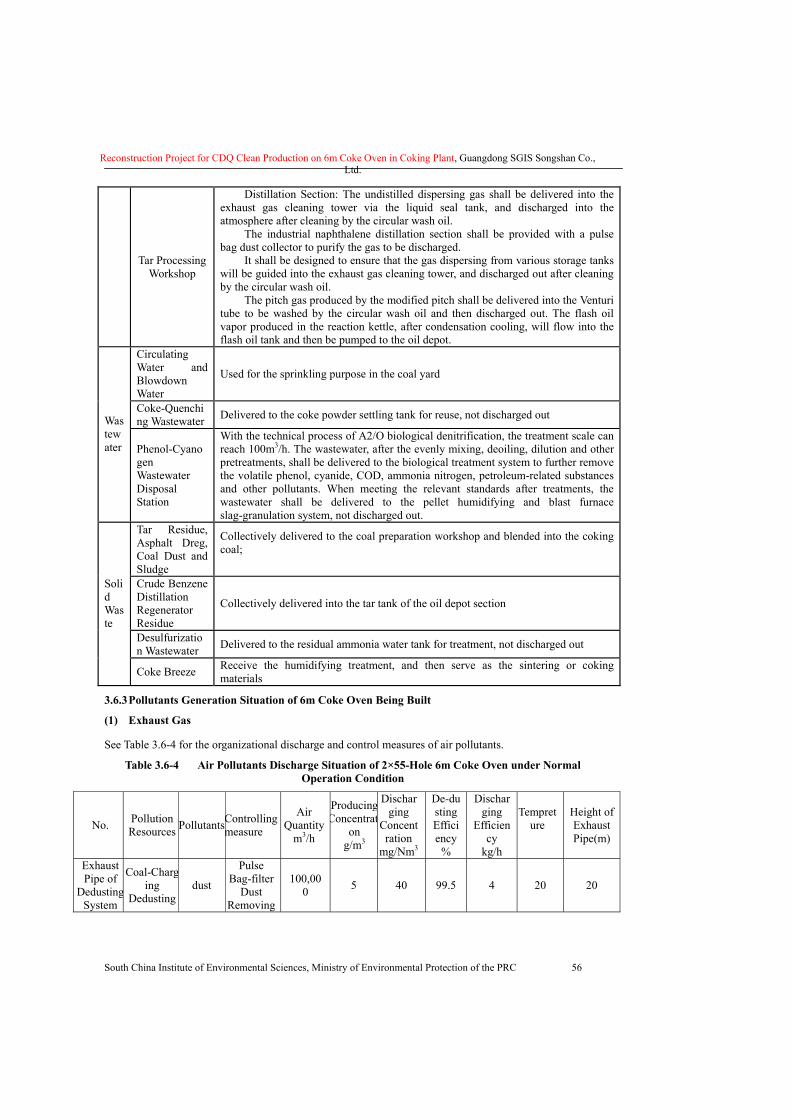
Reconstruction Project for CDQ Clean Production on 6m Coke Oven in Coking Plant, Guangdong SGIS Songshan Co., Ltd.
South China Institute of Environmental Sciences, Ministry of Environmental Protection of the PRC 56
Tar Processing Workshop
� Distillation Section: The undistilled dispersing gas shall be delivered into the exhaust gas cleaning tower via the liquid seal tank, and discharged into the atmosphere after cleaning by the circular wash oil. � The industrial naphthalene distillation section shall be provided with a pulse bag dust collector to purify the gas to be discharged. � It shall be designed to ensure that the gas dispersing from various storage tanks will be guided into the exhaust gas cleaning tower, and discharged out after cleaning by the circular wash oil. � The pitch gas produced by the modified pitch shall be delivered into the Venturi tube to be washed by the circular wash oil and then discharged out. The flash oil vapor produced in the reaction kettle, after condensation cooling, will flow into the flash oil tank and then be pumped to the oil depot.
Circulating Water and Blowdown Water
Used for the sprinkling purpose in the coal yard
Coke-Quenching Wastewater Delivered to the coke powder settling tank for reuse, not discharged out Was
tewater Phenol-Cyano
gen Wastewater Disposal Station
With the technical process of A2/O biological denitrification, the treatment scale can reach 100m3/h. The wastewater, after the evenly mixing, deoiling, dilution and other pretreatments, shall be delivered to the biological treatment system to further remove the volatile phenol, cyanide, COD, ammonia nitrogen, petroleum-related substances and other pollutants. When meeting the relevant standards after treatments, the wastewater shall be delivered to the pellet humidifying and blast furnace slag-granulation system, not discharged out.
Tar Residue, Asphalt Dreg, Coal Dust and Sludge
Collectively delivered to the coal preparation workshop and blended into the coking coal;
Crude Benzene Distillation Regenerator Residue
Collectively delivered into the tar tank of the oil depot section
Desulfurization Wastewater Delivered to the residual ammonia water tank for treatment, not discharged out
Solid Waste
Coke Breeze Receive the humidifying treatment, and then serve as the sintering or coking materials
3.6.3 Pollutants Generation Situation of 6m Coke Oven Being Built
(1) Exhaust Gas
See Table 3.6-4 for the organizational discharge and control measures of air pollutants.
Table 3.6-4 Air Pollutants Discharge Situation of 2×55-Hole 6m Coke Oven under Normal Operation Condition
No. Pollution Resources Pollutants Controlling
measure
Air Quantity
m3/h
ProducingConcentrat
on g/m3
Discharging
Concentration
mg/Nm3
De-dusting Efficiency
%
Discharging
Efficiency
kg/h
Tempreture �
Height of Exhaust Pipe(m)
Exhaust Pipe of
DedustingSystem
Coal-Charging
Dedusting dust
Pulse Bag-filter
Dust Removing
100,000 5 40 99.5 4 20 20
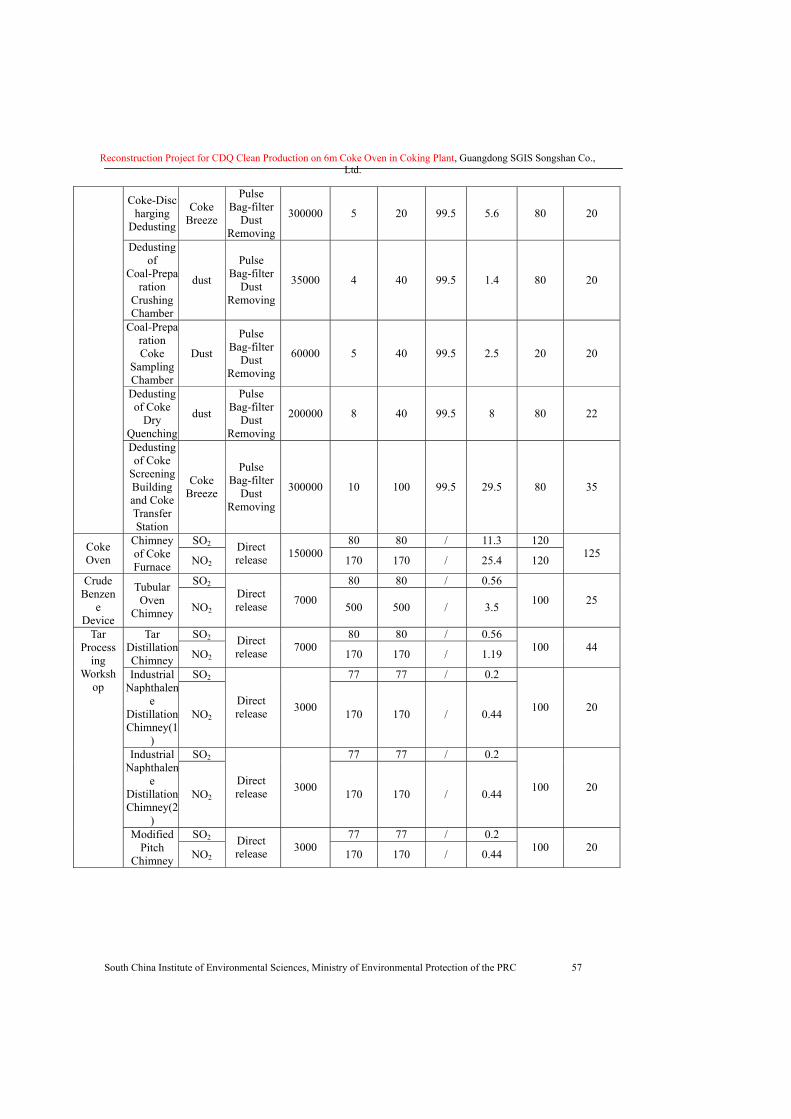
Reconstruction Project for CDQ Clean Production on 6m Coke Oven in Coking Plant, Guangdong SGIS Songshan Co., Ltd.
South China Institute of Environmental Sciences, Ministry of Environmental Protection of the PRC 57
Coke-Discharging
Dedusting
Coke Breeze
Pulse Bag-filter
Dust Removing
300000 5 20 99.5 5.6 80 20
Dedusting of
Coal-Preparation
Crushing Chamber
dust
Pulse Bag-filter
Dust Removing
35000 4 40 99.5 1.4 80 20
Coal-Preparation Coke
Sampling Chamber
Dust
Pulse Bag-filter
Dust Removing
60000 5 40 99.5 2.5 20 20
Dedusting of Coke
Dry Quenching
dust
Pulse Bag-filter
Dust Removing
200000 8 40 99.5 8 80 22
Dedusting of Coke
Screening Building and Coke Transfer Station
Coke Breeze
Pulse Bag-filter
Dust Removing
300000 10 100 99.5 29.5 80 35
SO2 80 80 / 11.3 120 Coke Oven
Chimney of Coke Furnace NO2
Direct release 150000 170 170 / 25.4 120 125
SO2 80 80 / 0.56 Crude Benzen
e Device
Tubular Oven
Chimney NO2 Direct release 7000 500 500 / 3.5 100 25
SO2 80 80 / 0.56 Tar Distillation Chimney NO2
Direct release 7000 170 170 / 1.19 100 44
SO2 77 77 / 0.2 Industrial Naphthalen
e Distillation Chimney(1
)
NO2 Direct release 3000 170 170 / 0.44 100 20
SO2 77 77 / 0.2 Industrial Naphthalen
e Distillation Chimney(2
)
NO2 Direct release 3000 170 170 / 0.44 100 20
SO2 77 77 / 0.2
Tar Process
ing Worksh
op
Modified Pitch
Chimney NO2 Direct release 3000 170 170 / 0.44 100 20
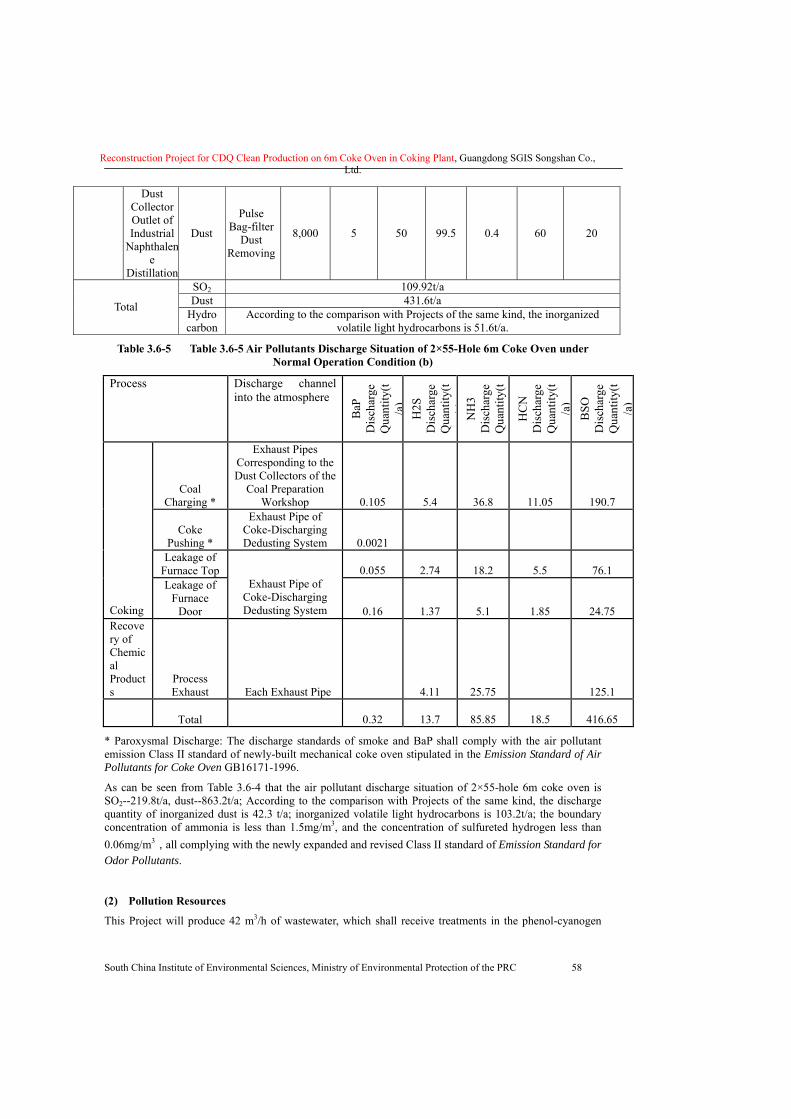
Reconstruction Project for CDQ Clean Production on 6m Coke Oven in Coking Plant, Guangdong SGIS Songshan Co., Ltd.
South China Institute of Environmental Sciences, Ministry of Environmental Protection of the PRC 58
Dust Collector Outlet of Industrial
Naphthalene
Distillation
Dust
Pulse Bag-filter
Dust Removing
8,000 5 50 99.5 0.4 60 20
SO2 109.92t/a Dust 431.6t/a Total Hydro
carbon According to the comparison with Projects of the same kind, the inorganized
volatile light hydrocarbons is 51.6t/a.
Table 3.6-5 Table 3.6-5 Air Pollutants Discharge Situation of 2×55-Hole 6m Coke Oven under Normal Operation Condition (b)
Process Discharge channel into the atmosphere
BaP
D
isch
arge
Q
uant
ity(t
/a)
H2S
D
isch
arge
Q
uant
ity(t
/)
NH
3 D
isch
arge
Q
uant
ity(t
HC
N
Dis
char
ge
Qua
ntity
(t/a
) B
SO
Dis
char
ge
Qua
ntity
(t/a
)
Coal Charging *
Exhaust Pipes Corresponding to the Dust Collectors of the
Coal Preparation Workshop 0.105 5.4 36.8 11.05 190.7
Coke Pushing *
Exhaust Pipe of Coke-Discharging Dedusting System 0.0021
Leakage of Furnace Top 0.055 2.74 18.2 5.5 76.1
Coking
Leakage of Furnace
Door
Exhaust Pipe of Coke-Discharging Dedusting System 0.16 1.37 5.1 1.85 24.75
Recovery of Chemical Products
Process Exhaust Each Exhaust Pipe 4.11 25.75 125.1
Total 0.32 13.7 85.85 18.5 416.65
* Paroxysmal Discharge: The discharge standards of smoke and BaP shall comply with the air pollutant emission Class II standard of newly-built mechanical coke oven stipulated in the Emission Standard of Air Pollutants for Coke Oven GB16171-1996.
As can be seen from Table 3.6-4 that the air pollutant discharge situation of 2×55-hole 6m coke oven is SO2--219.8t/a, dust--863.2t/a; According to the comparison with Projects of the same kind, the discharge quantity of inorganized dust is 42.3 t/a; inorganized volatile light hydrocarbons is 103.2t/a; the boundary concentration of ammonia is less than 1.5mg/m3, and the concentration of sulfureted hydrogen less than 0.06mg/m3,all complying with the newly expanded and revised Class II standard of Emission Standard for Odor Pollutants.
(2) Pollution Resources
This Project will produce 42 m3/h of wastewater, which shall receive treatments in the phenol-cyanogen
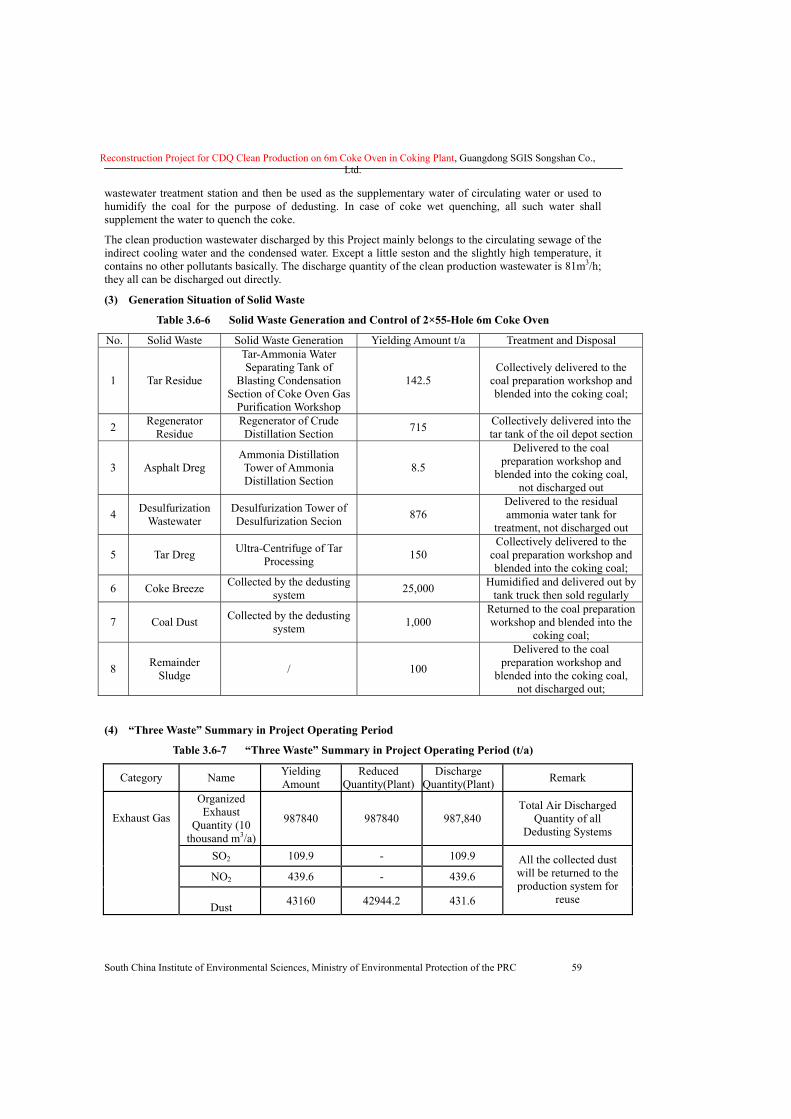
Reconstruction Project for CDQ Clean Production on 6m Coke Oven in Coking Plant, Guangdong SGIS Songshan Co., Ltd.
South China Institute of Environmental Sciences, Ministry of Environmental Protection of the PRC 59
wastewater treatment station and then be used as the supplementary water of circulating water or used to humidify the coal for the purpose of dedusting. In case of coke wet quenching, all such water shall supplement the water to quench the coke.
The clean production wastewater discharged by this Project mainly belongs to the circulating sewage of the indirect cooling water and the condensed water. Except a little seston and the slightly high temperature, it contains no other pollutants basically. The discharge quantity of the clean production wastewater is 81m3/h; they all can be discharged out directly.
(3) Generation Situation of Solid Waste
Table 3.6-6 Solid Waste Generation and Control of 2×55-Hole 6m Coke Oven
No. Solid Waste Solid Waste Generation Yielding Amount t/a Treatment and Disposal
1 Tar Residue
Tar-Ammonia Water Separating Tank of
Blasting Condensation Section of Coke Oven Gas
Purification Workshop
142.5 Collectively delivered to the
coal preparation workshop and blended into the coking coal;
2 Regenerator Residue
Regenerator of Crude Distillation Section 715 Collectively delivered into the
tar tank of the oil depot section
3 Asphalt Dreg Ammonia Distillation Tower of Ammonia Distillation Section
8.5
Delivered to the coal preparation workshop and
blended into the coking coal, not discharged out
4 Desulfurization Wastewater
Desulfurization Tower of Desulfurization Secion 876
Delivered to the residual ammonia water tank for
treatment, not discharged out
5 Tar Dreg Ultra-Centrifuge of Tar Processing 150
Collectively delivered to the coal preparation workshop and blended into the coking coal;
6 Coke Breeze Collected by the dedusting system 25,000 Humidified and delivered out by
tank truck then sold regularly
7 Coal Dust Collected by the dedusting system 1,000
Returned to the coal preparation workshop and blended into the
coking coal;
8 Remainder Sludge / 100
Delivered to the coal preparation workshop and
blended into the coking coal, not discharged out;
(4) “Three Waste” Summary in Project Operating Period
Table 3.6-7 “Three Waste” Summary in Project Operating Period (t/a)
Category Name Yielding Amount
Reduced Quantity(Plant)
Discharge Quantity(Plant) Remark
Organized Exhaust
Quantity (10 thousand m3/a)
987840 987840 987,840 Total Air Discharged
Quantity of all Dedusting Systems
SO2 109.9 - 109.9
NO2 439.6 - 439.6
Exhaust Gas
Dust 43160 42944.2 431.6
All the collected dust will be returned to the production system for
reuse
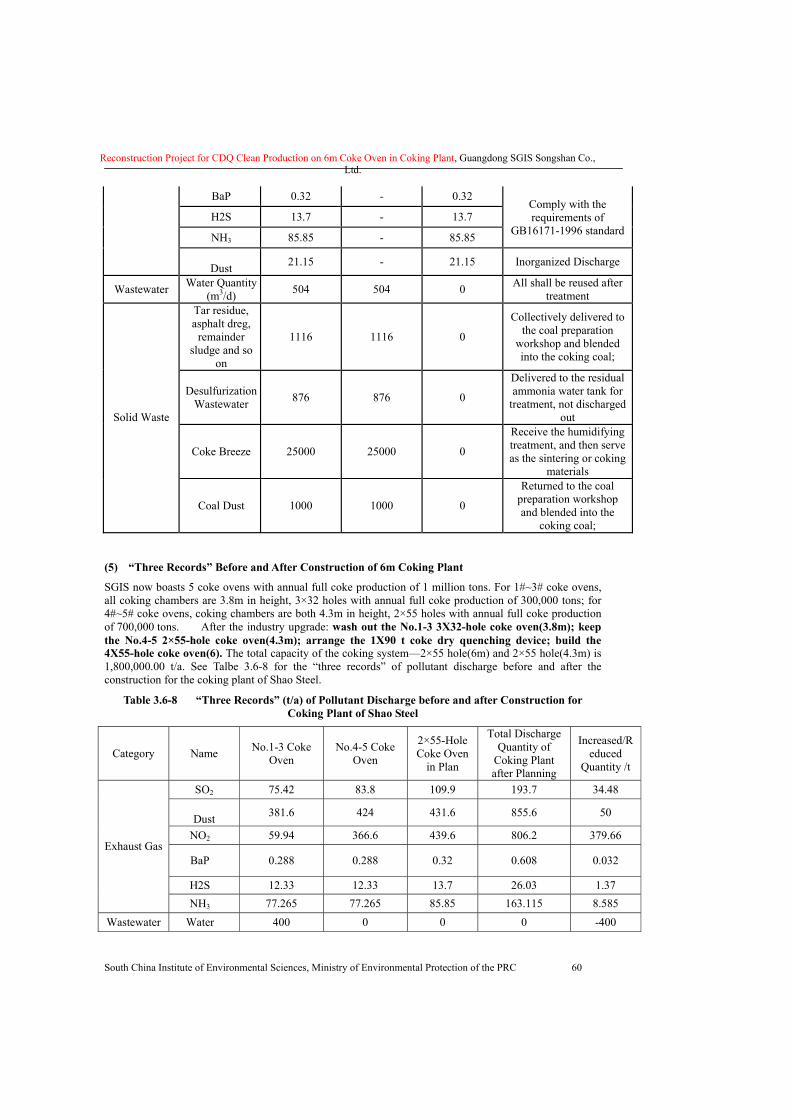
Reconstruction Project for CDQ Clean Production on 6m Coke Oven in Coking Plant, Guangdong SGIS Songshan Co., Ltd.
South China Institute of Environmental Sciences, Ministry of Environmental Protection of the PRC 60
BaP 0.32 - 0.32
H2S 13.7 - 13.7
NH3 85.85 - 85.85
Comply with the requirements of
GB16171-1996 standard
Dust 21.15 - 21.15 Inorganized Discharge
Wastewater Water Quantity (m3/d) 504 504 0 All shall be reused after
treatment Tar residue, asphalt dreg,
remainder sludge and so
on
1116 1116 0
Collectively delivered to the coal preparation
workshop and blended into the coking coal;
Desulfurization Wastewater 876 876 0
Delivered to the residual ammonia water tank for
treatment, not discharged out
Coke Breeze 25000 25000 0
Receive the humidifying treatment, and then serve as the sintering or coking
materials
Solid Waste
Coal Dust 1000 1000 0
Returned to the coal preparation workshop and blended into the
coking coal;
(5) “Three Records” Before and After Construction of 6m Coking Plant
SGIS now boasts 5 coke ovens with annual full coke production of 1 million tons. For 1#~3# coke ovens, all coking chambers are 3.8m in height, 3×32 holes with annual full coke production of 300,000 tons; for 4#~5# coke ovens, coking chambers are both 4.3m in height, 2×55 holes with annual full coke production of 700,000 tons. After the industry upgrade: wash out the No.1-3 3X32-hole coke oven(3.8m); keep the No.4-5 2×55-hole coke oven(4.3m); arrange the 1X90 t coke dry quenching device; build the 4X55-hole coke oven(6). The total capacity of the coking system—2×55 hole(6m) and 2×55 hole(4.3m) is 1,800,000.00 t/a. See Talbe 3.6-8 for the “three records” of pollutant discharge before and after the construction for the coking plant of Shao Steel.
Table 3.6-8 “Three Records” (t/a) of Pollutant Discharge before and after Construction for Coking Plant of Shao Steel
Category Name No.1-3 Coke Oven
No.4-5 Coke Oven
2×55-Hole Coke Oven
in Plan
Total Discharge Quantity of
Coking Plant after Planning
Increased/Reduced
Quantity /t
SO2 75.42 83.8 109.9 193.7 34.48
Dust 381.6 424 431.6 855.6 50
NO2 59.94 366.6 439.6 806.2 379.66
BaP 0.288 0.288 0.32 0.608 0.032
H2S 12.33 12.33 13.7 26.03 1.37
Exhaust Gas
NH3 77.265 77.265 85.85 163.115 8.585 Wastewater Water 400 0 0 0 -400
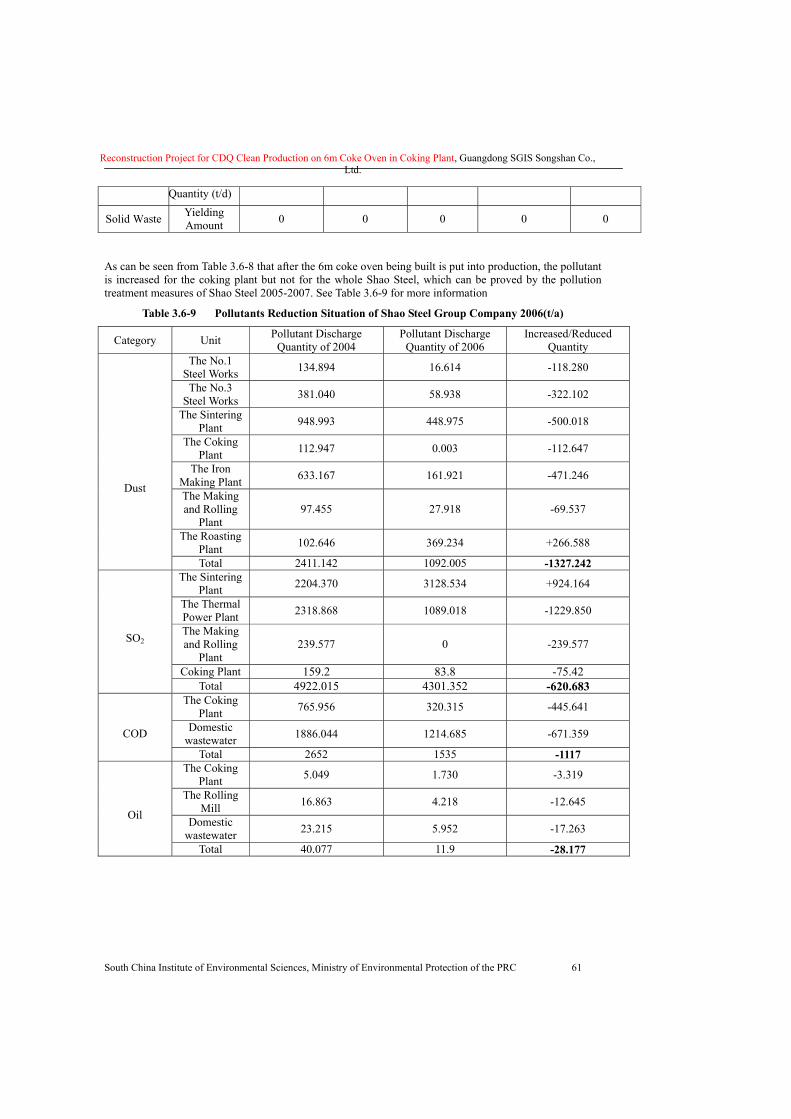
Reconstruction Project for CDQ Clean Production on 6m Coke Oven in Coking Plant, Guangdong SGIS Songshan Co., Ltd.
South China Institute of Environmental Sciences, Ministry of Environmental Protection of the PRC 61
Quantity (t/d)
Solid Waste Yielding Amount 0 0 0 0 0
As can be seen from Table 3.6-8 that after the 6m coke oven being built is put into production, the pollutant is increased for the coking plant but not for the whole Shao Steel, which can be proved by the pollution treatment measures of Shao Steel 2005-2007. See Table 3.6-9 for more information
Table 3.6-9 Pollutants Reduction Situation of Shao Steel Group Company 2006(t/a)
Category Unit Pollutant Discharge Quantity of 2004
Pollutant Discharge Quantity of 2006
Increased/Reduced Quantity
The No.1 Steel Works 134.894 16.614 -118.280
The No.3 Steel Works 381.040 58.938 -322.102
The Sintering Plant 948.993 448.975 -500.018
The Coking Plant 112.947 0.003 -112.647
The Iron Making Plant 633.167 161.921 -471.246
The Making and Rolling
Plant 97.455 27.918 -69.537
The Roasting Plant 102.646 369.234 +266.588
Dust
Total 2411.142 1092.005 -1327.242 The Sintering
Plant 2204.370 3128.534 +924.164
The Thermal Power Plant 2318.868 1089.018 -1229.850
The Making and Rolling
Plant 239.577 0 -239.577
Coking Plant 159.2 83.8 -75.42
SO2
Total 4922.015 4301.352 -620.683 The Coking
Plant 765.956 320.315 -445.641
Domestic wastewater 1886.044 1214.685 -671.359
COD
Total 2652 1535 -1117 The Coking
Plant 5.049 1.730 -3.319
The Rolling Mill 16.863 4.218 -12.645
Domestic wastewater 23.215 5.952 -17.263
Oil
Total 40.077 11.9 -28.177
Reconstruction Project for CDQ Clean Production on 6m Coke Oven in Coking Plant, Guangdong SGIS Songshan Co., Ltd.
South China Institute of Environmental Sciences, Ministry of Environmental Protection of the PRC 62
4 General Environment in the Project Surrounding Area 4.1 Natural Environment 4.1.1 Geographical Location
SGIS is located at 2~3km east of Maba Town, Qujiang County of Guangdong Province, and 14km away from Shaoguan City. Geographic coordinates for the site is longitude 113º19' east and latitude 24º43' north. The plant area is bordered by Yanshan Mountain to the south, Lianhua Mountain to the north, Maba Town of Qujiang County to the west, and Mashanding to the east. The site is located in a valley plain with the trend of “northeast to southwest” in the tributary ditch of Meihua River.
4.1.2 Topography
The previous topography of the plant area is generally higher in south and lower in north, with a height mark of approximate 70m. Height mark of the valley plain is in the scope of 90~110m, with 200m higher than that of Mashanding, 150m higher than that of the Yanshan Mountain and 120m higher than that of the Lianhua Mountain. The surrounding topography of the valley plain is complicated, with Guanshan Mountain to 10km of its east, a volcano to 10km of its north and the alpine group to 10km of its southwest. The plant area is neighbored with Hengguang railway line and Maba station to the southwest, and could be reached by the private railway line for enterprises. The factory area is elongated, long in east-west and narrow in south-north, with an occupied area of 7.8km2.
4.1.3 Geology
Geological structure of the plant area is extremely complicated. The surface soil consists of Quaternary loess, brown mild clay, mild sand clay and gravel with sand inclusion. The lower layer is mainly lime system, which is permian limestone, with large karst (Karst) and developing fault.
4.1.4 Hydrology
The proposed construction project is located in midstream and upstream of Meihua River, which flows to the west and meets with Maba River at 7km far away, and is combined with the Baitu River Segment at midstream of the North River in Qujiang County. Average flow of the Meihua River is approximately 3m3/s.
As the second largest water system of Pearl River Basin, North River has a catchment area of 46710km2, accounting for 10.3% of that of the Pearl River Basin. 92% of the basin area is located in Guangdong Province. Main River of the North River starts from the fountainhead and ends in Sixianjiao and flows into the West River, with a whole length of 468km and an average falling slope of 0.26%. North River starts from south of the fountainhead and ends in Shazhouwei in Shaoguan City and is combined with the Wujiang River. The upstream segment of North River is named as Zhenjiang River, which starts from the fountainhead and ends in Shazhouwei, with a whole length of 212km and an average falling slope of 0.59‰. After flowing into the Wujiang River, the North River is turned to south and combined with South Water at Mengzhou Dam, then flows to south and combined with Wengjiang River in Yingde County.
The average flow of North River Basin (Sixianjiao) in over years is 1,620m3/s, average flow in high water period is 2,520m3/s and average flow in low water period is 714m3/s. Average flow of the Baitu River section(with the catchment area of 16,750km2) nearby the project area in over years is 467m3/s, average flow in high water period is 697m3/s and average flow in low water period is 236m3/s. The average flow in 95% of the low water years is 210m3/s and the average flow in the driest period (in January) in over years is 170m3/s. The average flow in the driest month of 95% of low water years is 97m3/s and the monthly flow in 95% of the driest month is 77m3/s.
Xiaokeng Reservoir is located at 42km northeast of the plant area, which is a multi-functional reservoir for water supply in agricultural irrigation, aquiculture and poultry and power generation industry. Catchment area of the reservoir is 139km2, the designed standard water Class is 225m (with a relevant reservoir capacity of 53,350,000m3), and the designed flood Class Is 227m(with a relevant reservoir capacity of 6,092m3).
Reconstruction Project for CDQ Clean Production on 6m Coke Oven in Coking Plant, Guangdong SGIS Songshan Co., Ltd.
South China Institute of Environmental Sciences, Ministry of Environmental Protection of the PRC 63
4.1.5 Climate
The site is located in area of subtropical monsoon climate, and the cold and warm air mass from the north and south usually gather here as a result of the influence caused by the Nanling Mountain Range, thus the climate characteristics are as follows: continued rain in spring, ample rainfall in summer, fresh air and warm in autumn while cold and dry in winter. The average temperature in over years is 20.1�. The average temperature in July in summer is 28.9� with highest temperature of 42�. The average temperature in January is 9.5� with lowest temperature of -4.3�. Frost seldom appears in winter (approximately 4 days in a year). The annual average precipitation amount is 1638mm. Storm is intensive in a year with the rainy seasons from April to September, accounting for over 80% of the annual precipitation amount. The annual average relative humidity is 74.5%. Hours of sunshine are approximately 1,473~1,928 hours. North wind prevails in autumn and winter, south wind prevails in spring and summer, and south wind is dominant in a year. Static wind is frequent. The annual average wind speed is approximately 1.7m/s in over years in this area.
4.1.6 Vegetation and Soil
Vegetation in Shaoguan City has the characteristics of gathering from the north and south as a result of its geographic location, geologic structure and climate conditions, belonging to subtropical evergreen broad-leaved forest. The covered categories and ecological structures are mainly subtropical evergreen species, and some tropical and subtropical species are also included. Plant resources in Shaoguan City are in diversity, and plants in this area mainly include Fagaceae, Lauraceae, Theaceae and anil. Artificially cultivated fruit trees include peach, plum trees, sand pear trees, orange trees and chestnut trees. Main categories of soil include granite, sand shale, and red earth and paddy soil developed from the Quaternary red earth, as well as the terra rossa and acidic purple soil. Vegetation surrounding the plant site mainly includes Chinese silvergrass, Chinese francolin, Baeckea frutescens community and artificial cultivated rice, vegetables, cassava and peanut, etc. Soil is mainly sand shale red earth and Quaternary red earth, and river sandy fields are distributed next to the riverside.
4.1.7 Aquatic organism resources and fishery resources
Based on the data provided by the aquatic department, aquatic organism has a large diversity in North River, including 302 categories of phytoplankton, which belongs to seven phylums and 106 genus and are mainly Chrysophytax, Chlorellin and Cyanophyta, and including 99 categories of zooplankton(mainly the protozoan), and also including 73 genus and 85 categories of benthonic mollusks. Based on relevant data, there are 143 categories of natural fish in North River, including 45 categories of primary economic fish. Dominant fish with the biggest capture quantity include carp, mud carp, crucian carp, yellow alligator, Spinibarbus caldwelli, Varicorhinus, red-eye trout, loach, eel and four major Chinese carps. Since 1960s, for large amount of industrial wastewater and pesticide residues entering into North River, the water is polluted. And for random capture over years, the capture amount is very low.
In addition, based on data from the aquatic department, there is no valued fish or fish that require special protection in the assessed river section.
4.1.8 Natural landscape
There are a national autonomous county and a national autonomous town in Shaoguan City, as well as 4796 natural villages in 99 towns. Many landscape of tourism resources with high taste and based on the national and provincial evaluation, famous sites here include Danxia Mountain in the world physiognomy and Nanhua Buddhist Temple of the south zen. The Chebaling National Nature Reserve in Shixing County is the present habitat of south China tiger, also the treasury of plant categories. Multiple wild lives could be found in the NanLing National Park in Ruyuan. The first cave in Ruyuan is Tongtianluo and the first mountain peak is Shikengqiang (1,902m) also located in Ruyuan, which is the highest mountain peak in Guangdong Province. Tourist attractions include the Jinjiling and Jiulong Shibatan in Pingshi of Lechang. The seven sites above mentioned are national level. There are eleven provincial scenic spots, e.g. the ancient cultural relic’s site of Lion’s Crag, Yunmen Temple (the origin place of Yunmenzong), Jinshiyan Nunnery, Meiguan Zhonggu Rock, Shaoguan Furong Scenic, Nanxiong Zhuji Lane and Shaoguan Fengcai Building, etc. The water surface area of Nanshui Lake in Ruyuan is 55000mu, and the reservoir capacity is 1.2 billion m3. In addition, there are hotspring sanitaria districts, including Qujiang Fengwan, Xiaokeng and Lechang Longshan, etc. There are two relics’ sites in the assessed area, the Nanhua Temple and Shizi Rock.
Reconstruction Project for CDQ Clean Production on 6m Coke Oven in Coking Plant, Guangdong SGIS Songshan Co., Ltd.
South China Institute of Environmental Sciences, Ministry of Environmental Protection of the PRC 64
4.2 Society and economy Shaoguan is the heavy industrial city of Guangdong Province, with strong industrial foundation, and adequate development for its agriculture and the tertiary industry. In 1950s, 1960s and 1970s, Shaoguan had been under construction as the heavy industrial base and strategic foundation for Guangdong Province. A large amount of major industrial enterprises including Shaoguan Steel Plant, Shaoguan Smelting Plant, Shaoguan Digging Machine Plant, Fankou Lead-zinc Mine, Dabao Mountain Mine and Quren Coal Mine, etc. were built here, helping the Shaoguan industry act as a foundation of the local economy. In 1970s, Shaoguan became the important industrial base of Guangdong Province. Since 1980s, Shaoguan industry got a further development. There are over 21000 industrial enterprises in Shaoguan City. It has formed major industries consisting of the resource-type industries including the excavation, nonferrous smelting, iron and steel industry, forgings and castings, and construction materials; a processing industry with five major industries of mechanical manufacture, light industry, textile, petroleum and chemistry, and electric power; the high and new technology industry with major industries of electronic information technology, electromechanical integration, new materials and pharmaceutical industry. Where, annual production of steel in SGIS Group has exceeded 5 million tons and SGIS Group has been one of the Top-100 steel and iron enterprises in the world. Shaozhu Group is one of the biggest professional enterprises for forge piece manufacturing. In the equipment industry, there are large-scale enterprises including Xinyu Company, engineering machine plants and Zhongli Company involved in the manufacturing of large-sized construction machines, overhead working truck and large-scale water-turbine generator set.
In recent years, the economy of Shaoguan City has developed rapidly, and the increment speed is higher than the average speed of that in China. In 2006, the total regional output value is 39.383 billion RMB, with a growth of 12.4%, and the growth rate is 2.5% higher than that of the last year. Where, the output value for the primary industry increased with 6.304 billion RMB, with a growth of 3.4%; the output value for the secondary industry increased with 17.419 billion RMB, with a growth of 15.4%; and the output value for the tertiary industry increased with 15.660 billion RMB, with a growth of 13.2%. Calculation based on the residential population shows that the average output value is 13460RMB/person, with a growth of 11.5%. The proportion of three industrial structures was adjusted to 16.0:44.2:39.8 from the 17.5:42.5:40.0 in 2005. The primary industry decreased by 1.5% and the secondary industry increased by 1.7%.
The total agricultural output in the year was 10.583 billion RMB, with a growth of 3.4%. Where, the planting industry increased with 2.9%, the forestry increased with 7.8%, the livestock farming increased with 2.9%, and the fishery industry increased with 4.7%.
The sowing area of grain in 2006 is 2.587 million mu, with a growth of 1.9%. The planting area of sugar-cane is 75,200 mu, with a growth of 24.4%; the planting area of oil is 65,200 mu, with a decrease of 1%; the planting area of tobacco is 270,200 mu, with a growth of 14%;and the planting area of vegetation is 1.494 million mu, with a growth of 1.5%.
The industrial growth value in 2006 was 15.522 billion RMB, with a growth of 15.7%, which had a direct contribution rate of 47.5% to the economic growth in the year. Growth value for scaled industries is 13.628 billion RMB, with a growth of 16.0%. Where, the growth value for the state owned and state controlled industries is 9.823 billion RMB, with a growth of 14.1%; the growth value for foreign and Hongkong & Macao & Taiwan industries is 2.296 billion RMB, with a growth of 16.4%; the growth value for joint stock industries is 7.8 billion RMB, with a growth of 25.2%, and the growth value for the private industries is 1.69 billion RMB, with a growth of 18.0%.The growth value for light industry in the year is 3.207 billion RMB, with a decrease of 1.2%, and the growth value for heavy industry is 10.421 billion RMB, with a growth of 22.5%. The growth value for county industries is 5.456 billion RMB, with a growth of 18.3%. Growth value for three major industries including tobacco, metallurgy and electric power is 9.86 billion RMB, with a growth of 19.0%. Where, the tobacco industry increased with 11.0%, the metallurgy industry increased with 21.5% and the electric power industry increased with 22.2%.
There was one provincial-level priority engineering technology research and development center, six high & new technology enterprises recognized by Guangdong Province and fifteen provincial-level private scientific and technical enterprises in Shaoguan City by the end of 2006. In 2006, total 81 achievements were realized in scientific research, in which 3 achievements obtained the award of Scientific & Technological Progress of Guangdong Province, and 66 achievements obtained award of Scientific & Technological Progress of Shaoguan City. Eight “Torch Plans” were implemented in the year, including 5 national plans. Forty “Star-fire

Reconstruction Project for CDQ Clean Production on 6m Coke Oven in Coking Plant, Guangdong SGIS Songshan Co., Ltd.
South China Institute of Environmental Sciences, Ministry of Environmental Protection of the PRC 65
Plans” were implemented. There were 461 patents and 225 patent authorizations in the city, with an increase of 52.1% and 97.4% respectively.
The residential population of the city by the end of the year was 2,929,400, with an increase amount of 6,800. Including 1,258,800 non-agricultural population and 1,944,400 agricultural population. The birth population of the year was 37,300, with a birth rate of 11.67%. And the death population is 16,800, with a death rate of 5.27%. Population of the city by the end of the year was 3,203,200, with an increase amount of 16,600.
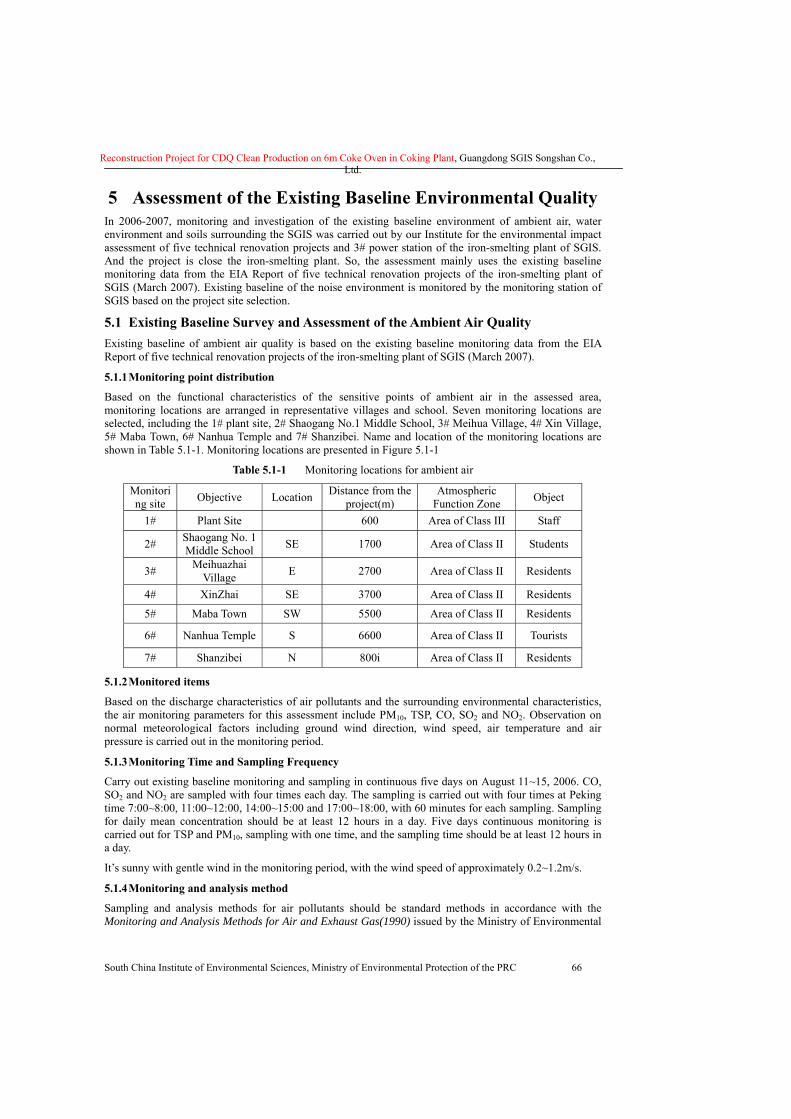
Reconstruction Project for CDQ Clean Production on 6m Coke Oven in Coking Plant, Guangdong SGIS Songshan Co., Ltd.
South China Institute of Environmental Sciences, Ministry of Environmental Protection of the PRC 66
5 Assessment of the Existing Baseline Environmental Quality In 2006-2007, monitoring and investigation of the existing baseline environment of ambient air, water environment and soils surrounding the SGIS was carried out by our Institute for the environmental impact assessment of five technical renovation projects and 3# power station of the iron-smelting plant of SGIS. And the project is close the iron-smelting plant. So, the assessment mainly uses the existing baseline monitoring data from the EIA Report of five technical renovation projects of the iron-smelting plant of SGIS (March 2007). Existing baseline of the noise environment is monitored by the monitoring station of SGIS based on the project site selection.
5.1 Existing Baseline Survey and Assessment of the Ambient Air Quality Existing baseline of ambient air quality is based on the existing baseline monitoring data from the EIA Report of five technical renovation projects of the iron-smelting plant of SGIS (March 2007).
5.1.1 Monitoring point distribution
Based on the functional characteristics of the sensitive points of ambient air in the assessed area, monitoring locations are arranged in representative villages and school. Seven monitoring locations are selected, including the 1# plant site, 2# Shaogang No.1 Middle School, 3# Meihua Village, 4# Xin Village, 5# Maba Town, 6# Nanhua Temple and 7# Shanzibei. Name and location of the monitoring locations are shown in Table 5.1-1. Monitoring locations are presented in Figure 5.1-1
Table 5.1-1 Monitoring locations for ambient air
Monitoring site Objective Location Distance from the
project(m) Atmospheric
Function Zone Object
1# Plant Site 600 Area of Class III Staff
2# Shaogang No. 1 Middle School SE 1700 Area of Class II Students
3# Meihuazhai Village E 2700 Area of Class II Residents
4# XinZhai SE 3700 Area of Class II Residents
5# Maba Town SW 5500 Area of Class II Residents
6# Nanhua Temple S 6600 Area of Class II Tourists
7# Shanzibei N 800i Area of Class II Residents
5.1.2 Monitored items
Based on the discharge characteristics of air pollutants and the surrounding environmental characteristics, the air monitoring parameters for this assessment include PM10, TSP, CO, SO2 and NO2. Observation on normal meteorological factors including ground wind direction, wind speed, air temperature and air pressure is carried out in the monitoring period.
5.1.3 Monitoring Time and Sampling Frequency
Carry out existing baseline monitoring and sampling in continuous five days on August 11~15, 2006. CO, SO2 and NO2 are sampled with four times each day. The sampling is carried out with four times at Peking time 7:00~8:00, 11:00~12:00, 14:00~15:00 and 17:00~18:00, with 60 minutes for each sampling. Sampling for daily mean concentration should be at least 12 hours in a day. Five days continuous monitoring is carried out for TSP and PM10, sampling with one time, and the sampling time should be at least 12 hours in a day.
It’s sunny with gentle wind in the monitoring period, with the wind speed of approximately 0.2~1.2m/s.
5.1.4 Monitoring and analysis method
Sampling and analysis methods for air pollutants should be standard methods in accordance with the Monitoring and Analysis Methods for Air and Exhaust Gas(1990) issued by the Ministry of Environmental
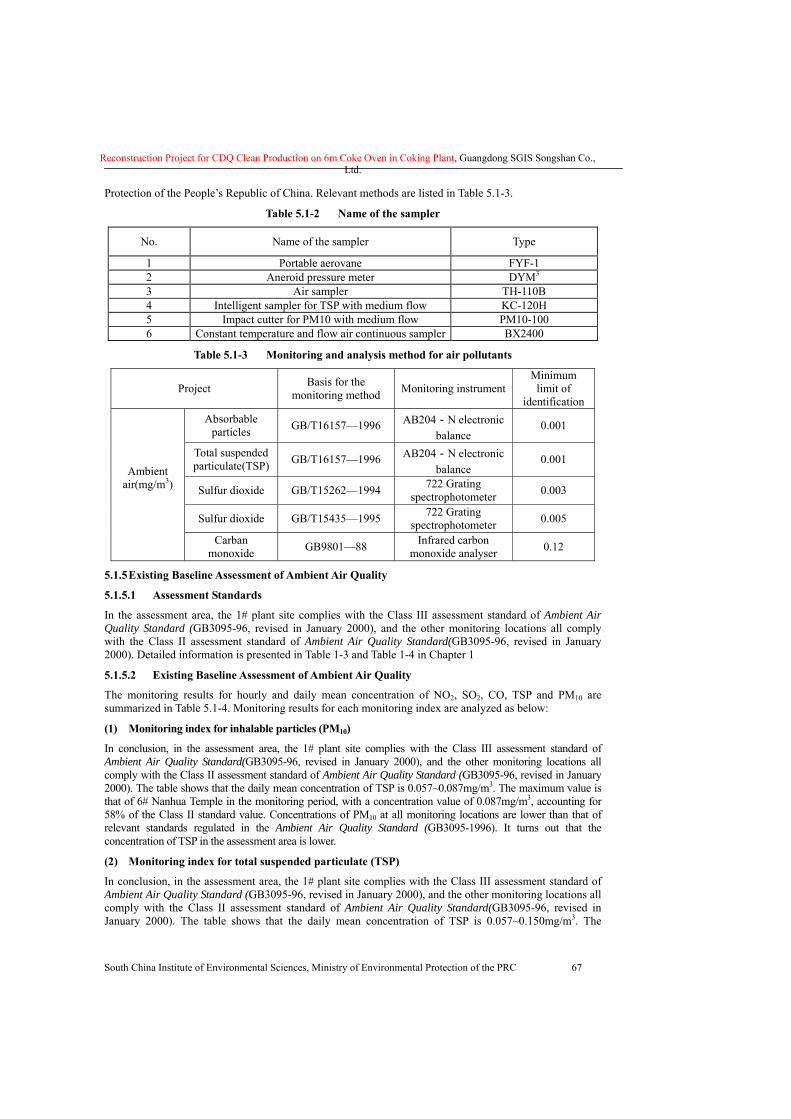
Reconstruction Project for CDQ Clean Production on 6m Coke Oven in Coking Plant, Guangdong SGIS Songshan Co., Ltd.
South China Institute of Environmental Sciences, Ministry of Environmental Protection of the PRC 67
Protection of the People’s Republic of China. Relevant methods are listed in Table 5.1-3.
Table 5.1-2 Name of the sampler
No. Name of the sampler Type
1 Portable aerovane FYF-1 2 Aneroid pressure meter DYM3 3 Air sampler TH-110B 4 Intelligent sampler for TSP with medium flow KC-120H 5 Impact cutter for PM10 with medium flow PM10-100 6 Constant temperature and flow air continuous sampler BX2400
Table 5.1-3 Monitoring and analysis method for air pollutants
Project Basis for the monitoring method Monitoring instrument
Minimum limit of
identification Absorbable
particles GB/T16157—1996 AB204-N electronic balance
0.001
Total suspended particulate(TSP) GB/T16157—1996 AB204-N electronic
balance 0.001
Sulfur dioxide GB/T15262—1994 722 Grating spectrophotometer 0.003
Sulfur dioxide GB/T15435—1995 722 Grating spectrophotometer 0.005
Ambient air(mg/m3)
Carban monoxide GB9801—88 Infrared carbon
monoxide analyser 0.12
5.1.5 Existing Baseline Assessment of Ambient Air Quality
5.1.5.1 Assessment Standards
In the assessment area, the 1# plant site complies with the Class III assessment standard of Ambient Air Quality Standard (GB3095-96, revised in January 2000), and the other monitoring locations all comply with the Class II assessment standard of Ambient Air Quality Standard(GB3095-96, revised in January 2000). Detailed information is presented in Table 1-3 and Table 1-4 in Chapter 1
5.1.5.2 Existing Baseline Assessment of Ambient Air Quality
The monitoring results for hourly and daily mean concentration of NO2, SO2, CO, TSP and PM10 are summarized in Table 5.1-4. Monitoring results for each monitoring index are analyzed as below:
(1) Monitoring index for inhalable particles (PM10)
In conclusion, in the assessment area, the 1# plant site complies with the Class III assessment standard of Ambient Air Quality Standard(GB3095-96, revised in January 2000), and the other monitoring locations all comply with the Class II assessment standard of Ambient Air Quality Standard (GB3095-96, revised in January 2000). The table shows that the daily mean concentration of TSP is 0.057~0.087mg/m3. The maximum value is that of 6# Nanhua Temple in the monitoring period, with a concentration value of 0.087mg/m3, accounting for 58% of the Class II standard value. Concentrations of PM10 at all monitoring locations are lower than that of relevant standards regulated in the Ambient Air Quality Standard (GB3095-1996). It turns out that the concentration of TSP in the assessment area is lower.
(2) Monitoring index for total suspended particulate (TSP)
In conclusion, in the assessment area, the 1# plant site complies with the Class III assessment standard of Ambient Air Quality Standard (GB3095-96, revised in January 2000), and the other monitoring locations all comply with the Class II assessment standard of Ambient Air Quality Standard(GB3095-96, revised in January 2000). The table shows that the daily mean concentration of TSP is 0.057~0.150mg/m3. The
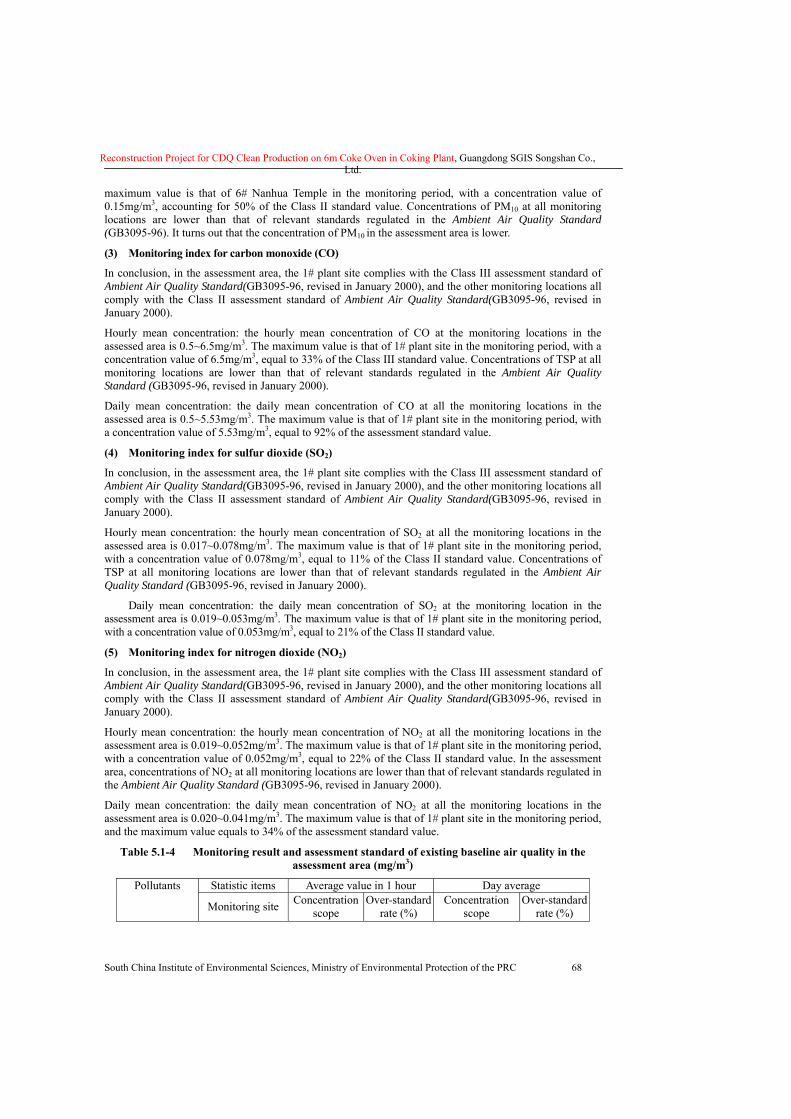
Reconstruction Project for CDQ Clean Production on 6m Coke Oven in Coking Plant, Guangdong SGIS Songshan Co., Ltd.
South China Institute of Environmental Sciences, Ministry of Environmental Protection of the PRC 68
maximum value is that of 6# Nanhua Temple in the monitoring period, with a concentration value of 0.15mg/m3, accounting for 50% of the Class II standard value. Concentrations of PM10 at all monitoring locations are lower than that of relevant standards regulated in the Ambient Air Quality Standard (GB3095-96). It turns out that the concentration of PM10 in the assessment area is lower.
(3) Monitoring index for carbon monoxide (CO)
In conclusion, in the assessment area, the 1# plant site complies with the Class III assessment standard of Ambient Air Quality Standard(GB3095-96, revised in January 2000), and the other monitoring locations all comply with the Class II assessment standard of Ambient Air Quality Standard(GB3095-96, revised in January 2000).
Hourly mean concentration: the hourly mean concentration of CO at the monitoring locations in the assessed area is 0.5~6.5mg/m3. The maximum value is that of 1# plant site in the monitoring period, with a concentration value of 6.5mg/m3, equal to 33% of the Class III standard value. Concentrations of TSP at all monitoring locations are lower than that of relevant standards regulated in the Ambient Air Quality Standard (GB3095-96, revised in January 2000).
Daily mean concentration: the daily mean concentration of CO at all the monitoring locations in the assessed area is 0.5~5.53mg/m3. The maximum value is that of 1# plant site in the monitoring period, with a concentration value of 5.53mg/m3, equal to 92% of the assessment standard value.
(4) Monitoring index for sulfur dioxide (SO2)
In conclusion, in the assessment area, the 1# plant site complies with the Class III assessment standard of Ambient Air Quality Standard(GB3095-96, revised in January 2000), and the other monitoring locations all comply with the Class II assessment standard of Ambient Air Quality Standard(GB3095-96, revised in January 2000).
Hourly mean concentration: the hourly mean concentration of SO2 at all the monitoring locations in the assessed area is 0.017~0.078mg/m3. The maximum value is that of 1# plant site in the monitoring period, with a concentration value of 0.078mg/m3, equal to 11% of the Class II standard value. Concentrations of TSP at all monitoring locations are lower than that of relevant standards regulated in the Ambient Air Quality Standard (GB3095-96, revised in January 2000).
Daily mean concentration: the daily mean concentration of SO2 at the monitoring location in the assessment area is 0.019~0.053mg/m3. The maximum value is that of 1# plant site in the monitoring period, with a concentration value of 0.053mg/m3, equal to 21% of the Class II standard value.
(5) Monitoring index for nitrogen dioxide (NO2)
In conclusion, in the assessment area, the 1# plant site complies with the Class III assessment standard of Ambient Air Quality Standard(GB3095-96, revised in January 2000), and the other monitoring locations all comply with the Class II assessment standard of Ambient Air Quality Standard(GB3095-96, revised in January 2000).
Hourly mean concentration: the hourly mean concentration of NO2 at all the monitoring locations in the assessment area is 0.019~0.052mg/m3. The maximum value is that of 1# plant site in the monitoring period, with a concentration value of 0.052mg/m3, equal to 22% of the Class II standard value. In the assessment area, concentrations of NO2 at all monitoring locations are lower than that of relevant standards regulated in the Ambient Air Quality Standard (GB3095-96, revised in January 2000).
Daily mean concentration: the daily mean concentration of NO2 at all the monitoring locations in the assessment area is 0.020~0.041mg/m3. The maximum value is that of 1# plant site in the monitoring period, and the maximum value equals to 34% of the assessment standard value.
Table 5.1-4 Monitoring result and assessment standard of existing baseline air quality in the assessment area (mg/m3)
Statistic items Average value in 1 hour Day average Pollutants
Monitoring site Concentration scope
Over-standard rate (%)
Concentration scope
Over-standard rate (%)
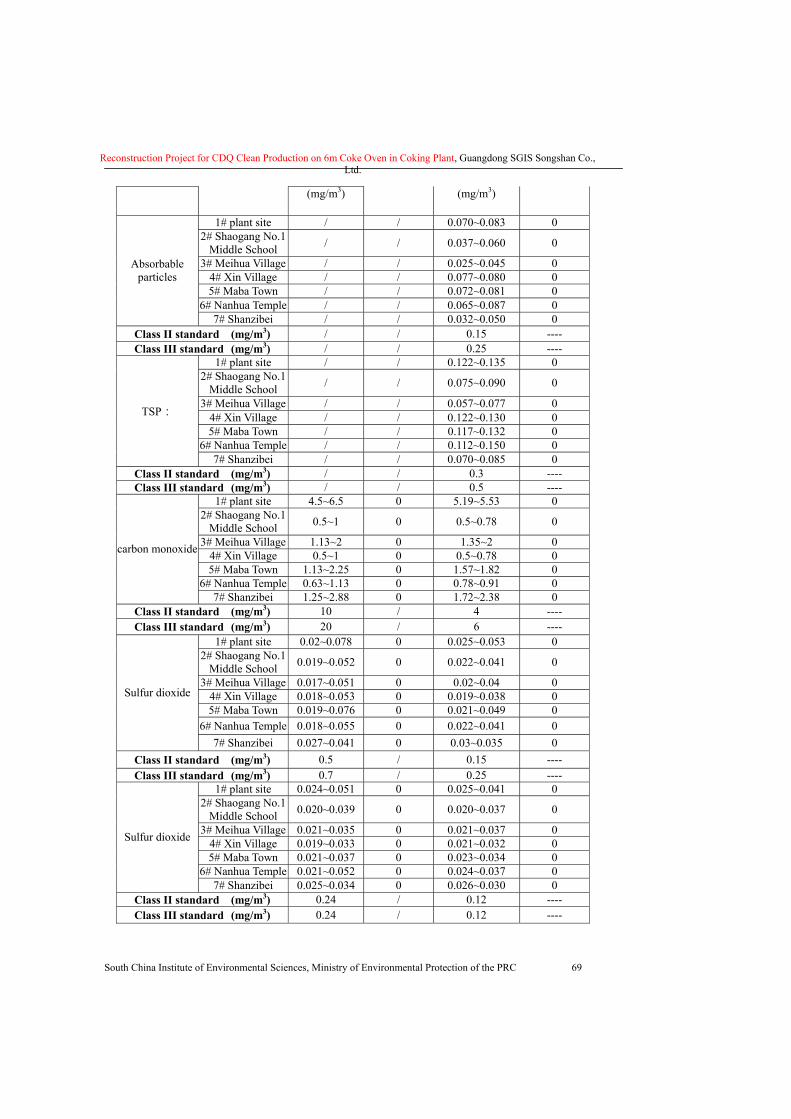
Reconstruction Project for CDQ Clean Production on 6m Coke Oven in Coking Plant, Guangdong SGIS Songshan Co., Ltd.
South China Institute of Environmental Sciences, Ministry of Environmental Protection of the PRC 69
(mg/m3) (mg/m3)
1# plant site / / 0.070~0.083 0 2# Shaogang No.1
Middle School / / 0.037~0.060 0
3# Meihua Village / / 0.025~0.045 0 4# Xin Village / / 0.077~0.080 0 5# Maba Town / / 0.072~0.081 0
6# Nanhua Temple / / 0.065~0.087 0
Absorbable particles
7# Shanzibei / / 0.032~0.050 0 Class II standard (mg/m3) / / 0.15 ---- Class III standard (mg/m3) / / 0.25 ----
1# plant site / / 0.122~0.135 0 2# Shaogang No.1
Middle School / / 0.075~0.090 0
3# Meihua Village / / 0.057~0.077 0 4# Xin Village / / 0.122~0.130 0 5# Maba Town / / 0.117~0.132 0
6# Nanhua Temple / / 0.112~0.150 0
TSP:
7# Shanzibei / / 0.070~0.085 0 Class II standard (mg/m3) / / 0.3 ---- Class III standard (mg/m3) / / 0.5 ----
1# plant site 4.5~6.5 0 5.19~5.53 0 2# Shaogang No.1
Middle School 0.5~1 0 0.5~0.78 0
3# Meihua Village 1.13~2 0 1.35~2 0 4# Xin Village 0.5~1 0 0.5~0.78 0 5# Maba Town 1.13~2.25 0 1.57~1.82 0
6# Nanhua Temple 0.63~1.13 0 0.78~0.91 0
carbon monoxide
7# Shanzibei 1.25~2.88 0 1.72~2.38 0 Class II standard (mg/m3) 10 / 4 ---- Class III standard (mg/m3) 20 / 6 ----
1# plant site 0.02~0.078 0 0.025~0.053 0 2# Shaogang No.1
Middle School 0.019~0.052 0 0.022~0.041 0
3# Meihua Village 0.017~0.051 0 0.02~0.04 0 4# Xin Village 0.018~0.053 0 0.019~0.038 0 5# Maba Town 0.019~0.076 0 0.021~0.049 0
6# Nanhua Temple 0.018~0.055 0 0.022~0.041 0
Sulfur dioxide
7# Shanzibei 0.027~0.041 0 0.03~0.035 0 Class II standard (mg/m3) 0.5 / 0.15 ---- Class III standard (mg/m3) 0.7 / 0.25 ----
1# plant site 0.024~0.051 0 0.025~0.041 0 2# Shaogang No.1
Middle School 0.020~0.039 0 0.020~0.037 0
3# Meihua Village 0.021~0.035 0 0.021~0.037 0 4# Xin Village 0.019~0.033 0 0.021~0.032 0 5# Maba Town 0.021~0.037 0 0.023~0.034 0
6# Nanhua Temple 0.021~0.052 0 0.024~0.037 0
Sulfur dioxide
7# Shanzibei 0.025~0.034 0 0.026~0.030 0 Class II standard (mg/m3) 0.24 / 0.12 ---- Class III standard (mg/m3) 0.24 / 0.12 ----
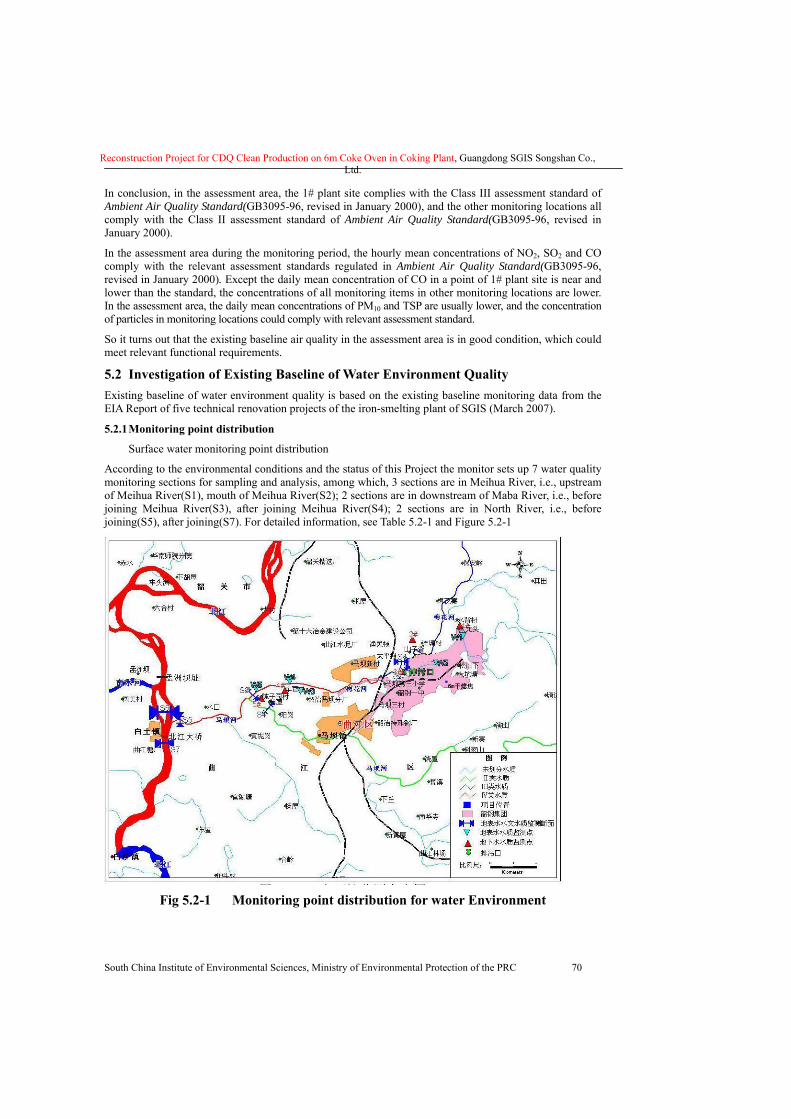
Reconstruction Project for CDQ Clean Production on 6m Coke Oven in Coking Plant, Guangdong SGIS Songshan Co., Ltd.
South China Institute of Environmental Sciences, Ministry of Environmental Protection of the PRC 70
In conclusion, in the assessment area, the 1# plant site complies with the Class III assessment standard of Ambient Air Quality Standard(GB3095-96, revised in January 2000), and the other monitoring locations all comply with the Class II assessment standard of Ambient Air Quality Standard(GB3095-96, revised in January 2000).
In the assessment area during the monitoring period, the hourly mean concentrations of NO2, SO2 and CO comply with the relevant assessment standards regulated in Ambient Air Quality Standard(GB3095-96, revised in January 2000). Except the daily mean concentration of CO in a point of 1# plant site is near and lower than the standard, the concentrations of all monitoring items in other monitoring locations are lower. In the assessment area, the daily mean concentrations of PM10 and TSP are usually lower, and the concentration of particles in monitoring locations could comply with relevant assessment standard.
So it turns out that the existing baseline air quality in the assessment area is in good condition, which could meet relevant functional requirements.
5.2 Investigation of Existing Baseline of Water Environment Quality Existing baseline of water environment quality is based on the existing baseline monitoring data from the EIA Report of five technical renovation projects of the iron-smelting plant of SGIS (March 2007).
5.2.1 Monitoring point distribution
� Surface water monitoring point distribution
According to the environmental conditions and the status of this Project the monitor sets up 7 water quality monitoring sections for sampling and analysis, among which, 3 sections are in Meihua River, i.e., upstream of Meihua River(S1), mouth of Meihua River(S2); 2 sections are in downstream of Maba River, i.e., before joining Meihua River(S3), after joining Meihua River(S4); 2 sections are in North River, i.e., before joining(S5), after joining(S7). For detailed information, see Table 5.2-1 and Figure 5.2-1
Fig 5.2-1 Monitoring point distribution for water Environment
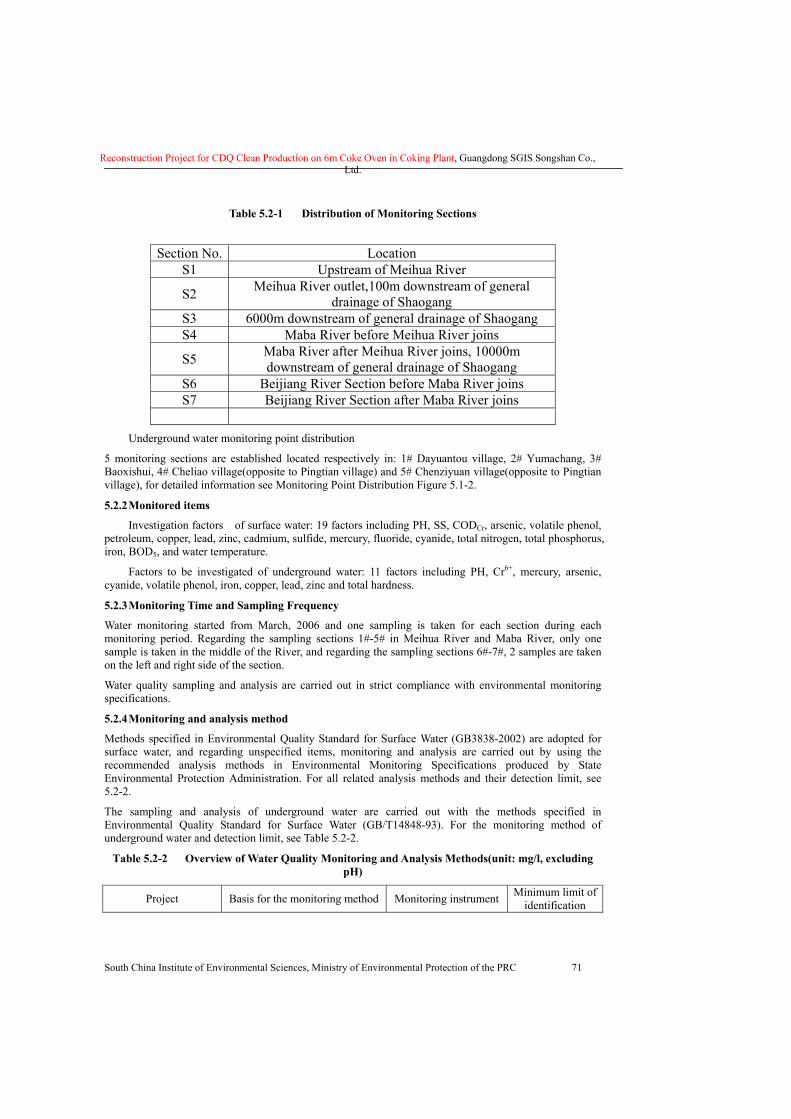
Reconstruction Project for CDQ Clean Production on 6m Coke Oven in Coking Plant, Guangdong SGIS Songshan Co., Ltd.
South China Institute of Environmental Sciences, Ministry of Environmental Protection of the PRC 71
Table 5.2-1 Distribution of Monitoring Sections
Section No. Location S1 Upstream of Meihua River
S2 Meihua River outlet,100m downstream of general drainage of Shaogang
S3 6000m downstream of general drainage of Shaogang S4 Maba River before Meihua River joins
S5 Maba River after Meihua River joins, 10000m downstream of general drainage of Shaogang
S6 Beijiang River Section before Maba River joins S7 Beijiang River Section after Maba River joins
� Underground water monitoring point distribution
5 monitoring sections are established located respectively in: 1# Dayuantou village, 2# Yumachang, 3# Baoxishui, 4# Cheliao village(opposite to Pingtian village) and 5# Chenziyuan village(opposite to Pingtian village), for detailed information see Monitoring Point Distribution Figure 5.1-2.
5.2.2 Monitored items
� Investigation factors of surface water: 19 factors including PH, SS, CODCr, arsenic, volatile phenol, petroleum, copper, lead, zinc, cadmium, sulfide, mercury, fluoride, cyanide, total nitrogen, total phosphorus, iron, BOD5, and water temperature.
� Factors to be investigated of underground water: 11 factors including PH, Cr6+, mercury, arsenic, cyanide, volatile phenol, iron, copper, lead, zinc and total hardness.
5.2.3 Monitoring Time and Sampling Frequency
Water monitoring started from March, 2006 and one sampling is taken for each section during each monitoring period. Regarding the sampling sections 1#-5# in Meihua River and Maba River, only one sample is taken in the middle of the River, and regarding the sampling sections 6#-7#, 2 samples are taken on the left and right side of the section.
Water quality sampling and analysis are carried out in strict compliance with environmental monitoring specifications.
5.2.4 Monitoring and analysis method
Methods specified in Environmental Quality Standard for Surface Water (GB3838-2002) are adopted for surface water, and regarding unspecified items, monitoring and analysis are carried out by using the recommended analysis methods in Environmental Monitoring Specifications produced by State Environmental Protection Administration. For all related analysis methods and their detection limit, see 5.2-2.
The sampling and analysis of underground water are carried out with the methods specified in Environmental Quality Standard for Surface Water (GB/T14848-93). For the monitoring method of underground water and detection limit, see Table 5.2-2.
Table 5.2-2 Overview of Water Quality Monitoring and Analysis Methods(unit: mg/l, excluding pH)
Project Basis for the monitoring method Monitoring instrument Minimum limit of identification
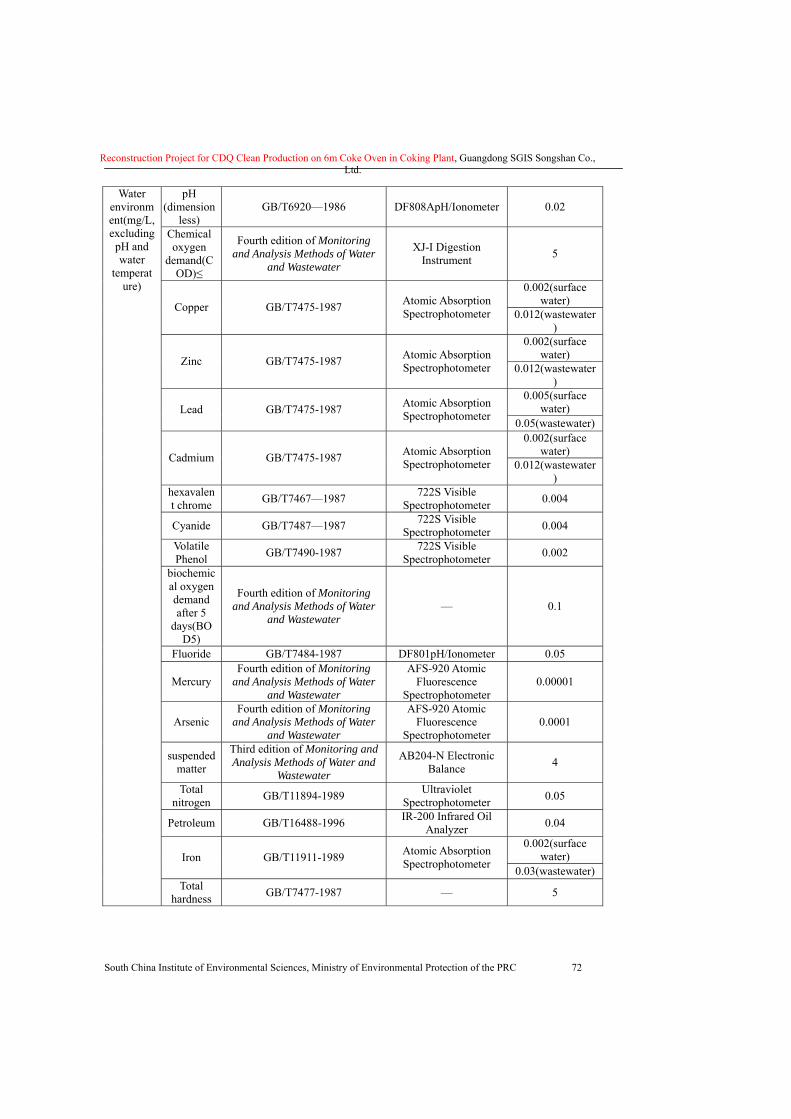
Reconstruction Project for CDQ Clean Production on 6m Coke Oven in Coking Plant, Guangdong SGIS Songshan Co., Ltd.
South China Institute of Environmental Sciences, Ministry of Environmental Protection of the PRC 72
pH (dimension
less) GB/T6920—1986 DF808ApH/Ionometer 0.02
Chemical oxygen
demand(COD)≤
Fourth edition of Monitoring and Analysis Methods of Water
and Wastewater
XJ-I Digestion Instrument 5
0.002(surface water) Copper GB/T7475-1987 Atomic Absorption
Spectrophotometer 0.012(wastewater)
0.002(surface water) Zinc GB/T7475-1987 Atomic Absorption
Spectrophotometer 0.012(wastewater)
0.005(surface water) Lead GB/T7475-1987 Atomic Absorption
Spectrophotometer 0.05(wastewater) 0.002(surface
water) Cadmium GB/T7475-1987 Atomic Absorption Spectrophotometer 0.012(wastewater
) hexavalent chrome GB/T7467—1987 722S Visible
Spectrophotometer 0.004
Cyanide GB/T7487—1987 722S Visible Spectrophotometer 0.004
Volatile Phenol GB/T7490-1987 722S Visible
Spectrophotometer 0.002
biochemical oxygen demand after 5
days(BOD5)
Fourth edition of Monitoring and Analysis Methods of Water
and Wastewater — 0.1
Fluoride GB/T7484-1987 DF801pH/Ionometer 0.05
Mercury Fourth edition of Monitoring
and Analysis Methods of Water and Wastewater
AFS-920 Atomic Fluorescence
Spectrophotometer 0.00001
Arsenic Fourth edition of Monitoring
and Analysis Methods of Water and Wastewater
AFS-920 Atomic Fluorescence
Spectrophotometer 0.0001
suspended matter
Third edition of Monitoring and Analysis Methods of Water and
Wastewater
AB204-N Electronic Balance 4
Total nitrogen GB/T11894-1989 Ultraviolet
Spectrophotometer 0.05
Petroleum GB/T16488-1996 IR-200 Infrared Oil Analyzer 0.04
0.002(surface water) Iron GB/T11911-1989 Atomic Absorption
Spectrophotometer 0.03(wastewater)
Water environment(mg/L, excluding
pH and water
temperature)
Total hardness GB/T7477-1987 — 5
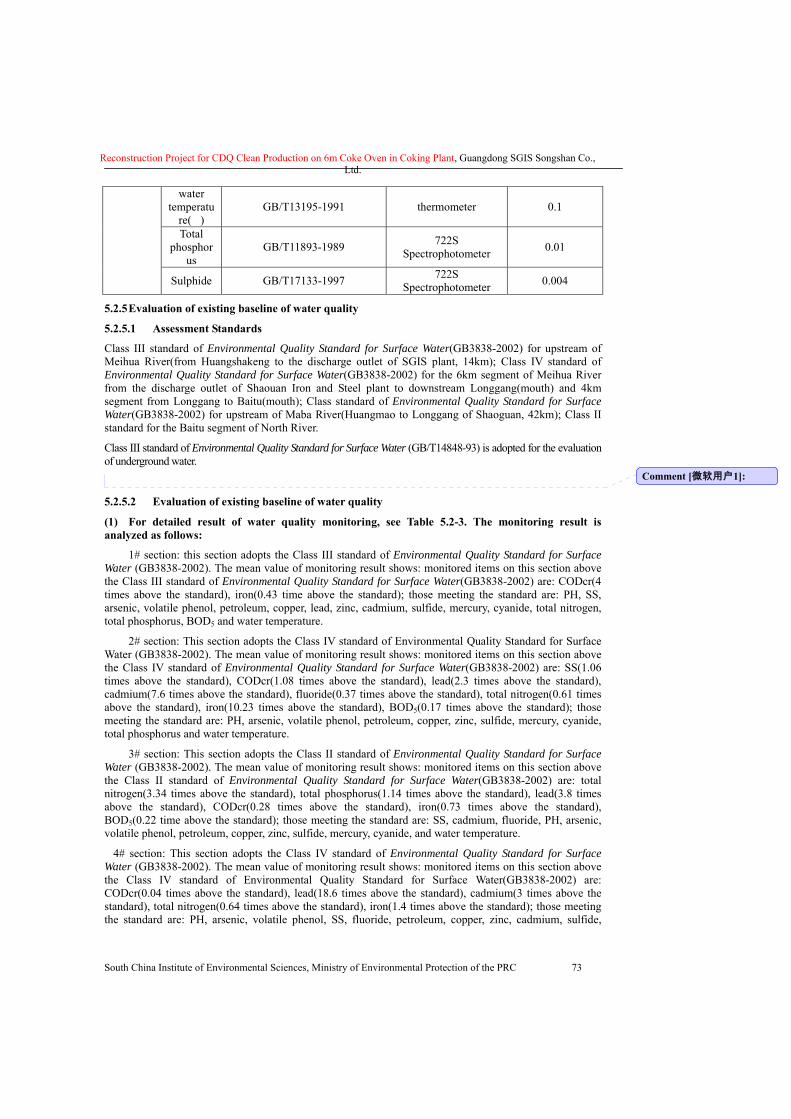
Reconstruction Project for CDQ Clean Production on 6m Coke Oven in Coking Plant, Guangdong SGIS Songshan Co., Ltd.
South China Institute of Environmental Sciences, Ministry of Environmental Protection of the PRC 73
water temperatu
re(�) GB/T13195-1991 thermometer 0.1
Total phosphor
us GB/T11893-1989 722S
Spectrophotometer 0.01
Sulphide GB/T17133-1997 722S Spectrophotometer 0.004
5.2.5 Evaluation of existing baseline of water quality
5.2.5.1 Assessment Standards
Class III standard of Environmental Quality Standard for Surface Water(GB3838-2002) for upstream of Meihua River(from Huangshakeng to the discharge outlet of SGIS plant, 14km); Class IV standard of Environmental Quality Standard for Surface Water(GB3838-2002) for the 6km segment of Meihua River from the discharge outlet of Shaouan Iron and Steel plant to downstream Longgang(mouth) and 4km segment from Longgang to Baitu(mouth); Class standard of Environmental Quality Standard for Surface Water(GB3838-2002) for upstream of Maba River(Huangmao to Longgang of Shaoguan, 42km); Class II standard for the Baitu segment of North River.
Class III standard of Environmental Quality Standard for Surface Water (GB/T14848-93) is adopted for the evaluation of underground water.
5.2.5.2 Evaluation of existing baseline of water quality
(1) For detailed result of water quality monitoring, see Table 5.2-3. The monitoring result is analyzed as follows:
� 1# section: this section adopts the Class III standard of Environmental Quality Standard for Surface Water (GB3838-2002). The mean value of monitoring result shows: monitored items on this section above the Class III standard of Environmental Quality Standard for Surface Water(GB3838-2002) are: CODcr(4 times above the standard), iron(0.43 time above the standard); those meeting the standard are: PH, SS, arsenic, volatile phenol, petroleum, copper, lead, zinc, cadmium, sulfide, mercury, cyanide, total nitrogen, total phosphorus, BOD5 and water temperature.
� 2# section: This section adopts the Class IV standard of Environmental Quality Standard for Surface Water (GB3838-2002). The mean value of monitoring result shows: monitored items on this section above the Class IV standard of Environmental Quality Standard for Surface Water(GB3838-2002) are: SS(1.06 times above the standard), CODcr(1.08 times above the standard), lead(2.3 times above the standard), cadmium(7.6 times above the standard), fluoride(0.37 times above the standard), total nitrogen(0.61 times above the standard), iron(10.23 times above the standard), BOD5(0.17 times above the standard); those meeting the standard are: PH, arsenic, volatile phenol, petroleum, copper, zinc, sulfide, mercury, cyanide, total phosphorus and water temperature.
� 3# section: This section adopts the Class II standard of Environmental Quality Standard for Surface Water (GB3838-2002). The mean value of monitoring result shows: monitored items on this section above the Class II standard of Environmental Quality Standard for Surface Water(GB3838-2002) are: total nitrogen(3.34 times above the standard), total phosphorus(1.14 times above the standard), lead(3.8 times above the standard), CODcr(0.28 times above the standard), iron(0.73 times above the standard), BOD5(0.22 time above the standard); those meeting the standard are: SS, cadmium, fluoride, PH, arsenic, volatile phenol, petroleum, copper, zinc, sulfide, mercury, cyanide, and water temperature.
�4# section: This section adopts the Class IV standard of Environmental Quality Standard for Surface Water (GB3838-2002). The mean value of monitoring result shows: monitored items on this section above the Class IV standard of Environmental Quality Standard for Surface Water(GB3838-2002) are: CODcr(0.04 times above the standard), lead(18.6 times above the standard), cadmium(3 times above the standard), total nitrogen(0.64 times above the standard), iron(1.4 times above the standard); those meeting the standard are: PH, arsenic, volatile phenol, SS, fluoride, petroleum, copper, zinc, cadmium, sulfide,
Comment [微软用户1]:
Reconstruction Project for CDQ Clean Production on 6m Coke Oven in Coking Plant, Guangdong SGIS Songshan Co., Ltd.
South China Institute of Environmental Sciences, Ministry of Environmental Protection of the PRC 74
mercury, cyanide, total phosphorus, BOD5 and water temperature.
� 5# section(left side): This section adopts the Class III standard of Environmental Quality Standard for Surface Water (GB3838-2002). The mean value of monitoring result shows: monitored items on this section above the Class III standard of Environmental Quality Standard for Surface Water(GB3838-2002) are: total nitrogen( 0.05 times above the standard), iron(0.13 time above the standard); those meeting the standard are: SS, CODcr, lead, cadmium, fluoride, PH, arsenic, volatile phenol, petroleum, copper, zinc, sulfide, mercury, cyanide, total phosphorus, BOD5 and water temperature.
5# section(right side): this section adopts the Class IV standard of Environmental Quality Standard for Underground Water(GB3838-2002).The average value of monitoring results shows that monitored items on this section above the Class IV standard of Environmental Quality Standard for Surface Water (GB3838-2002) are: SS (1.06 times above standard), CODcr (1.08 times above standard), lead (23 times above standard), cadmium (7.6 times above standard), fluoride (0.37 time above standard), total nitrogen (0.61 time above standard), iron (10.23 times above standard) and BOD5 (0.17 time above standard); those meeting the standard are: PH, arsenic, volatile phenol, petroleum-related substances, copper, zinc, sulfide, mercury, cyanide, total phosphorus and water temperature.
� 6# section(right side): this section adopts the Class IV standard of Environmental Quality Standard for Underground Water(GB3838-2002). The average value of monitoring results shows that monitored items on this section above the Class IV standard of Environmental Quality Standard for Surface Water (GB3838-2002) are: SS (1.06 times above standard), CODcr (1.08 times above standard), lead (23 times above standard), cadmium (7.6 times above standard), fluoride (0.37 time above standard), total nitrogen (0.61 time above standard), iron (10.23 times above standard) and BOD5 (0.17 time above standard); those meeting the standard are: PH, arsenic, volatile phenol, petroleum-related substances, copper, zinc, sulfide, mercury, cyanide, total phosphorus and water temperature The mean value of monitoring result shows: monitored items on this section above the Class IVstandard of Environmental Quality Standard for Surface Water(GB3838-2002) are: lead(1.46 times above the standard), cadmium(1 time above the standard), total nitrogen(0.52 times above the standard), iron(9.47 times above the standard); those meeting the standard are: SS, CODcr, fluoride, PH, arsenic, volatile phenol, petroleum, copper, zinc, sulfide, mercury, cyanide, total phosphorus, BOD5 and water temperature.
6# section(right side): this section adopts the Class IV standard of Environmental Quality Standard for Underground Water(GB3838-2002). The mean value of monitoring result shows: monitored items on this section above the Class _ standard of Environmental Quality Standard for Surface Water(GB3838-2002) are: total nitrogen(0.15 times above the standard), iron(0.93 time above the standard); those meeting the standard are: SS, CODcr, lead, cadmium, fluoride, PH, arsenic, volatile phenol, petroleum, copper, zinc, sulfide, mercury, cyanide, total phosphorus, BOD5 and water temperature.
To summarize, except iron and CODcr, all monitored items on the upstream section of Meihua river(1#) meet the requirements of Class III standard of GB3838-2002; the water quality on the section before Meihua River joins Maba River does not improve obviously with the increase of distance with the discharge outlet, and this is mainly because the incoming water from upstream is less than the amount of wastewater discharged along the river, and especially because the fact that, the discharge of wastewater from counties and enterprises along Qu River increases the amount of pollutant in the water body, making the degraded pollutant amount less than the increased one due to the limited dilution and degradation capacity of water body.
As learned from the monitoring result of the section before Maba River joins Meihua River(3#), the monitored items of CODcr, lead, total phosphorus, BOD5, total nitrogen and iron of the incoming water of upstream Maba River are all above the standard, whole several water quality indexes on the section before Maba River joins North River(4#)are above the standard.
On the section before North River joins Maba River (5#), the monitored items of water quality all meet the requirements of Class IV standard of GB3838-2002 except iron; lightly polluted by iron; on the section after North River joins Maba River, all monitored items meet requirements of Class _ standard of GB3838-2002 except total nitrogen and iron.
(2) For detailed result of water quality monitoring, see Table 5.2-4. The monitoring result is analyzed as follows:
Reconstruction Project for CDQ Clean Production on 6m Coke Oven in Coking Plant, Guangdong SGIS Songshan Co., Ltd.
South China Institute of Environmental Sciences, Ministry of Environmental Protection of the PRC 75
� 1# Dayuantou Village (He Fuyun)
This monitoring adopts Class III standard of Environmental Quality Standard for Underground Water (GB/T14848-93). The average value of monitoring results shows that all the monitored items of the point meet Class III standard of Environmental Quality Standard for Ground Water (GB/T14848-93); those meeting the standard are: PH, Cr6+, mercury, arsenic, cyanide, volatile phenol, iron, copper, lead, zinc and total hardness. The monitoring result shows: all monitored items on this monitoring point meet the Class III standard of Environmental Quality Standard for Underground Water(GB/T14848-93), including PH, Cr6+, mercury, arsenic, cyanide, volatile phenol, iron, copper, lead, zinc and total hardness.
� 2# Yumachang No.31
This monitoring adopts Class III standard of Environmental Quality Standard for Underground Water(GB/T14848-93). The monitoring result shows: all monitored items on this monitoring point meet the Class III standard of Environmental Quality Standard for Underground Water(GB/T14848-93), including PH, Cr6+, mercury, arsenic, cyanide, volatile phenol, iron, copper, lead, zinc and total hardness.
� 3# Baoxishui No. 38
This monitoring adopts Class III standard of Environmental Quality Standard for Underground Water (GB/T14848-93). The monitoring result shows: all monitored items on this monitoring point meet the Class III standard of Environmental Quality Standard for Underground Water(GB/T14848-93), including PH, Cr6+, mercury, arsenic, cyanide, volatile phenol, iron, copper, lead, zinc and total hardness.
� 4# Cheliao Village (opposite to Pingtian Village) No. 35
This monitoring adopts Class III standard of Environmental Quality Standard for Underground Water (GB/T14848-93). The monitoring result shows: all monitored items on this monitoring point meet the Class III standard of Environmental Quality Standard for Underground Water(GB/T14848-93), including PH, Cr6+, mercury, arsenic, cyanide, volatile phenol, iron, copper, lead, zinc and total hardness.
� 5# Chenziyuan Village No.22 (opposite to Pingtian Village)
This monitoring adopts Class III standard of Environmental Quality Standard for Underground Water (GB/T14848-93). The monitoring result shows: all monitored items on this monitoring point meet the Class III standard of Environmental Quality Standard for Underground Water(GB/T14848-93), including PH, Cr6+, mercury, arsenic, cyanide, volatile phenol, iron, copper, lead, zinc and total hardness.
To summarize, all measured results on the monitoring point meet Class III standard of Environmental Quality Standard for Underground Water(GB/T14848-93), indicating that the underground water in the evaluated area have fine water quality, and remain unpolluted.
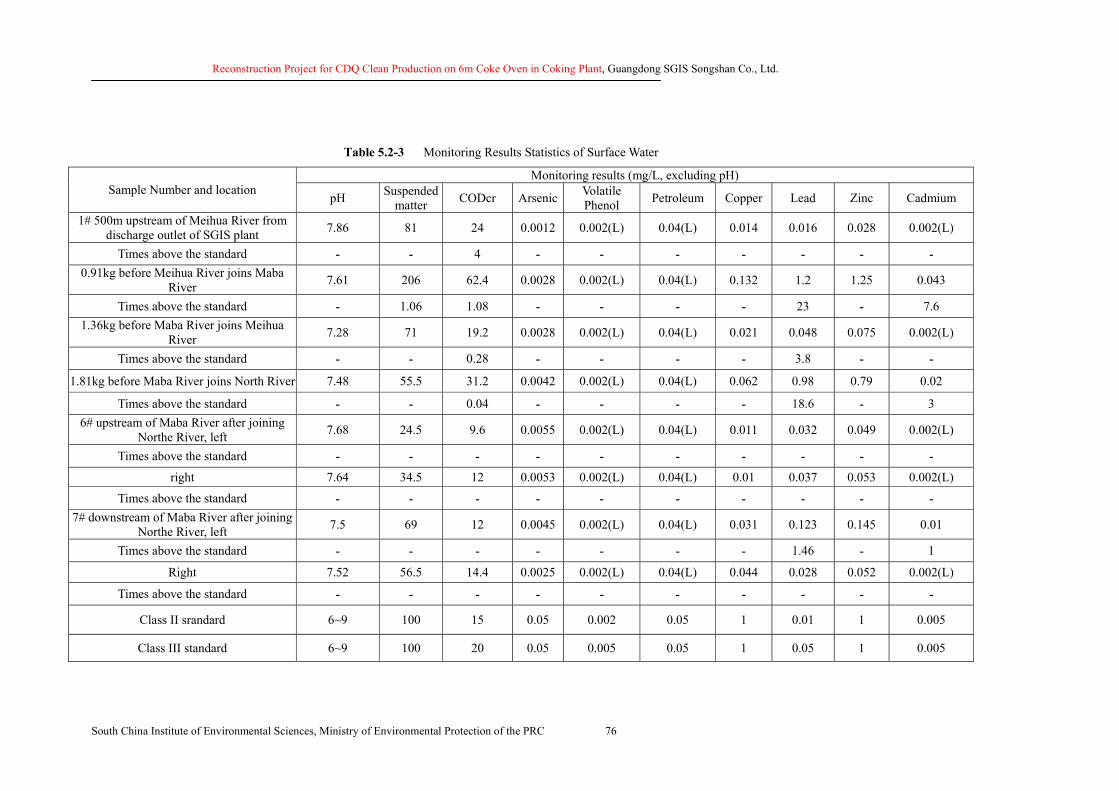
Reconstruction Project for CDQ Clean Production on 6m Coke Oven in Coking Plant, Guangdong SGIS Songshan Co., Ltd.
South China Institute of Environmental Sciences, Ministry of Environmental Protection of the PRC 76
Table 5.2-3 Monitoring Results Statistics of Surface Water
Monitoring results (mg/L, excluding pH) Sample Number and location pH Suspended
matter CODcr Arsenic Volatile Phenol Petroleum Copper Lead Zinc Cadmium
1# 500m upstream of Meihua River from discharge outlet of SGIS plant 7.86 81 24 0.0012 0.002(L) 0.04(L) 0.014 0.016 0.028 0.002(L)
Times above the standard - - 4 - - - - - - - 0.91kg before Meihua River joins Maba
River 7.61 206 62.4 0.0028 0.002(L) 0.04(L) 0.132 1.2 1.25 0.043
Times above the standard - 1.06 1.08 - - - - 23 - 7.6 1.36kg before Maba River joins Meihua
River 7.28 71 19.2 0.0028 0.002(L) 0.04(L) 0.021 0.048 0.075 0.002(L)
Times above the standard - - 0.28 - - - - 3.8 - -
1.81kg before Maba River joins North River 7.48 55.5 31.2 0.0042 0.002(L) 0.04(L) 0.062 0.98 0.79 0.02
Times above the standard - - 0.04 - - - - 18.6 - 3 6# upstream of Maba River after joining
Northe River, left 7.68 24.5 9.6 0.0055 0.002(L) 0.04(L) 0.011 0.032 0.049 0.002(L)
Times above the standard - - - - - - - - - - right 7.64 34.5 12 0.0053 0.002(L) 0.04(L) 0.01 0.037 0.053 0.002(L)
Times above the standard - - - - - - - - - - 7# downstream of Maba River after joining
Northe River, left 7.5 69 12 0.0045 0.002(L) 0.04(L) 0.031 0.123 0.145 0.01
Times above the standard - - - - - - - 1.46 - 1
Right 7.52 56.5 14.4 0.0025 0.002(L) 0.04(L) 0.044 0.028 0.052 0.002(L)
Times above the standard - - - - - - - - - -
Class II srandard 6~9 100 15 0.05 0.002 0.05 1 0.01 1 0.005
Class III standard 6~9 100 20 0.05 0.005 0.05 1 0.05 1 0.005
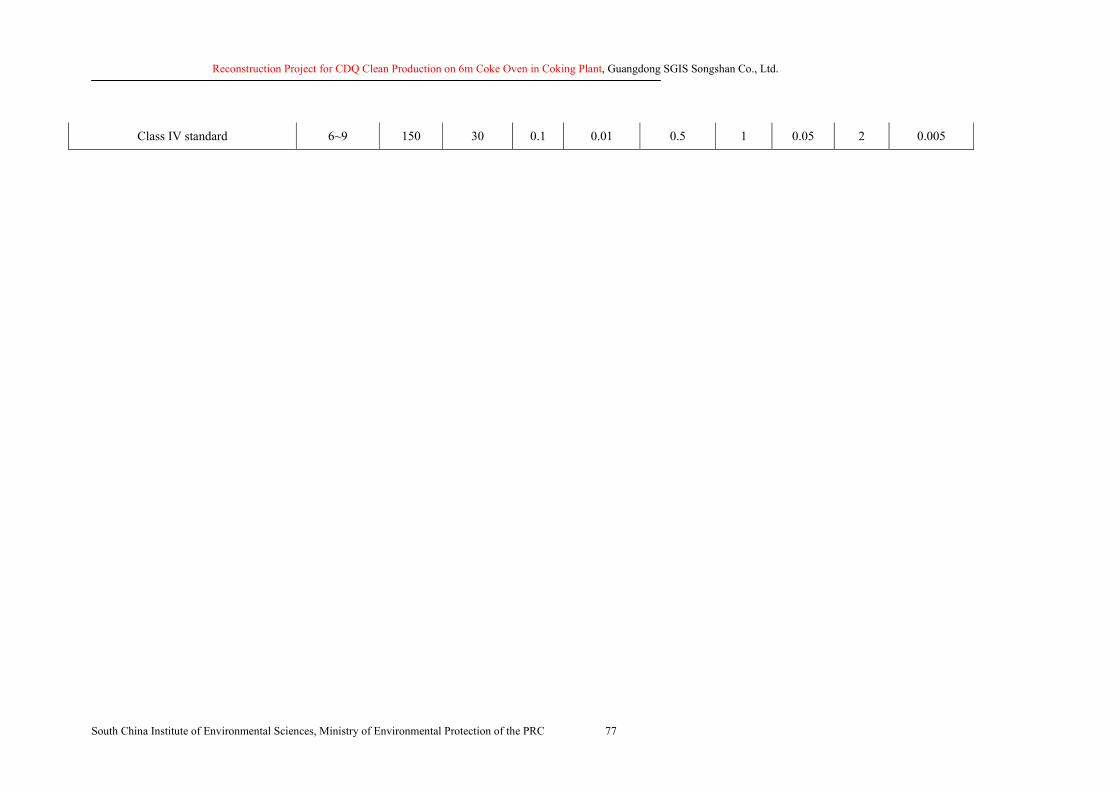
Reconstruction Project for CDQ Clean Production on 6m Coke Oven in Coking Plant, Guangdong SGIS Songshan Co., Ltd.
South China Institute of Environmental Sciences, Ministry of Environmental Protection of the PRC 77
Class IV standard 6~9 150 30 0.1 0.01 0.5 1 0.05 2 0.005
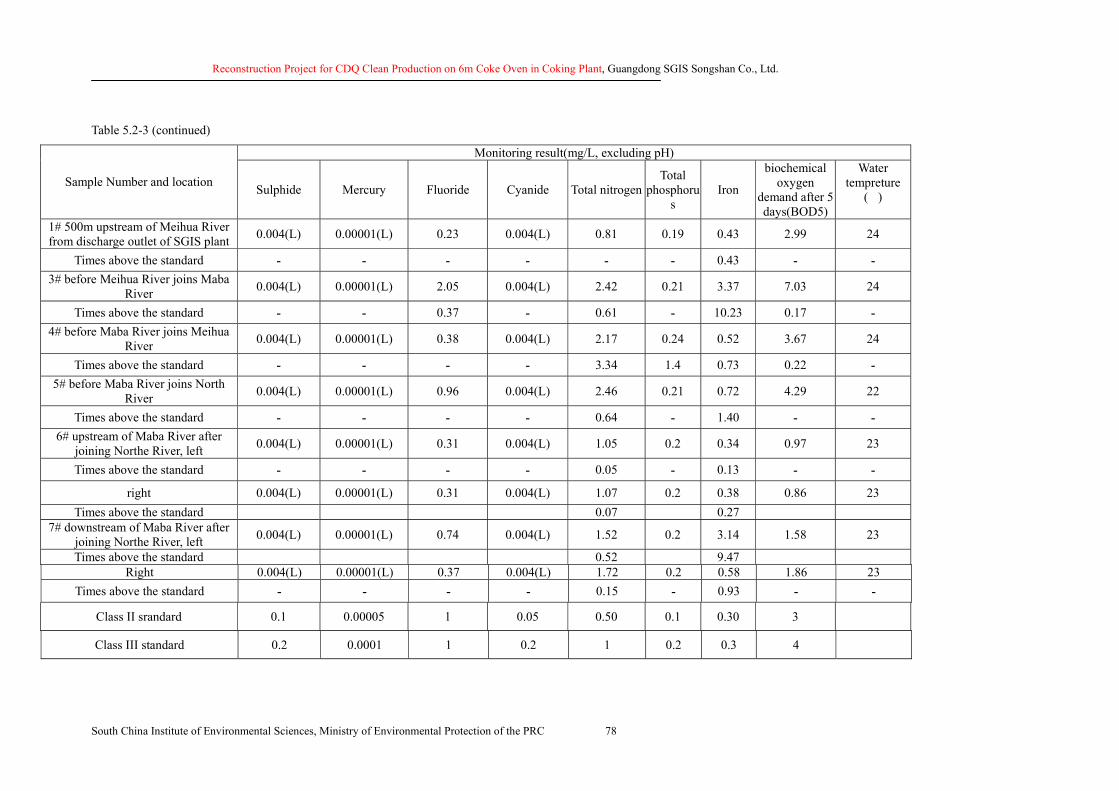
Reconstruction Project for CDQ Clean Production on 6m Coke Oven in Coking Plant, Guangdong SGIS Songshan Co., Ltd.
South China Institute of Environmental Sciences, Ministry of Environmental Protection of the PRC 78
Table 5.2-3 (continued)
Monitoring result(mg/L, excluding pH)
Sample Number and location Sulphide Mercury Fluoride Cyanide Total nitrogen Total
phosphorus
Iron
biochemical oxygen
demand after 5 days(BOD5)
Water tempreture
(�)
1# 500m upstream of Meihua River from discharge outlet of SGIS plant 0.004(L) 0.00001(L) 0.23 0.004(L) 0.81 0.19 0.43 2.99 24
Times above the standard - - - - - - 0.43 - - 3# before Meihua River joins Maba
River 0.004(L) 0.00001(L) 2.05 0.004(L) 2.42 0.21 3.37 7.03 24
Times above the standard - - 0.37 - 0.61 - 10.23 0.17 - 4# before Maba River joins Meihua
River 0.004(L) 0.00001(L) 0.38 0.004(L) 2.17 0.24 0.52 3.67 24
Times above the standard - - - - 3.34 1.4 0.73 0.22 - 5# before Maba River joins North
River 0.004(L) 0.00001(L) 0.96 0.004(L) 2.46 0.21 0.72 4.29 22
Times above the standard - - - - 0.64 - 1.40 - - 6# upstream of Maba River after
joining Northe River, left 0.004(L) 0.00001(L) 0.31 0.004(L) 1.05 0.2 0.34 0.97 23
Times above the standard - - - - 0.05 - 0.13 - -
right 0.004(L) 0.00001(L) 0.31 0.004(L) 1.07 0.2 0.38 0.86 23 Times above the standard 0.07 0.27
7# downstream of Maba River after joining Northe River, left 0.004(L) 0.00001(L) 0.74 0.004(L) 1.52 0.2 3.14 1.58 23
Times above the standard 0.52 9.47 Right 0.004(L) 0.00001(L) 0.37 0.004(L) 1.72 0.2 0.58 1.86 23
Times above the standard - - - - 0.15 - 0.93 - -
Class II srandard 0.1 0.00005 1 0.05 0.50 0.1 0.30 3
Class III standard 0.2 0.0001 1 0.2 1 0.2 0.3 4
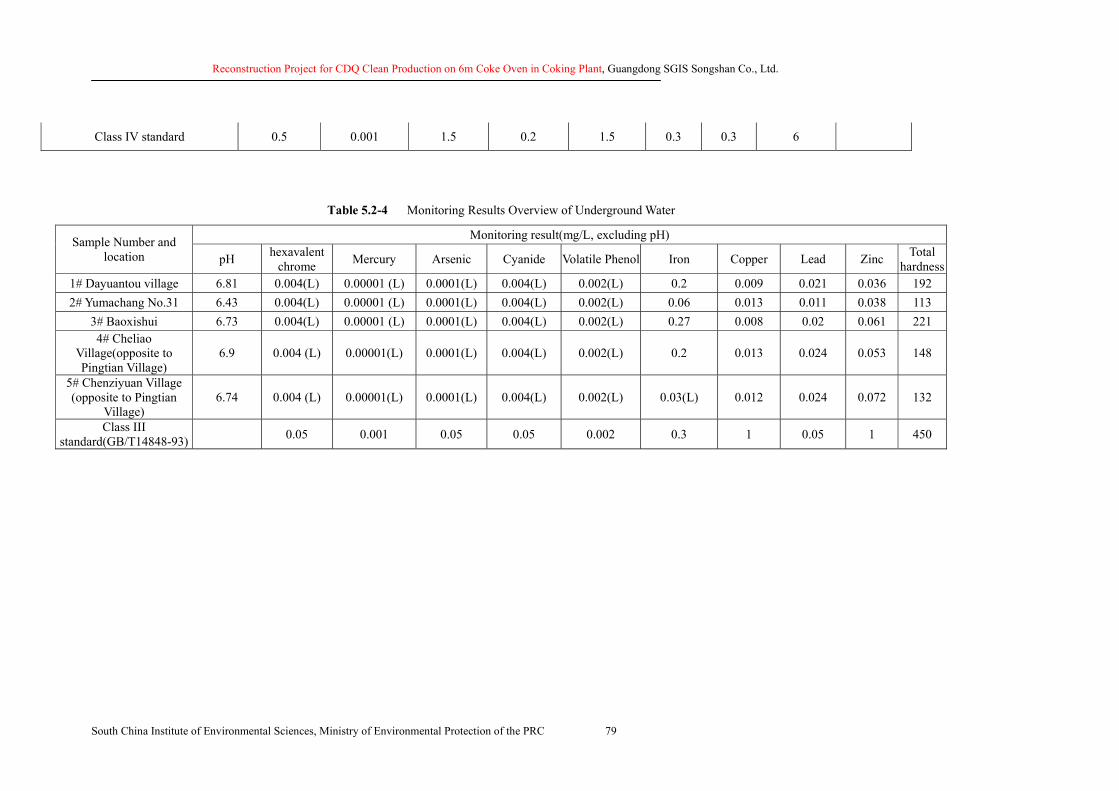
Reconstruction Project for CDQ Clean Production on 6m Coke Oven in Coking Plant, Guangdong SGIS Songshan Co., Ltd.
South China Institute of Environmental Sciences, Ministry of Environmental Protection of the PRC 79
Class IV standard 0.5 0.001 1.5 0.2 1.5 0.3 0.3 6
Table 5.2-4 Monitoring Results Overview of Underground Water
Monitoring result(mg/L, excluding pH) Sample Number and location pH hexavalent
chrome Mercury Arsenic Cyanide Volatile Phenol Iron Copper Lead Zinc Total hardness
1# Dayuantou village 6.81 0.004(L) 0.00001 (L) 0.0001(L) 0.004(L) 0.002(L) 0.2 0.009 0.021 0.036 192 2# Yumachang No.31 6.43 0.004(L) 0.00001 (L) 0.0001(L) 0.004(L) 0.002(L) 0.06 0.013 0.011 0.038 113
3# Baoxishui 6.73 0.004(L) 0.00001 (L) 0.0001(L) 0.004(L) 0.002(L) 0.27 0.008 0.02 0.061 221 4# Cheliao
Village(opposite to Pingtian Village)
6.9 0.004 (L) 0.00001(L) 0.0001(L) 0.004(L) 0.002(L) 0.2 0.013 0.024 0.053 148
5# Chenziyuan Village (opposite to Pingtian
Village) 6.74 0.004 (L) 0.00001(L) 0.0001(L) 0.004(L) 0.002(L) 0.03(L) 0.012 0.024 0.072 132
Class III standard(GB/T14848-93) 0.05 0.001 0.05 0.05 0.002 0.3 1 0.05 1 450
Reconstruction Project for CDQ Clean Production on 6m Coke Oven in Coking Plant, Guangdong SGIS Songshan Co., Ltd.
South China Institute of Environmental Sciences, Ministry of Environmental Protection of the PRC 80
5.3 Monitoring and Assessment of Existing Baseline of Acoustic Environment Quality 5.3.1 Monitoring point distribution
According to the distribution of noise sources in this Project and the locations of surrounding sensitive points of acoustic environment, 12 monitoring points are established around the plant boundary on the land for the project of this phase, around SGIS plant boundary and at sensitive points.
5.3.2 Monitoring time and sampling frequency
2 site monitoring of the monitoring points were conducted from 1st to 3rd ,August 2006 and from 27th to 28th, September 2006, both lasting continuously for 2 days, including daytime monitoring and night monitoring, typically conducting measurement through sampling in short time, i.e., monitoring in work time during daytime(e.g., 8:00-12:00 and 14:00-18:00) and in sleep time during night(e.g., 23:00-05:00), measuring equivalent consecutive sound level A through integral sound level meter.
5.3.3 Monitoring method
Monitoring method is adopted in accordance with relevant stipulations in Measuring Method of Environmental Noise of Urban Area (GB/T 14623-93).
5.3.4 Evaluation of existing baseline of acoustic environme nt quality
5.3.4.1 Standards for the execution of evaluation
In view of the requirements of Measuring Method of Environmental Noise of Urban Area(GB3093-93), the acoustic environment sensitive points including Yangwu village, Dayuantou village, Shanzibei school, Xiaogang village and Xiaojiang village belong to rural living environment, for which the Class I standard of Measuring Method of Environmental Noise of Urban Area(GB3093-93) shall be executed; Laojiang village and xiaojiang village are in 300m range of the SGIS plant boundary, for which the Class II standard of Measuring Method of Environmental Noise of Urban Area(GB 3093-93) shall be executed; the plant boundary range belongs to industrial area, for which the Class III standard of Measuring Method of Environmental Noise of Urban Area(GB3093-93) shall be executed.
5.3.4.2 Evaluation of existing baseline of acoustic environment quality
� Sensitive points
Sensitive points monitored of the project include Yangwu Village, Dayuantou Village, Shanzibei School, Xiaogang Village, Xiaojiang Village and Laojiang Village. All monitoring points but Laojiang Village within 300m of the plant boundary complies with the Class II standard of Standard of Environmental Noise of Urban Area (GB3096-93). In daytime, noise in Yangwu Village exceeds the standard, and noise in other monitoring points all meet relevant standards. In nighttime, all monitoring points exceed the standard, and noise in Shanzibei School exceeds the standard at most, the maximum vale exceeding 13.4dB (A) of the standard limit.
� SGIS plant boundary
The plant boundary area belongs to industrial area, for which the Class III standard of Measuring Method of Environmental Noise of Urban Area (GB 3093-93) shall be executed. The project has been in the trail operation phase, based on the monitoring result, noise of all monitoring points in daytime can be up to Class III standard of Standard of Environmental Noise of Urban Area (GB3096-93). And at nighttime, the monitoring point in boundary of SGIS Plant also is up to the Class III standard.
� Boundary of the land for the project
As for boundary of the land for the project the Class III standard of Measuring Method of Environmental Noise of Urban Area (GB 3093-93) shall be executed. As shown by the monitoring result, the noise level of all monitoring points during daytime meets the standards.
The noise produced in this Project contributes little to the impact on surrounding villages, but as the whole
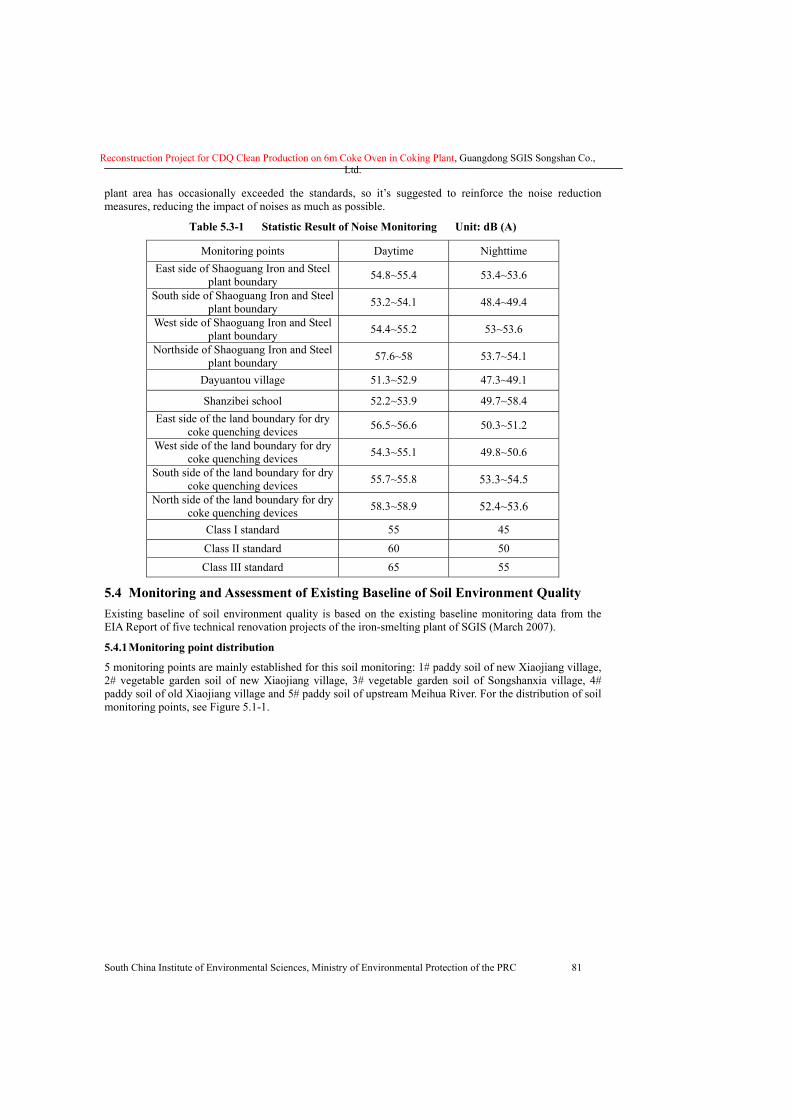
Reconstruction Project for CDQ Clean Production on 6m Coke Oven in Coking Plant, Guangdong SGIS Songshan Co., Ltd.
South China Institute of Environmental Sciences, Ministry of Environmental Protection of the PRC 81
plant area has occasionally exceeded the standards, so it’s suggested to reinforce the noise reduction measures, reducing the impact of noises as much as possible.
Table 5.3-1 Statistic Result of Noise Monitoring Unit: dB (A)
Monitoring points Daytime Nighttime East side of Shaoguang Iron and Steel
plant boundary 54.8~55.4 53.4~53.6
South side of Shaoguang Iron and Steel plant boundary 53.2~54.1 48.4~49.4
West side of Shaoguang Iron and Steel plant boundary 54.4~55.2 53~53.6
Northside of Shaoguang Iron and Steel plant boundary 57.6~58 53.7~54.1
Dayuantou village 51.3~52.9 47.3~49.1
Shanzibei school 52.2~53.9 49.7~58.4 East side of the land boundary for dry
coke quenching devices 56.5~56.6 50.3~51.2
West side of the land boundary for dry coke quenching devices 54.3~55.1 49.8~50.6
South side of the land boundary for dry coke quenching devices 55.7~55.8 53.3~54.5
North side of the land boundary for dry coke quenching devices 58.3~58.9 52.4~53.6
Class I standard 55 45 Class II standard 60 50 Class III standard 65 55
5.4 Monitoring and Assessment of Existing Baseline of Soil Environment Quality Existing baseline of soil environment quality is based on the existing baseline monitoring data from the EIA Report of five technical renovation projects of the iron-smelting plant of SGIS (March 2007).
5.4.1 Monitoring point distribution
5 monitoring points are mainly established for this soil monitoring: 1# paddy soil of new Xiaojiang village, 2# vegetable garden soil of new Xiaojiang village, 3# vegetable garden soil of Songshanxia village, 4# paddy soil of old Xiaojiang village and 5# paddy soil of upstream Meihua River. For the distribution of soil monitoring points, see Figure 5.1-1.
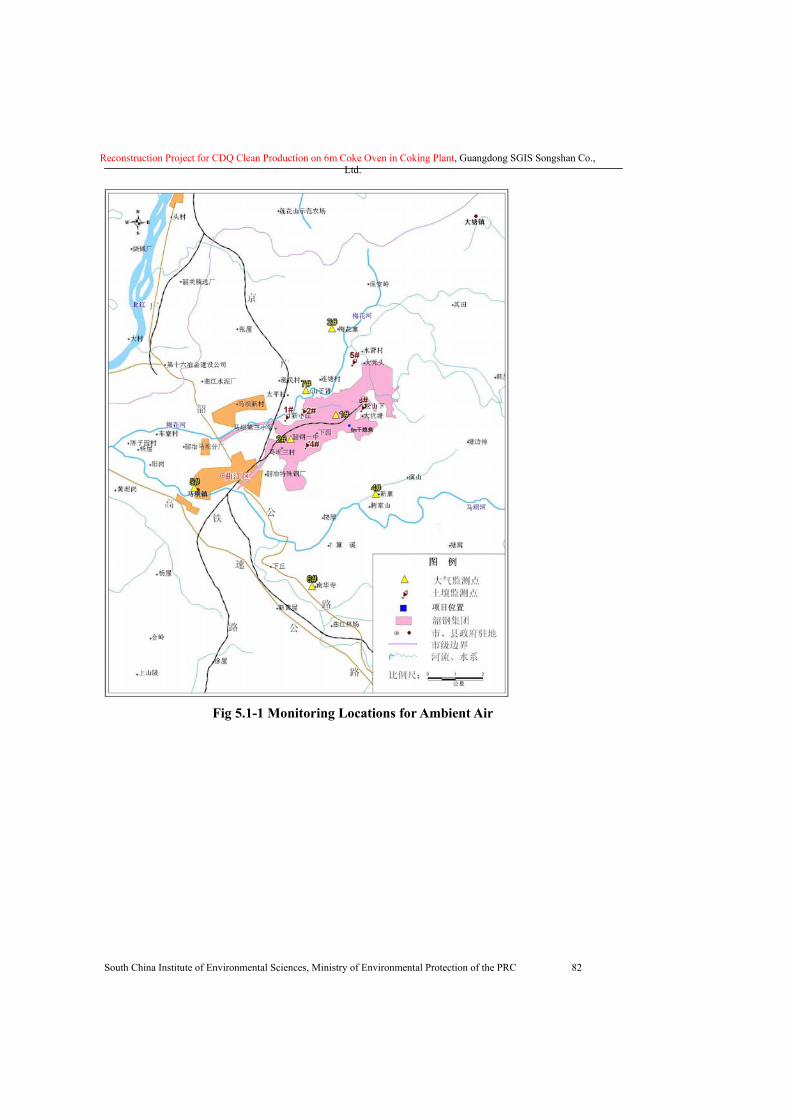
Reconstruction Project for CDQ Clean Production on 6m Coke Oven in Coking Plant, Guangdong SGIS Songshan Co., Ltd.
South China Institute of Environmental Sciences, Ministry of Environmental Protection of the PRC 82
Fig 5.1-1 Monitoring Locations for Ambient Air
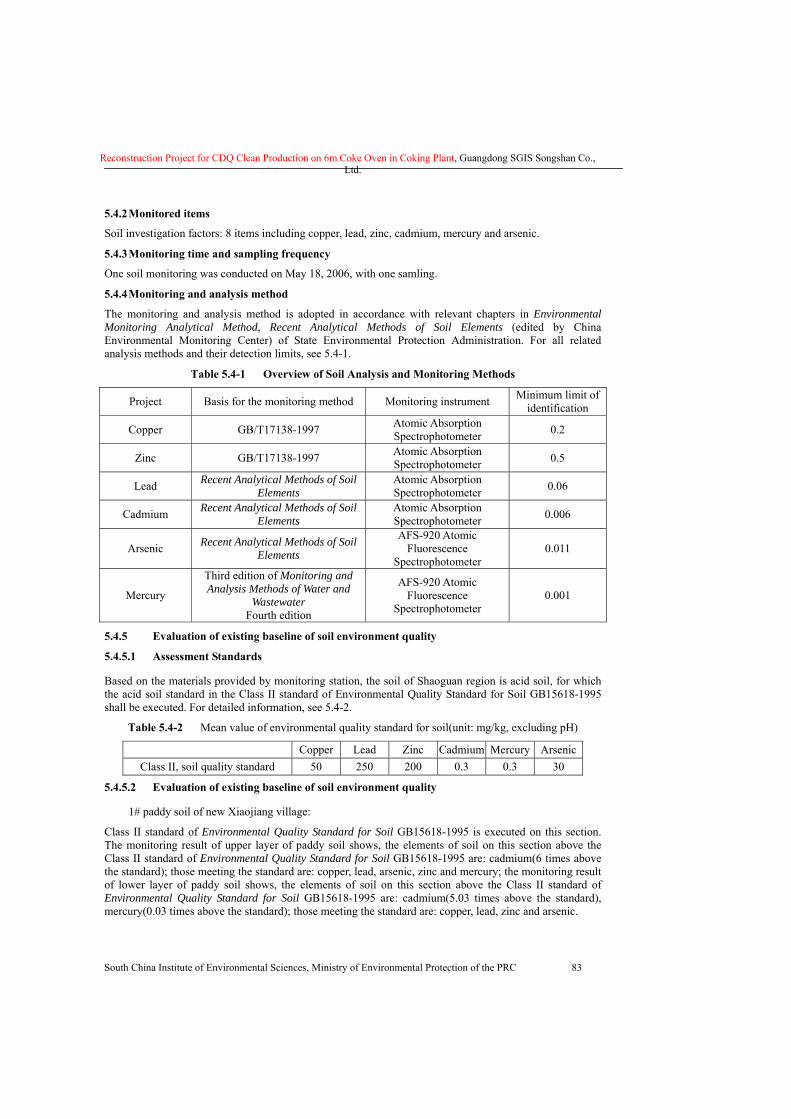
Reconstruction Project for CDQ Clean Production on 6m Coke Oven in Coking Plant, Guangdong SGIS Songshan Co., Ltd.
South China Institute of Environmental Sciences, Ministry of Environmental Protection of the PRC 83
5.4.2 Monitored items
Soil investigation factors: 8 items including copper, lead, zinc, cadmium, mercury and arsenic.
5.4.3 Monitoring time and sampling frequency
One soil monitoring was conducted on May 18, 2006, with one samling.
5.4.4 Monitoring and analysis method
The monitoring and analysis method is adopted in accordance with relevant chapters in Environmental Monitoring Analytical Method, Recent Analytical Methods of Soil Elements (edited by China Environmental Monitoring Center) of State Environmental Protection Administration. For all related analysis methods and their detection limits, see 5.4-1.
Table 5.4-1 Overview of Soil Analysis and Monitoring Methods
Project Basis for the monitoring method Monitoring instrument Minimum limit of identification
Copper GB/T17138-1997 Atomic Absorption Spectrophotometer 0.2
Zinc GB/T17138-1997 Atomic Absorption Spectrophotometer 0.5
Lead Recent Analytical Methods of Soil Elements
Atomic Absorption Spectrophotometer 0.06
Cadmium Recent Analytical Methods of Soil Elements
Atomic Absorption Spectrophotometer 0.006
Arsenic Recent Analytical Methods of Soil Elements
AFS-920 Atomic Fluorescence
Spectrophotometer 0.011
Mercury
Third edition of Monitoring and Analysis Methods of Water and
Wastewater Fourth edition
AFS-920 Atomic Fluorescence
Spectrophotometer 0.001
5.4.5 Evaluation of existing baseline of soil environment quality
5.4.5.1 Assessment Standards
Based on the materials provided by monitoring station, the soil of Shaoguan region is acid soil, for which the acid soil standard in the Class II standard of Environmental Quality Standard for Soil GB15618-1995 shall be executed. For detailed information, see 5.4-2.
Table 5.4-2 Mean value of environmental quality standard for soil(unit: mg/kg, excluding pH)
Copper Lead Zinc Cadmium Mercury Arsenic Class II, soil quality standard 50 250 200 0.3 0.3 30
5.4.5.2 Evaluation of existing baseline of soil environment quality
� 1# paddy soil of new Xiaojiang village:
Class II standard of Environmental Quality Standard for Soil GB15618-1995 is executed on this section. The monitoring result of upper layer of paddy soil shows, the elements of soil on this section above the Class II standard of Environmental Quality Standard for Soil GB15618-1995 are: cadmium(6 times above the standard); those meeting the standard are: copper, lead, arsenic, zinc and mercury; the monitoring result of lower layer of paddy soil shows, the elements of soil on this section above the Class II standard of Environmental Quality Standard for Soil GB15618-1995 are: cadmium(5.03 times above the standard), mercury(0.03 times above the standard); those meeting the standard are: copper, lead, zinc and arsenic.
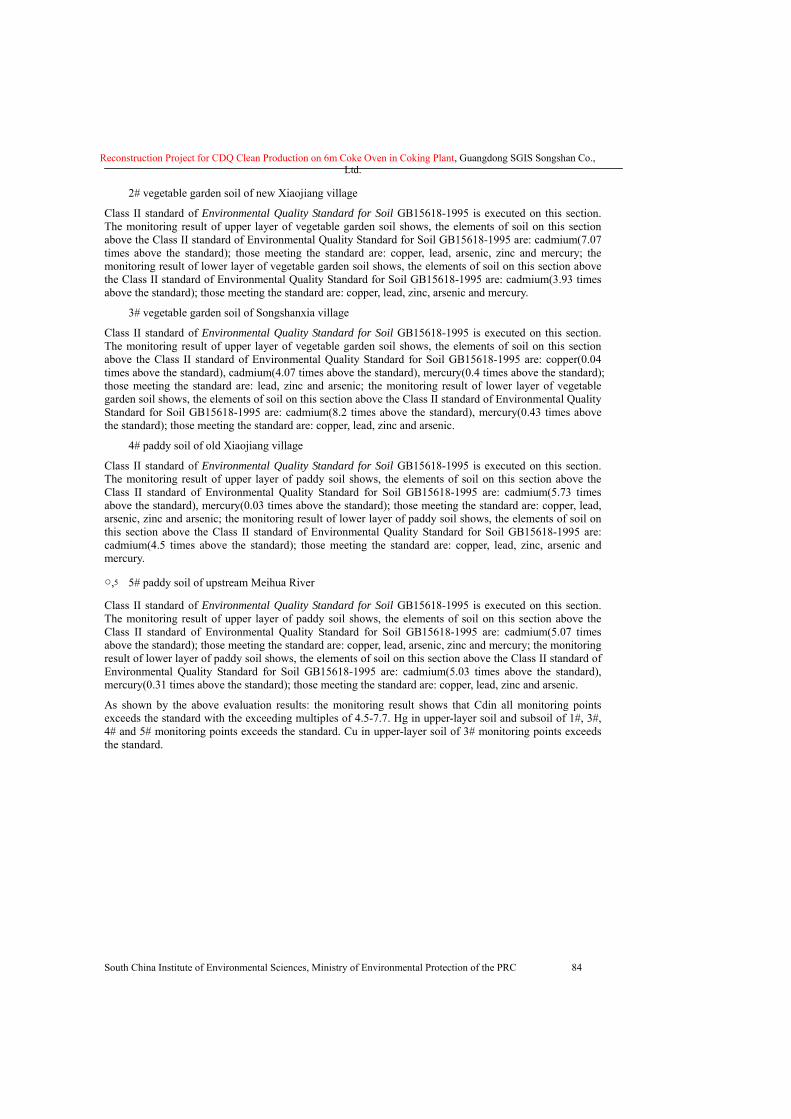
Reconstruction Project for CDQ Clean Production on 6m Coke Oven in Coking Plant, Guangdong SGIS Songshan Co., Ltd.
South China Institute of Environmental Sciences, Ministry of Environmental Protection of the PRC 84
� 2# vegetable garden soil of new Xiaojiang village
Class II standard of Environmental Quality Standard for Soil GB15618-1995 is executed on this section. The monitoring result of upper layer of vegetable garden soil shows, the elements of soil on this section above the Class II standard of Environmental Quality Standard for Soil GB15618-1995 are: cadmium(7.07 times above the standard); those meeting the standard are: copper, lead, arsenic, zinc and mercury; the monitoring result of lower layer of vegetable garden soil shows, the elements of soil on this section above the Class II standard of Environmental Quality Standard for Soil GB15618-1995 are: cadmium(3.93 times above the standard); those meeting the standard are: copper, lead, zinc, arsenic and mercury.
� 3# vegetable garden soil of Songshanxia village
Class II standard of Environmental Quality Standard for Soil GB15618-1995 is executed on this section. The monitoring result of upper layer of vegetable garden soil shows, the elements of soil on this section above the Class II standard of Environmental Quality Standard for Soil GB15618-1995 are: copper(0.04 times above the standard), cadmium(4.07 times above the standard), mercury(0.4 times above the standard); those meeting the standard are: lead, zinc and arsenic; the monitoring result of lower layer of vegetable garden soil shows, the elements of soil on this section above the Class II standard of Environmental Quality Standard for Soil GB15618-1995 are: cadmium(8.2 times above the standard), mercury(0.43 times above the standard); those meeting the standard are: copper, lead, zinc and arsenic.
� 4# paddy soil of old Xiaojiang village
Class II standard of Environmental Quality Standard for Soil GB15618-1995 is executed on this section. The monitoring result of upper layer of paddy soil shows, the elements of soil on this section above the Class II standard of Environmental Quality Standard for Soil GB15618-1995 are: cadmium(5.73 times above the standard), mercury(0.03 times above the standard); those meeting the standard are: copper, lead, arsenic, zinc and arsenic; the monitoring result of lower layer of paddy soil shows, the elements of soil on this section above the Class II standard of Environmental Quality Standard for Soil GB15618-1995 are: cadmium(4.5 times above the standard); those meeting the standard are: copper, lead, zinc, arsenic and mercury.
○,5 5# paddy soil of upstream Meihua River
Class II standard of Environmental Quality Standard for Soil GB15618-1995 is executed on this section. The monitoring result of upper layer of paddy soil shows, the elements of soil on this section above the Class II standard of Environmental Quality Standard for Soil GB15618-1995 are: cadmium(5.07 times above the standard); those meeting the standard are: copper, lead, arsenic, zinc and mercury; the monitoring result of lower layer of paddy soil shows, the elements of soil on this section above the Class II standard of Environmental Quality Standard for Soil GB15618-1995 are: cadmium(5.03 times above the standard), mercury(0.31 times above the standard); those meeting the standard are: copper, lead, zinc and arsenic.
As shown by the above evaluation results: the monitoring result shows that Cdin all monitoring points exceeds the standard with the exceeding multiples of 4.5-7.7. Hg in upper-layer soil and subsoil of 1#, 3#, 4# and 5# monitoring points exceeds the standard. Cu in upper-layer soil of 3# monitoring points exceeds the standard.
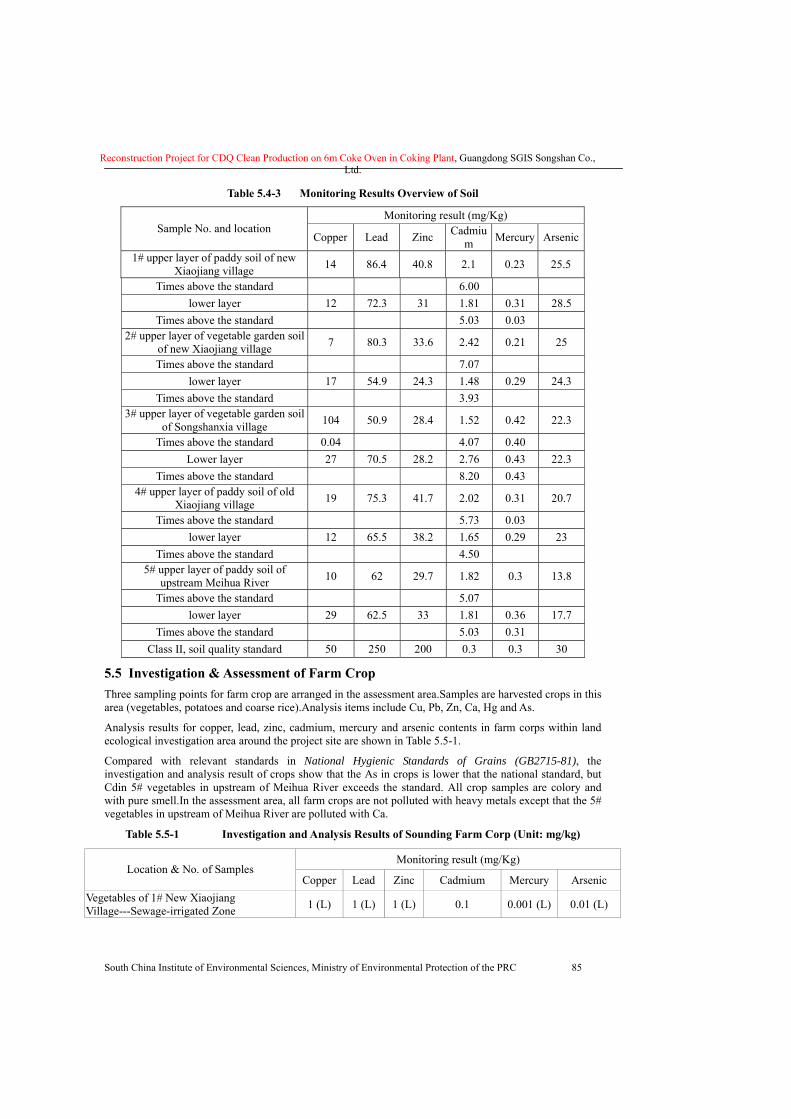
Reconstruction Project for CDQ Clean Production on 6m Coke Oven in Coking Plant, Guangdong SGIS Songshan Co., Ltd.
South China Institute of Environmental Sciences, Ministry of Environmental Protection of the PRC 85
Table 5.4-3 Monitoring Results Overview of Soil
Monitoring result (mg/Kg) Sample No. and location
Copper Lead Zinc Cadmium Mercury Arsenic
1# upper layer of paddy soil of new Xiaojiang village 14 86.4 40.8 2.1 0.23 25.5
Times above the standard 6.00 lower layer 12 72.3 31 1.81 0.31 28.5
Times above the standard 5.03 0.03 2# upper layer of vegetable garden soil
of new Xiaojiang village 7 80.3 33.6 2.42 0.21 25
Times above the standard 7.07 lower layer 17 54.9 24.3 1.48 0.29 24.3
Times above the standard 3.93 3# upper layer of vegetable garden soil
of Songshanxia village 104 50.9 28.4 1.52 0.42 22.3
Times above the standard 0.04 4.07 0.40 Lower layer 27 70.5 28.2 2.76 0.43 22.3
Times above the standard 8.20 0.43 4# upper layer of paddy soil of old
Xiaojiang village 19 75.3 41.7 2.02 0.31 20.7
Times above the standard 5.73 0.03 lower layer 12 65.5 38.2 1.65 0.29 23
Times above the standard 4.50 5# upper layer of paddy soil of
upstream Meihua River 10 62 29.7 1.82 0.3 13.8
Times above the standard 5.07 lower layer 29 62.5 33 1.81 0.36 17.7
Times above the standard 5.03 0.31 Class II, soil quality standard 50 250 200 0.3 0.3 30
5.5 Investigation & Assessment of Farm Crop Three sampling points for farm crop are arranged in the assessment area.Samples are harvested crops in this area (vegetables, potatoes and coarse rice).Analysis items include Cu, Pb, Zn, Ca, Hg and As.
Analysis results for copper, lead, zinc, cadmium, mercury and arsenic contents in farm corps within land ecological investigation area around the project site are shown in Table 5.5-1.
Compared with relevant standards in National Hygienic Standards of Grains (GB2715-81), the investigation and analysis result of crops show that the As in crops is lower that the national standard, but Cdin 5# vegetables in upstream of Meihua River exceeds the standard. All crop samples are colory and with pure smell.In the assessment area, all farm crops are not polluted with heavy metals except that the 5# vegetables in upstream of Meihua River are polluted with Ca.
Table 5.5-1 Investigation and Analysis Results of Sounding Farm Corp (Unit: mg/kg)
Monitoring result (mg/Kg) Location & No. of Samples
Copper Lead Zinc Cadmium Mercury Arsenic Vegetables of 1# New Xiaojiang Village---Sewage-irrigated Zone 1 (L) 1 (L) 1 (L) 0.1 0.001 (L) 0.01 (L)
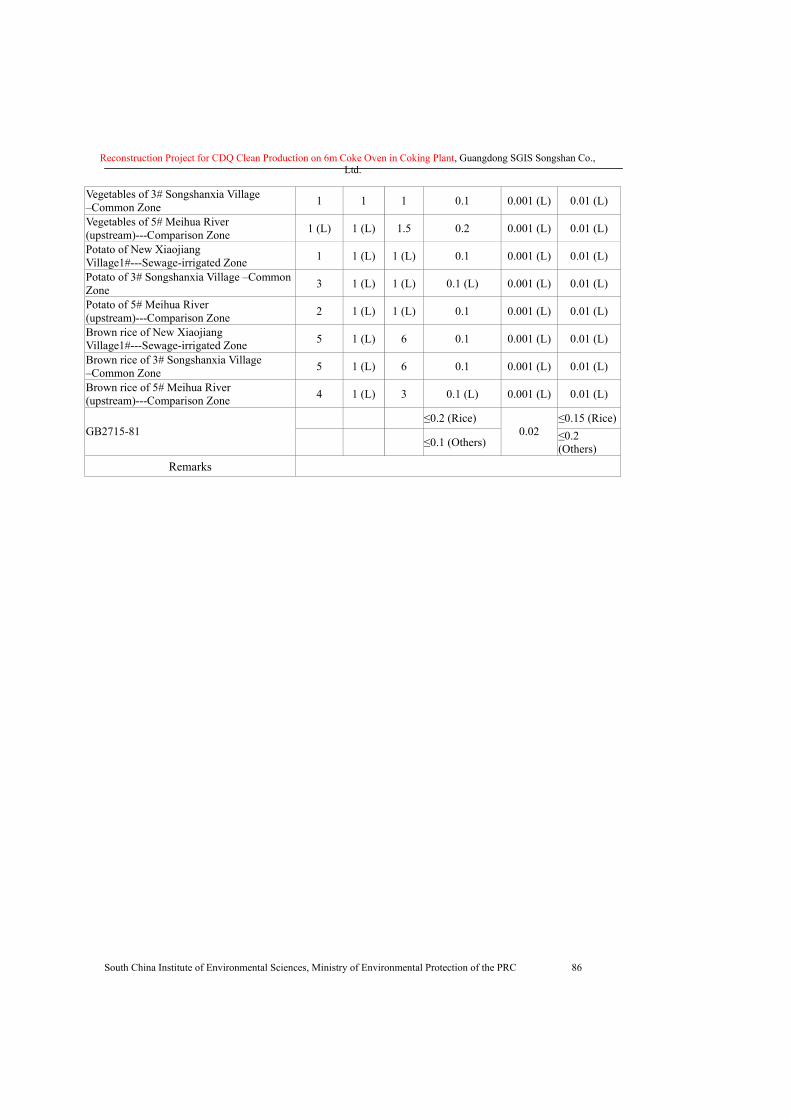
Reconstruction Project for CDQ Clean Production on 6m Coke Oven in Coking Plant, Guangdong SGIS Songshan Co., Ltd.
South China Institute of Environmental Sciences, Ministry of Environmental Protection of the PRC 86
Vegetables of 3# Songshanxia Village –Common Zone 1 1 1 0.1 0.001 (L) 0.01 (L)
Vegetables of 5# Meihua River (upstream)---Comparison Zone 1 (L) 1 (L) 1.5 0.2 0.001 (L) 0.01 (L)
Potato of New Xiaojiang Village1#---Sewage-irrigated Zone 1 1 (L) 1 (L) 0.1 0.001 (L) 0.01 (L)
Potato of 3# Songshanxia Village –Common Zone 3 1 (L) 1 (L) 0.1 (L) 0.001 (L) 0.01 (L)
Potato of 5# Meihua River (upstream)---Comparison Zone 2 1 (L) 1 (L) 0.1 0.001 (L) 0.01 (L)
Brown rice of New Xiaojiang Village1#---Sewage-irrigated Zone 5 1 (L) 6 0.1 0.001 (L) 0.01 (L)
Brown rice of 3# Songshanxia Village –Common Zone 5 1 (L) 6 0.1 0.001 (L) 0.01 (L)
Brown rice of 5# Meihua River (upstream)---Comparison Zone 4 1 (L) 3 0.1 (L) 0.001 (L) 0.01 (L)
≤0.2 (Rice) ≤0.15 (Rice) GB2715-81
≤0.1 (Others) 0.02 ≤0.2
(Others) Remarks
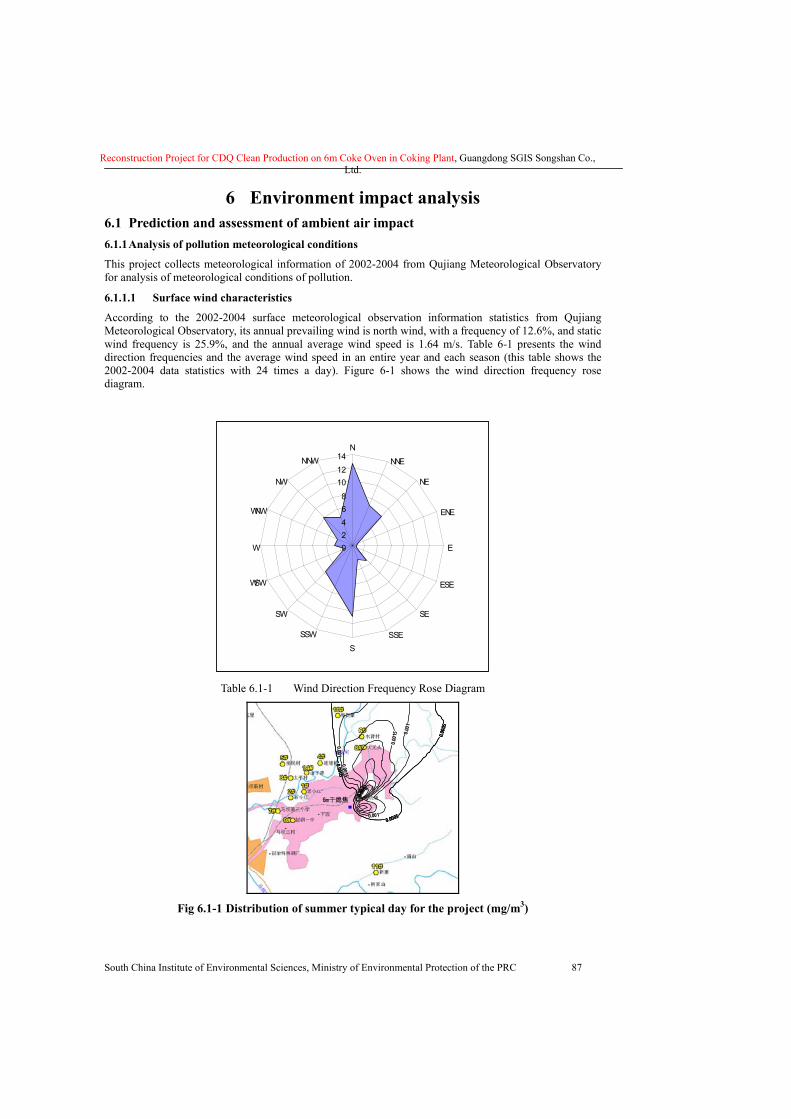
Reconstruction Project for CDQ Clean Production on 6m Coke Oven in Coking Plant, Guangdong SGIS Songshan Co., Ltd.
South China Institute of Environmental Sciences, Ministry of Environmental Protection of the PRC 87
6 Environment impact analysis 6.1 Prediction and assessment of ambient air impact 6.1.1 Analysis of pollution meteorological conditions
This project collects meteorological information of 2002-2004 from Qujiang Meteorological Observatory for analysis of meteorological conditions of pollution.
6.1.1.1 Surface wind characteristics
According to the 2002-2004 surface meteorological observation information statistics from Qujiang Meteorological Observatory, its annual prevailing wind is north wind, with a frequency of 12.6%, and static wind frequency is 25.9%, and the annual average wind speed is 1.64 m/s. Table 6-1 presents the wind direction frequencies and the average wind speed in an entire year and each season (this table shows the 2002-2004 data statistics with 24 times a day). Figure 6-1 shows the wind direction frequency rose diagram.
02468
101214
NNNE
NE
ENE
E
ESE
SE
SSES
SSW
SW
WSW
W
WNW
NW
NNW
Table 6.1-1 Wind Direction Frequency Rose Diagram
0.000
5
0.0005
0.0005
0.000
5
0.0005
0.0005
0.001
0.001
0.0010.0015
0.001
5
0.002
0.002
50.0
03
Fig 6.1-1 Distribution of summer typical day for the project (mg/m3)
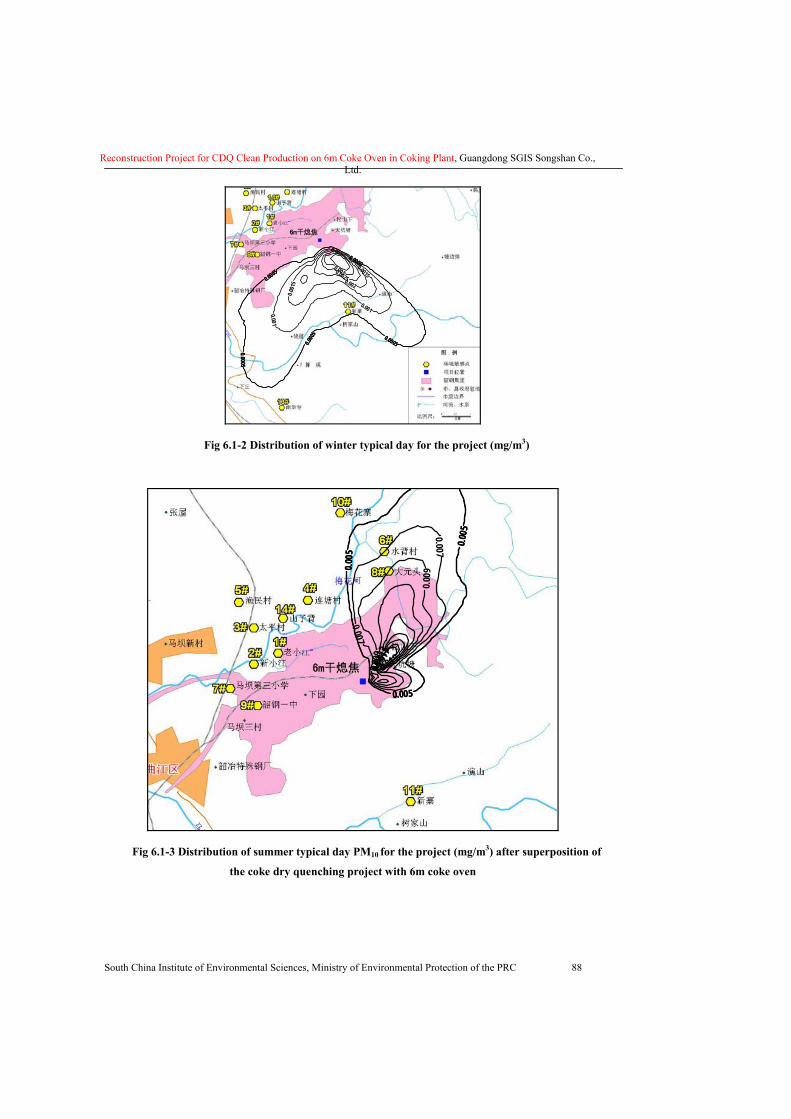
Reconstruction Project for CDQ Clean Production on 6m Coke Oven in Coking Plant, Guangdong SGIS Songshan Co., Ltd.
South China Institute of Environmental Sciences, Ministry of Environmental Protection of the PRC 88
0. 0005
0.0005
0.0005
0.00050.000
5
0.0005
0.0005
0.0005
0.00050.000
5
0.001
0.001
0.001
0.001
5
0.00150.002
0.0025
0.003
Fig 6.1-2 Distribution of winter typical day for the project (mg/m3)
0.0
05
0.005
0.005
0.005
0.005
0.005
0.007
0.007
0.009
0.009
0.0110.013
0.015
0.017
0.019
Fig 6.1-3 Distribution of summer typical day PM10 for the project (mg/m3) after superposition of
the coke dry quenching project with 6m coke oven
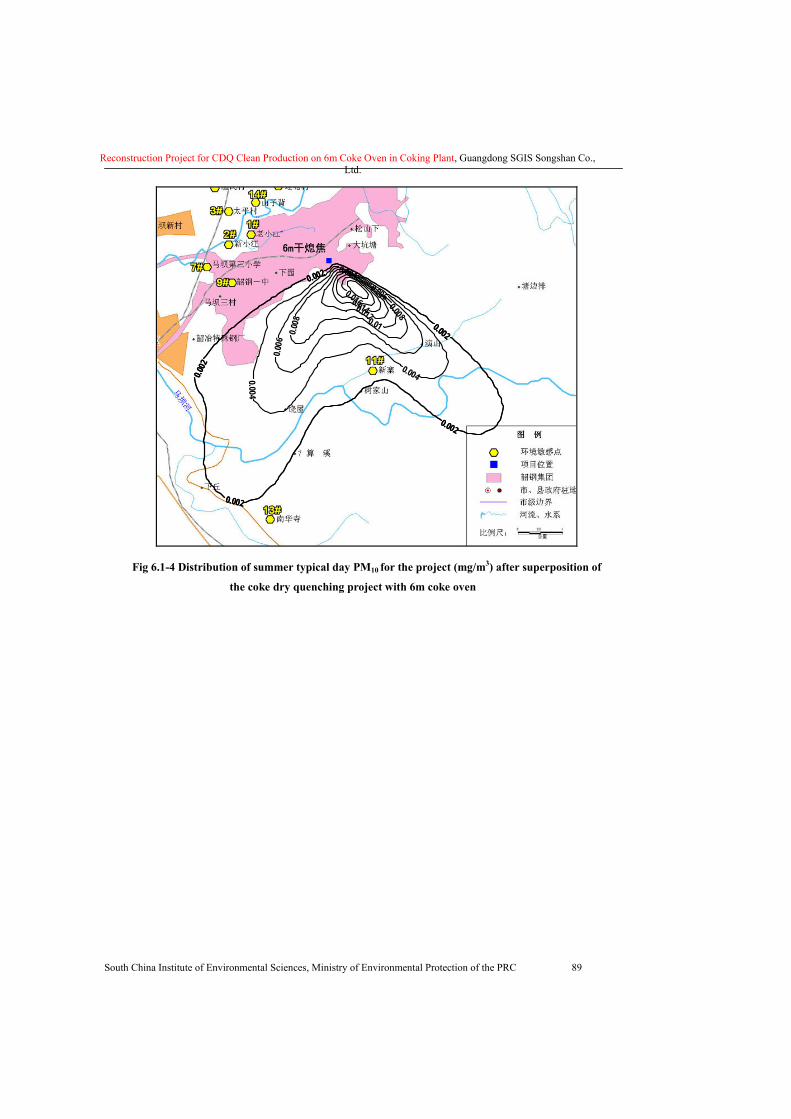
Reconstruction Project for CDQ Clean Production on 6m Coke Oven in Coking Plant, Guangdong SGIS Songshan Co., Ltd.
South China Institute of Environmental Sciences, Ministry of Environmental Protection of the PRC 89
0.002
0.002
0.002
0.002
0.002
0.002
0.002
0.002
0.002
0.002
0.004
0.004
0.004
0.006
0.0060.0
08
0.0080.01
0.0120.014
0.016
Fig 6.1-4 Distribution of summer typical day PM10 for the project (mg/m3) after superposition of
the coke dry quenching project with 6m coke oven
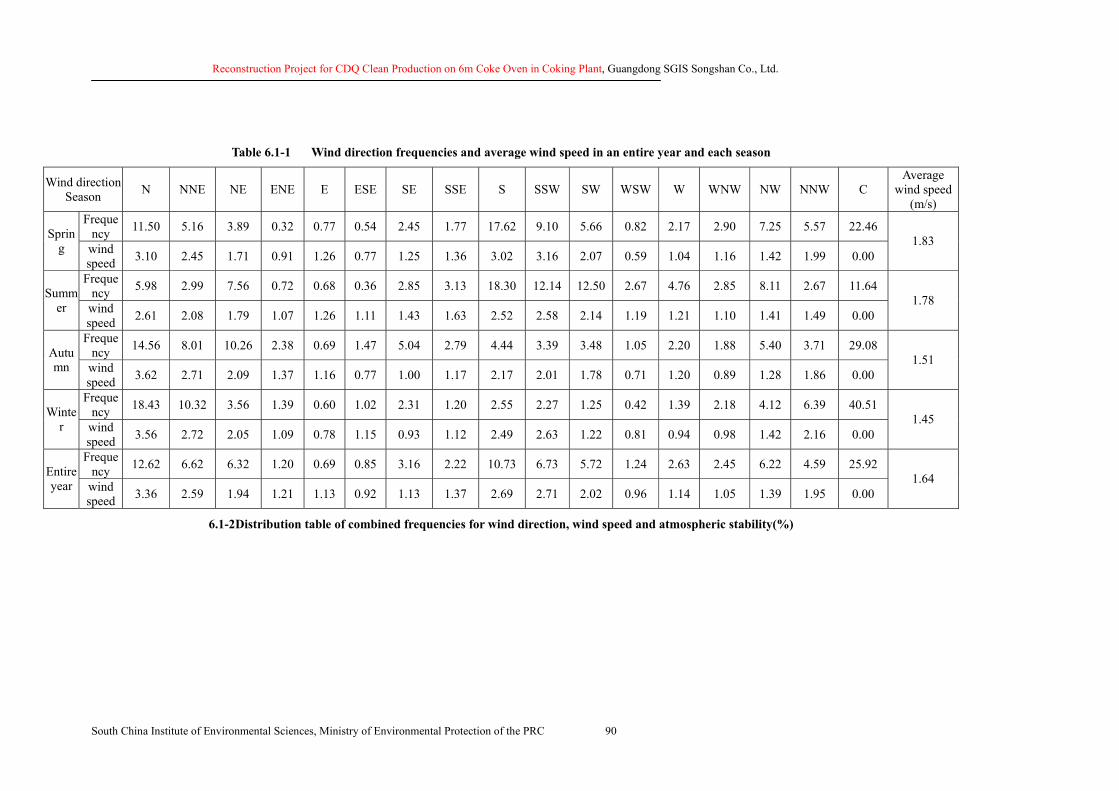
Reconstruction Project for CDQ Clean Production on 6m Coke Oven in Coking Plant, Guangdong SGIS Songshan Co., Ltd.
South China Institute of Environmental Sciences, Ministry of Environmental Protection of the PRC 90
Table 6.1-1 Wind direction frequencies and average wind speed in an entire year and each season
Wind direction Season N NNE NE ENE E ESE SE SSE S SSW SW WSW W WNW NW NNW C
Average wind speed
(m/s) Freque
ncy 11.50 5.16 3.89 0.32 0.77 0.54 2.45 1.77 17.62 9.10 5.66 0.82 2.17 2.90 7.25 5.57 22.46 Spring wind
speed 3.10 2.45 1.71 0.91 1.26 0.77 1.25 1.36 3.02 3.16 2.07 0.59 1.04 1.16 1.42 1.99 0.00 1.83
Frequency 5.98 2.99 7.56 0.72 0.68 0.36 2.85 3.13 18.30 12.14 12.50 2.67 4.76 2.85 8.11 2.67 11.64 Summ
er wind speed 2.61 2.08 1.79 1.07 1.26 1.11 1.43 1.63 2.52 2.58 2.14 1.19 1.21 1.10 1.41 1.49 0.00
1.78
Frequency 14.56 8.01 10.26 2.38 0.69 1.47 5.04 2.79 4.44 3.39 3.48 1.05 2.20 1.88 5.40 3.71 29.08 Autu
mn wind speed 3.62 2.71 2.09 1.37 1.16 0.77 1.00 1.17 2.17 2.01 1.78 0.71 1.20 0.89 1.28 1.86 0.00
1.51
Frequency 18.43 10.32 3.56 1.39 0.60 1.02 2.31 1.20 2.55 2.27 1.25 0.42 1.39 2.18 4.12 6.39 40.51 Winte
r wind speed 3.56 2.72 2.05 1.09 0.78 1.15 0.93 1.12 2.49 2.63 1.22 0.81 0.94 0.98 1.42 2.16 0.00
1.45
Frequency 12.62 6.62 6.32 1.20 0.69 0.85 3.16 2.22 10.73 6.73 5.72 1.24 2.63 2.45 6.22 4.59 25.92 Entire
year wind speed 3.36 2.59 1.94 1.21 1.13 0.92 1.13 1.37 2.69 2.71 2.02 0.96 1.14 1.05 1.39 1.95 0.00
1.64
6.1-2 Distribution table of combined frequencies for wind direction, wind speed and atmospheric stability(%)
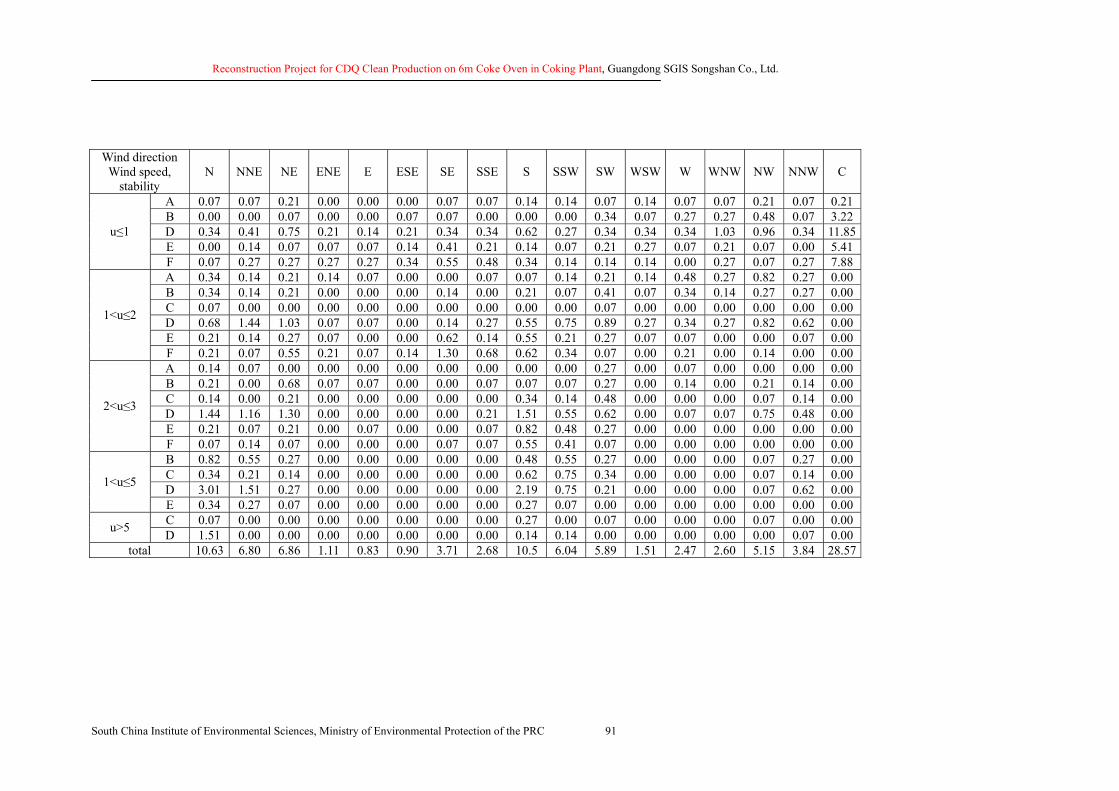
Reconstruction Project for CDQ Clean Production on 6m Coke Oven in Coking Plant, Guangdong SGIS Songshan Co., Ltd.
South China Institute of Environmental Sciences, Ministry of Environmental Protection of the PRC 91
Wind direction Wind speed,
stability N NNE NE ENE E ESE SE SSE S SSW SW WSW W WNW NW NNW C
A 0.07 0.07 0.21 0.00 0.00 0.00 0.07 0.07 0.14 0.14 0.07 0.14 0.07 0.07 0.21 0.07 0.21 B 0.00 0.00 0.07 0.00 0.00 0.07 0.07 0.00 0.00 0.00 0.34 0.07 0.27 0.27 0.48 0.07 3.22 D 0.34 0.41 0.75 0.21 0.14 0.21 0.34 0.34 0.62 0.27 0.34 0.34 0.34 1.03 0.96 0.34 11.85E 0.00 0.14 0.07 0.07 0.07 0.14 0.41 0.21 0.14 0.07 0.21 0.27 0.07 0.21 0.07 0.00 5.41
u≤1
F 0.07 0.27 0.27 0.27 0.27 0.34 0.55 0.48 0.34 0.14 0.14 0.14 0.00 0.27 0.07 0.27 7.88 A 0.34 0.14 0.21 0.14 0.07 0.00 0.00 0.07 0.07 0.14 0.21 0.14 0.48 0.27 0.82 0.27 0.00 B 0.34 0.14 0.21 0.00 0.00 0.00 0.14 0.00 0.21 0.07 0.41 0.07 0.34 0.14 0.27 0.27 0.00 C 0.07 0.00 0.00 0.00 0.00 0.00 0.00 0.00 0.00 0.00 0.07 0.00 0.00 0.00 0.00 0.00 0.00 D 0.68 1.44 1.03 0.07 0.07 0.00 0.14 0.27 0.55 0.75 0.89 0.27 0.34 0.27 0.82 0.62 0.00 E 0.21 0.14 0.27 0.07 0.00 0.00 0.62 0.14 0.55 0.21 0.27 0.07 0.07 0.00 0.00 0.07 0.00
1<u≤2
F 0.21 0.07 0.55 0.21 0.07 0.14 1.30 0.68 0.62 0.34 0.07 0.00 0.21 0.00 0.14 0.00 0.00 A 0.14 0.07 0.00 0.00 0.00 0.00 0.00 0.00 0.00 0.00 0.27 0.00 0.07 0.00 0.00 0.00 0.00 B 0.21 0.00 0.68 0.07 0.07 0.00 0.00 0.07 0.07 0.07 0.27 0.00 0.14 0.00 0.21 0.14 0.00 C 0.14 0.00 0.21 0.00 0.00 0.00 0.00 0.00 0.34 0.14 0.48 0.00 0.00 0.00 0.07 0.14 0.00 D 1.44 1.16 1.30 0.00 0.00 0.00 0.00 0.21 1.51 0.55 0.62 0.00 0.07 0.07 0.75 0.48 0.00 E 0.21 0.07 0.21 0.00 0.07 0.00 0.00 0.07 0.82 0.48 0.27 0.00 0.00 0.00 0.00 0.00 0.00
2<u≤3
F 0.07 0.14 0.07 0.00 0.00 0.00 0.07 0.07 0.55 0.41 0.07 0.00 0.00 0.00 0.00 0.00 0.00 B 0.82 0.55 0.27 0.00 0.00 0.00 0.00 0.00 0.48 0.55 0.27 0.00 0.00 0.00 0.07 0.27 0.00 C 0.34 0.21 0.14 0.00 0.00 0.00 0.00 0.00 0.62 0.75 0.34 0.00 0.00 0.00 0.07 0.14 0.00 D 3.01 1.51 0.27 0.00 0.00 0.00 0.00 0.00 2.19 0.75 0.21 0.00 0.00 0.00 0.07 0.62 0.00 1<u≤5
E 0.34 0.27 0.07 0.00 0.00 0.00 0.00 0.00 0.27 0.07 0.00 0.00 0.00 0.00 0.00 0.00 0.00 C 0.07 0.00 0.00 0.00 0.00 0.00 0.00 0.00 0.27 0.00 0.07 0.00 0.00 0.00 0.07 0.00 0.00 u>5 D 1.51 0.00 0.00 0.00 0.00 0.00 0.00 0.00 0.14 0.14 0.00 0.00 0.00 0.00 0.00 0.07 0.00
total 10.63 6.80 6.86 1.11 0.83 0.90 3.71 2.68 10.5 6.04 5.89 1.51 2.47 2.60 5.15 3.84 28.57
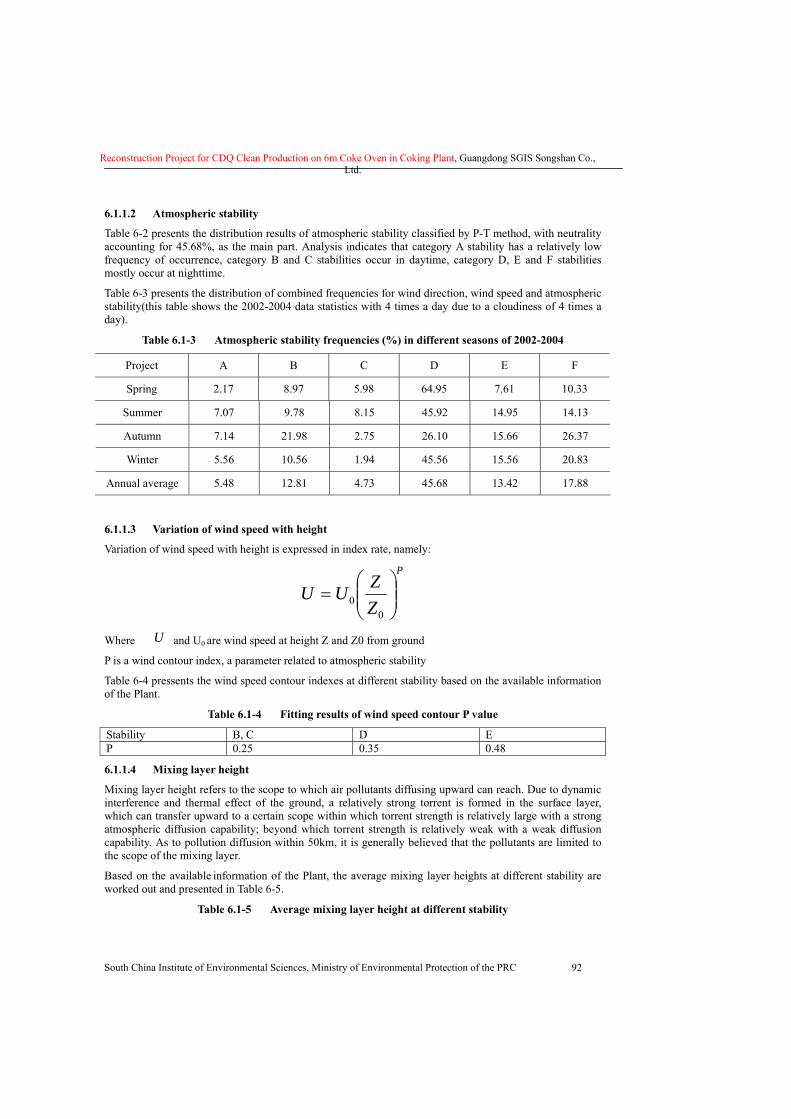
Reconstruction Project for CDQ Clean Production on 6m Coke Oven in Coking Plant, Guangdong SGIS Songshan Co., Ltd.
South China Institute of Environmental Sciences, Ministry of Environmental Protection of the PRC 92
6.1.1.2 Atmospheric stability
Table 6-2 presents the distribution results of atmospheric stability classified by P-T method, with neutrality accounting for 45.68%, as the main part. Analysis indicates that category A stability has a relatively low frequency of occurrence, category B and C stabilities occur in daytime, category D, E and F stabilities mostly occur at nighttime.
Table 6-3 presents the distribution of combined frequencies for wind direction, wind speed and atmospheric stability(this table shows the 2002-2004 data statistics with 4 times a day due to a cloudiness of 4 times a day).
Table 6.1-3 Atmospheric stability frequencies (%) in different seasons of 2002-2004
Project A B C D E F
Spring 2.17 8.97 5.98 64.95 7.61 10.33
Summer 7.07 9.78 8.15 45.92 14.95 14.13
Autumn 7.14 21.98 2.75 26.10 15.66 26.37
Winter 5.56 10.56 1.94 45.56 15.56 20.83
Annual average 5.48 12.81 4.73 45.68 13.42 17.88
6.1.1.3 Variation of wind speed with height
Variation of wind speed with height is expressed in index rate, namely:
P
ZZUU ⎟⎟⎠
⎞⎜⎜⎝
⎛=
00
Where U and U0 are wind speed at height Z and Z0 from ground
P is a wind contour index, a parameter related to atmospheric stability
Table 6-4 pressents the wind speed contour indexes at different stability based on the available information of the Plant.
Table 6.1-4 Fitting results of wind speed contour P value
Stability B, C D E P 0.25 0.35 0.48
6.1.1.4 Mixing layer height
Mixing layer height refers to the scope to which air pollutants diffusing upward can reach. Due to dynamic interference and thermal effect of the ground, a relatively strong torrent is formed in the surface layer, which can transfer upward to a certain scope within which torrent strength is relatively large with a strong atmospheric diffusion capability; beyond which torrent strength is relatively weak with a weak diffusion capability. As to pollution diffusion within 50km, it is generally believed that the pollutants are limited to the scope of the mixing layer.
Based on the available information of the Plant, the average mixing layer heights at different stability are worked out and presented in Table 6-5.
Table 6.1-5 Average mixing layer height at different stability
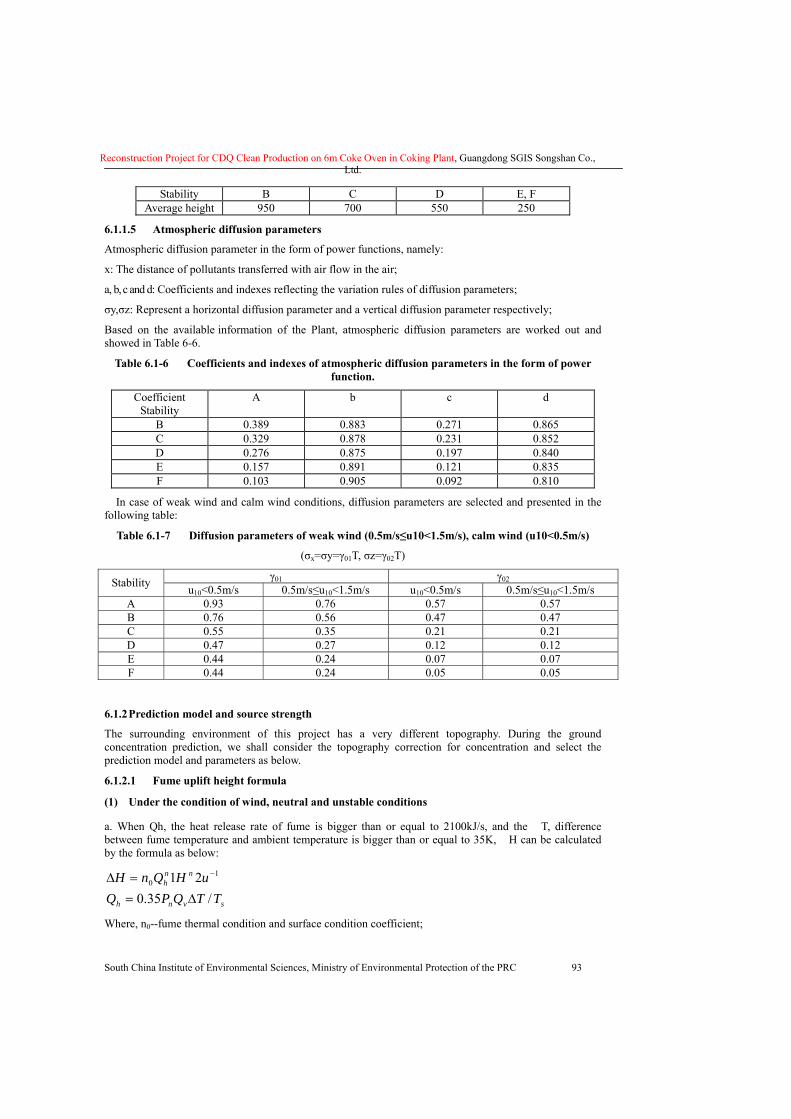
Reconstruction Project for CDQ Clean Production on 6m Coke Oven in Coking Plant, Guangdong SGIS Songshan Co., Ltd.
South China Institute of Environmental Sciences, Ministry of Environmental Protection of the PRC 93
Stability B C D E, F Average height 950 700 550 250
6.1.1.5 Atmospheric diffusion parameters
Atmospheric diffusion parameter in the form of power functions, namely:
x: The distance of pollutants transferred with air flow in the air;
a, b, c and d: Coefficients and indexes reflecting the variation rules of diffusion parameters;
σy,σz: Represent a horizontal diffusion parameter and a vertical diffusion parameter respectively;
Based on the available information of the Plant, atmospheric diffusion parameters are worked out and showed in Table 6-6.
Table 6.1-6 Coefficients and indexes of atmospheric diffusion parameters in the form of power function.
Coefficient Stability
A b c d
B 0.389 0.883 0.271 0.865 C 0.329 0.878 0.231 0.852 D 0.276 0.875 0.197 0.840 E 0.157 0.891 0.121 0.835 F 0.103 0.905 0.092 0.810
In case of weak wind and calm wind conditions, diffusion parameters are selected and presented in the following table:
Table 6.1-7 Diffusion parameters of weak wind (0.5m/s≤u10<1.5m/s), calm wind (u10<0.5m/s)
(σx=σy=γ01T, σz=γ02T)
γ01 γ02 Stability u10<0.5m/s 0.5m/s≤u10<1.5m/s u10<0.5m/s 0.5m/s≤u10<1.5m/s A 0.93 0.76 0.57 0.57 B 0.76 0.56 0.47 0.47 C 0.55 0.35 0.21 0.21 D 0.47 0.27 0.12 0.12 E 0.44 0.24 0.07 0.07 F 0.44 0.24 0.05 0.05
6.1.2 Prediction model and source strength
The surrounding environment of this project has a very different topography. During the ground concentration prediction, we shall consider the topography correction for concentration and select the prediction model and parameters as below.
6.1.2.1 Fume uplift height formula
(1) Under the condition of wind, neutral and unstable conditions
a. When Qh, the heat release rate of fume is bigger than or equal to 2100kJ/s, and the �T, difference between fume temperature and ambient temperature is bigger than or equal to 35K, �H can be calculated by the formula as below:
svnh
nnh
TTQPQuHQnH/35.0
21 10
Δ==Δ −
Where, n0--fume thermal condition and surface condition coefficient;
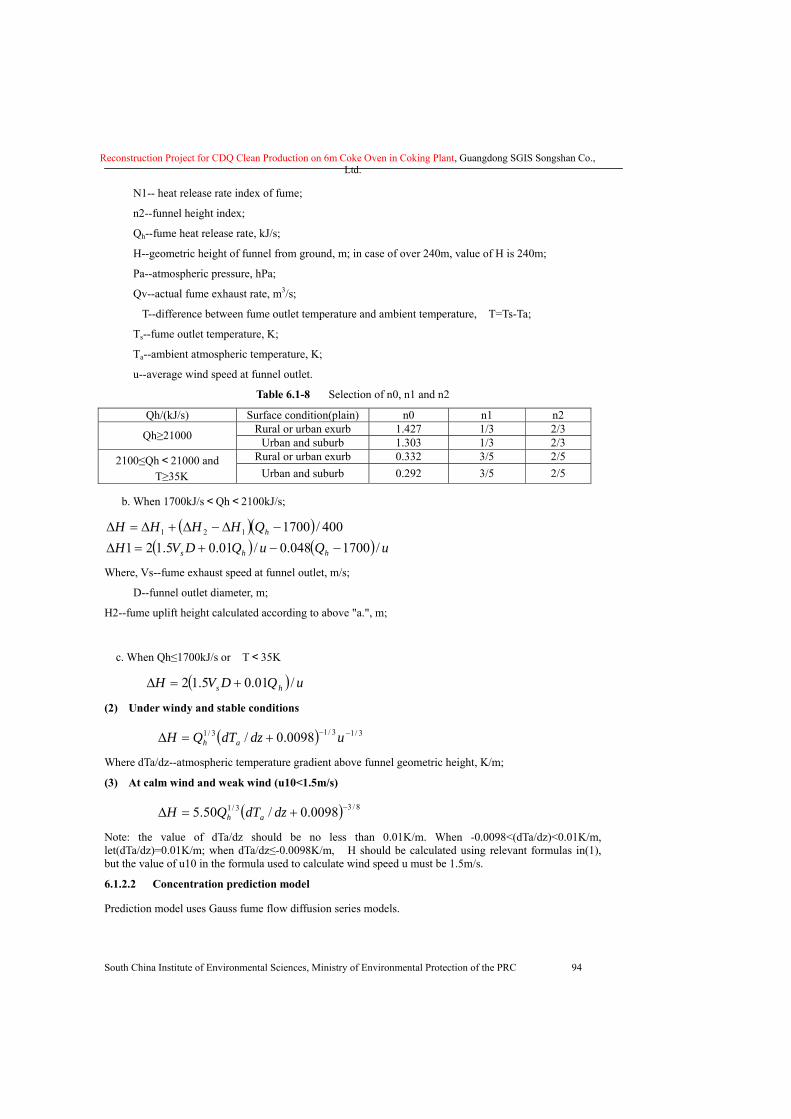
Reconstruction Project for CDQ Clean Production on 6m Coke Oven in Coking Plant, Guangdong SGIS Songshan Co., Ltd.
South China Institute of Environmental Sciences, Ministry of Environmental Protection of the PRC 94
N1-- heat release rate index of fume;
n2--funnel height index;
Qh--fume heat release rate, kJ/s;
H--geometric height of funnel from ground, m; in case of over 240m, value of H is 240m;
Pa--atmospheric pressure, hPa;
Qv--actual fume exhaust rate, m3/s;
�T--difference between fume outlet temperature and ambient temperature, �T=Ts-Ta;
Ts--fume outlet temperature, K;
Ta--ambient atmospheric temperature, K;
u--average wind speed at funnel outlet.
Table 6.1-8 Selection of n0, n1 and n2
Qh/(kJ/s) Surface condition(plain) n0 n1 n2 Rural or urban exurb 1.427 1/3 2/3 Qh≥21000 Urban and suburb 1.303 1/3 2/3 Rural or urban exurb 0.332 3/5 2/5 2100≤Qh<21000 and
�T≥35K Urban and suburb 0.292 3/5 2/5
b. When 1700kJ/s<Qh<2100kJ/s;
( )( )( ) ( ) uQuQDVH
QHHHH
hhs
h
/1700048.0/01.05.121400/1700121
−−+=Δ−Δ−Δ+Δ=Δ
Where, Vs--fume exhaust speed at funnel outlet, m/s;
D--funnel outlet diameter, m;
H2--fume uplift height calculated according to above "a.", m;
c. When Qh≤1700kJ/s or �T<35K
( ) uQDVH hs /01.05.12 +=Δ (2) Under windy and stable conditions
( ) 3/13/13/1 0098.0/ −−+=Δ udzdTQH ah Where dTa/dz--atmospheric temperature gradient above funnel geometric height, K/m;
(3) At calm wind and weak wind (u10<1.5m/s)
( ) 8/33/1 0098.0/50.5 −+=Δ dzdTQH ah Note: the value of dTa/dz should be no less than 0.01K/m. When -0.0098<(dTa/dz)<0.01K/m, let(dTa/dz)=0.01K/m; when dTa/dz≤-0.0098K/m, �H should be calculated using relevant formulas in(1), but the value of u10 in the formula used to calculate wind speed u must be 1.5m/s.
6.1.2.2 Concentration prediction model
Prediction model uses Gauss fume flow diffusion series models.
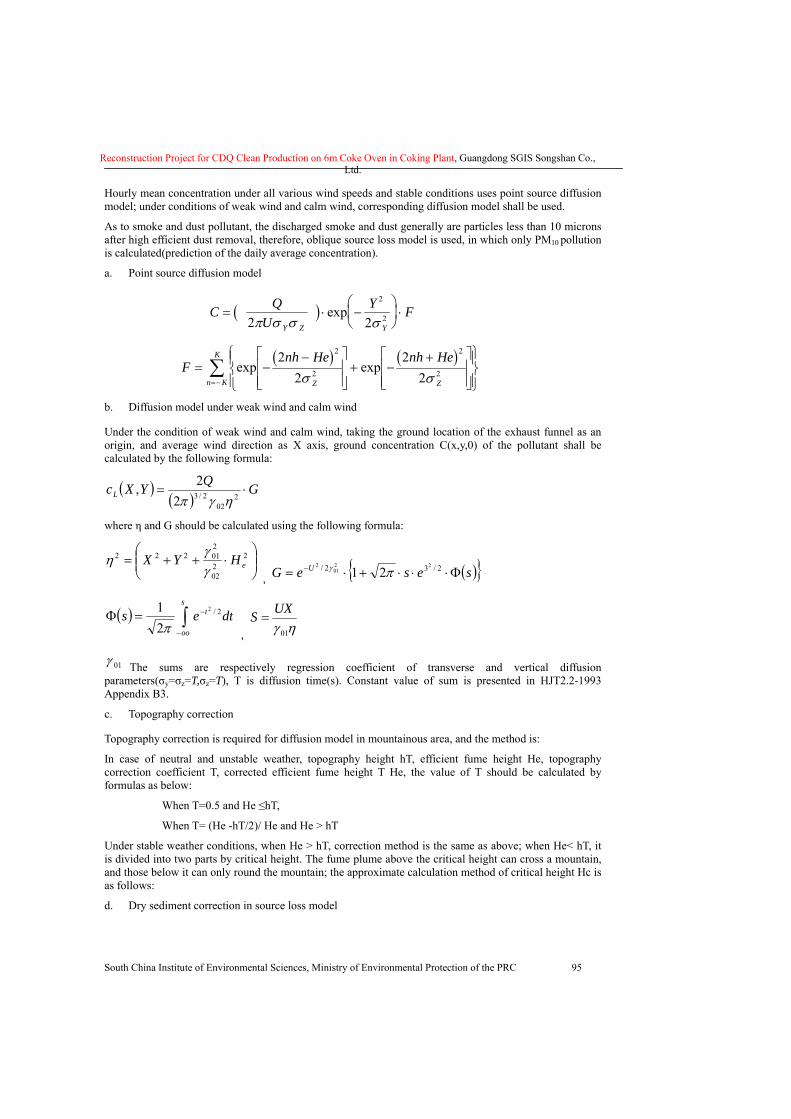
Reconstruction Project for CDQ Clean Production on 6m Coke Oven in Coking Plant, Guangdong SGIS Songshan Co., Ltd.
South China Institute of Environmental Sciences, Ministry of Environmental Protection of the PRC 95
Hourly mean concentration under all various wind speeds and stable conditions uses point source diffusion model; under conditions of weak wind and calm wind, corresponding diffusion model shall be used.
As to smoke and dust pollutant, the discharged smoke and dust generally are particles less than 10 microns after high efficient dust removal, therefore, oblique source loss model is used, in which only PM10 pollution is calculated(prediction of the daily average concentration).
a. Point source diffusion model
( )C QU
Y FY Z Y
= ⋅ −⎛
⎝⎜
⎞
⎠⎟ ⋅
2 2
2
2π σ σ σexp
( ) ( )F
nh He nh He
Z Zn K
K
= −−⎡
⎣⎢⎢
⎤
⎦⎥⎥+ −
+⎡
⎣⎢⎢
⎤
⎦⎥⎥
⎧⎨⎪
⎩⎪
⎫⎬⎪
⎭⎪=−∑ exp exp
22
22
2
2
2
2σ σ
b. Diffusion model under weak wind and calm wind
Under the condition of weak wind and calm wind, taking the ground location of the exhaust funnel as an origin, and average wind direction as X axis, ground concentration C(x,y,0) of the pollutant shall be calculated by the following formula:
( )( )
GQYXcL ⋅=2
022/32
2,ηγπ
where η and G should be calculated using the following formula:
⎟⎟⎠
⎞⎜⎜⎝
⎛⋅++= 2
202
201222
eHYXγγ
η, ( ){ }seseG U Φ⋅⋅⋅+⋅= − 2/32/ 22
012
21 πγ
( ) dtes ts
oo
2/2
21 −
−∫=Φ
π , ηγ 01
UXS =
01γ The sums are respectively regression coefficient of transverse and vertical diffusion parameters(σy=σz=T,σz=T), T is diffusion time(s). Constant value of sum is presented in HJT2.2-1993 Appendix B3.
c. Topography correction
Topography correction is required for diffusion model in mountainous area, and the method is:
In case of neutral and unstable weather, topography height hT, efficient fume height He, topography correction coefficient T, corrected efficient fume height T He, the value of T should be calculated by formulas as below:
When T=0.5 and He ≤hT,
When T= (He -hT/2)/ He and He > hT
Under stable weather conditions, when He > hT, correction method is the same as above; when He< hT, it is divided into two parts by critical height. The fume plume above the critical height can cross a mountain, and those below it can only round the mountain; the approximate calculation method of critical height Hc is as follows:
d. Dry sediment correction in source loss model
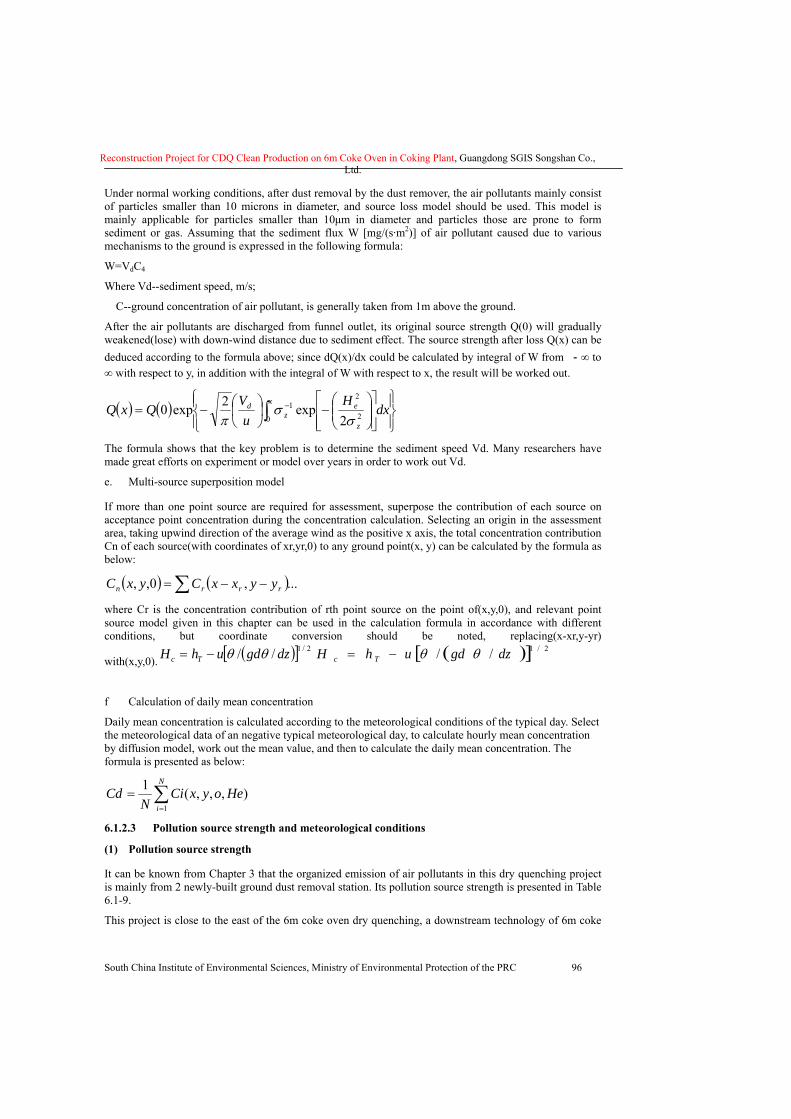
Reconstruction Project for CDQ Clean Production on 6m Coke Oven in Coking Plant, Guangdong SGIS Songshan Co., Ltd.
South China Institute of Environmental Sciences, Ministry of Environmental Protection of the PRC 96
Under normal working conditions, after dust removal by the dust remover, the air pollutants mainly consist of particles smaller than 10 microns in diameter, and source loss model should be used. This model is mainly applicable for particles smaller than 10μm in diameter and particles those are prone to form sediment or gas. Assuming that the sediment flux W [mg/(s·m2)] of air pollutant caused due to various mechanisms to the ground is expressed in the following formula:
W=VdC4
Where Vd--sediment speed, m/s;
C--ground concentration of air pollutant, is generally taken from 1m above the ground.
After the air pollutants are discharged from funnel outlet, its original source strength Q(0) will gradually weakened(lose) with down-wind distance due to sediment effect. The source strength after loss Q(x) can be deduced according to the formula above; since dQ(x)/dx could be calculated by integral of W from -∞ to ∞ with respect to y, in addition with the integral of W with respect to x, the result will be worked out.
( ) ( )⎪⎭
⎪⎬⎫
⎪⎩
⎪⎨⎧
⎥⎥⎦
⎤
⎢⎢⎣
⎡⎟⎟⎠
⎞⎜⎜⎝
⎛−⎟
⎠⎞
⎜⎝⎛−= ∫ − dx
Hu
VQxQ
x
z
ez
d
0 2
21
2exp2exp0
σσ
π
The formula shows that the key problem is to determine the sediment speed Vd. Many researchers have made great efforts on experiment or model over years in order to work out Vd.
e. Multi-source superposition model
If more than one point source are required for assessment, superpose the contribution of each source on acceptance point concentration during the concentration calculation. Selecting an origin in the assessment area, taking upwind direction of the average wind as the positive x axis, the total concentration contribution Cn of each source(with coordinates of xr,yr,0) to any ground point(x, y) can be calculated by the formula as below:
( ) ( )...,0,, rrrn yyxxCyxC −−= ∑ where Cr is the concentration contribution of rth point source on the point of(x,y,0), and relevant point source model given in this chapter can be used in the calculation formula in accordance with different conditions, but coordinate conversion should be noted, replacing(x-xr,y-yr)
with(x,y,0). ( )[ ] 2/1// dzgduhH Tc θθ−= ( )[ ] 2/1// dzgduhH Tc θθ−=
f Calculation of daily mean concentration
Daily mean concentration is calculated according to the meteorological conditions of the typical day. Select the meteorological data of an negative typical meteorological day, to calculate hourly mean concentration by diffusion model, work out the mean value, and then to calculate the daily mean concentration. The formula is presented as below:
∑=
=N
iHeoyxCi
NCd
1),,,(1
6.1.2.3 Pollution source strength and meteorological conditions
(1) Pollution source strength
It can be known from Chapter 3 that the organized emission of air pollutants in this dry quenching project is mainly from 2 newly-built ground dust removal station. Its pollution source strength is presented in Table 6.1-9.
This project is close to the east of the 6m coke oven dry quenching, a downstream technology of 6m coke
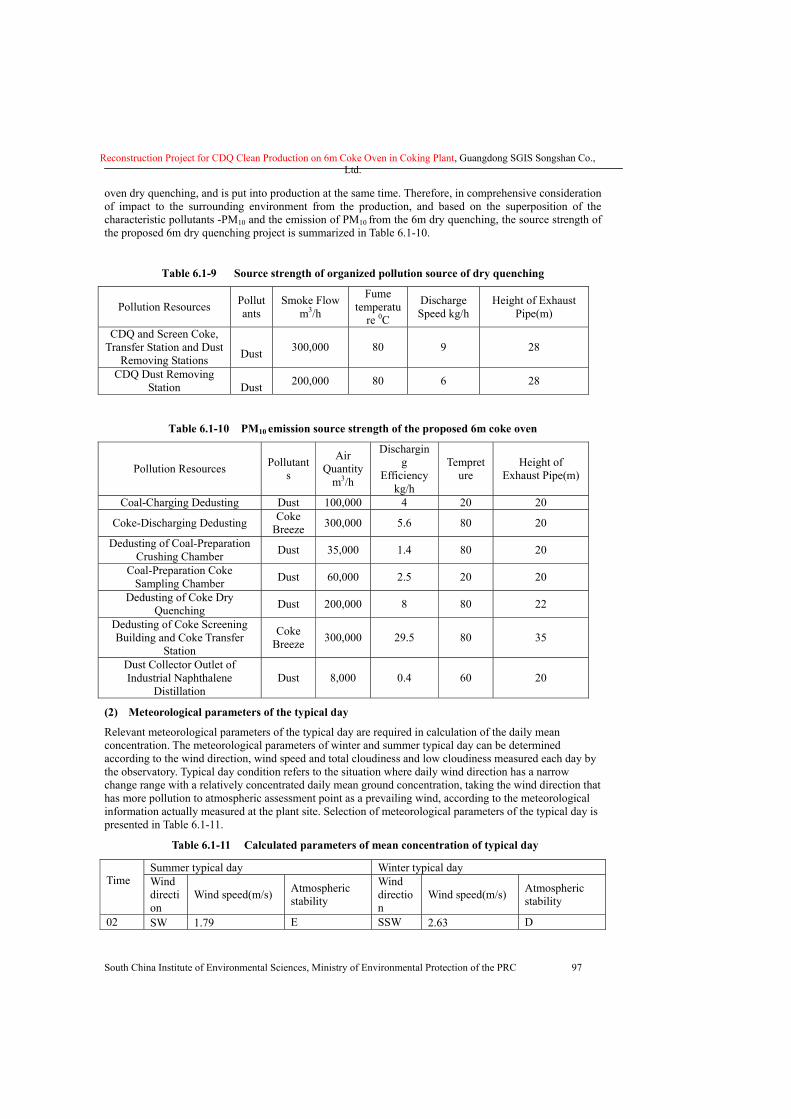
Reconstruction Project for CDQ Clean Production on 6m Coke Oven in Coking Plant, Guangdong SGIS Songshan Co., Ltd.
South China Institute of Environmental Sciences, Ministry of Environmental Protection of the PRC 97
oven dry quenching, and is put into production at the same time. Therefore, in comprehensive consideration of impact to the surrounding environment from the production, and based on the superposition of the characteristic pollutants -PM10 and the emission of PM10 from the 6m dry quenching, the source strength of the proposed 6m dry quenching project is summarized in Table 6.1-10.
Table 6.1-9 Source strength of organized pollution source of dry quenching
Pollution Resources Pollutants
Smoke Flow m3/h
Fume temperatu
re 0C
Discharge Speed kg/h
Height of Exhaust Pipe(m)
CDQ and Screen Coke, Transfer Station and Dust
Removing Stations
Dust 300,000 80 9 28
CDQ Dust Removing Station
Dust 200,000 80 6 28
Table 6.1-10 PM10 emission source strength of the proposed 6m coke oven
Pollution Resources Pollutants
Air Quantity
m3/h
Discharging
Efficiency kg/h
Tempreture
Height of Exhaust Pipe(m)
Coal-Charging Dedusting Dust 100,000 4 20 20
Coke-Discharging Dedusting Coke Breeze 300,000 5.6 80 20
Dedusting of Coal-Preparation Crushing Chamber Dust 35,000 1.4 80 20
Coal-Preparation Coke Sampling Chamber Dust 60,000 2.5 20 20
Dedusting of Coke Dry Quenching Dust 200,000 8 80 22
Dedusting of Coke Screening Building and Coke Transfer
Station
Coke Breeze 300,000 29.5 80 35
Dust Collector Outlet of Industrial Naphthalene
Distillation Dust 8,000 0.4 60 20
(2) Meteorological parameters of the typical day
Relevant meteorological parameters of the typical day are required in calculation of the daily mean concentration. The meteorological parameters of winter and summer typical day can be determined according to the wind direction, wind speed and total cloudiness and low cloudiness measured each day by the observatory. Typical day condition refers to the situation where daily wind direction has a narrow change range with a relatively concentrated daily mean ground concentration, taking the wind direction that has more pollution to atmospheric assessment point as a prevailing wind, according to the meteorological information actually measured at the plant site. Selection of meteorological parameters of the typical day is presented in Table 6.1-11.
Table 6.1-11 Calculated parameters of mean concentration of typical day
Summer typical day Winter typical day Time
Wind direction
Wind speed(m/s) Atmospheric stability
Wind direction
Wind speed(m/s) Atmospheric stability
02 SW 1.79 E SSW 2.63 D
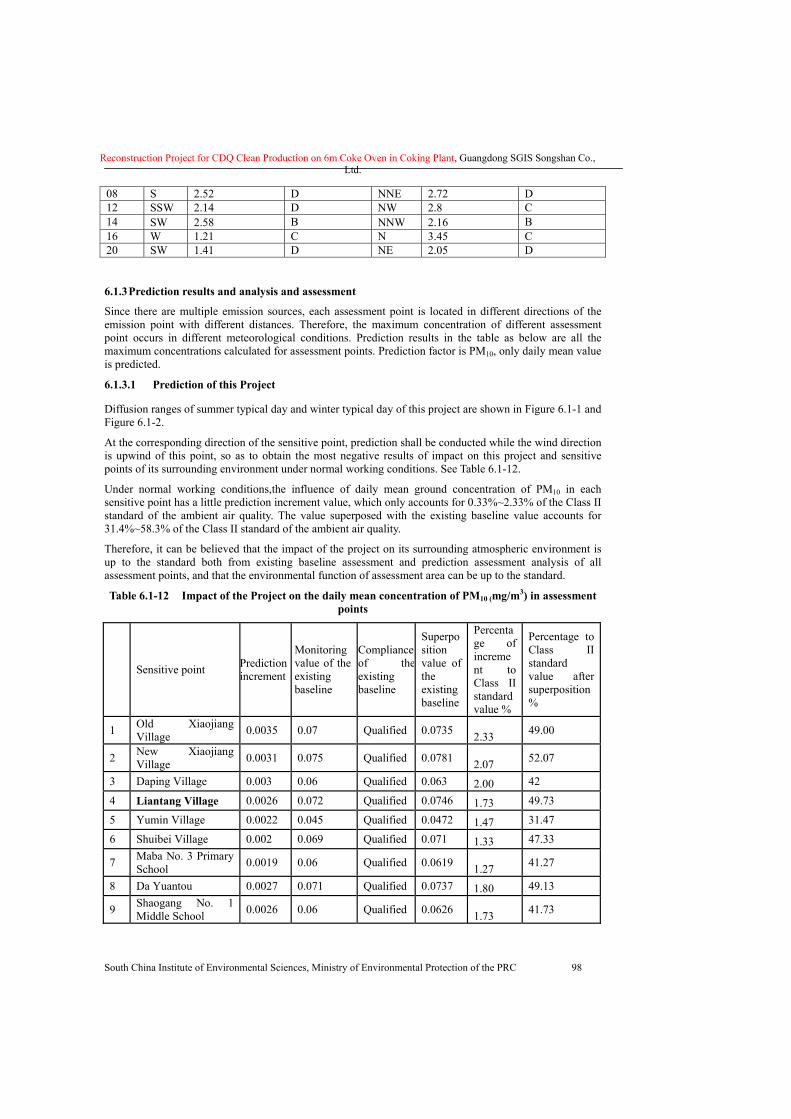
Reconstruction Project for CDQ Clean Production on 6m Coke Oven in Coking Plant, Guangdong SGIS Songshan Co., Ltd.
South China Institute of Environmental Sciences, Ministry of Environmental Protection of the PRC 98
08 S 2.52 D NNE 2.72 D 12 SSW 2.14 D NW 2.8 C 14 SW 2.58 B NNW 2.16 B 16 W 1.21 C N 3.45 C 20 SW 1.41 D NE 2.05 D
6.1.3 Prediction results and analysis and assessment
Since there are multiple emission sources, each assessment point is located in different directions of the emission point with different distances. Therefore, the maximum concentration of different assessment point occurs in different meteorological conditions. Prediction results in the table as below are all the maximum concentrations calculated for assessment points. Prediction factor is PM10, only daily mean value is predicted.
6.1.3.1 Prediction of this Project
Diffusion ranges of summer typical day and winter typical day of this project are shown in Figure 6.1-1 and Figure 6.1-2.
At the corresponding direction of the sensitive point, prediction shall be conducted while the wind direction is upwind of this point, so as to obtain the most negative results of impact on this project and sensitive points of its surrounding environment under normal working conditions. See Table 6.1-12.
Under normal working conditions,the influence of daily mean ground concentration of PM10 in each sensitive point has a little prediction increment value, which only accounts for 0.33%~2.33% of the Class II standard of the ambient air quality. The value superposed with the existing baseline value accounts for 31.4%~58.3% of the Class II standard of the ambient air quality.
Therefore, it can be believed that the impact of the project on its surrounding atmospheric environment is up to the standard both from existing baseline assessment and prediction assessment analysis of all assessment points, and that the environmental function of assessment area can be up to the standard.
Table 6.1-12 Impact of the Project on the daily mean concentration of PM10 (mg/m3) in assessment points
Sensitive point Prediction increment
Monitoring value of the existing baseline
Compliance of theexisting baseline
Superposition value of the existing baseline
Percentage of increment to Class II standard value %
Percentage to Class II standard value after superposition %
1 Old Xiaojiang Village 0.0035 0.07 Qualified 0.0735 2.33 49.00
2 New Xiaojiang Village 0.0031 0.075 Qualified 0.0781 2.07 52.07
3 Daping Village 0.003 0.06 Qualified 0.063 2.00 42
4 Liantang Village 0.0026 0.072 Qualified 0.0746 1.73 49.73
5 Yumin Village 0.0022 0.045 Qualified 0.0472 1.47 31.47
6 Shuibei Village 0.002 0.069 Qualified 0.071 1.33 47.33
7 Maba No. 3 Primary School 0.0019 0.06 Qualified 0.0619 1.27 41.27
8 Da Yuantou 0.0027 0.071 Qualified 0.0737 1.80 49.13
9 Shaogang No. 1 Middle School 0.0026 0.06 Qualified 0.0626 1.73 41.73
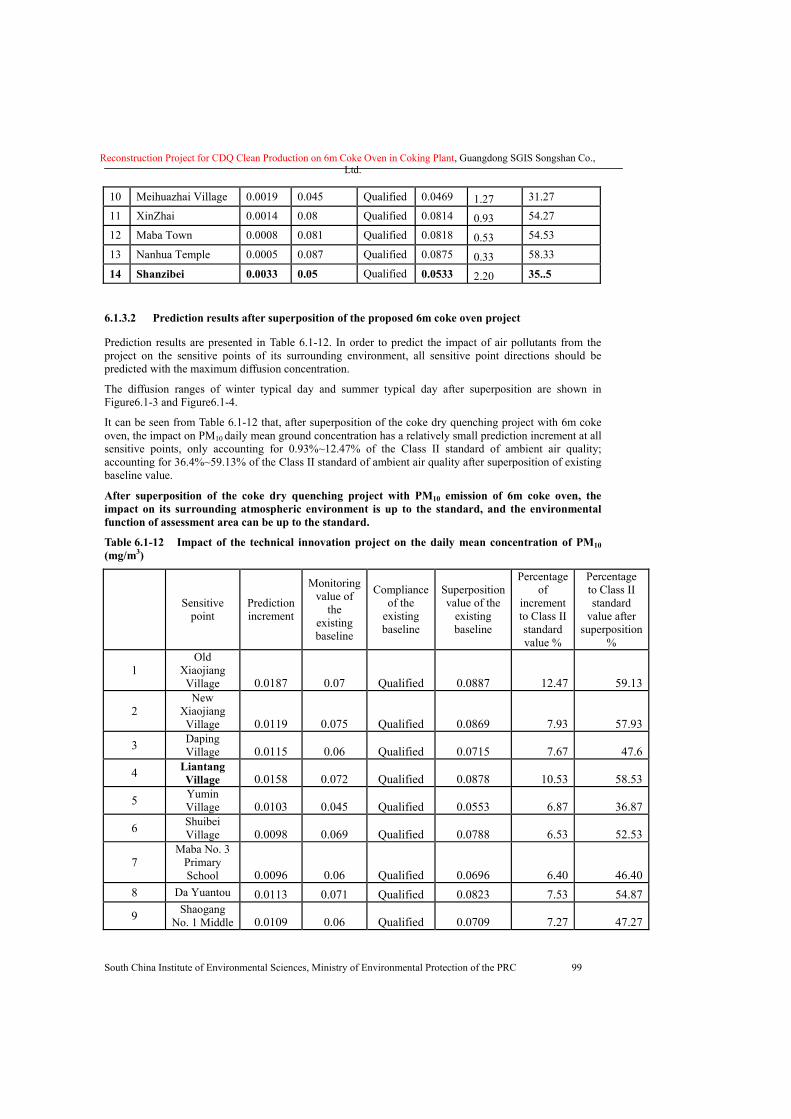
Reconstruction Project for CDQ Clean Production on 6m Coke Oven in Coking Plant, Guangdong SGIS Songshan Co., Ltd.
South China Institute of Environmental Sciences, Ministry of Environmental Protection of the PRC 99
10 Meihuazhai Village 0.0019 0.045 Qualified 0.0469 1.27 31.27
11 XinZhai 0.0014 0.08 Qualified 0.0814 0.93 54.27
12 Maba Town 0.0008 0.081 Qualified 0.0818 0.53 54.53
13 Nanhua Temple 0.0005 0.087 Qualified 0.0875 0.33 58.33
14 Shanzibei 0.0033 0.05 Qualified 0.0533 2.20 35..5
6.1.3.2 Prediction results after superposition of the proposed 6m coke oven project
Prediction results are presented in Table 6.1-12. In order to predict the impact of air pollutants from the project on the sensitive points of its surrounding environment, all sensitive point directions should be predicted with the maximum diffusion concentration.
The diffusion ranges of winter typical day and summer typical day after superposition are shown in Figure6.1-3 and Figure6.1-4.
It can be seen from Table 6.1-12 that, after superposition of the coke dry quenching project with 6m coke oven, the impact on PM10 daily mean ground concentration has a relatively small prediction increment at all sensitive points, only accounting for 0.93%~12.47% of the Class II standard of ambient air quality; accounting for 36.4%~59.13% of the Class II standard of ambient air quality after superposition of existing baseline value.
After superposition of the coke dry quenching project with PM10 emission of 6m coke oven, the impact on its surrounding atmospheric environment is up to the standard, and the environmental function of assessment area can be up to the standard.
Table 6.1-12 Impact of the technical innovation project on the daily mean concentration of PM10 (mg/m3)
Sensitive point
Prediction increment
Monitoring value of
the existing baseline
Compliance of the
existing baseline
Superposition value of the
existing baseline
Percentage of
increment to Class II standard value %
Percentage to Class II standard
value after superposition
%
1 Old
Xiaojiang Village 0.0187 0.07 Qualified 0.0887 12.47 59.13
2 New
Xiaojiang Village 0.0119 0.075 Qualified 0.0869 7.93 57.93
3 Daping Village 0.0115 0.06 Qualified 0.0715 7.67 47.6
4 Liantang Village 0.0158 0.072 Qualified 0.0878 10.53 58.53
5 Yumin Village 0.0103 0.045 Qualified 0.0553 6.87 36.87
6 Shuibei Village 0.0098 0.069 Qualified 0.0788 6.53 52.53
7 Maba No. 3
Primary School 0.0096 0.06 Qualified 0.0696 6.40 46.40
8 Da Yuantou 0.0113 0.071 Qualified 0.0823 7.53 54.87
9 Shaogang No. 1 Middle 0.0109 0.06 Qualified 0.0709 7.27 47.27

Reconstruction Project for CDQ Clean Production on 6m Coke Oven in Coking Plant, Guangdong SGIS Songshan Co., Ltd.
South China Institute of Environmental Sciences, Ministry of Environmental Protection of the PRC 100
School
10 Meihuazhai Village 0.0096 0.045 Qualified 0.0546 6.40 36.40
11 XinZhai 0.0064 0.08 Qualified 0.0864 4.27 57.60 12 Maba Town 0.0009 0.081 Qualified 0.0819 0.60 54.60
13 Nanhua Temple 0.0008 0.087 Qualified 0.0878 0.53 58.53
14 Shanzibei 0.0164 0.05 Qualified 0.0664 10.93 44.27
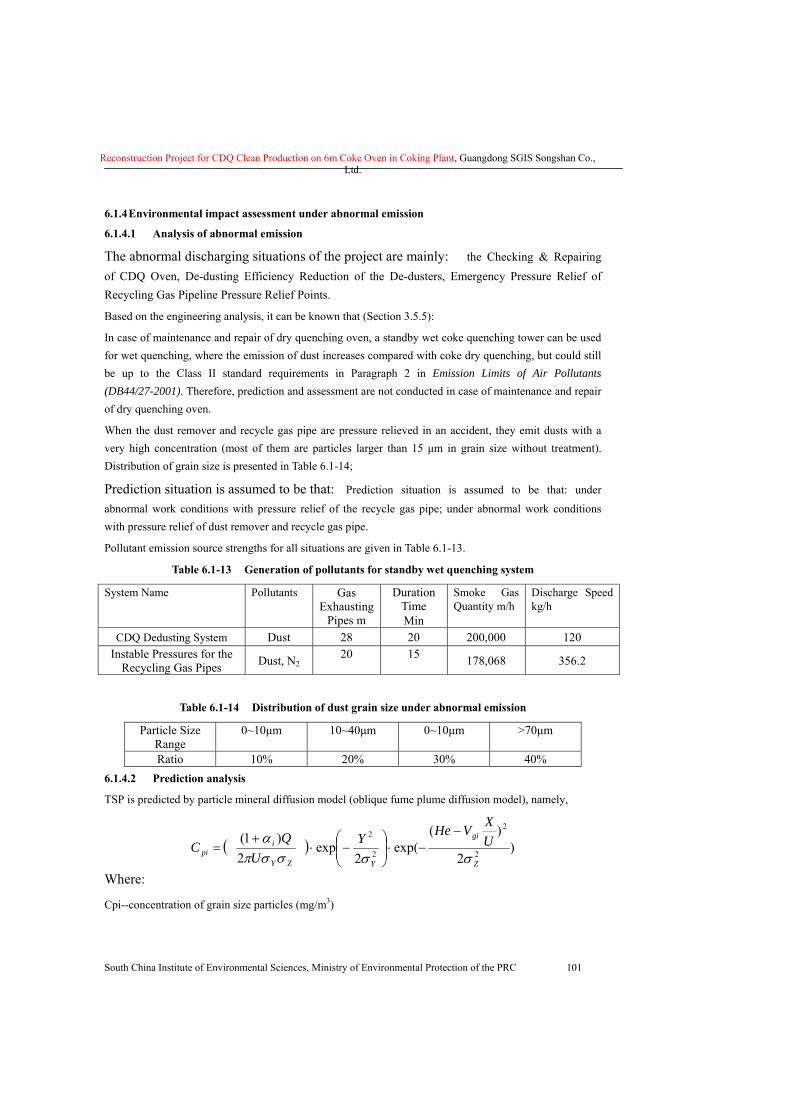
Reconstruction Project for CDQ Clean Production on 6m Coke Oven in Coking Plant, Guangdong SGIS Songshan Co., Ltd.
South China Institute of Environmental Sciences, Ministry of Environmental Protection of the PRC 101
6.1.4 Environmental impact assessment under abnormal emission
6.1.4.1 Analysis of abnormal emission
The abnormal discharging situations of the project are mainly: the Checking & Repairing of CDQ Oven, De-dusting Efficiency Reduction of the De-dusters, Emergency Pressure Relief of Recycling Gas Pipeline Pressure Relief Points. Based on the engineering analysis, it can be known that (Section 3.5.5): In case of maintenance and repair of dry quenching oven, a standby wet coke quenching tower can be used for wet quenching, where the emission of dust increases compared with coke dry quenching, but could still be up to the Class II standard requirements in Paragraph 2 in Emission Limits of Air Pollutants (DB44/27-2001). Therefore, prediction and assessment are not conducted in case of maintenance and repair of dry quenching oven. When the dust remover and recycle gas pipe are pressure relieved in an accident, they emit dusts with a very high concentration (most of them are particles larger than 15 μm in grain size without treatment). Distribution of grain size is presented in Table 6.1-14;
Prediction situation is assumed to be that: Prediction situation is assumed to be that: under
abnormal work conditions with pressure relief of the recycle gas pipe; under abnormal work conditions with pressure relief of dust remover and recycle gas pipe. Pollutant emission source strengths for all situations are given in Table 6.1-13.
Table 6.1-13 Generation of pollutants for standby wet quenching system
System Name Pollutants Gas Exhausting
Pipes m
Duration Time Min
Smoke Gas Quantity m/h
Discharge Speed kg/h
CDQ Dedusting System Dust 28 20 200,000 120 Instable Pressures for the
Recycling Gas Pipes Dust, N2 20 15 178,068 356.2
Table 6.1-14 Distribution of dust grain size under abnormal emission
Particle Size Range
0~10μm 10~40μm 0~10μm >70μm
Ratio 10% 20% 30% 40% 6.1.4.2 Prediction analysis TSP is predicted by particle mineral diffusion model (oblique fume plume diffusion model), namely,
( ) )2
)(exp(
2exp
2)1(
2
2
2
2
Z
gi
YZY
ipi
UXVHeY
UQ
Cσσσσπ
α −−⋅⎟⎟
⎠
⎞⎜⎜⎝
⎛−⋅
+=
Where:
Cpi--concentration of grain size particles (mg/m3)
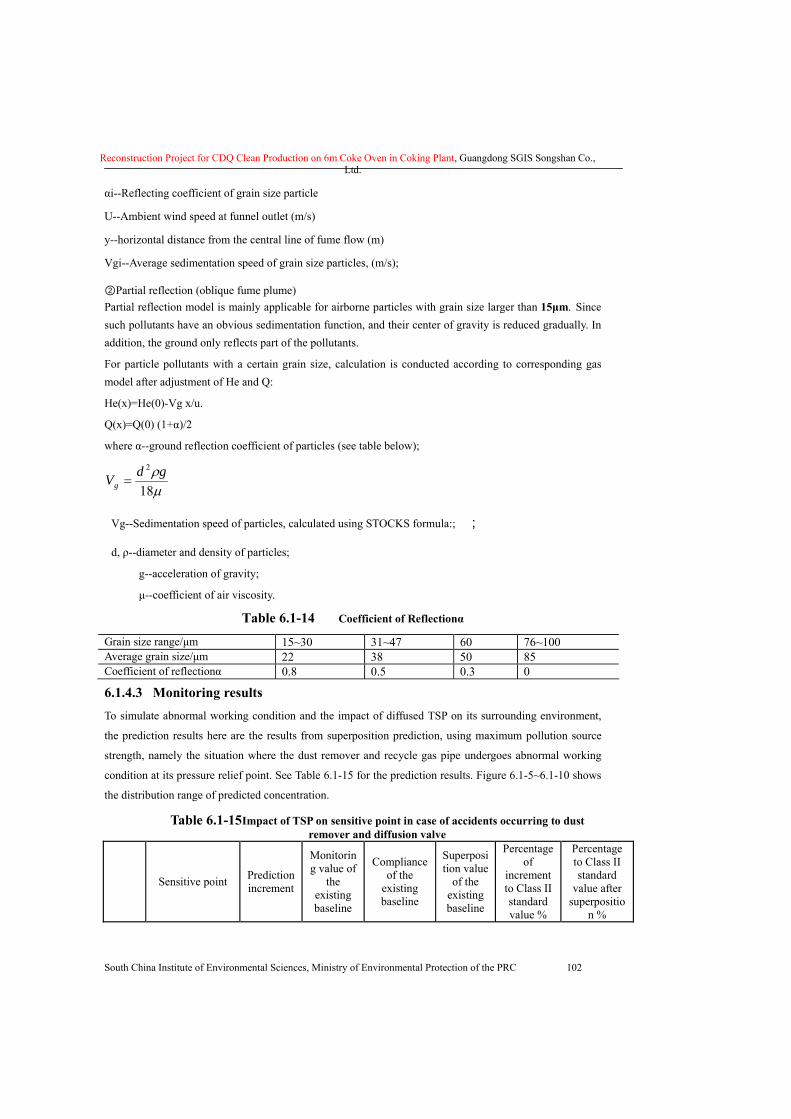
Reconstruction Project for CDQ Clean Production on 6m Coke Oven in Coking Plant, Guangdong SGIS Songshan Co., Ltd.
South China Institute of Environmental Sciences, Ministry of Environmental Protection of the PRC 102
αi--Reflecting coefficient of grain size particle
U--Ambient wind speed at funnel outlet (m/s)
y--horizontal distance from the central line of fume flow (m)
Vgi--Average sedimentation speed of grain size particles, (m/s);
②Partial reflection (oblique fume plume) Partial reflection model is mainly applicable for airborne particles with grain size larger than 15μm. Since such pollutants have an obvious sedimentation function, and their center of gravity is reduced gradually. In addition, the ground only reflects part of the pollutants. For particle pollutants with a certain grain size, calculation is conducted according to corresponding gas model after adjustment of He and Q: He(x)=He(0)-Vg x/u. Q(x)=Q(0) (1+α)/2 where α--ground reflection coefficient of particles (see table below);
μρ
18
2 gdVg =
Vg--Sedimentation speed of particles, calculated using STOCKS formula:; ;
d, ρ--diameter and density of particles; g--acceleration of gravity; μ--coefficient of air viscosity.
Table 6.1-14 Coefficient of Reflectionα
Grain size range/μm 15~30 31~47 60 76~100 Average grain size/μm 22 38 50 85 Coefficient of reflectionα 0.8 0.5 0.3 0
6.1.4.3 Monitoring results To simulate abnormal working condition and the impact of diffused TSP on its surrounding environment,
the prediction results here are the results from superposition prediction, using maximum pollution source
strength, namely the situation where the dust remover and recycle gas pipe undergoes abnormal working
condition at its pressure relief point. See Table 6.1-15 for the prediction results. Figure 6.1-5~6.1-10 shows
the distribution range of predicted concentration.
Table 6.1-15 Impact of TSP on sensitive point in case of accidents occurring to dust remover and diffusion valve
Sensitive point Prediction increment
Monitoring value of
the existing baseline
Compliance of the
existing baseline
Superposition value
of the existing baseline
Percentage of
increment to Class II standard value %
Percentage to Class II standard
value after superpositio
n %
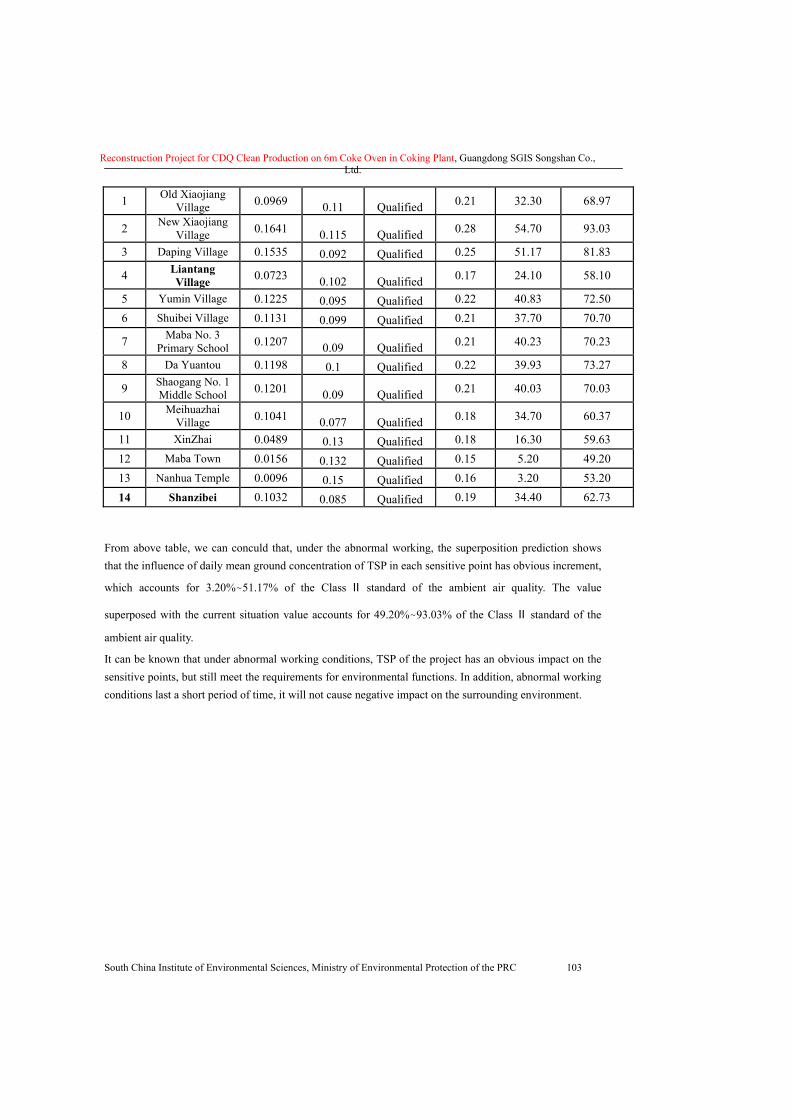
Reconstruction Project for CDQ Clean Production on 6m Coke Oven in Coking Plant, Guangdong SGIS Songshan Co., Ltd.
South China Institute of Environmental Sciences, Ministry of Environmental Protection of the PRC 103
1 Old Xiaojiang Village 0.0969 0.11 Qualified 0.21 32.30 68.97
2 New Xiaojiang Village 0.1641 0.115 Qualified 0.28 54.70 93.03
3 Daping Village 0.1535 0.092 Qualified 0.25 51.17 81.83
4 Liantang Village 0.0723 0.102 Qualified 0.17 24.10 58.10
5 Yumin Village 0.1225 0.095 Qualified 0.22 40.83 72.50 6 Shuibei Village 0.1131 0.099 Qualified 0.21 37.70 70.70
7 Maba No. 3 Primary School 0.1207 0.09 Qualified 0.21 40.23 70.23
8 Da Yuantou 0.1198 0.1 Qualified 0.22 39.93 73.27
9 Shaogang No. 1 Middle School 0.1201 0.09 Qualified 0.21 40.03 70.03
10 Meihuazhai Village 0.1041 0.077 Qualified 0.18 34.70 60.37
11 XinZhai 0.0489 0.13 Qualified 0.18 16.30 59.63 12 Maba Town 0.0156 0.132 Qualified 0.15 5.20 49.20 13 Nanhua Temple 0.0096 0.15 Qualified 0.16 3.20 53.20 14 Shanzibei 0.1032 0.085 Qualified 0.19 34.40 62.73
From above table, we can conculd that, under the abnormal working, the superposition prediction shows that the influence of daily mean ground concentration of TSP in each sensitive point has obvious increment,
which accounts for 3.20%~51.17% of the Class Ⅱ standard of the ambient air quality. The value
superposed with the current situation value accounts for 49.20%~93.03% of the Class Ⅱ standard of the
ambient air quality. It can be known that under abnormal working conditions, TSP of the project has an obvious impact on the sensitive points, but still meet the requirements for environmental functions. In addition, abnormal working conditions last a short period of time, it will not cause negative impact on the surrounding environment.
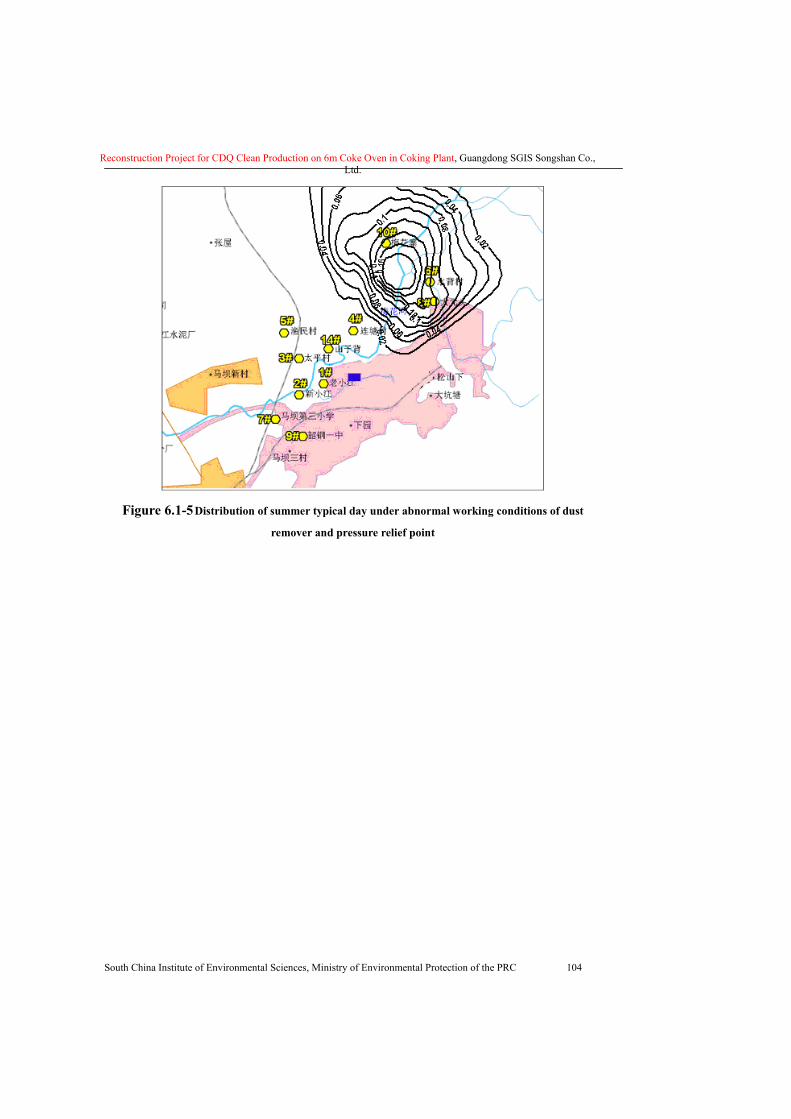
Reconstruction Project for CDQ Clean Production on 6m Coke Oven in Coking Plant, Guangdong SGIS Songshan Co., Ltd.
South China Institute of Environmental Sciences, Ministry of Environmental Protection of the PRC 104
Figure 6.1-5 Distribution of summer typical day under abnormal working conditions of dust
remover and pressure relief point
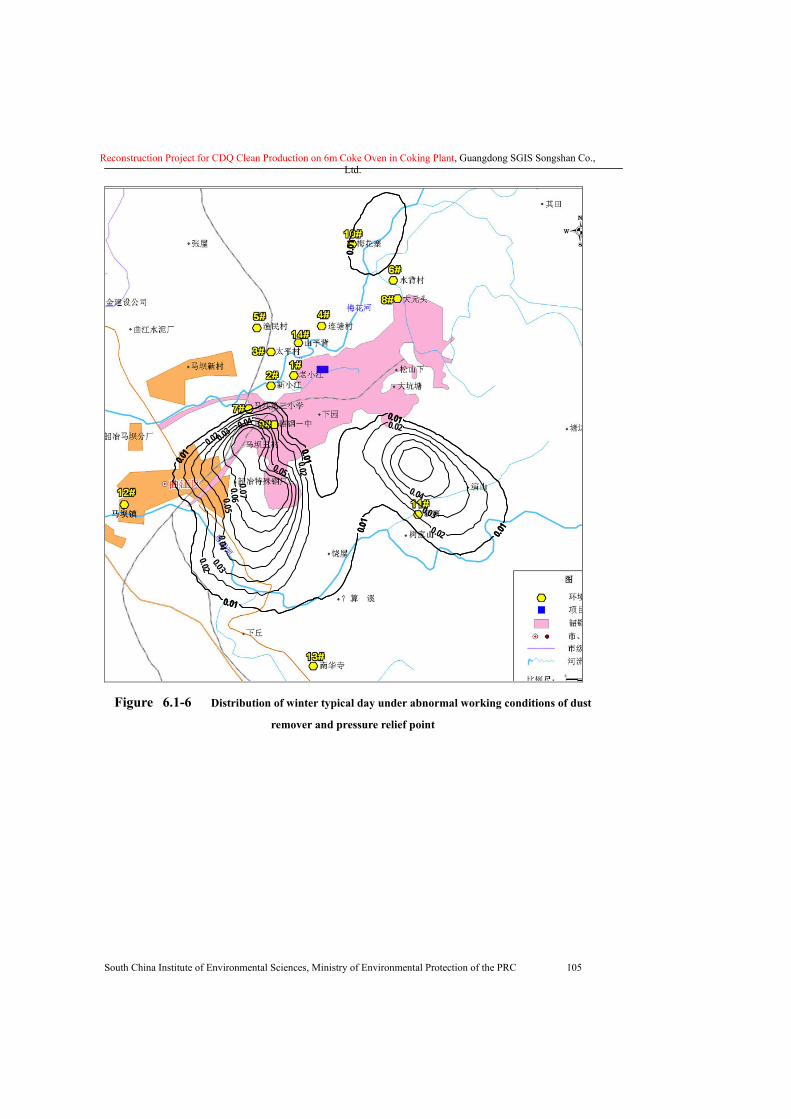
Reconstruction Project for CDQ Clean Production on 6m Coke Oven in Coking Plant, Guangdong SGIS Songshan Co., Ltd.
South China Institute of Environmental Sciences, Ministry of Environmental Protection of the PRC 105
0.01
0.01 0.01
0.01
0.010.0
10.0
1
0.01
0.01 0.01
0.01
0.010.0
10.0
1
0.02
0.02
0.02
0.02
0.02
0.03
0.03
0.03
0.04
0.04
0.040.05
0.05
0.060.07
Figure 6.1-6 Distribution of winter typical day under abnormal working conditions of dust
remover and pressure relief point
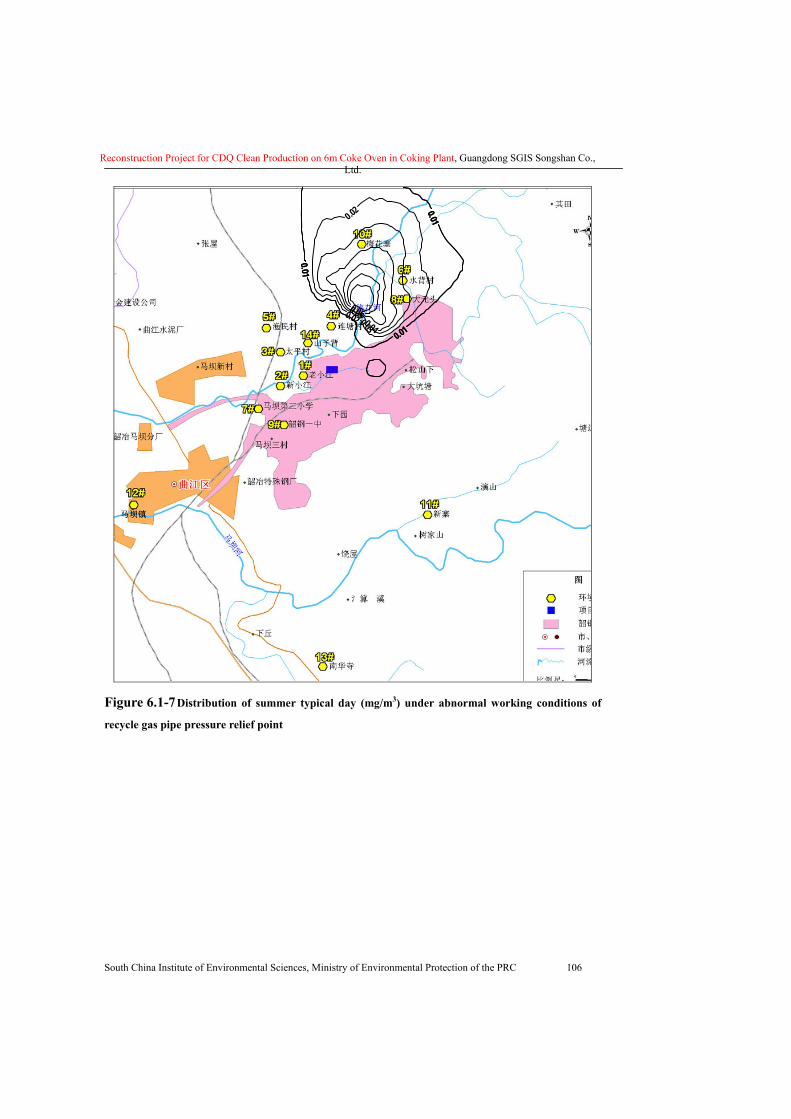
Reconstruction Project for CDQ Clean Production on 6m Coke Oven in Coking Plant, Guangdong SGIS Songshan Co., Ltd.
South China Institute of Environmental Sciences, Ministry of Environmental Protection of the PRC 106
0.01
0.01
0.01
0.01
0.01
0.01
0.02
0.02
0.030.04
0.050.06
Figure 6.1-7 Distribution of summer typical day (mg/m3) under abnormal working conditions of
recycle gas pipe pressure relief point
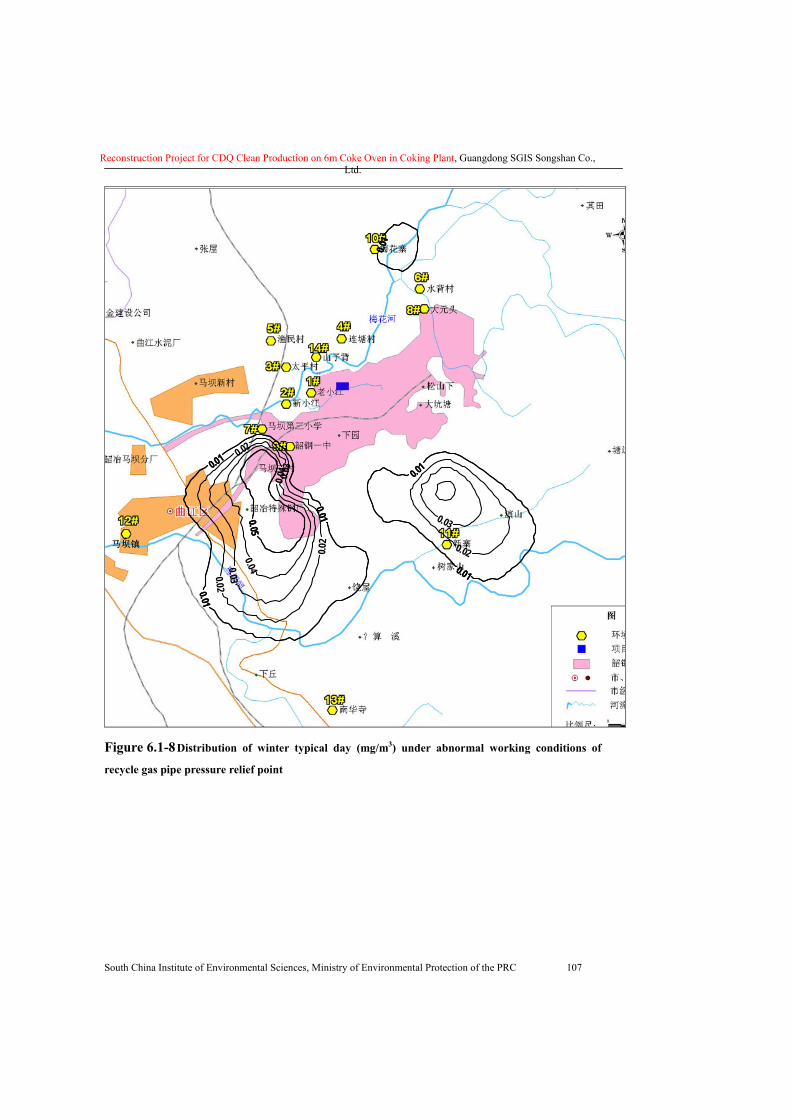
Reconstruction Project for CDQ Clean Production on 6m Coke Oven in Coking Plant, Guangdong SGIS Songshan Co., Ltd.
South China Institute of Environmental Sciences, Ministry of Environmental Protection of the PRC 107
0.01
0.010.01
0.01
0.01
0.01
0.01
0.010.01
0.01
0.01
0.01
0.02
0.02
0.02 0.02
0.03
0.03
0.03
0.04
0.04
0.050.05
Figure 6.1-8 Distribution of winter typical day (mg/m3) under abnormal working conditions of
recycle gas pipe pressure relief point
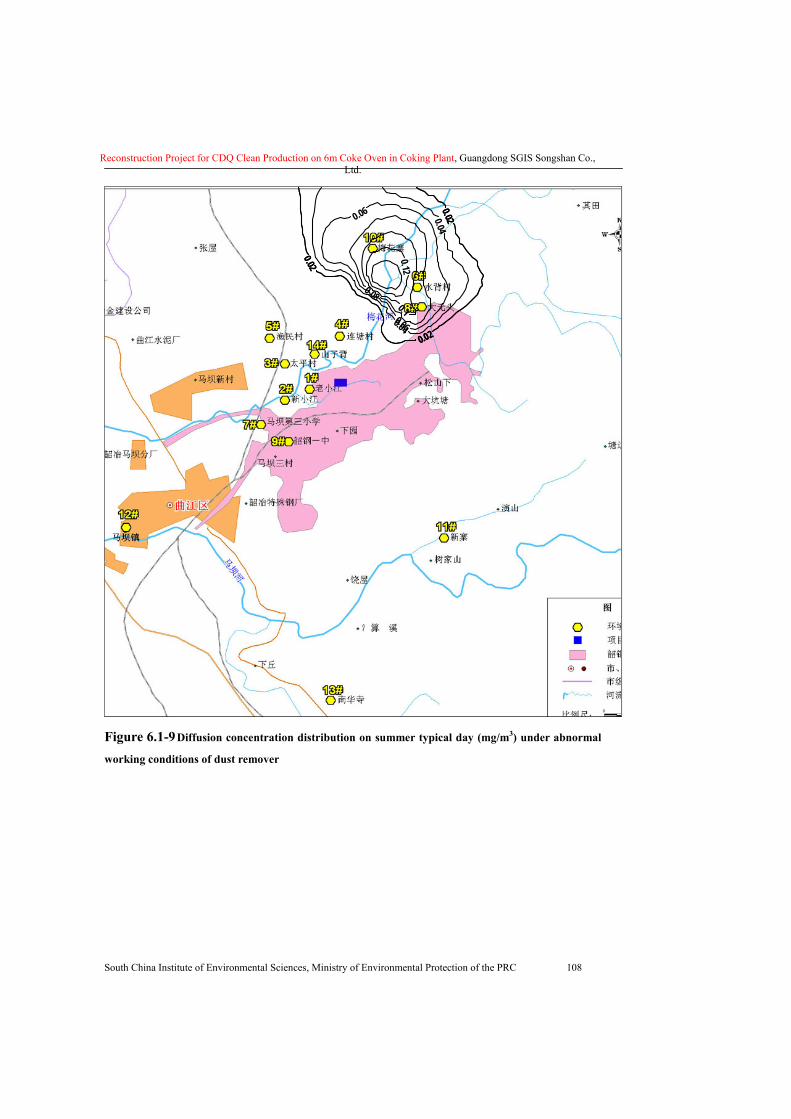
Reconstruction Project for CDQ Clean Production on 6m Coke Oven in Coking Plant, Guangdong SGIS Songshan Co., Ltd.
South China Institute of Environmental Sciences, Ministry of Environmental Protection of the PRC 108
0.020.02
0.02
0.020.02
0.02
0.04
0.040.06
0.06
0.08
0.10.12
Figure 6.1-9 Diffusion concentration distribution on summer typical day (mg/m3) under abnormal
working conditions of dust remover
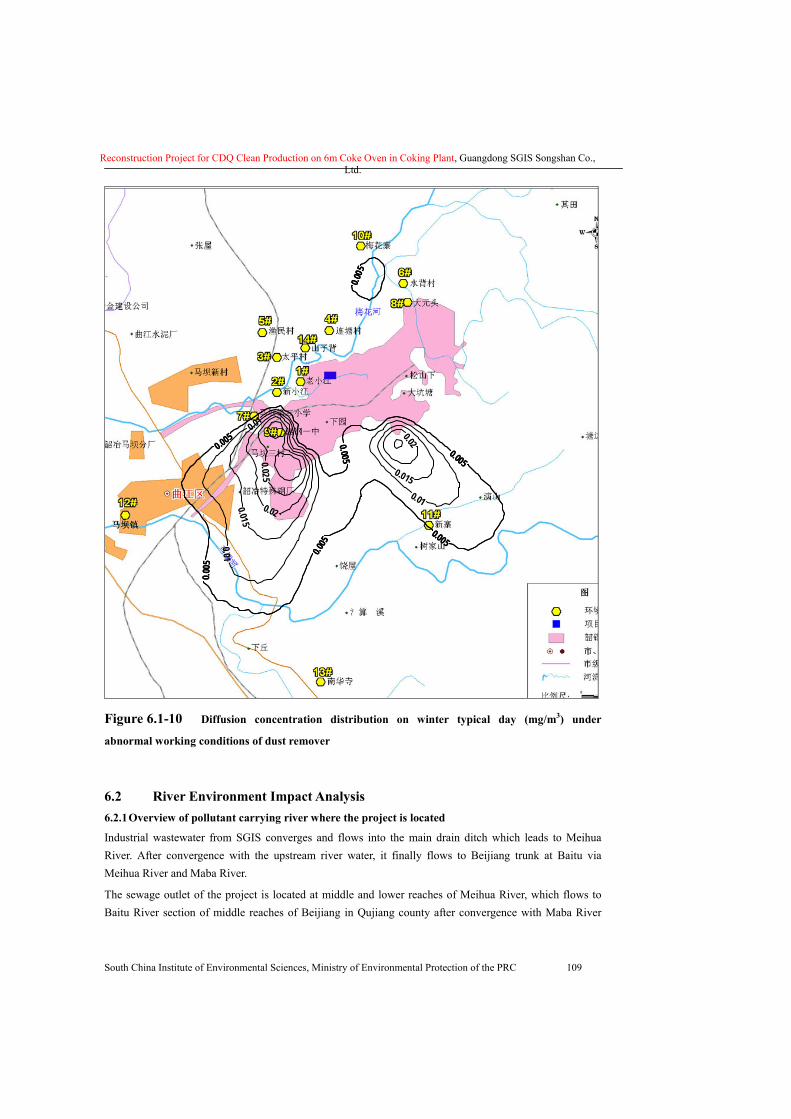
Reconstruction Project for CDQ Clean Production on 6m Coke Oven in Coking Plant, Guangdong SGIS Songshan Co., Ltd.
South China Institute of Environmental Sciences, Ministry of Environmental Protection of the PRC 109
0. 005
0.005 0.005 0.005
0.005
0.005
0.005
0.005
0.005 0.005 0.005
0.005
0.005
0.005
0.01
0.01
0.010.015
0.015
0.02
0.02
0.025
Figure 6.1-10 Diffusion concentration distribution on winter typical day (mg/m3) under
abnormal working conditions of dust remover
6.2 River Environment Impact Analysis 6.2.1 Overview of pollutant carrying river where the project is located
Industrial wastewater from SGIS converges and flows into the main drain ditch which leads to Meihua River. After convergence with the upstream river water, it finally flows to Beijiang trunk at Baitu via Meihua River and Maba River. The sewage outlet of the project is located at middle and lower reaches of Meihua River, which flows to Baitu River section of middle reaches of Beijiang in Qujiang county after convergence with Maba River
Reconstruction Project for CDQ Clean Production on 6m Coke Oven in Coking Plant, Guangdong SGIS Songshan Co., Ltd.
South China Institute of Environmental Sciences, Ministry of Environmental Protection of the PRC 110
6km away west. The average flow rate of Meihua River is about 3m3/s. Beijiang is the second largest water system of Pearl River basin, with a total length of 468 km and the average slope of 0.26%. Beijiang river basin (Sixianjiao) has an multi-year average flow rate of 1620 m3/s, average flow rate in high water period 2520 m3/s, and in low water period 714 m3/s. The project is near Baitu river reach (with a rainwater catchment area of 16750 square kilometers), and the average flow rate of the river is 467 m3/s over years. According to engineering analysis, the project generates wastewater with an amount of 2 m3/d, which is
recycled after it entering the wastewater treatment system and meeting standard. Clean sewage flows
to clean water drainage system in the plant area and is recycled as needed. No sewage is discharged from
the project to the surroundings directly.
6.2.2 River Environment Impact Analysis
6.2.2.1 Wastewater generation from the coke dry quenching project
� Production Wastewater
Production wastewater: water seal on the coke dry quenching oven discharges water with an amount of
about 2 m3/d, and flows to the existing phenol-cyanogen wastewater treatment system. It can be up to the
standard after treatment and can be used as makeup water for blast furnace slag system.
As for the Discharged Sewage of Recycling Cooling Water for CDQ Devices, the Discharged Sewage of
Cooling Water for Generators, Air Coolers, Oil Coolers and various Pumps, the Discharged Sewage of
Steam-condensed Water and Recycling Water for Waste-heat Boilers, there are not any hazardous
substances contained in them. With the comparatively high water temperature, the above-mentioned water
contains few pollutants. With the yielding amount as 1,884m3/d, those waste water goes into the
Purified-water Reuse System of SGIS as the Purified Water Drainage.
The Domestic wastewater is included into the current Domestic wastewater System of the Coking Plant. �Initial Rainfall
According to the calculation, the rainwater drainage capacity is about 1000m3 in the initial operational
phase of the project. Its pollutants are mainlypetroleum, CODCr and SS.
The Initial Ground Rainwater shall be unifiedly discharged to the Factory Sewage Treatment Field after
being collected and they shall be discharged only when reaching the discharging standards. According to
the designed plan of the Comprehensive Sewage Treatment Plants with the capacity of 9×10⁴m3/d in SGIS,
the Initial Rainwater Collecting Ponds shall be established during the construction period of the Sewage
Treatment Plant.
� Domestic wastewater
Daily domestic wastewater discharge amount is 7.2m3, which flows into the sanitary sewer network.
Through the above analysis it can be summarized that the Yielding Amount of the
Reconstruction Project for CDQ Clean Production on 6m Coke Oven in Coking Plant, Guangdong SGIS Songshan Co., Ltd.
South China Institute of Environmental Sciences, Ministry of Environmental Protection of the PRC 111
Production Wastewater under the normal production conditions is 2m3/d. The
external-discharged wastewater is mainly the cooling water of the Purified Recycling
Water, with little change on the water quality, being discharged into the Clean Sewer
Discharging System of the Factory.
6.2.2.2 Drainage direction
Sewage treatment measures include:
The water for the Water-sealing and Water-drainage of CDQ Oven is 2 m3/d or so. After
the sedimentation, the water goes into the current Phenol-cyanogen Wastewater
Treatment System. After reaching the standards through the treatment, the water serves
for the make-up water of the BF Water Slag System.
7.2 m3/d of domestic wastewater is collected by the existing domestic wastewater system of the coke oven
plant.
1,884 m3/d clean sewage enters the clean water system of the plant, and is used as slag removal water for
blast oven, applicable for work sections where the water quality is not high.
In conclusion, no wastewater of the coke oven plant is discharged outside. 6.2.2.3 Impact analysis
Water saving and recycling based on the quality are taken into consideration during the designing of 6m coke oven and coke dry quenching project. Small discharge amount of the clean sewage is also collected by the clean water system in the plant for recycle use. Under normal working conditions, no drainage from the project is discharged into the surroundings. The production wastewater of the project follows up indirect zero drainage, and its main pollution to the water environment is the direct discharge of a little amount of domestic wastewater. According to the engineering analysis above, the project generates domestic wastewater with an amount of 7.2m2/d, accounting for 0.06% of the discharge capacity. Therefore, the project has a relatively little impact on water environment. SGIS is now constructing a wastewater treatment plant. After it is constructed, all wastewater from the plant will be collected by the wastewater treatment plant where the wastewater is treated to meet standard prior to discharge. At that time, the pollution resulted from direct discharge of domestic wastewater will be solved, and the water quality of Meihua River, Maba River and Beijiang river downstream the drainage outlets will be significantly improved. Therefore, the project has a little impact on its surrounding water environment.
6.3 Acoustic environment impact assessment Acoustic environmental impact assessment refers to assessing the acoustic environmental impact brought about in the process of the construction and production of the project, acquiring the degree and range of the acoustic environmental impact on the surrounding environment of projects by means of field investigation and model calculation,
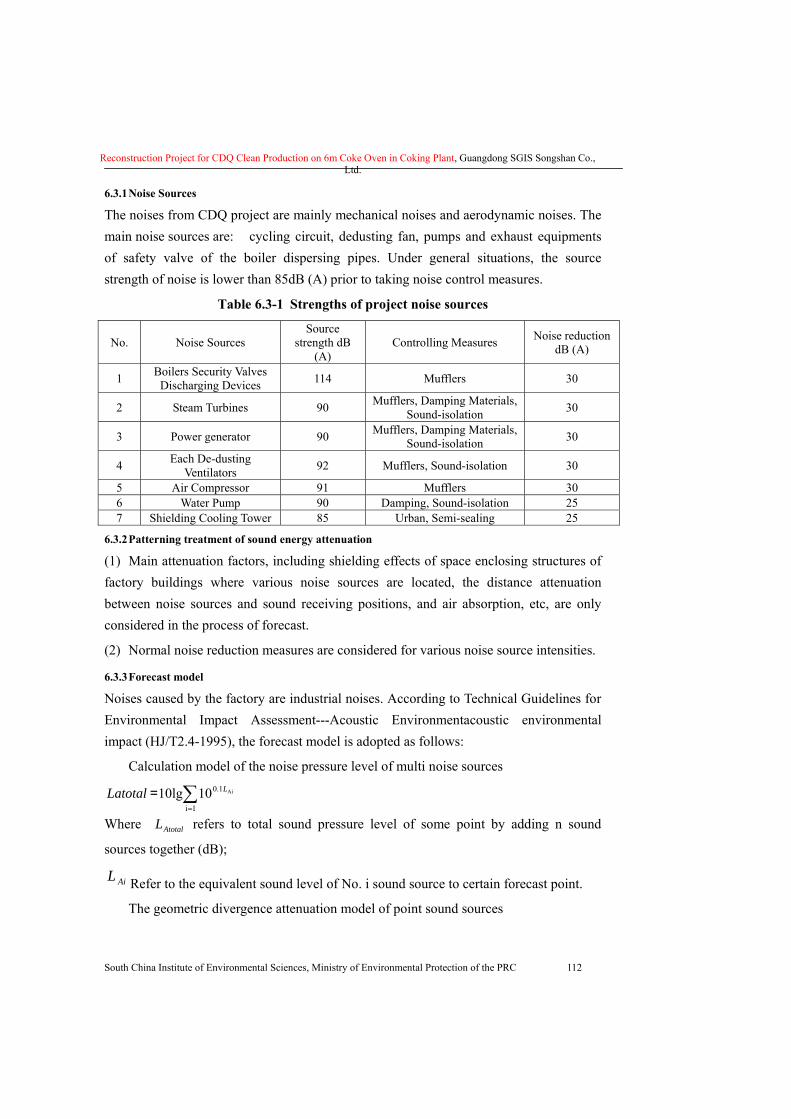
Reconstruction Project for CDQ Clean Production on 6m Coke Oven in Coking Plant, Guangdong SGIS Songshan Co., Ltd.
South China Institute of Environmental Sciences, Ministry of Environmental Protection of the PRC 112
6.3.1 Noise Sources
The noises from CDQ project are mainly mechanical noises and aerodynamic noises. The main noise sources are: cycling circuit, dedusting fan, pumps and exhaust equipments of safety valve of the boiler dispersing pipes. Under general situations, the source strength of noise is lower than 85dB (A) prior to taking noise control measures.
Table 6.3-1 Strengths of project noise sources
No. Noise Sources Source
strength dB (A)
Controlling Measures Noise reduction dB (A)
1 Boilers Security Valves Discharging Devices 114 Mufflers 30
2 Steam Turbines 90 Mufflers, Damping Materials, Sound-isolation 30
3 Power generator 90 Mufflers, Damping Materials, Sound-isolation 30
4 Each De-dusting Ventilators 92 Mufflers, Sound-isolation 30
5 Air Compressor 91 Mufflers 30 6 Water Pump 90 Damping, Sound-isolation 25 7 Shielding Cooling Tower 85 Urban, Semi-sealing 25
6.3.2 Patterning treatment of sound energy attenuation
(1) Main attenuation factors, including shielding effects of space enclosing structures of factory buildings where various noise sources are located, the distance attenuation between noise sources and sound receiving positions, and air absorption, etc, are only considered in the process of forecast.
(2) Normal noise reduction measures are considered for various noise source intensities.
6.3.3 Forecast model
Noises caused by the factory are industrial noises. According to Technical Guidelines for Environmental Impact Assessment---Acoustic Environmentacoustic environmental impact (HJ/T2.4-1995), the forecast model is adopted as follows:
� Calculation model of the noise pressure level of multi noise sources
∑=1i
1.0 Ai10lg10 LLatotal=
Where AtotalL refers to total sound pressure level of some point by adding n sound
sources together (dB);
AiL Refer to the equivalent sound level of No. i sound source to certain forecast point.
� The geometric divergence attenuation model of point sound sources
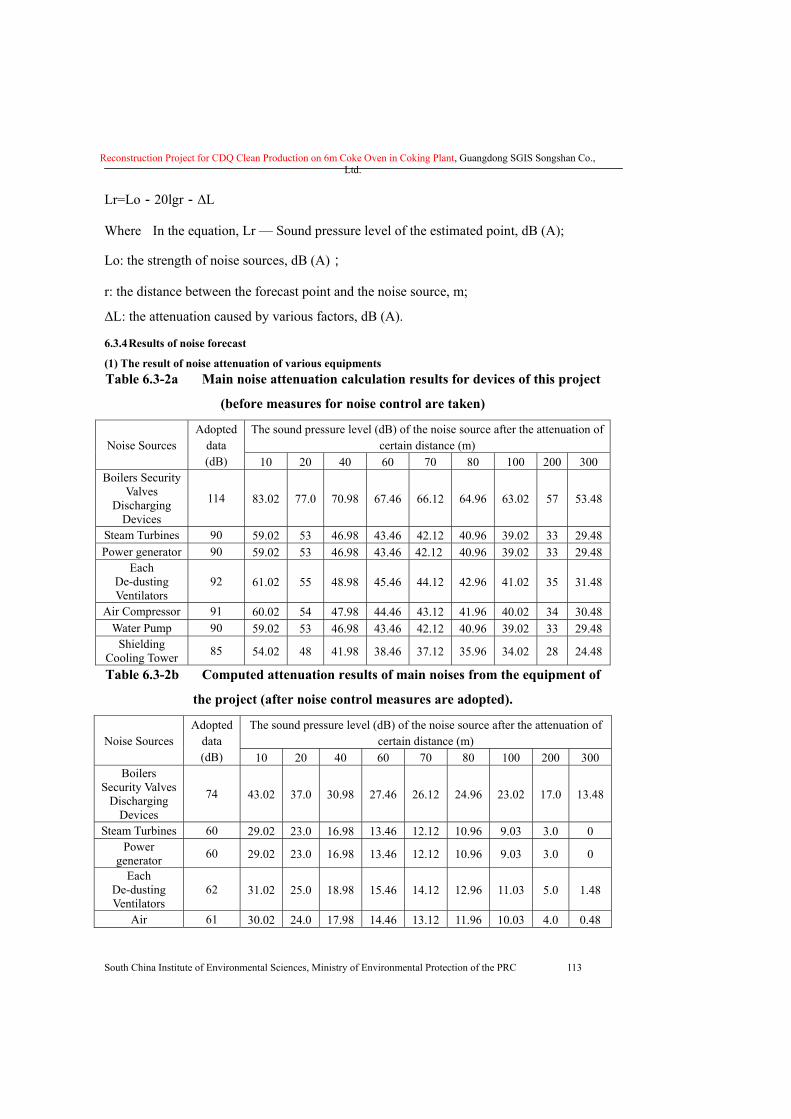
Reconstruction Project for CDQ Clean Production on 6m Coke Oven in Coking Plant, Guangdong SGIS Songshan Co., Ltd.
South China Institute of Environmental Sciences, Ministry of Environmental Protection of the PRC 113
Lr=Lo-20lgr-ΔL
Where In the equation, Lr — Sound pressure level of the estimated point, dB (A);
Lo: the strength of noise sources, dB (A);
r: the distance between the forecast point and the noise source, m;
ΔL: the attenuation caused by various factors, dB (A).
6.3.4 Results of noise forecast
(1) The result of noise attenuation of various equipments Table 6.3-2a Main noise attenuation calculation results for devices of this project
(before measures for noise control are taken)
The sound pressure level (dB) of the noise source after the attenuation of certain distance (m) Noise Sources
Adopted data (dB) 10 20 40 60 70 80 100 200 300
Boilers Security Valves
Discharging Devices
114 83.02 77.0 70.98 67.46 66.12 64.96 63.02 57 53.48
Steam Turbines 90 59.02 53 46.98 43.46 42.12 40.96 39.02 33 29.48 Power generator 90 59.02 53 46.98 43.46 42.12 40.96 39.02 33 29.48
Each De-dusting Ventilators
92 61.02 55 48.98 45.46 44.12 42.96 41.02 35 31.48
Air Compressor 91 60.02 54 47.98 44.46 43.12 41.96 40.02 34 30.48 Water Pump 90 59.02 53 46.98 43.46 42.12 40.96 39.02 33 29.48
Shielding Cooling Tower 85 54.02 48 41.98 38.46 37.12 35.96 34.02 28 24.48
Table 6.3-2b Computed attenuation results of main noises from the equipment of
the project (after noise control measures are adopted).
The sound pressure level (dB) of the noise source after the attenuation of certain distance (m) Noise Sources
Adopted data (dB) 10 20 40 60 70 80 100 200 300
Boilers Security Valves
Discharging Devices
74 43.02 37.0 30.98 27.46 26.12 24.96 23.02 17.0 13.48
Steam Turbines 60 29.02 23.0 16.98 13.46 12.12 10.96 9.03 3.0 0 Power
generator 60 29.02 23.0 16.98 13.46 12.12 10.96 9.03 3.0 0
Each De-dusting Ventilators
62 31.02 25.0 18.98 15.46 14.12 12.96 11.03 5.0 1.48
Air 61 30.02 24.0 17.98 14.46 13.12 11.96 10.03 4.0 0.48
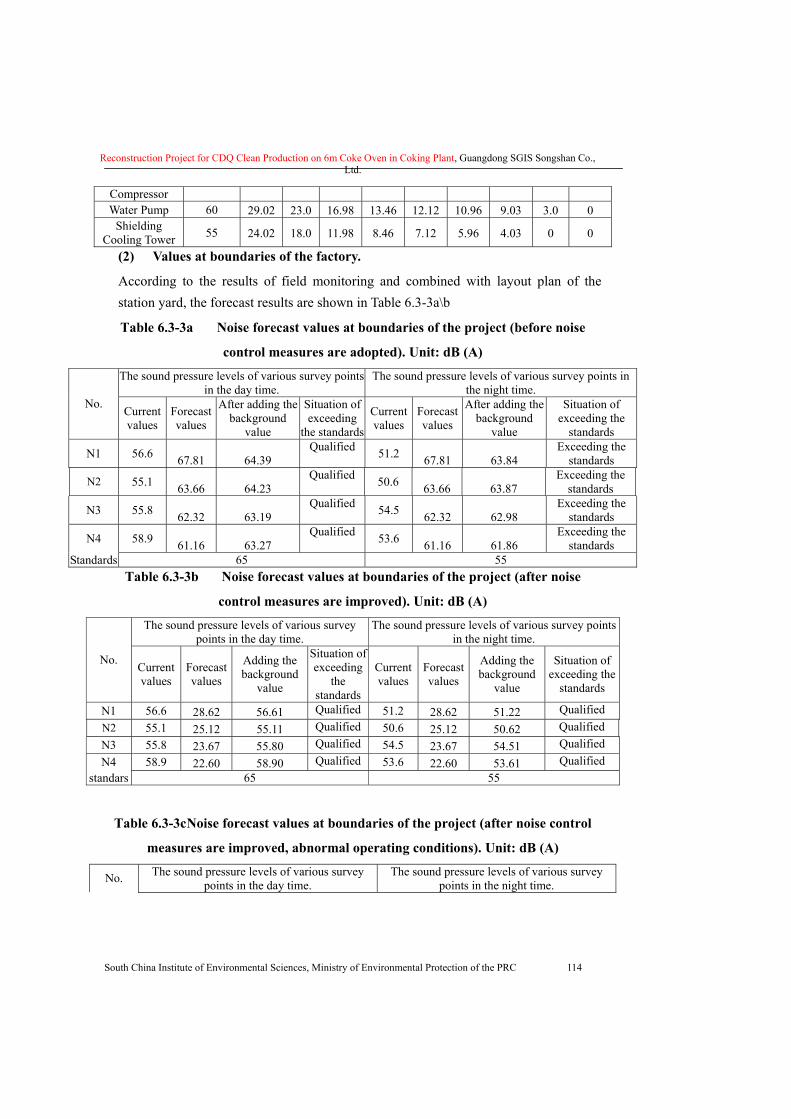
Reconstruction Project for CDQ Clean Production on 6m Coke Oven in Coking Plant, Guangdong SGIS Songshan Co., Ltd.
South China Institute of Environmental Sciences, Ministry of Environmental Protection of the PRC 114
Compressor Water Pump 60 29.02 23.0 16.98 13.46 12.12 10.96 9.03 3.0 0
Shielding Cooling Tower 55 24.02 18.0 11.98 8.46 7.12 5.96 4.03 0 0
(2) Values at boundaries of the factory.
According to the results of field monitoring and combined with layout plan of the station yard, the forecast results are shown in Table 6.3-3a\b
Table 6.3-3a Noise forecast values at boundaries of the project (before noise
control measures are adopted). Unit: dB (A)
The sound pressure levels of various survey points in the day time.
The sound pressure levels of various survey points in the night time.
No. Current values
Forecast values
After adding the background
value
Situation of exceeding
the standards
Current values
Forecast values
After adding the background
value
Situation of exceeding the
standards
N1 56.6 67.81 64.39 Qualified 51.2 67.81 63.84
Exceeding the standards
N2 55.1 63.66 64.23 Qualified 50.6 63.66 63.87
Exceeding the standards
N3 55.8 62.32 63.19 Qualified 54.5 62.32 62.98
Exceeding the standards
N4 58.9 61.16 63.27 Qualified 53.6 61.16 61.86
Exceeding the standards
Standards 65 55 Table 6.3-3b Noise forecast values at boundaries of the project (after noise
control measures are improved). Unit: dB (A)
The sound pressure levels of various survey points in the day time.
The sound pressure levels of various survey points in the night time.
No. Current values
Forecast values
Adding the background
value
Situation of exceeding
the standards
Current values
Forecast values
Adding the background
value
Situation of exceeding the
standards
N1 56.6 28.62 56.61 Qualified 51.2 28.62 51.22 Qualified N2 55.1 25.12 55.11 Qualified 50.6 25.12 50.62 Qualified N3 55.8 23.67 55.80 Qualified 54.5 23.67 54.51 Qualified N4 58.9 22.60 58.90 Qualified 53.6 22.60 53.61 Qualified
standars 65 55
Table 6.3-3c Noise forecast values at boundaries of the project (after noise control
measures are improved, abnormal operating conditions). Unit: dB (A)
No. The sound pressure levels of various survey points in the day time.
The sound pressure levels of various survey points in the night time.
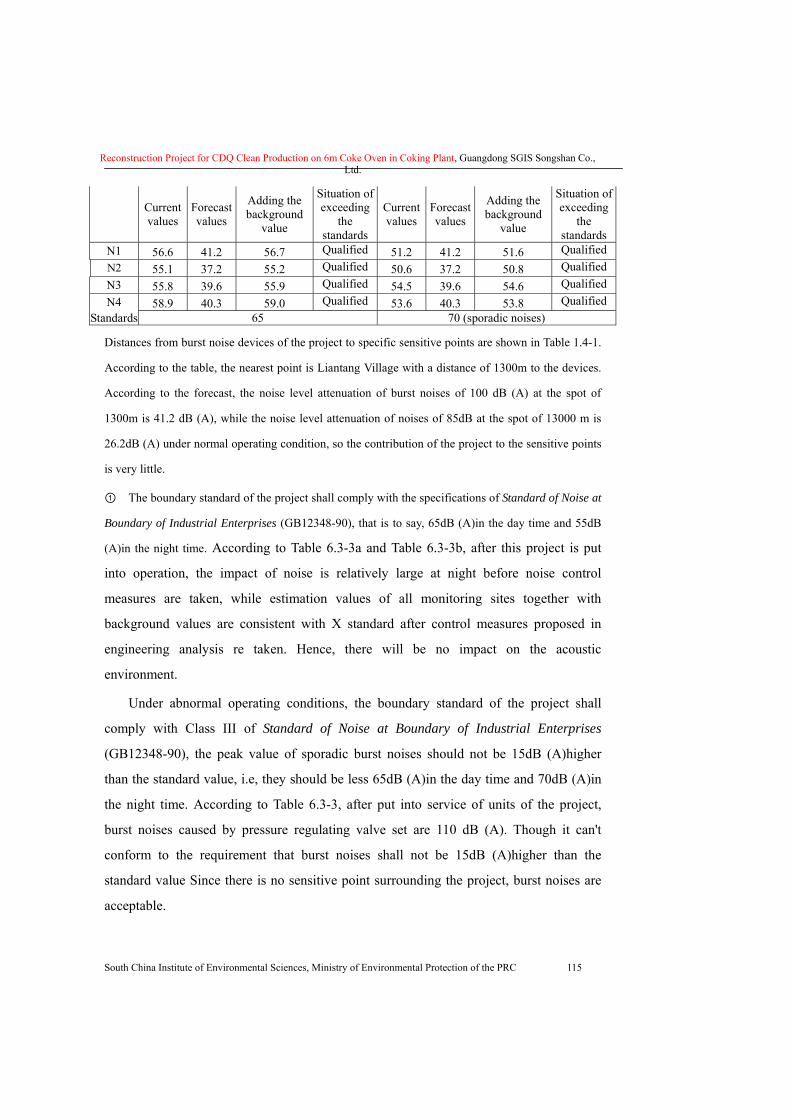
Reconstruction Project for CDQ Clean Production on 6m Coke Oven in Coking Plant, Guangdong SGIS Songshan Co., Ltd.
South China Institute of Environmental Sciences, Ministry of Environmental Protection of the PRC 115
Current values
Forecast values
Adding the background
value
Situation of exceeding
the standards
Current values
Forecast values
Adding the background
value
Situation of exceeding
the standards
N1 56.6 41.2 56.7 Qualified 51.2 41.2 51.6 Qualified N2 55.1 37.2 55.2 Qualified 50.6 37.2 50.8 Qualified N3 55.8 39.6 55.9 Qualified 54.5 39.6 54.6 Qualified N4 58.9 40.3 59.0 Qualified 53.6 40.3 53.8 Qualified
Standards 65 70 (sporadic noises)
Distances from burst noise devices of the project to specific sensitive points are shown in Table 1.4-1.
According to the table, the nearest point is Liantang Village with a distance of 1300m to the devices.
According to the forecast, the noise level attenuation of burst noises of 100 dB (A) at the spot of
1300m is 41.2 dB (A), while the noise level attenuation of noises of 85dB at the spot of 13000 m is
26.2dB (A) under normal operating condition, so the contribution of the project to the sensitive points
is very little.
① The boundary standard of the project shall comply with the specifications of Standard of Noise at
Boundary of Industrial Enterprises (GB12348-90), that is to say, 65dB (A)in the day time and 55dB
(A)in the night time. According to Table 6.3-3a and Table 6.3-3b, after this project is put
into operation, the impact of noise is relatively large at night before noise control
measures are taken, while estimation values of all monitoring sites together with
background values are consistent with X standard after control measures proposed in
engineering analysis re taken. Hence, there will be no impact on the acoustic
environment.
� Under abnormal operating conditions, the boundary standard of the project shall
comply with Class III of Standard of Noise at Boundary of Industrial Enterprises
(GB12348-90), the peak value of sporadic burst noises should not be 15dB (A)higher
than the standard value, i.e, they should be less 65dB (A)in the day time and 70dB (A)in
the night time. According to Table 6.3-3, after put into service of units of the project,
burst noises caused by pressure regulating valve set are 110 dB (A). Though it can't
conform to the requirement that burst noises shall not be 15dB (A)higher than the
standard value Since there is no sensitive point surrounding the project, burst noises are
acceptable.
Reconstruction Project for CDQ Clean Production on 6m Coke Oven in Coking Plant, Guangdong SGIS Songshan Co., Ltd.
South China Institute of Environmental Sciences, Ministry of Environmental Protection of the PRC 116
6.4 Solid Waste Environmental Impact Assessment
Only the single type solid waste, coke dust of about 24000t/a collected by the
dust-removal system, is produced in the process of production of the CDQ project. The
humidified coke dust is completely and comprehensively utilized by delivering to the
coal preparation workshop with carrier vehicles and incorporating in coking coal, or
delivering to the sinter plant as per requirements as the raw material.
At present, SGIS Company has recycled or comprehensively utilized all produced solid
wastes, and basically there is no pollution caused solid wastes.
6.5 Analysis of Impact of Dust on Crops Surrounded
Dust is most harmful to crops, especially to vegetables. Without direct harms to crops, dust mainly influences photosynthesis of crops by sticking on the leaf surfaces of crops. Once crops are polluted by dust, their photosynthesis will be reduced or stopped when the condition is serious; the growth of vegetables will be suppressed, causing different degrees of production reduction and great deterioration of vegetable quality.
The dust produced in the process of the project operation will have a certain influence on the quality of farm products at the surrounding area. On one hand, as for planted fruits and vegetables, the dust covered on the leaf surface of vegetables or the surface of fruits will not only influence their appearances but also make them hard to be cleaned; not only make their tastes poor but also influence the health of eaters to a certain degree. On the other hand, crops will have an enrichment effect to the metal elements contained in dust through the action of waters or soil, which will result in an abnormal metal content in fruits as well as deterioration of quality of farm products and potential safety hazards.
According to investigation into the current condition of the crops at the surrounding area, crops have not been polluted by heavy metals and conform to related values specified in National Hygienic Standard of Grain (GB2715-81); the sampled crops have normal luster and pure smell, which indicates that the crops within the assessed area have not been polluted by heavy metals; in combination with the forecast analysis results, it can be known that the dust discharged by the project is far less than related values specified by the state and will not influence the growth of crops at the surrounding area within a short term of period. With the accumulation of time, the accumulation effect that may be formed in the soil of farmland to a certain degree will have an influence on eco-system of crops, so corresponding regular monitoring at the surrounding farmlands shall be conducted in order to make a reasonable and scientific arrangement based on corresponding monitoring results.
6.6 Environmental impact analysis for the construction period.
During the construction period, various construction activities will inevitably have
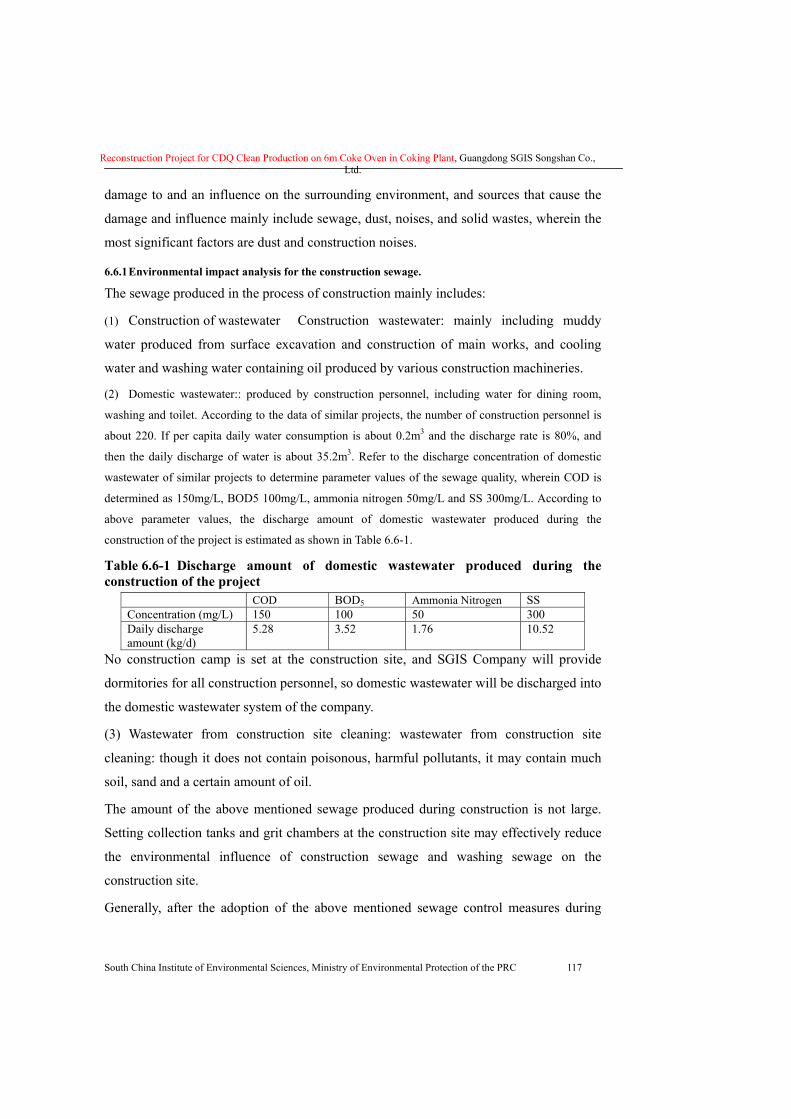
Reconstruction Project for CDQ Clean Production on 6m Coke Oven in Coking Plant, Guangdong SGIS Songshan Co., Ltd.
South China Institute of Environmental Sciences, Ministry of Environmental Protection of the PRC 117
damage to and an influence on the surrounding environment, and sources that cause the
damage and influence mainly include sewage, dust, noises, and solid wastes, wherein the
most significant factors are dust and construction noises.
6.6.1 Environmental impact analysis for the construction sewage.
The sewage produced in the process of construction mainly includes:
(1) Construction of wastewater Construction wastewater: mainly including muddy
water produced from surface excavation and construction of main works, and cooling
water and washing water containing oil produced by various construction machineries.
(2) Domestic wastewater:: produced by construction personnel, including water for dining room,
washing and toilet. According to the data of similar projects, the number of construction personnel is
about 220. If per capita daily water consumption is about 0.2m3 and the discharge rate is 80%, and
then the daily discharge of water is about 35.2m3. Refer to the discharge concentration of domestic
wastewater of similar projects to determine parameter values of the sewage quality, wherein COD is
determined as 150mg/L, BOD5 100mg/L, ammonia nitrogen 50mg/L and SS 300mg/L. According to
above parameter values, the discharge amount of domestic wastewater produced during the
construction of the project is estimated as shown in Table 6.6-1.
Table 6.6-1 Discharge amount of domestic wastewater produced during the construction of the project
COD BOD5 Ammonia Nitrogen SS Concentration (mg/L) 150 100 50 300 Daily discharge amount (kg/d)
5.28 3.52 1.76 10.52
No construction camp is set at the construction site, and SGIS Company will provide
dormitories for all construction personnel, so domestic wastewater will be discharged into
the domestic wastewater system of the company.
(3) Wastewater from construction site cleaning: wastewater from construction site
cleaning: though it does not contain poisonous, harmful pollutants, it may contain much
soil, sand and a certain amount of oil.
The amount of the above mentioned sewage produced during construction is not large.
Setting collection tanks and grit chambers at the construction site may effectively reduce
the environmental influence of construction sewage and washing sewage on the
construction site.
Generally, after the adoption of the above mentioned sewage control measures during
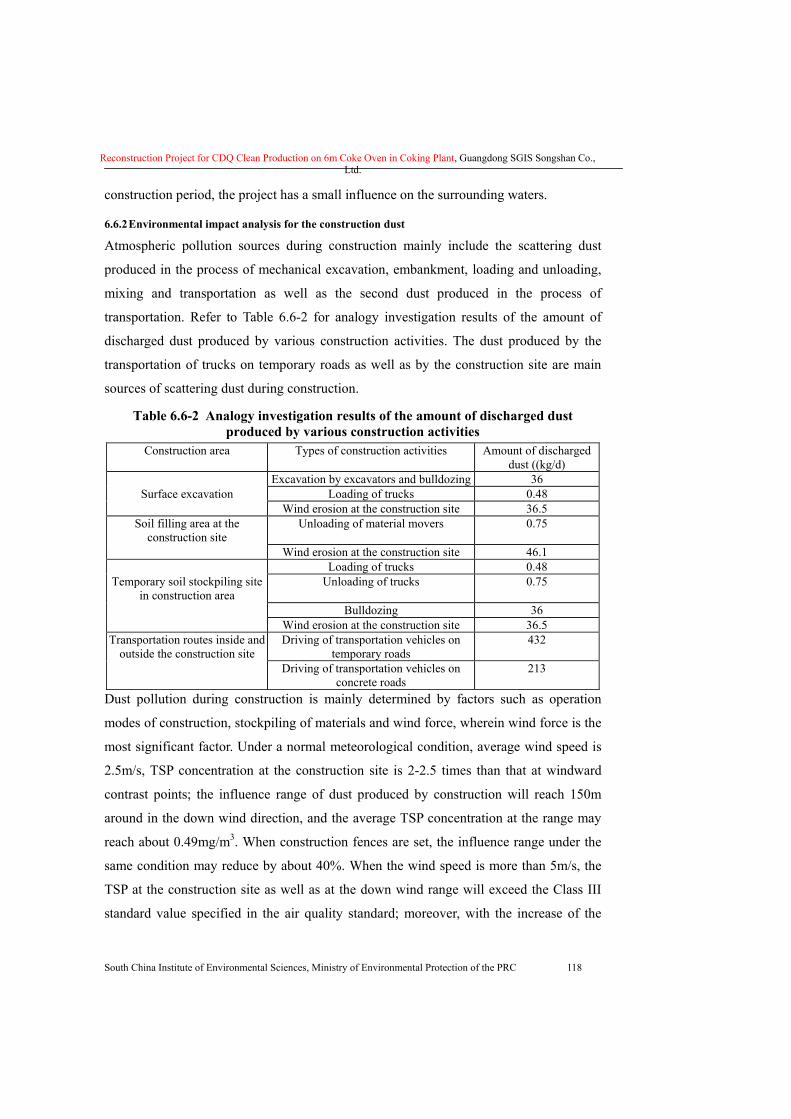
Reconstruction Project for CDQ Clean Production on 6m Coke Oven in Coking Plant, Guangdong SGIS Songshan Co., Ltd.
South China Institute of Environmental Sciences, Ministry of Environmental Protection of the PRC 118
construction period, the project has a small influence on the surrounding waters.
6.6.2 Environmental impact analysis for the construction dust
Atmospheric pollution sources during construction mainly include the scattering dust
produced in the process of mechanical excavation, embankment, loading and unloading,
mixing and transportation as well as the second dust produced in the process of
transportation. Refer to Table 6.6-2 for analogy investigation results of the amount of
discharged dust produced by various construction activities. The dust produced by the
transportation of trucks on temporary roads as well as by the construction site are main
sources of scattering dust during construction.
Table 6.6-2 Analogy investigation results of the amount of discharged dust produced by various construction activities
Construction area Types of construction activities Amount of discharged dust ((kg/d)
Excavation by excavators and bulldozing 36 Surface excavation Loading of trucks 0.48
Wind erosion at the construction site 36.5 Soil filling area at the
construction site Unloading of material movers 0.75
Wind erosion at the construction site 46.1 Loading of trucks 0.48
Temporary soil stockpiling site in construction area
Unloading of trucks 0.75
Bulldozing 36 Wind erosion at the construction site 36.5
Transportation routes inside and outside the construction site
Driving of transportation vehicles on temporary roads
432
Driving of transportation vehicles on concrete roads
213
Dust pollution during construction is mainly determined by factors such as operation
modes of construction, stockpiling of materials and wind force, wherein wind force is the
most significant factor. Under a normal meteorological condition, average wind speed is
2.5m/s, TSP concentration at the construction site is 2-2.5 times than that at windward
contrast points; the influence range of dust produced by construction will reach 150m
around in the down wind direction, and the average TSP concentration at the range may
reach about 0.49mg/m3. When construction fences are set, the influence range under the
same condition may reduce by about 40%. When the wind speed is more than 5m/s, the
TSP at the construction site as well as at the down wind range will exceed the Class III
standard value specified in the air quality standard; moreover, with the increase of the
Reconstruction Project for CDQ Clean Production on 6m Coke Oven in Coking Plant, Guangdong SGIS Songshan Co., Ltd.
South China Institute of Environmental Sciences, Ministry of Environmental Protection of the PRC 119
wind speed, the degree and range of the pollution caused by construction dust will be
correspondingly increased and enlarged
With good atmospheric diffusion condition of local area and the adoption of reasonable
and feasible control measures, the influence of dust and the influence range may be
reduced to a certain degree. Main control measures include:
(a) To ensure the scientific management and civilized construction at the construction
site. Sand and gravel shall be stockpiled together; cement shall be stockpiled in special
warehouses, reduce carrying operation as far as possible, and be careful for the carrying
in order to prevent the breakage and bale-off of cement packages.
(b) During excavation and removing, spray suitable amount of water on working
surfaces to keep the humidity to a certain degree in order to reduce scattering dust.
Moreover, excavated soil, removed construction materials and construction garbage shall
be removed in time.
(c) Ensure that transportation vehicles shall not be overloaded. Measures including
covering and sealing shall be adopted to reduce the scattering along the way. Timely
clean the mud and dust scattered on roads; clean wheel tires and vehicle bodies; spray
water regularly to reduce dust produced in the process of transportation.
(d) During the field construction of mixing mortar and concrete, be careful not to spill,
leak, leave or empty the mixed materials as far as possible; concrete mixers shall be
arranged in a shed and spraying and dust reduction measures shall be adopted during
mixing.
(e) Fences or part fences shall be set at the construction site in order to reduce as far as
possible dust diffusion range and the influence of dust on residents living nearby. When
the wind speed is too large, construction operation may be stopped and measures such as
covering shall be adopted for construction materials such as stockpiled sand and gravel.
After the adoption of air pollution control measures during the construction period, there
is less influence of the project on environment
6.6.3 Impact analysis for construction noises
(1) Assessment scope and assessment standards
During the construction, the assessment scope of acoustic environmental impact includes
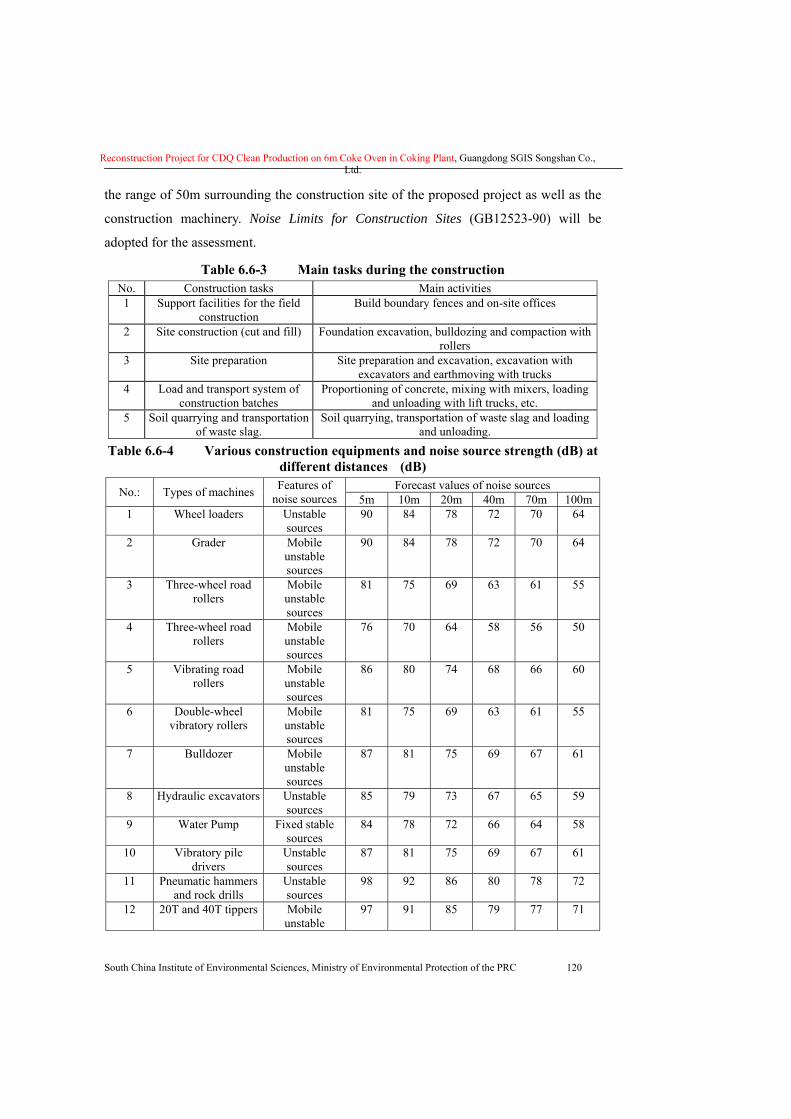
Reconstruction Project for CDQ Clean Production on 6m Coke Oven in Coking Plant, Guangdong SGIS Songshan Co., Ltd.
South China Institute of Environmental Sciences, Ministry of Environmental Protection of the PRC 120
the range of 50m surrounding the construction site of the proposed project as well as the
construction machinery. Noise Limits for Construction Sites (GB12523-90) will be
adopted for the assessment.
Table 6.6-3 Main tasks during the construction No. Construction tasks Main activities 1 Support facilities for the field
construction Build boundary fences and on-site offices
2 Site construction (cut and fill) Foundation excavation, bulldozing and compaction with rollers
3 Site preparation Site preparation and excavation, excavation with excavators and earthmoving with trucks
4 Load and transport system of construction batches
Proportioning of concrete, mixing with mixers, loading and unloading with lift trucks, etc.
5 Soil quarrying and transportation of waste slag.
Soil quarrying, transportation of waste slag and loading and unloading.
Table 6.6-4 Various construction equipments and noise source strength (dB) at different distances (dB)
Forecast values of noise sources No.: Types of machines Features of noise sources 5m 10m 20m 40m 70m 100m
1 Wheel loaders Unstable sources
90 84 78 72 70 64
2 Grader Mobile unstable sources
90 84 78 72 70 64
3 Three-wheel road rollers
Mobile unstable sources
81 75 69 63 61 55
4 Three-wheel road rollers
Mobile unstable sources
76 70 64 58 56 50
5 Vibrating road rollers
Mobile unstable sources
86 80 74 68 66 60
6 Double-wheel vibratory rollers
Mobile unstable sources
81 75 69 63 61 55
7 Bulldozer Mobile unstable sources
87 81 75 69 67 61
8 Hydraulic excavators Unstable sources
85 79 73 67 65 59
9 Water Pump Fixed stable sources
84 78 72 66 64 58
10 Vibratory pile drivers
Unstable sources
87 81 75 69 67 61
11 Pneumatic hammers and rock drills
Unstable sources
98 92 86 80 78 72
12 20T and 40T tippers Mobile unstable
97 91 85 79 77 71
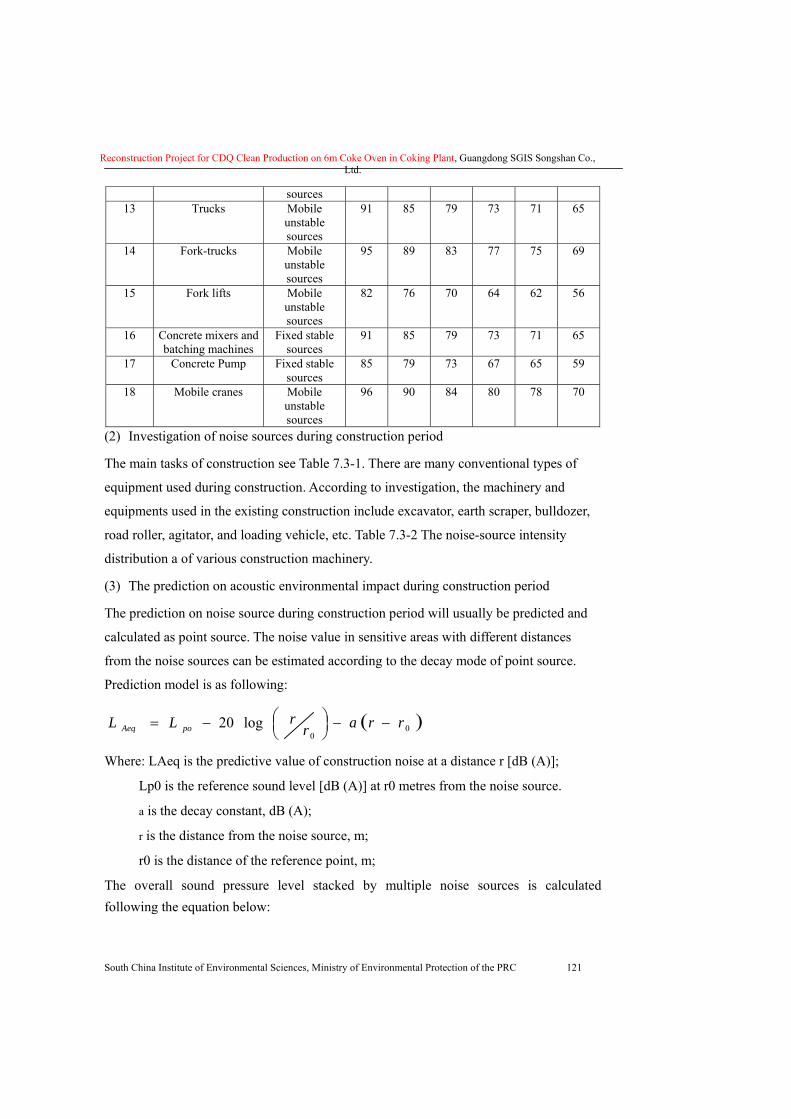
Reconstruction Project for CDQ Clean Production on 6m Coke Oven in Coking Plant, Guangdong SGIS Songshan Co., Ltd.
South China Institute of Environmental Sciences, Ministry of Environmental Protection of the PRC 121
sources 13 Trucks Mobile
unstable sources
91 85 79 73 71 65
14 Fork-trucks Mobile unstable sources
95 89 83 77 75 69
15 Fork lifts Mobile unstable sources
82 76 70 64 62 56
16 Concrete mixers and batching machines
Fixed stable sources
91 85 79 73 71 65
17 Concrete Pump Fixed stable sources
85 79 73 67 65 59
18 Mobile cranes Mobile unstable sources
96 90 84 80 78 70
(2) Investigation of noise sources during construction period
The main tasks of construction see Table 7.3-1. There are many conventional types of
equipment used during construction. According to investigation, the machinery and
equipments used in the existing construction include excavator, earth scraper, bulldozer,
road roller, agitator, and loading vehicle, etc. Table 7.3-2 The noise-source intensity
distribution a of various construction machinery.
(3) The prediction on acoustic environmental impact during construction period
The prediction on noise source during construction period will usually be predicted and
calculated as point source. The noise value in sensitive areas with different distances
from the noise sources can be estimated according to the decay mode of point source.
Prediction model is as following:
( )00
log20 rrarrLL poAeq −−⎟
⎠⎞⎜
⎝⎛−=
Where: LAeq is the predictive value of construction noise at a distance r [dB (A)];
Lp0 is the reference sound level [dB (A)] at r0 metres from the noise source.
a is the decay constant, dB (A);
r is the distance from the noise source, m;
r0 is the distance of the reference point, m;
The overall sound pressure level stacked by multiple noise sources is calculated following the equation below:
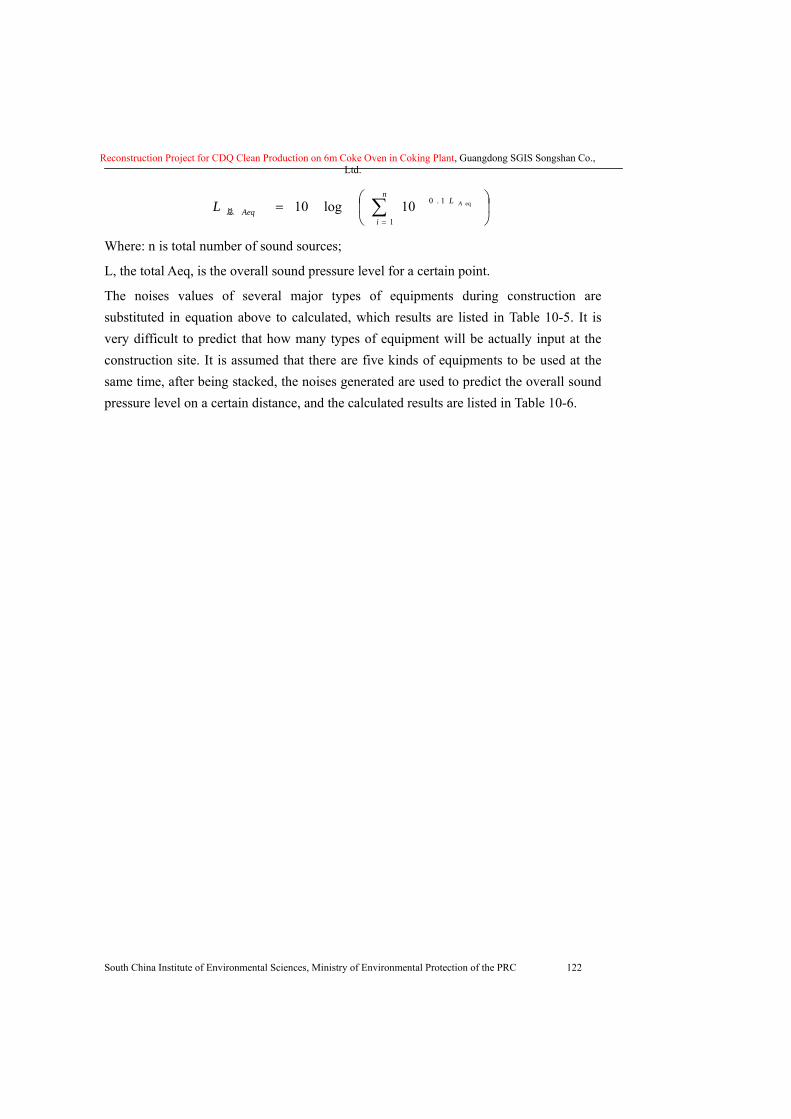
Reconstruction Project for CDQ Clean Production on 6m Coke Oven in Coking Plant, Guangdong SGIS Songshan Co., Ltd.
South China Institute of Environmental Sciences, Ministry of Environmental Protection of the PRC 122
⎟⎠
⎞⎜⎝
⎛= ∑
=
n
i
LAeq
AL1
1.0 eq10log10总
Where: n is total number of sound sources;
L, the total Aeq, is the overall sound pressure level for a certain point.
The noises values of several major types of equipments during construction are substituted in equation above to calculated, which results are listed in Table 10-5. It is very difficult to predict that how many types of equipment will be actually input at the construction site. It is assumed that there are five kinds of equipments to be used at the same time, after being stacked, the noises generated are used to predict the overall sound pressure level on a certain distance, and the calculated results are listed in Table 10-6.
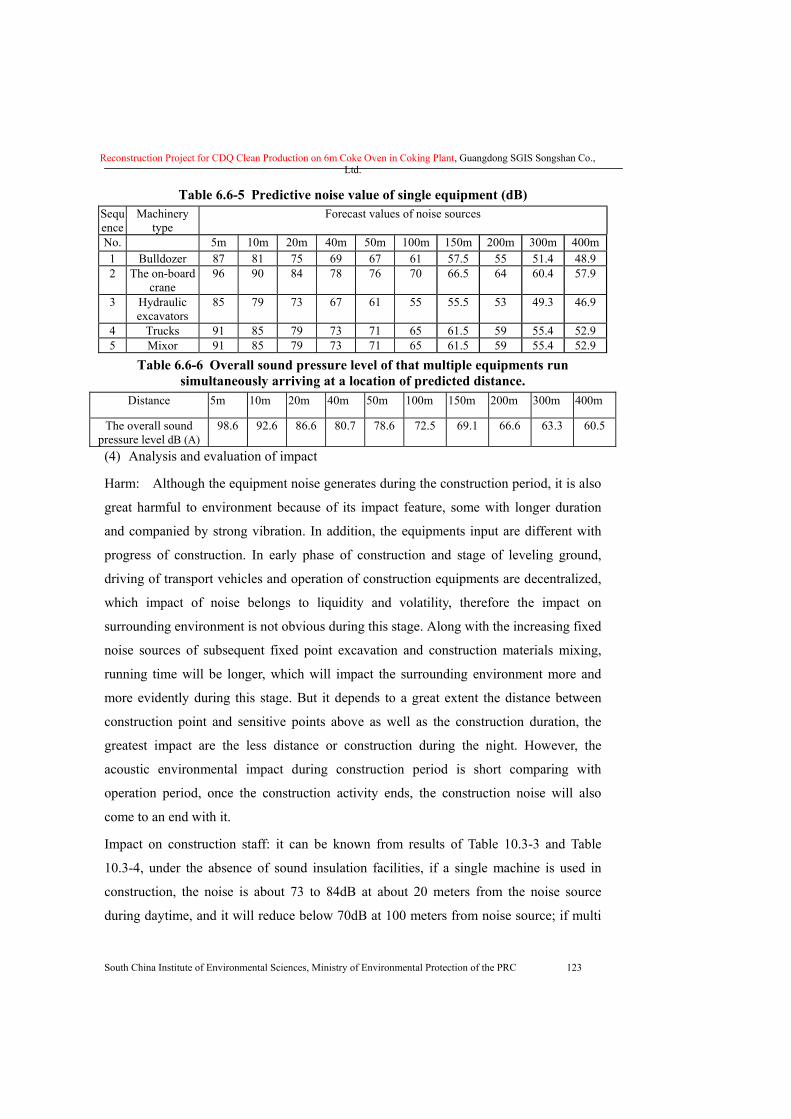
Reconstruction Project for CDQ Clean Production on 6m Coke Oven in Coking Plant, Guangdong SGIS Songshan Co., Ltd.
South China Institute of Environmental Sciences, Ministry of Environmental Protection of the PRC 123
Table 6.6-5 Predictive noise value of single equipment (dB) Sequence
Machinery type
Forecast values of noise sources
No. 5m 10m 20m 40m 50m 100m 150m 200m 300m 400m 1 Bulldozer 87 81 75 69 67 61 57.5 55 51.4 48.9 2 The on-board
crane 96 90 84 78 76 70 66.5 64 60.4 57.9
3 Hydraulic excavators
85 79 73 67 61 55 55.5 53 49.3 46.9
4 Trucks 91 85 79 73 71 65 61.5 59 55.4 52.9 5 Mixor 91 85 79 73 71 65 61.5 59 55.4 52.9
Table 6.6-6 Overall sound pressure level of that multiple equipments run simultaneously arriving at a location of predicted distance.
Distance 5m 10m 20m 40m 50m 100m 150m 200m 300m 400m
The overall sound pressure level dB (A)
98.6 92.6 86.6 80.7 78.6 72.5 69.1 66.6 63.3 60.5
(4) Analysis and evaluation of impact
Harm: Although the equipment noise generates during the construction period, it is also
great harmful to environment because of its impact feature, some with longer duration
and companied by strong vibration. In addition, the equipments input are different with
progress of construction. In early phase of construction and stage of leveling ground,
driving of transport vehicles and operation of construction equipments are decentralized,
which impact of noise belongs to liquidity and volatility, therefore the impact on
surrounding environment is not obvious during this stage. Along with the increasing fixed
noise sources of subsequent fixed point excavation and construction materials mixing,
running time will be longer, which will impact the surrounding environment more and
more evidently during this stage. But it depends to a great extent the distance between
construction point and sensitive points above as well as the construction duration, the
greatest impact are the less distance or construction during the night. However, the
acoustic environmental impact during construction period is short comparing with
operation period, once the construction activity ends, the construction noise will also
come to an end with it.
Impact on construction staff: it can be known from results of Table 10.3-3 and Table
10.3-4, under the absence of sound insulation facilities, if a single machine is used in
construction, the noise is about 73 to 84dB at about 20 meters from the noise source
during daytime, and it will reduce below 70dB at 100 meters from noise source; if multi
Reconstruction Project for CDQ Clean Production on 6m Coke Oven in Coking Plant, Guangdong SGIS Songshan Co., Ltd.
South China Institute of Environmental Sciences, Ministry of Environmental Protection of the PRC 124
machines are used in construction, the noise reduces to about 80dB at 40 meters from
noise source during daytime, it will reduce below 70dB at about 150 meters from the
source noise, and it can reduce below 60dB at the place out of 400 meters; Hence,
although the construction noise is at about 40 meters from the noise source, it can achieve
basically the daytime noise limit 85dB of hammers when multiple machines are operating,
but personnel within the peripheral of 20~150 meters of site scope will bear certain
acoustic environmental impact.
Impact on sensitive points: in case of no sound insulating facilities and a clear
environment from the sensitive points, a single machine produces noise at 60-70dB at
50m during construction, while the noise can reach about 78dB at 50m if multiple
machines work, the noise level is about 70dB at 150m and attenuates to about 66dB at
200m. Therefore, the noise of sensitive points within 300 meters around the peripheral of
construction point will be in 60~78dB during construction phase. It basically complies
with the daytime noise limits according to evaluation of Standard for noise limits for the
construction site for urban areas. As there is no environmental sensitive point within
500m of the evaluation scope, the construction noise will not impact the surrounding
residents. In addition, villages surrounding transport routes will suffer from acoustic
environmental impact from transport vehicles, because the construction will stop at night,
the acoustic environmental impact of vehicles is smaller during night anyway.
(5) Protective measures
In order to reduce environmental acoustic environmental impact during construction
period, the following control measures can be taken:
(1) Enhance construction management, arrange reasonably construction time; to
stagger the use time of high-intensity noise equipments as far as possible; to
prohibit high-noise construction during night operations to reduce possible adverse
impact of construction noise.
(2) Apply hydraulic tools in stead of pneumatic ones as much as possible to reduce
construction noise source intensity.
(3) Set up shelters around high noise equipments.
(4) Minimize vehicles number in construction area and traffic density as much as
Reconstruction Project for CDQ Clean Production on 6m Coke Oven in Coking Plant, Guangdong SGIS Songshan Co., Ltd.
South China Institute of Environmental Sciences, Ministry of Environmental Protection of the PRC 125
possible, control vehicle whistles.
(5) Make labor protection well, making workers operating near noise sources wear
protective earplugs.
Generally, the noise makes less impact to environment during project construction period
after control measures above are taken.
6.6.4 Analysis on environmental impact of solid waste
The solid wastes during construction period are work spoil and residue generated
primarily from work excavation and living garbage from construction personnel. The
following measures can be taken:
(1) Since no camp is established, living garbage from construction personnel can be
brought into the environmental sanitation collecting and disposal system in plant area for
processing according to the requirements of living quarter,.
(2) Since no borrow and spoil field will be established, the construction organ shall
make earthwork balance in construction site as far as possible.
(3) The construction waste can be piled at specified field temporarily in construction site,
and transported outward regularly to location designated for landfill, which is abandoned
randomly is not allowed.
(4) After finishing construction, the construction site is required to be cleaned up
promptly; the temporary building as temporary sheds shall be demolished, and waste
materials must be sent to disposal site designated.
Since the solid waste produced during construction period is little, it has smaller
environmental impact after implementing of measures above.
6.6.5 Analysis on impact of soil erosion
6.6.5.1 Analysis on environmental impact of soil erosion
Wastewater during construction project is mainly surface runoff of the heavy rain,
construction wastewater and domestic wastewater. Construction wastewater includes the
slurry water generated from processes of foundation and road excavation and workshop
construction, cooling and washing water from operation of machinery and equipments;
domestic wastewater includes the irrigation water of construction personnel, temporary
canteen and toilet. The rainy season is mainly from May to August. The summer
Reconstruction Project for CDQ Clean Production on 6m Coke Oven in Coking Plant, Guangdong SGIS Songshan Co., Ltd.
South China Institute of Environmental Sciences, Ministry of Environmental Protection of the PRC 126
rainstorms are concentrated, and rainfalls have high intensity and frequency. These
weather conditions bring adverse impact to soil erosion during the construction period of
project. As there are works of excavation and fill operation during construction process,
scour by rainfall will generate serious soil erosion if control is not enhanced. Scouring of
loosen soil, construction sand and gravel, garbage, the surface runoff will not only entrain
soil and sand, but also carry various pollutants of cement and a little oil, which will bring
short-term impact to quality of surrounding marine water.
6.6.5.2 The control measure and control scheme on soil erosion
� Before construction, the balance of earth and rock engineering shall be got as far as
possible, reducing spoil. The design of drainages, interception of water, preventing from
soil erosion shall be made well to prevent water and soil from flowing into surrounding
marine area.
� During construction, the construction plan, construction procedure shall be arranged
reasonably, and construction steps shall be coordinated. Excavating work surface shall be
minimized during rainy season, in order to avoid being scoured directly by rain. During
storm period, emergency measures shall be also taken, covering the soil surface
excavated newly with mulch as far as possible to prevent from erosion.
� The soil material shall be tried to be filled with pressure in plant area and road
construction site, without leaving loosen soil. Meanwhile, the side ditch is required to be
excavated. The filling works shall be concentrated as far as possible avoiding heavy rain
period.
� Catchment and desanding pool corresponding volume and drainage ditch are
required to be built in construction site to collect surface runoff and slurry water
produced during construction process, which shall be discharged into the drainage ditch
after pretreatment of desanding, slag removal and oil separation.
� During construction, the equipments need to be repaired shall be transferred to the
equipment maintenance location designated to repair, in order to avoid wastewater
containing oil to pollute surrounding marine area as far as possible; moreover, temporary
toilets shall be set up at construction site, and cleaned regularly, what cleaned out is sent
to the disposal site designated.
Reconstruction Project for CDQ Clean Production on 6m Coke Oven in Coking Plant, Guangdong SGIS Songshan Co., Ltd.
South China Institute of Environmental Sciences, Ministry of Environmental Protection of the PRC 127
� The trucks transporting soil and gravel are required to be maintained well, which
shall not be loaded too full in order to ensure not to be scattered out during the
transporting process.
� The clear space not set up with workshops shall be plant trees and turf during
construction for greening.
To conclude, noise, waste gas, wastewater and solid waste will have a certain impact to
the environment during construction period, but construction period is not very long,
therefore the pollution during construction period is temporary, such kind of pollution can
be removed after the end of construction. Environment will not be got adverse impact
significantly during construction period, as long as organizational work is done well by
construction organ to conduct civilized construction, and implement all environmental
protection measures above pressingly.
6.6.6 Environment supervision during construction
It can be known from analysis on environment impact during construction period in
sections, certain wastewater (including construction wastewater, domestic wastewater,
cleaning wastewater from construction site), waste gas (primarily dust), noise pollution
will generate during construction project, and a certain extent soil erosion will result
within scope of the project. In order to protect quality of local environment, principal of
the Third Party organ with corresponding qualifications is required to supervise the
implementation of environmental protection measures(including treatment measures and
management system) during construction of the project, i.e. to conduct environmental
supervision during construction period, implement mandatorily environmental protective
measures, to strengthen environmental management of these infrastructural projects
during construction period.
Qualified organ shall implement strictly environmental supervision in accordance with
the System of Environmental Supervision (Trial) Huan Jian (1996) No. 888. The land
used temporarily of borrowing and spoiling field, construction sidewalk newly opened,
and temporary resident shall be strengthened to audit. On one hand, the environment
supervisor shall strengthen contact with land resource, and environmental protection
departments of local government, strengthen monitor, management, and coordination to
contractors, particularly eliminating phenomenon of random mining. On the other hand,
Reconstruction Project for CDQ Clean Production on 6m Coke Oven in Coking Plant, Guangdong SGIS Songshan Co., Ltd.
South China Institute of Environmental Sciences, Ministry of Environmental Protection of the PRC 128
temporary land used must be audited by the environmental supervising engineer to
examine whether its position meets the environmental requirement in accordance with
relevant contract documents, laws and standards, on which construction only can be
started after completing the examination and verification. During the course of
construction, subsections and branch projects must be reported with environmental
protection measures before construction. The supervisor will not permit the starting of
construction till the environmental supervision engineer signature exams and agrees with
signature; the environmental supervision engineer monitors the implementation of
environmental protection measures by verification regularly and irregularly; the
completion acceptance of subsections and branch projects is required for signature
recognition of environmental supervision engineer by the same way.
Implementation of week examine, weekly report, and monthly examine, monthly report
system, the environmental issues table of construction period the project is worked out,
on which will be marked with environmental issues found in daily inspection. The
environmental issues dynamic graph shall be drawn according to the issues occurred
weekly; the improved monthly examination table shall be worked out, to mark
implementation effect of environmental protection measures of each type and bid section
along the line, analyze comprehensively implementation effect and inadequate aspect of
environmental protection measures of each bid section within one month, offering the
targeted basis for implementing environmental supervision next step.
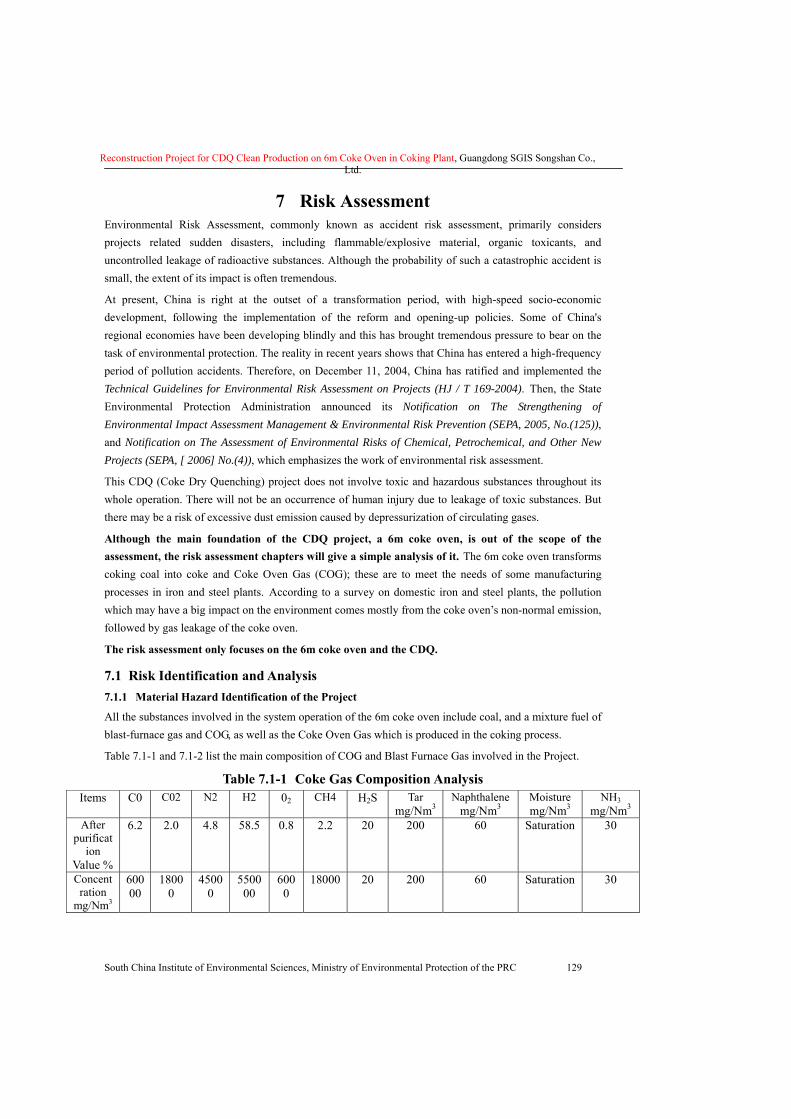
Reconstruction Project for CDQ Clean Production on 6m Coke Oven in Coking Plant, Guangdong SGIS Songshan Co., Ltd.
South China Institute of Environmental Sciences, Ministry of Environmental Protection of the PRC 129
7 Risk Assessment Environmental Risk Assessment, commonly known as accident risk assessment, primarily considers projects related sudden disasters, including flammable/explosive material, organic toxicants, and uncontrolled leakage of radioactive substances. Although the probability of such a catastrophic accident is small, the extent of its impact is often tremendous. At present, China is right at the outset of a transformation period, with high-speed socio-economic development, following the implementation of the reform and opening-up policies. Some of China's regional economies have been developing blindly and this has brought tremendous pressure to bear on the task of environmental protection. The reality in recent years shows that China has entered a high-frequency period of pollution accidents. Therefore, on December 11, 2004, China has ratified and implemented the Technical Guidelines for Environmental Risk Assessment on Projects (HJ / T 169-2004). Then, the State Environmental Protection Administration announced its Notification on The Strengthening of Environmental Impact Assessment Management & Environmental Risk Prevention (SEPA, 2005, No.(125)), and Notification on The Assessment of Environmental Risks of Chemical, Petrochemical, and Other New Projects (SEPA, [ 2006] No.(4)), which emphasizes the work of environmental risk assessment. This CDQ (Coke Dry Quenching) project does not involve toxic and hazardous substances throughout its whole operation. There will not be an occurrence of human injury due to leakage of toxic substances. But there may be a risk of excessive dust emission caused by depressurization of circulating gases. Although the main foundation of the CDQ project, a 6m coke oven, is out of the scope of the assessment, the risk assessment chapters will give a simple analysis of it. The 6m coke oven transforms coking coal into coke and Coke Oven Gas (COG); these are to meet the needs of some manufacturing processes in iron and steel plants. According to a survey on domestic iron and steel plants, the pollution which may have a big impact on the environment comes mostly from the coke oven’s non-normal emission, followed by gas leakage of the coke oven. The risk assessment only focuses on the 6m coke oven and the CDQ.
7.1 Risk Identification and Analysis 7.1.1 Material Hazard Identification of the Project
All the substances involved in the system operation of the 6m coke oven include coal, and a mixture fuel of blast-furnace gas and COG, as well as the Coke Oven Gas which is produced in the coking process. Table 7.1-1 and 7.1-2 list the main composition of COG and Blast Furnace Gas involved in the Project.
Table 7.1-1 Coke Gas Composition Analysis Items C0 C02 N2 H2 02 CH4 H2S Tar
mg/Nm3 Naphthalene
mg/Nm3 Moisture mg/Nm3
NH3 mg/Nm3
After purificat
ion Value %
6.2 2.0 4.8 58.5 0.8 2.2 20 200 60 Saturation 30
Concentration
mg/Nm3
60000
18000
45000
550000
6000
18000 20 200 60 Saturation 30
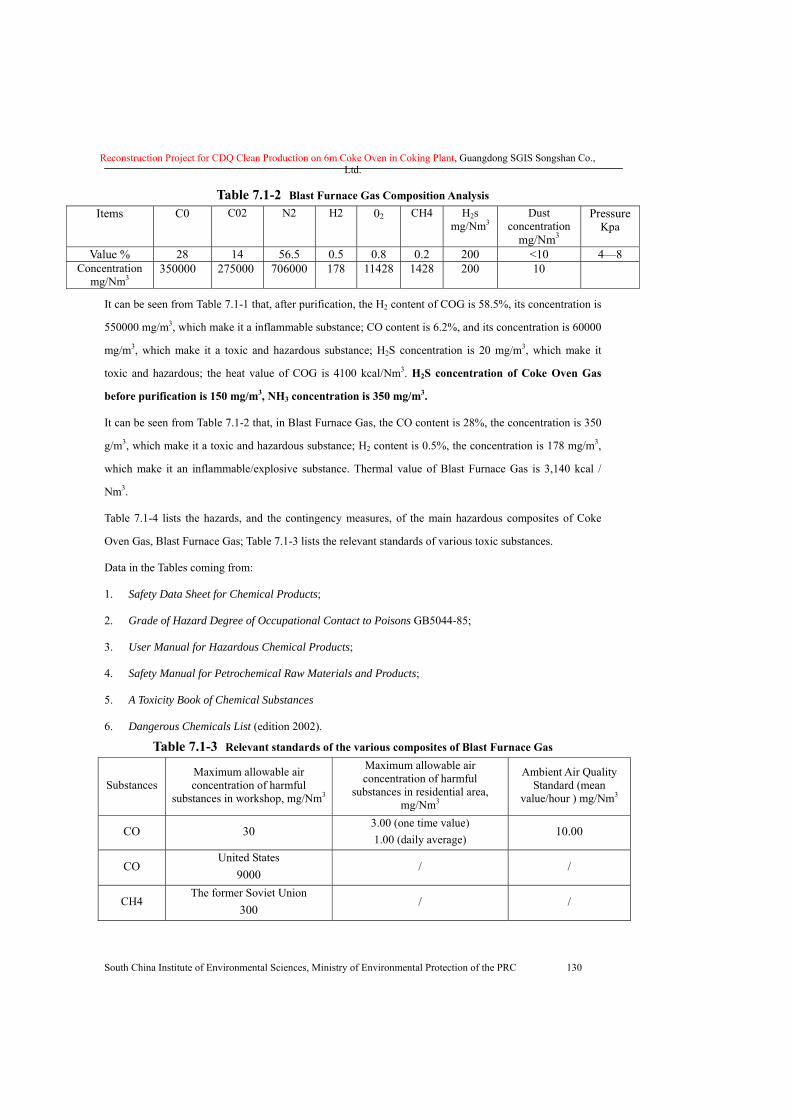
Reconstruction Project for CDQ Clean Production on 6m Coke Oven in Coking Plant, Guangdong SGIS Songshan Co., Ltd.
South China Institute of Environmental Sciences, Ministry of Environmental Protection of the PRC 130
Table 7.1-2 Blast Furnace Gas Composition Analysis Items C0 C02 N2 H2 02 CH4 H2s
mg/Nm3 Dust
concentration mg/Nm3
Pressure Kpa
Value % 28 14 56.5 0.5 0.8 0.2 200 <10 4—8 Concentration
mg/Nm3 350000 275000 706000 178 11428 1428 200 10
It can be seen from Table 7.1-1 that, after purification, the H2 content of COG is 58.5%, its concentration is
550000 mg/m3, which make it a inflammable substance; CO content is 6.2%, and its concentration is 60000
mg/m3, which make it a toxic and hazardous substance; H2S concentration is 20 mg/m3, which make it
toxic and hazardous; the heat value of COG is 4100 kcal/Nm3. H2S concentration of Coke Oven Gas
before purification is 150 mg/m3, NH3 concentration is 350 mg/m3.
It can be seen from Table 7.1-2 that, in Blast Furnace Gas, the CO content is 28%, the concentration is 350
g/m3, which make it a toxic and hazardous substance; H2 content is 0.5%, the concentration is 178 mg/m3,
which make it an inflammable/explosive substance. Thermal value of Blast Furnace Gas is 3,140 kcal /
Nm3.
Table 7.1-4 lists the hazards, and the contingency measures, of the main hazardous composites of Coke
Oven Gas, Blast Furnace Gas; Table 7.1-3 lists the relevant standards of various toxic substances.
Data in the Tables coming from:
1. Safety Data Sheet for Chemical Products;
2. Grade of Hazard Degree of Occupational Contact to Poisons GB5044-85;
3. User Manual for Hazardous Chemical Products;
4. Safety Manual for Petrochemical Raw Materials and Products;
5. A Toxicity Book of Chemical Substances
6. Dangerous Chemicals List (edition 2002).
Table 7.1-3 Relevant standards of the various composites of Blast Furnace Gas
Substances Maximum allowable air concentration of harmful
substances in workshop, mg/Nm3
Maximum allowable air concentration of harmful
substances in residential area, mg/Nm3
Ambient Air Quality Standard (mean
value/hour ) mg/Nm3
CO 30 3.00 (one time value) 1.00 (daily average)
10.00
CO United States
9000 / /
CH4 The former Soviet Union
300 / /

Reconstruction Project for CDQ Clean Production on 6m Coke Oven in Coking Plant, Guangdong SGIS Songshan Co., Ltd.
South China Institute of Environmental Sciences, Ministry of Environmental Protection of the PRC 131
H2S 10 0.01 Based on Table 7.1-4, make an analysis and comparison of fire/explosiveness of relevant materials and products, and screen out H2 in the Coke Oven Gas as a target for fire/explosiveness analysis. Based on analysis of the characteristics of toxic substances, select CO, H2S, as targets for analysis on leakage of toxic substances. Determine the maximum credible accident relevant to the material selected.
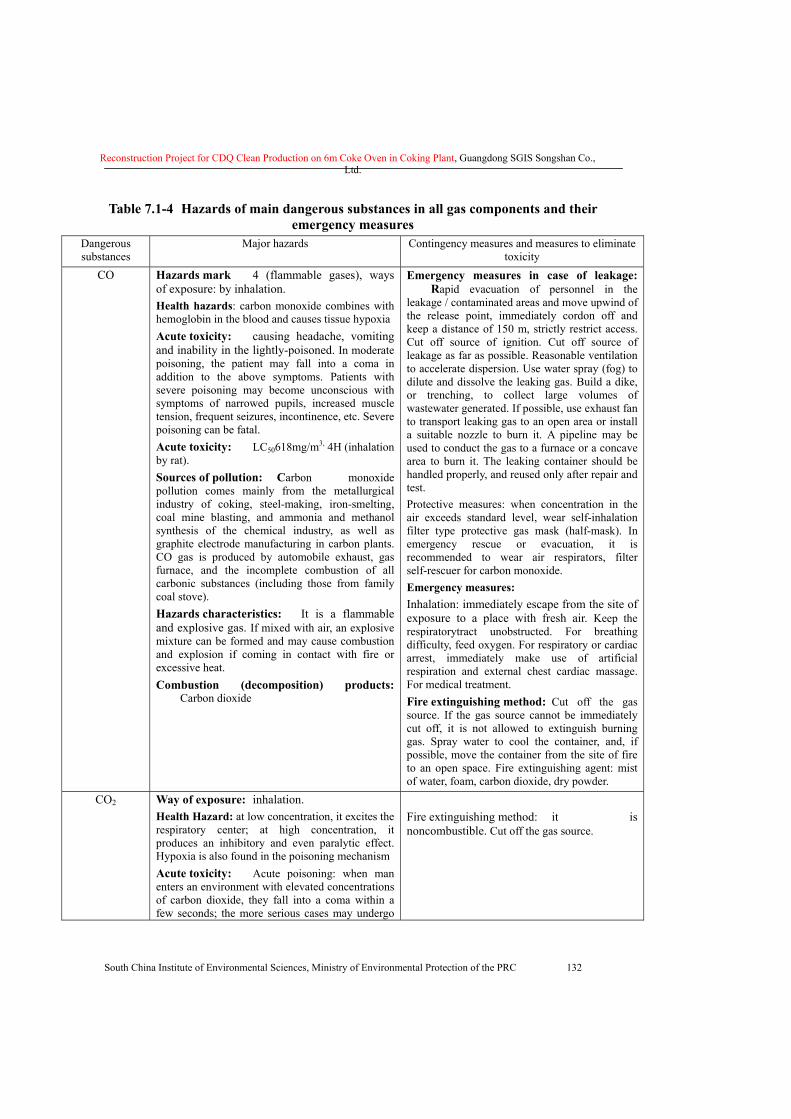
Reconstruction Project for CDQ Clean Production on 6m Coke Oven in Coking Plant, Guangdong SGIS Songshan Co., Ltd.
South China Institute of Environmental Sciences, Ministry of Environmental Protection of the PRC 132
Table 7.1-4 Hazards of main dangerous substances in all gas components and their
emergency measures Dangerous substances
Major hazards Contingency measures and measures to eliminate toxicity
CO Hazards mark 4 (flammable gases), ways of exposure: by inhalation. Health hazards: carbon monoxide combines with hemoglobin in the blood and causes tissue hypoxia Acute toxicity: causing headache, vomiting and inability in the lightly-poisoned. In moderate poisoning, the patient may fall into a coma in addition to the above symptoms. Patients with severe poisoning may become unconscious with symptoms of narrowed pupils, increased muscle tension, frequent seizures, incontinence, etc. Severe poisoning can be fatal. Acute toxicity: LC50618mg/m3, 4H (inhalation by rat). Sources of pollution: Carbon monoxide pollution comes mainly from the metallurgical industry of coking, steel-making, iron-smelting, coal mine blasting, and ammonia and methanol synthesis of the chemical industry, as well as graphite electrode manufacturing in carbon plants. CO gas is produced by automobile exhaust, gas furnace, and the incomplete combustion of all carbonic substances (including those from family coal stove). Hazards characteristics: It is a flammable and explosive gas. If mixed with air, an explosive mixture can be formed and may cause combustion and explosion if coming in contact with fire or excessive heat. Combustion (decomposition) products: Carbon dioxide
Emergency measures in case of leakage: Rapid evacuation of personnel in the leakage / contaminated areas and move upwind of the release point, immediately cordon off and keep a distance of 150 m, strictly restrict access. Cut off source of ignition. Cut off source of leakage as far as possible. Reasonable ventilation to accelerate dispersion. Use water spray (fog) to dilute and dissolve the leaking gas. Build a dike, or trenching, to collect large volumes of wastewater generated. If possible, use exhaust fan to transport leaking gas to an open area or install a suitable nozzle to burn it. A pipeline may be used to conduct the gas to a furnace or a concave area to burn it. The leaking container should be handled properly, and reused only after repair and test. Protective measures: when concentration in the air exceeds standard level, wear self-inhalation filter type protective gas mask (half-mask). In emergency rescue or evacuation, it is recommended to wear air respirators, filter self-rescuer for carbon monoxide. Emergency measures: Inhalation: immediately escape from the site of exposure to a place with fresh air. Keep the respiratorytract unobstructed. For breathing difficulty, feed oxygen. For respiratory or cardiac arrest, immediately make use of artificial respiration and external chest cardiac massage. For medical treatment. Fire extinguishing method: Cut off the gas source. If the gas source cannot be immediately cut off, it is not allowed to extinguish burning gas. Spray water to cool the container, and, if possible, move the container from the site of fire to an open space. Fire extinguishing agent: mist of water, foam, carbon dioxide, dry powder.
CO2 Way of exposure: inhalation. Health Hazard: at low concentration, it excites the respiratory center; at high concentration, it produces an inhibitory and even paralytic effect. Hypoxia is also found in the poisoning mechanism Acute toxicity: Acute poisoning: when man enters an environment with elevated concentrations of carbon dioxide, they fall into a coma within a few seconds; the more serious cases may undergo
Fire extinguishing method: it is noncombustible. Cut off the gas source.
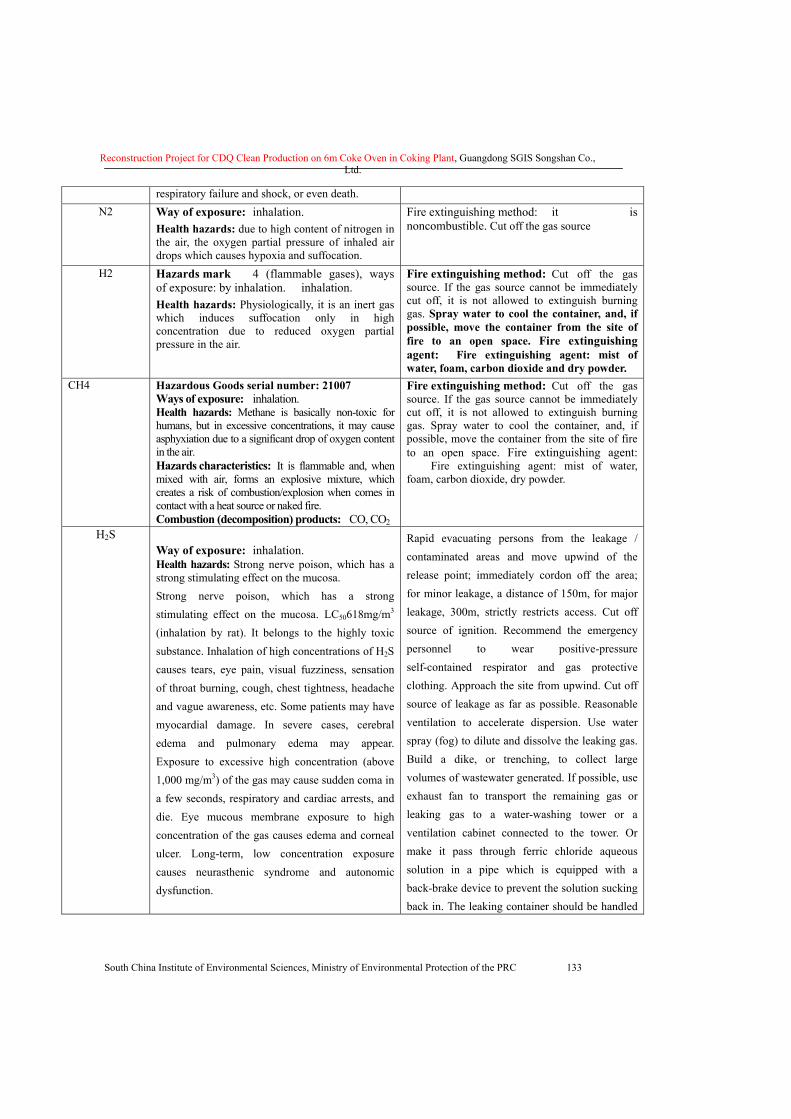
Reconstruction Project for CDQ Clean Production on 6m Coke Oven in Coking Plant, Guangdong SGIS Songshan Co., Ltd.
South China Institute of Environmental Sciences, Ministry of Environmental Protection of the PRC 133
respiratory failure and shock, or even death. N2 Way of exposure: inhalation.
Health hazards: due to high content of nitrogen in the air, the oxygen partial pressure of inhaled air drops which causes hypoxia and suffocation.
Fire extinguishing method: it is noncombustible. Cut off the gas source
H2 Hazards mark 4 (flammable gases), ways of exposure: by inhalation. inhalation. Health hazards: Physiologically, it is an inert gas which induces suffocation only in high concentration due to reduced oxygen partial pressure in the air.
Fire extinguishing method: Cut off the gas source. If the gas source cannot be immediately cut off, it is not allowed to extinguish burning gas. Spray water to cool the container, and, if possible, move the container from the site of fire to an open space. Fire extinguishing agent: Fire extinguishing agent: mist of water, foam, carbon dioxide and dry powder.
CH4 Hazardous Goods serial number: 21007 Ways of exposure: inhalation. Health hazards: Methane is basically non-toxic for humans, but in excessive concentrations, it may cause asphyxiation due to a significant drop of oxygen content in the air. Hazards characteristics: It is flammable and, when mixed with air, forms an explosive mixture, which creates a risk of combustion/explosion when comes in contact with a heat source or naked fire. Combustion (decomposition) products: CO, CO2
Fire extinguishing method: Cut off the gas source. If the gas source cannot be immediately cut off, it is not allowed to extinguish burning gas. Spray water to cool the container, and, if possible, move the container from the site of fire to an open space. Fire extinguishing agent: Fire extinguishing agent: mist of water, foam, carbon dioxide, dry powder.
H2S Way of exposure: inhalation. Health hazards: Strong nerve poison, which has a strong stimulating effect on the mucosa. Strong nerve poison, which has a strong stimulating effect on the mucosa. LC50618mg/m3 (inhalation by rat). It belongs to the highly toxic substance. Inhalation of high concentrations of H2S causes tears, eye pain, visual fuzziness, sensation of throat burning, cough, chest tightness, headache and vague awareness, etc. Some patients may have myocardial damage. In severe cases, cerebral edema and pulmonary edema may appear. Exposure to excessive high concentration (above 1,000 mg/m3) of the gas may cause sudden coma in a few seconds, respiratory and cardiac arrests, and die. Eye mucous membrane exposure to high concentration of the gas causes edema and corneal ulcer. Long-term, low concentration exposure causes neurasthenic syndrome and autonomic dysfunction.
Rapid evacuating persons from the leakage / contaminated areas and move upwind of the release point; immediately cordon off the area; for minor leakage, a distance of 150m, for major leakage, 300m, strictly restricts access. Cut off source of ignition. Recommend the emergency personnel to wear positive-pressure self-contained respirator and gas protective clothing. Approach the site from upwind. Cut off source of leakage as far as possible. Reasonable ventilation to accelerate dispersion. Use water spray (fog) to dilute and dissolve the leaking gas. Build a dike, or trenching, to collect large volumes of wastewater generated. If possible, use exhaust fan to transport the remaining gas or leaking gas to a water-washing tower or a ventilation cabinet connected to the tower. Or make it pass through ferric chloride aqueous solution in a pipe which is equipped with a back-brake device to prevent the solution sucking back in. The leaking container should be handled
Reconstruction Project for CDQ Clean Production on 6m Coke Oven in Coking Plant, Guangdong SGIS Songshan Co., Ltd.
South China Institute of Environmental Sciences, Ministry of Environmental Protection of the PRC 134
properly, and reused only after repair and test.
7.1.2 Hazard identification of production facilities involved in this project
The CDQ project mainly involves production facilities of 140t/h CDQ furnaces, Q=80t/h CDQ boilers, and steam turbine power stations; according to the conclusions of safety assessment, the risk possibility of fire and leakage is very small in the CDQ work section. 6m coke oven: coke production uses coking coal, after washing and crushed to the required fineness, which is fed into coking chamber from the top of coke oven. After high-temperatures carbonization, coke is gained. During coking process, crude gas or raw Coke Oven Gas is produced after the high-temperature carbonization and then exported from the coking chamber for recovering chemical products and purification before returned to the coke oven or for other use as fuel, commonly known as Coke Oven Gas or recycled Coke Oven Gas. Abnormal coke oven emissions mainly refer to raw gas emission accident; As there is no coke oven gas holder in coking plant, COG leakage is primarily due to leakage in gas pipeline. Therefore, the risk factors of 6m coke oven primarily involve crude gas and Coke Oven Gas.
7.1.3 Identification of major hazard installations
7.1.3.1 Basis on which to identify major hazard installations
Major hazard installations refer to units (including venues and facilities) which are engaged in long-term or temporary production, handling, use or storage of Hazardous Goods, the amount of which equal or exceed threshold quantity.
"Identification of Major Hazard Installations (GB18218-2000), Technical Guidelines for Environmental Risk Assessment on Projects shall serve as basis for identification.
Unit refers to a unit (set) of production equipment, devices or place, or that belonging to same plant and locating at the place where the intervals of these production equipment, device or places are less than 500m.
If there exists a single variety of hazardous goods in a unit, the quantity of which shall be deemed as the amount total of hazardous goods in the unit, which, if it equals or exceeds the threshold quantity, the unit is then identified as a Major Hazard Installation.
A variety of substances are stored in the Unit with the Project, the calculation of which, if satisfies the following equation, shall categorize the Unit a Major Hazard Installation.
Where: – The actual existing amount of each dangerous substance, t.
-- the threshold quantities of production or storage facilities which correspond to a variety of hazardous substances, t.
7.1.3.2 The result of the identification of major hazard installations
This CDQ project is quite simple considering the amount of equipment and the technical process involved; from the point of view of the general layout, there is no storage/transportation facilities and auxiliary
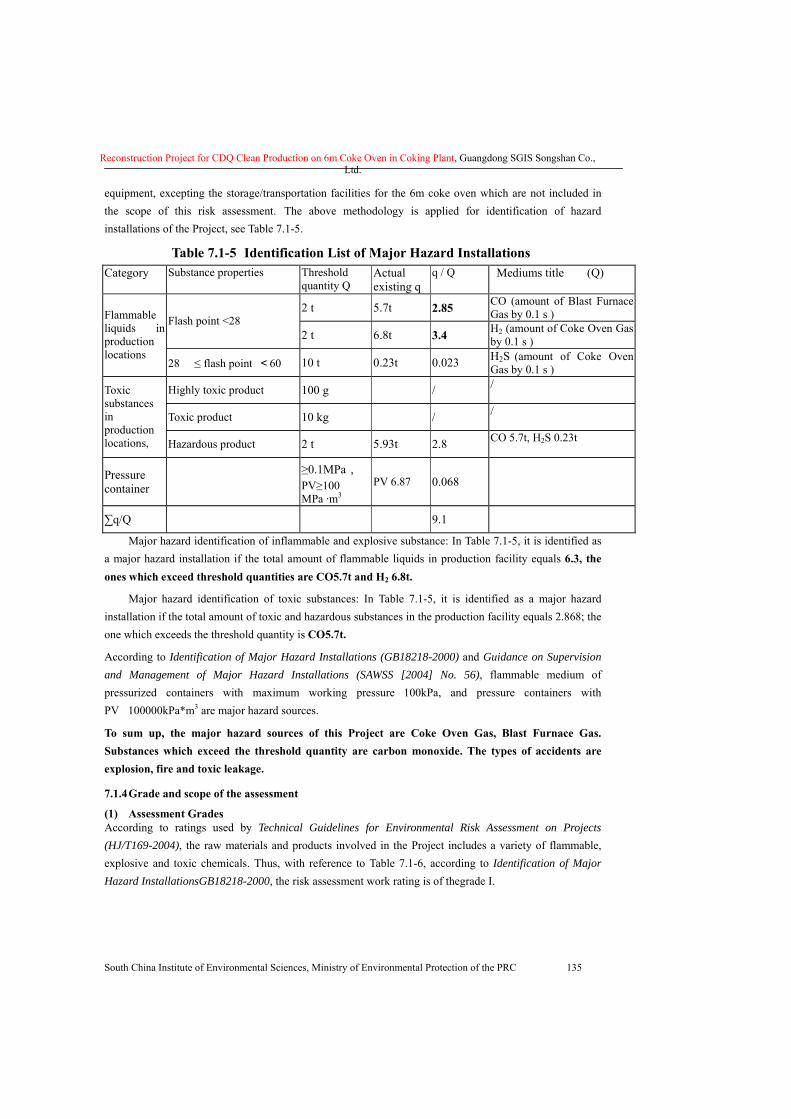
Reconstruction Project for CDQ Clean Production on 6m Coke Oven in Coking Plant, Guangdong SGIS Songshan Co., Ltd.
South China Institute of Environmental Sciences, Ministry of Environmental Protection of the PRC 135
equipment, excepting the storage/transportation facilities for the 6m coke oven which are not included in the scope of this risk assessment. The above methodology is applied for identification of hazard installations of the Project, see Table 7.1-5.
Table 7.1-5 Identification List of Major Hazard Installations Category Substance properties Threshold
quantity Q Actual existing q
q / Q Mediums title (Q)
2 t 5.7t 2.85 CO (amount of Blast Furnace Gas by 0.1 s ) Flash point <28 �
2 t 6.8t 3.4 H2 (amount of Coke Oven Gas by 0.1 s )
Flammable liquids in production locations
28 � ≤ flash point <60 � 10 t 0.23t 0.023 H2S (amount of Coke Oven Gas by 0.1 s )
Highly toxic product 100 g / /
Toxic product 10 kg / /
Toxic substances in production locations, Hazardous product 2 t 5.93t 2.8 CO 5.7t, H2S 0.23t
Pressure container
≥0.1MPa, PV≥100 MPa ·m3
PV 6.87 0.068
∑q/Q 9.1
� Major hazard identification of inflammable and explosive substance: In Table 7.1-5, it is identified as a major hazard installation if the total amount of flammable liquids in production facility equals 6.3, the ones which exceed threshold quantities are CO5.7t and H2 6.8t.
� Major hazard identification of toxic substances: In Table 7.1-5, it is identified as a major hazard installation if the total amount of toxic and hazardous substances in the production facility equals 2.868; the one which exceeds the threshold quantity is CO5.7t.
According to Identification of Major Hazard Installations (GB18218-2000) and Guidance on Supervision and Management of Major Hazard Installations (SAWSS [2004] No. 56), flammable medium of pressurized containers with maximum working pressure�100kPa, and pressure containers with PV�100000kPa*m3 are major hazard sources. To sum up, the major hazard sources of this Project are Coke Oven Gas, Blast Furnace Gas. Substances which exceed the threshold quantity are carbon monoxide. The types of accidents are explosion, fire and toxic leakage.
7.1.4 Grade and scope of the assessment
(1) Assessment Grades According to ratings used by Technical Guidelines for Environmental Risk Assessment on Projects (HJ/T169-2004), the raw materials and products involved in the Project includes a variety of flammable, explosive and toxic chemicals. Thus, with reference to Table 7.1-6, according to Identification of Major Hazard InstallationsGB18218-2000, the risk assessment work rating is of thegrade I.
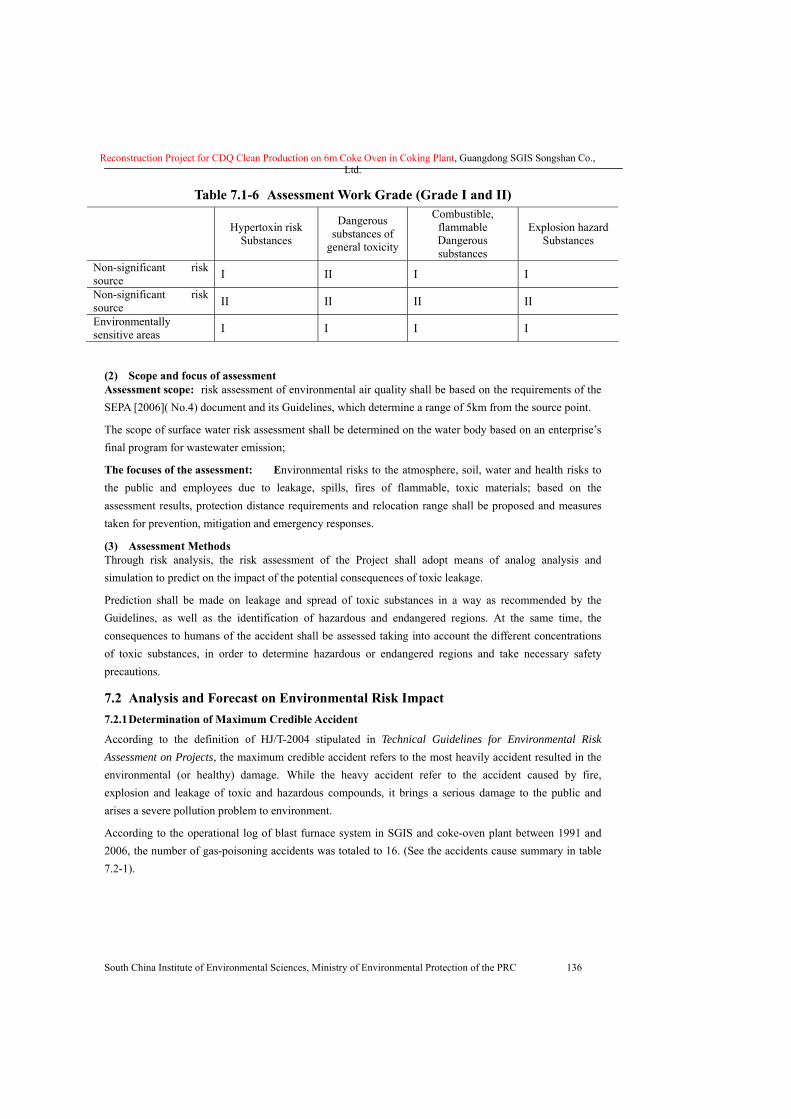
Reconstruction Project for CDQ Clean Production on 6m Coke Oven in Coking Plant, Guangdong SGIS Songshan Co., Ltd.
South China Institute of Environmental Sciences, Ministry of Environmental Protection of the PRC 136
Table 7.1-6 Assessment Work Grade (Grade I and II)
Hypertoxin risk Substances
Dangerous substances of
general toxicity
Combustible, flammable Dangerous substances
Explosion hazard Substances
Non-significant risk source I II I I
Non-significant risk source II II II II
Environmentally sensitive areas I I I I
(2) Scope and focus of assessment Assessment scope: risk assessment of environmental air quality shall be based on the requirements of the SEPA [2006]( No.4) document and its Guidelines, which determine a range of 5km from the source point.
The scope of surface water risk assessment shall be determined on the water body based on an enterprise’s final program for wastewater emission;
The focuses of the assessment: Environmental risks to the atmosphere, soil, water and health risks to the public and employees due to leakage, spills, fires of flammable, toxic materials; based on the assessment results, protection distance requirements and relocation range shall be proposed and measures taken for prevention, mitigation and emergency responses.
(3) Assessment Methods Through risk analysis, the risk assessment of the Project shall adopt means of analog analysis and simulation to predict on the impact of the potential consequences of toxic leakage.
Prediction shall be made on leakage and spread of toxic substances in a way as recommended by the Guidelines, as well as the identification of hazardous and endangered regions. At the same time, the consequences to humans of the accident shall be assessed taking into account the different concentrations of toxic substances, in order to determine hazardous or endangered regions and take necessary safety precautions.
7.2 Analysis and Forecast on Environmental Risk Impact 7.2.1 Determination of Maximum Credible Accident
According to the definition of HJ/T-2004 stipulated in Technical Guidelines for Environmental Risk Assessment on Projects, the maximum credible accident refers to the most heavily accident resulted in the environmental (or healthy) damage. While the heavy accident refer to the accident caused by fire, explosion and leakage of toxic and hazardous compounds, it brings a serious damage to the public and arises a severe pollution problem to environment. According to the operational log of blast furnace system in SGIS and coke-oven plant between 1991 and 2006, the number of gas-poisoning accidents was totaled to 16. (See the accidents cause summary in table 7.2-1).
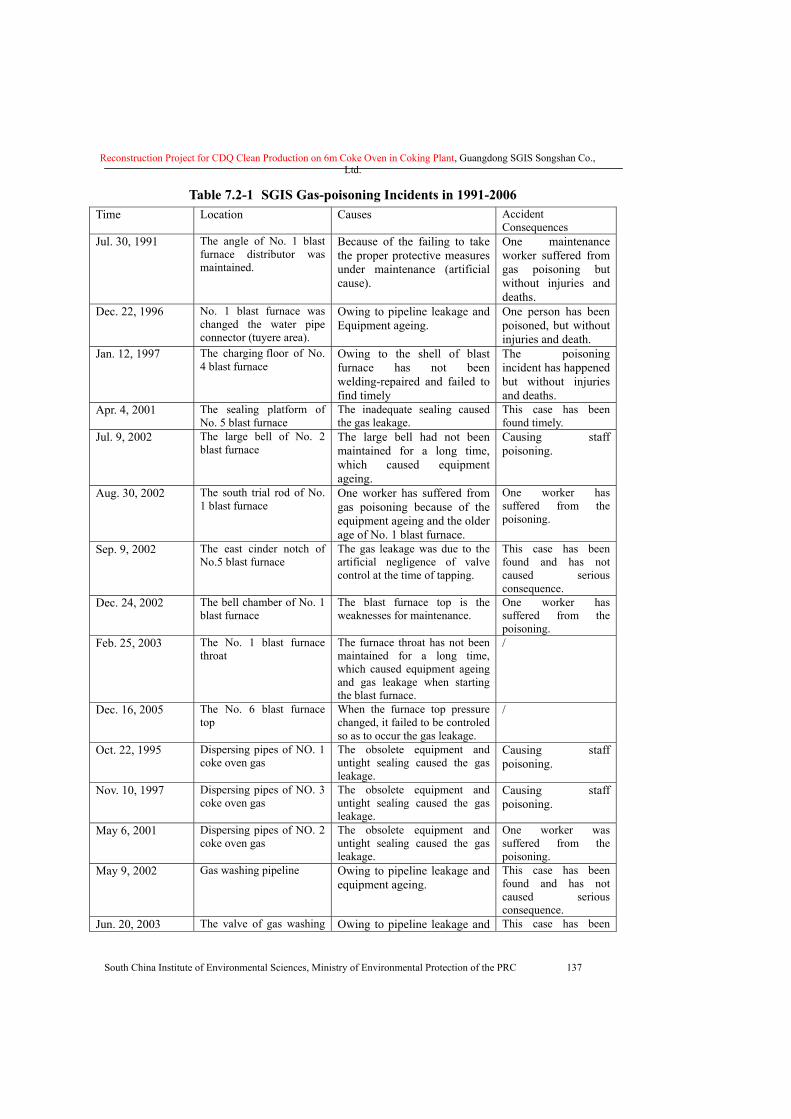
Reconstruction Project for CDQ Clean Production on 6m Coke Oven in Coking Plant, Guangdong SGIS Songshan Co., Ltd.
South China Institute of Environmental Sciences, Ministry of Environmental Protection of the PRC 137
Table 7.2-1 SGIS Gas-poisoning Incidents in 1991-2006 Time Location Causes Accident
Consequences Jul. 30, 1991 The angle of No. 1 blast
furnace distributor was maintained.
Because of the failing to take the proper protective measures under maintenance (artificial cause).
One maintenance worker suffered from gas poisoning but without injuries and deaths.
Dec. 22, 1996 No. 1 blast furnace was changed the water pipe connector (tuyere area).
Owing to pipeline leakage and Equipment ageing.
One person has been poisoned, but without injuries and death.
Jan. 12, 1997 The charging floor of No. 4 blast furnace
Owing to the shell of blast furnace has not been welding-repaired and failed to find timely
The poisoning incident has happened but without injuries and deaths.
Apr. 4, 2001 The sealing platform of No. 5 blast furnace
The inadequate sealing caused the gas leakage.
This case has been found timely.
Jul. 9, 2002 The large bell of No. 2 blast furnace
The large bell had not been maintained for a long time, which caused equipment ageing.
Causing staff poisoning.
Aug. 30, 2002 The south trial rod of No. 1 blast furnace
One worker has suffered from gas poisoning because of the equipment ageing and the older age of No. 1 blast furnace.
One worker has suffered from the poisoning.
Sep. 9, 2002 The east cinder notch of No.5 blast furnace
The gas leakage was due to the artificial negligence of valve control at the time of tapping.
This case has been found and has not caused serious consequence.
Dec. 24, 2002 The bell chamber of No. 1 blast furnace
The blast furnace top is the weaknesses for maintenance.
One worker has suffered from the poisoning.
Feb. 25, 2003 The No. 1 blast furnace throat
The furnace throat has not been maintained for a long time, which caused equipment ageing and gas leakage when starting the blast furnace.
/
Dec. 16, 2005 The No. 6 blast furnace top
When the furnace top pressure changed, it failed to be controled so as to occur the gas leakage.
/
Oct. 22, 1995 Dispersing pipes of NO. 1 coke oven gas
The obsolete equipment and untight sealing caused the gas leakage.
Causing staff poisoning.
Nov. 10, 1997 Dispersing pipes of NO. 3 coke oven gas
The obsolete equipment and untight sealing caused the gas leakage.
Causing staff poisoning.
May 6, 2001 Dispersing pipes of NO. 2 coke oven gas
The obsolete equipment and untight sealing caused the gas leakage.
One worker was suffered from the poisoning.
May 9, 2002 Gas washing pipeline Owing to pipeline leakage and equipment ageing.
This case has been found and has not caused serious consequence.
Jun. 20, 2003 The valve of gas washing Owing to pipeline leakage and This case has been
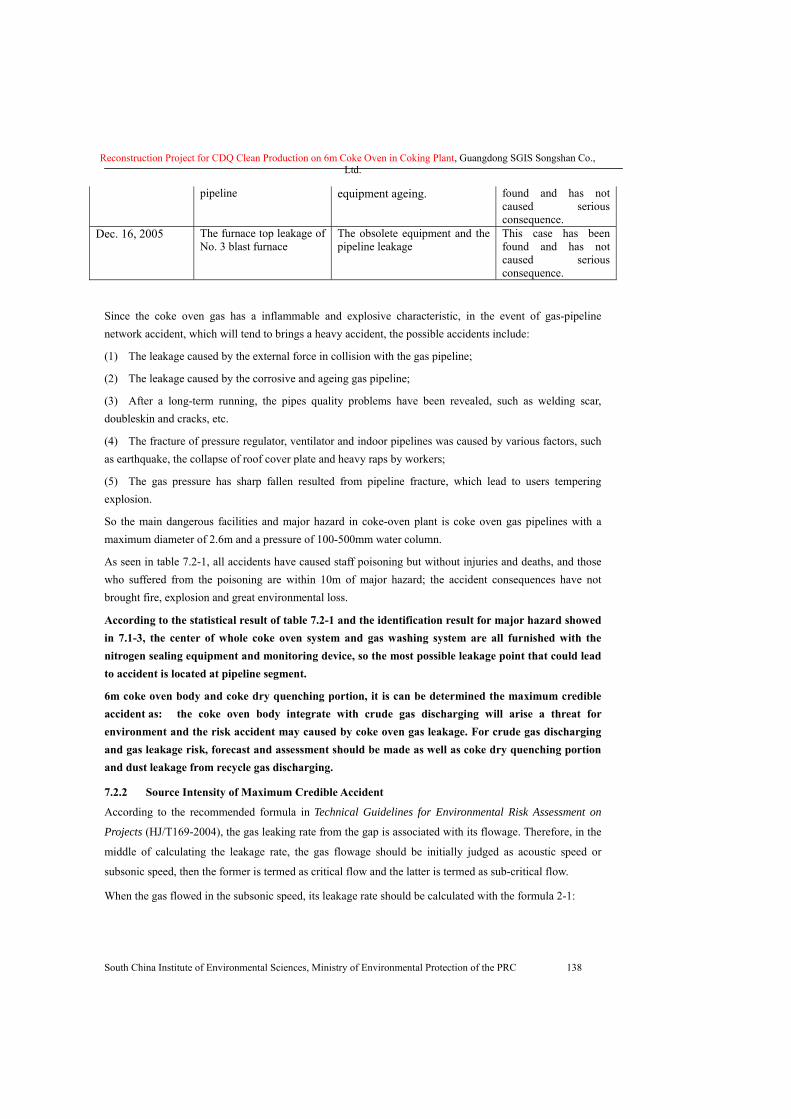
Reconstruction Project for CDQ Clean Production on 6m Coke Oven in Coking Plant, Guangdong SGIS Songshan Co., Ltd.
South China Institute of Environmental Sciences, Ministry of Environmental Protection of the PRC 138
pipeline equipment ageing. found and has not caused serious consequence.
Dec. 16, 2005 The furnace top leakage of No. 3 blast furnace
The obsolete equipment and the pipeline leakage
This case has been found and has not caused serious consequence.
Since the coke oven gas has a inflammable and explosive characteristic, in the event of gas-pipeline network accident, which will tend to brings a heavy accident, the possible accidents include: (1) The leakage caused by the external force in collision with the gas pipeline;
(2) The leakage caused by the corrosive and ageing gas pipeline;
(3) After a long-term running, the pipes quality problems have been revealed, such as welding scar, doubleskin and cracks, etc.
(4) The fracture of pressure regulator, ventilator and indoor pipelines was caused by various factors, such as earthquake, the collapse of roof cover plate and heavy raps by workers;
(5) The gas pressure has sharp fallen resulted from pipeline fracture, which lead to users tempering explosion.
So the main dangerous facilities and major hazard in coke-oven plant is coke oven gas pipelines with a maximum diameter of 2.6m and a pressure of 100-500mm water column. As seen in table 7.2-1, all accidents have caused staff poisoning but without injuries and deaths, and those who suffered from the poisoning are within 10m of major hazard; the accident consequences have not brought fire, explosion and great environmental loss.
According to the statistical result of table 7.2-1 and the identification result for major hazard showed in 7.1-3, the center of whole coke oven system and gas washing system are all furnished with the nitrogen sealing equipment and monitoring device, so the most possible leakage point that could lead to accident is located at pipeline segment.
6m coke oven body and coke dry quenching portion, it is can be determined the maximum credible accident as: the coke oven body integrate with crude gas discharging will arise a threat for environment and the risk accident may caused by coke oven gas leakage. For crude gas discharging and gas leakage risk, forecast and assessment should be made as well as coke dry quenching portion and dust leakage from recycle gas discharging.
7.2.2 Source Intensity of Maximum Credible Accident
According to the recommended formula in Technical Guidelines for Environmental Risk Assessment on
Projects (HJ/T169-2004), the gas leaking rate from the gap is associated with its flowage. Therefore, in the
middle of calculating the leakage rate, the gas flowage should be initially judged as acoustic speed or
subsonic speed, then the former is termed as critical flow and the latter is termed as sub-critical flow.
When the gas flowed in the subsonic speed, its leakage rate should be calculated with the formula 2-1:
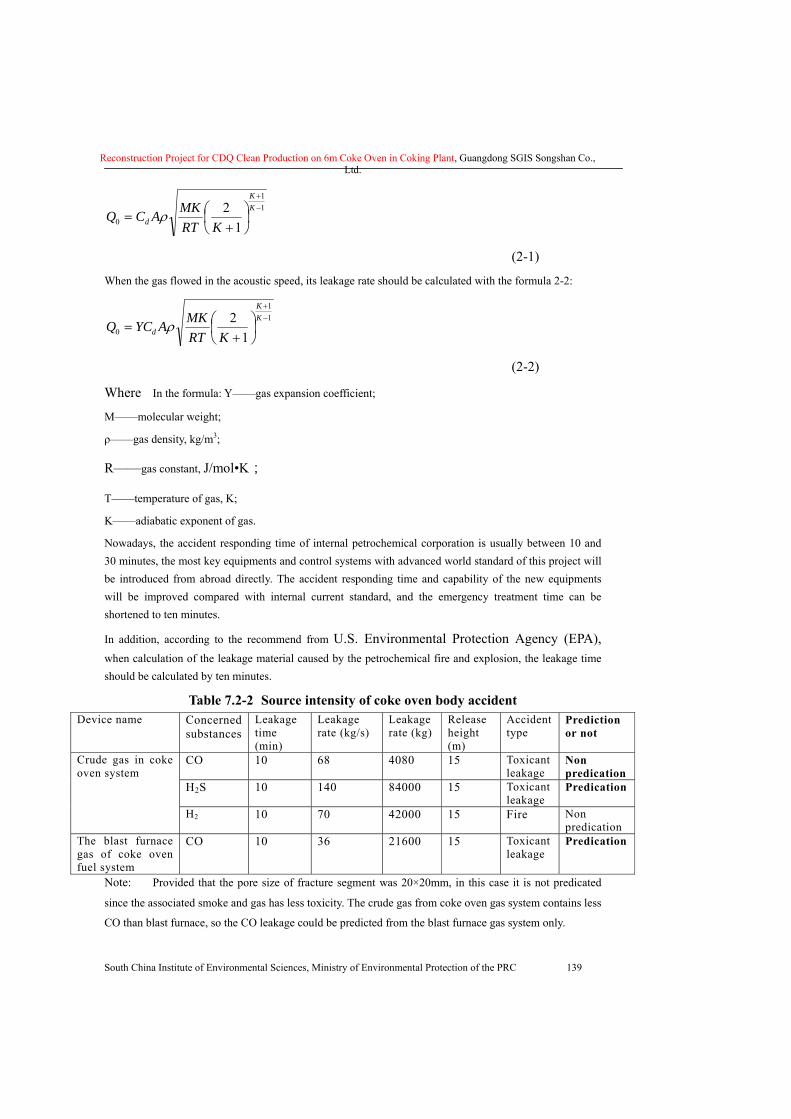
Reconstruction Project for CDQ Clean Production on 6m Coke Oven in Coking Plant, Guangdong SGIS Songshan Co., Ltd.
South China Institute of Environmental Sciences, Ministry of Environmental Protection of the PRC 139
11
0 12 −
+
⎟⎠⎞
⎜⎝⎛
+=
KK
d KRTMKACQ ρ
(2-1)
When the gas flowed in the acoustic speed, its leakage rate should be calculated with the formula 2-2:
11
0 12 −
+
⎟⎠⎞
⎜⎝⎛
+=
KK
d KRTMKAYCQ ρ
(2-2)
Where In the formula: Y——gas expansion coefficient;
M——molecular weight; ρ——gas density, kg/m3;
R——gas constant, J/mol•K;
T——temperature of gas, K; K——adiabatic exponent of gas. Nowadays, the accident responding time of internal petrochemical corporation is usually between 10 and 30 minutes, the most key equipments and control systems with advanced world standard of this project will be introduced from abroad directly. The accident responding time and capability of the new equipments will be improved compared with internal current standard, and the emergency treatment time can be shortened to ten minutes.
In addition, according to the recommend from U.S. Environmental Protection Agency (EPA), when calculation of the leakage material caused by the petrochemical fire and explosion, the leakage time should be calculated by ten minutes.
Table 7.2-2 Source intensity of coke oven body accident Device name Concerned
substances Leakage time (min)
Leakage rate (kg/s)
Leakage rate (kg)
Release height (m)
Accident type
Prediction or not
CO 10 68 4080 15 Toxicant leakage
Non predication
H2S 10 140 84000 15 Toxicant leakage
Predication
Crude gas in coke oven system
H2 10 70 42000 15 Fire Non predication
The blast furnace gas of coke oven fuel system
CO 10 36 21600 15 Toxicant leakage
Predication
Note: Provided that the pore size of fracture segment was 20×20mm, in this case it is not predicated
since the associated smoke and gas has less toxicity. The crude gas from coke oven gas system contains less
CO than blast furnace, so the CO leakage could be predicted from the blast furnace gas system only.
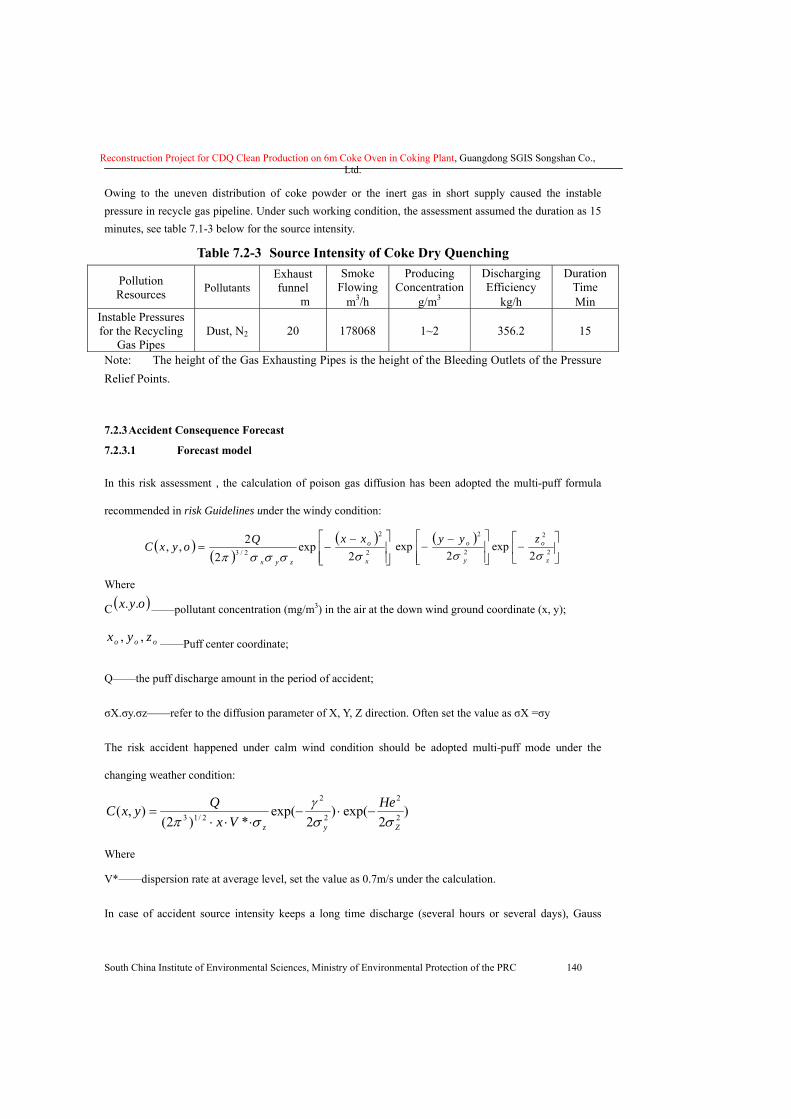
Reconstruction Project for CDQ Clean Production on 6m Coke Oven in Coking Plant, Guangdong SGIS Songshan Co., Ltd.
South China Institute of Environmental Sciences, Ministry of Environmental Protection of the PRC 140
Owing to the uneven distribution of coke powder or the inert gas in short supply caused the instable pressure in recycle gas pipeline. Under such working condition, the assessment assumed the duration as 15 minutes, see table 7.1-3 below for the source intensity.
Table 7.2-3 Source Intensity of Coke Dry Quenching
Pollution Resources Pollutants
Exhaust funnel m
Smoke Flowing
m3/h
Producing Concentration
g/m3
Discharging Efficiency
kg/h
Duration Time Min
Instable Pressures for the Recycling
Gas Pipes Dust, N2 20 178068 1~2 356.2 15
Note: The height of the Gas Exhausting Pipes is the height of the Bleeding Outlets of the Pressure Relief Points.
7.2.3 Accident Consequence Forecast
7.2.3.1 Forecast model
In this risk assessment,the calculation of poison gas diffusion has been adopted the multi-puff formula
recommended in risk Guidelines under the windy condition:
( )( )
( )⎥⎥⎦
⎤
⎢⎢⎣
⎡ −−= 2
2
2/3 2exp
22,,
x
o
zyx
xxQoyxCσσσσπ
( )⎥⎦
⎤⎢⎣
⎡−
⎥⎥⎦
⎤
⎢⎢⎣
⎡ −− 2
2
2
2
2exp
2exp
z
o
y
o zyyσσ
Where
C ( )oyx .. ——pollutant concentration (mg/m3) in the air at the down wind ground coordinate (x, y);
ooo zyx ,, ——Puff center coordinate;
Q——the puff discharge amount in the period of accident;
σX.σy.σz——refer to the diffusion parameter of X, Y, Z direction. Often set the value as σX =σy
The risk accident happened under calm wind condition should be adopted multi-puff mode under the
changing weather condition:
)2
exp()2
exp(*)2(
),( 2
2
2
2
2/13Zyz
HeVx
QyxCσσ
γσπ
−⋅−⋅⋅⋅
=
Where
V*——dispersion rate at average level, set the value as 0.7m/s under the calculation.
In case of accident source intensity keeps a long time discharge (several hours or several days), Gauss
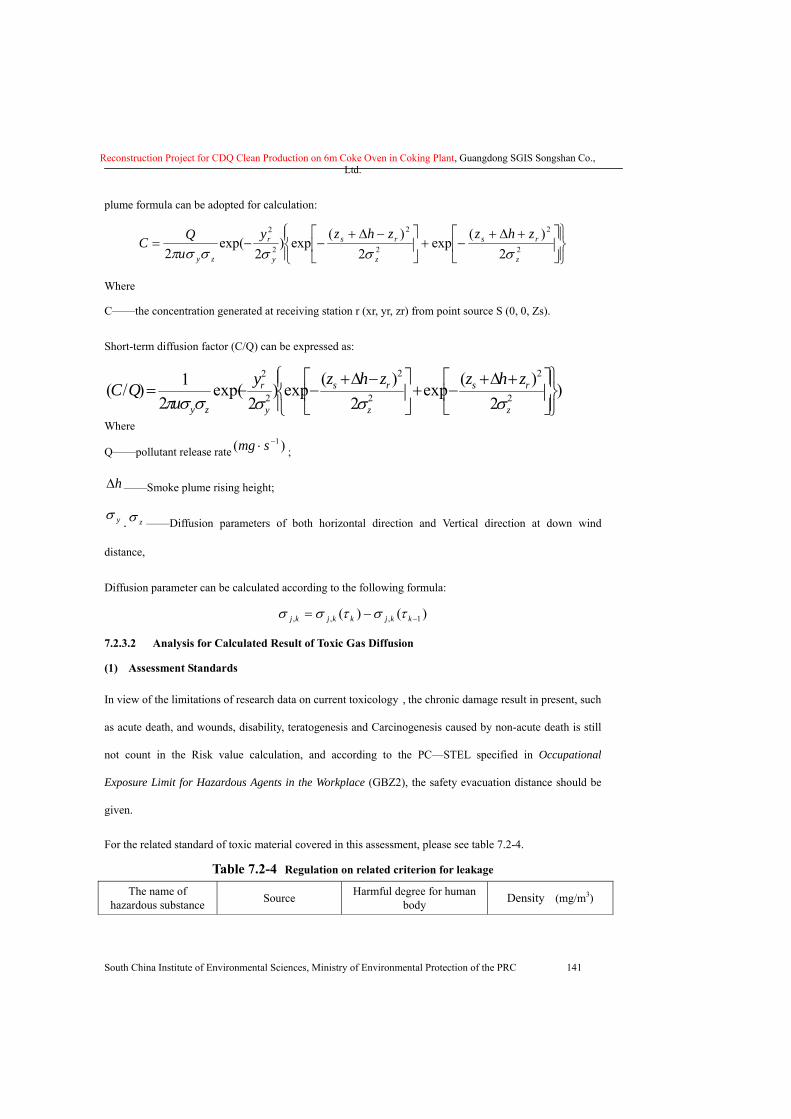
Reconstruction Project for CDQ Clean Production on 6m Coke Oven in Coking Plant, Guangdong SGIS Songshan Co., Ltd.
South China Institute of Environmental Sciences, Ministry of Environmental Protection of the PRC 141
plume formula can be adopted for calculation:
⎪⎭
⎪⎬⎫
⎪⎩
⎪⎨⎧
⎥⎦
⎤⎢⎣
⎡ +Δ+−+⎥
⎦
⎤⎢⎣
⎡ −Δ+−−= 2
2
2
2
2
2
2)(
exp2
)(exp)
2exp(
2 z
rs
z
rs
y
r
zy
zhzzhzyu
QCσσσσσπ
Where
C——the concentration generated at receiving station r (xr, yr, zr) from point source S (0, 0, Zs).
Short-term diffusion factor (C/Q) can be expressed as:
)2
)(exp
2)(
exp)2
exp(2
1)/( 2
2
2
2
2
2
⎪⎭
⎪⎬⎫
⎪⎩
⎪⎨⎧
⎥⎦
⎤⎢⎣
⎡ +Δ+−+⎥
⎦
⎤⎢⎣
⎡ −Δ+−−=
z
rs
z
rs
y
r
zy
zhzzhzyu
QCσσσσσπ
Where
Q——pollutant release rate )( 1−⋅ smg ;
hΔ ——Smoke plume rising height;
yσ . zσ ——Diffusion parameters of both horizontal direction and Vertical direction at down wind
distance,
Diffusion parameter can be calculated according to the following formula:
)()( 1,,, −−= kkjkkjkj τστσσ 7.2.3.2 Analysis for Calculated Result of Toxic Gas Diffusion
(1) Assessment Standards
In view of the limitations of research data on current toxicology,the chronic damage result in present, such
as acute death, and wounds, disability, teratogenesis and Carcinogenesis caused by non-acute death is still
not count in the Risk value calculation, and according to the PC—STEL specified in Occupational
Exposure Limit for Hazardous Agents in the Workplace (GBZ2), the safety evacuation distance should be
given.
For the related standard of toxic material covered in this assessment, please see table 7.2-4.
Table 7.2-4 Regulation on related criterion for leakage The name of
hazardous substance Source Harmful degree for human body Density (mg/m3)
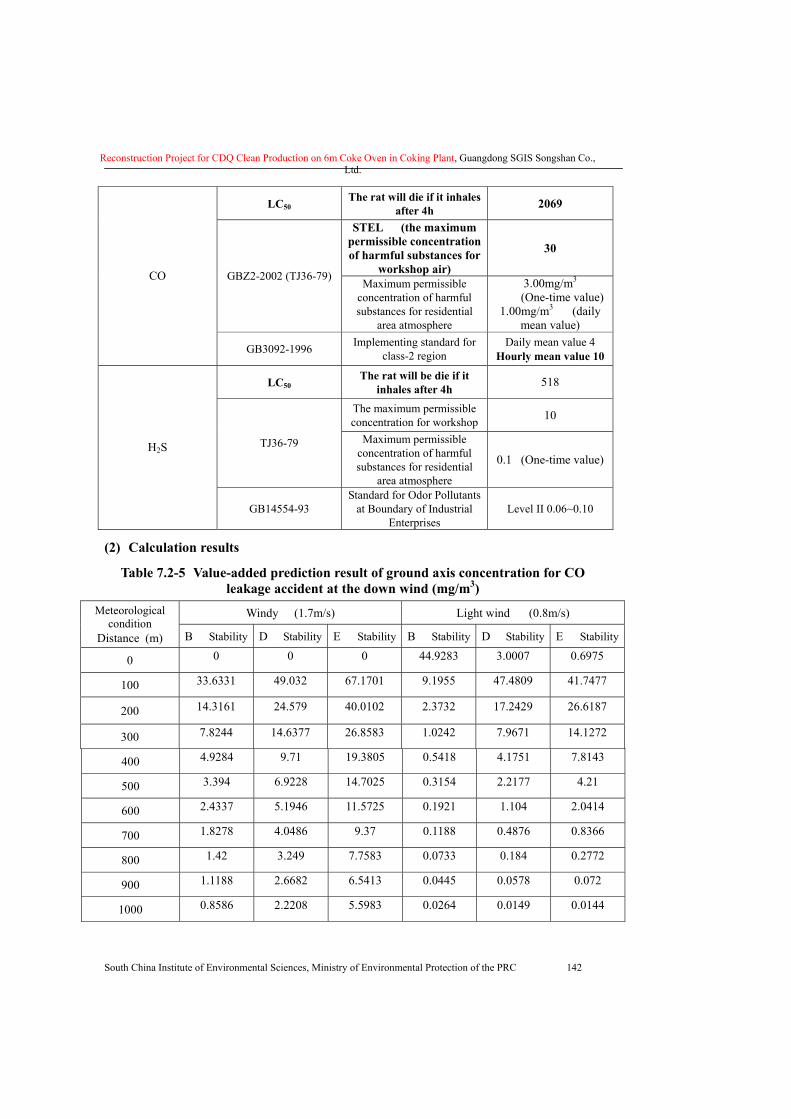
Reconstruction Project for CDQ Clean Production on 6m Coke Oven in Coking Plant, Guangdong SGIS Songshan Co., Ltd.
South China Institute of Environmental Sciences, Ministry of Environmental Protection of the PRC 142
LC50 The rat will die if it inhales
after 4h 2069
STEL (the maximum permissible concentration of harmful substances for
workshop air)
30
GBZ2-2002 (TJ36-79) Maximum permissible
concentration of harmful substances for residential
area atmosphere
3.00mg/m3
(One-time value) 1.00mg/m3 (daily
mean value)
CO
GB3092-1996 Implementing standard for class-2 region
Daily mean value 4 Hourly mean value 10
LC50 The rat will be die if it
inhales after 4h 518
The maximum permissible concentration for workshop 10
TJ36-79 Maximum permissible concentration of harmful substances for residential
area atmosphere
0.1 (One-time value) H2S
GB14554-93 Standard for Odor Pollutants
at Boundary of Industrial Enterprises
Level II 0.06~0.10
(2) Calculation results
Table 7.2-5 Value-added prediction result of ground axis concentration for CO leakage accident at the down wind (mg/m3)
Windy (1.7m/s) Light wind (0.8m/s) Meteorological condition
Distance (m) B Stability D Stability E Stability B Stability D Stability E Stability
0 0 0 0 44.9283 3.0007 0.6975
100 33.6331 49.032 67.1701 9.1955 47.4809 41.7477
200 14.3161 24.579 40.0102 2.3732 17.2429 26.6187
300 7.8244 14.6377 26.8583 1.0242 7.9671 14.1272
400 4.9284 9.71 19.3805 0.5418 4.1751 7.8143
500 3.394 6.9228 14.7025 0.3154 2.2177 4.21
600 2.4337 5.1946 11.5725 0.1921 1.104 2.0414
700 1.8278 4.0486 9.37 0.1188 0.4876 0.8366
800 1.42 3.249 7.7583 0.0733 0.184 0.2772
900 1.1188 2.6682 6.5413 0.0445 0.0578 0.072
1000 0.8586 2.2208 5.5983 0.0264 0.0149 0.0144
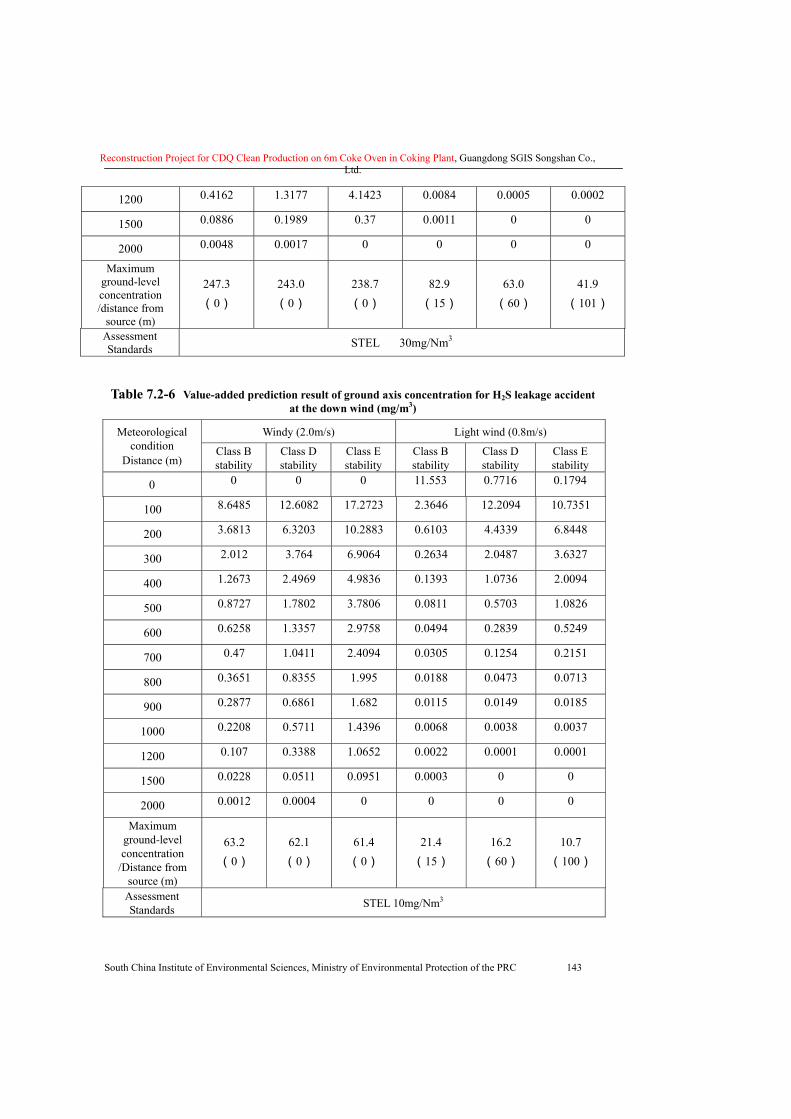
Reconstruction Project for CDQ Clean Production on 6m Coke Oven in Coking Plant, Guangdong SGIS Songshan Co., Ltd.
South China Institute of Environmental Sciences, Ministry of Environmental Protection of the PRC 143
1200 0.4162 1.3177 4.1423 0.0084 0.0005 0.0002
1500 0.0886 0.1989 0.37 0.0011 0 0
2000 0.0048 0.0017 0 0 0 0
Maximum ground-level concentration /distance from
source (m)
247.3 (0)
243.0 (0)
238.7 (0)
82.9 (15)
63.0 (60)
41.9 (101)
Assessment Standards STEL 30mg/Nm3
Table 7.2-6 Value-added prediction result of ground axis concentration for H2S leakage accident at the down wind (mg/m3)
Windy (2.0m/s) Light wind (0.8m/s) Meteorological condition
Distance (m) Class B stability
Class D stability
Class E stability
Class B stability
Class D stability
Class E stability
0 0 0 0 11.553 0.7716 0.1794
100 8.6485 12.6082 17.2723 2.3646 12.2094 10.7351
200 3.6813 6.3203 10.2883 0.6103 4.4339 6.8448
300 2.012 3.764 6.9064 0.2634 2.0487 3.6327
400 1.2673 2.4969 4.9836 0.1393 1.0736 2.0094
500 0.8727 1.7802 3.7806 0.0811 0.5703 1.0826
600 0.6258 1.3357 2.9758 0.0494 0.2839 0.5249
700 0.47 1.0411 2.4094 0.0305 0.1254 0.2151
800 0.3651 0.8355 1.995 0.0188 0.0473 0.0713
900 0.2877 0.6861 1.682 0.0115 0.0149 0.0185
1000 0.2208 0.5711 1.4396 0.0068 0.0038 0.0037
1200 0.107 0.3388 1.0652 0.0022 0.0001 0.0001
1500 0.0228 0.0511 0.0951 0.0003 0 0
2000 0.0012 0.0004 0 0 0 0
Maximum ground-level concentration
/Distance from source (m)
63.2 (0)
62.1 (0)
61.4 (0)
21.4 (15)
16.2 (60)
10.7 (100)
Assessment Standards STEL 10mg/Nm3
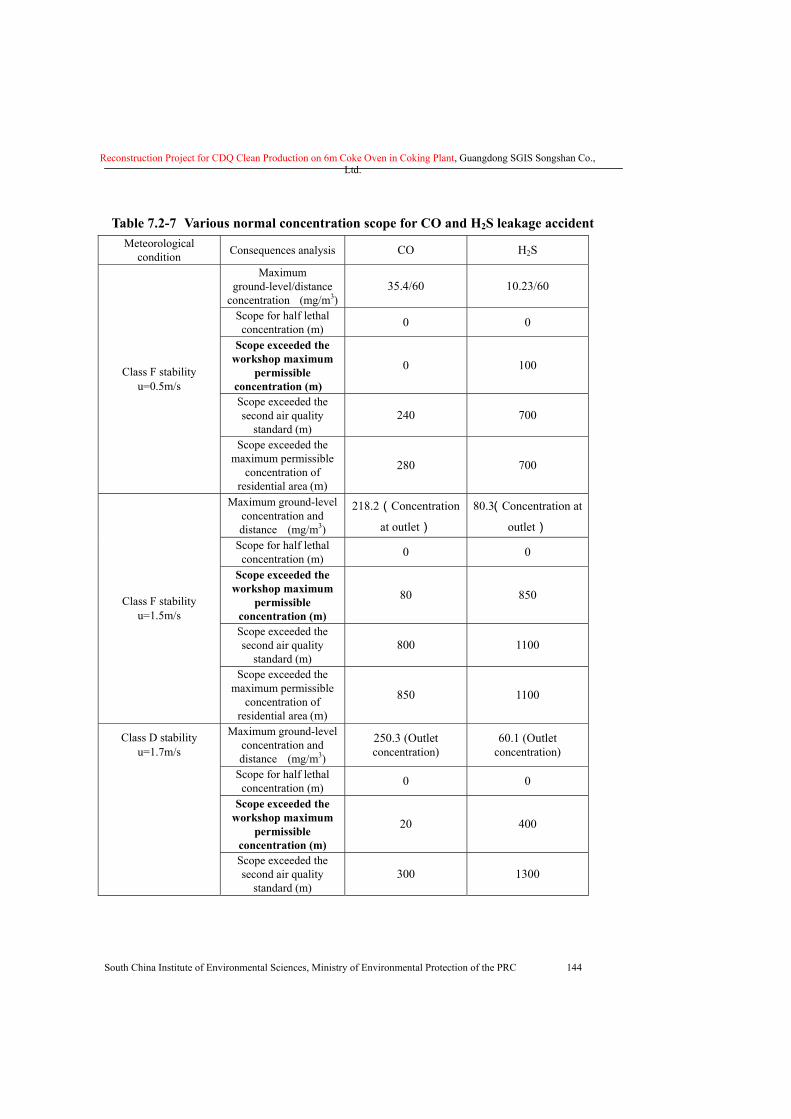
Reconstruction Project for CDQ Clean Production on 6m Coke Oven in Coking Plant, Guangdong SGIS Songshan Co., Ltd.
South China Institute of Environmental Sciences, Ministry of Environmental Protection of the PRC 144
Table 7.2-7 Various normal concentration scope for CO and H2S leakage accident Meteorological
condition Consequences analysis CO H2S
Maximum ground-level/distance
concentration (mg/m3) 35.4/60 10.23/60
Scope for half lethal concentration (m) 0 0
Scope exceeded the workshop maximum
permissible concentration (m)
0 100
Scope exceeded the second air quality
standard (m) 240 700
Class F stability u=0.5m/s
Scope exceeded the maximum permissible
concentration of residential area (m)
280 700
Maximum ground-level concentration and distance (mg/m3)
218.2(Concentration
at outlet)
80.3(Concentration at
outlet) Scope for half lethal concentration (m) 0 0
Scope exceeded the workshop maximum
permissible concentration (m)
80 850
Scope exceeded the second air quality
standard (m) 800 1100
Class F stability u=1.5m/s
Scope exceeded the maximum permissible
concentration of residential area (m)
850 1100
Maximum ground-level concentration and distance (mg/m3)
250.3 (Outlet concentration)
60.1 (Outlet concentration)
Scope for half lethal concentration (m) 0 0
Scope exceeded the workshop maximum
permissible concentration (m)
20 400
Class D stability u=1.7m/s
Scope exceeded the second air quality
standard (m) 300 1300
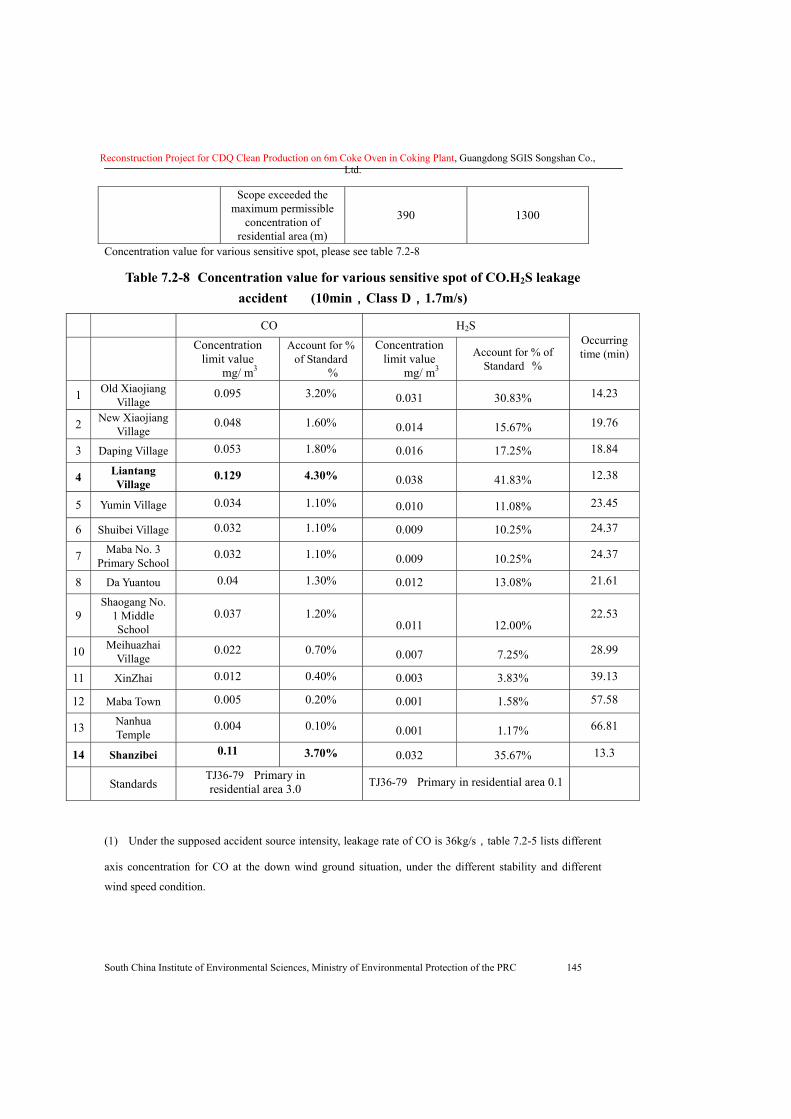
Reconstruction Project for CDQ Clean Production on 6m Coke Oven in Coking Plant, Guangdong SGIS Songshan Co., Ltd.
South China Institute of Environmental Sciences, Ministry of Environmental Protection of the PRC 145
Scope exceeded the maximum permissible
concentration of residential area (m)
390 1300
Concentration value for various sensitive spot, please see table 7.2-8
Table 7.2-8 Concentration value for various sensitive spot of CO.H2S leakage accident (10min,Class D,1.7m/s)
CO H2S
Concentration
limit value mg/ m3
Account for % of Standard
%
Concentration limit value
mg/ m3
Account for % of Standard %
Occurring time (min)
1 Old Xiaojiang Village
0.095 3.20% 0.031 30.83% 14.23
2 New Xiaojiang Village
0.048 1.60% 0.014 15.67% 19.76
3 Daping Village 0.053 1.80% 0.016 17.25% 18.84
4 Liantang Village
0.129 4.30% 0.038 41.83% 12.38
5 Yumin Village 0.034 1.10% 0.010 11.08% 23.45
6 Shuibei Village 0.032 1.10% 0.009 10.25% 24.37
7 Maba No. 3 Primary School
0.032 1.10% 0.009 10.25% 24.37
8 Da Yuantou 0.04 1.30% 0.012 13.08% 21.61
9 Shaogang No.
1 Middle School
0.037 1.20% 0.011 12.00%
22.53
10 Meihuazhai Village
0.022 0.70% 0.007 7.25% 28.99
11 XinZhai 0.012 0.40% 0.003 3.83% 39.13
12 Maba Town 0.005 0.20% 0.001 1.58% 57.58
13 Nanhua Temple
0.004 0.10% 0.001 1.17% 66.81
14 Shanzibei 0.11 3.70% 0.032 35.67% 13.3
Standards TJ36-79 Primary in residential area 3.0 TJ36-79 Primary in residential area 0.1
(1) Under the supposed accident source intensity, leakage rate of CO is 36kg/s,table 7.2-5 lists different
axis concentration for CO at the down wind ground situation, under the different stability and different
wind speed condition.
Reconstruction Project for CDQ Clean Production on 6m Coke Oven in Coking Plant, Guangdong SGIS Songshan Co., Ltd.
South China Institute of Environmental Sciences, Ministry of Environmental Protection of the PRC 146
� At a windy day and under the Class B stability, the maximum of one-hour axis concentration
increment for H2S ground axis can achieve to 247.3mg/m3, which arises at the outlet of accident and
exceeded the 30 mg/m3 of H2S STEL standard specified in Occupational Exposure Limit for Hazardous
Agents in the Workplace (GBZ2-2002); the concentration will harm the human body, and if the H2S
concentration is lower than the acute toxicity 2,069mg/m3, it will not cause injuries and deaths within this
scope.
� At a light wind day and under the Class B stability, the maximum of one-hour axis concentration
increment for CO ground axis can achieve 82.9mg/m3, which arises at 15m of down wind and below the
acute toxicity 2069mg/m3. It will not cause injuries and deaths.
(2) Under the supposed accident source intensity, leakage rate of H2S is 14kg/s,table 7.2-6 listed different
axis concentration for H2S at the down wind ground situation, under the different stability and different
wind speed condition.
� At a windy day and under the Class D stability, the maximum of one-hour axis concentration
increment for CO ground axis can achieve to 63.2mg/m3, which arises at the outlet of accident and exceed
the 10 mg/m3 of CO STEL standard specified in Occupational Exposure Limit for Hazardous Agents in the
Workplace (GBZ2-2002), the concentration will harm the human body and if the CO concentration is lower
than the acute toxicity 518mg/m3, it will not cause injuries and deaths within this scope.
� At a windy day and under the Class B stability, the maximum of one-hour axis concentration
increment for H2S ground axis can achieve to 21.4mg/m3, which arises at the outlet of accident and
exceeded the 15 mg/m3 of H2S STEL standard specified in Occupational Exposure Limit for Hazardous
Agents in the Workplace (GBZ2-2002); the concentration will harm the human body, and if the H2S
concentration is lower than the acute toxicity 518mg/m3, it will not cause injuries and deaths within this
scope.
(3) Various normal concentration scope for the leakage of CO and H2S, please see table 7.2-7:
� In case of the accidental leakage of CO, under the most unfavorable and credible meteorological
conditions, no semilethal concentration scope is appeared in the accident. Under the most credible
meteorological conditions and the wind speed of 1.7m/s of stability D, the maximum allowable
Reconstruction Project for CDQ Clean Production on 6m Coke Oven in Coking Plant, Guangdong SGIS Songshan Co., Ltd.
South China Institute of Environmental Sciences, Ministry of Environmental Protection of the PRC 147
concentration limit exceeding that of the workshop is 20m, limit exceeding that of the Class � F= standard
of the ambient air quality is 300m, and limit exceeding that of the residential area is 390m. Under the most
unfavorite meteorological conditions and the wind speed of 1.5m/s of stability F, the maximum allowable
concentration limit exceeding that of the workshop is 80m, limit exceeding that of the Class � F= standard
of the ambient air quality is 800m, and limit exceeding that of the residential area is 850m.Based on the
layout map and the location of project and the sensitive points, there is no sensitive point within 900m
outside the coking plant boundary, and no human injury will be caused.
� In the event of H2S leakage accident and under the least favorable and credible meteorologic condition,
such accident has not arised in the scope of half lethal concentration. under the credible meteorologic
condition and 1.7m/s wind speed of Class D stability, the scope exceeded the workshop maximum
permissible concentration is 400m, the scope exceeded the second air quality standard is 1300m and the
scope exceeded the maximum permissible concentration of residential area is 1300m; under the least
favorable meteorologic condition and 1.5m/s wind speed of Class F stability, the scope exceeded the
workshop maximum permissible concentration is 850m, the scope exceeded the second air quality standard
is 1100m and the scope exceeded the maximum permissible concentration of residential area is 1100m.
Under the environment of H2S exceeded the workshop maximum permissible concentration for 8 hours, it
will harm the human body, and while the accident time for coke-oven crude gas is 10 minutes, emergency
treatment time is 30 minutes, so it will not have impact on ambient air. The position relation among general
layout, project and the sensitive spot indicates that there is no environmental sensitive spot beyond the
boundary of coke-oven plant 900m and there is no resident within the scope of workshop maximum
permissible concentration, so it will not cause personal injury.
(4) Add-value of various sensitive spots for CO and H2S leakage accident, please see table 7.2-7:
We can see from table 7.2-8, the add-value of various sensitive spots has increased less and account for less
than 10% of maximum permissible concentration for residential area after the accident of CO leakage; the
add-value of various sensitive spots exceeded maximum permissible concentration for residential area both
at Liantang village and Shanzibei, but below the workshop maximum permissible concentration after the
accident of H2S leakage. 60 minutes after accident, it did not have a concentration increment within the
acceptable scope.
In summary, under the CO and H2S leakage accident and least favorable situation, it will harm those
who are within 850m distance but will not cause personal injury, so the safety distance for this
project is 850m. Considering the position of the project in SGIS, there is no sensitive spot within
850m.
Based on results of gas leakage accident and preventive measures accumulated in the past, the
assessment considers the environmental risk of this project is in the acceptable scope.
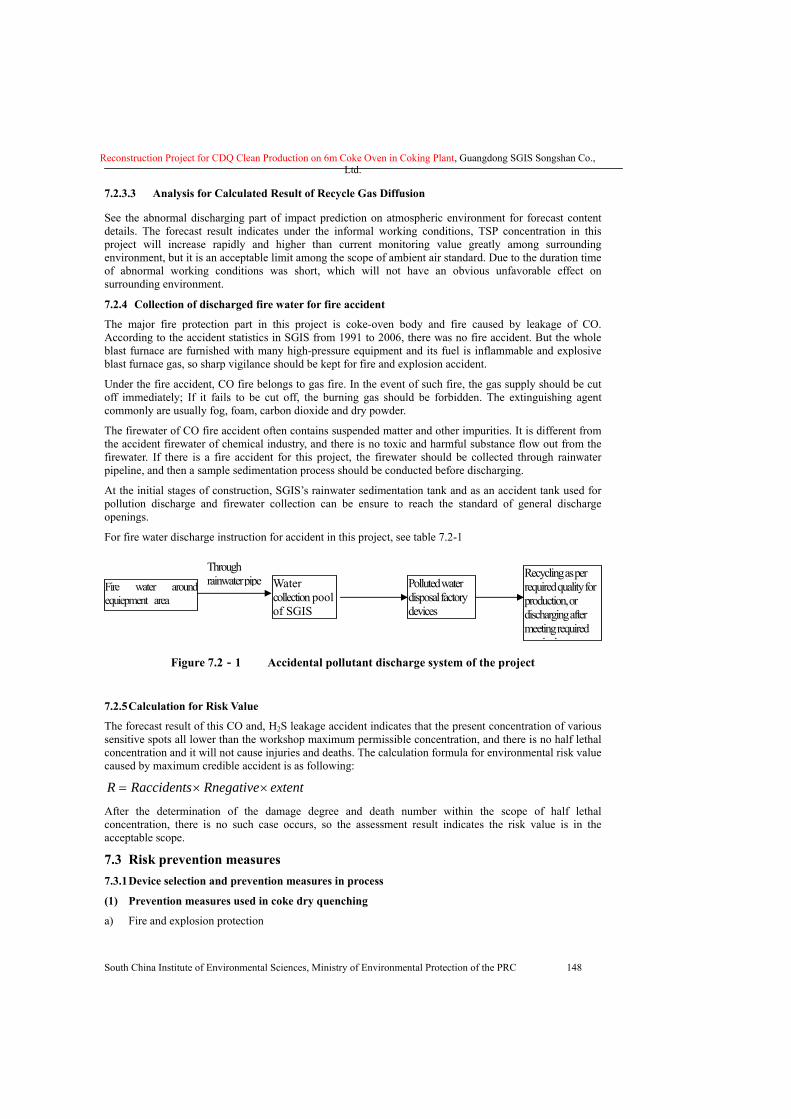
Reconstruction Project for CDQ Clean Production on 6m Coke Oven in Coking Plant, Guangdong SGIS Songshan Co., Ltd.
South China Institute of Environmental Sciences, Ministry of Environmental Protection of the PRC 148
7.2.3.3 Analysis for Calculated Result of Recycle Gas Diffusion
See the abnormal discharging part of impact prediction on atmospheric environment for forecast content details. The forecast result indicates under the informal working conditions, TSP concentration in this project will increase rapidly and higher than current monitoring value greatly among surrounding environment, but it is an acceptable limit among the scope of ambient air standard. Due to the duration time of abnormal working conditions was short, which will not have an obvious unfavorable effect on surrounding environment.
7.2.4 Collection of discharged fire water for fire accident
The major fire protection part in this project is coke-oven body and fire caused by leakage of CO. According to the accident statistics in SGIS from 1991 to 2006, there was no fire accident. But the whole blast furnace are furnished with many high-pressure equipment and its fuel is inflammable and explosive blast furnace gas, so sharp vigilance should be kept for fire and explosion accident.
Under the fire accident, CO fire belongs to gas fire. In the event of such fire, the gas supply should be cut off immediately; If it fails to be cut off, the burning gas should be forbidden. The extinguishing agent commonly are usually fog, foam, carbon dioxide and dry powder.
The firewater of CO fire accident often contains suspended matter and other impurities. It is different from the accident firewater of chemical industry, and there is no toxic and harmful substance flow out from the firewater. If there is a fire accident for this project, the firewater should be collected through rainwater pipeline, and then a sample sedimentation process should be conducted before discharging.
At the initial stages of construction, SGIS’s rainwater sedimentation tank and as an accident tank used for pollution discharge and firewater collection can be ensure to reach the standard of general discharge openings.
For fire water discharge instruction for accident in this project, see table 7.2-1
Figure 7.2-1 Accidental pollutant discharge system of the project
7.2.5 Calculation for Risk Value
The forecast result of this CO and, H2S leakage accident indicates that the present concentration of various sensitive spots all lower than the workshop maximum permissible concentration, and there is no half lethal concentration and it will not cause injuries and deaths. The calculation formula for environmental risk value caused by maximum credible accident is as following:
extentRnegativeRaccidentsR ××=
After the determination of the damage degree and death number within the scope of half lethal concentration, there is no such case occurs, so the assessment result indicates the risk value is in the acceptable scope.
7.3 Risk prevention measures 7.3.1 Device selection and prevention measures in process
(1) Prevention measures used in coke dry quenching
a) Fire and explosion protection
Fire water around equiepment area
Water collection pool of SGIS
Polluted water disposal factory devices
Recycling as per required quality for production, or discharging after meeting required t d d
Through rainwater pipe
Reconstruction Project for CDQ Clean Production on 6m Coke Oven in Coking Plant, Guangdong SGIS Songshan Co., Ltd.
South China Institute of Environmental Sciences, Ministry of Environmental Protection of the PRC 149
In the general drawing of transportation design, there is adequate fire protection safety distance set between devices and buildings, and the road is designed and paved according to the requirements of fire-fighting vehicles.
As for the process design, the fields with explosive materials are set with mechanical dedusting device and corresponding ventilating devices to control the density under the lower limit of explosion.
Consistent and automatic gas analysis (flamable components such as CO and H2) devices are set in coke dry quenching gas circulation system to control the concentration of combustible components under the safety range. Additionally, there are several explosion preventing and emergency dispersing devices set to guarantee the safe running of coke dry quenching.
The dedusting machine of CDQ dedusting ground station is equipped with cooling fire-fighting devices, in which the dedusting machine body is set with explosion discharging device, the dedusting machine has electrostatic grounding and the dedusting machine bag filter is made of electrostatic protection materials.
The CDQ boiler is set with over-pressure safety valve and ultra-pressure alarming interlock; the steam drum water level of CDQ boiler is set with upper and lower water level alarm and interlock. An automatic water filling adjustment device is set to ensure the safe running of boiler, and the water Level Indications are set separately on site and in CDQ main control room. The CDQ main control room is also set with upper and lower water level, too high/too low water level alarming and interlocking devices.
The main steam shut-off valve (driven by power) is closed when there is emergency shut off of CDQ boiler, and the circulation fan is stopped consequently. There is an interlocking device set between the circulation fan and the water level of CDQ boiler.
There is an interlocking device set between the condensation water pump of turbine power station and the water level of condenser.
In the turbine power station, if there is failure to turbine oil system, all the lubricating oils can flow to the outdoor emergency oil tank, which is located outside of turbine power station with CDQ devices.
In the electrical design, the fire fighting devices are provided with individual loop for power supply; the non flame retardant shielded cables are used for the power circuit of fire fighting device, which are laid within the wiring tray or underground so that the fire fighting power is guaranteed if the production and living power is cut off in case of fire accidents.
Corresponding electrical devices and lamps shall be equipped in the explosive and fire hazardous fields strictly according to the environmental hazard categories or areas and specifications, like Electrical Installations Design Code for Explosive Atmospheres and Fire Hazard, etc., and relevant lightning protection measures shall be taken to avoid the fire caused by lightning.
The indoor oil-immerse transformer is installed in an isolated room, and an accidental oil pit is set to prevent fire extension and spreading caused by the leakage of transformer oil.
Specifications like Code of Design on Building Fire Protection and Prevention shall be followed during the building design, and sufficient movable fire extinguishers shall be set in the fields with high possibility of fire hazards according to the corresponding regulations in Code for Design of Extinguisher Distribution in Buildings, to meet the requirements of fire protection and fire fighting.
According to the specifications like Code of Design on Building Fire Protection and Prevention, etc., corresponding devices like fire-fighting water supply pipes and fire hydrants are set in fire-fighting water supply design.
This project is set with fire alarming devices in hazardous combustible and explosive fields or important fields according to the requirements of Code for Design of Automatic Fire Alarm System (GB 50116-98).
Please refer to Section “Fire-fighting” for the fire and explosion protection safety measures of the project.
b) Safety measures of pressure container
CDQ boiler of the project is set with over-pressure safety valve, over-temperature and over-pressure alarm interlock, and designed strictly according to the specifications like Technical Supervision Regulation for Safety of Steam Boilers and Technical Supervision Regulation for Safety of Pressure Vessels, etc.
Reconstruction Project for CDQ Clean Production on 6m Coke Oven in Coking Plant, Guangdong SGIS Songshan Co., Ltd.
South China Institute of Environmental Sciences, Ministry of Environmental Protection of the PRC 150
c) Other safety measures
The CDQ system is set with starting indication signaling device to produce sound before starting, and the countercurrent flow interlocking measure is taken to prevent accidental stop and material blockage.
The electrical room of CDQ is set with acoustic and optical alarming devices for abnormal phenomena during production.
To prevent electrical shock and guarantee maintenance safety, devices with two or multi operation points are set with accidental switches besides the machine; the exposed electrical conductive parts of electrical device shall be grounded through PE or PEN lines according to the type of system grounding, and some of devices shall be set with current leakage protection device if necessary.
The lanes of belt conveyor are set with pavements on both sides, the net width of which is no less than 0.8m. The lanes with angle ≤10°is set with anti-slip strip; the lanes with angle >10° is set with anti-slip step to avoid the accidents of slip; And the belt conveyor is set with automatic failure interlocking shutdown device.
The belt conveyor for transporting coke is set in corresponding lanes to avoid the drop of materials, consequent hazards and mechanical injuring accidents.
The belt conveyor is set with protection devices as below: � automatic clean device for head and rear part, � check machine, � emergency shutdown device, � bias detector.
As coke tank is running in high altitude, it shall stop when the wind speed is higher than 20m/s, thus the wind speed meter is designed to monitor the wind speed.
To avoid the mechanical hurt or the accident of dropped materials, all the ladders, platforms and aerial passages in production fields shall be set with safety railings; the movable parts of devices are set with necessary safety protection nets and covers; and corresponding safety tags and accidental lighting devices are set in hazardous places.
d) Backup and emergency measures
All the important devices in process design are set with corresponding spare parts and backup system;
The central power transformation (distribution) stations of the project are set with two-way power supply, and each way can bear 100% of factory load.
The integral electrical room and turbine power supply station of CDQ are set with emergency lighting devices; the accidental lighting power of fire-fighting device construction is led from special power supply loop of fire-fighting device.
The main production buildings are designed with more than two safety exits.
(2) 6m coke oven body
The oven gas devices and leakage points are equipped with quick shut-off valves and other safety protection measures to prevent the hazards from oven gas leakage; the fields with possibility of oven gas leakage are set with oven gas (CO) monitoring and alarming devices and the areas easy to have oven gas leakage are set with safety tags.
Corresponding mechanical dedusting devices are installed in coal grinding room, coke tar filler and flaker machine room, CDQ devices and other places which have combustible and explosive dusts, to control the density of combustible and explosive dusts far under the lower limit of explosion; the corresponding ventilating devices are set in the workshops(e.g. fan room) producing combustible and explosive gas, to control the density of combustible and explosive gas far under the lower limit of explosion.
The belt conveyor of coke wharf pipe uses thermal-resistant glue tape, and the coke wharf is set with spraying devices; the oven gas collection pipe of coke oven is set with automatic pressure adjustment devices and igniting dispersing devices; and all the underground devices, storage tanks and coke transportation lanes are set with ventilation covers and devices.
The control of density of combustible components (CO and H2) in inert gases is an important measure to
Reconstruction Project for CDQ Clean Production on 6m Coke Oven in Coking Plant, Guangdong SGIS Songshan Co., Ltd.
South China Institute of Environmental Sciences, Ministry of Environmental Protection of the PRC 151
guarantee the safe running of CDQ devices; additionally, several explosion and emergency dispersing devices are set in the CDQ devices and gas circulation systems.
The Coke Oven Gas pipelines of coke oven are set with low pressure alarm and automatic gas shut-off devices to prevent the gas pipelines from inhaling air and causing hazards; the oven gas and benzol devices and pipelines are all set with corresponding electro-static protection grounding devices to prevent the fire from electro-static spark; and the piping gas is set with low pressure alarm and safety interlock.
The regenerator and other devices and pipelines are set with safety valves; the electric tar precipitator is set with interlocking device that will give off alarming signals once the content of oxygen in oven gas is over 0.8%, and switch off the power automatically in case the content is over 1%; the inlet and outlet pipes of pre-cooler, fan, desulfurization, spraying saturator and benzene washing tower are set with thermal and pressure monitoring apparatuses.
The devices and pipelines of gas system are set with corresponding steam blowing and sampling devices to prevent the fire caused by over oxygen content and explosion; mechanical ventilation is set in the rooms with gas pipelines passing through; the gas fan uses explosion protection motor; and the desulfurization circulation pump and gas fan use explosion protection motors.
The benzol devices and pipelines are set with electro static protection grounding; the coarse benzene pump room and piping oven are set with steam fire hydrants; and the benzol tank and the intermediate tank use sparkle level meter and electro-static protection intake pipes.
The storage of coal in every place is done according to timetable, and it can not extend the storage time limit to prevent too long-time storage of coal and oxidized self-ignition.
7.3.2 Automatic Control System, Emergency Shutdown and Accidental Handling Devices during Production
The acoustic and optical alarming devices are set in backup coal central control room, central room of dedusting ground station of coke oven, central control room of coke screening and dedusting, and 6KV comprehensive electrical room, etc. to indicate the abnormal phenomena during production.
The starting indication signaling devices are set in backup coal, coke screening, coke oven dedusting, CDQ, CDQ dedusting systems to give off sounds before starting, and the counterflow interlocking measure is taken to prevent accidental shutdown and material blockage.
A starting button for accidental ventilation is set outside the main passage leading to the outdoor field; the belt conveyor and related devices shall have central interlocked control according to process requirements.
An emergency switch is set besides the machine for two or multi operation devices to guarantee the safety of inspection.
The emergency boiler shutdown protection device is set for CDQ, i.e. the main steam shut-off valve will be closed right, the firing exhaust valve is opened and the circulation fan is stopped during emergency boiler shutdown. There is a locked protection device set between the circulation fan and the water level of CDQ boiler.
7.3.3 Prevention Measures to Hazardous Substances
a) Prevention and treatment of noxious dusts
The prevention and treatment of noxious dusts in the project is considered from two aspects: firstly, to control the source of noxious dusts from the process so as to reduce hazardous substance with noxious dust; Taking corresponding protective measures for operators to avoid the noxious dusts from doing harm to the operators. The main measures taken are as below:
Use CDQ to avoid the dispersing of hazardous gases which are produced by coke wet quenching.
A mechanical dedusting system is set in CDQ system and dust removal efficiency is higher than 99.5%.
The lanes of coke transporting station use closed design to prevent the harm caused by dust.
The coke intake of the CDQ top is set with an annular water seal block. The lifting sealing cover of the
Reconstruction Project for CDQ Clean Production on 6m Coke Oven in Coking Plant, Guangdong SGIS Songshan Co., Ltd.
South China Institute of Environmental Sciences, Ministry of Environmental Protection of the PRC 152
coke funnel cuts into the water seal block to form a water seal, preventing dust spill-over. Meanwhile, the coke funnel connects the movable dust pumpings inside the funnel is of negative pressure, which pumps a large amount of smokes and dusts into the dust pumping during coke intake, to reduce dust proliferation. In order to minimize dust spread during replacement of water seal cover and coke receiving hopper, oven top pressure keeps at -30Pa to -50Pa before the water seal cover is uncovered. And the adoption of linkage mechanism for hopper and oven cover shortens replacement time, which enables the gas in the oven not to escape as far as possible.
Coke discharge device adopts a continuous discharging device with grilled seal valve, of good air tightness and able to seal the smoke and dust when discharging coke; meanwhile, air is charged into the shell of the coke discharge device to withstand the pressure and avoid circulating gases spill-over.
To prevent the expansion and shrinkage from initiation, halt and temperature fluctuation, which lead to the gas leakage at the joint, a high-temperature compensator is set between the CDQ boiler and the primary dedusting machine, and between the primary dedusting machine and the CDQ waste heat boiler. The circulation gas pipes are also set with several compensators.
The operation room, control room and rest room which isolate hazardous noxious dust are set at important production fields, certain air ventilation and change measures are taken to avoid the harm to operators from noxious dust.
The density of all hazardous substances at the main working fields of the project meets the requirements of Occupational Exposure Limit for Hazardous Agents in the Workplace(GBZ 2-2002) through the control.
b) Protection measures against electromagnetic radiation
The transformers, power distribution plates and other devices are set in individual rooms to prevent electromagnetic radiation.
c) Protection measures against radiation from γ ray
Laying the γ ray level meter of CDQ device in a lead tank, which is under protective status at idle condition and the red warning lamp lights up to prevent the approach of workers when it runs.
When it is at idle condition, the activity of level meter 60Co is 3.7×101GBq (1Ci), the level meter can shield off the γ ray radiated by 60Co from the designed structure, that most of the γ ray will be absorbed by coke after passing through the coke in pre-storage chamber and the radiation dose ratio is less than 1μGy/h. Thus the radiation dose to surrounding environment meets the requirements of the state standard Basic Standards for Protection against Ionizing Radiation and for the Safety of Radiation Sources (GB18871-2002).
7.3.4 Preventive Measures of Fire Fighting System
7.3.4.1 Fire Fighting in General Drawing
The project is implemented in the coking plant area with former facilities of coking plant around, the distance between buildings of the project and the former facilities of coking plant shall meet the corresponding requirements of fire fighting safety distance.
In the general internal layout, each facility room is set according to its category and area, isolated with roads or passages, and adequate fire-fighting safety distance is set to prevent the fire expansion in case of fire.
The road width and overhead clearance within the factory area of this project both take into consideration the requirements of fire-fighting vehicle to keep the unblocked fire-fighting road.
The project is not provided with fire-fighting station, and all the fire-fighting cases are dealt by the company uniformly since its fire-fighting capability can meet the requirements of fire-fighting in this project.
7.3.4.2 Fire fighting of gas
As for the process design, the fields with explosive materials are set with mechanical dedusting device and corresponding ventilating devices to control the density of explosive dust farther under the lower limit of
Reconstruction Project for CDQ Clean Production on 6m Coke Oven in Coking Plant, Guangdong SGIS Songshan Co., Ltd.
South China Institute of Environmental Sciences, Ministry of Environmental Protection of the PRC 153
explosion.
A consistent and automatic gas (combustible components such as CO and H2) analysis device is set in the inert gas circulation system of CDQ, which charges air or N2 into circulation system consistently, controls the density of combustible components under the safety range, and is set with corresponding dispersing and explosion protection devices to guarantee the safe running of CDQ.
The CO alarming apparatuses are set around the coke discharge device.
In the turbine power station, if there is failure to turbine oil system, all the lubricating oils can flow to the outdoor failure oil tank, which is set out of turbine power station with CDQ devices.
The coke transportation belt is made of thermal resistant materials.
The safety tag and signaling device are set at the fields with high possibility of fire hazards.
7.3.4.3 Fire-fighting Water Supply
(1) The plant area is set with low pressure production——fire fighting water supplying system, and times of fire hazards, which happen at the same time, are considered as once; The outdoor fire fighting water supply is 30l/s. The indoor and outdoor fire-fighting network is set in circulation shape, and the indoor and outdoor fire hydrants are set according to specification requirements.
(2) The main plant, which is a high industry building, is set with separate normal/high pressure indoor fire-fighting water supplying system using blast furnace normal pressure water supplying system as the water source, the indoor fire-fighting water flow is 30l/s, meanwhile, 6 water guns are used and the minimal flow of every gun is 5l/s.
7.3.4.4 Fire prevention Measures of Buildings
According to GBJ16-87 Code For Design of Building Fire Protection(2001), sufficient fire-fighting distance is reserved between buildings/structures, and corresponding fire resistant degrees are designed according to the fire hazard category of every building/structure. The fire hazard class of electrical room, main control room, apparatus room and computer room is class �, and the fire resistant degree is II; the fire hazard class of cable pitches and cable tunnel is III, and the fire resistant degree is II.
7.3.4.5 Fire prevention and Lightning Protection of Electrical Device
Entrances of high voltage power distribution room, low voltage power distribution room and control room are set with sand tanks and fire extinguishers such as foam or dry powder fire extinguishers; the computer room and control room are set with fixed fire control equipment.
The cable is inflammable, and the cable exit is blocked with fire resistant materials. The fire-fighting powers of fire fighting door and fire fighting wall both use 2-way power supply, and the fire alarm and fire-fighting equipment is supplied with safeguard power.
The combustible and explosive buildings e.g. main plant, power supply system, gas, oil pump and pipes of oil supply pump station etc. are set with reliable thunder-proof and lightning protection grounding device according to GB50057-94 Design Code for Protection of Structures against Lightning.
7.3.4.6 Fire-fighting facilities
According to GBJ 140-90 Code for Design of Extinguisher Distribution in Buildings (Edition 1997), every point with hidden fire hazard is set with certain numbers of corresponding fire-fighting equipment according to the characteristics of its location.
7.3.4.7 Fire-fighting communication
The vital and combustible places e.g. blast furnace control room, electrical control room, gas management room and various hydraulic and lubrication station etc. are set with automatic and manual fire alarming equipment according to relevant national regulations.
Every operation room and duty room are set with direct dial telephone for fire-fighting communication.
Reconstruction Project for CDQ Clean Production on 6m Coke Oven in Coking Plant, Guangdong SGIS Songshan Co., Ltd.
South China Institute of Environmental Sciences, Ministry of Environmental Protection of the PRC 154
7.3.4.8 Safety signs
The “NO OPEN FLAMES” signs are set at obvious places in plant area, and the fire-fighting signs like “DANGER OF FIRE, DANGER OF EXPLOSION” are set in some fields with the danger of explosion. The detailed setup is done according to GB15630-95 Requirements for The Placement of Fire Safety Signs.
7.3.4.9 Fire-fighting mechanism
The project is located inside the plant area of SGIS, the fire-fighting work is considered uniformly by SGIS and no additional fire-fighting team is set. But the person responsible for fire-fighting concerning supervision and management thereof is included in the design.
7.3.4 Prevention against natural disaster factors
The protection measures against natural disasters, e.g. storm, flood, thunder and lightning, earthquake and extremely hot weather etc., were set during the construction of plant, and the design still uses the existing facilities.
(1) The new constructed buildings and comprehensive buildings are set with lightning rod to protect against lightning shock; And every equipment and pipe is set with lightning protection equipment.
(2) The design of plant scale height when SGIS was founded meets the highest over-year flood Class In this area and the construction is valid and practicable. The project still uses the prior flood control equipment. The indoor ground of the building is higher than outdoor ground to avoid the intrusion of storm water.
(3) The operation room and apparatus room are set with air conditioner or air cooler to reduce the temperature in summer; the devices and pipes with surface temperature above 60� will be provided with insulation measures.
(4) The earthquake intensity in this area is considered as degree 6.
7.3.5 Gas Protection Area and Management Measures
Personnel protection technology and measures
Every workshop has a dedicated safety person who is responsible for maintaining, checking and replacing protective mask, and for safety education, safety inspection, etc.
For the production concerning combustible and explosive, noxious and hazardous substances, the project shall be divided into several gas protection areas according to Classification of Health Hazard Levels from Occupational Exposure to Toxic Substances (GB 5044-85). It is divided into four areas according to 6 indexes with the acute and toxic degree of noxious substance, incidence status of acute poisoning, incidence status of chronic poisoning, con of chronic poisoning, character of causing cancer and allowed workshop density as classification standards: I (extreme harm), II (high harm), III (medium harm) and Ⅳ(light harm), and the gas protection areas are strictly managed.
The company shall set up a gas protection station, which is responsible for the gas protection first-aid, gas protection training, maintenance of gas protection instruments and the gas filling of breathing machine air tank.
The company shall prepare a Gas Protection First-Aid Plan, which includes the organization chapter and countermeasure chapter, of which the organization chapter shall have a systematical description of commanding structure and organizing structure of gas protection accident, alarm and protective alarm, strength that can be assembled and emergency contacts and communications, the influence of wind power and temperature on the dispersing of noxious substances, important area distribution and basic data needed by gas protection first-aid station and various necessary emergency devices and other substantial conditions for gas protection first-aid, it will play a good guiding role for gas protection accident first-aid.
Strict management shall be implemented through division of important areas, and emergency first-aid system shall be set up to ensure gas protection accident be under control.
Reconstruction Project for CDQ Clean Production on 6m Coke Oven in Coking Plant, Guangdong SGIS Songshan Co., Ltd.
South China Institute of Environmental Sciences, Ministry of Environmental Protection of the PRC 155
7.3.6 Environmental monitoring and environmental risk emergency monitoring
7.3.6.1 Routine monitoring
The monitoring of the project is the responsibility of SGIS.
SGIS is provided with a specialized environmental monitoring station, which is responsible for monitoring pollution source and environment.
(1) Water quality monitoring: Routine water quality monitoring items are recommended on wastewater quantity, pH, CODCr, BOD5, SS, NH3-N, cyanide, phenol, petroleum, animal oil, vegetable oil and so on. Monitoring sites should include main wastewater discharge outlet of plants, inlets and outlets of the sewage treatment facilities, general discharge outlet of the plants. Monitoring frequency can be determined on different monitoring projects, at least once a week. Additional measuring should be taken in case of abnormal production or accidental drainages. However, on-line monitoring of the wastewater flow and CODCr concentration should be implemented on the general drainage outlet. If there are temporary difficulties with on-line monitoring of CODCr concentration, the item of CODCr monitoring should be carried out every day.
(2) Noise monitoring
Monitoring item: Noise level
Monitoring site: Noise within Factory
Monitoring frequency: Once a quarter, day and night monitoring shall be carried out in the absence of rain with wind velocity less than 5.5 m/s.
(3) Requirements of the plan on discharge outlets
According to the State Standard "Graphical Signs For Environmental Protection Discharge Outlet(Source)" and the technical requirements of the State Environmental Protection Administration, "Requirements on Standardized Discharge Outlet Rectification(Trial Implementation)," all discharge outlets(including water, gas, sound, dregs) of the plants must be in accordance with principles and standardized requirements featuring "being easy in sampling, convenient to measure and monitor, and facilitated to routine on-site supervision”. Corresponding environmental protection graphic signs shall be set, and discharge outlet distribution map shall be drawn. Meanwhile flowmeters shall be installed on the sewage discharge outlets and operation monitoring devices shall be set in treatment facilities. The standardization of discharge outlets should comply with the relevant requirements of Environmental Supervision Office of Shunde District.
7.3.6.2 Emergency monitoring
SGIS implements a duty system for environmental risk accidents. Emergency duty room is set up in the company monitoring station with person on duty 24 hours a day.
Emergency monitoring facilities and personnel shall be allocated to be ready to receive pollution accident information from the general dispatchers’ office of the company, all department rooms, plants and the society, and take timely emergency monitoring program, assign monitoring staff and analysis staff, and coordinate with the Environment Department on the investigation and disposal of environmental pollution source.
In case of emergency pollution accidents, the persons work in the monitoring station shall arrive on the spot with necessary facilities for monitoring air and water quality upon being informed, and according to the arrangements of the company's Environment Department, carry out atmospheric and related water monitoring, and track a certain range in the back-wind direction or backward position for samplings. By accident types, emergency monitoring in high frequency(at least once an hour) shall be implemented on relevant sites, and monitoring items shall be chosen according to the situation, and the situation shall be monitored at any time to provide basis for emergency command.
The monitoring items that the company can not complete should be commissioned to local environment monitoring stations. In case of leakage of toxic or hazardous chemicals, reports shall be immediately sent to local environmental protection authority, and environmental monitoring station of the district shall be
Reconstruction Project for CDQ Clean Production on 6m Coke Oven in Coking Plant, Guangdong SGIS Songshan Co., Ltd.
South China Institute of Environmental Sciences, Ministry of Environmental Protection of the PRC 156
commissioned to undertake pollution impact monitoring, possible pollutants emitted shall be reported in advance, and the monitoring station shall be assisted to make emergency monitoring plan.
7.4 Emergency Scheme Project risk accidents may influence the surroundings to some degree. With a high level of safety measures, the accident probability will be lower, but not be zero. Once the accident occurs, emergency measures should be taken to control and reduce accident hazards. Since larger accidents may harm the environment, there are needs for community help. Therefore an emergency scheme needs to be made in advance.
Emergency scheme is an anticipated scheme for relief activities, which is based on the premise of prevention, aiming at possible accidents of the construction project, to control the hazard source timely, rescue the victims, guide residents for anti-expansion and evacuation, and eliminate hazard cons. It needs the integration of unit effort and social rescue.
Emergency scheme for gas leakage in the project is divided into two levels, the company-level and social interaction level.
Emergency scheme for the project goes as follows:
Emergency handling scheme of Type A hazard sources in Coking Plant
I. Serious accident emergency measures for CDQ body:
Reporting procedures:
1. When such serious accidents as coke oven hearth damage, explosion or collapse happen to the CDQ body, the first witness should immediately notify the front furnace duty room, then foreman on shift should immediately report to the dispatcher, section leaders and relevant departments and section offices.
2. On receiving the accident report, the dispatcher should immediately notify the staff in the possibly affected areas to evacuate. Meanwhile, he should report to the chief dispatcher, plant leaders and relevant sections for rescue and relief, and ask for rescue by 110, 120 or 119 if necessary.
Organization structures and responsibilities
Emergency leading group
Head: plant director
Deputy Head: vice director in charge of production, vice director in charge of equipment
Members: leaders of production management, technical equipment management, safety management, comprehensive management and different sections.
Major responsibilities of emergency leading group
1. Implement the regulations and rules of the state and the company on emergency rescue and handling in relevant accidents;
2. Led by the emergency command organization of the company, and request emergency assistance;
3. Study major emergency decisions and deployments;
4. Supervise the formulation and revision of the emergency scheme, and declare its implementation and termination;
5. Declare state of emergency and issue instructions; Relief the state of emergency;
Settings of the command center:
Dispatching center is the command center of accident handling, and the director dispatcher on duty is the commander, who commands the accident handling comprehensively.
Major responsibilities of the director dispatcher on duty in emergency handling:
1. Get the basic situation of the accident, and correctly judge the nature of the accident and scope affected;
Reconstruction Project for CDQ Clean Production on 6m Coke Oven in Coking Plant, Guangdong SGIS Songshan Co., Ltd.
South China Institute of Environmental Sciences, Ministry of Environmental Protection of the PRC 157
2. Timely report to the emergency leading group on the basic situation of the accident, correctly issue orders according to the group’s instructions, command accident handling, and control the affected scope, to effectively prevent further expansion of the accident.
3. Request rescue assistance (such as fire rescue, medical rescue, etc.) if necessary;
Emergency measures:
1. When such serious accidents as coke oven hearth damage, explosion or collapse happen to the CDQ body, the highest leader on-site should organize the staff to evacuate from the dangerous area immediately (Be advised to choose the safe evacuation route), notify staff in the possibly affected areas to evacuate, and take all the necessary measures to prevent further expansion of the accidents.
2. Under the premise of ensuring safety, it’s required to peremptorily shut off wind, water, power, and various gases(for example, if the gas pipeline is on fire, it’s prohibited to close gas valves until professionals arrive for handling).
3. After the withdrawal, it’s required to count the head, lay alerting line, and prohibit entry of those unrelated to the accident rescue.
4. The rescue personnel should be fully aware of the on-site situations before entering the site for rescue.
5. All the staff entering the site should be registered properly, with necessary protective gear, portable monitors (mainly for gas monitoring). Pay attention to the damage of the industry construction (collapse, falling objects) and the risk of explosion.
6. The on-the-spot highest leader is in charge of the spot organization of the emergency handling.
II. Emergency measures in serious gas accidents
Reporting procedures
1. When serious gas leakage happens, the first witness should immediately notify the dispatcher and staff of relevant sections.
2. On receiving the serious gas accident report, the dispatcher should immediately notify the staff in the possibly affected posts (including outer-plant), and notify the chief dispatcher, plant leaders and leaders of relevant departments and sections.
3. It’s required to request the Power Plant for dispatching professionals and seek rescue assistance by dialing 110, 120 or 119 if necessary.
Organization structures and responsibilities
emergency leading group
Head: plant director
Deputy Head: vice director in charge of production, vice director in charge of equipment
Members: leaders of production management, technical equipment management, safety management, comprehensive management and different sections.
Major responsibilities of emergency leading group
1. Implement the regulations and rules of the state and the company on emergency rescue and handling in relevant accidents;
2. Led by the emergency command organization of the company, and request emergency assistance;
3. Study major emergency decisions and deployments;
4. Supervise the formulation and revision of the emergency scheme, and declare its implementation and termination;
5. Declare state of emergency and issue instructions; Relieve the state of emergency;
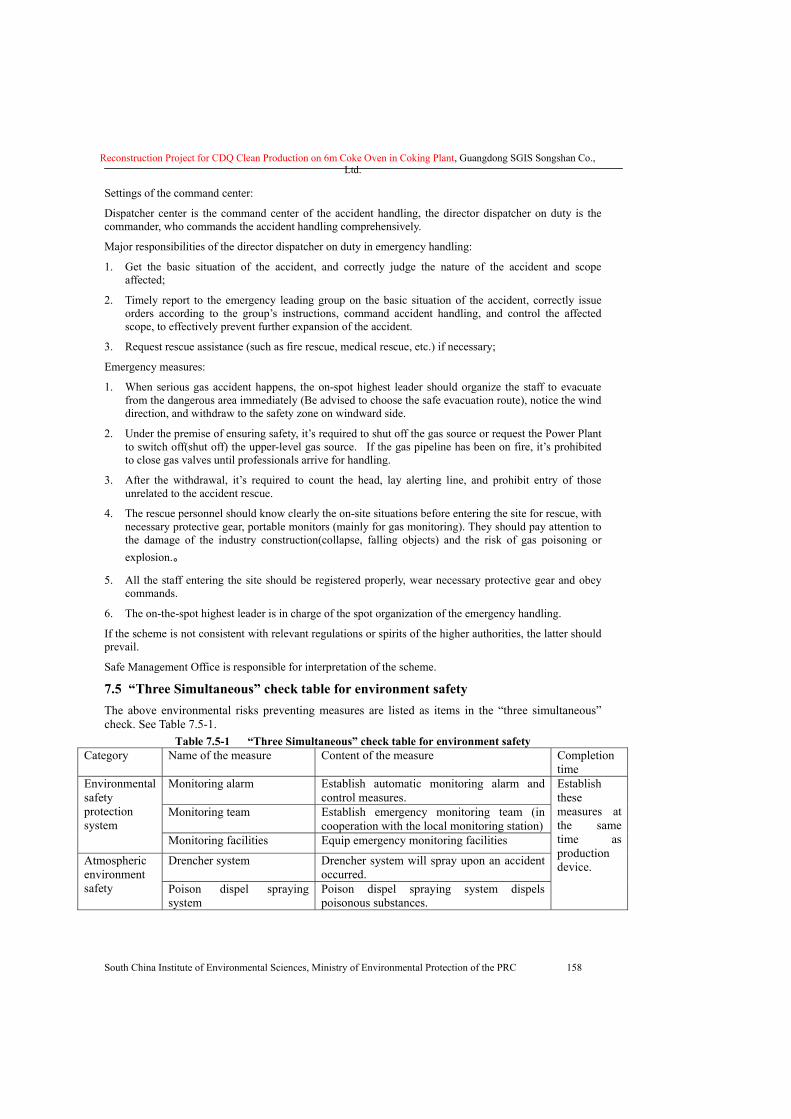
Reconstruction Project for CDQ Clean Production on 6m Coke Oven in Coking Plant, Guangdong SGIS Songshan Co., Ltd.
South China Institute of Environmental Sciences, Ministry of Environmental Protection of the PRC 158
Settings of the command center:
Dispatcher center is the command center of the accident handling, the director dispatcher on duty is the commander, who commands the accident handling comprehensively.
Major responsibilities of the director dispatcher on duty in emergency handling:
1. Get the basic situation of the accident, and correctly judge the nature of the accident and scope affected;
2. Timely report to the emergency leading group on the basic situation of the accident, correctly issue orders according to the group’s instructions, command accident handling, and control the affected scope, to effectively prevent further expansion of the accident.
3. Request rescue assistance (such as fire rescue, medical rescue, etc.) if necessary;
Emergency measures:
1. When serious gas accident happens, the on-spot highest leader should organize the staff to evacuate from the dangerous area immediately (Be advised to choose the safe evacuation route), notice the wind direction, and withdraw to the safety zone on windward side.
2. Under the premise of ensuring safety, it’s required to shut off the gas source or request the Power Plant to switch off(shut off) the upper-level gas source. If the gas pipeline has been on fire, it’s prohibited to close gas valves until professionals arrive for handling.
3. After the withdrawal, it’s required to count the head, lay alerting line, and prohibit entry of those unrelated to the accident rescue.
4. The rescue personnel should know clearly the on-site situations before entering the site for rescue, with necessary protective gear, portable monitors (mainly for gas monitoring). They should pay attention to the damage of the industry construction(collapse, falling objects) and the risk of gas poisoning or explosion.。
5. All the staff entering the site should be registered properly, wear necessary protective gear and obey commands.
6. The on-the-spot highest leader is in charge of the spot organization of the emergency handling.
If the scheme is not consistent with relevant regulations or spirits of the higher authorities, the latter should prevail.
Safe Management Office is responsible for interpretation of the scheme.
7.5 “Three Simultaneous” check table for environment safety The above environmental risks preventing measures are listed as items in the “three simultaneous” check. See Table 7.5-1.
Table 7.5-1 “Three Simultaneous” check table for environment safety Category Name of the measure Content of the measure Completion
time Monitoring alarm Establish automatic monitoring alarm and
control measures. Monitoring team Establish emergency monitoring team (in
cooperation with the local monitoring station)
Environmental safety protection system
Monitoring facilities Equip emergency monitoring facilities
Drencher system Drencher system will spray upon an accident occurred.
Atmospheric environment safety Poison dispel spraying
system Poison dispel spraying system dispels poisonous substances.
Establish these measures at the same time as production device.

Reconstruction Project for CDQ Clean Production on 6m Coke Oven in Coking Plant, Guangdong SGIS Songshan Co., Ltd.
South China Institute of Environmental Sciences, Ministry of Environmental Protection of the PRC 159
Backwater system Flow monitoring pool, backflow pipe and backflow valve of wastewater discharge system.
Changeover valve under clear water
Changeover valve is set for the collection system of clear water.
Rain water changeover valve
Changeover valve is set for the collection system of clear water.
Water environmental safety
Changeover valve of water for accidents and firefighting
Changeover valve is set for the collection system of water for accidents and firefighting.
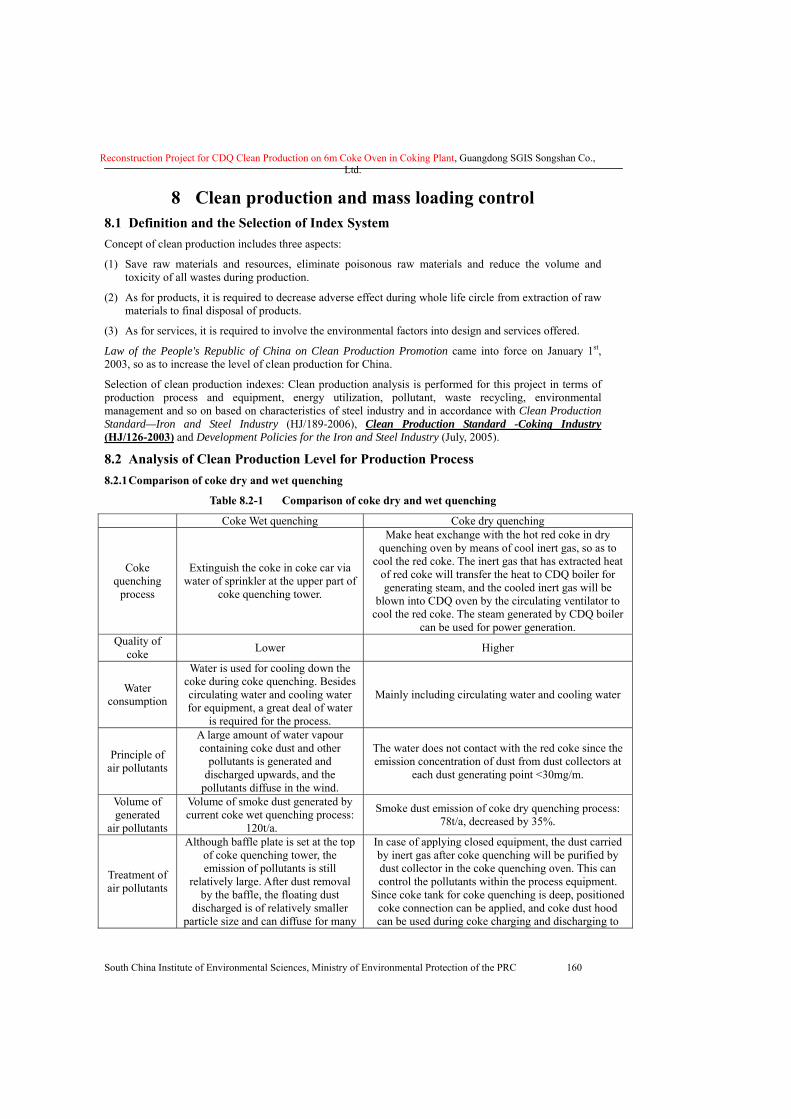
Reconstruction Project for CDQ Clean Production on 6m Coke Oven in Coking Plant, Guangdong SGIS Songshan Co., Ltd.
South China Institute of Environmental Sciences, Ministry of Environmental Protection of the PRC 160
8 Clean production and mass loading control 8.1 Definition and the Selection of Index System Concept of clean production includes three aspects:
(1) Save raw materials and resources, eliminate poisonous raw materials and reduce the volume and toxicity of all wastes during production.
(2) As for products, it is required to decrease adverse effect during whole life circle from extraction of raw materials to final disposal of products.
(3) As for services, it is required to involve the environmental factors into design and services offered.
Law of the People's Republic of China on Clean Production Promotion came into force on January 1st, 2003, so as to increase the level of clean production for China.
Selection of clean production indexes: Clean production analysis is performed for this project in terms of production process and equipment, energy utilization, pollutant, waste recycling, environmental management and so on based on characteristics of steel industry and in accordance with Clean Production Standard—Iron and Steel Industry (HJ/189-2006), Clean Production Standard -Coking Industry (HJ/126-2003) and Development Policies for the Iron and Steel Industry (July, 2005).
8.2 Analysis of Clean Production Level for Production Process 8.2.1 Comparison of coke dry and wet quenching
Table 8.2-1 Comparison of coke dry and wet quenching
Coke Wet quenching Coke dry quenching
Coke quenching
process
Extinguish the coke in coke car via water of sprinkler at the upper part of
coke quenching tower.
Make heat exchange with the hot red coke in dry quenching oven by means of cool inert gas, so as to
cool the red coke. The inert gas that has extracted heat of red coke will transfer the heat to CDQ boiler for generating steam, and the cooled inert gas will be
blown into CDQ oven by the circulating ventilator to cool the red coke. The steam generated by CDQ boiler
can be used for power generation. Quality of
coke Lower Higher
Water consumption
Water is used for cooling down the coke during coke quenching. Besides circulating water and cooling water for equipment, a great deal of water
is required for the process.
Mainly including circulating water and cooling water
Principle of air pollutants
A large amount of water vapour containing coke dust and other
pollutants is generated and discharged upwards, and the
pollutants diffuse in the wind.
The water does not contact with the red coke since the emission concentration of dust from dust collectors at
each dust generating point <30mg/m.
Volume of generated
air pollutants
Volume of smoke dust generated by current coke wet quenching process:
120t/a.
Smoke dust emission of coke dry quenching process: 78t/a, decreased by 35%.
Treatment of air pollutants
Although baffle plate is set at the top of coke quenching tower, the emission of pollutants is still
relatively large. After dust removal by the baffle, the floating dust
discharged is of relatively smaller particle size and can diffuse for many
In case of applying closed equipment, the dust carried by inert gas after coke quenching will be purified by dust collector in the coke quenching oven. This can control the pollutants within the process equipment.
Since coke tank for coke quenching is deep, positioned coke connection can be applied, and coke dust hood can be used during coke charging and discharging to
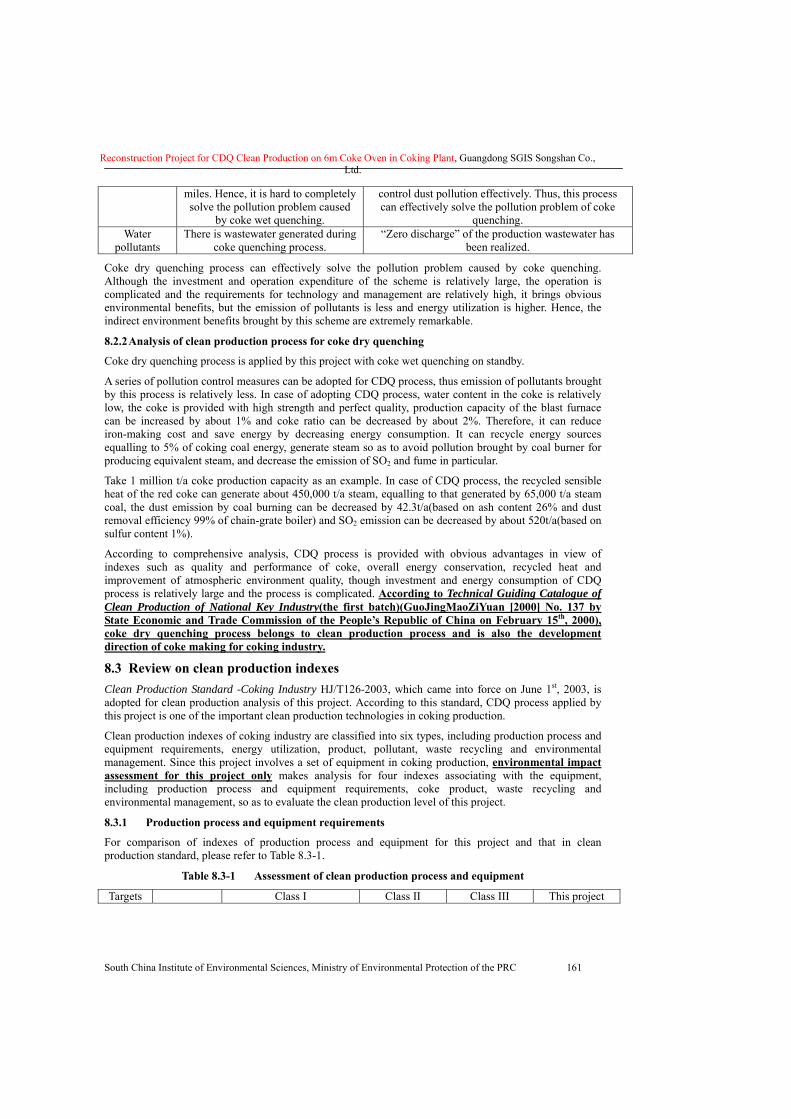
Reconstruction Project for CDQ Clean Production on 6m Coke Oven in Coking Plant, Guangdong SGIS Songshan Co., Ltd.
South China Institute of Environmental Sciences, Ministry of Environmental Protection of the PRC 161
miles. Hence, it is hard to completely solve the pollution problem caused
by coke wet quenching.
control dust pollution effectively. Thus, this process can effectively solve the pollution problem of coke
quenching. Water
pollutants There is wastewater generated during
coke quenching process. “Zero discharge” of the production wastewater has
been realized.
Coke dry quenching process can effectively solve the pollution problem caused by coke quenching. Although the investment and operation expenditure of the scheme is relatively large, the operation is complicated and the requirements for technology and management are relatively high, it brings obvious environmental benefits, but the emission of pollutants is less and energy utilization is higher. Hence, the indirect environment benefits brought by this scheme are extremely remarkable.
8.2.2 Analysis of clean production process for coke dry quenching
Coke dry quenching process is applied by this project with coke wet quenching on standby.
A series of pollution control measures can be adopted for CDQ process, thus emission of pollutants brought by this process is relatively less. In case of adopting CDQ process, water content in the coke is relatively low, the coke is provided with high strength and perfect quality, production capacity of the blast furnace can be increased by about 1% and coke ratio can be decreased by about 2%. Therefore, it can reduce iron-making cost and save energy by decreasing energy consumption. It can recycle energy sources equalling to 5% of coking coal energy, generate steam so as to avoid pollution brought by coal burner for producing equivalent steam, and decrease the emission of SO2 and fume in particular.
Take 1 million t/a coke production capacity as an example. In case of CDQ process, the recycled sensible heat of the red coke can generate about 450,000 t/a steam, equalling to that generated by 65,000 t/a steam coal, the dust emission by coal burning can be decreased by 42.3t/a(based on ash content 26% and dust removal efficiency 99% of chain-grate boiler) and SO2 emission can be decreased by about 520t/a(based on sulfur content 1%).
According to comprehensive analysis, CDQ process is provided with obvious advantages in view of indexes such as quality and performance of coke, overall energy conservation, recycled heat and improvement of atmospheric environment quality, though investment and energy consumption of CDQ process is relatively large and the process is complicated. According to Technical Guiding Catalogue of Clean Production of National Key Industry(the first batch)(GuoJingMaoZiYuan [2000] No. 137 by State Economic and Trade Commission of the People’s Republic of China on February 15th, 2000), coke dry quenching process belongs to clean production process and is also the development direction of coke making for coking industry.
8.3 Review on clean production indexes Clean Production Standard -Coking Industry HJ/T126-2003, which came into force on June 1st, 2003, is adopted for clean production analysis of this project. According to this standard, CDQ process applied by this project is one of the important clean production technologies in coking production.
Clean production indexes of coking industry are classified into six types, including production process and equipment requirements, energy utilization, product, pollutant, waste recycling and environmental management. Since this project involves a set of equipment in coking production, environmental impact assessment for this project only makes analysis for four indexes associating with the equipment, including production process and equipment requirements, coke product, waste recycling and environmental management, so as to evaluate the clean production level of this project.
8.3.1 Production process and equipment requirements
For comparison of indexes of production process and equipment for this project and that in clean production standard, please refer to Table 8.3-1.
Table 8.3-1 Assessment of clean production process and equipment
Targets Class I Class II Class III This project
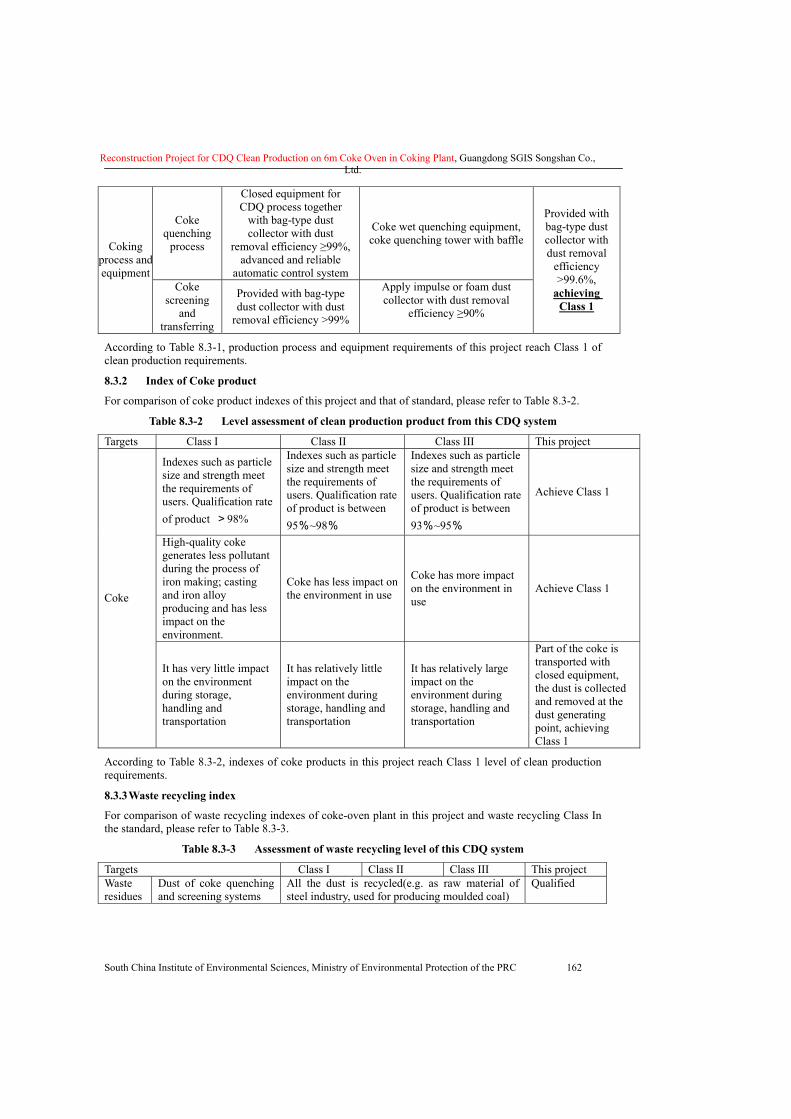
Reconstruction Project for CDQ Clean Production on 6m Coke Oven in Coking Plant, Guangdong SGIS Songshan Co., Ltd.
South China Institute of Environmental Sciences, Ministry of Environmental Protection of the PRC 162
Coke quenching
process
Closed equipment for CDQ process together
with bag-type dust collector with dust
removal efficiency ≥99%, advanced and reliable
automatic control system
Coke wet quenching equipment, coke quenching tower with baffle Coking
process andequipment
Coke screening
and transferring
Provided with bag-type dust collector with dust
removal efficiency >99%
Apply impulse or foam dust collector with dust removal
efficiency ≥90%
Provided with bag-type dust collector with dust removal
efficiency >99.6%,
achieving Class 1
According to Table 8.3-1, production process and equipment requirements of this project reach Class 1 of clean production requirements.
8.3.2 Index of Coke product
For comparison of coke product indexes of this project and that of standard, please refer to Table 8.3-2.
Table 8.3-2 Level assessment of clean production product from this CDQ system
Targets Class I Class II Class III This project
Indexes such as particle size and strength meet the requirements of users. Qualification rate of product >98%
Indexes such as particle size and strength meet the requirements of users. Qualification rate of product is between 95%~98%
Indexes such as particle size and strength meet the requirements of users. Qualification rate of product is between 93%~95%
Achieve Class 1
High-quality coke generates less pollutant during the process of iron making; casting and iron alloy producing and has less impact on the environment.
Coke has less impact on the environment in use
Coke has more impact on the environment in use
Achieve Class 1 Coke
It has very little impact on the environment during storage, handling and transportation
It has relatively little impact on the environment during storage, handling and transportation
It has relatively large impact on the environment during storage, handling and transportation
Part of the coke is transported with closed equipment, the dust is collected and removed at the dust generating point, achieving Class 1
According to Table 8.3-2, indexes of coke products in this project reach Class 1 level of clean production requirements.
8.3.3 Waste recycling index
For comparison of waste recycling indexes of coke-oven plant in this project and waste recycling Class In the standard, please refer to Table 8.3-3.
Table 8.3-3 Assessment of waste recycling level of this CDQ system
Targets Class I Class II Class III This project Waste residues
Dust of coke quenching and screening systems
All the dust is recycled(e.g. as raw material of steel industry, used for producing moulded coal)
Qualified
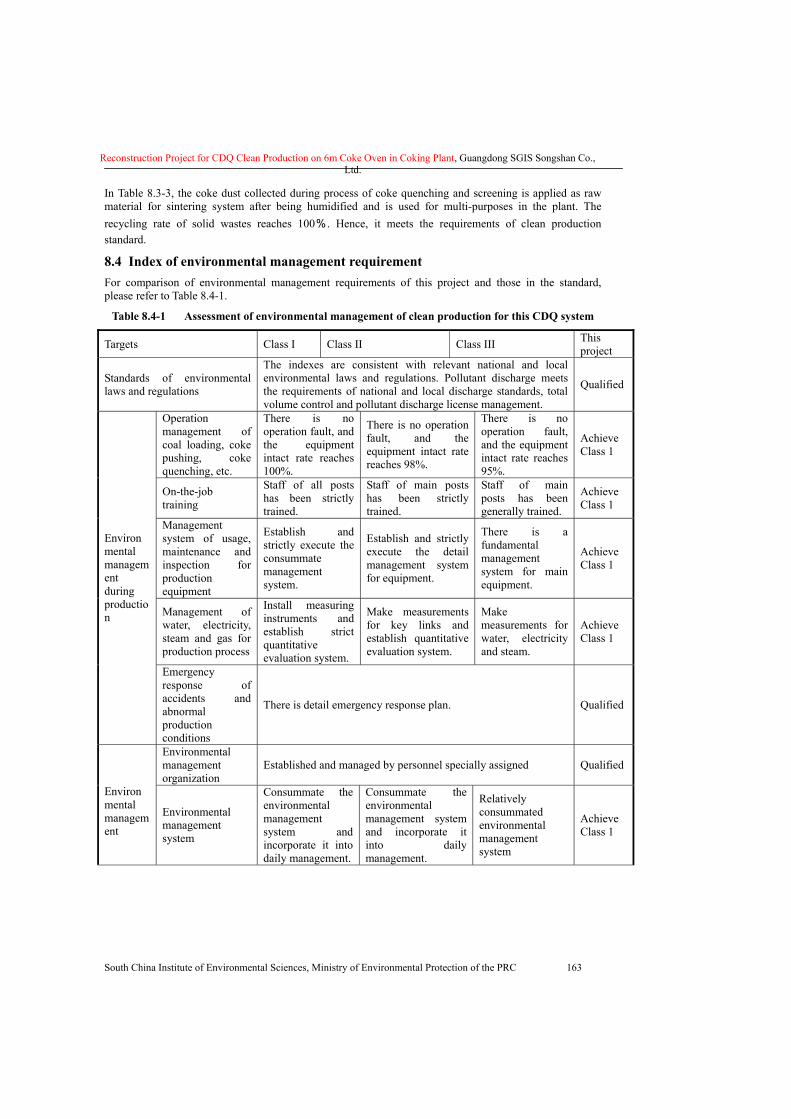
Reconstruction Project for CDQ Clean Production on 6m Coke Oven in Coking Plant, Guangdong SGIS Songshan Co., Ltd.
South China Institute of Environmental Sciences, Ministry of Environmental Protection of the PRC 163
In Table 8.3-3, the coke dust collected during process of coke quenching and screening is applied as raw material for sintering system after being humidified and is used for multi-purposes in the plant. The recycling rate of solid wastes reaches 100%. Hence, it meets the requirements of clean production standard.
8.4 Index of environmental management requirement For comparison of environmental management requirements of this project and those in the standard, please refer to Table 8.4-1.
Table 8.4-1 Assessment of environmental management of clean production for this CDQ system
Targets Class I Class II Class III This project
Standards of environmental laws and regulations
The indexes are consistent with relevant national and local environmental laws and regulations. Pollutant discharge meets the requirements of national and local discharge standards, total volume control and pollutant discharge license management.
Qualified
Operation management of coal loading, coke pushing, coke quenching, etc.
There is no operation fault, and the equipment intact rate reaches 100%.
There is no operation fault, and the equipment intact rate reaches 98%.
There is no operation fault, and the equipment intact rate reaches 95%.
Achieve Class 1
On-the-job training
Staff of all posts has been strictly trained.
Staff of main posts has been strictly trained.
Staff of main posts has been generally trained.
Achieve Class 1
Management system of usage, maintenance and inspection for production equipment
Establish and strictly execute the consummate management system.
Establish and strictly execute the detail management system for equipment.
There is a fundamental management system for main equipment.
Achieve Class 1
Management of water, electricity, steam and gas for production process
Install measuring instruments and establish strict quantitative evaluation system.
Make measurements for key links and establish quantitative evaluation system.
Make measurements for water, electricity and steam.
Achieve Class 1
Environmental management during production
Emergency response of accidents and abnormal production conditions
There is detail emergency response plan. Qualified
Environmental management organization
Established and managed by personnel specially assigned Qualified Environmental management
Environmental management system
Consummate the environmental management system and incorporate it into daily management.
Consummate the environmental management system and incorporate it into daily management.
Relatively consummated environmental management system
Achieve Class 1
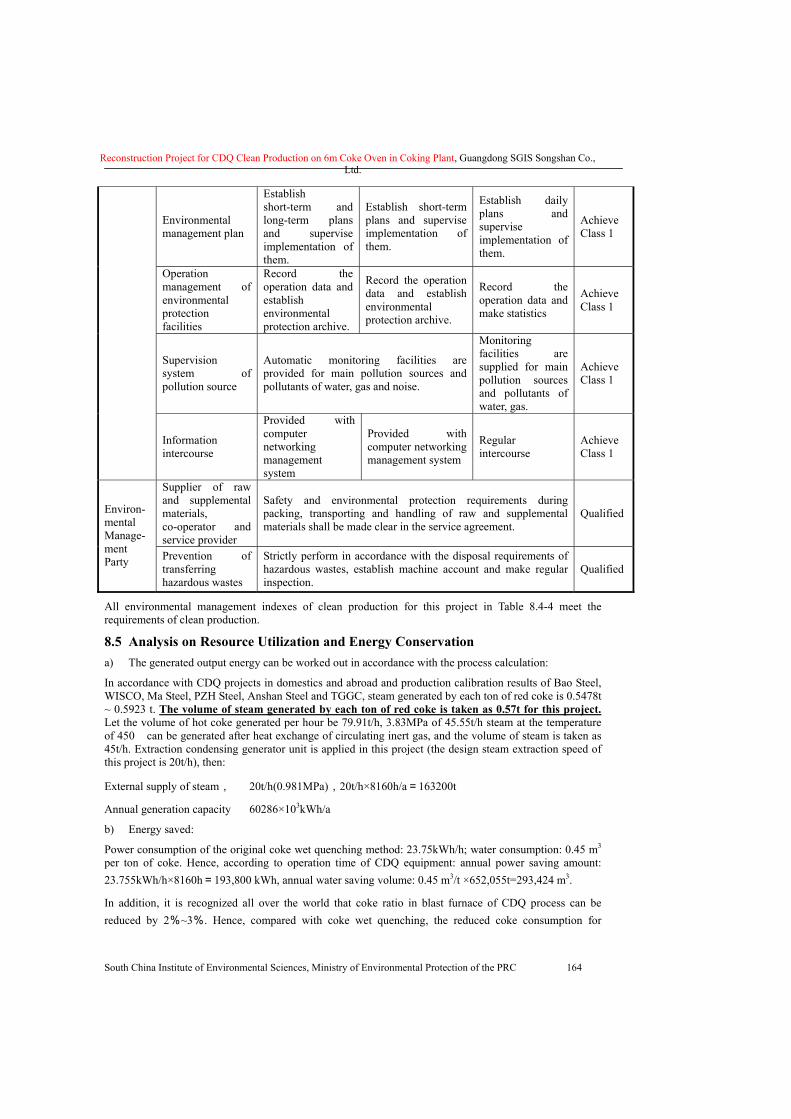
Reconstruction Project for CDQ Clean Production on 6m Coke Oven in Coking Plant, Guangdong SGIS Songshan Co., Ltd.
South China Institute of Environmental Sciences, Ministry of Environmental Protection of the PRC 164
Environmental management plan
Establish short-term and long-term plans and supervise implementation of them.
Establish short-term plans and supervise implementation of them.
Establish daily plans and supervise implementation of them.
Achieve Class 1
Operation management of environmental protection facilities
Record the operation data and establish environmental protection archive.
Record the operation data and establish environmental protection archive.
Record the operation data and make statistics
Achieve Class 1
Supervision system of pollution source
Automatic monitoring facilities are provided for main pollution sources and pollutants of water, gas and noise.
Monitoring facilities are supplied for main pollution sources and pollutants of water, gas.
Achieve Class 1
Information intercourse
Provided with computer networking management system
Provided with computer networking management system
Regular intercourse
Achieve Class 1
Supplier of raw and supplemental materials, co-operator and service provider
Safety and environmental protection requirements during packing, transporting and handling of raw and supplemental materials shall be made clear in the service agreement.
Qualified Environ-mental Manage-ment Party Prevention of
transferring hazardous wastes
Strictly perform in accordance with the disposal requirements of hazardous wastes, establish machine account and make regular inspection.
Qualified
All environmental management indexes of clean production for this project in Table 8.4-4 meet the requirements of clean production.
8.5 Analysis on Resource Utilization and Energy Conservation a) The generated output energy can be worked out in accordance with the process calculation:
In accordance with CDQ projects in domestics and abroad and production calibration results of Bao Steel, WISCO, Ma Steel, PZH Steel, Anshan Steel and TGGC, steam generated by each ton of red coke is 0.5478t ~ 0.5923 t. The volume of steam generated by each ton of red coke is taken as 0.57t for this project. Let the volume of hot coke generated per hour be 79.91t/h, 3.83MPa of 45.55t/h steam at the temperature of 450� can be generated after heat exchange of circulating inert gas, and the volume of steam is taken as 45t/h. Extraction condensing generator unit is applied in this project (the design steam extraction speed of this project is 20t/h), then:
External supply of steam, 20t/h(0.981MPa),20t/h×8160h/a=163200t
Annual generation capacity 60286×103kWh/a
b) Energy saved:
Power consumption of the original coke wet quenching method: 23.75kWh/h; water consumption: 0.45 m3 per ton of coke. Hence, according to operation time of CDQ equipment: annual power saving amount: 23.755kWh/h×8160h=193,800 kWh, annual water saving volume: 0.45 m3/t ×652,055t=293,424 m3.
In addition, it is recognized all over the world that coke ratio in blast furnace of CDQ process can be reduced by 2%~3%. Hence, compared with coke wet quenching, the reduced coke consumption for
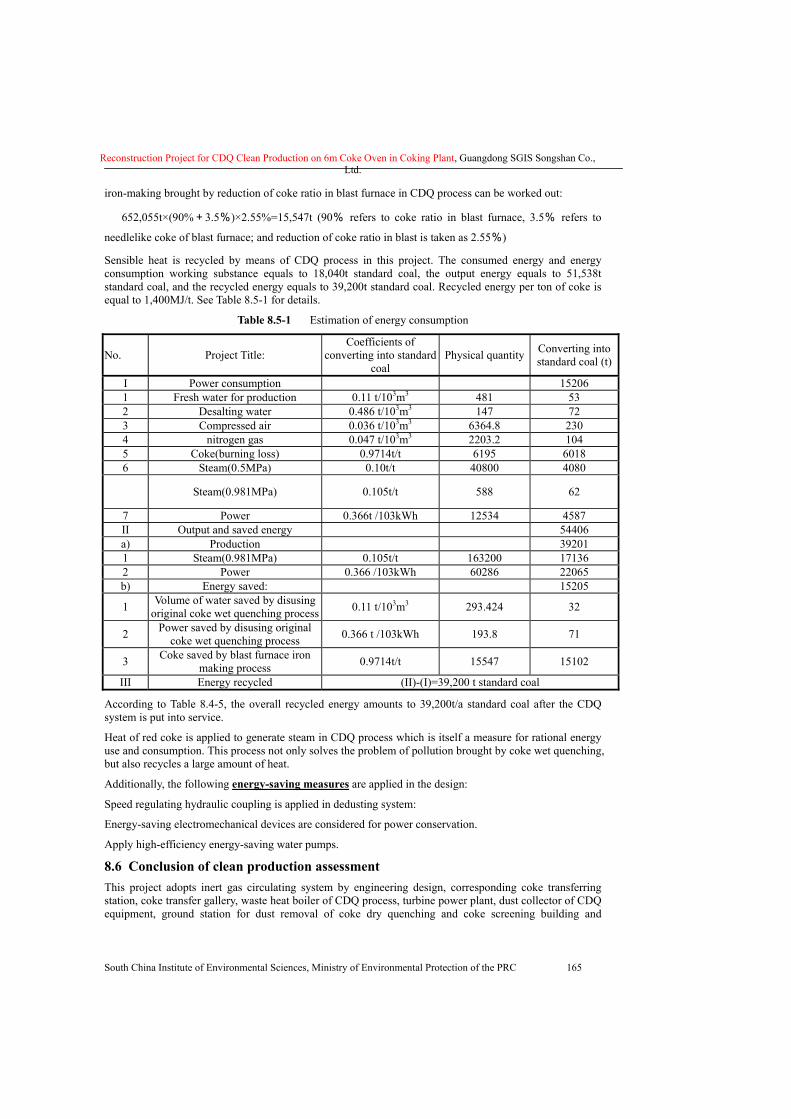
Reconstruction Project for CDQ Clean Production on 6m Coke Oven in Coking Plant, Guangdong SGIS Songshan Co., Ltd.
South China Institute of Environmental Sciences, Ministry of Environmental Protection of the PRC 165
iron-making brought by reduction of coke ratio in blast furnace in CDQ process can be worked out:
652,055t×(90%+3.5%)×2.55%=15,547t (90% refers to coke ratio in blast furnace, 3.5% refers to
needlelike coke of blast furnace; and reduction of coke ratio in blast is taken as 2.55%)
Sensible heat is recycled by means of CDQ process in this project. The consumed energy and energy consumption working substance equals to 18,040t standard coal, the output energy equals to 51,538t standard coal, and the recycled energy equals to 39,200t standard coal. Recycled energy per ton of coke is equal to 1,400MJ/t. See Table 8.5-1 for details.
Table 8.5-1 Estimation of energy consumption
No. Project Title: Coefficients of
converting into standard coal
Physical quantity Converting into standard coal (t)
I Power consumption 15206 1 Fresh water for production 0.11 t/103m3 481 53 2 Desalting water 0.486 t/103m3 147 72 3 Compressed air 0.036 t/103m3 6364.8 230 4 nitrogen gas 0.047 t/103m3 2203.2 104 5 Coke(burning loss) 0.9714t/t 6195 6018 6 Steam(0.5MPa) 0.10t/t 40800 4080
Steam(0.981MPa) 0.105t/t 588 62
7 Power 0.366t /103kWh 12534 4587 II Output and saved energy 54406 a) Production 39201 1 Steam(0.981MPa) 0.105t/t 163200 17136 2 Power 0.366 /103kWh 60286 22065 b) Energy saved: 15205
1 Volume of water saved by disusing original coke wet quenching process 0.11 t/103m3 293.424 32
2 Power saved by disusing original coke wet quenching process 0.366 t /103kWh 193.8 71
3 Coke saved by blast furnace iron making process 0.9714t/t 15547 15102
III Energy recycled (II)-(I)=39,200 t standard coal
According to Table 8.4-5, the overall recycled energy amounts to 39,200t/a standard coal after the CDQ system is put into service.
Heat of red coke is applied to generate steam in CDQ process which is itself a measure for rational energy use and consumption. This process not only solves the problem of pollution brought by coke wet quenching, but also recycles a large amount of heat.
Additionally, the following energy-saving measures are applied in the design:
Speed regulating hydraulic coupling is applied in dedusting system:
Energy-saving electromechanical devices are considered for power conservation.
Apply high-efficiency energy-saving water pumps.
8.6 Conclusion of clean production assessment This project adopts inert gas circulating system by engineering design, corresponding coke transferring station, coke transfer gallery, waste heat boiler of CDQ process, turbine power plant, dust collector of CDQ equipment, ground station for dust removal of coke dry quenching and coke screening building and
Reconstruction Project for CDQ Clean Production on 6m Coke Oven in Coking Plant, Guangdong SGIS Songshan Co., Ltd.
South China Institute of Environmental Sciences, Ministry of Environmental Protection of the PRC 166
circulating water system based on quality level. The water reuse rate is 98.3%, volume of generated pollutants compared with coke wet quenching is decreased largely, zero-emission of production wastewater is realized essentially and all solid wastes are reused.
Based on the comprehensive analysis of clean production indexes for the project, all indexes can generally be up to or exceed the Class II standard of clean production. Clean production of the project is better than that of the enterprises in this industry in China, complying with relevant regulations of Clean Production Standard for Coking Industry(HJ/126-2003) and Development Policies on Steel Industry(July 2005).
It is recommended by this assessment to establish strict internal management rules and regulations, implement safe production guidance, make job training, execute post responsibility system, carry out clean production approval as soon as possible, strengthen quality management, improve environmental management level, decrease pollutant discharge and increase the level of clean production further.
8.7 Analysis of total volume control (1) Total volume of Air Pollutants
This CDQ project effectively reduces the dust generated in original coke wet quenching process after being put into operation, and there is no SO2 discharged which belongs to pollutant of total volume control. Therefore, it is judged by this assessment that it is unnecessary to apply total volume of Air Pollutants for this CDQ project.
(2) Total volume water pollutants
Wastewater with generation capacity of 2m3/d after this CDQ project being put into operation is water seal water of CDQ oven. The wastewater is discharged into the current phenol-cyanogen wastewater treatment station of coke-oven plant and will be applied as washing water for blast furnace after being treated and meeting relevant standards. Domestic wastewater with generation capacity of 7.2m3/d is discharged into the existing domestic wastewater pipeline of SGIS. Staff of this department is re-assigned within SGIS. Hence, as for water pollutants, it is judged by this assessment that it is unnecessary to apply total volume of water pollutants for this CDQ project.
Reconstruction Project for CDQ Clean Production on 6m Coke Oven in Coking Plant, Guangdong SGIS Songshan Co., Ltd.
South China Institute of Environmental Sciences, Ministry of Environmental Protection of the PRC 167
9 Environmental Pollution Prevention Measures and Technical Feasibility Demonstration
9.1 Demonstration of exhaust gas control measures 9.1.1 Exhaust gas control measures taken for coke dry quenching
The coke dry quenching system emits pollutants which mainly consist of dust. The dust mainly comes from chute top loading device of coke dry quenching (when loading coke), transport process of red coke, coke removal device of dry quenching chute (continuous coke discharge), loading point and transporting point of belt conveyor, emitting pipe outlet (when gas is emitted), pressure relief point of recycle gas pipe (pressure relief in case of an accident), and dust humidification and loading point (loading), etc.
The Treatment Measures to be adopted aiming to the above-mentioned Waste Gas Resources are the following:
a. In the transportation of Red Cokes: Lids are covered for the Coke Tanks from the Lifting Tower to the Coke Loading Mouth.
b. The mode of Electro-magnetic Vibrating Feeder combining with the Rotary Sealing Valves shall be adopted for the Coke-discharging devices. The sealing covers shall be established for the Belt Conveyors, and the Dust-drawing Points shall also be installed at the Coke Discharging Outlets and Materials-receiving Points of Belt Conveyors for leading the smoke into the Ground Dust Removal Station for the final emission for the smoke after being de-dusted and purified.
c. The exhausted gas from the CDQ Trench Bleeding Pipes and the normal Recycling Gas Bleeding Pipes shall be introduced into the Dust Removing System through the blast-caps connected with the de-dusting pipes for the emission after being de-dusted. The System Emergency Bleeding Pipes and the Recycling Gas Pressure Relief Points are used for the emergency when the produced gas here is exhausted into the air directly.
d. Coke dry quenching is equipped with two integrated dust removal systems respectively at coke screening building and at transporting station, which are jointly constructed as a ground dust removal station. The dust remover has a dust removal air volume of 200000m3/h and 125000m3/h. Dust collector is provided at all dust production point.
The de-dusting devices of the Dust Removing System shall all be adopted the Off-line Pulse Bag Filter De-dusters, with the dust removing efficiency over 99.6%. The process of the de-dusting system is as the following:
Each de-dusting points of CDQ Oven, the Belt Conveyor Heads of Transfer Station, Tail De-dusting Points—De-dusting Channels—Coarse-grains Separator--- Pulse Bag Filter De-dusters—De-dustingventilator—being exhausted into the air.
The dust concentration of the exhausted waste gas of the CDQ Dust Removing Station shall be no more than 30mg/m3. The wasted gas of the two sets of de-dusting devices shall be respectively exhausted into the air through the chimney being 28m high, with the discharging concentration and rates complying with Class II Standard as120mg/m3 of the 2nd section, regulated by the Emission Limits for the Air Pollutants of Guangdong Province (DB4427-2001).
Besides that, the closed structure shall be adopted for the Coke Transfer Station and Corridor.
As to the main section where coke dusts are produced, dust control measures of the coke dry quenching system are described in detail as follows:
9.1.2 Exhaust Gas Control Measures & Environmental Protection Measures Take For CDQ System
Smokes and dusts, which are generated from coke loading, code discharge of CDQ devices, dispersed from pre-storage chamber and ventilator, etc., all enter the CDQ ground station dedusting system for dispersing after dust removal.
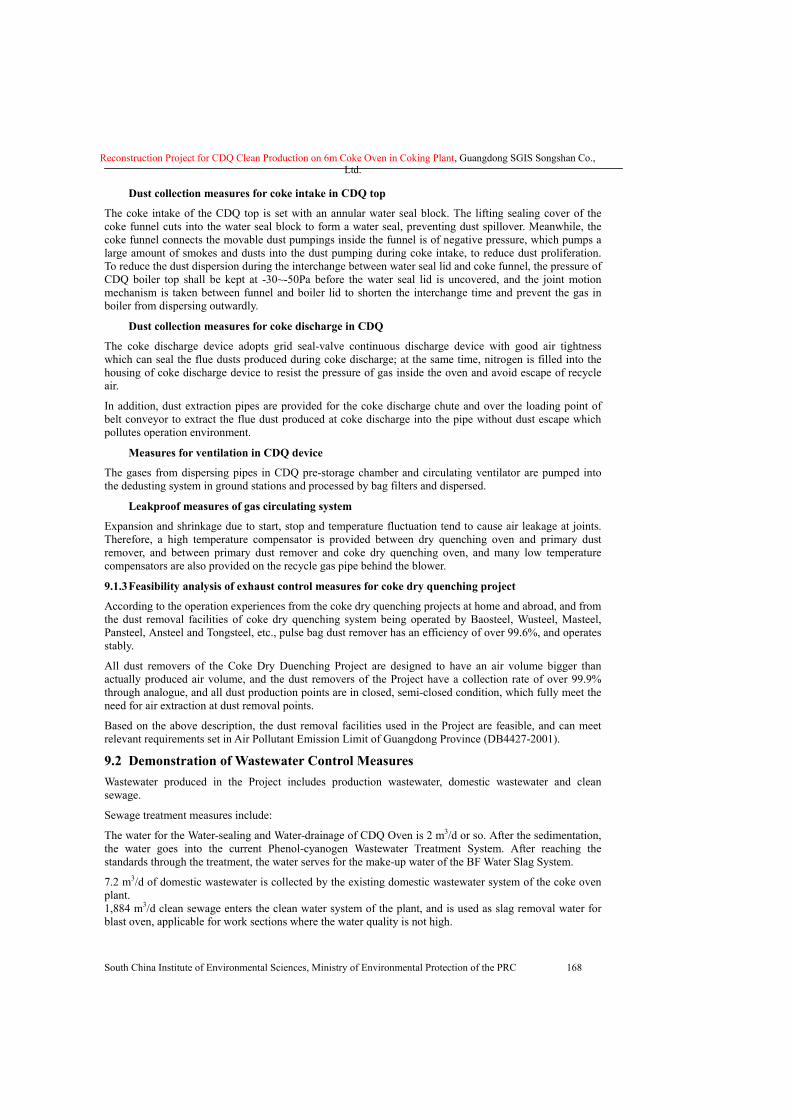
Reconstruction Project for CDQ Clean Production on 6m Coke Oven in Coking Plant, Guangdong SGIS Songshan Co., Ltd.
South China Institute of Environmental Sciences, Ministry of Environmental Protection of the PRC 168
� Dust collection measures for coke intake in CDQ top
The coke intake of the CDQ top is set with an annular water seal block. The lifting sealing cover of the coke funnel cuts into the water seal block to form a water seal, preventing dust spillover. Meanwhile, the coke funnel connects the movable dust pumpings inside the funnel is of negative pressure, which pumps a large amount of smokes and dusts into the dust pumping during coke intake, to reduce dust proliferation. To reduce the dust dispersion during the interchange between water seal lid and coke funnel, the pressure of CDQ boiler top shall be kept at -30~-50Pa before the water seal lid is uncovered, and the joint motion mechanism is taken between funnel and boiler lid to shorten the interchange time and prevent the gas in boiler from dispersing outwardly.
� Dust collection measures for coke discharge in CDQ
The coke discharge device adopts grid seal-valve continuous discharge device with good air tightness which can seal the flue dusts produced during coke discharge; at the same time, nitrogen is filled into the housing of coke discharge device to resist the pressure of gas inside the oven and avoid escape of recycle air.
In addition, dust extraction pipes are provided for the coke discharge chute and over the loading point of belt conveyor to extract the flue dust produced at coke discharge into the pipe without dust escape which pollutes operation environment.
� Measures for ventilation in CDQ device
The gases from dispersing pipes in CDQ pre-storage chamber and circulating ventilator are pumped into the dedusting system in ground stations and processed by bag filters and dispersed.
� Leakproof measures of gas circulating system
Expansion and shrinkage due to start, stop and temperature fluctuation tend to cause air leakage at joints. Therefore, a high temperature compensator is provided between dry quenching oven and primary dust remover, and between primary dust remover and coke dry quenching oven, and many low temperature compensators are also provided on the recycle gas pipe behind the blower.
9.1.3 Feasibility analysis of exhaust control measures for coke dry quenching project
According to the operation experiences from the coke dry quenching projects at home and abroad, and from the dust removal facilities of coke dry quenching system being operated by Baosteel, Wusteel, Masteel, Pansteel, Ansteel and Tongsteel, etc., pulse bag dust remover has an efficiency of over 99.6%, and operates stably.
All dust removers of the Coke Dry Duenching Project are designed to have an air volume bigger than actually produced air volume, and the dust removers of the Project have a collection rate of over 99.9% through analogue, and all dust production points are in closed, semi-closed condition, which fully meet the need for air extraction at dust removal points.
Based on the above description, the dust removal facilities used in the Project are feasible, and can meet relevant requirements set in Air Pollutant Emission Limit of Guangdong Province (DB4427-2001).
9.2 Demonstration of Wastewater Control Measures Wastewater produced in the Project includes production wastewater, domestic wastewater and clean sewage.
Sewage treatment measures include:
The water for the Water-sealing and Water-drainage of CDQ Oven is 2 m3/d or so. After the sedimentation, the water goes into the current Phenol-cyanogen Wastewater Treatment System. After reaching the standards through the treatment, the water serves for the make-up water of the BF Water Slag System.
7.2 m3/d of domestic wastewater is collected by the existing domestic wastewater system of the coke oven plant. 1,884 m3/d clean sewage enters the clean water system of the plant, and is used as slag removal water for blast oven, applicable for work sections where the water quality is not high.
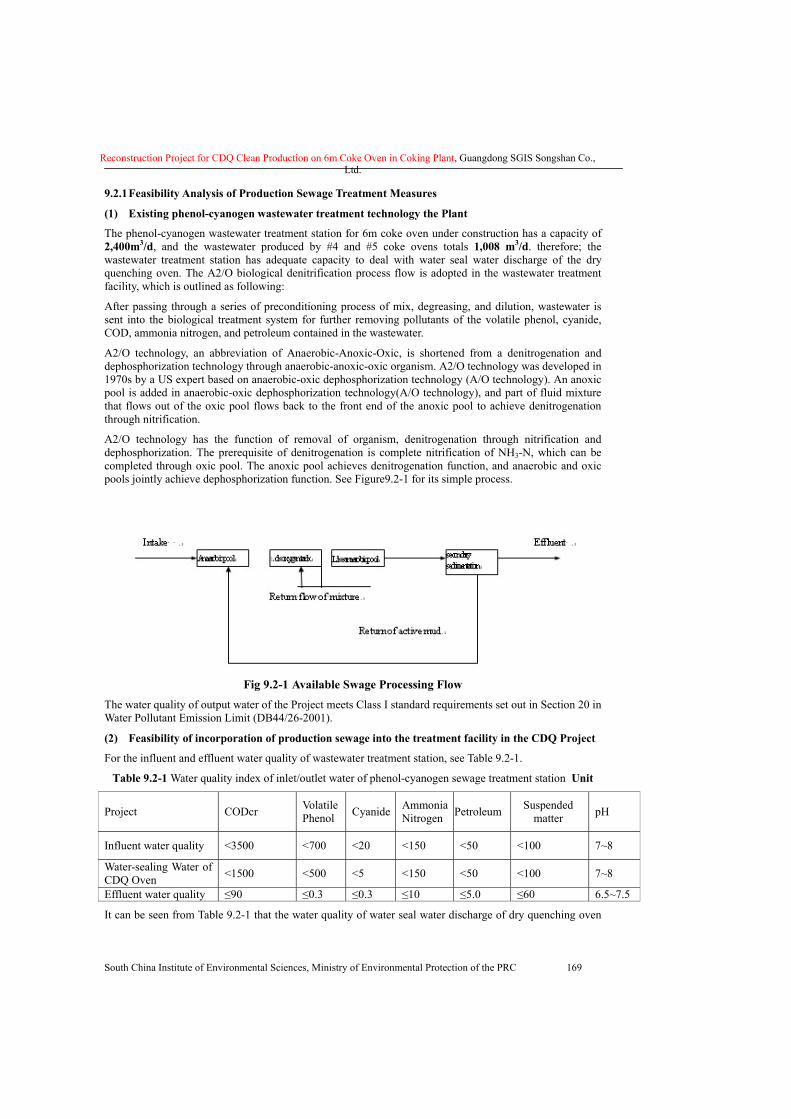
Reconstruction Project for CDQ Clean Production on 6m Coke Oven in Coking Plant, Guangdong SGIS Songshan Co., Ltd.
South China Institute of Environmental Sciences, Ministry of Environmental Protection of the PRC 169
9.2.1 Feasibility Analysis of Production Sewage Treatment Measures
(1) Existing phenol-cyanogen wastewater treatment technology the Plant
The phenol-cyanogen wastewater treatment station for 6m coke oven under construction has a capacity of 2,400m3/d, and the wastewater produced by #4 and #5 coke ovens totals 1,008 m3/d. therefore; the wastewater treatment station has adequate capacity to deal with water seal water discharge of the dry quenching oven. The A2/O biological denitrification process flow is adopted in the wastewater treatment facility, which is outlined as following:
After passing through a series of preconditioning process of mix, degreasing, and dilution, wastewater is sent into the biological treatment system for further removing pollutants of the volatile phenol, cyanide, COD, ammonia nitrogen, and petroleum contained in the wastewater.
A2/O technology, an abbreviation of Anaerobic-Anoxic-Oxic, is shortened from a denitrogenation and dephosphorization technology through anaerobic-anoxic-oxic organism. A2/O technology was developed in 1970s by a US expert based on anaerobic-oxic dephosphorization technology (A/O technology). An anoxic pool is added in anaerobic-oxic dephosphorization technology(A/O technology), and part of fluid mixture that flows out of the oxic pool flows back to the front end of the anoxic pool to achieve denitrogenation through nitrification.
A2/O technology has the function of removal of organism, denitrogenation through nitrification and dephosphorization. The prerequisite of denitrogenation is complete nitrification of NH3-N, which can be completed through oxic pool. The anoxic pool achieves denitrogenation function, and anaerobic and oxic pools jointly achieve dephosphorization function. See Figure9.2-1 for its simple process.
Fig 9.2-1 Available Swage Processing Flow
The water quality of output water of the Project meets Class I standard requirements set out in Section 20 in Water Pollutant Emission Limit (DB44/26-2001).
(2) Feasibility of incorporation of production sewage into the treatment facility in the CDQ Project
For the influent and effluent water quality of wastewater treatment station, see Table 9.2-1.
Table 9.2-1 Water quality index of inlet/outlet water of phenol-cyanogen sewage treatment station Unit
Project CODcr Volatile Phenol Cyanide Ammonia
Nitrogen Petroleum Suspended matter pH
Influent water quality <3500 <700 <20 <150 <50 <100 7~8
Water-sealing Water of CDQ Oven <1500 <500 <5 <150 <50 <100 7~8
Effluent water quality ≤90 ≤0.3 ≤0.3 ≤10 ≤5.0 ≤60 6.5~7.5
It can be seen from Table 9.2-1 that the water quality of water seal water discharge of dry quenching oven
Reconstruction Project for CDQ Clean Production on 6m Coke Oven in Coking Plant, Guangdong SGIS Songshan Co., Ltd.
South China Institute of Environmental Sciences, Ministry of Environmental Protection of the PRC 170
of the CDQ Project meets the acceptable standard of the existing phenol-cyanogen wastewater treatment station in the Plant.
The phenol-cyanogen wastewater treatment station has a capacity of 2400m3/d, and the wastewater produced by 6m coke ovens totals 1008 m3/d. therefore; the wastewater treatment station has adequate capacity to deal with 2 m3/d water seal water discharge of the dry quenching oven.
The phenol-cyanogen wastewater treatment station drains water at a rate of 42m3/h, which, meeting standard, is used as compensation water for slag removal water of blast oven, spraying water of raw material plant and for work section in the plant where water quality requirement is not high, so as to achieve zero discharge of the Plant; in case of maintenance and repair of coke dry quenching, such discharge water can be used as compensation water for coke wet quenching.
9.2.2 Feasibility analysis of domestic wastewater treatment measures
From the whole SGIS plant, its domestic wastewater is preliminarily treated before it is drained. Therefore, domestic wastewater control shall be strengthened for the whole Plant.
Since the phenol-cyanogen wastewater treatment station of the Coking Plant has adequate capacity to deal with about 95m3/d domestic wastewater of the Plant, and A2/O technology is a common technology for domestic wastewater treatment. It is suggested that the domestic wastewater of the Plant be treated by the phenol-cyanogen wastewater treatment station.
The integrated sewage treatment plant of the SGIS group is under planning, including 2×10⁴m3/d domestic wastewater treatment device, which can be incorporated into the integrated sewage treatment plant according to production need.
9.2.3 Construction of sewage treatment plant of SGIS group
The integrated sewage treatment plant of SGIS group is under planning, and is described in detail as follows:
(1) To strengthen technical reconstruction for the water treatment facilities of the existing production units so that all indexes of water treatment meet the national and local control standard and water recycle rate reaches over 90%.
(2) To build a plant-wide domestic wastewater and production sewage treatment plant, consider sewage recycle, and strive to achieve zero discharge.
The water quality of sewage after treatment will meet Class I discharge standard in Water Pollutants Discharge Limit of Guangdong Province(DB44/26-2001). Recycled sewage meets the requirements of industrial recycle water, and recycled water meets Specifications on Design of Industrial Recycled Cooling Water Treatment (GB50050-95) and the water quality standard for industrial water of SGIS.
(3) Design scale
The domestic wastewater treatment plant has a treatment capacity of 2.0X10⁴m3/d. In consideration that resident numbers in eastern area account for 50% respectively compared with western area, Red Flag area and Northern area, 1# and 2# sub-plants of the domestic wastewater treatment plant are designed to have a capacity of 1.0X10⁴m3/d, covering an area totaling 1400m2 ~2300 m2
Production sewage treatment plant: the production sewage treatment plant at the general discharge point is designed to have a capacity of 8.0×10⁴m3/d, covering an area totaling 6300 m2 ~9600 m2, and expropriation of rural land is needed.
(4) Treatment technology
First and Second sub-plant for domestic wastewater treatment (10,000m3/d each)
Adopt "Diatomite sewage treatment technology".
Production sewage treatment plant (80,000m3/d)
Adopt "Diatomite sewage treatment technology" and "biochemical sewage treatment technology".
Reconstruction Project for CDQ Clean Production on 6m Coke Oven in Coking Plant, Guangdong SGIS Songshan Co., Ltd.
South China Institute of Environmental Sciences, Ministry of Environmental Protection of the PRC 171
(5) Use of recycled water
Over 85% of the water used in SGIS is industrial water, 70% of which is cooling water with low water quality requirement. Substitution of recycled water for production new water for industrial recirculating cooling is easy to realize technically and in engineering, and allows reducing consumption of new water per ton steel in SGIS. Therefore, the recycled water after treatment in the production sewage treatment plant of SGIS can be mainly used for industry recirculating cooling. At the same time, it can be considered to collect initial rainwater which will be used for production in several times.
(6) Progress
The construction of SGIS sewage treatment plant is at the stage of report and environment assessment, and its supporting documents are given in Appendix.
9.3 Demonstration of Solid Waste Control Measures Only the single type solid waste, coke dust of about 24000t/a collected by the dust-removal system, is produced in the process of production of the CDQ project. The humidified coke dust is completely and comprehensively utilized by delivering to the coal preparation workshop with carrier vehicles and incorporating in coking coal, or delivering to the sinter plant as per requirements as the raw material.
At present, SGIS has recycled or comprehensively utilized all produced solid wastes, and basically there is no pollution caused solid wastes.
9.4 Demonstration of Noise Control Measures There is much equipment in the Project that produce noise, with big source strength. On condition that technology is ensured during design, try to select low-noise equipment. Try to reduce the impact of noise on the surrounding environment by reducing noise through control of source strength and transmission means.
� Equipment selection
The noise source strength of the Project is 80~115dB (A). Take care to select high precision, good quality and low noise equipment.
� Installation of noise silencer
A noise silencer is installed at the inlet and outlet of Roots blower and air compressor, which produce aerodynamic noise, to reduce its noise source strength. Such measures as vibration isolation and absorption are taken for those equipment that produce noise as a result of operation, such as grinding machine.
� Optimized layout
Arrange the equipment with bigger noise source strength far away from the sensitive points in the surrounding area.
� Noise isolation by sealing
Sealed workshop is adopted in the Project for the layout noise source, and soundproof room is arranged in the workshop. Try to use building and structure to block the transmission of acoustic wave. At the same time, try to strengthen greening outside workshop and at plant border area, and use its screening to isolate noise to a certain extent and reduce impact on its surrounding environment.
� Oven noise
When the oven discharges gas, it produces higher level noise which can be heard several kilometers away. Therefore, during design phase of the Project, take care to select noise silencer with big silence volume when selecting silencers for discharge outlet of oven.
Reconstruction Project for CDQ Clean Production on 6m Coke Oven in Coking Plant, Guangdong SGIS Songshan Co., Ltd.
South China Institute of Environmental Sciences, Ministry of Environmental Protection of the PRC 172
10 Public Participation 10.1 Purpose and Significance of Public Participation The purpose of public participation is to understand and master extensively demands and opinions of the public to the project construction, and their attitude toward environmental problems caused by the project construction; stressing the importance of relationship and communication between the parties of project and the public, the public participation is one of the important parts of the environmental assessment work, which is an effective method to perfect decision-making, being helpful to deepen understanding of the potential impacts from the proposed project, helpful to determine and alternatives or design schemes as well as measures to reduce pollution, helpful to gain understanding and support of the mass in the region around the proposed project more extensively. All of views from the public participation shall be reported to the relevant administrative departments, which is favor of that the important issues which are possibly caused by the project related to the public are to be resolved.
10.2. Stage and Mode of Public Participation According to requirements of the Regulation for Public Participation in the Environmental Impact Assessment (Huan Fa 006 [No.28]) and the Implementation opinion for public participation in environmental management of construction projects in Guangdong Province (Yue Huan [2007] No. 99), three stages of public participation for this project have been conducted.
10.2.1 Phase I: Project EIA Information Publicity
From February 27, 2008 to March 18, 2008, the construction unit publicized the information of this project on the website of Shaoguan Environmental Protection Bureau http://www.sgepb.gov.cn/ and the website of Shaoguan People’s Government http://www.shaoguan.gov.cn/ respectively. See Diagram 10.2-1 According to the related regulations of Interim Measures for Public Participation in the Environmental Impact Assessment (Huan Fa 006 [No.28]), the contents for this time of information publicity mainly include: ① the name and outline of the construction project; ② the construction unit
and the contact means of the construction project; ③ the name and the contact means of the
environmental impact assessment unit undertaking the environmental impact assessment task; ④ the
working procedure and main working contents of the environmental impact assessment task; ⑤ the main proceedings and means for seeking public suggestions and opinions.
10.2.2 Phase II: Public Participation in Preparation Stages of Report
In the process of compiling report, public participation was conducted by issuing the public questionnaires and communicating with the village committees of surrounding residential points. Meanwhile, feedback means and channels were made to public, including telephone numbers, fax numbers, E-mail addresses and the post address. After EIA results were initially obtained, specific follow-up visits were carried out on the basis of the results of public participation survey in the process of compiling report.
10.2.3 Phase III: Publicity of Simplified Version of Report
After the EIA report was completed initially, the abridged edition of report was announced separately on the external website of Shaoguan Environmental Protection Bureau http://www.sgepb.gov.cn/ and the external website of the EIA unit namely Huana Environmental Science Research Institute www.scies.com.cn from March 25, 2008 ~ April 18, 2008. Then EIA results were announced at each main environmental sensitive point and specific follow-up visits were carried out. Refer to Figure 10.2-2 for details.
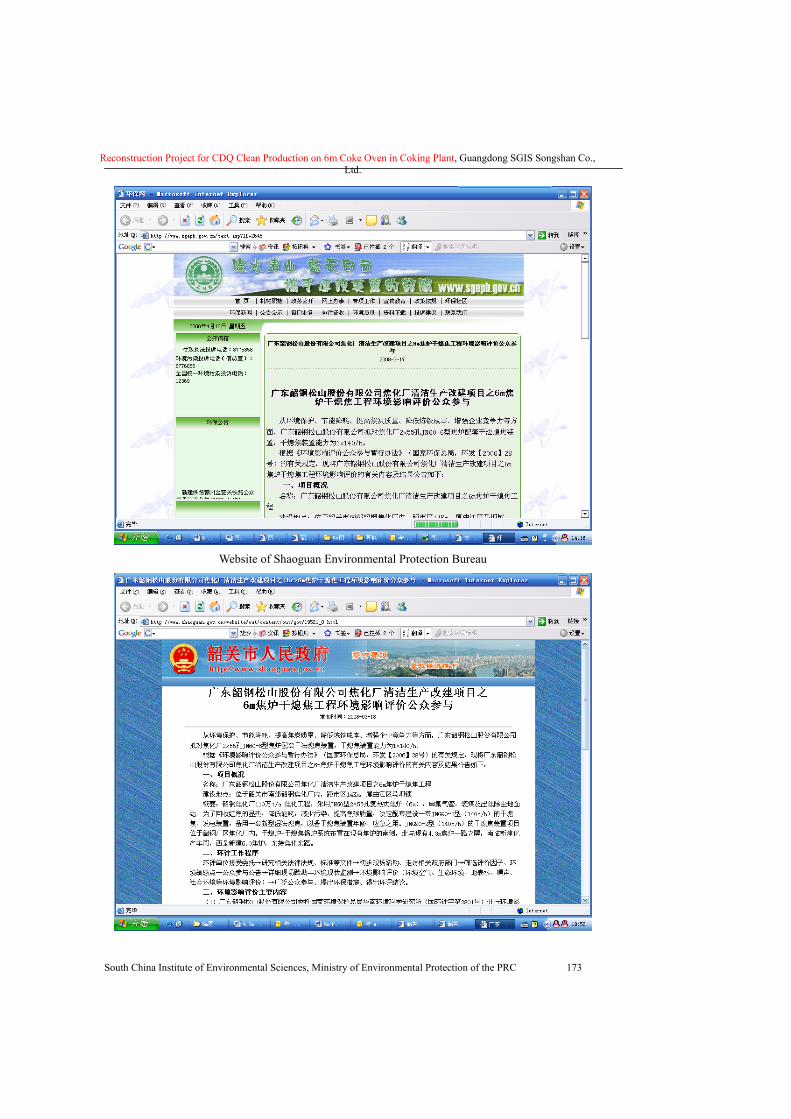
Reconstruction Project for CDQ Clean Production on 6m Coke Oven in Coking Plant, Guangdong SGIS Songshan Co., Ltd.
South China Institute of Environmental Sciences, Ministry of Environmental Protection of the PRC 173
Website of Shaoguan Environmental Protection Bureau

Reconstruction Project for CDQ Clean Production on 6m Coke Oven in Coking Plant, Guangdong SGIS Songshan Co., Ltd.
South China Institute of Environmental Sciences, Ministry of Environmental Protection of the PRC 174
Website of Shaoguan People’s Government
Figure 10.2-2 Picture of the simplified version of the Report
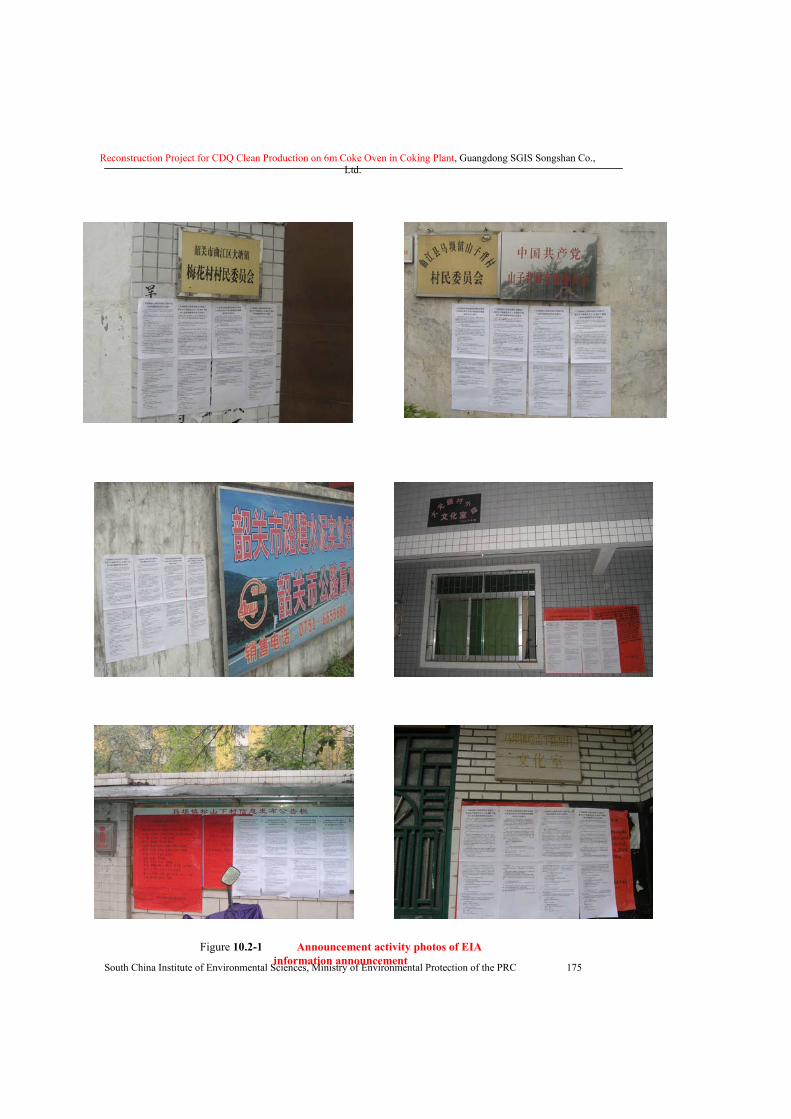
Reconstruction Project for CDQ Clean Production on 6m Coke Oven in Coking Plant, Guangdong SGIS Songshan Co., Ltd.
South China Institute of Environmental Sciences, Ministry of Environmental Protection of the PRC 175
Figure 10.2-1 Announcement activity photos of EIA information announcement
Reconstruction Project for CDQ Clean Production on 6m Coke Oven in Coking Plant, Guangdong SGIS Songshan Co., Ltd.
South China Institute of Environmental Sciences, Ministry of Environmental Protection of the PRC 176
10.3 Mode and Scope of Investigation 1) Mode of the investigation Public investigation was held based on progress of the EIA from April 9, 2008 to April 11, 2008, mainly by the cooperation of EIA holding organ and the Unit of the Project.The modes of written questionnaire and on-site consultingare mainly adopted, all investigations are recorded with real names.For details of questionnaire contents, please refer to Table 10.3-1 of public survey. 2) Scope of the investigation According to related regulations in the CIRCULAR on the Implementation opinion for public participation in environmental management of construction projects in Guangdong Province (Yue Huan [2007] No. 99), the investigation scope of this project includes government agencies, organs, and surrounding residential points and villages around the plant address reconstructed, etc. which are involved by CDQ clean production reconstructed project on 6m coke oven in the Coking Plant. The investigation scope of the public participation mainly includes Old Xiaojiang Village, Shanzibei Village, Liantang Village, Dayuantou Village, New Xiaojiang Village, Daping Village, Shuibei Village, Yumin Village, Shaogang No.1 Middle School and Maba No.3 Middle School, all within 1km around the plant. 3) Investigation subjects The subjects to be investigated are representatives of individuals or regional groups directly affected, and they are mainly registered residents, staff of SGIS as well as representatives of local society around construction project. 4) The number of people for invistigation Total 100 questionnaires were sent out in this investigation, and actually 97 valid questionnaires were recovered, of which effective recovery rate was 97%; the name, occupation, education level, place of residence etc. of the respondents were recorded simultaneously.
Reconstruction Project for CDQ Clean Production on 6m Coke Oven in Coking Plant, Guangdong SGIS Songshan Co., Ltd.
South China Institute of Environmental Sciences, Ministry of Environmental Protection of the PRC 177
Table 10.3-1 The public participation questionnaire on environmental impact assessment of the clean production reconstruction project of 6m coke oven CDQ of Coking Plantof Guangdong
SGIS Songshan Co., Ltd. Project Profile: Coking Plant of SGIS equips one of the planned 2×55 holes (6m) coke ovens with CDQ technology. A set of coke dry quenching devices of JNG90-2 (140t/h), a stand-by coke wet quenching device and a matching power system are to be constructed.Compared with the wet quenching, by adopting CDQ, 50,307t of standard coal could be recycled, which is equal to that one-ton of coke production could save 46kg of the standard coal. The project falls into the category of Encouragement in accordance with Development Policies for Iron and Steel Industry and Guidance Directory for Adjustment of Industrial Structures (2005 edition). The emission impact of waste gas, wastewater, noise, and solid waste will be brought during the construction of the project, its main pollutants are coke dust, water of CDQ water seal, sewage, and noise, etc.A series of pollution control technology, environmental management system, risk mitigation measures will be taken after completion of the project construction, which will be applied to manage effectively all types of pollutants and mitigate environmental risks that may exist. In order to reduce impact on surrounding environment during process of project construction and managing operation, the opinions on the project on construction of public in the regional impact will be listened to extensively. All in society related are sincerely asked to express opinions fully! Name Age Nationality Of the town and village/organ Occupation Farmer ( ) Worker ( ) Businessman ( ) Technician ( ) Cadre ( ) Others ( ) Education level University and above ( ) technical college ( ) high school/polytechnic school ( ) middle
school and below ( ) Questions Please choose (tick √ at the answer you choose) 1. Do you know well about the construction of this project?
Known ( ) Know a little ( ) I do not know ( )
2. How is the environment at the place you live?
Good ( ) Ordinary ( ) Bad ( )
3. According to you, what’s the most important problem of the local environment?
Air pollution ( ) Water pollution ( ) Noise pollution ( ) No pollution ( )
4.In your opinion, does the construction of
this project impact your life and work?
Beneficial impact ( ) Advantage is more than disadvantage ( ) Adverse impact ( ) I do not know ( )
5. According to you, to what degree will this project pose impact on the environment?
Heavier impact ( ) Lighter impact ( ) no impact ( )
6. What kind of main environmental problem do you think will possibly arise during construction of the project?
Construction noise ( ) Construction dust ( ) Construction waste ( ) Land occupancy ( ) Construction wastewater ( ) Traffic management ( )
7. What kind of main environmental problem do you think will possibly arise after the project is put into full operation?
Waste gas ( ) Wastewater ( ) Noise ( ) Solid waste ( ) other ( ) (please explain: )
8. How do you think that this project will play a role in residental employment of the region you live in?
Beneficial impact ( ) Advantage is more than disadvantage ( ) Adverse impact ( ) I do not know ( )
9. How do you think that construction of this project impacts economic development in region you live in?
Beneficial impact ( ) Advantage is more than disadvantage ( ) Adverse impact ( ) I do not know ( )
Reconstruction Project for CDQ Clean Production on 6m Coke Oven in Coking Plant, Guangdong SGIS Songshan Co., Ltd.
South China Institute of Environmental Sciences, Ministry of Environmental Protection of the PRC 178
10. In your opinion, whether the measures taken during construction and operation of this project are perfect or not?
Yes ( ) No ( ) I do not know ( )
11. If the Unit of the Project takes effective environmental protection measures, whether you support construction of this project?
Yes ( ) No ( ) It doesn’t matter( )
12. After completion of the construction project, the Unit of the Project will adopt measures of dust removal facility, wastewater treatment facility, noise prevention, comprehensive utilization of solid waste, greening, etc. What requirements and proposals else do you have:
10.4 Result Analysis of Public Investigation 10.4.1 Statistics on Circumstances of Public Participation of Investigated People
1) Distribution and composition of public representatives in scope of project environmental impact The project locates in the area of land used by SGIS. According to survey on the site of the project, it’s
decided that the surveyed core public representatives in scope of project environment (including risks
and accidents) impact are mainly persons from Old Xiaojiang Village, New Xiaojiang Village, Daping
Village, Shanzibei Village, Dayuantou Village, Liantang Village, Yumin Village, Shuibei Village,
Shaogang No.1 Middle School and Maba No.3 Middle School, all within 1km around the project.
Core public representatives are 87 in total, accounting for 89.7% of all people under survey. Moreover,
in this assessment, staff of SGIS and residents from Meihua Zhai and Maba Town and other residential
areas around the project were also investigated, 10 in total, accounting for 10.3% of all people under
survey.For regional distribution of the investigated people, refer to Table 10.4-1.For statistics of the
structure of public representatives, refer to Table 10.4-2.
Table 10.4-1 Regional Distribution of Investigated People Involved In Public Participation Types of the Public Distribution Quantity Proportion (%)
Old Xiaojiang Village 12 12.4 Liantang Village 12 12.4 Shanbeizi Village 9 9.3 Dayuantou village 9 9.3
New Xiaojiang Village 11 11.3 Shaogang No. 1 Middle School 10 10.3
The public in scope of project environmental impact
Maba No. 3 Primary School 8 8.2
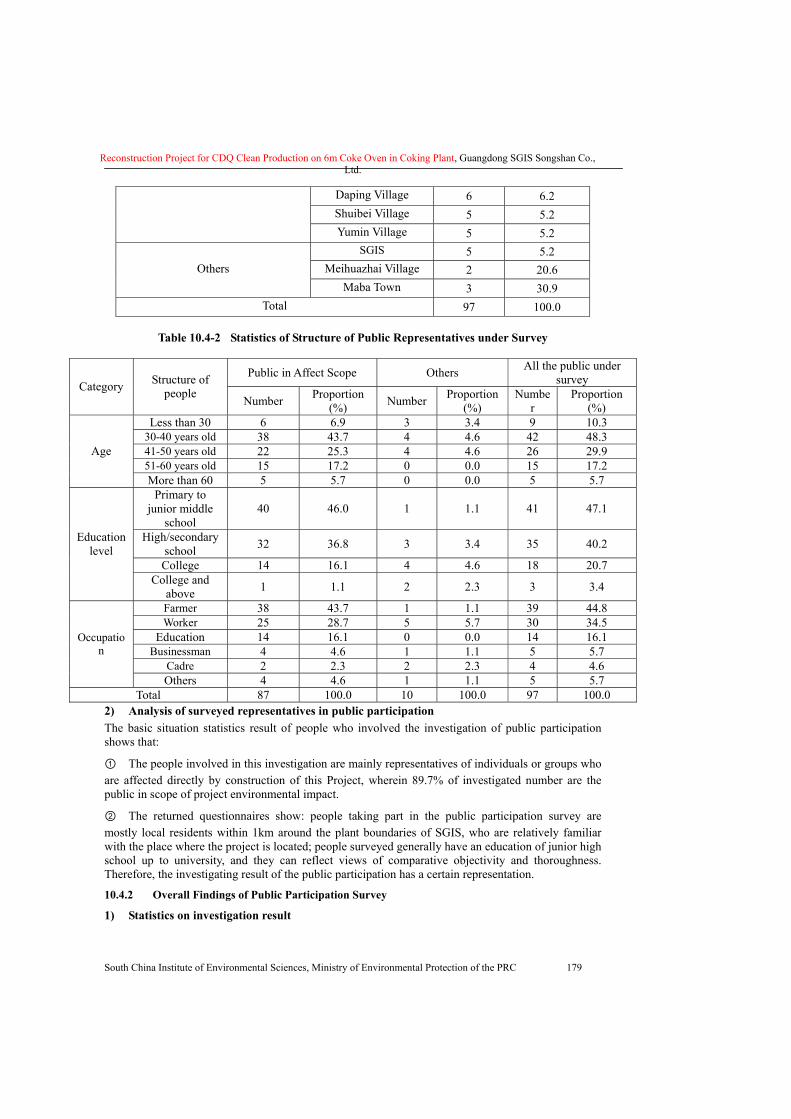
Reconstruction Project for CDQ Clean Production on 6m Coke Oven in Coking Plant, Guangdong SGIS Songshan Co., Ltd.
South China Institute of Environmental Sciences, Ministry of Environmental Protection of the PRC 179
Daping Village 6 6.2 Shuibei Village 5 5.2 Yumin Village 5 5.2
SGIS 5 5.2 Meihuazhai Village 2 20.6 Others
Maba Town 3 30.9 Total 97 100.0
Table 10.4-2 Statistics of Structure of Public Representatives under Survey
Public in Affect Scope Others All the public under survey Category Structure of
people Number Proportion (%) Number Proportion
(%) Numbe
r Proportion
(%) Less than 30 6 6.9 3 3.4 9 10.3
30-40 years old 38 43.7 4 4.6 42 48.3 41-50 years old 22 25.3 4 4.6 26 29.9 51-60 years old 15 17.2 0 0.0 15 17.2
Age
More than 60 5 5.7 0 0.0 5 5.7 Primary to
junior middle school
40 46.0 1 1.1 41 47.1
High/secondary school 32 36.8 3 3.4 35 40.2
College 14 16.1 4 4.6 18 20.7
Education level
College and above 1 1.1 2 2.3 3 3.4
Farmer 38 43.7 1 1.1 39 44.8 Worker 25 28.7 5 5.7 30 34.5
Education 14 16.1 0 0.0 14 16.1 Businessman 4 4.6 1 1.1 5 5.7
Cadre 2 2.3 2 2.3 4 4.6
Occupation
Others 4 4.6 1 1.1 5 5.7 Total 87 100.0 10 100.0 97 100.0
2) Analysis of surveyed representatives in public participation The basic situation statistics result of people who involved the investigation of public participation shows that:
① The people involved in this investigation are mainly representatives of individuals or groups who are affected directly by construction of this Project, wherein 89.7% of investigated number are the public in scope of project environmental impact.
② The returned questionnaires show: people taking part in the public participation survey are mostly local residents within 1km around the plant boundaries of SGIS, who are relatively familiar with the place where the project is located; people surveyed generally have an education of junior high school up to university, and they can reflect views of comparative objectivity and thoroughness. Therefore, the investigating result of the public participation has a certain representation.
10.4.2 Overall Findings of Public Participation Survey
1) Statistics on investigation result
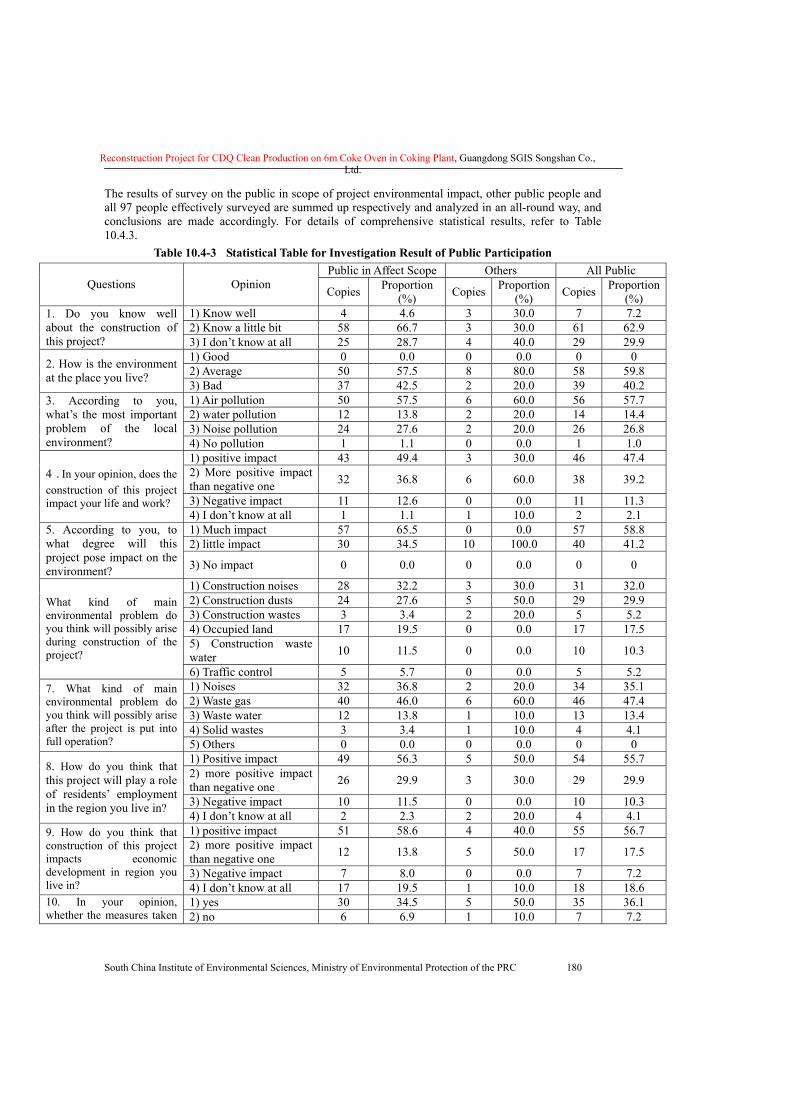
Reconstruction Project for CDQ Clean Production on 6m Coke Oven in Coking Plant, Guangdong SGIS Songshan Co., Ltd.
South China Institute of Environmental Sciences, Ministry of Environmental Protection of the PRC 180
The results of survey on the public in scope of project environmental impact, other public people and all 97 people effectively surveyed are summed up respectively and analyzed in an all-round way, and conclusions are made accordingly. For details of comprehensive statistical results, refer to Table 10.4.3.
Table 10.4-3 Statistical Table for Investigation Result of Public Participation Public in Affect Scope Others All Public
Questions Opinion Copies Proportion (%) Copies Proportion
(%) Copies Proportion (%)
1) Know well 4 4.6 3 30.0 7 7.2 2) Know a little bit 58 66.7 3 30.0 61 62.9
1. Do you know well about the construction of this project? 3) I don’t know at all 25 28.7 4 40.0 29 29.9
1) Good 0 0.0 0 0.0 0 0 2) Average 50 57.5 8 80.0 58 59.8 2. How is the environment
at the place you live? 3) Bad 37 42.5 2 20.0 39 40.2 1) Air pollution 50 57.5 6 60.0 56 57.7 2) water pollution 12 13.8 2 20.0 14 14.4 3) Noise pollution 24 27.6 2 20.0 26 26.8
3. According to you, what’s the most important problem of the local environment? 4) No pollution 1 1.1 0 0.0 1 1.0
1) positive impact 43 49.4 3 30.0 46 47.4 2) More positive impact than negative one 32 36.8 6 60.0 38 39.2
3) Negative impact 11 12.6 0 0.0 11 11.3
4.In your opinion, does the construction of this project impact your life and work?
4) I don’t know at all 1 1.1 1 10.0 2 2.1 1) Much impact 57 65.5 0 0.0 57 58.8 2) little impact 30 34.5 10 100.0 40 41.2
5. According to you, to what degree will this project pose impact on the environment? 3) No impact 0 0.0 0 0.0 0 0
1) Construction noises 28 32.2 3 30.0 31 32.0 2) Construction dusts 24 27.6 5 50.0 29 29.9 3) Construction wastes 3 3.4 2 20.0 5 5.2 4) Occupied land 17 19.5 0 0.0 17 17.5 5) Construction waste water 10 11.5 0 0.0 10 10.3
What kind of main environmental problem do you think will possibly arise during construction of the project?
6) Traffic control 5 5.7 0 0.0 5 5.2 1) Noises 32 36.8 2 20.0 34 35.1 2) Waste gas 40 46.0 6 60.0 46 47.4 3) Waste water 12 13.8 1 10.0 13 13.4 4) Solid wastes 3 3.4 1 10.0 4 4.1
7. What kind of main environmental problem do you think will possibly arise after the project is put into full operation? 5) Others 0 0.0 0 0.0 0 0
1) Positive impact 49 56.3 5 50.0 54 55.7 2) more positive impact than negative one 26 29.9 3 30.0 29 29.9
3) Negative impact 10 11.5 0 0.0 10 10.3
8. How do you think that this project will play a role of residents’ employment in the region you live in?
4) I don’t know at all 2 2.3 2 20.0 4 4.1 1) positive impact 51 58.6 4 40.0 55 56.7 2) more positive impact than negative one 12 13.8 5 50.0 17 17.5
3) Negative impact 7 8.0 0 0.0 7 7.2
9. How do you think that construction of this project impacts economic development in region you live in? 4) I don’t know at all 17 19.5 1 10.0 18 18.6
1) yes 30 34.5 5 50.0 35 36.1 10. In your opinion, whether the measures taken 2) no 6 6.9 1 10.0 7 7.2
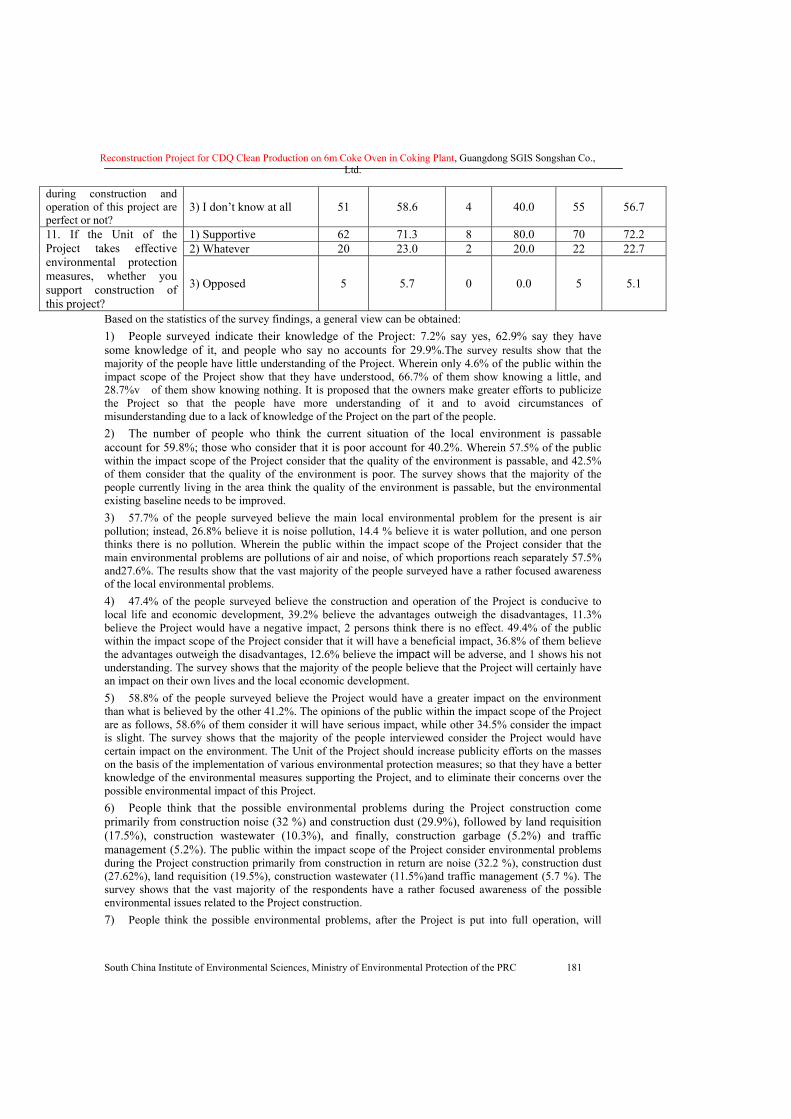
Reconstruction Project for CDQ Clean Production on 6m Coke Oven in Coking Plant, Guangdong SGIS Songshan Co., Ltd.
South China Institute of Environmental Sciences, Ministry of Environmental Protection of the PRC 181
during construction and operation of this project are perfect or not?
3) I don’t know at all 51 58.6 4 40.0 55 56.7
1) Supportive 62 71.3 8 80.0 70 72.2 2) Whatever 20 23.0 2 20.0 22 22.7
11. If the Unit of the Project takes effective environmental protection measures, whether you support construction of this project?
3) Opposed 5 5.7 0 0.0 5 5.1
Based on the statistics of the survey findings, a general view can be obtained: 1) People surveyed indicate their knowledge of the Project: 7.2% say yes, 62.9% say they have some knowledge of it, and people who say no accounts for 29.9%.The survey results show that the majority of the people have little understanding of the Project. Wherein only 4.6% of the public within the impact scope of the Project show that they have understood, 66.7% of them show knowing a little, and 28.7%v of them show knowing nothing. It is proposed that the owners make greater efforts to publicize the Project so that the people have more understanding of it and to avoid circumstances of misunderstanding due to a lack of knowledge of the Project on the part of the people. 2) The number of people who think the current situation of the local environment is passable account for 59.8%; those who consider that it is poor account for 40.2%. Wherein 57.5% of the public within the impact scope of the Project consider that the quality of the environment is passable, and 42.5% of them consider that the quality of the environment is poor. The survey shows that the majority of the people currently living in the area think the quality of the environment is passable, but the environmental existing baseline needs to be improved. 3) 57.7% of the people surveyed believe the main local environmental problem for the present is air pollution; instead, 26.8% believe it is noise pollution, 14.4 % believe it is water pollution, and one person thinks there is no pollution. Wherein the public within the impact scope of the Project consider that the main environmental problems are pollutions of air and noise, of which proportions reach separately 57.5% and27.6%. The results show that the vast majority of the people surveyed have a rather focused awareness of the local environmental problems. 4) 47.4% of the people surveyed believe the construction and operation of the Project is conducive to local life and economic development, 39.2% believe the advantages outweigh the disadvantages, 11.3% believe the Project would have a negative impact, 2 persons think there is no effect. 49.4% of the public within the impact scope of the Project consider that it will have a beneficial impact, 36.8% of them believe the advantages outweigh the disadvantages, 12.6% believe the impact will be adverse, and 1 shows his not understanding. The survey shows that the majority of the people believe that the Project will certainly have an impact on their own lives and the local economic development. 5) 58.8% of the people surveyed believe the Project would have a greater impact on the environment than what is believed by the other 41.2%. The opinions of the public within the impact scope of the Project are as follows, 58.6% of them consider it will have serious impact, while other 34.5% consider the impact is slight. The survey shows that the majority of the people interviewed consider the Project would have certain impact on the environment. The Unit of the Project should increase publicity efforts on the masses on the basis of the implementation of various environmental protection measures; so that they have a better knowledge of the environmental measures supporting the Project, and to eliminate their concerns over the possible environmental impact of this Project. 6) People think that the possible environmental problems during the Project construction come primarily from construction noise (32 %) and construction dust (29.9%), followed by land requisition (17.5%), construction wastewater (10.3%), and finally, construction garbage (5.2%) and traffic management (5.2%). The public within the impact scope of the Project consider environmental problems during the Project construction primarily from construction in return are noise (32.2 %), construction dust (27.62%), land requisition (19.5%), construction wastewater (11.5%)and traffic management (5.7 %). The survey shows that the vast majority of the respondents have a rather focused awareness of the possible environmental issues related to the Project construction. 7) People think the possible environmental problems, after the Project is put into full operation, will
Reconstruction Project for CDQ Clean Production on 6m Coke Oven in Coking Plant, Guangdong SGIS Songshan Co., Ltd.
South China Institute of Environmental Sciences, Ministry of Environmental Protection of the PRC 182
primarily be gas emissions (47.4%) and noise (35.1%), followed by wastewater (13.4%), and finally, solid waste (accounting for 4.1 %). 46% and 36.8% separately of the public within the impact scope of the Project consider waste gas emission and noise issues will be the main environmental problems during the operation. The survey shows that the vast majority of the respondents have a rather focused awareness of the possible environmental issues related to the Project operation. 8) 55.7% of the people surveyed believe the Project would be conducive to the development of local economy, 29.9% believe the advantages outweigh the disadvantages, and 10.3% believe the effect will be negative, while 4.1% show no interest. 56.3% of the public within the impact scope of the Project consider that it will have a beneficial impact, 29.9% of them consider the advantages are more than the disadvantages, 11.5% consider the impact will be adverse, and 2 shows their not understanding.The survey shows that the majority of the people believe the Project will play a facilitating role on the employment opportunities of local residents. 9) 56.7% of the people surveyed believe the Project would be conducive to the development of local economy, 17.5% believe the advantages outweigh the disadvantages, and 7.2% believe the effect will be negative, while 18.6% show no interest. The opinions of the public within the impact scope of the Project are basically consistent, 58.6% of them consider it will have a beneficial impact. The survey shows that the majority of the people believe the Project will have a beneficial impact on the development of local economy. 10) 36.1% of the people surveyed find perfection in the measures taken for the construction and operation of the Project, 7.2% think they are not perfect, while 56.7% show no interest. Most of the public within the impact scope of the Project show knowing nothing, which are 58.6%, 34.5% of them consider measures are perfect, and 6.9% of them consider they are not perfect. The survey shows that the majority of the people have little knowledge of the measures taken for the Project. It is proposed that the Unit of the Project give greater publicity to let more people have a thorough understanding of environmental measures for the Project and eliminate misunderstanding or concern over the Project because of ignorance. 11) If the Project unit takes effective environmental protection measures, 72.2% of the public support this project construction, 22.7% of them express that it is indifferent, 5.1% of them show they do not support, and all the public who oppose the Project are those who are in the impact scope of the Project; wherein, there are 62 of the public who are in impact scope of the Project show their support, and additional 20 express that it is indifferent. The survey shows that the majority of the people support the Project, but there are a small number of people who are against it. The Unit of the Project should make every effort to implement environmental protection measures to minimize the impact of the Project on the environment and, on the basis of this, should make greater publicity efforts to eliminate misunderstanding of the Project on the part of the masses due to ignorance. In addition, the Unit of the Project should step up communication with the neighboring residents, understand in a timely manner the impact on their life by the operation of the Project, and try to reconcile the contradictions on both sides.
10.4.3 Opinion Survey and Clarification on Feedback
10.4.3.1 Main Objections
There are 5 of the people have expressed in written form that they do not support this project construction. These 5 people are distributed separately in the Old Xiaojiang Village(3 people), New Xiaojiang Village(2 people), which opinions are summarized as follows: 1) The construction of the Project in the rural areas has brought air pollution, noise pollution, dust pollution and water pollution, contaminated vegetables and crops, and brought to the local villagers serious economic losses and health hazards. 2) The construction of the Project caused closure of the ways of access to the village and adversely affects the life of the villagers; hence, demanding the plant to open the roads. 3) The construction of the Project have resulted in serious economic losses to the surrounding countryside, fish farms, and crops, inflicting harm on the health of people; hence, demanding the plant to pay attention to resolving the existing problems. 10.4.3.2 Opinion Survey and Clarification on Feedback
1) Traffic management and security issues during construction: the Unit of the Project will see
Reconstruction Project for CDQ Clean Production on 6m Coke Oven in Coking Plant, Guangdong SGIS Songshan Co., Ltd.
South China Institute of Environmental Sciences, Ministry of Environmental Protection of the PRC 183
to it that the construction unit shall adopt standard protective measures, make good use of notices and traffic control during construction, and avoid causing inconvenience as far as possible to villagers’ life around the construction site. 2) Air pollution, water pollution and other issues during operation: after the completion of the technical renovation of the project, there will not be production wastewater, only a small amount of domestic wastewater which will not affect the drinking water quality of nearby residents. Moreover, after the technical renovation, emissions of air pollutants will be drastically reduced. The Project itself is a clean production project. The Unit of the Project commits itself to take effective environmental protection measures, and increase the intensity of publicity to surrounding residents, so that they understand the environmental protection measures supporting the Project are capable of avoiding environmental impact to a maximum degree, and can be run stable and safe. 3) Economic losses by the construction of the project: This project can effectively collect gas from SGIS and reduce gas emission impact on the environment while conserving energy.Therefore, the operation will not cause serious economic losses; on the contrary, it will play a facilitating role in improving the local environment. It will have a positive impact on the economy. In order to alleviate the misunderstanding and resentment of the masses, and reduce the pressure of running the Project, the Unit of the Project will strengthen communication with the public, and carry out exchange of views on the vital interests which concern them.
10.4.4 Summary of Opinion Feedback and Commitment on Part of Unit of the Project
Based on statistics of the public participation survey, the 5.1% of crowd who object the construction of the Project are mainly the public who live within the direct impact region of the Project. Key public concerns involve the questions of disturbance in the construction period of the Project and security issues, as well as possible air, water pollution problems during operation. A return visit on the part of the Unit of the Project was paid to Villages Da Yuantou, Lao Xiaojiang and Xin Xiaojiang, where the opinions were comparatively focused, and commitment was made related to pollution prevention and control measures; for detail, please see Annex × × ×, Opinion Summary and Commitment by the Unit of the Project, see Table 10.4 -4. All the people visited agree with the various environmental protection measures and management programs which are to be adopted on the part of the Unit of the Project, and expressed support and active cooperation with the Project's construction.
Table 10.4-4 Summary of public opinions and response measures
No. The number of people with the same opinion
Summary of opinions Response measures by the Unit of the Project
1 3
1. Possible air and water pollution caused during the period of operation of the Project 2. Road closed up due to the project construction will pose significant impact.
Response 1: take effective sewage, air pollution control measures to reduce the pollution. Response 2: construction unit implements the standardized construction protection measures, and issue announcements and take traffic control during the construction period.
2 2
1. Serious economic losses to the surrounding rural areas, fish farms and crops caused by the construction of the Project
Response 1: take effective environmental protection measures to reduce the pollution, and strengthen communication with the public.
10.5 Public Opinions on Notice of Simplified Version of Report No opinion received during the period of the notice
10.6 Conclusion on Public Participation According to the statistical result of the public participation survey form issued, generally, 72.2% of the respondents expressed support of the Project, 22.7 of the respondents said it does not matter one way or another, 5.1% of the respondents clearly expressed opposition due to concerns over air, water pollution,
Reconstruction Project for CDQ Clean Production on 6m Coke Oven in Coking Plant, Guangdong SGIS Songshan Co., Ltd.
South China Institute of Environmental Sciences, Ministry of Environmental Protection of the PRC 184
traffic inconvenience and economic losses during construction of the Project. Wherein, there are 62 of the public who are in impact scope of the Project show their support, and additional 20 say that it is indifferent. All the 5 of public who oppose the Project are in the impact scope of the Project, which are mainly in the Old Xiaojiang Village and New Xiaojiang Village. Their main opinions represent that they do not have enough confidence on the Project construction, and worry that the Project will affect the drinking water quality security of the Meihua River and cause air pollution. But after further communication as well as the commitments made by the owner, the people who opposed the Project are able to understand and support the implementation of the Project and its construction. So, if the Unit of the Project take measures on the “Three-waste” treatment in accordance with the requirements of environmental protection, meet emission standards, strictly implement the various management measures and safety precautions proposed by the EIA report, and reduce the impact on the life of the residents and on the environment following the completion of the Project, the majority of the public support the construction of the Project.
Reconstruction Project for CDQ Clean Production on 6m Coke Oven in Coking Plant, Guangdong SGIS Songshan Co., Ltd.
South China Institute of Environmental Sciences, Ministry of Environmental Protection of the PRC 185
11 Analyses of Compliance to Industrial Policies and Location Reasonability
11.1 Analysis of Compliance to State Industrial Policy (1) Compliance to Guiding Directory for Industrial Structure Adjustment (Decree No.40, the National Development and Reform Commission)
As prescribed by Decree No.40 of the National Development and Reform Commission, dry quenching is a project to be encouraged.
(2) Analysis of Compliance to Development Policies for the Iron and Steel Industry (July, 2005)
� Policy objectives
The objectives prescribed in the Development Policies for the Iron and Steel Industry is to “improve environmental protection and resource comprehensive utilization, save energy and reduce dissipation based on the concept of sustainable development and recycling economy.” Improve the comprehensive utilization of waste gases to the maximum, wastewater and wastes to the greatest extent, in order to build a recycling steel factory with zero emission. The steel enterprise must develop technologies of reusing residual heat and energy to generate electricity. ”
This dry quenching technique absorbs the heat of red cokes by using recycling inert gasses, which generate steams from desalted water through the heat swapper, and power is generated by the generator group, thus the heat energy is recycled. During the whole treatment process, dual recycling water systems are utilized to avoid producing wastewater, and to basically achieve “zero-emission”; the close circulation of gases and dust collection reduce the production of dusts during the process of wet quenching; techniques of recycling and reusing energies and resources such as transformed heat, smoke, dusts and residues etc., to improve the efficiency of energy utilization, resource recycling utilization and the environment.
Improves the comprehensive utilization of resources, and contributes to the creation of a recycling steel factory. This project complies with the objectives in the Development Policies for the Iron and Steel Industry.
� Policy for industrial techniques
The objectives prescribed in the Development Policies for the Iron and Steel Industry are that “the steel enterprises must development technologies of recycling residual heat and energies to generate power; steel joint ventures with a capacity of more than 5 million tons should strive to achieve power self-supply and produce superfluous power”, “the coke oven must complement the dry quenching device and match the dust collection device”, “the enterprise should adopt techniques like dry quench and joint recycling power generation by gas and steam according to the requirement of developing recycling economy”, and “the circular utilization of water should be more than 95%”.
The proposed CDQ project allocates a set of CDQ device of Model JNG9090 (140t/h), dust collection and separation devices and CDQ boilers. The water recycling rate is 98.2%. Solid waste is dust collected by the dust separator, which is transferred to the sintering workshop and used as raw materials after damped. Compared to the original wet quenching method, dry quenching improves the utilization efficiency of energies, the recycling utilization of resources and the environment. This project complies with the industrial technique policy in the Development Policies for the Iron and Steel Industry.
(3) Compliance to the Some Opinions on Rectifying and Standardizing of Coke Industry
Whereas, the requirements of Some Opinions on Rectifying and Standardizing of Coke Industry jointly promulgated by National Development and Reform Commission (NDPC), State Environmental Protection Administration (SEPA) and other ministries and commissions “Rely on the advancement of science and technology, and conduct transformation of coke ovens towards energy conservation and environmental protection. Encourage large enterprises to actively adopt new technologies such as CDQ, transform current coke enterprises, improve production and technical levels as well as products quality; …reduce energy consumption and improve the environment”;
Reconstruction Project for CDQ Clean Production on 6m Coke Oven in Coking Plant, Guangdong SGIS Songshan Co., Ltd.
South China Institute of Environmental Sciences, Ministry of Environmental Protection of the PRC 186
In response to the above requirements, the project replaces the traditional wet quenching technique with advanced dry quenching technique, i.e. new JNG86-1 dry quenching devices with a processing capacity of 1X90t/h are built. Dry quenching can basically resolve the problem of red coke recycle. The recycled energy is 39,200 tons of standard coal, and 1,400MJ/t of energy is recycled per ton. The recycled energy can generate a power of 60,286×103kWh.
Devices altered using this technique can produce 72 tons of steam per hour, and 587,520 tons of steam annually. It can replace the corresponding coal steam boiler, saving 65,280 tons of coal annually, reducing SO2 emission by 840 tons annually, reducing dust emission by 441.6 tons annually, and NOx emission by 640 tons annually; it can reduce the emission of carbon dioxide by 73,241 tons annually, contributing to alleviating the greenhouse effect; hence, dry quenching not only saves energy, and reduces energy dissipation, but effectively improves the ambient air quality in the Coking Plant of Guangdong SGIS Songshan Co., Ltd, even in Shaoguan City and the Maba area, with a conspicuous environmental performance.
This project complies with the relevant requirements in the Some Opinions on Rectifying and Standardizing of Coke Industry.
(4) Admittance Requisites to Coking Industry, Decree No.76, 2004, the National Development and Reform Commission.
Admission conditions are specially formulated based on the relevant laws and regulations and industrial policy requirements of the state, according to the principle of sustainable development of “controlling the total quantity, adjusting the structure, saving energies and resources, protecting the environment and achieving a reasonable distribution” to suppress the tendency of repeated low-quality constructions and blind expansion, promote the upgrading of industrial structure and standardize the order of market competition. The Admittance Requisites to Coking Industry, Decree No.76, 2004 by the National Development and Reform Commission requires “building new coke ovens or altering the old ones. On principle, dry quenching devices are needed as auxiliaries (for areas with water insufficiency and for steel enterprises)”;
This project complies with the relevant requirements of the Admittance Requisites to Coking Industry, Decree No.76, 2004 by the National Development and Reform Commission.
11.1.2 Analysis of Compliance to Local Industrial Policy
(1) Compliance to the Notification on Printing and Distributing the “Implementation Plan for Industrial Structure Adjustment of Guangdong Province (Revised Edition)”.
The Notification on Printing and Distributing the “Implementation Plan for Industrial Structure Adjustment of Guangdong Province (Revised Edition)” actively guides and promotes the structural optimization and upgrading of our province’s industry. In order to build up and implement a scientific development concept, further promote the structural adjustment of our province’s industry, accelerate industrial structural upgrading, and improve industrial competitiveness, the plan specifies the steel, petroleum and gas industries as those to be encouraged.
According to the prescription of the plan, blast furnace gas is used as the fuel in the major coke oven, which is a project of the steel industry to be encouraged.
(2) Compliance to the Guangdong Outline of Environmental Protection Planning (2006-2020).
Guangdong Outline of Environmental Protection Planning(2006-2020) prescribes that “the steel industry shall develop resource-saving technologies which reduce the gas emission by the sinter machine, recycle the waste gases, recycle the dusts and process and dispose the waste steel, to reduce energy and material dissipation, and decrease the emissions of pollutants such as sulfur dioxide and dusts”. Strengthen the technical alteration of the exiting enterprises, enforce clean production, and the newly built steel projects should attain an advanced Class In clean production domestically.”
Devices altered using this technique can produce 72 t/h of steam per hour, and 587,520 t/a of steam annually. It can replace the corresponding coal steam boiler, saving 65,280 t/a of coal annually, reducing SO2 emission by 840 t/a annually, reducing dust emission by 441.6 tons annually, and NOx emission by 640 t/a annually; it can reduce the emission of carbon dioxide by 73241 tons annually,
Reconstruction Project for CDQ Clean Production on 6m Coke Oven in Coking Plant, Guangdong SGIS Songshan Co., Ltd.
South China Institute of Environmental Sciences, Ministry of Environmental Protection of the PRC 187
contributing to alleviating the greenhouse effect. This is a leading technique of clean production in the same industry.
Besides, since December 2004, SGIS formally launched the first round of clean production review with the sintering factories first to be reviewed. After planning, organization, pre-evaluation, evaluation, and plan creation and filtration, 64 clean production plans were created by the review.
In comparison with the Clean Production Standards: Coking Industry, this dry quenching project attains clean production: level 1 in terms of coke product indicator, solid waste recycle and utilization, production technique and equipment requirements etc.
Besides, according to the planning by the SGIS, the power dissipation decreases by 15% in the “Eleventh Five-Year Plan” period from the “Tenth Five-Year Plan” period.
This project complies with the prescriptions for the steel industry by the Guangdong Outline of Environmental Protection Planning (2006-2020).
11.2 Reasonability Analysis of Factory Location 11.2.1 Analysis of Layout Reasonability
(1) This project is located in the coking factory area of SGIS, and the dry quenching oven system is located east to the existing coke ovens. Further beyond are the wagon puller platform and the dust removal system. The turbine chamber and the cooling tower are on either side of the chimney of coke oven No.2. For the specific location of the project in SGIS, see Fig 2.2. The location of the project complies with the internal planning of land use of SGIS.
(2) The project is in the proximity of the blast furnace plant. See Figure 2.2-2 for its specific location in the factory area. The products of the project are provided to the blast furnace plant, and the raw materials are derived from the raw material plant. The entire layout complies with the technical procedure. The location of the project complies with the production requirement of SGIS.
11.2.2 Reasonability Analysis of the Overall Layout
The overall layout of the project comprises one new 90t/h dry quenching device and its auxiliary facilities. The facilities newly constructed includes the dry quenching chamber, coke dry quenching boiler, ground dust removal station of the coke dry quenching, deoxygenation water pump station, steam turbine room, transfer station, belt conveyor gallery and so on.
The planning of the overall layout is carried out under the principle of minimal impact on the current production and minimal building dismantle and land use, based on the requirements in terms of production process, fire prevention, security, sanitation and inspection & repair etc., according to the current production status in the factory.
The dry quenching oven-boiler system is set beyond the 6m coke oven, and furthers beyond lie the wagon puller platform and the dust removal system. The turbine chamber and the cooling tower are on either side of the chimney of coke oven No.2.
The advantage of the layout is the compact connection of the dry quenching device with the coke oven, the production process is reasonable, with short pipes, smooth transportation and convenient contact with the exterior, contributing to the further development of Coking Plant of Guangdong SGIS Songshan Co., Ltd in the current factory area.
11.2.3 Environmental Availability Analysis
As seen from the estimation result, the environmental factors after the operation of this project can still satisfy the requirements of environmental function planning.
The dry quenching technique can prevent the coke dust containing steams generated by wet quenching from polluting the atmospheric environment and prevent the generation of wastewater, greatly reduce the emissions of all kinds of pollutants and play an active role in improving the atmospheric environment in the factory area, even in the nearby areas.
Besides, according to the “Tenth Five-Year Plan” of SGIS, SGIS also shut off the production of the
Reconstruction Project for CDQ Clean Production on 6m Coke Oven in Coking Plant, Guangdong SGIS Songshan Co., Ltd.
South China Institute of Environmental Sciences, Ministry of Environmental Protection of the PRC 188
eliminated sintering. The requirement of recycling water for the water users will improve the environmental quality in the whole region.
11.2.4 Feasibility of Prevention Distance
According to the prescriptions of the Technical Methods for Formulating Standards of Air Pollutants Emission (GB/T13201-91), when industrial enterprises are unable to release several hazardous gases, the prevention distance needed is calculated as the maximum value of Qc/Cm. According to the source strength analysis in the engineering analysis, this assessment is carried out based on the disorganized emission of dusts. As calculated, the prevention distance for dusts is 286m. According to the prescriptions of GB/T1320-91, the prevention distance can be 300m. All the distances between nearest sensitive points and the main pollution facilities meet this requirement of this health protection distance.
Based on the risk assessment parts, the safety evacuation distance of this project is 850m, which is worked out by prediction of CO leakage.
The location of SGIS, where the project is located, is shown in Figure 2.2-2. The requirements of prevention distance and safe evacuation distance can be satisfied.
Reconstruction Project for CDQ Clean Production on 6m Coke Oven in Coking Plant, Guangdong SGIS Songshan Co., Ltd.
South China Institute of Environmental Sciences, Ministry of Environmental Protection of the PRC 189
12 Analysis of Economic Gain and Loss 12.1 Investment on Environmental Protection of the Project to be Built 12.1.1 Main Measures of Environmental Protection
(1) Measures of Waste Gas Disposal
The smoke and dust collecting facilities are designed to establish on the coke loading position of the coke dry quenching oven top, coke releasing position of tank bottom, belt of coke outlet, emission outlet of circulating ventilator, etc.; dust produced during the production process of the coke dry quenching will be transmitted to the ground dust removal station of the coke dry quenching after being collected. Large-pulse hop-pocket dust removers are set in the ground dust removal stations (with a removal efficiency of over 99.5%). After purification, the dusts are released through the 28m chimneys, to align the emission concentration and rate to the “phase 2. Class II” standard in the Emission Limits for Air Pollutants.
Transit and transportation places and galleries of coke shall adopt enclosed design.
(2) Measures of Wastewater Disposal
Clearner swage is released into the original rain sewage system of the factory; the Clearner swage is released after settlement processing. Clearner swage is released into the existing comprehensive sewage pipes and to the hydroxybenzene-cyanogen sewage system after settlement processing. Living wastewater is released into the hydroxybenzen-cyanogen system after being processed by the septic tank.
(3) Measures of Solid Waste Disposal
The coke dusts collected by the dry quenching dust removal system are carried by the material trolley to the coal mixing workshop to be mixed into the coking coal after moistening.
(4) Noise Prevention Measures
Select low-noise products on a limited scale; set separate vibration reduction measures; set noise-eliminating devices and noise covers etc. for high-noise equipment; create a reasonable overall layout, and fully consider the effect of comprehensive treatment to reduce noise pollution.
(5) Plantation Engineering
Plant trees, flowers and grass in the open spaces within the factory area. The plantation coverage rate for this project is 20%.
12.1.2 Investment on Environmental Protection
The investment in fixed assets of the project is 196.66 million Yuan, including 18 million on environmental protection, which accounts for about 9.2% of the total investment.
See Table 12.1-1 for the detailed estimation of environmental protection investment.
Table 12.1-1 Environmental protection investment of the project.
No. Items of environmental protection investment.
Engineering expense(10,000 yuan)
Proportion in the total investment on environmental protection: %
1 CDQ Dedusting System 1050 77.4 2 Circling water system 238 17.6 3 Noise treatment facilities 38 2.8 4 Plantation 30 2.2 Total 1,800 100.0
Reconstruction Project for CDQ Clean Production on 6m Coke Oven in Coking Plant, Guangdong SGIS Songshan Co., Ltd.
South China Institute of Environmental Sciences, Ministry of Environmental Protection of the PRC 190
12.2 Analysis of the Overall Environment and Socioeconomic Performance of the Project 12.2.1 Social Performance Analysis
Upon completion of the project, it can not only add to the fiscal revenue of the area where it is, but promote the development of agriculture and forest in the surrounding areas, create job opportunities in the local area, and improve the living standard and quality of the peasants. During the operation period, the project provides 58 posts, which create a multitude of job opportunities for the superfluous labor and laid-off workers in the local area, and contribute to improving the living standard of the local people and to maintaining social prosperity and stability.
Besides, this project utilizes advanced, mature and reliable techniques, which not only achieve a good environmental performance, energy-saving performance and economic performance, but also strengthen the competitiveness of the local enterprises and enable them to step on to a path characterized by a favorable cycle and sustainable self-development.
12.2.2 Environmental Performance Analysis
In the dry quenching technique, the water sprayed by the water spray device at the upper part of the coke quenching tower is used to quench the coke in the coke quenching trolley. Therefore, the great amount of steam mixed with coke dusts generated when carrying out dry quenching is released upward and spread along with the wind. Although current folding plates are set at the top of the quenching tower, there are still a great number of pollutants released; besides, the granularity of the dusts released after the dust removal operation by the current folding plate is less than 10μ, so such dusts are floating dusts which can still spread for kilometers. Therefore, the wet quenching technique is unable to thoroughly resolve the problem of coke quenching pollution.
While in the dry quenching technique, the water does not contact the red coke, and close devices are adopted. The dusts mixed after the inert gas quenches the coke is purified by the dust remover in the dry quenching coke oven, so the pollution can be kept within the devices. Since the depth of coke tank for coke quenching is large, positioned coke connection can be applied, and coke dust hood can be used during coke charging and output to control dust pollution effectively. Thus, this process can effectively solve the pollution problem of coke quenching. This plan shows a conspicuous environmental performance, with a modest amount of pollutants emission. Especially, the energy utilization is high, so its indirect environmental performance is quite conspicuous.
The use of dry quenching can not only save water, but prevent the generation of pollutants, which are often generated in the wet quenching technique. Compared to the wet quenching technique, the dry quenching technique can reduce the emission of Air Pollutants by 57 tons annually, with a reduction rate of 60-65%.
Devices altered using this technique can produce 72 t/h of steam per hour, and 587,520 t/a of steam annually. It can replace the corresponding coal steam boiler, saving 65280 t/a of coal annually, reducing SO2 emission by 840 t/a annually, reducing dust emission by 441.6 t/a annually, and NOx emission by 640 t/a. Virtually, for each ton of coke, the energy dissipation is reduced by 46 kg of standard coal, with a good energy-saving effect. 73241 tons of carbon dioxide can be reduced annually, and this contributes to alleviating the greenhouse effect.
To sum up, the implementation of this project not only prevents the steam mixed with coke dusts generated in wet quenching from polluting the atmospheric environment, but avoids the creation of wastewater, greatly reduces the emissions of all kinds of pollutants, saves water, and recycles the energy, with a conspicuous environmental performance, and plays an active role in improving the atmospheric environment of the factory, even of the surrounding areas.
12.2.3 Economic Performance Analysis
12.2.3.1 Coke Sale in the Operation Period
Adopting the dry quenching technique, this project can recycle heat energy from red cokes, to acquire 45 tons of medium-pressure steam (3.82MPa) per hour, and utilizes the steam to generate 60,286×103kWh of power annually, where 47,752MWh is for external use. According 5to the mixed emission factor 0.778
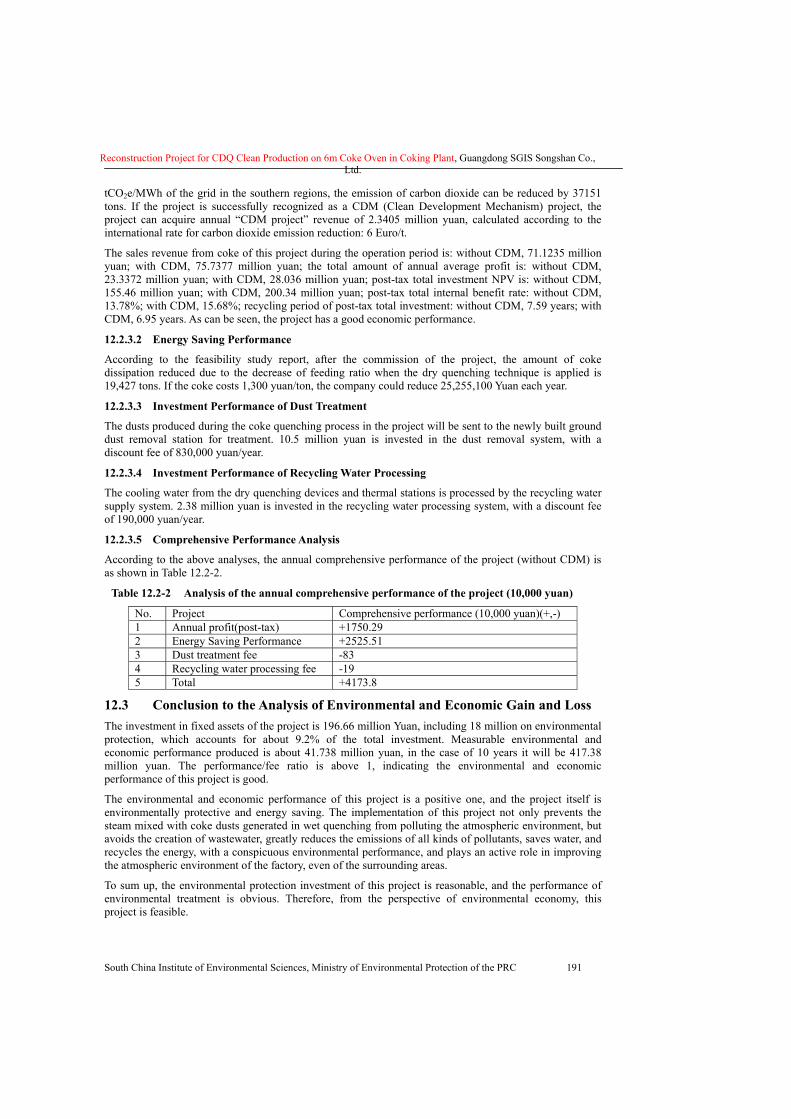
Reconstruction Project for CDQ Clean Production on 6m Coke Oven in Coking Plant, Guangdong SGIS Songshan Co., Ltd.
South China Institute of Environmental Sciences, Ministry of Environmental Protection of the PRC 191
tCO2e/MWh of the grid in the southern regions, the emission of carbon dioxide can be reduced by 37151 tons. If the project is successfully recognized as a CDM (Clean Development Mechanism) project, the project can acquire annual “CDM project” revenue of 2.3405 million yuan, calculated according to the international rate for carbon dioxide emission reduction: 6 Euro/t.
The sales revenue from coke of this project during the operation period is: without CDM, 71.1235 million yuan; with CDM, 75.7377 million yuan; the total amount of annual average profit is: without CDM, 23.3372 million yuan; with CDM, 28.036 million yuan; post-tax total investment NPV is: without CDM, 155.46 million yuan; with CDM, 200.34 million yuan; post-tax total internal benefit rate: without CDM, 13.78%; with CDM, 15.68%; recycling period of post-tax total investment: without CDM, 7.59 years; with CDM, 6.95 years. As can be seen, the project has a good economic performance.
12.2.3.2 Energy Saving Performance
According to the feasibility study report, after the commission of the project, the amount of coke dissipation reduced due to the decrease of feeding ratio when the dry quenching technique is applied is 19,427 tons. If the coke costs 1,300 yuan/ton, the company could reduce 25,255,100 Yuan each year.
12.2.3.3 Investment Performance of Dust Treatment
The dusts produced during the coke quenching process in the project will be sent to the newly built ground dust removal station for treatment. 10.5 million yuan is invested in the dust removal system, with a discount fee of 830,000 yuan/year.
12.2.3.4 Investment Performance of Recycling Water Processing
The cooling water from the dry quenching devices and thermal stations is processed by the recycling water supply system. 2.38 million yuan is invested in the recycling water processing system, with a discount fee of 190,000 yuan/year.
12.2.3.5 Comprehensive Performance Analysis
According to the above analyses, the annual comprehensive performance of the project (without CDM) is as shown in Table 12.2-2.
Table 12.2-2 Analysis of the annual comprehensive performance of the project (10,000 yuan)
No. Project Comprehensive performance (10,000 yuan)(+,-) 1 Annual profit(post-tax) +1750.29 2 Energy Saving Performance +2525.51 3 Dust treatment fee -83 4 Recycling water processing fee -19 5 Total +4173.8
12.3 Conclusion to the Analysis of Environmental and Economic Gain and Loss The investment in fixed assets of the project is 196.66 million Yuan, including 18 million on environmental protection, which accounts for about 9.2% of the total investment. Measurable environmental and economic performance produced is about 41.738 million yuan, in the case of 10 years it will be 417.38 million yuan. The performance/fee ratio is above 1, indicating the environmental and economic performance of this project is good.
The environmental and economic performance of this project is a positive one, and the project itself is environmentally protective and energy saving. The implementation of this project not only prevents the steam mixed with coke dusts generated in wet quenching from polluting the atmospheric environment, but avoids the creation of wastewater, greatly reduces the emissions of all kinds of pollutants, saves water, and recycles the energy, with a conspicuous environmental performance, and plays an active role in improving the atmospheric environment of the factory, even of the surrounding areas.
To sum up, the environmental protection investment of this project is reasonable, and the performance of environmental treatment is obvious. Therefore, from the perspective of environmental economy, this project is feasible.
Reconstruction Project for CDQ Clean Production on 6m Coke Oven in Coking Plant, Guangdong SGIS Songshan Co., Ltd.
South China Institute of Environmental Sciences, Ministry of Environmental Protection of the PRC 192
13 Environment Mangement and Monitoring Plan To establish a sound environment management and monitoring system will facilitate the application of State and local environmental protection regulations and policies, effectively improve the environment quality in the area where SGIS is located, as well as rationally exploit environmental resources to serve both SGIS’s economic development and environmental protection.
13.1 Responsibilities of Environment Management Organization (1) Conscientiously implement environmental protection related laws, regulations and standards issued by
the State or the local government. Assist SGIS’s top management to coordinate the company’s development with environmental protection activities.
(2) Assist SGIS’s top management to establish the company’s environmental protection guidelines, environment management goals, index and plans, including monitoring plan etc.
(3) Monitor the implementation of the company’s environment management plan, establish systems and policies related to environmental protection, collect environmental statistics, create pollution source archives, and make environment monitoring report, etc.
(4) Supervise the operation and maintenance of environmental protection facilities to ensure normal and stable operation.
(5) Organize environmental protection related education and training for staff responsible for company development.
(6) Responsible for outside liaison regarding environment related affairs. For example, learn the issue and revision of environmental protection related government policies and regulations, and organize the implementation; responsible for environmental protection related liaison, explanation and reply; and coordinate company activities or measures involving public interests.
(7) Make efforts to facilitate the establishment of environment management system as per ISO14000 Standard.
(8) Carry out clean production audit to pollutant discharge enterprises established or run by the company. To those who fail the audit, suspend their pollutant discharge permits and take severe measures to ask for corrections in a fixed period of time.
13.2 Environment Monitoring System 13.2.1 Introduction of SGIS Environment Monitoring Station
The environment monitoring of SGIS Songshan Co., Ltd is mainly undertaken by SGIS Environment Monitoring Station.
Currently, there are 20 monitors in the SGIS monitoring station. Among them, 6 are professionals, accounting for 30% of the total number of staff working in the station. The SGIS Monitoring Station is comprised of three departments – the general office, the atmospheric monitoring lab and the water quality monitoring lab. The atmospheric monitoring lab consists of three teams – the air, fume(exhaust gas) and noise monitoring teams. The SGIS Monitoring Station has a 700m2 monitoring building with 98 sets of various monitoring apparatuses and data processing machines for water, gas, dregs and noise monitoring, including atomic absorption spectrophotometer, ultraviolet spectrophotometer, visible spectrometer, gas chromatograph, oil analyzer, fume tester, thermostatic and continuous air sampler, sound level meter and PC etc. The Station is also equipped with a monitoring car. The total value of equipment and apparatuses is approximate to 1 million yuan. The Station is capable of monitoring and analyzing 100 items, including water quality and wastewater quality, atmospheric environment quality and exhaust gas pollution source, environmental and equipment noise, soil, biology and solid wastes etc.
13.2.2 Monitoring Range of SGIS Monitoring Station
1) Atmospheric Monitoring
a. Environment Quality Factors
Reconstruction Project for CDQ Clean Production on 6m Coke Oven in Coking Plant, Guangdong SGIS Songshan Co., Ltd.
South China Institute of Environmental Sciences, Ministry of Environmental Protection of the PRC 193
Natural falling dust content, TSP, SO2, NOX, BaP (sampling).
b. Atmospheric Parameters
Atmospheric pressure, temperature, humidity, wind speed, wind direction.
c. Monitoring Frequency and Cycle
Falling dust(natural dust fall content): 30±2 days/month, 12 months/year, TSP:
Lab analysis of continuous sampling – sample every other two days with 24±0.5 hours continuous monitoring. Monitor 5-6 days/month, 12 months/year. SO2.NOX:Lab analysis of continuous sampling –
24±0.5 hours continuous sampling every other day. Monitor 14-16 days/month, 12 months/year. CO: CO: Same monitoring cycle as TSP, frequency: three samplings per day. Bap: Same as TSP for living area. For production area, 5-6 days of monitoring in the first month of each quarter. Use one sheet of filter membrane per day to monitor 1.5 hours in the morning and the afternoon.
2) Wastewater Monitoring
a. Monitored items
Mainly 44 items, including PH, SS, COD, Phenol, CN-, oil, S2-, Cu2+, Pb2+, Zn2+, As, F-, Cr6+, total Cr, HCO3
-, CO32-, OH-, Cl-, SO4
2-, total hardness, ammonia and flow rate.
b. Monitoring Network
Total 37 monitoring sites located at discharge outlets of individual factories, inlets and outlets of treating facilities for monitoring hospital sewage, water for production, domestic water and underground water.
c. Monitoring Frequency and Cycle:
Water for Production, hospital sewage: once per ten days, three times per month and every month. Water for Production, Domestic Water and Underground Water: once per half a year(in wet and dry season).
3) Exhaust Gas Source Intensity Monitoring
a. Monitored items
Mainly 25 items, including dust, emission concentration and volume of fume, such as SO2, NOX and CO, sulphur content in fume, fume flow rate, velocity of flow, pressure, temperature and blackness etc.
b. Allocation of Monitoring Sites
Set up monitoring sites at inlets and outlets of flues, the major pollution source, in individual factories.
c. Monitoring Frequency and Cycle
Monitor once a month for smoky dust and smoke color, and once a year for dedusting efficiency.
4) Noise Monitoring
a. Noise within Factory
Monitoring Sites: Four sites respectively located at the east, south, west and north of SGIS and individual factories.
Monitoring Frequency and Cycle: Once per quarter, four times a year.
b. Strong Acoustic Sound Source
Sites arrangement as per Technical Specification for Environment Monitoring (Noise Part).
c. Monitoring Frequency and Cycle: Once a year.
Current Status and Future Plan
The following aspects should be strengthened to better serve the need of environment monitoring:
1) Improve the equipment in the monitoring station, and strengthen the implementation of updating
Reconstruction Project for CDQ Clean Production on 6m Coke Oven in Coking Plant, Guangdong SGIS Songshan Co., Ltd.
South China Institute of Environmental Sciences, Ministry of Environmental Protection of the PRC 194
existing equipment and adding more.
A. Replace apparatuses and equipment that cannot satisfy the need of monitoring.
New apparatuses needed are mainly advanced analysis apparatus and electronic analytical balance imported from abroad. Automatic atmospheric monitoring apparatus and precision sound level meter should be replaced.
B. Improve sampling and measuring devices at the chief wastewater discharge outlet of SGIS, sample and measure at wastewater outlets of individual branch factories, and equip the outlets with automatic wastewater flow rate recorder.
2) Add one monitoring car.
3) Beef up the station with 5 to 6 more special technicians.
4) Establish automatic atmospheric environment monitoring station.
5) Equip sampling port at chief wastewater discharge outlet with automatic wastewater flow rate measuring device.
6) Improve lab analysis conditions.
13.3 Environmental management plan (1) Environmental Protection Management System
SGIS implements an environmental protection management system which is “fully responsible by the general manager with graded and centralized management and individual responsibilities”. The general manager is fully responsible for the company’s environmental protection. Governing leaders are responsible for the environmental protection within their respective governing area. Leaders in individual branch factories (departments) are responsible for the environmental protection within their respective managing area. The Safety & Environmental Protection Department (SE Dept.), the functional department in the company responsible for environmental protection, implements and supervises all environmental protection activities in the company, supervises the implementation of environmental protection activities within the governing area of individual functional departments, as well as makes related management regulations.
(2) Function Plan of Environmental Protection Management Organization
1) Environmental Protection Related Functions of SE Dept.
Guided by the general manager and the governing deputy general manager, the environmental protection related managerial functions implemented by SE Dept. are as follows:
a. Implement State and local environmental protection guidelines, policies and regulations, so that the company’s production and development are synchronous with environmental protection in planning, implementation and development.
b. Coordinate with planning department for environmental protection plan. Specify general tasks, goals, standards and requirements of environmental protection related management provisions, as well as translate planned goals into detailed index which will be implemented in individual factories.
c. Organize and coordinate the implementation of individual departments’ environmental protection activities set in the plan, which are within their respective managing area.
d. Coordinate the rational resource & energy exploitation between individual branch factories and related management departments to reduce and prevent environmental pollution and damage, creating a benign cycle for the company’s reproduction.
e. Coordinate with propaganda, education and law departments for the propaganda and education of environmental protection related laws and knowledge.
f. Examine, supervise and assess the implementation of environmental protection goals set in the plan, and take measures to solve the problems found.
Reconstruction Project for CDQ Clean Production on 6m Coke Oven in Coking Plant, Guangdong SGIS Songshan Co., Ltd.
South China Institute of Environmental Sciences, Ministry of Environmental Protection of the PRC 195
2) Functions of Environmental Protection Supervision Department
Major responsibilities: Supervise the implementation of environmental protection plan set by individual factories or departments. Implement related State environmental protection regulations for construction projects for the factories’ new, expansion and rebuilding projects. Strictly implement the “Environmental Impact Statement” system and the “three synchrony” system which realizes synchronous design, construction and use of main projects and pollution and other public nuisance prevention projects, so that the pollutant discharge meets State and local standards or design requirements after the projects are completed. Collect pollutant discharge fee to pollutant discharging units. According to Internal Pollutant Discharge Fee Collecting Provisions of Guangdong SGIS Group (Interim), excess pollutant discharge fee will be collected to those who discharge pollutants in excess.
3) Functions of Environmental Protection Technology Department
Major responsibilities: Make monitoring plans and proposals. Carry out and organize environmental impact assessment and pollution source investigation. Study, make and revise various measures and regulations regarding monitoring quality. Make quality control flowchart. Organize technical training and exchange activities to improve lab monitors’ technical skills. Monitor and assess the quality of lab apparatuses. Check quality control process and deal with accidents and appeal or arbitration from the quality control process. Maintain normal operation of lab apparatuses. Responsible for repair, replacement and development of lab apparatuses, and archives management. Make supply plan of lab apparatuses and consumable like reagent. Implement modern lab management. Make plans for technical development, introduction and reform of integrated control of environmental pollution.
4) Functions of Central Monitoring Station
Complete routine and special monitoring tasks. Implement quality control as per lab quality control requirements. Maintain apparatuses used in the station. Keep the lab clean and tidy. Collect and process lab data, submit reports and print documents, and manage environmental science technical data archives.
5) Functions of Environment Engineering Control Center
Responsible for the development, introduction and reform of integrated control of environmental pollution technology and pollution source control technology. Make plans of and implement integrated control of environmental engineering program. Effectively carry out environmental management and supervision to reach the goal of reducing total volume of pollutants discharge.
(4) Methods of Environment Management
According to Environmental Protection Law of the People’s Republic of China and related regulations, SGIS implements a sound environment supervision management with eleven internal regulations issued, which are Provisions of Environmental Protection, Responsibility System of Environmental Protection, Management of Environmental Protection Facilities, Management of Pollution Prevention and Treatment Coordination of Environmental Protection Supervision, Economic Responsibility System of Reaching Environmental Protection Goals, Implementation of Interim Provisions of Integrated Resource Exploitation, Implementation of Environmental Protection Management of Construction Projects, Management of Environment Pollution and Malicious Events(Trial), Clean Factory Management of SGIS(Trial),and Internal Pollutant Discharge Fee Collecting Provisions of Guangdong SGIS Group(Interim). All these have fundamentally standardized the environment management methods, as well as people’s behavior in environmental protection.
13.4 Suggestions on Strengthening Environment Management Current problems in SGIS’s environment management system. The current SGIS’s environment monitoring management system is capable of carrying out basic routine monitoring tasks as per State Environmental Protection Administration’s related regulations and the Implementing Rules of Steel Industry Environment Monitoring, and supervising environment management according to State Environmental Protection Law and SGIS’s environmental protection regulations and factory regulations. However, with increasing monitoring tasks due to more expansion and rebuilding projects, the existing environment monitoring system can no longer satisfy the needs of increasing expansion and needs an assessment for making a new environment management plan. Major problems in existing environment monitoring system and
Reconstruction Project for CDQ Clean Production on 6m Coke Oven in Coking Plant, Guangdong SGIS Songshan Co., Ltd.
South China Institute of Environmental Sciences, Ministry of Environmental Protection of the PRC 196
environment management system:
a. The general equipment level of environment monitoring apparatuses is lower than that of other domestic backbone enterprises.
b. Outdated mobile monitoring equipment and lacking of vehicles result in low emergency dispatch ability in environment monitoring.
C. Low qualification of monitoring & maintenance staff and low configuration of apparatuses & equipment restrict the further development of environment monitoring and management.
d. Complicated coordination among different environment supervision and management departments makes uniform and high-efficient environment supervision and management difficult.
(2) Suggestions on Future Strengthening of Environment Management
a. Restructuring of Functional Departments
Transform the former general department and environmental protection department into plan & dispatch department and environmental protection technology department. Add environment supervision department and environment engineering control center. The environment supervision department is responsible for environment supervision and management. The environment engineering control center is mainly responsible for the development, introduction and reform of integrated control of environmental pollution technology and pollution source control technology, and for making plans of and implement integrated control of environmental engineering program. The environmental protection technology department is responsible for the development of environmental protection technology and apparatuses, and quality control. A new data processing center will be set up in the central monitoring station, responsible for monitoring data collecting and processing, report submitting, document printing and environmental science technical data archives management etc. Restructuring of other functional departments in the monitoring station: Cancel the former general office and set up a monitoring quality control office responsible for monitoring technology and quality management in environment monitoring. Quality control responsibilities of former general office will be coordinately taken by the monitoring quality control office and the control office of environmental protection technology department. Set up atmospheric monitoring lab, water quality monitoring lab and noise monitoring lab with their existing responsibilities unchanged.
b. Personnel Assignment of Environment Monitoring and Management Staff
Staff at the Environment Monitoring Station: 4 for atmospheric monitoring, 5 for water quality monitoring, 2 for noise monitoring, 5 for pollution source monitoring, 1 for monitoring quality management, 1 computer professional for data processing, and 3 for others;
Environmental Protection Supervision Department: 1 for environment supervision, 1 for environment management, and 1 for others;
Environmental Protection Technology Department: 2 for environmental protection technology development, 1 for environmental protection apparatus development, 1 for quality control, and 1 for others;
Environment Engineering Control Center: 2 for environment engineering, and 1 for others.
c. Strengthening the Building of Environment Monitoring Station
Replace apparatus and equipment that can no longer satisfy the needs of quality control with new ones according to the above mentioned requirements.
d. Suggestions on Strengthening Environment Supervision
Guided by the general manager, the SE Dept. is responsible for carrying out overall environment supervision. Establish position based responsibility system and environment supervision system, and supervise their implementation.
Establish an environment monitoring management system with the director of SE Dept. as the responsibility taker. The director of SE Dept is responsible for the environment monitoring quality and technology, as well as for reaching the factory’s total pollutant discharge volume control goal.
Reconstruction Project for CDQ Clean Production on 6m Coke Oven in Coking Plant, Guangdong SGIS Songshan Co., Ltd.
South China Institute of Environmental Sciences, Ministry of Environmental Protection of the PRC 197
The stationmaster of the monitoring station is responsible for environment monitoring technology and quality.
Actively involve in the propaganda and education of environmental protection laws, policies and regulations to increase people’s environmental protection awareness.
Actively involve in the development, introduction and reform of integrated control of environmental pollution technology and pollution source control technology to reduce pollution sources and discharge volume, so that the total pollutant discharge volume can reach the control goal.
(3) Suggestions on Strengthening Environment Monitoring
Following SGIS’s technical reform, the production scale and facilities have also changed a lot. Accordingly, the location of pollution source, the discharge scale, the type and quantity of pollutants and the discharge way will also change. Therefore, the monitoring system should be adjusted timely and reasonably so that it will be more directional and practical, truly playing its role of monitoring the realization of environmental protection and pollutant discharge goals. For the environment monitoring of the proposed CDQ project, the following aspects should be taken into account in addition to the above mentioned holistic environment monitoring plan:
1) Atmospheric monitoring sites should be set up at the(west and north) boundary of material stock yard to monitor the change of total suspended particulate(TSP) concentration, especially in dry season and the season when sensitive points are at the down wind, so that the impact of the stock yard’s random discharge to surrounding residential area and crops can be monitored. Noise monitoring items should also be set up at the above mentioned monitoring sites to monitor the impact of noise pollution to residential area.
2) Periodically set up atmospheric monitoring sites at the boundary of the factory and surrounding area including Maba Village(outside of the southwest gate) and the Yangwo Village and Dayuantou Village in the north, to monitor items like total suspended particulate(TSP), SO2 etc., so as to control the discharge from main pollution source and protect the atmospheric environment.
3) As the impact of high chimneys reaches far away, a representative monitoring site should be set up at Shaogang No.1 Middle School, which is 3km away in the down wind.
4) Set up water quality monitoring sites at Meihua River and Maba River (section): Monitor the water quality once a quarter.
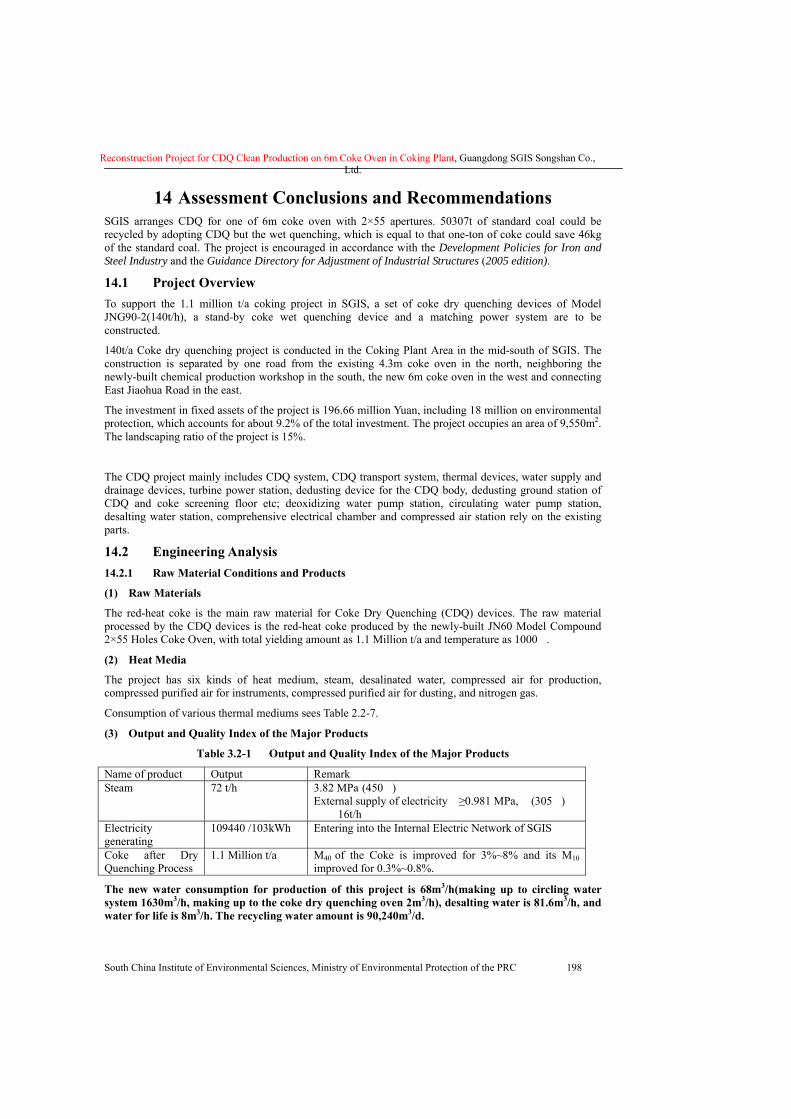
Reconstruction Project for CDQ Clean Production on 6m Coke Oven in Coking Plant, Guangdong SGIS Songshan Co., Ltd.
South China Institute of Environmental Sciences, Ministry of Environmental Protection of the PRC 198
14 Assessment Conclusions and Recommendations SGIS arranges CDQ for one of 6m coke oven with 2×55 apertures. 50307t of standard coal could be recycled by adopting CDQ but the wet quenching, which is equal to that one-ton of coke could save 46kg of the standard coal. The project is encouraged in accordance with the Development Policies for Iron and Steel Industry and the Guidance Directory for Adjustment of Industrial Structures (2005 edition).
14.1 Project Overview To support the 1.1 million t/a coking project in SGIS, a set of coke dry quenching devices of Model JNG90-2(140t/h), a stand-by coke wet quenching device and a matching power system are to be constructed.
140t/a Coke dry quenching project is conducted in the Coking Plant Area in the mid-south of SGIS. The construction is separated by one road from the existing 4.3m coke oven in the north, neighboring the newly-built chemical production workshop in the south, the new 6m coke oven in the west and connecting East Jiaohua Road in the east.
The investment in fixed assets of the project is 196.66 million Yuan, including 18 million on environmental protection, which accounts for about 9.2% of the total investment. The project occupies an area of 9,550m2. The landscaping ratio of the project is 15%.
The CDQ project mainly includes CDQ system, CDQ transport system, thermal devices, water supply and drainage devices, turbine power station, dedusting device for the CDQ body, dedusting ground station of CDQ and coke screening floor etc; deoxidizing water pump station, circulating water pump station, desalting water station, comprehensive electrical chamber and compressed air station rely on the existing parts.
14.2 Engineering Analysis 14.2.1 Raw Material Conditions and Products
(1) Raw Materials
The red-heat coke is the main raw material for Coke Dry Quenching (CDQ) devices. The raw material processed by the CDQ devices is the red-heat coke produced by the newly-built JN60 Model Compound 2×55 Holes Coke Oven, with total yielding amount as 1.1 Million t/a and temperature as 1000�.
(2) Heat Media
The project has six kinds of heat medium, steam, desalinated water, compressed air for production, compressed purified air for instruments, compressed purified air for dusting, and nitrogen gas.
Consumption of various thermal mediums sees Table 2.2-7.
(3) Output and Quality Index of the Major Products
Table 3.2-1 Output and Quality Index of the Major Products
Name of product Output Remark Steam 72 t/h 3.82 MPa (450�)
External supply of electricity ≥0.981 MPa, (305�) 16t/h
Electricity generating
109440 /103kWh Entering into the Internal Electric Network of SGIS
Coke after Dry Quenching Process
1.1 Million t/a M40 of the Coke is improved for 3%~8% and its M10 improved for 0.3%~0.8%.
The new water consumption for production of this project is 68m3/h(making up to circling water system 1630m3/h, making up to the coke dry quenching oven 2m3/h), desalting water is 81.6m3/h, and water for life is 8m3/h. The recycling water amount is 90,240m3/d.
Reconstruction Project for CDQ Clean Production on 6m Coke Oven in Coking Plant, Guangdong SGIS Songshan Co., Ltd.
South China Institute of Environmental Sciences, Ministry of Environmental Protection of the PRC 199
The utilization rate of circling water: 98.2%
14.2.2 Pollutant Discharge
(1) Gas Pollutant
Organized air pollutants from the proposed CDQ project are mainly dust from the two new-constructed dust separation stations. Concentration of air pollutants from the ground dust separators is less than 30mg/m3, which complies with the Class II standard in Phase II of the Discharge Limits of Air Pollutants in Guangdong Province (DB4427-2001).
Organized dust discharged in the project is 122.4t/a and fugitive dust discharge is 22t/a, with a total discharge amount of 144.4t/a.
(2) Water pollutants
Production wastewater: water seal on the coke dry quenching oven discharges water with an amount of about 2m3/d, and flows to the existing phenol-cyanogen wastewater treatment system. It can be up to the standard after treatment and can be used as makeup water for blast furnace slag system.
7.2 m3/d of domestic wastewater is collected by the existing domestic wastewater system of the coke oven plant.
1,884 m3/d clean sewage enters the clean water system of the plant, and is used as slag removal water for blast oven, applicable for work sections where the water quality is not high.
In conclusion, no wastewater of the coke oven plant is discharged outside.
(3) Solid Waste
Only the single type solid waste, coke dust of about 24000t/a collected by the dust-removal system, is produced in the process of production of the CDQ project. The humidified coke dust is completely and comprehensively utilized by delivering to the coal preparation workshop with carrier vehicles and incorporating in coking coal, or delivering to the sinter plant as per requirements as the raw material.
(4) Noise
Noise from the CDQ project mainly includes the mechanical noise and aerodynamic noise. Main noise sources include: Cycling circuit, dedusting fan, pumps and exhaust equipments of safety valve of the boiler dispersing pipes. Under general situations, the source strength of noise is lower than 85dB (A) prior to taking noise control measures.
14.2.3 Pollution Treatment Measures
(1) Waste gas treatment measures
The main pollution sources of coke dry quenching system are the loading inlet of the coke dry quenching oven, coke releasing outlet, emission gas outlet of pre-stored room, emission outlet of the circulating ventilator as well as unloading process of coke transport. The main pollutant produced is coke dust.
The smoke and dust collecting facilities are designed to establish on the coke loading position of the coke dry quenching oven top, coke releasing position of tank bottom, belt of coke outlet, emission outlet of circulating ventilator, etc.; dust produced during the production process of the coke dry quenching will be transmitted to the ground dust removal station of the coke dry quenching after being collected. The large-scale pulse bag dust removal filters are established in the ground dust removal station, of which dust removal efficiency is above 99.6%. The smoke and dust is emitted via the exhaust stack with a height of 28m after being purified. The dust density at the outlet of the exhaust stack is lower than 50mg/m3. All the dust emitting density and rate at the emitting outlet comply with the Class II standard requirement in the 2nd period of the Air Pollutant Emission Limit Value (DB44/27-2001).
Transit and transportation places and galleries of coke shall adopt enclosed design.
(2) Wastewater treatment measures
Water seal of the coke dry quenching oven discharges water is collected by the new-constructed
Reconstruction Project for CDQ Clean Production on 6m Coke Oven in Coking Plant, Guangdong SGIS Songshan Co., Ltd.
South China Institute of Environmental Sciences, Ministry of Environmental Protection of the PRC 200
phenol-cyanogen wastewater treatment system, the supporting system of 6m coke oven. It can be up to the standard after treatment and can be used as makeup water for blast furnace slag system.
The treatment scale of phenol-cyanogen wastewater treatment station newly constructed to support to 6m coking oven is 2,400 m3/d; the emitting volume of phenol-cyanogen wastewater produced from 6m coke oven newly constructed is 1,008 m3/d according to estimation, therefore the wastewater treatment station has enough surplus capacity to bear discharging water of water seal on the coke dry quenching oven. A2/O biological denitrogenation process is adopted for the wastewater treatment facilities. The water after treatment could be up to Class I standard of DB44/26-2001.
(3) Treatment measures for solid waste
The coke dust collected by the dust removal filter of the coke dry quenching system will be transported with material tankers to coal preparing workshop to mix into coking coal after being wetted, or to sintering workshop as needed.
(4) Noise treatment facilities
For equipment type selection, various types of ventilators and pumps shall be selected low-noise products as much as possible.
Individual foundations or vibration damping measures are established for the dust removal ventilators and pumps, and flexible connection modes are adopted among strong vibration equipment and pipelines to prevent the noise producing from vibration spreading outward.
Coke releasing facilities, circulating ventilators and cycling gas pipelines are adopted noise isolation measures.
The silencer devices are established accordingly on outlets of dust removal ventilators, emitting outlets of steam safety valve of coke dry quenching boilers.
The main bodies of steam turbines and generator exciters are equipped muffler enclosures, and muffler are arranged on anti-corrosion inspection tube of the steam turbine.
The rational deployment is conducted utilizing factors of terrain, plant house, and direction of noise sources as well as noise absorbing function of greening plants when the general layout is carried out; the role of comprehensive treatment is fully taken account to management to reduce noise pollution.
After the measures above are applied, the day and night noise values of factory boundary are predicted to be able to comply with the standard values Class III of Standard for Noise at Boundary of Industrial Enterprises(GB12348-90).
14.2.4 Health protection zone
The health protection distance for 6m coking project is 300m, which is calculated in accordance with GB/T13201-91. The project is located within SGIS plant, without any sensitive point within the range of 800m around, which meets this requirement.
All the distances between nearest sensitive points and the main pollution facilities meet this requirement of this health protection distance.
14.3 Existing baseline of the Environment In 2006, monitoring and investigation of the existing baseline environment of ambient air, water environment and soils surrounding the SGIS was carried out by our Institute for the environmental impact assessment of five technical renovation projects. So, the assessment mainly uses the existing baseline monitoring data from the EIA Report of five technical renovation projects of the iron-smelting plant of SGIS (March 2007). Existing baseline of the noise environment is monitored by the monitoring station of SGIS based on the project site selection.
(1) Existing baseline of ambient air
In conclusion, in the assessment area, the 1# plant site complies with the Class III assessment standard of Ambient Air Quality Standard(GB3095-96, revised in January 2000), and the other monitoring locations all
Reconstruction Project for CDQ Clean Production on 6m Coke Oven in Coking Plant, Guangdong SGIS Songshan Co., Ltd.
South China Institute of Environmental Sciences, Ministry of Environmental Protection of the PRC 201
comply with the Class II assessment standard of Ambient Air Quality Standard(GB3095-96, revised in January 2000).
In the assessment area, concentrations of CO at all monitoring locations are lower than that of relevant standards regulated in the Ambient Air Quality Standard(GB3095-96, revised in January 2000). In the assessment area, the daily mean concentrations of PM10 and TSP are usually lower, and the concentration of particles in monitoring locations could comply with relevant assessment standard.
So, though the technical renovation project of the proposed project has been completed and the trial operation has started, air pollutants not reduce the atmosphere environment functions with the normal operation of treatment facilities in the assessment area. Currently air quality in the assessment area is in good condition and could meet relevant functional requirements.
(2) Existing baseline of surface water environment
All monitoring items but Fe and CODcr comply with the requirement of Class III standard of Environmental Quality Standard for Surface Water(GB3838-2002); Water quality is worsen for wastewater from SGIS in drainage section(2#), and monitoring items of CODcr, Pb, Zn, fluoride, T-P and Fe exceed the standard differently, and the water quality cannot meet the requirement of Class Ⅳ standard of Environmental Quality Standard for Surface Water(GB3838-2002); the section(3#) in front of the meeting of Meihua River and Maba River is farther from the outlets, but the water quality is not improved, which is resulted from that water from the upstream is in a less amount than that of discharged wastewater, especially the wastewater from Qujiang County and enterprises in downstream of Meihua River, which increases the pollutant quantity in river but with a weak dilution and degradation capacity, so degraded pollutants are less than the increased pollutants.
Based on the monitoring result of the section (4#) in front of the meeting of Meihua River and Maba River, CODcr, Pb, T-P, BOD5, T-N and Fe in water from the upstream of Maba River all exceed the standard. Several items in section (5#) in front of the meeting of Beijaing River and Maba River exceed the standard.
On the section before North River joins Maba River (6#), the monitored items of water quality all meet the requirements of Class IV standard of GB3838-2002 except iron; lightly polluted by iron; on the section after North River joins Maba River, all monitored items meet requirements of Class Ⅳ standard of GB3838-2002 except total nitrogen and iron.
(3) Existing baseline of groundwater environment
Five groundwater monitoring points in the assessment all meet the requirement of Class III Standard of Environmental Quality Standard for Groundwater (GB/T14848-93), which indicates that the groundwater in the assessment area is in good condition.
(4) Existing baseline of the Environment
Sensitive points monitored of the project include Dayuantou Village, Shanzibei School, Xiaogang Village, Xiaojiang Village and Laojiang Village. All monitoring points but Laojiang Village within 300m of the plant boundary complies with the Class II standard of Standard of Environmental Noise of Urban Area (GB3093-93). As can be seen from the table, during daytime, all monitoring points meet relevant standard requirements except Yangwu village; during night all monitoring points exceed the standard, among which the most serious one is in Shanzibei School, the maximum monitored value of which is 13.4dB above the standard value.
(5) Existing baseline of soil environment
Monitoring on 1# rice soil of Xinxiaojiang Village, 2# vegetable soil in Xinxiaojiang Village, 3# vegetable soil in Songshanxia Village, 4# rice soil in Laoxiaojiang Village and 5# rice soil in upstream of Meihua River in this assessment, following the Class II standard of Environmental Quality Standards for Soils (GB15618-1995). As shown by the above evaluation results: the cadmium values monitored at all monitoring points are 4.5-7.7 times above the standard, the mercury values in the upper and lower soil of 1#, 3#, 4#, 5# monitoring point and the copper value of the upper soil of 3# monitoring point are above the standard.
Reconstruction Project for CDQ Clean Production on 6m Coke Oven in Coking Plant, Guangdong SGIS Songshan Co., Ltd.
South China Institute of Environmental Sciences, Ministry of Environmental Protection of the PRC 202
(6) Investigation and assessment of farm crop
Three sampling points for farm crop are arranged in the assessment area. Samples are harvested crops in this area (vegetables, potatoes and coarse rice). Analysis items include Cu, Pb, Zn, Ca, Hg and As.
Compared with relevant standards in National Hygienic Standards of Grains(GB2715-81), the investigation and analysis result of crops show that the As in crops is lower that the national standard, but Cdin 5# vegetables in upstream of Meihua River exceeds the standard. All crop samples are colory and with pure smell. In the assessment area, all farm crops are not polluted with heavy metals except that the 5# vegetables in upstream of Meihua River are polluted with Ca.
14.4 Environmental Impact Prediction (1) Assessment of atmospheric environment impact
Under normal working conditions, the impact of the project on PM10 daily mean ground concentration has a relatively small prediction increment at all sensitive points, only accounting for 0.33%~2.33% of the Class II standard of ambient air quality; and accounting for 31.4%~58.3% of Class II standard of ambient air quality after superposition of the existing baseline value. It can meet the requirement of environmental functions in the assessment area.
After superposition of the coke dry quenching project with 6m coke oven, the impact on PM10 daily mean ground concentration has a relatively small prediction increment at all sensitive points, only accounting for 0.93%~12.47% of the Class II standard of ambient air quality; accounting for 36.4%~59.13% of the Class II standard of ambient air quality after superposition of existing baseline value.
After superposition of the coke dry quenching project with PM10 emission of 6m coke oven, the impact on its surrounding atmospheric environment is up to the standard, and the environmental function of assessment area can be up to the standard.
Under abnormal working conditions, in case of the dust separator and pressure relief point of the recycle air under the abnormal working, the superposition prediction shows that the influence of daily mean ground concentration of TSP in each sensitive point has obvious increment, which accounts for 3.20%~51.17% of the Class II standard of the ambient air quality. The value superposed with the existing baseline value accounts for 49.20%~93.03% of the Class II standard of the ambient air quality. It can meet the requirement of environmental functions. And the abnormal working conditions last a short time, so it will not bring obvious negative influence on the surrounding environment.
(2) Water environment impact analysis
Water saving and recycling based on the quality are taken into consideration during the designing of 6m coke oven and coke dry quenching project. Small discharge amount of the clean sewage is also collected by the clean water system in the plant for recycle use. Under normal working conditions, no drainage from the project is discharged into the surroundings.
The production wastewater of the project follows up indirect zero drainage, and its main pollution to the water environment is the direct discharge of a little amount of domestic wastewater. According to the engineering analysis above, the project generates domestic wastewater with an amount of 7.2m2/d, accounting for 0.06% of the discharge capacity. Therefore, the project has a relatively little impact on water environment. SGIS is now constructing a wastewater treatment plant. After it is constructed, all wastewater from the plant will be collected by the wastewater treatment plant where the wastewater is treated to meet standard prior to discharge. At that time, the pollution resulted from direct discharge of domestic wastewater will be solved, and the water quality of Meihua River, Maba River and Beijiang river downstream the drainage outlets will be significantly improved.
Therefore, the project has a little impact on its surrounding water environment.
(3) Acoustic environmental impact assessment
According to Table 6.3-3a and Table 6.3-3b, after put into service of the project, all the forecast values exceed the specifications before noise control measures are adopted; but after the control measures proposed in the project analysis are improved, the values of various monitoring points adding the
Reconstruction Project for CDQ Clean Production on 6m Coke Oven in Coking Plant, Guangdong SGIS Songshan Co., Ltd.
South China Institute of Environmental Sciences, Ministry of Environmental Protection of the PRC 203
background value is predicted to reach Class III standard and there is no impact on the acoustic environment.
(4) Environmental impact analysis of solid waste
Only the single type solid waste, coke dust of about 3,262.8t/a collected by the dust-removal system, is produced in the process of production of the CDQ project. The humidified coke dust is completely and comprehensively utilized by delivering to the coal preparation workshop with carrier vehicles and incorporating in coking coal, or delivering to the sinter plant as per requirements as the raw material.
At present, SGIS Company has recycled or comprehensively utilized all produced solid wastes, and basically there is no pollution caused solid wastes.
(5) Environmental risk assessment
In case of the accidental leakage of CO, under the most unfavorable and credible meteorological conditions, no semilethal concentration scope is appeared in the accident. Under the most unfavorable meteorological conditions and the wind speed of 1.5m/s of stability F, the maximum allowable concentration limit exceeding that of the workshop is 80m, limit exceeding that of the Class II standard of the ambient air quality is 800m, and limit exceeding that of the residential area is 850m. Based on the layout map and the location of project and the sensitive points, there is no sensitive point within 900m outside the coking plant boundary, and no human injury will be caused.
In case of H2S leakage accident, under the most unfavorable meteorological conditions and the wind speed of 1.5m/s of stability F, the maximum allowable concentration limit exceeding that of the workshop is 850m, limit exceeding that of the Class II standard of the ambient air quality is 1100m, and limit exceeding that of the residential area is 1,100m. Human injury will be resulted from eight-hour operation in the workshop where the concentration of H2S exceeding the maximum allowable concentration limit. However, for this project, the accident occurring time of the waste Coke Oven Gas is 10min and the emergency response will be completed in 30min, so it will have no impact on the ambient air. Based on the layout map and the location of project and the sensitive points, there is no sensitive point within 900m outside the coking plant boundary, and there is no resident in the scope of the maximum allowable concentration of the workshop, so no human injury will be caused.
There is no sensitive spot within the scope of internal SGIS 850m.
Based on gas leakage accident results and preventive measures accumulated for each year in the past, the assessment considers the environmental risk of this project is in the acceptable scope.
The firewater of CO fire accident often contains suspended matter and other impurities. It is different from the accident firewater of chemical industry, because there is no toxic and harmful substance flow out from the firewater. If there is a fire accident for this project, the firewater should be collected through rainwater pipeline, and then a sample sedimentation process should be conducted before discharging.
It's recommended SGIS Group to construct a settling tank for the initial rainwater, which can also be worked as an accident tank for incident drainage and fire water collection, ensuring all discharge outlets could be up to standard.
14.5 Clean production and mass loading control (1) Clean production
In summary, according to comprehensive analysis of each clean production index, all indexes of this project basically reach or exceed the Class II standard of clean production and are relatively better than other domestic competitors. Also, they are consistent with relevant regulations of Clean Production Standard -Coking Industry (HJ/126-2003) and Development Policies for the Iron and Steel Industry(July, 2005) and occupy the advanced position in clean production of domestic steel industry.
It is recommended by this assessment to establish strict internal management rules and regulations, implement safe production guidance, make job training, execute post responsibility system, carry out clean production auditing as soon as possible, strengthen quality management, improve environmental management level, decrease pollutant discharge and increase the level of clean production further.
Reconstruction Project for CDQ Clean Production on 6m Coke Oven in Coking Plant, Guangdong SGIS Songshan Co., Ltd.
South China Institute of Environmental Sciences, Ministry of Environmental Protection of the PRC 204
(2) Mass loading control
This CDQ project effectively reduces the dust generated in original coke wet quenching process after being put into operation, and there is no SO2 discharged which belongs to pollutant of total volume control. Therefore, it is judged by this assessment that it is unnecessary to apply total volume of Air Pollutants for this CDQ project.
Wastewater with generation capacity of 2m3/d after this CDQ project being put into operation is water seal water of CDQ oven. The wastewater is discharged into the current phenol-cyanogen wastewater treatment station of coke-oven plant and will be applied as cooling water of blast furnace after being treated and meeting relevant standards. Domestic wastewater with generation capacity of 7.2m3/d is discharged into the existing domestic wastewater pipeline of SGIS. Staff of this department is re-assigned within SGIS. Hence, as for water pollutants, it is judged by this assessment that it is unnecessary to apply total volume of water pollutants for this CDQ project.
14.6 Industrial policies analysis and the rationality analysis of site selection (1) Analysis of compliance to industrial policies
This dry quenching system is equipped with a JNG90-2(140t/h) dry quenching device, dust collection and removal devices and dry quenching boilers. The circular utilization of water is 98.2%. The dusts collected by the dust remover constitute the solid wastes, which are moistened and sent to the sinter workshop as raw materials. Compared to the original wet quenching method, dry quenching improves the utilization efficiency of energies, the recycling utilization of resources and the environment. The project is in line with the industrial technical policies in accordance with the Development Policies on Steel Industry. And the project is encouraged in the Guidance Directory for Adjustment of Industrial Structures(the National Development and Reform Commission; Decree No. 40).
Devices altered using this technique can produce 72t/h, and 587520 tons of steam annually. It can replace the corresponding coal steam boiler, saving 65,280 tons of coal annually, reducing SO2 emission by 840 tons annually, reducing dust emission by 441.6 tons annually, and NOx emission by 640 tons annually; The circular utilization of water is 98.2%. It can reduce the emission of carbon dioxide by 73241 tons annually, contributing to alleviating the greenhouse effect. This is a leading technique of clean production in the same industry. Comply with relevant requirements of the General Plan of Guangdong Provincial Environmental Protection (2006-2020).
(2) Rationality analysis of the site selection
The project is located in the plant region of SGIS Songshan Co., Ltd, which is in line with the internal land usage planning of SGIS Group. The project has a proper connection with the smelting plant, providing product to the smelting plant and receiving raw materials from the raw material plant, and the general layout complies with the process flow. The location of the project complies with the production requirement of SGIS.
Based on the prediction results, all environmental factors shall comply with the requirements of layout of environmental functions, and are feasible in line with environmental requirements.
The health protection distance of 6m Coking Plant may be taken as 300 meters according to calculation basing on GB/T13201-91. All the distances between nearest sensitive points and the main pollution facilities meet this requirement of this health protection distance.
In the section dedicated to risk assessment, the safety distance of this project is determined as 850m according to the estimation of CO leakage. There is no sensitive spot within the scope of internal SGIS 850m.
The location of SGIS, where the project is located, is as shown in Figure 2.2-2. Comply with the requirements of health protection distance and safety evacuation distance.
14.7 Public participation analysis According to requirements of the Regulation for Public Participation in the Environmental Impact Assessment (Huan Fa 006 [No.28]) and the Implementation opinion for public participation in
Reconstruction Project for CDQ Clean Production on 6m Coke Oven in Coking Plant, Guangdong SGIS Songshan Co., Ltd.
South China Institute of Environmental Sciences, Ministry of Environmental Protection of the PRC 205
environmental management of construction projects in Guangdong Province (Yue Huan [2007] No. 99), three stages of public participation for this project have been conducted.
According to the statistical result of the public participation survey form issued, generally, 72.2% of the respondents expressed support of the Project, 22.7 of the respondents said it does not matter one way or another, 5.1% of the respondents clearly expressed opposition due to concerns over air, water pollution, traffic inconvenience and economic losses during construction of the Project. People who raise objections mostly are villagers of the surrounding area, that they do not have enough confidence on the Project, and are worried that the Project affecting the water quality of the Plum Blossom River and causing air pollution. But after further communication as well as the commitments made by the owner, the people who opposed the Project are able to understand and support the implementation of the Project and its construction. So, if the Unit of the Project take measures on the “Three-waste” treatment in accordance with the requirements of environmental protection, meet emission standards, strictly implement the various management measures and safety precautions proposed by the EIA report, and reduce the impact on the life of the residents and on the environment following the completion of the Project, the majority of the public support the construction of the Project.
In conclusion, the proposed project complies with relevant national and local industrial policies; complies with the requirement of clean production and circulation economic; not changes the environmental function zone of the assessment areas in operation; the environmental risk is lower than that of the mean level of this industry and the public has a supporting attitude for the project construction.
Based on the preconditions of that the construction party complies with the “three simultaneities” requirement of environmental protection, ensures the normal operation of environmental protection treatment facilities strictly, paies great attention to the environmental risk prevention and strictly implements relevant environmental protection measures proposed in this report, the construction of the proposed project is feasible in environmental protection.

Reconstruction Project for CDQ Clean Production on 6m Coke Oven in Coking Plant, Guangdong SGIS Songshan Co., Ltd.
South China Institute of Environmental Sciences, Ministry of Environmental Protection of the PRC 206
Appendix: 1. Shao Huan Han [2008] No.11, Letter on Opinions for Examination and Approval of Environmental
Impact Report of Gas Tank Engineering Construction Project of Guangdong SGIS Songshan Co., Ltd.;
2. Public notice of environmental evaluation results of this project; 3. Letter of attorney of the project;