fighting the hidden disaster
TRANSCRIPT
Fighting the Hidden DisasterAssessing support for disabled children by the Liliane Foundation
Centre for International DevelopmentIssues Nijmegen (CIDIN)Radboud UniversityPostbus 9104 6500 HE Nijmegen+31 (0)24 361 30 58E-mail [email protected]
Paul Hoebink with Jessica Rijpstra
Contents
Summary: Conclusions and Recommendations 4
Preface 8
Introduction 9Research Questions 10Methodology 10
Excursus 1: Disabilities explained 13
1 THE CONTEXT 18 1.1 Terms and concepts 18 1.2 The international context 20 1.2.1 The United Nations Convention on the Rights of Persons with Disabilities 20 1.2.2 International support for people with disabilities 22 1.3 Community Based Rehabilitation 23 1.4 The Liliane Foundation 23 1.5 Argentina 27 1.6 Ghana 27 1.7 India 31 1.8 The Philippines 32 1.9 Conclusions 34
2 POVERTY AND DISABILITY: STANDARD OF LIVING, HOUSING, ASSETS 35
2.1 Argentina 36 2.2 Ghana 37 2.3 India 38 2.4 The Philippines 39 2.5 Conclusions 40
3 THE SUPPORT OF THE LILIANE FOUNDATION: STRUCTURE AND ACTUAL SUPPORT 41
3.1 Argentina 43 3.2 Ghana 43 3.3 India 44 3.4 The Philippines 46 3.5 Some overall findings on support received 46
4 THE DISABILITIES OF THE CHILDREN THAT ARE SUPPORTED BY THE LILIANE FOUNDATION: VISIONS OF CHILDREN, PARENTS AND COMMUNITIES 47
4.1 Argentina 47 4.2 Ghana 48 4.3 India 50 4.4 The Philippines 50 4.5 Conclusions 51
5 EDUCATION AND JOBS 52
5.1 Argentina 53 5.2 Ghana 53 5.3 India 55 5.4 The Philippines 57
– 2 –
Contents
6 SOCIAL WELL-BEING: FAMILY, FRIENDS, ASSOCIATIONS AND THE FUTURE 58
6.1 Argentina 60 6.2 Ghana 62 6.3 India 63 6.4 The Philippines 63 6.5 Some overall results on well-being 64
7 CONCLUSIONS: WHAT DID THE SUPPORT OF THE LILIANE FOUNDATION ACHIEVE? 67
7.1 General judgments of the recipients 67 7.2 On poverty and disability 69 7.3 On education 70 7.4 On well-being 70
8 SOME REFLECTIONS ON THIS RESEARCH, THE SUPPORT OF THE LILIANE FOUNDATION AND THE FUTURE OF THIS SUPPORT 72
REFERENCES 74
APPENDICES 79
1 Topic List 79 2 Questionnaire 80 3 Scorecards 92 4 Places and organizations visited 95 5 Statistics 96
ABOUT THE AUTHORS 109
AbbreviationsCHAI Catholic Health Association of IndiaCBR Community Based RehabilitationCONADIS Comisión Nacional Asesora para la Integración de las Personas con Discapacidad
(Consultative Commission for the Integration of Persons with Disabilities) (Argentina)DFID Department for International Development (UK)DPO Disabled People/Persons OrganizationIBR Institution Based RehabilitationICDH International Classification of Functioning, Disability and Health (1980)DPO Disabled Persons OrganizationICF International Classification of Functioning, Disability and Health (2002)IDH International Statistical Classification of Diseases and Related Health ProblemsINDEC Instituto Nacional de Estadistica y Censos (Argentina)KAMPI Katipunanng May Kapansanansa Philippines Inc
(National Confederation of Organizations of People with Disabilities in the Philippines)PO Partner OrganizationPWD(s) Person(s) with DisabilitiesREDI Red por los derechos de las personas con discapacidad
(National Network for the Rights of Persons with Disabilities) of ArgentinaSWEB Samuel Wellington Botwey Foundation (Accra, Ghana)UK United KingdomUN United NationsUN CPRD United Nations Convention on the Rights of Persons with DisabilitiesWHO World Health Organization
– 3 –
Summary: Conclusions and Recommendations
The international context1 The international context surrounding the support for disabled people has benefited from three
major events in the last two decades. Firstly, there was the introduction of the International Classification of Functioning, Disability and Health (ICF), presenting a new model - that embraces medical and social aspects– to measure and analyze disability. In the second place, there was the United Nations Convention on the Rights of Persons with Disabilities (CRPD), which has given more protection and support to people with disabilities. Thirdly, there was the World Disability Report, which brought a lot of expertise and knowledge of several aspects of disability together for the first time.
2 The CRPD is already changing international and national environments and contexts for disability politics and the implementation of laws and policy programmes. It not only obliges the countries which have ratified the Convention to undertake all kinds of actions, but also serves as a point of departure, entry point and yardstick for Disabled People’s Organizations (DPOs) and their supporters. The four countries in this study have already ratified the CRPD, and some have presented action plans. The Netherlands is in the small group of countries which is (very) late with its ratification.
3 Only a few multilateral and bilateral donors have tried to formulate policies or assessment instruments with regard to disability and development. Mainstreaming of disability in development policies has up till now been a failure. Successful support for people with disabilities in the development programmes of international organizations and Western donors has come from some larger programmes financed by the World Bank and some small co-financing schemes by Nordic donors and the UK. The long-term absence of a poverty policy in the Dutch development cooperation programme makes it unsurprising that the Netherlands is also missing from those donors who at least have tried to integrate disability into their policies.
About this research4 The objective of this research was to assess what has happened to children that the Liliane
Foundation has supported over the years. For this we interviewed 117 disabled people in four countries (Argentina, Ghana, India and the Philippines) with the help of a questionnaire that was translated into a topic list and complemented with some ranking exercises.
5 The aim of the questionnaire was to provide insight into their living situation (housing, welfare, income), their disabilities, the support they have received over the years, the education they followed, the jobs they have, and the social and political aspects of their lives. In most cases we interviewed the respondents in their houses, which also gave us an opportunity to see how and where they lived.
6 We selected ‘children’ from different generations, also to get a better understanding of what kind of achievements supported ‘children’ could attain.
Findings: income and assets7 Nearly all the people we interviewed came from (very) poor families, many of them still living in
poor neighborhoods or villages, sometimes still under very poor circumstances. It is clear that looking at housing and assets, there were quite some differences between the four countries, but also within the four countries. In Argentina, an upper-middle income country, disabled people and also our respondents, receive social benefits. In Ghana this is not the case. Although the benefit payments are not sufficient to cover all the needs, in general the people we interviewed in Argentina have better houses and more assets, while in Ghana we found very poor disabled people, surviving on a few Cedis per day. In India and the Philippines, most of our respondents also came from poor families, generally having more assets in the Philippines than in India, where we found some extremely poor families as well as some who were a bit better off.
8 Most of our respondents could not survive from their own income or social benefit payments, also needing the support of their family or others. 54 percent of our respondents had a regular income, but only 35 percent indicated that their income was sufficient to pay for all the things they needed.
– 4 –
Findings: causes and acceptance of disabilities9 It is clear that when a country is more developed, its primary health care system is better and the
coverage of its immunization programmes is enlarged. As a consequence of this, different types of disability emerge or disappear. This is the case with polio in Argentina, which has had no outbreak since the 1950s. For this research it meant that in Ghana, for example, we interviewed more former polio patients, and in Argentina more mentally disabled people.
10 On average, 79 percent of our respondents were physically disabled; in Ghana this was 100 percent. Only in Argentina were the majority of our respondents mentally disabled.
11 The reaction of parents, families and communities to the disabilities of their children differed from
country to country. Acceptance seemed to be highest in India (where our interviews were in the south of the country) and lowest in Ghana, where children were excluded, also because of local beliefs and anxiety. It is encouraging to see that over the generations these prejudices are gradually disappearing.
Findings: support by the Liliane Foundation12 Support by the Liliane Foundation in the four countries started mainly via religious (catholic)
orders, which were the first network available, and which also offered institutional support. We found little evidence of Community Based Rehabilitation over the years, except maybe from the Philippines and India where in some cases families (mothers) were actively engaged in caring for their children, doing exercises with them. In Argentina, families received support and training via the neighbourhood centres. The engagement of parents also often depended on their attitudes and education (especially the mothers), but in Ghana, India and the Philippines we found little evidence of special training programmes for parents.
13 Our respondents had mostly started to receive support at the age when they should go to school, but in the early years of Liliane Foundation support, in the 1980s, sometimes also at an older age.
14 Altogether, 77 percent had received support for education, 59 percent had received medical support
and 54 percent financial support; 38 percent had received (orthopedic and sensory) devices and 18 percent had undergone (mental and/or speech) therapy (mainly in Argentina). In Ghana we found the most respondents who had received medical support and orthopedic devices, while the number of people who received direct financial (cash or income) support was highest in India.
Findings: education and employment15 Altogether, 77 percent of our respondents had received assistance for their education. This support
was lowest in Argentina, where the free education includes disabled children, and highest in Ghana (93 percent).
16 This support for education is highly valued. When disabled children were raised in institutions, such as in Ghana or India, they were most of the time (19 percent of the respondents on average; 60 percent in Ghana) trained in specific vocations, such as tailoring or shoe-making, regardless of their interests or capacities. Some of them now have their own shops and try to make a living out of it, which is not always easy.
17 Quite a number of respondents were able to go to college, are still going to college, or are hoping to be able to go to college. 24 percent finished their education with a Bachelor’s degree, 9 percent with a Master’s. Most of them, particularly in India and the Philippines, did remarkably better than their brothers and sisters.
18 Altogether, 56 percent of those we interviewed had a job, or even two or three jobs. This 56 percent included 22 percent who were self-employed, having their own shops as tailor or shoemaker; and 26 percent who were working as teachers or assistant-teachers. This leaves 27 percent who were unemployed, who had a job before but are now unemployed, who never will be able to have a job and/or who are in special day care; and also 16 percent who are still studying or going to school.
19 Altogether, 54 percent (of those who filled in the scorecards) had a regular income, but only 35 percent indicated that that income was sufficient to meet all their needs. This means that more than 56 percent are still dependent on their families for their survival, which is in particular true in
– 5 –
Argentina, where only half of the respondents were able to fill in the scorecards and where only one third of those who did fill them in had an income that could cover their basic needs.
Findings: social life, well-being and visions of the future20 Most of our respondents told us that they had enough friends and the numbers they gave were
definitely convincing. But isolation and difficulties with transport might make it difficult to really meet with them. When they do meet, patterns of activities differ, meeting and chatting is more common in Ghana, while meeting and going out (to e.g. shopping malls) seems more appropriate in (semi-)urban settings such as in the Philippines. Those with physical disabilities seemed to have fewer problems with meeting friends, unless they were living in isolated places.
21 Very few of the respondents were active in associations (DPOs) or politics. In Ghana we found the most active community, but the associations did not appear to be very strong. In the Philippines, several partners of the Liliane Foundation were DPOs and some of the people we interviewed were active members. Those who were not active in associations often had problems with transport going to meetings or had negative attitudes to these organizations.
22 Depending on the political situation in their countries our respondents mostly voted along traditional lines – looking also at how their families/fathers voted – but still in the Philippines and Ghana we found quite a number of respondents who looked also at how the policies of particular parties benefited their interests.
23 If we look at the scores on well-being, our respondents scored higher than UK residents and Londoners in recent British surveys. It was also remarkable that they scored much lower on their past and much higher on their future, which shows that they are very optimistic about where they will go.
Findings: rating the support of the Liliane Foundation24 On average, our respondents rated the support they received at 7.7 on a scale of 10. Altogether,
58 percent stated that the support had helped much or very much and 19 percent that the support helped them a little. 71 percent emphasized that their lives had changed much or very much. 16 percent stated that it had changed only a little.
25 The most positive responses were those regarding the support they received for their education. For 84 percent of those who filled in the scorecards, the benefits of education took first place. Second was the impact the support had on their physical well-being (particularly high in Ghana) and third was the impact on their social situation.
Recommendations26 The Liliane Foundation could bring its support for children with disabilities to the next level and
use the changing international climate around disability to engage more in activities to promote disability rights, to change the attitudes of the international donor community and to help partner organizations in developing countries to claim disability rights and changes in local, national and municipal, policies.
27 In the absence of an anti-poverty strategy in the development cooperation policy of the Netherlands, and with it, the absence of a strategy vis-à-vis specific disadvantaged groups in this development policy, and with the Netherlands also being one of the last nations to ratify the UN Convention on the Rights of Persons with Disabilities, the Dutch government might be the first target of such a lobbying campaign.
28 The Liliane Foundation could start a pilot project with three or four sister organizations in Europe and three or four partner organizations in developing countries, to lobby for changes at national and international levels in the fields of the rights of disabled people, poverty and international cooperation.
29 Argentina has shown that the Liliane Foundation was right to gradually phase out its programme there, because countries become responsible themselves for compatriots with disabilities – especially in the light of the UN Convention – when they achieve a certain level of development. The Liliane Foundation might therefore need to further reduce the number of countries in which it is active, also because it could have - with capacity building of disabled people’s organizations,
– 6 –
lobbying and advocacy – more complex programmes in the remaining countries.
30 Given the changes in disability prevalence, such as the disappearance of polio and tetanus, it might be that other patterns of assistance could also appear in the Liliane Foundation’s target group, with more support for children with mental disabilities. In this changed programme, it might be more difficult to show ‘visible successes’ of the support (for example from inactive lives in shacks or houses via walking to getting good results at school). The Liliane Foundation should be ready to define and present some of its results in different ways, more in terms of the improvement of the quality of life.
31 The Liliane Foundation should not hesitate to spend more money than average on children that are successful in secondary education and could go to college or university. A special fellowship fund for these children might also attract other (institutional) donors/investors.
32 The Liliane Foundation and its strategic partners should have a sharper strategy and have a deeper debate on the pros and cons of Institutional Based Rehabilitation versus Community Based Rehabilitation, as well as on the pros and cons of inclusive education. A two-track approach might be needed in both cases, given the lack of support that might appear for specific rehabilitation and support programmes.
33 Since the role and profile of mediators has been changing, the Liliane Foundation should discuss with its partners the possibility of paying a salary for the work that they are doing, and at least compensating them for their transport costs, and organizing capacity building for them. This also implies having a discussion on the overhead costs of partner organizations.
– 7 –
Preface
In a brochure published for the Liliane Foundation’s 10th anniversary in 1990 with the title ‘The Hidden Disaster’ it was stated that children with disabilities in developing countries had three disadvantages: they were poor, they had a mental or physical disability, and they had few or no possibilities for rehabilitation. This research report is about the fight against this ‘hidden disaster’, with the objective of seeing what the results of the Liliane Foundation’s support for disabled children have achieved.
Many miles have been travelled to compile the data for this report. We flew around 50,500 miles (around 81,000 kilometers) and covered an additional 2,600 miles in cars, and also on hand-driven ferries, in buses, Jeepneys, Chevrolets, tricycles, and even between the maize fields on foot. A lot of miles and kilometres to visit the respondents, children assisted by the Liliane Foundation in the last three decades, but it was worth every mile.
Many people have given us support to collect the data for this report. It started in the Philippines where sr. Agnetia took us around in the metropolis of Manila, and Zenaida Guevara of AKAPIN through the villages of Bulacan. Dr. Jessie Villarreal and the president and organizers of the Associations of Disabled Persons (ADP) Nemensio Flores and dr. Melvin de la Serna let us experience the countryside at Iloilo and Antique, together with the sisters Concordia and Rosa of the Saint Joseph the Worker Orphanage Center. We also thank the National Coordinating Team in the Philippines for their assistance.
It continued in Ghana where Nicholina Agbobada of the SWEB Foundation made us aware of the difficulties and joys of living in her home country, taking us on long rides to the east in Ghana to Abor and Keta and later to Kumasi. Also David Norden Botwey, director of the SWEB Foundation, helped us to decipher the problems of people with disabilities in his country.
Then we arrived in India with the support in particular of Vishai Gupta of the Catholic Health Association of India (CHAI), in Cochin with father Marian Arackal and his team of the Cochin Social Service Society and the sisters Suman, Sajeeva and Philomena of the Association of Social Development in Aluva and the Society of Mary Immaculate in Thrissur and Suhruth Sadan our translator, father Anthony of the Damien Institute, Ravi and Viji , who all showed us the social differences a society has to cope with.
And finally we arrived in Argentina where Nuria Aquino showed us around in the slum areas of Greater Buenos Aires and where we also had support on our visits from Celeste Santin, both of Lazos Profesionales. We were also glad to receive comments on the first draft of this report from most of those who helped us.
On this road we discovered the differences in culture (how in different societies there are different perceptions of impairments and disabilities). We discovered the differences in poverty and living circumstances of disabled people, with huge differences even in the same country, and how people struggle and fight to survive in often extremely difficult situations. We have seen the ‘bottom of the pyramid’ but also people who have become successful and fought themselves out of poverty. But they were all willing to talk with us and in nearly all cases were happy to tell us their life histories.
Many people within the Liliane Foundation have assisted us. Firstly our ‘sounding board’ with Henk Hofste, Bernard Morvan, Cobi Klappe, Anneke Hofs and Sofka Trajcevska; secondly, staff members that we interviewed and/or who supported our travel: Kees van den Broek, Willie Houben, Juultje Tulfer, Jorrit Frankhuizen, Clara van Eijk-Bos and Miel Claes, some of whom also commented on this report. We definitely appreciated their frankness and openness, not to forget their dedication and commitment.
Many children and adults, present and former ‘clients’, supported by the Liliane Foundation, have given us insights into their lives, and the obstacles, hopes and dreams affecting them. They all received us with warmth, happy to tell their stories to two people who came from far to listen to them. We would just like to thank all these people for the support and assistance they have provided to us. This was not only a journey of many miles, but (mainly) of many stories - some sad, some happy - and all colorful, of many new ideas and findings, of many pictures that you will find also in this report, and of many laughs, because humour transcends borders and cultures. We enjoyed it all.
Paul HoebinkJessica RijpstraNijmegen, August 2015
– 8 –
Introduction
On 14 March 2015 the Liliane Foundation celebrated its 35th anniversary, having been officially founded by Liliane Brekelmans-Gronert in 1980. In all those years, the Liliane Foundation has tried ‘to open the world’ for disabled children in developing countries, starting in Sumatra and Indonesia, then expanding its work over three continents, working with local partners on empowering these children, on capacity development of local organizations, and indirectly through its local partners also on the position of the disabled in the societies concerned.
This report is the result of a research project to assess the impacts of the activities of the Liliane Foundation over the past 35 years by means of a tracer study, using life histories as a methodology to look at the position of supported children in their economic and social environments.
Background and objectives of the studyThe ways in which disabled people are seen and are supported, have been changed considerably in these last 35 years. From a pure medical-individual approach, aimed at physical rehabilitation, the social and political environment has become much more in the focus of the support for and activities by disabled people. Definitions, concepts and thus also support activities have been the subjects of sometimes heated debates, often fueled by organizations of the disabled themselves. The construction of the International Classification of Functioning, Disability and Health (ICF) in 2001, with its three broader dimensions of disability, and the adoption of the UN Convention on the Rights of Persons with Disabilities in 2006 have changed the discussion on disability and disability support considerably. Proof of that is the path-breaking World Report on Disability by the World Health Organization (and the World Bank), which presents a balanced overview of the international discussions on disability, its physical, personal, social and political aspects. We will come back to these changes in the international environment in Chapter 1.
It can be seen from this World Report that many aspects of disability are under-researched. This is clearly visible in the chapters on rehabilitation and on enabling environments (Krahn 2011). This lack of knowledge of the social and economic lives of people with disabilities is also acknowledged in a recent article on the relationship between poverty and disability (Mitra et al. 2013). Not only the World Report on Disability but also some older papers show that we know very little about the results of Community Based Rehabilitation programmes. This is because evaluations are often anecdotal and methodologically not very sound (Flinkenflügel a.o. 2005; Wirz & Thomas 2002), and also because they are often focused on medical assistance and capacity of intervention. There are indications that Community Based Rehabilitation is cost-effective, and has resulted in increased income and greater social inclusion and increased self-esteem, but at the same time there is criticism of unmet medical rehabilitation and the participation of disabled people themselves in projects and programmes (Hartley et al. 2009).
A preliminary literature review on evaluation reports and in scientific journals such as The Lancet, International Journal of Rehabilitation Research, the Disability and Health Journal, but in particular Disability (Handicap) and Society confirmed these blind spots in publications on disability in developing countries and on success and failure of support programmes. A wider literature search in anthropological and development journals did not correct this assessment, but seeing the absence of views and attention given to disability in the Millennium Development Goals (MDGs) and in development cooperation programmes, this could be expected.
The relationship between poverty and disability is complex and has several dimensions, generally being seen as bi-directional: poverty could or might increase the risk of becoming disabled and if you are disabled or becoming disabled, it might be difficult to escape from poverty and you could also easily fall into poverty (WHO 2011). Poverty is often – as the title of Anirudh Krishna’s book indicates – ‘one illness away’. This bi-directional link weighs more heavily on developing countries, since disabled people and their families are more likely to experience poverty and disadvantages in the economic and political climates of developing countries.
This means that an important objective of this study was to gain an insight into what had happened to the children supported by the Liliane Foundation and its partners in the last 35 years.
– 9 –
Research Questions
This led to an overall research question asking about the impact of the Liliane Foundation’s support:
What has been the impact over the years of the support of the Liliane Foundation through its partners in Argentina, Ghana, India and the Philippines on the lives and well-being of the children it supported?
This question was detailed in a series of sub-questions:
1 What kind of impairments do the children (adults) who were and/or are supported by the Liliane Foundation have, when were they detected and what were the attitudes within the social environment to these impairments?
2 What kind of support did they receive from the Liliane Foundation, when did it start and when did it end?3 What are the current living conditions of children (adults) who were and/or are supported by the
Liliane Foundation through its partners, looking at housing, (family) income?4 Did these children go to school, for how many years and what was the final level of their schooling?5 Do they have jobs, or have they had jobs before, and do these jobs bring an income that is sufficient
to live from, or do they receive a social allowance?6 What kind of social networks do they have (family, friends) and how do these contribute to their
well-being?7 Are they members of associations or organizations of disabled people, and are they politically
active with regard to disability?
All these questions ended in a questionnaire and a topic list as will be explained below.
Methodology
The design of this research project aimed to use a set of methodological approaches and techniques to present a new look at the Liliane Foundation’s history, and results over time. This involved interviews with staff members of the Liliane Foundation and also former staff members and volunteers. These interviews aimed to document the history of the Liliane Foundation, including important changes in policies and strategies, as well as to prepare for the country visits. In the four countries, we had mostly short interviews with Liliane Foundation partner organizations and their staff, again documenting the history of the relations with the Liliane Foundation and present day strategies and policies. It should be emphasized, however, that this is not an evaluation study on the Liliane Foundation’s policies and the changes therein, nor of the Liliane Foundation’s partner organizations and their policies and implementation. We used these interviews mainly as background information to assess the context within which the ‘clients’ of the Liliane Foundation and its partners were supported.
The most important ingredient of this research was a set of tracer studies on children supported by the Liliane Foundation. For the tracer studies we used questionnaires and a topic list. A tracer study is a type of research methodology in which you try to follow an individual on his or her life trajectory and attempt to measure the support she or he has received from health institutions, social centres, education facilities or other types of support.
Tracer studies – widely used in (bio)chemical studies on the effects of chemical substances – are used only to a limited extent in the social studies, particularly in education studies. In education studies they are used to assess the results – mostly social – of former students, be it in training programmes, or education from vocational schools to universities. Ingeneral they are survey-based, looking for a high number of respondents to assess the social – and to a certain extend the economic – value of training and education. In this study we used these by developing a questionnaire in which life histories, support by the Liliane Foundation and its partners, as well as the well-being of the interviewees are assessed.
It is clear that changes in the direct or wider environment of the disabled individual might have had positive or negative influences on the well-being of the disabled person we interviewed (which is called the attribution problem in evaluation research). We tried to control for these in our questionnaire by also posing questions on these types of changes, as well as on the ideas on attribution of the interviewees themselves. Furthermore, we also asked questions regarding family members, their education, jobs, income, etc.
In this research we used a tracer study to assess the assistance of the Liliane Foundation and its partners by collecting data on children assisted by the Liliane Foundation over the years. We tried to
– 10 –
interview three generations of Liliane Foundation supported children on their life histories. With the help of the partner organizations of the Liliane Foundation, we tried to find and select children from the 1980s, the 1990s and the early 2000s. We hoped initially that this would result in the following selection of respondents:
1 10 respondents from different generations, ideally 10 from the period 1980-1986; 10 from the period 1990-1996; 10 from 2000-2004.
2 Half of the respondents should have been female, half male. 3 We tried to select respondents with different disabilities, physical as well as neurological, but we
also limited the number of people with neurological disabilities (Down’s Syndrome, cerebral palsy), because often we could not interview them, only their parents.
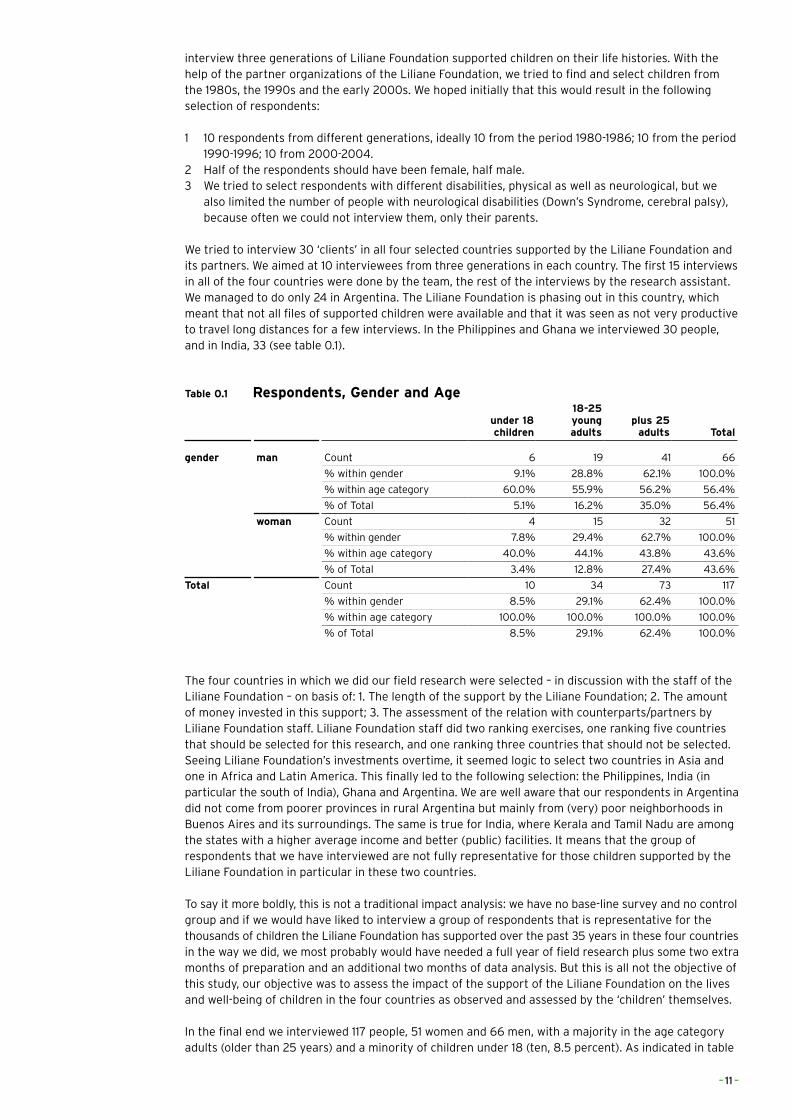
We tried to interview 30 ‘clients’ in all four selected countries supported by the Liliane Foundation and its partners. We aimed at 10 interviewees from three generations in each country. The first 15 interviews in all of the four countries were done by the team, the rest of the interviews by the research assistant. We managed to do only 24 in Argentina. The Liliane Foundation is phasing out in this country, which meant that not all files of supported children were available and that it was seen as not very productive to travel long distances for a few interviews. In the Philippines and Ghana we interviewed 30 people, and in India, 33 (see table 0.1).
Table 0.1 Respondents, Gender and Age
under 18children
18-25youngadults
plus 25adults Total
gender man Count 6 19 41 66
% within gender 9.1% 28.8% 62.1% 100.0%
% within age category 60.0% 55.9% 56.2% 56.4%
% of Total 5.1% 16.2% 35.0% 56.4%
woman Count 4 15 32 51
% within gender 7.8% 29.4% 62.7% 100.0%
% within age category 40.0% 44.1% 43.8% 43.6%
% of Total 3.4% 12.8% 27.4% 43.6%
Total Count 10 34 73 117
% within gender 8.5% 29.1% 62.4% 100.0%
% within age category 100.0% 100.0% 100.0% 100.0%
% of Total 8.5% 29.1% 62.4% 100.0%
The four countries in which we did our field research were selected – in discussion with the staff of the Liliane Foundation – on basis of: 1. The length of the support by the Liliane Foundation; 2. The amount of money invested in this support; 3. The assessment of the relation with counterparts/partners by Liliane Foundation staff. Liliane Foundation staff did two ranking exercises, one ranking five countries that should be selected for this research, and one ranking three countries that should not be selected. Seeing Liliane Foundation’s investments overtime, it seemed logic to select two countries in Asia and one in Africa and Latin America. This finally led to the following selection: the Philippines, India (in particular the south of India), Ghana and Argentina. We are well aware that our respondents in Argentina did not come from poorer provinces in rural Argentina but mainly from (very) poor neighborhoods in Buenos Aires and its surroundings. The same is true for India, where Kerala and Tamil Nadu are among the states with a higher average income and better (public) facilities. It means that the group of respondents that we have interviewed are not fully representative for those children supported by the Liliane Foundation in particular in these two countries.
To say it more boldly, this is not a traditional impact analysis: we have no base-line survey and no control group and if we would have liked to interview a group of respondents that is representative for the thousands of children the Liliane Foundation has supported over the past 35 years in these four countries in the way we did, we most probably would have needed a full year of field research plus some two extra months of preparation and an additional two months of data analysis. But this is all not the objective of this study, our objective was to assess the impact of the support of the Liliane Foundation on the lives and well-being of children in the four countries as observed and assessed by the ‘children’ themselves.
In the final end we interviewed 117 people, 51 women and 66 men, with a majority in the age category adults (older than 25 years) and a minority of children under 18 (ten, 8.5 percent). As indicated in table
– 11 –
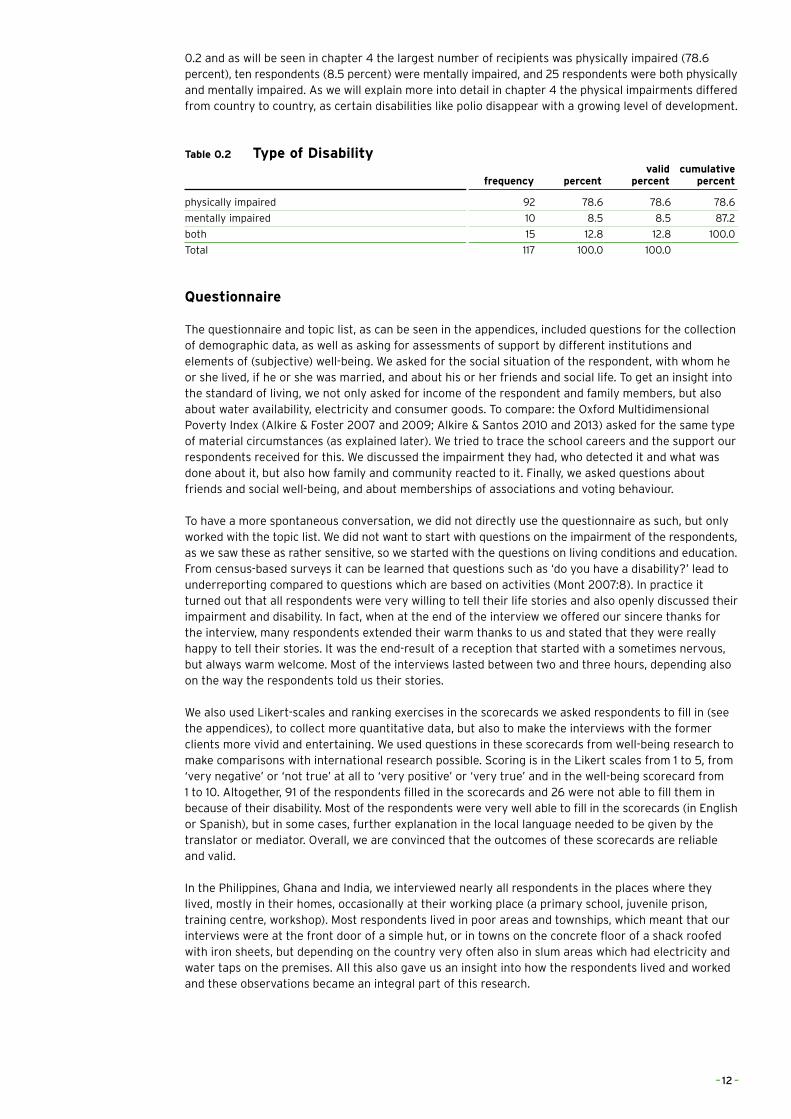
0.2 and as will be seen in chapter 4 the largest number of recipients was physically impaired (78.6 percent), ten respondents (8.5 percent) were mentally impaired, and 25 respondents were both physically and mentally impaired. As we will explain more into detail in chapter 4 the physical impairments differed from country to country, as certain disabilities like polio disappear with a growing level of development.
Table 0.2 Type of Disability
frequency percentvalid
percentcumulative
percent
physically impaired 92 78.6 78.6 78.6
mentally impaired 10 8.5 8.5 87.2
both 15 12.8 12.8 100.0
Total 117 100.0 100.0
Questionnaire
The questionnaire and topic list, as can be seen in the appendices, included questions for the collection of demographic data, as well as asking for assessments of support by different institutions and elements of (subjective) well-being. We asked for the social situation of the respondent, with whom he or she lived, if he or she was married, and about his or her friends and social life. To get an insight into the standard of living, we not only asked for income of the respondent and family members, but also about water availability, electricity and consumer goods. To compare: the Oxford Multidimensional Poverty Index (Alkire & Foster 2007 and 2009; Alkire & Santos 2010 and 2013) asked for the same type of material circumstances (as explained later). We tried to trace the school careers and the support our respondents received for this. We discussed the impairment they had, who detected it and what was done about it, but also how family and community reacted to it. Finally, we asked questions about friends and social well-being, and about memberships of associations and voting behaviour.
To have a more spontaneous conversation, we did not directly use the questionnaire as such, but only worked with the topic list. We did not want to start with questions on the impairment of the respondents, as we saw these as rather sensitive, so we started with the questions on living conditions and education. From census-based surveys it can be learned that questions such as ‘do you have a disability?’ lead to underreporting compared to questions which are based on activities (Mont 2007:8). In practice it turned out that all respondents were very willing to tell their life stories and also openly discussed their impairment and disability. In fact, when at the end of the interview we offered our sincere thanks for the interview, many respondents extended their warm thanks to us and stated that they were really happy to tell their stories. It was the end-result of a reception that started with a sometimes nervous, but always warm welcome. Most of the interviews lasted between two and three hours, depending also on the way the respondents told us their stories.
We also used Likert-scales and ranking exercises in the scorecards we asked respondents to fill in (see the appendices), to collect more quantitative data, but also to make the interviews with the former clients more vivid and entertaining. We used questions in these scorecards from well-being research to make comparisons with international research possible. Scoring is in the Likert scales from 1 to 5, from ‘very negative’ or ‘not true’ at all to ‘very positive’ or ‘very true’ and in the well-being scorecard from 1 to 10. Altogether, 91 of the respondents filled in the scorecards and 26 were not able to fill them in because of their disability. Most of the respondents were very well able to fill in the scorecards (in English or Spanish), but in some cases, further explanation in the local language needed to be given by the translator or mediator. Overall, we are convinced that the outcomes of these scorecards are reliable and valid.
In the Philippines, Ghana and India, we interviewed nearly all respondents in the places where they lived, mostly in their homes, occasionally at their working place (a primary school, juvenile prison, training centre, workshop). Most respondents lived in poor areas and townships, which meant that our interviews were at the front door of a simple hut, or in towns on the concrete floor of a shack roofed with iron sheets, but depending on the country very often also in slum areas which had electricity and water taps on the premises. All this also gave us an insight into how the respondents lived and worked and these observations became an integral part of this research.
– 12 –
Excursus 1: Disabilities explained
Autism Autism is a condition that affects interest, social interaction, communication, and behaviour. Amongst others it includes Asperger Syndrome and childhood autism.
Autism causes a wide range of symptoms, which can be grouped into two core categories: > Having problems with social interaction and communication: this includes problems understanding
and being aware of other people’s emotions and feelings; another symptom is delayed language development and an inability to start or take part in conversations.
> Having restricted and repetitive patterns of thought and physical behaviours: including making repetitive movements, and becoming upset if these set routines are disrupted.
People with ASD are often also affected by other mental health conditions such as attention deficit hyperactivity disorder (ADHD), anxiety or depression. About half of those with autism also experience learning difficulties (National Health Service, 2013a) (The National Autistic society, 2014).
BedriddenA person is bedridden when he or she is confined to bed because of illness, especially for a long or indefinite period. Mainly old people are bound to bed, but also people with a severe physical disability or disease are bedridden (The Free Dictionary, 2014a).
Behavioural and Personal DisorderThe most common behaviour disorders include oppositional defiant disorder (ODD), conduct disorder (CD) and attention deficit hyperactivity disorder (ADHD). These three behavioural disorders share some common symptoms. A person may have two disorders at the same time. Other factors can include emotional problems, mood disorders, family difficulties and substance abuse.
Symptoms of ODD include: Easily angered, annoyed or irritated, Frequent temper tantrums, frequent arguments, refusing to obey rules deliberately trying to annoy or aggravate others, low self-esteem, low frustration threshold and blaming others for any misfortunes or misdeeds.
Typical behaviours of a child with CD may include: Frequent refusal to obey parents’ and authority figures, repeated non-attendance, tendency to use narcotics at a very early age, lack of empathy for others, being aggressive or showing sadistic behaviours against other people and animals, including bullying and physical or sexual abuse, attempting to get in physical fights, using weapons in physical fights, frequently lying, criminal behaviour such as stealing, fire-raising, breaking into houses, vandalism and a tendency to run away from home.
The characteristics of ADHD can include: inattention - difficulty concentrating, forgetting instructions, not completing any tasks, Impulsivity-talking over the top of others, having a ‘short fuse’, being accident-prone, over-activity - constant fidgeting and restlessness.
The causes of ODD, CD and ADHD are unknown but some of the risk factors include: > Gender – boys are much more likely to suffer from behavioural disorders than girls. > Gestation and birth – difficult pregnancies, premature birth and low birth weight may contribute to
the child’s problematic behaviour.. > Temperament – children who are difficult to manage, temperamental or aggressive from an early
age are more likely to develop behavioural disorder. > Family life – behavioural disorders are more likely in dysfunctional families. For example, a child is
at risk in families where domestic violence, poverty, poor parenting skills or substance abuse are more common.
> Intellectual disabilities – children with intellectual disabilities are twice as likely to have a behavioural disorder.
> Brain development – studies have shown that lesser active areas of the brain that control attention are present in children with ADHD.
(Better Health, 2014) (Pacer Centre, What is an emotional of behavioural disorder?, 2006)
– 13 –
Cerebral palsy Cerebral palsy is the general term for a multiple neurological conditions that affect co-ordination and mobility. Neurological conditions are caused by problems in the nervous system and in the brain. More specifically, cerebral palsy is caused by a problem in the parts of the brain that are responsible for controlling muscles. The condition can occur if the brain develops abnormally or when it is damaged before, during or shortly after birth.
Causes of cerebral palsy consist of: > an infection caught by the mother during her pregnancy > a difficult or premature birth > a bleeding in the baby’s brain > mutations in the genes that affect development of the brain
The main symptoms of cerebral palsy are: > muscle stiffness or floppiness > muscle weakness > random and uncontrolled body movements > balance and co-ordination problems
These symptoms can affect different areas of the body and vary in severity for each person. Some people will only experience minor problems, while others will be severely disabled. Many people will also have a number of associated problems, such as repeated seizures or fits, drooling problems and difficulties swallowing. Even though intelligence is often unaffected, some people with the condition may have communication and learning difficulties (National Health Service, 2014b).
Deaf and mute, Profoundly deafSevere hearing loss means you can hear some sounds, but very poorly. You may be able to hear only very loud sounds. Hearing loss can happen in many different ways to people of all ages. It’s different for everyone. Causes are: > Age > Exposure to loud noises > Genetic hearing loss: some people are born deaf or become deaf over time due to a genetic
abnormality. > A viral infections of the inner ear, such as mumps or measles > A viral infections of the auditory nerve, such as mumps or rubella > Meniere’s disease: where a person suffers with vertigo (spinning dizziness), hearing loss, tinnitus
and a feeling of a blockage in the ear > A acoustic neuroma: a non-cancerous growth on or near the auditory nerve > Meningitis: an infection that surround the brain and spinal cord > Encephalitis – inflammation of the brain > Multiple sclerosis – a neurological condition affecting the central nervous system > A stroke – where the blood supply to the brain is cut off or interrupted
Many Deaf people do not use a spoken language, thus they are technically “mute”. They use methods like lip reading or sign language to communicate (National Health Service, 2013c).
Down’s SyndromeDown’s Syndrome is a genetic condition that typically causes some level of learning disability and a characteristic range of physical features. This varies widely between individual children. The condition is caused by the presence of an extra copy of chromosome 21 in a baby’s cells. It occurs by chance at conception and is irreversible.
Those with Down’s Syndrome nearly always have physical and intellectual disabilities. As adults, their mental abilities are typically similar to those of an 8- or 9-year-old.They also typically have poor immune function and generally reach developmental milestones at a later age. They have an increased risk of a number of other health problems, including congenital heart disease, leukaemia, thyroid disorders, and mental illness, among others (National Down’s Syndrome Society, 2012).
EpilepsyEpilepsy is a neurological condition where a person has a tendency to have returning seizures. The cause of epilepsy and the type/severity of seizures experienced will vary between people. The impact of seizures will also depend on the lifestyle of each individual.
– 14 –
There are two main categories of epilepsy: 1) idiopathic epilepsy – where no obvious cause can be found, but there may be a family history, suggesting that the condition is inherited; 2) symptomatic epilepsy – where there is a known cause.
Causes of symptomatic epilepsy can include: > cerebrovascular disease (problems with the blood vessels that supply the brain) – such as a stroke
or subarachnoid haemorrhage > brain tumours > severe head injuries > drug abuse and alcohol misuse > infections that can damage the brain – such as meningitis > problems during birth that cause a baby to be deprived of oxygen – such as the umbilical cord
getting twisted or compressed during labour > some parts of the brain not developing properly
Epilepsy can have undesirable effects on social and psychological well-being. These effects may include social isolation, stigmatization, or disability. Learning difficulties are common for those with epilepsy (National Health Service, 2014).
Intellectual disability (mental retardation)People with intellectual disability learn more slowly than a typical child. They may take longer to learn language, develop social skills, and take care of their personal needs, such as dressing or eating. Learning will take them longer, require more repetition, and skills may need to be adapted to their learning levels.
Intellectual disability (ID), also called intellectual development disorder (IDD) and formerly known as mental retardation, is a neurodevelopment disorder. It is characterized by impaired intellectual and adaptive functioning which is defined by an IQ score below 70 as well as a delay in general daily living skills. Down’s Syndrome and Fragile X Syndrome often overlap with ID.
Among children, the cause is partly unknown. Down’s Syndrome, velocariofacial Syndrome, and fatal alcohol Syndrome are the three most common inborn causes. However, doctors have found many other causes: > Genetic conditions. Sometimes a disability is caused by abnormal genes inherited from parents,
errors when genes combine, or other reasons. > Problems during pregnancy. > Problems at birth. If a baby has problems during labour and birth, for example not getting enough
oxygen, they may have developmental disability due to brain damage. > Exposure to certain types of disease or toxins. Diseases like whooping cough, measles, or
meningitis can cause intellectual disability if medical care is delayed or inadequate. Exposure to poisons like lead or mercury may also affect mental ability.
> Iodine deficiency > Malnutrition is a common cause of reduced intelligence in parts of the world affected by famine. > Absence of the arcuate fasciculus.
(WebMD, 2014) Learning disorderA learning disability affects the way a person learns new things in different areas of life. It influences the way a person understands information and communicates. This means they can have difficulties in understanding new or complex information, learning new skills and coping independently.
A learning disability is not the same as a learning difficulty or mental illness. A learning disability happens when a person’s brain development is affected. This can happen before birth, during birth or in early childhood. Several factors can affect brain development, including: > the mother becoming ill in pregnancy > problems during the birth that stop the oxygen flow to the brain > the unborn baby developing certain genes > genetics, when parents pass certain genes to the unborn baby.(known as inherited learning
disability) > illness, such as meningitis, or injury in early childhood
However a learning disability does not always have a known cause.
– 15 –
Some conditions, are associated with having a learning disability. This is because people with these conditions are more likely to have one. People with Down’s Syndrome, have some kind of learning disability, and so do many people with cerebral palsy. People with autism may also have learning disabilities, and around 30% of people with epilepsy have a learning disability (National Health Service, 2013e).
Physical deformity A physical deformity is an absence or major difference in the shape of a body part compared to the average shape of that part (the medical dictionary, 2014b). The severity of a deformity and effects on a person’s life differ per individual. Deformity may arise from various causes: > Genetic mutation > Damage to the fetus or uterus > Complications at birth > A growth or hormone disorder > Reconstructive surgery following a severe injury, e.g. burn injury > Arthritis and other rheumatoid disorders > Fractured bones left to heal without being properly set (malunion) > Chronic application of external forces, e.g. artificial cranial deformation > Chronic paresis, paralysis or muscle imbalance, especially in children, e.g. due to poliomyelitis or
cerebral palsy(Right Diagnosis, 2014)
Restricted growth (Dwarfism)Restricted growth is a condition characterised by a person’s short stature. There are two main types: 1) proportionate short stature (PSS) which is a general lack of growth, 2) disproportionate short stature (DSS) which is a problem with the way bones grow.
Dwarfism can be caused by many conditions. Causes of proportionate dwarfism include metabolic and hormonal disorders.
The most common types of dwarfism (skeletal dysplasias) are genetic. Skeletal dysplasias are conditions of abnormal bone growth that cause disproportionate dwarfism. People with the most common form of dwarfism achondroplasia have a long trunk and shortened upper parts of their arms and legs. Other features of achondroplasia include: > a large head with a prominent forehead > a flattened bridge of the nose > protruding jaw > crowded and misaligned teeth > forward curvature of the lower spine > bowed legs > flat, short, broad feet > “double-jointedness”
(WebMD, 2014)
Visual impairementA person is visually impaired when he or she has sight loss that cannot be fully corrected using glasses. Visual impairment is usually classified as ’sight impaired’ when a person is partly seeing, or ‘severely sight impaired’ when a person is so blind that they cannot do any work for which eyesight is essential’.
The following eye diseases and conditions can cause blindness: > Glaucoma, which refers to four different eye conditions that damage the optic nerve. > Macular degeneration, this destroys the part of your eye that enables you to see details. > Cataracts cause cloudy vision and are more common in older people. > A lazy eye > Optic neuritis, an inflammation that can cause temporary or permanent vision loss. > Retinitis pigmentosa, which refers to retina damage, but leads to blindness only in rare cases. > Tumors that affect the retina or optic nerve can also cause blindness.
If a person suffers from diabetes or has a stroke, blindness is a potential complication. Birth defects and eye injuries are other common causes of blindness.(National Health Service, 2013d)
– 16 –
References
Better Health (2014). Consulted October 2014, on: http://www.betterhealth.vic.gov.au/bhcv2/bhcarticles.nsf/pages/Behavioural_disorders_in_children
National Health Service (2013a, Autism Spectrum Disorder. Consulted October 2014, on: http://www.nhs.uk/Conditions/Autistic-spectrum-disorder/Pages/Introduction.aspx
National Health Service (2013b)., Cerebral palsy. Consulted October 2014, on: http://www.nhs.uk/conditions/Cerebral-palsy/Pages/Introduction.aspx
National Health Service (2014)., Epilepsy. Consulted October 2014, on: http://www.nhs.uk/conditions/epilepsy/pages/introduction.aspx
National Health Service (2013c), Hearing loss. Consulted October 2014, on: http://www.nhs.uk/conditions/hearing-impairment/pages/introduction.aspx
National Health Service (2013d), Visual impairment. Consulted October 2014, on: http://www.nhs.uk/conditions/visual-impairment/pages/introduction.aspx
National Health Service (2013e), What is a learning disability? Consulted October 2014, on: http://www.nhs.uk/livewell/childrenwithalearningdisability/pages/whatislearningdisability.aspx
National Down’s Syndrome Society (2012), What is Down Syndrome. Consulted October 2014, on: http://www.ndss.org/Down-Syndrome/What-Is-Down-Syndrome/
PACER Centre (2006) , Action information sheets, What is an emotional or behavioural disorder? Minneapolis. On: http://www.pacer.org/parent/php/PHP-c81.pdf
Right Diagnosis (2014), Causes of deformity symptoms Consulted October 2014, on: http://www.rightdiagnosis.com/symptoms/deformity_symptoms/common.htm
The Free Dictionary: the medical dictionary, bedridden (2014a). Consulted October 2014, on: http://www.thefreedictionary.com/bedridden
The free dictionary: the medical dictionary (2014b), Dysmorphism. Consulted October 2014, on: http://medical-dictionary.thefreedictionary.com/dysmorphism
The National Autistic Society (2014), What is Autism. Consulted October 2014, on: http://www.autism.org.uk/about-autism/autism-and-asperger-syndrome-an-introduction/ what-is-autism.aspx
WebMD, Dwarfism (2014). Consulted October 2014, on: http://www.webmd.com/children/dwarfism-causes-treatments
WebMD, Intellectual Disability (mental retardation) (2014). Consulted October 2014, on: http://www.webmd.com/children/intellectual-disability-mental-retardation
– 17 –
1 THE CONTEXT
1.1 Terms and conceptsThe World Report on Disability (2009:3) opens it’s section on the definition of disability with the indication that it is complex, dynamic, multidimensional and contested. Indeed, there have been quite long, and sometimes heated, debates internationally, in developed and developing countries, on the terms and concepts of impairment and disability as well as on ways to identify and classify disabilities. Since the end of the 1970s the World Health Organization (WHO) has tried to harmonize the classification of disabilities, which in 1980 led to the first trial publication of the International Classification of Functioning, Disability and Health, known better from its acronym ICDH, which later by its revision to ICDH-2 became known as ICF. In this latter acronym the ‘F’ of ‘functioning’ stands for the functions of the body, where the ‘disability’ stands for functioning in society, limitations in activity and/or restrictions in the participation in society. Next to the ICF the WHO developed the International Statistical Classification of Diseases and Related Health Problems (ICD-10), adopted by the World Health Assembly of May 1990, being used by the WHO member states since 1994 and updated since then. The ICF can be seen as complementary to ICD-10 (WHO 2002).
The ICF was updated and got its actual form in 2002 (officially known since then as ICFDH-2), which can be seen and is seen as a great breakthrough in measuring and counting disabilities and disabled people. It aimed at standardizing data on disability and health and generating world-wide data on the health situation in WHO’s member countries. The way impairments and disabilities are seen is influenced by culture, convictions and religion and an impairment might have quite different aspects on the limitations or restrictions a person might find on his or her participation in society: a polio victim in principle has much better opportunities to participate in a highly developed country than in a rural setting in Asia or Africa. It means that it is not easy to conceptualize and classify disabilities and the ICF was thus a big step forward in trying to grasp the complexities of the interaction between impaired individuals and their societies. The ICF with its manuals, the checklist and the Disability Assessment Schedule (WHO-DAS 2.0) attempts - apart from the individual assessment - also to provide services not only for the individual, but also at the institutional and social levels. It is not only an instrument for diagnosis, but also a tool to indicate services needed by presenting data about levels of functioning and disability (WHO 2002).
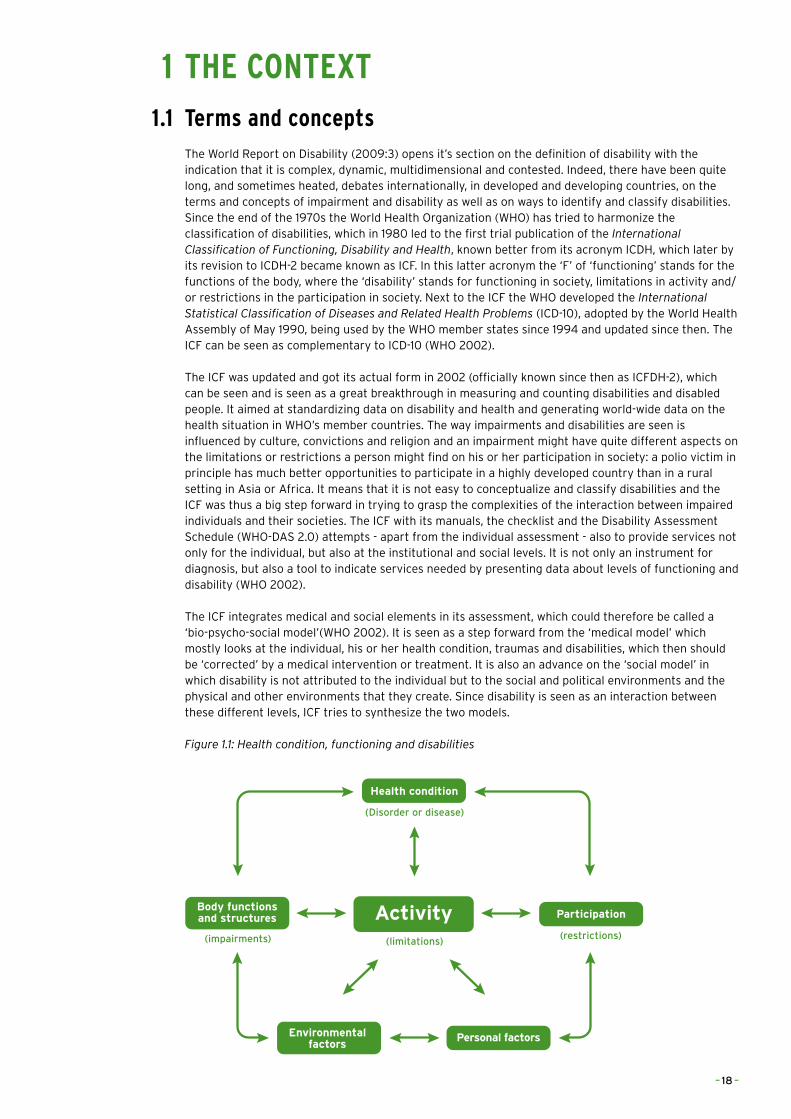
The ICF integrates medical and social elements in its assessment, which could therefore be called a ‘bio-psycho-social model’(WHO 2002). It is seen as a step forward from the ‘medical model’ which mostly looks at the individual, his or her health condition, traumas and disabilities, which then should be ‘corrected’ by a medical intervention or treatment. It is also an advance on the ‘social model’ in which disability is not attributed to the individual but to the social and political environments and the physical and other environments that they create. Since disability is seen as an interaction between these different levels, ICF tries to synthesize the two models.
Figure 1.1: Health condition, functioning and disabilities
Activity
Health condition
Body functionsand structures Participation
Environmentalfactors
Personal factors
(limitations)(restrictions)(impairments)
(Disorder or disease)
– 18 –
The ICF thus looks at physiological and neurological body functions; body structures like limbs and organs, and impairments, as problems with body functions or body structures. As indicated in figure 1.1, ICF also tries to assess the activities of the individual, his or her participation in life situations and the limitations and restrictions the individual may have or experience. It finally looks at personal and environmental factors that might create these limitations and restrictions.
It is important to keep in mind that the ICF not only looks at environmental factors but also at personal characteristics. Environmental factors have been brought forward, amongst others by the disability movement claiming better access to infrastructure and buildings, but also fighting discrimination. So apart from the natural and built environments, it is also about networks of support and relations (social), attitudes in society (cultural), and policies (political). But personal factors, such as the level of education, self-esteem and motivation might also create disabilities and/or capabilities to (better) participation in society.
There is a remarkable difference between the definition of the ICF and the one promoted by the World Report on Disability which follows both the ICF, and the UN Convention on the Rights of Persons with Disabilities (CRPD). The CRPD does not define disability, but speaks about people with disabilities in a way that seems logical if rights are being discussed. The Convention formulates it solely in a medical way and restricts it to ‘long-term’ impairments, which excludes a large group of people who might have temporary impairments or impairments that fluctuate (see e.g. Leonardi et al. 2006).
Box 1.1 Definitions of Disability
ICF Definition of Disability (2001)The negative aspects of the interaction between an individual (with a health condition) and that individual’s contextual factors (personal and environmental factors
UN Convention Definition of Disability, Article 1 (2006)Persons with disabilities include those who have long-term physical, mental, intellectual, or sensory impairments which in interaction with various barriers may hinder their full and effective participation in society on an equal basis with others.
Box 1.2 Impairments, limitations and restrictions
ImpairmentsProblems in body structure or alterations in body structure, e.g. paralysis, deafness, blindness.
LimitationsDifficulties in executing activities, e.g. walking, seeing, eating.
RestrictionsProblems with participating or involvement in any area of life, e.g. access to building or to transportation, discrimination in the labour market.
Source: World Report on Disability
Disability has many faces, it can even be invisible or people can have impairments that are stronger in some periods and weaker in others. Disabilities can be there at birth, be genetic or caused by unhealthy practices during pregnancy, but they very often also come with age. Disability is also not synonymous with ‘unhealthy’; many disabled people, also people we met during this research, consider themselves to be in good health. As we shall see later, there is quite an active debate on the relation between disability and poverty, but it is important to indicate here that poverty and disability are not necessarily connected or that the social position or class position of disabled people are fixed and that there is no (social) mobility. Disability is thus not ‘static’, it can be altered by changes in the environment, in legislation or by changes in attitudes. These are changes that can be brought forward by education, by political action or by ‘by-standers’ who provide support.
The introduction of the ICF was also intended to improve knowledge of, and available data on disability prevalence. Reported prevalence varies widely across countries (in particular in UN statistics), because
– 19 –
of definitions being used in surveys which only apply to a limited set of disabilities, or which are wide, and encompass many sources of disability, because of other measurement problems or the quality and type of research.1 The general picture is that some developed countries, but also countries such as Bangladesh and India, report rather high prevalence rates (between 18 and 20 percent), while other countries such as Mexico and France report low rates, and also different rates in the World Health Survey and in national censuses.2 In particular, censuses in Africa tended to under-report disability prevalence by large margins (Mont 2007). The Washington Group on Disability Statistics, instituted by the UN, has tried since 2001 to generate a common approach to measuring prevalence, by carrying out trials in several countries.
The WHO recently estimated the number of disabled people in the world at more than 1 billion or around 15 percent of the world population. This is higher than the 10 percent that it, and also the World Bank, has reported since the 1970s. The WHO indicated that it raised its estimates because of an ageing world population and a global increase in chronic health conditions (WHO 2013). It is still a guesstimate of course. It means that for the four countries in this research, reported prevalence rates might also not be very reliable. It is generally assumed – even in the absence of reliable data - that prevalence rates are higher in developing countries, because of lower levels of primary health care, under-nutrition, malnutrition and poverty.3 A more precise guesstimate of prevalence rates by the World Bank shows a prevalence of disability of between 10 and 15 percent in developing countries, and around four to five percent for severe disabilities.
1.2 International contextThe United Nations has a long history of supporting people with disabilities, in its human rights treaties and conventions, but also in the Economic and Social Council. Over the years the UN has shifted from a human welfare approach, dominant in the 1950s, to a rights based approach. The disability movement which started to contest the medical model of disability from the end of the 1960s, in particular in the UK and the US, moved its critique also to international level in the 1970s, and gained influence rather quickly in the international fora, in particular of the UN. In 1974, the UN General Assembly adopted the Declaration on the Rights of Disabled People, while in the same year the UN Commission for Social Development recommended elimination of social and physical barriers that prevent the integration of disabled people. The same General Assembly proclaimed 1981 as the International Year for Disabled Persons.
One outcome of this International Year for Disabled Persons in 1981 was the World Programme of Action concerning Disabled Persons, adopted in December 1982. This action plan called for policies in three areas: prevention, rehabilitation and equalization of opportunities. This was followed by the UN Decade of Disabled Persons (1983-1992), followed by regional decades in Asia and Africa. The theme of the UN Decade was ‘full participation and equality’. In 1981, the international coalition of Disabled Peoples Organizations (DPOs) was also established as Disabled Peoples’ International, which started to have an important role in international negotiations and conferences. All this also showed that the ‘social model’ became widely accepted in the course of all those events (see e.g. Lang 2009; Meekosha & Soldatic 2011; UN 2003-4). In 1984, the first Special Rapporteur was appointed for human rights violations and disability. And although new principles and standards were approved in 1991 and 1993, regular reports of the Special Rapporteur and the Secretary General indicate in diplomatic terms that little progress has been made over the years in securing equal rights for disabled people and their integration in society.
1.2.1 The United Nations Convention on the Rights of Persons with Disabilities
Negotiated in a record time of four years, with only eight sessions, in December 2006 the UN Convention on the Rights of Persons with Disabilities (CRPD) was adopted by the General Assembly and came into force in May 2008. It also broke records for the number of signatories on the first day. The CRPD is seen by many authors (e.g. Lang 2009; Lang et al. 2011; Mladenov 2013) as an important breakthrough, as a paradigm shift (Moriarty & Dew 2011; Harpur 2012) and as ‘the biggest victory for the disability movement in the three decades of its existence’ (Meekosha & Soldatic 2011:1384). All these authors also agree, however, on the point, as Lang et al. (2011:7) put it that ‘there remains a gulf between the laudable statements, and what actually happens in practice’.
1 World Report on Disability,
Chapter 2; and also: Eide &
Loeb 2005; Fujiura et al.
2005; Mont 2007. E.g.
specific surveys show a
higher prevalence than
censuses, because of the
fact that in censuses the
definitions of disability are
limited, but also because of
self-reporting and the very
negative connotations or
stigma disability might have.
2 See the Technical Appendix
A in the World Report on
Disability.
3 Fujiura et al. (2005) report
three to five times higher
intellectual disability
prevalence rates for some
developing countries
compared to developed
countries. See e.g. also
Elwan (1999).
– 20 –
Source: UN Enable
– 21 –
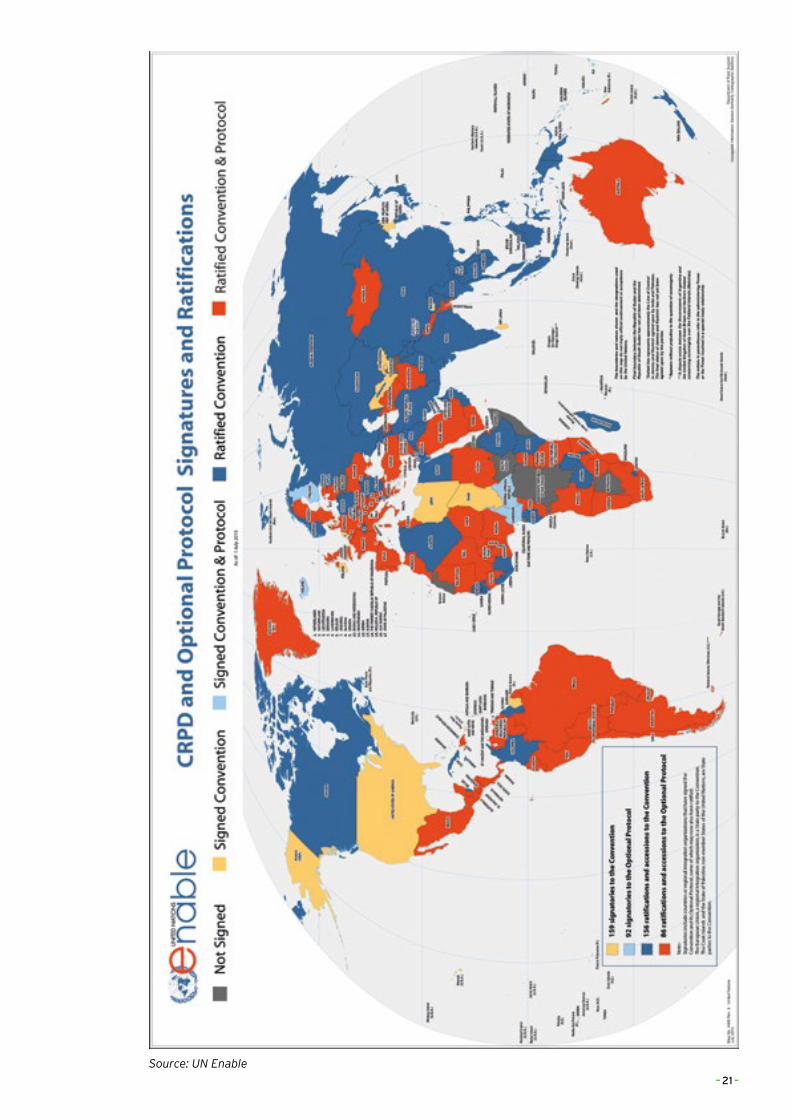
The CRPD is seen as the ‘first legally binding international treaty that provides a comprehensive portfolio of disability rights, and has the potential to create a paradigm shift in the manner in which disability policy and practice is formulated and implemented’ (Lang et al. 2011:2008). The CRPD reads ‘like a standard human rights instrument’ (Bartlett 2009:496), with its emphasis on the classic encyclopedia of liberal rights, equal recognition and access to justice, the social rights such as the rights to education and health, but there is also a set of articles which clearly came from the disability movement, such as the right to independent living and to personal mobility as well as to work and employment. The CPRD is thus more a clarification of existing human rights for disabled people, but it is a legally binding human rights instrument and upon ratification, State Parties are obliged to amend their own legislation and to implement policies in compliance with the provisions of the CRPD (Mladenov 2013:72). This could of course also be important for development policy, as policy coherence demands that governments apply these principles and rights in all their policies. But, as Marta Russell indicated earlier in a seminal article (2002), to have rights is one thing, to have them implemented is quite another.
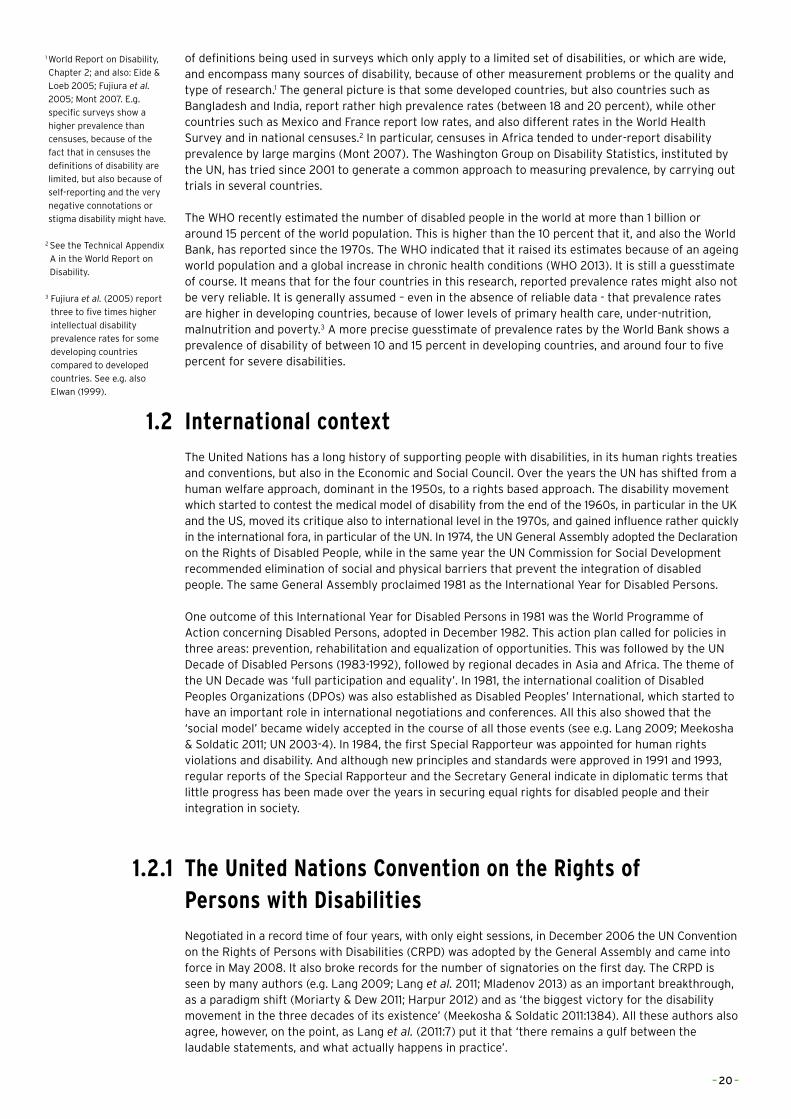
The CPRD has now been ratified by 151 countries, according to the UN Enable website, (see map next page). The Netherlands is not among them, but Argentina, Ghana, India and the Philippines are.
1.2.2 International support for people with disabilitiesA third major event was the publication of the World Report on Disability in 2011, produced by the World Health Organization and the World Bank and written by a team of more than 370 editors, experts, contributors and peer reviewers from 74 countries, including such well-known disability researchers and activists, as Katherine Seelman and Tom Shakespeare.4 The report comprises 325 pages on understanding disability, the global picture of disability, disability and poverty, rehabilitation, assistance and support, the enabling environments, education and employment, that has been called ‘comprehensive, current and highly informative’ and at the same time ‘remarkably readable, comprehensive and concise’ (Krahn 2011:141). In other words, the report presented the most recent knowledge and understanding on disability and its different aspects of inclusion and integration.
Most of the chapters are thus an encyclopedia of most recent knowledge and debates on several aspects of disability, with information that is extremely useful for researchers, practitioners and activists. The discussion on inclusive education could have been a bit more extensive (Krahn 2011) and the report does not go deep into the evaluation of support programmes and is very short on the role of the international donor community.
Until now, the international donor community has not responded in a very spectacular way. In an earlier overview on what donors are doing with the CRPD and disability (Lord et al. 2010) it was concluded that only a few multilateral donors, notably the World Bank, UNICEF and WHO, had done some research and produced (in the case of the WHO important) policy documents and guidelines.
The Nordic countries organized an international conference on ‘The inclusion of the disability dimension in Nordic development cooperation’ in Copenhagen in 2000, but a few years later it was apparent that the only country that already had a strategy, Norway, was still the only one (Ulland 2003), but that Norway was at the same time maybe also the most disappointing example, when some field research revealed that the guidelines were not known or were not applied by the Norwegian embassies. An official evaluation of 2012 (NORAD) confirmed this again and related this to a lack of political priority, a lack of understanding, and weak advocacy by Disabled Persons Organizations (DPOs). A SIDA evaluation in 2013 showed similar results. Finland tried to renew its mainstreaming activities in 2012, also by adding a Disability Relevance Assessment, and other donors, such as Australia (where it is one of the ten objectives of aid policy) and Austria also have similar policy papers and instruments, but very few of them have been evaluated.5 The Department for International Development (DFID), together with USAID, has maybe the longest track record on disability and development, producing policy papers and research, as well as funding a Disability Rights Fund with around £600,000 annually since 2008.6 Norad (around $24 million annually in the first decade of the 2000s) and SIDA have had co-financing funds with Norwegian (Atlas Alliance) and Swedish DPOs (Swedish Organizations of Disabled Persons International Aid Association) for more than ten to fifteen years. In all these studies on the international donor community, the Netherlands are notably absent, which is in line with the absence of a clear poverty strategy in Dutch development cooperation for a very long time.
Of the multilaterals, apart from the WHO, UNICEF and the World Bank have been most active with regard to disability and development. UNICEF’s role is mainly limited to technical advice and awareness rising
4 See the Introduction to the
new edition of his book
(2014).
5 A rather uncritical overview
of donor activities and
policies vis à vis disability
is presented by Lord et al.
(2010).
6 In April 2014, the
International Development
Committee of the British
Parliament felt the urgency
to call on the British
government to spend more
and play a more active role
in promoting disability
rights and mainstreaming
disability.
– 22 –
around the Convention on the Rights of Children and the CRPD. A baseline assessment by the World Bank concluded that in terms of inclusion, knowledge and participation, it was still at the very beginning (Stienstra et al. 2002). Four years later, an extensive document was produced to help Bank staff to make inclusion of disability operational. The World Bank’s Disability and Development Team still produced some interesting research in the first years of this century,7 although it had ‘to fight to make an impression in a bean-counting culture which in practice eschews appeals to human rights’ (Albert et al. 2006:68). The Independent Evaluation Group, the Bank’s official evaluation unit, has done no evaluation on disability programmes, projects or policies. The Bank financed around 20 projects in the last decade from integration of disabled children in mainstream schools to community-based rehabilitation projects, in particular in South Asia but also in Armenia and Bosnia.
1.3 Community Based Rehabilitation (CBR)The concept of Community Based Rehabilitation (CBR) appeared in the late 1970s, when the World Health Organization acknowledged that in developing countries in particular, Institution Based Rehabilitation (IBR) would not be achievable: building institutions, training staff and trying to catch up with the large number of disabled people who were not served by the institutions until then would be impossible for poor countries, which also had another long list of health priorities. The WHO estimated that in developing countries, only 2-3 percent of people with disabilities made use of these institutions which were very often urban based (Helander et al. 1989: 14-16).
CBR was based on the principles of primary health care and tried to integrate internationally accepted rehabilitation practices together with local practices. As Hartley et al. (2009) indicated, CBR started originally from an individualized medical model, but after listening to the concerns of DPOs, the concept was broadened over time to also address social and political aspects of disability such as discrimination and exclusion. This was acknowledged in a joint position of the ILO, UNESCO and the WHO in 2004. It means that CBR not only tries to enhance the physical and mental abilities of disabled people, but also attempts to let them participate, to give access to their communities and to encourage communities to promote and respect the human rights of people with disabilities. Where the World Report on Disability stresses the importance of the decentralization of services, it sees CBR as an intervention instrument for ‘low-resource, capacity-constrained settings’, in which CBR should be complemented with referral to secondary services. After a CBR review meeting in Helsinki in 2003, the CBR matrix was published by the WHO, followed by the CBR Guidelines in 2010 with, apart from the introduction, five booklets on the different intervention areas and a seventh booklet on specific issues.
CBR has not developed without criticism, as Hartley et al. (2009) note. In an overview of CBR literature, Flinkenflügel et al. come to the conclusion that theory and descriptive papers prevail and that intervention studies and case reports are relatively rare. This means that the evidence base of CBR is ‘fragmented and incoherent on almost all aspects of CBR’ (Flinkenflügel et al. 2005: 187). Also, Wirz & Thomas (2002) in an earlier paper came to the conclusion that there were few evaluations of CBR, and those which were undertaken were more on the practice than on the effectiveness of the practice. Neglect of psycho-social dimensions and prejudice (Kassah 1998), neglect of participation of disabled people themselves and increasing the burden for women were among the most common critiques of CBR programmes. It was also concluded that CBR projects collapsed when donor money stopped (Kuyini et al. 2011).
1.4 The Liliane FoundationOn 14 March 1980 the Liliane Foundation was founded by Liliane Brekelmans-Gronert (herself a disabled person because of a polio infection) and Ignace Brekelmans, her husband. A few years before, Liliane (Lieke) had visited Sumatra (Indonesia) where she had been born, and started to support disabled children there. Upon discovering that there were no private development organizations in the Netherlands supporting disabled children, she started the Liliane Foundation.
The Foundation, although it was not an organization with a religious connection, worked in the first decades closely with catholic networks and institutions for the disabled, with nuns, fathers and missionaries, to identify disabled children or support them in institutions and boarding schools. The organization worked on supporting individual children, with an expanding number of volunteers, corresponding with the mediators, literally in the first years working from a kitchen table in Vlijmen, a small town in the province of Noord-Brabant, moving later to Den Bosch, the provincial capital.
7 In the Open Knowledge
Repository of the World
Bank however, disability is
not a topic.
– 23 –
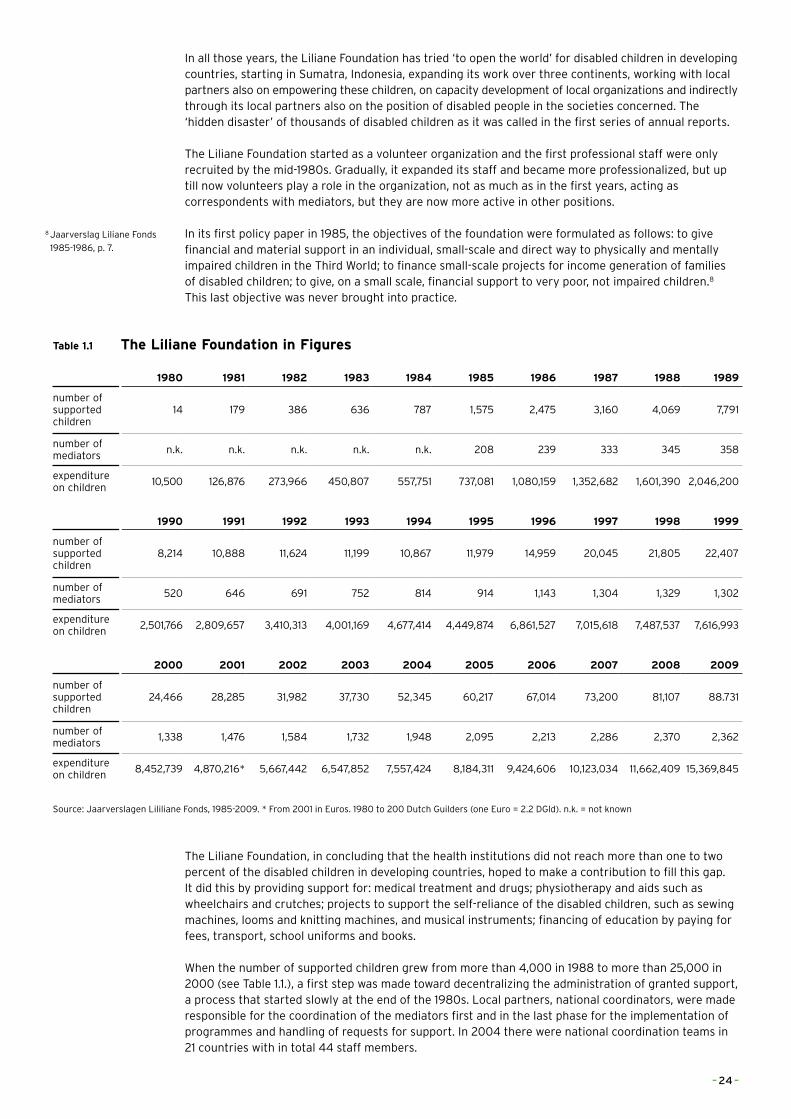
In all those years, the Liliane Foundation has tried ‘to open the world’ for disabled children in developing countries, starting in Sumatra, Indonesia, expanding its work over three continents, working with local partners also on empowering these children, on capacity development of local organizations and indirectly through its local partners also on the position of disabled people in the societies concerned. The ‘hidden disaster’ of thousands of disabled children as it was called in the first series of annual reports.
The Liliane Foundation started as a volunteer organization and the first professional staff were only recruited by the mid-1980s. Gradually, it expanded its staff and became more professionalized, but up till now volunteers play a role in the organization, not as much as in the first years, acting as correspondents with mediators, but they are now more active in other positions.
In its first policy paper in 1985, the objectives of the foundation were formulated as follows: to give financial and material support in an individual, small-scale and direct way to physically and mentally impaired children in the Third World; to finance small-scale projects for income generation of families of disabled children; to give, on a small scale, financial support to very poor, not impaired children.8 This last objective was never brought into practice.
Table 1.1 The Liliane Foundation in Figures
1980 1981 1982 1983 1984 1985 1986 1987 1988 1989
number of supported children
14 179 386 636 787 1,575 2,475 3,160 4,069 7,791
number of mediators
n.k. n.k. n.k. n.k. n.k. 208 239 333 345 358
expenditure on children
10,500 126,876 273,966 450,807 557,751 737,081 1,080,159 1,352,682 1,601,390 2,046,200
1990 1991 1992 1993 1994 1995 1996 1997 1998 1999
number of supported children
8,214 10,888 11,624 11,199 10,867 11,979 14,959 20,045 21,805 22,407
number of mediators
520 646 691 752 814 914 1,143 1,304 1,329 1,302
expenditure on children
2,501,766 2,809,657 3,410,313 4,001,169 4,677,414 4,449,874 6,861,527 7,015,618 7,487,537 7,616,993
2000 2001 2002 2003 2004 2005 2006 2007 2008 2009
number of supported children
24,466 28,285 31,982 37,730 52,345 60,217 67,014 73,200 81,107 88.731
number of mediators
1,338 1,476 1,584 1,732 1,948 2,095 2,213 2,286 2,370 2,362
expenditure on children
8,452,739 4,870,216* 5,667,442 6,547,852 7,557,424 8,184,311 9,424,606 10,123,034 11,662,409 15,369,845
Source: Jaarverslagen Lililiane Fonds, 1985-2009. * From 2001 in Euros. 1980 to 200 Dutch Guilders (one Euro = 2.2 DGld). n.k. = not known
The Liliane Foundation, in concluding that the health institutions did not reach more than one to two percent of the disabled children in developing countries, hoped to make a contribution to fill this gap. It did this by providing support for: medical treatment and drugs; physiotherapy and aids such as wheelchairs and crutches; projects to support the self-reliance of the disabled children, such as sewing machines, looms and knitting machines, and musical instruments; financing of education by paying for fees, transport, school uniforms and books.
When the number of supported children grew from more than 4,000 in 1988 to more than 25,000 in 2000 (see Table 1.1.), a first step was made toward decentralizing the administration of granted support, a process that started slowly at the end of the 1980s. Local partners, national coordinators, were made responsible for the coordination of the mediators first and in the last phase for the implementation of programmes and handling of requests for support. In 2004 there were national coordination teams in 21 countries with in total 44 staff members.
8 Jaarverslag Liliane Fonds
1985-1986, p. 7.
– 24 –
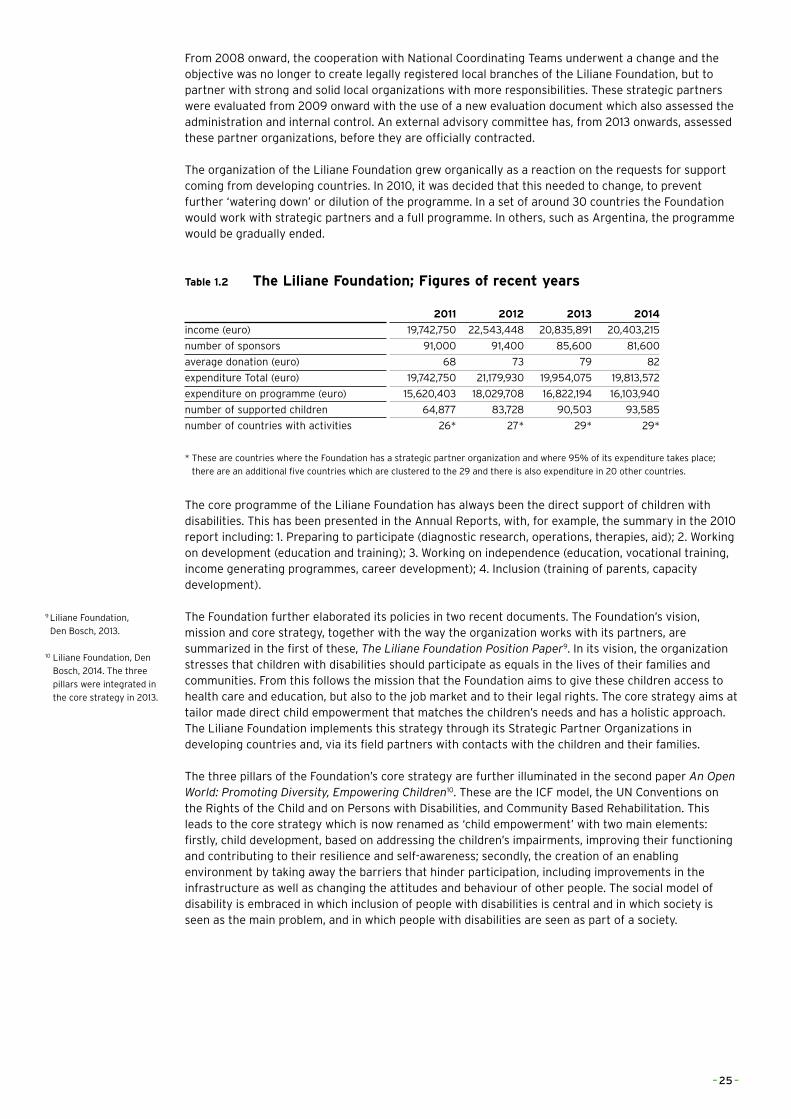
From 2008 onward, the cooperation with National Coordinating Teams underwent a change and the objective was no longer to create legally registered local branches of the Liliane Foundation, but to partner with strong and solid local organizations with more responsibilities. These strategic partners were evaluated from 2009 onward with the use of a new evaluation document which also assessed the administration and internal control. An external advisory committee has, from 2013 onwards, assessed these partner organizations, before they are officially contracted.
The organization of the Liliane Foundation grew organically as a reaction on the requests for support coming from developing countries. In 2010, it was decided that this needed to change, to prevent further ‘watering down’ or dilution of the programme. In a set of around 30 countries the Foundation would work with strategic partners and a full programme. In others, such as Argentina, the programme would be gradually ended.
Table 1.2 The Liliane Foundation; Figures of recent years
2011 2012 2013 2014
income (euro) 19,742,750 22,543,448 20,835,891 20,403,215
number of sponsors 91,000 91,400 85,600 81,600
average donation (euro) 68 73 79 82
expenditure Total (euro) 19,742,750 21,179,930 19,954,075 19,813,572
expenditure on programme (euro) 15,620,403 18,029,708 16,822,194 16,103,940
number of supported children 64,877 83,728 90,503 93,585
number of countries with activities 26* 27* 29* 29*
* These are countries where the Foundation has a strategic partner organization and where 95% of its expenditure takes place;
there are an additional five countries which are clustered to the 29 and there is also expenditure in 20 other countries.
The core programme of the Liliane Foundation has always been the direct support of children with disabilities. This has been presented in the Annual Reports, with, for example, the summary in the 2010 report including: 1. Preparing to participate (diagnostic research, operations, therapies, aid); 2. Working on development (education and training); 3. Working on independence (education, vocational training, income generating programmes, career development); 4. Inclusion (training of parents, capacity development).
The Foundation further elaborated its policies in two recent documents. The Foundation’s vision, mission and core strategy, together with the way the organization works with its partners, are summarized in the first of these, The Liliane Foundation Position Paper9. In its vision, the organization stresses that children with disabilities should participate as equals in the lives of their families and communities. From this follows the mission that the Foundation aims to give these children access to health care and education, but also to the job market and to their legal rights. The core strategy aims at tailor made direct child empowerment that matches the children’s needs and has a holistic approach. The Liliane Foundation implements this strategy through its Strategic Partner Organizations in developing countries and, via its field partners with contacts with the children and their families.
The three pillars of the Foundation’s core strategy are further illuminated in the second paper An Open World: Promoting Diversity, Empowering Children10. These are the ICF model, the UN Conventions on the Rights of the Child and on Persons with Disabilities, and Community Based Rehabilitation. This leads to the core strategy which is now renamed as ‘child empowerment’ with two main elements: firstly, child development, based on addressing the children’s impairments, improving their functioning and contributing to their resilience and self-awareness; secondly, the creation of an enabling environment by taking away the barriers that hinder participation, including improvements in the infrastructure as well as changing the attitudes and behaviour of other people. The social model of disability is embraced in which inclusion of people with disabilities is central and in which society is seen as the main problem, and in which people with disabilities are seen as part of a society.
9 Liliane Foundation,
Den Bosch, 2013.
10 Liliane Foundation, Den
Bosch, 2014. The three
pillars were integrated in
the core strategy in 2013.
– 25 –
– 26 –
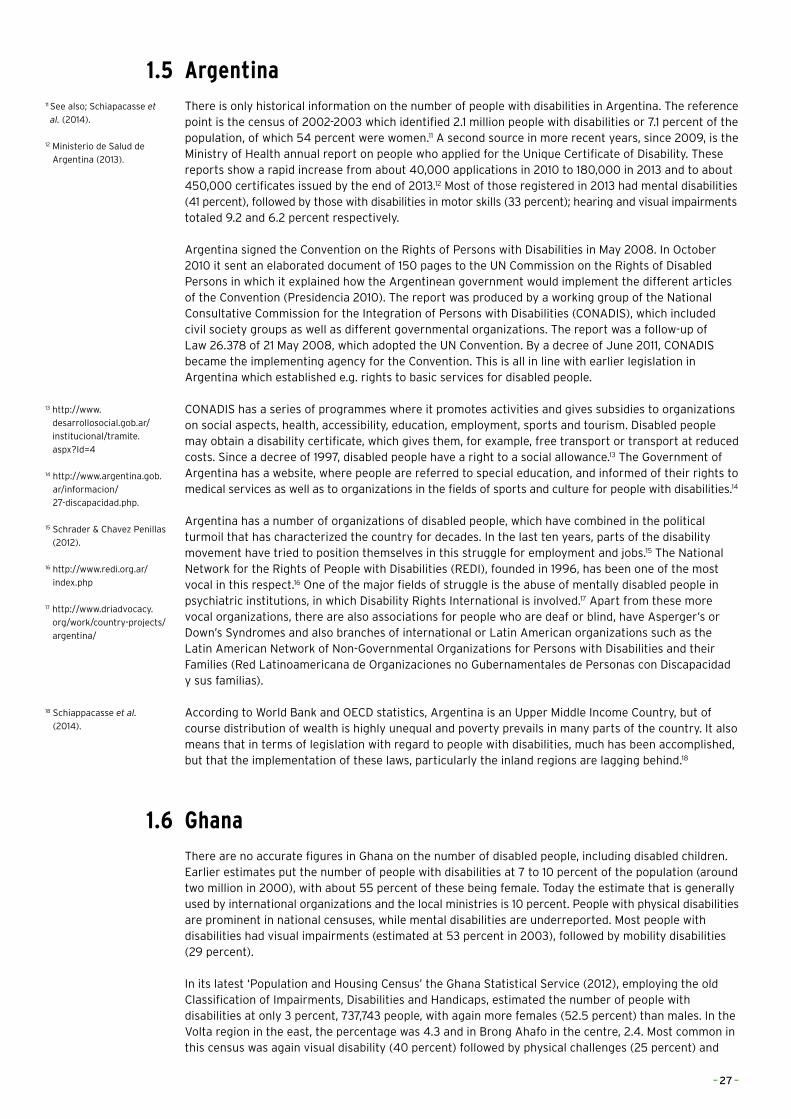
1.5 ArgentinaThere is only historical information on the number of people with disabilities in Argentina. The reference point is the census of 2002-2003 which identified 2.1 million people with disabilities or 7.1 percent of the population, of which 54 percent were women.11 A second source in more recent years, since 2009, is the Ministry of Health annual report on people who applied for the Unique Certificate of Disability. These reports show a rapid increase from about 40,000 applications in 2010 to 180,000 in 2013 and to about 450,000 certificates issued by the end of 2013.12 Most of those registered in 2013 had mental disabilities (41 percent), followed by those with disabilities in motor skills (33 percent); hearing and visual impairments totaled 9.2 and 6.2 percent respectively.
Argentina signed the Convention on the Rights of Persons with Disabilities in May 2008. In October 2010 it sent an elaborated document of 150 pages to the UN Commission on the Rights of Disabled Persons in which it explained how the Argentinean government would implement the different articles of the Convention (Presidencia 2010). The report was produced by a working group of the National Consultative Commission for the Integration of Persons with Disabilities (CONADIS), which included civil society groups as well as different governmental organizations. The report was a follow-up of Law 26.378 of 21 May 2008, which adopted the UN Convention. By a decree of June 2011, CONADIS became the implementing agency for the Convention. This is all in line with earlier legislation in Argentina which established e.g. rights to basic services for disabled people.
CONADIS has a series of programmes where it promotes activities and gives subsidies to organizations on social aspects, health, accessibility, education, employment, sports and tourism. Disabled people may obtain a disability certificate, which gives them, for example, free transport or transport at reduced costs. Since a decree of 1997, disabled people have a right to a social allowance.13 The Government of Argentina has a website, where people are referred to special education, and informed of their rights to medical services as well as to organizations in the fields of sports and culture for people with disabilities.14
Argentina has a number of organizations of disabled people, which have combined in the political turmoil that has characterized the country for decades. In the last ten years, parts of the disability movement have tried to position themselves in this struggle for employment and jobs.15 The National Network for the Rights of People with Disabilities (REDI), founded in 1996, has been one of the most vocal in this respect.16 One of the major fields of struggle is the abuse of mentally disabled people in psychiatric institutions, in which Disability Rights International is involved.17 Apart from these more vocal organizations, there are also associations for people who are deaf or blind, have Asperger’s or Down’s Syndromes and also branches of international or Latin American organizations such as the Latin American Network of Non-Governmental Organizations for Persons with Disabilities and their Families (Red Latinoamericana de Organizaciones no Gubernamentales de Personas con Discapacidad y sus familias).
According to World Bank and OECD statistics, Argentina is an Upper Middle Income Country, but of course distribution of wealth is highly unequal and poverty prevails in many parts of the country. It also means that in terms of legislation with regard to people with disabilities, much has been accomplished, but that the implementation of these laws, particularly the inland regions are lagging behind.18
1.6 GhanaThere are no accurate figures in Ghana on the number of disabled people, including disabled children. Earlier estimates put the number of people with disabilities at 7 to 10 percent of the population (around two million in 2000), with about 55 percent of these being female. Today the estimate that is generally used by international organizations and the local ministries is 10 percent. People with physical disabilities are prominent in national censuses, while mental disabilities are underreported. Most people with disabilities had visual impairments (estimated at 53 percent in 2003), followed by mobility disabilities (29 percent).
In its latest ‘Population and Housing Census’ the Ghana Statistical Service (2012), employing the old Classification of Impairments, Disabilities and Handicaps, estimated the number of people with disabilities at only 3 percent, 737,743 people, with again more females (52.5 percent) than males. In the Volta region in the east, the percentage was 4.3 and in Brong Ahafo in the centre, 2.4. Most common in this census was again visual disability (40 percent) followed by physical challenges (25 percent) and
11 See also; Schiapacasse et
al. (2014).
12 Ministerio de Salud de
Argentina (2013).
13 http://www.
desarrollosocial.gob.ar/
institucional/tramite.
aspx?Id=4
14 http://www.argentina.gob.
ar/informacion/
27-discapacidad.php.
15 Schrader & Chavez Penillas
(2012).
16 http://www.redi.org.ar/
index.php
17 http://www.driadvocacy.
org/work/country-projects/
argentina/
18 Schiappacasse et al.
(2014).
– 27 –
– 28 –
this time with emotional/behavioural problems (19 percent) and intellectual malfunctioning (15 percent) in third and fourth place. Comparing this with earlier and international figures, it is clear that the census is underreporting the number of people with disabilities by a large margin.
Ghana signed the UN CRPD in March 2007 and ratified it in July 2012. It also took a very long time before the Disability Act was passed through parliament: the government published it already in December 2000, but it was only adopted in June 2006. This Act is still the main document ensuring disability rights, with its 12 objectives on informing and educating Ghanaians on disability, ensuring access to education, health and transport, promoting participation in development but also in cultural and sports activities. The Act is, however, not fully in line with the UN CRPD.19 The Act created the National Council for Persons with Disabilities (originally the National Council on Disability), which is now under the Ministry of Gender, Children and Social Protection.
In nearly all papers, articles and reports on disability in Ghana, authors indicate that discrimination of and prejudice about people with disabilities are still very much prevalent in the country (e.g. Kassah 1998, 2001; Slikker 2009; Reynolds 2010; Naami & Hayashi 2012). Many Ghanaians are (born-again) Christians, but traditional beliefs and practices still seem to prevail. This means that it is believed by many that disabilities are caused by sorcery, are punishments from the gods and ancestors, or are a symbol of ‘juju’, a bad spell that has fallen upon the disabled person. Children with Down’s Syndrome are supposed to be under the spell of water gods and were often drowned to be given back to these. Kassah (1998) reported that as recently as 1991 when the ministerial conference of the Non-Aligned Movement was hosted in Accra, all people with disabilities were removed from the city centres. Although these traditional beliefs might gradually be substituted by more ‘modern’ insights into the medical and neurological causes of disabilities (Slikker 2009; Reynolds 2010), 38 percent of the respondents in Slikker’s research indicated spiritual reasons as causes for disabilities and several traditional chiefs protested in January 2013 when a visually impaired lawyer was nominated as a minister (Stacey 2014).
Legislation on employment discrimination has been in place for 46 years: The Labour legislation of 1969 tried to abolish discrimination against people with disabilities and established a quota of 0.5 percent for all establishments. These rights were confirmed in the Constitutions of 1979 and 1982 in line with the UN Conventions. In practice, however, unemployment among people with disabilities is far higher than among non-disabled Ghanaians (figures indicate a 23 percent unemployment rate for disabled people compared with 14 percent for able-bodied people) and the quota system was poorly monitored and finally dropped. Case studies confirm these problems (Reynolds 2010; Grischow 2014), in particular also for women with disabilities (Naami, Hayashi & Liese 2012).
As is the case with employment, inclusion in education faces some of the same problems. The Ministry of Education has a special division for education of children with disabilities, which runs 12 primary schools and one secondary school for the deaf, two schools for the blind and nine schools for children with intellectual disabilities. Apart from these, there are 38 vocational training (and rehabilitation) centres. The Education Strategic Plan (2003-2015), the Disability Act, and the Education Act of 2007 all aimed at inclusive education, with the goal of all children with non-severe education needs being integrated in mainstream schools by 2015. But these commitments to adhere to international standards and declarations were stopped by a wall of traditional superstitions, lack of training of teachers and lack of funds (Ocloo & Subbey 2008; Antony 2011), in particular also for children with intellectual disabilities (Botts & Owusu 2013).
Ghana has some very long-standing organizations of disabled people: The Ghana Society for the Blind (later Sight Savers) was established in 1951 (as a branch of the British organization) the Ghana Association of the Blind was founded in 1963 (since 2010 they both merged in the Ghana Blind Union with 8,000 members), the Ghana National Association of the Deaf was established in 1968 (6,000 members) and the Ghana Society of the Physically Disabled in 1980. The Ghana Federation of the Disabled was founded in 1987 as an umbrella organization, but it faced the criticism of its member in 2007 and 2008 that it did not function as such due to its focus on international politics (Slikker 2009). The federation received support from Denmark, and more recently from the multi-donor Ghana Research Advocacy Programme (GRAP), but there is little evidence of the Federation’s organizational strengths and impact and also little sign of its founding partners. Slikker (2009: 31) concluded that despite the fact that there are many organizations active in the field of disability in Ghana, disability policies are not implemented and the Disability Act is widely unknown. Stacey (2014) indicated that due to stigmatization, lack of resources and access and low educational levels, political participation of people with disabilities in Ghana, as in many other countries, is still very low.
19 Draft Gap Analysis Report
on the Persons with
Disability Act 2006 (Act
715), which was conducted
by Law and Development
Associate in April 2013.
– 29 –
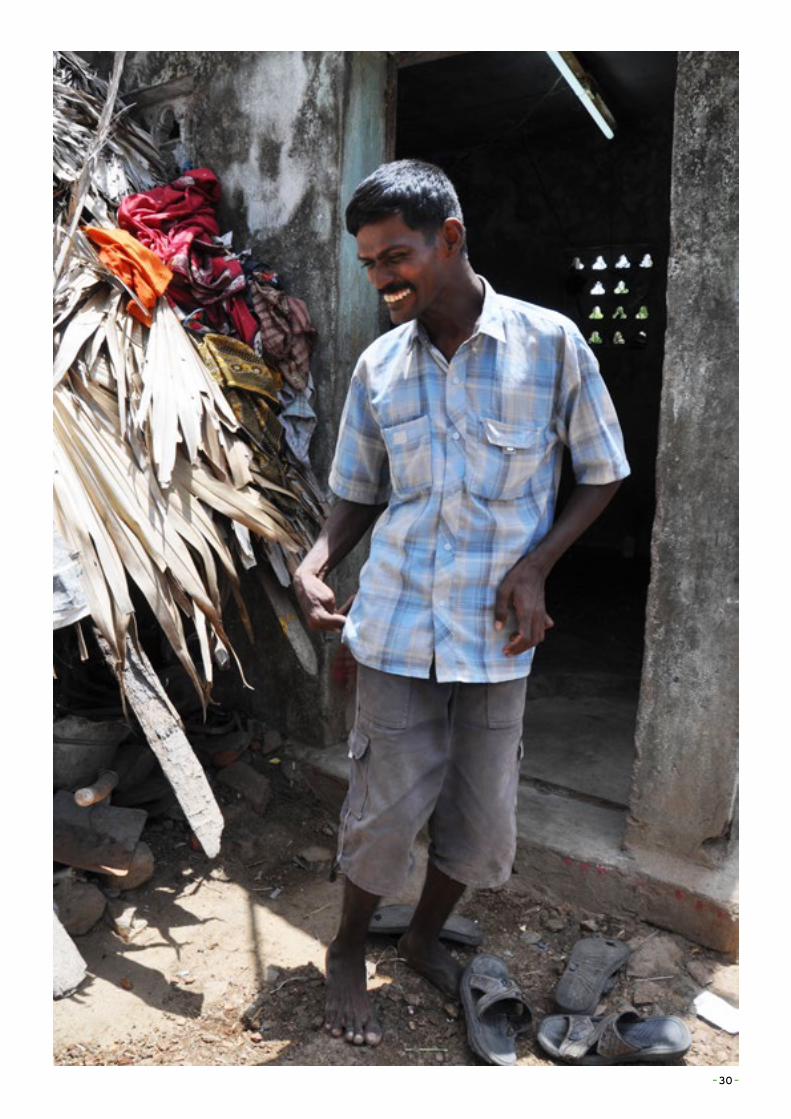
– 30 –
1.7 IndiaThe number of people with disabilities in India is also widely under-reported: The National Sample Survey estimated it at 1.9 percent of the population, the census of 2001 at 2.13 percent, the Disability survey of 2002 at 1.8 percent, and the 2011 census put it at 2.21 percent. This means in total 26.8 million people with disabilities in 2011, 14.98 million males and 11.82 million females, with 69.5 percent of disabled people living in rural areas. This means an increase of around 5 million in comparison with the census of 2001. The largest groups are those with visual or hearing disabilities (both around 5 million, 19 percent) and those with mobility problems (5.44 million; 20.3 percent); people with ‘mental retardation’ amounted to 1.5 million (5.6 percent) and with ‘mental illness‘ to 0.7 million (2.7 percent).20 Problems with seeing and hearing was higher among females, and in mobility higher among males, while disability in mobility was also far higher in rural areas than in urban settings. It is clear from the 2011 census that disability prevalence in India was also far higher in the 60 plus population than among other age groups, and also lowest in the below 10 age group.
It is remarkable to see that the figures for disabled children in the age groups of 0-4 and 5-9 were far lower than those in the older age groups, in particular in the category of disabilities in mobility, but also in those of visual and hearing impairments. This confirms earlier observations that polio immunization in particular has had effects on disability prevalence. There are, however, as in other indicators on the social position of disabled people, important differences between states, which is also confirmed by the Human Development Index which is far higher in states such as Kerala and Punjab than in states at the low end such as Orissa and Bihar. The same is true for the human health index, where again Kerala is at the top (CHAI 2012). This implementation gap between the states could also appear with regard to disability policies, such as social welfare benefits.
The meaning and causes of disability have multiple interpretations in the culture of India, a vast continent, with high diversity and huge regional differences. In the dominant Hindu culture, disability has been seen as a retribution for past karma (Singh & Ghai 2009) or the sins of fathers and mothers (World Bank 2007). It can also be attributed to God’s will. The disabled then ‘stoically’ accept their fate (Dalal & Pande 1999; Sing & Ghai 2009; CHAI 2012). This is confirmed by more authors and Rao et al. found, for example in Andhra Pradesh that 40 percent of their respondents believed that disabilities were caused by supernatural events.21 In Hindu mythology, disabled men are very often powerful, but side with the forces of evil, and in Bollywood films a set of caricature disabled people appear, with important differences between disabled men and women (World Bank 2007). This all leads to social discrimination against people with disabilities, with which they are confronted in daily life, in their communities, schools and on the labour market. We should note however that some observers see important differences between the north and the south of India, and between Hindus and other religions, in the acceptance of children and adults with disabilities.
The 2011 census confirmed again that a large part of the population of people with disabilities (45.5 percent) is illiterate. This is particularly the case for women with disabilities where the majority (55.4 percent) is illiterate. Illiteracy among people with severe disabilities is estimated at more than 70 percent. Adult literacy in India stands at 74 percent, way below international averages, and India has the highest number of illiterates of any country in the world (287 million according to the UNDP, in particular women). But the educational levels of people with disabilities are still far lower than those of the non-disabled population. Altogether, 38 percent of children with disabilities (aged 6 to 13 years) are estimated to be out of school, and school attendance by these children never rises above 70 percent (World Bank 2007). In urban areas they are a bit higher but not much, and attendance for boys is 8 to 10 percentage points higher than for girls.
The first schools for children with disabilities were already established in the 1880s, with a school for deaf children in Bombay in 1883 and for the blind in Amritsar in 1887. Hundreds of these schools were set up in the following years (with an estimated total of 2,500 in 2007). This initiated a tradition of special schools for disabled children in the country (World Bank 2007). Inclusive education only came on the agenda from 1974 onwards, when a scheme for Integrated Education of Disabled Children was brought forward, but as the World Bank has indicated, the tensions between the role of special and general schools for these children remain until today. There is then quite some discussion as to whether ‘inclusive education’ should be seen as a ‘Northern concept’, a ‘progressive cliché’ or even ‘educational colonialism’ promoting ‘false universalism’ (Singal 2005; Johansson 2014), but some authors stress that the outcomes of inclusive education might not include employment, but are still positive in the eyes of those disabled people who went to school (Singal et al. 2011).
20 http://punarbhava.in/
index.php?option=com_
content&view=article&id=1
463&Itemid=758. Disability
was covered in the
historical censuses of
colonial times, but in the
censuses from 1941 to 1971
it was not taken into
account. It was taken up
again in 1981 but dropped
in 1991. In 2011 information
on eight types of disability
were collected. See also
World Bank (2007) Annex 1
on the sample differences.
We use the terms that are
used in the censuses here.
21 This is in contrast with
Buckingham (2011) who
sees stigmatization of
disabled people as a
typical western Judeo-
Christian construct and is
convinced of having found
different attitudes in India,
although what exactly is
unclear from her article.
– 31 –
While there is some good information on education and illiteracy among people with disabilities in India, there is hardly any information on employment of disabled people since they are not taken into account in strategy papers, working committee reports etc. (NCPEDP 2009). The Disability Act of 1995 promised equal opportunities for people with disabilities and quotas for governments posts of not less than 3 percent. The World Bank (2007) calculated, however, that the employment rate among people with disabilities had fallen, despite this law, from 42.7 percent in 1991 to 37.6 percent in 2001. The overall unemployment rate in India in 2012 stood at 6.3 percent and following government plans it fell below 5 percent in 2014. Youth unemployment, however, is far higher at 12.9 percent. NCPEDP (2009) calculated that only 0.44 percent of government and public sector posts had been filled with disabled people and in the private sector the situation was even worse. Cobley (2013: 443) argued that ‘despite the gloomy picture of widespread discrimination’ there is some evidence that the landscape is starting to change, with the UN CRPD in the background, and the Confederation of Indian Industry publishing a disability manual.
The government of India signed the UN CRPD in March 2007 and ratified it in December 2007. As already observed by Myrdal in his famous Asian Drama India has progressive legislation on many aspects of political, economic and social life, but there is a lack of implementation; India, in his eyes being a ‘soft state’. With regard to people with disabilities in India, the Constitution has already commissioned the Indian government to protect people with disabilities. India has its ‘Persons with Disabilities (Equal Opportunities, Protection of Rights and Full Participation) Act’ from 1995, an earlier Mental Health Act (1987) and an Act on Autism, Cerebral Palsy, Mental Retardation and Multiple Disabilities (1999), as well as a National Policy for Persons with Disabilities (2006) and its guidelines for barrier free access (1998). The discrepancies between this disability legislation and what we see happening in practice, can be partly explained because of the differences between states, which are in many instances responsible for these laws and policies (Menon, Parish & Rose 2014). It is, however, clear that there are few countries where the gap between legislation and national policies and the implementation of these is so wide.
The defunct implementation by state governments might only be part of the explanation, however. It is reported that the disability movement in India is rather weak and invisible compared to the labour or environment movements or women’s groups: People with disabilities form one of the most politically invisible and under-represented groups in India (DCODP 2002; Mehrotra 2011). People with disabilities don’t see themselves as a political force and the fragmented disability organizations function more as service organizations and as an auxiliary arm for government than as advocacy and rights claiming organizations. Many of the local branches are more like self-help organizations (CHAI 2012). There are some umbrella organizations at state level, but not at national level.
1.8 The Philippines22
In the Philippines, The National Census of Population and Housing of 2010 put the number of people with disabilities at 1.44 million, up from 0.935 million in the census of 2000. This means that 1.57 percent of the total population is now considered to be disabled, whereas in 2000 this was 1.23 percent. Males comprised a slight majority of people with disabilities with 52.0 percent of the total, with the largest excess in the age group of 0 to 14 years. In the age group of 65 and over females were in the majority.23
In a 2010 survey of the situation of people with disabilities in the rural Philippines, it was concluded that the majority did not even finish primary school and that more than half of them were unemployed. The most common reason for not going to school or not completing school was poverty.24 An earlier, smaller study on (un)employment among people with disabilities also came to the conclusion that half of them were unemployed.25 A second study in Metropolitan Manila revealed that the incidence of poverty among people with disabilities in this mega-city was in general much higher than among the total population, but also that the income disparities among them were very large, related to the level of education and gender.26
The Republic Act No. 7277 of 1991, the ‘Magna Carta for Disabled Persons’, provides for rehabilitation, self-development and self-reliance of disabled people and their integration into the mainstream of society. It reserves 5 percent of all positions in government ministries, agencies and state corporations for disabled people. The Equal Opportunity Employment Act of 2012 brought this percentage down to 1 percent, but extended it to private companies with more than 100 employees.
A National Council on Disability Affairs was established in 2008, attached to the Office of the President,
22 There are remarkably few
publications on disability,
disability prevalence and
the social, economic and
political position of people
with disabilities.
23 www.census.gov.php/
content/persons-dosbility-
philippines-results-2010-
census.
24 Reyes et al. (2011). These
studies ended in a book
published this year with
Routledge on poverty
reduction of the disabled
in the Philippines.
25 Mina (2010).
26 Albert et al. (2010).
– 32 –
– 33 –
with representatives of 12 departments and agencies and with 6 representatives of DPOs and other NGOs. It is a successor to earlier national commissions, dating from 1971. The Philippine constitution of 1987 provided not only the social rights and rights to social welfare for people with disabilities , and also secured their political rights.27 In 2009 this was extended by a new law obliging provincial and municipal authorities to establish an office for disability issues and an officer for people with disabilities.
There is a wide range of public and private organizations to assist people with disabilities, some organized by disabled people themselves (DPOs). Katipunanng May Kapansanansa Philippines Inc (KAMPI), established in July 1990, is the umbrella organization of around 250 grassroots organizations and self-help groups, which has developed itself, with Danish assistance, from an advocacy organization to an organization that delivers all kinds of services, such as Community Based Rehabilitation and income generating programmes. As in the other countries, there are in the Philippines also Associations and Federations, Christian and Catholic Foundations and Ministries of and for the Deaf and Blind. We counted 44 organizations, including grassroots organizations, for the deaf alone. There is the Mental Health Organization, and there are private organizations such as the Autism Society or the NORFIL Foundation, which try to assist people with disabilities.
1.9 ConclusionsThree major events have changed the international climate surrounding disability and disability and development: the new international classification which includes physical/psychological and social elements, the UN Convention on the Rights of Persons with Disabilities, and the publication of the World Report on Disability. Maybe it is too early to conclude, but this publication seems to have had rather little impact on the donor community to date. This is in particular true for the Netherlands and its development policy, which, in the absence of a clear poverty strategy, cannot show any policy documents on disability and development. It means that in the Netherlands, the only organizations supporting disabled people are private aid organizations such as the Liliane Foundation.
The CRPD has already had some influence in the four countries visited during the course of this research. All four countries have ratified it and they are endorsing new legislation. The implementation of these laws lags behind, however, but the CRPD and the new legislation are certainly anchor points that can be used in lobbying and advocacy trajectories. However, apart maybe from the Philippines, and maybe to a certain extent also Argentina, disability organizations (DPOs) do not appear to be very strong and maybe also come too much from a charity background, not acting so much as ‘trade unions for the disabled’.
27 See also Purcil (2009).
– 34 –
2 POVERTY AND DISABILITY: STANDARD OF LIVING, HOUSING, ASSETS
When visiting our respondents in their houses, it was obvious that the vast majority of them lived in poverty. This is of course a rather subjective observation, so the first thing we tried to do in our interviews was to assess their living situation and standard of living. Poverty measures or poverty thresholds are, however, also known to be rather subjective. Most of the time they are calculated on the basis of a basket of essential food products based on a minimum calorie intake, and on a number of other products and services that are deemed essential in a given society. It is obvious that what people need to survive differs from country to country. What to include in the basket of essential goods and services and what to leave out is of course not only culturally loaded, but very open to debate. Poverty thresholds are also often the subject of heated debate in developed countries (in a typical British understatement it could be called an ‘emotive topic’), because they lead to social policies that might leave out important strata of the poor or, on the other hand, lead to policies which turn out to be too expensive. In India, the Planning Commission regularly nominates expert groups to re-assess poverty thresholds. In the summer of 2014, the most recent report, the Rangarajan-report, appeared, which by its new calculations raised the number of poor to 363 million or 29.6 percent of the population compared with 269.8 million (21.9 percent) in the earlier report of the Planning Commission in 2013.
The best-known poverty threshold is the $1 a day (which was raised to $ 1.25 in 2005) used by the World Bank to assess the number of people living in extreme poverty, and $ 2.00 a day for poor people. Since it is well known that you can buy a lot more with one dollar in India than in Argentina, this dollar is recalculated by the World Bank to its purchasing power (with the PPP = Purchasing Power Parities). In this chapter we also use the $1.25 and $2.00 World Bank thresholds for the Philippines, India and Ghana, but not for Argentina since the World Bank does not provide a PPP for this country. We also use poverty analysis and reports from all four countries’ statistics offices, bureaus or planning commissions. It is clear that being poor means something different in Ghana or in Argentina, but within India there are also different poverty thresholds for urban and rural regions, as there are differences between states. In the two states where we did our interviews, the poverty threshold for rural areas was set at Rs. 803.06 (around 12 $) and for urban areas at Rs. 1139.81 in Kerala, and for Tamil Nadu at respectively Rs. 785.66 and Rs. 1179.80.28
There are, however, also other methods of measuring poverty and there is a long and old debate on poverty thresholds and poverty measurement, going back as far as the first poverty studies by Rowntree in England 115 years ago, and by Bowley 100 years ago, to the more recent work of Sen (1986) and Atkinson (1986). They all emphasize the need to take more aspects or dimensions of poverty into account than income or expenditure. The Basic Needs approach, fuelled by the International Labour Organization in the 1970s, also influenced the discussion on poverty measurement. If poverty is taken to mean the incapacity to fulfill basic needs, then goods and services that often cannot be bought, so-called non-market goods (such as access to education and health), should also be included in the measurement.
One of these efforts to measure poverty multi-dimensionally is the Multi-Dimensional Poverty Index of the Oxford Poverty & Human Development Initiative (Alkire and Foster 2007, 2009; Alkire and Santos 2010, 2013). In this index, health and education are also integrated, as we will also do in the next chapters, and in addition, access to electricity, water and sanitation, flooring (dirt, sand or dung), cooking fuel (wood, charcoal or dung) and assets (not owning more than one of the following assets: radio, television, telephone, bicycle or motorcycle). We also asked our respondents about their assets, but in our case it was about televisions, computers, fridges and washing machines.
Since poverty is mostly measured at household level, (as also for this study), there are shortcomings here too. Households differ in size and also in their internal functioning among cultures, castes and classes. Ravallion (1996) and Haddad and Kanbur (1990) amongst others emphasized the importance of looking at distribution within households and suggested that this could be measured by looking at child nutrition. This might be particularly true for disabled children, when families feel ashamed to have a disabled child and hide them for the eyes of the community.
It is important not to mix indicators and causes of poverty. As poor health might be a result of poverty, it could also be a cause of poverty because of high expenditure on health and the inability to work and earn an income, as suggested by the title of Anirudh Krishna’s book One Illness Away. Along with the
28 For the discussions on the
poverty line in India see
also the reports of the
Tendulkar (2009) and
Rangarajan (2014)
committees.
– 35 –
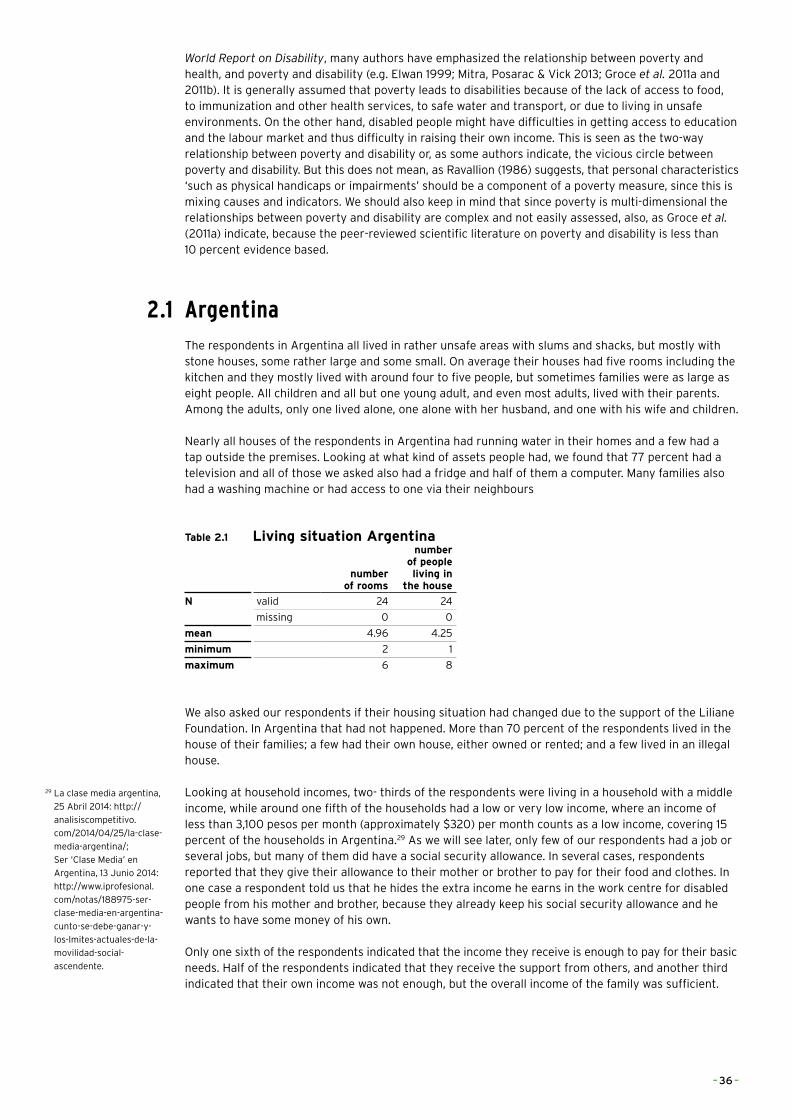
World Report on Disability, many authors have emphasized the relationship between poverty and health, and poverty and disability (e.g. Elwan 1999; Mitra, Posarac & Vick 2013; Groce et al. 2011a and 2011b). It is generally assumed that poverty leads to disabilities because of the lack of access to food, to immunization and other health services, to safe water and transport, or due to living in unsafe environments. On the other hand, disabled people might have difficulties in getting access to education and the labour market and thus difficulty in raising their own income. This is seen as the two-way relationship between poverty and disability or, as some authors indicate, the vicious circle between poverty and disability. But this does not mean, as Ravallion (1986) suggests, that personal characteristics ‘such as physical handicaps or impairments’ should be a component of a poverty measure, since this is mixing causes and indicators. We should also keep in mind that since poverty is multi-dimensional the relationships between poverty and disability are complex and not easily assessed, also, as Groce et al. (2011a) indicate, because the peer-reviewed scientific literature on poverty and disability is less than 10 percent evidence based.
2.1 ArgentinaThe respondents in Argentina all lived in rather unsafe areas with slums and shacks, but mostly with stone houses, some rather large and some small. On average their houses had five rooms including the kitchen and they mostly lived with around four to five people, but sometimes families were as large as eight people. All children and all but one young adult, and even most adults, lived with their parents. Among the adults, only one lived alone, one alone with her husband, and one with his wife and children.
Nearly all houses of the respondents in Argentina had running water in their homes and a few had a tap outside the premises. Looking at what kind of assets people had, we found that 77 percent had a television and all of those we asked also had a fridge and half of them a computer. Many families also had a washing machine or had access to one via their neighbours
Table 2.1 Living situation Argentina
number of rooms
number of people living in
the house
N valid 24 24
missing 0 0
mean 4.96 4.25
minimum 2 1
maximum 6 8
We also asked our respondents if their housing situation had changed due to the support of the Liliane Foundation. In Argentina that had not happened. More than 70 percent of the respondents lived in the house of their families; a few had their own house, either owned or rented; and a few lived in an illegal house.
Looking at household incomes, two- thirds of the respondents were living in a household with a middle income, while around one fifth of the households had a low or very low income, where an income of less than 3,100 pesos per month (approximately $320) per month counts as a low income, covering 15 percent of the households in Argentina.29 As we will see later, only few of our respondents had a job or several jobs, but many of them did have a social security allowance. In several cases, respondents reported that they give their allowance to their mother or brother to pay for their food and clothes. In one case a respondent told us that he hides the extra income he earns in the work centre for disabled people from his mother and brother, because they already keep his social security allowance and he wants to have some money of his own.
Only one sixth of the respondents indicated that the income they receive is enough to pay for their basic needs. Half of the respondents indicated that they receive the support from others, and another third indicated that their own income was not enough, but the overall income of the family was sufficient.
29 La clase media argentina,
25 Abril 2014: http://
analisiscompetitivo.
com/2014/04/25/la-clase-
media-argentina/;
Ser ‘Clase Media’ en
Argentina, 13 Junio 2014:
http://www.iprofesional.
com/notas/188975-ser-
clase-media-en-argentina-
cunto-se-debe-ganar-y-
los-lmites-actuales-de-la-
movilidad-social-
ascendente.
– 36 –
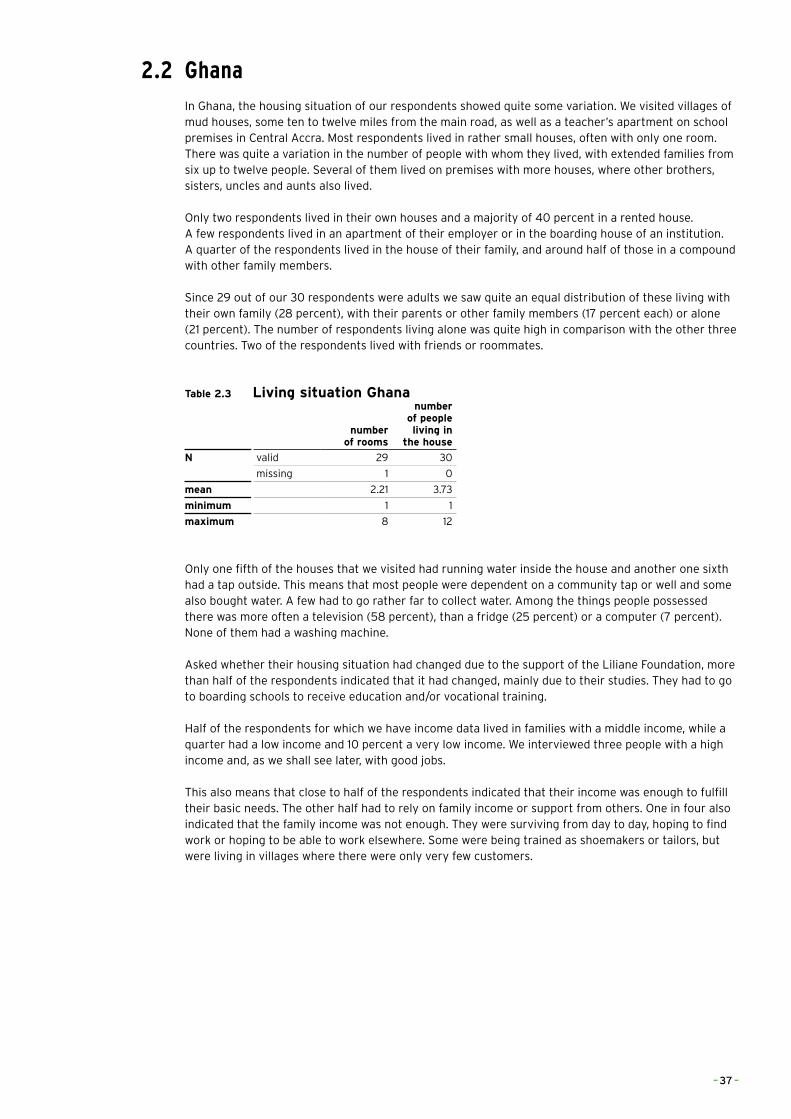
2.2 GhanaIn Ghana, the housing situation of our respondents showed quite some variation. We visited villages of mud houses, some ten to twelve miles from the main road, as well as a teacher’s apartment on school premises in Central Accra. Most respondents lived in rather small houses, often with only one room. There was quite a variation in the number of people with whom they lived, with extended families from six up to twelve people. Several of them lived on premises with more houses, where other brothers, sisters, uncles and aunts also lived.
Only two respondents lived in their own houses and a majority of 40 percent in a rented house. A few respondents lived in an apartment of their employer or in the boarding house of an institution. A quarter of the respondents lived in the house of their family, and around half of those in a compound with other family members.
Since 29 out of our 30 respondents were adults we saw quite an equal distribution of these living with their own family (28 percent), with their parents or other family members (17 percent each) or alone (21 percent). The number of respondents living alone was quite high in comparison with the other three countries. Two of the respondents lived with friends or roommates.
Table 2.3 Living situation Ghana
number of rooms
number of people living in
the house
N valid 29 30
missing 1 0
mean 2.21 3.73
minimum 1 1
maximum 8 12
Only one fifth of the houses that we visited had running water inside the house and another one sixth had a tap outside. This means that most people were dependent on a community tap or well and some also bought water. A few had to go rather far to collect water. Among the things people possessed there was more often a television (58 percent), than a fridge (25 percent) or a computer (7 percent). None of them had a washing machine.
Asked whether their housing situation had changed due to the support of the Liliane Foundation, more than half of the respondents indicated that it had changed, mainly due to their studies. They had to go to boarding schools to receive education and/or vocational training.
Half of the respondents for which we have income data lived in families with a middle income, while a quarter had a low income and 10 percent a very low income. We interviewed three people with a high income and, as we shall see later, with good jobs.
This also means that close to half of the respondents indicated that their income was enough to fulfill their basic needs. The other half had to rely on family income or support from others. One in four also indicated that the family income was not enough. They were surviving from day to day, hoping to find work or hoping to be able to work elsewhere. Some were being trained as shoemakers or tailors, but were living in villages where there were only very few customers.
– 37 –
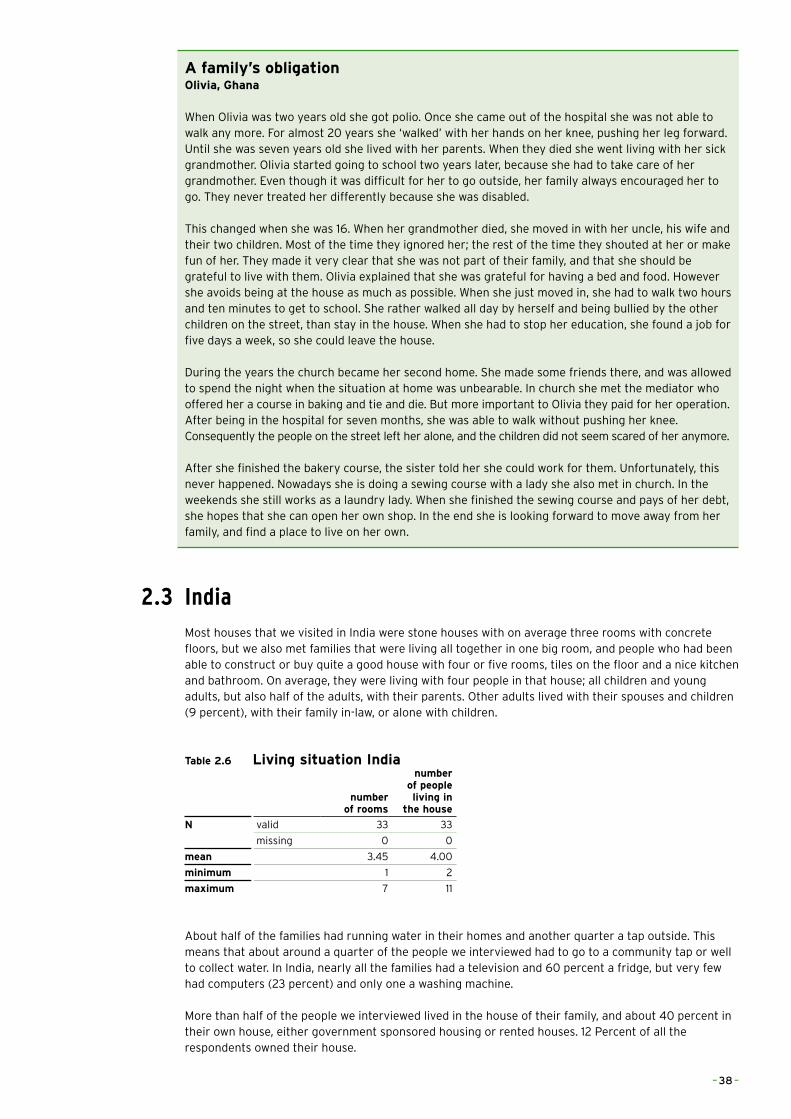
A family’s obligationOlivia, Ghana
When Olivia was two years old she got polio. Once she came out of the hospital she was not able to walk any more. For almost 20 years she ‘walked’ with her hands on her knee, pushing her leg forward. Until she was seven years old she lived with her parents. When they died she went living with her sick grandmother. Olivia started going to school two years later, because she had to take care of her grandmother. Even though it was difficult for her to go outside, her family always encouraged her to go. They never treated her differently because she was disabled.
This changed when she was 16. When her grandmother died, she moved in with her uncle, his wife and their two children. Most of the time they ignored her; the rest of the time they shouted at her or make fun of her. They made it very clear that she was not part of their family, and that she should be grateful to live with them. Olivia explained that she was grateful for having a bed and food. However she avoids being at the house as much as possible. When she just moved in, she had to walk two hours and ten minutes to get to school. She rather walked all day by herself and being bullied by the other children on the street, than stay in the house. When she had to stop her education, she found a job for five days a week, so she could leave the house.
During the years the church became her second home. She made some friends there, and was allowed to spend the night when the situation at home was unbearable. In church she met the mediator who offered her a course in baking and tie and die. But more important to Olivia they paid for her operation. After being in the hospital for seven months, she was able to walk without pushing her knee. Consequently the people on the street left her alone, and the children did not seem scared of her anymore.
After she finished the bakery course, the sister told her she could work for them. Unfortunately, this never happened. Nowadays she is doing a sewing course with a lady she also met in church. In the weekends she still works as a laundry lady. When she finished the sewing course and pays of her debt, she hopes that she can open her own shop. In the end she is looking forward to move away from her family, and find a place to live on her own.
2.3 IndiaMost houses that we visited in India were stone houses with on average three rooms with concrete floors, but we also met families that were living all together in one big room, and people who had been able to construct or buy quite a good house with four or five rooms, tiles on the floor and a nice kitchen and bathroom. On average, they were living with four people in that house; all children and young adults, but also half of the adults, with their parents. Other adults lived with their spouses and children (9 percent), with their family in-law, or alone with children.
Table 2.6 Living situation India
number of rooms
number of people living in
the house
N valid 33 33
missing 0 0
mean 3.45 4.00
minimum 1 2
maximum 7 11
About half of the families had running water in their homes and another quarter a tap outside. This means that about around a quarter of the people we interviewed had to go to a community tap or well to collect water. In India, nearly all the families had a television and 60 percent a fridge, but very few had computers (23 percent) and only one a washing machine.
More than half of the people we interviewed lived in the house of their family, and about 40 percent in their own house, either government sponsored housing or rented houses. 12 Percent of all the respondents owned their house.
– 38 –
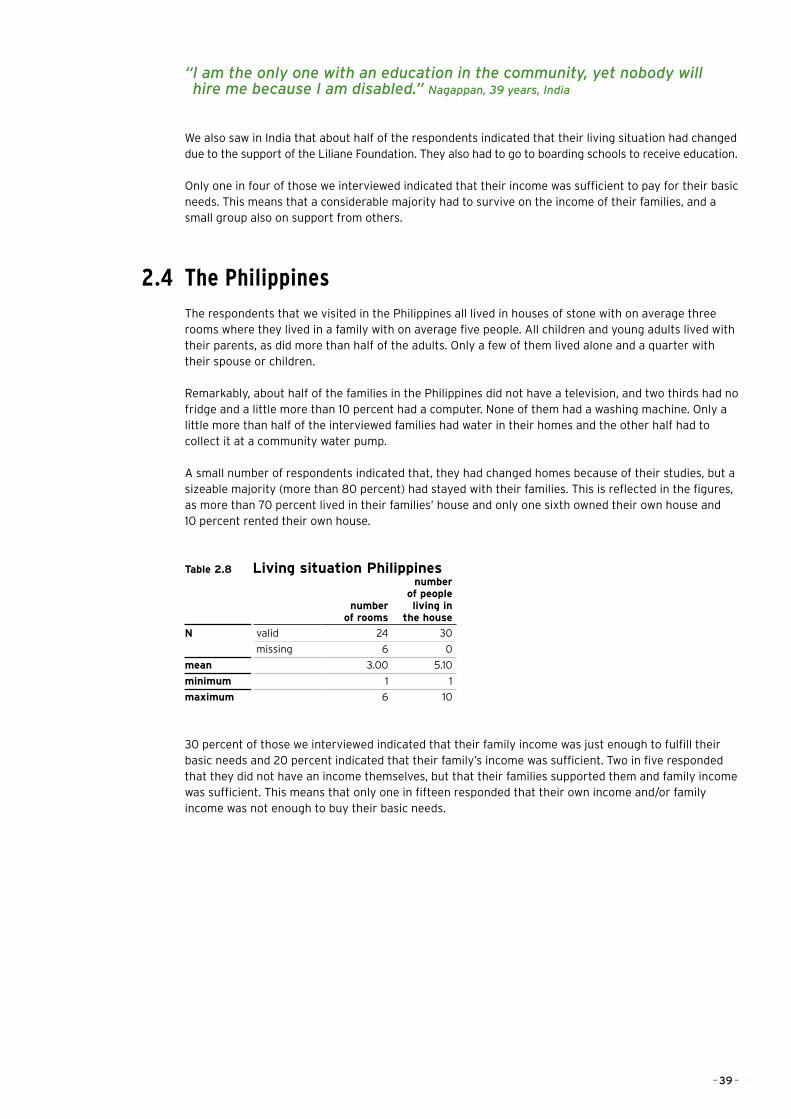
“�I�am�the�only�one�with�an�education�in�the�community,�yet�nobody�will��hire�me�because�I�am�disabled.”�Nagappan,�39�years,�India
We also saw in India that about half of the respondents indicated that their living situation had changed due to the support of the Liliane Foundation. They also had to go to boarding schools to receive education.
Only one in four of those we interviewed indicated that their income was sufficient to pay for their basic needs. This means that a considerable majority had to survive on the income of their families, and a small group also on support from others.
2.4 The PhilippinesThe respondents that we visited in the Philippines all lived in houses of stone with on average three rooms where they lived in a family with on average five people. All children and young adults lived with their parents, as did more than half of the adults. Only a few of them lived alone and a quarter with their spouse or children.
Remarkably, about half of the families in the Philippines did not have a television, and two thirds had no fridge and a little more than 10 percent had a computer. None of them had a washing machine. Only a little more than half of the interviewed families had water in their homes and the other half had to collect it at a community water pump.
A small number of respondents indicated that, they had changed homes because of their studies, but a sizeable majority (more than 80 percent) had stayed with their families. This is reflected in the figures, as more than 70 percent lived in their families’ house and only one sixth owned their own house and 10 percent rented their own house.
Table 2.8 Living situation Philippines
number of rooms
number of people living in
the house
N valid 24 30
missing 6 0
mean 3.00 5.10
minimum 1 1
maximum 6 10
30 percent of those we interviewed indicated that their family income was just enough to fulfill their basic needs and 20 percent indicated that their family’s income was sufficient. Two in five responded that they did not have an income themselves, but that their families supported them and family income was sufficient. This means that only one in fifteen responded that their own income and/or family income was not enough to buy their basic needs.
– 39 –
2.5 ConclusionsThe housing situation of the respondents differed according to the level of development of their respective countries, but in general most of them lived in poor areas or villages, in small houses with of course many more amenities in Buenos Aires, where all houses had electricity and at least a water tap on the premises, than in Ghana, where most people did not have access to these.
All children and all but one young adult lived with their parents, but also here there were some differences from country to country. In Ghana and India, we saw more children and adults living in nuclear or extended families, but we also observed, in particular in Argentina, children living in broken families, often with violence and alcohol. There was, as expected, a bigger spread among adults in their living situation, but 40 percent still lived with their parents compared with 23 percent with their own family and 12 percent living alone. This was reflected in the figures on house ownership. Among the adults only 14 percent owned the house they were living in and 25 percent lived in a rented house. In Ghana we found more adults living in their own houses than in the other three countries.
The important differences in poverty levels can also be seen from the belongings of people, where nearly all families we visited in Argentina had a television, fridge, computer and washing machine, while only a few in Ghana had a fridge, two a computer and none a washing machine. In general, families in the Philippines had fewer possessions than in India, which might be due to the fact that we visited some of the richer states in India, where state governments also paid social security benefits for disabled people.
Differences in poverty levels were also reflected in the income situation. 15 percent of our respondents had a high income and more than half a middle income. Low incomes in total were a bit more than 30 percent, with around half of these earning very low incomes. This not only means that a very high proportion of our respondents had to rely on their families for their basic needs, but also that for one in seven, their family or own income was not sufficient to get these basic needs. Most of these cases were found in Ghana and India.
In Ghana and India in particular, we saw that when they started receiving support from the Liliane Foundation, a large number of children changed homes and went to boarding schools. Although children in Buenos Aires or in Malolo had sometimes to travel long distances to receive special education, their schools were within travelling distance. This is obviously not the case in Ghana and India where these distances were too far, and disabled children already went to a boarding school at a rather early age.
– 40 –
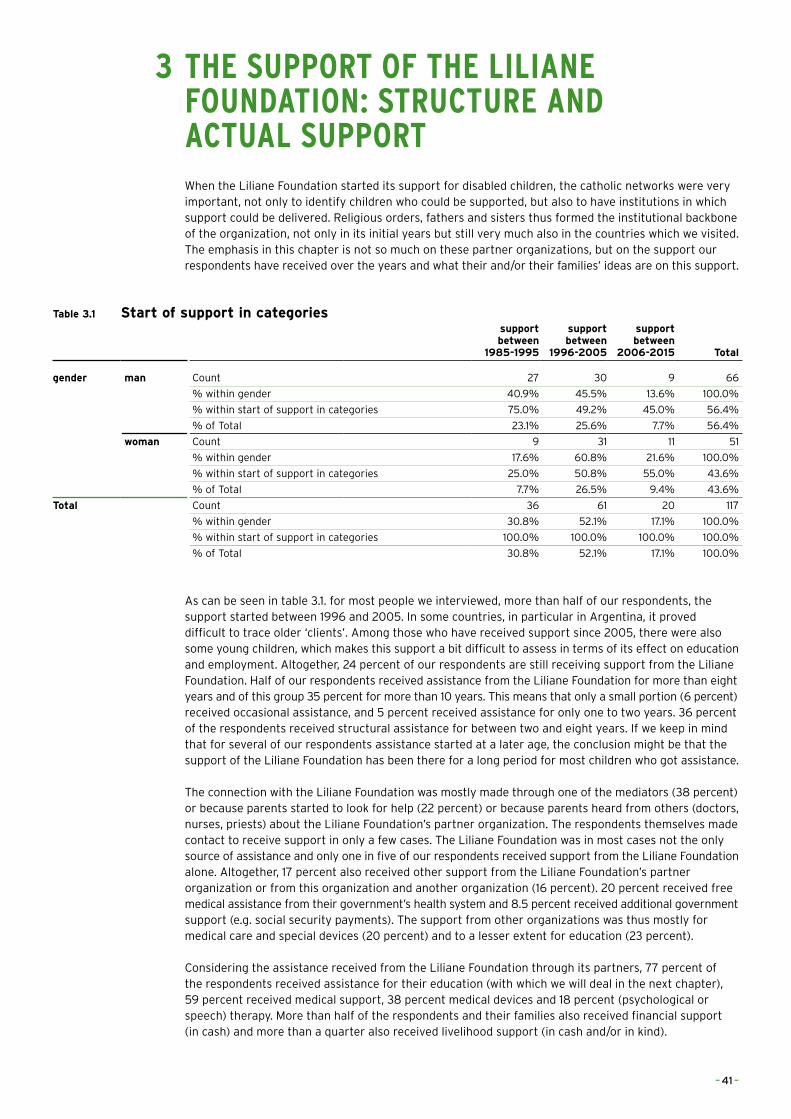
3 THE SUPPORT OF THE LILIANE FOUNDATION: STRUCTURE AND ACTUAL SUPPORT
When the Liliane Foundation started its support for disabled children, the catholic networks were very important, not only to identify children who could be supported, but also to have institutions in which support could be delivered. Religious orders, fathers and sisters thus formed the institutional backbone of the organization, not only in its initial years but still very much also in the countries which we visited. The emphasis in this chapter is not so much on these partner organizations, but on the support our respondents have received over the years and what their and/or their families’ ideas are on this support.
Table 3.1 Start of support in categoriessupport between
1985-1995
support between
1996-2005
support between
2006-2015 Total
gender man Count 27 30 9 66
% within gender 40.9% 45.5% 13.6% 100.0%
% within start of support in categories 75.0% 49.2% 45.0% 56.4%
% of Total 23.1% 25.6% 7.7% 56.4%
woman Count 9 31 11 51
% within gender 17.6% 60.8% 21.6% 100.0%
% within start of support in categories 25.0% 50.8% 55.0% 43.6%
% of Total 7.7% 26.5% 9.4% 43.6%
Total Count 36 61 20 117
% within gender 30.8% 52.1% 17.1% 100.0%
% within start of support in categories 100.0% 100.0% 100.0% 100.0%
% of Total 30.8% 52.1% 17.1% 100.0%
As can be seen in table 3.1. for most people we interviewed, more than half of our respondents, the support started between 1996 and 2005. In some countries, in particular in Argentina, it proved difficult to trace older ‘clients’. Among those who have received support since 2005, there were also some young children, which makes this support a bit difficult to assess in terms of its effect on education and employment. Altogether, 24 percent of our respondents are still receiving support from the Liliane Foundation. Half of our respondents received assistance from the Liliane Foundation for more than eight years and of this group 35 percent for more than 10 years. This means that only a small portion (6 percent) received occasional assistance, and 5 percent received assistance for only one to two years. 36 percent of the respondents received structural assistance for between two and eight years. If we keep in mind that for several of our respondents assistance started at a later age, the conclusion might be that the support of the Liliane Foundation has been there for a long period for most children who got assistance.
The connection with the Liliane Foundation was mostly made through one of the mediators (38 percent) or because parents started to look for help (22 percent) or because parents heard from others (doctors, nurses, priests) about the Liliane Foundation’s partner organization. The respondents themselves made contact to receive support in only a few cases. The Liliane Foundation was in most cases not the only source of assistance and only one in five of our respondents received support from the Liliane Foundation alone. Altogether, 17 percent also received other support from the Liliane Foundation’s partner organization or from this organization and another organization (16 percent). 20 percent received free medical assistance from their government’s health system and 8.5 percent received additional government support (e.g. social security payments). The support from other organizations was thus mostly for medical care and special devices (20 percent) and to a lesser extent for education (23 percent).
Considering the assistance received from the Liliane Foundation through its partners, 77 percent of the respondents received assistance for their education (with which we will deal in the next chapter), 59 percent received medical support, 38 percent medical devices and 18 percent (psychological or speech) therapy. More than half of the respondents and their families also received financial support (in cash) and more than a quarter also received livelihood support (in cash and/or in kind).
– 41 –
90 percent of the respondents indicated that they really needed this support. 5 percent answered that the assistance was not needed and another 5 percent that they did not know. We will return to how the respondents valued the support in chapter 7.
If we look at the devices the respondents received, one of the problems with physically disabled children is of course that they might outgrow their crutches, orthopedic shoes, wheelchairs or other aids they received. We saw cases where adults could not afford to buy new devices when they lost them (e.g. with the floods in the Philippines), but also where they received new wheelchairs or even a small motor vehicle from other organizations or from the local government. From the data that we have, we can only make these observations and cannot make firm statements on the number of problems there were with these aids.
The support of the Liliane Foundation mostly ended because the respondents finished their education (50 percent) or they finished their education and left the institution (16 percent). In 10 percent of the cases, this was because the age level was reached and in some single cases because their families got a better income or a job where medical insurance was included, where there was a budget cut with the partner organization or when the local government took over the support.
From parent to childSandra, Argentina
Sandra grew up in one of the bad neighbourhoods in the Buenos Aires district. Today she is living in one of the nicer areas of the city. She was able to get an education which was the key for change in Sandra’s life.
She grew up with four siblings. Her mother was responsible for the household income as a cleaning lady. Her father was unemployed and an alcoholic. He used a lot of violence against the mother and his children. It was so bad that one of her sisters ran away to live with other homeless children in a house under even poorer conditions than their own house. Sandra described her old neighbourhood as: ‘Very unsafe to live in because of drugs, alcohol, weapons, and violence against women’. When her father became ill, her mother got very depressed and neglected her job, and her children. Sandra was the oldest child and took care of her brothers and sister. The thing she loved most in those days was going to school. She was very good at studying and decided to help other children and make some money by tutoring in the community centre when she was eleven.
The centre was run by Sisters. When she was 15 the sisters discovered that Sandra started acting differently and was actually very ill. She had several psychological disorders, amongst them serious depressions and she was very violent to others and herself. Even though her parents noticed that she was changing, they did not do anything. The Sisters at the centre helped her to get medical support. She was sent to a psychologist, and got the medicine she needed. The Sisters even tried to do some family counselling, but this did not help. After she finished high school, one of the sisters arranged a scholarship in a private university. She studied Psychology and did a post graduate course in disability studies.
Nowadays she has three jobs; being a personal teacher for a disabled child, a general coordinator of the centre, and she is working in another centre for disabled adults. She was inspired by the Sisters to help people with disabilities. She is earning over 10,000 Pesos a month, which is twice the average salary in Argentina.
She told us that she is honestly happy, without the support, she would never have received a good education, and would be a housewife now like her sisters, who only finished primary education and high school. She still has a lot of contact with her brothers and sisters and helps her little brother in finishing his education. Because she raised her brothers and sisters when she was a child, she decided not to become a parent again.
A special category in this support is training and advice for parents. The Liliane Foundation indicates that it has regularly paid for parents’ training, which would be in line with CBR principles and implementation. Table 3.2 shows that we did not find evidence of parental training in the answers of our respondents. It was only clear in Argentina that mothers with their disabled children visited community centres and received advice, and if necessary training there. In Ghana it seemed that the disabled themselves went out to get advice and training. It is important to note that, apart from Argentina, we did not find any differences among generations in this respect.
– 42 –
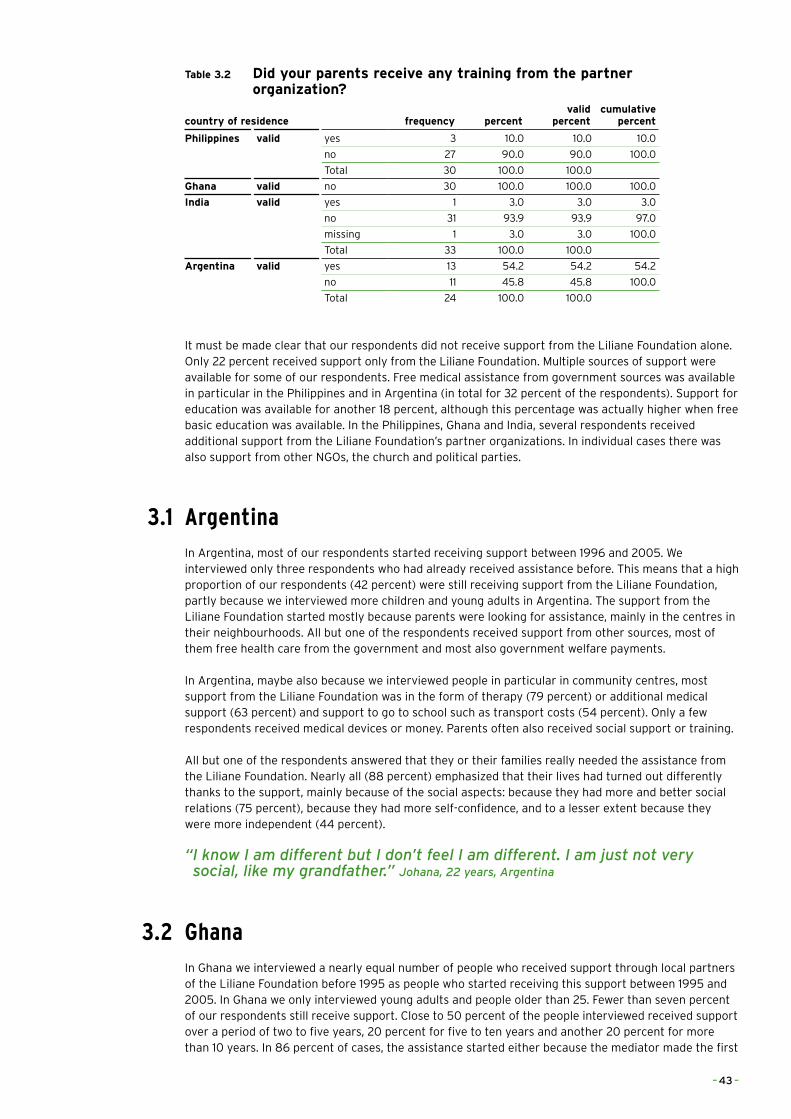
Table 3.2 Did your parents receive any training from the partner organization?
country of residence frequency percentvalid
percentcumulative
percent
Philippines valid yes 3 10.0 10.0 10.0
no 27 90.0 90.0 100.0
Total 30 100.0 100.0
Ghana valid no 30 100.0 100.0 100.0
India valid yes 1 3.0 3.0 3.0
no 31 93.9 93.9 97.0
missing 1 3.0 3.0 100.0
Total 33 100.0 100.0
Argentina valid yes 13 54.2 54.2 54.2
no 11 45.8 45.8 100.0
Total 24 100.0 100.0
It must be made clear that our respondents did not receive support from the Liliane Foundation alone. Only 22 percent received support only from the Liliane Foundation. Multiple sources of support were available for some of our respondents. Free medical assistance from government sources was available in particular in the Philippines and in Argentina (in total for 32 percent of the respondents). Support for education was available for another 18 percent, although this percentage was actually higher when free basic education was available. In the Philippines, Ghana and India, several respondents received additional support from the Liliane Foundation’s partner organizations. In individual cases there was also support from other NGOs, the church and political parties.
3.1 ArgentinaIn Argentina, most of our respondents started receiving support between 1996 and 2005. We interviewed only three respondents who had already received assistance before. This means that a high proportion of our respondents (42 percent) were still receiving support from the Liliane Foundation, partly because we interviewed more children and young adults in Argentina. The support from the Liliane Foundation started mostly because parents were looking for assistance, mainly in the centres in their neighbourhoods. All but one of the respondents received support from other sources, most of them free health care from the government and most also government welfare payments.
In Argentina, maybe also because we interviewed people in particular in community centres, most support from the Liliane Foundation was in the form of therapy (79 percent) or additional medical support (63 percent) and support to go to school such as transport costs (54 percent). Only a few respondents received medical devices or money. Parents often also received social support or training.
All but one of the respondents answered that they or their families really needed the assistance from the Liliane Foundation. Nearly all (88 percent) emphasized that their lives had turned out differently thanks to the support, mainly because of the social aspects: because they had more and better social relations (75 percent), because they had more self-confidence, and to a lesser extent because they were more independent (44 percent).
“�I�know�I�am�different�but�I�don’t�feel�I�am�different.�I�am�just�not�very�social,�like�my�grandfather.”�Johana,�22�years,�Argentina
3.2 GhanaIn Ghana we interviewed a nearly equal number of people who received support through local partners of the Liliane Foundation before 1995 as people who started receiving this support between 1995 and 2005. In Ghana we only interviewed young adults and people older than 25. Fewer than seven percent of our respondents still receive support. Close to 50 percent of the people interviewed received support over a period of two to five years, 20 percent for five to ten years and another 20 percent for more than 10 years. In 86 percent of cases, the assistance started either because the mediator made the first
– 43 –
contact or because parents heard from others about the possibility or receiving assistance.
One third of the respondents only received assistance from the Liliane Foundation, a quarter also got additional support from the partner organization of the Liliane Foundation and 13 percent also from other NGOs. In single cases, additional support came from the church, an individual or medical assistance from the government. Medical support and support for devices, and in some cases also support for education, were thus mostly received in addition to the assistance of the Liliane Foundation.
Nearly all respondents in Ghana (93 percent) received support to go to school, but 70 percent (more than in the other three countries because of the high prevalence of polio victims) also received medical support and 60 percent also received support for medical devices. A bit more than half of the respondents and their families also received financial support, sometimes only pocket money when they lived in boarding schools, but also livelihood support. None of the parents received any training.
Only one single person answered that the assistance of the Liliane Foundation was not really needed. Many respondents (80 percent) in Ghana also stated that the support from the Liliane Foundation really made a difference in their lives. Most valued was the support for education, also in comparison to the other three countries (90 percent).
3.3 IndiaOf the 33 people we interviewed (or parents of supported children we interviewed) six were rather young and have received support since 2006. 15 started getting support between 1996 and 2005 and 12 before 1995. The number of people still receiving assistance in India was also rather high (30 percent), mainly because more than half of the people we interviewed were young adults. Half of the people we interviewed in India had received their assistance for more than ten years. Only three respondents received occasional assistance. The mediator was also an important first contact point in India (44 percent of cases), but parents were also informed by others or by the church.
In India, the vast majority of the respondents (94 percent) also received assistance from other donors. Mostly (in 52 percent of cases) this came from the partner organization of the Liliane Foundation or from this organization and another NGO or institution. 19 percent also received government support and in single cases support came from a political party, another NGO or individual or in the form of free medical support. This additional support was received in the form of Medical support and devices (44 percent), support for education (28 percent) and cash (19 percent).
Looking at the support provided by the Liliane Foundation, half of the respondents received medical assistance and 36 percent medical devices; only one received therapy. This means that a considerable majority (76 percent), rather typically for the Indian situation, primarily received financial support for which they had to go to the offices of the charity organizations, mostly connected to the (catholic) church. Parents only received training in one single case.
Four respondents in India answered that they or their families did not really need the support of the Liliane Foundation and three answered that they did not know if it was really needed. In general, the results of the support as seen by the respondents (or their parents) themselves were less positive in India than in the other three countries. 52 percent indicated that their lives had changed very little as a result of the support, and only 45 percent that it had really changed their lives.
“�When�I�was�young�I�was�not�allowed�at�the�community�festival;�they�believed�that�I�would�have�a�negative�influence�on�all�that�was�good.��Now�everybody�in�the�community�is�proud�of�me;�I�act�as�an�example��for�the�children.”�Rajkumar,�31�years,�India
– 44 –
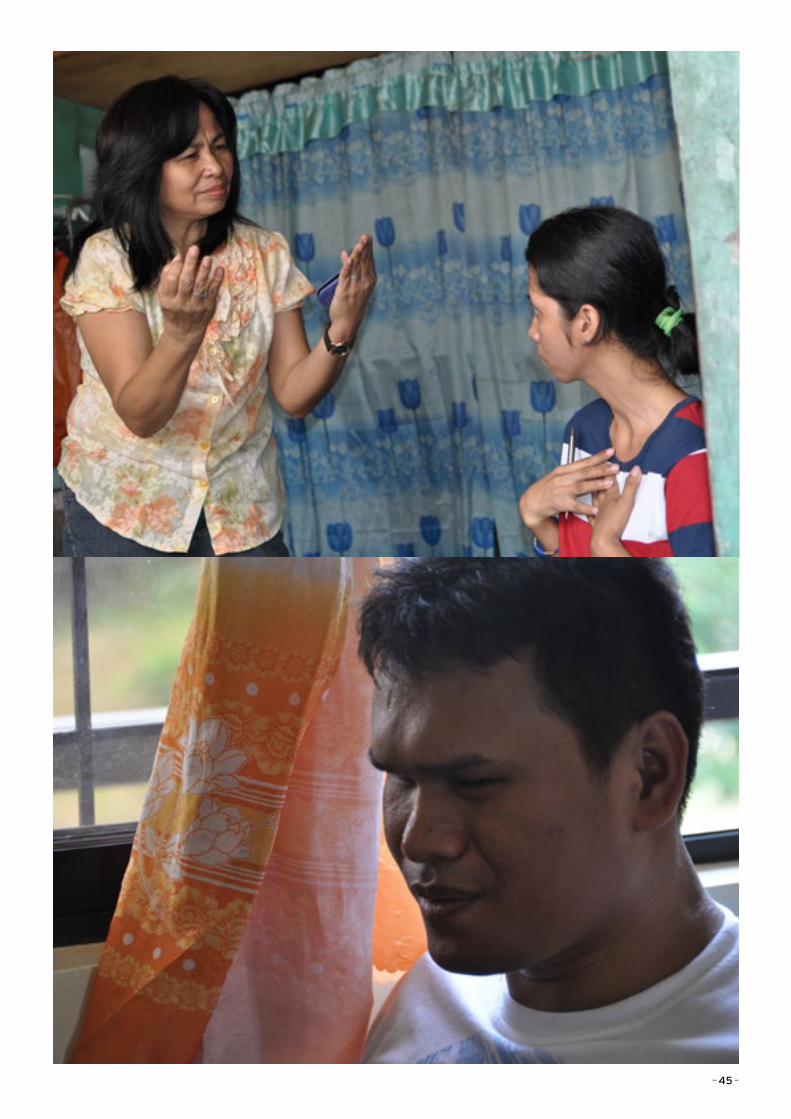
– 45 –
3.4 The PhilippinesThe majority of respondents we interviewed in the Philippines started receiving support from the Liliane Foundation and its partners between 1996 and 2005. We had only one respondent who started getting support in the last decade, and 30 percent of our respondents got their first assistance before 1995. Three of our respondents were children, eight were young adults and 19 were 25 or older. One in five of our respondents still receives support from the Liliane Foundation. Half the respondents has received assistance for eight years or more, and more than a quarter for two to eight years. Support started in most cases through the visit of a mediator, and to a lesser extent because parents started to look for assistance or heard from others about that possibility.
More than 40 percent of the respondents only received support from the Liliane Foundation and another 17 percent from the Liliane Foundation and also from the partner organization. In a few cases, there was also medical support and other support from the Philippine government. The additional support our respondents received was thus mainly support for education and medical support.
All but five of the respondents received support from the Liliane Foundation for schooling, and 63 percent also received additional financial support, about half further medical support and one third orthopedic and sensory devices, mostly to enhance their mobility. Three parents received training, e.g. in sign language but also in community self-help.
3.5 Some overall findings on support receivedFrom the above, three things are very clear: most children having received assistance from the Liliane Foundation also received support from other organizations. In particular, in the more developed countries, they received medical support and social assistance. Secondly, nearly all the families and children had a strong need for this support, as it gave them opportunities to receive therapies and medical devices, and to go to school. Thirdly, the most valued support was that received for education, but the social aspects, having more self-confidence and being more independent, were also seen by many as very important.
There were some further differences between the four countries, partly related to the differences in disabilities of those we interviewed. Of those we interviewed in Argentina, most had received support via community centres and schools, and since medical assistance was free for most of them, support was given mainly in the form of therapy and financial support for transportation. In Ghana and India much aid was provided in institutional settings with boarding schools and vocational training, but in India also in financial allowances via (catholic) charity branches attached to the dioceses.
“�Amongst�all�the�help�I�received�the�psychological�help�was�the�most�important.�The�sister�told�me�I�was�allowed�to�see�myself�as�a�person;��and�that�I�am�not�different�from�other�people.”�Anthony,�43�years,�The�Philippines
– 46 –
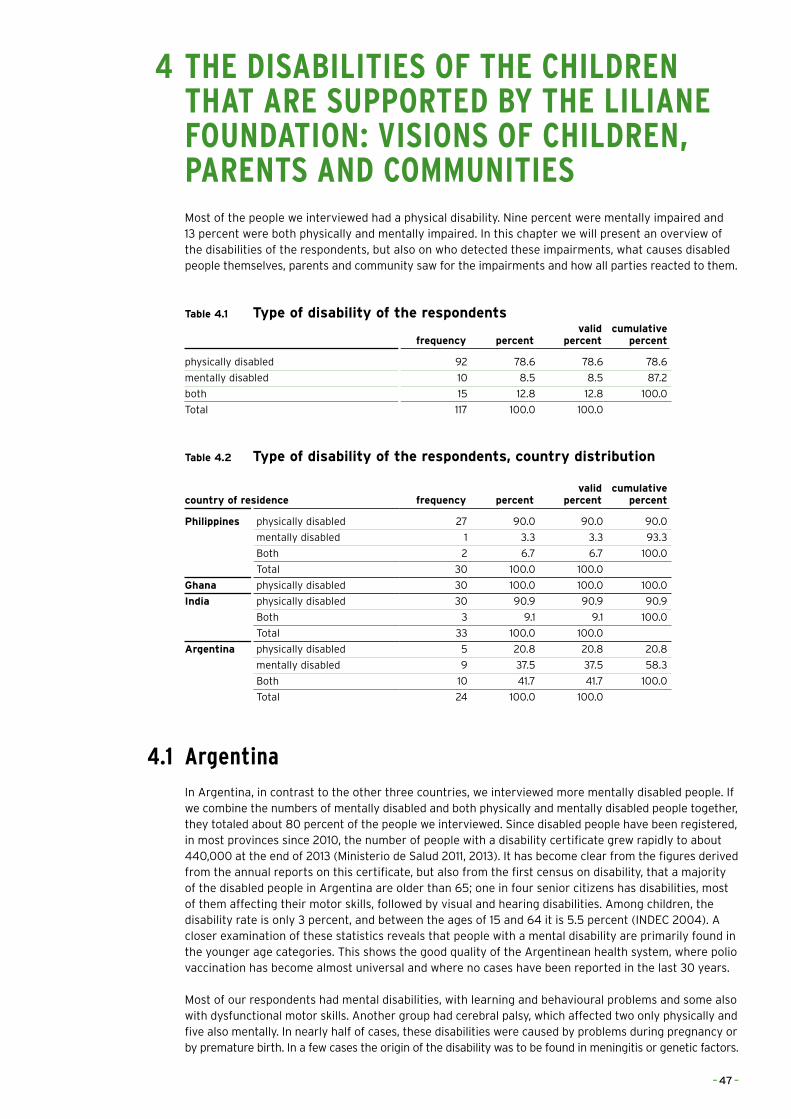
4 THE DISABILITIES OF THE CHILDREN THAT ARE SUPPORTED BY THE LILIANE
FOUNDATION: VISIONS OF CHILDREN, PARENTS AND COMMUNITIES
Most of the people we interviewed had a physical disability. Nine percent were mentally impaired and 13 percent were both physically and mentally impaired. In this chapter we will present an overview of the disabilities of the respondents, but also on who detected these impairments, what causes disabled people themselves, parents and community saw for the impairments and how all parties reacted to them.
Table 4.1 Type of disability of the respondents
frequency percentvalid
percentcumulative
percent
physically disabled 92 78.6 78.6 78.6
mentally disabled 10 8.5 8.5 87.2
both 15 12.8 12.8 100.0
Total 117 100.0 100.0
Table 4.2 Type of disability of the respondents, country distribution
country of residence frequency percentvalid
percentcumulative
percent
Philippines physically disabled 27 90.0 90.0 90.0
mentally disabled 1 3.3 3.3 93.3
Both 2 6.7 6.7 100.0
Total 30 100.0 100.0
Ghana physically disabled 30 100.0 100.0 100.0
India physically disabled 30 90.9 90.9 90.9
Both 3 9.1 9.1 100.0
Total 33 100.0 100.0
Argentina physically disabled 5 20.8 20.8 20.8
mentally disabled 9 37.5 37.5 58.3
Both 10 41.7 41.7 100.0
Total 24 100.0 100.0
4.1 Argentina
In Argentina, in contrast to the other three countries, we interviewed more mentally disabled people. If we combine the numbers of mentally disabled and both physically and mentally disabled people together, they totaled about 80 percent of the people we interviewed. Since disabled people have been registered, in most provinces since 2010, the number of people with a disability certificate grew rapidly to about 440,000 at the end of 2013 (Ministerio de Salud 2011, 2013). It has become clear from the figures derived from the annual reports on this certificate, but also from the first census on disability, that a majority of the disabled people in Argentina are older than 65; one in four senior citizens has disabilities, most of them affecting their motor skills, followed by visual and hearing disabilities. Among children, the disability rate is only 3 percent, and between the ages of 15 and 64 it is 5.5 percent (INDEC 2004). A closer examination of these statistics reveals that people with a mental disability are primarily found in the younger age categories. This shows the good quality of the Argentinean health system, where polio vaccination has become almost universal and where no cases have been reported in the last 30 years.
Most of our respondents had mental disabilities, with learning and behavioural problems and some also with dysfunctional motor skills. Another group had cerebral palsy, which affected two only physically and five also mentally. In nearly half of cases, these disabilities were caused by problems during pregnancy or by premature birth. In a few cases the origin of the disability was to be found in meningitis or genetic factors.
– 47 –
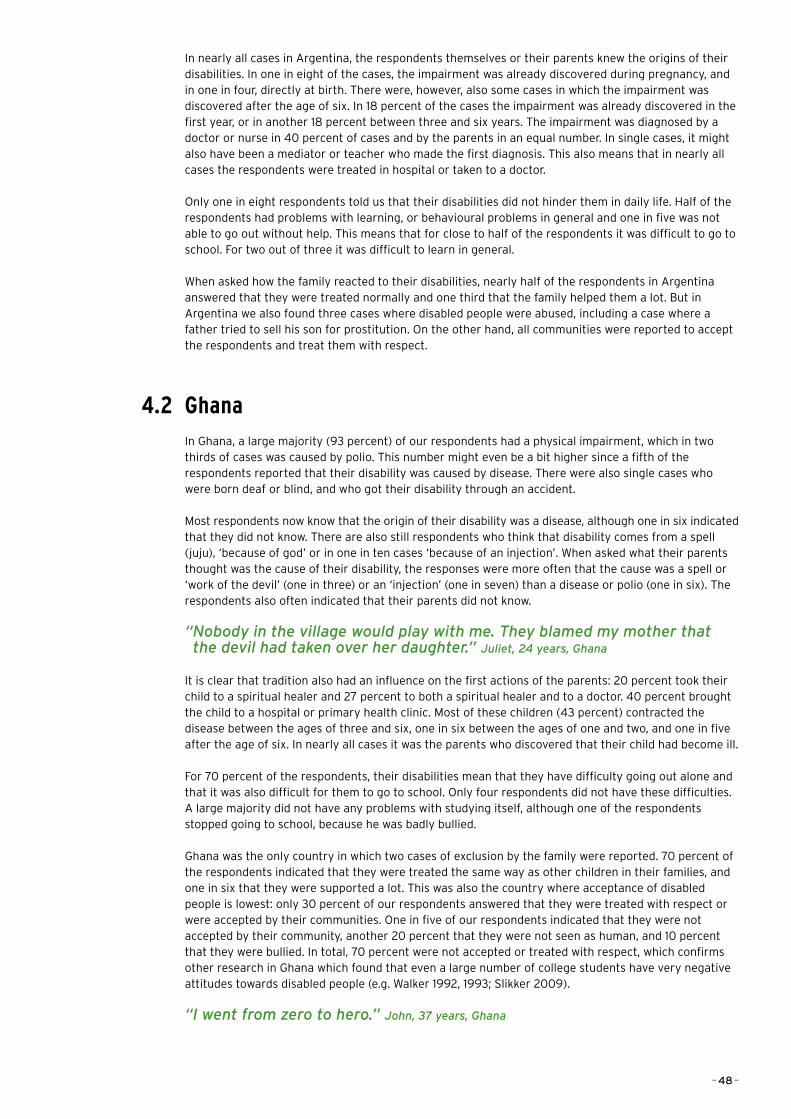
In nearly all cases in Argentina, the respondents themselves or their parents knew the origins of their disabilities. In one in eight of the cases, the impairment was already discovered during pregnancy, and in one in four, directly at birth. There were, however, also some cases in which the impairment was discovered after the age of six. In 18 percent of the cases the impairment was already discovered in the first year, or in another 18 percent between three and six years. The impairment was diagnosed by a doctor or nurse in 40 percent of cases and by the parents in an equal number. In single cases, it might also have been a mediator or teacher who made the first diagnosis. This also means that in nearly all cases the respondents were treated in hospital or taken to a doctor.
Only one in eight respondents told us that their disabilities did not hinder them in daily life. Half of the respondents had problems with learning, or behavioural problems in general and one in five was not able to go out without help. This means that for close to half of the respondents it was difficult to go to school. For two out of three it was difficult to learn in general.
When asked how the family reacted to their disabilities, nearly half of the respondents in Argentina answered that they were treated normally and one third that the family helped them a lot. But in Argentina we also found three cases where disabled people were abused, including a case where a father tried to sell his son for prostitution. On the other hand, all communities were reported to accept the respondents and treat them with respect.
4.2 GhanaIn Ghana, a large majority (93 percent) of our respondents had a physical impairment, which in two thirds of cases was caused by polio. This number might even be a bit higher since a fifth of the respondents reported that their disability was caused by disease. There were also single cases who were born deaf or blind, and who got their disability through an accident.
Most respondents now know that the origin of their disability was a disease, although one in six indicated that they did not know. There are also still respondents who think that disability comes from a spell (juju), ‘because of god’ or in one in ten cases ‘because of an injection’. When asked what their parents thought was the cause of their disability, the responses were more often that the cause was a spell or ‘work of the devil’ (one in three) or an ‘injection’ (one in seven) than a disease or polio (one in six). The respondents also often indicated that their parents did not know.
“�Nobody�in�the�village�would�play�with�me.�They�blamed�my�mother�that�the�devil�had�taken�over�her�daughter.”�Juliet,�24�years,�Ghana
It is clear that tradition also had an influence on the first actions of the parents: 20 percent took their child to a spiritual healer and 27 percent to both a spiritual healer and to a doctor. 40 percent brought the child to a hospital or primary health clinic. Most of these children (43 percent) contracted the disease between the ages of three and six, one in six between the ages of one and two, and one in five after the age of six. In nearly all cases it was the parents who discovered that their child had become ill.
For 70 percent of the respondents, their disabilities mean that they have difficulty going out alone and that it was also difficult for them to go to school. Only four respondents did not have these difficulties. A large majority did not have any problems with studying itself, although one of the respondents stopped going to school, because he was badly bullied.
Ghana was the only country in which two cases of exclusion by the family were reported. 70 percent of the respondents indicated that they were treated the same way as other children in their families, and one in six that they were supported a lot. This was also the country where acceptance of disabled people is lowest: only 30 percent of our respondents answered that they were treated with respect or were accepted by their communities. One in five of our respondents indicated that they were not accepted by their community, another 20 percent that they were not seen as human, and 10 percent that they were bullied. In total, 70 percent were not accepted or treated with respect, which confirms other research in Ghana which found that even a large number of college students have very negative attitudes towards disabled people (e.g. Walker 1992, 1993; Slikker 2009).
“I�went�from�zero�to�hero.”�John,�37�years,�Ghana
– 48 –
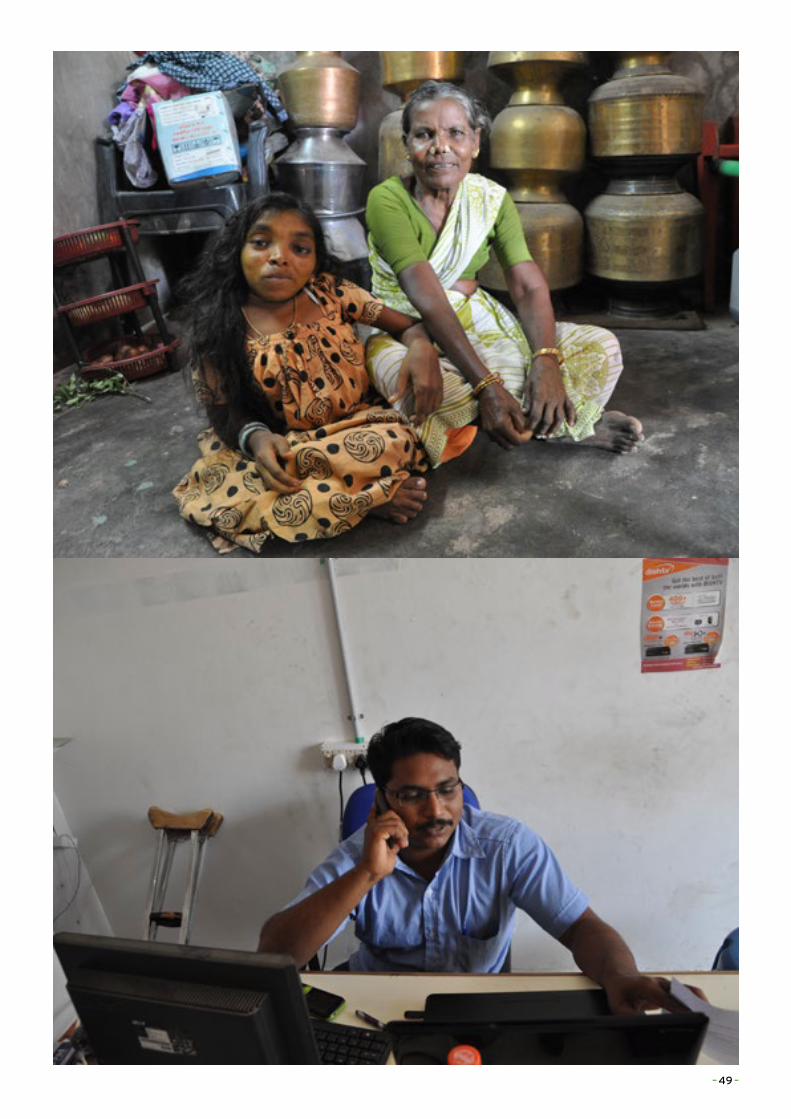
– 49 –
4.3 IndiaIn India we interviewed the parents of three children who were totally bedridden and did not react to any stimuli. Excluding these brought the number of respondents with cerebral palsy to about a fifth of those we interviewed, where nearly half of those interviewed had physical disabilities and a fifth were blind. For both these types of disability, polio and problems during pregnancy were the most common causes in about 30 percent of cases. Minor causes of the disabilities were problems at birth, meningitis, a tumor and genetic factors. Only two of the respondents believed that their disability had supernatural causes. More than half of the respondents thus related their disability to a disease (polio), to premature birth, or to problems during pregnancy. Two indicated that their disability might have been caused by the fact that their parents were close relatives, and one indicated that it had been caused because the blood groups of the parents did not match. It is clear that in a large majority of cases, the idea of the origin of the impairment was shared by the disabled people and their parents.
In three quarters of the cases it was the parents who discovered the disease, often directly at birth (24 percent) or when the child fell ill (21 percent in the first year, 43 percent between the ages of one and six). Four respondents were taken to a spiritual healer or to both a spiritual healer and a doctor, after the discovery of the disease or disability. Two thirds of the children were brought to a hospital and one in six to a homeopathic doctor.
More than half of the respondents were not able to move around without help and as reported earlier, three of the children were totally inactive, being bedridden. Two others were also not able to care for themselves and needed daily assistance. This means that one in five of the respondents did not go to school, and half had difficulties with going to school. For one in three of them, this was not a hindrance, also because several of them were in an institutional setting. More than half of the respondents had no problems with studying; blind children of course had and needed special support and adjustments.
More than half of the respondents in India indicated that their families treated them the same way as other children, and another 36 percent that they were supported and assisted by their families. In single cases they even reported being spoilt or over protected. No cases of exclusion or misuse were reported, which is in line with our observations where we found caring mothers and fathers even under very severe and difficult circumstances. Communities were in general also seen as accepting, helping and treating the disabled children with respect. Only two single cases of non-acceptance and bullying were reported.
4.4 The PhilippinesAccording to the official statistics from the 2010 census, only 1.57 percent of the close to 100 million Filipinos are disabled (Philippine Statistics Authority 2013). That is an increase from 1.2 percent disability prevalence in the census of 2000. The Philippines thus appears to have one of the lowest prevalence rate in the Asia-Pacific region, in particular compared with those of Australia (18.5) and New Zealand (16.5) (ESCAP 2012a) and of the World Health Organization’s global estimate of 15 percent and the OECD countries average of 14 percent. It thus seems that the census of 2010 only identified people with ‘severe’ or ‘profound’ disabilities.
About half of the people we interviewed in the Philippines had physical disabilities, some caused by problems during birth or pregnancy, and, in a sixth of the total, from polio. There were five respondents who were deaf, mostly from problems during pregnancy and birth. There were also single or few cases with cerebral palsy, dwarfism, epilepsy and Down’s Syndrome. This means that 90 percent of our respondents in the Philippines were physically disabled.
In one third of the cases, the cause of the disability was during birth and in one in four it was related to problems during pregnancy. One in six of the disabilities were caused by polio. Other causes were genetic factors, tetanus, and an accident. In general, the causes of the disabilities were very well understood by the respondents to relate to diseases, difficulties during pregnancy or to genetic causes, and were not seen as having a supernatural origin. This was also true for their parents, who discovered the disability in 75 percent of cases.
– 50 –
This means that in 75 percent of the cases, the children were brought to a doctor or hospital for treatment, also because in more than one third of the cases, the disability was discovered at birth or in the first year (23 percent). Some polio cases were discovered in the second year, or between the ages of three and six. A spiritual healer and a massage healer were sought only in two single cases.
About half of the respondents in the Philippines indicated that their disability did not hinder them in daily life, but one in four was not able to move around without help and 28 percent had difficulties with communication, mostly because of being deaf. This means that for half of the respondents it was difficult to go to school, although more than half of the respondents did not have any problems with studying. One in five needed special adjustments and one in ten had difficulties with learning in general.
Families in the Philippines were reported as caring and helping, in single cases being a bit overprotective, and in general treating their disabled children the same way as other children. In the wider community, one in five of our respondents indicated that they were bullied, and in a single case that they were not seen as human. 70 percent stated that they were treated with respect, and 7 percent of these responded that the community helped them.
4.5 ConclusionsWhen the level of development in a country rises, its primary health care services improve and immunization campaigns become more extensive, we also see changes in the type of disabilities (and also a reduction of disabilities) that children might have. That is clearly visible in the four countries under study, where we recorded most polio cases in Ghana and fewest in Argentina, and as a consequence, a higher percentage of children with cerebral palsy and cognitive disabilities in Argentina.
This level of development and literacy is also reflected in the causes that people see for the disabilities, where they correctly emphasized diseases and problems with pregnancy in the Philippines. Supernatural causes were more often given in Ghana, but this has changed over time: disabled people themselves were less inclined to emphasize ‘magic’, ‘spirits’ or ‘gods’ as a cause of their disabilities than their parents.
This of course also has its effects on the acceptance of disabled people by their families, and by the communities they live in, where many more cases of non-acceptance and exclusion were reported in Ghana than in India. In Argentina, because we interviewed in poor neighborhoods with a lot of drug and alcohol abuse, we found family violence and cases of harassment.
– 51 –
5 EDUCATION AND JOBS
Since the world conference on education in Jomtien (Thailand) in 1990 and the World Education Forum in Dakar (Senegal) in 2000 ‘Education for All’ has become an official goal for the international community. As such it was also integrated into the Millennium Development Goals and will appear again in the Sustainable Development Goals that the world community will embrace in 2015. Although disabled children are not mentioned in the six goals of the Education for All declaration, goal number 1 - ‘Expanding and improving comprehensive early childhood care and education, especially for the most vulnerable and disadvantaged children’- clearly includes them, as has also been regularly stated by UNESCO. Education for all was again adopted in the World Education Forum in Incheon (Republic of Korea) in May 2015, but this time, together with equity in and quality of education, life-long learning and inclusive education.30
The UN Human Rights Commission reported in 2014, however, that schools all over the world have discriminatory practices creating barriers for disabled children.31 The report confirmed again that the right to inclusive education is a universal right, laid down in several instruments including the Convention on the Rights of the Child and the Convention on Rights of Persons with Disabilities. The CRPD and its article 24 on inclusive education are seen as ‘the first legally binding instrument to contain an explicit reference to the concept of inclusive education’.32 According to this paragraph, students cannot be rejected from general education on the basis of their disability and State Parties should ensure an inclusive education system at all levels.
The UN Commission’s report stated that schools had three different approaches to children with disability: exclusion (refusing access, and placing children in social welfare institutions without access to education); segregation (sending children to schools designed to respond to children with a specific disability); and integration (when children are admitted into a mainstream school when they can adjust to the standardized requirements of the school). The Salamanca Statement of 1994 called for the inclusion of children with disabilities for ‘a child centered pedagogy capable of successfully educating all children, including those who have serious disadvantages and disabilities’.33 This not only calls for eliminating barriers, but also for changes in school culture, policy and practice. This is also seen as important by the UN Commission, because from a social point of view, it could provide a platform for countering stigmatization and discrimination.
The discussion on ‘inclusive education’ raged not only in European countries, where some (e.g. Norway and Sweden) had already introduced such a system for a longer time and others had already relied for a very long time on a system of special schools, as in Belgium and the Netherlands (with ten different types of special schools for all kinds of disabilities). In developing countries, in particular in India, the discussion is also heated. As one of the staff members of the Liliane Foundation stated: ‘Inclusive education is not suited for India, disabled children are better off in institutions’.34
The same kind of discrimination that disabled children might find when they want to enter a ‘mainstream’, ’regular’, ‘ordinary’, ‘normal’ school or ‘general education’, might also occur when as adults they want to obtain or accept a ‘normal’, ‘regular’ or ‘ordinary’ job in the ‘mainstream’ labour market. People with disabilities in this situation can be designated to work in ‘sheltered workshops’ or ‘social work centres’, renamed recently as ‘social enterprises’ or ‘disability enterprises’. These are also criticized for contributing to segregation, being exploitative and discriminatory.35 In the four countries in this research, only Argentina has such work centres and we found only one respondent working there. In all four countries, there are anti-discrimination laws and support programmes for disabled people to be integrated into the labour market, but as in most developed countries, progress on ‘regular’ employment for disabled people is slow, as is indicated by high levels of unemployment for disabled people. It should be kept in mind here that in many countries there are no statistics on employment for disabled people, and that the employment ratio varies widely over countries.36 Employment rates of disabled people in comparison with employment rates of the overall population, vary from being very low as in South Africa (30 percent) and Japan (38 percent to high, as in Zambia (81 percent) or Switzerland (81 percent).37
As indicated in chapter three, 77 percent of those interviewed received support for their education from the Liliane Foundation. This rate was lowest in Argentina (54 percent), because the Argentinean government itself provides assistance to disabled children, and highest in Ghana (93 percent) where nearly all received support for their education. 15 percent of those we interviewed had not gone to school before the support of the Liliane Foundation started, partly because there was no special education in their neighborhood. Half of the respondents already went to school, but stated that the
30 http://en.unesco.org/
world-education-
forum-2015/
31 UN Human Rights
Commission, Thematic
study on the right of
persons with disabilities
to education. New York,
18 December 2013.
32 Idem, p. 7.
33 Salamanca Statement and
Framework for action on
Special Needs Education,
June 1994, § 3, p.6.
34 Interview 19 June 2014.
35 See the report
‘Segregated & Exploited’
by the National Disability
Rights Network (US) of
2011. Last year in July
President Obama signed a
law phasing out ‘sheltered
workshops’.
36 World Report on Disability,
p. 237.
37 These figures should be
treated with caution,
because there are
different definitions of
employment, employment
also varies with age and
data collection might not
be very reliable.
– 52 –
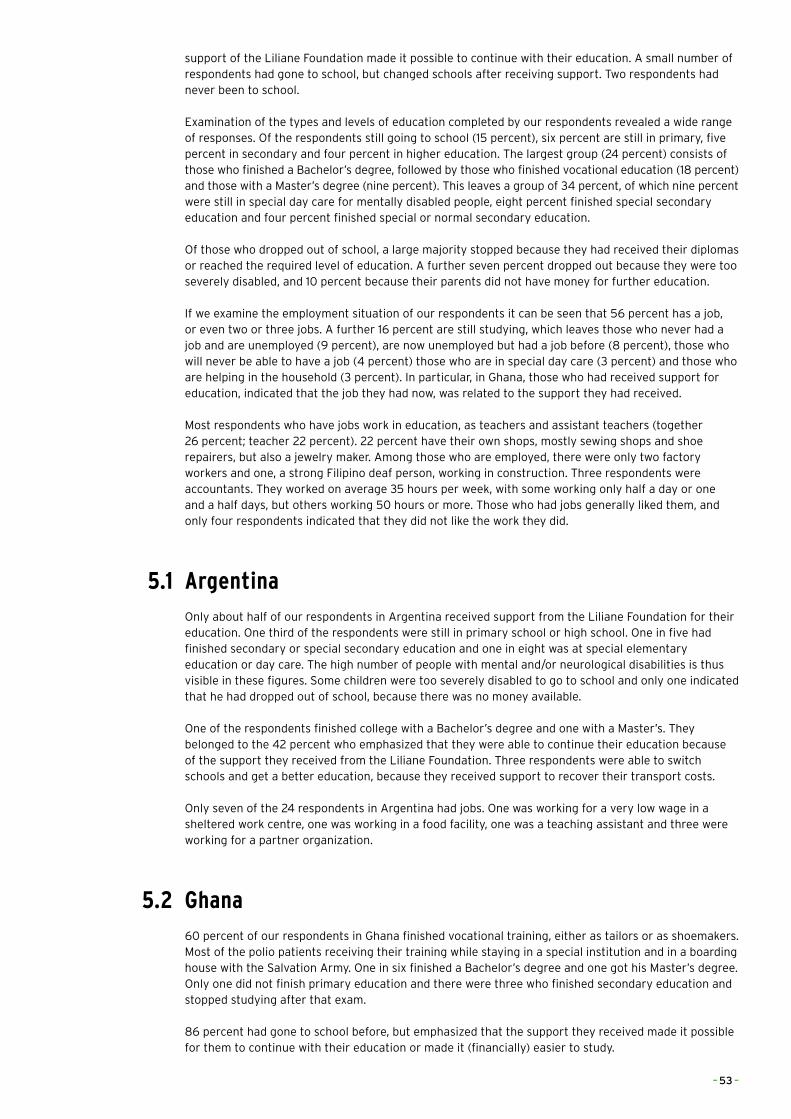
support of the Liliane Foundation made it possible to continue with their education. A small number of respondents had gone to school, but changed schools after receiving support. Two respondents had never been to school.
Examination of the types and levels of education completed by our respondents revealed a wide range of responses. Of the respondents still going to school (15 percent), six percent are still in primary, five percent in secondary and four percent in higher education. The largest group (24 percent) consists of those who finished a Bachelor’s degree, followed by those who finished vocational education (18 percent) and those with a Master’s degree (nine percent). This leaves a group of 34 percent, of which nine percent were still in special day care for mentally disabled people, eight percent finished special secondary education and four percent finished special or normal secondary education.
Of those who dropped out of school, a large majority stopped because they had received their diplomas or reached the required level of education. A further seven percent dropped out because they were too severely disabled, and 10 percent because their parents did not have money for further education.
If we examine the employment situation of our respondents it can be seen that 56 percent has a job, or even two or three jobs. A further 16 percent are still studying, which leaves those who never had a job and are unemployed (9 percent), are now unemployed but had a job before (8 percent), those who will never be able to have a job (4 percent) those who are in special day care (3 percent) and those who are helping in the household (3 percent). In particular, in Ghana, those who had received support for education, indicated that the job they had now, was related to the support they had received.
Most respondents who have jobs work in education, as teachers and assistant teachers (together 26 percent; teacher 22 percent). 22 percent have their own shops, mostly sewing shops and shoe repairers, but also a jewelry maker. Among those who are employed, there were only two factory workers and one, a strong Filipino deaf person, working in construction. Three respondents were accountants. They worked on average 35 hours per week, with some working only half a day or one and a half days, but others working 50 hours or more. Those who had jobs generally liked them, and only four respondents indicated that they did not like the work they did.
5.1 ArgentinaOnly about half of our respondents in Argentina received support from the Liliane Foundation for their education. One third of the respondents were still in primary school or high school. One in five had finished secondary or special secondary education and one in eight was at special elementary education or day care. The high number of people with mental and/or neurological disabilities is thus visible in these figures. Some children were too severely disabled to go to school and only one indicated that he had dropped out of school, because there was no money available.
One of the respondents finished college with a Bachelor’s degree and one with a Master’s. They belonged to the 42 percent who emphasized that they were able to continue their education because of the support they received from the Liliane Foundation. Three respondents were able to switch schools and get a better education, because they received support to recover their transport costs.
Only seven of the 24 respondents in Argentina had jobs. One was working for a very low wage in a sheltered work centre, one was working in a food facility, one was a teaching assistant and three were working for a partner organization.
5.2 Ghana60 percent of our respondents in Ghana finished vocational training, either as tailors or as shoemakers. Most of the polio patients receiving their training while staying in a special institution and in a boarding house with the Salvation Army. One in six finished a Bachelor’s degree and one got his Master’s degree. Only one did not finish primary education and there were three who finished secondary education and stopped studying after that exam.
86 percent had gone to school before, but emphasized that the support they received made it possible for them to continue with their education or made it (financially) easier to study.
– 53 –
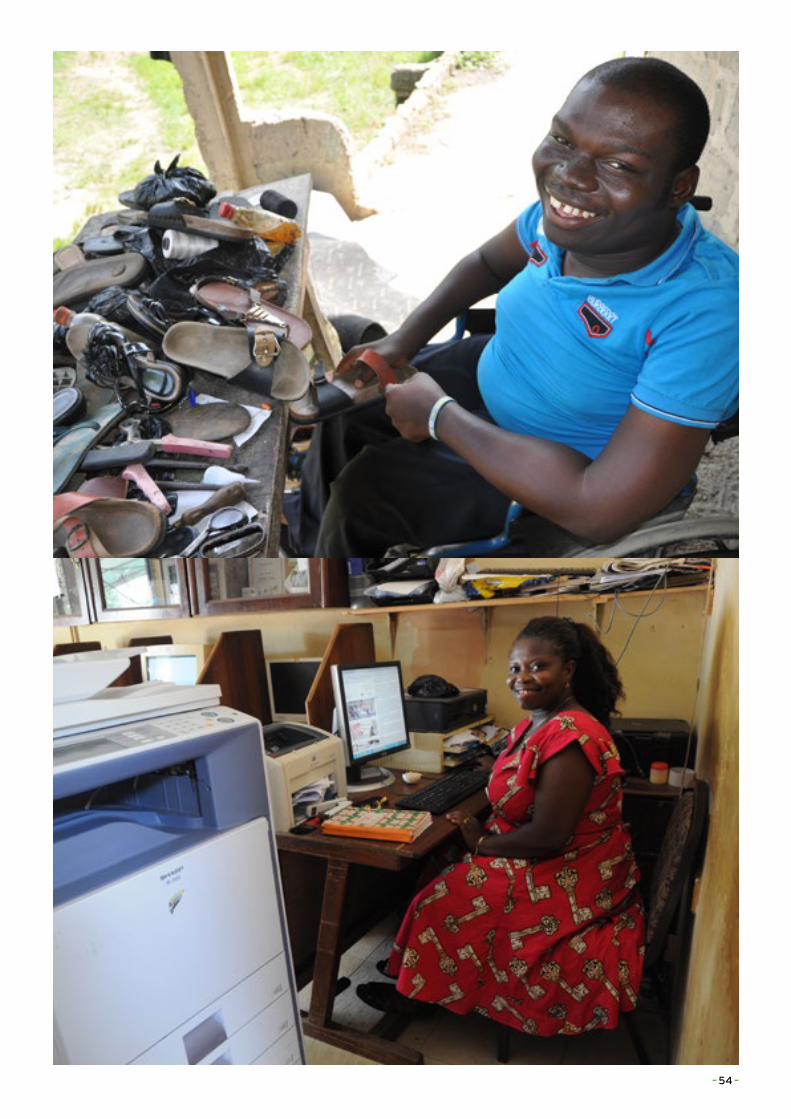
– 54 –
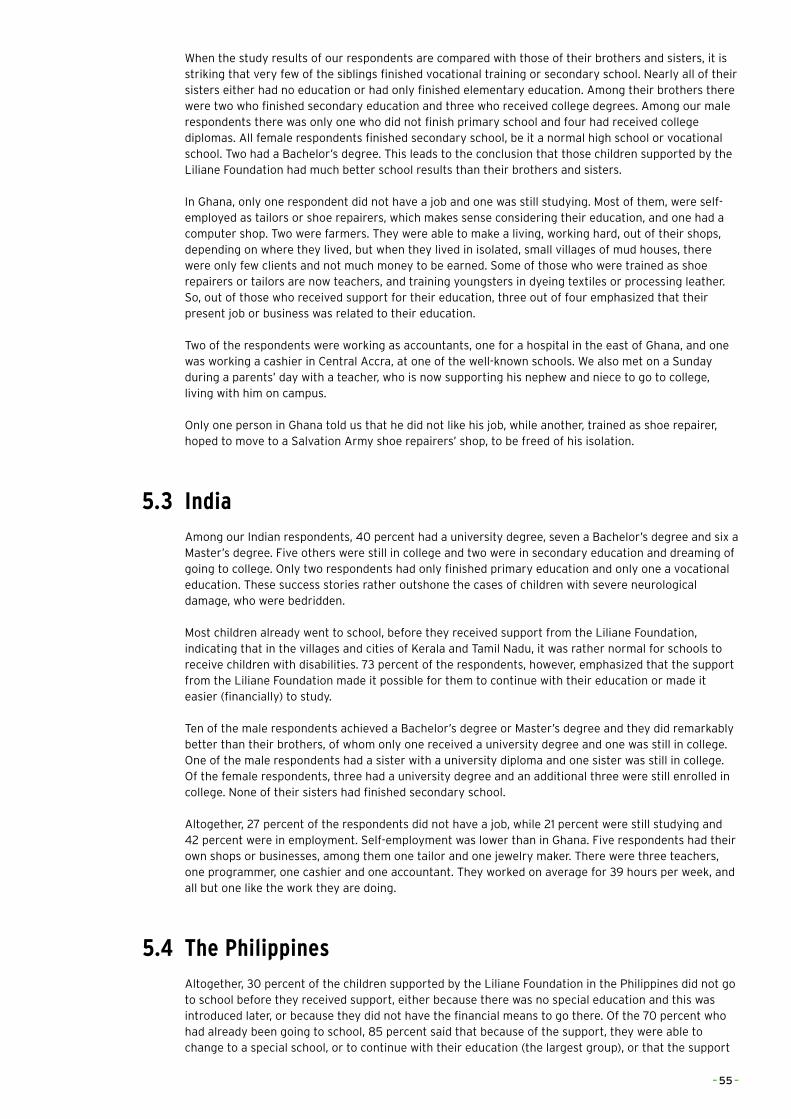
When the study results of our respondents are compared with those of their brothers and sisters, it is striking that very few of the siblings finished vocational training or secondary school. Nearly all of their sisters either had no education or had only finished elementary education. Among their brothers there were two who finished secondary education and three who received college degrees. Among our male respondents there was only one who did not finish primary school and four had received college diplomas. All female respondents finished secondary school, be it a normal high school or vocational school. Two had a Bachelor’s degree. This leads to the conclusion that those children supported by the Liliane Foundation had much better school results than their brothers and sisters.
In Ghana, only one respondent did not have a job and one was still studying. Most of them, were self-employed as tailors or shoe repairers, which makes sense considering their education, and one had a computer shop. Two were farmers. They were able to make a living, working hard, out of their shops, depending on where they lived, but when they lived in isolated, small villages of mud houses, there were only few clients and not much money to be earned. Some of those who were trained as shoe repairers or tailors are now teachers, and training youngsters in dyeing textiles or processing leather. So, out of those who received support for their education, three out of four emphasized that their present job or business was related to their education.
Two of the respondents were working as accountants, one for a hospital in the east of Ghana, and one was working a cashier in Central Accra, at one of the well-known schools. We also met on a Sunday during a parents’ day with a teacher, who is now supporting his nephew and niece to go to college, living with him on campus.
Only one person in Ghana told us that he did not like his job, while another, trained as shoe repairer, hoped to move to a Salvation Army shoe repairers’ shop, to be freed of his isolation.
5.3 IndiaAmong our Indian respondents, 40 percent had a university degree, seven a Bachelor’s degree and six a Master’s degree. Five others were still in college and two were in secondary education and dreaming of going to college. Only two respondents had only finished primary education and only one a vocational education. These success stories rather outshone the cases of children with severe neurological damage, who were bedridden.
Most children already went to school, before they received support from the Liliane Foundation, indicating that in the villages and cities of Kerala and Tamil Nadu, it was rather normal for schools to receive children with disabilities. 73 percent of the respondents, however, emphasized that the support from the Liliane Foundation made it possible for them to continue with their education or made it easier (financially) to study.
Ten of the male respondents achieved a Bachelor’s degree or Master’s degree and they did remarkably better than their brothers, of whom only one received a university degree and one was still in college. One of the male respondents had a sister with a university diploma and one sister was still in college. Of the female respondents, three had a university degree and an additional three were still enrolled in college. None of their sisters had finished secondary school.
Altogether, 27 percent of the respondents did not have a job, while 21 percent were still studying and 42 percent were in employment. Self-employment was lower than in Ghana. Five respondents had their own shops or businesses, among them one tailor and one jewelry maker. There were three teachers, one programmer, one cashier and one accountant. They worked on average for 39 hours per week, and all but one like the work they are doing.
5.4 The PhilippinesAltogether, 30 percent of the children supported by the Liliane Foundation in the Philippines did not go to school before they received support, either because there was no special education and this was introduced later, or because they did not have the financial means to go there. Of the 70 percent who had already been going to school, 85 percent said that because of the support, they were able to change to a special school, or to continue with their education (the largest group), or that the support
– 55 –
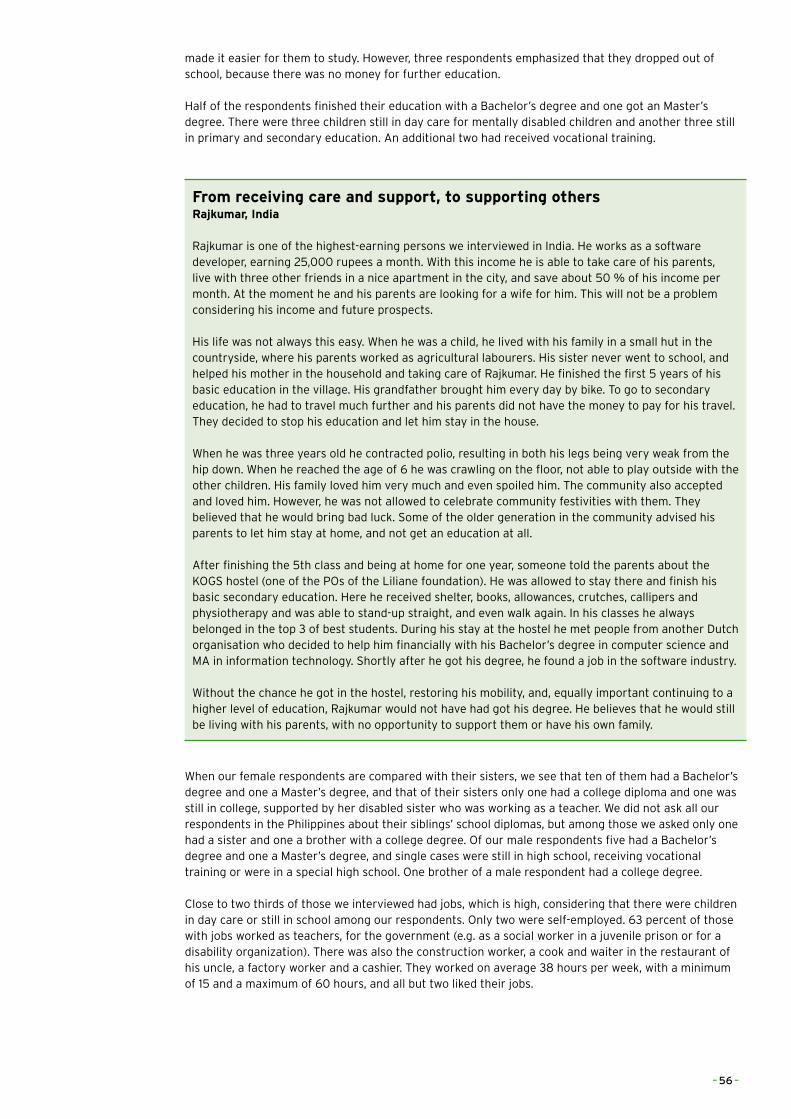
made it easier for them to study. However, three respondents emphasized that they dropped out of school, because there was no money for further education.
Half of the respondents finished their education with a Bachelor’s degree and one got an Master’s degree. There were three children still in day care for mentally disabled children and another three still in primary and secondary education. An additional two had received vocational training.
From receiving care and support, to supporting othersRajkumar, India
Rajkumar is one of the highest-earning persons we interviewed in India. He works as a software developer, earning 25,000 rupees a month. With this income he is able to take care of his parents, live with three other friends in a nice apartment in the city, and save about 50 % of his income per month. At the moment he and his parents are looking for a wife for him. This will not be a problem considering his income and future prospects.
His life was not always this easy. When he was a child, he lived with his family in a small hut in the countryside, where his parents worked as agricultural labourers. His sister never went to school, and helped his mother in the household and taking care of Rajkumar. He finished the first 5 years of his basic education in the village. His grandfather brought him every day by bike. To go to secondary education, he had to travel much further and his parents did not have the money to pay for his travel. They decided to stop his education and let him stay in the house.
When he was three years old he contracted polio, resulting in both his legs being very weak from the hip down. When he reached the age of 6 he was crawling on the floor, not able to play outside with the other children. His family loved him very much and even spoiled him. The community also accepted and loved him. However, he was not allowed to celebrate community festivities with them. They believed that he would bring bad luck. Some of the older generation in the community advised his parents to let him stay at home, and not get an education at all.
After finishing the 5th class and being at home for one year, someone told the parents about the KOGS hostel (one of the POs of the Liliane foundation). He was allowed to stay there and finish his basic secondary education. Here he received shelter, books, allowances, crutches, callipers and physiotherapy and was able to stand-up straight, and even walk again. In his classes he always belonged in the top 3 of best students. During his stay at the hostel he met people from another Dutch organisation who decided to help him financially with his Bachelor’s degree in computer science and MA in information technology. Shortly after he got his degree, he found a job in the software industry.
Without the chance he got in the hostel, restoring his mobility, and, equally important continuing to a higher level of education, Rajkumar would not have had got his degree. He believes that he would still be living with his parents, with no opportunity to support them or have his own family.
When our female respondents are compared with their sisters, we see that ten of them had a Bachelor’s degree and one a Master’s degree, and that of their sisters only one had a college diploma and one was still in college, supported by her disabled sister who was working as a teacher. We did not ask all our respondents in the Philippines about their siblings’ school diplomas, but among those we asked only one had a sister and one a brother with a college degree. Of our male respondents five had a Bachelor’s degree and one a Master’s degree, and single cases were still in high school, receiving vocational training or were in a special high school. One brother of a male respondent had a college degree.
Close to two thirds of those we interviewed had jobs, which is high, considering that there were children in day care or still in school among our respondents. Only two were self-employed. 63 percent of those with jobs worked as teachers, for the government (e.g. as a social worker in a juvenile prison or for a disability organization). There was also the construction worker, a cook and waiter in the restaurant of his uncle, a factory worker and a cashier. They worked on average 38 hours per week, with a minimum of 15 and a maximum of 60 hours, and all but two liked their jobs.
– 56 –
“�When�I�was�studying�for�social�worker�our�first�exposure�to�field�work�was�on�an�island�where�there�was�no�public�transport�and�where�there�many�hills.�We�were�there�for�10�weeks�and�my�student�colleagues�said:��‘When�we�go�up�we�come�after�you,�when�we�go�down�we�go�before�you’.”��Anthony,�43�years,�The�Philippines,�physically�disabled
5.5 ConclusionsSupport for education has been an important element of the Liliane Foundation’s assistance to disabled children. In a country with free education (for all) this turned to be of less importance than in a country such as Ghana, where few schools are inclusive and disabled children very often had to go to institutions with boarding houses and vocational training. The good news is that the children who were supported in general did very well, often much better than their brothers and sisters, and that a relatively high number of them were able to attain college degrees.
This does not always bring them jobs, as it is always difficult for people with disabilities to find jobs, even in countries where there is progressive legislation forcing government institutions and private employers to take on a prescribed quota of disabled people. Altogether, 56 of our respondents had jobs, most of them in education, and a large number also being self-employed, having their own shops. A big majority of them are very happy with the jobs they have.
From zero to heroJohn, Ghana
One day, after almost a decade, John decided to go back to the village in the rural area of central Ghana where he grew up, to visit his grandmother. For a long time, he had no desire to go back there. Even though his family treated him well, the community did not. The people had been mean to him, children had excluded him, and they found him worthless and looked down on him, simply because he looked and moved differently than the other children.
When John was three years old he contracted polio. Both his legs were affected and he could not use them to stand or walk. His parents did not know anything about the disease and believed he had been cursed. His father took him to all kinds of spiritual healers and fortune-tellers to find out who put a spell on his son. The search ended with no results, and he lived on the floor moving around on his hands.
He was sent to primary education, just like his brothers and sisters, but when he was ready for secondary school, his father decided to stop his education. He had recently lost his job and there was no money for all the children to go to school. Rationally the father decided to let the able sons go to school and John was at home again for the next four years helping his mother around the house. In 1995, John met one of the mediators in the hospital. The mediator asked him if he wanted to go to school, and he sent him to secondary education. After finishing this level, the mediator offered him a place at a vocational training centre. At that time, most of the people with a disability were brought to vocational training centres where they were taught a specific skill, like sewing or repairing shoes. After the first interview it was obvious that John was too smart for this kind of practical education, and he was sent to higher education. The mediator of the Liliane Foundation helped him financially with getting a diploma in accountancy, arranged a boarding house and paid for his study books. They also provided him with a wheelchair, which made it possible for him to get around and actually go to school.
After finishing his first diploma in accountancy, John found a job and could fund the next steps of his education. He finally received his MA in accountancy in 2011. At the moment he is principal accountant at the Kumasi Hospital. He met his wife at the hospital and they are living together with their son next to the hospital. Besides taking care of his own family, he also takes care of his mother, and sends his younger brother and sister to school.
When visiting his grandmother, he entered his home village in his personally modified estate car. This astonished the community. Nowadays, the people look up to him. In their eyes he went from being the one who had nothing to a person who has everything: from zero to hero.
– 57 –
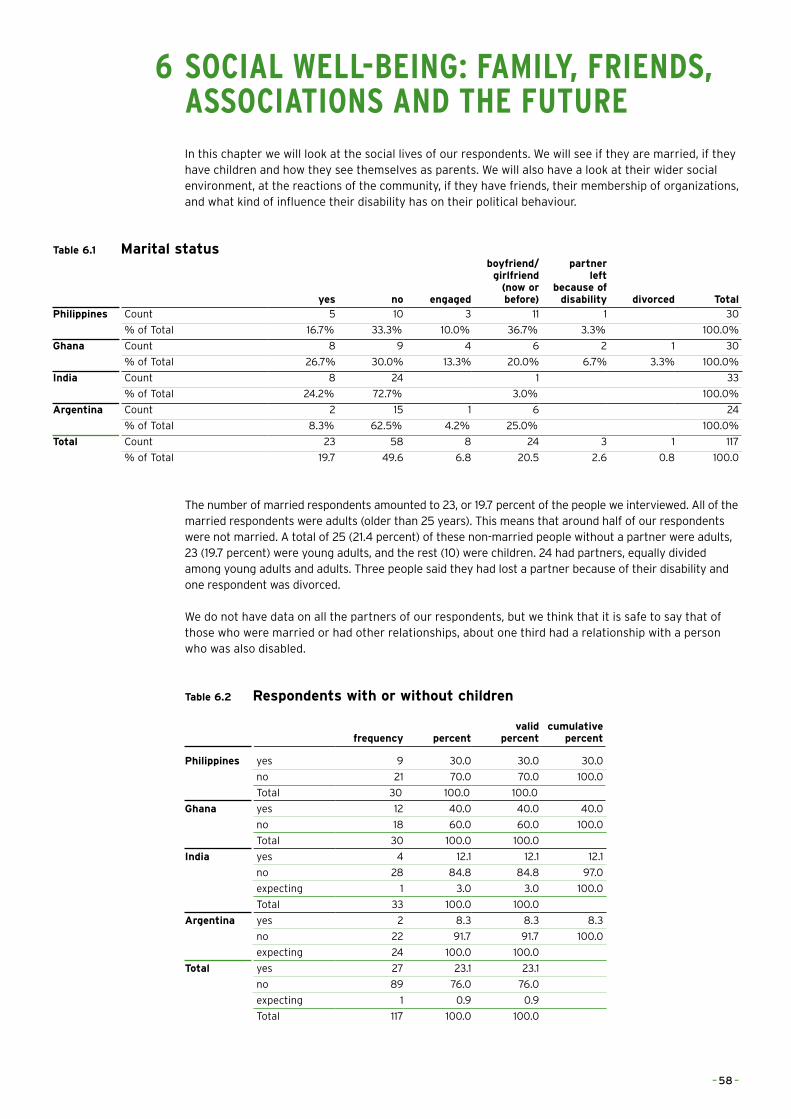
6 SOCIAL WELL-BEING: FAMILY, FRIENDS, ASSOCIATIONS AND THE FUTURE
In this chapter we will look at the social lives of our respondents. We will see if they are married, if they have children and how they see themselves as parents. We will also have a look at their wider social environment, at the reactions of the community, if they have friends, their membership of organizations, and what kind of influence their disability has on their political behaviour.
Table 6.1 Marital status
yes no engaged
boyfriend/girlfriend
(now or before)
partner left
because of disability divorced Total
Philippines Count 5 10 3 11 1 30
% of Total 16.7% 33.3% 10.0% 36.7% 3.3% 100.0%
Ghana Count 8 9 4 6 2 1 30
% of Total 26.7% 30.0% 13.3% 20.0% 6.7% 3.3% 100.0%
India Count 8 24 1 33
% of Total 24.2% 72.7% 3.0% 100.0%
Argentina Count 2 15 1 6 24
% of Total 8.3% 62.5% 4.2% 25.0% 100.0%
Total Count 23 58 8 24 3 1 117
% of Total 19.7 49.6 6.8 20.5 2.6 0.8 100.0
The number of married respondents amounted to 23, or 19.7 percent of the people we interviewed. All of the married respondents were adults (older than 25 years). This means that around half of our respondents were not married. A total of 25 (21.4 percent) of these non-married people without a partner were adults, 23 (19.7 percent) were young adults, and the rest (10) were children. 24 had partners, equally divided among young adults and adults. Three people said they had lost a partner because of their disability and one respondent was divorced.
We do not have data on all the partners of our respondents, but we think that it is safe to say that of those who were married or had other relationships, about one third had a relationship with a person who was also disabled.
Table 6.2 Respondents with or without children
frequency percentvalid
percentcumulative
percent
Philippines yes 9 30.0 30.0 30.0
no 21 70.0 70.0 100.0
Total 30 100.0 100.0
Ghana yes 12 40.0 40.0 40.0
no 18 60.0 60.0 100.0
Total 30 100.0 100.0
India yes 4 12.1 12.1 12.1
no 28 84.8 84.8 97.0
expecting 1 3.0 3.0 100.0
Total 33 100.0 100.0
Argentina yes 2 8.3 8.3 8.3
no 22 91.7 91.7 100.0
expecting 24 100.0 100.0
Total yes 27 23.1 23.1
no 89 76.0 76.0
expecting 1 0.9 0.9
Total 117 100.0 100.0
– 58 –
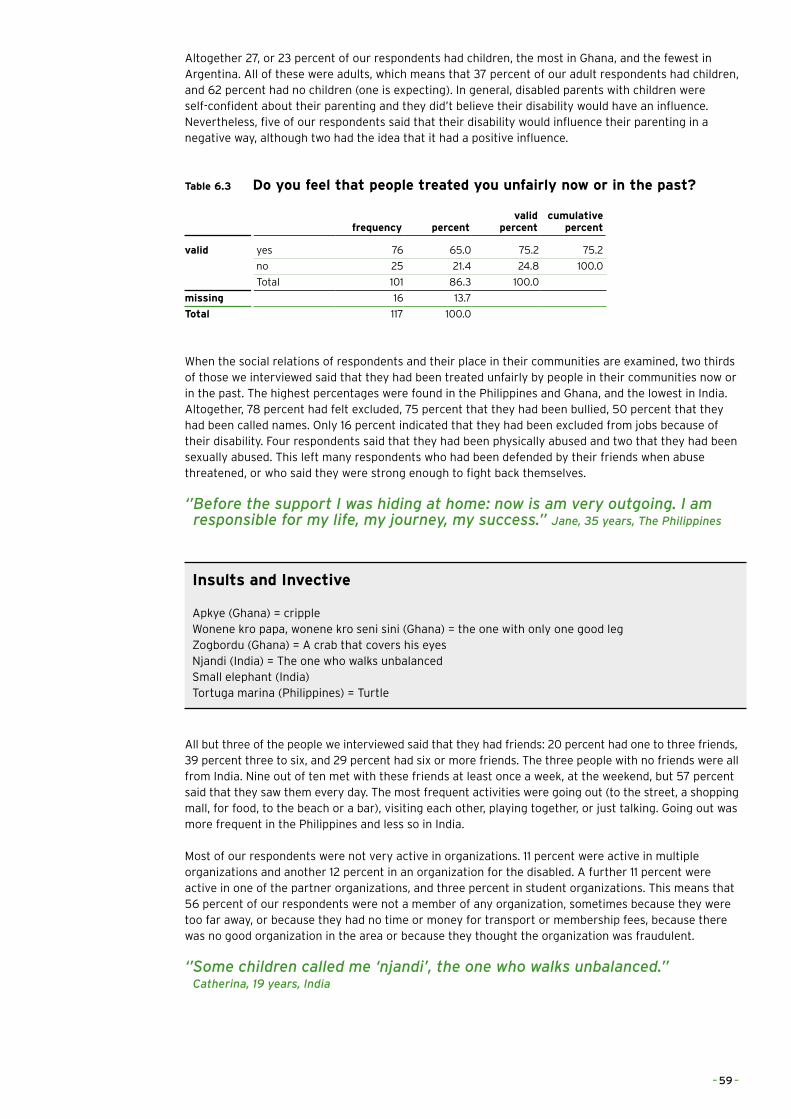
Altogether 27, or 23 percent of our respondents had children, the most in Ghana, and the fewest in Argentina. All of these were adults, which means that 37 percent of our adult respondents had children, and 62 percent had no children (one is expecting). In general, disabled parents with children were self-confident about their parenting and they did’t believe their disability would have an influence. Nevertheless, five of our respondents said that their disability would influence their parenting in a negative way, although two had the idea that it had a positive influence.
Table 6.3 Do you feel that people treated you unfairly now or in the past?
frequency percentvalid
percentcumulative
percent
valid yes 76 65.0 75.2 75.2
no 25 21.4 24.8 100.0
Total 101 86.3 100.0
missing 16 13.7
Total 117 100.0
When the social relations of respondents and their place in their communities are examined, two thirds of those we interviewed said that they had been treated unfairly by people in their communities now or in the past. The highest percentages were found in the Philippines and Ghana, and the lowest in India. Altogether, 78 percent had felt excluded, 75 percent that they had been bullied, 50 percent that they had been called names. Only 16 percent indicated that they had been excluded from jobs because of their disability. Four respondents said that they had been physically abused and two that they had been sexually abused. This left many respondents who had been defended by their friends when abuse threatened, or who said they were strong enough to fight back themselves.
‘’�Before�the�support�I�was�hiding�at�home:�now�is�am�very�outgoing.�I�am�responsible�for�my�life,�my�journey,�my�success.”�Jane,�35�years,�The�Philippines
Insults and Invective
Apkye (Ghana) = crippleWonene kro papa, wonene kro seni sini (Ghana) = the one with only one good legZogbordu (Ghana) = A crab that covers his eyesNjandi (India) = The one who walks unbalancedSmall elephant (India)Tortuga marina (Philippines) = Turtle
All but three of the people we interviewed said that they had friends: 20 percent had one to three friends, 39 percent three to six, and 29 percent had six or more friends. The three people with no friends were all from India. Nine out of ten met with these friends at least once a week, at the weekend, but 57 percent said that they saw them every day. The most frequent activities were going out (to the street, a shopping mall, for food, to the beach or a bar), visiting each other, playing together, or just talking. Going out was more frequent in the Philippines and less so in India.
Most of our respondents were not very active in organizations. 11 percent were active in multiple organizations and another 12 percent in an organization for the disabled. A further 11 percent were active in one of the partner organizations, and three percent in student organizations. This means that 56 percent of our respondents were not a member of any organization, sometimes because they were too far away, or because they had no time or money for transport or membership fees, because there was no good organization in the area or because they thought the organization was fraudulent.
‘’�Some�children�called�me�‘njandi’,�the�one�who�walks�unbalanced.”��Catherina,�19�years,�India
– 59 –
Three out of four of those who were active in an organization were members, but there were also four chairmen, four board members and two secretaries. Most of them met regularly, at least once a week, but sometimes two to three times a week. Our respondents in Ghana were most active, and we met three chairmen and two board members. The least active were in Argentina. We found the most members of partner organizations in the Philippines, where several of our respondents worked in local organizations for the disabled.
Two thirds of the respondents went out to vote in the most recent elections. Only a few did not vote because they were disinterested. About one in four could not vote, because they were too young or mentally disabled. Several people indicated that they could not vote because they could not enter the polling station or because the polling station was too far away.
When they vote, disability is an important issue when casting their vote for only a small majority of respondents (43 percent). This is not an issue for a sizeable minority (39 percent). For our voters in the Philippines and Ghana, disability is much more an issue in elections than for those in India, which seems logical, in view of what the political parties in the states we visited already do for disabled people.
6.1 ArgentinaOnly two of our respondents in Argentina were married. This was one in five (20 percent) of the adults we interviewed. Of the young adults, five had partners. It is therefore logical that only two of our respondents in Argentina (8 percent) had children.
‘’�I�am�not�able�to�vote,�because�of�the�construction�of�the�building.�I�am�not�able�to�walk�any�stairs.”�Shinto,�33�years,�India�
The figures on maltreatment in Argentina should be treated with caution, because we did not receive many answers. The number of people who felt excluded, were bullied or called names seemed a bit smaller than the other three countries.
All of our respondents claimed to have friends, mostly one to three. They saw them regularly, to play together, but one in three also went out or see them in the streets, mostly every day and one in four only at the weekends.
Because most of our respondents in Argentina were rather young or mentally disabled, most of them were not a member of any organizations. Only one person indicated that she was a member of multiple organizations, including disability organizations, and that she regularly goes to meetings. Only half of the respondents in Argentina are allowed to vote and of those only two said that disability was an issue for them when they vote.
– 60 –
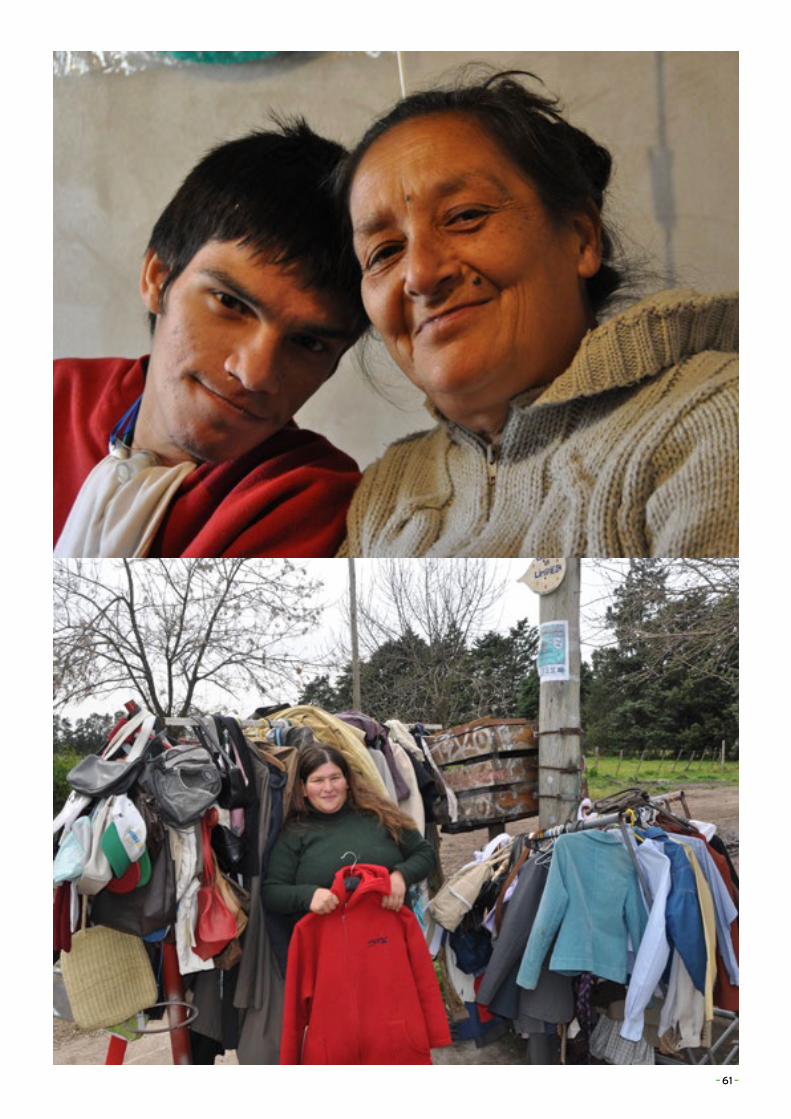
– 61 –
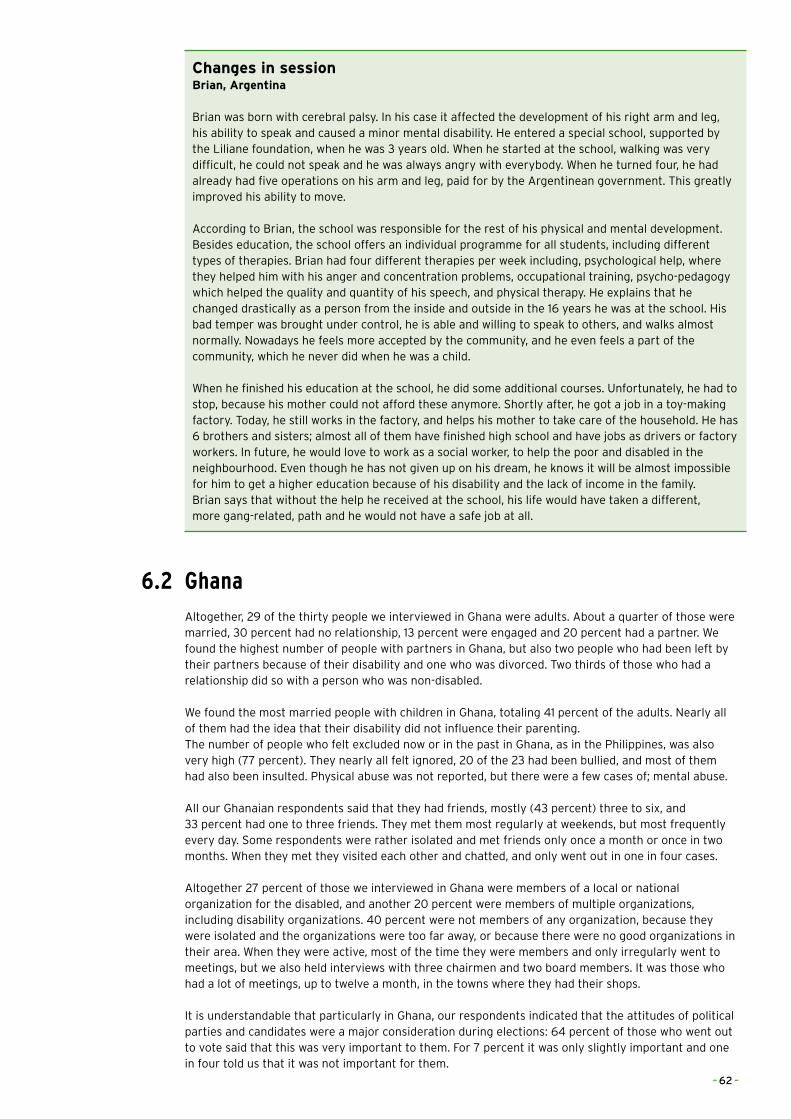
Changes in sessionBrian, Argentina
Brian was born with cerebral palsy. In his case it affected the development of his right arm and leg, his ability to speak and caused a minor mental disability. He entered a special school, supported by the Liliane foundation, when he was 3 years old. When he started at the school, walking was very difficult, he could not speak and he was always angry with everybody. When he turned four, he had already had five operations on his arm and leg, paid for by the Argentinean government. This greatly improved his ability to move.
According to Brian, the school was responsible for the rest of his physical and mental development. Besides education, the school offers an individual programme for all students, including different types of therapies. Brian had four different therapies per week including, psychological help, where they helped him with his anger and concentration problems, occupational training, psycho-pedagogy which helped the quality and quantity of his speech, and physical therapy. He explains that he changed drastically as a person from the inside and outside in the 16 years he was at the school. His bad temper was brought under control, he is able and willing to speak to others, and walks almost normally. Nowadays he feels more accepted by the community, and he even feels a part of the community, which he never did when he was a child.
When he finished his education at the school, he did some additional courses. Unfortunately, he had to stop, because his mother could not afford these anymore. Shortly after, he got a job in a toy-making factory. Today, he still works in the factory, and helps his mother to take care of the household. He has 6 brothers and sisters; almost all of them have finished high school and have jobs as drivers or factory workers. In future, he would love to work as a social worker, to help the poor and disabled in the neighbourhood. Even though he has not given up on his dream, he knows it will be almost impossible for him to get a higher education because of his disability and the lack of income in the family. Brian says that without the help he received at the school, his life would have taken a different, more gang-related, path and he would not have a safe job at all.
6.2 GhanaAltogether, 29 of the thirty people we interviewed in Ghana were adults. About a quarter of those were married, 30 percent had no relationship, 13 percent were engaged and 20 percent had a partner. We found the highest number of people with partners in Ghana, but also two people who had been left by their partners because of their disability and one who was divorced. Two thirds of those who had a relationship did so with a person who was non-disabled.
We found the most married people with children in Ghana, totaling 41 percent of the adults. Nearly all of them had the idea that their disability did not influence their parenting.The number of people who felt excluded now or in the past in Ghana, as in the Philippines, was also very high (77 percent). They nearly all felt ignored, 20 of the 23 had been bullied, and most of them had also been insulted. Physical abuse was not reported, but there were a few cases of; mental abuse.
All our Ghanaian respondents said that they had friends, mostly (43 percent) three to six, and 33 percent had one to three friends. They met them most regularly at weekends, but most frequently every day. Some respondents were rather isolated and met friends only once a month or once in two months. When they met they visited each other and chatted, and only went out in one in four cases.
Altogether 27 percent of those we interviewed in Ghana were members of a local or national organization for the disabled, and another 20 percent were members of multiple organizations, including disability organizations. 40 percent were not members of any organization, because they were isolated and the organizations were too far away, or because there were no good organizations in their area. When they were active, most of the time they were members and only irregularly went to meetings, but we also held interviews with three chairmen and two board members. It was those who had a lot of meetings, up to twelve a month, in the towns where they had their shops.
It is understandable that particularly in Ghana, our respondents indicated that the attitudes of political parties and candidates were a major consideration during elections: 64 percent of those who went out to vote said that this was very important to them. For 7 percent it was only slightly important and one in four told us that it was not important for them.
– 62 –
6.3 IndiaIn India we interviewed 17 young adults, none of whom was married and only one of whom had a girlfriend. Of the adults, about half were married and the other half were not, and did not have a partner. About half of those with a partner had one who was also disabled. Half of the married adults had children. They indicated that their disability would not influence their parenting.
The number of people who felt excluded in India was noticeably lower than in the Philippines or Ghana. Only 39 percent said they had been treated unfairly, 69 percent, however, felt that from time to time they had been excluded, 44 percent had been bullied and only 19 percent had been called names. Physical and emotional abuse were only reported in single cases.
All those who were able to have friends, said that they had one to three friends (27 percent), three to six friends (36 percent) or even more than six (27 percent). They saw them most of the time every day in school or college, or visited them at their homes. Only a few of them went out with their friends, mostly during weekends.
Five of our respondents were members of disability organizations, but 21 were not, some because it was too far to go, others because they had no time. There were also three members of students’ organizations, one of a community organization and one of more organizations. Those who were active in organization were only members and did not hold any positions. They visited the meetings only once in a month, or at the most once a week.
Disability was only a minor issue for those who went out to vote. Only three out of all our respondents told us that the attitudes of political parties to disability was of great importance to them when they voted. This means that for 75 percent of the voters among our respondents it was not of importance, also because they followed their families, and particularly their fathers, in their voting patterns.
6.4 The PhilippinesOne sixth of the respondents in the Philippines was married, all of them adults. Among these adults we also found people who were engaged (three) and most of those who had a partner. Nearly two thirds of the young adults had a partner. One third of the respondents had no relationship at all. About half of the adults in the Philippines - and that is more than were married – had children. Most of them said that they did not feel that their disability would influence their parenting, and two were of the opinion that it would influence it positively. There were, however, also three respondents who said that their disability would influence their parenting in a negative way.
The number of people who felt they had been treated unfairly in the Philippines was high (83 percent). This was in particular because they were bullied (88 percent) or called names (72 percent). 32 percent had also been physically abused in the past. Mental and sexual abuse were only reported in one single case of mental abuse.
People we interviewed in the Philippines also said they had many friends. Half of them even reported having more than six friends and 37 percent had three to six. 47 percent saw their friends every day, mostly at work, school, or college. 40 percent saw them only at weekends. More than in the other three countries (63 percent) they saw these friends when going out, very often to go to shopping malls, to have some food and drinks there, or just to chat.
Because we interviewed ten respondents from local disability organizations, one third of the respondents were members of such organizations. Five respondents said that they were members of multiple organizations. Most of these were ordinary members, but there was also one chairman, and there were two board members, one secretary and two other officers of these organizations. This means that several of these active respondents were in meetings almost three times a week.
Fewer than half of those who voted cast their votes for parties with specific, positive policies for the disabled. 18 percent gave this issue little importance and 27 percent no importance at all.
– 63 –
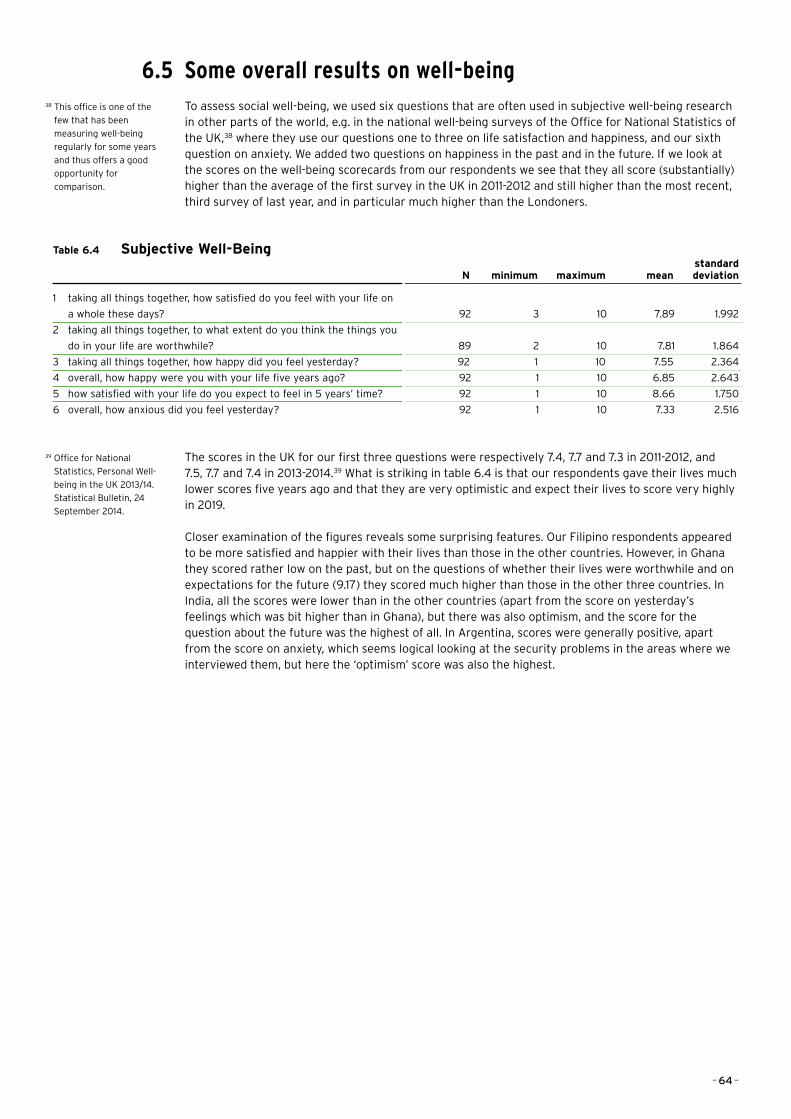
6.5 Some overall results on well-beingTo assess social well-being, we used six questions that are often used in subjective well-being research in other parts of the world, e.g. in the national well-being surveys of the Office for National Statistics of the UK,38 where they use our questions one to three on life satisfaction and happiness, and our sixth question on anxiety. We added two questions on happiness in the past and in the future. If we look at the scores on the well-being scorecards from our respondents we see that they all score (substantially) higher than the average of the first survey in the UK in 2011-2012 and still higher than the most recent, third survey of last year, and in particular much higher than the Londoners.
Table 6.4 Subjective Well-Being
N minimum maximum meanstandard deviation
1 taking all things together, how satisfied do you feel with your life on
a whole these days? 92 3 10 7.89 1.992
2 taking all things together, to what extent do you think the things you
do in your life are worthwhile? 89 2 10 7.81 1.864
3 taking all things together, how happy did you feel yesterday? 92 1 10 7.55 2.364
4 overall, how happy were you with your life five years ago? 92 1 10 6.85 2.643
5 how satisfied with your life do you expect to feel in 5 years’ time? 92 1 10 8.66 1.750
6 overall, how anxious did you feel yesterday? 92 1 10 7.33 2.516
The scores in the UK for our first three questions were respectively 7.4, 7.7 and 7.3 in 2011-2012, and 7.5, 7.7 and 7.4 in 2013-2014.39 What is striking in table 6.4 is that our respondents gave their lives much lower scores five years ago and that they are very optimistic and expect their lives to score very highly in 2019.
Closer examination of the figures reveals some surprising features. Our Filipino respondents appeared to be more satisfied and happier with their lives than those in the other countries. However, in Ghana they scored rather low on the past, but on the questions of whether their lives were worthwhile and on expectations for the future (9.17) they scored much higher than those in the other three countries. In India, all the scores were lower than in the other countries (apart from the score on yesterday’s feelings which was bit higher than in Ghana), but there was also optimism, and the score for the question about the future was the highest of all. In Argentina, scores were generally positive, apart from the score on anxiety, which seems logical looking at the security problems in the areas where we interviewed them, but here the ‘optimism’ score was also the highest.
38 This office is one of the
few that has been
measuring well-being
regularly for some years
and thus offers a good
opportunity for
comparison.
39 Office for National
Statistics, Personal Well-
being in the UK 2013/14.
Statistical Bulletin, 24
September 2014.
– 64 –
Home aloneMario, the Philippines
After a 20-minute walk through the dry rice fields in Antique province, the Philippines, we arrived at the home of Mario. As one of the few inhabitants of the area, he lives alone. His mother died when he was a child, his brothers left a long time ago for Manila to have better future prospects; and his father decided to move in with one of his brothers a few years ago after a neighbourhood fight. The only family he still sees are his aunt and her children, who live in the hut next door.
Mario was born with no hands or feet. His parents believed it was his mother’s fault that he was born this way, looking like the roots of a tree. During the pregnancy she ate a lot of ‘root crabs’, a local snack made of the roots of certain plants. When he was 8 years old, his father took him to a local mediator. Because of her help he was able to go to primary school. She paid for his tuition fees and books. She also gave him allowances, but this was mainly spent on household items and his brothers and sisters. Besides educational support, Mario received special shoes, and the family received a new waterproof roof for the hut. After elementary school, the family did not receive any more support. However, Mario’s father was convinced that he should go to school, and he was allowed to go to secondary school. In both schools he was the only person with a disability, and he had a hard time making friends.
Ten years after he finished his education, the mediator, a sister who runs an orphanage, asked him to help construct a new building for the children’s home. This was his first job. Before this he depended on selling the chicken his father left him, and renting out an ox, which he received as livelihood support from the organisation, to the neighbouring farmers. Occasionally his brother sends him some money for food and clothes. The community accepts him, but he has no friends in the area, the people and mainly the children are scared of him and avoid him as much as possible. When he is at home, he has some contact with the neighbours because the common water well is next to his house.
A few years ago he became a member of a special organisation for disabled persons. The meetings are once a month, but most of the time he has no money to travel there. Currently, he has no time for meetings because he is working for the sister again. He is painting the buildings in the orphanage. The sister does not pay him very much, but she let him stay at the home, and gives him food. The people he is closest to are the girls and staff in the orphanage. He does not call them his friends. But at least they are nice to him, and do not ignore him because of his disability.
– 65 –
Two legs and a jobChristine, the Philippines
When Christine was born her mother almost rejected her. She was scared of her own daughter because she was missing one of her lower legs. When she got used to her newborn child, and noticed that she was just like her other children, mother and daughter became inseparable. The mother carried Christine everywhere until she was about six years old. The family did not have the money for an operation or anything that could help Christine. When she was six years old, they met Dr Jessie, one of the mediators on the Island, and her situation changed. In the same year he operated on her stump, and made a prosthetic leg for her. Christine was able to stand and learned how to walk. Because she was still a growing child, she received a new prosthetic leg every two years.
The mediator did not only help her with her disability, he also helped her with accepting life how it comes, and accepting who she is. When she was a child, Christine had to deal with a lot of bullying, being called all kinds of names, and she preferred to stay inside the house. When she went to high school she finally felt sufficiently brave and self-assured to be outside and make friends.
During her years at high school, she met a couple from Europe who were willing to sponsor her through university. When she finished her cooperative management degree, she went looking for a job. With very high grades, it was not difficult to find a one. Today, Christine is working in a Pawn shop in Iloilo as a cashier 6 days a week, earning more than enough to support herself and contribute to the family expenses. She is still living in a small apartment with her sister and 10 other relatives, but she does not want to live alone. In future, when she marries her boyfriend, they will move out and find a place of their own.
Christine emphasizes that all of this: going to school, having a job, a boyfriend and a lot of friends would not be possible if she had not received support from Doctor Jessie and the Liliane Foundation. Besides the ability to walk and go wherever she wants, she has much more confidence. Without the help she would still be hiding inside, and cleaning the house. In her own words: ‘Because of this leg, I have a job and can take care of myself’.
– 66 –
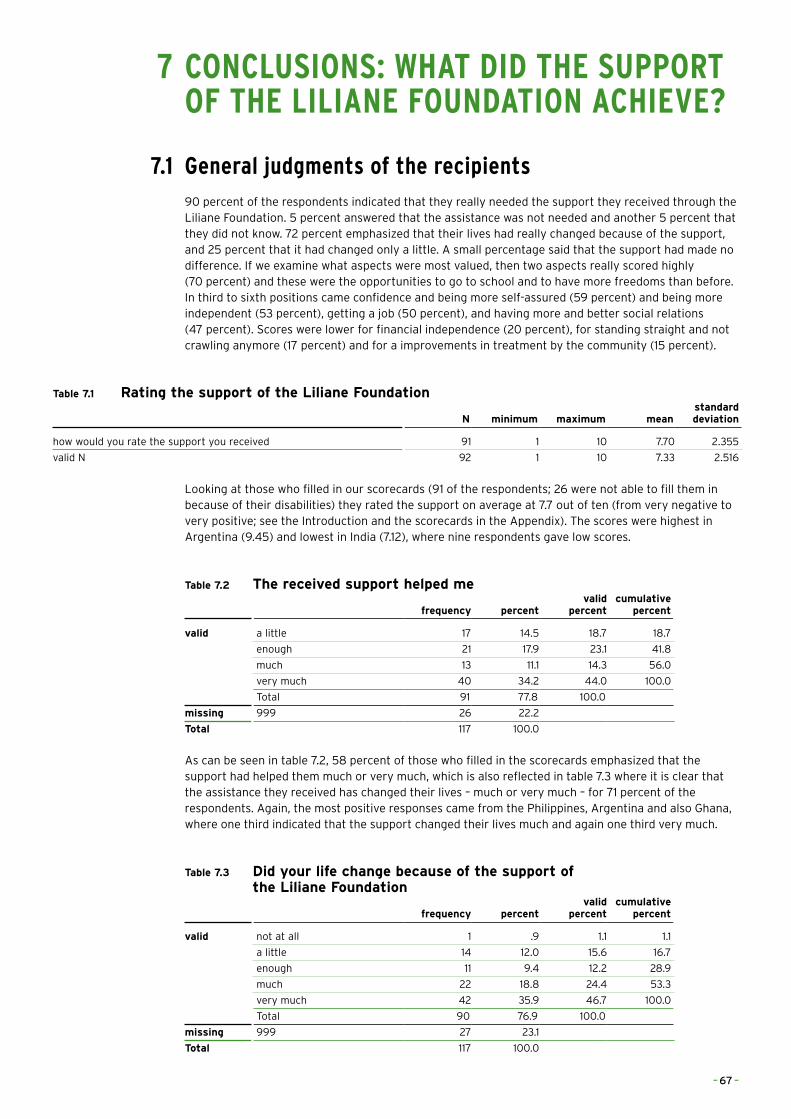
7 CONCLUSIONS: WHAT DID THE SUPPORT OF THE LILIANE FOUNDATION ACHIEVE?
7.1 General judgments of the recipients90 percent of the respondents indicated that they really needed the support they received through the Liliane Foundation. 5 percent answered that the assistance was not needed and another 5 percent that they did not know. 72 percent emphasized that their lives had really changed because of the support, and 25 percent that it had changed only a little. A small percentage said that the support had made no difference. If we examine what aspects were most valued, then two aspects really scored highly (70 percent) and these were the opportunities to go to school and to have more freedoms than before. In third to sixth positions came confidence and being more self-assured (59 percent) and being more independent (53 percent), getting a job (50 percent), and having more and better social relations (47 percent). Scores were lower for financial independence (20 percent), for standing straight and not crawling anymore (17 percent) and for a improvements in treatment by the community (15 percent).
Table 7.1 Rating the support of the Liliane Foundation
N minimum maximum meanstandard deviation
how would you rate the support you received 91 1 10 7.70 2.355
valid N 92 1 10 7.33 2.516
Looking at those who filled in our scorecards (91 of the respondents; 26 were not able to fill them in because of their disabilities) they rated the support on average at 7.7 out of ten (from very negative to very positive; see the Introduction and the scorecards in the Appendix). The scores were highest in Argentina (9.45) and lowest in India (7.12), where nine respondents gave low scores.
Table 7.2 The received support helped me
frequency percentvalid
percentcumulative
percent
valid a little 17 14.5 18.7 18.7
enough 21 17.9 23.1 41.8
much 13 11.1 14.3 56.0
very much 40 34.2 44.0 100.0
Total 91 77.8 100.0
missing 999 26 22.2
Total 117 100.0
As can be seen in table 7.2, 58 percent of those who filled in the scorecards emphasized that the support had helped them much or very much, which is also reflected in table 7.3 where it is clear that the assistance they received has changed their lives – much or very much – for 71 percent of the respondents. Again, the most positive responses came from the Philippines, Argentina and also Ghana, where one third indicated that the support changed their lives much and again one third very much.
Table 7.3 Did your life change because of the support of the Liliane Foundation
frequency percentvalid
percentcumulative
percent
valid not at all 1 .9 1.1 1.1
a little 14 12.0 15.6 16.7
enough 11 9.4 12.2 28.9
much 22 18.8 24.4 53.3
very much 42 35.9 46.7 100.0
Total 90 76.9 100.0
missing 999 27 23.1
Total 117 100.0
– 67 –
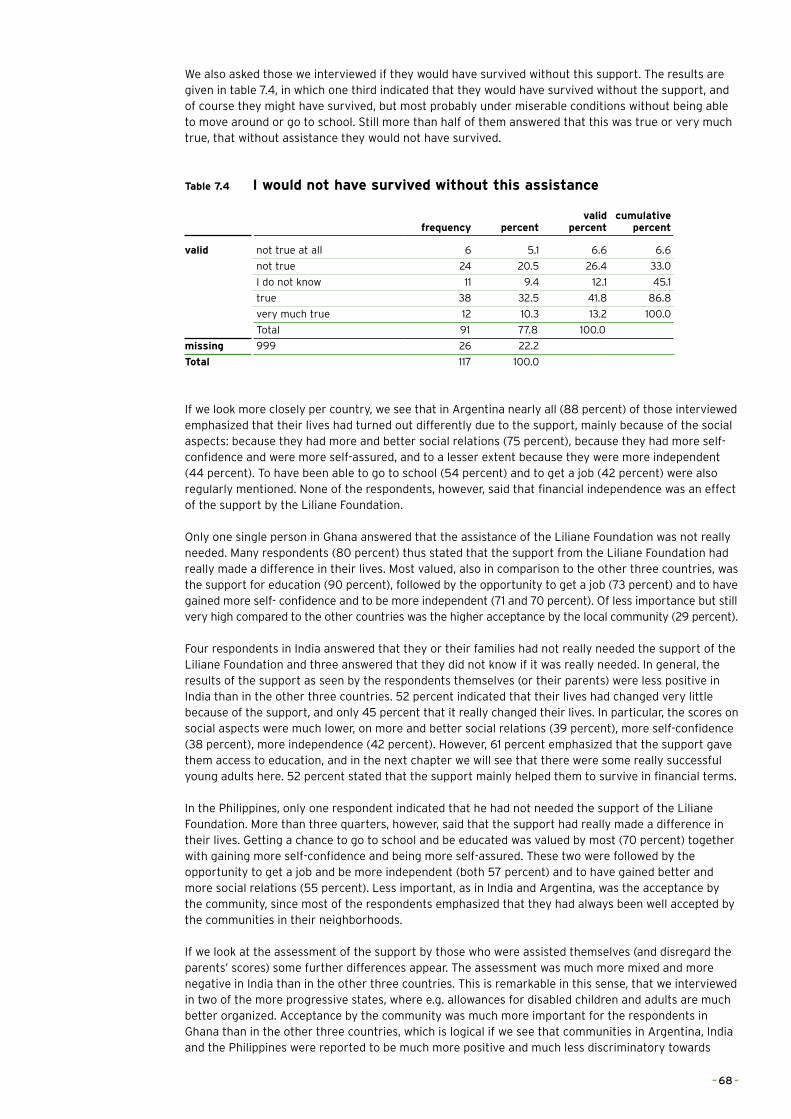
We also asked those we interviewed if they would have survived without this support. The results are given in table 7.4, in which one third indicated that they would have survived without the support, and of course they might have survived, but most probably under miserable conditions without being able to move around or go to school. Still more than half of them answered that this was true or very much true, that without assistance they would not have survived.
Table 7.4 I would not have survived without this assistance
frequency percentvalid
percentcumulative
percent
valid not true at all 6 5.1 6.6 6.6
not true 24 20.5 26.4 33.0
I do not know 11 9.4 12.1 45.1
true 38 32.5 41.8 86.8
very much true 12 10.3 13.2 100.0
Total 91 77.8 100.0
missing 999 26 22.2
Total 117 100.0
If we look more closely per country, we see that in Argentina nearly all (88 percent) of those interviewed emphasized that their lives had turned out differently due to the support, mainly because of the social aspects: because they had more and better social relations (75 percent), because they had more self-confidence and were more self-assured, and to a lesser extent because they were more independent (44 percent). To have been able to go to school (54 percent) and to get a job (42 percent) were also regularly mentioned. None of the respondents, however, said that financial independence was an effect of the support by the Liliane Foundation.
Only one single person in Ghana answered that the assistance of the Liliane Foundation was not really needed. Many respondents (80 percent) thus stated that the support from the Liliane Foundation had really made a difference in their lives. Most valued, also in comparison to the other three countries, was the support for education (90 percent), followed by the opportunity to get a job (73 percent) and to have gained more self- confidence and to be more independent (71 and 70 percent). Of less importance but still very high compared to the other countries was the higher acceptance by the local community (29 percent).
Four respondents in India answered that they or their families had not really needed the support of the Liliane Foundation and three answered that they did not know if it was really needed. In general, the results of the support as seen by the respondents themselves (or their parents) were less positive in India than in the other three countries. 52 percent indicated that their lives had changed very little because of the support, and only 45 percent that it really changed their lives. In particular, the scores on social aspects were much lower, on more and better social relations (39 percent), more self-confidence (38 percent), more independence (42 percent). However, 61 percent emphasized that the support gave them access to education, and in the next chapter we will see that there were some really successful young adults here. 52 percent stated that the support mainly helped them to survive in financial terms.
In the Philippines, only one respondent indicated that he had not needed the support of the Liliane Foundation. More than three quarters, however, said that the support had really made a difference in their lives. Getting a chance to go to school and be educated was valued by most (70 percent) together with gaining more self-confidence and being more self-assured. These two were followed by the opportunity to get a job and be more independent (both 57 percent) and to have gained better and more social relations (55 percent). Less important, as in India and Argentina, was the acceptance by the community, since most of the respondents emphasized that they had always been well accepted by the communities in their neighborhoods.
If we look at the assessment of the support by those who were assisted themselves (and disregard the parents’ scores) some further differences appear. The assessment was much more mixed and more negative in India than in the other three countries. This is remarkable in this sense, that we interviewed in two of the more progressive states, where e.g. allowances for disabled children and adults are much better organized. Acceptance by the community was much more important for the respondents in Ghana than in the other three countries, which is logical if we see that communities in Argentina, India and the Philippines were reported to be much more positive and much less discriminatory towards
– 68 –
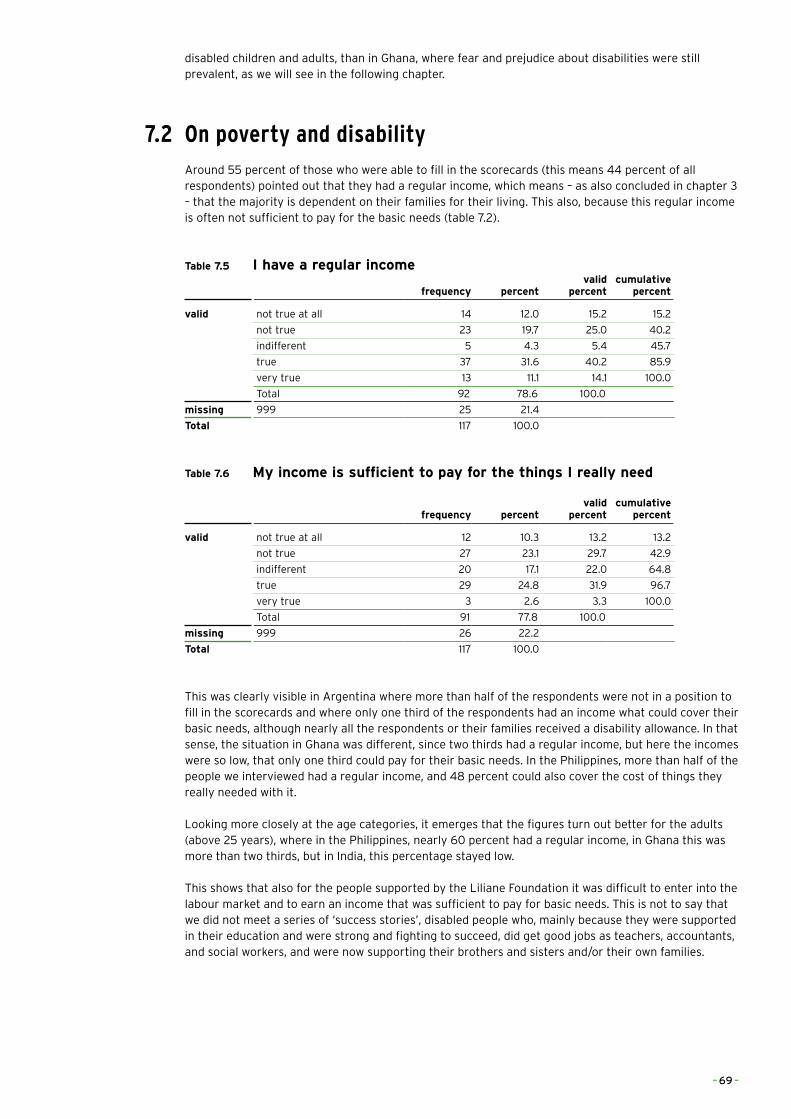
disabled children and adults, than in Ghana, where fear and prejudice about disabilities were still prevalent, as we will see in the following chapter.
7.2 On poverty and disabilityAround 55 percent of those who were able to fill in the scorecards (this means 44 percent of all respondents) pointed out that they had a regular income, which means – as also concluded in chapter 3 – that the majority is dependent on their families for their living. This also, because this regular income is often not sufficient to pay for the basic needs (table 7.2).
Table 7.5 I have a regular income
frequency percentvalid
percentcumulative
percent
valid not true at all 14 12.0 15.2 15.2
not true 23 19.7 25.0 40.2
indifferent 5 4.3 5.4 45.7
true 37 31.6 40.2 85.9
very true 13 11.1 14.1 100.0
Total 92 78.6 100.0
missing 999 25 21.4
Total 117 100.0
Table 7.6 My income is sufficient to pay for the things I really need
frequency percentvalid
percentcumulative
percent
valid not true at all 12 10.3 13.2 13.2
not true 27 23.1 29.7 42.9
indifferent 20 17.1 22.0 64.8
true 29 24.8 31.9 96.7
very true 3 2.6 3.3 100.0
Total 91 77.8 100.0
missing 999 26 22.2
Total 117 100.0
This was clearly visible in Argentina where more than half of the respondents were not in a position to fill in the scorecards and where only one third of the respondents had an income what could cover their basic needs, although nearly all the respondents or their families received a disability allowance. In that sense, the situation in Ghana was different, since two thirds had a regular income, but here the incomes were so low, that only one third could pay for their basic needs. In the Philippines, more than half of the people we interviewed had a regular income, and 48 percent could also cover the cost of things they really needed with it.
Looking more closely at the age categories, it emerges that the figures turn out better for the adults (above 25 years), where in the Philippines, nearly 60 percent had a regular income, in Ghana this was more than two thirds, but in India, this percentage stayed low.
This shows that also for the people supported by the Liliane Foundation it was difficult to enter into the labour market and to earn an income that was sufficient to pay for basic needs. This is not to say that we did not meet a series of ‘success stories’, disabled people who, mainly because they were supported in their education and were strong and fighting to succeed, did get good jobs as teachers, accountants, and social workers, and were now supporting their brothers and sisters and/or their own families.
– 69 –
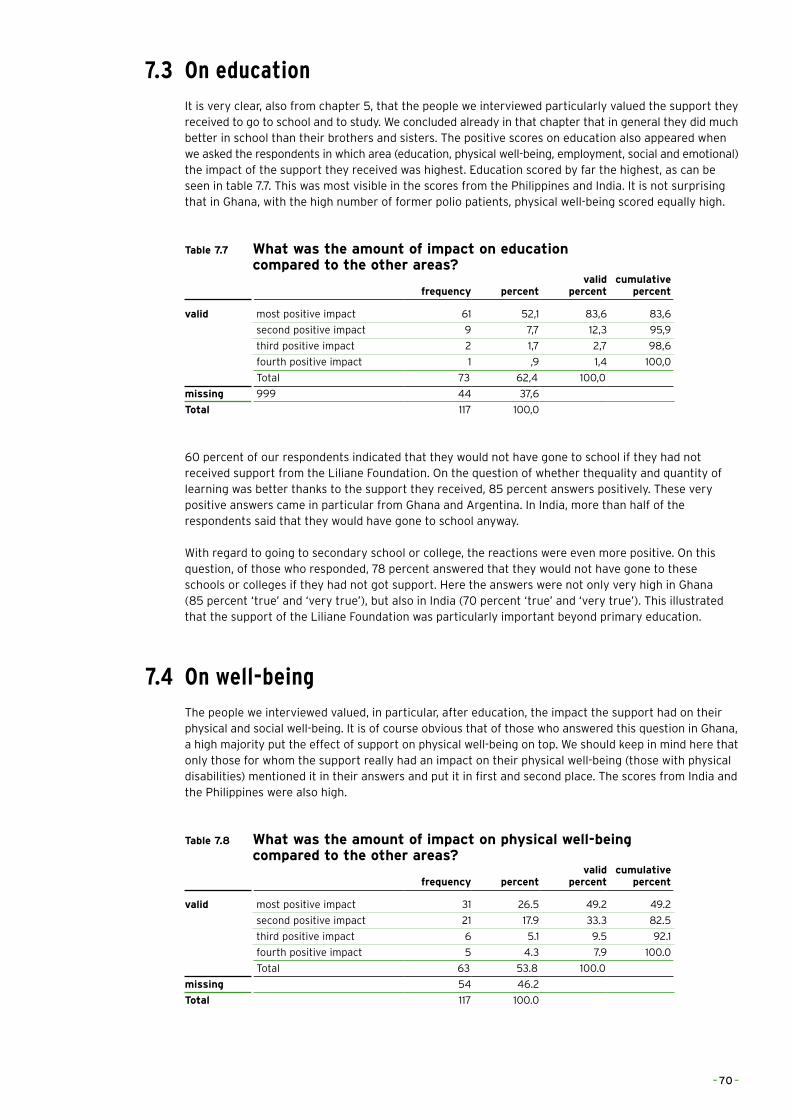
7.3 On educationIt is very clear, also from chapter 5, that the people we interviewed particularly valued the support they received to go to school and to study. We concluded already in that chapter that in general they did much better in school than their brothers and sisters. The positive scores on education also appeared when we asked the respondents in which area (education, physical well-being, employment, social and emotional) the impact of the support they received was highest. Education scored by far the highest, as can be seen in table 7.7. This was most visible in the scores from the Philippines and India. It is not surprising that in Ghana, with the high number of former polio patients, physical well-being scored equally high.
Table 7.7 What was the amount of impact on education compared to the other areas?
frequency percentvalid
percentcumulative
percent
valid most positive impact 61 52,1 83,6 83,6
second positive impact 9 7,7 12,3 95,9
third positive impact 2 1,7 2,7 98,6
fourth positive impact 1 ,9 1,4 100,0
Total 73 62,4 100,0
missing 999 44 37,6
Total 117 100,0
60 percent of our respondents indicated that they would not have gone to school if they had not received support from the Liliane Foundation. On the question of whether thequality and quantity of learning was better thanks to the support they received, 85 percent answers positively. These very positive answers came in particular from Ghana and Argentina. In India, more than half of the respondents said that they would have gone to school anyway.
With regard to going to secondary school or college, the reactions were even more positive. On this question, of those who responded, 78 percent answered that they would not have gone to these schools or colleges if they had not got support. Here the answers were not only very high in Ghana (85 percent ‘true’ and ‘very true’), but also in India (70 percent ‘true’ and ‘very true’). This illustrated that the support of the Liliane Foundation was particularly important beyond primary education.
7.4 On well-beingThe people we interviewed valued, in particular, after education, the impact the support had on their physical and social well-being. It is of course obvious that of those who answered this question in Ghana, a high majority put the effect of support on physical well-being on top. We should keep in mind here that only those for whom the support really had an impact on their physical well-being (those with physical disabilities) mentioned it in their answers and put it in first and second place. The scores from India and the Philippines were also high.
Table 7.8 What was the amount of impact on physical well-being compared to the other areas?
frequency percentvalid
percentcumulative
percent
valid most positive impact 31 26.5 49.2 49.2
second positive impact 21 17.9 33.3 82.5
third positive impact 6 5.1 9.5 92.1
fourth positive impact 5 4.3 7.9 100.0
Total 63 53.8 100.0
missing 54 46.2
Total 117 100.0
– 70 –
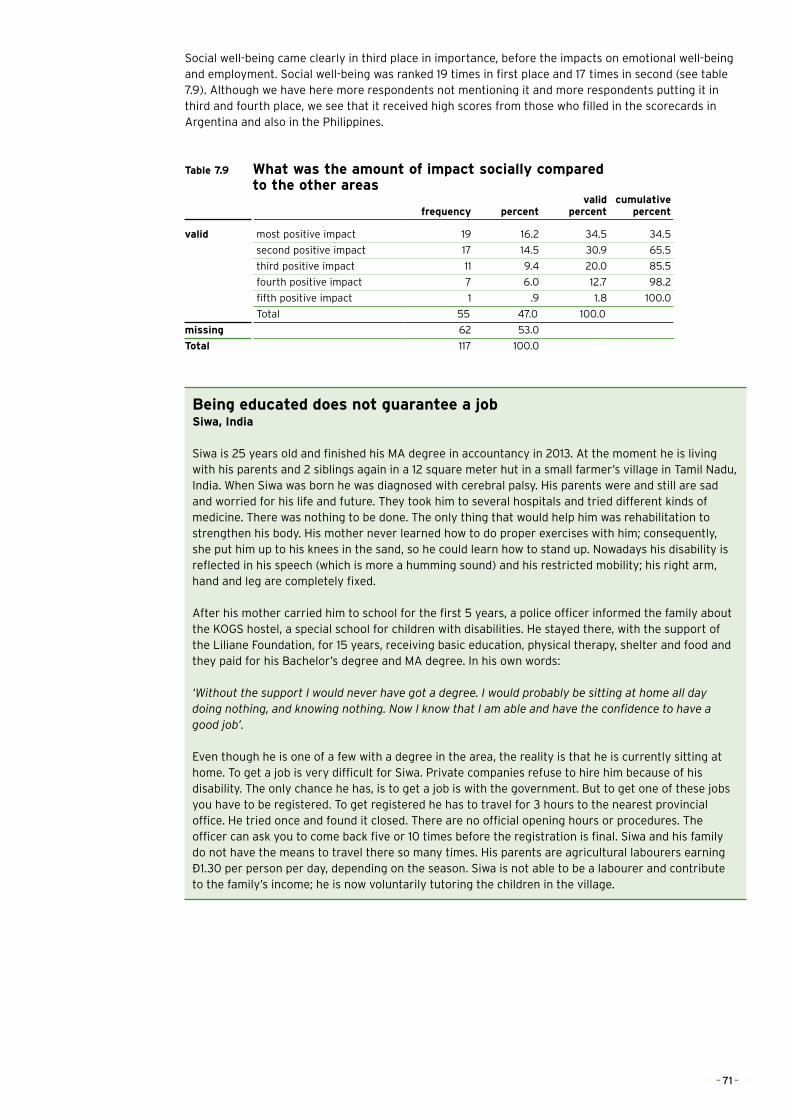
Social well-being came clearly in third place in importance, before the impacts on emotional well-being and employment. Social well-being was ranked 19 times in first place and 17 times in second (see table 7.9). Although we have here more respondents not mentioning it and more respondents putting it in third and fourth place, we see that it received high scores from those who filled in the scorecards in Argentina and also in the Philippines.
Table 7.9 What was the amount of impact socially compared to the other areas
frequency percentvalid
percentcumulative
percent
valid most positive impact 19 16.2 34.5 34.5
second positive impact 17 14.5 30.9 65.5
third positive impact 11 9.4 20.0 85.5
fourth positive impact 7 6.0 12.7 98.2
fifth positive impact 1 .9 1.8 100.0
Total 55 47.0 100.0
missing 62 53.0
Total 117 100.0
Being educated does not guarantee a job Siwa, India
Siwa is 25 years old and finished his MA degree in accountancy in 2013. At the moment he is living with his parents and 2 siblings again in a 12 square meter hut in a small farmer’s village in Tamil Nadu, India. When Siwa was born he was diagnosed with cerebral palsy. His parents were and still are sad and worried for his life and future. They took him to several hospitals and tried different kinds of medicine. There was nothing to be done. The only thing that would help him was rehabilitation to strengthen his body. His mother never learned how to do proper exercises with him; consequently, she put him up to his knees in the sand, so he could learn how to stand up. Nowadays his disability is reflected in his speech (which is more a humming sound) and his restricted mobility; his right arm, hand and leg are completely fixed. After his mother carried him to school for the first 5 years, a police officer informed the family about the KOGS hostel, a special school for children with disabilities. He stayed there, with the support of the Liliane Foundation, for 15 years, receiving basic education, physical therapy, shelter and food and they paid for his Bachelor’s degree and MA degree. In his own words: ‘Without the support I would never have got a degree. I would probably be sitting at home all day doing nothing, and knowing nothing. Now I know that I am able and have the confidence to have a good job’.
Even though he is one of a few with a degree in the area, the reality is that he is currently sitting at home. To get a job is very difficult for Siwa. Private companies refuse to hire him because of his disability. The only chance he has, is to get a job is with the government. But to get one of these jobs you have to be registered. To get registered he has to travel for 3 hours to the nearest provincial office. He tried once and found it closed. There are no official opening hours or procedures. The officer can ask you to come back five or 10 times before the registration is final. Siwa and his family do not have the means to travel there so many times. His parents are agricultural labourers earning €1.30 per person per day, depending on the season. Siwa is not able to be a labourer and contribute to the family’s income; he is now voluntarily tutoring the children in the village.
– 71 –
8 SOME REFLECTIONS ON THIS RESEARCH, THE SUPPORT OF THE LILIANE FOUNDATION AND THE FUTURE OF THIS SUPPORT
This has been for me a very special research project. In the past I have been doing research on Policy Coherence for Development, visiting Senegal and Morocco, being confronted with the bright, well-educated men and women at the top of their ministries. Now I found myself 15 miles from the tarmac road between seven or eight clay houses, interviewing a former polio patient, trying to be a tailor in a place where there are no customers. We indeed met people with disabilities in very poor situations with few opportunities to improve their situation, but as might be clear from the preceding chapters, we also met many successful people who are earning a decent income, have the profession they like, are supporting their families and in many cases are doing better than their brothers and sisters. For most, this might be due to their fighting spirit, because of the battles they fought and the opposition they had to overcome, changing a disability that puts them at a distance into a leap forward. In many cases, the support they received from the Liliane Foundation through its partners has been the catalyst, taking them out of their isolation, making them walk and bringing them to school. Most valued was this last support: getting a chance to join other children of their age, to learn and to study.
As one of the staff members of the Liliane Foundation in the early years put it in one of the interviews we had: ‘The Liliane Foundation has been and is an organization that is continuously developing itself’, changing with its own growth and adapting to the changes in the outside world. Although the Liliane Foundation is explicitly not a catholic organization, it did rely in its first decades on the catholic networks of religious orders and congregations which also offered the institutions for rehabilitation. The orders then also became the first national coordinators in the decentralization efforts from 2002 onwards. In these settings it seems logical to find partners with primarily a charity approach (also sometimes paying mainly monthly allowances to poor families and to families with disabled children) and, secondly, to see little Community Based Rehabilitation and finding the children in institutions. When institutions are there, they tend to stay and arguments are quickly found against more inclusive policies and practices. The resistance against inclusion of children with disabilities in ‘normal’ schools is not typically Indian, but can be found in the Netherlands too. This leaves quite some room for the Liliane Foundation to push for more CBR and to stimulate inclusion and emancipation. On the other hand, we should avoid the dogmatic discussions of ‘CBR Only’ and ‘no Institution Based Rehabilitation’ leading to ‘one choice only’. In cases, children with disabilities might be better off in institutions which have the facilities for rehabilitation, special training programmes in braille or sign language, that might not be present in local communities or schools.
In building its networks it was logical that the Liliane Foundation also relied on congregations and orders in the selection of its mediators. Since these nuns (and fathers) were supported by their orders and congregations there was no need to compensate them for their hours of work and maybe also not for their travel costs. The network of mediators has, however, expanded over time and more and more lay workers, social workers, have become partners in this mediators’ network. Since these are not or not always supported by congregations and orders it thus appears logical to compensate them not only for their travel costs, since the Liliane Foundation wants them to visit their ‘clients’ more than once in a year, but also for the hours they spend on visiting them. It arrives at a discussion on so-called ‘overhead costs’, costs that partner organizations not only make for implementing projects and programmes for the Liliane Foundation, but also for their management. Dutch private aid organizations are known for their flexibility and understanding that these costs exist and that you cannot escape paying a justifiable part of these in support of the projects and programmes you want to have implemented. Capacity building, which the Liliane Foundation also sees as one of its tasks, is not only a matter of training of Partner Organizations staff (which is definitely necessary and needs a better worked out strategy), but also of other overhead costs. Both issues need discussion and harmonization with partner organizations. Furthermore, I can imagine that, in countries or regions where Civil Society is rather weak, the Liliane Foundation might be better off, in looking for strategic partners in church organizations than in NGOs, which are often not much more than INGOs (Individual Non-Governmental Organizations or One/Two Person(s) NGOs).
In our travels in three continents we met, as illustrated in chapter 4, mainly people with physical disabilities; in Ghana in particular former polio patients. In Argentina, the last polio epidemic was in the 1950s and this is an illustration of how global progress in this field has been made. With a coverage of
– 72 –
polio vaccination reaching 100 percent in many developing countries we will hopefully see that this disease is eradicated and following it, other diseases like river blindness. I don’t know if home and traffic accidents or armed conflicts and disasters will increase the number of children with physical disabilities to the same level, I do know from the Netherlands Public Health Atlas that the percentages of children with disabilities in hearing, seeing and mobility are extremely low (around 3.1 to 3.7 percent) in my country. The Jonker Verwey Institute indicated that among children with disabilities fewer than 20 percent had physical disabilities, 13 percent sensory and about 10 percent had multiple disabilities, which leaves the largest group of more than 57 percent with mental disabilities. This shows that the Liliane Foundation’s target group might change in composition in the coming years, and this should lead to discussions on future strategies with regard to the support for children with mental disabilities, but also to new definitions on what kind of results might be expected in the support programmes for them.
Since more and more governments have ratified the Convention on the Rights of Persons with Disabilities, we will also see that more legislation will be adopted to bring policies and practices into line with the Convention. In the four countries which were part of this research, this is clearly visible in the gap between ‘good’ laws and acts and the lack of implementation and discrimination that people with disabilities still face. This points at a changing role for the Liliane Foundation and its partners. Since governments and official donors certainly have more money available than the Liliane Foundation can ever raise, activities to get laws, legislation, policies and plans implemented will become more important. This calls not only for advocacy work here in the Netherlands and with international organizations, but also for broader coalitions with organizations of disabled people and private organizations that are active in other fields of disability. In particular, capacity building of DPOs seems important, as weak organizational capacity in Ghana and India shows. Here, lessons from Danish, Norwegian and Swedish disability organizations and programmes should be learned. The fight for better access to (public) buildings and transport, to schools and education, to social allowances and work has only just started and is not only a struggle to claim the rights that the Convention offers, but at the same time, a road to the emancipation of disabled men and women. But there is also a battle here in Europe (and in New York and Washington) to force bilateral and multilateral donors to take up their responsibilities and to pay much more attention to this specific group (of often very poor) people and integrate them into their programmes.
Finally, the Liliane Foundation derives its core business, its ‘niche’ in the Dutch ‘private aid market’, its attractiveness for all its different types of sponsors, and its spectacular growth in the last 35 years from the direct support it has given and gives to children with disabilities. It is important to maintain and defend this ‘niche’. In all its recent documents, the Liliane Foundation has again and again stressed this important link and shown an awareness of the origins of its existence. We discovered this in all the interviews we had and it underlines one of the first slogans of the Liliane Foundation that nickels and dimes can also make a difference in a child’s life.
– 73 –
REFERENCES
Albert, J.R. et al. (2010), Income Disparity among Persons with Disabilities Assessed by Education and Sex: Findings from a Field Survey Conducted in Metro Manila, the Philippines. Chiba (Japan): Institute of Developing Economies.
Alkire, S. and Foster, J. (2007), Counting and multidimensional poverty measures, OPHI Working Paper Series 7, www.ophi.org.uk
Alkire, S. and Foster, J. (2009), Counting and multidimensional poverty measures, OPHI Working Paper Series 32, www.ophi.org.uk
Alkire, S. and Santos, M.E. (2010), Acute multidimensional poverty: A new index for developing countries, OPHI Working Paper Series 38, www.ophi.org.uk
Alkire, S. & Santos, M.E. (2013), Measuring Acute Poverty in the Developing World: Robustness and Scope of the Multidimensional Poverty Index. Oxford: OPHI Working Paper No. 59, www.ophi.org.uk
Anthony, J. (2011), Conceptualising disability in Ghana: implications for EFA and inclusive education. In: International Journal of Inclusive Education, Vol. 15, No. 10, pp. 1073-1086.
Atkinson, A. (1987), On the Measurement of Poverty. In: Econometrica, 55 (July), 749-764.
Avoke, M. (2002), Models of Disability in the Labelling and Attitudinal Discourse in Ghana. In: Disability & Society, Vol. 17, No. 7, pp. 769-777.
Bartlett, P. (2009), The United Nations Convention on the Rights of Persons with Disabilities and the future of mental health law. In: Psychiatry, Vol. 8, no. 12, pp. 496-498.
Biggeri, M. et al. (2014), Do community-based rehabilitation programmes promote the participation of persons with disabilities? A case control study from Mandya District in India. Disability and Rehabilitation, Vol. 36, No. 18, pp. 1508-1517.
Biritwum, R., Devres, J., Ofusu-Amaah, S., Marfo, C., Essah, E. (2001), Prevalence of children with disabilities in central region, Ghana. In: West African Journal of Medicine, 20(3): 249-25.
Braithwaite, J. & Mont, D. (2009), Disability and poverty: A survey of World Bank Poverty Assessments and Implications. European Journal of Disability, Vol. 3, pp. 219-232.
Botts, B. & Owusu, N.A. (2013), The State of Inclusive Education in Ghana, West Africa. In: Preventing School Failure: Alternative Education for Children and Youth, Vol. 57, No. 3, pp. 135-143.
Bourguignon, F. & Chakravarty, S. (2003), Measuring multidimensional poverty. In: Journal of Economic Inequality 1(1), 25-49.
Cleaver, S. & Nixon, S. (2014), A scoping review of 10 years of published literature on community based rehabilitation. In: Disability & Rehabilitation, Vol. 26, No. 17, pp. 1385-1394.
Cobley, D. (2012), Towards economic empowerment: segregation versus inclusion in the Kenyan context. In: Disability & Society, Vol. 27, no. 3, pp. 371-384.
Commonwealth Human Rights Initiative (2010), A simplified version of disability rights in Ghana. Accra.
Dawn, R. (2014), “Our lives, our identity”: women with disabilities in India. In: Disability and Rehabilitation. Vol. 36, No. 21, pp. 1768-1773.
Dede Adjei, Naomi Naa (2013) Putting decision into action: The Disability Act of Ghana, six years down the line. Bergen: University of Bergen, MA thesis.
Economic and Social Commission for Asia and the Pacific (ESCAP), (2012a), Disability at a Glance 2012. Bangkok: United Nations.
– 74 –
Economic and Social Commission for Asia and the Pacific (ESCAP), (2012b), Disability, Livelihood and Poverty in Asia and the Pacific. Bangkok: United Nations.
Eide, A. & Loeb, M. (2005), Data and statistics on disability in developing countries. London: DFID, Disability Knowledge & Research Programme.
Elwan, A. (1999), Poverty and Disability: A survey of the literature. Washington: World Bank, Social Porotection Discussion Paper Series.
Flinkenflügel, H., Wolffers, I. & Huijsman, R. (2005), The evidence base for community-based rehabilitation: a literature review. International Journal of Rehabilitation Research, Vol. 28, no. 3, pp. 187-201.
Fujiura, G., Park, H., Rutkowski-Kmitta, V. (2005), Disability Statistics in the Developing World: A Reflection on the Meaning of Numbers. In: Journal of Applied Research in Intellectual Disabilities, Vol. 18, pp. 295-304.
Ghana Satistical Service (2012), 2010 Population & Housing Census. Summary report of final results. Accra.
Groce, N. , Kett, M., Lang, R., Trani, F. & Kett, M. (2011a), Poverty and Disability – A Critical Review. London: Leonard Cheshire Centre on Disability and Inclusive Development. Working Paper 18.
Groce, N. Kembhavi, G., Wirz, S., Lang, R., & Trani, F. (2011b), Disability and Poverty: the need for a more nuanced understanding of implications for development policy and practice. In: Third World Quarterly, 32(8), 1493-1513.
Gyamfi, E.A. (2013), Ghana. In: African Disability Rights Yearbook. Stellenbosch: University of Stellenbosch, pp. 221-243. http://www.adry.up.ac.za
Haddad, L. & Kanbur, R.(1990), How serious is the neglect of intra-household inequality. In: Economic Journal, 100 (September).
Hartley. S., Flinkenflügel, H. & Kuijpers, P. (2009), Community-based rehabilitation: opportunity and challenge. The Lancet, Vol. 374, November 28.
Harpur, P. (2011), Embracing the new disability rights paradigm: the importance of the Convention on the Rights of Persons with Disabilities. In: Disability & Society, Vol. 27, no. 1, pp. 1-14.
Hartley, S. et al. (2009), Community-based rehabilitation: opportunity and challenge. In: The Lancet, Vol. 374, November 28, pp. 1803-1804.
Helander, E., et al. (1989), Training in the community for people with disabilities. Geneva: World Health Organization.
INDEC (2003), Acerca del método utilizado para la medición de la pobreza en Argentina.
INDEC (2004), La población con discapacidad en Argentina. Aquí se cuenta. Revista informativo del censo 2011. No. 14, Diciembre.
INDEC (2012), Canasta básica alimentaria y canasta básica total. Historia, forma de cálculo e interpretación.
INDEC (2013), Incidencia de la Pobreza y de la Indigencia.
Kassah, A.K. (1998). Community-based rehabilitation and stigma management by physically disabled in Ghana. In: Disability and Rehabilitation, Vol. 20, pp. 66-73.
Krahn, G. (2011), WHO Report on Disability. A Review. Disability and Health Journal, Vol. 4, pp. 141-142.
Krishna, A. (2011), One Illness Away: Why people become poor and how they escape poverty. Oxford: Oxford University Press.
– 75 –
Kuyini A.B., Alhassan, A-R. & Mahama, F. (2011), The Ghana Community-Based Rehabilitation Programme for People with Disabilities: What Happened at the End of Donor Support? In: Journal of Social Work in Disability & Rehabilitation, Vol. 10, No. 4, pp. 247-267.
Lang, R. (2009), The United Nations Convention on the rights and dignities for persons with a disability: A panacea for ending disability discrimination? In: ALTER European Journal of Disability Research, Vol. 3, pp. 266-285.
Lang, R., Kett, M., Groce, N. & Trani, J-F. (2011), Implementing the United Nations Convention on the rights of persons with a disability: principles, implications, practice and limitations. In: ALTER European Journal of Disability Research, Vol. 5, pp. 206-220.
Lang, R. (2014), Disability, Citizenship and Global Governance: The Challenge of the UN Convention on the Rights of Persons with Disabilities to create a Paradigm Shift in Disability Policy and Programming. Paper EADI Conference Bonn, June.
Leonardi, M., Bickenbach, J., Bedirhan Ustun, T., Kostansjek, N., Chatterji, S. (2006), The definition of disability: what is in a name?. In: The Lancet, Vol. 368, October, pp. 1219-1221.
Liliane Fonds, Jaarbeeld. Several years.
Liliane Fonds, Jaarrekening. Several years.
Liliane Fonds (2013), Jaarplan 2014 plus bijlages.
Liliane Fonds, Jaarverslag. 1985-1986 to 2013.
Liliane Fonds (2012), Towards More Effective Collaboration. The Liliane Foundation and Strategic Partner Organisations. Explorative Paper. April.
Liliane Foundation (2013), Liliane Foundation Position Paper. Den Bosch.
Liliane Foundation (2014), An Open World: Promoting Diversity, Empowering Children. Den Bosch.
Lind Kassah, B., Kassah, A.K. & Agbota, T.K. (2014), Abuse of physically disabled women in Ghana: Its emotional consequences and coping strategies. In: Disability and Rehabilitation, Vol. 36, No. 8, 665-671.
Meekosha, H. & Soldatic, K. (2011), Human Rights and the Global South: the case of disability. In: Third World Quarterly, Vol. 32, n0. 8, pp. 1383-1398.
Ministerio de Salud (de Argentina) (2011), Anuario Estadístico Nacional sobre Discapacidad 2011.
Ministerio de Salud (de Argentina) (2013), Anuario Estadístico Nacional sobre Discapacidad 2013.
Mitra, S., Posarac, A., Vick, B. (2013), Disability and poverty in Developing Countries: A Multidimensional Study. World Development, Vol. 41, pp. 1-18.
Mitra, S. & Samnamoorthi, U. (2014), Disability prevalence among adults: estimates for 54 countries and progress towards a global estimate. In: Disability and Rehabilitation, Vol. 26, No. 11, pp. 940-947.
Mladenov, T. (2013), The UN Convention on the rights of persons with disabilities and its interpretation. In: ALTER European Journal of Disability Research, Vol. 7, pp. 69-82.
Mina, C. (2010), Employment Choices of Persons with Disability (PWDs) in Metro Manila. Makati City: Philippine Institute for Development Studies.
Moriarity, L. & Dew, K. (2011), The United Nations Convention on the Rights of Persons with Disabilities and participation in Aotearoa New Zealand. In: Disability &Society, Vol. 26, no. 6, pp.683-697.
Naami, A., & Hayashi, R. (2012), Perceptions about disability among Ghanaian university students. In: Disability and Rehabilitation, Vol. 11, No. 2, pp. 100-111.
– 76 –
Naami, A., Hayashi, R. & Liese, H. (2012), The unemployment of women with physical disabilities in Ghana: issues and recommendations. In: Disability & Society, Vol. 27, No. 2, pp. 191-204.
National Centre for Promotion of Employment for Disabled People (NCPEDP) (2009), Employment of disabled people in India. Baseline report. New Delhi, February.
Ocloo, M.A., &Subbey, M. (2008), Perception of basic education school teachers towards inclusive education in the Hohoe District, Ghana. In: International Journal of Inclusive Education, Vol. 12, No. 5-6, pp. 639-650.
Philippine Statistics Authority (2013), Persons with Disability in the Philippines (Results from the 2010 Census). http://web0.psa.gov.ph/content/persons-disability-philippines-results-2010-census
Purcil, L. (2009), Monitoring the Human Rights of Persons with Disabilities: Laws, Policies and Programmes in the Philippines. Toronto: Disability Rights Promotion International.
Presidencia de la Nación (2010). Convención sobre los Derechos de las Personas con Discapacidad. Primer Informe Republica Argentina. Buenos Aires.
Rangarajan Committee (2014), Report of the expert group to review the methodology for measurement of poverty. New Delhi: Planning Commission.
Ravallion, M. (1996), Issues in measuring and modelling poverty. In: Economic Journal, 106 (September), 1328-1343.
Reyes, C. et al. (2011), Persons with Disability (PWDs) in Rural Philippines: Results from the 2010 Field Survey in Rosario, Batangas. Makati City: Philippine Institute for Development Studies.
Russell, M. (2002), What disability civil rights cannot do: employment and political economy. In: Disability & Society, Vol. 17, no. 2, pp. 117-135.
Sackey, E. (2014), Disability and political participation in Ghana: an alternative perspective. In: Scandinavian Journal of Disability Research, August, pp. 1-16.
Schiappacasse, C. et al. (2014), Reflecting on the World Report on Disability: A Short Report from Argentina. In; American Journal of Physical Medicine & Rehabilitation, Vol. 93, No. 1, pp. S39-S41.
Schrader, S. & Chavez Penillas, F. (2012), Crisis, Class, and Disability in Argentina: Red por los Derechos de las Personas con Discapacidad. In: Disabilities Quarterly, Vol. 32, no. 3. http://dsq-sds.org/article/view/3274/3107
Sen, A. (1976), Poverty: an ordinal approach to measurement. In: Econometrica, 44(2), 219-231.
Shakespeare. T. (2014), Disability. Rights and Wrongs Revisited. Abingdon (Oxon): Routledge.
Slikker, J. (2009), Attitudes towards Persons With Disability in Ghana. VSO, May.
Social Security Programs around the World. Social Security Administration (USA). http://www.ssa.gov/policy/docs/progdesc/index.html
Tendulkar Committee (2009), Report of the expert group to review the methodology for measurement of poverty. New Delhi: Planning Commission.
United Nations (2003-2004), The United Nations and Disabled Persons – The First Fifty Years. http://www.un.org/esa/socdev/enable/dis50y00.htm
Velema, J. & Cornielje, H. (2003), Reflect before you act: providing structure to the evaluation of rehabilitation programmes. Disability and Rehabilitation, Vol. 25, no. 22, pp. 1252-1264.
Officer A. & Groce, N.R (2009), Key Concept in Disability. The Lancet, Vol. 374, November 28.
– 77 –
Wirz, S. & Thomas, M. (2002), Evaluation of community-based rehabilitation programmes: a search for appropriate indicators. International Journal of Rehabilitation Research, Vol. 25, no. 3, pp. 163-171.
World Bank (2007), People with disabilities in India: From commitments to outcomes. Washington: Humand Development Unit, South Asia Region.
World Health Organization (and the World Bank) (2011). World Report on Disability.
World Health Organization (2013), Disability. Report by the Secretariat. 66th World Health Assembly, No. A66
– 78 –
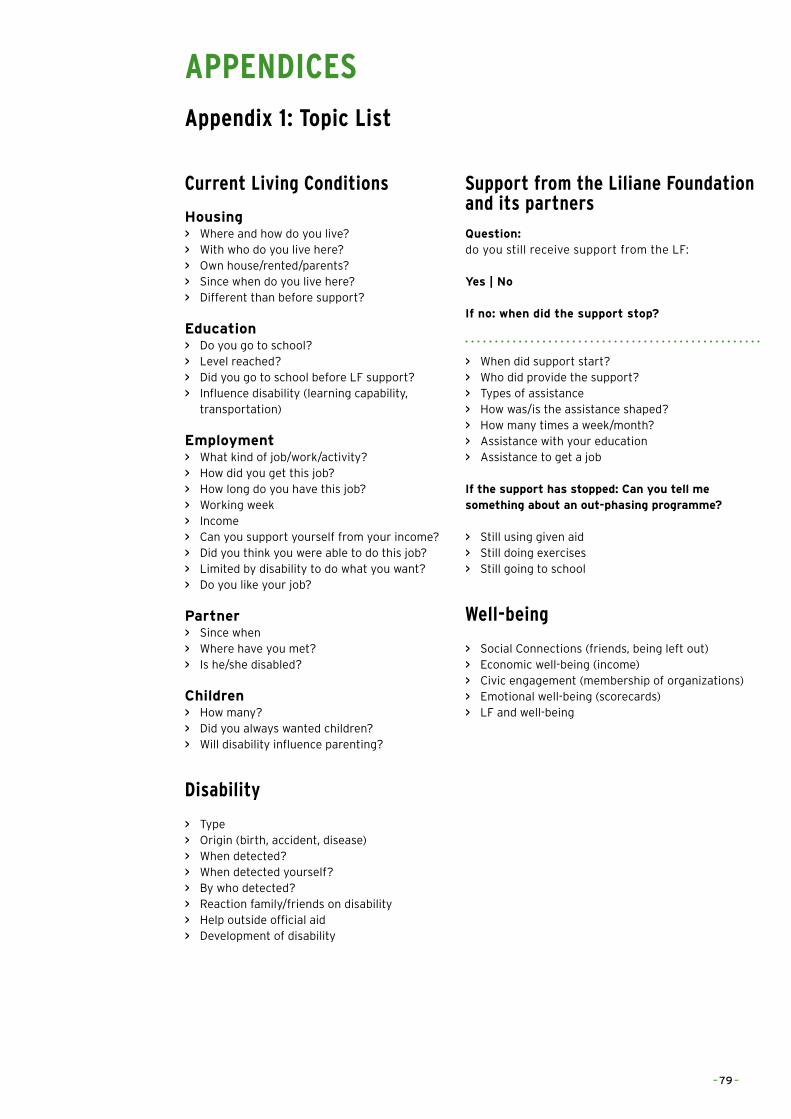
APPENDICES Appendix 1: Topic List
Current Living Conditions
Housing > Where and how do you live? > With who do you live here? > Own house/rented/parents? > Since when do you live here? > Different than before support?
Education > Do you go to school? > Level reached? > Did you go to school before LF support? > Influence disability (learning capability,
transportation)
Employment > What kind of job/work/activity? > How did you get this job? > How long do you have this job? > Working week > Income > Can you support yourself from your income? > Did you think you were able to do this job? > Limited by disability to do what you want? > Do you like your job?
Partner > Since when > Where have you met? > Is he/she disabled?
Children > How many? > Did you always wanted children? > Will disability influence parenting?
Disability
> Type > Origin (birth, accident, disease) > When detected? > When detected yourself? > By who detected? > Reaction family/friends on disability > Help outside official aid > Development of disability
Support from the Liliane Foundation and its partners
Question: do you still receive support from the LF:
Yes | No
If no: when did the support stop?
> When did support start? > Who did provide the support? > Types of assistance > How was/is the assistance shaped? > How many times a week/month? > Assistance with your education > Assistance to get a job
If the support has stopped: Can you tell me something about an out-phasing programme?
> Still using given aid > Still doing exercises > Still going to school
Well-being
> Social Connections (friends, being left out) > Economic well-being (income) > Civic engagement (membership of organizations) > Emotional well-being (scorecards) > LF and well-being
– 79 –
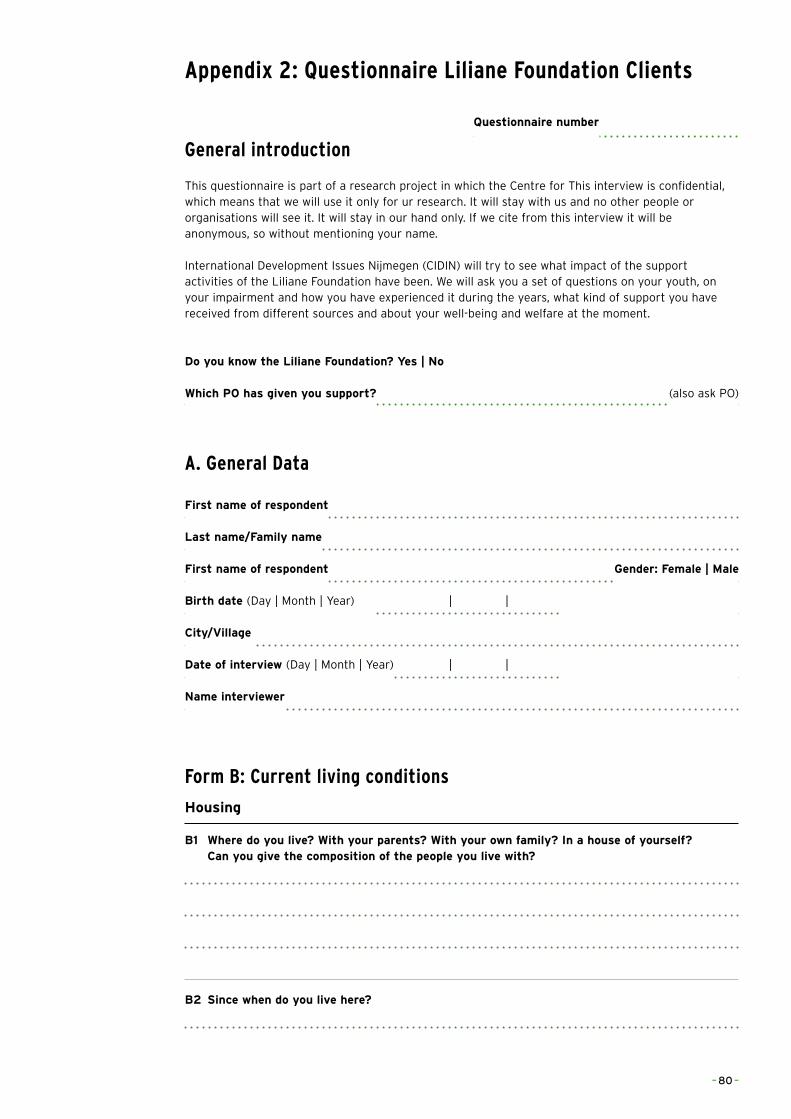
Appendix 2: Questionnaire Liliane Foundation Clients
General introduction
This questionnaire is part of a research project in which the Centre for This interview is confidential, which means that we will use it only for ur research. It will stay with us and no other people or organisations will see it. It will stay in our hand only. If we cite from this interview it will be anonymous, so without mentioning your name.
International Development Issues Nijmegen (CIDIN) will try to see what impact of the support activities of the Liliane Foundation have been. We will ask you a set of questions on your youth, on your impairment and how you have experienced it during the years, what kind of support you have received from different sources and about your well-being and welfare at the moment.
Do you know the Liliane Foundation? Yes | No
Which PO has given you support? (also ask PO)
A. General Data
First name of respondent
Last name/Family name
First name of respondent Gender: Female | Male
Birth date (Day | Month | Year) | |
City/Village
Date of interview (Day | Month | Year) | |
Name interviewer
Form B: Current living conditions
Housing
B1 Where do you live? With your parents? With your own family? In a house of yourself? Can you give the composition of the people you live with?
B2 Since when do you live here?
Questionnaire number
– 80 –
B3 Is this a different situation than before you got support from the Liliane Foundation? If yes, that is the difference and how and why did it change?
Education
B4 Do you go to school? Yes
a No
b No, I never went to school
c I did go before and finished my education (please note education level reached: )
d I did go before but quit (please note education level reached: )
e Other:
B5 Did you go to school before you got support from the Liliane Foundation?
Yes | No
If not, Why not?
If yes, what kinds of school? Private/ public | Special education/ mainstream
B6 When you received support from the Liliane Foundation/PO did this change the situation and did you go to school?
B7 Did your condition make it difficult to go to school and to learn? Why?
– 81 –
Work and income
B8 Do you have work (this can mean a paid job, or meaning full activity as: cleaning the house, helping people etc.) at the moment? Yes | No
B9 If yes, what kind work? Do you have an employer or are you self-employed
B10 How did you get this work? Is this related to your education? And is this your first job?
B11 How many hours and days a week do you work?
B12 Did you ever thought you could do or not do this work? Why?
B13 Were you limited by your impairment to do what you wanted?
B14 Do you like your work? If yes or no, why?
– 82 –
B15 How much do you earn per day/week/month? Can you support yourself from that income? Do you get other financial assistance?
B16 When you were still a child what kind of work did you want? Are you still thinking about getting that job? Do you know any people with an impairment working at this kind of position?
Spouse
B17 Do you have a Husband or Wife?
a Yes
b No (got to next section)
c No, I have a boyfriend or girlfriend
d Not anymore
B18 Since when do you have a husband/wife (partner)?
B19 Where have you met your husband/wife (partner)?
B20 Is he or she also impaired? If yes, what type of impairment?
– 83 –
Children
B21 Do you have any children?
a Yes
b No (got to next section)
B22 How many children do you have?
B23 Did you always wanted children?
B24 Do you think your impairment will influence the parenting of your children?
Form B: Current living conditions
C1 What type of impairment do you have?
C2 What is the origin of your impairment? (birth, accident, disease)
C3 When is your impairment diagnosed/detected?
– 84 –
C4 By who is your impairment diagnosed/detected?
C5 How did you yourself detect your impairment?
C6 Can you describe how you felt when you discovered that you were impaired?
C7 How did your parents react when they discovered your impairment?
C8 How did people in your family and your neighbourhood react to you?
C9 Can you describe how your condition hinders you in daily life?
C10 Can you describe how you felt when you discovered that you were impaired?
a It will get better
b It will worsen
c It will stay the same
– 85 –
C11 Can you tell me why your impairment will develop like this (answer C10)?
C12 Before the Liliane Foundation/PO supported you, was there someone who helped you with your impairment? And how?
Form D: Support from the Liliane Foundation/PO
D1 When did the support from the Liliane foundation/PO start?
D2 How (or by whom) was the support established?
D3 How did you feel, when you heard you were getting assistance and support?
D4a Can you tell me about the type of assistance you received?
– 86 –
D4b This support you received, was it really needed?
D4c Did you receive any assistance devises? Yes | No
(since when)
How did you experience the quality (appropriate technology) of this device? Are you still using the device? Where was it produced?
D5 Did you also received support from other organization? Yes | No
D6 if D5 is yes: What kind of support did you receive? And from which organization(s)?
D7 Did you also receive assistance with your education? Did you go to primary and secondary schools?
D8 Did you also receive assistance to get work (training, contact with employers)?
– 87 –
D9 How did you receive that support (every day, every week, via your parents)?
D10 Are you still receiving assistance from the LF/PO?
a Yes
b No
Only ask if answer on D10 is b) No
D10.1 If not: When did it stop? And why?
D10.2 Is or was there and out-phasing programme? What was the content of this programme?
D10.3 Are you still using the aids (devices, knowledge) they gave to you? If not, why not?
D10.4 Are you still doing exercises or other things you have learned from your supportprogramme?
– 88 –
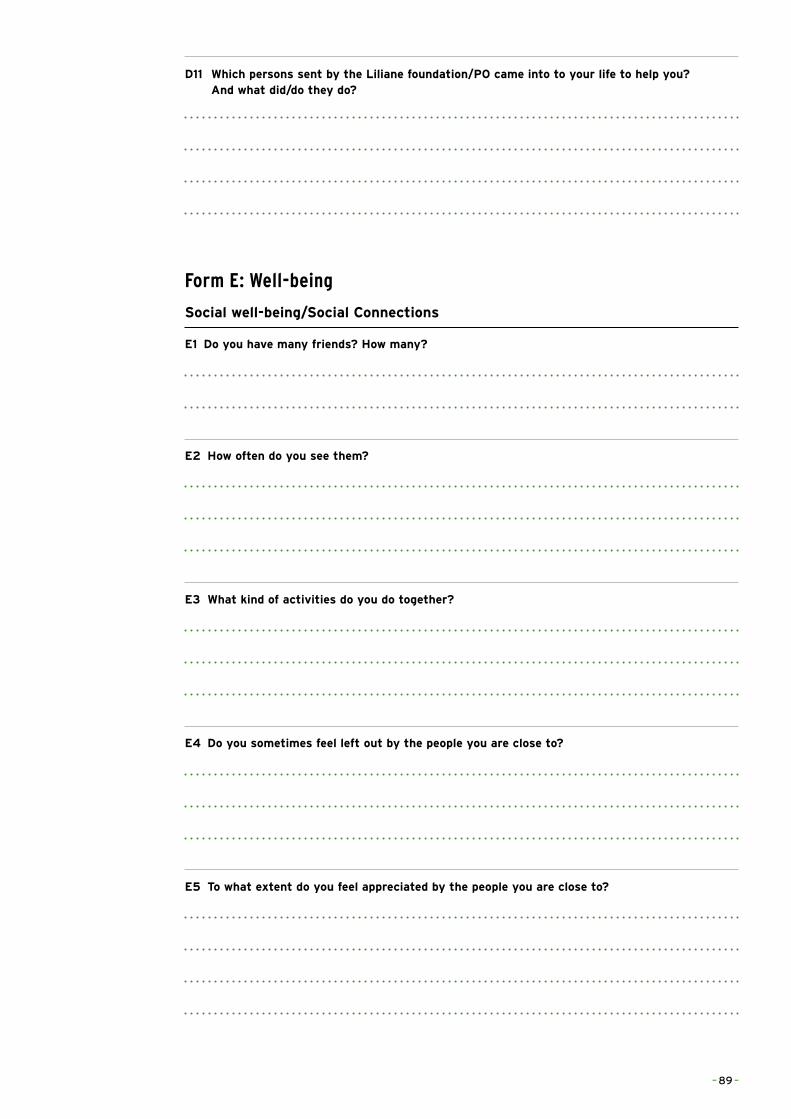
D11 Which persons sent by the Liliane foundation/PO came into to your life to help you? And what did/do they do?
Form E: Well-being
Social well-being/Social Connections
E1 Do you have many friends? How many?
E2 How often do you see them?
E3 What kind of activities do you do together?
E4 Do you sometimes feel left out by the people you are close to?
E5 To what extent do you feel appreciated by the people you are close to?
– 89 –
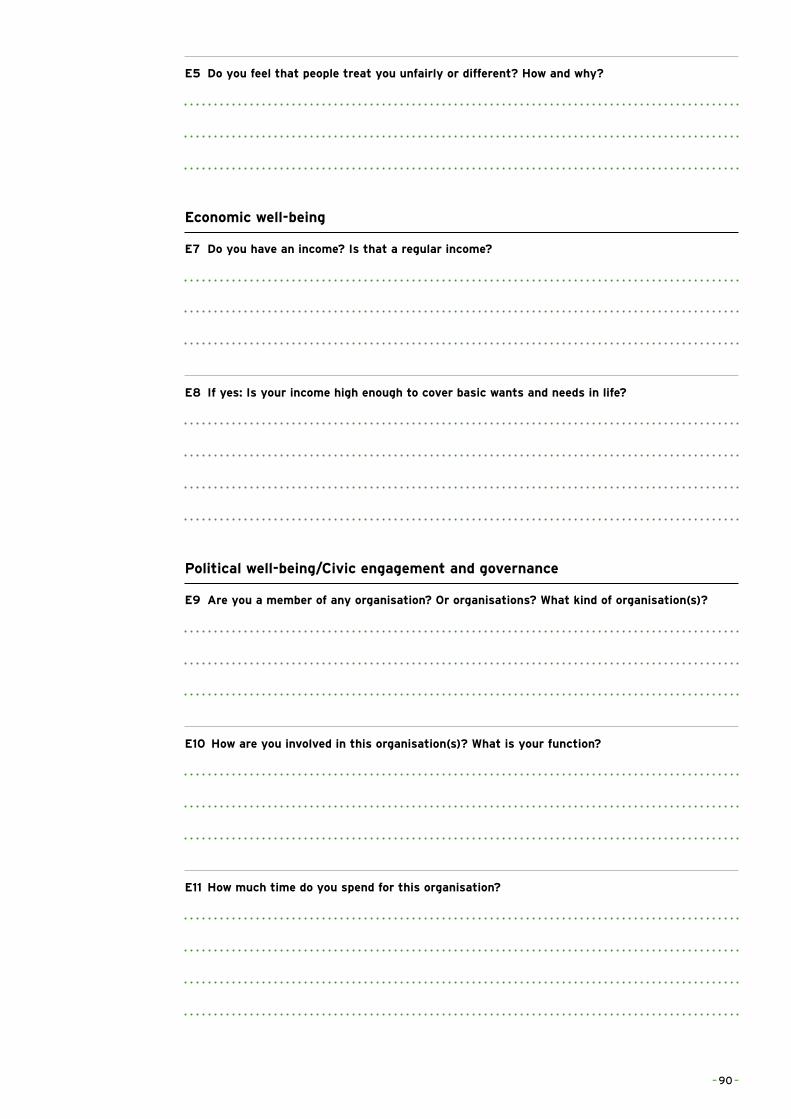
E5 Do you feel that people treat you unfairly or different? How and why?
Economic well-being
E7 Do you have an income? Is that a regular income?
E8 If yes: Is your income high enough to cover basic wants and needs in life?
Political well-being/Civic engagement and governance
E9 Are you a member of any organisation? Or organisations? What kind of organisation(s)?
E10 How are you involved in this organisation(s)? What is your function?
E11 How much time do you spend for this organisation?
– 90 –
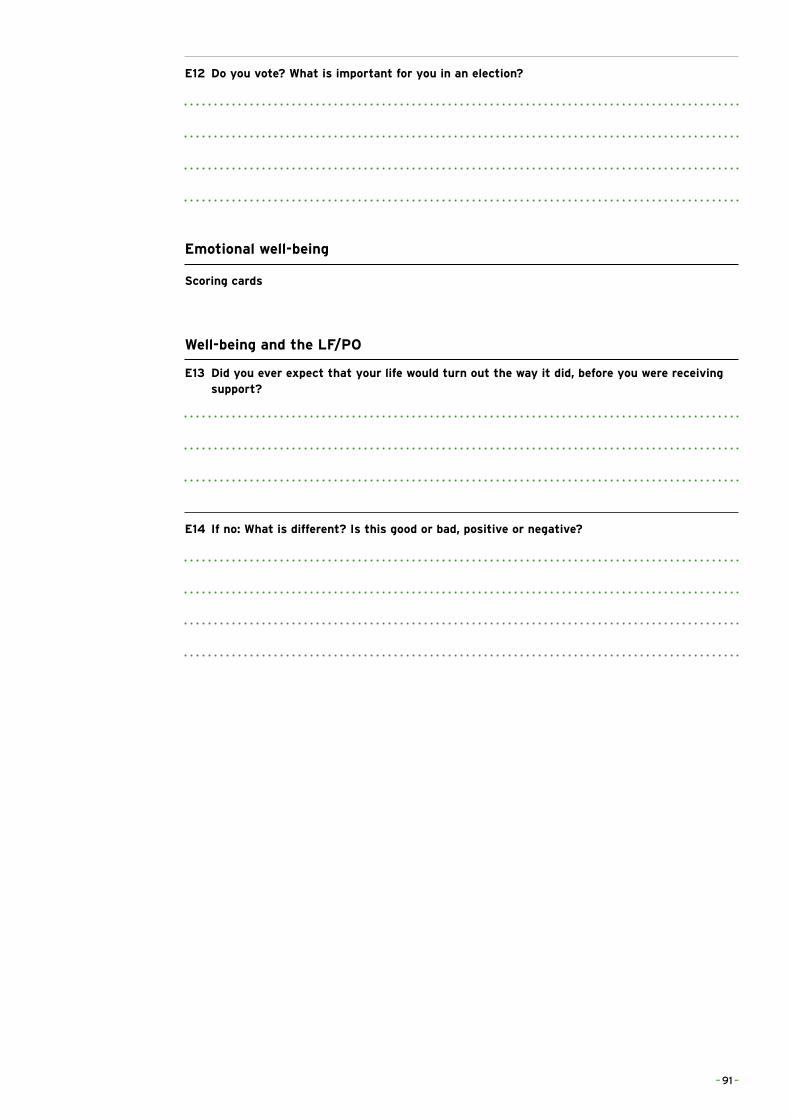
E12 Do you vote? What is important for you in an election?
Emotional well-being
Scoring cards
Well-being and the LF/PO
E13 Did you ever expect that your life would turn out the way it did, before you were receiving support?
E14 If no: What is different? Is this good or bad, positive or negative?
– 91 –
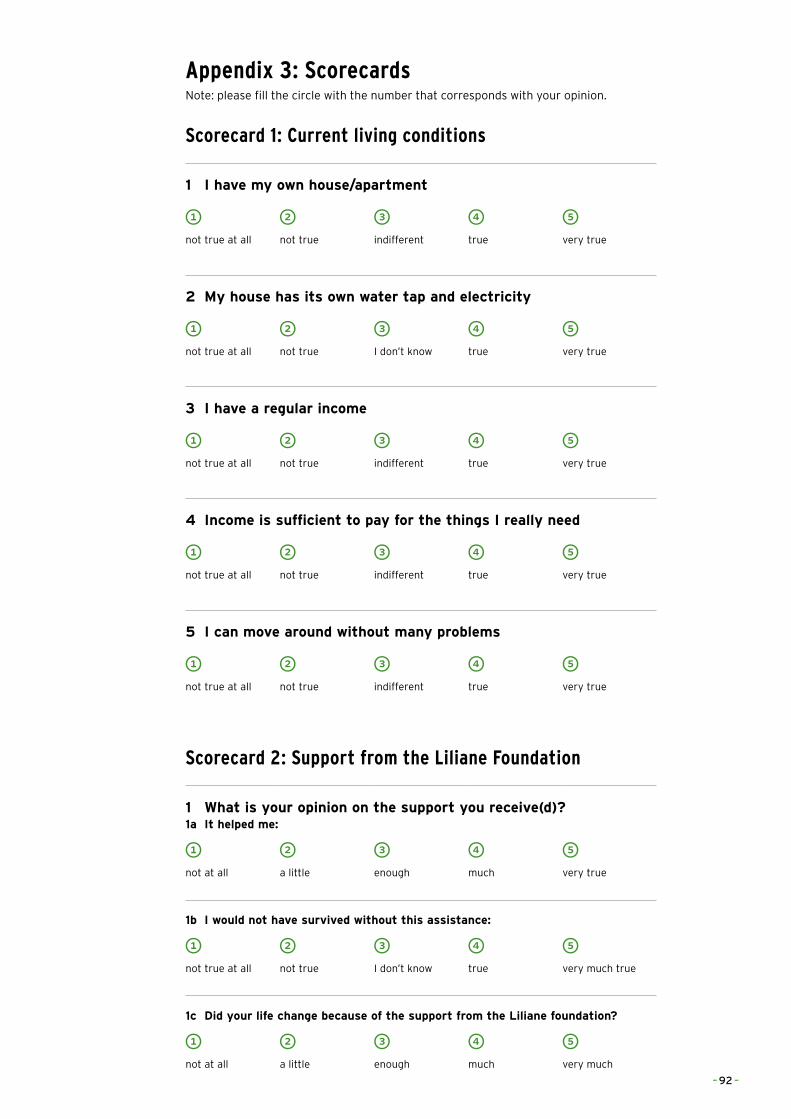
Appendix 3: Scorecards Note: please fill the circle with the number that corresponds with your opinion.
Scorecard 1: Current living conditions
1 I have my own house/apartment
1 2 3 4 5
not true at all not true indifferent true very true
2 My house has its own water tap and electricity
1 2 3 4 5
not true at all not true I don’t know true very true
3 I have a regular income
1 2 3 4 5
not true at all not true indifferent true very true
4 Income is sufficient to pay for the things I really need
1 2 3 4 5
not true at all not true indifferent true very true
5 I can move around without many problems
1 2 3 4 5
not true at all not true indifferent true very true
Scorecard 2: Support from the Liliane Foundation
1 What is your opinion on the support you receive(d)?1a It helped me:
1 2 3 4 5
not at all a little enough much very true
1b I would not have survived without this assistance:
1 2 3 4 5
not true at all not true I don’t know true very much true
1c Did your life change because of the support from the Liliane foundation?
1 2 3 4 5
not at all a little enough much very much
– 92 –
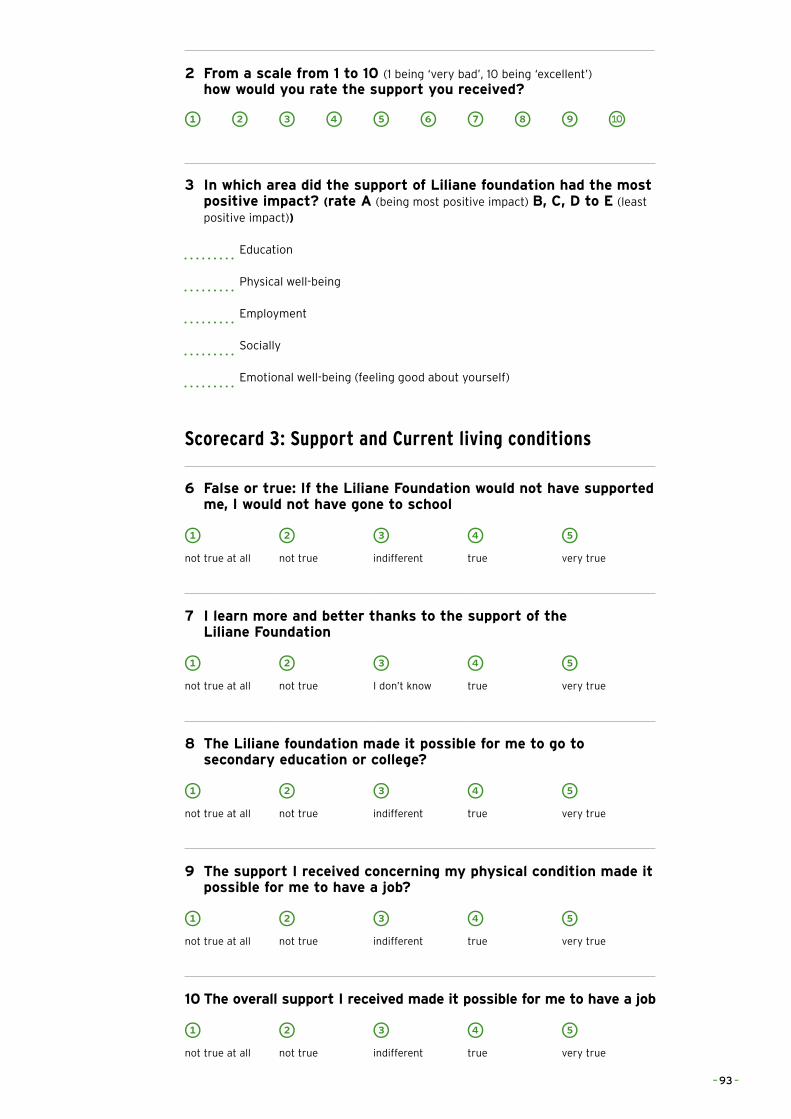
2 From a scale from 1 to 10 (1 being ‘very bad’, 10 being ‘excellent’) how would you rate the support you received?
1 2 3 4 5 6 7 8 9
3 In which area did the support of Liliane foundation had the most positive impact? (rate A (being most positive impact) B, C, D to E (least positive impact))
Education
Physical well-being
Employment
Socially
Emotional well-being (feeling good about yourself)
Scorecard 3: Support and Current living conditions
6 False or true: If the Liliane Foundation would not have supported me, I would not have gone to school
1 2 3 4 5
not true at all not true indifferent true very true
7 I learn more and better thanks to the support of the Liliane Foundation
1 2 3 4 5
not true at all not true I don’t know true very true
8 The Liliane foundation made it possible for me to go to secondary education or college?
1 2 3 4 5
not true at all not true indifferent true very true
9 The support I received concerning my physical condition made it possible for me to have a job?
1 2 3 4 5
not true at all not true indifferent true very true
10 The overall support I received made it possible for me to have a job
1 2 3 4 5
not true at all not true indifferent true very true
– 93 –
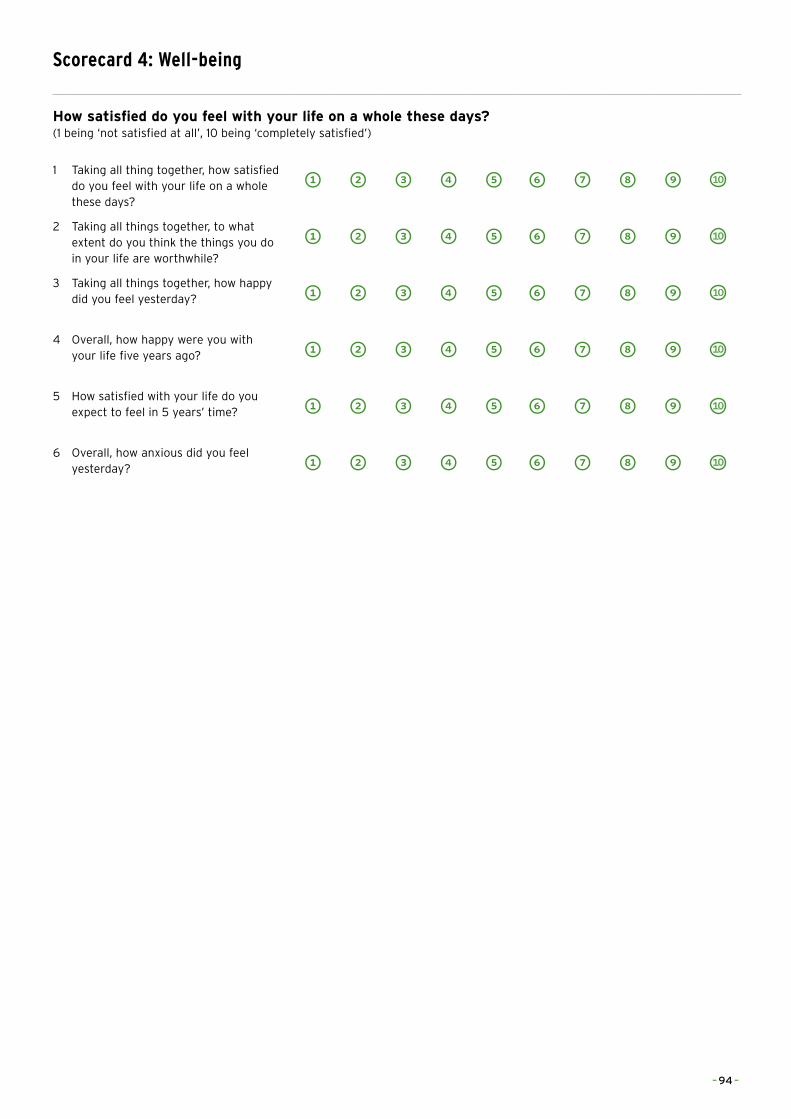
Scorecard 4: Well-being
How satisfied do you feel with your life on a whole these days? (1 being ‘not satisfied at all’, 10 being ‘completely satisfied’)
1 Taking all thing together, how satisfied do you feel with your life on a whole these days?
1 2 3 4 5 6 7 8 9
2 Taking all things together, to what extent do you think the things you do in your life are worthwhile?
1 2 3 4 5 6 7 8 9
3 Taking all things together, how happy did you feel yesterday? 1 2 3 4 5 6 7 8 9
4 Overall, how happy were you with your life five years ago? 1 2 3 4 5 6 7 8 9
5 How satisfied with your life do you expect to feel in 5 years’ time? 1 2 3 4 5 6 7 8 9
6 Overall, how anxious did you feel yesterday? 1 2 3 4 5 6 7 8 9
– 94 –
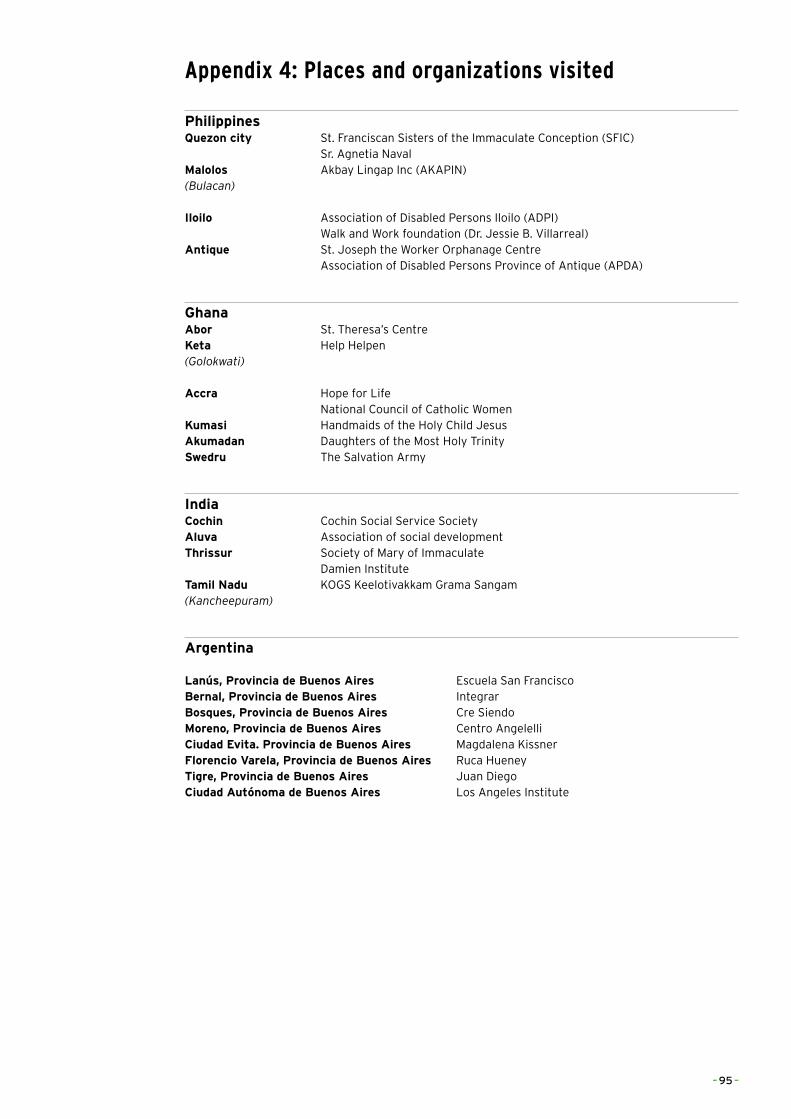
Appendix 4: Places and organizations visited
PhilippinesQuezon city St. Franciscan Sisters of the Immaculate Conception (SFIC) Sr. Agnetia NavalMalolos Akbay Lingap Inc (AKAPIN)(Bulacan)
Iloilo Association of Disabled Persons Iloilo (ADPI) Walk and Work foundation (Dr. Jessie B. Villarreal)Antique St. Joseph the Worker Orphanage Centre Association of Disabled Persons Province of Antique (APDA)
GhanaAbor St. Theresa’s CentreKeta Help Helpen(Golokwati)
Accra Hope for Life National Council of Catholic WomenKumasi Handmaids of the Holy Child JesusAkumadan Daughters of the Most Holy TrinitySwedru The Salvation Army
IndiaCochin Cochin Social Service SocietyAluva Association of social developmentThrissur Society of Mary of Immaculate Damien InstituteTamil Nadu KOGS Keelotivakkam Grama Sangam(Kancheepuram)
Argentina
Lanús, Provincia de Buenos Aires Escuela San FranciscoBernal, Provincia de Buenos Aires IntegrarBosques, Provincia de Buenos Aires Cre SiendoMoreno, Provincia de Buenos Aires Centro AngelelliCiudad Evita. Provincia de Buenos Aires Magdalena KissnerFlorencio Varela, Provincia de Buenos Aires Ruca HueneyTigre, Provincia de Buenos Aires Juan DiegoCiudad Autónoma de Buenos Aires Los Angeles Institute
– 95 –
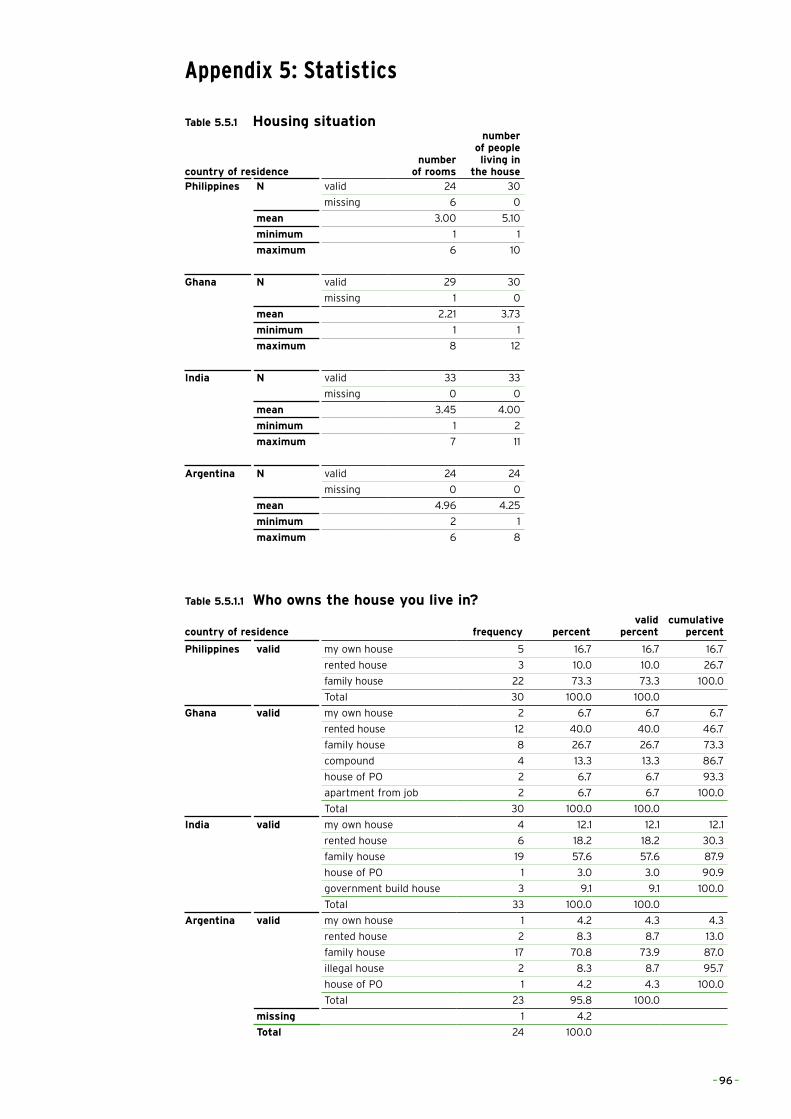
Appendix 5: Statistics
Table 5.5.1 Housing situation
country of residencenumber
of rooms
number of people living in
the housePhilippines N valid 24 30
missing 6 0
mean 3.00 5.10
minimum 1 1
maximum 6 10
Ghana N valid 29 30
missing 1 0
mean 2.21 3.73
minimum 1 1
maximum 8 12
India N valid 33 33
missing 0 0
mean 3.45 4.00
minimum 1 2
maximum 7 11
Argentina N valid 24 24
missing 0 0
mean 4.96 4.25
minimum 2 1
maximum 6 8
Table 5.5.1.1 Who owns the house you live in?
country of residence frequency percentvalid
percentcumulative
percent
Philippines valid my own house 5 16.7 16.7 16.7
rented house 3 10.0 10.0 26.7
family house 22 73.3 73.3 100.0
Total 30 100.0 100.0
Ghana valid my own house 2 6.7 6.7 6.7
rented house 12 40.0 40.0 46.7
family house 8 26.7 26.7 73.3
compound 4 13.3 13.3 86.7
house of PO 2 6.7 6.7 93.3
apartment from job 2 6.7 6.7 100.0
Total 30 100.0 100.0
India valid my own house 4 12.1 12.1 12.1
rented house 6 18.2 18.2 30.3
family house 19 57.6 57.6 87.9
house of PO 1 3.0 3.0 90.9
government build house 3 9.1 9.1 100.0
Total 33 100.0 100.0
Argentina valid my own house 1 4.2 4.3 4.3
rented house 2 8.3 8.7 13.0
family house 17 70.8 73.9 87.0
illegal house 2 8.3 8.7 95.7
house of PO 1 4.2 4.3 100.0
Total 23 95.8 100.0
missing 1 4.2
Total 24 100.0
– 96 –
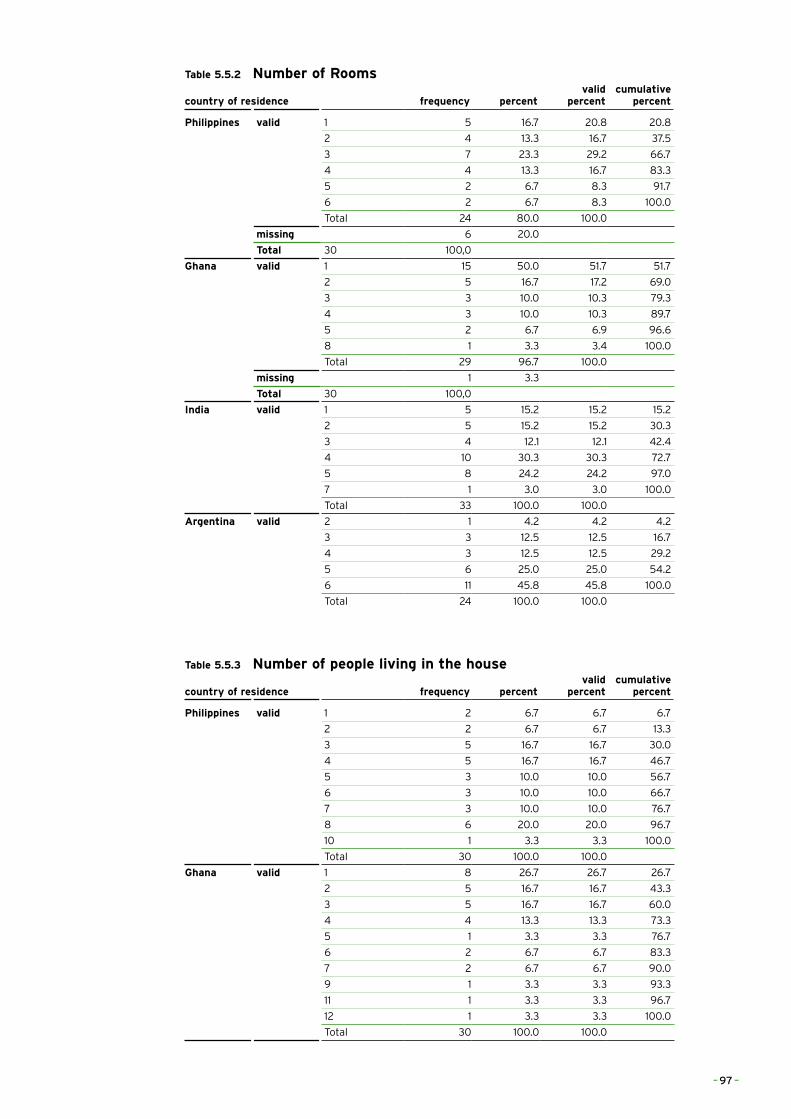
Table 5.5.2 Number of Rooms
country of residence frequency percentvalid
percentcumulative
percent
Philippines valid 1 5 16.7 20.8 20.8
2 4 13.3 16.7 37.5
3 7 23.3 29.2 66.7
4 4 13.3 16.7 83.3
5 2 6.7 8.3 91.7
6 2 6.7 8.3 100.0
Total 24 80.0 100.0
missing 6 20.0
Total 30 100,0
Ghana valid 1 15 50.0 51.7 51.7
2 5 16.7 17.2 69.0
3 3 10.0 10.3 79.3
4 3 10.0 10.3 89.7
5 2 6.7 6.9 96.6
8 1 3.3 3.4 100.0
Total 29 96.7 100.0
missing 1 3.3
Total 30 100,0
India valid 1 5 15.2 15.2 15.2
2 5 15.2 15.2 30.3
3 4 12.1 12.1 42.4
4 10 30.3 30.3 72.7
5 8 24.2 24.2 97.0
7 1 3.0 3.0 100.0
Total 33 100.0 100.0
Argentina valid 2 1 4.2 4.2 4.2
3 3 12.5 12.5 16.7
4 3 12.5 12.5 29.2
5 6 25.0 25.0 54.2
6 11 45.8 45.8 100.0
Total 24 100.0 100.0
Table 5.5.3 Number of people living in the house
country of residence frequency percentvalid
percentcumulative
percent
Philippines valid 1 2 6.7 6.7 6.7
2 2 6.7 6.7 13.3
3 5 16.7 16.7 30.0
4 5 16.7 16.7 46.7
5 3 10.0 10.0 56.7
6 3 10.0 10.0 66.7
7 3 10.0 10.0 76.7
8 6 20.0 20.0 96.7
10 1 3.3 3.3 100.0
Total 30 100.0 100.0
Ghana valid 1 8 26.7 26.7 26.7
2 5 16.7 16.7 43.3
3 5 16.7 16.7 60.0
4 4 13.3 13.3 73.3
5 1 3.3 3.3 76.7
6 2 6.7 6.7 83.3
7 2 6.7 6.7 90.0
9 1 3.3 3.3 93.3
11 1 3.3 3.3 96.7
12 1 3.3 3.3 100.0
Total 30 100.0 100.0
– 97 –
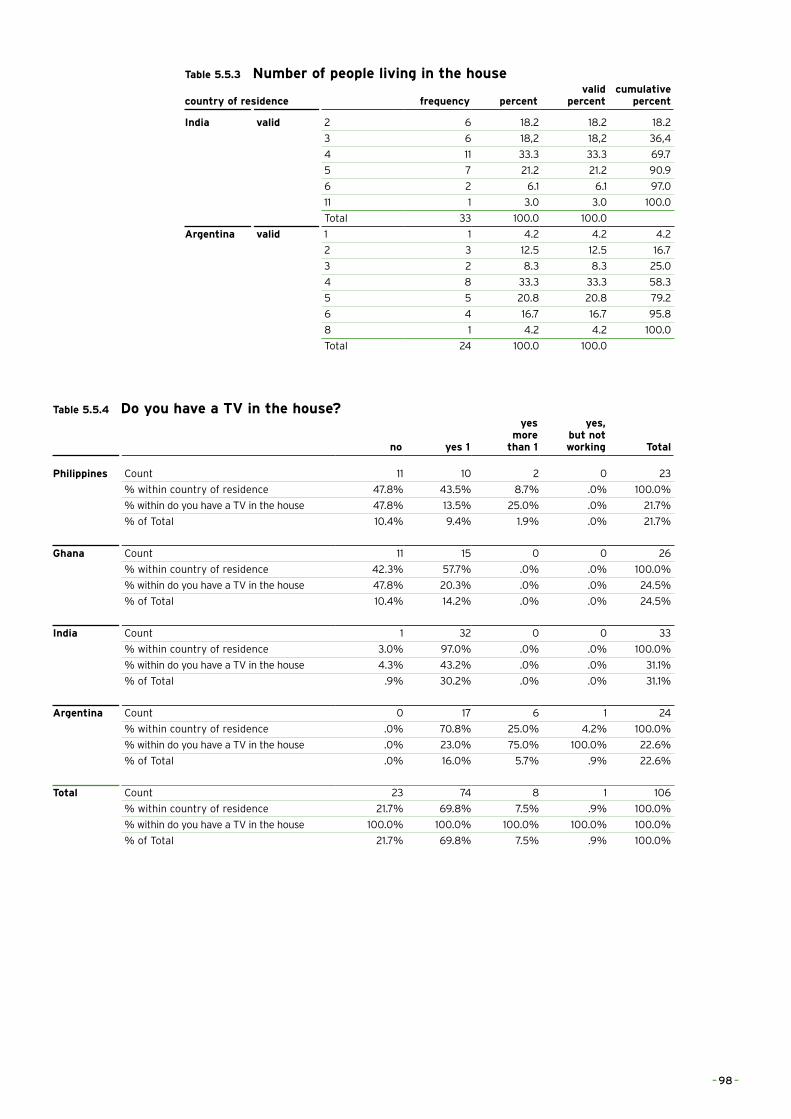
Table 5.5.3 Number of people living in the house
country of residence frequency percentvalid
percentcumulative
percent
India valid 2 6 18.2 18.2 18.2
3 6 18,2 18,2 36,4
4 11 33.3 33.3 69.7
5 7 21.2 21.2 90.9
6 2 6.1 6.1 97.0
11 1 3.0 3.0 100.0
Total 33 100.0 100.0
Argentina valid 1 1 4.2 4.2 4.2
2 3 12.5 12.5 16.7
3 2 8.3 8.3 25.0
4 8 33.3 33.3 58.3
5 5 20.8 20.8 79.2
6 4 16.7 16.7 95.8
8 1 4.2 4.2 100.0
Total 24 100.0 100.0
Table 5.5.4 Do you have a TV in the house?
no yes 1
yes more
than 1
yes, but not working Total
Philippines Count 11 10 2 0 23
% within country of residence 47.8% 43.5% 8.7% .0% 100.0%
% within do you have a TV in the house 47.8% 13.5% 25.0% .0% 21.7%
% of Total 10.4% 9.4% 1.9% .0% 21.7%
Ghana Count 11 15 0 0 26
% within country of residence 42.3% 57.7% .0% .0% 100.0%
% within do you have a TV in the house 47.8% 20.3% .0% .0% 24.5%
% of Total 10.4% 14.2% .0% .0% 24.5%
India Count 1 32 0 0 33
% within country of residence 3.0% 97.0% .0% .0% 100.0%
% within do you have a TV in the house 4.3% 43.2% .0% .0% 31.1%
% of Total .9% 30.2% .0% .0% 31.1%
Argentina Count 0 17 6 1 24
% within country of residence .0% 70.8% 25.0% 4.2% 100.0%
% within do you have a TV in the house .0% 23.0% 75.0% 100.0% 22.6%
% of Total .0% 16.0% 5.7% .9% 22.6%
Total Count 23 74 8 1 106
% within country of residence 21.7% 69.8% 7.5% .9% 100.0%
% within do you have a TV in the house 100.0% 100.0% 100.0% 100.0% 100.0%
% of Total 21.7% 69.8% 7.5% .9% 100.0%
– 98 –
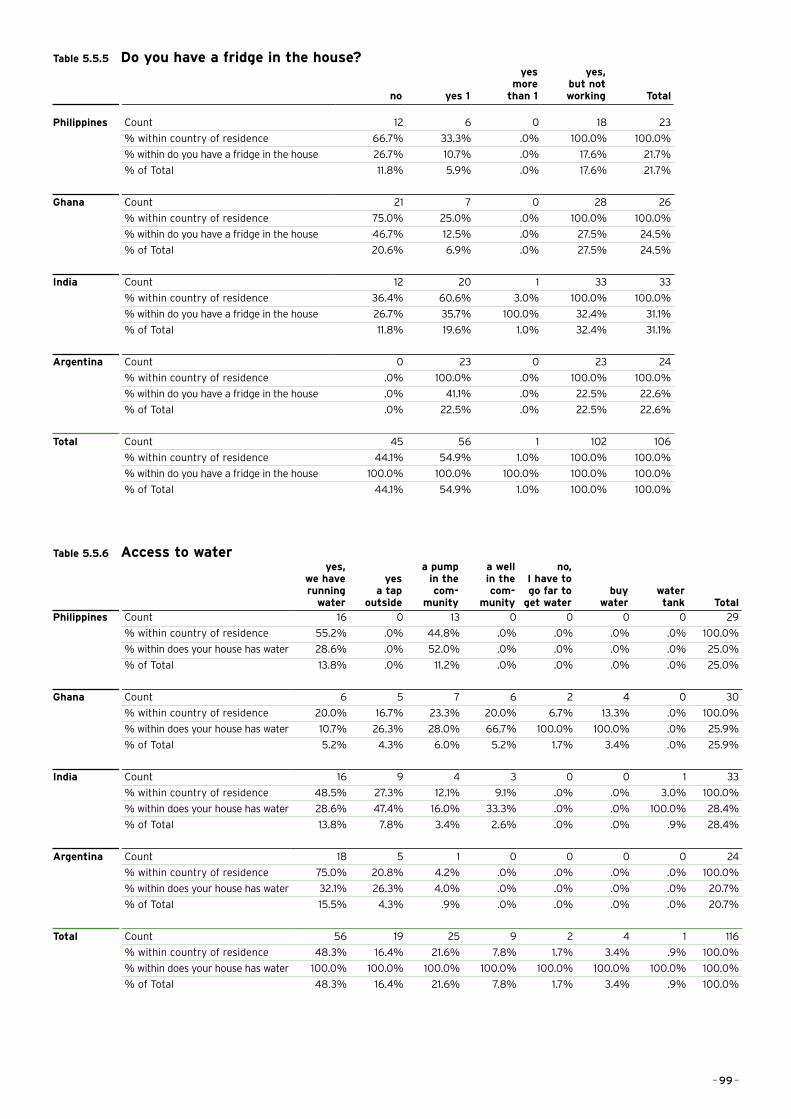
Table 5.5.5 Do you have a fridge in the house?
no yes 1
yes more
than 1
yes, but not working Total
Philippines Count 12 6 0 18 23
% within country of residence 66.7% 33.3% .0% 100.0% 100.0%
% within do you have a fridge in the house 26.7% 10.7% .0% 17.6% 21.7%
% of Total 11.8% 5.9% .0% 17.6% 21.7%
Ghana Count 21 7 0 28 26
% within country of residence 75.0% 25.0% .0% 100.0% 100.0%
% within do you have a fridge in the house 46.7% 12.5% .0% 27.5% 24.5%
% of Total 20.6% 6.9% .0% 27.5% 24.5%
India Count 12 20 1 33 33
% within country of residence 36.4% 60.6% 3.0% 100.0% 100.0%
% within do you have a fridge in the house 26.7% 35.7% 100.0% 32.4% 31.1%
% of Total 11.8% 19.6% 1.0% 32.4% 31.1%
Argentina Count 0 23 0 23 24
% within country of residence .0% 100.0% .0% 100.0% 100.0%
% within do you have a fridge in the house .0% 41.1% .0% 22.5% 22.6%
% of Total .0% 22.5% .0% 22.5% 22.6%
Total Count 45 56 1 102 106
% within country of residence 44.1% 54.9% 1.0% 100.0% 100.0%
% within do you have a fridge in the house 100.0% 100.0% 100.0% 100.0% 100.0%
% of Total 44.1% 54.9% 1.0% 100.0% 100.0%
Table 5.5.6 Access to wateryes,
we have running
water
yes a tap
outside
a pump in the com-
munity
a well in the com-
munity
no, I have to go far to
get waterbuy
waterwater tank Total
Philippines Count 16 0 13 0 0 0 0 29
% within country of residence 55.2% .0% 44.8% .0% .0% .0% .0% 100.0%
% within does your house has water 28.6% .0% 52.0% .0% .0% .0% .0% 25.0%
% of Total 13.8% .0% 11.2% .0% .0% .0% .0% 25.0%
Ghana Count 6 5 7 6 2 4 0 30
% within country of residence 20.0% 16.7% 23.3% 20.0% 6.7% 13.3% .0% 100.0%
% within does your house has water 10.7% 26.3% 28.0% 66.7% 100.0% 100.0% .0% 25.9%
% of Total 5.2% 4.3% 6.0% 5.2% 1.7% 3.4% .0% 25.9%
India Count 16 9 4 3 0 0 1 33
% within country of residence 48.5% 27.3% 12.1% 9.1% .0% .0% 3.0% 100.0%
% within does your house has water 28.6% 47.4% 16.0% 33.3% .0% .0% 100.0% 28.4%
% of Total 13.8% 7.8% 3.4% 2.6% .0% .0% .9% 28.4%
Argentina Count 18 5 1 0 0 0 0 24
% within country of residence 75.0% 20.8% 4.2% .0% .0% .0% .0% 100.0%
% within does your house has water 32.1% 26.3% 4.0% .0% .0% .0% .0% 20.7%
% of Total 15.5% 4.3% .9% .0% .0% .0% .0% 20.7%
Total Count 56 19 25 9 2 4 1 116
% within country of residence 48.3% 16.4% 21.6% 7.8% 1.7% 3.4% .9% 100.0%
% within does your house has water 100.0% 100.0% 100.0% 100.0% 100.0% 100.0% 100.0% 100.0%
% of Total 48.3% 16.4% 21.6% 7.8% 1.7% 3.4% .9% 100.0%
– 99 –
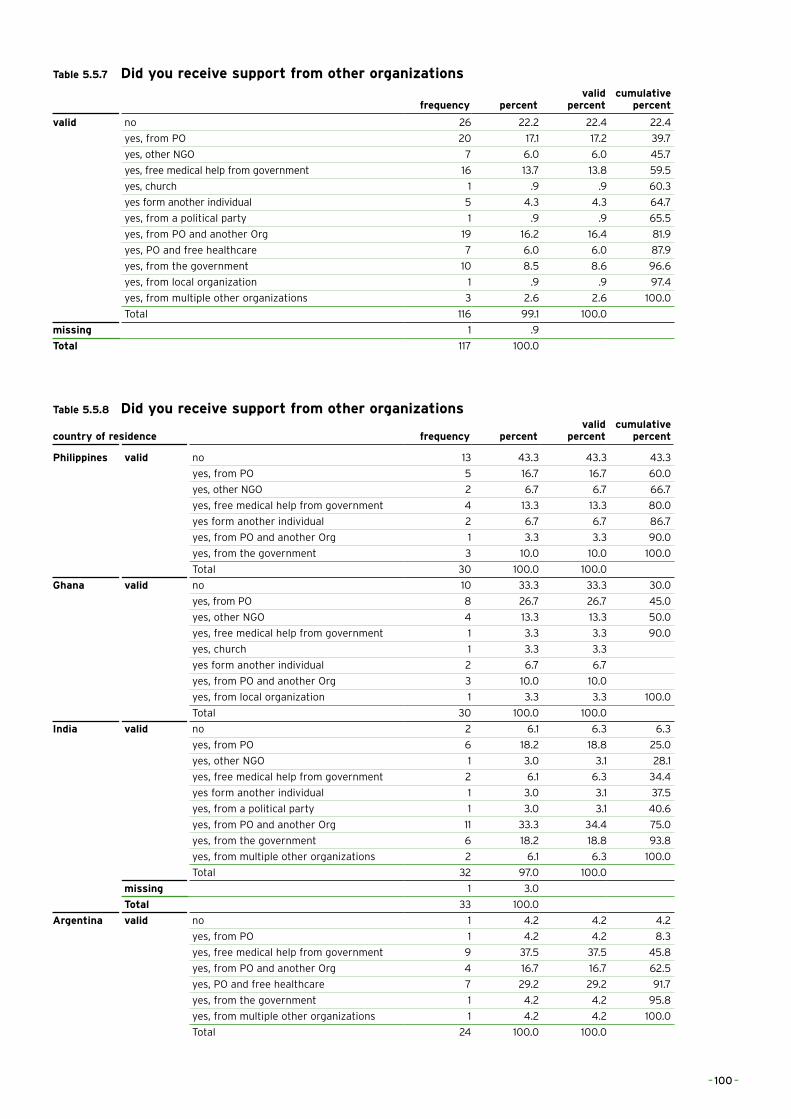
Table 5.5.7 Did you receive support from other organizations
frequency percentvalid
percentcumulative
percent
valid no 26 22.2 22.4 22.4
yes, from PO 20 17.1 17.2 39.7
yes, other NGO 7 6.0 6.0 45.7
yes, free medical help from government 16 13.7 13.8 59.5
yes, church 1 .9 .9 60.3
yes form another individual 5 4.3 4.3 64.7
yes, from a political party 1 .9 .9 65.5
yes, from PO and another Org 19 16.2 16.4 81.9
yes, PO and free healthcare 7 6.0 6.0 87.9
yes, from the government 10 8.5 8.6 96.6
yes, from local organization 1 .9 .9 97.4
yes, from multiple other organizations 3 2.6 2.6 100.0
Total 116 99.1 100.0
missing 1 .9
Total 117 100.0
Table 5.5.8 Did you receive support from other organizations
country of residence frequency percentvalid
percentcumulative
percent
Philippines valid no 13 43.3 43.3 43.3
yes, from PO 5 16.7 16.7 60.0
yes, other NGO 2 6.7 6.7 66.7
yes, free medical help from government 4 13.3 13.3 80.0
yes form another individual 2 6.7 6.7 86.7
yes, from PO and another Org 1 3.3 3.3 90.0
yes, from the government 3 10.0 10.0 100.0
Total 30 100.0 100.0
Ghana valid no 10 33.3 33.3 30.0
yes, from PO 8 26.7 26.7 45.0
yes, other NGO 4 13.3 13.3 50.0
yes, free medical help from government 1 3.3 3.3 90.0
yes, church 1 3.3 3.3
yes form another individual 2 6.7 6.7
yes, from PO and another Org 3 10.0 10.0
yes, from local organization 1 3.3 3.3 100.0
Total 30 100.0 100.0
India valid no 2 6.1 6.3 6.3
yes, from PO 6 18.2 18.8 25.0
yes, other NGO 1 3.0 3.1 28.1
yes, free medical help from government 2 6.1 6.3 34.4
yes form another individual 1 3.0 3.1 37.5
yes, from a political party 1 3.0 3.1 40.6
yes, from PO and another Org 11 33.3 34.4 75.0
yes, from the government 6 18.2 18.8 93.8
yes, from multiple other organizations 2 6.1 6.3 100.0
Total 32 97.0 100.0
missing 1 3.0
Total 33 100.0
Argentina valid no 1 4.2 4.2 4.2
yes, from PO 1 4.2 4.2 8.3
yes, free medical help from government 9 37.5 37.5 45.8
yes, from PO and another Org 4 16.7 16.7 62.5
yes, PO and free healthcare 7 29.2 29.2 91.7
yes, from the government 1 4.2 4.2 95.8
yes, from multiple other organizations 1 4.2 4.2 100.0
Total 24 100.0 100.0
– 100 –
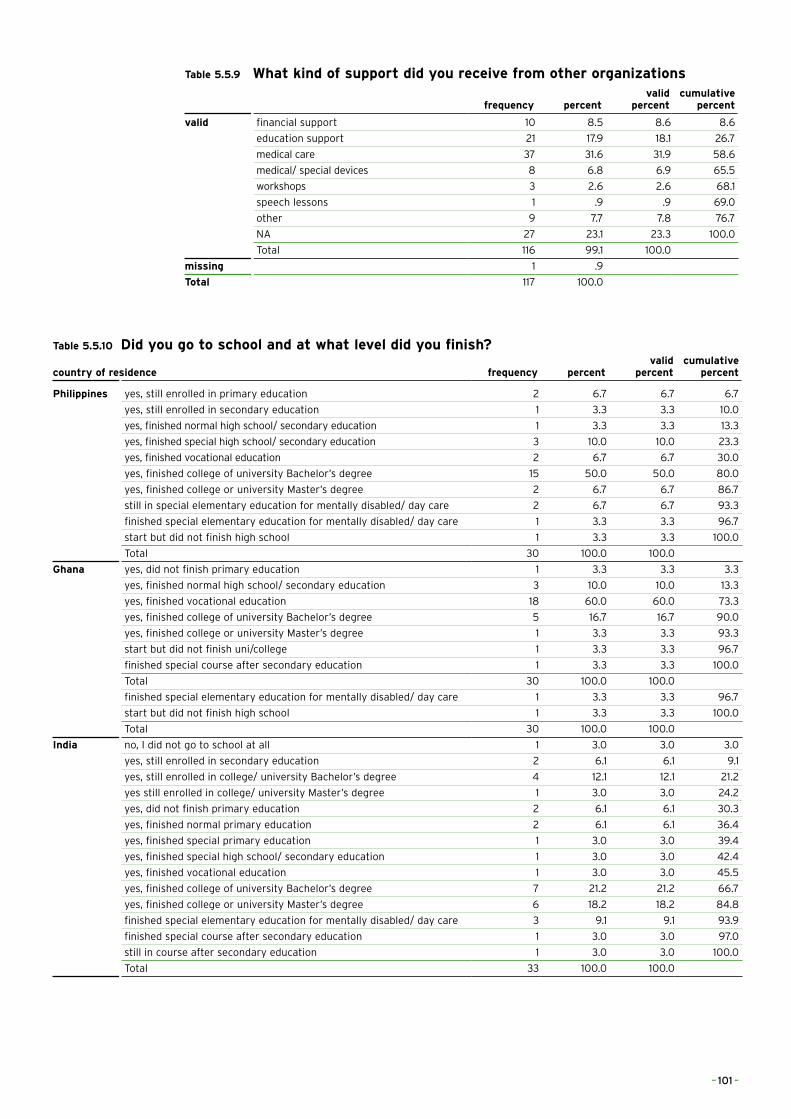
Table 5.5.9 What kind of support did you receive from other organizations
frequency percentvalid
percentcumulative
percent
valid financial support 10 8.5 8.6 8.6
education support 21 17.9 18.1 26.7
medical care 37 31.6 31.9 58.6
medical/ special devices 8 6.8 6.9 65.5
workshops 3 2.6 2.6 68.1
speech lessons 1 .9 .9 69.0
other 9 7.7 7.8 76.7
NA 27 23.1 23.3 100.0
Total 116 99.1 100.0
missing 1 .9
Total 117 100.0
Table 5.5.10 Did you go to school and at what level did you finish?
country of residence frequency percentvalid
percentcumulative
percent
Philippines yes, still enrolled in primary education 2 6.7 6.7 6.7
yes, still enrolled in secondary education 1 3.3 3.3 10.0
yes, finished normal high school/ secondary education 1 3.3 3.3 13.3
yes, finished special high school/ secondary education 3 10.0 10.0 23.3
yes, finished vocational education 2 6.7 6.7 30.0
yes, finished college of university Bachelor’s degree 15 50.0 50.0 80.0
yes, finished college or university Master’s degree 2 6.7 6.7 86.7
still in special elementary education for mentally disabled/ day care 2 6.7 6.7 93.3
finished special elementary education for mentally disabled/ day care 1 3.3 3.3 96.7
start but did not finish high school 1 3.3 3.3 100.0
Total 30 100.0 100.0
Ghana yes, did not finish primary education 1 3.3 3.3 3.3
yes, finished normal high school/ secondary education 3 10.0 10.0 13.3
yes, finished vocational education 18 60.0 60.0 73.3
yes, finished college of university Bachelor’s degree 5 16.7 16.7 90.0
yes, finished college or university Master’s degree 1 3.3 3.3 93.3
start but did not finish uni/college 1 3.3 3.3 96.7
finished special course after secondary education 1 3.3 3.3 100.0
Total 30 100.0 100.0
finished special elementary education for mentally disabled/ day care 1 3.3 3.3 96.7
start but did not finish high school 1 3.3 3.3 100.0
Total 30 100.0 100.0
India no, I did not go to school at all 1 3.0 3.0 3.0
yes, still enrolled in secondary education 2 6.1 6.1 9.1
yes, still enrolled in college/ university Bachelor’s degree 4 12.1 12.1 21.2
yes still enrolled in college/ university Master’s degree 1 3.0 3.0 24.2
yes, did not finish primary education 2 6.1 6.1 30.3
yes, finished normal primary education 2 6.1 6.1 36.4
yes, finished special primary education 1 3.0 3.0 39.4
yes, finished special high school/ secondary education 1 3.0 3.0 42.4
yes, finished vocational education 1 3.0 3.0 45.5
yes, finished college of university Bachelor’s degree 7 21.2 21.2 66.7
yes, finished college or university Master’s degree 6 18.2 18.2 84.8
finished special elementary education for mentally disabled/ day care 3 9.1 9.1 93.9
finished special course after secondary education 1 3.0 3.0 97.0
still in course after secondary education 1 3.0 3.0 100.0
Total 33 100.0 100.0
– 101 –
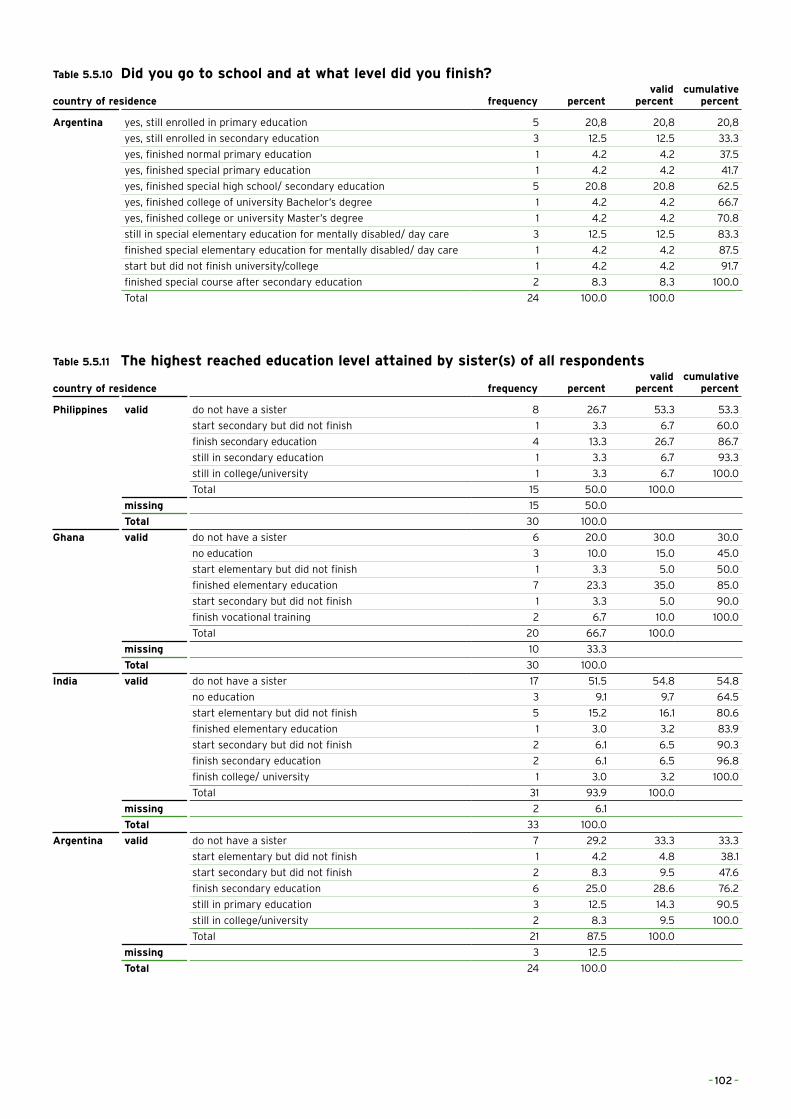
Table 5.5.10 Did you go to school and at what level did you finish?
country of residence frequency percentvalid
percentcumulative
percent
Argentina yes, still enrolled in primary education 5 20,8 20,8 20,8
yes, still enrolled in secondary education 3 12.5 12.5 33.3
yes, finished normal primary education 1 4.2 4.2 37.5
yes, finished special primary education 1 4.2 4.2 41.7
yes, finished special high school/ secondary education 5 20.8 20.8 62.5
yes, finished college of university Bachelor’s degree 1 4.2 4.2 66.7
yes, finished college or university Master’s degree 1 4.2 4.2 70.8
still in special elementary education for mentally disabled/ day care 3 12.5 12.5 83.3
finished special elementary education for mentally disabled/ day care 1 4.2 4.2 87.5
start but did not finish university/college 1 4.2 4.2 91.7
finished special course after secondary education 2 8.3 8.3 100.0
Total 24 100.0 100.0
Table 5.5.11 The highest reached education level attained by sister(s) of all respondents
country of residence frequency percentvalid
percentcumulative
percent
Philippines valid do not have a sister 8 26.7 53.3 53.3
start secondary but did not finish 1 3.3 6.7 60.0
finish secondary education 4 13.3 26.7 86.7
still in secondary education 1 3.3 6.7 93.3
still in college/university 1 3.3 6.7 100.0
Total 15 50.0 100.0
missing 15 50.0
Total 30 100.0
Ghana valid do not have a sister 6 20.0 30.0 30.0
no education 3 10.0 15.0 45.0
start elementary but did not finish 1 3.3 5.0 50.0
finished elementary education 7 23.3 35.0 85.0
start secondary but did not finish 1 3.3 5.0 90.0
finish vocational training 2 6.7 10.0 100.0
Total 20 66.7 100.0
missing 10 33.3
Total 30 100.0
India valid do not have a sister 17 51.5 54.8 54.8
no education 3 9.1 9.7 64.5
start elementary but did not finish 5 15.2 16.1 80.6
finished elementary education 1 3.0 3.2 83.9
start secondary but did not finish 2 6.1 6.5 90.3
finish secondary education 2 6.1 6.5 96.8
finish college/ university 1 3.0 3.2 100.0
Total 31 93.9 100.0
missing 2 6.1
Total 33 100.0
Argentina valid do not have a sister 7 29.2 33.3 33.3
start elementary but did not finish 1 4.2 4.8 38.1
start secondary but did not finish 2 8.3 9.5 47.6
finish secondary education 6 25.0 28.6 76.2
still in primary education 3 12.5 14.3 90.5
still in college/university 2 8.3 9.5 100.0
Total 21 87.5 100.0
missing 3 12.5
Total 24 100.0
– 102 –
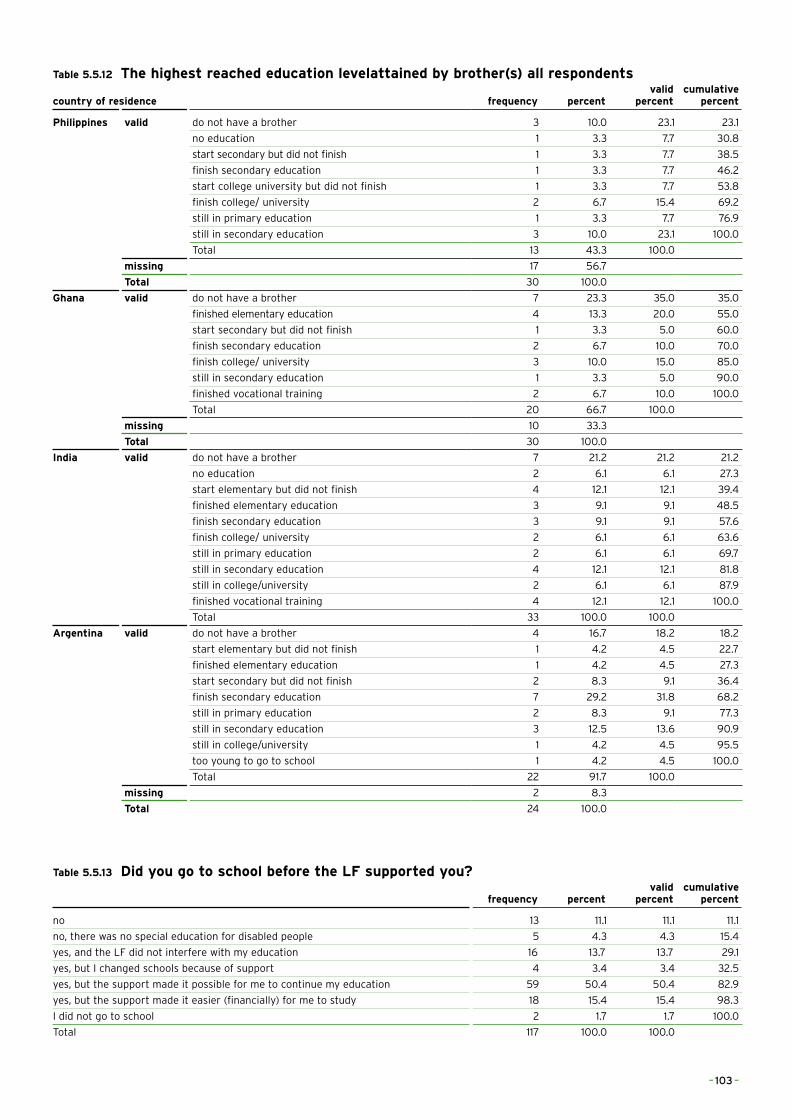
Table 5.5.12 The highest reached education levelattained by brother(s) all respondents
country of residence frequency percentvalid
percentcumulative
percent
Philippines valid do not have a brother 3 10.0 23.1 23.1
no education 1 3.3 7.7 30.8
start secondary but did not finish 1 3.3 7.7 38.5
finish secondary education 1 3.3 7.7 46.2
start college university but did not finish 1 3.3 7.7 53.8
finish college/ university 2 6.7 15.4 69.2
still in primary education 1 3.3 7.7 76.9
still in secondary education 3 10.0 23.1 100.0
Total 13 43.3 100.0
missing 17 56.7
Total 30 100.0
Ghana valid do not have a brother 7 23.3 35.0 35.0
finished elementary education 4 13.3 20.0 55.0
start secondary but did not finish 1 3.3 5.0 60.0
finish secondary education 2 6.7 10.0 70.0
finish college/ university 3 10.0 15.0 85.0
still in secondary education 1 3.3 5.0 90.0
finished vocational training 2 6.7 10.0 100.0
Total 20 66.7 100.0
missing 10 33.3
Total 30 100.0
India valid do not have a brother 7 21.2 21.2 21.2
no education 2 6.1 6.1 27.3
start elementary but did not finish 4 12.1 12.1 39.4
finished elementary education 3 9.1 9.1 48.5
finish secondary education 3 9.1 9.1 57.6
finish college/ university 2 6.1 6.1 63.6
still in primary education 2 6.1 6.1 69.7
still in secondary education 4 12.1 12.1 81.8
still in college/university 2 6.1 6.1 87.9
finished vocational training 4 12.1 12.1 100.0
Total 33 100.0 100.0
Argentina valid do not have a brother 4 16.7 18.2 18.2
start elementary but did not finish 1 4.2 4.5 22.7
finished elementary education 1 4.2 4.5 27.3
start secondary but did not finish 2 8.3 9.1 36.4
finish secondary education 7 29.2 31.8 68.2
still in primary education 2 8.3 9.1 77.3
still in secondary education 3 12.5 13.6 90.9
still in college/university 1 4.2 4.5 95.5
too young to go to school 1 4.2 4.5 100.0
Total 22 91.7 100.0
missing 2 8.3
Total 24 100.0
Table 5.5.13 Did you go to school before the LF supported you?
frequency percentvalid
percentcumulative
percent
no 13 11.1 11.1 11.1
no, there was no special education for disabled people 5 4.3 4.3 15.4
yes, and the LF did not interfere with my education 16 13.7 13.7 29.1
yes, but I changed schools because of support 4 3.4 3.4 32.5
yes, but the support made it possible for me to continue my education 59 50.4 50.4 82.9
yes, but the support made it easier (financially) for me to study 18 15.4 15.4 98.3
I did not go to school 2 1.7 1.7 100.0
Total 117 100.0 100.0
– 103 –
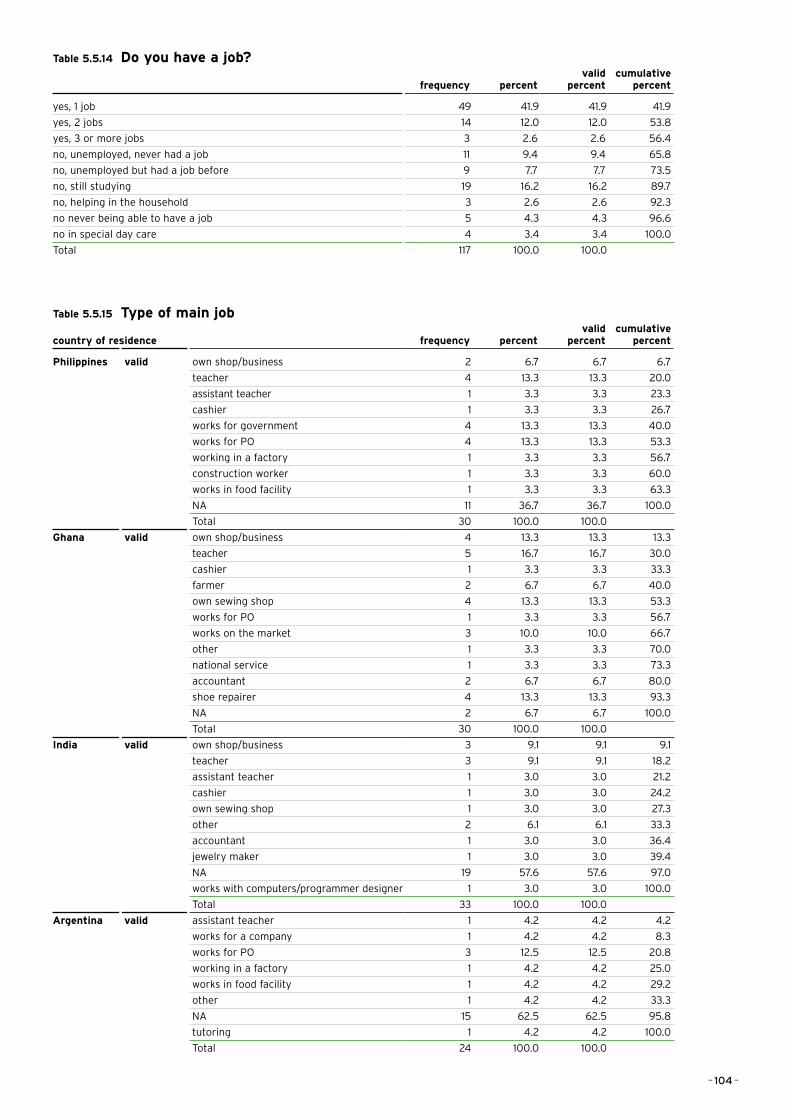
Table 5.5.14 Do you have a job?
frequency percentvalid
percentcumulative
percent
yes, 1 job 49 41.9 41.9 41.9
yes, 2 jobs 14 12.0 12.0 53.8
yes, 3 or more jobs 3 2.6 2.6 56.4
no, unemployed, never had a job 11 9.4 9.4 65.8
no, unemployed but had a job before 9 7.7 7.7 73.5
no, still studying 19 16.2 16.2 89.7
no, helping in the household 3 2.6 2.6 92.3
no never being able to have a job 5 4.3 4.3 96.6
no in special day care 4 3.4 3.4 100.0
Total 117 100.0 100.0
Table 5.5.15 Type of main job
country of residence frequency percentvalid
percentcumulative
percent
Philippines valid own shop/business 2 6.7 6.7 6.7
teacher 4 13.3 13.3 20.0
assistant teacher 1 3.3 3.3 23.3
cashier 1 3.3 3.3 26.7
works for government 4 13.3 13.3 40.0
works for PO 4 13.3 13.3 53.3
working in a factory 1 3.3 3.3 56.7
construction worker 1 3.3 3.3 60.0
works in food facility 1 3.3 3.3 63.3
NA 11 36.7 36.7 100.0
Total 30 100.0 100.0
Ghana valid own shop/business 4 13.3 13.3 13.3
teacher 5 16.7 16.7 30.0
cashier 1 3.3 3.3 33.3
farmer 2 6.7 6.7 40.0
own sewing shop 4 13.3 13.3 53.3
works for PO 1 3.3 3.3 56.7
works on the market 3 10.0 10.0 66.7
other 1 3.3 3.3 70.0
national service 1 3.3 3.3 73.3
accountant 2 6.7 6.7 80.0
shoe repairer 4 13.3 13.3 93.3
NA 2 6.7 6.7 100.0
Total 30 100.0 100.0
India valid own shop/business 3 9.1 9.1 9.1
teacher 3 9.1 9.1 18.2
assistant teacher 1 3.0 3.0 21.2
cashier 1 3.0 3.0 24.2
own sewing shop 1 3.0 3.0 27.3
other 2 6.1 6.1 33.3
accountant 1 3.0 3.0 36.4
jewelry maker 1 3.0 3.0 39.4
NA 19 57.6 57.6 97.0
works with computers/programmer designer 1 3.0 3.0 100.0
Total 33 100.0 100.0
Argentina valid assistant teacher 1 4.2 4.2 4.2
works for a company 1 4.2 4.2 8.3
works for PO 3 12.5 12.5 20.8
working in a factory 1 4.2 4.2 25.0
works in food facility 1 4.2 4.2 29.2
other 1 4.2 4.2 33.3
NA 15 62.5 62.5 95.8
tutoring 1 4.2 4.2 100.0
Total 24 100.0 100.0
– 104 –
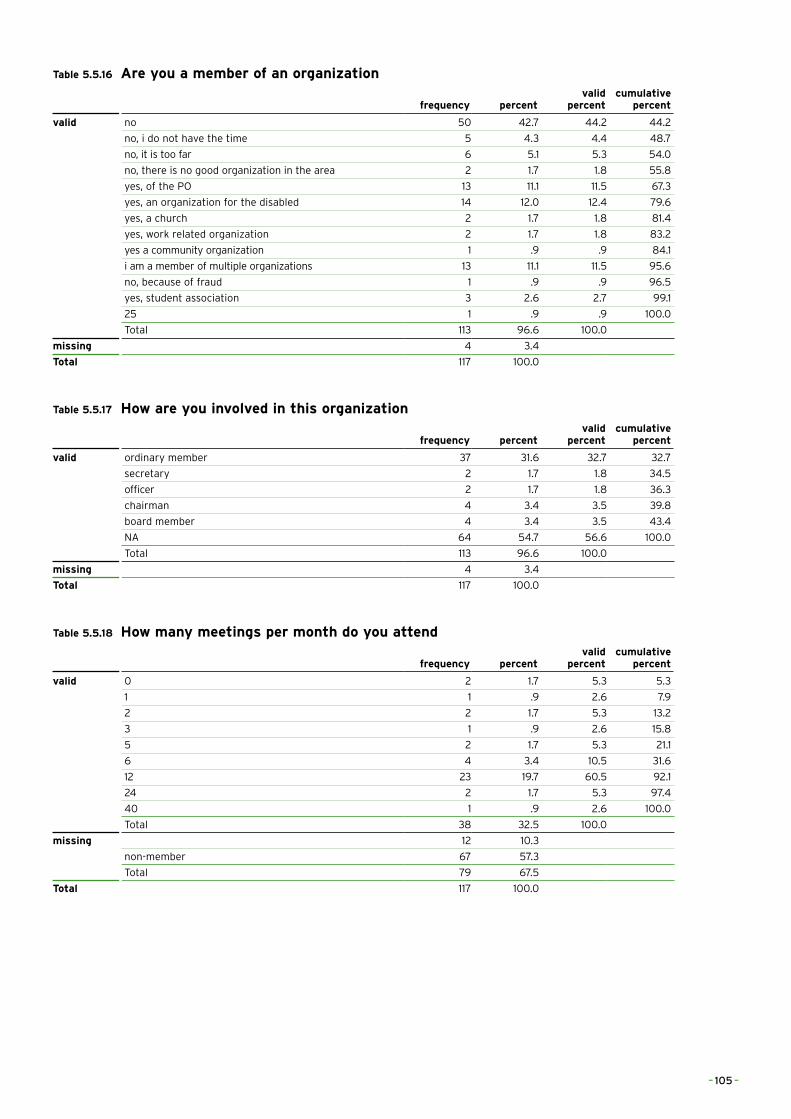
Table 5.5.16 Are you a member of an organization
frequency percentvalid
percentcumulative
percent
valid no 50 42.7 44.2 44.2
no, i do not have the time 5 4.3 4.4 48.7
no, it is too far 6 5.1 5.3 54.0
no, there is no good organization in the area 2 1.7 1.8 55.8
yes, of the PO 13 11.1 11.5 67.3
yes, an organization for the disabled 14 12.0 12.4 79.6
yes, a church 2 1.7 1.8 81.4
yes, work related organization 2 1.7 1.8 83.2
yes a community organization 1 .9 .9 84.1
i am a member of multiple organizations 13 11.1 11.5 95.6
no, because of fraud 1 .9 .9 96.5
yes, student association 3 2.6 2.7 99.1
25 1 .9 .9 100.0
Total 113 96.6 100.0
missing 4 3.4
Total 117 100.0
Table 5.5.17 How are you involved in this organization
frequency percentvalid
percentcumulative
percent
valid ordinary member 37 31.6 32.7 32.7
secretary 2 1.7 1.8 34.5
officer 2 1.7 1.8 36.3
chairman 4 3.4 3.5 39.8
board member 4 3.4 3.5 43.4
NA 64 54.7 56.6 100.0
Total 113 96.6 100.0
missing 4 3.4
Total 117 100.0
Table 5.5.18 How many meetings per month do you attend
frequency percentvalid
percentcumulative
percent
valid 0 2 1.7 5.3 5.3
1 1 .9 2.6 7.9
2 2 1.7 5.3 13.2
3 1 .9 2.6 15.8
5 2 1.7 5.3 21.1
6 4 3.4 10.5 31.6
12 23 19.7 60.5 92.1
24 2 1.7 5.3 97.4
40 1 .9 2.6 100.0
Total 38 32.5 100.0
missing 12 10.3
non-member 67 57.3
Total 79 67.5
Total 117 100.0
– 105 –
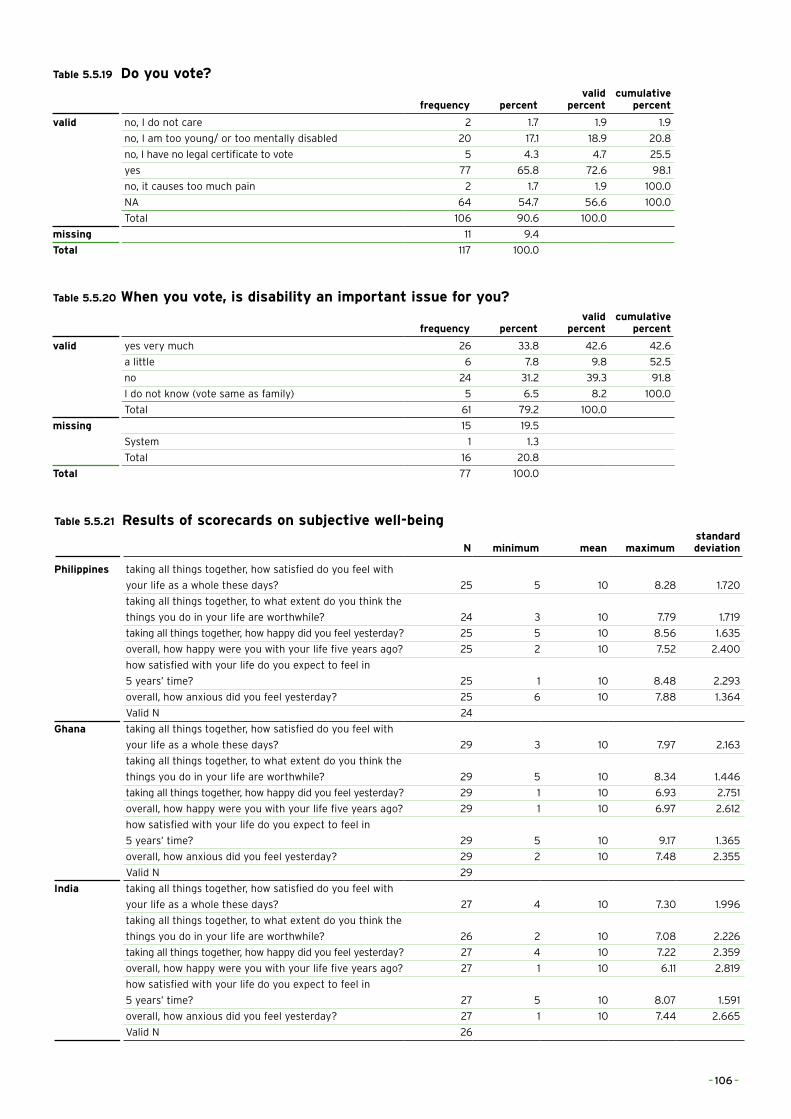
Table 5.5.19 Do you vote?
frequency percentvalid
percentcumulative
percent
valid no, I do not care 2 1.7 1.9 1.9
no, I am too young/ or too mentally disabled 20 17.1 18.9 20.8
no, I have no legal certificate to vote 5 4.3 4.7 25.5
yes 77 65.8 72.6 98.1
no, it causes too much pain 2 1.7 1.9 100.0
NA 64 54.7 56.6 100.0
Total 106 90.6 100.0
missing 11 9.4
Total 117 100.0
Table 5.5.20 When you vote, is disability an important issue for you?
frequency percentvalid
percentcumulative
percent
valid yes very much 26 33.8 42.6 42.6
a little 6 7.8 9.8 52.5
no 24 31.2 39.3 91.8
I do not know (vote same as family) 5 6.5 8.2 100.0
Total 61 79.2 100.0
missing 15 19.5
System 1 1.3
Total 16 20.8
Total 77 100.0
Table 5.5.21 Results of scorecards on subjective well-being
N minimum mean maximumstandard deviation
Philippines taking all things together, how satisfied do you feel with
your life as a whole these days? 25 5 10 8.28 1.720
taking all things together, to what extent do you think the
things you do in your life are worthwhile? 24 3 10 7.79 1.719
taking all things together, how happy did you feel yesterday? 25 5 10 8.56 1.635
overall, how happy were you with your life five years ago? 25 2 10 7.52 2.400
how satisfied with your life do you expect to feel in
5 years’ time? 25 1 10 8.48 2.293
overall, how anxious did you feel yesterday? 25 6 10 7.88 1.364
Valid N 24
Ghana taking all things together, how satisfied do you feel with
your life as a whole these days? 29 3 10 7.97 2.163
taking all things together, to what extent do you think the
things you do in your life are worthwhile? 29 5 10 8.34 1.446
taking all things together, how happy did you feel yesterday? 29 1 10 6.93 2.751
overall, how happy were you with your life five years ago? 29 1 10 6.97 2.612
how satisfied with your life do you expect to feel in
5 years’ time? 29 5 10 9.17 1.365
overall, how anxious did you feel yesterday? 29 2 10 7.48 2.355
Valid N 29
India taking all things together, how satisfied do you feel with
your life as a whole these days? 27 4 10 7.30 1.996
taking all things together, to what extent do you think the
things you do in your life are worthwhile? 26 2 10 7.08 2.226
taking all things together, how happy did you feel yesterday? 27 4 10 7.22 2.359
overall, how happy were you with your life five years ago? 27 1 10 6.11 2.819
how satisfied with your life do you expect to feel in
5 years’ time? 27 5 10 8.07 1.591
overall, how anxious did you feel yesterday? 27 1 10 7.44 2.665
Valid N 26
– 106 –
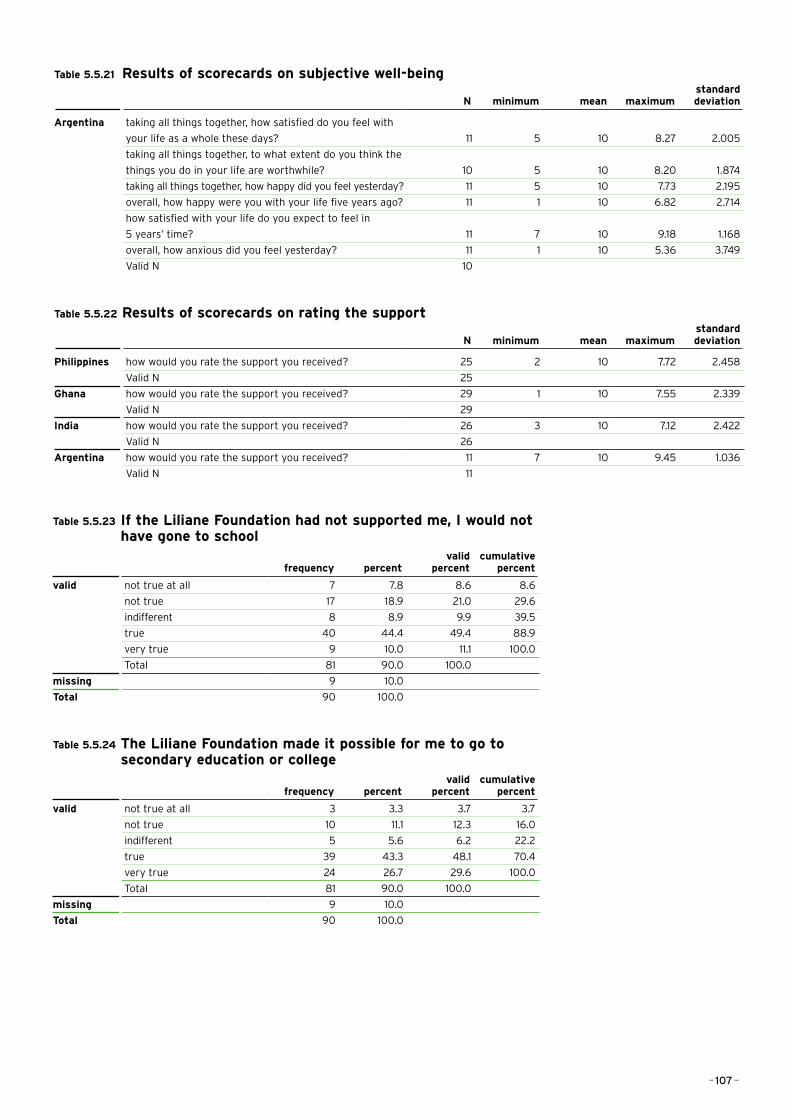
Table 5.5.21 Results of scorecards on subjective well-being
N minimum mean maximumstandard deviation
Argentina taking all things together, how satisfied do you feel with
your life as a whole these days? 11 5 10 8.27 2.005
taking all things together, to what extent do you think the
things you do in your life are worthwhile? 10 5 10 8.20 1.874
taking all things together, how happy did you feel yesterday? 11 5 10 7.73 2.195
overall, how happy were you with your life five years ago? 11 1 10 6.82 2.714
how satisfied with your life do you expect to feel in
5 years’ time? 11 7 10 9.18 1.168
overall, how anxious did you feel yesterday? 11 1 10 5.36 3.749
Valid N 10
Table 5.5.22 Results of scorecards on rating the support
N minimum mean maximumstandard deviation
Philippines how would you rate the support you received? 25 2 10 7.72 2.458
Valid N 25
Ghana how would you rate the support you received? 29 1 10 7.55 2.339
Valid N 29
India how would you rate the support you received? 26 3 10 7.12 2.422
Valid N 26
Argentina how would you rate the support you received? 11 7 10 9.45 1.036
Valid N 11
Table 5.5.23 If the Liliane Foundation had not supported me, I would not have gone to school
frequency percentvalid
percentcumulative
percent
valid not true at all 7 7.8 8.6 8.6
not true 17 18.9 21.0 29.6
indifferent 8 8.9 9.9 39.5
true 40 44.4 49.4 88.9
very true 9 10.0 11.1 100.0
Total 81 90.0 100.0
missing 9 10.0
Total 90 100.0
Table 5.5.24 The Liliane Foundation made it possible for me to go to secondary education or college
frequency percentvalid
percentcumulative
percent
valid not true at all 3 3.3 3.7 3.7
not true 10 11.1 12.3 16.0
indifferent 5 5.6 6.2 22.2
true 39 43.3 48.1 70.4
very true 24 26.7 29.6 100.0
Total 81 90.0 100.0
missing 9 10.0
Total 90 100.0
– 107 –
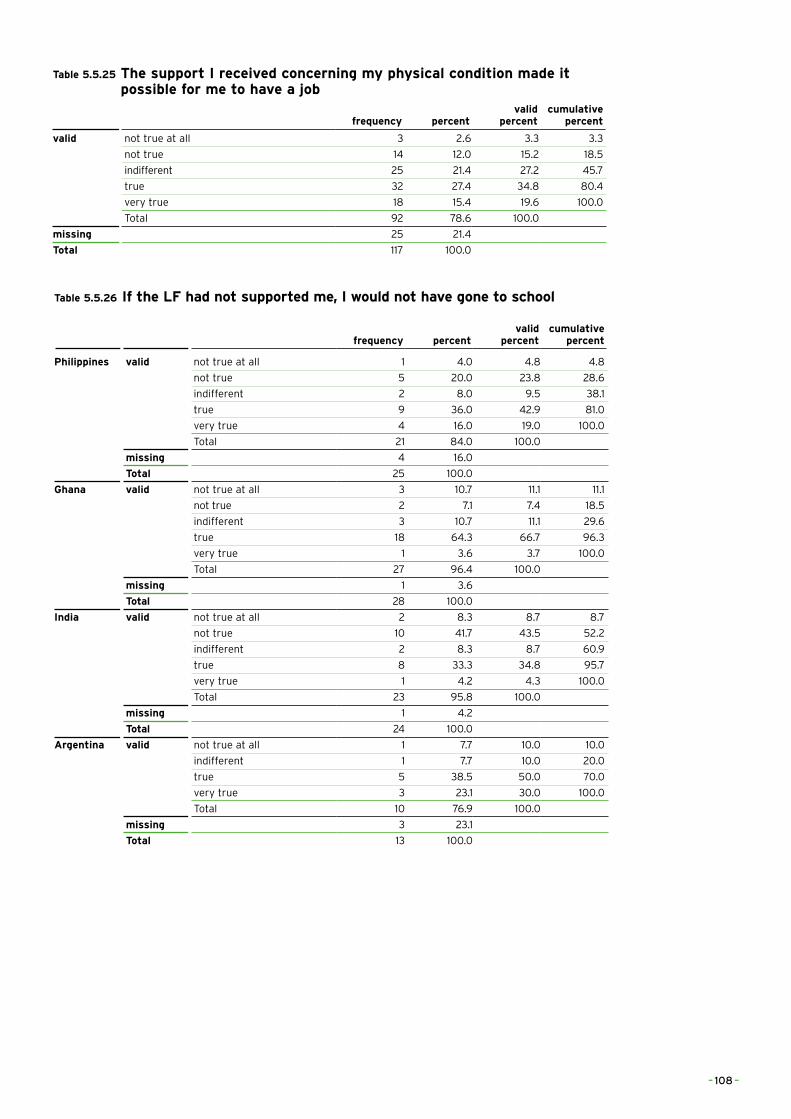
Table 5.5.25 The support I received concerning my physical condition made it possible for me to have a job
frequency percentvalid
percentcumulative
percent
valid not true at all 3 2.6 3.3 3.3
not true 14 12.0 15.2 18.5
indifferent 25 21.4 27.2 45.7
true 32 27.4 34.8 80.4
very true 18 15.4 19.6 100.0
Total 92 78.6 100.0
missing 25 21.4
Total 117 100.0
Table 5.5.26 If the LF had not supported me, I would not have gone to school
frequency percentvalid
percentcumulative
percent
Philippines valid not true at all 1 4.0 4.8 4.8
not true 5 20.0 23.8 28.6
indifferent 2 8.0 9.5 38.1
true 9 36.0 42.9 81.0
very true 4 16.0 19.0 100.0
Total 21 84.0 100.0
missing 4 16.0
Total 25 100.0
Ghana valid not true at all 3 10.7 11.1 11.1
not true 2 7.1 7.4 18.5
indifferent 3 10.7 11.1 29.6
true 18 64.3 66.7 96.3
very true 1 3.6 3.7 100.0
Total 27 96.4 100.0
missing 1 3.6
Total 28 100.0
India valid not true at all 2 8.3 8.7 8.7
not true 10 41.7 43.5 52.2
indifferent 2 8.3 8.7 60.9
true 8 33.3 34.8 95.7
very true 1 4.2 4.3 100.0
Total 23 95.8 100.0
missing 1 4.2
Total 24 100.0
Argentina valid not true at all 1 7.7 10.0 10.0
indifferent 1 7.7 10.0 20.0
true 5 38.5 50.0 70.0
very true 3 23.1 30.0 100.0
Total 10 76.9 100.0
missing 3 23.1
Total 13 100.0
– 108 –
ABOUT THE AUTHORS
Paul Hoebink is Extraordinary Professor in Development Cooperation at the Radboud University in Nijmegen and director of the Centre for International Development Issues Nijmegen (CIDIN). He has more than 35 years of research on development cooperation, including evaluations and policy advice, advising the Minister for Development Cooperation of the Netherlands, the European Commission and also private aid agencies. His latest two books are on the effects of coffee certification and on private aid organizations in Europe (edited volumes, both published in 2014).
Jessica Rijpstra holds an MA in Development Studies and an MA in Administration Sciences. Her MA research in Development Studies was on the Millennium Development Village in Uganda. She was research assistant in this research project for six months.
© All photographs taken by Jessica Rijpstra
– 109 –