faculty salaries and the maximization of prestige
TRANSCRIPT
FACULTY SALARIES AND THE MAXIMIZATIONOF PRESTIGE
Tatiana Melguizo,*,† and Myra H. Strober**
..................................................................................................................................................................................
Through the lens of the emerging economic theory of higher education, we look atthe relationship between salary and prestige. Starting from the premise thatacademic institutions seek to maximize prestige, we hypothesize that monetaryrewards are higher for faculty activities that confer prestige. We use data from the1999 National Study of Postsecondary Faculty (NSOPF), and regression analysisto examine the determinants of salaries. The results are consistent with the theorythat faculty members are financially rewarded for enhancing institutional prestige.There is some evidence that the rewards are higher in science and engineering.Spending more time on teaching has no effect on salary, even in comprehensiveuniversities and liberal arts colleges. Findings suggest that other types ofinstitutions are emulating research institutions in their pursuit of prestige. Lookingat faculty salaries through this lens raises serious questions about the implicationsof the current reward system in higher education.
..................................................................................................................................................................................KEY WORDS: prestige maximization; economics; faculty; compensation.
In recent years, economists have begun to examine the ways in whichthe economics of higher educational institutions is similar to and differ-ent from the economics of the firm (Breneman, 1970; Clotfelter, 1999;Frank and Cook, 2000; Ehrenberg, 2000a; Garvin, 1980; Massy andZemsky, 1994; Winston, 1997, 1999, 2000a, b, 2001; Zemsky and Massy,1995). While economic theory analyzes for-profit firms as profit maxi-mizers, the developing economic theory of higher education seesnon-profit higher education institutions as prestige maximizers
*Rossier School of Education, University of Southern California, 3470 Trousdale Parkway,
WPH 702G Los Angeles, CA, 90089 USA.
**School of Education, Stanford University, Stanford, CA, 94305 USA.
†Address correspondence to: Tatiana Melguizo, Rossier School of Education, 3470 Trous-
dale Parkway, WPH 702G Los Angeles, CA, 90089 USA. E-mail: [email protected].
633
0361-0365/07/0900-0633/0 � 2007 Springer Science+Business Media LLC
Research in Higher Education, Vol. 48, No. 6, September 2007 (� 2007)DOI: 10.1007/s11162-006-9045-0
(Breneman, 1970; Brewer, Gates and Goldman, 2002; Garvin, 1980; James,1990; Massy and Zemsky, 1994; Zemsky, Wegner and Massy, 2006).In fact, institutions of higher education behave both like firms and
like charitable institutions. For example, like firms, they operate innumerous markets and seek to minimize certain costs; but like charita-ble institutions, they provide subsidies for their students. In Winston�scolorful phrase (2001), higher educational institutions act like both a cardealer and a church. As a result, Winston (1999) calls the economics ofhigher education ‘‘awkward.’’ Clotfelter (1999) calls it ‘‘curious’’.The work on the determination of faculty salaries has not yet caught
up with the economics literature that views educational institutions ashybrids, (car dealers and churches) that seek to maximize prestige.Rather, economic models of faculty salary determination have beenbased solely on human capital theory, a theory derived from the theoryof the profit maximizing firm.In this paper, we seek to unsettle usual modes of thinking about fac-
ulty salaries and explore an additional explanatory framework, the max-imization of prestige. That is, we view faculty salary as a reward forenhancing individual and institutional prestige as well as a reward forincreasing productivity through on-the-job training.The data set we use (the 1999 National Study of Postsecondary Fac-
ulty (NSOPF)) does not provide direct measures of either prestige orwork experience (the key construct in the human capital model). More-over, since many of the variables we use in our empirical work toexplain faculty salaries are also used in the standard human capitalmodels of salary determination, our paper does not seek to provide atest of the superiority of the prestige model of salary determination ascompared to the human capital model of salary determination. Rather,we seek to alert scholars and practitioners of higher education of a pos-sible alternative way of viewing the determination of faculty salaries.Just as signaling theorists and institutional theorists in the 1970s ledlabor economists to understand that the human capital theory is onlyone possible explanation for the correlation between earnings and edu-cational attainment, and that the causal mechanism for the correlationmay include numerous other factors (See Strober, 1990, for a review ofthese arguments), our work aims to provide a recognition that facultysalaries are not solely determined by human capital and ‘‘productivity.’’Of equal importance, our paper seeks to show that viewing faculty sal-
aries as returns to the generation of prestige provides an opening forserious discussion about the missions of higher education. Because thehuman capital theory is so entrenched in our thinking, the fact that fac-ulty are paid according to their ‘‘on the job training’’ (measured by years
634 MELGUIZO AND STROBER
since their Ph.D.) and their research output (their ‘‘productivity’’) hasbecome conventional wisdom, widely accepted as just and proper. How-ever, viewing faculty salaries as a return to the generation of prestige (forthe individual as well as the institution) leads us to ask whether the sys-tem of rewarding faculty for research activities that generate prestigecauses them to slight other activities (such as teaching, advising, andcommunity service), thereby causing them and their institutions to driftaway from some of the most important missions of higher education.
CONCEPTUAL FRAMEWORK
Maximization of Prestige by Higher Educational Institutions
Webster�s dictionary defines prestige as ‘‘reputation based on brillianceof achievement, character, etc.; renown’’ (Webster, 1996). The emergingeconomic theory of higher educational institutions argues that it is pre-cisely this reputation and renown that institutions are seeking to maximizeand that such institutions ‘‘weigh...considerations...of institutional pres-tige...heavily...in organizational decision making’’ (Garvin, 1980:22).Moreover, not only are institutions seeking to maximize prestige, so aredepartments and faculty members (Breneman, 1970). Institutions seek toincrease their prestige vis a vis other institutions; departments seek to in-crease their prestige vis a vis other departments in the same field at otherinstitutions (and also, for purposes of resource allocations vis a vis depart-ments in their own institution); and faculty members seek to increase theirown reputations among colleagues, within their own institution, but mostespecially nationally and internationally among their academic peers.Underlying this economic theory is an explicit assumption of purpo-
sive behavior. All actors (institutions, departments, and faculty) areassumed to be engaged in enhancing their own self interest and pursuingprestige with intentionality. Moreover, the theory assumes that there arecompetitive markets in higher education—for faculty, and also for stu-dents and donations.Breneman (1970) and Garvin (1980) argue that in maximizing their
individual prestige, faculty members simultaneously maximize the pres-tige of their departments and institutions. Faculty members increasetheir own prestige by publishing articles and books, obtaining researchgrants and patents, being elected to various national academies, andgarnering prestigious and well-publicized prizes. And when the renownand influence of their faculty members grow by these means, the pres-tige of the departments and institutions that employ these faculty growscommensurately.
FACULTY SALARIES AND THE MAXIMIZATION OF PRESTIGE 635
Although the accrual of derivative prestige through faculty members�activities is the primary source of institutional prestige, institutions alsoseek to maximize prestige directly by increasing the size of their endow-ments, and setting and achieving high goals in fundraising campaigns.Institutions may also achieve renown for success in developing new cur-riculum, building particularly innovative facilities, or otherwise seekingto improve their undergraduate education. And in some quarters, theirprestige may be enhanced through stunning successes by athletic teamsin prominent sports, particularly football and basketball. Faculty maygain both prestige and monetary advantage from these institutionalactivities. In particular, when institutions are successful in fundraising,they may be better able to compete for prestigious new faculty or bemore successful in retaining existing faculty who are courted by otherinstitutions.It is normally assumed that not all four-year institutions are equally
concerned with maximizing prestige. Although over the last 20 yearsnon-research institutions have sought to emulate research universitiesand increase their own institutional prestige by changing hiring and pro-motion criteria to accord more weight to research activities (Massy andZemsky, 1994), most observers of higher education still suppose thatnot all types of institutions of higher education are in the prestige gameto the same extent. As Zemsky, Shaman and Iannozzi (1997) hasshown, postsecondary institutions can be arrayed in descending order ofinterest in prestige, with research institutions having the greatest interestand community colleges having the least. Like community colleges,most liberal arts colleges are thought to be primarily interested in goodteaching and less interested in faculty research, although there are somehighly prestigious liberal arts colleges that play the reputation game invirtually the same league as the most prestigious research universities.
The Measurement of Prestige
The most widely recognized measure of the relative prestige of highereducational institutions is the annual rankings assembled by U.S. Newsand World Reports (USNWR). While college presidents and others railagainst these rankings, they remain the closest approximation to what isgenerally acknowledged as prestige.Although the precise formula for calculating prestige rankings chan-
ges periodically, which can result in substantial positional shifts for par-ticular institutions (Monks and Ehrenberg, 1999), in general 25% of theranking is made up of institutional performance on the retention andgraduation of undergraduates, and 20% is based on faculty resources,
636 MELGUIZO AND STROBER
including faculty compensation, the percentage of faculty with Ph.D.�s,the percentage of the faculty that are full-time, the student/faculty ratio,and class size (the percentage of undergraduate classes with less than 20students and the percentage with more than 50). Fifteen percent of theranking is based on student selectivity (the acceptance rate of under-graduates, the yield rate, the high school standing and SAT or ACTscores of incoming students), 10% is based on financial resources asmeasured by educational expenditures per student and 5% is based onalumni satisfaction, measured by the percentage of alumni who makefinancial contributions to the institution (Ehrenberg, 2000b).Twenty five percent of the prestige ranking is based on the much more
ambiguous construct of academic reputation, which is measured by US-NWR by surveying college and university presidents, provosts, and deansof admission and asking them about other institutions� reputations.There are, of course, other measures of prestige. Professional pro-
grams in business, law, and medicine are ranked (Business Week ranksMaster of Business Administration (MBA) programs annually) and doc-toral programs are ranked about every 10 years by the NationalResearch Council (NRC) through a survey of faculty within each disci-pline who are asked to rank training programs with respect to the fac-ulty who teach in them and the Ph.D. students who graduate from them(Ehrenberg, 2000b). However, the most widely known rankings remainthose done by USNWR.
Prestige Markets
The prestige system in higher education operates to produce whatRobert Merton (1973) termed a Matthew effect—to those that alreadyhave, more is given. Or, in more recent language, the prestige systemproduces what Robert Frank and Philip Cook (1995) describe as a‘‘winner take all’’ market.It is very difficult for institutions with lower prestige rankings to over-
take institutions that start the reputation game with higher prestige.Rather, those who assist institutions in gaining high prestige (highlyranked students with high rates of retention and graduation, well-knownfaculty, and alumni who provide gifts to their alma mater) are mostlikely to continue to be attracted to those institutions that already havehigh prestige. The greater an institution�s ability to attract students withhigh grade point averages and high test scores, the more likely it will beto attract future applicants with similar characteristics. And the lesslikely it will need to discount tuition to maintain enrollment (Monksand Ehrenberg, 1999), thus freeing up resources for smaller class size.
FACULTY SALARIES AND THE MAXIMIZATION OF PRESTIGE 637
Similarly, higher-ranked institutions with higher ability studentsattract better-known faculty who want to teach bright students. And thecombination of bright students and well-known faculty attract addi-tional donors, who want to be associated with institutions that are‘‘winners.’’ This additional funding can be used to build more studentamenities (better athletic facilities, nicer dorms, fancier food service sys-tems) as well as more attractive teaching and research facilities. It canalso be used to pay higher faculty salaries to attract additional highprestige faculty, particularly faculty with the ability to bring in largeresearch grants. Some of the increased revenues may also be allocatedto endowments, providing well-heeled institutions with a financial cush-ion in hard times, if they choose to increase their endowment payout,and providing assurance to all stakeholders that they will be able tocontinue to carry out their missions into the long run, indeed, into ‘‘per-petuity’’. This further enhances their prestige.
PRESTIGE AND SALARY
There are two important relationships between institutional prestigeand faculty salary. On the one hand, as we have seen, faculty salary is acomponent of the USNWR measurement of institutional prestige. Thatis, institutions that pay higher salaries have a higher score on the fac-ulty resources component of the rankings. However, the causal relation-ship of interest for our analysis of salary determination runs in theopposite direction, namely, that faculty who help their institution to beprestigious are rewarded by the institution with higher salaries.Faculty members increase their salaries by boosting both their own
prestige and that of their employing institutions through their researchoutput (including articles, books, and patents) and also through severalinputs to the research process (including being a PI on a grant, andhaving received an advanced degree from an institution with a presti-gious undergraduate program).
Research Output
When a faculty member publishes an article or book, not only is hisor her own prestige enhanced, but the institution where the facultymember is employed basks in the reflected ‘‘glory.’’ Publications by fac-ulty always include the name of the institution where the author isemployed, and reviews of a book or article in scholarly journals and thepopular press generally do as well. Even when a faculty member isinterviewed on radio or TV about a publication, the institution at which
638 MELGUIZO AND STROBER
s/he is employed is usually mentioned. Thus, faculty publications, espe-cially articles and books, raise their institutions� prestige.Even though institutions provide the libraries, computers, offices, and
laboratories that are critical inputs for faculty publications, institutionsrarely receive direct monetary payments from their faculty�s publishedwork. Only in the rare, but potentially extremely lucrative cases in thesciences, when a scholarly article is associated with a patentable researchfinding, are institutions directly rewarded monetarily for their facultymember�s research output. Sometimes they are rewarded indirectly whencorporations provide funding for particular types of research based onearlier publications by faculty members. Still, by and large, the currencyin which institutions are paid for faculty research output is prestige. As aresult, institutions provide financial rewards to scholarly output.In their efforts to improve or maintain the reputation of their depart-
ments, institutions of higher education participate in what Frank andCook (2000) terms a positional arms race, using higher and higher sala-ries to either entice new faculty away from other institutions or preventexisting faculty from being bid away. So, despite the fact that institu-tions of higher education do not seek to maximize profits, their attemptsto maximize prestige leads them to a competitive process that results inhigher salaries for faculty with strong publishing records.
Inputs
In the process of maximizing prestige, institutions of higher educationnot only reward faculty research output, but also certain inputs to theresearch process. Some of these inputs directly affect institutional pres-tige. For example when a faculty member obtains a research grant andbecomes a principal investigator (PI), the grant is generally announcedand prestige accrues to both the faculty member and the institution.Some may argue that faculty are rewarded for being a PI not so
much because the grants they obtain increase their institution�s prestige,but because they lower their institutions� financial obligations. However,this is not always the case. While grant money often relieves some finan-cial pressure on universities, since it pays a portion of faculty members�salaries, if the overhead that the grant pays is insufficient, which is oftenthe case, particularly for non-Federal grants, these grants may be a netfinancial drain for an institution. In our view, faculty accrue financialrewards from PI status because that status is prestige-enhancing forboth themselves and their employing institution.A second input to the research process—prestige of the institution at
which the faculty member received his or her highest degree—may have a
FACULTY SALARIES AND THE MAXIMIZATION OF PRESTIGE 639
more indirect connection to institutional prestige. Of course, faculty whohave completed their Ph.D., M.D., or L.L.D. at prestigious institutionsmay do higher quality research as a result of superior training. But whe-ther their work is of higher quality or not, they may bring a certain cacheto their departments and their institutions may reward them for this.A third input is teaching. It is expected that faculty spend a minimum
amount of time teaching and this percentage differs by type of institu-tion. However, faculty have the option to ‘‘buy out’’ their teaching andspend more time on research. Teaching and research can be complemen-tary in the sense that better trained students can participate and con-tribute to faculty research, but teaching and research are mostlysubstitutes; the more time faculty spend on teaching the less time theyhave available for research and vice versa.
DATA
Our data are from the 1999 National Study of Postsecondary Faculty(NSOPF), which surveyed 960 public and private non-profit degree-granting postsecondary institutions and 28,576 faculty and instructionalstaff. The response rate of the faculty survey was about 83%. All theinformation in the data set is based on faculty self-reports.NSOPF:99 was conducted between August 1997 and July 1998.
Designed to allow detailed comparisons and high levels of precision atboth the institution and faculty levels, the sample represents all publicand private not-for-profit Title IV-participating, degree-granting institu-tions in the 50 states and the District of Columbia. Both the sample ofinstitutions and the sample of faculty were stratified, systematic samples.The institution sample was stratified by Carnegie classification; the fac-ulty sample was stratified by gender, race and ethnicity.1
We include in our sample only those who held the Ph.D. degree orterminal professional degree, were employed full-time at a four-yearinstitution, taught at least one course, and were engaged primarily inteaching and research. We excluded faculty without a Ph.D. or profes-sional degree because their salaries might be lower. We eliminated full-time administrators and faculty who were employed in institutions thatthe Carnegie Classification labeled ‘‘miscellaneous.’’ We also deleted fac-ulty members whose annual salary was greater than $250,000 or lessthan $20,000 and those whose disciplines were categorized as ‘‘other.’’There were 4,651 faculty in our sample. Because NSOPF:99 is a cross-section rather than a longitudinal sample, we observe only faculty whohave remained in academe; those who left academe, for whatever rea-sons are not in the sample, suggesting that our estimates may be biased.
640 MELGUIZO AND STROBER
EMPIRICAL MODELS AND MEASUREMENT OF VARIABLES
Our conceptual framework suggests that faculty are rewarded finan-cially for increasing institutional prestige. However, because we have nodirect measures of faculty prestige, our empirical work examines therelationship between faculty salary and the output and input variables.Almost all of the variables that we use in our model are also used inhuman capital models. However, our reasons for putting them into themodel and our interpretation of them are different from those who usea human capital model.
The Model
Our salary model in Equ. (1) is in the form used by Barbezat (1991),Barbezat and Hughes (2005), Fairweather (1993, 1995, 1996) andToutkoushian (1998). We estimate it using Ordinary Least Squares(OLS):
InWagesi ¼ ai þ XiBbB þ XiPbp þ ui ð1Þ
Variables
Dependent variable
In Wagesi = Natural log of wagesThe subscript ‘‘i’’ refers to the faculty member.
Explanatory variables: inputs and outputs
P(input) = Being a PI on a research grant, Selectivity of institutionwhere Ph.D. was obtained and percentage of time spent on teaching.P(output) = Articles in refereed journals during career, Non-reviewed
articles during career, Books published during career, Chapters pub-lished during career, and Patents received during career.
Control variables
B = variables reflecting individual demographic and family character-istics (gender, marital status, race and ethnicity, number of financialdependents, years of experience, years of experience squared, tenuretrack, and whether the faculty moved from first institution); and
FACULTY SALARIES AND THE MAXIMIZATION OF PRESTIGE 641
variables reflecting institutional status (type of institution, whether insti-tution is unionized, whether it is a public institution, and its geographi-cal location).ui, = error termThe coefficients for the variables included in ‘‘P’’ are the primary
focus of the analysis. Because we think that incentives to maximize pres-tige at the institutional level vary by type of institution, and thereforecould be expected to vary with respect to rewards to faculty for generat-ing prestige at various types of institutions, we include interactionsbetween each explanatory variable and type of institution. So, for exam-ple, we test whether research institutions pay a higher reward to facultyfor an additional publication, or for being a PI, as compared to com-prehensive institutions.The model is estimated separately for each of the following fields:
natural sciences, engineering, professional fields, social sciences, educa-tion, and humanities and fine arts.The model described above contains ten explanatory variables (pres-
tige indicators) and more than twenty additional variables used as con-trols.2 We estimate three types of salary regressions. First, in sixdifferent models, (one for each field) we examine the effects of theexplanatory and control variables on faculty salary (Table 2). Second,we examine interactions between output and type of institution toexplore differences in the rewards to the generation of institutional pres-tige at different types of institutions (Table 3). Third, we run a fixedeffects model, in which we enter a dummy variable for each institution(except one) in which faculty are employed (Table 4).Because faculty sort themselves into specific types of institutions with
unobserved characteristics that might affect the scholarly work of theirfaculty, the estimations specified in the equations above could be biasedbecause of omitted variables both at the individual and the institutionallevel. At the individual level we don�t know whether the financial rewardfor an additional unit of output at research institutions is higher thanthe one at comprehensive institutions because faculty with higher abilityand/or motivation self-select themselves into research institutions. Thehigher pay at research institutions might actually be reflecting the higherquality of the work produced. Thus, the variable, selectivity of the insti-tution where the faculty got their Ph.D., is not only a measure of pres-tige, but is also a proxy for this unobserved ability.At the institutional level, even though we control for a number of
institutional factors that might confound the impact of output on sal-ary, there may be additional institutional characteristics that we cannotobserve and therefore cannot control for. A conventional correction for
642 MELGUIZO AND STROBER
this type of problem is to estimate the model described above usingfixed-effects. This estimation consists of including a dummy variable forevery postsecondary institution and omitting one.We test four hypotheses. First, with respect to the impact of the input
and output variables on salary, we hypothesize that being a principalinvestigator on a grant, having attended a graduate institution that ismore selective for undergraduates, having one or more patents, andhaving published additional articles in refereed journals, and/or addi-tional books, are associated with receiving a salary premium. Second, atthe same time, we hypothesize that spending more time on teaching hasa negative effect on salary, because teaching does not confer prestige,either to the faculty member or to the institution.The third hypothesis is that the prestige maximization model is more
powerful in the natural sciences and engineering because research in sci-ence and engineering generally confers more prestige on an institutionthan research in other fields. We test for these disciplinary differences byestimating our models separately for six fields: science, engineering, pro-fessional fields, social sciences, education, and humanities and arts. Wecontrol for sub-disciplines in each of these fields.3
Our fourth hypothesis is that, variables that measure prestige will bemost powerful in research universities and doctoral universities and leastpowerful in liberal arts colleges. This hypothesis is derived from the lit-erature, which views research universities as the institutions that aremost concerned with research and the prestige it generates, and liberalarts colleges, as concerned primarily with teaching rather than research.
Measurement of Variables
Salary
The dependent variable in all of the models is the natural log ofannualized base salary
Publication Output
Because research output norms vary across disciplines, we have nor-malized each publication output variable by field of study, controllingfor sub-field. For each of the six fields (natural science, professional,engineering, social science, education, and humanities and arts), we esti-mated for each field and each output variable an equation in which out-put was specified to be a function of a set of explanatory variables thatinclude sub-field, experience, experience squared and type of institution.
FACULTY SALARIES AND THE MAXIMIZATION OF PRESTIGE 643
The residuals of this equation were normalized and then used in theregression equation.We control for sub-disciplines because, within fields, there is also a
hierarchy of prestige for faculty within the sub-disciplines of thosefields. For example, the personal and institutional prestige that accruesto an economist who attracts grant money or publishes a widely-citedarticle or book is likely to be greater than that accruing to an anthro-pologist or her institution in a similar situation. Moreover, the availabil-ity of large grants is greater for economists than for anthropologists.Some of the difference between economists� salaries and those of anthro-pologists with the same experience in the same institution is a result ofthe high opportunity cost for academic economists as compared to aca-demic anthropologists. But, in addition, we think that the difference inthe ability of the two groups to garner prestige also contributes to thedifference in their salaries.Another reason for controlling for sub-disciplines is that the value
placed on different types of publications in a given field may vary acrosssub-disciplines. For example, within the social sciences, economists mayget less credit for books and more credit for peer-reviewed articles,while the opposite is likely to be true for historians.Number of articles in refereed journals is a straightforward variable
and we expect it to be positively related to salary. Non-reviewed articlesare defined as: articles published in non-refereed professional or tradejournals and creative works published in non-juried media or in-housenewsletters. Books published include textbooks as well as other types ofbooks and also include research or technical reports disseminated inter-nally or to clients. Finally, number of chapters in books is defined as:published reviews of books, articles or creative works and chapters inedited books.Because of the heterogeneous nature of these categories with respect
to the production of prestige, it is not clear whether non-reviewed arti-cles, books, and chapters published will be positively related to salary inour regressions. We hope that in future NSOPF surveys, these varioustypes of non-reviewed articles, books, and chapters will be appropriatelydisaggregated so that it will be possible to observe more clearly exactlywhich types of publications are rewarded.
Being a Principal Investigator
Being a principal investigator is a dummy variable equal to 1 forfaculty who are PIs. We expect this variable to be positively related tosalary.
644 MELGUIZO AND STROBER
Patents
Patents is a dummy variable equal to 1 if the faculty member has oneor more patents.Even after holding constant discipline, we expect this variable to be
positively related to salary.
Selectivity of Institution Where Respondent Earned Highest Degree
NSOPF data contain information on the IPEDS code and name ofthe institution where faculty got their highest graduate degree. UsingBarron�s 1999 guide, we use this information to rank all of the institu-tions by their average SAT score for entering undergraduates in 1999.As we have seen earlier, average SAT scores of incoming students is onecomponent of institutional prestige.The selectivity index was derived by the Higher Education Research
Institute, (HERI) at the University of California at Los Angeles. Thescores, which represent the average SAT Composite Score of the institu-tion�s entering class, were derived largely from public information suchas printed college guides, college guide websites on the Internet, and thewebsites of individual colleges and universities. Some of the institutionsreported the ACT scores, which HERI converted to SAT scores. Therange of the variable is 786–1,500.4
Percentage of time spent on teaching
This variable was taken directly from the data set and is the percent-age of time a faculty member reported spending on activities related toteaching. It is important to mention that this variable measures only theamount of time spent on teaching and not the quality of that teaching.Ideally we would like to use a proxy to account for quality of teaching,but unfortunately, the dataset does not enable us to do this. For rea-sons discussed earlier, we expect this variable to have a negative impacton salary.
Control Variables
Type of Institution On average, research institutions pay higher sala-ries than doctoral institutions, which, in turn, pay higher salaries thancomprehensive institutions. Liberal arts colleges pay the lowest salaries.We expect to find positive coefficients on Research Institution and Doc-toral Institution, with the coefficient on Research Institution being lar-ger; we expect to find a negative coefficient on Liberal Arts Institution.
FACULTY SALARIES AND THE MAXIMIZATION OF PRESTIGE 645
Female Female is a dummy variable equal to 1 for all women in thesample. Toutkoushian and Conley (2005), who also used the NSOPF:99data, found that the unexplained gap between men and women�s salariesranged from )0.032 to )0.063, depending on the model used, and wasstatistically significant (These gaps were considerably smaller than theyhad been for NSOPF data for 1993). The 1999 gap was largest in re-search universities. In doctoral institutions and liberal arts colleges, the1999 gap was small and not statistically significant.Barbezat and Hughes (2005), exploring differences in the gender wage
gap by type of institution, concluded that there is evidence that the sal-ary structure varies by institutional type. For liberal arts colleges, gen-der-specific effects accounted for all of the difference in gender salarygaps. In other words, all the differences in pay were the result ofobservable differences. This was not the case for women at researchinstitutions. Relative to liberal arts colleges, women at research universi-ties received less favorable labor market treatment. The more equaltreatment of women at liberal art colleges may be the result of greatervalue placed on overall salary equity at these types of institutions, andless emphasis on performance-based pay structures. But, they noted thatthis more equal treatment comes at a cost; women at liberal arts col-leges are paid on average 30% less than women at research universities.
Field of Study Unlike most previous studies of faculty salary thatcontrol for differences in output within field by including broad disci-plinary fields as control variables: natural sciences, engineering, profes-sional fields (including law, business and health sciences), social sciences,education, and humanities and fine arts (Fairweather, 1993; Perna,2001; 2003), we have normalized all of the publication variables by fieldof study controlling for sub-discipline, experience and type of institu-tion. We then estimate salary equations independently for each of thesix broad disciplinary fields. This normalization procedure coupled withthe estimation strategy is likely to provide more accurate estimates ofthe impact of publications on salary.
Years of Experience and Years of Experience Squared Years of experi-ence is a key variable in human capital models of the determination ofsalary because human capital theory postulates that work experience isa proxy for on-the-job training, which increases marginal productivity,and that faculty are paid according to their marginal productivity.Experience squared is included in human capital models to take accountof the fact that, after some point, on-the-job training results in dimin-ishing returns to increases in marginal productivity.
646 MELGUIZO AND STROBER
In this model, we include experience and experience squared to cap-ture the fact that custom (in private institutions) and institutional salaryschedules (in public institutions) generally accord faculty salary premi-ums for additional years of service.Experience may also be a proxy for quality of work. As their experi-
ence increases, faculty may become better researchers. On the otherhand, if a great deal of time elapses since they were trained and theyhaven�t kept up in their field, faculty output may suffer a decline inquality. Experience squared may pick up a decline in quality of work asfaculty get older, or it may pick up institutions� salary schedules, whichdo not provide for percentage salary increases that are as high in lateryears as they are in early years.NSOPF data do not have information on total years of faculty expe-
rience. They provide no information about whether a faculty memberhas been employed in academia continuously or whether he or she everdropped out of the labor force entirely. We use number of years sincereceiving the Ph.D. (or other highest degree such as M.D. or L.L.D.) asa proxy for work experience.
Tenure Since the granting of tenure is often associated with a salaryincrease, a dummy variable equal to 1 is entered into the regression if afaculty member is tenured.
Mobility The dummy variable, Moved from First Institution, takeson the value of 1 if the faculty member is no longer at the institutionwhere she or he held their first academic position. Faculty who havechanged their institutional affiliation may have moved in response to amore lucrative job offer. On the other hand, they may have moved be-cause they were turned down for promotion, in which case their newjob may not pay more than the one they left.
Union Membership The dummy variable, Union Member, is equal to1 if the respondent is a union member. In comprehensive universities,where union membership is more common than elsewhere, faculty inunionized institutions may enjoy higher salaries than faculty in non-un-ion institutions. On the other hand, if non-unionized institutions pay thesame as unionized institutions in order to forestall faculty unionization,there may not be a salary premium associated with union membership.
Race and Ethnicity This series of dummy variables, African Ameri-can, Hispanic, Asian, and Native American, are equal to 1 if therespondent is a member of the minority racial or ethnic group. Theomitted race/ethnicity category is Caucasian.
Being Married and Having Financial Dependent(s) Being married is adummy variable equal to 1 if the respondent is married. Having finan-cial dependents is a dummy variable equal to 1 when someone receives
FACULTY SALARIES AND THE MAXIMIZATION OF PRESTIGE 647
at least half of his or her financial support from the faculty respondent.On the one hand, being married and having one or more financialdependents may be positively related to salary because the existence ofthese dependents motivates faculty members to work harder; on theother hand, these dependents may take time away from work and nega-tively influence willingness to move in response to a more lucrative out-side offer.
Employment at a Public Institution The dummy variable, Public Insti-tution, is equal to 1 if the faculty member is employed at a public insti-tution.
Geographic Location Eight dummy variables representing geographiclocation are also entered into the regressions. (See Table 1 for a list ofall of the geographic location variables.) The South East and SouthWest categories were aggregated in one single category, South and itwas omitted from the regression.
FINDINGS
Means of Key Variables
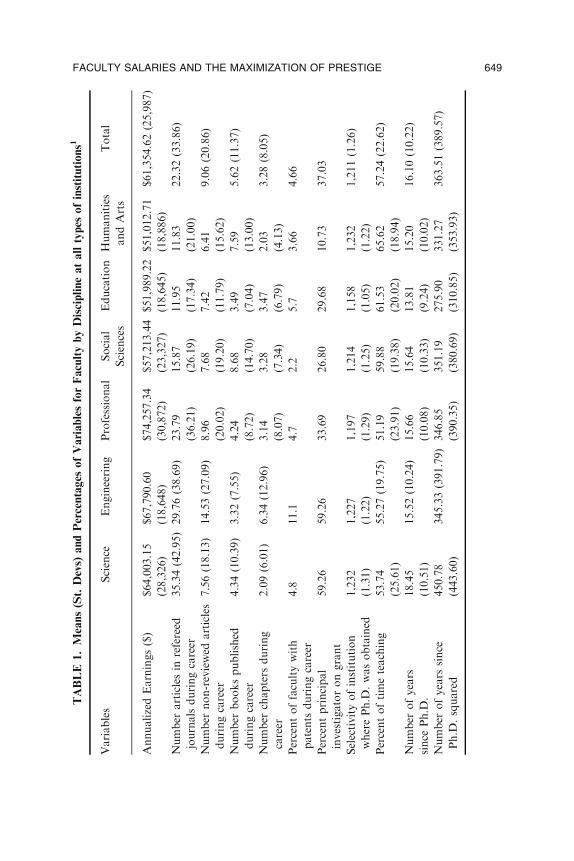
Table 1 shows the means and standard deviations for the variablesused in the salary regressions presented in Tables 2– 4.The mean annualized salary for the sample as a whole was $61,355,
ranging from a high of $74,257 for faculty in professional fields to a lowof $51,013 for faculty in the humanities and fine arts. It is interesting tonote that salaries in engineering were more equal than salaries in otherfields. (The coefficient of variation [CV] of salaries in engineering was($18,648) as compared with that in the sciences ($28,326), professionalfields ($30,872) and the social sciences ($23,327).On average, faculty published 22.3 articles in refereed journals over
the course of their career, ranging from 35.3 in science to 11.8 inhumanities and fine arts.The average number of books published over the career for all faculty
was 5.6, ranging from 8.7 in the social sciences to 3.3 in engineering.Only 5% of the faculty reported having patents.5 Among engineers,
11% of the sample had patents, among those in education, 6%; amongthose in science, 5%. Among faculty who had patents, the number var-ied widely, between 1 and 15.Thirty-seven percent of faculty in the sample were PIs on research
grants, ranging from a high of almost 60% for those in science andengineering to a low of 11% for those in the humanities.
648 MELGUIZO AND STROBER
TABLE
1.Means(St.Devs)
andPercentages
ofVariablesforFacultybyDisciplineatalltypes
ofinstitutions1
Variables
Science
Engineering
Professional
Social
Sciences
Education
Humanities
andArts
Total
AnnualizedEarnings($)
$64,003.15
(28,326)
$67,790.60
(18,648)
$74,257.34
(30,872)
$57,213.44
(23,327)
$51,989.22
(18,645)
$51,012.71
(18,886)
$61,354.62(25,987)
Number
articlesin
refereed
journalsduringcareer
35.34(42.95)
29.76(38.69)
23.79
(36.21)
15.87
(26.19)
11.95
(17.34)
11.83
(21.00)
22.32(33.86)
Number
non-reviewed
articles
duringcareer
7.56(18.13)
14.53(27.09)
8.96
(20.02)
7.68
(19.20)
7.42
(11.79)
6.41
(15.62)
9.06(20.86)
Number
bookspublished
duringcareer
4.34(10.39)
3.32(7.55)
4.24
(8.72)
8.68
(14.70)
3.49
(7.04)
7.59
(13.00)
5.62(11.37)
Number
chapters
during
career
2.09(6.01)
6.34(12.96)
3.14
(8.07)
3.28
(7.34)
3.47
(6.79)
2.03
(4.13)
3.28(8.05)
Percentoffacultywith
patents
duringcareer
4.8
11.1
4.7
2.2
5.7
3.66
4.66
Percentprincipal
investigatorongrant
59.26
59.26
33.69
26.80
29.68
10.73
37.03
Selectivityofinstitution
wherePh.D
.wasobtained
1,232
(1.31)
1,227
(1.22)
1,197
(1.29)
1,214
(1.25)
1,158
(1.05)
1,232
(1.22)
1,211(1.26)
Percentoftimeteaching
53.74
(25.61)
55.27(19.75)
51.19
(23.91)
59.88
(19.38)
61.53
(20.02)
65.62
(18.94)
57.24(22.62)
Number
ofyears
since
Ph.D
.
18.45
(10.51)
15.52(10.24)
15.66
(10.08)
15.64
(10.33)
13.81
(9.24)
15.20
(10.02)
16.10(10.22)
Number
ofyears
since
Ph.D
.squared
450.78
(443.60)
345.33(391.79)
346.85
(390.35)
351.19
(380.69)
275.90
(310.85)
331.27
(353.93)
363.51(389.57)
FACULTY SALARIES AND THE MAXIMIZATION OF PRESTIGE 649
TABLE
1.Continued
Variables
Science
Engineering
Professional
Social
Sciences
Education
Humanities
andArts
Total
Percentwithtenure
66.44
66.44
57.01
63.88
58.90
62.88
62.89
Percentwhomoved
from
firstinstitution
40.99
49.31
40.64
35.05
40.87
34.72
39.36
Percentunionized
15.50
11.34
12.60
19.90
25.34
22.00
17.99
Percentem
ployed
inpublicinstitutions
70.63
74.54
63.72
69.90
77.40
61.49
69.49
PercentFem
ale
22.70
11.34
38.87
38.16
57.99
44.82
34.59
PercentWhite
82.70
68.29
82.33
86.89
85.39
90.03
83.69
PercentAfricanAmerican
3.33
6.02
6.36
7.67
9.36
4.92
6.10
PercentHispanic
3.96
6.02
3.65
5.73
5.94
9.72
5.56
PercentAsian
13.87
25.23
11.31
5.83
4.57
4.67
10.08
PercentNativeAmerican
0.90
1.16
0.71
1.36
1.14
0.88
1.02
PercentMarried
80.45
84.72
81.51
75.53
72.15
69.82
77.35
Number
ofFinancialdependents
1.41
(1.34)
1.63
(1.43)
1.43
(1.34)
1.18
(1.27)
1.05
(1.19)
1.05
(1.25)
1.30
(1.32)
Percentin
Science
1.00
0.00
0.00
0.00
0.00
0.00
0.22
Percentin
Engineering
0.00
1.00
0.00
0.00
0.00
0.00
0.09
Percentin
ProfessionalFld
0.00
0.00
1.00
0.00
0.00
0.00
0.17
Percentin
SocialSciences
0.00
0.00
0.00
1.00
0.00
0.00
0.21
Percentin
Education
0.00
0.00
0.00
0.00
1.00
0.00
0.09
Percentin
Hum
andArts
0.00
0.00
0.00
0.00
0.00
1.00
0.16
Percentworkingatinstitutionin
New
England
6.13
8.10
6.60
8.25
4.11
6.94
6.78
Percentworkingatinstitutionin
Mid
Atlantic
19.19
18.29
19.55
19.90
17.81
21.46
19.37
Percentworkingatinstitutionin
theGreatLakes
19.37
14.58
20.02
19.22
20.32
20.33
18.89
650 MELGUIZO AND STROBER
TABLE
1.Continued
Percentworkingatinstitutionin
thePlains
8.83
8.80
7.66
9.22
10.27
9.60
8.98
Percentworkingatinstitutionin
theSouth
East
24.41
27.78
25.09
20.68
28.54
19.82
23.93
Percentworkingatinstitutionin
theSouth
West
7.21
9.26
6.24
6.99
5.94
6.82
7.04
Percentworkingatinstitutionin
theRockyMountains
3.96
3.94
2.12
4.08
4.57
3.91
3.84
Percentworkingatinstitutionin
theFarWest
10.90
9.26
12.72
11.65
8.45
11.11
11.16
N1,110
432
849
1,030
438
792
4,651
Source:
NationalSurvey
onPostsecondary
Faculty(N
SPF:99)
FACULTY SALARIES AND THE MAXIMIZATION OF PRESTIGE 651
TABLE
2.Coeffi
cients
(St.Errors)ofOLSRegressions-FacultySalary
Determination,byDiscipline
Variable
Science
Engineering
Professional
Social
Sciences
Education
Humanities
andArts
Articlesin
refereed
journalsduringcareer
0.072(0.012)**
0.057(0.013)**
0.039(0.012)**
0.032(0.010)**
0.024(0.009)**
0.01(0.01)
Non-reviewed
articlesduringcareer
0.001(0.00)
0.026(0.008)**
0.016(0.01)
0.012(0.01)
)0.009(0.01)
)0.005(0.01)
Bookspublished
during
career
0.001(0.00)
)0.012(0.01)
0.004(0.01)
)0.003(0.01)
0.017(0.01)
0.021(0.01)
Chapters
published
during
career
0.002(0.001)*
0.015(0.01)
)0.004(0.01)
0.024(0.009)*
)0.003(0.01)
0.016(0.008)*
Patents
career
(dummy)
0.007(0.01)
0.022(0.008)**
0.007(0.01)
0.01(0.01)
0.002(0.01)
0.002(0.01)
Principalinvestigator
ongrant
0.091(0.024)**
0.017(0.03)
)0.019(0.04)
0.081(0.021)**
0.017(0.03)
0.037(0.02)
Selectivityofinstitution
wherePh.D
.wasobtained
0.016(0.01)
0.03(0.009)**
0.021(0.009)*
0.03(0.008)**
0.018(0.01)
0.028(0.008)**
Percentageoftimeteaching
)0.002(0.001)**
)0.001(0.001)*
)0.003(0.001)**
)0.002(0.001)**
)0.002(0.001)**
)0.001(0.001)**
ResearchInstitution
0.193(0.027)**
0.158(0.034)**
0.184(0.036)**
0.189(0.024)**
0.043()0.031)
0.046()0.024)
DoctoralInstitution
0.051(0.03)
0.091(0.035)*
0.047(0.04)
0.078(0.027)**
)0.038(0.03)
)0.005(0.03)
LiberalArtsInstitution
)0.019(0.03)
0.048(0.07)
)0.156(0.047)**
)0.004(0.04)
)0.013(0.04)
)0.042(0.03)
Controlsforsubfield
Yes
Yes
Yes
Yes
Yes
Yes
Other
controls
Yes
Yes
Yes
Yes
Yes
Yes
Constant
10.295(0.109)**
10.417(0.167)**
10.725(0.136)**
10.139(0.125)**
10.385(0.143)**
10.181(0.114)**
N1,110
432
849
1,030
438
792
R-squared
0.62
0.55
0.43
0.61
0.58
0.55
Source:
NationalSurvey
onPostsecondary
Faculty(N
SPF:99)
*significantat5%
;**significantat1%
Controlvariablesinclude:AfricanAmerican,Hispanic,NativeAmerican,Fem
ale,Married,Financialdependents,Experience,Experience
squared,
Geographic
location,Tenured,Unionized,PublicinstitutionandMoved
from
firsthiringinstitution.
652 MELGUIZO AND STROBER
TABLE
3.Coeffi
cients
(St.Errors)in
OLSRegressions—
FacultySalary
Determinationbydiscipline—
WithInteractions(1)
Variables
Science
Engineering
Professional
Social
Sciences
Education
Humanities
andArts
Typeofinstitution*Principal
investigatorongrant
Principalinvestigatoron
grant
0.046(0.03)
0.033(0.05)
)0.071(0.05)
0.076(0.032)*
0.034(0.05)
)0.011(0.05)
ResearchInstitution
0.143(0.034)**
0.116(0.043)**
0.178(0.042)**
0.171(0.028)**
0.04(0.03)
0.031(0.03)
DoctoralInstitution
0.101(0.045)*
0.156(0.049)**
0.012(0.05)
0.093(0.030)**
)0.008(0.04)
)0.009(0.03)
LiberalArts
)0.034(0.04)
0.03(0.08)
)0.158(0.054)**
0.008(0.04)
)0.014(0.04)
)0.035(0.03)
ResearchInstitution*Principal
investigatorongrant
0.094(0.040)*
0.039(0.06)
0.049(0.06)
0.052(0.05)
)0.001(0.05)
0.121(0.061)*
DoctoralInstitution*Principal
investigatorongrant
)0.049(0.06)
)0.146(0.065)*
0.142(0.09)
)0.059(0.05)
)0.143(0.064)*
0.04(0.06)
LiberalArts*Principal
investigatorongrant
0.056(0.05)
0.074(0.1)
)0.022(0.16)
)0.062(0.06)
0.008(0.07)
)0.063(0.08)
Controlsforsubfield
Yes
Yes
Yes
Yes
Yes
Yes
Controls
Yes
Yes
Yes
Yes
Yes
Yes
R-squared
0.62
0.57
0.44
0.62
0.58
0.55
N1,110
407
849
1,087
438
760
Typeofinstitution*Selectivity
Selectivityofinstitutionwhere
PhD
wasobtained
0.023(0.01)
0.038(0.02)
0.002(0.02)
0.011(0.01)
0.015(0.02)
)0.001(0.01)
ResearchInstitution
0.31(0.26)
0.138(0.30)
)0.197(0.29)
)0.132(0.27)
0.111(0.25)
)0.499(0.227)*
DoctoralInstitution
0.253(0.24)
0.685(0.45)
)0.221(0.31)
)0.142(0.26)
)0.306(0.31)
)0.458(0.277)
LiberalArts
)0.081(0.29)
1.117(0.78)
)0.478(0.37)
)0.395(0.26)
0.124(0.30)
)0.59(0.270)*
FACULTY SALARIES AND THE MAXIMIZATION OF PRESTIGE 653
TABLE
3.Continued
Variables
Science
Engineering
Professional
Social
Sciences
Education
Humanities
andArts
ResearchInstitution*Selectivity
ofinstitutionwherePhD
wasobtained
)0.01(0.02)
0.001(0.03)
0.031(0.02)
0.027(0.02)
)0.005(0.02)
0.043(0.018)*
DoctoralInstitution*Selectivity
ofinstitutionwherePhD
wasobtained
)0.016(0.02)
)0.049(0.04)
0.022(0.03)
0.019(0.02)
0.024(0.03)
0.037(0.02)
LiberalArts*Selectivity
ofinstitutionwherePhD
wasobtained
0.006(0.02)
)0.091(0.07)
0.027(0.03)
0.033(0.02)
)0.013(0.03)
0.046(0.023)*
Controlsforsub-field
Yes
Yes
Yes
Yes
Yes
Yes
Controls
Yes
Yes
Yes
Yes
Yes
Yes
R-squared
0.62
0.56
0.44
0.62
0.58
0.56
N1,110
407
849
1,087
438
760
Type*articlesin
refereed
journalsduringcareer
Articlesin
refereed
journals
duringcareer
0.103(0.037)**
)0.023(0.02)
0.019(0.02)
0.02(0.02)
0.023(0.01)
0.029(0.02)
ResearchInstitution
0.244(0.061)**
0.072(0.04)
0.163(0.049)**
0.173(0.036)**
0.043(0.05)
0.062(0.03)
DoctoralInstitution
0.094(0.047)*
0.035(0.04)
0.035(0.04)
0.078(0.033)*
)0.043(0.04)
)0.001(0.04)
LiberalArts
)0.013(0.03)
)0.015(0.07)
)0.155(0.051)**
)0.017(0.04)
)0.041(0.04)
)0.024(0.03)
ResearchInstitution*articles
inrefereed
journals
)0.001(0.00)
0.003(0.001)**
0.001(0.00)
0.001(0.00)
0.00(0.00)
0.00(0.00)
654 MELGUIZO AND STROBER
TABLE
3.Continued
DoctoralInstitution*articles
inrefereed
journals
)0.001(0.00)
0.002(0.001)*
0.001(0.00)
0.00(0.00)
0.00(0.00)
0.00(0.00)
LiberalArtsInstitution*articles
inrefereed
journals
0.00(0.00)
0.01(0.003)**
).001(0.00)
0.00(0.00)
0.01(0.01)
).002(0.00)
Controlsforsub-field
Yes
Yes
Yes
Yes
Yes
Yes
Other
controls
Yes
Yes
Yes
Yes
Yes
Yes
R-squared
0.62
0.57
0.43
0.62
0.58
0.55
N1,110
407
849
1,087
438
760
Source:
NationalSurvey
onPostsecondary
Faculty(N
SPF:99).
(1)Everymodelreported
included
allthegeneralcontrolslisted
belowandthecontrolsbysub-field.Wereportonly
thecoeffi
cientsforthevariables
included
ineach
oftheinteractionterm
sreported.
*significantat5%
;**significantat1%
.
Controlvariablesinclude:AfricanAmerican,Hispanic,NativeAmerican,Fem
ale,Married,Financialdependents,Experience,Experience
squared,
Geographic
location,Tenured,Unionized,PublicinstitutionandMoved
from
firsthiringinstitution.
FACULTY SALARIES AND THE MAXIMIZATION OF PRESTIGE 655
TABLE
4.Coeffi
cients
(St.Errors)in
FacultySalary
DeterminationRegressions,bydiscipline—
withFixed-Effects
(1)
Variables
Science
Engineering
Professional
SocialSciences
Education
HumanitiesandArts
Articlesin
refereed
journals
duringcareer
0.072(0.009)**
0.039(0.011)**
0.045(0.015)**
0.016(0.01)
0.029(0.02)
0.011(0.01)
Non-reviewed
articles
duringcareer
0.01(0.01)
0.02(0.01)
0.02(0.01)
0.01(0.01)
0.01(0.02)
(0.01)(0.01)
Bookspublished
during
career
0.006(0.01)
)0.015(0.01)
)0.012(0.01)
)0.002(0.01)
)0.001(0.02)
0.025(0.011)*
Chapters
published
duringcareer
0.01(0.01)
0.01(0.01)
(0.01)(0.01)
0.02(0.01)
(0.01)(0.02)
0.01(0.01)
Patents
career
(dummy)
0.00(0.01)
0.03(0.013)*
0.00(0.01)
0.01(0.01)
0.00(0.02)
0.02(0.01)
Principalinvestigator
ongrant
0.069(0.022)**
0.071(0.028)*
)0.002(0.03)
0.047(0.020)*
0.01(0.04)
0.029(0.03)
Percentoftimeteaching
)0.002(0.000)**)0.00(0.00)
)0.00(0.001)**
)0.00(0.000)**
)0.00(0.00)
)0.00(0.00)
Controls(1)
Yes
Yes
Yes
Yes
Yes
Yes
Fixed
Effects
Yes
Yes
Yes
Yes
Yes
Yes
Constant
10.677(0.046)**10.772(0.106)**11.019(0.071)**10.571(0.060)**10.718(0.159)**
10.534(0.054)**
N1,110
432
849
1,030
438
792
Adjusted
RSquared
0.76
0.83
0.61
0.79
0.83
0.77
Source:
NationalSurvey
onPostsecondary
Faculty(N
SPF:99)
*significantat5%
;**significantat1%
(1)Controlvariablesinclude:
AfricanAmerican,Hispanic,NativeAmerican,Married,Financialdependents,Experience,Experience
squared,
Moved
from
firstinstitutionandTenured.
Nocontrolsrelatedto
institutionalcharacteristics
wereincluded.
656 MELGUIZO AND STROBER
The average SAT scores of entering undergraduates at the institutionswhere faculty received their Ph.D. or terminal professional degree was1,211. Faculty from science, and from the humanities and arts camefrom the most selective institutions (1,232); faculty in education camefrom the least selective (1,158).On average, faculty spent 57% of their time teaching. Those in the
humanities and arts spent, on average, two-thirds of their time teaching,while those in professional fields spent about half of their time teaching.It is important to remember that these averages are for all facultyregardless of their type of institution. On average, faculty in researchinstitutions spent considerably less time on teaching, about 47% of theirtime, as compared to 57% for faculty at doctoral institutions, 67 forfaculty at comprehensive institutions and more than 70% for faculty inliberal arts colleges. (These percentages by type of institution are notlisted in Table 1.)
REGRESSIONS
Rewards for Enhancing Institutional Prestige
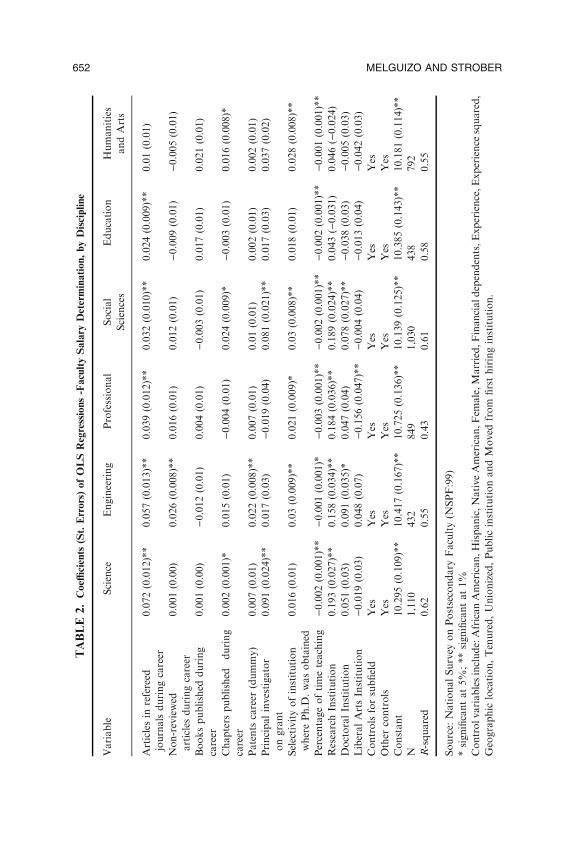
The results in Table 2 are consistent with the theory that facultymembers are financially rewarded for enhancing the prestige of theirinstitutions. Across all fields, the regression models explain between43% (professional fields) and 62% (sciences) of the variance in the logof salary. Publishing articles in refereed journals was significantlyrelated to salary in all fields except for the humanities and arts. (Recallthat all publication measures in the regressions are normalized by fieldcontrolling for sub-field, experience, and type of institution). The effectof published articles in refereed journals was largest in thesciences—holding all else constant, an increase of one standard devia-tion in the number of refereed articles written over the career increasedsalary by 7% for faculty in the sciences. In engineering and the profes-sional fields, the effect was 6%; in the social sciences and education, 3and 2%, respectively.We used a t-test to test whether the differences between the coeffi-
cients in the different fields were significant. The results suggest that thedifferences in the magnitudes of the coefficients between science andsocial science and between science and education were both statisticallysignificant. The same was true for the difference between the coefficientsfor engineering and education. These results support our hypothesis thatthe prestige model is more powerful for the sciences and engineering.
FACULTY SALARIES AND THE MAXIMIZATION OF PRESTIGE 657
An increase of one standard deviation in the number of non-reviewedarticles significantly affected salary only for engineers, by 3%.An increase of one standard deviation in the number of books pub-
lished over the career did not significantly affect salary. This may bebecause, as noted earlier, the NSOPF measure includes textbooks intheir definition of books.For chapters published, an increase of one standard deviation had a
significant effect on salary in the social sciences, science and humanitiesand arts. In all of these cases, the effects were less than 3%. The differ-ences in the coefficients across fields were statistically significant.Having at least one patent had a significant, positive effect on salaries
only for engineers, slightly over 2%.Being a PI on a grant significantly increased salary for faculty in
the sciences (by 9%), and in the social sciences (by 8%). The differ-ence in the magnitude of these two coefficients was not statisticallysignificant.The undergraduate selectivity of the institution where the faculty
member received the Ph.D. or other terminal degree had a significanteffect on salary for all fields except the natural sciences and education;an additional 100 points on the selectivity measure (SAT or ACT scorefor entering freshmen in 1999) raised faculty salary by almost 3% in thesocial sciences, engineering and the humanities and arts, and 2% in theprofessional fields. It is interesting that this measure of prestige was notimportant in the sciences. Perhaps this variable is more important inthose fields that have fewer more direct measures of prestige, such asbeing a PI on a grant or having patents.The percentage of time spent in teaching was significantly negative for
all fields, but the magnitude of the coefficents was extremely small. Basi-cally, the regressions tell us that spending more time on teaching has nofinancial reward for faculty, regardless of field.Being in a research institution (as compared to a comprehensive insti-
tution) had a large payoff in four of the six fields: in professional fieldsthose in research universities, ceteris paribus earned 18% more; in thesciences, 19% more; in the social sciences, 16% more and in engineering16% more.Being in a doctoral institution (as compared to a comprehensive insti-
tution) provided a significant positive return for faculty in engineering(9%) and social science (8%), but those returns were much lower thanfor faculty in those two fields in research universities.In liberal arts institutions, faculty in professional fields suffered a sal-
ary loss of 16% as compared to their counterparts in comprehensiveuniversities.
658 MELGUIZO AND STROBER
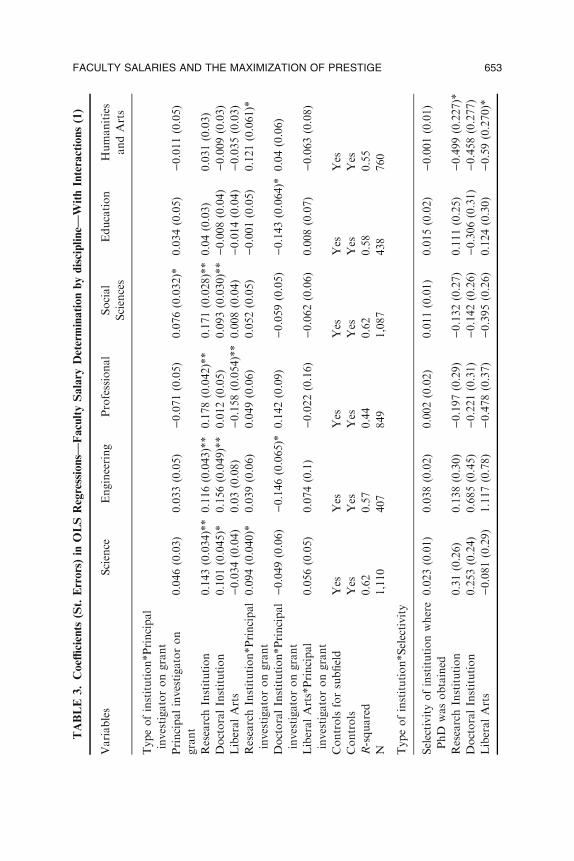
TYPE OF INSTITUTION
The regressions by field of study reported in Table 3 present theresults for several variables� interactions with type of institution: being aPI on a grant, selectivity of institution where Ph.D. was obtained; andarticles in refereed journals. In all instances, comprehensive universitywas the omitted category. For example, in order to capture salary differ-ences related to being a PI by type of institution, three interaction termswere included. The variable being a PI on a grant was multiplied firstby the variable research institution, second by doctoral institution andthird by liberal arts college. These three new variables were included inthe regression. The omitted category is being a PI on a grant at a com-prehensive institution.All of the models included all of the controls listed in the table
as well as the controls by sub-field. The table reports only the coef-ficients for the variables included in each of the interaction termslisted.
Research Institutions
The interaction term between being a PI with type of institution, waspositive and significant at a research university for faculty in thesciences and in the humanities and fine arts. The return for faculty inthe sciences at research institutions is about 14% (the total impact isestimated by adding the coefficient of being a PI with the interactionterm) compared to about 5% for faculty in the sciences at comprehen-sive institutions, holding all else constant. For faculty in humanities andarts, the return for faculty at research universities is 11%, as comparedto about zero for faculty in the humanities and arts at comprehensiveinstitutions, holding all else constant.The interaction term between selectivity of institution where Ph.D. or
other terminal degree was obtained with being in a research university,was significant for faculty in the humanities and arts. Holding all elseconstant, a 10% increase in the average undergraduate selectivity of theinstitution where the faculty member in the humanities or arts obtainedhis or her terminal degree was related to a salary increment of 0.03% atresearch universities, as compared to )0.001 in comprehensive institu-tions. The coefficients on the interaction terms for other fields were notstatistically significant.The only interaction terms between articles in refereed journal with
the three types of institutions that were significant were for faculty inengineering in research institutions, doctoral universities and liberal arts
FACULTY SALARIES AND THE MAXIMIZATION OF PRESTIGE 659
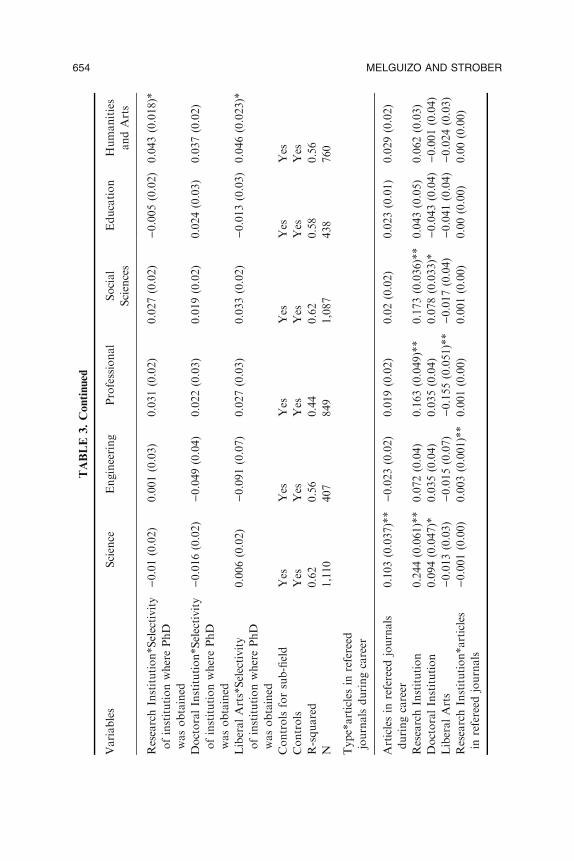
colleges. However, these coefficients were extremely small, so that itseems safe to say that the rewards for articles in refereed journals werenot different across the four types of institutions.Our results indicate that doctoral universities, comprehensive institu-
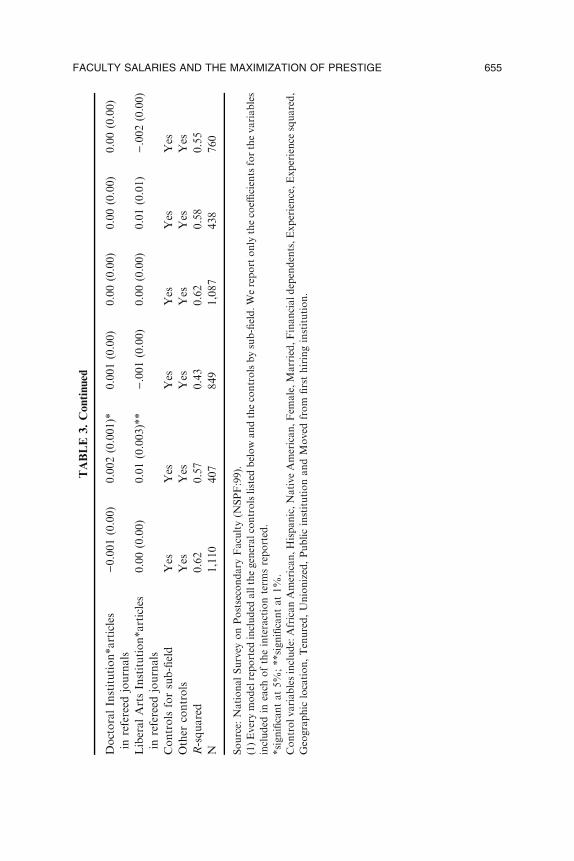
tions, and liberal arts colleges are not all that different from researchuniversities with respect to their rewards for faculty who generate pres-tige. While it is true that in certain fields research universities single outPIs for financial rewards and that liberal arts colleges and doctoral insti-tutions appear to especially reward faculty in the humanities and artswho got their terminal degrees at institutions with prestigious under-graduate programs, with respect to rewards for publications, other typesof institutions appear to have emulated research universities to such adegree that differences among them in the rewards for publications arequite small.To further investigate the relationships at different types of institu-
tions between percentage time spent on teaching and research andfinancial rewards, we used the Data Analysis System (DAS) for theNSOPF: (1987, 1993, 1999 and 2004) to compare the salaries of fac-ulty at research, doctoral, comprehensive and liberal arts colleges bythe percentage of time they spent on research and teaching activities.We examined the salaries of faculty that spent a very small percentageof their time teaching (5–35%) and the salaries of faculty that spent arelatively high percentage of their time on research (30–40%). Theresults indicate that over the last 10–15 years, the financial returns forfaculty at liberal arts colleges who do a substantial amount of researchand a relatively small amount of teaching have become more similarto the financial returns for colleagues who allocate their time similarlyat research universities.For the late eighties, we found that faculty in liberal art colleges who
spent a small percentage of time teaching earned one third of the sala-ries of faculty at research institutions. However, by 2004 the ratio wastwo thirds. Similarly, for the early nineties, we found that faculty in lib-eral arts colleges who spent 30–40% of their time on research earned60% of what faculty at research institutions who spent the same per-centage of their time on research earned. But by 2004, that ratio hadrisen to 70%.6
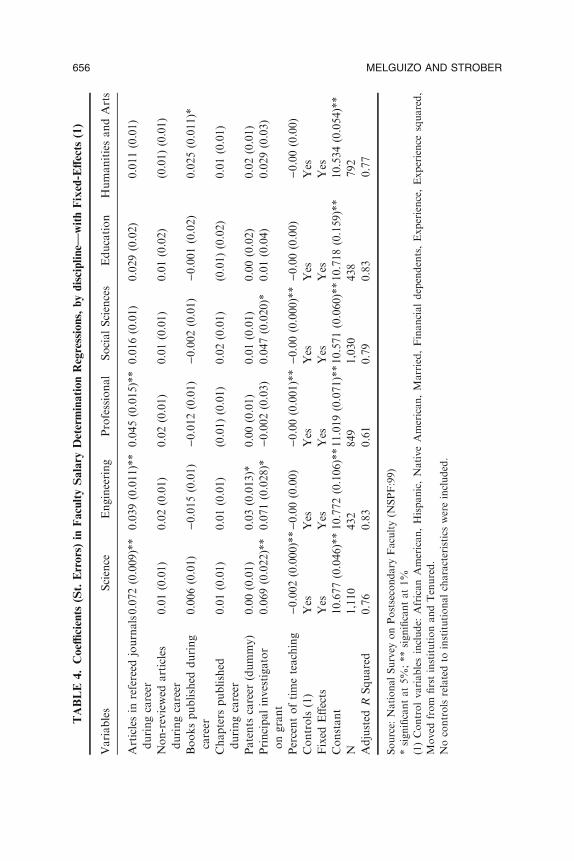
Fixed Effects Model
To control more fully for institutional characteristics, we use a fixedeffects model, which includes a dummy variable for all except one of theinstitutions where faculty were employed. (The total number of institu-
660 MELGUIZO AND STROBER
tions at which faculty were employed was 462). An advantage of thismethod is that after controlling for institution there are no longerbetween institutional differences, only within institutional differences.The results of the fixed effects model are presented in Table 4. The
estimates are similar to the OLS model without interactions, (Table 2),but the R-squared is considerably higher, (0.61–0.83 for the fixed effectsmodels as compared to, 0.43–0.62 for the OLS models). As was the casein the OLS models without interactions, in the fixed effects models wefound statistically significant coefficients for articles in refereed journalsfor faculty in the natural sciences, engineering, professional and socialscience fields. There was a small premium for being a PI on a grant forfaculty in the sciences and engineering.However, the coefficient for articles in refereed journals for faculty in
social sciences and education is no longer significant. In other words, inthis field, once the particular institution of employment is controlledfor, the effect of increased output on salary is no longer significant. Thisresult is not unexpected in a fixed effects model since it is quite possiblethat there is simultaneity between institution of employment andresearch output; being productive may well lead to a position in a highquality institution and, at the same time, being at a high quality institu-tion may lead to additional output as time is freed up for additionalresearch.However, it is not clear why the fixed effects model either decreases or
eliminates the significance of refereed articles in these fields, but not inthe natural sciences, engineering and the professional fields. One possi-ble explanation is that prestige is rewarded differently in certain fields.For example, the results of Table 2 suggests that faculty in education,unlike other faculty, are not rewarded for the prestige of the institutionwhere their Ph.D. was obtained. This means that there might be differ-ences in what this field considers prestigious. So when we control forunobserved institutional characteristics we find that the positive and sig-nificant return to output disappears.
CONCLUSION
This paper examines faculty salary determination through the lens ofthe emerging economic theory of higher educational institutions. Start-ing from the premise that academic institutions seek to maximize pres-tige, we argue that faculty gain monetary rewards for activities thatconfer prestige on their employing institution. The results of the empiri-cal model are consistent with the theory that faculty members are finan-cially rewarded for enhancing the prestige of their institutions. The
FACULTY SALARIES AND THE MAXIMIZATION OF PRESTIGE 661
models we have estimated fit well, with R-squares that account forabout 40–60% of the variance in faculty salaries in the models reportedin Table 2 and 60–80% in the fixed effects models reported in Table 4.The first three of our hypotheses are supported or partially supported
by the results. First, with respect to the inputs in our model, being a PIon a grant was an activity that had a positive and significant impact onfaculty salary. This was particularly so for research universities in thefields of science and social science. It is likely that there are multiplereasons why institutions, and particularly research universities, rewardfaculty for bringing in grants. One is that having grants enhances theprestige of both the faculty members who are PIs and the institutionsthat employ them. Second, is that having a grant signals future researchoutput. It may be that the positive financial reward given to PIs are tosome extent ‘‘advances’’ on the rewards that will accrue from theirfuture output.We also found that, except in science and education, faculty were
rewarded for having obtained their terminal degree at an institution thathas a prestigious undergraduate program. In testing for interactioneffects with type of institution, we found that having a prestigiousdegree was particularly rewarded in the humanities and arts in researchinstitutions.The coefficient on having one or more patents and the coefficients on
articles in refereed and non-refereed journals were significant and posi-tively related to salary.Our second hypothesis, that spending more time on teaching has a
negative effect on salary, was also supported by our analyses, althoughthe negative effect was very small. It would be more correct to say thatspending more time on teaching has no effect on salary. Still, this is astunning and concerning finding.Our third hypothesis, that the prestige model is more powerful in the
natural sciences and engineering than in other disciplines, obtained onlypartial support. In support of the hypothesis, we found that the returnto an additional article in a refereed journal was statistically signifi-cantly higher in science and engineering as compared to other disci-plines. However, it is interesting that one of our measures of prestige,the undergraduate selectivity of the institution from which the facultymember received his or her terminal degree, was not significant for sci-entists (although it was significant for engineering and for several of theother fields).Given the mission of research universities, our fourth hypothesis was
that the prestige model would most accurately describe the monetaryrewards for faculty at these types of institutions. However, we found
662 MELGUIZO AND STROBER
that while research institutions rewarded being a PI on a grant (in sci-ence and social sciences) more than comprehensive institutions did,research universities did not reward publication in refereed journalsmore than comprehensive universities. While the coefficients on theinteractions for engineering were significant, they were extremely small.The small coefficients on the interaction terms for engineering and theabsence of significant interaction terms for research universities or doc-toral institutions for the other fields suggests that other types of univer-sities have emulated research universities to such a degree that rewardsto faculty for the production of prestige in comprehensive and doctoralinstitutions are now quite similar to those of research universities.Moreover, more time spent on teaching was not rewarded in any of thetypes of institutions. These findings have serious consequences for thetraditional teaching mission of comprehensive institutions.It appears that even liberal arts colleges emulate universities in
their rewarding of faculty publications. Most of the coefficients onthe interaction terms between activities related to prestige and liberalarts colleges were not statistically significant, specifically, the coeffi-cients on the interactions between research output and liberal art col-lege, which suggests that there are no statistically significantdifferences in rewards for faculty at liberal arts colleges as comparedto comprehensive institutions.Examining faculty salaries through the lens of prestige maximization
raises several important and potentially disturbing questions. The geniusof the American university has been its melding of research and teach-ing in a single institution. Unlike the German model, for example,where research is performed in institutes that are not attached to univer-sities, the American model is built on combining these two activities.Our system is also built on the expectation that faculty in research uni-versities will spend a greater percentage of their time engaged inresearch while faculty in liberal arts colleges and comprehensive univer-sities will spend more of their time on teaching.But recently, concern that faculty may not be spending adequate time
on teaching and concern that this decline in faculty input has led to adeterioration in the quality of the education provided, has led to numer-ous calls for formalized assessment of students to determine more pre-cisely the value added of colleges and universities on the teaching side(Brewer, Gates and Goldman, 2002; Fairweather, 1996; Zemsky, Weg-ner and Massy, 2006). There is also concern about ‘‘mission creep,’’ thephenomenon that describes non-research universities� increasing fascina-tion with emulating research universities� concerns with research.
FACULTY SALARIES AND THE MAXIMIZATION OF PRESTIGE 663
Our results suggest that these concerns may have merit. We findthat the rewards to faculty for articles in refereed journals are not thatdifferent across the four types of institutions. We also find that spend-ing more time on teaching does not raise salaries, even in liberal artscolleges with their traditional emphasis on teaching. If faculty arebeing rewarded financially for research output, so as to increase theirinstitutions� prestige, but are not being rewarded financially for spend-ing time on teaching, there is a case to be made that higher educa-tion�s reward systems do not parallel its rhetoric about thefundamental importance of both teaching and research and the syner-gies to be obtained by combining them. It may be that for some fac-ulty research and teaching are complementary and enhance oneanother, but for most, good teaching takes time away from research,and if it is only research that is financially rewarded, the incentives tospend any more than the minimally required time on teaching and stu-dent advising are absent.Explaining faculty salaries with a human capital model tends to
validate the status quo. Because we are so used to endorsing thenotion that people should be paid for their output, the human capitalframework fails to bring to the fore some of the negative effects onstudents and higher educations� mission when the system rewards fac-ulty only for their research output and its ability to enhance theirown prestige and that of their institutions. Looking at faculty salariesthough a prestige lens helps scholars and policymakers to ask seriousquestions about the implications of the current reward system in high-er education.The idea that faculty in non-profit institutions are paid for enhanc-
ing their employers� prestige and that this has an impact on the waythey allocate time to research and teaching is an important modifica-tion to the human capital model, which suggests that faculty are paidfor increases in productivity brought about by increases in theiron-the-job training, as proxied by their years of work experience. Tra-ditional economic theory, which underlies the human capital model,assumes that individuals will allocate their time to those activitieswhere they are the most productive and that this will lead to a more‘‘efficient’’ production function. But by maximizing prestige, universi-ties provide incentives for faculty to spend more time on activitiesthat garner prestige. Faculty understand the incentives and thus allo-cate more time to these activities and less to other activities such asteaching, mentoring and service.
664 MELGUIZO AND STROBER
Faculty behavior in a prestige maximizing model may result in anagency problem. While students think they are coming to college or uni-versity to study with faculty who have students� best interests at heart,they soon come to see that in fact faculty are not motivated to put stu-dent interests first. Rather, the institutional and professional incentivesmove faculty to concentrate on research in order to maximize their ownand their institution�s prestige and to support their institutions� push toprovide increasing amounts of teaching through the employment ofnon-tenure track lecturers and instructors. Although students stand tobenefit in the job market when the institution from which they obtaintheir diploma moves ahead in the prestige rankings, the price of suchjob-market benefits may be that students learn less because their profes-sors spend less time teaching, preparing to teach, meeting with students,advising, etc.To the extent that students are more concerned with the job market
benefits of their diploma than about the actual learning that they gainduring their four years at college or university, they have no incentive toquestion or seek to change the status quo. All the more reason whythose who care deeply about the quality of teaching and learning inhigher education need to examine some of the unintended ill effects ofprestige maximization.Our results raise many questions. First, although many institutions
talk about the importance of good teaching, how many of them seri-ously assess teaching and learning and financially reward those facultywho are truly excellent teachers and contribute substantially to their stu-dents� learning?Second, does it make sense for all of academia, in all types of institu-
tions, to financially reward their faculty for research? Or should themajority of institutions concentrate on teaching and reward their facultyprimarily for teaching rather than for research?Finally, does it make sense to financially reward faculty in all disci-
plines for research and scholarship rather than for teaching? Our resultsshow that the financial rewards for research publications are highest inscience, suggesting that perhaps there is not only mission creep, with allinstitutions seeking to emulate research universities focus on research,but also some kind of science envy, with all disciplines seeking to emu-late scientists� absorption with research. We suggest that this tendencycould be consciously counteracted by providing substantial financialrewards for non-scientists who achieve excellence in teaching.
FACULTY SALARIES AND THE MAXIMIZATION OF PRESTIGE 665
NOTES
1. Because NSOPF:99 data are collected through a multi-stage samplingscheme involving stratification, disproportionate sampling of certainstrata, and clustered probability sampling, faculty have unequal prob-abilities of being selected into the sample, the observations for differ-ent faculty may not be independent, and standard errors may beunderstated if they are calculated through standard methods. Usingthe data set requires using sampling weights and special methods forvariance estimations. For this study we chose the appropriate weightsand used the software package STATA that uses Taylor Seriesapproximations to calculate precise estimates of standard errors forcomplex samples. (See Abram, Steigher, Montgomery, Kuhr, Touran-geau, Montgomery and Chattopadhyay (2002), Methodology Report).
2. In response to a suggestion from an anonymous reviewer, we testedfor multicollinearity problems in our model by running a varianceinflator factor, (VIF) and a simple test for dependency (regressing thesuspected collinear variable against all the other variables). None ofthe tests suggested that our model had multicollinearity problems.The correlation matrix is available upon request.
3. We controlled for the following sub-fields within each of the six fieldsstudied. Natural science (mathematics/statistics, biological sciences andphysical sciences); professional (law, health and business); engineering (ci-vil engineering, electrical engineering, mechanical engineering, chemicalengineering, computer science, other engineering, engineering and relatedtechnologies and architecture); social science (social science general,anthropology, archeology, demography, economics, geography, history,international relations, psychology, sociology, other social sciences, eth-nic studies and communications); education (education general, basicskills, bilingual/cross-cultural education, curriculum and instruction, edu-cation administration, education, evaluation and research, educationalpsychology, higher education, special education, student counseling andpersonnel services, other education and teacher education) and humani-ties (arts, English literature, foreign languages and philosophy). (See U.S.DOE, 1999 for the complete list of sub-fields).
4. In about 10% of our sample, there was no information about theinstitution where the faculty member received his or her highest de-gree. Fortunately, the missing observations were distributed aboutequally across the four types of institutions (10% in research institu-tions, 9% in doctoral institutions, 7% in comprehensive institutions,
666 MELGUIZO AND STROBER
and 8% in liberal arts colleges). To keep the maximum number ofobservations in the regression, we created dummy variables to controlfor the missing values in this specific variable. All of the regressionsinclude this dummy variable, but because its coefficient has no mean-ing, it is not reported in the regression tables.
5. Given the unique nature of this variable, we assumed that it is veryunlikely that the faculty who left this question unanswered had pat-ents. Therefore we decided that for this particular variable we couldreplace the missing values with a zero.
6. Details of these calculations are available from the authors.
ACKNOWLEDGEMENTS
We are grateful for comments on an earlier version from AnthonyAntonio, Clair Brown, Cassie Guarino, Ben Ho, Lois Joy, SusannaLoeb, Peggy O�Brien-Strain, Cathy Weinberger and five anonymousreviewers.
REFERENCES
Abraham, S. Y., Steigher, D. M., Montgomery, M., Kuhr, B. D., Tourangeau, R.,
Montgomery, B., and Chattopadhyay, M. (2002). National Study of Postsecondary Faculty
(NSOPF:99) Methodology Report., (NCES 2002-154), U.S. Department of Education,
National Center for Education Statistics, Washington, D.C.
Barbezat, D., and Hughes, J. (2005). Salary structure effects and the gender pay gap in
academia. Research in Higher Education 46(6): 621–640.
Barbezat, D. (1991). Updating estimates of male-female salary differentials in the academic
labor market. Economics Letters 36(2): 191–195.
Breneman, D. (1970). The Ph.D. production function: The Case of Berkeley. Paper P-8. Ford
Foundation Program for Research in University Administration..
Brewer , D., Gates, S., and Goldman, C. A. (2002). In Pursuit of Prestige: Strategy and
Competition in U.S. Higher Education. Transaction Publishers, New Brunswick, USA and
London, U.K.
Clotfelter, C. T. (1999). The familiar but curious economics of higher education: introduction to
a symposium. The Journal of Economic Perspectives 13(1): 2–12.
Ehrenberg, R. G. (2000a). Tuition Rising: Why College Costs So Much, Harvard University
Press, Cambridge, MA.
Ehrenberg, R. (2000b, September). Method or madness? Inside the USNWR college rankings,
paper presented at the Wisconsin Center for the Advancement of Postsecondary Education
Forum on the use and abuse of college rankings.
Fairweather, J. S. (1996). Faculty Work and Public Trust: Restoring the Value of Teaching and
Public Service in American Academic Life, Allyn and Bacon, Boston.
FACULTY SALARIES AND THE MAXIMIZATION OF PRESTIGE 667
Fairweather, J. S. (1995). Myths and realities of academic labor markets. Economics of
Education Review 14(2): 179–192.
Fairweather, J. S. (1993). Academic values and faculty rewards. The Review of Higher Education
17(1): 43–68.
Frank, R., and Cook, P. (1995). The Winner-Take-All Society: Why the Few at the Top Get So
Much More than the Rest of Us, The Free Press, New York.
Frank, R., and Cook, P. (2000). Winner Take All—Even In Higher Education. Futures Forum
2000, Forum for the Future of Higher Education, Cambridge, MA 11–13.
Garvin, D. A. (1980). The Economics of University Behavior, Academic Press, New York.
James, E. (1990). Decision processes and priorities in higher education. In: Hoenack, S. A., and
Collins, E. L. (eds.), The Economics of American Universities, State University of New York
Press, Buffalo, NY.
Massy, W. F., and Zemsky, R. (1994). Faculty discretionary time: departments and the
academic ratchet. Journal of Higher Education 65(1): 1–22.
Merton, R. K. (1973). The Sociology Of Science: Theoretical and Empirical Investigations, The
University of Chicago Press, Chicago.
Monks, J., and Ehrenberg, R. G. (1999).Why theymatter.Change, November/December, 43–51.
Perna, L. (2003). Studying faculty salary equity: A review of theoretical and methodological
approaches. In: Smart, J. C., and Bayer, A. (eds.),Higher Education: Handbook of Theory and
Research (Vol. 18), Kluwer Academic Publishers, Dordrecht, The Netherlands, pp. 323–388.
Perna, L. (2001). Sex differences in faculty salaries: A cohort analysis. Review of Higher
Education 24: 283–307.
Strober, M. H. (1990). Challenges to Human Capital Theory: Implications for HR Managers,
Industrial Relations, Spring.
Toutkoushian, R. K., and Conley, V. M. (2005). Progress for women in academe, yet inequities
persist: evidence from NSOPF:99. Research in Higher Education 46(1): 1–28.
Toutkoushian, R. K. (1998). Sex matters less for younger faculty: Evidence of disaggregate pay
disparities from the 1988 and 1993NCES surveys.Economics of EducationReview 17(1): 55–71.
U.S. DOE. (1999). Restricted-use data file: 1999 National Study of Postsecondary Faculty
(NSOPF:1999), U.S. Department of Education, National Center for Education Statistics,
Washington, D.C.
Webster�s New World College Dictionary (1996) Macmillan, New York.
Winston, G. C. (2001). Is Princeton acting like a church or a car dealer? The Chronicle of Higher
Education, February 23, B24.
Winston, G. C. (2000a). The positional arms race in higher education. Discussion Paper DP-54.
Williams Project on the Economics of Higher Education, 1–20.
Winston, G. C. (2000b). Where is aggressive price competition taking higher education?
Change, July/August, 10–18.
Winston, G. C. (1999). Subsidies, hierarchy and peers: the awkward economics of higher
education. The Journal of Economic Perspectives 13(1): 13–36.
Winston,G. C. (1997).Why can�t a college bemore like a firm?Change, September/October, 33–37.
Zemsky, R., and Massy, W. F. (1995). Expanding perimeters, melting cores, and sticky
functions: toward an understanding of our current predicaments. Change, November/
December, 41–49.
Zemsky, R., Shaman, S., and Iannozzi, M. (1997). In search of strategic perspective: a tool for
mapping the market in potsecondary education. Change, November/December, 23–38.
Zemsky, R., Wegner, G. R., and Massy, W. F. (2006). Remaking the American University:
Market-Smart and Mission-Centered, Rutgers University Press, New Brunswick.
Received January 5, 2006; accepted July 31, 2006
668 MELGUIZO AND STROBER