comparative starting salaries and career progression of
TRANSCRIPT
Comparative Starting Salaries and Career Progression of Graduates in Science, Engineering and Technology (SET)
June 2006
Table of Contents
Acknowledgements .............................................................................................. 4
Executive Summary .............................................................................................. 5
Chapter 1 - College Application Trends.......................................................................... 7
1.1 Introduction ............................................................................................. 7
1.2 Level 8 Applications ................................................................................... 7
1.3 Level 6 and Level 7 Applications..................................................................... 8
1.4 Acceptances of Higher Education Places by Graduates with High Points..................... 9
Chapter 2 - Starting Salaries of Graduates at Honours Bachelor Degree Level and Above .............10
2.1 Introduction ............................................................................................10
2.2 Disciplines of Study in Higher Education ..........................................................11
2.3 Primary Degrees .......................................................................................13
2.4 Higher Diplomas and Graduate Diplomas ..........................................................16
2.5 Taught Masters Degrees ..............................................................................18
2.6 Research Masters Degrees ...........................................................................20
2.7 PhD Degrees ............................................................................................22
2.9 Comparisons of Graduate Salaries with Incomes Available to Research Students ........24
2.10 Trends in SET Graduate Salaries ....................................................................24
Chapter 3 Employment Sectors and Occupations Entered by Level 8 Graduates ..................25
3.1 Introduction ............................................................................................25
3.2 Employment Sectors ..................................................................................25
3.3 Occupations ............................................................................................36
Chapter 4 Starting Salaries of Higher Education Graduates at Levels 6 and 7 ....................49
4.1 Introduction ............................................................................................49
4.2 Certificate Level Salaries ............................................................................49
4.3 Diploma Level Salaries ...............................................................................50
Chapter 5 Destinations after Graduation ...................................................................51
SET Graduate Salaries and Career Progression 2 June 2006
Chapter 6 Career Progression - Data from Census 2002 .................................................. 53
6.1 Introduction ............................................................................................53
6.2 Employment Data for Past Graduates at Level 8 and Above..................................54
6.3 Employment Data for Past Graduates at Levels 6 and 7 ........................................56
6.4 Socio-Economic Groups at Level 8..................................................................58
6.5 Socio-Economic Groups at Levels 6 and 7 .........................................................60
Chapter 7 Salary Progression..................................................................................62
7.1 Introduction ............................................................................................62
7.2 Progression in Engineering Salaries.................................................................62
7.3 Progression in Software Salaries ....................................................................63
Chapter 8 Data from Overseas................................................................................64
8.1 Introduction ............................................................................................64
8.2 US Data .................................................................................................64
8.3 UK Data .................................................................................................65
SET Graduate Salaries and Career Progression 3 June 2006

Acknowledgements This report was prepared by Publica Consulting on behalf of the Forfás and the Discover Science and Engineering Awareness Programme.
The consultants wish to acknowledge, with thanks, the assistance of the following organisations in providing data.
� The Statistics Section of the Higher Education Authority provided anonymised data from the First Destination of Award Recipients Survey of graduates of 2004.
� The Central Statistics Office approved the release of COPSAR (Census of Population Sample Anonymised Record) data to Forfás by the Irish Social Science Data Archive for the purposes of this study.
� ICT Ireland provided information on salary progression.
SET Graduate Salaries and Career Progression 4 June 2006
Executive Summary This report looks at graduate salaries and graduate career progression in Ireland, focusing on graduates in Science, Engineering and Technology (SET) disciplines, and making comparisons with those in other disciplines.
As it provides considerable levels of statistical detail, the report is more suitable for browsing, or for scanning for information on specific disciplines, than for reading straight through. Gaps in the information provided exist mainly where the data sample is too small to allow useful figures to be produced.
Chapter 1 looks at trends in college applications. It finds that, after falling with the onset of the ICT sector downturn around 2001/02, overall applications in SET disciplines are now stable or increasing, while applications in Business and Law are falling. The introduction of degree programmes in Nursing has caused applications for Healthcare courses to rise.
Chapter 2 analyses starting salaries at Honours Bachelor Degree level and above. Based on an original analysis of data provided by the Higher Education Authority from its First Destination of Award Recipients Survey, it provides detailed information on salaries obtained by graduates in a wide range of SET and non-SET disciplines, at a range of levels of qualification.
It shows that:
� graduates in disciplines with a strong science and technology content tend to be paid better after graduation than graduates in other disciplines, with graduates in Medicine and other Healthcare disciplines being among the best paid, followed by those in Engineering and then those in Computing and Science; and
� graduates with higher qualifications, such as PhDs, tend to be paid significantly more than those with just primary degrees, with over 80% of PhD graduates in a range of areas including Engineering and Biosciences earning starting salaries in excess of €33,000 in starting salary.
Chapter 3 addresses the employment sectors and occupations entered by primary degree graduates. It demonstrates that graduates in most disciplines enter a diverse range of employment sectors and occupations, and are thus not locked into a particular career path.
Chapter 4 draws on published by the Higher Education Authority in its First Destination of Award Recipients in Higher Education report for graduates of 2003 to provide information on starting salaries achieved by certificate and diploma graduates.
Chapter 5 draws on anonymised data from Census 2002 to analyse how the careers of past graduates have progressed for different disciplines. Drawing on two indicators - the percentage in employment and the percentage of those employed in higher socio-economic groups - it shows that careers of both male and female graduates in SET disciplines tend to progress well.
SET Graduate Salaries and Career Progression 5 June 2006
Chapter 6 looks at how salaries progress with career development in a sample of two SET professions.
Chapter 7 uses data on graduate salaries from the US and the UK to make international comparisons. It demonstrates that SET graduates in the US are very well paid relative to those with other bachelor degrees, while those in the UK occupy the middle ground in graduate salaries. While SET graduates in Ireland are paid well relative to their counterparts in other disciplines, those in the US and the UK are paid better. This supports the view that Ireland remains competitive as a location in which to obtain access to technically skilled graduates.
SET Graduate Salaries and Career Progression 6 June 2006
Chapter 1 - College Application Trends
1.1 Introduction This chapter reviews trends in college applications recorded by the Central Applications Office (CAO).
The first section addresses Honours Bachelor Degree applications, which are positioned at Level 8 in the National Framework of Qualifications.
The second section addresses higher education courses positioned at Levels 6 and 7 in the National Framework of Qualifications. Historically these were the National Certificate and DIT Certificate (positioned retrospectively at Level 6), and the National Diploma and DIT Diploma (positioned retrospectively at Level 7). Now, they are the Higher Certificate (Level 6) and the Ordinary Bachelor Degree (Level 7).
1.2 Level 8 Applications Figure 1.1 shows how first preference applications for different subject groupings have developed since 2000, at Level 8 in the National Framework of Qualifications.
Key points are as follows:
� The share of applications for Engineering / Technology, which includes many Information and Communications Technology (ICT) oriented courses, fell a little in 2001, and more steeply in 2002, in response to a severe global slowdown in ICT business. However, it has been steady since then, supported in part by strong demand for graduates in construction related disciplines, but numbers taking Electronic Engineering and Computing have yet to recover.
� Nursing degree courses were introduced in 2003, accounting for a major increase in applications for healthcare courses. This coincided with step losses in share of applications for Arts/Social Science and Science/Applied Science.
� The share of applications accounted for by Science/Applied Science is now rising gradually.
� The share of applications accounted for by Administration/Business has been falling steadily since 2000. The share accounted for by Law has been falling since 2002.
SET Graduate Salaries and Career Progression 7 June 2006
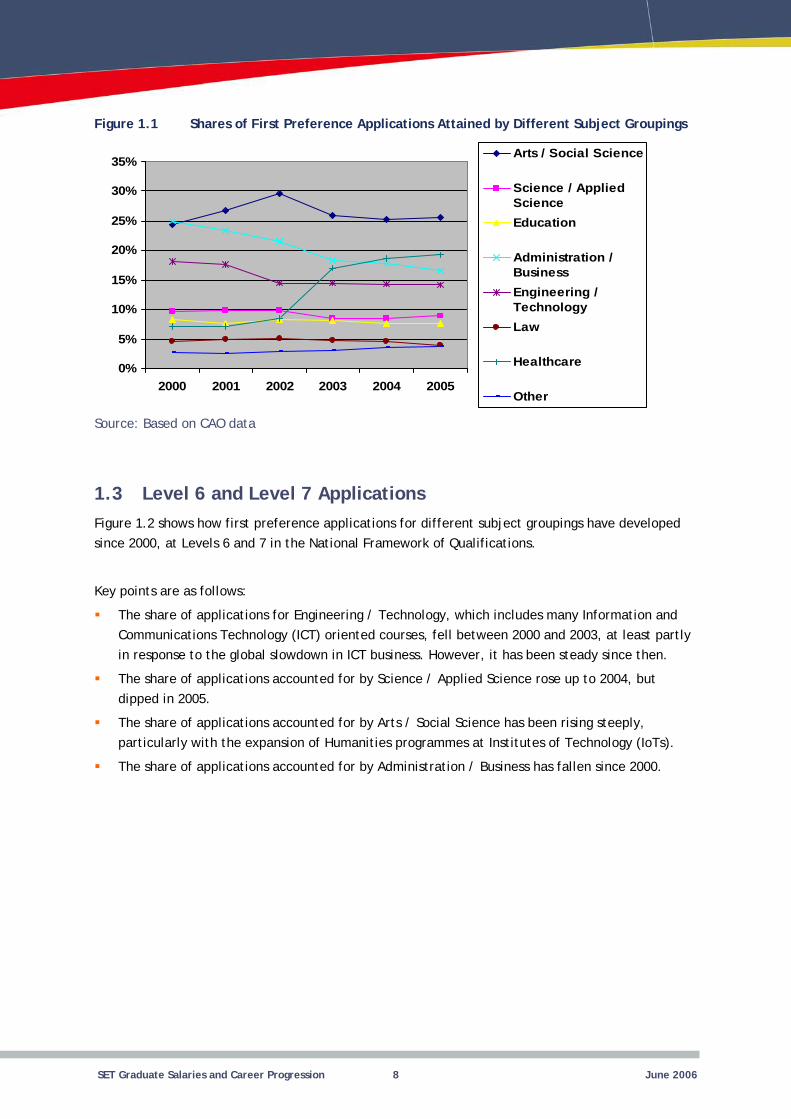
Figure 1.1
0%
5%
Shares of First Preference Applications Attained by Different Subject Groupings
10%
15%
20%
25%
30%
35%
2000 2001 2002 2003 2004 2005
Arts / Social Science
Science / Applied Science Education
Administration / Business Engineering / Technology Law
Healthcare
Other
Source: Based on CAO data
1.3 Level 6 and Level 7 Applications Figure 1.2 shows how first preference applications for different subject groupings have developed since 2000, at Levels 6 and 7 in the National Framework of Qualifications.
Key points are as follows:
� The share of applications for Engineering / Technology, which includes many Information and Communications Technology (ICT) oriented courses, fell between 2000 and 2003, at least partly in response to the global slowdown in ICT business. However, it has been steady since then.
� The share of applications accounted for by Science / Applied Science rose up to 2004, but dipped in 2005.
� The share of applications accounted for by Arts / Social Science has been rising steeply, particularly with the expansion of Humanities programmes at Institutes of Technology (IoTs).
� The share of applications accounted for by Administration / Business has fallen since 2000.
SET Graduate Salaries and Career Progression 8 June 2006
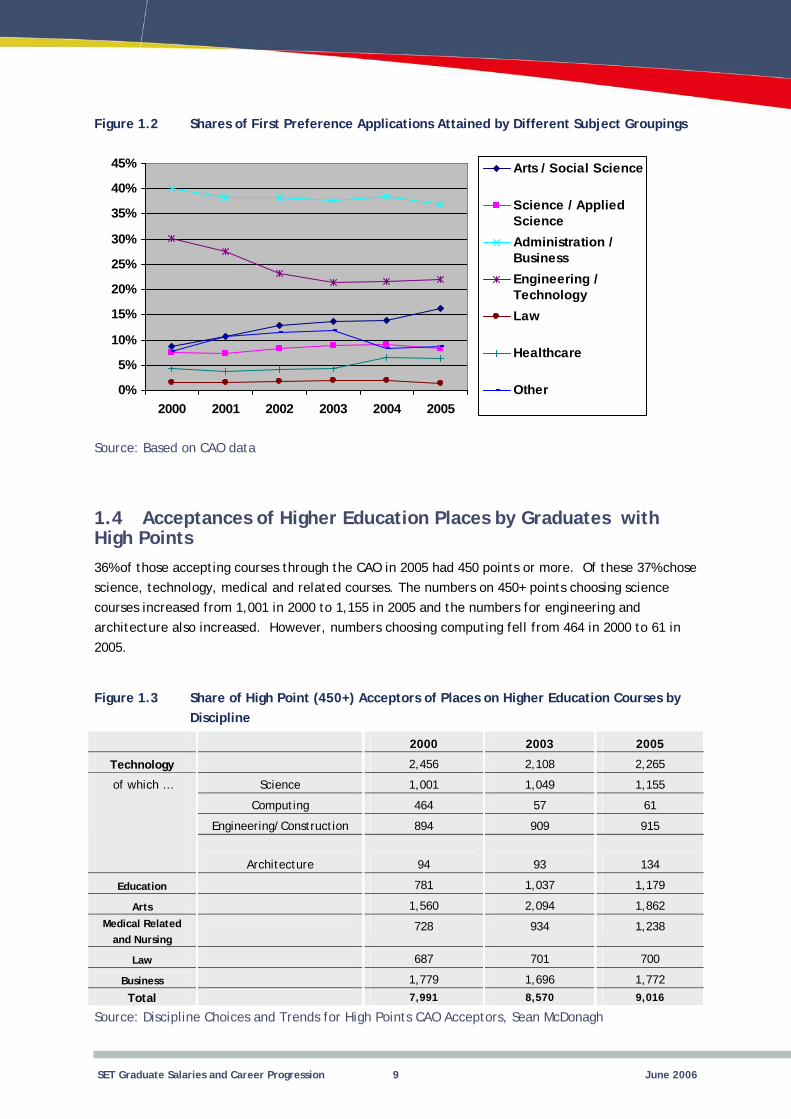
Figure 1.2
0%
5%
/
Shares of First Preference Applications Attained by Different Subject Groupings
10%
15%
20%
25%
30%
35%
40%
45%
2000 2001 2002 2003 2004 2005
Arts / Social Science
Science Applied Science Administration / Business Engineering / Technology Law
Healthcare
Other
Source: Based on CAO data
1.4 Acceptances of Higher Education Places by Graduates with High Points 36% of those accepting courses through the CAO in 2005 had 450 points or more. Of these 37% chose science, technology, medical and related courses. The numbers on 450+ points choosing science courses increased from 1,001 in 2000 to 1,155 in 2005 and the numbers for engineering and architecture also increased. However, numbers choosing computing fell from 464 in 2000 to 61 in 2005.
Figure 1.3 Share of High Point (450+) Acceptors of Places on Higher Education Courses by Discipline
2000 2003 2005
Technology 2,456 2,108 2,265
Science 1,001 1,049 1,155
464 57 61
Engineering/Construction 894 909 915
94 93 134
Education 781 1,037 1,179
Arts 1,560 2,094 1,862
and Nursing 728 934 1,238
Law 687 701 700
1,779 1,696 1,772
Total 7,991 8,570 9,016
Computing
of which …
Architecture
Medical Related
Business
Source: Discipline Choices and Trends for High Points CAO Acceptors, Sean McDonagh
SET Graduate Salaries and Career Progression 9 June 2006

Chapter 2 - Starting Salaries of Graduates at Honours Bachelor Degree Level and Above
2.1 Introduction Each spring, the Higher Education Authority (HEA) coordinates and collates a survey of graduates from the previous year, asking what they are currently doing. The front line survey work is undertaken by the careers services of individual colleges and by the Higher Education and Training Awards Council (HETAC). Those in employment are asked what industry they are working in, what type of work they are doing, and how much they are being paid.
The survey asks graduates to position the amount they are being paid in one of eight bands. The majority of the bands are €4,000 in width. The top band is simply "Over €33,000". The bands now in use have been in place for a number of years, maintaining consistency in the statistics produced from year to year. Over this time graduate salaries have increased, bringing significant numbers to levels in excess of €33,000, particularly among graduates in healthcare disciplines and with postgraduate research degrees, as can be seen in the tables and charts presented.
This section presents a detailed analysis of salary data from the survey of graduates of 2004 at primary degree level and above. Primary degrees are equivalent to Honours Bachelor Degrees, which are positioned at Level 8 in the National Framework of Qualifications.
Three relevant types of qualification have been positioned at Level 9 in the National Framework of Qualifications.
These are:
� Higher Diplomas and Graduate Diplomas, such as the Higher Diploma in Education and various Graduate Diplomas in Computing;
� Taught Masters Degrees, which are Masters level qualifications obtained from a taught courses; and
� Research Masters Degrees, which are Masters level qualifications obtained on the basis of research.
The PhD and other Doctoral level qualifications are positioned at Level 10 in the National Framework of Qualifications.
Higher Diplomas, Graduate Diplomas, Taught Masters Degrees and Research Masters Degrees are generally undertaken by graduates who already have Honours Bachelor Degree qualifications. In some cases, a Higher Diploma or Graduate Diploma serves as an intermediate step on the way to a Masters qualification.
SET Graduate Salaries and Career Progression 10 June 2006
Higher Diploma and Graduate Diploma courses are typically of one, or sometimes one and a half, academic years in duration. Some Taught Masters courses are of one year in duration, others of two years. Research Masters qualifications are generally awarded after anything from one to three years of research.
Entrants to PhD research programmes generally have an Honours Bachelor Degree, and may have a Masters degree. A PhD is typically awarded after three to four years of study, although it is not unusual for the process to take longer.
2.2 Disciplines of Study in Higher Education Science, Engineering and Technology (SET) disciplines account for a substantial minority of primary degrees awarded, and account for the majority of Research Masters and PhD degrees awarded. There is a great diversity of disciplines within the broad SET area, much of which is reflected in the detailed salary information provided in this section of the report.
Detailed salary information is also provided on Medical and Paramedical disciplines, which have a substantial scientific content. Information is also provided on other disciplines, such as Business, Humanities, Teaching, Social Studies and Law for comparison, although at a lower level of detail.
The following are some points of explanation.
� Electronic Engineering, Computer Engineering and Telecommunications Engineering are closely related disciplines that share a considerable amount of content.
� The Mechanical, Production and Manufacturing Engineering category encompasses courses with a wide range of titles concerned with production operations. Mechanical Engineering courses are frequently concerned both with design and production operations, but graduates more commonly work in operations after graduation.
� The Chemical and Process Engineering category encompasses both Chemical Engineering and Food Process Engineering.
� Within Biosciences, some specialisms have a particular relevance to Biotechnology, and to other industrial applications of Biology. The analysis distinguishes graduates in these “Core Biotech” disciplines from graduates who have specialised in other Biosciences disciplines.
� The Computer Applications / Computer Science / Software Engineering category encompasses the majority of computing-focused courses. Computing courses with a very substantial (often 50%) business content are classified as Business Information Systems courses.
� In many Arts courses, final year students specialise in two or more distinct subjects. The analysis separates these from other disciplinary categories in three areas: where the graduate has studied both Computing and another discipline; where the graduate has studied both Mathematics and another discipline; and where the graduate has studied both Law and another discipline. For analytic purposes, the third of these groups has been amalgamated with courses that combine Business Studies and Law with similar emphasis on both.
� It was difficult to classify the disciplines taken by some graduates at the level of detail used for the more general analysis. The salaries obtained by these graduates are set out under “Remaining” categories.
SET Graduate Salaries and Career Progression 11 June 2006
The following tables provide data on 25th, 50th and 75th percentile salary levels. The 25th percentile level indicates 25% of graduates earn below that level, and 75% above. The 50th percentile level (or median) indicates 50% of graduates earn below that level, and 50% above. The 75th percentile level indicates that 75% of graduates earn below that level, and 25% above.
The consultants have analysed the data to identify the salary band into which each 25th, 50th and 75th percentile salary level fits, and have applied a formula to estimate where in the band it sits.
SET Graduate Salaries and Career Progression 12 June 2006
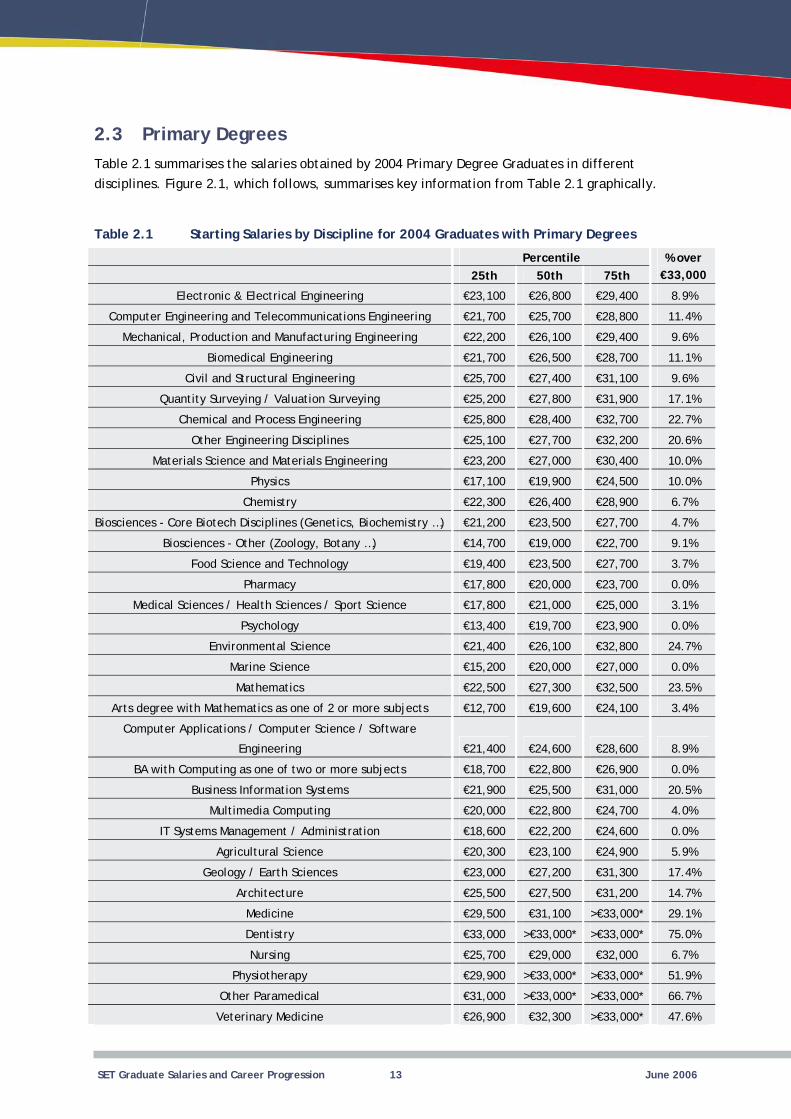
2.3 Primary Degrees Table 2.1 summarises the salaries obtained by 2004 Primary Degree Graduates in different disciplines. Figure 2.1, which follows, summarises key information from Table 2.1 graphically.
Table 2.1 Starting Salaries by Discipline for 2004 Graduates with Primary Degrees
Percentile 25th 50th 75th
% over €33,000
8.9%
11.4%
9.6%
Biomedical Engineering 11.1%
9.6%
17.1%
22.7%
20.6%
Materials Science and Materials Engineering 10.0%
Physics 10.0%
6.7%
4.7%
9.1%
Food Science and Technology 3.7%
Pharmacy 0.0%
Medical Sciences / Health Sciences / Sport Science 3.1%
0.0%
Environmental Science 24.7%
Marine Science 0.0%
Mathematics 23.5%
3.4%
Engineering 8.9%
0.0%
20.5%
Multimedia Computing 4.0%
IT Systems Management / Administration 0.0%
5.9%
Geology / Earth Sciences 17.4%
14.7%
29.1%
Dentistry 75.0%
Nursing 6.7%
Physiotherapy 51.9%
66.7%
Veterinary Medicine 47.6%
Electronic & Electrical Engineering €23,100 €26,800 €29,400
Computer Engineering and Telecommunications Engineering €21,700 €25,700 €28,800
Mechanical, Production and Manufacturing Engineering €22,200 €26,100 €29,400
€21,700 €26,500 €28,700
Civil and Structural Engineering €25,700 €27,400 €31,100
Quantity Surveying / Valuation Surveying €25,200 €27,800 €31,900
Chemical and Process Engineering €25,800 €28,400 €32,700
Other Engineering Disciplines €25,100 €27,700 €32,200
€23,200 €27,000 €30,400
€17,100 €19,900 €24,500
Chemistry €22,300 €26,400 €28,900
Biosciences - Core Biotech Disciplines (Genetics, Biochemistry …) €21,200 €23,500 €27,700
Biosciences - Other (Zoology, Botany …) €14,700 €19,000 €22,700
€19,400 €23,500 €27,700
€17,800 €20,000 €23,700
€17,800 €21,000 €25,000
Psychology €13,400 €19,700 €23,900
€21,400 €26,100 €32,800
€15,200 €20,000 €27,000
€22,500 €27,300 €32,500
Arts degree with Mathematics as one of 2 or more subjects €12,700 €19,600 €24,100
Computer Applications / Computer Science / Software
€21,400 €24,600 €28,600
BA with Computing as one of two or more subjects €18,700 €22,800 €26,900
Business Information Systems €21,900 €25,500 €31,000
€20,000 €22,800 €24,700
€18,600 €22,200 €24,600
Agricultural Science €20,300 €23,100 €24,900
€23,000 €27,200 €31,300
Architecture €25,500 €27,500 €31,200
Medicine €29,500 €31,100 >€33,000*
€33,000 >€33,000* >€33,000*
€25,700 €29,000 €32,000
€29,900 >€33,000* >€33,000*
Other Paramedical €31,000 >€33,000* >€33,000*
€26,900 €32,300 >€33,000*
SET Graduate Salaries and Career Progression 13 June 2006
Humanities 3.0%
25.2%
5.4%
Teaching Qualifications* ** ** **
8.9%
5.1%
Law 0.0%
0.0%
16.0%
7.1%
€22,600 €26,800 €28,200
Social Work / Social Care / Sociology / Community Development €19,700 €25,900 >€33,000*
Art & Design €15,600 €20,800 €25,800
Other Education / Learning Support / Early Childhood Studies €15,600 €21,000 €26,800
Commerce & Business Studies €18,000 €22,400 €25,800
€11,000 €20,300 €23,600
Combinations of Law with Business and BA degrees with Law as
one of two or more Subjects €16,300 €19,800 €23,800
Remaining Science €22,000 €26,800 €31,300
Remaining Engineering €26,000 €29,000 €32,000
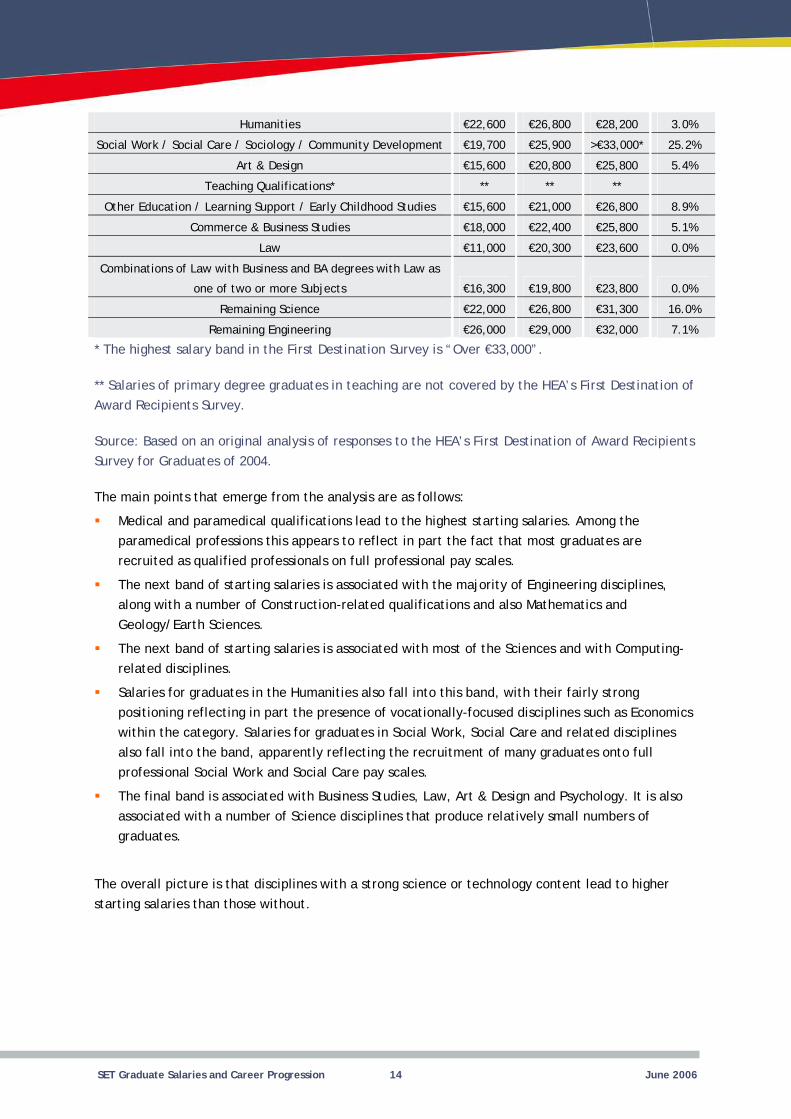
* The highest salary band in the First Destination Survey is “Over €33,000”.
** Salaries of primary degree graduates in teaching are not covered by the HEA’s First Destination of Award Recipients Survey.
Source: Based on an original analysis of responses to the HEA’s First Destination of Award Recipients Survey for Graduates of 2004.
The main points that emerge from the analysis are as follows:
� Medical and paramedical qualifications lead to the highest starting salaries. Among the paramedical professions this appears to reflect in part the fact that most graduates are recruited as qualified professionals on full professional pay scales.
� The next band of starting salaries is associated with the majority of Engineering disciplines, along with a number of Construction-related qualifications and also Mathematics and Geology/Earth Sciences.
� The next band of starting salaries is associated with most of the Sciences and with Computing-related disciplines.
� Salaries for graduates in the Humanities also fall into this band, with their fairly strong positioning reflecting in part the presence of vocationally-focused disciplines such as Economics within the category. Salaries for graduates in Social Work, Social Care and related disciplines also fall into the band, apparently reflecting the recruitment of many graduates onto full professional Social Work and Social Care pay scales.
� The final band is associated with Business Studies, Law, Art & Design and Psychology. It is also associated with a number of Science disciplines that produce relatively small numbers of graduates.
The overall picture is that disciplines with a strong science or technology content lead to higher starting salaries than those without.
SET Graduate Salaries and Career Progression 14 June 2006
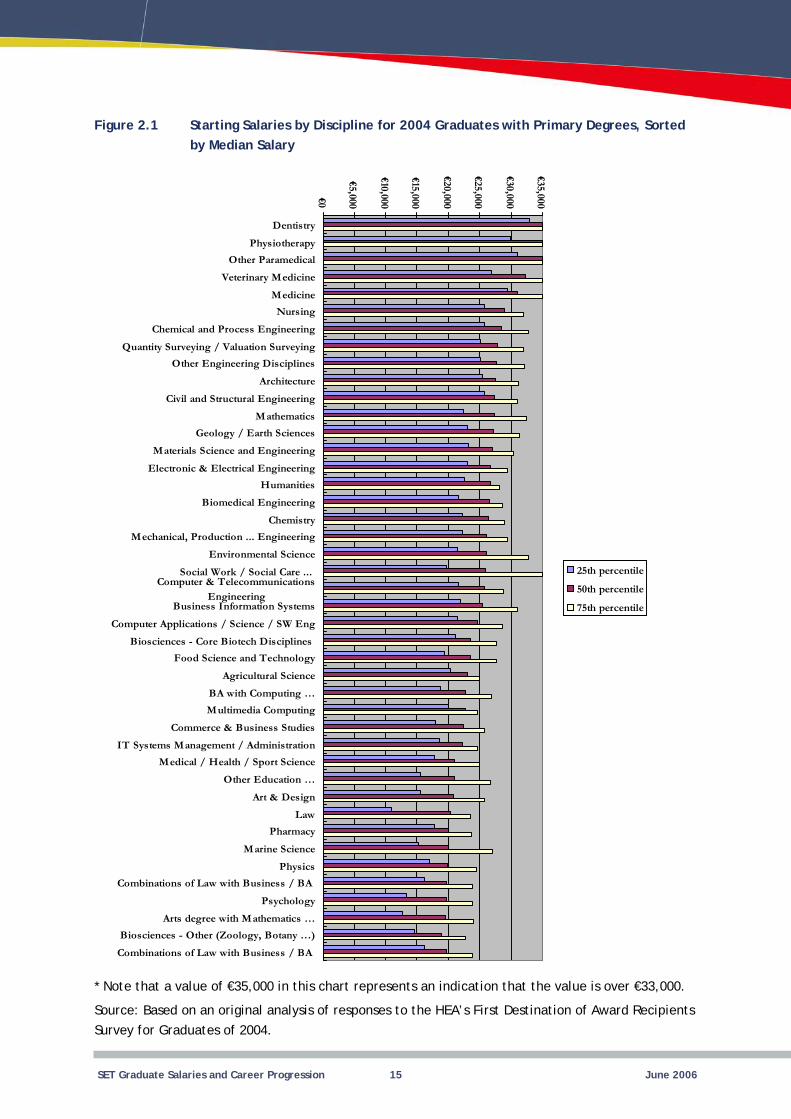
Figure 2.1 Starting Salaries by Discipline for 2004 Graduates with Primary Degrees, Sorted by Median Salary
€35,000
€30,000
€25,000
€20,000
€15,000
€10,000
€5,000
€0
Dentistry
Physiotherapy
Other Paramedical
Veterinary M edicine
Medicine
Nursing
Chemical and Process Engineering
Quantity Surveying / Valuation Surveying
Other Engineering Disciplines
Architecture
Civil and Structural Engineering
Mathematics
Geology / Earth Sciences
M aterials Science and Engineering
Electronic & Electrical Engineering
Humanities
Biomedical Engineering
Chemistry
M echanical, Production ... Engineering
Environmental Science
Social Work / Social Care ... Computer & Telecommunications
Engineering Business Information Systems
Computer Applications / Science / SW Eng
Biosciences - Core Biotech Disciplines
Food Science and Technology
Agricultural Science
BA with Computing …
Multimedia Computing
Commerce & Business Studies
IT Systems M anagement / Administration
M edical / Health / Sport Science
Other Education …
Art & Design
Law
Pharmacy
M arine Science
Physics
Combinations of Law with Business / BA
Psychology
Arts degree with M athematics …
Biosciences - Other (Zoology, Botany …)
Combinations of Law with Business / BA
25th percentile
50th percentile
75th percentile
* Note that a value of €35,000 in this chart represents an indication that the value is over €33,000.
Source: Based on an original analysis of responses to the HEA’s First Destination of Award Recipients Survey for Graduates of 2004.
SET Graduate Salaries and Career Progression 15 June 2006
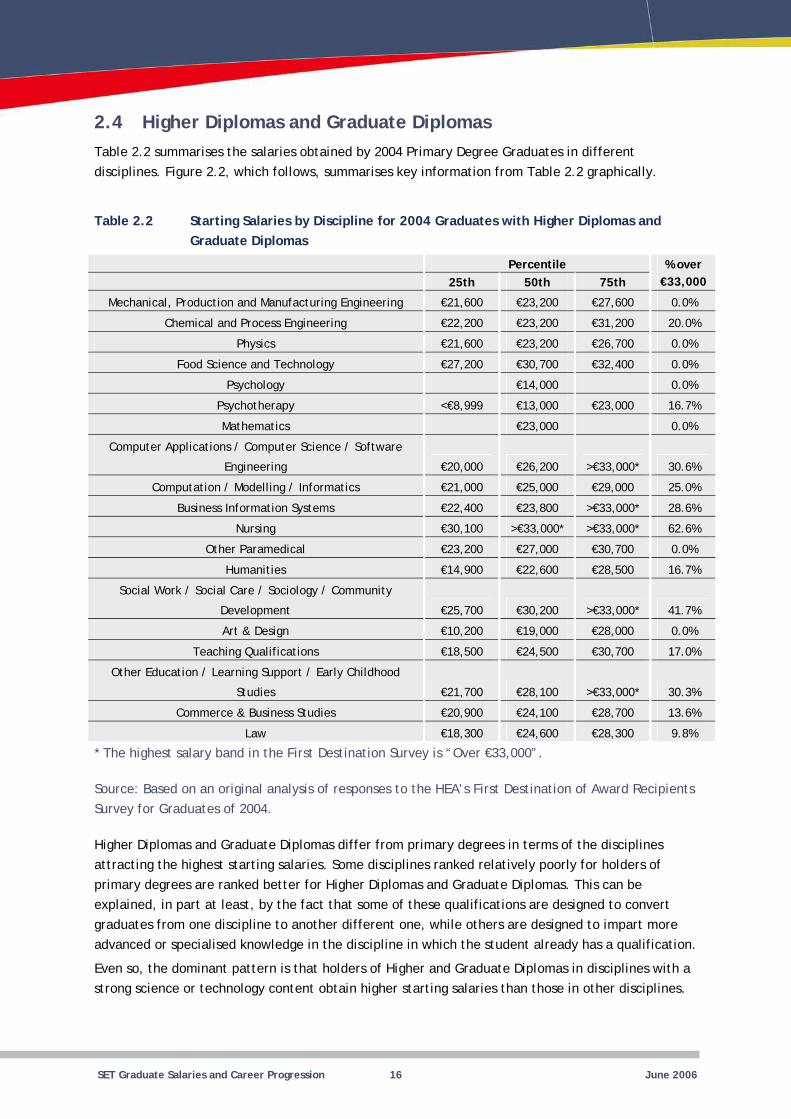
2.4 Higher Diplomas and Graduate Diplomas Table 2.2 summarises the salaries obtained by 2004 Primary Degree Graduates in different disciplines. Figure 2.2, which follows, summarises key information from Table 2.2 graphically.
Table 2.2 Starting Salaries by Discipline for 2004 Graduates with Higher Diplomas and Graduate Diplomas
Percentile 25th 50th 75th
% over €33,000
0.0%
20.0%
Physics 0.0%
Food Science and Technology 0.0%
0.0%
Psychotherapy 16.7%
Mathematics 0.0%
Engineering 30.6%
25.0%
28.6%
Nursing 62.6%
0.0%
Humanities 16.7%
Development 41.7%
0.0%
Teaching Qualifications 17.0%
Studies 30.3%
13.6%
Law 9.8%
Mechanical, Production and Manufacturing Engineering €21,600 €23,200 €27,600
Chemical and Process Engineering €22,200 €23,200 €31,200
€21,600 €23,200 €26,700
€27,200 €30,700 €32,400
Psychology €14,000
<€8,999 €13,000 €23,000
€23,000
Computer Applications / Computer Science / Software
€20,000 €26,200 >€33,000*
Computation / Modelling / Informatics €21,000 €25,000 €29,000
Business Information Systems €22,400 €23,800 >€33,000*
€30,100 >€33,000* >€33,000*
Other Paramedical €23,200 €27,000 €30,700
€14,900 €22,600 €28,500
Social Work / Social Care / Sociology / Community
€25,700 €30,200 >€33,000*
Art & Design €10,200 €19,000 €28,000
€18,500 €24,500 €30,700
Other Education / Learning Support / Early Childhood
€21,700 €28,100 >€33,000*
Commerce & Business Studies €20,900 €24,100 €28,700
€18,300 €24,600 €28,300
* The highest salary band in the First Destination Survey is “Over €33,000”.
Source: Based on an original analysis of responses to the HEA’s First Destination of Award Recipients Survey for Graduates of 2004.
Higher Diplomas and Graduate Diplomas differ from primary degrees in terms of the disciplines attracting the highest starting salaries. Some disciplines ranked relatively poorly for holders of primary degrees are ranked better for Higher Diplomas and Graduate Diplomas. This can be explained, in part at least, by the fact that some of these qualifications are designed to convert graduates from one discipline to another different one, while others are designed to impart more advanced or specialised knowledge in the discipline in which the student already has a qualification.
Even so, the dominant pattern is that holders of Higher and Graduate Diplomas in disciplines with a strong science or technology content obtain higher starting salaries than those in other disciplines.
SET Graduate Salaries and Career Progression 16 June 2006
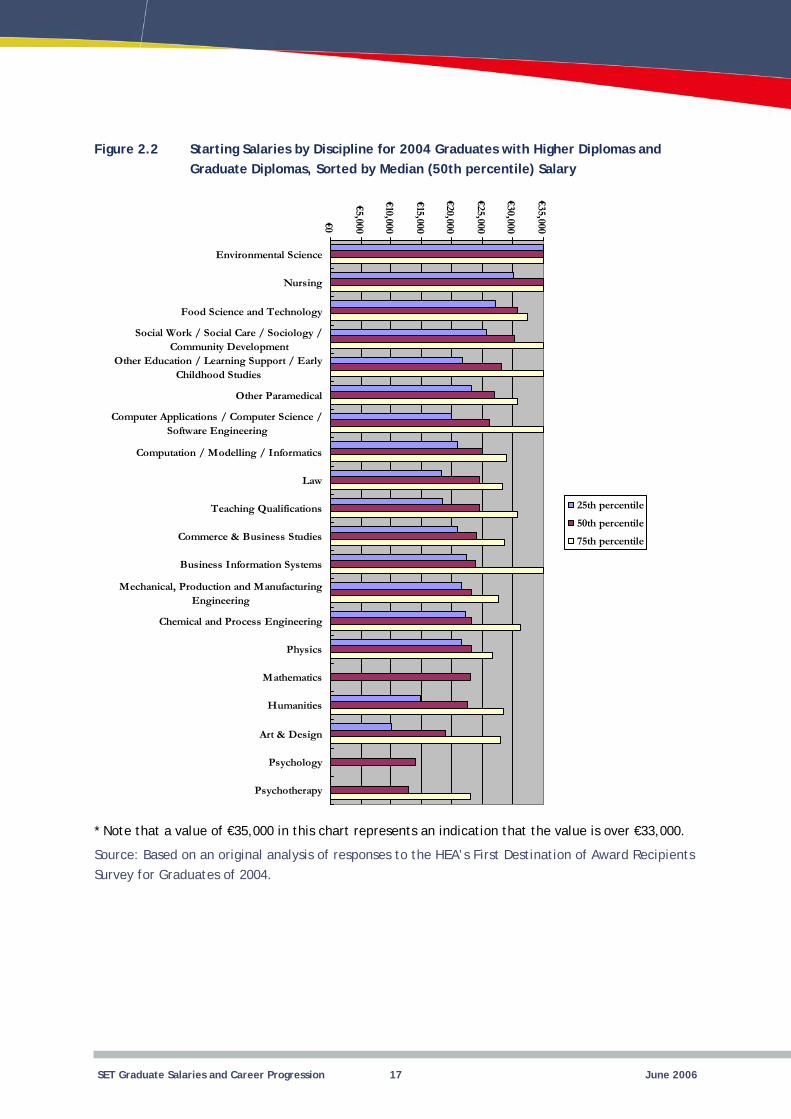
Figure 2.2 Starting Salaries by Discipline for 2004 Graduates with Higher Diplomas and Graduate Diplomas, Sorted by Median (50th percentile) Salary
€35,000
€30,000
€25,000
€20,000
€15,000
€10,000
€5,000
€0
Environmental Science
Nursing
Food Science and Technology
Social Work / Social Care / Sociology / Community Development
Other Education / Learning Support / Early Childhood Studies
Other Paramedical
Computer Applications / Computer Science / Software Engineering
Computation / Modelling / Informatics
Law
Teaching Qualifications
Commerce & Business Studies
Business Information Systems
Mechanical, Production and M anufacturing Engineering
Chemical and Process Engineering
Physics
Mathematics
Humanities
Art & Design
Psychology
Psychotherapy
25th percentile
50th percentile
75th percentile
* Note that a value of €35,000 in this chart represents an indication that the value is over €33,000.
Source: Based on an original analysis of responses to the HEA’s First Destination of Award Recipients Survey for Graduates of 2004.
SET Graduate Salaries and Career Progression 17 June 2006
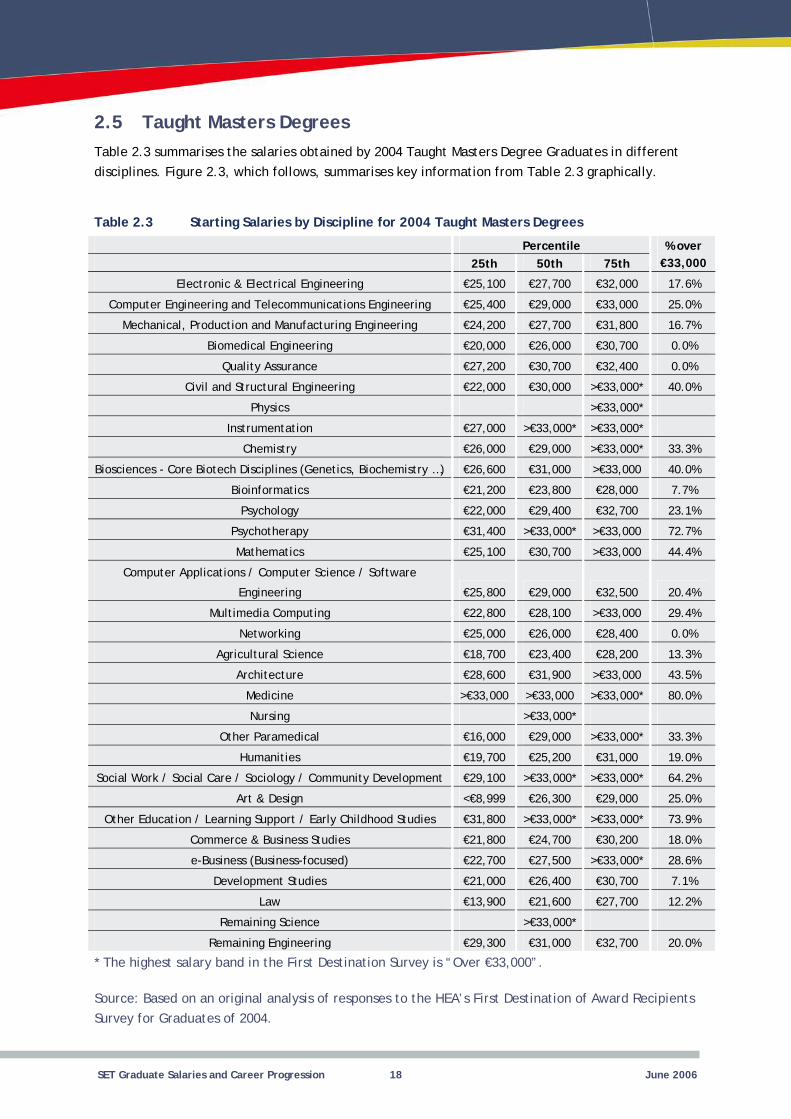
2.5 Taught Masters Degrees Table 2.3 summarises the salaries obtained by 2004 Taught Masters Degree Graduates in different disciplines. Figure 2.3, which follows, summarises key information from Table 2.3 graphically.
Table 2.3 Starting Salaries by Discipline for 2004 Taught Masters Degrees
Percentile 25th 50th 75th
% over €33,000
17.6%
25.0%
16.7%
Biomedical Engineering 0.0%
0.0%
40.0%
Physics
Instrumentation
33.3%
40.0%
7.7%
23.1%
Psychotherapy 72.7%
Mathematics 44.4%
Engineering 20.4%
Multimedia Computing 29.4%
0.0%
13.3%
43.5%
80.0%
Nursing
33.3%
Humanities 19.0%
64.2%
25.0%
73.9%
18.0%
28.6%
Development Studies 7.1%
Law 12.2%
20.0%
Electronic & Electrical Engineering €25,100 €27,700 €32,000
Computer Engineering and Telecommunications Engineering €25,400 €29,000 €33,000
Mechanical, Production and Manufacturing Engineering €24,200 €27,700 €31,800
€20,000 €26,000 €30,700
Quality Assurance €27,200 €30,700 €32,400
Civil and Structural Engineering €22,000 €30,000 >€33,000*
>€33,000*
€27,000 >€33,000* >€33,000*
Chemistry €26,000 €29,000 >€33,000*
Biosciences - Core Biotech Disciplines (Genetics, Biochemistry …) €26,600 €31,000 >€33,000
Bioinformatics €21,200 €23,800 €28,000
Psychology €22,000 €29,400 €32,700
€31,400 >€33,000* >€33,000
€25,100 €30,700 >€33,000
Computer Applications / Computer Science / Software
€25,800 €29,000 €32,500
€22,800 €28,100 >€33,000
Networking €25,000 €26,000 €28,400
Agricultural Science €18,700 €23,400 €28,200
Architecture €28,600 €31,900 >€33,000
Medicine >€33,000 >€33,000 >€33,000*
>€33,000*
Other Paramedical €16,000 €29,000 >€33,000*
€19,700 €25,200 €31,000
Social Work / Social Care / Sociology / Community Development €29,100 >€33,000* >€33,000*
Art & Design <€8,999 €26,300 €29,000
Other Education / Learning Support / Early Childhood Studies €31,800 >€33,000* >€33,000*
Commerce & Business Studies €21,800 €24,700 €30,200
e-Business (Business-focused) €22,700 €27,500 >€33,000*
€21,000 €26,400 €30,700
€13,900 €21,600 €27,700
Remaining Science >€33,000*
Remaining Engineering €29,300 €31,000 €32,700
* The highest salary band in the First Destination Survey is “Over €33,000”.
Source: Based on an original analysis of responses to the HEA’s First Destination of Award Recipients Survey for Graduates of 2004.
SET Graduate Salaries and Career Progression 18 June 2006
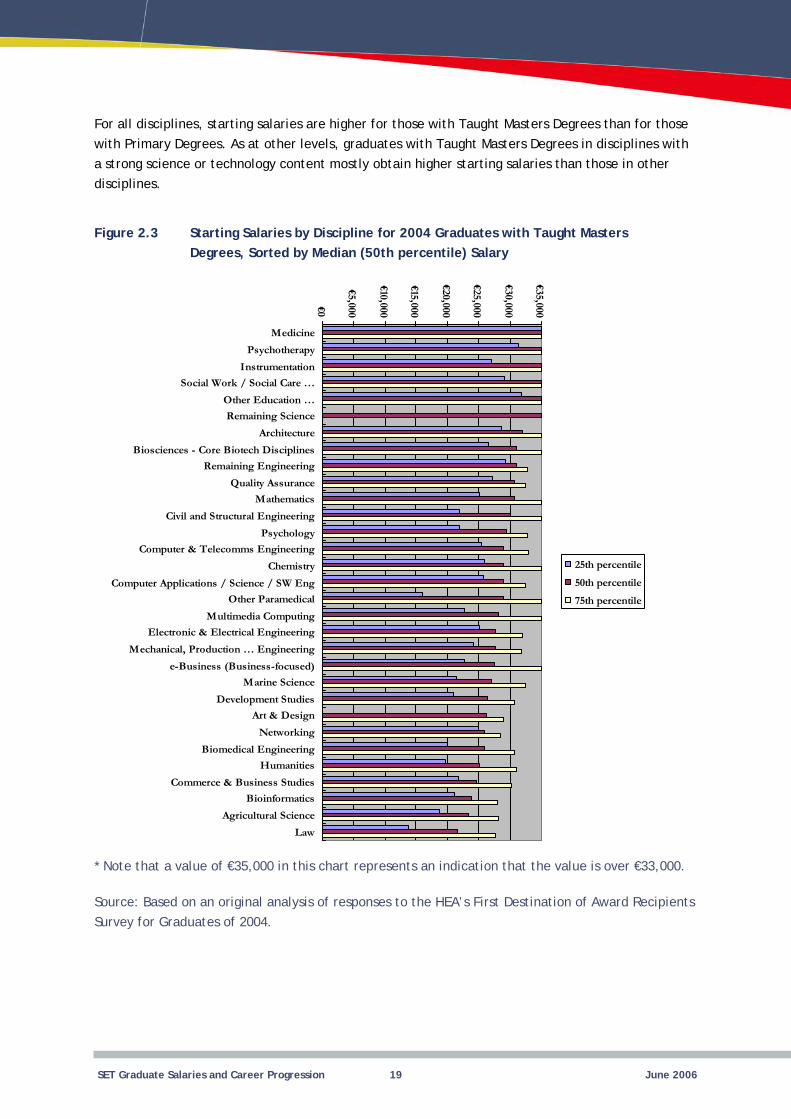
For all disciplines, starting salaries are higher for those with Taught Masters Degrees than for those with Primary Degrees. As at other levels, graduates with Taught Masters Degrees in disciplines with a strong science or technology content mostly obtain higher starting salaries than those in other disciplines.
Figure 2.3 Starting Salaries by Discipline for 2004 Graduates with Taught Masters Degrees, Sorted by Median (50th percentile) Salary
€35,000
€30,000
€25,000
€20,000
€15,000
€10,000
€5,000
€0
Medicine
Psychotherapy
Instrumentation
Social Work / Social Care …
Other Education …
Remaining Science
Architecture
Biosciences - Core Biotech Disciplines
Remaining Engineering
Quality Assurance
Mathematics
Civil and Structural Engineering
Psychology
Computer & Telecomms Engineering
Chemistry
Computer Applications / Science / SW Eng
Other Paramedical
Multimedia Computing
Electronic & Electrical Engineering
M echanical, Production … Engineering
e-Business (Business-focused)
Marine Science
Development Studies
Art & Design
Networking
Biomedical Engineering
Humanities
Commerce & Business Studies
Bioinformatics
Agricultural Science
Law
25th percentile
50th percentile
75th percentile
* Note that a value of €35,000 in this chart represents an indication that the value is over €33,000.
Source: Based on an original analysis of responses to the HEA’s First Destination of Award Recipients Survey for Graduates of 2004.
SET Graduate Salaries and Career Progression 19 June 2006
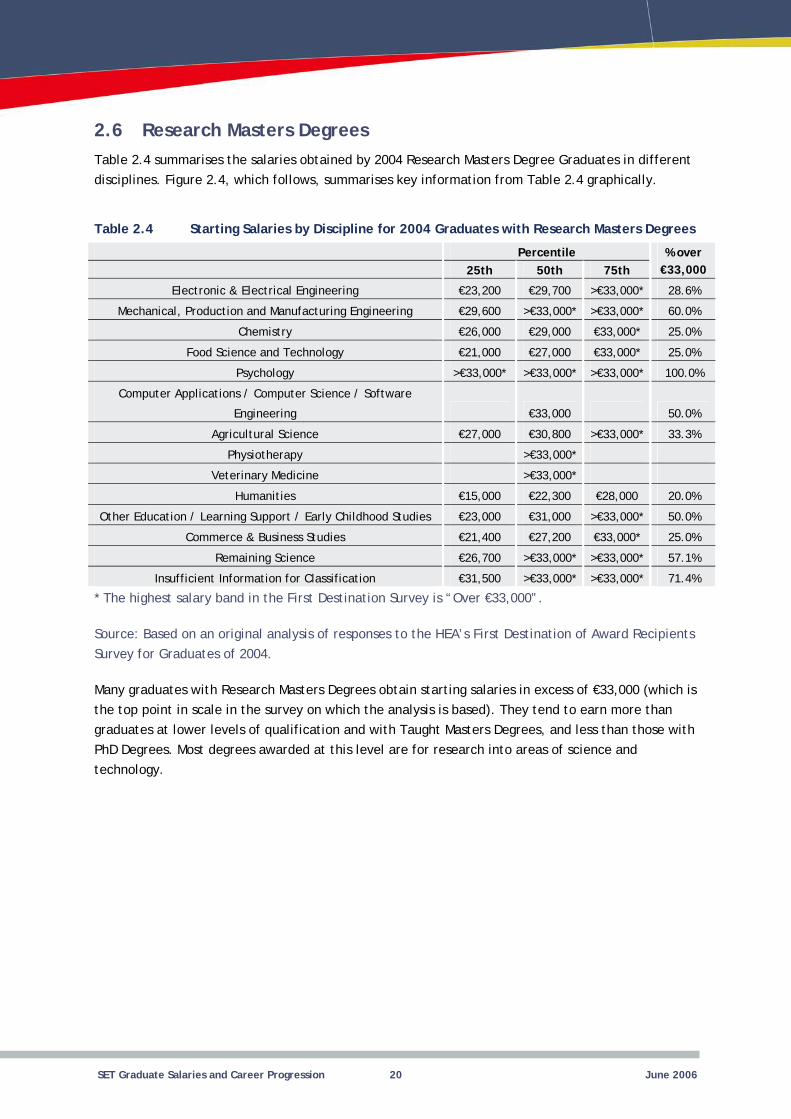
2.6 Research Masters Degrees Table 2.4 summarises the salaries obtained by 2004 Research Masters Degree Graduates in different disciplines. Figure 2.4, which follows, summarises key information from Table 2.4 graphically.
Table 2.4 Starting Salaries by Discipline for 2004 Graduates with Research Masters Degrees
Percentile 25th 50th 75th
% over €33,000
28.6%
60.0%
25.0%
Food Science and Technology 25.0%
100.0%
Engineering 50.0%
33.3%
Physiotherapy
Veterinary Medicine
Humanities 20.0%
50.0%
25.0%
57.1%
71.4%
Electronic & Electrical Engineering €23,200 €29,700 >€33,000*
Mechanical, Production and Manufacturing Engineering €29,600 >€33,000* >€33,000*
Chemistry €26,000 €29,000 €33,000*
€21,000 €27,000 €33,000*
Psychology >€33,000* >€33,000* >€33,000*
Computer Applications / Computer Science / Software
€33,000
Agricultural Science €27,000 €30,800 >€33,000*
>€33,000*
>€33,000*
€15,000 €22,300 €28,000
Other Education / Learning Support / Early Childhood Studies €23,000 €31,000 >€33,000*
Commerce & Business Studies €21,400 €27,200 €33,000*
Remaining Science €26,700 >€33,000* >€33,000*
Insufficient Information for Classification €31,500 >€33,000* >€33,000*
* The highest salary band in the First Destination Survey is “Over €33,000”.
Source: Based on an original analysis of responses to the HEA’s First Destination of Award Recipients Survey for Graduates of 2004.
Many graduates with Research Masters Degrees obtain starting salaries in excess of €33,000 (which is the top point in scale in the survey on which the analysis is based). They tend to earn more than graduates at lower levels of qualification and with Taught Masters Degrees, and less than those with PhD Degrees. Most degrees awarded at this level are for research into areas of science and technology.
SET Graduate Salaries and Career Progression 20 June 2006
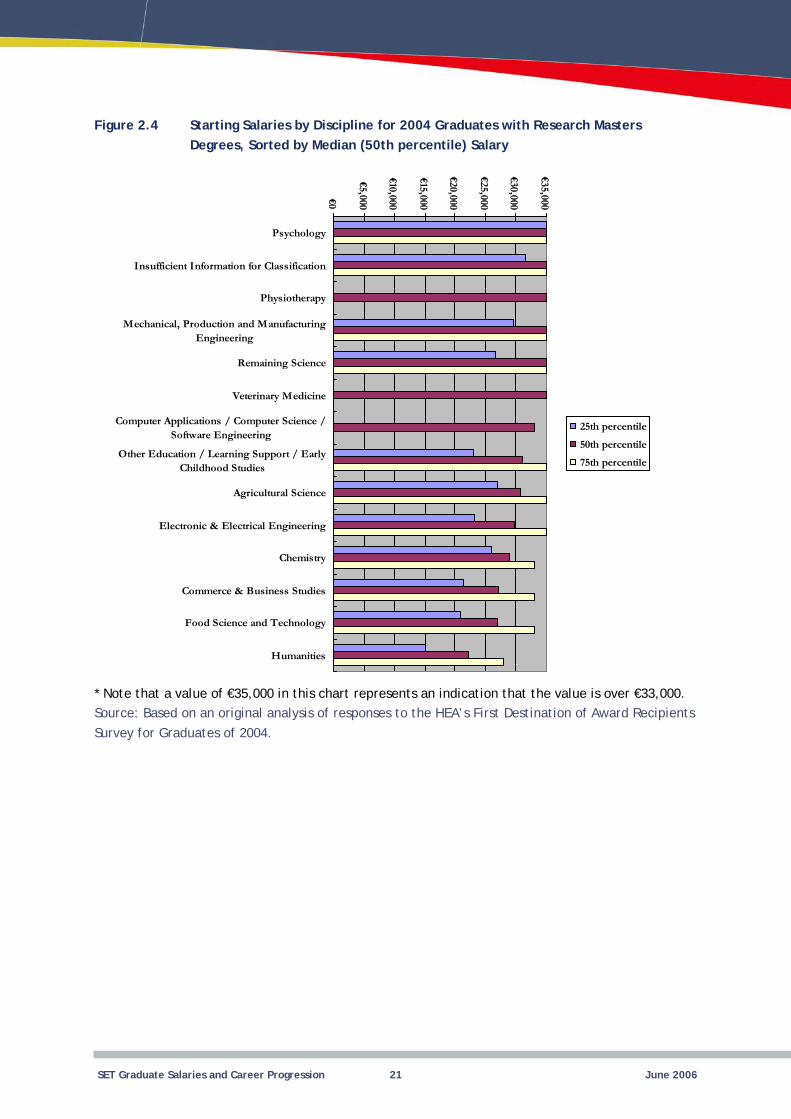
Figure 2.4 Starting Salaries by Discipline for 2004 Graduates with Research Masters Degrees, Sorted by Median (50th percentile) Salary
€35,000
€30,000
€25,000
€20,000
€15,000
€10,000
€5,000
€0
Psychology
Insufficient Information for Classification
Physiotherapy
M echanical, Production and M anufacturing Engineering
Remaining Science
Veterinary Medicine
Computer Applications / Computer Science / Software Engineering
Other Education / Learning Support / Early Childhood Studies
Agricultural Science
Electronic & Electrical Engineering
Chemistry
Commerce & Business Studies
Food Science and Technology
Humanities
25th percentile
50th percentile
75th percentile
* Note that a value of €35,000 in this chart represents an indication that the value is over €33,000. Source: Based on an original analysis of responses to the HEA’s First Destination of Award Recipients Survey for Graduates of 2004.
SET Graduate Salaries and Career Progression 21 June 2006
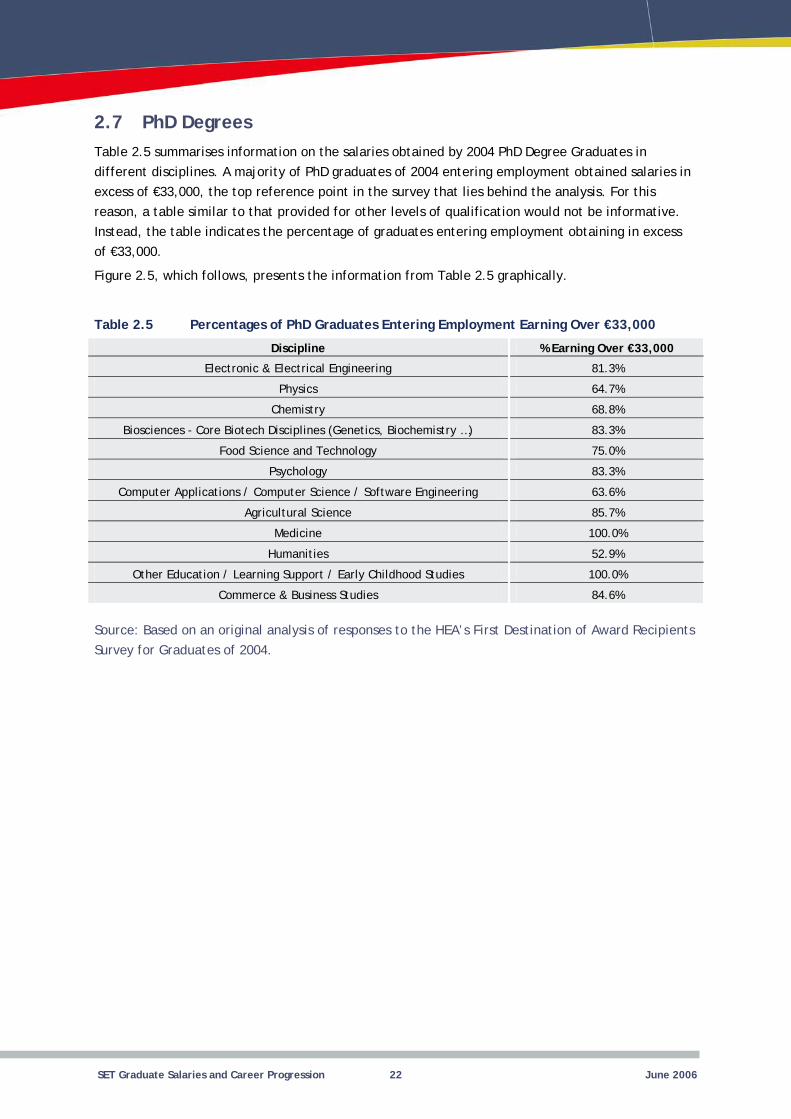
2.7 PhD Degrees Table 2.5 summarises information on the salaries obtained by 2004 PhD Degree Graduates in different disciplines. A majority of PhD graduates of 2004 entering employment obtained salaries in excess of €33,000, the top reference point in the survey that lies behind the analysis. For this reason, a table similar to that provided for other levels of qualification would not be informative. Instead, the table indicates the percentage of graduates entering employment obtaining in excess of €33,000.
Figure 2.5, which follows, presents the information from Table 2.5 graphically.
Table 2.5 Percentages of PhD Graduates Entering Employment Earning Over €33,000
% Earning Over €33,000
81.3%
Physics 64.7%
68.8%
83.3%
Food Science and Technology 75.0%
83.3%
63.6%
85.7%
100.0%
Humanities 52.9%
100.0%
84.6%
Discipline
Electronic & Electrical Engineering
Chemistry
Biosciences - Core Biotech Disciplines (Genetics, Biochemistry …)
Psychology
Computer Applications / Computer Science / Software Engineering
Agricultural Science
Medicine
Other Education / Learning Support / Early Childhood Studies
Commerce & Business Studies
Source: Based on an original analysis of responses to the HEA’s First Destination of Award Recipients Survey for Graduates of 2004.
SET Graduate Salaries and Career Progression 22 June 2006
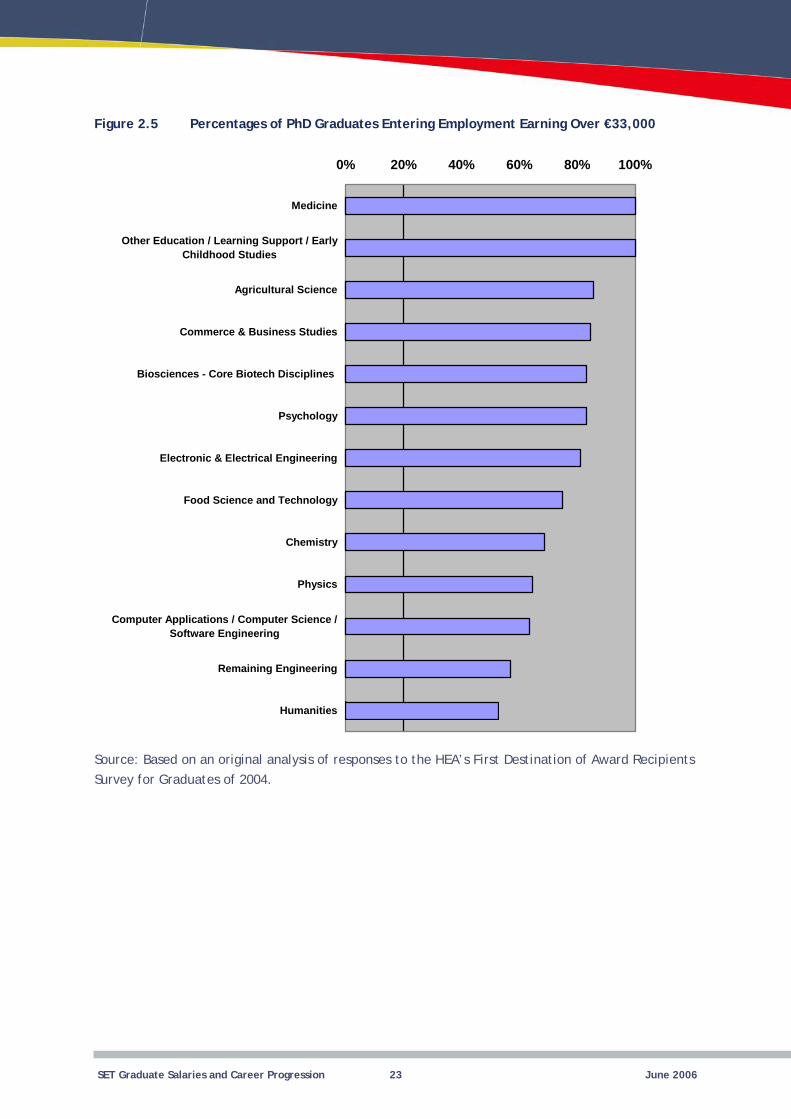
Figure 2.5 Percentages of PhD Graduates Entering Employment Earning Over €33,000
0% 20% 40% 60% 80% 100%
Medicine
Other Education / Learning Support / Early Childhood Studies
Agricultural Science
Commerce & Business Studies
Biosciences - Core Biotech Disciplines
Psychology
Electronic & Electrical Engineering
Food Science and Technology
Chemistry
Physics
Computer Applications / Computer Science / Software Engineering
Remaining Engineering
Humanities
Source: Based on an original analysis of responses to the HEA’s First Destination of Award Recipients Survey for Graduates of 2004.
SET Graduate Salaries and Career Progression 23 June 2006
2.9 Comparisons of Graduate Salaries with Incomes Available to Research Students
Honours Bachelor Degree graduates in SET disciplines increasingly continue their studies by undertaking research towards a PhD or a research Masters degree. Significant funding is now available from a variety of sources to support this.
Two of the major routes for funding are:
� Employment as a research assistant by research programmes funded by bodies such as Science Foundation Ireland; and
� Postgraduate stipends under the Embark Programme administered on behalf of the Government by the Irish Research Council for Science, Engineering and Technology.
As of June 2006, the Irish University Association's salary scale for Research Assistants starts at €20,850, and extends to €33,800, which is comparable with the range of salaries available in industry for students in SET disciplines.
An award under the Embark Programme pays €24,003 each year, of which one third is intended to cover the cost of education. The remaining €16,002 is to maintain the student. As this amount is free of tax, it is equivalent to a larger sum in the form of a salary. The exact amount will vary depending on individual circumstances, but for a typical single person with only standard tax credits it is equivalent to approximately €18,900. While this is somewhat less than a graduate with a good degree is likely to obtain from an employer, it has proven to be sufficiently attractive to encourage effective competition for research places amongst the most able candidates from Ireland and overseas.
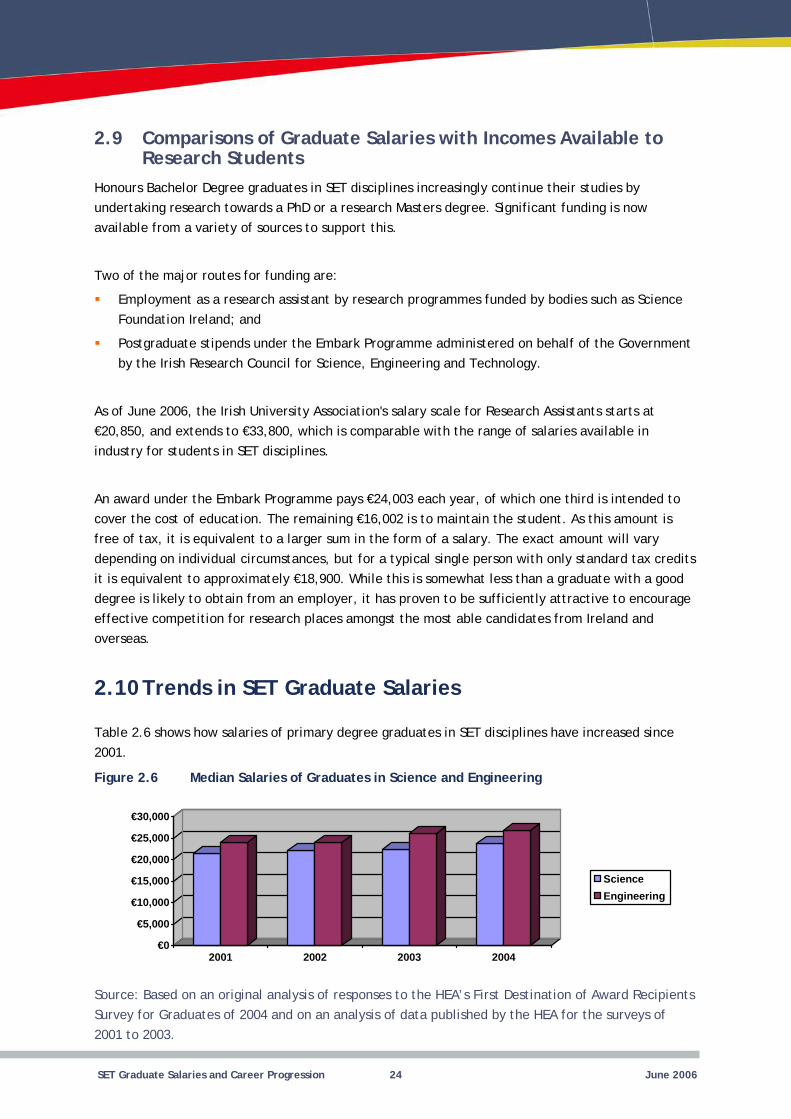
2.10 Trends in SET Graduate Salaries
Table 2.6 shows how salaries of primary degree graduates in SET disciplines have increased since 2001.
Figure 2.6 Median Salaries of Graduates in Science and Engineering
€0 2001 2003
€5,000
€10,000
€15,000
€20,000
€25,000
€30,000
2002 2004
Science Engineering
Source: Based on an original analysis of responses to the HEA’s First Destination of Award Recipients Survey for Graduates of 2004 and on an analysis of data published by the HEA for the surveys of 2001 to 2003.
SET Graduate Salaries and Career Progression 24 June 2006
Chapter 3 Employment Sectors and Occupations Entered by Level 8 Graduates
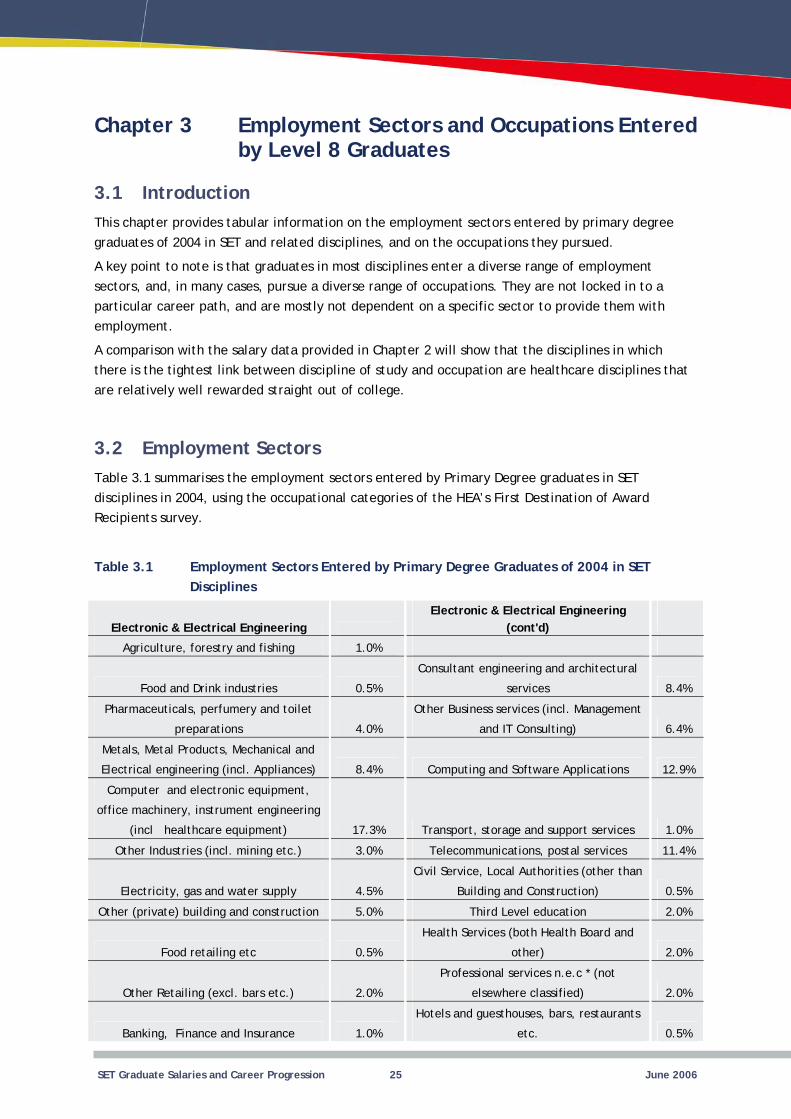
3.1 Introduction This chapter provides tabular information on the employment sectors entered by primary degree graduates of 2004 in SET and related disciplines, and on the occupations they pursued.
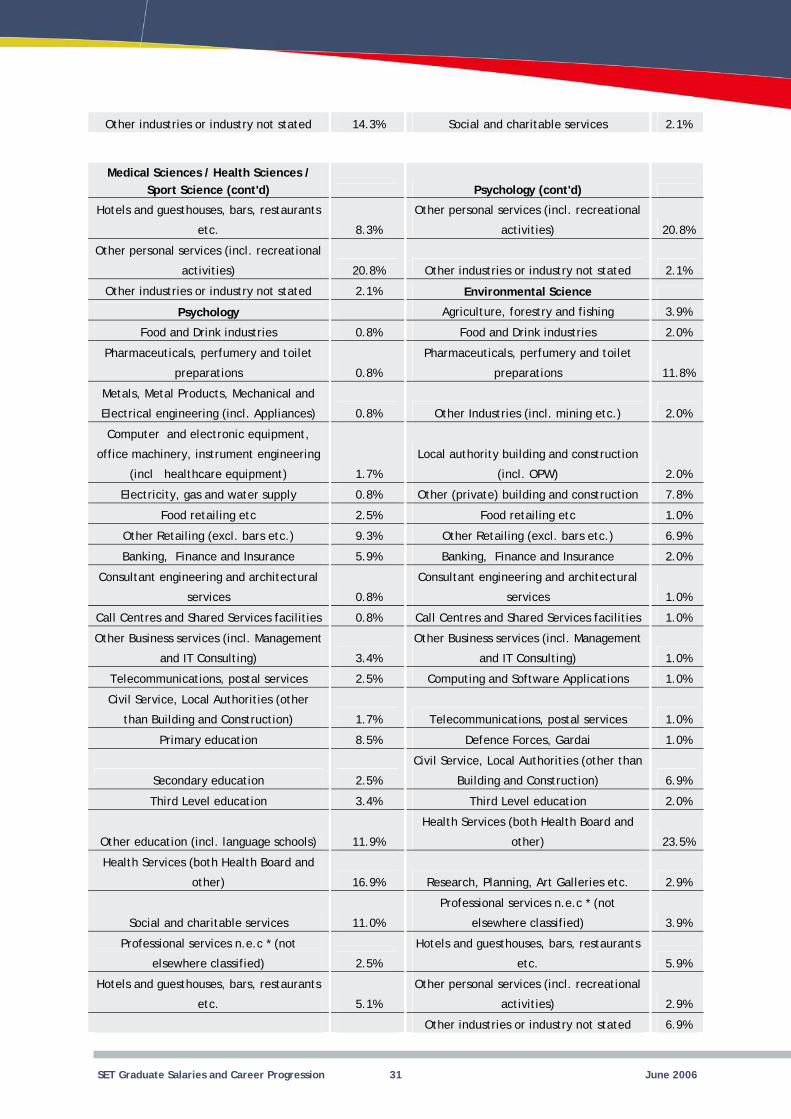
A key point to note is that graduates in most disciplines enter a diverse range of employment sectors, and, in many cases, pursue a diverse range of occupations. They are not locked in to a particular career path, and are mostly not dependent on a specific sector to provide them with employment.
A comparison with the salary data provided in Chapter 2 will show that the disciplines in which there is the tightest link between discipline of study and occupation are healthcare disciplines that are relatively well rewarded straight out of college.
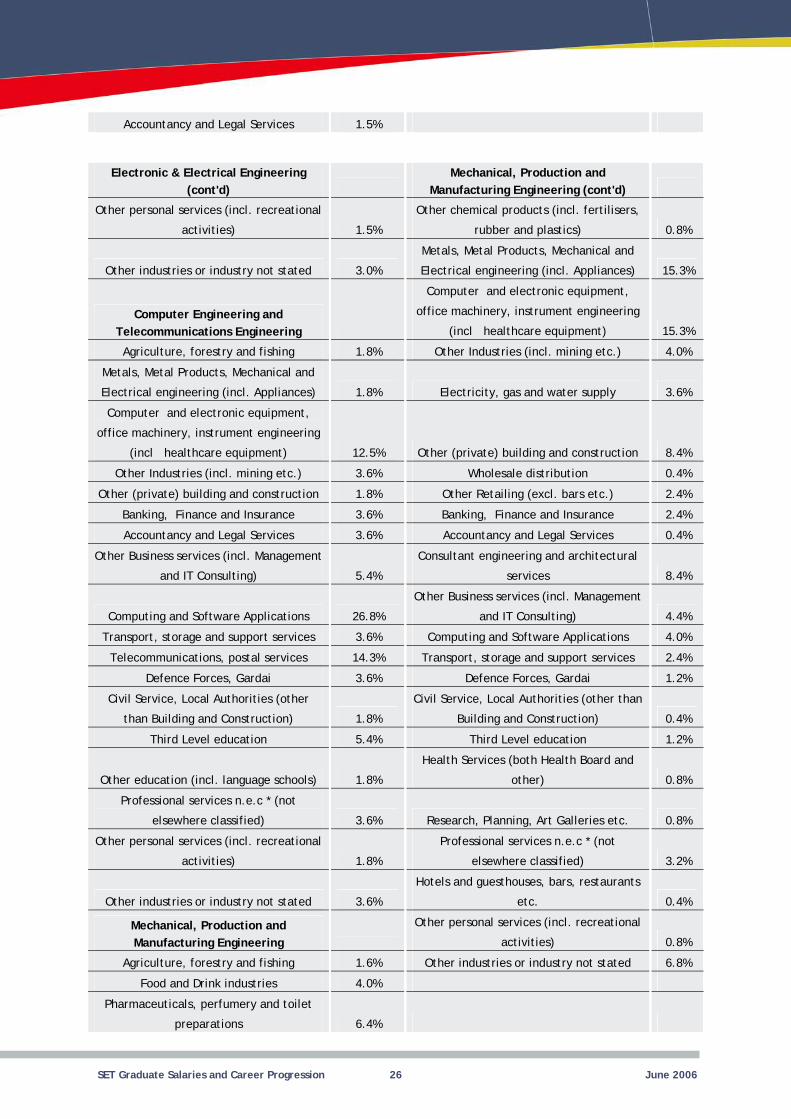
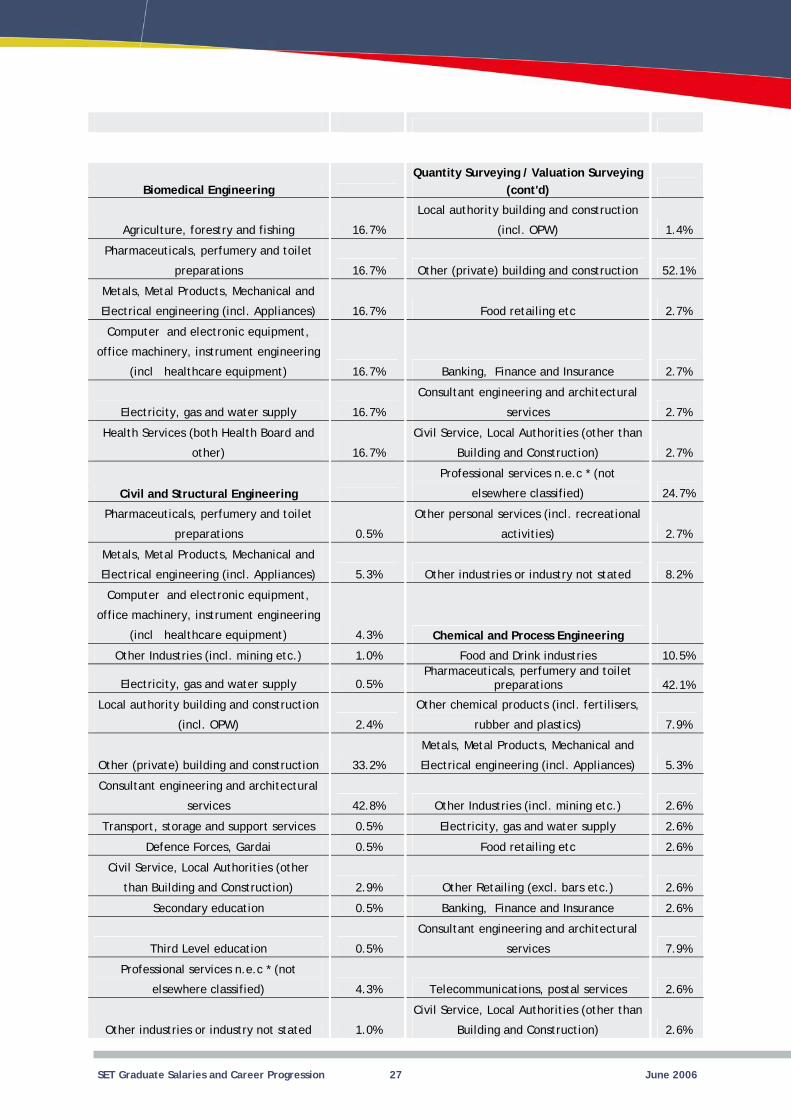
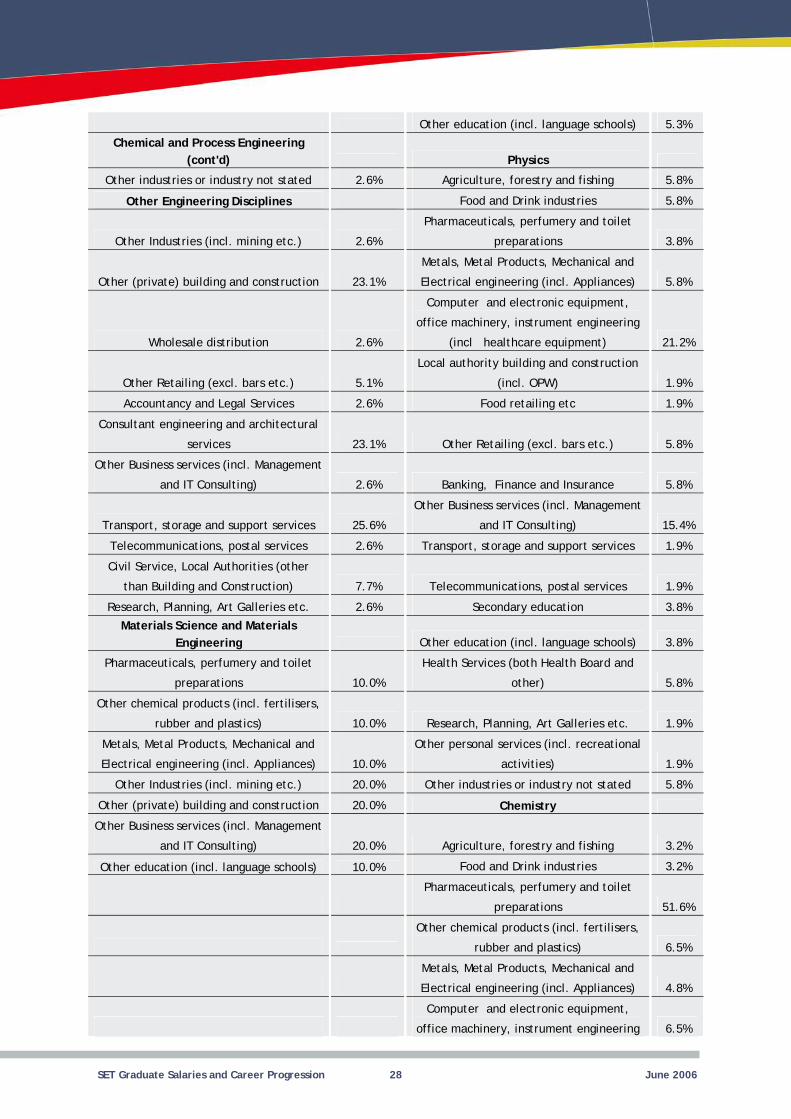
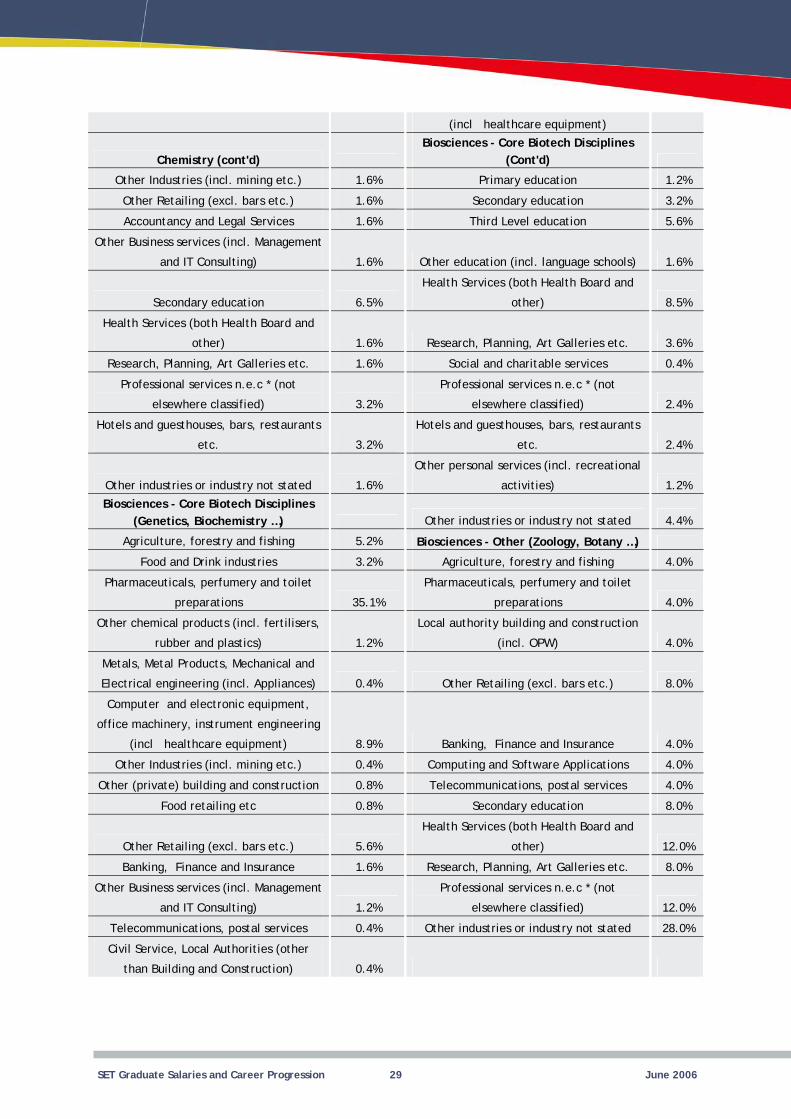
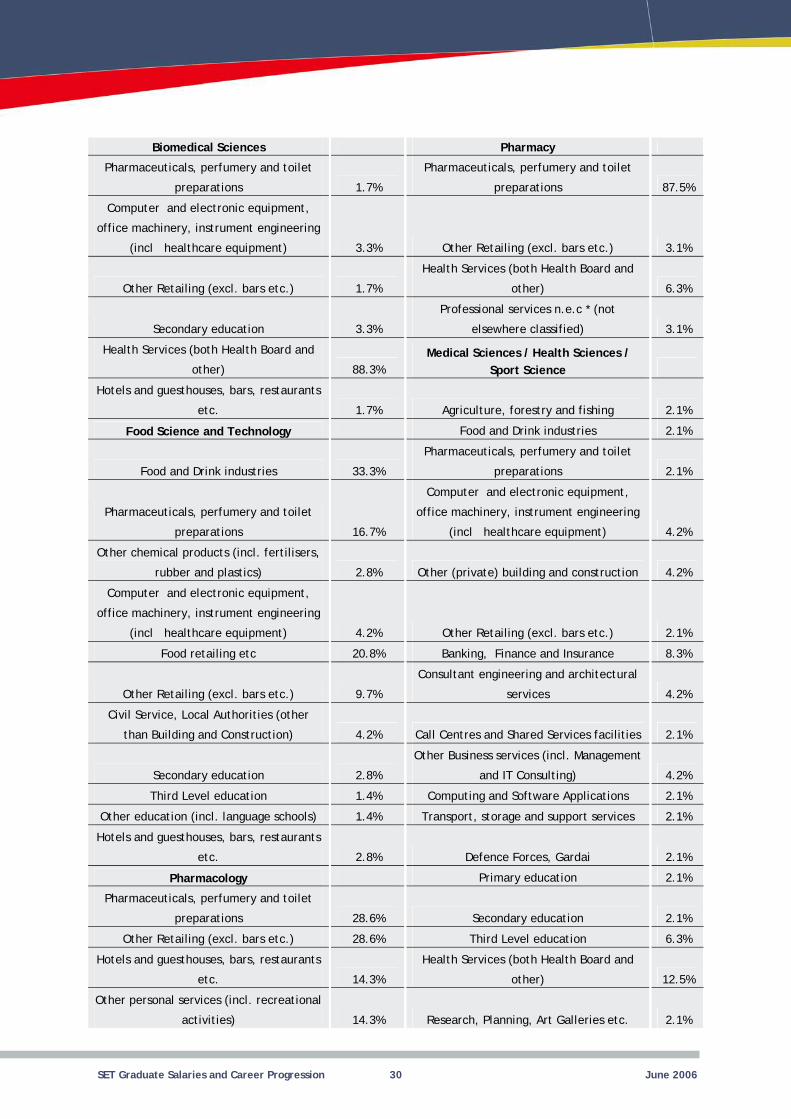
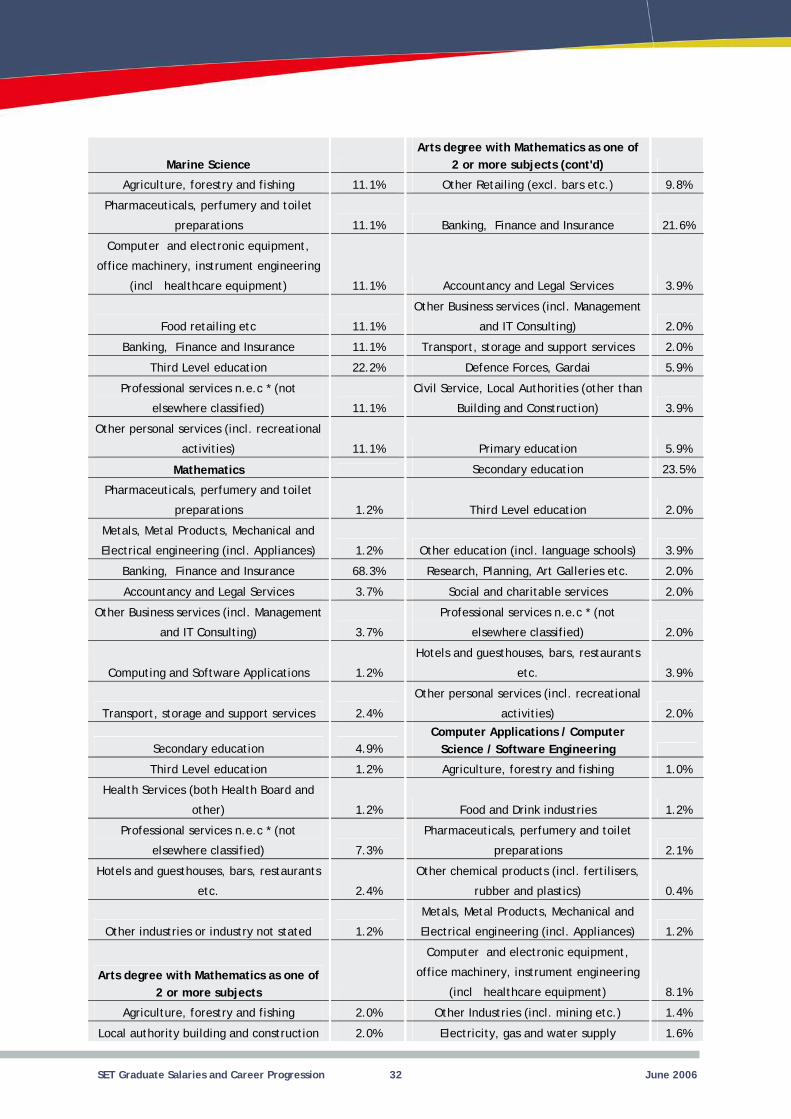
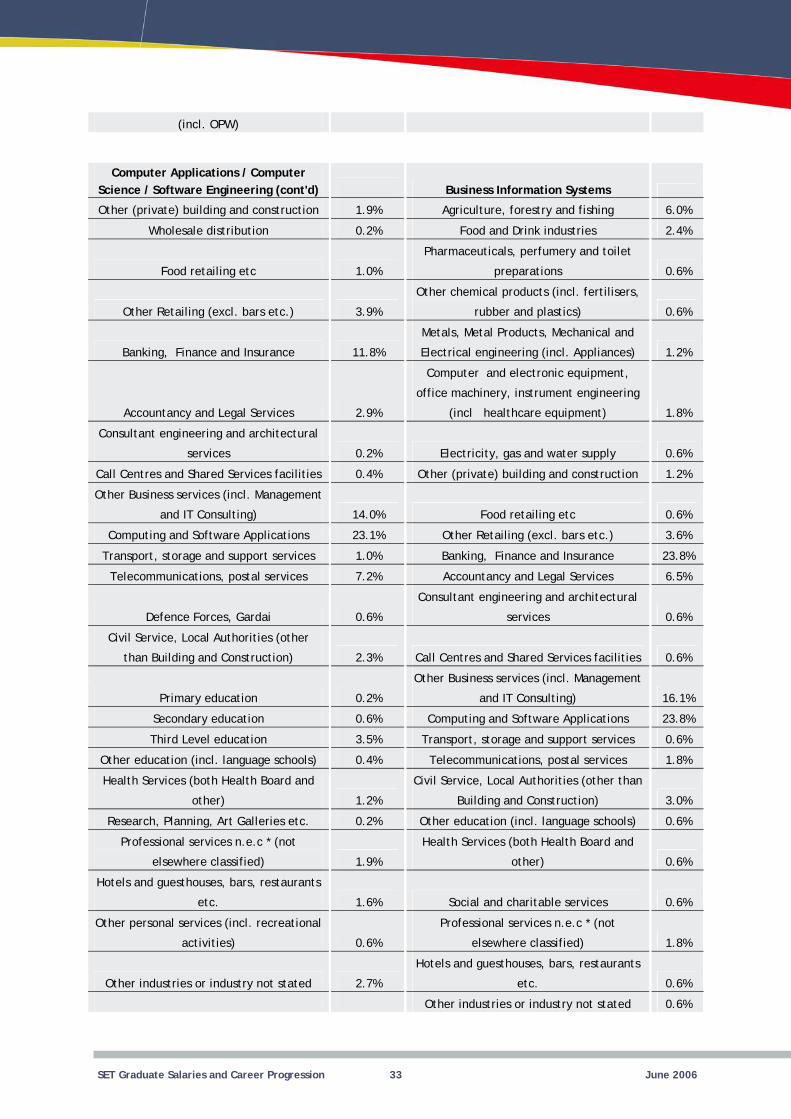
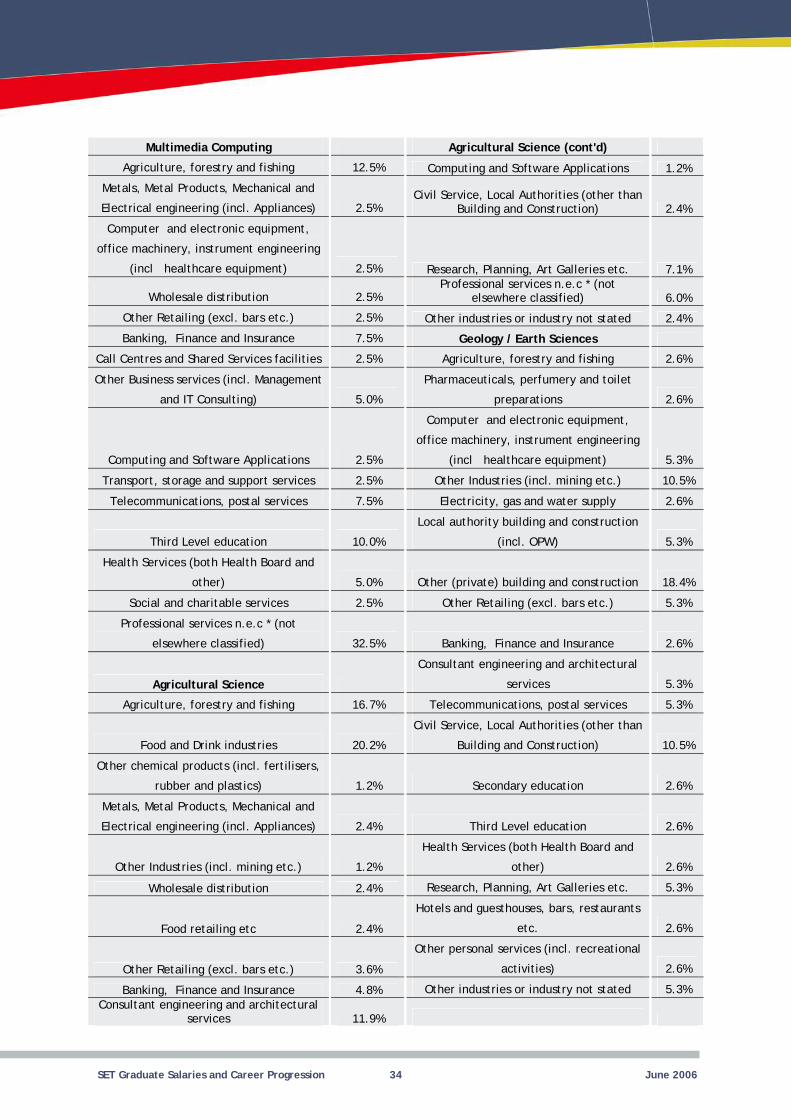
3.2 Employment Sectors Table 3.1 summarises the employment sectors entered by Primary Degree graduates in SET disciplines in 2004, using the occupational categories of the HEA’s First Destination of Award Recipients survey.
Table 3.1 Employment Sectors Entered by Primary Degree Graduates of 2004 in SET Disciplines
(cont'd)
1.0%
Food and Drink industries 0.5% services 8.4%
preparations 4.0% and IT Consulting) 6.4%
8.4% 12.9%
Computer and electronic equipment,
(incl 17.3% 1.0%
Other Industries (incl. mining etc.) 3.0% 11.4%
4.5% 0.5%
5.0% Third Level education 2.0%
0.5% other) 2.0%
2.0%
Professional services n.e.c * (not
2.0%
Banking, 1.0% etc. 0.5%
Electronic & Electrical Engineering Electronic & Electrical Engineering
Agriculture, forestry and fishing
Consultant engineering and architectural
Pharmaceuticals, perfumery and toilet Other Business services (incl. Management
Metals, Metal Products, Mechanical and
Electrical engineering (incl. Appliances) Computing and Software Applications
office machinery, instrument engineering
healthcare equipment) Transport, storage and support services
Telecommunications, postal services
Electricity, gas and water supply
Civil Service, Local Authorities (other than
Building and Construction)
Other (private) building and construction
Food retailing etc
Health Services (both Health Board and
Other Retailing (excl. bars etc.) elsewhere classified)
Finance and Insurance
Hotels and guesthouses, bars, restaurants
SET Graduate Salaries and Career Progression 25 June 2006
1.5%
(cont'd)
1.5%
Other chemical products (incl. fertilisers,
0.8%
3.0% 15.3%
Computer and electronic equipment,
(incl 15.3%
1.8% Other Industries (incl. mining etc.) 4.0%
1.8% 3.6%
Computer and electronic equipment,
(incl 12.5% 8.4%
Other Industries (incl. mining etc.) 3.6% Wholesale distribution 0.4%
1.8% 2.4%
Banking, 3.6% Banking, 2.4%
3.6% 0.4%
and IT Consulting) 5.4% services 8.4%
26.8% and IT Consulting) 4.4%
3.6% 4.0%
14.3% 2.4%
3.6% 1.2%
than Building and Construction) 1.8% 0.4%
Third Level education 5.4% Third Level education 1.2%
1.8% other) 0.8%
Professional services n.e.c * (not
3.6% 0.8%
1.8%
Professional services n.e.c * (not
3.2%
3.6% etc. 0.4%
Manufacturing Engineering 0.8%
1.6% 6.8%
Food and Drink industries 4.0%
preparations 6.4%
Accountancy and Legal Services
Electronic & Electrical Engineering Mechanical, Production and Manufacturing Engineering (cont'd)
Other personal services (incl. recreational
activities) rubber and plastics)
Other industries or industry not stated
Metals, Metal Products, Mechanical and
Electrical engineering (incl. Appliances)
Computer Engineering and Telecommunications Engineering
office machinery, instrument engineering
healthcare equipment)
Agriculture, forestry and fishing
Metals, Metal Products, Mechanical and
Electrical engineering (incl. Appliances) Electricity, gas and water supply
office machinery, instrument engineering
healthcare equipment) Other (private) building and construction
Other (private) building and construction Other Retailing (excl. bars etc.)
Finance and Insurance Finance and Insurance
Accountancy and Legal Services Accountancy and Legal Services
Other Business services (incl. Management Consultant engineering and architectural
Computing and Software Applications
Other Business services (incl. Management
Transport, storage and support services Computing and Software Applications
Telecommunications, postal services Transport, storage and support services
Defence Forces, Gardai Defence Forces, Gardai
Civil Service, Local Authorities (other Civil Service, Local Authorities (other than
Building and Construction)
Other education (incl. language schools)
Health Services (both Health Board and
elsewhere classified) Research, Planning, Art Galleries etc.
Other personal services (incl. recreational
activities) elsewhere classified)
Other industries or industry not stated
Hotels and guesthouses, bars, restaurants
Mechanical, Production and Other personal services (incl. recreational
activities)
Agriculture, forestry and fishing Other industries or industry not stated
Pharmaceuticals, perfumery and toilet
SET Graduate Salaries and Career Progression 26 June 2006
Biomedical Engineering Quantity Surveying / Valuation Surveying
(cont'd)
16.7% (incl. OPW) 1.4%
preparations 16.7% 52.1%
16.7% 2.7%
Computer and electronic equipment,
(incl 16.7% Banking, 2.7%
16.7% services 2.7%
other) 16.7% 2.7%
Professional services n.e.c * (not
24.7%
preparations 0.5% 2.7%
5.3% 8.2%
Computer and electronic equipment,
(incl 4.3%
Other Industries (incl. mining etc.) 1.0% Food and Drink industries 10.5%
0.5% preparations 42.1%
(incl. OPW) 2.4%
Other chemical products (incl. fertilisers,
7.9%
33.2% 5.3%
services 42.8% Other Industries (incl. mining etc.) 2.6%
0.5% 2.6%
0.5% 2.6%
than Building and Construction) 2.9% 2.6%
Secondary education 0.5% Banking, 2.6%
Third Level education 0.5% services 7.9%
Professional services n.e.c * (not
4.3% 2.6%
1.0% 2.6%
Agriculture, forestry and fishing
Local authority building and construction
Pharmaceuticals, perfumery and toilet
Other (private) building and construction
Metals, Metal Products, Mechanical and
Electrical engineering (incl. Appliances) Food retailing etc
office machinery, instrument engineering
healthcare equipment) Finance and Insurance
Electricity, gas and water supply
Consultant engineering and architectural
Health Services (both Health Board and Civil Service, Local Authorities (other than
Building and Construction)
Civil and Structural Engineering elsewhere classified)
Pharmaceuticals, perfumery and toilet Other personal services (incl. recreational
activities)
Metals, Metal Products, Mechanical and
Electrical engineering (incl. Appliances) Other industries or industry not stated
office machinery, instrument engineering
healthcare equipment) Chemical and Process Engineering
Electricity, gas and water supply Pharmaceuticals, perfumery and toilet
Local authority building and construction
rubber and plastics)
Other (private) building and construction
Metals, Metal Products, Mechanical and
Electrical engineering (incl. Appliances)
Consultant engineering and architectural
Transport, storage and support services Electricity, gas and water supply
Defence Forces, Gardai Food retailing etc
Civil Service, Local Authorities (other
Other Retailing (excl. bars etc.)
Finance and Insurance
Consultant engineering and architectural
elsewhere classified) Telecommunications, postal services
Other industries or industry not stated
Civil Service, Local Authorities (other than
Building and Construction)
SET Graduate Salaries and Career Progression 27 June 2006
5.3%
(cont'd) Physics
2.6% 5.8%
Food and Drink industries 5.8%
Other Industries (incl. mining etc.) 2.6% preparations 3.8%
23.1% 5.8%
Wholesale distribution 2.6%
Computer and electronic equipment,
(incl 21.2%
5.1% (incl. OPW) 1.9%
2.6% 1.9%
services 23.1% 5.8%
and IT Consulting) 2.6% Banking, 5.8%
25.6% and IT Consulting) 15.4%
2.6% 1.9%
than Building and Construction) 7.7% 1.9%
2.6% Secondary education 3.8%
Engineering 3.8%
preparations 10.0% other) 5.8%
Other chemical products (incl. fertilisers,
10.0% 1.9%
10.0% 1.9%
Other Industries (incl. mining etc.) 20.0% 5.8%
20.0% Chemistry
and IT Consulting) 20.0% 3.2%
10.0% Food and Drink industries 3.2%
preparations 51.6%
Other chemical products (incl. fertilisers,
6.5%
4.8%
Computer and electronic equipment,
6.5%
Other education (incl. language schools)
Chemical and Process Engineering
Other industries or industry not stated Agriculture, forestry and fishing
Other Engineering Disciplines
Pharmaceuticals, perfumery and toilet
Other (private) building and construction
Metals, Metal Products, Mechanical and
Electrical engineering (incl. Appliances)
office machinery, instrument engineering
healthcare equipment)
Other Retailing (excl. bars etc.)
Local authority building and construction
Accountancy and Legal Services Food retailing etc
Consultant engineering and architectural
Other Retailing (excl. bars etc.)
Other Business services (incl. Management
Finance and Insurance
Transport, storage and support services
Other Business services (incl. Management
Telecommunications, postal services Transport, storage and support services
Civil Service, Local Authorities (other
Telecommunications, postal services
Research, Planning, Art Galleries etc.
Materials Science and Materials Other education (incl. language schools)
Pharmaceuticals, perfumery and toilet Health Services (both Health Board and
rubber and plastics) Research, Planning, Art Galleries etc.
Metals, Metal Products, Mechanical and
Electrical engineering (incl. Appliances)
Other personal services (incl. recreational
activities)
Other industries or industry not stated
Other (private) building and construction
Other Business services (incl. Management
Agriculture, forestry and fishing
Other education (incl. language schools)
Pharmaceuticals, perfumery and toilet
rubber and plastics)
Metals, Metal Products, Mechanical and
Electrical engineering (incl. Appliances)
office machinery, instrument engineering
SET Graduate Salaries and Career Progression 28 June 2006
(incl
Chemistry (cont'd) (Cont'd)
Other Industries (incl. mining etc.) 1.6% 1.2%
1.6% Secondary education 3.2%
1.6% Third Level education 5.6%
and IT Consulting) 1.6% 1.6%
Secondary education 6.5% other) 8.5%
other) 1.6% 3.6%
1.6% Social and charitable services 0.4%
Professional services n.e.c * (not
3.2%
Professional services n.e.c * (not
2.4%
etc. 3.2% etc. 2.4%
1.6% 1.2%
(Genetics, Biochemistry …) 4.4%
5.2%
Food and Drink industries 3.2% 4.0%
preparations 35.1% preparations 4.0%
Other chemical products (incl. fertilisers,
1.2% (incl. OPW) 4.0%
0.4% 8.0%
Computer and electronic equipment,
(incl 8.9% Banking, 4.0%
Other Industries (incl. mining etc.) 0.4% 4.0%
0.8% 4.0%
0.8% Secondary education 8.0%
5.6% other) 12.0%
Banking, 1.6% 8.0%
and IT Consulting) 1.2%
Professional services n.e.c * (not
12.0%
0.4% 28.0%
than Building and Construction) 0.4%
healthcare equipment)
Biosciences - Core Biotech Disciplines
Primary education
Other Retailing (excl. bars etc.)
Accountancy and Legal Services
Other Business services (incl. Management
Other education (incl. language schools)
Health Services (both Health Board and
Health Services (both Health Board and
Research, Planning, Art Galleries etc.
Research, Planning, Art Galleries etc.
elsewhere classified) elsewhere classified)
Hotels and guesthouses, bars, restaurants Hotels and guesthouses, bars, restaurants
Other industries or industry not stated
Other personal services (incl. recreational
activities)
Biosciences - Core Biotech Disciplines Other industries or industry not stated
Agriculture, forestry and fishing Biosciences - Other (Zoology, Botany …)
Agriculture, forestry and fishing
Pharmaceuticals, perfumery and toilet Pharmaceuticals, perfumery and toilet
rubber and plastics)
Local authority building and construction
Metals, Metal Products, Mechanical and
Electrical engineering (incl. Appliances) Other Retailing (excl. bars etc.)
office machinery, instrument engineering
healthcare equipment) Finance and Insurance
Computing and Software Applications
Other (private) building and construction Telecommunications, postal services
Food retailing etc
Other Retailing (excl. bars etc.)
Health Services (both Health Board and
Finance and Insurance Research, Planning, Art Galleries etc.
Other Business services (incl. Management
elsewhere classified)
Telecommunications, postal services Other industries or industry not stated
Civil Service, Local Authorities (other
SET Graduate Salaries and Career Progression 29 June 2006
Biomedical Sciences Pharmacy
preparations 1.7% preparations 87.5%
Computer and electronic equipment,
(incl 3.3% 3.1%
1.7% other) 6.3%
Secondary education 3.3%
Professional services n.e.c * (not
3.1%
other) 88.3%
etc. 1.7% 2.1%
Food and Drink industries 2.1%
Food and Drink industries 33.3% preparations 2.1%
preparations 16.7%
Computer and electronic equipment,
(incl 4.2%
Other chemical products (incl. fertilisers,
2.8% 4.2%
Computer and electronic equipment,
(incl 4.2% 2.1%
20.8% Banking, 8.3%
9.7% services 4.2%
than Building and Construction) 4.2% Call Centres and Shared Services facilities 2.1%
Secondary education 2.8% and IT Consulting) 4.2%
Third Level education 1.4% 2.1%
1.4% 2.1%
etc. 2.8% 2.1%
Pharmacology 2.1%
preparations 28.6% Secondary education 2.1%
28.6% Third Level education 6.3%
etc. 14.3% other) 12.5%
14.3% 2.1%
Pharmaceuticals, perfumery and toilet Pharmaceuticals, perfumery and toilet
office machinery, instrument engineering
healthcare equipment) Other Retailing (excl. bars etc.)
Other Retailing (excl. bars etc.)
Health Services (both Health Board and
elsewhere classified)
Health Services (both Health Board and Medical Sciences / Health Sciences / Sport Science
Hotels and guesthouses, bars, restaurants
Agriculture, forestry and fishing
Food Science and Technology
Pharmaceuticals, perfumery and toilet
Pharmaceuticals, perfumery and toilet office machinery, instrument engineering
healthcare equipment)
rubber and plastics) Other (private) building and construction
office machinery, instrument engineering
healthcare equipment) Other Retailing (excl. bars etc.)
Food retailing etc Finance and Insurance
Other Retailing (excl. bars etc.)
Consultant engineering and architectural
Civil Service, Local Authorities (other
Other Business services (incl. Management
Computing and Software Applications
Other education (incl. language schools) Transport, storage and support services
Hotels and guesthouses, bars, restaurants
Defence Forces, Gardai
Primary education
Pharmaceuticals, perfumery and toilet
Other Retailing (excl. bars etc.)
Hotels and guesthouses, bars, restaurants Health Services (both Health Board and
Other personal services (incl. recreational
activities) Research, Planning, Art Galleries etc.
SET Graduate Salaries and Career Progression 30 June 2006
14.3% Social and charitable services 2.1%
Psychology (cont'd)
etc. 8.3% 20.8%
20.8% 2.1%
2.1%
Psychology 3.9%
Food and Drink industries 0.8% Food and Drink industries 2.0%
preparations 0.8% preparations 11.8%
0.8% Other Industries (incl. mining etc.) 2.0%
Computer and electronic equipment,
(incl 1.7% (incl. OPW) 2.0%
0.8% 7.8%
2.5% 1.0%
9.3% 6.9%
Banking, 5.9% Banking, 2.0%
services 0.8% services 1.0%
Call Centres and Shared Services facilities 0.8% Call Centres and Shared Services facilities 1.0%
and IT Consulting) 3.4% and IT Consulting) 1.0%
2.5% 1.0%
than Building and Construction) 1.7% 1.0%
8.5% 1.0%
Secondary education 2.5% 6.9%
Third Level education 3.4% Third Level education 2.0%
11.9% other) 23.5%
other) 16.9% 2.9%
Social and charitable services 11.0%
Professional services n.e.c * (not
3.9%
Professional services n.e.c * (not
2.5% etc. 5.9%
etc. 5.1% 2.9%
6.9%
Other industries or industry not stated
Medical Sciences / Health Sciences / Sport Science (cont'd)
Hotels and guesthouses, bars, restaurants Other personal services (incl. recreational
activities)
Other personal services (incl. recreational
activities) Other industries or industry not stated
Other industries or industry not stated Environmental Science
Agriculture, forestry and fishing
Pharmaceuticals, perfumery and toilet Pharmaceuticals, perfumery and toilet
Metals, Metal Products, Mechanical and
Electrical engineering (incl. Appliances)
office machinery, instrument engineering
healthcare equipment)
Local authority building and construction
Electricity, gas and water supply Other (private) building and construction
Food retailing etc Food retailing etc
Other Retailing (excl. bars etc.) Other Retailing (excl. bars etc.)
Finance and Insurance Finance and Insurance
Consultant engineering and architectural Consultant engineering and architectural
Other Business services (incl. Management Other Business services (incl. Management
Telecommunications, postal services Computing and Software Applications
Civil Service, Local Authorities (other
Telecommunications, postal services
Primary education Defence Forces, Gardai
Civil Service, Local Authorities (other than
Building and Construction)
Other education (incl. language schools)
Health Services (both Health Board and
Health Services (both Health Board and
Research, Planning, Art Galleries etc.
elsewhere classified)
elsewhere classified)
Hotels and guesthouses, bars, restaurants
Hotels and guesthouses, bars, restaurants Other personal services (incl. recreational
activities)
Other industries or industry not stated
SET Graduate Salaries and Career Progression 31 June 2006
2 or more subjects (cont'd)
11.1% 9.8%
preparations 11.1% Banking, 21.6%
Computer and electronic equipment,
(incl 11.1% 3.9%
11.1% and IT Consulting) 2.0%
Banking, 11.1% 2.0%
Third Level education 22.2% 5.9%
Professional services n.e.c * (not
11.1% 3.9%
11.1% 5.9%
Mathematics Secondary education 23.5%
preparations 1.2% Third Level education 2.0%
1.2% 3.9%
Banking, 68.3% 2.0%
3.7% Social and charitable services 2.0%
and IT Consulting) 3.7%
Professional services n.e.c * (not
2.0%
1.2% etc. 3.9%
2.4% 2.0%
Secondary education 4.9%
Third Level education 1.2% 1.0%
other) 1.2% Food and Drink industries 1.2%
Professional services n.e.c * (not
7.3% preparations 2.1%
etc. 2.4%
Other chemical products (incl. fertilisers,
0.4%
1.2% 1.2%
2 or more subjects
Computer and electronic equipment,
(incl 8.1%
2.0% Other Industries (incl. mining etc.) 1.4%
2.0% 1.6%
Marine Science Arts degree with Mathematics as one of
Agriculture, forestry and fishing Other Retailing (excl. bars etc.)
Pharmaceuticals, perfumery and toilet
Finance and Insurance
office machinery, instrument engineering
healthcare equipment) Accountancy and Legal Services
Food retailing etc
Other Business services (incl. Management
Finance and Insurance Transport, storage and support services
Defence Forces, Gardai
elsewhere classified)
Civil Service, Local Authorities (other than
Building and Construction)
Other personal services (incl. recreational
activities) Primary education
Pharmaceuticals, perfumery and toilet
Metals, Metal Products, Mechanical and
Electrical engineering (incl. Appliances) Other education (incl. language schools)
Finance and Insurance Research, Planning, Art Galleries etc.
Accountancy and Legal Services
Other Business services (incl. Management
elsewhere classified)
Computing and Software Applications
Hotels and guesthouses, bars, restaurants
Transport, storage and support services
Other personal services (incl. recreational
activities)
Computer Applications / Computer Science / Software Engineering
Agriculture, forestry and fishing
Health Services (both Health Board and
elsewhere classified)
Pharmaceuticals, perfumery and toilet
Hotels and guesthouses, bars, restaurants
rubber and plastics)
Other industries or industry not stated
Metals, Metal Products, Mechanical and
Electrical engineering (incl. Appliances)
Arts degree with Mathematics as one of office machinery, instrument engineering
healthcare equipment)
Agriculture, forestry and fishing
Local authority building and construction Electricity, gas and water supply
SET Graduate Salaries and Career Progression 32 June 2006
(incl. OPW)
1.9% 6.0%
Wholesale distribution 0.2% Food and Drink industries 2.4%
1.0% preparations 0.6%
3.9%
Other chemical products (incl. fertilisers,
0.6%
Banking, 11.8% 1.2%
2.9%
Computer and electronic equipment,
(incl 1.8%
services 0.2% 0.6%
Call Centres and Shared Services facilities 0.4% 1.2%
and IT Consulting) 14.0% 0.6%
23.1% 3.6%
1.0% Banking, 23.8%
7.2% 6.5%
0.6% services 0.6%
than Building and Construction) 2.3% Call Centres and Shared Services facilities 0.6%
0.2% and IT Consulting) 16.1%
Secondary education 0.6% 23.8%
Third Level education 3.5% 0.6%
0.4% 1.8%
other) 1.2% 3.0%
0.2% 0.6%
Professional services n.e.c * (not
1.9% other) 0.6%
etc. 1.6% Social and charitable services 0.6%
0.6%
Professional services n.e.c * (not
1.8%
2.7% etc. 0.6%
0.6%
Computer Applications / Computer Science / Software Engineering (cont'd) Business Information Systems
Other (private) building and construction Agriculture, forestry and fishing
Food retailing etc
Pharmaceuticals, perfumery and toilet
Other Retailing (excl. bars etc.) rubber and plastics)
Finance and Insurance
Metals, Metal Products, Mechanical and
Electrical engineering (incl. Appliances)
Accountancy and Legal Services
office machinery, instrument engineering
healthcare equipment)
Consultant engineering and architectural
Electricity, gas and water supply
Other (private) building and construction
Other Business services (incl. Management
Food retailing etc
Computing and Software Applications Other Retailing (excl. bars etc.)
Transport, storage and support services Finance and Insurance
Telecommunications, postal services Accountancy and Legal Services
Defence Forces, Gardai
Consultant engineering and architectural
Civil Service, Local Authorities (other
Primary education
Other Business services (incl. Management
Computing and Software Applications
Transport, storage and support services
Other education (incl. language schools) Telecommunications, postal services
Health Services (both Health Board and Civil Service, Local Authorities (other than
Building and Construction)
Research, Planning, Art Galleries etc. Other education (incl. language schools)
elsewhere classified)
Health Services (both Health Board and
Hotels and guesthouses, bars, restaurants
Other personal services (incl. recreational
activities) elsewhere classified)
Other industries or industry not stated
Hotels and guesthouses, bars, restaurants
Other industries or industry not stated
SET Graduate Salaries and Career Progression 33 June 2006
Multimedia Computing Agricultural Science (cont'd)
12.5% 1.2%
2.5% 2.4%
Computer and electronic equipment,
(incl 2.5% 7.1%
Wholesale distribution 2.5% Professional services n.e.c * (not
6.0%
2.5% 2.4%
Banking, 7.5% Geology / Earth Sciences
Call Centres and Shared Services facilities 2.5% 2.6%
and IT Consulting) 5.0% preparations 2.6%
2.5%
Computer and electronic equipment,
(incl 5.3%
2.5% Other Industries (incl. mining etc.) 10.5%
7.5% 2.6%
Third Level education 10.0% (incl. OPW) 5.3%
other) 5.0% 18.4%
Social and charitable services 2.5% 5.3%
Professional services n.e.c * (not
32.5% Banking, 2.6%
Agricultural Science services 5.3%
16.7% 5.3%
Food and Drink industries 20.2% 10.5%
Other chemical products (incl. fertilisers,
1.2% Secondary education 2.6%
2.4% Third Level education 2.6%
Other Industries (incl. mining etc.) 1.2% other) 2.6%
Wholesale distribution 2.4% 5.3%
2.4% etc. 2.6%
3.6% 2.6%
Banking, 4.8% 5.3%
services 11.9%
Agriculture, forestry and fishing Computing and Software Applications
Metals, Metal Products, Mechanical and
Electrical engineering (incl. Appliances) Civil Service, Local Authorities (other than
Building and Construction)
office machinery, instrument engineering
healthcare equipment) Research, Planning, Art Galleries etc.
elsewhere classified)
Other Retailing (excl. bars etc.) Other industries or industry not stated
Finance and Insurance
Agriculture, forestry and fishing
Other Business services (incl. Management Pharmaceuticals, perfumery and toilet
Computing and Software Applications
office machinery, instrument engineering
healthcare equipment)
Transport, storage and support services
Telecommunications, postal services Electricity, gas and water supply
Local authority building and construction
Health Services (both Health Board and
Other (private) building and construction
Other Retailing (excl. bars etc.)
elsewhere classified) Finance and Insurance
Consultant engineering and architectural
Agriculture, forestry and fishing Telecommunications, postal services
Civil Service, Local Authorities (other than
Building and Construction)
rubber and plastics)
Metals, Metal Products, Mechanical and
Electrical engineering (incl. Appliances)
Health Services (both Health Board and
Research, Planning, Art Galleries etc.
Food retailing etc
Hotels and guesthouses, bars, restaurants
Other Retailing (excl. bars etc.)
Other personal services (incl. recreational
activities)
Finance and Insurance Other industries or industry not stated Consultant engineering and architectural
SET Graduate Salaries and Career Progression 34 June 2006
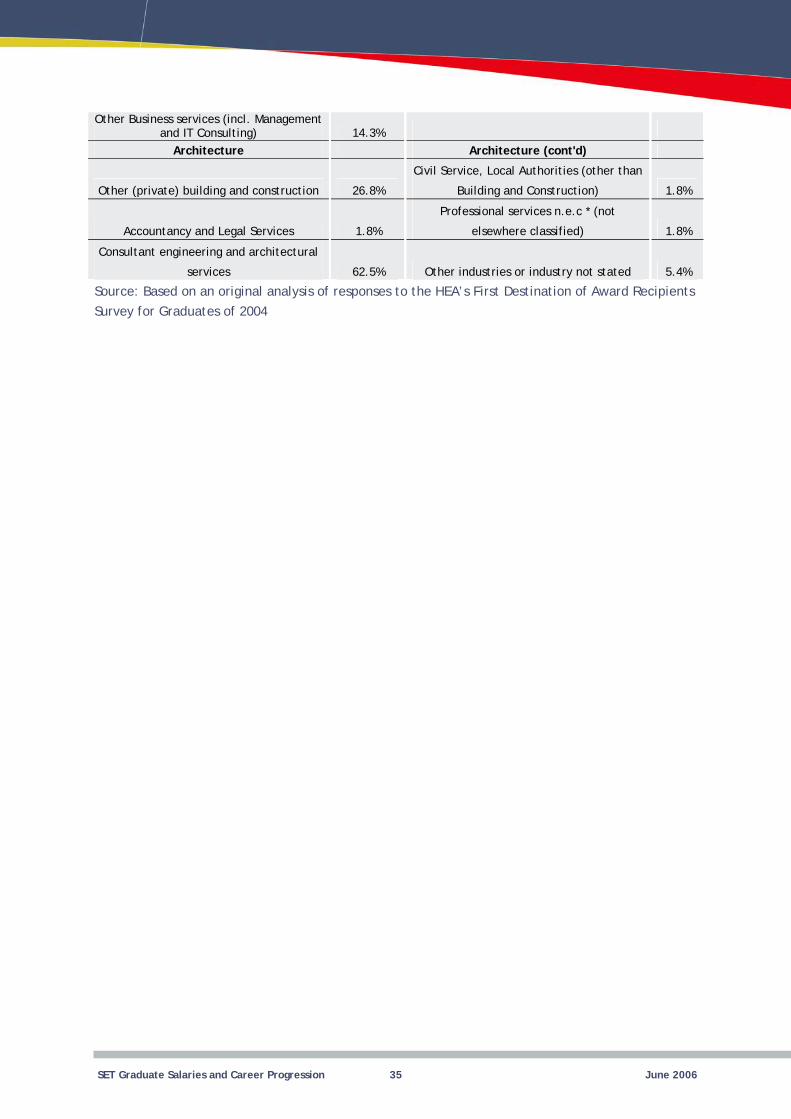
and IT Consulting) 14.3% Architecture
26.8% 1.8%
1.8%
Professional services n.e.c * (not
1.8%
services 62.5% 5.4%
Other Business services (incl. Management
Architecture (cont'd)
Other (private) building and construction
Civil Service, Local Authorities (other than
Building and Construction)
Accountancy and Legal Services elsewhere classified)
Consultant engineering and architectural
Other industries or industry not stated
Source: Based on an original analysis of responses to the HEA’s First Destination of Award Recipients Survey for Graduates of 2004
SET Graduate Salaries and Career Progression 35 June 2006
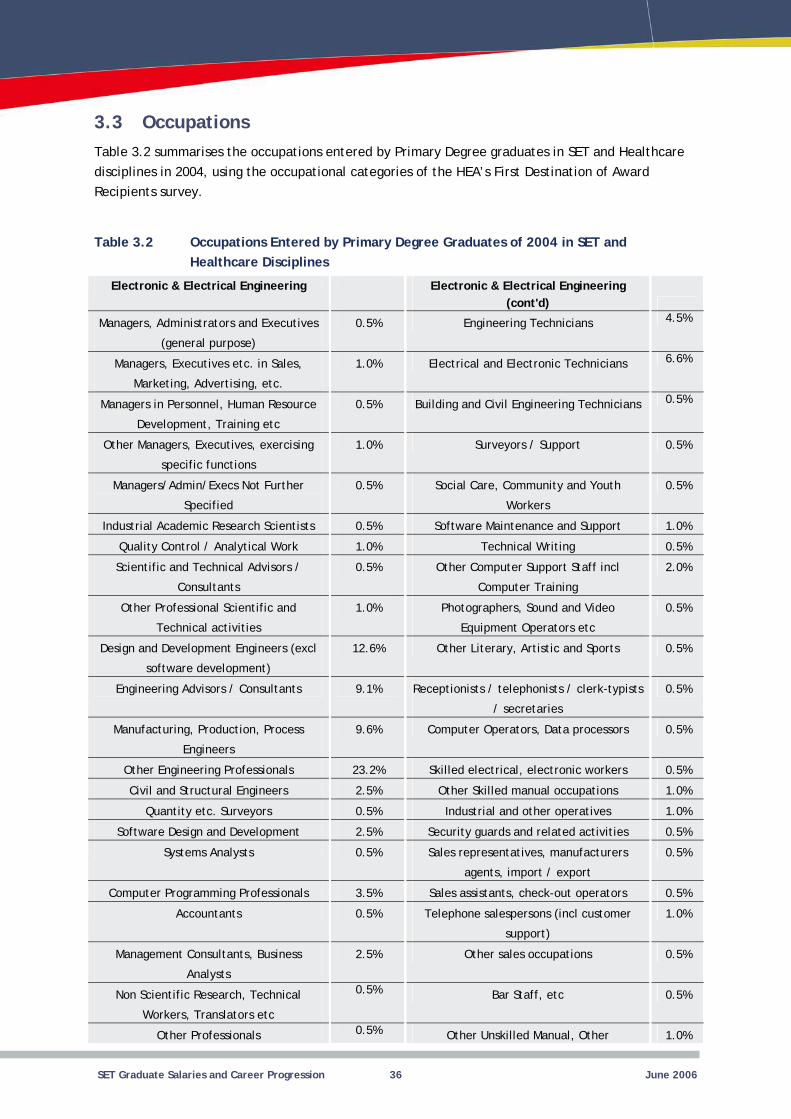
3.3 Occupations Table 3.2 summarises the occupations entered by Primary Degree graduates in SET and Healthcare disciplines in 2004, using the occupational categories of the HEA’s First Destination of Award Recipients survey.
Table 3.2 Occupations Entered by Primary Degree Graduates of 2004 in SET and Healthcare Disciplines
(cont'd)
(general purpose)
0.5% Engineering Technicians 4.5%
1.0% 6.6%
Managers in Personnel, Human Resource
Development, Training etc
0.5% 0.5%
1.0% 0.5%
Managers/Admin/Execs Not Further
Specified
0.5%
Workers
0.5%
Industrial Academic Research Scientists 0.5% 1.0%
1.0% Technical Writing 0.5%
Consultants
0.5%
Computer Training
2.0%
1.0% 0.5%
12.6% 0.5%
Engineering Advisors / Consultants 9.1%
/ secretaries
0.5%
Engineers
9.6% 0.5%
23.2% 0.5%
2.5% Other Skilled manual occupations 1.0%
Quantity etc. Surveyors 0.5% 1.0%
2.5% 0.5%
0.5%
agents, import / export
0.5%
3.5% 0.5%
0.5% 1.0%
2.5% 0.5%
Workers, Translators etc
0.5% Bar Staff, etc 0.5%
0.5% 1.0%
Electronic & Electrical Engineering Electronic & Electrical Engineering
Managers, Administrators and Executives
Managers, Executives etc. in Sales,
Marketing, Advertising, etc.
Electrical and Electronic Technicians
Building and Civil Engineering Technicians
Other Managers, Executives, exercising
specific functions
Surveyors / Support
Social Care, Community and Youth
Software Maintenance and Support
Quality Control / Analytical Work
Scientific and Technical Advisors / Other Computer Support Staff incl
Other Professional Scientific and
Technical activities
Photographers, Sound and Video
Equipment Operators etc
Design and Development Engineers (excl
software development)
Other Literary, Artistic and Sports
Receptionists / telephonists / clerk-typists
Manufacturing, Production, Process Computer Operators, Data processors
Other Engineering Professionals Skilled electrical, electronic workers
Civil and Structural Engineers
Industrial and other operatives
Software Design and Development Security guards and related activities
Systems Analysts Sales representatives, manufacturers
Computer Programming Professionals Sales assistants, check-out operators
Accountants Telephone salespersons (incl customer
support)
Management Consultants, Business
Analysts
Other sales occupations
Non Scientific Research, Technical
Other Professionals Other Unskilled Manual, Other
SET Graduate Salaries and Career Progression 36 June 2006
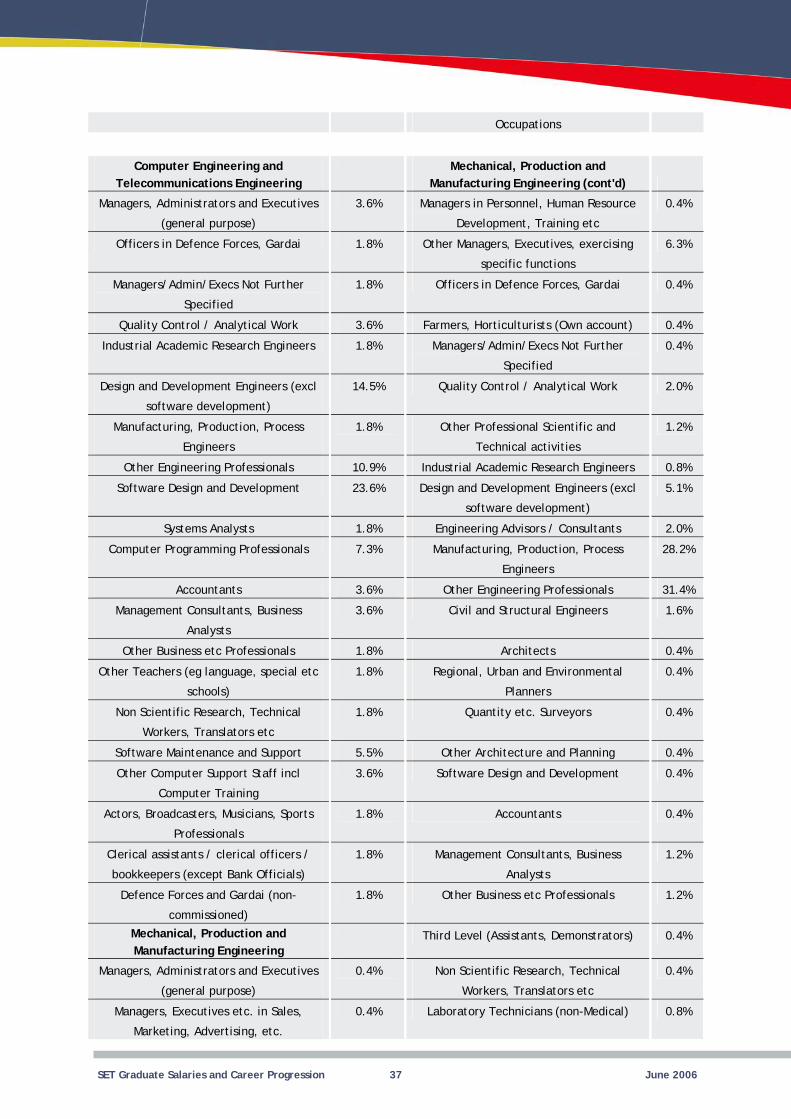
Occupations
(general purpose)
3.6% Managers in Personnel, Human Resource
Development, Training etc
0.4%
1.8% 6.3%
Managers/Admin/Execs Not Further
Specified
1.8% 0.4%
3.6% 0.4%
Industrial Academic Research Engineers 1.8% Managers/Admin/Execs Not Further
Specified
0.4%
14.5% 2.0%
Engineers
1.8% 1.2%
10.9% Industrial Academic Research Engineers 0.8%
23.6% 5.1%
1.8% Engineering Advisors / Consultants 2.0%
7.3%
Engineers
28.2%
3.6% 31.4%
3.6% 1.6%
1.8% 0.4%
Other Teachers (eg language, special etc 1.8%
Planners
0.4%
Workers, Translators etc
1.8% Quantity etc. Surveyors 0.4%
5.5% Other Architecture and Planning 0.4%
Computer Training
3.6% 0.4%
1.8% 0.4%
1.8% 1.2%
1.8% 1.2%
Manufacturing Engineering 0.4%
(general purpose)
0.4%
Workers, Translators etc
0.4%
0.4% Laboratory Technicians (non-Medical) 0.8%
Computer Engineering and Telecommunications Engineering
Mechanical, Production and Manufacturing Engineering (cont'd)
Managers, Administrators and Executives
Officers in Defence Forces, Gardai Other Managers, Executives, exercising
specific functions
Officers in Defence Forces, Gardai
Quality Control / Analytical Work Farmers, Horticulturists (Own account)
Design and Development Engineers (excl
software development)
Quality Control / Analytical Work
Manufacturing, Production, Process Other Professional Scientific and
Technical activities
Other Engineering Professionals
Software Design and Development Design and Development Engineers (excl
software development)
Systems Analysts
Computer Programming Professionals Manufacturing, Production, Process
Accountants Other Engineering Professionals
Management Consultants, Business
Analysts
Civil and Structural Engineers
Other Business etc Professionals Architects
schools)
Regional, Urban and Environmental
Non Scientific Research, Technical
Software Maintenance and Support
Other Computer Support Staff incl Software Design and Development
Actors, Broadcasters, Musicians, Sports
Professionals
Accountants
Clerical assistants / clerical officers /
bookkeepers (except Bank Officials)
Management Consultants, Business
Analysts
Defence Forces and Gardai (non
commissioned)
Other Business etc Professionals
Mechanical, Production and Third Level (Assistants, Demonstrators)
Managers, Administrators and Executives Non Scientific Research, Technical
Managers, Executives etc. in Sales,
Marketing, Advertising, etc.
SET Graduate Salaries and Career Progression 37 June 2006
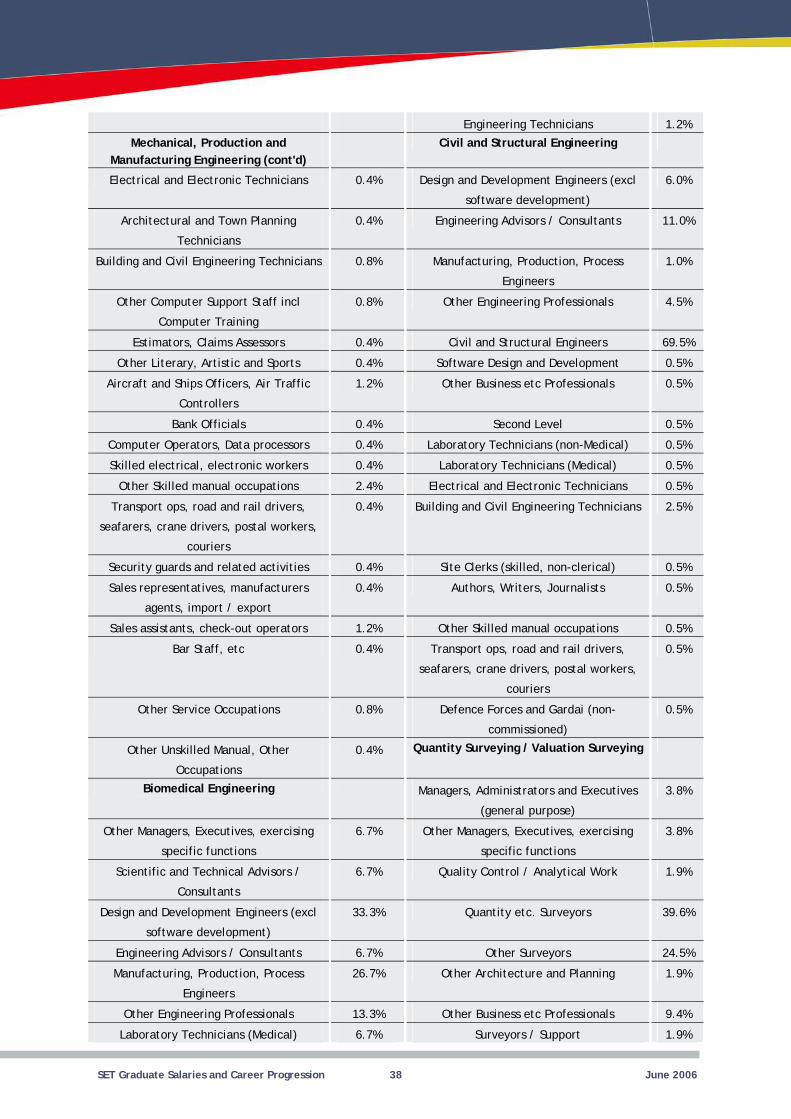
Engineering Technicians 1.2%
0.4% 6.0%
Technicians
0.4% Engineering Advisors / Consultants 11.0%
0.8%
Engineers
1.0%
Computer Training
0.8% 4.5%
0.4% 69.5%
0.4% 0.5%
1.2% 0.5%
0.4% Second Level 0.5%
0.4% Laboratory Technicians (non-Medical) 0.5%
0.4% 0.5%
Other Skilled manual occupations 2.4% 0.5%
couriers
0.4% 2.5%
0.4% 0.5%
agents, import / export
0.4% 0.5%
1.2% Other Skilled manual occupations 0.5%
Bar Staff, etc 0.4%
couriers
0.5%
0.8% 0.5%
Occupations
0.4% Quantity Surveying / Valuation Surveying
Biomedical Engineering
(general purpose)
3.8%
6.7% 3.8%
Consultants
6.7% 1.9%
33.3% Quantity etc. Surveyors 39.6%
Engineering Advisors / Consultants 6.7% 24.5%
Engineers
26.7% Other Architecture and Planning 1.9%
13.3% 9.4%
6.7% 1.9%
Mechanical, Production and Manufacturing Engineering (cont'd)
Civil and Structural Engineering
Electrical and Electronic Technicians Design and Development Engineers (excl
software development)
Architectural and Town Planning
Building and Civil Engineering Technicians Manufacturing, Production, Process
Other Computer Support Staff incl Other Engineering Professionals
Estimators, Claims Assessors Civil and Structural Engineers
Other Literary, Artistic and Sports Software Design and Development
Aircraft and Ships Officers, Air Traffic
Controllers
Other Business etc Professionals
Bank Officials
Computer Operators, Data processors
Skilled electrical, electronic workers Laboratory Technicians (Medical)
Electrical and Electronic Technicians
Transport ops, road and rail drivers,
seafarers, crane drivers, postal workers,
Building and Civil Engineering Technicians
Security guards and related activities Site Clerks (skilled, non-clerical)
Sales representatives, manufacturers Authors, Writers, Journalists
Sales assistants, check-out operators
Transport ops, road and rail drivers,
seafarers, crane drivers, postal workers,
Other Service Occupations Defence Forces and Gardai (non
commissioned)
Other Unskilled Manual, Other
Managers, Administrators and Executives
Other Managers, Executives, exercising
specific functions
Other Managers, Executives, exercising
specific functions
Scientific and Technical Advisors / Quality Control / Analytical Work
Design and Development Engineers (excl
software development)
Other Surveyors
Manufacturing, Production, Process
Other Engineering Professionals Other Business etc Professionals
Laboratory Technicians (Medical) Surveyors / Support
SET Graduate Salaries and Career Progression 38 June 2006
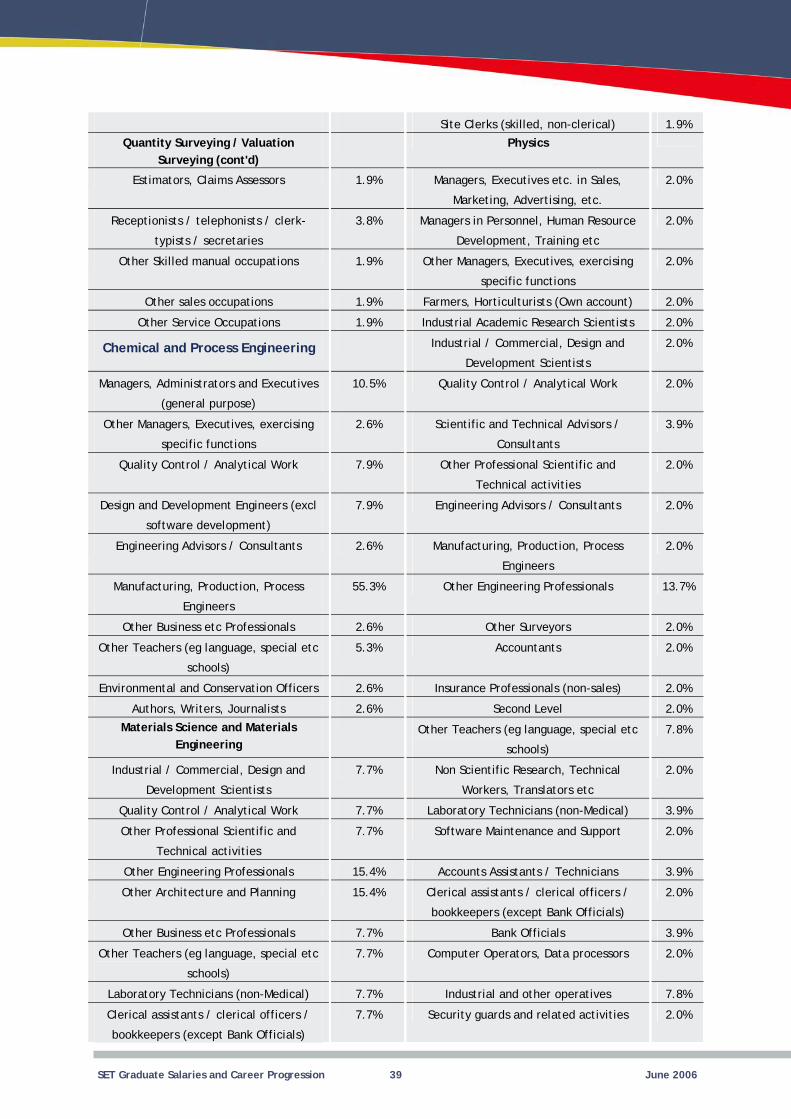
1.9%
Physics
1.9% 2.0%
3.8% Managers in Personnel, Human Resource
Development, Training etc
2.0%
Other Skilled manual occupations 1.9% 2.0%
1.9% 2.0%
1.9% Industrial Academic Research Scientists 2.0%
Development Scientists
2.0%
(general purpose)
10.5% 2.0%
2.6%
Consultants
3.9%
7.9% 2.0%
7.9% Engineering Advisors / Consultants 2.0%
Engineering Advisors / Consultants 2.6%
Engineers
2.0%
Engineers
55.3% 13.7%
2.6% 2.0%
Other Teachers (eg language, special etc 5.3% 2.0%
2.6% Insurance Professionals (non-sales) 2.0%
2.6% Second Level 2.0%
Engineering Other Teachers (eg language, special etc 7.8%
Development Scientists
7.7%
Workers, Translators etc
2.0%
7.7% Laboratory Technicians (non-Medical) 3.9%
7.7% 2.0%
15.4% 3.9%
Other Architecture and Planning 15.4% 2.0%
7.7% 3.9%
Other Teachers (eg language, special etc 7.7% 2.0%
Laboratory Technicians (non-Medical) 7.7% 7.8%
7.7% 2.0%
Site Clerks (skilled, non-clerical)
Quantity Surveying / Valuation Surveying (cont'd)
Estimators, Claims Assessors Managers, Executives etc. in Sales,
Marketing, Advertising, etc.
Receptionists / telephonists / clerk-
typists / secretaries
Other Managers, Executives, exercising
specific functions
Other sales occupations Farmers, Horticulturists (Own account)
Other Service Occupations
Chemical and Process Engineering Industrial / Commercial, Design and
Managers, Administrators and Executives Quality Control / Analytical Work
Other Managers, Executives, exercising
specific functions
Scientific and Technical Advisors /
Quality Control / Analytical Work Other Professional Scientific and
Technical activities
Design and Development Engineers (excl
software development)
Manufacturing, Production, Process
Manufacturing, Production, Process Other Engineering Professionals
Other Business etc Professionals Other Surveyors
schools)
Accountants
Environmental and Conservation Officers
Authors, Writers, Journalists
Materials Science and Materials
schools)
Industrial / Commercial, Design and Non Scientific Research, Technical
Quality Control / Analytical Work
Other Professional Scientific and
Technical activities
Software Maintenance and Support
Other Engineering Professionals Accounts Assistants / Technicians
Clerical assistants / clerical officers /
bookkeepers (except Bank Officials)
Other Business etc Professionals Bank Officials
schools)
Computer Operators, Data processors
Industrial and other operatives
Clerical assistants / clerical officers /
bookkeepers (except Bank Officials)
Security guards and related activities
SET Graduate Salaries and Career Progression 39 June 2006
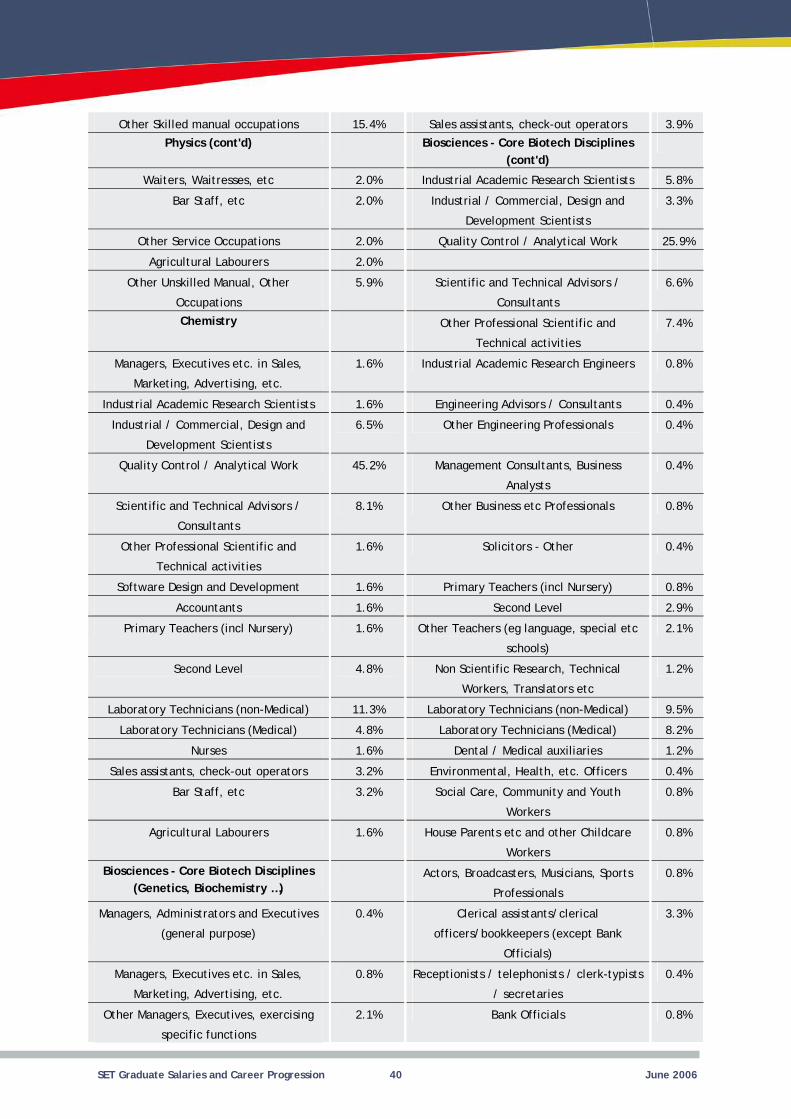
Other Skilled manual occupations 15.4% 3.9%
(cont'd)
Waiters, Waitresses, etc 2.0% Industrial Academic Research Scientists 5.8%
Bar Staff, etc 2.0%
Development Scientists
3.3%
2.0% 25.9%
2.0%
Occupations
5.9%
Consultants
6.6%
Chemistry 7.4%
1.6% Industrial Academic Research Engineers 0.8%
Industrial Academic Research Scientists 1.6% Engineering Advisors / Consultants 0.4%
Development Scientists
6.5% 0.4%
45.2% 0.4%
Consultants
8.1% 0.8%
1.6% 0.4%
1.6% 0.8%
1.6% Second Level 2.9%
1.6% Other Teachers (eg language, special etc 2.1%
Second Level 4.8%
Workers, Translators etc
1.2%
Laboratory Technicians (non-Medical) 11.3% Laboratory Technicians (non-Medical) 9.5%
4.8% 8.2%
Nurses 1.6% Dental / Medical auxiliaries 1.2%
3.2% 0.4%
Bar Staff, etc 3.2%
Workers
0.8%
1.6%
Workers
0.8%
(Genetics, Biochemistry …) 0.8%
(general purpose)
0.4%
Officials)
3.3%
0.8%
/ secretaries
0.4%
2.1% 0.8%
Sales assistants, check-out operators
Physics (cont'd) Biosciences - Core Biotech Disciplines
Industrial / Commercial, Design and
Other Service Occupations Quality Control / Analytical Work
Agricultural Labourers
Other Unskilled Manual, Other Scientific and Technical Advisors /
Other Professional Scientific and
Technical activities
Managers, Executives etc. in Sales,
Marketing, Advertising, etc.
Industrial / Commercial, Design and Other Engineering Professionals
Quality Control / Analytical Work Management Consultants, Business
Analysts
Scientific and Technical Advisors / Other Business etc Professionals
Other Professional Scientific and
Technical activities
Solicitors - Other
Software Design and Development Primary Teachers (incl Nursery)
Accountants
Primary Teachers (incl Nursery)
schools)
Non Scientific Research, Technical
Laboratory Technicians (Medical) Laboratory Technicians (Medical)
Sales assistants, check-out operators Environmental, Health, etc. Officers
Social Care, Community and Youth
Agricultural Labourers House Parents etc and other Childcare
Biosciences - Core Biotech Disciplines Actors, Broadcasters, Musicians, Sports
Professionals
Managers, Administrators and Executives Clerical assistants/clerical
officers/bookkeepers (except Bank
Managers, Executives etc. in Sales,
Marketing, Advertising, etc.
Receptionists / telephonists / clerk-typists
Other Managers, Executives, exercising
specific functions
Bank Officials
SET Graduate Salaries and Career Progression 40 June 2006
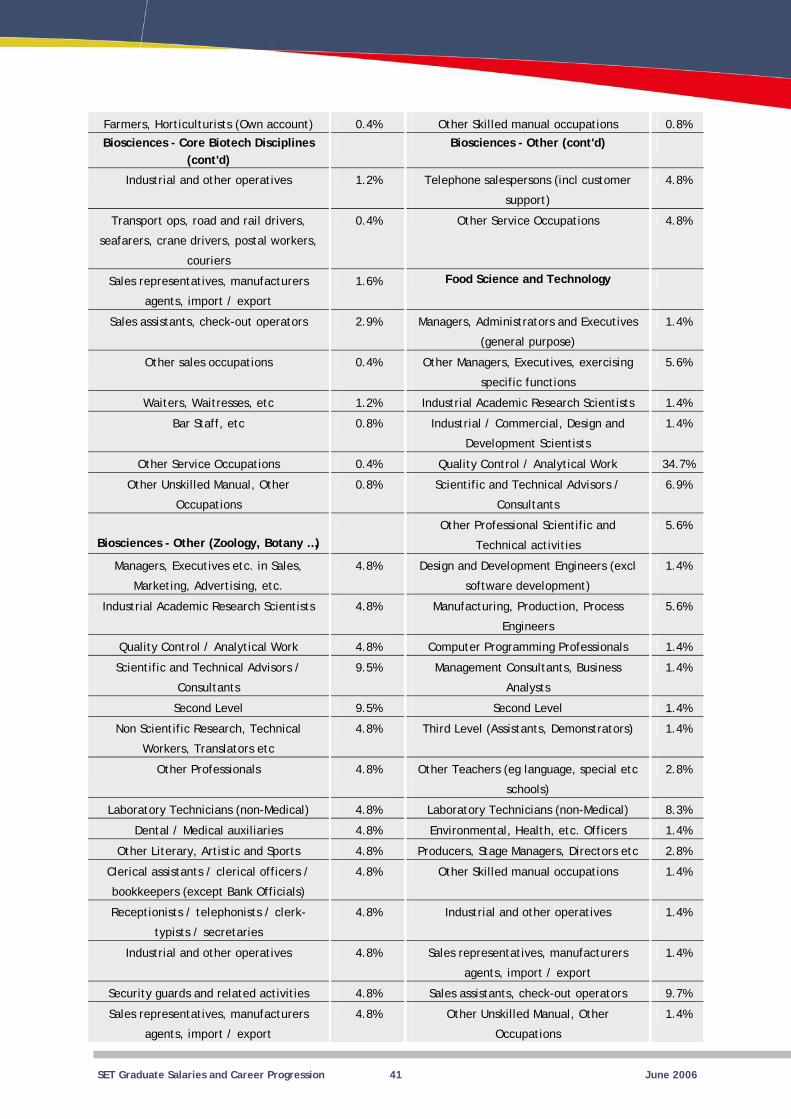
0.4% Other Skilled manual occupations 0.8%
(cont'd)
1.2% 4.8%
couriers
0.4% 4.8%
agents, import / export
1.6%
2.9%
(general purpose)
1.4%
0.4% 5.6%
Waiters, Waitresses, etc 1.2% Industrial Academic Research Scientists 1.4%
Bar Staff, etc 0.8%
Development Scientists
1.4%
0.4% 34.7%
Occupations
0.8%
Consultants
6.9%
5.6%
4.8% 1.4%
Industrial Academic Research Scientists 4.8%
Engineers
5.6%
4.8% 1.4%
Consultants
9.5% 1.4%
Second Level 9.5% Second Level 1.4%
Workers, Translators etc
4.8% 1.4%
4.8% Other Teachers (eg language, special etc 2.8%
Laboratory Technicians (non-Medical) 4.8% Laboratory Technicians (non-Medical) 8.3%
Dental / Medical auxiliaries 4.8% 1.4%
4.8% 2.8%
4.8% Other Skilled manual occupations 1.4%
4.8% 1.4%
4.8%
agents, import / export
1.4%
4.8% 9.7%
agents, import / export
4.8%
Occupations
1.4%
Farmers, Horticulturists (Own account)
Biosciences - Core Biotech Disciplines Biosciences - Other (cont'd)
Industrial and other operatives Telephone salespersons (incl customer
support)
Transport ops, road and rail drivers,
seafarers, crane drivers, postal workers,
Other Service Occupations
Sales representatives, manufacturers Food Science and Technology
Sales assistants, check-out operators Managers, Administrators and Executives
Other sales occupations Other Managers, Executives, exercising
specific functions
Industrial / Commercial, Design and
Other Service Occupations Quality Control / Analytical Work
Other Unskilled Manual, Other Scientific and Technical Advisors /
Biosciences - Other (Zoology, Botany …) Other Professional Scientific and
Technical activities
Managers, Executives etc. in Sales,
Marketing, Advertising, etc.
Design and Development Engineers (excl
software development)
Manufacturing, Production, Process
Quality Control / Analytical Work Computer Programming Professionals
Scientific and Technical Advisors / Management Consultants, Business
Analysts
Non Scientific Research, Technical Third Level (Assistants, Demonstrators)
Other Professionals
schools)
Environmental, Health, etc. Officers
Other Literary, Artistic and Sports Producers, Stage Managers, Directors etc
Clerical assistants / clerical officers /
bookkeepers (except Bank Officials)
Receptionists / telephonists / clerk-
typists / secretaries
Industrial and other operatives
Industrial and other operatives Sales representatives, manufacturers
Security guards and related activities Sales assistants, check-out operators
Sales representatives, manufacturers Other Unskilled Manual, Other
SET Graduate Salaries and Career Progression 41 June 2006
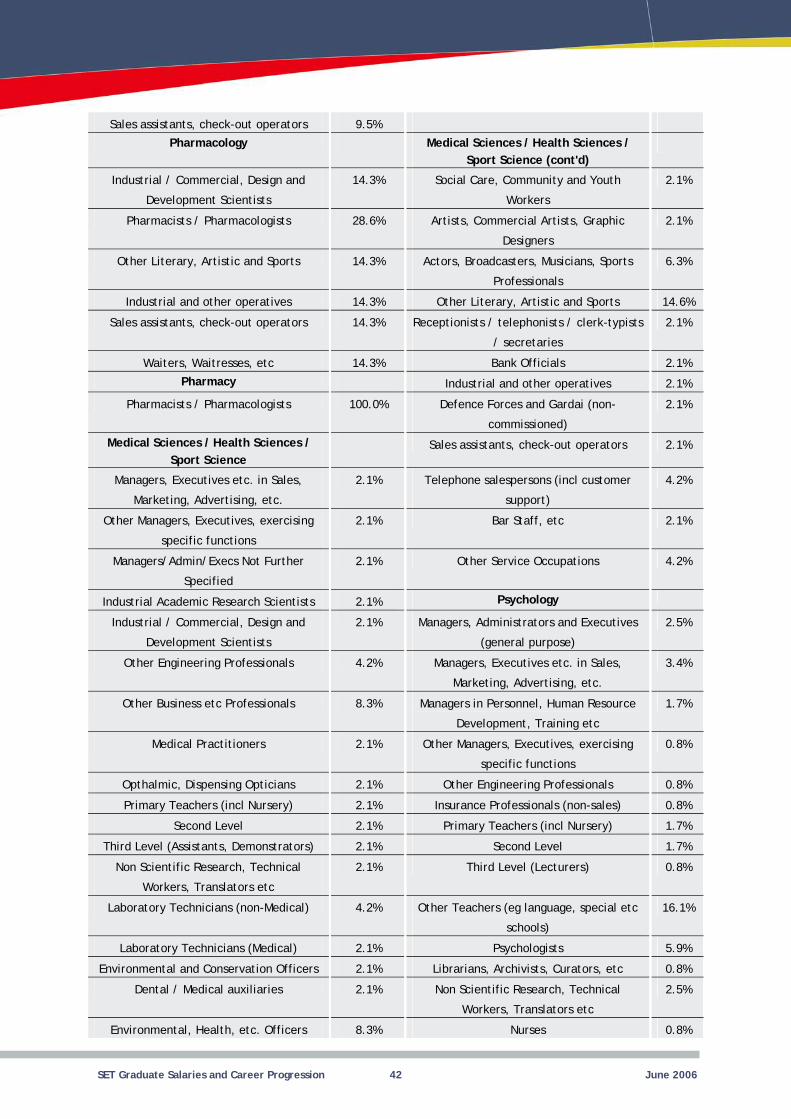
9.5%
Pharmacology
Development Scientists
14.3%
Workers
2.1%
28.6%
Designers
2.1%
14.3% 6.3%
14.3% 14.6%
14.3%
/ secretaries
2.1%
Waiters, Waitresses, etc 14.3% 2.1%
Pharmacy 2.1%
100.0% 2.1%
2.1%
2.1% 4.2%
2.1% Bar Staff, etc 2.1%
Managers/Admin/Execs Not Further
Specified
2.1% 4.2%
Industrial Academic Research Scientists 2.1% Psychology
Development Scientists
2.1%
(general purpose)
2.5%
4.2% 3.4%
8.3% Managers in Personnel, Human Resource
Development, Training etc
1.7%
Medical Practitioners 2.1% 0.8%
2.1% 0.8%
2.1% Insurance Professionals (non-sales) 0.8%
Second Level 2.1% 1.7%
2.1% Second Level 1.7%
Workers, Translators etc
2.1% 0.8%
Laboratory Technicians (non-Medical) 4.2% Other Teachers (eg language, special etc 16.1%
2.1% 5.9%
2.1% Librarians, Archivists, Curators, etc 0.8%
Dental / Medical auxiliaries 2.1%
Workers, Translators etc
2.5%
8.3% Nurses 0.8%
Sales assistants, check-out operators
Medical Sciences / Health Sciences / Sport Science (cont'd)
Industrial / Commercial, Design and Social Care, Community and Youth
Pharmacists / Pharmacologists Artists, Commercial Artists, Graphic
Other Literary, Artistic and Sports Actors, Broadcasters, Musicians, Sports
Professionals
Industrial and other operatives Other Literary, Artistic and Sports
Sales assistants, check-out operators Receptionists / telephonists / clerk-typists
Bank Officials
Industrial and other operatives
Pharmacists / Pharmacologists Defence Forces and Gardai (non
commissioned)
Medical Sciences / Health Sciences / Sport Science
Sales assistants, check-out operators
Managers, Executives etc. in Sales,
Marketing, Advertising, etc.
Telephone salespersons (incl customer
support)
Other Managers, Executives, exercising
specific functions
Other Service Occupations
Industrial / Commercial, Design and Managers, Administrators and Executives
Other Engineering Professionals Managers, Executives etc. in Sales,
Marketing, Advertising, etc.
Other Business etc Professionals
Other Managers, Executives, exercising
specific functions
Opthalmic, Dispensing Opticians Other Engineering Professionals
Primary Teachers (incl Nursery)
Primary Teachers (incl Nursery)
Third Level (Assistants, Demonstrators)
Non Scientific Research, Technical Third Level (Lecturers)
schools)
Laboratory Technicians (Medical) Psychologists
Environmental and Conservation Officers
Non Scientific Research, Technical
Environmental, Health, etc. Officers
SET Graduate Salaries and Career Progression 42 June 2006
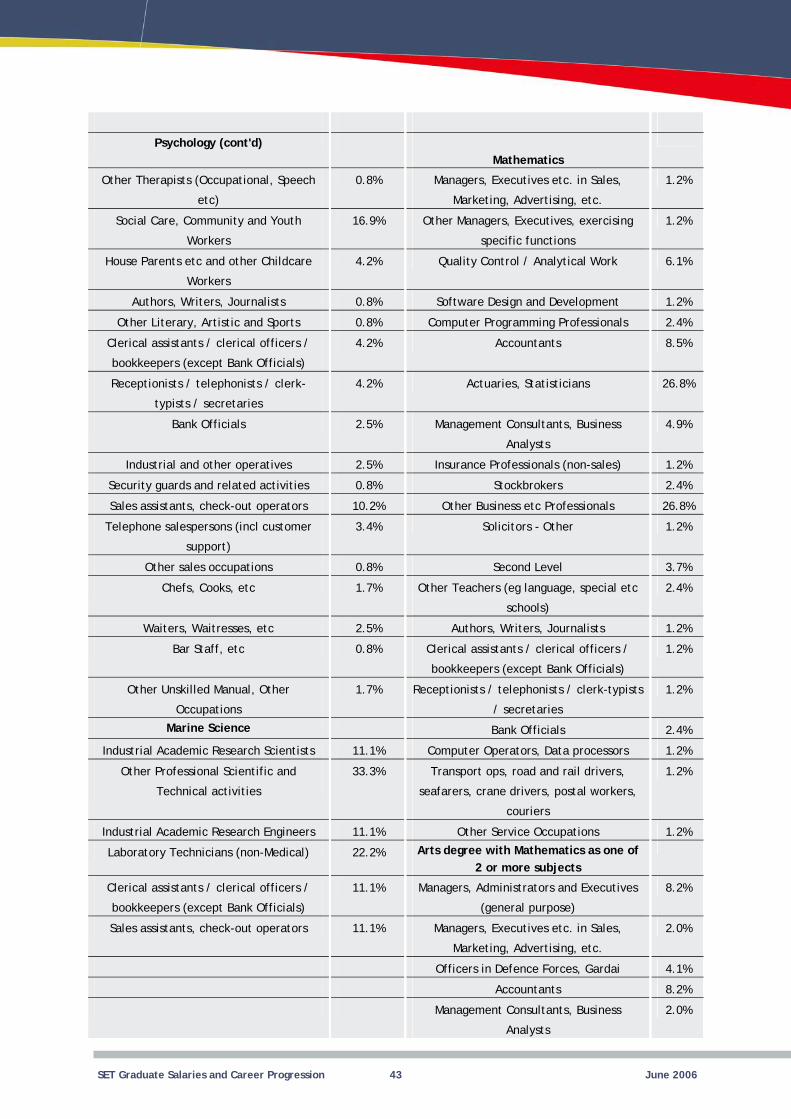
Psychology (cont'd) Mathematics
etc)
0.8% 1.2%
Workers
16.9% 1.2%
Workers
4.2% 6.1%
0.8% 1.2%
0.8% 2.4%
4.2% 8.5%
4.2% 26.8%
2.5% 4.9%
2.5% Insurance Professionals (non-sales) 1.2%
0.8% 2.4%
10.2% 26.8%
3.4% 1.2%
0.8% Second Level 3.7%
1.7% Other Teachers (eg language, special etc 2.4%
Waiters, Waitresses, etc 2.5% 1.2%
Bar Staff, etc 0.8% 1.2%
Occupations
1.7%
/ secretaries
1.2%
2.4%
Industrial Academic Research Scientists 11.1% 1.2%
33.3%
couriers
1.2%
Industrial Academic Research Engineers 11.1% 1.2%
Laboratory Technicians (non-Medical) 22.2% 2 or more subjects
11.1%
(general purpose)
8.2%
11.1% 2.0%
4.1%
8.2%
2.0%
Other Therapists (Occupational, Speech Managers, Executives etc. in Sales,
Marketing, Advertising, etc.
Social Care, Community and Youth Other Managers, Executives, exercising
specific functions
House Parents etc and other Childcare Quality Control / Analytical Work
Authors, Writers, Journalists Software Design and Development
Other Literary, Artistic and Sports Computer Programming Professionals
Clerical assistants / clerical officers /
bookkeepers (except Bank Officials)
Accountants
Receptionists / telephonists / clerk-
typists / secretaries
Actuaries, Statisticians
Bank Officials Management Consultants, Business
Analysts
Industrial and other operatives
Security guards and related activities Stockbrokers
Sales assistants, check-out operators Other Business etc Professionals
Telephone salespersons (incl customer
support)
Solicitors - Other
Other sales occupations
Chefs, Cooks, etc
schools)
Authors, Writers, Journalists
Clerical assistants / clerical officers /
bookkeepers (except Bank Officials)
Other Unskilled Manual, Other Receptionists / telephonists / clerk-typists
Marine Science Bank Officials
Computer Operators, Data processors
Other Professional Scientific and
Technical activities
Transport ops, road and rail drivers,
seafarers, crane drivers, postal workers,
Other Service Occupations
Arts degree with Mathematics as one of
Clerical assistants / clerical officers /
bookkeepers (except Bank Officials)
Managers, Administrators and Executives
Sales assistants, check-out operators Managers, Executives etc. in Sales,
Marketing, Advertising, etc.
Officers in Defence Forces, Gardai
Accountants
Management Consultants, Business
Analysts
SET Graduate Salaries and Career Progression 43 June 2006
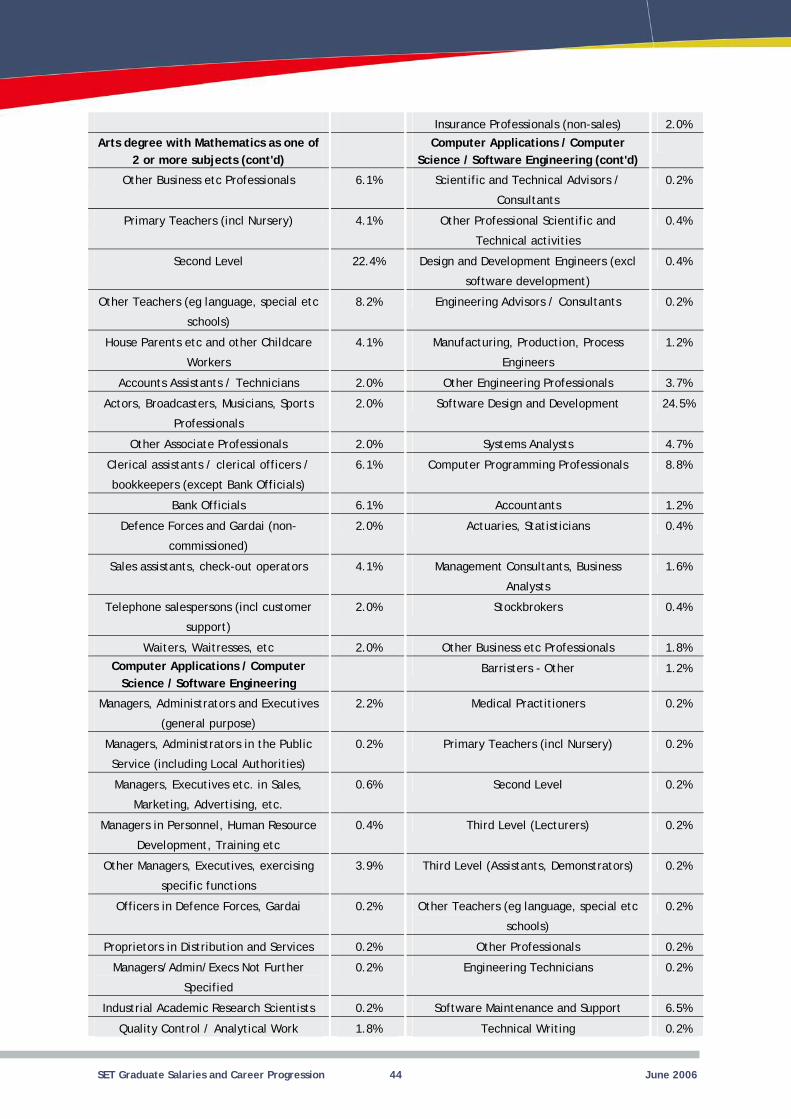
Insurance Professionals (non-sales) 2.0%
2 or more subjects (cont'd)
6.1%
Consultants
0.2%
4.1% 0.4%
Second Level 22.4% 0.4%
Other Teachers (eg language, special etc 8.2% Engineering Advisors / Consultants 0.2%
Workers
4.1%
Engineers
1.2%
2.0% 3.7%
2.0% 24.5%
2.0% 4.7%
6.1% 8.8%
6.1% 1.2%
2.0% 0.4%
4.1% 1.6%
2.0% 0.4%
Waiters, Waitresses, etc 2.0% 1.8%
1.2%
(general purpose)
2.2% Medical Practitioners 0.2%
0.2% 0.2%
0.6% Second Level 0.2%
Managers in Personnel, Human Resource
Development, Training etc
0.4% 0.2%
3.9% 0.2%
0.2% Other Teachers (eg language, special etc 0.2%
0.2% 0.2%
Managers/Admin/Execs Not Further
Specified
0.2% Engineering Technicians 0.2%
Industrial Academic Research Scientists 0.2% 6.5%
1.8% Technical Writing 0.2%
Arts degree with Mathematics as one of Computer Applications / Computer Science / Software Engineering (cont'd)
Other Business etc Professionals Scientific and Technical Advisors /
Primary Teachers (incl Nursery) Other Professional Scientific and
Technical activities
Design and Development Engineers (excl
software development)
schools)
House Parents etc and other Childcare Manufacturing, Production, Process
Accounts Assistants / Technicians Other Engineering Professionals
Actors, Broadcasters, Musicians, Sports
Professionals
Software Design and Development
Other Associate Professionals Systems Analysts
Clerical assistants / clerical officers /
bookkeepers (except Bank Officials)
Computer Programming Professionals
Bank Officials Accountants
Defence Forces and Gardai (non
commissioned)
Actuaries, Statisticians
Sales assistants, check-out operators Management Consultants, Business
Analysts
Telephone salespersons (incl customer
support)
Stockbrokers
Other Business etc Professionals
Computer Applications / Computer Science / Software Engineering
Barristers - Other
Managers, Administrators and Executives
Managers, Administrators in the Public
Service (including Local Authorities)
Primary Teachers (incl Nursery)
Managers, Executives etc. in Sales,
Marketing, Advertising, etc.
Third Level (Lecturers)
Other Managers, Executives, exercising
specific functions
Third Level (Assistants, Demonstrators)
Officers in Defence Forces, Gardai
schools)
Proprietors in Distribution and Services Other Professionals
Software Maintenance and Support
Quality Control / Analytical Work
SET Graduate Salaries and Career Progression 44 June 2006
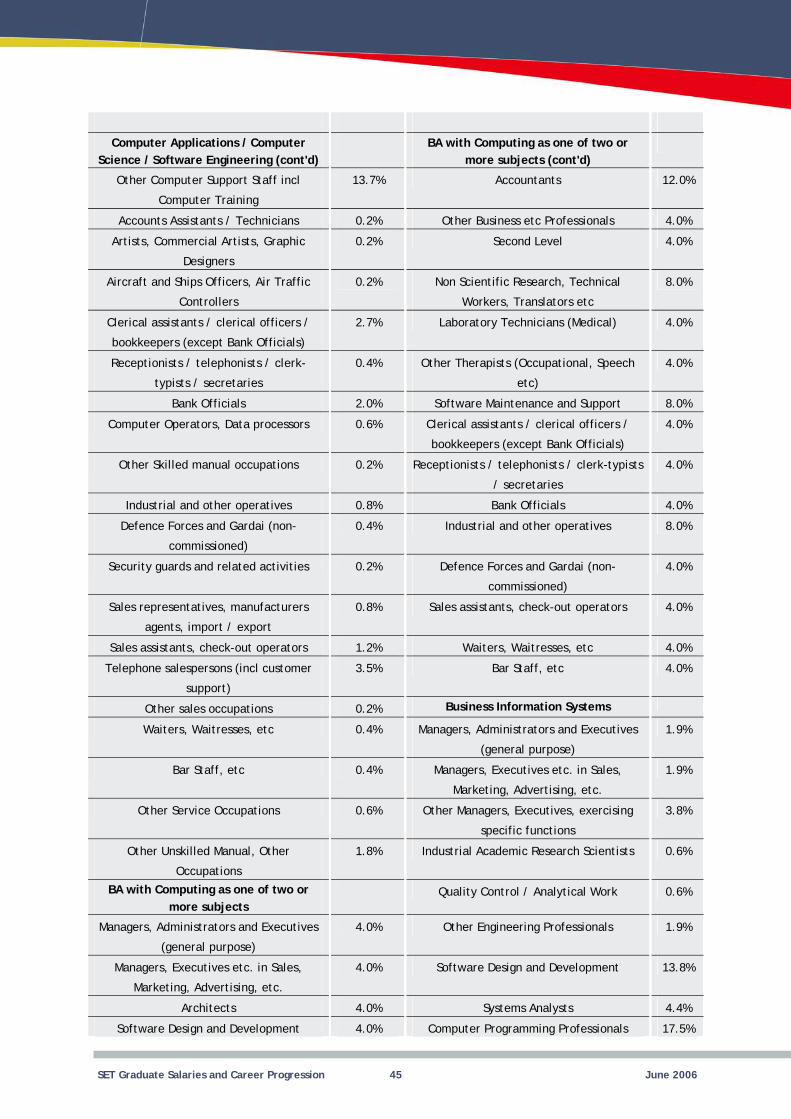
Computer Training
13.7% 12.0%
0.2% 4.0%
Designers
0.2% Second Level 4.0%
0.2%
Workers, Translators etc
8.0%
2.7% 4.0%
0.4%
etc)
4.0%
2.0% 8.0%
0.6% 4.0%
Other Skilled manual occupations 0.2%
/ secretaries
4.0%
0.8% 4.0%
0.4% 8.0%
0.2% 4.0%
agents, import / export
0.8% 4.0%
1.2% Waiters, Waitresses, etc 4.0%
3.5% Bar Staff, etc 4.0%
0.2%
Waiters, Waitresses, etc 0.4%
(general purpose)
1.9%
Bar Staff, etc 0.4% 1.9%
0.6% 3.8%
Occupations
1.8% Industrial Academic Research Scientists 0.6%
more subjects 0.6%
(general purpose)
4.0% 1.9%
4.0% 13.8%
4.0% 4.4%
4.0% 17.5%
Computer Applications / Computer Science / Software Engineering (cont'd)
BA with Computing as one of two or more subjects (cont'd)
Other Computer Support Staff incl Accountants
Accounts Assistants / Technicians Other Business etc Professionals
Artists, Commercial Artists, Graphic
Aircraft and Ships Officers, Air Traffic
Controllers
Non Scientific Research, Technical
Clerical assistants / clerical officers /
bookkeepers (except Bank Officials)
Laboratory Technicians (Medical)
Receptionists / telephonists / clerk-
typists / secretaries
Other Therapists (Occupational, Speech
Bank Officials Software Maintenance and Support
Computer Operators, Data processors Clerical assistants / clerical officers /
bookkeepers (except Bank Officials)
Receptionists / telephonists / clerk-typists
Industrial and other operatives Bank Officials
Defence Forces and Gardai (non
commissioned)
Industrial and other operatives
Security guards and related activities Defence Forces and Gardai (non
commissioned)
Sales representatives, manufacturers Sales assistants, check-out operators
Sales assistants, check-out operators
Telephone salespersons (incl customer
support)
Other sales occupations Business Information Systems
Managers, Administrators and Executives
Managers, Executives etc. in Sales,
Marketing, Advertising, etc.
Other Service Occupations Other Managers, Executives, exercising
specific functions
Other Unskilled Manual, Other
BA with Computing as one of two or Quality Control / Analytical Work
Managers, Administrators and Executives Other Engineering Professionals
Managers, Executives etc. in Sales,
Marketing, Advertising, etc.
Software Design and Development
Architects Systems Analysts
Software Design and Development Computer Programming Professionals
SET Graduate Salaries and Career Progression 45 June 2006
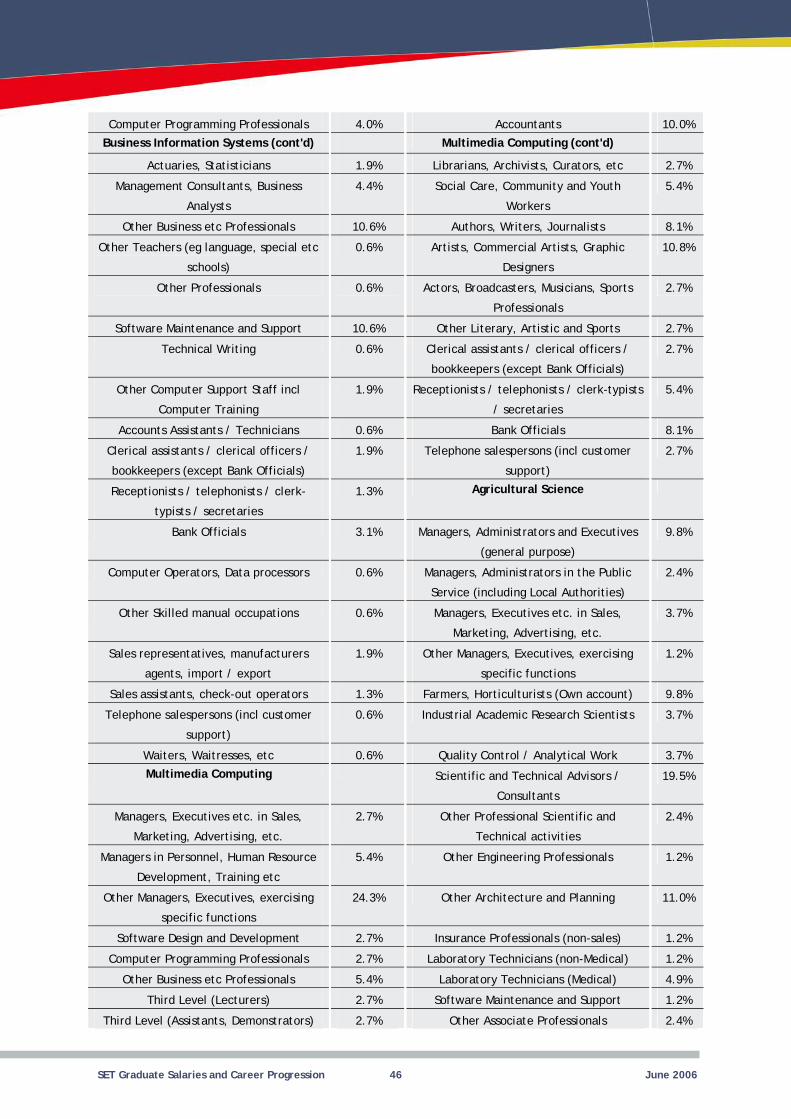
4.0% 10.0%
Multimedia Computing (cont'd)
1.9% Librarians, Archivists, Curators, etc 2.7%
4.4%
Workers
5.4%
10.6% 8.1%
Other Teachers (eg language, special etc 0.6%
Designers
10.8%
0.6% 2.7%
10.6% 2.7%
Technical Writing 0.6% 2.7%
Computer Training
1.9%
/ secretaries
5.4%
0.6% 8.1%
1.9% 2.7%
1.3% Agricultural Science
3.1%
(general purpose)
9.8%
0.6% 2.4%
Other Skilled manual occupations 0.6% 3.7%
agents, import / export
1.9% 1.2%
1.3% 9.8%
0.6% Industrial Academic Research Scientists 3.7%
Waiters, Waitresses, etc 0.6% 3.7%
Multimedia Computing
Consultants
19.5%
2.7% 2.4%
Managers in Personnel, Human Resource
Development, Training etc
5.4% 1.2%
24.3% Other Architecture and Planning 11.0%
2.7% Insurance Professionals (non-sales) 1.2%
2.7% Laboratory Technicians (non-Medical) 1.2%
5.4% 4.9%
Third Level (Lecturers) 2.7% 1.2%
2.7% 2.4%
Computer Programming Professionals Accountants
Business Information Systems (cont'd)
Actuaries, Statisticians
Management Consultants, Business
Analysts
Social Care, Community and Youth
Other Business etc Professionals Authors, Writers, Journalists
schools)
Artists, Commercial Artists, Graphic
Other Professionals Actors, Broadcasters, Musicians, Sports
Professionals
Software Maintenance and Support Other Literary, Artistic and Sports
Clerical assistants / clerical officers /
bookkeepers (except Bank Officials)
Other Computer Support Staff incl Receptionists / telephonists / clerk-typists
Accounts Assistants / Technicians Bank Officials
Clerical assistants / clerical officers /
bookkeepers (except Bank Officials)
Telephone salespersons (incl customer
support)
Receptionists / telephonists / clerk-
typists / secretaries
Bank Officials Managers, Administrators and Executives
Computer Operators, Data processors Managers, Administrators in the Public
Service (including Local Authorities)
Managers, Executives etc. in Sales,
Marketing, Advertising, etc.
Sales representatives, manufacturers Other Managers, Executives, exercising
specific functions
Sales assistants, check-out operators Farmers, Horticulturists (Own account)
Telephone salespersons (incl customer
support)
Quality Control / Analytical Work
Scientific and Technical Advisors /
Managers, Executives etc. in Sales,
Marketing, Advertising, etc.
Other Professional Scientific and
Technical activities
Other Engineering Professionals
Other Managers, Executives, exercising
specific functions
Software Design and Development
Computer Programming Professionals
Other Business etc Professionals Laboratory Technicians (Medical)
Software Maintenance and Support
Third Level (Assistants, Demonstrators) Other Associate Professionals
SET Graduate Salaries and Career Progression 46 June 2006
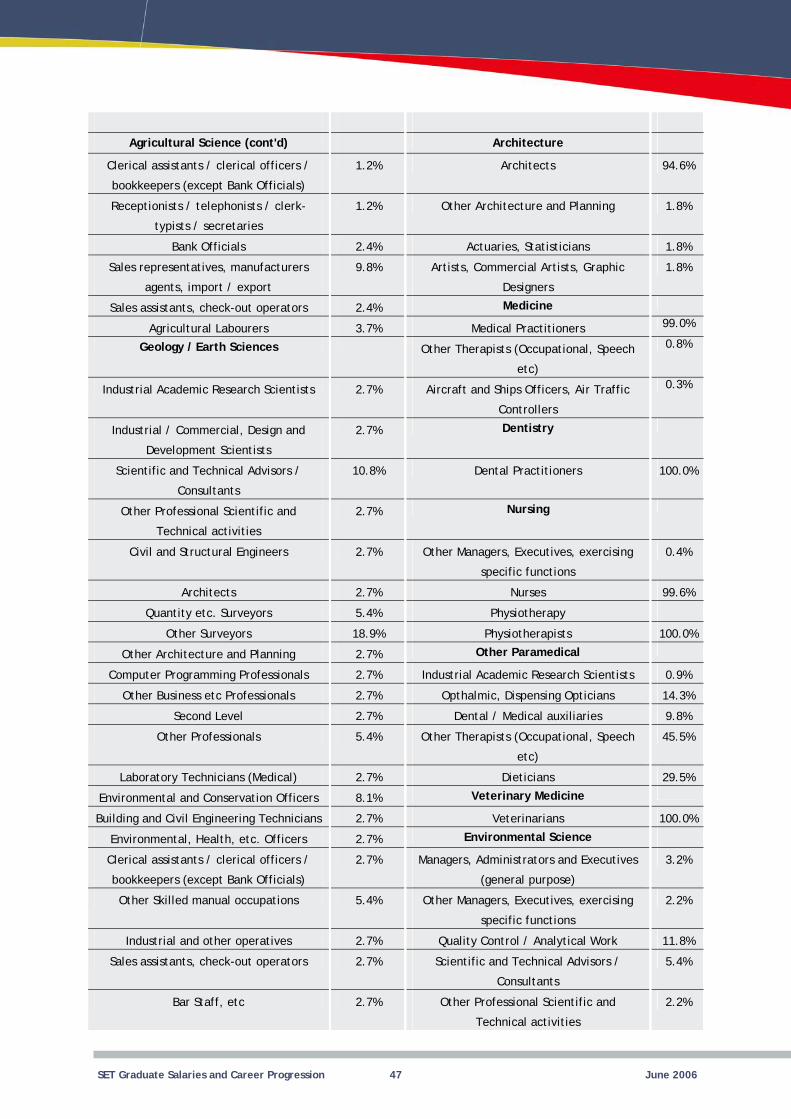
Agricultural Science (cont'd) Architecture
1.2% 94.6%
1.2% Other Architecture and Planning 1.8%
2.4% 1.8%
agents, import / export
9.8%
Designers
1.8%
2.4% Medicine
3.7% Medical Practitioners 99.0%
Geology / Earth Sciences
etc)
0.8%
Industrial Academic Research Scientists 2.7% 0.3%
Development Scientists
2.7%
Consultants
10.8% 100.0%
2.7% Nursing
2.7% 0.4%
2.7% Nurses 99.6%
Quantity etc. Surveyors 5.4% Physiotherapy
18.9% 100.0%
Other Architecture and Planning 2.7% Other Paramedical
2.7% Industrial Academic Research Scientists 0.9%
2.7% 14.3%
Second Level 2.7% Dental / Medical auxiliaries 9.8%
5.4%
etc)
45.5%
2.7% Dieticians 29.5%
8.1%
2.7% Veterinarians 100.0%
2.7%
2.7%
(general purpose)
3.2%
Other Skilled manual occupations 5.4% 2.2%
2.7% 11.8%
2.7%
Consultants
5.4%
Bar Staff, etc 2.7% 2.2%
Clerical assistants / clerical officers /
bookkeepers (except Bank Officials)
Architects
Receptionists / telephonists / clerk-
typists / secretaries
Bank Officials Actuaries, Statisticians
Sales representatives, manufacturers Artists, Commercial Artists, Graphic
Sales assistants, check-out operators
Agricultural Labourers
Other Therapists (Occupational, Speech
Aircraft and Ships Officers, Air Traffic
Controllers
Industrial / Commercial, Design and Dentistry
Scientific and Technical Advisors / Dental Practitioners
Other Professional Scientific and
Technical activities
Civil and Structural Engineers Other Managers, Executives, exercising
specific functions
Architects
Other Surveyors Physiotherapists
Computer Programming Professionals
Other Business etc Professionals Opthalmic, Dispensing Opticians
Other Professionals Other Therapists (Occupational, Speech
Laboratory Technicians (Medical)
Environmental and Conservation Officers Veterinary Medicine
Building and Civil Engineering Technicians
Environmental, Health, etc. Officers Environmental Science
Clerical assistants / clerical officers /
bookkeepers (except Bank Officials)
Managers, Administrators and Executives
Other Managers, Executives, exercising
specific functions
Industrial and other operatives Quality Control / Analytical Work
Sales assistants, check-out operators Scientific and Technical Advisors /
Other Professional Scientific and
Technical activities
SET Graduate Salaries and Career Progression 47 June 2006
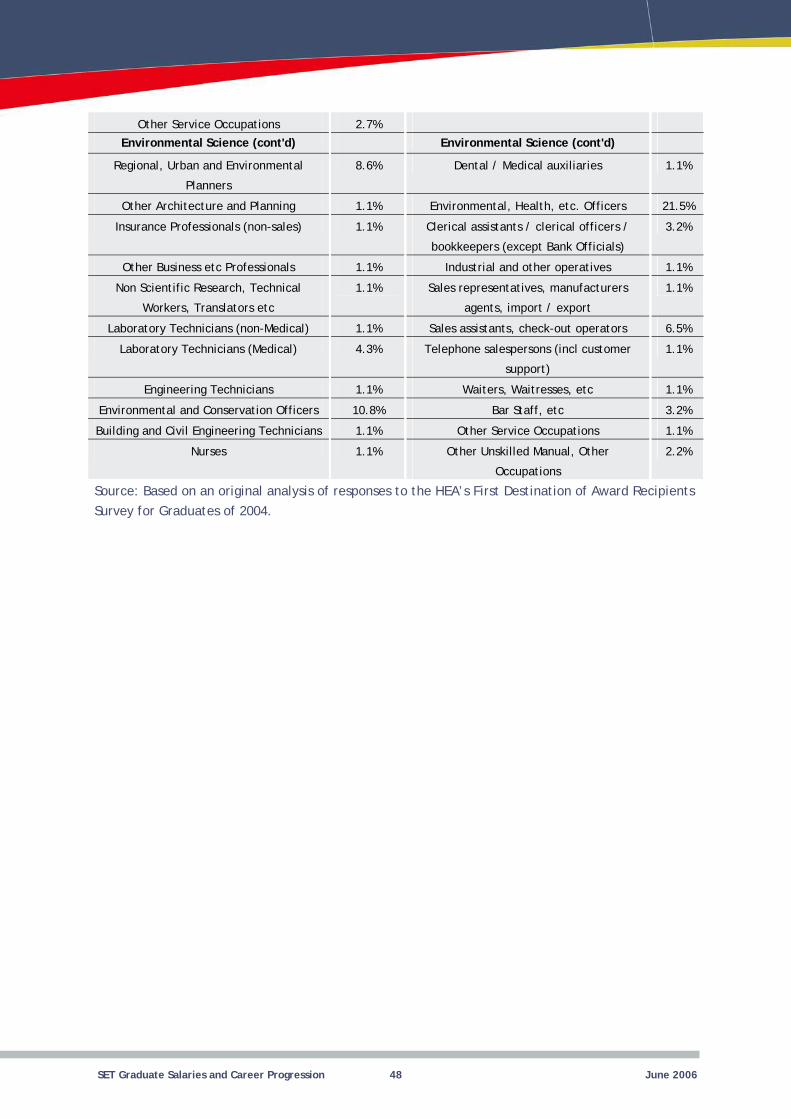
2.7%
Planners
8.6% Dental / Medical auxiliaries 1.1%
Other Architecture and Planning 1.1% 21.5%
Insurance Professionals (non-sales) 1.1% 3.2%
1.1% 1.1%
Workers, Translators etc
1.1%
agents, import / export
1.1%
Laboratory Technicians (non-Medical) 1.1% 6.5%
4.3% 1.1%
Engineering Technicians 1.1% Waiters, Waitresses, etc 1.1%
10.8% Bar Staff, etc 3.2%
1.1% 1.1%
Nurses 1.1%
Occupations
2.2%
Other Service Occupations
Environmental Science (cont'd) Environmental Science (cont'd)
Regional, Urban and Environmental
Environmental, Health, etc. Officers
Clerical assistants / clerical officers /
bookkeepers (except Bank Officials)
Other Business etc Professionals Industrial and other operatives
Non Scientific Research, Technical Sales representatives, manufacturers
Sales assistants, check-out operators
Laboratory Technicians (Medical) Telephone salespersons (incl customer
support)
Environmental and Conservation Officers
Building and Civil Engineering Technicians Other Service Occupations
Other Unskilled Manual, Other
Source: Based on an original analysis of responses to the HEA’s First Destination of Award Recipients Survey for Graduates of 2004.
SET Graduate Salaries and Career Progression 48 June 2006
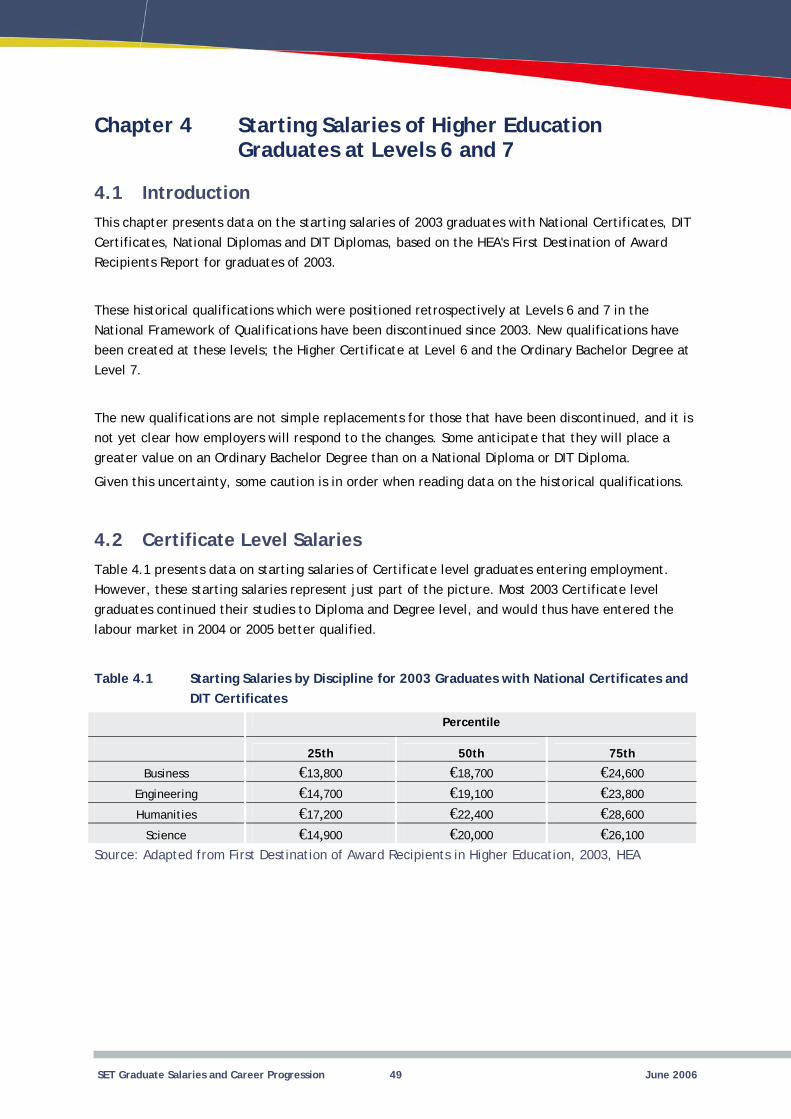
Chapter 4 Starting Salaries of Higher Education Graduates at Levels 6 and 7
4.1 Introduction This chapter presents data on the starting salaries of 2003 graduates with National Certificates, DIT Certificates, National Diplomas and DIT Diplomas, based on the HEA's First Destination of Award Recipients Report for graduates of 2003.
These historical qualifications which were positioned retrospectively at Levels 6 and 7 in the National Framework of Qualifications have been discontinued since 2003. New qualifications have been created at these levels; the Higher Certificate at Level 6 and the Ordinary Bachelor Degree at Level 7.
The new qualifications are not simple replacements for those that have been discontinued, and it is not yet clear how employers will respond to the changes. Some anticipate that they will place a greater value on an Ordinary Bachelor Degree than on a National Diploma or DIT Diploma.
Given this uncertainty, some caution is in order when reading data on the historical qualifications.
4.2 Certificate Level Salaries Table 4.1 presents data on starting salaries of Certificate level graduates entering employment. However, these starting salaries represent just part of the picture. Most 2003 Certificate level graduates continued their studies to Diploma and Degree level, and would thus have entered the labour market in 2004 or 2005 better qualified.
Table 4.1 Starting Salaries by Discipline for 2003 Graduates with National Certificates and DIT Certificates
Percentile
25th 50th 75th
Business €13, €18, €24,Engineering €14, €19, €23,Humanities €17, €22, €28,
Science €14, €20, €26,
800 700 600
700 100 800
200 400 600
900 000 100
Source: Adapted from First Destination of Award Recipients in Higher Education, 2003, HEA
SET Graduate Salaries and Career Progression 49 June 2006
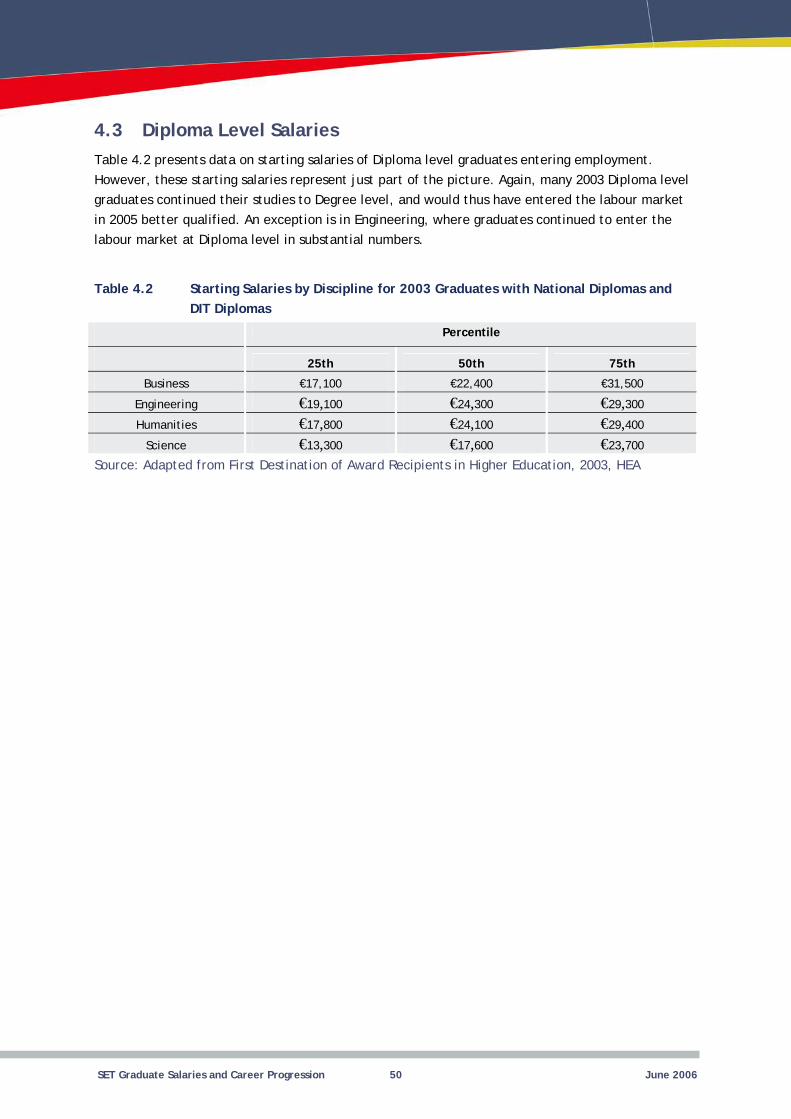
4.3 Diploma Level Salaries Table 4.2 presents data on starting salaries of Diploma level graduates entering employment. However, these starting salaries represent just part of the picture. Again, many 2003 Diploma level graduates continued their studies to Degree level, and would thus have entered the labour market in 2005 better qualified. An exception is in Engineering, where graduates continued to enter the labour market at Diploma level in substantial numbers.
Table 4.2 Starting Salaries by Discipline for 2003 Graduates with National Diplomas and DIT Diplomas
Percentile
25th 50th 75th
Business
Engineering €19, €24, €29,Humanities €17, €24, €29,
Science €13, €17, €23,
€17,100 €22,400 €31,500
100 300 300
800 100 400
300 600 700
Source: Adapted from First Destination of Award Recipients in Higher Education, 2003, HEA
SET Graduate Salaries and Career Progression 50 June 2006
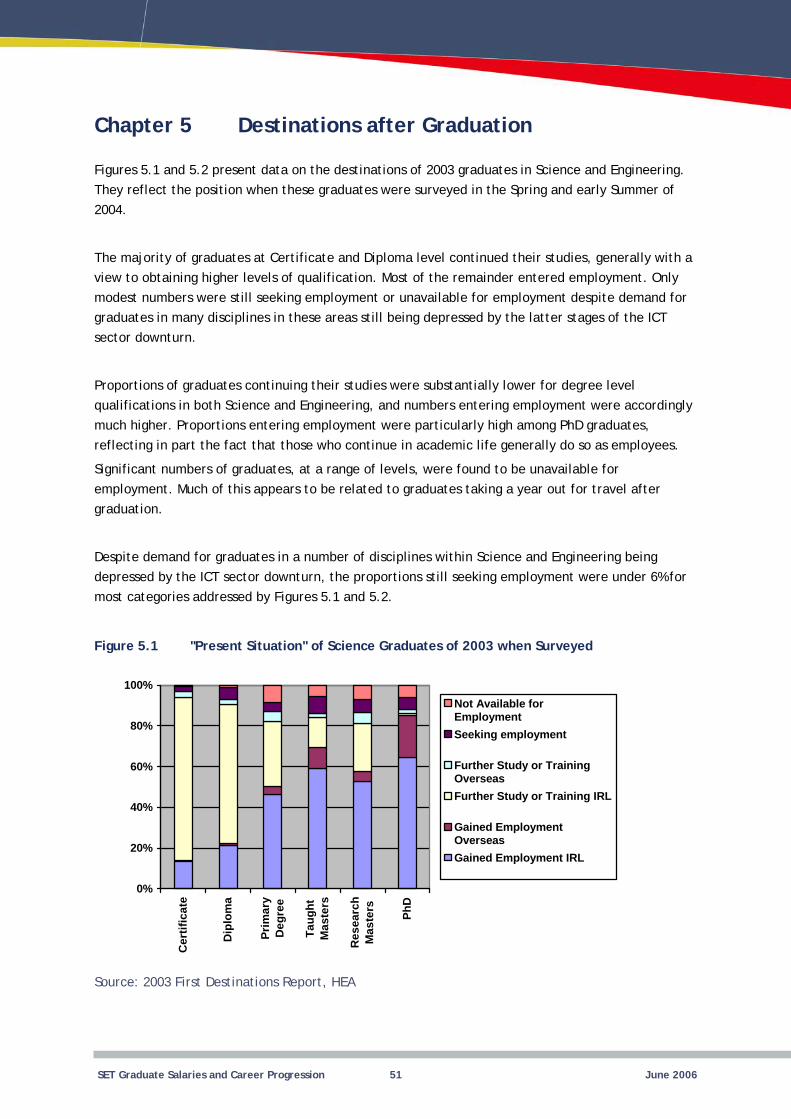
Chapter 5 Destinations after Graduation
Figures 5.1 and 5.2 present data on the destinations of 2003 graduates in Science and Engineering. They reflect the position when these graduates were surveyed in the Spring and early Summer of 2004.
The majority of graduates at Certificate and Diploma level continued their studies, generally with a view to obtaining higher levels of qualification. Most of the remainder entered employment. Only modest numbers were still seeking employment or unavailable for employment despite demand for graduates in many disciplines in these areas still being depressed by the latter stages of the ICT sector downturn.
Proportions of graduates continuing their studies were substantially lower for degree level qualifications in both Science and Engineering, and numbers entering employment were accordingly much higher. Proportions entering employment were particularly high among PhD graduates, reflecting in part the fact that those who continue in academic life generally do so as employees.
Significant numbers of graduates, at a range of levels, were found to be unavailable for employment. Much of this appears to be related to graduates taking a year out for travel after graduation.
Despite demand for graduates in a number of disciplines within Science and Engineering being depressed by the ICT sector downturn, the proportions still seeking employment were under 6% for most categories addressed by Figures 5.1 and 5.2.
Figure 5.1 "Present Situation" of Science Graduates of 2003 when Surveyed
100%
80%
60%
40%
20%
0%
Not Available for Employment Seeking employment
Further Study or Training Overseas Further Study or Training IRL
Gained Employment Overseas Gained Employment IRL
Cer
tific
ate
Dip
lom
a
Prim
ary
Deg
ree
Taug
ht
Mas
ters
Res
earc
h M
aste
rs
PhD
Source: 2003 First Destinations Report, HEA
SET Graduate Salaries and Career Progression 51 June 2006
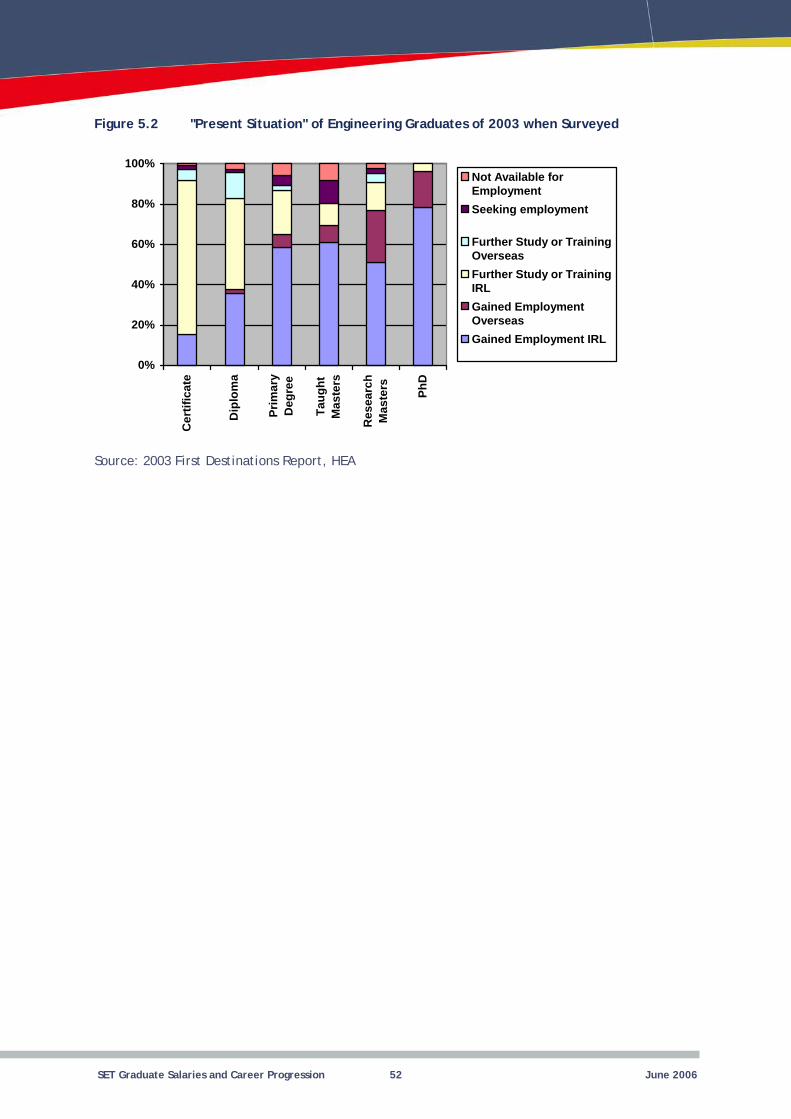
Figure 5.2 "Present Situation" of Engineering Graduates of 2003 when Surveyed
100%
80%
60%
40%
20%
0%
Not Available for Employment Seeking employment
Further Study or Training Overseas Further Study or Training IRL Gained Employment Overseas Gained Employment IRL
Cer
tific
ate
Dip
lom
a
Prim
ary
Deg
ree
Taug
htM
aste
rs
Res
earc
h M
aste
rs
PhD
Source: 2003 First Destinations Report, HEA
SET Graduate Salaries and Career Progression 52 June 2006
Chapter 6 Career Progression - Data from Census 2002
6.1 Introduction This chapter presents information on what past graduates have done as their lives progressed, drawing in data from Census 2002, focusing on groups then aged 30-34 and 40-44.
It presents information on the percentages of people with different qualifications in employment, for males and females. This provides an indication as to how well the qualification prepares a person to be active in the workplace over the years. People may be out of employment for a variety of reasons, including further looking after home/family, unemployment, further study and disability.
The chapter also presents information on the percentages of people with different qualifications and in employment in the upper socio-economic groups1. This provides an indication as to how well the qualification prepares a person to work at a high level through their career.
The analysis is presented for people with third level "degree" qualifications (i.e. those with qualifications at Level 8 or above in the National Framework of Qualifications), and for people with "non-degree" third level qualifications (i.e. those with qualifications at Levels 6 and 7 in the National Framework of Qualifications). Readers should bear in mind that the Irish higher education system has developed rapidly since the early 1980s, when many of those who were aged 40-44 at the time of Census 2002 originally graduated. Numbers undertaking higher education have increased dramatically throughout the system.
The numbers presented are based on a 5% sample of anonymised responses provided by the Central Statistics Office, rather than on the full set of responses to the Census of Population. In cases where the number of graduates in a particular discipline and in a particular age group is low, data has been omitted in response to the risk of significant sampling errors.
1 Defined for these purposes as employers and managers, higher professionals, lower professionals and own account workers.
SET Graduate Salaries and Career Progression 53 June 2006
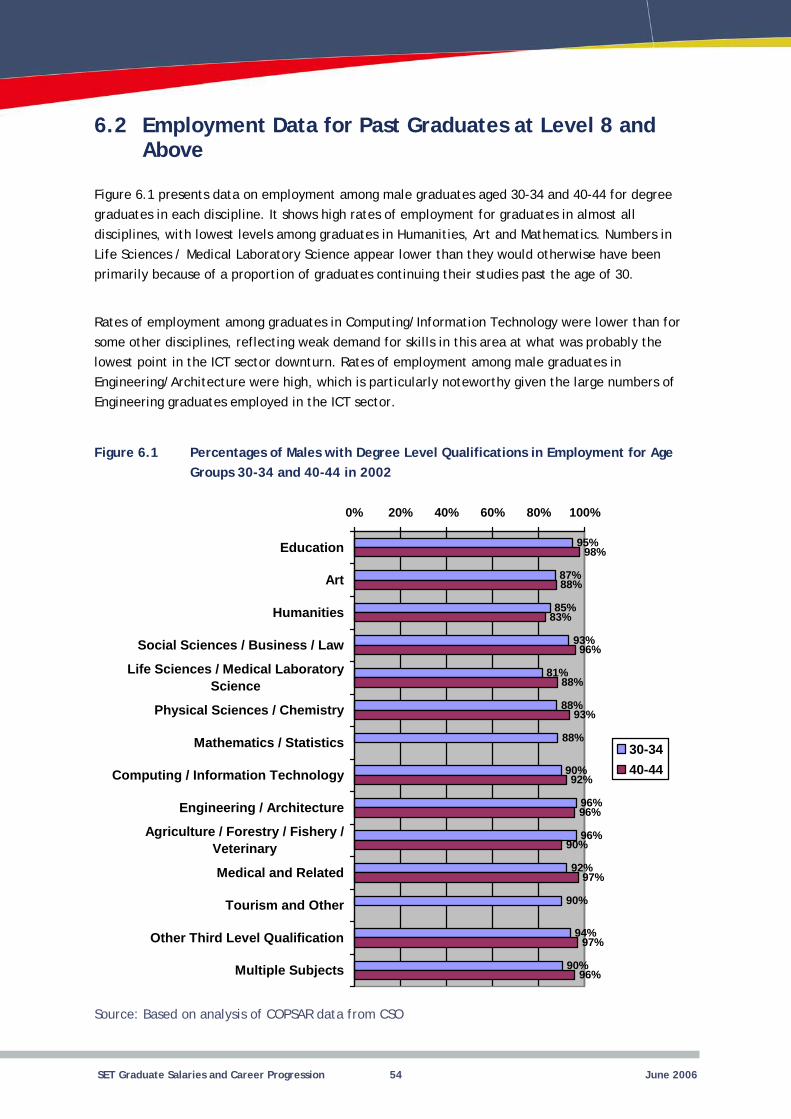
6.2 Employment Data for Past Graduates at Level 8 and Above
Figure 6.1 presents data on employment among male graduates aged 30-34 and 40-44 for degree graduates in each discipline. It shows high rates of employment for graduates in almost all disciplines, with lowest levels among graduates in Humanities, Art and Mathematics. Numbers in Life Sciences / Medical Laboratory Science appear lower than they would otherwise have been primarily because of a proportion of graduates continuing their studies past the age of 30.
Rates of employment among graduates in Computing/Information Technology were lower than for some other disciplines, reflecting weak demand for skills in this area at what was probably the lowest point in the ICT sector downturn. Rates of employment among male graduates in Engineering/Architecture were high, which is particularly noteworthy given the large numbers of Engineering graduates employed in the ICT sector.
Figure 6.1 Percentages of Males with Degree Level Qualifications in Employment for Age Groups 30-34 and 40-44 in 2002
0% 20% 40% 60% 80% 100%
Education
Art
Humanities
Social Sciences / Business / Law
Life Sciences / Medical Laboratory Science
Physical Sciences / Chemistry
Mathematics / Statistics
Computing / Information Technology
Engineering / Architecture
Agriculture / Forestry / Fishery / Veterinary
Medical and Related
Tourism and Other
Other Third Level Qualification
Multiple Subjects
87%
85%
81%
88%
88%
90%
90%
90%
98%
88%
83%
88%
92%
90%
97%
95%
93%
96%
96%
92%
94%
96%
93%
96%
97%
96%
30-34 40-44
Source: Based on analysis of COPSAR data from CSO
SET Graduate Salaries and Career Progression 54 June 2006
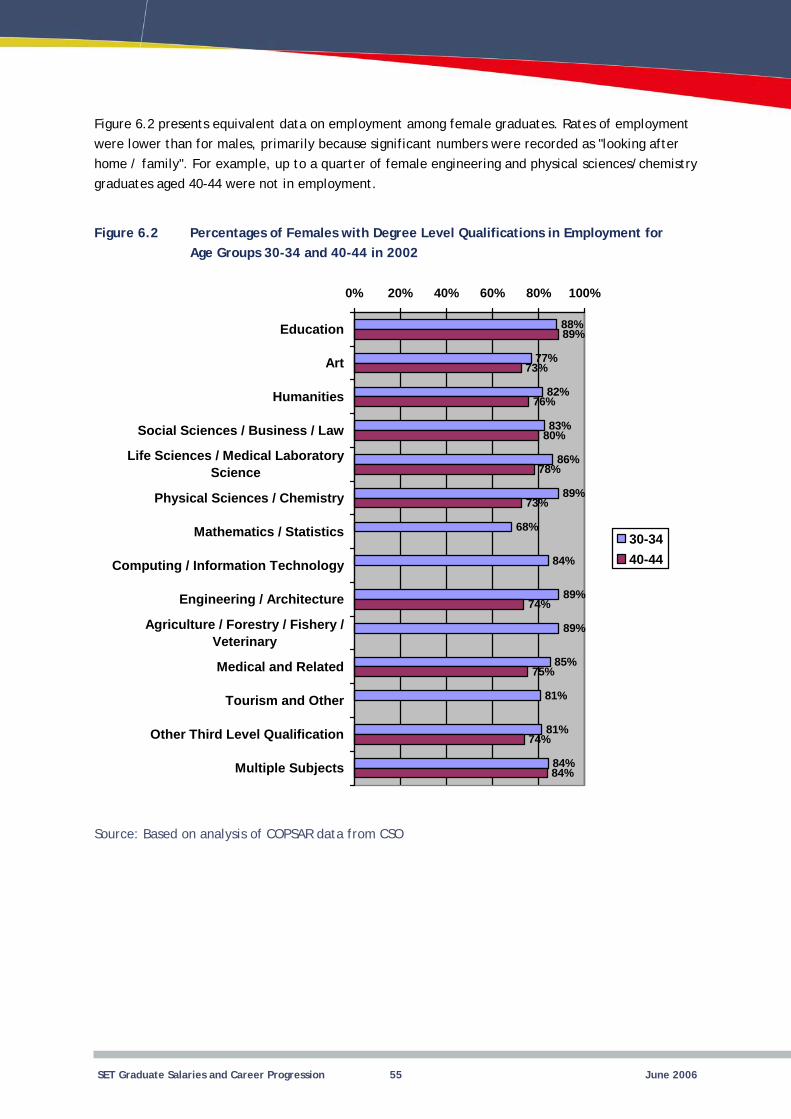
Figure 6.2 presents equivalent data on employment among female graduates. Rates of employment were lower than for males, primarily because significant numbers were recorded as "looking after home / family". For example, up to a quarter of female engineering and physical sciences/chemistry graduates aged 40-44 were not in employment.
Figure 6.2 Percentages of Females with Degree Level Qualifications in Employment for Age Groups 30-34 and 40-44 in 2002
0% 20% 40% 60% 80% 100%
Education
Art
Humanities
Social Sciences / Business / Law
Life Sciences / Medical Laboratory Science
Physical Sciences / Chemistry
Mathematics / Statistics
Computing / Information Technology
Engineering / Architecture
Agriculture / Forestry / Fishery / Veterinary
Medical and Related
Tourism and Other
Other Third Level Qualification
Multiple Subjects
88%
82%
83%
86%
89%
68%
84%
89%
89%
85%
81%
84%
89%
73%
73%
74%
75%
74%
84%
77%
81%
76%
80%
78%
30-34 40-44
Source: Based on analysis of COPSAR data from CSO
SET Graduate Salaries and Career Progression 55 June 2006
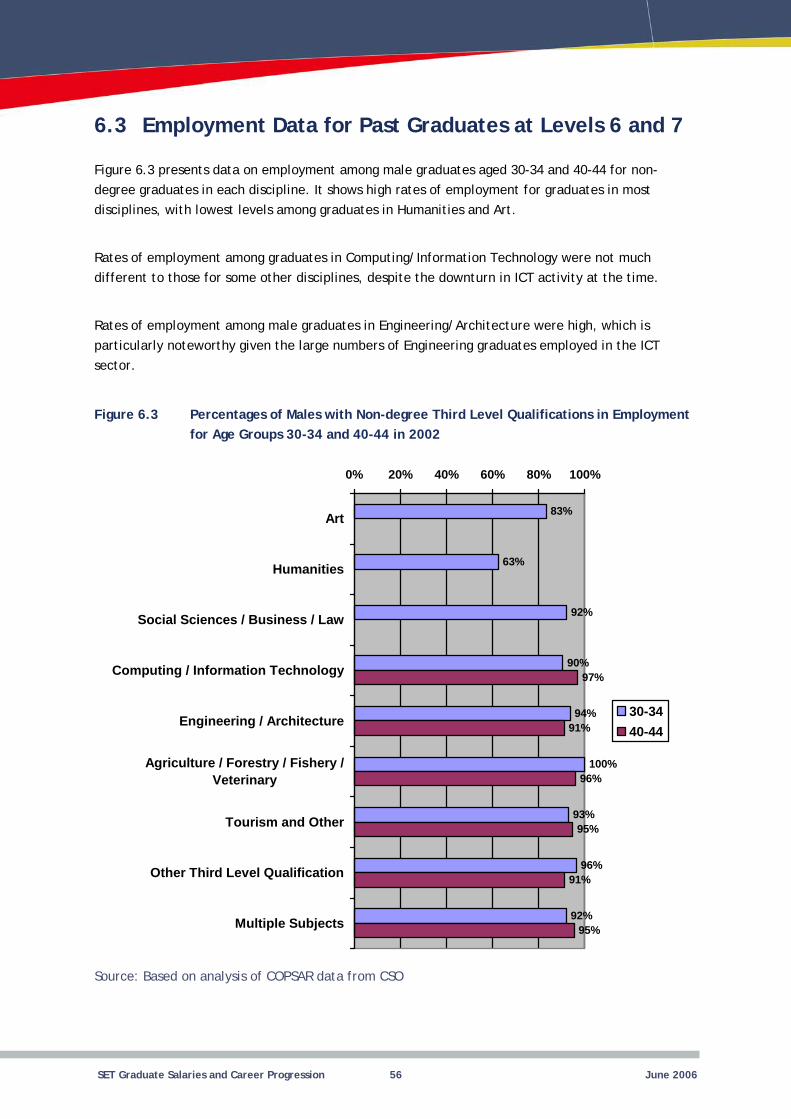
6.3 Employment Data for Past Graduates at Levels 6 and 7
Figure 6.3 presents data on employment among male graduates aged 30-34 and 40-44 for non-degree graduates in each discipline. It shows high rates of employment for graduates in most disciplines, with lowest levels among graduates in Humanities and Art.
Rates of employment among graduates in Computing/Information Technology were not much different to those for some other disciplines, despite the downturn in ICT activity at the time.
Rates of employment among male graduates in Engineering/Architecture were high, which is particularly noteworthy given the large numbers of Engineering graduates employed in the ICT sector.
Figure 6.3 Percentages of Males with Non-degree Third Level Qualifications in Employment for Age Groups 30-34 and 40-44 in 2002
0% 20% 40% 60% 80% 100%
Art
Humanities
Social Sciences / Business / Law
Computing / Information Technology
Engineering / Architecture
Agriculture / Forestry / Fishery / Veterinary
Tourism and Other
Other Third Level Qualification
Multiple Subjects
83%
90%
92%
97%
91%
91%
63%
92%
94%
93%
96%
96%
95%
95%
30-34 40-44
100%
Source: Based on analysis of COPSAR data from CSO
SET Graduate Salaries and Career Progression 56 June 2006
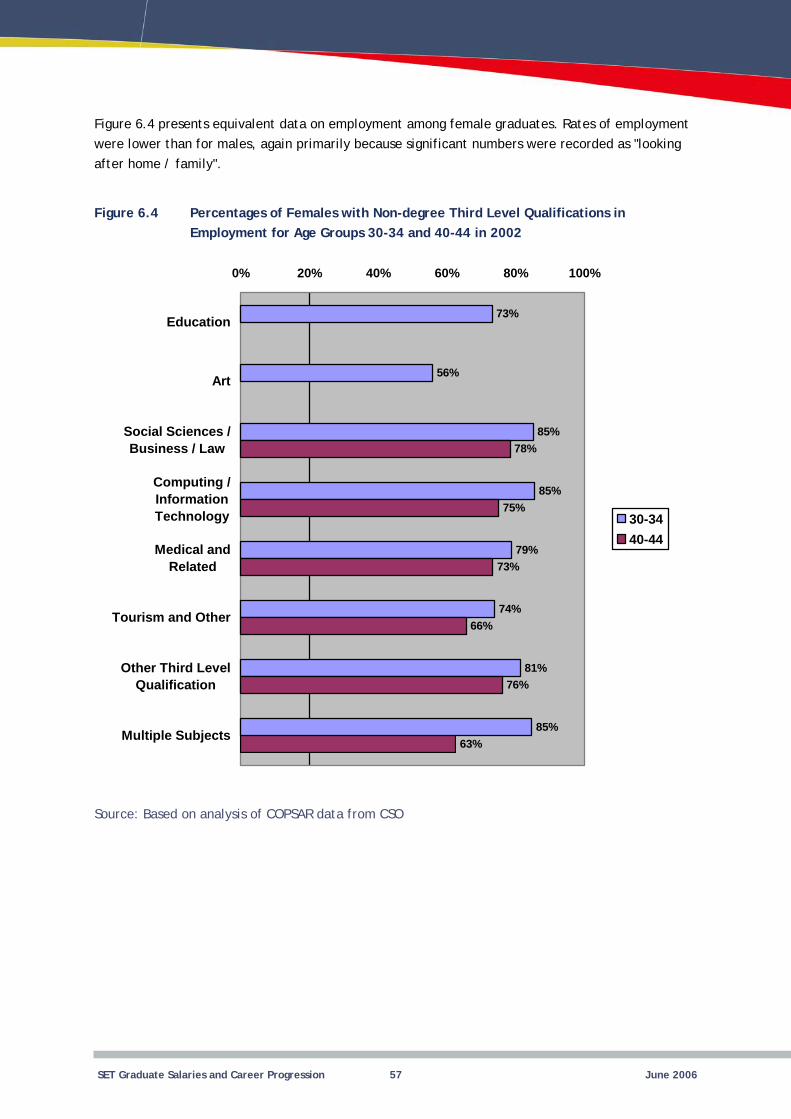
Figure 6.4 presents equivalent data on employment among female graduates. Rates of employment were lower than for males, again primarily because significant numbers were recorded as "looking after home / family".
Figure 6.4 Percentages of Females with Non-degree Third Level Qualifications in Employment for Age Groups 30-34 and 40-44 in 2002
0% 20% 40% 60% 80% 100%
Education
Art
Social Sciences / Business / Law
Computing / Information Technology
Medical and Related
Tourism and Other
Other Third Level Qualification
Multiple Subjects
56%
66%
63%
73%
85%
85%
79%
74%
81%
85%
78%
75%
73%
76%
30-34 40-44
Source: Based on analysis of COPSAR data from CSO
SET Graduate Salaries and Career Progression 57 June 2006
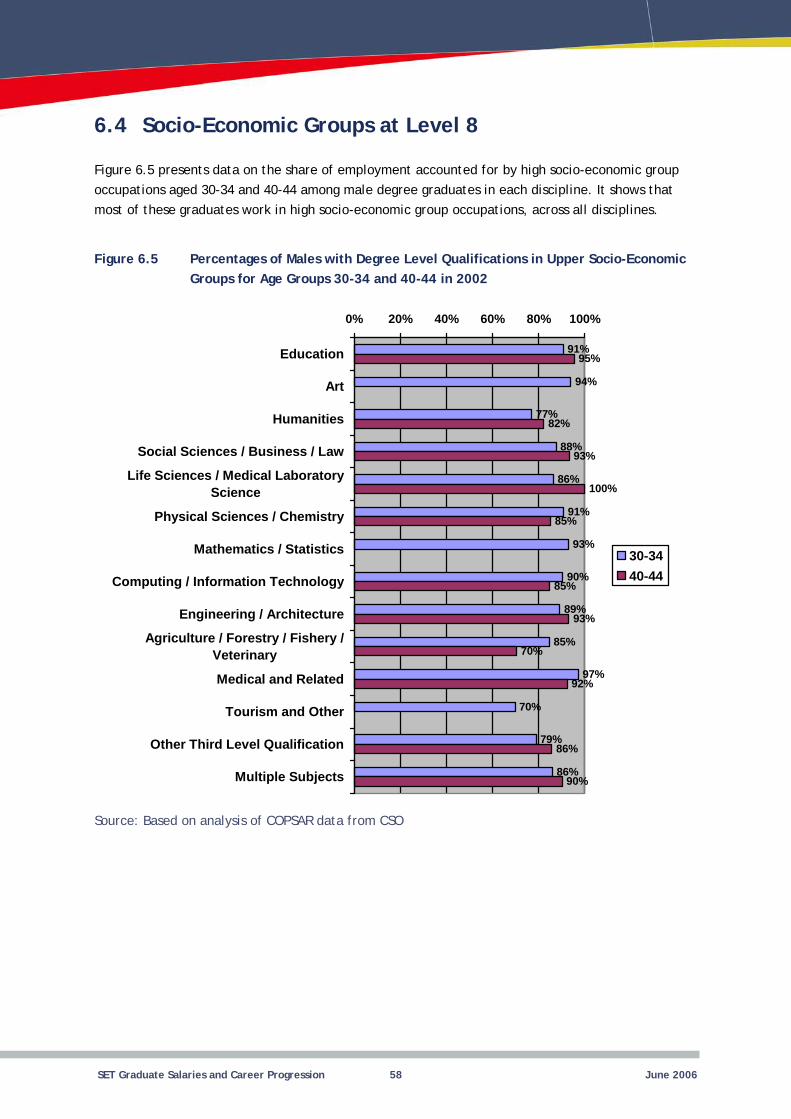
6.4 Socio-Economic Groups at Level 8
Figure 6.5 presents data on the share of employment accounted for by high socio-economic group occupations aged 30-34 and 40-44 among male degree graduates in each discipline. It shows that most of these graduates work in high socio-economic group occupations, across all disciplines.
Figure 6.5 Percentages of Males with Degree Level Qualifications in Upper Socio-Economic Groups for Age Groups 30-34 and 40-44 in 2002
0% 20% 40% 60% 80% 100%
Education
Art
Humanities
Social Sciences / Business / Law
Life Sciences / Medical Laboratory Science
Physical Sciences / Chemistry
Mathematics / Statistics
Computing / Information Technology
Engineering / Architecture
Agriculture / Forestry / Fishery / Veterinary
Medical and Related
Tourism and Other
Other Third Level Qualification
Multiple Subjects
91%
88%
86%
91%
90%
89%
85%
97%
70%
86%
82%
85%
85%
70%
86%
90%
94%
77%
93%
79%
95%
93%
93%
92%
100%
30-34 40-44
Source: Based on analysis of COPSAR data from CSO
SET Graduate Salaries and Career Progression 58 June 2006
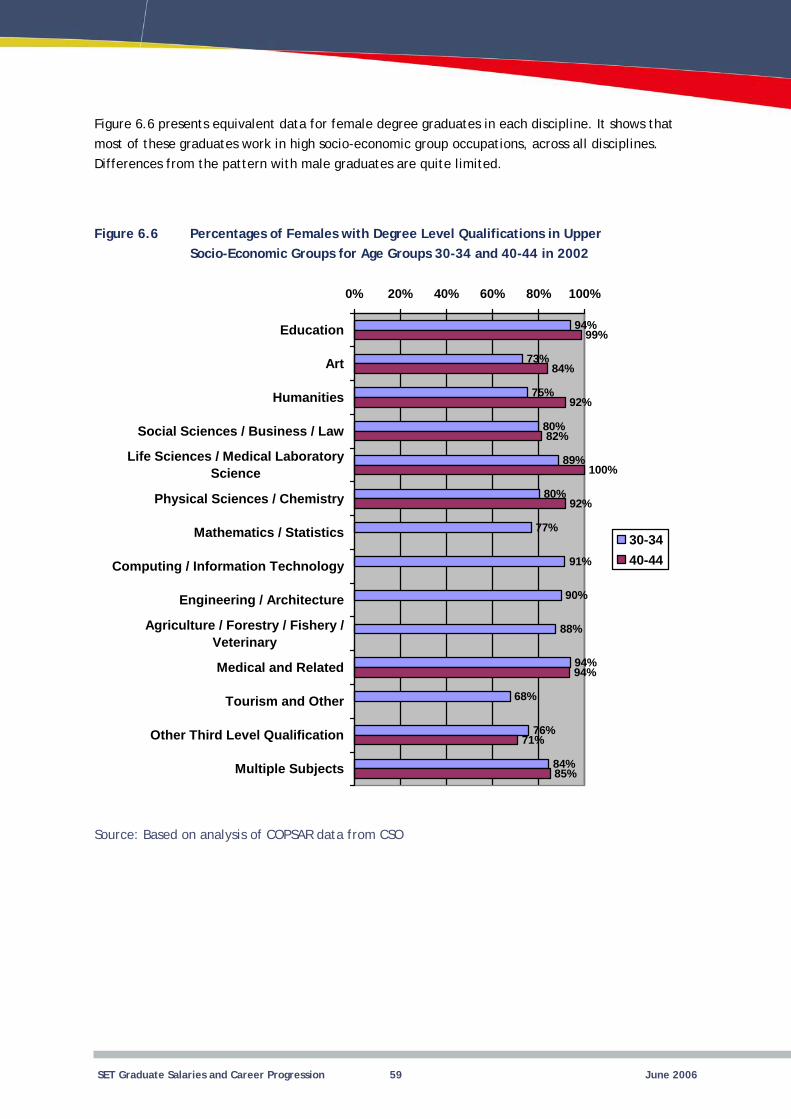
Figure 6.6 presents equivalent data for female degree graduates in each discipline. It shows that most of these graduates work in high socio-economic group occupations, across all disciplines. Differences from the pattern with male graduates are quite limited.
Figure 6.6 Percentages of Females with Degree Level Qualifications in Upper Socio-Economic Groups for Age Groups 30-34 and 40-44 in 2002
0% 20% 40% 60% 80% 100%
Education
Art
Humanities
Social Sciences / Business / Law
Life Sciences / Medical Laboratory Science
Physical Sciences / Chemistry
Mathematics / Statistics
Computing / Information Technology
Engineering / Architecture
Agriculture / Forestry / Fishery / Veterinary
Medical and Related
Tourism and Other
Other Third Level Qualification
Multiple Subjects
73%
75%
89%
90%
88%
68%
84%
99%
84%
82%
71%
85%
94%
80%
80%
77%
91%
94%
76%
92%
92%
94%
100%
30-34 40-44
Source: Based on analysis of COPSAR data from CSO
SET Graduate Salaries and Career Progression 59 June 2006
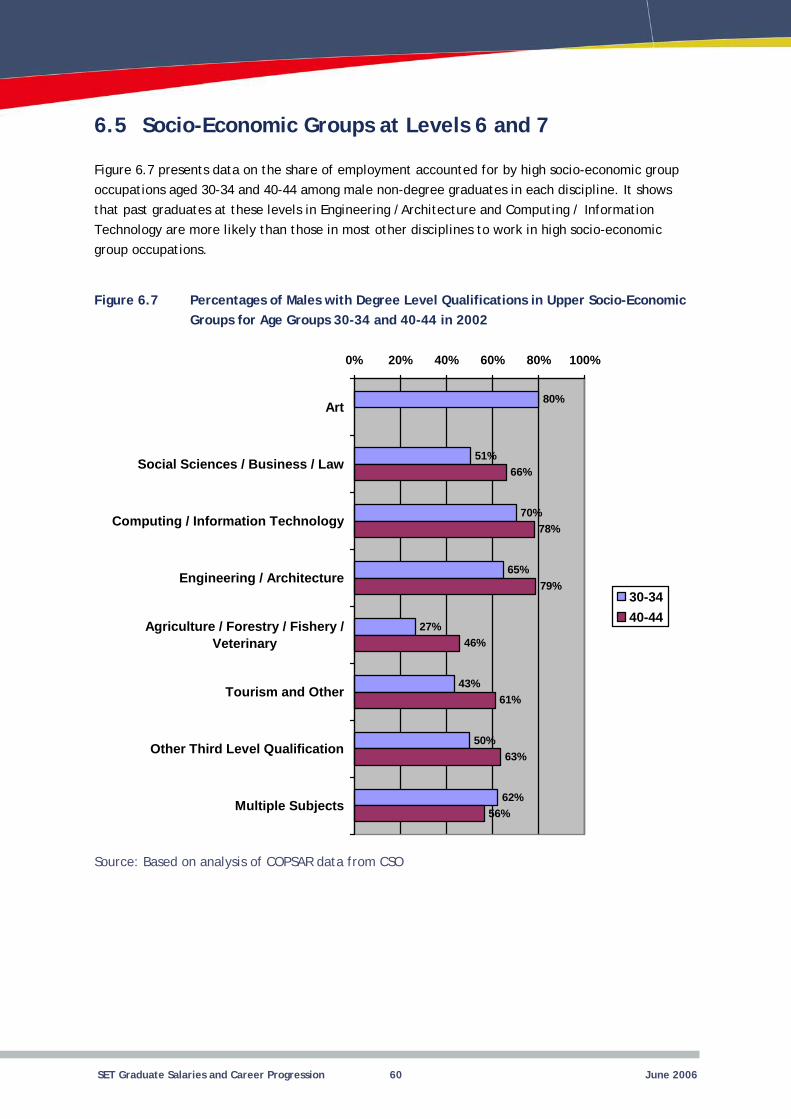
6.5 Socio-Economic Groups at Levels 6 and 7
Figure 6.7 presents data on the share of employment accounted for by high socio-economic group occupations aged 30-34 and 40-44 among male non-degree graduates in each discipline. It shows that past graduates at these levels in Engineering /Architecture and Computing / Information Technology are more likely than those in most other disciplines to work in high socio-economic group occupations.
Figure 6.7 Percentages of Males with Degree Level Qualifications in Upper Socio-Economic Groups for Age Groups 30-34 and 40-44 in 2002
0% 20% 40% 60% 80% 100%
Art
Social Sciences / Business / Law
Computing / Information Technology
Engineering / Architecture
Agriculture / Forestry / Fishery / Veterinary
Tourism and Other
Other Third Level Qualification
Multiple Subjects
51%
70%
27%
43%
66%
56%
80%
65%
50%
62%
78%
79%
46%
61%
63%
30-34 40-44
Source: Based on analysis of COPSAR data from CSO
SET Graduate Salaries and Career Progression 60 June 2006
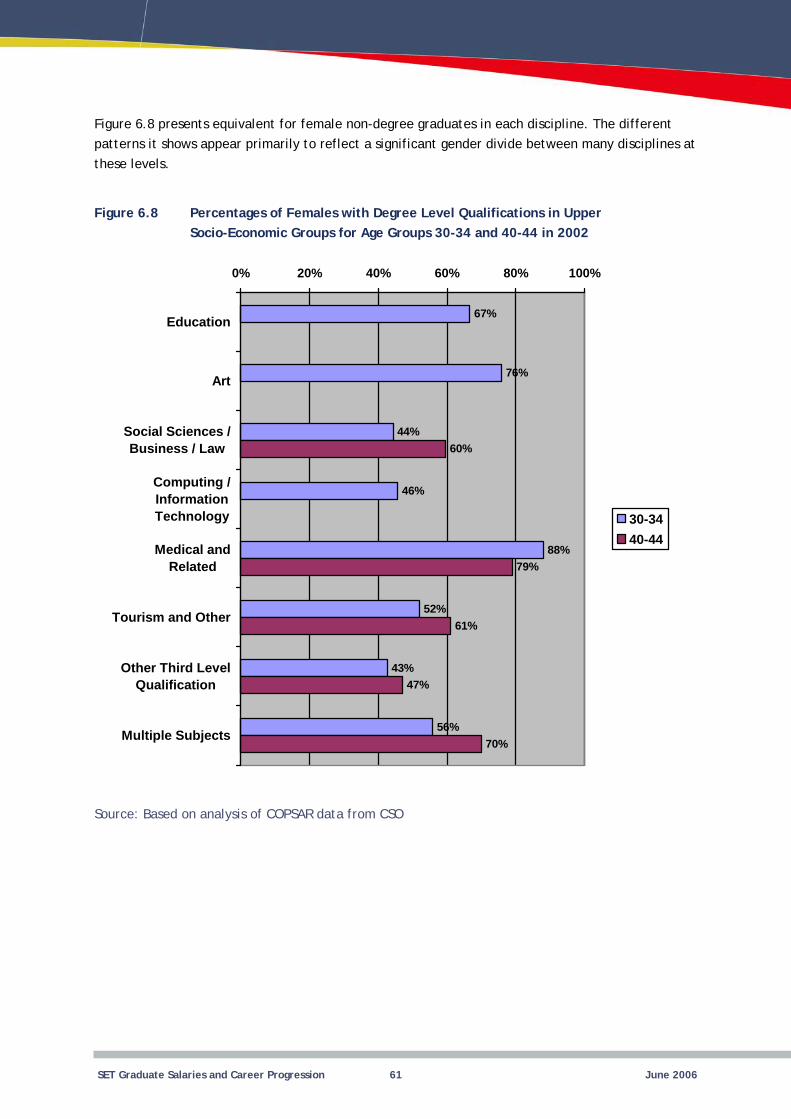
Figure 6.8 presents equivalent for female non-degree graduates in each discipline. The different patterns it shows appear primarily to reflect a significant gender divide between many disciplines at these levels.
Figure 6.8 Percentages of Females with Degree Level Qualifications in Upper Socio-Economic Groups for Age Groups 30-34 and 40-44 in 2002
0% 20% 40% 60% 80% 100%
Education
Art
Social Sciences / Business / Law
Computing / Information Technology
Medical and Related
Tourism and Other
Other Third Level Qualification
Multiple Subjects
67%
46%
88%
52%
60%
79%
61%
47%
70%
76%
44%
43%
56%
30-34 40-44
Source: Based on analysis of COPSAR data from CSO
SET Graduate Salaries and Career Progression 61 June 2006
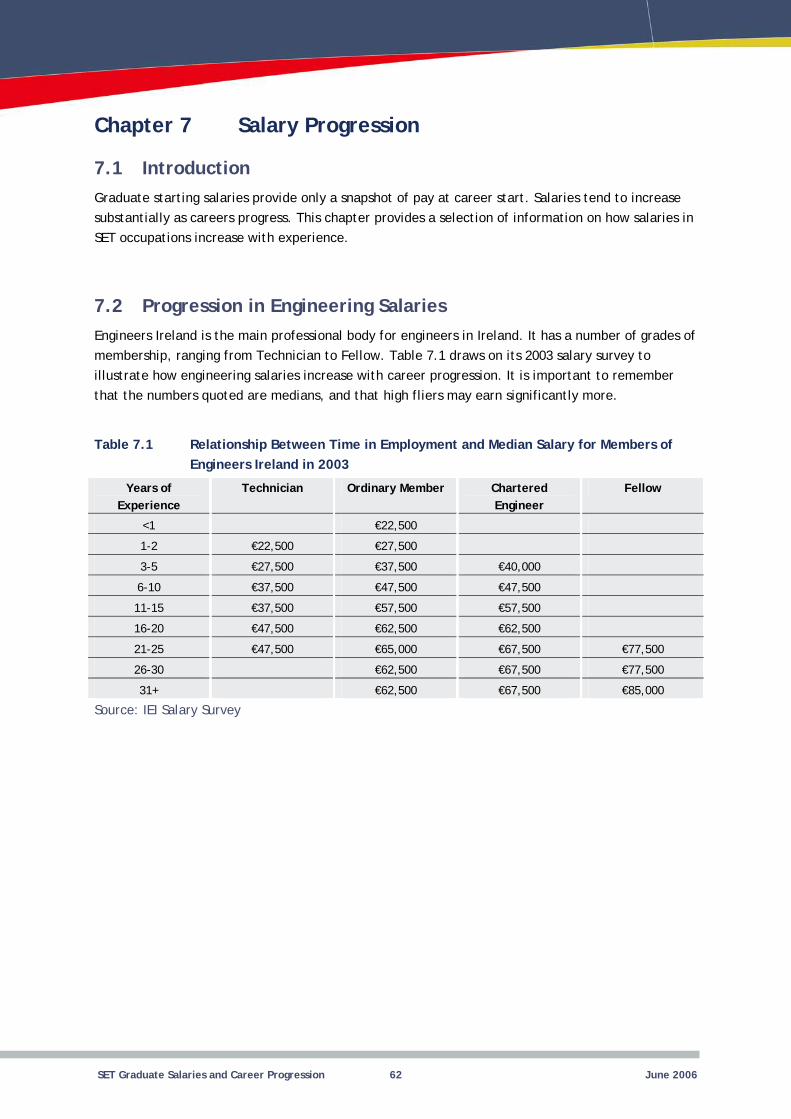
Chapter 7 Salary Progression
7.1 Introduction Graduate starting salaries provide only a snapshot of pay at career start. Salaries tend to increase substantially as careers progress. This chapter provides a selection of information on how salaries in SET occupations increase with experience.
7.2 Progression in Engineering Salaries Engineers Ireland is the main professional body for engineers in Ireland. It has a number of grades of membership, ranging from Technician to Fellow. Table 7.1 draws on its 2003 salary survey to illustrate how engineering salaries increase with career progression. It is important to remember that the numbers quoted are medians, and that high fliers may earn significantly more.
Table 7.1 Relationship Between Time in Employment and Median Salary for Members of Engineers Ireland in 2003
Years of Ordinary Member Chartered Engineer
Fellow
<1
1-2
3-5
6-10
11-15
16-20
21-25
26-30
31+
Experience Technician
€22,500
€22,500 €27,500
€27,500 €37,500 €40,000
€37,500 €47,500 €47,500
€37,500 €57,500 €57,500
€47,500 €62,500 €62,500
€47,500 €65,000 €67,500 €77,500
€62,500 €67,500 €77,500
€62,500 €67,500 €85,000
Source: IEI Salary Survey
SET Graduate Salaries and Career Progression 62 June 2006
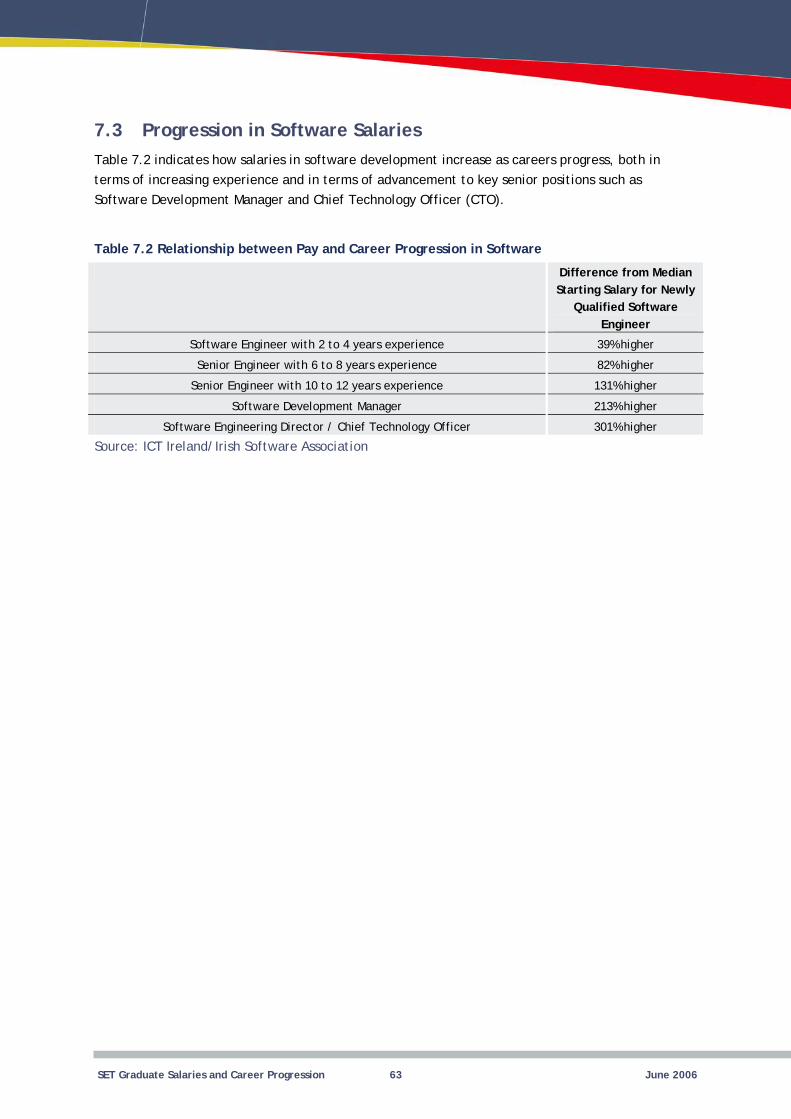
7.3 Progression in Software Salaries Table 7.2 indicates how salaries in software development increase as careers progress, both in terms of increasing experience and in terms of advancement to key senior positions such as Software Development Manager and Chief Technology Officer (CTO).
Table 7.2 Relationship between Pay and Career Progression in Software
Qualified Software Engineer
39% higher
82% higher
131% higher
213% higher
301% higher
Difference from Median Starting Salary for Newly
Software Engineer with 2 to 4 years experience
Senior Engineer with 6 to 8 years experience
Senior Engineer with 10 to 12 years experience
Software Development Manager
Software Engineering Director / Chief Technology Officer
Source: ICT Ireland/Irish Software Association
SET Graduate Salaries and Career Progression 63 June 2006
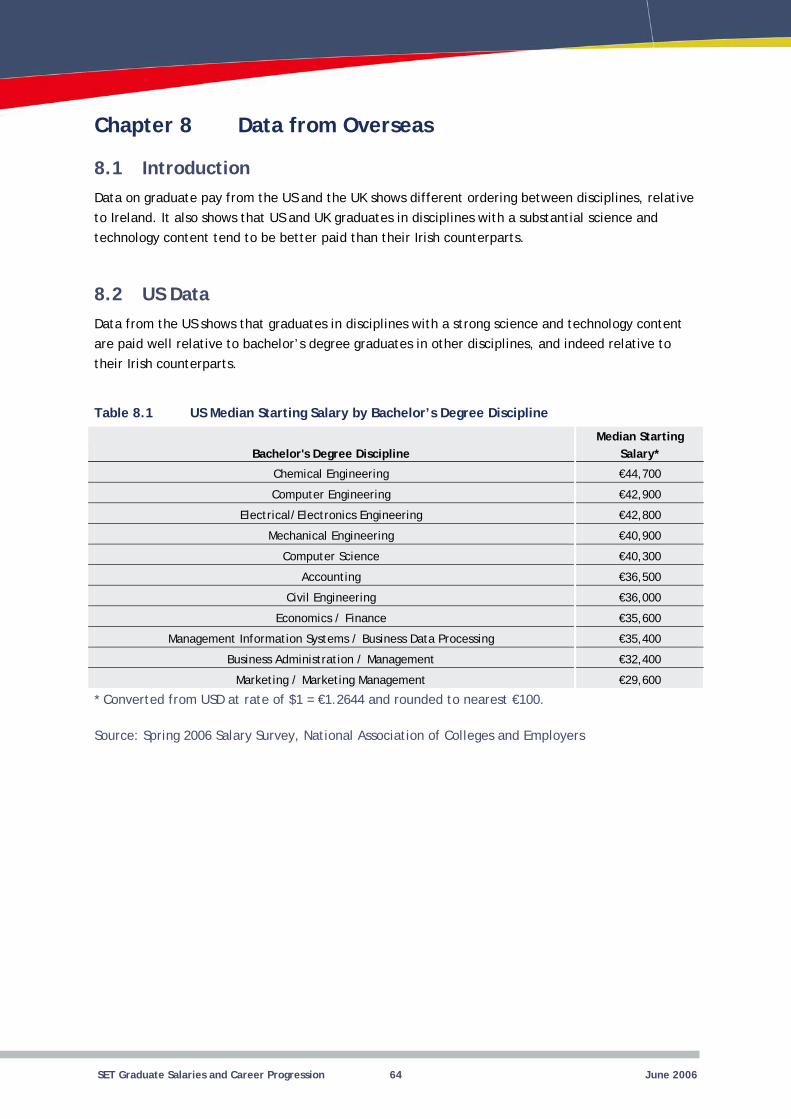
Chapter 8 Data from Overseas
8.1 Introduction Data on graduate pay from the US and the UK shows different ordering between disciplines, relative to Ireland. It also shows that US and UK graduates in disciplines with a substantial science and technology content tend to be better paid than their Irish counterparts.
8.2 US Data Data from the US shows that graduates in disciplines with a strong science and technology content are paid well relative to bachelor’s degree graduates in other disciplines, and indeed relative to their Irish counterparts.
Table 8.1 US Median Starting Salary by Bachelor’s Degree Discipline
Median Starting Salary*
Chemical Engineering
Computer Engineering
Computer Science
Civil Engineering
Bachelor's Degree Discipline
€44,700
€42,900
Electrical/Electronics Engineering €42,800
Mechanical Engineering €40,900
€40,300
Accounting €36,500
€36,000
Economics / Finance €35,600
Management Information Systems / Business Data Processing €35,400
Business Administration / Management €32,400
Marketing / Marketing Management €29,600
* Converted from USD at rate of $1 = €1.2644 and rounded to nearest €100.
Source: Spring 2006 Salary Survey, National Association of Colleges and Employers
SET Graduate Salaries and Career Progression 64 June 2006
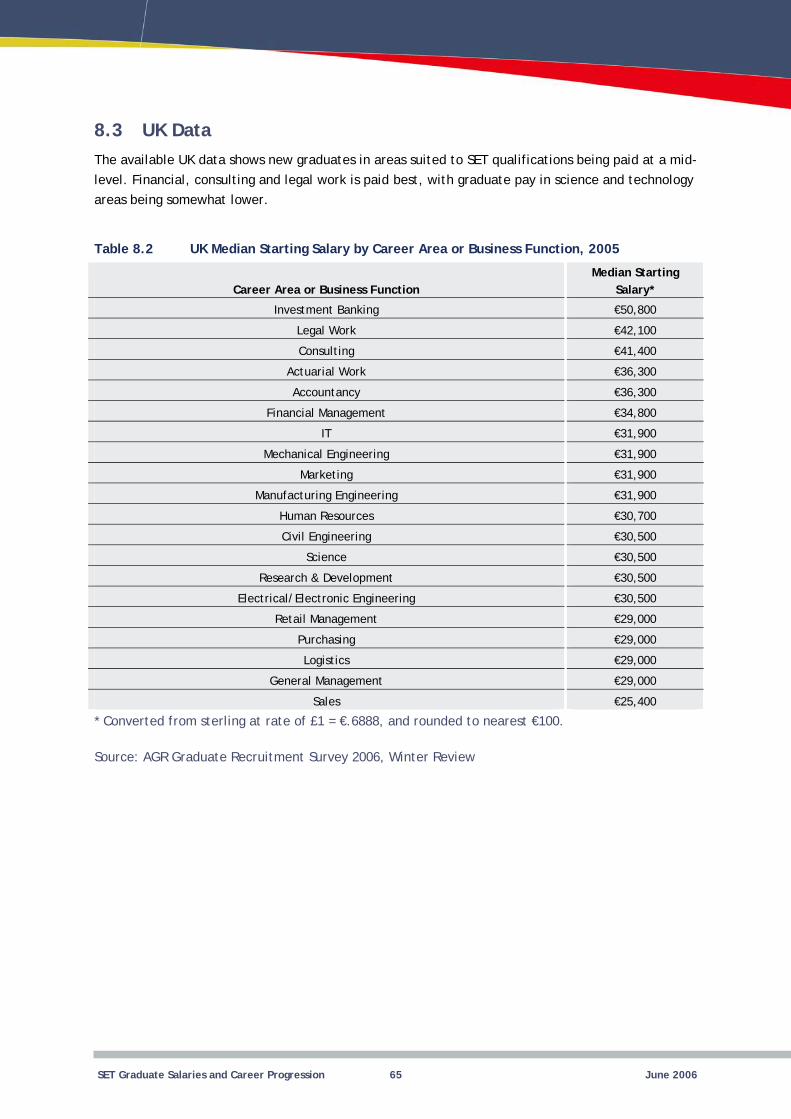
8.3 UK Data The available UK data shows new graduates in areas suited to SET qualifications being paid at a mid-level. Financial, consulting and legal work is paid best, with graduate pay in science and technology areas being somewhat lower.
Table 8.2 UK Median Starting Salary by Career Area or Business Function, 2005
Median Starting Salary*
Investment Banking
Legal Work
Consulting
IT
Marketing
Manufacturing Engineering
Human Resources
Civil Engineering
Science
Research & Development
Purchasing
General Management
Sales
Career Area or Business Function
€50,800
€42,100
€41,400
Actuarial Work €36,300
Accountancy €36,300
Financial Management €34,800
€31,900
Mechanical Engineering €31,900
€31,900
€31,900
€30,700
€30,500
€30,500
€30,500
Electrical/Electronic Engineering €30,500
Retail Management €29,000
€29,000
Logistics €29,000
€29,000
€25,400
* Converted from sterling at rate of £1 = €.6888, and rounded to nearest €100.
Source: AGR Graduate Recruitment Survey 2006, Winter Review
SET Graduate Salaries and Career Progression 65 June 2006