extending the strategy and structure - insead
TRANSCRIPT

INSEAD-Whartofor Global Resear
BusinessExtending the
20
(Revised Ver
n Alliance Centerch & Development
Strategy and Business Model: Strategy-Structure-Performance
Paradigm
by C. Zott
and R. Amit
05/26/ENT/SM/ACGRD 11
sion of 2004/84/ENT/SM/ACGRD 8)
Working Paper Series
Business Strategy and Business Model: Extending the Strategy-Structure-Performance Paradigm*
Christoph Zott
INSEAD Euro-Asia Center 006
Boulevard de Constance 77305 Fontainebleau Cedex
FRANCE Telephone: 33 1 6072 4364
Fax: 33 1 60 72 42 23 E-mail: [email protected]
Raphael Amit The Wharton School
University of Pennsylvania 3620 Locust walk
Philadelphia, PA 19104-6370 Telephone: (215) 898-7731
Fax: (215) 573-7189 E-Mail: [email protected]
15 November 2004
* Both authors contributed equally to this article. We gratefully acknowledge the financial support of the Wharton-INSEAD Alliance Center for Global Research & Development. Christoph Zott acknowledges support from the Rudolf and Valeria Maag Fellowship in Entrepreneurship at INSEAD. Raffi Amit acknowledges financial support from the Wharton e-business Research Center (a unit of WeBI) and the Robert B. Goergen Chair in Entrepreneurship at the Wharton School. We thank Iwona Bancerek, Amee Kamdar, Jenny Koelle and Gueram Sargsyan for valuable research assistance.
Business Strategy and Business Model: Extending the Strategy-Structure-Performance Paradigm
ABSTRACT
We extend the strategy-structure-performance paradigm to highlight the interdependencies
among a firm’s product market strategy, the structure of transactions it enables with external
stakeholders (its business model), and its performance. By developing a formal model, we are
able to explore theoretically the contingent effects of product market strategy and business
model design on firm performance. Investigating a unique manually collected data set, we find
that novelty-centered business model design, coupled with product market strategies that
emphasize differentiation, cost leadership, or early market entry, enhances firm performance.
KEYWORDS: Product market strategy, business model, performance, strategy-structure-
performance paradigm, competitive strategy.
2

Business Strategy and Business Model: Extending the Strategy-Structure-Performance
Paradigm
The Strategy-Structure-Performance (SSP) paradigm addresses linkages between corporate
strategy (e.g., the extent of diversification) and the administrative structure (e.g., divisional versus
functional forms) of firms (Chandler, 1962). While this relationship has been thoroughly investigated
(e.g., Amburgey and Dacin, 1994), the received literature seems to have paid surprisingly “little
attention to extending the question of strategy/structure fit issues for other structural forms of
organization” (Yin and Zajac, 2004: 365). Yet, rapid advances in information and communication
technologies – in particular, Internet and broadband technologies - have facilitated new types of
technology-mediated interactions between economic agents (Geoffrion and Krishnan, 2003). This has
enabled firms to change fundamentally the way they organize and transact both within and across firm
and industry boundaries (Mendelson, 2000). Thus, the focus of organization design has shifted from
the administrative structure of the firm to the structural organization, or architecture, of its exchanges.
Echoing this shift, researchers have observed that the locus of value creation increasingly extends
traditional firm boundaries (Dyer and Singh, 1998; Gulati, Nohira and Zaheer, 2000; Normann, 2001),
and they have called for a broader conceptualization of organizational boundaries beyond the legally
relevant demarcation of the firm from its environment (Santos and Eisenhardt, Forthcoming).
These developments have important implications for strategic management research, because
they affect the possibilities for value creation and capture by firms. In order to improve our
understanding of these phenomena, two key questions need to be addressed: First, how can the
structure of a firm’s exchange relationships with external parties be described and measured? And
second, how do the structure of these boundary-spanning exchanges and firm strategy impact firm
performance, independently and jointly? Addressing these issues, which lie at the heart of the
strategy-structure-performance relationship, promises to re-frame and broaden the paradigm,
reflecting recent fundamental shifts in technology-enabled organizational design.
3
In this paper, we address these questions by examining the interplay between a firm’s
product-market positioning choices (strategy) and its business model design (structure). We develop
the notion of structure as architectural design of boundary-spanning transactions, to which we refer as
business model design, and we examine how business model design is distinct from a firm’s product-
market positioning. We also investigate how product market strategies and business model designs
interact to affect firm performance. Thereby, we begin to extend the debate on the strategy-structure-
performance relationship.
More specifically, by introducing formal notations, we explore theoretically the
interdependencies among salient dimensions of product market strategy, different business model
design themes, and firm performance, thereby addressing the question of fit among these constructs.
Examining a unique hand-collected data set on business strategy and business models, we establish
empirically that a firm’s product market strategy and the design of a firm’s business model are distinct
constructs that affect firm performance. Specifically, we find that novelty-centered business model
design, coupled either with a differentiation or cost leadership strategy, enhances firm performance. In
addition, we ascertain that a novelty-centered business model design joined with early entry into a
market positively affects performance.
This study attempts to make the following contributions: First, it extends the perspective of
the SSP paradigm on structure, from being concerned with the administrative structure of the firm to a
focus on the architectural structure of transactions the focal firm enables with external stakeholders.
Second, in this paper we argue theoretically, and show empirically that the business model construct
is valid and distinct from received notions of a firm’s product market strategy. Third, we articulate
formally how interactions among our main constructs are expected to affect firm performance. Fourth,
we test these theoretical developments empirically, and show that novel business model design can
augment the competitive advantage realized through superior product market strategy. In other words,
both product market strategy and structure as embodied by the design of the business model can
enhance the firm’s competitive advantage, independently as well as jointly.
4

The remainder of the paper is organized as follows: We proceed in the next section to present
our theory, after which we explain the data and methods we used to test it. We then present our
results, and we conclude with a discussion of our findings and implications for future research.
THEORY
Strategy and Structure
In his study of large American corporations and their approaches toward product-market
diversification, Alfred Chandler (1962) observed that major increases in volume, geographic
dispersion, and vertical and horizontal integration of firms were followed by changes in their
administrative activity, which eventually led to the emergence of the M-form of organization. That
line of reasoning, however, provoked the counterargument that “strategy follows structure" (e.g.,
Bower, 1970), which was predicated on the logic that managerial cognition and skills mediate
between structure and strategy. The ensuing debate in the strategy literature on the relationship
between strategy, structure, and firm performance – known as the SSP debate – flourished in the
1970s and 1980s, but (with few exceptions, e.g., Amburgey and Dacin, 1994 and Yin and Zajac,
2004) seems to have received less attention recently.
Some management scholars have pointed to the relatively narrow focus of the traditional SSP
debate on corporate strategy and administrative firm structures, which might limit the applicability of
SSP theory to large, established corporations. However, there might be “much more to the concepts of
both strategy and structure” (Miller, 1986: 233). In this paper, we attempt to enrich the SSP debate
mainly by focusing on the firm’s architecture of transactions with external parties – i.e., its business
model – instead of its administrative structures, and by shifting the focus of the SSP debate from
corporate to business strategy. Specifically, with respect to of the latter, we concentrate on some
salient aspects of a firm’s product market strategy. We view product market strategy as the way in
which a firm chooses to build, exploit, and safeguard advantages in its addressable market spaces by
making the following decisions: (1) What type of product market positioning approach to adopt (i.e.,
cost leadership and/or product/service differentiation; see Porter, 1985); and (2) When to enter the
5
market (Lieberman and Montgomery, 1988). The answers to these questions are central to our
understanding of how firms that operate in competitive product markets create and appropriate value.
Towards a New Perspective on Structure
Technological progress has brought about new opportunities for the creation of
organizational arrangements among firms, partners, and customers (Geoffrion and Krishnan, 2003;
Mendelson, 2000; Normann, 2001). The holistic design of an organization’s boundary-spanning
economic exchanges can be defined as the firm’s business model. The business model is a structural
template of how a focal firm interacts and transacts with customers, partners, and vendors; it refers to
the overall gestalt of these possibly interlinked transactions. On-line communities for open source
software development are a case in point (Lee and Cole, 2003). Another example is the case of
Priceline.com Inc., a provider of an electronic pricing system, known as a demand collection system
(Hann and Terwiesch, 2003). Transactions are enabled through a reverse market auction mechanism
for which the company has secured a business method patent. It allows the customer to name the price
at which they wish to transact and the company will attempt to find a provider of the product or
service within a specified range. That business model enables buyers to save money on a wide range
of products and services by trading flexibility regarding the choice of brands, product features, timing,
convenience and/or sellers in return for prices that are lower than those charged through traditional
retail channels. Further, Priceline enables sellers to generate incremental revenue by disposing of
excess inventory or capacity at prices that are lower than the ones they offer through other channels
while protecting their brand.
The design elements of the business model can then be defined as “the structure, content, and
governance of transactions” between the focal firm and its exchange partners (Amit and Zott,
6
2001:511). Thus, the business model serves as a conceptualization of the architectural links between
the firm and its exchange partners.1
In discussing different types of business models, Christensen, Verlinden and Westerman
(2002) distinguish between two design principles for business model architectures – vertical
integration and horizontal stratification. A business model can also be characterized by its design
themes, which capture common threads that orchestrate and connect its design elements (Zott and
Amit, 2003). In particular, we distinguish between “novelty-centered” and “efficiency-centered”
business model designs. Novelty-centered business model design refers to new ways of conducting
economic exchanges among various participants (see the example of Priceline). Efficiency-centered
business model design refers to the measures firms may take with the intention to achieve transaction
efficiency, i.e., reduce transaction costs for all participants; it does not refer to the outcome (i.e.,
efficiency) itself. An example of an efficiency-centered design element would be the order-tracking
feature in Amazon’s business model, which is aimed at enhancing transaction transparency, and thus
at increasing efficiency. These design themes are neither orthogonal (for instance, novel design
elements may engender lower transaction costs), nor are they mutually exclusive: Both may be
present in the design of any given business model. Moreover, the design themes are not exhaustive as
there may be other themes present in the design of a business model. The design themes describe the
holistic gestalt of a firm’s business model, and they facilitate its conceptualization and measurement.
The business model can be a source of competitive advantage that is distinct from the firm’s
market position (Christensen, 2001). Firms that address the same customer need, and that pursue
similar product market strategies, can nonetheless do so with very different business models.
1 We note that the business model construct is distinct from the value net strategic analysis framework
developed by Brandenburger and Nalebuff (1996). The players in the value net such as competitors
and certain complementors may or may not be part of the business model because some of these
players may not transact with the focal firm.
7
Consider, for example, the market for navigation software for handheld devices such as personal
digital assistants, handheld computers, or smart phones. Some firms in that space offer non-wireless
solutions directly to the end-user in a one-shot transaction, while others offer wireless navigation
solutions that are sold through the wireless carriers, and that require a very distinct set of on-going
exchanges between the firm, end-users, and the wireless carriers. A firm with a distinct business
model that creates more value than that of its rivals holds a potential advantage over its rivals as it has
the possibility to capture more value for its shareholders, all other things being equal. In Table 1 we
contrast business model and product market strategy.
[INSERT TABLE 1 HERE]
Examining Table 1 leads us to conclude that product market strategy differs from the business
model mainly through its focus on the positioning of the firm vis-à-vis rivals, whereas the business
model centers more on the architectural design (i.e., structure) of transactions with customers,
suppliers and partners so as to enable economic exchanges among parties in the firm’s addressable
product markets. Referring to the Priceline example, we note that although the product-market
strategy of Priceline is cost leadership, its business model centers on novelty in the design of
transactions. This leads us to establish the following corollary.
Corollary: Business model design (as, for example, measured by design themes) is distinct from product market strategy (as, for example, measured by generic strategies).
Recent research has emphasized the contingent nature of the relationship between strategy
and structure, suggesting a moderating, rather than a mediating, effect of these constructs on firm
performance (Mintzberg, 1990; Siggelkow and Levinthal, 2003). This research has highlighted the
usefulness of examining interactions between salient dimensions of strategy and structure on firm
performance. Hence, we explore the contingency relationship between a firm’s product market
strategy and the structural design of its business model. A core tenet of contingency theory is that
alignment between contingency factors, such as business model and product market strategy, might
8
result in higher performance. This is also reflected in SSP research, where alignment between
administrative structure and firm strategy is argued to have positive implications on firm performance
(e.g., Chandler, 1962; Siggelkow and Levinthal, 2003).
Fit Between Product Market Strategy and Business Model Design
To evaluate the implications of business model design and product market strategy on firm
performance, independently as well as jointly, we consider two main business model design themes –
novelty-centered and efficiency-centered business model design (Zott and Amit, 2003) – along with
three product market positioning choices – cost leadership and differentiation (Porter, 1985), and the
timing of entry into a market (Lieberman and Montgomery, 1988).
Which design of a firm’s business model fits best with its choice of product market strategy?
In other words, what constitutes a good fit between these constructs? The literature on fit generally
considers coherent configurations of design elements as good fit that manifest themselves as peaks in
the performance landscape (Siggelkow, 2001). Concretely, two design elements (A and B) fit well if
complementarities exist between them, that is, if the marginal benefit of A increases with the level of
B, and if the levels of A and B are adjusted optimally to achieve a local performance optimum
(Milgrom and Roberts, 1995).
We next introduce a formal notation that allows us to investigate which combinations of
business model design themes and product market strategies fit well. That notation helps us to
theorize about these relationships in a more structured and rigorous way than would be possible
through a merely qualitative analysis, although the objective of this paper is not to derive a fully
specified model and closed form analytical solutions. Rather, we seek to provide a theoretically
guided empirical analysis.
Since the total value created by a focal firm and its exchange partners is an upper limit for the
value that can be appropriated by the focal firm (i.e., for its performance), the starting point of our
analysis will be a framework that seeks to explain total value created. Within this framework the
question can then be addressed how much value each exchange partner can extract. More specifically,
9
we build on the model developed by Brandenburger and Stuart (1996) for value creation in a simple
static setting with one firm, one customer, and one supplier. Extending this model, the total value
created by a business model can be expressed as the sum of the values created for all the participants
in a business model, over all transactions that the business model enables in a given time period. More
formally, drawing on Besanko, Dranove and Shanley (1996), let m be an index ranging from 1 to M,
with M denoting the total number of market segments served by a focal firm through its business
model, and let Pm(t) be the price that a homogeneous customer from segment m pays for a good
acquired in transaction t, or for the right to participate in the transaction. Furthermore, let Bm(t) denote
the customer’s perceived net benefit from participating in t. Bm(t) is net of the transaction, purchasing,
and user costs that accrue to the customer (Besanko et al., 1996: 443). It can be thought of as the
customer’s willingness-to-pay. Consequently, the value created for a customer in transaction t can be
written as
Vm(t) = Bm(t) - Pm(t) (1)
The focal firm has adopted a business model of design type d, where d is a vector describing the
extent to which the business model emphasizes the design themes novelty and efficiency. As well, it has
adopted a product market strategy s, where s is a vector describing the extent to which the firm
emphasizes differentiation, cost leadership, and entry timing. For simplicity, denote that firm as Fds ≡ F.
Denote the focal firm’s suppliers and partners (other than customers) as i, where i is an index ranging
from 1 to I, the total number of suppliers and partners in the business model. Let Ri(t,m) be the revenues
that focal firm F gets from partner i in a particular transaction, t, involving a customer from segment m,
let Ci(t,m) denote the flow of revenues from F to i, and let OCF(t,m) be F’s opportunity costs for
providing its own resources. Then the value created for firm F in transaction t involving a customer from
segment m can be expressed as
VF(t,m) = Pm(t) + Σi Ri(t,m) - Σi Ci(t,m) - OCF(t,m) (2)
Let us furthermore denote the opportunity costs of supplier or partner i of supplying resources
(including, for example, complementary products or services) to F as OCi(t,m). Then the value created
10
for partner i in transaction t with a customer from segment m can be written as
Vi(t,m) = Ci(t,m) - Ri(t,m) - OCi(t,m) (3)
Assuming that the set of stakeholders in a business model comprises the focal firm, its
customers, suppliers, and partners, and given that the total value created by the business model equals
the sum of values created for all business model stakeholders, it follows that the total value created in
transaction t is
TV(t,m) = Vm(t) + VF(t,m) + Σi Vi(t,m) (4)
Inserting (1), (2) and (3) into (4) yields
TV(t,m) = Bm(t) - OCF(t,m) - Σi OCi(t,m) (5)
that is a generalized version of Brandenburger and Stuart’s (1996) formula for total value
created. However, equation (5) focuses on a particular transaction, t, with a particular market segment,
m, rather than on a particular product or service. Finally, the total value created through a business
model, TVC, is the value created over all market segments m, and over all the types of transactions t that
the business model enables, where t is an index ranging from 1 to T, and T denotes the number of
transaction types. n(t,m) is the average number of transactions of type t conducted with customers from
segment m:
TVC = Σt Σm [TV(t,m)*n(t,m)] (6)
Inserting (5) into (6) yields
TVC = Σt Σm {[Bm(t) - OCF(t,m) - Σi OCi(t,m)]*n(t,m)} (7)
Similarly, the total value appropriated by the focal firm, TVA, can be expressed as
TVA = Σt Σm [VF(t,m)*n(t,m)] (8)
Inserting (2) into (8) yields
TVA = Σt Σm {[Pm(t) + Σi Ri(t,m) - Σi Ci(t,m) - OCF(t,m)]*n(t,m)} (9)
TVA as a proxy for firm F’s performance is contingent on F’s business model design, d, and
its product market strategy, s. If d and s are choice variables of the firm, their impact on each term of
the right hand side of equation (9) must be considered to understand their collective impact on TVA.
11
Following Siggelkow (2002), a useful thought experiment for evaluating the fit between a particular
business model design theme and a particular product market strategy is to consider whether the
marginal value of a the business model design theme would be affected (in particular, whether it
would increase) if a firm were to put more emphasis on the respective product market strategy. This
thought experiment is consistent with the definition of fit as indicative of complementarity (Milgrom
and Roberts, 1995; Siggelkow, 2001). Hence, in keeping with the aims of this paper, we proceed to
explore qualitatively the marginal effects of business model design themes and product market
strategies on TVA.
Novelty-centered design and TVA. Novelty-centered business model design refers to the
conceptualization and adoption of new ways of conducting economic exchanges among transaction
participants. Novelty primarily aims at creating new types of transactions, i.e., increasing T, but also
at addressing new market segments, i.e., increasing M. It also strengthens the focal firm’s bargaining
power vis-à-vis other business model stakeholders (Zott and Amit, 2003). Consequently, stronger
emphasis on novelty-centered design will have a positive effect on Pm(t) and will exert downward
pressure on Ci(t,m) due to the increased bargaining power of the focal firm. Hence, we observe that a
marginal increase in a firm’s emphasis on novelty-centered design may affect TVA in equation (9)
through T (+), M (+), Pm (+), and Ci (-).2
We next examine the marginal effect on TVA of changing a particular product market
strategy, followed by an analysis of the impact of such a change on the marginal value of novelty-
centered business model design on TVA.
First, consider product market differentiation. A stronger emphasis on differentiation will
positively influence customers’ willingness-to-pay, Bm(t), and therefore make it easier for the focal
2 The sign in brackets gives the expected direction of change in the respective variable from a
marginal increase in novelty-centered business model design. E.g., T(+) means that T increases in
novelty-centered design.
12
firm to charge higher prices to customers, Pm(t), and possibly to lower the costs of suppliers, Ci(t,m)
(Porter, 1985). Hence, a marginal increase in a firm’s emphasis on differentiation may affect TVA
through Pm (+), and Ci (-). In addition, a focus on innovation in multiple domains (business model,
product market strategy) may help firms create a consistent image, thus increase n, and allow for
economies of scope, thus decrease OCF. Moreover, a firm that focuses all its activities and
transactions on innovation may become an even more skillful innovator over time, thus decreasing
OCF even further (Zott, 2003). Hence, we expect a positive joint effect on TVA.
Second, consider cost leadership. A stronger emphasis on cost leadership implies lower prices
charged to customers, Pm(t), as well as lower input and production costs, Ci(t,m) and OCF(t,m) (Porter,
1985). Furthermore, new low-cost customer segments can be addressed, thus raising M, and
customers within given segments will be motivated to increase their number of repeat transactions,
thus raising n. In other words, a marginal increase in a firm’s emphasis on cost leadership may affect
TVA through Pm (-), Ci (-), OCF(-), M (+) and n (+). Moreover, a greater emphasis on cost leadership
will also enhance the marginal effect of novelty-centered business model design on TVA. First, a
more pronounced cost leadership approach interacts positively with the firm’s strengthened
bargaining power over its suppliers through increased novelty-centered design as it puts additional
downward pressure on Ci. Second, customers in the new market segments will now have two motives
to be drawn to the firm - novelty and low cost - which enhances the positive impact of novelty-
centered design on M. Therefore, we expect a positive joint effect of cost leadership and novelty-
centered business model design on TVA.
Third, consider timing of market entry. Firms that enter markets earlier may enjoy
considerable advantages. These stem from the creation of customer switching costs, brand awareness,
and reputation, thus allowing these firms to charge higher prices, Pm(t) (Lieberman and Montgomery,
1988). Early market entrants can also gain by learning and accumulating proprietary knowledge and
by pre-empting scarce resources, thus lowering their opportunity costs, OCF(t,m) (Lieberman and
Montgomery, 1988). As the early entrant attempts to address – and perhaps even create – a new
13
market, the number of transactions, n, is likely to be limited. In other words, a marginal increase in a
firm’s emphasis on early market entry timing may affect TVA through Pm (+), OCF(-), and n (-). In
addition, moving into a market earlier allows the firm to capture the rents from business model
innovation, which can be considered entrepreneurial rents, i.e., rents that accrue between the
introduction of an innovation and its diffusion (Rumelt, 1987). In particular, the positive effect of
novelty-centered design on Pm may be more pronounced, and more sustainable if the firm enters a
market early. Hence, we expect a positive joint effect on TVA.
In summary, the above analysis of novelty-centered business model design suggests that
coupling a novelty-centered design with a product market strategy of differentiation, cost leadership,
or early market entry represents good fit. The following hypotheses (H1 - H3) capture these
relationships.
Hypothesis 1: Novelty-centered business model design and a strategy of product
market differentiation affect firm performance jointly in a positive
way.
Hypothesis 2: Novelty-centered business model design and a strategy of product
market cost leadership affect firm performance jointly in a positive
way.
Hypothesis 3: Novelty-centered business model design and a strategy of early
market entry affect firm performance jointly in a positive way.
Efficiency-centered design and TVA. Efficiency-centered business model design aims at
reducing transaction costs for all transaction participants. This explains the likely negative effects of a
marginal emphasis in such design on OCF(t,m). By reducing transaction costs, efficiency-centered
business model design may also lead to higher transaction volume, n(t,m); more new customers will
be drawn to transact with the focal firm, and existing customers may transact more frequently as a
14
result of the lowered transaction costs. Hence, a marginal increase in a firm’s emphasis on efficiency-
centered business model design may affect TVA through OCF (-), and n (+).3
Next, to evaluate the possible fit between efficiency-centered business model design and
particular choices of business strategy, we examine whether the marginal value of efficiency-centered
design would increase if a firm were to put more emphasis on a particular product market strategy.
First, consider the strategy of differentiation. As shown above, a marginal increase in a firm’s
emphasis on product market differentiation may affect TVA through Pm (+), and Ci (-). It is not clear
per se, however, whether and how product differentiation would affect the marginal effect of
efficiency-centered business model on TVA design through OCF, and n. Hence, the joint effect of
differentiation and efficiency-centered business model design on TVA is expected to be
indeterminate.
Second, consider cost leadership. We have seen that a marginal increase in a firm’s emphasis
on cost leadership may affect TVA through Pm (-), Ci (-), OCF(-), n (+) and M (+). In addition, a focus
on low costs in multiple domains (business model, product market strategy) may help firms create a
consistent corporate culture and image, thus increase n, and allow for economies of scope, thus
decrease OCF. Moreover, a firm that focuses in all its activities and transactions on cost reductions
may become even more skillful at reducing costs over time, thus decreasing OCF even further. Hence,
we expect a positive joint effect of cost leadership and efficiency-centered business model design on
TVA.
Third, consider timing of market entry. As shown above, a marginal increase in a firm’s
emphasis on early market entry timing may affect TVA through Pm (+), OCF(-), and n (-). However, it
is not clear per se whether and how early market entry timing would affect the marginal benefit of
3 Again, the sign in brackets gives the expected direction of change in that variable from a marginal
increase in the degree of efficiency-centered business model design.
15
efficiency-centered business model design. We expect, therefore, that the joint effect of early market
entry and efficiency-centered business model design on TVA is indeterminate.
In summary, the above analysis of efficiency-centered business model design suggests that
coupling an efficiency-centered design with a product market strategy of cost leadership represents
good fit, whereas the fit with either a product market strategy of differentiation or with early market
entry cannot be clearly predicted. These theoretical considerations are captured by the following
hypothesis.
Hypothesis 4: Efficiency-centered business model design and a strategy of product
market cost leadership jointly affect firm performance in a positive
way.
DATA AND METHODS
Sample
We collected data on a sample of firms that had gone public in Europe or in the U.S. between
April 1996 and May 2000. This sample selection strategy enabled us to create a data set of about 300
firms that conducted part of their business over the Internet (e.g., firms like Avis, eTrade, Guess, and
Priceline), and hence served as fertile ground to investigate technology-enabled business model
designs. We randomly sampled 170 firms on their business model design characteristics and product
market strategies. We considered companies that had recently gone public in order to ensure the
availability and consistency of the data. Furthermore, relatively young firms have fewer lines of
business than older, more established corporations, and their business models are therefore easier to
describe and measure as they involve fewer transaction types and exchange partners. Data collection
from initial public offering documents is an acknowledged method for studying firms’ strategies (e.g.,
Dowling and McGee, 1994).
Data Collection
16
The data collection proceeded in two stages. We first built composite scales for business
model design themes, and we identified and measured relevant items on the basis of a content analysis
of IPO prospectuses. We then followed a similar procedure to ascertain and measure relevant
dimensions of product market strategies.
To determine the business model design themes, we built measurement scales as none were
readily available in the literature. This process proceeded in five stages: (1) development of survey
instrument, (2) development of measurement scales, (3) pre-testing of survey, (4) development of
online web interface and of central database, and (5) data collection. In collecting the data, we built on
the use of expert panelists in management research (see, for example, MacCormack et al., 2001). We
hired eleven part- or full-time research assistants (primarily MBA students), and we trained them as
expert raters to analyze assigned sample companies. We carefully selected our raters and trained them
in data collection and data analysis. On average, it took a rater about two days to collect data on a
given business model, to understand the model, and to assess it. Data sources included IPO
prospectuses primarily (Dowling and McGee, 1994), but also, annual reports, investment analysts’
reports, and web sites. The data were collected from May 2000 to June 2001. During that time period,
we were able to take one measurement of the design themes for each of the business models in our
sample.
We validated inter-rater reliability by assigning a randomly chosen business model to two
different expert raters (each of whom was assigned to a different project manager), and by conducting
a pair-wise comparison of responses, yielding a Cronbach alpha of 0.81, and a Pearson correlation
coefficient of 0.72. Raters were in broad agreement with each other for 82% of the individual items.
We repeated the test periodically, and we found that all indicators of reliability further improved.
Regarding the product market strategy scales, we first consulted with the strategy and
management literatures which aspects of product market strategy should in theory affect the
performance of a firm (i.e., product market positioning through differentiation and cost leadership,
timing of market entry), and which measurement scales had been used in previous research for these
17

variables. We found that most of the empirical work on Porter’s (1985) generic strategies, for
example, had been conducted on the basis of surveys administered to managers (e.g., Miller, 1988). A
few researchers (e.g., Dowling and McGee, 1994) have used IPO prospectuses to measure these items.
We then adapted these survey-based instruments so as to analyze the content of our primary data
source.
We iteratively selected a set of items to measure product market strategy dimensions. We
started with 51 items derived from the literature that measured various aspects of generic firm-level
strategy. After pilot-testing these items on our sample firms, we refined some items and dropped
others, mainly on the basis of data availability. As a result of this process, we retained five items
referring to differentiation and four items referring to cost leadership. We also retained a single-item
measure for market-entry timing. Two raters then used these measures to analyze independently all
170 firms in our sample. Inter-rater reliability was established by conducting a pair-wise comparison
of responses for five randomly chosen firms, yielding a Cronbach alpha of 0.92, and a Pearson
correlation coefficient of 0.91. Raters were in exact agreement with each other on 77% of the
individual items (on a five point scale). All initial differences were resolved through discussions, so
the final agreement percentage was 100%.
Econometric Modeling and Estimation Approach
We conducted a confirmatory factor analysis and a partial least squares regression analysis in
order to establish the discriminant validity of our business model and product market strategy
constructs. We then proceeded to analyze the data using multivariate regression techniques. We
confirmed that conventional assumptions underlying OLS regression analysis held in our data set.
First, after performing a logarithmic transformation of our dependent variable, we found that the null
hypothesis of normality could not be rejected at the 5% level of significance using a Shapiro-Wilk
test. Second, we used White’s general test for homoskedasticity to detect evidence of
heteroskedasticity. We corrected the p-values and t-statistics of estimates using White’s variance-
covariance matrix for those models in which heteroskedasticity appeared to be present (White, 1980).
18

As a third measure to verify the validity of our model, we tested for multicollinearity among
independent variables by calculating Variance Inflation Factors (VIF) (Kleinbaum et al., 1998) in
regression models that contained only first-order terms before mean-centering our measures. The VIF
levels that we observed were smaller than 2, hence much smaller than the critical threshold of 10, thus
eliminating the concern about multicollinearity among first-order terms in the regression analysis.
Multicollinearity may, however, arise due to the introduction of the interaction term, in which case
mean-centering can be applied to all first- and second-order variables as a standard and valid
procedure to attenuate multicollineariry (Aiken and West, 1991). Interaction terms are entered as
orthogonalized effects, and this approach yields interaction variables that are uncorrelated with their
component variables. The VIF levels that we observed in regression models containing first- and
second-order terms after mean-centering our first-order measures were all smaller than 2. Our model
specification, therefore, proved robust to multicollinearity.
Independent Variables
In this study, two latent variables characterize the design of a business model (novelty and
efficiency), and another two latent variables characterize the product market positioning of the firm
(differentiation and cost leadership). After scale purification, we retained 13 items as measures of
novelty, and 11 items as measures of efficiency. Similarly, we retained 3 items for differentiation, and
4 items for cost leadership (see the Appendix for details on the scales). Given the difficulty of
obtaining objective measures of business model design and product market strategy, we deemed the
use of perceptual measures obtained from expert raters appropriate (Dess and Robinson, 1984). The
strength of each of these items was measured using five point Likert-type scales, which we coded into
a standardized score. After coding, we aggregated the item scores for each design theme into an
overall score for the composite scale using equal weights (see Mendelson, 2000). This process yielded
distinct quantitative measures of business model design and product market strategy.
We validated the internal consistency and reliability of our measures using standardized
Cronbach alpha coefficients, which were 0.71 for the business model novelty measure, 0.70 for the
19

business model efficiency measure, 0.66 for the differentiation strategy measure, and 0.76 for the cost
leadership strategy measure. Hence, our measures sufficiently satisfy Nunnally’s (1978) guidelines,
which suggest 0.7 as a benchmark for internal consistency.
Dependent Variables
A firm’s stock-market value reflects the market’s expectations of future cash flows to
shareholders, and hence can be viewed as a measure of perceived firm performance, as opposed to
realized performance, which is typically embodied in historical measures of firm profitability (e.g.,
ROI, ROA). Given the level of uncertainty often associated with the true prospects of firms that had a
recent Initial Public Offering, perceived performance operationalized as stock market value is a
measure that is particularly germane in such a setting (Stuart et al., 1999). Measures of realized
performance, such as ROI, ROA, or Tobin’s q, are less appropriate for these firms, which often have
negative earnings, few tangible assets, and low (or even negative) book values.
Since most firms in our sample have relatively low levels of debt, the market value of a firm’s
equity is a good approximation of the market value of the whole firm. We measured the market value
of equity at a given date as the number of shares outstanding multiplied by the firm’s stock price,
taken from the combined CRSP and Datastream databases. We then took the logarithm of the market
value of the equity in order to comply with the normality assumption of OLS.
Control Variables
We included further factors that might influence the market value of a firm’s equity as control
variables in the analysis because their omission might confound the analysis. On the firm level, we
included variables that controlled for the age and size (i.e., the number of employees) of the firm. We
also controlled for additional dimensions of a firm’s product market strategy, such as the mode of
market entry, and its product and market scope (see the Appendix for details on these variables). On
20

the industry level of analysis we controlled for the degree of competition4 and estimated market size5.
We also controlled for quadratic interaction effects among our main variables, to establish the linear
nature of the hypothesized effects.
RESULTS
Descriptive Statistics
Table 2 provides an overview of the data we use in this study. We note that our sample firms
are relatively young and small, having an average age of seven years (median of 4.3 years) in 2000,
and a median of 270 employees. We also note the large variance among sample firms as evidenced
by the median, minimum, and maximum values of these variables. Furthermore, our sample firms
draw from relatively broad and highly competitive market segments and focus on a narrow array of
products. There are few early entrants into the market among our sample firms. Our sample, thus,
consists of emerging growth companies that address relatively established markets.
[INSERT TABLE 2 ABOUT HERE]
Table 2 also lists the Pearson correlations among the variables used in the regression analysis.
The correlations between novelty-centered business model design and differentiation strategy (0.148),
and between efficiency-centered business model design and cost leadership strategy (-0.064) are low,
which supports the argument that business model design themes and product market strategies are
distinct. We also note that while some correlations among explanatory variables are significant and
4 Our raters measured the degree of competition on a four-point Likert scale based on information
found in annual reports, prospectuses, competitors’ SEC documents and web sites, benchmark studies,
Hoovers’ Database (which lists each focal firm’s main competitors), as well as investment analysts’
reports.
5 This information was obtained from Forrester research reports and from the U.S. Department of
Commerce.
21
relatively high (e.g., between age and entry mode: 0.488), they do not appear to pose a
multicollinearity problem as the Variance Inflation Factors (VIF) are low for all these variables.
Confirmatory Factor Analysis and Partial Least Squares Regression
To establish the discriminant validity of our main constructs, we first conducted the
confirmatory factor analytic method proposed by Gatignon, Tushman, Smith, and Anderson (2002). The
method consists in selecting pairs of constructs and then conducting confirmatory factor analysis (CFA)
for each pair. In applying this method, we first ran a CFA for each pair of factors in an unconstrained
measurement model with the two factors. In this first model, the correlation between the factors was
estimated. For example, take novelty and differentiation as the chosen pair of factors. Novelty traits
loaded onto the novelty factor, and the differentiation traits loaded onto the differentiation factor. Table
3 depicts the results from this analysis in the rows where the correlation between the factors is reported
as freely estimated (i.e., not set equal to 0 or 1). For example, the estimated correlation between novelty
and differentiation was 0.19.
[INSERT TABLE 3 ABOUT HERE]
We then ran a CFA on a measurement model with only one factor, where the correlation
between the constructs of interest was constrained to be 1. If the unconstrained model where the
correlation is freely estimated improves the fit significantly compared to the constrained model, the two
constructs can be said to be distinct from each other, although they still can be significantly correlated
(Gatignon et al. 2002; Gatignon 2003). To illustrate this, consider novelty and differentiation. The
results from the CFA demonstrate that novelty-centered business model design and differentiation in
product markets are distinct constructs, although they are positively correlated. This is confirmed by a
significantly (at the 0.01 level) improved confirmatory factor analytic model when the correlation is
estimated, compared to a measurement model where the correlation is constrained to 1 (chi-squared =
260 – 186 = 74, degrees of freedom = 104 – 103 = 1). As Table 3 shows, we obtain similar results for all
other pairs involving generic product market strategies and business model design themes, which
provides support for our corollary [“Business model design (as, for example, measured by design
22
themes) is distinct from product market strategy (as, for example, measured by generic strategies)”].
In addition to CFA, the literature suggests partial least squares (PLS) as another method for
assessing discriminant validity. Using PLS, one can determine whether a construct shares more variance
with its measures than it shares with other constructs in the model (Hulland, 1999). This is achieved by
(1) calculating the square roots of the Average Variance Extracted (AVE) values, which measure the
average variance shared between a construct and its measures, and by (2) calculating the correlations
between different constructs. A matrix can then be constructed where the square root of AVE is in the
diagonal, and the correlations between the constructs are in the off-diagonal. This matrix is shown in
Table 4. For adequate discriminant validity, the diagonal elements should be greater than the off-
diagonal elements in the corresponding rows and columns (Fornell and Larcker, 1981). This is the case
here, which is further evidence in support of the discriminant validity of our main constructs.
[INSERT TABLE 4 ABOUT HERE]
We note that the CFA can also be used to assess the convergent validity of the constructs
(Gatignon et al., 2002; Gatignon, 2003). For this, a measurement model where the correlation between
the two constructs is estimated and a model where the correlation is constrained to be 0 are compared. A
significant improvement in fit (moving from zero to estimated correlation) would indicate that the two
constructs are indeed related, which would confirm convergent validity. Using as an illustration again
the example of novelty and differentiation in Table 3, the results from the CFA demonstrate that
novelty-centered design and product market differentiation are independent constructs. The
confirmatory factor analytic model when the correlation is estimated, compared to a measurement model
where the correlation is constrained to 0, is not significantly improved (chi-squared = 189 – 186 = 3,
degrees of freedom = 104 – 103 = 1). This same qualitative result holds for all pairs of generic strategies
and business model design themes.
Hierarchical OLS Regressions
Table 5 depicts the results from selected hierarchical OLS regression runs. Panel A reports the
full results for the models that included the interaction between novelty-centered business model design
23
and differentiation strategy. In the Panel, the top display refers to regressions that used the logarithm of
market value averaged over the fourth quarter of 2000, and the bottom display refers to regressions that
used the logarithm of market value averaged over the entire year 2000. Panel B shows the main results
for the other interactions of interest.
[INSERT TABLE 5, Panels A & B HERE]
Table 5 Panel A supports the prediction made in Hypothesis 1 that coupling a novelty-centered
business model design with a differentiation product market strategy represents good fit; these variables
jointly produce a significant positive effect on perceived performance -- for both dependent variables
used (see the top and bottom display of the Panel) -- in most models that we ran. Furthermore, Table 5
Panel B supports the hypothesized good fit between novelty-centered business model design and cost
leadership strategy according to Hypothesis 2, and between novelty-centered business model designs
and early market entry timing according to Hypothesis 3. Our data produce a positive coefficient on the
relevant interaction terms in all of our regressions. That coefficient is statistically significant at the 5%
level in a majority of the models that exhibit an adequate F-value.
Regarding the fit between efficiency-centered business model design and product market
strategies, we note that our empirical analysis (as shown in Table 5 Panel B, which summarizes models
that were very similar in nature to those shown in Table 5 Panel A) did not support the predicted good fit
between efficiency-centered design and cost leadership strategy (Hypothesis 4); it produced insignificant
results. Lastly, the finding of statistically insignificant interaction terms involving efficiency-centered
design and product market differentiation or early market timing is consistent with our model, which
suggested neither good nor bad fit between these variables.
We note that even when the interaction terms reported in Table 5 were statistically significant,
the coefficients on the corresponding main variables were sometimes insignificant. This points to the
importance of interactions between product market strategy and business model design.
DISCUSSION AND CONCLUSION
24

Our analysis reveals that product market strategy and business model design are distinct
constructs that affect firm performance in important ways. Using hierarchical OLS regression
techniques, we find significant effects of their interaction on the perceived performance of firms, as
measured by market capitalization. More specifically, we find empirical support for the theoretical
predictions about the positive and significant interactions between novelty-centered business model
design and product market strategies. With respect to efficiency-centered business model design, our
empirical findings are, in general, consistent with the theoretical analysis: No clear predictions can be
made with respect to complementarities with a differentiation strategy or with the timing of entry, and
indeed our empirical analysis did not reveal any such relationship.
We believe that our study makes several important contributions to the strategic management
literature. First, it extends the concept of structure beyond administrative elements to include
boundary-spanning transactions between a focal firm and its ecosystem of partners, customers, and
suppliers. By examining the business model, which captures the architecture of a firm’s transactions
with its exchange partners rather than its administrative structure, and by considering business-level
competitive strategy instead of corporate strategy we extend the strategy-structure-performance
paradigm to highlight the interdependence between the competitive strategy of a firm, the
architectural structure of the transactions it enables with external stakeholders, and its performance.
We show that adopting a broader view of organizations, one that transcends traditional firm
boundaries, can be valuable for understanding wealth creation and performance. By doing so, our
study may inspire new research on the relationship between strategy and structure, and on the
boundaries of firms. Second, our study explores the fit between the design of a business model and a
firm’s product market strategy. In doing so, we elaborate on the notion of “good fit” between these
constructs by offering a formal notation and performing a marginal effects analysis within our
framework. Third, our study points to the need to examine the design of a firm’s business model as
the source of its competitive advantage. We suggest that competitive advantage can emerge from
superior product-market positioning, as well as from the design of the firm’s business model. Indeed,
25
the empirical results presented in this paper show that both product market strategy and structure, as
embodied by the design of the business model, can enhance the firm’s competitive advantage,
independently as well as jointly, which supports previously held conjectures (Christensen, 2001). Our
study thus points to the need to investigate competition among various business models within an
industry (Markides and Charistou, 2004). Such rivalry may have implications both for the wealth-
creation potential of a given business model and for value capture by the focal firm relative to its
rivals. In order to better understand these phenomena, we need to know more about the strategic
effects of business model design and how business model design influences the positioning of firms in
their competitive environment.
Finally, our study raises the issue of timing of business model and product market strategy
design. Business model and product market strategy may be simultaneously determined. For example,
when entrepreneurs define and refine their business models, they may concurrently identify customer
needs and map them against the products and services offered by competitors (McGrath and MacMillan,
2000). However, it is also conceivable that product market strategy follows business model design, or
vice versa. Little research has been conducted so far on how business models evolve and in particular
how they co-evolve with the product market strategy of the firm. In this study, we hope to have laid
some of the foundations that are necessary to fruitfully explore these new avenues for research.
26
REFERENCES
Aiken LS, West SG. 1991. (Paperback 1996). Multiple Regression: Testing and Interpreting
Interactions. Sage: Thousand Oaks CA.
Amburgey TL, Dacin T. 1994. As the left foot follows the right? The dynamics of strategic and
structural change. Academy of Management Journal 37: 1427-1452.
Amit R, Zott C. 2001. Value creation in e-business. Strategic Management Journal 22: 493-520.
Besanko D, Dranove D, Shanley M. 1996. Economics of Strategy. John Wiley & Sons: New York.
Bower JL. 1970. Managing the Resource Allocation Process: A Study of Corporate Planning and
Investment. Harvard Business School Press: Boston MA.
Brandenburger AM, Stuart H. 1996. Value-based business strategy. Journal of Economics and
Management Strategy 5: 5-25.
Brandenburger AM, Nalebuff BJ. 1996. Co-opetition. Doubleday: New York.
Chandler A. 1962. Strategy and Structure: Chapters in the History of American Industrial Enterprise.
MIT Press: Cambridge.
Christensen CM. 2001. The past and future of competitive advantage. MIT Sloan Management Review
Winter: 105-109.
Christensen CM, Verlinden M, Westerman G. 2002. Disruption, disintegration and the dissipation of
differentiability. Industrial and Corporate Change 11: 955-993.
Dess GG, Robinson R. 1984. Measuring organizational performance in the absence of objective
measures. Strategic Management Journal 5: 265-73.
Dowling MJ, McGee JE. 1994. Business and technology strategies and new venture performance: A
study of the telecommunications equipment industry. Management Science 40: 1663-1677.
Dyer JH, Singh H. 1998. The relational view: cooperative strategy and sources of interorganizational
competitive advantage. Academy of Management Review 23: 660-679.
Fornell C, Larcker DF. 1981. Evaluating structural equation models with unobservable variables and
management error. Journal of Marketing Research 18: 39-50.
27
Gatignon H. 2003. Statistical Analysis of Management Data. Kluwer Academic Publishers: Boston.
Gatignon H, Tushman M, Smith W, Anderson P. 2002. A structural approach to assessing innovation:
construct development of innovation locus, type and characteristics. Management Science 48:
1103-1122.
Geoffrion AM, Krishnan R. 2003. E-business and management science: Mutual impacts (Part 1 of 2).
Management Science 49: 1275-1286.
Gulati R, Nohira N, Zaheer A. 2000. Strategic networks. Strategic Management Journal 21: 203–215.
Hann I, Terwiesch C. 2003. Measuring the frictional costs of online transactions: The case of a name-
your-own-price channel. Management Science 48: 1563-1579.
Hulland J. 1999. Use of partial least squares (PLS) in strategic management research: A review of
four recent studies. Strategic Management Journal. 20: 195-204.
Kleinbaum DG, Kupper LL, Muller KE, Nizam A. 1998. Applied Regression Analysis and Other
Multivariable Methods (3rd ed.). Duxberry Press: Pacific Grove CA.
Lee GK, Cole RE. 2003. From a firm-based to a community-based model of knowledge creation: The
case of Linux kernel development. Organization Science 14: 633-649.
Lieberman M, Montgomery D. 1988. First-mover advantages. Strategic Management Journal 9: 41-
58.
MacCormack A, Verganti R, Iansiti M. 2001. Developing products on “Internet time”: The anatomy
of a flexible development process. Management Science 47: 133-150.
Markides, C, Charitou CD. 2004. Competing with dual business models: A contingency approach.
Academy of Management Executive 18: 22-36.
McGrath R, MacMillan I. 2000. The Entrepreneurial Mindset. Harvard Business School Press:
Boston MA.
Mendelson H. 2000. Organizational architecture and success in the information technology industry.
Management Science 46: 513-529.
28
Milgrom P, Roberts J. 1995. Complementarities and fit: strategy, structure, and organizational change
in manufacturing. Journal of Accounting and Economics 19: 179-208.
Miller D. 1986. Configurations of strategy and structure: towards a synthesis. Strategic Management
Journal 7:233-249.
Miller D. 1988. Relating Porter’s business strategies to environment and structure. Academy of
Management Journal 31: 280-308.
Mintzberg H. 1990. The design school: reconsidering the basic premises of strategic management.
Strategic Management Journal 11: 171-195.
Normann R. 2001. Reframing Business: When The Map Changes The Landscape. Wiley: Chichester.
Nunnally JC. 1978. Psychometric Theory. McGraw-Hill: New York.
Porter ME. 1985. Competitive Advantage: Creating and Sustaining Superior Performance. Free
Press/MacMillan: New York.
Rumelt R. 1987. Theory, strategy, and entrepreneurship. In D. J. Teece (Ed.), The competitive
challenge: 137-158. Ballinger Publishing Company: Cambridge.
Santos FM, Eisenhardt KM. Forthcoming. Perspectives on organizational boundaries. Organization
Science Special Issue on “New Directions for Organizational Theory.”
Siggelkow N. 2001. Change in the presence of fit: the rise, the fall, and the renaissance of Liz
Claiborne. Academy of Management Journal 44: 838-857.
Siggelkow N. 2002. Evolution toward fit. Administration Science Quarterly 47: 125-159.
Siggelkow N, Levinthal DA. 2003. Temporarily divide to conquer: centralized, decentralized, and
reintegrated organizational approaches to exploration and adaptation. Organization Science
14: 650-669.
Stuart TE, Hoang H, Hybels RC. 1999. Interorganizational endorsements and the performance of
entrepreneurial ventures. Administrative Science Quarterly 44: 315-349.
White H. 1980. A heteroskedasicity-consistent covariance matrix estimator and a direct test for
heteroskedasticity. Econometrica 48: 817-838.
29

Yin X, Zajac E. 2004. The strategy/governance structure fit relationship: theory and evidence in
franchising arrangements. Strategic Management Journal 25: 365-383.
Zott C. 2003. Dynamic capabilities and the emergence of intra-industry differential firm performance:
insights from a simulation study. Strategic Management Journal 24: 97-125.
Zott C, Amit R. 2003. Business model design and the performance of entrepreneurial firms. Working
Paper 2003/94/ENT/SM/ACGRD 4. INSEAD: Fontainebleau France.
30
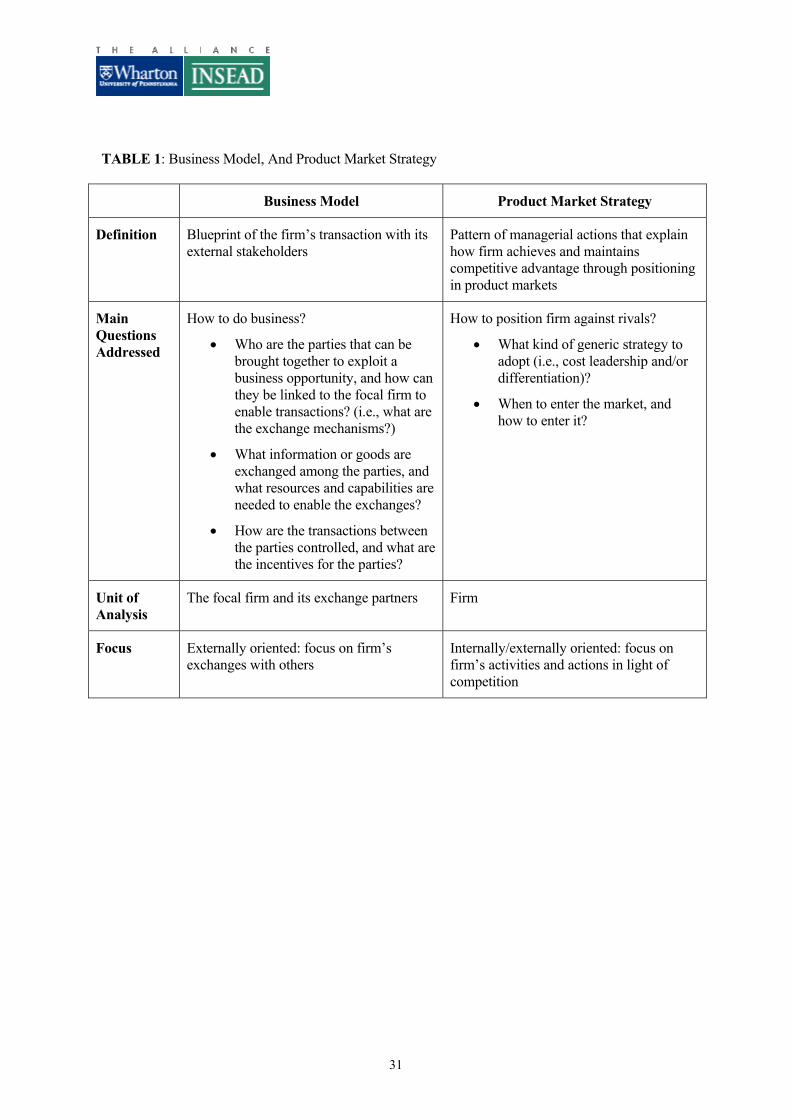
TABLE 1: Business Model, And Product Market Strategy
Business Model Product Market Strategy
Definition Blueprint of the firm’s transaction with its external stakeholders
Pattern of managerial actions that explain how firm achieves and maintains competitive advantage through positioning in product markets
Main Questions Addressed
How to do business?
• Who are the parties that can be brought together to exploit a business opportunity, and how can they be linked to the focal firm to enable transactions? (i.e., what are the exchange mechanisms?)
• What information or goods are exchanged among the parties, and what resources and capabilities are needed to enable the exchanges?
• How are the transactions between the parties controlled, and what are the incentives for the parties?
How to position firm against rivals?
• What kind of generic strategy to adopt (i.e., cost leadership and/or differentiation)?
• When to enter the market, and how to enter it?
Unit of Analysis
The focal firm and its exchange partners Firm
Focus Externally oriented: focus on firm’s exchanges with others
Internally/externally oriented: focus on firm’s activities and actions in light of competition
31
TABLE 2: Pearson Correlations and Descriptive Statistics
Variable Name (Acronym)
Nov
elty
Eff
icie
ncy
Diff
eren
tiatio
n
Cos
t Lea
ders
hip
Ent
ry T
imin
g
Ln
(mar
ket v
alue
av
g. Q
4 20
00)
Ln
(mar
ket v
alue
av
g. 2
000)
Com
petit
ion
Ln
[mar
ket s
ize]
Age
of f
irm
Ln
[em
ploy
ees]
Ent
ry M
ode
Prod
uct S
cope
Mar
ket S
cope
Indep. Var.
Novelty 1.000
Efficiency 0.193* 1.000
Differentiation 0.148 0.053 1.000
Cost Leadership -0.013 -0.064 -0.061 1.000
Entry Timing 0.238** 0.004 0.197* 0.164* 1.000
Dependent Var.
Ln (market value average Q4 2000) 0.176* 0.79 0.115 0.008 0.125 1.000
Ln (market value average 2000) 0.241** 0.120 0.279** -0.037 0.170* 0.929** 1.000
Control Var.
Competition -0.476** -0.198** -0.151* 0.025 -0.148 -0.148 -0.189* 1.000
Ln [market size] -0.065 -0.004 -0.260** 0.094 -0.052 0.217** 0.105 0.179* 1.000
Age of firm -0.135 -0.101 -0.295** 0.072 -0.026 0.219** 0.044 0.071 0.191* 1.000 Ln [employees] 0.067 -0.027 -0.164* 0.11 -0.016 0.632** 0.547** 0.012 0.339** 0.459** 1.000 Entry Mode 0.069 -0.037 0.443** -0.068 0.075 -0.163* 0.014 0.007 -0.222** -0.488** -0.301** 1.000
Product Scope -0.060 -0.016 0.009 0.054 0.092 -0.093 -0.144 0.073 -0.076 0.106 -0.140 -0.134 1.000
Market Scope 0.155* 0.107 -0.131 -0.153* -0.060 -0.012 -0.026 -0.136 0.045 0.031 -0.035 -0.145 0.100 1.000
Descriptive Stat. Mean 0.382 0.742 3.598 2.657 2.147 517 883 0.624 22410 7.0 1145 3.971 3.765 1.871 Median 0.372 0.750 3.667 2.500 1 77 183 0.639 5400 4.3 270 4 4 1 Std. Deviation 0.138 0.124 0.796 1.028 1.590 1491 2262 0.175 69111 7.9 3749 1.275 1.011 1.047 Min 0.077 0.386 1.667 1 1 2 5 0 120 0.4 17 1 1 1 Max 0.814 1 5 5 5 12304 16651 0.972 744000 46 31000 5 5 5 N 170 170 170 170 170 161 169 170 170 170 170 170 170 170 Note on descriptive statistics: (1) The independent variables are indices that have been coded such that low values represent a low emphasis, and high values represent a high emphasis on the respective business model design theme, or product market strategy. High values of Entry Timing indicate early market entry timing. (2) Market value and market size are given in $ millions, without taking the logarithm. (3) Firm size is given as number of employees, without taking the logarithm. (3) High values of Entry Mode indicate high reliance on strategic partnerships and/or joint ventures in developing, producing, or marketing products. (4) High values of Product Scope indicate a highly focused product offering. (5) High values of Market Scope indicate a very focused market approach. ** p <0.01, * 0.01<=p<0.05, 0.05<=p<0.1
32
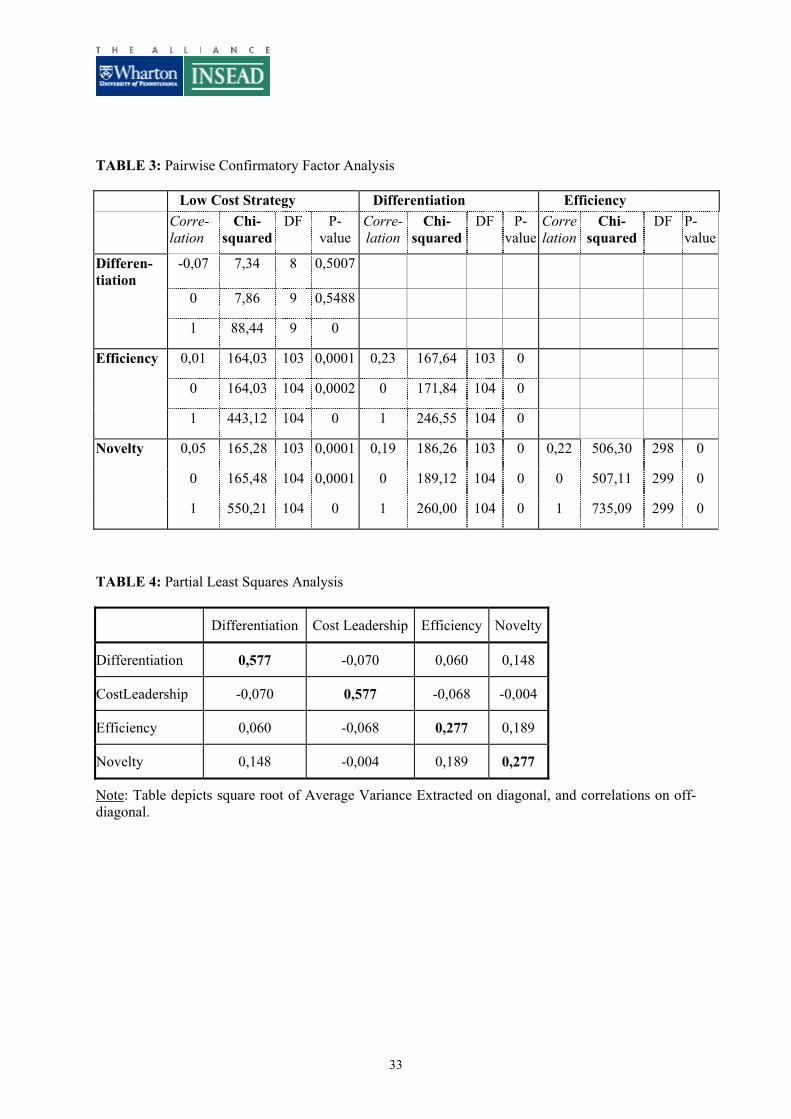
TABLE 3: Pairwise Confirmatory Factor Analysis
Low Cost Strategy Differentiation Efficiency Corre-
lation Chi-
squared DF P-
value Corre-lation
Chi-squared
DF P-value
Correlation
Chi-squared
DF P-value
Differen-tiation
-0,07 7,34 8 0,5007
0 7,86 9 0,5488
1 88,44 9 0
Efficiency 0,01 164,03 103 0,0001 0,23 167,64 103 0
0 164,03 104 0,0002 0 171,84 104 0
1 443,12 104 0 1 246,55 104 0
Novelty 0,05 165,28 103 0,0001 0,19 186,26 103 0 0,22 506,30 298 0
0 165,48 104 0,0001 0 189,12 104 0 0 507,11 299 0
1 550,21 104 0 1 260,00 104 0 1 735,09 299 0
TABLE 4: Partial Least Squares Analysis
Differentiation Cost Leadership Efficiency Novelty
Differentiation 0,577 -0,070 0,060 0,148
CostLeadership -0,070 0,577 -0,068 -0,004
Efficiency 0,060 -0,068 0,277 0,189
Novelty 0,148 -0,004 0,189 0,277
Note: Table depicts square root of Average Variance Extracted on diagonal, and correlations on off-diagonal.
33
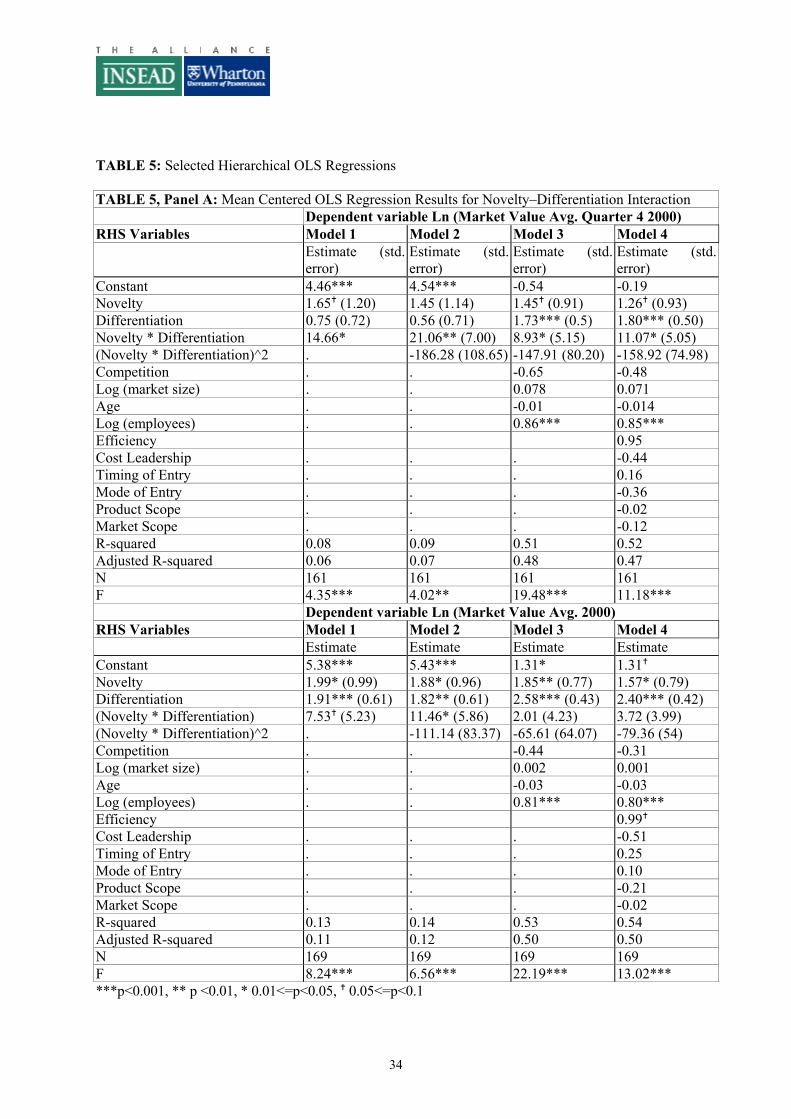
TABLE 5: Selected Hierarchical OLS Regressions
TABLE 5, Panel A: Mean Centered OLS Regression Results for Novelty–Differentiation Interaction Dependent variable Ln (Market Value Avg. Quarter 4 2000) RHS Variables Model 1 Model 2 Model 3 Model 4
Estimate (std. error)
Estimate (std. error)
Estimate (std. error)
Estimate (std. error)
Constant 4.46*** 4.54*** -0.54 -0.19 Novelty 1.65 (1.20) 1.45 (1.14) 1.45 (0.91) 1.26 (0.93) Differentiation 0.75 (0.72) 0.56 (0.71) 1.73*** (0.5) 1.80*** (0.50) Novelty * Differentiation 14.66* 21.06** (7.00) 8.93* (5.15) 11.07* (5.05) (Novelty * Differentiation)^2 . -186.28 (108.65) -147.91 (80.20) -158.92 (74.98) Competition . . -0.65 -0.48 Log (market size) . . 0.078 0.071 Age . . -0.01 -0.014 Log (employees) . . 0.86*** 0.85*** Efficiency 0.95 Cost Leadership . . . -0.44 Timing of Entry . . . 0.16 Mode of Entry . . . -0.36 Product Scope . . . -0.02 Market Scope . . . -0.12 R-squared 0.08 0.09 0.51 0.52 Adjusted R-squared 0.06 0.07 0.48 0.47 N 161 161 161 161 F 4.35*** 4.02** 19.48*** 11.18*** Dependent variable Ln (Market Value Avg. 2000) RHS Variables Model 1 Model 2 Model 3 Model 4 Estimate Estimate Estimate Estimate Constant 5.38*** 5.43*** 1.31* 1.31 Novelty 1.99* (0.99) 1.88* (0.96) 1.85** (0.77) 1.57* (0.79) Differentiation 1.91*** (0.61) 1.82** (0.61) 2.58*** (0.43) 2.40*** (0.42) (Novelty * Differentiation) 7.53 (5.23) 11.46* (5.86) 2.01 (4.23) 3.72 (3.99) (Novelty * Differentiation)^2 . -111.14 (83.37) -65.61 (64.07) -79.36 (54) Competition . . -0.44 -0.31 Log (market size) . . 0.002 0.001 Age . . -0.03 -0.03 Log (employees) . . 0.81*** 0.80*** Efficiency 0.99 Cost Leadership . . . -0.51 Timing of Entry . . . 0.25 Mode of Entry . . . 0.10 Product Scope . . . -0.21 Market Scope . . . -0.02 R-squared 0.13 0.14 0.53 0.54 Adjusted R-squared 0.11 0.12 0.50 0.50 N 169 169 169 169 F 8.24*** 6.56*** 22.19*** 13.02*** ***p<0.001, ** p <0.01, * 0.01<=p<0.05, 0.05<=p<0.1
34
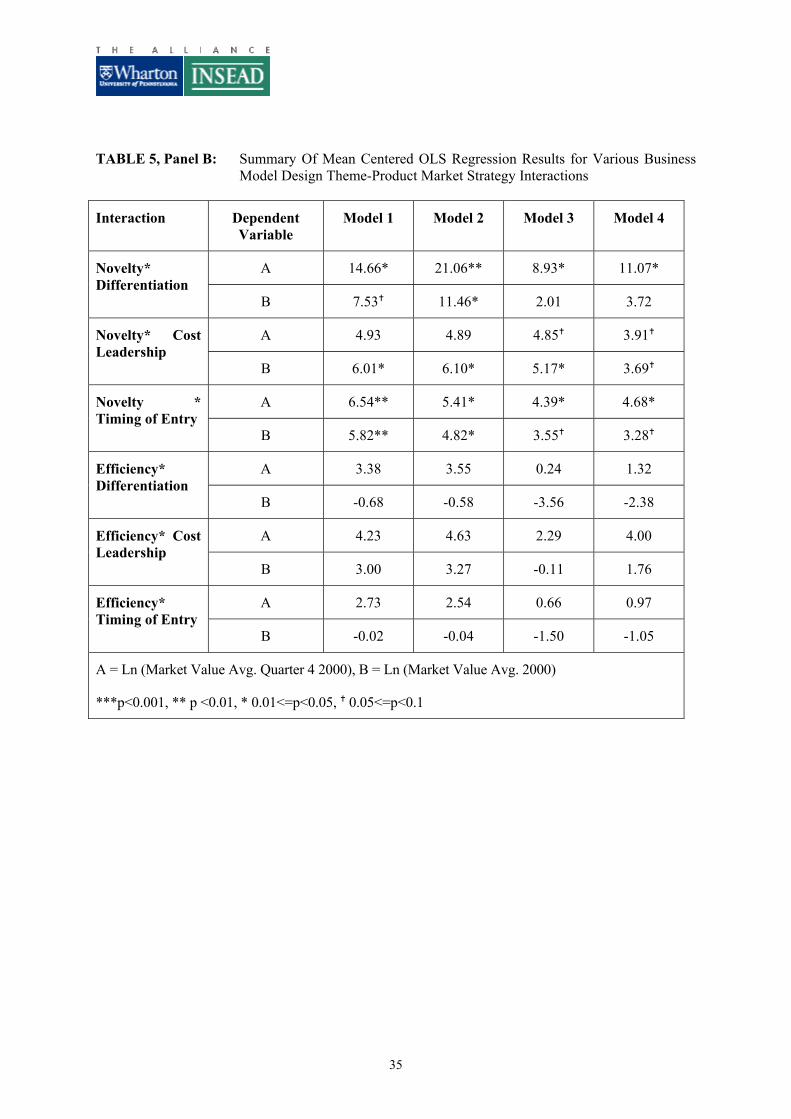
TABLE 5, Panel B: Summary Of Mean Centered OLS Regression Results for Various Business Model Design Theme-Product Market Strategy Interactions
Interaction Dependent Variable
Model 1 Model 2 Model 3 Model 4
A 14.66* 21.06** 8.93* 11.07* Novelty* Differentiation
B 7.53 11.46* 2.01 3.72
A 4.93 4.89 4.85 3.91 Novelty* Cost Leadership
B 6.01* 6.10* 5.17* 3.69
A 6.54** 5.41* 4.39* 4.68* Novelty * Timing of Entry
B 5.82** 4.82* 3.55 3.28
A 3.38 3.55 0.24 1.32 Efficiency* Differentiation
B -0.68 -0.58 -3.56 -2.38
A 4.23 4.63 2.29 4.00 Efficiency* Cost Leadership
B 3.00 3.27 -0.11 1.76
A 2.73 2.54 0.66 0.97 Efficiency* Timing of Entry
B -0.02 -0.04 -1.50 -1.05
A = Ln (Market Value Avg. Quarter 4 2000), B = Ln (Market Value Avg. 2000)
***p<0.001, ** p <0.01, * 0.01<=p<0.05, 0.05<=p<0.1
35
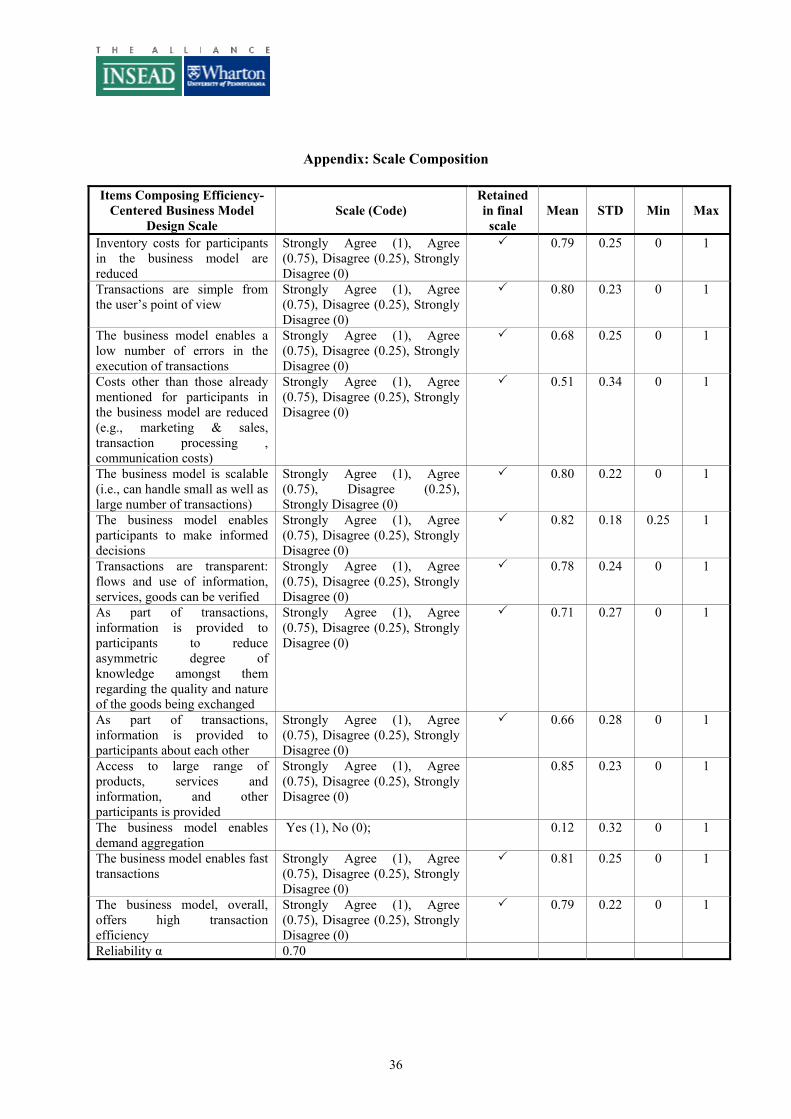
Appendix: Scale Composition Items Composing Efficiency-
Centered Business Model Design Scale
Scale (Code) Retained in final scale
Mean STD Min Max
Inventory costs for participants in the business model are reduced
Strongly Agree (1), Agree (0.75), Disagree (0.25), Strongly Disagree (0)
0.79 0.25 0 1
Transactions are simple from the user’s point of view
Strongly Agree (1), Agree (0.75), Disagree (0.25), Strongly Disagree (0)
0.80 0.23 0 1
The business model enables a low number of errors in the execution of transactions
Strongly Agree (1), Agree (0.75), Disagree (0.25), Strongly Disagree (0)
0.68 0.25 0 1
Costs other than those already mentioned for participants in the business model are reduced (e.g., marketing & sales, transaction processing , communication costs)
Strongly Agree (1), Agree (0.75), Disagree (0.25), Strongly Disagree (0)
0.51 0.34 0 1
The business model is scalable (i.e., can handle small as well as large number of transactions)
Strongly Agree (1), Agree (0.75), Disagree (0.25), Strongly Disagree (0)
0.80 0.22 0 1
The business model enables participants to make informed decisions
Strongly Agree (1), Agree (0.75), Disagree (0.25), Strongly Disagree (0)
0.82 0.18 0.25 1
Transactions are transparent: flows and use of information, services, goods can be verified
Strongly Agree (1), Agree (0.75), Disagree (0.25), Strongly Disagree (0)
0.78 0.24 0 1
As part of transactions, information is provided to participants to reduce asymmetric degree of knowledge amongst them regarding the quality and nature of the goods being exchanged
Strongly Agree (1), Agree (0.75), Disagree (0.25), Strongly Disagree (0)
0.71 0.27 0 1
As part of transactions, information is provided to participants about each other
Strongly Agree (1), Agree (0.75), Disagree (0.25), Strongly Disagree (0)
0.66 0.28 0 1
Access to large range of products, services and information, and other participants is provided
Strongly Agree (1), Agree (0.75), Disagree (0.25), Strongly Disagree (0)
0.85 0.23 0 1
The business model enables demand aggregation
Yes (1), No (0); 0.12 0.32 0 1
The business model enables fast transactions
Strongly Agree (1), Agree (0.75), Disagree (0.25), Strongly Disagree (0)
0.81 0.25 0 1
The business model, overall, offers high transaction efficiency
Strongly Agree (1), Agree (0.75), Disagree (0.25), Strongly Disagree (0)
0.79 0.22 0 1
Reliability α 0.70
36
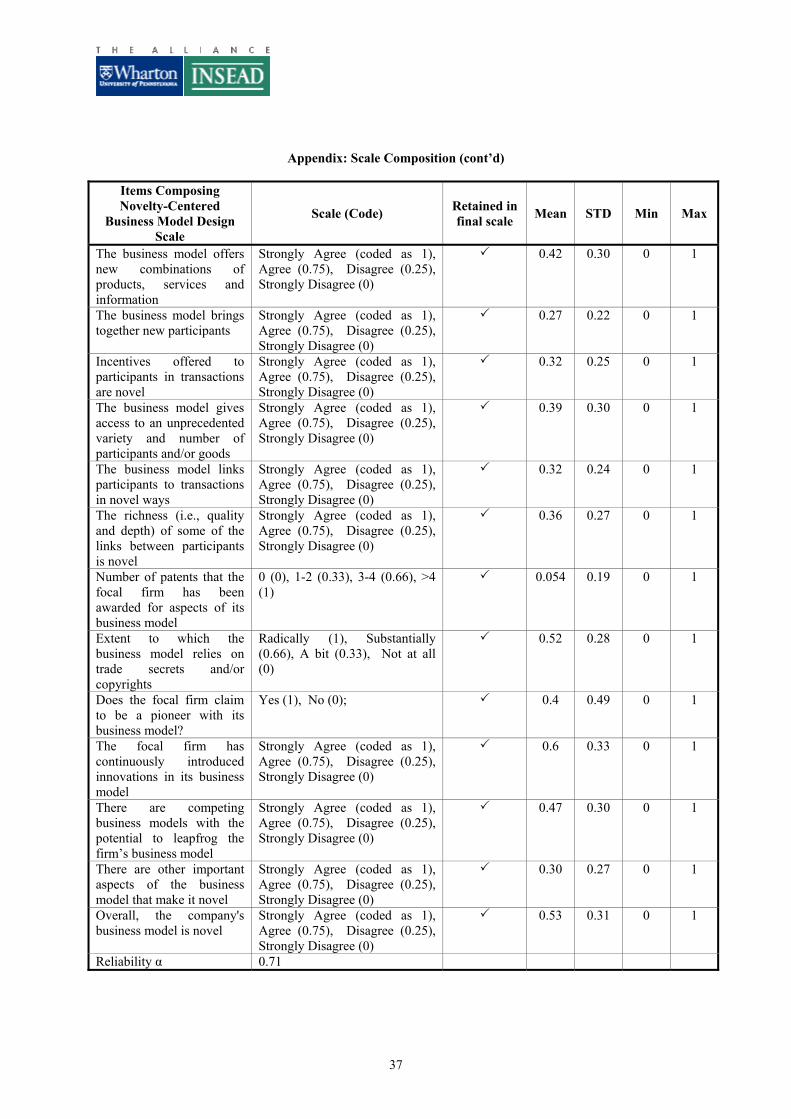
Appendix: Scale Composition (cont’d)
Items Composing Novelty-Centered
Business Model Design Scale
Scale (Code) Retained in final scale Mean STD Min Max
The business model offers new combinations of products, services and information
Strongly Agree (coded as 1), Agree (0.75), Disagree (0.25), Strongly Disagree (0)
0.42 0.30 0 1
The business model brings together new participants
Strongly Agree (coded as 1), Agree (0.75), Disagree (0.25), Strongly Disagree (0)
0.27 0.22 0 1
Incentives offered to participants in transactions are novel
Strongly Agree (coded as 1), Agree (0.75), Disagree (0.25), Strongly Disagree (0)
0.32 0.25 0 1
The business model gives access to an unprecedented variety and number of participants and/or goods
Strongly Agree (coded as 1), Agree (0.75), Disagree (0.25), Strongly Disagree (0)
0.39 0.30 0 1
The business model links participants to transactions in novel ways
Strongly Agree (coded as 1), Agree (0.75), Disagree (0.25), Strongly Disagree (0)
0.32 0.24 0 1
The richness (i.e., quality and depth) of some of the links between participants is novel
Strongly Agree (coded as 1), Agree (0.75), Disagree (0.25), Strongly Disagree (0)
0.36 0.27 0 1
Number of patents that the focal firm has been awarded for aspects of its business model
0 (0), 1-2 (0.33), 3-4 (0.66), >4 (1)
0.054 0.19 0 1
Extent to which the business model relies on trade secrets and/or copyrights
Radically (1), Substantially (0.66), A bit (0.33), Not at all (0)
0.52 0.28 0 1
Does the focal firm claim to be a pioneer with its business model?
Yes (1), No (0); 0.4 0.49 0 1
The focal firm has continuously introduced innovations in its business model
Strongly Agree (coded as 1), Agree (0.75), Disagree (0.25), Strongly Disagree (0)
0.6 0.33 0 1
There are competing business models with the potential to leapfrog the firm’s business model
Strongly Agree (coded as 1), Agree (0.75), Disagree (0.25), Strongly Disagree (0)
0.47 0.30 0 1
There are other important aspects of the business model that make it novel
Strongly Agree (coded as 1), Agree (0.75), Disagree (0.25), Strongly Disagree (0)
0.30 0.27 0 1
Overall, the company's business model is novel
Strongly Agree (coded as 1), Agree (0.75), Disagree (0.25), Strongly Disagree (0)
0.53 0.31 0 1
Reliability α 0.71
37

Appendix: Scale Composition (cont’d)
Items Composing Differentiation Strategy
Scale Scale Retained in
final scale Mean STD Min Max
Importance and use of product-service-related patents,
SCALE: 1 = not important at all, 2 = slightly important, 3 = moderately important, 4 = important, 5 = very important
3.05 1.30 1 5
Importance of new product development, innovation and R&D activity
SCALE: 1 = not important at all, 2 = slightly important, 3 = moderately important, 4 = important, 5 = very important
4.24 1.01 1 5
Emphasis on growth by acquiring, or merging with R&D / technology intensive firms, firms
SCALE: 1 = not important at all, 2 = slightly important, 3 = moderately important, 4 = important, 5 = very important
3.45 1.30 1 5
Branding and advertising as part of firm’s marketing strategy / approach
SCALE: 1 = not important at all, 2 = slightly important, 3 = moderately important, 4 = important, 5 = very important
4.15 1.23 1 5
Differentiation strategy SCALE: 1 = do not use this strategy at all, 2 = strategy is not important, 3 = use this strategy a bit, 4 = employ this strategy, 5 = very important strategy
3.59 0.55 1 5
Reliability α 0.66
Items Composing Cost Leadership Strategy
Scale Scale Retained in
final scale Mean STD Min Max
Offering products / services at low prices / prices lower than competition
SCALE: 1 = not important at all, 2 = slightly important, 3 = moderately important, 4 = important, 5 = very important
3.18 1.55 1 5
Minimizing product-related expenditures, in particular through process innovations
SCALE: 1 = not important at all, 2 = slightly important, 3 = moderately important, 4 = important, 5 = very important
2.79 1.57 1 5
Emphasizing economies of scale and scope with products and services
SCALE: 1 = not important at all, 2 = slightly important, 3 = moderately important, 4 = important, 5 = very important
1.82 1.37 1 5
Low-cost strategy SCALE: 1 = do not use this strategy at all, 2 = strategy is not important, 3 = use this strategy a bit, 4 = employ this strategy, 5 = very important strategy
2.84 1.02 1 5
Reliability α 0.76
38

39
Appendix: Scale Composition (cont’d)
Items For Other Strategy
Variables Scale Retained in
final scale Mean STD Min Max
Timing of market entry (Being the first to enter a market, and/or first to introduce products / services in a market, or realizing first mover advantage in another way)
SCALE: 1 = not important at all, 2 = slightly important, 3 = moderately important, 4 = important, 5 = very important
2.15 1.59 1 5
Mode of market entry (Relying on strategic partnerships, and joint ventures in order to develop, produce, distribute, or market products / services)
SCALE: 1 = not important at all, 2 = slightly important, 3 = moderately important, 4 = important, 5 = very important
3.97 1.27 1 5
Breadth of product offering (Pursuing a narrow, focused product scope)
SCALE 1: 1 = not important at all, 2 = slightly important, 3 = moderately important, 4 = important, 5 = very important
3.76 1.01 1 5
Breadth of targeted market segments (Pursuing a narrow, focused market scope)
SCALE: 1 = not important at all, 2 = slightly important, 3 = moderately important, 4 = important, 5 = very important
1.87 1.05 1 5