expression patterns for glucose transporters glut1 and glut3 in the normal rat lens and in models of...
TRANSCRIPT
Expression Patterns for Glucose Transporters GLUT1and GLUT3 in the Normal Rat Lens and in Models ofDiabetic Cataract
B. Rachelle Merriman-Smith,1 Anatoly Krushinsky,1 Joerg Kistler,2 and Paul J. Donaldson1
PURPOSE. To determine whether the expression levels and cel-lular distribution of the facilitative glucose transporters GLUT1and -3 undergo changes in the hyperglycemic lens.
METHODS. Hyperglycemia was induced in vivo by injecting ratswith streptozotocin or in vitro by culturing lenses in the pres-ence of 50 mM glucose. Northern blot analysis and quantitativeRT-PCR were used to detect changes in GLUT1 and -3 tran-script levels, and Western blot analysis was used to monitorchanges in GLUT3 protein expression levels in diabetic rats.Immunocytochemistry was used to map the cellular distribu-tion of GLUT3 in normal and hyperglycemic lenses.
RESULTS. GLUT1 and -3 were found to be differentially ex-pressed in the epithelial and fiber cells, respectively. In thefiber cells, the distribution of GLUT3 protein changed as afunction of fiber cell differentiation. In young differentiatingfiber cells, GLUT3 was mainly found in the cytoplasm, but withincreasing depth into the lens became inserted into the narrowsides of older fiber cells, before becoming completely dis-persed around the entire membrane of the oldest fiber cells.Hyperglycemia had similar effects on tissue damage and trans-porter expression in both the in vitro and in vivo models.Tissue damage was characterized by an initial local cell swell-ing that with prolonged insult gradually spread and resultedin the creation of large areas of tissue liquefaction. Northernblot analysis and quantitative RT-PCR showed that transcriptfor GLUT3 but not GLUT1 was upregulated under hyperglyce-mic conditions. This increase in GLUT3 expression wasconfirmed at the protein level by both Western blot analy-sis and immunocytochemistry. In hyperglycemic lenses,GLUT3 antibody labeling was localized to the region of tissueliquefaction.
CONCLUSIONS. GLUT3 in the lens exhibits dynamic changes inexpression levels and cellular localization as a function of fibercell differentiation and hyperglycemia. In the lens cortex, re-gions of GLUT3 overexpression and hyperglycemic tissue dam-age overlap, suggesting a functional relationship. (Invest Oph-thalmol Vis Sci. 2003;44:3458–3466) DOI:10.1167/iovs.02-1235
The energy to maintain lens transparency is primarily de-rived from the uptake of extracellular glucose and its
subsequent metabolism.1 Recently, we have shown that inneonatal rats there is a differential expression of two facilitativeglucose transporter isoforms with GLUT1 being located to theepithelial cells and GLUT3 to the cortical fiber cells.2 Ouridentification of GLUT3 in the fiber cells suggests that thesecells directly extract glucose from the extracellular space. Thisnotion supports the postulated existence of an internal micro-circulation system that is generated by a circulating flux of ionsthat transports water and nutrients by convection and solventdrag, respectively.3,4 Furthermore, although GLUT1 and -3 areboth classified as high-affinity glucose transporters, GLUT3 hasthe higher affinity.5 Thus, the differential expression of thesetwo transporters in the lens creates an affinity gradient forglucose uptake with the higher affinity transporter, GLUT3,extracting glucose from the tortuous extracellular space,where its concentration may normally be rate-limiting.
In the diabetic lens elevated levels of extracellular glucoseare associated with the accumulation of sorbitol,6 a product ofglucose metabolism, suggesting that a significant increase inglucose uptake occurs. This increase in sorbitol induces os-motic and oxidative stresses that have been postulated tooverwhelm the ability of the circulation system to control lenshydration.4 The earliest tissue damage associated with diabeticcataract is a localized zone of cortical fiber cell swelling.7 Thisinitial cell swelling is then followed by more extensive tissuebreakdown that results in the formation of fluid lakes andcortical opacities. The localized nature of the tissue damageobserved in response to hyperglycemia suggests that the re-gional uptake of glucose may contribute to this pattern ofdamage. Our finding that GLUT3 is the predominant glucosetransporter in fiber cells indicates that this transporter is themost likely candidate to mediate the accumulation of intracel-lular glucose in these damaged fiber cells. However, being ahigh-affinity glucose transporter,5 GLUT3 would be expectedto be near saturation at physiological plasma glucose concen-trations. Thus, if GLUT3 is responsible for the increase inglucose uptake, we conclude that the number of glucose trans-porters in the fiber cells must be upregulated in response tohyperglycemia.
In other tissues, the effect of elevated glucose on trans-porter expression is controversial8–10 and is associated with adifferential regulation of both GLUT1 and -3 in a concentration-and time-dependent manner.11 Thus, to investigate these ques-tions in the lens, we have used two models of sugar cataractthat produce identical damage phenotypes. Because both mod-els require the use of adult rats, we performed a detailedmapping of GLUT1 and -3 expression in the normal adult ratlens. Although this verified the differential expression ofGLUT1 and -3 observed in neonatal rats,2 it further revealedthat GLUT3 exists as a cytoplasmic pool of transporters thatundergo a differentiation-dependent insertion into the mem-branes of the fiber cells. In addition, we determined thatexposure to hyperglycemia induced an increase in the expres-sion of GLUT3, but not of GLUT1, at transcript and proteinlevels. Because this increase in GLUT3 expression was local-
From the 1Division of Physiology, School of Medical Sciences andthe 2School of Biological Sciences, University of Auckland, Auckland,New Zealand.
Supported by the Health Research Council of New Zealand, theLottery Grants Board, and the University of Auckland Research Com-mittee.
Submitted for publication December 2, 2002; revised March 12and April 2, 2003; accepted April 3, 2003.
Disclosure: B.R. Merriman-Smith, None; A. Krushinsky, None;J. Kistler, None; P.J. Donaldson, None
The publication costs of this article were defrayed in part by pagecharge payment. This article must therefore be marked “advertise-ment” in accordance with 18 U.S.C. §1734 solely to indicate this fact.
Corresponding author: Paul J. Donaldson, Division of Physiology,School of Medicine, University of Auckland, Private Bag 92019, Auck-land, New Zealand; [email protected].
Investigative Ophthalmology & Visual Science, August 2003, Vol. 44, No. 83458 Copyright © Association for Research in Vision and Ophthalmology
ized to the zone of cortical fiber cell damage, it suggests thatGLUT3 is the transporter responsible for the increased glucoseuptake that occurs in the diabetic rat lens.
MATERIALS AND METHODS
Hyperglycemic Models of Lens Cataract
All animals were treated according to the ARVO Statement for the Useof Animals in Ophthalmic and Vision Research. Two models of hyper-glycemic insult were used. An in vivo model used 28-day-old femalerats injected with 60 mg/kg streptozotocin (Sigma-Aldrich, St. Louis,MO) in 0.9% NaCl. Age-matched control female rats were injected with0.9% NaCl. Blood glucose levels were monitored weekly, before lenstissue collection. Streptozotocin-induced diabetic animals with a bloodglucose level lower than 11.5 mmol/mL were not used for furtherstudy. Blood glucose levels were also measured in age-matched controlanimals (average, �6.2 mmol/mL) and any abnormal animals werediscarded from further study. After 1, 2, 3, or 4 weeks after injection,whole lenses were extracted from the rat eyes in sterile RNase free(dimethyldicarbonate [DMDC]-treated) phosphate-buffered saline(PBS; Sigma, St. Louis, MO). The second in vitro model used culturedlenses. Lenses were removed from 28-day-old female rats and trans-ferred into sterile modified M199 (Sigma-Aldrich) with a curved glassrod. Lenses were incubated for 24 hours at 37°C in a CO2 incubator.Lenses that were damaged during the extraction process becamecloudy after this time and were discarded. Typically, approximately50% of the extracted lenses were discarded, leaving a very smallnumber of viable cultured lenses for further analysis. Transparentlenses were transferred into individual wells of a 24-well culture traycontaining 2 mL of either modified M199 or modified M199 plus 50mM glucose. Lenses were incubated in the appropriate medium for upto 8 days. Culture media were replaced daily with sterile, prewarmedmedia of the same experimental composition.
Morphological Analysis
The transparency of lenses from both models was initially monitoredby digital dark-field microscopy. Lenses were then fixed in 25% Kar-novsky’s solution (50 mM Na cacodylate, 1% paraformaldehyde, 1.25%glutaraldehyde) in PBS (pH 7.4; osmolality 300 mOsmol/kg) for 4 hoursat room temperature for morphologic analysis. Fixed lenses weresuperglued to the plate of a vibratome (Vibratome 1000; TechnicalProducts International, Inc., St. Louis, MO). Equatorial or axial sections(170 �m thick) were cut. Sections were incubated in FITC-conjugatedwheat germ agglutinin (WGA; 1 �g/mL in PBS) overnight in the dark atroom temperature. Sections were then given four 10 minute washes inPBS. Labeled sections were mounted in a medium that reduces fading(Citifluor; Agar Scientific, Stansted, UK), and examined by confocalmicroscopy.
Northern Blot Analysis
Total RNA was isolated from lens tissue with a kit (High Pure; RocheDiagnostics, Mannheim, Germany) according to standard manufactur-er’s protocol. RNA was isolated from three preparations: whole lenses,epithelial cells, and fiber cells. To separate epithelial and fiber cells,lenses were decapsulated with a sharpened pair of forceps.12 Becausethe epithelial cells stay largely attached to the capsule, the lens couldbe separated into epithelial (material adhering to the capsule) and fibercell portions which were then processed separately. Total RNA waselectrophoresed for approximately 5 hours through a 1%-agarose form-aldehyde gel in 3-(N-morpholino)propanesulfonic acid (MOPS) bufferat 4°C. RNA was transferred overnight by capillary action to a nylonmembrane. Hybridization was performed overnight at 50°C accordingto the manufacturer’s instructions (Roche Diagnostics) with 10 ng/mLof digoxigenin random-labeled DNA probes. The sequence-verifiedcDNAs were obtained with RT-PCR products derived as in Merriman-Smith et al.2 GLUT1-, GLUT3-, and Cx46-specific transcripts weredetected with anti-DIG antibodies conjugated to alkaline phosphatase
(1:20,000: Roche Diagnostics) in buffer (50 mM maleic acid, 75 mMNaCl pH 7.5) for 30 minutes, followed by chemiluminescence (CDP-star; Roche Diagnostics) and exposure onto autoradiograph film (Hy-perfilm ECL; Amersham, Arlington Heights, IL).
Quantitative PCR
Quantitative PCR real-time analysis was performed with a fluoresceinPCR detection system (LightCycler) and DNA master mix (SYBR GreenI kit; both from Roche Diagnostics). cDNA was transcribed from totallens RNA extracted from age-matched diabetic and nondiabetic animalswith the a cDNA synthesis system (Expand; Roche Diagnostics) ac-cording to the manufacturers standard protocol. Before cDNA synthe-sis, RNA tertiary structures were removed by a 10-minute incubation ofthe RNA (0.5 �g) and random hexamer (5 pM) at 65°C. AppropriatePCR thermal cycling conditions, such as amplification efficiency, fluo-rescence acquisition temperature, and optimal cDNA dilution, weredetermined for all primer sets. Five dilutions from a known concen-tration of sequenced confirmed cDNA, was prepared for every exper-iment to give a standard curve allowing for optimal quantification ofgene concentration. To compensate for variations in the RT’s efficacy,the target gene was normalized to a reference gene. Primers and cDNAsequences are published in Merriman-Smith et al.2 PCR reactions wereperformed in 20-�L reaction volumes with final concentrations of 1�DNA master mix (LightCycler-DNA Master SYBR Green I; Roche Diag-nostics), 0.5 �M sense primer, 0.5 �M antisense primer, 2 mM MgCl2,and 2 �L template. Template consisted of either the cDNA samples(3–300 pg), sequenced DNA template (standard dilution curve), or thefalse amplification control (water only). Before thermocycling, the Taqpolymerase was activated by a 30-second incubation at 95°C. Cyclingconditions were: for the GLUT1 primer set, melting at 95°C for 0seconds, annealing at 50°C for 5 seconds, and extension at 72°C for 10seconds, for 45 cycles; for the GLUT3 primer set melting at 95°C for0 seconds, annealing at 55°C for 5 seconds, and extension at 72°C for10 seconds, for 40 cycles; and for the Cx46 primer set, melting at 95°Cfor 0 seconds, annealing at 55°C for 5 seconds and extension at72°C for 15 seconds, for 40 cycles. All reactions were performed induplicate, and a maximum difference of 0.5 cycles between the thresh-old cycle (CT; the exponential phase of amplification, at least 10 timesabove baseline emission) was accepted. Nontemplate controls (no RTand water only) were included for each primer set to measure levels ofcontaminants. These samples were consistently low, with a differencein CT of at least 15 to 20 cycles. Fluorescence for the real-time PCRreactions were recorded and analyzed with the software (LightCyler;Roche Diagnostics) supplied with the thermocycler. Transcript con-centrations were determined for each of the samples by extrapolationfrom the standard curve.
Immunocytochemistry
Control and experimental lenses were fixed in 2% paraformaldehyde inPBS (pH 7.4; osmolality 300 mOsmol/kg) for 4 hours at room temper-ature. Fixed lenses were sectioned at 180 �m with a vibratome or at 16�m with a cryostat (CM3050; Leica Lasertechnik, Heidelberg, Ger-many). Peptide-specific antibodies directed against the cytoplasmictails of GLUT1 and -3 (Research Diagnostics, Flanders, NJ) were used tolabel lens sections that were first permeabilized with a 30-minuteincubation in 0.1% Triton X-100 (Sigma-Aldrich). After three 15-minutewashes in PBS, the lens sections were incubated with either primaryantibody diluted to 0.5 �g in PBS for 2 hours at room temperature. Foreach antibody, appropriate controls were performed that used eitherno primary antibody or the primary antibody preincubated in thepresence of its specific antigenic peptide. After three 5-minute washesin PBS, the sections were incubated with the appropriate secondaryantibody for 1 hour. To detect GLUT3 an anti-rabbit IgG rhodamine red(Molecular Probes, Eugene OR) diluted 1:120 was used and an anti-goatFITC (Santa Cruz Biotechnology, Santa Cruz, CA) diluted 1:120 wasused to detect anti-GLUT1. When appropriate, tissue architecture wasvisualized with FITC-conjugated WGA, as described earlier. Sectionswere washed three times for 5 minutes in PBS before being mounted
IOVS, August 2003, Vol. 44, No. 8 Glucose Transporters in the Diabetic Lens 3459
onto slides and examined by confocal microscopy (model TCS 4D;Leica Lasertechnik).
Western Blot Analysis
Rat lenses were homogenized in 10 mL of Tris-buffered saline (TBS; 10mM Tris-HCl [pH 7.4], 5 mM EDTA, and 5 mM EGTA). The homogenatewas centrifuged at 12,000g for 15 minutes at 4°C and resuspended in1 mL of 4 M urea and 5 mM Tris (pH 9.5). This process was performedthree times, and the final pellet was resuspended in 100 �L of 5 mMTris-HCl (pH 8.0), 2 mM EDTA, 2 mM EGTA, and 100 mM NaCl. Theconcentration of lens protein was determined with the bicinchoninicacid (BCA) protein detection kit (Pierce, Rockford, IL), according tothe manufacturer’s protocol. Proteins were separated on a 10% SDSpolyacrylamide gel and transferred onto a nitrocellulose membrane byelectrophoresis for 90 minutes at 170 mA. Membranes were incubatedovernight at room temperature in a blocking solution (1% BSA and0.1% Tween 20 in 1� TBS (2 mM Tris-HCl, 140 mM NaCl [pH 7.6]) andsubsequently incubated for 2 hours in with either rabbit anti-GLUT3 orrabbit anti-Cx46 (Alpha Diagnostic International, San Antonio, TX)antibodies diluted 1:1000 in 1� TBS. Membranes were then exposedto biotinylated anti-rabbit IgG secondary antibody (Amersham Bio-sciences Corp., Piscataway, NJ) diluted 1:1000 for 1 hour, followed bystreptavidin horseradish peroxidase (Amersham Biosciences Corp.)diluted 1:1000. After each incubation, membranes were rinsed threetimes with water and washed three times for 15 minutes in 1� TBS.The presence of GLUT3 or Cx46 protein was detected by chemilumi-nescence and exposed on autoradiograph film (Hyperfilm, ECL recy-cling kit; Amersham Biosciences Corp.). Western blots were strippedwith a Western blot recycling kit (Alpha Diagnostic International, SanAntonio, TX) according to the manufacturer’s instructions. Band inten-sities were measured using image processing software (Image ver. 4.1;Scion, Frederick, MD).
RESULTS
Expression of GLUT1 and -3 in the Normal AdultRat Lens
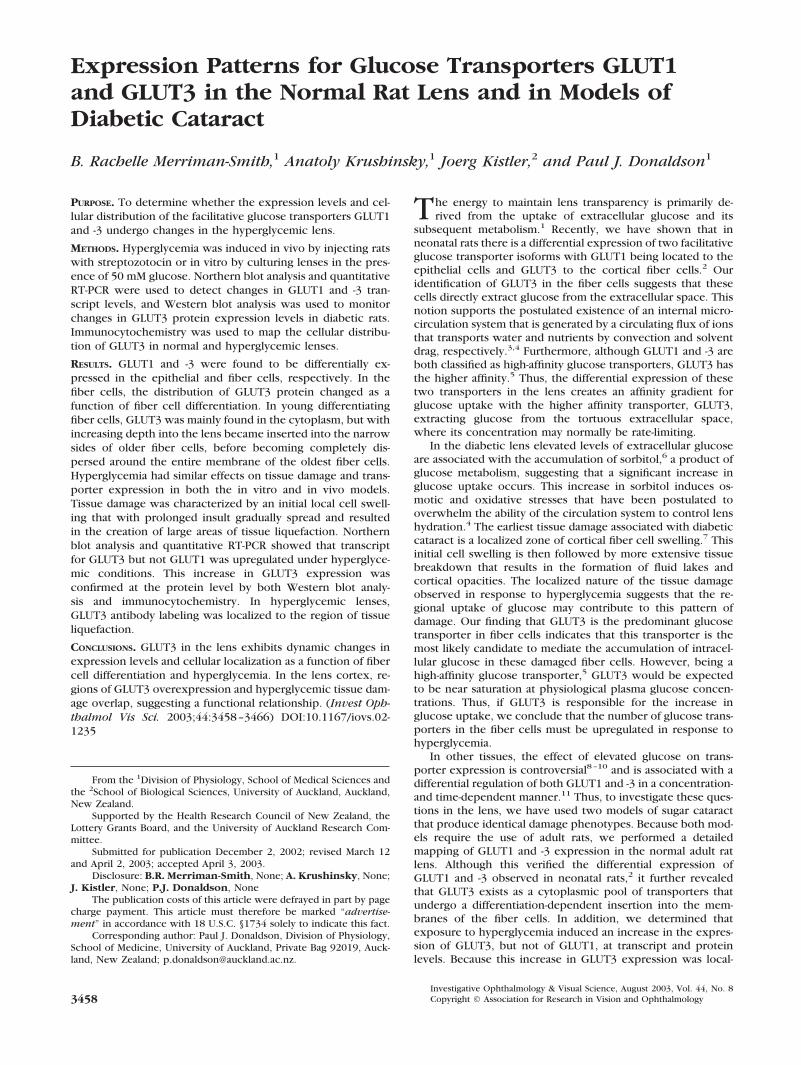
To characterize transcript levels in the normal adult rat lens,Northern blot analysis was performed on RNA separately ex-tracted from epithelial cells and fiber cells (Fig. 1A). GLUT1transcript was abundantly expressed in the epithelial cell frac-tion but was not found in the fiber cells (Fig. 1A). GLUT3,however, was predominantly expressed in the fiber cells withlittle expression detected in the epithelial cells. The expressionof GLUTs in the lens was further investigated at the proteinlevel by immunocytochemistry. In axial sections, GLUT1 label-ing was localized to the basolateral membrane of the epithelialcell layer (Fig. 1B). In contrast, GLUT3 labeling was minimal inthe epithelium and predominantly localized to the corticalfiber cells (Fig. 1B).
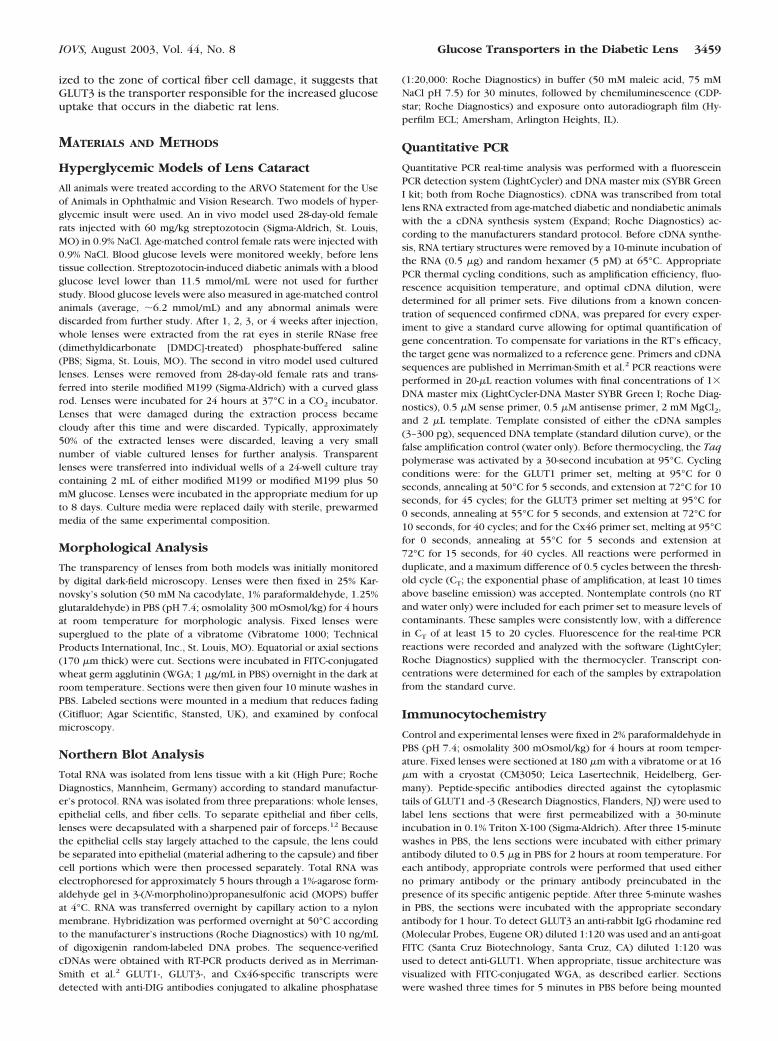
Newly elongated fiber cells near the equator did not appearto express GLUT3, suggesting that the expression of GLUT3 inthe fiber cells is a differentiation-dependent phenomenon (Fig.1B). To investigate this possibility further, high-resolution map-ping of GLUT3 in the lens was conducted in equatorial sec-tions, in which the cell membranes were labeled with WGA-FITC (Fig. 2). In the overview, GLUT3 initially appearedcytoplasmic before localizing to fiber cell membranes in thedeeper lens (Fig. 2A). Neither the cytoplasmic nor the mem-brane labeling was observed in sections labeled with GLUT3antibodies preincubated with antigenic control peptide (Fig.2A, inset). At higher resolution, GLUT3 protein was detectedintracellularly in a cortical zone approximately 100 �m in fromthe capsule (Fig. 2B). At a depth of approximately 200 to 400�m from the capsule, GLUT3 labeling became increasinglyassociated with the membranes and was confined mostly to thenarrow sides of the hexagonal fiber cells (Fig. 2C). Fiber cells
deeper in the lens (400–600 �m) exhibited a more uniformmembrane labeling pattern, with both the broad and narrowsides labeled (Fig. 2D).
Effects of Elevation of Glucose Concentration onTissue Architecture
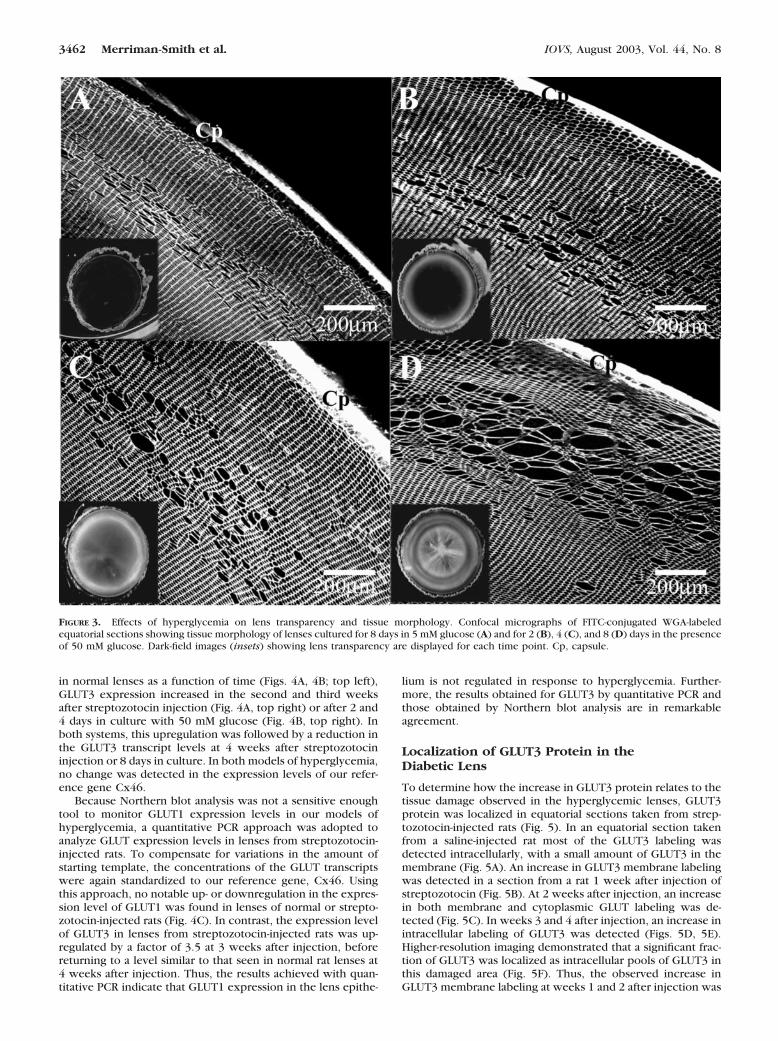
In the rat, long-term diabetes is associated with a reduction inGLUT1 mRNA expression in the kidney8 but with an increasedexpression of GLUT3 in the placenta9,10 and in the hippo-campus.13,14 To assess what effect elevated glucose levels haveon the expression of glucose transporters in the lens, twomodel systems were used. The first involved the chronic ele-vation of glucose. This was achieved in vivo by a bolus injec-tion of streptozotocin that destroyed the beta islet cells, ren-dering the injected rats diabetic.15 The second model involvedan acute in vitro elevation of glucose achieved by culturinglenses in the presence of 50 mM glucose.16 Examination of lensopacification and fiber cell architecture by dark-field and con-focal microscopy, respectively, revealed that the elevation ofglucose in the two models induced essentially identical damagephenotypes but with different time courses. Both models werecharacterized by cortical opacities caused by a discrete zone oftissue liquefaction. Because the changes in lens morphologyresponsible for this opacification have been documented instreptozotocin-injected rats7 (and are also evident in Fig. 5),herein we show only the changes in lens transparency andfiber cell morphology induced in vitro by culturing lenses in 50mM glucose (Fig. 3). Lenses cultured in the presence of normalglucose levels for 8 days were transparent and exhibited atypically well-ordered array of cortical fiber cells (Fig. 3A). Incontrast, lenses exposed to 50 mM glucose showed increasing
FIGURE 1. Differential distribution of GLUT1 and -3 in the adult ratlens. (A) Northern blot of total RNA extracted from the lens epitheliumand fiber cells hybridized with GLUT1 (left) and GLUT3 (right). (B)Axial section from a lens showing GLUT1 labeling (red) is predomi-nantly localized to the basolateral membrane of the epithelium (ar-row), whereas the GLUT3 protein (green) is localized to the fiber cells.Cp, capsule; F, fiber; E, epithelium.
3460 Merriman-Smith et al. IOVS, August 2003, Vol. 44, No. 8
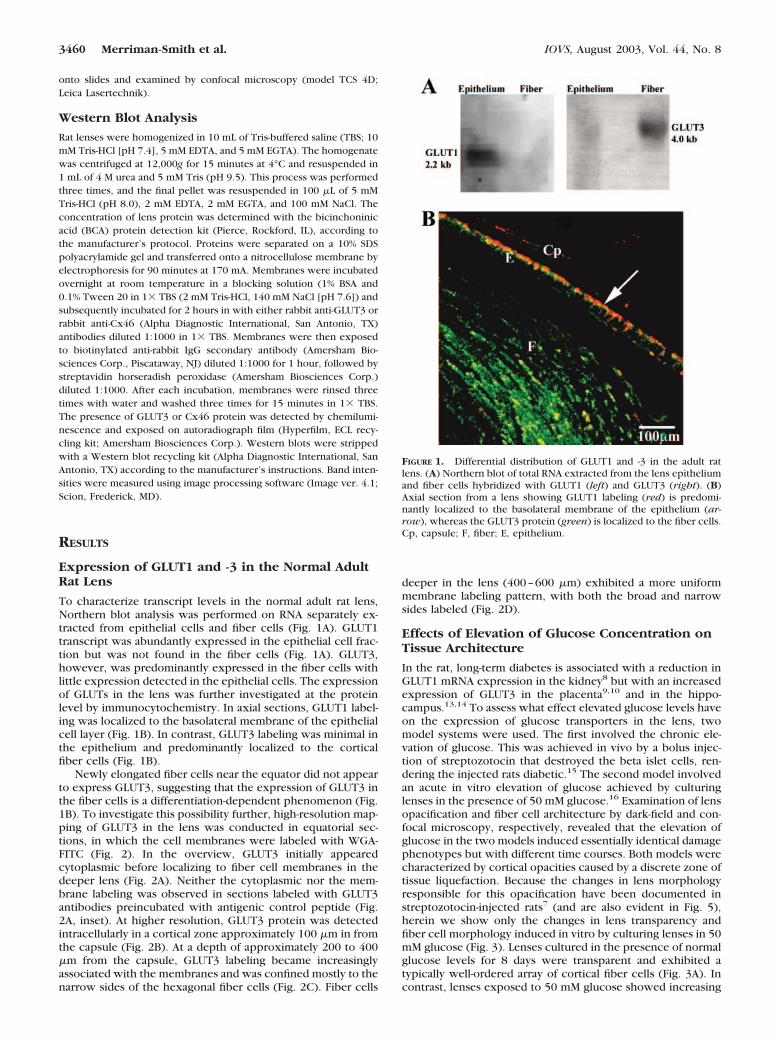
degrees of opacification (Fig 3, insets) and fiber cell damageover the 8 days of exposure. After 2 days of exposure, an innerzone of swollen fiber cells that was bounded on both sides byapparently normal fiber cells was already apparent (Fig. 3B). At4 days of exposure to high glucose, fiber cell swellings becamemore abundant (Fig. 3C) until, after 8 days of exposure, thecells burst, creating areas of tissue liquefaction (Fig. 3D). Thus,it appears that the cortical opacities observed in our in vivo andin vitro models of hyperglycemia were both initiated by fibercell swellings that originated in a discrete zone, some 100 to200 �m in from the capsule.
Changes in GLUT1 and -3 Transcript Levels inResponse to Hyperglycemia
Because chronic hyperglycemia is known to affect gene ex-pression in a number of tissues,17,18 we determined whetherGLUT1 and -3 transcripts are upregulated in our two lensmodels of hyperglycemia. Initially, Northern blot analysis wasperformed with RNA extracted from the whole lenses (epithe-
lium plus fiber cells) obtained from the two models of hyper-glycemia and their respective controls. Blots were hybridizedwith probes specific for GLUT1, GLUT3, and the referencegene Cx46.19 Cx46 was chosen as a reference gene because wefound that its expression levels were unaffected by elevatedglucose (Figs. 4A, 4B). More traditional housekeeping genesoften used as markers, such as �-actin and GAPDH, wereconsidered inappropriate for this work, because both had beendocumented to be affected either directly or indirectly byhyperglycemia in other tissues (John M, et al. IOVS 2001;42:ARVO Abstract 546).20 No signal was detected for GLUT1 (datanot shown). This is not surprising, because GLUT1 transcriptwas detectable by Northern blot analysis only when RNA wasextracted exclusively from epithelial cells collected from over15 lenses (Fig. 1A). In contrast, GLUT3 transcript was readilydetected in both control and experimental lenses as a promi-nent 4-kb band by Northern blot analysis, thereby allowing theeffects of hyperglycemia on GLUT3 expression to be studied.Although no change in the level of GLUT3 expression occurred
FIGURE 2. The distribution of GLUT3 as a function of fiber cell differentiation. An equatorial section double labeled with GLUT3 (green) and thegeneral membrane label WGA (red). (A) Low-power overview image of GLUT3 labeling in the lens; inset: shows no labeling when the GLUT3antibody was preabsorbed using its antigenic peptide. (B–D) Representative high-power images taken from the area indicated in (A); (B) 50 �mfrom the capsule; (C) 250 �m from the capsule; (D) 600 �m the capsule. Cp, capsule; Nu, fiber cell nuclei.
IOVS, August 2003, Vol. 44, No. 8 Glucose Transporters in the Diabetic Lens 3461
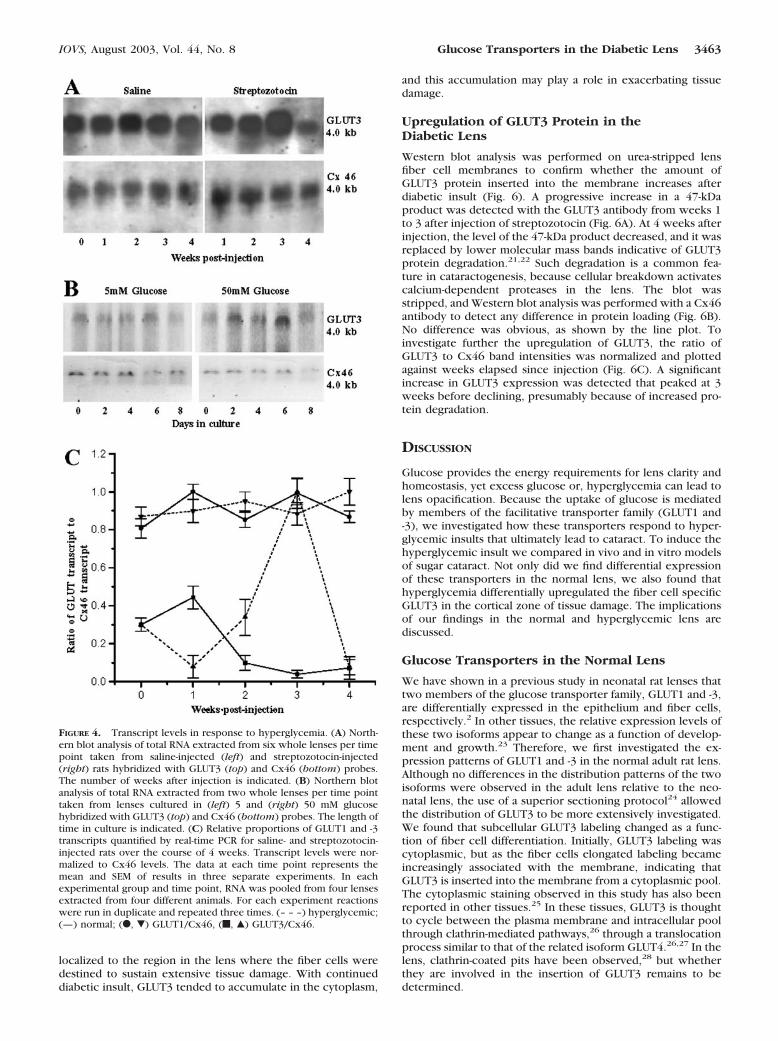
in normal lenses as a function of time (Figs. 4A, 4B; top left),GLUT3 expression increased in the second and third weeksafter streptozotocin injection (Fig. 4A, top right) or after 2 and4 days in culture with 50 mM glucose (Fig. 4B, top right). Inboth systems, this upregulation was followed by a reduction inthe GLUT3 transcript levels at 4 weeks after streptozotocininjection or 8 days in culture. In both models of hyperglycemia,no change was detected in the expression levels of our refer-ence gene Cx46.
Because Northern blot analysis was not a sensitive enoughtool to monitor GLUT1 expression levels in our models ofhyperglycemia, a quantitative PCR approach was adopted toanalyze GLUT expression levels in lenses from streptozotocin-injected rats. To compensate for variations in the amount ofstarting template, the concentrations of the GLUT transcriptswere again standardized to our reference gene, Cx46. Usingthis approach, no notable up- or downregulation in the expres-sion level of GLUT1 was found in lenses of normal or strepto-zotocin-injected rats (Fig. 4C). In contrast, the expression levelof GLUT3 in lenses from streptozotocin-injected rats was up-regulated by a factor of 3.5 at 3 weeks after injection, beforereturning to a level similar to that seen in normal rat lenses at4 weeks after injection. Thus, the results achieved with quan-titative PCR indicate that GLUT1 expression in the lens epithe-
lium is not regulated in response to hyperglycemia. Further-more, the results obtained for GLUT3 by quantitative PCR andthose obtained by Northern blot analysis are in remarkableagreement.
Localization of GLUT3 Protein in theDiabetic Lens
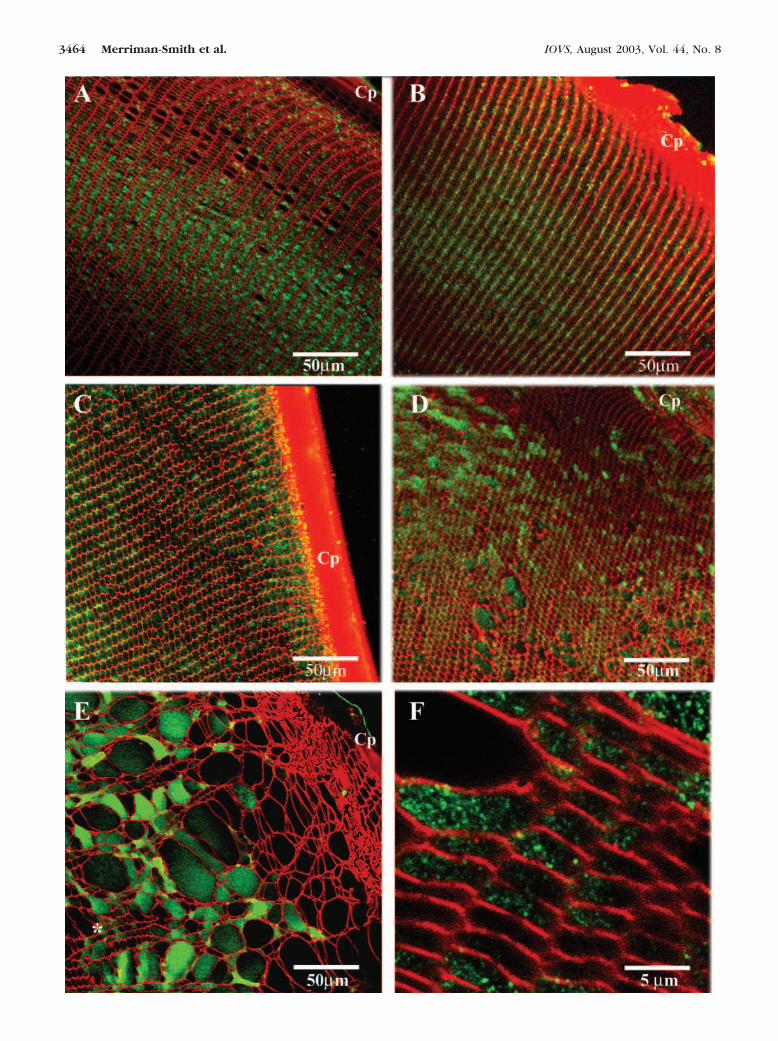
To determine how the increase in GLUT3 protein relates to thetissue damage observed in the hyperglycemic lenses, GLUT3protein was localized in equatorial sections taken from strep-tozotocin-injected rats (Fig. 5). In an equatorial section takenfrom a saline-injected rat most of the GLUT3 labeling wasdetected intracellularly, with a small amount of GLUT3 in themembrane (Fig. 5A). An increase in GLUT3 membrane labelingwas detected in a section from a rat 1 week after injection ofstreptozotocin (Fig. 5B). At 2 weeks after injection, an increasein both membrane and cytoplasmic GLUT labeling was de-tected (Fig. 5C). In weeks 3 and 4 after injection, an increase inintracellular labeling of GLUT3 was detected (Figs. 5D, 5E).Higher-resolution imaging demonstrated that a significant frac-tion of GLUT3 was localized as intracellular pools of GLUT3 inthis damaged area (Fig. 5F). Thus, the observed increase inGLUT3 membrane labeling at weeks 1 and 2 after injection was
FIGURE 3. Effects of hyperglycemia on lens transparency and tissue morphology. Confocal micrographs of FITC-conjugated WGA-labeledequatorial sections showing tissue morphology of lenses cultured for 8 days in 5 mM glucose (A) and for 2 (B), 4 (C), and 8 (D) days in the presenceof 50 mM glucose. Dark-field images (insets) showing lens transparency are displayed for each time point. Cp, capsule.
3462 Merriman-Smith et al. IOVS, August 2003, Vol. 44, No. 8
localized to the region in the lens where the fiber cells weredestined to sustain extensive tissue damage. With continueddiabetic insult, GLUT3 tended to accumulate in the cytoplasm,
and this accumulation may play a role in exacerbating tissuedamage.
Upregulation of GLUT3 Protein in theDiabetic Lens
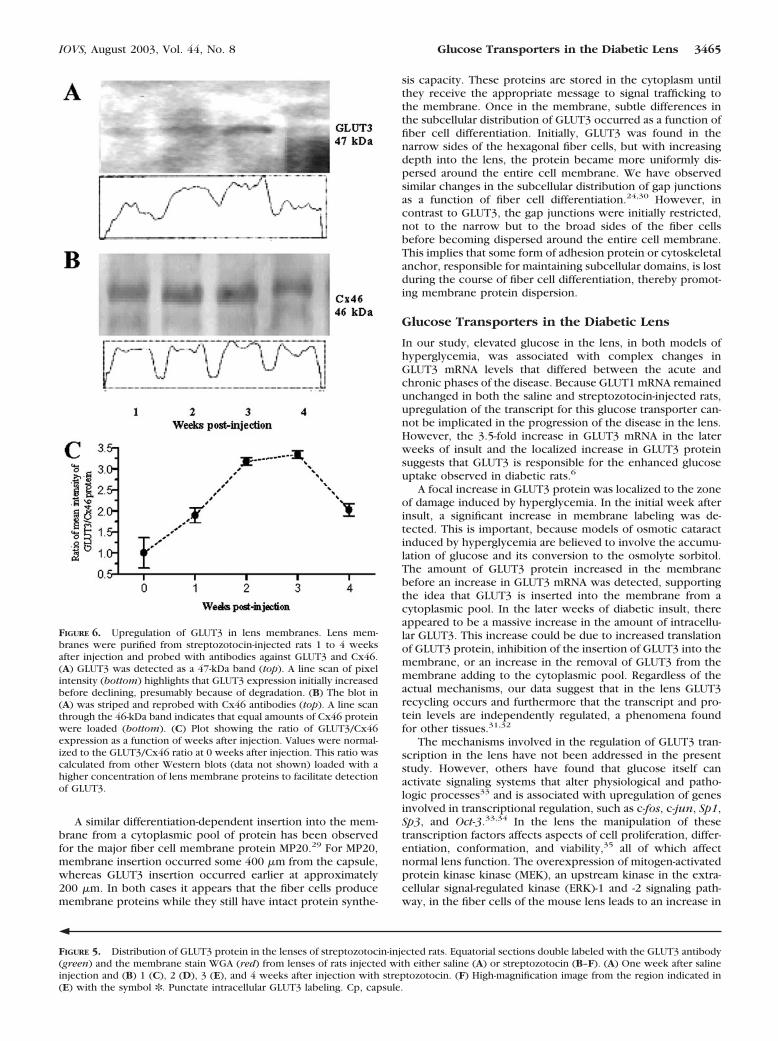
Western blot analysis was performed on urea-stripped lensfiber cell membranes to confirm whether the amount ofGLUT3 protein inserted into the membrane increases afterdiabetic insult (Fig. 6). A progressive increase in a 47-kDaproduct was detected with the GLUT3 antibody from weeks 1to 3 after injection of streptozotocin (Fig. 6A). At 4 weeks afterinjection, the level of the 47-kDa product decreased, and it wasreplaced by lower molecular mass bands indicative of GLUT3protein degradation.21,22 Such degradation is a common fea-ture in cataractogenesis, because cellular breakdown activatescalcium-dependent proteases in the lens. The blot wasstripped, and Western blot analysis was performed with a Cx46antibody to detect any difference in protein loading (Fig. 6B).No difference was obvious, as shown by the line plot. Toinvestigate further the upregulation of GLUT3, the ratio ofGLUT3 to Cx46 band intensities was normalized and plottedagainst weeks elapsed since injection (Fig. 6C). A significantincrease in GLUT3 expression was detected that peaked at 3weeks before declining, presumably because of increased pro-tein degradation.
DISCUSSION
Glucose provides the energy requirements for lens clarity andhomeostasis, yet excess glucose or, hyperglycemia can lead tolens opacification. Because the uptake of glucose is mediatedby members of the facilitative transporter family (GLUT1 and-3), we investigated how these transporters respond to hyper-glycemic insults that ultimately lead to cataract. To induce thehyperglycemic insult we compared in vivo and in vitro modelsof sugar cataract. Not only did we find differential expressionof these transporters in the normal lens, we also found thathyperglycemia differentially upregulated the fiber cell specificGLUT3 in the cortical zone of tissue damage. The implicationsof our findings in the normal and hyperglycemic lens arediscussed.
Glucose Transporters in the Normal Lens
We have shown in a previous study in neonatal rat lenses thattwo members of the glucose transporter family, GLUT1 and -3,are differentially expressed in the epithelium and fiber cells,respectively.2 In other tissues, the relative expression levels ofthese two isoforms appear to change as a function of develop-ment and growth.23 Therefore, we first investigated the ex-pression patterns of GLUT1 and -3 in the normal adult rat lens.Although no differences in the distribution patterns of the twoisoforms were observed in the adult lens relative to the neo-natal lens, the use of a superior sectioning protocol24 allowedthe distribution of GLUT3 to be more extensively investigated.We found that subcellular GLUT3 labeling changed as a func-tion of fiber cell differentiation. Initially, GLUT3 labeling wascytoplasmic, but as the fiber cells elongated labeling becameincreasingly associated with the membrane, indicating thatGLUT3 is inserted into the membrane from a cytoplasmic pool.The cytoplasmic staining observed in this study has also beenreported in other tissues.25 In these tissues, GLUT3 is thoughtto cycle between the plasma membrane and intracellular poolthrough clathrin-mediated pathways,26 through a translocationprocess similar to that of the related isoform GLUT4.26,27 In thelens, clathrin-coated pits have been observed,28 but whetherthey are involved in the insertion of GLUT3 remains to bedetermined.
FIGURE 4. Transcript levels in response to hyperglycemia. (A) North-ern blot analysis of total RNA extracted from six whole lenses per timepoint taken from saline-injected (left) and streptozotocin-injected(right) rats hybridized with GLUT3 (top) and Cx46 (bottom) probes.The number of weeks after injection is indicated. (B) Northern blotanalysis of total RNA extracted from two whole lenses per time pointtaken from lenses cultured in (left) 5 and (right) 50 mM glucosehybridized with GLUT3 (top) and Cx46 (bottom) probes. The length oftime in culture is indicated. (C) Relative proportions of GLUT1 and -3transcripts quantified by real-time PCR for saline- and streptozotocin-injected rats over the course of 4 weeks. Transcript levels were nor-malized to Cx46 levels. The data at each time point represents themean and SEM of results in three separate experiments. In eachexperimental group and time point, RNA was pooled from four lensesextracted from four different animals. For each experiment reactionswere run in duplicate and repeated three times. (– – –) hyperglycemic;(—) normal; (F, �) GLUT1/Cx46, (f, Œ) GLUT3/Cx46.
IOVS, August 2003, Vol. 44, No. 8 Glucose Transporters in the Diabetic Lens 3463
3464 Merriman-Smith et al. IOVS, August 2003, Vol. 44, No. 8
A similar differentiation-dependent insertion into the mem-brane from a cytoplasmic pool of protein has been observedfor the major fiber cell membrane protein MP20.29 For MP20,membrane insertion occurred some 400 �m from the capsule,whereas GLUT3 insertion occurred earlier at approximately200 �m. In both cases it appears that the fiber cells producemembrane proteins while they still have intact protein synthe-
sis capacity. These proteins are stored in the cytoplasm untilthey receive the appropriate message to signal trafficking tothe membrane. Once in the membrane, subtle differences inthe subcellular distribution of GLUT3 occurred as a function offiber cell differentiation. Initially, GLUT3 was found in thenarrow sides of the hexagonal fiber cells, but with increasingdepth into the lens, the protein became more uniformly dis-persed around the entire cell membrane. We have observedsimilar changes in the subcellular distribution of gap junctionsas a function of fiber cell differentiation.24,30 However, incontrast to GLUT3, the gap junctions were initially restricted,not to the narrow but to the broad sides of the fiber cellsbefore becoming dispersed around the entire cell membrane.This implies that some form of adhesion protein or cytoskeletalanchor, responsible for maintaining subcellular domains, is lostduring the course of fiber cell differentiation, thereby promot-ing membrane protein dispersion.
Glucose Transporters in the Diabetic Lens
In our study, elevated glucose in the lens, in both models ofhyperglycemia, was associated with complex changes inGLUT3 mRNA levels that differed between the acute andchronic phases of the disease. Because GLUT1 mRNA remainedunchanged in both the saline and streptozotocin-injected rats,upregulation of the transcript for this glucose transporter can-not be implicated in the progression of the disease in the lens.However, the 3.5-fold increase in GLUT3 mRNA in the laterweeks of insult and the localized increase in GLUT3 proteinsuggests that GLUT3 is responsible for the enhanced glucoseuptake observed in diabetic rats.6
A focal increase in GLUT3 protein was localized to the zoneof damage induced by hyperglycemia. In the initial week afterinsult, a significant increase in membrane labeling was de-tected. This is important, because models of osmotic cataractinduced by hyperglycemia are believed to involve the accumu-lation of glucose and its conversion to the osmolyte sorbitol.The amount of GLUT3 protein increased in the membranebefore an increase in GLUT3 mRNA was detected, supportingthe idea that GLUT3 is inserted into the membrane from acytoplasmic pool. In the later weeks of diabetic insult, thereappeared to be a massive increase in the amount of intracellu-lar GLUT3. This increase could be due to increased translationof GLUT3 protein, inhibition of the insertion of GLUT3 into themembrane, or an increase in the removal of GLUT3 from themembrane adding to the cytoplasmic pool. Regardless of theactual mechanisms, our data suggest that in the lens GLUT3recycling occurs and furthermore that the transcript and pro-tein levels are independently regulated, a phenomena foundfor other tissues.31,32
The mechanisms involved in the regulation of GLUT3 tran-scription in the lens have not been addressed in the presentstudy. However, others have found that glucose itself canactivate signaling systems that alter physiological and patho-logic processes33 and is associated with upregulation of genesinvolved in transcriptional regulation, such as c-fos, c-jun, Sp1,Sp3, and Oct-3.33,34 In the lens the manipulation of thesetranscription factors affects aspects of cell proliferation, differ-entiation, conformation, and viability,35 all of which affectnormal lens function. The overexpression of mitogen-activatedprotein kinase kinase (MEK), an upstream kinase in the extra-cellular signal-regulated kinase (ERK)-1 and -2 signaling path-way, in the fiber cells of the mouse lens leads to an increase in
FIGURE 6. Upregulation of GLUT3 in lens membranes. Lens mem-branes were purified from streptozotocin-injected rats 1 to 4 weeksafter injection and probed with antibodies against GLUT3 and Cx46.(A) GLUT3 was detected as a 47-kDa band (top). A line scan of pixelintensity (bottom) highlights that GLUT3 expression initially increasedbefore declining, presumably because of degradation. (B) The blot in(A) was striped and reprobed with Cx46 antibodies (top). A line scanthrough the 46-kDa band indicates that equal amounts of Cx46 proteinwere loaded (bottom). (C) Plot showing the ratio of GLUT3/Cx46expression as a function of weeks after injection. Values were normal-ized to the GLUT3/Cx46 ratio at 0 weeks after injection. This ratio wascalculated from other Western blots (data not shown) loaded with ahigher concentration of lens membrane proteins to facilitate detectionof GLUT3.
Š
FIGURE 5. Distribution of GLUT3 protein in the lenses of streptozotocin-injected rats. Equatorial sections double labeled with the GLUT3 antibody(green) and the membrane stain WGA (red) from lenses of rats injected with either saline (A) or streptozotocin (B–F). (A) One week after salineinjection and (B) 1 (C), 2 (D), 3 (E), and 4 weeks after injection with streptozotocin. (F) High-magnification image from the region indicated in(E) with the symbol ✽ . Punctate intracellular GLUT3 labeling. Cp, capsule.
IOVS, August 2003, Vol. 44, No. 8 Glucose Transporters in the Diabetic Lens 3465
glucose uptake36 and is later associated with cortical damage,similar to but not identical with that in the diabetic rat lens.7
The elevated intracellular glucose levels observed in thesemouse lenses were not attributed to GLUT3, but to the inap-propriate additional expression of GLUT1 in the fiber cells.
In summary, these results explain the increase in glucose-derived metabolites during diabetes and show that the glucosetransport system is dynamic. GLUT3 is locally upregulated inthe diabetic lens, accounting for the high lenticular glucoselevels in diabetic animals. An increase in GLUT3 protein ob-served in a region overlapping the cortical zone of disruptedcell structure may contribute to the osmotic damage in thecortex. Hence, the localization of GLUT3 to the swollen fibercell membranes suggests that GLUT3 mediates the observedincreased uptake of glucose and is therefore a potential targetfor anti-cataract therapies.
Acknowledgments
The authors thank Colin Green for his tuition in the use of the confocalmicroscope, and to Roche Diagnostics, especially John McKay andAlison Weaver, for supplying the use of the LightCycler and for tech-nical instructions.
References
1. Berman ER. Biochemistry of the Eye. New York; Plenum Press;1991.
2. Merriman-Smith R, Donaldson P, Kistler J. Differential expressionof facilitative glucose transporters GLUT1 and GLUT3 in the lens.Invest Ophthalmol Vis Sci. 1999;40:3224–3230.
3. Mathias RT, Rae JL, Baldo GJ. Physiological properties of thenormal lens. Physiol Rev. 1997;77:21–50.
4. Donaldson PJ, Kistler J, Mathias RT. Molecular solutions to lenstransparency. News Physiol Sci. 2001;16:118–123.
5. Gould GW, Holman D. The glucose transporter family: structure,function and tissue specific expression. Biochem J. 1993;295:329–341.
6. Obrosova I, Cao X, Greene DA, Stevens MJ. Diabetes-inducedchanges in lens antioxidant status, glucose utilization and energymetabolism: effect of DL-alpha-lipoic acid. Diabetologia. 1998;41:1442–1450.
7. Bond J, Green C, Donaldson P, Kistler J. Liquefaction of corticaltissue in diabetic and galactosemic rat lenses defined by confocallaser microscopy. Invest Ophthalmol Vis Sci. 1996;37:1557–1565.
8. Chin E, Zamah AM, Landau D, et al. Changes in facilitative glucosetransporter messenger ribonucleic acid levels in the diabetic ratkidney. Endocrinology. 1997;138:1267–1275.
9. Boileau P, Mrejen C, Hauguel-de Mouzon, S. Overexpression ofGLUT3 placental glucose transporter in diabetic rats. J Clin Invest.1995;96:309–317.
10. Das UG, Sadiq F, Soares MJ, Hay WW, Devaskar SU. Time-depen-dent physiological regulation of rodent and ovine placental glu-cose transporter (GLUT-1) protein. Am J Physiol. 1998;274:R339–R347.
11. Knott RM, Robertson M, Muckersie E, Forrester JV. Regulation ofglucose transporters (GLUT-1 and GLUT-3) in human retinal endo-thelial cells. Biochem J. 1996;318:313–317.
12. Merriman-Smith R, Tunstall M, Kistler J, Donaldson P, Housley G,Eckert R. Expression profiles of P2-receptor isoforms P2Y(1) andP2Y(2) in the rat lens. Invest Ophthalmol Vis Sci. 1998;39:2791–2796.
13. Reagan LP, Magarinos AM, McEwen BS. Neurological changesinduced by stress in streptozotocin diabetic rats. Ann NY Acad Sci.1999;893:126–137.
14. Reagan LP, Magarinos AM, Lucas LR, Van Bueren AV, McCall AL,McEwen BS. Regulation of GLUT-3 glucose transporter in thehippocampus of diabetic rats subjected to stress. Am J Physiol.1999;276:E879–E886.
15. Lukic M, Stosic-Grujicic S, Shahin A. Effector mechanisms in low-dose streptozotocin-induced diabetes. Dev Immunol. 1998;6:119–128.
16. Kilic F, Bhardwaj R, Trevithick JR. Modelling cortical cataractogen-esis. 18. In vitro diabetic cataract reduction by venoruton: aflavonoid which prevents lens opacification. Acta OphthalmolScand. 1996;74:372–378.
17. Sasson S, Kaiser N, Dan-Goor M, et al. Substrate autoregulation ofglucose transport: hexose-6-phosphate mediates the cellular distri-bution of glucose transporters. Diabetologica. 1997;40:30–39.
18. Kumagai AK, Glasgow BJ, Pardridge WM. GLUT1 glucose trans-porter expression in the diabetic and non-diabetic human eye.Invest Ophthalmol Vis Sci. 1994;35:2887–2894.
19. Paul DL, Ebihara L, Takemoto LJ, Swenson KI, Goodenough DA.Connexin46, a novel lens gap junction protein, induces voltage-gated currents in nonjunctional plasma membrane of Xenopusoocytes. J Cell Biol. 1991;115:1077–1089.
20. Roche E, Assimacppoulos-Jeannet F, Witters LA, et al. Induction byglucose of genes coding for glycolytic enzymes in a pancreaticbeta-cell line (INS-1). J Biol Chem. 1997;272:3091–3098.
21. Lin JS, Eckert R, Kistler J, Donaldson P. Spatial differences in gapjunction gating in the lens are a consequence of connexin cleav-age. Eur J Cell Biol. 1998;76:246–250.
22. Lampi KJ, Ma Z, Hanson SR, et al. Age-related changes in humanlens crystallins identified by two-dimensional electrophoresis andmass spectrometry. Exp Eye Res. 1998;67:31–43.
23. Vannucci SJ, Maher F, Simpson, IA. Glucose transporter proteins inbrain: delivery of glucose to neurons and glia. Glia. 1997;21:2–21.
24. Jacobs MD, Soeller C, Cannell MB, Donaldson PJ. Quantifyingchanges in gap junction structure as a function of lens fiber celldifferentiation. Cell Commun Adhes. 2001;8:349–353.
25. Choeiri C, Staines W, Messier C. Immunohistological localizationand quantification of glucose transporters in mouse brain. Neuro-science. 2002;111:19–34.
26. Thoides G, Kupriyanovai T, Cunningham JM, et al. Glucose trans-porter GLUT3 is targeted to secretory vesicles in neurons andPC12 cells. J Biol Chem. 1999;274:14062–14066.
27. Sorbara LR, Davies-Hill TM, Koehler-Stec EM, Vannuccis SJ, HornMK, Simpson JA. Thrombin-induced translocation of GLUT3 glu-cose transporters in human platelets. Biochem J. 1997;1:511–516.
28. Brown HG, Pappas GD, Ireland ME, Kuszak JR. Ultrastructural,biochemical, and immunological evidence of receptor-mediatedendocytosis in the crystalline lens. Invest Ophthalmol Vis Sci.1990;31:2579–2592.
29. Gonen T, Grey AC, Jacobs MD, Donaldson PJ, Kistler J. MP20, thesecond most abundant lens membrane protein and member of thetetraspanin superfamily, joins the list of ligands of galectin-3 (serialonline). BMC Cell Biol. 2001;17.
30. Gruijters WTM, Kistler J, Bullivant S. Formation, distribution anddissociation of intercellular junctions in the lens. J Cell Science.1987;88:351–359.
31. Prapong T, Buss J, Hsu WH, Heine P, Greenlee HW, Uemura E.Amyloid �-peptide decreases neuronal glucose uptake despitecausing increase in GLUT3 mRNA transcription and GLUT3 trans-location to the plasma membrane. Exp Neurol. 2002;174:253–258.
32. Barros LF, Barnes K, Ingram JC, Castro J, Porras OH, Baldwin SA.Hyperosmotic shock induces both activation and translocation ofglucose transporters in mammalian cells. Eur J Physiol. 2001;442:614–621.
33. Susini S, Roche E, Prentki M, Schlegel W. Glucose and glucoincre-tin peptides synergize to induce c-fos, c-jun, junB, zif-268, andnur-77 gene expression in pancreatic beta(INS-1) cells. FASEB J.1998;12:1173–1182.
34. Kreisberg JI, Radnik RA, Ayo SH, Garoni J, Saikumar P. Highglucose elevates c-fos and c-jun transcripts and proteins in mesan-gial cell cultures. Kidney Int. 1994;46:105–112.
35. Li D, Spector A. Hydrogen peroxide-induced expression of theproto-oncogenes, c-jun, c-fos and c-myc in rabbit lens epithelialcells. Mol Cell Biochem. 1997;173:59–69.
36. Gong X, Wang X, Han J, Niesman I, Huang Q, Horwitz J. Devel-opment of cataractous macrophthalmia in mice expressing anactive MEK1 in the lens. Invest Ophthalmol Vis Sci. 2001;42:539–548.
3466 Merriman-Smith et al. IOVS, August 2003, Vol. 44, No. 8