exploring foreign market access in government procurement
TRANSCRIPT
Foreign market access in government procurement
Anirudh Shingal1
August 2011
Abstract
Governments are known to prefer domestic over foreign suppliers in the award of procurement contracts despite cost and quality considerations. Literature exploring this “home-bias” in public purchases has exclusively focused on the microeconomic interplay between the tendering entity and the bidding firms. There are, however, other factors that influence governments’ buying decisions. Using self-assembled and hitherto unexplored data on government procurement submitted by Japan and Switzerland to the WTO, we study the determinants of foreign public procurement over the period 1990-2003. In doing so, we make a threefold contribution to this literature. One, we examine the effect of macroeconomic, political economy, procurement-specific and domestic policy factors that influence governments’ sourcing decisions. Two, we provide for an empirical test of Baldwin's (1970, 1984) "neutrality proposition" after controlling for other factors. Three, we test empirically whether the WTO's Agreement on Government Procurement (GPA) has been successful in increasing foreign market access. Our results suggest the importance of the magnitude of procurement demand and of the average contract size awarded to foreign suppliers in these governments' purchases from abroad. While the impacts of domestic firm competitiveness attributes, political budget cycles and Keynesian macroeconomic compulsions depend on the econometric specification used, we find that Baldwin's "neutrality proposition" does not hold for the public purchase pattern of either country. Moreover, membership of the GPA is not found to increase the value of foreign procurement in either country, though it seems to increase the import demand for contracts. JEL classification: F10, F13, F14, D72, H57 Key words: Government procurement, home-bias, GPA, Japan, Switzerland
1 Senior Research Fellow, WTI & Research Affiliate, CARIS. The usual disclaimer applies. Address for correspondence: World Trade Institute, Hallerstrasse 6, CH - 3012, Bern; Email: [email protected].

Table of Contents
1. Introduction............................................................................................................... 3
2. A simple model of procurement decision-making.................................................... 6
3. Empirical model and issues in estimation................................................................. 8
4. Data availability and limitations ............................................................................. 11
5. Data description and preliminary diagnosis............................................................ 14
6. Results from empirical analysis .............................................................................. 17
7. Conclusion .............................................................................................................. 21
Bibliography ................................................................................................................ 23
List of tables
Table 1: Explanatory variables, their description and purpose in estimation .............. 27
Table 2: A snapshot of Japanese government procurement (1990-2003).................... 28
Table 3: A snapshot of Swiss public purchases (1990-2003) ...................................... 29
Table 4: Evolution of sample variables over time ....................................................... 30
Table 5: Estimating Japanese foreign procurement value ........................................... 31
Table 6: Estimating Swiss foreign procurement value ................................................ 31
Table 7: Estimating Japanese import demand for contracts ........................................ 32
Table 8: Estimating Swiss import demand for contracts ............................................. 32
List of annex tables
Table A1: Goods procured by the Japanese and Swiss governments.......................... 33
Table A2: Services procured by the Japanese government ......................................... 34
Table A3: Services procured by the Swiss government .............................................. 35
Table A4: Data description for the empirical model ................................................... 36
2
1. Introduction
It is well known that governments prefer domestic over foreign firms in the award of
procurement contracts despite cost and quality considerations, giving rise to the so-called
"home-bias" in public purchase decisions. Evidence in support of this home-bias has been
provided in the literature - Mastanduno (1991), Hoekman and Mavroidis (1997), Trionfetti
(2000), the European Commission (1997), Evenett and Shingal (2006), Shingal (2011).
Literature has also evolved to explain this home-bias in public procurement - McAfee and
McMillan (1989), Laffont and Tirole (1991), Rothenberg (1993), Branco (1994), Breton and
Salmon (1995), Chen (1995), Vagstad (1995), Naegelen and Mougeot (1998), Weichenrieder
(2001). Another branch of this literature has looked at corruption and bribery as determinants
of the home-bias in public procurement - Rose-Ackerman (1975), Rose-Ackerman (1978),
Burguet and Perry (2000), Burguet and Che (2004), Compte et.al. (2005). However, almost
exclusively, this literature has focused on the interaction between the tendering entity and the
bidding firms in a microeconomic setting of asymmetric information and contract theory.
In this paper, we depart from this line of research and consider other factors - procurement-
specific, macroeconomic, political economy and domestic policy - that influence a
government's propensity to source from foreign suppliers. Review of related literature and
anecdotal evidence both suggest the importance of these factors, but to the best of our
knowledge, this area remains un-researched in the procurement literature.
The impact of political institutions on economic policy has been extensively studied in the
political budget cycles literature2 – Rogoff and Silbert (1988), Persson and Tabellini (1990),
Rogoff (1990), Alesina et.al. (1997), Diermeier and Merlo (1999), Blanchard and Wolfers
(2000), Drazen (2000), Persson and Tabellini (2000), Shi and Svensson (2000), Persson
(2002). This body of literature explores the implications of electoral cycles on the size and
composition of government spending using signalling and moral hazard models to conclude
that governments increase spending before elections to enhance their chances of re-election. In
this paper, we extend this intuition to government procurement – governments are more likely 2 An initial review of the theoretical and empirical literature can be found in Alesina et.al. (1997).
3
to award contracts to domestic firms in an election period since this would improve their
chances of being re-elected. This analysis is also related to recent literature that looks at the
effect of political connections on the allocation of procurement contracts (Goldman et.al.,
2009; Hyytinen et.al., 2009) and that studying tenure in office and public procurement
(Coviello & Gagliarducci, 2010).
Similarly, the impact of macroeconomic variables, especially exchange rate stability, on trade
has been studied in the literature (Helpman, 1976; Cushman, 1983; Bacchetta & van Wincoop,
2000), but not on public procurement. In this paper, we bridge this gap in research too.
Governments are more likely to award contracts to domestic firms in a recession to stimulate
Keynesian multiplier effects in the economy. Similarly, a currency devaluation or depreciation
of the exchange rate that makes imports more expensive would also make it more cost-
effective for governments to purchase from domestic firms. On the other hand, an increase in
government spending at home may result in a depreciation of the real exchange (Ravn et. al.,
2008). Thus, causality in this case may work both ways.
Anecdotal evidence cited in Shingal (2009) also suggests that the home-bias in procurement
may be driven by a range of procurement-specific and domestic policy factors. These include
the nature of the good or service3 being procured; the value of the procurement contract4; the
extent of domestic competition5; practical considerations of the tender6; compliance costs7;
regulatory burden8; and the domestic policy environment9.
3 Some goods and services are easily procurable domestically which renders the entire exercise of initiating a global tender cumbersome. On the other hand, some goods and services are too specialized for them to be available domestically, which mandates their foreign procurement. Moreover, if the structure of production is dominated by intermediate inputs, then demand is more likely to be locally-driven, giving rise to a home-bias in both consumption and trade (Hillberry & Hummels, 2002) and this may well extend to the domain of public procurement (Brenton, 2001). 4 The contract value may not be large enough to be economically attractive to foreign suppliers or to warrant a global tender, especially in the case of goods procurement. 5 A competitive domestic market ensures both availability of suppliers and cost minimization through competition. In some cases, however, governments may need to restrict competition to ensure contract performance (Laffont and Tirole, 1991; Rothenberg, 1993; Breton and Salmon, 1995). 6 Would the tender documentation require translation? Is there enough time to respond to the tender? Such considerations also govern the participation decisions of foreign firms besides inflating their costs. 7 Breton & Salmon (1995) show that the premium required to ensure contract compliance may increase with the number of potential bidders and in such situations minimizing expected procurement costs may require limiting the number of potential suppliers. Problems of asymmetric information may also induce procuring entities to choose suppliers located within their jurisdictions so as to reduce monitoring costs. Moreover, search costs of
4
To motivate our analysis, we consider a simple model of government procurement decision-
making used in this literature to illustrate how some of these factors work to the detriment of
foreign firms. We then empirically examine the importance of these factors using self-
assembled and hitherto unexplored data submitted by Japan and Switzerland to the WTO over
1990-2003. In doing so, we also provide an empirical test of Baldwin's (1970, 1984)
"neutrality proposition"10 after controlling for all these other factors and also test empirically
whether the WTO's Agreement on Government Procurement (GPA) has been successful in
increasing foreign market access in these countries' goods procurement market. To the best of
our knowledge, these are all original contributions to this literature.
The choice of countries in this paper is primarily determined by data availability. Both
countries have submitted detailed procurement data sufficiently11 regularly over 1990-2003
and in a form amenable to empirical analysis. But there are other considerations as well: both
are large open economies and have large governments, federal as well as sub-federal. The
average share of total government expenditure in GDP over 1990-2003 was almost 50% in
Japan and 37% in Switzerland, while the average share of trade in GDP in these economies
was 19.2 and 74.6%, respectively, over this time period.
Across specifications, our results suggest the importance of the magnitude of procurement
demand and average contract size awarded to foreign suppliers in the public purchase patterns
operating across complex networks of contacts in modern economies are likely to be lower within than between countries (Rauch, 1999) while the element of trust required in lowering transaction costs is likely to be higher (Fukuyama, 1995). All these factors act to the detriment of foreign firms. 8 Cumbersome regulatory requirements can discourage a foreign firm from participating in a bid. For instance, the firm may need to be pre-registered with the domestic accreditation body before it can submit a bid. A foreign firm may also be faced with more stringent quality requirements compared to domestic firms. A study of such regulatory barriers in the EU’s government procurement market can be found in Khorana and Shingal (2008). It would also be useful to remember here that services procurement depends upon the particular sector being first scheduled under the GATS; hence, there may already be a range of market access, national treatment and regulatory barriers confronting foreign suppliers in services procurement. 9 Purchase and price preferences and product reservations followed by the importing countries systematically discriminate against foreign firms. The absence of a domestic bid challenge procedure in the importing country may also influence a foreign firm’s participation decision. On the other hand, economies that are more integrated with the rest of the world are also more likely to be open to foreign procurement. 10 In a Hecksher-Ohlin model with a home-bias in government procurement, the reduction in imports from the government is compensated by a corresponding increase in the imports of the private sector. 11 Data is missing for Japan from 1994-1996 and for Switzerland in 1992.
5

of both countries. Foreign procurement is found to vary inversely with domestic firm
competitiveness in Switzerland and Japan, with and without controlling for unobserved
industry-specific effects, respectively. Baldwin's "neutrality proposition" does not hold true
for the public purchase patterns of these countries in general but Keynesian macroeconomic
factors are found to be important in Japanese and Swiss public purchases after controlling for
unobserved year effects. Political budget cycles seem more important for services procurement
in both countries though this result is counter-intuitive. Membership of the GPA is not found
to increase foreign market access in either country, though it does seem to increase the import
demand for contracts in both.
The rest of this paper is structured as follows. The next section considers a formal treatment of
a government’s procurement decision. Section 3 introduces the empirical model and discusses
relevant estimation issues. Section 4 discusses the data used in the paper and its limitations for
analysis. Section 5 conducts a preliminary analysis of the data while Section 6 describes the
results from the empirical analysis. Section 7 concludes.
2. A simple model of procurement decision-making
Government procurement rules at the WTO require that only contracts above a certain
threshold12 value be subject to internationally competitive bidding (ICB). One way of
discriminating against foreign firms is by splitting contracts to keep them below such
thresholds.
12 Thresholds differ depending on the type of procurement and on the level of government making the purchase and are stated in terms of the IMF’s accounting unit, the SDR. For central government entities, the threshold values are SDR 130,000 for procurement of goods and services and SDR 5 million for procurement of construction services. For sub-central government entities, the thresholds are SDR 200,000 for goods and services, (except for the United States and Canada which apply a SDR 355,000 threshold) and SDR 5 million for construction services (with the exception of Japan and the South Korea, which apply a SDR 15 million threshold). For utilities, the threshold values are SDR 400,000 for goods and services (with the exception that the United States applies a US$ 250,000 threshold for federally owned utilities) and SDR 5 million for construction services (barring Japan and Korea, which apply a threshold of SDR 15 million). Additionally, Annexes of individual signatories may specify higher thresholds for particular Contracting Parties in a bid to ensure reciprocity.
6
More formally, consider a government wishing to purchase a good or service whose value is
given by V(q,p) where q is the characteristics/quality, p is the expected payment or the price
vector. Let the corruption parameter be m and the preferences to the domestic firms be s where
s�(0,1). Denote the costs of the bidding process by k.
Now in the absence of corruption and preferential treatment, a procurement contract is subject
to ICB if V(q,p) > k; this describes the threshold condition.
Allowing for corruption and preferences the threshold condition becomes
[1-(m+s)].V(q,p) > k
Corollary 1: If the preferential treatment is absolute i.e. s=1, then the contract is not subject to
ICB
Corollary 2: As m→1, it is in the government’s own interest to keep the contract below
threshold
The other way of discriminating against foreign firms is to award fewer of the above-threshold
contracts to foreign suppliers. Let the cost of producing the procured good or service for the
domestic and foreign firm be cd(q) and cf(q), respectively with cf(.)<cd(.) by assumption. Let
factors increasing the cost of participation for foreign suppliers relative to domestic suppliers
be denoted by z(V(.)).
Then, expected profit of the domestic firm, πd = p – [cd(q) + m(V(.))], and expected profit of
the foreign firm, πf = p – [cf(q) + z(V(.)) + m(V(.))]. Thus, even if cf(.)<cd(.), πf<πd if
z(V(.))>(cd-cf). The foreign firm may therefore decide not to participate in the bidding process
itself, which is an illustration of how the home-bias works.
Similarly, the government’s objective is to maximize the expected value of [V(q,p) – p],
which is equivalent to minimizing the expected payment as each bidder will choose the cost
minimizing quality. Now, p = f(bd,bf) where bd, bf are the bid prices of the domestic and
7

foreign firm, respectively, and bd = g(cd(.)) and bf = h[(cf(.), z(V(.))]. Even in the absence of
z(v(.)), McAfee & McMillan (1989) and Branco (1994) have shown that the optimal
procurement policy implies that the contract be awarded to the domestic firm. With
z(V(.))>(cd-cf), minimizing expected payment would necessarily imply that the government
award the contract to the domestic firm.
3. Empirical model and issues in estimation
Ideally, the empirical estimation would entail a two-stage Heckman selection model, where
stage one would estimate whether (or not) a procuring entity put a contract above threshold
and stage two would estimate the share of the above-threshold contracts that was awarded to
foreign suppliers. Unfortunately, available government procurement data meet the
requirements of stage two analysis only; data required for stage one analysis are not required
by the GPA to be reported at the level of the individual goods and services.
The empirical analysis in this paper therefore models stage two only. The determinants of
foreign procurement discussed in the preceding sections are the explanatory variables in this
empirical model. The functional form and specification of the model are in the spirit of the
standard import demand function of the following form:
log MDit = a0 + a1log (PMi/PDi)t + a2logYit + Ut ,
where MDit is the value of imports of country “i" at time “t”, PM is the unit value of imports,
PD is the domestic price level, Y is the real GNP, and Ut is an error term associated with each
observation.
In our empirical model, the value of the government’s foreign procurement is the dependent
variable. In the absence of data on the price of individual government contracts awarded to
domestic and foreign firms, competitiveness effects are proxied by domestic industry-specific
variables such as output, employment, productivity and tariffs. Economy-wide income and
prices effects are represented by macroeconomic variables such as economic growth,
8
unemployment and exchange rates. In addition, we also control for political economy factors
like election cycles. The list of explanatory variables, their description and use in estimation is
provided in Table 1.
<Insert Table 1 here>
We set up the data in separate panels for Japan and Switzerland to gain information from both
the variation in time and that across categories of goods and services that are procured by the
governments of these two countries. The dependent variable is the value of goods and services
contracts awarded to foreign suppliers. The empirical model takes the following specification:
fpvit = α + β1RDN13it + β2y14
it + β3aplit + β4n15it + β5mit + β6TAR16
it + β7rogt + β8reer17t +
β9ELECt + β10 ELECt-1 + β11URGPA18t + µit
where all lower case variables are in log levels and all economic data are expressed in real
USD using the US GDP Implicit Price Deflator. A priori, we expect the signs of β1, β8 and β11
to be positive and β2 through β6, β9 and β10 to be negative. Negative sign on the β7 coefficient
would suggest the absence of Keynesian macroeconomics in governments' procurement
decisions.
It may be useful to point out that only industry-specific factors such as an increase in the
productivity of the domestic firms would be considered as non-discriminatory reasons for
governments purchasing fewer goods and services from abroad. Most of the other factors for a
decline in foreign procurement would, on the other hand, suggest the presence of a home-bias.
13 The relative demand variable takes the value zero for 4.6% of the observations in the case of Japan and 22.8% of the observations in the case of Switzerland. We therefore do not use its log form in the estimation as doing so effectively reduces the sample size given that the log of zero is not defined. 14 The firm-level output and employment variables are used interchangeably in the estimations. 15 The number of firms is excluded in the estimation for Switzerland as data on this variable is available only for 20% of the observations. 16 The simple average applied tariff is effectively zero in the case of Switzerland, so this variable is excluded while estimating the foreign procurement of Swiss goods. In the case of Japan, this variable takes the value zero in 48.4% of the observations, which is why it is not used in its log form. 17 An increase in REER means currency appreciation and loss in competitiveness. 18 The URGPA dummy is only used in the goods estimation. Since the coverage of services in the GPA only began with the Uruguay Round, the URGPA dummy is rendered redundant in the services estimation.
9
Robustness check: Number and average value of procurement contracts - Data are also
available on the number of goods and services contracts that these governments purchased
from foreign suppliers. The average value of a contract procured domestically and
internationally can be further calculated from these data by dividing the total contract value
purchased from domestic and foreign firms by the respective number of contracts. As a
robustness check, therefore, we further estimate a separate pseudo-import demand function in
a secondary estimation. The dependent variable in this secondary estimation is the number of
goods and services contracts purchased from abroad (MDD) and in addition to the control
variables used in the primary estimation, we include the average value of a contract procured
domestically (PD) and internationally (PF).
mddit = α' + β1RDVit + β2yit + β3aplit + β4nit + β5mit + β6TARit + β7rogt + β8reert + β9ELECt +
β10 ELECt-1 + β11URGPAt + β12pdit + β13pfit + δit
The domestic and foreign average contract values are expected to impact, negatively and
positively, respectively, on the pseudo-import demand for contracts given that a larger value
contract is expected to be more attractive to a bidding firm.
The choice of estimation technique is primarily governed by the characteristics of the data at
our disposal. Primarily, we found the incidence of zeroes in our dependent variable19, which
meant that using a log-linearized model would effectively truncate the size of the sample20 and
hence, bias the estimates. One way to solve this problem would be by adding a small positive
constant to all zero values of the dependent variable21, but this not only amounts to data
manipulation but also biases estimates if the incidence of these zeroes is correlated with other
observed or unobserved factors i.e. if there is some economic rationale for the incidence of
these zeroes22. Another way to account for the “zero problem23” is to estimate a logit or probit
model. However, these models are based on the dependent variables being discrete choice and 19 The foreign procurement value was found to be zero for 29.4% of the observations in the case of Japan and 49.4% of the observations in the case of Switzerland. 20 This is because log of zero is not defined. 21 Normally this is done by adding 1 to all zeroes because log(1)=0. 22 For instance, in the context of gravity model estimations, Baldwin and Harigan (2008) have shown the export zeroes to be strongly correlated with distance and size of the importing country. 23 Helpman et. al (2008).
10
not continuous as in our case. Moreover, the explanatory power of the model was found to be
reduced considerably in a logit or probit estimation24. Additionally, the coefficients from logit
and probit estimations cannot be interpreted as elasticities. In view of all these issues, we
therefore decided to use the simple Poisson Pseudo-Maximum Likelihood (PPML) (Silva &
Tenreyro, 2006; Siliverstovs & Schumacher, 2007), which retains the dependent variable in
levels (and hence solves for the log-linearization induced issues with the incidence of zeroes in
the dependent variable), with the estimated coefficients still being interpretable as elasticities.
Moreover, we also found the data in our sample to be heteroskedastic for both countries,
because of which a standard log-linearized model would yield inconsistent estimates.25 The
PPML thus accounts for this as well.
4. Data availability and limitations
Statistics submitted by the GPA signatories to the WTO Secretariat are the primary source of
data on government procurement. Article XIX: 5 of the GPA requires that Contracting Parties
submit procurement-related data to the Committee on Government Procurement.
Unfortunately, only half of the 40 Contracting Parties (Canada, the EC, Hong Kong, Japan,
Norway and the United States) have submitted these data regularly since the Uruguay Round,
especially over 1997-200726. Moreover, these submissions have been made electronically
only since the Uruguay Round, which meant that the database for analysis in this paper before
the year 1996 was assembled manually.
Even amongst the countries that have submitted these data, there are significant differences,
both in terms of what is included and how it is included27, and the need for consistency, has
24 Across specifications, the coefficient of determination was reduced to 20-49% for Japan and 42-56% for Switzerland, even after controlling for year and category effects. 25 “This is because the expected value of the logarithm of a random variable depends on higher-order moments of its distribution. Therefore, if the errors are heteroskedastic, the transformed errors will be generally correlated with the covariates.” (Silva & Tenreyro, 2006). Note however that this only renders the estimates inconsistent but not biased. 26 Switzerland has not provided data beyond 2003. A snapshot of country procurement submissions is available in Shingal (2011). 27 For instance, Norway and the US employ a different classification system compared to the EC, Japan and Switzerland which makes it impossible to analyze data at the level of the disaggregated good or service before the
11
thus determined the choice of sample countries for the analysis that follows. For both Japan
and Switzerland, we consider all goods and services, including construction, included by them
in Annexes 1, 4 and 5 of Appendix 1 of the GPA; the list is provided in Annex Tables A1-A3
of this paper.
Industry-specific data on goods purchased by these two governments are taken from three
different sources. Data on goods output, employment and number of firms in Japan are
sourced from OECD STAN (various years) and Nicita & Olarreaga (2006) for the period
1990-93 and from UNIDO (2010) 1994 onwards. Data on goods output in Switzerland are
taken from Nicita & Olarreaga (2006) for the period 1991-96 and from UNIDO (2010) and
OECD STAN (various years) for the period 1997-2003. Data on goods employment in
Switzerland are taken from UNIDO (2010) and OECD STAN (various years) and that on the
number of firms from UNIDO (2010). The last were available only for the period 1997-2003
and that too were rather scant; the variable was therefore excluded from analysis.
Industry-specific goods trade data on Japan are taken from OECD STAN (various years) and
those on tariffs from Nicita & Olarreaga (2006). Swiss trade data are taken from OECD STAN
(various years) and Nicita & Olarreaga (2006). Swiss tariffs on the goods included in our
analysis are zero. Data on sector-specific services output and employment for the two
countries are taken from OECD STAN (various years) and those on trade from OECD Trade
in Services by Service Category (various years).
Data availability imposed significant constraints on our analysis, since we needed industry-
specific information on output, employment and trade for the two countries for the same
categories of goods and services over 1990-2003 and then needed to map this information with
that on foreign procurement. To begin with, there were definitional issues for both goods and
services, which assumed importance as we needed to achieve consistency across different
classification systems used in the data sources28. Then in some cases, industry-specific output,
year 2008. Canada too uses a different classification system for services and provides no information on suppliers, so the amount of foreign procurement in services cannot be calculated. Hong Kong’s submissions until the year 2008 can only be accessed via the WTO Members’ website. 28 The concordances used in this paper are provided in Annex Tables A1-A3.
12

employment and trade data were not available at the level of the individual goods categories
that these two governments purchased, which meant that data needed to be aggregated into
broader categories to enable meaningful analysis. This was especially true of categories 11-13
and 22-26 for both countries. In some of these cases, however, more disaggregated data were
available for exports but not for output or employment (and vice versa); thus, wherever
possible, the aggregated data for output and employment were disaggregated using the export
data (and vice versa).
Despite all these efforts, a few goods categories in both countries still had industry-specific
output, employment, trade and tariff data missing. For instance, there were no data on output,
employment, number of firms or trade for categories 2 and 21 amongst the goods that the
Japanese procured; tariff data were unavailable for categories 2, 4, 14-15 and 21 over 1990-96
and for categories 2, 4, 14-15 and 21-22, 1997 onwards. In the case of Switzerland, goods-
specific data on output and employment were unavailable for categories 2, 4, 10, 14-15 and
17-26 over 1990-96; for categories 2, 4, 10, and 18-21 for the year 1997; and for categories 2-
4, 9-10 and 18-21 over 1998-2003. Trade data were missing for categories 2 and 21 across this
entire time period.
As in the case of goods, sector-specific data on output, employment and trade were not
available for all services categories. In this case too, the individual services categories were
aggregated into broader categories29 to enable meaningful analysis. Even then, the absence of
trade data for Swiss construction and computer-related services over the sample period meant
that the effective sample size was further truncated in the case of Switzerland. This also led to
relatively few services observations in the sample for both countries, due to which results from
the empirical analysis that follows for services alone are more suggestive than conclusive.
29 This yielded seven broad services sectors for Japan [construction (41), maintenance & repair (51-52), OBS (42, 72-73, 75-77), transportation (53-57), communication (58, 61-65), computer-related (66-67, 71) and sewage & sanitation (78)] and six for Switzerland [construction, OBS (1, 8-18), financial (6), transportation (2-4), communication (5) and computer-related (7)].
13
5. Data description and preliminary diagnosis
The diversity in the availability of data can be seen in Annex Table A4 that shows the mean
value for the sample variables, along with their minimum, maximum and the standard
deviation, for both Japan and Switzerland. Procurement data is reported in the country
submissions in terms of Special Drawing Rights, which is the IMF’s accounting unit. These
values have thus first been converted to USD using exchange rates from the IMF’s
International Financial Statistics (various years). All economic data are reported in real terms
using the US GDP implicit price deflator. As this table shows, there is lot of diversity in the
availability of data on the variables used in the model, leading to several missing values,
especially for industry-specific variables. We are thus left with unbalanced panels for both
Japan and Switzerland.
Preceding the empirical analysis, we present a snapshot of the procurement data submitted by
Japan and Switzerland in Tables 2 and 3, respectively. Each table shows the value and number
of contracts that these governments awarded above threshold (AT) in their “covered” goods
and services categories and the share therein that was sourced from foreign suppliers (FP)
averaged over 1990-91, 1997-98 and 2002-03. The last row of each table shows the proportion
of total procurement by value that was put above-threshold and hence, subject to ICB.
<Insert Tables 2 and 3 here>
Looking first at Japanese public purchases, we see that the value of AT goods procurement
almost tripled from USD 3.3 bn in 1990-91 to USD 9.3 bn in 1997-98 before falling sharply to
USD 5.4 bn in 2002-03. The share of FP in this was virtually stagnant at 14% in the first two
periods before falling by one percentage point in 2002-03. The average number of AT goods
contracts over 1990-2003 increased from 7576.5 to 9634 before falling to 7628 but the share
of FP in this was higher at 26% in the first two periods before falling to 23.2% in 2002-03.
This suggests that more non-large value contracts were awarded to foreign suppliers. Within
goods, the majority of Japanese public purchases were concentrated in categories 4, 6, 14-17,
22, 24 and 26; procurement in these accounted for 84.3% of AT goods procurement by value
14
and 59.7% by number, but fewer of these purchases were made from foreign firms - the
average share of FP across these categories was 15% by value and 15.5% by number
(averaged over the three time periods).
Japanese AT services procurement was much larger in value, but this too fell sharply from
USD 14.8 bn to USD 11.1 bn over 1997-98/2002-03. On the other hand, the number of
services contracts awarded AT increased by nearly one-third from 2180.5 to 3007.5, which
suggests that the average value of a services contract went up considerably over this period.
However, the share of FP in services was very low both in terms of contract value (1.2% on
average over 1997-98/2002-03) and number (3.3% on average over the same period). The
majority of Japanese public purchases in services were concentrated in construction and
computer-related services (categories 41 and 71, respectively); procurement in these
accounted for 95% of AT services procurement by value and 62.3% by number but again, the
average share of FP across these services was low - 3.7% by value and 3.8% by number
(averaged over 1997-98/2002-03).
On the whole, total AT goods and services procurement by the Japanese as well as FP therein
declined over 1997-8/2002-3 both in terms of value and number of contracts. Moreover, the
share of total procurement that was subject to ICB fell progressively from 42.9% in 1990-91 to
36.2% in 1997-98 and 32.2% in 2002-03. Both these findings, prima facie, suggest a decline
in foreign access to the Japanese government procurement market.
In the case of Switzerland, the value of AT goods procurement declined progressively from
USD 284 mn in 1990-91 to USD 233.2 mn in 1996-97 and USD 212.3 mn in 2002-03. The
share of FP in this fell sharply from 70.9% in 1990-91 to 37.5% in 1996-97 before rising to
52.3% in 2002-03. The number of AT goods contracts over 1990-2003 more than doubled
from 406 to 940 though there was a dip in this number 1996-97; the share of FP in these was
higher at 62.8% (averaged over the three time periods). These results suggest that the average
value of a Swiss goods contract fell progressively over time but this average contract size did
not seem to influence the government’s choice of supplier. Within goods, the majority of the
purchases were concentrated in categories 1, 14 and 17; procurement in these accounted for
15

56.3% of AT goods procurement by value and 38.6% by number and the average share of FP
across these categories was also high at 63.2% by value and 62.5% by number (averaged over
the three time periods).
Swiss AT services procurement (excluding that in construction) rose by nearly a fourth from
USD 204.4 mn to USD 254.5 mn over 1996-7/2002-3 (the corresponding increase in the
average number of contracts was from 234 to 321.5), while procurement of construction
services witnessed a more than five-fold increase in value from USD 16.5 mn to USD 89 mn
(number of construction services contracts increased three-fold). Within non-construction
services, the share of FP increased from 5.2 to 27.6% by value and 5.6 to 18.5% by number
over this period, while construction services moved from a 23.3% FP share in 1996-97 to
100% domestic sourcing in 2002-03. Technical, scientific and consulting services (category
14), computer-related (category 7), and construction and repair services (category 1)
dominated Swiss services procurement during this period, accounting for 69.3% of all services
contracts by value and 65.8% by number, but fewer of these services were purchased from
foreign firms - the average share of FP across these services was lower at 9.7% by value and
9.2% by number (averaged over 1996-97/2002-03).
Put together, while the number and value of total goods and services contracts awarded by the
Swiss AT and the share of FP therein increased over 1996-7/2002-3, the share of total
procurement itself that was subject to ICB fell sharply from 41.7% in 1990-91 to 27.7% in
2002-03, which also suggests that more of services were procured below-threshold.
Finally, comparing the evolution of these procurement metrics over 1990-2003 with that of the
other sample variables in Table 4, we find that the marginal increase in the share of FP in AT
procurement of goods and services by value in both countries was accompanied by a
considerable rise in the labour productivity of the domestic firms (from USD 156,000 to USD
197,000 in Japan and from USD 100,000 to USD 224,000 in Switzerland) and a significant
fall in the number of domestic firms (20% in Japan and 38% in Switzerland). At the same
time, the annual rate of economic growth fell sharply in both countries, the unemployment rate
went up considerably and the REER also appreciated by 6% over 1990-2003. This preliminary
16

diagnosis suggests that these governments’ sourcing decisions were driven as much by
domestic firm-specific factors as by classic Keynesian macroeconomic compulsions.
<Insert Table 4 here>
6. Results from empirical analysis
The results from the primary estimation carried on Japanese data are reported in Table 5 and
those on Swiss data in Table 6. In each of these tables, columns I-IV report results for goods
and services together, columns V-VIII report results for only goods and columns IX-X for
only services. In each case, we begin by estimating the empirical model without controlling
for any effects and then progressively control for year effects, category effects and finally,
both year and category effects. By including year effects in the estimation, we control for
time-dependent unobservable factors in each procurement year that may have a bearing on
foreign procurement but which are not accounted for by the macroeconomic and political
economy variables already included in the estimation. Similarly, with category effects, we
control for time-invariant industry- and service sector-specific unobservables that may have an
impact on foreign procurement but which are not accounted for by the set of industry- and
sector-specific variables already included in the estimating equations.
<Insert Tables 5 and 6 here>
Across specifications, our results suggest the importance of the magnitude of procurement
demand in explaining foreign public procurement of goods in both countries and of Japanese
services procurement. The associated elasticities30 range from 0.12 in the case of Japanese
goods and services procurement to 0.6 for Swiss goods and services procurement. In each
case, these elasticities are halved in magnitude (and even more in the case of services alone)
when the estimating equations control for category-effects, thereby suggesting that not
controlling for sector- and industry-specific unobservables biases these results upwards. Thus, 30 These are obtained by multiplying the respective coefficient values by the mean sample value of the relative demand variable.
17

unobservables such as the price, quality or even the nature of the good/service being procured
seem to explain some of the variation in foreign procurement value that was earlier explained
by the relative demand variable, which is what anecdotal evidence (Shingal, 2009) suggests.
Foreign procurement of Swiss services alone, however, reports a negative impact of relative
contract demand, a counter-intuitive result which is also found to be statistically insignificant.
Japanese foreign procurement of goods and services varies inversely with domestic firm
attributes of employment, labour productivity and number of firms in the absence of category
effects. However, once these effects are included in estimation31, foreign procurement of
goods moves in the same direction as industry-specific employment and labour productivity, a
result that goes against our model's predictions. This seems to suggest a strong correlation
between industry-specific unobservables and the employment and labour productivity
variables that are explicitly included in our estimation. In the case of Switzerland, on the other
hand, foreign procurement of goods alone and goods and services together varies directly with
output across specifications and with labour productivity in the absence of category effects,
which again is a counter-intuitive result. Thus, despite rising domestic firm productivity, the
Swiss government continued to purchase from foreign firms, which either suggests that the
rising productivity did not translate into lower procurement costs for the government or that
the quality or nature of good/service to be procured determined the choice of the government.
As it turns out, the latter does seem to explain this result because once category effects are
included in estimation,32 our labour productivity variable has a negative impact on foreign
procurement. Swiss services alone, on the other hand, report a negative relationship between
foreign procurement and labour productivity of domestic firms, and a positive relationship
between foreign procurement and output across specifications, thereby suggesting that these
relationships may be more robust for Swiss services. The elasticities are also much larger in
magnitude in this case.
31 The category effects themselves turn up to be positive (and statistically significant for 21 goods and services categories) in the case of Japan. 32 These category effects are negative in the case of Switzerland and statistically significant for 10 goods and services categories.
18

Public and private sector imports are not found to be substitutes in the case of Japanese and
Swiss goods, Swiss services or Japanese and Swiss goods and services in the absence of
category effects. In the case of Switzerland, the result becomes statistically insignificant once
we control for category-effects. However, Japanese goods (after controlling for year- and
category-effects) and Japanese services alone, with and without year-effects, seem to satisfy
Baldwin’s neutrality proposition.
The annual rate of economic growth is generally statistically insignificant as a determinant of
Japanese foreign procurement, except when both year and category effects are included in
estimation. In that case, the elasticity of this variable is 0.3 for goods and services and 0.9 for
services alone. In the case of Switzerland, the economy’s annual growth rate has a positive
impact on the foreign procurement of goods and services and goods alone after controlling for
year-effects, but this impact becomes negative, once both year- and category-effects are
included in estimation. Thus, time-dependent unobservables seem to render the procurement
patterns of these countries responsive to Keynesian macroeconomic compulsions.
Procurement of Swiss services, on the other hand, seems strongly influenced by Keynesian
macroeconomic compulsions across specifications and the elasticities are also larger in
magnitude than for Japan.
Foreign procurement of Japanese goods responds positively to an appreciation of the REER;
this result becomes counter-intuitive with category- and year-effects included in the
estimation. The impact of the REER variable is otherwise statistically insignificant in almost
all other specifications, except in the case of Japanese goods and services after controlling for
category effects, where the result is as expected. In the case of Swiss goods and goods and
services together, the impact of REER on foreign procurement is positive only with year-
effects included in estimation; otherwise the impact of this variable is negative. Procurement
of Swiss services seems strongly influenced by REER appreciation across specifications. Once
again, these elasticities are larger in magnitude for Switzerland than for Japan, which suggests
that foreign procurement in Switzerland is more responsive to fluctuations in macroeconomic
fundamentals.
19
The electoral cycle seems to have a negative impact on Japanese foreign procurement patterns,
though this result lacks statistical significance in some specifications. Japanese services
foreign procurement, however, seems to respond positively to the electoral cycles, with and
without year effects, though this result too is weakly significant. In the case of Switzerland,
the impact of the political budget cycle on public procurement seems more evident in the year
preceding the election year, once year-effects are controlled for. In the absence of these
effects, however, the impact is positive. Procurement of Swiss services, on the other hand,
seems to respond strongly to electoral cycles; foreign procurement always goes up in an
election year irrespective of the econometric specification, which is counter-intuitive. Thus
both Japanese and Swiss governments seem to tend to purchase more of their required services
from foreign suppliers during elections, which is hard to explain unless we attribute this to the
purchase of specialized services from foreign firms for use during elections. Our data show,
for instance, that the Japanese government purchased more computer-related services from
foreign firms during election periods. However, given the rather small number of services
observations in both countries, this result may just need to be discounted.
The coefficient on the URGPA dummy is statistically insignificant across most specifications
in the case of Japan, which suggests that the disciplining mechanisms of the GPA may not
have led to greater foreign access to the Japanese goods procurement market. In the case of
Switzerland, our results suggest that the URGPA may have actually had a negative impact on
goods procurement once year-effects were included in estimation. Thus after stripping out the
variation created by traditional macroeconomic variables (economic growth, exchange rates,
etc.) and by several proxies for the ability of firms to win state contracts at home, we do not
find a statistically significant positive estimate of the effect of the URGPA for either country
in any specification.
As a robustness check, we also report results from estimating our secondary model which has
the number of contracts purchased from foreign firms as the dependent variable. Table 7
reports these results for Japan and Table 8 for Switzerland. The results from this estimation
confirm the findings from the primary estimation with respect to the importance of the
magnitude of procurement demand, the mixed relationship with domestic firm-level attributes,
20
the non-applicability of Baldwin’s ineffectiveness proposition, the responsiveness to
macroeconomic fundamentals and the role of the political budget cycles.
<Insert Tables 7 and 8 here>
The biggest turnaround in these results, however, emerges in the coefficients on the URGPA
dummy. Unlike in the primary estimation, the GPA seems to foster import demand for
Japanese goods contracts (with and without year effects) and that for Swiss goods contracts in
the absence of any effects. This result, coupled with the opposite finding from the primary
estimation of foreign procurement value, suggests that the disciplining mechanisms of the
GPA may have been more successful in increasing import demand for those goods contracts
where the average contract value was not large.
Finally, looking at the impact of average contract value on the import demand for contracts,
we find that across specifications, the average value of a contract awarded to a domestic firm
has a negative impact on the import demand for Japanese goods and services and Swiss
services contracts, which is an expected outcome. The average value of a contract awarded to
a foreign firm has a positive impact on Japanese government import demand but a negative
impact on government import demand in the case of Switzerland. The latter result is counter-
intuitive and seems to suggest that foreign firms may be in the market for Swiss goods and
services procurement irrespective of average contract value.
7. Conclusion
In this paper, we bridge a gap in research by analyzing procurement data submitted by Japan
and Switzerland to the WTO over the period 1990-2003 for the effect of macroeconomic,
political economy, procurement-specific and domestic policy factors that may have influenced
these governments’ sourcing decisions from abroad. To the best of our knowledge, this is also
the first empirical test of the effectiveness of the GPA in increasing market access for foreign
suppliers and of Baldwin’s (1970, 1984) “neutrality proposition.”
21
Our first major conclusion is that the most important factors that have a bearing on
governments’ sourcing decisions are those related to domestic firm attributes and the size of
the procurement contract. Thus, rising labour productivity and related domestic firm attributes
seem to have made Japanese firms more competitive than their foreign counterparts in that
country’s procurement market. In the case of Switzerland, on the other hand, this result is
specific to the good or service being procured; moreover macroeconomic fundamentals seem
more important in determining the choice of suppliers by Swiss governments over time. These
results also suggest that Swiss public purchase patterns may have been discriminatory towards
foreign suppliers during these years. On the other hand, Japanese governments have tended to
award larger-value contracts to foreign suppliers, a result that also supports anecdotal evidence
in general.
The finding that public and private sector imports are not substitutes seems to suggest that
these governments’ domestic procurement requirement exceeds the undistorted free trade level
of domestic production, but the impact of time- and industry-specific unobservable factors
reverses the result for Japanese public purchases. These unobservables also lead to an increase
in foreign procurement of goods and services following appreciations of the REER in both
countries. We also find that year effects make Swiss governments purchase less from foreign
firms in the year preceding the election year; they also render the procurement patterns of both
governments responsive to Keynesian macroeconomic compulsions. Thus, unobserved factors
related to the good/ service being procured and/or to time significantly alter our empirical
results; this underlines the importance of controlling for these factors in such estimations.
Finally, though the GPA requires that contracts above a certain minimum threshold value be
subject to internationally competitive bidding, this does not always ensure that high value
contracts are awarded to foreign suppliers, even if the latter were more efficient, which
underlines the scope for plugging this loophole in possible reform of this agreement.
22

Bibliography
Alesina, A., N. Roubini & G. Cohen (1997). Political Cycles and the Macroeconomy, Cambridge, MA: MIT Press. Bacchetta, P. & E. van Wincoop (2000). 'Does Exchange-Rate Stability Increase Trade and Welfare?' The American Economic Review 90(5): 1093-1109. Baldwin, R.E. (1970). Non-tariff Distortions of International Trade, Washington, DC: Brookings. Baldwin, R.E. (1984). 'Trade policies in developed countries,' in Jones, R., Kenen, P. (Eds.), Handbook of International Economics, North-Holland, Amsterdam. Baldwin, R. & J. Harrigan (2008). ‘Zeroes, Quality and Space: Trade Theory and Trade Evidence,’ NBER Working Paper 13214, March. Blanchard, O. & J. Wolfers (2000). 'The Role of Shocks and Institutions in the Rise of European Unemployment: The Aggregate Evidence, 1999 Harry Johnson Lecture,' Economic Journal 100, C1-33. Branco, F. (1994). ‘Favouring Domestic Firms in Procurement Contracts,’ Journal of International Economics 37: 65-80. Brenton, P. (2001). ‘What are the limits to economic integration?’ Centre for European Policy Studies, Working Document No. 177, November. Breton, A. & P. Salmon (1995). ‘Are Discriminatory Procurement Policies Motivated by Protectionism?’ Kyklos 49: 47-68.
Burguet, R. & Y. Che (2004). 'Competitive Procurement with Corruption,' The RAND Journal of Economics 35(1): 50-68.
Burguet, R. & M. Perry (2000). ‘Bribery and Favouritism by Auctioneers in Sealed Bid Auctions,’ Mimeo, Rutgers University & Institut d'Analisi Economica (CSIC).
Chen, X. (1995). ‘Directing Government Procurement as an Incentive of Production,’ Journal of Economic Integration 10: 130-40. Compte, O., A. Lambert-Mogiliansky & T. Verdier (2005). 'Corruption and Competition in Procurement Auctions,' The RAND Journal of Economics 36(1): 1-15. Coviello, D. & S. Gagliarducci (2010). ‘Tenure in Office and Public Procurement,’ mimeo.
23

Cushman, D. O. (1983). 'The Effects of Real Exchange Rate risk on International Trade,' Journal of International Economics 15: 45-63. Diermeier, D. & A. Merlo (1999). ‘A Structural Model of Government Formation,’ Mimeo, Northwestern University. Drazen, A. (2000). Political Economy in Macroeconomics, Princeton: Princeton University Press. European Commission (1997). Single Market Review: Public Procurement. Kogan Page, London. Evenett, S.J. & A. Shingal (2006). ‘Monitoring Implementation: Japan and the WTO Agreement on Government Procurement,’ in Economic Development & Multilateral Trade Cooperation, The World Bank. Fukuyama, F (1995). Trust: The Social Virtues and the Creation of Prosperity, Free Press, New York. Goldman, E., J. Rocholl & J. So (2009). ‘Political Connections and the Allocation of Procurement Contracts,’ Mimeo. Helpman, E. (1976). 'Macroeconomic Policy in a Model of International Trade with a Wage Restriction,' International Economic Review 17(2): 262-277. Helpman, E., M. Melitz & Y. Rubinstein (2008). ‘Estimating Trade Flows: Trading Partners and Trading Volumes,’ Quarterly Journal of Economics 123(2): 441-487. Hillberry, R. & D. Hummels (2002). ‘Explaining home bias in consumption: The role of intermediate input trade,’ NBER Working Paper 9020. Hoekman, B. & P. Mavroidis (1997). Law and Policy in Public Purchasing: The WTO Agreement on Government Procurement, University of Michigan Press. Hyytinen, A., S. Lundberg & O. Toivanen (2009). ‘Politics and Procurement: Evidence from Cleaning Contracts,’ Mimeo. IMF (various years). International Financial Statistics. Khorana S. and A. Shingal (2008). ‘Barriers to Government Procurement in the European Union,’ in Strategies and Preparedness for Trade and Globalization in India, UNCTAD (eds.), February. Laffont, J.J. & J. Tirole (1991).’Auction Design and Favouritism,’ International Journal of Industrial Organization 9: 9-42.
24

Mastanduno, M. (1991). 'Do relative gains matter? America’s response to Japanese industrial policy,' International Security 16: 73–113. McAfee, R. P. & J. McMillan (1989). ‘Government Procurement and International Trade,' Journal of International Economics 26: 291-308. Naegelen, F. & M. Mougeot (1998). 'Discriminatory public procurement policy and cost reduction incentives,' Journal of Public Economics 67: 349–367. Nicita, A. and M. Olarreaga (2006). 'Trade, Production and Protection 1976-2004,' World Bank Economic Review 21(1). OECD (various years). STAN database, ‘StatExtracts’ (http://stats.oecd.org/Index.aspx) OCED (various years). Trade in Services by Service Category database, ‘StatExtracts’ (http://stats.oecd.org/Index.aspx). Persson, T. (2002). 'Do Political Institutions Shape Economic Policy?,' Econometrica 70(3): 883-905. Persson, T. & G. Tabellini (1990). Macroeconomic Policy, Credibility and Politics, London: Hardwood Academy Publishers. Persson, T. & G. Tabellini (2000). 'Political Institutions and Economic Policy Outcomes: What Are the Stylized Facts? Mimeo, Institute for International Economic Studies. Rauch, J (1996). ‘Networks versus Markets in International Trade,’ Working Paper 5617, NBER, Cambridge, MA. Ravn, M.O., S. Schmitt-Grohé & M. Uribe (2008). ‘Explaining the Effects of Government Spending Shocks on Consumption and the Real Exchange Rate,’ Mimeo. Rogoff, K. (1990). 'Equilibrium Political Budget Cycles,' American Economic Review 80: 21-36. Rogoff, K. & A. Silbert (1988). 'Elections and macroeconomic political cycles,' Review of Economic Studies 55: 1-16. Rose-Ackerman, S. (1975). ‘The Economics of Corruption,’ Journal of Public Economics 4: 187-203. Rose-Ackerman, S. (1978). Corruption: A Study in Political Economy, New York: Academic Press. Rothenberg, J. (1993). “Comment” in Jim Leitzel & Jean Tirole eds. Incentives in Procurement Contracting, Boulder: Westview Press.
25

Santos Silva, J. M. C. and S. Tenreyro (2006). ‘The log of gravity,’ The Review of Economics and Statistics 88 (4): 641- 658. Schumacher, D. and B. Siliverstovs (2007). ‘Estimating gravity equations: To log or not to log?,’ Discussion Paper 739, German Institute for Economic Research, DIW Berlin, October. Shi, M. & J. Svensson (2000). 'Conditional Political Business Cycles: Theory and Evidence,' Mimeo, Institute for International Economic Studies. Shingal, A. (2009). ‘Three Essays on Trade in Services: Exploring tradability, regional trade and government procurement of services,’ unpublished DPhil dissertation, University of Sussex. Shingal, A. (2011). ‘The WTO's Agreement on Government Procurement: Whither market access?’ World Trade Review, 10:4, 1-23 (in press)/ NCCR Trade Working Paper 2011/02. Trionfetti, F. (2000). 'Discriminatory public procurement and international trade,' World Economy 23: 57–76. UNIDO (2010). INDSTAT4 database. UNSC (2002). ‘GATS, CPC Version 1.1,’ GNS/W/120. (http://unstats.un.org/unsd/statcom/doc02/cpc.pdf) UNSD (http://unstats.un.org/unsd/cr/registry/regso.asp?Ci=1&Lg=1) Vagstad, S. (1995). 'Promoting fair competition in public procurement,' Journal of Public Economics 58: 283–307. Weichenrieder, J.A. (2001). 'Public procurement in the presence of capital taxation,' Regional Science and Urban Economics 31: 339–353. World Bank (various years). World Development Indicators. World Trade Organization (various years). ‘Statistics reports under Article XIX: 5 of the GPA,’ Committee on Government Procurement. (http://www.wto.org/english/tratop_e/gproc_e/gpstat_e.htm)"
26
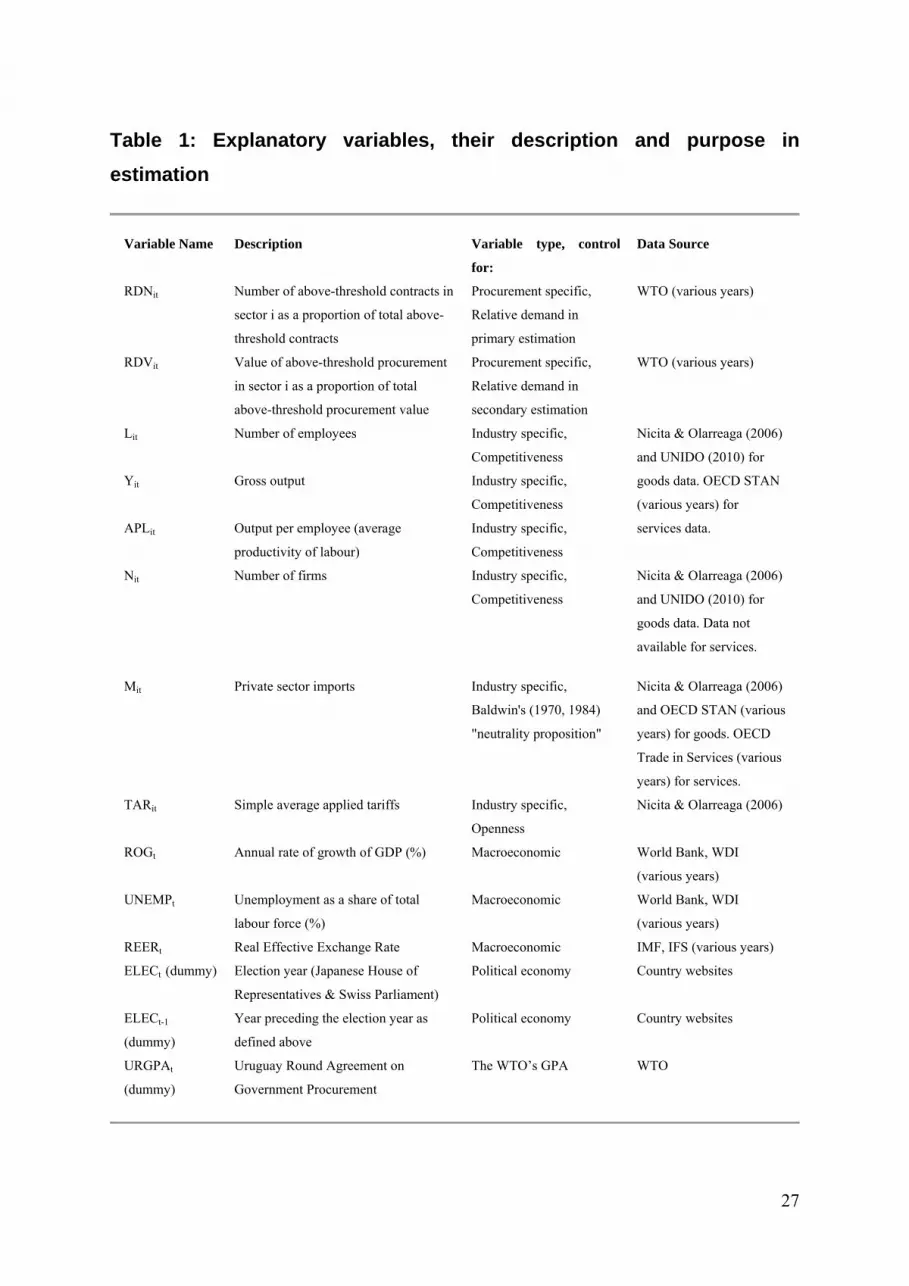
Table 1: Explanatory variables, their description and purpose in estimation
Variable Name Description Variable type, control
for:
Data Source
RDNit Number of above-threshold contracts in
sector i as a proportion of total above-
threshold contracts
Procurement specific,
Relative demand in
primary estimation
WTO (various years)
RDVit Value of above-threshold procurement
in sector i as a proportion of total
above-threshold procurement value
Procurement specific,
Relative demand in
secondary estimation
WTO (various years)
Lit Number of employees Industry specific,
Competitiveness
Yit Gross output Industry specific,
Competitiveness
APLit Output per employee (average
productivity of labour)
Industry specific,
Competitiveness
Nicita & Olarreaga (2006)
and UNIDO (2010) for
goods data. OECD STAN
(various years) for
services data.
Nit Number of firms Industry specific,
Competitiveness
Nicita & Olarreaga (2006)
and UNIDO (2010) for
goods data. Data not
available for services.
Mit Private sector imports Industry specific,
Baldwin's (1970, 1984)
"neutrality proposition"
Nicita & Olarreaga (2006)
and OECD STAN (various
years) for goods. OECD
Trade in Services (various
years) for services.
TARit Simple average applied tariffs Industry specific,
Openness
Nicita & Olarreaga (2006)
ROGt Annual rate of growth of GDP (%) Macroeconomic World Bank, WDI
(various years)
UNEMPt Unemployment as a share of total
labour force (%)
Macroeconomic World Bank, WDI
(various years)
REERt Real Effective Exchange Rate Macroeconomic IMF, IFS (various years)
ELECt (dummy) Election year (Japanese House of
Representatives & Swiss Parliament)
Political economy Country websites
ELECt-1
(dummy)
Year preceding the election year as
defined above
Political economy Country websites
URGPAt
(dummy)
Uruguay Round Agreement on
Government Procurement
The WTO’s GPA WTO
27
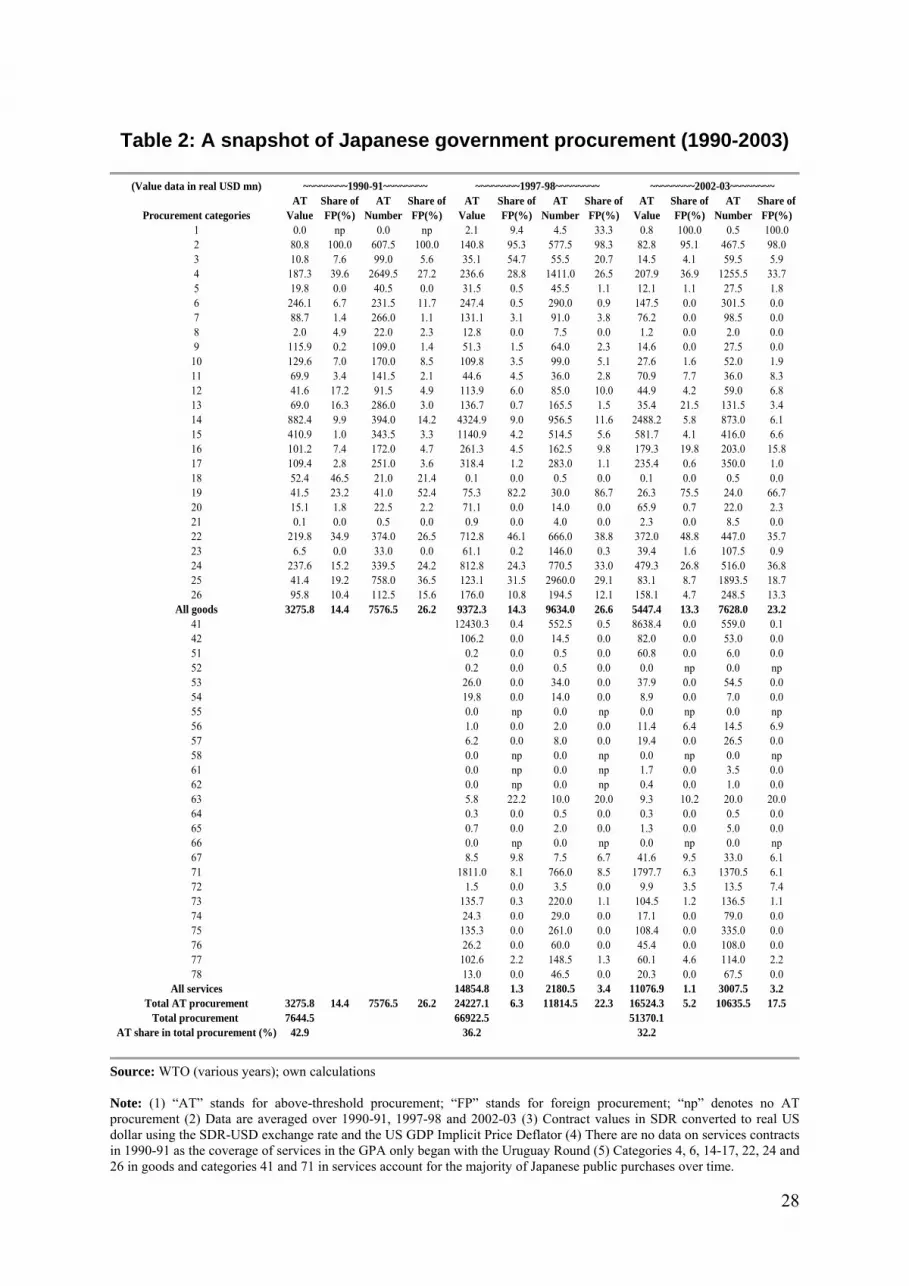
Table 2: A snapshot of Japanese government procurement (1990-2003)
(Value data in real USD mn)AT Share of AT Share of AT Share of AT Share of AT Share of AT Share of
Procurement categories Value FP(%) Number FP(%) Value FP(%) Number FP(%) Value FP(%) Number FP(%)1 0.0 np 0.0 np 2.1 9.4 4.5 33.3 0.8 100.0 0.5 100.02 80.8 100.0 607.5 100.0 140.8 95.3 577.5 98.3 82.8 95.1 467.5 98.03 10.8 7.6 99.0 5.6 35.1 54.7 55.5 20.7 14.5 4.1 59.5 5.94 187.3 39.6 2649.5 27.2 236.6 28.8 1411.0 26.5 207.9 36.9 1255.5 33.75 19.8 0.0 40.5 0.0 31.5 0.5 45.5 1.1 12.1 1.1 27.5 1.86 246.1 6.7 231.5 11.7 247.4 0.5 290.0 0.9 147.5 0.0 301.5 0.07 88.7 1.4 266.0 1.1 131.1 3.1 91.0 3.8 76.2 0.0 98.5 0.08 2.0 4.9 22.0 2.3 12.8 0.0 7.5 0.0 1.2 0.0 2.0 0.09 115.9 0.2 109.0 1.4 51.3 1.5 64.0 2.3 14.6 0.0 27.5 0.0
10 129.6 7.0 170.0 8.5 109.8 3.5 99.0 5.1 27.6 1.6 52.0 1.911 69.9 3.4 141.5 2.1 44.6 4.5 36.0 2.8 70.9 7.7 36.0 8.312 41.6 17.2 91.5 4.9 113.9 6.0 85.0 10.0 44.9 4.2 59.0 6.813 69.0 16.3 286.0 3.0 136.7 0.7 165.5 1.5 35.4 21.5 131.5 3.414 882.4 9.9 394.0 14.2 4324.9 9.0 956.5 11.6 2488.2 5.8 873.0 6.115 410.9 1.0 343.5 3.3 1140.9 4.2 514.5 5.6 581.7 4.1 416.0 6.616 101.2 7.4 172.0 4.7 261.3 4.5 162.5 9.8 179.3 19.8 203.0 15.817 109.4 2.8 251.0 3.6 318.4 1.2 283.0 1.1 235.4 0.6 350.0 1.018 52.4 46.5 21.0 21.4 0.1 0.0 0.5 0.0 0.1 0.0 0.5 0.019 41.5 23.2 41.0 52.4 75.3 82.2 30.0 86.7 26.3 75.5 24.0 66.720 15.1 1.8 22.5 2.2 71.1 0.0 14.0 0.0 65.9 0.7 22.0 2.321 0.1 0.0 0.5 0.0 0.9 0.0 4.0 0.0 2.3 0.0 8.5 0.022 219.8 34.9 374.0 26.5 712.8 46.1 666.0 38.8 372.0 48.8 447.0 35.723 6.5 0.0 33.0 0.0 61.1 0.2 146.0 0.3 39.4 1.6 107.5 0.924 237.6 15.2 339.5 24.2 812.8 24.3 770.5 33.0 479.3 26.8 516.0 36.825 41.4 19.2 758.0 36.5 123.1 31.5 2960.0 29.1 83.1 8.7 1893.5 18.726 95.8 10.4 112.5 15.6 176.0 10.8 194.5 12.1 158.1 4.7 248.5 13.3
All goods 3275.8 14.4 7576.5 26.2 9372.3 14.3 9634.0 26.6 5447.4 13.3 7628.0 23.241 12430.3 0.4 552.5 0.5 8638.4 0.0 559.0 0.142 106.2 0.0 14.5 0.0 82.0 0.0 53.0 0.051 0.2 0.0 0.5 0.0 60.8 0.0 6.0 0.052 0.2 0.0 0.5 0.0 0.0 np 0.0 np53 26.0 0.0 34.0 0.0 37.9 0.0 54.5 0.054 19.8 0.0 14.0 0.0 8.9 0.0 7.0 0.055 0.0 np 0.0 np 0.0 np 0.0 np56 1.0 0.0 2.0 0.0 11.4 6.4 14.5 6.957 6.2 0.0 8.0 0.0 19.4 0.0 26.5 0.058 0.0 np 0.0 np 0.0 np 0.0 np61 0.0 np 0.0 np 1.7 0.0 3.5 0.062 0.0 np 0.0 np 0.4 0.0 1.0 0.063 5.8 22.2 10.0 20.0 9.3 10.2 20.0 20.064 0.3 0.0 0.5 0.0 0.3 0.0 0.5 0.065 0.7 0.0 2.0 0.0 1.3 0.0 5.0 0.066 0.0 np 0.0 np 0.0 np 0.0 np67 8.5 9.8 7.5 6.7 41.6 9.5 33.0 6.171 1811.0 8.1 766.0 8.5 1797.7 6.3 1370.5 6.172 1.5 0.0 3.5 0.0 9.9 3.5 13.5 7.473 135.7 0.3 220.0 1.1 104.5 1.2 136.5 1.174 24.3 0.0 29.0 0.0 17.1 0.0 79.0 0.075 135.3 0.0 261.0 0.0 108.4 0.0 335.0 0.076 26.2 0.0 60.0 0.0 45.4 0.0 108.0 0.077 102.6 2.2 148.5 1.3 60.1 4.6 114.0 2.278 13.0 0.0 46.5 0.0 20.3 0.0 67.5 0.0
All services 14854.8 1.3 2180.5 3.4 11076.9 1.1 3007.5 3.2Total AT procurement 3275.8 14.4 7576.5 26.2 24227.1 6.3 11814.5 22.3 16524.3 5.2 10635.5 17.5
Total procurement 7644.5 66922.5 51370.1AT share in total procurement (%) 42.9 36.2 32.2
~~~~~~~~1990-91~~~~~~~~ ~~~~~~~~1997-98~~~~~~~~ ~~~~~~~~2002-03~~~~~~~~
Source: WTO (various years); own calculations Note: (1) “AT” stands for above-threshold procurement; “FP” stands for foreign procurement; “np” denotes no AT procurement (2) Data are averaged over 1990-91, 1997-98 and 2002-03 (3) Contract values in SDR converted to real US dollar using the SDR-USD exchange rate and the US GDP Implicit Price Deflator (4) There are no data on services contracts in 1990-91 as the coverage of services in the GPA only began with the Uruguay Round (5) Categories 4, 6, 14-17, 22, 24 and 26 in goods and categories 41 and 71 in services account for the majority of Japanese public purchases over time.
28
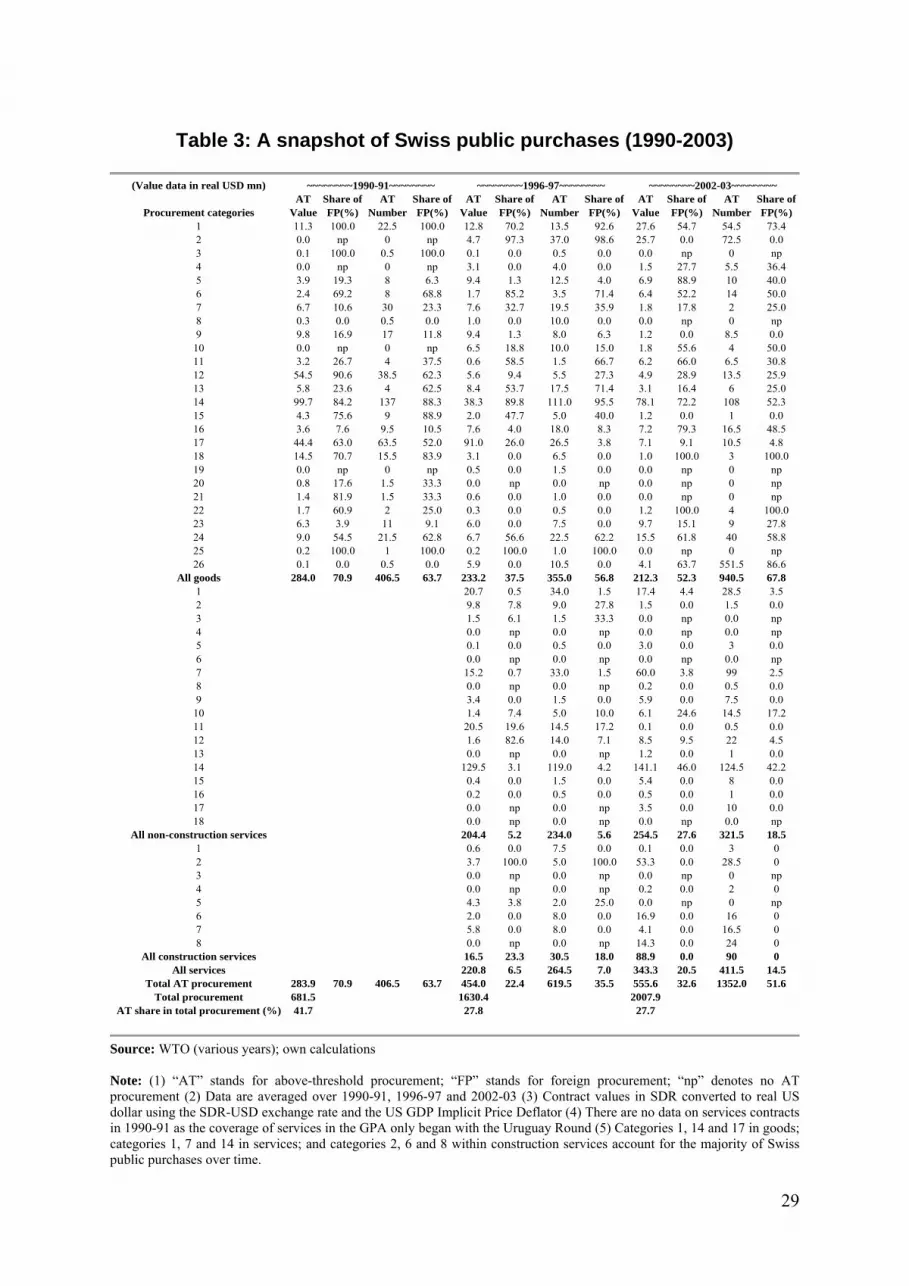
Table 3: A snapshot of Swiss public purchases (1990-2003)
(Value data in real USD mn)AT Share of AT Share of AT Share of AT Share of AT Share of AT Share of
Procurement categories Value FP(%) Number FP(%) Value FP(%) Number FP(%) Value FP(%) Number FP(%)1 11.3 100.0 22.5 100.0 12.8 70.2 13.5 92.6 27.6 54.7 54.5 73.42 0.0 np 0 np 4.7 97.3 37.0 98.6 25.7 0.0 72.5 0.03 0.1 100.0 0.5 100.0 0.1 0.0 0.5 0.0 0.0 np 0 np4 0.0 np 0 np 3.1 0.0 4.0 0.0 1.5 27.7 5.5 36.45 3.9 19.3 8 6.3 9.4 1.3 12.5 4.0 6.9 88.9 10 40.06 2.4 69.2 8 68.8 1.7 85.2 3.5 71.4 6.4 52.2 14 50.07 6.7 10.6 30 23.3 7.6 32.7 19.5 35.9 1.8 17.8 2 25.08 0.3 0.0 0.5 0.0 1.0 0.0 10.0 0.0 0.0 np 0 np9 9.8 16.9 17 11.8 9.4 1.3 8.0 6.3 1.2 0.0 8.5 0.0
10 0.0 np 0 np 6.5 18.8 10.0 15.0 1.8 55.6 4 50.011 3.2 26.7 4 37.5 0.6 58.5 1.5 66.7 6.2 66.0 6.5 30.812 54.5 90.6 38.5 62.3 5.6 9.4 5.5 27.3 4.9 28.9 13.5 25.913 5.8 23.6 4 62.5 8.4 53.7 17.5 71.4 3.1 16.4 6 25.014 99.7 84.2 137 88.3 38.3 89.8 111.0 95.5 78.1 72.2 108 52.315 4.3 75.6 9 88.9 2.0 47.7 5.0 40.0 1.2 0.0 1 0.016 3.6 7.6 9.5 10.5 7.6 4.0 18.0 8.3 7.2 79.3 16.5 48.517 44.4 63.0 63.5 52.0 91.0 26.0 26.5 3.8 7.1 9.1 10.5 4.818 14.5 70.7 15.5 83.9 3.1 0.0 6.5 0.0 1.0 100.0 3 100.019 0.0 np 0 np 0.5 0.0 1.5 0.0 0.0 np 0 np20 0.8 17.6 1.5 33.3 0.0 np 0.0 np 0.0 np 0 np21 1.4 81.9 1.5 33.3 0.6 0.0 1.0 0.0 0.0 np 0 np22 1.7 60.9 2 25.0 0.3 0.0 0.5 0.0 1.2 100.0 4 100.023 6.3 3.9 11 9.1 6.0 0.0 7.5 0.0 9.7 15.1 9 27.824 9.0 54.5 21.5 62.8 6.7 56.6 22.5 62.2 15.5 61.8 40 58.825 0.2 100.0 1 100.0 0.2 100.0 1.0 100.0 0.0 np 0 np26 0.1 0.0 0.5 0.0 5.9 0.0 10.5 0.0 4.1 63.7 551.5 86.6
All goods 284.0 70.9 406.5 63.7 233.2 37.5 355.0 56.8 212.3 52.3 940.5 67.81 20.7 0.5 34.0 1.5 17.4 4.4 28.5 3.52 9.8 7.8 9.0 27.8 1.5 0.0 1.5 0.03 1.5 6.1 1.5 33.3 0.0 np 0.0 np4 0.0 np 0.0 np 0.0 np 0.0 np5 0.1 0.0 0.5 0.0 3.0 0.0 3 0.06 0.0 np 0.0 np 0.0 np 0.0 np7 15.2 0.7 33.0 1.5 60.0 3.8 99 2.58 0.0 np 0.0 np 0.2 0.0 0.5 0.09 3.4 0.0 1.5 0.0 5.9 0.0 7.5 0.0
10 1.4 7.4 5.0 10.0 6.1 24.6 14.5 17.211 20.5 19.6 14.5 17.2 0.1 0.0 0.5 0.012 1.6 82.6 14.0 7.1 8.5 9.5 22 4.513 0.0 np 0.0 np 1.2 0.0 1 0.014 129.5 3.1 119.0 4.2 141.1 46.0 124.5 42.215 0.4 0.0 1.5 0.0 5.4 0.0 8 0.016 0.2 0.0 0.5 0.0 0.5 0.0 1 0.017 0.0 np 0.0 np 3.5 0.0 10 0.018 0.0 np 0.0 np 0.0 np 0.0 np
All non-construction services 204.4 5.2 234.0 5.6 254.5 27.6 321.5 18.51 0.6 0.0 7.5 0.0 0.1 0.0 3 02 3.7 100.0 5.0 100.0 53.3 0.0 28.5 03 0.0 np 0.0 np 0.0 np 0 np4 0.0 np 0.0 np 0.2 0.0 2 05 4.3 3.8 2.0 25.0 0.0 np 0 np6 2.0 0.0 8.0 0.0 16.9 0.0 16 07 5.8 0.0 8.0 0.0 4.1 0.0 16.5 08 0.0 np 0.0 np 14.3 0.0 24 0
All construction services 16.5 23.3 30.5 18.0 88.9 0.0 90 0All services 220.8 6.5 264.5 7.0 343.3 20.5 411.5 14.5
Total AT procurement 283.9 70.9 406.5 63.7 454.0 22.4 619.5 35.5 555.6 32.6 1352.0 51.6Total procurement 681.5 1630.4 2007.9
AT share in total procurement (%) 41.7 27.8 27.7
~~~~~~~~1990-91~~~~~~~~ ~~~~~~~~1996-97~~~~~~~~ ~~~~~~~~2002-03~~~~~~~~
Source: WTO (various years); own calculations Note: (1) “AT” stands for above-threshold procurement; “FP” stands for foreign procurement; “np” denotes no AT procurement (2) Data are averaged over 1990-91, 1996-97 and 2002-03 (3) Contract values in SDR converted to real US dollar using the SDR-USD exchange rate and the US GDP Implicit Price Deflator (4) There are no data on services contracts in 1990-91 as the coverage of services in the GPA only began with the Uruguay Round (5) Categories 1, 14 and 17 in goods; categories 1, 7 and 14 in services; and categories 2, 6 and 8 within construction services account for the majority of Swiss public purchases over time.
29

Table 4: Evolution of sample variables over time
Year TPV ATV FPV(%) ATN FPN(%) Y M_Prop (%) X_Prop (%) N L APL TAR ROG UNEMP REER1997 45485 32567.3 3.2 45353 5.8 3974816.0 7.0 10.3 247372 25454726 0.156 1.74 1.6 3.4 83.61998 88360 39356.9 5.3 20427 12.8 3978926.7 7.0 11.2 256891 25040011 0.159 1.53 -2 4.1 82.21999 49745 22254.2 4.1 26035 7.5 4492294.8 6.8 10.6 237509 24506305 0.183 1.47 -0.1 4.7 93.02000 44137 19345.8 5.3 22887 8.9 4550177.1 6.9 10.6 233480 24510280 0.186 1.37 2.9 4.8 100.02001 41291 21317.6 3.6 25430 7.1 4007848.5 7.3 10.2 216167 23989704 0.167 1.47 0.2 5 89.52002 47749 24267.6 3.8 29698 6.9 4061717.9 7.8 11.7 199669 23432420 0.173 1.47 0.3 5.4 82.92003 54991.1 17116.7 4.6 9747 17.3 4599233.1 7.9 12.2 na 23346708 0.197 2.42 1.4 5.2 81.4
Year TPV ATV FPV(%) ATN FPN(%) Y M_Prop (%) X_Prop (%) N L APL TAR ROG UNEMP REER1990 7194 2953.0 13.8 7081 27.8 1575292.7 6.8 13.7 371556 12455507 0.126 2.41 5.2 2.1 75.01991 8095 3598.7 14.8 8072 24.7 1849721.4 6.4 13.4 388619 12685728 0.146 2.29 3.4 2 80.81992 8143 3713.1 14.9 7424 27.4 2005705.4 5.9 14.0 374488 12709965 0.158 2.24 1 2.2 83.41993 8941 4488.7 20.8 9060 28.9 2168615.0 6.3 14.2 372382 12135989 0.179 2.24 0.2 2.5 98.41997 45485 6045.6 14.9 9206 28.0 1952595.8 10.6 18.3 247372 7548248 0.259 1.74 1.6 3.4 83.61998 88360 12698.9 14.0 10062 25.3 1726083.8 12.5 23.2 256891 7421873 0.233 1.53 -2 4.1 82.21999 49745 6257.0 12.7 8396 22.3 1917741.1 12.6 22.5 237509 7098685 0.270 1.47 -0.1 4.7 93.02000 44137 5438.6 16.5 8242 23.7 2134796.7 11.6 20.2 233480 6951040 0.307 1.37 2.9 4.8 100.02001 41291 5268.6 12.1 7629 22.6 1885233.7 12.1 19.0 216167 6461663 0.292 1.47 0.2 5 89.52002 47749 4980.9 15.5 8127 23.8 1738423.3 14.6 24.4 199669 6101126 0.285 1.47 0.3 5.4 82.92003 54991.1 5913.8 11.4 7129 22.4 1959497.4 15.3 25.9 na 5973331 0.328 2.42 1.4 5.2 81.4
Year TPV ATV FPV(%) ATN FPN(%) Y M_Prop (%) X_Prop (%) N L APL TAR ROG UNEMP REER1996 1404.5 395.3 31.1 481 40.3 170542.7 37.3 46.2 na 1705464 0.100 0.0 0.6 3.7 111.31997 1856.3 538.7 15.4 744 32.9 309123.1 21.7 27.0 17905 1522327 0.203 0.0 2.1 4.1 102.91998 1551.5 717.3 23.5 782 25.4 277298.3 27.6 33.1 17440 1460920 0.190 0.0 2.6 3.6 104.21999 1517.7 628.1 24.9 607 29.7 244516.9 29.0 36.2 16975 1547689 0.158 0.0 1.3 3.1 102.32000 1744.5 591.3 18.3 763 21.0 254339.4 31.4 38.3 17366 1591581 0.160 0.0 3.6 2.6 1002001 1898.2 777.3 19.5 744 22.4 255801.8 31.7 38.1 16168 1649461 0.155 0.0 1.2 2.5 103.12002 1815.1 516.0 19.2 1224 49.1 320141.4 27.7 35.4 11036 1657331 0.193 0.0 0.4 2.9 106.82003 2200.7 773.8 34.0 1473 53.9 364715.7 27.6 35.7 na 1626922 0.224 0.0 -0.2 4.1 106.4
Year TPV ATV FPV(%) ATN FPN(%) Y M_Prop (%) X_Prop (%) N L APL TAR ROG UNEMP REER1990 642.5 274.5 76.0 368 69.6 130443.9 40.1 39.0 na 1147900 0.114 0.0 3.8 0.5 100.21991 720.6 293.5 66.0 428 61.2 131137.5 38.7 38.4 na 716602 0.183 0.0 -0.9 1.7 102.21993 652.5 231.7 70.0 486 74.9 130167.8 37.1 41.2 na 645064 0.202 0.0 -0.2 3.7 102.71994 690.3 278.6 69.0 368 65.8 147454.7 37.1 40.8 na 636931 0.232 0.0 1.2 3.8 107.41995 676.3 222.0 59.3 292 63.0 177647.2 37.3 40.2 na 640642 0.277 0.0 0.4 3.3 114.41996 1404.5 184.0 56.0 287 61.7 170542.7 34.8 37.7 na 621350 0.274 0.0 0.6 3.7 111.31997 1856.3 283.3 25.5 424 53.3 148625.3 42.6 46.0 17905 439963 0.338 0.0 2.1 4.1 102.91998 1551.5 228.8 56.1 327 54.1 97334.7 73.8 76.9 17440 367999 0.264 0.0 2.6 3.6 104.21999 1517.7 322.3 44.3 323 48.3 83580.5 78.9 83.5 16975 433966 0.193 0.0 1.3 3.1 102.32000 1744.5 272.7 36.1 461 30.8 84574.2 88.2 91.4 17366 445409 0.190 0.0 3.6 2.6 1002001 1898.2 299.3 42.9 417 35.3 85198.6 89.0 92.8 16168 448889 0.190 0.0 1.2 2.5 103.12002 1815.1 168.3 53.6 845 69.7 101399.2 82.9 93.1 11036 435998 0.233 0.0 0.4 2.9 106.82003 2200.7 256.3 51.5 1026 67.0 114269.8 83.7 94.0 na 411384 0.278 0.0 -0.2 4.1 106.4
JAPANESE PROCUREMENT OF GOODS & SERVICES
JAPANESE PROCUREMENT OF GOODS
SWISS PROCUREMENT OF GOODS & SERVICES
SWISS PROCUREMENT OF GOODS
Source: WTO (various years); World Bank, World Development Indicators (various years); Nicita & Olarreaga (2006); OECD STAN (various years); OECD Trade in Services (various years); UNIDO (2010); own calculations Note: (1) “TPV” stands for total procurement value; “ATV” stands for above-threshold procurement by value of contracts; “FPV” stands for share of foreign procurement in AT procurement by value of contracts; “ATN” stands for above-threshold procurement by number of contracts; “FPN” stands for share of foreign procurement in AT procurement by number of contracts; “M_Prop” denotes the share of private sector imports in output; “X_Prop” denotes the share of private sector exports in output; rest of the variables are as defined in Table 1 (2) TPV, ATV, Y and APL are reported in USD mn (3) There are no data on services procurement before 1996 as the coverage of services in the GPA only began with the Uruguay Round.
30

Table 5: Estimating Japanese foreign procurement value
Variable I IIY IIIC IVY,C V VIY VIIC VIIIY,C IX XY XIC XIIY,C
RELDD 3.94*** 3.86*** 1.88* 1.67** 6.60*** 5.97*** 7.07*** 5.87*** 12.19* 12.19* 3.68** 3.68**ln(APl) -0.10 -0.08 0.69 1.47** -2.38*** -2.42*** 0.39 2.59** -7.42*** -7.42*** 11.04** 11.04**ln(L) -.61*** -.62*** 0.33# 0.33# -0.13 -0.18 1.64*** 2.06*** -1.60* -1.60* 0.33 0.33ln(N) -.38* -.34* -0.41 -.62**ln(M) .50** .50** 0.05 0.10 1.12*** 1.14*** -0.45 -.72* -2.14* -2.14* 0.88 0.88TAR -.51*** -.53*** 0.71 0.56#ln(ROG) -0.01 0.20 0.00 .30*** 0.02 0.71 -0.03 -0.02 -0.32 -0.32 .92*** .92***ln(REER) 2.41 1.58 1.54** 0.88 3.21# 12.33* 1.06 -19.09*** 5.09 5.09 2.04 2.04ELECt -0.11 -0.43 -0.11 -.67*** -0.27 -2.82# -0.03 2.89*** 1.31# 1.31# -4.07*** -4.07***ELECt-1 0.00 0.08 -0.02 0.13 -0.01 0.81 0.09 -0.48# 1.10# 1.10# -1.10** -1.10**URGPA -0.39 -0.05 -0.02 -1.61** 0.98 -1.37 0.99 0.06 (omitted) (omitted) (omitted) (omitted)Constant -4.27 -0.68 -12.33*** -7.06 -20.77** -58.63* -29.36* 65.43** 4.30 4.30 7.52 7.52
Obs. 223 223 223 223 142 142 142 142 25 25 25 25df_m 9 12 37 40 11 13 30 32 8 8 12 12Pseudo-R^2 0.22 0.23 0.85 0.87 0.69 0.7 0.87 0.88 0.71 0.71 0.93 0.93
~~~~Goods and services~~~~ ~~~~~~~~~~Goods~~~~~~~~~~ ~~~~~~~~~~Services~~~~~~~~~~
Note: (1) Levels of significance: ***(.1%), **(1%), *(5%), #(10%) (2) Y = year effects, C = category effects, effects not reported
Table 6: Estimating Swiss foreign procurement value
Variable I IIY IIIC IVY,C V VIY VIIC VIIIY,C IX XY XIC XIIY,C
RELDD 15.21*** 16.87*** 7.89** 6.98*** 16.86*** 19.38*** 9.19** 9.14*** -8.07 -9.90 -17.31# -70.46ln(APl) 0.42 0.77# -0.72 -1.02* 0.10 0.35 -0.86# -1.34** -19.95*** -19.44*** -25.97*** -9.19#ln(Y) 0.12 0.17# 0.24 0.79 0.21 .27* 0.33 1.02 9.29*** 9.37*** 20.04** 29.10#ln(M) .79*** .92*** -0.75 -0.82 .49* .58* -1.00 -1.66 1.19*** 1.11*** -0.644638 -1.57ln(ROG) -0.43 1.02* -0.22 -1.19** -0.58 0.99# -0.40# -1.46*** 3.50*** 3.70*** 5.35** 10.67#ln(REER) -13.96# 79.75** -3.07 -21.97* -14.87# 88.42** -5.02 -26.66* 124.09*** 134.07** 178.09** 414.08#ELECt 0.29 0.34 0.12 -1.12 0.22 0.22 0.02 -0.86 1.30*** 1.32*** 2.51*** 3.68*ELECt-1 .79* -1.69* .43* -0.61# 0.69# -2.00* 0.34 -0.62# -1.28 -1.78 -3.38* -17.19URGPA 0.32 -3.10** -0.01 -1.49** 0.43 -3.19** 0.01 -1.31* (omitted) (omitted) (omitted) (omitted)Constant 58.51 -373.40** 18.75 103.33* 63.96 -412.06** 28.79 129.11* -716.91*** -762.15** -1067.78** -2203.17#
Obs. 125 125 125 125 101 101 101 101 24 24 24 24df_m 9 13 25 29 9 13 21 25 8 9 10 11Pseudo-R^2 0.594 0.64 0.7492 0.7653 0.5967 0.65 0.7467 0.765 0.8125 0.8127 0.8213 0.8348
~~~~~~~~~~Goods~~~~~~~~~~ ~~~~~~~~~~Services~~~~~~~~~~~~~~Goods and services~~~~
Note: (1) Levels of significance: ***(.1%), **(1%), *(5%), #(10%) (2) Y = year effects, C = category effects, effects not reported
31
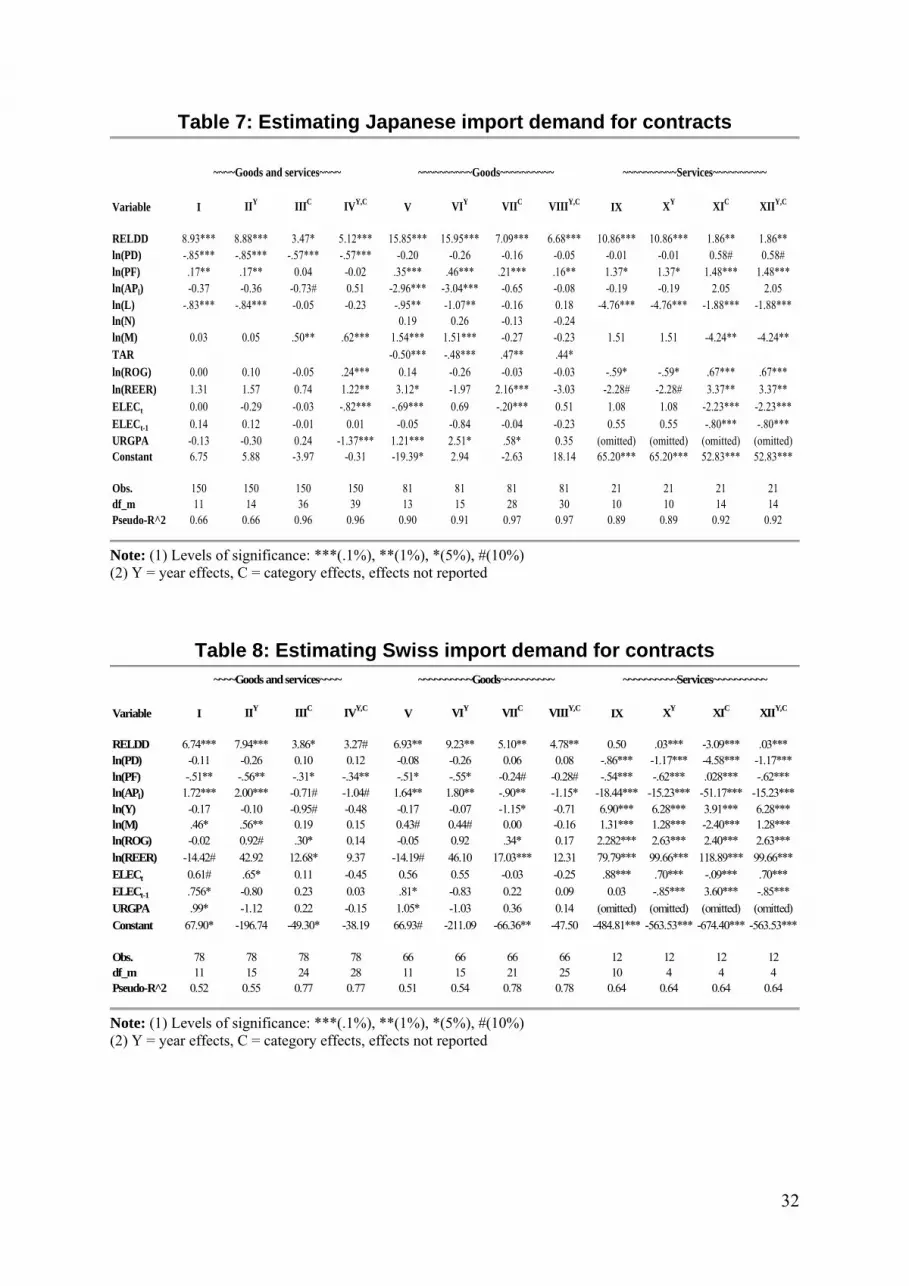
Table 7: Estimating Japanese import demand for contracts
Variable I IIY IIIC IVY,C V VIY VIIC VIIIY,C IX XY XIC XIIY,C
RELDD 8.93*** 8.88*** 3.47* 5.12*** 15.85*** 15.95*** 7.09*** 6.68*** 10.86*** 10.86*** 1.86** 1.86**ln(PD) -.85*** -.85*** -.57*** -.57*** -0.20 -0.26 -0.16 -0.05 -0.01 -0.01 0.58# 0.58#ln(PF) .17** .17** 0.04 -0.02 .35*** .46*** .21*** .16** 1.37* 1.37* 1.48*** 1.48***ln(APl) -0.37 -0.36 -0.73# 0.51 -2.96*** -3.04*** -0.65 -0.08 -0.19 -0.19 2.05 2.05ln(L) -.83*** -.84*** -0.05 -0.23 -.95** -1.07** -0.16 0.18 -4.76*** -4.76*** -1.88*** -1.88***ln(N) 0.19 0.26 -0.13 -0.24ln(M) 0.03 0.05 .50** .62*** 1.54*** 1.51*** -0.27 -0.23 1.51 1.51 -4.24** -4.24**TAR -0.50*** -.48*** .47** .44*ln(ROG) 0.00 0.10 -0.05 .24*** 0.14 -0.26 -0.03 -0.03 -.59* -.59* .67*** .67***ln(REER) 1.31 1.57 0.74 1.22** 3.12* -1.97 2.16*** -3.03 -2.28# -2.28# 3.37** 3.37**ELECt 0.00 -0.29 -0.03 -.82*** -.69*** 0.69 -.20*** 0.51 1.08 1.08 -2.23*** -2.23***ELECt-1 0.14 0.12 -0.01 0.01 -0.05 -0.84 -0.04 -0.23 0.55 0.55 -.80*** -.80***URGPA -0.13 -0.30 0.24 -1.37*** 1.21*** 2.51* .58* 0.35 (omitted) (omitted) (omitted) (omitted)Constant 6.75 5.88 -3.97 -0.31 -19.39* 2.94 -2.63 18.14 65.20*** 65.20*** 52.83*** 52.83***
Obs. 150 150 150 150 81 81 81 81 21 21 21 21df_m 11 14 36 39 13 15 28 30 10 10 14 14Pseudo-R^2 0.66 0.66 0.96 0.96 0.90 0.91 0.97 0.97 0.89 0.89 0.92 0.92
~~~~~~~~~~Services~~~~~~~~~~~~~~Goods and services~~~~ ~~~~~~~~~~Goods~~~~~~~~~~
Note: (1) Levels of significance: ***(.1%), **(1%), *(5%), #(10%) (2) Y = year effects, C = category effects, effects not reported
Table 8: Estimating Swiss import demand for contracts
Variable I IIY IIIC IVY,C V VIY VIIC VIIIY,C IX XY XIC XIIY,C
RELDD 6.74*** 7.94*** 3.86* 3.27# 6.93** 9.23** 5.10** 4.78** 0.50 .03*** -3.09*** .03***ln(PD) -0.11 -0.26 0.10 0.12 -0.08 -0.26 0.06 0.08 -.86*** -1.17*** -4.58*** -1.17***ln(PF) -.51** -.56** -.31* -.34** -.51* -.55* -0.24# -0.28# -.54*** -.62*** .028*** -.62***ln(APl) 1.72*** 2.00*** -0.71# -1.04# 1.64** 1.80** -.90** -1.15* -18.44*** -15.23*** -51.17*** -15.23***ln(Y) -0.17 -0.10 -0.95# -0.48 -0.17 -0.07 -1.15* -0.71 6.90*** 6.28*** 3.91*** 6.28***ln(M) .46* .56** 0.19 0.15 0.43# 0.44# 0.00 -0.16 1.31*** 1.28*** -2.40*** 1.28***ln(ROG) -0.02 0.92# .30* 0.14 -0.05 0.92 .34* 0.17 2.282*** 2.63*** 2.40*** 2.63***ln(REER) -14.42# 42.92 12.68* 9.37 -14.19# 46.10 17.03*** 12.31 79.79*** 99.66*** 118.89*** 99.66***ELECt 0.61# .65* 0.11 -0.45 0.56 0.55 -0.03 -0.25 .88*** .70*** -.09*** .70***ELECt-1 .756* -0.80 0.23 0.03 .81* -0.83 0.22 0.09 0.03 -.85*** 3.60*** -.85***URGPA .99* -1.12 0.22 -0.15 1.05* -1.03 0.36 0.14 (omitted) (omitted) (omitted) (omitted)Constant 67.90* -196.74 -49.30* -38.19 66.93# -211.09 -66.36** -47.50 -484.81*** -563.53*** -674.40*** -563.53***
Obs. 78 78 78 78 66 66 66 66 12 12 12 12df_m 11 15 24 28 11 15 21 25 10 4 4 4Pseudo-R̂ 2 0.52 0.55 0.77 0.77 0.51 0.54 0.78 0.78 0.64 0.64 0.64 0.64
~~~~Goods and services~~~~ ~~~~~~~~~~Goods~~~~~~~~~~ ~~~~~~~~~~Services~~~~~~~~~~
Note: (1) Levels of significance: ***(.1%), **(1%), *(5%), #(10%) (2) Y = year effects, C = category effects, effects not reported
32
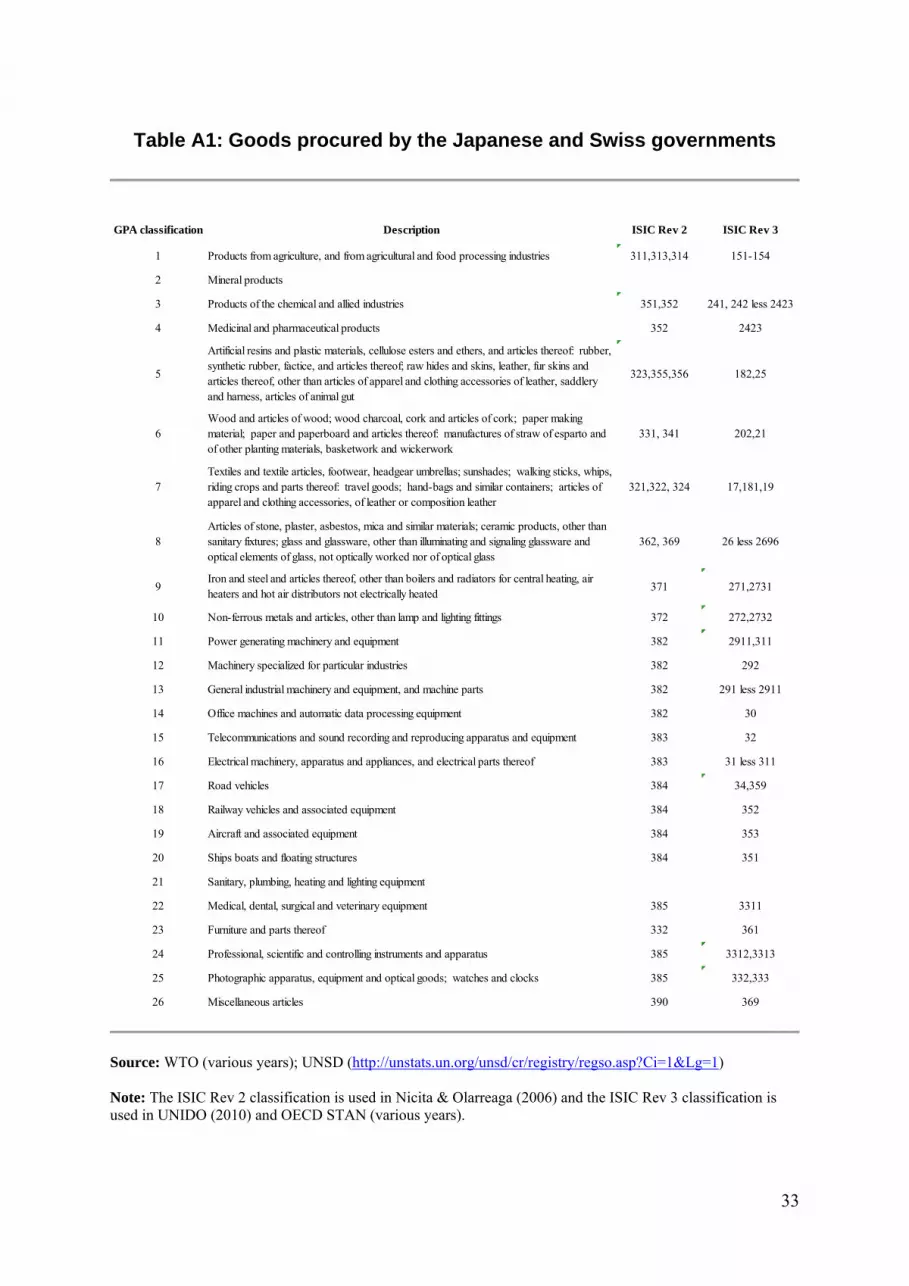
Table A1: Goods procured by the Japanese and Swiss governments
GPA classification Description ISIC Rev 2 ISIC Rev 3
1 Products from agriculture, and from agricultural and food processing industries 311,313,314 151-154
2 Mineral products
3 Products of the chemical and allied industries 351,352 241, 242 less 2423
4 Medicinal and pharmaceutical products 352 2423
5
Artificial resins and plastic materials, cellulose esters and ethers, and articles thereof: rubber, synthetic rubber, factice, and articles thereof; raw hides and skins, leather, fur skins and articles thereof, other than articles of apparel and clothing accessories of leather, saddlery and harness, articles of animal gut
323,355,356 182,25
6Wood and articles of wood; wood charcoal, cork and articles of cork; paper making material; paper and paperboard and articles thereof: manufactures of straw of esparto and of other planting materials, basketwork and wickerwork
331, 341 202,21
7Textiles and textile articles, footwear, headgear umbrellas; sunshades; walking sticks, whips, riding crops and parts thereof: travel goods; hand-bags and similar containers; articles of apparel and clothing accessories, of leather or composition leather
321,322, 324 17,181,19
8Articles of stone, plaster, asbestos, mica and similar materials; ceramic products, other than sanitary fixtures; glass and glassware, other than illuminating and signaling glassware and optical elements of glass, not optically worked nor of optical glass
362, 369 26 less 2696
9Iron and steel and articles thereof, other than boilers and radiators for central heating, air heaters and hot air distributors not electrically heated 371 271,2731
10 Non-ferrous metals and articles, other than lamp and lighting fittings 372 272,2732
11 Power generating machinery and equipment 382 2911,311
12 Machinery specialized for particular industries 382 292
13 General industrial machinery and equipment, and machine parts 382 291 less 2911
14 Office machines and automatic data processing equipment 382 30
15 Telecommunications and sound recording and reproducing apparatus and equipment 383 32
16 Electrical machinery, apparatus and appliances, and electrical parts thereof 383 31 less 311
17 Road vehicles 384 34,359
18 Railway vehicles and associated equipment 384 352
19 Aircraft and associated equipment 384 353
20 Ships boats and floating structures 384 351
21 Sanitary, plumbing, heating and lighting equipment
22 Medical, dental, surgical and veterinary equipment 385 3311
23 Furniture and parts thereof 332 361
24 Professional, scientific and controlling instruments and apparatus 385 3312,3313
25 Photographic apparatus, equipment and optical goods; watches and clocks 385 332,333
26 Miscellaneous articles 390 369
Source: WTO (various years); UNSD (http://unstats.un.org/unsd/cr/registry/regso.asp?Ci=1&Lg=1) Note: The ISIC Rev 2 classification is used in Nicita & Olarreaga (2006) and the ISIC Rev 3 classification is used in UNIDO (2010) and OECD STAN (various years).
33
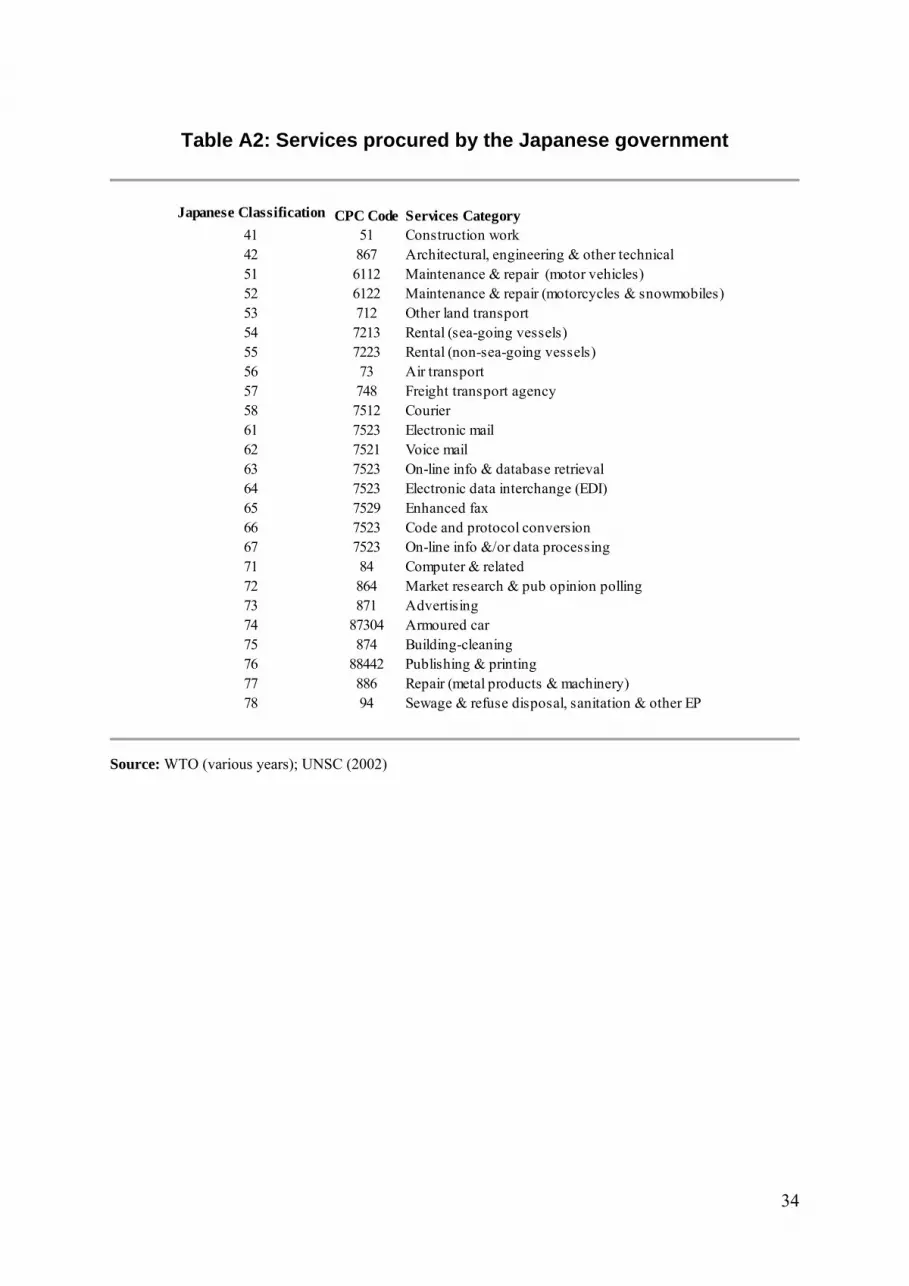
Table A2: Services procured by the Japanese government
Japanese Classification CPC Code Services Category
41 51 Construction work42 867 Architectural, engineering & other technical 51 6112 Maintenance & repair (motor vehicles)52 6122 Maintenance & repair (motorcycles & snowmobiles)53 712 Other land transport 54 7213 Rental (sea-going vessels)55 7223 Rental (non-sea-going vessels)56 73 Air transport 57 748 Freight transport agency 58 7512 Courier 61 7523 Electronic mail62 7521 Voice mail63 7523 On-line info & database retrieval64 7523 Electronic data interchange (EDI)65 7529 Enhanced fax 66 7523 Code and protocol conversion67 7523 On-line info &/or data processing 71 84 Computer & related 72 864 Market research & pub opinion polling 73 871 Advertising 74 87304 Armoured car 75 874 Building-cleaning 76 88442 Publishing & printing 77 886 Repair (metal products & machinery)78 94 Sewage & refuse disposal, sanitation & other EP
Source: WTO (various years); UNSC (2002)
34
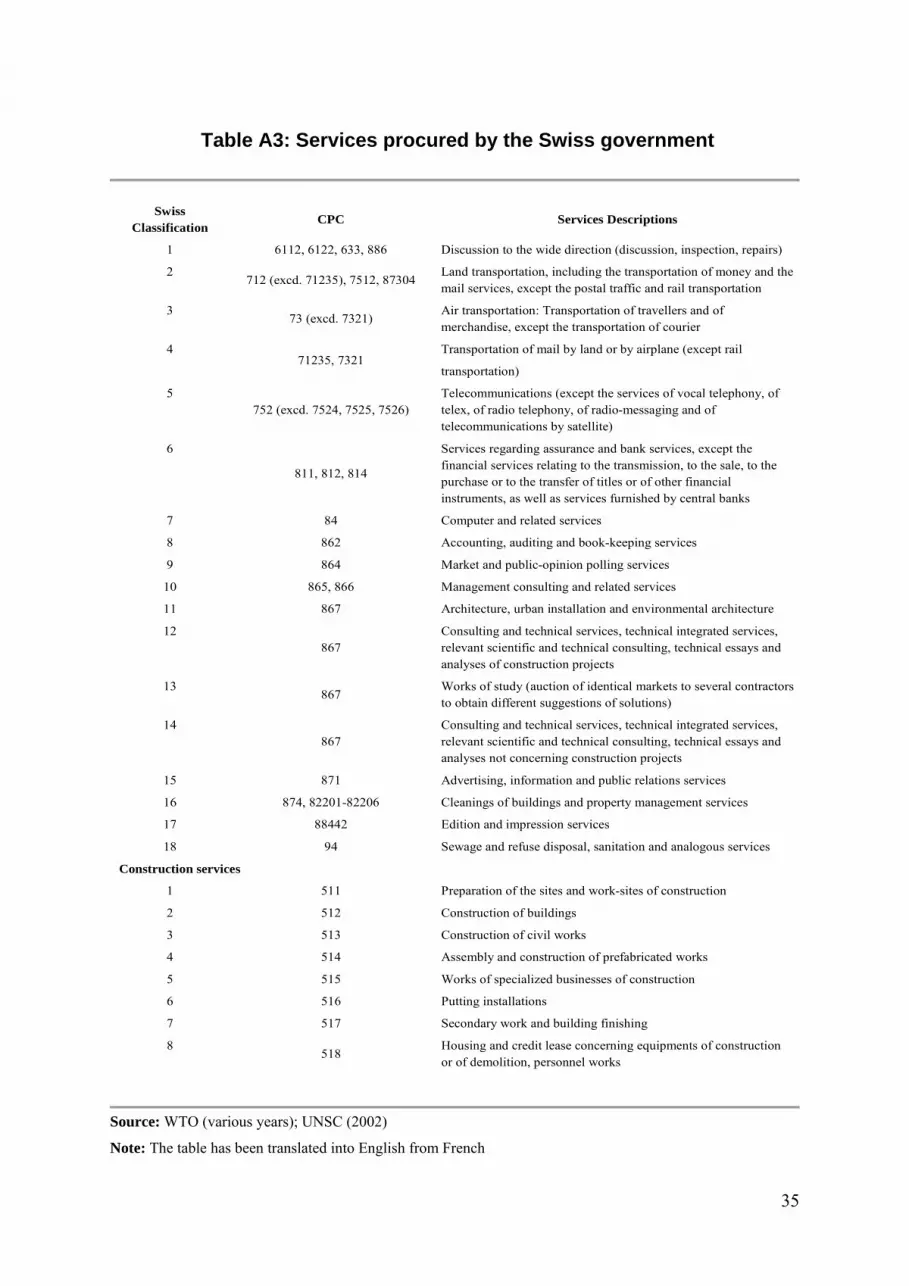
Table A3: Services procured by the Swiss government
Swiss
Classification CPC Services Descriptions
1 6112, 6122, 633, 886 Discussion to the wide direction (discussion, inspection, repairs)
2 712 (excd. 71235), 7512, 87304
Land transportation, including the transportation of money and the mail services, except the postal traffic and rail transportation
3 73 (excd. 7321)
Air transportation: Transportation of travellers and of merchandise, except the transportation of courier
4 71235, 7321
Transportation of mail by land or by airplane (except rail
transportation)
5 752 (excd. 7524, 7525, 7526)
Telecommunications (except the services of vocal telephony, of telex, of radio telephony, of radio-messaging and of telecommunications by satellite)
6
811, 812, 814
Services regarding assurance and bank services, except the financial services relating to the transmission, to the sale, to the purchase or to the transfer of titles or of other financial instruments, as well as services furnished by central banks
7 84 Computer and related services
8 862 Accounting, auditing and book-keeping services
9 864 Market and public-opinion polling services
10 865, 866 Management consulting and related services
11 867 Architecture, urban installation and environmental architecture
12 867
Consulting and technical services, technical integrated services, relevant scientific and technical consulting, technical essays and analyses of construction projects
13 867
Works of study (auction of identical markets to several contractors to obtain different suggestions of solutions)
14 867
Consulting and technical services, technical integrated services, relevant scientific and technical consulting, technical essays and analyses not concerning construction projects
15 871 Advertising, information and public relations services
16 874, 82201-82206 Cleanings of buildings and property management services
17 88442 Edition and impression services
18 94 Sewage and refuse disposal, sanitation and analogous services
Construction services
1 511 Preparation of the sites and work-sites of construction
2 512 Construction of buildings
3 513 Construction of civil works
4 514 Assembly and construction of prefabricated works
5 515 Works of specialized businesses of construction
6 516 Putting installations
7 517 Secondary work and building finishing
8 518
Housing and credit lease concerning equipments of construction or of demolition, personnel works
Source: WTO (various years); UNSC (2002)
Note: The table has been translated into English from French
35
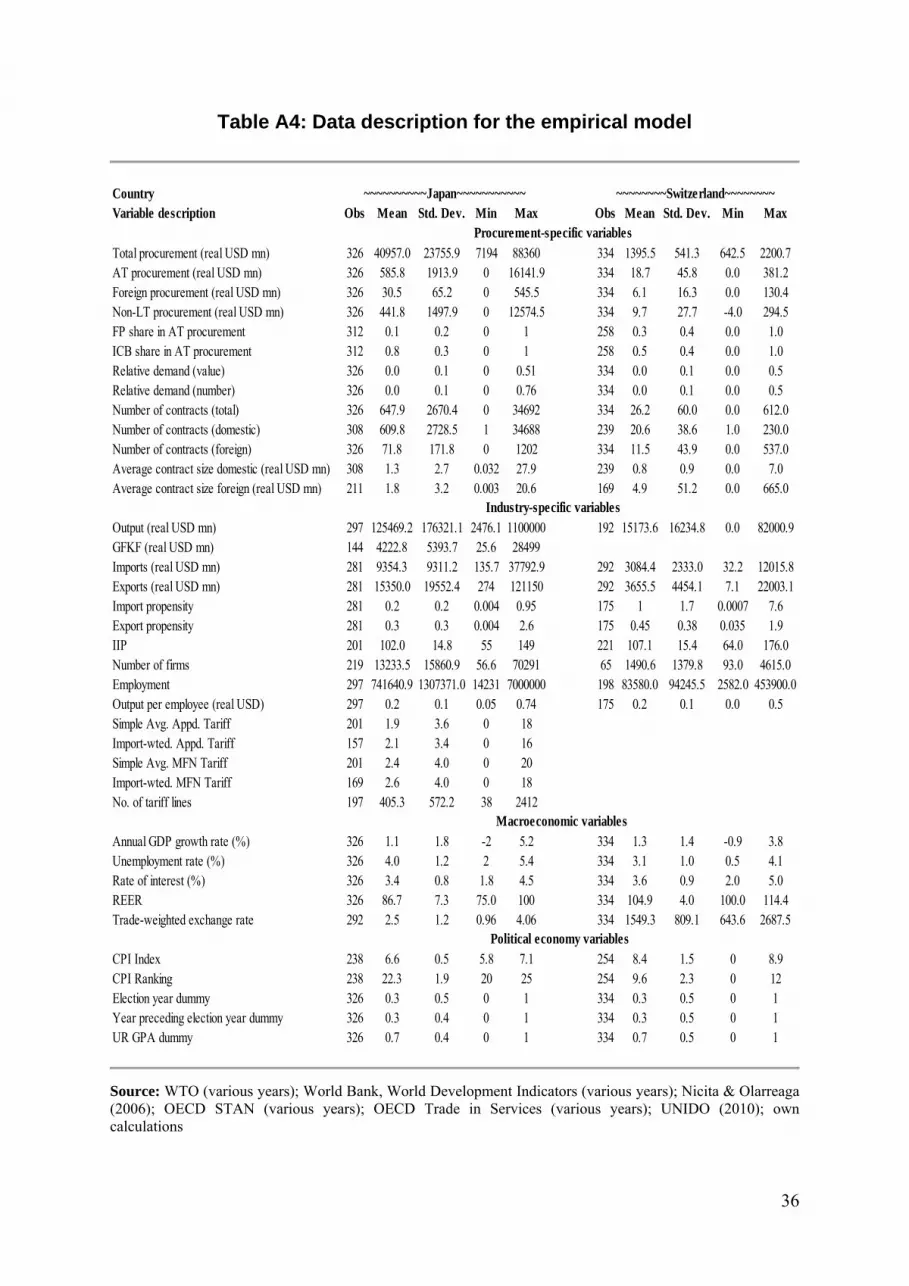
Table A4: Data description for the empirical model
CountryVariable description Obs Mean Std. Dev. Min Max Obs Mean Std. Dev. Min Max Procurement-specific variablesTotal procurement (real USD mn) 326 40957.0 23755.9 7194 88360 334 1395.5 541.3 642.5 2200.7AT procurement (real USD mn) 326 585.8 1913.9 0 16141.9 334 18.7 45.8 0.0 381.2Foreign procurement (real USD mn) 326 30.5 65.2 0 545.5 334 6.1 16.3 0.0 130.4Non-LT procurement (real USD mn) 326 441.8 1497.9 0 12574.5 334 9.7 27.7 -4.0 294.5FP share in AT procurement 312 0.1 0.2 0 1 258 0.3 0.4 0.0 1.0ICB share in AT procurement 312 0.8 0.3 0 1 258 0.5 0.4 0.0 1.0Relative demand (value) 326 0.0 0.1 0 0.51 334 0.0 0.1 0.0 0.5Relative demand (number) 326 0.0 0.1 0 0.76 334 0.0 0.1 0.0 0.5Number of contracts (total) 326 647.9 2670.4 0 34692 334 26.2 60.0 0.0 612.0Number of contracts (domestic) 308 609.8 2728.5 1 34688 239 20.6 38.6 1.0 230.0Number of contracts (foreign) 326 71.8 171.8 0 1202 334 11.5 43.9 0.0 537.0Average contract size domestic (real USD mn) 308 1.3 2.7 0.032 27.9 239 0.8 0.9 0.0 7.0Average contract size foreign (real USD mn) 211 1.8 3.2 0.003 20.6 169 4.9 51.2 0.0 665.0 Industry-specific variablesOutput (real USD mn) 297 125469.2 176321.1 2476.1 1100000 192 15173.6 16234.8 0.0 82000.9GFKF (real USD mn) 144 4222.8 5393.7 25.6 28499Imports (real USD mn) 281 9354.3 9311.2 135.7 37792.9 292 3084.4 2333.0 32.2 12015.8Exports (real USD mn) 281 15350.0 19552.4 274 121150 292 3655.5 4454.1 7.1 22003.1Import propensity 281 0.2 0.2 0.004 0.95 175 1 1.7 0.0007 7.6Export propensity 281 0.3 0.3 0.004 2.6 175 0.45 0.38 0.035 1.9IIP 201 102.0 14.8 55 149 221 107.1 15.4 64.0 176.0Number of firms 219 13233.5 15860.9 56.6 70291 65 1490.6 1379.8 93.0 4615.0Employment 297 741640.9 1307371.0 14231 7000000 198 83580.0 94245.5 2582.0 453900.0Output per employee (real USD) 297 0.2 0.1 0.05 0.74 175 0.2 0.1 0.0 0.5Simple Avg. Appd. Tariff 201 1.9 3.6 0 18Import-wted. Appd. Tariff 157 2.1 3.4 0 16Simple Avg. MFN Tariff 201 2.4 4.0 0 20Import-wted. MFN Tariff 169 2.6 4.0 0 18No. of tariff lines 197 405.3 572.2 38 2412 Macroeconomic variablesAnnual GDP growth rate (%) 326 1.1 1.8 -2 5.2 334 1.3 1.4 -0.9 3.8Unemployment rate (%) 326 4.0 1.2 2 5.4 334 3.1 1.0 0.5 4.1Rate of interest (%) 326 3.4 0.8 1.8 4.5 334 3.6 0.9 2.0 5.0REER 326 86.7 7.3 75.0 100 334 104.9 4.0 100.0 114.4Trade-weighted exchange rate 292 2.5 1.2 0.96 4.06 334 1549.3 809.1 643.6 2687.5
CPI Index 238 6.6 0.5 5.8 7.1 254 8.4 1.5 0 8.9CPI Ranking 238 22.3 1.9 20 25 254 9.6 2.3 0 12Election year dummy 326 0.3 0.5 0 1 334 0.3 0.5 0 1Year preceding election year dummy 326 0.3 0.4 0 1 334 0.3 0.5 0 1UR GPA dummy 326 0.7 0.4 0 1 334 0.7 0.5 0 1
Political economy variables
~~~~~~~~~~Japan~~~~~~~~~~~ ~~~~~~~~Switzerland~~~~~~~~
Source: WTO (various years); World Bank, World Development Indicators (various years); Nicita & Olarreaga (2006); OECD STAN (various years); OECD Trade in Services (various years); UNIDO (2010); own calculations
36