exploring cluster formation in the american craft brewing
TRANSCRIPT
1
A Recipe for Success: Exploring Cluster Formation in the American
Craft Brewing Industry By Michelle Rosas
Abstract
The U.S. craft brewing industry was born in the 1970s and has since seen rapid growth. While every state has experienced the emergence of craft brewing to some extent, growth has occurred remarkably unevenly. In 2011, for example, Vermont had one craft brewery for every 26,073 people. Mississippi, meanwhile, had one craft brewery for every 1,483,649 people. Several researchers have described and explained the high growth rate of U.S. craft breweries. There has also been significant research on the subject of cluster theory, focusing on why clusters emerge and how they function. There is a lack of research, however, regarding industry clusters in the craft brewing industry specifically. My thesis aims to address this gap by addressing why craft brewery clusters develop in certain regions and not in others. To identify possible conditions associated with high levels of craft brewery concentration, I propose that three key factors were—and continue to be—important for cluster formation: sense of community, openness to experience, and well-being among a region’s residents. I evaluate the effect of each of these factors through secondary data collection and personal interviews with professionals in the craft brewing industry. My results may be useful to policymakers in other regions who wish to establish a similar market and to craft brewery entrepreneurs across the country making key startup decisions. Key Words: Industry clusters, craft brewing industry, environmental forces
Submitted under the faculty supervision of Professor Myles Shaver, in partial fulfillment of the
requirements for the Bachelor of Science in Business, magna cum laude, Carlson School of
Management, University of Minnesota, Spring 2013.
2
1. Introduction
Since the mid-1990s, the American brewing industry has experienced significant changes
due to the emergence of craft breweries. In 1980, there were a mere eight craft breweries. By
1994, that number increased to 537, and as of June 2012, craft breweries made up 2,075 of all
2,126 breweries in the United States. Impressively, while U.S. beer sales as a whole have
decreased in each of the last two years, sales of craft beer grew 12% in 2010 and 13% in 2011.
Not only did sales of craft beer grow in terms of volume, but the industry also saw 250 craft
breweries open in 2012.
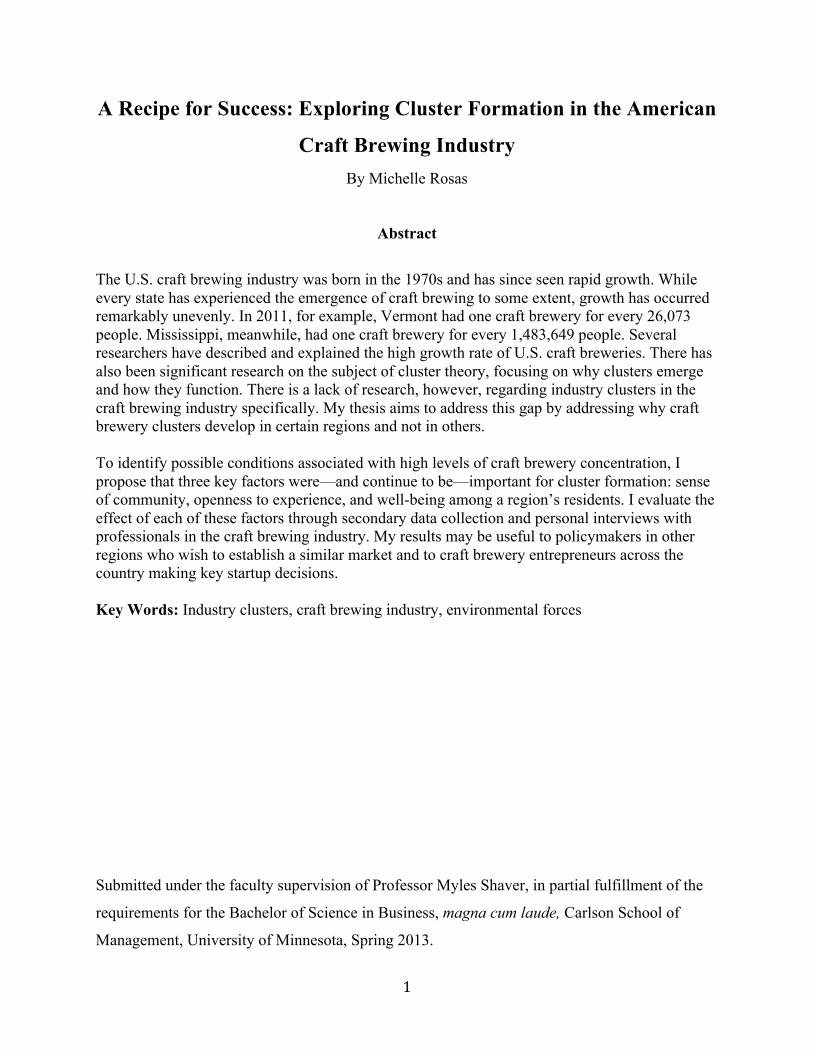
Interestingly, growth has been uneven across the U.S., with some states experiencing
much more growth than others. Oregon, for example, boasts 124 breweries compared to
Mississippi’s two breweries. Rather than entering untapped markets where few breweries
currently exist, potential entrants instead seem to go where there are already a number of other
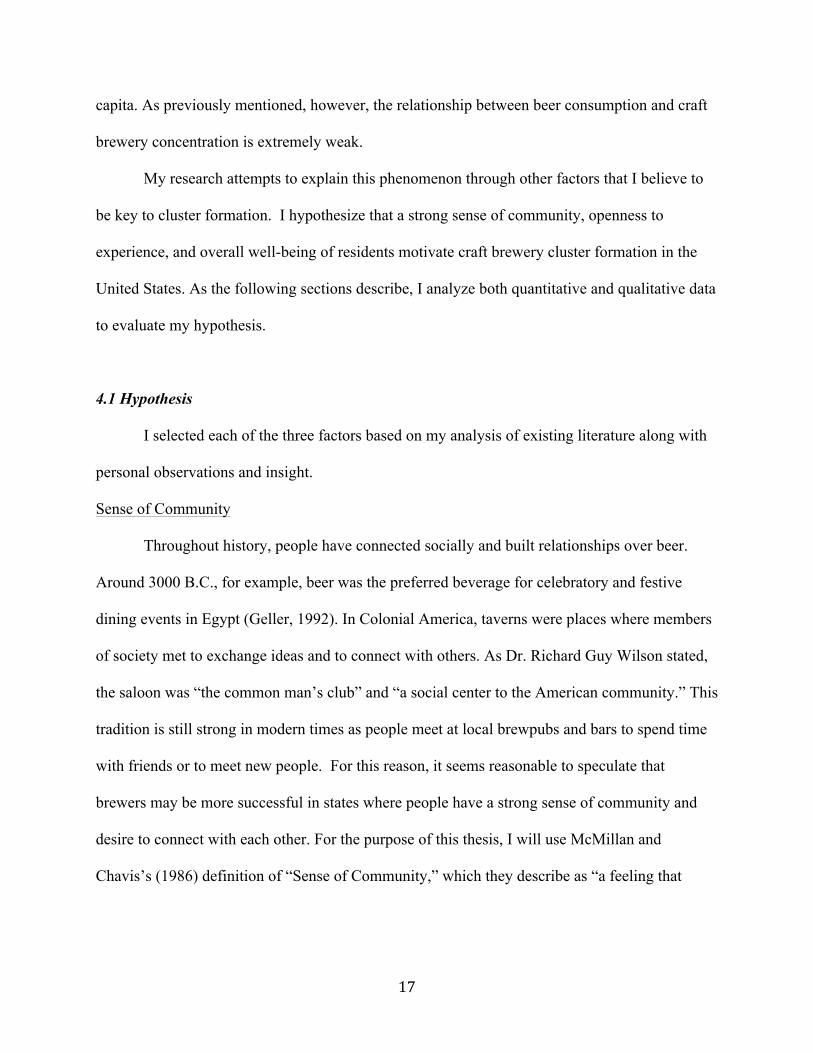
players, forming regional clusters. Figure 1.1 shows the distribution of breweries by state, where
the darkest states represent those with the greatest concentration of breweries, measured by
capita per craft brewery (Florida, 2012).
Figure 1.1: 2011 Craft brewery concentration in the U.S. Map courtesy of MPI's Zara Matheson, compiled from data provided by the Brewers Association
3
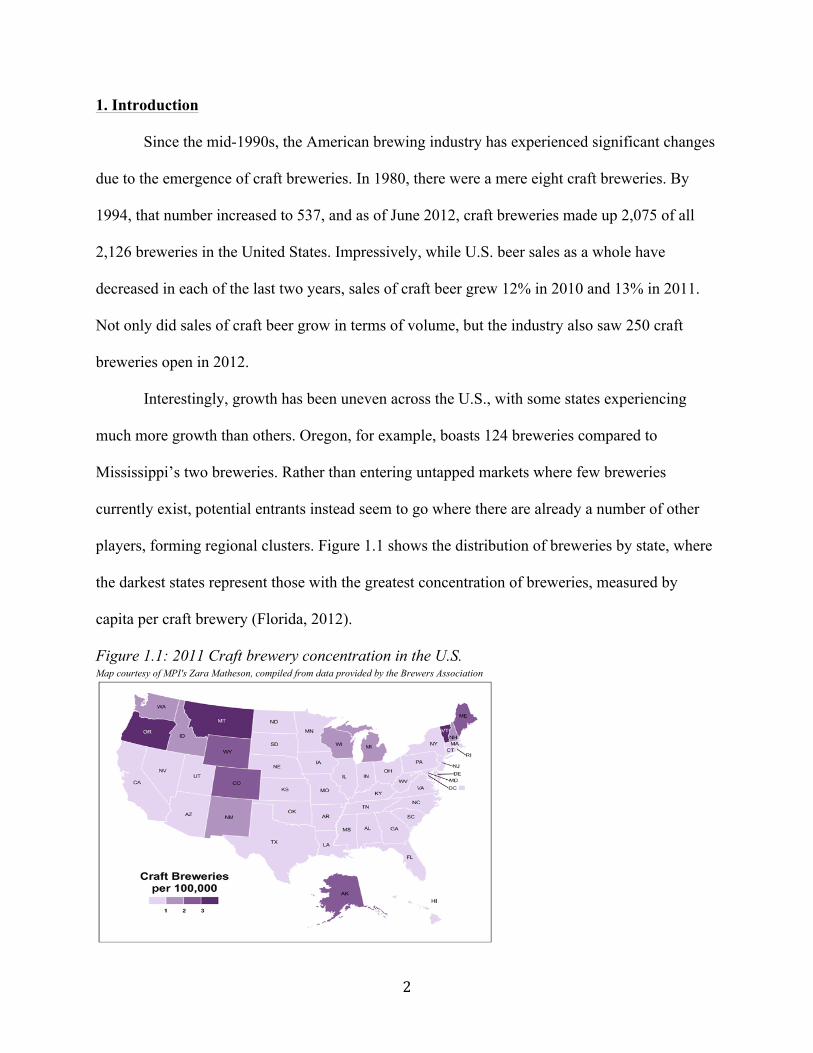
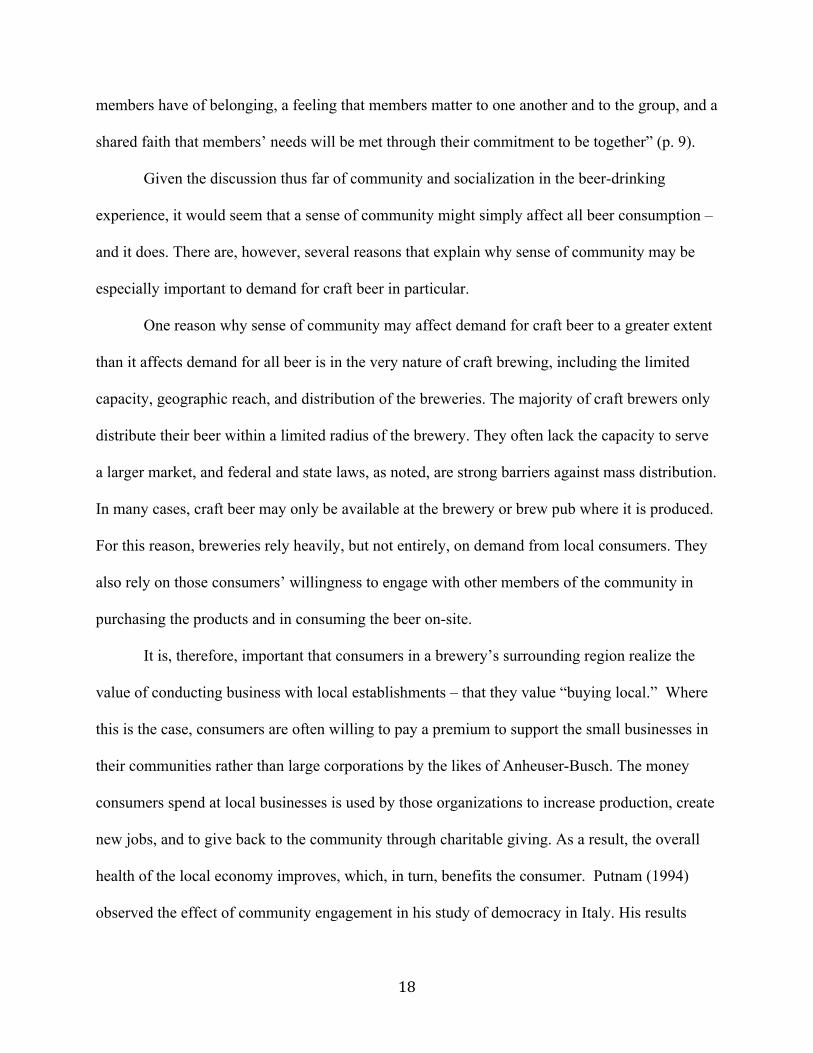
Surprisingly, this cluster phenomenon cannot be explained by a mere demand for beer.
Using data from the Beer Institute, published in its 2012 Brewers Almanac, along with data from
the Brewers Association, figure 1.2 illustrates this weak relationship by comparing beer
consumption per capita with capita per craft brewery across all 50 states as well as the District of
Columbia. This measure of capita per craft brewery is specific to the 1,987 craft breweries in the
U.S. as of 2011. It does not, for example, include the 23 “Large Non-Craft Breweries” or the 34
“Other Non-Craft Breweries” also in operation, as reported by the Brewers Association. By
focusing on the number of craft breweries, rather than all breweries, I can more accurately assess
the geographic distribution of craft breweries.
In 2011, the correlation between beer consumption per capita and capita per brewery was
very weak at -0.0467. In fact, states with some of the highest levels of beer consumption are
among those with the fewest craft breweries per capita. North Dakota, for example, ranks second
highest in beer consumption per capita, yet it has the fourth fewest craft breweries per capita.
Figure 1.2: 2011 State beer consumption per capita vs. 2011 capital/brewery
Correlation = -0.0467
-‐ 200 400 600 800
1,000 1,200 1,400 1,600
0 5 10 15 20 25 30 35 40 45 50
Cap
ita/B
rew
ery
(tho
usan
ds)
Beer Consumption per Capita
2011 Beer Consumption per Capita vs Capita per Brewery
4
If beer consumption alone is not related to craft brewery cluster formation, there must be
other factors at play. This thesis aims to identify and explain those factors that enable a state to
sustain a high concentration of craft breweries.
To answer this question, I use quantitative data along with interviews with craft brewing
professionals. With my qualitative approach to this question, the results inevitably carry some
limitations. In particular, my results do not prove causation. Instead, I aim to identify
relationships between craft breweries per capita and key environmental factors. In doing so, I
hope to provide useful insights to current and future players in the craft brewing industry.
One group of stakeholders is new breweries. Starting any new venture is risky, and
breweries, in particular, require significant capital and time investments for equipment and
product development. One concern of potential breweries is whether there is room in the market
for them to be successful. By understanding key factors that support craft brewery clusters, these
breweries may be able to make better decisions regarding location and distribution.
Policy makers may also use these findings to strengthen their local economies and
communities. For example, if they recognize that the areas they represent have characteristics
associated with craft brewery clusters, they could introduce new legislation or programs to make
the environment even more favorable to new and existing breweries. These regions would, in
turn, benefit from the creation of new jobs, a higher level of production, and the involvement
breweries often have in their communities.
This industry is still fairly young, and there is little scholarly literature to date. It is,
therefore, appropriate that my approach is an exploratory one that will continue the conversation
and create room for subsequent research. Most of the existing literature in this field looks at
overall growth of the industry or about cluster formation in general. My thesis applies Michael
5
Porter’s cluster theory specifically to the craft brewing industry, exploring why clusters form in
some regions but not others. In particular, I explore whether sense of community, openness to
experience, and well-being are important to craft brewery cluster formation. Before delving into
the relevant literature and the research question itself, I will first give a brief overview of the
history and definition of craft brewing in the United States.
2.0 History of Craft Brewing
For centuries, beer has been an integral part of society for cultures around the world.
Craft beer, however, is fairly new to the United States. While it can be argued that some of
America’s first breweries were, in fact, “craft breweries,” those establishments were completely
wiped out during the 1920–1933 prohibition, which saw the country’s 1300 full-strength beer
breweries close their doors (Blocker, 2006). For this reason, I consider the modern craft brewing
industry in the U.S. to be the rebirth of craft brewing since then – something which did not occur
until recent decades.
2.1 Definition of Craft Brewery
The definition of craft brewery focuses on three factors: size, ownership structure, and
brewing style. To meet the size requirement, the brewery’s annual production must not exceed 6
million barrels of beer, which is the equivalent of 189 million gallons. The brewery must also be
independent. Members of the alcoholic beverage industry who are not craft brewers themselves
may not have more than 25% stake in the company. The third requirement emphasizes the
importance of malted grain in the brewing process. A craft brewery either has a flagship beer that
6
is an all malt beer or beers that use malt or fermentable ingredients to enhance, not lighten, the
flavor make up the majority of the brewery’s total volume.
To illustrate, Budweiser, Coors, Pabst Blue Ribbon, and Leinenkugel’s Original, are all
flagship beers of large breweries, and they are all made in the American adjunct lager style. This
style is characterized as having “low bitterness, thin malts, and moderate alcohol,” where adjunct
cereal grains, such as rice and corn, are used to reduce flavor (BeerAdvocate). Specifically,
Budweiser, the flagship beer of Anheuser-Busch In Bev lists as its ingredients water, yeast, hops,
and barley, along with verdant rice, “brewed for a light and crisp taste” (Budweiser). In this
instance, the rice acts as an adjunct that reduces flavor, rather than enhance it as the “craft beer”
definition requires. In contrast, Bristol Brewing’s Laughing Lab is a Scottish Ale that uses a
blend of malts to create its characteristic flavor that highlights these ingredients (Bristol). This
does not mean, however, that other ingredients cannot be used. Many breweries experiment with
different flavors such as pumpkin, chilies, or coffee, but unlike the rice used in Budweiser, these
additions are used to enhance flavor, consistent with the Brewers Association’s definition of
“craft beer.”
2.2 Emergence of Craft Brewing
Tremblay and Tremblay (2005, p. 114) argue that craft brewing began in 1965 when Fritz
Maytag purchased Anchor Brewing Company and limited its capacity in order to produce and
sell a more full-bodied beer. By 1975, Anchor reached sales of 7,500 barrels and earned its first
profit. Subsequently, other brewers entered the market in an attempt to replicate Anchor’s
success. In these cases, however, brewers used the resources of established breweries to create
full-bodied “craft”-style beers. By today’s definition, this would disqualify these breweries from
7
the “craft brewery” classification since they were not independent. The first true independent
craft brewery built in the U.S. did not come until 1977 when John McAuliffe started the New
Albion Brewing Company from the ground up in Sonoma, California (Johnson, 1993).
Thereafter, the U.S. the craft brewing movement gained momentum with more firms
experiencing success. From 1977 to 1986, new breweries entered the market at a slow rate. One
key event during that time was the 1978 legalization of the home manufacture of beer, or
“homebrewing.” This enabled more Americans to experiment with small-batch brewing and to
share their experiences with other homebrewers. What usually starts as a hobby, the practice of
homebrewing has made significant contributions to the craft brewing industry. According to the
American Homebrewers Association, at least 90% of professional brewers today started brewing
as homebrewers. In fact, two of the most prolific craft breweries, Sierra Nevada Brewing
Company, and New Belgium Brewing Company, were both founded by homebrewers. The
aforementioned founder of the first craft brewery, John McAuliffe, also started as a homebrewer
(American Homebrewers Association).
The leap from homebrewing to craft beer production, however, did not come without
challenges. Most notably was the difficulty brewers had to convert traditional equipment to
accommodate smaller batch sizes, making initial testing a lengthy process. Furthermore,
homebrewing techniques were not widely known. This placed a constraint on the labor pool and
made it hard for new breweries to hire individuals with knowledge and skill in small-batch
brewing. These reasons, among others, may explain the slow growth of craft breweries in the late
1970s and early 1980s (Colorado Brewers Guild).
One industry pioneer who hoped to change that was Charlie Papazian. As a nuclear
engineering student at the University of Virginia, Charlie learned how to brew a range of beer
8
styles in his own kitchen. After graduating in 1972, Charlie moved to Boulder, Colorado, where
he shared his newfound love with others by teaching homebrewing classes. He also founded the
American Homebrewers Association (AHA) in 1978 and the Association of Brewers in 1979,
which eventually merged with the Brewers Association. His book, The Complete Joy of
Homebrewing, published in 1984, is arguably the most trusted guide in the industry (UVA
Magazine). Charlie’s contributions played a key role in the birth of the modern craft brewing
industry. Through 1998, the number of craft breweries increased dramatically from 461 in 1993
to 1,631 in 1998 (Tremblay and Tremblay, 2005, p.117). As of March 2013, this number has
increased even more to a total of 2,360 craft breweries in the U.S., representing 97.7% of all U.S.
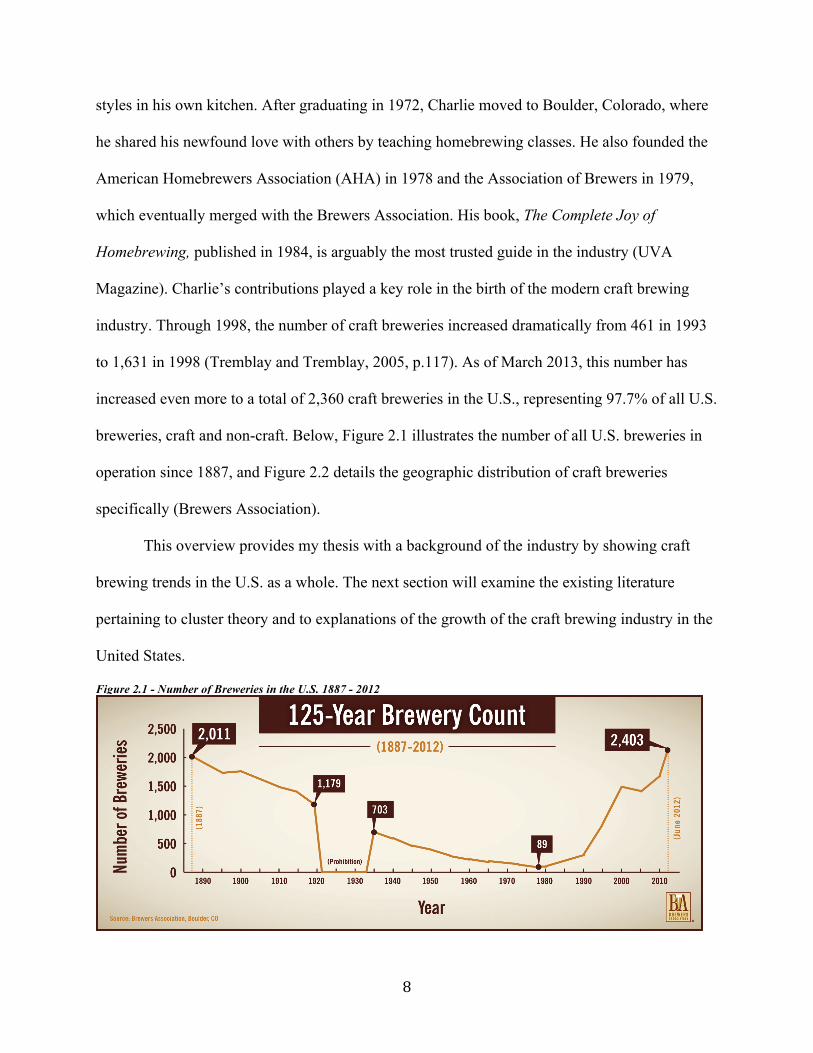
breweries, craft and non-craft. Below, Figure 2.1 illustrates the number of all U.S. breweries in
operation since 1887, and Figure 2.2 details the geographic distribution of craft breweries
specifically (Brewers Association).
This overview provides my thesis with a background of the industry by showing craft
brewing trends in the U.S. as a whole. The next section will examine the existing literature
pertaining to cluster theory and to explanations of the growth of the craft brewing industry in the
United States.
Figure 2.1 - Number of Breweries in the U.S. 1887 - 2012
9
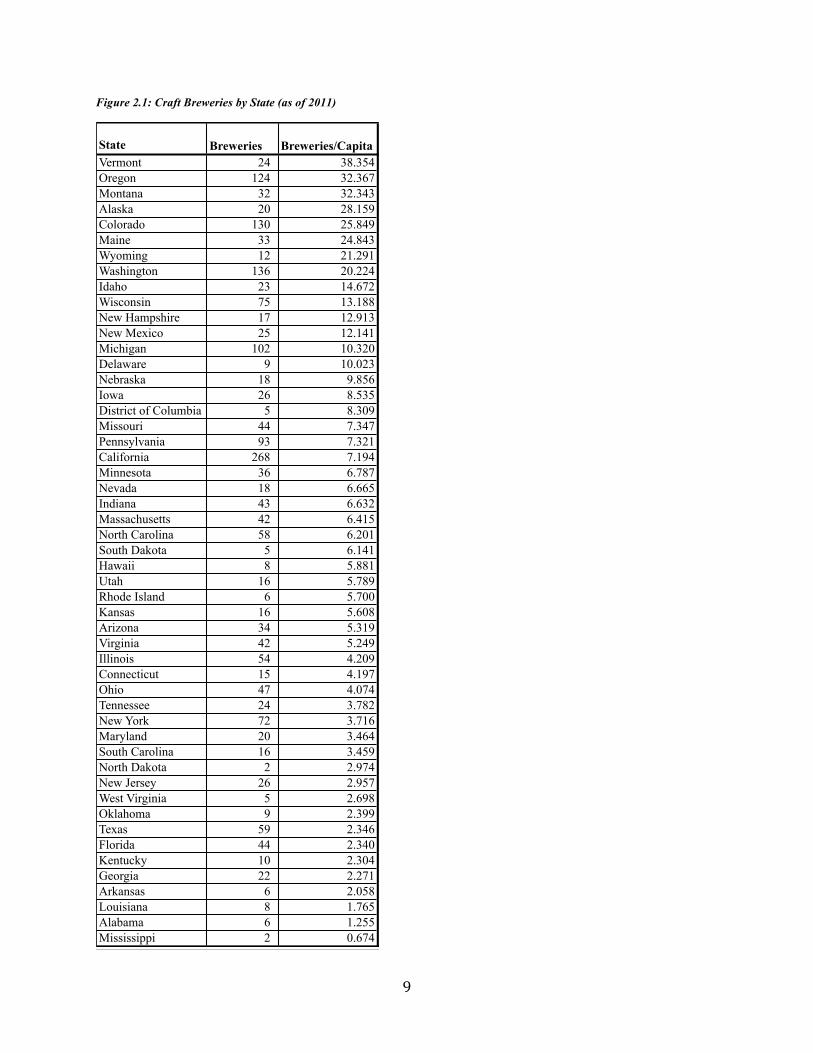
Figure 2.1: Craft Breweries by State (as of 2011)
State Breweries Breweries/CapitaVermont 24 38.354Oregon 124 32.367Montana 32 32.343Alaska 20 28.159Colorado 130 25.849Maine 33 24.843Wyoming 12 21.291Washington 136 20.224Idaho 23 14.672Wisconsin 75 13.188New Hampshire 17 12.913New Mexico 25 12.141Michigan 102 10.320Delaware 9 10.023Nebraska 18 9.856Iowa 26 8.535District of Columbia 5 8.309Missouri 44 7.347Pennsylvania 93 7.321California 268 7.194Minnesota 36 6.787Nevada 18 6.665Indiana 43 6.632Massachusetts 42 6.415North Carolina 58 6.201South Dakota 5 6.141Hawaii 8 5.881Utah 16 5.789Rhode Island 6 5.700Kansas 16 5.608Arizona 34 5.319Virginia 42 5.249Illinois 54 4.209Connecticut 15 4.197Ohio 47 4.074Tennessee 24 3.782New York 72 3.716Maryland 20 3.464South Carolina 16 3.459North Dakota 2 2.974New Jersey 26 2.957West Virginia 5 2.698Oklahoma 9 2.399Texas 59 2.346Florida 44 2.340Kentucky 10 2.304Georgia 22 2.271Arkansas 6 2.058Louisiana 8 1.765Alabama 6 1.255Mississippi 2 0.674
10
3.0 Literature Review
This thesis relies on existing research and literature in two fields: the concept of industry
cluster formation and the landscape of craft brewing in the United States. While existing U.S.
craft brewing industry research is not extensive, most of it focuses on the emergence of the
industry and its high growth-rate in recent years. Researchers explain this boom due to changes
in legislation and public policy, greater consumer demand for darker beer, and more effective
business practices of breweries (Tremblay and Tremblay, 2005).
The scholarly literature groups factors related to the booming growth of craft breweries
into two categories: those related to consumer-demand and those related to location. In addition
to environmental factors, I also consider management practices in explaining the craft brewing
boom, particularly by highlighting the role of marketing and promotional strategies. Finally, I
review the academic conversation on clusters that has evolved over the last 200 years.
In order to comment on the motivating factors of craft brewery clusters, I must first
define “cluster.” To do so, I review a range of existing literature, with foundations that date back
to the 1800s. The academic and business community has studied the topic of business
agglomeration or “clusters” extensively, and most theories can be categorized into two or three
schools of thought. There is also much agreement on a core set of dimensions in which clusters
exist and on “micro-foundations” of clusters, which will be addressed in the following discussion.
Ultimately, this review will demonstrate that existing research fails to apply cluster
theory to the growth of the craft brewing industry. While the literature addresses important
factors to individual craft brewery success and to the role of clusters, there is little discussion as
to which factors explain cluster formation. My thesis attempts to fill this gap by addressing both
topics.
11
3.1 Industry Cluster Theories
While the literature clearly identifies a high growth rate in the craft brewing industry, it is
important to note that some areas are experiencing more of this growth than others. As a result,
craft breweries are more concentrated in those areas. The disproportionate concentration of craft
breweries in a certain region can best be identified as an industry cluster. There has been
extensive research aiming to both define and explain clusters in a wide range of industries. So far,
there is no universally accepted definition of a “cluster,” but most researchers and commentators
agree on the broad characteristics and dimensions that qualify a group of businesses as a cluster.
Much literature on the topic of clusters can be attributed to Alfred Marshall and Michael
Porter. Marshall, a noted British economist, is also credited for his work in other areas of
microeconomics, such as the standard supply and demand graph and the idea of marginal utility.
In the late 1800s, manufacturers in England demonstrated a unique pattern of organization
whereby firms manufacturing certain products were concentrated in the same geographic region.
Alfred Marshall studied these “industrial districts,” and explained the phenomenon extensively in
his book Principles of Economics (1920).
Marshall’s work established the first school of thought on clusters and provides the first
definition of clusters as “an industry concentrated in certain localities” (IV.X.1). Specifically, he
argues that related firms form clusters based on physical proximity in order to achieve “external
economies of scale.” This is an advantage of spatial proximity where firms share the costs of
common resources such as infrastructure, skilled labor, and knowledge. He goes on to identify
three factors that sustain clusters: labor pool (IV.X.1), supplier specialization, and knowledge
transfer (IV. X. 7). Subsequent literature, including the work of economists Malmberg and
12
Maskell’s on industry agglomeration, refers to these factors collectively as the “Marshallian
Trinity” (2002).
Marshall uses the concept of external economies of scale to explain why clusters emerge,
and he outlines how certain factors help clusters remain successful. What he fails to identify,
however, are the specific conditions that cause firms to cluster in one region over another.
Research in the twentieth century has expanded on Marshall’s theories in the neoclassical
economic school of thought, which emphasizes the interaction between firms and consumers.
Michael Porter was perhaps the first to describing the phenomenon of clusters in The
Competitive Advantage of Nations (1990) and again in his article “Clusters and the New
Economics of Competition” (1998). He defines clusters as “geographic concentrations of
interconnected companies and institutions in a particular field” (1998). Porter’s theory focuses
on the role of location on a firm’s performance and strategy. While Marshall identified the
importance of specialized suppliers in industry localities, Porter expands on this point by
emphasizing that clusters impact the entire value chain, from product design and marketing to
sales and delivery. Each of these steps requires interactions with various external parties:
suppliers, competitors, distributors, customers, and others. Geographic location, and proximity to
these parties, therefore, can have a significant impact on a firm’s activities and overall strategy.
Porter also identifies four factors that help create industry clusters, which together
comprise the “diamond of competitive advantage.” When these factors are in place, firms receive
more benefit by forming a cluster than by remaining an isolated entity. The “diamond” includes
factor endowments, such as available resources and labor pool, demand conditions, related and
supporting industries, and firm strategy, structure, and rivalry (Porter, 1990).
13
Clearly, there are multiple views and perspectives on industry clusters. While there is no
true quantitative definition, there has been agreement on a set of broad cluster characteristics.
Cortright (2006) summarizes these views into a set of dimensions in which clusters operate:
physical distance between firms, technological distance, skill or labor distance, market distance,
and social distance. Cortright (2006) goes on to identify a set of “micro-foundations” of clusters.
These are forces that work alone, or in some combination, to create and sustain clusters. Building
from the Marshallian trinity of labor market pooling, supplier specialization and knowledge
spillovers, this list of factors also includes entrepreneurship, path dependence, culture, and local
demand. This thesis will primarily focus on clusters based on physical proximity and the role of
entrepreneurship and culture as micro-foundations. It will also rely on Porter’s definition of
“cluster” in describing cluster formation in the American craft brewing industry that has
occurred as a result of disproportionate growth. While failing to explain cluster formation
specifically, existing research does address the rapid overall growth of craft brewing in the
United States, as described in the following section.
3.2 Prevailing Explanations for the Craft Brewery Boom
Consumer-generated Demand
Demand for beer in general is driven by price, the price of substitutes, consumer income,
product characteristics, and the consumer’s level of consumption capital (Tremblay and
Tremblay, 2005). Craft beer, for the most part, is no different. For example, as consumer income
levels increased in the 1980s and 1990s, there was a greater demand for higher-priced premium
beer. Whereas traditional brewers use advertising to push their products, craft brewers benefit
14
from having an existing customer base that demands full-bodied, high-quality beer and are
willing to pay for it.
This set of customers has emerged partially due to the actions of mass-brewers. While
traditional breweries try to appeal to the mass market, craft brewers target a very specific group
of consumers. Over time, brewers such as Anheuser-Busch, Coors, and Miller have produced
increasingly lighter beer, giving consumers fewer options for dark beer. Unsatisfied by this trend,
a set of customers arose demanding darker, more full-bodied beer. Clemons, Gao, and Hitt
(2006) add that demand has also risen due to more educated consumers and greater awareness
for craft beer. Therefore, a difference in consumer demand is likely an important potential driver
of a difference in industry growth across states.
This level of demand for craft beer, however, varies dramatically across individual states
and regions. Not surprisingly, areas with high levels of beer consumption are attractive markets
for craft brewers. However, this factor alone does not guarantee success, as consumer
preferences often vary across geographic locations. In the south, for example, beer consumption
per capita is among the highest in the country, yet craft beer is much less popular than traditional
light beer (Tremblay and Tremblay).
Location-specific Motivators
Most of the existing research regarding location-specific motivators for craft brewers has
dealt with public policy. Most alcohol laws in the U.S. are dictated by individual states, making
location an important consideration for new breweries. Tremblay and Tremblay (2005) cited low
state excise tax rates as possible incentives for new brewers in some states; however, there is no
discussion on the extent to which brewers consider state tax rates before entering the market.
15
Importantly, brewers may respond not only to absolute rates but also to uncertainty driven by a
high frequency of rate changes.
Further research regarding location-specific motivators includes access to malt suppliers
and the presence of an existing, proven market. Bastian et al. (1995) found that craft brewers
place importance on malting technique, cost of transportation, timeliness of delivery, and price.
Therefore, differences in access to suppliers in terms of cost of transportation and timelines of
delivery may contribute to the success of the craft brewing industry in some locations relative to
others.
Carroll and Swaminiathan (1992) examine the role of industry density on the success of
mass production breweries, microbreweries, and brewpubs. This research concludes that
founding rates of both microbreweries and brewpubs increase with density and that mortality
rates for both segments decline with industry concentration, indicating that areas with a high
density of craft brewing establishments tend to perform well. It is not clear whether this is a
motivating factor or simply a result of other factors in an area conducive to craft brewer success.
Regardless, research on the growth of craft brewing should assess the role of density.
Role of Promotional Strategies
Another major theme in the existing literature includes specific business strategies and
practices that craft brewers use to be successful, especially those concerning brand promotion.
Tremblay and Tremblay (2005) point out that due to scale limitations and different growth
strategies, craft brewers do not use traditional tactics used by mass-producers, particularly
regarding advertising strategies. Whereas traditional brewers spend millions on advertising each
year, craft brewers often rely on word-of-mouth and online reviews for low-cost means of
promotion (Clemons et al., 2006). Most advertising expenses come in the form of education and
16
awareness to further increase this “consumer-generated pull demand” already in place (Clemons
et al., 2006, p. 157). Brewers can avoid high customer acquisition costs by operating in markets
where consumers already use and rely on word-of-mouth referrals from others. Examples include
the use of social media, review sites, and recommendations through everyday conversation. As
individuals use their own channels of communication to promote a brewery’s products, they
become evangelists for the brewery, encouraging others to join them as a loyal fan base. The
literature sites this advocacy among consumers as a major contributor to the recent growth of the
craft brewing industry.
Overall, the existing literature points to several potential drivers of growth in craft
brewing on a national level. However, there clearly exists disproportionate growth throughout
the country, with some states experiencing much more activity than others in terms of craft
breweries per capita (Brewers Association, 2010). The literature does not explain why some
states attract more craft breweries than others. To fill this gap, I identify the unique
characteristics of areas that have a strong presence of craft. The purpose of my study is to
analyze the impact of external factors, such as levels of well-being, on craft brewery clusters in
the United States. The next section will outline my approach to analyzing those factors and
filling the gap in the existing literature.
4.0 Methodology
Conventional wisdom suggests that craft brewery concentration would be highest in areas
where there is the highest demand for beer. This reflects a generally-accepted “maintained
hypothesis” that high beer consumption per capita is associated with more craft breweries per
17
capita. As previously mentioned, however, the relationship between beer consumption and craft
brewery concentration is extremely weak.
My research attempts to explain this phenomenon through other factors that I believe to
be key to cluster formation. I hypothesize that a strong sense of community, openness to
experience, and overall well-being of residents motivate craft brewery cluster formation in the
United States. As the following sections describe, I analyze both quantitative and qualitative data
to evaluate my hypothesis.
4.1 Hypothesis
I selected each of the three factors based on my analysis of existing literature along with
personal observations and insight.
Sense of Community
Throughout history, people have connected socially and built relationships over beer.
Around 3000 B.C., for example, beer was the preferred beverage for celebratory and festive
dining events in Egypt (Geller, 1992). In Colonial America, taverns were places where members
of society met to exchange ideas and to connect with others. As Dr. Richard Guy Wilson stated,
the saloon was “the common man’s club” and “a social center to the American community.” This
tradition is still strong in modern times as people meet at local brewpubs and bars to spend time
with friends or to meet new people. For this reason, it seems reasonable to speculate that
brewers may be more successful in states where people have a strong sense of community and
desire to connect with each other. For the purpose of this thesis, I will use McMillan and
Chavis’s (1986) definition of “Sense of Community,” which they describe as “a feeling that
18
members have of belonging, a feeling that members matter to one another and to the group, and a
shared faith that members’ needs will be met through their commitment to be together” (p. 9).
Given the discussion thus far of community and socialization in the beer-drinking
experience, it would seem that a sense of community might simply affect all beer consumption –
and it does. There are, however, several reasons that explain why sense of community may be
especially important to demand for craft beer in particular.
One reason why sense of community may affect demand for craft beer to a greater extent
than it affects demand for all beer is in the very nature of craft brewing, including the limited
capacity, geographic reach, and distribution of the breweries. The majority of craft brewers only
distribute their beer within a limited radius of the brewery. They often lack the capacity to serve
a larger market, and federal and state laws, as noted, are strong barriers against mass distribution.
In many cases, craft beer may only be available at the brewery or brew pub where it is produced.
For this reason, breweries rely heavily, but not entirely, on demand from local consumers. They
also rely on those consumers’ willingness to engage with other members of the community in
purchasing the products and in consuming the beer on-site.
It is, therefore, important that consumers in a brewery’s surrounding region realize the
value of conducting business with local establishments – that they value “buying local.” Where
this is the case, consumers are often willing to pay a premium to support the small businesses in
their communities rather than large corporations by the likes of Anheuser-Busch. The money
consumers spend at local businesses is used by those organizations to increase production, create
new jobs, and to give back to the community through charitable giving. As a result, the overall
health of the local economy improves, which, in turn, benefits the consumer. Putnam (1994)
observed the effect of community engagement in his study of democracy in Italy. His results
19
support my notion, holding that social capital embodied in “norms and networks of civic
engagement contribute to economic prosperity” (p. 180).
These elements of the craft brewing industry lead me to believe that those breweries tend
to be concentrated in areas where members share a strong sense of community.
Openness to Experience
“Openness to Experience,” or “openness” is one of the dimensions of the five-factor
model of personality, originally identified by Costa and McCrae (1976). People who exhibit a
high Openness to Experience are willing to try new things and are comfortable with variety and
novelty. There is also a correlation between openness and sensation-seeking (Garcia, et al. 2005).
People with a sensation-seeking personality trait actively search for “varied, novel, complex and
intense” experiences and are more risk-tolerant when it comes to those experiences (Zuckerman,
2009).
By definition, craft brewers use adjuncts to “enhance rather than lighten flavor,” whereas
larger brewers, such as Budweiser, lighten flavor (Brewers Association). In addition, craft beer
often has a higher alcohol content than the beer most Americans are familiar with, and craft
brewers often use non-traditional ingredients in their products, such as chilies, lavender, or
pumpkin. For this reason, brewers’ success relies on consumers’ willingness to experiment with
beers that differ from those of Budweiser, Coors, and the like. This Openness for Experience is
what stimulates demand for new and stronger products, and creates an environment where many
breweries can coexist.
Well-Being
This thesis adopts University of Illinois professor Ed Diener’s definition of well-being as
“all of the various types of evaluations, both positive and negative, that people make of their
20
lives. It includes reflective cognitive evaluations, such as life satisfaction and work satisfaction,
interest and engagement, and affective reactions to life events, such as joy and sadness” (2005).
This definition stems from a contemporary view of well-being that encompasses both the
“experienced” and “evaluative” facets of well-being as described by Nobel laureate Daniel
Kahneman. Kahneman (2005) differentiates these facets of well-being, noting that experienced
well-being relates to momentary feelings about experiences as they happen, while evaluative
well-being relates to how people remember past experiences.
These views lay the foundation for the Well-Being Index published annually by Gallup,
Inc. and Healthways, Inc. The Index uses six dimensions of well-being to evaluate various
aspects of health in a region: life evaluation, emotional health, physical health, healthy behavior,
work environment, and basic access. I chose this Index because it measures health across such a
broad spectrum, providing a well-rounded sense of an area’s well-being. Together, the six
dimensions effectively capture both the experienced and evaluative aspects of well-being.
The reasoning behind my selection of well-being as a key factor in craft brewery cluster
formation is admittedly less substantiated than those of the first two factors. Consequently, it
involves the most conjecture of the three. Based on my personal observations and conversations
with craft beer drinkers, the experience of drinking craft beer is often one that is savored and
enjoyed. This requires that consumers grant themselves time for relaxation and enjoyment; it also
requires consumers to be mentally present during the experience. Both of these are attributes of
people with stable mental health and a healthy sense of balance in their lives. It also aligns very
closely with Kahneman’s concept of experienced well-being, pertaining to the momentary
feelings and emotions of consumers during the beer-drinking experience. This leads me to
21
speculate that well-being is associated with greater success for craft breweries and, therefore,
with cluster formation in the industry.
4.2 Data and Measures
There are a number of ways to evaluate craft brewery concentration in the United States:
by region, by state, by county, or by city. My analysis will use individual states as the unit of
observation. Separating geographic areas by state is appropriate for many reasons. Most
importantly, alcohol regulations, distribution laws, and excise tax are imposed on the state level.
Consequently, the effects of significant differences in state regulatory environments would be
observable by comparing states. Regional comparisons may not show the effects of these
regulations, and it may be unnecessary to delve into city-specific data. Furthermore, regional
comparisons may not be comparable if different sources use different regional boundaries. For
example, some researchers may categorize Colorado in the West, while others may include a
Rocky Mountain region. Based on these reasons, I will attempt to identify factors that contribute
to a greater number of craft breweries per capita in some states than in others.
As stated, the three key factors I believe to be associated with a high number of craft
breweries per capita are Sense of Community, Openness to Experience, and Well-Being among
residents. For each factor, I have identified several proxy measures that indicate if that factor
exists in a state. The measures I will use to evaluate each factor along with my method for
obtaining the data are listed in Figure 4.1.
22
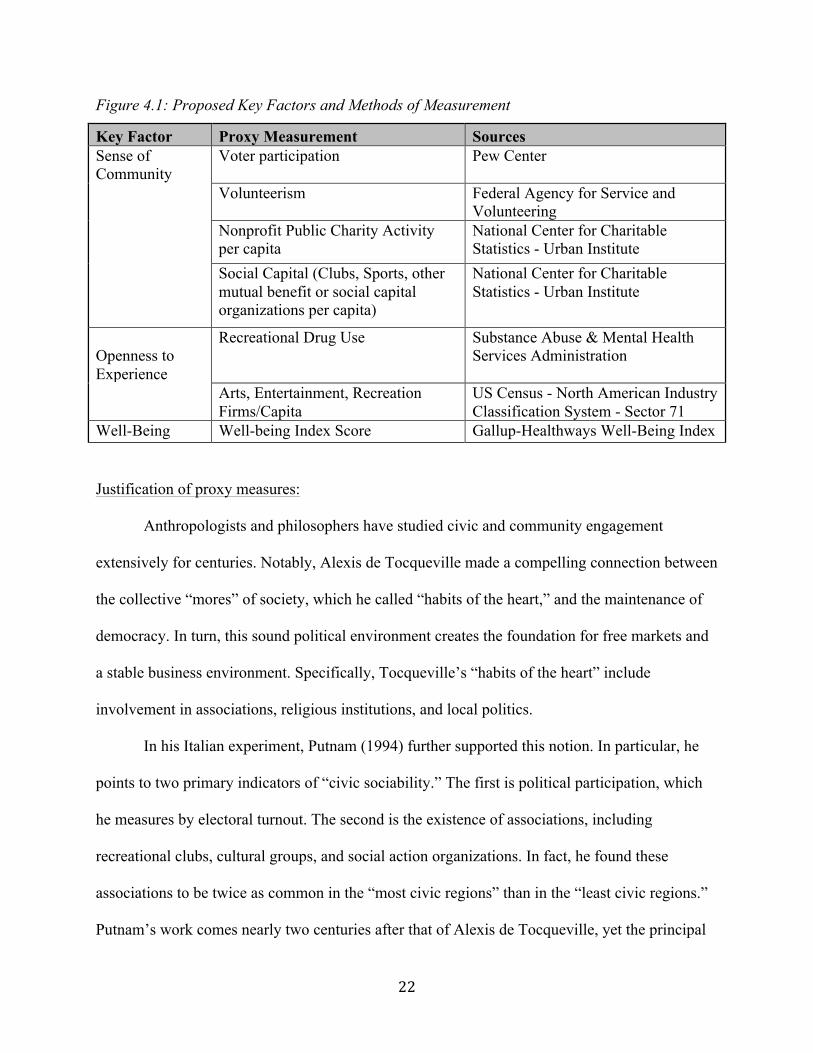
Figure 4.1: Proposed Key Factors and Methods of Measurement
Key Factor Proxy Measurement Sources Sense of Community
Voter participation Pew Center
Volunteerism Federal Agency for Service and
Volunteering
Nonprofit Public Charity Activity per capita
National Center for Charitable Statistics - Urban Institute
Social Capital (Clubs, Sports, other mutual benefit or social capital organizations per capita)
National Center for Charitable Statistics - Urban Institute
Openness to Experience
Recreational Drug Use Substance Abuse & Mental Health Services Administration
Arts, Entertainment, Recreation Firms/Capita
US Census - North American Industry Classification System - Sector 71
Well-Being Well-being Index Score Gallup-Healthways Well-Being Index
Justification of proxy measures:
Anthropologists and philosophers have studied civic and community engagement
extensively for centuries. Notably, Alexis de Tocqueville made a compelling connection between
the collective “mores” of society, which he called “habits of the heart,” and the maintenance of
democracy. In turn, this sound political environment creates the foundation for free markets and
a stable business environment. Specifically, Tocqueville’s “habits of the heart” include
involvement in associations, religious institutions, and local politics.
In his Italian experiment, Putnam (1994) further supported this notion. In particular, he
points to two primary indicators of “civic sociability.” The first is political participation, which
he measures by electoral turnout. The second is the existence of associations, including
recreational clubs, cultural groups, and social action organizations. In fact, he found these
associations to be twice as common in the “most civic regions” than in the “least civic regions.”
Putnam’s work comes nearly two centuries after that of Alexis de Tocqueville, yet the principal
23
idea remains: social groups and affiliations are key indicators of community engagement. It is,
therefore, appropriate to use voter participation, volunteerism, and social organization rates as
proxy measures for “sense of community.”
The second proposed key factor for craft brewery cluster formation is openness to
experience. As previously mentioned, openness to experience is strongly associated with
Zuckerman’s concept of sensation-seeking, which is strongly correlated with creativity and risky
behaviors such as gambling, sexual activity, financial risk taking, smoking, and risky driving
(1994). Similarly, Costa et al. identified two adjectives associated with an “unmistakable
openness factor:” daring and original. Therefore, to test the degree to which people in a state
exhibit openness to experience, I use illicit drug use and activity in the arts, entertainment, and
recreation sector as two key proxy measures. To obtain a consistent measurement of “arts,
entertainment, and recreation” activity, I use the number of Sector 71 firms per capita recorded
by the North American Industry Classification System (NAICS). This source serves as an
effective and appropriate measure of openness to experience because it encompasses a variety of
activities and events in which residents partake. The NAICS defines Sector 71 firms as those that
(1) are involved in “producing, promoting, or participating in live performances, events, or
exhibits intended for public viewing;” (2) “preserve and exhibit objects and sites of historical,
cultural, or educational interest;” and (3) “operate facilities or provide services that enable
patrons to participate in recreational activities or pursue amusement, hobby, and leisure-time
interests.” These activities, along with illicit drug use, all involve an appreciation for novelty,
adventure, or creativity – common characteristics of individuals who exhibit strong openness to
experience (Zuckerman, 1994).
24
Finally, I have chosen to use the Gallup-Healthways Well-Being Index as a proxy
measure for my third key factor, well-being. This is appropriate because it measures many
dimensions of well-being from physical health, to work environment and safety. Not only will I
be able to draw conclusions from the relationship between industry concentration and overall
well-being, but I will also be able to further dissect the relationship by focusing on specific
dimensions that may yield stronger relationships than others.
4.3 Analysis of Hypothesis
As previously discussed, the variable this research attempts to explain is craft brewery
concentration, measured by craft breweries per capita. The data for craft breweries per capita
comes from the Brewers Association, a well-respected authority in the craft brewing community.
The organization is comprised of over 1,500 U.S. brewery members, 34,000 members of the
American Homebrewer Association, as well as members of the allied trade and beer wholesalers
associations.
To identify and assess the relationships between key factors and craft brewery
concentration, I use the existence and impact of proxy measures. In addition to my analysis of
existing data, I also conducted a number of interviews with professionals in the craft brewing
industry. The interviewees represent different breweries or craft beer blogs. I chose to interview
bloggers because these writers are very familiar with the beer news, events, and trends in their
region. Over the course of several years, they have observed how craft brewing in the region has
changed and have built relationships with many owners and brewers. Bloggers and local news
outlets play a key role in the industry by educating consumers and existing as a source of free
publicity for breweries. They are also independent of any one brewery, so they provide a unique
25
perspective on the industry that brewers themselves might not have. Brewers, meanwhile,
provide valuable insights into how individual companies operate in the industry.
I conducted eight interviews, one of which involved two co-owners. For my analysis of
interview results, I treat this interview as one response, even though there were two interviewees.
A detailed list of interviewees and the organizations and regions they represent is included in
appendix A. Of these nine professionals, three work in Colorado Springs, Colorado, two in
Portland, Oregon, and four in and around Burlington, Vermont. I conducted some interviews in
person and some over email, depending on availability and location. In both cases, however, I
asked the same set of questions, allowing the interviewee to elaborate on key points as
appropriate. My questions ranged from personal experience to the industry or the region as a
whole. See appendix B for list of standard questions. The results of these interviews serve to
validate or refute my initial conclusions. I will also refer to these interviews in my discussion as I
attempt to explain why each fact does or does not promote craft brewery cluster formation.
Inherent in this methodology are several assumptions and limitations. The main
assumption upon which my thesis relies is the use of craft breweries per capita as an effective
way to identify if and where craft brewery clusters exist. Similarly, I assume that each of the
proxy measures I have selected is a reliable indicator of a corresponding key factor. Finally,
because my interviewees represent only three craft brewery clusters, I assume that in instances
where answers agree, I could reasonably expect to find similar agreement in other cluster regions.
The greatest limitation to my methodology is that my results do not indicate a causal
relationship. To do so would require further research. It would also require the identification of
an independent source of variation in the key factors, which would be a very difficult, if not
impossible, task. Instead, my objective is to examine whether or not certain relationships exist
26
and to explore why they do or do not exist. It is also important to note that the industry is still
young and growing. As the industry grows and matures, the roles of key factors may change,
and clusters may still form in areas where there is low concentration today.
I have incorporated several elements to my methodology that serve to mitigate the effects
of these limitations. My analysis explores clusters across the entire United States rather than just
one or two cluster regions. This will allow me to more reliably apply my conclusions to the
country as a whole. To avoid a potentially false assumption, I use more than one proxy measure,
in most cases, to determine if a factor is present. For sense of community and openness to
experience, it is also necessary to include multiple proxies since they are both fairly broad and
can include a number of components. Another strength is my use of quantitative data along with
the qualitative findings of my interviews. These interviews include people who are very familiar
with the industry. Not only did I interview brewers and brewery owners who are involved in the
day-to-day operations of a brewery, but I also interviewed professionals in the media community,
who are just as knowledgeable but who have a unique outside perspective. The next section will
outline the data and results I obtained through this methodology.
5.0 Results
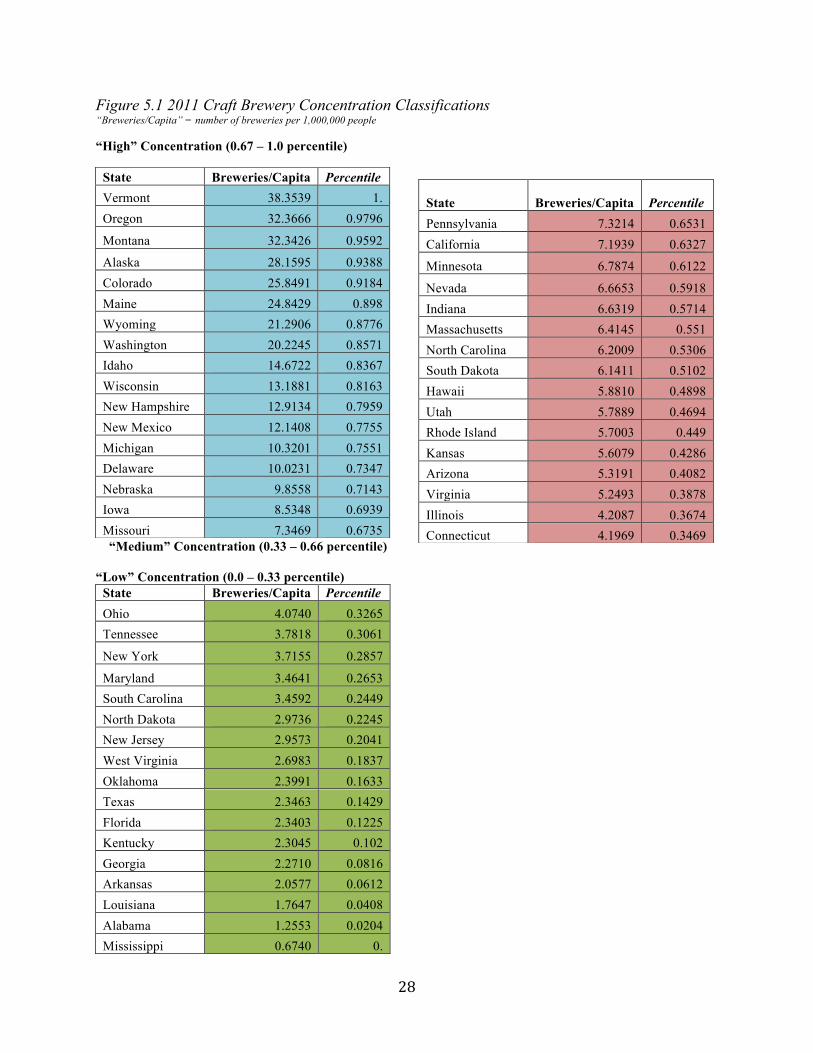
To evaluate my hypothesis, I first identify the level of craft brewery concentration that
qualifies as a cluster. Using craft breweries per capita as a guide, my thesis assumes that clusters
exist in the states with the highest craft breweries per capita: Vermont, Oregon, Montana,
Colorado, and Maine. However, to complete an accurate evaluation of each factor, I distinguish
the states even further. I have identified three ranges of craft brewery concentration based on
percentiles as shown in Figure 5.1 below. States with “high concentration” are those in the 67th

27
percentile or above, with 7.34 or more craft breweries per one million people. States with
“medium concentration” are those between the 33rd and 67th percentiles, with 4.1 to 7.33 craft
breweries per one million people. Finally, states with “low concentration” rank in the 33rd
percentile or lower and have fewer than 4.1 craft breweries per one million people.
28
Figure 5.1 2011 Craft Brewery Concentration Classifications “Breweries/Capita” = number of breweries per 1,000,000 people
“High” Concentration (0.67 – 1.0 percentile)
“Medium” Concentration (0.33 – 0.66 percentile) “Low” Concentration (0.0 – 0.33 percentile)
State Breweries/Capita Percentile Vermont 38.3539 1. Oregon 32.3666 0.9796
Montana 32.3426 0.9592
Alaska 28.1595 0.9388 Colorado 25.8491 0.9184 Maine 24.8429 0.898 Wyoming 21.2906 0.8776 Washington 20.2245 0.8571 Idaho 14.6722 0.8367 Wisconsin 13.1881 0.8163 New Hampshire 12.9134 0.7959 New Mexico 12.1408 0.7755 Michigan 10.3201 0.7551 Delaware 10.0231 0.7347 Nebraska 9.8558 0.7143 Iowa 8.5348 0.6939 Missouri 7.3469 0.6735
State Breweries/Capita Percentile Pennsylvania 7.3214 0.6531 California 7.1939 0.6327
Minnesota 6.7874 0.6122
Nevada 6.6653 0.5918 Indiana 6.6319 0.5714 Massachusetts 6.4145 0.551 North Carolina 6.2009 0.5306 South Dakota 6.1411 0.5102 Hawaii 5.8810 0.4898 Utah 5.7889 0.4694 Rhode Island 5.7003 0.449 Kansas 5.6079 0.4286 Arizona 5.3191 0.4082 Virginia 5.2493 0.3878 Illinois 4.2087 0.3674 Connecticut 4.1969 0.3469
State Breweries/Capita Percentile Ohio 4.0740 0.3265 Tennessee 3.7818 0.3061
New York 3.7155 0.2857
Maryland 3.4641 0.2653 South Carolina 3.4592 0.2449 North Dakota 2.9736 0.2245 New Jersey 2.9573 0.2041 West Virginia 2.6983 0.1837 Oklahoma 2.3991 0.1633 Texas 2.3463 0.1429 Florida 2.3403 0.1225 Kentucky 2.3045 0.102 Georgia 2.2710 0.0816 Arkansas 2.0577 0.0612 Louisiana 1.7647 0.0408 Alabama 1.2553 0.0204 Mississippi 0.6740 0.
29
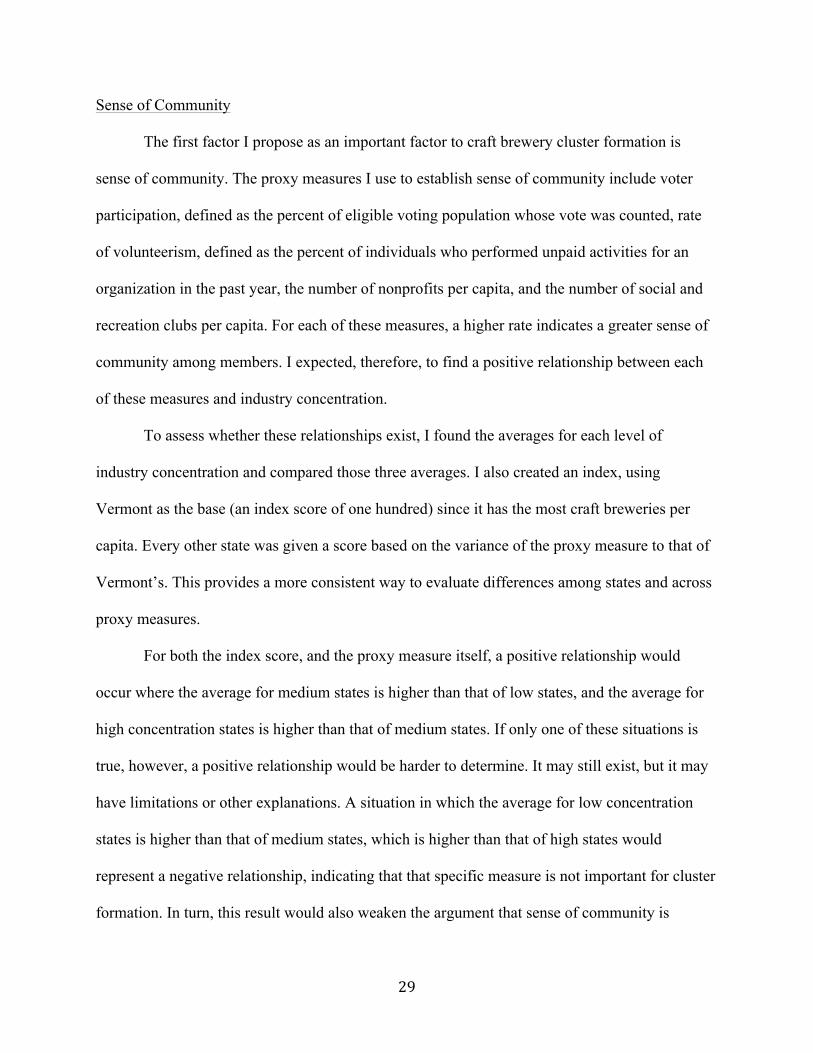
Sense of Community The first factor I propose as an important factor to craft brewery cluster formation is
sense of community. The proxy measures I use to establish sense of community include voter
participation, defined as the percent of eligible voting population whose vote was counted, rate
of volunteerism, defined as the percent of individuals who performed unpaid activities for an
organization in the past year, the number of nonprofits per capita, and the number of social and
recreation clubs per capita. For each of these measures, a higher rate indicates a greater sense of
community among members. I expected, therefore, to find a positive relationship between each
of these measures and industry concentration.
To assess whether these relationships exist, I found the averages for each level of
industry concentration and compared those three averages. I also created an index, using
Vermont as the base (an index score of one hundred) since it has the most craft breweries per
capita. Every other state was given a score based on the variance of the proxy measure to that of
Vermont’s. This provides a more consistent way to evaluate differences among states and across
proxy measures.
For both the index score, and the proxy measure itself, a positive relationship would
occur where the average for medium states is higher than that of low states, and the average for
high concentration states is higher than that of medium states. If only one of these situations is
true, however, a positive relationship would be harder to determine. It may still exist, but it may
have limitations or other explanations. A situation in which the average for low concentration
states is higher than that of medium states, which is higher than that of high states would
represent a negative relationship, indicating that that specific measure is not important for cluster
formation. In turn, this result would also weaken the argument that sense of community is
30
associated with a high concentration of craft breweries. In addition to comparing averages among
the three classifications for industry concentration, I also found the correlation between each
proxy measure and craft breweries per capita. Similarly, a higher positive correlation would
indicate that a measure is associated with cluster formation, strengthening the case for the role of
sense of community in a region’s ability to sustain a high concentration of craft breweries. Figure
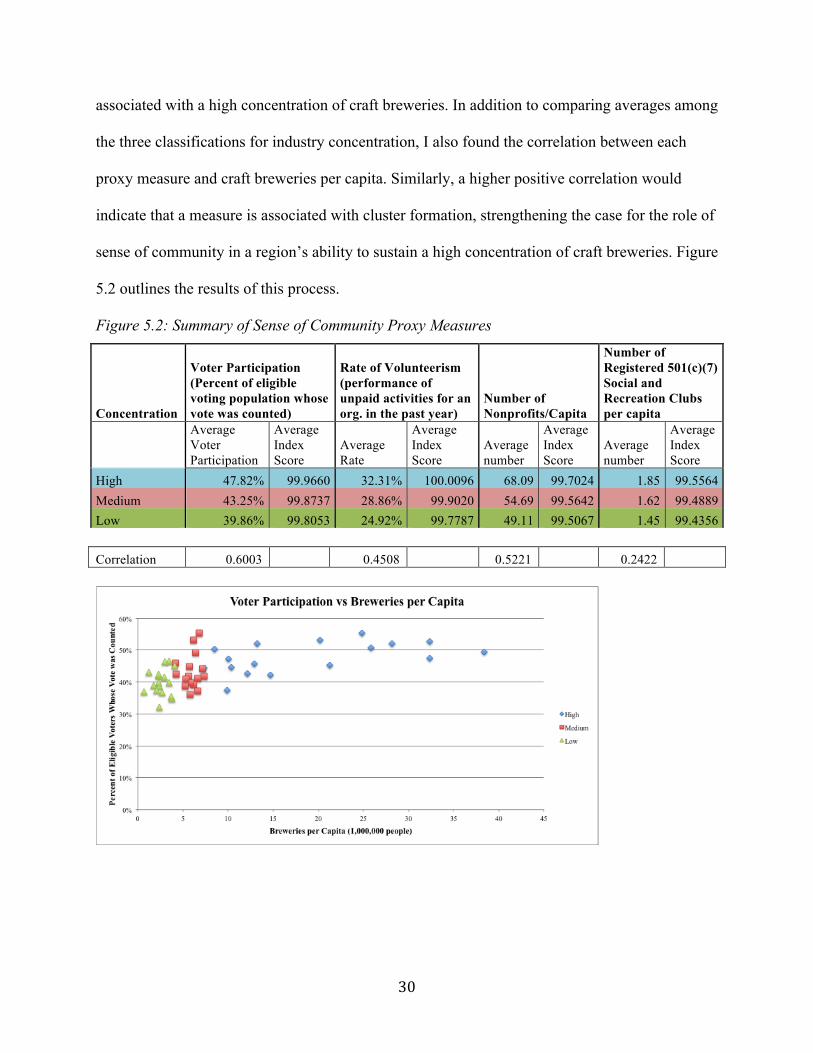
5.2 outlines the results of this process.
Figure 5.2: Summary of Sense of Community Proxy Measures
Concentration
Voter Participation (Percent of eligible voting population whose vote was counted)
Rate of Volunteerism (performance of unpaid activities for an org. in the past year)
Number of Nonprofits/Capita
Number of Registered 501(c)(7) Social and Recreation Clubs per capita
Average Voter Participation
Average Index Score
Average Rate
Average Index Score
Average number
Average Index Score
Average number
Average Index Score
High 47.82% 99.9660 32.31% 100.0096 68.09 99.7024 1.85 99.5564 Medium 43.25% 99.8737 28.86% 99.9020 54.69 99.5642 1.62 99.4889 Low 39.86% 99.8053 24.92% 99.7787 49.11 99.5067 1.45 99.4356 Correlation 0.6003 0.4508 0.5221 0.2422
31
32
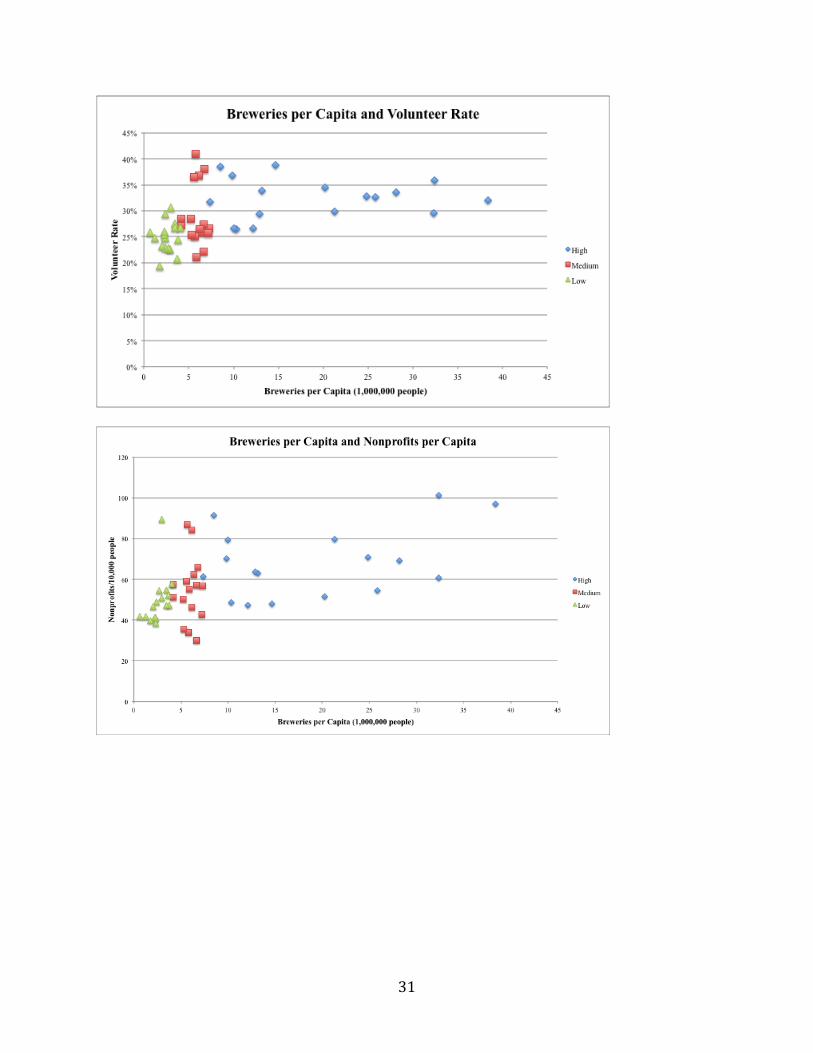
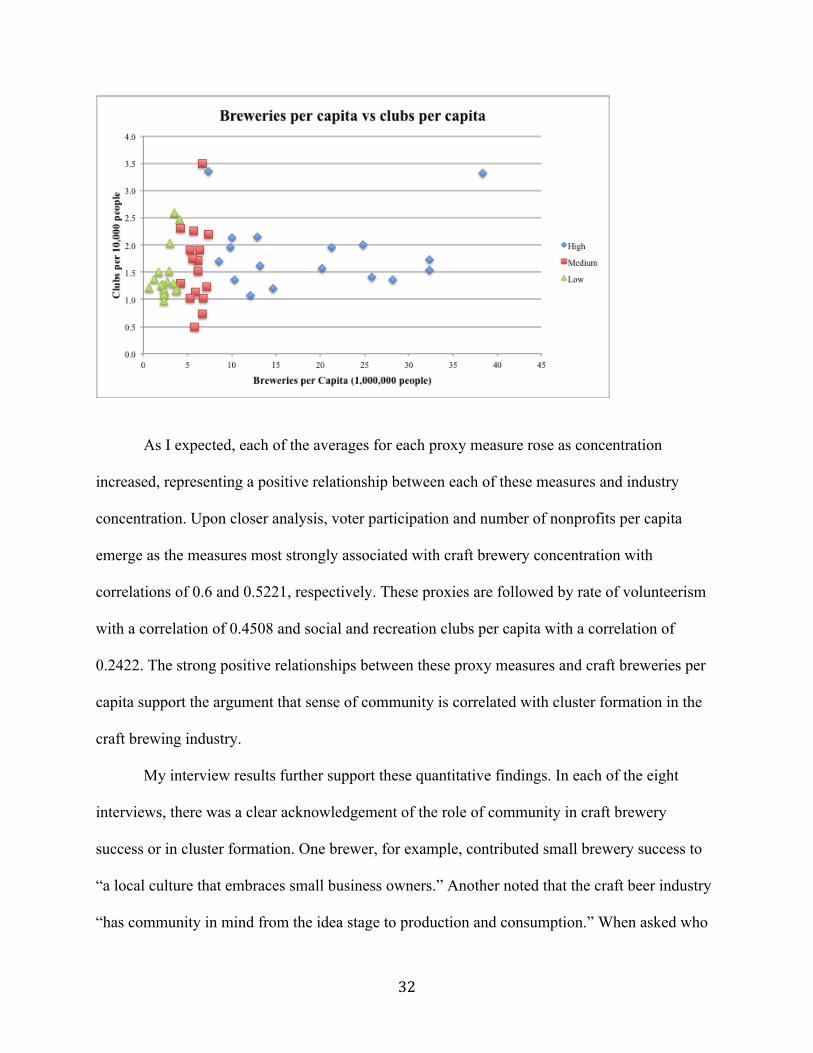
As I expected, each of the averages for each proxy measure rose as concentration
increased, representing a positive relationship between each of these measures and industry
concentration. Upon closer analysis, voter participation and number of nonprofits per capita
emerge as the measures most strongly associated with craft brewery concentration with
correlations of 0.6 and 0.5221, respectively. These proxies are followed by rate of volunteerism
with a correlation of 0.4508 and social and recreation clubs per capita with a correlation of
0.2422. The strong positive relationships between these proxy measures and craft breweries per
capita support the argument that sense of community is correlated with cluster formation in the
craft brewing industry.
My interview results further support these quantitative findings. In each of the eight
interviews, there was a clear acknowledgement of the role of community in craft brewery
success or in cluster formation. One brewer, for example, contributed small brewery success to
“a local culture that embraces small business owners.” Another noted that the craft beer industry
“has community in mind from the idea stage to production and consumption.” When asked who
33
their primary competitors are, nearly all brewers viewed other brewers more as “brothers in
brewing” than competitors. It was clear that brewers within a geographic region are willing and
eager to help each other and to support collective actions. State craft brewery guilds, for example,
often lobby heavily for favorable legislation at the state and federal level that will benefit all craft
breweries. The insights from these interviews serve to further validate the positive relationship
between sense of community and cluster formation suggested by the quantitative data.
Openness to Experience The next proxy measure I explored was openness to experience using the proxy measures
of illicit drug use and engagement with the arts, entertainment and recreation in a region. For the
purposes of this thesis, illicit drug use rate refers to the number of individuals per state, age 26 or
older, who engaged in illicit drug use in the past month, provided by the Substance Abuse and
Mental Health Services Administration. Next, I use NAICS Sector 71 to establish how many arts,
entertainment, and recreation clubs there are per 10,000 in each state, indicating how engaged
community members are in these activities. As with sense of community measures, I expected to
find a positive relationship between craft brewery concentration and both illicit drug use and
NAICS Sector 71 firms per capita. I can reasonably conclude a positive relationship if the
average rate or number of firms increases from low to medium to high concentration states.
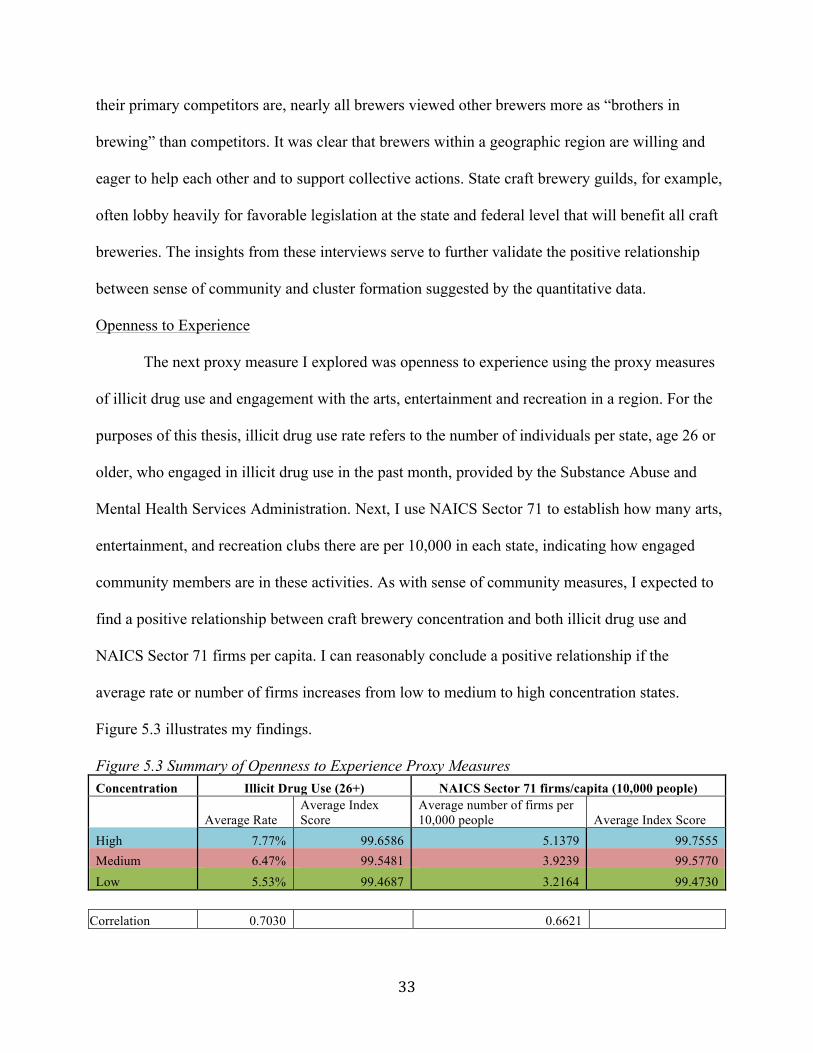
Figure 5.3 illustrates my findings.
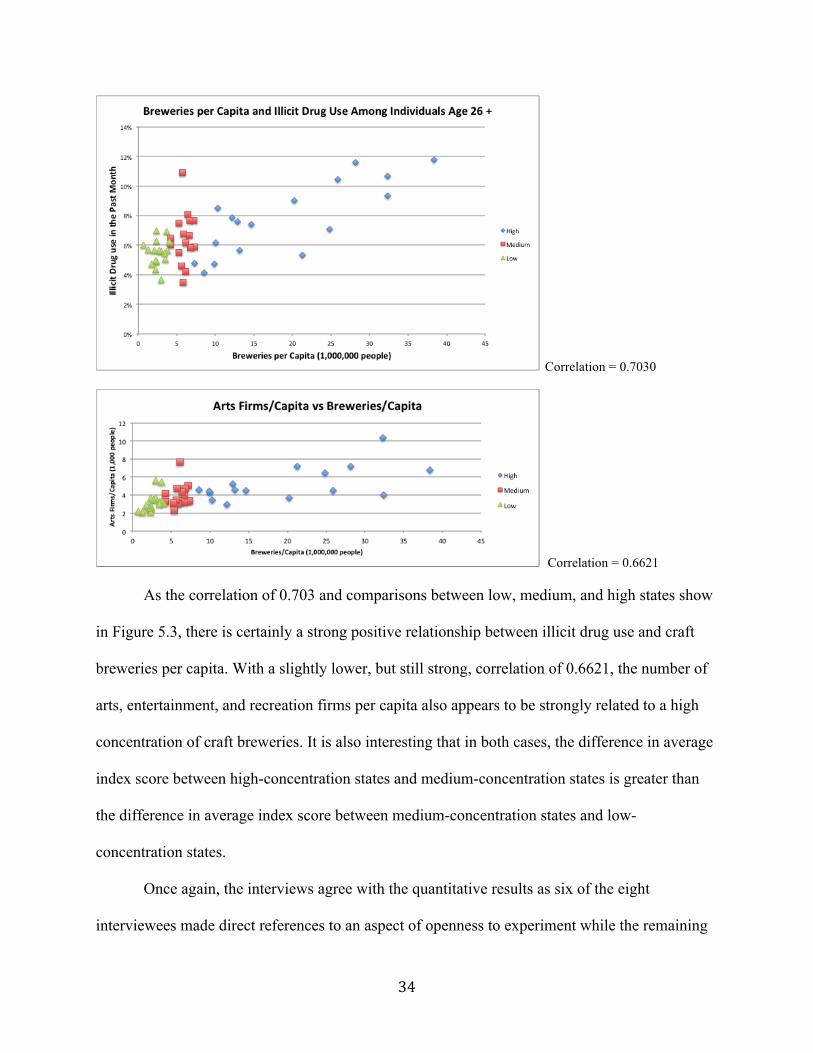
Figure 5.3 Summary of Openness to Experience Proxy Measures Concentration Illicit Drug Use (26+) NAICS Sector 71 firms/capita (10,000 people)
Average Rate Average Index Score
Average number of firms per 10,000 people Average Index Score
High 7.77% 99.6586 5.1379 99.7555 Medium 6.47% 99.5481 3.9239 99.5770 Low 5.53% 99.4687 3.2164 99.4730
Correlation 0.7030 0.6621
34
Correlation = 0.7030
Correlation = 0.6621
As the correlation of 0.703 and comparisons between low, medium, and high states show
in Figure 5.3, there is certainly a strong positive relationship between illicit drug use and craft
breweries per capita. With a slightly lower, but still strong, correlation of 0.6621, the number of
arts, entertainment, and recreation firms per capita also appears to be strongly related to a high
concentration of craft breweries. It is also interesting that in both cases, the difference in average
index score between high-concentration states and medium-concentration states is greater than
the difference in average index score between medium-concentration states and low-
concentration states.
Once again, the interviews agree with the quantitative results as six of the eight
interviewees made direct references to an aspect of openness to experiment while the remaining
35
two made more indirect references. Many of the direct references related to consumers’
willingness to experiment and try new flavors. This suggests that unlike the typical brand-loyal
customer of mass distributors of light beer, craft beer consumers are more interested in finding
the best product. According to one interviewee, today’s craft beer drinkers have very short-lived
personal favorites. “His favorite may only be his favorite for a couple of months.” Several
brewers also mentioned the fact that customers appreciate variety – they continue to seek beers
that are more “loud,” rarer, and more expensive. Indirect references to openness to experience
included descriptions of customers’ “acceptance of the oddball” and a “do-it-yourself attitude.”
Finally, it is also interesting that three of the four brewers interviewed started brewing by
experimenting in their own homes. This demonstrates openness in brewers themselves and in the
actual startup of a new brewery, emphasizing the importance of this trait among the population
as a whole, not just among consumers. Based on the quantitative data and support from
interviews, I find support for my argument that openness to experience is associated with craft
brewery cluster formation.
Well-Being
The third and final factor I proposed as an important motivator of cluster formation in the
craft brewing industry is well-being. To evaluate this notion, I used Gallup Incorporated’s Well-
Being Index to find a possible relationship between well-being and low capita per brewery.
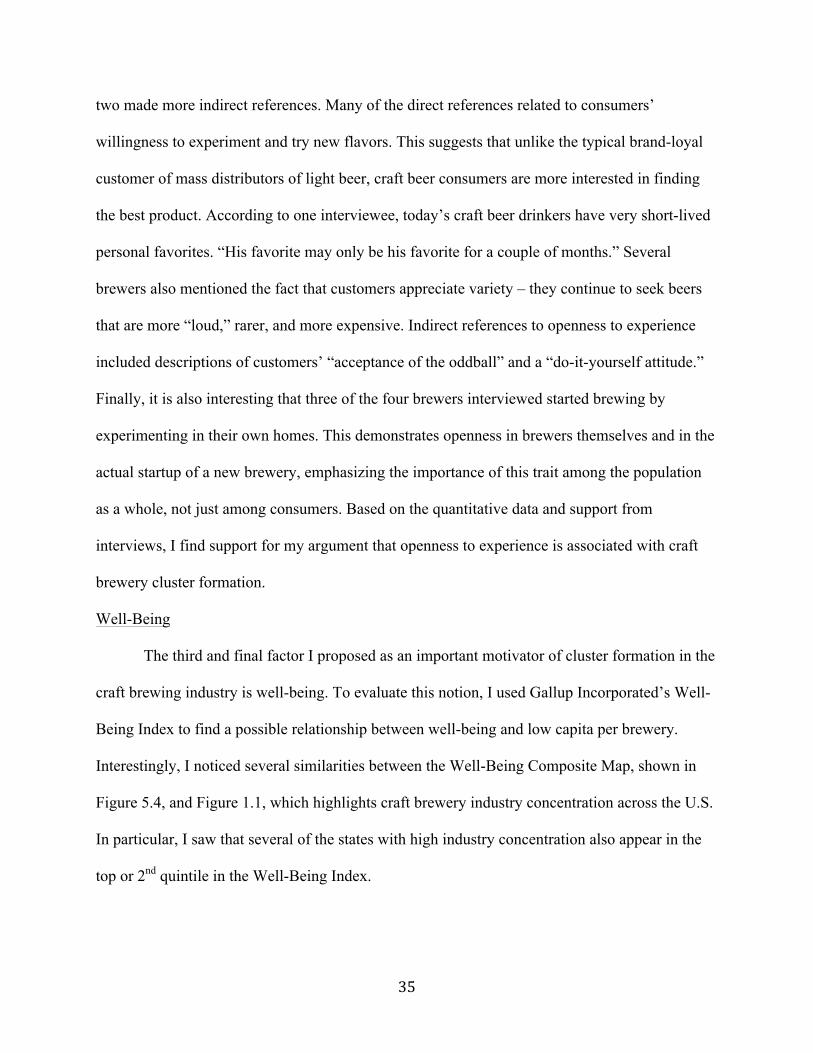
Interestingly, I noticed several similarities between the Well-Being Composite Map, shown in
Figure 5.4, and Figure 1.1, which highlights craft brewery industry concentration across the U.S.
In particular, I saw that several of the states with high industry concentration also appear in the
top or 2nd quintile in the Well-Being Index.
36
Figure 5.4: 2011 Overall Well-Being Score Map
To further explore this observation, I then compared overall well-being score to industry
concentration level in figure 5.5.
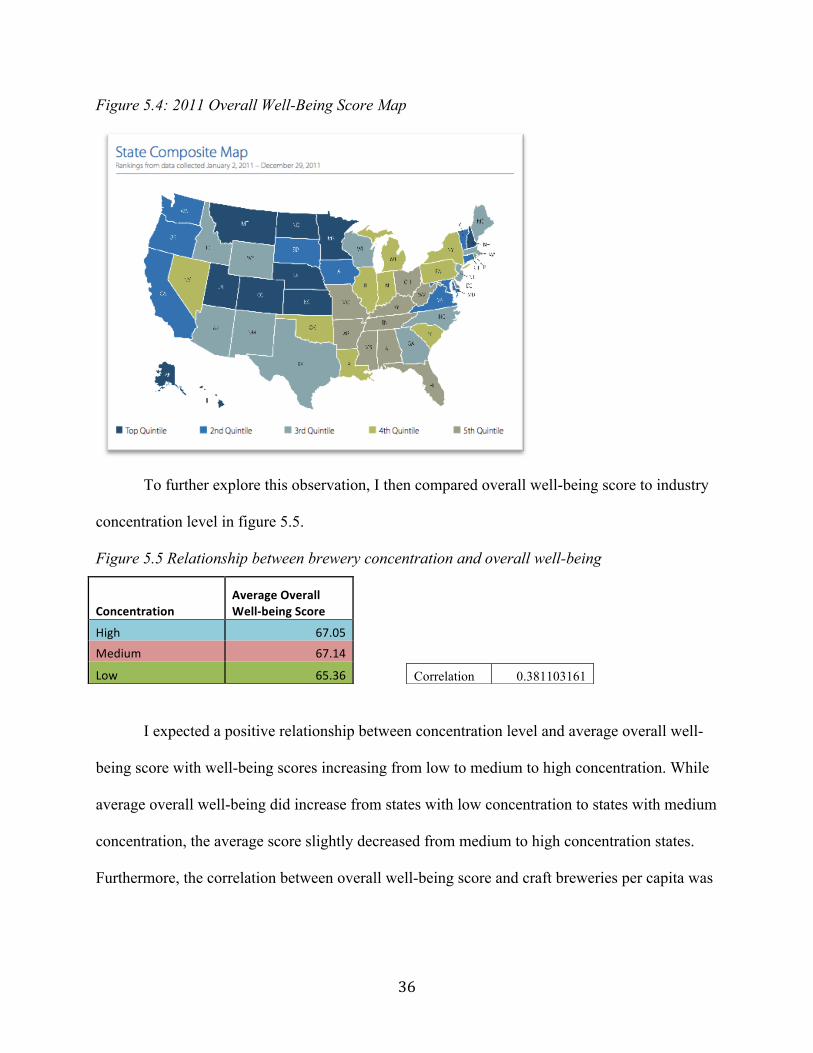
Figure 5.5 Relationship between brewery concentration and overall well-being
I expected a positive relationship between concentration level and average overall well-
being score with well-being scores increasing from low to medium to high concentration. While
average overall well-being did increase from states with low concentration to states with medium
concentration, the average score slightly decreased from medium to high concentration states.
Furthermore, the correlation between overall well-being score and craft breweries per capita was
Concentration Average Overall Well-‐being Score
High 67.05
Medium 67.14
Low 65.36 Correlation 0.381103161
37
0.3811, indicating that the relationship is indeed positive but is not as strong as those for factors
relating to sense of community or openness to experience.
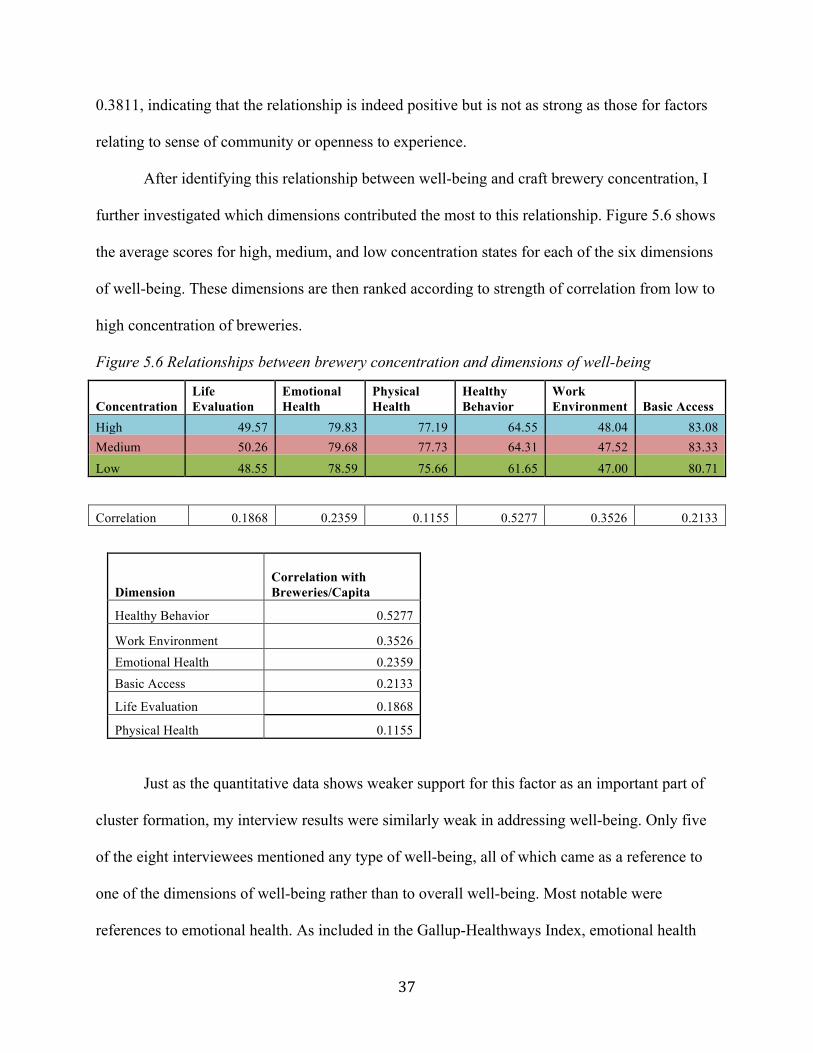
After identifying this relationship between well-being and craft brewery concentration, I
further investigated which dimensions contributed the most to this relationship. Figure 5.6 shows
the average scores for high, medium, and low concentration states for each of the six dimensions
of well-being. These dimensions are then ranked according to strength of correlation from low to
high concentration of breweries.
Figure 5.6 Relationships between brewery concentration and dimensions of well-being
Concentration Life Evaluation
Emotional Health
Physical Health
Healthy Behavior
Work Environment Basic Access
High 49.57 79.83 77.19 64.55 48.04 83.08 Medium 50.26 79.68 77.73 64.31 47.52 83.33 Low 48.55 78.59 75.66 61.65 47.00 80.71
Correlation 0.1868 0.2359 0.1155 0.5277 0.3526 0.2133
Just as the quantitative data shows weaker support for this factor as an important part of
cluster formation, my interview results were similarly weak in addressing well-being. Only five
of the eight interviewees mentioned any type of well-being, all of which came as a reference to
one of the dimensions of well-being rather than to overall well-being. Most notable were
references to emotional health. As included in the Gallup-Healthways Index, emotional health
Dimension Correlation with Breweries/Capita
Healthy Behavior 0.5277
Work Environment 0.3526 Emotional Health 0.2359 Basic Access 0.2133
Life Evaluation 0.1868
Physical Health 0.1155
38
was based on individuals’ daily experiences and feelings, such as happiness, sadness, enjoyment,
worry, stress, and smiling or laughter.
In reference to emotional health, several brewers mentioned that consumers are driven to
craft beer because it is “fun” and “unpretentious,” indicating that consumers are aware of their
personal emotional needs and that they fulfill those needs. In particular, this shows that these
consumers have high experience well-being since they engage in beer drinking in order feel
enjoyment and fun in the moment. In this case, there again appears to be a positive relationship
between well-being and craft brewery concentration; however, it does not appear to be as closely
related to cluster formation as sense of community and openness to experience. See Appendix C,
D, and E for detail of each proxy measure on a state-by-state basis.
So far, these results have consisted only of univariate analyses of the data to assess the
relationships between each proxy measure and craft breweries per capita. This does not, however,
provide insight into how the independent variable collectively relate to craft breweries per capita.
To address this limitation, I performed a multivariate regression, where craft breweries per capita
was the dependent variable, and the thirteen proxy measures together served as independent
variables. The resulting positive correlation statistics support the results obtained by the
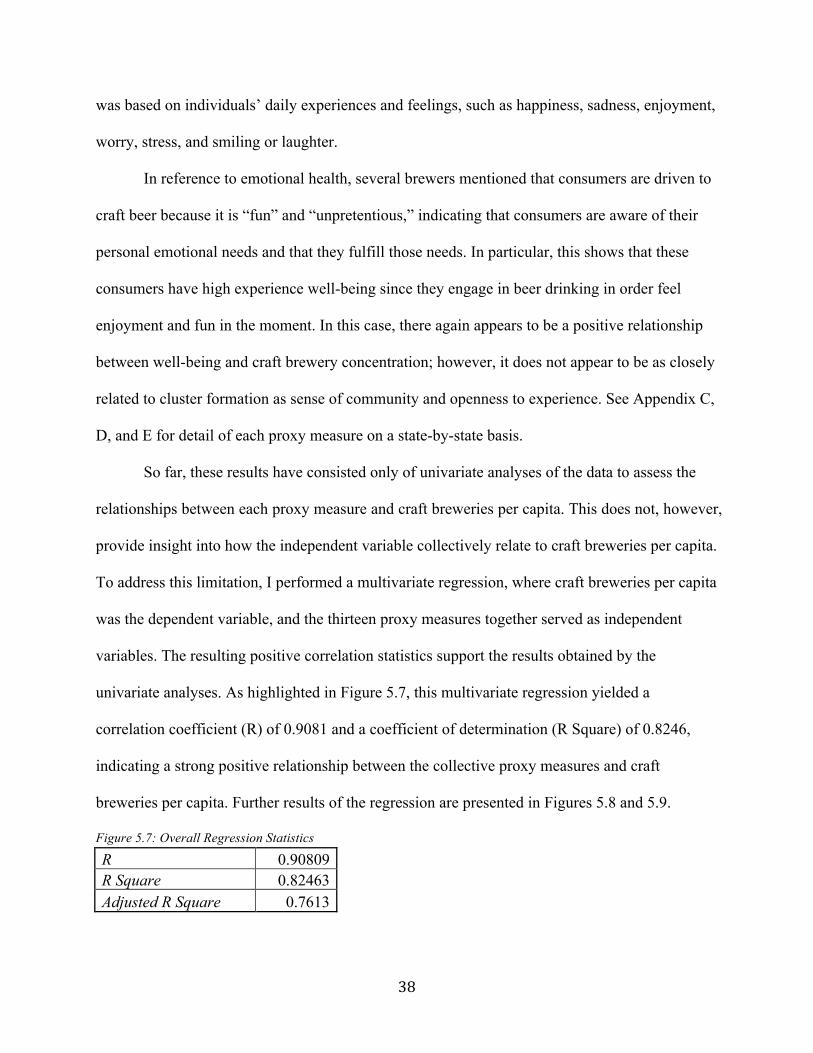
univariate analyses. As highlighted in Figure 5.7, this multivariate regression yielded a
correlation coefficient (R) of 0.9081 and a coefficient of determination (R Square) of 0.8246,
indicating a strong positive relationship between the collective proxy measures and craft
breweries per capita. Further results of the regression are presented in Figures 5.8 and 5.9.
Figure 5.7: Overall Regression Statistics
R 0.90809 R Square 0.82463 Adjusted R Square 0.7613
39
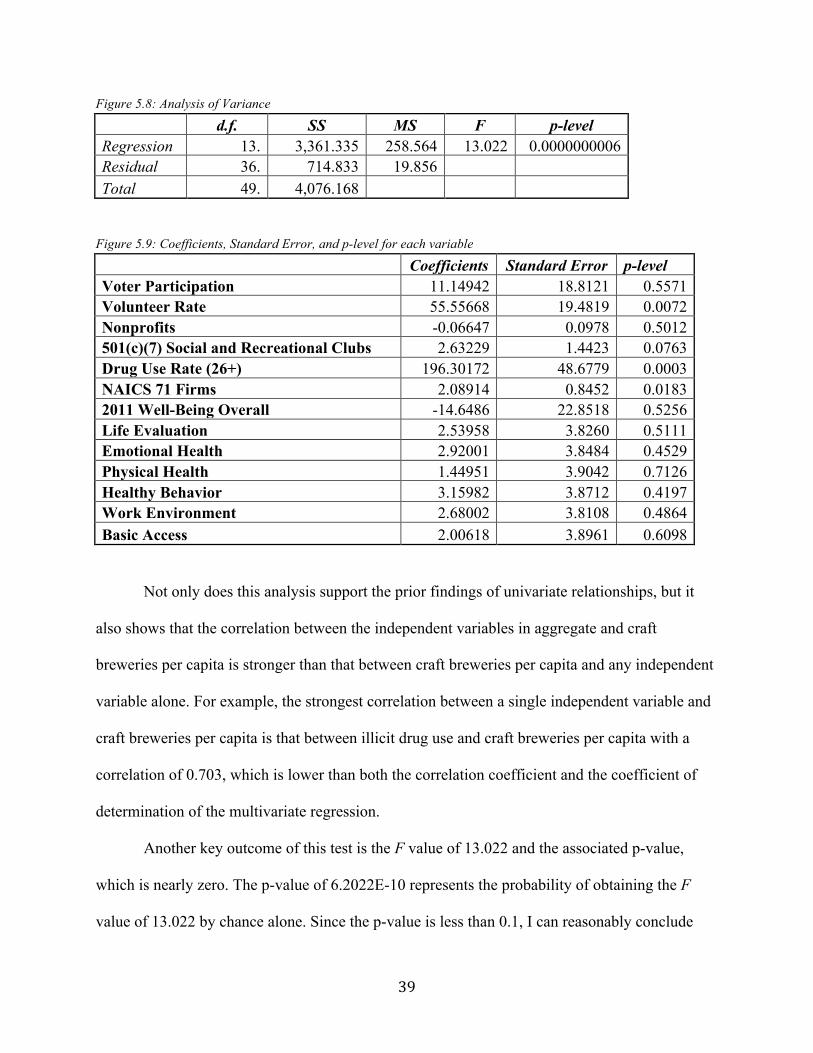
Figure 5.8: Analysis of Variance
d.f. SS MS F p-level Regression 13. 3,361.335 258.564 13.022 0.0000000006 Residual 36. 714.833 19.856 Total 49. 4,076.168
Figure 5.9: Coefficients, Standard Error, and p-level for each variable
Coefficients Standard Error p-level Voter Participation 11.14942 18.8121 0.5571 Volunteer Rate 55.55668 19.4819 0.0072 Nonprofits -0.06647 0.0978 0.5012 501(c)(7) Social and Recreational Clubs 2.63229 1.4423 0.0763 Drug Use Rate (26+) 196.30172 48.6779 0.0003 NAICS 71 Firms 2.08914 0.8452 0.0183 2011 Well-Being Overall -14.6486 22.8518 0.5256 Life Evaluation 2.53958 3.8260 0.5111 Emotional Health 2.92001 3.8484 0.4529 Physical Health 1.44951 3.9042 0.7126 Healthy Behavior 3.15982 3.8712 0.4197 Work Environment 2.68002 3.8108 0.4864 Basic Access 2.00618 3.8961 0.6098
Not only does this analysis support the prior findings of univariate relationships, but it
also shows that the correlation between the independent variables in aggregate and craft
breweries per capita is stronger than that between craft breweries per capita and any independent
variable alone. For example, the strongest correlation between a single independent variable and
craft breweries per capita is that between illicit drug use and craft breweries per capita with a
correlation of 0.703, which is lower than both the correlation coefficient and the coefficient of
determination of the multivariate regression.
Another key outcome of this test is the F value of 13.022 and the associated p-value,
which is nearly zero. The p-value of 6.2022E-10 represents the probability of obtaining the F
value of 13.022 by chance alone. Since the p-value is less than 0.1, I can reasonably conclude
40
that the F value is significant and that a relationship does indeed exist. Focusing on the
independent variables individually, as shown in Figure 5.9 above, I can gain further insight into
how these variable contribute to the overall relationship. Most notable is the fact that the p-value
for each variable is positive, indicating a positive relationship between each measure and craft
breweries per capita.
The p-values of each independent variable also show which variables are most significant,
or least likely to be explained by chance. Assuming a confidence level of 0.10, the following
variables appear to be statistically significant: Volunteer Rate, Social and Recreational Clubs per
10,000 people, Illicit Drug Use Among Individuals 26 + Years of Age, and NAICS 71 (Arts and
Entertainment) firms per 1,000 people. Interestingly, this list includes both of the proxy measures
used to determine Openness to Experience and two of the four proxy measures used to determine
Sense of Community. Furthermore, this holds with my prior findings that the relationships
between each of these factors and craft breweries per are stronger than the relationship between
Well-Being and craft breweries per capita.
Finally, the multivariate regression indicates the impact of each independent variable on
craft breweries per capita through the coefficient value. This number represents the units of
change in craft breweries per capita when the independent variable increases by one unit,
factoring in, of course, the scale applied to each variable. The coefficient of Drug Use Rate, for
example, is 196.3. Since drug use is measured as a percentage of the population 26 years of age
and older who engage in illicit drug use, this value should be interpreted according to that scale. I
could, therefore, conclude that a 1% increase in Drug Use Rate would result in a 1.963 increase
in craft breweries per 1,000,000 people. It is important to note that this does not assume a cause-
41
and-effect relationship, but rather a model of prediction for how craft breweries per capita may
be affected by changes in the independent variables.
Another notable coefficient is that for NAICS 71 (Arts and Entertainment) Firms per
1,000 people, measured at 2.089. This indicates that an increase of 1 NAICS 71 firm per 1,000
people is associated with an increase of 2.089 craft breweries per capita. The two other
statistically significant independent variables, as previously noted, are Volunteer Rate and Social
and Recreational Clubs per 10,000 people, with coefficients of 55.56 and 2.63, respectively.
Accounting for scale, this indicates that a 1% increase in Volunteer Rate is associated with an
increase of 0.56 craft breweries per capita, and an increase of one Social and Recreational Club
per 10,000 people is associated with an increase of 2.63 craft breweries per capita. Ultimately,
this serves to demonstrate the degree to which changes in the independent variable may be
related to craft breweries per capita.
The next section includes a deeper discussion of the results outlined above, addressing
both the implications and limitations of these findings.
6.0 Discussion
Based on the results included in the preceding section, I can reasonably argue that sense
of community and openness to experience are strongly related to a state’s ability to sustain a craft
brewery cluster, measured by craft breweries per capita. Meanwhile, overall well-being of
residents appears to have a weaker relationship to cluster formation, indicating that it still a
related factor but is less important than sense of community and openness to experience.
It is this seemingly weak relationship between cluster formation and well-being that is the
most surprising outcome of the study. As such, it deserves further analysis and speculation as to
42
why it seems to be a less important factor. It could, for example, be explained by weather acting
as a confounding variable, affecting both well-being and craft beer demand independently.
Specifically, I speculate that warm weather has a positive impact on general health, making it
easier for people to be physically active and eliminating much of the physical stress of cold
temperatures on the body. In a study to evaluate the relationship between weather and physical
activity, Chan et al. (2006) found that individuals were less likely to engage in routine physical
activity, measured by steps walked per day, in colder climates. The study also indicated that both
rain and snow negatively affected daily physical activity.
Research has also indicated that cold temperature is a major source of stress on the body,
influencing the likelihood of other physical health problems such as illness, cardiovascular stress,
and even death. In fact, Baker-Blocker (1982) found that cardiovascular mortality, in particular,
is influenced by snow and colder temperatures. Stanford University Senior Fellow Thomas Gale
Moore (1998) further supports this relationship between cold temperature and mortality. In an
analysis of deaths in 89 large counties in the United States, he found that warmer weather
resulted in lower death rates across the country, estimating that an increase in temperature of just
2.5 °C would result in 40,000 fewer deaths in the United States. Moore concluded that,
“Undoubtedly a warmer climate would promote health and wellbeing.”
Based on these findings demonstrating the negative impact of cold temperature on health
and well-being, the outcomes of my analysis become more reasonable. My results support this
notion since the physical health dimension of well-being had the weakest correlation to craft
breweries per capita of any of the well-being dimensions.
Meanwhile, as warmer weather may lead to higher levels of well-being, it may also result
in a lower demand for craft beer. This is based on my speculation that the darker quality and
43
higher alcohol content of craft beer is less appealing when air temperature rises. The reason for
this is a biological one regarding the mere effect of alcohol on the body. Shirreffs and Maughan
(1997) revealed the function of alcohol as a diuretic by comparing the effects 0%, 1%, 2%, and
4% alcohol content on body water content and electrolyte balance. They found that while urine
production increased as the alcohol content increased, the only statistically significant difference
was observed when the 4% alcohol beverage was consumed. Interestingly, this is around the
same level of alcohol concentration that distinguishes craft beer from typical light beer. Heinekin
Light and Amstel Light, for example, both have an alcohol content of 3.5%. Bristol Brewing
Company’s Laughing Lab Scottish Ale, meanwhile, has an alcohol content of 5.3%. Fuller craft
beer styles such as stouts, dark ales, and many Belgian styles contain even higher alcohol
contents. For these reasons, it would make sense that consumers in warmer temperatures may be
able to drink lighter beer without feeling the diuretic effects of alcohol. However, as the alcohol
content exceeds a level of 4%, as most craft beer does, consumers risk body water loss in an
environment where they may already be dehydrated due to the temperature.
The second reason that higher temperatures may result in weaker demand for craft beer is
simply one of taste. A common marketing tactic of many mass-produced light beers, such as
Coors Light, tout the “refreshing” quality of the beer. In warm climates, however, consumers
may not choose craft beers because they consider them to be too dark or heavy.
This is just one possible explanation for the weaker-than-predicted relationship between
well-being and craft brewery cluster formation. I also speculate that consumers perceive craft
beer to be more calorie-dense than most mainstream beer, especially “light” varieties. In many
cases, this perception is true. Big Sky I.P.A., for example, contains 195 calories per 12-ounce
serving. Meanwhile, 12 ounces of Bud Light contains just 110 calories. People who contribute to
44
a region’s high well-being score may be more conscious than most of the nutritional content of
the foods and beverages they consume, often making decisions based on a desire for fewer
calories. People that value well-being, therefore, may be less inclined to choose a beer with more
calories, explaining why demand for craft beer may be lower in areas that have high well-being
index scores.
Just as other factors may explain the observed relationship between well-being and craft
brewery concentration, it is possible that the strong relationships between craft breweries per
capita and both sense of community and openness to experience may also be affected by
confounding variables. To address this potential limitation, I consider other factors that the
measures of sense of community and openness to experience may be capturing in the data.
One such factor is income. As it pertains to openness to experience, measured by illicit
drug use and number of entertainment and arts firms per capita, individuals with higher income
also have more discretionary income with which to spend on drugs and arts and entertainment
activities. In addition, individuals with higher incomes likely have a greater ability to help
sustain nonprofit organizations in a community through charitable giving. The relationship
between income and volunteering, however, is not as clear. Freeman (1997), for example, found
a negative relationship between income and volunteering. Meanwhile, Menchik and Weisbrod
(1987) identified a positive correlation between income and volunteering but at a decreasing rate.
Despite these results, Wuthnow (1998) has concluded that “membership in civic and other
voluntary organizations is significantly lower in low-income, central city areas than elsewhere”
(p. 113). These examples indicate that while sense of community and openness to experience
seem to be positively related with craft brewery concentration, income level may act as an
extraneous variable that is also related to craft brewery concentration.
45
Education may be another underlying factor, and one that may even be linked to higher
income. According to research by the Wallace Foundation (2008), demand for the arts stems
from individuals with the “capacity for aesthetic perception,” noting that “level of education in
general … is strongly associated with adult involvement in the arts” (Zakaras and Lowell, 2008,
xxvi). Similarly, research suggests that educational attainment has “large and statistically
significant effects on subsequent voter participation” (Dee, 2004) and is “the most consistent
predictor of volunteering” (Wilson, J., 2000). These findings indicate that educational level may
be an underlying factor in the measures of both sense of community and openness to experience.
This discussion attempts to explore possible underlying factors at play behind the
observed relationships, making note of other factors that the measures might be capturing. The
weaker-than-anticipated relationship between well-being and craft breweries per capita, for
example, may be impacted by weather, the presence of calorie-conscious consumers, or both.
Meanwhile, the strong positive relationships between craft breweries per capita and both sense of
community and openness to experience may be influenced by factors such as income or
education. These are, of course, only a few speculations. Future research could explore these
relationships in greater detail and the roles of other forces that may influence these measures.
Given the relationships of sense of community, openness to experience, and well-being
on craft brewery concentration, it is clear that there are a number of factors at play, possibly
including some of the underlying factors discussed in this section. This does not, however, mean
that the results are entirely inconclusive. In fact, these factors demonstrate why craft breweries
per capita are essentially unrelated to mere beer consumption: there are other forces at play, and
these factors may be some of them. The positive relationships between craft breweries per capita
and sense of community, openness to experience, and, to a lesser extent, well-being provide
46
insight into why craft beer may be in greater demand in some areas, leading to cluster formation
as brewers react to this unique market pull that encompasses more than just a demand for mass-
produced beer.
7.0 Conclusion
It should be noted that these results merely illustrate the degree to which relationships
exist between key factors and craft brewery concentration. They do not, in fact, imply causation.
Accordingly, the application of these results on a larger scale does have some limitations. That
said, there are still several ways in which these results can benefit communities, craft breweries,
and the craft brewing industry as a whole. In fact, by the very nature of the industry, success for
one player benefits the entire industry by enhancing the reputation of craft beer and by spreading
positive awareness and education that help small breweries create and maintain customers. This
thesis may contribute to the success of new breweries in aiding location-based decisions. For
example, breweries may use these results to open or distribute to areas where people are more
risk-tolerant and, therefore, more open to experience. By identifying regions with a strong sense
of community, openness to experience, and well-being, craft brewers can select areas that may
be more supportive of another entrant and of craft brewery success.
47
8.0 References
About. Coloradobeer.org. Colorado Brewers Guild. Web. Retrieved 07 Mar. 2013 from
http://coloradobeer.org/about.
American Adjunct Lager. (n.d.). Beeradvocate.com. Web. Retrieved 4 Apr. 2013 from
http://beeradvocate.com/beer/style/38.
Baker-Blocker, Anita (1982). Winter weather and cardiovascular mortality in Minneapolis-
St.Paul. American journal of public health, 72(3), 261-265.
Bastian, C. T., Oakley-Simpson, D. M., McLeod, D. M., Menkhaus, D. J., Alsup, D., Ogden, J.,
et al. (1999). Niche market potential: The case of the U.S. craft brewing industry. Review
of Agricultural Economics, 21(2), pp. 552-562. Retrieved from
http://www.jstor.org/stable/1349898
Blocker Jr, Jack S. (2006). "Did prohibition really work? Alcohol prohibition as a public health
innovation." American journal of public health 96.2: 233.
Brewers Association. “Capita per Brewery 2010.” www.brewersassociation.org.
Brewers Association. “Craft Brewer Defined.” http://www.brewersassociation.org/pages/
business-tools/craft-brewing-statistics/craft-brewer-defined
Carroll, G. R., & Swaminiathan, A. (1992). The organizational ecology of strategic groups in the
American brewing industry from 1975 to 1990. Industrial & Corporate Change, 1(1), 65-
99. Retrieved from http://search.ebscohost.com/login.aspx?direct=true&db=buh&AN=
11647752&site=ehost-live.
Chan, C. B., Ryan, D. A., & Tudor-Locke, C. (2006). Relationship between objective measures
of physical activity and weather: a longitudinal study. International Journal of Behavioral
Nutrition and Physical Activity, 3(1), 21.
48
"City, State, and Congressional District Well-Being Reports." www.well-beingindex.com.
Gallup, Inc. and Healthways, Inc., 2012. Web. Retrieved 5 Nov. 2012 from
http://www.well-beingindex.com/stateCongresDistrictRank.asp.
Clemons, E. K., Gao, G. G., & Hitt, L. M. (2006). When online reviews meet
hyperdifferentiation: A study of the craft beer industry. Journal of Management
Information Systems, 23(2), 149-171.
Cortright, Joseph. 2006. Making Sense of Clusters: Regional Competitiveness and Economic
Development. Publication. Washington, DC: Brookings Institution.
Costa. P. T.. Jr., & McCrae, R. R. (1976). Age differences in personality structure: A
cluster analytic approach. Journal of Gerontology, 31, 564-570.
Dee, T. S. (2004). Are there civic returns to education?. Journal of Public Economics, 88(9),
1697-1720.
Diener, E. (2005). Guidelines for national indicators of subjective well-being and ill-being.
Social Indicators Network News, 84, 4-6
Federal Agency for Service and Volunteering. (2012). Volunteer Rates – States [Data set].
Available from Corporation for National & Community Service.
http://www.volunteeringinamerica.gov/rankings.cfm.
Florida, Richard. "The Geography of Craft Beer." - Richard Florida. The Atlantic.
http://www.theatlanticcities.com, 20 Aug. 2012. Web. Retrieved 24 Sept. 2013 from
http://www.theatlanticcities.com/arts-and-lifestyle/2012/08/geography-craft-beer/2931/.
Freeman R. (1997). Working for nothing: the supply of volunteer labor. J. Labor Econ. 15:140-
67.
49
García, Luis F.; Aluja, Anton; García, Óscar; Cuevas, Lara (2005). "Is Openness to Experience
an Independent Personality Dimension?". Journal of Individual Differences 26 (3): 132.
doi:10.1027/1614-0001.26.3.132.
Geller, J. R. (1992). From prehistory to history: beer in Egypt. The Followers of Horus (Egyptian
Studies Association Publication 2). Oxford: Oxbow, 19-26.
"Industry Statistics Sampler: NAICS 71 Arts, Entertainment, and Recreation." www.census.gov.
U.S. Department of Commerce, 2010. Web. Retrieved 15 Feb. 2013 from
http://www.census.gov/econ/industry/current/c71.htm.
"Industry Statistics Sampler: NAICS 71 Arts, Entertainment, and Recreation." www.census.gov.
U.S. Department of Commerce, 2010. Web. Retrieved 15 Feb. 2013 from
http://www.census.gov/econ/industry/def/d71.htm.
Johnson, Steve, 1993. On Tap: Guide to North American Brew Pubs. WBR
Kahneman, D., & Riis, J. (2005). Living and thinking about it: Two perspectives on life. In F.
Huppert, N. Baylis, & B. Kaverne (Eds.), The science of well-being. (pp. 285-306). New
York: Oxford University Press.
Malmberg, A., & Maskell, P. (2002). The elusive concept of localization economies: towards a
knowledge-based theory of spatial clustering. Environment and planning A, 34(3), 429-
450.
Marshall, Alfred. "Industrial Organization, Continued. The Concentration of Specialized
Industries in Particular Localities." Principles of Economics. 8th ed. London: Macmillan
and, Ltd, 1920. N. pag. Marshall: Book IV, Chapter X. Library of Economics and Liberty,
2000. Web. 07 March 2013.
50
McMillan, D. W., & Chavis, D. M. (1986). Sense of community: A definition and theory.
Journal of Community Psychology, 14, 6–23.
Menchik, P., Weisbrod, B. (1987). Volunteer labor supply. J Publ. Econ. 32:159-83.
“Methodology.” www.well-beingindex.com. Gallup, Inc. and Healthways, Inc., 2012. Web.
Retrieved 5 Nov. 2012 from http://www.well-beingindex.com/methodology.asp.
Moore, T. G. (1998). Health and amenity effects of gobal warming. Economic Inquiry, 36(3),
471-488.
National Center for Charitable Statistics. (2012). US Nonprofit Sector. Available from the Urban
Institute. nccs.urban.org/statistics/.
Number of Breweries. (2013). Brewers Association. Web. Retrieved 4 Apr 2013 from
http://www.brewersassociation.org/pages/business-tools/craft-brewing-statistics/number-
of-breweries.
Our Beers: Laughing Lab Scottish Ale. (n.d.). Bristol Brewing Company. Web. Retrieved 4 Apr
2013 from http://www.bristolbrewing.com/our_beers.asp.
Our Five Ingredients. (n.d.). Budweiser. Web. Retrieved 4 Apr. 2013 from
http://www.budweiser.com/en/us/content/king-of-beers/article/our-five-ingredients.
Pew Charitable Trusts. (2012). U.S. Voter Participation 1990-2010. [Interactive Data
Visualization]. Available from the Pew Center on the States. http://www.pewstates.org/
research/data-visualizations/us-voter-participation-1990-2010-85899410519.
"Pioneer of Beer." uvamagazine.org. University of Virginia Alumni Association, 10 Dec. 2009.
Web. Retrieved 07 Mar. 2013 from http://uvamagazine.org/only_online/article/pioneer_
of_beer/#.UUK0JhlisXx.
51
Porter, Michael E. “Clusters and the new economics of competition.” Vol. 76. Boston: Harvard
Business Review, 1998.
Porter, Michael E. The Competitive Advantage of Nations. New York: Free, 1990. Print.
Putnam, Robert, Leonardi, Robert, Nanetti, Raffaella. Making Democracy Work: Civic
Traditions in Modern Italy. Princeton University Press, 1994.
"Snapshot Findings." Gallup-Healthways Well-Being Index. Gallup, Inc. and Healthways, Inc.,
29 Dec. 2011. Web. 14 Nov. 2012.
Shirreffs, S. M., & Maughan, R. J. (1997). Restoration of fluid balance after exercise-induced
dehydration: effects of alcohol consumption. Journal of Applied Physiology, 83(4), 1152-
1158).
Substance Abuse and Mental Health Services Administration. (2012). 2009-2010 NSDUH State
Estimates of Substance Use and Mental Disorders [Data sets]. Available from Substance
Abuse and Mental Health Services Administration web site
http://www.samhsa.gov/data/NSDUH/2k10State/NSDUHsae2010/Index.aspx.
Talking Points for Homebrew Legalization. (2010). American Homebrewers Association. Web.
Retrieved 4 Apr. 2013 from http://www.homebrewersassociation.org/pages/government-
affairs/talking-points.
Tocqueville, A. de (1840/1966).Democracy in America. New York: Anchor Books.
Tremblay, C. H. & Tremblay V. J. (2005). Imports and Domestic Specialty Brewers. The U.S.
brewing industry: data and economic analysis (pp. 103-134). MIT Press.
Wilson, Richard, Guy. Empires of Industry: Brewed in America. History Channel, 2006. Film.
Wilson, J. (2000). Volunteering. Annual review of sociology, 215-240.
52
Wuthnow R. (1998). Loose Connections: Joining Together in America’s Fragmented
Communities. Cambridge: Harvard Univ. Press.
Zakaras, L., & Lowell, J. F. (2008). Cultivating demand for the arts: Arts learning, arts
engagement, and state arts policy. Rand Corporation.
Zuckerman, Marvin (2009). "Chapter 31. Sensation seeking". In Leary, Mark R. & Hoyle, Rick
H.. Handbook of Individual Differences in Social behavior. New York/London: The
Guildford Press. pp. 455–465.
Zuckerman M. (1994) Behavioural Expressions and Biosocial Bases of Sensation Seeking.
University of Cambridge Press, Cambridge.
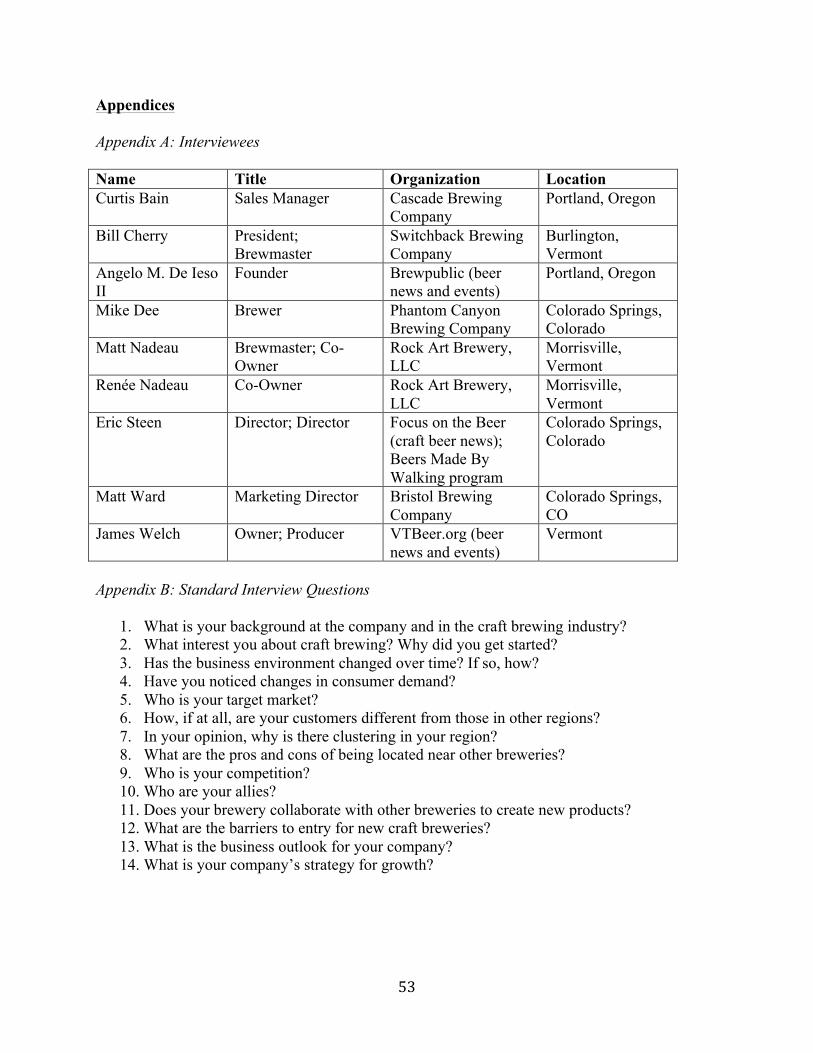
53
Appendices Appendix A: Interviewees Name Title Organization Location Curtis Bain Sales Manager Cascade Brewing
Company Portland, Oregon
Bill Cherry President; Brewmaster
Switchback Brewing Company
Burlington, Vermont
Angelo M. De Ieso II
Founder Brewpublic (beer news and events)
Portland, Oregon
Mike Dee Brewer Phantom Canyon Brewing Company
Colorado Springs, Colorado
Matt Nadeau Brewmaster; Co-Owner
Rock Art Brewery, LLC
Morrisville, Vermont
Renée Nadeau Co-Owner Rock Art Brewery, LLC
Morrisville, Vermont
Eric Steen Director; Director Focus on the Beer (craft beer news); Beers Made By Walking program
Colorado Springs, Colorado
Matt Ward Marketing Director Bristol Brewing Company
Colorado Springs, CO
James Welch Owner; Producer VTBeer.org (beer news and events)
Vermont
Appendix B: Standard Interview Questions
1. What is your background at the company and in the craft brewing industry? 2. What interest you about craft brewing? Why did you get started? 3. Has the business environment changed over time? If so, how? 4. Have you noticed changes in consumer demand? 5. Who is your target market? 6. How, if at all, are your customers different from those in other regions? 7. In your opinion, why is there clustering in your region? 8. What are the pros and cons of being located near other breweries? 9. Who is your competition? 10. Who are your allies? 11. Does your brewery collaborate with other breweries to create new products? 12. What are the barriers to entry for new craft breweries? 13. What is the business outlook for your company? 14. What is your company’s strategy for growth?
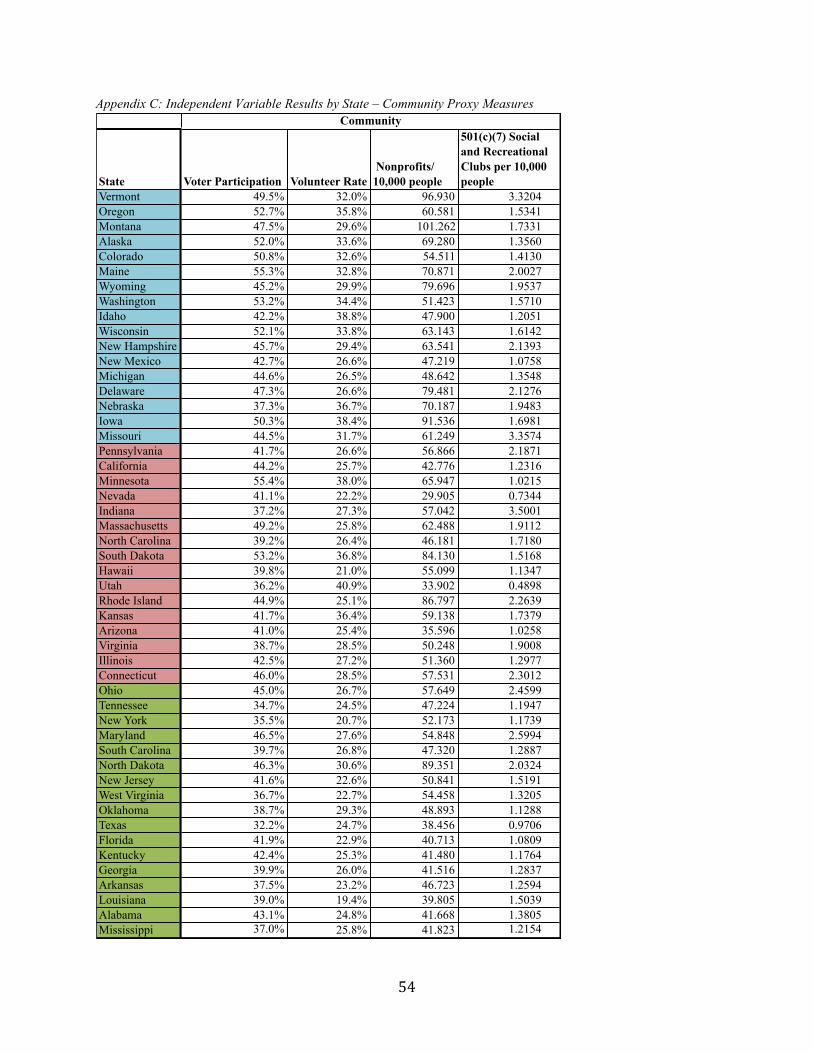
54
Appendix C: Independent Variable Results by State – Community Proxy Measures
State Voter Participation Volunteer Rate Nonprofits/ 10,000 people
501(c)(7) Social and Recreational Clubs per 10,000 people
Vermont 49.5% 32.0% 96.930 3.3204 Oregon 52.7% 35.8% 60.581 1.5341 Montana 47.5% 29.6% 101.262 1.7331 Alaska 52.0% 33.6% 69.280 1.3560 Colorado 50.8% 32.6% 54.511 1.4130 Maine 55.3% 32.8% 70.871 2.0027 Wyoming 45.2% 29.9% 79.696 1.9537 Washington 53.2% 34.4% 51.423 1.5710 Idaho 42.2% 38.8% 47.900 1.2051 Wisconsin 52.1% 33.8% 63.143 1.6142 New Hampshire 45.7% 29.4% 63.541 2.1393 New Mexico 42.7% 26.6% 47.219 1.0758 Michigan 44.6% 26.5% 48.642 1.3548 Delaware 47.3% 26.6% 79.481 2.1276 Nebraska 37.3% 36.7% 70.187 1.9483 Iowa 50.3% 38.4% 91.536 1.6981 Missouri 44.5% 31.7% 61.249 3.3574 Pennsylvania 41.7% 26.6% 56.866 2.1871 California 44.2% 25.7% 42.776 1.2316 Minnesota 55.4% 38.0% 65.947 1.0215 Nevada 41.1% 22.2% 29.905 0.7344 Indiana 37.2% 27.3% 57.042 3.5001 Massachusetts 49.2% 25.8% 62.488 1.9112 North Carolina 39.2% 26.4% 46.181 1.7180 South Dakota 53.2% 36.8% 84.130 1.5168 Hawaii 39.8% 21.0% 55.099 1.1347 Utah 36.2% 40.9% 33.902 0.4898 Rhode Island 44.9% 25.1% 86.797 2.2639 Kansas 41.7% 36.4% 59.138 1.7379 Arizona 41.0% 25.4% 35.596 1.0258 Virginia 38.7% 28.5% 50.248 1.9008 Illinois 42.5% 27.2% 51.360 1.2977 Connecticut 46.0% 28.5% 57.531 2.3012 Ohio 45.0% 26.7% 57.649 2.4599 Tennessee 34.7% 24.5% 47.224 1.1947 New York 35.5% 20.7% 52.173 1.1739 Maryland 46.5% 27.6% 54.848 2.5994 South Carolina 39.7% 26.8% 47.320 1.2887 North Dakota 46.3% 30.6% 89.351 2.0324 New Jersey 41.6% 22.6% 50.841 1.5191 West Virginia 36.7% 22.7% 54.458 1.3205 Oklahoma 38.7% 29.3% 48.893 1.1288 Texas 32.2% 24.7% 38.456 0.9706 Florida 41.9% 22.9% 40.713 1.0809 Kentucky 42.4% 25.3% 41.480 1.1764 Georgia 39.9% 26.0% 41.516 1.2837 Arkansas 37.5% 23.2% 46.723 1.2594 Louisiana 39.0% 19.4% 39.805 1.5039 Alabama 43.1% 24.8% 41.668 1.3805 Mississippi 37.0% 25.8% 41.823 1.2154
Community
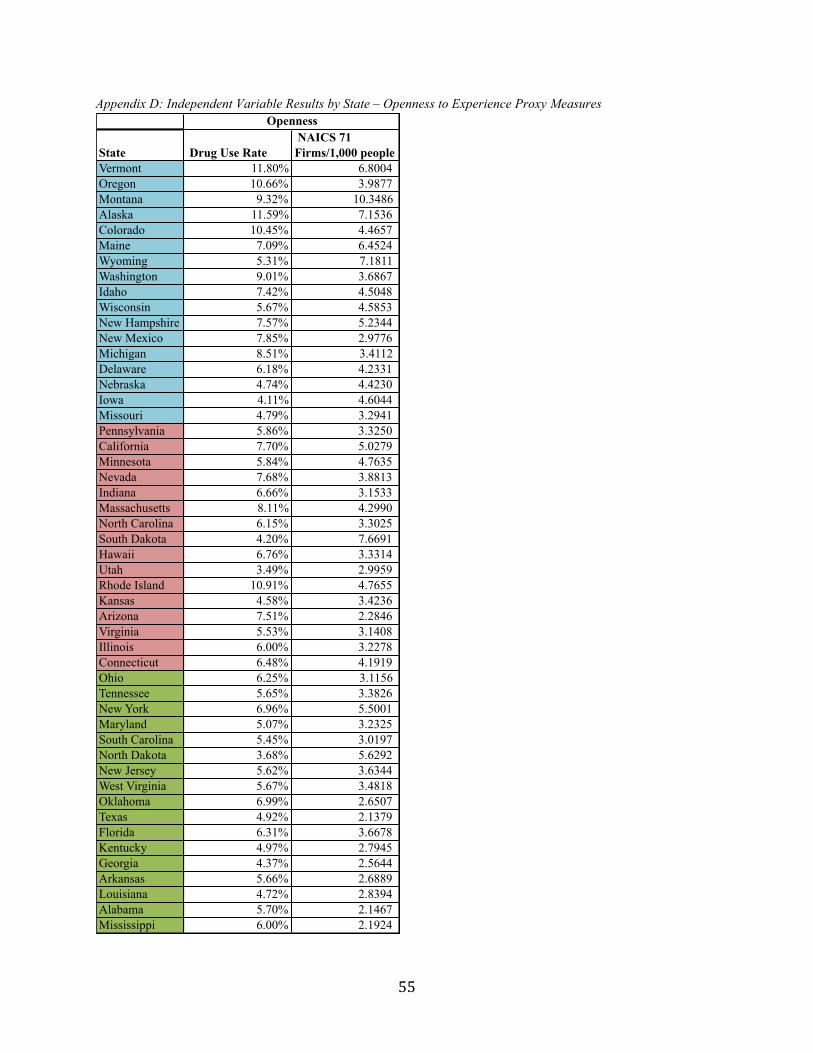
55
Appendix D: Independent Variable Results by State – Openness to Experience Proxy Measures
State Drug Use Rate NAICS 71 Firms/1,000 people
Vermont 11.80% 6.8004 Oregon 10.66% 3.9877 Montana 9.32% 10.3486 Alaska 11.59% 7.1536 Colorado 10.45% 4.4657 Maine 7.09% 6.4524 Wyoming 5.31% 7.1811 Washington 9.01% 3.6867 Idaho 7.42% 4.5048 Wisconsin 5.67% 4.5853 New Hampshire 7.57% 5.2344 New Mexico 7.85% 2.9776 Michigan 8.51% 3.4112 Delaware 6.18% 4.2331 Nebraska 4.74% 4.4230 Iowa 4.11% 4.6044 Missouri 4.79% 3.2941 Pennsylvania 5.86% 3.3250 California 7.70% 5.0279 Minnesota 5.84% 4.7635 Nevada 7.68% 3.8813 Indiana 6.66% 3.1533 Massachusetts 8.11% 4.2990 North Carolina 6.15% 3.3025 South Dakota 4.20% 7.6691 Hawaii 6.76% 3.3314 Utah 3.49% 2.9959 Rhode Island 10.91% 4.7655 Kansas 4.58% 3.4236 Arizona 7.51% 2.2846 Virginia 5.53% 3.1408 Illinois 6.00% 3.2278 Connecticut 6.48% 4.1919 Ohio 6.25% 3.1156 Tennessee 5.65% 3.3826 New York 6.96% 5.5001 Maryland 5.07% 3.2325 South Carolina 5.45% 3.0197 North Dakota 3.68% 5.6292 New Jersey 5.62% 3.6344 West Virginia 5.67% 3.4818 Oklahoma 6.99% 2.6507 Texas 4.92% 2.1379 Florida 6.31% 3.6678 Kentucky 4.97% 2.7945 Georgia 4.37% 2.5644 Arkansas 5.66% 2.6889 Louisiana 4.72% 2.8394 Alabama 5.70% 2.1467 Mississippi 6.00% 2.1924
Openness
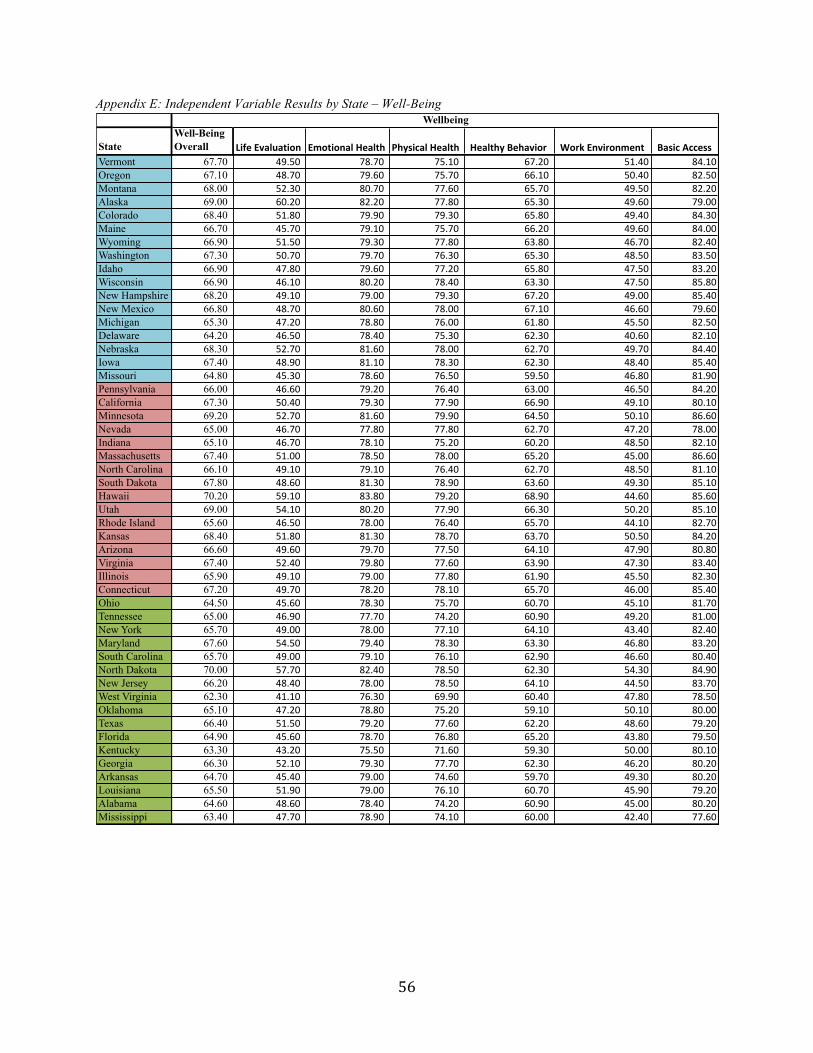
56
Appendix E: Independent Variable Results by State – Well-Being
StateWell-Being Overall Life%Evaluation Emotional%Health Physical%Health Healthy%Behavior Work%Environment Basic%Access
Vermont 67.70 49.50&&&&&&&&&&&&&&& 78.70&&&&&&&&&&&&&&&&&&&& 75.10&&&&&&&&&&&&&&&& 67.20&&&&&&&&&&&&&&&&&&&&&& 51.40 84.10Oregon 67.10 48.70&&&&&&&&&&&&&&& 79.60&&&&&&&&&&&&&&&&&&&& 75.70&&&&&&&&&&&&&&&& 66.10&&&&&&&&&&&&&&&&&&&&&& 50.40 82.50Montana 68.00 52.30&&&&&&&&&&&&&&& 80.70&&&&&&&&&&&&&&&&&&&& 77.60&&&&&&&&&&&&&&&& 65.70&&&&&&&&&&&&&&&&&&&&&& 49.50 82.20Alaska 69.00 60.20&&&&&&&&&&&&&&& 82.20&&&&&&&&&&&&&&&&&&&& 77.80&&&&&&&&&&&&&&&& 65.30&&&&&&&&&&&&&&&&&&&&&& 49.60 79.00Colorado 68.40 51.80&&&&&&&&&&&&&&& 79.90&&&&&&&&&&&&&&&&&&&& 79.30&&&&&&&&&&&&&&&& 65.80&&&&&&&&&&&&&&&&&&&&&& 49.40 84.30Maine 66.70 45.70&&&&&&&&&&&&&&& 79.10&&&&&&&&&&&&&&&&&&&& 75.70&&&&&&&&&&&&&&&& 66.20&&&&&&&&&&&&&&&&&&&&&& 49.60 84.00Wyoming 66.90 51.50&&&&&&&&&&&&&&& 79.30&&&&&&&&&&&&&&&&&&&& 77.80&&&&&&&&&&&&&&&& 63.80&&&&&&&&&&&&&&&&&&&&&& 46.70 82.40Washington 67.30 50.70&&&&&&&&&&&&&&& 79.70&&&&&&&&&&&&&&&&&&&& 76.30&&&&&&&&&&&&&&&& 65.30&&&&&&&&&&&&&&&&&&&&&& 48.50 83.50Idaho 66.90 47.80&&&&&&&&&&&&&&& 79.60&&&&&&&&&&&&&&&&&&&& 77.20&&&&&&&&&&&&&&&& 65.80&&&&&&&&&&&&&&&&&&&&&& 47.50 83.20Wisconsin 66.90 46.10&&&&&&&&&&&&&&& 80.20&&&&&&&&&&&&&&&&&&&& 78.40&&&&&&&&&&&&&&&& 63.30&&&&&&&&&&&&&&&&&&&&&& 47.50 85.80New Hampshire 68.20 49.10&&&&&&&&&&&&&&& 79.00&&&&&&&&&&&&&&&&&&&& 79.30&&&&&&&&&&&&&&&& 67.20&&&&&&&&&&&&&&&&&&&&&& 49.00 85.40New Mexico 66.80 48.70&&&&&&&&&&&&&&& 80.60&&&&&&&&&&&&&&&&&&&& 78.00&&&&&&&&&&&&&&&& 67.10&&&&&&&&&&&&&&&&&&&&&& 46.60 79.60Michigan 65.30 47.20&&&&&&&&&&&&&&& 78.80&&&&&&&&&&&&&&&&&&&& 76.00&&&&&&&&&&&&&&&& 61.80&&&&&&&&&&&&&&&&&&&&&& 45.50 82.50Delaware 64.20 46.50&&&&&&&&&&&&&&& 78.40&&&&&&&&&&&&&&&&&&&& 75.30&&&&&&&&&&&&&&&& 62.30&&&&&&&&&&&&&&&&&&&&&& 40.60 82.10Nebraska 68.30 52.70&&&&&&&&&&&&&&& 81.60&&&&&&&&&&&&&&&&&&&& 78.00&&&&&&&&&&&&&&&& 62.70&&&&&&&&&&&&&&&&&&&&&& 49.70 84.40Iowa 67.40 48.90&&&&&&&&&&&&&&& 81.10&&&&&&&&&&&&&&&&&&&& 78.30&&&&&&&&&&&&&&&& 62.30&&&&&&&&&&&&&&&&&&&&&& 48.40 85.40Missouri 64.80 45.30&&&&&&&&&&&&&&& 78.60&&&&&&&&&&&&&&&&&&&& 76.50&&&&&&&&&&&&&&&& 59.50&&&&&&&&&&&&&&&&&&&&&& 46.80 81.90Pennsylvania 66.00 46.60&&&&&&&&&&&&&&& 79.20&&&&&&&&&&&&&&&&&&&& 76.40&&&&&&&&&&&&&&&& 63.00&&&&&&&&&&&&&&&&&&&&&& 46.50 84.20California 67.30 50.40&&&&&&&&&&&&&&& 79.30&&&&&&&&&&&&&&&&&&&& 77.90&&&&&&&&&&&&&&&& 66.90&&&&&&&&&&&&&&&&&&&&&& 49.10 80.10Minnesota 69.20 52.70&&&&&&&&&&&&&&& 81.60&&&&&&&&&&&&&&&&&&&& 79.90&&&&&&&&&&&&&&&& 64.50&&&&&&&&&&&&&&&&&&&&&& 50.10 86.60Nevada 65.00 46.70&&&&&&&&&&&&&&& 77.80&&&&&&&&&&&&&&&&&&&& 77.80&&&&&&&&&&&&&&&& 62.70&&&&&&&&&&&&&&&&&&&&&& 47.20 78.00Indiana 65.10 46.70&&&&&&&&&&&&&&& 78.10&&&&&&&&&&&&&&&&&&&& 75.20&&&&&&&&&&&&&&&& 60.20&&&&&&&&&&&&&&&&&&&&&& 48.50 82.10Massachusetts 67.40 51.00&&&&&&&&&&&&&&& 78.50&&&&&&&&&&&&&&&&&&&& 78.00&&&&&&&&&&&&&&&& 65.20&&&&&&&&&&&&&&&&&&&&&& 45.00 86.60North Carolina 66.10 49.10&&&&&&&&&&&&&&& 79.10&&&&&&&&&&&&&&&&&&&& 76.40&&&&&&&&&&&&&&&& 62.70&&&&&&&&&&&&&&&&&&&&&& 48.50 81.10South Dakota 67.80 48.60&&&&&&&&&&&&&&& 81.30&&&&&&&&&&&&&&&&&&&& 78.90&&&&&&&&&&&&&&&& 63.60&&&&&&&&&&&&&&&&&&&&&& 49.30 85.10Hawaii 70.20 59.10&&&&&&&&&&&&&&& 83.80&&&&&&&&&&&&&&&&&&&& 79.20&&&&&&&&&&&&&&&& 68.90&&&&&&&&&&&&&&&&&&&&&& 44.60 85.60Utah 69.00 54.10&&&&&&&&&&&&&&& 80.20&&&&&&&&&&&&&&&&&&&& 77.90&&&&&&&&&&&&&&&& 66.30&&&&&&&&&&&&&&&&&&&&&& 50.20 85.10Rhode Island 65.60 46.50&&&&&&&&&&&&&&& 78.00&&&&&&&&&&&&&&&&&&&& 76.40&&&&&&&&&&&&&&&& 65.70&&&&&&&&&&&&&&&&&&&&&& 44.10 82.70Kansas 68.40 51.80&&&&&&&&&&&&&&& 81.30&&&&&&&&&&&&&&&&&&&& 78.70&&&&&&&&&&&&&&&& 63.70&&&&&&&&&&&&&&&&&&&&&& 50.50 84.20Arizona 66.60 49.60&&&&&&&&&&&&&&& 79.70&&&&&&&&&&&&&&&&&&&& 77.50&&&&&&&&&&&&&&&& 64.10&&&&&&&&&&&&&&&&&&&&&& 47.90 80.80Virginia 67.40 52.40&&&&&&&&&&&&&&& 79.80&&&&&&&&&&&&&&&&&&&& 77.60&&&&&&&&&&&&&&&& 63.90&&&&&&&&&&&&&&&&&&&&&& 47.30 83.40Illinois 65.90 49.10&&&&&&&&&&&&&&& 79.00&&&&&&&&&&&&&&&&&&&& 77.80&&&&&&&&&&&&&&&& 61.90&&&&&&&&&&&&&&&&&&&&&& 45.50 82.30Connecticut 67.20 49.70&&&&&&&&&&&&&&& 78.20&&&&&&&&&&&&&&&&&&&& 78.10&&&&&&&&&&&&&&&& 65.70&&&&&&&&&&&&&&&&&&&&&& 46.00 85.40Ohio 64.50 45.60&&&&&&&&&&&&&&& 78.30&&&&&&&&&&&&&&&&&&&& 75.70&&&&&&&&&&&&&&&& 60.70&&&&&&&&&&&&&&&&&&&&&& 45.10 81.70Tennessee 65.00 46.90&&&&&&&&&&&&&&& 77.70&&&&&&&&&&&&&&&&&&&& 74.20&&&&&&&&&&&&&&&& 60.90&&&&&&&&&&&&&&&&&&&&&& 49.20 81.00New York 65.70 49.00&&&&&&&&&&&&&&& 78.00&&&&&&&&&&&&&&&&&&&& 77.10&&&&&&&&&&&&&&&& 64.10&&&&&&&&&&&&&&&&&&&&&& 43.40 82.40Maryland 67.60 54.50&&&&&&&&&&&&&&& 79.40&&&&&&&&&&&&&&&&&&&& 78.30&&&&&&&&&&&&&&&& 63.30&&&&&&&&&&&&&&&&&&&&&& 46.80 83.20South Carolina 65.70 49.00&&&&&&&&&&&&&&& 79.10&&&&&&&&&&&&&&&&&&&& 76.10&&&&&&&&&&&&&&&& 62.90&&&&&&&&&&&&&&&&&&&&&& 46.60 80.40North Dakota 70.00 57.70&&&&&&&&&&&&&&& 82.40&&&&&&&&&&&&&&&&&&&& 78.50&&&&&&&&&&&&&&&& 62.30&&&&&&&&&&&&&&&&&&&&&& 54.30 84.90New Jersey 66.20 48.40&&&&&&&&&&&&&&& 78.00&&&&&&&&&&&&&&&&&&&& 78.50&&&&&&&&&&&&&&&& 64.10&&&&&&&&&&&&&&&&&&&&&& 44.50 83.70West Virginia 62.30 41.10&&&&&&&&&&&&&&& 76.30&&&&&&&&&&&&&&&&&&&& 69.90&&&&&&&&&&&&&&&& 60.40&&&&&&&&&&&&&&&&&&&&&& 47.80 78.50Oklahoma 65.10 47.20&&&&&&&&&&&&&&& 78.80&&&&&&&&&&&&&&&&&&&& 75.20&&&&&&&&&&&&&&&& 59.10&&&&&&&&&&&&&&&&&&&&&& 50.10 80.00Texas 66.40 51.50&&&&&&&&&&&&&&& 79.20&&&&&&&&&&&&&&&&&&&& 77.60&&&&&&&&&&&&&&&& 62.20&&&&&&&&&&&&&&&&&&&&&& 48.60 79.20Florida 64.90 45.60&&&&&&&&&&&&&&& 78.70&&&&&&&&&&&&&&&&&&&& 76.80&&&&&&&&&&&&&&&& 65.20&&&&&&&&&&&&&&&&&&&&&& 43.80 79.50Kentucky 63.30 43.20&&&&&&&&&&&&&&& 75.50&&&&&&&&&&&&&&&&&&&& 71.60&&&&&&&&&&&&&&&& 59.30&&&&&&&&&&&&&&&&&&&&&& 50.00 80.10Georgia 66.30 52.10&&&&&&&&&&&&&&& 79.30&&&&&&&&&&&&&&&&&&&& 77.70&&&&&&&&&&&&&&&& 62.30&&&&&&&&&&&&&&&&&&&&&& 46.20 80.20Arkansas 64.70 45.40&&&&&&&&&&&&&&& 79.00&&&&&&&&&&&&&&&&&&&& 74.60&&&&&&&&&&&&&&&& 59.70&&&&&&&&&&&&&&&&&&&&&& 49.30 80.20Louisiana 65.50 51.90&&&&&&&&&&&&&&& 79.00&&&&&&&&&&&&&&&&&&&& 76.10&&&&&&&&&&&&&&&& 60.70&&&&&&&&&&&&&&&&&&&&&& 45.90 79.20Alabama 64.60 48.60&&&&&&&&&&&&&&& 78.40&&&&&&&&&&&&&&&&&&&& 74.20&&&&&&&&&&&&&&&& 60.90&&&&&&&&&&&&&&&&&&&&&& 45.00 80.20Mississippi 63.40 47.70&&&&&&&&&&&&&&& 78.90&&&&&&&&&&&&&&&&&&&& 74.10&&&&&&&&&&&&&&&& 60.00&&&&&&&&&&&&&&&&&&&&&& 42.40 77.60
Wellbeing