exploratory and higher order factor analysis of the wj-iii full test battery: a school-aged analysis
TRANSCRIPT
Exploratory and Higher Order Factor Analysis of the WJ-III Full TestBattery: A School-Aged Analysis
Stefan C. DombrowskiRider University
Marley W. WatkinsBaylor University
Development of the Woodcock-Johnson (3rd ed.; WJ-III; Woodcock, McGrew & Mather, 2001a) wasguided in part by Carroll’s (1993) 3-stratum theory of cognitive abilities and based on confirmatory factoranalysis (CFA), even though Carroll used exploratory factor analysis (EFA) to derive his theory. UsingCFA, McGrew and Woodcock (2001) found a 9-factor model across all age ranges. To determine if the9-factor structure holds for the full WJ-III battery, we applied currently recognized best practices in EFAto 2 school-aged 42-subtest correlation matrices (ages 9–13 and 14–19 years). Six factors emerged at the9–13 age range, while 5 factors were indicated at the 14–19 age range. The resulting 1st-order factorsdisplayed patterns of both convergence with and divergence from the WJ-III results presented in theTechnical Manual. These results also revealed a robust manifestation of general intelligence (g) thatdwarfed the variance attributed to the lower order factors. It is surprising that this study represents thefirst time the WJ-III full battery was subjected to EFA analyses given the instrument’s significant use bypractitioners and that it served as the initial evidentiary basis for Cattell-Horn-Carroll (CHC) theory. Thelack of confirmation of CFA results with EFA methods in the current study permits questioning of thestructure of the WJ-III and its relationship with CHC theory. Additional independent, structural analysesare clearly indicated for the WJ-III full test battery before we can be confident in its structure.
Keywords: exploratory factor analysis, higher order factor analysis, Cattell-Horn-Carroll theory, Schmid-Leiman orthogonalization, general intelligence
The Woodcock-Johnson III (WJ-III; Woodcock, McGrew &Mather, 2001a) is a battery of two co-normed tests that measurecognitive ability with 20 tests (WJ-III Tests of Cognitive Abilities;Woodcock, McGrew & Mather, 2001b) and academic achieve-ment with 22 tests (WJ-III Tests of Achievement; Woodcock,McGrew & Mather, 2001c). The WJ-III is a reformulation of theWoodcock Johnson–Revised (WJ-R; Woodcock & Johnson, 1989)to include a higher order (g) factor and the unification of thecognitive and achievement subtests under one theory known asCattell-Horn-Carroll (CHC) theory. The inclusion of both cogni-tive ability and academic achievement tests in one battery underone theory is a novel contribution of the WJ-III. In all other cases,these instruments are presented as separate achievement and cog-nitive ability instruments without an overarching theory to connectintelligence with academic achievement.
From a theoretical perspective, the authors of the WJ-III re-ported that they were guided by Carroll’s (1993) three-stratum
theory of cognitive abilities and the work of Horn and Cattell(1966), which were then combined into a new theory calledCattell-Horn-Carroll (CHC) theory. McGrew and Woodcock(2001) claimed that CHC theory is the most comprehensive andempirically validated theory of cognitive abilities ever created andthat the WJ-III provided the initial evidentiary basis for the theory.The Technical Manual (McGrew & Woodcock, 2001) indicatesthat the WJ-III total battery is aligned with nine broad CHC factors(e.g., Crystallized Ability/Comprehension-Knowledge [Gc], Long-Term Retrieval [Glr], Visual-Spatial Thinking [Gv], Auditory Pro-cessing [Ga], Fluid Reasoning [Gf], Processing Speed [Gs],Reading-Writing Ability [Grw], and Quantitative Reasoning [Gq[)across the cognitive and achievement subtests. The TechnicalManual also reports a higher order (g) factor, which contrasts withthe WJ-R that recognized lower order factors and distanced itselffrom full acknowledgment of a higher order factor (Woodcock,1990). Within the WJ-III Technical Manual, the test authors in-cluded the 42 subtest correlation matrix across seven different ageranges (2 to 3; 4 to 5; 6 to 8; 9 to 13; 14 to 19; 20 to 39; 40 plusyears) to show the correlation among cognitive and achievementsubtests.
When considering the structural validity of the overall WJ-IIIbattery, the test authors relied solely upon confirmatory factoryanalysis (McGrew & Woodcock, 2001). The Technical Manualdescribes the proposed alignment of the 42 subtests, in addition toseven nonpublished research subtests, with the nine broad CHCfactors by presenting confirmatory factor analysis (CFA) factorloadings (McGrew & Woodcock, 2001, p. 199) and depicting apath-like analysis that does not contain structural relationship
This article was published Online First January 28, 2013.Stefan C. Dombrowski, School Psychology Program, Department of
Graduate Education, Leadership & Counseling, Rider University; MarleyW. Watkins, Department of Educational Psychology, Baylor University.
This research was supported by a summer research fellowship to StefanC. Dombrowski from Rider University.
Correspondence concerning this article should be addressed to Stefan C.Dombrowski, School Psychology Program, Rider University, 2083 Law-renceville Road, Lawrenceville, NJ 08648. E-mail: [email protected]
Psychological Assessment © 2013 American Psychological Association2013, Vol. 25, No. 2, 442–455 1040-3590/13/$12.00 DOI: 10.1037/a0031335
442
coefficients (McGrew & Woodcock, 2001, p. 62). This path anal-ysis displays the relationship among the 42 subtests with the ninefirst-order CHC factors and between the nine factors and g. Inex-plicably, the Technical Manual did not present fit statistics tosupport the adequacy of this structural model.
Subsequently, CFA analyses of portions of the WJ-III havetended to support the structure delineated in the Technical Manual(Keith, Reynolds, Patel, & Ridley, 2008; Taub, Floyd, Keith, &McGrew, 2008; Taub & McGrew, 2004). However, all subsequentstructural analyses of the WJ-III have relied on CFA methods andnone has included all 42 WJ-III tests. Consequently, the legitimacyof the favored McGrew-Woodcock (McGrew & Woodcock, 2001)model rests on one CFA analysis that failed to report fit statistics.Sole reliance on CFA might be ill advised (Brannick, 1995;Canivez & Watkins, 2010; Dombrowski, Watkins, & Brogan,2009; Goldberg & Velicer, 2006; Gorsuch, 1983; Greenwald,Pratkanis, Leippe, & Baumgardner, 1986; Haig, 2005; Thompson,2004). There is a complementary relationship between exploratoryfactor analysis (EFA) and CFA, but factor analysts generallyrecommend that EFA precede CFA when evaluating a new test ortheory (Brown, 2006; Gerbing & Hamilton, 1996; Gorsuch, 1983;Schmitt, 2011). EFA is also appropriate when initial CFA resultsare unclear or inadequate (Gorsuch, 1997). The strength of CFA isits focused test of a specific hypothesis about a population factorstructure. When the hypothesized structure is rejected by a CFA,the “use of exploratory factor analysis, with rotation of the factormatrix, appears preferable” (Browne, 2001, p. 113).
Given the importance of EFA, specific analytic procedures havebeen recommended for its application to the exploration of internalstructure in tests of cognitive ability where factors tend to behierarchical in nature and highly correlated. These proceduresinclude principal axis factoring (PAF) with an oblique rotation(promax) followed by a Schmid-Leiman (Schmid & Leiman,1957) orthogonalization (Carroll, 1993; Gorsuch, 1983; Guttman,1954; Horn, 1965; Schmid & Leiman, 1957; Velicer, 1976; Ve-licer, Eaton, & Fava, 2000). The Schmid-Leiman orthogonaliza-tion helps to uncover simple structure by partialing out the influ-ence of higher order factors (Caretta & Ree, 2001; Carroll, 1993,1995, 2003; Gustafsson & Snow, 1997).
The omission of EFA analyses to describe the internal structureof the WJ-III, particularly those recommended by Carroll (1993,1995, 2003), is ironic. Carroll relied on EFA to develop histhree-stratum theory of cognitive abilities, and his theory washighly influential in the development of the WJ-III as well as CHCtheory. The omission of EFA is unfortunate (e.g., Canivez, 2008;Carroll, 1995; DiStefano & Dombrowski, 2006; Dombrowski, inpress; Dombrowski et al., 2009; Fabrigar, Wegener, MacCallum,& Strahan, 1999; Frazier & Youngstrom, 2007; Nelson, Canivez,Lindstrom, & Hatt, 2007; Thompson & Daniel, 1996; Watkins,2006) and suggests that our understanding of the structure of thefull WJ-III test battery may be incomplete. For example, Frazierand Youngstrom (2007) subjected the correlation matrices of theWJ-III Cognitive to Horn’s (1965) parallel analysis and the min-imum average partial test (Velicer, 1976), yielding the suggestedretention of three and two factors, respectively, instead of theTechnical Manual’s suggested seven factors. Frazier and Young-strom (2007) indicated that the WJ-III Cognitive may be overfac-tored by four to five factors but never subjected the full WJ-IIIbattery to analysis.
The purpose of this study is to evaluate the structure of theWJ-III full battery (cognitive and achievement) using best practiceEFA procedures (Cudeck, 2000; Fabrigar & Wegener, 2012; Fab-rigar et al., 1999; Goldberg & Velicer, 2006; Gorsuch, 1988;Henson & Roberts, 2006; Kline, 1994; Thompson & Daniel, 1996)on the two normative sample correlation matrices (for ages 9 to 13and 14 to 19) that span the school-aged time period. We chose torestrict our examination to these two age ranges for several rea-sons. First, all the WJ-III subtests were administered to partici-pants in these age ranges. Second, cognitive abilities have beenshown to display a lack of invariance at earlier age ranges(DiStefano & Dombrowski, 2006; Keith & Reynolds, 2010; Tus-ing & Ford, 2004). Third, the age 9 to 19 time period represents apopulation that is readily available in the schools to researchersand practitioners. Finally, space limitations allowed a detailedpresentation of only two matrices.
For the first EFA analysis, principal axis factoring was appliedfollowed by an oblique rotation (promax). This is consistent withthe recommendation of Carroll (1993, 1997) and others (Gorsuch,1983; Guttman, 1954; Thompson, 2004) who recognized thatfactors on tests of cognitive ability and achievement tend to behighly correlated. Factor extraction decisions were based on par-allel analysis and the minimum average partial test, which areconsidered among the most accurate (Horn, 1965; Velicer, 1976;Velicer et al., 2000; Zwick & Velicer, 1986). These methods weresupplemented by a visual scree test (Cattell, 1966), as suggested byVelicer et al. (2000). Because higher order factors are implicit inall oblique rotations, factors were extracted and examined throughthe use of the Schmid-Leiman (Schmid & Leiman, 1957) proce-dure (Carroll, 1993, 1995, 2003; Gorsuch, 1983; Thompson,2004). This procedure involves making first-order factors orthog-onal to second-order factors by first extracting the variance ex-plained by the second-order factors (Schmid & Leiman, 1957).The next step in the procedure is to residualize the first-orderfactors of all the variance present in the second-order factors.Schmid and Leiman (1957) argued that this process “preserves thedesired characteristics of the oblique solution” and “discloses thehierarchical structure of the variables” (p. 53). Carroll (1995)emphasized that orthogonal factors are appropriate only whenproduced in the context of a Schmid-Leiman solution: “I insist,however, that the orthogonal factors should be those produced bythe Schmid-Leiman (1957) orthogonalization procedure” (Carroll,1995, p. 437).
Thus, from several perspectives, a case can be made that inter-pretative emphasis in understanding the latent structure of theWJ-III should have also been placed on the EFA procedures ofprincipal axis factoring (promax rotation) followed by a higherorder factor analysis using the Schmid-Leiman solution. If theresults from both EFA and CFA procedures converge, then we canbe confident in the derived factor structure (Gorsuch, 1983). Toour knowledge, this study represents the first time that the fullWJ-III battery of tests has been subjected to EFA analysis.
Method
Participants
The WJ-III authors collected and reported information relativeto seven age groups: 2 to 3 years, 4 to 5 years, 6 to 8 years, 9 to
443HIGHER ORDER FACTOR ANALYSIS OF THE WJ-III FULL BATTERY
13 years, 14 to 19 years, 20 to 39 years, 40 years and older. Thedata for the WJ-III norms were collected from a nationally repre-sentative sample of 8,818 participants from age 2 through 90 plus.The WJ-III Technical Manual reports that the normative data werematched to the 2000 U.S. Census for geographic region, commu-nity size, sex, race, educational level, and occupation. Detaileddemographic characteristics are provided in the WJ-III TechnicalManual. For this study, we used two school-aged (9 to 13 yearsand 14 to 19 years) subtest correlation matrices (42 � 42) obtainedfrom the Technical Manual. The 9 to 13 age range contained anaverage of 1,572 participants while the 14 to 19 age range con-tained an average of 1,299 participants.
Instrument
The WJ-III is an individually administered measure of cognitiveability and academic achievement that contains 20 cognitive sub-tests and 22 achievement subtests. The WJ-III is hypothesized tomeasure g and nine CHC factors: Visual-Spatial Thinking (Gv),Fluid Reasoning (Gf), Quantitative Reasoning (Gq), ProcessingSpeed (Gs), Long-Term Retrieval (Glr), Reading-Writing (Grw),Auditory Processing (Ga), Short-Term Memory (Gsm), and Crys-tallized Ability/Comprehension-Knowledge (Gc). The WJ-III alsoyields a general intellectual ability score reflective of g. The WJ-IIIAchievement yields a total achievement score reflective of perfor-mance on that test. Please see the instrument’s respective exam-iner’s manual for a synopsis of subtest demands.
Procedure
The two correlation matrices selected for this study were analyzedusing several EFA methodologies. First, the intercorrelation matriceswere evaluated using Bartlett’s Test of Sphericity (Bartlett, 1954) andthe Kaiser-Meyer-Olkin (KMO; Kaiser, 1974) statistic to ensure thatthe matrices were suitable for factor analysis. Second, each intercor-relation matrix was subjected to principal axis factoring (Cudeck,2000; Fabrigar et al., 1999; Tabachnick & Fidel, 2007) with promax
rotation (k � 4; Tataryn, Wood, & Gorsuch, 1999) because of theassumption of correlated factors (Gorsuch, 1983; Schmitt, 2011;Tabachnick & Fidell, 2007). Pattern coefficients of .30 or higher wereconsidered salient (Child, 2006). Next, minimum average partials(MAP; Velicer, 1976) and parallel analysis (Horn, 1965) were used todetermine the number of factors to extract. These procedures wereconducted using O’Conner’s (2000) and Watkins’s (2000) programs.Scree plots (Cattell, 1966) were also inspected as a supplementalmeans to determine the number of factors to retain for rotation.Finally, because the Technical Manual posits that the three-stratumtheory of Carroll (1993) was influential in the creation of the WJ-III,a higher order factor analysis using the Schmid-Leiman (Schmid &Leiman, 1957) procedure was applied to the oblique first-order factorswith the SPSS program furnished by Wolff and Preising (2005).
Results
Exploratory (First-Order) Analyses
Results from Bartlett’s Test of Sphericity (Bartlett, 1950) for bothanalyses indicated that the correlation matrices were not random (9 to13 age range �2 � 44,305.6, df � 861, p � .001; 14 to 19 age range�2 � 38,814.5, df � 861, p � .001). For the 9 to 13 and 14 to 19 ageranges, the KMO (Kaiser, 1974) statistic was .947 and .955, respec-tively, well above the minimum standard for conducting a factoranalysis suggested by Kline (1994). Measures of sampling adequacyfor each variable were also within reasonable limits. Thus, the corre-lation matrices were appropriate for factor analysis.
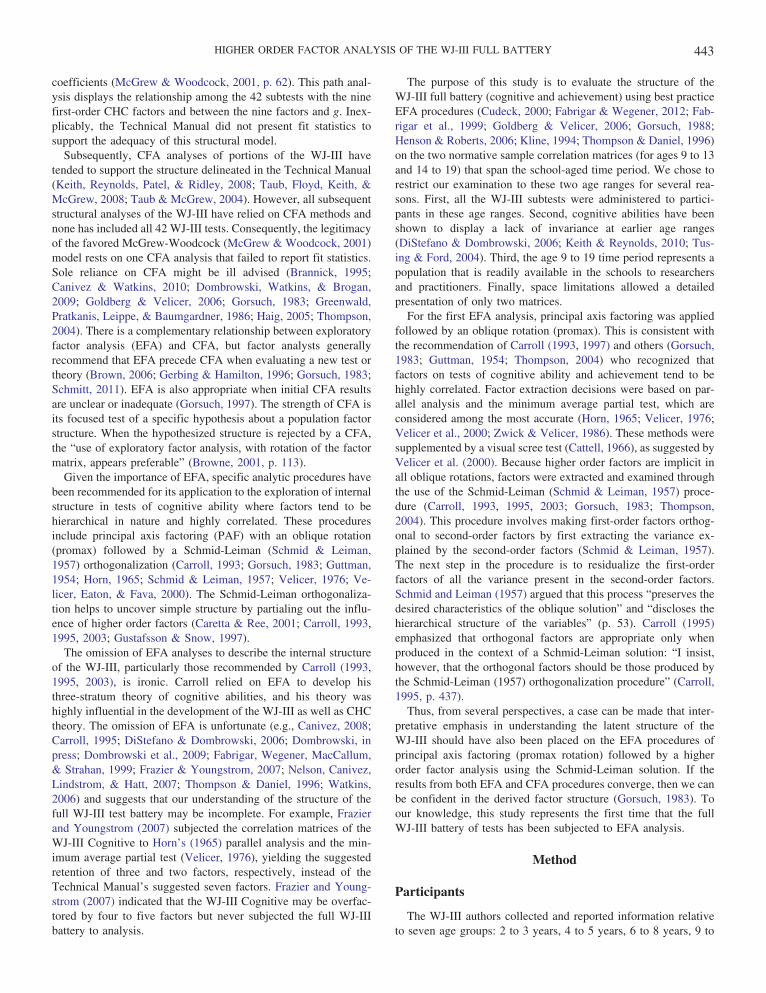
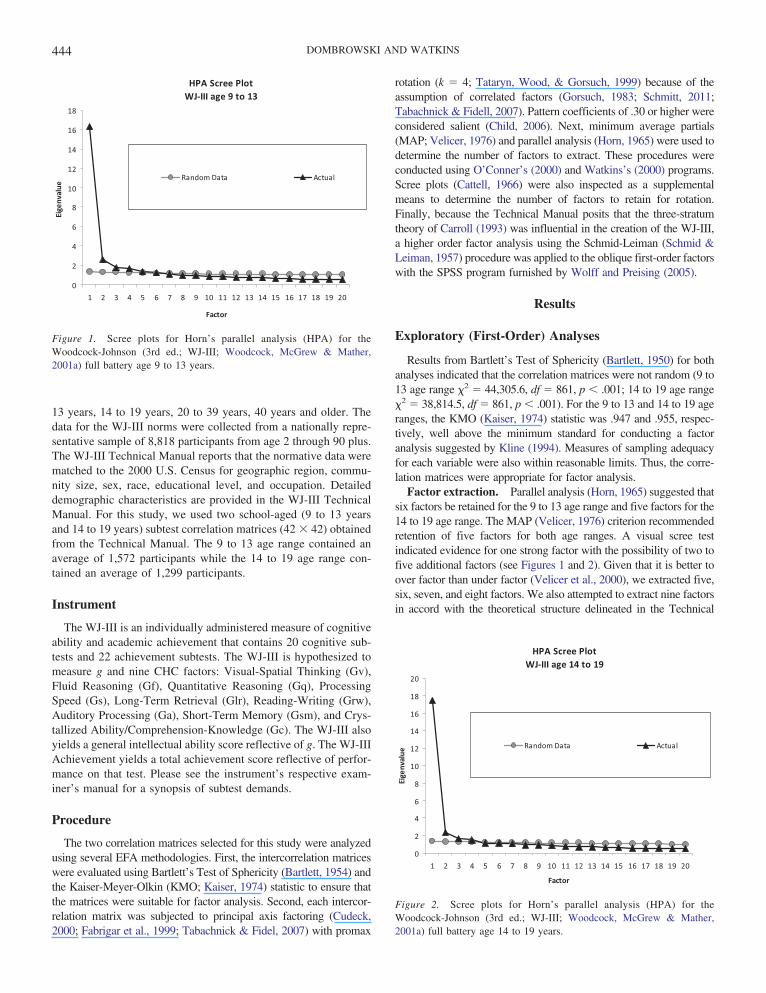
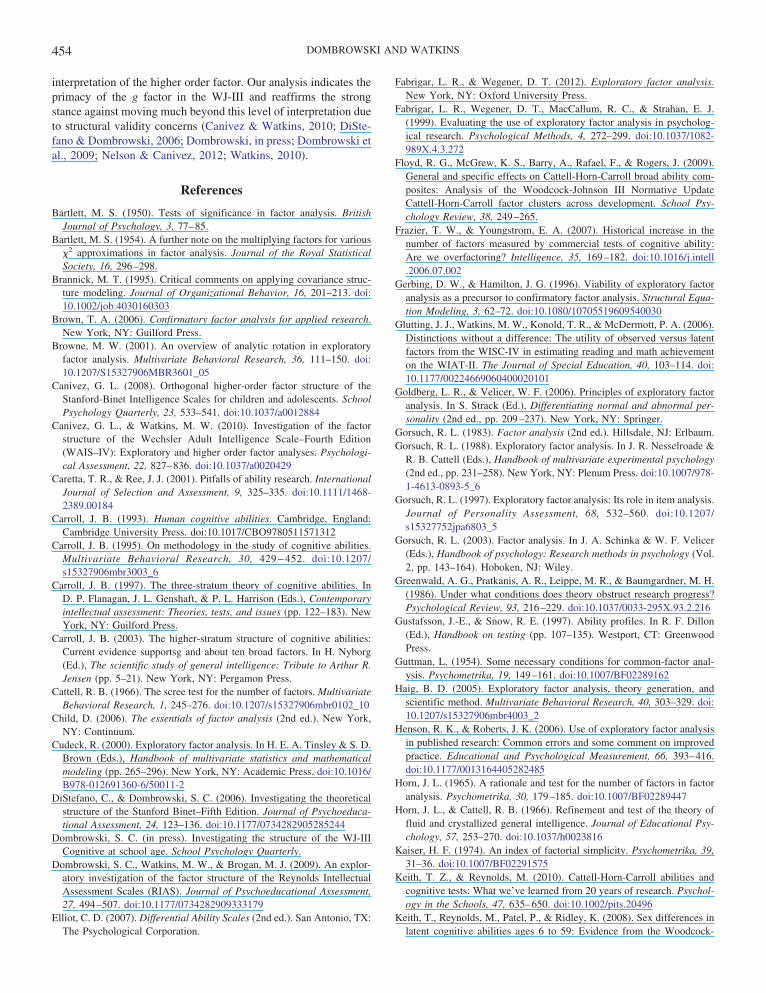
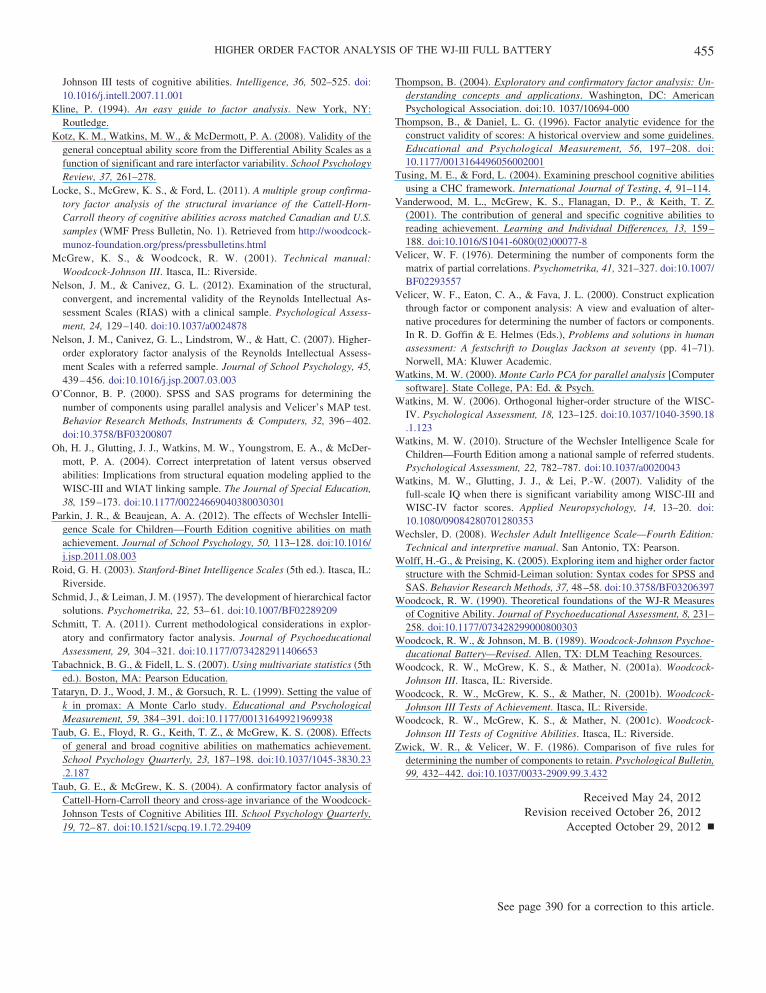
Factor extraction. Parallel analysis (Horn, 1965) suggested thatsix factors be retained for the 9 to 13 age range and five factors for the14 to 19 age range. The MAP (Velicer, 1976) criterion recommendedretention of five factors for both age ranges. A visual scree testindicated evidence for one strong factor with the possibility of two tofive additional factors (see Figures 1 and 2). Given that it is better toover factor than under factor (Velicer et al., 2000), we extracted five,six, seven, and eight factors. We also attempted to extract nine factorsin accord with the theoretical structure delineated in the Technical
HPA Scree PlotWJ-III age 9 to 13
0
2
4
6
8
10
12
14
16
18
1 2 3 4 5 6 7 8 9 10 11 12 13 14 15 16 17 18 19 20
Factor
Eige
nval
ue
Random Data Actual
Figure 1. Scree plots for Horn’s parallel analysis (HPA) for theWoodcock-Johnson (3rd ed.; WJ-III; Woodcock, McGrew & Mather,2001a) full battery age 9 to 13 years.
HPA Scree PlotWJ-III age 14 to 19
0
2
4
6
8
10
12
14
16
18
20
1 2 3 4 5 6 7 8 9 10 11 12 13 14 15 16 17 18 19 20
Factor
Eige
nval
ue
Random Data Actual
Figure 2. Scree plots for Horn’s parallel analysis (HPA) for theWoodcock-Johnson (3rd ed.; WJ-III; Woodcock, McGrew & Mather,2001a) full battery age 14 to 19 years.
444 DOMBROWSKI AND WATKINS
Manual. Extraction of more than six factors yielded either a spurioussolution because of Heywood cases (e.g., communalities � 1.0),which often occur when too many factors are extracted, theoreticallyincoherent factors, or trivial factors with only one or two salientloadings.
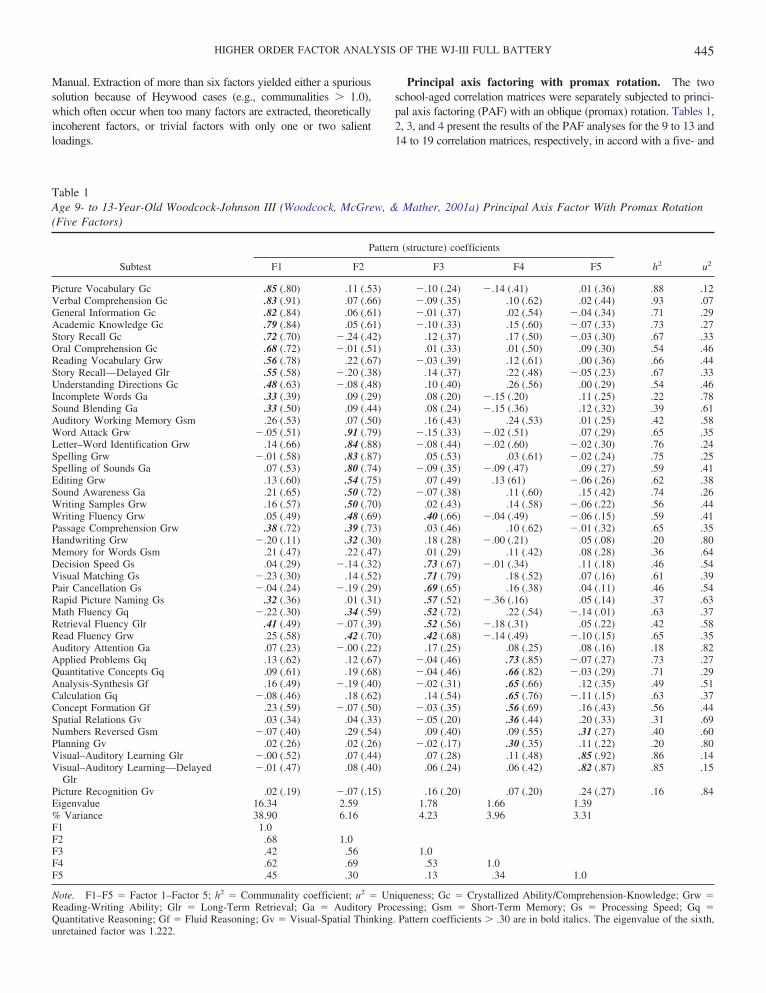
Principal axis factoring with promax rotation. The twoschool-aged correlation matrices were separately subjected to princi-pal axis factoring (PAF) with an oblique (promax) rotation. Tables 1,2, 3, and 4 present the results of the PAF analyses for the 9 to 13 and14 to 19 correlation matrices, respectively, in accord with a five- and
Table 1Age 9- to 13-Year-Old Woodcock-Johnson III (Woodcock, McGrew, & Mather, 2001a) Principal Axis Factor With Promax Rotation(Five Factors)
Subtest
Pattern (structure) coefficients
h2 u2F1 F2 F3 F4 F5
Picture Vocabulary Gc .85 (.80) .11 (.53) �.10 (.24) �.14 (.41) .01 (.36) .88 .12Verbal Comprehension Gc .83 (.91) .07 (.66) �.09 (.35) .10 (.62) .02 (.44) .93 .07General Information Gc .82 (.84) .06 (.61) �.01 (.37) .02 (.54) �.04 (.34) .71 .29Academic Knowledge Gc .79 (.84) .05 (.61) �.10 (.33) .15 (.60) �.07 (.33) .73 .27Story Recall Gc .72 (.70) �.24 (.42) .12 (.37) .17 (.50) �.03 (.30) .67 .33Oral Comprehension Gc .68 (.72) �.01 (.51) .01 (.33) .01 (.50) .09 (.30) .54 .46Reading Vocabulary Grw .56 (.78) .22 (.67) �.03 (.39) .12 (.61) .00 (.36) .66 .44Story Recall—Delayed Glr .55 (.58) �.20 (.38) .14 (.37) .22 (.48) �.05 (.23) .67 .33Understanding Directions Gc .48 (.63) �.08 (.48) .10 (.40) .26 (.56) .00 (.29) .54 .46Incomplete Words Ga .33 (.39) .09 (.29) .08 (.20) �.15 (.20) .11 (.25) .22 .78Sound Blending Ga .33 (.50) .09 (.44) .08 (.24) �.15 (.36) .12 (.32) .39 .61Auditory Working Memory Gsm .26 (.53) .07 (.50) .16 (.43) .24 (.53) .01 (.25) .42 .58Word Attack Grw �.05 (.51) .91 (.79) �.15 (.33) �.02 (.51) .07 (.29) .65 .35Letter–Word Identification Grw .14 (.66) .84 (.88) �.08 (.44) �.02 (.60) �.02 (.30) .76 .24Spelling Grw �.01 (.58) .83 (.87) .05 (.53) .03 (.61) �.02 (.24) .75 .25Spelling of Sounds Ga .07 (.53) .80 (.74) �.09 (.35) �.09 (.47) .09 (.27) .59 .41Editing Grw .13 (.60) .54 (.75) .07 (.49) .13 (61) �.06 (.26) .62 .38Sound Awareness Ga .21 (.65) .50 (.72) �.07 (.38) .11 (.60) .15 (.42) .74 .26Writing Samples Grw .16 (.57) .50 (.70) .02 (.43) .14 (.58) �.06 (.22) .56 .44Writing Fluency Grw .05 (.49) .48 (.69) .40 (.66) �.04 (.49) �.06 (.15) .59 .41Passage Comprehension Grw .38 (.72) .39 (.73) .03 (.46) .10 (.62) �.01 (.32) .65 .35Handwriting Grw �.20 (.11) .32 (.30) .18 (.28) �.00 (.21) .05 (.08) .20 .80Memory for Words Gsm .21 (.47) .22 (.47) .01 (.29) .11 (.42) .08 (.28) .36 .64Decision Speed Gs .04 (.29) �.14 (.32) .73 (.67) �.01 (.34) .11 (.18) .46 .54Visual Matching Gs �.23 (.30) .14 (.52) .71 (.79) .18 (.52) .07 (.16) .61 .39Pair Cancellation Gs �.04 (.24) �.19 (.29) .69 (.65) .16 (.38) .04 (.11) .46 .54Rapid Picture Naming Gs .32 (.36) .01 (.31) .57 (.52) �.36 (.16) .05 (.14) .37 .63Math Fluency Gq �.22 (.30) .34 (.59) .52 (.72) .22 (.54) �.14 (.01) .63 .37Retrieval Fluency Glr .41 (.49) �.07 (.39) .52 (.56) �.18 (.31) .05 (.22) .42 .58Read Fluency Grw .25 (.58) .42 (.70) .42 (.68) �.14 (.49) �.10 (.15) .65 .35Auditory Attention Ga .07 (.23) �.00 (.22) .17 (.25) .08 (.25) .08 (.16) .18 .82Applied Problems Gq .13 (.62) .12 (.67) �.04 (.46) .73 (.85) �.07 (.27) .73 .27Quantitative Concepts Gq .09 (.61) .19 (.68) �.04 (.46) .66 (.82) �.03 (.29) .71 .29Analysis-Synthesis Gf .16 (.49) �.19 (.40) �.02 (.31) .65 (.66) .12 (.35) .49 .51Calculation Gq �.08 (.46) .18 (.62) .14 (.54) .65 (.76) �.11 (.15) .63 .37Concept Formation Gf .23 (.59) �.07 (.50) �.03 (.35) .56 (.69) .16 (.43) .56 .44Spatial Relations Gv .03 (.34) .04 (.33) �.05 (.20) .36 (.44) .20 (.33) .31 .69Numbers Reversed Gsm �.07 (.40) .29 (.54) .09 (.40) .09 (.55) .31 (.27) .40 .60Planning Gv .02 (.26) .02 (.26) �.02 (.17) .30 (.35) .11 (.22) .20 .80Visual–Auditory Learning Glr �.00 (.52) .07 (.44) .07 (.28) .11 (.48) .85 (.92) .86 .14Visual–Auditory Learning—Delayed
Glr�.01 (.47) .08 (.40) .06 (.24) .06 (.42) .82 (.87) .85 .15
Picture Recognition Gv .02 (.19) �.07 (.15) .16 (.20) .07 (.20) .24 (.27) .16 .84Eigenvalue 16.34 2.59 1.78 1.66 1.39% Variance 38.90 6.16 4.23 3.96 3.31F1 1.0F2 .68 1.0F3 .42 .56 1.0F4 .62 .69 .53 1.0F5 .45 .30 .13 .34 1.0
Note. F1–F5 � Factor 1–Factor 5; h2 � Communality coefficient; u2 � Uniqueness; Gc � Crystallized Ability/Comprehension-Knowledge; Grw �Reading-Writing Ability; Glr � Long-Term Retrieval; Ga � Auditory Processing; Gsm � Short-Term Memory; Gs � Processing Speed; Gq �Quantitative Reasoning; Gf � Fluid Reasoning; Gv � Visual-Spatial Thinking. Pattern coefficients � .30 are in bold italics. The eigenvalue of the sixth,unretained factor was 1.222.
445HIGHER ORDER FACTOR ANALYSIS OF THE WJ-III FULL BATTERY
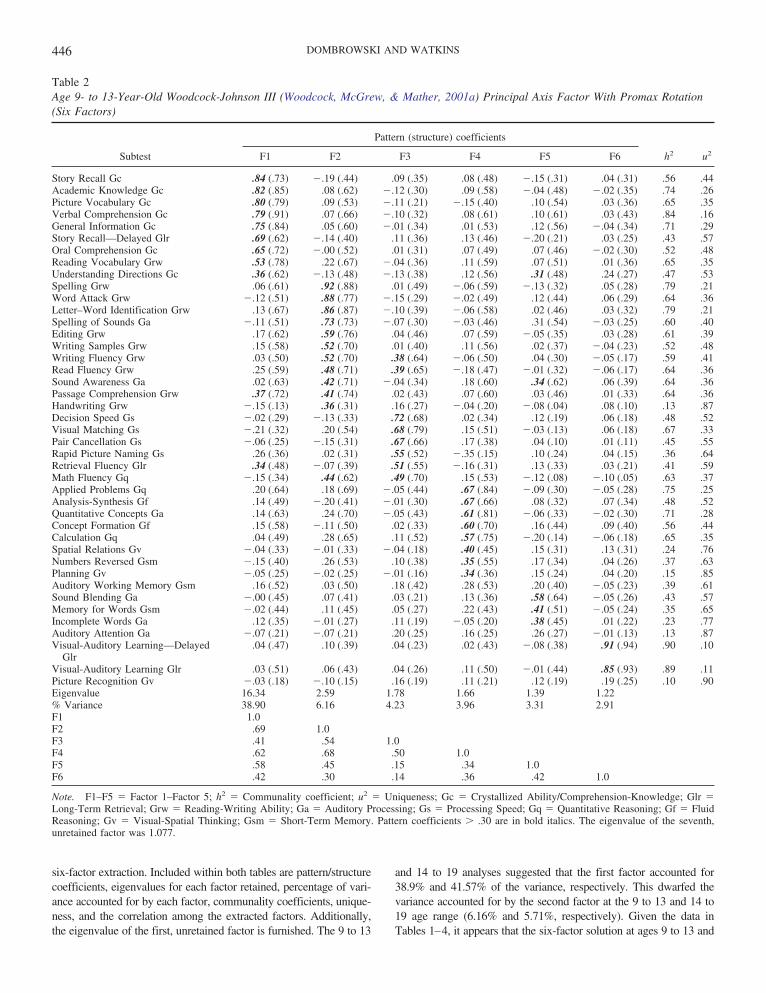
six-factor extraction. Included within both tables are pattern/structurecoefficients, eigenvalues for each factor retained, percentage of vari-ance accounted for by each factor, communality coefficients, unique-ness, and the correlation among the extracted factors. Additionally,the eigenvalue of the first, unretained factor is furnished. The 9 to 13
and 14 to 19 analyses suggested that the first factor accounted for38.9% and 41.57% of the variance, respectively. This dwarfed thevariance accounted for by the second factor at the 9 to 13 and 14 to19 age range (6.16% and 5.71%, respectively). Given the data inTables 1–4, it appears that the six-factor solution at ages 9 to 13 and
Table 2Age 9- to 13-Year-Old Woodcock-Johnson III (Woodcock, McGrew, & Mather, 2001a) Principal Axis Factor With Promax Rotation(Six Factors)
Subtest
Pattern (structure) coefficients
h2 u2F1 F2 F3 F4 F5 F6
Story Recall Gc .84 (.73) �.19 (.44) .09 (.35) .08 (.48) �.15 (.31) .04 (.31) .56 .44Academic Knowledge Gc .82 (.85) .08 (.62) �.12 (.30) .09 (.58) �.04 (.48) �.02 (.35) .74 .26Picture Vocabulary Gc .80 (.79) .09 (.53) �.11 (.21) �.15 (.40) .10 (.54) .03 (.36) .65 .35Verbal Comprehension Gc .79 (.91) .07 (.66) �.10 (.32) .08 (.61) .10 (.61) .03 (.43) .84 .16General Information Gc .75 (.84) .05 (.60) �.01 (.34) .01 (.53) .12 (.56) �.04 (.34) .71 .29Story Recall—Delayed Glr .69 (.62) �.14 (.40) .11 (.36) .13 (.46) �.20 (.21) .03 (.25) .43 .57Oral Comprehension Gc .65 (.72) �.00 (.52) .01 (.31) .07 (.49) .07 (.46) �.02 (.30) .52 .48Reading Vocabulary Grw .53 (.78) .22 (.67) �.04 (.36) .11 (.59) .07 (.51) .01 (.36) .65 .35Understanding Directions Gc .36 (.62) �.13 (.48) �.13 (.38) .12 (.56) .31 (.48) .24 (.27) .47 .53Spelling Grw .06 (.61) .92 (.88) .01 (.49) �.06 (.59) �.13 (.32) .05 (.28) .79 .21Word Attack Grw �.12 (.51) .88 (.77) �.15 (.29) �.02 (.49) .12 (.44) .06 (.29) .64 .36Letter–Word Identification Grw .13 (.67) .86 (.87) �.10 (.39) �.06 (.58) .02 (.46) .03 (.32) .79 .21Spelling of Sounds Ga �.11 (.51) .73 (.73) �.07 (.30) �.03 (.46) .31 (.54) �.03 (.25) .60 .40Editing Grw .17 (.62) .59 (.76) .04 (.46) .07 (.59) �.05 (.35) .03 (.28) .61 .39Writing Samples Grw .15 (.58) .52 (.70) .01 (.40) .11 (.56) .02 (.37) �.04 (.23) .52 .48Writing Fluency Grw .03 (.50) .52 (.70) .38 (.64) �.06 (.50) .04 (.30) �.05 (.17) .59 .41Read Fluency Grw .25 (.59) .48 (.71) .39 (.65) �.18 (.47) �.01 (.32) �.06 (.17) .64 .36Sound Awareness Ga .02 (.63) .42 (.71) �.04 (.34) .18 (.60) .34 (.62) .06 (.39) .64 .36Passage Comprehension Grw .37 (.72) .41 (.74) .02 (.43) .07 (.60) .03 (.46) .01 (.33) .64 .36Handwriting Grw �.15 (.13) .36 (.31) .16 (.27) �.04 (.20) �.08 (.04) .08 (.10) .13 .87Decision Speed Gs �.02 (.29) �.13 (.33) .72 (.68) .02 (.34) .12 (.19) .06 (.18) .48 .52Visual Matching Gs �.21 (.32) .20 (.54) .68 (.79) .15 (.51) �.03 (.13) .06 (.18) .67 .33Pair Cancellation Gs �.06 (.25) �.15 (.31) .67 (.66) .17 (.38) .04 (.10) .01 (.11) .45 .55Rapid Picture Naming Gs .26 (.36) .02 (.31) .55 (.52) �.35 (.15) .10 (.24) .04 (.15) .36 .64Retrieval Fluency Glr .34 (.48) �.07 (.39) .51 (.55) �.16 (.31) .13 (.33) .03 (.21) .41 .59Math Fluency Gq �.15 (.34) .44 (.62) .49 (.70) .15 (.53) �.12 (.08) �.10 (.05) .63 .37Applied Problems Gq .20 (.64) .18 (.69) �.05 (.44) .67 (.84) �.09 (.30) �.05 (.28) .75 .25Analysis-Synthesis Gf .14 (.49) �.20 (.41) �.01 (.30) .67 (.66) .08 (.32) .07 (.34) .48 .52Quantitative Concepts Ga .14 (.63) .24 (.70) �.05 (.43) .61 (.81) �.06 (.33) �.02 (.30) .71 .28Concept Formation Gf .15 (.58) �.11 (.50) .02 (.33) .60 (.70) .16 (.44) .09 (.40) .56 .44Calculation Gq .04 (.49) .28 (.65) .11 (.52) .57 (.75) �.20 (.14) �.06 (.18) .65 .35Spatial Relations Gv �.04 (.33) �.01 (.33) �.04 (.18) .40 (.45) .15 (.31) .13 (.31) .24 .76Numbers Reversed Gsm �.15 (.40) .26 (.53) .10 (.38) .35 (.55) .17 (.34) .04 (.26) .37 .63Planning Gv �.05 (.25) �.02 (.25) �.01 (.16) .34 (.36) .15 (.24) .04 (.20) .15 .85Auditory Working Memory Gsm .16 (.52) .03 (.50) .18 (.42) .28 (.53) .20 (.40) �.05 (.23) .39 .61Sound Blending Ga �.00 (.45) .07 (.41) .03 (.21) .13 (.36) .58 (.64) �.05 (.26) .43 .57Memory for Words Gsm �.02 (.44) .11 (.45) .05 (.27) .22 (.43) .41 (.51) �.05 (.24) .35 .65Incomplete Words Ga .12 (.35) �.01 (.27) .11 (.19) �.05 (.20) .38 (.45) .01 (.22) .23 .77Auditory Attention Ga �.07 (.21) �.07 (.21) .20 (.25) .16 (.25) .26 (.27) �.01 (.13) .13 .87Visual-Auditory Learning—Delayed
Glr.04 (.47) .10 (.39) .04 (.23) .02 (.43) �.08 (.38) .91 (.94) .90 .10
Visual-Auditory Learning Glr .03 (.51) .06 (.43) .04 (.26) .11 (.50) �.01 (.44) .85 (.93) .89 .11Picture Recognition Gv �.03 (.18) �.10 (.15) .16 (.19) .11 (.21) .12 (.19) .19 (.25) .10 .90Eigenvalue 16.34 2.59 1.78 1.66 1.39 1.22% Variance 38.90 6.16 4.23 3.96 3.31 2.91F1 1.0F2 .69 1.0F3 .41 .54 1.0F4 .62 .68 .50 1.0F5 .58 .45 .15 .34 1.0F6 .42 .30 .14 .36 .42 1.0
Note. F1–F5 � Factor 1–Factor 5; h2 � Communality coefficient; u2 � Uniqueness; Gc � Crystallized Ability/Comprehension-Knowledge; Glr �Long-Term Retrieval; Grw � Reading-Writing Ability; Ga � Auditory Processing; Gs � Processing Speed; Gq � Quantitative Reasoning; Gf � FluidReasoning; Gv � Visual-Spatial Thinking; Gsm � Short-Term Memory. Pattern coefficients � .30 are in bold italics. The eigenvalue of the seventh,unretained factor was 1.077.
446 DOMBROWSKI AND WATKINS
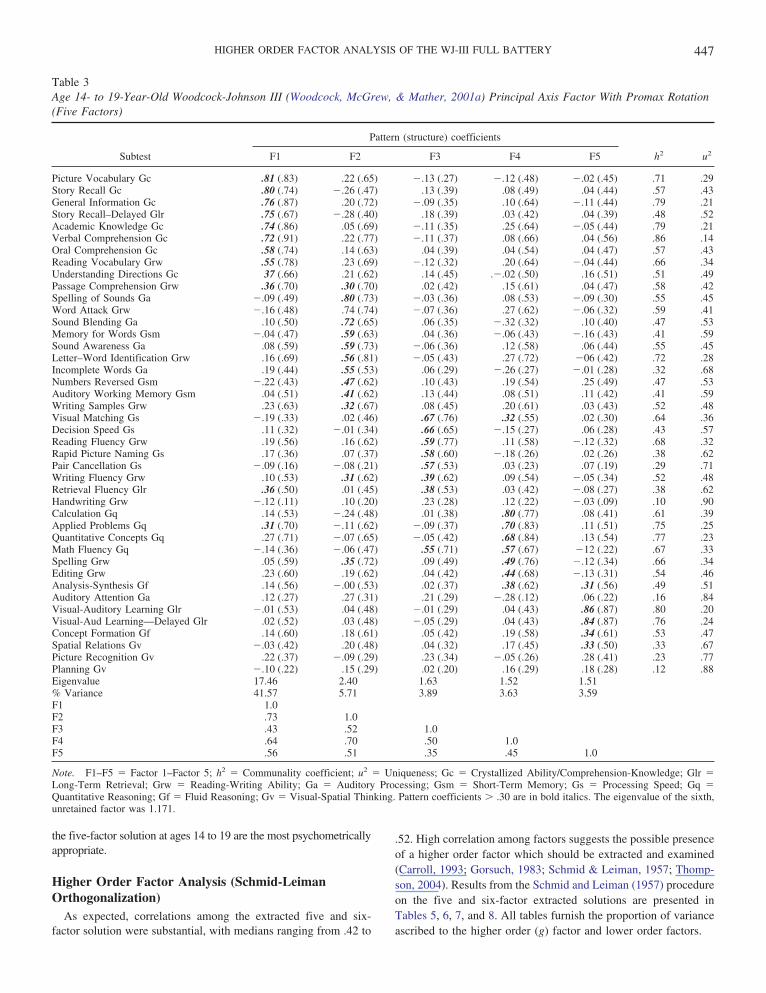
the five-factor solution at ages 14 to 19 are the most psychometricallyappropriate.
Higher Order Factor Analysis (Schmid-LeimanOrthogonalization)
As expected, correlations among the extracted five and six-factor solution were substantial, with medians ranging from .42 to
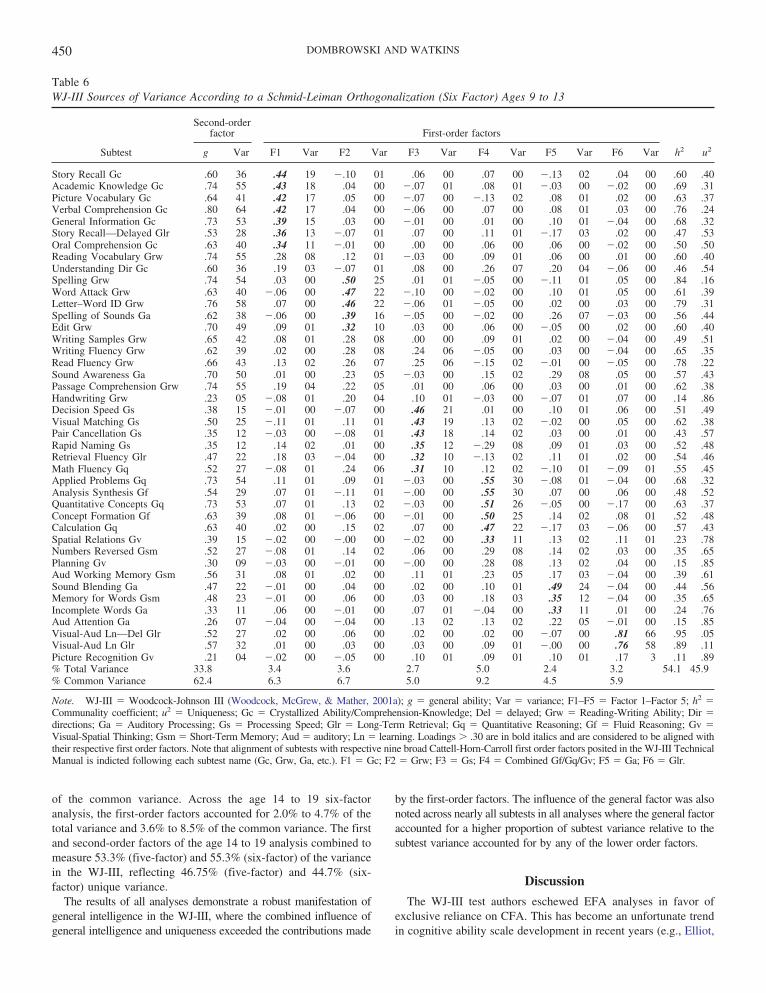
.52. High correlation among factors suggests the possible presenceof a higher order factor which should be extracted and examined(Carroll, 1993; Gorsuch, 1983; Schmid & Leiman, 1957; Thomp-son, 2004). Results from the Schmid and Leiman (1957) procedureon the five and six-factor extracted solutions are presented inTables 5, 6, 7, and 8. All tables furnish the proportion of varianceascribed to the higher order (g) factor and lower order factors.
Table 3Age 14- to 19-Year-Old Woodcock-Johnson III (Woodcock, McGrew, & Mather, 2001a) Principal Axis Factor With Promax Rotation(Five Factors)
Subtest
Pattern (structure) coefficients
h2 u2F1 F2 F3 F4 F5
Picture Vocabulary Gc .81 (.83) .22 (.65) �.13 (.27) �.12 (.48) �.02 (.45) .71 .29Story Recall Gc .80 (.74) �.26 (.47) .13 (.39) .08 (.49) .04 (.44) .57 .43General Information Gc .76 (.87) .20 (.72) �.09 (.35) .10 (.64) �.11 (.44) .79 .21Story Recall–Delayed Glr .75 (.67) �.28 (.40) .18 (.39) .03 (.42) .04 (.39) .48 .52Academic Knowledge Gc .74 (.86) .05 (.69) �.11 (.35) .25 (.64) �.05 (.44) .79 .21Verbal Comprehension Gc .72 (.91) .22 (.77) �.11 (.37) .08 (.66) .04 (.56) .86 .14Oral Comprehension Gc .58 (.74) .14 (.63) .04 (.39) .04 (.54) .04 (.47) .57 .43Reading Vocabulary Grw .55 (.78) .23 (.69) �.12 (.32) .20 (.64) �.04 (.44) .66 .34Understanding Directions Gc 37 (.66) .21 (.62) .14 (.45) .�.02 (.50) .16 (.51) .51 .49Passage Comprehension Grw .36 (.70) .30 (.70) .02 (.42) .15 (.61) .04 (.47) .58 .42Spelling of Sounds Ga �.09 (.49) .80 (.73) �.03 (.36) .08 (.53) �.09 (.30) .55 .45Word Attack Grw �.16 (.48) .74 (.74) �.07 (.36) .27 (.62) �.06 (.32) .59 .41Sound Blending Ga .10 (.50) .72 (.65) .06 (.35) �.32 (.32) .10 (.40) .47 .53Memory for Words Gsm �.04 (.47) .59 (.63) .04 (.36) �.06 (.43) �.16 (.43) .41 .59Sound Awareness Ga .08 (.59) .59 (.73) �.06 (.36) .12 (.58) .06 (.44) .55 .45Letter–Word Identification Grw .16 (.69) .56 (.81) �.05 (.43) .27 (.72) �06 (.42) .72 .28Incomplete Words Ga .19 (.44) .55 (.53) .06 (.29) �.26 (.27) �.01 (.28) .32 .68Numbers Reversed Gsm �.22 (.43) .47 (.62) .10 (.43) .19 (.54) .25 (.49) .47 .53Auditory Working Memory Gsm .04 (.51) .41 (.62) .13 (.44) .08 (.51) .11 (.42) .41 .59Writing Samples Grw .23 (.63) .32 (.67) .08 (.45) .20 (.61) .03 (.43) .52 .48Visual Matching Gs �.19 (.33) .02 (.46) .67 (.76) .32 (.55) .02 (.30) .64 .36Decision Speed Gs .11 (.32) �.01 (.34) .66 (.65) �.15 (.27) .06 (.28) .43 .57Reading Fluency Grw .19 (.56) .16 (.62) .59 (.77) .11 (.58) �.12 (.32) .68 .32Rapid Picture Naming Gs .17 (.36) .07 (.37) .58 (.60) �.18 (.26) .02 (.26) .38 .62Pair Cancellation Gs �.09 (.16) �.08 (.21) .57 (.53) .03 (.23) .07 (.19) .29 .71Writing Fluency Grw .10 (.53) .31 (.62) .39 (.62) .09 (.54) �.05 (.34) .52 .48Retrieval Fluency Glr .36 (.50) .01 (.45) .38 (.53) .03 (.42) �.08 (.27) .38 .62Handwriting Grw �.12 (.11) .10 (.20) .23 (.28) .12 (.22) �.03 (.09) .10 .90Calculation Gq .14 (.53) �.24 (.48) .01 (.38) .80 (.77) .08 (.41) .61 .39Applied Problems Gq .31 (.70) �.11 (.62) �.09 (.37) .70 (.83) .11 (.51) .75 .25Quantitative Concepts Gq .27 (.71) �.07 (.65) �.05 (.42) .68 (.84) .13 (.54) .77 .23Math Fluency Gq �.14 (.36) �.06 (.47) .55 (.71) .57 (.67) �12 (.22) .67 .33Spelling Grw .05 (.59) .35 (.72) .09 (.49) .49 (.76) �.12 (.34) .66 .34Editing Grw .23 (.60) .19 (.62) .04 (.42) .44 (.68) �.13 (.31) .54 .46Analysis-Synthesis Gf .14 (.56) �.00 (.53) .02 (.37) .38 (.62) .31 (.56) .49 .51Auditory Attention Ga .12 (.27) .27 (.31) .21 (.29) �.28 (.12) .06 (.22) .16 .84Visual-Auditory Learning Glr �.01 (.53) .04 (.48) �.01 (.29) .04 (.43) .86 (.87) .80 .20Visual-Aud Learning—Delayed Glr .02 (.52) .03 (.48) �.05 (.29) .04 (.43) .84 (.87) .76 .24Concept Formation Gf .14 (.60) .18 (.61) .05 (.42) .19 (.58) .34 (.61) .53 .47Spatial Relations Gv �.03 (.42) .20 (.48) .04 (.32) .17 (.45) .33 (.50) .33 .67Picture Recognition Gv .22 (.37) �.09 (.29) .23 (.34) �.05 (.26) .28 (.41) .23 .77Planning Gv �.10 (.22) .15 (.29) .02 (.20) .16 (.29) .18 (.28) .12 .88Eigenvalue 17.46 2.40 1.63 1.52 1.51% Variance 41.57 5.71 3.89 3.63 3.59F1 1.0F2 .73 1.0F3 .43 .52 1.0F4 .64 .70 .50 1.0F5 .56 .51 .35 .45 1.0
Note. F1–F5 � Factor 1–Factor 5; h2 � Communality coefficient; u2 � Uniqueness; Gc � Crystallized Ability/Comprehension-Knowledge; Glr �Long-Term Retrieval; Grw � Reading-Writing Ability; Ga � Auditory Processing; Gsm � Short-Term Memory; Gs � Processing Speed; Gq �Quantitative Reasoning; Gf � Fluid Reasoning; Gv � Visual-Spatial Thinking. Pattern coefficients � .30 are in bold italics. The eigenvalue of the sixth,unretained factor was 1.171.
447HIGHER ORDER FACTOR ANALYSIS OF THE WJ-III FULL BATTERY
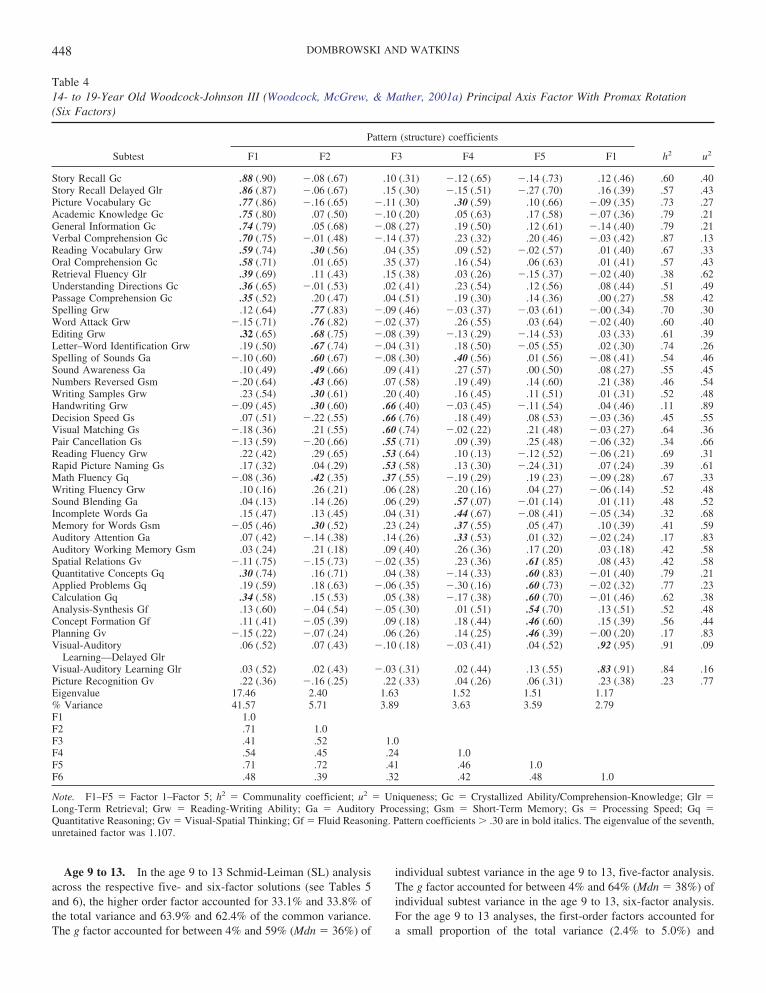
Age 9 to 13. In the age 9 to 13 Schmid-Leiman (SL) analysisacross the respective five- and six-factor solutions (see Tables 5and 6), the higher order factor accounted for 33.1% and 33.8% ofthe total variance and 63.9% and 62.4% of the common variance.The g factor accounted for between 4% and 59% (Mdn � 36%) of
individual subtest variance in the age 9 to 13, five-factor analysis.The g factor accounted for between 4% and 64% (Mdn � 38%) ofindividual subtest variance in the age 9 to 13, six-factor analysis.For the age 9 to 13 analyses, the first-order factors accounted fora small proportion of the total variance (2.4% to 5.0%) and
Table 414- to 19-Year Old Woodcock-Johnson III (Woodcock, McGrew, & Mather, 2001a) Principal Axis Factor With Promax Rotation(Six Factors)
Subtest
Pattern (structure) coefficients
h2 u2F1 F2 F3 F4 F5 F1
Story Recall Gc .88 (.90) �.08 (.67) .10 (.31) �.12 (.65) �.14 (.73) .12 (.46) .60 .40Story Recall Delayed Glr .86 (.87) �.06 (.67) .15 (.30) �.15 (.51) �.27 (.70) .16 (.39) .57 .43Picture Vocabulary Gc .77 (.86) �.16 (.65) �.11 (.30) .30 (.59) .10 (.66) �.09 (.35) .73 .27Academic Knowledge Gc .75 (.80) .07 (.50) �.10 (.20) .05 (.63) .17 (.58) �.07 (.36) .79 .21General Information Gc .74 (.79) .05 (.68) �.08 (.27) .19 (.50) .12 (.61) �.14 (.40) .79 .21Verbal Comprehension Gc .70 (.75) �.01 (.48) �.14 (.37) .23 (.32) .20 (.46) �.03 (.42) .87 .13Reading Vocabulary Grw .59 (.74) .30 (.56) .04 (.35) .09 (.52) �.02 (.57) .01 (.40) .67 .33Oral Comprehension Gc .58 (.71) .01 (.65) .35 (.37) .16 (.54) .06 (.63) .01 (.41) .57 .43Retrieval Fluency Glr .39 (.69) .11 (.43) .15 (.38) .03 (.26) �.15 (.37) �.02 (.40) .38 .62Understanding Directions Gc .36 (.65) �.01 (.53) .02 (.41) .23 (.54) .12 (.56) .08 (.44) .51 .49Passage Comprehension Gc .35 (.52) .20 (.47) .04 (.51) .19 (.30) .14 (.36) .00 (.27) .58 .42Spelling Grw .12 (.64) .77 (.83) �.09 (.46) �.03 (.37) �.03 (.61) �.00 (.34) .70 .30Word Attack Grw �.15 (.71) .76 (.82) �.02 (.37) .26 (.55) .03 (.64) �.02 (.40) .60 .40Editing Grw .32 (.65) .68 (.75) �.08 (.39) �.13 (.29) �.14 (.53) .03 (.33) .61 .39Letter–Word Identification Grw .19 (.50) .67 (.74) �.04 (.31) .18 (.50) �.05 (.55) .02 (.30) .74 .26Spelling of Sounds Ga �.10 (.60) .60 (.67) �.08 (.30) .40 (.56) .01 (.56) �.08 (.41) .54 .46Sound Awareness Ga .10 (.49) .49 (.66) .09 (.41) .27 (.57) .00 (.50) .08 (.27) .55 .45Numbers Reversed Gsm �.20 (.64) .43 (.66) .07 (.58) .19 (.49) .14 (.60) .21 (.38) .46 .54Writing Samples Grw .23 (.54) .30 (.61) .20 (.40) .16 (.45) .11 (.51) .01 (.31) .52 .48Handwriting Grw �.09 (.45) .30 (.60) .66 (.40) �.03 (.45) �.11 (.54) .04 (.46) .11 .89Decision Speed Gs .07 (.51) �.22 (.55) .66 (.76) .18 (.49) .08 (.53) �.03 (.36) .45 .55Visual Matching Gs �.18 (.36) .21 (.55) .60 (.74) �.02 (.22) .21 (.48) �.03 (.27) .64 .36Pair Cancellation Gs �.13 (.59) �.20 (.66) .55 (.71) .09 (.39) .25 (.48) �.06 (.32) .34 .66Reading Fluency Grw .22 (.42) .29 (.65) .53 (.64) .10 (.13) �.12 (.52) �.06 (.21) .69 .31Rapid Picture Naming Gs .17 (.32) .04 (.29) .53 (.58) .13 (.30) �.24 (.31) .07 (.24) .39 .61Math Fluency Gq �.08 (.36) .42 (.35) .37 (.55) �.19 (.29) .19 (.23) �.09 (.28) .67 .33Writing Fluency Grw .10 (.16) .26 (.21) .06 (.28) .20 (.16) .04 (.27) �.06 (.14) .52 .48Sound Blending Ga .04 (.13) .14 (.26) .06 (.29) .57 (.07) �.01 (.14) .01 (.11) .48 .52Incomplete Words Ga .15 (.47) .13 (.45) .04 (.31) .44 (.67) �.08 (.41) �.05 (.34) .32 .68Memory for Words Gsm �.05 (.46) .30 (.52) .23 (.24) .37 (.55) .05 (.47) .10 (.39) .41 .59Auditory Attention Ga .07 (.42) �.14 (.38) .14 (.26) .33 (.53) .01 (.32) �.02 (.24) .17 .83Auditory Working Memory Gsm .03 (.24) .21 (.18) .09 (.40) .26 (.36) .17 (.20) .03 (.18) .42 .58Spatial Relations Gv �.11 (.75) �.15 (.73) �.02 (.35) .23 (.36) .61 (.85) .08 (.43) .42 .58Quantitative Concepts Gq .30 (.74) .16 (.71) .04 (.38) �.14 (.33) .60 (.83) �.01 (.40) .79 .21Applied Problems Gq .19 (.59) .18 (.63) �.06 (.35) �.30 (.16) .60 (.73) �.02 (.32) .77 .23Calculation Gq .34 (.58) .15 (.53) .05 (.38) �.17 (.38) .60 (.70) �.01 (.46) .62 .38Analysis-Synthesis Gf .13 (.60) �.04 (.54) �.05 (.30) .01 (.51) .54 (.70) .13 (.51) .52 .48Concept Formation Gf .11 (.41) �.05 (.39) .09 (.18) .18 (.44) .46 (.60) .15 (.39) .56 .44Planning Gv �.15 (.22) �.07 (.24) .06 (.26) .14 (.25) .46 (.39) �.00 (.20) .17 .83Visual-Auditory
Learning—Delayed Glr.06 (.52) .07 (.43) �.10 (.18) �.03 (.41) .04 (.52) .92 (.95) .91 .09
Visual-Auditory Learning Glr .03 (.52) .02 (.43) �.03 (.31) .02 (.44) .13 (.55) .83 (.91) .84 .16Picture Recognition Gv .22 (.36) �.16 (.25) .22 (.33) .04 (.26) .06 (.31) .23 (.38) .23 .77Eigenvalue 17.46 2.40 1.63 1.52 1.51 1.17% Variance 41.57 5.71 3.89 3.63 3.59 2.79F1 1.0F2 .71 1.0F3 .41 .52 1.0F4 .54 .45 .24 1.0F5 .71 .72 .41 .46 1.0F6 .48 .39 .32 .42 .48 1.0
Note. F1–F5 � Factor 1–Factor 5; h2 � Communality coefficient; u2 � Uniqueness; Gc � Crystallized Ability/Comprehension-Knowledge; Glr �Long-Term Retrieval; Grw � Reading-Writing Ability; Ga � Auditory Processing; Gsm � Short-Term Memory; Gs � Processing Speed; Gq �Quantitative Reasoning; Gv � Visual-Spatial Thinking; Gf � Fluid Reasoning. Pattern coefficients � .30 are in bold italics. The eigenvalue of the seventh,unretained factor was 1.107.
448 DOMBROWSKI AND WATKINS
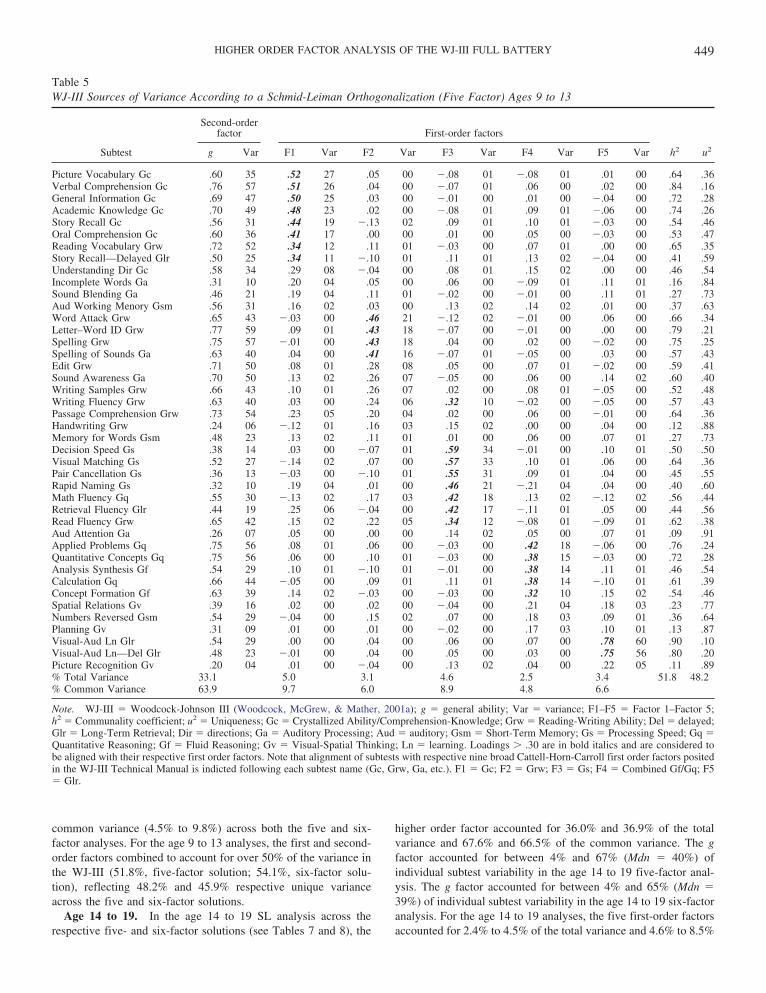
common variance (4.5% to 9.8%) across both the five and six-factor analyses. For the age 9 to 13 analyses, the first and second-order factors combined to account for over 50% of the variance inthe WJ-III (51.8%, five-factor solution; 54.1%, six-factor solu-tion), reflecting 48.2% and 45.9% respective unique varianceacross the five and six-factor solutions.
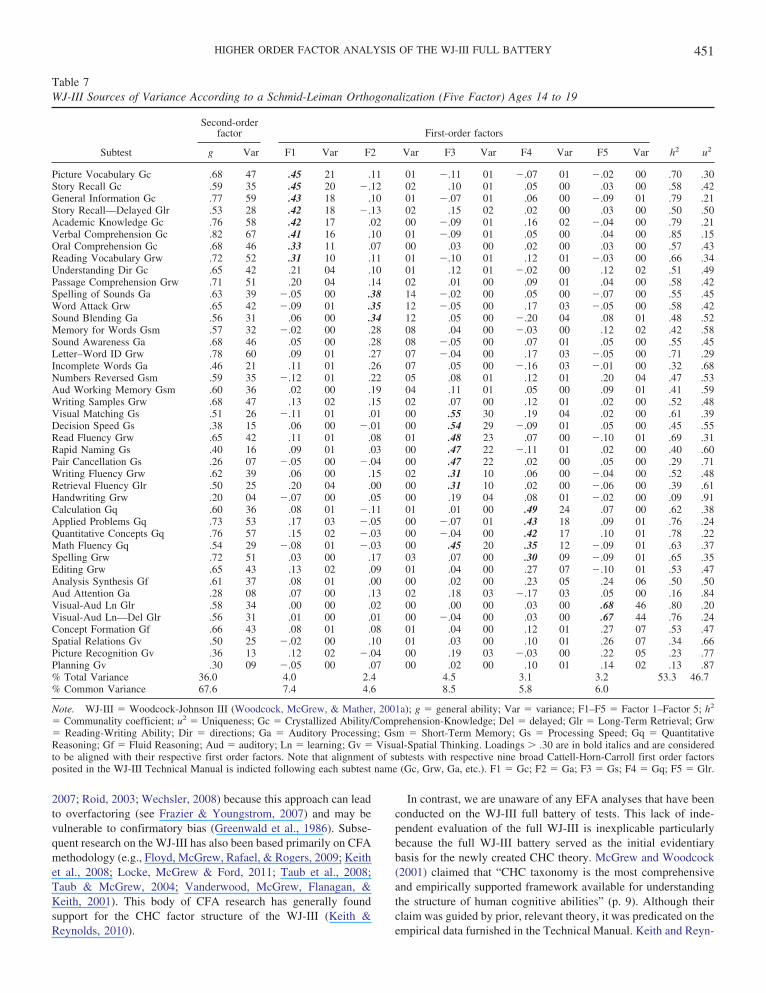
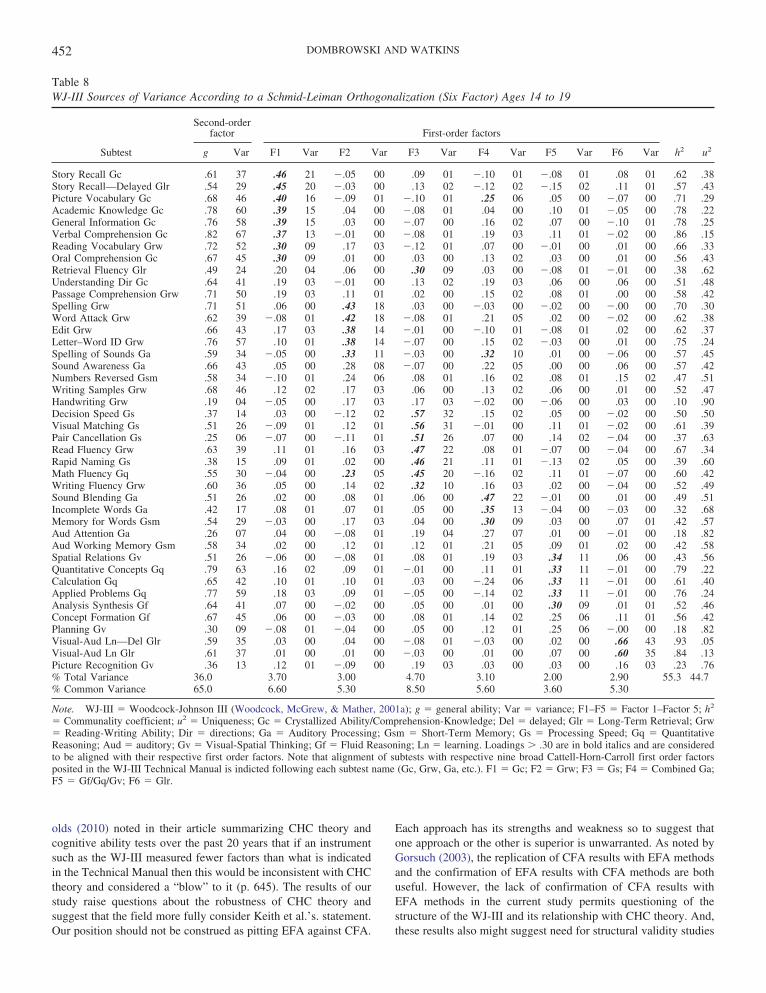
Age 14 to 19. In the age 14 to 19 SL analysis across therespective five- and six-factor solutions (see Tables 7 and 8), the
higher order factor accounted for 36.0% and 36.9% of the totalvariance and 67.6% and 66.5% of the common variance. The gfactor accounted for between 4% and 67% (Mdn � 40%) ofindividual subtest variability in the age 14 to 19 five-factor anal-ysis. The g factor accounted for between 4% and 65% (Mdn �39%) of individual subtest variability in the age 14 to 19 six-factoranalysis. For the age 14 to 19 analyses, the five first-order factorsaccounted for 2.4% to 4.5% of the total variance and 4.6% to 8.5%
Table 5WJ-III Sources of Variance According to a Schmid-Leiman Orthogonalization (Five Factor) Ages 9 to 13
Subtest
Second-orderfactor First-order factors
h2 u2g Var F1 Var F2 Var F3 Var F4 Var F5 Var
Picture Vocabulary Gc .60 35 .52 27 .05 00 �.08 01 �.08 01 .01 00 .64 .36Verbal Comprehension Gc .76 57 .51 26 .04 00 �.07 01 .06 00 .02 00 .84 .16General Information Gc .69 47 .50 25 .03 00 �.01 00 .01 00 �.04 00 .72 .28Academic Knowledge Gc .70 49 .48 23 .02 00 �.08 01 .09 01 �.06 00 .74 .26Story Recall Gc .56 31 .44 19 �.13 02 .09 01 .10 01 �.03 00 .54 .46Oral Comprehension Gc .60 36 .41 17 .00 00 .01 00 .05 00 �.03 00 .53 .47Reading Vocabulary Grw .72 52 .34 12 .11 01 �.03 00 .07 01 .00 00 .65 .35Story Recall—Delayed Glr .50 25 .34 11 �.10 01 .11 01 .13 02 �.04 00 .41 .59Understanding Dir Gc .58 34 .29 08 �.04 00 .08 01 .15 02 .00 00 .46 .54Incomplete Words Ga .31 10 .20 04 .05 00 .06 00 �.09 01 .11 01 .16 .84Sound Blending Ga .46 21 .19 04 .11 01 �.02 00 �.01 00 .11 01 .27 .73Aud Working Menory Gsm .56 31 .16 02 .03 00 .13 02 .14 02 .01 00 .37 .63Word Attack Grw .65 43 �.03 00 .46 21 �.12 02 �.01 00 .06 00 .66 .34Letter–Word ID Grw .77 59 .09 01 .43 18 �.07 00 �.01 00 .00 00 .79 .21Spelling Grw .75 57 �.01 00 .43 18 .04 00 .02 00 �.02 00 .75 .25Spelling of Sounds Ga .63 40 .04 00 .41 16 �.07 01 �.05 00 .03 00 .57 .43Edit Grw .71 50 .08 01 .28 08 .05 00 .07 01 �.02 00 .59 .41Sound Awareness Ga .70 50 .13 02 .26 07 �.05 00 .06 00 .14 02 .60 .40Writing Samples Grw .66 43 .10 01 .26 07 .02 00 .08 01 �.05 00 .52 .48Writing Fluency Grw .63 40 .03 00 .24 06 .32 10 �.02 00 �.05 00 .57 .43Passage Comprehension Grw .73 54 .23 05 .20 04 .02 00 .06 00 �.01 00 .64 .36Handwriting Grw .24 06 �.12 01 .16 03 .15 02 .00 00 .04 00 .12 .88Memory for Words Gsm .48 23 .13 02 .11 01 .01 00 .06 00 .07 01 .27 .73Decision Speed Gs .38 14 .03 00 �.07 01 .59 34 �.01 00 .10 01 .50 .50Visual Matching Gs .52 27 �.14 02 .07 00 .57 33 .10 01 .06 00 .64 .36Pair Cancellation Gs .36 13 �.03 00 �.10 01 .55 31 .09 01 .04 00 .45 .55Rapid Naming Gs .32 10 .19 04 .01 00 .46 21 �.21 04 .04 00 .40 .60Math Fluency Gq .55 30 �.13 02 .17 03 .42 18 .13 02 �.12 02 .56 .44Retrieval Fluency Glr .44 19 .25 06 �.04 00 .42 17 �.11 01 .05 00 .44 .56Read Fluency Grw .65 42 .15 02 .22 05 .34 12 �.08 01 �.09 01 .62 .38Aud Attention Ga .26 07 .05 00 .00 00 .14 02 .05 00 .07 01 .09 .91Applied Problems Gq .75 56 .08 01 .06 00 �.03 00 .42 18 �.06 00 .76 .24Quantitative Concepts Gq .75 56 .06 00 .10 01 �.03 00 .38 15 �.03 00 .72 .28Analysis Synthesis Gf .54 29 .10 01 �.10 01 �.01 00 .38 14 .11 01 .46 .54Calculation Gq .66 44 �.05 00 .09 01 .11 01 .38 14 �.10 01 .61 .39Concept Formation Gf .63 39 .14 02 �.03 00 �.03 00 .32 10 .15 02 .54 .46Spatial Relations Gv .39 16 .02 00 .02 00 �.04 00 .21 04 .18 03 .23 .77Numbers Reversed Gsm .54 29 �.04 00 .15 02 .07 00 .18 03 .09 01 .36 .64Planning Gv .31 09 .01 00 .01 00 �.02 00 .17 03 .10 01 .13 .87Visual-Aud Ln Glr .54 29 .00 00 .04 00 .06 00 .07 00 .78 60 .90 .10Visual-Aud Ln—Del Glr .48 23 �.01 00 .04 00 .05 00 .03 00 .75 56 .80 .20Picture Recognition Gv .20 04 .01 00 �.04 00 .13 02 .04 00 .22 05 .11 .89% Total Variance 33.1 5.0 3.1 4.6 2.5 3.4 51.8 48.2% Common Variance 63.9 9.7 6.0 8.9 4.8 6.6
Note. WJ-III � Woodcock-Johnson III (Woodcock, McGrew, & Mather, 2001a); g � general ability; Var � variance; F1–F5 � Factor 1–Factor 5;h2 � Communality coefficient; u2 � Uniqueness; Gc � Crystallized Ability/Comprehension-Knowledge; Grw � Reading-Writing Ability; Del � delayed;Glr � Long-Term Retrieval; Dir � directions; Ga � Auditory Processing; Aud � auditory; Gsm � Short-Term Memory; Gs � Processing Speed; Gq �Quantitative Reasoning; Gf � Fluid Reasoning; Gv � Visual-Spatial Thinking; Ln � learning. Loadings � .30 are in bold italics and are considered tobe aligned with their respective first order factors. Note that alignment of subtests with respective nine broad Cattell-Horn-Carroll first order factors positedin the WJ-III Technical Manual is indicted following each subtest name (Gc, Grw, Ga, etc.). F1 � Gc; F2 � Grw; F3 � Gs; F4 � Combined Gf/Gq; F5� Glr.
449HIGHER ORDER FACTOR ANALYSIS OF THE WJ-III FULL BATTERY
of the common variance. Across the age 14 to 19 six-factoranalysis, the first-order factors accounted for 2.0% to 4.7% of thetotal variance and 3.6% to 8.5% of the common variance. The firstand second-order factors of the age 14 to 19 analysis combined tomeasure 53.3% (five-factor) and 55.3% (six-factor) of the variancein the WJ-III, reflecting 46.75% (five-factor) and 44.7% (six-factor) unique variance.
The results of all analyses demonstrate a robust manifestation ofgeneral intelligence in the WJ-III, where the combined influence ofgeneral intelligence and uniqueness exceeded the contributions made
by the first-order factors. The influence of the general factor was alsonoted across nearly all subtests in all analyses where the general factoraccounted for a higher proportion of subtest variance relative to thesubtest variance accounted for by any of the lower order factors.
Discussion
The WJ-III test authors eschewed EFA analyses in favor ofexclusive reliance on CFA. This has become an unfortunate trendin cognitive ability scale development in recent years (e.g., Elliot,
Table 6WJ-III Sources of Variance According to a Schmid-Leiman Orthogonalization (Six Factor) Ages 9 to 13
Subtest
Second-orderfactor First-order factors
h2 u2g Var F1 Var F2 Var F3 Var F4 Var F5 Var F6 Var
Story Recall Gc .60 36 .44 19 �.10 01 .06 00 .07 00 �.13 02 .04 00 .60 .40Academic Knowledge Gc .74 55 .43 18 .04 00 �.07 01 .08 01 �.03 00 �.02 00 .69 .31Picture Vocabulary Gc .64 41 .42 17 .05 00 �.07 00 �.13 02 .08 01 .02 00 .63 .37Verbal Comprehension Gc .80 64 .42 17 .04 00 �.06 00 .07 00 .08 01 .03 00 .76 .24General Information Gc .73 53 .39 15 .03 00 �.01 00 .01 00 .10 01 �.04 00 .68 .32Story Recall—Delayed Glr .53 28 .36 13 �.07 01 .07 00 .11 01 �.17 03 .02 00 .47 .53Oral Comprehension Gc .63 40 .34 11 �.01 00 .00 00 .06 00 .06 00 �.02 00 .50 .50Reading Vocabulary Grw .74 55 .28 08 .12 01 �.03 00 .09 01 .06 00 .01 00 .60 .40Understanding Dir Gc .60 36 .19 03 �.07 01 .08 00 .26 07 .20 04 �.06 00 .46 .54Spelling Grw .74 54 .03 00 .50 25 .01 01 �.05 00 �.11 01 .05 00 .84 .16Word Attack Grw .63 40 �.06 00 .47 22 �.10 00 �.02 00 .10 01 .05 00 .61 .39Letter–Word ID Grw .76 58 .07 00 .46 22 �.06 01 �.05 00 .02 00 .03 00 .79 .31Spelling of Sounds Ga .62 38 �.06 00 .39 16 �.05 00 �.02 00 .26 07 �.03 00 .56 .44Edit Grw .70 49 .09 01 .32 10 .03 00 .06 00 �.05 00 .02 00 .60 .40Writing Samples Grw .65 42 .08 01 .28 08 .00 00 .09 01 .02 00 �.04 00 .49 .51Writing Fluency Grw .62 39 .02 00 .28 08 .24 06 �.05 00 .03 00 �.04 00 .65 .35Read Fluency Grw .66 43 .13 02 .26 07 .25 06 �.15 02 �.01 00 �.05 00 .78 .22Sound Awareness Ga .70 50 .01 00 .23 05 �.03 00 .15 02 .29 08 .05 00 .57 .43Passage Comprehension Grw .74 55 .19 04 .22 05 .01 00 .06 00 .03 00 .01 00 .62 .38Handwriting Grw .23 05 �.08 01 .20 04 .10 01 �.03 00 �.07 01 .07 00 .14 .86Decision Speed Gs .38 15 �.01 00 �.07 00 .46 21 .01 00 .10 01 .06 00 .51 .49Visual Matching Gs .50 25 �.11 01 .11 01 .43 19 .13 02 �.02 00 .05 00 .62 .38Pair Cancellation Gs .35 12 �.03 00 �.08 01 .43 18 .14 02 .03 00 .01 00 .43 .57Rapid Naming Gs .35 12 .14 02 .01 00 .35 12 �.29 08 .09 01 .03 00 .52 .48Retrieval Fluency Glr .47 22 .18 03 �.04 00 .32 10 �.13 02 .11 01 .02 00 .54 .46Math Fluency Gq .52 27 �.08 01 .24 06 .31 10 .12 02 �.10 01 �.09 01 .55 .45Applied Problems Gq .73 54 .11 01 .09 01 �.03 00 .55 30 �.08 01 �.04 00 .68 .32Analysis Synthesis Gf .54 29 .07 01 �.11 01 �.00 00 .55 30 .07 00 .06 00 .48 .52Quantitative Concepts Gq .73 53 .07 01 .13 02 �.03 00 .51 26 �.05 00 �.17 00 .63 .37Concept Formation Gf .63 39 .08 01 �.06 00 �.01 00 .50 25 .14 02 .08 01 .52 .48Calculation Gq .63 40 .02 00 .15 02 .07 00 .47 22 �.17 03 �.06 00 .57 .43Spatial Relations Gv .39 15 �.02 00 �.00 00 �.02 00 .33 11 .13 02 .11 01 .23 .78Numbers Reversed Gsm .52 27 �.08 01 .14 02 .06 00 .29 08 .14 02 .03 00 .35 .65Planning Gv .30 09 �.03 00 �.01 00 �.00 00 .28 08 .13 02 .04 00 .15 .85Aud Working Memory Gsm .56 31 .08 01 .02 00 .11 01 .23 05 .17 03 �.04 00 .39 .61Sound Blending Ga .47 22 �.01 00 .04 00 .02 00 .10 01 .49 24 �.04 00 .44 .56Memory for Words Gsm .48 23 �.01 00 .06 00 .03 00 .18 03 .35 12 �.04 00 .35 .65Incomplete Words Ga .33 11 .06 00 �.01 00 .07 01 �.04 00 .33 11 .01 00 .24 .76Aud Attention Ga .26 07 �.04 00 �.04 00 .13 02 .13 02 .22 05 �.01 00 .15 .85Visual-Aud Ln—Del Glr .52 27 .02 00 .06 00 .02 00 .02 00 �.07 00 .81 66 .95 .05Visual-Aud Ln Glr .57 32 .01 00 .03 00 .03 00 .09 01 �.00 00 .76 58 .89 .11Picture Recognition Gv .21 04 �.02 00 �.05 00 .10 01 .09 01 .10 01 .17 3 .11 .89% Total Variance 33.8 3.4 3.6 2.7 5.0 2.4 3.2 54.1 45.9% Common Variance 62.4 6.3 6.7 5.0 9.2 4.5 5.9
Note. WJ-III � Woodcock-Johnson III (Woodcock, McGrew, & Mather, 2001a); g � general ability; Var � variance; F1–F5 � Factor 1–Factor 5; h2 �Communality coefficient; u2 � Uniqueness; Gc � Crystallized Ability/Comprehension-Knowledge; Del � delayed; Grw � Reading-Writing Ability; Dir �directions; Ga � Auditory Processing; Gs � Processing Speed; Glr � Long-Term Retrieval; Gq � Quantitative Reasoning; Gf � Fluid Reasoning; Gv �Visual-Spatial Thinking; Gsm � Short-Term Memory; Aud � auditory; Ln � learning. Loadings � .30 are in bold italics and are considered to be aligned withtheir respective first order factors. Note that alignment of subtests with respective nine broad Cattell-Horn-Carroll first order factors posited in the WJ-III TechnicalManual is indicted following each subtest name (Gc, Grw, Ga, etc.). F1 � Gc; F2 � Grw; F3 � Gs; F4 � Combined Gf/Gq/Gv; F5 � Ga; F6 � Glr.
450 DOMBROWSKI AND WATKINS
2007; Roid, 2003; Wechsler, 2008) because this approach can leadto overfactoring (see Frazier & Youngstrom, 2007) and may bevulnerable to confirmatory bias (Greenwald et al., 1986). Subse-quent research on the WJ-III has also been based primarily on CFAmethodology (e.g., Floyd, McGrew, Rafael, & Rogers, 2009; Keithet al., 2008; Locke, McGrew & Ford, 2011; Taub et al., 2008;Taub & McGrew, 2004; Vanderwood, McGrew, Flanagan, &Keith, 2001). This body of CFA research has generally foundsupport for the CHC factor structure of the WJ-III (Keith &Reynolds, 2010).
In contrast, we are unaware of any EFA analyses that have beenconducted on the WJ-III full battery of tests. This lack of inde-pendent evaluation of the full WJ-III is inexplicable particularlybecause the full WJ-III battery served as the initial evidentiarybasis for the newly created CHC theory. McGrew and Woodcock(2001) claimed that “CHC taxonomy is the most comprehensiveand empirically supported framework available for understandingthe structure of human cognitive abilities” (p. 9). Although theirclaim was guided by prior, relevant theory, it was predicated on theempirical data furnished in the Technical Manual. Keith and Reyn-
Table 7WJ-III Sources of Variance According to a Schmid-Leiman Orthogonalization (Five Factor) Ages 14 to 19
Subtest
Second-orderfactor First-order factors
h2 u2g Var F1 Var F2 Var F3 Var F4 Var F5 Var
Picture Vocabulary Gc .68 47 .45 21 .11 01 �.11 01 �.07 01 �.02 00 .70 .30Story Recall Gc .59 35 .45 20 �.12 02 .10 01 .05 00 .03 00 .58 .42General Information Gc .77 59 .43 18 .10 01 �.07 01 .06 00 �.09 01 .79 .21Story Recall—Delayed Glr .53 28 .42 18 �.13 02 .15 02 .02 00 .03 00 .50 .50Academic Knowledge Gc .76 58 .42 17 .02 00 �.09 01 .16 02 �.04 00 .79 .21Verbal Comprehension Gc .82 67 .41 16 .10 01 �.09 01 .05 00 .04 00 .85 .15Oral Comprehension Gc .68 46 .33 11 .07 00 .03 00 .02 00 .03 00 .57 .43Reading Vocabulary Grw .72 52 .31 10 .11 01 �.10 01 .12 01 �.03 00 .66 .34Understanding Dir Gc .65 42 .21 04 .10 01 .12 01 �.02 00 .12 02 .51 .49Passage Comprehension Grw .71 51 .20 04 .14 02 .01 00 .09 01 .04 00 .58 .42Spelling of Sounds Ga .63 39 �.05 00 .38 14 �.02 00 .05 00 �.07 00 .55 .45Word Attack Grw .65 42 �.09 01 .35 12 �.05 00 .17 03 �.05 00 .58 .42Sound Blending Ga .56 31 .06 00 .34 12 .05 00 �.20 04 .08 01 .48 .52Memory for Words Gsm .57 32 �.02 00 .28 08 .04 00 �.03 00 .12 02 .42 .58Sound Awareness Ga .68 46 .05 00 .28 08 �.05 00 .07 01 .05 00 .55 .45Letter–Word ID Grw .78 60 .09 01 .27 07 �.04 00 .17 03 �.05 00 .71 .29Incomplete Words Ga .46 21 .11 01 .26 07 .05 00 �.16 03 �.01 00 .32 .68Numbers Reversed Gsm .59 35 �.12 01 .22 05 .08 01 .12 01 .20 04 .47 .53Aud Working Memory Gsm .60 36 .02 00 .19 04 .11 01 .05 00 .09 01 .41 .59Writing Samples Grw .68 47 .13 02 .15 02 .07 00 .12 01 .02 00 .52 .48Visual Matching Gs .51 26 �.11 01 .01 00 .55 30 .19 04 .02 00 .61 .39Decision Speed Gs .38 15 .06 00 �.01 00 .54 29 �.09 01 .05 00 .45 .55Read Fluency Grw .65 42 .11 01 .08 01 .48 23 .07 00 �.10 01 .69 .31Rapid Naming Gs .40 16 .09 01 .03 00 .47 22 �.11 01 .02 00 .40 .60Pair Cancellation Gs .26 07 �.05 00 �.04 00 .47 22 .02 00 .05 00 .29 .71Writing Fluency Grw .62 39 .06 00 .15 02 .31 10 .06 00 �.04 00 .52 .48Retrieval Fluency Glr .50 25 .20 04 .00 00 .31 10 .02 00 �.06 00 .39 .61Handwriting Grw .20 04 �.07 00 .05 00 .19 04 .08 01 �.02 00 .09 .91Calculation Gq .60 36 .08 01 �.11 01 .01 00 .49 24 .07 00 .62 .38Applied Problems Gq .73 53 .17 03 �.05 00 �.07 01 .43 18 .09 01 .76 .24Quantitative Concepts Gq .76 57 .15 02 �.03 00 �.04 00 .42 17 .10 01 .78 .22Math Fluency Gq .54 29 �.08 01 �.03 00 .45 20 .35 12 �.09 01 .63 .37Spelling Grw .72 51 .03 00 .17 03 .07 00 .30 09 �.09 01 .65 .35Editing Grw .65 43 .13 02 .09 01 .04 00 .27 07 �.10 01 .53 .47Analysis Synthesis Gf .61 37 .08 01 .00 00 .02 00 .23 05 .24 06 .50 .50Aud Attention Ga .28 08 .07 00 .13 02 .18 03 �.17 03 .05 00 .16 .84Visual-Aud Ln Glr .58 34 .00 00 .02 00 .00 00 .03 00 .68 46 .80 .20Visual-Aud Ln—Del Glr .56 31 .01 00 .01 00 �.04 00 .03 00 .67 44 .76 .24Concept Formation Gf .66 43 .08 01 .08 01 .04 00 .12 01 .27 07 .53 .47Spatial Relations Gv .50 25 �.02 00 .10 01 .03 00 .10 01 .26 07 .34 .66Picture Recognition Gv .36 13 .12 02 �.04 00 .19 03 �.03 00 .22 05 .23 .77Planning Gv .30 09 �.05 00 .07 00 .02 00 .10 01 .14 02 .13 .87% Total Variance 36.0 4.0 2.4 4.5 3.1 3.2 53.3 46.7% Common Variance 67.6 7.4 4.6 8.5 5.8 6.0
Note. WJ-III � Woodcock-Johnson III (Woodcock, McGrew, & Mather, 2001a); g � general ability; Var � variance; F1–F5 � Factor 1–Factor 5; h2
� Communality coefficient; u2 � Uniqueness; Gc � Crystallized Ability/Comprehension-Knowledge; Del � delayed; Glr � Long-Term Retrieval; Grw� Reading-Writing Ability; Dir � directions; Ga � Auditory Processing; Gsm � Short-Term Memory; Gs � Processing Speed; Gq � QuantitativeReasoning; Gf � Fluid Reasoning; Aud � auditory; Ln � learning; Gv � Visual-Spatial Thinking. Loadings � .30 are in bold italics and are consideredto be aligned with their respective first order factors. Note that alignment of subtests with respective nine broad Cattell-Horn-Carroll first order factorsposited in the WJ-III Technical Manual is indicted following each subtest name (Gc, Grw, Ga, etc.). F1 � Gc; F2 � Ga; F3 � Gs; F4 � Gq; F5 � Glr.
451HIGHER ORDER FACTOR ANALYSIS OF THE WJ-III FULL BATTERY
olds (2010) noted in their article summarizing CHC theory andcognitive ability tests over the past 20 years that if an instrumentsuch as the WJ-III measured fewer factors than what is indicatedin the Technical Manual then this would be inconsistent with CHCtheory and considered a “blow” to it (p. 645). The results of ourstudy raise questions about the robustness of CHC theory andsuggest that the field more fully consider Keith et al.’s. statement.Our position should not be construed as pitting EFA against CFA.
Each approach has its strengths and weakness so to suggest thatone approach or the other is superior is unwarranted. As noted byGorsuch (2003), the replication of CFA results with EFA methodsand the confirmation of EFA results with CFA methods are bothuseful. However, the lack of confirmation of CFA results withEFA methods in the current study permits questioning of thestructure of the WJ-III and its relationship with CHC theory. And,these results also might suggest need for structural validity studies
Table 8WJ-III Sources of Variance According to a Schmid-Leiman Orthogonalization (Six Factor) Ages 14 to 19
Subtest
Second-orderfactor First-order factors
h2 u2g Var F1 Var F2 Var F3 Var F4 Var F5 Var F6 Var
Story Recall Gc .61 37 .46 21 �.05 00 .09 01 �.10 01 �.08 01 .08 01 .62 .38Story Recall—Delayed Glr .54 29 .45 20 �.03 00 .13 02 �.12 02 �.15 02 .11 01 .57 .43Picture Vocabulary Gc .68 46 .40 16 �.09 01 �.10 01 .25 06 .05 00 �.07 00 .71 .29Academic Knowledge Gc .78 60 .39 15 .04 00 �.08 01 .04 00 .10 01 �.05 00 .78 .22General Information Gc .76 58 .39 15 .03 00 �.07 00 .16 02 .07 00 �.10 01 .78 .25Verbal Comprehension Gc .82 67 .37 13 �.01 00 �.08 01 .19 03 .11 01 �.02 00 .86 .15Reading Vocabulary Grw .72 52 .30 09 .17 03 �.12 01 .07 00 �.01 00 .01 00 .66 .33Oral Comprehension Gc .67 45 .30 09 .01 00 .03 00 .13 02 .03 00 .01 00 .56 .43Retrieval Fluency Glr .49 24 .20 04 .06 00 .30 09 .03 00 �.08 01 �.01 00 .38 .62Understanding Dir Gc .64 41 .19 03 �.01 00 .13 02 .19 03 .06 00 .06 00 .51 .48Passage Comprehension Grw .71 50 .19 03 .11 01 .02 00 .15 02 .08 01 .00 00 .58 .42Spelling Grw .71 51 .06 00 .43 18 .03 00 �.03 00 �.02 00 �.00 00 .70 .30Word Attack Grw .62 39 �.08 01 .42 18 �.08 01 .21 05 .02 00 �.02 00 .62 .38Edit Grw .66 43 .17 03 .38 14 �.01 00 �.10 01 �.08 01 .02 00 .62 .37Letter–Word ID Grw .76 57 .10 01 .38 14 �.07 00 .15 02 �.03 00 .01 00 .75 .24Spelling of Sounds Ga .59 34 �.05 00 .33 11 �.03 00 .32 10 .01 00 �.06 00 .57 .45Sound Awareness Ga .66 43 .05 00 .28 08 �.07 00 .22 05 .00 00 .06 00 .57 .42Numbers Reversed Gsm .58 34 �.10 01 .24 06 .08 01 .16 02 .08 01 .15 02 .47 .51Writing Samples Grw .68 46 .12 02 .17 03 .06 00 .13 02 .06 00 .01 00 .52 .47Handwriting Grw .19 04 �.05 00 .17 03 .17 03 �.02 00 �.06 00 .03 00 .10 .90Decision Speed Gs .37 14 .03 00 �.12 02 .57 32 .15 02 .05 00 �.02 00 .50 .50Visual Matching Gs .51 26 �.09 01 .12 01 .56 31 �.01 00 .11 01 �.02 00 .61 .39Pair Cancellation Gs .25 06 �.07 00 �.11 01 .51 26 .07 00 .14 02 �.04 00 .37 .63Read Fluency Grw .63 39 .11 01 .16 03 .47 22 .08 01 �.07 00 �.04 00 .67 .34Rapid Naming Gs .38 15 .09 01 .02 00 .46 21 .11 01 �.13 02 .05 00 .39 .60Math Fluency Gq .55 30 �.04 00 .23 05 .45 20 �.16 02 .11 01 �.07 00 .60 .42Writing Fluency Grw .60 36 .05 00 .14 02 .32 10 .16 03 .02 00 �.04 00 .52 .49Sound Blending Ga .51 26 .02 00 .08 01 .06 00 .47 22 �.01 00 .01 00 .49 .51Incomplete Words Ga .42 17 .08 01 .07 01 .05 00 .35 13 �.04 00 �.03 00 .32 .68Memory for Words Gsm .54 29 �.03 00 .17 03 .04 00 .30 09 .03 00 .07 01 .42 .57Aud Attention Ga .26 07 .04 00 �.08 01 .19 04 .27 07 .01 00 �.01 00 .18 .82Aud Working Memory Gsm .58 34 .02 00 .12 01 .12 01 .21 05 .09 01 .02 00 .42 .58Spatial Relations Gv .51 26 �.06 00 �.08 01 .08 01 .19 03 .34 11 .06 00 .43 .56Quantitative Concepts Gq .79 63 .16 02 .09 01 �.01 00 .11 01 .33 11 �.01 00 .79 .22Calculation Gq .65 42 .10 01 .10 01 .03 00 �.24 06 .33 11 �.01 00 .61 .40Applied Problems Gq .77 59 .18 03 .09 01 �.05 00 �.14 02 .33 11 �.01 00 .76 .24Analysis Synthesis Gf .64 41 .07 00 �.02 00 .05 00 .01 00 .30 09 .01 01 .52 .46Concept Formation Gf .67 45 .06 00 �.03 00 .08 01 .14 02 .25 06 .11 01 .56 .42Planning Gv .30 09 �.08 01 �.04 00 .05 00 .12 01 .25 06 �.00 00 .18 .82Visual-Aud Ln—Del Glr .59 35 .03 00 .04 00 �.08 01 �.03 00 .02 00 .66 43 .93 .05Visual-Aud Ln Glr .61 37 .01 00 .01 00 �.03 00 .01 00 .07 00 .60 35 .84 .13Picture Recognition Gv .36 13 .12 01 �.09 00 .19 03 .03 00 .03 00 .16 03 .23 .76% Total Variance 36.0 3.70 3.00 4.70 3.10 2.00 2.90 55.3 44.7% Common Variance 65.0 6.60 5.30 8.50 5.60 3.60 5.30
Note. WJ-III � Woodcock-Johnson III (Woodcock, McGrew, & Mather, 2001a); g � general ability; Var � variance; F1–F5 � Factor 1–Factor 5; h2
� Communality coefficient; u2 � Uniqueness; Gc � Crystallized Ability/Comprehension-Knowledge; Del � delayed; Glr � Long-Term Retrieval; Grw� Reading-Writing Ability; Dir � directions; Ga � Auditory Processing; Gsm � Short-Term Memory; Gs � Processing Speed; Gq � QuantitativeReasoning; Aud � auditory; Gv � Visual-Spatial Thinking; Gf � Fluid Reasoning; Ln � learning. Loadings � .30 are in bold italics and are consideredto be aligned with their respective first order factors. Note that alignment of subtests with respective nine broad Cattell-Horn-Carroll first order factorsposited in the WJ-III Technical Manual is indicted following each subtest name (Gc, Grw, Ga, etc.). F1 � Gc; F2 � Grw; F3 � Gs; F4 � Combined Ga;F5 � Gf/Gq/Gv; F6 � Glr.
452 DOMBROWSKI AND WATKINS
on the separate WJ-III Cognitive and WJ-III Achievement batter-ies across all age ranges.
Even the CFA analyses presented in the Technical Manual maygive one pause. The test authors did not present CFA fit statisticsfor the broad, nine factor CHC model despite presenting CFAcorrelation coefficients between WJ-III subtests (achievement andcognitive) and CHC factors (p. 199), a path-like analysis withoutstructural relationship coefficients (p. 62), and then the 42 � 42correlation matrix for the WJ-III subtests that contributed to thebroad nine factor model. The absence of CFA fit statistics for thefull WJ-III battery and the omission of EFA and higher orderprocedures might indicate that our understanding of the structureof the full instrument is incomplete. Because of these evidentiary,theoretical, and logical omissions, we subjected the correlationmatrices of the full WJ-III test battery at two age ranges (9 to 13years; 14 to 19 years) to EFA.
The results of our analysis on the full WJ-III battery are gener-ally inconsistent with those presented in the Technical Manual.Our results suggest the existence of six factors across the 9 to 13age range and five factors at the 14 to 19 age range. This contrastswith the nine factor CFA model presented in the Technical Man-ual. Our results also suggest the prominence of a hierarchicalmodel as the total and common variance accounted for by thehigher order (g) factor dwarfed that apportioned to the lower orderfactors. At the individual subtest level, the variance accounted forby the higher order (g) factor exceeds that apportioned to anylower order factor. This too supports the primacy of the higherorder factor.
The orthogonalized five (age 14 to 19) and six (age 9 to 13)factor lower order solutions suggest patterns of both convergencewith and divergence from the results presented in the TechnicalManual. Our results indicate the possibility of a CrystallizedAbility/Comprehension-Knowledge (Gc) factor; however, this fac-tor looks different from the Gc factor presented in the TechnicalManual across both age ranges. Subtests identified in the TechnicalManual to load on Grw (Reading Vocabulary) and Glr (StoryRecall Delayed) instead loaded on the first extracted factor (pre-sumably Gc) in our analysis.
Our analysis also found evidence for a Reading-Writingfactor (presumably Grw) within the 9 to 13 age range. However,our results on this factor are not identical with those presentedin the Technical Manual. Instead, our analysis at age 9 to 13suggests that subtests posited in the Technical Manual to loadon Ga (e.g., Spelling of Sounds; Sound Awareness) instead loadon our second factor (presumably Grw). Moreover, our resultssuggest that Grw contains fewer subtests (e.g., Spelling andWord Attack) than what is indicated in the Technical Manual.At age 14 to 19 years the five-factor solution did not produce aGrw factor.
Our analysis suggests a factor possibly measuring processingspeed/fluency (Gs) across both age ranges. However, comparedwith the results in the Technical Manual, our findings suggestthat additional subtests load the processing speed factor (e.g.,Retrieval Fluency [Glr], Math Fluency [Gq], and Writing Flu-ency [Grw] at age 14 to 19). This may indicate that thesesubtests are a better measure of processing speed than they areof Glr, Gq, and Glr, respectively.
Our results also produced a factor resembling auditory process-ing (Ga) with Spelling of Sounds (Ga), Sound Blending (Ga) and
Word Attack (Grw) loading this factor at age 14 to 19 and Memoryfor Words (Gsm), Sound Blending (Ga) and Incomplete Words(Ga) loading the factor at age 9 to 13. This factor also failed tocapture several auditory processing subtests (e.g., Sound Aware-ness [Ga] and Auditory Attention [Ga]).
A fourth factor produced the most divergent results between ouranalysis and the WJ-III full model presented in the TechnicalManual. At age 9 to 13 years, the fourth factor appears to be acombination of subtests that purportedly measure Gq, Gf, and Gv(e.g., Applied Problems [Gq], Analysis-Synthesis [Gf], Quantita-tive Concepts [Gq], Concept Formation [Gf], and Spatial Relations[Gv]). At age 14 to 19, this factor appears to be generally a Gqfactor but also loads Spelling (Grw).
The last factor in our analysis appears to be a long term retrievalfactor (Glr). However, this factor contains only two subtests acrossboth age ranges which may be decried by methodologists as toofew variables to be considered a distinct factor (Fabrigar et al.,1999; Gorsuch, 1988). Notably absent from our analyses acrossboth age ranges are clear Gsm and Gv factors.
Conclusion and Implications
Although we recognize that our EFA analyses were not con-ducted on independent samples, they produced some interestingresults. First, they indicate that the structure of the WJ-III ishierarchical with the majority of its variance accounted for by thehigher order g factor. Our results also suggest six lower orderfactors at age 9 to 13 and five at age 14 to 19, but the factorsuncovered in our analysis are difficult to interpret because ofdivergence from the posited alignment of subtests within theTechnical Manual. Third, there were some areas of convergence.There seems to be evidence for a Grw factor at age 9 to 13, whichis consistent with CHC theory (Keith & Reynolds, 2010) andcontrasts with Carroll’s three-stratum theory, where Grw wassubsumed by Gc. Still, this is tepid convergent evidence becauseselected subtests posited in the Technical Manual to load Grw didnot, while subtests posited to load Gc and Ga instead loaded oursecond factor (Grw). And, at age 14 to 19, our results did notproduce a Grw factor with the five-factor solution. Although welocated a quantitative reasoning factor at age 14 to 19, we foundevidence for a combined Gq, Gf, and Gv factor at age 9 to 13. Ouranalysis also found evidence for a two-subtest Glr factor acrossboth age ranges, but this may be criticized as technically too fewfor extraction even though the practice is fairly common in cog-nitive ability scale development (e.g., Reynolds Intellectual As-sessment Scales; Stanford-Binet, 5th ed.).
Overall, our results diverge from the nine factor model positedin the WJ-III Technical Manual and therefore suggest caution inmoving to an interpretation of broad WJ-III factors until additionalresearch is conducted. Interpretation much beyond g has beendiscussed as potentially problematic because of concern over pre-dictive validity of lower order factors (e.g., Glutting, Watkins,Konold, & McDermott, 2006; Kotz, Watkins, & McDermott,2008; Oh, Glutting, Watkins, Youngstrom, & McDermott, 2004;Parkin & Beaujean, 2012; Watkins, Glutting, & Lei, 2007). Ourstructural validity analysis of the WJ-III lends support to thesecriticisms. It is time that the field, particularly the practitionercommunity, recognizes the psychometric danger in placing greateremphasis on individual subtest or index scores at the expense of
453HIGHER ORDER FACTOR ANALYSIS OF THE WJ-III FULL BATTERY
interpretation of the higher order factor. Our analysis indicates theprimacy of the g factor in the WJ-III and reaffirms the strongstance against moving much beyond this level of interpretation dueto structural validity concerns (Canivez & Watkins, 2010; DiSte-fano & Dombrowski, 2006; Dombrowski, in press; Dombrowski etal., 2009; Nelson & Canivez, 2012; Watkins, 2010).
References
Bartlett, M. S. (1950). Tests of significance in factor analysis. BritishJournal of Psychology, 3, 77–85.
Bartlett, M. S. (1954). A further note on the multiplying factors for various�2 approximations in factor analysis. Journal of the Royal StatisticalSociety, 16, 296–298.
Brannick, M. T. (1995). Critical comments on applying covariance struc-ture modeling. Journal of Organizational Behavior, 16, 201–213. doi:10.1002/job.4030160303
Brown, T. A. (2006). Confirmatory factor analysis for applied research.New York, NY: Guilford Press.
Browne, M. W. (2001). An overview of analytic rotation in exploratoryfactor analysis. Multivariate Behavioral Research, 36, 111–150. doi:10.1207/S15327906MBR3601_05
Canivez, G. L. (2008). Orthogonal higher-order factor structure of theStanford-Binet Intelligence Scales for children and adolescents. SchoolPsychology Quarterly, 23, 533–541. doi:10.1037/a0012884
Canivez, G. L., & Watkins, M. W. (2010). Investigation of the factorstructure of the Wechsler Adult Intelligence Scale–Fourth Edition(WAIS–IV): Exploratory and higher order factor analyses. Psychologi-cal Assessment, 22, 827–836. doi:10.1037/a0020429
Caretta, T. R., & Ree, J. J. (2001). Pitfalls of ability research. InternationalJournal of Selection and Assessment, 9, 325–335. doi:10.1111/1468-2389.00184
Carroll, J. B. (1993). Human cognitive abilities. Cambridge, England:Cambridge University Press. doi:10.1017/CBO9780511571312
Carroll, J. B. (1995). On methodology in the study of cognitive abilities.Multivariate Behavioral Research, 30, 429 – 452. doi:10.1207/s15327906mbr3003_6
Carroll, J. B. (1997). The three-stratum theory of cognitive abilities. InD. P. Flanagan, J. L. Genshaft, & P. L. Harrison (Eds.), Contemporaryintellectual assessment: Theories, tests, and issues (pp. 122–183). NewYork, NY: Guilford Press.
Carroll, J. B. (2003). The higher-stratum structure of cognitive abilities:Current evidence supportsg and about ten broad factors. In H. Nyborg(Ed.), The scientific study of general intelligence: Tribute to Arthur R.Jensen (pp. 5–21). New York, NY: Pergamon Press.
Cattell, R. B. (1966). The scree test for the number of factors. MultivariateBehavioral Research, 1, 245–276. doi:10.1207/s15327906mbr0102_10
Child, D. (2006). The essentials of factor analysis (2nd ed.). New York,NY: Continuum.
Cudeck, R. (2000). Exploratory factor analysis. In H. E. A. Tinsley & S. D.Brown (Eds.), Handbook of multivariate statistics and mathematicalmodeling (pp. 265–296). New York, NY: Academic Press. doi:10.1016/B978-012691360-6/50011-2
DiStefano, C., & Dombrowski, S. C. (2006). Investigating the theoreticalstructure of the Stanford Binet–Fifth Edition. Journal of Psychoeduca-tional Assessment, 24, 123–136. doi:10.1177/0734282905285244
Dombrowski, S. C. (in press). Investigating the structure of the WJ-IIICognitive at school age. School Psychology Quarterly.
Dombrowski, S. C., Watkins, M. W., & Brogan, M. J. (2009). An explor-atory investigation of the factor structure of the Reynolds IntellectualAssessment Scales (RIAS). Journal of Psychoeducational Assessment,27, 494–507. doi:10.1177/0734282909333179
Elliot, C. D. (2007). Differential Ability Scales (2nd ed.). San Antonio, TX:The Psychological Corporation.
Fabrigar, L. R., & Wegener, D. T. (2012). Exploratory factor analysis.New York, NY: Oxford University Press.
Fabrigar, L. R., Wegener, D. T., MacCallum, R. C., & Strahan, E. J.(1999). Evaluating the use of exploratory factor analysis in psycholog-ical research. Psychological Methods, 4, 272–299. doi:10.1037/1082-989X.4.3.272
Floyd, R. G., McGrew, K. S., Barry, A., Rafael, F., & Rogers, J. (2009).General and specific effects on Cattell-Horn-Carroll broad ability com-posites: Analysis of the Woodcock-Johnson III Normative UpdateCattell-Horn-Carroll factor clusters across development. School Psy-chology Review, 38, 249–265.
Frazier, T. W., & Youngstrom, E. A. (2007). Historical increase in thenumber of factors measured by commercial tests of cognitive ability:Are we overfactoring? Intelligence, 35, 169–182. doi:10.1016/j.intell.2006.07.002
Gerbing, D. W., & Hamilton, J. G. (1996). Viability of exploratory factoranalysis as a precursor to confirmatory factor analysis. Structural Equa-tion Modeling, 3, 62–72. doi:10.1080/10705519609540030
Glutting, J. J., Watkins, M. W., Konold, T. R., & McDermott, P. A. (2006).Distinctions without a difference: The utility of observed versus latentfactors from the WISC-IV in estimating reading and math achievementon the WIAT-II. The Journal of Special Education, 40, 103–114. doi:10.1177/00224669060400020101
Goldberg, L. R., & Velicer, W. F. (2006). Principles of exploratory factoranalysis. In S. Strack (Ed.), Differentiating normal and abnormal per-sonality (2nd ed., pp. 209–237). New York, NY: Springer.
Gorsuch, R. L. (1983). Factor analysis (2nd ed.). Hillsdale, NJ: Erlbaum.Gorsuch, R. L. (1988). Exploratory factor analysis. In J. R. Nesselroade &
R. B. Cattell (Eds.), Handbook of multivariate experimental psychology(2nd ed., pp. 231–258). New York, NY: Plenum Press. doi:10.1007/978-1-4613-0893-5_6
Gorsuch, R. L. (1997). Exploratory factor analysis: Its role in item analysis.Journal of Personality Assessment, 68, 532–560. doi:10.1207/s15327752jpa6803_5
Gorsuch, R. L. (2003). Factor analysis. In J. A. Schinka & W. F. Velicer(Eds.), Handbook of psychology: Research methods in psychology (Vol.2, pp. 143–164). Hoboken, NJ: Wiley.
Greenwald, A. G., Pratkanis, A. R., Leippe, M. R., & Baumgardner, M. H.(1986). Under what conditions does theory obstruct research progress?Psychological Review, 93, 216–229. doi:10.1037/0033-295X.93.2.216
Gustafsson, J.-E., & Snow, R. E. (1997). Ability profiles. In R. F. Dillon(Ed.), Handbook on testing (pp. 107–135). Westport, CT: GreenwoodPress.
Guttman, L. (1954). Some necessary conditions for common-factor anal-ysis. Psychometrika, 19, 149–161. doi:10.1007/BF02289162
Haig, B. D. (2005). Exploratory factor analysis, theory generation, andscientific method. Multivariate Behavioral Research, 40, 303–329. doi:10.1207/s15327906mbr4003_2
Henson, R. K., & Roberts, J. K. (2006). Use of exploratory factor analysisin published research: Common errors and some comment on improvedpractice. Educational and Psychological Measurement, 66, 393–416.doi:10.1177/0013164405282485
Horn, J. L. (1965). A rationale and test for the number of factors in factoranalysis. Psychometrika, 30, 179–185. doi:10.1007/BF02289447
Horn, J. L., & Cattell, R. B. (1966). Refinement and test of the theory offluid and crystallized general intelligence. Journal of Educational Psy-chology, 57, 253–270. doi:10.1037/h0023816
Kaiser, H. F. (1974). An index of factorial simplicity. Psychometrika, 39,31–36. doi:10.1007/BF02291575
Keith, T. Z., & Reynolds, M. (2010). Cattell-Horn-Carroll abilities andcognitive tests: What we’ve learned from 20 years of research. Psychol-ogy in the Schools, 47, 635–650. doi:10.1002/pits.20496
Keith, T., Reynolds, M., Patel, P., & Ridley, K. (2008). Sex differences inlatent cognitive abilities ages 6 to 59: Evidence from the Woodcock-
454 DOMBROWSKI AND WATKINS
Johnson III tests of cognitive abilities. Intelligence, 36, 502–525. doi:10.1016/j.intell.2007.11.001
Kline, P. (1994). An easy guide to factor analysis. New York, NY:Routledge.
Kotz, K. M., Watkins, M. W., & McDermott, P. A. (2008). Validity of thegeneral conceptual ability score from the Differential Ability Scales as afunction of significant and rare interfactor variability. School PsychologyReview, 37, 261–278.
Locke, S., McGrew, K. S., & Ford, L. (2011). A multiple group confirma-tory factor analysis of the structural invariance of the Cattell-Horn-Carroll theory of cognitive abilities across matched Canadian and U.S.samples (WMF Press Bulletin, No. 1). Retrieved from http://woodcock-munoz-foundation.org/press/pressbulletins.html
McGrew, K. S., & Woodcock, R. W. (2001). Technical manual:Woodcock-Johnson III. Itasca, IL: Riverside.
Nelson, J. M., & Canivez, G. L. (2012). Examination of the structural,convergent, and incremental validity of the Reynolds Intellectual As-sessment Scales (RIAS) with a clinical sample. Psychological Assess-ment, 24, 129–140. doi:10.1037/a0024878
Nelson, J. M., Canivez, G. L., Lindstrom, W., & Hatt, C. (2007). Higher-order exploratory factor analysis of the Reynolds Intellectual Assess-ment Scales with a referred sample. Journal of School Psychology, 45,439–456. doi:10.1016/j.jsp.2007.03.003
O’Connor, B. P. (2000). SPSS and SAS programs for determining thenumber of components using parallel analysis and Velicer’s MAP test.Behavior Research Methods, Instruments & Computers, 32, 396–402.doi:10.3758/BF03200807
Oh, H. J., Glutting, J. J., Watkins, M. W., Youngstrom, E. A., & McDer-mott, P. A. (2004). Correct interpretation of latent versus observedabilities: Implications from structural equation modeling applied to theWISC-III and WIAT linking sample. The Journal of Special Education,38, 159–173. doi:10.1177/00224669040380030301
Parkin, J. R., & Beaujean, A. A. (2012). The effects of Wechsler Intelli-gence Scale for Children—Fourth Edition cognitive abilities on mathachievement. Journal of School Psychology, 50, 113–128. doi:10.1016/j.jsp.2011.08.003
Roid, G. H. (2003). Stanford-Binet Intelligence Scales (5th ed.). Itasca, IL:Riverside.
Schmid, J., & Leiman, J. M. (1957). The development of hierarchical factorsolutions. Psychometrika, 22, 53–61. doi:10.1007/BF02289209
Schmitt, T. A. (2011). Current methodological considerations in explor-atory and confirmatory factor analysis. Journal of PsychoeducationalAssessment, 29, 304–321. doi:10.1177/0734282911406653
Tabachnick, B. G., & Fidell, L. S. (2007). Using multivariate statistics (5thed.). Boston, MA: Pearson Education.
Tataryn, D. J., Wood, J. M., & Gorsuch, R. L. (1999). Setting the value ofk in promax: A Monte Carlo study. Educational and PsychologicalMeasurement, 59, 384–391. doi:10.1177/00131649921969938
Taub, G. E., Floyd, R. G., Keith, T. Z., & McGrew, K. S. (2008). Effectsof general and broad cognitive abilities on mathematics achievement.School Psychology Quarterly, 23, 187–198. doi:10.1037/1045-3830.23.2.187
Taub, G. E., & McGrew, K. S. (2004). A confirmatory factor analysis ofCattell-Horn-Carroll theory and cross-age invariance of the Woodcock-Johnson Tests of Cognitive Abilities III. School Psychology Quarterly,19, 72–87. doi:10.1521/scpq.19.1.72.29409
Thompson, B. (2004). Exploratory and confirmatory factor analysis: Un-derstanding concepts and applications. Washington, DC: AmericanPsychological Association. doi:10. 1037/10694-000
Thompson, B., & Daniel, L. G. (1996). Factor analytic evidence for theconstruct validity of scores: A historical overview and some guidelines.Educational and Psychological Measurement, 56, 197–208. doi:10.1177/0013164496056002001
Tusing, M. E., & Ford, L. (2004). Examining preschool cognitive abilitiesusing a CHC framework. International Journal of Testing, 4, 91–114.
Vanderwood, M. L., McGrew, K. S., Flanagan, D. P., & Keith, T. Z.(2001). The contribution of general and specific cognitive abilities toreading achievement. Learning and Individual Differences, 13, 159–188. doi:10.1016/S1041-6080(02)00077-8
Velicer, W. F. (1976). Determining the number of components form thematrix of partial correlations. Psychometrika, 41, 321–327. doi:10.1007/BF02293557
Velicer, W. F., Eaton, C. A., & Fava, J. L. (2000). Construct explicationthrough factor or component analysis: A view and evaluation of alter-native procedures for determining the number of factors or components.In R. D. Goffin & E. Helmes (Eds.), Problems and solutions in humanassessment: A festschrift to Douglas Jackson at seventy (pp. 41–71).Norwell, MA: Kluwer Academic.
Watkins, M. W. (2000). Monte Carlo PCA for parallel analysis [Computersoftware]. State College, PA: Ed. & Psych.
Watkins, M. W. (2006). Orthogonal higher-order structure of the WISC-IV. Psychological Assessment, 18, 123–125. doi:10.1037/1040-3590.18.1.123
Watkins, M. W. (2010). Structure of the Wechsler Intelligence Scale forChildren—Fourth Edition among a national sample of referred students.Psychological Assessment, 22, 782–787. doi:10.1037/a0020043
Watkins, M. W., Glutting, J. J., & Lei, P.-W. (2007). Validity of thefull-scale IQ when there is significant variability among WISC-III andWISC-IV factor scores. Applied Neuropsychology, 14, 13–20. doi:10.1080/09084280701280353
Wechsler, D. (2008). Wechsler Adult Intelligence Scale—Fourth Edition:Technical and interpretive manual. San Antonio, TX: Pearson.
Wolff, H.-G., & Preising, K. (2005). Exploring item and higher order factorstructure with the Schmid-Leiman solution: Syntax codes for SPSS andSAS. Behavior Research Methods, 37, 48–58. doi:10.3758/BF03206397
Woodcock, R. W. (1990). Theoretical foundations of the WJ-R Measuresof Cognitive Ability. Journal of Psychoeducational Assessment, 8, 231–258. doi:10.1177/073428299000800303
Woodcock, R. W., & Johnson, M. B. (1989). Woodcock-Johnson Psychoe-ducational Battery—Revised. Allen, TX: DLM Teaching Resources.
Woodcock, R. W., McGrew, K. S., & Mather, N. (2001a). Woodcock-Johnson III. Itasca, IL: Riverside.
Woodcock, R. W., McGrew, K. S., & Mather, N. (2001b). Woodcock-Johnson III Tests of Achievement. Itasca, IL: Riverside.
Woodcock, R. W., McGrew, K. S., & Mather, N. (2001c). Woodcock-Johnson III Tests of Cognitive Abilities. Itasca, IL: Riverside.
Zwick, W. R., & Velicer, W. F. (1986). Comparison of five rules fordetermining the number of components to retain. Psychological Bulletin,99, 432–442. doi:10.1037/0033-2909.99.3.432
Received May 24, 2012Revision received October 26, 2012
Accepted October 29, 2012 �
See page 390 for a correction to this article.
455HIGHER ORDER FACTOR ANALYSIS OF THE WJ-III FULL BATTERY
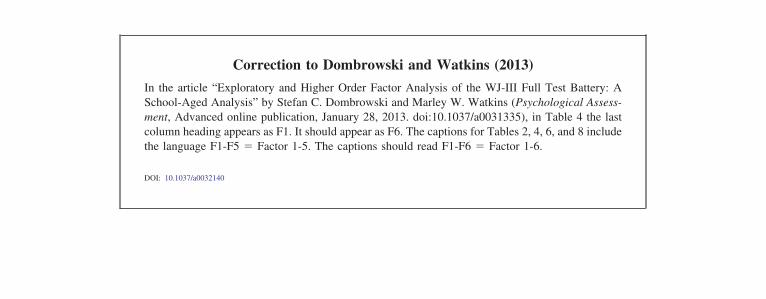
palliative settings: A meta-analysis. Journal of Affective Disorders, 126,335–348. doi:10.1016/j.jad.2010.01.067
National Breast Cancer Centre, National Cancer Control Initiative. (2003).Clinical practice guidelines for the psychosocial care of adults withcancer. Canberra: Commonwealth of Australia.
National Comprehensive Cancer Network. (2007). Clinical practice guide-lines in oncology: Distress management. Retrieved June 1, 2011, fromhttp://www.nccn.org/professionals/physician_gls/PDF/distress.pdf
Pallant, J. F., & Tennant, A. (2007). An introduction to the Rasch mea-surement model: An example using the Hospital Anxiety and DepressionScale (HADS). British Journal of Clinical Psychology, 46, 1–18. doi:10.1348/014466506X96931
Rabin, E. G., Heldt, E., Hirakata, V. N., Bittelbrunn, A. C., Chachamovich,E., & Fleck, M. P. A. (2009). Depression and perceptions of quality oflife of breast cancer survivors and their male partners. Oncology NursingForum, 36, E153–E158. doi:10.1188/09.ONF.E153-E158
Rasch, G. (1960). Probabilistic models for some intelligence and attain-ment tests. Chicago, IL: University of Chicago Press.
Razavi, D., Delvaux, N., Farvacques, C., & Robaye, E. (1990). Screeningfor adjustment disorders and major depressive disorders in cancer in-patients. The British Journal of Psychiatry, 156, 79–83. doi:10.1192/bjp.156.1.79
Rodgers, J., Martin, C., Morse, R., Kendell, K., & Verrill, M. (2005). Aninvestigation into the psychometric properties of the Hospital Anxietyand Depression Scale in patients with breast cancer. Health and Qualityof Life Outcomes, 3, 41. doi:10.1186/1477-7525-3-41
Schönberger, M., & Ponsford, J. (2010). The factor structure of the Hos-pital Anxiety and Depression Scale in individuals with traumatic braininjury. Psychiatry Research, 179, 342–349. doi:10.1016/j.psychres.2009.07.003
Sellick, S. M., & Edwardson, A. D. (2007). Screening new cancer patientsfor psychological distress using the Hospital Anxiety and DepressionScale. Psycho-Oncology, 16, 534–542. doi:10.1002/pon.1085
Shea, T. L., Tennant, A., & Pallant, J. F. (2009). Rasch model analysis ofthe Depression, Anxiety and Stress Scales (DASS). BMC Psychiatry, 9,21.
Singer, S., Kuhnt, S., Götze, H., Hauss, J., Hinz, A., Liebmann, A., . . .Schwarz, R. (2009). Hospital anxiety and depression scale cutoff scoresfor cancer patients in acute care. British Journal of Cancer, 100, 908–912. doi:10.1038/sj.bjc.6604952
Smith, A. B., Selby, P. J., Velikova, G., Stark, D., Wright, E. P., Gould, A.,& Cull, A. (2002). Factor analysis of the Hospital Anxiety and Depres-sion Scale from a large cancer population. Psychology and Psychother-apy: Theory, Research and Practice, 75, 165–176.
Smith, D. P., Supramaniam, R., King, M. T., Ward, J., Berry, M., &Armstrong, B. K. (2007). Age, health, and education determine support-
ive care needs of men younger than 70 years with prostate cancer.Journal of Clinical Oncology, 25, 2560–2566.
Smith, A. B., Wright, E. P., Rush, R., Stark, D. P., Velikova, G., & Selby,P. J. (2006). Rasch analysis of the dimensional structure of the HospitalAnxiety and Depression Scale. Psycho-Oncology, 15, 817–827. doi:10.1002/pon.1015
Snaith, R. (1991). The GHQ and the HAD. British Journal of Psychiatry,158, 433a.
Tang, W. K., Wong, E., Chiu, H. F. K., Lum, C. M., & Ungvari, G. S.(2008). Examining item bias in the anxiety subscale of the HospitalAnxiety and Depression Scale in patients with chronic obstructive pul-monary disease. International Journal of Methods in Psychiatric Re-search, 17, 104–110. doi:10.1002/mpr.234
Tang, W. K., Wong, E., Chiua, H. F. K., & Ungvari, G. S. (2007). Raschanalysis of the scoring scheme of the HADS Depression subscale inChinese stroke patients. Psychiatry Research, 150, 97–103. doi:10.1016/j.psychres.2006.01.015
Tennant, A., & Conaghan, P. G. (2007). The Rasch Measurement Model inrheumatology: What is it and why use it? When should it be applied, andwhat should one look for in a Rasch paper? Arthritis and Rheumatism,57, 1358–1362. doi:10.1002/art.23108
Tennant, A., McKenna, S. P., & Hagell, P. (2004). Application of Raschanalysis in the development and application of quality of life instru-ments. Value in Health, 7(Suppl.1), S22–26. doi:10.1111/j.1524-4733.2004.7s106.x
Tennant, A., & Pallant, J. F. (2006). Unidimensionality matters! RaschMeasurement Transactions, 20, 1048–1051.
Vodermaier, A., & Roanne, D. M. (2011). Accuracy of the HospitalAnxiety and Depression Scale as a screening tool in cancer patients: Asystematic review and meta-analysis. Supportive Care in Cancer, 19,1899–1908. doi:10.1007/s00520-011-1251-4
Walker, J., Postma, K., McHugh, G. S., Rush, R., Coyle, B., Strong, V., &Sharpe, M. (2007). Performance of the Hospital Anxiety and DepressionScale as a screening tool for major depressive disorder in cancer patients.Journal of Psychosomatic Research, 63, 83–91. doi:10.1016/j.jpsychores.2007.01.009
Zabora, J., BrintzenhofeSzoc, K., Curbow, B., Hooker, C., & Plantadosi, S.(2001). The prevalence of psychological distress by cancer site. Psycho-Oncology, 10, 19 –28. doi:10.1002/1099-1611(200101/02)10:1�19::AID-PON501�3.0.CO;2-6
Zigmond, A. S., & Snaith, R. P. (1983). The Hospital Anxiety and De-pression Scale. Acta Psychiatrica Scandinavica, 67, 361–370. doi:10.1111/j.1600-0447.1983.tb09716.x
Received July 16, 2011Revision received August 29, 2012
Accepted October 22, 2012 �
Correction to Dombrowski and Watkins (2013)
In the article “Exploratory and Higher Order Factor Analysis of the WJ-III Full Test Battery: ASchool-Aged Analysis” by Stefan C. Dombrowski and Marley W. Watkins (Psychological Assess-ment, Advanced online publication, January 28, 2013. doi:10.1037/a0031335), in Table 4 the lastcolumn heading appears as F1. It should appear as F6. The captions for Tables 2, 4, 6, and 8 includethe language F1-F5 � Factor 1-5. The captions should read F1-F6 � Factor 1-6.
DOI: 10.1037/a0032140
390 LAMBERT ET AL.