explaining the uneven economic performance of the eu cohesion countries: an export-led growth...
TRANSCRIPT
Centro de Estudos da União Europeia (CEUNEUROP) Faculdade de Economia da Universidade de Coimbra
Av. Dias da Silva, 165-3004-512 COIMBRA – PORTUGAL e-mail: [email protected] website: www4.fe.uc.pt/ceue
EXPLAINING THE UNEVEN ECONOMIC PERFORMANCE OF THE COHESION COUNTRIES. AN EXPORT-LED GROWTH APPROACH.
Catarina Cardoso and Elias Soukiazis
DOCUMENTO DE TRABALHO/DISCUSSION PAPER (APRIL) Nº 32
Nenhuma parte desta publicação poderá ser reproduzida ou transmitida por qualquer forma ou processo, electrónico, mecânico ou fotográfico, incluindo fotocópia, xerocópia ou gravação, sem autorização PRÉVIA.
COIMBRA — 2005
Impresso na Secção de Textos da FEUC
1
EXPLAINING THE UNEVEN ECONOMIC PERFORMANCE OF THE COHESION COUNTRIES. AN EXPORT-LED GROWTH APPROACH.
Catarina Cardoso
Polytechnic Institute of Setubal, Portugal [email protected]
Elias Soukiazis
Faculty of Economics, University of Coimbra, Portugal [email protected]
Abstract
The purpose of this paper is to explain differences in growth rates between the four countries that constitute the cohesion group of the EU, Ireland, Spain, Portugal and Greece. Through a decomposition approach of per capita income, it is shown that productivity growth contributes mostly in explaining the different economic performance of the four cohesion countries. The remarkable higher growth rates of Ireland, especially in the nineties, are due to higher achievements in productivity growth resulted from higher investment in human capital and technology. Employing an export-led growth approach it is shown that Thirlwall´s Law predicts reasonably well the actual growth rates of the cohesion countries, through the Harrodian foreign trade multiplier. The accuracy of the prediction is still higher when differences in productivity growth are introduced into the model reflecting disparities in human capital and technology rates. Higher economic growth is mainly explained by higher income elasticity of demand for exports over imports. Higher competitiveness due to higher productivity growth is the keystone factor in explaining different economic performance between the four cohesion countries.
JEL classification: O47, O57, P52.
Keywords: cohesion countries, per capita income, productivity, export-led growth, price and income elasticities of foreign trade, error correction models. Address for correspondence: Faculdade de Economia Universidade de Coimbra, Av. Dias da Silva, 165, 3004-512 Coimbra, Portugal.
2
1. Introduction
Portugal, Greece, Ireland and Spain are the countries within the European Union all
received structural assistance from the community as members of the “cohesion group”.
Among the four countries, Spain in the beginning of the seventies was the richest
economy and Portugal the poorest in terms of per capita income. However, during the
nineties, Ireland made a remarkable economic improvement, converging rapidly to the
richest countries of the EU. By the end of that decade the Irish GDP per head was
already higher than the EU average. On the other hand, both Spain and Portugal had
grown steadily over time, especially in the early post-adhesion period (after 1986), and
the gap between each country and the EU average has become smaller over the
following years. Greece, after joining the EEC in 1981, has shown some difficulties of
adaptation in the integrated European market diverging initially from the cohesion
group and the EU standards. Only in the late 90´s Greece managed to achieve relatively
higher growth rates and in 2002 per capita income in Greece exceeded the Portuguese
one. On the contrary, Portugal grew at very moderate rates in the late nineties and with
negative rates in 2002-2003, diverging from its partners in terms of per capita income
and productivity standards in this late period. Portugal in recent years became again the
poorest country among the four members of the so-called “cohesion group”.
The main purpose of this study is to explain why the cohesion countries had a
different economic performance after the 80´s. The paper tries to shed light to this
question through a theoretical, an empirical and a descriptive framework. Our goal is to
identify the different characteristics of the economies able to explain the different
growth patterns of the four cohesion countries To do so an export-led growth approach
is used in the empirical analysis which predicts growth rates compatible with the
equilibrium of the balance of payments in the current account.
The sources of growth can first be identified by a decomposition approach of the
growth of per capita income. According to the evidence, the most important
contribution comes from productivity growth which is much higher in Ireland than in
the other three countries. There is strong evidence that the remarkable Irish economic
improvement was due to higher accumulation of human and technological capital and
not to physical capital as happens with Portugal, Greece and even with Spain. Another
source of higher growth in Ireland is the higher export performance due to
3
improvements in competitiveness and the production of goods with high elasticity of
demand in international markets.
The remainder of the paper is organized as follows: Section 2 provides some
historical evidence on the main factors that characterise economic growth trying to
identify some common tendencies or differences that can explain the uneven patterns of
economic growth in the four cohesion countries. Section 3, through a decomposition
analysis of the growth of per capita income, tries to identify the main sources which
drove economic growth in the four countries. Section 4 applies an export-led growth
approach to explain differences in growth rates between the cohesion countries. Along
with income and relative prices the productivity gap is used to control for export
competitiveness. The last section summarises the main findings.
2. Economic performance of the Cohesion Countries
At the beginning of the sixties the four cohesion countries had a lot in common. They
were low income and less open economies. Their economic structures were similar,
characterised by a high share of agriculture in output and employment. Since the sixties
the agricultural share has been declining in the four countries but different sectors have
risen in its place. The shift of resources to the industrial sector is more intensive in
Ireland than in Portugal, Greece and Spain. The share of manufacturing in GDP grew
faster in Ireland while in the other three countries the share of services gained more
importance. Evidence from recent years shows that the contribution of the industrial
sector to GDP is still higher in Ireland, around 40%, while in Spain and Portugal the
industrial share is around 30% and in Greece it is even lower. This shows that Ireland
devotes more resources to activities with higher increasing returns to scale
characteristics relatively to the other cohesion countries. On the other hand, Irish
industrial share in employment is the lowest reflecting higher levels of productivity.
Living standards measured by GDP per head (in PPP terms) and productivity
levels proxied by GDP per worker, were significantly below the European average
when they joined the Community (Ireland in 1973, Greece in 1981 and both Portugal
and Spain in 1986). Among the four countries, Portugal and Ireland started with lower
levels, but Irish higher economic performance in the nineties changed this backward
position as can be seen in Table 1 and Figure 1.
4
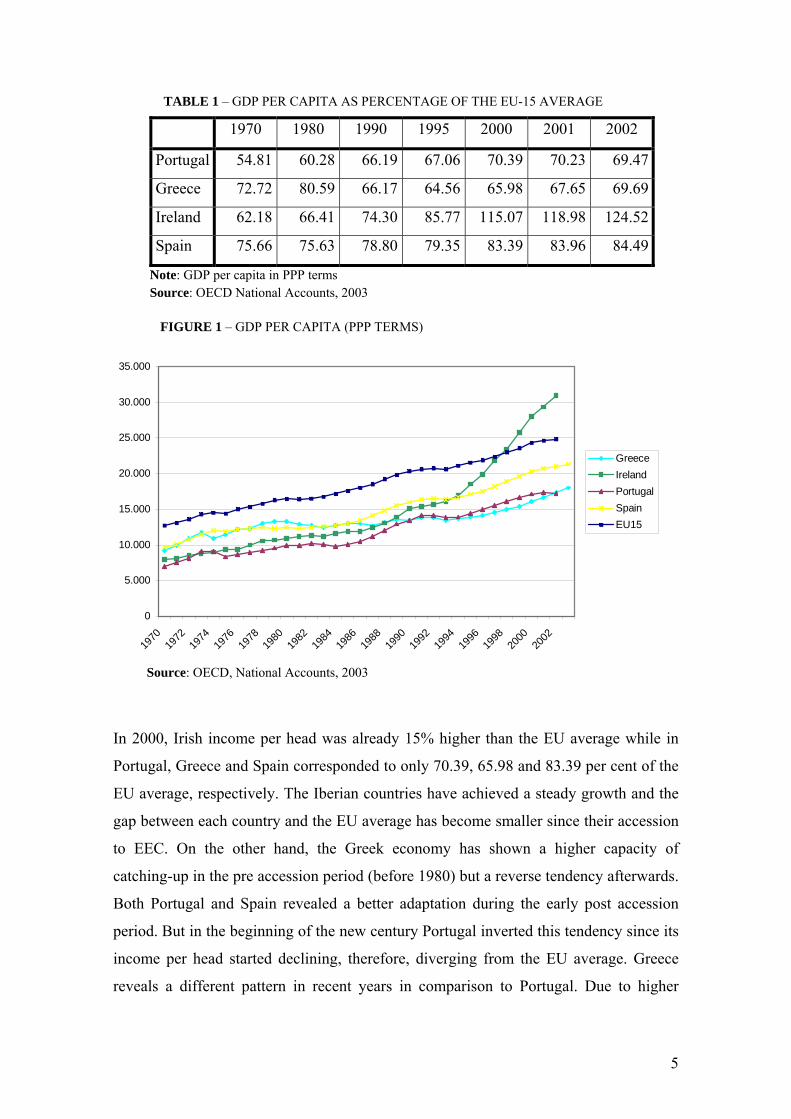
TABLE 1 – GDP PER CAPITA AS PERCENTAGE OF THE EU-15 AVERAGE
1970 1980 1990 1995 2000 2001 2002
Portugal 54.81 60.28 66.19 67.06 70.39 70.23 69.47
Greece 72.72 80.59 66.17 64.56 65.98 67.65 69.69
Ireland 62.18 66.41 74.30 85.77 115.07 118.98 124.52
Spain 75.66 75.63 78.80 79.35 83.39 83.96 84.49
Note: GDP per capita in PPP terms Source: OECD National Accounts, 2003
FIGURE 1 – GDP PER CAPITA (PPP TERMS)
0
5.000
10.000
15.000
20.000
25.000
30.000
35.000
1970
1972
1974
1976
1978
1980
1982
1984
1986
1988
1990
1992
1994
1996
1998
2000
2002
GreeceIrelandPortugalSpainEU15
In 2
Port
EU
gap
to E
catc
Both
peri
inco
reve
Source: OECD, National Accounts, 2003
000, Irish income per head was already 15% higher than the EU average while in
ugal, Greece and Spain corresponded to only 70.39, 65.98 and 83.39 per cent of the
average, respectively. The Iberian countries have achieved a steady growth and the
between each country and the EU average has become smaller since their accession
EC. On the other hand, the Greek economy has shown a higher capacity of
hing-up in the pre accession period (before 1980) but a reverse tendency afterwards.
Portugal and Spain revealed a better adaptation during the early post accession
od. But in the beginning of the new century Portugal inverted this tendency since its
me per head started declining, therefore, diverging from the EU average. Greece
als a different pattern in recent years in comparison to Portugal. Due to higher
5
economic growth, per capita income in Greece exceeded again the Portuguese one in
2002.
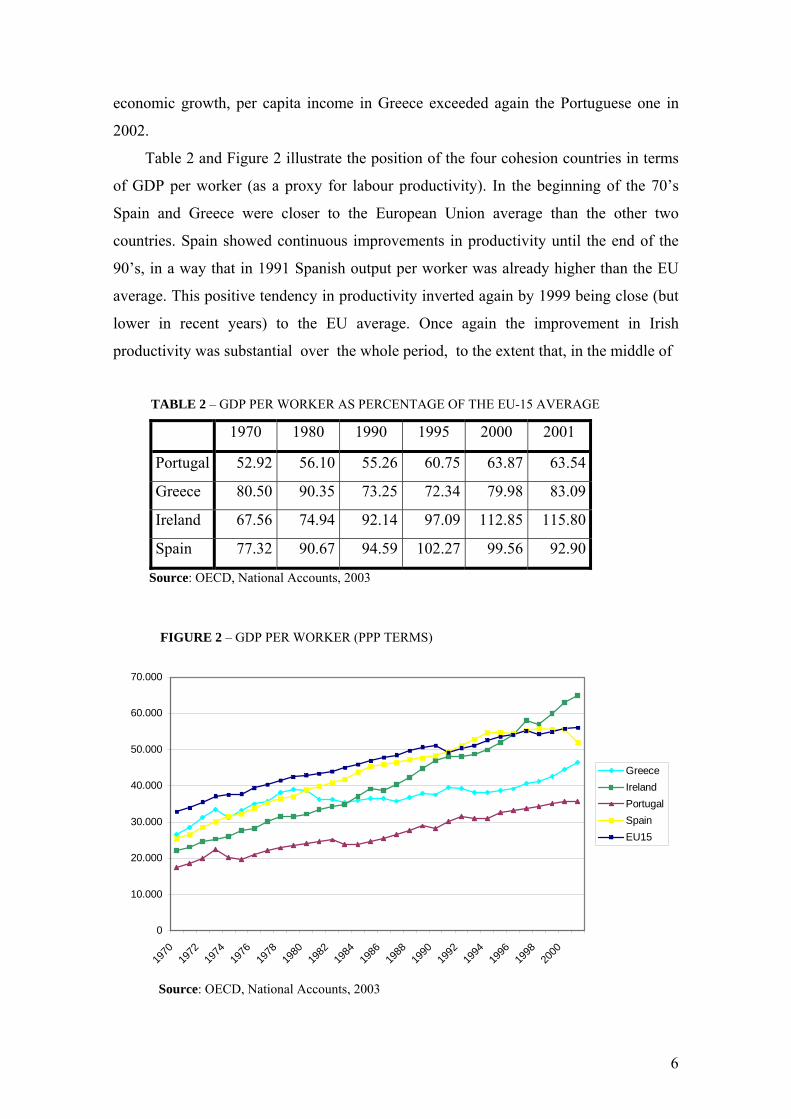
Table 2 and Figure 2 illustrate the position of the four cohesion countries in terms
of GDP per worker (as a proxy for labour productivity). In the beginning of the 70’s
Spain and Greece were closer to the European Union average than the other two
countries. Spain showed continuous improvements in productivity until the end of the
90’s, in a way that in 1991 Spanish output per worker was already higher than the EU
average. This positive tendency in productivity inverted again by 1999 being close (but
lower in recent years) to the EU average. Once again the improvement in Irish
productivity was substantial over the whole period, to the extent that, in the middle of
TABLE 2 – GDP PER WORKER AS PERCENTAGE OF THE EU-15 AVERAGE
1970 1980 1990 1995 2000 2001
Portugal 52.92 56.10 55.26 60.75 63.87 63.54
Greece 80.50 90.35 73.25 72.34 79.98 83.09
Ireland 67.56 74.94 92.14 97.09 112.85 115.80
Spain 77.32 90.67 94.59 102.27 99.56 92.90
Source: OECD, National Accounts, 2003
FIGURE 2 – GDP PER WORKER (PPP TERMS)
0
10.000
20.000
30.000
40.000
50.000
60.000
70.000
1970
1972
1974
1976
1978
1980
1982
1984
1986
1988
1990
1992
1994
1996
1998
2000
GreeceIrelandPortugalSpainEU15
Source: OECD, National Accounts, 2003
6
the 90’s the Irish output per worker was clearly above the EU-15 average. Both
Portugal and Greece have remained below the average, but the Portuguese disadvantage
is clearer. Greece has shown higher productivity levels than Portugal, but the pattern
was unstable. Similarly to its per capita income performance, the achievements in
productivity levels were higher in the pre accession period. As can be seen from Tables
1 and 2, Greece was closer to the European Union standards in GDP per head and per
worker before the eighties than it was in the nineties. As in the case of per capita
income, Greece shows again clear signs of recovery in productivity in recent years,
leaving behind Portugal and approaching the Spanish levels.
It is well accepted in now days that differences in productivity levels can be
explained by differences in human and technological capital accumulation (Barro,1991).
Human capital qualifications, technical progress and innovation are fundamental factors
for higher economic growth and gains in productivity. The new endogenous growth
theory focused heavily on these issues as the engine of growth. To have some idea
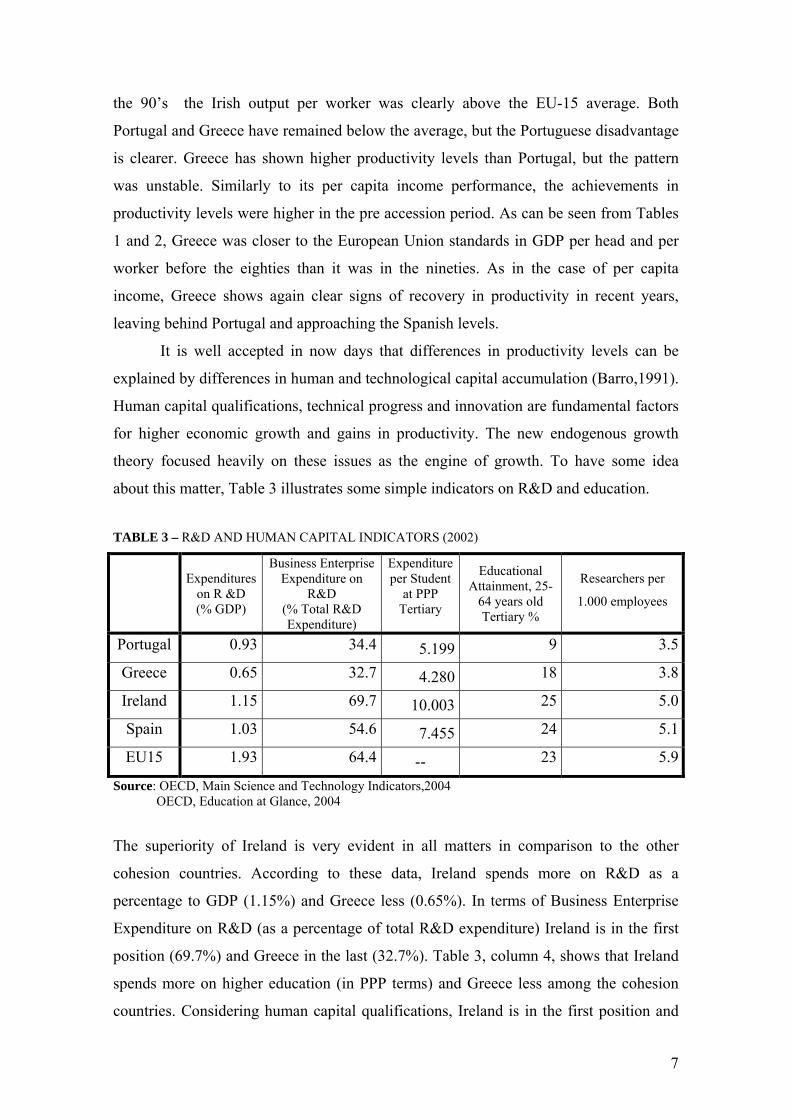
about this matter, Table 3 illustrates some simple indicators on R&D and education.
TABLE 3 – R&D AND HUMAN CAPITAL INDICATORS (2002)
Expenditures
on R &D (% GDP)
Business Enterprise Expenditure on
R&D (% Total R&D Expenditure)
Expenditure per Student
at PPP Tertiary
Educational Attainment, 25-
64 years old Tertiary %
Researchers per
1.000 employees
Portugal 0.93 34.4 5.199 9 3.5
Greece 0.65 32.7 4.280 18 3.8
Ireland 1.15 69.7 10.003 25 5.0
Spain 1.03 54.6 7.455 24 5.1
EU15 1.93 64.4 -- 23 5.9
Source: OECD, Main Science and Technology Indicators,2004 OECD, Education at Glance, 2004
The superiority of Ireland is very evident in all matters in comparison to the other
cohesion countries. According to these data, Ireland spends more on R&D as a
percentage to GDP (1.15%) and Greece less (0.65%). In terms of Business Enterprise
Expenditure on R&D (as a percentage of total R&D expenditure) Ireland is in the first
position (69.7%) and Greece in the last (32.7%). Table 3, column 4, shows that Ireland
spends more on higher education (in PPP terms) and Greece less among the cohesion
countries. Considering human capital qualifications, Ireland is in the first position and
7
Portugal in the last. The backwardness of Portugal is notorious in higher education
attainment having the half of the attainment than Greece and almost three times less
than Ireland. Finally, Spain and Ireland are in the first position concerning the number
of researchers and Portugal again in the last position. From these data description it is
very evident that Ireland invests more in human capital qualifications and technology
and this event can be the explanation of having higher productivity levels among the
countries of the cohesion group.
3. Main sources of economic growth in the Cohesion Countries
A simple way to identify the sources of economic growth is by partitioning the series of
per capita output into different components. Using the available data for the cohesion
countries, the GDP per head series can be analysed as the product of four terms, as it is
shown bellow:
(i) output per worker as a proxy for labour productivity;
(ii) employment rate obtained by the ratio of employment to total labour force;
(iii) participation rate defined as the ratio of labour force to the working age population;
(iv) dependency rate obtained by the ratio of working age population to total population.
PopulationPopulation
PopulationeLabourforc
eLabourforcEmployment
EmploymentGDP
PopulationGDP years 64-15
years 64-15 ⋅⋅⋅=
The growth rate of output per head is, therefore, the sum of the growth of these four
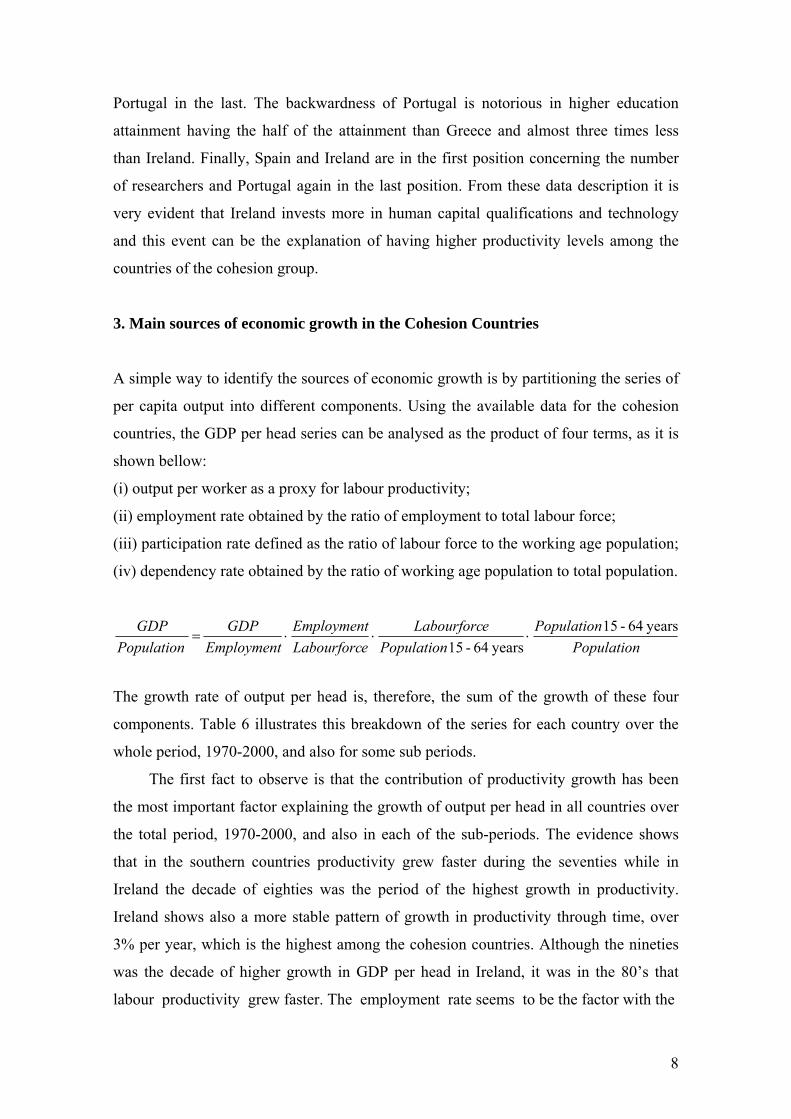
components. Table 6 illustrates this breakdown of the series for each country over the
whole period, 1970-2000, and also for some sub periods.
The first fact to observe is that the contribution of productivity growth has been
the most important factor explaining the growth of output per head in all countries over
the total period, 1970-2000, and also in each of the sub-periods. The evidence shows
that in the southern countries productivity grew faster during the seventies while in
Ireland the decade of eighties was the period of the highest growth in productivity.
Ireland shows also a more stable pattern of growth in productivity through time, over
3% per year, which is the highest among the cohesion countries. Although the nineties
was the decade of higher growth in GDP per head in Ireland, it was in the 80’s that
labour productivity grew faster. The employment rate seems to be the factor with the
8
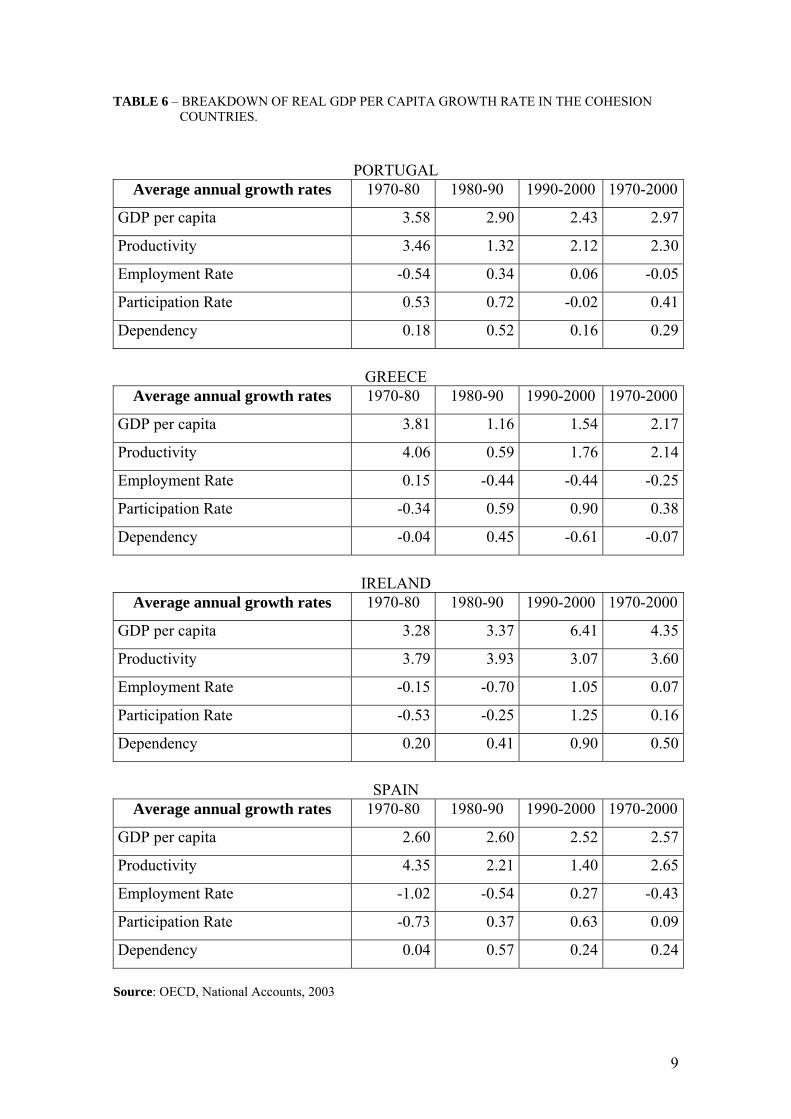
TABLE 6 – BREAKDOWN OF REAL GDP PER CAPITA GROWTH RATE IN THE COHESION COUNTRIES.
PORTUGAL Average annual growth rates 1970-80 1980-90 1990-2000 1970-2000
GDP per capita 3.58 2.90 2.43 2.97
Productivity 3.46 1.32 2.12 2.30
Employment Rate -0.54 0.34 0.06 -0.05
Participation Rate 0.53 0.72 -0.02 0.41
Dependency 0.18 0.52 0.16 0.29
GREECE
Average annual growth rates 1970-80 1980-90 1990-2000 1970-2000
GDP per capita 3.81 1.16 1.54 2.17
Productivity 4.06 0.59 1.76 2.14
Employment Rate 0.15 -0.44 -0.44 -0.25
Participation Rate -0.34 0.59 0.90 0.38
Dependency -0.04 0.45 -0.61 -0.07
IRELAND
Average annual growth rates 1970-80 1980-90 1990-2000 1970-2000
GDP per capita 3.28 3.37 6.41 4.35
Productivity 3.79 3.93 3.07 3.60
Employment Rate -0.15 -0.70 1.05 0.07
Participation Rate -0.53 -0.25 1.25 0.16
Dependency 0.20 0.41 0.90 0.50
SPAIN
Average annual growth rates 1970-80 1980-90 1990-2000 1970-2000
GDP per capita 2.60 2.60 2.52 2.57
Productivity 4.35 2.21 1.40 2.65
Employment Rate -1.02 -0.54 0.27 -0.43
Participation Rate -0.73 0.37 0.63 0.09
Dependency 0.04 0.57 0.24 0.24 Source: OECD, National Accounts, 2003
9
lowest contribution in the growth of per capita income. The contribution of the
employment rate on the growth of per capita income was negative in the southern
countries, in the whole period, but positive in Ireland, especially in the nineties, due to
its higher economic performance. The participation rate contributed positively to growth
over the whole period (1970-2000) in the four countries, the highest contribution
occurring in Portugal. This outcome can be explained by the higher female participation
in the labour market in Portugal and the massive return of migrants from the former
Portuguese colonies in Africa.
Finally, the dependency ratio makes a positive contribution to growth over time in
all countries but not in Greece. The highest contribution of this factor occurs again in
Ireland.
As the evidence shows, labour productivity seems to be the main source of growth
in the four cohesion countries, since the seventies. According to various authors (Fuente
et.al. (1997), (Barry et. al,1999), Freitas (2000), among others) an intensive investment
in human capital and innovation seems to be the most plausible explanation for the
higher growth rates achieved in Ireland during the nineties.
In this section the factors explaining the growth patterns were supply driven.
Growth differences between the three countries were explained in terms of differences
in the growth of factor supplies and productivity. This analysis does not take into
account the fact that growth can be constrained by demand, especially from external
demand. The next section considers this hypothesis.
4. Export-led growth as the explanation of differences in growth rates. 4.1. The model The Keynesian approach to growth stresses the importance of the strength of demand as
the explanation of the differences in growth rates between countries. According to this
theory it is the growth of demand that drives the expansion of the economic system, and
therefore, demand can constrain economic growth. Insufficient effective demand can be
the explanation for lower output growth and higher unemployment. Some authors of the
Keynesian tradition (Kaldor,1957 and Thirlwall,1979, among others) emphasised that
foreign demand for the national products is the most important element of exogenous
demand that can constrain growth. Exports are the most potent element of demand that
generate higher growth through the Harrodian foreign trade multiplier (Thirlwall, 2002).
10
This is the essence of export-led growth models, which attribute to exports the role of
the engine of growth for various reasons:
- Exports are the only autonomous element of demand generated outside the
economy;
- Exports are the element of demand with the highest multiplier effect on national
income and have the highest saving propensity;
- Exports among the other elements of demand have the lowest import content;
- Exports allow for higher imports (especially capital goods and raw materials)
necessary for further economic development, without incurring Balance of
Payments crises;
- Exports have the important role of relaxing international payments constraints
on demand and thus on growth;
- Technology is transferred through exports and in general, trade is the vehicle for
faster diffusion of knowledge from frontier to laggard countries through trade-
related R&D spillovers;
- Exports induce innovation and higher efficiency;
- Exports can increase the supply capacity of the economy;
- Exports are responsible for generating higher growth with cumulative
characteristics.
According to Kaldor (1966) exports can generate a virtuous circle of growth with
cumulative causation properties. An increase in exports (for any reason) raises industrial
output since this sector produces mostly tradable goods; productivity will increase
through the link between productivity growth and industrial output growth (the well-
known Verdoorn Law)1; a fall in production costs and efficient wages will be the next
consequence improving further export competitiveness; a virtuous circle between
exports and output growth will start to operate having cumulative characteristics.
Countries or regions with an initial comparative advantage will grow faster and
reinforce their competitive position making it difficult for others to compete in the same
activities.
1 Verdoorn Law relates the growth of productivity to the growth of output assuming that productivity is endogenous in the growth process. This dynamic relationship captures the technical properties of the production function, namely, the economies to scale characteristics, Verdoorn (1949).
11
Thilrwall (1979) developed Kaldor´s ideas and formalized an export-led growth model
taking into account the cumulative causation principle developed earlier by Myrdal
(1957). Further, Thirlwall presented a model explaining the importance of Balance-of-
Payments as a constraint to growth. The core idea is that balance-of-payments deficits
(in current account) prevent the expansion of demand and consequently the growth of
output. The necessary condition for higher output growth is that a country’s income
elasticity of the demand of exports must be higher than that of imports.
Thirlwall (1979), proposed a model which determines a country’s growth rate
consistent with the Balance-of-Payments equilibrium. In this model the demand
function of imports is positively related to national income and negatively to relative
prices of imports, and the demand for exports function is positively related to foreign
income and inversely to relative prices of exports. The import and export demand
functions, taking variables in growth rates, are the following:
import demand function (1) ( ) tttt πypxepmψm +−+=
export demand function (2) ( ttttt εwepmpxηx +−−= )where m and x are the rates of growth of real imports and exports, respectively; pm and
px are import and export prices growth rates, respectively; is the exchange rate
variation; y is the rate of growth of real domestic output; w stands for the world income
growth rate;
e
ψ is the price elasticity of the demand for imports and π is the income
elasticity of the demand for imports; η is the price elasticity of the demand of exports
and ε the income elasticity of the demand of exports.
In line with Léon-Ledesma (2000), we can extend Thirlwall´s model by
introducing in the export demand function a technological factor that captures the
innovation effects reflected in productivity. The gap in productivity between each
country and the EU average is used to count for differences in technology and
innovation. The higher the gap in productivity the lower the demand for exports due to
lower competitiveness. The intention of introducing this factor is to capture explicitly
the non-price characteristics of exports associated to higher quality. Taking the variables
in growth rates, the extended export demand function becomes the following:
( ) )( ttttttt pupcεwepmpxηx −++−−= δ (3)
where pc is the growth of productivity of the cohesion country, pu the growth of
productivity of the EU average and δ the productivity gap elasticity with respect to
exports.
12
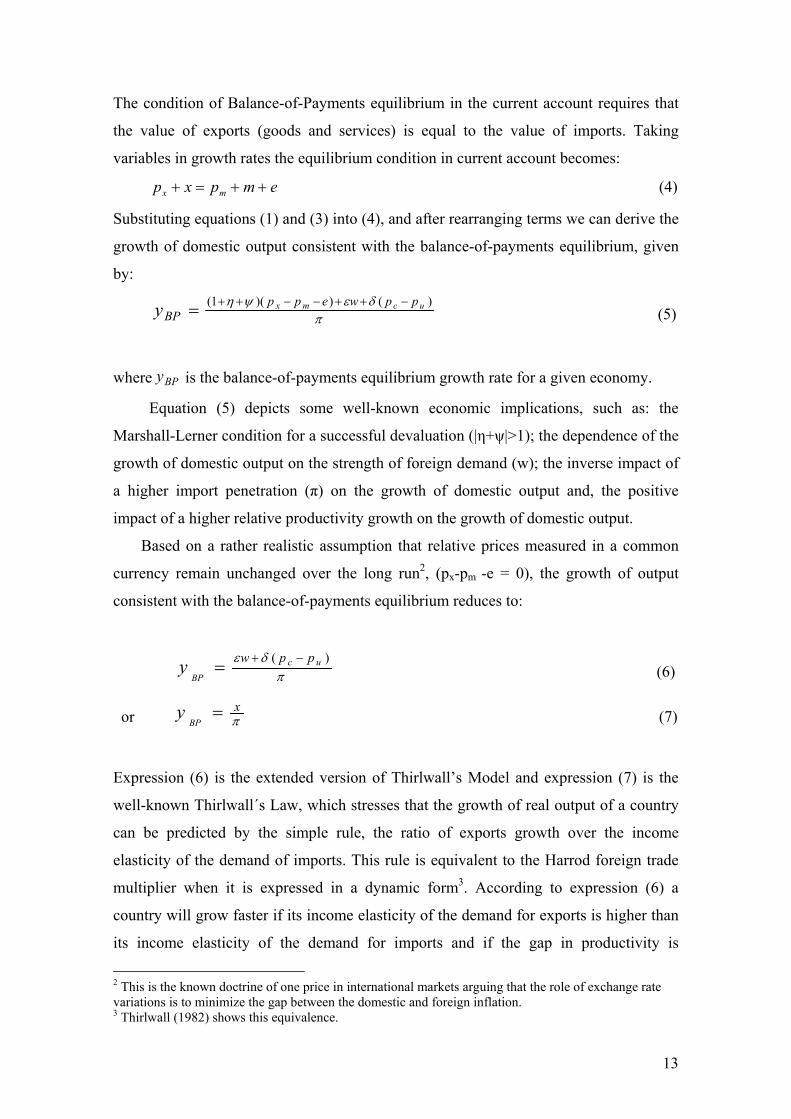
The condition of Balance-of-Payments equilibrium in the current account requires that
the value of exports (goods and services) is equal to the value of imports. Taking
variables in growth rates the equilibrium condition in current account becomes:
empxp mx ++=+ (4)
Substituting equations (1) and (3) into (4), and after rearranging terms we can derive the
growth of domestic output consistent with the balance-of-payments equilibrium, given
by:
)())(1(π
δεψη ucmx ppweppBPy −++−−++= (5)
where is the balance-of-payments equilibrium growth rate for a given economy. BPy
Equation (5) depicts some well-known economic implications, such as: the
Marshall-Lerner condition for a successful devaluation (|η+ψ|>1); the dependence of the
growth of domestic output on the strength of foreign demand (w); the inverse impact of
a higher import penetration (π) on the growth of domestic output and, the positive
impact of a higher relative productivity growth on the growth of domestic output.
Based on a rather realistic assumption that relative prices measured in a common
currency remain unchanged over the long run2, (рx-рm -e = 0), the growth of output
consistent with the balance-of-payments equilibrium reduces to:
)(π
δε uc
BP
ppwy −+= (6)
or πx
BPy = (7)
Expression (6) is the extended version of Thirlwall’s Model and expression (7) is the
well-known Thirlwall´s Law, which stresses that the growth of real output of a country
can be predicted by the simple rule, the ratio of exports growth over the income
elasticity of the demand of imports. This rule is equivalent to the Harrod foreign trade
multiplier when it is expressed in a dynamic form3. According to expression (6) a
country will grow faster if its income elasticity of the demand for exports is higher than
its income elasticity of the demand for imports and if the gap in productivity is
2 This is the known doctrine of one price in international markets arguing that the role of exchange rate variations is to minimize the gap between the domestic and foreign inflation. 3 Thirlwall (1982) shows this equivalence.
13
declining (when country’s productivity grows faster relatively to the benchmark). As a
policy implication for higher growth this model suggests the reallocation of resources
towards the production of tradable goods with high elasticity of demand in international
markets. Additionally, according to the extended model (6), a higher investment is
needed in technology, innovation and human capital qualification to improve
productivity and therefore turn exports more competitive in the international markets.
4.1 Evidence of Export-led growth in the cohesion countries
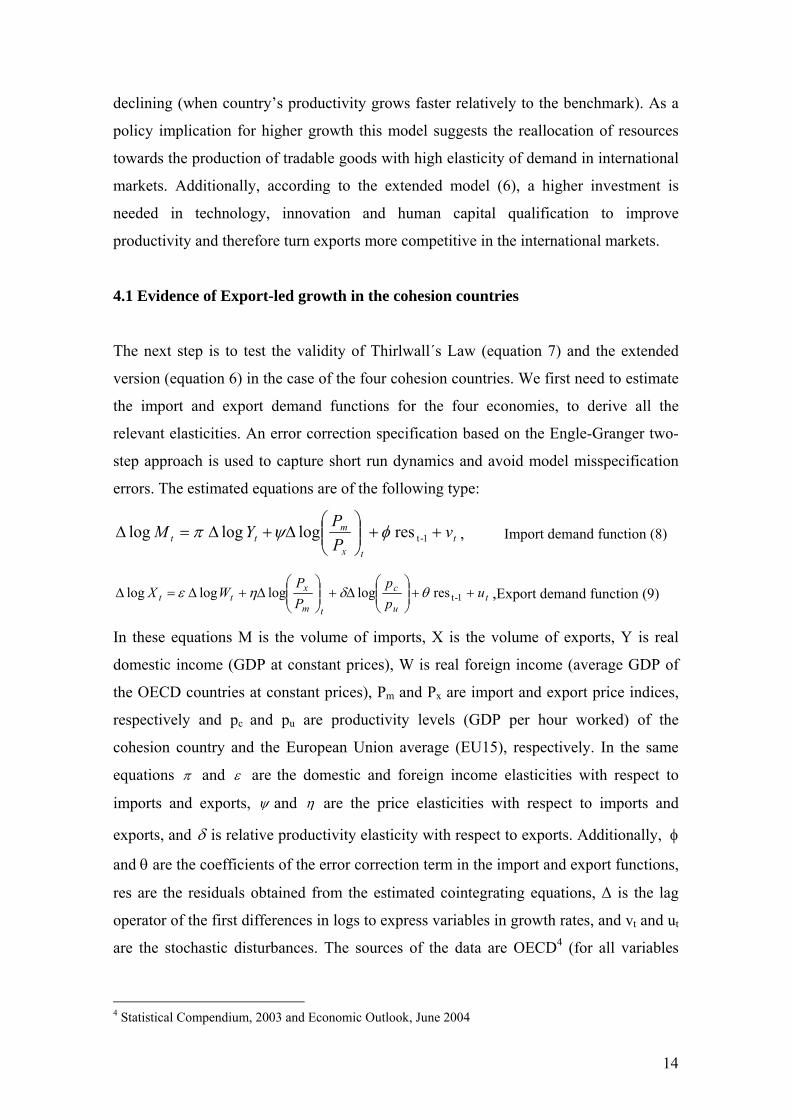
The next step is to test the validity of Thirlwall´s Law (equation 7) and the extended
version (equation 6) in the case of the four cohesion countries. We first need to estimate
the import and export demand functions for the four economies, to derive all the
relevant elasticities. An error correction specification based on the Engle-Granger two-
step approach is used to capture short run dynamics and avoid model misspecification
errors. The estimated equations are of the following type:
ttx
mtt v
PPYM ++⎟⎟
⎠
⎞⎜⎜⎝
⎛∆+∆=∆ 1-tres loglog log φψπ , Import demand function (8)
tu
c
tm
xtt u
pp
PP
WX ++⎟⎟⎠
⎞⎜⎜⎝
⎛∆+⎟⎟
⎠
⎞⎜⎜⎝
⎛∆+∆=∆ 1-tres logloglog log θδηε ,Export demand function (9)
In these equations M is the volume of imports, X is the volume of exports, Y is real
domestic income (GDP at constant prices), W is real foreign income (average GDP of
the OECD countries at constant prices), Pm and Px are import and export price indices,
respectively and pc and pu are productivity levels (GDP per hour worked) of the
cohesion country and the European Union average (EU15), respectively. In the same
equations π and ε are the domestic and foreign income elasticities with respect to
imports and exports, ψ and η are the price elasticities with respect to imports and
exports, and δ is relative productivity elasticity with respect to exports. Additionally, φ
and θ are the coefficients of the error correction term in the import and export functions,
res are the residuals obtained from the estimated cointegrating equations, ∆ is the lag
operator of the first differences in logs to express variables in growth rates, and vt and ut
are the stochastic disturbances. The sources of the data are OECD4 (for all variables
4 Statistical Compendium, 2003 and Economic Outlook, June 2004
14
except productivity) and Groningen Growth and Development Centre5 (for productivity)
covering the period 1970-2003.
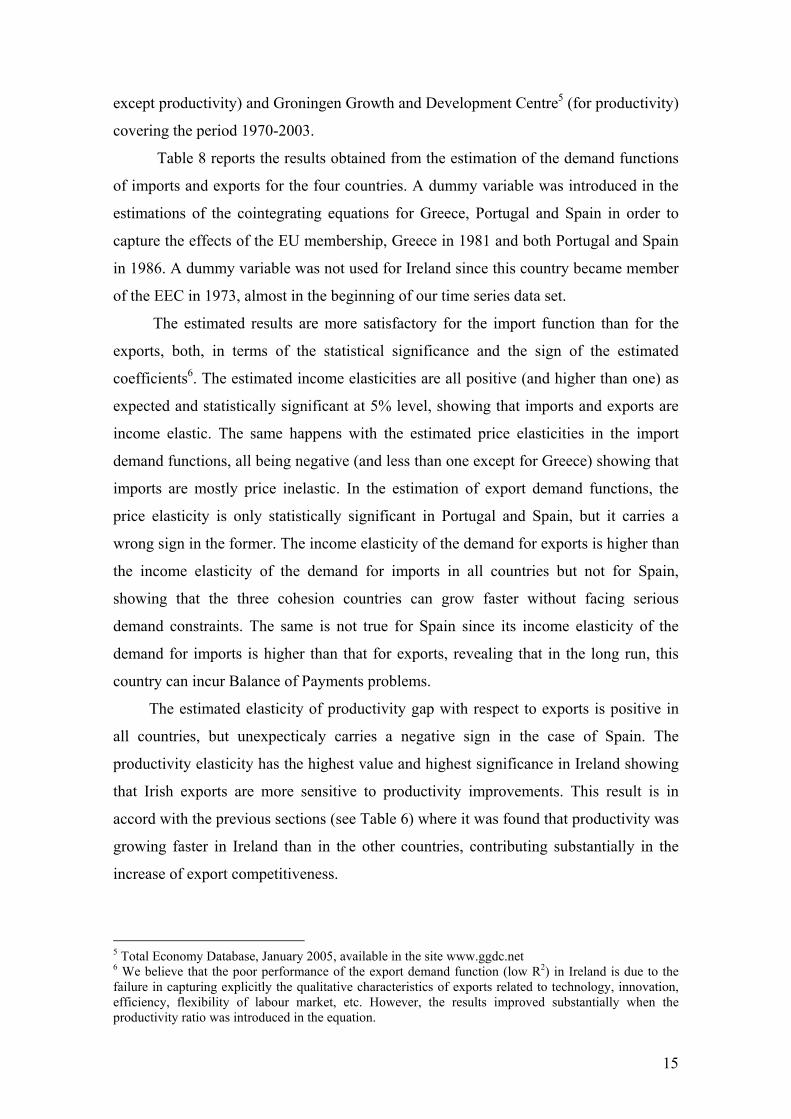
Table 8 reports the results obtained from the estimation of the demand functions
of imports and exports for the four countries. A dummy variable was introduced in the
estimations of the cointegrating equations for Greece, Portugal and Spain in order to
capture the effects of the EU membership, Greece in 1981 and both Portugal and Spain
in 1986. A dummy variable was not used for Ireland since this country became member
of the EEC in 1973, almost in the beginning of our time series data set.
The estimated results are more satisfactory for the import function than for the
exports, both, in terms of the statistical significance and the sign of the estimated
coefficients6. The estimated income elasticities are all positive (and higher than one) as
expected and statistically significant at 5% level, showing that imports and exports are
income elastic. The same happens with the estimated price elasticities in the import
demand functions, all being negative (and less than one except for Greece) showing that
imports are mostly price inelastic. In the estimation of export demand functions, the
price elasticity is only statistically significant in Portugal and Spain, but it carries a
wrong sign in the former. The income elasticity of the demand for exports is higher than
the income elasticity of the demand for imports in all countries but not for Spain,
showing that the three cohesion countries can grow faster without facing serious
demand constraints. The same is not true for Spain since its income elasticity of the
demand for imports is higher than that for exports, revealing that in the long run, this
country can incur Balance of Payments problems.
The estimated elasticity of productivity gap with respect to exports is positive in
all countries, but unexpecticaly carries a negative sign in the case of Spain. The
productivity elasticity has the highest value and highest significance in Ireland showing
that Irish exports are more sensitive to productivity improvements. This result is in
accord with the previous sections (see Table 6) where it was found that productivity was
growing faster in Ireland than in the other countries, contributing substantially in the
increase of export competitiveness.
5 Total Economy Database, January 2005, available in the site www.ggdc.net 6 We believe that the poor performance of the export demand function (low R2) in Ireland is due to the failure in capturing explicitly the qualitative characteristics of exports related to technology, innovation, efficiency, flexibility of labour market, etc. However, the results improved substantially when the productivity ratio was introduced in the equation.
15
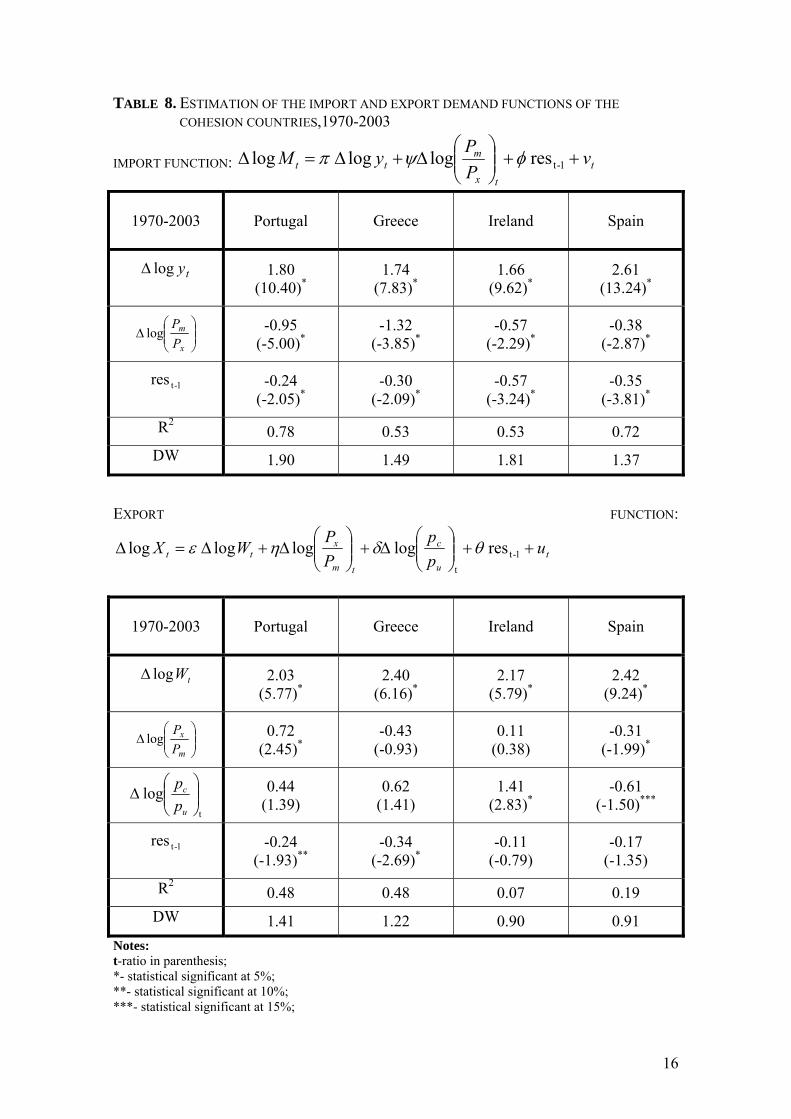
TABLE 8. ESTIMATION OF THE IMPORT AND EXPORT DEMAND FUNCTIONS OF THE COHESION COUNTRIES,1970-2003
IMPORT FUNCTION: ttx
mtt v
PPyM ++⎟⎟
⎠
⎞⎜⎜⎝
⎛∆+∆=∆ 1-tres loglog log φψπ
1970-2003
Portugal
Greece Ireland Spain
tylog∆
1.80 (10.40)*
1.74 (7.83)*
1.66 (9.62)*
2.61 (13.24)*
⎟⎟⎠
⎞⎜⎜⎝
⎛∆
x
m
PP
log -0.95 (-5.00)*
-1.32 (-3.85)*
-0.57 (-2.29)*
-0.38 (-2.87)*
1-tres
-0.24 (-2.05)*
-0.30 (-2.09)*
-0.57 (-3.24)*
-0.35 (-3.81)*
R2 0.78 0.53 0.53 0.72
DW 1.90 1.49 1.81 1.37
EXPORT FUNCTION:
tu
c
tm
xtt u
pp
PP
WX ++⎟⎟⎠
⎞⎜⎜⎝
⎛∆+⎟⎟
⎠
⎞⎜⎜⎝
⎛∆+∆=∆ 1-t
t
res log loglog log θδηε
1970-2003
Portugal
Greece Ireland Spain
tWlog∆
2.03 (5.77)*
2.40 (6.16)*
2.17 (5.79)*
2.42 (9.24)*
⎟⎟⎠
⎞⎜⎜⎝
⎛∆
m
x
PP
log 0.72 (2.45)*
-0.43 (-0.93)
0.11 (0.38)
-0.31 (-1.99)*
t
log ⎟⎟⎠
⎞⎜⎜⎝
⎛∆
u
c
pp 0.44
(1.39) 0.62
(1.41) 1.41
(2.83)*-0.61
(-1.50)***
1-tres
-0.24 (-1.93)**
-0.34 (-2.69)*
-0.11 (-0.79)
-0.17 (-1.35)
R20.48 0.48 0.07 0.19
DW 1.41 1.22 0.90 0.91 Notes: t-ratio in parenthesis; *- statistical significant at 5%; **- statistical significant at 10%; ***- statistical significant at 15%;
16
Comparing the four countries, Portugal reports the lowest export income elasticity
showing difficulties in placing its products in the foreign markets and Spain the highest.
On the other hand, the Spanish income elasticity of the demand for imports is the
highest and the Irish the lowest showing the difficulties of other countries to penetrate
the Irish market.
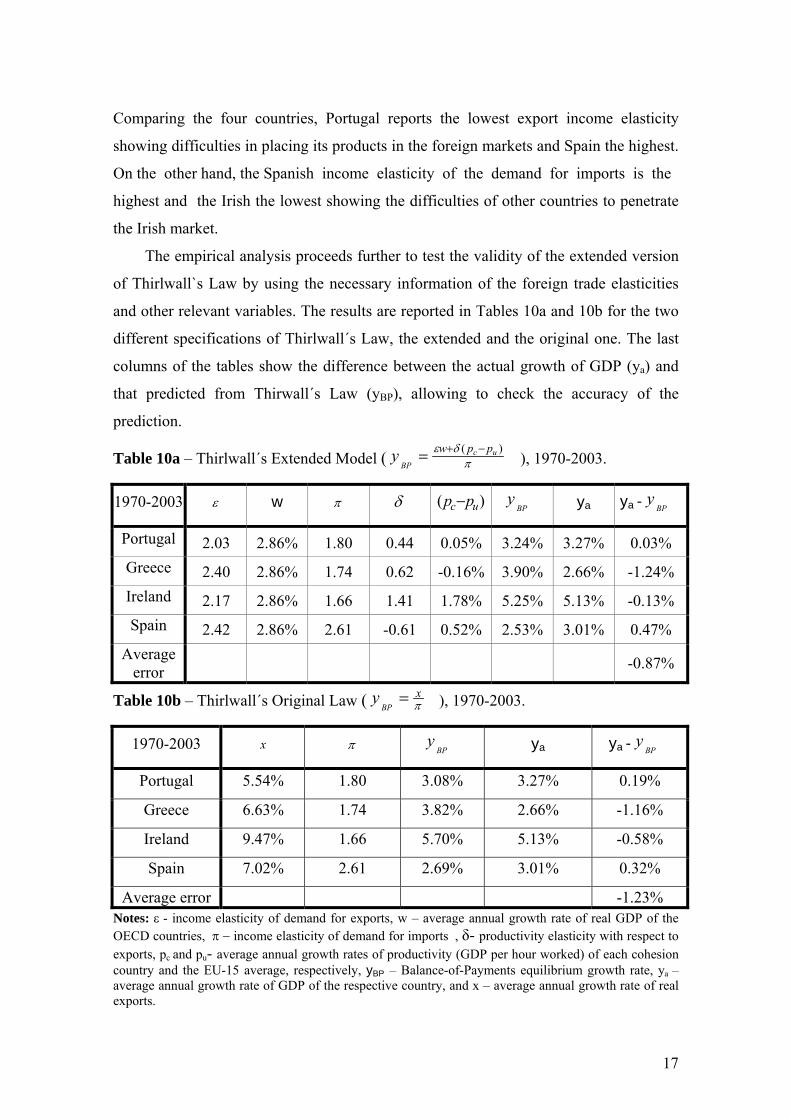
The empirical analysis proceeds further to test the validity of the extended version
of Thirlwall`s Law by using the necessary information of the foreign trade elasticities
and other relevant variables. The results are reported in Tables 10a and 10b for the two
different specifications of Thirlwall´s Law, the extended and the original one. The last
columns of the tables show the difference between the actual growth of GDP (ya) and
that predicted from Thirwall´s Law (yBP), allowing to check the accuracy of the
prediction.
Table 10a – Thirlwall´s Extended Model ( )(π
δε ucBP
ppwy −+= ), 1970-2003.
1970-2003 ε w π δ )( uc pp − BP
y ya ya - BP
y
Portugal 2.03 2.86% 1.80 0.44 0.05% 3.24% 3.27% 0.03% Greece 2.40 2.86% 1.74 0.62 -0.16% 3.90% 2.66% -1.24% Ireland 2.17 2.86% 1.66 1.41 1.78% 5.25% 5.13% -0.13% Spain 2.42 2.86% 2.61 -0.61 0.52% 2.53% 3.01% 0.47%
Average error -0.87%
Table 10b – Thirlwall´s Original Law ( πx
BPy = ), 1970-2003.
1970-2003 x π BP
y ya ya - BP
y
Portugal 5.54% 1.80 3.08% 3.27% 0.19%
Greece 6.63% 1.74 3.82% 2.66% -1.16%
Ireland 9.47% 1.66 5.70% 5.13% -0.58%
Spain 7.02% 2.61 2.69% 3.01% 0.32%
Average error -1.23% Notes: ε - income elasticity of demand for exports, w – average annual growth rate of real GDP of the OECD countries, π − income elasticity of demand for imports , δ- productivity elasticity with respect to exports, pc and pu- average annual growth rates of productivity (GDP per hour worked) of each cohesion country and the EU-15 average, respectively, yBP – Balance-of-Payments equilibrium growth rate, ya – average annual growth rate of GDP of the respective country, and x – average annual growth rate of real exports.
17
Comparing the two tables, equation )(π
δε uc
BP
ppwy −+= seems to predict better the
growth rate of domestic output, since the average absolute error of the actual growth
rate from that predicted by the extended model is in fact smaller than the error of
prediction from the simple rule (-0.87 percentage points compared with -1.23). The
accuracy of the prediction is especially satisfactory in Portugal (only 0.03 percentage
points of failure) while in Greece the failure is greater (-1.24 p.p.). The estimated
Balance-of-Payments equilibrium growth rate (yBP) in Greece and Ireland is higher than
their actual growth rate (ya), implying that the two countries could grow faster without
confronting problems in their Balance-of-Payments. On the contrary, Spain (and to a
lesser extend Portugal) has grown faster than the Balance-of-Payments condition
allows, a situation that can create some pressure on demand and the growth of output
over the long run period.
Table 10b reports the results from the original specification of Thirlwall´s Law
given by the ratio, yBP=x/π, which also predicts closely the actual growth of real output
with higher accuracy in the case of Portugal. According to this specification, the higher
growth of real output in Ireland, in comparison with the other cohesion countries, can be
explained by the higher growth of real exports (9.47% per annum in average) and the
lower income elasticity of the demand for imports (1.66). The combination of these two
factors can explain the higher competitiveness of the Irish economy not only in the
external markets but in the domestic market too.
According to our evidence, the predicted growth rate of the Spanish economy is
the lowest among the cohesion countries as can been seen from tables 10a and 10b. Two
main factors contributed to this result, the higher income elasticity of the demand for
imports (higher than the income elasticity of the demand for exports) and the negative
impact of the productivity gap on exports. Despite the fact that the income elasticity of
the demand for exports in Spain is the highest among the other countries revealing a
higher penetration of the Spanish exports in foreign markets, this advantage is countered
off by the higher penetration of imports in the domestic market, not allowing for higher
growth.
The evidence from the export-led growth model shows that the main Portuguese
disadvantage relatively to other cohesion countries is its lower income elasticity of the
demand for exports (lower competitiveness of exports) as the impediment to achieve
18
higher growth rates. This is more obvious from Table 10b, where exports in Portugal
grow at a lower annual rate in the whole period.
Finally, the main problem with the Greek economy relatively to other cohesion
countries seems to be the negative growth of relative productivity (GDP per hour
worked) showing that labour productivity in Greece grows, in average, slower than the
EU average.
4.3 Export-led growth evidence from a more recent period
It is interesting to use the same methodology to predict growth rates for a more recent
period (1986-2003), after Portugal and Spain joining the EEC and when Ireland
recorded higher rates of economic activity converging rapidly to the richest members of
the EU. Table 11 reports the results of the estimated import and export demand
functions for the four countries over the new period 1986-2003.
We focus on the income elasticities of the demand for imports and exports since
these are the basic parameters to predict countries growth rates through the specification
of Thirlwall´s Law. Both income elasticities with respect to imports and exports are
statistically significant and carry their expected sign. It is obvious again the comfortable
position of Ireland recording the lowest income elasticity of the demand for imports
(1.75) and the highest income elasticity of the demand for exports (3.90) among the
other cohesion countries. This gives to Ireland the advantage to grow relatively faster.
Knowing the income elasticities of external trade for all the cohesion countries we
can predict the balance of payments equilibrium growth rate obtained by Thirlwall´s
Law. The results for the two alternative specifications of this rule, the extended and the
original, are given in Tables 12a and 12b, respectively. As we can see Thirwall´s
equations predict fairly well the growth rates of domestic output in the four countries,
and the approximation between the actual growth rate (ya) and that predicted by this
Law (yBP) is closer in the case of Ireland. Once more, the absolute error of the
prediction is much smaller in the extended model (0.59 percentage points in comparison
with 1.56 p.p. in the original version) when the productivity gap is considered. In
Greece and Ireland, the estimated Balance-of-Payments equilibrium growth rates are
higher than the actual rates, indicating that both countries had the potentiality to grow
faster than actually did.
19
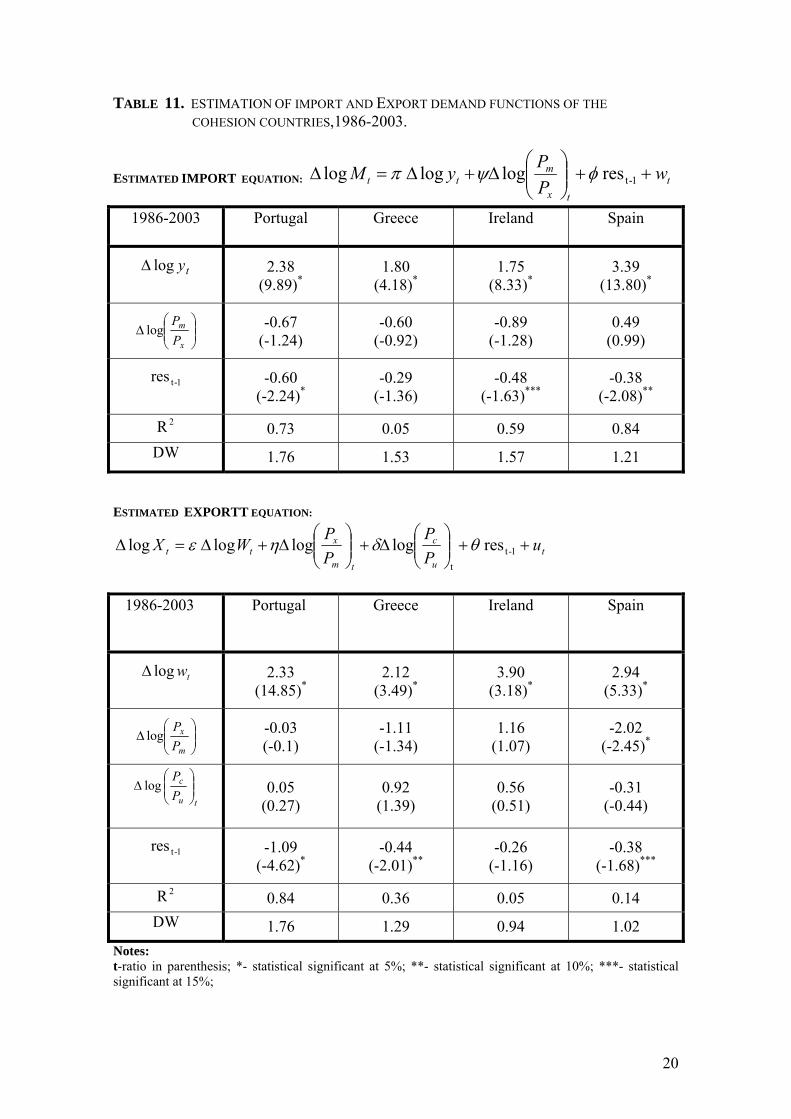
TABLE 11. ESTIMATION OF IMPORT AND EXPORT DEMAND FUNCTIONS OF THE COHESION COUNTRIES,1986-2003.
ESTIMATED IMPORT EQUATION: ttx
mtt w
PPyM ++⎟⎟
⎠
⎞⎜⎜⎝
⎛∆+∆=∆ 1-tres loglog log φψπ
1986-2003 Portugal
Greece
Ireland
Spain
tylog∆
2.38 (9.89)*
1.80 (4.18)*
1.75 (8.33)*
3.39 (13.80)*
⎟⎟⎠
⎞⎜⎜⎝
⎛∆
x
m
PP
log -0.67 (-1.24)
-0.60 (-0.92)
-0.89 (-1.28)
0.49 (0.99)
1-tres
-0.60 (-2.24)*
-0.29 (-1.36)
-0.48 (-1.63)***
-0.38 (-2.08)**
2R 0.73 0.05 0.59 0.84 DW 1.76 1.53 1.57 1.21
ESTIMATED EXPORTT EQUATION:
tu
c
tm
xtt u
PP
PP
WX ++⎟⎟⎠
⎞⎜⎜⎝
⎛∆+⎟⎟
⎠
⎞⎜⎜⎝
⎛∆+∆=∆ 1-t
t
res logloglog log θδηε
1986-2003 Portugal
Greece
Ireland
Spain
twlog∆
2.33 (14.85)*
2.12 (3.49)*
3.90 (3.18)*
2.94 (5.33)*
⎟⎟⎠
⎞⎜⎜⎝
⎛∆
m
x
PP
log -0.03 (-0.1)
-1.11 (-1.34)
1.16 (1.07)
-2.02 (-2.45)*
tu
c
PP
⎟⎟⎠
⎞⎜⎜⎝
⎛∆ log
0.05 (0.27)
0.92 (1.39)
0.56 (0.51)
-0.31 (-0.44)
1-tres
-1.09 (-4.62)*
-0.44 (-2.01)**
-0.26 (-1.16)
-0.38 (-1.68)***
2R 0.84 0.36 0.05 0.14 DW 1.76 1.29 0.94 1.02
Notes: t-ratio in parenthesis; *- statistical significant at 5%; **- statistical significant at 10%; ***- statistical significant at 15%;
20
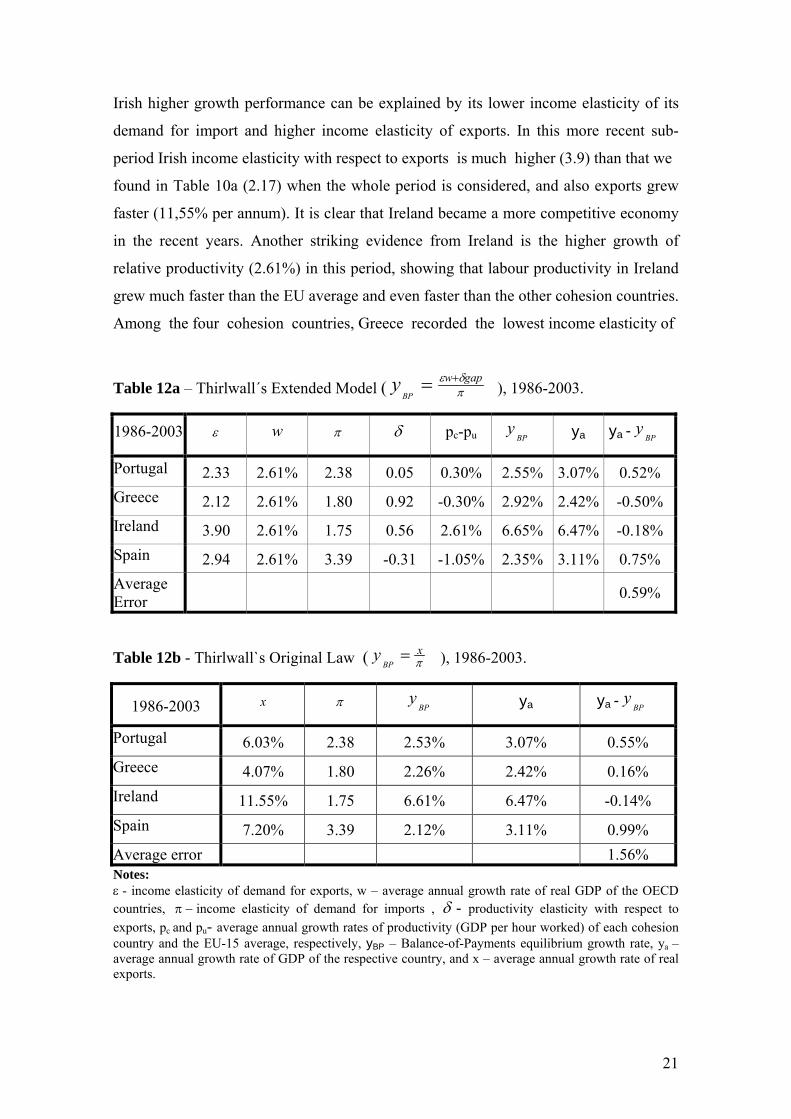
Irish higher growth performance can be explained by its lower income elasticity of its
demand for import and higher income elasticity of exports. In this more recent sub-
period Irish income elasticity with respect to exports is much higher (3.9) than that we
found in Table 10a (2.17) when the whole period is considered, and also exports grew
faster (11,55% per annum). It is clear that Ireland became a more competitive economy
in the recent years. Another striking evidence from Ireland is the higher growth of
relative productivity (2.61%) in this period, showing that labour productivity in Ireland
grew much faster than the EU average and even faster than the other cohesion countries.
Among the four cohesion countries, Greece recorded the lowest income elasticity of
Table 12a – Thirlwall´s Extended Model ( πδε gapw
BPy += ), 1986-2003.
1986-2003 ε w π δ pc-pu BP
y ya ya - BP
y
Portugal 2.33 2.61% 2.38 0.05 0.30% 2.55% 3.07% 0.52% Greece 2.12 2.61% 1.80 0.92 -0.30% 2.92% 2.42% -0.50% Ireland 3.90 2.61% 1.75 0.56 2.61% 6.65% 6.47% -0.18% Spain 2.94 2.61% 3.39 -0.31 -1.05% 2.35% 3.11% 0.75% Average Error 0.59%
Table 12b - Thirlwall`s Original Law ( πx
BPy = ), 1986-2003.
1986-2003 x π BP
y ya ya - BP
y
Portugal 6.03% 2.38 2.53% 3.07% 0.55% Greece 4.07% 1.80 2.26% 2.42% 0.16% Ireland 11.55% 1.75 6.61% 6.47% -0.14% Spain 7.20% 3.39 2.12% 3.11% 0.99% Average error 1.56% Notes: ε - income elasticity of demand for exports, w – average annual growth rate of real GDP of the OECD countries, π − income elasticity of demand for imports , δ - productivity elasticity with respect to exports, pc and pu- average annual growth rates of productivity (GDP per hour worked) of each cohesion country and the EU-15 average, respectively, yBP – Balance-of-Payments equilibrium growth rate, ya – average annual growth rate of GDP of the respective country, and x – average annual growth rate of real exports.
21
exports (and lowest growth of exports, around 4% per annum) and the second (after
Spain) lower negative increase in the productivity gap. The combination of these two
factors - lose of competitiveness and productivity decline - could probably explain the
lowest actual growth rates achieved by the Greek economy in this period.
Both Portugal and Spain present a situation where the income elasticity of imports
(2.38 and 3.39, respectively) is higher than the income elasticity of exports (2.33 and
2.94, respectively). This fact pronounces balance of payments difficulties in the long
run and competitiveness problems.
Finally, all countries registered a higher income elasticity with respect to imports
and exports in this more recent period (1986-2003), except Greece in the case of
exports. This is a clear evidence of higher trade intensification among the EU countries
after the setting up of the single market in 1986 implying higher trade integration.
5. Summarizing the main conclusions
The purpose of this study was to explain differences in growth rates between the four
cohesion countries of the EU. Two main procedures were employed to explain the
uneven economic performance of the cohesion countries during the period 1970-2003.
A descriptive approach based on the decomposition of per capita income into its main
sources, and a demand approach relied on an export-led growth principle predicting the
actual growth of output consistent with the balance of payments equilibrium in current
account.
The decomposition approach revealed that productivity growth was the main source
of output growth in the four countries. The remarkable higher growth of output per head
in Ireland can be explained by the higher growth in productivity which runs at an
average annual rate of 3.6% for the whole period in comparison to around 2% of the
northern countries. The statistical evidence shows clearly that the higher productivity
performance in Ireland was due to higher investment in human capital qualifications and
technical progress advances.
The export-led growth analysis revealed that the competitiveness of the economies is
a crucial factor in explaining their economic performance. The application of
Thirlwall´s Law predicts reasonably well the growth of real output in the four countries
and the prediction is more accurate through the extended model where relative
productivity growth between each cohesion country and the EU average is considered.
22
The relatively higher economic growth in Ireland is explained by its higher income
elasticity of the demand for exports relatively to imports and this advantage is even
stronger in more recent years. Ireland has the advantage to grow faster without incurring
balance of payments problems and facing demand constraints. Exports in Ireland grew
at a higher annual rate of 11.5% almost twice much as in the other cohesion countries.
This dynamic performance of exports induced higher output growth in Ireland through
the external trade multiplier of the Harrodian type. Productivity gains reinforce export
competitiveness and this is more evident in the estimation of the export function with
concern to Ireland. Productivity grows faster in Ireland in comparison to the EU average
and to other cohesion countries, contributing decisively to the growth of its output.
The export-led growth analysis indicates that Spain (and Portugal only in the recent
period) is the only country where the income elasticity of the demand for imports is
greater than the income elasticity of the demand for exports and this is true for the
whole period 1970-2003 and the more recent period 1986-2003, after Spain joining the
EU. Interpreting this result in the light of the export-led growth principle means that
Spain eventually will face balance of payments problems and demand constraints in the
future. This observation is reinforced by the fact that Spain actually grows at higher
rates that that allowed by the balance of payments equilibrium condition.
Portugal reports the lowest export income elasticity in the whole period but this
position is gained by Greece in the more recent period. Low income elasticity of exports
is associated with lower export competitiveness which explains in turn the lower output
growth performance of these two countries relatively to Ireland and Spain. The
difference between the two countries is that Greece grows at lower rates than the
balance of payments permits pronouncing supply constraints. Another difference is also
that productivity growth in Greece is lagging behind the EU average rate and this also
happens with Spain in the more recent period.
Two main policy recommendations can be suggested for the cohesion countries to
achieve the growth records of Ireland: improvements in productivity through higher
investment in human capital qualifications and technology, and improvements in export
competitiveness reallocating resources to sectors with higher elasticity of demand in
international markets.
23
References
Barro, R. (1991), Economic growth in a cross section of countries, Quarterly Journal of Economics, 106, May, 407-501. Barry, F. and Crafts, N. (1999), Some comparative aspects of Ireland´s economic transformation, Irish Banking Review, Autumn, pp.39-44. Freitas M. (2000), Quantidade versus qualidade: a contabilidade do crescimento da Irlanda, Boletim Económico do Banco de Portugal, Março. Fuente, A. and Vives, X. (1997), The sources of Irish growth, CEPR Discussion Paper nº 1756. Kaldor N. (1957), A Model of Economic Growth, Economic Journal, December. Kaldor, N. (1966), Causes of the Slow Rate of Economic Growth of the United Kingdom. An Inaugural Lecture, Cambridge: Cambridge University Press. Leon-Ladesma, M. (2000), Accumulation, Innovation and Catching-Up: an Extended Cumulative Growth Model, Cambridge Journal of Economics, May. Myrdal, G. (1957), Economic Theory and Underdeveloped Regions (London: Duckworth). Thirlwall, A.P. (1979), The Balance of Payments Constraint as an Explanation of International Growth Rate Differences, Banca Nazionale del Lavoro Quarterly Review, March. Thirlwall, A.P.(2002), The Nature of Economic Growth: An alternative framework for understanding the performance of Nations, Edward Elgar, Cheltenham, U.K. Verdoorn, P. J. (1949), Fattori che Regolano lo Sviluppo della Produttivita de Lavoro, L´Índustria, nº.1. English translation by A.P. Thirlwall in L. Pasinetti(ed.), Italian Economic Papers Vol. II (Oxford: Oxford University Press, 1993).
24
List of the Discussion Papers published by CEUNEUROP Year 2000 Alfredo Marques - Elias Soukiazis (2000). “Per capita income convergence across countries and across regions in the European Union. Some new evidence”. Discussion Paper Nº1, January. Elias Soukiazis (2000). “What have we learnt about convergence in Europe? Some theoretical and empirical considerations”. Discussion Paper Nº2, March. Elias Soukiazis (2000). “ Are living standards converging in the EU? Empirical evidence from time series analysis”. Discussion Paper Nº3, March. Elias Soukiazis (2000). “Productivity convergence in the EU. Evidence from cross-section and time-series analyses”. Discussion Paper Nº4, March. Rogério Leitão (2000). “ A jurisdicionalização da política de defesa do sector têxtil da economia portuguesa no seio da Comunidade Europeia: ambiguidades e contradições”. Discussion Paper Nº5, July. Pedro Cerqueira (2000). “ Assimetria de choques entre Portugal e a União Europeia”. Discussion Paper Nº6, December. Year 2001 Helena Marques (2001). “A Nova Geografia Económica na Perspectiva de Krugman: Uma Aplicação às Regiões Europeias”. Discussion Paper Nº7, January. Isabel Marques (2001). “Fundamentos Teóricos da Política Industrial Europeia”. Discussion Paper Nº8, March. Sara Rute Sousa (2001). “O Alargamento da União Europeia aos Países da Europa Central e Oriental: Um Desafio para a Política Regional Comunitária”. Discussion Paper Nº9, May. Year 2002 Elias Soukiazis e Vitor Martinho (2002). “Polarização versus Aglomeração: Fenómenos iguais, Mecanismos diferentes”. Discussion Paper Nº10, February. Alfredo Marques (2002). “Crescimento, Produtividade e Competitividade. Problemas de desempenho da economia Portuguesa” . Discussion Paper Nº 11, April. Elias Soukiazis (2002). “Some perspectives on the new enlargement and the convergence process in Europe”. Discussion Paper Nº 12, September. Vitor Martinho (2002). “ O Processo de Aglomeração nas Regiões Portuguesas”. Discussion Paper, Nº 13, November.
25
Year 2003 Elias Soukiazis (2003). “Regional convergence in Portugal”. Discussion Paper, Nº 14, May. Elias Soukiazis and Vítor Castro (2003). “The Impact of the Maastricht Criteria and the Stability Pact on Growth and Unemployment in Europe” Discussion Paper, Nº 15, July. Stuart Holland (2003a). “Financial Instruments and European Recovery – Current Realities and Implications for the New European Constitution”. Discussion Paper, Nº 16, July. Stuart Holland (2003b). “How to Decide on Europe - The Proposal for an Enabling Majority Voting Procedure in the New European Constitution”. Discussion Paper, Nº 17, July. Elias R. Silva (2003). “Análise Estrutural da Indústria Transformadora de Metais não Ferrosos Portuguesa”, Discussion Paper, Nº 18, September. Catarina Cardoso and Elias Soukiazis (2003). “What can Portugal learn from Ireland? An empirical approach searching for the sources of growth”, Discussion Paper, Nº 19, October. Luis Peres Lopes (2003). “Border Effect and Effective Transport Cost”. Discussion Paper, Nº 20, November. Alfredo Marques (2003). “A política industrial face às regras de concorrência na União Europeia: A questão da promoção de sectores específicos” Discussion Paper, Nº 21, December. Year 2004 Pedro André Cerqueira (2004). “How Pervasive is the World Business Cycle?” Discussion Paper, Nº 22, April. Helena Marques and Hugh Metcalf (2004). “Immigration of skilled workers from the
new EU members: Who stands to lose?” Discussion Paper, Nº 23, April.
Elias Soukiazis and Vítor Castro (2004). “How the Maastricht rules affected the convergence process in the European Union. A panel data analysis”. Discussion Paper, Nº 24, May.
Elias Soukiazis and Micaela Antunes (2004). “The evolution of real disparities in Portugal among the Nuts III regions. An empirical analysis based on the convergence approach”. Discussion Paper, Nº 25, June.
26
Catarina Cardoso and Elias Soukiazis (2004). “What can Portugal learn from Ireland and to a less extent from Greece? A comparative analysis searching for the sources of growth”. Discussion Paper, Nº 26, July. Sara Riscado (2004), “Fusões e Aquisições na perspectiva internacional: consequências económicas e implicações para as regras de concorrência”. Documento de trabalho, Nº 27, Outubro.
Year 2005 Micaela Antunes and Elias Soukiazis (2005). “Two speed regional convergence in Portugal and the importance of structural funds on growth”. Discussion Paper, Nº 28, February. Sara Proença and Elias Soukiazis (2005). “Demand for tourism in Portugal. A panel data approach”. Discussion Paper, Nº 29, February. Vitor João Pereira Martinho (2005). “Análise dos Efeitos Espaciais na Produtividade Sectorial entre as Regiões Portuguesas”. Discussion Paper, Nº 30, Abril. Tânia Constâncio(2005). “Efeitos dinâmicos de integração de Portugal na UE” Discussion Paper, Nº 31, Março. Catarina Cardoso and Elias Soukiazis (2005). “Explaining the Uneven Economic Performance of the Cohesion Countries. An Export-led Growth Approach.” Discussion Paper, Nº 32, April.
27