structure and the uneven distribution of the
TRANSCRIPT
1
3.1. HYDROSPHERE –
STRUCTURE AND THE
UNEVEN
DISTRIBUTION
OF THE
FRESHWATER
IN EUROPE.
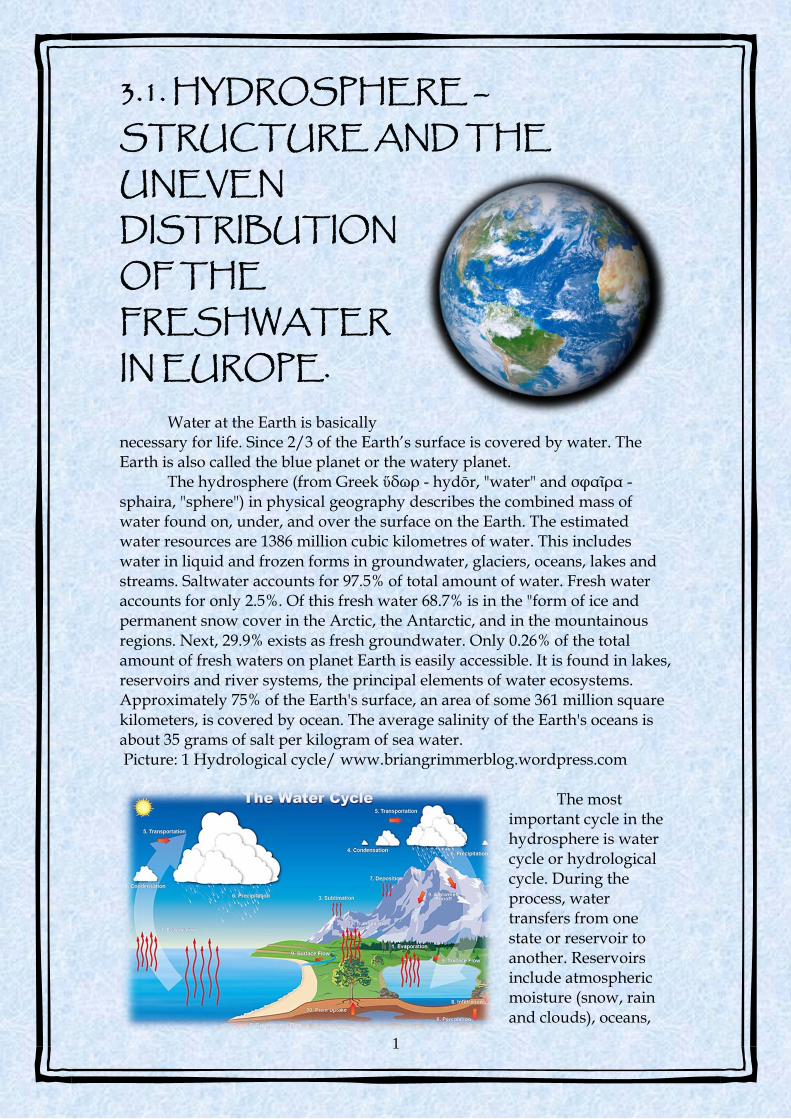
Water at the Earth is basically necessary for life. Since 2/3 of the Earth’s surface is covered by water. The Earth is also called the blue planet or the watery planet.
The hydrosphere (from Greek ὕδωρ - hydōr, "water" and σφαῖρα - sphaira, "sphere") in physical geography describes the combined mass of water found on, under, and over the surface on the Earth. The estimated water resources are 1386 million cubic kilometres of water. This includes water in liquid and frozen forms in groundwater, glaciers, oceans, lakes and streams. Saltwater accounts for 97.5% of total amount of water. Fresh water accounts for only 2.5%. Of this fresh water 68.7% is in the "form of ice and permanent snow cover in the Arctic, the Antarctic, and in the mountainous regions. Next, 29.9% exists as fresh groundwater. Only 0.26% of the total amount of fresh waters on planet Earth is easily accessible. It is found in lakes, reservoirs and river systems, the principal elements of water ecosystems. Approximately 75% of the Earth's surface, an area of some 361 million square kilometers, is covered by ocean. The average salinity of the Earth's oceans is about 35 grams of salt per kilogram of sea water. Picture: 1 Hydrological cycle/ www.briangrimmerblog.wordpress.com
The most
important cycle in the hydrosphere is water cycle or hydrological cycle. During the process, water transfers from one state or reservoir to another. Reservoirs include atmospheric moisture (snow, rain and clouds), oceans,
2
rivers, lakes, groundwater, subterranean aquifers, polar icecaps and saturated soil. Solar energy, in the form of heat and light (insolation), and gravity cause the transfer from one state to another over periods from hours to thousands of years. Most evaporation comes from the oceans and is returned to the earth as snow or rain. Sublimation (3) refers to evaporation from snow and ice. Transpiration refers to the expiration of water through the minute pores or stomata of trees. Evapotranspiration is the term used by hydrologists in reference to the three processes together, transpiration, sublimation and evaporation.
Fresh water availability "Water, water, everywhere, nor any drop to drink"
- Rhyme of the Ancient Mariner, by Coleridge. Fresh water resources are unevenly distributed in terms of space and time and can go from floods to water shortages within months in the same area.
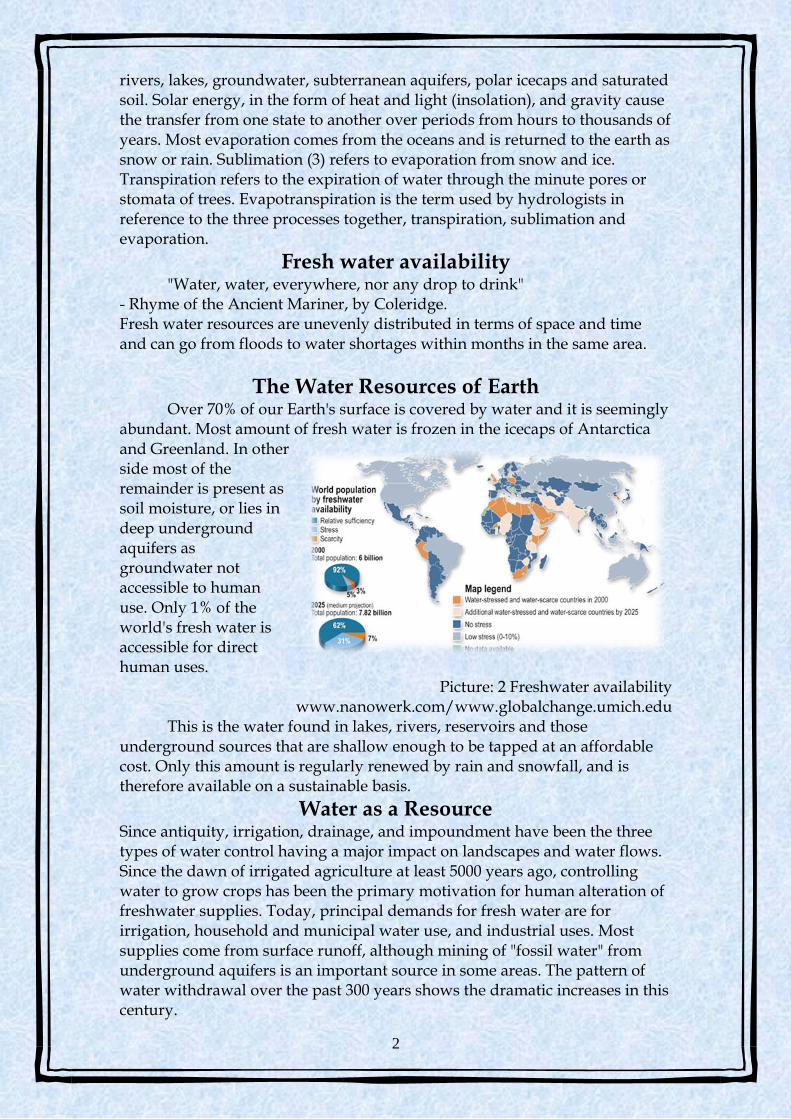
The Water Resources of Earth Over 70% of our Earth's surface is covered by water and it is seemingly
abundant. Most amount of fresh water is frozen in the icecaps of Antarctica and Greenland. In other side most of the remainder is present as soil moisture, or lies in deep underground aquifers as groundwater not accessible to human use. Only 1% of the world's fresh water is accessible for direct human uses.
Picture: 2 Freshwater availability www.nanowerk.com/www.globalchange.umich.edu
This is the water found in lakes, rivers, reservoirs and those underground sources that are shallow enough to be tapped at an affordable cost. Only this amount is regularly renewed by rain and snowfall, and is therefore available on a sustainable basis.
Water as a Resource Since antiquity, irrigation, drainage, and impoundment have been the three types of water control having a major impact on landscapes and water flows. Since the dawn of irrigated agriculture at least 5000 years ago, controlling water to grow crops has been the primary motivation for human alteration of freshwater supplies. Today, principal demands for fresh water are for irrigation, household and municipal water use, and industrial uses. Most supplies come from surface runoff, although mining of "fossil water" from underground aquifers is an important source in some areas. The pattern of water withdrawal over the past 300 years shows the dramatic increases in this century.
3
A timeline of human water use: 12,000 yrs. ago: hunter-gatherers continually return to fertile river valleys 7,000 yrs. ago: water shortages spur humans to invent irrigation 1,100 yrs ago: collapse of Mayan civilization due to drought Mid 1800's: fecal contamination of surface water causes severe health problems (typhoid, cholera) in some major North American cities, notably Chicago 1858: "Year of the Great Stink" in London, due to sewage and wastes in Thames Late 1800s-early 1900: Dams became popular as a water management tool 1900s: The green revolution strengthens human dependency on irrigation for agriculture World War II: water quality impacted by industrial and agricultural chemicals 1972: Clean Water Act passed; humans recognize need to protect water
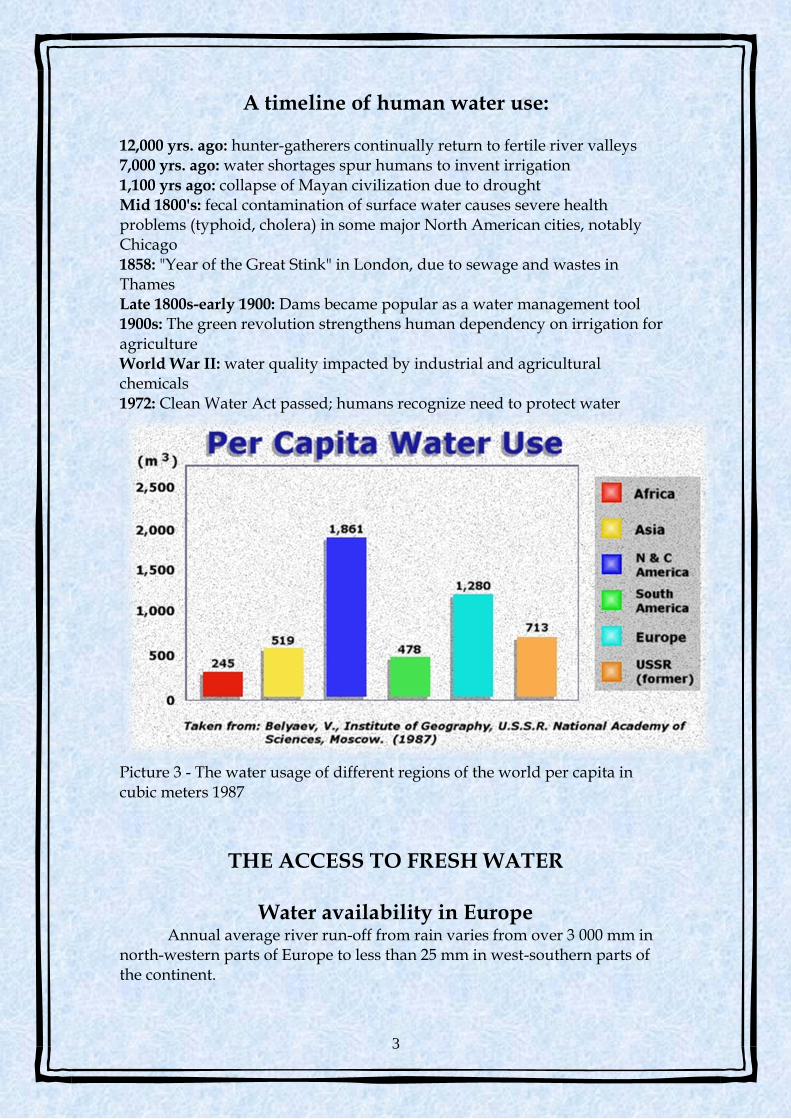
Picture 3 - The water usage of different regions of the world per capita in cubic meters 1987
THE ACCESS TO FRESH WATER
Water availability in Europe
Annual average river run-off from rain varies from over 3 000 mm in north-western parts of Europe to less than 25 mm in west-southern parts of the continent.
4
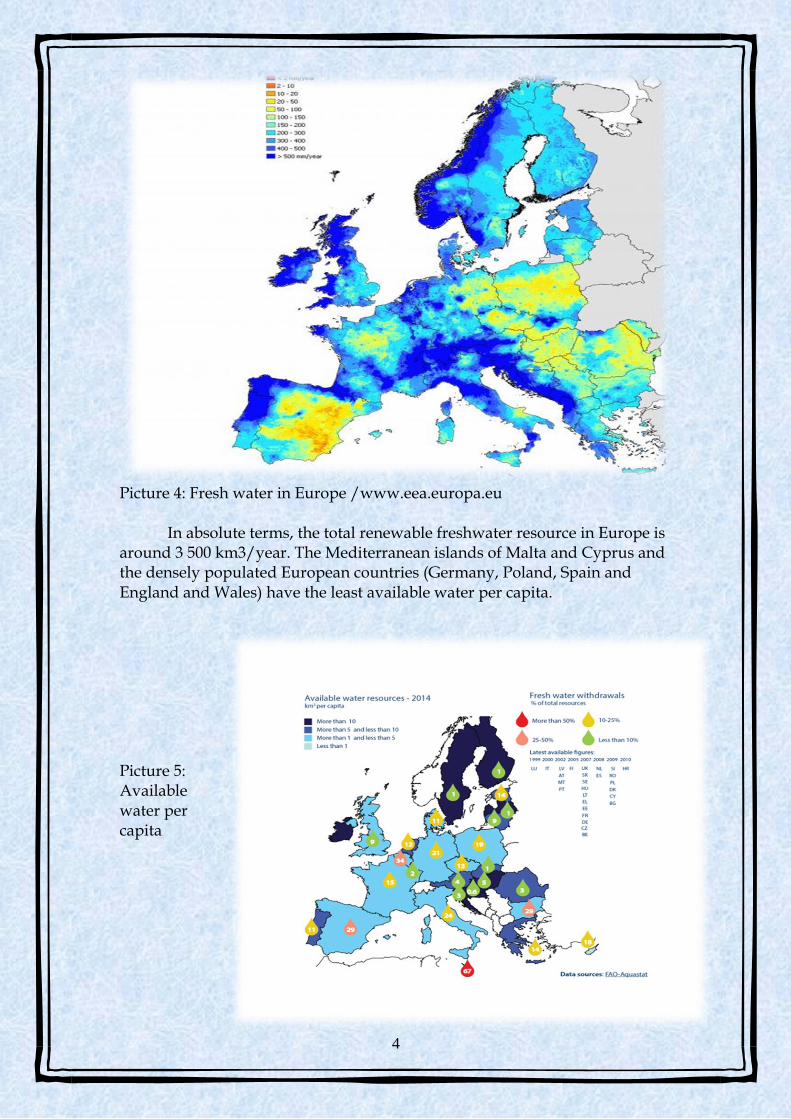
Picture 4: Fresh water in Europe /www.eea.europa.eu
In absolute terms, the total renewable freshwater resource in Europe is around 3 500 km3/year. The Mediterranean islands of Malta and Cyprus and the densely populated European countries (Germany, Poland, Spain and England and Wales) have the least available water per capita. Picture 5: Available water per capita
5
Fresh water resources in Bulgaria
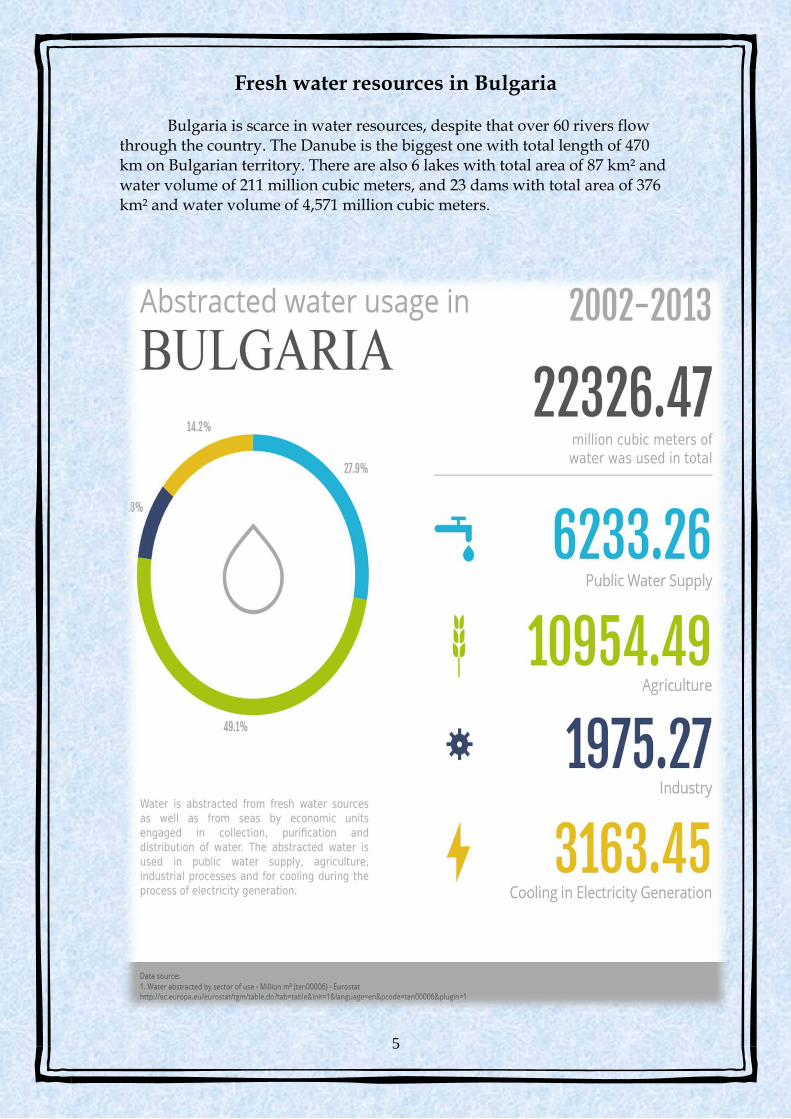
Bulgaria is scarce in water resources, despite that over 60 rivers flow through the country. The Danube is the biggest one with total length of 470 km on Bulgarian territory. There are also 6 lakes with total area of 87 km² and water volume of 211 million cubic meters, and 23 dams with total area of 376 km² and water volume of 4,571 million cubic meters.
6
Fresh water resources in Czech Republic
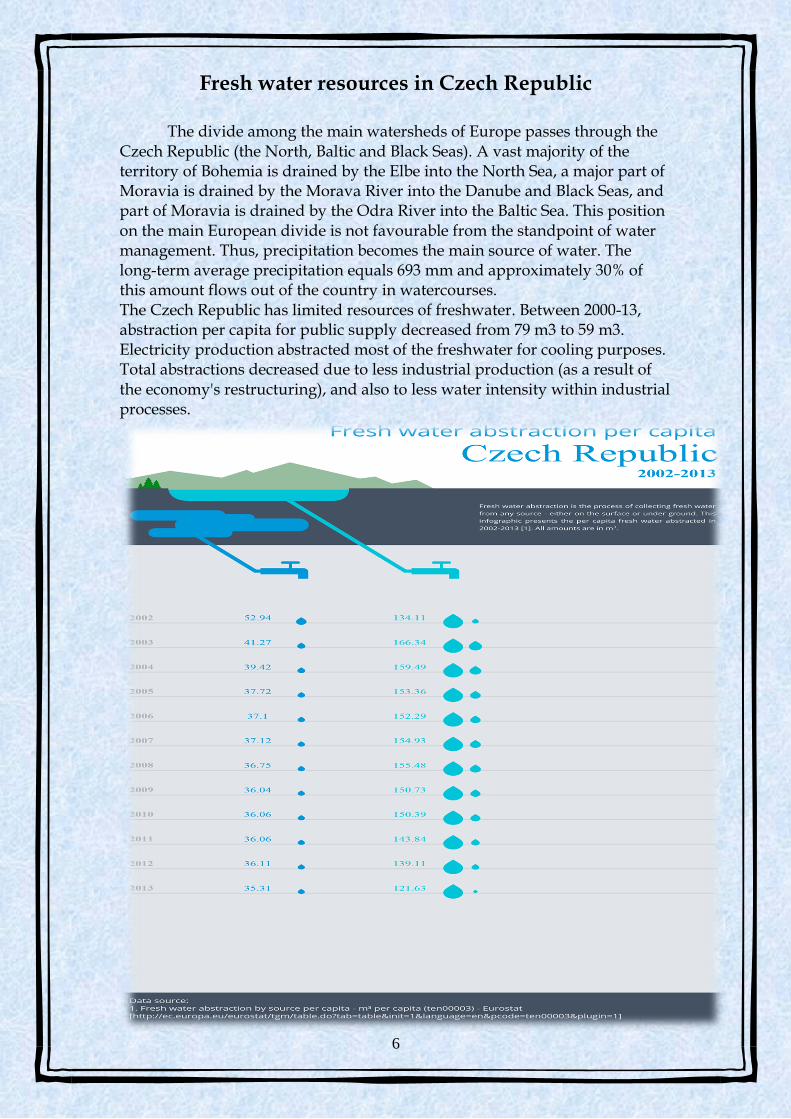
The divide among the main watersheds of Europe passes through the Czech Republic (the North, Baltic and Black Seas). A vast majority of the territory of Bohemia is drained by the Elbe into the North Sea, a major part of Moravia is drained by the Morava River into the Danube and Black Seas, and part of Moravia is drained by the Odra River into the Baltic Sea. This position on the main European divide is not favourable from the standpoint of water management. Thus, precipitation becomes the main source of water. The long-term average precipitation equals 693 mm and approximately 30% of this amount flows out of the country in watercourses. The Czech Republic has limited resources of freshwater. Between 2000-13, abstraction per capita for public supply decreased from 79 m3 to 59 m3. Electricity production abstracted most of the freshwater for cooling purposes. Total abstractions decreased due to less industrial production (as a result of the economy's restructuring), and also to less water intensity within industrial processes.
7
Fresh water resources in Greece
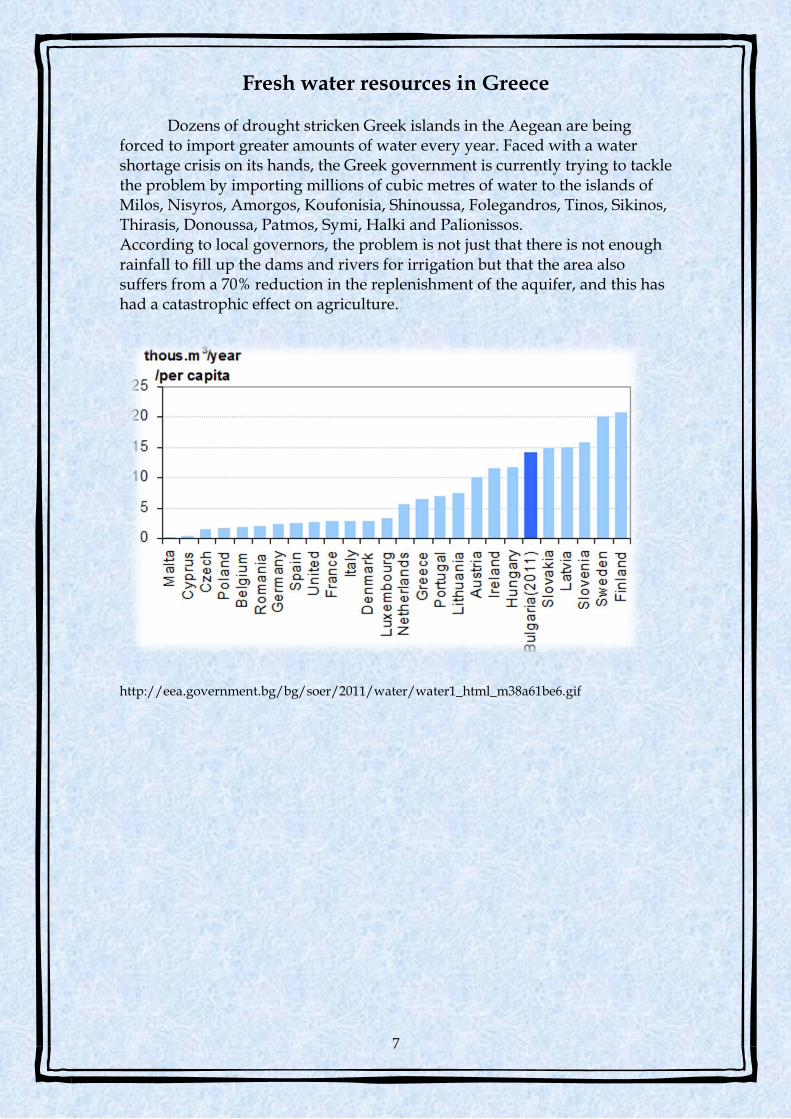
Dozens of drought stricken Greek islands in the Aegean are being forced to import greater amounts of water every year. Faced with a water shortage crisis on its hands, the Greek government is currently trying to tackle the problem by importing millions of cubic metres of water to the islands of Milos, Nisyros, Amorgos, Koufonisia, Shinoussa, Folegandros, Tinos, Sikinos, Thirasis, Donoussa, Patmos, Symi, Halki and Palionissos. According to local governors, the problem is not just that there is not enough rainfall to fill up the dams and rivers for irrigation but that the area also suffers from a 70% reduction in the replenishment of the aquifer, and this has had a catastrophic effect on agriculture.
http://eea.government.bg/bg/soer/2011/water/water1_html_m38a61be6.gif
8
Fresh water resources in France
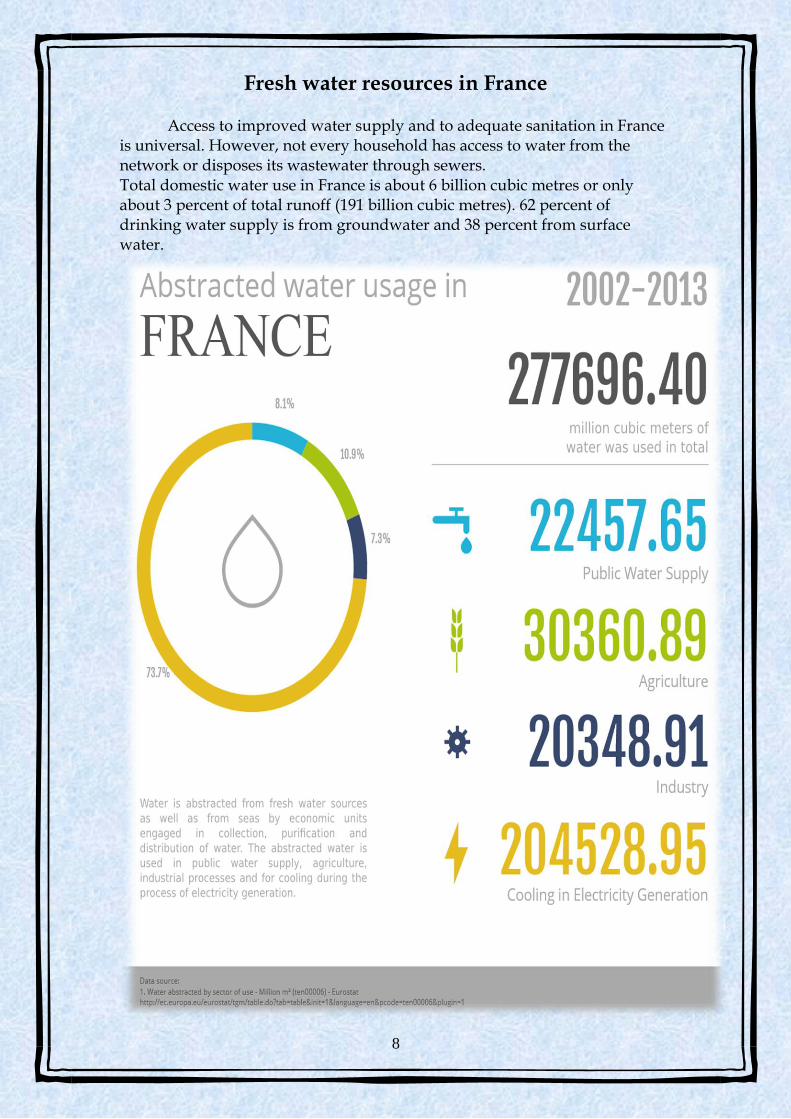
Access to improved water supply and to adequate sanitation in France is universal. However, not every household has access to water from the network or disposes its wastewater through sewers. Total domestic water use in France is about 6 billion cubic metres or only about 3 percent of total runoff (191 billion cubic metres). 62 percent of drinking water supply is from groundwater and 38 percent from surface water.
9
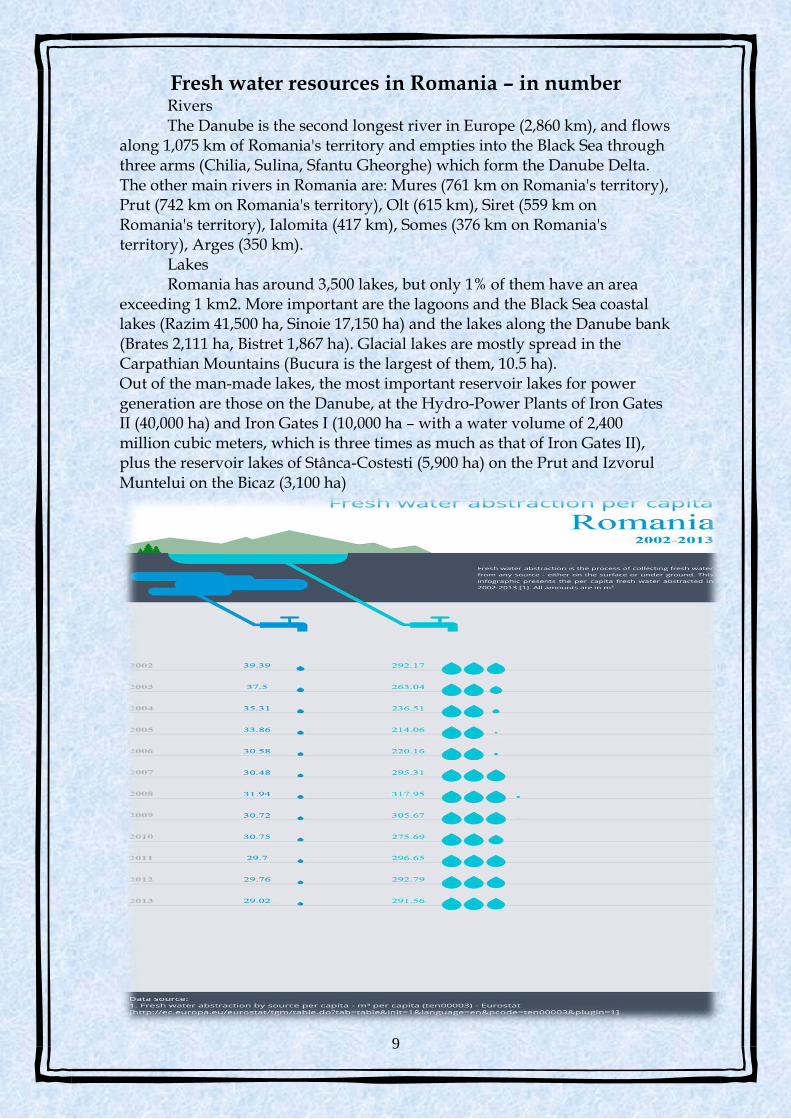
Fresh water resources in Romania – in number Rivers The Danube is the second longest river in Europe (2,860 km), and flows
along 1,075 km of Romania's territory and empties into the Black Sea through three arms (Chilia, Sulina, Sfantu Gheorghe) which form the Danube Delta. The other main rivers in Romania are: Mures (761 km on Romania's territory), Prut (742 km on Romania's territory), Olt (615 km), Siret (559 km on Romania's territory), Ialomita (417 km), Somes (376 km on Romania's territory), Arges (350 km).
Lakes Romania has around 3,500 lakes, but only 1% of them have an area
exceeding 1 km2. More important are the lagoons and the Black Sea coastal lakes (Razim 41,500 ha, Sinoie 17,150 ha) and the lakes along the Danube bank (Brates 2,111 ha, Bistret 1,867 ha). Glacial lakes are mostly spread in the Carpathian Mountains (Bucura is the largest of them, 10.5 ha). Out of the man-made lakes, the most important reservoir lakes for power generation are those on the Danube, at the Hydro-Power Plants of Iron Gates II (40,000 ha) and Iron Gates I (10,000 ha – with a water volume of 2,400 million cubic meters, which is three times as much as that of Iron Gates II), plus the reservoir lakes of Stânca-Costesti (5,900 ha) on the Prut and Izvorul Muntelui on the Bicaz (3,100 ha)
10
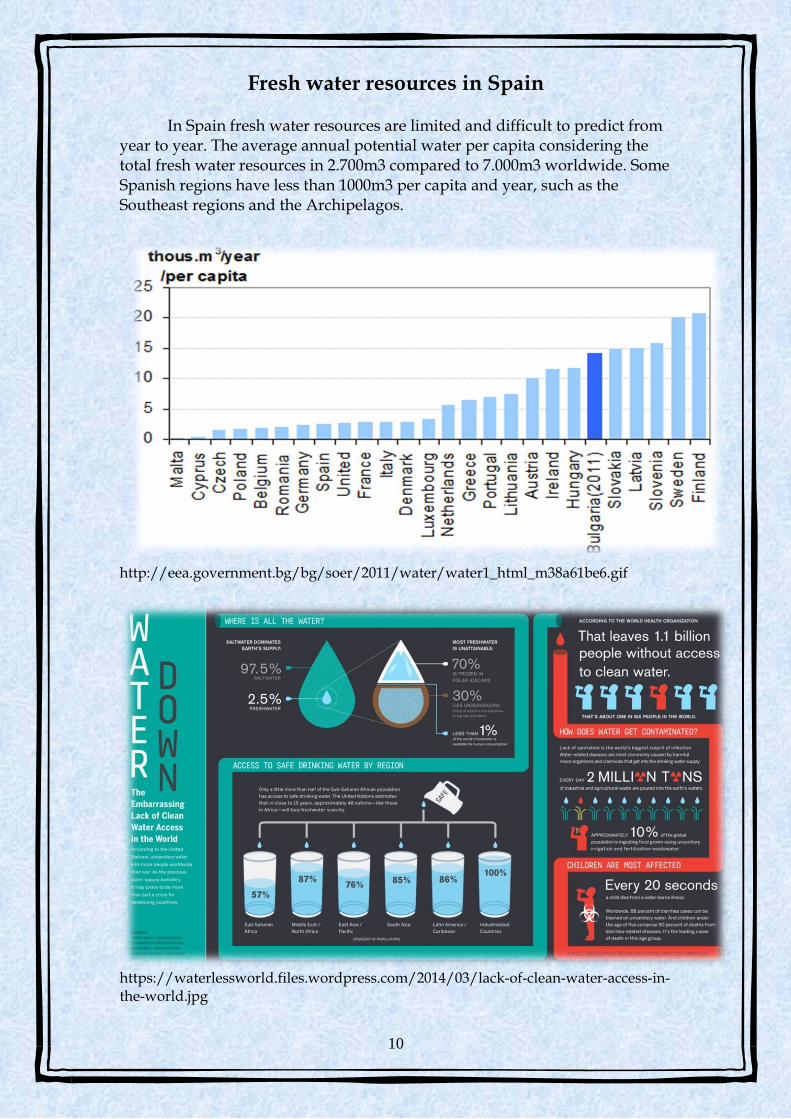
Fresh water resources in Spain
In Spain fresh water resources are limited and difficult to predict from year to year. The average annual potential water per capita considering the total fresh water resources in 2.700m3 compared to 7.000m3 worldwide. Some Spanish regions have less than 1000m3 per capita and year, such as the Southeast regions and the Archipelagos.
http://eea.government.bg/bg/soer/2011/water/water1_html_m38a61be6.gif
https://waterlessworld.files.wordpress.com/2014/03/lack-of-clean-water-access-in-the-world.jpg
11
3.2. WATER POLLUTION
Sources of pollution Water pollution is a major global problem and affects the entire biosphere
as plants and organisms living in it. The contamination of water species (e.g. lakes, rivers, oceans, aquifers and groundwater) occurs when pollutants are directly or indirectly discharged without adequate treatment to remove harmful compounds.
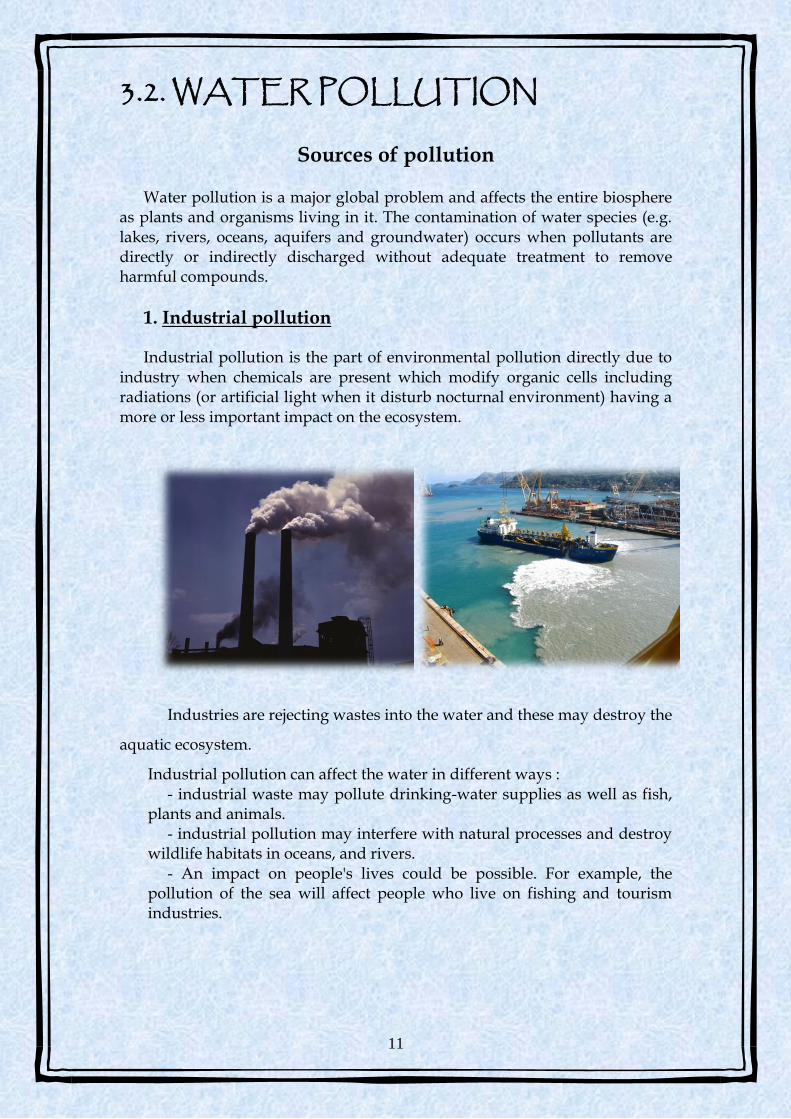
1. Industrial pollution
Industrial pollution is the part of environmental pollution directly due to industry when chemicals are present which modify organic cells including radiations (or artificial light when it disturb nocturnal environment) having a more or less important impact on the ecosystem.
Industries are rejecting wastes into the water and these may destroy the
aquatic ecosystem.
Industrial pollution can affect the water in different ways : - industrial waste may pollute drinking-water supplies as well as fish,
plants and animals. - industrial pollution may interfere with natural processes and destroy
wildlife habitats in oceans, and rivers. - An impact on people's lives could be possible. For example, the
pollution of the sea will affect people who live on fishing and tourism industries.
12
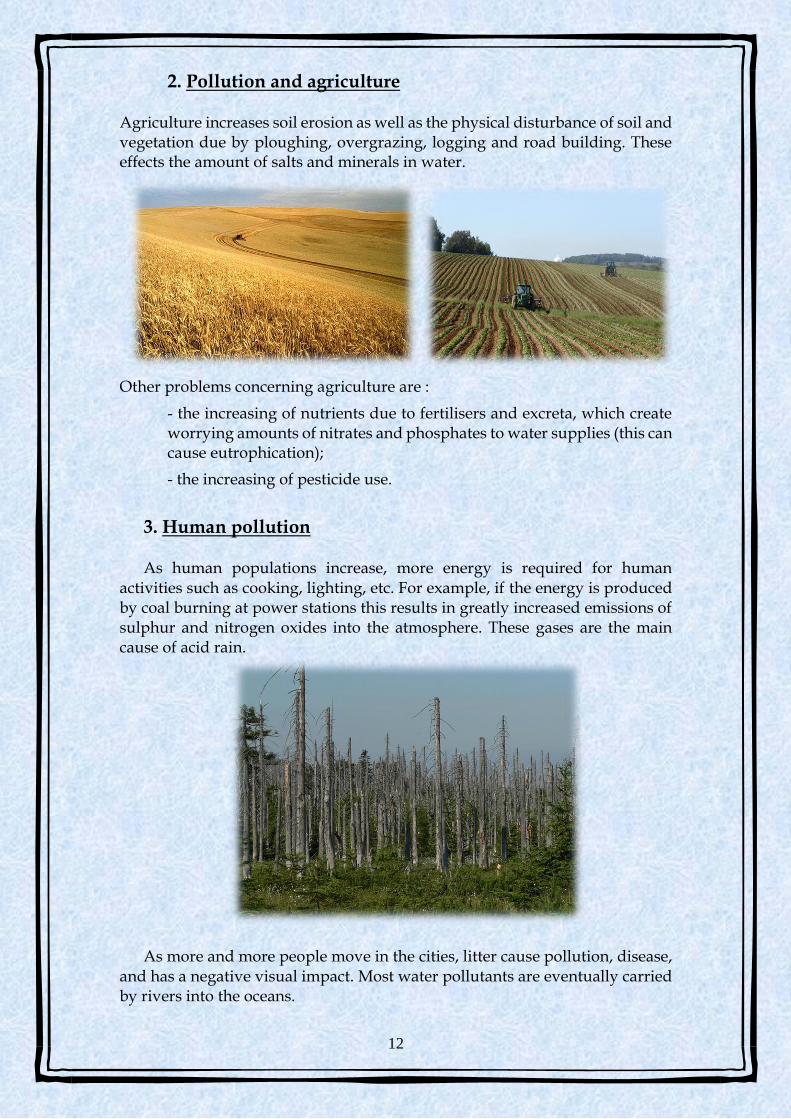
2. Pollution and agriculture
Agriculture increases soil erosion as well as the physical disturbance of soil and vegetation due by ploughing, overgrazing, logging and road building. These effects the amount of salts and minerals in water.
Other problems concerning agriculture are :
- the increasing of nutrients due to fertilisers and excreta, which create worrying amounts of nitrates and phosphates to water supplies (this can cause eutrophication);
- the increasing of pesticide use.
3. Human pollution As human populations increase, more energy is required for human
activities such as cooking, lighting, etc. For example, if the energy is produced by coal burning at power stations this results in greatly increased emissions of sulphur and nitrogen oxides into the atmosphere. These gases are the main cause of acid rain.
As more and more people move in the cities, litter cause pollution, disease, and has a negative visual impact. Most water pollutants are eventually carried by rivers into the oceans.
13
The human being pollutes the water, the water-treatment plants can allow to pass molecules in water and consequently the tap water get polluted.
4. Oil spill An oil spill is the release of a liquid petroleum hydrocarbon into the
environment, especially marine areas. Oil spills usually have only a localized effect on wildlife. They can spread for hundreds of nautical miles in a thin oil slick which can cover beaches with a thin coating of oil.
The oil may kill many fish and get stuck to the feathers of seabirds causing them to lose their ability to fly. Largest oil spill in Europe were :
- On 15 February 1996, the Liberian oil tanker the Sea Empress, loaded
with 130,000 tons of crude oil, grounded on the rocks at the entrance to
Milford Haven port (Wales, Great Britain).
- On 12 December 1999, the Maltese tanker the Erika was caught in a
storm and broke in two off the coast of Brittany (France), with 31,000
tons of heavy fuel oil onboard. Nearly 20,000 tons polluted over 400 km
of French coastline, with significant consequences for fishing and tourist
industries.
- On 13 November 2002, the Bahamian oil tanker the Prestige, carrying
77,000 tons of heavy fuel oil for Singapore, requested assistance due to
14
damage to her hull. During the following weeks, the remaining fuel
polluted more than 1,000 km of Spanish and later French coastline.
Cleanup and recovery from an oil spill is difficult and depends upon many
factors, including the type of oil spilled, the temperature of the water (affecting
evaporation and biodegradation), and the types of shorelines and beaches
involved.
Another source of pollution for oceans is the degassing. The degassing is a
current transaction consisting in ventilation of tanks to eliminate hydrocarbon
vapors and allow access for inspection or repair work. Sometimes, boats made
degassing in a forbidden area.
Pollutants
Water pollution occurs when pollutants (particles, chemicals or substances that make water contaminated) are discharged directly or indirectly into water bodies without enough treatment. Consequently, pollutants get into water mainly by human causes (or factors).
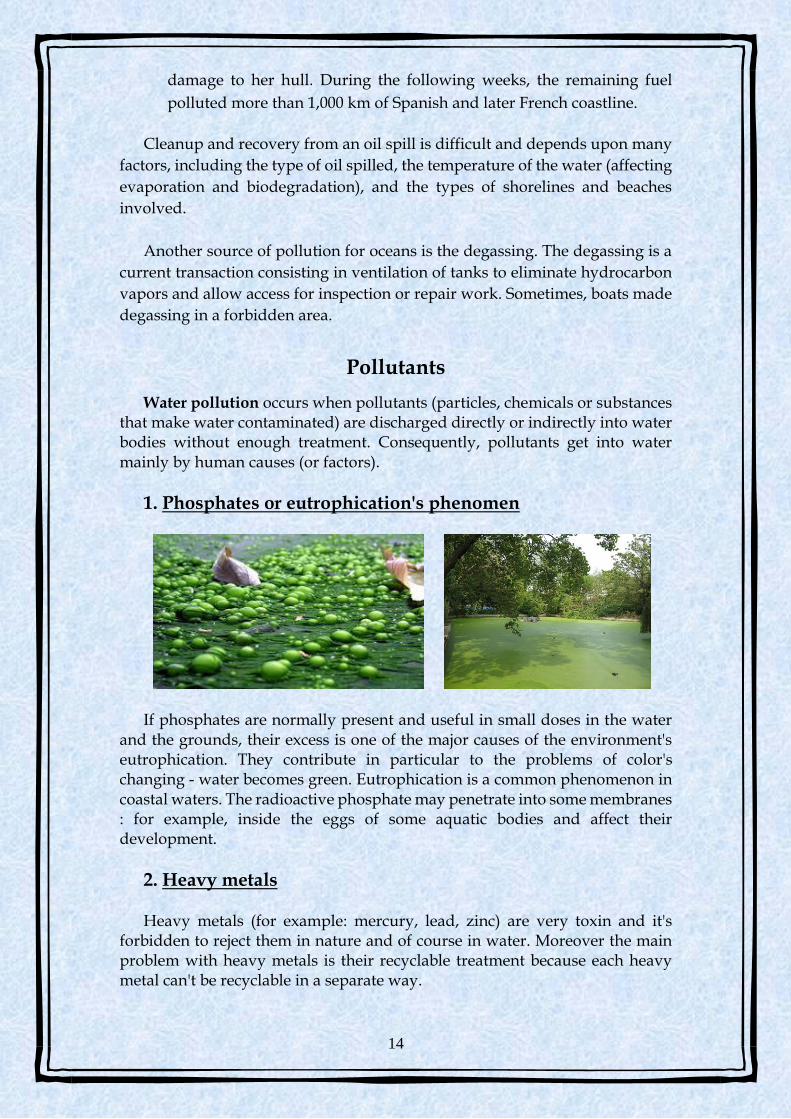
1. Phosphates or eutrophication's phenomen
If phosphates are normally present and useful in small doses in the water
and the grounds, their excess is one of the major causes of the environment's eutrophication. They contribute in particular to the problems of color's changing - water becomes green. Eutrophication is a common phenomenon in coastal waters. The radioactive phosphate may penetrate into some membranes : for example, inside the eggs of some aquatic bodies and affect their development.
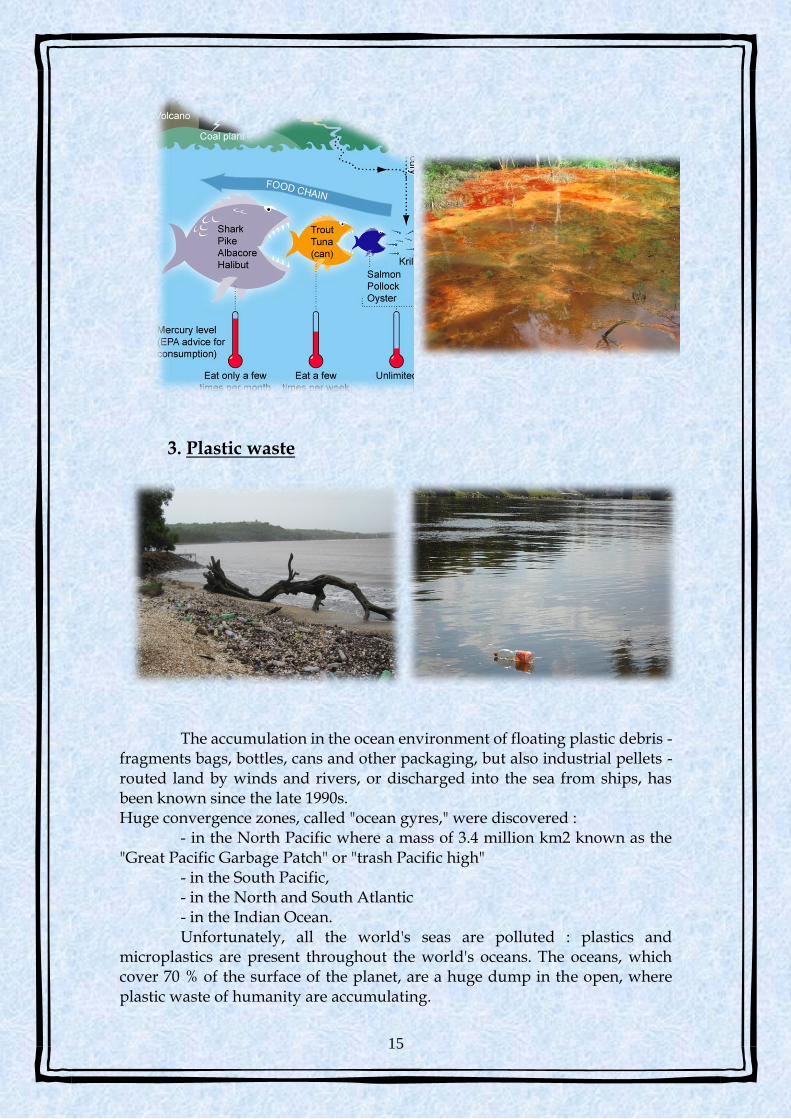
2. Heavy metals Heavy metals (for example: mercury, lead, zinc) are very toxin and it's
forbidden to reject them in nature and of course in water. Moreover the main problem with heavy metals is their recyclable treatment because each heavy metal can't be recyclable in a separate way.
15
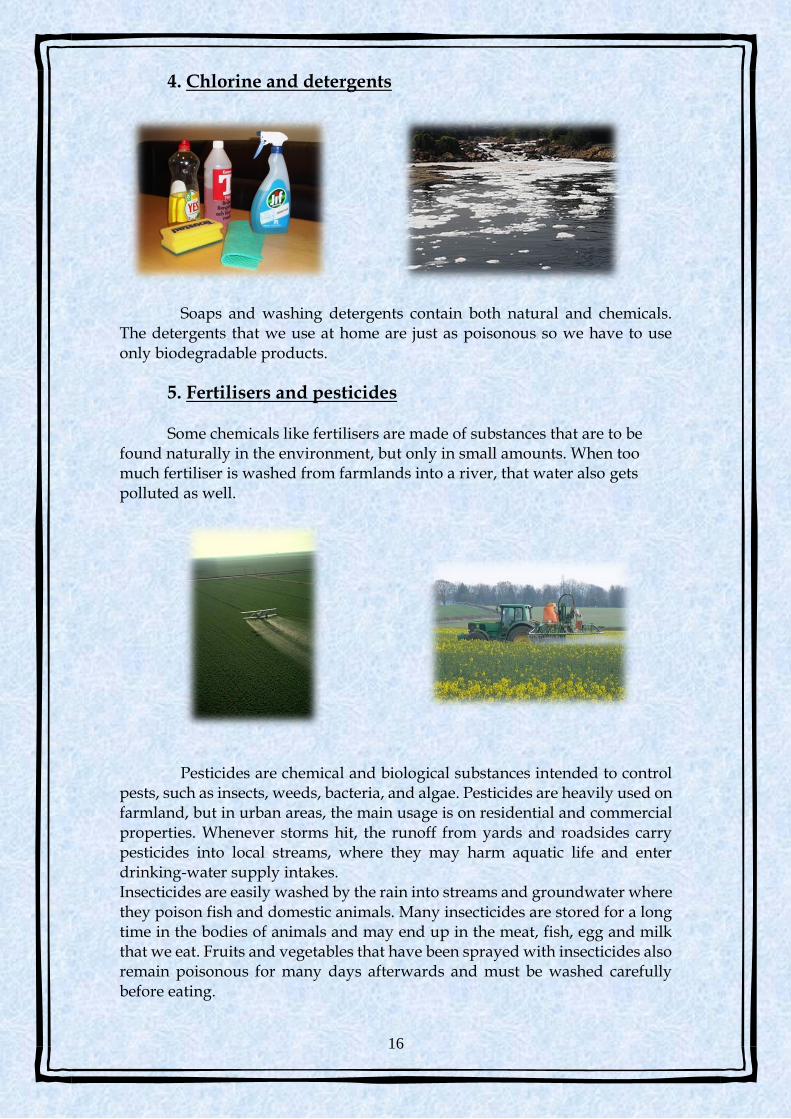
3. Plastic waste
The accumulation in the ocean environment of floating plastic debris - fragments bags, bottles, cans and other packaging, but also industrial pellets - routed land by winds and rivers, or discharged into the sea from ships, has been known since the late 1990s. Huge convergence zones, called "ocean gyres," were discovered : - in the North Pacific where a mass of 3.4 million km2 known as the "Great Pacific Garbage Patch" or "trash Pacific high" - in the South Pacific, - in the North and South Atlantic - in the Indian Ocean. Unfortunately, all the world's seas are polluted : plastics and microplastics are present throughout the world's oceans. The oceans, which cover 70 % of the surface of the planet, are a huge dump in the open, where plastic waste of humanity are accumulating.
16
4. Chlorine and detergents
Soaps and washing detergents contain both natural and chemicals. The detergents that we use at home are just as poisonous so we have to use only biodegradable products.
5. Fertilisers and pesticides Some chemicals like fertilisers are made of substances that are to be
found naturally in the environment, but only in small amounts. When too much fertiliser is washed from farmlands into a river, that water also gets polluted as well.
Pesticides are chemical and biological substances intended to control pests, such as insects, weeds, bacteria, and algae. Pesticides are heavily used on farmland, but in urban areas, the main usage is on residential and commercial properties. Whenever storms hit, the runoff from yards and roadsides carry pesticides into local streams, where they may harm aquatic life and enter drinking-water supply intakes. Insecticides are easily washed by the rain into streams and groundwater where they poison fish and domestic animals. Many insecticides are stored for a long time in the bodies of animals and may end up in the meat, fish, egg and milk that we eat. Fruits and vegetables that have been sprayed with insecticides also remain poisonous for many days afterwards and must be washed carefully before eating.
17
6. Medecine
For a few years, we have been confronted to a new shape of pollution: that of the medicinal residues. Once ingested, the medicine finds itself in saddles and urines, and joins water-treatment plants. Now, water-treatment plants do not degrade totally medicine and a part finds itself in rivers then in the water that we drink. But water quality experts and environmental advocates are increasingly concerned about another kind of water pollution: chemicals from prescription drugs and over-the-counter medications that get into lakes, rivers, and streams. Water also gets contaminated by perfume, cologne, skin lotions, and sunscreens that wash off people’s skin. Drug pollution or pharmaceutical pollution is the pollution of the environment with pharmaceutical drugs and their metabolites, which reach the marine environment (groundwater, rivers, lakes, and oceans) through wastewater. Drug pollution is therefore mainly a form of water pollution.
7. PCB contamination The PCB, or Polychlorinated biphenyls, more known in France under the
name of Pyralenes, has contaminate rivers and surface water fish since decades.
A particularly firm pollution: these chlorinated chemical by-products, for a
long time used in the industry for their qualities of electric insulation,
lubrication, are little biodegradable persistent organic pollutants. Not soluble
in the water, they concentrate in grounds and river sediments and accumulate
in the whole of the food chain. Today, the PCB is omnipresent in the
environment
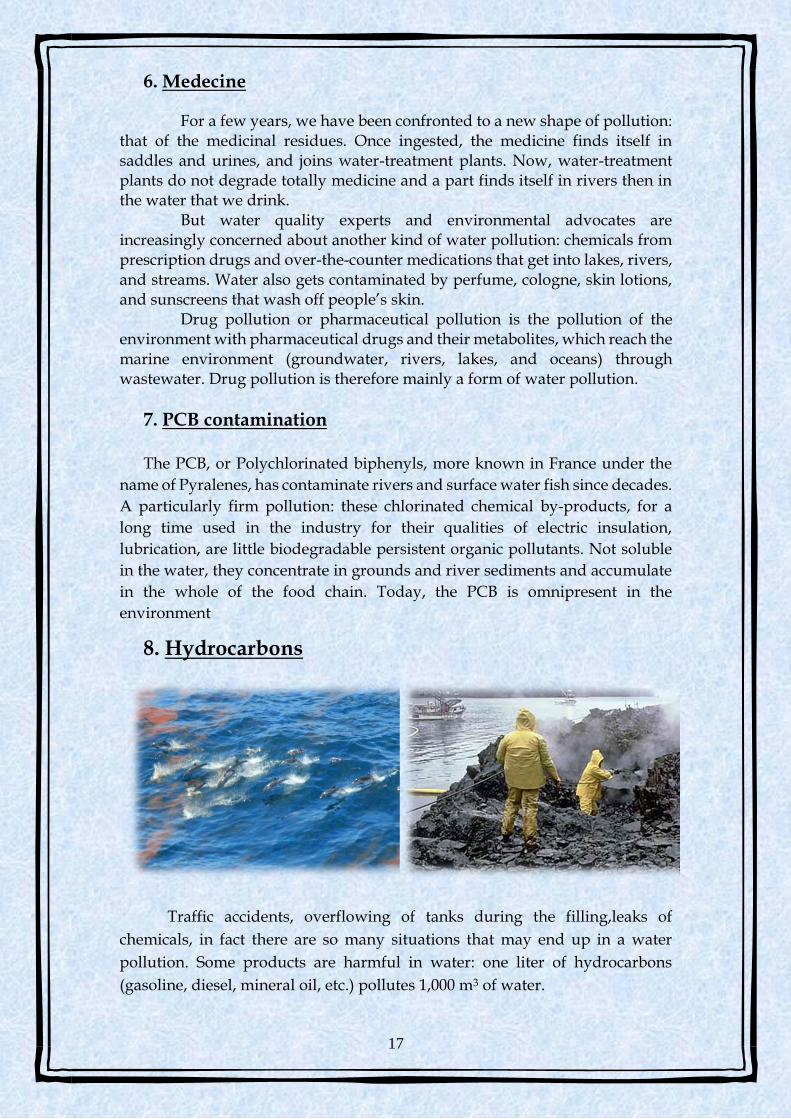
8. Hydrocarbons
Traffic accidents, overflowing of tanks during the filling,leaks of
chemicals, in fact there are so many situations that may end up in a water
pollution. Some products are harmful in water: one liter of hydrocarbons
(gasoline, diesel, mineral oil, etc.) pollutes 1,000 m3 of water.
18
3.3. URBANIZATION AND ITS
INFLUENCE ON WATER Introduction
Throughout history man has seen an ascending evolution, making newer
descoveries all the time. As a result, the dominant feature of this century is the
continuously rising level of the knowledge of mankind, and, consequently,
nowadays its living standards in civilized countries, has reached its peak (this
being determined by the implementations of the discoveries in the research and
development department).
The increasing tendency in the
development takes on an explosive
character due to the growth and
diversification of production, the
productivity of rising economic activity,
the more and more competitive
methods, techniques and technologies
which are used.
Image 1
But, we must not forget the fact that the first factor which led to human
development was the environment: water, air, soil, subsoil, vegetation, and
fauna, from which man has been extracting incessantly, sometimes draining the
resources completely – raw materials: wood, salt, iron, copper, coal, petroleum,
water, chemical substances – without which we couldn’t have recorded the
progress that characterizes humanity today. In its evolution, this scientific and
technical progress materialised in a mechanised and chemicalized agriculture,
in an automated and robotic industry, in faster and faster, more and more
efficient and comfortable means of transport, man settling its habitat firstly in
rural settlements, then in cities which developed both horizontally and
vertically.
19
These days, between the scientific and technical progress and the notion of
“urbanism”, there is a direct connection: the progress has led to the
development of cities and intensifying of the economic and social activities.
Urbanism represents an activity of general interest, continuous by nature, that
runs throughout the national territory, being based on the principle of
sustainable development – sustainable growth – that is, the current
generation’s decisions have to ensure the development of the society without
compromising the right of future generations to existence and development.
Urbanization is a process often associated with industrialization,
modernization, and development. It also refers to the percent of the number of
citizens that live in cities, versus the population of a country. Developed
countries (the U.S.A., Western Europe) are more urbanized than developing
countries.
1. The historical evolution of urbanism
Ancient Urbanism represents an array of experiences gathered over
time by man, regarding organizing the spaces destined for civil, religious,
military, productive and recreation usage, from the oldest times to the end of
the Middle Ages. The first cities developed in Mesopotamia, Egypt, Syria,
Central Asia, India and China.
Roman Urbanism used in a creative way the experience of the
predecessors, applying in the urbanistic achievements norms and rules still
valid today.
Medieval Urbanism was highlighted by physical structures which
prove the assertion of Christianity in the West: castles, churches, and
monasteries.
Modern Urbanism appeared in the 18th century in England and led
to the depopulation of the villages and overpopulation of the cities.
20
Image 1
2. The effects of urbanism on the environment
Unquestionably, the development of cities has unfavorable
consequences for the space and the environment, for the quality of people’s
lives. A specific and dramatic effect of the proces of urbanization is connected
to the transformation of the ambient medium in a manner and at a scale never
seen before. Urbanization is the current phenomenon with the deepest
implications for the scale and patterns of consumption, which leads to a
growing demand of energy and natural resources. The city, taken as a whole,
behaves like a body that “absorbs a lot, but transforms and throws equally”.
The changes that have affected the environment, especially after the
Second World War, created the so-called "environmental issue " and generated
"environmental alert" of the last decades . When talking about progress or
poverty we are talking, in fact, about the environment which characterizes our
planet at a given moment, because all these and pollution, water and air quality
degradation, the threat to the ozone layer, desertification, toxic and radioactive
waste and many others are closely interdependent .
The main "disturbing phenomena" related to urbanization are:
• the use of space with an impact on the ecosystem by deforestation, drainage,
erosion, changes in the ratio between the population and habitat;
• the unrestricted exploitation of natural resources, especially the non-
renewable ones, raw materials, water, timber;
21
• the polluting effects of large cities which addresses the issue of urban waste,
pollution and degradation of green spaces, climate change, the effect on
wildlife etc.;
• the increase of auto and air traffic and air pollution with highly toxic
substances;
• the increase of the amount of fluid untreated or incompletely treated,
discharged into the environment;
• the fragmentation of natural ecosystems through excessive expansion of the
anthropic barriers such as highways, major industrial sites etc.;
• the effects on people's health by increasing mental illness, cardiovascular
diseases, etc.
3. The impact of urbanization on water
Water is a fundemental condidion for the civilised life. It ensures
economic activity, and, equally, comfort, hygiene, and recreation. Water is a
cheap way of communication, trade and an inexhaustible source of energy.
Earth’s Ocean contains numerous mineral and food resources, representing at
the same time an important freshwater resource.
The need of freshwater for mankind increases from year to year. 100
years ago people used about 4 billion m3 of water per year. In the coming years
it is estimated that the demand for freshwater will exceed 8 thousand billion
m3 per year. Although it covers three quarters of the Earth’s surface, water
represents less than 7% of its mass.
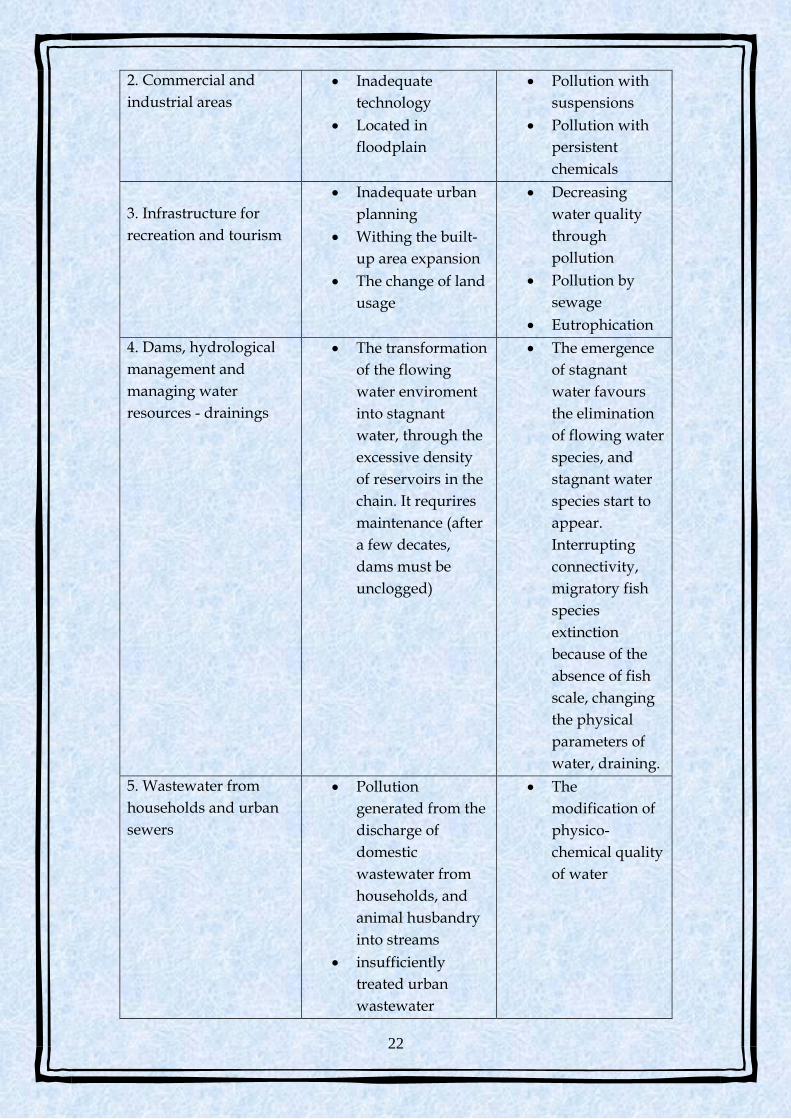
Table 1. The effects of urbanism on water
Disturbing factors Urban causes Impact
1. Urban housing and
settlements
Inadequate urban
planning;
Outside build-up
areas expansion
Holiday home
areas – increasing
the demand for
water, increasing
the amount of
wastewater
Reserve
reduction
Decline in water
quality
Fragmentation
of natural
habitats by
organizing
capture /
discharge
22
2. Commercial and
industrial areas
Inadequate
technology
Located in
floodplain
Pollution with
suspensions
Pollution with
persistent
chemicals
3. Infrastructure for
recreation and tourism
Inadequate urban
planning
Withing the built-
up area expansion
The change of land
usage
Decreasing
water quality
through
pollution
Pollution by
sewage
Eutrophication
4. Dams, hydrological
management and
managing water
resources - drainings
The transformation
of the flowing
water enviroment
into stagnant
water, through the
excessive density
of reservoirs in the
chain. It requrires
maintenance (after
a few decates,
dams must be
unclogged)
The emergence
of stagnant
water favours
the elimination
of flowing water
species, and
stagnant water
species start to
appear.
Interrupting
connectivity,
migratory fish
species
extinction
because of the
absence of fish
scale, changing
the physical
parameters of
water, draining.
5. Wastewater from
households and urban
sewers
Pollution
generated from the
discharge of
domestic
wastewater from
households, and
animal husbandry
into streams
insufficiently
treated urban
wastewater
The
modification of
physico-
chemical quality
of water
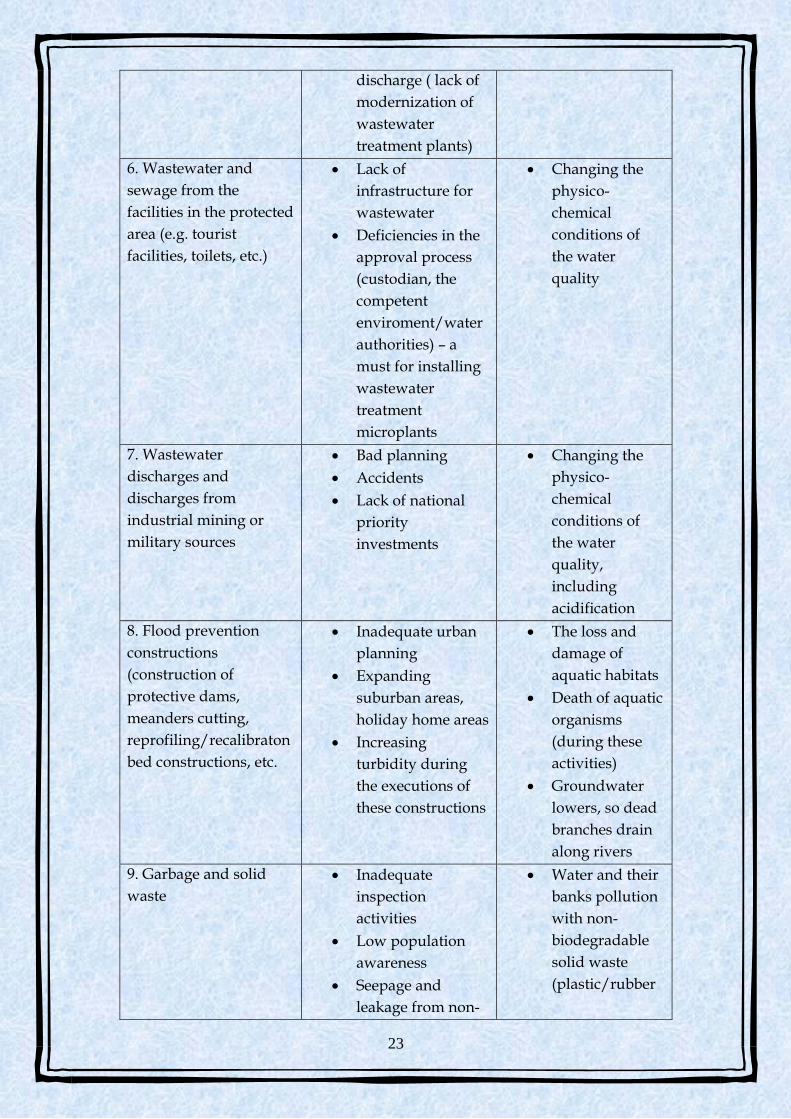
23
discharge ( lack of
modernization of
wastewater
treatment plants)
6. Wastewater and
sewage from the
facilities in the protected
area (e.g. tourist
facilities, toilets, etc.)
Lack of
infrastructure for
wastewater
Deficiencies in the
approval process
(custodian, the
competent
enviroment/water
authorities) – a
must for installing
wastewater
treatment
microplants
Changing the
physico-
chemical
conditions of
the water
quality
7. Wastewater
discharges and
discharges from
industrial mining or
military sources
Bad planning
Accidents
Lack of national
priority
investments
Changing the
physico-
chemical
conditions of
the water
quality,
including
acidification
8. Flood prevention
constructions
(construction of
protective dams,
meanders cutting,
reprofiling/recalibraton
bed constructions, etc.
Inadequate urban
planning
Expanding
suburban areas,
holiday home areas
Increasing
turbidity during
the executions of
these constructions
The loss and
damage of
aquatic habitats
Death of aquatic
organisms
(during these
activities)
Groundwater
lowers, so dead
branches drain
along rivers
9. Garbage and solid
waste
Inadequate
inspection
activities
Low population
awareness
Seepage and
leakage from non-
Water and their
banks pollution
with non-
biodegradable
solid waste
(plastic/rubber

24
waterproof rubbish
dumps
packaging: bags,
bottles, tyres)
Groundwater
pollution in the
rubbish dump
areas
Rivers and
riverbanks
landscape
degradation
Damage to
fauna
10. Atmospheric
pollutants
Outdated
technology
Lack of filters for
air emmisions
Changing the
physico-
chemical
conditions of
the water
quality
11. Erosion and/or
clogging
(hydrotechnic)
constructions or
constructions that
trigger or
accelerate
erosion/silting
(e.g. incorrectly
stabilizing a shore
can lead to sharp
erosions on the
opposite bank)
Morphological
changes of the
bank or bottom
habitat, or
changes in
water dynamics
3.1. The quantitative impact of urbanization on
underground water
Urban development usually is accounted for raising the underground
water levels, which affects urban structures that have been planned, and
constructed during the period when the groundwater level was low, without
acknowledging the possibility that the level could rise. (e.g. problems in many
European cities: underground, railway and subway tunnels, underground car
parks, basements of buildings, etc.)
25
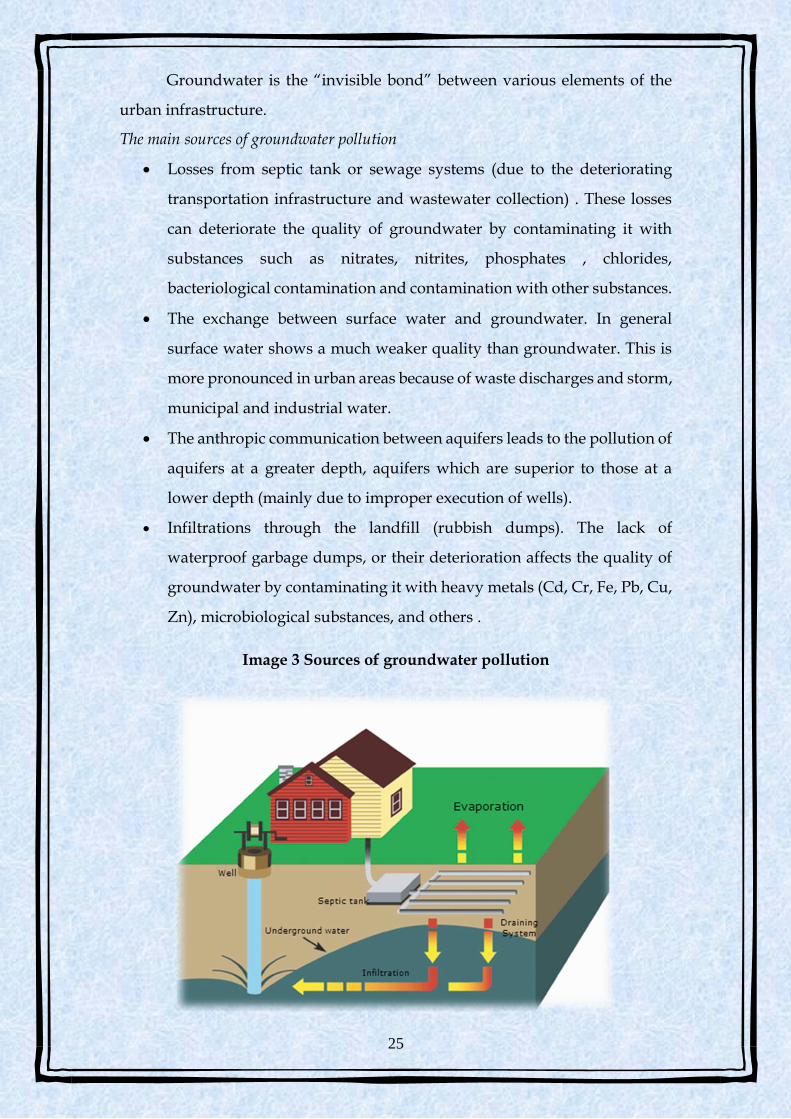
Groundwater is the “invisible bond” between various elements of the
urban infrastructure.
The main sources of groundwater pollution
Losses from septic tank or sewage systems (due to the deteriorating
transportation infrastructure and wastewater collection) . These losses
can deteriorate the quality of groundwater by contaminating it with
substances such as nitrates, nitrites, phosphates , chlorides,
bacteriological contamination and contamination with other substances.
The exchange between surface water and groundwater. In general
surface water shows a much weaker quality than groundwater. This is
more pronounced in urban areas because of waste discharges and storm,
municipal and industrial water.
The anthropic communication between aquifers leads to the pollution of
aquifers at a greater depth, aquifers which are superior to those at a
lower depth (mainly due to improper execution of wells).
Infiltrations through the landfill (rubbish dumps). The lack of
waterproof garbage dumps, or their deterioration affects the quality of
groundwater by contaminating it with heavy metals (Cd, Cr, Fe, Pb, Cu,
Zn), microbiological substances, and others .
Image 3 Sources of groundwater pollution
26
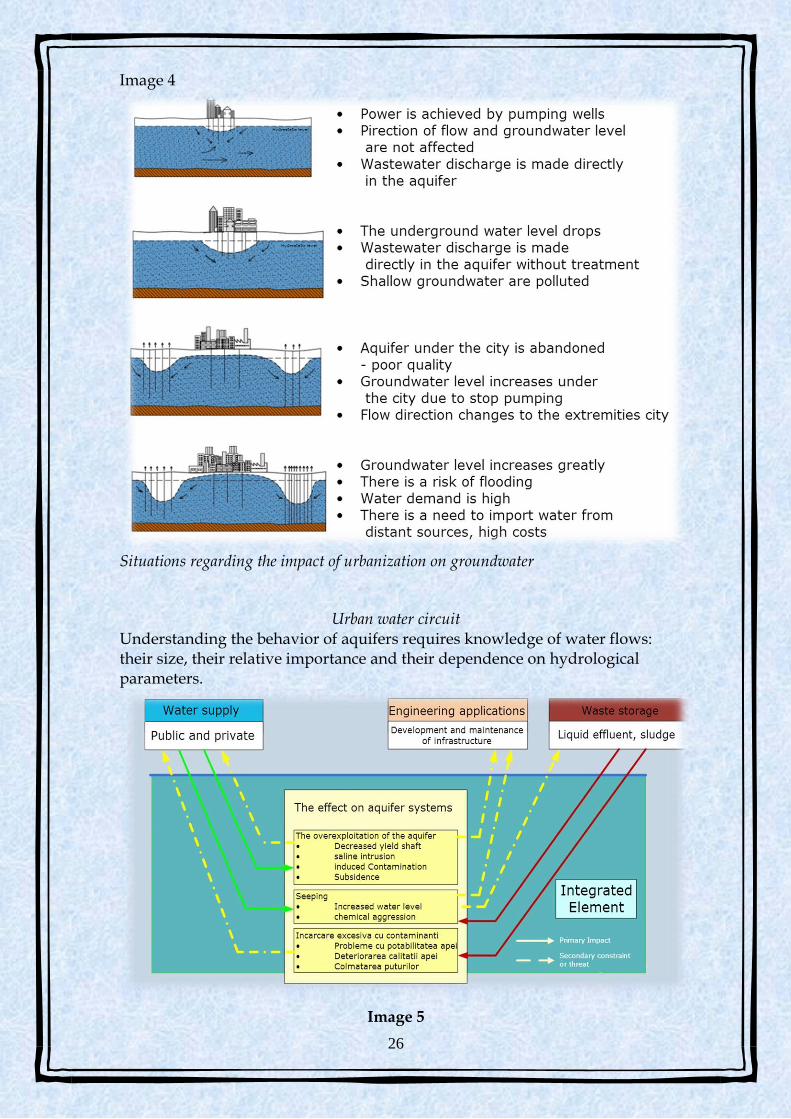
Image 4
Situations regarding the impact of urbanization on groundwater
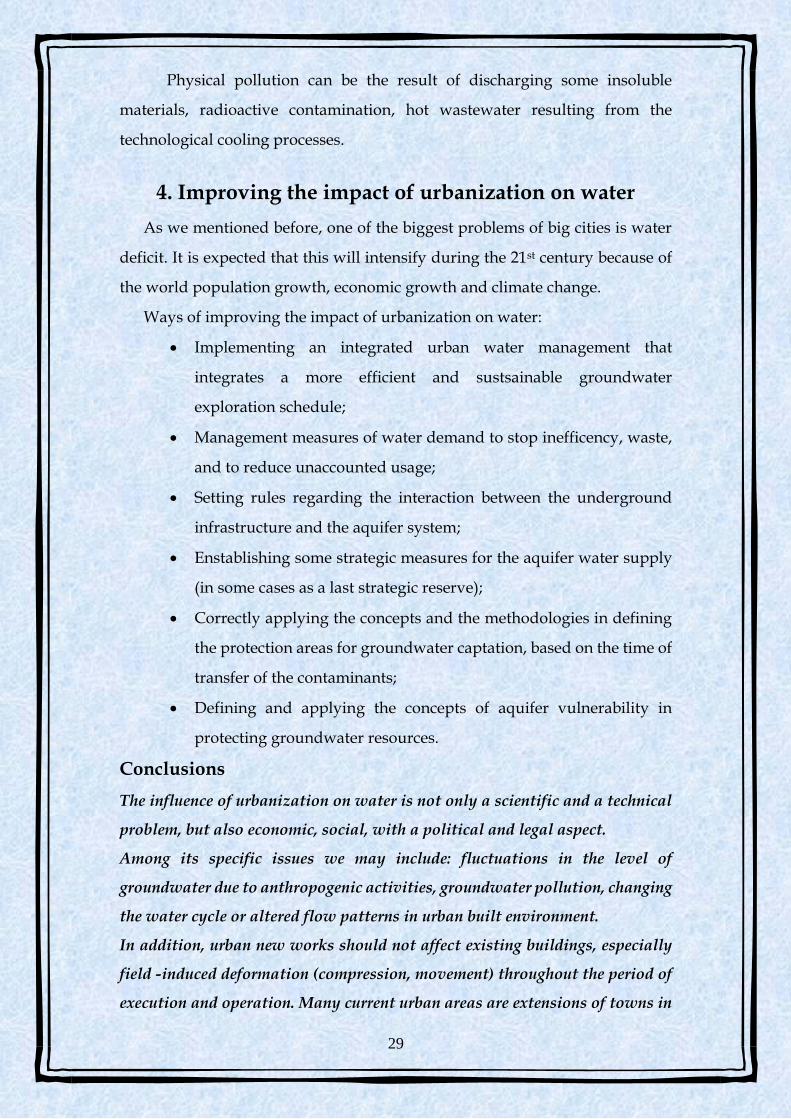
Urban water circuit Understanding the behavior of aquifers requires knowledge of water flows: their size, their relative importance and their dependence on hydrological parameters.
Image 5
27
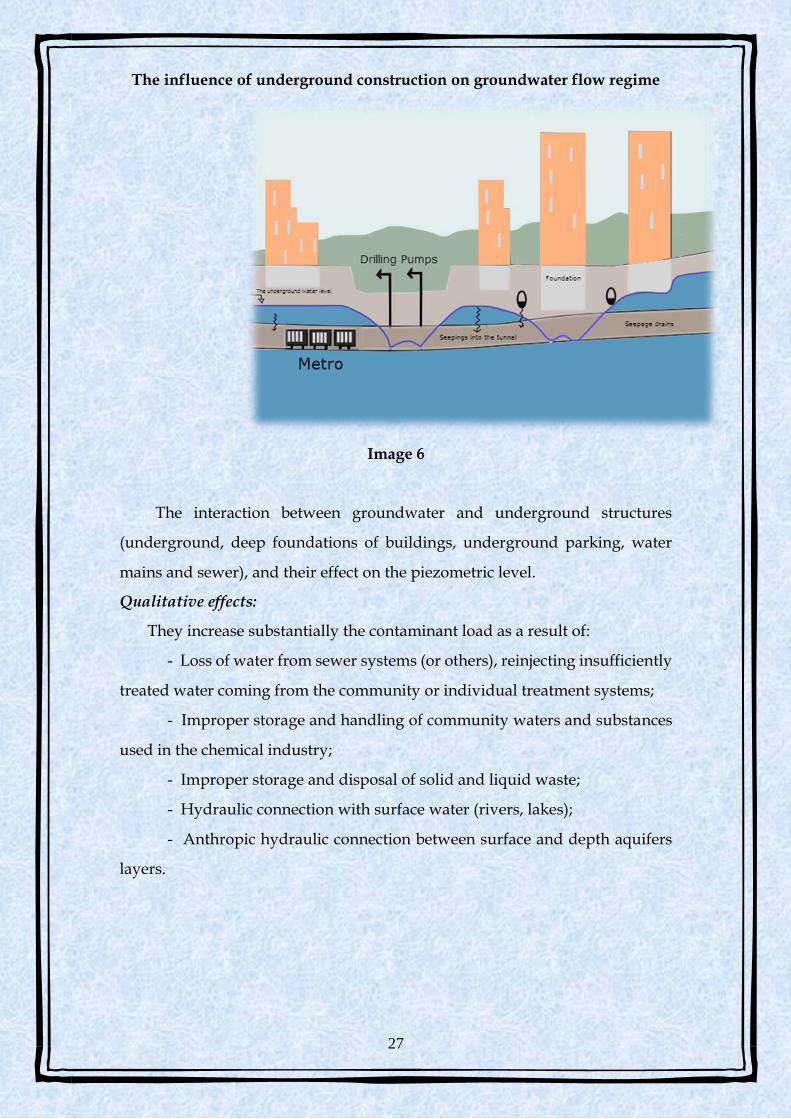
The influence of underground construction on groundwater flow regime
Image 6
The interaction between groundwater and underground structures
(underground, deep foundations of buildings, underground parking, water
mains and sewer), and their effect on the piezometric level.
Qualitative effects:
They increase substantially the contaminant load as a result of:
- Loss of water from sewer systems (or others), reinjecting insufficiently
treated water coming from the community or individual treatment systems;
- Improper storage and handling of community waters and substances
used in the chemical industry;
- Improper storage and disposal of solid and liquid waste;
- Hydraulic connection with surface water (rivers, lakes);
- Anthropic hydraulic connection between surface and depth aquifers
layers.
28
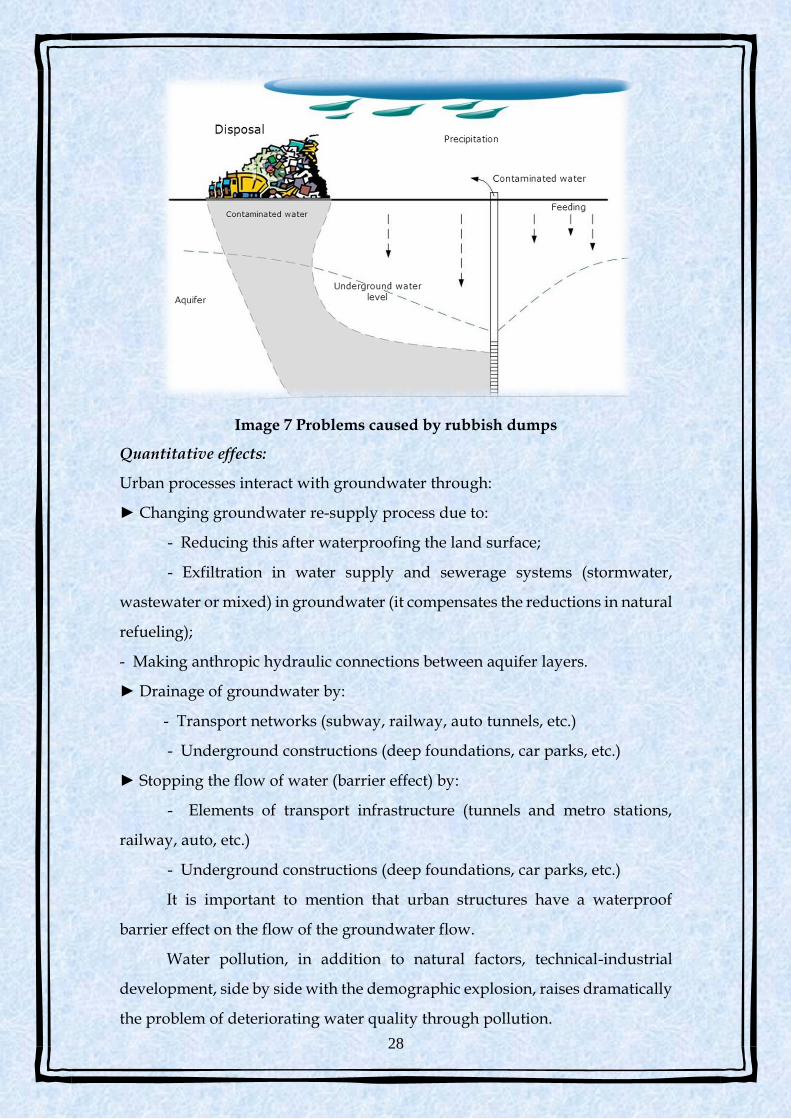
Image 7 Problems caused by rubbish dumps
Quantitative effects:
Urban processes interact with groundwater through:
► Changing groundwater re-supply process due to:
- Reducing this after waterproofing the land surface;
- Exfiltration in water supply and sewerage systems (stormwater,
wastewater or mixed) in groundwater (it compensates the reductions in natural
refueling);
- Making anthropic hydraulic connections between aquifer layers.
► Drainage of groundwater by:
- Transport networks (subway, railway, auto tunnels, etc.)
- Underground constructions (deep foundations, car parks, etc.)
► Stopping the flow of water (barrier effect) by:
- Elements of transport infrastructure (tunnels and metro stations,
railway, auto, etc.)
- Underground constructions (deep foundations, car parks, etc.)
It is important to mention that urban structures have a waterproof
barrier effect on the flow of the groundwater flow.
Water pollution, in addition to natural factors, technical-industrial
development, side by side with the demographic explosion, raises dramatically
the problem of deteriorating water quality through pollution.
29
Physical pollution can be the result of discharging some insoluble
materials, radioactive contamination, hot wastewater resulting from the
technological cooling processes.
4. Improving the impact of urbanization on water
As we mentioned before, one of the biggest problems of big cities is water
deficit. It is expected that this will intensify during the 21st century because of
the world population growth, economic growth and climate change.
Ways of improving the impact of urbanization on water:
Implementing an integrated urban water management that
integrates a more efficient and sustsainable groundwater
exploration schedule;
Management measures of water demand to stop inefficency, waste,
and to reduce unaccounted usage;
Setting rules regarding the interaction between the underground
infrastructure and the aquifer system;
Enstablishing some strategic measures for the aquifer water supply
(in some cases as a last strategic reserve);
Correctly applying the concepts and the methodologies in defining
the protection areas for groundwater captation, based on the time of
transfer of the contaminants;
Defining and applying the concepts of aquifer vulnerability in
protecting groundwater resources.
Conclusions
The influence of urbanization on water is not only a scientific and a technical
problem, but also economic, social, with a political and legal aspect.
Among its specific issues we may include: fluctuations in the level of
groundwater due to anthropogenic activities, groundwater pollution, changing
the water cycle or altered flow patterns in urban built environment.
In addition, urban new works should not affect existing buildings, especially
field -induced deformation (compression, movement) throughout the period of
execution and operation. Many current urban areas are extensions of towns in
30
old, abandoned industrial areas, where there are deposits of industrial waste,
demolition debris or old quarries or mining areas that have underground voids
left behind which lead to subsidence phenomena.
In urban areas, the underground space is used more and more for underground
constructions (tunnels, deep basements, drainage galleries, utility lines, etc.).
That is why, the impact of these constructions on the environment is more and
more pronounced, and the scientific research is needed to sustainably manage
the influence of urbanization on water resources.
Bibliography 1. Alpopi, C., Elemente de urbanism, Bucureşti, Editura Universitară,
2008
2. Beaujeau-Garnier, J., G. Chabot, Geografia urbană, Editura Ştiinţifică,
Bucureşti, 1971
3. Ioan, C. A., Urbanism şi amenajarea teritoriului, Galaţi, Editura
Zigotto, 2006
4. Ioanid, V., Urbanism şi mediu, Bucureşti, Editura Tehnică, 1991
5. Luca, O., Teoria şi practica urbanismului, Bucureşti, Editura Matrix
Rom, 2003
6. Pascariu, G., Curs de planificare şi dezvoltare spaţială, curs post-
universitar, Bucureşti, 2004
7. Popescu, I., Oraşul şi competiţia urbană, Bucureşti, Editura Economică,
2007
8. Vişan. S., Angelescu A. Alpopi C. Mediul înconjurător. Poluare şi
protecţie, Bucureşti, Editura Economică, 2000
9. http://www.academia.edu/9451911/Curs-
Influente_antropice_in_hidrogeologia_urbana
10. www.ahgr.ro/media/.../ASPECTE-HIDROGEOLOGIE-
URBANA10.ppt
31
3.4. AGRICULTURE AND
IRRIGATION. THEIR IMPACT
ON FRESH WATER
THE BEGINNING OF IRRIGATION
The irrigation is the action of watering a piece of land dedicated to farming. We don´t know exactly where the irrigation started, but there are some facts we know about its origin:
In the Neolithic period, people began farming the land and to mate animals.
Despite it, agriculture is a recent activity, and so it is irrigating. The first attempt to irrigate was two thousand years ago after the developing of farming.
The first use of the irrigation was in the nearby lands next to the Tigris River in the Sumerian time, and later, the Chinese people started irrigating in the Hoag Hon valley about four thousand years ago.
But it´s essential to know that the modernization of the irrigation depended on the efforts and progress from some old nations that studied and learnt to use the floods of the rivers to develop agriculture, like the Egyptians.
In America, we have found traces of old irrigated areas in the Inca Empire and in the Olmec civilization (in the Gulf of Mexico), as well as in populated areas by Salt River Valley (Arizona) where old Native Americans lived.
We must remember the important and numerous works for driving the water built by the Roman and Arabic people. These two cultures are in the origin of the best irrigation systems because they constructed ditches in the most fertile plains of the country.
In the classical Greece we have found remains of a more than 1 kilometer long tunnel built for driving water to Samos, crossing the Monte Castro.
Later, the two most important constructions were, undoubtedly, the Valencian irrigation systems and canals made by the Romans.
Since its origins irrigation has suffered a lot of changes that made it more effective. This way, the new systems of irrigation like drip irrigation, have been great help and benefit in the last century
32
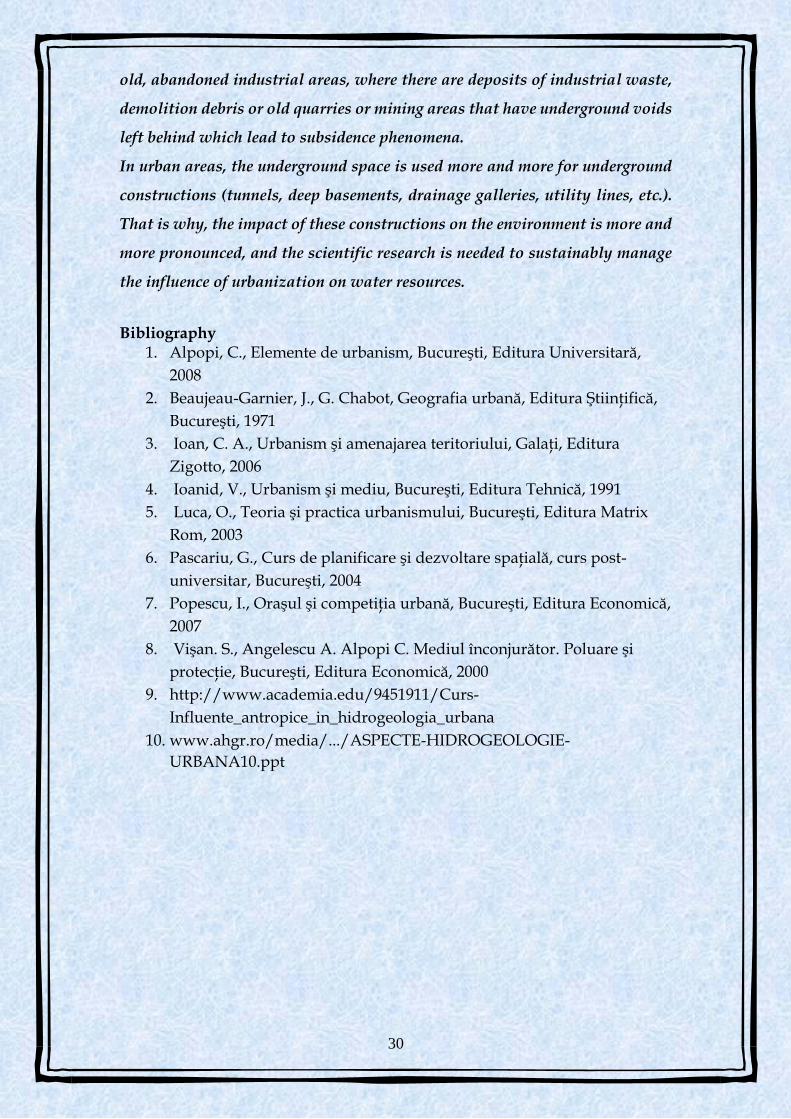
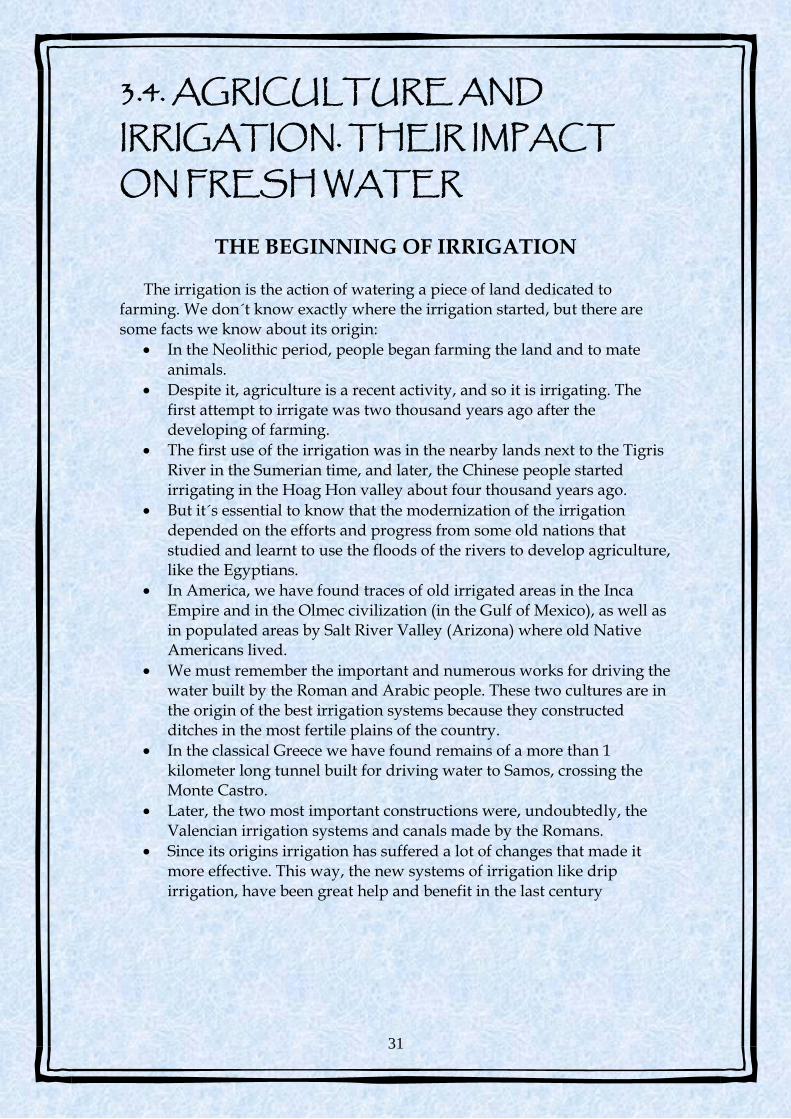
Irrigation in Tigris River:
The very first irrigation systems were built about 5.000 years ago in the old Mesopotamia, from the Persis Golf up to the city of Ur where the Tigris, Euphrates, and Karum rivers run into the sea. There, the farmers of Sumer and Akkad cultivated wheat with waters from the Tigris and Euphrates thanks to many channels. Besides, it is known that the cities of Unima and Lagash also used the water from the Euphrates for cultivation, but after some problems, Lagash had to give up using water from the Euphrates and made a canal to bring the water from the Tigris, taking so much water that the excess reached the water table that was brackish and eventually polluted the soil, making it unsuitable for cultivation.
33
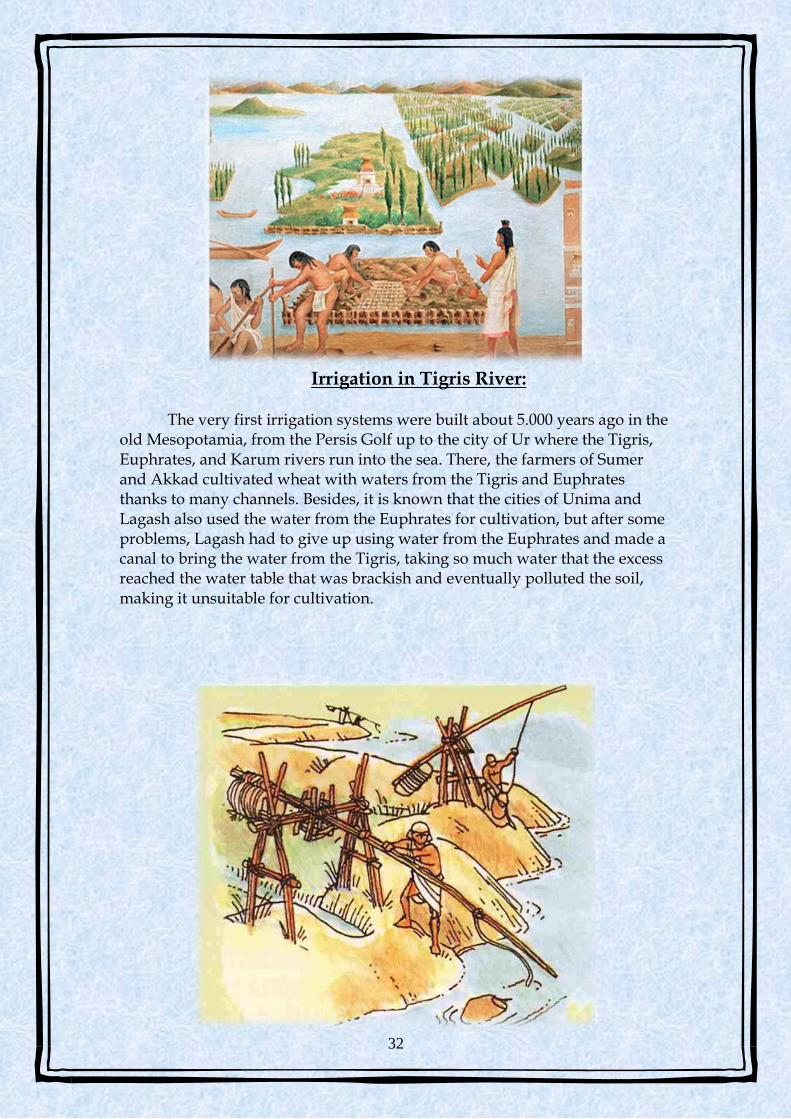
Irrigation in the Yellow River:
In China, around the year 2200 BC, large tracts of land were irrigated.
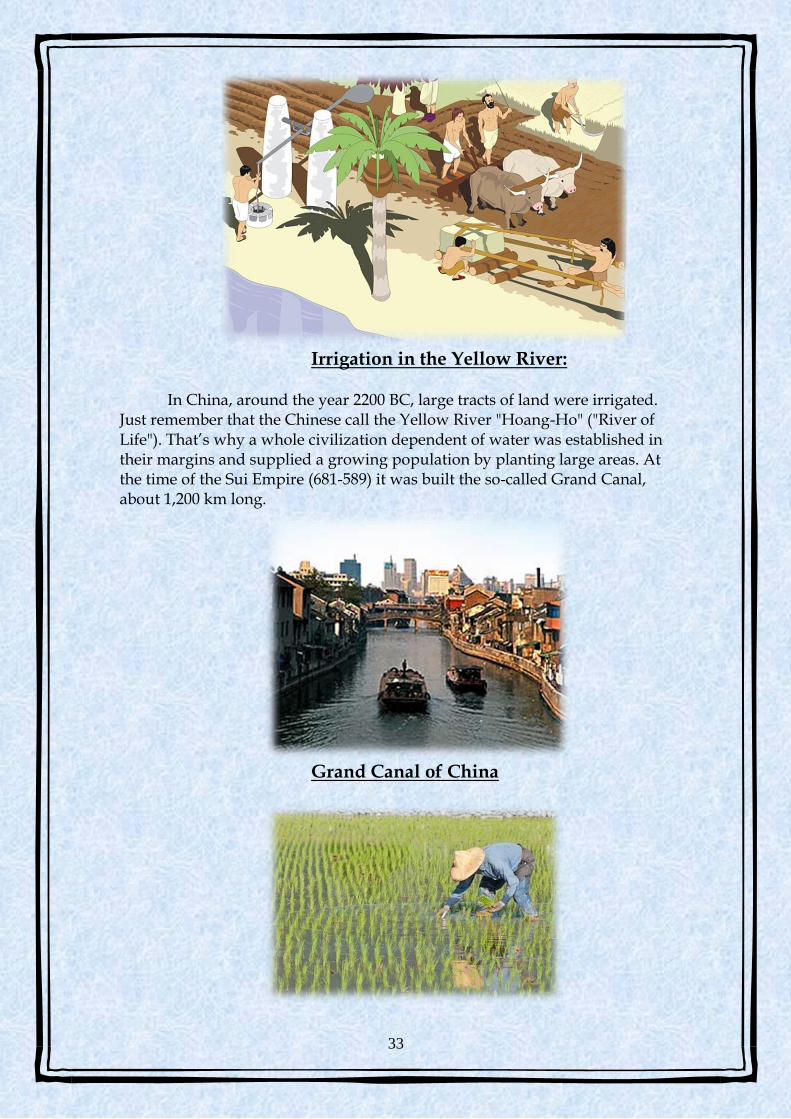
Just remember that the Chinese call the Yellow River "Hoang-Ho" ("River of Life"). That’s why a whole civilization dependent of water was established in their margins and supplied a growing population by planting large areas. At the time of the Sui Empire (681-589) it was built the so-called Grand Canal, about 1,200 km long.
Grand Canal of China
34
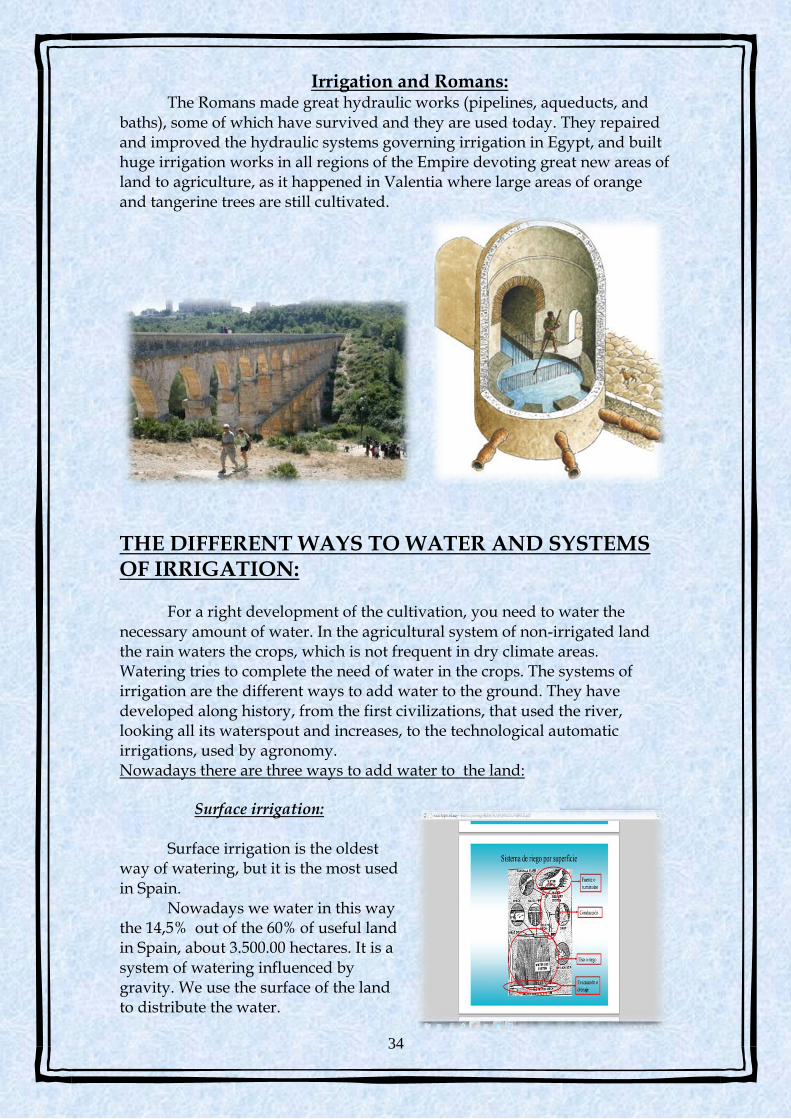
Irrigation and Romans: The Romans made great hydraulic works (pipelines, aqueducts, and
baths), some of which have survived and they are used today. They repaired and improved the hydraulic systems governing irrigation in Egypt, and built huge irrigation works in all regions of the Empire devoting great new areas of land to agriculture, as it happened in Valentia where large areas of orange and tangerine trees are still cultivated.
THE DIFFERENT WAYS TO WATER AND SYSTEMS OF IRRIGATION:
For a right development of the cultivation, you need to water the necessary amount of water. In the agricultural system of non-irrigated land the rain waters the crops, which is not frequent in dry climate areas. Watering tries to complete the need of water in the crops. The systems of irrigation are the different ways to add water to the ground. They have developed along history, from the first civilizations, that used the river, looking all its waterspout and increases, to the technological automatic irrigations, used by agronomy. Nowadays there are three ways to add water to the land:
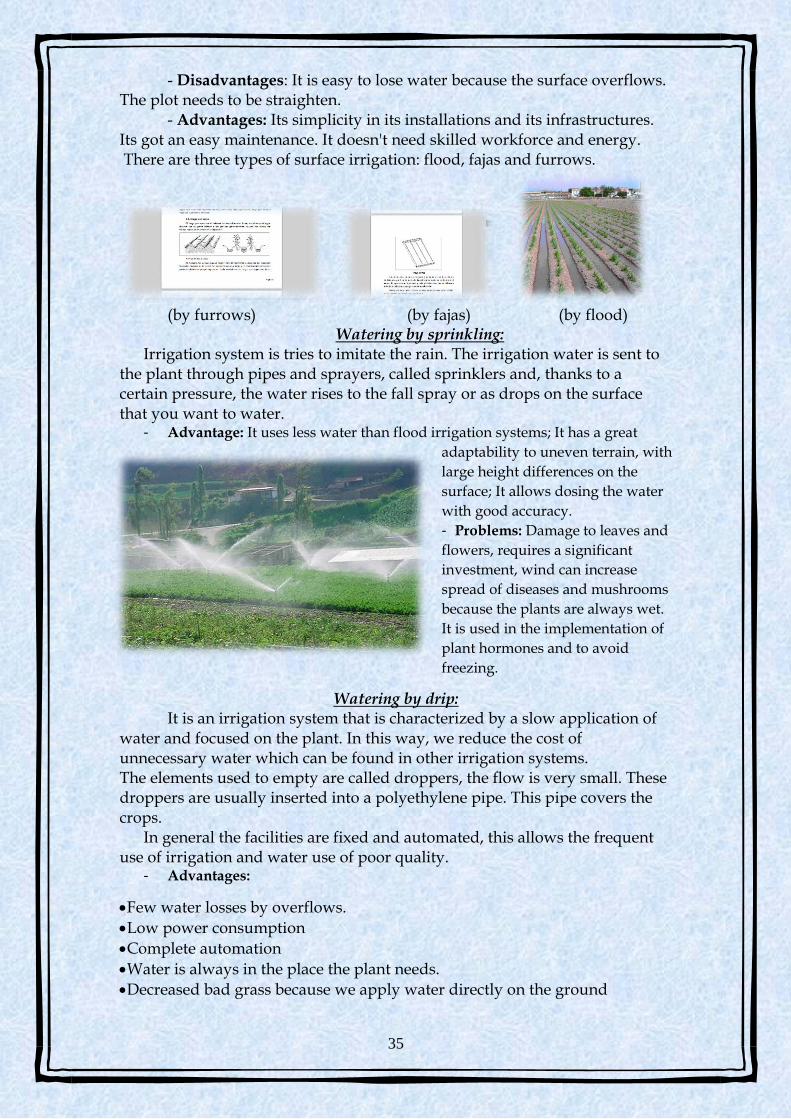
Surface irrigation: Surface irrigation is the oldest
way of watering, but it is the most used in Spain.
Nowadays we water in this way the 14,5% out of the 60% of useful land in Spain, about 3.500.00 hectares. It is a system of watering influenced by gravity. We use the surface of the land to distribute the water.
35
- Disadvantages: It is easy to lose water because the surface overflows. The plot needs to be straighten.
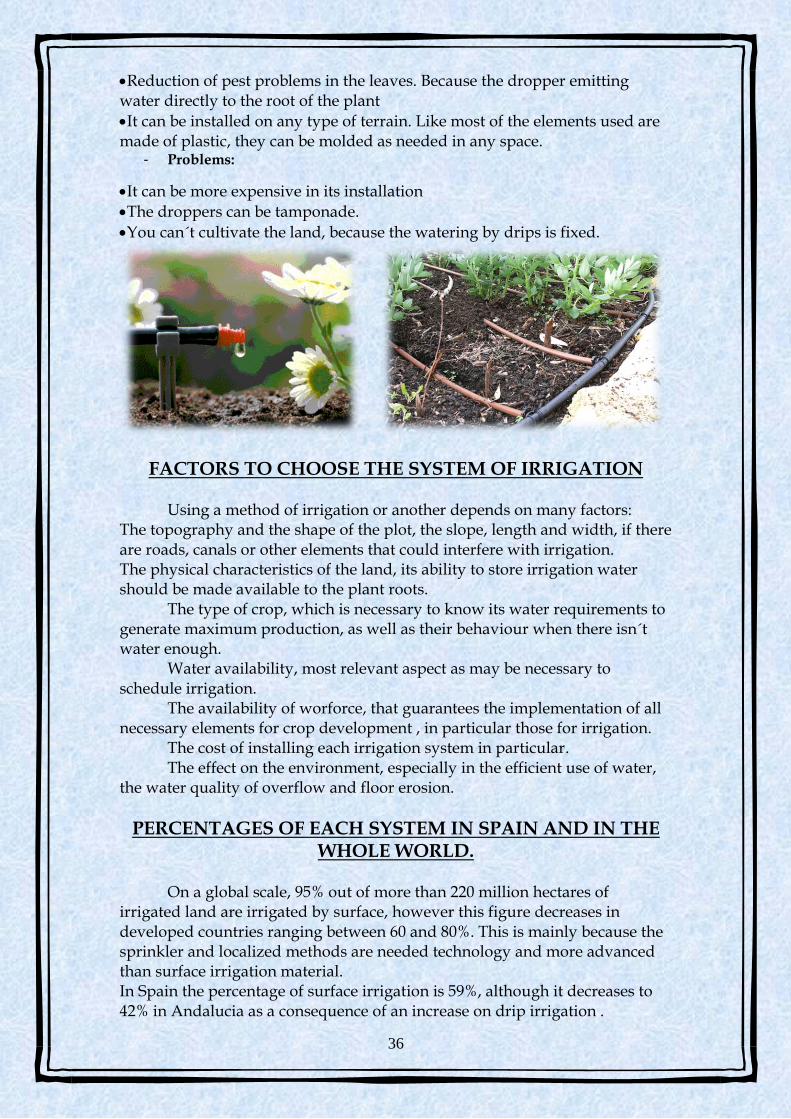
- Advantages: Its simplicity in its installations and its infrastructures. Its got an easy maintenance. It doesn't need skilled workforce and energy. There are three types of surface irrigation: flood, fajas and furrows.
(by furrows) (by fajas) (by flood)
Watering by sprinkling: Irrigation system is tries to imitate the rain. The irrigation water is sent to
the plant through pipes and sprayers, called sprinklers and, thanks to a certain pressure, the water rises to the fall spray or as drops on the surface that you want to water.
- Advantage: It uses less water than flood irrigation systems; It has a great
adaptability to uneven terrain, with
large height differences on the
surface; It allows dosing the water
with good accuracy.
- Problems: Damage to leaves and
flowers, requires a significant
investment, wind can increase
spread of diseases and mushrooms
because the plants are always wet.
It is used in the implementation of
plant hormones and to avoid
freezing.
Watering by drip: It is an irrigation system that is characterized by a slow application of
water and focused on the plant. In this way, we reduce the cost of unnecessary water which can be found in other irrigation systems. The elements used to empty are called droppers, the flow is very small. These droppers are usually inserted into a polyethylene pipe. This pipe covers the crops.
In general the facilities are fixed and automated, this allows the frequent use of irrigation and water use of poor quality.
- Advantages:
Few water losses by overflows.
Low power consumption
Complete automation
Water is always in the place the plant needs.
Decreased bad grass because we apply water directly on the ground
36
Reduction of pest problems in the leaves. Because the dropper emitting water directly to the root of the plant
It can be installed on any type of terrain. Like most of the elements used are made of plastic, they can be molded as needed in any space.
- Problems:
It can be more expensive in its installation
The droppers can be tamponade.
You can´t cultivate the land, because the watering by drips is fixed.
FACTORS TO CHOOSE THE SYSTEM OF IRRIGATION
Using a method of irrigation or another depends on many factors: The topography and the shape of the plot, the slope, length and width, if there are roads, canals or other elements that could interfere with irrigation. The physical characteristics of the land, its ability to store irrigation water should be made available to the plant roots.
The type of crop, which is necessary to know its water requirements to generate maximum production, as well as their behaviour when there isn´t water enough.
Water availability, most relevant aspect as may be necessary to schedule irrigation.
The availability of worforce, that guarantees the implementation of all necessary elements for crop development , in particular those for irrigation.
The cost of installing each irrigation system in particular. The effect on the environment, especially in the efficient use of water,
the water quality of overflow and floor erosion.
PERCENTAGES OF EACH SYSTEM IN SPAIN AND IN THE WHOLE WORLD.
On a global scale, 95% out of more than 220 million hectares of
irrigated land are irrigated by surface, however this figure decreases in developed countries ranging between 60 and 80%. This is mainly because the sprinkler and localized methods are needed technology and more advanced than surface irrigation material. In Spain the percentage of surface irrigation is 59%, although it decreases to 42% in Andalucia as a consequence of an increase on drip irrigation .
37
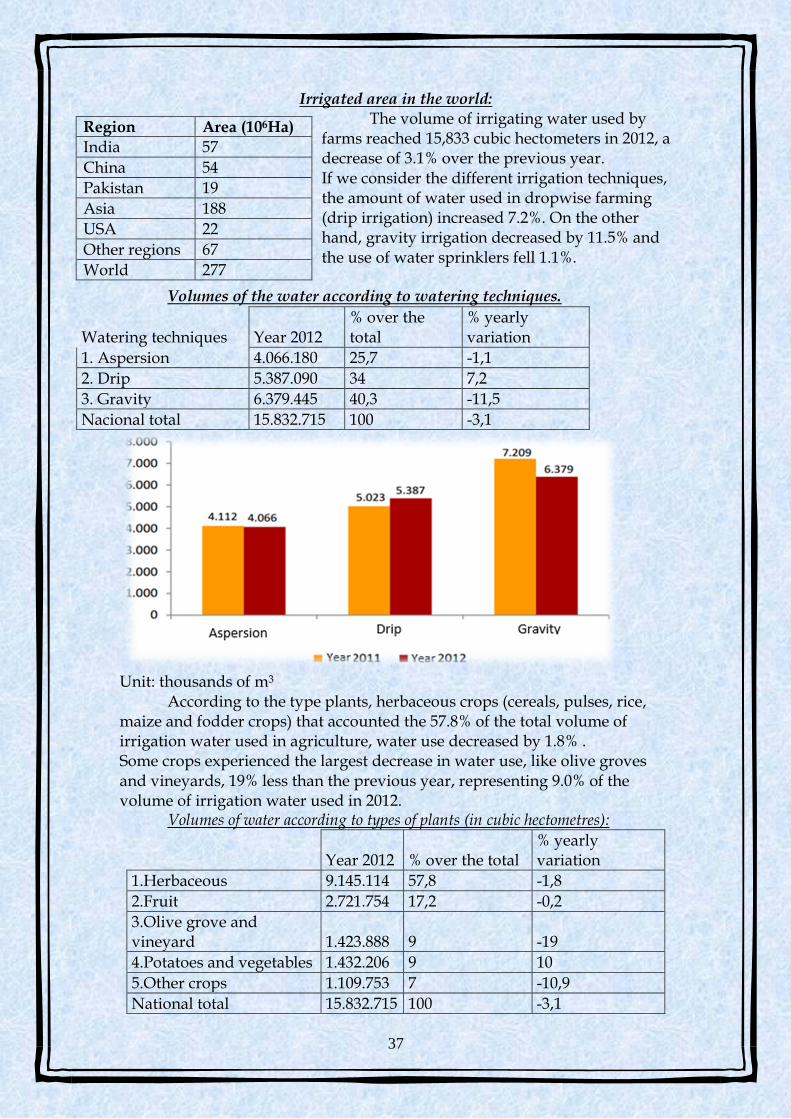
Irrigated area in the world:
The volume of irrigating water used by farms reached 15,833 cubic hectometers in 2012, a decrease of 3.1% over the previous year. If we consider the different irrigation techniques, the amount of water used in dropwise farming (drip irrigation) increased 7.2%. On the other hand, gravity irrigation decreased by 11.5% and the use of water sprinklers fell 1.1%.
Volumes of the water according to watering techniques.
Unit: thousands of m3
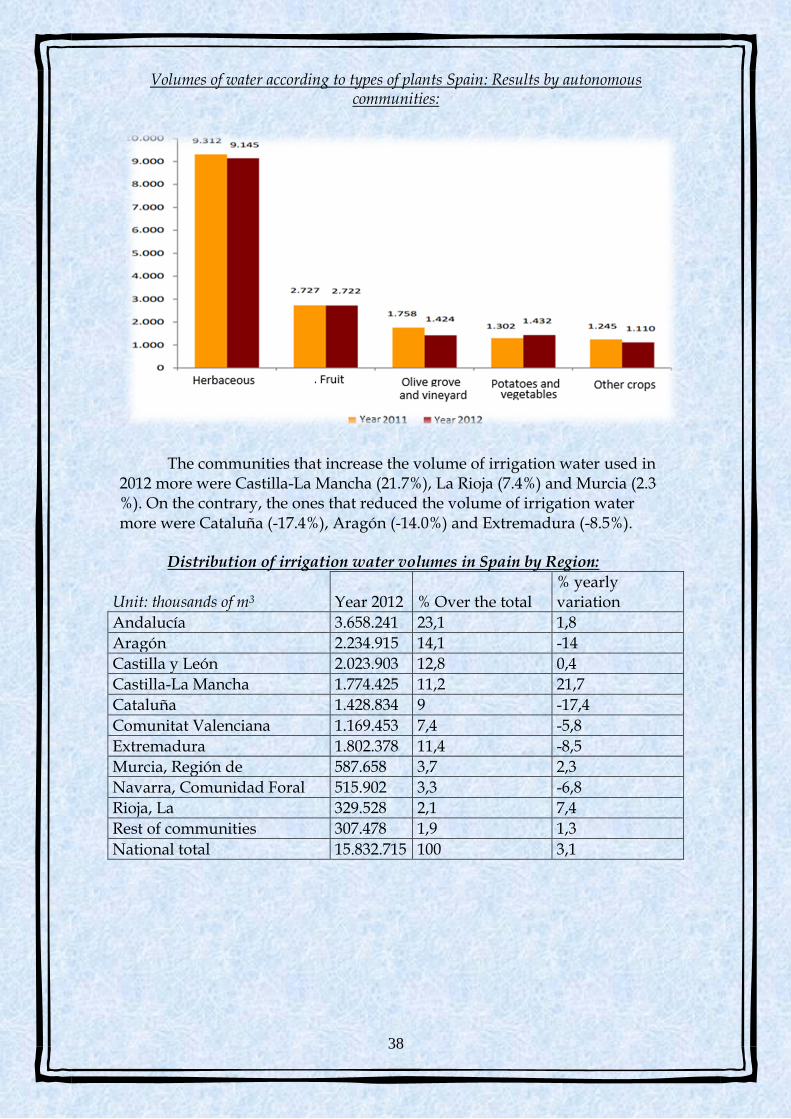
According to the type plants, herbaceous crops (cereals, pulses, rice, maize and fodder crops) that accounted the 57.8% of the total volume of irrigation water used in agriculture, water use decreased by 1.8% . Some crops experienced the largest decrease in water use, like olive groves and vineyards, 19% less than the previous year, representing 9.0% of the volume of irrigation water used in 2012.
Volumes of water according to types of plants (in cubic hectometres):
Year 2012 % over the total % yearly variation
1.Herbaceous 9.145.114 57,8 -1,8
2.Fruit 2.721.754 17,2 -0,2
3.Olive grove and vineyard 1.423.888 9 -19
4.Potatoes and vegetables 1.432.206 9 10
5.Other crops 1.109.753 7 -10,9
National total 15.832.715 100 -3,1
Region Area (106Ha)
India 57
China 54
Pakistan 19
Asia 188
USA 22
Other regions 67
World 277
Watering techniques Year 2012 % over the total
% yearly variation
1. Aspersion 4.066.180 25,7 -1,1
2. Drip 5.387.090 34 7,2
3. Gravity 6.379.445 40,3 -11,5
Nacional total 15.832.715 100 -3,1
38
Volumes of water according to types of plants Spain: Results by autonomous communities:
The communities that increase the volume of irrigation water used in
2012 more were Castilla-La Mancha (21.7%), La Rioja (7.4%) and Murcia (2.3 %). On the contrary, the ones that reduced the volume of irrigation water more were Cataluña (-17.4%), Aragón (-14.0%) and Extremadura (-8.5%).
Distribution of irrigation water volumes in Spain by Region:
Unit: thousands of m3 Year 2012 % Over the total % yearly variation
Andalucía 3.658.241 23,1 1,8
Aragón 2.234.915 14,1 -14
Castilla y León 2.023.903 12,8 0,4
Castilla-La Mancha 1.774.425 11,2 21,7
Cataluña 1.428.834 9 -17,4
Comunitat Valenciana 1.169.453 7,4 -5,8
Extremadura 1.802.378 11,4 -8,5
Murcia, Región de 587.658 3,7 2,3
Navarra, Comunidad Foral 515.902 3,3 -6,8
Rioja, La 329.528 2,1 7,4
Rest of communities 307.478 1,9 1,3
National total 15.832.715 100 3,1
39
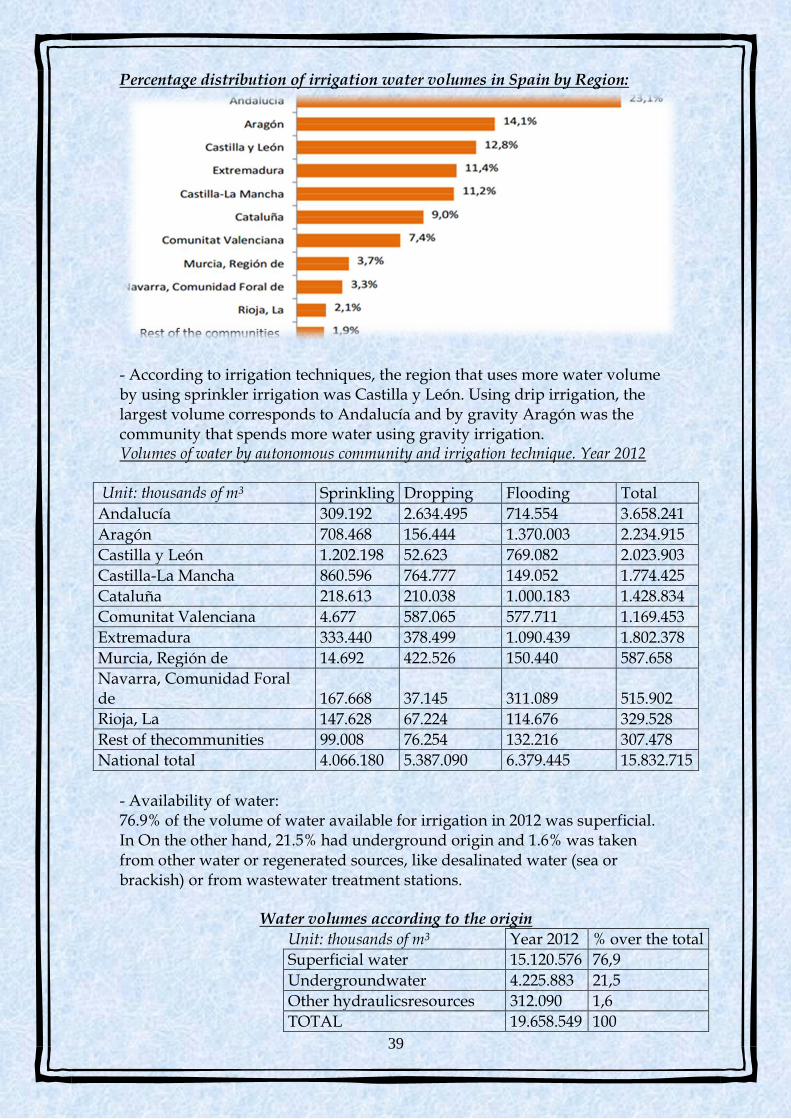
Percentage distribution of irrigation water volumes in Spain by Region:
- According to irrigation techniques, the region that uses more water volume by using sprinkler irrigation was Castilla y León. Using drip irrigation, the largest volume corresponds to Andalucía and by gravity Aragón was the community that spends more water using gravity irrigation. Volumes of water by autonomous community and irrigation technique. Year 2012
Unit: thousands of m3 Sprinkling Dropping Flooding Total
Andalucía 309.192 2.634.495 714.554 3.658.241
Aragón 708.468 156.444 1.370.003 2.234.915
Castilla y León 1.202.198 52.623 769.082 2.023.903
Castilla-La Mancha 860.596 764.777 149.052 1.774.425
Cataluña 218.613 210.038 1.000.183 1.428.834
Comunitat Valenciana 4.677 587.065 577.711 1.169.453
Extremadura 333.440 378.499 1.090.439 1.802.378
Murcia, Región de 14.692 422.526 150.440 587.658
Navarra, Comunidad Foral de 167.668 37.145 311.089 515.902
Rioja, La 147.628 67.224 114.676 329.528
Rest of thecommunities 99.008 76.254 132.216 307.478
National total 4.066.180 5.387.090 6.379.445 15.832.715
- Availability of water: 76.9% of the volume of water available for irrigation in 2012 was superficial. In On the other hand, 21.5% had underground origin and 1.6% was taken from other water or regenerated sources, like desalinated water (sea or brackish) or from wastewater treatment stations.
Water volumes according to the origin
Unit: thousands of m3 Year 2012 % over the total
Superficial water 15.120.576 76,9
Undergroundwater 4.225.883 21,5
Other hydraulicsresources 312.090 1,6
TOTAL 19.658.549 100
40
WATER STORAGE IN SPAIN:
Reservoirs: We called reservoir to the accumulation of water produced by a
blockage in the river bed of a stream that is totally or partly closed. Reservoirs can be artificial or natural. In Spain there are more than 350 reservoirs with a storage capacity of 54,000 cubic hectometres, what means 50% of the flowing waters. The most important reservoirs or dams in Spain could be:
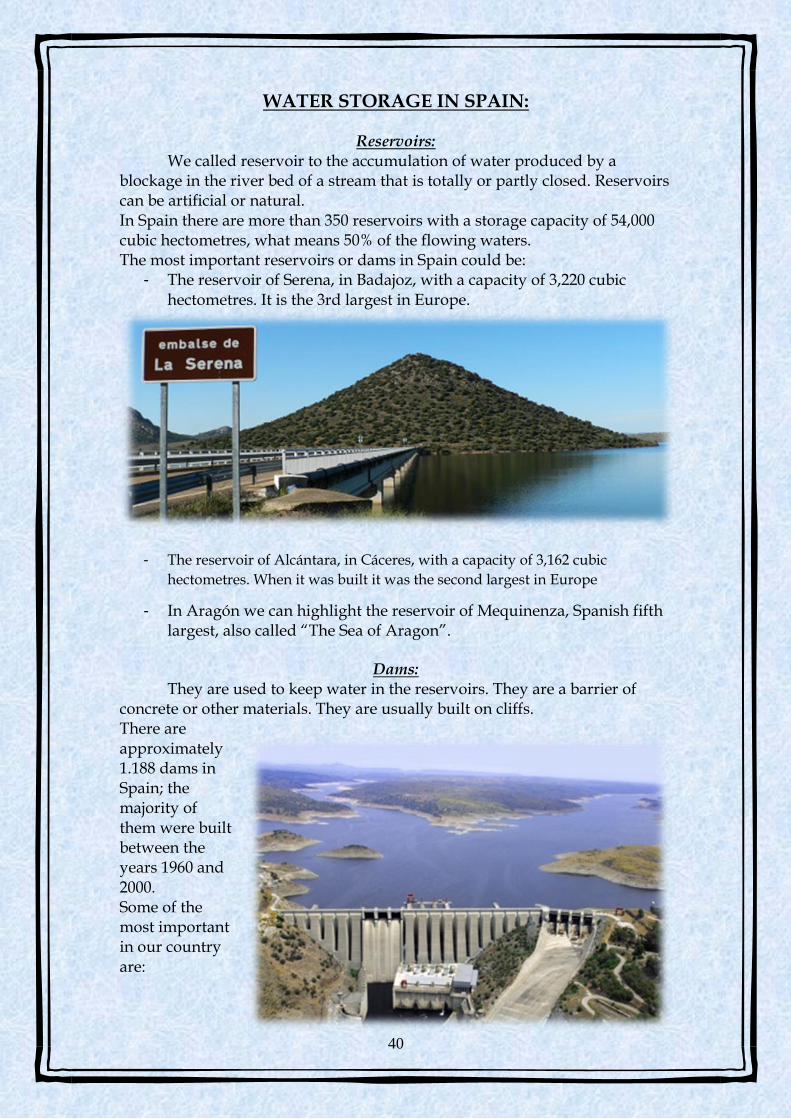
- The reservoir of Serena, in Badajoz, with a capacity of 3,220 cubic hectometres. It is the 3rd largest in Europe.
- The reservoir of Alcántara, in Cáceres, with a capacity of 3,162 cubic
hectometres. When it was built it was the second largest in Europe
- In Aragón we can highlight the reservoir of Mequinenza, Spanish fifth largest, also called “The Sea of Aragon”.
Dams:
They are used to keep water in the reservoirs. They are a barrier of concrete or other materials. They are usually built on cliffs. There are approximately 1.188 dams in Spain; the majority of them were built between the years 1960 and 2000. Some of the most important in our country are:
41
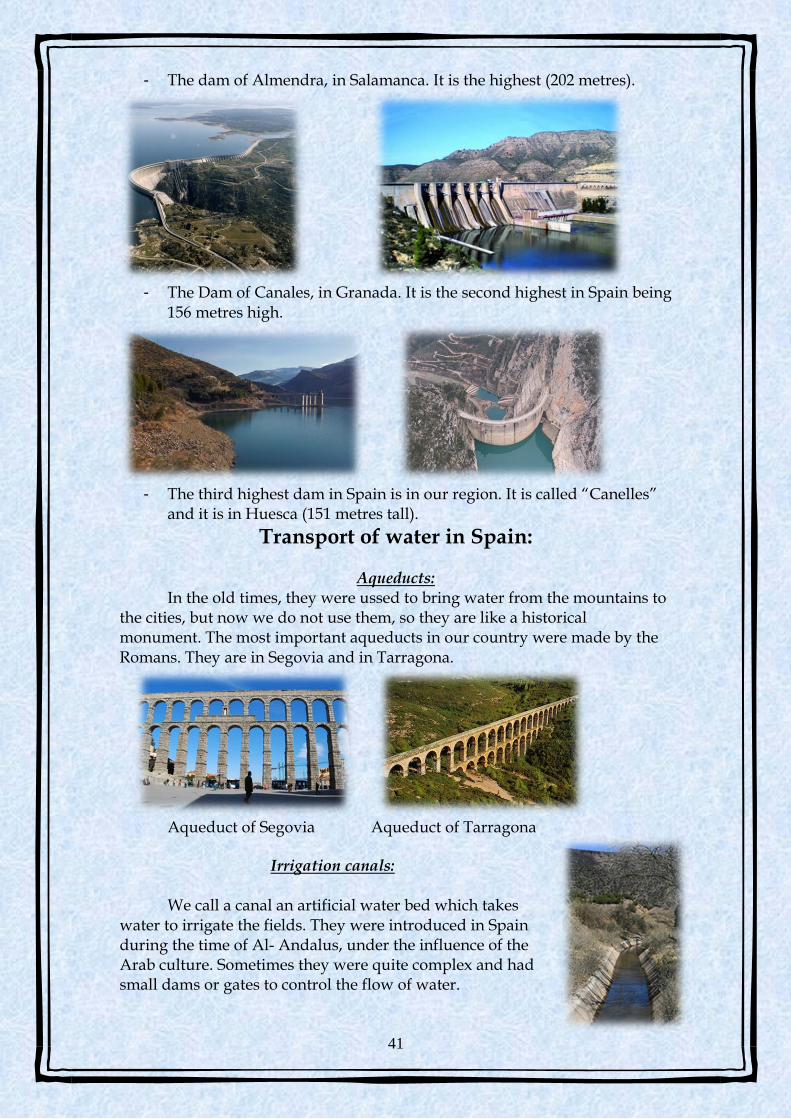
- The dam of Almendra, in Salamanca. It is the highest (202 metres).
- The Dam of Canales, in Granada. It is the second highest in Spain being
156 metres high.
- The third highest dam in Spain is in our region. It is called “Canelles”
and it is in Huesca (151 metres tall).
Transport of water in Spain:
Aqueducts: In the old times, they were ussed to bring water from the mountains to
the cities, but now we do not use them, so they are like a historical monument. The most important aqueducts in our country were made by the Romans. They are in Segovia and in Tarragona.
Aqueduct of Segovia Aqueduct of Tarragona
Irrigation canals:
We call a canal an artificial water bed which takes water to irrigate the fields. They were introduced in Spain during the time of Al- Andalus, under the influence of the Arab culture. Sometimes they were quite complex and had small dams or gates to control the flow of water.
42
3.5. TOURISM AND ITS IMPACT
ON THE HYDROSPHERE
The Consequences of Tourism on the Hydrosphere Introduction
Nature comprises a key element in tourism as it is directly connected to
its quality and configuration therefore defining its forms and affecting its
competitiveness. A reciprocal negative relationship between tourism and the
environment can be seen in our days. As tourism increases, the devastating
effects on the environment rise as well. According to the Third European
Evaluation of the Environment (European Environmental Organization, 2003)
the direct impact of tourism on people and the environment, depends greatly
on the number of tourists gathering at a specific destination and the season.
We can concur with the statement “Tourism contains the seeds of its
own destruction. Tourism can kill tourism, destroying the exact elements for
which tourists are drawn to a specific area to enjoy” (Glasson, Goodey and
Goodey, 1995:27)
As it is well known, 43 of the Earth’s surface is covered by water. The
total amount of water reserves existing on Earth are characterized as
hydrosphere, meaning oceans, seas, lakes and rivers, the total amount of
groundwater, as well as that composed of vapor in the atmosphere. When
defining the word ‘hydrosphere’ we include whatever is composed of water
(ex. fog, ice, etc.) and whatever includes precipitation and retention. All the
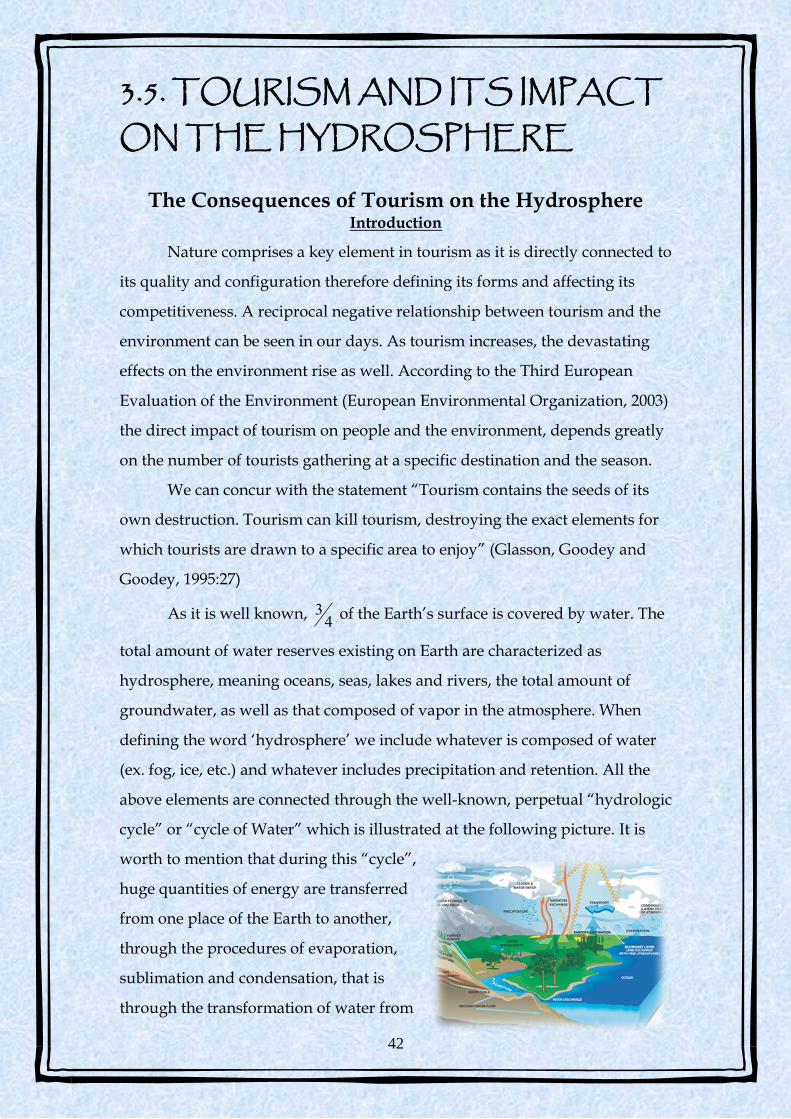
above elements are connected through the well-known, perpetual “hydrologic
cycle” or “cycle of Water” which is illustrated at the following picture. It is
worth to mention that during this “cycle”,
huge quantities of energy are transferred
from one place of the Earth to another,
through the procedures of evaporation,
sublimation and condensation, that is
through the transformation of water from
43
one form to another. For example, when a cumulonimbus cloud gives a
thunderstorm of a moderate intensity, the energy that is released to the
surrounding atmosphere, during the procedure of condensation, is more than
the nuclear energy that was released from the atomic bomb that destroyed the
city of Hirosima.
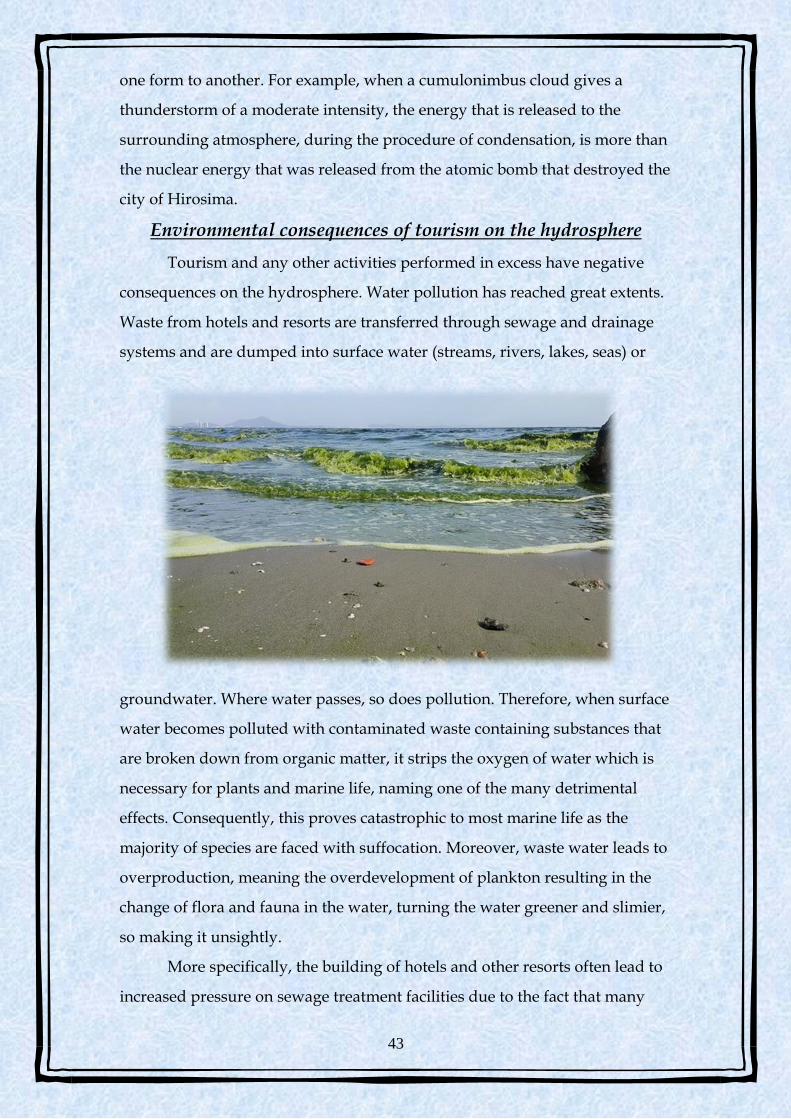
Environmental consequences of tourism on the hydrosphere
Tourism and any other activities performed in excess have negative
consequences on the hydrosphere. Water pollution has reached great extents.
Waste from hotels and resorts are transferred through sewage and drainage
systems and are dumped into surface water (streams, rivers, lakes, seas) or
groundwater. Where water passes, so does pollution. Therefore, when surface
water becomes polluted with contaminated waste containing substances that
are broken down from organic matter, it strips the oxygen of water which is
necessary for plants and marine life, naming one of the many detrimental
effects. Consequently, this proves catastrophic to most marine life as the
majority of species are faced with suffocation. Moreover, waste water leads to
overproduction, meaning the overdevelopment of plankton resulting in the
change of flora and fauna in the water, turning the water greener and slimier,
so making it unsightly.
More specifically, the building of hotels and other resorts often lead to
increased pressure on sewage treatment facilities due to the fact that many
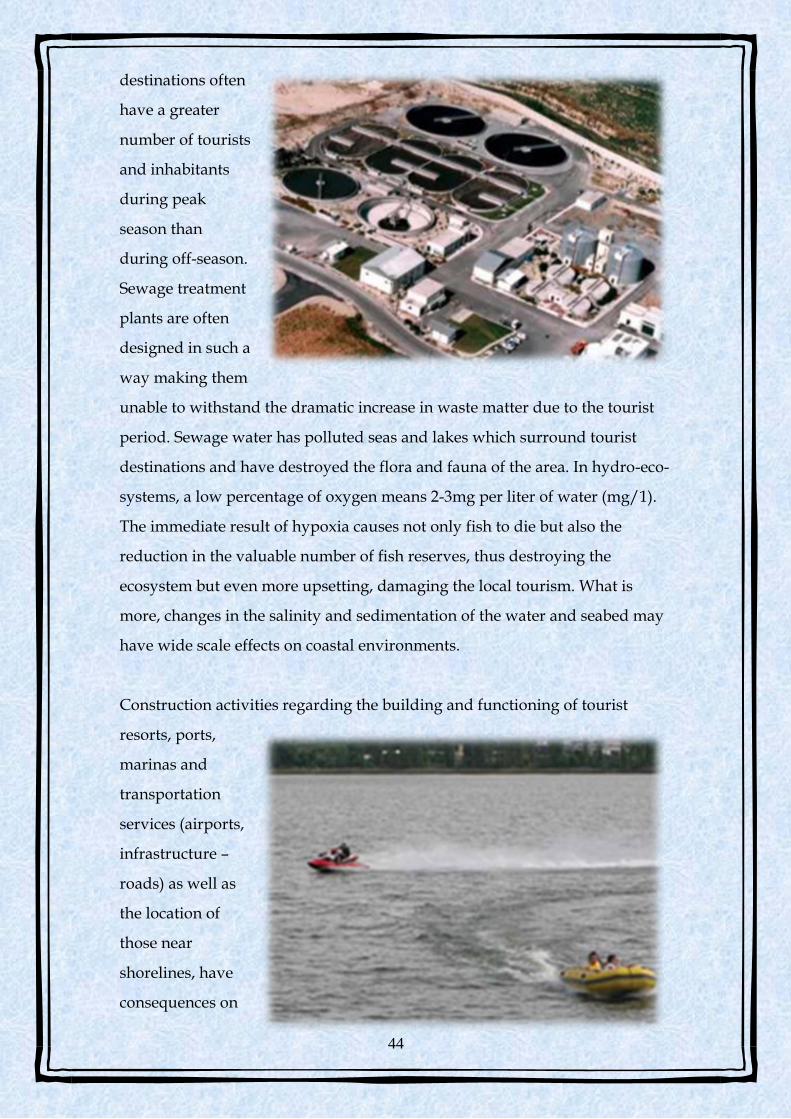
44
destinations often
have a greater
number of tourists
and inhabitants
during peak
season than
during off-season.
Sewage treatment
plants are often
designed in such a
way making them
unable to withstand the dramatic increase in waste matter due to the tourist
period. Sewage water has polluted seas and lakes which surround tourist
destinations and have destroyed the flora and fauna of the area. In hydro-eco-
systems, a low percentage of oxygen means 2-3mg per liter of water (mg/1).
The immediate result of hypoxia causes not only fish to die but also the
reduction in the valuable number of fish reserves, thus destroying the
ecosystem but even more upsetting, damaging the local tourism. What is
more, changes in the salinity and sedimentation of the water and seabed may
have wide scale effects on coastal environments.
Construction activities regarding the building and functioning of tourist
resorts, ports,
marinas and
transportation
services (airports,
infrastructure –
roads) as well as
the location of
those near
shorelines, have
consequences on
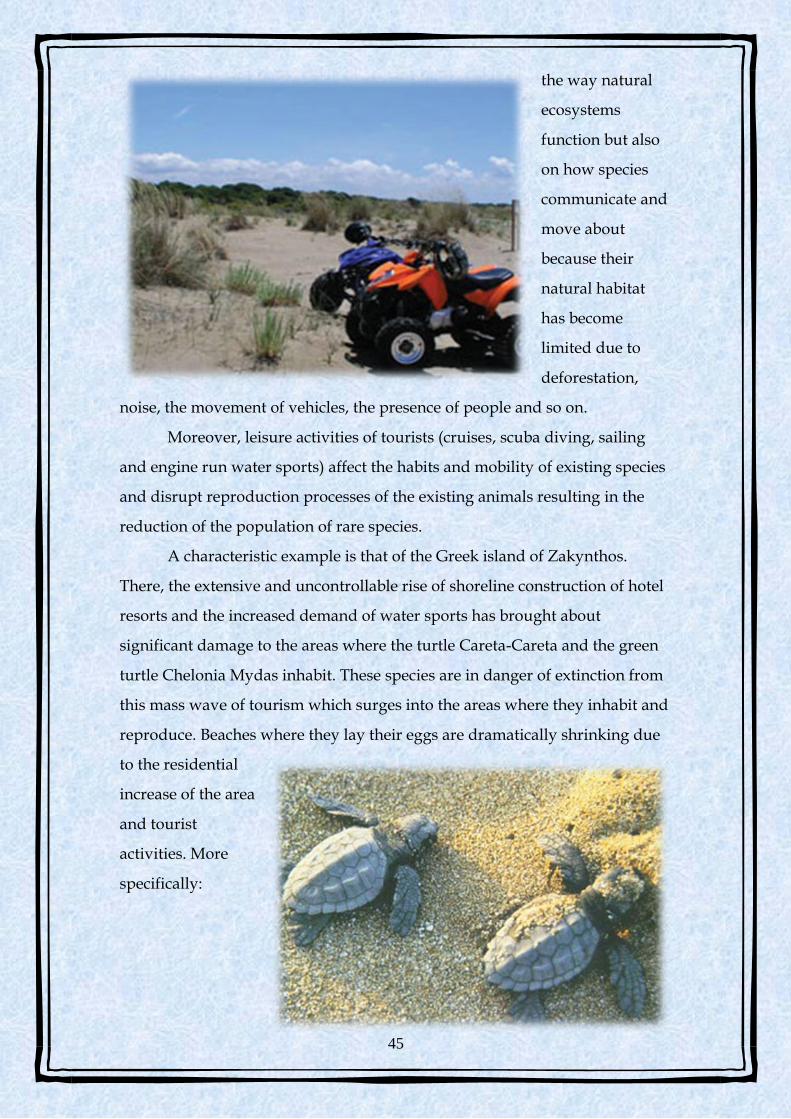
45
the way natural
ecosystems
function but also
on how species
communicate and
move about
because their
natural habitat
has become
limited due to
deforestation,
noise, the movement of vehicles, the presence of people and so on.
Moreover, leisure activities of tourists (cruises, scuba diving, sailing
and engine run water sports) affect the habits and mobility of existing species
and disrupt reproduction processes of the existing animals resulting in the
reduction of the population of rare species.
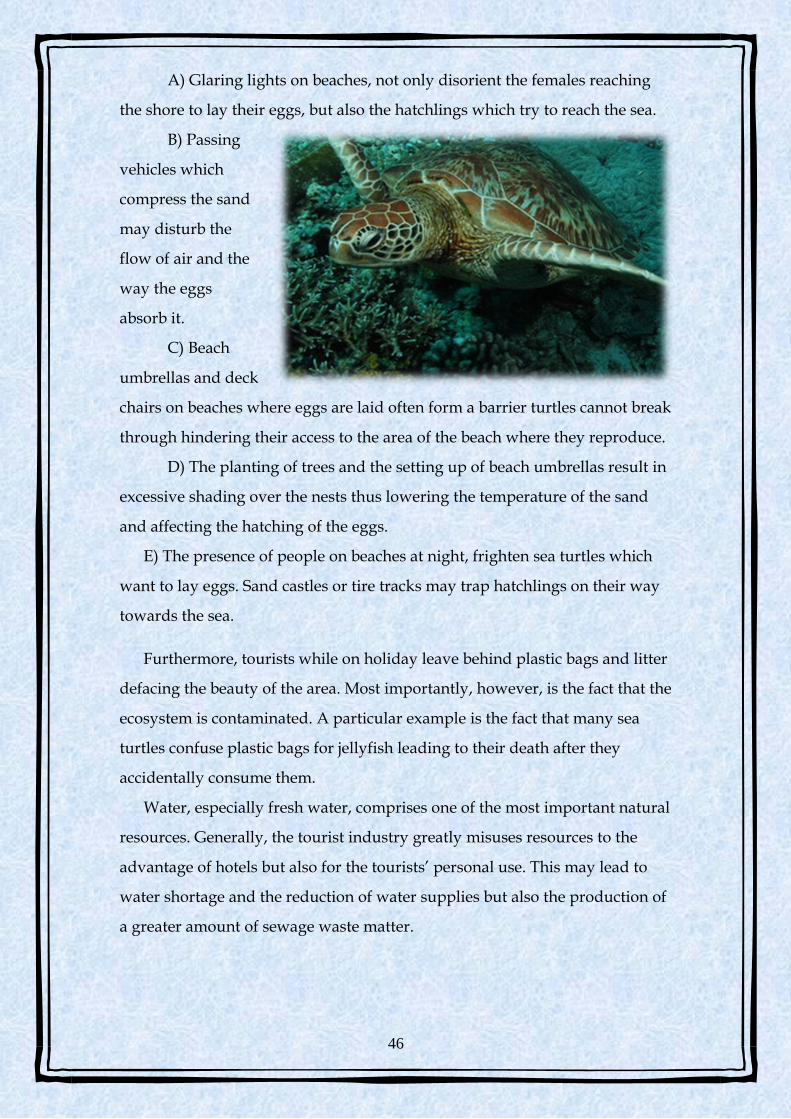
A characteristic example is that of the Greek island of Zakynthos.
There, the extensive and uncontrollable rise of shoreline construction of hotel
resorts and the increased demand of water sports has brought about
significant damage to the areas where the turtle Careta-Careta and the green
turtle Chelonia Mydas inhabit. These species are in danger of extinction from
this mass wave of tourism which surges into the areas where they inhabit and
reproduce. Beaches where they lay their eggs are dramatically shrinking due
to the residential
increase of the area
and tourist
activities. More
specifically:
46
A) Glaring lights on beaches, not only disorient the females reaching
the shore to lay their eggs, but also the hatchlings which try to reach the sea.
B) Passing
vehicles which
compress the sand
may disturb the
flow of air and the
way the eggs
absorb it.
C) Beach
umbrellas and deck
chairs on beaches where eggs are laid often form a barrier turtles cannot break
through hindering their access to the area of the beach where they reproduce.
D) The planting of trees and the setting up of beach umbrellas result in
excessive shading over the nests thus lowering the temperature of the sand
and affecting the hatching of the eggs.
E) The presence of people on beaches at night, frighten sea turtles which
want to lay eggs. Sand castles or tire tracks may trap hatchlings on their way
towards the sea.
Furthermore, tourists while on holiday leave behind plastic bags and litter
defacing the beauty of the area. Most importantly, however, is the fact that the
ecosystem is contaminated. A particular example is the fact that many sea
turtles confuse plastic bags for jellyfish leading to their death after they
accidentally consume them.
Water, especially fresh water, comprises one of the most important natural
resources. Generally, the tourist industry greatly misuses resources to the
advantage of hotels but also for the tourists’ personal use. This may lead to
water shortage and the reduction of water supplies but also the production of
a greater amount of sewage waste matter.
47
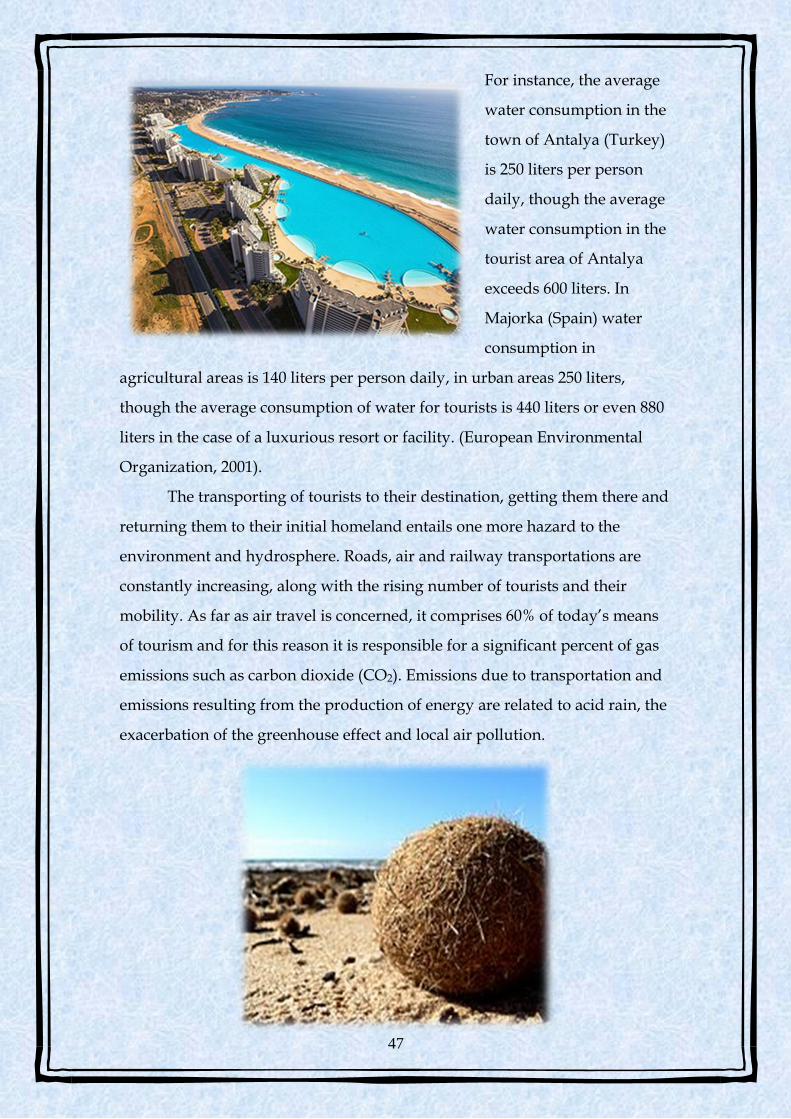
For instance, the average
water consumption in the
town of Antalya (Turkey)
is 250 liters per person
daily, though the average
water consumption in the
tourist area of Antalya
exceeds 600 liters. In
Majorka (Spain) water
consumption in
agricultural areas is 140 liters per person daily, in urban areas 250 liters,
though the average consumption of water for tourists is 440 liters or even 880
liters in the case of a luxurious resort or facility. (European Environmental
Organization, 2001).
The transporting of tourists to their destination, getting them there and
returning them to their initial homeland entails one more hazard to the
environment and hydrosphere. Roads, air and railway transportations are
constantly increasing, along with the rising number of tourists and their
mobility. As far as air travel is concerned, it comprises 60% of today’s means
of tourism and for this reason it is responsible for a significant percent of gas
emissions such as carbon dioxide (CO2). Emissions due to transportation and
emissions resulting from the production of energy are related to acid rain, the
exacerbation of the greenhouse effect and local air pollution.
48
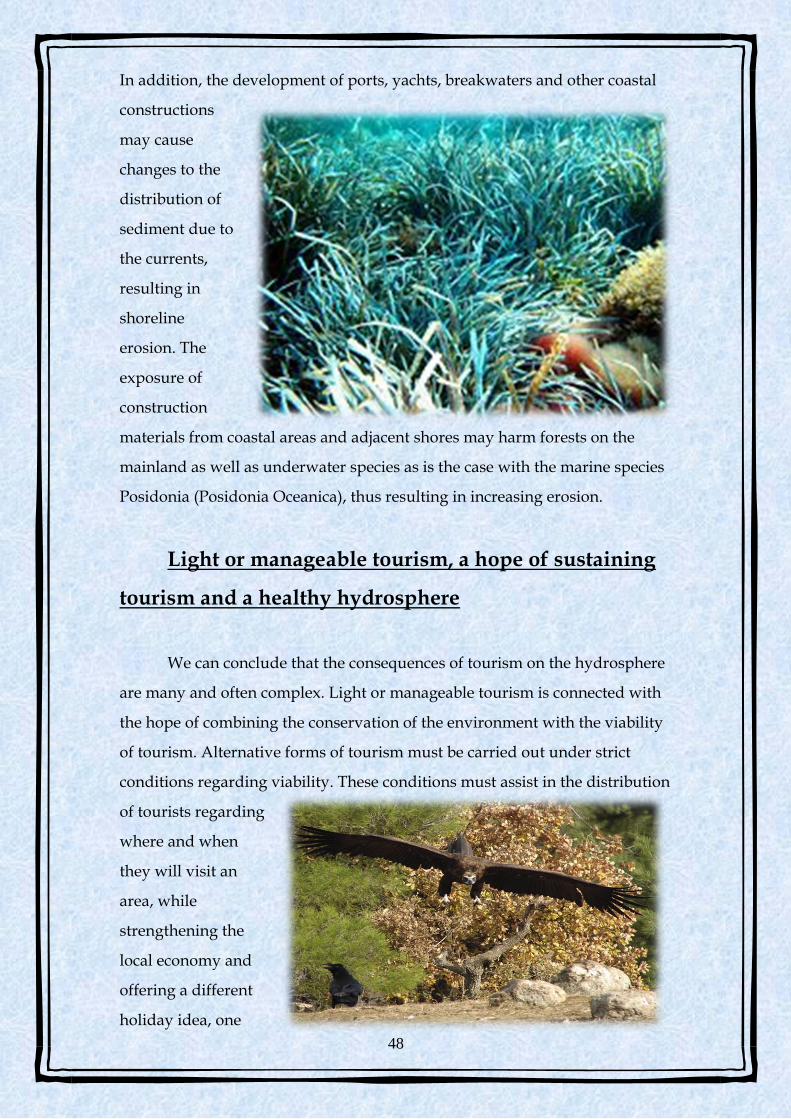
In addition, the development of ports, yachts, breakwaters and other coastal
constructions
may cause
changes to the
distribution of
sediment due to
the currents,
resulting in
shoreline
erosion. The
exposure of
construction
materials from coastal areas and adjacent shores may harm forests on the
mainland as well as underwater species as is the case with the marine species
Posidonia (Posidonia Oceanica), thus resulting in increasing erosion.
Light or manageable tourism, a hope of sustaining
tourism and a healthy hydrosphere
We can conclude that the consequences of tourism on the hydrosphere
are many and often complex. Light or manageable tourism is connected with
the hope of combining the conservation of the environment with the viability
of tourism. Alternative forms of tourism must be carried out under strict
conditions regarding viability. These conditions must assist in the distribution
of tourists regarding
where and when
they will visit an
area, while
strengthening the
local economy and
offering a different
holiday idea, one
49
differing from the usual “sun, sea and beach.” Alternative tourism focuses on
the increasing need people exhibit for adventure and taking part in activities
and not just leisurely enjoying a destination. Such forms of tourism include
agricultural tourism, visits to thermal spas, spiritual tourism, cultural
enlightenment, hiking, skiing, and sessional tourism associated with a
convention. For instance in Greece, the economy of which is based on ‘Water’
tourism at a huge degree, there are numerous examples of such forms of
tourist destinations which meet the concept of viability and sustainable
tourism.
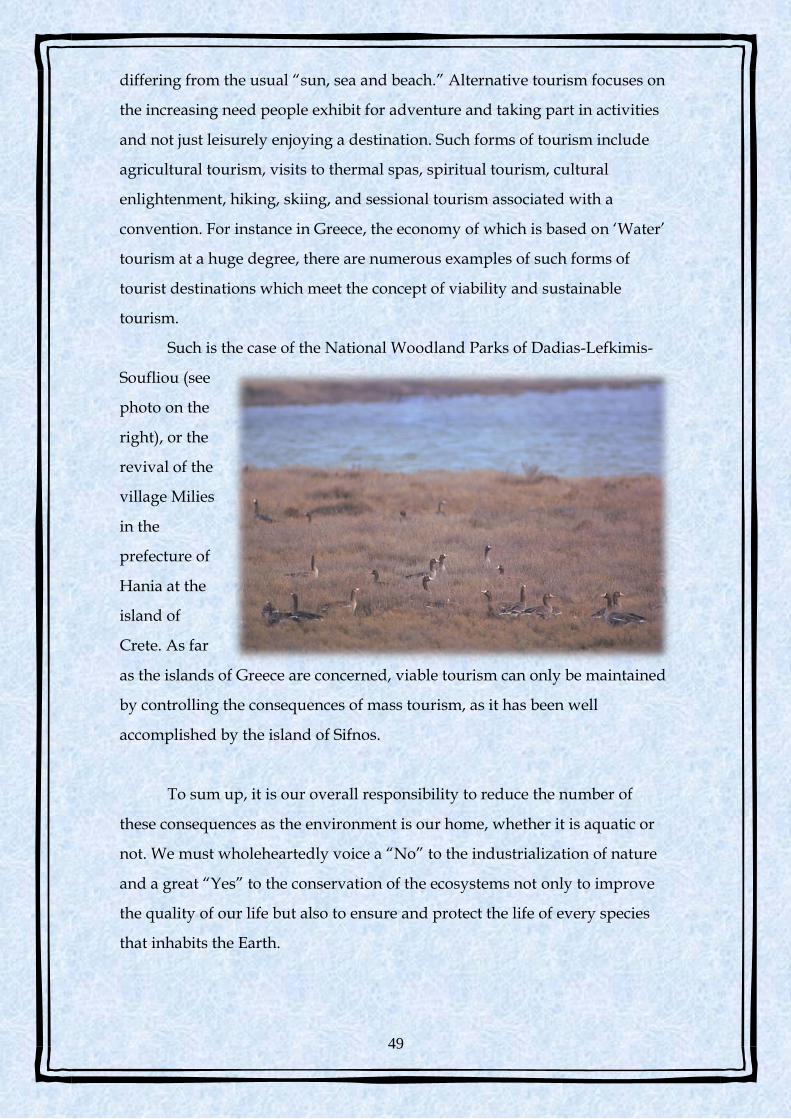
Such is the case of the National Woodland Parks of Dadias-Lefkimis-
Soufliou (see
photo on the
right), or the
revival of the
village Milies
in the
prefecture of
Hania at the
island of
Crete. As far
as the islands of Greece are concerned, viable tourism can only be maintained
by controlling the consequences of mass tourism, as it has been well
accomplished by the island of Sifnos.
To sum up, it is our overall responsibility to reduce the number of
these consequences as the environment is our home, whether it is aquatic or
not. We must wholeheartedly voice a “No” to the industrialization of nature
and a great “Yes” to the conservation of the ecosystems not only to improve
the quality of our life but also to ensure and protect the life of every species
that inhabits the Earth.
50
3.6. “THE SKY IS ANGRY”
GREENHOUSE EFFECT,
ACID RAIN, DROUGHT,
FLOOD, MELTING OF ICE IN
ALPS, GREENLAND
“The sky broke like an egg into full sunset and the water caught fire.“ P. H. Johnson
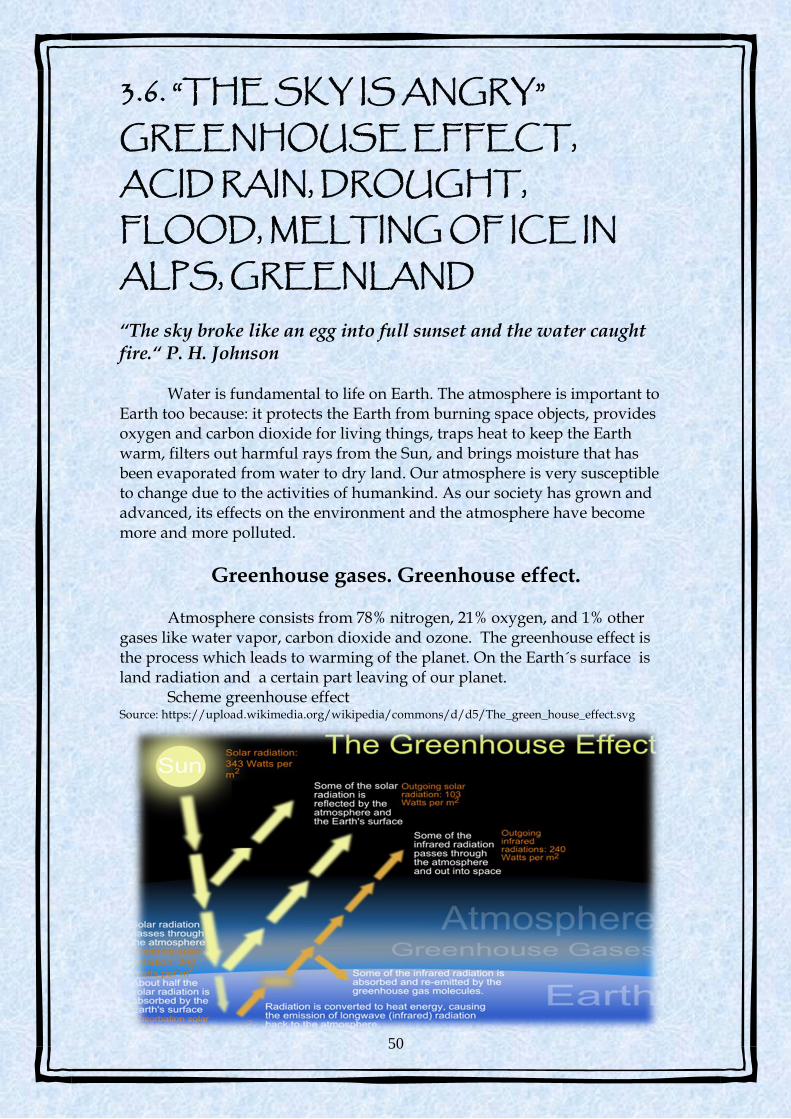
Water is fundamental to life on Earth. The atmosphere is important to Earth too because: it protects the Earth from burning space objects, provides oxygen and carbon dioxide for living things, traps heat to keep the Earth warm, filters out harmful rays from the Sun, and brings moisture that has been evaporated from water to dry land. Our atmosphere is very susceptible to change due to the activities of humankind. As our society has grown and advanced, its effects on the environment and the atmosphere have become more and more polluted.
Greenhouse gases. Greenhouse effect.
Atmosphere consists from 78% nitrogen, 21% oxygen, and 1% other gases like water vapor, carbon dioxide and ozone. The greenhouse effect is the process which leads to warming of the planet. On the Earth´s surface is land radiation and a certain part leaving of our planet.
Scheme greenhouse effect Source: https://upload.wikimedia.org/wikipedia/commons/d/d5/The_green_house_effect.svg
51
Leaving radiation takes two forms: the reflected sun radiation and thermal
radiation.
Thermal radiation when leaving our planet from the capture of greenhouse
gases.
The water vapor causes about 60% of the Earth´s natural greenhouse effect.
Carbon dioxide causes about 26%. Methane, nitrous oxide and ozone cause
about 8%. Accumulation of thermal radiation is getting the planet warmer.
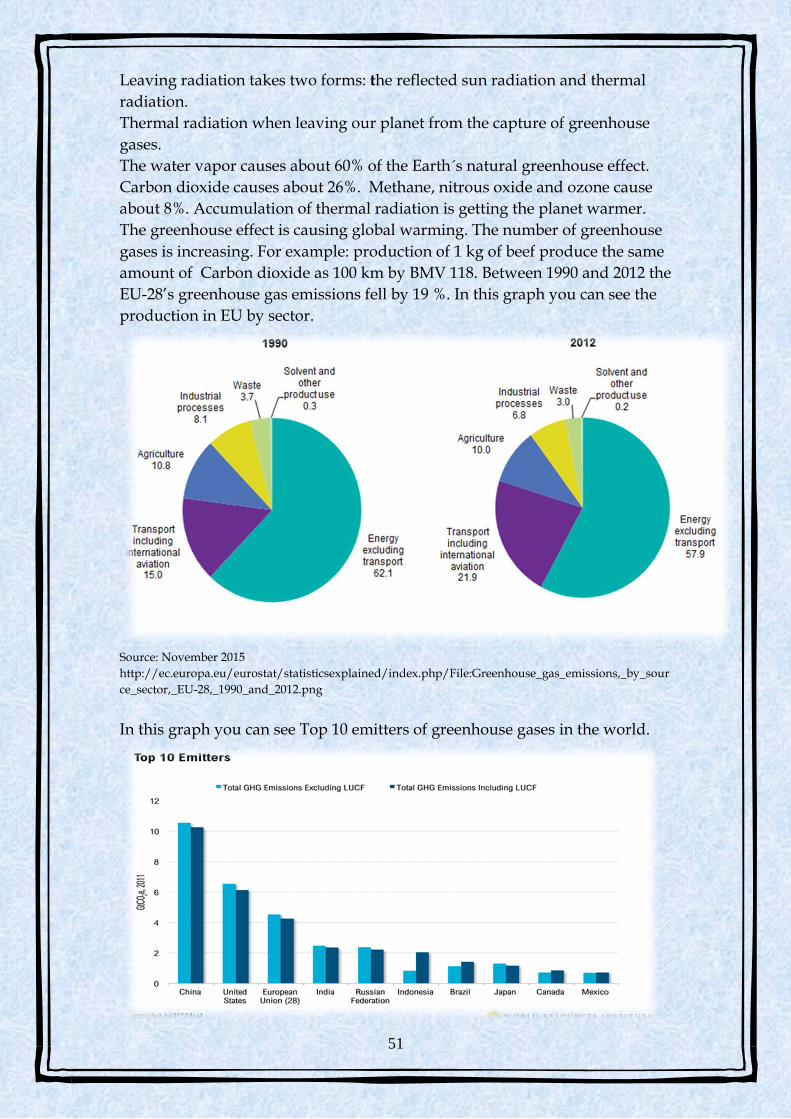
The greenhouse effect is causing global warming. The number of greenhouse
gases is increasing. For example: production of 1 kg of beef produce the same
amount of Carbon dioxide as 100 km by BMV 118. Between 1990 and 2012 the
EU-28’s greenhouse gas emissions fell by 19 %. In this graph you can see the
production in EU by sector.
Source: November 2015
http://ec.europa.eu/eurostat/statisticsexplained/index.php/File:Greenhouse_gas_emissions,_by_sour
ce_sector,_EU-28,_1990_and_2012.png
In this graph you can see Top 10 emitters of greenhouse gases in the world.
52
Global warming
Each greenhouse gas has a different capacity to cause global warming. A climate change represents a change in long-term weather patterns. They can become warmer or colder. Annual amounts of rainfall or snowfall can increase or decrease.
The climate change is an important and constant change in statistics of weather realitionships ongoing in between one decade and many milions years. That can go about change in a normal climate condition or change extreme weather effects.
These are the factors of changing climate: biological trials, changes of sunshine falling on Earth, changes of tectonic boards and vulcanic eruptions. We call today´s climate changes a global warming. They are faster and caused by human society.
Today, we use the term global warming for the last warming. That have been since 20th century. We are watching the grow of normal temperature climate system of Earth. People influence this climate system. This warming has been in the oceans (90%) since 1971. The temperature of air and water is about 0,6 – 0,8°C warmer. Earth is warmer than before. The ten warmest years in the 134-year record all have occurred since 2000, with the exception of 1998. The year 2014 ranks as the warmest one on record (NASA,2014).
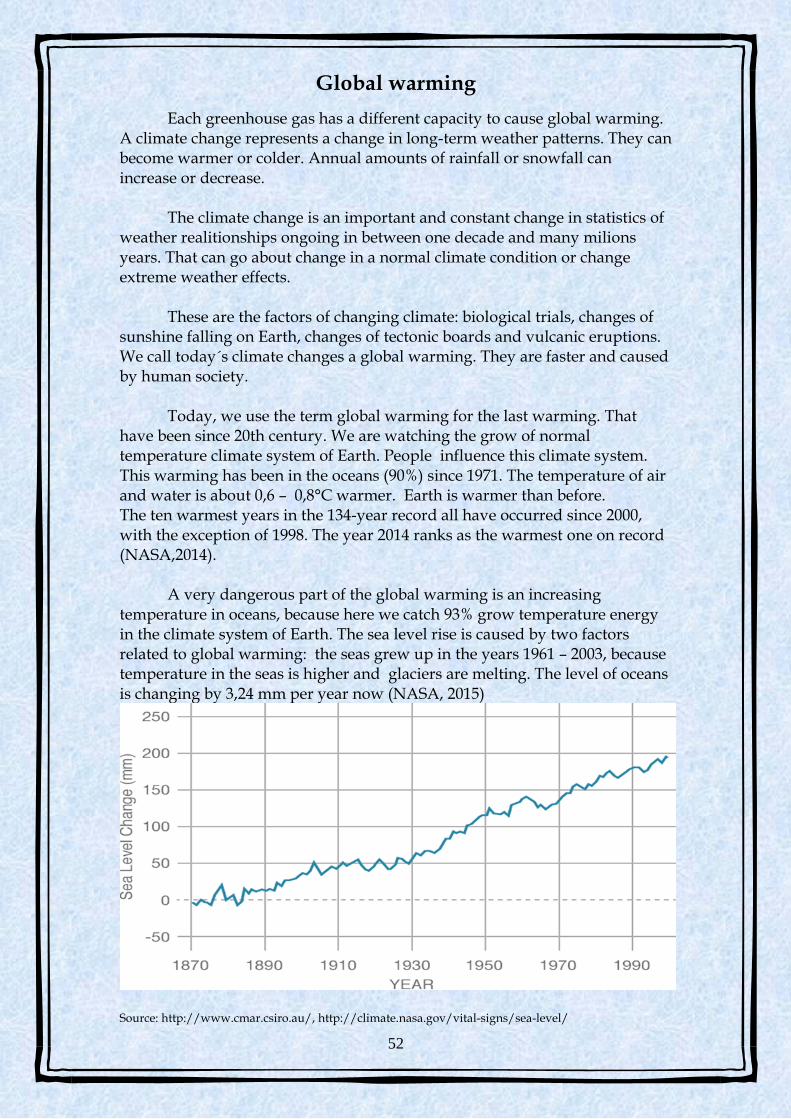
A very dangerous part of the global warming is an increasing temperature in oceans, because here we catch 93% grow temperature energy in the climate system of Earth. The sea level rise is caused by two factors related to global warming: the seas grew up in the years 1961 – 2003, because temperature in the seas is higher and glaciers are melting. The level of oceans is changing by 3,24 mm per year now (NASA, 2015)
Source: http://www.cmar.csiro.au/, http://climate.nasa.gov/vital-signs/sea-level/
53
The other changes in oceans
El Niño is a climate pattern where the water in the Pacific Ocean near the equator gets hotter than usual and affects the atmosphere and weather around the world. El Niño climate conditions occur every few years, and they are not predictable. El Niño is Spanish for The Little Boy. It refers to the Christ child and was named by Mexican fisherman, who noticed the climate pattern often formed around Christmas time. In 1982-83, and in 1997-98, we experienced the strongest El Nino effects in the 1900s. El Nino has been responsible for floods, droughts, thunderstorms, extreme rainfall, milder Canadian winters, lowered cyclone and hurricane activity, and dryer-than-normal monsoons. In recent years, however, the Pacific has cooled thanks to a corresponding ocean phenomenon, known as La Niña (Spanish for "the girl"). It depresses sea surface temperatures and has played a key role in limiting global warming since the turn of the century.
As a result, global temperatures have been prevented from rising above their 1998 record level. That cooling has now stopped, however, and a new El Niño warming period has just started in the Pacific. This climate pattern can influence more than fifty percent of the world climate.
The melting of ice
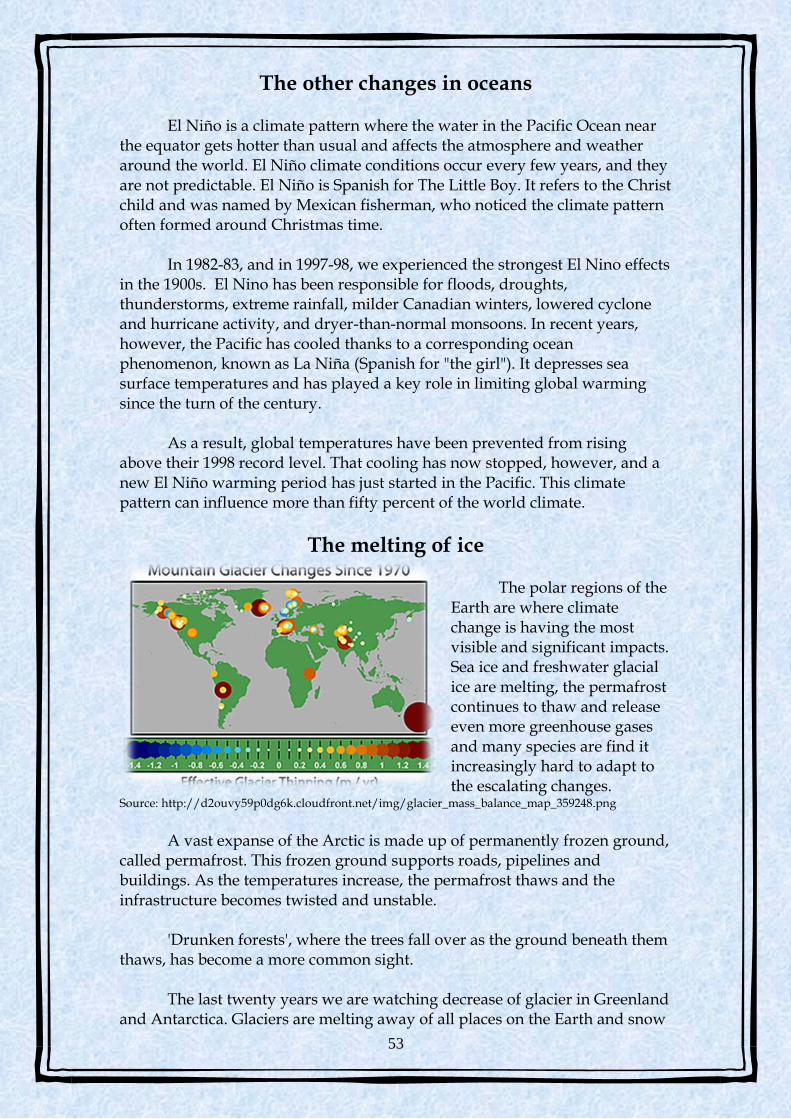
The polar regions of the Earth are where climate change is having the most visible and significant impacts. Sea ice and freshwater glacial ice are melting, the permafrost continues to thaw and release even more greenhouse gases and many species are find it increasingly hard to adapt to the escalating changes.
Source: http://d2ouvy59p0dg6k.cloudfront.net/img/glacier_mass_balance_map_359248.png
A vast expanse of the Arctic is made up of permanently frozen ground,
called permafrost. This frozen ground supports roads, pipelines and buildings. As the temperatures increase, the permafrost thaws and the infrastructure becomes twisted and unstable.
'Drunken forests', where the trees fall over as the ground beneath them thaws, has become a more common sight.
The last twenty years we are watching decrease of glacier in Greenland and Antarctica. Glaciers are melting away of all places on the Earth and snow
54
is disappearing on the northern hemisphere in spring months.
Since 1850 the glaciers of the European Alps have lost about 30 to 40% of their surface area and about a half of their volume. The glacier melting has accelerated in the European Alps since 1980, and 10 to 20% of glacier ice in the Alps were lost in less than two decades. Arctic glaciers have been receding, with the exception of Scandinavia and Iceland where they increase in precipitation resulted in glacier growth.
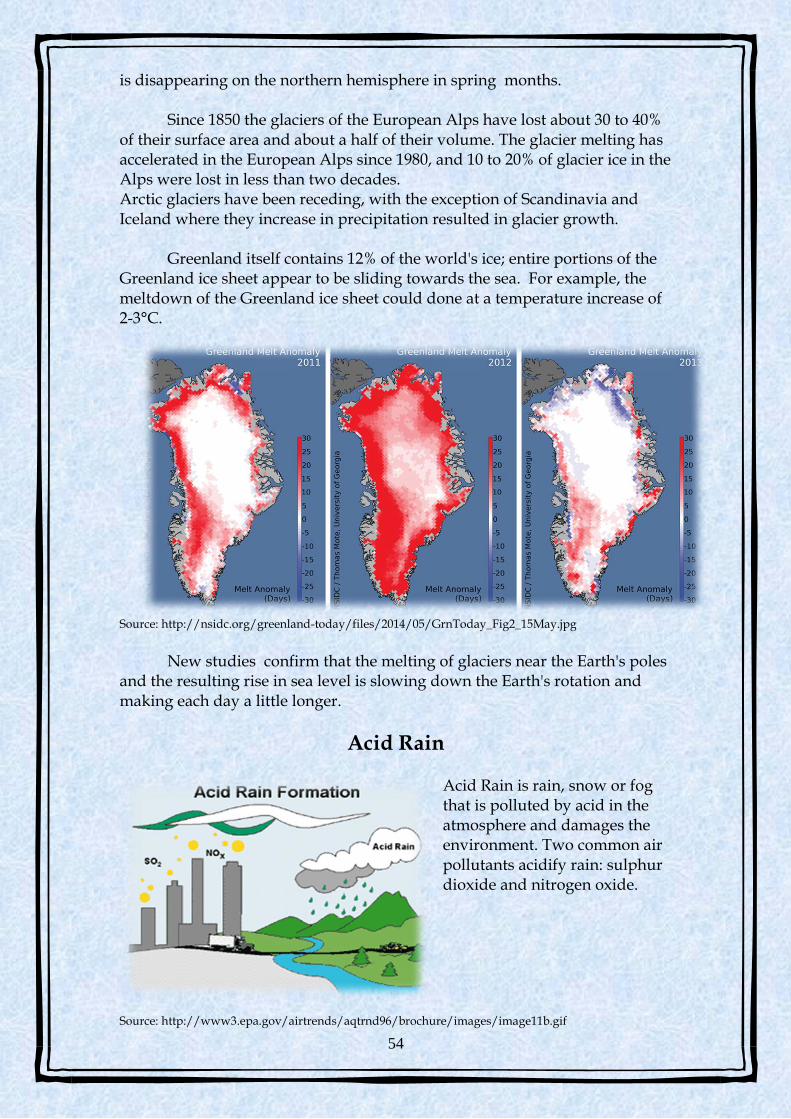
Greenland itself contains 12% of the world's ice; entire portions of the Greenland ice sheet appear to be sliding towards the sea. For example, the meltdown of the Greenland ice sheet could done at a temperature increase of 2-3°C.
Source: http://nsidc.org/greenland-today/files/2014/05/GrnToday_Fig2_15May.jpg
New studies confirm that the melting of glaciers near the Earth's poles
and the resulting rise in sea level is slowing down the Earth's rotation and making each day a little longer.
Acid Rain
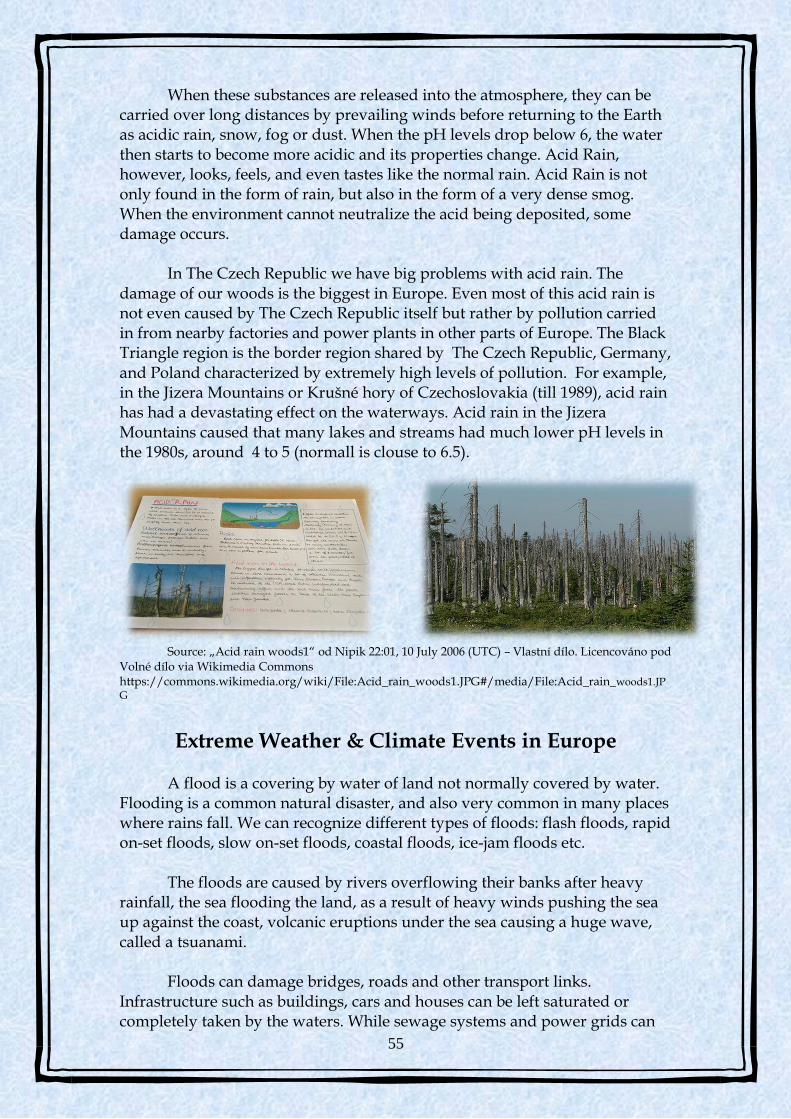
Acid Rain is rain, snow or fog that is polluted by acid in the atmosphere and damages the environment. Two common air pollutants acidify rain: sulphur dioxide and nitrogen oxide.
Source: http://www3.epa.gov/airtrends/aqtrnd96/brochure/images/image11b.gif
55
When these substances are released into the atmosphere, they can be carried over long distances by prevailing winds before returning to the Earth as acidic rain, snow, fog or dust. When the pH levels drop below 6, the water then starts to become more acidic and its properties change. Acid Rain, however, looks, feels, and even tastes like the normal rain. Acid Rain is not only found in the form of rain, but also in the form of a very dense smog. When the environment cannot neutralize the acid being deposited, some damage occurs.
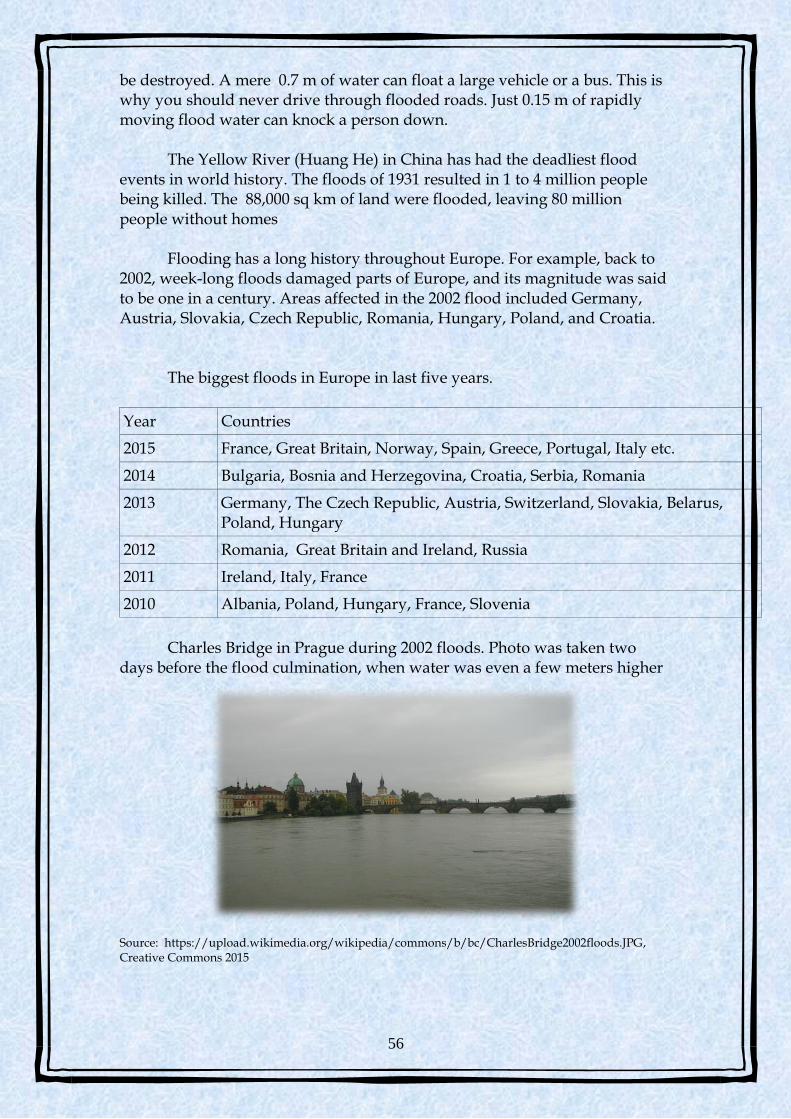
In The Czech Republic we have big problems with acid rain. The damage of our woods is the biggest in Europe. Even most of this acid rain is not even caused by The Czech Republic itself but rather by pollution carried in from nearby factories and power plants in other parts of Europe. The Black Triangle region is the border region shared by The Czech Republic, Germany, and Poland characterized by extremely high levels of pollution. For example, in the Jizera Mountains or Krušné hory of Czechoslovakia (till 1989), acid rain has had a devastating effect on the waterways. Acid rain in the Jizera Mountains caused that many lakes and streams had much lower pH levels in the 1980s, around 4 to 5 (normall is clouse to 6.5).
Source: „Acid rain woods1“ od Nipik 22:01, 10 July 2006 (UTC) – Vlastní dílo. Licencováno pod Volné dílo via Wikimedia Commons https://commons.wikimedia.org/wiki/File:Acid_rain_woods1.JPG#/media/File:Acid_rain_woods1.JPG
Extreme Weather & Climate Events in Europe
A flood is a covering by water of land not normally covered by water.
Flooding is a common natural disaster, and also very common in many places where rains fall. We can recognize different types of floods: flash floods, rapid on-set floods, slow on-set floods, coastal floods, ice-jam floods etc.
The floods are caused by rivers overflowing their banks after heavy rainfall, the sea flooding the land, as a result of heavy winds pushing the sea up against the coast, volcanic eruptions under the sea causing a huge wave, called a tsuanami.
Floods can damage bridges, roads and other transport links. Infrastructure such as buildings, cars and houses can be left saturated or completely taken by the waters. While sewage systems and power grids can
56
be destroyed. A mere 0.7 m of water can float a large vehicle or a bus. This is why you should never drive through flooded roads. Just 0.15 m of rapidly moving flood water can knock a person down.
The Yellow River (Huang He) in China has had the deadliest flood events in world history. The floods of 1931 resulted in 1 to 4 million people being killed. The 88,000 sq km of land were flooded, leaving 80 million people without homes
Flooding has a long history throughout Europe. For example, back to 2002, week-long floods damaged parts of Europe, and its magnitude was said to be one in a century. Areas affected in the 2002 flood included Germany, Austria, Slovakia, Czech Republic, Romania, Hungary, Poland, and Croatia.
The biggest floods in Europe in last five years.
Year Countries
2015 France, Great Britain, Norway, Spain, Greece, Portugal, Italy etc.
2014 Bulgaria, Bosnia and Herzegovina, Croatia, Serbia, Romania
2013 Germany, The Czech Republic, Austria, Switzerland, Slovakia, Belarus, Poland, Hungary
2012 Romania, Great Britain and Ireland, Russia
2011 Ireland, Italy, France
2010 Albania, Poland, Hungary, France, Slovenia
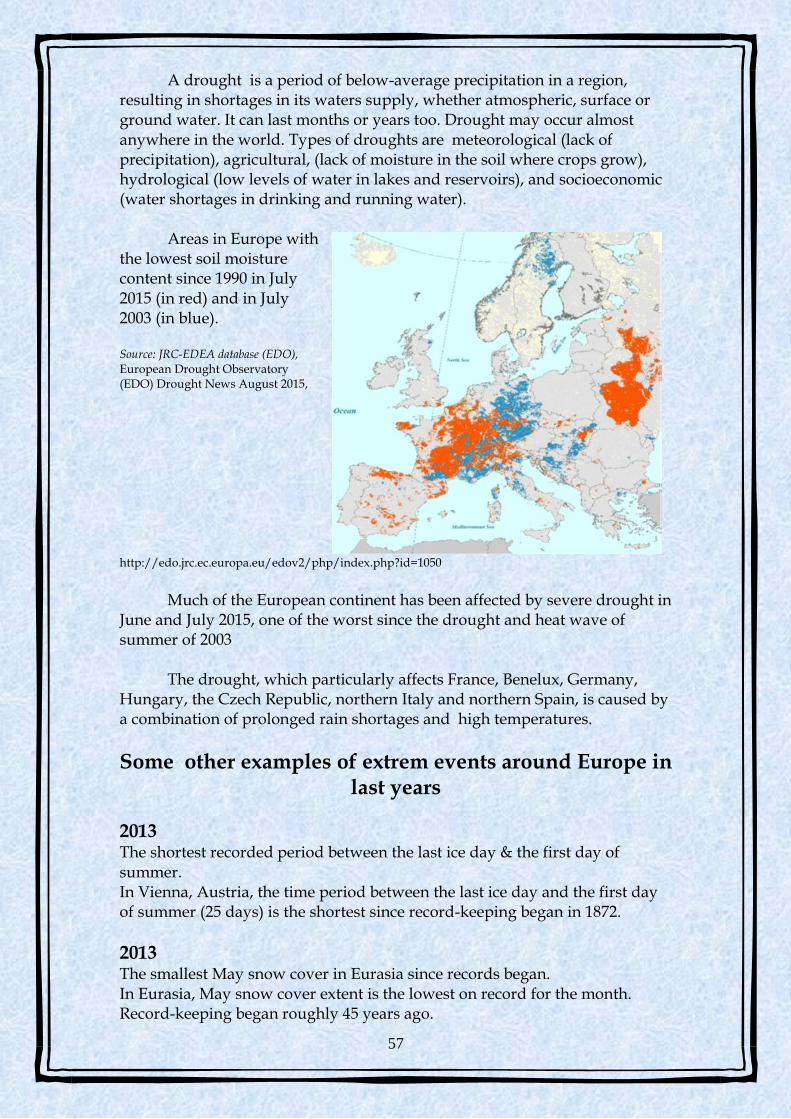
Charles Bridge in Prague during 2002 floods. Photo was taken two
days before the flood culmination, when water was even a few meters higher Source: https://upload.wikimedia.org/wikipedia/commons/b/bc/CharlesBridge2002floods.JPG, Creative Commons 2015
57
A drought is a period of below-average precipitation in a region, resulting in shortages in its waters supply, whether atmospheric, surface or ground water. It can last months or years too. Drought may occur almost anywhere in the world. Types of droughts are meteorological (lack of precipitation), agricultural, (lack of moisture in the soil where crops grow), hydrological (low levels of water in lakes and reservoirs), and socioeconomic (water shortages in drinking and running water).
Areas in Europe with the lowest soil moisture content since 1990 in July 2015 (in red) and in July 2003 (in blue). Source: JRC-EDEA database (EDO), European Drought Observatory (EDO) Drought News August 2015,
http://edo.jrc.ec.europa.eu/edov2/php/index.php?id=1050
Much of the European continent has been affected by severe drought in
June and July 2015, one of the worst since the drought and heat wave of summer of 2003
The drought, which particularly affects France, Benelux, Germany, Hungary, the Czech Republic, northern Italy and northern Spain, is caused by a combination of prolonged rain shortages and high temperatures.
Some other examples of extrem events around Europe in last years
2013 The shortest recorded period between the last ice day & the first day of summer. In Vienna, Austria, the time period between the last ice day and the first day of summer (25 days) is the shortest since record-keeping began in 1872.
2013 The smallest May snow cover in Eurasia since records began. In Eurasia, May snow cover extent is the lowest on record for the month. Record-keeping began roughly 45 years ago.
58
2013 The fourth-lowest snow coverage in Northern Hemisphere. Snow cover in the Northern Hemisphere is the fourth-lowest since 1967, following the three years with the lowest recorded snow cover in 2012, 2010, and 2011, respectively.
2013 Scotland has its wettest December on record, which lasts more than a century. Precipitation is 181 percent of the monthly average.
2013 The cold lasts for three weeks and is accompanied by heavy snowfall. More than 650 lives are lost as a result, with the majority of deaths occurring in Russia, Ukraine, and Poland.
2013 All-time record number of storms over the British Isles in winter 2013-14
2015 The Czech Republic has been hit with a severe heat wave. Currents of hot air coming from north Africa via France and southern Germany raised temperatures by to a new record of 40.4 degrees Celsius. Germany's all-time heat record was toppled July 5 in Kitzingen, topping out at 40.3 degrees Celsius.
International cooperation
The adoption of the Kyoto Protocol at the Earth Summit in Rio de Janeiro, Brazil, in 1992 was a milestone in the international negotiations on tackling climate change. Adopted in 1997 and in force since 2005, the Kyoto Protocol set binding greenhouse gas emissions targets for developed countries for the period 2008-2012. The protocol renewed until 2020.
There were 21st Conference of the Parties to the United Nations
Framework Convention on Climate Change (COP21/CMP11), from 30
November to 11 December 2015 in Paris. The goal of COP21 is to reach a new
international agreement on climate that is universal (agreed by and applicable
to all countries), keeping global warming below 2°C etc.
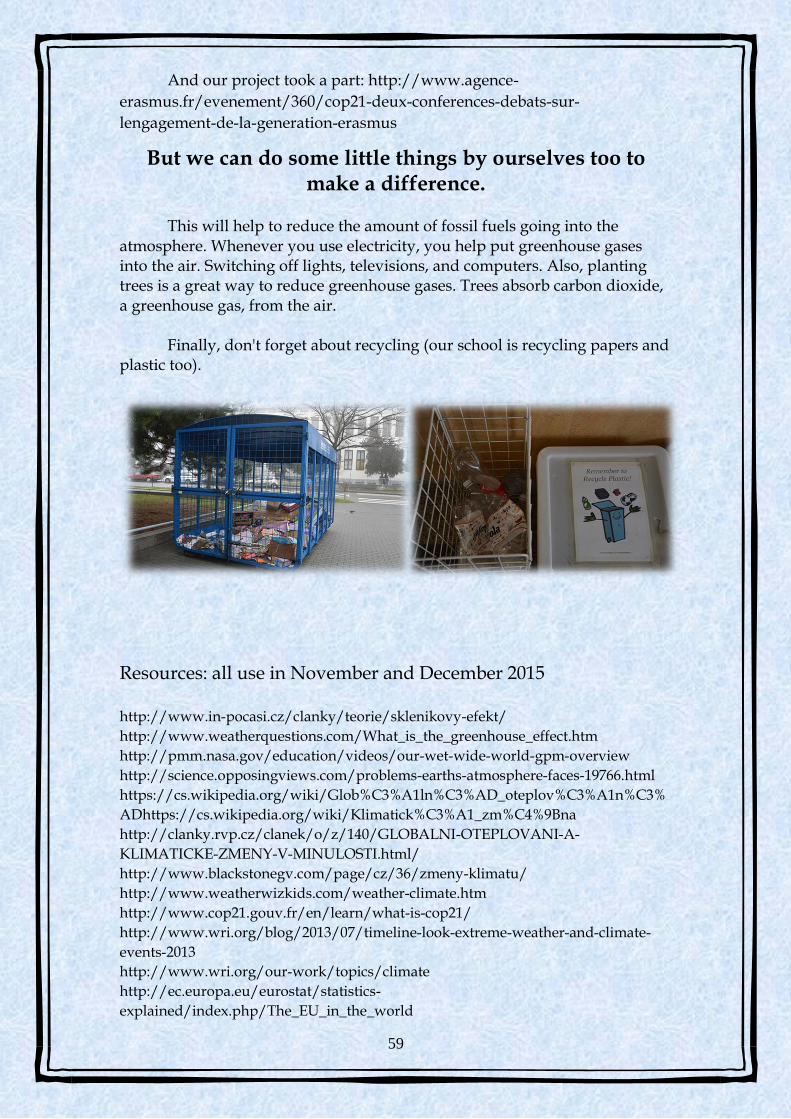
59
And our project took a part: http://www.agence-
erasmus.fr/evenement/360/cop21-deux-conferences-debats-sur-
lengagement-de-la-generation-erasmus
But we can do some little things by ourselves too to make a difference.
This will help to reduce the amount of fossil fuels going into the
atmosphere. Whenever you use electricity, you help put greenhouse gases into the air. Switching off lights, televisions, and computers. Also, planting trees is a great way to reduce greenhouse gases. Trees absorb carbon dioxide, a greenhouse gas, from the air.
Finally, don't forget about recycling (our school is recycling papers and plastic too).
Resources: all use in November and December 2015 http://www.in-pocasi.cz/clanky/teorie/sklenikovy-efekt/
http://www.weatherquestions.com/What_is_the_greenhouse_effect.htm
http://pmm.nasa.gov/education/videos/our-wet-wide-world-gpm-overview
http://science.opposingviews.com/problems-earths-atmosphere-faces-19766.html
https://cs.wikipedia.org/wiki/Glob%C3%A1ln%C3%AD_oteplov%C3%A1n%C3%
ADhttps://cs.wikipedia.org/wiki/Klimatick%C3%A1_zm%C4%9Bna
http://clanky.rvp.cz/clanek/o/z/140/GLOBALNI-OTEPLOVANI-A-
KLIMATICKE-ZMENY-V-MINULOSTI.html/
http://www.blackstonegv.com/page/cz/36/zmeny-klimatu/
http://www.weatherwizkids.com/weather-climate.htm
http://www.cop21.gouv.fr/en/learn/what-is-cop21/
http://www.wri.org/blog/2013/07/timeline-look-extreme-weather-and-climate-
events-2013
http://www.wri.org/our-work/topics/climate
http://ec.europa.eu/eurostat/statistics-
explained/index.php/The_EU_in_the_world

60
http://wwf.panda.org/about_our_earth/aboutcc/problems/impacts/glaciers/
http://www.cbc.ca/news/technology/sea-level-earth-rotation-1.3361446
http://edo.jrc.ec.europa.eu/edov2/php/index.php?id=1050
Extreme Weather Events in Europe: preparing for climate change adaptation. October
2013. ISBN 978-82-7144-100-5.
http://www.sciencekids.co.nz/sciencefacts/weather/floods.html
The international disasters database http://www.emdat.be/