“experiments with pretty good chemicals!” - ccchemteach
TRANSCRIPT
“Experiments with Pretty Good Chemicals!”
CHEMISTRY 1A
LAB MANUAL
Lawrence Yee 2019, 8th ed.

ii
Copyright © 2019 by Lawrence Yee All rights reserved. CCChemTeach.com (http://ccchemteach.com) for community college chemistry

iii
CONTENTS
SAFETYINTHECHEMISTRYLABORATORY 1LaboratorySafetyAgreement 5SomeGeneralChemistryLaboratoryEquipment 6GroupandCollaborativeWork 7CriticalandAnalyticalThinkinginScience:DataAnalysis 8ScientificMeasurementandSignificantFigures 11Lab1.What’sInANumber? 15Lab2.“Test,NotTaste.”UsingPropertiestoIdentifyandSeparateSubstances 23Lab3.Oh,WhatAReliefItIs!PreparationofAnAntacid 31Lab4.AcidandBaseMagic 34Lab5.GiveandTake:MoreAcidsandBases 37Lab6.MoreGiversandTakers:RustandBleach 45Lab7.GainandLoss:HeatingandCooling 49
Appendix. Graphical Determination of ΔT. 51Lab8.LetThereBeLight!(andMatter) 59Lab9.AStainInTimeSavesNine 70Lab10.HowtoPassGas(Laws) 77Lab11.HowtoApplyGas(Laws) 82

1
SAFETY IN THE CHEMISTRY LABORATORY The experiments presented in this manual have been designed with your safety in mind. Nevertheless, whenever you work in a chemistry laboratory, potential hazards exist. However, a knowledge of the most common sources of hazard, as well as the safety precautions routinely observed in the laboratory, will help to avoid any serious accidents. Safety Equipment The safety equipment listed below are found in our chemistry laboratories. You should know the location of each piece of safety equipment and how to use it. 1. Eye Protection and Safety Glasses/Goggles “Safety glasses are impact resistant lenses that protect the eyes from blows or other injury” (http://medical-dictionary.thefreedictionary.com/safety+glasses). Since our eyes and eyesight are precious, wearing safety glasses or safety goggles will protect your eyes from lab hazards when you are in the laboratory, even if you are not doing any experimental work.. Hazards include chemicals splashing out of containers, glassware shattering upon heating, and test tubes flying out of a centrifuge. Safety glasses/goggles should be worn at all times when you are in the laboratory. NOTE: (i) you are responsible for bringing your own pair of safety goggles/glasses to lab. (ii) In 1998, the American Chemical Society (ACS) made the following recommendation regarding contact lenses (http://pubs.acs.org/cen/safety/19980601.html): “contact lenses can be worn in most work environments provided the same approved eye protection is worn as required of other workers in the area.” See also http://www.snopes.com/horrors/techno/cornea.asp 2. Eyewash Fountain An eyewash fountain is a water fountain with two faucets directed at one another. When the eyewash fountain is turned on with your head an appropriate distance from the fountain, the two faucets flush water into both eyes. It is unlikely that chemicals will get in your eyes if you are wearing safety glasses,. However, if chemicals should get in your eyes, go immediately to the eyewash fountain and flush them for 15 minutes to wash the chemicals out of the eyes. Always report such an accident to your instructor, who may wish to have you see a doctor. 3. Fire Extinguisher Fire extinguishers are classified and chosen based on the type of fire (http://www.fire-extinguisher101.com/). For example, a water extinguisher is suitable for Class A fires that involve ordinary combustible materials, such as paper and wood, but not for Class B fires that involve flammable or combustible liquids, like gasoline. Carbon dioxide and dry chemical extinguishers containing sodium bicarbonate or potassium bicarbonate are used for Class B and C fires (Class C fires involve electrical equipment). Class D fire extinguishers contain a dry powder such as sodium chloride or graphite (http://en.wikipedia.org/wiki/Fire_extinguisher#Class_D) and are used on combustible metals. 4. Fire Blanket A fire blanket is a sheet of fire retardant material that is used to extinguish small fires. A fire blanket can be used to wrap a victim who has caught fire. Use the Stop, Drop, and Roll technique to smother the fire. 5. Safety Shower A safety shower is an emergency shower that is designed to deluge continuously at 30-60 gallons per minute for at least 15 minutes (http://www.answers.com/topic/shower). The safety shower is found next to the eyewash fountain. If a large quantity of a hazardous chemical has spilled on a person, use the safety shower to flush large quantities of water on the victim. Usually, clothing needs to be removed for the water to reach the victim’s skin. Stay under the shower for at least 15 minutes to wash off the chemical 6. Fume Hood A fume hood is a laboratory bench having a fan that will carry fumes out of the laboratory into the open air above the building. The fume hood is used to perform experiments that produce toxic fumes. Your

2
laboratory instructor will direct you to carry out experiments in the fume hood. However, if you are doing an experiment that is producing an obnoxious or choking odor in the open lab, do not wait for your instructor and take your work under the hood. If you know you have a sensitivity to a chemical that is being used in lab that day, inform your instructor so you can work in the hood. 7. First-Aid Kit A first-aid kit is located either in the lab or the prep room. This kit contains bandages, burn spray, antiseptic spray, cold spray, and other items. Always report any injury to your instructor that requires the first-aid kit, since follow-up measures may be needed. Miscellaneous Hazards The chemistry laboratory is a safe place to work as long as you and your co-workers are aware of the various hazards in the laboratory and follow lab safety rules and regulations. 1. People Our chemistry lab has a capacity of 27 students. With so many people in the lab, it is easy to bump into another person or trip over a chair while moving about the lab. Focus on what you are doing but be aware of your surroundings and what other people are doing. You may be practicing lab safety but if another person standing next to you is not handling a chemical properly, you may be inadvertently involved in an accident. 2. Broken Glass In the chemistry lab, we will use glassware, such as beakers to prepare hot or cold water baths, graduated cylinders to measure substances, and flasks to carry out chemical reactions. For many experiments, you will have to assemble several pieces of equipment and monitor your experiment from start to finish. Accidents occur when something tips over and glassware breaks. Use a broom and dust pan or wet paper towels to clean up the broken glass. Dispose of the broken glass in the broken glass container. 3. Fires In the chemistry lab, we will use Bunsen burners, flammable liquids, and perform chemical reactions that generate heat. If something or someone catches on fire, act immediately and use either water, a fire extinguisher, the safety shower, or fire blanket to extinguish the fire. The method you use depends in the type of fire. See the section above on Fire Extinguisher. 4. Chemical Spills: Acids, Bases, and Other Caustic Chemicals If you spill a small amount of chemical on a small area of your body, like your finger, flush the exposed area for 15 minutes with tap water from a sink. If a burning sensation accompanies the spill, flush the exposed area with water and report it immediately to your instructor. Some chemical burns begin with only a minor burning sensation, but develop into a more serious injury if not treated promptly. Your instructor will be able to recommend further action or send you to a doctor if the burn seems serious. If you spill a large amount of chemical over a large area of your body, use the safety shower. See the section above on Safety Shower. If an acid is spilled on the floor or lab bench, use the baking soda solution to neutralize the acid. Then, clean up the spill. If a base is spilled on the floor or lab bench, use the boric acid solution to neutralize the base. Then, clean up the spill. 5. Diluting Concentrated Acids When preparing a dilute acid solution from a concentrated acid solution, always add the acid to water ("when you’re doing what you oughter, add the acid to the water"). If water is added to concentrated acid, the solution will become hot and acid may spatter on you. 6. Spattering from Test Tubes
3
Spattering may occur when heating liquids in a test tube. To minimize the danger of spattering, heat the test tube near the liquid surface, and agitate the contents to and fro. Never point a test tube being heated toward you or another person. Be aware of your surroundings and what other people are doing. 7. Flame-Drying Glassware The glass beakers and flasks are designed to withstand the heat of your Bunsen burner. However, certain pieces of glassware, such as graduated cylinders, burets, volumetric flasks, and pipets, should never be heated with a burner, as they are likely to shatter. Hot glass looks the same as cold glass so be careful touching or approaching glass that someone else is using. 8. Inserting Glass Tubing in Stoppers The Chemistry Stock Room has an assortment of glass tubing in stoppers that you can use. However, if you need to insert glass tubing into a rubber or cork stopper, make sure the hole is the proper size for the glass tubing and use glycerol (glycerin) or soap as a lubricant. Hold the glass near the end being inserted, and twist the glass into the hole. Never force a piece of glass tubing into a hole. The glass may snap, and the jagged edges on the broken glass can cause a serious cut. 9. Detecting Odors If your lab instructor directs you to smell a chemical, do not place your nose directly over a container and inhale deeply. Hold the container away from your nose and use your hand to waft the odors gently toward your nose. Partially fill your lungs with air before inhaling the odors to avoid over-inhalation of the fumes. See the Material Safety Data Sheet (MSDS) of the substance for more information. 10. Tasting Never taste chemicals prepared in a chemistry laboratory unless specifically directed to do so by your instructor. Many chemicals are toxic or hazardous to our health. Your equipment have been cleaned but still may have trace amounts of toxic or hazardous chemicals. See the Material Safety Data Sheet (MSDS) of the substance for more information. 11. Horseplay The laboratory is no place for horseplay, since there is always the danger of breaking or spilling something. While a relaxed atmosphere is the most conducive for productive lab work, fooling around in the laboratory is an invitation for a serious accident. General Laboratory Procedures and Conduct The following chemistry laboratory safety procedures apply to everyone (instructors, students, and staff) using the chemistry laboratory. Disregard of these procedures will result in disciplinary action. 1. Protective goggles or safety glasses with side shields must be worn at all times in the lab. 2. Learn the locations and the use and operation of the fire extinguishers, safety shower, eyewash fountain, fire blankets, fume hoods, and first aid kit. Learn the location of the fire alarm. 3. Learn the primary, secondary, and handicapped escape routes from the laboratory in case of fire, earthquake, or other disaster. A map of the escape route from the lab is posted next to the hall door. 4. Learn the use and operation of laboratory equipment and instruments. A diagram of laboratory equipment is shown below. 5. Read chemical labels carefully. Be sure you are using the chemical required. Put the cap or lid back on the bottle. Clean up any spills. 6. Never return unused chemical to the stock bottle to avoid contamination.
4
7. Dispose of chemicals in the appropriate waste container. Never discard solid residues or paper into the sinks. 8. Never perform unauthorized experiments. 9. Eating, drinking, and smoking in the laboratory are forbidden. Do not bring food or drink into the laboratory. You may eat or drink in the hallway outside of the lab. 10. Never taste a chemical. 11. If instructed to smell a chemical, do so by gently wafting the vapors toward your nose. 12. When diluting, ALWAYS add acid to the water. 13. Never point a test tube that is being heated toward you or others. 14. Never pipet by mouth. Use a pipet filler bulb when using a pipet. 15. Long pants are recommended. Footwear should cover the feet completely. No open-toe shoes. Long hair and loose clothing should be secured. 16. At the end of each lab period or when you have finished an experiment, wipe and clean your lab bench area and the balance room, clean and dry equipment; account for and put away the equipment in your locker, and lock your locker. Return all community equipment, e.g., ring stands and hot plates, to their proper places. Dispose of chemicals in the proper waste container. Accidents 1. Clean up all spills or breakages immediately. Dispose of broken glass in the broken glass container. If a mercury thermometer breaks, do not touch the mercury. Notify lab staff immediately. 2. In case of contact with a chemical, wash the affected area immediately and thoroughly with water. Notify lab staff. 3. In case of an injury, no matter how minor, notify lab staff.
5
Laboratory Safety Agreement I have carefully read the instructions on good laboratory safety practices and procedures. I understand the importance of good safety practices for my own welfare and of all people in the laboratory and I, therefore, pledge to follow the safety regulations of the college. Date: ____________________ Signature: ____________________ Drawer Number: ____________ Print Name: ___________________

6
Some General Chemistry Laboratory Equipment
6
7
Group and Collaborative Work
The ability to work with people is an important skill that many employers value. A good group or team is able to share their diverse experiences, knowledge, abilities, and opinions to work effectively and efficiently to accomplish goals that one person may not be able to do as well or as quickly. Group or teamwork means members work together in a non-competitive, collaborative atmosphere. Skills include listening to others, being assertive with your input but not dominating the whole group, and taking responsibility for your role on the team and making sure other members are doing their role. It helps to focus on the “big picture”, i.e., the overall goal of the group, rather than getting caught up in individual issues.
For most of the labs, you will work in a group of four. Working in a larger group requires teamwork and communication. Each group member will be assigned one of the following roles so that duties are shared equally: Group Leader: responsible for supervising the group and makes sure each member contributes equally to the team. Communicator: responsible for communicating with the instructor and for completing all materials to be submitted by the team that reflects the thinking of all team members. Record Keeper: responsible for keeping records of all materials discussed and is for informing absent team members of work missed and progress made. Counselor: responsible for making sure all members of the team agree on planning, execution, and presentation of work. Roles should be rotated with each different lab so each member of the group has the opportunity to perform a different function.
8
Critical and Analytical Thinking in Science: Data Analysis
Learning how to analyze data to get results, interpreting your data and results to understand what they mean, and drawing conclusions from those results is one very important objective in this course. One way to learn and develop critical thinking skills is to try to prove or disprove a hypothesis. According to the American Heritage Dictionary, New College Edition, Houghton Mifflin, 1979, a hypothesis is “an assertion subject to verification or proof, as: a. a proposition stated as a basis for argument or reasoning. b. a premise from which a conclusion is drawn. c. a conjecture that accounts, within a theory or ideational framework, for a set of facts and that can be used as a basis for further investigation.” In each lab, you will be presented with one or more problems to solve. For each problem, there is a hypothesis for you to prove or disprove. In general, you will prove or disprove a hypothesis by doing the following:
1. collect data from an experiment that is relevant to the hypothesis; 2. analyze the data, usually by calculations using chemical principles, to obtain results; 3. interpret your experimental results to determine the validity of the hypothesis.
Using a hypothesis makes you focus on the important experimental variables and helps you understand how chemical principles are used in the experiment. To help you analyze data, you can represent your data and results in the form of tables or graphs or both to help you see trends and patterns in the data and results. We will also be collecting data by computer to enable you more time to analyze data in lab. Also, you will learn to find information from various information sources and use that information to help you prove or disprove hypotheses and draw conclusions. Chemistry is a quantitative, predictive science. In lab, we will make quantitative observations (see Scientific Measurement and Significant Figures section). From these quantitative observations, we look for patterns and trends in natural phenomena. These patterns are often described by mathematical equations from which hypotheses can be inferred. Once these hypotheses and equations are tested and supported (or refuted) with more observations, theories are developed. The power of science and chemistry lies in the ability to predict future events using established theories. Representing Data and Results in Tables and Spreadsheets and with Graphs
In each lab, you will be making observations - some qualitative and some quantitative. For the quantitative observations, you will attach numbers to your observations. You will analyze your numerical data by doing calculations to get results. Then, you will interpret your results, i.e., figure out what these numbers mean, to draw conclusions about your experiment. You will record all of this information in your lab notebook. Tables You will want to organize your data and results in a way that makes it easy for you to read and interpret as well as another person who looks at your lab notebook. Preparing a table is an excellent way to organize your data and results. In general, a table will show data in columns (as opposed to rows). For example, see Table 1 on p. 12 of this Lab Manual. Note that this table consists of two columns: Measuring Devices and Uncertainty. Each device is clearly listed with its corresponding uncertainty. When you prepare a table, do the following:
1. Give the table a specific number and title, e.g., “Table 1. Uncertainties of Various Measuring Devices” is a good title whereas “Devices” is not specific and doesn’t state what information is shown in the table.
2. Label each column (or row) with the appropriate units. Use the appropriate number of significant figures.
3. Make your table legible. Spreadsheets
In the lab, we will prepare tables using a spreadsheet, e.g., Microsoft Excel or Google Sheets. You can program Excel to do calculations that help you analyze data. For example, you can multiply the number in one cell (A1) by a number in another cell (B1) to give you the product in a third cell (C1). Of course, you can also do this on your calculator. However, the advantage of Excel becomes evident when
9
you have a big set of data. If you have the same calculation to do 10 times, you can have Excel to do it for you very quickly.
Cell A B C 1 3 5 15
Type in “=A1*B1” in cell C1 or use the Formula wizard After you prepare your Excel spreadsheet/table, print it out and staple it into your notebook. Graphs
Often, you will want to show the data you have organized in a table in a graph. A graph is another excellent way to represent data. A graph can show trends in your data or results that you may not see from a table. The data that is represented in a graph can give you a result. For example, in Lab 1, you will graph mass of water on the y-axis and volume of water on the x-axis. The slope of this line gives you the result you are looking for. The slope includes data from all of your data points. Another way to do this is to individually calculate the mass/volume and then take the average. However, the graph gives you this information quickly and also gives you information about the error in your experiment.
For every graph that you do, do the following: 1. Give your graph a specific number and title, e.g., “Graph 1. Graphical determination of ______
from mass and volume.” 2. Label each axis with the appropriate quantity and show the units. 3. Label the divisions on your graph paper so that each data point may be easily interpreted by an
individual, e.g., your instructor, who attempts to interpret the graph. Furthermore, the divisions should be laid out so that the graph covers most of the graph paper.
4. Usually, you will not want to just show data points. You may draw a smooth curve through your data points (do NOT connect the data point) or fit a straight line (with a linear regression analysis) through your data points.
You can graph your data using the Graphical Analysis software. You enter your data in a table and this software automatically graphs the data for you. You can do a linear regression using this software or fit your data to other math functions. Then, you can print out your graph and staple it into your notebook. Computer-Assisted Data Acquisition
You will acquire data and take measurements using a computer for several experiments using Vernier Science and Technology hardware and software. You will take temperature, conductivity, pH, and pressure readings using the appropriate sensors and probes. To make these measurements, you will need the following equipment:
1. Computer with Vernier LoggerPro software 2. Vernier LabPro hardware interface or LabQuest Mini 3. AC power adapter (output: 6 V DC at 600 mA) for the LabPro; none needed for LabQuest Mini. 4. USB cable that connects LabPro/LabQuest Mini interface to the computer 5. Appropriate probe that connects to LabPro/LabQuest Mini interface
Your lab instructor will help you connect the probe to the computer.
Open the LoggerPro software (it should be on the computer desktop). The interface and software automatically senses the probe that is connected to the computer. You will also use the Vernier spectrophotometer to measure absorption and emission spectra (the amount of light absorbed or emitted by a sample at each wavelength). Each spectrophotometer is connected to a computer. To use the spectrophotometer, you will need:
1. UV-VIS (deuterium tungsten) light source and integrated cuvette holder. 2. Spectrophotometer detector. 3. Fiber optic cable that connects light source and holder to the spectrophotometer detector. 4. Serial cable that connects the light source and holder to the spectrophotometer detector. 5. USB cable that connects the spectrophotometer detector to the computer.
10
6. AC power adapter (output: 12 V DC at 1.25 A) for the UV-VIS light source. 7. A cuvette for your sample.
Your lab instructor will help you connect the spectrophotometer to the computer. The Vernier LabPro software is also used with the spectrophotometer. Chemistry References There are many reference sources in science and chemistry. Here are a few common references that are available in the chemistry lab:
1. CRC Handbook of Chemistry and Physics. This reference compiles a lot of science information in one book.
2. Chemical vendor catalogs, e.g., Sigma-Aldrich. 3. Merck Index.
Internet Access in the Chemistry Lab There are 12 computers in each chemistry lab in Merrill Hall. These computers are for chemistry students to use. To log onto the Hartnell College network, use the username shown on the computer tower or on the top of monitor. The password is: hartnel.
You will use several chemistry websites to look up information. Here are some websites of interest in chemistry:
1. Los Alamos National Laboratories Periodic Table of the Elements (http://periodic.lanl.gov/index.shtml). Click on an element for more information.
2. Wikipedia (http://en.wikipedia.org). Search for a chemical by name and get information on properties, structure, and references to other information.
3. Material Safety Data Sheets (http://hazard.com/msds/). Type in a chemical name and get the MSDS of that substance.
4. Chemistry Data Tables (http://www.wiredchemist.com/chemistry/data). This web site includes thermodynamic properties of elements, compounds, and ions; solubilities of ionic compounds in water.
5. National Institutes of Standards and Technology Chemistry WebBook (http://webbook.nist.gov/chemistry/). This site provides thermochemical, thermophysical, and ion energetics data compiled by NIST under the Standard Reference Data Program.
11
Scientific Measurement and Significant Figures KEY POINTS:
1. Observations are quantified by using scientific instruments or equipment to make measurements, e.g., mass and volume.
2. Every measurement has uncertainty associated with it. 3. The uncertainty of a measurement is reflected by the number of significant figures. The last
significant digit is the uncertain digit. 4. Calculated results must reflect the uncertainty in the measurement (data collected).
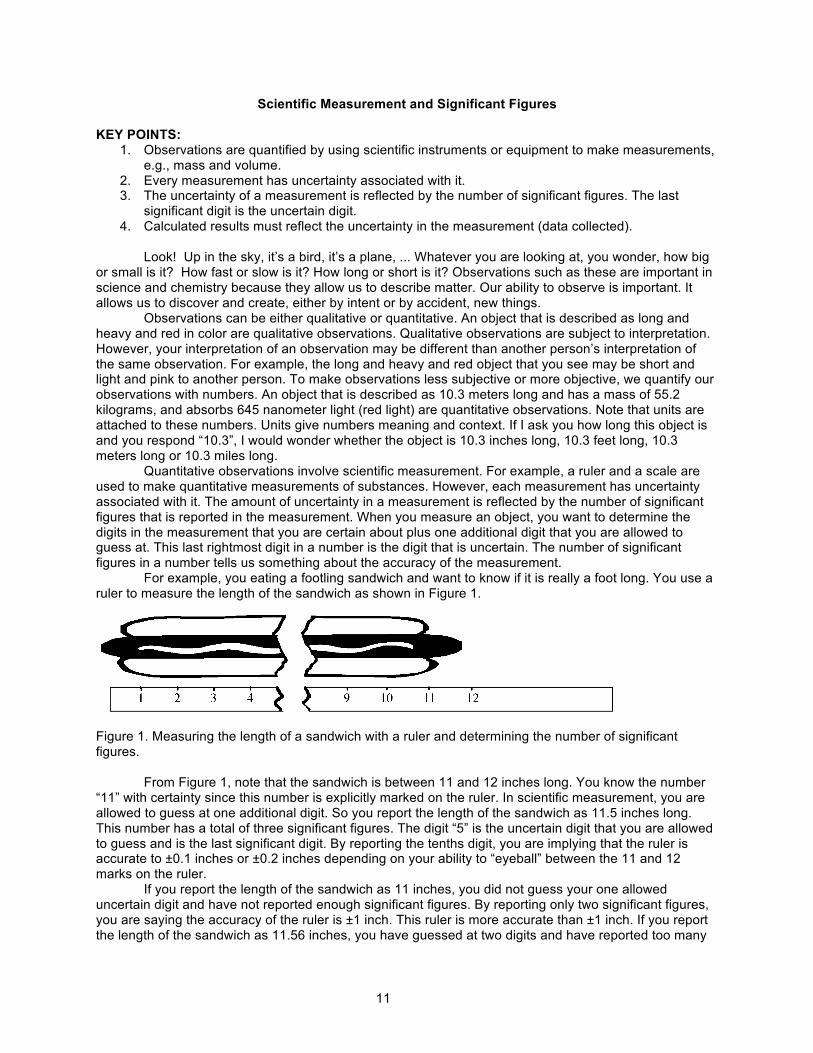
Look! Up in the sky, it’s a bird, it’s a plane, ... Whatever you are looking at, you wonder, how big or small is it? How fast or slow is it? How long or short is it? Observations such as these are important in science and chemistry because they allow us to describe matter. Our ability to observe is important. It allows us to discover and create, either by intent or by accident, new things. Observations can be either qualitative or quantitative. An object that is described as long and heavy and red in color are qualitative observations. Qualitative observations are subject to interpretation. However, your interpretation of an observation may be different than another person’s interpretation of the same observation. For example, the long and heavy and red object that you see may be short and light and pink to another person. To make observations less subjective or more objective, we quantify our observations with numbers. An object that is described as 10.3 meters long and has a mass of 55.2 kilograms, and absorbs 645 nanometer light (red light) are quantitative observations. Note that units are attached to these numbers. Units give numbers meaning and context. If I ask you how long this object is and you respond “10.3”, I would wonder whether the object is 10.3 inches long, 10.3 feet long, 10.3 meters long or 10.3 miles long. Quantitative observations involve scientific measurement. For example, a ruler and a scale are used to make quantitative measurements of substances. However, each measurement has uncertainty associated with it. The amount of uncertainty in a measurement is reflected by the number of significant figures that is reported in the measurement. When you measure an object, you want to determine the digits in the measurement that you are certain about plus one additional digit that you are allowed to guess at. This last rightmost digit in a number is the digit that is uncertain. The number of significant figures in a number tells us something about the accuracy of the measurement. For example, you eating a footling sandwich and want to know if it is really a foot long. You use a ruler to measure the length of the sandwich as shown in Figure 1.
Figure 1. Measuring the length of a sandwich with a ruler and determining the number of significant figures. From Figure 1, note that the sandwich is between 11 and 12 inches long. You know the number “11” with certainty since this number is explicitly marked on the ruler. In scientific measurement, you are allowed to guess at one additional digit. So you report the length of the sandwich as 11.5 inches long. This number has a total of three significant figures. The digit “5” is the uncertain digit that you are allowed to guess and is the last significant digit. By reporting the tenths digit, you are implying that the ruler is accurate to ±0.1 inches or ±0.2 inches depending on your ability to “eyeball” between the 11 and 12 marks on the ruler. If you report the length of the sandwich as 11 inches, you did not guess your one allowed uncertain digit and have not reported enough significant figures. By reporting only two significant figures, you are saying the accuracy of the ruler is ±1 inch. This ruler is more accurate than ±1 inch. If you report the length of the sandwich as 11.56 inches, you have guessed at two digits and have reported too many
12
significant figures. By reporting four significant figures, you are saying the accuracy of the ruler is ±0.01 inches and this ruler is not this accurate. Science and chemistry use computers and hand-held calculators extensively. These instruments display many digits in numbers so it is easy to include too many significant figures in your answer. The following rules will help you determine the number of significant figures and how to round numbers: 1. zeros that are in between non-zero digits are considered significant. E.g., 2.003 has 4 significant figures. The 3 is the uncertain digit. 2. For numbers that have a decimal point, a. all zeros to the right of the last non-zero digit are significant. E.g., 2.0030 has 5 significant figures. The last 0 is the uncertain digit. b. All zeros to the left of the first non-zero digit are not significant. E.g., 0.0020030 has 5 significant figures. The last 0 is the uncertain digit. 3. For numbers that do not have a decimal point, all zeros to the right of the last non-zero digit are not significant. E.g., 20030 has 4 significant figures. The 3 is the uncertain digit. 4. When converting numbers between the expanded (regular) notation and scientific notation, keep the same number of significant figures in each notation. E.g., 20030 = 2.003 x 10⁴. Each number has 4 significant figures. The 3 is the uncertain digit. 5. For mathematical operations, a calculated result is no better than the experimental data from which it came. Calculated results will have to be rounded to reflect the significant figures in the quantitative measurements. a. Rounding numbers:
• if the discarded digit is greater than 5, increase the last retained digit by one. E.g., 15.7 (3 significant figures) rounds to 16 (2 significant figures).
• if the discarded digit is less than 5, leave the last retained digit unchanged. E.g., 15.4 (3 significant figures) rounds to 15 (2 significant figures).
• if the discarded digit is equal to 5, increase the last retained digit by one if this digit is an odd number or leave it unchanged if it is an even number. E.g., 15.5 (3 significant figures) rounds to 16 (2 significant figures) or 14.5 (3 significant figures) rounds to 14 (2 significant figures).
b. Addition and subtraction. The number of decimal places in the numbers that are being added or subtracted determines the number of significant figures in the answer. The answer will have the same number of decimal places as the number with the fewest decimal places that is being added or subtracted. The number with the fewest decimal places reflects the least accurate measurement. E.g., 22.2 cm one decimal place - least accurate measurement + 11.67 cm two decimal places 33.87 cm answer needs to be rounded to one decimal place = 33.9 cm. c. Multiplication and division. The product or quotient will have the same number of significant figures as the factor with the fewest number of significant figures. E.g., 14.0 three significant figures x 6.000 four significant figures 84.0 answer has three significant figures d. Combining operations in a series of calculations. To avoid rounding errors, carry through all the digits in intermediate calculation steps and then round your final answer. Use the addition/subtraction and multiplication/division rules to determine the number of significant figures. E.g., 22.2 / 14 + 6.000 = ? 22.2/14 = 1.5|857143 the digits in the intermediate answer to the left of the line between the 5 and 8 are the significant figures 1.5|857143 + 6.000 = 7.5|857143 rounded to 7.6
13
To summarize, every measurement has uncertainty associated with it. The uncertainty is reflected in the last significant digit (the uncertain digit or the digit with which you are allowed to guess). By looking at the measuring device you are using, you can determine the digits you know with certainty with the next digit being the uncertain digit. The sum of the digits you know with certainty plus the uncertain digit gives you the number of significant figures. The uncertain digit tells you the sensitivity of the measuring device. Random Error and Systematic Error Each measurement has uncertainty associated with it, i.e., each measurement has error. Error refers to the numerical difference between a measured value and the true value. There are two types of errors: random error and systematic error. You take 10 g of sand and weigh it 10 times. If you use a coarse mass measuring device, such as a triple beam balance that measures mass to the nearest 1 g, each measurement should give you the same result each time. In other words, your 10 measurements are reproducible. However, if you used a more sensitive balance, such as an analytical balance, each mass measurement will of slightly different in the last digit. These random fluctuations in the measured quantity are called random errors. Random error is caused by unpredictable and imperceptible factors that are beyond the control of the experimenter, i.e., you.
Errors that are due to definite causes are called systematic errors. A systematic error is, in general, reproducible and always higher than the true value or always lower than the true value. In many cases, a systematic error can be predicted or identified by a person who thoroughly understands all the aspects of the measurement. Examples of sources of systematic errors include a corroded weight, parallax reading of a buret, a poorly calibrated buret, an impurity in a reagent, an appreciably solubility of a precipitate, a side reaction in a titration, and heating a sample at too high a temperature. During the course of Chem 1A lab, you will often compare your experimental result to a true value. Random errors are always present but you want to reduce or eliminate systematic errors in your experimental measurements. Accuracy and Precision Since each measurement has uncertainty associated with it, we will determine how “good” our measurements and experiments are. Error in measurement is reflected in accuracy and precision. Recall the last time you played darts. A throw that is very close to the bull’s eye is accurate. A set of throws that is spread all over the board is not precise. Accuracy refers to the closeness of an experimental value to its “true” value. Precision refers to the closeness of a set of data to each other. Quantitatively, accuracy is represented by absolute error and percent error. Absolute error is the difference between the experimental value and the true value: Absolute error = experimental value - true value (1). The percent error is the absolute error relative to the true value:
100 X value true
error absolute error % = (2).
In science, we want our observations to be reproducible, i.e., we want to get the same result each time to tell us that what we are seeing is what we want to see. In Chem 1A, we will quantify precision by calculating the % difference:
100 x average
low - high difference % = (3).
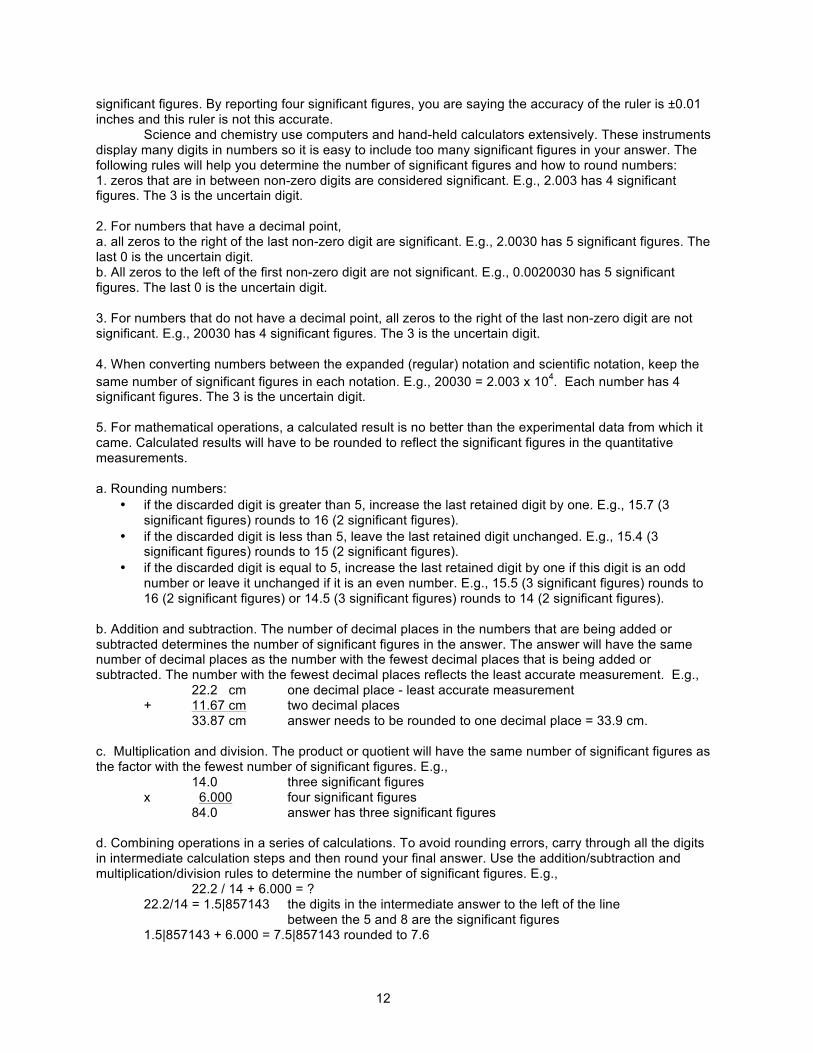
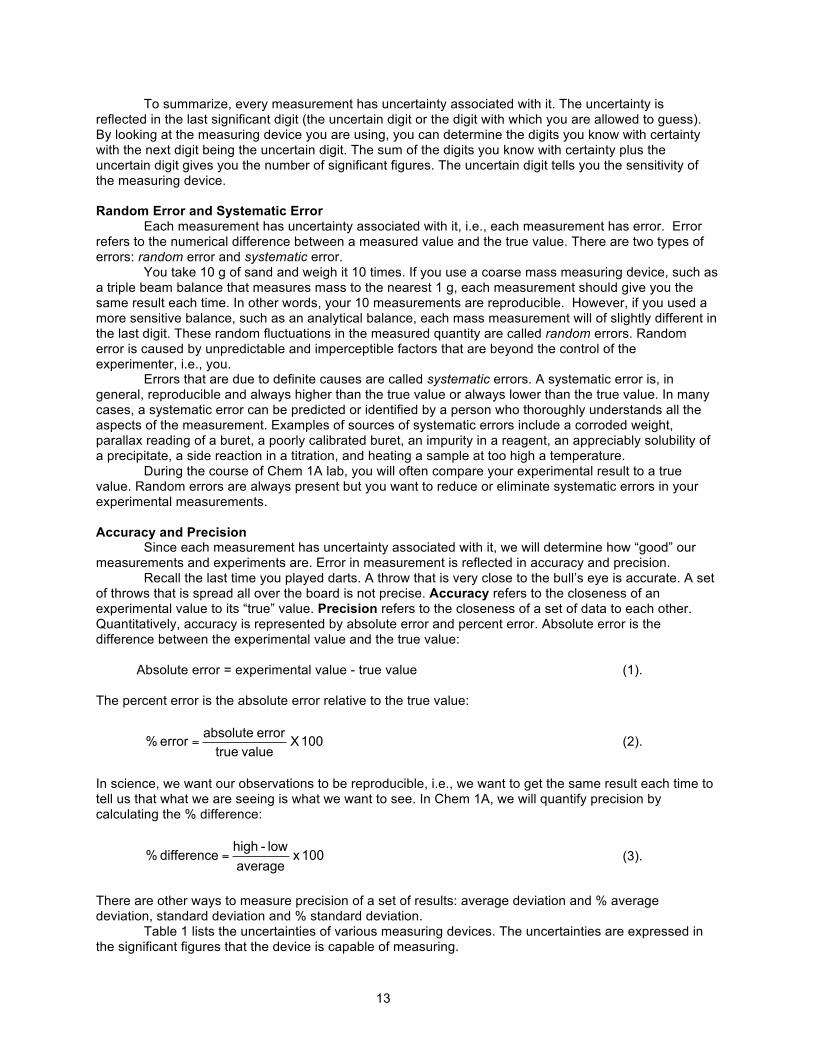
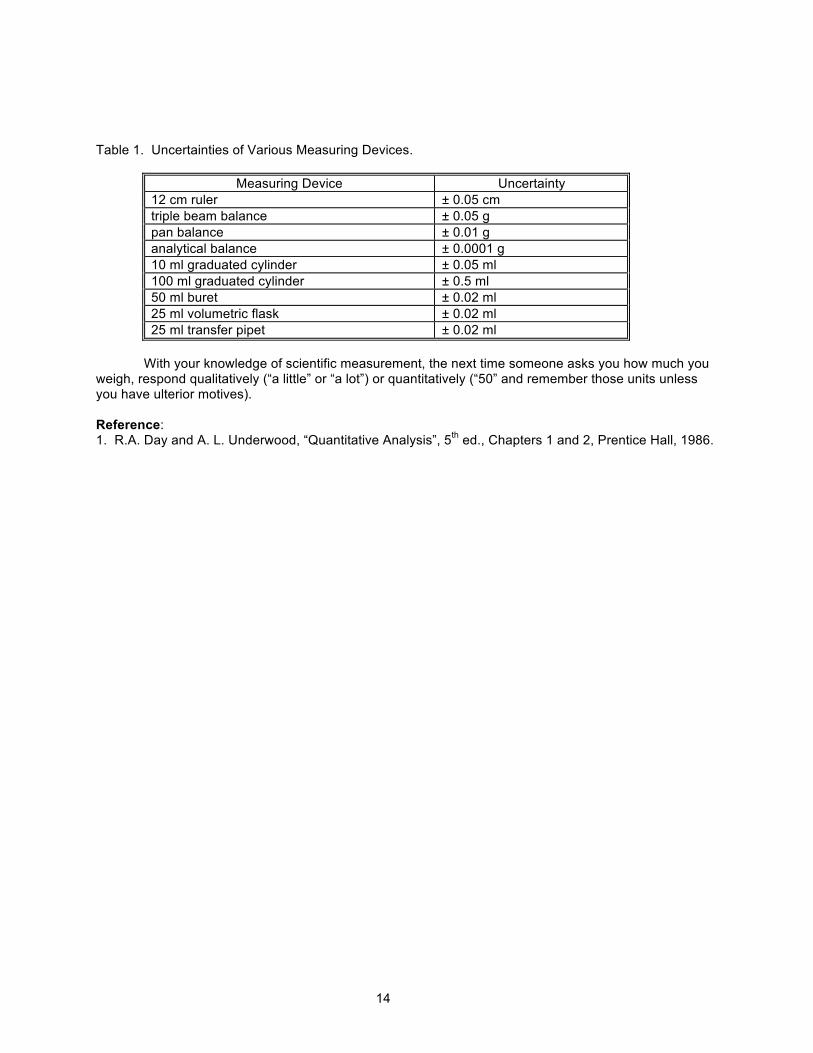
There are other ways to measure precision of a set of results: average deviation and % average deviation, standard deviation and % standard deviation. Table 1 lists the uncertainties of various measuring devices. The uncertainties are expressed in the significant figures that the device is capable of measuring.
14
Table 1. Uncertainties of Various Measuring Devices.
Measuring Device Uncertainty 12 cm ruler ± 0.05 cm triple beam balance ± 0.05 g pan balance ± 0.01 g analytical balance ± 0.0001 g 10 ml graduated cylinder ± 0.05 ml 100 ml graduated cylinder ± 0.5 ml 50 ml buret ± 0.02 ml 25 ml volumetric flask ± 0.02 ml 25 ml transfer pipet ± 0.02 ml
With your knowledge of scientific measurement, the next time someone asks you how much you weigh, respond qualitatively (“a little” or “a lot”) or quantitatively (“50” and remember those units unless you have ulterior motives). Reference: 1. R.A. Day and A. L. Underwood, “Quantitative Analysis”, 5th ed., Chapters 1 and 2, Prentice Hall, 1986.
Lab 1: What’s In A Number?
15
Lab 1. What’s In A Number? Which measuring device should I use? What do significant figures tell me? Is there really that much sugar in my soda? Objectives (i) Make measurements and calibrate measuring devices. (ii) Relate significant figures to uncertainty and error. (iii) Use significant figures in calculations. Materials mass measuring devices: triple beam balance and pan balance volume measuring devices: 10 ml and 50 ml graduated cylinders, 50 ml beaker, 10 ml volumetric pipet, 10 ml transfer pipet Vernier LabQuest Mini, USB cable, temperature probe Students: bring a regular and diet soda for Part 2. Part 1. How many numbers should I use when I measure something? Introduction
We measure things, i.e., attach a number to an observation, for many reasons: to identify something, to classify something into a group, rank something on a scale, construct something, trade something, to investigate, understand, and control scientific processes, to develop theories, to predict something, etc.
What does the number mean? How accurate is it? How much error or uncertainty does the measured number have? Prelab Spend 5 minutes doing the following activity. Assign a notetaker. Report to class. Every measurement has error or uncertainty associated with it.
• When you make a measurement in science and get a number, you want to know which digits in the number you know with certainty and which digit is the uncertain digit.
• When you look at the lines on a measuring device, you know the quanity and unit represented by each line with certainty.
• You are allowed to “guess” in between lines. The “guess” that you make is the uncertain digit and tells you the error in your measurement.
• The uncertain digit is the last signficant figure (digit) in your number. 1. In 1880, Lord Rayleigh measured the density of N2 from air to be 1.2561 g/L. The density of N2 obtained by burning NH3 gave 1.2498 g/L. They were not the same. How many significant figures are reported in each number? Rayleigh, along with Ramsay, came to realize air contained an unknown, heavier gas, which proved to be argon. Thus, the noble gases were found. Rayleigh and Ransay won Nobel Prizes in 1904 and 1905. Had Rayleigh's work been good to only three significant figures (1.25 g/L), they would have lost their place in history. 2. a. To measure the temperature of water, which device or instrument would you use, your finger (as in stick your finger in the water), a thermometer, a balance, or a spectrometer? b. To measure how heavy your dog is, which device or instrument would you use, your hand (as in hold the dog in your hand), a thermometer, a balance, or a spectrometer? c. To measure the wavelength of the light emitted by a firefly, which device or instrument would you use, your eye (as in look at the firefly), a thermometer, a balance, or a spectrometer? 3. Find a penny or nickel or dime or quarter. a. Each person in your group does this measurement.

Lab 1: What’s In A Number?
16
(i) Look at your index finger. You see two lines between the tip and the base of your finger. Call the line at the base on your index finger “0”. The first line from the base is “1”, the second line is “2”, and the tip of your index finger is “3”. (ii) Measure the diameter of the coin with your index finger. What is the error or uncertainty in your measurement? Record the length of the penny using the correct number of significant figures in Table 1. Table 1. Length of coin using finger and ruler. Coin = _____. Length measuring device Each line represents
(include units) Uncertainty Length
(include units) Uncertain digit
_____’s (Name) finger ± _____’s (Name) finger ± _____’s (Name) finger ± ruler ± b. (i) Use a ruler. What length does each line on your ruler represent? (ii) Measure the diameter of the coin with your ruler. What is the error or uncertainty in your measurement? Record the diameter of the coin using the correct number of significant figures in Table 1. c. See your length measurements. Which digit(s) do you know with certainty? Which digit is the uncertain digit (the digit that has error associated with it)? d. How is the line on each measuring device related to the uncertainty (error)? 4. Look carefully at the measuring devices in Table 2. NOTE: there are two different types of pan balances in the balance room. a. For each measuring device, what does each line represent? For the triple beam balance, what does each line on the beam closest to you represent? b. State the uncertainty for each device, e.g., ±1 g. Table 2. Uncertainty of various measuring devices. Measuring device Each line represents (include units) Uncertainty Uncertain digit 10 ml transfer pipet ± 10 ml graduated cylinder ± 50 ml graduated cylinder ± 400 ml beaker ± Triple beam balance ± Pan balance (Type 1) ± Pan balance (Type 2) ± Procedure You’re making a fancy sauce and the recipe reads, “Add 2 teaspoons of vinegar to the sauce and heat gently.” You don’t have a teaspoon but you know 1 teaspoon is 5 ml so your scientific mind reads the recipe as an experimental procedure which states, “Add 10 ml of liquid reactant to the flask. Place the flask in a hot water bath.” You don’t have a teaspoon but you and your lab partners think, “How accurately do I have to measure the liquid?” “Should I use a 50 ml beaker or 10 ml graduated cylinder or 50 ml graduated cylinder or 125 ml flask?” “How hot is the water bath?” 1. Let’s see how accurately a 50 ml beaker, 10 ml graduated cylinder, and 50 ml graduated cylinder reads volume. Calibrate the volume of each container. The groups on each bench will calibrate the same volume measuring device: Bench 1 = 50 ml beaker Bench 2 = 10 ml graduated cylinder Bench 3 = 50 ml graduated cylinder. a. Find a 10 ml transfer pipet in the lab. Your instructor will demonstrate the use of a 10 ml transfer pipet and a 10 ml volumetric pipet.
Lab 1: What’s In A Number?
17
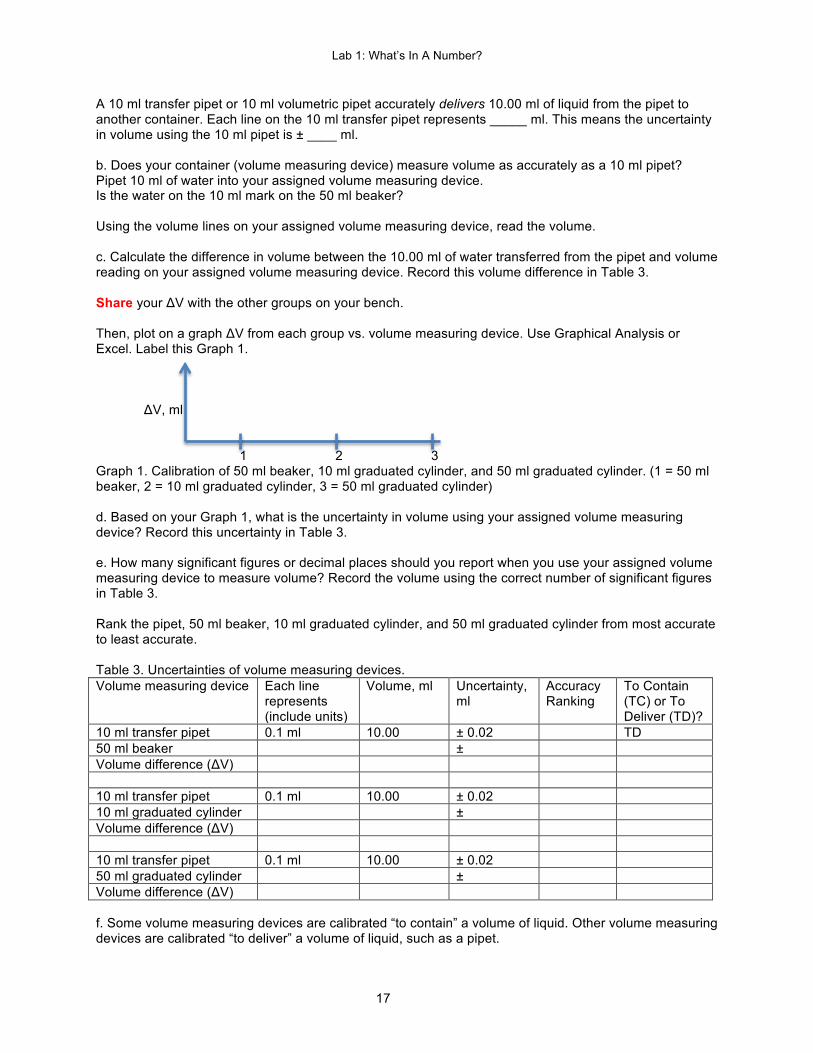
A 10 ml transfer pipet or 10 ml volumetric pipet accurately delivers 10.00 ml of liquid from the pipet to another container. Each line on the 10 ml transfer pipet represents _____ ml. This means the uncertainty in volume using the 10 ml pipet is ± ____ ml. b. Does your container (volume measuring device) measure volume as accurately as a 10 ml pipet? Pipet 10 ml of water into your assigned volume measuring device. Is the water on the 10 ml mark on the 50 ml beaker? Using the volume lines on your assigned volume measuring device, read the volume. c. Calculate the difference in volume between the 10.00 ml of water transferred from the pipet and volume reading on your assigned volume measuring device. Record this volume difference in Table 3. Share your ΔV with the other groups on your bench. Then, plot on a graph ΔV from each group vs. volume measuring device. Use Graphical Analysis or Excel. Label this Graph 1. ΔV, ml 1 2 3 Graph 1. Calibration of 50 ml beaker, 10 ml graduated cylinder, and 50 ml graduated cylinder. (1 = 50 ml beaker, 2 = 10 ml graduated cylinder, 3 = 50 ml graduated cylinder) d. Based on your Graph 1, what is the uncertainty in volume using your assigned volume measuring device? Record this uncertainty in Table 3. e. How many significant figures or decimal places should you report when you use your assigned volume measuring device to measure volume? Record the volume using the correct number of significant figures in Table 3. Rank the pipet, 50 ml beaker, 10 ml graduated cylinder, and 50 ml graduated cylinder from most accurate to least accurate. Table 3. Uncertainties of volume measuring devices. Volume measuring device Each line
represents (include units)
Volume, ml Uncertainty, ml
Accuracy Ranking
To Contain (TC) or To Deliver (TD)?
10 ml transfer pipet 0.1 ml 10.00 ± 0.02 TD 50 ml beaker ± Volume difference (ΔV) 10 ml transfer pipet 0.1 ml 10.00 ± 0.02 10 ml graduated cylinder ± Volume difference (ΔV) 10 ml transfer pipet 0.1 ml 10.00 ± 0.02 50 ml graduated cylinder ± Volume difference (ΔV) f. Some volume measuring devices are calibrated “to contain” a volume of liquid. Other volume measuring devices are calibrated “to deliver” a volume of liquid, such as a pipet.

Lab 1: What’s In A Number?
18
Pour the water from your assigned volume measuring device into another beaker. Did all of the water get transferred (delivered) into the other beaker? g. Based on Graph 1, which volume measuring device, the 50 ml beaker, the 10 ml graduated cylinder, or 50 ml graduated cylinder, would you use to “Add 10 ml of liquid reactant to the flask”? Give reasons. h. Which volume measuring device in your locker would you use for the “hot water bath”? How much water should you use in the hot water bath? Waste Disposal: water – in sink. 2. Calibrate a temperature probe. You want to check the temperature of your hot water bath. You think, “How hot is it? Should I put my finger in the water bath to check the temperature?” Many instruments have gone digital. Is the last digit shown on the instrument really the uncertain digit? How do you know how accurate the instrument is? a. Hold your finger (choose which digit you want to use) in the air. What is the temperature of the room right now? Record this temperature in Table 4. b. You will measure and collect data using sensors and probes connected to a computer. We have 12 computers in the lab.
• Turn on a computer. Your instructor will give you the username and password. • Find a Vernier LabQuest Mini, USB cable, and temperature probe and connect it to the computer.
Open the LoggerPro software (on the desktop). • What is the temperature in the room using the temperature probe? How many signficant figures
does the temperature reading show? Record your information in Table 3 on the chalk board. • Squeeze the tip of the temperature probe between your index finger and thumb for one minute.
What is the temperature? Table 4. Temperature (T) Measurements Made in Lab on ______ (date). Group T of room
using finger, oC
T of room using T probe, oC
T of Body, oC
T of Calibration Substance (_____)
T of calibration substance using T probe, oC
T Difference (ΔT), oC
Uncertainty, oC
Average Uncertainty/ error
c. How do you know how accurately your temperature probe measures temperature? Calibrate a temperature probe. How would you calibrate a temperature probe? Spend 5 minutes designing an experiment to calibrate your temperature probe. Report your calibration experimental design to the class. The class will agree to do the same experiment to calibrate their temperature probe. Calibrate the temperature probe. d. (i) Calculate the difference in temperature between the temperature of the calibration source and the temperature reading of the temperature probe. Record this temperature difference in Table 4.
Lab 1: What’s In A Number?
19
(ii) What is the uncertainty (± error) in the temperature probe? (iii) Based on this uncertainty, how many significant figures should you report for temperature using the temperature probe? (iv) Should you adjust or correct the temperature of the room or body temperature based on the temperature probe calibration? e. Let’s see how the data looks for the entire lab class. (i) Calculate the average body temperature and the average temperatures of the room using the finger and temperature probe. (ii) Calculate the % difference for each set of temperatures. (See Eq. (3) in the “Scientific Measurement and Significant Figures” section of this book.) (iii) Which set of temperatures is the most precise? (iv) Should every group’s temperature reading for the room using their finger been the same? Why? (v) Should every group’s temperature reading for the room using the temperature probe been the same? Why? (vi) Should every group’s body temperature reading been the same? Why? Waste Disposal: water – in sink. Note: You’ll use other sensors and probes later this semester. How accurate is each sensor? What is the uncertainty? How many significant figures should I report? Questions 1. a. Show your Tables 3 and 4. Check significant figures in each number. b. Show your Graph 1. Calculate an average ΔV for each measuring device. Which measuring device is the most accurate? Give reasons. Which measuring device is the most precise? Give reasons. 2. You see the following volumes in a report. Identify the volume measuring device (beaker, 10 ml or 50 ml graduated cylinder, pipet) used in each volume: a. 8.75 ml b. 25.0 ml c. 25 ml 3. Determine the uncertainty, e.g., ±10 ml, of each measuring device. Include units. a. pan balance b. 10 ml graduated cylinder c. 50 ml graduated cylinder d. 50 ml beaker e. 400 ml beaker f. 125 ml Erlenmeyer flask 4. Which volume measuring device (400 ml beaker, 50 ml graduated cylinder, 10 ml pipet) should you use: a. For water in a water bath b. To make a cup of coffee c. To add a specific volume of liquid in a reaction d. To dilute 25 ml of a 1 M solution to 50 ml of a 0.5 M solution. BRING A REGULAR SODA AND DIET SODA TO LAB FOR PART 2.
Lab 1: What’s In A Number?
20
Part 2. Do Regular Soda and Diet Soda have the same density? Introduction
You are on a diet and will only drink diet soda because there is tooo much sugar in regular soda. Someone gives you an unlabeled soda. How will you determine whether this soda is regular or diet? You see a few sodas a ice chest. The ice has melted. Some sodas float; others sink. Why?
Your car is having a hard time starting. You could check to see if your car battery is ok by using a hydrometer to measure the density of the battery acid.
In the “old” days, soap makers checked the concentration of their lye (NaOH) solution by seeing by placing an egg in the solution and seeing whether it floated or sank. The concentration of the solution is proportional to the density of the solution.
You don’t float as well in the pool. What does this tell you about body composition? In this lab activity, you will make mass and volume measurements to calculate density. Density is
related to mass and volume by:
The mass and volume of a substance can change, but the ratio of mass to volume, i.e., density, will be the same for that substance. Density is a unique property of a substance and is used to identify a substance and distinguish one substance from another. Prelab Spend 5 minutes doing the following activity. Assign a notetaker. Report to class. 1. Some days, I feel like an air head; other days, I’m pretty dense. Today, I measured the mass of my head to be 11.5 kg. I dunked my head in water and it displaced 6.2 liters. I plugged these numbers into my calculator and I got 1.854839 kg/l for the density. It looks like I’m a little dense today. a. What is the uncertainty in the mass measurement? b. What is the uncertainty in the volume measurement? c. Based on your answer to (a) and (b), you can calculate a “high” density and “low” density: “high” density = (mass + uncertainty in mass)/(volume – uncertainty in volume)
“low” density = (mass - uncertainty in mass)/(volume + uncertainty in volume) Compare the “high” density and “low” density. What is the uncertainty in the density calculation? d. How many significant figures should be reported in the density calculation? (See Prelab Question 1 from Part 1 about the discovery of Argon.) e. See Section 5 in the “Scientific Measurement and Significant Figures” section in this book. Apply the significant figures in calculation rules for this example. Does your answer match the number of significant figures you determined in part (d)? 2. Do the following conversions with a calculation. Use the correct number of significant figures in your answer. a. How many moles are in 18 g of water? (Molar mass of water = ____ g/mole) b. How many grams are in 1 cup of ethanol? (1 cup = 240 ml, density of ethanol = 0.79 g/ml) c. How many moles of acetic acid are in 0.500 l of 0.89 M vinegar? (0.9 M = 0.9 moles/liter) d. You are heating up 240 ml of water from 25oC to 66oC. Calculate heat = q = m s ΔT. (s = specific heat = 4.18 J/g oC) e. The red laser light in a supermarket scanner has a wavelength of 633 nm. Calculate the frequency. (frequency units = 1/sec, frequency = speed of light/wavelength in m, speed of light = 3.00 x 10⁸ m/sec) f. What is the volume in liters of 1.00 moles of gas at P = 1.0 atm and T = 273 K. Use P V = n R T where R = 0.082 l atm/mole K. 3. Estimate the density of each soda by placing an unopened can or bottle of soda in water. Based on your observation, what can you conclude about the density of the soda? 4. Open a soda can or bottle. Pour a small amount of soda into a container. a. What are the bubbles in the liquid?
Lab 1: What’s In A Number?
21
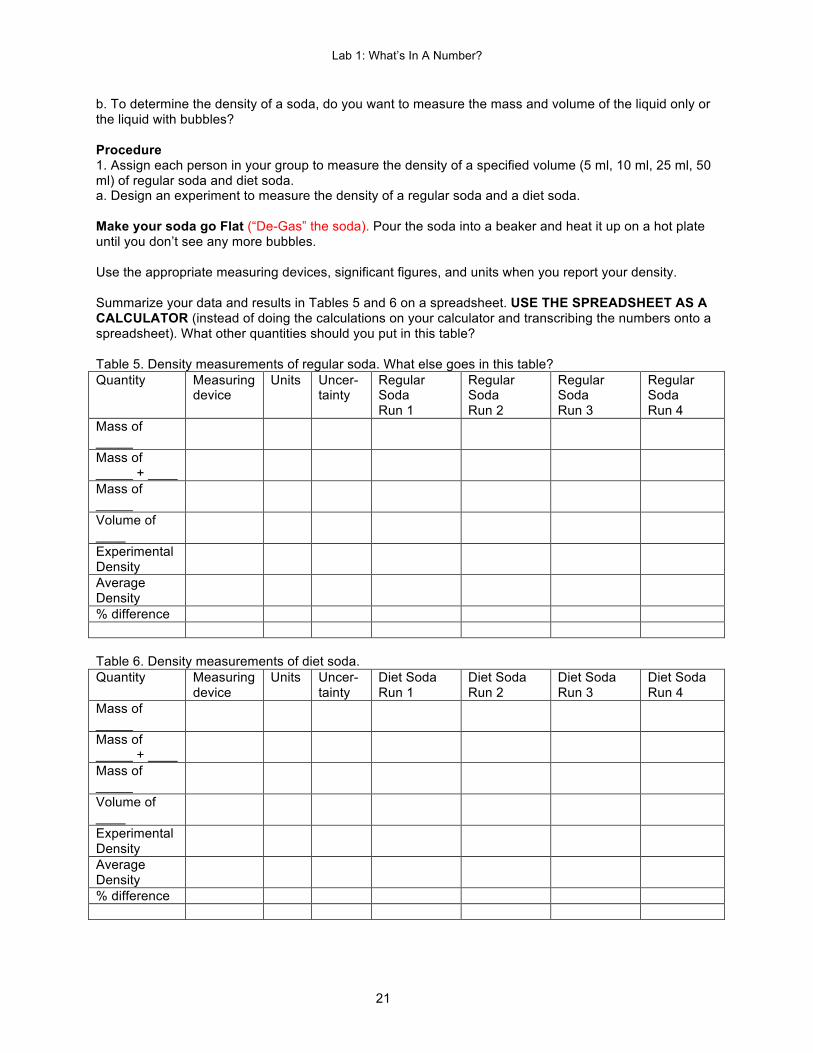
b. To determine the density of a soda, do you want to measure the mass and volume of the liquid only or the liquid with bubbles? Procedure 1. Assign each person in your group to measure the density of a specified volume (5 ml, 10 ml, 25 ml, 50 ml) of regular soda and diet soda. a. Design an experiment to measure the density of a regular soda and a diet soda. Make your soda go Flat (“De-Gas” the soda). Pour the soda into a beaker and heat it up on a hot plate until you don’t see any more bubbles. Use the appropriate measuring devices, significant figures, and units when you report your density. Summarize your data and results in Tables 5 and 6 on a spreadsheet. USE THE SPREADSHEET AS A CALCULATOR (instead of doing the calculations on your calculator and transcribing the numbers onto a spreadsheet). What other quantities should you put in this table? Table 5. Density measurements of regular soda. What else goes in this table? Quantity Measuring
device Units Uncer-
tainty Regular Soda Run 1
Regular Soda Run 2
Regular Soda Run 3
Regular Soda Run 4
Mass of _____
Mass of _____ + ____
Mass of _____
Volume of ____
Experimental Density
Average Density
% difference Table 6. Density measurements of diet soda. Quantity Measuring
device Units Uncer-
tainty Diet Soda Run 1
Diet Soda Run 2
Diet Soda Run 3
Diet Soda Run 4
Mass of _____
Mass of _____ + ____
Mass of _____
Volume of ____
Experimental Density
Average Density
% difference
Lab 1: What’s In A Number?
22
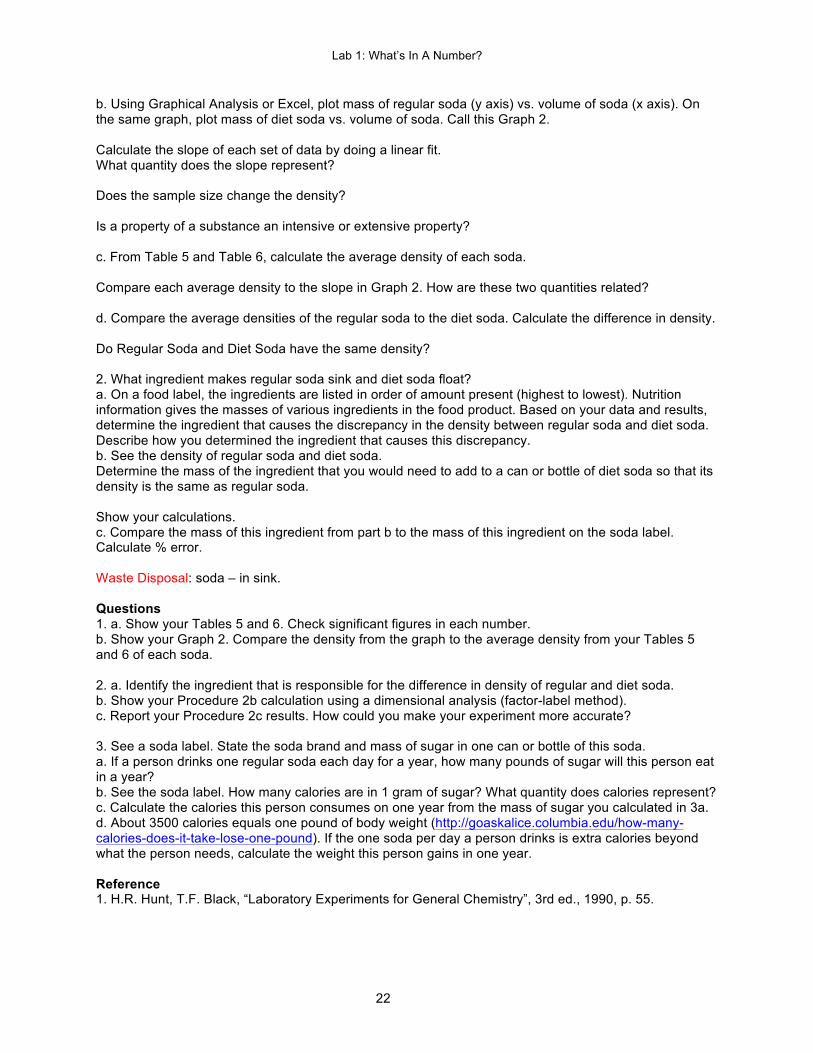
b. Using Graphical Analysis or Excel, plot mass of regular soda (y axis) vs. volume of soda (x axis). On the same graph, plot mass of diet soda vs. volume of soda. Call this Graph 2. Calculate the slope of each set of data by doing a linear fit. What quantity does the slope represent? Does the sample size change the density? Is a property of a substance an intensive or extensive property? c. From Table 5 and Table 6, calculate the average density of each soda. Compare each average density to the slope in Graph 2. How are these two quantities related? d. Compare the average densities of the regular soda to the diet soda. Calculate the difference in density. Do Regular Soda and Diet Soda have the same density? 2. What ingredient makes regular soda sink and diet soda float? a. On a food label, the ingredients are listed in order of amount present (highest to lowest). Nutrition information gives the masses of various ingredients in the food product. Based on your data and results, determine the ingredient that causes the discrepancy in the density between regular soda and diet soda. Describe how you determined the ingredient that causes this discrepancy. b. See the density of regular soda and diet soda. Determine the mass of the ingredient that you would need to add to a can or bottle of diet soda so that its density is the same as regular soda. Show your calculations. c. Compare the mass of this ingredient from part b to the mass of this ingredient on the soda label. Calculate % error. Waste Disposal: soda – in sink. Questions 1. a. Show your Tables 5 and 6. Check significant figures in each number. b. Show your Graph 2. Compare the density from the graph to the average density from your Tables 5 and 6 of each soda. 2. a. Identify the ingredient that is responsible for the difference in density of regular and diet soda. b. Show your Procedure 2b calculation using a dimensional analysis (factor-label method). c. Report your Procedure 2c results. How could you make your experiment more accurate? 3. See a soda label. State the soda brand and mass of sugar in one can or bottle of this soda. a. If a person drinks one regular soda each day for a year, how many pounds of sugar will this person eat in a year? b. See the soda label. How many calories are in 1 gram of sugar? What quantity does calories represent? c. Calculate the calories this person consumes on one year from the mass of sugar you calculated in 3a. d. About 3500 calories equals one pound of body weight (http://goaskalice.columbia.edu/how-many-calories-does-it-take-lose-one-pound). If the one soda per day a person drinks is extra calories beyond what the person needs, calculate the weight this person gains in one year. Reference 1. H.R. Hunt, T.F. Black, “Laboratory Experiments for General Chemistry”, 3rd ed., 1990, p. 55.
Lab 2: “Test, Not Taste”
23
Lab 2. “Test, Not Taste.” Using Properties to Identify and Separate Substances What is a property? How do I determine the identity of a substance? How do I separate a mixture into its components? Objectives (i) Identify a substance using properties. (ii) Identify a property of a substance to separate a mixture. (iii) Use a difference in this property to separate a mixture. Introduction
Your favorite TV detective sees a white solid in the floor. He tastes it, spits it out, and immediately knows what it is. You see a fluid leak under your car. You’re not going to taste it. How can you determine the identity of this liquid? One way is by measuring a property of that substance, such as density (see Lab 1). A property is a characteristic feature of a substance. If your property measurement matches the known or true value of this property of a substance, you can identify the substance. In other words, you can identify a substance by chemical tests (but not by tasting). Usually, more than one property measurement is done to verify the identity of a substance.
Compounds are classified as ionic compounds or molecular (covalent) compounds. Solutions are classified as ionic solutions and molecular solutions. A conductivity test can help you identify solution type.
Many substances are either an acid or a base. The most produced chemical in this country is an acid (sulfuric acid). Acids and bases have specific properties that can help with substance identification. For example, the sour taste of a lemon is due to the presence of an acid (citric acid). The bitter taste of (unflavored) Tums is due to the presence of a base (calcium carbonate). A geologist may carry around a bottle of hydrochloric acid to test rock samples for limestone (calcium carbonate). Soap is slippery and slips out of your hand because soap is a base. (What is the reason for getting your mouth washed with soap if you said something bad?) Rather than tasting, you can test for acids or bases with litmus paper, phenolphthalein, and pH. pH is a measure of the H+ concentration in a solution: pH = - log [H+] (1).
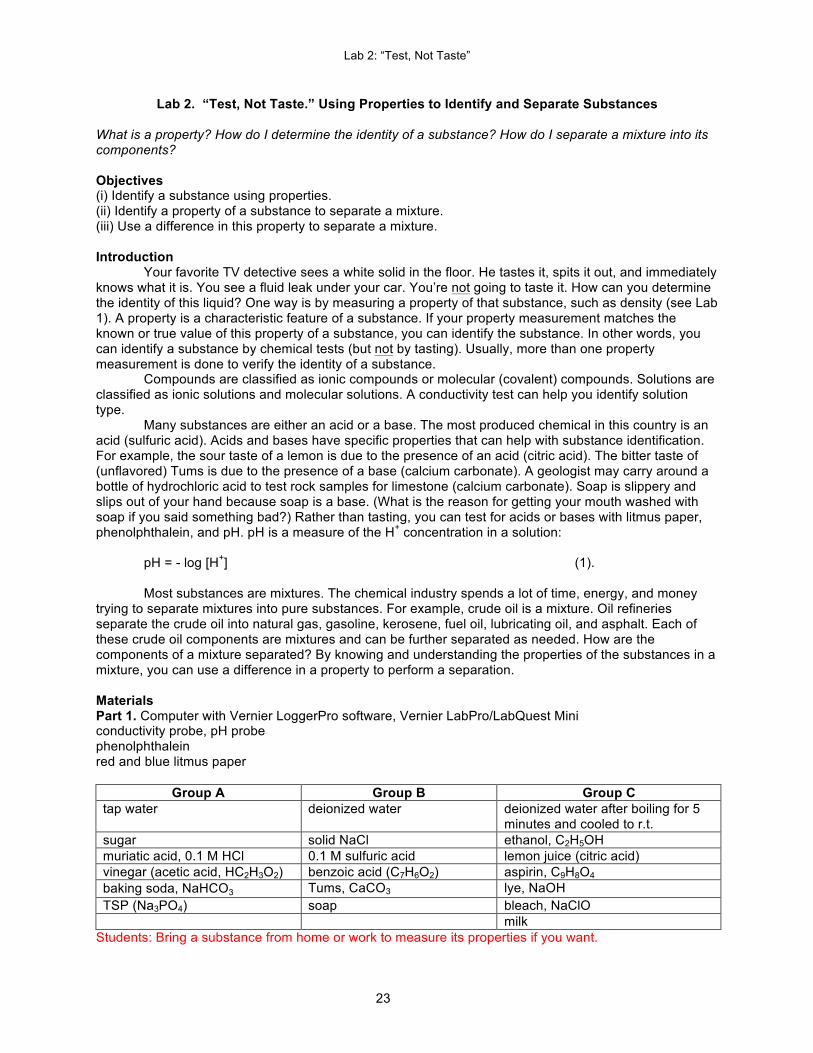
Most substances are mixtures. The chemical industry spends a lot of time, energy, and money trying to separate mixtures into pure substances. For example, crude oil is a mixture. Oil refineries separate the crude oil into natural gas, gasoline, kerosene, fuel oil, lubricating oil, and asphalt. Each of these crude oil components are mixtures and can be further separated as needed. How are the components of a mixture separated? By knowing and understanding the properties of the substances in a mixture, you can use a difference in a property to perform a separation. Materials Part 1. Computer with Vernier LoggerPro software, Vernier LabPro/LabQuest Mini conductivity probe, pH probe phenolphthalein red and blue litmus paper
Group A Group B Group C tap water deionized water deionized water after boiling for 5
minutes and cooled to r.t. sugar solid NaCl ethanol, C2H5OH muriatic acid, 0.1 M HCl 0.1 M sulfuric acid lemon juice (citric acid) vinegar (acetic acid, HC2H3O2) benzoic acid (C7H6O2) aspirin, C9H8O4 baking soda, NaHCO3 Tums, CaCO3 lye, NaOH TSP (Na3PO4) soap bleach, NaClO milk
Students: Bring a substance from home or work to measure its properties if you want.
Lab 2: “Test, Not Taste”
24
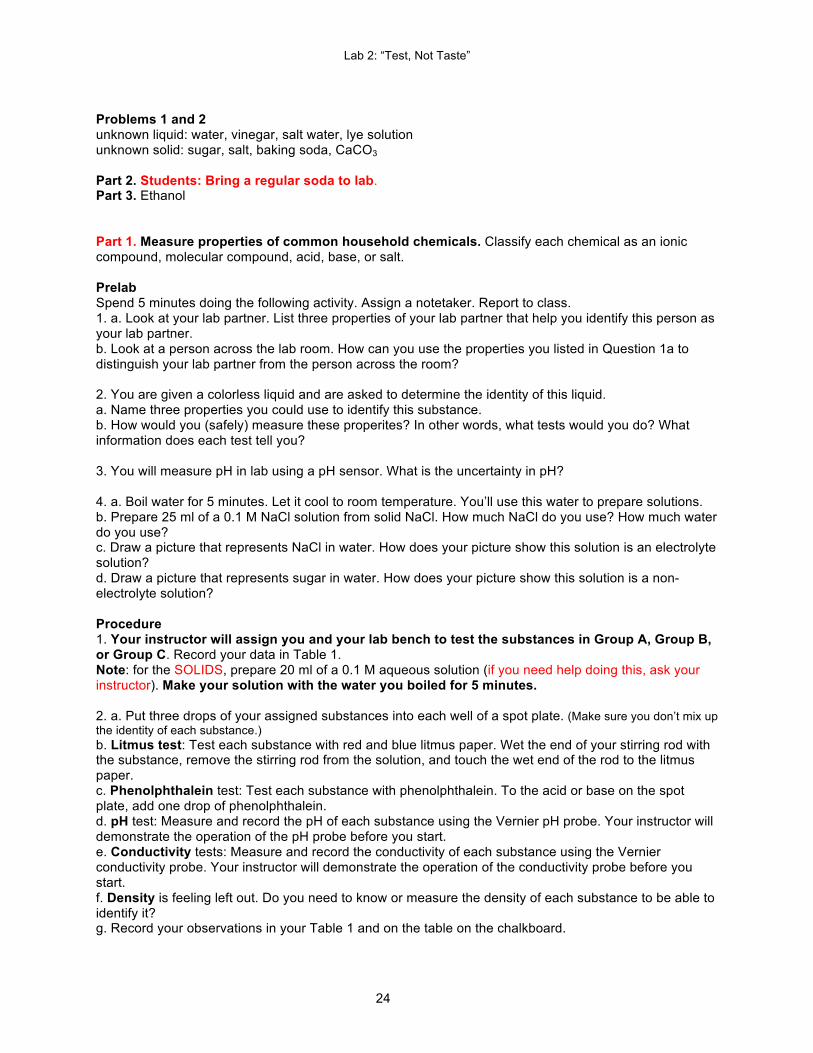
Problems 1 and 2 unknown liquid: water, vinegar, salt water, lye solution unknown solid: sugar, salt, baking soda, CaCO3 Part 2. Students: Bring a regular soda to lab. Part 3. Ethanol Part 1. Measure properties of common household chemicals. Classify each chemical as an ionic compound, molecular compound, acid, base, or salt. Prelab Spend 5 minutes doing the following activity. Assign a notetaker. Report to class. 1. a. Look at your lab partner. List three properties of your lab partner that help you identify this person as your lab partner. b. Look at a person across the lab room. How can you use the properties you listed in Question 1a to distinguish your lab partner from the person across the room? 2. You are given a colorless liquid and are asked to determine the identity of this liquid. a. Name three properties you could use to identify this substance. b. How would you (safely) measure these properites? In other words, what tests would you do? What information does each test tell you? 3. You will measure pH in lab using a pH sensor. What is the uncertainty in pH? 4. a. Boil water for 5 minutes. Let it cool to room temperature. You’ll use this water to prepare solutions. b. Prepare 25 ml of a 0.1 M NaCl solution from solid NaCl. How much NaCl do you use? How much water do you use? c. Draw a picture that represents NaCl in water. How does your picture show this solution is an electrolyte solution? d. Draw a picture that represents sugar in water. How does your picture show this solution is a non-electrolyte solution? Procedure 1. Your instructor will assign you and your lab bench to test the substances in Group A, Group B, or Group C. Record your data in Table 1. Note: for the SOLIDS, prepare 20 ml of a 0.1 M aqueous solution (if you need help doing this, ask your instructor). Make your solution with the water you boiled for 5 minutes. 2. a. Put three drops of your assigned substances into each well of a spot plate. (Make sure you don’t mix up the identity of each substance.) b. Litmus test: Test each substance with red and blue litmus paper. Wet the end of your stirring rod with the substance, remove the stirring rod from the solution, and touch the wet end of the rod to the litmus paper. c. Phenolphthalein test: Test each substance with phenolphthalein. To the acid or base on the spot plate, add one drop of phenolphthalein. d. pH test: Measure and record the pH of each substance using the Vernier pH probe. Your instructor will demonstrate the operation of the pH probe before you start. e. Conductivity tests: Measure and record the conductivity of each substance using the Vernier conductivity probe. Your instructor will demonstrate the operation of the conductivity probe before you start. f. Density is feeling left out. Do you need to know or measure the density of each substance to be able to identify it? g. Record your observations in your Table 1 and on the table on the chalkboard.
Lab 2: “Test, Not Taste”
25
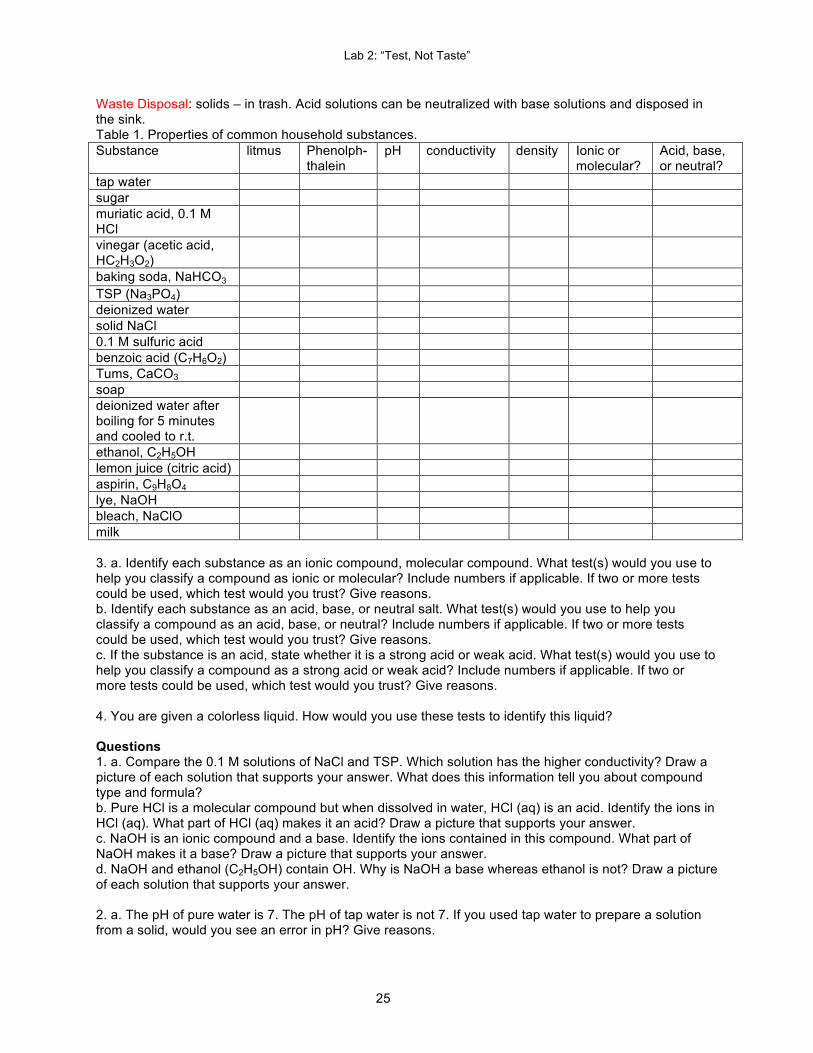
Waste Disposal: solids – in trash. Acid solutions can be neutralized with base solutions and disposed in the sink. Table 1. Properties of common household substances. Substance litmus Phenolph-
thalein pH conductivity density Ionic or
molecular? Acid, base, or neutral?
tap water sugar muriatic acid, 0.1 M HCl
vinegar (acetic acid, HC2H3O2)
baking soda, NaHCO3 TSP (Na3PO4) deionized water solid NaCl 0.1 M sulfuric acid benzoic acid (C7H6O2) Tums, CaCO3 soap deionized water after boiling for 5 minutes and cooled to r.t.
ethanol, C2H5OH lemon juice (citric acid) aspirin, C9H8O4 lye, NaOH bleach, NaClO milk 3. a. Identify each substance as an ionic compound, molecular compound. What test(s) would you use to help you classify a compound as ionic or molecular? Include numbers if applicable. If two or more tests could be used, which test would you trust? Give reasons. b. Identify each substance as an acid, base, or neutral salt. What test(s) would you use to help you classify a compound as an acid, base, or neutral? Include numbers if applicable. If two or more tests could be used, which test would you trust? Give reasons. c. If the substance is an acid, state whether it is a strong acid or weak acid. What test(s) would you use to help you classify a compound as a strong acid or weak acid? Include numbers if applicable. If two or more tests could be used, which test would you trust? Give reasons. 4. You are given a colorless liquid. How would you use these tests to identify this liquid? Questions 1. a. Compare the 0.1 M solutions of NaCl and TSP. Which solution has the higher conductivity? Draw a picture of each solution that supports your answer. What does this information tell you about compound type and formula? b. Pure HCl is a molecular compound but when dissolved in water, HCl (aq) is an acid. Identify the ions in HCl (aq). What part of HCl (aq) makes it an acid? Draw a picture that supports your answer. c. NaOH is an ionic compound and a base. Identify the ions contained in this compound. What part of NaOH makes it a base? Draw a picture that supports your answer. d. NaOH and ethanol (C2H5OH) contain OH. Why is NaOH a base whereas ethanol is not? Draw a picture of each solution that supports your answer. 2. a. The pH of pure water is 7. The pH of tap water is not 7. If you used tap water to prepare a solution from a solid, would you see an error in pH? Give reasons.
Lab 2: “Test, Not Taste”
26
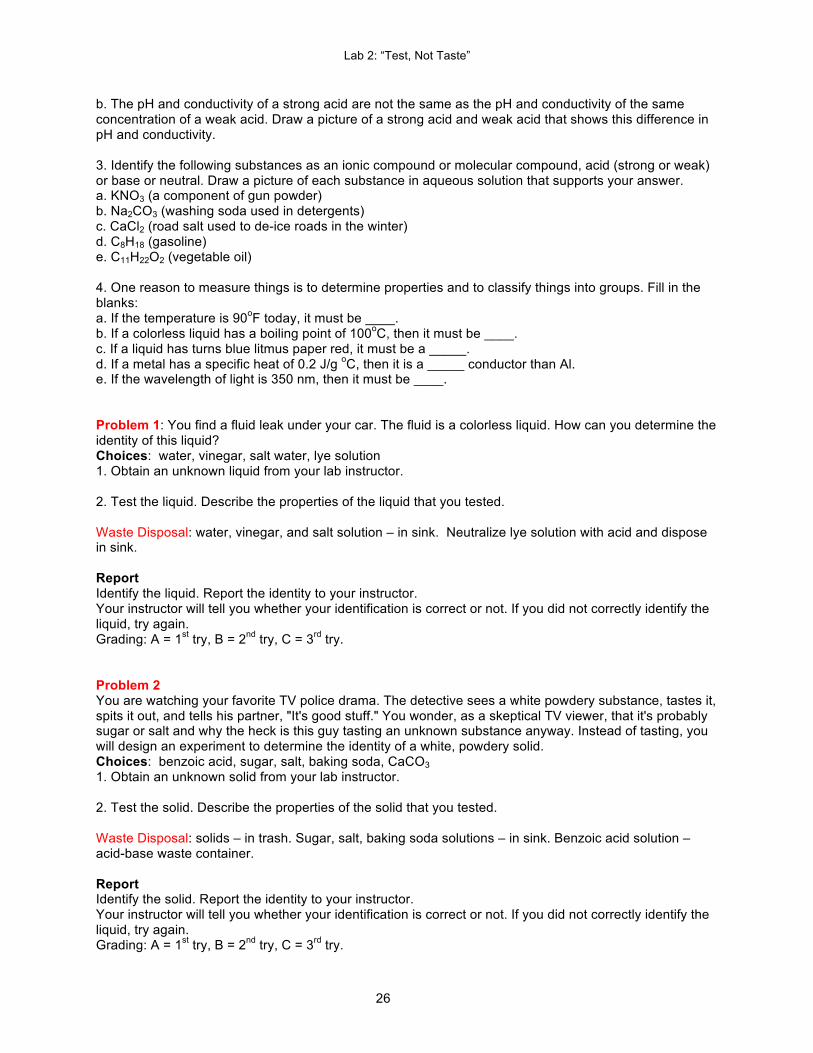
b. The pH and conductivity of a strong acid are not the same as the pH and conductivity of the same concentration of a weak acid. Draw a picture of a strong acid and weak acid that shows this difference in pH and conductivity. 3. Identify the following substances as an ionic compound or molecular compound, acid (strong or weak) or base or neutral. Draw a picture of each substance in aqueous solution that supports your answer. a. KNO3 (a component of gun powder) b. Na2CO3 (washing soda used in detergents) c. CaCl2 (road salt used to de-ice roads in the winter) d. C8H18 (gasoline) e. C11H22O2 (vegetable oil) 4. One reason to measure things is to determine properties and to classify things into groups. Fill in the blanks: a. If the temperature is 90oF today, it must be ____. b. If a colorless liquid has a boiling point of 100oC, then it must be ____. c. If a liquid has turns blue litmus paper red, it must be a _____. d. If a metal has a specific heat of 0.2 J/g oC, then it is a _____ conductor than Al. e. If the wavelength of light is 350 nm, then it must be ____. Problem 1: You find a fluid leak under your car. The fluid is a colorless liquid. How can you determine the identity of this liquid? Choices: water, vinegar, salt water, lye solution 1. Obtain an unknown liquid from your lab instructor. 2. Test the liquid. Describe the properties of the liquid that you tested. Waste Disposal: water, vinegar, and salt solution – in sink. Neutralize lye solution with acid and dispose in sink. Report Identify the liquid. Report the identity to your instructor. Your instructor will tell you whether your identification is correct or not. If you did not correctly identify the liquid, try again. Grading: A = 1st try, B = 2nd try, C = 3rd try. Problem 2 You are watching your favorite TV police drama. The detective sees a white powdery substance, tastes it, spits it out, and tells his partner, "It's good stuff." You wonder, as a skeptical TV viewer, that it's probably sugar or salt and why the heck is this guy tasting an unknown substance anyway. Instead of tasting, you will design an experiment to determine the identity of a white, powdery solid. Choices: benzoic acid, sugar, salt, baking soda, CaCO3 1. Obtain an unknown solid from your lab instructor. 2. Test the solid. Describe the properties of the solid that you tested. Waste Disposal: solids – in trash. Sugar, salt, baking soda solutions – in sink. Benzoic acid solution – acid-base waste container. Report Identify the solid. Report the identity to your instructor. Your instructor will tell you whether your identification is correct or not. If you did not correctly identify the liquid, try again. Grading: A = 1st try, B = 2nd try, C = 3rd try.
Lab 2: “Test, Not Taste”
27
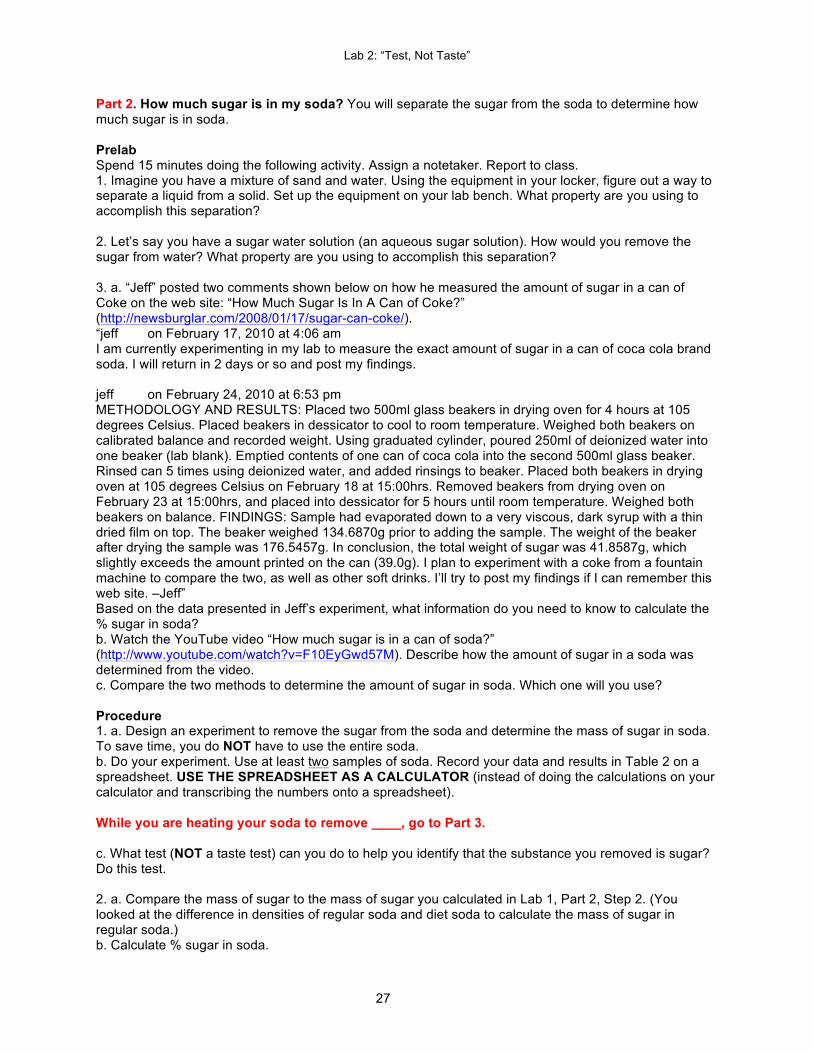
Part 2. How much sugar is in my soda? You will separate the sugar from the soda to determine how much sugar is in soda. Prelab Spend 15 minutes doing the following activity. Assign a notetaker. Report to class. 1. Imagine you have a mixture of sand and water. Using the equipment in your locker, figure out a way to separate a liquid from a solid. Set up the equipment on your lab bench. What property are you using to accomplish this separation? 2. Let’s say you have a sugar water solution (an aqueous sugar solution). How would you remove the sugar from water? What property are you using to accomplish this separation? 3. a. “Jeff” posted two comments shown below on how he measured the amount of sugar in a can of Coke on the web site: “How Much Sugar Is In A Can of Coke?” (http://newsburglar.com/2008/01/17/sugar-can-coke/). “jeff on February 17, 2010 at 4:06 am I am currently experimenting in my lab to measure the exact amount of sugar in a can of coca cola brand soda. I will return in 2 days or so and post my findings. jeff on February 24, 2010 at 6:53 pm METHODOLOGY AND RESULTS: Placed two 500ml glass beakers in drying oven for 4 hours at 105 degrees Celsius. Placed beakers in dessicator to cool to room temperature. Weighed both beakers on calibrated balance and recorded weight. Using graduated cylinder, poured 250ml of deionized water into one beaker (lab blank). Emptied contents of one can of coca cola into the second 500ml glass beaker. Rinsed can 5 times using deionized water, and added rinsings to beaker. Placed both beakers in drying oven at 105 degrees Celsius on February 18 at 15:00hrs. Removed beakers from drying oven on February 23 at 15:00hrs, and placed into dessicator for 5 hours until room temperature. Weighed both beakers on balance. FINDINGS: Sample had evaporated down to a very viscous, dark syrup with a thin dried film on top. The beaker weighed 134.6870g prior to adding the sample. The weight of the beaker after drying the sample was 176.5457g. In conclusion, the total weight of sugar was 41.8587g, which slightly exceeds the amount printed on the can (39.0g). I plan to experiment with a coke from a fountain machine to compare the two, as well as other soft drinks. I’ll try to post my findings if I can remember this web site. –Jeff” Based on the data presented in Jeff’s experiment, what information do you need to know to calculate the % sugar in soda? b. Watch the YouTube video “How much sugar is in a can of soda?” (http://www.youtube.com/watch?v=F10EyGwd57M). Describe how the amount of sugar in a soda was determined from the video. c. Compare the two methods to determine the amount of sugar in soda. Which one will you use? Procedure 1. a. Design an experiment to remove the sugar from the soda and determine the mass of sugar in soda. To save time, you do NOT have to use the entire soda. b. Do your experiment. Use at least two samples of soda. Record your data and results in Table 2 on a spreadsheet. USE THE SPREADSHEET AS A CALCULATOR (instead of doing the calculations on your calculator and transcribing the numbers onto a spreadsheet). While you are heating your soda to remove ____, go to Part 3. c. What test (NOT a taste test) can you do to help you identify that the substance you removed is sugar? Do this test. 2. a. Compare the mass of sugar to the mass of sugar you calculated in Lab 1, Part 2, Step 2. (You looked at the difference in densities of regular soda and diet soda to calculate the mass of sugar in regular soda.) b. Calculate % sugar in soda.
Lab 2: “Test, Not Taste”
28
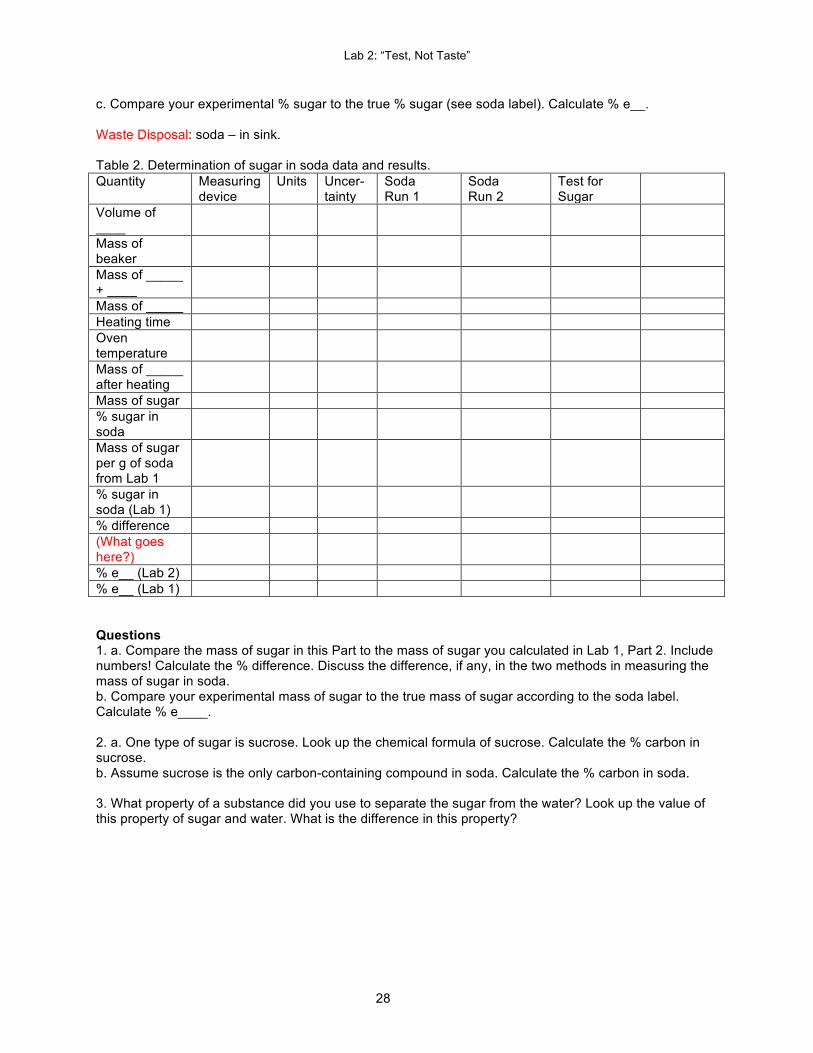
c. Compare your experimental % sugar to the true % sugar (see soda label). Calculate % e__. Waste Disposal: soda – in sink. Table 2. Determination of sugar in soda data and results. Quantity Measuring
device Units Uncer-
tainty Soda Run 1
Soda Run 2
Test for Sugar
Volume of ____
Mass of beaker
Mass of _____ + ____
Mass of _____ Heating time Oven temperature
Mass of _____ after heating
Mass of sugar % sugar in soda
Mass of sugar per g of soda from Lab 1
% sugar in soda (Lab 1)
% difference (What goes here?)
% e__ (Lab 2) % e__ (Lab 1) Questions 1. a. Compare the mass of sugar in this Part to the mass of sugar you calculated in Lab 1, Part 2. Include numbers! Calculate the % difference. Discuss the difference, if any, in the two methods in measuring the mass of sugar in soda. b. Compare your experimental mass of sugar to the true mass of sugar according to the soda label. Calculate % e____. 2. a. One type of sugar is sucrose. Look up the chemical formula of sucrose. Calculate the % carbon in sucrose. b. Assume sucrose is the only carbon-containing compound in soda. Calculate the % carbon in soda. 3. What property of a substance did you use to separate the sugar from the water? Look up the value of this property of sugar and water. What is the difference in this property?
Lab 2: “Test, Not Taste”
29
Part 3. How to fortify my beverage. Introduction
Beer, wine, distilled spirits. All have ethanol but in different concentrations. When sugar is fermented, ethanol is produced. This method makes ethanol with a 10-15% concentration. How do you get more concentrated ethanol?
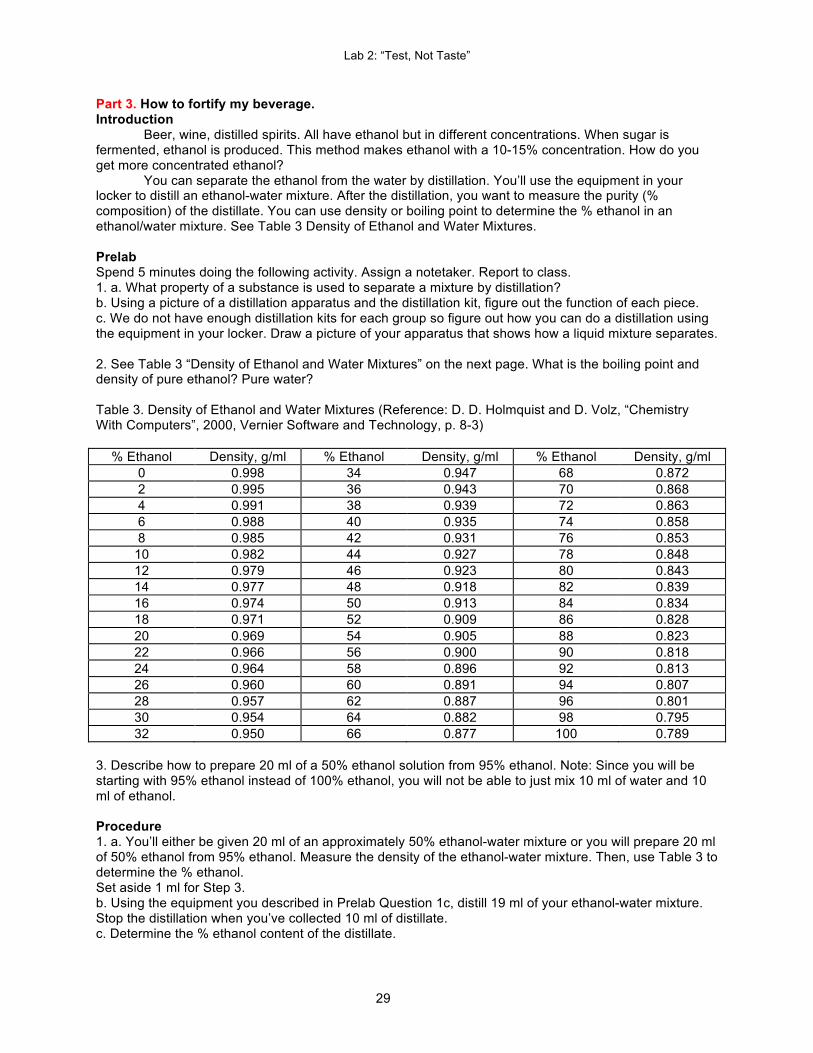
You can separate the ethanol from the water by distillation. You’ll use the equipment in your locker to distill an ethanol-water mixture. After the distillation, you want to measure the purity (% composition) of the distillate. You can use density or boiling point to determine the % ethanol in an ethanol/water mixture. See Table 3 Density of Ethanol and Water Mixtures. Prelab Spend 5 minutes doing the following activity. Assign a notetaker. Report to class. 1. a. What property of a substance is used to separate a mixture by distillation? b. Using a picture of a distillation apparatus and the distillation kit, figure out the function of each piece. c. We do not have enough distillation kits for each group so figure out how you can do a distillation using the equipment in your locker. Draw a picture of your apparatus that shows how a liquid mixture separates. 2. See Table 3 “Density of Ethanol and Water Mixtures” on the next page. What is the boiling point and density of pure ethanol? Pure water? Table 3. Density of Ethanol and Water Mixtures (Reference: D. D. Holmquist and D. Volz, “Chemistry With Computers”, 2000, Vernier Software and Technology, p. 8-3)
% Ethanol Density, g/ml % Ethanol Density, g/ml % Ethanol Density, g/ml 0 0.998 34 0.947 68 0.872 2 0.995 36 0.943 70 0.868 4 0.991 38 0.939 72 0.863 6 0.988 40 0.935 74 0.858 8 0.985 42 0.931 76 0.853
10 0.982 44 0.927 78 0.848 12 0.979 46 0.923 80 0.843 14 0.977 48 0.918 82 0.839 16 0.974 50 0.913 84 0.834 18 0.971 52 0.909 86 0.828 20 0.969 54 0.905 88 0.823 22 0.966 56 0.900 90 0.818 24 0.964 58 0.896 92 0.813 26 0.960 60 0.891 94 0.807 28 0.957 62 0.887 96 0.801 30 0.954 64 0.882 98 0.795 32 0.950 66 0.877 100 0.789
3. Describe how to prepare 20 ml of a 50% ethanol solution from 95% ethanol. Note: Since you will be starting with 95% ethanol instead of 100% ethanol, you will not be able to just mix 10 ml of water and 10 ml of ethanol. Procedure 1. a. You’ll either be given 20 ml of an approximately 50% ethanol-water mixture or you will prepare 20 ml of 50% ethanol from 95% ethanol. Measure the density of the ethanol-water mixture. Then, use Table 3 to determine the % ethanol. Set aside 1 ml for Step 3. b. Using the equipment you described in Prelab Question 1c, distill 19 ml of your ethanol-water mixture. Stop the distillation when you’ve collected 10 ml of distillate. c. Determine the % ethanol content of the distillate.
Lab 2: “Test, Not Taste”
30
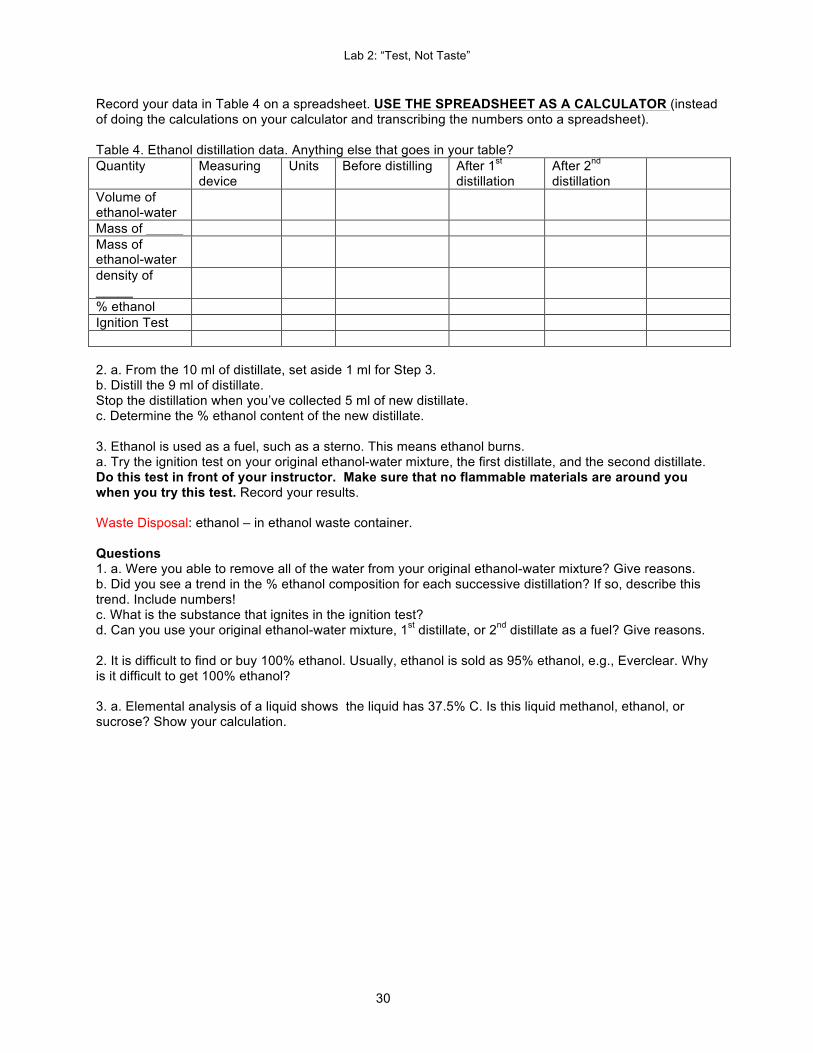
Record your data in Table 4 on a spreadsheet. USE THE SPREADSHEET AS A CALCULATOR (instead of doing the calculations on your calculator and transcribing the numbers onto a spreadsheet). Table 4. Ethanol distillation data. Anything else that goes in your table? Quantity Measuring
device Units Before distilling After 1st
distillation After 2nd distillation
Volume of ethanol-water
Mass of _____ Mass of ethanol-water
density of _____
% ethanol Ignition Test 2. a. From the 10 ml of distillate, set aside 1 ml for Step 3. b. Distill the 9 ml of distillate. Stop the distillation when you’ve collected 5 ml of new distillate. c. Determine the % ethanol content of the new distillate. 3. Ethanol is used as a fuel, such as a sterno. This means ethanol burns. a. Try the ignition test on your original ethanol-water mixture, the first distillate, and the second distillate. Do this test in front of your instructor. Make sure that no flammable materials are around you when you try this test. Record your results. Waste Disposal: ethanol – in ethanol waste container. Questions 1. a. Were you able to remove all of the water from your original ethanol-water mixture? Give reasons. b. Did you see a trend in the % ethanol composition for each successive distillation? If so, describe this trend. Include numbers! c. What is the substance that ignites in the ignition test? d. Can you use your original ethanol-water mixture, 1st distillate, or 2nd distillate as a fuel? Give reasons. 2. It is difficult to find or buy 100% ethanol. Usually, ethanol is sold as 95% ethanol, e.g., Everclear. Why is it difficult to get 100% ethanol? 3. a. Elemental analysis of a liquid shows the liquid has 37.5% C. Is this liquid methanol, ethanol, or sucrose? Show your calculation.
Lab 3: Preparation of an Antacid
31
Lab 3. Oh, What A Relief It Is! Preparation of An Antacid What is an antacid? How do I make an antacid? How do I know a chemical reaction occurred? Objectives (i) Use solubility of ionic compounds in water to do a precipitation reaction. (ii) Write net ionic equations. Introduction You ate too much and have an upset stomach. You need an antacid. An antacid neutralizes excess stomach acid (HCl). This means an antacid is a _____. Two common antacid ingredients are CaCO3, which is found inTums and Rolaids, and Mg(OH)2, which is found in Milk of Magnesia. You will make these two antacids by doing a precipitation reaction (a type of double replacement reaction). You will identify the reactants to use, make a solution of each reactant, mix the two solutions together, see a reaction occur, and voila! you’ve made your antacid. Once you’ve made each antacid, you will confirm you’ve made the antacid by measuring properties of the antacid. Materials phenolphthalein, red and blue litmus paper solid NaOH or KOH solid Na2CO3 or K2CO3 solid MgCl2 or Mg(NO3) 2 solid CaCl2 or Ca(NO3) 2 1 M HCl Prelab Spend 5 minutes doing the following activity. Assign a notetaker. Report to class. 1. See the Table Solubility of Ionic Compounds in Water in your textbook or on a website. a. Is CaCl2 soluble in water? Draw a picture of this mixture that supports your answer. b. Is AgCl soluble in water? Draw a picture of this mixture that supports your answer. c. An aqueous solution contains Ca2+ and Cl- ions. A second solution contains Na+ and OH- ions. You add one solution to the other and see a solid form. Draw a picture of this mixture that shows what happens. 2. You have a mixture of a solid and liquid. How would you separate this mixture? Set up this separation using the equipment in your locker. Procedure – Work with another group. One group will make CaCO3; the other group will make Mg(OH)2. Share your data. Part 1. You want to make 1 g of CaCO3 antacid. 1. a. Identify the ionic compounds you will use as reactants. b. Write a chemical equation that shows how these reactants react to make CaCO3. Then, write a net ionic equation. c. What is the mole ratio of reactant to reactant and each reactant to CaCO3? Calculate three ratios in all. Record your data in Table 1 on a spreadsheet. USE THE SPREADSHEET AS A CALCULATOR (instead of doing the calculations on your calculator and transcribing the numbers onto a spreadsheet). d. What is the mass ratio of reactant to reactant and each reactant to CaCO3? 2. a. Calculate the mass of each reactant to use to make 1 g of CaCO3. b. Measure the mass of each reactant in separate beakers. Add water to make a solution of each reactant. (How much water should you use?) c. For each solution, determine whether it is an acid, base, or neutral. What test did you do?

Lab 3: Preparation of an Antacid
32
Table 1. Antacid synthesis data and results. Antacid Reactant 1 Reactant 2 Product 1 Product 2 Reactant 1:
Reactant 2 Reactant 1: antacid
Reactant 2: antacid
CaCO3 Coefficient in balanced equation
Molar Mass Mass Moles Acid, base, neutral?
Actual yield % yield Mg(OH)2 Coefficient in balanced equation
Molar Mass Mass Moles Acid, base, neutral?
Actual yield % yield 3. a. Add one solution to the other. What happens? Test the mixture to determine whether it is an acid, base, or neutral. b. Separate the CaCO3 from the rest of the mixture. Do not discard the rest of the mixture. See Step e. c. Dry the CaCO3. d. Measure the mass of the dry CaCO3. This mass is called the actual yield. e. The “rest of the mixture” from step c contains _____ and _____. Separate the ____ from the ____. After you do your separation, one substance should be a solid. Dry this solid. Measure the mass of this solid. 4. How do you know you made CaCO3? What properties of CaCO3 can you test? a. Is CaCO3 soluble in water? Test a small amount to see. b. Another name for an antacid is a ____. c. How much stomach acid reacts with CaCO3? Write a chemical equation that represents the reaction of CaCO3 with stomach acid. Calculate the volume of stomach acid (___ M ____ (fill in concentration and substance)) that reacts with the mass of CaCO3 that you made. Add this volume of ____. Record your observations. Waste Disposal: filtrate (NaCl (aq)) – in sink. HCl – neutralize with base and dispose in sink. Solids – in trash.

Lab 3: Preparation of an Antacid
33
Part 2. You want to make 1 g of Mg(OH)2 antacid. 1. a. Identify the ionic compounds you will use as reactants. b. Write a chemical equation that shows how these reactants react to make Mg(OH)2. Then, write a net ionic equation. c. What is the mole ratio of reactant to reactant and each reactant to Mg(OH)2? Calculate three ratios in all. Record your data in Table 1. d. What is the mass ratio of reactant to reactant and each reactant to Mg(OH)2? 2. a. Calculate the mass of each reactant to use to make 1 g of Mg(OH)2. b. Measure the mass of each reactant in separate beakers. Add water to make a solution of each reactant. (Does it matter how much water you use?) c. For each solution, determine whether it is an acid, base, or neutral. What test did you do? 3. a. Add one solution to the other. What happens? Test the mixture to determine whether it is an acid, base, or neutral. b. Separate the Mg(OH)2 from the rest of the mixture. Do not discard the rest of the mixture. See Step e. c. Dry the Mg(OH)2. d. Measure the mass of the dry Mg(OH)2. This mass is called the actual yield. e. The “rest of the mixture” from step c contains _____ and _____. Separate the ____ from the ____. After you do your separation, one substance should be a solid. Dry this solid. Measure the mass of this solid. 4. How do you know you made Mg(OH)2? What properties of Mg(OH)2 can you test? a. Is Mg(OH)2 soluble in water? Test a small amount to see. b. Another name for an antacid is a ____. c. How much stomach acid reacts with Mg(OH)2? Write a chemical equation that represents the reaction of Mg(OH)2 with this substance. Calculate the volume of stomach acid (___ M ____ (fill in concentration and substance)) that reacts with the mass of CaCO3 that you made. Add this volume of ____. Record your observations. Waste Disposal: filtrate (NaCl (aq)) – in sink. HCl – neutralize with base and dispose in sink. Solids – in trash. Questions 1. If your % yield of antacid was not 100%, determine one specific part of the experiment where you lost (or gained) yield. 2. a. For each antacid synthesis, show your net ionic equation. b. For each reaction, you measured the masses of reactants and products. Show whether the conservation of mass law was obeyed. Include numbers! c. How do you know you made your antacid? Describe the experiments you did to identify each antacid. d. Could you use density to identify each antacid? Why? e. Could you use conductivity to identify each antacid? Why? 3. Baking soda (NaHCO3) is used as an antacid. Could you synthesize baking soda using a double replacement reaction like you did with CaCO3 and Mg(OH)2? Give reasons. Show a chemical equation as needed.

Lab 4: Acid and Base Magic
34
Lab 4. Acid and Base Magic What do acids react with? What if I add too much acid? What if I add too much base? Objectives (i) Demonstrate properties and reactions of acids and bases. (ii) Be an expert at volumetric analysis (moles, volume, molarity). (iii) Determine limiting and excess reactants. Introduction We know, of course, that when we want to do a chemical reaction, we should understand the reaction with a chemical equation and plan the amounts of reactants we mix together so we will know how much products are produced. When you use pure substances, you can measure mass and then calculate moles from molar mass. But if the pure substances are solids, it is not so easy to mix the solids together and get them to react. It is easier to dissolve the solids in a liquid to make solutions and mix the solutions together to get reactants to react. (You did this in Lab 3.) When you use solutions, you can measure concentration and volume to calculate moles. In this lab, you and your group will do a demonstration in front of the class using acids and bases. Your group will demonstrate acids react with ____ and ____, bases react with ____, and an acid-base reaction is a type of ______ reaction. You’ll show these properties of acids and bases by using colorto figure out which substance is the limiting reactant and which is the excess reactant. Materials 1 M HCl (50 ml per group) vinegar (50 ml per group) NaOH or KOH pellets Phenolphthalein NaCl solid Mg(NO3)2 or MgCl2 solid Mg(OH)2 solid Ca(NO3)2 or CaCl2 solid Na2CO3 solid magnesium metal Baking soda (NaHCO3) iron metal Tums tablet (CaCO3) ethanol Prelab Spend 15 minutes doing the following activity. Assign a notetaker. Report to class. Solution A and Solution B are colorless. You have 30 ml of Solution A. Approximately 20 ml of Solution A is poured into 25 ml of Solution B. The resulting solution turns pink. This pink solution is then poured back into the colorless soution A. This solution turns colorless. a. Is Solution A an acid or a base? Give reasons. b. Is the concentration of Solution A the same as Solution B or are the concentrations different? Give reasons. What concentration should you use for Solution A and Solution B? c. Why did the solution turn pink when Solution A was poured into Solution B? Write a chemical equation that represent the reaction that occurred. d. When the resulting solution was poured back into Solution A, why did the solution turn colorless? Write a chemical equation that represent the reaction that occurred. e. Using the acids and bases in the Chem 1A lab, do this demonstration in front of your lab class. Procedure Your group will do this demonstration in front of your lab class: You watch this science geek showing off some science magic to some kids. The scientist pours ____ g of white solid (A) into ___ ml of water in a ___ ml flask. The solid disappears and the water turns pink. Then the chemist pours ___ ml of a colorless liquid (B) into the flask, puts a rubber stopper on the flask, and shakes the flask for a few seconds. The stopper flies through the air. The solution stays pink. Then, the person adds ___ ml of a second colorless liquid (C) to the flask. A white solid forms and the pink solution turns colorless. 1. a. See the Materials list. What white solid did the science guy pour into the water? Give reasons. Why did the water turn pink? b. Calculate the molar concentration of this solution. Is this solution acidic or basic?
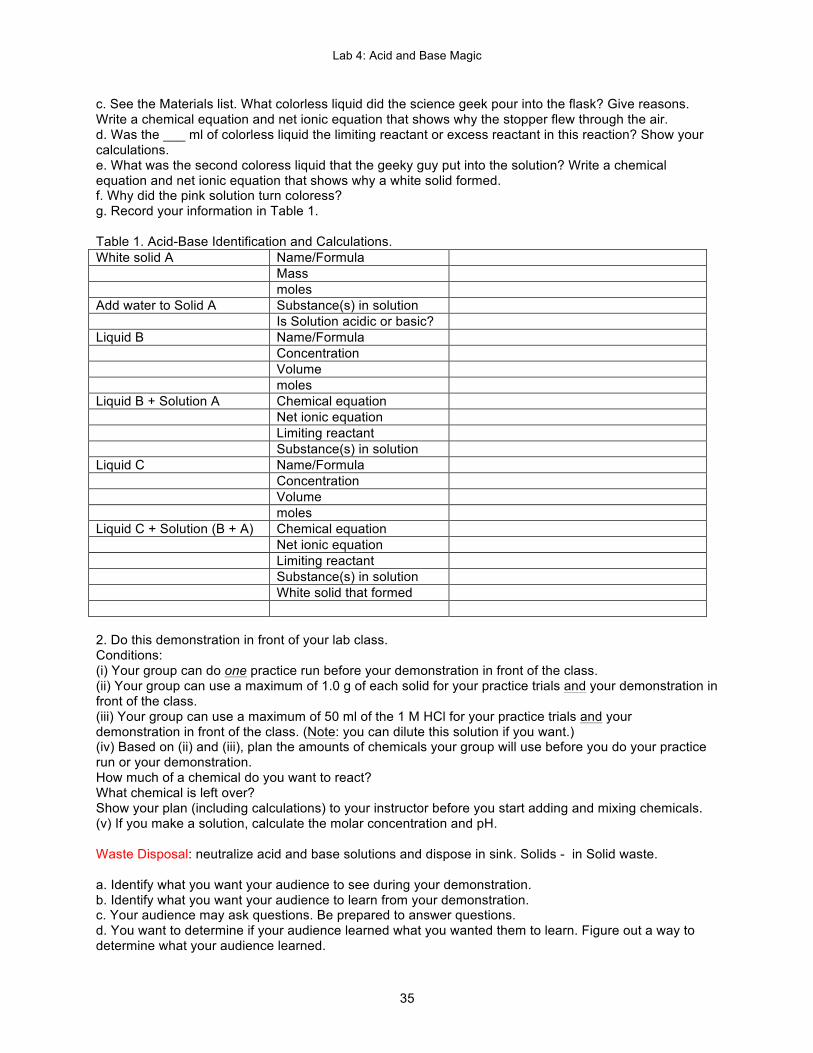
Lab 4: Acid and Base Magic
35
c. See the Materials list. What colorless liquid did the science geek pour into the flask? Give reasons. Write a chemical equation and net ionic equation that shows why the stopper flew through the air. d. Was the ___ ml of colorless liquid the limiting reactant or excess reactant in this reaction? Show your calculations. e. What was the second coloress liquid that the geeky guy put into the solution? Write a chemical equation and net ionic equation that shows why a white solid formed. f. Why did the pink solution turn coloress? g. Record your information in Table 1. Table 1. Acid-Base Identification and Calculations. White solid A Name/Formula Mass moles Add water to Solid A Substance(s) in solution Is Solution acidic or basic? Liquid B Name/Formula Concentration Volume moles Liquid B + Solution A Chemical equation Net ionic equation Limiting reactant Substance(s) in solution Liquid C Name/Formula Concentration Volume moles Liquid C + Solution (B + A) Chemical equation Net ionic equation Limiting reactant Substance(s) in solution White solid that formed 2. Do this demonstration in front of your lab class. Conditions: (i) Your group can do one practice run before your demonstration in front of the class. (ii) Your group can use a maximum of 1.0 g of each solid for your practice trials and your demonstration in front of the class. (iii) Your group can use a maximum of 50 ml of the 1 M HCl for your practice trials and your demonstration in front of the class. (Note: you can dilute this solution if you want.) (iv) Based on (ii) and (iii), plan the amounts of chemicals your group will use before you do your practice run or your demonstration. How much of a chemical do you want to react? What chemical is left over? Show your plan (including calculations) to your instructor before you start adding and mixing chemicals. (v) If you make a solution, calculate the molar concentration and pH. Waste Disposal: neutralize acid and base solutions and dispose in sink. Solids - in Solid waste. a. Identify what you want your audience to see during your demonstration. b. Identify what you want your audience to learn from your demonstration. c. Your audience may ask questions. Be prepared to answer questions. d. You want to determine if your audience learned what you wanted them to learn. Figure out a way to determine what your audience learned.

Lab 4: Acid and Base Magic
36
Report No report but … Your demonstration will be graded on the following criteria: did the demonstration work? Was each step of the demonstration clearly described and explained? Did the audience understand what you did? Evaluate what your audience learned.
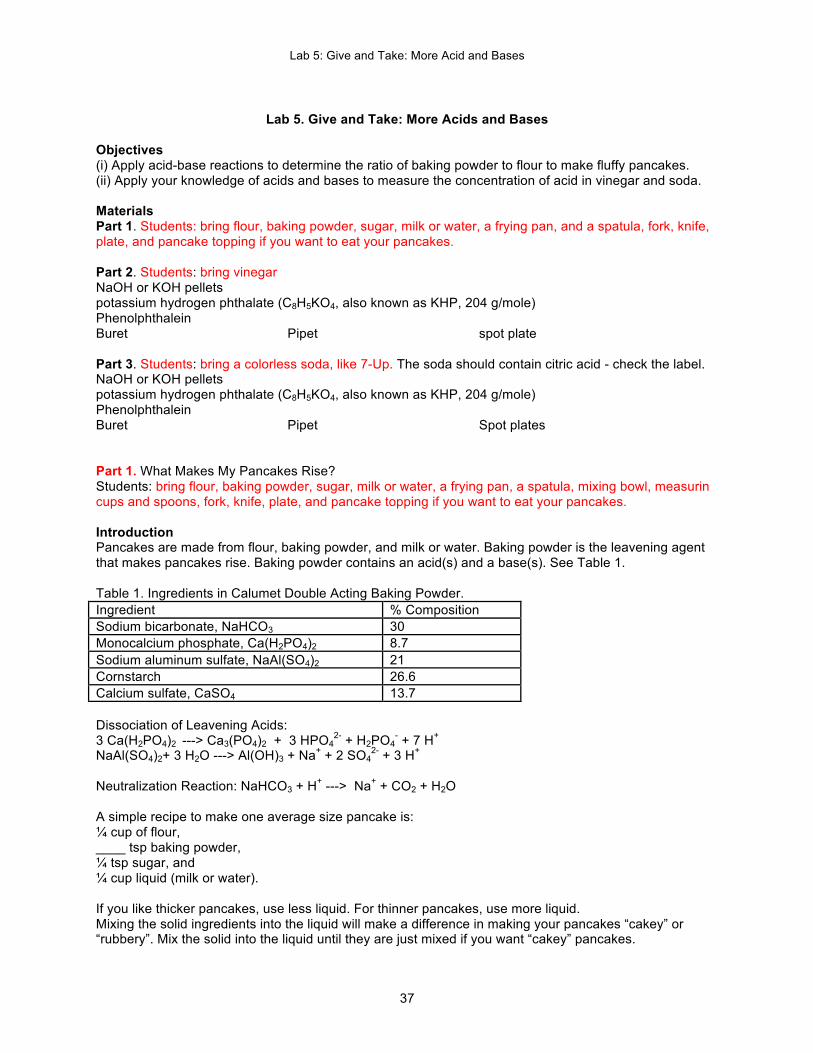
Lab 5: Give and Take: More Acid and Bases
37
Lab 5. Give and Take: More Acids and Bases
Objectives (i) Apply acid-base reactions to determine the ratio of baking powder to flour to make fluffy pancakes. (ii) Apply your knowledge of acids and bases to measure the concentration of acid in vinegar and soda. Materials Part 1. Students: bring flour, baking powder, sugar, milk or water, a frying pan, and a spatula, fork, knife, plate, and pancake topping if you want to eat your pancakes. Part 2. Students: bring vinegar NaOH or KOH pellets potassium hydrogen phthalate (C8H5KO4, also known as KHP, 204 g/mole) Phenolphthalein Buret Pipet spot plate Part 3. Students: bring a colorless soda, like 7-Up. The soda should contain citric acid - check the label. NaOH or KOH pellets potassium hydrogen phthalate (C8H5KO4, also known as KHP, 204 g/mole) Phenolphthalein Buret Pipet Spot plates Part 1. What Makes My Pancakes Rise? Students: bring flour, baking powder, sugar, milk or water, a frying pan, a spatula, mixing bowl, measurin cups and spoons, fork, knife, plate, and pancake topping if you want to eat your pancakes. Introduction Pancakes are made from flour, baking powder, and milk or water. Baking powder is the leavening agent that makes pancakes rise. Baking powder contains an acid(s) and a base(s). See Table 1. Table 1. Ingredients in Calumet Double Acting Baking Powder. Ingredient % Composition Sodium bicarbonate, NaHCO3 30 Monocalcium phosphate, Ca(H2PO4)2 8.7 Sodium aluminum sulfate, NaAl(SO4)2 21 Cornstarch 26.6 Calcium sulfate, CaSO4 13.7 Dissociation of Leavening Acids: 3 Ca(H2PO4)2 ---> Ca3(PO4)2 + 3 HPO4
2- + H2PO4- + 7 H+
NaAl(SO4)2+ 3 H2O ---> Al(OH)3 + Na+ + 2 SO42- + 3 H+
Neutralization Reaction: NaHCO3 + H+ ---> Na+ + CO2 + H2O A simple recipe to make one average size pancake is: ¼ cup of flour, ____ tsp baking powder, ¼ tsp sugar, and ¼ cup liquid (milk or water). If you like thicker pancakes, use less liquid. For thinner pancakes, use more liquid. Mixing the solid ingredients into the liquid will make a difference in making your pancakes “cakey” or “rubbery”. Mix the solid into the liquid until they are just mixed if you want “cakey” pancakes.
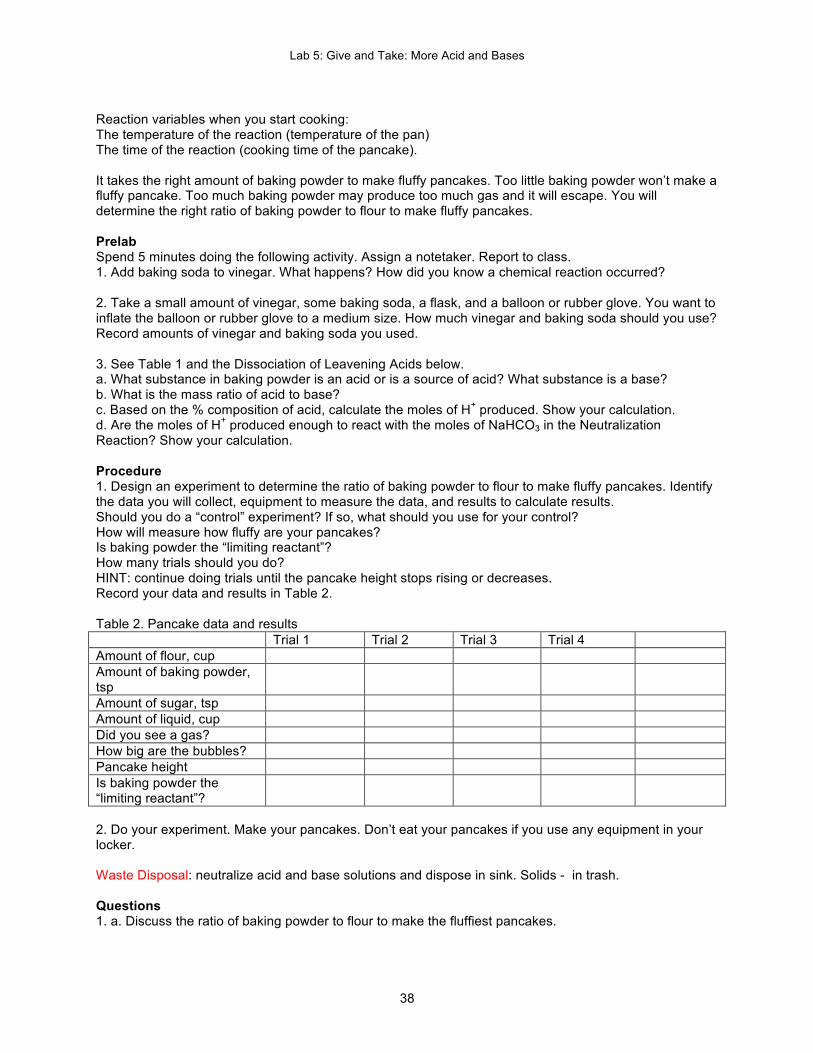
Lab 5: Give and Take: More Acid and Bases
38
Reaction variables when you start cooking: The temperature of the reaction (temperature of the pan) The time of the reaction (cooking time of the pancake). It takes the right amount of baking powder to make fluffy pancakes. Too little baking powder won’t make a fluffy pancake. Too much baking powder may produce too much gas and it will escape. You will determine the right ratio of baking powder to flour to make fluffy pancakes. Prelab Spend 5 minutes doing the following activity. Assign a notetaker. Report to class. 1. Add baking soda to vinegar. What happens? How did you know a chemical reaction occurred? 2. Take a small amount of vinegar, some baking soda, a flask, and a balloon or rubber glove. You want to inflate the balloon or rubber glove to a medium size. How much vinegar and baking soda should you use? Record amounts of vinegar and baking soda you used. 3. See Table 1 and the Dissociation of Leavening Acids below. a. What substance in baking powder is an acid or is a source of acid? What substance is a base? b. What is the mass ratio of acid to base? c. Based on the % composition of acid, calculate the moles of H+ produced. Show your calculation. d. Are the moles of H+ produced enough to react with the moles of NaHCO3 in the Neutralization Reaction? Show your calculation. Procedure 1. Design an experiment to determine the ratio of baking powder to flour to make fluffy pancakes. Identify the data you will collect, equipment to measure the data, and results to calculate results. Should you do a “control” experiment? If so, what should you use for your control? How will measure how fluffy are your pancakes? Is baking powder the “limiting reactant”? How many trials should you do? HINT: continue doing trials until the pancake height stops rising or decreases. Record your data and results in Table 2. Table 2. Pancake data and results Trial 1 Trial 2 Trial 3 Trial 4 Amount of flour, cup Amount of baking powder, tsp
Amount of sugar, tsp Amount of liquid, cup Did you see a gas? How big are the bubbles? Pancake height Is baking powder the “limiting reactant”?
2. Do your experiment. Make your pancakes. Don’t eat your pancakes if you use any equipment in your locker. Waste Disposal: neutralize acid and base solutions and dispose in sink. Solids - in trash. Questions 1. a. Discuss the ratio of baking powder to flour to make the fluffiest pancakes.
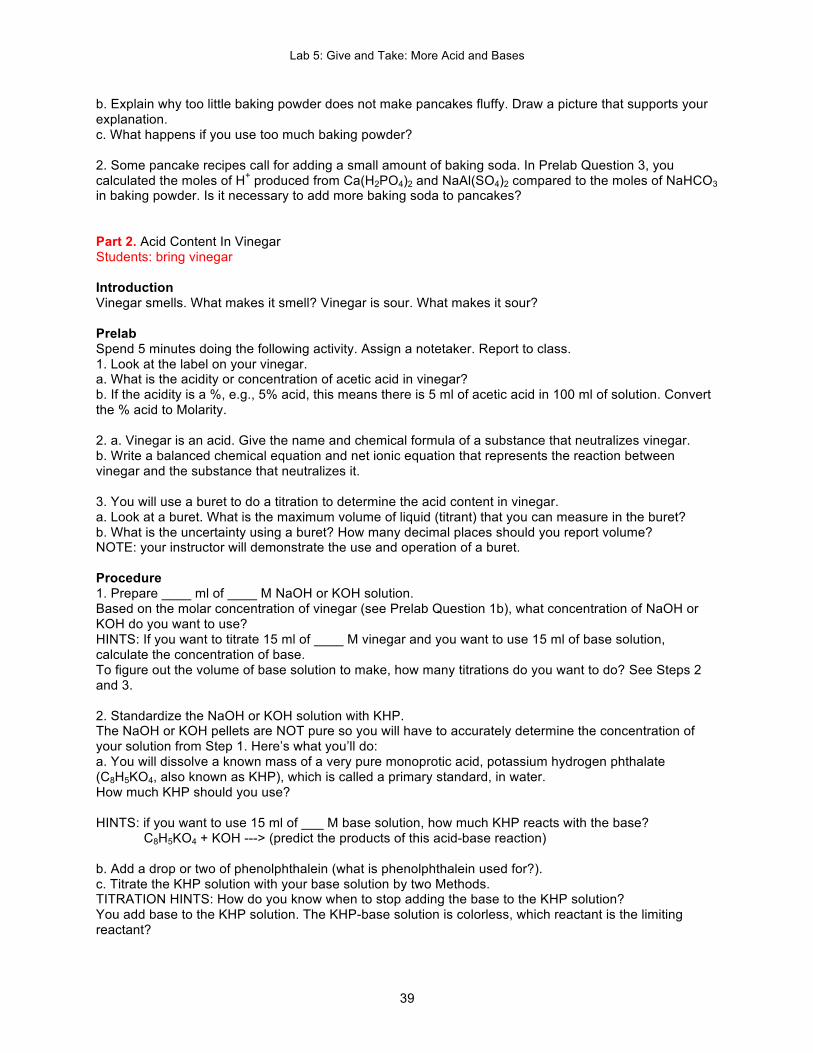
Lab 5: Give and Take: More Acid and Bases
39
b. Explain why too little baking powder does not make pancakes fluffy. Draw a picture that supports your explanation. c. What happens if you use too much baking powder? 2. Some pancake recipes call for adding a small amount of baking soda. In Prelab Question 3, you calculated the moles of H+ produced from Ca(H2PO4)2 and NaAl(SO4)2 compared to the moles of NaHCO3 in baking powder. Is it necessary to add more baking soda to pancakes? Part 2. Acid Content In Vinegar Students: bring vinegar Introduction Vinegar smells. What makes it smell? Vinegar is sour. What makes it sour? Prelab Spend 5 minutes doing the following activity. Assign a notetaker. Report to class. 1. Look at the label on your vinegar. a. What is the acidity or concentration of acetic acid in vinegar? b. If the acidity is a %, e.g., 5% acid, this means there is 5 ml of acetic acid in 100 ml of solution. Convert the % acid to Molarity. 2. a. Vinegar is an acid. Give the name and chemical formula of a substance that neutralizes vinegar. b. Write a balanced chemical equation and net ionic equation that represents the reaction between vinegar and the substance that neutralizes it. 3. You will use a buret to do a titration to determine the acid content in vinegar. a. Look at a buret. What is the maximum volume of liquid (titrant) that you can measure in the buret? b. What is the uncertainty using a buret? How many decimal places should you report volume? NOTE: your instructor will demonstrate the use and operation of a buret. Procedure 1. Prepare ____ ml of ____ M NaOH or KOH solution. Based on the molar concentration of vinegar (see Prelab Question 1b), what concentration of NaOH or KOH do you want to use? HINTS: If you want to titrate 15 ml of ____ M vinegar and you want to use 15 ml of base solution, calculate the concentration of base. To figure out the volume of base solution to make, how many titrations do you want to do? See Steps 2 and 3. 2. Standardize the NaOH or KOH solution with KHP. The NaOH or KOH pellets are NOT pure so you will have to accurately determine the concentration of your solution from Step 1. Here’s what you’ll do: a. You will dissolve a known mass of a very pure monoprotic acid, potassium hydrogen phthalate (C8H5KO4, also known as KHP), which is called a primary standard, in water. How much KHP should you use? HINTS: if you want to use 15 ml of ___ M base solution, how much KHP reacts with the base? C8H5KO4 + KOH ---> (predict the products of this acid-base reaction) b. Add a drop or two of phenolphthalein (what is phenolphthalein used for?). c. Titrate the KHP solution with your base solution by two Methods. TITRATION HINTS: How do you know when to stop adding the base to the KHP solution? You add base to the KHP solution. The KHP-base solution is colorless, which reactant is the limiting reactant?

Lab 5: Give and Take: More Acid and Bases
40
TWO METHODS: You do Method (i) and your lab partner do Method (ii). (i) Macroscale titration with buret: Fill the buret with your base solution and titrate (add) the base to the acidic KHP solution until you’ve neutralized all of the KHP. Record the volume of base you added in Table 3. (ii) Microscale titration with pipet: Calibrate the plastic pipet (dropper) from your locker. What quantity do you want to calibrate? Using your calibrated plastic pipet, add 5 drops of the vinegar to one well on the spot plate. Add ____ to the vinegar. Using your calibrated plastic dropper, titrate the KHP solution (this solution should be different than the KHP solution in Method (i)) until it turns ____. (Count the number of ____ of base that you added.) Record the volume of base you added in Table 3. d. Repeat your titration with you doing Method (ii) and your lab partner doing Method (i). e. Calculate the: (i) average base concentration by Method (i). (ii) average base concentration by Method (ii). (iii) average of (i) and (ii). (iv) % difference of (i) and (ii). HINT: this % difference should be ____. 3. Determine the acid content in vinegar. a. Titrate the vinegar with base. You do the Macroscale titration with buret and your lab partner do the Microscale titration with pipet. Does the vinegar go in the buret / pipet or in the beaker or flask? Does the base solution go in the buret / pipet or in the beaker or flask? What volume of vinegar should I use? How do you know when to stop adding base? Record your data and results in Table 3. b. Repeat your titration with you doing Method (ii) and your lab partner doing Method (i). Save your base solution until the end of Lab 5. Waste Disposal: neutralize acid and base solutions and dispose in sink. c. Calculate the: (i) average _____ concentration by Method (i). (ii) % error in concentration by Method (i). (What is the true concentration?) (iii) average _____ concentration by Method (ii). (iv) % error in concentration by Method (ii). (What is the true concentration?) (v) average of (i) and (ii). (vi) % _____ of (i) and (ii). HINT: this % ____ should be small, which means your measurements are precise.
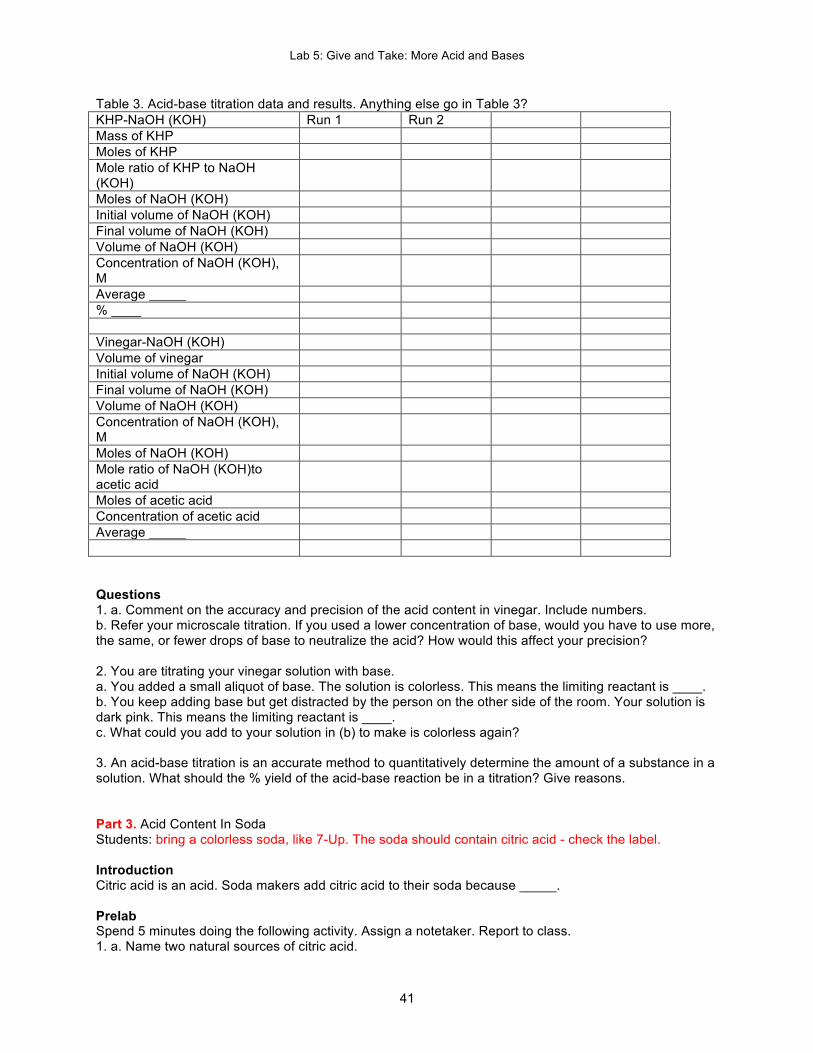
Lab 5: Give and Take: More Acid and Bases
41
Table 3. Acid-base titration data and results. Anything else go in Table 3? KHP-NaOH (KOH) Run 1 Run 2 Mass of KHP Moles of KHP Mole ratio of KHP to NaOH (KOH)
Moles of NaOH (KOH) Initial volume of NaOH (KOH) Final volume of NaOH (KOH) Volume of NaOH (KOH) Concentration of NaOH (KOH), M
Average _____ % ____ Vinegar-NaOH (KOH) Volume of vinegar Initial volume of NaOH (KOH) Final volume of NaOH (KOH) Volume of NaOH (KOH) Concentration of NaOH (KOH), M
Moles of NaOH (KOH) Mole ratio of NaOH (KOH)to acetic acid
Moles of acetic acid Concentration of acetic acid Average _____ Questions 1. a. Comment on the accuracy and precision of the acid content in vinegar. Include numbers. b. Refer your microscale titration. If you used a lower concentration of base, would you have to use more, the same, or fewer drops of base to neutralize the acid? How would this affect your precision? 2. You are titrating your vinegar solution with base. a. You added a small aliquot of base. The solution is colorless. This means the limiting reactant is ____. b. You keep adding base but get distracted by the person on the other side of the room. Your solution is dark pink. This means the limiting reactant is ____. c. What could you add to your solution in (b) to make is colorless again? 3. An acid-base titration is an accurate method to quantitatively determine the amount of a substance in a solution. What should the % yield of the acid-base reaction be in a titration? Give reasons. Part 3. Acid Content In Soda Students: bring a colorless soda, like 7-Up. The soda should contain citric acid - check the label. Introduction Citric acid is an acid. Soda makers add citric acid to their soda because _____. Prelab Spend 5 minutes doing the following activity. Assign a notetaker. Report to class. 1. a. Name two natural sources of citric acid.
Lab 5: Give and Take: More Acid and Bases
42
b. Look up the chemical formula of citric acid. Is citric acid a strong acid or weak acid? c. How many H+ does citric acid donate? In other words, is citric acid a monoprotic, diprotic, or triprotic acid? d. What substance neutralizes citric acid? Write a balanced chemical equation and net ionic equation that represents the reaction between citric acid and the substance that neutralizes it. 2. a. What are the bubbles in soda? b. You’ll do a titration to determine the acid content in soda. Should you titrate the soda with or without bubbles? Give reasons. 3. You will use a buret to do a titration to determine the acid content in soda. a. What is the uncertainty using a buret? How many decimal places should you report volume? NOTE: your instructor will demonstrate the use and operation of a buret. Procedure 0. Open your soda. Let it go flat. What is being removed from the soda when it goes flat? Is there a way to make soda go flat faster? (HINT: see a previous Chem 1A experiment.) 1. Prepare ____ ml of 0.1 M NaOH or KOH solution. To figure out the volume of base solution to make, how many titrations do you want to do? If you have leftover base solution from the Acid Content in Vinegar, you can d_____ this solution to 0.1 M. 2. Standardize the NaOH or KOH solution with KHP. The NaOH or KOH pellets are not pure so you will have to accurately determine the concentration of your solution from Step 1. Here’s what you’ll do: a. You will dissolve a known mass of a very pure acid, potassium hydrogen phthalate (C8H5KO4, also known as KHP), which is called a primary standard, in water. How much KHP should you use? HINT: if you want to use 15 ml of ___ M base solution, how much KHP reacts with the base? b. Add a drop or two of phenolphthalein (what is phenolphthalein used for?). c. Titrate the KHP solution with your base solution. Fill the buret with your base solution and add the base to the acidic KHP solution until you’ve neutralized all of the KHP. How do you know when to stop adding the base? Record your data and results in Table 4. 3. Determine the acid content in soda. Titrate the FLAT soda with base. Does the soda go in the buret or in the beaker or flask? Does the base solution go in the buret or in the beaker or flask? What volume of soda should I use? How do you know when to stop adding base? Record your data and results in Table 4. Save your base solution until the end of Lab 5. Waste Disposal: neutralize acid and base solutions and dispose in sink.
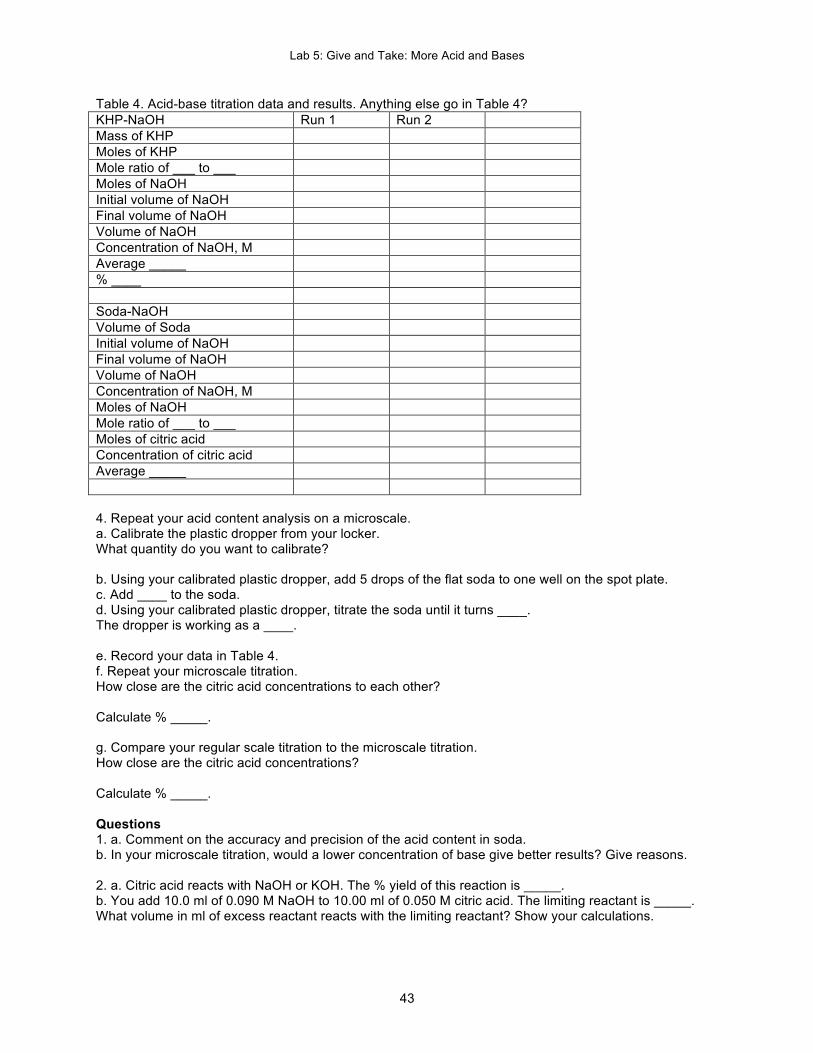
Lab 5: Give and Take: More Acid and Bases
43
Table 4. Acid-base titration data and results. Anything else go in Table 4? KHP-NaOH Run 1 Run 2 Mass of KHP Moles of KHP Mole ratio of ___ to ___ Moles of NaOH Initial volume of NaOH Final volume of NaOH Volume of NaOH Concentration of NaOH, M Average _____ % ____ Soda-NaOH Volume of Soda Initial volume of NaOH Final volume of NaOH Volume of NaOH Concentration of NaOH, M Moles of NaOH Mole ratio of ___ to ___ Moles of citric acid Concentration of citric acid Average _____ 4. Repeat your acid content analysis on a microscale. a. Calibrate the plastic dropper from your locker. What quantity do you want to calibrate? b. Using your calibrated plastic dropper, add 5 drops of the flat soda to one well on the spot plate. c. Add ____ to the soda. d. Using your calibrated plastic dropper, titrate the soda until it turns ____. The dropper is working as a ____. e. Record your data in Table 4. f. Repeat your microscale titration. How close are the citric acid concentrations to each other? Calculate % _____. g. Compare your regular scale titration to the microscale titration. How close are the citric acid concentrations? Calculate % _____. Questions 1. a. Comment on the accuracy and precision of the acid content in soda. b. In your microscale titration, would a lower concentration of base give better results? Give reasons. 2. a. Citric acid reacts with NaOH or KOH. The % yield of this reaction is _____. b. You add 10.0 ml of 0.090 M NaOH to 10.00 ml of 0.050 M citric acid. The limiting reactant is _____. What volume in ml of excess reactant reacts with the limiting reactant? Show your calculations.
Lab 5: Give and Take: More Acid and Bases
44
3. You may have heard that drinking soda or acid is bad for your teeth. The enamel on your teeth consists of the mineral hydroxyapatite, Ca10(PO4)6(OH)2. a. Is hydroxyapatite an acid or base? HINT: look at the ions in the chemical formula. b. Based on your answer to 3a, is acid good or bad for your teeth? Give reasons. c. How does flouride prevent cavities? HINT: Fluoride reacts with hydroxyapatite in a double replacement reaction. The product is fluorapatite, which does _____ with acid.

Lab 6: More Givers and Takers: Rust and Bleach
45
Lab 6. More Givers and Takers: Rust and Bleach How causes rust? What does bleach do? Objectives (i) Identify conditions that prevent iron oxidation. Calculate % iron that rusted. (ii) Compare halogen oxidizing strength and rank halogens by strength. Introduction You’ve seen rust. You’ve probably seen bleach spilled on a colored shirt. You may have used hydrogen peroxide on a cut to produce bubbles. These are examples of oxidation-reduction reactions. Oxidation is when a substance loses electrons (oxidized) whereas reduction is when a substance gains of electrons (reduced).
The terms oxidation and oxidizing agents and reduction and reducing agents can be confusing:
• Oxidizing agents are substances that oxidize another substance. If the other substance is being oxidized (loses electrons), that means the oxidizing agent is being reduced (gains electrons). When an oxidizing agent gains (accepts) an electron, the resulting substance is a reducing agent.
• Reducing agents are substances that reduce another substance. If the other substance is being reduced (gains electrons), that means the reducing agent is being oxidized (loses electrons). When a reducing agent loses (donates) an electron, the resulting substance is an oxidizing agent. Common oxidizing agents are bleach, hydrogen peroxide, metal ions, and non-metal elements. A
strong oxidizing agent easily gains electrons. A weak oxidizing agent does not easily gain electrons. Common reducing agents are metal elements, and non-metal ions. A strong reducing agent
easily _____ electrons. A weak reducing agent does not easily _____ electrons. Since oxidizing agents _____ electrons and reducing agents _____ electrons, an oxidizing agent
can react with a reducing agent in an oxidation-reduction reaction. This very common reaction is also called an electron transfer reaction. Oxidation-reduction reactions are similar to acid-base reactions in that something is donated (lost) and accepted (gained). Try to keep the terminology in oxidation-reduction reactions straight! Materials Problem 1 iron nails, Mg wire or strips, Zn wire or strips, Cu wire or strips 0.1 M solutions of HCl, Mg2+, Zn2+, and Cu2+ (e.g., nitrate or chloride or sulfate) bleach Students: bring a substance that works as a protective coating to prevent a nail from rusting, e.g., paint. Problem 2 solutions: chlorine water (bleach), bromine water, iodine water, and hexane 0.1 M NaCl, NaBr, NaI Problem 1 You notice that the iron nails in the fence you put up last year are rusted. You have a lot of nails left and don’t want to buy new nails. So you figure you can use your chemistry knowledge to do something to those nails to prevent them from rusting. How can you prevent rust from forming on an iron nail? There are several methods for corrosion protection (see Whitten et al., “General Chemistry”, 5th ed., Saunders, 1996, p. 795 or any general chemistry textbook):
1. allow a protective film, such as a metal oxide, to form naturally on the surface of the metal. 2. Galvanizing, or coating steel with zinc, a more active metal 3. Apply a protective coating, such as paint. 4. Connect the metal directly to a “sacrificial anode”, a piece of another metal that is more active
and is preferentially oxidized. 5. Plate the metal with a thin layer of a less easily oxidized metal.
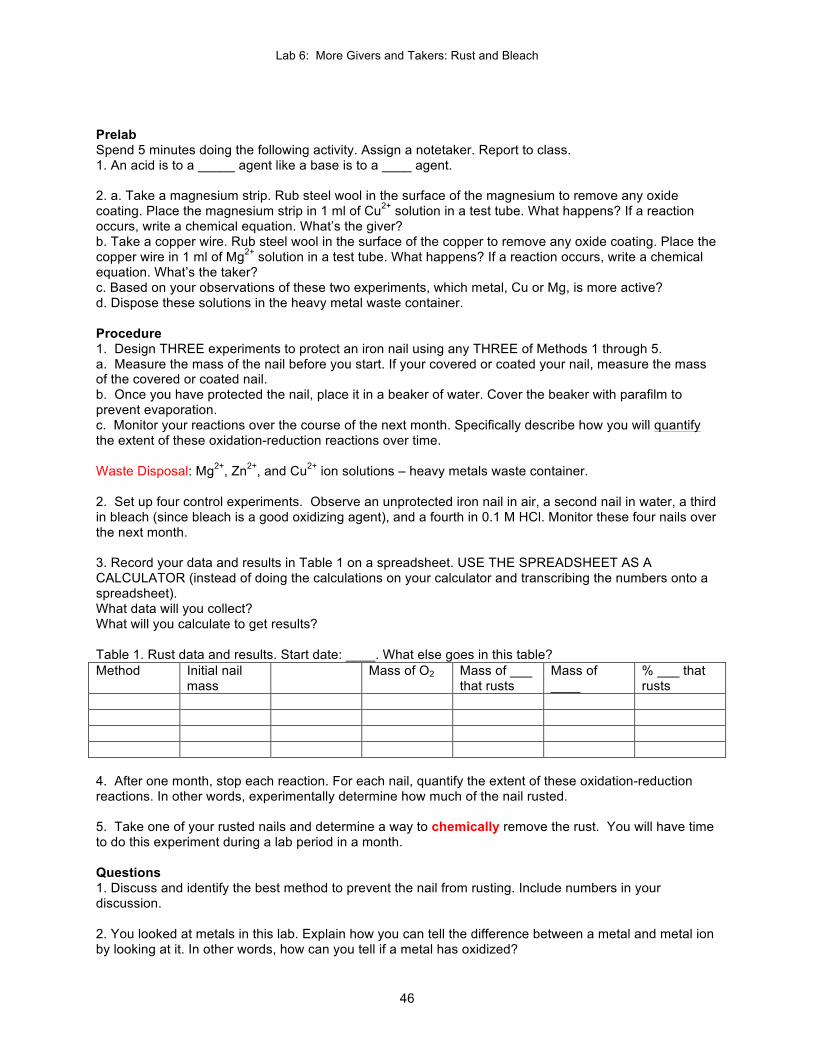
Lab 6: More Givers and Takers: Rust and Bleach
46
Prelab Spend 5 minutes doing the following activity. Assign a notetaker. Report to class. 1. An acid is to a _____ agent like a base is to a ____ agent. 2. a. Take a magnesium strip. Rub steel wool in the surface of the magnesium to remove any oxide coating. Place the magnesium strip in 1 ml of Cu2+ solution in a test tube. What happens? If a reaction occurs, write a chemical equation. What’s the giver? b. Take a copper wire. Rub steel wool in the surface of the copper to remove any oxide coating. Place the copper wire in 1 ml of Mg2+ solution in a test tube. What happens? If a reaction occurs, write a chemical equation. What’s the taker? c. Based on your observations of these two experiments, which metal, Cu or Mg, is more active? d. Dispose these solutions in the heavy metal waste container. Procedure 1. Design THREE experiments to protect an iron nail using any THREE of Methods 1 through 5. a. Measure the mass of the nail before you start. If your covered or coated your nail, measure the mass of the covered or coated nail. b. Once you have protected the nail, place it in a beaker of water. Cover the beaker with parafilm to prevent evaporation. c. Monitor your reactions over the course of the next month. Specifically describe how you will quantify the extent of these oxidation-reduction reactions over time. Waste Disposal: Mg2+, Zn2+, and Cu2+ ion solutions – heavy metals waste container. 2. Set up four control experiments. Observe an unprotected iron nail in air, a second nail in water, a third in bleach (since bleach is a good oxidizing agent), and a fourth in 0.1 M HCl. Monitor these four nails over the next month. 3. Record your data and results in Table 1 on a spreadsheet. USE THE SPREADSHEET AS A CALCULATOR (instead of doing the calculations on your calculator and transcribing the numbers onto a spreadsheet). What data will you collect? What will you calculate to get results? Table 1. Rust data and results. Start date: ____. What else goes in this table? Method Initial nail
mass Mass of O2 Mass of ___
that rusts Mass of ____
% ___ that rusts
4. After one month, stop each reaction. For each nail, quantify the extent of these oxidation-reduction reactions. In other words, experimentally determine how much of the nail rusted. 5. Take one of your rusted nails and determine a way to chemically remove the rust. You will have time to do this experiment during a lab period in a month. Questions 1. Discuss and identify the best method to prevent the nail from rusting. Include numbers in your discussion. 2. You looked at metals in this lab. Explain how you can tell the difference between a metal and metal ion by looking at it. In other words, how can you tell if a metal has oxidized?
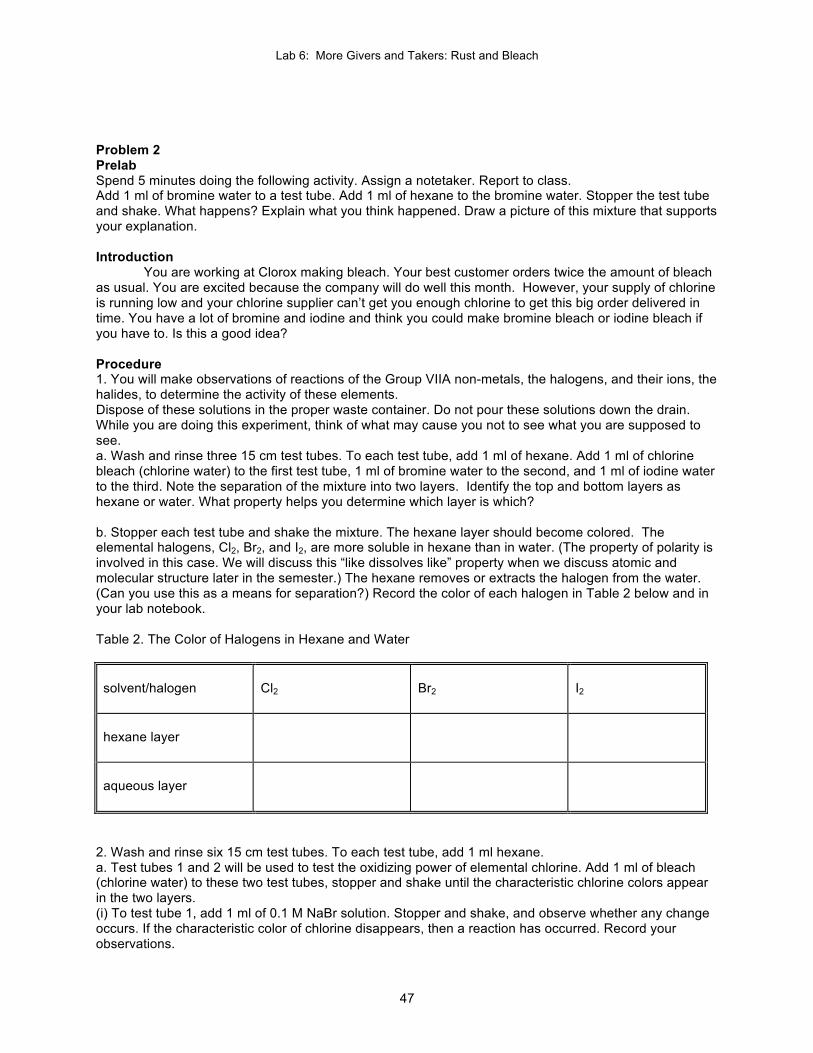
Lab 6: More Givers and Takers: Rust and Bleach
47
Problem 2 Prelab Spend 5 minutes doing the following activity. Assign a notetaker. Report to class. Add 1 ml of bromine water to a test tube. Add 1 ml of hexane to the bromine water. Stopper the test tube and shake. What happens? Explain what you think happened. Draw a picture of this mixture that supports your explanation. Introduction
You are working at Clorox making bleach. Your best customer orders twice the amount of bleach as usual. You are excited because the company will do well this month. However, your supply of chlorine is running low and your chlorine supplier can’t get you enough chlorine to get this big order delivered in time. You have a lot of bromine and iodine and think you could make bromine bleach or iodine bleach if you have to. Is this a good idea? Procedure 1. You will make observations of reactions of the Group VIIA non-metals, the halogens, and their ions, the halides, to determine the activity of these elements. Dispose of these solutions in the proper waste container. Do not pour these solutions down the drain. While you are doing this experiment, think of what may cause you not to see what you are supposed to see. a. Wash and rinse three 15 cm test tubes. To each test tube, add 1 ml of hexane. Add 1 ml of chlorine bleach (chlorine water) to the first test tube, 1 ml of bromine water to the second, and 1 ml of iodine water to the third. Note the separation of the mixture into two layers. Identify the top and bottom layers as hexane or water. What property helps you determine which layer is which? b. Stopper each test tube and shake the mixture. The hexane layer should become colored. The elemental halogens, Cl2, Br2, and I2, are more soluble in hexane than in water. (The property of polarity is involved in this case. We will discuss this “like dissolves like” property when we discuss atomic and molecular structure later in the semester.) The hexane removes or extracts the halogen from the water. (Can you use this as a means for separation?) Record the color of each halogen in Table 2 below and in your lab notebook. Table 2. The Color of Halogens in Hexane and Water
solvent/halogen
Cl2
Br2
I2
hexane layer
aqueous layer
2. Wash and rinse six 15 cm test tubes. To each test tube, add 1 ml hexane. a. Test tubes 1 and 2 will be used to test the oxidizing power of elemental chlorine. Add 1 ml of bleach (chlorine water) to these two test tubes, stopper and shake until the characteristic chlorine colors appear in the two layers. (i) To test tube 1, add 1 ml of 0.1 M NaBr solution. Stopper and shake, and observe whether any change occurs. If the characteristic color of chlorine disappears, then a reaction has occurred. Record your observations.
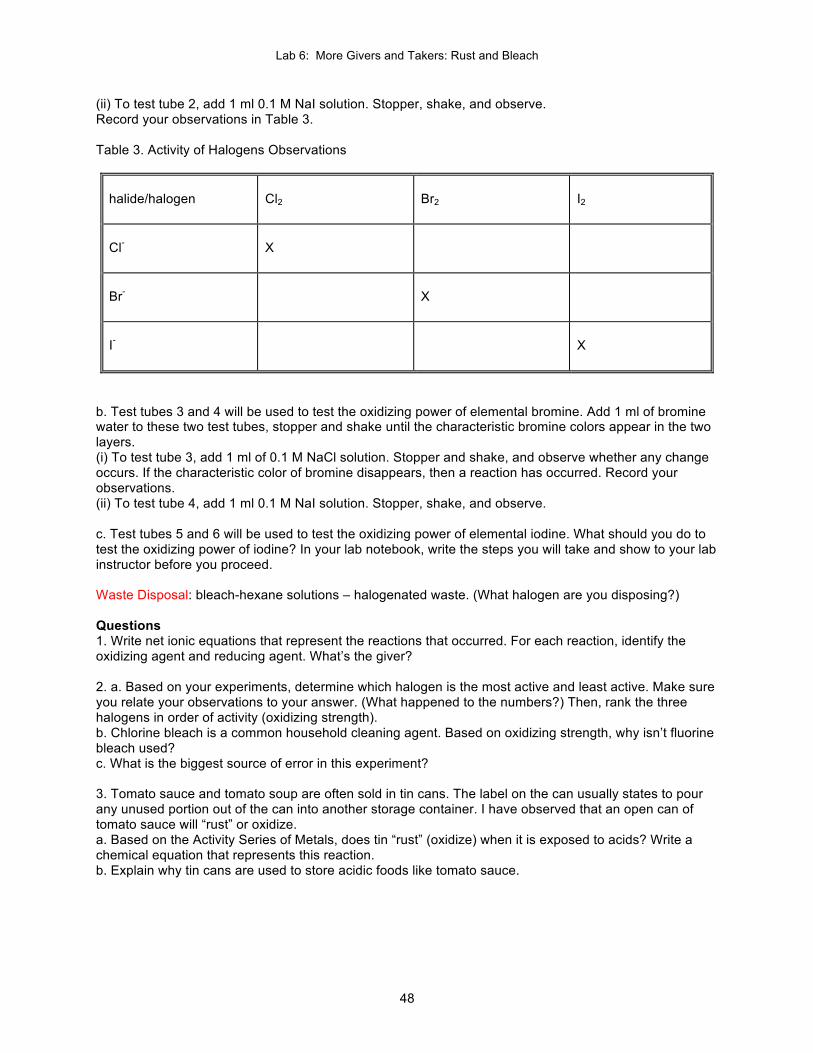
Lab 6: More Givers and Takers: Rust and Bleach
48
(ii) To test tube 2, add 1 ml 0.1 M NaI solution. Stopper, shake, and observe. Record your observations in Table 3. Table 3. Activity of Halogens Observations
halide/halogen
Cl2
Br2
I2
Cl-
X
Br-
X
I-
X
b. Test tubes 3 and 4 will be used to test the oxidizing power of elemental bromine. Add 1 ml of bromine water to these two test tubes, stopper and shake until the characteristic bromine colors appear in the two layers. (i) To test tube 3, add 1 ml of 0.1 M NaCl solution. Stopper and shake, and observe whether any change occurs. If the characteristic color of bromine disappears, then a reaction has occurred. Record your observations. (ii) To test tube 4, add 1 ml 0.1 M NaI solution. Stopper, shake, and observe. c. Test tubes 5 and 6 will be used to test the oxidizing power of elemental iodine. What should you do to test the oxidizing power of iodine? In your lab notebook, write the steps you will take and show to your lab instructor before you proceed. Waste Disposal: bleach-hexane solutions – halogenated waste. (What halogen are you disposing?) Questions 1. Write net ionic equations that represent the reactions that occurred. For each reaction, identify the oxidizing agent and reducing agent. What’s the giver? 2. a. Based on your experiments, determine which halogen is the most active and least active. Make sure you relate your observations to your answer. (What happened to the numbers?) Then, rank the three halogens in order of activity (oxidizing strength). b. Chlorine bleach is a common household cleaning agent. Based on oxidizing strength, why isn’t fluorine bleach used? c. What is the biggest source of error in this experiment? 3. Tomato sauce and tomato soup are often sold in tin cans. The label on the can usually states to pour any unused portion out of the can into another storage container. I have observed that an open can of tomato sauce will “rust” or oxidize. a. Based on the Activity Series of Metals, does tin “rust” (oxidize) when it is exposed to acids? Write a chemical equation that represents this reaction. b. Explain why tin cans are used to store acidic foods like tomato sauce.
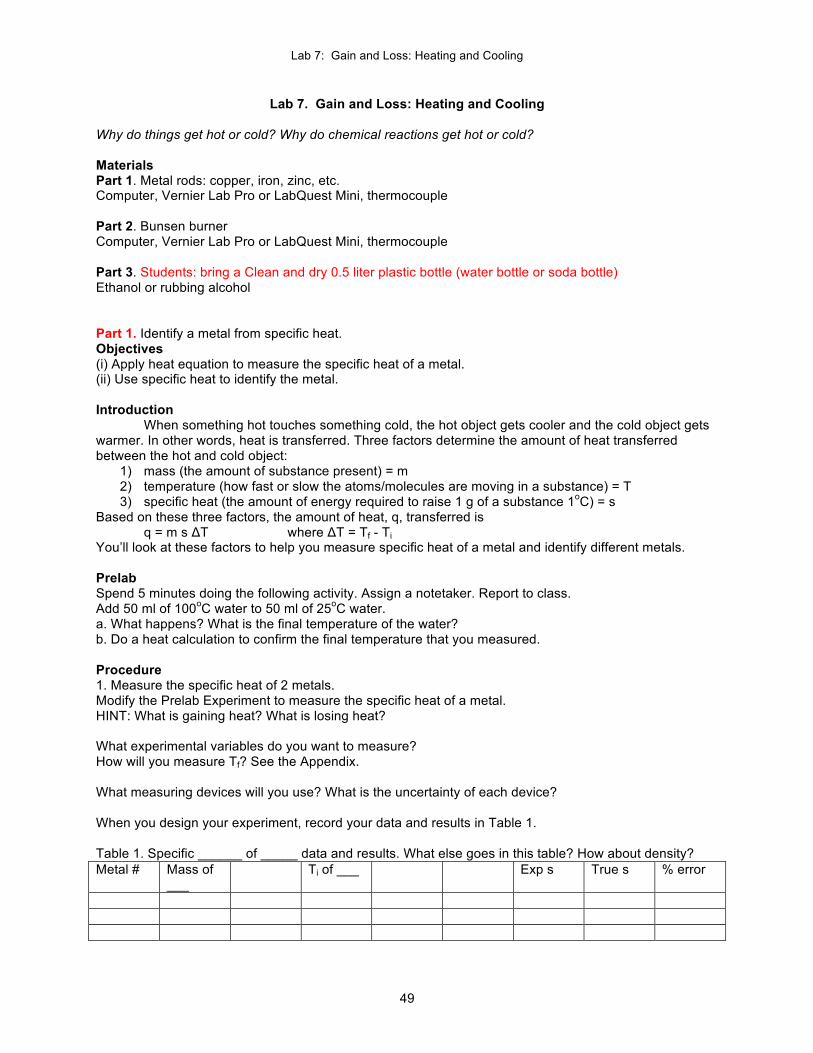
Lab 7: Gain and Loss: Heating and Cooling
49
Lab 7. Gain and Loss: Heating and Cooling Why do things get hot or cold? Why do chemical reactions get hot or cold? Materials Part 1. Metal rods: copper, iron, zinc, etc. Computer, Vernier Lab Pro or LabQuest Mini, thermocouple Part 2. Bunsen burner Computer, Vernier Lab Pro or LabQuest Mini, thermocouple Part 3. Students: bring a Clean and dry 0.5 liter plastic bottle (water bottle or soda bottle) Ethanol or rubbing alcohol Part 1. Identify a metal from specific heat. Objectives (i) Apply heat equation to measure the specific heat of a metal. (ii) Use specific heat to identify the metal. Introduction When something hot touches something cold, the hot object gets cooler and the cold object gets warmer. In other words, heat is transferred. Three factors determine the amount of heat transferred between the hot and cold object:
1) mass (the amount of substance present) = m 2) temperature (how fast or slow the atoms/molecules are moving in a substance) = T 3) specific heat (the amount of energy required to raise 1 g of a substance 1oC) = s
Based on these three factors, the amount of heat, q, transferred is q = m s ΔT where ΔT = Tf - Ti You’ll look at these factors to help you measure specific heat of a metal and identify different metals. Prelab Spend 5 minutes doing the following activity. Assign a notetaker. Report to class. Add 50 ml of 100oC water to 50 ml of 25oC water. a. What happens? What is the final temperature of the water? b. Do a heat calculation to confirm the final temperature that you measured. Procedure 1. Measure the specific heat of 2 metals. Modify the Prelab Experiment to measure the specific heat of a metal. HINT: What is gaining heat? What is losing heat? What experimental variables do you want to measure? How will you measure Tf? See the Appendix. What measuring devices will you use? What is the uncertainty of each device? When you design your experiment, record your data and results in Table 1. Table 1. Specific ______ of _____ data and results. What else goes in this table? How about density? Metal # Mass of
___ Ti of ___ Exp s True s % error
Lab 7: Gain and Loss: Heating and Cooling
50
2. Identify each metal. Check your identification with your instructor. Waste Disposal: water – in sink. Return the metals to the Stockroom. Report Your instructor will tell you whether your identification is correct or not. If you did not correctly identify the liquid, try again. Grading: A = 1st try, B = 2nd try, C = 3rd try. Question You may have set up your experiment exactly the same way for each metal. Compare the Tf you measured for each metal. Based on Tf, which metal gained/lost more heat? Which metal is the better conductor? Is conductivity related to specific heat?
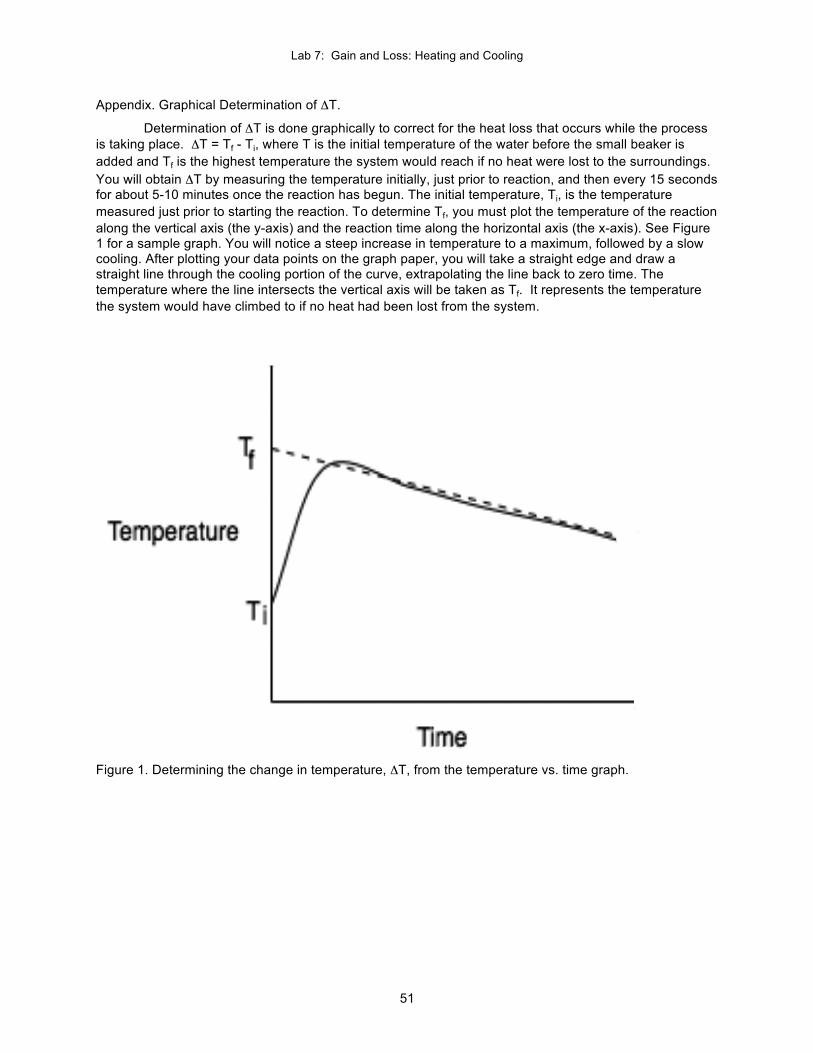
Lab 7: Gain and Loss: Heating and Cooling
51
Appendix. Graphical Determination of ΔT.
Determination of ΔT is done graphically to correct for the heat loss that occurs while the process is taking place. ΔT = Tf - Ti, where T is the initial temperature of the water before the small beaker is added and Tf is the highest temperature the system would reach if no heat were lost to the surroundings. You will obtain ΔT by measuring the temperature initially, just prior to reaction, and then every 15 seconds for about 5-10 minutes once the reaction has begun. The initial temperature, Ti, is the temperature measured just prior to starting the reaction. To determine Tf, you must plot the temperature of the reaction along the vertical axis (the y-axis) and the reaction time along the horizontal axis (the x-axis). See Figure 1 for a sample graph. You will notice a steep increase in temperature to a maximum, followed by a slow cooling. After plotting your data points on the graph paper, you will take a straight edge and draw a straight line through the cooling portion of the curve, extrapolating the line back to zero time. The temperature where the line intersects the vertical axis will be taken as Tf. It represents the temperature the system would have climbed to if no heat had been lost from the system.
Figure 1. Determining the change in temperature, ΔT, from the temperature vs. time graph.
Lab 7: Heating and Cooling, Design of a Hot Pack and Cold Pack
37
Appendix. Graphical Determination of !T.Determination of !T is done graphically to correct for the heat loss that occurs while the
process is taking place. !T = Tf - Ti, where T is the initial temperature of the water before the smallbeaker is added and Tf is the highest temperature the system would reach if no heat were lost to thesurroundings. You will obtain !T by measuring the temperature initially, just prior to reaction, andthen every 15 seconds for about 5-10 minutes once the reaction has begun. The initial temperature,Ti, is the temperature measured just prior to starting the reaction. To determine Tf, you must plot thetemperature of the reaction along the vertical axis (the y-axis) and the reaction time along thehorizontal axis (the x-axis). See Figure 1 for a sample graph. You will notice a steep increase intemperature to a maximum, followed by a slow cooling. After plotting your data points on the graphpaper, you will take a straight edge and draw a straight line through the cooling portion of the curve,extrapolating the line back to zero time. The temperature where the line intersects the vertical axis willbe taken as Tf. It represents the temperature the system would have climbed to if no heat had beenlost from the system.
Figure 1. Determining the change in temperature, !T, from the temperature vs. time graph.
Lab 7: Gain and Loss: Heating and Cooling
52
Part 2. Quest for Fire Objectives (i) Learn how a Bunsen burner works. (ii) Relate flame color to temperature and limiting/excess reactants. Introduction Humankind’s quest for fire has fascinated us since the dawn of time. The dancing flame gives us a lot of information. Prelab Spend 5 minutes doing the following activity. Assign a notetaker. Report to class. 1. A Bunsen burner uses natural gas as a fuel. Natural gas is methane, CH4. a. A fuel needs an oxidizer. What is the oxidizer in this reaction? Write a balanced chemical equation that represents the combustion of CH4. b. A combustion reaction is exothermic. Calcuate ΔH of this reaction. c. Draw a reaction energy diagram for the CH4 combustion reaction. Is the energies of the reactants higher or lower than the energies of the products? 2. Take a look at a Bunsen burner. a. Draw a picture of a Bunsen burner. Where does CH4 mix with O2? b. Where and how do you adjust the amount (flow) of gas that enters the burner? There are two adjustments. c. Where and how do you adjust the amount (flow) of oxygen that enters the burner? Procedure 1. Connect a Bunsen burner to the natural gas valve. Light the burner. Adjust the flame so it is blue and about 3 inches high. 2. Does the amount of oxygen affect how much energy is produced in this reaction? Record your data in Table 2. a. From the blue flame, turn the barrel of the burner clockwise to adjust the amount (flow) of oxygen that enters the burner until the flame turns yellow. What happened to the height of the flame? Which reactant is the limiting reactant? How hot is the flame? Your instructor will use a thermocouple to measure the temperature of the flame. b. Next, turn the barrel of the burner counterclockwise to adjust the amount (flow) of oxygen that enters the burner until the flame turns blue. What happened to the height of the flame? Which reactant is the limiting reactant? How hot is the flame? Your instructor will use a thermocouple to measure the temperature of the flame. c. Continue turning the barrel of the burner counterclockwise until the flame is yellow again. What happened to the height of the flame? Which reactant is the limiting reactant? How hot is the flame? Your instructor will use a thermocouple to measure the temperature of the flame.
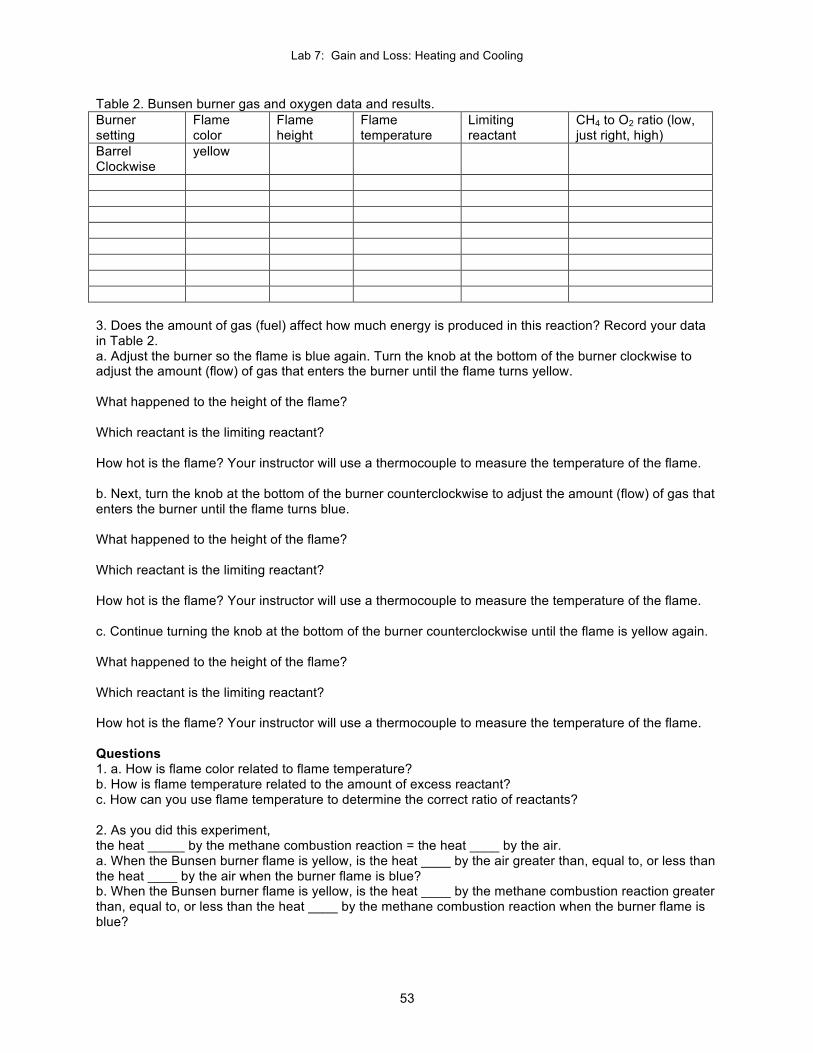
Lab 7: Gain and Loss: Heating and Cooling
53
Table 2. Bunsen burner gas and oxygen data and results. Burner setting
Flame color
Flame height
Flame temperature
Limiting reactant
CH4 to O2 ratio (low, just right, high)
Barrel Clockwise
yellow
3. Does the amount of gas (fuel) affect how much energy is produced in this reaction? Record your data in Table 2. a. Adjust the burner so the flame is blue again. Turn the knob at the bottom of the burner clockwise to adjust the amount (flow) of gas that enters the burner until the flame turns yellow. What happened to the height of the flame? Which reactant is the limiting reactant? How hot is the flame? Your instructor will use a thermocouple to measure the temperature of the flame. b. Next, turn the knob at the bottom of the burner counterclockwise to adjust the amount (flow) of gas that enters the burner until the flame turns blue. What happened to the height of the flame? Which reactant is the limiting reactant? How hot is the flame? Your instructor will use a thermocouple to measure the temperature of the flame. c. Continue turning the knob at the bottom of the burner counterclockwise until the flame is yellow again. What happened to the height of the flame? Which reactant is the limiting reactant? How hot is the flame? Your instructor will use a thermocouple to measure the temperature of the flame. Questions 1. a. How is flame color related to flame temperature? b. How is flame temperature related to the amount of excess reactant? c. How can you use flame temperature to determine the correct ratio of reactants? 2. As you did this experiment, the heat _____ by the methane combustion reaction = the heat ____ by the air. a. When the Bunsen burner flame is yellow, is the heat ____ by the air greater than, equal to, or less than the heat ____ by the air when the burner flame is blue? b. When the Bunsen burner flame is yellow, is the heat ____ by the methane combustion reaction greater than, equal to, or less than the heat ____ by the methane combustion reaction when the burner flame is blue?
Lab 7: Gain and Loss: Heating and Cooling
54
c. ΔH = q. If your answer to 2b is greater than or less than, does it mean that ΔH for the methane combustion changes? Give reasons. 3. You light a candle. The flame is _____. a. The fuel is ____. b. The energy of the fuel is _____ (higher/lower/same) as the energy of the products. c. The limiting reactant is _____. d. How do you think you can make a candle flame blue, like a Bunsen burner? 4. a. You have a gas (CH4) stove at home. What color should the flame be? b. You light a butane (C4H10) lighter. The flame is yellow. (i) What should be the O2 to butane ratio by mass? (ii) What does the flame color tell you? More Practice: Some cars, e.g., Honda Civic GX, run on natural gas. a. Calculate the O2 to fuel ratio by mass. b. Since the source of O2 is air and air is 20% O2 and 80% N2 by moles, calculate the air to fuel ratio by mass. c. Most cars run on octane (C8H18). The air:fuel ratio is approximately 16:1. Do a calculation to confirm this ratio. Part 3. Flex Fuel Students: bring a Clean and dry 0.5 liter plastic bottle (water bottle or soda bottle) Objectives (i) Compare combustion of a liquid fuel to gaseous fuel. (ii) Measure % yield of combustion reaction. Introduction With our quest for fire came the desire to do something with the fire. What can we do with fire? Prelab Spend 5 minutes doing the following activity. Assign a notetaker. Report to class. 1. Ethanol, C2H5OH, is a fuel. It is also used for other purposes. a. A fuel needs an oxidizer. What is the oxidizer in this reaction? Write a balanced chemical equation that represents the combustion of C2H5OH. b. Is this reaction exothermic or endothermic? Calcuate ΔH to support your answer. 2. Isopropanol, C3H7OH, is a fuel. It is also called rubbing alcohol and used as a disinfectant. a. Write a balanced chemical equation that represents the combustion of C3H7OH. b. Is this reaction exothermic or endothermic? Calcuate ΔH to support your answer. c. For this reaction, are the reactants more stable or less stable than the products? Procedure 1. How does liquid alcohol burn? (You did an ignition test with ethanol in an eariler Chem 1A lab.) Which alcohol are you using? Pour about 1 ml of liquid alcohol on the lab bench. Using a match or wooden splint, light the alcohol on fire. What color is the flame? Is this reaction exothermic or endothermic? How can you tell?
Lab 7: Gain and Loss: Heating and Cooling
55
Is this reaction fast or slow? How can you tell? Is the speed of this reaction fast enough to run a car engine? 2. How does gaseous alcohol burn? a. Measure the mass of your clean and dry 0.5 liter plastic bottle. b. Add fuel. Add about 5 drops of alcohol to the bottle. Measure the mass of the bottle and alcohol. Record your data in Table 3. c. Cap the bottle and shake it. Turn it upside down. Hold the bottle in your hands and let your warm hands vaporize the alcohol. Make sure all of the alcohol has evaporated! How can you tell all of the alcohol has evaporated? d. Ignition. Remove the cap. Light a splint. Carefully, place the burning splint over the top of the open bottle. Keep your hair and face and body parts away from the mouth of the bottle. What happened? What color is the flame? Is this reaction exothermic or endothermic? How can you tell? Is this reaction fast or slow compared to the liquid alcohol? Is the speed of this reaction fast enough to run a car engine (or rocket)? Table 3. Alcohol combustion data and results. Anything else go in this table? Alcohol = ______ Run 1 Run 2 Mass of bottle Mass of bottle + alcohol Mass of ___ Flame color Is reaction exothermic or endothermic?
Is reaction fast or slow? Mass of bottle + liquid after burning Mass of liquid Identify of liquid Moles of alcohol that burned (theory)
Moles of water produced (theory) Theoretical yield of water % yield of water Volume of bottle Moles of air Moles of O2 Alcohol to O2 ratio (low, just right, high)
Limiting reactant e. Cap the bottle again. Let the bottle and contents inside the bottle cool to room temperature.
Lab 7: Gain and Loss: Heating and Cooling
56
Do you see a liquid inside the bottle? What is this liquid? Where did it come from? Remove the cap. Measure the mass of this liquid. Record your data in Table 3. f. Based on the mass of alcohol that you used, calculate the theoretical yield of water. Then, calculate the % yield of water. 3. Can you make it burn better? a. Determine the limiting reactant. Air is 20% O2. Calculate the moles of air in the bottle from the ideal gas law, PV = nRT. Given: P = 1 atm, V = ____ liters, R = 0.082 l atm/mole K, T = ____ K. Solve for n = moles of air. Once you know the moles of air, multiple by ____ to calculate the moles of O2. Compare the moles of alcohol to the moles of O2. Is this ratio too low, just right, or too high? Give reasons. What is the limiting reactant? b. Based on your answer to 3a, make any adjustments in the amount of alcohol used and do Step 2 again. Waste Disposal: Ethanol, isopropanol – in sink. Plastic bottles – in trash. Questions 1. a. (i) Which burned better, liquid alcohol or gaseous alcohol? (ii) Why do you think one burned better than the other? (iii) Is liquid alcohol more stable, less stable, or the same stability as gaseous alcohol? Give reasons based on ΔHf. b. Compare your Run 1 to Run 2. Was there a difference in how the alcohol burned? 2. a. (i) Based on your data in Table 3, what reactant is the limiting reactant? (ii) What reactant should be the limiting reactant? Give reasons. b. Based on the limiting reactant for Run 1, (i) calculate the moles of alcohol that burned. (ii) Then, calculate q for this reaction. c. Based on the limiting reactant for Run 2, (i) calculate the moles of alcohol that burned. (ii) Then, calculate q for this reaction. d. Compare b(ii) to c(ii). Which reaction would you use in a rocket engine? Why? 3. Was your % yield of water 100%. If not, identify a specific step in the experimental procedure that could have lowered the yield. 4. Name 2 useful applications of burning alcohol in a bottle.

Lab 7: Gain and Loss: Heating and Cooling
57
Part 4. Hot Packs and Cold Packs Objectives (i) Choose an ionic compound to use in a hot pack and cold pack. (ii) Make a hot pack and cold pack. (iii) Identify the factors that make the best hot/cold pack. Introduction
While you were driving to school with the steering wheel in one hand and a cup of coffee in the other, you hit a pothole and spill some hot coffee on your hand. (What water temperature will burn your tongue (or skin)?) You wish you had some ice. Since ice melts unless refrigerated, another source of something cold is a chemical reaction. You will apply your knowledge of thermochemistry to design a cold pack. While you’re at it, you figure you might as well design a hot pack.
In hot packs and cold packs, a solid ionic salt is separated from water by some sort of barrier in a small plastic bag. To use the bag, the barrier is broken and mixes the salt and water together. This dissolution reaction either ______ heat (hot pack) or ______ heat (cold pack). Materials ionic salts: NaCl, LiCl, NH4Cl, NH4NO3, KNO3, NaNO3, CaCl2, MgSO4, CaSO4, ... Styrofoam cup or beaker or flask and cardboard lid Computer, Vernier LabPro or LabQuest Mini, temperature probe Prelab Spend 5 minutes doing the following activity. Assign a notetaker. Report to class. 1. a. Add some water to a beaker or test tube. Add NaCl to the water. What happens? How would you make a hot/cold pack out of these materials? b. Would you use an exothermic reaction or endothermic reaction for a hot pack? c. In a hot pack, what is gaining heat? What is losing heat? 2. a. Read the Plan below. b. When dissolved in water, NaCl dissociates into its ions. (i) Calculate or look up ΔH of dissolution for each salt in the Materials section. (ii) Based on ΔH, determine whether the salt can be used in a hot pack or cold pack. (iii) Calculate the mass of salt that raises or lowers the temperature of water based on the design considerations in the Plan. (iv) Look up the cost of the mass of each salt you calculated in Step 2b(iii) in a chemical supplier catalog, e.g., Sigma-Aldrich. (v) If the hot/cold pack breaks and spills in the user, there could be a safety problem. Look up the MSDS or NFPA Rating of each compound. Determine the safety of each compound. Record your information in Table 4. Table 4. Hot and Cold Pack data. Ionic Compound
ΔHreaction, kJ/mole
Hot pack or cold pack?
Mass to use in hot/cold pack
Cost/pack, $
Solubility in 100 g H2O
Safety (NFPA Ratings)
NaCl Procedure 1. Design a hot pack and cold pack. Refer to the design considerations in the Plan. Plan Your group will design a hot pack and cold pack using these design specifications and considerations: (i) Your hot pack must be at a temperature of 40oC for 10 minutes. Your cold pack must be at a temperature of 0oC for 10 minutes. Record temperature and time data using a Vernier temperature probe.
Lab 7: Gain and Loss: Heating and Cooling
58
(ii) Since your pack is portable, you want it to be relatively small. Use a maximum of 25 ml of water. Based on the heat of dissolution of the ionic salt in 25 ml of water, calculate the mass of ionic salt that you need to raise or lower the temperature to the design specification. (iii) Try two different salts for each pack. Check the price of each salt. See a chemical catalog for prices. LIMIT: 2 runs per salt. Make sure you plan before you start you start this experiment. (iv) If the pack breaks and spills on the user, what will be the effect of this salt on the user? Look up safety information on the salts. a. Fill in Table 4 for each salt in the Materials section. b. Based on ____________, choose TWO salts to test for a hot pack and two salts to test for a cold pack. Identify the criteria you used to make this choice. 2. a. Do an experiment to test the performance (see Design Specifications) of the salts you choose in Step 1b. Add additional columns or rows to your Table 4 to show the data you collected and results you calculated. b. Based on ____________, which salt would you use for the hot pack? Identify the criteria you used to make this choice. c. Based on ____________, which salt would you use for cold hot pack? Identify the criteria you used to make this choice. Waste Disposal: hot/cold pack ionic solutions – in sink. (None of the metals are heavy metals.) Questions 1. Prepare a 5 minute presentation of your data and results to your lab class. a. Show your Table 4. b. Compare the two salts you tested for the hot pack. Which salt did you choose and why? Include numbers! c. Compare the two salts you tested for the cold pack. Which salt did you choose and why? Include numbers! 2. You calculated ΔH of dissolution for various ionic compounds using Hess’ law. a. For a hot pack, are the reactants more stable or less stable than the products? b. For a cold pack, are the reactants more stable or less stable than the products? c. How do the stabilities of reactants compared to products determine whether a reaction is exothermic or endothermic?
Lab 8: Let There Be Light! (and Matter)
59
Lab 8. Let There Be Light! (and Matter) What causes color? Do my sunglasses protect my eyes from UV light? Does my sunscreen protect my skin from UV light? Materials Part 1. UV-VIS spectrophotometer gas spectrum tubes (hydrogen, helium, argon, bromine, chlorine, iodine, mercury, neon) light bulb Spectroscopes and power supplies Pickles Part 2A. UV-VIS spectrophotometer Students: bring a pair of sunglasses. Your group should have at least two different sunglasses. Students: bring your favorite sunscreen. Your group should have at least two sunscreens with different SPFs. Part 2B. UV-VIS spectrophotometer Students: bring a colored food or plant, e.g., colored hard candy, red cabbage, grape juice, grass, blueberries Food coloring test tubes volume measuring devices (pipet or graduated cylinders) ethanol hexane Introduction: A Brief History of Color and Atomic Structure In a fireworks show, you see a variety of colors from the different fireworks. It turns out that certain substances produce specific colors. For example, sodium salts produce yellow, strontium salts produce red, barium salts produce green, and copper salts produces blue. Why do these elements produce different colors? In the 1850’s, Kirchoff and Bunsen (of Bunsen burner fame) observed that when light is shone through a heated gas emanating from one particular element of the Periodic Table, analysis of the emerging light revealed distinctive lines peculiar only to that element. They analyzed this light using a spectroscope to obtain an emission line spectrum. (Substances that emit light of all frequencies of its spectrum give a continuous spectrum.) A spectroscope contains a diffraction grating that disperses the light into its component colors. A few years later, they pointed their spectroscope in the direction of a fire in Manheim, Germany and were amazed to observe that the resulting light from the distant fire revealed the lines of barium and strontium. Note that they used a line spectrum to identify a substance. Next, they pointed their spectroscope at the sun and other stars to learn their composition. Kirchoff and Bunsen concluded that stars consist of the same elements as on earth. The key to their conclusion is the nature of color. Their work was one of the first pieces of the puzzle that led to the elucidation of the structure of the atom. In the early 1900’s, Planck investigated black body radiation. He observed that an atom that is heated emits radiation. Based on his observations, he assumed, incredibly, a minimum quantity of energy is emitted at any given time. He called this minimum quantity, or small bundle, of energy a quantum and said that the energy of a quantum is related to the frequency of the light emitted. Einstein, from his photoelectric effect observations, showed that these bundles of light, which he called photons, travel through space and related the energy of the photon to the wavelength by which it is propagated. These observations showed that light has a dual nature - it appears to behave like a wave (it has a frequency and wavelength) or a particle (photon). As you know, an atom consists of a nucleus and electrons. In the 1900’s, the structure of the atom was not known although there were many theories. Lord Kelvin in 1902 proposed that the structure of an atom was a homogeneous sphere of positive charge with electrons embedded in this sphere (like raisins in a cup of Jell-O). In 1910, Rutherford tested this model by directing a beam of alpha particles at a gold foil. His experiments showed most of the alpha particles passed through the gold foil and some were deflected. However, a few of the particles were deflected backwards. He concluded that the nucleus
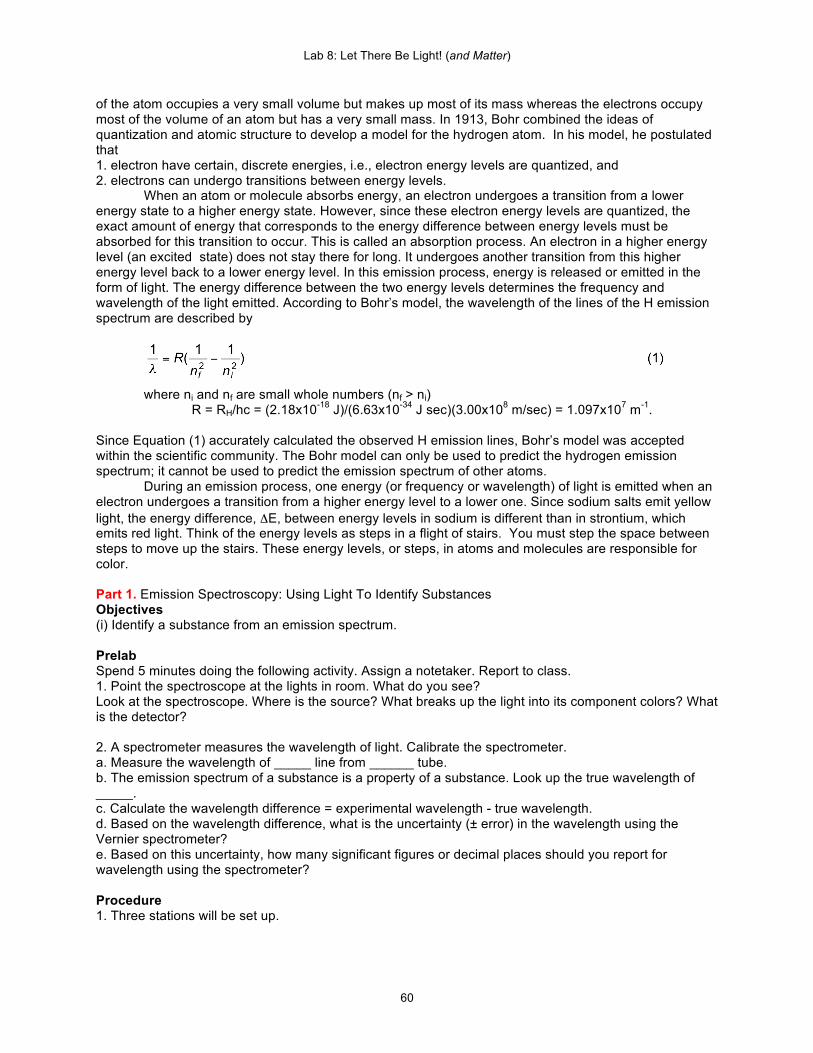
Lab 8: Let There Be Light! (and Matter)
60
of the atom occupies a very small volume but makes up most of its mass whereas the electrons occupy most of the volume of an atom but has a very small mass. In 1913, Bohr combined the ideas of quantization and atomic structure to develop a model for the hydrogen atom. In his model, he postulated that 1. electron have certain, discrete energies, i.e., electron energy levels are quantized, and 2. electrons can undergo transitions between energy levels.
When an atom or molecule absorbs energy, an electron undergoes a transition from a lower energy state to a higher energy state. However, since these electron energy levels are quantized, the exact amount of energy that corresponds to the energy difference between energy levels must be absorbed for this transition to occur. This is called an absorption process. An electron in a higher energy level (an excited state) does not stay there for long. It undergoes another transition from this higher energy level back to a lower energy level. In this emission process, energy is released or emitted in the form of light. The energy difference between the two energy levels determines the frequency and wavelength of the light emitted. According to Bohr’s model, the wavelength of the lines of the H emission spectrum are described by where ni and nf are small whole numbers (nf > ni) R = RH/hc = (2.18x10⁻¹⁸ J)/(6.63x10-34 J sec)(3.00x10⁸ m/sec) = 1.097x10⁷ m-1. Since Equation (1) accurately calculated the observed H emission lines, Bohr’s model was accepted within the scientific community. The Bohr model can only be used to predict the hydrogen emission spectrum; it cannot be used to predict the emission spectrum of other atoms.
During an emission process, one energy (or frequency or wavelength) of light is emitted when an electron undergoes a transition from a higher energy level to a lower one. Since sodium salts emit yellow light, the energy difference, ΔE, between energy levels in sodium is different than in strontium, which emits red light. Think of the energy levels as steps in a flight of stairs. You must step the space between steps to move up the stairs. These energy levels, or steps, in atoms and molecules are responsible for color. Part 1. Emission Spectroscopy: Using Light To Identify Substances Objectives (i) Identify a substance from an emission spectrum. Prelab Spend 5 minutes doing the following activity. Assign a notetaker. Report to class. 1. Point the spectroscope at the lights in room. What do you see? Look at the spectroscope. Where is the source? What breaks up the light into its component colors? What is the detector? 2. A spectrometer measures the wavelength of light. Calibrate the spectrometer. a. Measure the wavelength of _____ line from ______ tube. b. The emission spectrum of a substance is a property of a substance. Look up the true wavelength of _____. c. Calculate the wavelength difference = experimental wavelength - true wavelength. d. Based on the wavelength difference, what is the uncertainty (± error) in the wavelength using the Vernier spectrometer? e. Based on this uncertainty, how many significant figures or decimal places should you report for wavelength using the spectrometer? Procedure 1. Three stations will be set up.

Lab 8: Let There Be Light! (and Matter)
61
Station Source 1 a. Solid source - light bulb with W
filament b. Unknown A
2 a. Gas source – Ne b. Unknown B
3 Hydrogen gas source At each station, use the spectroscope and the spectrophotometer connected to the computer to do the following: a. determine whether the emission spectrum is a continuous spectrum or line spectrum. b. For the line spectra, count the number of lines that you see. Record the intensity of each line - whether it is bright (tall line) or faint (short line). c. Record the color and wavelength of each line that you see. Use at least three significant figures for the wavelength. 2. a. For the hydrogen emission, record your observed wavelengths and colors in Table 1 as a spreadsheet. USE THE SPREADSHEET AS A CALCULATOR (instead of doing the calculations on your calculator and transcribing the numbers onto a spreadsheet). b. Use algebra to rearrange Equation (1) so 1/λR is on the left side of the equation. For each line you observed, calculate 1/λR. c. Determine the values for nf and ni. Check your nf and ni, values by calculating (1/nf
2 – 1/ni2).
d. Calculate ΔE. e. Draw an energy level diagram of the H atom. (The y axis is the energy scale in J.) Use an arrow to show the electronic transition from one energy state to another. Show ΔE of each transition. Table 1. Hydrogen Emission Spectrum Data and Calculations
Observed Wavelength, nm
Observed Color
1 λR
nf ni ΔE, J
Questions 1. Show your energy level diagram of the H atom. 2. a. Describe how light is produced. Draw a picture that supports your description b. The neon gas source showed many lines in its emission spectrum. Why does neon appear red? c. How is an emission spectrum of a substance like a fingerprint? 3. A sentence in the last paragraph of the Introduction states, “Think of the energy levels as steps in a flight of stairs.” a. How do energy levels as a flight of stairs produce a line spectrum? b. If a flight of stairs corresponds to a line spectrum, a ____ corresponds to a continuous spectrum. Problem 1. Identify substances from emission spectra. Procedure 1. Measure the emission spectrum of Unknown A and Unknown B.
)11(22if nn
−
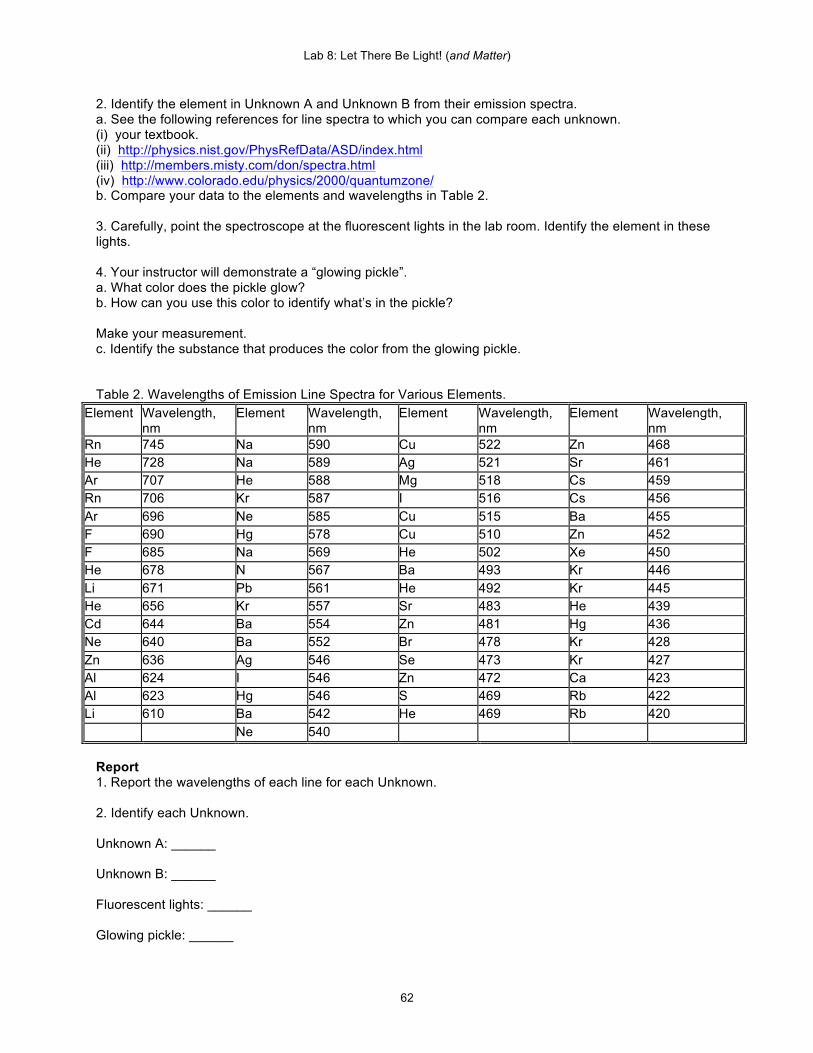
Lab 8: Let There Be Light! (and Matter)
62
2. Identify the element in Unknown A and Unknown B from their emission spectra. a. See the following references for line spectra to which you can compare each unknown. (i) your textbook. (ii) http://physics.nist.gov/PhysRefData/ASD/index.html (iii) http://members.misty.com/don/spectra.html (iv) http://www.colorado.edu/physics/2000/quantumzone/ b. Compare your data to the elements and wavelengths in Table 2. 3. Carefully, point the spectroscope at the fluorescent lights in the lab room. Identify the element in these lights. 4. Your instructor will demonstrate a “glowing pickle”. a. What color does the pickle glow? b. How can you use this color to identify what’s in the pickle? Make your measurement. c. Identify the substance that produces the color from the glowing pickle. Table 2. Wavelengths of Emission Line Spectra for Various Elements.
Element Wavelength, nm
Element Wavelength, nm
Element Wavelength, nm
Element Wavelength, nm
Rn 745 Na 590 Cu 522 Zn 468 He 728 Na 589 Ag 521 Sr 461 Ar 707 He 588 Mg 518 Cs 459 Rn 706 Kr 587 I 516 Cs 456 Ar 696 Ne 585 Cu 515 Ba 455 F 690 Hg 578 Cu 510 Zn 452 F 685 Na 569 He 502 Xe 450 He 678 N 567 Ba 493 Kr 446 Li 671 Pb 561 He 492 Kr 445 He 656 Kr 557 Sr 483 He 439 Cd 644 Ba 554 Zn 481 Hg 436 Ne 640 Ba 552 Br 478 Kr 428 Zn 636 Ag 546 Se 473 Kr 427 Al 624 I 546 Zn 472 Ca 423 Al 623 Hg 546 S 469 Rb 422 Li 610 Ba 542 He 469 Rb 420 Ne 540
Report 1. Report the wavelengths of each line for each Unknown. 2. Identify each Unknown. Unknown A: ______ Unknown B: ______ Fluorescent lights: ______ Glowing pickle: ______
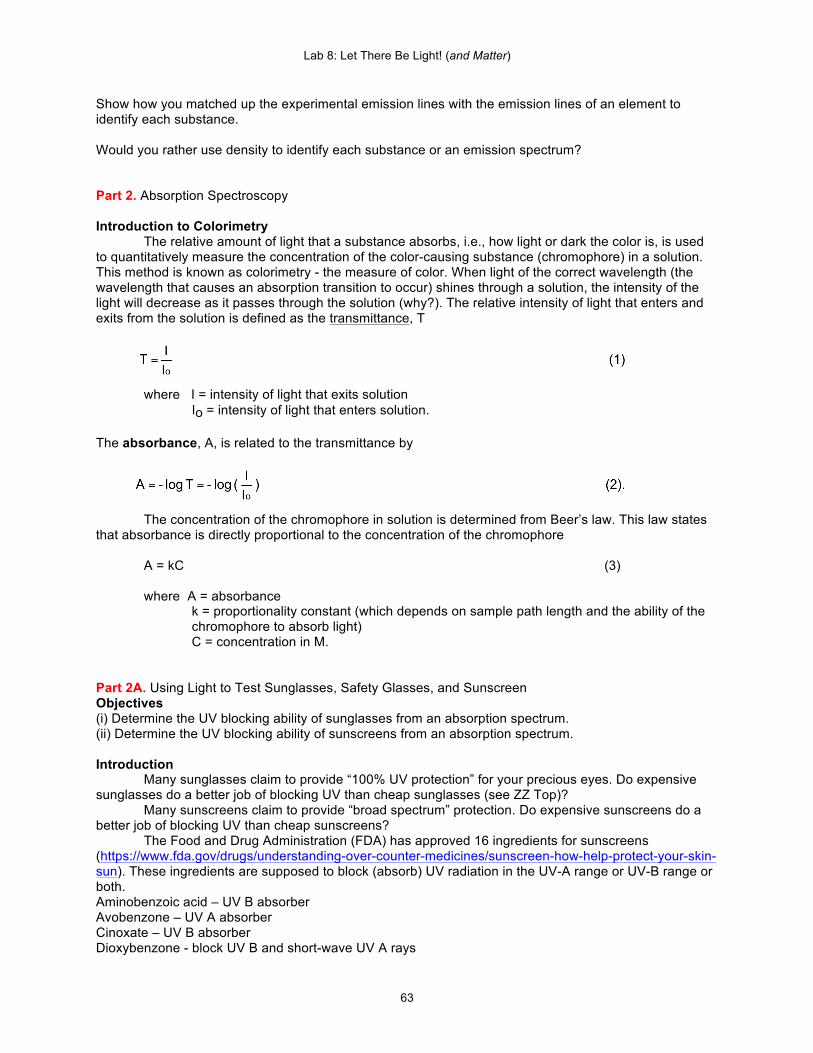
Lab 8: Let There Be Light! (and Matter)
63
Show how you matched up the experimental emission lines with the emission lines of an element to identify each substance. Would you rather use density to identify each substance or an emission spectrum? Part 2. Absorption Spectroscopy Introduction to Colorimetry The relative amount of light that a substance absorbs, i.e., how light or dark the color is, is used to quantitatively measure the concentration of the color-causing substance (chromophore) in a solution. This method is known as colorimetry - the measure of color. When light of the correct wavelength (the wavelength that causes an absorption transition to occur) shines through a solution, the intensity of the light will decrease as it passes through the solution (why?). The relative intensity of light that enters and exits from the solution is defined as the transmittance, T where I = intensity of light that exits solution Io = intensity of light that enters solution. The absorbance, A, is related to the transmittance by The concentration of the chromophore in solution is determined from Beer’s law. This law states that absorbance is directly proportional to the concentration of the chromophore A = kC (3) where A = absorbance
k = proportionality constant (which depends on sample path length and the ability of the chromophore to absorb light)
C = concentration in M. Part 2A. Using Light to Test Sunglasses, Safety Glasses, and Sunscreen Objectives (i) Determine the UV blocking ability of sunglasses from an absorption spectrum. (ii) Determine the UV blocking ability of sunscreens from an absorption spectrum. Introduction
Many sunglasses claim to provide “100% UV protection” for your precious eyes. Do expensive sunglasses do a better job of blocking UV than cheap sunglasses (see ZZ Top)?
Many sunscreens claim to provide “broad spectrum” protection. Do expensive sunscreens do a better job of blocking UV than cheap sunscreens?
The Food and Drug Administration (FDA) has approved 16 ingredients for sunscreens (https://www.fda.gov/drugs/understanding-over-counter-medicines/sunscreen-how-help-protect-your-skin-sun). These ingredients are supposed to block (absorb) UV radiation in the UV-A range or UV-B range or both. Aminobenzoic acid – UV B absorber Avobenzone – UV A absorber Cinoxate – UV B absorber Dioxybenzone - block UV B and short-wave UV A rays
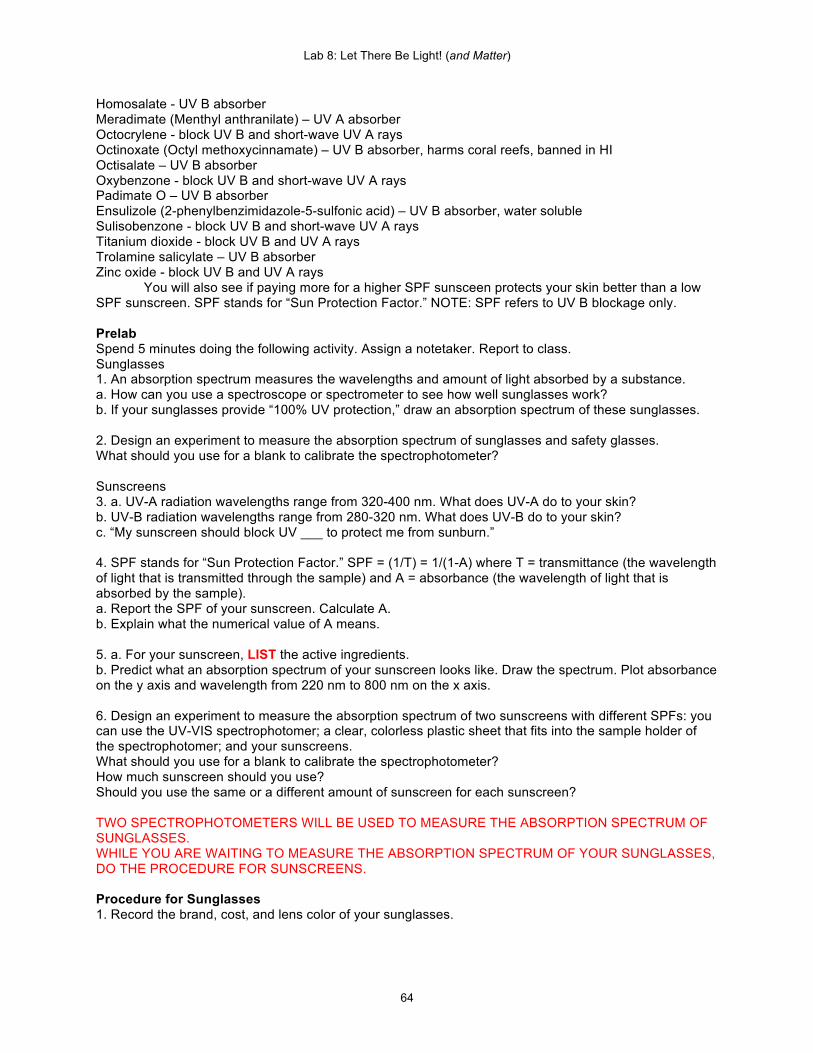
Lab 8: Let There Be Light! (and Matter)
64
Homosalate - UV B absorber Meradimate (Menthyl anthranilate) – UV A absorber Octocrylene - block UV B and short-wave UV A rays Octinoxate (Octyl methoxycinnamate) – UV B absorber, harms coral reefs, banned in HI Octisalate – UV B absorber Oxybenzone - block UV B and short-wave UV A rays Padimate O – UV B absorber Ensulizole (2-phenylbenzimidazole-5-sulfonic acid) – UV B absorber, water soluble Sulisobenzone - block UV B and short-wave UV A rays Titanium dioxide - block UV B and UV A rays Trolamine salicylate – UV B absorber Zinc oxide - block UV B and UV A rays
You will also see if paying more for a higher SPF sunsceen protects your skin better than a low SPF sunscreen. SPF stands for “Sun Protection Factor.” NOTE: SPF refers to UV B blockage only. Prelab Spend 5 minutes doing the following activity. Assign a notetaker. Report to class. Sunglasses 1. An absorption spectrum measures the wavelengths and amount of light absorbed by a substance. a. How can you use a spectroscope or spectrometer to see how well sunglasses work? b. If your sunglasses provide “100% UV protection,” draw an absorption spectrum of these sunglasses. 2. Design an experiment to measure the absorption spectrum of sunglasses and safety glasses. What should you use for a blank to calibrate the spectrophotometer? Sunscreens 3. a. UV-A radiation wavelengths range from 320-400 nm. What does UV-A do to your skin? b. UV-B radiation wavelengths range from 280-320 nm. What does UV-B do to your skin? c. “My sunscreen should block UV ___ to protect me from sunburn.” 4. SPF stands for “Sun Protection Factor.” SPF = (1/T) = 1/(1-A) where T = transmittance (the wavelength of light that is transmitted through the sample) and A = absorbance (the wavelength of light that is absorbed by the sample). a. Report the SPF of your sunscreen. Calculate A. b. Explain what the numerical value of A means. 5. a. For your sunscreen, LIST the active ingredients. b. Predict what an absorption spectrum of your sunscreen looks like. Draw the spectrum. Plot absorbance on the y axis and wavelength from 220 nm to 800 nm on the x axis. 6. Design an experiment to measure the absorption spectrum of two sunscreens with different SPFs: you can use the UV-VIS spectrophotomer; a clear, colorless plastic sheet that fits into the sample holder of the spectrophotomer; and your sunscreens. What should you use for a blank to calibrate the spectrophotometer? How much sunscreen should you use? Should you use the same or a different amount of sunscreen for each sunscreen? TWO SPECTROPHOTOMETERS WILL BE USED TO MEASURE THE ABSORPTION SPECTRUM OF SUNGLASSES. WHILE YOU ARE WAITING TO MEASURE THE ABSORPTION SPECTRUM OF YOUR SUNGLASSES, DO THE PROCEDURE FOR SUNSCREENS. Procedure for Sunglasses 1. Record the brand, cost, and lens color of your sunglasses.
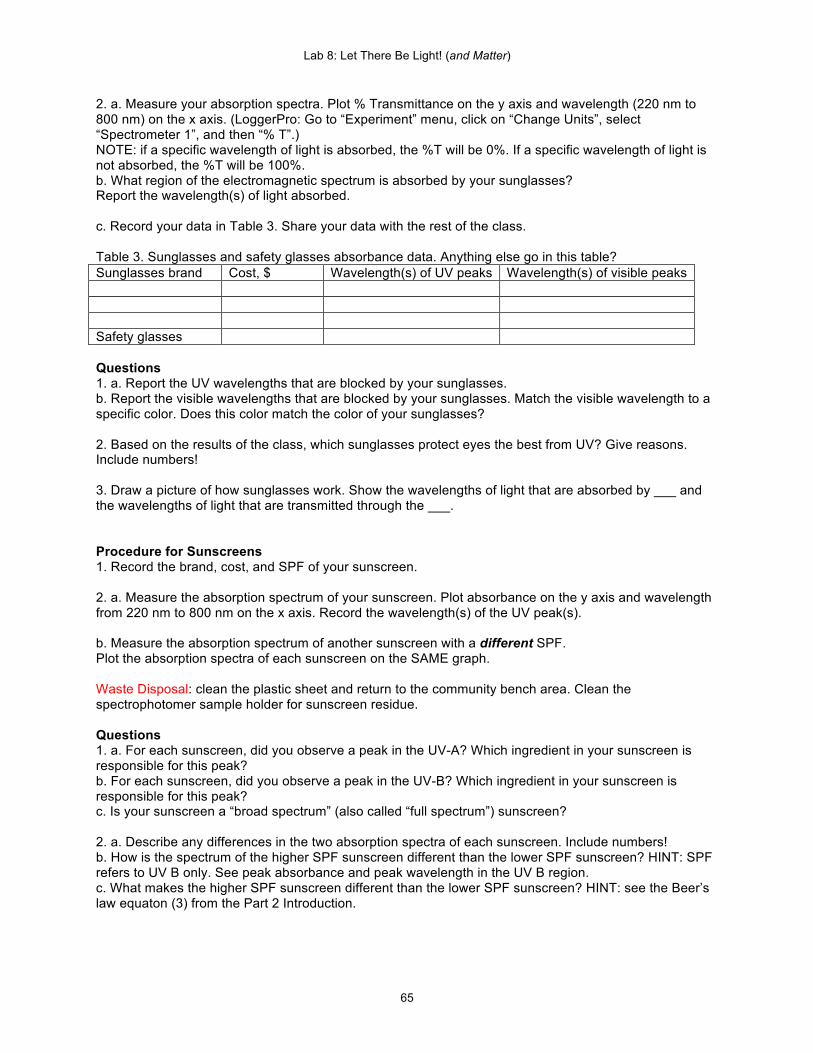
Lab 8: Let There Be Light! (and Matter)
65
2. a. Measure your absorption spectra. Plot % Transmittance on the y axis and wavelength (220 nm to 800 nm) on the x axis. (LoggerPro: Go to “Experiment” menu, click on “Change Units”, select “Spectrometer 1”, and then “% T”.) NOTE: if a specific wavelength of light is absorbed, the %T will be 0%. If a specific wavelength of light is not absorbed, the %T will be 100%. b. What region of the electromagnetic spectrum is absorbed by your sunglasses? Report the wavelength(s) of light absorbed. c. Record your data in Table 3. Share your data with the rest of the class. Table 3. Sunglasses and safety glasses absorbance data. Anything else go in this table? Sunglasses brand Cost, $ Wavelength(s) of UV peaks Wavelength(s) of visible peaks Safety glasses Questions 1. a. Report the UV wavelengths that are blocked by your sunglasses. b. Report the visible wavelengths that are blocked by your sunglasses. Match the visible wavelength to a specific color. Does this color match the color of your sunglasses? 2. Based on the results of the class, which sunglasses protect eyes the best from UV? Give reasons. Include numbers! 3. Draw a picture of how sunglasses work. Show the wavelengths of light that are absorbed by ___ and the wavelengths of light that are transmitted through the ___. Procedure for Sunscreens 1. Record the brand, cost, and SPF of your sunscreen. 2. a. Measure the absorption spectrum of your sunscreen. Plot absorbance on the y axis and wavelength from 220 nm to 800 nm on the x axis. Record the wavelength(s) of the UV peak(s). b. Measure the absorption spectrum of another sunscreen with a different SPF. Plot the absorption spectra of each sunscreen on the SAME graph. Waste Disposal: clean the plastic sheet and return to the community bench area. Clean the spectrophotomer sample holder for sunscreen residue. Questions 1. a. For each sunscreen, did you observe a peak in the UV-A? Which ingredient in your sunscreen is responsible for this peak? b. For each sunscreen, did you observe a peak in the UV-B? Which ingredient in your sunscreen is responsible for this peak? c. Is your sunscreen a “broad spectrum” (also called “full spectrum”) sunscreen? 2. a. Describe any differences in the two absorption spectra of each sunscreen. Include numbers! b. How is the spectrum of the higher SPF sunscreen different than the lower SPF sunscreen? HINT: SPF refers to UV B only. See peak absorbance and peak wavelength in the UV B region. c. What makes the higher SPF sunscreen different than the lower SPF sunscreen? HINT: see the Beer’s law equaton (3) from the Part 2 Introduction.
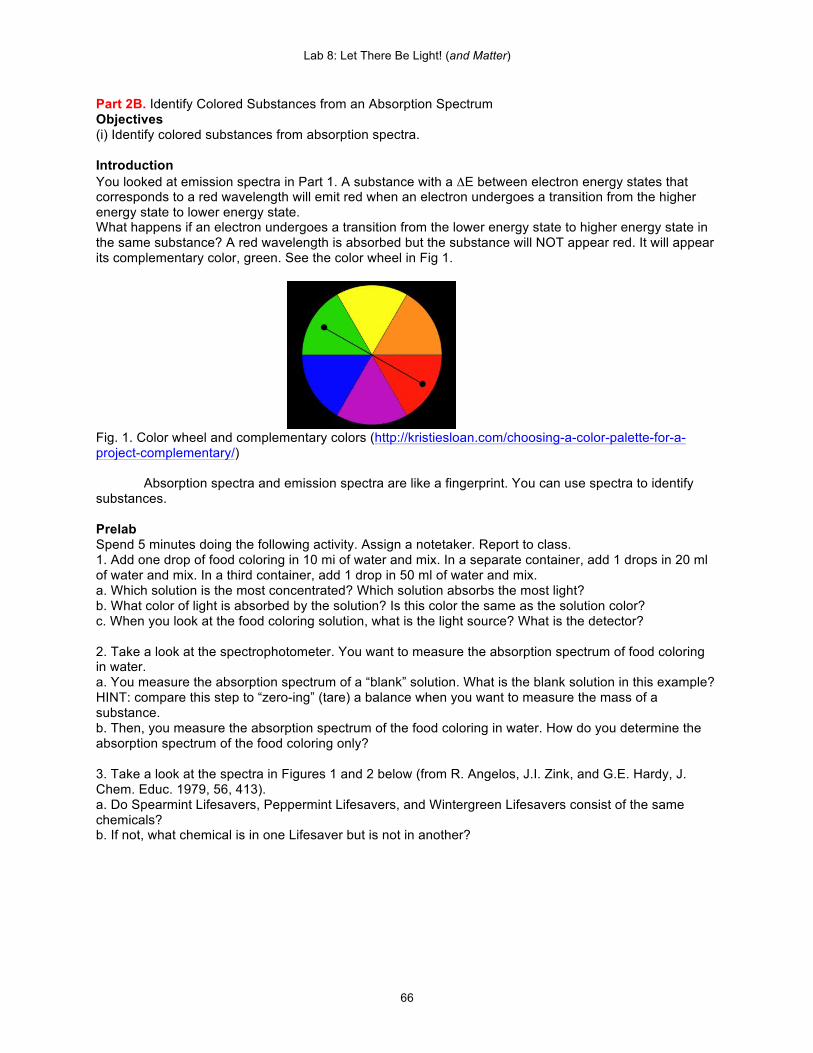
Lab 8: Let There Be Light! (and Matter)
66
Part 2B. Identify Colored Substances from an Absorption Spectrum Objectives (i) Identify colored substances from absorption spectra. Introduction You looked at emission spectra in Part 1. A substance with a ΔE between electron energy states that corresponds to a red wavelength will emit red when an electron undergoes a transition from the higher energy state to lower energy state. What happens if an electron undergoes a transition from the lower energy state to higher energy state in the same substance? A red wavelength is absorbed but the substance will NOT appear red. It will appear its complementary color, green. See the color wheel in Fig 1.
Fig. 1. Color wheel and complementary colors (http://kristiesloan.com/choosing-a-color-palette-for-a-project-complementary/) Absorption spectra and emission spectra are like a fingerprint. You can use spectra to identify substances. Prelab Spend 5 minutes doing the following activity. Assign a notetaker. Report to class. 1. Add one drop of food coloring in 10 mi of water and mix. In a separate container, add 1 drops in 20 ml of water and mix. In a third container, add 1 drop in 50 ml of water and mix. a. Which solution is the most concentrated? Which solution absorbs the most light? b. What color of light is absorbed by the solution? Is this color the same as the solution color? c. When you look at the food coloring solution, what is the light source? What is the detector? 2. Take a look at the spectrophotometer. You want to measure the absorption spectrum of food coloring in water. a. You measure the absorption spectrum of a “blank” solution. What is the blank solution in this example? HINT: compare this step to “zero-ing” (tare) a balance when you want to measure the mass of a substance. b. Then, you measure the absorption spectrum of the food coloring in water. How do you determine the absorption spectrum of the food coloring only? 3. Take a look at the spectra in Figures 1 and 2 below (from R. Angelos, J.I. Zink, and G.E. Hardy, J. Chem. Educ. 1979, 56, 413). a. Do Spearmint Lifesavers, Peppermint Lifesavers, and Wintergreen Lifesavers consist of the same chemicals? b. If not, what chemical is in one Lifesaver but is not in another?
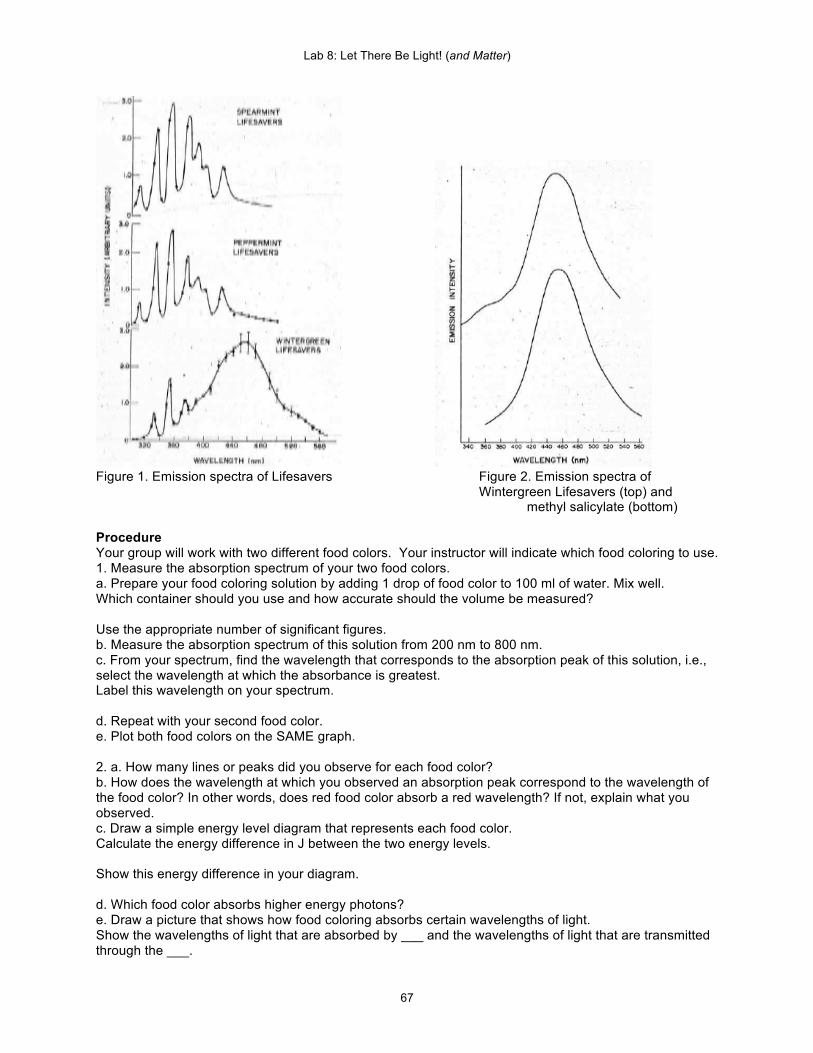
Lab 8: Let There Be Light! (and Matter)
67
Figure 1. Emission spectra of Lifesavers Figure 2. Emission spectra of Wintergreen Lifesavers (top) and methyl salicylate (bottom) Procedure Your group will work with two different food colors. Your instructor will indicate which food coloring to use. 1. Measure the absorption spectrum of your two food colors. a. Prepare your food coloring solution by adding 1 drop of food color to 100 ml of water. Mix well. Which container should you use and how accurate should the volume be measured? Use the appropriate number of significant figures. b. Measure the absorption spectrum of this solution from 200 nm to 800 nm. c. From your spectrum, find the wavelength that corresponds to the absorption peak of this solution, i.e., select the wavelength at which the absorbance is greatest. Label this wavelength on your spectrum. d. Repeat with your second food color. e. Plot both food colors on the SAME graph. 2. a. How many lines or peaks did you observe for each food color? b. How does the wavelength at which you observed an absorption peak correspond to the wavelength of the food color? In other words, does red food color absorb a red wavelength? If not, explain what you observed. c. Draw a simple energy level diagram that represents each food color. Calculate the energy difference in J between the two energy levels. Show this energy difference in your diagram. d. Which food color absorbs higher energy photons? e. Draw a picture that shows how food coloring absorbs certain wavelengths of light. Show the wavelengths of light that are absorbed by ___ and the wavelengths of light that are transmitted through the ___.

Lab 8: Let There Be Light! (and Matter)
68
3. You make a new food color by mixing two food colors together. Is the new food color the result of a chemical reaction or just mixing? a. Mix the two food colorings that you used in the first step in Part 2B by adding 1 drop of each food color to 100 ml of water. What is the resulting color? From this color, PREDICT the number of absorption peaks and the wavelength that corresponds to these peaks. c. Measure the absorption spectrum of the resulting solution. d. Plot your absorption spectrum of the mixture of two food colorings on the SAME graph as the absorption spectra of the individual food colorings. This graph should show three spectra. Label your graph and give it a title. d. Summarize your peak wavelength data clearly in Table 4. Give Table 4 a title. Waste Disposal: food coloring solutions – in sink. Hexane – non-halogenated waste. Questions 1. a. Show your Table 4 and graph of the three absorption spectra (the two individual food colors and the mixture). b. Is the actual absorption spectrum of the mixture of two food colors the sum of the absorption spectra of the two colors that comprised the mixture or a completely different spectrum altogether? Give reasons. Include numbers! c. Discuss whether a chemical reaction occurred to give the resulting color of the food coloring mixture. Include numbers! 2. You have a blue pen. a. Could the blue color from this pen come from one substance? If so, you would see ____ peaks in an absorption spectrum and the peak corresponds to a ______ (what color)? wavelength. b. Could the blue color from this pen come from two substances? If so, what would you see in an absorption spectrum of the blue pen? c. Could the blue color from this pen come from more than two substances? If so, what would you see in an absorption spectrum of the blue pen? Problem 2. Is the color from your food from food coloring? Extract the color from a food or plant and compare the color chemical to food colors. Prelab Spend 5 minutes doing the following activity. Assign a notetaker. Report to class. Students: bring a colored food or plant, e.g., colored hard candy, red cabbage, grape juice, grass, blueberries Cut a piece of your colored food or plant into small pieces and place it in a small volume of water. Stir. What happens? If nothing happens, add heat. Cut a piece of your colored food or plant into small pieces and place it in a small volume of ethanol. Stir. What happens? If nothing happens, add heat. Procedure 1. Design an experiment to remove (extract) the color from a food or plant. You can use a colored hard candy, red cabbage, grass, red grapes, etc. You can use water, ethanol, or hexane as the solvent. Clearly state the plant or food from which you extracted the color.
Lab 8: Let There Be Light! (and Matter)
69
2. Measure the absorption spectrum of the color you removed from the food or plant. What is the peak wavelength? 3. Plot your absorption spectrum of the plant or food on the SAME graph as the absorption spectrum of the food color that most closely matches the color of the plant or food. Waste Disposal: food coloring solutions – in sink. Solids – in trash. Questions 1. Show your absorption spectra of the plant or food and the food color. Include numbers! 2. Discuss the identity of the color from the plant or food compared to the food color. Does the color from the food or plant come from the same chemical as a food color? Give reasons. Include numbers! 3. Some food companies are replacing artificial food coloring with natural food colors. Would you rather eat your red lollipop that has FDC Red No. 40 or strawberry extract? Give reasons.

Lab 9: Name is Bond, ___ Bond
70
Lab 9. A Stain In Time Saves Nine Why does ethanol dissolve in water? Why doesn’t oil and water mix? Objectives (i) Identify chemical force(s) between atoms; draw Lewis structures, determine molecular shape, and determine polarity. (ii) Identify chemical force(s) between compounds and explain solubility, attraction, and repulsion. Introduction
The way atoms bond together determines molecular structure which determines shape which determines properties, like polarity, solubility, boiling point, melting point, etc. In earlier Chem 1A labs, we found some substances are soluble in water but others are not. Why? Bonding and structure and shape can explain. In this lab, we’ll use bonding and structure and shape to explain why oil and ethanol don’t mix and how to choose a chemical to remove stains. Materials Part 1. Students: bring in an old piece of white cotton fabric and polyester fabric Stains: motor oil vegetable oil pencil
blue food coloring ketchup coffee Part 2. Cleaning agents:
vinegar baking soda TSP (Na3PO4) hexane soap ethanol bleach
Part 1. Oops! I spilled some ____ on my shirt. What chemical force binds a stain to a fabric? Prelab Spend 5 minutes doing the following activity. Assign a notetaker. Report to class. Water is called the universal solvent. We know the formula and structure of water as well as the shape and polarity. Let’s take a more detailed look at water. a. Go to chemagic.com (http://chemagic.com) and click on the Classic Virtual Model Kit. Click on the “Draw” box to go to the chemical structure drawing screen. Click on the single line (single bond) tool in the upper left corner. Draw your structure of H2O. NOTE: the Virtual Model Kit assumes C is at the end of each bond (line). To change the C to a H, click on the “X” box (lower left corner). “H” should be shown in the box. If not, type in H. Then, click on the end of the bond where you want H. b. Then, click on the “2D to 3D into Model Window”. You will see a 3D structure of H2O. Use the mouse to rotate the molecule. Describe the shape of water molecule you see. c. Click on the “Charge” box. What is the charge on each atom? What causes the charge on each atom? d. Click on the “Dipole” box. You will see 2 arrows appear on the water molecule. Which direction does each arrow point? Why do you think each arrow is pointing in that direction? e. Then, click on “Dipole - Net”. A third arrow will appear on the water molecule. Which direction does each arrow point? Why do you think each arrow is pointing in that direction? Procedure 1. Water and ethanol: your adult beverage is too strong (see Lab 2, Part 3) so you weaken your beverage by adding water. a. Add 5 drops of water to a small test tube. Add 5 drops of ethanol to the water. Record your observations. HINT: do you see a solution or do you see two layers form, like oil and vinegar salad dressing? b. Explain why water is soluble in ethanol by doing the following. Use http://chemagic.com like you did in the Prelab questions. (i) Draw the Lewis structures of water and ethanol (C2H5OH).
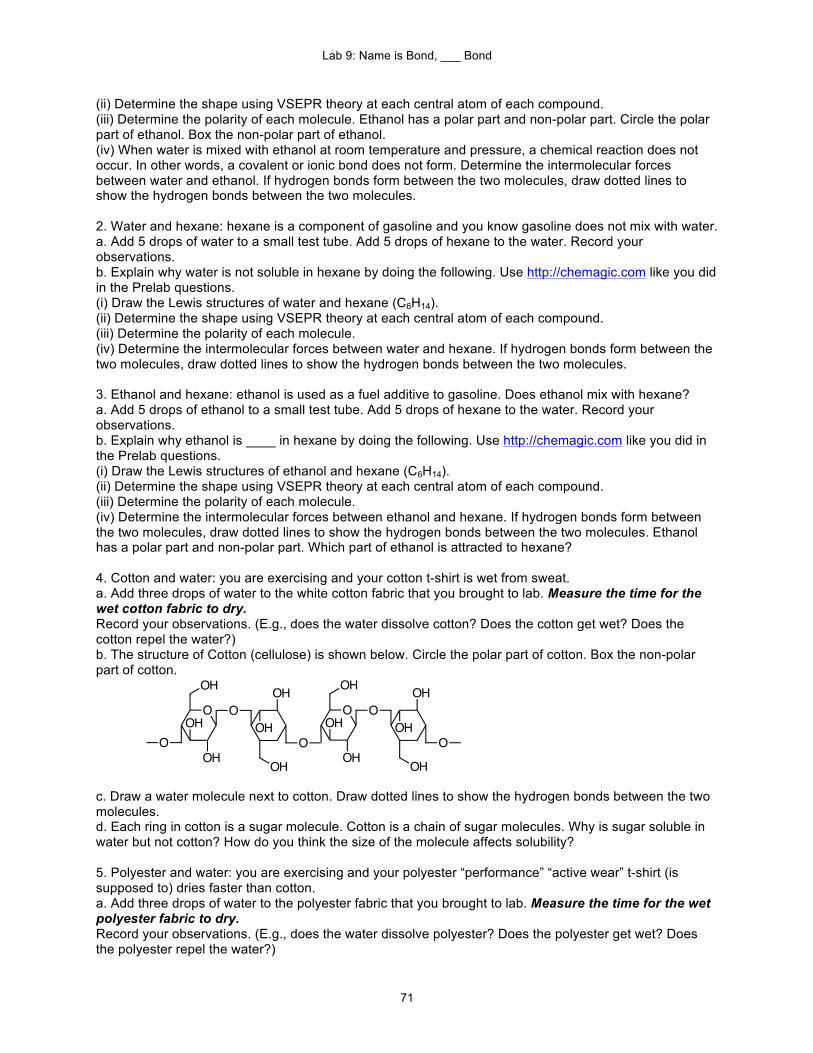
Lab 9: Name is Bond, ___ Bond
71
(ii) Determine the shape using VSEPR theory at each central atom of each compound. (iii) Determine the polarity of each molecule. Ethanol has a polar part and non-polar part. Circle the polar part of ethanol. Box the non-polar part of ethanol. (iv) When water is mixed with ethanol at room temperature and pressure, a chemical reaction does not occur. In other words, a covalent or ionic bond does not form. Determine the intermolecular forces between water and ethanol. If hydrogen bonds form between the two molecules, draw dotted lines to show the hydrogen bonds between the two molecules. 2. Water and hexane: hexane is a component of gasoline and you know gasoline does not mix with water. a. Add 5 drops of water to a small test tube. Add 5 drops of hexane to the water. Record your observations. b. Explain why water is not soluble in hexane by doing the following. Use http://chemagic.com like you did in the Prelab questions. (i) Draw the Lewis structures of water and hexane (C6H14). (ii) Determine the shape using VSEPR theory at each central atom of each compound. (iii) Determine the polarity of each molecule. (iv) Determine the intermolecular forces between water and hexane. If hydrogen bonds form between the two molecules, draw dotted lines to show the hydrogen bonds between the two molecules. 3. Ethanol and hexane: ethanol is used as a fuel additive to gasoline. Does ethanol mix with hexane? a. Add 5 drops of ethanol to a small test tube. Add 5 drops of hexane to the water. Record your observations. b. Explain why ethanol is ____ in hexane by doing the following. Use http://chemagic.com like you did in the Prelab questions. (i) Draw the Lewis structures of ethanol and hexane (C6H14). (ii) Determine the shape using VSEPR theory at each central atom of each compound. (iii) Determine the polarity of each molecule. (iv) Determine the intermolecular forces between ethanol and hexane. If hydrogen bonds form between the two molecules, draw dotted lines to show the hydrogen bonds between the two molecules. Ethanol has a polar part and non-polar part. Which part of ethanol is attracted to hexane? 4. Cotton and water: you are exercising and your cotton t-shirt is wet from sweat. a. Add three drops of water to the white cotton fabric that you brought to lab. Measure the time for the wet cotton fabric to dry. Record your observations. (E.g., does the water dissolve cotton? Does the cotton get wet? Does the cotton repel the water?) b. The structure of Cotton (cellulose) is shown below. Circle the polar part of cotton. Box the non-polar part of cotton.
c. Draw a water molecule next to cotton. Draw dotted lines to show the hydrogen bonds between the two molecules. d. Each ring in cotton is a sugar molecule. Cotton is a chain of sugar molecules. Why is sugar soluble in water but not cotton? How do you think the size of the molecule affects solubility? 5. Polyester and water: you are exercising and your polyester “performance” “active wear” t-shirt (is supposed to) dries faster than cotton. a. Add three drops of water to the polyester fabric that you brought to lab. Measure the time for the wet polyester fabric to dry. Record your observations. (E.g., does the water dissolve polyester? Does the polyester get wet? Does the polyester repel the water?)
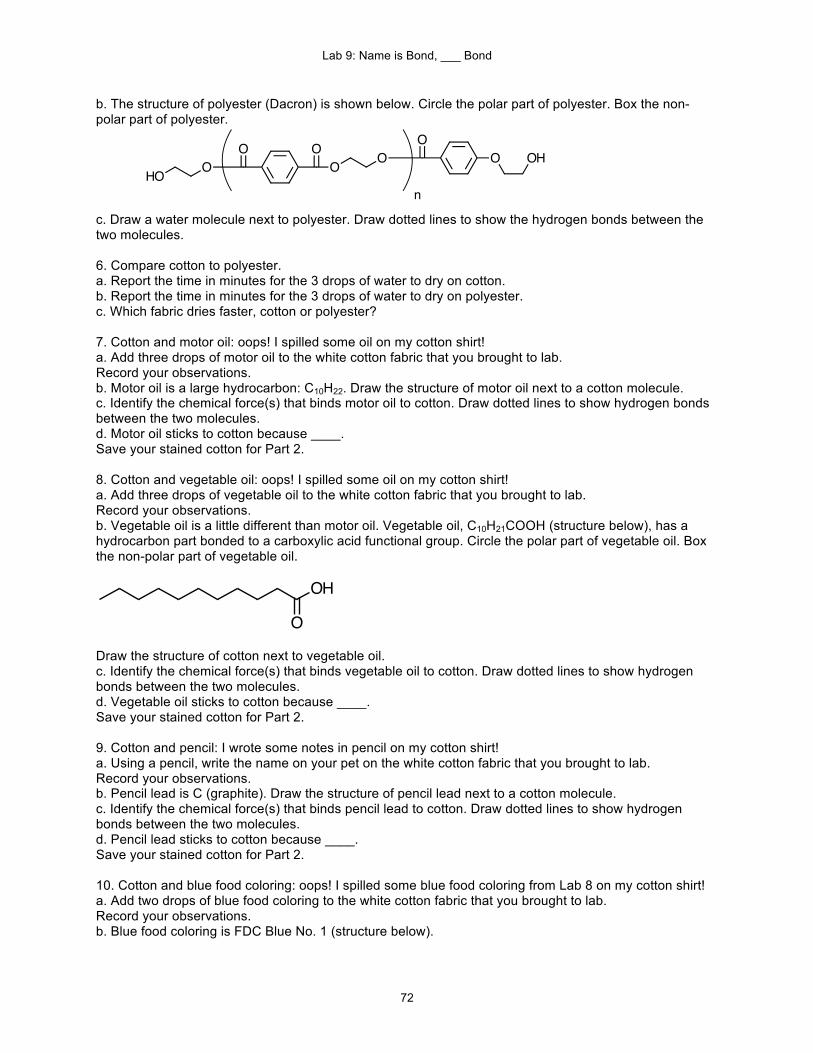
Lab 9: Name is Bond, ___ Bond
72
b. The structure of polyester (Dacron) is shown below. Circle the polar part of polyester. Box the non-polar part of polyester.
c. Draw a water molecule next to polyester. Draw dotted lines to show the hydrogen bonds between the two molecules. 6. Compare cotton to polyester. a. Report the time in minutes for the 3 drops of water to dry on cotton. b. Report the time in minutes for the 3 drops of water to dry on polyester. c. Which fabric dries faster, cotton or polyester? 7. Cotton and motor oil: oops! I spilled some oil on my cotton shirt! a. Add three drops of motor oil to the white cotton fabric that you brought to lab. Record your observations. b. Motor oil is a large hydrocarbon: C10H22. Draw the structure of motor oil next to a cotton molecule. c. Identify the chemical force(s) that binds motor oil to cotton. Draw dotted lines to show hydrogen bonds between the two molecules. d. Motor oil sticks to cotton because ____. Save your stained cotton for Part 2. 8. Cotton and vegetable oil: oops! I spilled some oil on my cotton shirt! a. Add three drops of vegetable oil to the white cotton fabric that you brought to lab. Record your observations. b. Vegetable oil is a little different than motor oil. Vegetable oil, C10H21COOH (structure below), has a hydrocarbon part bonded to a carboxylic acid functional group. Circle the polar part of vegetable oil. Box the non-polar part of vegetable oil.
Draw the structure of cotton next to vegetable oil. c. Identify the chemical force(s) that binds vegetable oil to cotton. Draw dotted lines to show hydrogen bonds between the two molecules. d. Vegetable oil sticks to cotton because ____. Save your stained cotton for Part 2. 9. Cotton and pencil: I wrote some notes in pencil on my cotton shirt! a. Using a pencil, write the name on your pet on the white cotton fabric that you brought to lab. Record your observations. b. Pencil lead is C (graphite). Draw the structure of pencil lead next to a cotton molecule. c. Identify the chemical force(s) that binds pencil lead to cotton. Draw dotted lines to show hydrogen bonds between the two molecules. d. Pencil lead sticks to cotton because ____. Save your stained cotton for Part 2. 10. Cotton and blue food coloring: oops! I spilled some blue food coloring from Lab 8 on my cotton shirt! a. Add two drops of blue food coloring to the white cotton fabric that you brought to lab. Record your observations. b. Blue food coloring is FDC Blue No. 1 (structure below).
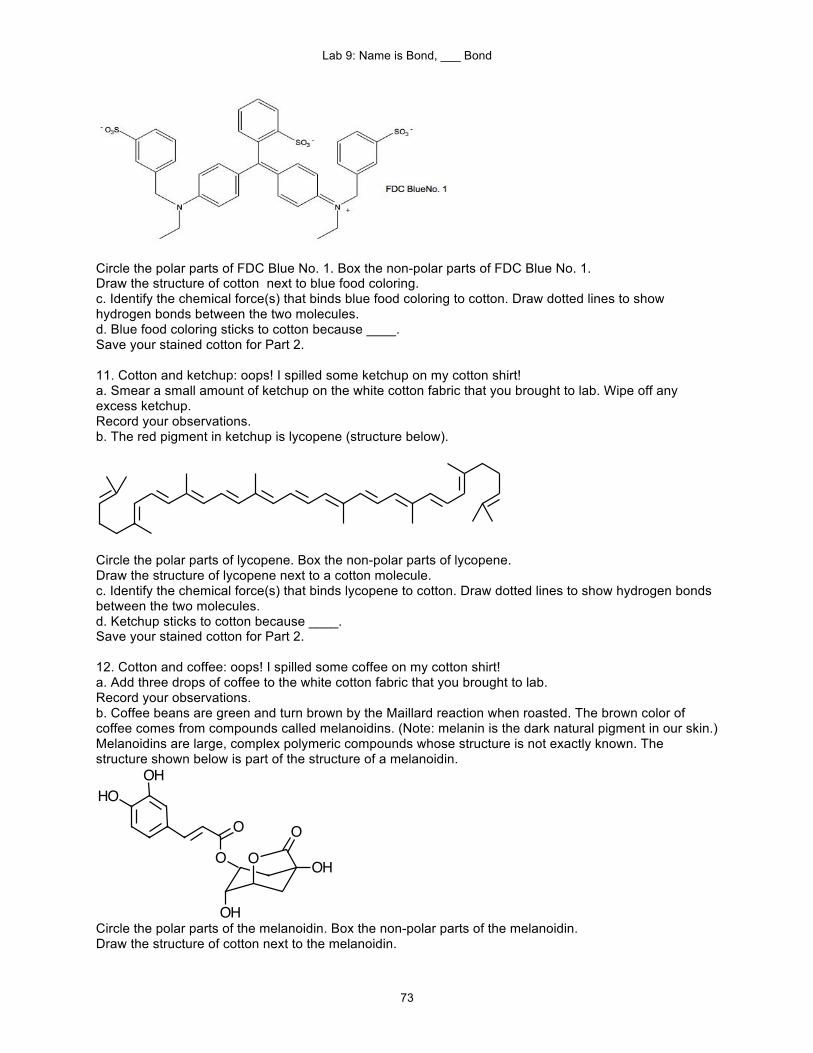
Lab 9: Name is Bond, ___ Bond
73
Circle the polar parts of FDC Blue No. 1. Box the non-polar parts of FDC Blue No. 1. Draw the structure of cotton next to blue food coloring. c. Identify the chemical force(s) that binds blue food coloring to cotton. Draw dotted lines to show hydrogen bonds between the two molecules. d. Blue food coloring sticks to cotton because ____. Save your stained cotton for Part 2. 11. Cotton and ketchup: oops! I spilled some ketchup on my cotton shirt! a. Smear a small amount of ketchup on the white cotton fabric that you brought to lab. Wipe off any excess ketchup. Record your observations. b. The red pigment in ketchup is lycopene (structure below).
Circle the polar parts of lycopene. Box the non-polar parts of lycopene. Draw the structure of lycopene next to a cotton molecule. c. Identify the chemical force(s) that binds lycopene to cotton. Draw dotted lines to show hydrogen bonds between the two molecules. d. Ketchup sticks to cotton because ____. Save your stained cotton for Part 2. 12. Cotton and coffee: oops! I spilled some coffee on my cotton shirt! a. Add three drops of coffee to the white cotton fabric that you brought to lab. Record your observations. b. Coffee beans are green and turn brown by the Maillard reaction when roasted. The brown color of coffee comes from compounds called melanoidins. (Note: melanin is the dark natural pigment in our skin.) Melanoidins are large, complex polymeric compounds whose structure is not exactly known. The structure shown below is part of the structure of a melanoidin.
Circle the polar parts of the melanoidin. Box the non-polar parts of the melanoidin. Draw the structure of cotton next to the melanoidin.
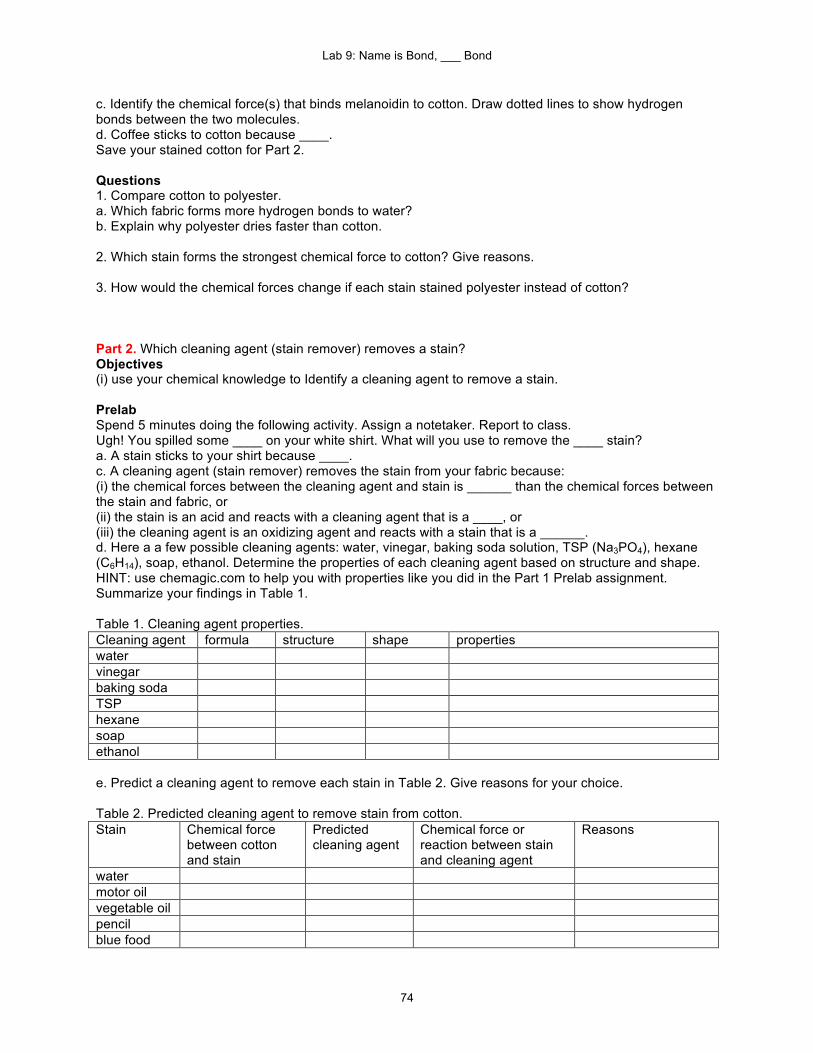
Lab 9: Name is Bond, ___ Bond
74
c. Identify the chemical force(s) that binds melanoidin to cotton. Draw dotted lines to show hydrogen bonds between the two molecules. d. Coffee sticks to cotton because ____. Save your stained cotton for Part 2. Questions 1. Compare cotton to polyester. a. Which fabric forms more hydrogen bonds to water? b. Explain why polyester dries faster than cotton. 2. Which stain forms the strongest chemical force to cotton? Give reasons. 3. How would the chemical forces change if each stain stained polyester instead of cotton? Part 2. Which cleaning agent (stain remover) removes a stain? Objectives (i) use your chemical knowledge to Identify a cleaning agent to remove a stain. Prelab Spend 5 minutes doing the following activity. Assign a notetaker. Report to class. Ugh! You spilled some ____ on your white shirt. What will you use to remove the ____ stain? a. A stain sticks to your shirt because ____. c. A cleaning agent (stain remover) removes the stain from your fabric because: (i) the chemical forces between the cleaning agent and stain is ______ than the chemical forces between the stain and fabric, or (ii) the stain is an acid and reacts with a cleaning agent that is a ____, or (iii) the cleaning agent is an oxidizing agent and reacts with a stain that is a ______. d. Here a a few possible cleaning agents: water, vinegar, baking soda solution, TSP (Na3PO4), hexane (C6H14), soap, ethanol. Determine the properties of each cleaning agent based on structure and shape. HINT: use chemagic.com to help you with properties like you did in the Part 1 Prelab assignment. Summarize your findings in Table 1. Table 1. Cleaning agent properties. Cleaning agent formula structure shape properties water vinegar baking soda TSP hexane soap ethanol e. Predict a cleaning agent to remove each stain in Table 2. Give reasons for your choice. Table 2. Predicted cleaning agent to remove stain from cotton. Stain Chemical force
between cotton and stain
Predicted cleaning agent
Chemical force or reaction between stain and cleaning agent
Reasons
water motor oil vegetable oil pencil blue food
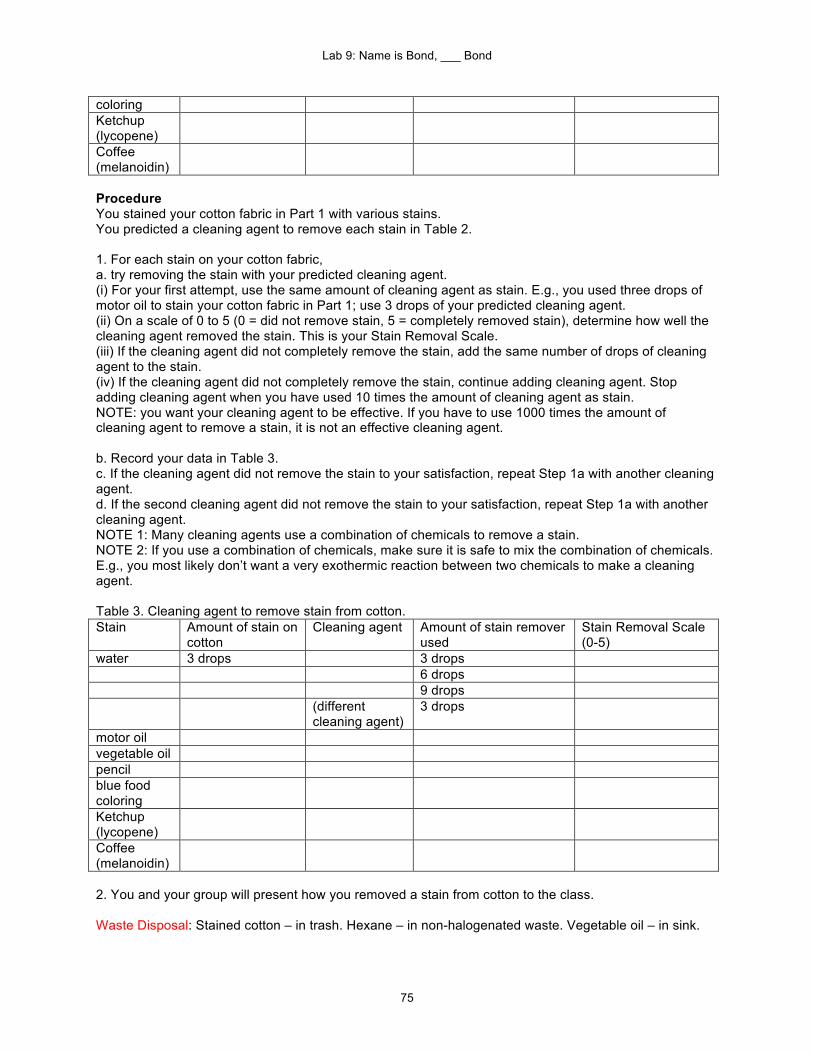
Lab 9: Name is Bond, ___ Bond
75
coloring Ketchup (lycopene)
Coffee (melanoidin)
Procedure You stained your cotton fabric in Part 1 with various stains. You predicted a cleaning agent to remove each stain in Table 2. 1. For each stain on your cotton fabric, a. try removing the stain with your predicted cleaning agent. (i) For your first attempt, use the same amount of cleaning agent as stain. E.g., you used three drops of motor oil to stain your cotton fabric in Part 1; use 3 drops of your predicted cleaning agent. (ii) On a scale of 0 to 5 (0 = did not remove stain, 5 = completely removed stain), determine how well the cleaning agent removed the stain. This is your Stain Removal Scale. (iii) If the cleaning agent did not completely remove the stain, add the same number of drops of cleaning agent to the stain. (iv) If the cleaning agent did not completely remove the stain, continue adding cleaning agent. Stop adding cleaning agent when you have used 10 times the amount of cleaning agent as stain. NOTE: you want your cleaning agent to be effective. If you have to use 1000 times the amount of cleaning agent to remove a stain, it is not an effective cleaning agent. b. Record your data in Table 3. c. If the cleaning agent did not remove the stain to your satisfaction, repeat Step 1a with another cleaning agent. d. If the second cleaning agent did not remove the stain to your satisfaction, repeat Step 1a with another cleaning agent. NOTE 1: Many cleaning agents use a combination of chemicals to remove a stain. NOTE 2: If you use a combination of chemicals, make sure it is safe to mix the combination of chemicals. E.g., you most likely don’t want a very exothermic reaction between two chemicals to make a cleaning agent. Table 3. Cleaning agent to remove stain from cotton. Stain Amount of stain on
cotton Cleaning agent Amount of stain remover
used Stain Removal Scale (0-5)
water 3 drops 3 drops 6 drops 9 drops (different
cleaning agent) 3 drops
motor oil vegetable oil pencil blue food coloring
Ketchup (lycopene)
Coffee (melanoidin)
2. You and your group will present how you removed a stain from cotton to the class. Waste Disposal: Stained cotton – in trash. Hexane – in non-halogenated waste. Vegetable oil – in sink.
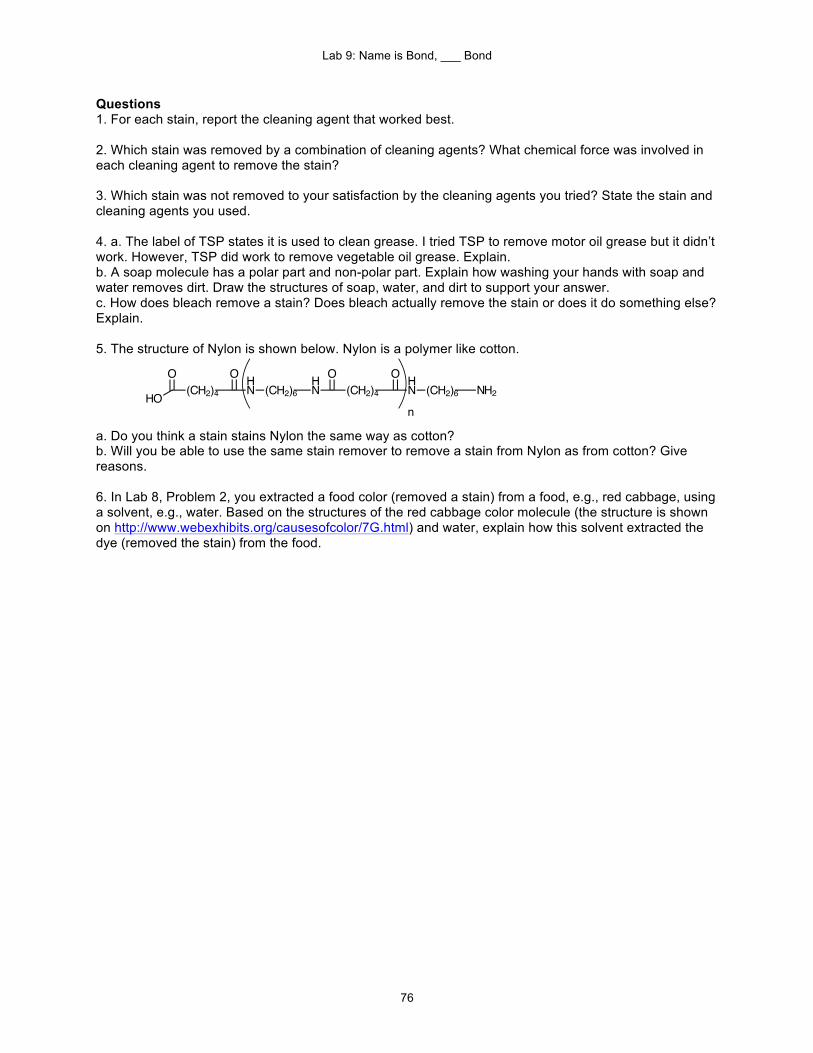
Lab 9: Name is Bond, ___ Bond
76
Questions 1. For each stain, report the cleaning agent that worked best. 2. Which stain was removed by a combination of cleaning agents? What chemical force was involved in each cleaning agent to remove the stain? 3. Which stain was not removed to your satisfaction by the cleaning agents you tried? State the stain and cleaning agents you used. 4. a. The label of TSP states it is used to clean grease. I tried TSP to remove motor oil grease but it didn’t work. However, TSP did work to remove vegetable oil grease. Explain. b. A soap molecule has a polar part and non-polar part. Explain how washing your hands with soap and water removes dirt. Draw the structures of soap, water, and dirt to support your answer. c. How does bleach remove a stain? Does bleach actually remove the stain or does it do something else? Explain. 5. The structure of Nylon is shown below. Nylon is a polymer like cotton.
a. Do you think a stain stains Nylon the same way as cotton? b. Will you be able to use the same stain remover to remove a stain from Nylon as from cotton? Give reasons. 6. In Lab 8, Problem 2, you extracted a food color (removed a stain) from a food, e.g., red cabbage, using a solvent, e.g., water. Based on the structures of the red cabbage color molecule (the structure is shown on http://www.webexhibits.org/causesofcolor/7G.html) and water, explain how this solvent extracted the dye (removed the stain) from the food.
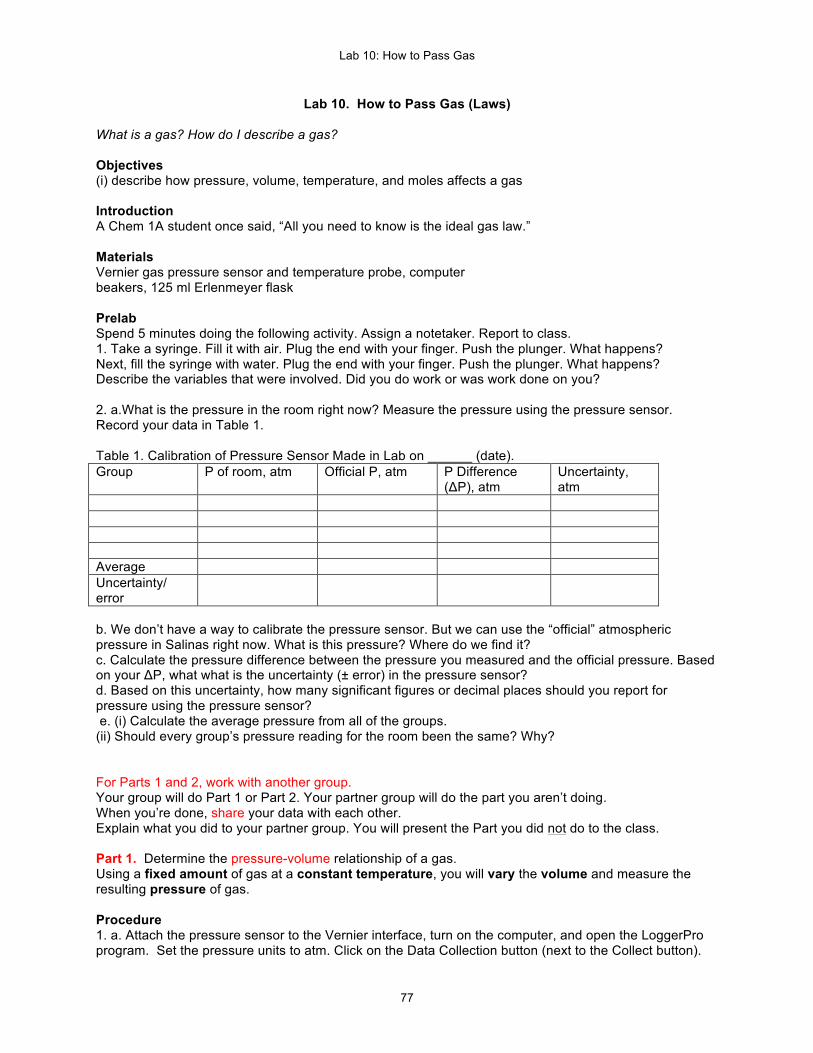
Lab 10: How to Pass Gas
77
Lab 10. How to Pass Gas (Laws) What is a gas? How do I describe a gas? Objectives (i) describe how pressure, volume, temperature, and moles affects a gas Introduction A Chem 1A student once said, “All you need to know is the ideal gas law.” Materials Vernier gas pressure sensor and temperature probe, computer beakers, 125 ml Erlenmeyer flask Prelab Spend 5 minutes doing the following activity. Assign a notetaker. Report to class. 1. Take a syringe. Fill it with air. Plug the end with your finger. Push the plunger. What happens? Next, fill the syringe with water. Plug the end with your finger. Push the plunger. What happens? Describe the variables that were involved. Did you do work or was work done on you? 2. a.What is the pressure in the room right now? Measure the pressure using the pressure sensor. Record your data in Table 1. Table 1. Calibration of Pressure Sensor Made in Lab on ______ (date). Group P of room, atm Official P, atm P Difference
(ΔP), atm Uncertainty, atm
Average Uncertainty/ error
b. We don’t have a way to calibrate the pressure sensor. But we can use the “official” atmospheric pressure in Salinas right now. What is this pressure? Where do we find it? c. Calculate the pressure difference between the pressure you measured and the official pressure. Based on your ΔP, what what is the uncertainty (± error) in the pressure sensor? d. Based on this uncertainty, how many significant figures or decimal places should you report for pressure using the pressure sensor? e. (i) Calculate the average pressure from all of the groups. (ii) Should every group’s pressure reading for the room been the same? Why? For Parts 1 and 2, work with another group. Your group will do Part 1 or Part 2. Your partner group will do the part you aren’t doing. When you’re done, share your data with each other. Explain what you did to your partner group. You will present the Part you did not do to the class. Part 1. Determine the pressure-volume relationship of a gas. Using a fixed amount of gas at a constant temperature, you will vary the volume and measure the resulting pressure of gas. Procedure 1. a. Attach the pressure sensor to the Vernier interface, turn on the computer, and open the LoggerPro program. Set the pressure units to atm. Click on the Data Collection button (next to the Collect button).
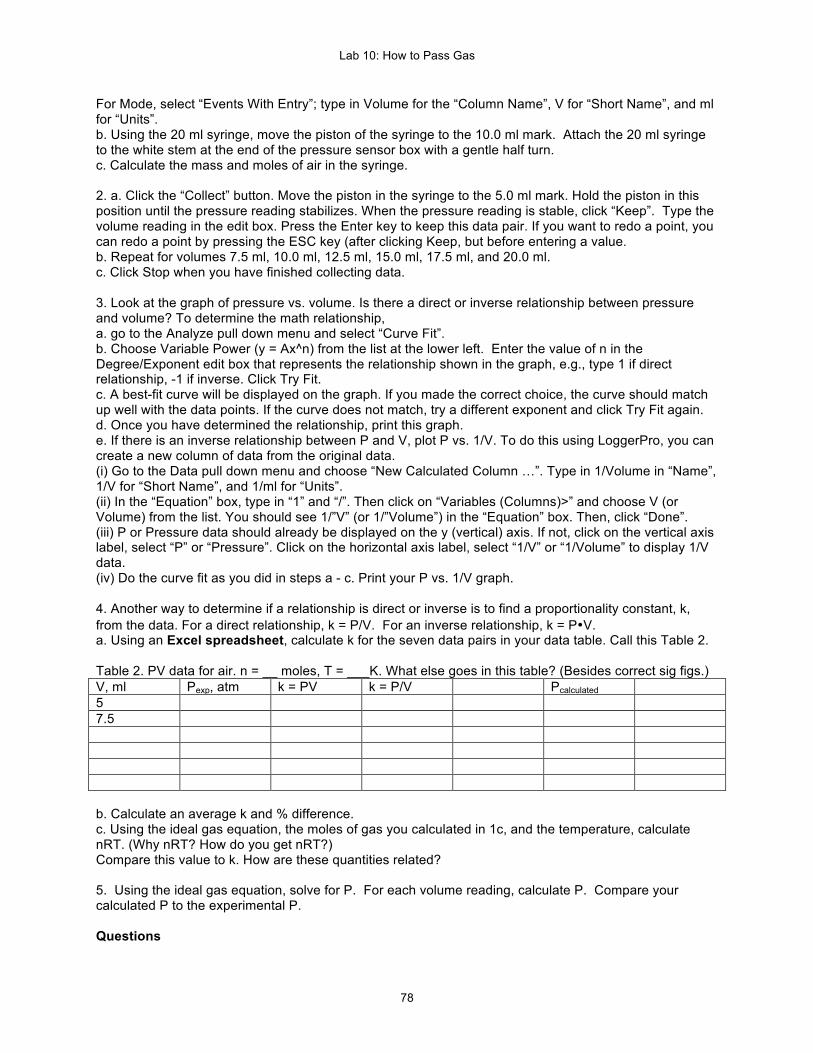
Lab 10: How to Pass Gas
78
For Mode, select “Events With Entry”; type in Volume for the “Column Name”, V for “Short Name”, and ml for “Units”. b. Using the 20 ml syringe, move the piston of the syringe to the 10.0 ml mark. Attach the 20 ml syringe to the white stem at the end of the pressure sensor box with a gentle half turn. c. Calculate the mass and moles of air in the syringe. 2. a. Click the “Collect” button. Move the piston in the syringe to the 5.0 ml mark. Hold the piston in this position until the pressure reading stabilizes. When the pressure reading is stable, click “Keep”. Type the volume reading in the edit box. Press the Enter key to keep this data pair. If you want to redo a point, you can redo a point by pressing the ESC key (after clicking Keep, but before entering a value. b. Repeat for volumes 7.5 ml, 10.0 ml, 12.5 ml, 15.0 ml, 17.5 ml, and 20.0 ml. c. Click Stop when you have finished collecting data. 3. Look at the graph of pressure vs. volume. Is there a direct or inverse relationship between pressure and volume? To determine the math relationship, a. go to the Analyze pull down menu and select “Curve Fit”. b. Choose Variable Power (y = Ax^n) from the list at the lower left. Enter the value of n in the Degree/Exponent edit box that represents the relationship shown in the graph, e.g., type 1 if direct relationship, -1 if inverse. Click Try Fit. c. A best-fit curve will be displayed on the graph. If you made the correct choice, the curve should match up well with the data points. If the curve does not match, try a different exponent and click Try Fit again. d. Once you have determined the relationship, print this graph. e. If there is an inverse relationship between P and V, plot P vs. 1/V. To do this using LoggerPro, you can create a new column of data from the original data. (i) Go to the Data pull down menu and choose “New Calculated Column …”. Type in 1/Volume in “Name”, 1/V for “Short Name”, and 1/ml for “Units”. (ii) In the “Equation” box, type in “1” and “/”. Then click on “Variables (Columns)>” and choose V (or Volume) from the list. You should see 1/”V” (or 1/”Volume”) in the “Equation” box. Then, click “Done”. (iii) P or Pressure data should already be displayed on the y (vertical) axis. If not, click on the vertical axis label, select “P” or “Pressure”. Click on the horizontal axis label, select “1/V” or “1/Volume” to display 1/V data. (iv) Do the curve fit as you did in steps a - c. Print your P vs. 1/V graph. 4. Another way to determine if a relationship is direct or inverse is to find a proportionality constant, k, from the data. For a direct relationship, k = P/V. For an inverse relationship, k = P•V. a. Using an Excel spreadsheet, calculate k for the seven data pairs in your data table. Call this Table 2. Table 2. PV data for air. n = __ moles, T = ___K. What else goes in this table? (Besides correct sig figs.) V, ml Pexp, atm k = PV k = P/V Pcalculated 5 7.5 b. Calculate an average k and % difference. c. Using the ideal gas equation, the moles of gas you calculated in 1c, and the temperature, calculate nRT. (Why nRT? How do you get nRT?) Compare this value to k. How are these quantities related? 5. Using the ideal gas equation, solve for P. For each volume reading, calculate P. Compare your calculated P to the experimental P. Questions
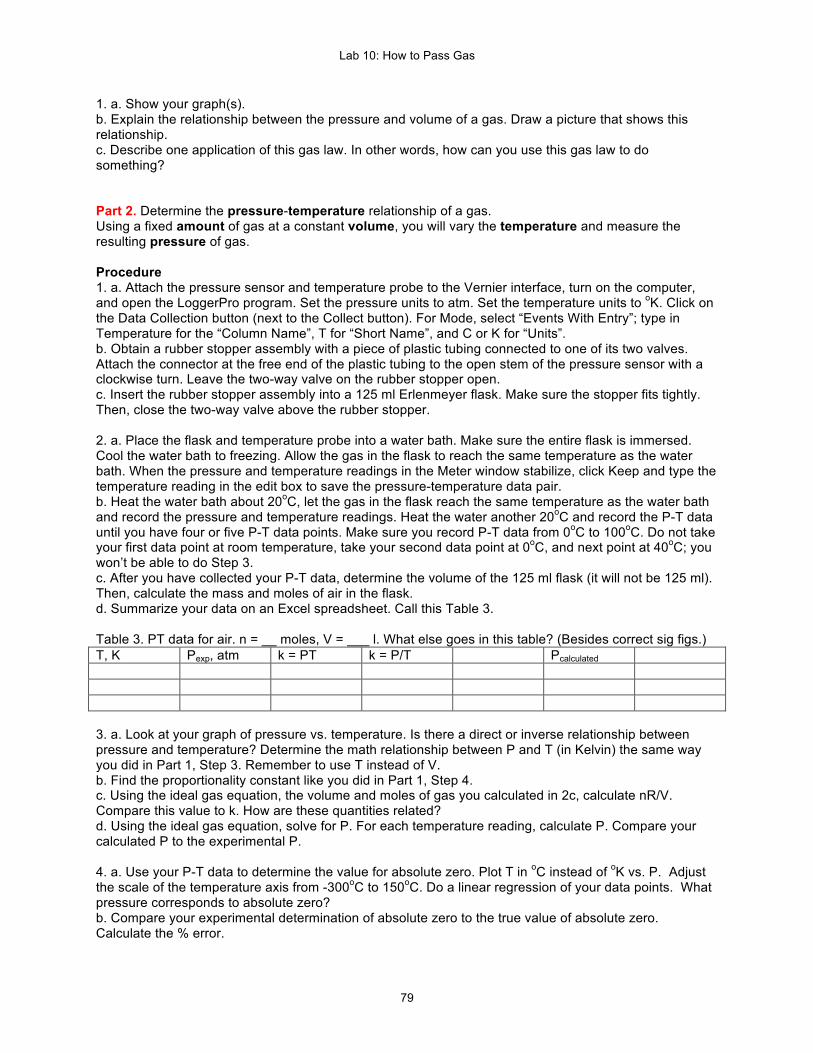
Lab 10: How to Pass Gas
79
1. a. Show your graph(s). b. Explain the relationship between the pressure and volume of a gas. Draw a picture that shows this relationship. c. Describe one application of this gas law. In other words, how can you use this gas law to do something? Part 2. Determine the pressure-temperature relationship of a gas. Using a fixed amount of gas at a constant volume, you will vary the temperature and measure the resulting pressure of gas. Procedure 1. a. Attach the pressure sensor and temperature probe to the Vernier interface, turn on the computer, and open the LoggerPro program. Set the pressure units to atm. Set the temperature units to oK. Click on the Data Collection button (next to the Collect button). For Mode, select “Events With Entry”; type in Temperature for the “Column Name”, T for “Short Name”, and C or K for “Units”. b. Obtain a rubber stopper assembly with a piece of plastic tubing connected to one of its two valves. Attach the connector at the free end of the plastic tubing to the open stem of the pressure sensor with a clockwise turn. Leave the two-way valve on the rubber stopper open. c. Insert the rubber stopper assembly into a 125 ml Erlenmeyer flask. Make sure the stopper fits tightly. Then, close the two-way valve above the rubber stopper. 2. a. Place the flask and temperature probe into a water bath. Make sure the entire flask is immersed. Cool the water bath to freezing. Allow the gas in the flask to reach the same temperature as the water bath. When the pressure and temperature readings in the Meter window stabilize, click Keep and type the temperature reading in the edit box to save the pressure-temperature data pair. b. Heat the water bath about 20oC, let the gas in the flask reach the same temperature as the water bath and record the pressure and temperature readings. Heat the water another 20oC and record the P-T data until you have four or five P-T data points. Make sure you record P-T data from 0oC to 100oC. Do not take your first data point at room temperature, take your second data point at 0oC, and next point at 40oC; you won’t be able to do Step 3. c. After you have collected your P-T data, determine the volume of the 125 ml flask (it will not be 125 ml). Then, calculate the mass and moles of air in the flask. d. Summarize your data on an Excel spreadsheet. Call this Table 3. Table 3. PT data for air. n = __ moles, V = ___ l. What else goes in this table? (Besides correct sig figs.) T, K Pexp, atm k = PT k = P/T Pcalculated 3. a. Look at your graph of pressure vs. temperature. Is there a direct or inverse relationship between pressure and temperature? Determine the math relationship between P and T (in Kelvin) the same way you did in Part 1, Step 3. Remember to use T instead of V. b. Find the proportionality constant like you did in Part 1, Step 4. c. Using the ideal gas equation, the volume and moles of gas you calculated in 2c, calculate nR/V. Compare this value to k. How are these quantities related? d. Using the ideal gas equation, solve for P. For each temperature reading, calculate P. Compare your calculated P to the experimental P. 4. a. Use your P-T data to determine the value for absolute zero. Plot T in oC instead of oK vs. P. Adjust the scale of the temperature axis from -300oC to 150oC. Do a linear regression of your data points. What pressure corresponds to absolute zero? b. Compare your experimental determination of absolute zero to the true value of absolute zero. Calculate the % error.
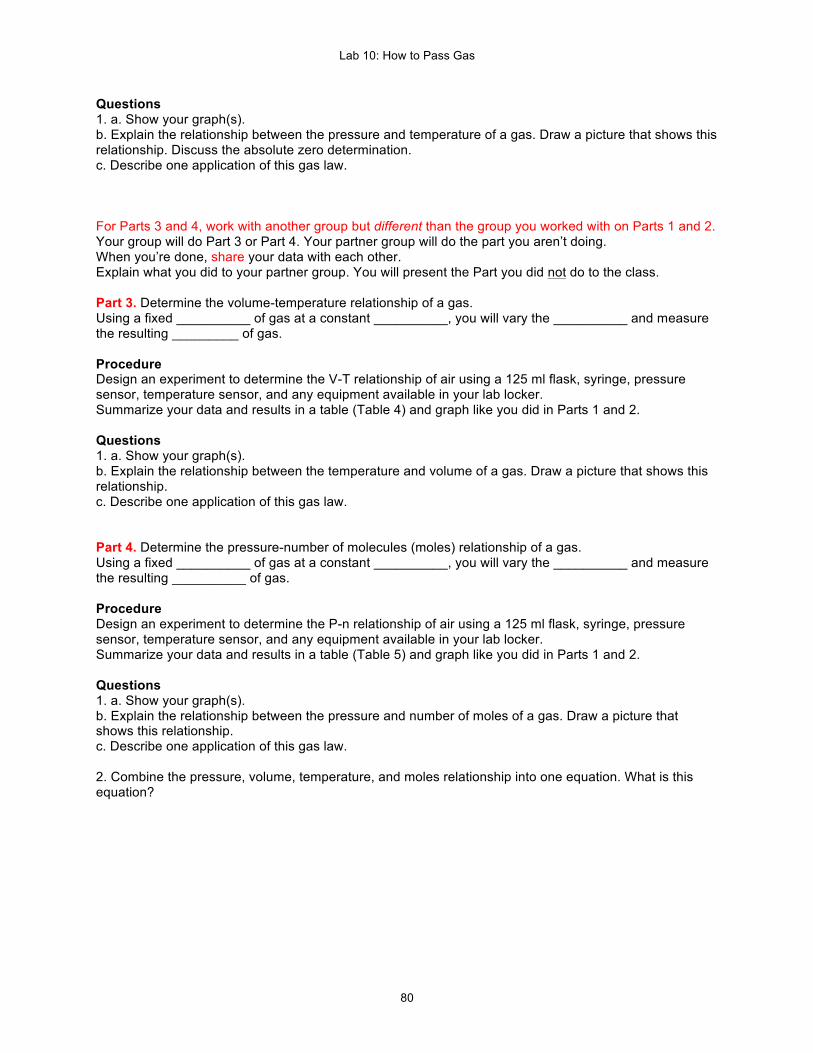
Lab 10: How to Pass Gas
80
Questions 1. a. Show your graph(s). b. Explain the relationship between the pressure and temperature of a gas. Draw a picture that shows this relationship. Discuss the absolute zero determination. c. Describe one application of this gas law. For Parts 3 and 4, work with another group but different than the group you worked with on Parts 1 and 2. Your group will do Part 3 or Part 4. Your partner group will do the part you aren’t doing. When you’re done, share your data with each other. Explain what you did to your partner group. You will present the Part you did not do to the class. Part 3. Determine the volume-temperature relationship of a gas. Using a fixed __________ of gas at a constant __________, you will vary the __________ and measure the resulting _________ of gas. Procedure Design an experiment to determine the V-T relationship of air using a 125 ml flask, syringe, pressure sensor, temperature sensor, and any equipment available in your lab locker. Summarize your data and results in a table (Table 4) and graph like you did in Parts 1 and 2. Questions 1. a. Show your graph(s). b. Explain the relationship between the temperature and volume of a gas. Draw a picture that shows this relationship. c. Describe one application of this gas law. Part 4. Determine the pressure-number of molecules (moles) relationship of a gas. Using a fixed __________ of gas at a constant __________, you will vary the __________ and measure the resulting __________ of gas. Procedure Design an experiment to determine the P-n relationship of air using a 125 ml flask, syringe, pressure sensor, temperature sensor, and any equipment available in your lab locker. Summarize your data and results in a table (Table 5) and graph like you did in Parts 1 and 2. Questions 1. a. Show your graph(s). b. Explain the relationship between the pressure and number of moles of a gas. Draw a picture that shows this relationship. c. Describe one application of this gas law. 2. Combine the pressure, volume, temperature, and moles relationship into one equation. What is this equation?
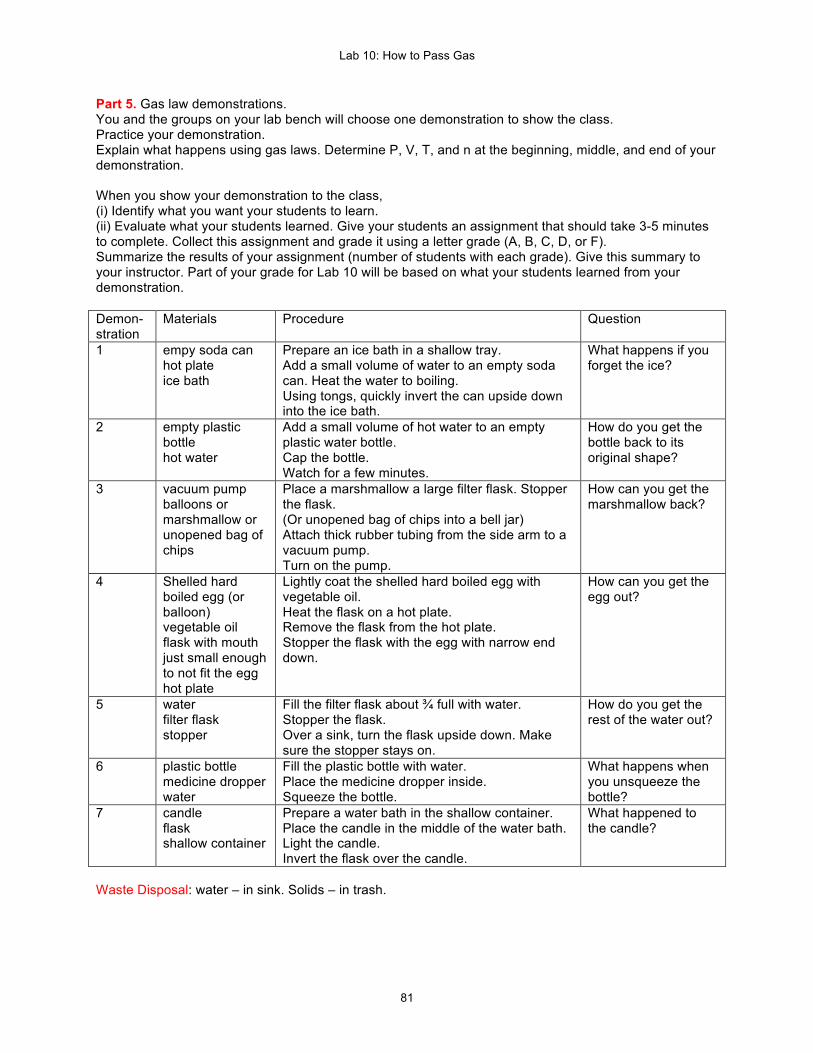
Lab 10: How to Pass Gas
81
Part 5. Gas law demonstrations. You and the groups on your lab bench will choose one demonstration to show the class. Practice your demonstration. Explain what happens using gas laws. Determine P, V, T, and n at the beginning, middle, and end of your demonstration. When you show your demonstration to the class, (i) Identify what you want your students to learn. (ii) Evaluate what your students learned. Give your students an assignment that should take 3-5 minutes to complete. Collect this assignment and grade it using a letter grade (A, B, C, D, or F). Summarize the results of your assignment (number of students with each grade). Give this summary to your instructor. Part of your grade for Lab 10 will be based on what your students learned from your demonstration. Demon-stration
Materials Procedure Question
1 empy soda can hot plate ice bath
Prepare an ice bath in a shallow tray. Add a small volume of water to an empty soda can. Heat the water to boiling. Using tongs, quickly invert the can upside down into the ice bath.
What happens if you forget the ice?
2 empty plastic bottle hot water
Add a small volume of hot water to an empty plastic water bottle. Cap the bottle. Watch for a few minutes.
How do you get the bottle back to its original shape?
3 vacuum pump balloons or marshmallow or unopened bag of chips
Place a marshmallow a large filter flask. Stopper the flask. (Or unopened bag of chips into a bell jar) Attach thick rubber tubing from the side arm to a vacuum pump. Turn on the pump.
How can you get the marshmallow back?
4 Shelled hard boiled egg (or balloon) vegetable oil flask with mouth just small enough to not fit the egg hot plate
Lightly coat the shelled hard boiled egg with vegetable oil. Heat the flask on a hot plate. Remove the flask from the hot plate. Stopper the flask with the egg with narrow end down.
How can you get the egg out?
5 water filter flask stopper
Fill the filter flask about ¾ full with water. Stopper the flask. Over a sink, turn the flask upside down. Make sure the stopper stays on.
How do you get the rest of the water out?
6 plastic bottle medicine dropper water
Fill the plastic bottle with water. Place the medicine dropper inside. Squeeze the bottle.
What happens when you unsqueeze the bottle?
7 candle flask shallow container
Prepare a water bath in the shallow container. Place the candle in the middle of the water bath. Light the candle. Invert the flask over the candle.
What happened to the candle?
Waste Disposal: water – in sink. Solids – in trash.

Lab 11: How to Apply Gas
82
Lab 11. How to Apply Gas (Laws) Can water boil at room temperature? How can you use baking soda and vinegar to pop a stopper? Temperature or pressure or both determine the state of matter (solid, liquid, or gas) of a substance. At room temperature, the state of matter depends on the chemical forces between atoms or molecules. A phase change occurs by changing the temperature or pressure or both. In this lab, you’ll apply gas laws to measure the pressure inside popcorn to make it pop, make water boil with ice, figure out how to propel a rubber stopper with a solid and liquid, and how to keep your car spotless, and how to make dried fruit. Materials Part 1. Students: bring popcorn (unbuttered) beakers, 125 ml Erlenmeyer flask Part 2. beakers, 125 ml Erlenmeyer flask ice Part 3. Students: bring vinegar beakers, 125 ml Erlenmeyer flask baking soda Part 4. Students: bring pennies beaker, dropper Water ethanol wax b. Students: bring fruit to make dried fruit Filter flask, vacuum tubing, one hole rubber stopper Vernier pressure sensor Part 1. How Does Popcorn Pop? Students: bring popcorn (unbuttered) Objectives (i) describe how pressure, volume, and temperature affects a gas Introduction
You’ve rented a video (who does that any more?). You’ve got a beverage. You’ve got popcorn. You put the unpopped popcorn bag into the your microwave oven and turn on the oven. You wonder, “What’s happening inside that bag? I bet gas laws are involved here.”
Popcorn consists of three components: the germ (embryo), endosperm (mainly starch), and pericarp (hull). Popcorn needs about 14% water to pop. The water is found in starch granules in the endosperm. Compared to other types of corn, the popcorn hull is thicker, has a denser arrangment of cellulose fibers, conducts heat several times faster to the endosperm, and can withstand higher steam pressures. As the kernel heats up, the water evaporates (at what temperature?), the steam turns the starch into a gelatin, and the pressure ____. Popcorn pops best at about 400oF (____oC). At this temperature, the pressure is high enough to burst the hull. When the hull breaks, the pressure _____ and the steam expands along with the soft starch. As the starch cools, it solidifies and forms your light and crispy and delicious popcorn. There are three common ways to pop popcorn: in a microwave oven, in a pot on a stove with oil, and with an air popper. In this experiment, you will make popcorn by air popping and by heating oil. The, you’ll use gas laws to estimate the pressure of steam inside a popcorn kernel to make it pop into a healthy, nutritious snack.
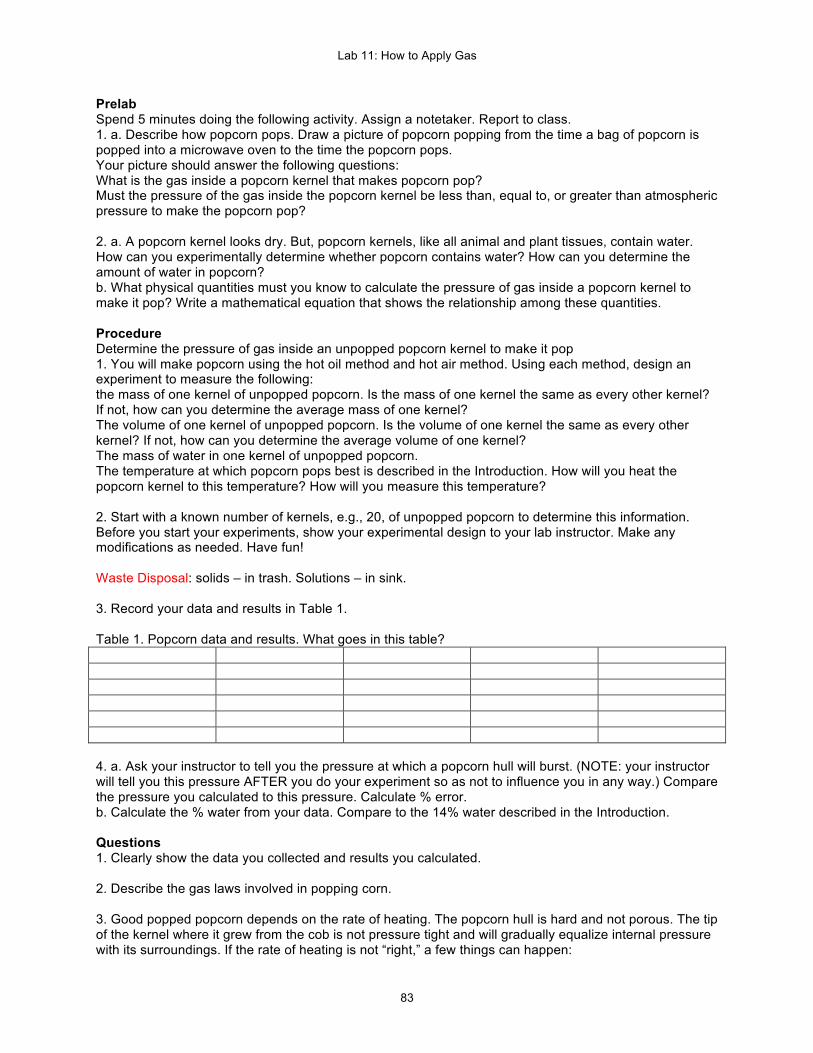
Lab 11: How to Apply Gas
83
Prelab Spend 5 minutes doing the following activity. Assign a notetaker. Report to class. 1. a. Describe how popcorn pops. Draw a picture of popcorn popping from the time a bag of popcorn is popped into a microwave oven to the time the popcorn pops. Your picture should answer the following questions: What is the gas inside a popcorn kernel that makes popcorn pop? Must the pressure of the gas inside the popcorn kernel be less than, equal to, or greater than atmospheric pressure to make the popcorn pop? 2. a. A popcorn kernel looks dry. But, popcorn kernels, like all animal and plant tissues, contain water. How can you experimentally determine whether popcorn contains water? How can you determine the amount of water in popcorn? b. What physical quantities must you know to calculate the pressure of gas inside a popcorn kernel to make it pop? Write a mathematical equation that shows the relationship among these quantities. Procedure Determine the pressure of gas inside an unpopped popcorn kernel to make it pop 1. You will make popcorn using the hot oil method and hot air method. Using each method, design an experiment to measure the following: the mass of one kernel of unpopped popcorn. Is the mass of one kernel the same as every other kernel? If not, how can you determine the average mass of one kernel? The volume of one kernel of unpopped popcorn. Is the volume of one kernel the same as every other kernel? If not, how can you determine the average volume of one kernel? The mass of water in one kernel of unpopped popcorn. The temperature at which popcorn pops best is described in the Introduction. How will you heat the popcorn kernel to this temperature? How will you measure this temperature? 2. Start with a known number of kernels, e.g., 20, of unpopped popcorn to determine this information. Before you start your experiments, show your experimental design to your lab instructor. Make any modifications as needed. Have fun! Waste Disposal: solids – in trash. Solutions – in sink. 3. Record your data and results in Table 1. Table 1. Popcorn data and results. What goes in this table? 4. a. Ask your instructor to tell you the pressure at which a popcorn hull will burst. (NOTE: your instructor will tell you this pressure AFTER you do your experiment so as not to influence you in any way.) Compare the pressure you calculated to this pressure. Calculate % error. b. Calculate the % water from your data. Compare to the 14% water described in the Introduction. Questions 1. Clearly show the data you collected and results you calculated. 2. Describe the gas laws involved in popping corn. 3. Good popped popcorn depends on the rate of heating. The popcorn hull is hard and not porous. The tip of the kernel where it grew from the cob is not pressure tight and will gradually equalize internal pressure with its surroundings. If the rate of heating is not “right,” a few things can happen:
Lab 11: How to Apply Gas
84
The starch at the center of the kernel does not turn to gelatin and does not soften. The rise in pressure inside the hull is slower than the loss of steam from the tip of the kernel. The starch at the outer edge reaches the required temperature and causes the hull to rupture but the uncooked starch at the center of the kernel does not expand and forms a small hard partially popped kernel of corn. Kernel does not pop (called an “old maid” in popcorn circles). a. If the rate of heating is too fast, which two things happen? b. If the rate of heating is too slow, which two things happen? Part 2. Make water boil with ice. Objectives (i) explain how you can make water boil at room temperature using a phase diagram Introduction Water boils at 100oC at 1 atm pressure. Does the boiling point change if the pressure changes? Prelab Spend 5 minutes doing the following activity. Assign a notetaker. Report to class. In a beaker, boil water. a. What chemical force(s) are breaking when water boils? b. Draw a picture of liquid water boiling. c. From your picture, what prevents the liquid water molecules from escaping into the gas phase? d. Is there a way to lower or decrease the “thing” that prevents liquid water molecules from escaping into the gas phase? Procedure You perform the following demonstration. You heat some water to boiling in an Erlenmeyer flask. You remove the flask from the heating source and close the flask with a rubber stopper. Next, you make the water in the flask boil simply by rubbing an ice cube on the outside walls of the flask. (Reference: See Chang, “General Chemistry: The Essential Concepts”, 5th ed., 2008, p. 423, Problem 12.116) Report Do this demonstration in front of your instructor. Explain why the water boiled using your knowledge of gas laws, states of matter, and phase diagrams. Part 3. SLAC Students: bring some vinegar to lab. Objectives (i) apply a gas forming reaction to do work Introduction
Each year, the Physics Olympics is held at Hartnell College. In Spring 1999, the Hartnell College Chemistry Club designed a chemistry event: Salinas’s Linear Accelerating Corks (SLAC). In this event, the reaction between baking soda and vinegar is used to propel a rubber stopper from a container toward a target. The score is based on distance and accuracy. We’ll focus on distance. Prelab Spend 5 minutes doing the following activity. Assign a notetaker. Report to class. Add baking soda to vinegar. a. What happens? Does the reaction get hot or cold? How can you tell? b. What happens to the pH as the reaction goes? Use litmus or a pH probe.

Lab 11: How to Apply Gas
85
c. What happens to the mass as the reaction goes? Use a balance if you wish but don’t spill anything on the balance. Procedure 1. Design your SLAC. Use your investigation of the vinegar-baking soda reaction to help your design. a. You can use a maximum of 0.5 g of baking soda. You can use as much vinegar as you need. b. You can use one of the pieces of equipment in your Chem 1A locker as your reaction chamber. Check out a rubber stopper that fits your container from the stockroom. c. Use your knowledge of gas laws to design an apparatus that will propel the rubber stopper as far as possible. Show your calculations of your design. Your calculations should include: the amounts of baking soda and vinegar that you use, the pressure of gas (which gas is present?) that propels the stopper, a comparison of at least two container sizes and gas pressures, any other relevant aspects to your design. d. Identify the data you will collect, equipment to measure the data, and results to calculate results. Summarize your data and results in Table 2. Give this table a title. e. Do your experiment. Table 2. (title). What goes in this table? Waste Disposal: Vinegar solutions – in sink. Solids – in trash. Questions 1. a. Discuss the conditions that made the stopper travel the farthest. Include numbers! What gas laws are involved? b. Discuss any relationship between distance and pressure. Include numbers! Part 4. How Much Keep Your Car Spotless Students: bring some pennies to lab. Objectives (i) relate liquid properties to chemical forces Introduction
You’ve seen these before: water beading on your car, water droplets beading up on a leaf, bugs floating of the surface of water, water dripping from a faucet. These phenomena are due to a specific property of a liquid. This liquid property is due to chemical forces between liquid molecules. Prelab Spend 5 minutes doing the following activity. Assign a notetaker. Report to class. 1. a. Take a 50 ml beaker. Fill it about half way with water. b. Look where the water touches the glass. Does the water creep up the glass or down the glass? c. Based on your answer to 1b, this means water is ___ attracted to itself than it is to glass. In other words, is water more attracted to water or is water more attracted to glass? d. What is this liquid property called? What chemical force is responsible for this property? 2. As a youngster, you saw bugs float on water. a. Using a dropper, add water to the beaker from 1a until you see a “mound” of water above the beaker b. Take a paper clip and make it float on the water’s surface. The paper clip is like the bug. If you are not able to get the paper clip to float, try again. c. What is this liquid property called? What chemical force between water molecules is responsible for forming this mound? d. Add something to the water to make the paper clip (bug) sink.
Lab 11: How to Apply Gas
86
Something: _____ Did it work? If so, you killed a bug! e. Is this liquid property of water higher or lower than other liquids, e.g., ethanol? f. If you used ethanol instead of water, would the paper clip (or bug) float? Procedure 1. Find a penny. Make sure it is clean and dry. 2. a. Calibrate a dropper. How many drops are in 1.00 ml of water? b. Repeat your calibration. Calculate an average and % difference. 3. You will measure the number of drops of water you can add to the surface of a penny until the water spills over. Can your group use more drops than the other groups? a. Predict how many drops the penny can hold without the water spilling over. b. Add one drop of water to the surface of the penny. Did it spill over? If not, continue adding drops of water until the water spills over. How high is the mound of water on the penny? c. Record your data in Table 3. Share your data with the class. Table 3. Penny drops data and results. What goes in this table? d. Using the class data for all groups, calculate the average number of drops and % difference. e. Compare the pennies for the groups with the highest number of drops and lowest number of drops. Is there any difference between these pennies? 4. You will compare the liquid property of water to the same liquid property of ethanol. Repeat Step 3 except use ethanol instead of water. 5. You want to change (increase or decrease) this liquid property of water. a. Take another dry penny. b. Add 20 drops of water to the surface of this penny. How high is the mound of water? c. Find a substance in the lab so that adding one drop of this substance to the water will make the water spill over. HINT: do you want this substance to increase or decrease the liquid property of water? d. Add one drop of this substance to the water. Record your observations. e. Using chemical forces, explain how this substance increased or decreased the liquid property of water. 6. How to keep your car (windshield) spotless. a. See Fig. 1. You just washed and waxed your car. A little water gets on your car. The water should __(A or B?) __.

Lab 11: How to Apply Gas
87
A B Fig. 1. Water on car (taken from http://photo20.ir/images/dljpgkixmlb1hm8frdo3.jpg) b. Take a glass beaker and turn it upside down. The beaker will substitue for your car windshield. Spray some water on the beaker using your wash bottle. Water __(did / did not) __ bead up on the surface of the beaker because the water is _____ attracted to the glass than it is to itself. c. Identify a substance in the lab that you can use to “treat” the beaker (windshield) so the water beads on the surface. HINTS: do you want water to be more attracted or less attracted to this substance? Should this substance be a solid or liquid or gas? Should this substance be soluble in water? Substance: _____ d. Apply a small amount of this substance to the top of the beaker. Spray some water on the “treated” beaker using your wash bottle. Did the water bead up on the surface of the beaker? If the water does NOT bead up, what does this mean based on chemical forces? Find a different substance to treat the beaker. e. Spray a lot of water on the “treated” beaker using your wash bottle so the water sheets off the beaker. Using chemical forces, explain why the water sheets off the glass instead of beading up. Waste Disposal: ethanol – in sink. Solids – in trash. When you are done, remove the substance you applied to the beaker and clean your beaker. Questions 1. a. Look up the numerical values of the surface tension of water and ethanol. Cite the reference where you found this information. b. What chemical force accounts for the difference in surface tension of water and ethanol? c. Based on your observations, is water more attracted to other water molecules or is water more attracted to the penny? d. How is your answer to Question 1d related to the meniscus of water in a straw? 2. From Step 6, you treated glass so water beads up or sheets off. a. The water beads up because water is ____ attracted to itself than it is to the beaker. b. This means you want to treat the glass with a substance with a ____ surface tension than water. c. Explain the difference between water beading up or sheeting off the treated glass. 3. a. You clean your lab glassware OR you pull your clean cups and glasses out of your dishwasher. Should water bead up on the glass? Give reasons. b. You see water bead on your car after a rain. The clouds part and the sun is out. When the water on your car evaporates, you see spots on your car because _____. c. If you want to keep your car spotless, you should _____ when you see water bead up on your car.
Lab 11: How to Apply Gas
86
http://photo20.ir/images/dljpgkixmlb1hm8frdo3.jpg b. Take a glass beaker and turn it upside down. The beaker will be like your car windshield. Spray some water on the beaker using your wash bottle. Did the water bead up on the surface of the beaker? c. Identify a substance in the lab that you can use to “treat” the beaker (windshield) so the water beads on the surface. HINTS: do you want water to be more attracted or less attracted to this substance? Should this substance be a solid or liquid or gas? Should this substance be soluble in water? Substance: _____. d. Apply a small amount of this substance to the top of the beaker. Spray some water on the “treated” beaker using your wash bottle. Did the water bead up on the surface of the beaker? If the water does NOT bead up, what does this mean? Should you find a different substance? If so, find a different substance. e. Spray a lot of water on the “treated” beaker using your wash bottle. Did the water bead up or did it sheet off the beaker? Waste Disposal: ethanol – in sink. Solids – in trash. When you are done, remove the substance you applied to the beaker and clean your beaker. Questions 1. a. Show your Table 3. b. Look up the numerical values of the surface tension of water and ethanol. Cite the reference where you found this information. c. What chemical force accounts for the difference in surface tension of water and ethanol? d. Based on your observations, is water more attracted to other water molecules or is water more attracted to the penny? e. How is your answer to Question 1d related to the meniscus of water in a straw? 2. From Step 7, you treated glass so water beads up or sheets off. a. The water beads up because water is ____ attracted to itself than it is to the beaker. b. This means you want to treat the glass with a substance with a ____ surface tension than water. c. Explain the difference between water beading up or sheeting off the treated glass. 3. a. You clean your lab glassware OR you pull your clean cups and glasses out of your dishwasher. Should water bead up or sheet off the glass? Give reasons. b. You see water bead on your car after a rain. The clouds part and the sun is out. When the water on your car evaporates, you see spots on your car because _____. c. If you want to keep your car spotless, you should _____ when you see water bead up on your car.
Lab 11: How to Apply Gas
88
Part 5. How To Make Dried Fruit Students: bring some fruit to make dried fruit. Objectives (i) relate liquid properties to chemical forces Introduction
You make sure you eat two or more servings of fruit each day. But sometimes the fruit gets more ripe than I like. So, maybe I can preserve the fruit by drying it.
Drying fruit involves removing water from the fruit. One way to remove water is to heat the fruit but I don’t really want cooked fruit. Another way is to change the pressure. Changing the pressure changes the boiling point of water. Prelab Spend 5 minutes doing the following activity. Assign a notetaker. Report to class. 1. a. Take a filter flask. Attach vacuum tubing from the side arm to the vacuum line. b. Add about 10 ml of water to the flask. Stopper the flask with a one hole stopper. Attach a Vernier pressure sensor to the stopper. Connect the pressure sensor to the computer. Open the LoggerPro program. Set the pressure to atmosphere units. c. Turn on the vacuum. Does the water boil? What is the pressure inside the flask? If not, warm the water by holding the flask with your hands. Does the water boil? What is the pressure inside the flask? If not, set up a warm water bath on a hot plate. Make sure the filter flask fits in your bath. Warm the water in the flask in the wam water bath. Does the water boil? What is the pressure inside the flask? 2. a. Look up the amount of water in your fruit. Fruit: _____ Water content: ____ g of water in 100 g of fruit. b. Prepare a table of data and results. Label this Table 4. Procedure Record your data and results in Table 4. 1. a. Slice your fruit. b. Measure mass of a fruit slice. You want to measure the amount of water lost from the fruit. 2. a. Place ____ in the filter flask. Connect the ____ to the vacuum line. Stopper the flask with a one hole stopper. Attach a Vernier pressure sensor to the stopper. Connect the pressure sensor to the computer. Open the LoggerPro program. Set the pressure to atmosphere units. b. Turn on the vacuum. c. After five minutes, record the temperature, pressure inside the flask, and your observations. Turn off the vacuum. Measure the mass of the fruit. Is your fruit getting dry? d. Put your fruit back in the filter flask. Warm up the flask to about 40oC by placing the filter flask in a warm water bath. After five more minutes, record the temperature, pressure inside the flask, and your observations. Turn off the vacuum. Measure the mass of the fruit. Is your fruit getting drier? e. Continue drying your fruit. Record the experimental variables. 3. After drying your fruit, measure the mass of your dried fruit. Calculate % water lost.

Lab 11: How to Apply Gas
89
Questions 1. a. Compare your data from Step 2c and 2d. How much more water did your fruit lose after heating? Did the pressure remain the same? b. Compare the class data in Table 4. Which fruit is easiest to dry? Hint: What data or result helps you answer this question? References: 1. D. D. Holmquist and D. Volz, “Chemistry With Computers”, 2nd ed., 2000, Vernier Software and Technology, p. 6-1 to 7-5.