experimental characterisation of the tangential and cylindrical fertiliser distribution pattern from...
TRANSCRIPT
Biosystems Engineering (2003) 86 (3), 327–337doi:10.1016/j.biosystemseng.2003.08.004
Available online at www.sciencedirect.com
PM}Power and Machinery
Experimental Characterisation of the Tangential and Cylindrical FertiliserDistribution Pattern from a Spinning Disc: A Parameter Study
J. Reumers; E. Tijskens; H. Ramon
Department for Agro-Engineering and Economics, K.U. Leuven, Kasteelpark Arenberg 30, B-3001 Leuven, Belgium;e-mail of corresponding author: [email protected]
(Received 19 April 2002; accepted in revised form 8 August 2003; published online 16 September 2003)
Traditionally the performance of centrifugal spreaders is evaluated in spreading halls by measuring fertiliserdistribution patterns in standardised tests. Alternative distribution patterns can be measured with compactdevices that intercept the particle flow immediately after leaving the spinning disc. An experimental facilitywas built which allowed the measurement of the tangential, as well as the cylindrical distribution of theparticle flow at the disc edge. A number of experiments were carried out, using one type of centrifugal spreaderwith a conical disc. The influences of vane length, mass flow rate, particle size and fertiliser type on both thetangential and the cylindrical distribution patterns have been investigated. The results show that flows ofparticles with a larger mean diameter achieve a higher velocity on the disc, causing the distribution patterns toshift to lower angular positions. Furthermore, it is concluded that a smaller average particle size leads to ahigher mass discharge flow rate from the hopper. In addition, a shift of the cylindrical distribution to a lowervertical position is observed when the mass flow rate increases.# 2003 Silsoe Research Institute. All rights reserved
Published by Elsevier Ltd
1. Introduction
In Europe, fertiliser particles are mainly spread bymeans of centrifugal spreaders (Persson, 1998). Thespatial distribution of the particles across the field hasan important influence on the growth of the crop.Mostly one tries to achieve an even distribution ofparticles across the field, i.e. a constant mass of fertiliserper unit soil area. Application of too small or too largedoses at certain spots will results in qualitative andquantitative yield losses (Sogaard & Kierkegaard, 1994)and can lead to losses of profits of 10% and more(Prummel & Datema, 1962). Excessive applicationobviously can avoid nutrient deficiency. On the otherhand, it results not only in additional costs and theabove-mentioned yield losses, but also causes pollutionof groundwater and surface water (Parris & Reille,1999).
The distribution pattern is influenced by a largenumber of factors. Four types can be distinguished: (1)the properties of the artificial fertiliser particles (size andshape, density, air resistance coefficient, friction coeffi-
cient with the disc and the vanes); (2) the properties ofthe spreader (disc shape and speed, shape and positionof the vanes, position, size and shape of the hoppersorifice); (3) the working width; and (4) external factors(wind, humidity, surface irregularities and mechanicalvibrations).
Several types of distribution patterns can be measuredin order to evaluate the performance of a certainspreader for a certain type of fertiliser. The transversedistribution is the only standardised distribution pattern(ISO, 1983). Measurement of the transverse distributionis done in spreading halls. In these halls most externalfactors influencing distribution patterns are excluded. Insome halls, even temperature and humidity are con-trolled (Persson, 1998). Spreading halls suffer from a fewimportant drawbacks: they are large and expensive andperforming tests requires large amounts of fertiliser,which causes additional costs for purchase and trans-portation. After a spreading test, the market value of thefertiliser is very low, due to damage and mixing ofdifferent products. The static spatial distribution is anon-standardised distribution pattern, which represents
ARTICLE IN PRESS
1537-5110/$30.00 327 # 2003 Silsoe Research Institute. All rights reserved
Published by Elsevier Ltd
the two-dimensional mass distribution for a non-movingspreader. It can be registered by adding individualtransverse distribution patterns, measured for a stati-cally placed spreader, with incremental positions alongthe driving direction (Pettersen et al., 1991; Olieslagers,1997).
In this research, alternative distributions were mea-sured, namely the tangential and cylindrical distribu-tion patterns. The cylindrical distribution pattern isdefined as
Cðy; zÞ ¼Dm
DyDzDtð1Þ
where Dm is the amount of mass, in kg, that passesthrough a part of the surface of a concentric cylinderduring a time period Dt, in s. Each part of the surface ischaracterised by its angular position y, relative to thedriving direction of the spreader, and angular width Dy,both in deg, and its vertical position z and heightDz, both in m. The tangential distribution pattern isdefined as
TðyÞ ¼Dm
DyDt¼
ZCðy; zÞ dz ð2Þ
Note that both distributions are dependent on the radiusof the cylinder. Even when the cylinder is close to theedge of the disc, this dependence cannot be ignoredbecause the particles do not leave the disc in the radialdirection. In order to compare the flow processes ondifferent discs, possibly with varying radii, the mostgeneral approach would be to consider distributionswith a cylinder radius equal to the disc radius.
No standardisation exists for the registration oftangential or cylindrical distribution patterns. Circulartrays, divided into compartments, were used by Ad-jroudi (1993), Heppler (1993) and Olieslagers (1997) tomeasure tangential distributions. Persson and Skovs-gaard (1998) used a collection unit with a 0�10m by0�20m inlet moving around the disc. The measuredtangential distributions can be transformed into dis-tributions at the disc edge, when the horizontal angles of
flight of the particles during their short ballistic flightbetween leaving the vane and landing in the compart-ments are known. Hofstee (1993) developed a rotatingDoppler meter for analysing particle flows around thespreader. Heppler (1993) and Persson (1996) measuredthe outlet angle of the particles at the edge of the disc bymeans of a free rotating plate, which was forced in thedirection of particle flow movement. Particle velocityand direction information can be derived from theDoppler frequency shift of an ultrasonic beam (Hofstee,1994), but extensive data processing is required. Noprecise specification on the accuracy was given. Griftand Hofstee (1997) developed an optical method fortwo-dimensional velocity measurements (5% accuracy),which also allows registration of the passing positionand the particle diameter (2% accuracy). The authorsmention that various problems have to be solved beforeit can be applied to testing of fertiliser spreaders. Innsand Reece (1962) and G .oohlich and Kesten (1972)measured the horizontal angle of flight on photographicimages taken of the particle flow. Olieslagers (1997) alsoused this method and validated it by means of high-speed video image analysis and concluded that themethod produces reliable results. In order to facilitatethe measurement of the angle of flight on photographicimages, semi-automatic approaches using a digitalcamera are currently being developed (Vangeyte &Langenaekens, 2001).
Distribution patterns can also be determined usingcomputer simulations. Starting with the geometrical andphysical properties of the spreader and fertiliser, particletrajectories have been calculated by applying physicallaws (Hofstee, 1993; Olieslagers, 1997; Dobler & Flatow,1968; Pitt et al., 1982; Heppler, 1993). Tissot (1995)concluded that the use of equations of motion is notsatisfactory when being used for the prediction offertiliser distribution in the field. He stated that, as thephenomena of particle interactions, the impact betweenparticles and vane, the changing particle characteristicsand the unpredictable amount of particles not beingtaken by the vanes are difficult to simulate, the use of
ARTICLE IN PRESS
Notation
C(y, z) cylindrical distribution pattern,kgm�1 deg�1 s�1
T(y) tangential distribution pattern, kg deg�1 s�1
z vertical position of part of cylindricalsurface, m
b particle outlet angle with respect to the radialdirection through the vane end, deg
Dm mass of fertiliser captured in part of cylindricalsurface, kg
Dt time period of spreading test, sDz height of part of cylindrical surface, mDy angular width of part of cylindrical surface,
degy angular position of part of cylindrical surface,
degf particle position angle at the disc edge with
regard to spreader driving direction, deg
J. REUMERS ET AL.328
existing equations describing the particle motion doesnot give satisfactory results.
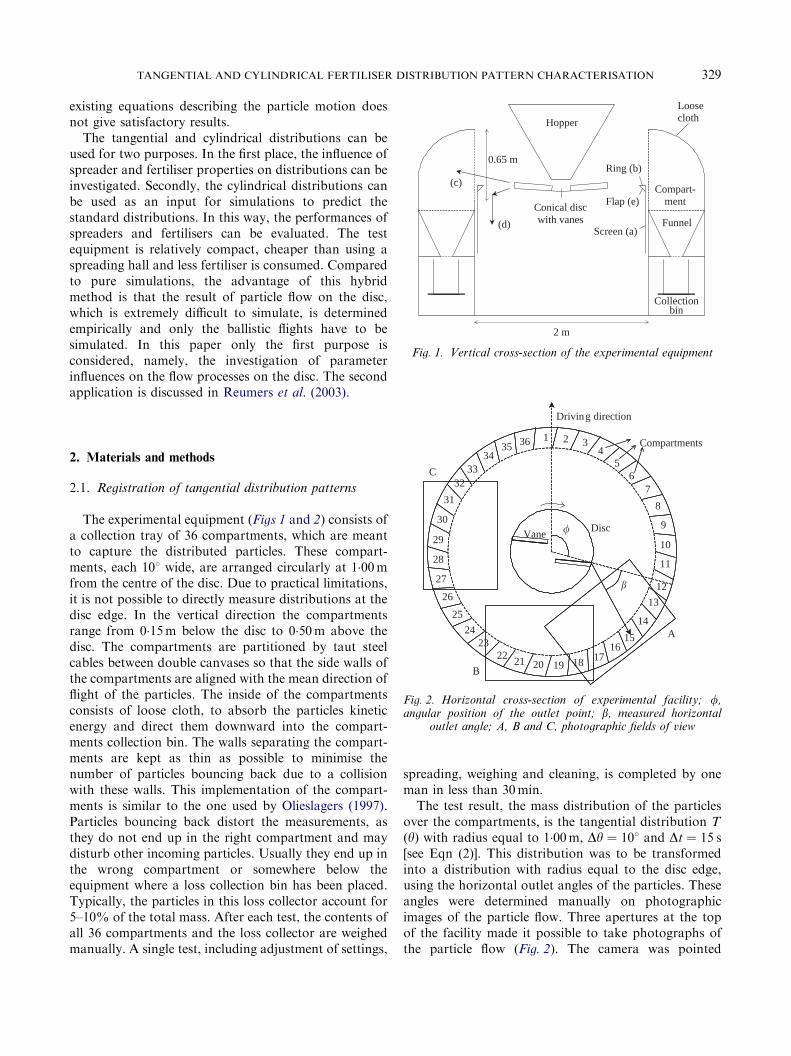
The tangential and cylindrical distributions can beused for two purposes. In the first place, the influence ofspreader and fertiliser properties on distributions can beinvestigated. Secondly, the cylindrical distributions canbe used as an input for simulations to predict thestandard distributions. In this way, the performances ofspreaders and fertilisers can be evaluated. The testequipment is relatively compact, cheaper than using aspreading hall and less fertiliser is consumed. Comparedto pure simulations, the advantage of this hybridmethod is that the result of particle flow on the disc,which is extremely difficult to simulate, is determinedempirically and only the ballistic flights have to besimulated. In this paper only the first purpose isconsidered, namely, the investigation of parameterinfluences on the flow processes on the disc. The secondapplication is discussed in Reumers et al. (2003).
2. Materials and methods
2.1. Registration of tangential distribution patterns
The experimental equipment (Figs 1 and 2) consists ofa collection tray of 36 compartments, which are meantto capture the distributed particles. These compart-ments, each 108 wide, are arranged circularly at 1�00mfrom the centre of the disc. Due to practical limitations,it is not possible to directly measure distributions at thedisc edge. In the vertical direction the compartmentsrange from 0�15m below the disc to 0�50m above thedisc. The compartments are partitioned by taut steelcables between double canvases so that the side walls ofthe compartments are aligned with the mean direction offlight of the particles. The inside of the compartmentsconsists of loose cloth, to absorb the particles kineticenergy and direct them downward into the compart-ments collection bin. The walls separating the compart-ments are kept as thin as possible to minimise thenumber of particles bouncing back due to a collisionwith these walls. This implementation of the compart-ments is similar to the one used by Olieslagers (1997).Particles bouncing back distort the measurements, asthey do not end up in the right compartment and maydisturb other incoming particles. Usually they end up inthe wrong compartment or somewhere below theequipment where a loss collection bin has been placed.Typically, the particles in this loss collector account for5–10% of the total mass. After each test, the contents ofall 36 compartments and the loss collector are weighedmanually. A single test, including adjustment of settings,
spreading, weighing and cleaning, is completed by oneman in less than 30min.
The test result, the mass distribution of the particlesover the compartments, is the tangential distribution T
ðyÞ with radius equal to 1�00m, Dy ¼ 108 and Dt ¼ 15 s[see Eqn (2)]. This distribution was to be transformedinto a distribution with radius equal to the disc edge,using the horizontal outlet angles of the particles. Theseangles were determined manually on photographicimages of the particle flow. Three apertures at the topof the facility made it possible to take photographs ofthe particle flow (Fig. 2). The camera was pointed
ARTICLE IN PRESS
Compart-ment
Funnel
0.65 m
Screen (a)
Flap (e)
Hopper
Conical disc with vanes
Ring (b)
2 m
Loose cloth
Collection
(c)
(d)
bin
Fig. 1. Vertical cross-section of the experimental equipment
Driving direction
DiscVane
Compartments
�
�
B
A
C
3635 34
26
3332
30
31 8
16
27
23 24
25
28
29
22 21 20 19 18 17
15
14
13
12
11
10
34
9
67
5
21
Fig. 2. Horizontal cross-section of experimental facility; f,angular position of the outlet point; b, measured horizontal
outlet angle; A, B and C, photographic fields of view
TANGENTIAL AND CYLINDRICAL FERTILISER DISTRIBUTION PATTERN CHARACTERISATION 329
vertically down and focused on the height were theparticles passed by. Four fluorescent lamps wereinstalled inside the facility and an additional halogenlamp was placed on top. Photographic films of 200ASAwere used, the shutter speed adjusted to 1/30 s and thediaphragm adjusted to f/3�5. Because of the relative longopening of the shutter compared to the speed of theparticles, these particles appeared on the photographs asstraight lines. As the disc was outside the field of view, aboard with a reference frame was placed underneath theparticle flow. The starting point of each straight linerepresenting a flying particle could then be determined.Hence, for a large number of points on the surroundingsof the disc, the horizontal angle of departure of theparticles could be measured. Consequently, it waspossible to calculate for each compartment the angularpositions of the outlet points at the disc edge of theparticles that ended up in this compartment. Therefore,it was possible to transform the tangential distributionwith radius equal to 1�00m into a distribution withradius equal to the disc radius. Discharge orifice size andparticle size influence the total distributed mass. There-fore, the measurement values were normalised withrespect to the total distributed mass, which allows acomparison of the shape of different patterns. The totalmass of each distribution was always equated to 10 kg.
2.2. Registration of cylindrical distribution patterns
In order to measure cylindrical distributions, theexperimental facility (see Fig. 1) was equipped with avertically adjustable screen (a), which was suspended ona metal ring (b) 2mm thick, with an outer radius of 1mand an inner radius of 0�96m. The screen was positionedexactly in front of the entrances of the compartments toseparate the particle flow into the required directions.The upper flow (c) ended up in the compartments, butthe lower flow (d) was blocked by the screen anddirected downwards to the collector for losses under-neath the facility (not shown in Fig. 1). The transitionbetween the ring and the screen was covered with arubber flap (e).
The determination of the cylindrical distributionrequired a series of tests with increasing screen heights.The results of all tests were normalised with respect tothe total distributed mass of each test. By calculating thedifferences between the successive normalised masses ofeach compartment, the vertical distribution of particlesover each compartment was known. In this way, themass captured in a (fictitious) horizontal segment of acompartment was measured indirectly. The tangentialand vertical mass distribution over all these segments ofthe cylindrical surface constituted the cylindrical dis-
tribution pattern Cðy; zÞ with radius equal to 1m,Dy ¼ 108, Dz ¼ 0�01 m and Dt ¼ 15 s [see Eqn (1)]. Notransformation into a distribution with radius equal tothe disc radius could be done in the case of thecylindrical pattern. Too many assumptions would berequired to perform a transformation of the verticalaxis. Instead, it was preferred to describe the entiredistribution as a function of the cylindrical surface at thecompartment entrances. In order to compare cylindricaldistribution patterns, the measurements were normal-ised first. The total mass of each distribution was alwaysequated to 3 kg. This way distributions with peak valuesaround 0�1 kg were achieved.
2.3. Spreader settings and fertiliser properties
Different types of spreaders can be mounted in theexperimental facility, but in order to study the influencesof fertiliser and disc properties, all tests were carried outwith the same commercial spreader (Amazone ZA-M).Only one of its two discs was used. The type of disc usedwas an OS 20-28. The disc is conical (108). It was notinclined. Normally, it is equipped with a short and along vane, but for examining the influences of disc andfertiliser properties either two long or two short vaneswere symmetrically mounted on the disc. The position ofthe vanes could be adjusted (radial, pitched forwards orbackwards), but was kept constant during the experi-ments. The short vanes were in position 68 and the longvanes in position 87, both corresponding to a backwardpitch of �8�58. In these positions, the ends of the shortand the long vanes have radii of 0�29 and 0�39m,respectively. The disc has a radius of 0�22m and wasalways spinning at a constant angular velocity(720min�1). As the vanes extended beyond the discedge, the tangential distribution actually had a radiusequal to the radius of the vane end instead of equal tothe disc edge. The hopper above the disc was equippedwith an agitator to promote a constant discharge rate.The mass flow rate could be tuned by adjusting the sizeof the discharge orifice. This orifice has the shape of acircle segment with radius 0�07m. One side of thesegment can be rotated with a lever, to adjust the angleof the segment. Only three different orifice sizes wereapplied during the tests, which were denoted by orificeposition 25, 32 and 43. The corresponding mass flowrates were depending on fertiliser properties. A pneu-matically driven lever was responsible for the automaticopening and closing of the discharge orifice, assuring aconstant opening time equal to 15 s for each test.
Two different types of fertiliser were used: CAN 27%N granular product (Hydro Agri Sluiskil) and NPK 16-16-16 prilled product (Hydro Agri Porsgrunn). Their
ARTICLE IN PRESSJ. REUMERS ET AL.330
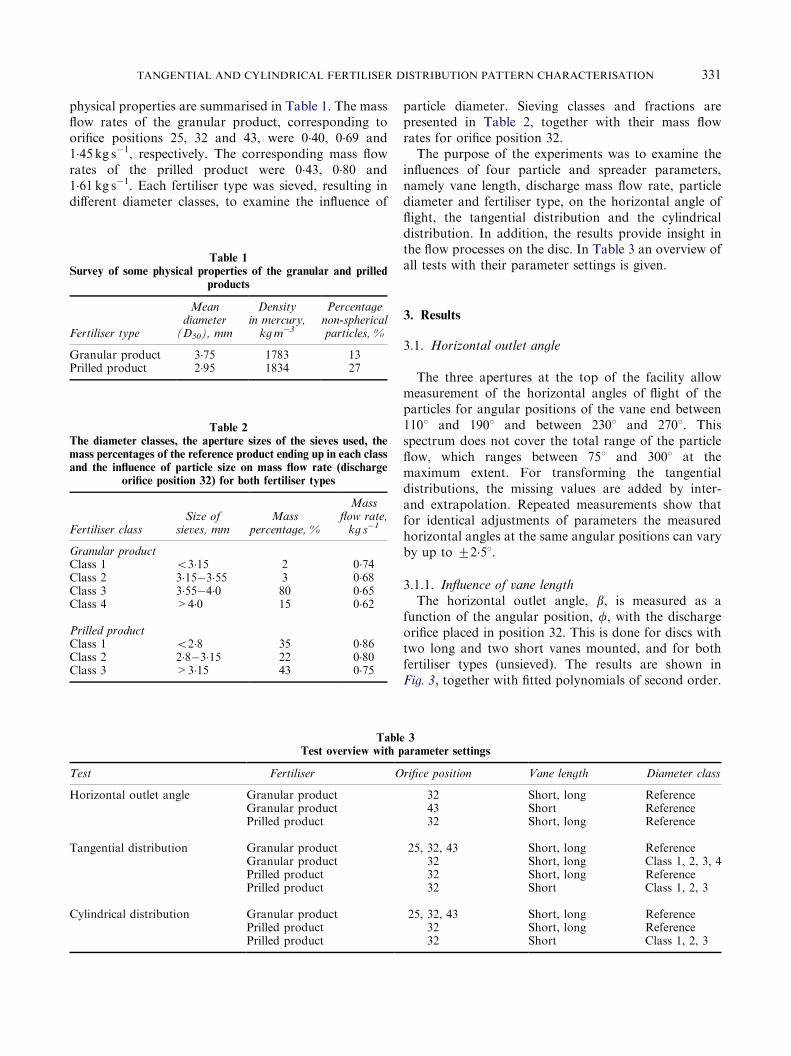
physical properties are summarised in Table 1. The massflow rates of the granular product, corresponding toorifice positions 25, 32 and 43, were 0�40, 0�69 and1�45 kg s�1, respectively. The corresponding mass flowrates of the prilled product were 0�43, 0�80 and1�61 kg s�1. Each fertiliser type was sieved, resulting indifferent diameter classes, to examine the influence of
particle diameter. Sieving classes and fractions arepresented in Table 2, together with their mass flowrates for orifice position 32.
The purpose of the experiments was to examine theinfluences of four particle and spreader parameters,namely vane length, discharge mass flow rate, particlediameter and fertiliser type, on the horizontal angle offlight, the tangential distribution and the cylindricaldistribution. In addition, the results provide insight inthe flow processes on the disc. In Table 3 an overview ofall tests with their parameter settings is given.
3. Results
3.1. Horizontal outlet angle
The three apertures at the top of the facility allowmeasurement of the horizontal angles of flight of theparticles for angular positions of the vane end between1108 and 1908 and between 2308 and 2708. Thisspectrum does not cover the total range of the particleflow, which ranges between 758 and 3008 at themaximum extent. For transforming the tangentialdistributions, the missing values are added by inter-and extrapolation. Repeated measurements show thatfor identical adjustments of parameters the measuredhorizontal angles at the same angular positions can varyby up to �2�58.
3.1.1. Influence of vane length
The horizontal outlet angle, b, is measured as afunction of the angular position, f, with the dischargeorifice placed in position 32. This is done for discs withtwo long and two short vanes mounted, and for bothfertiliser types (unsieved). The results are shown inFig. 3, together with fitted polynomials of second order.
ARTICLE IN PRESS
Table 3
Test overview with parameter settings
Test Fertiliser Orifice position Vane length Diameter class
Horizontal outlet angle Granular product 32 Short, long ReferenceGranular product 43 Short ReferencePrilled product 32 Short, long Reference
Tangential distribution Granular product 25, 32, 43 Short, long ReferenceGranular product 32 Short, long Class 1, 2, 3, 4Prilled product 32 Short, long ReferencePrilled product 32 Short Class 1, 2, 3
Cylindrical distribution Granular product 25, 32, 43 Short, long ReferencePrilled product 32 Short, long ReferencePrilled product 32 Short Class 1, 2, 3
Table 2
The diameter classes, the aperture sizes of the sieves used, themass percentages of the reference product ending up in each class
and the influence of particle size on mass flow rate (discharge
orifice position 32) for both fertiliser types
Fertiliser classSize of
sieves, mmMass
percentage, %
Massflow rate,
kg s�1
Granular productClass 1 53�15 2 0�74Class 2 3�15�3�55 3 0�68Class 3 3�55�4�0 80 0�65Class 4 >4�0 15 0�62
Prilled productClass 1 52�8 35 0�86Class 2 2�8�3�15 22 0�80Class 3 >3�15 43 0�75
Table 1
Survey of some physical properties of the granular and prilled
products
Fertiliser type
Meandiameter
(D50), mm
Densityin mercury,
kg m�3
Percentagenon-sphericalparticles, %
Granular product 3�75 1783 13Prilled product 2�95 1834 27
TANGENTIAL AND CYLINDRICAL FERTILISER DISTRIBUTION PATTERN CHARACTERISATION 331
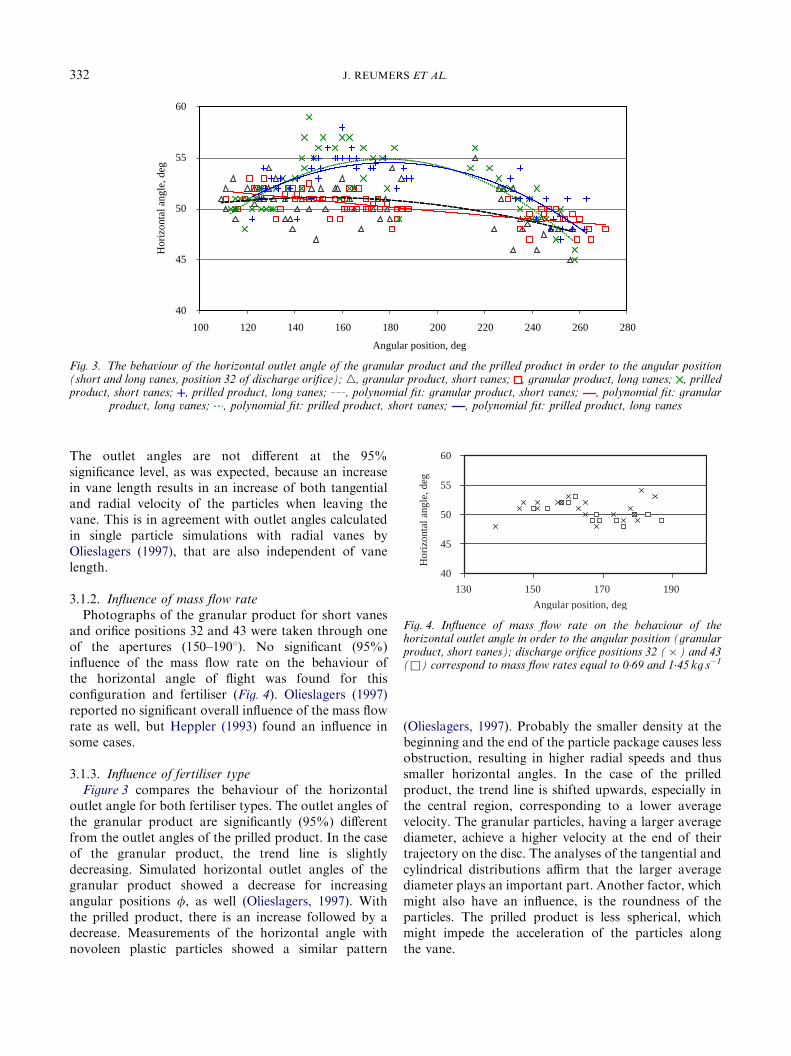
The outlet angles are not different at the 95%significance level, as was expected, because an increasein vane length results in an increase of both tangentialand radial velocity of the particles when leaving thevane. This is in agreement with outlet angles calculatedin single particle simulations with radial vanes byOlieslagers (1997), that are also independent of vanelength.
3.1.2. Influence of mass flow rate
Photographs of the granular product for short vanesand orifice positions 32 and 43 were taken through oneof the apertures (150–1908). No significant (95%)influence of the mass flow rate on the behaviour ofthe horizontal angle of flight was found for thisconfiguration and fertiliser (Fig. 4). Olieslagers (1997)reported no significant overall influence of the mass flowrate as well, but Heppler (1993) found an influence insome cases.
3.1.3. Influence of fertiliser type
Figure 3 compares the behaviour of the horizontaloutlet angle for both fertiliser types. The outlet angles ofthe granular product are significantly (95%) differentfrom the outlet angles of the prilled product. In the caseof the granular product, the trend line is slightlydecreasing. Simulated horizontal outlet angles of thegranular product showed a decrease for increasingangular positions f, as well (Olieslagers, 1997). Withthe prilled product, there is an increase followed by adecrease. Measurements of the horizontal angle withnovoleen plastic particles showed a similar pattern
(Olieslagers, 1997). Probably the smaller density at thebeginning and the end of the particle package causes lessobstruction, resulting in higher radial speeds and thussmaller horizontal angles. In the case of the prilledproduct, the trend line is shifted upwards, especially inthe central region, corresponding to a lower averagevelocity. The granular particles, having a larger averagediameter, achieve a higher velocity at the end of theirtrajectory on the disc. The analyses of the tangential andcylindrical distributions affirm that the larger averagediameter plays an important part. Another factor, whichmight also have an influence, is the roundness of theparticles. The prilled product is less spherical, whichmight impede the acceleration of the particles alongthe vane.
ARTICLE IN PRESS
40
45
50
55
60
130 150 170 190
Angular position, deg
Hor
izon
tal a
ngle
, deg
Fig. 4. Influence of mass flow rate on the behaviour of thehorizontal outlet angle in order to the angular position (granularproduct, short vanes); discharge orifice positions 32 (� ) and 43(&) correspond to mass flow rates equal to 0�69 and 1�45 kg s�1
40
45
50
55
60
100 120 140 160 180 200 220 240 260 280
Angular position, deg
Hor
izon
tal a
ngle
, deg
Fig. 3. The behaviour of the horizontal outlet angle of the granular product and the prilled product in order to the angular position(short and long vanes, position 32 of discharge orifice); n, granular product, short vanes; , granular product, long vanes; , prilledproduct, short vanes; , prilled product, long vanes; , polynomial fit: granular product, short vanes; , polynomial fit: granular
product, long vanes; , polynomial fit: prilled product, short vanes; , polynomial fit: prilled product, long vanes
J. REUMERS ET AL.332
3.2. Tangential distribution pattern
A spreading test without screen results in a massdistribution over the 36 compartments. Together withthe (average) behaviour of the horizontal angle of flight,measured on photographic images of the particle flow,this distribution can be converted to a tangentialdistribution pattern with radius equal to the radius ofthe vane end.
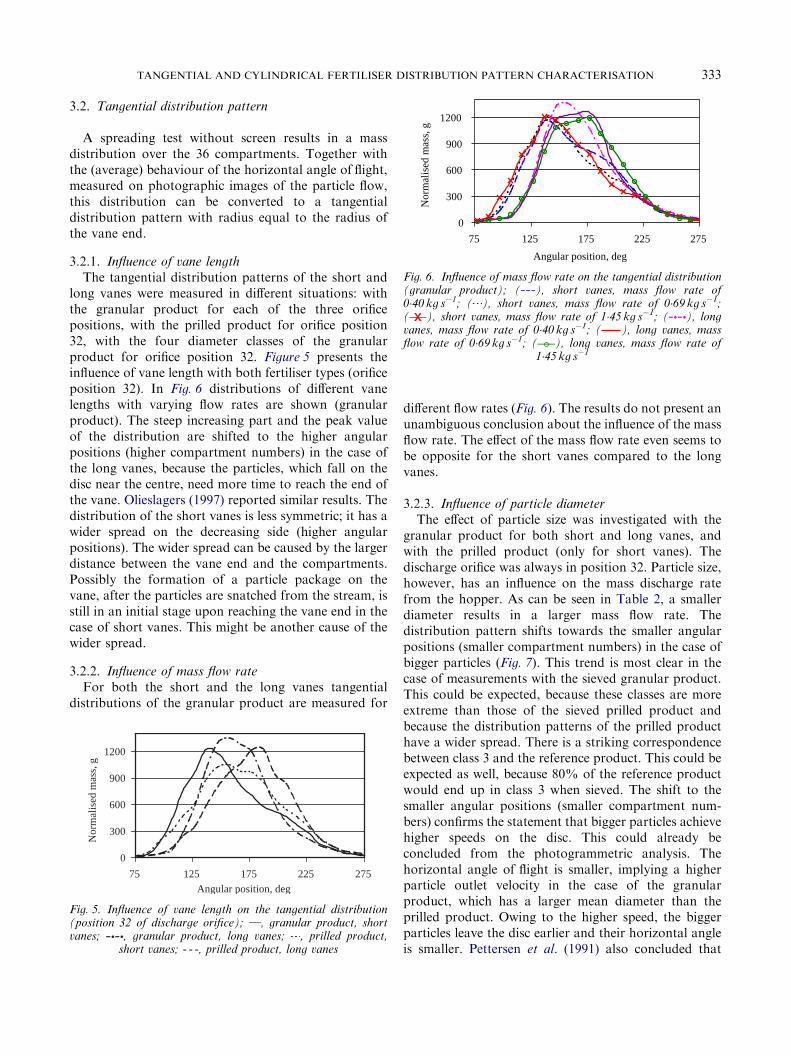
3.2.1. Influence of vane length
The tangential distribution patterns of the short andlong vanes were measured in different situations: withthe granular product for each of the three orificepositions, with the prilled product for orifice position32, with the four diameter classes of the granularproduct for orifice position 32. Figure 5 presents theinfluence of vane length with both fertiliser types (orificeposition 32). In Fig. 6 distributions of different vanelengths with varying flow rates are shown (granularproduct). The steep increasing part and the peak valueof the distribution are shifted to the higher angularpositions (higher compartment numbers) in the case ofthe long vanes, because the particles, which fall on thedisc near the centre, need more time to reach the end ofthe vane. Olieslagers (1997) reported similar results. Thedistribution of the short vanes is less symmetric; it has awider spread on the decreasing side (higher angularpositions). The wider spread can be caused by the largerdistance between the vane end and the compartments.Possibly the formation of a particle package on thevane, after the particles are snatched from the stream, isstill in an initial stage upon reaching the vane end in thecase of short vanes. This might be another cause of thewider spread.
3.2.2. Influence of mass flow rate
For both the short and the long vanes tangentialdistributions of the granular product are measured for
different flow rates (Fig. 6). The results do not present anunambiguous conclusion about the influence of the massflow rate. The effect of the mass flow rate even seems tobe opposite for the short vanes compared to the longvanes.
3.2.3. Influence of particle diameter
The effect of particle size was investigated with thegranular product for both short and long vanes, andwith the prilled product (only for short vanes). Thedischarge orifice was always in position 32. Particle size,however, has an influence on the mass discharge ratefrom the hopper. As can be seen in Table 2, a smallerdiameter results in a larger mass flow rate. Thedistribution pattern shifts towards the smaller angularpositions (smaller compartment numbers) in the case ofbigger particles (Fig. 7). This trend is most clear in thecase of measurements with the sieved granular product.This could be expected, because these classes are moreextreme than those of the sieved prilled product andbecause the distribution patterns of the prilled producthave a wider spread. There is a striking correspondencebetween class 3 and the reference product. This could beexpected as well, because 80% of the reference productwould end up in class 3 when sieved. The shift to thesmaller angular positions (smaller compartment num-bers) confirms the statement that bigger particles achievehigher speeds on the disc. This could already beconcluded from the photogrammetric analysis. Thehorizontal angle of flight is smaller, implying a higherparticle outlet velocity in the case of the granularproduct, which has a larger mean diameter than theprilled product. Owing to the higher speed, the biggerparticles leave the disc earlier and their horizontal angleis smaller. Pettersen et al. (1991) also concluded that
ARTICLE IN PRESS
0
300
600
900
1200
75 125 175 225 275
Angular position, deg
Nor
mal
ised
mas
s, g
Fig. 5. Influence of vane length on the tangential distribution(position 32 of discharge orifice); }, granular product, shortvanes; , granular product, long vanes; , prilled product,
short vanes; - - -, prilled product, long vanes
0
300
600
900
1200
75 125 175 225 275
Angular position, deg
Nor
mal
ised
mas
s, g
Fig. 6. Influence of mass flow rate on the tangential distribution(granular product); ( ), short vanes, mass flow rate of0�40 kg s�1; ( ), short vanes, mass flow rate of 0�69 kg s�1;( ), short vanes, mass flow rate of 1�45 kg s�1; ( ), longvanes, mass flow rate of 0�40 kg s�1; ( ), long vanes, massflow rate of 0�69 kg s�1; ( ), long vanes, mass flow rate of
1�45 kg s�1
TANGENTIAL AND CYLINDRICAL FERTILISER DISTRIBUTION PATTERN CHARACTERISATION 333
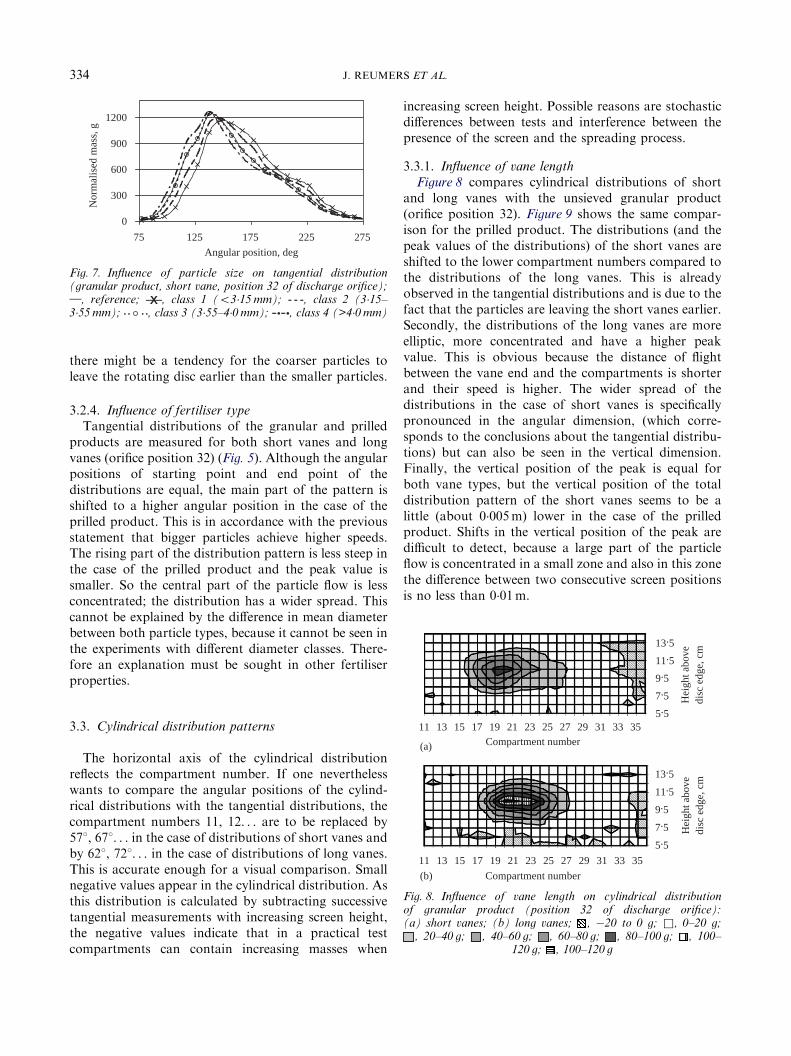
there might be a tendency for the coarser particles toleave the rotating disc earlier than the smaller particles.
3.2.4. Influence of fertiliser type
Tangential distributions of the granular and prilledproducts are measured for both short vanes and longvanes (orifice position 32) (Fig. 5). Although the angularpositions of starting point and end point of thedistributions are equal, the main part of the pattern isshifted to a higher angular position in the case of theprilled product. This is in accordance with the previousstatement that bigger particles achieve higher speeds.The rising part of the distribution pattern is less steep inthe case of the prilled product and the peak value issmaller. So the central part of the particle flow is lessconcentrated; the distribution has a wider spread. Thiscannot be explained by the difference in mean diameterbetween both particle types, because it cannot be seen inthe experiments with different diameter classes. There-fore an explanation must be sought in other fertiliserproperties.
3.3. Cylindrical distribution patterns
The horizontal axis of the cylindrical distributionreflects the compartment number. If one neverthelesswants to compare the angular positions of the cylind-rical distributions with the tangential distributions, thecompartment numbers 11, 12. . . are to be replaced by578, 678. . . in the case of distributions of short vanes andby 628, 728. . . in the case of distributions of long vanes.This is accurate enough for a visual comparison. Smallnegative values appear in the cylindrical distribution. Asthis distribution is calculated by subtracting successivetangential measurements with increasing screen height,the negative values indicate that in a practical testcompartments can contain increasing masses when
increasing screen height. Possible reasons are stochasticdifferences between tests and interference between thepresence of the screen and the spreading process.
3.3.1. Influence of vane length
Figure 8 compares cylindrical distributions of shortand long vanes with the unsieved granular product(orifice position 32). Figure 9 shows the same compar-ison for the prilled product. The distributions (and thepeak values of the distributions) of the short vanes areshifted to the lower compartment numbers compared tothe distributions of the long vanes. This is alreadyobserved in the tangential distributions and is due to thefact that the particles are leaving the short vanes earlier.Secondly, the distributions of the long vanes are moreelliptic, more concentrated and have a higher peakvalue. This is obvious because the distance of flightbetween the vane end and the compartments is shorterand their speed is higher. The wider spread of thedistributions in the case of short vanes is specificallypronounced in the angular dimension, (which corre-sponds to the conclusions about the tangential distribu-tions) but can also be seen in the vertical dimension.Finally, the vertical position of the peak is equal forboth vane types, but the vertical position of the totaldistribution pattern of the short vanes seems to be alittle (about 0�005m) lower in the case of the prilledproduct. Shifts in the vertical position of the peak aredifficult to detect, because a large part of the particleflow is concentrated in a small zone and also in this zonethe difference between two consecutive screen positionsis no less than 0�01m.
ARTICLE IN PRESS
11 13 15 17 19 21 23 25 27 29 31 33 355.5
7.5
9.5
11.5
13.5
Compartment number
Hei
ght a
bove
di
sc e
dge,
cm
11 13 15 17 19 21 23 25 27 29 31 33 35
5.5
7.5
9.5
11.5
13.5
Hei
ght a
bove
di
sc e
dge,
cm
Compartment number
(a)
(b)
Fig. 8. Influence of vane length on cylindrical distributionof granular product (position 32 of discharge orifice):(a) short vanes; (b) long vanes; , �20 to 0 g; &, 0–20 g;
, 20–40 g; , 40–60 g; , 60–80 g; , 80–100 g; , 100–120 g; , 100–120 g
0
300
600
900
1200
75 125 175 225 275
Angular position, deg
Nor
mal
ised
mas
s, g
Fig. 7. Influence of particle size on tangential distribution(granular product, short vane, position 32 of discharge orifice);}, reference; , class 1 (53�15 mm); - - -, class 2 (3�15–3�55 mm); , class 3 (3�55–4�0 mm); , class 4 (>4�0 mm)
J. REUMERS ET AL.334
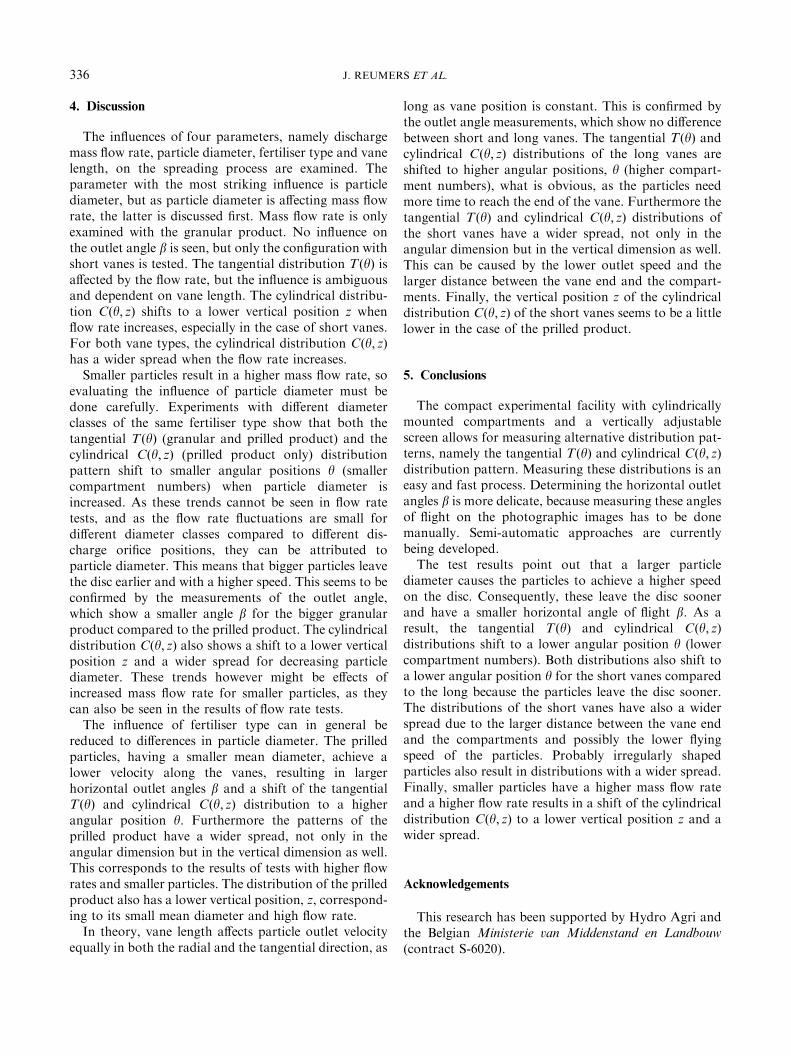
3.3.2. Influence of mass flow rate
From a comparison of the cylindrical distributions ofthe granular product with three different flow rates (forboth short and long vanes) can be seen that an increaseof the flow rate causes the distribution pattern to shift toa lower vertical position. This is most pronounced forthe short vanes. Even a shift of the peak to a lowervertical position can be observed in that case. Thiscannot be seen for the long vanes. The vertical intervalsbetween screen positions are no less than 0�01m, makingthe shifts in peak position hard to detect. For both vanetypes, the distribution has a wider spread when the flowrate increases. This is hard to examine in the case of theshort vane because these distributions are obtained fromshort series of measurements (a limited number ofvertical screen positions).
3.3.3. Influence of particle diameter
The influence of particle diameter is investigated withthe prilled product (short vanes, orifice position 32).Smaller particles, however, result in a larger mass flowrate for the same orifice position. Although thedifferences in mass flow rate are not as big betweendifferent diameter classes compared to different orificepositions, it is still possible that the observed effects areflow rate effects instead of diameter effects. Thedistributions of different diameter classes namely aremeasured with short vanes, which are most sensitive toflow rate effects.
The position of the peak value is equal for eachdiameter class. With increasing mean diameter, the total
distribution pattern however shifts slightly to the lowercompartment numbers and is more concentrated in theangular dimension. These observations confirm that theparticles with a larger diameter achieve a higher speedon the disc. As a consequence, they will reach the end ofthe vane sooner and the horizontal outlet angle will besmaller. This can also be concluded from the analyses ofthe measured horizontal directions and the tangentialdistributions patterns. Furthermore, a shift towards ahigher vertical position can be seen for a larger meandiameter. This, however, can be an effect of flow rate, fora larger diameter results in a smaller flow rate and bydecreasing the flow rate the cylindrical distribution shiftsupwards.
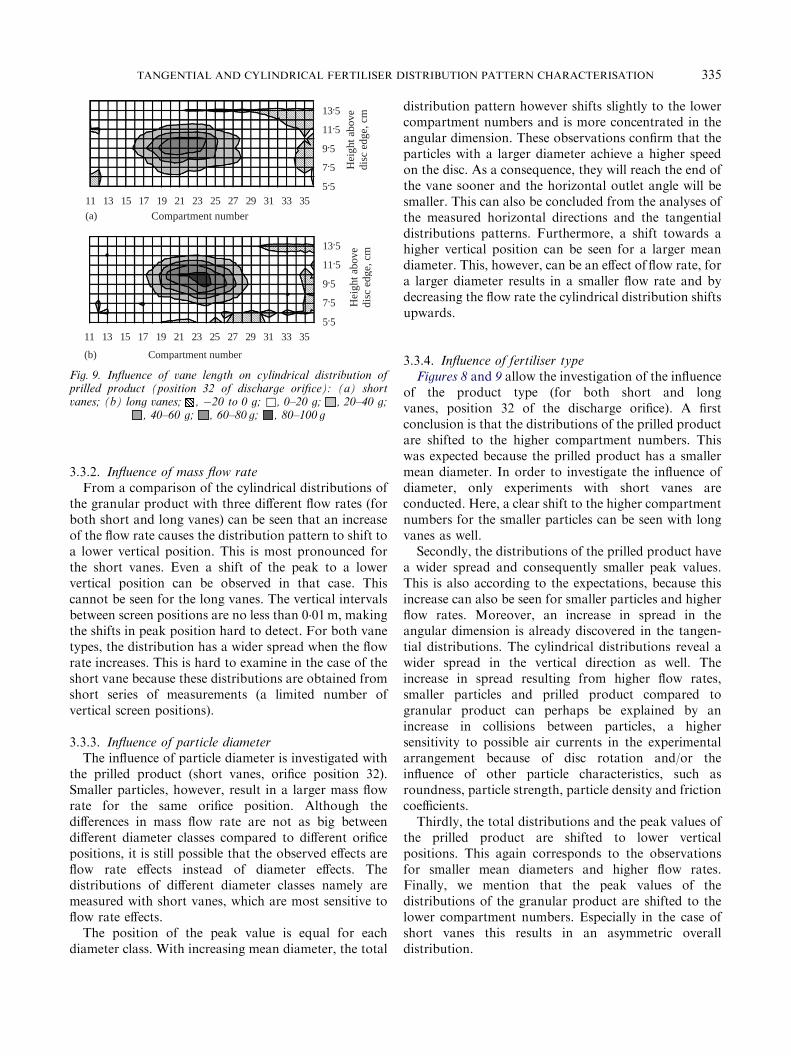
3.3.4. Influence of fertiliser type
Figures 8 and 9 allow the investigation of the influenceof the product type (for both short and longvanes, position 32 of the discharge orifice). A firstconclusion is that the distributions of the prilled productare shifted to the higher compartment numbers. Thiswas expected because the prilled product has a smallermean diameter. In order to investigate the influence ofdiameter, only experiments with short vanes areconducted. Here, a clear shift to the higher compartmentnumbers for the smaller particles can be seen with longvanes as well.
Secondly, the distributions of the prilled product havea wider spread and consequently smaller peak values.This is also according to the expectations, because thisincrease can also be seen for smaller particles and higherflow rates. Moreover, an increase in spread in theangular dimension is already discovered in the tangen-tial distributions. The cylindrical distributions reveal awider spread in the vertical direction as well. Theincrease in spread resulting from higher flow rates,smaller particles and prilled product compared togranular product can perhaps be explained by anincrease in collisions between particles, a highersensitivity to possible air currents in the experimentalarrangement because of disc rotation and/or theinfluence of other particle characteristics, such asroundness, particle strength, particle density and frictioncoefficients.
Thirdly, the total distributions and the peak values ofthe prilled product are shifted to lower verticalpositions. This again corresponds to the observationsfor smaller mean diameters and higher flow rates.Finally, we mention that the peak values of thedistributions of the granular product are shifted to thelower compartment numbers. Especially in the case ofshort vanes this results in an asymmetric overalldistribution.
ARTICLE IN PRESS
11 13 15 17 19 21 23 25 27 29 31 33 355.5
7.5
9.5
11.5
13.5
(a)
(b)
11 13 15 17 19 21 23 25 27 29 31 33 355.5
7.5
9.5
11.5
13.5
Hei
ght a
bove
di
sc e
d ge,
cm
Hei
ght a
bove
di
sc e
dge,
cm
Compartment number
Compartment number
Fig. 9. Influence of vane length on cylindrical distribution ofprilled product (position 32 of discharge orifice): (a) shortvanes; (b) long vanes; , �20 to 0 g; &, 0–20 g; , 20–40 g;
, 40–60 g; , 60–80 g; , 80–100 g
TANGENTIAL AND CYLINDRICAL FERTILISER DISTRIBUTION PATTERN CHARACTERISATION 335
4. Discussion
The influences of four parameters, namely dischargemass flow rate, particle diameter, fertiliser type and vanelength, on the spreading process are examined. Theparameter with the most striking influence is particlediameter, but as particle diameter is affecting mass flowrate, the latter is discussed first. Mass flow rate is onlyexamined with the granular product. No influence onthe outlet angle b is seen, but only the configuration withshort vanes is tested. The tangential distribution TðyÞ isaffected by the flow rate, but the influence is ambiguousand dependent on vane length. The cylindrical distribu-tion Cðy; zÞ shifts to a lower vertical position z whenflow rate increases, especially in the case of short vanes.For both vane types, the cylindrical distribution Cðy; zÞhas a wider spread when the flow rate increases.
Smaller particles result in a higher mass flow rate, soevaluating the influence of particle diameter must bedone carefully. Experiments with different diameterclasses of the same fertiliser type show that both thetangential TðyÞ (granular and prilled product) and thecylindrical Cðy; zÞ (prilled product only) distributionpattern shift to smaller angular positions y (smallercompartment numbers) when particle diameter isincreased. As these trends cannot be seen in flow ratetests, and as the flow rate fluctuations are small fordifferent diameter classes compared to different dis-charge orifice positions, they can be attributed toparticle diameter. This means that bigger particles leavethe disc earlier and with a higher speed. This seems to beconfirmed by the measurements of the outlet angle,which show a smaller angle b for the bigger granularproduct compared to the prilled product. The cylindricaldistribution Cðy; zÞ also shows a shift to a lower verticalposition z and a wider spread for decreasing particlediameter. These trends however might be effects ofincreased mass flow rate for smaller particles, as theycan also be seen in the results of flow rate tests.
The influence of fertiliser type can in general bereduced to differences in particle diameter. The prilledparticles, having a smaller mean diameter, achieve alower velocity along the vanes, resulting in largerhorizontal outlet angles b and a shift of the tangentialTðyÞ and cylindrical Cðy; zÞ distribution to a higherangular position y. Furthermore the patterns of theprilled product have a wider spread, not only in theangular dimension but in the vertical dimension as well.This corresponds to the results of tests with higher flowrates and smaller particles. The distribution of the prilledproduct also has a lower vertical position, z, correspond-ing to its small mean diameter and high flow rate.
In theory, vane length affects particle outlet velocityequally in both the radial and the tangential direction, as
long as vane position is constant. This is confirmed bythe outlet angle measurements, which show no differencebetween short and long vanes. The tangential TðyÞ andcylindrical Cðy; zÞ distributions of the long vanes areshifted to higher angular positions, y (higher compart-ment numbers), what is obvious, as the particles needmore time to reach the end of the vane. Furthermore thetangential TðyÞ and cylindrical Cðy; zÞ distributions ofthe short vanes have a wider spread, not only in theangular dimension but in the vertical dimension as well.This can be caused by the lower outlet speed and thelarger distance between the vane end and the compart-ments. Finally, the vertical position z of the cylindricaldistribution Cðy; zÞ of the short vanes seems to be a littlelower in the case of the prilled product.
5. Conclusions
The compact experimental facility with cylindricallymounted compartments and a vertically adjustablescreen allows for measuring alternative distribution pat-terns, namely the tangential TðyÞ and cylindrical Cðy; zÞdistribution pattern. Measuring these distributions is aneasy and fast process. Determining the horizontal outletangles b is more delicate, because measuring these anglesof flight on the photographic images has to be donemanually. Semi-automatic approaches are currentlybeing developed.
The test results point out that a larger particlediameter causes the particles to achieve a higher speedon the disc. Consequently, these leave the disc soonerand have a smaller horizontal angle of flight b. As aresult, the tangential TðyÞ and cylindrical Cðy; zÞdistributions shift to a lower angular position y (lowercompartment numbers). Both distributions also shift toa lower angular position y for the short vanes comparedto the long because the particles leave the disc sooner.The distributions of the short vanes have also a widerspread due to the larger distance between the vane endand the compartments and possibly the lower flyingspeed of the particles. Probably irregularly shapedparticles also result in distributions with a wider spread.Finally, smaller particles have a higher mass flow rateand a higher flow rate results in a shift of the cylindricaldistribution Cðy; zÞ to a lower vertical position z and awider spread.
Acknowledgements
This research has been supported by Hydro Agri andthe Belgian Ministerie van Middenstand en Landbouw
(contract S-6020).
ARTICLE IN PRESSJ. REUMERS ET AL.336
References
Adjroudi R (1993). Comportement d’un flux de particles solidesh!eet!eerog"eenes sous l’action d’un lanceur rotatif. [Behaviour ofa flux of heterogeneous solid particles during treatment by acentrifugal spreader.] PhD Thesis, Institut National Agro-nomique, Paris-Grignon, France
Dobler K; Flatow J (1968). Berechnung der W .uurfg.aange beimSchleuderd .uungerstreuern. [Calculation of particle trajec-tories, forced by a centrifugal spreader.] Grundlagen derLandtechnik, 18(4), 129–164
G.oohlich H; Kesten E (1972). Einfl .uusse auf das Verhaltenvon Haufwerkstr .oomen auf Schleuderscheiben von Miner-ald .uungerstreuern. Teil 1: Aufgabenstellung und Versuch.[Influences on the behaviour of particle outlet streams ofcentrifugal spreading discs of mineral fertiliser spreaders.Part 1: task list and conducted tests.] Grundlagen derLandtechnik Bd., 22, No. 1
Grift T E; Hofstee (1997). Measurement of velocity anddiameter of individual fertilizer particles by an opticalmethod. Journal of Agricultural Engineering Research,66(3), 235–238, doi:10.1006/jaer.1996.0129
Heppler K (1993). Parameterstudien zur Granulatausbringungmit Schleuderscheiben. [A parameter study on granularfertiliser distribution by centrifugal spreaders.] PhD Thesis,Facult.aat f .uur Maschinenbau der Universit.aat Karlsruhe (TH),Germany
Hofstee J W (1993). Physical properties of fertilizer in relationto handling and spreading. PhD Thesis, AgriculturalUniversity, Wageningen, The Netherlands
Hofstee J W (1994). Handling and spreading of fertilizers: part3, measurements of particle velocities and directions withultrasonic transducers, theory, measurement system andexperimental arrangements. Journal of Agricultural Engi-neering Research, 58(1), 1–16, doi:10.1006/jaer.1994.1030
Inns F M; Reece A R (1962). The theory of the centrifugaldistributor II: motion on the disc, off-centre feed. Journal ofAgricultural Engineering Research, 7(4), 345–353
ISO (1983). ISO 5690 Equipment for distributing fertili-sers}test methods}part 1: full width fertiliser distributors.International Organization for Standardisation StandardsHandbook 13, Agricultural Machinery, pp. 373–386
Olieslagers B (1997). Fertilizer distribution modelling forcentrifugal spreader design. PhD Thesis, Faculteit Land-
bouwkundige en Toegepaste Biologische Wetenschappen,K.U.Leuven, Belgium
Parris K; Reille L (1999). Measuring the environmentalimpacts of agriculture: use and management of nutrients.Proceedings no. 442. The International Fertiliser Society,York, UK
Persson K (1996). Interactions between fertilisers and sprea-ders. Proceedings no. 389. The International FertiliserSociety, York, UK
Persson K (1998). Physical qualities of fertilisers and variablerate spreading-interactions. Proceedings no. 424. The Inter-national Fertiliser Society, York, UK
Persson K; Skovsgaard H (1998). Fertiliser characteristics andspreading patterns from centrifugal spreaders. Proceedingsof the International Conference on Agricultural Engineer-ing, AgEng, Oslo, EurAgEng Paper No. 98-A-058
Pettersen J M; Svendsen J A; Ovland S (1991). A method ofstudying the influence of fertilizer particle size on thedistribution from a twin-disc spreader. Journal of Agricul-tural Engineering Research, 50(4), 291–303
Pitt R E; Farmer G S; Walker L P (1982). Approximatingequations for rotary distributor spread patterns. Transac-tions of the ASAE, 25(6), 1544–1552
Prummel J; Datema P (1962). Strooiregelmaat van kunstmest-strooiers en de betekenis daarvan voor de opbrengst.[Regularity of spreading of artificial fertiliser spreadersand the meaning thereof to yield.] Landbouwmechanisatie,13, 742–753
Reumers J; Tijskens E; Ramon H (2003). Experimentalcharacterisation of the tangential and cylindrical distri-bution pattern of centrifugal fertiliser spreaders: towardsan alternative for spreading hall measurements. Bio-systems Engineering, doi:10.1016/j.biosystemseng.2003.09.002
Sogaard H T; Kierkegaard P (1994). Yield reduction resultingfrom uneven fertilizer distribution. Transactions of theASAE, 37(6), 1749–1752
Tissot S (1995). Analyse de l’homog!eeneite de la repartitiontransversale des engrais !eepandus par des distributeurscentrifuges. [Analysis of the homogeneity of the transversedistribution of fertiliser distributed by centrifugal spreaders.]PhD Thesis, Facult!ee des Sciences Agronomiques deGembloux, Belgium
Vangeyte J; Langenaekens J (2001). Personal communication
ARTICLE IN PRESSTANGENTIAL AND CYLINDRICAL FERTILISER DISTRIBUTION PATTERN CHARACTERISATION 337