constant tangential angle elected interest points
TRANSCRIPT
Constant Tangential Angle Elected Interest Points
Ahmed REBAIINRIA Rocquencourt78153 Le chesnay
France
Alexis JOLYINRIA Rocquencourt78153 Le chesnay
France
Nozha BOUJEMAAINRIA Rocquencourt78153 Le chesnay
France
ABSTRACT
This paper presents a new interest points detector whosegoal is to better catch visual attention than standard de-tectors. It is based on the generalization of Loy and Zelin-sky transform [18] which was originally developed to detectradial symmetry centers. The voting algorithm is here ex-tended to a set of voting orientations which allows the con-struction of a more complete analyze space. The specificityof this detector is that it enables the detection of pointswith different topological natures with the same detector.Centers of geometric forms or curves as well as junctions orvanishing points can be detected depending on the imagecontent. The paper describes and illustrates the principleof this new algorithm and discusses some properties andimprovements. Preliminary experiments are also given andshow that the detected points are stable under several typi-cal transformations and that they are promising in terms ofobjects generic subparts detection.
Categories and Subject Descriptors
I.4.7 [Image Processing and Computer Vision]: Fea-ture Measurement—Feature representation
General Terms
Algorithms
1. INTRODUCTION AND
RELATED WORKTo improve automatic processing, scientists are often in-
spired by natural principles. Like human visual systemwhich focus on some specific points more than others, re-searchers have used interest points to solve various problemsin computer vision such as object recognition [17, 13], widebaseline matching for stereo pairs [1], image retrieval [25],etc. Many different interest points detectors exist in the lit-erature : corners and junctions detectors [9, 10, 7], wavelet-based detectors [2, 11], phase-based detectors [3], Difference
Permission to make digital or hard copies of all or part of this work forpersonal or classroom use is granted without fee provided that copies arenot made or distributed for profit or commercial advantage and that copiesbear this notice and the full citation on the first page. To copy otherwise, torepublish, to post on servers or to redistribute to lists, requires prior specificpermission and/or a fee.MIR’06, October 26–27, 2006, Santa Barbara, California, USA.Copyright 2006 ACM 1-59593-495-2/06/0010 ...$5.00.
of Gaussian based detectors [22, 17], color based detectors[8], etc. To improve the relevance of the detected points, in-variance to view point changes has also been widely studied.The scale-space theory [15, 6] has been prolific in the designof scale-invariant detectors [19] and several affine-invariantdetectors have been recently compared in [19] and [20]. Theevaluation studies typically use two common criteria: re-peatability and matching score under viewpoint changes orimage transformations [27, 20]. The repeatability meansthat the points remain stable after changing the imagingconditions or transforming the image and the matching scoregives a distinctiveness measure of a given local feature com-puted around each interest point (it is thus more indicativethan quantitative).These metrics are however not sufficient for several ap-
plications and particularly for generic objects recognitionor object class recognition methods based on local features[21, 5]. In such applications, generalization properties aswell as invariance properties are required. That means thatthe points should be detected at the same location in twodifferent objects of the same category. Such a criterion ishighly related to the human interpretation of the detectedpoints and is thus more difficult to assess. The evaluationis thus classically performed after the learning selection ofrelevant local features and is thus dependent on the featurescomputed around the interest points and on the learningstrategy. It is however well known that only a very few per-centage of the initial detected features are used in the finalobject class model. This tends to prove that most of theinitial detected points are unsuitable for such tasks and thisamount of undesirable points is problematic both in termof computation time and efficiency. It is thus essential toreduce the input of local features by improving their visualinterpretability.A number of context-free attentional operators have been
proposed in that way for automatically detecting points ofinterest in images. These operators have tended to use localradial symmetry as a measure of interest [18]. This corre-lates well with psychophysical findings on fixation points ofthe human visual system. It has been observed that visualfixations tend to concentrate along lines of symmetry [16].Sela and Levine [28] noted that some psychophysical find-ings corroborated this, placing the mean eye fixation pointsat the intersection of lines of symmetry on a number of sim-ple 2D geometric figures. It has also been observed thatvisual fixations are attracted to centers of mass of objectsand that these centers of mass are more readily determinedfor objects with multiple symmetry axes [18]. Stark and
203
Pritevera [23] compared the responses of a number of arti-ficial region of interest detectors, including Reisfeld’s gen-eralized symmetry transform [24], with regions of interestdetected by human subjects. By using several different algo-rithms in conjunction with a clustering procedure, they wereable to predict the locations of human-detected regions ofinterest. The approach developed by Loy and Zelinsky wasinspired by these results, although the final method baresmore similarity to the work of Sela and Levine [28] and thecircular Hough transform [12]. It determines the contribu-tion each pixel makes to the symmetry of pixels around it,rather than considering the contribution of a local neigh-borhood to a central pixel. Unlike previous techniques thathave used this approach [12, 28, 14], it does not require thegradient to be quantized into angular bins, the contributionof every orientation is computed in a single pass over theimage.In this paper, we propose a generalization of Loy and
Zelinsky’s method. The novelty of this work comes fromproviding a new way of exploring symmetry. By adding anorientation parameter to the voting vectors, we can con-struct a 3-dimensional voting space in which the maximaare expected to be more stable and more topologically di-versified than the radial symmetry centers initially detected.We also provide some improvements by adding an alignmentrejection criterion avoiding unstable points on contours anda sub-pixel location estimation at low-resolution to detectpoints corresponding to large objects without strongly de-grading the computation time. Section 2 of this paper givesthe description of the proposed method and discusses thenature of the detected points. Improvements of the methodare presented in section 3. Section 4 relates some promisingpreliminary experiments and section 5 discusses prospectiveworks and upcoming full experiments.
2. CONSTANT TANGENTIAL
ANGLE ELECTED INTEREST POINTS
2.1 Generalization of Loy andZelinsky’s transform
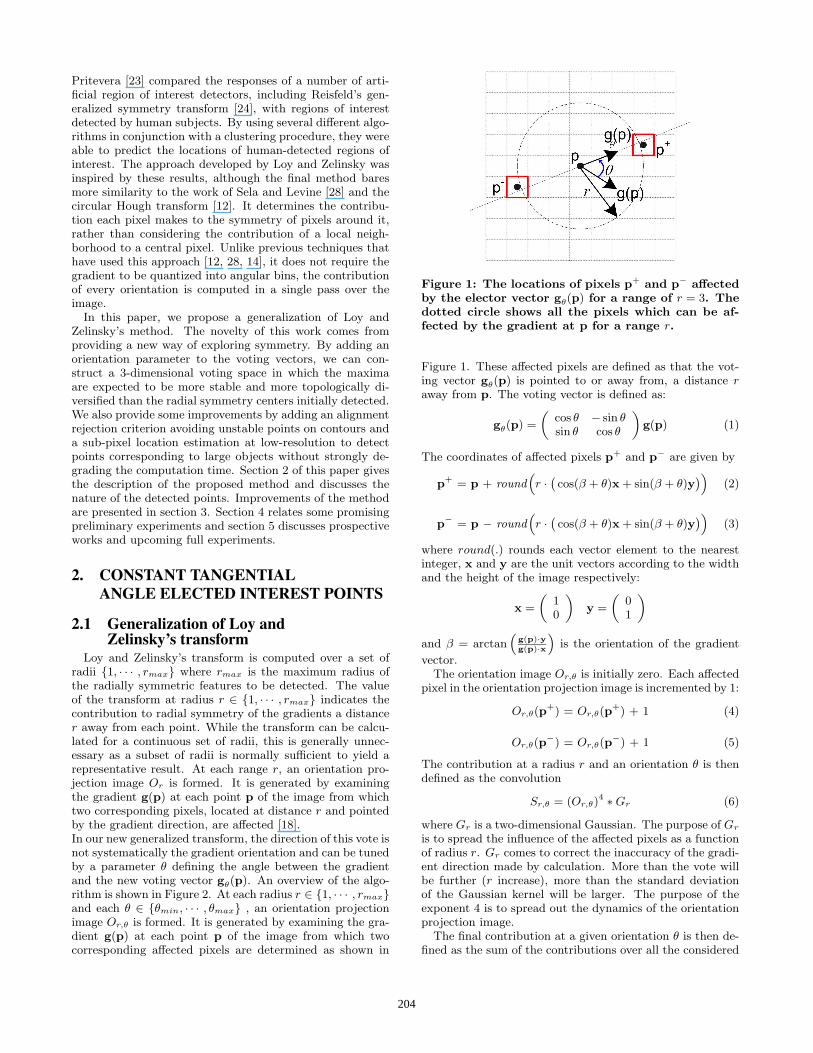
Loy and Zelinsky’s transform is computed over a set ofradii {1, · · · , rmax} where rmax is the maximum radius ofthe radially symmetric features to be detected. The valueof the transform at radius r ∈ {1, · · · , rmax} indicates thecontribution to radial symmetry of the gradients a distancer away from each point. While the transform can be calcu-lated for a continuous set of radii, this is generally unnec-essary as a subset of radii is normally sufficient to yield arepresentative result. At each range r, an orientation pro-jection image Or is formed. It is generated by examiningthe gradient g(p) at each point p of the image from whichtwo corresponding pixels, located at distance r and pointedby the gradient direction, are affected [18].In our new generalized transform, the direction of this vote isnot systematically the gradient orientation and can be tunedby a parameter θ defining the angle between the gradientand the new voting vector gθ(p). An overview of the algo-rithm is shown in Figure 2. At each radius r ∈ {1, · · · , rmax}and each θ ∈ {θmin, · · · , θmax} , an orientation projectionimage Or,θ is formed. It is generated by examining the gra-dient g(p) at each point p of the image from which twocorresponding affected pixels are determined as shown in
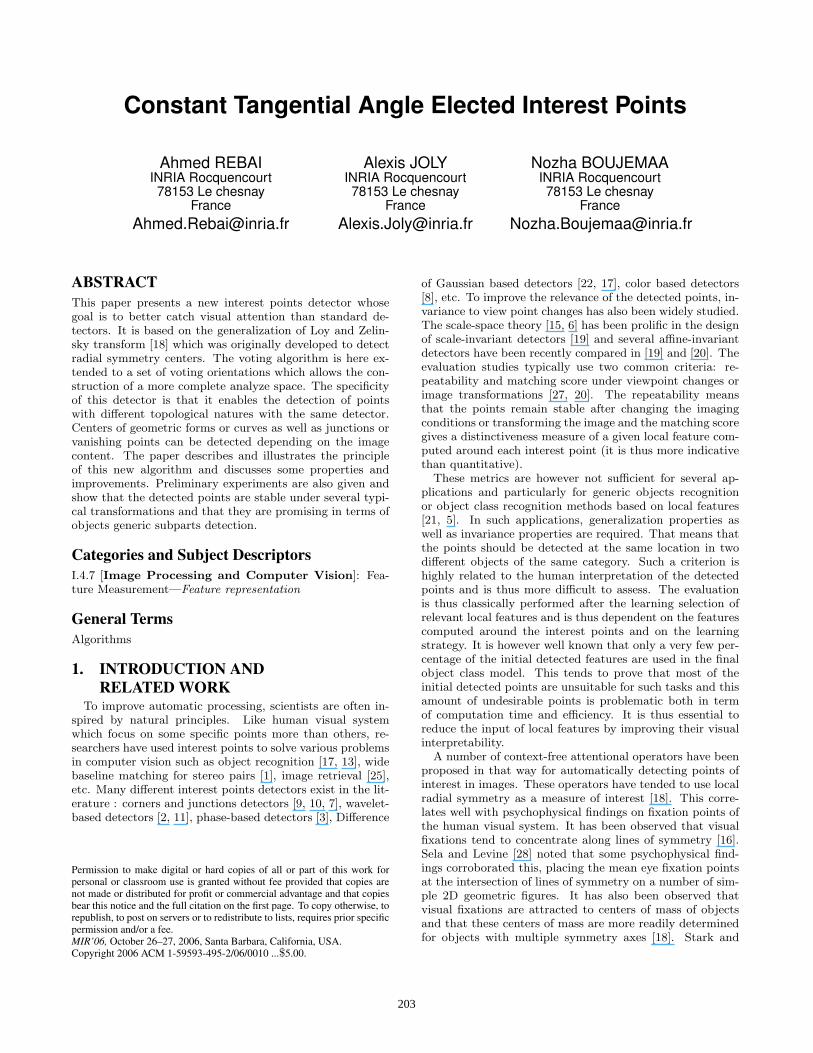
Figure 1: The locations of pixels p+ and p− affectedby the elector vector gθ(p) for a range of r = 3. Thedotted circle shows all the pixels which can be af-fected by the gradient at p for a range r.
Figure 1. These affected pixels are defined as that the vot-ing vector gθ(p) is pointed to or away from, a distance raway from p. The voting vector is defined as:
gθ(p) =
„
cos θ − sin θsin θ cos θ
«
g(p) (1)
The coordinates of affected pixels p+ and p− are given by
p+ = p + round“
r ·`
cos(β + θ)x+ sin(β + θ)y´
”
(2)
p− = p − round“
r ·`
cos(β + θ)x+ sin(β + θ)y´
”
(3)
where round(.) rounds each vector element to the nearestinteger, x and y are the unit vectors according to the widthand the height of the image respectively:
x =
„
10
«
y =
„
01
«
and β = arctan“
g(p)·yg(p)·x
”
is the orientation of the gradient
vector.The orientation image Or,θ is initially zero. Each affected
pixel in the orientation projection image is incremented by 1:
Or,θ(p+) = Or,θ(p
+) + 1 (4)
Or,θ(p−) = Or,θ(p
−) + 1 (5)
The contribution at a radius r and an orientation θ is thendefined as the convolution
Sr,θ = (Or,θ)4 ∗Gr (6)
where Gr is a two-dimensional Gaussian. The purpose of Gris to spread the influence of the affected pixels as a functionof radius r. Gr comes to correct the inaccuracy of the gradi-ent direction made by calculation. More than the vote willbe further (r increase), more than the standard deviationof the Gaussian kernel will be larger. The purpose of theexponent 4 is to spread out the dynamics of the orientationprojection image.The final contribution at a given orientation θ is then de-
fined as the sum of the contributions over all the considered
204
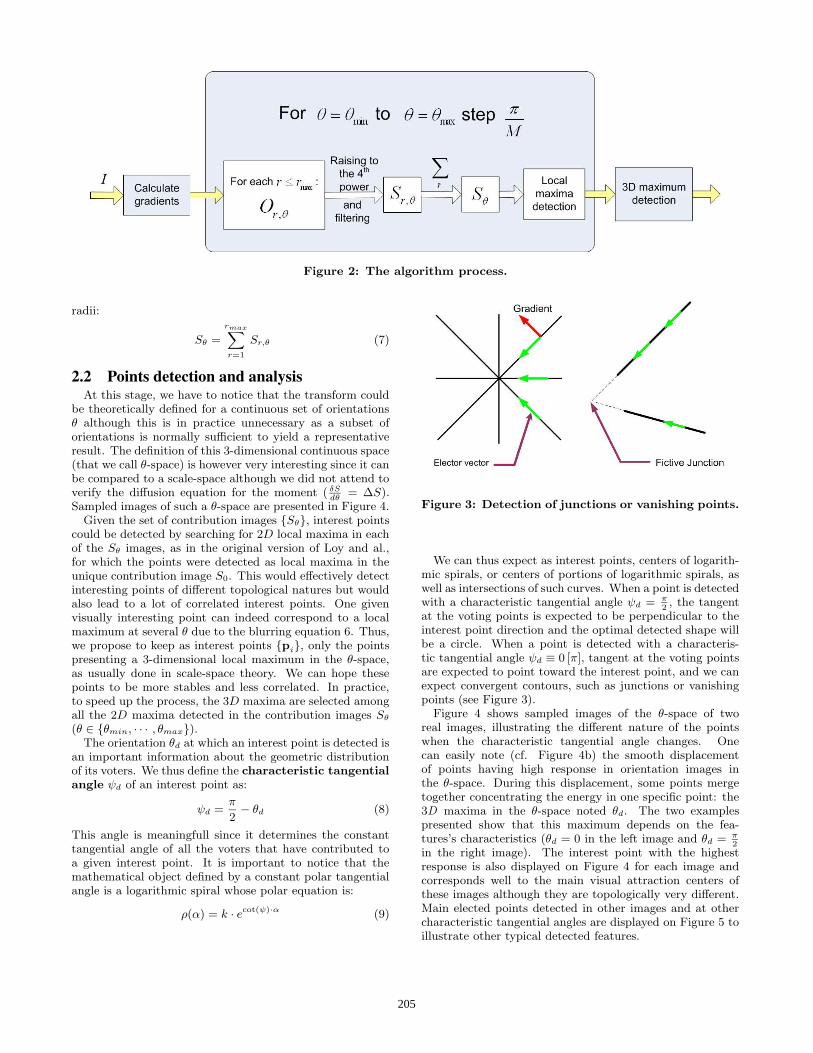
Figure 2: The algorithm process.
radii:
Sθ =
rmaxX
r=1
Sr,θ (7)
2.2 Points detection and analysisAt this stage, we have to notice that the transform could
be theoretically defined for a continuous set of orientationsθ although this is in practice unnecessary as a subset oforientations is normally sufficient to yield a representativeresult. The definition of this 3-dimensional continuous space(that we call θ-space) is however very interesting since it canbe compared to a scale-space although we did not attend toverify the diffusion equation for the moment ( δS
dθ= ∆S).
Sampled images of such a θ-space are presented in Figure 4.Given the set of contribution images {Sθ}, interest points
could be detected by searching for 2D local maxima in eachof the Sθ images, as in the original version of Loy and al.,for which the points were detected as local maxima in theunique contribution image S0. This would effectively detectinteresting points of different topological natures but wouldalso lead to a lot of correlated interest points. One givenvisually interesting point can indeed correspond to a localmaximum at several θ due to the blurring equation 6. Thus,we propose to keep as interest points {pi}, only the pointspresenting a 3-dimensional local maximum in the θ-space,as usually done in scale-space theory. We can hope thesepoints to be more stables and less correlated. In practice,to speed up the process, the 3D maxima are selected amongall the 2D maxima detected in the contribution images Sθ(θ ∈ {θmin, · · · , θmax}).The orientation θd at which an interest point is detected is
an important information about the geometric distributionof its voters. We thus define the characteristic tangentialangle ψd of an interest point as:
ψd =π
2− θd (8)
This angle is meaningfull since it determines the constanttangential angle of all the voters that have contributed toa given interest point. It is important to notice that themathematical object defined by a constant polar tangentialangle is a logarithmic spiral whose polar equation is:
ρ(α) = k · ecot(ψ)·α (9)
Figure 3: Detection of junctions or vanishing points.
We can thus expect as interest points, centers of logarith-mic spirals, or centers of portions of logarithmic spirals, aswell as intersections of such curves. When a point is detectedwith a characteristic tangential angle ψd = π
2, the tangent
at the voting points is expected to be perpendicular to theinterest point direction and the optimal detected shape willbe a circle. When a point is detected with a characteris-tic tangential angle ψd ≡ 0 [π], tangent at the voting pointsare expected to point toward the interest point, and we canexpect convergent contours, such as junctions or vanishingpoints (see Figure 3).Figure 4 shows sampled images of the θ-space of two
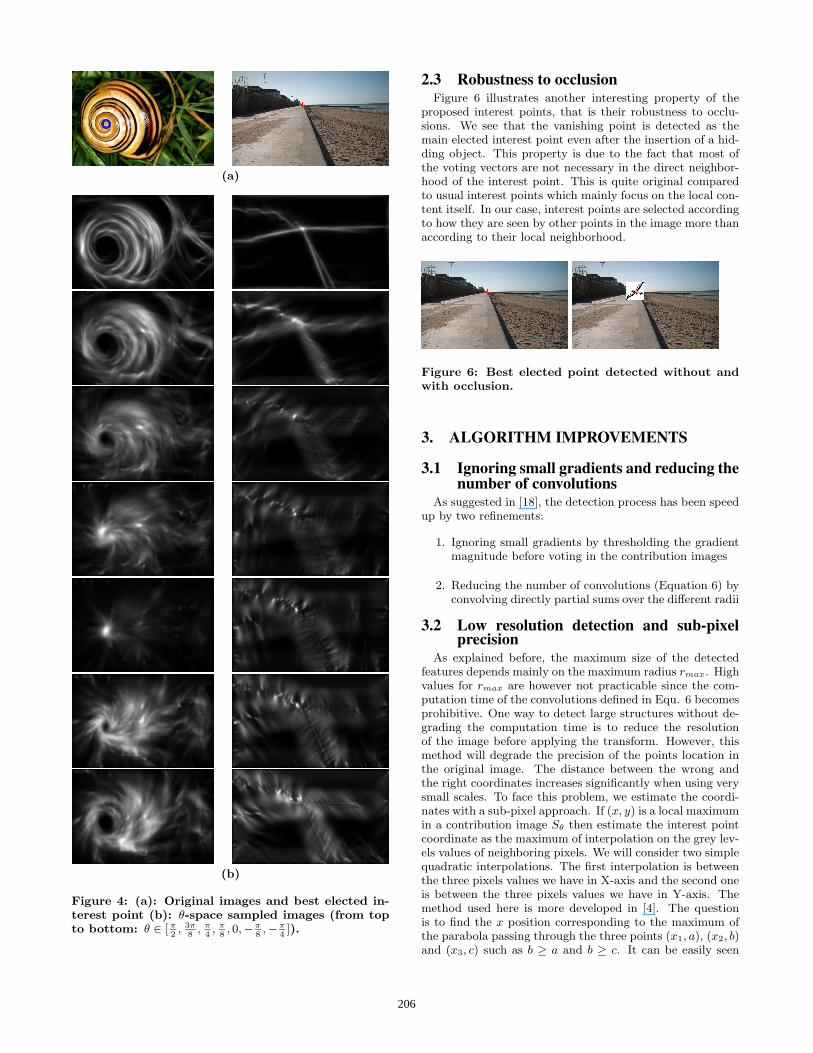
real images, illustrating the different nature of the pointswhen the characteristic tangential angle changes. Onecan easily note (cf. Figure 4b) the smooth displacementof points having high response in orientation images inthe θ-space. During this displacement, some points mergetogether concentrating the energy in one specific point: the3D maxima in the θ-space noted θd. The two examplespresented show that this maximum depends on the fea-tures’s characteristics (θd = 0 in the left image and θd = π
2in the right image). The interest point with the highestresponse is also displayed on Figure 4 for each image andcorresponds well to the main visual attraction centers ofthese images although they are topologically very different.Main elected points detected in other images and at othercharacteristic tangential angles are displayed on Figure 5 toillustrate other typical detected features.
205
(a)
(b)
Figure 4: (a): Original images and best elected in-terest point (b): θ-space sampled images (from topto bottom: θ ∈ [π
2, 3π
8, π
4, π
8, 0,−π
8,−π
4]).
2.3 Robustness to occlusionFigure 6 illustrates another interesting property of the
proposed interest points, that is their robustness to occlu-sions. We see that the vanishing point is detected as themain elected interest point even after the insertion of a hid-ding object. This property is due to the fact that most ofthe voting vectors are not necessary in the direct neighbor-hood of the interest point. This is quite original comparedto usual interest points which mainly focus on the local con-tent itself. In our case, interest points are selected accordingto how they are seen by other points in the image more thanaccording to their local neighborhood.
Figure 6: Best elected point detected without andwith occlusion.
3. ALGORITHM IMPROVEMENTS
3.1 Ignoring small gradients and reducing thenumber of convolutions
As suggested in [18], the detection process has been speedup by two refinements:
1. Ignoring small gradients by thresholding the gradientmagnitude before voting in the contribution images
2. Reducing the number of convolutions (Equation 6) byconvolving directly partial sums over the different radii
3.2 Low resolution detection and sub-pixelprecision
As explained before, the maximum size of the detectedfeatures depends mainly on the maximum radius rmax. Highvalues for rmax are however not practicable since the com-putation time of the convolutions defined in Equ. 6 becomesprohibitive. One way to detect large structures without de-grading the computation time is to reduce the resolutionof the image before applying the transform. However, thismethod will degrade the precision of the points location inthe original image. The distance between the wrong andthe right coordinates increases significantly when using verysmall scales. To face this problem, we estimate the coordi-nates with a sub-pixel approach. If (x, y) is a local maximumin a contribution image Sθ then estimate the interest pointcoordinate as the maximum of interpolation on the grey lev-els values of neighboring pixels. We will consider two simplequadratic interpolations. The first interpolation is betweenthe three pixels values we have in X-axis and the second oneis between the three pixels values we have in Y-axis. Themethod used here is more developed in [4]. The questionis to find the x position corresponding to the maximum ofthe parabola passing through the three points (x1, a), (x2, b)and (x3, c) such as b ≥ a and b ≥ c. It can be easily seen
206
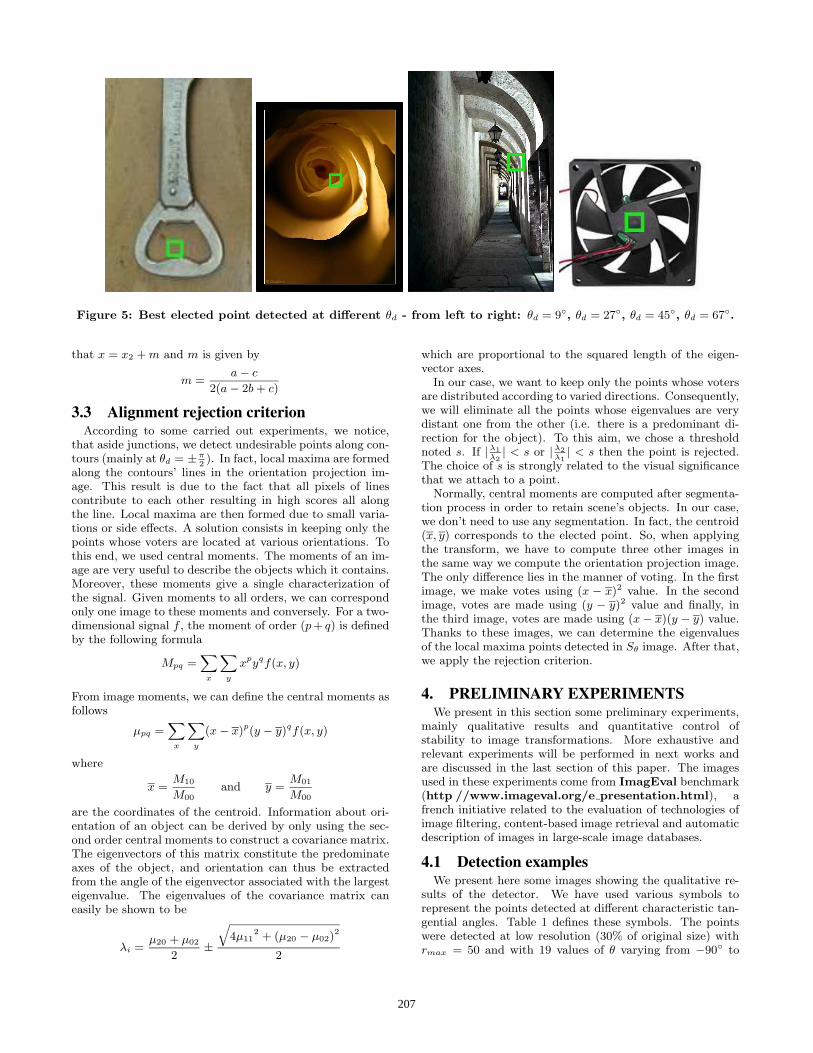
Figure 5: Best elected point detected at different θd - from left to right: θd = 9◦, θd = 27◦, θd = 45◦, θd = 67◦.
that x = x2 +m and m is given by
m =a− c
2(a− 2b+ c)
3.3 Alignment rejection criterionAccording to some carried out experiments, we notice,
that aside junctions, we detect undesirable points along con-tours (mainly at θd = ±
π2). In fact, local maxima are formed
along the contours’ lines in the orientation projection im-age. This result is due to the fact that all pixels of linescontribute to each other resulting in high scores all alongthe line. Local maxima are then formed due to small varia-tions or side effects. A solution consists in keeping only thepoints whose voters are located at various orientations. Tothis end, we used central moments. The moments of an im-age are very useful to describe the objects which it contains.Moreover, these moments give a single characterization ofthe signal. Given moments to all orders, we can correspondonly one image to these moments and conversely. For a two-dimensional signal f , the moment of order (p+ q) is definedby the following formula
Mpq =X
x
X
y
xpyqf(x, y)
From image moments, we can define the central moments asfollows
µpq =X
x
X
y
(x− x)p(y − y)qf(x, y)
where
x =M10
M00and y =
M01
M00
are the coordinates of the centroid. Information about ori-entation of an object can be derived by only using the sec-ond order central moments to construct a covariance matrix.The eigenvectors of this matrix constitute the predominateaxes of the object, and orientation can thus be extractedfrom the angle of the eigenvector associated with the largesteigenvalue. The eigenvalues of the covariance matrix caneasily be shown to be
λi =µ20 + µ02
2±
q
4µ112 + (µ20 − µ02)
2
2
which are proportional to the squared length of the eigen-vector axes.In our case, we want to keep only the points whose voters
are distributed according to varied directions. Consequently,we will eliminate all the points whose eigenvalues are verydistant one from the other (i.e. there is a predominant di-rection for the object). To this aim, we chose a thresholdnoted s. If |λ1
λ2
| < s or |λ2
λ1
| < s then the point is rejected.The choice of s is strongly related to the visual significancethat we attach to a point.Normally, central moments are computed after segmenta-
tion process in order to retain scene’s objects. In our case,we don’t need to use any segmentation. In fact, the centroid(x, y) corresponds to the elected point. So, when applyingthe transform, we have to compute three other images inthe same way we compute the orientation projection image.The only difference lies in the manner of voting. In the firstimage, we make votes using (x − x)2 value. In the secondimage, votes are made using (y − y)2 value and finally, inthe third image, votes are made using (x− x)(y − y) value.Thanks to these images, we can determine the eigenvaluesof the local maxima points detected in Sθ image. After that,we apply the rejection criterion.
4. PRELIMINARY EXPERIMENTSWe present in this section some preliminary experiments,
mainly qualitative results and quantitative control ofstability to image transformations. More exhaustive andrelevant experiments will be performed in next works andare discussed in the last section of this paper. The imagesused in these experiments come from ImagEval benchmark(http //www.imageval.org/e presentation.html), afrench initiative related to the evaluation of technologies ofimage filtering, content-based image retrieval and automaticdescription of images in large-scale image databases.
4.1 Detection examplesWe present here some images showing the qualitative re-
sults of the detector. We have used various symbols torepresent the points detected at different characteristic tan-gential angles. Table 1 defines these symbols. The pointswere detected at low resolution (30% of original size) withrmax = 50 and with 19 values of θ varying from −90◦ to
207
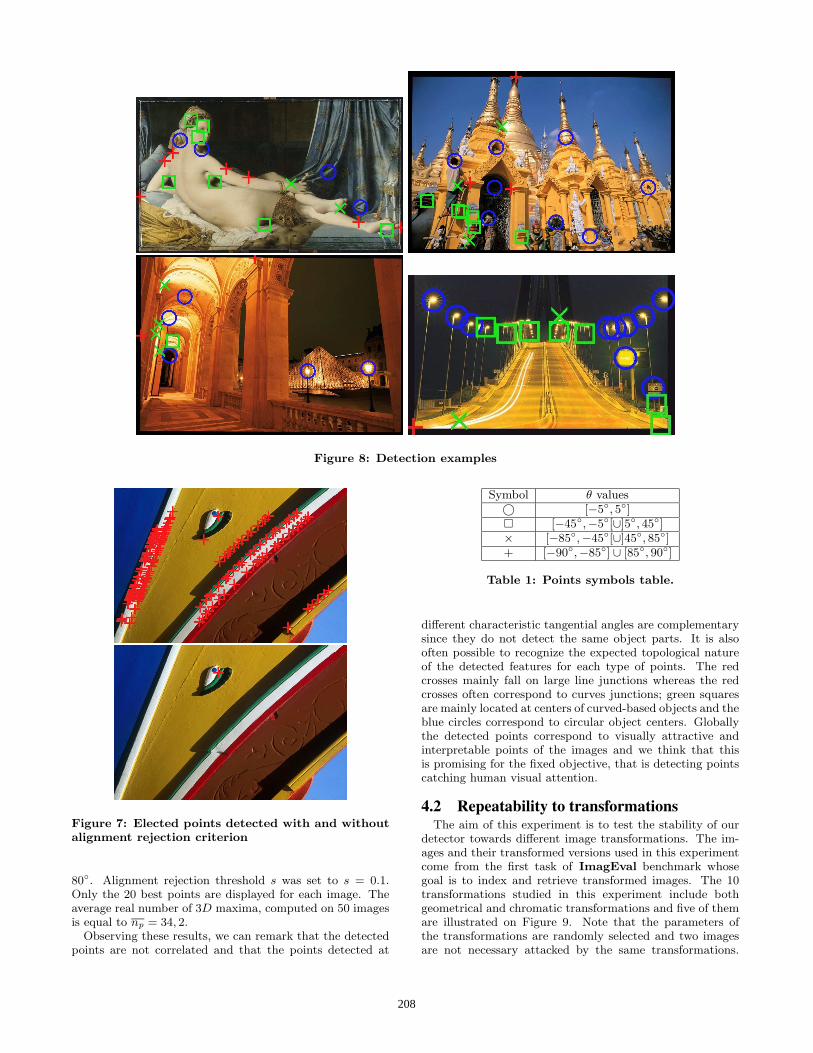
Figure 8: Detection examples
Figure 7: Elected points detected with and withoutalignment rejection criterion
80◦. Alignment rejection threshold s was set to s = 0.1.Only the 20 best points are displayed for each image. Theaverage real number of 3D maxima, computed on 50 imagesis equal to np = 34, 2.Observing these results, we can remark that the detected
points are not correlated and that the points detected at
Symbol θ values© [−5◦, 5◦]¤ [−45◦,−5◦[∪]5◦, 45◦]× [−85◦,−45◦[∪]45◦, 85◦]+ [−90◦,−85◦] ∪ [85◦, 90◦]
Table 1: Points symbols table.
different characteristic tangential angles are complementarysince they do not detect the same object parts. It is alsooften possible to recognize the expected topological natureof the detected features for each type of points. The redcrosses mainly fall on large line junctions whereas the redcrosses often correspond to curves junctions; green squaresare mainly located at centers of curved-based objects and theblue circles correspond to circular object centers. Globallythe detected points correspond to visually attractive andinterpretable points of the images and we think that thisis promising for the fixed objective, that is detecting pointscatching human visual attention.
4.2 Repeatability to transformationsThe aim of this experiment is to test the stability of our
detector towards different image transformations. The im-ages and their transformed versions used in this experimentcome from the first task of ImagEval benchmark whosegoal is to index and retrieve transformed images. The 10transformations studied in this experiment include bothgeometrical and chromatic transformations and five of themare illustrated on Figure 9. Note that the parameters ofthe transformations are randomly selected and two imagesare not necessary attacked by the same transformations.
208
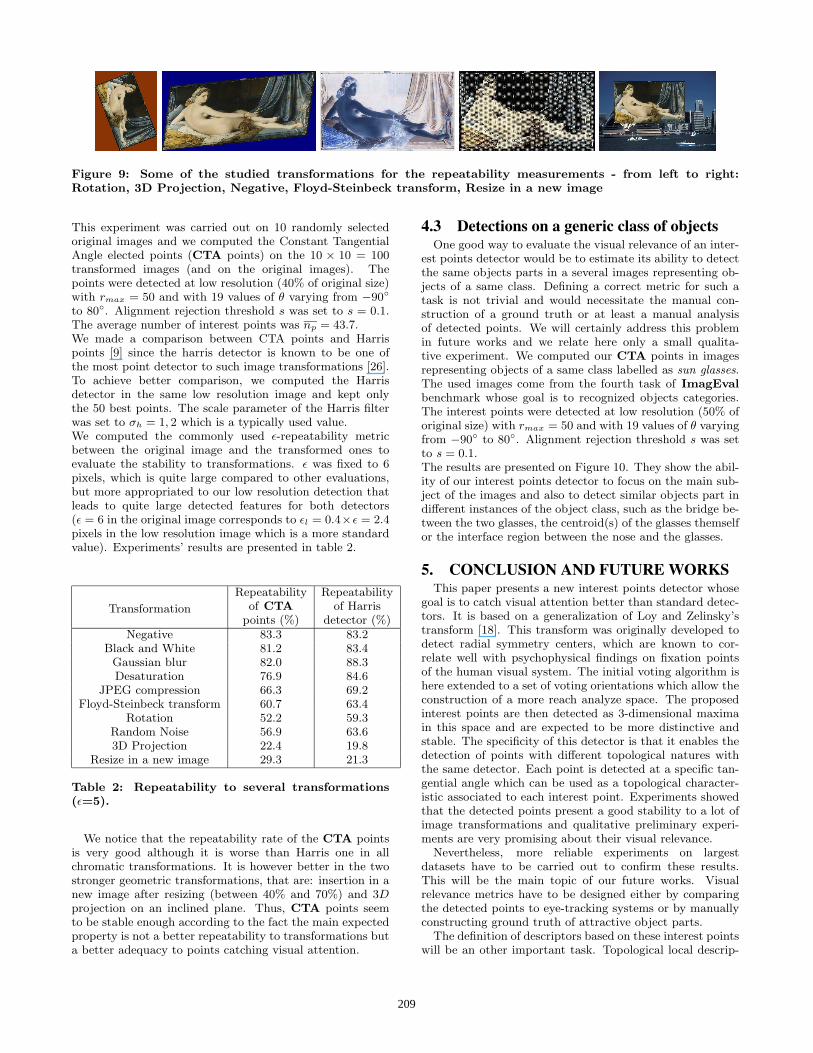
Figure 9: Some of the studied transformations for the repeatability measurements - from left to right:Rotation, 3D Projection, Negative, Floyd-Steinbeck transform, Resize in a new image
This experiment was carried out on 10 randomly selectedoriginal images and we computed the Constant TangentialAngle elected points (CTA points) on the 10 × 10 = 100transformed images (and on the original images). Thepoints were detected at low resolution (40% of original size)with rmax = 50 and with 19 values of θ varying from −90◦
to 80◦. Alignment rejection threshold s was set to s = 0.1.The average number of interest points was np = 43.7.We made a comparison between CTA points and Harrispoints [9] since the harris detector is known to be one ofthe most point detector to such image transformations [26].To achieve better comparison, we computed the Harrisdetector in the same low resolution image and kept onlythe 50 best points. The scale parameter of the Harris filterwas set to σh = 1, 2 which is a typically used value.We computed the commonly used ε-repeatability metricbetween the original image and the transformed ones toevaluate the stability to transformations. ε was fixed to 6pixels, which is quite large compared to other evaluations,but more appropriated to our low resolution detection thatleads to quite large detected features for both detectors(ε = 6 in the original image corresponds to εl = 0.4×ε = 2.4pixels in the low resolution image which is a more standardvalue). Experiments’ results are presented in table 2.
Repeatability Repeatabilityof CTA of HarrisTransformationpoints (%) detector (%)
Negative 83.3 83.2Black and White 81.2 83.4Gaussian blur 82.0 88.3Desaturation 76.9 84.6
JPEG compression 66.3 69.2Floyd-Steinbeck transform 60.7 63.4
Rotation 52.2 59.3Random Noise 56.9 63.63D Projection 22.4 19.8
Resize in a new image 29.3 21.3
Table 2: Repeatability to several transformations(ε=5).
We notice that the repeatability rate of the CTA pointsis very good although it is worse than Harris one in allchromatic transformations. It is however better in the twostronger geometric transformations, that are: insertion in anew image after resizing (between 40% and 70%) and 3Dprojection on an inclined plane. Thus, CTA points seemto be stable enough according to the fact the main expectedproperty is not a better repeatability to transformations buta better adequacy to points catching visual attention.
4.3 Detections on a generic class of objectsOne good way to evaluate the visual relevance of an inter-
est points detector would be to estimate its ability to detectthe same objects parts in a several images representing ob-jects of a same class. Defining a correct metric for such atask is not trivial and would necessitate the manual con-struction of a ground truth or at least a manual analysisof detected points. We will certainly address this problemin future works and we relate here only a small qualita-tive experiment. We computed our CTA points in imagesrepresenting objects of a same class labelled as sun glasses.The used images come from the fourth task of ImagEvalbenchmark whose goal is to recognized objects categories.The interest points were detected at low resolution (50% oforiginal size) with rmax = 50 and with 19 values of θ varyingfrom −90◦ to 80◦. Alignment rejection threshold s was setto s = 0.1.The results are presented on Figure 10. They show the abil-ity of our interest points detector to focus on the main sub-ject of the images and also to detect similar objects part indifferent instances of the object class, such as the bridge be-tween the two glasses, the centroid(s) of the glasses themselfor the interface region between the nose and the glasses.
5. CONCLUSION AND FUTURE WORKSThis paper presents a new interest points detector whose
goal is to catch visual attention better than standard detec-tors. It is based on a generalization of Loy and Zelinsky’stransform [18]. This transform was originally developed todetect radial symmetry centers, which are known to cor-relate well with psychophysical findings on fixation pointsof the human visual system. The initial voting algorithm ishere extended to a set of voting orientations which allow theconstruction of a more reach analyze space. The proposedinterest points are then detected as 3-dimensional maximain this space and are expected to be more distinctive andstable. The specificity of this detector is that it enables thedetection of points with different topological natures withthe same detector. Each point is detected at a specific tan-gential angle which can be used as a topological character-istic associated to each interest point. Experiments showedthat the detected points present a good stability to a lot ofimage transformations and qualitative preliminary experi-ments are very promising about their visual relevance.Nevertheless, more reliable experiments on largest
datasets have to be carried out to confirm these results.This will be the main topic of our future works. Visualrelevance metrics have to be designed either by comparingthe detected points to eye-tracking systems or by manuallyconstructing ground truth of attractive object parts.The definition of descriptors based on these interest points
will be an other important task. Topological local descrip-
209
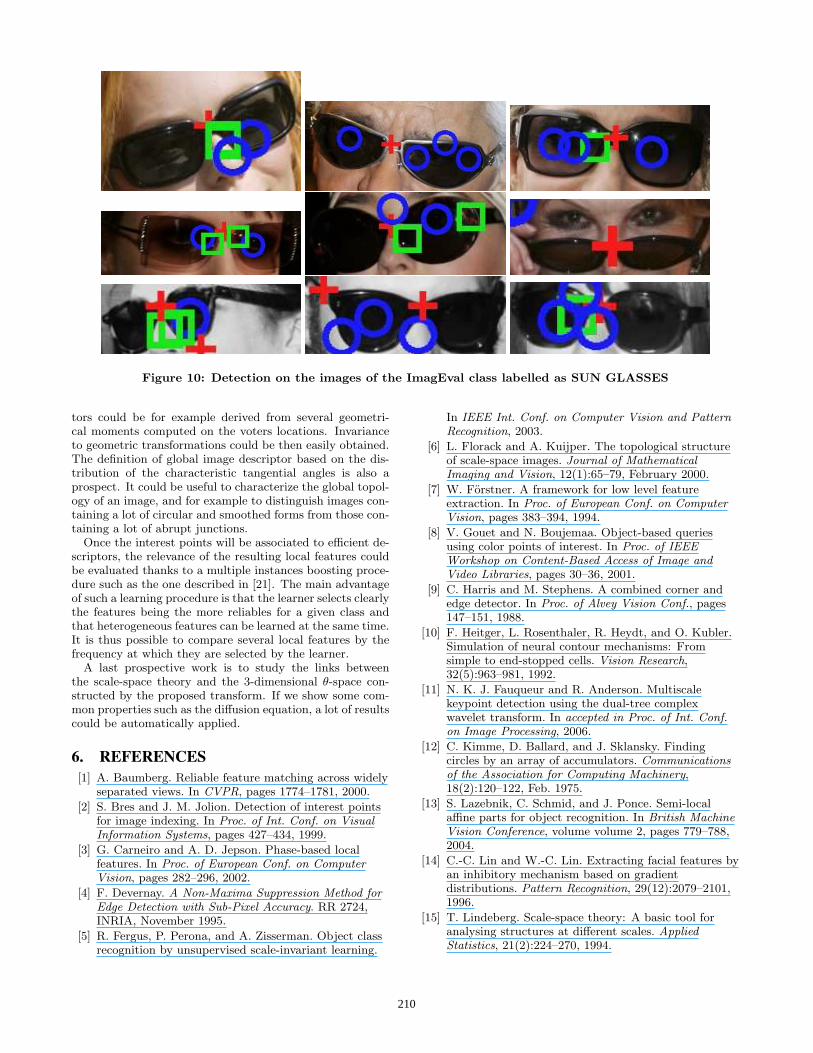
Figure 10: Detection on the images of the ImagEval class labelled as SUN GLASSES
tors could be for example derived from several geometri-cal moments computed on the voters locations. Invarianceto geometric transformations could be then easily obtained.The definition of global image descriptor based on the dis-tribution of the characteristic tangential angles is also aprospect. It could be useful to characterize the global topol-ogy of an image, and for example to distinguish images con-taining a lot of circular and smoothed forms from those con-taining a lot of abrupt junctions.Once the interest points will be associated to efficient de-
scriptors, the relevance of the resulting local features couldbe evaluated thanks to a multiple instances boosting proce-dure such as the one described in [21]. The main advantageof such a learning procedure is that the learner selects clearlythe features being the more reliables for a given class andthat heterogeneous features can be learned at the same time.It is thus possible to compare several local features by thefrequency at which they are selected by the learner.A last prospective work is to study the links between
the scale-space theory and the 3-dimensional θ-space con-structed by the proposed transform. If we show some com-mon properties such as the diffusion equation, a lot of resultscould be automatically applied.
6. REFERENCES
[1] A. Baumberg. Reliable feature matching across widelyseparated views. In CVPR, pages 1774–1781, 2000.
[2] S. Bres and J. M. Jolion. Detection of interest pointsfor image indexing. In Proc. of Int. Conf. on Visual
Information Systems, pages 427–434, 1999.
[3] G. Carneiro and A. D. Jepson. Phase-based localfeatures. In Proc. of European Conf. on Computer
Vision, pages 282–296, 2002.
[4] F. Devernay. A Non-Maxima Suppression Method for
Edge Detection with Sub-Pixel Accuracy. RR 2724,INRIA, November 1995.
[5] R. Fergus, P. Perona, and A. Zisserman. Object classrecognition by unsupervised scale-invariant learning.
In IEEE Int. Conf. on Computer Vision and Pattern
Recognition, 2003.
[6] L. Florack and A. Kuijper. The topological structureof scale-space images. Journal of Mathematical
Imaging and Vision, 12(1):65–79, February 2000.
[7] W. Forstner. A framework for low level featureextraction. In Proc. of European Conf. on Computer
Vision, pages 383–394, 1994.
[8] V. Gouet and N. Boujemaa. Object-based queriesusing color points of interest. In Proc. of IEEE
Workshop on Content-Based Access of Image and
Video Libraries, pages 30–36, 2001.
[9] C. Harris and M. Stephens. A combined corner andedge detector. In Proc. of Alvey Vision Conf., pages147–151, 1988.
[10] F. Heitger, L. Rosenthaler, R. Heydt, and O. Kubler.Simulation of neural contour mechanisms: Fromsimple to end-stopped cells. Vision Research,32(5):963–981, 1992.
[11] N. K. J. Fauqueur and R. Anderson. Multiscalekeypoint detection using the dual-tree complexwavelet transform. In accepted in Proc. of Int. Conf.
on Image Processing, 2006.
[12] C. Kimme, D. Ballard, and J. Sklansky. Findingcircles by an array of accumulators. Communications
of the Association for Computing Machinery,18(2):120–122, Feb. 1975.
[13] S. Lazebnik, C. Schmid, and J. Ponce. Semi-localaffine parts for object recognition. In British Machine
Vision Conference, volume volume 2, pages 779–788,2004.
[14] C.-C. Lin and W.-C. Lin. Extracting facial features byan inhibitory mechanism based on gradientdistributions. Pattern Recognition, 29(12):2079–2101,1996.
[15] T. Lindeberg. Scale-space theory: A basic tool foranalysing structures at different scales. Applied
Statistics, 21(2):224–270, 1994.
210
[16] P. J. Locher and C. F. Nodine. Symmetry Catches theEye. In A. Levy-Schoen and J. K. O’Reagan, editors,Eye Movements: From Physiology to Cognition, pages353–361. Elsevier Science Publishers B. V. (NorthHolland), 1987.
[17] D. G. Lowe. Object recognition from localscale-invariant features. In Proc. of Int. Conf. on
Computer Vision, pages 1150–1157, 1999.
[18] G. Loy and A. Zelinsky. Fast radial symmetry fordetecting points of interest. IEEE Transactions on
Pattern Analysis and Machine Intelligence, 25(8),August 2003.
[19] K. Mikolajczyk and C. Schmid. Scale and affineinvariant interest point detectors. International
Journal of Computer Vision, 60(1):63–86, 2004.
[20] K. Mikolajczyk, T. Tuytelaars, C. Schmid,A. Zisserman, J. Matas, F. Schaffalitzky, T. Kadir,and L. V. Gool. A comparison of affine regiondetectors. International Journal of Computer Vision,65(1/2):43–72, 2005.
[21] A. Opelt, M. Fussenegger, and P. Auer. Genericobject recognition with boosting. IEEE Trans.
Pattern Anal. Mach. Intell., 28(3):416–431, 2006.
[22] A. C. Parker. A representation for shape based onpeaks and ridges in the difference of low passtransform. IEEE Transactions on PAMI, 6(2), mar1984.
[23] C. Privitera and L. Stark. Algorithms for definingvisual regions-of-interest : Comparison with eyefixation. IEEE Transactions on Pattern Analysis and
Machine Intelligence, 22(1):970–982, 2000.
[24] D. Reisfeld, H. Wolfson, and Y. Yeshurun.Context-free attentional operators: the generalizedsymmetry transform. Computer Vision,14(2):119–130, 1995.
[25] C. Schmid and R. Mohr. Local grayvalue invariantsfor image retrieval. IEEE Trans. on Pattern Analysis
and Machine Intelligence, 19(5):530–535, 1997.
[26] C. Schmid, R. Mohr, and C. Bauckhage. Comparingand evaluating interest points. In International
Conference on Computer Vision, Real-Time Imaging,pages 230–235, January 1998.
[27] C. Schmid, R. Mohr, and C. Bauckhage. Evaluation ofinterest point detectors. Computer Vision,37(2):151–172, 2000.
[28] G. Sela and M. D. Levine. Real-time attention forrobotic vision. Real-Time Imaging, 3(3):173–194, 1997.
211